Microbiological Spoilage of Fruits and Vegetables - USDA ARS
Upload
khangminh22Category
view
6download
0
.
The Market for
Dehydrated Vegetables
In the European Union
ITC
INTERNATIONAL TRADE CENTRE UNCTAD/WTO GENEVA
2002
The designations employed and the presentation of material in this study do not imply the expression of any opinion whatsoever on the part of the International Trade Centre UNCTAD/WTO concerning the legal status of any country, territory, city or area or of its authorities, or concerning the delimitation of its frontiers or boundaries.
Short extracts from this document may be freely reproduced, with due acknowledgement of the source. Permission should be requested for more extensive reproduction or translation. A copy
of the reprinted or translated material should be sent to ITC.
This Market Brief has not been formally edited by the International Trade Centre UNCTAD/WTO.
Prepared by Nourane Doyen E-mail: [email protected]
M.DPMD/02/0135
The image on the front cover was provided by Catz International B.V. / Rotterdam
TABLE OF CONTENTS
A. PRODUCT DESCRIPTION .............................................................................................1
B. PRODUCTION, CONSUMPTION AND FOREIGN TRADE.............................................1
PRODUCTION AND CONSUMPTION..........................................................................1
FOREIGN TRADE...........................................................................................................2
C. MARKET CHARACTERISTICS.........................................................................................4
D. MARKET ACCESS ..........................................................................................................5
TARIFFS .........................................................................................................................5
REGULATIONS..............................................................................................................6
PRODUCT SPECIFICATIONS .........................................................................................7
E. PRICES...........................................................................................................................8
F. DISTRIBUTION CHANNELS ..........................................................................................8
G. PACKAGING AND LABELLING.....................................................................................9
H. COMMERCIAL PRACTICES ...........................................................................................9
I. SALES PROMOTION......................................................................................................9
J. MARKET PROSPECTS...................................................................................................10
ANNEXES
I. Imports of Dehydrated/Dried Vegetables in the European Union...............................11
II. Useful Addresses......................................................................................................21
III. Examples of Specifications........................................................................................26
IV. Specialized Publications...........................................................................................30
V. Countries Benefitting from the GSP; LDCs and ACP Countries ..................................31
VI. Sources of Information..............................................................................................33

ABBREVIATIONS ACP African, Caribbean and Pacific States CAD Cash against documents CBI Centre for the Promotion of Imports from Developing Countries CEN European Committee for Standardization CIF Cost, Insurance and Freight EU European Union EUROPROMS European production and market statistics FOB Free on board GSP Generalized System of Preferences HACCP Hazard Analysis Critical Control Point HS Harmonized Commodity description and Coding System LDCs Least developed countries MT Metric tons MFN Most Favoured Nation N.E.S. Not elsewhere specified PRODCOM PROduction COMmunautaire SGS Société Générale de Surveillance SITC3 Standard International Trade Classification (Revision 3)

EXECUTIVE SUMMARY
The EU imported during the period 1996-2000 on average 140,000 MT of dehydrated vegetables annually with a trend of approximately 9% and a total value of approximately US$ 390 million of which, on average: 46,000 MT of onions (approximate value US$ 95 million), 8,000 MT of mushrooms (approximate value US$ 105 million) and 85,000 MT tons of vegetables and mixtures not elsewhere specified (approximate value US$ 193 million). The leading markets in the EU are Germany, the United Kingdom and France. In Germany, many importers re-process the imported dehydrated vegetables before re-exporting them to other EU countries. Dehydrated vegetables are largely consumed in the EU and demand is showing a positive growth. Their success results from their various advantages, mainly to the industry, like reduction in bulk, long storage period, time saving in eliminating tasks such as peeling, cleaning or cutting of fresh produce etc. A variety of sectors use them, the major one being the food processing industry (soups, baby food etc.) that represents around 30% of the EU consumption of dehydrated vegetables. Other users are the pet food and the spice industries, the food sector (canteens, cafeterias, etc.) and the retail sector. Among developing countries, China has a leading position as producer and exporter of dehydrated vegetables, mainly garlic. It is very active in developing its production for exports not only of garlic but also of a variety of vegetables like bell peppers, soya-beans, spinach and potatoes that may represent new opportunities in the EU market. Knowing that onions are the largest dehydrated vegetables imported in the EU, suppliers from developing countries might take advantage of their low labour costs and usually preferential tariffs in order to compete with the USA, which currently dominates the EU market with high quality but also highly priced white onions. Organic dehydrated vegetables represent another interesting niche as demand for organic produce is growing considerably.


1
A. PRODUCT DESCRIPTION This Market Brief covers the European Union market for dehydrated vegetables, dried by various artificially induced dehydration processes, classified under the following codes: SITC3 HS Product description
056.1 0712 Vegetables dried (excluding leguminous vegetables), whole, cut, sliced,
broken or in powder, but not further prepared 056.12 0712.20 Onions dried but not further prepared 056.13 0712.30 Mushrooms and truffles dried but not further prepared 056.19 0712.90 Vegetables and mixtures dried, but not further prepared, not elsewhere
specified Contrary to the ancient sun drying method which causes chemical changes in the structure of products (for example grapes become raisins), dehydration today offers the advantage of preserving foods in a form such that when reconstituted they return to the same state that they were in when fresh. Dehydrated vegetables can be cut, powdered, in granules or in flakes. They can be used for a variety of processing applications. For example, powdered products are used as flavouring ingredients, in the preparation of baby foods and in colouring (beetroot powder). B. PRODUCTION, CONSUMPTION AND FOREIGN TRADE
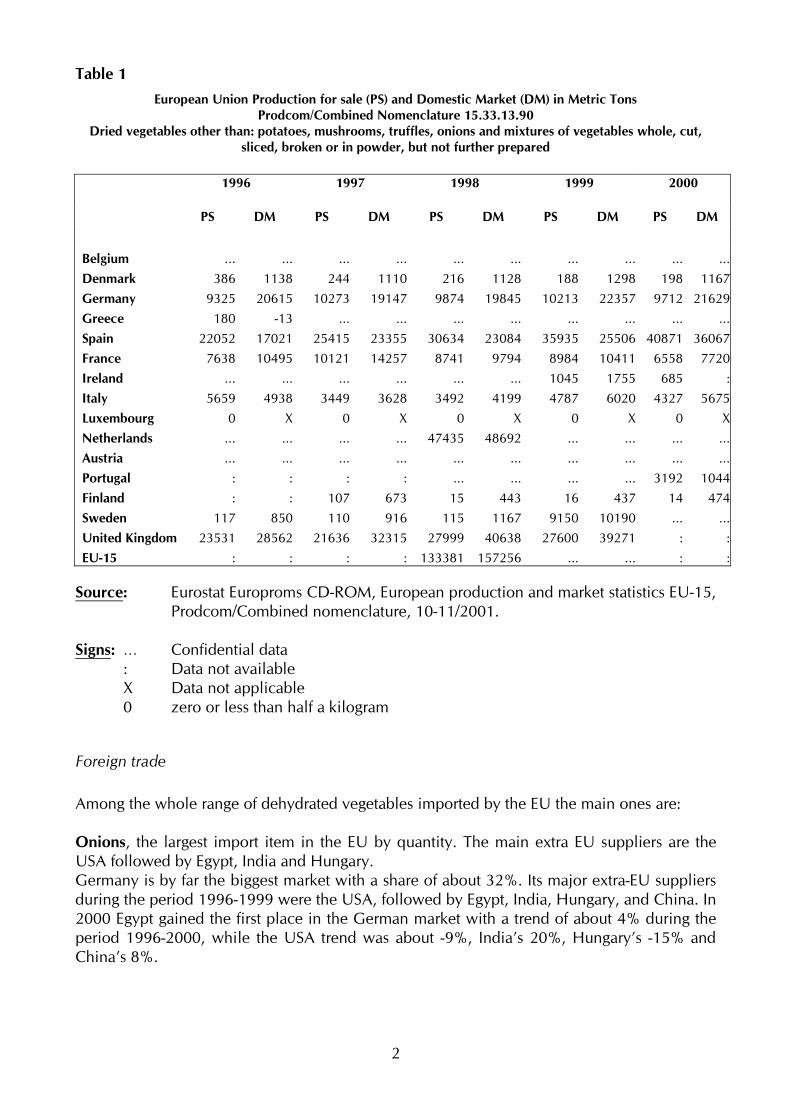
Production and consumption Among developing countries, China is known to have a leading position as a producer of dehydrated garlic. Dehydrated bell peppers are another important Chinese production with about 6,000 metric tons per year. In addition, production of dehydrated organic products such as soya-beans, spinach, sesame, peanuts and potatoes is being developed. Egypt is known to be a large producer of dehydrated onions, after the USA. Nevertheless, it is difficult to give an overall view of world production of dehydrated vegetables as very few countries publish production statistics on this product group. As concerns the EU, production data on dried vegetables n.e.s. are shown in table 1 below. They are classified according to EU-15 Prodcom/Combined nomenclature 15.33.13.90, “dried vegetables other than: potatoes, mushrooms, truffles, onions and mixtures of vegetables whole, cut, sliced, broken or in powder, but not further prepared”. Data given in table 1 cannot be directly compared to the data contained in the statistical tables of annex I as the source of information and the product coverage are not the same. Table 1 provides EU production for sale (PS), which is used for products where production is not immediately followed by sale and EU domestic market (DM) or apparent consumption.
$ Domestic market = production (sold or for sale) + imports – exports.
2
Table 1 European Union Production for sale (PS) and Domestic Market (DM) in Metric Tons
Prodcom/Combined Nomenclature 15.33.13.90 Dried vegetables other than: potatoes, mushrooms, truffles, onions and mixtures of vegetables whole, cut,
sliced, broken or in powder, but not further prepared
1996 1997 1998 1999 2000
PS DM PS DM PS DM PS DM PS DM
Belgium ... ... ... ... ... ... ... ... ... ... Denmark 386 1138 244 1110 216 1128 188 1298 198 1167 Germany 9325 20615 10273 19147 9874 19845 10213 22357 9712 21629 Greece 180 -13 ... ... ... ... ... ... ... ... Spain 22052 17021 25415 23355 30634 23084 35935 25506 40871 36067 France 7638 10495 10121 14257 8741 9794 8984 10411 6558 7720 Ireland ... ... ... ... ... ... 1045 1755 685 : Italy 5659 4938 3449 3628 3492 4199 4787 6020 4327 5675 Luxembourg 0 X 0 X 0 X 0 X 0 X Netherlands ... ... ... ... 47435 48692 ... ... ... ... Austria ... ... ... ... ... ... ... ... ... ... Portugal : : : : ... ... ... ... 3192 1044 Finland : : 107 673 15 443 16 437 14 474 Sweden 117 850 110 916 115 1167 9150 10190 ... ... United Kingdom 23531 28562 21636 32315 27999 40638 27600 39271 : : EU-15 : : : : 133381 157256 ... ... : :
Source: Eurostat Europroms CD-ROM, European production and market statistics EU-15,
Prodcom/Combined nomenclature, 10-11/2001. Signs: … Confidential data : Data not available X Data not applicable 0 zero or less than half a kilogram
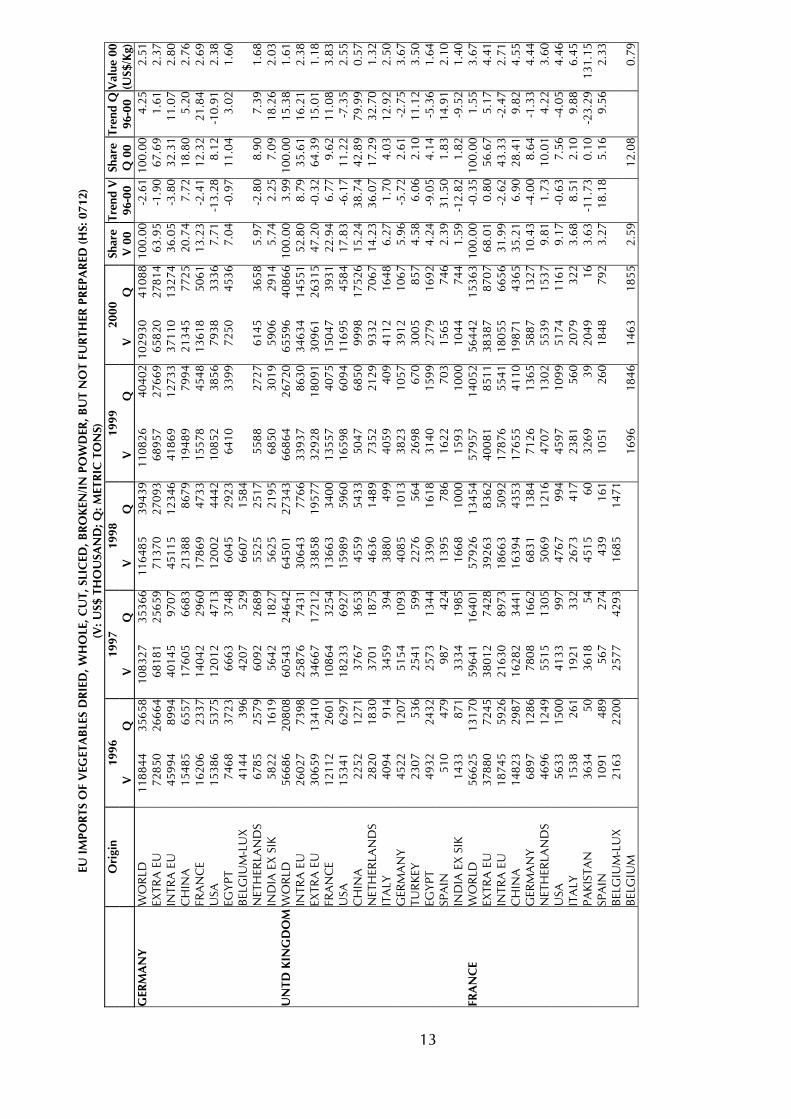
Foreign trade Among the whole range of dehydrated vegetables imported by the EU the main ones are: Onions, the largest import item in the EU by quantity. The main extra EU suppliers are the USA followed by Egypt, India and Hungary. Germany is by far the biggest market with a share of about 32%. Its major extra-EU suppliers during the period 1996-1999 were the USA, followed by Egypt, India, Hungary, and China. In 2000 Egypt gained the first place in the German market with a trend of about 4% during the period 1996-2000, while the USA trend was about -9%, India’s 20%, Hungary’s -15% and China’s 8%.

3
Mushrooms and truffles, the second largest import item by quantity. The main extra EU suppliers are China, followed by Viet Nam, Yugoslavia and Chile; the biggest EU markets being Italy, France, Germany and the United Kingdom.
The quantity of dehydrated truffles is negligible compared to mushrooms. Truffles are mainly consumed fresh as they loose almost all their flavour when dehydrated.
Carrots and garlic are not listed separately in the COMTRADE database. According to trade sources, carrots are an important consumption item mainly produced and exported by EU countries and Poland; garlic being mainly imported from China, India and Egypt, which are leading developing country suppliers of this product. In the COMTRADE database, Vegetables and mixtures include all vegetables and culinary herbs except onions, mushrooms and truffles. They account for approximately 60% of the total quantity of dehydrated vegetables imported in each individual EU country. For the above-mentioned products except carrots and garlic see:
Annex I for detailed import statistics by origin. Table 3 for the share and trend of developing countries.
Table 2 gives, for 2000, statistical data for dehydrated vegetables that are not shown separately in the COMTRADE database.
Table 2
EU imports of selected dehydrated vegetables (2000), in metric tons
Potatoes
07129005
Sweet corn for sowing
07129011
Sweet corn Excl. for sowing
07129019
Tomatoes
07129030
Carrots
07129050 Intra EU 1092 632 461 14656 6229 Extra EU 128 733 148 4213 4384 Source: Eurostat, European Commission, Intra – and Extra – EU trade (Annual data –
combined nomenclature), 2001. For the following products, except sweet corn for sowing, intra EU imports by quantity were by far more important than extra EU imports: Potatoes, sweet corn for sowing and sweet corn excluding for sowing: the major extra EU supplier was the USA with 128 MT, 734 MT and 148 MT respectively. Tomatoes: the major extra EU suppliers were Turkey (2,261 MT), Israel (494 MT), Morocco (425 MT) and Tunisia (242 MT). Carrots: the major extra EU suppliers were Poland (3,302MT), Namibia (706 MT) and China (335 MT).
4
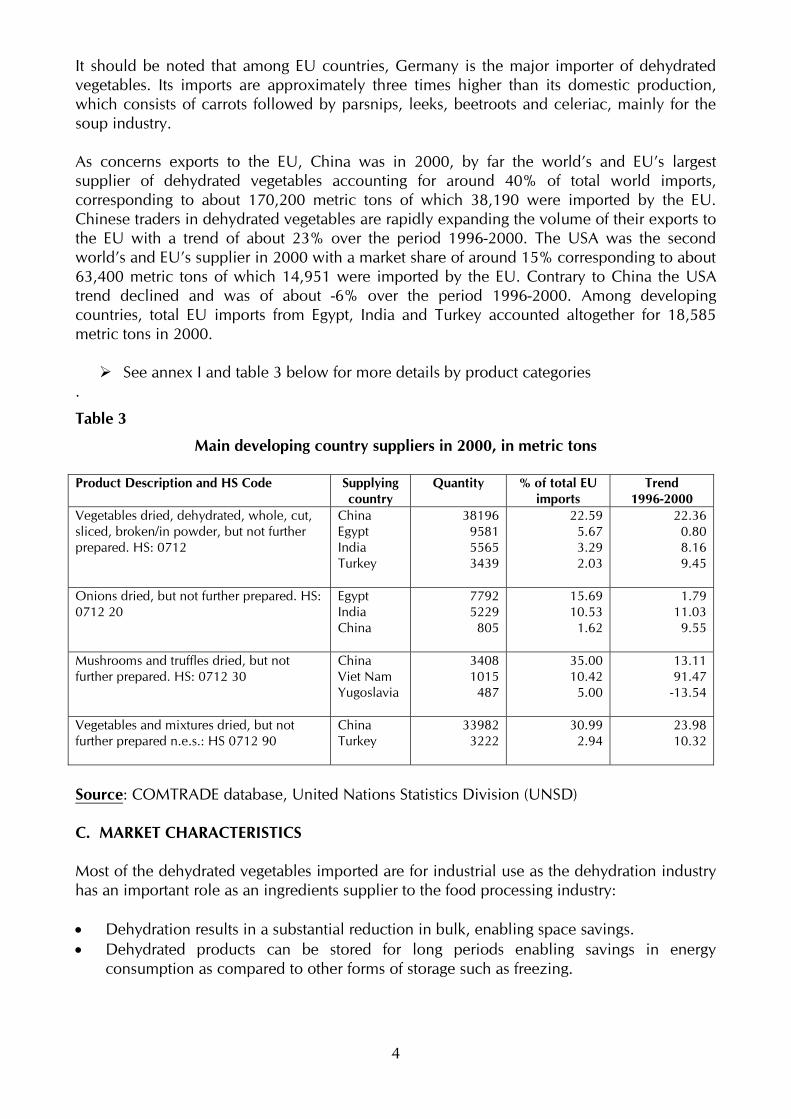
It should be noted that among EU countries, Germany is the major importer of dehydrated vegetables. Its imports are approximately three times higher than its domestic production, which consists of carrots followed by parsnips, leeks, beetroots and celeriac, mainly for the soup industry. As concerns exports to the EU, China was in 2000, by far the world’s and EU’s largest supplier of dehydrated vegetables accounting for around 40% of total world imports, corresponding to about 170,200 metric tons of which 38,190 were imported by the EU. Chinese traders in dehydrated vegetables are rapidly expanding the volume of their exports to the EU with a trend of about 23% over the period 1996-2000. The USA was the second world’s and EU’s supplier in 2000 with a market share of around 15% corresponding to about 63,400 metric tons of which 14,951 were imported by the EU. Contrary to China the USA trend declined and was of about -6% over the period 1996-2000. Among developing countries, total EU imports from Egypt, India and Turkey accounted altogether for 18,585 metric tons in 2000.
See annex I and table 3 below for more details by product categories .
Table 3
Main developing country suppliers in 2000, in metric tons
Product Description and HS Code Supplying country
Quantity
% of total EU imports
Trend 1996-2000
Vegetables dried, dehydrated, whole, cut, sliced, broken/in powder, but not further prepared. HS: 0712
China Egypt India Turkey
38196 9581 5565 3439
22.59 5.67 3.29 2.03
22.36 0.80 8.16 9.45
Onions dried, but not further prepared. HS: 0712 20
Egypt India China
7792 5229
805
15.69 10.53
1.62
1.79 11.03
9.55
Mushrooms and truffles dried, but not further prepared. HS: 0712 30
China Viet Nam Yugoslavia
3408 1015
487
35.00 10.42
5.00
13.11 91.47
-13.54
Vegetables and mixtures dried, but not further prepared n.e.s.: HS 0712 90
China Turkey
33982 3222
30.99 2.94
23.98 10.32
Source: COMTRADE database, United Nations Statistics Division (UNSD) C. MARKET CHARACTERISTICS Most of the dehydrated vegetables imported are for industrial use as the dehydration industry has an important role as an ingredients supplier to the food processing industry: • Dehydration results in a substantial reduction in bulk, enabling space savings. • Dehydrated products can be stored for long periods enabling savings in energy
consumption as compared to other forms of storage such as freezing.

5
• Supply can be rationalized by purchasing ingredients from a specialist dehydration company.
• Time saving for food processors: by eliminating tasks such as peeling, cleaning and cutting of fresh produce.
Other benefits to the food processors are: certain price stability, continuous availability and products ready for immediate use. The main market segments for dehydrated vegetables are:
1. The soup industry, the largest end-user of dehydrated vegetables. Large multinational
companies dominate the soup industry in the EU, the main ones being Unilever (Knorr and Unox) and Nestlé (Maggi). The main products are packet soups (dried), followed by instant soups (dried); canned soups and frozen soups.
2. The food processing industry (other than of soup): processors of meat and fish products;
processors of prepared meals, bakery products, dairy products, baby food, etc.
Both of the above industries utilize most types of dehydrated vegetables, mainly potatoes, onions, tomatoes, leeks, carrots, peas, mushrooms, asparagus, garlic, parsley, bell peppers, cabbage and cauliflower.
3. The pet food industry, which uses mainly carrots, garlic and onions. 4. The spice industry, which utilizes dehydrated vegetables and culinary herbs in the
production of seasonings and flavouring, salad dressings, etc. 5. The food service: this sector is very important accounting for around 30 % of all
dehydrated vegetables consumed. Canteens, cafeterias etc. use them as a raw material replacing fresh produce in the preparation of meals. In addition to dehydrated vegetables as a raw material, the food service also uses dried soups, sauces and other prepared foods that are produced and sold in catering packs by the food industry.
6. The retail trade: with the exception of potato products, mushrooms and culinary herbs,
very little dehydrated vegetables as such are sold in retail packs. In addition to these products the full range of processed food products containing the dehydrated vegetables referred to in points 1 to 4 above can be found in the retail trade offering the consumer a convenient and quick way of preparing dishes.
D. MARKET ACCESS
Tariffs Duty rates MFN levied in the EU are 12.8% ad valorem for HS 071220, 071230 and 071290, except for potatoes (10.2%) and for sweet corn for sowing (free). Imports from a number of developing countries, except Thailand, Mexico and Chile are subject to tariff reductions under the Generalized System of Preferences (GSP) scheme. The

6
GSP rate for the products under review is 9.3% ad valorem, at the exception of HS heading 0712.90 for which the rate is 8.9% and potatoes for which the rate is 6.7%. For all the HS codes under review, the following countries are exempt and benefit from duty-free imports: • Least developed countries (LDCs). • African, Caribbean and Pacific (ACP) countries, under the Lomé Convention. • Bolivia, Colombia, Costa Rica, Ecuador, El Salvador, Guatemala, Honduras, Nicaragua,
Panama, Peru and Venezuela.
See annex V for the list of countries (GSP, LDC and ACP). In addition, the following countries benefit also from duty-free imports: HS 0712.20: Bulgaria, Hungary, Latvia, Pakistan, Poland Syria and Turkey HS 0712.30: Morocco, Pakistan, Poland, Slovenia, and Turkey HS 0712.90: Bulgaria, Hungary, Morocco, Pakistan, Poland and Turkey. Other duty rates may apply to imports from various countries on the basis of bilateral agreements. Source: - Official Journal of the European Communities L357/6, 30 December1998. - Integrated tariff of the United Kingdom (TARIFF), 1 January 2002. More information is available on: http://europa.eu.int/comm/taxation_customs or may be obtained at: [email protected] Or at: European Commission Taxation and Customs Union Directorate General MO51 5/28 1049 Brussels Belgium
Regulations The EU Directive on Hygiene for Foodstuffs (93/43/EC) which became effective the 1st of July 1996 stipulates that: “foodstuffs companies shall identify each aspect of their activities which has a bearing on the safety of foodstuffs and ensure that suitable safety procedures are established, applied, maintained and revised on the basis of the HACCP system”. The HACCP (Hazard Analysis and Critical Control Points) system is mandatory to EU companies which process, treat, pack, transport, distribute or trade foodstuffs. It concerns risks such as macro biological (vermin), microbiological (viruses, bacteria, moulds) and toxicological (contamination by pesticides, heavy metals or dioxin). Although not mandatory for exporters to the EU, an approved HACCP system is an asset for them.

7
The EU Directive (95/2/EC) on food additives other than colours and sweeteners of 18 March 1995 specifies the additives that are allowed in food products. The EU Regulation EC 2092/91 on organic standards and its supplement EC 1804/99 can be useful for exporters of organic dehydrated vegetables who should be aware that their production process and their products must be certified by EU control bodies before their products can be sold in EU markets. As legislation concerning food is changing continuously, exporters are recommended to check the situation with importers who might also have higher quality demands.
Product specifications General quality specifications such as appearance, moisture content, type of processing, grade, cut and dimension, colour, flavour, microbial counts, moisture content, sulphur dioxide level, hygiene, etc. and analysis sheets showing the nutritional component of every vegetable are important. They may vary depending upon very precise and strict customer’s requirements. Insect damage and other blemishes should be minimal. Fumigation against insects is essential and phytosanitary certificates are required. The product should resemble the colour of the fresh produce. Browning caused by oxidation should be kept to a minimum. Better quality dehydrated vegetables can be produced by freeze-drying, but this raises the cost considerably. Cut pieces of dehydrated vegetables are available in a wide range of sizes. Those commonly available are: 10 mm x 10 mm x 10 mm; 10 mm x 10 mm x 7 mm; 10 mm x 10 mm x 2 mm; 16 mm x 16 mm x 3 mm. Some dehydrates can be in flakes or in powder form. The size of flakes or kibbled pieces can vary, depending on the customer’s requirements, which can be very precise.
Examples of specifications provided by a major producer in the USA are given in annex III.
Another asset to exporters is the compliance with ISO 9000 standards that provide a framework for standardising procedures and working methods and guarantee that things are always done the same way. Each company’s ISO 9000 system has to be certified and regularly audited by an authorized certifying body. Additional information on standards can be found in: • The FAO/WHO Food Standard “Recommended international code of hygienic practice
for dehydrated fruits and vegetables including edible fungi” (CAC/RCP 5-1971). • ISO 5559:1995: Dehydrated onion (Alium Cepa Linneaus) – specification. • ISO 5567:1997 Dehydrated garlic (alium Sativum L.) - Specification. • ISO 5567:1982 Dehydrated garlic - determination of volatile organic sulphur
compounds.
8
Or obtained from the: • European Committee for Standardization (CEN)
Rue de Stassart 36 1050 Brussels Belgium Tel: +32 2 550 08 11 Fax: +32 2 550 08 19 E- mail: [email protected] URL: http://www.cenorm.be
See annex II for the list of national members of the CEN.
E. PRICES Prices of dehydrated vegetables depend on the origin and quality of the product, the time of the year and the quality requirements of the clients. They are generally negotiated between the supplier and the importer, re-processor or agent. With a few exceptions, like the USA, most sources of supply need their produce to be cleaned and graded prior to being sold to end-users. The cleaning process can add around US$ 150 or more per ton to the price of the product. Therefore it is important that suppliers assess the requirements of end users mainly as regards cleaning and grading in order to provide high quality products and thus obtain higher prices. New suppliers should price their products in relation to products imported in the EU from traditional suppliers or produced in the EU. F. DISTRIBUTION CHANNELS In general, intermediaries handle most imports of dehydrated vegetables: agents/brokers working on commission or importers. Some specialized companies are also producers and re-processors as they clean and grade the products, carry out microbiological tests and often blend the products prior to selling them, mainly to the food industry or to fast food restaurant chains as McDonald’s or Kentucky Fried Chicken. They may also act as wholesaler/distributor. Today, importers/re-processors often aim at outsourcing the reprocessing phase in developing countries to take advantage of their lower labour costs. Food processors in the EU may import certain quantities direct but they mostly obtain their requirements through intermediaries. Canteens, cafeterias, restaurants, etc. which absorb a large share of sales of dehydrated vegetables, obtain them through specialized catering or food service companies. These companies rarely import direct but obtain their supplies through agents/brokers and importers. The retail trade sells very small quantities of dehydrated vegetables.
9
G. PACKAGING AND LABELLING Dehydrated vegetables are generally packed in cotton, jute, paper or polypropylene sacks and/or in cartons of 10 - 50 kg. Paper sacks are preferred to jute sacks for hygiene reasons, whereas polypropylene sacks are preferred to avoid moisture damage. Suppliers should be careful that metal closures or staples do not damage the product otherwise an extensive cleaning is to be done by the importer. There is no mandatory type of packaging and exporters must comply with the specifications of the importers on a contractual basis. For bulk shipments labelling consists of the: • Name of the product • Origin of the product • Name and address of the exporter • Final destination (when a trader is intermediary between exporter and importer) • Net weight • Code permitting traceability of the product. H. COMMERCIAL PRACTICES Most importers place their orders either after visiting producers or exporters or on the basis of samples or technical sheets provided by the exporters or requested by the importers. The technical sheets generally stipulate the size, colour, moisture content, bacterial count, chemical composition, etc. Payments are generally made by letter of credit or cash against documents (CAD), although importers try to insist on payment after arrival and inspection. CAD is also known as documents against payment (D/P). I. SALES PROMOTION Food Ingredients-Europe is the major trade fair where exporters of dehydrated products can establish personal contacts with buyers and obtain information on market trend and commercial practices in the EU. Food Ingredients-Europe is a biennial trade fair, which take place in various locations. The next event will take place in Frankfurt, Germany from 18 to 20 November 2003. For additional information contact: Expoconsult BV trading as CMP Information PO Box 200 3600 AE Maarssen The Netherlands Tel: +31 346 559 444 Fax: +31346 573 811 E-mail: [email protected] URL: www.fi-events.com In addition to visiting trade fairs, exporters can place advertisements in specialized publications (see annex IV) or advertise their products through the Web.

10
J. MARKET PROSPECTS According to information received from trade sources, there are many opportunities for new exporters in developing countries. The major EU importers, although having their established suppliers, are interested in receiving offers from new suppliers provided they take special care in observing commitments made, regarding mainly, delivery schedules, quality, and stipulated price; provided they also give guarantees on the measures taken during the production process, e.g. way of drying, HACCP, ISO certification, metal residue. New suppliers should also be aware of the importance of adapting the quality of their products to the needs of their partners and of building with them a long lasting commercial relationship. In addition, suppliers in developing countries who are able to offer their products on a regular basis around the year have an advantage over seasonal suppliers. A major trader suggested that production for export of high quality dehydrated white onions could be a niche for exporters in developing countries. Taking into account the advantage of their low labour costs and usually preferential tariffs, they could compete with the USA’s high quality but also high-priced white onions, currently dominating the European market. Development of organic products represents another niche as demand for organics is increasing strongly in the EU. In addition, exporters in developing countries should be aware that many food companies in the EU import dehydrated vegetables mainly through German and Dutch importers/re-processors.

ANNEX I
IMPORTS OF DEHYDRATED/DRIED VEGETABLES IN THE EUROPEAN UNION

12
EU IM
PORT
S O
F V
EGET
ABL
ES D
RIED
, WH
OLE
, CU
T, S
LIC
ED, B
ROKE
N/IN
PO
WD
ER, B
UT
NO
T FU
RTH
ER P
REPA
RED
(HS:
071
2)
(V: U
S$ T
HO
USA
ND
; Q: M
ETRI
C T
ON
S)
O
rigi
n 19
96
1997
19
98
1999
20
00
Shar
e Tr
end
V S
hare
Tre
nd Q
Val
ue 0
0
V
Q
V
Q
V
Q
V
Q
V
Q
V
00
96-0
0 Q
00
96-0
0 (U
S$/K
g)
TOTA
L EU
W
OR
LD
3858
1911
6379
3839
6812
8727
4116
4213
1669
4027
8714
9483
3756
1916
9053
100.
00-0
.06
100.
009.
382.
22
EXTR
A E
U
2174
7969
532
2211
3876
068
2382
3978
437
2260
9676
965
2107
8687
431
56.1
2-0
.40
51.7
24.
812.
41
INTR
A E
U
1683
4046
847
1628
3052
659
1734
0353
231
1766
9072
518
1648
3281
622
43.8
80.
4048
.28
15.3
82.
02
CH
INA
48
912
1620
853
643
1917
266
532
2669
863
007
2596
974
344
3819
619
.79
10.5
022
.59
22.3
61.
95
FRA
NC
E 49
661
1202
543
791
1254
753
626
1567
353
880
2145
349
402
2044
313
.15
1.99
12.0
917
.32
2.42
U
SA
5221
519
222
5027
718
649
5050
217
791
4690
916
459
4032
714
951
10.7
4-5
.69
8.84
-6.0
82.
70
GER
MA
NY
38
969
9225
4105
293
5737
293
9317
3828
010
560
3282
311
312
8.74
-4.0
56.
695.
432.
90
NET
HER
LAN
DS
2406
811
320
2519
914
154
2591
813
232
2730
922
634
2959
122
771
7.88
5.06
13.4
720
.53
1.30
EG
YPT
18
572
9352
1489
980
2416
300
7835
1591
582
8115
395
9581
4.10
-3.0
55.
670.
801.
61
ITA
LY
1769
341
8315
293
3198
1679
433
0216
450
4183
1479
753
473.
94-2
.81
3.16
7.89
2.77
TU
RK
EY
1244
426
8198
8320
2210
824
2653
1230
630
3011
753
3439
3.13
1.06
2.03
9.45
3.42
SP
AIN
99
2729
7095
3530
3411
039
3891
1386
547
9911
524
4985
3.07
6.96
2.95
16.1
22.
31
BEL
GIU
M-L
UX
92
9233
3499
1957
9111
344
4033
IND
IA E
X S
IK
1143
338
7314
730
5564
1280
944
9213
745
5901
1100
155
652.
93-1
.45
3.29
8.16
1.98
Y
UG
OSL
AV
IA
1355
992
718
363
1017
1673
774
112
759
731
9895
662
2.63
-9.4
60.
39-9
.53
14.9
4
BEL
GIU
M
1177
950
4278
1348
742.
08
2.88
1.
60
HU
NG
AR
Y
1209
342
3510
290
3621
9306
2975
7441
2383
7367
2902
1.96
-12.
331.
72-1
1.08
2.54
PO
LAN
D
6421
3922
5147
3671
5696
3695
7251
5258
6518
4749
1.74
3.80
2.81
7.70
1.37
U
NTD
KIN
GD
OM
62
7718
9855
6921
6855
2614
8862
4718
0461
5418
711.
640.
761.
11-2
.11
3.29
PO
RTU
GA
L 40
393
177
5230
492
503
307
3489
5807
0.93
70.8
93.
43
0.60
PE
RU
32
1915
837
0523
229
2816
438
6329
333
2423
70.
881.
060.
1411
.01
14.0
2
DEN
MA
RK
54
4956
948
9631
645
9039
330
6927
430
9225
60.
82-1
4.78
0.15
-16.
0112
.10
PA
KIS
TAN
42
2011
546
1711
251
9213
239
1311
229
1671
0.78
-8.6
50.
04-9
.14
40.8
0
IREL
AN
D
3727
631
4545
815
4434
942
2336
349
2724
391
0.73
-12.
130.
23-1
6.52
6.97
B
ULG
AR
IA
4816
723
7213
529
7380
567
6914
725
2615
279
0.70
-11.
870.
16-1
4.72
9.38
C
HIL
E 32
3454
832
3662
930
3358
730
7252
023
8943
30.
64-6
.37
0.26
-6.4
25.
52
RO
MA
NIA
26
2034
538
6429
434
1818
340
2122
122
5910
80.
60-2
.53
0.06
-22.
9620
.92
TF
YR
MA
CED
NA
38
7443
223
3131
859
0941
440
5325
919
7218
00.
53-7
.66
0.11
-17.
7210
.93
V
IET
NA
M
490
110
589
165
381
114
1586
797
1636
1141
0.44
40.5
30.
6787
.05
1.43
M
OR
OC
CO
19
9236
823
0345
527
1158
519
7251
215
2852
30.
41-6
.63
0.31
8.56
2.92
A
UST
RIA
93
619
312
4681
510
7847
314
1264
514
7713
180.
3910
.92
0.78
43.5
11.
12
ISR
AEL
18
9749
414
7141
612
7938
613
3642
314
5352
60.
39-6
.10
0.31
1.42
2.76
R
USS
IAN
FED
54
113
23
191
412
1787
0.32
0.
05
13.9
4
GR
EEC
E 13
5123
698
821
082
224
010
0928
911
7613
670.
31-2
.54
0.81
46.7
30.
86
13
EU IM
PORT
S O
F V
EGET
ABL
ES D
RIED
, WH
OLE
, CU
T, S
LIC
ED, B
ROKE
N/IN
PO
WD
ER, B
UT
NO
T FU
RTH
ER P
REPA
RED
(HS:
071
2)
(V: U
S$ T
HO
USA
ND
; Q: M
ETRI
C T
ON
S)
O
rigi
n 19
96
1997
19
98
1999
20
00
Shar
e Tr
end
V S
hare
Tre
nd Q
Val
ue 0
0
V
Q
V
Q
V
Q
V
Q
V
Q
V
00
96-0
0 Q
00
96-0
0 (U
S$/K
g)
GER
MA
NY
WO
RLD
11
8844
3565
810
8327
3536
611
6485
3943
911
0826
4040
210
2930
4108
810
0.00
-2.6
110
0.00
4.25
2.51
EX
TRA
EU
72
850
2666
468
181
2565
971
370
2709
368
957
2766
965
820
2781
463
.95
-1.9
067
.69
1.61
2.37
IN
TRA
EU
45
994
8994
4014
597
0745
115
1234
641
869
1273
337
110
1327
436
.05
-3.8
032
.31
11.0
72.
80
CH
INA
15
485
6557
1760
566
8321
388
8679
1948
979
9421
345
7725
20.7
47.
7218
.80
5.20
2.76
FR
AN
CE
1620
623
3714
042
2960
1786
947
3315
578
4548
1361
850
6113
.23
-2.4
112
.32
21.8
42.
69
USA
15
386
5375
1201
247
1312
002
4442
1085
238
5679
3833
367.
71-1
3.28
8.12
-10.
912.
38
EGY
PT
7468
3723
6663
3748
6045
2923
6410
3399
7250
4536
7.04
-0.9
711
.04
3.02
1.60
B
ELG
IUM
-LU
X
4144
396
4207
529
6607
1584
NET
HER
LAN
DS
6785
2579
6092
2689
5525
2517
5588
2727
6145
3658
5.97
-2.8
08.
907.
391.
68
IND
IA E
X S
IK
5822
1619
5642
1827
5625
2195
6850
3019
5906
2914
5.74
2.25
7.09
18.2
62.
03U
NTD
KIN
GD
OM
WO
RLD
56
686
2080
860
543
2464
264
501
2734
366
864
2672
065
596
4086
610
0.00
3.99
100.
0015
.38
1.61
IN
TRA
EU
26
027
7398
2587
674
3130
643
7766
3393
786
3034
634
1455
152
.80
8.79
35.6
116
.21
2.38
EX
TRA
EU
30
659
1341
034
667
1721
233
858
1957
732
928
1809
130
961
2631
547
.20
-0.3
264
.39
15.0
11.
18
FRA
NC
E 12
112
2601
1086
432
5413
663
3400
1355
740
7515
047
3931
22.9
46.
779.
6211
.08
3.83
U
SA
1534
162
9718
233
6927
1598
959
6016
598
6094
1169
545
8417
.83
-6.1
711
.22
-7.3
52.
55
CH
INA
22
5212
7137
6736
5345
5954
3350
4768
5099
9817
526
15.2
438
.74
42.8
979
.99
0.57
N
ETH
ERLA
ND
S 28
2018
3037
0118
7546
3614
8973
5221
2993
3270
6714
.23
36.0
717
.29
32.7
01.
32
ITA
LY
4094
914
3459
394
3880
499
4059
409
4112
1648
6.27
1.70
4.03
12.9
22.
50
GER
MA
NY
45
2212
0751
5410
9340
8510
1338
2310
5739
1210
675.
96-5
.72
2.61
-2.7
53.
67
TUR
KEY
23
0753
625
4159
922
7656
426
9867
030
0585
74.
586.
062.
1011
.12
3.50
EG
YPT
49
3224
3225
7313
4433
9016
1831
4015
9927
7916
924.
24-9
.05
4.14
-5.3
61.
64
SPA
IN
510
479
987
424
1395
786
1622
703
1565
746
2.39
31.5
01.
8314
.91
2.10
IN
DIA
EX
SIK
14
3387
133
3419
8516
6810
0015
9310
0010
4474
41.
59-1
2.82
1.82
-9.5
21.
40FR
AN
CE
WO
RLD
56
625
1317
059
641
1640
157
926
1345
457
957
1405
256
442
1536
310
0.00
-0.3
510
0.00
1.55
3.67
EX
TRA
EU
37
880
7245
3801
274
2839
263
8362
4008
185
1138
387
8707
68.0
10.
8056
.67
5.17
4.41
IN
TRA
EU
18
745
5926
2163
089
7318
663
5092
1787
655
4118
055
6656
31.9
9-2
.62
43.3
3-2
.47
2.71
C
HIN
A
1482
329
8716
282
3441
1639
443
5317
655
4110
1987
143
6535
.21
6.90
28.4
19.
824.
55
GER
MA
NY
68
9712
8678
0816
6268
3113
8471
2613
6558
8713
2710
.43
-4.0
08.
64-1
.33
4.44
N
ETH
ERLA
ND
S 46
9612
4955
1513
0550
6912
1647
0713
0255
3915
379.
811.
7310
.01
4.22
3.60
U
SA
5633
1500
4133
997
4767
994
4597
1099
5174
1161
9.17
-0.6
37.
56-4
.05
4.46
IT
ALY
15
3826
119
2133
226
7341
723
8156
020
7932
23.
688.
512.
109.
886.
45
PAK
ISTA
N
3634
5036
1854
4515
6032
6939
2049
163.
63-1
1.73
0.10
-23.
2913
1.15
SP
AIN
10
9148
956
727
443
916
110
5126
018
4879
23.
2718
.18
5.16
9.56
2.33
B
ELG
IUM
-LU
X
2163
2200
2577
4293
1685
1471
BEL
GIU
M
1696
1846
1463
1855
2.59
12
.08
0.
79

14
EU IM
PORT
S O
F V
EGET
ABL
ES D
RIED
, WH
OLE
, CU
T, S
LIC
ED, B
ROKE
N/IN
PO
WD
ER, B
UT
NO
T FU
RTH
ER P
REPA
RED
(HS:
071
2)
(V: U
S$ T
HO
USA
ND
; Q: M
ETRI
C T
ON
S)
O
rigi
n 19
96
1997
19
98
1999
20
00
Shar
e Tr
end
V S
hare
Tre
nd Q
Val
ue 0
0
V
Q
V
Q
V
Q
V
Q
V
Q
V
00
96-0
0 Q
00
96-0
0 (U
S$/K
g)
TU
RK
EY
2470
156
1136
6610
7988
1585
7712
2711
62.
17-1
0.11
0.75
-4.5
110
.62
M
OR
OC
CO
17
6130
916
8829
618
0433
815
2533
077
116
81.
37-1
6.08
1.10
-10.
484.
58IT
ALY
W
OR
LD
4673
866
6649
904
7175
6105
487
7356
222
9699
4582
388
9310
0.00
0.80
100.
009.
185.
15
EXTR
A E
U
3686
342
7641
287
4106
5187
653
7546
537
5572
3848
554
2983
.99
2.08
61.0
48.
147.
09
INTR
A E
U
9876
2390
8617
3069
9178
3398
9685
4126
7338
3465
16.0
1-4
.66
38.9
610
.94
2.12
C
HIN
A
9722
1132
7143
1203
1565
125
8914
521
2045
1580
221
6834
.49
18.3
124
.38
20.0
97.
29
YU
GO
SLA
VIA
12
141
670
1750
284
215
558
586
1116
147
489
1642
519
.46
-10.
124.
78-1
3.80
20.9
9
FRA
NC
E 45
8812
0426
1699
634
1714
5941
6920
7932
0315
306.
99-2
.50
17.2
012
.90
2.09
TU
RK
EY
2963
919
2166
524
2724
850
2771
964
2401
950
5.24
-1.7
310
.69
6.99
2.53
B
ULG
AR
IA
3062
129
6104
271
5864
215
5332
186
2158
984.
71-8
.01
1.11
-8.7
721
.92
R
OM
AN
IA
2139
119
3025
187
2919
144
3860
211
1924
764.
200.
320.
86-7
.44
25.2
3
GER
MA
NY
25
4962
233
7711
5529
1586
724
8185
219
0084
34.
15-8
.57
9.48
3.10
2.25
TF
YR
MA
CED
NA
29
8718
318
2093
5331
220
3630
162
1797
873.
92-3
.21
0.98
-8.7
920
.54
B
OSN
IA H
ERZ
G
31
352
670
3316
6080
1054
372.
30
0.42
28
.41
NET
HER
LAN
DS
WO
RLD
39
879
1322
037
008
1147
139
354
1332
239
456
1946
840
923
2781
710
0.00
1.16
100.
0022
.34
1.47
IN
TRA
EU
21
138
4179
2141
550
9820
369
5512
2316
611
813
2492
019
247
60.8
94.
1669
.19
47.6
21.
29
EXTR
A E
U
1874
190
4115
593
6373
1898
578
1016
290
7656
1600
385
7039
.11
-2.6
830
.81
0.77
1.87
FR
AN
CE
6174
1250
6531
1933
7679
2397
9955
6120
8632
6007
21.0
911
.53
21.5
953
.62
1.44
G
ERM
AN
Y
8786
1638
8105
1609
6156
1595
7056
2746
6956
3032
17.0
0-5
.88
10.9
019
.32
2.29
U
SA
5307
2209
5296
2059
7592
2949
5055
1956
6164
2404
15.0
62.
568.
641.
182.
56
POR
TUG
AL
116
3484
2531
5156
717.
70
20.3
9
0.56
EG
YPT
35
6718
3028
5614
4437
0717
8039
6519
5130
3618
917.
420.
066.
803.
731.
61
CH
INA
27
8719
8224
2610
6923
2714
0419
8816
7927
9722
726.
84-1
.90
8.17
7.51
1.23
B
ELG
IUM
-LU
X
2087
434
2421
569
2200
579
IREL
AN
D
599
8534
741
237
5198
597
2129
276
5.20
43.0
70.
9937
.71
7.71
B
ELG
IUM
22
9213
8618
1318
454.
43
6.63
0.
98
ITA
LY
2336
458
2284
371
2385
403
1673
1139
1174
1119
2.87
-15.
524.
0233
.75
1.05
IN
DIA
EX
SIK
10
0462
088
161
295
758
311
1868
090
268
72.
200.
242.
473.
161.
31
POLA
ND
63
042
752
841
536
928
289
270
179
968
81.
9510
.52
2.47
15.9
21.
16
TUR
KEY
16
5642
281
519
710
1424
569
819
867
120
51.
64-1
7.81
0.74
-13.
363.
27

15
EU IM
PORT
S O
F O
NIO
NS
DRI
ED, B
UT
NO
T FU
RTH
ER P
REPA
RED
(HS:
071
220)
(V
: US$
TH
OU
SAN
D; Q
: MET
RIC
TO
NS)
Ori
gin
1996
19
97
1998
19
99
2000
Sh
are
Tren
d V
Sha
re T
rend
Q V
alue
00
V
Q
V
Q
V
Q
V
Q
V
Q
V 0
0 96
-00
Q 0
0 96
-00
(US$
/Kg)
TO
TAL
EU
WO
RLD
95
323
4210
392
748
4630
999
584
4488
310
2131
5100
786
863
4967
510
0.00
-0.8
910
0.00
4.37
1.75
EX
TRA
EU
68
626
3058
963
992
2899
764
905
2792
963
766
2918
952
772
2704
060
.75
-5.1
554
.43
-2.3
71.
95
INTR
A E
U
2669
711
514
2875
617
312
3467
916
954
3836
521
818
3409
122
636
39.2
58.
0845
.57
17.1
51.
51
USA
33
772
1404
833
908
1412
333
627
1355
230
902
1267
925
965
1126
129
.89
-6.0
022
.67
-5.3
52.
31
FRA
NC
E 12
977
5090
1325
363
8718
597
8911
2213
013
187
1950
712
795
22.4
614
.20
25.7
629
.28
1.52
EG
YPT
15
628
7510
1192
661
7513
558
6164
1370
468
4912
752
7792
14.6
8-2
.64
15.6
91.
791.
64
IND
IA E
X S
IK
6444
3518
7907
4319
7063
3938
9626
5568
7792
5229
8.97
5.94
10.5
311
.03
1.49
G
ERM
AN
Y
5920
2249
6467
2652
6629
2371
6449
2637
5111
2632
5.88
-2.9
25.
303.
131.
94
NET
HER
LAN
DS
3750
2272
4593
4588
5375
4131
4647
3830
4349
3751
5.01
3.13
7.55
8.56
1.16
H
UN
GA
RY
68
6723
1956
3921
1646
9514
9538
6911
0030
5110
863.
51-1
8.12
2.19
-19.
522.
81
UN
TD K
ING
DO
M
953
375
746
273
607
227
2342
927
2214
993
2.55
32.7
32.
0037
.31
2.23
B
ELG
IUM
-LU
X
1931
937
2183
1921
2038
504
SPA
IN
133
208
572
390
847
507
784
332
1593
957
1.83
69.6
71.
9333
.46
1.67
C
HIN
A
1511
684
1631
852
2483
1179
3219
1531
1587
805
1.83
8.10
1.62
9.55
1.97
B
ELG
IUM
12
4965
191
456
21.
05
1.13
1.
63
SYR
IA A
. R.
1510
823
1398
751
1673
887
561
247
486
286
0.56
-27.
220.
58-2
7.57
1.70
PE
RU
14
67
291
1232
714
286
2234
718
0.40
18.6
70.
0429
.67
19.3
8G
ERM
AN
Y W
OR
LD
3428
314
247
3317
414
803
3674
215
441
3497
215
908
3050
015
949
100.
00-1
.79
100.
003.
021.
91
EXTR
A E
U
2769
112
260
2527
011
560
2607
011
111
2522
711
430
2137
411
350
70.0
8-5
.06
71.1
7-1
.64
1.88
IN
TRA
EU
65
9219
8779
0532
4310
672
4330
9745
4478
9127
4599
29.9
28.
9828
.83
22.1
51.
98
FRA
NC
E 42
5913
9153
1521
1381
3235
0181
4237
7870
8438
1823
.23
15.5
423
.94
29.7
11.
86
USA
95
9141
4887
4938
9187
7136
0080
6733
4661
9328
6120
.30
-9.1
217
.94
-8.5
52.
16
EGY
PT
6104
2819
5445
2865
4822
2086
5224
2592
5920
3593
19.4
1-1
.02
22.5
33.
931.
65
IND
IA E
X S
IK
3040
1554
3324
1589
3970
2129
5158
2938
4294
2843
14.0
811
.96
17.8
219
.99
1.51
H
UN
GA
RY
47
7315
8842
4715
6237
1611
8229
8185
725
9594
18.
51-1
4.55
5.90
-15.
192.
76
NET
HER
LAN
DS
1107
366
1397
434
955
372
821
383
1253
424
4.11
-2.8
02.
661.
742.
95
BEL
GIU
M-L
UX
10
7517
867
612
712
4622
9
C
HIN
A
1173
554
1277
674
2055
997
2238
1098
1187
648
3.89
6.03
4.06
8.35
1.83
SY
RIA
A. R
. 13
2476
211
5661
714
4276
233
112
642
824
11.
40-2
9.61
1.51
-32.
231.
78U
NTD
KIN
GD
OM
WO
RLD
21
181
9408
2306
611
283
2160
796
4723
607
1068
219
402
8773
100.
00-1
.51
100.
00-1
.93
2.21
EX
TRA
EU
16
428
7349
1758
778
5015
935
6845
1612
371
2012
045
5759
62.0
8-6
.83
65.6
4-5
.68
2.09
IN
TRA
EU
47
5420
5954
7934
3356
7128
0274
8535
6173
5730
1437
.92
12.5
934
.36
8.32
2.44
U
SA
9813
4162
1211
049
3511
059
4443
1112
544
8884
4535
0043
.53
-3.7
839
.89
-4.3
22.
41
FRA
NC
E 41
2015
9440
0722
2840
5520
9156
2728
3857
1522
9129
.46
10.4
526
.12
10.1
62.
49
EGY
PT
4700
2255
2400
1245
3256
1541
3070
1556
2611
1603
13.4
6-8
.87
18.2
8-4
.48
1.63
IN
DIA
EX
SIK
12
3171
827
3615
2712
7173
714
4988
484
258
74.
34-1
3.03
6.69
-9.0
61.
43

16
EU IM
PORT
S O
F O
NIO
NS
DRI
ED, B
UT
NO
T FU
RTH
ER P
REPA
RED
(HS:
071
220)
(V
: US$
TH
OU
SAN
D; Q
: MET
RIC
TO
NS)
Ori
gin
1996
19
97
1998
19
99
2000
Sh
are
Tren
d V
Sha
re T
rend
Q V
alue
00
V
Q
V
Q
V
Q
V
Q
V
Q
V 0
0 96
-00
Q 0
0 96
-00
(US$
/Kg)
N
ETH
ERLA
ND
S W
OR
LD
1245
054
7810
619
4741
1442
463
5514
011
8799
1281
491
1710
0.00
3.40
100.
0017
.79
1.41
EX
TRA
EU
89
2043
6170
1334
9710
393
4775
8793
4183
7913
4342
61.7
5-0
.14
47.6
31.
721.
82
INTR
A E
U
3530
1117
3606
1244
4030
1580
5218
4616
4901
4775
38.2
510
.80
52.3
752
.44
1.03
U
SA
4131
1794
3453
1522
5760
2483
3557
1528
3956
1766
30.8
7-0
.57
19.3
7-0
.27
2.24
FR
AN
CE
1608
455
1653
621
2666
1106
4057
3879
3773
4144
29.4
429
.74
45.4
586
.87
0.91
EG
YPT
30
7216
1923
9912
4833
5616
0937
0718
5227
6417
7721
.57
2.26
19.4
95.
981.
56
IND
IA E
X S
IK
979
604
840
579
911
555
1093
676
886
680
6.91
0.65
7.46
4.01
1.30
BELG
IUM
-LU
X W
OR
LD
3189
1971
3433
2878
4665
3567
INTR
A E
U
2399
1623
2360
2378
3179
2895
EXTR
A E
U
789
348
1073
500
1486
671
NET
HER
LAN
DS
1314
968
1635
2151
2142
2557
EGY
PT
443
205
692
342
1006
457
SW
EDEN
W
OR
LD
3738
1380
4278
1620
4785
1790
5064
1946
4039
1724
100.
003.
2910
0.00
6.49
2.34
EX
TRA
EU
33
5912
5937
5214
4834
9313
5533
4413
1230
0312
4474
.34
-3.3
472
.14
-1.2
22.
41
INTR
A E
U
379
121
526
171
1292
435
1720
634
1037
480
25.6
637
.68
27.8
650
.15
2.16
U
SA
3067
1158
3472
1321
3318
1288
3084
1221
2828
1173
70.0
0-2
.77
68.0
4-0
.53
2.41
FR
AN
CE
124
4517
273
578
229
1150
491
835
411
20.6
877
.14
23.8
488
.32
2.03
H
UN
GA
RY
28
198
221
107
141
5619
268
143
573.
54-1
3.91
3.31
-14.
252.
51FR
AN
CE
WO
RLD
62
3028
5751
8832
6139
1215
2146
6819
2737
7117
0510
0.00
-10.
5010
0.00
-14.
432.
21
EXTR
A E
U
4535
1836
3383
1433
2466
1120
3071
1376
2179
1017
57.7
9-1
4.47
59.6
6-1
1.49
2.14
IN
TRA
EU
16
9510
2118
0518
2914
4640
215
9755
115
9268
842
.21
-2.4
540
.34
-18.
042.
31
USA
26
5294
717
1860
711
5239
513
4151
911
6546
130
.91
-17.
2427
.05
-14.
742.
53
GER
MA
NY
59
413
950
114
889
824
211
7633
659
920
915
.88
9.10
12.2
717
.77
2.86
IN
DIA
EX
SIK
49
928
547
729
433
421
266
939
351
230
513
.58
3.96
17.8
84.
391.
68
SPA
IN
4234
1320
32
3518
458
236
12.1
677
.64
13.8
145
.21
1.95
N
ETH
ERLA
ND
S 35
412
522
793
311
9030
513
135
111
59.
322.
846.
771.
753.
04
BEL
GIU
M-L
UX
49
767
586
515
3016
852
EGY
PT
524
249
249
114
239
125
242
119
135
723.
58-2
3.96
4.23
-21.
611.
87
CH
INA
16
867
271
136
210
8241
016
312
837
3.39
-1.3
52.
18-9
.55
3.44
BELG
IUM
W
OR
LD
3738
3490
3578
3444
100.
00
100.
00
1.04
IN
TRA
EU
24
4428
5618
8725
5852
.75
74
.28
0.
74
EXTR
A E
U
1294
634
1690
886
47.2
5
25.7
2
1.91
N
ETH
ERLA
ND
S
15
4124
8212
1819
4334
.04
56
.42
0.
63
USA
30
515
581
639
122
.81
11
.36
2.
09
EGY
PT
847
408
726
430
20.2
9
12.4
9
1.69

17
EU IM
PORT
S O
F M
USH
ROO
MS
AN
D T
RUFF
LES
DRI
ED, B
UT
NO
T FU
RTH
ER P
REPA
RED
(HS:
071
230)
(V
: US$
TH
OU
SAN
D; Q
: MET
RIC
TO
NS)
Ori
gin
1996
19
97
1998
19
99
2000
Sh
are
Tren
d V
Sh
are
Tren
d Q
Val
ue 0
0
V
Q
V
Q
V
Q
V
Q
V
Q
V
00
96-0
0 Q
00
96-0
0 (U
S$/K
g)
TOTA
L EU
W
OR
LD
9800
265
5210
0024
7179
1128
3185
4610
7074
8383
9885
097
3910
0.00
0.86
100.
009.
9410
.15
EX
TRA
EU
70
104
4072
7623
745
9187
603
5315
8393
054
2578
221
5854
79.1
33.
2060
.11
9.34
13.3
6
INTR
A E
U
2789
724
7923
787
2587
2522
832
3123
144
2958
2061
938
8520
.86
-6.1
239
.89
10.8
85.
31
CH
INA
29
253
2092
2753
422
5637
169
3235
3778
329
1445
955
3408
46.4
912
.97
35.0
013
.11
13.4
8
YU
GO
SLA
VIA
13
380
795
1813
689
616
494
638
1239
055
796
5148
79.
76-9
.83
5.00
-13.
5419
.82
FR
AN
CE
1223
393
395
5311
0292
1710
6682
8910
2669
9294
37.
07-1
1.85
9.69
-0.5
07.
41
GER
MA
NY
79
7450
275
9147
260
8037
767
7596
362
3946
76.
31-5
.86
4.79
5.83
13.3
7
ITA
LY
2558
147
2640
154
3781
212
4456
280
4200
1425
4.25
16.3
614
.63
67.3
22.
95
PAK
ISTA
N
4068
5645
1265
5058
6637
7842
2822
262.
85-8
.69
0.26
-17.
9410
9.66
B
ULG
AR
IA
3876
169
6865
312
6865
258
6192
233
2334
872.
36-1
0.58
0.89
-14.
9126
.82
R
OM
AN
IA
2271
124
3769
227
3316
158
4020
221
2217
952.
240.
160.
97-5
.54
23.4
0
IND
IA E
X S
IK
4576
9053
6711
349
1694
3088
5919
4240
1.96
-20.
290.
41-2
0.15
48.1
6
TFY
R M
AC
EDN
A
3400
199
1928
8454
0520
038
5016
118
4284
1.86
-5.2
00.
86-1
0.21
21.8
8
CH
ILE
942
117
999
125
929
101
1794
136
1727
171
1.75
19.7
11.
758.
8610
.11
N
ETH
ERLA
ND
S 19
0533
318
7531
619
3839
014
4724
915
6060
51.
58-6
.38
6.22
10.0
62.
58
VIE
T N
AM
43
797
419
110
315
9111
9565
913
3310
151.
3538
.76
10.4
291
.47
1.31
R
USS
IAN
FED
54
111
13
191
412
1787
1.23
0.
90
13.9
4
TUR
KEY
23
7156
1432
4412
8880
1863
4911
3441
1.15
-11.
420.
42-5
.02
27.7
1
BO
SNIA
HER
ZG
3
135
270
438
1715
8111
2644
1.14
0.
45
25.5
5
SPA
IN
674
4346
253
328
7496
417
710
9228
01.
1018
.55
2.88
64.3
73.
90
CA
NA
DA
50
08
372
638
367
34
784
60.
7916
.09
0.06
-10.
3513
9.62
U
SA
632
1366
027
691
1568
69
745
60.
753.
760.
06-2
3.83
132.
61
SWIT
Z.L
IEC
HT
469
3252
425
1023
3412
2163
396
180.
405.
210.
19-2
.24
21.9
8
HO
NG
KO
NG
49
043
431
3952
958
559
4635
655
0.36
-3.7
40.
566.
296.
52
ZIM
BA
BW
E 21
49
138
664
231
17
339
110.
3418
.87
0.11
7.68
30.7
9
THA
ILA
ND
38
925
272
5034
710
142
530
292
310.
30-1
.27
0.32
-0.9
19.
48
HU
NG
AR
Y
284
2439
130
352
2629
128
284
270.
29-2
.90
0.28
1.37
10.5
0
POLA
ND
36
610
754
106
411
411
278
250.
28-1
.45
0.25
31.0
711
.29
SL
OV
ENIA
28
822
755
3975
736
543
2524
215
0.24
-6.5
90.
16-1
1.03
15.8
4
AR
GEN
TIN
A
158
230
29
122
71
228
20.
2331
.71
0.02
-3.2
612
7.96
JA
PAN
22
16
140
517
27
128
218
26
0.18
-4.7
10.
06-8
.79
32.3
9
BEL
GIU
M
154
8815
790
0.16
0.
92
1.75
U
KR
AIN
E 30
911
294
2383
422
18
156
170.
16-1
5.21
0.17
-1.8
99.
20
OTH
.ASI
A N
ES
318
1922
012
299
2021
821
131
150.
13-1
6.38
0.15
-0.1
38.
85
SOU
TH A
FRIC
A
974
0.10
0.
04
24.3
3

18
EU IM
PORT
S O
F M
USH
ROO
MS
AN
D T
RUFF
LES
DRI
ED, B
UT
NO
T FU
RTH
ER P
REPA
RED
(HS:
071
230)
(V
: US$
TH
OU
SAN
D; Q
: MET
RIC
TO
NS)
Ori
gin
1996
19
97
1998
19
99
2000
Sh
are
Tren
d V
Sha
re T
rend
Q V
alue
00
V
Q
V
Q
V
Q
V
Q
V
Q
V 0
0 96
-00
Q 0
0 96
-00
(US$
/Kg)
IT
ALY
W
OR
LD
3265
619
2437
413
1947
4675
920
9440
851
1903
3278
618
0410
0.00
0.96
100.
00-1
.50
18.1
7
EXTR
A E
U
3043
317
3635
988
1840
4570
420
2840
063
1870
3189
917
3797
.29
2.03
96.2
50.
1818
.37
IN
TRA
EU
22
2218
814
2610
710
5566
787
3288
768
2.71
-21.
573.
75-2
7.68
13.1
2
CH
INA
89
4862
457
3735
113
888
791
1298
471
214
488
947
44.1
919
.49
52.4
616
.65
15.3
0
YU
GO
SLA
VIA
12
141
670
1750
284
215
558
586
1116
147
489
1642
527
.19
-10.
1223
.54
-13.
8020
.99
B
ULG
AR
IA
3022
118
6097
266
5836
194
5318
178
2107
726.
43-8
.23
4.00
-12.
9129
.18
R
OM
AN
IA
2126
115
3016
181
2841
132
3860
211
1924
765.
870.
484.
23-6
.42
25.2
3
TFY
R M
AC
EDN
A
2887
145
1779
7552
6919
135
8914
017
7980
5.43
-2.6
34.
41-5
.58
22.3
8
BO
SNIA
HER
ZG
3
135
267
033
1660
8010
5437
3.21
2.
06
28.4
1
RU
SSIA
N F
ED
592
412
211.
26
1.17
19
.55
FRA
NC
E W
OR
LD
2462
011
8424
821
1326
2607
816
0227
617
2212
2741
124
8110
0.00
3.27
100.
0022
.04
11.0
5
EXTR
A E
U
2167
910
2022
122
1113
2263
113
2323
835
1734
2334
018
2585
.15
2.25
73.5
417
.43
12.7
9
INTR
A E
U
2941
163
2699
214
3447
278
3781
478
4071
657
14.8
510
.38
26.4
643
.16
6.20
C
HIN
A
1085
657
311
315
725
1146
794
713
068
905
1523
968
955
.60
8.57
27.7
66.
0722
.12
PA
KIS
TAN
36
3450
3618
5445
1560
3269
3920
4916
7.48
-11.
730.
63-2
3.29
131.
15
GER
MA
NY
16
0875
1485
8216
3095
1661
7417
7689
6.48
3.16
3.59
2.45
19.9
1
VIE
T N
AM
32
171
228
6116
553
957
596
1034
940
3.77
45.8
437
.87
1.
10G
ERM
AN
Y W
OR
LD
1967
211
6318
433
1393
1981
417
3619
869
1606
2130
019
4710
0.00
2.37
100.
0012
.45
10.9
4
EXTR
A E
U
1362
493
313
790
1192
1515
014
9215
649
1371
1819
016
8985
.40
7.30
86.7
314
.19
10.7
7
INTR
A E
U
6047
230
4643
201
4664
244
4220
235
3110
258
14.6
0-1
3.29
13.2
73.
9912
.03
C
HIN
A
7052
640
8076
901
9645
1207
9630
1023
1347
813
5563
.28
15.8
569
.60
17.6
69.
94
FRA
NC
E 57
2719
543
8019
244
3123
336
8418
826
4616
712
.42
-15.
788.
58-3
.23
15.8
4
CH
ILE
625
5966
982
632
6590
395
1158
132
5.44
16.5
96.
7619
.11
8.80
IN
DIA
EX
SIK
27
4958
1975
5814
5543
1239
3610
2028
4.79
-21.
721.
45-1
7.42
36.0
5
PAK
ISTA
N
343
478
59
439
533
93
540
52.
530.
670.
27-7
.46
101.
60U
NTD
KIN
GD
OM
WO
RLD
55
4428
052
8432
478
6090
569
0368
463
9518
0910
0.00
5.68
100.
0056
.44
3.54
IN
TRA
EU
43
1117
344
0722
567
8474
358
0656
055
2716
9386
.43
8.03
93.6
172
.96
3.26
EX
TRA
EU
12
3310
787
710
010
7616
210
9612
486
811
513
.57
-4.6
86.
393.
677.
51
ITA
LY
1402
4312
7840
1601
7721
9510
522
8712
7735
.77
16.4
170
.59
1.
79
FRA
NC
E 21
0564
1929
8320
5879
1873
121
1920
125
30.0
2-2
.11
6.91
18.8
815
.36
G
ERM
AN
Y
769
5891
258
684
5089
814
176
568
11.9
6-0
.24
3.74
12.6
011
.32
N
ETH
ERLA
ND
S 14
124
737
345
6927
761
447
193
6.98
10
.67
2.
31
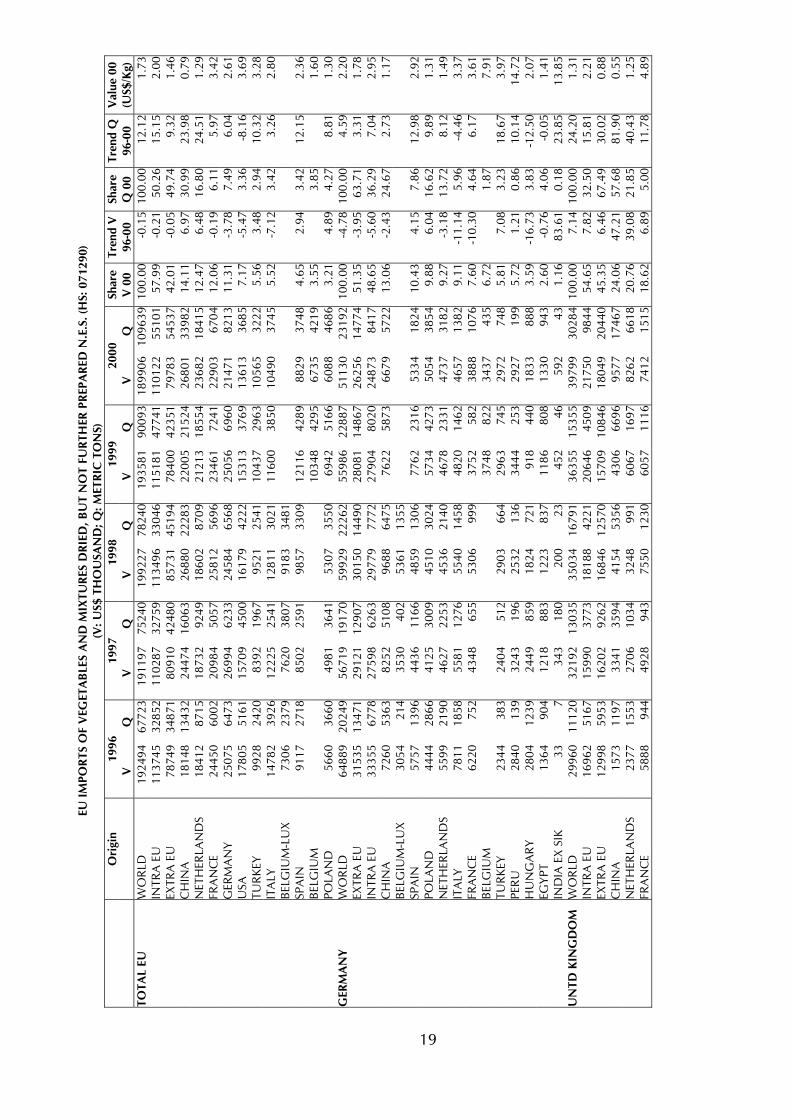
19
EU IM
PORT
S O
F V
EGET
ABL
ES A
ND
MIX
TURE
S D
RIED
, BU
T N
OT
FURT
HER
PRE
PARE
D N
.E.S
. (H
S: 0
7129
0)
(V: U
S$ T
HO
USA
ND
; Q: M
ETRI
C T
ON
S)
O
rigi
n 19
96
1997
19
98
1999
20
00
Shar
e Tr
end
V
Shar
e Tr
end
Q
Val
ue 0
0
V
Q
V
Q
V
Q
V
Q
V
Q
V
00
96-0
0 Q
00
96-0
0 (U
S$/K
g)
TOTA
L EU
W
OR
LD
1924
9467
723
1911
9775
240
1992
2778
240
1935
8190
093
1899
0610
9639
100.
00-0
.15
100.
0012
.12
1.73
IN
TRA
EU
11
3745
3285
211
0287
3275
911
3496
3304
611
5181
4774
111
0122
5510
157
.99
-0.2
150
.26
15.1
52.
00
EXTR
A E
U
7874
934
871
8091
042
480
8573
145
194
7840
042
351
7978
354
537
42.0
1-0
.05
49.7
49.
321.
46
CH
INA
18
148
1343
224
474
1606
326
880
2228
322
005
2152
426
801
3398
214
.11
6.97
30.9
923
.98
0.79
N
ETH
ERLA
ND
S 18
412
8715
1873
292
4918
602
8709
2121
318
554
2368
218
415
12.4
76.
4816
.80
24.5
11.
29
FRA
NC
E 24
450
6002
2098
450
5725
812
5696
2346
172
4122
903
6704
12.0
6-0
.19
6.11
5.97
3.42
G
ERM
AN
Y
2507
564
7326
994
6233
2458
465
6825
056
6960
2147
182
1311
.31
-3.7
87.
496.
042.
61
USA
17
805
5161
1570
945
0016
179
4222
1531
337
6913
613
3685
7.17
-5.4
73.
36-8
.16
3.69
TU
RK
EY
9928
2420
8392
1967
9521
2541
1043
729
6310
565
3222
5.56
3.48
2.94
10.3
23.
28
ITA
LY
1478
239
2612
225
2541
1281
130
2111
600
3850
1049
037
455.
52-7
.12
3.42
3.26
2.80
B
ELG
IUM
-LU
X
7306
2379
7620
3807
9183
3481
SPA
IN
9117
2718
8502
2591
9857
3309
1211
642
8988
2937
484.
652.
943.
4212
.15
2.36
B
ELG
IUM
10
348
4295
6735
4219
3.55
3.
85
1.60
PO
LAN
D
5660
3660
4981
3641
5307
3550
6942
5166
6088
4686
3.21
4.89
4.27
8.81
1.30
GER
MA
NY
WO
RLD
64
889
2024
956
719
1917
059
929
2226
255
986
2288
751
130
2319
210
0.00
-4.7
810
0.00
4.59
2.20
EX
TRA
EU
31
535
1347
129
121
1290
730
150
1449
028
081
1486
726
256
1477
451
.35
-3.9
563
.71
3.31
1.78
IN
TRA
EU
33
355
6778
2759
862
6329
779
7772
2790
480
2024
873
8417
48.6
5-5
.60
36.2
97.
042.
95
CH
INA
72
6053
6382
5251
0896
8864
7576
2258
7366
7957
2213
.06
-2.4
324
.67
2.73
1.17
B
ELG
IUM
-LU
X
3054
214
3530
402
5361
1355
SPA
IN
5757
1396
4436
1166
4859
1306
7762
2316
5334
1824
10.4
34.
157.
8612
.98
2.92
PO
LAN
D
4444
2866
4125
3009
4510
3024
5734
4273
5054
3854
9.88
6.04
16.6
29.
891.
31
NET
HER
LAN
DS
5599
2190
4627
2253
4536
2140
4678
2331
4737
3182
9.27
-3.1
813
.72
8.12
1.49
IT
ALY
78
1118
5855
8112
7655
4014
5848
2014
6246
5713
829.
11-1
1.14
5.96
-4.4
63.
37
FRA
NC
E 62
2075
243
4865
553
0699
937
5258
238
8810
767.
60-1
0.30
4.64
6.17
3.61
B
ELG
IUM
37
4882
234
3743
56.
72
1.87
7.
91
TUR
KEY
23
4438
324
0451
229
0366
429
6374
529
7274
85.
817.
083.
2318
.67
3.97
PE
RU
28
4013
932
4319
625
3213
634
4425
329
2719
95.
721.
210.
8610
.14
14.7
2
HU
NG
AR
Y
2804
1239
2449
859
1824
721
918
440
1833
888
3.59
-16.
733.
83-1
2.50
2.07
EG
YPT
13
6490
412
1888
312
2383
711
8680
813
3094
32.
60-0
.76
4.06
-0.0
51.
41
IND
IA E
X S
IK
337
343
180
200
2345
246
592
431.
1683
.61
0.18
23.8
513
.85
UN
TD K
ING
DO
M
WO
RLD
29
960
1112
032
192
1303
535
034
1679
136
355
1535
539
799
3028
410
0.00
7.14
100.
0024
.20
1.31
IN
TRA
EU
16
962
5167
1599
037
7318
188
4221
2064
645
0921
750
9844
54.6
57.
8232
.50
15.8
12.
21
EXTR
A E
U
1299
859
5316
202
9262
1684
612
570
1570
910
846
1804
920
440
45.3
56.
4667
.49
30.0
20.
88
CH
INA
15
7311
9733
4135
9441
5453
5643
0666
9695
7717
467
24.0
647
.21
57.6
881
.90
0.55
N
ETH
ERLA
ND
S 23
7715
5327
0610
3432
4899
160
6716
9782
6266
1820
.76
39.0
821
.85
40.4
31.
25
FRA
NC
E 58
8894
449
2894
375
5012
3060
5711
1674
1215
1518
.62
6.89
5.00
11.7
84.
89

20
EU IM
PORT
S O
F V
EGET
ABL
ES A
ND
MIX
TURE
S D
RIED
, BU
T N
OT
FURT
HER
PRE
PARE
D N
.E.S
. (H
S: 0
7129
0)
(V: U
S$ T
HO
USA
ND
; Q: M
ETRI
C T
ON
S
Ori
gin
1996
19
97
1998
19
99
2000
Sh
are
Tren
d V
Sh
are
Tren
d Q
Val
ue 0
0
V
Q
V
Q
V
Q
V
Q
V
Q
V
00
96-0
0 Q
00
96-0
0 (U
S$/K
g)
FRA
NC
E W
OR
LD
2577
591
3029
633
1181
427
935
1033
125
672
9912
2526
111
176
100.
00-1
.82
100.
002.
322.
26
EXTR
A E
U
1166
643
8812
507
4882
1416
659
1913
175
5401
1286
858
6550
.94
2.51
52.4
77.
052.
19
INTR
A E
U
1410
947
4217
126
6931
1376
944
1312
497
4511
1239
353
1249
.06
-5.5
847
.53
-2.0
02.
33
NET
HER
LAN
DS
4272
1115
5212
1205
4720
1122
4244
1114
4822
1261
19.0
90.
3711
.28
1.68
3.83
C
HIN
A
3799
2346
4695
2580
4718
3324
4178
3042
4504
3639
17.8
32.
2632
.56
10.9
91.
24
USA
27
4754
922
0938
733
1559
631
4358
035
7969
714
.17
9.22
6.24
9.20
5.13
G
ERM
AN
Y
4695
1072
5822
1432
4303
1047
4289
956
3512
1029
13.9
0-8
.48
9.20
-4.7
53.
41
BEL
GIU
M-L
UX
16
5615
2216
5527
3514
4613
95
IT
ALY
85
519
810
6025
312
2533
113
9746
812
7826
25.
0611
.41
2.35
12.4
44.
87
BEL
GIU
M
1532
1703
1230
1697
4.87
15
.18
0.
72
MO
RO
CC
O
1753
309
1670
296
1797
337
1519
330
771
168
3.05
-15.
951.
51-1
0.46
4.58
NET
HER
LAN
DS
WO
RLD
22
564
7451
2200
363
9221
781
6717
2115
098
8323
836
1826
810
0.00
0.70
100.
0024
.97
1.30
IN
TRA
EU
14
002
2886
1479
236
6314
589
3829
1492
165
4717
200
1422
172
.16
4.29
77.8
545
.79
1.21
EX
TRA
EU
85
6345
6472
1127
2971
9128
8862
2933
3666
3640
4727
.84
-6.3
522
.15
-0.4
01.
64
GER
MA
NY
46
1596
345
0410
8245
5214
3441
6718
1346
2226
6019
.39
-0.7
514
.56
29.0
21.
74
FRA
NC
E 37
5575
144
4212
8245
7012
5251
7521
8341
0718
0117
.23
3.38
9.86
25.6
12.
28
POR
TUG
AL
116
3484
2531
5156
7113
.22
31
.04
0.
56
USA
11
7041
518
4353
718
3146
614
9842
722
0863
89.
2611
.22
3.49
6.53
3.46
IR
ELA
ND
59
985
347
4123
450
983
9621
2927
68.
9343
.05
1.51
37.6
47.
71
BEL
GIU
M-L
UX
17
7436
818
5840
016
7239
5
C
HIN
A
1937
1890
1474
957
1469
1278
1411
1584
1563
2070
6.56
-4.6
211
.33
7.10
0.76
B
ELG
IUM
18
3310
0614
0715
145.
90
8.29
0.
93
ITA
LY
2204
431
2117
357
2313
398
1598
1132
953
1089
4.00
-17.
785.
9635
.10
0.88
PO
LAN
D
630
427
528
415
369
282
892
701
797
687
3.34
10.4
63.
7615
.90
1.16
ITA
LY
WO
RLD
11
241
3475
1008
138
1711
571
5321
1262
056
5211
044
5499
100.
001.
9110
0.00
14.0
12.
01
EXTR
A E
U
5772
2246
4743
1989
5873
3235
5841
3085
6243
3501
56.5
33.
7263
.67
14.1
91.
78
INTR
A E
U
5469
1228
5338
1828
5699
2086
6779
2567
4801
1997
43.4
7-0
.21
36.3
314
.02
2.40
TU
RK
EY
2955
918
2085
518
2710
849
2771
964
2336
946
21.1
5-1
.84
17.2
07.
032.
47
FRA
NC
E 23
2950
415
4444
718
2556
324
7689
316
9653
515
.35
-1.6
09.
738.
473.
17
CH
INA
68
447
213
6483
017
0817
6912
6612
0712
2311
7111
.08
11.4
821
.29
24.4
91.
04
GER
MA
NY
14
5734
819
7063
716
5959
717
8454
711
7451
810
.63
-5.1
89.
436.
662.
26
AU
STR
IA
197
4350
123
759
225
978
938
290
050
48.
1541
.81
9.16
71.9
41.
79
HU
NG
AR
Y
803
297
499
230
568
196
695
292
711
375
6.44
0.87
6.83
7.30
1.89
N
ETH
ERLA
ND
S 52
014
956
826
564
531
078
236
251
718
84.
683.
123.
428.
002.
75
TUN
ISIA
3
16
299
8023
617
446
924
14.
25
4.39
1.
94
MO
RO
CC
O
1810
8757
227
8080
6937
019
83.
3582
.33
3.60
85.8
21.
87So
urce
: CO
MTR
AD
E da
taba
se, U
nite
d N
atio
ns S
tatis
tics
Div
isio
n (U
NSD
)
ANNEX II
USEFUL ADDRESSES

22
LIST OF SELECTED IMPORTERS BELGIUM Caldic Food Ter Locht Weg 1 2620 Hemiksem Tel: +32 3 870 4911 Fax: +32 3 870 4919 FRANCE Ducros SAS Z.I. de Carpensud B.P. 150 84971 Carpentras Cedex Tel: +33 490 638 989 Fax: +33 490 638 901 GERMANY Brückner-Werke Wendenstrasse 4 20097 Hamburg Tel: +49 4023 730 801 Fax: +49 4023 730 856 E.H. Worlée Grusonstrasse 22 22113 Hamburg Tel: +49 40 733 330 Fax: +49 40 733 33290 http://www.worlee.de Tro-Kost GmbH Heidenackerstrasse17 69207 Sandhausen Tel: +49 622 493 010 Fax: +49 622 493 0150 McCormick GmbH Sperberstrasse 45 65812 Bad Saden Tel: +49 6196 528 073 Fax: +49 6196 528 074
ITALY Allione Industrie Alimentari SPA Via Centallo 15 12020 (CN) Tarantasca Tel: +39 0171 949 111 E-mail: [email protected] Banfi SPA Castello di Poggio alle Mura 53024 (SI) Montalcino Tel: +39 0577 840 351 E-mail: [email protected] C.A.S. SPA Via Borgonovo 87 37043 (VR) Castagnaro Tel: +39 0442 635 611 E-mail: [email protected] E&O Von Felten SPA Strada Langhirano 243 Gaione 43010 (PR) Fontanini Tel: +39 0521 649 911 E-mail: [email protected] Kerry Gasparini SRL Via Sondrio 9 20053 (MI) Muggio Tel: +39 039 271 711 E-mail: [email protected] RODEXPORT SRL Via Cimarosa 15/17 44100 (FE) Ferrara Tel: +39 0532 904 044 E-mail: [email protected]

23
NETHERLANDS Dika Fabrieken BV Buiten de Veerpoort 5 2871 CC Schoonhoven Tel: +31 182 382 665 Fax: +31 182 383 580 Catz International B.V. P. O. Box 180 3000 AD, Rotterdam Tel: +31 10 411 34 40 Fax: +31 10 411 89 13 E-Mail: [email protected] URL: http://www.catz.nl UNITED KINGDOM European Food Ingredients Ltd Station Road Offenham B97 1PC Tel: +44 138 683 3123 Fax: +44 138 683 3655 Carrex International Ltd –MV Carib Ltd Haslington Hall, Haslington Crewe, Cheshire, CW1 5RX Tel: +44 1270 588 722 Fax: +44 1270 255 050 URL: http://www.carrexint.co.uk
24
IMPORT PROMOTION OFFICES DENMARK DIPO (The Danish Import Promotion Office for Products from Developing Countries) Borsen 1217 COPENHAGEN K Tel: +45 339 505 00 Fax: +45 331 205 25 E-mail: [email protected] URL: http://www.dipo.dk GERMANY Deutsche Gesellschaft für Technische Zusammenarb. (GTZ) GmbH Dag-Hammarskjöld-Weg 1-5 65760 ESCHBORN Tel: +496 196 791 229 Fax: +496 196 796 150 URL: http://www.gtz.de/english ITALY Istituto Nazionale per il Commercio Estero (ICE) Via Liszt, 21 00144 ROME EUR Tel: +39 06 599 294 84 Fax: +3906 542 200 07 E-mail: [email protected] URL: http://www.italtrade.com NETHERLANDS Centre for the Promotion of Imports from Developing Countries (CBI) Beursplein 37, 5th Floor P.O. Box 30009 3001 DA ROTTERDAM Tel: +31 10 201 34 34 Fax: +31 10 411 40 81 E-mail: [email protected] URL: http://www.cbi.nl
SWEDEN Association of Swedish Chambers of Commerce P.O. Box 16050 103 21 STOCKHOLM Tel: +46 8 555 100 00 Fax: +46 8 566 316 35 E-mail: [email protected] URL: http://www.cci.se
25
NATIONAL MEMBERS OF THE EUROPEAN COMMITTEE FOR STANDARDIZATION
Österreichisches Normungsinstitut (ON) Tel: +43 1 213 00 Fax: +43 1 213 00 650 E-mail: [email protected] URL: http://www.on-norm.at Institut Belge de Normalisation / Belgisch Instituut voor Normalisatie (IBN / BIN) Tel: +32 2 738 01 11 Fax: +32 2 733 42 64 E-mail: [email protected] URL: http://www.ibn.be Dansk Standard (DS) Tel: +45 39 96 61 01 Fax: +45 39 96 61 02 E-mail: [email protected] URL: http://www.ds.dk Suomen Standardisoimisliitto r.y. (SFS) Tel: +358 9 149 93 31 Fax: +358 9 146 49 25 E-mail: [email protected] URL: http://www.sfs.fi Association Française de Normalisation (AFNOR) Tel: +33 1 41 62 80 80 Fax: +33 1 49 17 90 00 URL: http://www.afnor.fr Deutsches Institut für Normung e.V. (DIN) Tel: +49 30 26 01 0 Fax: +49 30 26 01 12 31 E-mail: [email protected] URL: http://www.din.de Hellenic Organization for Standardization (ELOT) Tel: +30 1 212 01 00 Fax: +30 1 228 62 19 E-mail: [email protected] URL: http://www.elot.gr National Standard Authority of Ireland (NSAI) Tel: +353 1 807 38 00 Fax: +353 1 807 38 38 E-mail: [email protected] URL: http://www.nsai.ie
Ente Nazionale Italiano di Unificazione (UNI) Tel: +39 02 70 02 41 Fax: +39 02 70 10 61 06 E-mail: [email protected] URL: http://www.uni.com Service de l’Energie de l’ ETAT (SEE) Tel: +352 46 97 56 1 Fax: +352 46 97 46 39 E-mail: [email protected] URL: http://www.etat.lu/see Nederlands Normalisatie-instituut (NEN) Tel: +31 15 269 03 90 Fax: +31 15 269 01 90 E-mail: [email protected] URL: http://www.nen.nl Instituto Português da Qualidade (IPQ) Tel: +351 21 294 81 00 Fax: +351 21 294 81 01 E-mail: [email protected] URL: http://www.ipq.pt Asociación Española de Normalización y Certificación (AENOR) Tel: +34 91 432 60 00 Fax: +34 91 310 40 32 E-mail: [email protected] URL: http://www.aenor.es Swedish Standards Institute (SIS) Tel: +46 8 555 520 00 Fax: +46 8 555 520 01 E-mail: [email protected] URL: http://www.sis.se British Standards Institution (BSI) Tel: +44 208 996 90 00 Fax: +44 208 996 74 00 E-mail: [email protected] URL: http://www.bsi-global.com
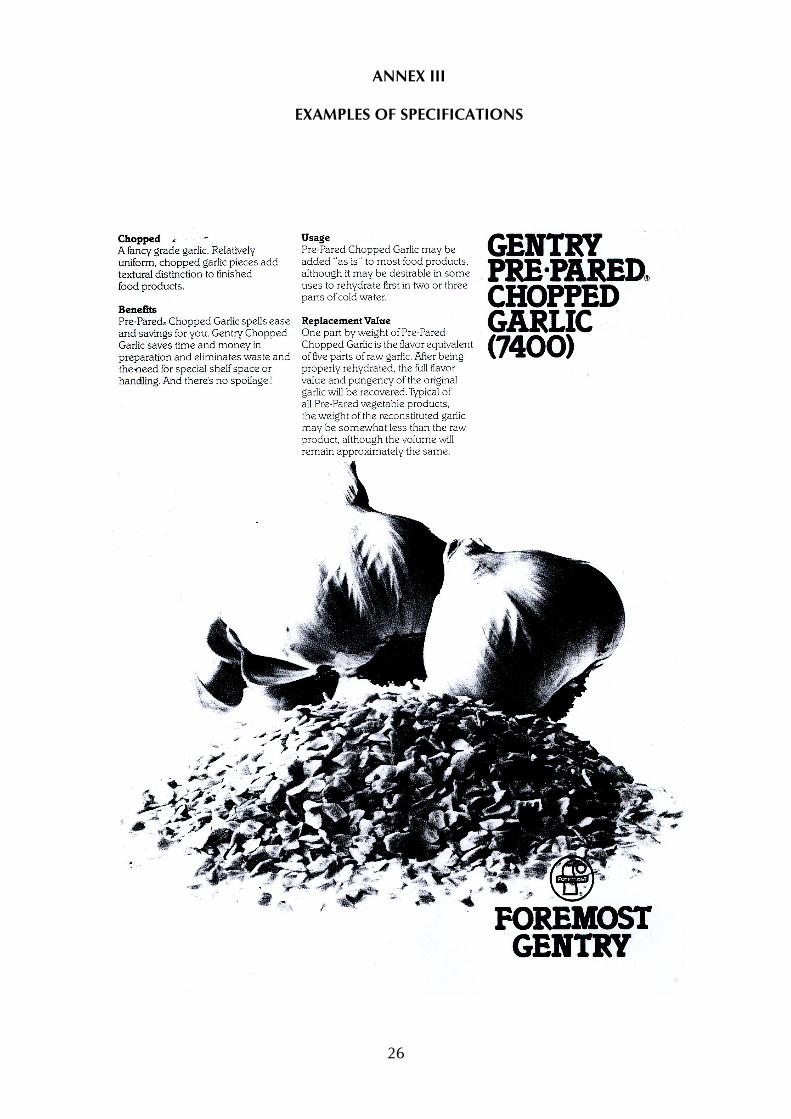
26
ANNEX III
EXAMPLES OF SPECIFICATIONS

27

28

29

30
ANNEX IV
SPECIALIZED PUBLICATIONS
International Food Ingredients Miller Freeman BV P.O. Box 200 3600 AE Maarssen The Netherlands Tel: +31 346 55 94 44 Fax: +31 346 57 38 11 URL: http://www.ifi-online.com Eurofruit Agra Europe 80 Calverley Road Tunbridge Wells Kent, TN1 2UN Tel: +44 1 892 533 813 Fax: +44 1 892 544 895 URL: http//www.agra-europe.com Veille Internationale; Fruits et légumes transformés Centre français du commerce extérieur Librairie du commerce international 10, avenue d'Iéna B.P. 428-16, Paris, France Tel: +33 140 73 34 60 Fax: +331 40 73 31 46 Email: [email protected] URL: http://www.cfce.fr International Fruit World AgroPress Inc. Missionsstrasse 34, Switzerland Tel: +4161 386 90 90 Fax: +4161 386 90 99 Email: [email protected] URL: http://www.agropress.com
Eurofruit Market Intelligence Ltd 1 Nine Elms Lane London United Kingdom Tel: +4420 7501 3700, 7501 3707 Fax: +4420 7498 6472 E-mail: [email protected] URL: http://www.fruitnet.com Clipper, The Journal for the International Trade in Processed Food, Dried Fruit and Nuts AgroPress Inc Missionsstrasse 34 BASEL Switzerland Tel: +4161 386 90 90 Fax: +4161 386 90 99 URL: http://www.agropress.com

31
ANNEX V
COUNTRIES BENEFITTING FROM THE GSP; ACP AND LEAST DEVELOPED COUNTRIES
Country GSP LDC ACP Country GSP LDC ACP Afghanistan X X Ethiopia X X X Albania X Falkland Islands X Algeria X Fiji X Angola X X X French Polynesia X Anguilla X French Southern Territories X Antigua And Barbuda X Gabon X Argentina X Gambia X X X Armenia X Georgia X Aruba X Ghana X Azerbaijan X Gibraltar X Bahamas X Greenland X Bahrain X Grenada X Bangladesh X X Guatemala X Barbados X Guinea X X X Belarus X Guinea-Bissau X X X Belize X Guyana X Benin X X X Haiti X X X Bermuda X Heard & Mc Donald Islands X Bhutan X X Honduras X Bolivia X India X Bosnia And Herzegowina X Indonesia X Botswana X Iran (Islamic Republic Of) X Brazil X Iraq X British Indian Ocean Territory X Jamaica X Brunei Darussalam X Jordan X Burkina Faso X X X Kazakhstan X Burundi X X X Kenya X Cambodia X X Kiribati X X X Cameroon X Kuwait X Cape Verde X X X Kyrgyzstan X Cayman Islands X Lao People'S Dem Republic X X Central African Republic X X X Lebanon X Chad X X X Lesotho X X X Chile X Liberia X X X China X Libyan Arab Jamahiriya X Christmas Island X Macau X Cocos (Keeling) Islands X Madagascar X X X Colombia X Malawi X X X Comoros X X X Malaysia X Congo X Maldives X X Congo (Democratic Republic) X X X Mali X X X Cook Islands X Marshall Islands X Costa Rica X Mauritania X X X Cote D'Ivoire X Mauritius X Croatia X Mayotte X Cuba X Mexico X Cyprus X Micronesia X Djibouti X X X Moldova, Republic Of X Dominica X Mongolia X Dominican Republic X Moldova, Republic Of X Ecuador X Mongolia X Egypt X Montserrat X El Salvador X Morocco X Equatorial Guinea X X X Mozambique X X X Eritrea X X X Myanmar X X
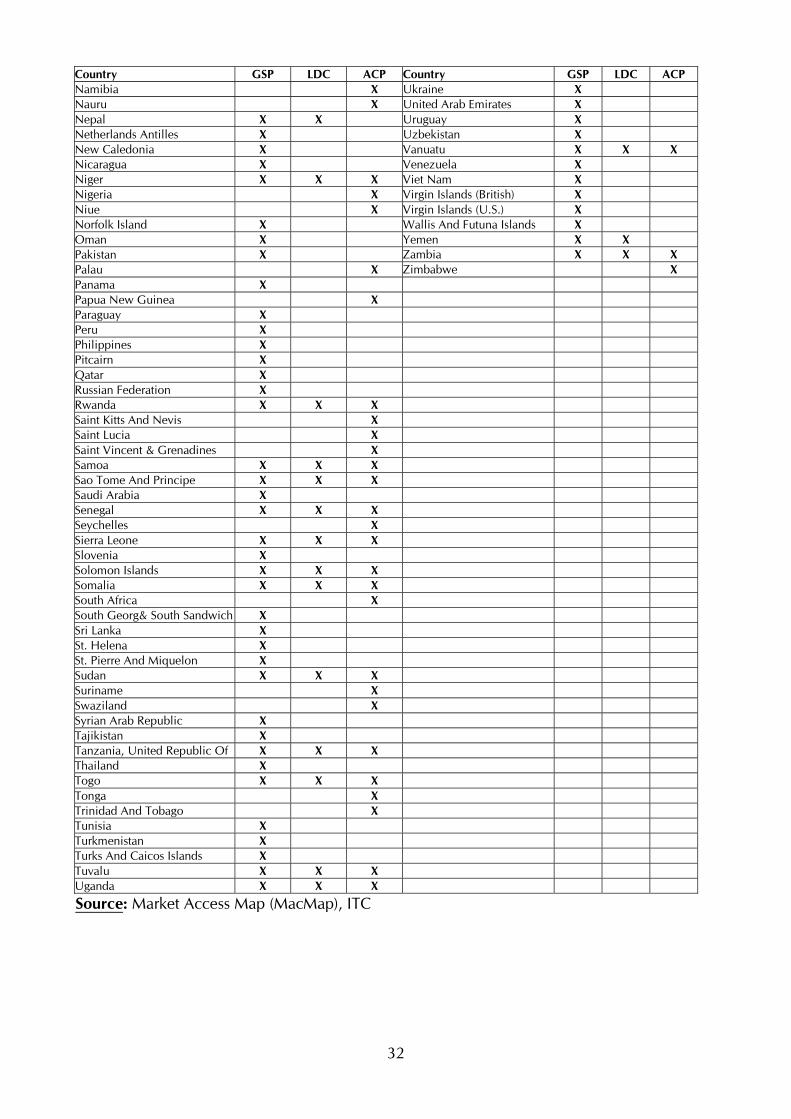
32
Country GSP LDC ACP Country GSP LDC ACP Namibia X Ukraine X Nauru X United Arab Emirates X Nepal X X Uruguay X Netherlands Antilles X Uzbekistan X New Caledonia X Vanuatu X X X Nicaragua X Venezuela X Niger X X X Viet Nam X Nigeria X Virgin Islands (British) X Niue X Virgin Islands (U.S.) X Norfolk Island X Wallis And Futuna Islands X Oman X Yemen X X Pakistan X Zambia X X X Palau X Zimbabwe X Panama X Papua New Guinea X Paraguay X Peru X Philippines X Pitcairn X Qatar X Russian Federation X Rwanda X X X Saint Kitts And Nevis X Saint Lucia X Saint Vincent & Grenadines X Samoa X X X Sao Tome And Principe X X X Saudi Arabia X Senegal X X X Seychelles X Sierra Leone X X X Slovenia X Solomon Islands X X X Somalia X X X South Africa X South Georg& South Sandwich X Sri Lanka X St. Helena X St. Pierre And Miquelon X Sudan X X X Suriname X Swaziland X Syrian Arab Republic X Tajikistan X Tanzania, United Republic Of X X X Thailand X Togo X X X Tonga X Trinidad And Tobago X Tunisia X Turkmenistan X Turks And Caicos Islands X Tuvalu X X X Uganda X X X Source: Market Access Map (MacMap), ITC

33
ANNEX VI
SOURCES OF INFORMATION
• Worldtariff Guidebook on Customs Tariff Schedules of Import Duties for European
Union, 40th annual edition: 2000, World Tariff, Ltd, 220 Montgomery Street, Suite 448, San Francisco, California 94104, USA.
• Generalized System of Preferences, Handbook on the Scheme of the European Community, UNCTAD Technical Cooperation Project on Market Access, Trade Laws and Preferences, February 1999.
• Dehydrated vegetables, A survey of major markets, International Trade Centre UNCTAD/GATT, 1993.
• COMTRADE Data Base, United Nations Statistics Division (UNSD). • Eurostat Europroms CD-ROM, European production and market statistics EU-15,
Prodcom/Combined nomenclature, 10-11/2001. • Intra-and Extra-EU Trade, Annual Data-Combined Nomenclature, Supplement 2, 2001. • Foodnews (various issues) • Veille internationale PEE-CFCE, Fruits et légumes transformés, n°11 - November 2000,
n°6 - June 1999. • Dehydrated vegetables, http://www.waltonfeed.com • UK Market Notes, Dried pulses, dehydrated vegetables and fruit, edible nuts, DeCTA,
March 1995. • EU Strategic Marketing Guide 2000 - Preserved Fruit and Vegetables for Industrial Use,
Compiled for CBI by ProFound Advertisers in Development in collaboration with Ir. A. F. Eshuis, November 2000.
• EU Market Survey 2001 - Preserved Fruit and Vegetables for Industrial Use, Compiled for CBI by ProFound Advertisers in Development in collaboration with Ir. A. F. Eshuis, September 2001.
• Commercial Processing of Vegetables, Noyes Data Corporation, 1975. • Food Dehydration, The AVI Publishing Company, Inc. Vo.1 1963, Vol. 2 1964. • Integrated Tariff of the United Kingdom (Tariff), 2002 edition, vol. 1 and 2, 1January
2002. • Eurostat, European Commission, Intra – and Extra – EU trade (Annual data – combined
nomenclature), 2001 • Eurostat Europroms CD-ROM, European production and market statistics EU-15,
Prodcom/Combined nomenclature, 10-11/2001. • Official Journal, EU, URL: http://www.europa.eu.int/eur-lex/en/search/index.html. • FAO/WHO food standards, URL: http://www.codexalimentarius.net/standard_list.asp. • Annual Report, European Committee for Standardization (CEN), July 2000.
Copyright © 2022 FDOKUMEN