Federal Marketing Orders for Fruits, Vegetables, Nuts, and ...
43
A^^)-^ íki^i^i^mSM United Stiries Department of Agriculture Economic '» Research Service Agricultural Economic Report Number 629 '^^0 Federal Marketing Orders for Fruits, Vegetables, Nuts, and Specialty Crops Nicholas J. Powers .. ,./ . .^ * ^^.^
-
Upload
khangminh22 -
Category
Documents
-
view
2 -
download
0
Transcript of Federal Marketing Orders for Fruits, Vegetables, Nuts, and ...

A^^)-^ íki^i^i^mSM
United Stiries Department of Agriculture
Economic '» Research Service
Agricultural Economic Report Number 629
'^^0
Federal Marketing Orders for Fruits, Vegetables, Nuts, and Specialty Crops Nicholas J. Powers
..™,./ .
.^►*
^^.^

It's Easy To Order Another Copy!
Just dial 1-800-999-6779. Toll free.
Ask for Federal Marketing Orders for Fruits, Vegetables, Nuts, arid Specialty Crops (AER-629).
The cost is $8.00 per copy. For non-U.S. addresses, add 25 percent (includes Canada). Cliarge your purchase to your VISA or MasterCard, or we can bill you.
Or send a check or purchase order (made payable to ERS-NASS) to:
ERS-NASS P.O. Box 1808 Rockville, MD 20849-1608.
We'll fill your order by first-class mail.

Federal Marketing Orders for Fruits, Vegetables, Nuts, and Specialty Crops. By Nicholas J. Powers. Commodity Economics Division, Economic Research Service, U.S. Department of Agriculture. Agricultural Economic Report No. 629.
Abstract
Many marketing orders have regulations for funding promotion and research and estab- lishing package, container, grade, and size requirements. The intent of these regulations is to increase sales by increasing buyer awareness of the product, developing more desir- able products, and reducing marketing costs. A few marketing orders control the volume of produce entering certain markets and are intended to even out supplies and prices over time. These regulations can restrict sales of high-quality produce to the fresh-use market and boost farm prices for a given quantity. However, production increases stimulated by the higher prices subsequently reduce them.
Keywords: Federal marketing orders, free rider, promotion, research, package, con- tainer, grade, size, volume controls, and economic effects.
Acknowledgments
I am indebted to Richard G. Heifner and Glenn A. Zepp, of the Economic Research Service for numerous constructive comments on several earlier drafts of the manuscript. Sara Wampler provided valuable editorial assistance and Nadine Loften composed the manuscript.
Washington, DC 20005-4788 March 1990

Preface
This report explains why there is a Federal mariceüng order program for horticultural crops, its development and operation, and its impact on market participants. The sections on the evolution and operation of marketing orders explains the rationale for orders and the mechanics of initiating and administ^ing marketing apeements and orders and identi- fies changes in the number, type, and industry structure of crops with orders over time. Effects of the regulations on market participants, such as growers, input suppliers, food processors, and consumers, are discussed in terms of the direction of change in farm prices and revenues, marketing margins, input use, output, market utilization, retail price, and consumer expenditures.
The report is written principally for persons affected by or interested in the program, such as farmers, marketers, food processors, staff members at public and private organizations, and consumers.
Similar questions and issues on marketing orders were addressed in earlier Federal Government publications, including Federal and State Enabling Legislation for Fruit and Vegetable Marketing Orders: Evolution and Current Status and A Review of Federal Marketing Orders for Fruits, Vegetables, and Specialty Crops: Economic Efficiency and Welfare Implications (see References). The status of mariceting orders and our under- standing of their effects have changed in several ways since the time that these two studies were written. However, it is unavoidable that much of the material in this report overlaps with that in earlier publications. Overlapping is due to the objectives of this report, such as documenting the current status and evolution of marketing orders.

Contents
Glossary iv
Summary vi
Introduction 1
Why Do We Have Marketing Agreements and Orders? 1
Administering Marketing Agreements and Orders 4
Characteristics of the Commodities and industries with Marketing Orders . 6 Commodities . 6 Industry Structure 6 Methods of Pricing 10 Marketing OrderCoverage of the Crop Supply 14
The Regulations ... 15 Why Do We Have Regulations? 15 Promotion, Research, and Package Regulations 18 Grade and Size Regulations 22 Volume Controls 23 Other Functions .30
References 30
Appendix I: Effects of Product Diversion 32
Appendix II: Potential Effects of Marketing Allotments 34
Ul

Glossary
Agricultural Marketing Agreement Act of 1937 (AMAA), as amended—^Legislation authorizing Federal marketing agreements and orders for selected horticultural crops.
Competitive market—An industry with many small firms, no insurmountable barriers to firms to enter or exit the industry, small costs for firm entry or exit, and no one firm able to impact market prices by its actions.
Cost-saving input-^A cost-saving input reduces the amount of at least one input needed to produce a unit of output.
Externality—An externality occurs when one person's (or group's) action benefits or costs another person (or group). The benefits or costs from the externality-generating activity are not priced in the marketplace and are often outside the control of the individ- ual or individuals affected.
Federal marketing agreement—^A marketing institution authorized by the Agricultural Marketing Agreement Act of 1937, as amended, which enables handlers to collectively regulate certain aspects of the marketing of produce in interstate and foreign commerce. Regulations are binding only on signatory handlers in the designated area.
Federal marketing order—A marketing institution authorized by the Agricultural Mar- keting Agreement Act of 1937, as amended, which enables growers to collectively regu- late certain aspects of the marketing of produce in interstate and foreign commerce. Regulations approved by the Secretary of Agriculture are compulsory on all handlers in the designated area.
Free rider—A firm that benefits from a funded activity without contributing to its costs.
Grade and size requirements—Grade requirements (regulations) set the minimum qual- ity produce must meet to be eligible for shipment to regulated markets (such as the fresh- use market). Size requirements usually set the minimum produce size eligible for shipment to regulated markets.
Grower price—^The unit price of the commodity paid to growers by handlers.
Handler price—The unit price of the commodity paid to handlers by wholesalers and retailers.
Imperfect information—Information is imperfect when firms lack knowledge and an understanding of past, current, and future events which affect the market outcome.
Incomplete risk markets—^Risk markets are said to be incomplete when there is an absence of a means for growers, marketers, and consumers to exchange (conditional) promises today about something that they will do at a future date. Absence of forward- pricing markets or crop insurance markets are examples.
Increasing economies of scale—The range of output where the average total cost of pro- ducing a unit of output, such as produce, research experiments, or advertising, is falling. Average total cost equals average variable cost plus average fixed cost.
IV

Market failure—^The inability of growers to provide certain goods, such as market infor- mation, generic advertising, and production and marketing research, because of free riders. Market failures include externalities, imperfect information, or incomplete risk markets. Such failures tend to elevate production and marketing costs and, thus, retail prices.
Market power—^The potential for a firm or group of firms to affect market prices by con- trolling certain aspects of marketing, such as sales to a market, quality of produce sold, and funding for promotion and research.
Product diversion—Diverting sales of high-quality produce from the more price-respon- sive market (usually the fresh-use market) to the less price-responsive market (such as the processing-use market) with the objective of boosting weighted average farm prices and revenues.
Promotion» research, and package regulations—^The set of regulations authorizing grower funding for generic advertising and promotion and production and marketing research and establishing package and container standards.
Retail price—The unit price for the commodity paid to retailers by consumers.
Risk aversion—^Preference for a certain (monetary) payoff over a random (monetary) payoff with equal expected value.
Volume control—Regulations that can limit sales within a period of the marketing sea- son or annual sales to some markets, such as the fresh-use, export, and processing-use markets.

Summary
Federal marketing orders for horticultural crops enable growers to collectively regulate certain marketing activities. Many marketing orders have regulations for funding promo- tion and research and establishing package, container, grade, and size requirements. The intent of these regulations is to increase sales by increasing buyer awareness of the product, developing more desirable products, and reducing marketing costs. A few marketing orders control the volume of pro- duce entering certain markets and mc intended to even out supplies and prices over time. Tliese regulations can restrict sales of high-quality produce to the fresh-use market and boost farm prices for a given quantity. However, production increases stimulated by the higher prices cause those prices to fall.
The reason for having a Federal marketing order program and how it works are explained in this report. Marketing orders can be composed of many different kinds of regula- tions and can cover marketing activities (such as generic advertising, research, and promotion), grade and size require- ments, and the control of the flow of farm produce to certain markets.
Marketing orders that authorize funding for generic advertis- ing and commodity promotion programs (used when the commodity is highly homogeneous and produced by many growers) can expand demand by informing food processors, the food service industry, and consumers of new and existing products and uses and cultivating a more favorable image of the produce. Funding for research and standardization of packages and containers can reduce production and food dis- tribution costs, resulting in lower retail prices and more sales. Demand expansion appeals to producers who can potentially sell more output at higher farm prices, but compe- tition between products limits the potential increases in farm prices and sales.
Grade standards categorize produce by its quality, such as maturity, fermentation, decay or off-flavor, color, and shape. Size standards categorize produce by its size. Grade and size standards facilitate business transactions between han- dlers and retailers and retailers and consumers by conveying information about the attributes of the produce. Grade requirements can help keep immature, damaged, or defective produce off the market, while size requirements typically exclude small-sized produce. Such requirements reduce mar- keting costs if they prevent handlers from shipping produce that is likely to spoil or be unwanted by consumers.
Volume controls limit the produce that can be sold to regu- lated markets during a season or a period within the season. The regulated market is often the fresh-use market. Volume regulations can help stabilize prices and shipments, which can make planning easier for food distributors and retailers and reduce marketing costs. Risk-averse growers tend to produce more when prices ^e more predictable, which low- ers prices and causes risk-averse marketers to handle more produce. Consumers may prefer stable prices and ship- ments over alternating periods of sparse and plentiful supplies.
Volume or, less frequently, grade or size regulations can restrict sales of high-quality produce to a more price-respon- sive market, such as the fresh-use market, causing some pro- duce to be diverted to a less price-responsive market, such as the processing-use market. Product diversions tend to ele- vate weighted average farm prices and revenues. Higher prices stimulate production if the product diversion occurs over extended periods, which, in turn, lowers the prices. Growers' returns to limited factors of production, such as land, consequently are higher in the beginning, but as prices fall, so do returns. Product diversions cause a greater propor- tion of the crop to enter the low-valued processing-use market over time. Product diversions are controversial because consumers of fresh produce pay a higher price and purchase a smaller quantity while consumers of processed products pay a lower price and purchase a larger quantity. Consumers' total expenditures for the fresh produce and pro- cessed products are higher, however.
Product diversion over extended periods is unlikely to ele- vate farm prices permanently for most of the crops with a marketing order. Because most growers of crops with a mar- keting order compete with nonregulated domestic and foreign growers, consumers can usually substitute the mar- keting order commodity with a nonmarketing order com- modity. Furthermore, growers expand output when the farm price is higher, causing the price to fall. Few marketing orders authorize volume regulations, which have the greatest ability to cause product diversions.
The net effect of volume regulations depends on their use. Stabilizing within-season and year-to-year prices and sup- plies can benefit growers, marketers, and consumers alike. Regulations used to permanently restrict sales to the fresh- use market would likely benefit only growers with land at the time the diversion program is initiated.
Vi

Federal Marketing Orders for Fruits, Vegetables, Nuts, and Specialty Crops
Nicholas J. Powers
Introduction
The annual farm value of fruit» vegetable, nut, and specialty crops regulated by Federal marketing orders and sold from marketing year 1985/86 to 1987/88 averaged nearly $4.58 billion (table 1). Vegetables (including potatoes) had the highest average annual farm value at about $1.64 billion; nuts, dried fruits, and spearmint oil totaled $1.23 billion; citrus crops were next at $933.1 million; while noncitrus crops totaled $780.8 million. Fourteen Federal marketing orders regulated produce with an average annual farm value exceeding $100 million while 29 marketing orders covered crops with an average annual value under $100 million.
Marketing orders are concentrated in the West and South- east. Marketing orders regulate 36 crops grown west of the Mississippi River, 8 crops grown east of the Mississippi River and south of Pennsylvania, and 2 crops grown east of the Mississippi River and north of Maryland. Most geo- graphic regions of the United States grow at least one fruit, vegetable, nut, or specialty crop whose marketing is regu- lated by a Federal marketing order.
Federal marketing orders are used extensively for fluid milk, but they are administered much differentiy than those for hor- ticultural crops, so they arc not examined in this report. State marketing orders, which typically authorize gmde and size regulations and funding for generic advertising and com- modity promotion, also arc not examined. For example, the advertisements for California raisins are authorized under a State marketing order.
Federal marketing orders authorize the use of three broad categories of regulations for growers:
• Funding for commodity promotion and research and establishing package and container requirements,
• Grade and size requirements,
• Volume controls.
Funding for commodity promotion is intended to expand demand by informing consumers and food processors of new and existing products and uses and by developing a positive reputation and goodwill for the commodity. Funding for research and establishing package and container rcquire- ments is intended to lower p-oduction and marketing costs, which can lower retail prices and increase sales. Grade and size requirements can rcstrict the mariceting of undesirable produce, such as small-sized and immature produce. Vol- ume controls regulate the quantity of produce entering the fresh-use market and sometimes the export and processing- use markets as well.
Why Do We Have Marketing Agreements and Orders?
Federal mariceting orders were devised to help growers use collective action. Collective action consists of a group of growers contributing to the costs of their joint effort and shar- ing any benefits. Such action can be beneficial to growers, marketers, and consumers when there are market failures or economies of scale that individual growers cannot realize. Growers sometimes adopt collective action when the costs connected with forming the coalition arc not insurmountable.
Collective action sometimes fails because of free ridership. A free-riding grower benefits disproportionately in relation to his contribution to the program costs (56). Free ridership is likely to occur when farmers believe that they can benefit from the collective effort witiiout contributing to the pro- gram costs. Before too long, so few growers are participat- ing that the costs to the group exceed the benefits and the collective action collapses.
Farm prices were historically low during the Great Depres- sion of the 1930*s. Several marketing cooperatives attempted to elevate farm prices during the early 20th cen- tury by shipping only high-quality, fresh produce and limit- ing sales to a market, but were unsuccessful because nonparticipating growers would benefit without bearing any of the costs of withholding produce from the market. State
^The cranberry marketing order covers production in 10 States from Mas- sachusetts to Washington and, thus, is counted in two regions—west of the Mississippi River and east of the Mississippi River and north of Maryland,
italicized numbers in parentheses refer to items cited in References at the end of this report.
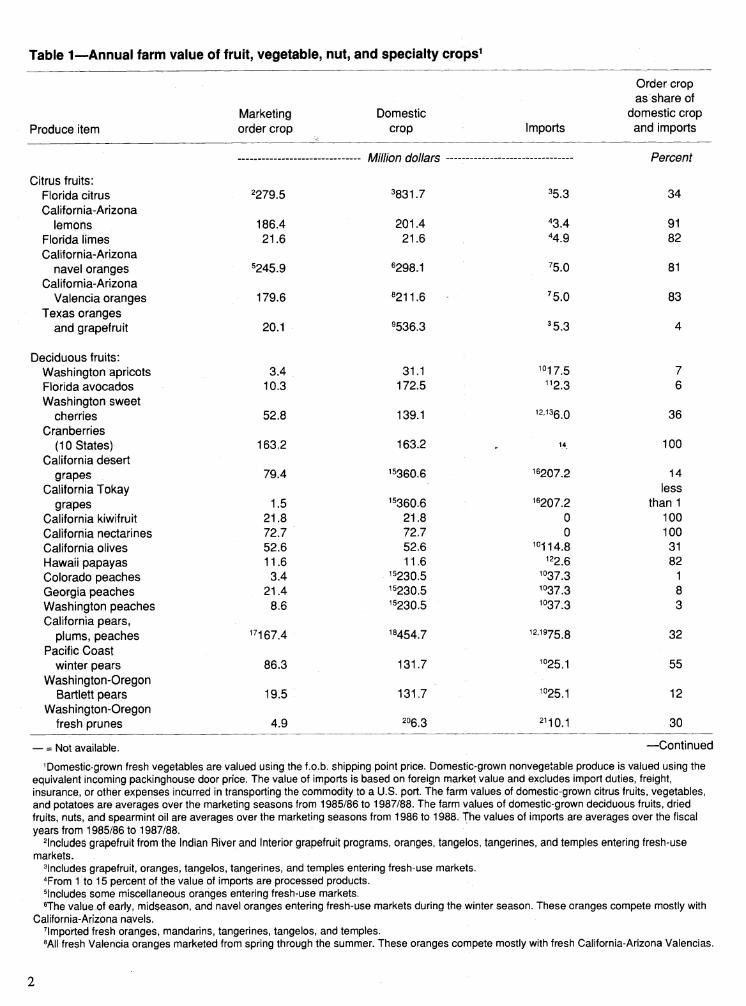
Table 1—Annual farm value of fruit, vegetable, nut, and specialty crops^
Produce item Marketing order crop
Domestic crop Imports
Order crop as share of
domestic crop and imports
Citrus fruits: Florida citrus California-Arizona
lemons Florida limes California-Arizona
navel oranges California-Ari^zona
Valencia oranges Texas oranges
and grapefruit
Deciduous fruits: Washington apricots Florida avocados Washington sweet
cherries Cranberries
(10 States) California desert
grapes California Tokay
grapes California kiwifruit California nectarines California olives Hawaii papayas Colorado peaches Georgia peaches Washington peaches California pears,
plums, peaches Pacific Coast
winter pears Washington-Oregon
Bartlett pears Washington-Oregon
fresh prunes
2279.5
186.4 21.6
5245.9
179.6
20.1
3.4 10.3
52,8
163.2
79.4
1.5 21.8 72.7 52.6 11.6 3.4
21.4 8.6
1^167.4
86.3
19.5
4.9
Million dollars
^831.7
201.4 21.6
^298.1
Ö211.6
^536.3
31,1 172.5
139.1
163.2
15360.6
1^360.6 21.8 72.7 52.6 11.6
^5230.5 ^5230.5 ^^230.5
19454.7
131.7
131.7
206.3
35.3
Percent
34
"3.4 91 "4.9 82
^5.0 81
'5.0 83
'5.3 4
i°17.5 7 "2.3 6
'=•^36.0 36
\* 100
16207.2 14 less
16207.2 than 1 0 100 0 100
^"114.8 31 1^2.6 82
^''37.3 1 ^»37.3 8 '037.3 3
'=•'875.8 32
'»25.1 55
'°25.1 12
2'10.1 30
—Continued — = Not available.
^Domestic-grown fresh vegetables are valued using the f.o.b. shipping point price, Domesiic-grown nonvegetable produce is valued using the equivalent incoming packinghouse door price. The value of imports is based on foreign market value and excludes import duties, freight, insurance, or other expenses incurred in transporting the commodity to a U.S. port. The farm values of domestic-grown citrus fruits, vegetables, and potatoes are averages over the marketing seasons from 1985/86 to 1987/88. The farm values of domestic-grown deciduous fruits, dried fruits, nuts, and spearmint oil are averages over the marketing seasons from 1986 to 1988. The values of imports are averages over the fiscal years from 1985/86 to 1987/88.
^Includes grapefruit from the Indian River and Interior grapefruit programs, oranges, tangelos, tangerines, and temples entering fresh-use markets.
^Includes grapefruit, oranges, tangelos, tangerines, and temples entering fresh-use markets. ^From 1 to 15 percent of the value of imports are processed products. ^Includes some miscellaneous oranges entering fresh-use markets. ^The value of early, midseason, and navel oranges entering fresh-use markets during the winter season. These oranges compete mostly with
California-Arizpna navels. imported fresh oranges, mandarins, tangerines, tangelos, and temples. Mil fresh Valencia oranges marketed from spring through the summer. These oranges compete mostly with fresh California-Arizona Valencias.
Table 1—Annual farm value of fruit, vegetable, nut, and specialty crops—Continued
Order crop as share of
Marketing Domestic domestic crop Produce item order crop crop Imports and imports
h/fiUJ/^n /i/^ll^i'c Percent tvlUnUil UUIfarö
Dried fruits: California dates 17.1 17.1 M.7 78 California prunes 121.1 121.1 0 100 California raisins 274.3 274.3 ^'4.6 98
Vegetables: Florida celery 44.6 213.5 3.0 21 South Texas lettuce 6.3 935.2 ^^6.0 1 Texas melons 58.5 ^70.0 Idaho-E. Oregon onions 83.9 455.0 ^^59.8 16 Soutfi Texas onions 47.8 455.0 ^^59.8 9 Vidalia onions — 455.0 ^^59.8 Florida tomatoes 502.9 ^^861.9 22221.2 46 Rio Grande Valley less
(Texas) tomatoes 6.4 ^^861.9 22221.2 than1
Potatoes: Colorado 61.7 1,712.9 2383.4 3 Idaho-E. Oregon 371.9 1,712.9 2^83.4 21 Maine 109.0 1,712.9 2383.4 6 S. Oregon-N. California 92.3 1,712.9 2383.4 5 Texas-New Mexico — 1,712.9 2383.4 Virginia-N. Carolina 12.0 1,712.9 2383.4 1 Washington 239.0 1,712.9 2383.4 13
Nuts: California almonds 569.9 569.9 233.7 99 Oregon-Washington
hazelnuts 15.3 15.3 ^°7.0 69 California walnuts 209.5 209.5 ^01.3 99
Other specialty crops: Spearmint oil 2^21.4 25.8 0.6 81
^Grapefruits and early, midseason, and navef oranges entering fresh-use markets during the winter season, since they compete mostly with Texas citrus entering fresh-use markets.
'°From 90 to 100 percent of the value of imports are processed products. ^'Less than 1 percent of the value of imports are processed products. ^^From 50 to 90 percent of the value of imports are processed products. ^^Fresh and processed cherry imports. ^^Value is less than $0.1 million. ^^Produce to fresh use. ^^Imported fresh produce. ^^Covers the handling of fresh Bartlett pears, all plums, and fresh freestone peaches grown in the State of California. ^«Fresh pears, all plums grown in the State of California, and fresh peaches. ^^Includes all imported peaches, pears, and prunes, and fresh plums. 2oproduce to fresh use. Estimates include small quantities of prunes. 2^Fresh plums. ^^Fresh and frozen tomato imports. 2^From 25 to 50 percent of the value of imports are processed products. 2^Spearmint oil order covers States of Washington, Idaho, Montana, Nevada, Utah, Oregon, and California, but the reported farm value is for
produce grown in Idaho, Oregon, and Washington.
Sources: U.S. Dept. Agr., Nat. Agr. Stat. Serv.; and, U.S. Dept. Agr., Econ. Res. Serv., Foreign Agricultural Trade of the United States: Fiscal Year 1988 Supplement, May 1989.

marketing orders also failed to boost farm prices because growers in other States benefited without paying any pro- gram costs.
Congress responded to growers* requests for a means to find a solution to the free-rider problem by passing the Agricul- tural Marketing Agreement Act of 1937 (AMAA), as amended. The AMAA, as amended, is a reenactment of the Agricultural Adjustment Act (AAA) of 1935 which is an amended version of the original Agricultural Adjustment Act (AAA) of 1933 {29). The AMAA was motivated by several U.S. Supreme Court rulings which questioned the constitu- tionality of the AAA of 1933 and the AAA of 1935 {29\
The AMAA gave growers unprecedented market power by authorizing Federal marketing agreements and orders for specific fruit, vegetable, nut, and specialty crops. The legis- lation enabled growers to use collective action by making marketing order regulations compulsory on all handlers in the designated area. Marketing orders provide growers greater market power than agreements because the latter apply only to handlers who sign the agreement. In passing legislation authorizing Federal marketing agreements and orders. Congress intended growers to enhance their prices and revenues while also protecting consumer interests by assuring that farm prices did not rise too fast nor too high (for example, not above parity).
Administering l\/larketing Agreements and Orders
The AMAA authorized Federal maiketing agreements and orders for many fruit, vegetable, and tree nut crops, and their products, but there are exceptions and restrictions (see box "Marketing orders hold little promise..."). For instance, the only eligible canning and freezing crops covered by market- ing agreements and orders are pears, olives, grapefruit, aspar- agus, cherries, cranberries, and apri^s grown in selected States. Apples grown for fresh use are eligible only in selected States. The list of horticultural crops eligible for marketing agreements and orders has been changed several times by amending the AMAA.
The process for implementing marketing agreements and orders is specified in the AMAA. The process typically starts when a group of growers requests the Secretary of
The parity price of a produce item is the base faim price (the average farm price in the last 10 years divided by the index of prices received by famiers for all commodities during the last 10 years, 1910-14 = 100) times the current index of prices paid by fanners, 1910-14 = 100. Parity is an approximate measure of the farmers* retums (as measured by the index of prices received by farmers) in relation to the farmers* costs (as measured by the input price index). The basic notion of parity price is dial the grower price needs to increase by about the same amount as the infMit prices in order for fanners to be as well off as they were in some base period. The defini- tion of parity is severely limited because it does not account for the effect of technological change. For instance, while input prices have risen over time, less inputs are required to produce an equal amount of output. Therefore, the parity price index would tend to be biased upward (4Í).
Marketing Orders Hold Little Promise for Major Field Crops
Could marketing orders substitute for Federal price and income support progmms covering the major field crops? The idea has considerable appeal because mar- keting orders involve no direct outlays from the U.S. Treasury. Other than some administrative expenses, direct outlays do not show up in the Federal budget, so marketing orders have been called "farm programs you don't see,"
In most cases, it would be difficult to develop marketing orders that most growers would agree to because of the diverse production and marketing conditions for field crops. Most crops covered by a maiketing order are grown by few producers within well-defined geographic areas and are marketed to a few markets. Field crop pro- duction occurs over wide areas of the country and in- volves many producers marketing crops to many markets.
In addition, growers can successfully boost farm prices by restricting sales of high-quality produce to a price- responsive market only when an industry can isolate its market from other suppliers. It is generally easier to iso- late markets for horticultural crops than it is for the major field crops because of specialized production regions and short marketing seasons for many specialty crops.
Field crop producers in other countries compete directly with U.S. producers through world trade and any attempt to elevate the U.S. price of field crops would likely cause domestic field crop producers to lose export market shares. If the marketing orders enhanced U.S. prices for field crops above the world price, imports would enter the United States and cause domestic prices to fall.
Furthermoi^, higher farm prices would encourage domestic grain users to circumvent the maiketing restric- tions by producing their own grain and selling it in a dif- ferent form. Feedlot operators, for example, could grow their own com and market it through fed cattle.
Despite their potential benefits for producers of many horticultural crops, marketing orders do not appear to offer a workable alternative to the current price and income support programs, which can boost farm prices for major field crops.

Agriculture to establish a marketing order on their behalf. USDA is responsible for defining the marketing agreement and order area, which is the smallest area that can effectively carry out the declared policy of the AMAA. If the Secretary judges the marketing agreement/order to be feasible, a public hearing is held where interested parties debate the merits of the proposal. The Secretary, after reviewing the hearing records, decides whether the proposal would tend to support the declared policy of the AMAA and should go before a grower referendum.
A marketing order is issued by the Secretary of Agriculture after approval by at least two-thirds of the growers voting in the referendum or by growers producing at least two-thirds of the output (by volume) represented in the referendum. Approval by three-fourths of voting growers is required for orders covering western citrus crops. Growers vote on mar- keting orders, but authorized regulations are compulsory for all handlers shipping produce grown in the designated area. Orders for grapefruit, cherries, apples, or cranberries for can- ning and/or freezing must be favored by processors repre- senting at least 50 percent of the volume frozen or canned.
Marketing agreements are voluntary, in contrast to marketing orders, and their regulations are binding only on signatory handlers. The Secretary issues a marketing agreement with an order if handlers who market at least half of the total vol- ume of the crop covered by the order sign the agreement. Handlers who market at least 80 percent of the total volume of produce for the California-Arizona citrus crops must approve before the Secretary can issue a marketing agree- ment. Marketing agreements for grapefruit, cherries, apples, or cranberries for canning or freezing must be approved by processors who control at least half of the total volume of the produce frozen or canned. While a marketing agreement is not necessary for an order, it symbolizes handler support and industry unity for the regulations. The procedure for amend- ing marketing agreements and orders parallels that for initiat- ing one or the other.
Regulations authorized under a marketing agreement or order apply to the marketings of the crop in interstate and for- eign commerce. If the Secretary of Agriculture determines that the handling of produce within a State directly burdens,
^e Agricultural Marketing Service (AMS) of the U.S. Department of Agriculture (USDA) maintains specialists in strategically located field offices to assist growers with defining their perceived marketing problems. Growers usually discuss the feasibility of a marketing order with AMS mar- keting specialists before a formal request is submitted to the Secretary of Agriculture.
Marketing cooperatives can vote as a block. Block voting occurs when the marketing cooperative casts a single vote on behalf of its grower mem- bers. The cooperative's vote represents the majority view of its grower members, but it counts (for purposes of administering the marketing order) as if all growers voted in unison. USDA's guidelines on Federal marketing orders for horticultural crops, issued on January 25,1982» do not encourage block voting because it can obscure the measure of grower support (46).
obstructs, or affects interstate commerce, a marketing agree- ment or order can include regulation of intrastate commerce.
USDA's guidelines on Fierai marketing orders encourage periodic referendums for every order to determine the extent of grower support (46). The Secretary of Agriculture con- ducts such referendums for most, but not all, orders every 6 years. The order is continued if at least two-thirds of the vot- ing growers or growers representing at least two-thirds of the production (three-fourths for California-Arizona citrus crops) approve. The Secretary decides whether to continue or suspend the order if the approval rate is between one-half and two-thirds.
The Secretary of Agriculture must terminate or suspend any marketing agreement or order that is found to obstruct or not effectuate the declared policy of the AMAA. However, if a suspension in the midst of a marketing season would create large grower and handler inequities, the Secretary may con- tinue the order with all or some of its regulations. The Secre- tary must terminate a marketing agreement or order when at least half of the growers by number or volume of production favor termination.
Each marketing order has an administrative committee or board that recommends on the specific use of the regulations to the Secretary, attempts to maintain grower and handler equity, prepares and submits a marketing policy to the Secretary of Agriculture, administers and enforces regula- tions approved by the Secretary, and oversees the operation of the order. Equity refers to a state of outcomes between growers and handlers considered fair by most growers and handlers. The marketing policy is prepared near the begin- ning of the marketing season. This policy reviews the past, current, and expected economic conditions for the crop, which forms a basis for justifying the proposed regulations for marketing the new crop. Some administrative commit- tees recommend regulations during the marketing season. The recommended regulations are reviewed by USDA staff and may be approved, approved subject to change, or rejected by the Secretary. Marketing order regulations become legally binding on all handlers in the designated area if, and when, approved. Administrative committees may revise the marketing policy as the season progresses to adapt to changes in supply and demand.
Administrative committees consist of between 4 and 54 growers, handlers, and often a consumer or public interest representative. Committee members are nominated by grow- ers and handlers, but the Secretary of Agriculture must appoint all nominees before they serve. USDA's guidelines recommend a tenure of 6 years to encourage grower involve-
Criteria to assist the USDA and administrative committees in evaluating and administering marketing policies and regulations are developed in (29).
ment, but not every marketing order limits tenure to 6 years
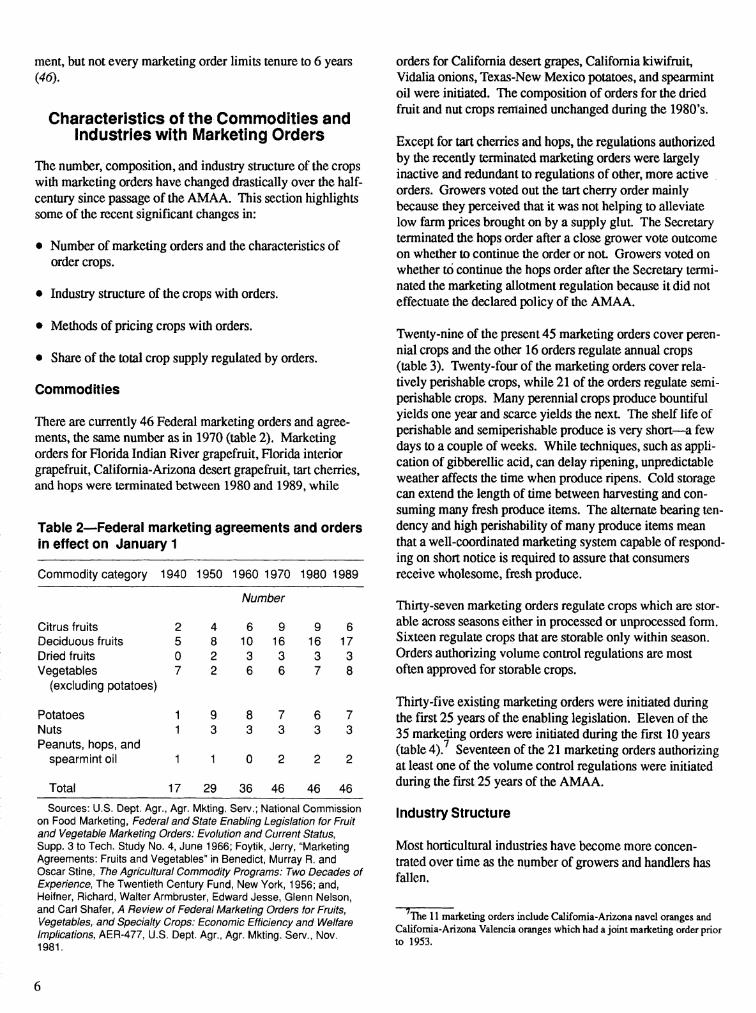
Characteristics of the Commodities and Industries with Marketing Orders
The number, composition, and industry structure of the crops with marketing orders have changed drastically over the half- century since passage of the AMAA. This section highlights some of the recent significant changes in:
• Number of marketing orders and the characteristics of order crops.
• Industry structure of the crops with orders.
• Methods of pricing crops with orders.
• Share of the total crop supply regulated by orders.
Commodities
There are currently 46 Federal marketing orders and agree- ments, the same number as in 1970 (table 2). Marketing orders for Florida Indian River grapefruit, Horida interior grapefruit, California-Arizona desert grapefruit, tm"t cherries, and hops were terminated between 1980 and 1989, while
Table 2—Federal marketing agreements and orders in effect on January 1
Commodity category 1940 1950 1960 1970 1980 1989
Number
Citrus fruits Deciduous fruits Dried fruits Vegetables
(excluding potatoes)
2 5 0 7
4 8 2 2
6 10 3 6
9 16 3 6
9 16 3 7
6 17
3 8
Potatoes Nuts Peanuts, hops, and
spearmint oil
1 1
1
9 3
1
8 3
0
7 3
2
6 3
2
7 3
2
Total 17 29 36 46 46 46
Sources: U.S. Dept. Agr., Agr. Mkting. Sen/.; National Commission on Food Marketing, Federal and State Enabling Legislation for Fruit and Vegetable Marketing Orders: Evolution and Current Status, Supp. 3 to Tech. Study No. 4, June 1966; Foytik, Jerry, "Marketing Agreements: Fruits and Vegetables" in Benedict, Murray R. and Oscar Stine, The Agricultural Commodity Programs: Two Decades of Experience, The Twentieth Century Fund, New York, 1956; and, Heifner, Richard, Walter Armbruster, Edward Jesse, Glenn Nelson, and Carl Shafer, A Review of Federal Marketing Orders for Fruits, Vegetables, and Specialty Crops: Economic Efficiency and Welfare Implications, AER-477, U.S. Dept. Agr,, Agr. Mkting. Sen/., Nov. 1981.
orders for California desert grapes, California kiwifruit, Vidalia onions, Texas-New Mexico potatoes, and spearmint oil were initiated. The composition of orders for the dried fruit and nut crops remained unchanged during the 1980's.
Except for tact cherries and hops, Üie regulations authorized by the recently terminated marketing orders were largely inactive and redundant to regulations of other, more active orders. Growers voted out the tart cherry order mainly because they perceived that it was not helping to alleviate low farm prices brought on by a supply glut. The Secretary tenninated the hops order after a close grower vote outcome on whether to continue the order or not Growers voted on wheth^ to continue the hops order after the Secretary termi- nated the marketing allotment regulation because it did not effectuate the declared policy of üie AMAA.
Twenty-nine of the present 45 marketing orders cover peren- nial crops and the other 16 orders regulate annual crops (table 3). Twenty-four of the marketing orders cover rela- tively perishable crops, while 21 of the orders regulate semi- perishable crops. Many perennial crops produce bountiful yields one year and scarce yields the next The shelf life of perishable and semiperishable produce is very short—^a few days to a couple of weeks. While techniques, such as appli- cation of gibberellic acid, can delay ripening, unpredictable weather affects the time when produce ripens. Cold storage can extend the length of time between harvesting and con- suming many fresh produce items. The alternate bearing ten- dency and high perishability of many produce items mean that a well-coordinated maiketing system capable of respond- ing on short notice is required to assure that consumers receive wholesome, fresh produce.
Thirty-seven marketing orders regulate crops which are stor- able across seasons either in processed or unprocessed form. Sixteen regulate crops that are storable only within season. Orders authorizing volume control regulations are most often approved for storable crops.
Thirty-five existing marketing orders were initiated during the first 25 years of the enabling legislation. Eleven of the 35 marketing orders were initiated during the first 10 years (table 4). Seventeen of the 21 marketing orders authorizing at least one of the volume confrol regulations were initiated during the first 25 years of the AMAA.
Industry Structure
Most horticultural industries have become more concen- trated over time as the number of growers and handlers has fallen.
The 11 marketing orders include California-Arizona navel oranges and California-Arizona Valencia oranges which had a joint marketing order prior to 1953.

Grower Trends
Most marketing orders affect few growers because the orders cover limited geographic areas, such as a group of Slates, a State, or a portion of a State (table 5). One marketing order regulates peaches grown only in Mesa, Colorado. The cran- berry order covers 10 States from Washington to Massachu- setts and is the only order that approaches a national scope.
Most marketing orders cover a small geographic area because growers typically face more similar growing and marketing conditions than growers over a large, diverse area and, consequently, may have a more similar means of achieving common goals and objectives. Seventeen market- ing orders have more than 1,000 growers, 15 have fewer than 250 growers, and 13 have between 250 and 1,000 growers.
Table 3—Production and storage characteristics of produce covered by Federal marketing orders
Produce item
Citrus fruits: California-Arizona
navel oranges California-Arizona
Valencia oranges California-Arizona
lemons Florida citrus Florida limes Texas oranges
and grapefruit
Production characteristics
Annual Perennial
Storage characteristics
Perishable Semi-
perishable Within season
Category
Across season
Deciduous fruits: California nectarines California peaches,
pears, plums California kiwifruit California desert
grapes California Tokay
grapes California olives Colorado peaches Florida avocados Georgia peaches Hawaii papayas Pacific Coast
winter pears Washington apricots Washington sweet
cherries Washington peaches Washington-Oregon
Bartlett pears Washington-Oregon
fresh prunes Cranberries
(10 States)
^x
^x
^x
^x
^x
—Continued

The quantity of produce regulated by most marketing orders has risen over time, but the number of growers has fallen. Costly mechanical harvesting and irrigation systems have encouraged larger farms and reduced grower numbers. Exceptions are Hawaiian papayas, where grower numbers have risen slightly over time, and Rorida citrus. Pacific Coast winter pears, Washington sweet cherries, Washington-Oregon Bartlett pears, California raisins, Idaho- eastern Oregon onions, California almonds, and spear-
mint oil, where grower numbers have remained stable over time.
Handler Marketing Trends
Some growers integrated forward into handling fresh pro- duce and processing over time. Only well-financed growers could enter processing because of the large investment in plant equipment needed for processing.
Table 3—Production and storage characteristics of produce covered by Federal marketing orders- Continued
Produce item
Production characteristics
Storage characteristics
Annual Perennial Perishable Semi-
perishable Within season
Across season
Dried fruits: California dates California prunes California raisins
Category
Vegetables: Florida celery Florida tomatoes Idaho-E. Oregon onions Rio Grande Valley
(Texas) tomatoes South Texas lettuce South Texas onions Texas melons Vidalia onions
Potatoes: Colorado Idaho-E. Oregon Maine S. Oregon-N. California Texas-New Mexico Virginia-N. Carolina Washington
Nuts: California almonds California walnuts Oregon-Washington
hazelnuts
X
X
X
X
X
X
^x ^x ^x ^x ^x ^x ^x
Other specialty crops: Spearmint oil
(six western States)
^Onty storable across seasons in processed form.

Some crops with marketing orders are marketed by coopera- tives, particularly in the West where the cooperative move- ment was strong during the early 20th century. For example, cooperatives handle significant shares of the western-grown citrus crops (navel and Valencia oranges and lemons), noncitrus crops (cranberries, prunes, and rai- sins), and nut crops (almonds, hazelnuts, and walnuts). Cooperatives are much less significant for the other order crops.
The number of handlers in many marketing orders has fallen over time, despite production expansion, because of increas- ing economies of scale in marketing and transportation. Large investments in marketing and transportation equip- ment encouraged larger marketing firms and reduced handler numbers. Exceptions are orders for:
• Colorado potatoes and California almonds where the number of handlers has risen slightiy over time.
Handlers directly market some fresh produce either to whole- salers located near major metropolitan areas or to retailers. The share of fresh produce going to wholesalers has remained constant during the past 20 years. Processors directiy market most products to retailers and major institu- tional buyers.
• California-Arizona lemons. Ronda limes, Rorida avocados, Georgia peaches, Washington apricots, Washington sweet cherries, Idaho-eastern Oregon onions, Colorado potatoes, and Oregon-Washington hazelnuts, where the number of handlers has remained stable over time.
Primary and/or secondary data on maiket shares of cooperatives and independent handlers are unavailable. Information on handler trends is based on conversations with knowledgeable industry personnel.
Most marketing orders have fewer than 100 handlers, and the handler market is becoming more concentrated as han- dler numbers fall over time (table 6). Because of greater
Table A—Year Federal marketing order Initiated
Produce item Year Produce item Year
Citrus fruits: Vegetables: California-Arizona navel oranges 1953 Florida celery 1965 California-Arizona Valencia oranges 1954 Florida tomatoes 1955 California-Arizona lemons 1941 Idaho-E. Oregon onions 1957 Florida citrus 1939 Rio Grande Valley (Texas) tomatoes 1959 Florida limes 1955 South Texas lettuce 1960 Texas oranges and grapefruit 1960 South Texas onions
Texas melons 1961 1979
Deciduous fruits: Vidalia onions 1988 California nectarines 1958 California pears, plums, peaches 1939 Potatoes: California kiwifruit 1984 Colorado 1941 California desert grapes 1980 Idaho-E. Oregon 1941 California Tokay grapes 1940 Maine 1954 California olives 1965 S. Oregon-N. California 1942 Colorado peaches 1956 Texas-New Mexico 1988 Florida avocados 1954 Virginia-N. Carolina 1948 Georgia peaches 1942 Washington 1949 Hawaii papayas 1971 Pacific Coast winter pears 1939 Nuts: Washington apricots 1957 California almonds 1950 Washington sweet cherries 1957 California walnuts 1948 Washington peaches 1960 Oregon-Washington hazelnuts 1949 Washington-Oregon Bartlett pears 1965 Washington-Oregon fresh prunes 1960 Other specialty crops: Cranberries (10 States) 1960 Spearmint oil (six western States) 1980
Dried fruits: Sources: U.S. Dept. Agr., Agr. Mkting. Serv .;and 1, Heifner,
Richard, Walter Armbruster, Edward Jesse, Glenn Nelson, and Carl California dates 1955 Shafer, A Review of Federal Marketing Orders for Fruits, Vegetables, California prunes 1949 arid Specialty Crops: Economic Efficiency and Welfare Implications, California raisins 1949 AER-477, U.S. Dept. Agr., Agr. Mkting. Serv., Nov. 1981.
economies of scale, there are fewer handlers of processing- use crops than of fresh-use crops. For example, while the volume of (mostly fresh-use) California-Arizona navel orange and Valencia orange crops is only about a third the volume of the (mostly processing-use) Florida citrus crop, both industries have about the same number of handlers.
Methods of Pricing
The first place of sale for most fresh produce covered with a marketing order, such as cimis, noncitnis, and vegetables, is at the shipping point or wholesale maiket Pricing of fresh produce at the shipping point occurs through: (1) negotia- tions between a handler and wholesaler or retailer, usually
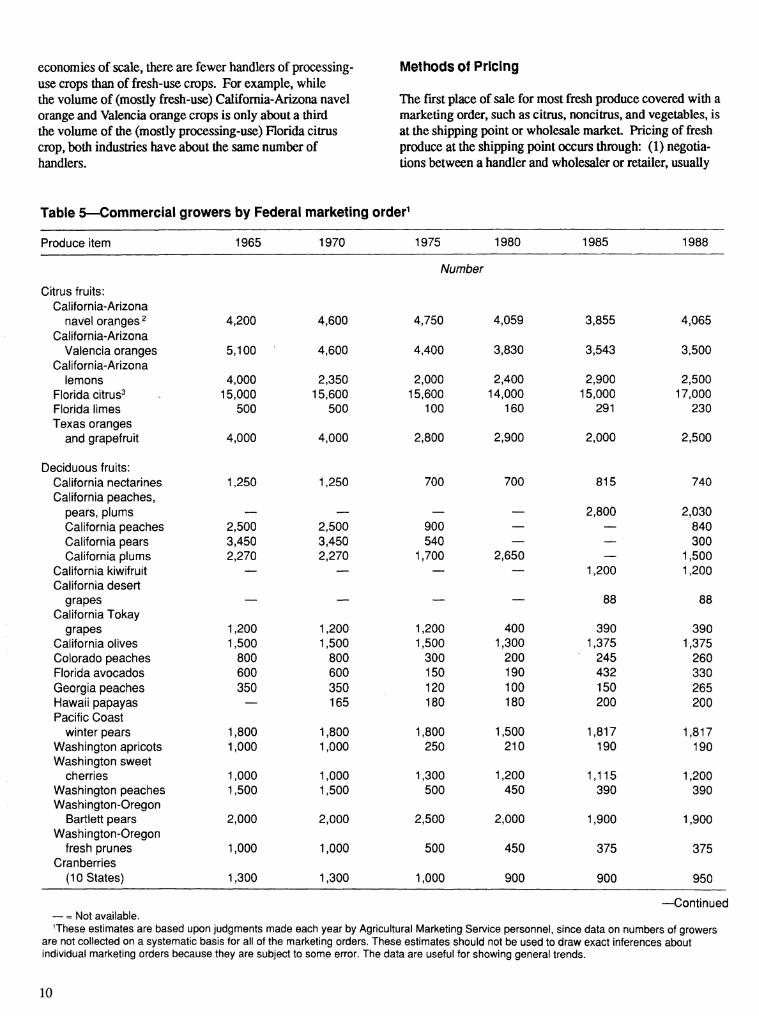
Table 5—Commercial growers by Federal marlceting order^
Produce item 1965 1970 1975 1980 1985 1988
Number
Citrus fruits: California-Arizona
navel oranges^ 4,200 4,600 4,750 4,059 3,855 4,065 California-Arizona
Valencia oranges 5.100 4,600 4,400 3,830 3,543 3,500 California-Arizona
lemons 4,000 2,350 2,000 2,400 2.900 2,500 Florida citrus^ 15,000 15,600 15,600 14,000 15,000 17,000 Florida limes 500 500 100 160 291 230 Texas oranges
and grapefruit 4,000 4,000 2,800 2,900 2,000 2,500
Deciduous fruits: California nectarines 1,250 1,250 700 700 815 740 California peaches,
pears, plums — — — — 2,800 2,030 California peaches 2,500 2,500 900 — — 840 California pears 3,450 3,450 540 — — 300 California plums 2,270 2,270 1,700 2,650 — 1,500
California kiwifruit — — — — 1,200 1,200 California desert
grapes — — — — 88 88 California Tokay
grapes 1,200 1,200 1,200 400 390 390 California olives 1,500 1,500 1,500 1,300 1,375 1,375 Colorado peaches 800 800 300 200 245 260 Florida avocados 600 600 150 190 432 330 Georgia peaches 350 350 120 100 150 265 Hawaii papayas — 165 180 180 200 200 Pacific Coast
winter pears 1,800 1,800 1.800 1.500 1,817 1,817 Washington apricots 1,000 1,000 250 210 190 190 Washington sweet
cherries 1,000 1,000 1,300 1,200 1.115 1,200 Washington peaches 1,500 1,500 500 450 390 390 Washington-Oregon
Bartlett pears 2,000 2,000 2,500 2,000 1,900 1,900 Washington-Oregon
fresh prunes 1,000 1,000 500 450 375 375 Cranberries
(10 States) 1,300 1,300 1,000 900 900 950
—Continued — = Not available. These estimates are based upon judgments made each year by Agricultural Marketing Service personnel, since data on numbers of growers
are not collected on a systematic basis for all of the marketing orders. These estimates should not be used to draw exact inferences about individual marketing orders because they are subject to some error. The data are useful for showing general trends.
10

by telephone; or (2) a broker who negotiates for handlers and wholesalers or retailers, usually by telephone, and charges either the handler or buyer a service fee. National and major regional retailers often have buyers located near major pro- ducing areas who directly purchase produce from handlers. Most sales of fresh produce at the handler market are sold free-on-board, which means that the handler is responsible for loading the containers into the cargo hold of a carrier and the buyer pays hauling charges. The buyer typically arranges for a transportation carrier to haul the produce.
Handlers and buyers negotiate price, volume of sale, price discounts for volume purchases, quality of produce, promo- tional credit, credit for produce delivered damaged, and time and date of loading. Buyers sometimes have the option of refusing delivery when the produce anives if it is of lower quality than negotiated. The buyer usually pays the h^dler or broker upon delivery and inspection of the fresh produce.
Pricing of fresh produce at the wholesale market occurs through: (1) face-to-face negotiations between wholesalers
Table 5—Comnfiercial growers by Federal marketing order—Continued
Produce item 1965 1970 1975 1980 1985 1988
Number
Dried fruits: California dates 235 160 175 143 135 150 California prunes 4,300 4,500 2,600 2,000 2,000 1,200 California raisins 5,000 4,600 4,500 4,800 5.000 5,000
Vegetables: Florida celery — 49 42 26 11 13 Florida tomatoes 1,360 435 100 185 170 180 Idaho-E. Oregon
onions 300 295 400 250 337 360 Rio Grande Valley
(Texas) tomatoes 1,200 300 70 40 25 30 South Texas lettuce 146 146 50 47 33 33 South Texas onions 600 342 195 180 160 160 Texas melons — — — 76 79 72 Vidalia onions — — — — — 260
Potatoes: Colorado 1,455 812 280 395 330 290 Idaho-E. Oregon 5,624 3,817 1,900 2,000 3,793 3,100 Maine 3,003 2,148 900 1,281 750 — S. Oregon-N. California 1,003 850 750 464 469 470 Texas-New Mexico — — — — — 110 Virginia-N. Carolina 3.955 1,400 300 300 169 150 Washington 850 704 425 400 361 360
Nuts: California almonds 8,000 6,954 6,500 7,091 7,500 7,500 California walnuts^ 10,000 9,000 7,900 9,000 8,000 — Oregon-Washington hazelnuts 2,600 M.390 1,062 1,081 1,063 1,300
Other specialty crops: Spearmint oil
(six western States) — — — 250 253 253
^Includes growers of miscellaneous oranges in California and Arizona. ^Includes commercial growers of oranges, grapefruit in the Indian River and Interior programs, tangerines, and tangelos. '^Included Oregon and Washington State before 1976 and after 1985 ^Only includes growers with at least 50 trees.
Sources: U.S. Dept. Agr., Agr. Mkting. Serv.; and, Heifner, Richard, Walter Armbruster, Edward Jesse, Glenn Nelson, and Carl Shafer, A Review of Federal Marketing Orders for Fruits, Vegetables, and Specialty Crops: Economic Efficiency and Welfare Implications, AER-477, U.S. Dept. Agr., Agr. Ml<ting. Serv., Nov. 1981.
11

and buyers, including retailers, at central markets; or (2) con- signment sales at central markets. Central markets are typi- cally located near major metropolitan areas. Retailers and restaurants are significant buyers at wholesale markets. Major retailers who directly purchase fresh produce from handlers also buy in the wholesale market when the quantity demanded by consumers exceeds the quantity they directly purchased from handlers. Fresh produce sales at the whole- sale market are usually sold with payment within 30 days. Buyers and sellers negotiate price, quantity of produce,
quality of produce, and sometimes terms of payment. Wholesalers usually pay the hauling cost of delivering pro- duce to the wholesale market and buyers pay the hauling cost of delivering the produce to their place of business.
Growers of fresh produce typically negotiate a contract with a handler who markets their crop. The handier is often responsible for harvesting, cleaning, inspecting, grading, packaging, and selling the produce. The grower receives from the handler a price derived from the handler price. It
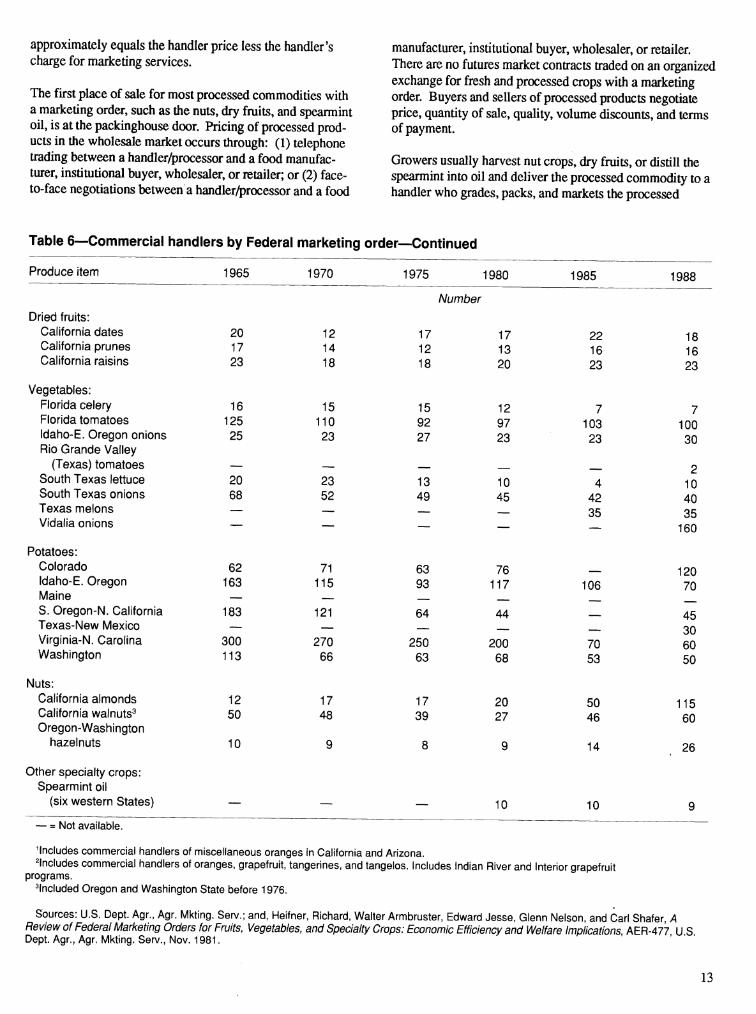
Table 6—Commercial handlers by Federal marketing order^
Produce item 1965 1970 1975 1980 1985 1988
Number Citrus fruits:
California-Arizona navel oranges^ 147 145 118 111 119 125
California-Arizona Valencia oranges 152 148 130 119 115 115
California-Arizona lemons 66 63 65 67 — 85
Florida citrus 2 157 144 142 135 107 99 Florida limes 17 18 24 28 20 18 Texas oranges
and grapefruit 21 21 23 25 0 13
Deciduous fruits: California nectarines — 275 226 240 247 245 California peaches,
pears, plums — 1,115 745 — 770 755 California peaches — 442 242 -- 334 320 California pears — 73 61 — 43 45 California plums — 600 442 — 393 390
California kiwifruit — — — — 67 145 California desert
grapes — — — -- 22 25 California Tokay
grapes 35. 23 22 21 14 9 California olives 29 12 10 7 8 8 Colorado peaches 43 95 63 72 28 53 Florida avocados 35 40 36 39 28 36 Georgia peaches 36 42 34 32 30 30 Hawaii papayas — 86 174 73 100 122 Pacific Coast
winter pears 95 107 103 83 94 91 Washington apricots 25 61 82 63 57 58 Washington sweet
cherries 22 68 142 69 64 65 Washington peaches 118 124 139 112 89 85 Washington-Oregon
Bartlett pears 95 107 95 70 89 72 Washington-Oregon
fresh prunes 40 45 51 35 38 41 Cranberries
(10 States) — 35 20 25 — 31
—Continued
12
approximately equals the handler price less the handler's charge for marketing services.
The first place of sale for most processed commodities with a marketing order, such as the nuts, dry fruits, and spearmint oil, is at the packinghouse door. Pricing of processed prod- ucts in the wholesale market occurs through: (1) telephone trading between a handler/processor and a food manufac- turer, institutional buyer, wholesaler, or retailer; or (2) face- to-face negotiations between a handler/processor and a food
manufacturer, institutional buyer, wholesaler, or retailer. There are no futures market contracts traded on an organized exchange for fresh and processed crops witii a marketing order. Buyers and sellers of processed products negotiate price, quantity of sale, quality, volume discounts, and terms of payment.
Growers usually harvest nut crops, dry fruits, or distill tiie spearmint into oil and deliver the processed commodity to a handler who grades, packs, and markets the jKocessed
Table 6—Comnftercial handlers by Federal marketing order—Continued
Produce Item 1965 1970 1975 1980 1985 1988
Number
Dried fruits: California dates 20 12 17 17 22 18 California prunes 17 14 12 13 16 16 California raisins 23 18 18 20 23 23
Vegetables: Florida celery 16 15 15 12 7 7 Florida tomatoes 125 110 92 97 103 100 Idaho-E. Oregon onions 25 23 27 23 23 30 Rio Grande Valley
(Texas) tomatoes — — __ 2 South Texas lettuce 20 23 13 10 4 10 South Texas onions 68 52 49 45 42 40 Texas melons — — — 35 35 Vidalia onions — — — — 160
Potatoes: Colorado 62 71 63 76 __ 120 Idaho-E. Oregon 163 115 93 117 106 70 Maine — S. Oregon-N. California 183 121 64 44 __ 45 Texas-New Mexico — 30 Virginia-N. Carolina 300 270 250 200 70 60 Washington 113 66 63 68 53 50
Nuts: California almonds 12 17 17 20 50 115 California walnuts^ 50 48 39 27 46 60 Oregon-Washington
hazelnuts 10 9 8 9 14 26
Other specialty crops: Spearmint oil
(six western States) — — — 10 10 9
Includes commercial handlers of miscellaneous oranges in California and Arizona. ^Includes commercial handlers of oranges, grapefruit, tangerines, and tangelos. Includes Indian River and Interior grapefruit
programs. ^Included Oregon and Washington State before 1976.
Sources: U.S. Dept. Agr., Agr. Mkting. Serv.; and, Heifner, Richard, Walter Armbruster, Edward Jesse, Glenn Nelson, and Carl Shafer, A Review of Federal Marketing Orders for Fruits, Vegetables, and Specialty Crops: Economic Efficiency and Welfare Implications, AER-477 U S Dept. Agr., Agr. Mkting. Serv., Nov. 1981.
13

commodity to food processors, wholesalers, or retailers. The handler typically pays the grower when the commodity is delivered.
Marketing Order Coverage of the Crop Supply
Marketing orders authorizing grade, size, or volume control regulations can sometimes divert sales of high-quality pro- duce to a regulated market, such as the fresh-use, to a non- regulated market, such as the processing-use. The price for produce entering the fresh-use market rises, but the price for produce entering the processing-use mm-ket may fsll The weighted average farm price, however, is higher if the fresh- use market is more price responsive to sales than is the pro- cessing-use market. Such product diversion is more likely to boost the weighted average farm price when the market is isolated from competitors, supply is less responsive to a higher weighted average farm price, and consumers cannot easily substitute the high-quality produce with other produce items. The ability of a product diversion to permanently boost farm prices is probably limited for most crops with a marketing order because most growers of the crops with a marketing order compete with nonregulated domestic and foreign growers, consumers can substitute the marketing order commodity with a nonmarketing order commodity, and growers can expand ouq^ut when the farm price is higher, which causes prices to fall.
One indicator of the degree to which a crop with an order is isolated from competitors is the share of the annual farm value of the domestic crop and imports covered by tíie order. This share lies between zero and one. A zero signifies a crop whose marketing is completely nonregulated, whereas a one signifies a crop whose marketing is completely regu- lated. As the share approaches one, marketing order cover- age of the domestic crop and imports is more complete and product diversions are more likely to boost the weighted average farm prices.
Marketing orders are arranged according to the completeness of their coverage of the crop supply (column 5. table Î). Marketing orders covering 90 percent or more of the con'e- sponding annual farm value of the domestic crop and imports are:
• California-Arizona lemons,
• Cranberries,
• California kiwifruit,
• California nectarines,
• California prunes,
• California raisins,
• California almonds,
• California walnuts.
Each of these eight marketing orders authorizes a grade, size, or volume control regulation.
Marketing orders covering more than 75 but less than 90 per- cent of the corresponding annud farm value of the domestic crop and imports are:
• Florida limes,
• California-Arizona navel oranges,
• California-Arizona Valencia oranges,
• ifewaiian papayas,
• California dates,
• Spearmint oil.
Each of these six marketing orders authorizes a grade, size, or volume control regulation. Orders for the crops in the second category are less likely to lift farm prices through product diversions as compared with the orders in the first category, brause the OIúGXS in the second category cover a smaller share of the crop supply.
Maiketíng orders covering between 33 and 75 percent of the corresponding annual farm value of the domestic crop and imports are:
• Rorida citrus,
• Washington sweet cherries,
• Pacific Coast winter pears,
• Florida tomatoes,
• Oregon-Washington hazelnuts.
Each of these five marketing orders are less likely to boost farm prices through product diversion as compared with the crops in the first two categories because of greater supply competition from nonregulated domestic and foreign growers.
The remaining 26 marketing orders cover less than 33 per- cent of the corresponding annual farm value of the domestic
14

crop and imports. These marketing orders are unlikely to raise farm prices through product diversion because of intense supply competition from nonregulated domestic and foreign growers.
The Regulations
The AMAA, as amended, authorizes three broad categories of regulations (table 7). Thirty-six of Öie 45 marketing orders authorize collecting funds for promotion and research and 28 include establishing package and container regula- tions. Forty-two authorize grade or size regulations. Twenty- one authorize volume control regulations. All marketing orders authorize more than one regulation. The number of authorized regulations varies from a low of two for Georgia peaches to a high of eight for Florida celery.
Why Do We Have Regulations?
Economic theory suggests that efficient use of resources results from free markets unless there are market failures or market imperfections, such as few firms. Efficient can mean that competitive growers, processors, and marketers produce the largest amount of output demanded by consumers, which maximizes firms profits given the prevailing maricet prices and production and marketing technology (32), This defini- tion of efficiency says nothing about equity, such as the com- position and distribution of the output among members of society. Three kinds of market failures pertaining to market- ing—externalities, imperfect information, and incomplete risk markets—can lead to inefficiencies (/5,39).
Externalities occur when an individual's action is beneficial or costly to other individuals. The benefit or cost from the externality-generating activity is not priced in the market- place and is outside of the control of the individuals affected. Externalities create inefficiencies because the grower and or handler often does not internalize the costs on othei^ (or benefits on others) of his action and, consequently, he pro- duces too much (or too littie) of the good or service. Most marketing externalities are costiy and their consequences include higher costs for consumers and lower revenues for other growers and handlers. For example, a costiy external- ity is created when a handler, encouraged by high farm prices in the early months of the season, ships outwardly attractive but immature produce. The consequences include disappointment and higher costs for consumers who pur- chase the undesirable produce. Any resulting loss of con- sumer confidence and goodwill probably depresses farm prices and lowers revenues for growers and handlers who ship high-quality produce.
Information is imperfect when growers, handlers, and con- sumers lack relevant knowledge about past, present, and
future events. This condition can lead some growers and handlers to occasionally supply misleading information to consumers. For example, when consumers cannot accu- rately assess nonobservable product attributes (internal quality) prior to purchase, some growers and handlers are tempted to supply misleading information, such as about the maturity or flavor. Such information can lead to inefficien- cies because consumers are sometimes fooled into purchas- ing produce of inferior quality. A related problem is that some large national and regional retailers, who possess supe- rior information because of their geographical dispersion and financial support, may sometimes use that information advantage to bargain for a lower price from growers and han- dlers. Asymmetric information is said to occur when one individual possesses more information than another. Another problem is tiiat individual growers and handlers have a tendency to produce too little information. Some types of information are largely public goods and paying han- dlers have üroubles capturing all information benefits. Pay- ing handlers contribute to the cost of collecting information, whereas nonpaying handlers do not contribute to these costs. Goods for which rationing is infeasible (because it is too costly to exclude the good from nonpaying handlers) and undesirable (because of efficiency reasons and also because one handler's consumption of the good does not detract from the amount that others can consume of the good) are called public goods (39). Public goods are generally undersupplied in üie free market,, which results in inefficiencies. Examples of goods witii some characteristics of a public good include market information, generic advertising and promotion, and production, marketing, and product research. Excluding the information from nonpaying handlers is not easy and often infeasible. Too littie information, misleading information, or asymmetric information can result in markets operating less efficientiy.
Risk markets are said to be incomplete when there is an absence of means for growers, marketers, and consumers to exchange (conditional) promises today about something that they will do at a future date. Risk markets are intended to transfer risks between firms. Absence of forward-pricing markets and crop insurance markets are examples of incom- plete risk markets. These markets are sometimes absent when the sunk costs of establishing tiie market are high and few firms are willing to contribute collectively to the cost (free-rider problem). Noncontributing firms believe that otiier firms will bear tiie sunk costs and the noncontributors can enjoy the benefits of the market.
Examples of market failures often overlap. For instance, die externality generated from shipments of immature produce can also be explained by the fact that consumers possess imperfect information about product quality. The need for risk-transferring markets arises because firms possess imper- fect information.
15

Table 7—Authorized regulations of Federal marketing agreements and orders^
Produce item
Promotion, research, and package
1 2 :
Grade and size Volume controls
10
Category
Citrus fruits: California-Arizona
navel oranges ^ California-Arizona
Valencia oranges^ California-Arizona
lemons^ Florida citrus^ Florida limes Texas oranges
and grapefruit"*
Deciduous fruits: California nectarines California pears,
plums, peaches California kiwifruit California jdesert
grapes California Tokay
grapes California olives Colorado peaches Florida avocados Georgia peaches Hawaii papayas Pacific Coast
winter pears Washington apricots Washington sweet
cherries Washington peaches Washington-Oregon
Bartlett pears Washington-Oregon
fresh prunes Cranberries
(10States)5
1. Generic advertising and promotion. 2. Production and marketing research. 3. Package and container requirements. 4. Grade requirements. 5. Size requirements. 6. Shipping holidays. 7. Prorates. 8. Market allocation. 9. Reserve pool.
10. Marketing allotment.
—Continued
16

Table 7—Authorized regulations of Federal marketing agreements and orders—Continued
Volume controls Promotion, research,
and package Grade and size
Produce item 1
Dried fruits: California dates X X
California prunes X X
California raisins X X
Vegetables: Florida celery X X
Florida tomatoes X X
Idaho-E. Oregon X X
onions Rio Grande Valley
(Texas) tomatoes^ X X
South Texas lettuce X X
South Texas onions X X
Texas melons X X
Vidalia onions X X
Potatoes: Colorado X X
Idaho-E. Oregon Maine S. Oregon-
N. California X X
Texas-New Mexico^ X X
Virginia-N. Carolina Washington
Nuts: California almonds X X
California walnuts X X
Oregon-Washington hazelnuts
Peanuts^^
Other specialty crops: Spearmint oil
(six western States)® X X
Category
X
X
X
X
X
X
X
10
^As of September 1, 1989. ^Marketing order only; no marketing agreement. _,, . x * ^Covers oranges, grapefruit, tangerines, and tangelos entering fresh-use markets. Includes Indian River and Intenor grapefruit programs. ^Restricting handler deliveries is specifically prohibited. ^Grade and size requirements apply only to portion of crop placed into the reserve pool. ^Marketing agreement only; no marketing order. Covers States of Alabama, Florida, Georgia, Mississippi. South Carolina, Arizona, Arkansas.
California, Louisiana, New Mexico, Oklahoma. Texas, Missouri, North Carolina, Tennessee, and Virginia. ^Contains a provision authorizing the inspection for aflatoxin damaged peanuts. ^Covers States of Washington, Idaho, Montana, Nevada, Utah, Oregon, and California.
Sources: U.S. Dept. Agr., Agr. Mkting. Serv.; and. General Services Administration, Office of the Federal Register National Archives and Records Service, Code of Federal Regulations.
17

Growers and handles sometimes attempt to remedy market failures through Gollective action. For example, growers and hangers collectively have a financial incentive to establish arrangements for iniemalizing the cost of an externality, gen- erating information, and developing risk-ttansferring mar- kets. Eliminating market failures can potentially improve efficiency.
Collective action often fails because of the free-rider prob- lem (J9). The benefits of removing market failures accrue to all growers and handlers—participants and nonparticipants alike—while the costs from organizing the collective action are borne only by jmrticipants. The elimination of many mar- ket failures has characteristics of a public good. That is, it is generally too costly to exclude nonconlributors and noncontributors' consumption of the good does not affect contributors' consumption of the good. Each grower and handler has an incentive to not participate (free ride) and enjoy the benefits of tiie otiier growers' and handlers' effort. The demise of the collective action is inevitable as more growers and handlers free ride.
One way to eliminate firee riders and, hence, market failures, is to make handler participation in collective action compul- sory. Mandatory handler participation requires public inter- vention usually in the form of regulations, such as marketing orders (39), Mandatory participation transfers some of the individual grower and handler marketing decisions to the group with the expectation that collectively growers and han- dlers are "better-off." While most growers must expect to be "better-off'with the marketing order, this does not mean that all growers do. Grower support for a marketing order is sel- dom unanimous. Collective action can also create a new set of market failures which can potentially m^e some growers and handlers " worse-off."
Modifications in the regulations of ap'oposed marketing order can help persuade a majority of g^owers to vote favor- ably. Hallagan, in an examination of the now suspended hops marketing order, found that changes in the proposed marketing order may have sufficiently altered the amount and expected distribution of benefits and costs between growers to persuade enough powers to vote favorably (18),
It is not feasible to eliminate all market failures, nor is it effi- cient when the costs of regulating exceed the generated bene- fits (39), Program costs include organizing grower groups, administering programs, collecting fees, and monitoring and enforcing regulations. Program benefits include higher farm
The élimination of one maricet failure without the removal of all others does not necessarily improve efficiency because market prices remain dis- torted when there is at least one market failure. Removing some market fail- ures, but n<Ä all, can potentially lead to less efficient market outcomes (24).
prices, lower production and marketing cost through greater efficiency, and lower retail prices.
Some economists believe that policymakers often initiate reg- ulation programs on grounds of removing market failures, but regulated g^^owers eventually use the regulations to extract benefits fix)m consumers (28,30,55). Such transfers are more likely to occur when the potential benefits per grower resulting from üie regulations are relatively high and potential costs per consumer are inconsequential. In a study of California-Arizona navel oranges, the annual cost to con- sumers of the promte regulation program vmied fi'om 0.7 cent per capita during a small crop year to 7 cents per capita during a large crop year, while the annual average gain to growers varied from $478 per grower in a small crop year to $4,912 per grower in a large crop year (31), Consumers per- mit such transfers because, individually, they have littie incentive to form a coalition and intervene to offi^t the influ- ence regulated growers may exert on persons in positions of public anthori^. Economists embracing this view argue that the rationale for regulations extends beyond efficiency, encompassing allocation and distribution of wealtii as well.
Proinotion, Research, and Package Regulations
Funding for promotion is intended to expand demand. Fund- ing for research and establishing package standards is intended to lower production and marketing costs, resulting in alower retail price and an increase in the quantity demanded by consumers. Although demand expansion appeals to growers who can potentially sell more output at higher prices, competition between industries can limit the potential increases in farm prices and sales.
Generic Advertising and Promotion
Generic adveilising and commodity promotion involve grow- eis directing messages to food processors, wholesalers, retail- eESv food services, and consumers with the purpose of increasing to^ sales of a commodity. Brand advertising and promotion, in contrast witii generic advertising and promo- tion, are aimed at increasing the demand for the product of a single firm. Generic advertising and promotion are used when the final product is derived from a homogeneous com- modity produced by many growers. Thirty-six of the market- ing orders authorize generic advertising and promotion programs (table 7).
Generic advertising includes radio, television, newspaper, magazine, and billboard messages, while commodity promo- tion includes sponsoring buyer seminars and product booths at trade shows, providing point of purchase pamphlets and posters, and making direct contact to existing and potential buyers. The objective of generic advertising and promotion
18

is to convince potential buyers to purchase the commodity and to persuade existing buyers to continue buying the com- modity and to purchase more of it. Advertising supplies information on the uses and availability of new and existing products, nutritional value, price, terms and places of sale, and product guarantees (see box "How does advertising work...") (10). Generic advertising and promotion, like all types of advertising, have informative and entertaining ele- ments which are generally inseparable (29),
Collective funding of generic advertising and promotion overcomes problems of economies of scale and free riders and helps assure that handlers share the costs in proportion to any benefits. The minimum investment required for adver- tising and promotion to be effective in developing and expanding regional, national, and overseas markets is gener- ally too large for most individual handlers. Handlers must have the financial resources to wait before realizing any
How Does Advertising Work and Why Does It Work?
How do successful, informative advertising and promo- tion work? First, buyers must become cognizant of the advertisement before they listen to its content. Enter- taining elements (noninformative aspects) of advertising can help increase potential and existing buyers' aware- ness of the advertisement. Second, after listening to the message, consumers become curious about the product. The message helps potential buyers decide whether to inquire further about the product, purchase the product, or do nothing. The message reminds existing buyers of the reasons why they purchase the product.
Why do informative advertising and promotion work? Three views offer explanations. One, advertising can help consumers discover tiieir true preferences for prod- ucts (relative level of satisfaction derived from prod- ucts). If the advertising changes consumer preferences favorably toward the product, consumers usually pur- chase more of the advertised product and less of others. Two, it can change consumers' terms of acquiring üie product by reducing consumers' search cost (11,38), Search cost is Üie value of time and resources buyers expend searching for information on prices, product quality, safety, place of sale, and terms of sale prior to making purchases. Lower search cost for marketers and consumers lowers the cost of completing business trans- actions, which helps to lower prices. Three, advertising can help consumers purchase products with desh-able attributes. Product attributes are real or fancied. Real product attributes include objective characteristics of the product, such as nutritional value. Fancied product attri- butes include subjective characteristics of the product, such as social fashion (37).
return on tiieir investment, because generic advertising grad- ually expands demand (2).
Consumers actively and passively acquire information on products, and their knowledge of products changes over time as some old information is eventually forgotten or replaced with new information. Consumers tend to adjust their pur- chase patterns only gradually in response to advertising, thus the effect of advertising on demand is spread over several periods after the advertising initially appears. The forgetting of information means that an advertising campaign needs to be continued to permanenfly enhance demand.
The administrative committee proposes an annual advertis- ing budget and the USDA reviews and, subject to any changes, approves or denies the request. All production sold from the area covered with a marketing order is assessed a proportionate share of the advertising and promotion expenses. The assessment is levied on handlers who may deduct all or part of it from growers' net return or pass all or some of the assessment onto marketers. Handlers would probably pass some of the benefits from the generic advertis- ing and promotion back to growers.
When generic advertising and promotion successfully per- suade consumers to purchase more of the commodity, demand shifts upward and die price rises (fig. 1). Buyers benefit from advertising when it broadens product awareness and reduces the cost of searching for desired products and, thus, indirectiy increases buyers' satisfaction. Handlers and growers benefit when the higher revenues from advertising
Figure 1
Effects of generic advertising
Pnce Demand without advertising
y<{ Demand with advertising
With </\ /supply
advertising \ y \ Without X \
advertising \^/
/ \
Without With advertising advertising Quantity
19

exceed the costs of the effort. Handlers and growers may sometimes advertise to offset a potential sales loss from a competitor's advertising. The economic benefits to consum- ers and handlers and growers when handlers and growers compete in marketing with advertising are ambiguous.
Per capita total food consumption is relatively constant, and advertising a given food product generally reduces demand for close substitutes. The potential effectiveness of advertis- ing in increasing demand for each product probably declines as more products are advertised. Nevertheless, advertising can potentially increase demand for the advertised commod- ity or it may also effectively slow or stop a declining trend in demand. Handlers and growers may benefit further if adver- tising persuades consumers to purchase higher valued products.
Handler and grower inequities may result from permitting handlers to advertise and promote brand name commodities and receive credit for their brand advertising against their sh^e of the indusü^'s cost for generic advertising. The mes- sages of generic advertising and promotion cairy informa- tion about a generic (industry) product, whereas brand advertising conveys information mosdy about a brand (firm) product. Generic advertising expands the total demand for the commodity (brand and nonbrand products), but brand advertising likely expands the demand for the target product more than, and perhaps at the expense of, the nonbrand prod- ucts. The equity issue is whether to perm it handlers who brand advertise and promote to receive credit for their expenses against their share of the industry's expense for generic advertising and promotion. Opponents claim that brand advertisers benefit from the generic advertising pro- gram without paying. Brand advertisers argue that their advertising expands total demand and benefits the industiy as well as themselves. In real world markets, handlers who brand advertise often use brand advertising to develop new markets rather than to expand or increase their share of exist- ing markets. Brand advertising used to develop new markets is unlikely to reduce demand for nonbrand products in exist- ing markets. The marketing orders for California almonds, hazelnuts, and olives permit handlers who advertise their own brands to obtain at least partial credit for their expenses against the assessments of the marketing order, but the pro- gram is currently in effect only for almonds.
Several empirical studies suggest that generic advertising can temporarily boost sales. Clarke found in his literature review that about 90 percent of the cumulative effect of advertising on sales of established, frequently purchased, low-priced products occurs within 3 to 9 months of the advertisement (S). Kinnuncan and Forker reported that generic advertising enhanced sales of fluid milk in New York City for 6 months after the advertisement appeared (23). Blaylock and Blisard found that generic advertising
increased sales of natural cheese during the month the adver- tisements appeared while brand advertising did not affect sales of natural cheese (2). Biaylock and Blisard also reported that brand and generic advertising, when combined together in a statistical analysis, increased sales of processed cheese for 12 months (2). Farris and Albion, in a survey of empirical studies, found mixed results of the effect of adver- tising on price (J 5).
ProductJon, Marketing, and Product Research
Industry-sponsored research seeks to solve production, mar- keting, and product problems, such as high rates of shrinkage and spoilage, inferior quality, or poor consumer acceptance. Such problems create inefficiencies and limit growers' com- petitiveness.
Collective funding of research overcomes problems of econo- mies of scale and free riders and helps assure tiiat handlers share costs in proportion to benefits. Most individual han- dlers cannot afford the minimum outiays required to conduct effective research. Handlers who can afford such research frequently undersupply funding because research has charac- teristics of a public good and paying handlers cannot fully isolate the benefits exclusively for themselves. Nonpaying handlers benefit from research when it enters the public domain. Thirty-four of the marketing orders authorize pro- duction and marketing research.
Research is funded much the same way as generic advertis- ing and promotion with pro rata assessments on handlers based on the quantity of produce shipped. The level of assessment is proposed by the administi-ative committee and is subject to the review and approve of the USDA. Han- dlers may deduct all or part of the assessment from growers* net returns or pass all or some of the assessment onto market- ers. Handlers, therefore, pay for research in proportion to the benefits that they receive. Competing handlers would likely pass some of the benefits from research onto growers in the form of greater sales and higher farm prices.
Growers become more competitive with domestic and over- seas rivals when research lowers per-unit production cost, thereby helping growers maintain or increase their market share. Research can increase productivity (or lower cost) by developing new practices and technologies that enable grow- ers to either produce the same output with fewer inputs or produce more output with the same inputs. Examples of pro- duction research include developing more efficient irrigation
Access to basic innovations, such as a new tomato variety, can be pro- tected with a patent. However, most applied research applies existing meth- ods and technology to solve problems and, access to the results cannot be restricted by a patent. For example, applied iraiovations are easily trans- ferred and diffused to nonexperimenting handlers/farmers who direaly observe field experiments.
20
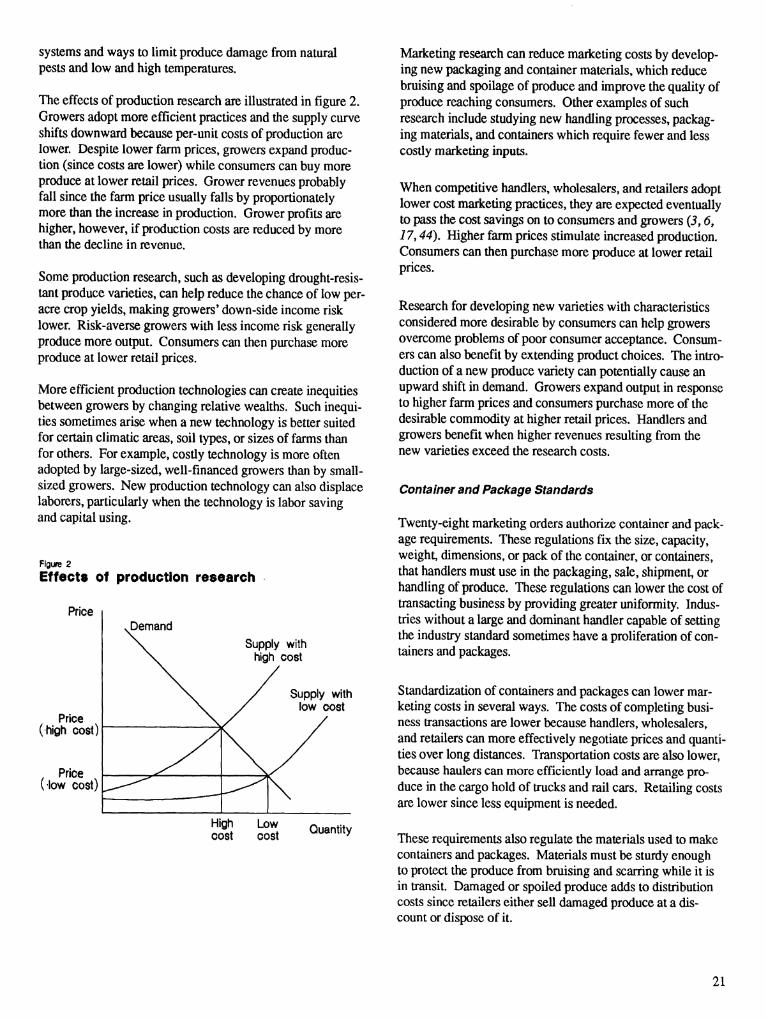
systems and ways to limit produce damage from natural pests and low and high temperatures.
The effects of production research are illustrated in figure 2. Growers adopt more efficient practices and the supply curve shifts downward because per-unit costs of production are lower. Despite lower farm prices, growers expand produc- tion (since costs are lower) while consumers can buy more produce at lower retail prices. Grower revenues probably fall since the farm price usually falls by proportionately more than the increase in production. Grower profits are higher, however, if production costs are reduced by more than the decline in revenue.
Some production research, such as developing drought-resis- tant produce varieties, can help reduce the chance of low per- acre crop yields, making growers* down-side income risk lower. Risk-averse growers with less income risk generally produce more output. Consumers can then purchase more produce at lower retail prices.
More efficient production technologies can create inequities between growers by changing relative wealths. Such inequi- ties sometimes arise when a new technology is better suited for certain climatic areas, soil types, or sizes of farms than for others. For example, costly technology is more often adopted by large-sized, well-financed growers than by small- sized growers. New production technology can also displace laborers, particularly when the technology is labor saving and capital using.
Figure 2
Effects of production research
Price ^Demand
Supply with higli cost
Price (high cost)
Price ^ Mow cost)
Supply with low cost
Low cost Quantity
Marketing research can reduce marketing costs by develop- ing new packaging and container materials, which reduce bruising and spoilage of produce and improve the quality of produce reaching consumers. Other examples of such research include studying new handling processes, packag- ing materials, and containers which require fewer and less costly marketing inputs.
When competitive handlers, wholesalers, and retailers adopt lower cost marketing practices, they are expected eventually to pass the cost savings on to consumers and growers (J, 6, 17,44), Higher farm prices stimulate increased production. Consumers can then purchase more produce at lower retail prices.
Research for developing new varieties with characteristics considered more desirable by consumers can help growers overcome problems of poor consumer acceptance. Consum- ers can also benefit by extending product choices. The intro- duction of a new produce variety can potentially cause an upward shift in demand. Growers expand output in response to higher farm prices and consumers purchase more of the desirable commodity at higher retail prices. Handlers and growers benefit when higher revenues resulting from the new varieties exceed the research costs.
Container and Package Standards
Twenty-eight marketing orders authorize container and pack- age requirements. These regulations fix the size, capacity, weight, dimensions, or pack of the container, or containers, that handlers must use in the packaging, sale, shipment, or handling of produce. These regulations can lower the cost of transacting business by providing greater uniformity. Indus- tries without a large and dominant handler capable of setting the industry standard sometimes have a proliferation of con- tainers and packages.
Standardization of containers and packages can lower mar- keting costs in several ways. The costs of completing busi- ness transactions are lower because handlers, wholesalers, and retailers can more effectively negotiate prices and quanti- ties over long distances. Transportation costs are also lower, because haulers can more efficiently load and arrange pro- duce in the cargo hold of trucks and rail cars. Retailing costs are lower since less equipment is needed.
These requirements also regulate the materials used to make containers and packages. Materials must be sturdy enough to protect the produce from bruising and scarring while it is in transit. Damaged or spoiled produce adds to distribution costs since retailers either sell damaged produce at a dis- count or dispose of it.
21

The potential effects of these stanctods on prices and sales are similar to the effects of marketing research. Cost savings resulting from standardization of cantamers and packages translate intoiiigher farm prices and lower retail prices if marketers are competitive. Despite smaller marketing mar- gins, marketers' revenues may rise because consumers buy more produce at the lower retail price. Marketers' revenues are higher if the percentage increase in sales exceeds the per- centage decrease in the marketing margin.
Grade and Size Regulations
Grade standards categorize produce by attributes observable by consumers prior to purchase, such as certain defects, color, and shape, and by attributes nonobservable by consum- ers prior to purchase, such as maturity, fermentation, decay, disease, or off-flavor. Size standards categorize produce by its size. Grade and size standards can convey information about the quality of the produce to marketers and consumers, so buyers are not required to travel and see the produce prior to purchase. Such information can lower the costs of completing transactions for marketers and consumers (38),
Grade requirements (regulations) prohibit handlers from shipping substandard-quality produce while size require- ments typically prohibit handlers from shipping small-sized produce. Minimum size and grade requirements are enforced by authorizing inspection services, which require inspectors to visually observe the external appearance of the produce and to cut open the produce and check that die inter- nal quality of the prtxluce meets minimum grade require- ments. These requirements can restrict sales of potentially unprofitable produce or produce likely to shrink excessively, and enhance efficiency. However, these requirements can also restrict sales of fresh-quality produce to a market, and that restriction may boost farm prices (4,5,27), Size require- ments, the most frequently authorized regulation, are author- ized in 41 marketing orders. Thirty-nine of the marketing orders authorize ^ade requirements, making grade the sec- ond most often authorized regulation.
The economic rationale for grade requirements covering the external attributes (observable by consumers prior to pin- chase) of produce and size requirements is to help prevent handlers from shipping produce that sells for less than the variable costs of marketing. A few who have incomplete price information sometimes ship such produce. Improving the dissemination of market prices for different grades and sizes of produce to handlers could also help eliminate this problem. Misshapen, damaged, or off-color produce is some- times unprofitable to ship because it is either likely to spoil while in transit, shrink excessively, or be unwanted by con- sumers. Marketing and retailing costs should be lower when handlers do not ship such produce.
The economic rationale for grade requirements covering the internal attributes (unobservable by consumers prior to pur- chase) of produce is to help build and maintain a reputation with consumers for consistently supplying produce of high quality. A few handlers tempted by high prices early in the season sometimes ship outwardly attractive but immature or off-flavor produce. Consumers who cannot observe the inter- nal quality of produce prior to purchase are disappointed by the undesirable taste of the produce. Any resulting loss of consumer goodwill and confidence weakens demand for the produce. Retailei^ usually discount the selling price to com- pensate consumers for the uneven internal quality of the pro- duce. Retail buyers who can identify only tíie shipping area often become suspect of all produce from the area and dis- count the price they are willing to pay, purchase less produce from the area, or purchase produce elsewhere. Sometimes it is difficult for buyers to identify the handlers shipping imma- ture produce or mixing inferior-quality produce in shipments since produce is commingled and often it is not branded. Branding produce is not economically feasible for small- sized and medium-sized handlers who cannot justify the moderate fixed costs. The industry reputation tends to suffer when a few handlers commingle low-quality produce with high-quality produce. Growers and handlers who ship pro- duce of high quality suffer the costs of this externality, namely lower farm prices and revenues.
Grade requirements are typically used to cultivate a positive image of a consistent and reUable supplier of high-quality produce. Economists believe this goodwill- and confidence- building activity strengthens demand and boosts farm prices (26). Grade and size standards also provide a tool whereby handlers can straÜfy consumer demand and expand overall demand by more closely matching supplies with consumer- desired choices of produce. Handlers and growers can profit by continuing to add new categories of grade and size stan- dards if the gains in lower transaction costs for marketers andconsumers^^exceed the costs in establishing the new cate- gory. Grade and size standards can create more categories of produce than recognized by marketers and consumers. For example, Sun, in her study of Florida green tomatoes, found that the grade and size standards draw finer distinctions than do consumers (40). This finding suggests that too many spe- cific grade and size standards can be superfluous and may only hike marketing costs. Careful use of grade require- ments and standards has been credited with the growth in output and consumer acceptance of California nectarines (29), Melon growers and shippers in Texas report that before their marketing order became effective, shipments of overripe melons with short shelf life weakened the market for all melons within a day's truck drive from the point of production (29),
Grade and size requirements are controversial because they can sometimes restrict sales of fresh-quality produce to the
22

regulated market (such as fresh use) and divert shipments to nonregulated markets (such as processing). Handlers and growers may be tempted to impose such requirements because revenues are higher if the regulated market is more price responsive to fewer sales than the nonregulated market is to more sales. Retail prices for produce and consumer expenditures in the regulated market are higher, while those in the nonregulated market usually are lower. However, a higher farm price does not translate into a proportionately higher retail price since marketing services constitute a large part of the retail price. Restricting sales to the regulated mar- ket tends to limit consumer choices. For example, high- quality produce that are misshapen and off-color may be the only fresh produce affordable to lower income consumers. Restricting sales of this produce can mean that some lower income consumers cannot afford any.
Section 8e of the AMA A authorizes that whenever a market- ing order regulates the grade and size of certain horticultural crops, imports of the same commodities are prohibited unless they meet the grade and size requirements of the order or comparable restrictions (29). Grade and size require- ments for marketing order crops currently apply to the imports of 18 commodities. This section of the AMAA pre- vents imports of low-quality commodities which could dam- age domestic handler and grower efforts to develop the domestic market by creating a positive image of the com- modity. Rigorous grade and size requirements could poten- tially prohibit some high-quality imports into the United States and lift domestic farm prices.
Volume Controls
Volume controls include shipping holidays, prorates, market allocations, reserve pools, and marketing allotments. These regulations establish a ceiling on the maximum quantity of produce that can enter certain markets during the season or a period within the season.
Shipping Holidays
Shipping holidays prohibit handlers from sending produce to the market during brief periods, such as a few days or a week. These holidays are intended to prevent sharp declines in farm prices when there is a temporary oversupply. For example, some handlers, who have imperfect information on shortrun price expectations, sometimes ship large volumes of produce and are disappointed by the unexpected low prices. Improving the accuracy and dissemination of information can help handlers boost revenues by better planning of ship- ping schedules. Shipping holidays prevent Üiis type of prob- lem by allowing time for the market to realign a temporary market supply and demand imbalance. The shipping holiday is the mildest form of volume control.
The Florida citrus industry sometimes uses shipping holidays to clear markets of unsold fresh produce following the pre- Christmas volume buildup. This shipping holiday is some- times controversial. Some Florida growers feel that the shipping holidays prevent sharp declines in prices when con- sumer demand for fresh citrus falls off sharply for a week or so after Christmas and retailers often hold some leftover inventory. Other growers feel that competitors in Texas and California-Arizona increase their shipments during the ship- ping holidays, resulting in lost marketing opportimities for Florida growers.
Shipping holidays are unlikely to greatly affect the season's price and sales to markets because they are used infrequently and are only temporary. Higher farm prices cannot be sus- tained since the holidays do not restrict sales for a substantial portion of the marketing season.
Four of the nine marketing orders authorizing shipping holi- days are for highly perishable crops (California desert grapes and Tokay grapes, Florida celery, and south Texas lettuce) and the remaining five are for slightiy less perishable crops (Florida citrus, limes, and avocados, Idaho-eastern Oregon onions, and south Texas onions).
Prorates
Prorates regulate shipments to the markets over longer peri- ods than shipping holidays (see box, "What do prorates mean..."). Prorates set an upper limit on weekly shipments to a market, or markets, that handlers can ship on behalf of the contracted growers. Prorates seldom, in practice, com- pletely prevent handlers from sending produce to a market as do shipping holidays. Prorates usually regulate weekly ship- ments to the higher priced fresh-use market. Each handler's share of the industry prorate is proportional to the share of the industry production controlled by the handler. This crite- rion does not encompass quality considerations. Growers and handlers with low-quality produce have equal access to the regulated market as do growers with high-quality pro- duce.
Prorate is intended to provide some of the benefits of absent risk-transferring markets, such as forward-pricing markets, by stabilizing intraseasonal prices and shipments. Opportuni- ties for growers to reduce price risks by forward pricing are very limited or absent for most of the commodities covered by marketing orders authorizing prorate regulations. For- ward pricing involves entering a contract Üiat fixes prices for a product to be delivered in the future. The seller agrees to ship a fixed amount of the product of specified grade and size to the buyer on a set future date at an agreed-upon price. To be most successful, forward pricing must be accompanied by futures trading on organized exchanges, which brings large numbers of traders together and allows price risks to be
23

What Do Prorates Mean for the California Navel Orange Farmer?
To better understand how prorates operate, consider the following example:
Farmer Peterson grows navel oranges in California's San Joaquin Valley and contracts with a packer-handler. Oranges, Inc., to harvest, grade, pack, and market the fruit. Oranges, Inc., deducts a handling charge and pays Peterson what is left of the proceeds.
Navel oranges are excellent eating, so Oranges, Inc., likes to sell most of the crop in the fresh maricet, bringing the highest return. Small, scarred, or misshapen oranges that do not meet fresh-use market standards are sold to a processor for making juice concentrate. Since navels do not make good juice oranges, processors pay a lower price for them.
Peterson's farm is in California and Oranges, Inc., must abide by the regulations of the Federal marketing order for Califor- nia-Arizona navel oranges. Under the marketing order, the Navel Orange Administrative Committee (Committee), subject to the USDA's review and approval, determines the maximum weekly quantities that may be sold in the fresh-use market (the industry's prorate) during a portion of the season. The Committee takes into account the supply and expected demand for oranges, and sets the quantity of prorate to avoid market gluts and a sharp decline in farm prices. Initial prorates are esti- mated at the beginning of the season, but can be adjusted upward or downward as the season progresses. Oranges, Inc.'s share of the industry's prorate is proportional to the share of total industry production which it has under contract with grow- ers like Peterson.
Oranges, Inc., may sell as many of its oranges in the fresh-use market as its share of the prorate permits. The remainder may be held for later sale, exported, sold for processing, or donated to charitable organizations. Peterson receives an aver- age of Oranges, Inc.'s return from all sales.
Experience has demonstrated that a glut of oranges depresses tiie fresh price more than an equal amount of oranges, if diverted, reduces the processing price. If the marketing order diverts some fresh-quality oranges to processing (most likely during large crop years), Peterson's returns rise. Consumers pay higher prices for fewer fresh oranges during large crop years if diversion to processing happens.
However, there may be some benefits to consumers tiiat offset the costs of higher prices during large crop years. If prorates help even out supplies over the season, resulting in smaller week-to-week swings in prices and quantities marketed, market- ing costs are probably lower and, eventually, retail prices are lower if marketers are competitive.
The higher average prices spur Peterson to eventually produce more oranges. In a small crop year, consumers find that they would likely have more fresh oranges at a lower price than otherwise.
shifted to speculators. Fruit and vegetable products gener- ally lack the homogeneity or volume needed to attract large numbers of speculative traders required for futures tmding to succeed. Growers of many horticultural crops can purchase crop insurance. Crop insurance, however, is meant to protect growers from low income when crop yields are low. Crop insurance does little, if anything, to protect growers from low prices when crop yields are large. Risk-transferring mar- kets are absent when the sunk costs of establishing them are high, buyers or sellers are likely to default on the contract and recourse is infeasible, costs of completing the transac- tion are high, or there are few buyers and sellers (thin mar- ket). Marketers and growers who desire to avoid down-side price risk, which can lead to bankruptcy, generally benefit from transferring some risks. Economists tend to believe that many growers are risk averse and act to avoid down-side price risk. Establishing some, but not all, absent risk-trans-
ferring markets, however, does not necessarily improve mar- keting efficiency (79). Whether prorate regulation can pro- vide greater within-season stability of prices and shipments than die free market, or other market institutions, is debat- able and controversial and probably deserves further empiri- cal work.
Two empirical studies investigated whether tiie level of weekly shipments and prices were less uniform without pro-
Greater stability refers to less risky prices and shipments and/or less variation in observed prices and shipments. Prices and shipments are risky because, before the outcomes of unpredictable events are known, prices and shipments can take on one of many values for given supply and demand con- ditions. Weather and labor strikes are examples of unpredictable events which impact prices and shipments. Observed prices and shipments are vari- able because they change over time in response to unpredictable events and changing supply and demand conditions.
24

rate regulation by comparing the variability of weekly ship- ments and prices (as measured by the variance and coeffi- cient of variation) during a period of prorate suspension with a comparable period with prorate regulation. Powers and others, in a study of California-Arizona navel oranges, reported mixed results (5i). Carman and Pick, in a study of California-Arizona lemons, found fresh domestic shipments and handler prices were more stable during the prorated period compared with several seasons when prorate was not used (7). In another study, Jesse and Johnson reported mixed findings when comparing the variability of annual prices for each marketing order commodity with the corre- sponding nonmarketing order commodity (or a close substi- tute) {2iy
Can Prorates Stabilize Within-Season Prices and Shipments? Instability of within-season prices and ship- ments is important because it affects prices, shipments, and costs. Risk-averse growers produce less when exposed to price risk. Risk-averse handlers, processors, and inventory holders handle fewer shipments or take larger markups. Retailers experience greater difficulties planning business operations, such as in-store promotions and labor schedules. Food processors can incur more one-time labor, mainte- nance, and administrative costs since when supplies are erratic, plant capacity changes more frequentiy. Cost savings from stabilizing within-season prices and ship- ments shrink marketing margins and translate into higher farm prices and lower retail prices if marketers are com- petitive.
Smoothing out within-season shipments can help stabihze within-season prices (25), Shipments can be smoothed out by temporarily withholding produce from the market during weeks of abundant supplies and releasing produce during weeks of scarce supplies. Prorate regulations can temporar- ily withhold produce from the regulated market by establish- ing a small enough prorate quantity. Semiperishable crops, such as oranges, lemons, and grapefruit, can be stored on the tree for short periods of time without significanüy affect- ing their quality. Reducing within-season shipment variability would stabilize within-season prices more when demand is more steeply downward sloping (more price inelastic). The aggregate farm-level demand for most pro- duce items is fairly price inelastic. However, the farm-level demand for many crops with marketing orders covering a rel- atively small portion of the total crop supply is less price inelastic because there are many close substitutes.
Stabilizing within-season shipments does not necessarily sta- bilize prices when demand shifts erratically. Within-season demand shifts destabilize within-season prices for a given volume of shipments. The seasonal shifts in the market demand can be caused by hoHdays, such as Thanksgiving and Christmas, seasonal suppUes of substitute crops, or an
external shock to the general economy (economic recession or recovery). In this case, within-season prices can be made more stable only by making within-season shipments less sta- ble. Prorate regulation can do littie to stabilize within-sea- son prices if within-season shipments of substitute crops are erratic and the marketing order covers only a small portion of the total crop supply.
Product Diversion Can Boost Farm Prices. Not only can prorate regulation shift sales within the season, but it can restrict annual sales to the regulated market (such as fresh use) and effectively divert sales to nonregulated markets (such as processing). Such product diversion would likely occur if prorate regulation is used throughout most of the marketing season and the quantity prorated is consistently less than the amount handlers would ship otherwise.
If prorate regulations had restricted sales to the higher priced fresh-use market, handlers would be expected to compete for greater shares of the fresh-use market when the regulations were suspended. A test of this hypothesis using data from California-Arizona navel oranges indicated that there were few differences in the share of shipments going to fresh-use and export markets across handlers of similar size, location, and organization structure following the midseason 1984/85 prorate suspension as compared with an earlier period with prorate regulation (31). The suspension was for a partial season, and handler marketing shares might change if the suspension were continued for an extended period.
Product diversion can boost the weighted farm price and grower revenues if the processing-use market is less price sensitive to greater sales than the fresh-use market for a given supply (9). Appendix I describes in more technical terms the implications of using prorate regulation to restrict sales to tiie fresh-use market. The box on prorates boosting farm prices summarizes the empirical findings from case studies of the effects of using prorate regulation to divert sales. Such diversions are controversial because more out- put enters the lower valued processing-use market and less output enters the higher valued fresh-use market.
The consequences of a product diversion continued over extended periods depend on the size of the production response. The higher shortrun weighted farm price stimu- lates longrun production which causes prices to fall. The larger the production response, the more likely is the longrun price to return to its free-market level. Production response is larger when inputs, such as water, fertilizer, labor, and ara- ble land suitable for growing the crop, are available. Land can limit production growth for those horticultural crops restricted to a narrow geographic area endowed with specific climatic and soil conditions. Land may come from reducing plantings of competing crops.
25
Empirical Findings Suggest Prorates Can Boost Farm Prices
The simulated results from two studies suggested that the marketing orders for CaHfomia-Arizona navel and Valencia oranges had restricted sales of high-quality produce from the ftesh-use maiket, which boosted the weighted farm price and subsequently stimulated increased production over time (55,43), TTie simulated results from the two studies suggested that permanent suspension of the prorate regulation would likely lead to greater sales of navels and Valencias to the fresh-use market at a lower price, and fewer sales to processing at about the same price. Grower revenue would be lower. Both stud- ies found that annual farm prices and sales to the fresh-use market would be more variable after a continued suspension, while annual prices and sales to processing would be less variable. Handlers of fresh navel oranges may derive some bene- fits from more stable prices and shipments to the fresh-use market with the prorate regulation. Processors would probably incur higher costs from less stable prices and shipments to processing with the prorate regulation. Consumers may prefer stable supplies and prices of fresh omnges over fluctuating ones.
A related study investigated Üie impacts of suspending prorate regulations in the California-Arizona navel orange industty for 1 -2 seasons (31), Tlie findings suggested that sales to the fresh-use market, farm prices, and grower revenues would be little affected during a short crop year, but farm prices for fresh produce and grower revenue would likely fall if sales to the fresh-use market increased during a large crop year.
The effects of prorate regulation on C^ifomia-Arizona lemons has been the subject of inquiry in several studies. Smith argued that restricting sales to the fresh-use market can temporarily elevate farm prices, but higher prices would stimulate increased output in the long run, which depresses price toward the free-maricet level (34), French and Dressier modeled Cal- ifornia-Arizona lemon production and illustrated that the lemon production cycle tends to shift upward if sales to the fresh- use market are restricted to maintain specified farm prices (14), The production cycle results i^rtly from biological factors, but its shape can be affected by economic factors, such as farm prices. Kinney and others provided further evidence of the effect of prorate regulation by simulating and comparing farm prices, market uses, output, and grower revenues for alterna- tive prorate policies (22), They found that restricting sales to the fresh-use market would likely boost longrun farm prices even though output would probably be higher.
The consequences of a permanent product diversion to con- sumers include higher prices for fresh produce and fewer supplies of fresh produce. Consumers of processed prod- ucts, however, can buy more products at lower retail prices. Some consumers who are unable to afford fresh produce begin to purchase some processed products or more of them. Consumer expenditures for fresh produce and processed pro- ducts combined together are higher when sales to the fresh- use market are restricted, since the higher expenditures for fresh produce offset the lower expenditures, if any, for pro- cessing products. Product diversion encourages growers to produce more output for the lower valued processing-use market and less output for the higher valued fresh-use mar- ket in comparison with the free market. Prices may be higher for crops which compete with the diverted crop for land.
Consumers and growers may both benefit from product diversion if it is used only to prevent a sharp decline in grower prices and revenues during large crop years. Permit- ting growers to divert sales of produce only during large crop years would probably boost low farm prices and reduce down-side income risk. Grower revenues are typically lower
1^ Expenditures in ihe procès sing-use market may rise if the greater quan- tity results in movement to a less price-responsive portion of the respective demand (that is» a less price-elastic part of the market demand).
when the crop is larger because the farm-level demand for most crops is price inelastic. The higher price coupled with lower income risk would stimulate production. Conse- quently, supplies during small crop years would be higher than if there were no diversion. Consumers would benefit from having more supplies at lower farm prices during small crop years, however, they also lose from having fewer sup- plies of fresh produce at higher prices during large crop years. Consumers would benefit from such a program if ben- efits during small crop years outweighed the cost during large crop years. Growers would benefit from risk-reduc- tion.
Market Allocations and Reserve Pools
Market allocations place a maximum on the quantity of pro- duce that handlers may ship into regulated markets during a marketing season (see box, "What do market allocations and reserve pools mean..."). While prorates regulate within-sea- son shipment flows, maricet allocations regulate annual ship- ment flows. Production in excess of the market allocation can be sold in nonregulated markets or stored and sold in a future period. Six marketing orders for semiperishable crops authorize market allocations (cranberries; California dates, raisins, almonds» and walnuts; and Oregon-Washington hazelnuts).
26

What Do Market Allocations and Reserve Pools Mean for the California Almond Farmer?
To better understand how market allocations and reserve pools operate, consider the following example:
Farmer Jones grows almonds in Califomia*s San Joaquín Valley and delivers the harvested almonds to a packer-handler, Almonds, Inc., to grade, pack, process, and market the nut. Almonds, Inc., pays Jones for the free percentage of the almonds and holds the reserve pool percentage of almonds for the account of the Almond Board of California (Board). The free percentage is the proportion of the almond crop that can be sold in the domestic and export markets. The reserve pool percentage is the proportion of the almond crop that must be held in storage.
Jones' farm is in California and Almonds, Inc., must abide by the regulations of the Federal marketing order for almonds. Under the marketing order, the Board, subject to the USDA's review and approval, determines the maximum annual quanti- ties that may be sold in the domestic and export markets (the industry's market allocations and the free percentage) and the quantity of almonds that cannot be sold in commercial markets (the industry's reserve pool and the resale pool percentage) during the current season. The Board takes into account the supply and expected demand for almonds in the domestic and export markets, and sets the quantities of market allocations to avoid market gluts and low farm prices in the domestic and export markets. Initial market allocations to the domestic and export markets are determined at the beginning of the season, but they can be adjusted upward if demand is stronger than the Committee expected. Almonds, Inc. 's share of the market allocations is proportional to the share of total industry production, which it has bought from growers like Jones. Almonds, Inc., places the remaining proportion of the crop into the reserve pool.
Almonds, Inc., can sell up to its share of the market allocations for the domestic and export markets. The almonds in the reserve pool are held in storage until sold or released by the Board. The Board typically releases the almonds in the reserve pool for sale during a year with small supplies. The Board sometimes uses almonds in the reserve pool to develop new prod- ucts, such as almond butter. Almonds, Inc., may act as an agent of the Board in the sale of its part of the reserve pool in authorized markets. Almonds, Inc., pays Jones the respective annual farm price when the almonds are released from the reserve pool.
Experience has demonstrated that a glut of almonds depresses the price by more than an equal amount of almonds withheld from commercial markets and disposed of in noncommercial markets or carried over and sold during a year with small sup- plies. If the marketing order causes some almonds to be withheld from the market or disposed of (most likely during large crop years), Jones* returns are higher. Almonds carried over and sold during a year with small supplies result in higher prices to consumers for almonds during large crop years, but lower prices during small crop years.
Reserve pools prohibit handlers from selling a minimum share of the current season's production (see box, "What do reserve pools mean..."). This share of the harvested crop is placed into storage or commonly called the reserve pool and it is shipped to commercial markets when grower prices have strengthened, which usually occurs during a short crop year, or is diverted to processing when there is a chronic buildup of inventory. Five marketing orders for semiperish- able crops authorize the reserve pool (California prunes, liai- sins, almonds, and walnuts; and spearmint oil).
Market allocations and reserve pools are intended to help sta- bilize interseasonal prices and shipments and, consequently, generate some of the benefits of forward-pricing markets. Whether market allocations and reserve pools can provide
—Î3 A few of the crc^s with marketing orders authorizing maricet allocations and reserve pools have forward-pricing cooiracts, but these contracts are only for one or two seasons into the future.
greater interseasonal stability of prices and shipments than the free market, or other market institutions, is debatable. Some of the potential benefits of more stable prices and ship- ments were discussed in the section on prorates.
Reserve pools may partly offset a tendency for inventory holders to carry insufficient interyear stocks. Inventory hold- ers have a financial incentive to hold stocks from the current year to the next if the price expected next year exceeds the current year's price plus storage cost in a well-functioning competitive market. The current year's price will be rela- tively low in a large crop year compared with the next year's expected price, if the next year's expected supplies are nor- mal. Inventory holders carry a larger quantity of stocks from the current year to the next year when the difference between the current year's price and the next year's expected price is wider. The converse is also true. However, uncertainty about next year's price may cause risk-averse inventory hold- ers to experience difficulties forming an accurate expected
27

What Do Reserve Pools Mean for the California Raisin Farmer?
To better understand how reserve pools operate, consider the following example:
Farmer Baker grows raisins in Califomia*s San Joaquin Valley and delivers the harvested raisins to a packer-handler. Raisins, Inc., to grade, pack, and market the fruit Raisins, Inc., pays Baker for the free percentage of his raisins and holds the reserve percentage of raisins for the account of the Raisin Administrative Committee (Committee). The free percentage is the propor- tion of the raisin crop that can be sold in commercial markets. The reserve pool percentage is the proportion of the raisin crop that must be held in storage and not sold until authorized by the Committee.
Baker's farm is in California and Raisins, Inc., must abide by the regulations of the Federal marketing order for California rai- sins. Under the marketing order, the Committee, subject to the USDA's review and approval, determines the quantity of rai- sins that cannot be sold in commercial markets (the industry's reserve pool and reserve pool percentage) during the current season. The Committee takes into account the supply and expected demand for raisins, and sets the size of the reserve pool to avoid market gluts and a sharp decline in farm prices. The initial level of the resale pool is determined near the beginning of the season, but it can be adjusted downward as the season progresses. Raisins, Inc., holds the reserve percentage of all the rai- sins it receives from growers for the account of the Committee. Raisins, Inc., can sell the free percentage of the raisins it receives in commercial markets. Raisins, Inc., pays for the free percentage of the raisins Baker delivers. The raisins in the reserve pool are held in storage until released for sale by the Committee, Baker receives a weighted average of the Committee's returns from sales of reserve raisins.
Experience has demonstrated that a glut of raisins usually depresses the price of raisins by more if sold in commercial mar- kets than if withheld and disposed of in noncommercial markets, or carried over and sold during a year with small supplies. Baker's returns rise if the marketing order causes some raisins to be withheld from sale during a large crop year and sold dur- ing a small crop year. Raisins withheld from sale results in higher prices to consumers for raisins during large crop years, but lower prices during small crop years.
Reserve pools may also even out annual supplies, resulting in smaller year-to-year swings in prices and quantities marketed. Greater stability can aid the industry in developing new markets and maintaining established markets in years with small supplies.
price and, consequently, carry less of the commodity than otherwise. Such difficulty may be more prevalent when the free market generates too little information on current and expected supply and demand. An industry with few inven- tory holders or a monopoly inventory holder also tends to carry fewer stocks from one year to the next as compared with a competitive market (7(5).
Many of the perennial crops display pronounced alternate- bearing tendencies. That is, a year with large crop yields is followed by a year with small yields. Yield variability is one source of interseasonal price and shipment instability. Market allocations are intended to help stabilize inter- seasonal prices and shipments in the regulated markets by diverting sales from the regulated markets during large crop years to nonregulated markets. Commodities are principally used in the regulated markets, which are gener- ally more price responsive than the nonregulated markets. Consequently, stabilizing shipments to the regulated market helps to stabilize farm prices more than stabilizing sales to the nonregulated markets. The ability of market allocations to stabilize prices in the regulated market is probably
reduced when supplies of competing crops are erratic and the marketing order covers only a small part of the crop supply.
Market allocations and reserve pools are intended to help an industry develop marketing and product strategies, such as assuring buyers reliable supplies of the produce at stable prices, which can help establish and expand markets for new and existing products. Cherry growers feel that the reserve pool has helped assure a steady supply of the commodity for processed products (29). Processors can be more willing to invest in the development of new products when the input price and supplies are stable because costs are lower. Retail- ers tend to be more willing to stock and promote a new prod- uct whose year-to-year supplies are reliable because many marketers believe that consumers more easily develop prod- uct loyalty with products regularly available. Retailers can also more easily plan business, which lowers marketing costs. Many industry members believe that the reserve pool and market allocation regulations helped the almond indus- try develop new products, such as almond butter and roasted almonds.
28

Market allocations can divert produce to nonregulated markets if the size of the allocation is less than the amount handlers would ship otherwise. Reserve pools also can divert produce to nonregulated markets if the contents of the pool enter the nonregulated markets. These two volume reg- ulations are controversial because they can permanently divert products to nonregulated markets. The economic effects of product diversion are described in the section on prorates.
The raisin industry initiated a payment-in-kind program in the early 1980's. Growers agreeing to remove planted acre- age from production received, as a payment, produce from the reserve pool. The program can help prop low farm prices by reducing bearing acreage and inventories.
Marketing Allotments
Marketing allotments require handlers to market only pro- duce for which the grower possesses a marketing quota (see box, "What do marketing allotments mean..."). Growers can sell only up to their allotted quantities. Marketing allotments indirectly control the maximum output, since growers not possessing allotments would not produce a commodity that cannot be sold. Allotments are normally established by the administrative committee based on growers* historical sales.
Marketing allotments are intended to stabilize year-to-year supply and prices and generate some of the benefits of miss-
ing risk-transferring markets. The potential benefits of sta- ble prices and supplies are discussed in the section on pro- rates. Whether interseasonai supplies and prices are more stable with a marketing allotment program than the free mar- ket, or other market institution, is a question open to further research.
Marketing allotments are intended to stabilize seasonal prices and sales by preventing growers from overplanting because of imperfect information. The effects of over- planting can linger many years, especially for perennial crops, such as the tree nuts and tree fruits. Shortrun effects of overplanting include temporary crop abandonment if the price falls to or below harvesting costs. Medium run effects include lower farm prices and lower orchard values. Once growers have incurred the large sunk cost of developing a viable orchard, they are reluctant to uproot the trees unless the prices fall below production costs for extended periods. Disinvesting perennial crops at a faster rate than the deprecia- tion rate is costly for growers.
Marketing allotments are the most controversial of the mar- keting order regulations because they potentially have the greatest market power. Growers can cooperatively act as a monopoly if the marketing order completely covers produc- tion of the crop. A monopoly usually sells less produce at higher prices than do competitive producers (see appendix II) (9). Consumers consequently face higher prices and smaller quantities of the commodity. A monopoly tends to produce less output as compared with a competitive market.
What Do Marketing Allotments Mean for the Washington Spearmint Oil Farmer?
To better understand how marketing allotments operate, consider the following example:
Farmer Douglas grows spearmint in Washington State, distills the spearmint oil out of the spearmint, and sells the oil to a han- dler, Spearmint, Inc., to market the oil to food processors. Spearmint oil is used mostly in products such as chewing gums, mouthwash, confections, and cooking ingredients.
Douglas' farm is in Washington State and Spearmint, Inc., must abide by the regulations of the Federal marketing order for spearmint oil. Under the marketing order, the Spearmint Administrative Committee (Committee), subject to the USDA's review and approval, determines the quantity of marketing allotments for the marketing order area during the season. The Committee takes into account the supply and expected demand for spearmint oil, and sets the quantity of marketing allotment to avoid market gluts and a sharp decline in farm prices. Marketing allotments for the current season are determined before the crop is planted. Douglas' share of the marketing allotment is equal to his historical share of the industry base sales times the industry's allotment percentage for the season. Douglas can grow as much spearmint as he wants, but can only market spearmint for which he has an allotment. If Douglas produces oil in excess of his marketing allotment, he may put the excess oil in the reserve pool. The Committee sometimes increases the allotment percentage if demand is stronger than the Commit- tee expected. Douglas may then use any oil he placed in the reserve pool to fill his increased allotment.
The reserve pool can help smooth out annual supplies and prices by carrying supplies from toge crop years over to small crop years. However, farm prices are higher if growers like Douglas produce less under the allotment program than otherwise. Consumer prices are unlikely to increase much if the allotment persistently restricts production since spearmint oil constitutes a sniall share of the total cost of the products that contain spearmint oil.
29

Growers seldom can act as a monopoly, in practice, since the marketing orders authorizing allotments usually cover only a part of tiie crop's potential growing area and entry by new growers and expansion by existing growers is permitted.
The net effect of marketing allotment regulations depends on their use. Preventing overplanting, when some growers have overoptimistic price expectations, reduces losses from crop abandonment and overinvesting. Allotment regulations, however, used to permanentiy restrict production would likely benefit growers at consumers' expense. Allotments in the marketing orders for cranbeiries have never been used. Although allotments are set for Florida celery and spearmint oil, their effectiveness in raising prices appears limited. Any attempt on the part of Florida celery growers to raise prices by reducing sales would likely be thw^ted by increased mar- ketings of California celery. Growth in imports and expanded domestic i^oduction in nonm^keting order States would likely counter high spearmint oil prices caused by an allotment restricting spearmint oil production in the market- ing order area. All of the marketing orders authorizing mar- keting allotments (cranberries, Florida celery, and spearmint oil) provide for assigning some allotments to new and exist- ing growers each season, thus limiting the allotment's poten- tial ability to restrict output.
Other Functions
The enabling legislation authorizes the administrative com- mittee of each marketing order to collect and disseminate information on production, shipment flows, and inventories. This regulation helps individual growers and handlers over- come some economies of scale, imperfect information, and asymmetric information problems. Individual handlers and growers generally spend too little on market information since some types of information enters the public domain. Wide dissemination of information is essential for a free mar- ket to operate efficientiy.
Information is not a free good since resources must be expended to gather statistics and interpret them. Handlers and growers have a financial incentive to collect information until the cost of collecting the information just equals its ben- efits. Handler and grower benefits include increased profits because of better planning, hence, lower costs, and the oppor- tunity to take advantage of changing markets.
Wide dissemination of market information can improve the bargaining power of small- and medium-sized handlers by providing information comparable with that of buyeß. Buy- ers, such as large-sized food processors and major regional and national retailers, who possess superior market informa- tion because they are geographically widespread and well financed, may otherwise use their superior information to bargain for a lower selling price from handlers (42),
The enabling legislation also authorizes tiie Secretary of Agriculture to prevent handlers and growei^ from engaging in unfair methods of competition and trade practices. TTie norms applied to delineate fair methods of competition and trade practices from unfair methods vary across industries and over time. A marketing order provides a social forum wh^eby handlers and growers can reach a consensus on what constitutes fair methods of competition and trade practices.
The administrative committee is responsible for helping to resolve industry conflicts, such as business differences between handlers and growers, in addition to defining unfair competition for the subject under the purview of marketing orders. The social forum of a marketing order may provide the most cost-effective institution for settiing business differ- ences when the industry has expertise and knowledge in the aiea. Other institutions may be unworkable because of a lack of expertise and, tiierefore, become too cumbersome and expensive.
References
1. Berck, Peter, and Jeffrey M. Perloff. "A Dynamic Analy- sis of Marketing Orders, Voting, and Welfare " American Journal of Agricultural Economics, 67( 1985): 487-496.
2. Blaylock, James R., and William N. Blisard. Effects of Advertising on the Demand for Cheese, TB-Î752. U.S. Dept. Agr., Econ, Res. Serv., December 1988.
3. Blinder, A, S. "Inventories and Sticky Prices: More on the Microfoundations of Macroeconomics," American Economic Review, n(19S2): 334-348.
4. Bocksteal, Nancy E. "The Welfare Implications of Mini- mum Quality Standards," American Journal of Agricultural Economics, 66(1984): 466^71.
_. "Economic Efficiency Issues of Grading and Minimum QualityStandards," Economic Effi- ciency in Agricultural and Food Marketing. Editors, Rich- ard L. Kilmer and Walter J. Armbruster. Iowa State University Press. 1987. Pages 231-250.
6. Cariton, Dennis W. "The Rigidity of Prices," Amencan Economic Review, M19S6): 637-658.
7. Carman, Hoy E, and Daniel H, Pick. "Marketing California-Arizona Lemons Without Marketing Order Ship- ment Controls," Agribusiness: An International Journal, 4(1988): 245-259.
30

8. Clarke, D. G. "Econometric Measurement of the Dura- tion of Advertising Effects on Sales," Journal of Marketing Research, 1K1916): 345-357.
9. Cohen, Kaiman J., and Richard M. Cyert. Theory of the Firm: Resource Allocation in a Market Economy, Prentice- Hall, Inc. 1975.
10. Cornell University, Department of Agricultural Economics. Generic Agricultural Commodity Advertising and Promotion, Editors, Walter J. Armbruster and Robert L. Wüls. A.E.Ext. 88-3. March 1988.
11. Ehrlich, Isaac, and Lawrence Fisher. "The Derived De- mand for Advertising: A Theoretical and Empirical Investi- gation," American Economic Review, 72(1982): 366-388.
12. Farrell, Kenneth R. Federal and State Enabling Legisla-" tionfor Fruit and Vegetable Marketing Orders: Evolution and Current Status, Supplement No. 3 to Technical Study No. 4. Report of the National Commission on Food Marketing. June 1966.
13. Farris, Paul W., and Mark S. Albion. "The Impact of Advertising on the Price of Consumer Products," Journal of MarketingA^{\9m): 17-35.
14. French, Ben C, and Raymond G. Dressier. "The Lemon Cycle," Journal of Farm Economics, 44(1962): 1021-1036.
15. French, Ben C. "Fruit and Vegetable Marketing Orders: A Critique of the Issues and State of Analysis,"Am^n¿:¿zn Journal of Agricultural Economics, 64(1982): 916-923.
16. Gardner, Bruce. "Efficiency in Commodity Storage," Economic Efficiency in Agricultural and Food Marketing. Editors, Richard L. Kilmer and Walter J. Armbruster. Iowa State University Press. 1987. Pages 274-285.
17. Gordon, Robert J. "Output Fluctuations and Gradual Price Adjustment," Journal of Economic Literature, 19(1981): 493-530.
18. Hallagan, William S. "Contracting Problems and the Adoption of Regulatory Cartels." Economic Inquiry, 23(1985): 37-56.
19. Hart,0. "OntheOptimality of Equilibrium When the Market Structure is Incomplete," Journal of Economic Theory, 11(1975): 418-443.
20. Heifner, Richard, Walter Armbruster, Edward Jesse, Glenn Nelson, and Carl Shafer. A Review of Federal Market- ing Orders for Fruits, Vegetables, and Specialty Crops: Economic Efficiency and Welfare Implications, AER-477. U.S. Dept. Agr., Agr. Mktg. Serv., November 1981.
21. Jesse, Edward v., and Aaron C. Johnson, Jr. Effective- ness of Federal Marketing Orders for Fruits and Vegetables. AER-471. U.S. Dept. Agr., Econ. Res. Serv., June 1981.
22. Kinney, William, Hoy Carman, Richard Green, and John O'Connell. An Analysis of Economic Adjustments in the California-Arizona Lemon Industry, Giannini Foundation Research Report No. 337. California Agricultural Experi- ment Station. April 1987.
23. Kinnucan, Henry, and Olan D. Forker. "Seasonality in the Consumer Response to Milk Advertising with Implica- tions for Milk Promotion Policy," American Journal of Agri- cultural Economics, 68(1986): 562-571.
24. Lipsey, R. G., and R. K. Lancaster. "The General Theory of the Second Best," Review of Economic Studies, 24(1956): 11-32.
25. Newberry, D. M. G., and Joseph E. Stiglitz. The Theory of Commodity Price Stabilization: A Study in the Economics of Risk. Oxford:Clarendon Press. 1981.
26. Nguyen, Dung, and Trang T. Vo. "On Discarding Low Quality Produce," American Journal of Agricultural Economics, 67(1985): 614-618.
27. Nichols, John P. "Economic Efficiency Issues of Grading and Minimum Quality Standards: A Discussion," Economic Efficiency in Agricultural and Food Marketing. Editors, Richard L. Kilmer and Walter J. Armbruster. Iowa State University Press. 1987. Pages 251-255.
28. Peltzman, Sam. "Toward a More General Theory of Regulation," The Journal of Law and Economics, 19(1976): 211-240.
29. Polopolus, Leo C, Hoy F. Carman, Edward V. Jesse, and James D. Shaffer. Criteria for Evaluating Federal Market- ing Orders: Fruits Vegetables, Nuts, and Specialty Commod- ities. A report prepared by an independent marketing order study team published through U.S. Dept. Agr., Econ. Res. Serv., December 1986.
30. Posner, Richard A. "Theories of Economic Regulation," Bell Journal of Economics and Management Science, 5(1974): 335-358.
31. Powers, Nicholas J., Glenn A. Zepp, and Frederic L. Hoff. Assessment of A Marketing Order Prorate Suspension: A Study of California-Arizona Navel Oranges, AER-557. U.S. Dept. Agr., Econ. Res. Serv., June 1986.
32. Rausser, Gordon C, Jeffery M. Perloff, and Pinhas Zusman. "The Marketing System: The Relevance of Eco- nomic Efficiency Measures," Economic Efficiency in Agri- cultural and Food Marketing, Editors, Richard L. Kilmer and Walter J. Armbruster. Iowa State University Press. 1987. Pages 3-31.
31
33. Shepard, Lawrence. "Cartelizatíon of the California- Arizona Orange Industry, 1934-1981," Journal of Law and Economics, 29(1986): 83-123.
34. Smith, Roy J. "The Lemon Prorate in the Long Run," Journal of Political Economy, 69(1961): 573-586,
35. Stigler, George J. "The Theory of Economic Regula- tion," Bell Journal of Economics and Management Science, 2(1971): 3-21.
_. "Free-Riders and Collective Action," 36. Bell Journal of Economics and Management Science, 5(1974): 359-365.
37. Stigler, George J., and Gary S.Becker. "DeGustibus Non Est Disputandum," American Economic Review, 67(1977): 76-90.
38. Stiglitz, Joseph E. "Equilibrium in Product Markets With Imperfect Information," American Economic Review, Papers and Proceedings, 69(1979): 339-345.
_. Economics of the Public Sector, W. W. 39. Norton and Company. 1986.
40. Sun, TTieresa. Quality Demand and Policy Implications for Florida Green Tomatoes, TB-1728. U.S. Dept. Agr., Econ. Res. Serv., August 1987.
41. Teigen, Lloyd D. Agricultural Parity: Historical Review and Alternative Calculations, AER-571. U.S. Dept. Agr., Econ. Res. Serv., June 1987.
42. Telser, Lester G. Theories of Competition. North- Holland. Elsevier Science Publishing Co., Inc. 1988,
43. Thor, Peter K., and Edward V.Jesse. Economic Effects of Terminating Federal Marketing Orders for California- Arizona Oranges. TB-1664. U.S. Dept. Agr., Econ. Res. Serv., November 1981.
44. Tomek, William G., and Kenneth L. Robinson. Agricul- tural Product Prices, Ithaca, New York: Cornell. 1981.
45. U.S. Department of Agriculture, Agricultural Marketing Service. Marketing Agreement and Order Operations Manual. September 1987.
46. _. Guidelines for Fruit, Vegetable, and Specialty Crop Marketing Orders. January 25,1982.
Appendix I: Effects of Product Diversion
The shortrun and longrun effects of restricting sales of fresh- quality produce to the fresh-use market over an extended period are illustrated using figures 3a-3c. Figure 3a indi- cates that consumers demand more fresh produce at a lower price and figure 3b reveals that consumers demand more pro- cessed products at a lower price. The marginal revenue mea- sures the change in revenue in the market when sales to the market change by a small amount. The marginal revenue in each market falls as sales rise. The marginal revenue in the processing-use market is higher than in the fresh-use market, except when sales are small. This difference means that the fall in revenue from a small increase in sales to processing is less than the rise in revenue from a small decrease in sales to fresh use. The total demand (the horizontal summation of ¿he demands in the fresh-use and processing-use markets), as presented in figure 3c, shows that consumers demand more produce as the weighted price falls. The supply of output indicates that farmers grow more produce at a higher weighted price. The dashed line lying above the aggregate demand and l^eled "weighted maximum farm price" shows the price received by growers when the crop is allocated between fresh use and processing so as to maximize grower revenue. Grower revenue is maximized by allocating a given supply between the fresh-use and processing-use mar- kets until the marginal revenue in the two markets is equal.
In real world markets, the price in the fresh-use market is usually greater than in the processing-use market because higher quality produce enters fresh use. To easily illustrate the implications of a product diversion, we assume that in a free market, prices in fresh use and processing and the weighted average farm price are equal {Pf = Pp = PV} and output is qf. Thus, in a free market, sales to fresh use are qf and sales to processing use are ^.
The shortrun effects of product diversion can be evaluated by comparing the free-market outcome with allocating the quantity supplied in a free market in a way to maximize grower revenues. While it is unlikely growers could use pro- rate regulation to maximize revenue, we consider this alterna- tive to illustrate the potential implications of a product diversion. Growers are unlikely to maximize revenue because information is inexact and the goals and beliefs among growers differ. The short run is defined as the period of time when growers are unable to adjust (expand or con- tract) their level of output. Growers of tree crops can expand production in about 5-7 years. Growers of tree crops can contract production during 1-2 seasons. Growers of annual crops can expand and/or contract production in a year. Sales to fresh use are lower and the price for fresh produce is higher in the short run, while sales to processing are higher and the price for processed produce is lower. The weighted maximum farm price and grower revenue are higher, how-
32

ever. Growers divert produce to processing until the mar- ginal revenues in the processing-use and fresh-use markets are equal. Thus, sales to fresh use are <^ and sales to pro- cessing are (fp and the corresponding fresh price is P} and the processing price is Pp. The weighted maximum farm price is Fi. Grower revenue is higher by the area Pi'A-q'rD lessFÎ-C-<7?-D.
Figure 3
Effects of product diversion
Price 3a. Fresh-use market
Marginal revenue from a small rise in quantity
Farm demand
^:<^' Quantity
3b. Processing-use
Price
Marginal revenue from a small rise in quantity
Pp XvC..^^^
p; u::::^!^^??5^ï^>v^ p^ \^ Î l^^^v^Farm demand
Price
P«
P' pc
Qp P; Qp Quantity
3c, Supply and aggregate demand
Weighted maximum farm price
Farm demand for fresh use and processing use
The longrun effects of a permanent product diversion are different than the shortrun effects. The long run is a period of time sufficiently long for growers to complete production adjustments. The long run for tree crop expansion is about 10-12 years» whereas expansion of annual crops, such as lettuce, tomatoes, or potatoes, can usually occur in about 1-2 years. In response to a sustained higher farm price, profit- maximizing growers expand output until the marginal cost of producing an additional unit of output equals the weighted maximum farm price, as given by point B in figure 3c, Growers expand output to q^ in the long run and the weighted maximum farm price is H. As output increases, growers divert more produce to processing and continue to equate the marginal revenues in fresh-use and processing- use markets. While sales to the fi-esh-use market in the long run (qß are lower than in the free market, sales to the fresh- use market in the long run are higher than in the short run with a product diversion. The price for fresh produce is higher in the long run (P^ as compared with the free market, but price is lower in the long run as compared with in the short run with a product diversion. Sales to processing in the long run (qp) are higher than in the short run with a prod- uct diversion. The price of processing produce is lower in the long run (Pp) as compared with either the shortrun prod- uct diversion or the free market. Grower revenue is higher in the long run (PÍ • J5 • <?; • D) as compared with the frce market, but revenue is not necessarily higher in the long run as compared with in the short run with a product diversion.
The weighted maximum farm price is less in the long run than in the short run with a product diversion because of higher output, but farm price is higher in the long run than in the free market. Product diversions tend to elevate the weighted maximum farm price more when production is less responsive to a higher price. Production tends to be less re- sponsive when inputs, such as water, fertilizer, and labor, and arable land suitable for growing the crop, are limited. More production inputs can frequently be supplied without much of an increase in their prices. Land, however, can be a limiting input factor in fffoduetion, since some horticultural crops can only be grown in a narrow geographic area endow- ed with desirable climatic and soil characteristics. Land may come from competing crops, which would lower production of the competing commodities and elevate farm prices.
The higher revenues are typically capitalized into the price of limited factors of production, such as the land suitable for growing the produce. The wealth of landowners at the initi- ating time of the product diversion program is boosted, but land becomes more expensive for new and expanding grow- ers (i). New landowners lose equity if the product diver- sions are discontinued because land is revalued at the lower free-market level. Farm creditors may be exposed to more credit risk if unpredictable program changes lower land values.
Quantity
33

Appendix II: Potential Effects of Marketing Allotments
The effects of marketing allotments are illustrated in figure 4. The demand indicates that consumers buy more of a com- modity when the price falls. The free-market supply indi- cates that growers produce more ouÇ)ut when the farm price rises. Growers prcwduce the quantity of output where the sup- ply curve intersects the demand curve {q^) and receive the market clearing price of/^in a free market. The marketing allotment does not affect the level of prices unless the allot- ted quantity is less than the free-market output. For exam- ple, the producer allotment of quantity q^ exceeds the free-market output and, consequently, has no effect on the price. But, the allotted quantity of q^ restricts output and, thus, lifts price to P^.
Allotments take on value when they successfully restrict the free-market output and elevate price because allotments are transferable rights. The allotment value equals the differ- ence between grower revenue and total cost of production inputs.
In the real world, marketing orders authorizing allotments provide for assigning some allotments to new and existing growers each year, thus, reducing the allotment's ability to restrict output. In most marketing orders, allotments appear with other volume control regulations, such as the
reserve pool. An allotment, when used with a reserve pool, may help stabilize annual prices and supplies. The box on marketing allotments discusses how growers use the allotment and reserve pool in the spearmint marketing order.
Figure 4
Effects of marketing allotments
Price
Quantity
34
Ji-U.S. Government Printing Office : 1990 - 261-455/20148

Keep Up-To-Date on Food Developments!
Subscribe to the National Food Review and receive timely analysis and research results directly from the Economic Research Service. Subscription Includes four issues. Save money by subscribing for more than 1 year.
National Food Review Subscription
Domestic
Foreign
1 Year _ $11.00
_ $13.75
2 Years _$21.00
3 Years _ $30,00
.$26.25 .$37.50
For fastest service, call toll free,1-800-999-6779
(8:30-5:00 ET in U.S. and Canada; other areas please call 301-725-7937)
[ I Bill me. Q Enclosed is $
Credit Card Orders:
I I MasterCard Q^ VISA Total charges $_
Use purchase orders, checks drawn on U.S. banks, cashier's checks, or international money orders. Make payable to ERS-NASS.
Credit card number: Expfrstlon dâte- Month/YMf
Name
Address
City, State, Zip.
Daytime phone (_
Mail to:
ERS-NASS P.O. Box 1608 RockvHIe, MD
20849-1608