the eu fruit and vegetables sector
202
-
Upload
khangminh22 -
Category
Documents
-
view
5 -
download
0
Transcript of the eu fruit and vegetables sector


DIRECTORATE GENERAL FOR INTERNAL POLICIES
POLICY DEPARTMENT B: STRUCTURAL AND COHESION POLICIES
AGRICULTURE AND RURAL DEVELOPMENT
THE EU FRUIT AND VEGETABLES SECTOR: OVERVIEW AND POST 2013
CAP PERSPECTIVE
STUDY

This document was requested by the European Parliament's Committee on Agriculture and Rural Development AUTHORS Ms Gaetana Petriccione (project manager), Mr Crescenzo dell’Aquila (project leader), Ms Maria Angela Perito, Mr Roberto Solazzo, INEA (Istituto Nazionale di Economia Agraria) Mr Antonio Cioffi, University of Naples Federico II Mr José-Maria Garcia-Alvarez-Coque, University of Valencia RESPONSIBLE ADMINISTRATOR Mr Albert Massot Policy Department Structural and Cohesion Policies European Parliament B-1047 Brussels E-mail: [email protected] EDITORIAL ASSISTANCE Ms Catherine Morvan LINGUISTIC VERSIONS Original: EN ABOUT THE EDITOR To contact the Policy Department or to subscribe to its monthly newsletter please write to: [email protected] Manuscript completed in April 2011. Brussels, © European Parliament, 2011. This document is available on the Internet at: http://www.europarl.europa.eu/studies DISCLAIMER The opinions expressed in this document are the sole responsibility of the author and do not necessarily represent the official position of the European Parliament. Reproduction and translation for non-commercial purposes are authorized, provided the source is acknowledged and the publisher is given prior notice and sent a copy.

DIRECTORATE-GENERAL FOR INTERNAL POLICIES
POLICY DEPARTMENT B: STRUCTURAL AND COHESION POLICIES
AGRICULTURE AND RURAL DEVELOPMENT
THE EU FRUIT AND VEGETABLES SECTOR: OVERVIEW AND POST 2013
CAP PERSPECTIVE
STUDY
Abstract:
This study provides an overview of recent economic and policy developments of the EU F&V sector, considering ongoing changes in supply chains and market dynamics and current profiles of domestic and trade policies. Findings suggest that current difficulties for EU producers, particularly for small farming, arises mainly from long-term changes at different levels of the global F&V sector: consumers, retail and multinational agribusiness. The preliminary assessment of the 2007 reformed CMO, derived from both National Strategies and a survey targeting POs of Italy, Spain and France, validate the cornerstones of the current EU policy schemes for the F&V sector. However plausible improvements are envisaged for support and trade protection measures in the framework of the CAP after 2013. Main proposals focus a strengthened role of POs, selecting and increasing effectiveness of crises and risk management measures, rebalancing bargaining power of POs in the supply chain, reducing fluctuations in producers’ income, refining trade policy solutions in a context of increased trading openness and further integration with Mediterranean Partner Countries.
IP/B/AGRI/IC/2010-045 April 2011 PE 460.043 EN


The EU Fruit and Vegetables Sector
PE 460.043 5
CONTENTS
List of abbreviations 7
List of tables 11
List of figures 12
Executive Summary 13
Introduction and objectives of the study 19
1. A general overview of the EU fruit and vegetable sector 21
1.1. Trends in the functioning of the F&V value chain 21
1.2. EU F&V market dynamics 26
1.3. Focus on Citrus 31
1.4. Focus on peaches and nectarines 32
1.5. Focus on table grapes 33
2. Impact of the fruit and vegetable CMO measures and trade agreement policy 35
2.1. The implementation of the F&V CMO in the EU 35
2.2. Trading arrangements and preferential agreements in F&V sector 46
2.3. The issues relating to food standards 54
3. Results from INEA survey 57
3.1. The survey 57
3.2. Swot analysis: EU F&V sector and CMO measures 70
4. Exploring new measures and tools to improve organizational framework and bargaining power of producers 73
4.1. The EU’s evolutionary policy setting 73
4.2. Market measures and risk management in the F&V sector 75
4.3. Regulating F&V vertical market relationships: contractual models 78
4.4. Competition policy and regulation of F&V market relationships 85

Policy Department B: Structural and Cohesion Policies
PE 460.043 6
5. Exploring ways to address trade agreements AND SAFETY STANDARDS 91
5.1. EU F&V industry and trade partners: is further liberalization possible? 91
5.2. Safety and quality standards: implementation and effects on the third countries’ growing areas 95
5.3. Trade and development of the EU F&V sector 96
6. Conclusions and policy recommendations 103
6.1. F&V market and supply chain dynamics 103
6.2. Current features and possible changes of EU domestic support for F&V producers 105
6.3. Current features and possible changes of EU external protection for F&V producers 110
References 113

The EU Fruit and Vegetables Sector
PE 460.043 7
LIST OF ABBREVIATIONS
AA Agricultural Area
APO Association of Producer Organisation
BRC British Retail Consortium
CAP Common Agricultural Policy
CEEC Central and Eastern European Countries
CEPS Centre for European Policy Studies
CFEPSR Centro per la Formazione in Economia e Politica nello Sviluppo Rurale
CMO Common Market Organisation
COGECA General Committee for Agricultural Cooperation in the EU
COPA Committee of Professional Agricultural Organisations
CSO Centro Servizi Ortofrutticoli
DB Data Base
EAGF European Agricultural Guarantee Fund
EEC European Economic Community
EESC European Economic and Social Committee
EMP Environmental Management of Packaging
EP Entry Price
EPS Entry Price System
ER Export Refunds
EU European Union
EUREP-GAP Euro-Retailer Produce Working Group (Eurep)/
Good Agricultural Practices (GAP)
F&V Fruit and Vegetables
FAO Food and Agriculture Organization
FCOJ Frozen Concentrate Orange Juice
FDI Foreign Direct Investment
FTA Free Trade Area
FWU Family Work Units
GAP Good Agricultural Practices
GDP Gross Domestic Product
GMP Good Manufacturing Practices

Policy Department B: Structural and Cohesion Policies
PE 460.043 8
GSP Generalised System of Preferences
HACCP Hazard Analysis Critical Control Point
HC Health Check
HLG High Level Group
HS Harmonized System
ICE Intercontinental Exchange
IDB Integrated Data Base
ISF International Food Standard
MEDA Middle East and Developing Africa
MFN Most Favoured Nation
MPC Mediterranean Pertner Countries
MS Member State
MTE Maximum Tariff Equivalent
NTB Non-tariff barriers
OECD Organisation for Economic Co-operation and Development
OFIMER
Office National Interprofessionnel des Produits de la Mer et de
l'Aquaculture
OIV Organisation Internationale de la Vigne et du Vin
ONIGC Office National Interprofessionnel des Grandes Cultures
ONIPPAM Office National Interprofessionnel des Plantes à Parfum, Aromatiques et
Médicinales
P&N Peach and Nectarine
PO Producer Organisation
SFP Single Farm Payment
SIV Standard Import Value
SME Small and medium enterprises
SPS Single Payment Scheme
SPS Sanitary and Phytosanitary Standards
TBT Technical Barriers to Trade
TEP Triggering Entry Price
TFEU Treaty on the Functioning of the European Union
TQ Tariff Quota
TRQ Tariff-Rate Quota
UAA Utilised Agricultural Area

The EU Fruit and Vegetables Sector
PE 460.043 9
UK United Kingdom
UIAPOA Unione Italiana Associazioni Produttori Ortofrutticoli e Agrumari
UNACOA Unione Nazionale tra le Organizzazioni di Produttori Ortofrutticoli
Agrumari e di Frutta in Guscio
UNAPROA Unione Nazionale tra le Organizzazioni di Produttori Ortofrutticoli
Agrumari e di Frutta in Guscio
UR Uruguay Round
URAA Uruguay Round Agreement on Agriculture
USDA United States Department of Agiculture
VMP Value of Marketed Production
WHO World Health Organisation
WTO World Trade Organisation

Policy Department B: Structural and Cohesion Policies
PE 460.043 10

The EU Fruit and Vegetables Sector
PE 460.043 11
LIST OF TABLES TABLE 1. 1.
Top 15 Food Retailers in Europe 2009 turnover in billion euro 23
TABLE 1. 2.
EU import of F&V 2000-2009 (value in € million, volume in thousand tons) 28
TABLE 1. 3.
EU export of F&V 2000-2009 (value in € million, volume in thousand tons) 28
TABLE 2. 1.
Comparison of tariffs in selected HS Chapters 47
TABLE 2. 2.
Elements of entry prices for selected F&V 48
TABLE 2. 3.
Breakings of the trigger EPs 50
TABLE 2. 4.
Extra-EU exports and Export refunds 51
TABLE 2. 5.
Structure of EU trade protection and concessions to main preferential partners for some fresh F&V products 53
TABLE 3. 1.
In which measure the pursuit of the following objectives (a., b., c., d., e.) of the CMO has been positively affected by such provisions? 58
TABLE 3. 2.
In which measure in the POs' operational programmes the actions have been more effective in contributing to achieve the strategic objectives of reformed CMO? 59
TABLE 3. 3.
Number of POs adopting risk and crisis management measures from 2008 to 2010 60
TABLE 3. 4.
Number of POs adopting risk and crisis management measures from 2008 to 2010 according their size 61
TABLE 5. 1.
Scenarios for external protection of selected F&V in the Doha Round of multilateral negotiations 92

Policy Department B: Structural and Cohesion Policies
PE 460.043 12
TABLE 5. 2.
Opinions of Italian POs on current F&V trade policy measures and perspectives of further liberalization 99
LIST OF FIGURES
FIGURE 1. 1. EU imports of fresh Vegetables from leading suppliers, 2000-2009 (Million EUR) 29
FIGURE 1. 2.
EU imports of fresh Fruit from leading suppliers, 2000-2009 (Million EUR) 30

The EU Fruit and Vegetables Sector
PE 460.043 13
EXECUTIVE SUMMARY
1. Overview of the EU fruit and vegetable sector
F&V is a key sector in EU agriculture, with a weight of 18% of EU agricultural production, almost equally shared between vegetables and fruit, of which 9% are citrus fruits. Production is highly geographically concentrated: the two main producing countries, Spain and Italy, gather 40% of vegetables production and more than 50% of fruit (includ. citrus). Italy, Spain and Greece originate more than 95% of EU citrus production. Italy remains the largest European F&V producing country and showed, in the last ten years, the greater variability of output, while Spain and Greece showed greater price volatility in the same period. Among the new Members from Eastern Europe, Poland has shown a strong growth in F&V production in the last 10 years.
The EU’s role in the world F&V sector remains significant, although slowly declining in the last decade to a share of 8.3% in world production in 2009, with fruit (excl. citrus) most affected (-5.1%), followed by vegetables (-2.3%) and citrus fruit (-0.9%). The reduction of weight in world production is partly due to the growth of many other areas and mirrors the dynamic of EU production, that in 2009 is by 8.7% lower than the volume produced in 2000. In the last decade the trend is declining for production, with a stronger tendency for fruit (excl. citrus), which has decreased of 14.6%, although also vegetables production has reduced (-5.8%), while citrus fruit has increased (+7%) in the same period.
One of main structural limits of the EU F&V sector is the small size of farms and, in 2007, over 70% of the F&V farms did not reach an area of 5 ha. This causes higher costs for farmers, not allowing to reach an efficient production scale and poses limits on competitiveness in the world market.
The current difficult situation of the European F&V sector arises mainly from long-term changes in the structure of the global F&V sector: consumers increasingly demand services, including convenience in food purchasing and preparation, taste, and variety, and are increasingly concerned for food safety and quality; sales are increasingly being controlled by fewer and fewer retailers, with a growing bargaining power; the role of the WTO and bilateral negotiations are becoming more important in widening competition; multinational agribusiness is becoming more important due to upgrading of logistics, communication and information technology, transport enabling fresh products to be transported from many origins.
Producers prices have usually been volatile for fresh F&V and seem declining in trend in the last few years, while retail prices are either constant or increasing, indicating either increasing rents being captured by downstream actors or increasing levels of value added;.
Final demand for F&V is generally more stable than supply and changes tend to occur over longer periods of time. Available data on consumption suggests a trend of slow increase in consumption of F&V in the EU, particularly for those countries starting from lower levels of per capita consumption.

Policy Department B: Structural and Cohesion Policies
PE 460.043 14
F&V supply chains are increasingly driven by large retailers. Increasing concentration and consolidation in retail chains, as well as their global expansion, has improved their position and augmented their buying power in the market. The major effects of the emergence of food retailers in the global food supply chains are through the procurement system of large volumes of products from suppliers. Retailers are building up long term relationships with key suppliers – either producers or wholesalers - capable to meet the requirements necessary to respond to the increased consumer interest for purchasing fresh F&V products from supermarkets.
While competition at the retail stage fuels changes in formats of retailing and outlets, the tendency to concentration and consolidation also in upstream stages of supply chains materializes a bias against small farms and fuels forms of association at farm level stage. This is the major challenge for small F&V farmers, either from the EU or other supplying areas: how to be part of modern EU-based chains where the retail stage coordinate the other actors.
Effects of structural changes can be detected also when observing changes in the trade pattern of the EU’s F&V sector. A slow decline of the share of Intra-EU imports (from 70.3% to 68% in the last decade) and a slow increase of the structural unbalance between Extra-EU import and export (-7.3 billion euro for EU27 in 2009) show a gradual increase in openness to external trade and suggest a slow process of substitution of EU suppliers incapable of meeting demand and retail requirements stemming from globalized supply chains.
“Substitutes” in supply of vegetables are mainly from the Mediterranean area, but also from Central-South America and some African countries, while Central and South America prevails for fruit (also because of the role played by tropical and off-seasons F&V products), although with a significant role of Mediterranean countries for some products, such as citrus. Survival of traditional marketing channels in the EU market, structural backwardness of non-EU suppliers, and EU trade policy devices, converge in determining a relatively slow pace of inclusion of external F&V suppliers in the EU-based supply chains for F&V.
2. Impact of the fruit and vegetable CMO measures and trade agreement policy
The F&V sector shows a heterogeneous rate of organisation among the Member States, that on average is around 30%. The objective of supply concentration has been set by the EU on the basis of the logic of supporting producers’ organisations (POs) in the F&V sector. Relevant differences exist also in development dynamics of the POs’ number among Member States alike and can be explained by several factors, both internal and external to the CMO scheme.
The special importance of market crises in the fresh F&V industry arises from two circumstances: a) the very limited storability of F&V produce; b) the distributive margins rather high in proportion to retail prices of fresh F&V, which make demand at the farm gate less price elastic and therefore concurring at a larger variability of prices at the farm gate. The 2007 CMO reform introduced measures for direct management of market crises by POs. These measures were integrated in the operational programs of POs also with the objective to increase attractiveness of POs to producers. Although crises prevention and management measures are considered generally useful, their effectiveness is thought as

The EU Fruit and Vegetables Sector
PE 460.043 15
very limited and the reasons pled are generally linked to the difficulties of their adoption, as well as the limited amount of resources made available.
The 2007 CMO reform integrated the F&V sector into the single payment scheme and allowed Member States to adopt a transitional hectare payment. Many differences exist among the implementation modalities at Member State level. There is a particular a particular concern on the security of raw material supplying the industry. Another great concern regards the prospected regionalisation of the single farm payment that add new issues around the F&V sector perspectives in terms of possible effects on farmers’ behaviour as well as on the supply chains involved.
The EU trade regime for F&V is rather complex and its measures are set differently according to products, partner countries and seasonality. External protection remains a cornerstone of the set of measures supporting EU F&V producers and it is mainly based on tariffs and an entry price system (EPS). The EPS works by adding surcharges to the normal tariff whenever the import price is detected to be below a defined level of entry price. Trade preferences are very relevant in F&V trade of the EU, in terms of both import flows and concessions on tariff and non-tariff measures, although preferential treatments are sometimes bound by tariff quotas restricting concessions to predetermined quantities. The major preferential trade concessions for fresh F&V relate to agreements with Mediterranean partner countries, most relevant due to both overlapping production calendars with EU domestic production and weight of import flows.
The EU considers promotion as one of the cornerstones for the efficiency of the food chains and for the success of the agriculture policy in Europe. The European Commission has also developed specific strategies in order to increase the consumption of F&V. promoting through the CMO consumption of F&V at schools.
Over the past few years, food safety and quality has become an important concern for the general public opinion, policy makers, researchers, stakeholders involved into food production, transport and trading. Overall, F&V standards indicate the complex aggregate of rules at different levels (national and international standards); standards from different sources (public and private standards); and standards on different product and process characteristics (e.g. quality standards, sanitary and phytosanitary measures, traceability regulations, etc.). The European Union, within the F&V CMO, specifically provides acts to improve product’s quality, also with production methods respecting the environment (including organic products) of POs through the operational programmes. Also private standards are playing an increasing role in the governance of agricultural and food supply chain. Retailers, but also processing industries, have implemented new collective private (voluntary) standards in order to improve food safety.
3. Exploring new measures and tools to improve organizational framework and bargaining power of producers
A key question for the future of the CMO for F&V is whether the F&V CMO with its specificity is still consistent with the ongoing CAP reform. The main issues regard: (i) increasing the level of Community aid in order to encourage mergers of Pos, set up of APOs, and development at transnational level; (ii) developing competition rules better addressed to the organisational framework; (iii) improving/reviewing crisis prevention and management measures within POs’ operational programmes; (iv) providing at a horizontal level additional and complementary tools aim at managing more severe crises. Many

Policy Department B: Structural and Cohesion Policies
PE 460.043 16
stakeholders have expressed great concern and supported maintaining of the specificity of the F&V CMO within the CAP reform and the EU budget resources devoted to the sector as well.
The support system to F&V POs should be improved in the CAP after 2013 in order to encourage supply concentration, rebalance bargaining power in the supply chain, improve efficiency and transparency of the F&V supply chain, reduce fluctuations in producers’ income, strengthen EU trade sector and improve instruments stimulating F&V consumption. All that taking into account EU budgetary constraints and WTO requirements.
Critical issues of market crises management within the current CMO are: i) withdrawals do not fit adequately the way market crises are managed in the current CMO. Rethinking withdrawals in a wider context of modulation and flexibility of the mix of measures for managing crises and risk would be advisable; ii) the possibility to support the payment of insurance premiums is improper on a general ground, but also for the way in which it has been implemented which makes it only a partial replacement of support measures to payment of agricultural insurance premiums that were previously charged on MS budgets in a framework of compatibility with EU state aid rules; iii) promotion and communication measures are those measures resulting more widely adopted by POs that implemented the set of measures. Their success seems related to its easier accessibility comparing the others; iv) financial limits of market crises measures: they are constant overtime and it is advisable introducing arrangements for wider intertemporal flexibility of financial limits and a wider modulation of market crises measures; v) measures for the implementation of mutual funds didn’t get very much attention, probably because the support is oriented only toward administrative expenses for their implementation, although they would deserve support in a general orientation at enhancing the role of saving/credit in transferring risk overtime.
Contractual relations have gradually become established over the last decades as a result of the process of concentration that has accompanied the substantial growth of large-scale retail and the strengthening of its contractual power over upstream suppliers. With the introduction of commercial brands, large-scale retail has further consolidated its contractual strength towards upstream suppliers, attaining a pattern of "vertical control of the supply chain". The agricultural sector – in particular, the F&V sector - finds itself in a relatively weak negotiating position, made worse by the low level of concentration from which farmers approach the market. This is a weakness that can only be overcome by resorting to POs. Further strengthening of the coordination and collaboration action between various stages of the supply chain can come from the interbranch device (organisation and agreements), thanks to which opportunistic behaviour may be countered and reduced, while encouraging cooperative behaviour. POs can constitute a valid and useful counterweight by taking up a strategic role in restoring balance to market relationships, acting as a contractual power and for redistributing added value, while contributing towards transforming forms of economic dominion into models of cooperative behaviour.
Information constitutes a key issue in achieving any form of coordination: it is needed to determine the best use of resources and can be considered a strategic element in the development process of an agro-food system. Market transparency is particularly important for F&V sector that, following a major market orientation, requires reliable information about prices and quantities and their formation along the chain. The availability and the quality of market information are very important especially in relation to the market regulation, but also to contractual relations, crisis prevention, and so on. EU Commission expressed concern about information on prices as source of competitive advantage for

The EU Fruit and Vegetables Sector
PE 460.043 17
buyers (and their collusive strategies) to the detriment of farmers. For the purpose of enhancing market transparency, it could be envisaged a suggestion about the establishment of an appropriate market observatory for the F&V sector at Member State level.
Agricultural contracts can offer several advantages to producers (reduced price risks, assured market outlets, increased return for high quality products) and lead to improvements in efficiency of supply chain organisation, through transaction costs reduction. Accordingly, the use of contracts in agriculture has increased in recent years, characterized by a wide variety of arrangements that can differ a lot both among agricultural sectors and among single products within a same sector. While the issue of making contract compulsory is still debated (also based upon the recent French experience in the milk end F&V sectors), it is clear enough that most of the benefit for agricultural producers are conditioned to the role of POs and/or associations of POs or cooperatives in managing contracts and to the possible role played by policy intervention in regulating contractual arrangements in order to prevent unfair contractual practices.
The backdrop of public intervention on the F&V sector (POs, as well as contracts) is the EU competition policy and regulation. The agricultural sector is subject to the EU's competition rules with a special regime applicable to it. However, several inquiries of European and National Competition Authorities show that agricultural exemptions are very rarely recognized, because of a very strict interpretation of competition rules. In a context of increasing concern for possible malfunctions of the European food supply chain (price hikes of 2007-2008 and potential price stickiness in the food supply chain), consideration for the weak bargaining power of the F&V producers should give the way towards less unfavorable competition rules for them. One of the key points when analysing the interface between agricultural and competition rules is the issue of the role of POs and other forms of farmers’ associations to increase the bargaining power of farmers. Although competition law imposes restrictions to farmers’ agreements, there is the opportunity for POs to operate as cooperative organisations, recognised by European Courts as pro-competitive structures, which may collectively negotiate. EU competition rules view such agreements favourably if the farmers involved in these forms of cooperation do not collectively hold a level of market power such as to restrict competition in the market to the detriment of consumers.
4. Exploring ways to address trade agreement issues
Liberalization of EU’s F&V trade is an ongoing process stemming from overlapped results of MFN liberalization in the WTO arena and preferential liberalization in the context of the wide array of agreements and unilateral concessions linking the EU to many preferential partners.
The component of EU preferential policy relevant to F&V trade deepens mainly along the lines of the Euro-Mediterranean Roadmap adopted on 28 November 2005 for the acceleration of liberalisation of trade in agricultural products, processed agricultural products, as well as the EU-Mercosur negotiations, re-launched in May 2010 and targeting an EU-Mercosur Free Trade Agreement. In the multilateral arena, the current Doha Development Agenda might fuel further moves towards world-wide trade liberalization and determine both preference erosion and/or further changes in EU trade policy for F&V. Based on the draft proposal tabled in late 2008 by the Chair of the Committee on Agriculture, the Doha Round of WTO negotiations will probably affect the level of entry prices and of both normal tariffs and specific duties applied to F&V trade. The reduction of the level of

Policy Department B: Structural and Cohesion Policies
PE 460.043 18
protection could be significant, although, in principle, there would be a certain room for selected F&V products to be considered “sensitive” and be partially shielded from liberalization. Studies reviewed suggest that only for some products/months/partners the EPS is effective in stabilizing domestic prices. Therefore, the EU could pursue the selection of sensitive products/months/partners as a driving criterion for the negotiating strategy in the WTO.
On the other hand, trade data show that the bulk of EU’s F&V imports comes either from off-season trading partners (when the EPS is usually inactive) or from “preferred” Mediterranean countries engaged in deepening their integration with EU. The perspective of tariffs and entry prices dismantling as a result of the Doha Round negotiations should therefore be assessed in the wake of the actual profile of EU’s trade partners – where the EPS is of lesser importance for off-season providers, while on the Mediterranean scene EPs and preferential quotas can still be useful tools for their (limited and selective) property of stabilizing domestic prices, as well as for easing integration between Southern EU and North African agricultures by monitoring integration patterns and smoothing the process. For these reasons, the EU could argue in favor of the maintaining the system, not only on the sake of protecting the EU F&V sector, but also on considering the risk of preference erosion against MPCs. This would make room for an outcome of the Doha round with a limited liberalization, supported also by the MPCs as substantially derived from carefully crafted preferential agreements with them, which would also be in line with the traditional EU approach to trade policy for the F&V sector.
As far as border controls are concerned, a last recommendation relevant in the WTO context is the need of an effective use of the mechanisms foreseen in the WTO agreements to defend the competitive position of EU produce while careful moving towards trade liberalization. Such measures include (i) antidumping and safeguards, from the defensive point of view, and (ii) the resort to the SPS and TBT agreements when unjustified barriers are applied in third partners.
Finally, since the main issues of F&V trade liberalization relate to the role of MPCs, it is to be recalled that both historical trading and political ties, as well as ongoing troublesome political changes, call for a strategic, long-term view of Mediterranean agriculture allowing for developing synergies between both shores of the Mediterranean. This long-term view certainly includes trade policy issues - such as insuring a slow expansion of tariff rate quotas, maintaining a preference margin for MPCs, accurately selecting products to be handled as “sensitive”, keeping the EPS in place for sensitive products and using safeguard clauses of the agreements – but also a wider rethinking of support schemes and territorial policies supporting organization, business oriented practices, knowledge creation towards sustainable practices. The strategic view to strengthening the EU competitive position through continuing support to POs should put POs well oriented to partnership with the most dynamic retail segment in the best position to gain from liberalization. In such a policy context cooperation of POs with marketing and producing organizations in MPCs could be further encouraged.

The EU Fruit and Vegetables Sector
PE 460.043 19
INTRODUCTION AND OBJECTIVES OF THE STUDY
The fruit and vegetable (F&V) sector shows peculiar features connected with the perishable nature of its products and their great vulnerability to weather changes. As a result of “normal” crop fluctuations there is also a tendency to volatility of the market, with relevant effects on production prices and producers’ income.
Until the last F&V CMO reform, specific market measures (withdrawals, entry price schemes and export subsidies) guaranteed a certain stabilization of the F&V market in terms of prices and income. Also thanks to the role played by producer organisations (POs), through the use of operational programs, during the years of implementation of the 1996 F&V CMO reform supply had been better adapted to demand. Nevertheless, the sector had suffered frequently recurring market crises. This was the reason for which the following CMO reform, in 2007, provided for a wider range of tools for crisis management to be carried out through POs.
On the other hand, the last reform set out the integration of the F&V into the single payment scheme. In line with the Fischler CAP Reform, the F&V sector has moved to further market orientation, with increased exposure to market fluctuations. The current crisis, however, when compared with normal market fluctuation, suggests different causal factors.
In the recent years, emerging causes of instability (market price volatility, overproduction in certain sector, increasing costs of production, stagnating consumptions, growing F&V imports as effect of bilateral/multilateral accords) add to structural and established weaknesses (sector fragmentation, and its weak bargaining power, versus retail concentration and agro-food industry competition), further exacerbating the tense relationship in the fruit and vegetable supply chain.
EU experience has shown the key role played by the producer organisations in rebalancing the bargaining power and stabilizing prices and income, through the concentration and the planning of supply. The European Commission itself considers the POs “an economic necessity in order to strengthen the position of producers in the market”.
Taking into consideration the very differentiated development of POs from one Member State (MS) to another and among products, and also considering the opinion of the F&V operators claiming that “the objectives of the aid scheme for the fruit and vegetable sector will remain valid in the post-2013 CAP” , the question is how the support system to F&V producer organisations should be improved in the CAP after 2013. In other words, based on an assessment of the current market and policy scenario, the question is how to encourage supply concentration, rebalance bargaining power in the supply chain, improve efficiency and transparency of the F&V supply chain, reduce fluctuations in the producers’ income, strengthen EU trade sector and improve instruments stimulating F&V consumption. All that taking into account EU budgetary constraints and WTO requirements.

Policy Department B: Structural and Cohesion Policies
PE 460.043 20
In consideration of this scenario, the study aims at the following objectives:
(1) Developing an analysis of both the evolution of the F&V market and the organisational framework of European producers.
(2) Developing a qualitative/quantitative analysis of the recent EU agriculture and trade measures concerning the F&V sector, with particular attention to the citrus, peach and grape products;
(3) Exploring new measures and tools, in the context of the post 2013 CAP, to improve the bargaining power of producers and strengthen the role of POs in risk management and regrouping of supply;
(4) Suggesting concrete ways to address the issues relating to international trade agreements.
The study will be articulated in four sections concerning: (1) a brief analysis introducing the sector and the relevant policy themes (chapters 1 and 2); (2) a brief overview of the results of a survey focusing POs opinions and proposals on the F&V CMO (chapter 3); (3) an analysis of new aid and protection schemes for the F&V sector in the framework of the CAP after 2013 (chapters 4 and 5); and (4) summary of conclusions and strategic recommendations for the European Parliament.

The EU Fruit and Vegetables Sector
PE 460.043 21
1. A GENERAL OVERVIEW OF THE EU FRUIT AND VEGETABLE SECTOR
1.1. Trends in the functioning of the F&V value chain
1.1.1. Global value chains and the F&V sector
Over the past decades the fruit and vegetable (F&V) sector has undergone major changes in structure and behaviour, following changes in the agro-food system in general and also reflecting the experience of non-food sectors. Advances in information and transportation technology, changing consumer demands, as well as shifts in market structure fuelled by concentration and consolidation in the sector, foreign direct investments, global competition and new financial arrangements, have redesigned both the economic environment and incentive structure.
Changes in the structure of the global agro-food sector have fuelled a stream of economic and business literature in the past decades devoting attention to supply chain management principles and value chain approaches (Fearne-Hughes 1998; Kaplinsky-Morris, 2002; Fischer et al., 2007). The main messages of this stream of literature are concerned with the treatment of information and the way core competences and competitive advantages are handled in the supply chain.
The concern is on sharing information in order to save time, reduce costs, increase effectiveness at meeting customer demand, and adding value. The fundamental change in the way firms operate is considering the questions of core competence and competitive advantage from the perspective of the entire supply chain not merely from the stage where single operators are positioned1. This also represents a major threat to the status quo of existing authority relationships, responsibilities, and the balance of bargaining power, within and between firms operating in the supply chain. Modern global value chain analysis puts emphasis on relationships among actors as a way of reducing uncertainty, improving access to key resources and increasing chain efficiency.
In this context, there are several broad themes underlying and explaining the long-term changes in the structure of the global F&V sector:
- global consumers are becoming more affluent, discerning and cautious about their consumption choices, increasingly demanding services, including convenience in food purchasing and preparation (fresh cut fruit and vegetable), taste, and variety, and increasingly concerned for food safety and quality;
- global sales are increasingly being controlled by fewer and fewer retailers, with a growing bargaining power; a tendency to concentration and consolidation is detected also in upstream stages of supply chains;
1 At the origin of this body of literature lies the interpretation of the success of the Japanese motor industry
during the 1970s as the result of a pattern of cooperation between manufacturers and their suppliers. Cooperation replaces the traditional adversarial relationships with suppliers and customers, due to the recognition of a competitive edge to the benefit of those organisations able to develop supply chains through cooperative partnerships.

Policy Department B: Structural and Cohesion Policies
PE 460.043 22
- the role of the WTO and bilateral negotiations are becoming more important in widening competition, due to ongoing trade liberalisation and domestic policies reforms related to trade liberalisation;
- producers prices have usually been volatile for fresh F&V and seem declining in trend in the last few years, while retail prices are either constant or increasing, indicating either increasing rents being captured by downstream actors or increasing levels of value added;
- multinational agribusiness is becoming more important due to upgrading of logistics, communication and information technology, transport enabling fresh products to be transported from many origins and due to related increase of trade and investment, consolidation, and foreign direct investment (FDI) in many countries (often developing countries) that are providers of the EU market.
In this context, we deepen three main global trends in the F&V sector highlighting the increasing importance of global value chain approaches:
- the emergence of food retailers as the dominant force in the global food supply chain;
- the tendency to concentration and consolidation in upstream stages of supply chains;
- the bias against small farms and tendency to forms of association at farm level stages.
Concentration and consolidation underway in the F&V sector, along with changes in consumer choices will continue to shape the future of the fruit and vegetable economy in the EU and will deepen as the sector becomes more globalised and interconnected, in the context in which F&V European products are losing market share to North Africa, Latin America and South Africa. From this ground stem most of the challenges and opportunities for firms and farms at all levels of the supply chains.
1.1.2. Growing importance of food retailers
Food retail has become very concentrated in both Europe and other developed economies in recent decades. In 2008, the share of top three largest retailers in European grocery markets was more than 70% in Austria, Sweden and Denmark; approximately 60% in France and UK, and more than 50% in Italy2. In Europe in 2009 there are fifteen big retailers with a market share of average 50%. Of the top ten retail companies in the world five of them are from the U.S. and the other five are located in Europe.
Changes in food retailing materialize major challenges, including a tendency to exclusion of small independent shops, small enterprises, and small farmers from these new developments. Increasing concentration and consolidation in retail chains, as well as their global expansion, have improved their position and augmented their buying power in the market.
2 Largo Consumo, Pianeta distribuzione, 2010, Italy.

The EU Fruit and Vegetables Sector
PE 460.043 23
It must be noted, moreover, that in the last few years European modern retailing has turned to competitive strategies against small retail shops based upon developing its own formats of small to medium scale outlets3. Although from the 1980s the growth in size of retail outlets has been considered to be the best strategy, insofar as it offered the customer “everything in the same place”, current socio-economic and demographic changes (for example, the ever greater number of elderly people and those living alone) have led to strategic re-thinking for the main European retailing groups The mini-retail now constitutes the greatest challenge to modern retailing in Europe. (INEA, 2010).
Table 1. 1.: Top 15 Food Retailers in Europe 2009 turnover in billion euro
Rank Retailer Turnover Headquarter
1 Carrefour 78.6 France
2 Metro 63.2 Germany
3 Schwarz 54 Germany
4 Tesco 52.3 UK
5 Rewe 50 Germany
6 Aldi 47 Germany
7 Edeka 43 Germany
8 Auchan 40 France
9 ITM 33 France
10 E.Leclerc 26.7 France
11 Casino 26.7 France
12 Sainsbury 21 UK
13 WalMart 21 USA
14 Morrison 19.3 UK
15 Systeme U 17.8 France
Source: www.retail-index.com In order to function effectively these dominant food retailers have to organize production, processing, logistics, trade, and distribution of numerous other players. The major effects of the emergence of food retailers in the global food supply chains are through the procurement system of large volumes of products from suppliers. Competition from both small retail shops and other forms of retail (i.e. food-away from home, farmers markets, street sellers, etc.) drives cutting costs and raising quality and diversity. Cutting costs in turn requires the improvement of all aspects of procurement, including product and transaction costs. This is done by improving coordination and logistic systems such as distribution centers, logistics platforms, cold chain development, contracts with wholesalers and producers, and private standards specifying quality, safety, volume, and packaging of products (Bazoche et al., 2005; Green, Schaller,1996; Sans, Coquart, 1998). Distribution
3 These new formats, defined as mini-retail, are usually less than 50 square metres in size, with a simplified lay-
out to allow rapid purchasing, and with an assortment particularly of ready-to serve foods, fresh, even very fresh, local products, and long hours of opening (often 24 hours a day for seven days a week).

Policy Department B: Structural and Cohesion Policies
PE 460.043 24
centers imply an increase in the scale and volume of procurement, which tends to lead to procure products from large areas, in higher volumes, and to serve a number of stores, and work with suppliers whose scale, capital, and managerial capacity are sufficient to meet the requirements of the new procurement system. The scale of larger supermarket chains gives them the capacity to pursue the above objectives, since they have the bargaining power, the finance to make investments in logistics, and the geographical presence required.
Suppliers are in turn required to make larger investments deemed to be worthwhile if they can get on a retail chain procurement list. Retailers are building up long term relationships with key suppliers – either producers or wholesalers - capable to meet the requirements necessary to respond to the increased consumer interest for purchasing fresh F&V products from supermarkets.
The basic scheme of trying direct trading lines between producers and exporters and the large retail chains generated direct contract of retail chains with producers and producers organizations. This has resulted in fresh F&V producers to face larger buyers either from the retail stage or from globalized exporters/wholesaler. The major challenge for small farmers, either from the EU or other supplying areas, is how to be part of modern EU-based chains where the retail stage coordinate the other actors.
1.1.3. Development of other F&V chain actors
Increasing concentration is fuelled by different factors relevant not only at the retail stage, but also at the upstream stages that are pushed to exploit economies of size, scale, and scope in marketing and processing of food commodities (Koontz, 2000). Commonly cited reasons for concentration and vertical coordination/integration, also through mergers and acquisitions, include: i) to maintain bargaining power with other stages of the supply chain undergoing consolidation; ii) to ensure a market outlet in an increasingly consolidate downstream segment; iii) to ensure a consistent, high-quality source of primary products; iv) to capture efficiency gains and lower procurement costs.
In Europe this kind of “transformation” in the structure of the downstream and upstream stages of the F&V sector has been taking place from 1980s with differences between countries. In fact, the traditional supply structure was inefficient from the view-point of modern retail trade: farmers were often unable to enter into more direct negotiations with their retail counterparts and unprepared to meet consumer demand directly. Due to the fragmented structure and low efficiency in marketing operations at the farm stage, the first changes took place in the wholesale sector with a restructuring process involving the concentration and internationalization of wholesale and logistics platforms (e.g. Mercabarna in Spain, Rungis and Perpignan in France, etc.).
Actually, European wholesale stages gather different types of activities and operators: importers, exporters, commissionaires/agents, packers and logistic service providers. Most importing wholesalers take care of the import official procedures and processes and re-palletize the imported goods for re-export to other countries. In most cases, wholesalers have long-term contracts with their suppliers, regarding quality, size and packaging (Cesaretti, Green, 2006).
With concentration and vertical coordination of upstream stages larger scale suppliers emerge as part of the restricted number of firms with sufficient financial resources and capacity to bear costs and risks linked to global sourcing. These suppliers are organized into value chains that act on a truly global scale with production carried out in numerous countries. Often, by making use of different seasonality of agricultural production around

The EU Fruit and Vegetables Sector
PE 460.043 25
the world, they can provide commodities, products, and services on a consistent basis throughout the year.
The specific ways of organizing these value chains differ not only by country, but also by products, as value chains are characterised by a wide diversity of market structures, with varying degrees of horizontal concentration and/or vertical integration, and a large diversity of economic actors from independent SMEs to multinational enterprises. This diversity occurs both at product and Member State levels and can contribute to explain the different degree of price transmission between sectors and countries. What is common to different chains, however, is the increasing concentration of the industry leading to increased horizontal and vertical coordination.
1.1.4. Structural evolution at farm level and the organisational patterns
F&V in the EU is grown mainly by small farmers, with a great number of suppliers and intermediaries that intervene at various stages, mainly in Southern EU regions. The complexity of this type of chain implies a number of structural inefficiencies often coupled with low productivity of different actors of the chain. The main challenge for small farmers – pretty much like for traditional wholesalers - is how to be part of retail-led chains. But supermarkets decide the products that farmer have to grow, according to standards that are often too high for small farmers to comply with. Meeting the demand of procurement officers requires technical and management skills that small farmers often do not have. In fact, they are often unable to build a critical mass in terms of volumes and lack an efficient and speedy delivery infrastructure that would allow them to supply ranges of products within a given category.
Moreover, it also true, that the asymmetry in bargaining power puts upstream actors under unfair trading practices, with larger and more powerful actors who require contractual arrangements to their advantage, either through better prices, late payments or through improved terms and conditions (European Commission, 2009d).
For small farmers, getting into a supermarket’s procurement system implies being able to properly respond to: i) food safety and quality requirements; ii) the need to offer more added value in the form of more convenience (pre-packed, pre-cut products), wider assortment and year-round availability; iii) the need to “shorten the length” of the supply chain, in order to improve the control exerted over the transactions within the chain; iv) the need to develop and manage information technologies, so as to take advantage of applications allowing to optimize the management of the operation within vertically coordinated (or vertically integrated) supply chains. All these requirements may mean investing in irrigation, greenhouses, trucks, cooling sheds and packing technologies, among other things. Farmers need to be able to sort and grade their produce, meet timing and delivery requirements, and document their farming practices. In many cases farmers simply do not have the knowledge or the money to make investments in equipment and logistics support to meet these requirements on their own.
As a matter of fact, ongoing developments in F&V chains imply a significant bias towards large farms. This makes collective action among individual farmers a necessary step in many EU regions. The problem is not only to concentrate supply and give producers a pre-requisite necessary to start interacting within modern supply chains, but also to undertake contractual or co-ownership arrangements in order to successfully coordinate with packers, wholesalers and large retailers, with the purpose of optimizing operations, so that

Policy Department B: Structural and Cohesion Policies
PE 460.043 26
production will comply with demand, in particular with regard to quality attributes of the products (Fischer et al., 2007; Camanzi et al., 2009).
Producer organisations should keep to be encouraged as an effective way to increase collaboration between growers and other members of the supply chain and develop partnerships around shared interests in cost reduction, quality upgrading and risk management. Furthermore, collective action at producer level and effective coordination within the chain appear to be pre-conditions for any successful strategy in coping with declining relative producer prices and the gap between farm and retail prices.
Both phenomena are a function of the increasing productivity at farm level, increasing services delivered between farm and retail stages, and the increased concentration of the retail business. Many options have been proposed by analysts in order to respond to price decline at farmers level, but all of them involve capacity rarely available at the level of single small farmers:
1. Adding value at the production level through participation of small farmers in post-harvest operations;
2. Establishing quality standards and facilitating the production of consistent specialty products;
3. Facilitating trust between supplier, exporters, and importers;
4. Establishing systems of certification that favor smallholder farmers (i.e. organic products);
5. Facilitating producer-consumer communication through e-commerce;
6. Monitoring of corporate concentration and competition; and
7. Promoting different types of producer associations and cooperatives.
The variety of the measures proposed is partly related to the difficulty of addressing a fundamental structural problem: that the gap between farm-prices and consumer-prices is widening because increasingly more affluent and discerning consumers require an increasing number of services and attributes. As long as producers are unable to meet these requirements their share of the total value added will remain low and declining.
1.2. EU F&V market dynamics4
1.2.1. Structure and recent trends of production and prices
Fruit and vegetables (F&V) is a key sector in EU agriculture, with a weight of about 18% (table A1.1). The amount of EU F&V production in 2009 is more than 121 million tons, almost equally shared between Vegetables (49.8%) and Fruit (50.2%), of which 9% are Citrus fruit (table A1.2). The production is highly geographically concentrated in the EU. Spain and Italy, the two main producing countries, gather 40% of Vegetables production and more than 50% of Fruit (includ. citrus). Citrus produce basically comes from Italy,
4 Tables and figures discussed here and in the following paragraphs are in Annex 1.

The EU Fruit and Vegetables Sector
PE 460.043 27
Spain and Greece, since they concentrate more than 95% of EU production (tables A1.4-A1.5-A1.6-A1.7-A1.8-A1.9).
One of main structural limits of the EU F&V sector is the small size of farms. In 2007 over 70% of the F&V farms did not reach an area of 5 hectares. Among leading producing countries, only France and Poland show a significantly higher size than the European average, while in Italy, the main producing country, less than 17% farms exceed the threshold of 5 hectares (figure A1.2). This causes higher costs for farmers, not allowing to reach an efficient level of scale economies and poses limits on the competitiveness of European farms in the world market.
The EU’s role in the world F&V sector remains significant, although with some 3% decline in the last decade, which lead to 8.3% share in world production in 2009, with Fruit (excl. Citrus) most affected (-5.1%), followed by Vegetables (-2.3%) and Citrus fruit (-0.9%) (table A1.3.). The reduction of weight in world production is partly due to the growth of many other producing areas and mirrors the decreasing dynamic of EU production (table A1.1). In aggregate terms both Vegetables and Fruit (excl. citrus) have shown a similar general pattern of production and prices (table A1.1 and figures A1.3-A1.4). In the last decade, despite the peak in 2004, the trend is declining for production, with a stronger tendency for Fruit (excl. Citrus), at least until 2007, which has decreased of 14.6%, although also Vegetables production has reduced (-5.8%). On the contrary, Citrus fruit has increased (+7%) in the same period, with a strong variability, mainly from 2005.
Data on prices show a very similar pattern for the main producing countries with a steady growth since 2000: it led to a peak in 2003 and the subsequent decline in the following two years period. Therefore data seem to suggest that, in the shorter run, sharp declines in prices usually follow phases of growth in production and anticipate downward turns of it; moreover, quarterly data on prices show since 2006 less fluctuation in F&V prices for all major producing countries, with smaller variations compared to previous period.
In 2009 Italy remains the largest European F&V producing country, although the weight in the EU Vegetables production fell from 25% in 2004 to 20% in 2009. Italy is also the country that showed, in the last ten years, the greater variability of output, while Spain and Greece have witnessed greater price volatility in the same period. Among the new Member States, Poland has shown a strong growth in F&V production in the last 10 years. In fact, over the decade Poland almost doubled its weight as producer of fresh Fruit (6% in 2009), becoming the fourth largest producer after Italy, Spain and France; also for Vegetables Poland becomes the third largest producer in EU, outstripping French production in 2009.
Production variability and price fluctuations can be understood in two different dimensions: in the short run, they are typical features of the functioning of the F&V sector, mostly due to weather variability and some structural characteristics of sector, such as a high concentration in few regions influencing the whole European market, or product perishability. The latter can make market unbalances potentially very onerous to producers because it fuels a high responsiveness of producer prices to the quantity being sold (CFEPSR, 2009). In a longer run, a declining trend in production and prices might depend on several structural determinants of change in the functioning of F&V world markets and supply chains (see par. 1.1.).

Policy Department B: Structural and Cohesion Policies
PE 460.043 28
1.2.2. Trade flows: structure and recent trends
Freshness and perishability of F&V produce, as well as the fairly wide variety of products offered by EU countries, make intra-EU trade a very significant share of the sector’s total trade (tables 1.2.-1.3.). Intra-EU import covered about 68% of the value of EU’s F&V imports in 2009, against a higher rate in 2000 (70.3%). The increased importance of extra-EU F&V trade in the last 10 years is particularly evident for EU vegetable imports: the share, in quantity, originating from non-EU partners has risen from 9% (2000) to 14% (2009). Such a tendency is mirrored also in Intra-EU exports, that is much more relevant, but still slightly declining from 91% of the value of exports in 2000 to 88.2% of 2009.
Data analysis shows, therefore, a certain tendency to increased openness to external trade over the past 10 years; the only exception is the decline in 2008 due to the global economic crisis that hit the extra-EU trade more than intra-EU.
Table 1. 2. EU import of F&V 2000-2009 (value in € million, volume in thousand tons)
2000 2003 2006 2009
VALUE QUANTITY VALUE QUANTITY VALUE QUANTITY VALUE QUANTITY
INTRA-EU 15,726 21,329 18,782 22,924 21,291 25,182 22,247 26,183
EXTRA-EU 6,656 9,144 8,244 10,672 9,687 12,099 10,377 12,671
Total EU 22,382 30,473 27,026 33,597 30,978 37,280 32,625 38,853
Source: EUROSTAT Comext Table 1. 3. EU export of F&V 2000-2009 (value in € million, volume in thousand tons)
2000 2003 2006 2009
VALUE QUANTITY VALUE QUANTITY VALUE QUANTITY VALUE QUANTITY
INTRA-EU 15,525 21,558 18,905 23,014 21,011 24,919 22,652 26,313
EXTRA-EU 1,542 2,475 1,978 2,798 2,578 3,585 3,035 4,329
Total EU 17,067 24,033 20,882 25,812 23,589 28,504 25,687 30,643
Source: EUROSTAT Comext Also the analysis of the overall European trade pattern of F&V (in value) shows a steady increase over the past 10 years with the exception of 2004 (only because of falling prices) and the last year analyzed (even with a slight decrease in quantity) linked to the global economic crisis.
Level and dynamic of Extra-EU F&V trade also implies a structural unbalance between import and export that, in 2009, reached an amount of -7,343 million euro for EU27, with 3,035 euro million of exports and 10,377 euro million of imports (tables A1.12.-A1.17.).

The EU Fruit and Vegetables Sector
PE 460.043 29
1.2.3. Trade flows: the role of key trading partners
The main extra-EU providers of Vegetable products are concentrated in the Mediterranean area and Central-South America as well as some African countries. With different degrees, most of the countries involved enjoy preferential trading arrangements with the EU (see par. 2.2.). In particular, four of the six major suppliers of Vegetables belonging to the Mediterranean area (Morocco, Israel, Turkey and Egypt) represent 58% of extra-EU imports for this sector; among them, the most important country is Morocco, from which the EU imported 537 million euros in 2009 (of which almost 60% tomato), equal to more than 30% of extra-EU Vegetable imports (figure 1.1.). Also Kenya and Peru play an important role as suppliers, mainly for beans (Kenya) and asparagus (Peru).
Over the past 10 years there has been an increase in Vegetable imports from all major suppliers (with the exception of Kenya in the last three years), in the case of Morocco with an increase of over 180%. The Mediterranean area has further increased its share on the total amount of Vegetables at the expense of other important suppliers such as Kenya, Thailand and New Zealand.
Figure 1. 1. EU imports of fresh Vegetables from leading suppliers, 2000-2009 (Million EUR)
0
100
200
300
400
500
600
2000 2003 2006 2009
MOROCCO ISRAEL TURKEY KENYA PERU EGYPT
Source: EUROSTAT Comext Regarding the Fruit, Central and South America is the main supply basin for the EU, particularly for bananas, pineapples and grapes. However the primacy in the value of import flows appertains to South Africa, mainly because of important flows of oranges and grapes (figure 1.2.).
The last 10 years have shown also for Fruit a constant increase in the value of imports from the main countries. In terms of shares on total EU imports Central-South America has further increased its weight at the expense of other major fruit suppliers, such as South Africa, New Zealand and Morocco.

Policy Department B: Structural and Cohesion Policies
PE 460.043 30
Figure 1. 2. EU imports of fresh Fruit from leading suppliers, 2000-2009 (Million EUR)
0
200
400
600
800
1000
1200
2000 2003 2006 2009
SOUTH AFRICA COSTA RICA COLOMBIA CHILE ECUADOR BRAZIL
Source: EUROSTAT Comext
1.2.4. Structure and recent trends in F&V consumption
Consumer behaviour is not homogenous within the European market and there are considerable differences in the amount of fresh F&V available for human consumption in the Member States. Within a framework of cultural and lifestyle differences that characterise Europe we could describe a major trend in the North for fast food, supermarkets’ high concentration and vertical coordinated supply chains, while in the South life evolves still around the family and F&V markets are still largely dominated from street markets and high level of dispersion of specialised grocery stores, with low level of supermarket concentration. However each country is different and deviations exist even at regional and local level (Kalaitzis et al, 2007).
Especially for Vegetables, the biggest per capita consumption is concentrated in the South, where main producing countries are, and there is a strong differentiation between EU countries with values ranging from 74.6 (Bulgaria) to 241 Kg/capita/yr (Greece). Very high values are, also, in Portugal, Spain, Italy (in EU-15) as well as in Malta and Cyprus (in EU-12), as shown in figures A1.8.-A1.9. Also Eastern European Countries have achieved, as well as in production, considerable importance in Vegetable consumption, with Romania (151 Kg/capita/yr) and Poland (130 Kg/capita/yr) which reached values similar to some Mediterranean countries.
With regard to Fruit consumption, unlike Vegetables, there is less differentiation in Europe, with values ranging from 85 to 190 Kg/capita/yr in EU-15 and from 50 to 120 Kg/capita/yr in EU-12 New Member States (figures A1.10.-A1.11.). It is worth underlining that many Northern countries reach (and sometimes exceed) the levels of apparent consumption in Mediterranean countries.
Consumption of Citrus fruit shows differentiated trends: Spain consumption strongly increases, getting close to Italy that, with a constant rate, retains primacy. There are not important changes for French consumption, while we have to emphasize the sharp contraction in Germany in the last three years (a drop of 80,000 tons from 2006 to 2009).

The EU Fruit and Vegetables Sector
PE 460.043 31
Overall, between 1995 and 2007 there was an increase in apparent consumption of F&V, particularly for those countries with a lower per capita consumption as evidenced by sharp increases in median share and minimum values (figures A1.8-A1.11). Despite that, according to the Freshfel Consumption Monitor 2008, in 2007 only half the European Member States achieved per capita consumption of 400 grams of fresh fruit and vegetables a day, the minimum intake recommended by the World Health Organisation (WHO).
Demand for F&V is generally more constant than supply and changes tend to occur over longer periods of time. The demand for F&V is relatively inelastic in price. Small increases in price will have limited negative effect on the sales volume. Large price increases have proven to have a significant negative effect on sales volumes (tables A1.23.-A1.24.).
1.2.5. The dynamics of producers’ income
Over the years, the guarantees of a greater stability of income for European F&V farms have been pursued by specific market measures (withdrawals, entry price schemes and export subsidies) and after the most recent F&V CMO reform by measures of crisis prevention and risk management.
Analysing the trend of income of horticulture and fruit specialist farms in the last 20 years, until 2003 it emerges a steady growth of income per family work unit and very similar values in the major EU producing countries; the only one exception is Greece, with significantly lower values than the European average and less variability. From 2004, over-production and price decrease have had a negative impact on F&V farms incomes followed, for some countries, by a slight recovery in recent years.
These dynamics have led to a reallocation of productive choices in the EU with a reduction trend of the area allocated to F&V crops (between 2005 and 2008), whose weight on the total primary crops area fell from 7.5% to 7.1%; instead in 2009 there seems to be a recovery.
Analysing the trend of net income in horticulture specialist farms for major producing countries, Italy and Spain show the best performance: especially between 1998 and 2004 an acceleration of the increase in income led to high values (in 2004) and larger differentiation between EU MSs. The above described turning point, with negative trend in farms income, quickly canceled gains (figure A1.12).
A less variable increase of income has instead been for fruit specialist farms in the major countries, except France which showed a rather high fluctuation of income over the past 20 years (figure A1.13).
1.3. Focus on Citrus
As mentioned above, during the last 10 years Citrus fruit has further strengthened its importance at European level and reached an output of almost 11 million tons (2009), equal to 9% of EU-27 F&V production.
Over 85% of Citrus production is made up of oranges (58%) and mandarins (29%), whose weight has further increased at the expense of the lemons (Ierugan, 2010). This situation is the result of a ten-years growth of EU production of oranges (+10%) and especially mandarin (+21%) to the detriment of lemon (-24%).These dynamics have produced a 7% increase in whole Citrus fruit production between 2000 and 2009.

Policy Department B: Structural and Cohesion Policies
PE 460.043 32
The European Citrus production is concentrated almost exclusively in Spain, Italy and Greece. In particular, Italy, thanks mainly to a significant increase in yield, increased its production over the past 10 years by acquiring ever greater importance in the European market. At the same time in Spain there was a significantly decrease in yields that nullified the effect of the surface increase (tables A1.8-A1.9-A1.25).
As regards commercial exchanges with extra-EU countries, Citrus imports has increased their weight on total import highlighting a share of more than 31% in 2009. Over a quarter of Citrus imports come from South Africa, regarding in particular oranges, which weight is almost 40%. Argentina is the second largest extra-EU supplier country followed by the Mediterranean Partner Countries (MPCs), which show a reduction of their weight as suppliers, notwithstanding a slightly increased in volume between 2000 and 2009. Within MPCs Egypt and Turkey have increased their weights reaching shares respectively of 18.5% and 40%, to the detriment of Syria and especially Morocco, whose share fell from 43% in 2000 to less than 25% in 2009. In the next years it will be necessary to assess the impact on European producers of the Euro-Mediterranean Free Trade Area and possible problems of overproduction and market saturation that may ensue (see par. 5).
As regards exports to extra-EU areas Russian market highlighted, especially during the last three years,a significant growth, meanwhile flows to the United States declined (-40% over the past 10 years), partly due to increased competition of the South American markets.
However, almost 90% of flows is towards intra-EU market and the major exporters are certainly Italy, Spain and Greece although the development of Eastern countries has reshaped the geography of European trade (tables A1.14-A1.15-A1-16-A1.17-A1.18-A1.19-A1.20; figure A1.4).
1.4. Focus on peaches and nectarines
In 2009, European production of peaches and nectarines (P&N) was close to 4.1 million tons, 70% of which composed by peaches and 30% by nectarines. Except for the sharp decline in 2003, due to adverse weather conditions, there was no strong variations in production over the last decade with an overall slight decrease of total European production.
Also P&N production, like Citrus fruit, shows a strong concentration: four countries (Italy, Spain, Greece and Spain) represent 95% of European output. In particular, Italy and Spain in 2009 concentrated almost 70% of production, thanks to a strengthening of their role in the last 10 years at the expense of France and Greece (table A1.27).
For Italy, there was a decrease in the production of peaches (for f.c.) more than offset by the increase in nectarines, while Spain has showed a positive performance in both segments.
Europe has considerably reduced its world market share for peaches: from one third in 2000 its weight dropped of over 10% during the last ten years.
In the last years there are no significant variations for cosumer prices in main EU markets with the values observed in 2009 very close to 2005 levels. In the main producing countries also the trend in consumption is stagnant and suggests, in the view of a growing supply, that markets could be unable to absorb increasing shares of the product.

The EU Fruit and Vegetables Sector
PE 460.043 33
The EU P&N exports increased during the last 10 years more than 25%, especially as regards extra-EU flows. Spain has consolidated its outflows to the long-standing partners such as France, Italy and Germany while Italy has changed substantially its target markets moving from standing customers (Germany and the UK) to new customers of Eastern Europe (such as Poland and Czech Republic). Regarding to extra-EU countries, there was a sharp increase in European exports to Russia that becomes the third importing country after Germany and France. Germany remains the largest importer, although in recent years imports have declined. The most dynamic extra-EU providers for P&N, that are gaining an increasing share as supplier of Europe, are South America (especially Chile) and the Mediterranean area, with strong rise in flows from Morocco and Egypt (tables A1.28-A1.29).
1.5. Focus on table grapes
In recent years, table grapes has become increasingly important in the world involving all five continents. Europe is the second largest producer of table grapes for fresh consumption with 3.77 million tons, 18.8% of world production, followed by America and Africa, while Asia is the first producing continent with over 55% of world production (OIV, 2008).
In recent years in Europe the table grapes production slightly increased after a difficult period for the sector in which about 30% of table grape vines were abandoned (from 1993 to 2003), mainly due to the reduced profitability of this crop, poor yields, high input costs, as well as rising pressure from imports. This was particularly true in Spain, where during that period about one third of table grape vines were uprooted. Italy has also been affected by the above situation, worsened by a difficult market trend (very low farmers’ prices while production costs were continuing to grow) and a crop quality not always meeting the requirement of domestic and European demand, especially from the leading supermarket chains. More recently, however, the downward trend of planted area has halted, mainly due to the increased profitability, despite the still very strong competition from other leading suppliers on the EU market (USDA, 2008a).
The analysis of consumption in the EU has shown, in the last years, a downward trend in all main countries (with contractions of 25% for Germany), while prices have increased significantly in these markets: +40% in Italy in the last 10 years.
As regards commercial exchanges, European table grape imports from extra-EU countries have grown much more rapidly than EU exports, highlighting an increase of more than 75% during the last ten years. Among the major extra-EU supplier countries Chile has overcome in importance South Africa thanks to a considerable increase of its table grape production. Overall, South America has increased its weight as table grape supplier for the EU market thanks also to the greater flows from Brazil and Peru.
On the export-side, also EU table grape flows towards Russia show a strong increase. As regards intra-EU exchanges, Germany, the first importer (and consumer) in Europe and the second largest importer in the world, highlighted a reduction of 25% of table grape consumption between 2003 and 2009 (CSO). Moreover, Italy, the main table grape supplier for the German market, showed its share decreased from 53% to 32% during the last ten years for reason of greater flows from extra-EU countries (tables A1.30-A1.31-A1.32).

Policy Department B: Structural and Cohesion Policies
PE 460.043 34

The EU Fruit and Vegetables Sector
PE 460.043 35
2. IMPACT OF THE FRUIT AND VEGETABLE CMO MEASURES AND TRADE AGREEMENT POLICY
2.1. The implementation of the F&V CMO in the EU
2.1.1. Overview of POs’ measures: differences among MS
The objective of supply concentration has been set by the EU on the basis of the logic of supporting producers’ organisations (POs) in the fruit and vegetable sector. European Commission considers the concentration of supply “an economic necessity in order to strengthen the position of producers in the market”5, in order to cope with ever greater concentration of demand.
In response to the stronger position of the food retail sector in the market, the EU already in 1996, with the important CMO reform for F&V introduced by Regulation (EC) No. 2200, entrusted a key role to POs in rebalancing bargaining power and stabilising prices and income, through the concentration and the planning of F&V supply. POs may set up operational programmes, joint financed by Community (50%) and their members with a cap of 4.1% of the PO’s value of marketed production (VMP).
The 2007 reform of CMO for F&V strengthened POs’ role by introducing some elements with the purpose of favouring a major competitiveness and market orientation of the sector, as well as its better sustainability. In order to further improve the attractiveness of POs, the reformed CMO provided to make them more flexible in their operation by introducing some new elements (product range of a producer organisation; the extent of direct sales permitted and the extension of rules to non-members; permitting associations of producer organizations to carry out any of the activities of their members and permitting the outsourcing of activities). At the same time it provided for a wide range of tools for crisis prevention and management to be carried out through POs (see par. 2.1.2), as well as more incentives to mergers of POs and associations of them (APOs), and to those regions with a particularly low level of organisation rate. Moreover, in order to make more effective the POs’ activities carried out through the operational programmes, the reformed CMO introduced the possibility for Member States to develop a National Strategy for sustainable operational programmes in the F&V market.
Thanks to the two last reforms of the CMO, the European F&V sector has been object of an extended process of growth and reorganisation of the production system, involving Member States in different ways in terms of dynamics and characteristics. Nonetheless, empirical evidence shows that the path undertaken to encourage F&V POs has proven to be anything but straightforward.
In the European Union in 2007 the fruit and vegetable sector had 1.506 POs with a total value of marketed production of 15.458 million of euros, showing in one year an increase of the average VMP of 8.4% in old Member States (EU-15) and of 12.6% in new Member States (EU-10) (Jacquin, 2010). A great difference exists on the average level of VMP between these two areas: 10,44 million of euros in the first case against 3,84 million of euros in the second one.
5 Council Regulation (EC) No 1182/2007 laying down specific rules as regards the fruit and vegetable sector.

Policy Department B: Structural and Cohesion Policies
PE 460.043 36
The F&V sector shows a rate of organisation that on average is at a relatively low level and, however, very far from the objective of 60% estblished by the CMO: in 2006 it was 34% in the EU-25 and 35% in the EU-15, falling of 1.2% since 2000 (Agrosynergie, 2008a). After the EU enlargement of 2007 to Bulgaria and Romania, there seems to be an apparent overall decrease, due to an organisation rate below 1% in these two countries (Jacquin, 2010).
The rate of organisation is very heterogeneous among the Member States: it has risen to over 80% only in the Nederlands, Belgium and Ireland. In particular, in the case of Nederland the rate of organisation is over 100% because of transnational POs. On the other side, it doesn’t reach 15% in most new Member States, Portugal, Greece and Finland; other Member States show rates around 35%. Among this last group there are Spain and Italy, the two biggest fruit and vegetable producers in the EU, with an organisation rate below the Community average.
At the same time, the rate of organisation shows a great difference between new and old Member States non only as percentage level, but also in terms of variation: the former (EU-10) varies from 6% in 2004 to 9% in 2007; the latter (EU-15) varies from 32% in 2004 to 39% in 2007 (Jacquin, 2010).
Relevant differences in development dynamics exist among Member States alike: in some cases (among which France, Greece, United Kingdom and Germany) there has been a decrease of the POs’ number as a result of activity closures as well as, in a very few cases, of mergers; in other cases, instead, it has been registered an increase of POs’ number (Belgium, Spain and above all the Nederlands, Italy and Portugal).
These differences can be explained by several factors, that an EU evaluation report (Agrosynergie, 2008a) has identified in internal and external to the CMO scheme. In the first case it’s a result of Member States’ implementation decisions, as well as in 2003 the reduction at the Community level of the minimum criteria for recognition of POs (minimum value of marketed production and number of members). The recognition criteria may have facilitated the setting up of POs in the new Member States and in the regions with low organisation rate, but however “in the older Member States this had sometimes favoured the division of existing producer organisations and the emergence of small size organisation”. As regards factors external to the scheme, it seems that structural factors and those linked with the attractiveness of POs for the producers themselves, as well as other factors (historical and cultural factors, etc.) have assumed a certain relevance in determining the above mentioned differences.
As regards the Association of producer organisations, their development in EU is very limited, except in Italy and Belgium. According to the EU evaluation report (Agrosynergie, 2008a), probably it depends on the POs’ perception of the need to improve their competitiveness and reduce their transaction costs. However, recent information on APOs’ development (Jacquin, 2010) shows that their VMP increased by 9.3% from 2000 to 2007, whereas their number decreased by 13.6%. This different evolution would show a process of increasing concentration that could mean a stronger role played by APOs in the F&V sector.
In relation to the operational programmes, the above mentioned EU evaluation report highlights that « the programmes are effective vis-à-vis the objectives of improving the competitiveness », as well as in improving product quality. On the other hand, the programmes show « a marginal role on the reinforcement of the position of producers in

The EU Fruit and Vegetables Sector
PE 460.043 37
the market », because of, above all, their weak effectiveness concerning promotion and advertisements activities.
2.1.2. Overview of crisis management tools: differences in their utilization
Farmers have different strategies to cope with risk as well as crises that arise managing their activities. Such strategies may be broadly classified as ex-ante or ex-post approaches: the former are based on the reduction of the probability of occurrence of events affecting negatively incomes, while the latter are based on the engagement in risky activities with the absorbition of the occurrence of events affecting negatively income or their transferring in the future by mean of saving/borrowing. Risk may also be transferred to other economic agents. Ex-ante approaches are essentially based on diversification of the activities or in avoiding the involvement in risky activities. Transferring of risk on economic agents is made by means of insurance or futures markets and it is a relevant opportunity for farmers wanting to enter in more risky, but also more profitable activities in which they can earn higher incomes.
Market for insurance may fail under informative problems as adverse selection and moral hazards. In the first case market failures are caused by the buying of insurance contracts by agents with higher risk than the average agent on which the premium is defined. As a consequence more damages than expected will occur and premium will increase entering in a spiral of rising premiums up to the disappearing of the market. Moral hazard arises from the possibility that, after the signing of a contract, insured could deliberately affect both the probability that the insured event occurs and the amount of damages. Also in this case the consequence is the failure of insurance market.
Agricultural risks have also another problem that put their transfer at stake. The difficulty is linked to correlation of damages among insured, that for farming activities is quite usual because of the effects of weather on yields observed in large areas. When correlation is very high and damages are also relevant putting farm survival at stake we refer to such situation as a catastrophe. Of course, large falls in market price also affect the totality of farmers selling their products in that market, in this case there is the insurgence of a market crisis. Management of catastrophic damages or of market crises is very difficult to attain because of the limited transferability of such risks on other economic agents. Very often public intervention, through solidarity funds, is granted to give relief to farmers hurt from catastrophic damages. In a certain sense solidarity funds may be seen as a way to pool risks within a community by charging the cost of damages on the public budget. Also for market crises there is the possibility that public intervention is a way to help the management of such situations.
Market crises in the fresh F&V industry have a special importance that arises from two circumstances. The first one is the very limited storability of F&V produce that generally must be sold within a few days after harvesting. Perishability prevents or limits intertemporal hedging that for more storable products is a factor adding up to price stability. The second reason is linked to distributive margins that, being rather high in proportion to retail prices of fresh F&V, make the produce demand at the farm gate less price elastic and therefore concurring at a larger variability of prices at the farm gate.
As for many other CMOs, the 1972 CMO for F&V gave a wide relevance to domestic market stabilization measures that were essentially based on two instruments: the reference price system and market withdrawals that received an intervention price. The former was aimed at avoiding imports at low prices that could create, or contributing at, the EU domestic

Policy Department B: Structural and Cohesion Policies
PE 460.043 38
market crises, while the latter had the role to eliminate or at least reduce surpluses from the market giving a push on prices in such situations. Withdrawals of produce in a MS were possible when the Commission after observing market prices declared the crisis situation. Withdrawn products received the intervention price. Market withdrawals of F&V have always been a source of concerns, because of their moral as well as environmental acceptability, since the most part of withdrawn products were destroyed. Moreover there were strong concerns for possible frauds linked to the implementation of withdrawals and as a matter of fact some frauds were discovered.
The most relevant criticism to this market instrument came up from its moral hazard problems. In the case of withdrawals moral hazard come from the possibility that such outlet could be seen by F&V producers as a stable market channel for low quality and cost products unable to find different destinations. For that reason withdrawals of F&V were put under control and subject to quantitative constraints.
The 1996 CMO reform, aiming at a stronger market orientation of F&V production, introduced radical changes to withdrawals, that were no more a coordinated market intervention instrument, becoming a possible tool that POs could use autonomously in case of market crises. The reform also introduced limits to the quantity of product that could be withdrawn as well as on the compensations paid to producers. An evaluation report (Agrosynergie, 2007) underlined that withdrawals were especially relevant for products like cauliflowers, tomatoes, apricots, apples, peaches and nectarines. However their significance largely dropped following the 1996 reform. Although their effectiveness on prices, and therefore on market crises, was not clearly evident, after the 1996 CMO reform they were no more able to significantly affect F&V market prices.
There are two possible situations respect to market crises in the F&V industry requiring the implementation of different tools for their management. The two situations may be defined as transitory crises and structural crises. The former are temporary crises in some cases very acute and also lasting for long periods in which market prices stay at very low levels. Such crises are caused by strong shocks in demand or supply that however are transitory and absorbed in the long run. Transitory crises may have a considerable impact on the income of producers hit by such crises. Structural crises are extended crises that are destined to be renewed with low prices with a continuous diminishing trend. These crises are produced by several possible factors such as the lowering of competitiveness of a national or regional industry; changes in consumer demand shifting toward other types of produce or cultivars; growing supply of a product that becomes steadily exceeding market demand. Such crises are characterized by lowering trend in farm gate prices that is slower than the one observed in temporary crises, while prices are not able to change their direction.
Transitory crises are often produced by shocks on the supply side as for example larger yields that cannot be absorbed by consumer demand in the short run causing price plummeting. Sometimes they are produced by a sudden and very fast reduction in consumer demand as it happens, for example, when there are strikes in the transportation industry or a food scare that causes a fall in food demand. They are characterized by sudden and plummeting price reduction that are also rapidly absorbed when the determining cause is eliminated.
In temporary crises prices drops are amplified by the reduced storability of produce that doesn’t allow intertemporal arbitrage as well as spatial arbitrage. Since for fresh F&V storability is generally short, but changes according the different products, crises have a

The EU Fruit and Vegetables Sector
PE 460.043 39
higher frequency for less storable products (cauliflowers, tomatoes, peaches) with larger prices changes respect to storable products (apples, oranges, potatoes).
Generally for fresh fruit if, at least for some produce, temporary crises are less severe because of the longer storability of products, structural crises are more frequent and also difficult to afford, and therefore longer lasting because for the effects of sunk costs deriving from investments in plantations. On the other side in the fresh vegetable industry the short production cycles allow a fast adaptation to market conditions.
The distinction we made about the two different types of market crises is relevant because it follows that there are different approaches for farmers to manage such crises and therefore the possible role of public policies in this environment would be different. The distinction made between the two kinds of crisis is aimed at defining different tools for their management. Structural crises require financial resources for investments necessary to recover farm competitiveness, if this is possible, because such crises are irreversible and recurrent from one year to another. On the other side temporary crises require the possibility to get compensations for their occurrence and these compensations are viable because of their transitory nature.
The ability of farmers to manage crises as well as risk on a general ground is a relevant factor affecting the profitability of their holdings. Since risk management activities may be aimed at reducing risks or at transferring risk both in time through saving or borrowing activities and to other individuals, the main role of public policies is to remove possible failures of markets for contingent claim to exist. Policies simply aimed at reducing risks in the fresh F&V market without charging farmers of the cost of reducing or transferring risks could have negative effects in terms of incentive to produce larger surpluses that the markets couldn’t absorb. Moreover such policies could be very expensive because of the high individual correlation of such risks, as well as for the informative problems linked to them.
The ability of farmers to manage risks is largely constrained by farm size. Small holdings may find more difficult to reduce risks through diversification. Furthermore diversification reduces the ability to reach efficient levels of scale economies increasing farm costs. In such situation farmers may enter in risky activities only if they have the possibility to transfer risks.
An important point is regarding cooperatives as well as POs. Such institutions are particularly suited in reducing price and marketing risks through the pooling of sales across time, space and market outlets. Moreover they can better afford contracting with final users. On the other side, POs cannot help their members if payments are made according to actual deliveries (Ligon, 2009). Therefore membership of farmers in POs is an effective way to improve the management of market risks provided that POs are capable to pool individual risks in effective way within their activity.
The 2007 CMO reform introduced measures for direct management of market crises by POs. These measures were integrated in the operational programs of POs also with the objective to increase attractiveness of POs to producers. Moreover these measures may be extended to non-members of POs, although with a limited subsidy. When POs decide to implement measures for the management of market crises the Community financial assistance is increased from 4,1 % of the value of the marketed production of each POs to 4,6%. The increased amount of financial resources can only be used for measures of crisis prevention and management.

Policy Department B: Structural and Cohesion Policies
PE 460.043 40
Measures for crisis prevention and management that according the CMO the POs can carry out are:
- market withdrawals;
- green harvesting or non-harvesting of fruit and vegetables;
- promotion and communication;
- training measures;
- harvest insurance;
- support for the administrative costs of setting up mutual funds.
Alternatively, POs may take out loans charging the repayment of the capital and interest on the operational funds. Moreover such measures cannot be financed with more than 1/3 of operational funds.
In the case of market withdrawals the Community financial assistance may be increased at 100% within a limit of 5% of the volume of marketed production of each POs considering as a reference the production of the last three years with an error margin of 3%. To increase the financial assistance withdrawn products must be used for free distribution to schools, hospitals, penal institutions, etc. Transportation costs as well as sorting and packing costs for free distribution may be charged on the POs operational funds.
Withdrawn products not to be used for free distribution have a limit of 5% of each marketed products. It is worth observing that indemnities paid for withdrawals have the same amount they had before the CMO reform.
To make these measures applicable and operative they must be introduced within the National Strategy for sustainable operational programs in the fruit and vegetable market. Among MS there are significant differences in the kind of measures for crisis prevention and management that could be implemented. While France adopted the whole set of measures, Spain did not included harvest insurance and Italy drop both training measures and the support for administrative costs of setting up mutual funds.
The efficacy of the set of measures for market crisis prevention and management introduced with the 2007 CMO reform is not clear since there aren’t specific analysis on this topic. The opinion of operators of the F&V industry and of POs on this issue is oriented toward a certain skepticism about the efficacy of measures even though there is a general consensus on their utility and on the necessity to keep them alive although modified.
First data extracted from the field survey (see par. 3.1) showed that only part of POs adopted measures of market crises. These POs are mainly oriented in the fruit industry and also have a lower share of product sold through large retailing while traditional wholesale markets are the main outlet. Among adopters of crisis management provisions the main instrument used are promotion and communication, while market withdrawals have a lower relevance. No one adopted green harvesting or non harvesting measures.
Although crisis prevention and management measures are considered generally useful, their effectiveness is thought as very limited. The reasons pled are generally linked to the difficulties of their adoption, as in the case of green harvesting, or to the low appealing, as it happens for withdrawals. In this case POs agreed that the very low indemnities make this instrument totally unable to cover costs as well as to help in recovering from market crises.

The EU Fruit and Vegetables Sector
PE 460.043 41
2.1.3. Promotion of F&V consumption
The most recent studies highlight the importance of the consumption of fruit and vegetables among the nutritional factors, preventing chronic diseases. In particular, F&V are important sources of a wide range of vital micronutrients and their consumption can prevent a number of diseases and some cancers (WHO, 2003). For these reasons, the promotion of F&V consumption is one of the most important topic in a context where it is widely recognized there is room for further increases in consumption.
The promotion activities on F&V sector in Europe aim at stimulating consumption of food that has specific health benefits. At the same time they also respond to other different objectives: encouraging producers (by their professional or interbranch organisations), promoting their products in domestic market or in third countries; improving effectiveness of campaigns; informing domestic market or third countries on specific quality productions.
EU has started to develop specific measures related to the promotion from 1980s. These measures were managed sector by sector, in the various CMOs, and since 1999 they were included in two main regulations: for the promotion in third Countries (Council Regulation (EC) No. 2702/1999) and in the internal market (Council Regulation (EC) No. 2826/2000). At the beginning of 2008 the previous regulations were replaced, without modifying significantly the contents, in a single regulation (Council Regulation (EC) No. 3/2008). The single Member States are responsible for the implementation of the selected programmes and a monitoring group supervises on their implementation. The financing of these programmes is provided by the European Commission (up to 50% of the total cost), Member States (up to 30%) and the proposing organisations (up to 20%).
The procedure and the detailed rules for the application of the Regulation (EC) No. 3/2008 are defined in the Council Regulation (EC) No 501/2008, that also sets the list of the themes and products, gives indications to the companies that are interested in the programme and provides detailed guidelines for different sectors (among which F&V). Furthermore, annex III defines indicative annual budget amounting to 46 million EUR, of which almost 22% for F&V sector (10 million EUR).
According to the White paper on “A Strategy for Europe on Nutrition, Overweight and Obesity related health issues” and to the Green paper “Promoting healthy diets and physical activity: a European dimension for the prevention of overweight, obesity and chronic diseases”, European Commission (2007; 2005) has also developed specific strategies in order to increase the consumption of F&V. This objective can be achieved by acting on internal market (such as labelling requirements, health claims authorizations and food controls procedures), the CAP (in this case the F&V CMO), various Commission initiatives in the field of education.
Within the CAP reform of F&V CMO the Commission has provided the promotion of public health through specific initiatives as promoting the consumption of F&V at school. In this context the Commission has implemented specific actions for promotion projects, managed by POs, targeting younger people, especially children,. Furthermore, according to the results of INEA survey, “promotion and communication” measure results to be one of the most adopted by F&V POs within operational programmes. Promotion campaigns are carried out both on internal market and third countries (especially for Russia, China and Japan), with the purpose of improving the image of fruit and vegetable products with consumers.

Policy Department B: Structural and Cohesion Policies
PE 460.043 42
With this regard it is worth mentioning a document of the European Court of Auditors (2009) that analysed on the results of the application of these policies and their effectiveness. Its conclusion was that the impact of the policy is probably positive, but at moment difficult to measure. According to this analysis, the annual budget for information provisions and promotion measures of agricultural products has significantly increased, in recent years, rising from 17 million euros (in 2002) to 50 million euros (from 2007 onwards). Italy, with 47% of the UE support, is the first recipient, followed by France (18%) and Spain (17%).
BOX: The EU School Fruit Scheme
Following the global trend, in most EU countries, more than half of the adult population is overweight. In the last year, the proportion of childhood obesity is over 28% in Europe, with peaks of 35-40% in some European Countries. In order to face the low consumption of fresh F&V, especially for younger people (44% of children are weak consumers of fruit with less than 1.5 servings per day), and obesity prevalence as well EU introduced the “School Fruit Scheme” with Council Regulation (EC) No. 13/2009. Its main purpose was to increase the share of F&V in children’ diet at the stage where they are developing their eating habits.
The EU Member States have accessed to Community funding co-financing the programme, provided that they draw up a “National Strategy”. This should also include accompanying measures that will ensure the successful implementation of its scheme. Those measures may focus on improving the target group’s knowledge on the F&V sector or healthy eating habits, such as the development of websites or the organisation of farm visits or gardening sessions.
Member States shall monitor the implementation of their School Fruit Scheme on an annual basis.
The definitive allocation of Community aid per Member State participating in the School Fruit Scheme established for the period from 1 August 2009 to 31 July 2010 (Commission Decision of 22.7.2009) and has shared such as figure 2.1. In the 2009/2010 school year, 4,7 million children in participating Member States benefited from the Scheme by receiving portions of F&V in the school.

The EU Fruit and Vegetables Sector
PE 460.043 43
Figure 2.1. Definitive allocation of Community aid per Member State
Source: Elaborations on Commission Decision of 22.7.2009
2.1.4. Impacts of the single payment scheme in the F&V sector
Since 1 January 2008 the CMO reform in fruit and vegetables introduced by Regulation (EC) No 1182/2007 has integrated this sector into the single payment scheme (SPS). At the same time it has allowed Member States to choose, during a transition period, the adoption of partially decoupled payments for processed production (tomatoes, pears and peaches, prunes, and citrus fruits).
Furthermore, the CMO reform amended Article 51 of Regulation (EC) No 1782/2003 to remove the ban on eligible hectares for permanent F&V crops, ware potatoes and nurseries, but allowed Member States to opt for implementation of the rules until 2011.
In 2008 the so-called CAP Health Check (HC) reform confirmed the option introduced by F&V CMO reform to defer integration of the sector into the SPS, because of the recent introduction of a similar scheme and only as a transitional measure.
As shown in the following scheme, many differences exist among the implementation modalities of the last F&V CMO at Member State level. It regards both the level of hectare payment (vegetable hectares are eligible for direct payments in some countries and not in others) and the possible use of a transitional hectare payment. This situation creates a distortion of competition between farmers and industries, and, in the latter, between those Member States which adopted a transitional coupled aid and those which did not.
An impact assessment of the SPS on the F&V sector is not available yet, but for the single sector as processing tomato in Italy (Arfini et al., 2011), for which an evaluation of the effects of the HC on F&V producers has been done in order to identify their potential reactions to regionalisation.
The existing differences in the F&V CMO implementation are a particular concern expressed, in the public debate on the CAP after 2013, by industries for processing peaches

Policy Department B: Structural and Cohesion Policies
PE 460.043 44
and pears, that focus on the relevant issue at the security of raw material supplying the industry itself. A similar condition occurs for citrus fruit, for which a recent analysis (Agrosynergie, 2010) highlights that some industries, especially in Italy, have preferred to modify their core activities, developing the processing of juice concentrate bought in international markets to the detriment of processing EU citrus fruit. As emphasized by Arfini et al. (2011) for processing tomato “the introduction of decoupled payments brought much uncertainty to the market concerning the likelihood of a considerable production decrease and the consequent difficulty of commodities’ supplies”.
Furthermore, another great concern regards the prospected regionalisation of the single farm payment (SFP) that adds new issues around the F&V sector perspective in terms of possible effects on the behaviour of famers as well as on the supply chains involved.
In general terms, the implementation of the historical SFP has determined considerable changes in production processes and in the profitability of farm. It is likely that the consequences at the extension of the regional SFP will be equally important. In this regard, some analysis show that the SFP regionalisation process could considerably influence farmers’ decisions and, what is more important, their economic results. In particular, the redistribution effects of regionalisation are closely connected to the production processes on which historical payments were calculated.
In the case of F&V sector, for which the modifications inside the production plan become evident only when the CAP mechanism moves from a coupling scenario to a total decoupling one, and in the case of a variation in price levels (Arfini et al., 2011), the issue is how CAP payments can influence the competitiveness of farms, that is their ability to adapt their organisation for the purpose of improving economic and productive farm performances. The ability to respond to the changes arising from the Health Check reform becomes more difficult for a sector, such as F&V, which went quite suddenly from a coupled support to historical decoupled payments and possibly moving on to regional single payment scheme.
Overview of the implementation of the Fruit and Vegetables Reform in Member States at 1 January 2008
MS
Start
SPS
Model
SPS / SAPS
Implementation of the Fruit and Vegetables sector
Transitional Coupled Payments applicable as of 2008
(Council Reg. (EC) No 1182/2007)
Agricultural use of the land
(Art 51 of Council Reg. (EC)
No 1182/2007)
Belgium
2005 SPS historical
Land under F&V, potatoes and nurseries will become eligible in 2009
Bulgaria SAPS Transitional soft fruit payment 100%
Czech
Republic
SAPS Separate payment for tomatoes intended for processing 100%
Greece
2006 SPS historical
Until end 2010: 30% of the envelope for tomatoes intended for processing
Until end 2012: 60% of the envelope for citrus fruits
No derogation for eligibility of land under F&V applied

The EU Fruit and Vegetables Sector
PE 460.043 45
intended for processing
Spain
2006 SPS historical
Until end 2010: 50% of the envelope for tomatoes intended for processing
Until end 2009: 100% of the envelope for citrus fruits intended for processing
Will be eligible in 2008: tomatoes for processing and certain peaches, pears, prunes, figs and grapes
France
2006 SPS historical
Until end 2011: 50% of the envelope for tomatoes intended for processing
Until end 2010: 98% of envelope for orchards producing prunes, peaches, and pears intended for processing
From 2011 until end 2012 : 75% of envelope for orchards producing prunes, peaches, and pears intended for processing
Will be eligible in 2008: bigarreaux cherries for industrial use, vegetables intended for processing incl. tomatoes,
melons, chicory, onions and cauliflowers
Italy
2005 SPS historical
Until end 2010: 50% of envelope for tomatoes intended for processing
Until end 2010: 100% for pears, peaches and prunes intended for processing
From 2011 until end 2012: 75% of envelope for prunes
Until 2010 land will not be eligible for ware potatoes and F&V except for citrus fruits
Cyprus
SAPS Until end 2010: 100% of national envelope for citrus fruits
Until end 2012: 75% of national envelope for citrus fruits
Latvia SAPS Transitional soft fruit payment 100%
Lithuania SAPS Transitional soft fruit payment 100%
Hungary
SAPS Separate fruit and vegetables payments (tomatoes and other fruits)
Transitional soft fruit payment 100%
Malta 2007 SPS regional
model
No transitional fruit and vegetables payments
Austria 2005 SPS historical
Until end 2010 no eligibility for F&V, ware potatoes and nurseries
Poland
SAPS Separate fruit and vegetables payments for tomatoes, peaches and pears 100%
Transitional soft fruit payment 100%
Portugal
2005 SPS historical
Until end 2011: 50% of envelope for tomatoes intended for processing
Derogation F&V not applied
Romania SAPS Until end 2011: 50% of envelope for tomatoes intended for processing

Policy Department B: Structural and Cohesion Policies
PE 460.043 46
Slovakia SAPS Separate fruit and vegetables payments:
- 50% of the envelope for tomatoes intended for processing
- 100% of the envelope for fruits other than annual crops
Transitional fruit and vegetables payments:
- 50% of the envelope for tomatoes intended for processing
Source: European Commission.
2.2. Trading arrangements and preferential agreements in F&V
sector
The EU trade regime for fresh fruit and vegetables (F&V) is rather complex and its measures are set differently according to products, partner countries and seasonality. This is also the outcome of different - and sometime conflicting - objectives stated in the EU trade policy for the sector. The EU is at the same time the largest importing country in the world and one of the most relevant producing country, circumstances that make room for different aims policy measures should help to attain: protection and stabilisation of revenues of EU producer of F&V; large and differentiated supply of F&V products to EU consumers at reasonable price; integration of the import regime within the international relationships that the EU is promoting, particularly with developing and neighbouring countries6.
After the phasing out of export subsidies, completed by the F&V CMO reform occurred in 2007, external protection remains a cornerstone of the set of measures supporting EU F&V producers. The peculiar import regime has been kept alive even after the Uruguay round agreement on agriculture (URAA), making F&V the only products whose external protection is provided, along with ordinary custom duties, by an entry price system. Even the new revisions of the preferential trade arrangements with selected partners (the last one with Morocco to be shortly ratified by the European Parliament, see Annex 4) maintain the entry price system. Other relevant import measures are: i) the special agricultural safeguard clause, provided by the URAA; ii) tariff rate quotas, covering preferential agreements with several countries; iii) sanitary and fitosanitary measures, designed to protect human, animal or plant life or health7. Some of these policies might be considerably reformed after the completion of the current Doha round of WTO negotiations.
2.2.1. Trade measures: tariffs, entry prices and the phasing out of the export subsidies
Tariffs and entry prices
From its outset, the core of external protection to EU producers of all F&V has been obtained by means of tariffs and, for the main products, by policy devices meant to operate as minimum import prices (Annex 2). Table 2.1. shows that tariffs are fairly low for most of over 300 Fresh F&V tariff lines and 300 Processed F&V tariff lines. Simple averages are
6 See Council Regulation (EEC) No 1035/72 and Annex 2 to this Section. 7 This paragraph treats the following measures: a) tariffs, b) entry prices, c) tariff rate quotas, d) export
subsidies, and e) preferential agreements. Some details on a), b), c), as well as information on import licensing systems and on the special agricultural safeguard clause are available in Annex 2 Details on e) are available in Annexes 3 and 4 Sanitary and fitosanitary measures are treated in par. 2.3.

The EU Fruit and Vegetables Sector
PE 460.043 47
around 25% below other products such as meats, sugar, dairy products and cereals (Jean-Laborde, 2008).
In the middle ‘90s an entry price system (EPS) replaced the old reference price system8, but much of the functioning of the new system resembles the old one: if the import price of a product is above the triggering entry price (TEP) it only pays the tariff. When the import price is lower than the TEP by a percentage no greater than 8%, a specific duty is added whose amount is roughly equal to the difference between the TEP and the import price (a sort of a variable levy). If the percentage exceeds 8% the specific duty is the maximum tariff equivalent (MTE). MTEs are fixed tariffs bound in the URAA9.
Tariffs, TEPs and MTEs change during the year according the seasonality of EU production. For many F&V products the entry price operate only for a limited period when internal supply is marketed, in some cases covering also the periods right before and after the season of production when smaller amount of EU produce can be marketed at higher prices10.
Table 2. 1. Comparison of tariffs in selected HS Chapters
Ad valorem equivalents Number of tariff lines falling in each tariff band
Average Maximum
bound bound <20% [20%,50%] [50%,75%] >75%
HS Chapter tariff tariff
2 Meats 67.5 407.8 127 50 22 34
4 Dairy products 55.9 264.3 33 44 44 54
7 Fresh vegetables 25.0 118.9 109 7 2 4
8 Fresh fruits 25.2 117.1 140 60 0 1
10 Cereals 78.4 93.6 19 23 7 6
12 Oilseeds 0.3 179.1 78 0 1 1
15 Fats and oils 11.9 118.7 110 3 4 3
17 Sugar 129.1 218.1 30 6 2 9
20 Processed F&V 27.2 217.4 214 76 7 10
52 Cotton 0 0 0 0 0 0
Source: Jean-Laborde (2008). Authors’ elaboration. The amount of MTEs is high enough that they can be seen as prohibitive tariffs, capable to make still effective the entry price as a minimum import price and reach substantial ad valorem equivalents for certain products and seasons (Garcia-Alvarez-Coque et al., 2010).
8 Reference prices were considered as non-tariff barriers (Ntb) by the URAA and consequently eliminated. In the
case of F&V products already covered by reference prices, the EU replaced the old system with entry prices. The reasons why this new version of Ntb was introduced after the URAA are discussed by Swinbank and Ritson (1995) and Grethe and Tangermann (1996). More details on this point can be derived from Annex 2.
9 More technicalities on this point are in Annex 2 and derive from Commission Regulation No 3223/94 and the explanatory note concerning it [D (99) 01/10/1999].
10 Fresh F&V products under EPS are: Tomatoes, Cucumbers, Artichokes, Courgettes, Oranges, Clementines, Mandarins and similar citrus hybrids, Lemons, Table grapes, Apples, Pears, Apricots, Cherries, Peaches (including nectarines), Plums. See Annex 2.

Policy Department B: Structural and Cohesion Policies
PE 460.043 48
Table 2.2. shows the current feature of tariffs and entry prices for selected F&V products, with a focus on citrus, peaches and nectarines and table grapes. Tariff equivalents can be significant and, if we add the ad valorems custom duty to the maximum equivalents derived from the entry price system, can reach over 60% for lemons, over 50% for mandarins, and over 30% in the rest of citrus, table grapes, and peaches and nectarines.
The functioning of the current import regime has been thoroughly analysed in the literature by both comparing it to the previous trade regime, in order to assess changes in the degree of openness of the EU F&V market and in the trade pattern, as well as investigating the effectiveness of the EPS in contributing to domestic price stabilization.
Right after the introduction of the EPS, Swinbank and Ritson (1995) comparing the new import regime to the previous one, were rather skeptical about its ability to significantly increase EU F&V market openness. However, traders now can possibly avoid the payment of the specific duty showing that the actual sale price of the consignment is such that a lower duty is to be paid (Swinbank and Ritson 1995; Agrosynergie, 2008b) 11. Moreover, importers may also avoid the payment of the specific duty waiting for custom clearance when the SIVs are higher that the TEP12. This also suggests that both capability of operators to deal with customs procedures and degree of perishability of products can play a relevant role in making possible to avoid specific F&V duties.
Table 2. 2. Elements of entry prices for selected F&V Specific tariff
MFN MFN EP Period of Preferential % of the Maximum
tariff (%) level (€/t) Application EP level
(€/t) MFN EP Tariff (€/t)
Clementines 16.0 649 01.01 - 28.02 484 16.3 106
Lemons 6.4 462 - 558 01.01 - 31.12 45.9 - 55.4 256
Mandarins 16.0 286 01.01 - 28.02 37.1 106
Oranges 3.2 - 16.0 354 01.12 - 31.05 264 20.1 71
Peaches/nectarines 17.6 600 - 883 11.06 - 30.09 491 14.7 - 21.7 130
Table grapes 8 - 17.6 476 - 546 21.07 - 20.11 358 17.6 - 20.2 96
Source: DG Trade, EU export-helpdesk. Authors’ calculations The functioning of the EPS on a consignment basis may also make possible, at least in principle, to avoid the penalisation of high quality imports from a country. Data on the number of cases in which the price of imports undercut the TEP in the first years of implementation of the EPS suggested to Cioffi and dell’Aquila (2004) a possible selection effect on the growth of EU imports of F&V preventing imports of low quality/low price produce. However, a recent evaluation report on the EPS demonstrated that in recent years
11 The new system is administered on a shipment-by-shipment level instead of a country-by-country level. The
additional specific tariff is charged per individual shipment and, if the c.i.f. price of one shipment undercuts the entry price, this does not affect subsequent shipments from the same country. See Annex 2.
12 Problems of detecting c.i.f. prices of imports have been overcome with different methodologies for monitoring of compliance with entry prices (see Annex 2 and the EU Commission explanatory note concerning Commission Regulation No 3223/94 [D (99) 01/10/1999]). Relevant for the working of the system are the "standard import values" (SIVs) that the Commission calculates on a daily basis for each country that actually exports to the EU. SIVs are based on prices monitored on the domestic EU market at wholesale level. One of the methodologies used for assessing compliance with the EPS is based on an entry price - SIV comparison.

The EU Fruit and Vegetables Sector
PE 460.043 49
imports of F&V products covered by the import regime grew at a rate not differing from that shown by F&V not covered by the EPS (Agrosynergie, 2008b).
The econometric analysis by Emlinger et al. (2008) through a gravity model approach showed that the import regime had effects on the EU import flows of F&V, although for some product other factors should also be taken into account. Goetz and Grethe (2009), using a multivariate statistic analysis approach, showed that the relevance of the EPS is not homogeneous among different products and origins, being wider for more perishable products and for neighbouring partner countries. As a whole, those studies suggest that the effects of the EPS on EU import flows of F&V are significant, but probably not generalized to entire set of products/partners.
Most studies agree on showing that the EPS is most relevant for the import of artichokes, courgettes, cucumbers, lemons, plums and tomatoes; significantly lower for apples, clementines and pears; and least relevant for apricots, mandarins, oranges, peaches and nectarines and table grapes. This is supported by data from Table 2.3. based on SIV recorded between 1995 and 2007. Among the products recorded in the table, only for lemons the EPS system appears to be restrictive, in particular for products originating in the Southern Hemisphere.
Somehow similar is the picture offered by some recent studies targeting impact of the EPS on prices of EU domestic products. Here the main policy issue is assessing the contribution of the EPS to domestic prices stabilisation. The recent evaluation report on the EPS (Agrosynergie, 2008b) suggests that it does not affect domestic prices globally, but for single products/country/month there could be significant effects.
Results of the aforementioned studies indicate that EP could be significantly lowered in several periods of the marketing year without substantially affecting trade. In fact, between 1995 and 2001, all the components of the protective system (EPs, ad valorem duties, and MTEs) were already reduced in accordance with the Uruguay Round commitments, easing the protective effect of the system. This conclusion does not contradict the fact that the system helps to stabilize prices in certain periods of the marketing year. In fact, the system functions in the contingency of an import surge and its elimination could involve substantial downward pressure on the prices of specific third-country products in the EU market. Though many fruit imports have a counter seasonal nature, the EP may still be active in periods when Southern Hemisphere crops overlap the early EU harvests.

Policy Department B: Structural and Cohesion Policies
PE 460.043 50
Table 2. 3. Breakings of the trigger EPs
% of SIV below TEP Main partners, number or % of breakings
Clementines 5% Turkey (42) Israel (6) Morocco (2)
Grapes 3% Tunisia (16)
Lemons 10% Argentina (20%) Uruguay Turkey South Africa
Mandarins 0.2% Morocco (4) Turkey (1)
Oranges 5% Cuba (50%) South Africa Turkey Egypt
Peaches 2% Turkey (3) Macedonia (1)
Source: DG Trade, EU export-helpdesk. Authors’ calculations Garcia Alvarez Coque et al. (2009, 2010) used simulation of changes in the border measures with partial equilibrium models of four products finding that the removal of the EPS, as well as the reduction of the TEP and of the specific tariff while keeping alive the EPS, would have a moderate impact on prices of EU domestic products. Although the stabilization issue is not directly addressed in these papers, such findings also imply a certain effectiveness of the EPS in price stabilization. Furthermore, the recent econometric work by Cioffi et al. (2010) shows that EU domestic prices in some cases behave differently when import prices are above/below the TEP. Also this paper suggests that in some cases isolation effect of the EPS seems reached and the resulting stabilization effects. Phasing out of export refunds
The progressive decline and phasing out of export refunds (ER) is summarized in Tab. 2.4. Starting from the 1994 URAA ER have globally declined to levels such that literature had already stressed both the uselessness and the useless bureaucratic burden of keeping the system in place (Cioffi-dell’Aquila 2004), as well as the potential net welfare gains coming from its phasing out (Agrosynergie, 2008b). The last cut performed by the F&V CMO reform occurred in 2007 put ER out of picture and made EU’s support to export competitiveness in line with WTO recommendations13.
With reference to fresh products only, oranges received the highest share of ER, accounting for 58.45% of overall expenditure for ER over the period 1996-2005. Lemons and apples followed, with shares of 17.33% and 11.17% respectively, then table grapes and tomatoes, having a share of about 4% each. All remaining eligible products (almonds, hazelnuts, walnuts, peaches and nectarines) had negligible shares.
13 See Council Regulation (EC) No 1234/2007 of 22 October 2007.

The EU Fruit and Vegetables Sector
PE 460.043 51
Table 2. 4. Extra-EU exports and Export refunds
1995/1996 (*) 2003/2004 (*) 2005/2006 (**)
Oranges
Q (000 t) 546.3 488.8 270.5
V (million €) 41.7 7.6 7.4
Lemons
Q (000 t) 203.4 259.2 91.2
V (million €) 12.8 4.0 2.9
Table grapes
Q (000 t) 135 205.8 127.2
V (million €) 3.6 1.2 0.7
Peaches
Q (000 t) 98.6 138.9 342.1
V (million €) 0.7 0 0.2
Source: COMEXT and DAGRI Data processed. (*) EU-15; (**) EU-25 The possible impact on the overall EU domestic market, therefore, should be expected to be relevant for oranges and lemons. According to the Agrosynergie (2008b) study, the impact on total EU exports may reach a range of between 7 and 14% of total export volumes. The impact on prices is around 1.5%. However, it is not possible to isolate the impact of the ER scheme from other effects that determine export competitiveness. In the case of fresh fruits as oranges and apples, the increasing competition of a wider variety of fresh fruits, many of them of tropical/exotic character, is not favouring export growth. 2.2.2. Preferential trade agreements
Preferential trading partners are very relevant in EU F&V trade, in terms of both import flows and concessions on tariff and non-tariff measures. Ad valorem duties and entry prices depend on preferential treatments negotiated between the EU and a number of partners14 (treatments sometimes bound by tariff quotas15). Table 2.5. displays the trade measures and concessions applied to major exporters of the products selected for this study. It also shows that counter-season productions favors trade flows.
The EU has long managed the F&V package by pursuing, at the same time, protection of EU producers (above all from Southern EU), maintenance of traditional import flows, and improvement of political-diplomatic relationships with several developing countries16. This, in turn, implies that a sort of protection, through preferences, has been granted to the competitive advantage of these countries on the EU market.
14 See Annex 3 for the country composition of agreements relevant for EU F&V and sources of information on
arrangements applicable to non-EU countries. 15 Tariff rate quotas (TRQs) are deepened in Annex 2 Within TRQs a predetermined volume of goods originating in
a specified country can benefit from imports into the EU having a more favorable rate of duty than the MFN duty mentioned in the combined nomenclature. In the case of F&V, most of TRQs as well as all the few entry price quotas are generated by preferential agreements where EU preferences are limited to a predetermined quantity. This kind of preferences are called preferential tariff quotas (TQs). See also Annex 3.
16 The comprehensive system of EU trade concessions is the result of the Common Commercial Policy and the Development Policy, in the common framework provided by External Relations. These Community policies are also affected by the provisions on preferential agreements embodied in the WTO commitments. See Annex 3.

Policy Department B: Structural and Cohesion Policies
PE 460.043 52
The major preferential trade concessions for fresh F&V relates to agreements with Mediterranean partner countries (MPC)17, most relevant due to both overlapping production calendars with EU domestic production and weight of import flows. Trade concessions normally consist of reduced or zero tariffs, often bounded within TRQs, for a set of products defined for each country. Some preferential conditions are also granted to African, Caribbean, and Pacific countries (Cotonou agreements), other developing countries involved in the GSP, as well as some Latin American, CEECs and fr/Yugoslavian countries (see Annex 3).
Trade preferences are relevant not only in the current picture of EU F&V policies, but also because they are a relevant dimension of the ongoing process of trade liberalization, where the interaction between WTO deals and regional/preferential agreements can move the EU F&V market to a condition of increased openness. Section 4 deepens problems and policy choices of this process.
In the case of products for which the EU declared EPs at the WTO, the bilateral protection system is applied according to the same procedures described in the previous paragraph, but with some relevant concessions on the level of some EPs (Table 2.5. and Annex 3). Lower EPs occur only in favour of few F&V products coming from some Mediterranean partners and are also restricted by quota and/or seasonality of MFN protection levels. No preferential measures, however, are foreseen regarding MTEs, which entirely apply whenever operators are not able to prove the import price was above the (preferential) TEP18.
The literature investigating the effectiveness of the EPS (see previous par.) provides analyses and evidence about the role of the preferential setting of EPs for some countries/products. Earlier contribution stressed a new feature of the EPS emerging from the URAA: imports from countries that enjoy a tariff preference could be sold at lower prices on the EU market than those from MFN suppliers19. In this sense, the major losers from the EU’s concern for traditional inner and outer providers of F&V would be “unpreferred” exporters.
17 The EuroMed Partnership includes, besides EU members, nine countries (Algeria, Egypt, Israel, Jordan,
Lebanon, Morocco, Palestinian Authority, Syria and Tunisia). With the other Mediterranean partner, Turkey, the EU signed first generation association agreements in the 1960s, followed by a customs union with the EU came into force on 1 January 1996. More details are in Annex 3.
18 Detailed discussions of trade agreements with MPCs affecting F&V trade are available in Swinbank-Ritson (1995); Grethe-Tangermann (1998); INEA (2002), Garcia-Alvarez-Coque (2002); Cioffi-dell’Aquila (2004); Agrosynergie (2008b).
19 Under the old system wholesale prices minus the full MFN tariffs and a marketing margin were compared to the reference prices. As a result imports from all countries had to accept the same minimum wholesale prices, regardless of tariffs applied to the individual country. The management of the EPS - namely, the consignment-based setting of custom duties and the features of the ex-post assessment of the import price - allows preferred exporters to price at preferential entry prices and zero tariffs, undercutting the price of any other exporter who must abide by MFN entry price and tariff (Tangermann, 1996; Swinbank-Ritson, 1995).

The EU Fruit and Vegetables Sector
PE 460.043 53
Table 2. 5.: Structure of EU trade protection and concessions to main preferential partners for some fresh F&V products
EU Import (2009)
Tariff concessions Preferential Entry Price
Product/ Country
tonn
% tariff reduction
TRQ (t) Period of application
Value (euro/tonn)
Period of application
Oranges
SouthAfrica 333,823 Egypt 134,555 60 60,000 01.12 – 21.05 264 01.12 – 31-05
Morocco 90,769 100 01.01 – 31.12 264 01.12 – 31-05 Argentina 69,971 Uruguay 59,283
Clementines
80 175,000 01.01 – 28.02 484 01.01 – 28.02 Morocco 77,305 100 01.03 – 31.12
South Africa 33,997 100 01.01 – 28.02 Uruguay 9,929
Argentina 9,563 Israel 6,014
60 40,000 01.01 – 28.02
Mandarins and hybrids
Turkey 73,410
100 01.01 – 28.02
Argentina 37,456
South Africa 31,262 100 01.01 – 28.02 Uruguay 24,018
Israel 18,201
60 40,000 01.01 – 28.02
Lemons
Argentina 163,985 Turkey 118,407 100 01.01 – 30.04 Brazil 55,793
South Africa 39,006 Mexico 22,957
Peaches and Nectarines
Chile 16,730 100 01.01 – 10.06 South Africa 5,208 100 01.01 – 30.04
Morocco 4,692 100 01.01 – 30.04 491 11.06 – 30.09 Egypt 2,213
100 500 15.03 – 31.05
Table grapes
Chile 190,393 100 01.01 – 14.07 South Africa 181,338 100 01.01 – 30.04
Egypt 48,833 100 01.02 – 14.07 Brazil 38,768
Source: COMEXT; DG Trade, EU export-helpdesk. Authors’ calculations However the EPs have been kept at MFN levels for most of the preferential origin countries and with some of them trade increased after the signature of Association Agreements dealing with the removal of ad valorem duties only (South Africa, Chile) (Agrosynergie, 2008b). Among the gainers in F&V trade with the EU are to be mentioned also new Member States (mostly Bulgaria, Poland, Romania and Hungary). In this case countries involved enjoyed full liberalization, as they were constrained by EPs in certain products before EU accession.

Policy Department B: Structural and Cohesion Policies
PE 460.043 54
Moreover, we have seen that recent studies suggest that only in some cases EPs are effective in influencing the trade pattern and stabilizing domestic prices. This might make room for moves towards a simplification of the a cumbersome effort of distributing EU market shares among preferential partners by crafting concessions on a product/country basis, with seasonal restraints and quotas on a large number of products.
2.3. The issues relating to food standards 2.3.1. F&V public quality standards and marketing standards
The globalization of fruit and vegetable trade is changing food production and distribution. F&V products are distributed over far greater distances than before, creating the conditions necessary for general outbreaks of foodborne illness.
Other factors account for the emergence of F&V safety as a public health issue. Increasing urbanization leads to greater requirements for transport, storage and harvesting of fruit and vegetables. All these changes lead to situations in which a single source of contamination can have widespread, even global consequences.
As a result of this evolution, over the past few years, food safety and quality (with particular reference to F&V) has become an important concern for the general public opinion, policy makers, researchers, stakeholders involved into food production, transport and trading.
Overall, fruit and vegetable standards refer to the complex aggregate of rules at different levels (national and international standards), from different sources (public and private standards); and standards on different product and process characteristics (e.g. quality standards, sanitary and phytosanitary measures, traceability regulations, etc.).
The European Union, with the CMO for F&V, specifically provides acts to improve product’s quality, also with production methods respecting the environment (including organic products) of POs through the operational programmes. According to the results of INEA’s survey, the F&V POs have used operational programmes to improve the F&V quality and the safety of the supply chain in terms of handling conditions and cold chains from the producer to the consumer. Large investments have been made to improve the integrated production and organic products. The majority of organized producers participate in quality control systems such as marketing standards, GLOBALGAP, HACCP, the BRC, the ISF, the ISO, etc.
In recent years, the European Union, in the purpose to ensure adequate levels of fruit and vegetables quality on the Community markets has developed specific marketing standards for the sector. Particularly, with an historical point of view, the common marketing standards were introduced in 1962 (EEC Council Regulation 23 concerning the gradual implementation of a common organization of the markets in the fruit and vegetable sector).
In 2008, the Commission Regulation (EC) No. 1221/2008 repealed 26 of the 36 specific marketing standards. Thus, the 36 specific standards defined by 34 regulations have been replaced by only one regulation for 11 standards (1 general marketing standard and 10 specific ones). The general marketing standard is applicable to all fresh fruit and vegetables covered by the CMO, but the other 10 specific marketing standards are maintained for the following products: apples, tomatoes, strawberries, peaches and nectarines, citrus, peppers, kiwi, lettuce, pears and grapes.
Marketing standards include criteria such as quality, size, labeling, packaging and presentation. Specially for products covered by the general marketing standard, the

The EU Fruit and Vegetables Sector
PE 460.043 55
country of origin must be indicated in any language understandable by the consumers of the country of destination.
The objectives of the marketing standards are to facilitate international trade by encouraging production of high quality food, improving profitability and protecting consumer’s health.
Fresh fruit and vegetable imports into the EU are checked for compliance with EU marketing standards. If produce does not meet these standards, then it is not allowed to be sold in the market, although enforcement of these standards is the responsibility of each member state. Farm-gate sales and products used for processing do not have to meet the standards.
Several other national standards, involving different stages of the supply chain, have been developed in different member states in Europe in the last years: for example, in German QS-System covers the whole supply chain; in the same way, the Belgian Certus requires that each link of the production chain be examined; instead, the French Label Rouge, the British ABM, the Dutch IKB and the Danish DS are much less extended and cover only one stage of the supply chain.
Still others, European Member State have developed standards on environmental issues. In 2008, 16 Member States had included Environmental Management of Packaging (EMP) actions under their national framework for environmental actions20. As regards other specific provisions for the fruit and vegetables sector, Regulation (EC) No. 1182/2007 considers their production as an issue of recognition of the producer organizations the technical means for collecting, storing, packaging and marketing. Support of cost coming from these issues can cover by the producer organization or its members, over and above: costs deriving from compliance with the relevant mandatory requirements established by national legislation and conventional costs.
A number of systems have been developed, at an international level, to serve as a basis set of guidelines for various aspects of food quality, such as Codex Alimentarius, ISO, GMP, and legally mandatory HACCP (Hazard Analysis Critical Control Points) and Hygiene codes. HACCP and ISO 9000 are the most widely-applied general standards. In many countries, legislation on food safety requires HACCP to be put in place by any food business or organization.
Food safety standards are not part of the basic regulation for fruit and vegetables although the food safety standards contribute to improve market transparency and consumer demand. The question of implementation of food safety standards into the Common market organization has been often raised.
It is very clear that bringing all standards for fruit and vegetables under the same legal framework would increase clarity, transparency and better coordination between different control procedures. 2.3.2. Private standards and implication for the farmers
While much of the focus in the economics literature has been on the role of public food safety and quality standards both as policy instruments and as non-tariff barriers to trade, it is evident that private standards are playing an increasing role in the governance of agricultural and food supply chain. Retailers, but also processing industries and third part firms, have implemented new collective private (voluntary) standards in order to improve food safety and reduce the risks related to microbial contamination and pesticide residues but also firm-specific private standards that are defined, controlled and used by retailers.
20 F&V sector – Analysis of the implementation of EMP actions in Member States – MANCOM 13 July 2010.

Policy Department B: Structural and Cohesion Policies
PE 460.043 56
During the last years several collective standards have been introduced by the food retailer (e.g. GlobalGap, BRC21, etc.) to obtain goods that fulfill more rigorous standards than those are produced in existing spot markets. This objective has been achieved by creating new intermediary markets rather than using supply contracts and potentially costly firm-specific private schemes. These protocols operate on a business-to-business basis, namely clients vis-à-vis suppliers. In this way supermarkets and retailers transfer the control costs that they formerly assumed towards the grower and the exporter upstream the supply chain. Compliance with private certification is an addition to the list of services which suppliers are asked to provide as a condition of sustained market access.
In European Union many POs have used operational programmes to realize collective investments in order to improve quality and safety standards, as for example, Global GAP, and also develop quality-control system.
Apart from those above-mentioned standards, individual supermarkets have developed their own systems and labels. For example, in the UK, Tesco has developed “Tesco’s Nature’s Choice,” and Marks & Spencer, “Farm to Fork.” Similarly, some major French supermarkets have developed quality assurance schemes for their own brands, such as Terre et Saveur of Casino, Filiere Agriculture Raisonnee of Auchan, Filiere Qualite of Carrefour. 2.3.3. The fulfillment of standards by third countries
Previous paragraphs show that, in the last years, many new standards have been introduced by the EU, governments and retailers. At the same time, standards that have existed for a long time, like in the field of food safety (sanitary and phytosanitary measures) are applied more rigorously in trade with third countries. This can profoundly impact on trade flows with developing countries. In international relations it is clear that the developed countries are the standard setters, and the developing countries must adapt.
The standards are very often highly discriminating against poor and less well organized countries and producers; they exclude small-holder participation from markets and act as a technical barrier to trade (see, paragraph 4.5). On the other hand, standards might also provide opportunities for smallholders to supply market niches domestically and globally: for example certified organic food or fair trade label.
Generally, with quality and safety standards, trade exclusion danger for third countries is higher than the opportunities of inclusion. Furthermore, more and more standards are private and many of them are “buyer-driven”, because they are linked to supermarkets. European supermarkets export their standards - through international investments and procurement policies - to domestic markets in developing countries.
In order to evaluate the impact of food standards on exports from developing countries, we shall start understanding their requirements and how they set these. For example, most of the European retailers require their producers in developing countries to be GlobalGAP or BRC certified. These standards consist in a set of general regulations and an auditing system with a checklist. In general, where there are explicit EU regulations, private standards normally refer to them; but some member states can set more rigorous requirements than EU ones. For these reasons some major exporting countries operate to the most stringent member state requirements so that they are sure that they will meet all the legal requirements
21 GlobalGAP refers to the pre-farm gate and has developed specific standards for the first stage of the supply
chain. Besides, the BRC Global Standard deals with main pack-house operations, including high care and minimal processing facilities.

The EU Fruit and Vegetables Sector
PE 460.043 57
3. RESULTS FROM INEA SURVEY
3.1. The survey
3.1.1. Italy
The survey carried out in Italy concerned a rather representative sample of 74 POs placed in all relevant F&V producing areas. The sample has been chosen taking into account POs’ dimensions (large, medium, small), their territorial localization, as well as their product composition. With this regard, Italian sample of POs above all concentrates citrus fruit, peaches and nectarines, and table grapes, also with a representation of other F&V products.
The inquiry is based on a questionnaire delivered thanks to the collaboration of the three National Unions on behalf of POs (UNAPROA, UIAPOA, and UNACOA), and the Centro Servizi Ortofrutticoli (CSO) as well. The questionnaire is composed of three sections: the first one concerns general information on the POs surveyed; the second section relates to the impact of the F&V CMO measures and trade policy; the final section gathers POs’ opinions and suggestions about new aid scheme for the F&V sector (see Annex 5).
All surveyed POs answered to the INEA questionnaire, but for only 61 among them we have had complete answers.
The sample of POs includes:
- 4 POs, defined “large”, with a value of marketed production (VMP) higher than 100 MEuro;
- 14 POs, defined “medium”, with a VMP included between 20 and 100 MEuro;
- 43 POs, defined “small”, with a VMP less than 20 MEuro.
Implementation of reformed F&V CMO
Answering to a first set of general questions regarding the strategic objectives of the F&V CMO and the elements of further flexibility introduced by the last reform, the sample of Italian POs has couched a positive evaluation of the effectiveness of the provided provisions22 in contributing to achieve those objectives. However, some relevant differences can be appreciated based on the different judgements inserted in the survey.
As shown in table 3.1, a very high percentage of POs, between 50% and 75.4%, retains significant and very significant the provisions introduced by reformed CMO in order to improve the attractiveness of POs, increase the concentration of F&V supply, and improve the competitiveness in the F&V sector. Considering the differences by POs’ dimension, it is interesting to notice that medium size POs emphasize higher percentages, retaining these objectives more positively affected by such provisions. In particular, in correspondence with the objective relating to improve the competitiveness in the F&V sector almost all medium size POs have expressed a positive judgement.
22 They are: product range of a producer organisation; the extent of direct sales permitted; the extension of rules
to non-members; permitting APOs to carry out any of the activities of their members; permitting the outsourcing of activities; more incentives to mergers of POs, APOs, etc.; more incentives to regions where the level of concentration of the supply through POs is particularly low.

Policy Department B: Structural and Cohesion Policies
PE 460.043 58
Table 3. 1.: In which measure the pursuit of the following objectives (a., b., c., d., e.) of the CMO has been positively affected by such provisions?
VERY SIGNIFICANT SIGNIFICANT POORLY
SIGNIFICANT NOT
SIGNIFICANT NO
ANSWER Total
LARGE 25.0 25.0 25.0 25.0 4 MEDIUM 28.6 57.1 14.3 .. 14 SMALL 16.3 58.1 23.3 2.3 43
improve the attractiveness of POs
Total 19.7 55.7 21.3 3.3 61 LARGE .. 25.0 50.0 25.0 4 MEDIUM 14.3 50.0 35.7 .. 14 SMALL 7.0 44.2 44.2 4.6 43
increase and/or stabilize producer income
Total 8.2 44.3 42.6 4.9 61 LARGE 25.0 25.0 25.0 25.0 4 MEDIUM 35.7 42.9 21.4 .. 14
SMALL 4.7 65.1 27.9 2.3 43
increase the concentration of the F&V supply on the EU market or contribute more effectively than the previous CMO Total 13.1 57.4 26.2 3.3 61
LARGE .. 50.0 25.0 25.0 4 MEDIUM 21.4 78.6 .. .. 14 SMALL 9.3 51.2 34.9 4.6 43
improve the competitiveness in the F&V sector
Total 11.5 57.4 26.2 4.9 61 LARGE .. 25.0 50.0 25.0 4 MEDIUM 21.4 42.9 7.1 21.4 7.1 14 SMALL 16.3 32.6 41.9 7.0 2.2 43
strengthen producers’ negotiating ability on the EU market
Total 16.4 34.4 34.4 11.5 3.3 61
Most interviewed POs consider this increased flexibility suited to foster the attractiveness of POs, because, first of all, it has allowed to improve the provision of services to PO members. Moreover, also guarantees on products delivery and quality have improved.
As regards the other objectives (increase and/or stabilize producer income, strengthen producers’ negotiating ability), a lower percentage of POs, around 50%, retains significant and very significant the provisions provided by CMO. Moreover, it is worth observing that this opinion is not shared by large POs that, as explained below, are also those with a larger use of stabilization measures. The same can be seen concerning the answers to the question related to the ability of such measures to help in joining CMOs main objectives. However, a very widespread opinion is that the provisions introduced by F&V CMO have not been adequately effective to achieve both these objectives.
Interviewed POs retain that the current tools of the F&V CMO have only partially responded in positive terms to the issue of increasing and/or stabilizing producers’ income. This has been particularly clear on the occasion of the last market crises for which many factors influencing market dynamics and affecting its variability have increased pressures on farmers’ return. At the same time, POs retain that current crisis prevention and management measures have turned out to be too complex to manage and not quite adequate to cope with these situations.
Similarly, POs declared that the last CMO reform has not strengthened producers’ negotiating ability and that F&V supply’s positioning on the market is still too weak. In general, in very few cases the answers have been negative (“not significant”) and have affected, above all, larger POs. Their opinion is that no new significant element has been introduced by the last reform compared to the previous CMO. On the other hand, these are

The EU Fruit and Vegetables Sector
PE 460.043 59
POs which mirror very advanced entrepreneurial segments and have already achieved in satisfactory way CMO’s objectives.
As regards operational programmes the judgements of interviewed POs have been much more positive than those expressed for above mentioned provisions. The table 3.2. highlights a very high percentages in correspondence of some actions, considered significant and very significant by at least 85% of POs, whatever dimension they have. These are actions aimed at: planning of production, improving/maintaining product quality, improving marketing, and environmental types of actions. A lower percentage of positive judgements has been expressed by POs for crisis prevention and management measures (47.5%), considered not quite effective and too rigid in their implementation. Table 3. 2.: In which measure in the POs' operational programmes the actions have been more effective in contributing to achieve the strategic objectives of reformed CMO?
VERY SIGNIFICANT SIGNIFICANT POORLY
SIGNIFICANT NOT
SIGNIFICANT NO
ANSWER Total
LARGE 75.0 25.0 .. .. 4
MEDIUM 50.0 50.0 .. .. 14
SMALL 30.2 55.8 9.3 2.3 2.3 43
actions aimed at planning of production (3.2.1)
Total 37.7 52.5 6.6 1.6 1.6 61
LARGE 25.0 75.0 .. .. 4
MEDIUM 57.1 35.7 .. .. 7.1 14
SMALL 58.1 39.5 2.3 .. 43
actions aimed at improving or maintaining product quality (3.2.2) Total 55.7 41.0 1.6 0.0 1.6 61
LARGE 50.0 50.0 .. .. 4
MEDIUM 42.9 42.9 7.1 7.1 14
SMALL 53.5 30.2 14.0 2.3 43
actions aimed at improving marketing (3.2.3)
Total 50.8 34.4 11.5 3.3 61
LARGE .. .. 100.0 .. 4
MEDIUM .. 21.4 64.3 14.3 14
SMALL .. 18.6 44.2 34.9 2.3 43
research and experimental production (3.2.4)
Total 0.0 18.0 52.5 27.9 1.6 61
LARGE .. 50.0 .. 50.0 4
MEDIUM .. 21.4 50.0 28.6 14 SMALL 2.3 18.6 46.5 27.9 4.7 43
training types of actions (other than in relation to crisis prevention and management) and actions aimed at promoting access to advisory services (3.2.5) Total 1.6 21.3 44.3 29.5 3.3 61
LARGE .. 50.0 .. 50.0 4
MEDIUM 7.1 35.7 50.0 7.1 14
SMALL 23.3 25.6 25.6 20.9 4.7 43
crisis prevention and management measures (3.2.6)
Total 18.0 29.5 29.5 19.7 3.3 61
LARGE 50.0 50.0 .. .. 4
MEDIUM 64.3 35.7 .. .. 14
SMALL 55.8 37.2 7.0 .. 43
environmental types of actions (3.2.7)
Total 57.4 37.7 4.9 0.0 61
LARGE 25.0 25.0 25.0 .. 25.0 4
MEDIUM .. 14.3 28.6 28.6 28.6 14
SMALL 9.3 27.9 20.9 25.6 16.3 43 other types of actions (3.2.8)
Total 8.2 24.6 23.0 24.6 19.7 61

Policy Department B: Structural and Cohesion Policies
PE 460.043 60
A very indicative judgement regards actions related to research and experimental production, and training as well. In the opinion of about 80% of interviewed POs these actions are poorly or not significant. This means that very few POs look at the future with long run strategies that, through investments in research and training, would allow to better cope with market change. Turning to an in-depth analysis of the adoption of risk and crisis management measures we found that an increasing number of POs have adopted them. The adopting POs were 12 over 49 in 2008, 26 over 60 in 2009 and 29 over 59 in 2010. The most adopted measure was “promotion and communication” used by 9 POs in 2008 and 21 POs in 2009 and 2010 (Table 3.3.). The second most popular measure was market withdrawal, followed at a lower extent by harvest insurance. Green harvesting was adopted once in the three year by one PO, while the other measures provided by the CMO were not adopted. The promotion and communication measure is not only the most popular, but it is also by far the one that absorbs the largest amount of funds for this set of intervention measures. Table 3. 3.: Number of POs adopting risk and crisis management measures from 2008 to 2010
MEASURES 2008 2009 2010 Harvest insurance 1 3 5 Training measures Promotion and communication 9 21 21 Green harvesting / non harvesting
1 Market withdrawal
4 11 9 Support for setting up mutual funds
POs adopting risk and crisis measures 12 26 29 Total POs 49 60 59 POs that adopted measures of risk and crisis management are generally of larger size. Among large POs 75% adopted risk and crises management measures in 2008 and 2009, reaching 100% in 2010 (table 3.4.). The share of medium size POs was less than 50% in 2008, increasing substantially in the following years to 70%. On the other side, among small POs the share grew from 14,3% in 2008, at 31,7% and 38,1% in the two following years. Looking at other structural factors that can affect the adoption of risk and crisis management measures, it is worth observing that there is no difference between POs specialized in fruit or vegetables, as well as there is no difference according the outlet (large retailing or wholesale market). On the other side there is a large difference in adoption of these measures between POs oriented toward the export and those selling prevailingly on the domestic market. The latter are usually less inclined to adopt such measures.

The EU Fruit and Vegetables Sector
PE 460.043 61
Table 3. 4.: Number of POs adopting risk and crisis management measures from 2008 to 2010 according their size
CLASSES MEASURES 2008 2009 2010 Harvest insurance 1 2 2 Training measures Promotion and communication 2 3 4 Green harvesting / non harvesting 1 Market withdrawal 2 2 2 Support for setting up mutual funds POs adopting risk and crisis measures 3 3 4
Large
Total POs 4 4 4
Harvest insurance Training measures Promotion and communication 4 9 8 Green harvesting / non harvesting Market withdrawal 3 3 Support for setting up mutual funds POs adopting risk and crisis measures 4 10 9
Medium
Total POs 9 14 12
Harvest insurance 1 3 Training measures Promotion and communication 3 9 9 Green harvesting / non harvesting Market withdrawal 2 6 4 Support for setting up mutual funds POs adopting risk and crisis measures 5 13 16
Small
Total POs 35 41 42 These data clearly show that “promotion and communication” is the most popular measure of risk and crisis management. These is probably due to the fact that the measure is the easiest to implement. The issue of the complexity of these measures could also be an explanation why large and medium POs adopt them much more than the smaller one: POs with better structured as well as better endowed of managerial skills find adoption less difficult. This is in a certain sense a paradox, since smaller POs are more sensitive to the effects of market risks and crises. Therefore the issue of easing the adoption of such measures should be opportunely addressed in the future to give more effectiveness to policy intervention.

Policy Department B: Structural and Cohesion Policies
PE 460.043 62
Towards 2020 The widespread positive opinion on the current CMO tools expressed by interviewed POs has obviously been translated in a favourable judgement on carrying on the various instruments of EU support in the Post-2013 CMO for F&V. However, some differences among them are pointed out. Almost all POs are in favour of continuing operational programmes (93.4%), because it is considered an essential instrument aiming at favouring growth processes of the F&V sector, as well as “the sole effective instrument of aggregation able to guarantee the competitiveness of the F&V sector”. With a positive judgement by 85.2% of interviewed POs, the operational programme is considered an adequate instrument to pursue F&V CMO’s objectives. They recognize its effectiveness, most of all, in investment planning and environmental protection, as well as guaranteeing product quality, but they complain about its increasing complexity and the inadequate level of Community support. About this aspect in fact almost all POs ask for an increase of the current support to POs in order to improve the concentration of the F&V supply. At the same time they deem necessary to maintain or increase the current additional support to mergers of POs, APOs, as well as to those regions with a particularly low level of supply concentration. A lower share of POs (80.3%) argues the need for carrying on the crisis prevention and management measures. Although the feeling of POs on the effectiveness of risk and crisis measures is rather sceptical, or at least not clearly defined, the opinion supporting the opportunity of keeping them is very clear. However, the large majority of interviewed POs suggested a revision of the set of measures (45 over 56 respondent), they also agreed to introduce further and more powerful instruments to create an effective safety net (39 over 53 respondent). The most asked changes were related to the increase of withdrawal indemnities, the easing of measures adoption, the elimination of green harvesting. Interviewed POs also asked for a larger financial availability of funds for the set of measures (45 over 54 interviewed). In the case, instead, of the single payment scheme, for which 51 POs have responded over 61 interviewed, the opinions are very differentiated with only 23 POs favourable to carry on CAP support, 9 suggesting its reduction and 19 its removal. It is very difficult to summarize the wide range of not always clear reasons stated by POs, although a sense of scepticism about the impact of this instrument is clear enough. This seems related to a certain concern on possible negative effects that this measure could have on F&V production and farm structures, particularly discouraging the pursuit of product quality. Conclusion
In conclusion, the answer of the interviewed POs to the question on “how to improve the use of existing tools and measures in order to make the F&V supply chain functioning better” is that the current framework of the F&V CMO should be maintained in the Post-2013 scenario. However POs also suggest adjustments aimed at:
- strengthening the support to measures in favour of supply concentration through POs and APOs;
- increasing Community support to operational programmes, especially for those actions that encourage product quality improvement and their promotion in the market, as well as investment planning and environmental protection;

The EU Fruit and Vegetables Sector
PE 460.043 63
- carrying on the crisis prevention and management measures within the set of intervention tools provided by the F&V CMO. However, most POs suggested a revision of this set and the introduction of further and more powerful instrument to create an effective safety net,
- increasing financial avaibility of funds for crisis prevention and management measures;
- reducing administrative burden and simplifying operative commitments;
- improving F&V chain organisation also through the setting-out of collective contracts.
3.1.2. Spain
The survey carried out in Spain was concentrated in the region of Valencia. This region represents around 30% of the Spanish POs (Ferrer, 2005) with a strong concentration of citrus fruit but also with a representation of other fruit and vegetables. The average marketed production by POs in the region is fairly small (about 6 million euro) and their total number is 150. That structure implied difficulties to obtain a representative sample in the survey. Therefore, the strategy of the fieldwork concentrated on relatively homogenous size POs with some differences in their product composition. The team succeeded in surveying a group of the largest POs in the region. The sample included:
- An Association of POs with over 70 members and a total marketed production of over half a million tons, which represents one of the largest shippers of F&V in Europe.
- Five of the largest individual POs belonging to such association with a value of
market production ranging between 18 million euro and 45 million euro in 2010. Note that such values lie in the top 10% of the range of Spanish POs according to their value of marketed production. The largest sample shows a strong specialization (over 80%) on the production of fresh vegetable and the second largest one is specialized in citrus, with a 60% of the total production devoted to fresh oranges. The other three POs have a mixed production, including fruits other than citrus as the leading products, with strong presence of kaki in two of them and of medlar trees the remaining one. Many of the associates to those POs are small farmers, with strong presence of part-time farmers.
- Three POs that do not belong to an association of POs, and show a strong
specialization on citrus fruit with different values of marketed production: one with relatively smaller value (around 6 million euro) and two large (average value of 30 million euro). In these organizations small farmers are mixed with medium size and professional farmers.
Most of the 8 POs surveyed sell their production mainly in the fresh market though processing is considered a relevant outlet by one PO. The sample can be considered as one consisting of enterprises with strong market orientation. Two of the POs studied have over 3 thousand associates, two of them have around 2 thousand associates, with the smallest PO consisting of 30 farmers an the other three ranging between 180 and 600 hundred associates. The firms surveyed represent what can be considered the typical social structure in the Valencia irrigated lands, based on small horticultural farms, with slight presence of medium size farmers.

Policy Department B: Structural and Cohesion Policies
PE 460.043 64
In the next paragraphs we summarise the findings of the field study: Implementation of reformed F&V CMO
Among the POs surveyed no consensus was found about the effectiveness of the CMO in contributing to achieve the strategic objectives of the CMO. Two of the surveyed POs expressed the CMO was no effective or was weakly effective in all the objectives presented. In the opposite side, two POs considered the provisions significantly effective or strongly effective for five or more objectives. Five POs considered that provisions for widening the product range and providing incentives to further mergers were effective and four POs also recognised the effectiveness of the CMO for concentrating supply in regions where such concentration is low. Only one PO considered that the CMO was significantly effective for extension of rules. Some POs give some value to the possibility of outsourcing (3) and permitting association of POs to perform some activities (2). The association surveyed considered that the CMO was strongly effective in permitting that the associations carry out activities and in giving incentives to mergers of POs. The opinion was also favourable to the role of the CMO in allowing a wider range of products. However, its opinion was negative about the effectiveness of the CMO in favouring rule extension, outsourcing and encouraging supply concentration.
The opinion about the effectiveness of the operational programmes is quite more positive than about the other provisions mentioned before. 7 POs expressed a significantly or very significantly valuation to at least three of the possible actions contemplated in the operational programmes. The favourable opinion to actions to improve quality and marketing was unanimous. Also, planning of production and environment were considered as an effective action by seven POs. Crisis prevention and management were considered as relevant actions by 5 POs (three of them considered crises management as a strongly effective measure). Training and research received the lowest valuations and were considered as significantly or strongly effective only by 2 POs in the case of training and one PO in the case of research. Interestingly, the association of POs surveyed ranked research and quality at the top, with good valuations for planning of production, marketing and environment.
As indicated above, crisis prevention and management measures were considered relevant by most of the POs surveyed. Only two of them declared not to implement the measures foreseen in the CMO. Five of them have made use of the additional EU support (0.5%) to operational programs. Five POs concentrate their measures on market withdrawal, and only one avoids such measure and devotes the budget to training measures. Apart from this PO, only two of them declare to apply other measures different from market withdrawal, in particular, promotion and communication and green harvesting, but in shares of use less then 10% of the budget allocated to that kind of measures.
Towards 2020
The opinion is in general favourable to carrying on the single payment scheme, but two of the surveyed firms proposed its elimination. Those that showed sceptical about the single payment scheme argue that it is not very effective to improve the quality of production.
All of them were strongly favourable to the continuation of operational programmes. What is more, all support that such instrument should be strengthened. The position is also unanimous towards strengthening the crisis management measures. The association of POs surveyed is fully in favour of carrying on present instruments such as operational programs and crisis prevention and management schemes. However, it is not showing enthusiastic

The EU Fruit and Vegetables Sector
PE 460.043 65
around the single payment scheme, which believes “it is good for supporting income but not for improving farm structures”.
Most of the POs surveyed believe that support must be given in regions where supply concentration is low, but one of them expressed the opposite opinion in the sense that support should be given to large organizations for not to encourage fragmentation. A PO argued in favour of supporting organizations of larger size, but with higher numbers of farmers to prevent big private holdings from controlling production.
Except for one of the PO surveyed, the rest believe that the range of tools for crisis prevention and management should be maintained. However, five of them suggested that administrative procedures for the crisis management measures are cumbersome and two of them indicated that withdrawals and free distribution should be enhanced. As for including new safety nets, one POs considered that it was not necessary but the rest expresses a favourable opinion about new safety net mechanisms, including revenue or income stabilization programs.
Conclusion
We cannot accept without reserves that results of the fieldwork are fully representative of the whole Spanish F&V sector. However, the sample is quite homogenous in indicating typical medium-large POs with orientation to the fresh market. They are also representative of organizations formed by small farmers.
In summary, the fieldwork has suggested the following points:
- Favourable assessment of the current CMO, with full agreement in the effectiveness of operational programmes for certain activities, in particular quality improvement, planning production, environmental programs, marketing and crisis prevention and management.
- Most of the firms surveyed believe that crisis prevention and management should be
continued, but that administrative procedures for that should be simplified. - New instruments for revenue or income stabilization tools should be introduced,
according to most POs surveyed. - The association of POs is also in favour of operational programmes but also pays high
attention to research activities. - Most firms surveyed are in favour of carrying on the single payment scheme but
some expressed their concern about the negative impact on farm structures.
3.1.3. France
The team succeeded in surveying two large French Associations of POs in the Loire region. The whole APOs represent about 80 members specialised chiefly in fresh fruit production (mainly apple) and also in fresh vegetables production (mainly tomatoes, cucumbers).

Policy Department B: Structural and Cohesion Policies
PE 460.043 66
In the next paragraphs we summarise the findings of the field study:
Implementation of reformed F&V CMO
Both Associations of POs had a quite positive opinion about the effectiveness of CMO provisions in contributing to achieve its strategic objectives. They considered the provisions significantly effective in improving the attractiveness of POs and increasing the concentration of the F&V supply on the EU market. The opinion was, instead, less favourable on the role of the CMO in increasing or stabilizing producers’ income, while one APO stressed the very strong effectiveness of provisions in strengthening producers’ negotiating ability on the EU market.
Both APOs expressed a favourable opinion about the provisions for widening the product range, considered significantly effective in contributing to achieve the strategic objectives of the reformed CMO. The extension of rules to non-members was reckoned not relevant.
Different opinions, between the two APOs, emerge about the role of the other provisions: no effective according to one of the surveyed APOs and significantly effective for the other one.
Very homogeneous, instead, is the APOs’ orientation about the importance of the operational programmes. Both of them stressed the very strong effectiveness of actions aimed at planning of production and improving or maintaining product quality. The other actions, instead, were considered no or weakly incisive; in particular, training actions received the lowest valuations from both APOs. Also crisis prevention and risk management measures were considered not very relevant actions while the opinion for environmental types of actions was a little more positive.
Both APOs have made use of the additional EU support (0.5%) to operational programs for crisis prevention and management measures: mainly for harvest insurance and, to a lesser extent, for promotion and communication measures. The opinion was not very positive on the effectiveness of such measures to cope with risk of price variability and income stabilisation; the main criticism was about the too complicated administrative management.
The institutional promotion measures for F&V consumption were considered quite positive but, according to both APOs, they need additional economic resources to be more effective.
Current trade policy was reckoned too lax and, according to APOs, further trade liberalization will not produce benefits, getting worse an already difficult situation for the EU F&V sector.
Both Associations developed a strategy aimed at improving the quality of the F&V products through public and private standards; in both cases EU Regulation has favoured mainly the further development of integrated production.
Towards 2020
Concerning Post 2013 CMO for F&V, both APOs are strongly favourable to the continuation of operational programmes, which are considered a fundamental tool to support farms’ strategies; however they hope for a simplified management. The APOs are also in favour of carrying on the crisis prevention and management scheme, provided that it is less complicated in administrative management, “technically possible” and more attractive. In

The EU Fruit and Vegetables Sector
PE 460.043 67
order to improve the concentration of the F&V supply, both Associations ask for a larger financial availability of funds for the set of measures.
Conclusion
In summary, the fieldwork has suggested the following points:
Favourable assessment of the current CMO and agreement in the effectiveness of operational programmes for certain activities: in particular quality improvement, planning production and environmental programs.
Current trade policy is considered too lax and the APOs expressed their concern
about the effects of further trade liberalization in F&V sector. Doubts about the effectiveness of crisis prevention and management measures to
cope with risk of price variability and income stabilisation have been expressed. Despite the above criticism, APOs are in favour of carrying on the crisis
prevention and management scheme, but administrative procedures should be simplified.
Associations ask for a larger financial availability of funds for the set of masures.

Policy Department B: Structural and Cohesion Policies
PE 460.043 68
3.1.4. Synthesis and comparison of the results
Italy Spain France
1. Implementation of reformed F&V CMO:
objectives and measures
A widespread positive opinion of the effectiveness of provisions, especially for those regarding the improvement of POs’ attractiveness, the F&V supply concentration and the competitiveness in the F&V sector
Favourable valuation of provisions for widening the product range and providing incentives to mergers. Also effectiveness is recognised for concentrating supply in regions where concentration is low.
Positive valuation of the effectiveness of provisions for improving the attractiveness of POs and increasing the concentration of the F&V supply. Criticisms have been raised about the frequency of administrative controls, considered as overshooting the real needs of control
2. Implementation of reformed F&V CMO:
operational programs
Very positive judgement.
Planning production, improving product quality, marketing, and environment are considered effective actions.
Crisis management within operational programmes is also well considered, even if too rigid in its implementation.
Very positive opinion.
Planning production, quality improvement, environment and marketing are considered effective actions.
Crisis management within operational programmes is also well considered.
Very positive opinion.
Planning production, quality improvement, and marketing are considered effective actions. Environmental actions positive, but less effective. although .
Crisis management within operational programmes is also well considered, although still too weak in terms of effectiveness.
3. Implementation of reformed F&V CMO:
crisis prevention and management measures
Within crisis measures “promotion and communication” is the most adopted measure, followed by market withdrawal and at a lower extent by harvest insurance.
Most of the firms surveyed consider that operational programs must continue including crisis prevention and management measures.
Predominance of market withdrawals and wide use of the 0.5% of additional budget.
Most of the firms surveyed consider that operational programs must continue including crisis prevention and management measures.
Most adopted measures are , “promotion and communication”, followed by « crop insurance”
4. Implementation of reformed F&V CMO:
single payment scheme
Spreading scepticism about SPS effects on farm structures and product quality.
Most POs are in favour of maintaining the system but some are sceptical about their effects on farm structures.
No direct effects on interviewed PO sas they deal entirely with products for fresh consumption
5. Towards 2020.
Role of POs: limitations and plausible improvements
Strengthening support to POs and APOs.
Reducing administrative burden and simplifying operative commitments.
Administrative burden for crisis management measures should be simplified.
Administrative burden for crisis management measures should be simplified.

The EU Fruit and Vegetables Sector
PE 460.043 69
6. Towards 2020.
Policy mix for F&V CMO: suggested changes in relative
weights of tools (single payment scheme, operational funds and programmes, crisis prevention and management
scheme, etc.).
Operational programmes are considered as a key instrument.
Crisis prevention and management should be kept.
No priority is given to the single payment scheme, though the general opinion is not against it.
Operational programmes are considered as a key instrument.
Crisis prevention and management should be kept.
No priority is given to the single payment scheme, though the general opinion is not against it.
Operational programmes are considered as a key instrument.
Crisis prevention and management should be kept.
No priority is given to the single payment scheme, though the general opinion is not against it.
7. Towards 2020.
Suggested changes in crisis prevention and management
schemes
Simplification of crisis management procedures and introduction of further and more powerful instrument to create an effective safety net.
Simplification of crisis management procedures.
Introduction of revenue and income stabilization tools.
Simplification of crisis management procedures.

Policy Department B: Structural and Cohesion Policies
PE 460.043 70
3.2. Swot analysis: EU F&V sector and CMO measures
Strengths Weaknesses
a) Complete range of fruit, vegetable and citrus products of the temperate zone within the common market
b) Large quantities of products coming from integrated and organic EU agriculture
c) Skills and technological knowhow widely available within the people working in the EU F&V industry
d) Excellent organizational and business performance in some areas and for certain products, particularly in central and northern regions of the EU
e) Existence of EU-wide networks of modern grower-shippers and logistic platforms
f) Presence of recognized corporate brand, local products and/or geographical indications
g) Positive role of CMO's Producer Organizations in concentrating production and managing operational programs
a) Large share of production coming from small farms with higher production costs, particularly in Southern EU regions
b) Significant quantities of product does not conform to emerging quality standards
c) Insufficient production control and insufficient organizational performance in some areas and for certain products, particularly in Southern EU regions
d) Inadequate business approach - with an orientation to production and shipment instead of demand and market management - in some areas and for certain products, particularly in Southern EU regions
e) Large share of unbranded production, particularly in Southern EU regions, sold to traders and distributors using their own brand
f) Obsolete and inefficient logistic networks and marketing channels, particularly in Southern EU regions
g) Weak inter-branch organization and agreements
h) Strong heterogeneity of organization rates, which makes difficult matching policy tools and objectives
i) Weakening of conditions for recognitions of CMO’s Producer Organizations making them less effective
l) Financial rigidity of the endowment of risk and crises prevention tools provided in the operational fund by the current CMO
m) Complexity of adoption of risk and crises prevention tools that becomes a factor of biased selection among measures and a source of bias against small farms (usually more vulnerable to risks and crisis)
n) Weakness of: market monitoring, border controls, use of antidumping and safeguard measures on imports, challenges to unjustified SPS and TBT on EU exports

The EU Fruit and Vegetables Sector
PE 460.043 71
Opportunities Threats
a) Affluent domestic markets, with a positive image of Community’s productions and high willingness to pay for quality products
b) Construction of development projects for strategic productions and their integration into programs of consolidation
c) CMO and policies to strengthen producer organizations for greater concentration of supply
d) Evolution of supply chain relationships and regulatory market mechanisms towards greater coordination
e) Presence of important F&V districts in several EU regions, particularly in Southern EU
f) Package of crises and risk prevention tools provided by the CMO
g) Enhancement of Community’s F&V production by setting quality standards guaranteed and perceivable by consumers
h) Policy of promotion of F&V consumption, including programs of communications and nutrition education to the consumer
i) Development of healthy habits with a positive impact on F&V consumption, including a new trend for consumption of local and seasonal products
l) Cooperation of EU POs with producer and marketing organization based in non-EU Mediterranean Countries
a) Shrinkage of the EU F&V sector, particularly in regions where a large share of production is unfit to the requirements of modern retail
b) Deterioration of competitiveness and margins of agricultural production in the face of increasing demands for services by the GDO
c) Deterioration of margins of agricultural production due to the weakening of bargaining power with respect to the distribution system and in particular to the buyers of large retail chains
d) Displacement of EU F&V production due to the increasing production and trading role of emerging non-EU countries (Mediterranean, South Africa, Central-South America)
e) Increased frequency and severity of market crisis in connection with the increasing openness of markets and globalization of supply chains
f) WTO and preferential trade agreements facilitating access to the EU markets of F&V products from emerging developing countries
g) Increasing competition from countries where the labour and environmental standards are weaker than in the EU

Policy Department B: Structural and Cohesion Policies
PE 460.043 72

The EU Fruit and Vegetables Sector
PE 460.043 73
4. EXPLORING NEW MEASURES AND TOOLS TO IMPROVE ORGANIZATIONAL FRAMEWORK AND BARGAINING POWER OF PRODUCERS
4.1. The EU’s evolutionary policy setting
4.1.1. The CAP-2013 scenario
The recent Communication of the European Commission on the EU budget review (COM (2010) 700) highlights how the new amount of resources in each budget item should consider the main policy priorities set in the Treaty of Lisbon together with the broad objectives of the Europe 2020 strategy: an intelligent, sustainable and inclusive growth. More in details, improving the level of employment, investments of at least 3% of the GDP in research and development; reduction of the greenhouse effects and improving the production and use of alternative sources of energy; increasing education and reducing poverty are the main objective of the EU for the next future.
At the same time, the EU Commission shall present the proposals of the CAP regulations that will follow up the Communication of November 2010 (COM (2010) 672).
The two reforms, although formally independent, are of course strictly connected and show many interlinks. Indeed, this relationship has occurred also in the past: the definition of the budget frameworks has always been influenced by the need to find a reasonable balance between the CAP expenditure (the most relevant in quantity) and the other budget items, given the increasing necessity of a budget control. Another element that supports the interlinks between the two processes is the frequent cross-quotations of the two Communications in each other, at a level that is now quite unpredictable to establish which one of the two will have the priority and will lead the whole process of reform.
In the context of the post-2013 CAP process and the adoption of the Commission’s Communication on the CAP towards 2020, the Quality Package and the Milk Package an extensive debate about policy instruments has been developed, stimulated by the public consultation launched by the European Commission itself. The debate has been dominated by the nature and the goals of the direct payments (Buckwell, 2009 ; Bureau, Mahé, 2008 ; Bureau, Witzke, 2010 ; Swinnen, 2009 ; Zahrnt, 2009), but also market measures have been undertaken relevance, especially related to: (i) market orientation; (ii) streamlining and simplification; and (iii) improved food chain functioning.
The Commission’s Communication of November 2010 has also focused on direct payment, whilst has maintained on a more general level the issues relating to both market measures and rural development. As regards market measures, the Commission has considered necessary to keep the overall market orientation of the CAP, “streamlining and simplifying instruments currently in place, as well as introducing new policy elements with respect to the functioning of the food chain”. With the removal of the traditional intervention instruments and the supply 23 control tools (as dairy quotas and sugar), the focus moves on “safety nets”, to be used in case of “price crisis and potential market disruption”, and on those measures that act on contractual relationships along the chain in order to strengthen
23 As regards, it is worth mentioning the resolution of the Advisory Group on Fruit and Vegetables (2010).

Policy Department B: Structural and Cohesion Policies
PE 460.043 74
producers’ negotiating ability. For the crisis management measures, they could instead move towards the second pillar. Within the policy field concerning “market measures” the Commission has outlined, as key issues of interest, “the current imbalance of bargaining power along the chain, the level of competition at each stage in the chain, the contractual relations, the need for restructuring and consolidation of the farm sector, transparency, and the functioning of the agricultural commodity derivatives markets”.
Moreover, the Commission has asserted that the two pillars of current CAP policy would remain: a first pillar on direct payments and market measures defined at the EU level, and a second pillar addressing multi-annual rural development measures that Member States can adapt to their specific needs. The second pillar should also include a risk management toolkit “to deal more effectively with income uncertainties and market volatility”.
4.1.2. Strategic issues of F&V CMO reform within the current post-2013 CAP debate
The political debate on the CAP reform has been the occasion of starting an extensive discussion on the future of CMO for fruit and vegetable sector, in which many stakeholders as well as some institutional subjects have been involved. Many key issues have been focused, arising from the need of understanding whether the set of existing instruments for the F&V sector is still relevant and adequate to face the increasing market competition and its volatility, as well as to bring the F&V sector to the post-2013 CAP scenario. In other words, a key question is whether the F&V CMO with its specificity is still consistent with the ongoing CAP reform. On this subject many stakeholders have expressed a great concern about the future of the F&V CMO, asserting that it would be more suitable to maintain the specificity of the F&V CMO within the CAP reform and the EU budget resources devoted to the sector as well. This, in particular, has been remarked especially owing to the Commission’s Communication of November 2010 in which it has been made reference to tools affecting other sectors, but without specific indications for the CMO for fruit and vegetables. Thus, notwithstanding the F&V CMO itself with its instruments, namely POs, has been considered as an example for other sectors, such as in the case of Milk Package.
The main issues on which the debate24 relating to F&V sector has focused its attention regard: (i) increasing the level of Community aid in order to encourage mergers of POs and set up of APOs and on a transnational level; (ii) developing competition rules better addressed to the organisational framework; (iii) improving/reviewing crisis prevention and management measures within POs’ operational programmes; (iv) providing at a horizontal level additional and complementary tools aimed at managing more severe crises.
Taking into consideration the very differentiated development of producer organisations among Member States (see paragraph 2.1), and also considering the opinion of the F&V operators, claiming that “the objectives of the aid scheme for the fruit and vegetable sector will remain valid in the post-2013 CAP” (Copa-Cogeca, 2010), the question is how the support system to F&V producer organisations should be improved in the CAP after 2013 in order to encourage the supply concentration, rebalance the bargaining power in the supply chain, improve the efficiency and transparency of the F&V supply chain, reduce the fluctuations of producers’ income, strengthen EU trade sector and improve instruments stimulating F&V consumption. All that taking into account EU budgetary constraints and WTO requirements.
24 Among the several contributions to the debte on the future of the F&V sector developed at both EU and
Member State levels, it can be mentioned Appeltans (2010) and Rabboni (2011).

The EU Fruit and Vegetables Sector
PE 460.043 75
4.2. Market measures and risk management in the F&V sector
4.2.1. Relevance and adequacy of the current EU F&V market measures
Withdrawals are a market measure that had great importance in past years in the management of the CMO of fresh F&V when they were used aiming at supporting prices when they were particularly low. Nowadays they do not fit adequately the way in which market crises are managed within the CMO’s measures for their prevention and ex-post management. The poor adequacy of withdrawal to the management of market crises is related to the fact that producers are compensated for not selling on the market, which does not make very much sense. Compensations, if any, should be granted in case of low revenues/incomes after the sales are made because of low prices. This would have the merit to avoid ethic or environmental problems arising from a measure that being not coordinated among POs doesn’t have any effect on market prices and therefore on market crises. Moreover, also consumers would benefit from low prices. Of course, in such situation of market crisis compensations for low prices, borne by taxpayers, would show clear problems of moral hazard with increasing cost for supporting such measures.
Another critical issue in the present way in which market crises are managed within the CMOs is related to the possibility to support the payment of insurance premiums. Such possibility is improper on a general ground, but also for the way in which it has been implemented. In some circumstances, at least for countries that adopted this measure in their National Strategy, like Italy and France, this measure would be a substitution of support measures to payment of agricultural insurance premiums that were previously charged on MS budgets in a framework of compatibility with EU state aid rules. Spain, that has the most developed system of support to agricultural insurance, has not implemented the measure within its National Strategy. Moreover, since only 1/3 of the operational fund may be used to finance market crises measures, even in the case all financial resources would be used to support insurance, in spite of the increased EU contribution to the operational fund may be up to 4,6% of the value of POs marketed production, it is hardly possible that such resources would be enough for the payment of premiums given their usual amounts.
Besides these considerations, it cannot be forgotten that current Gatt rules allowing the classification of support to payment of agricultural insurance premiums within the green box oblige to insure the whole farm production. This requirement doesn’t fit the current institutional arrangements of POs allowing the membership of F&V producers also for a single product. Therefore the only insurance contracts that could be funded by the operational fund is related to the risk of losses to POs arising from the decrease of marketable production due to negative effects of weather on yields of POs members.
Among the measures defined by the reformed CMO of F&V for prevention and management of market crises, promotion and communication measures are those resulting more widely adopted by POs implementing the set of measures. The success of these measures seems related to its easier accessibility comparing the others. However, they often add to other standard activities provided by the POs operational programme. The effectiveness of promotion and communication activities provided by POs within the crisis prevention and management measures is not known. According to managers of POs that used this measure, it helps in affirming their brands on the market and also in finding new market outlets when crises occur. However, it seems compelling a clearer definition of operating contents of the tool and of its implementation modalities, defining the way in which it

Policy Department B: Structural and Cohesion Policies
PE 460.043 76
integrates the same kind of measures that can be implemented within the operational programme.
A critical point in the present organization of market crisis measures within the CMO is related to their financial limits that are constant overtime. Since temporary market crises -structural market crises are a different issue- are not a stable variable in time, it is necessary to introduce arrangements allowing a wider intertemporal flexibility of financial limits to the measures according the needs of intervention. Currently, the possibility of a modulation of market crisis measures from one year to another is completely missing. Of course, in the mean time it is necessary to introduce arrangements aimed at avoiding a recurrent use of this type of measures with the negative effects that this could have.
4.2.2. Preventing/managing market crises
It is worth to underline that a first and relatively easy measure of crisis prevention that producers may adopt to manage market crises for F&V is the joining of POs. Membership of such organizations is an effective system of market risks pooling among members. Moreover, the diversification of market channels and outlets granted by the POs operation is also a strong system of market risk management. Of course these conditions require a functioning of the POs in which both market sales of all product transferred by their members and the production activities at the farm level are centrally managed by the POs. Therefore large POs, with a better structured organization and a strong orientation towards large retailing are also more successful in market risk prevention and management than smaller and diversified POs. This means that the easing of conditions for the recognition of POs requiring lower value of marketable production does not match the need to improve risk management capability in the EU F&V industry. However, any action aiming at the improvement of the share of organized production particularly in area where it is not adequate is a good way to prevent as well as to manage market crises.
A further instrument for the prevention of market crises is the implementation of market intelligence activities. Monitoring of F&V markets through the collection, elaboration and analysis of relevant data on prices, consumer preferences and behaviours, product supply and meteorological trends and their spreading among POs may give help in anticipating possible temporary or structural crisis that could be better managed and prevented with timely intervention. The implementation of this activity is not easy and would require a certain degree of centralization in agencies able to serve association of POs or the totality of POs in a country (see also par. 3.3.2).
4.2.3. Stabilizing the F&V market and producers’ income
There are several suggestions aimed at the improvement of efficacy of CMO measures of market crises management. In the previous pages it has been stressed that a wider modulation of market crises measures is highly advisable. This could be obtained either allowing a certain degree of yearly variability of expenditure for the management of market crises within a PO or through exchange of intervention rights among different POs perhaps within the framework of an association of POs. This could be obtained fixing the caps to market crises intervention measures either at a three years average level for each PO or at the level of association of POs.
In such a framework it would be also possible to increase withdrawal indemnities keeping constant the expenditure overtime. For example it would be possible to introduce a limit to stay in the cap within two years. However, withdrawals must be used very carefully

The EU Fruit and Vegetables Sector
PE 460.043 77
particularly if indemnities are increased for the moral hazard problems involved in their use. Higher indemnities may boost the production of hardly saleable low quality products, that would create difficulties also to higher quality products. Therefore the quantity limits should be kept unchanged.
Measures for the implementation of mutual funds didn’t get very much attention, probably because the support is oriented only towards administrative expenses for their implementation. However the role of saving/credit should be enhanced given their ability to transfer risk overtime. At this aim it would be useful to analyse the conditions for implementation of security funds within POs with an approach similar to the Agristabilty program implemented in Canada25. This could be obtained defining ranges of revenues calculated on the last three year average, for example -30% and +20%. When revenues are above the upper limit of the range, the exceeding revenues could be saved in a fund with a matching quota from the operational fund (or from EAGF). This money could be invested in EU state bonds earning interest paid. In the case the revenues fall below the lower limit the POs have the possibility to withdraw money from the security fund to cover losses exceeding -30%.
At the beginning of the operation of the security fund, when its size is not yet enough to cover possible losses, it would be necessary to use funds from commercial credit banks with interest paid on the POs operational funds.
Beside this tools thought for the management of temporary short term market crises it is necessary to design tools for the management of long term structural crises. To this aim it is necessary to imagine the possibility for POs to borrow funds from commercial banks in order to support restructuring of activities of their members particularly in the fruit industry where long term crises are more relevant.
Box: Futures contracts: the case of Florida oranges
Futures markets are institutions in which futures contracts are exchanged among agents wanting to insure the price of a transaction in a certain future time. Their rise was due to the necessity of producers and users of commodities to know the price they will receive/pay in at the expiring of the contract. Agricultural products are among the most traded commodities in futures markets. Contract exchanged on these markets refers to standardized products. Among the different characters contributing to standardization, quality is one of the most important and must be clearly identifiable, this condition is relevant since it makes possible a large participation of agents in the market. For this reason not all agricultural commodities are suited to be exchanged on a futures market.
In the case of fruit and vegetables the only product for which there is a regular and continuously working futures market is the frozen concentrate orange juice (FCOJ). These contracts are traded on the New York Intercontinental exchange (ICE) and are referred to a USDA Grade A product with a Brix value of not less than 62.5 degrees, with the grading performed by USDA. For fresh F&V products there is a difficulty in setting futures markets because the quality of these products is largely variable and therefore it is not easy to define standard contracts.
25 Canada has a long history of risk management programs built on security funds in which farmers contribute in
years of higher income with support from government, while withdrawing in years of low incomes (Cafiero et al. 2007).

Policy Department B: Structural and Cohesion Policies
PE 460.043 78
Although the FCOJ futures and options may be an effective instrument for price risk management, in the orange juice industry the volume of contract negotiations is relatively low if compared to other commodities. The daily volume of transactions of FCOJ in the ICE market is on average less than 2% of total agricultural commodities (other traded commodities on this market are cocoa, coffee, cotton and sugar, that is the most traded). The reason of such weak interest seems related to the high transaction costs to participate in the market. For this reason Brazilian producer of orange juice prefer to use forward contracts referring to the Rotterdam price with the delivery of the product instead of contracting on futures (De Figueredo Tavares, 2008), while contracts on the ICE market are generally subscribed by US firms. However there is a strong relationship between spot prices on the Rotterdam market and the price of futures contracts exchanged on the ICE market.
Studies on the dynamics of price of FCOJ futures contracts underlined that there is a close link between these prices and fundamentals of the market such as temperatures close to or below freezing in the Orlando area in Florida, were the most part of US oranges for juice are produced. However their relationship with price of oranges for the fresh market are not known. Such relationship would be relevant for the use of futures contracts on FCOJ to hedge price risk in the fresh oranges market.
Differences between futures prices of an agricultural commodity and the price that farmers receive selling that commodity are a source of the so called “basis risk”. The size of basis risk affects the possibility to use a contract to hedge the price risk of a commodity. Differences between spot prices observed on a market and future prices depend on several factors such as the distance between the two physical markets, differential in quality, exchange rate, in the case of markets located in different countries.
An attempt to establish a futures market for fresh F&V products in the EU was the Valencia futures market for citrus fruits in the ’90. Although there were high expectations on the ability of this market to create more transparencies on the price determination process of fresh oranges, it was not able to become an effective instrument for price risk management. Relationships between futures and spot prices of Navel-Navelina oranges were rather poor (Fernandez Izquierdo and Munoz Torres, 1998). The reason of the poor performance were linked to the low participation of agents operating in the spot markets, even though the traded volumes were not small. The lack of consolidation of the Valencia futures market for citrus fruit caused the ending of its operation after few years.
4.3. Regulating F&V vertical market relationships: contractual models
4.3.1. Rebalancing bargaining power and improving relationships along the F&V chain
Contractual relations have gradually become established over the last decades as a result of the process of concentration that has accompanied the substantial growth of large-scale retail, causing a strengthening of contractual power vis a vis upstream suppliers, especially when they are operating in sectors, even as F&V, where many areas and productions are characterized by a low level of concentration (see par.2.1.1.). This development has led to an imbalance in power relations within the agro-food market, bringing about significant change in the relations that large-scale retail has with agricultural producers, as well as in

The EU Fruit and Vegetables Sector
PE 460.043 79
the process of formation of added value along the agro-food supply chain, at the expense of the agricultural sector (see par.1.1.1.).
This situation poses two questions which are closely interrelated, and which take on particular relevance in the F&V supply chain: the first concerns the increased buying power of large-scale retail; the second concerns the contractual relationships that large-scale retail maintains with upstream subjects in the chain, namely agricultural producers and the food industry. On the other hand, "an increase in buying power of large-scale retail also necessarily translates into strong negotiating power in contractual clauses with supplying subjects" (Marette, Raynaud, 2003) as well as an increased share in overall profits within the vertical structure that large-scale retail can require (Allain, Chambolle, 2003).
In this process, commercial brands (private labels) and other distinguishing marks of quality play an important part, forming the basis of the undertakings' competitive strategy and a central element in the reorganisation process of productive systems. This is because ownership of brands, especially if they are strong and used to full advantage, can also be a means of altering power relations between the actors in a supply chain (Marette, Raynaud, 2003). In particular, with the introduction of commercial brands, large-scale retail has further consolidated its contractual strength towards upstream suppliers, attaining a pattern of "vertical control of the supply chain". On one hand this enables them to improve overall efficiency of exchanges within the supply chain (by reducing information asymmetry and relative transaction costs) and to maximize "aggregate profit", but on the other hand it puts large-scale retail in a position to dictate pricing policies and product characteristics and to exercise control over production operations themselves.
These types of highly binding contractual integration realise oligopsonistic situations within which the agricultural producers find themselves in a position of subordination and greater dependence than in the past on a single preferred buyer (OECD, 2005), which is made even worse by the profound changes the relationships in the supply chain have undergone.
In the current situation, where difficulties and imbalance in the market functioning are on the rise, the contractual system which has gradually established itself with forms of vertical integration is not only incapable of reducing the distorting effects but also increases instability. So the "rules of the game" have to be changed, by recourse to organisation solutions which will enable the reconstitution of better balanced exchange relationships. On a more general level, it is the adoption of other methods of intervention which can work through a market regulatory mechanism, of institutional nature, such as interbranch organisation. In other words, the producer associations are a strategic lever that can "restore symmetry to the organisation of the transaction, between a multiplicity of scattered producers and a highly concentrated distribution sector" (Ménard, 2003).
4.3.2. Enhancing market transparency
Information constitutes a key issue in achieving any form of coordination, as it is needed to determine the best use of resources: making effective choices needs information on available resources, technological possibilities and consumer tastes (Milgrom, Roberts, 1992). In the agro-food market it is well known that the input supply companies and large-scale retail traditionally hold information, while agriculture remains in an extremely weak position.
Information can therefore be considered a strategic element in the development process of an agro-food system and this is exactly why it confers a competitive advantage to its

Policy Department B: Structural and Cohesion Policies
PE 460.043 80
holder. In the current set up of market relationships, price role has been greatly reduced, having been replaced by coordination based especially on a system of rules, such as those established through contracts (Raynaud, Valceschini, 2007).
The availability and the quality of market information are very important especially in relation to market regulation, but also to contractual relations, crisis prevention, and so on. However, a debate has developed around the opportunity to achieve greater price transparency and whether this is really advantageous to farmers. As regards, EU Commission expressed a great concern about the use of detailed information on prices, because it could determine a major advantage for buyers (and their collusive strategies) to the detriment of farmers. Thus, because “buyers have an increased knowledge of supply pricing and they consequently use this information in negotiations with farmers” (European Commission, 2010a).
On the other hand, the European Commission itself (2009a) identified in the lack of price transparency and asymmetries of information regarding price formation mechanisms along the supply chain some of the factors which are contributing to market failure. At the same time the High Level Group on the Competitiveness of the Agro-Food Industry in its Final Recommendations (2009) asserted that “improving the understanding and knowledge of price transmission as well as of contractual arrangements along the food supply chain is of crucial importance and should be a priority action of existing national ‘Markets and Price Observatories’. The outcome of these actions would contribute to improving the effectiveness of market positioning strategies by agricultural producers through the setting up of producer groups and agro-food cooperatives” (Recommendation no. 14: Support the effective integration of agro-food SMEs in the food chain).
As regards, it is worth mentioning an interesting example coming from the United States and relating always to the dairy sector. It is the Dairy Product Mandatory Reporting Program (USDA, 2008b) that requires dairy manufactures “to provide to USDA certain information including price, quantity […] of dairy products” sold by them and stored as well. Thus, in order to provide for “timely, accurate, and reliable market information” that may facilitate more informed marketing decisions and promote competition in the dairy product manufacturing industry.
Another just recent project, regarding several agricultural products among which F&V, comes from France, where an observatory on the price and margin formation (Observatoire de la formation des prix et des marges des produits alimentaires)26 set up by the relevant law « Loi de modernisation de l’agriculture et de la pêche », following a former and more informal body operating since 2008. The observatory is entrusted to an institutional subject, FranceAgriMer27, which, in collaboration with the public statistic services, makes and spreads each month some national references of product prices at the different stages in the chain, and analyses gross margins through the identification of the various types of costs at each stage.
For the purpose of enhancing market transparency, it could be envisaged a suggestion about the establishment of a market observatory for F&V sector at Member State level (see par. 4.2.2.). The observatory could be, first of all, a monitoring tool – by collecting and aggregating price and quantity data - which would contribute to better understand how prices evolve not only on the F&V market but also at each stage in the chain. This could be
26 See FranceAgriMer: http://www.franceagrimer.fr/projet_02/04infor_eco/index401.htm 27 FranceAgriMer is a public administrative institution set up in 2009 by the merger of fives agricultural offices
(Ofimer, Office de l’Elevage, ONIGC, Onippam and Viniflhor) as exchange and arbitrage place.

The EU Fruit and Vegetables Sector
PE 460.043 81
a very difficult exercise because of the complex process of price formation along the F&V chain, which depends on several factors embodied in the relational frameworks and structural inefficiencies existing inside the chain.
The observatory could be entrusted to an institutional subject (for instance, interbranch organisation, if any, or otherwise some other suitable established body) which, in collaboration with national statistic services and national institutions of public research, would furthermore have the task of making analyses and reports supporting the decisions of economic actors and policy makers.
4.3.3. Contractual arrangements: from single/collective contracts to interbranch agreements
Production and marketing contracts have been used in agriculture for a long time, particularly for perishable products delivered to the processing industry, such as fruit and vegetables. Contracts offer several advantages to farmers (MacDonald, Korb, 2011): a reduction of the income risks arising from fluctuations in commodity prices and yields; an assured market outlet for products, especially delivered in markets with few buyers and, consequently, a better return on investments in physical capital and time assured to farmers; prices tied more closely to product attributes and, then, higher returns provided to farmers who adopt quality attributes.
On the other hand contracts can also increase certain types of risks for farmers due to the fact that they are tied to a sole buyer, whatever its economic choices may be.
However, agricultural contracts can lead to improvements in efficiency of supply chain organisation, through a transaction cost reduction, above all as a result of the remarkable transformation process that has involved agro-food chains. These changes, consisting in consolidation (increasing concentration in processing and retailing), new patterns of consumption (food quality and safety concerns), and technological changes, have stimulated changes also in organisational scheme towards greater degrees of vertical control by the downstream subjects (Vavra, 2009). The result of this process is an increased use in recent years of contracts in agriculture, characterized by a wide variety of arrangements that can differ a lot both among agricultural sectors and among single products within a same sector.
The contracting issues in agriculture rise a question about a possible role played by policy intervention in regulating this arrangement, for which a suggestion could be fixing common rules and a shared vocabulary for contracts which would allow to reduce the transaction costs of negotiating (Schwartz, 2002; Wu, 2006; Vavra, 2009). A related very sensitive issues regard unequal market power and fairness of contracts. In order to prevent abuses of market power towards weaker subjects, as generally farmers are, and rent seeking as well, the public authorities could have an important role in overseeing the contractual relationships between upstream and downstream actors, ensuring that “the margin-sharing throughout the sector takes place under the most transparent and, where possible, most balanced conditions” (Chatellier, 2009).
In this view, considering that “action is needed to eliminate unfair contractual practices between business actors all along the food supply chain” the European Commission, in the Communication A better functioning food supply chain in Europe, suggested a number of policy initiatives aimed at overcoming problems tied to contractual imbalance associated with unequal bargaining power and promoting sustainable and market-based relationships

Policy Department B: Structural and Cohesion Policies
PE 460.043 82
between actors along food supply chain. These initiatives will entail: (i) exchanging of information on contractual practices, launching of awareness campaigns, exchanging of best practices on notification of contractual practices; (ii) preparation of sets of standard contracts; (iii) assessing unfair contractual practices on internal market and proposing any necessary Community measures to address them. These actions require to improve monitoring of potential competition issues in the chain by developing a common approach together with European Competition Authorities.
The EC policy initiatives aimed at supporting the activities of the High Level Expert Group on Milk, especially those regarding the assurance that all actors of the chain rely on fair and sustainable contracts and the preparation of sets of standard contracts.
On the basis of the recommendation on contractual relations expressed by the High Level Expert Group on Milk (2010), the recent proposal of European Commission (2010d) provides for optional written contracts between farmers and processors to be drawn up in advance for deliveries of raw material, which would include the key aspects of price, the timing and volume of deliveries, and the duration of contract. Member States can make these contracts compulsory. In order to take into account the specific nature of cooperatives, these are not required to subscrive contracts on the condition that their statutes provide for rules addressing the same objectives.
It is worth pointing out a recent experience in France where the Government has decided, for milk and F&V sectors, to make the contractualisation between producers and their buyers compulsory. At the end of 2010, on the basis of the French law « Loi de modernisation de l’agriculture et de la pêche », a decree has been issued regulating the signing of writing contracts for the selling of fresh F&V. The commitments provided by the decree regard its duration of at least three years, as well as the specification of some relevant elements such as the volume and quality characteristics of delivered products, the modality of produce collection and delivery, the criterion of price determination for each product and so on.
The French Government’s decision has arisen a wide debate involving F&V stakeholders. In particular, opposite voices to compulsory contractualisation have been expressed by the French agricultural world which is, on the contrary, in favour of a contractualisation developed within an interbranch organisation, that is, in an official concerted view that involves all actors of F&V chain.
Another crucial aspect refers to the duration of contract, because if, on the one hand, a longer contract allows farmers to decide for “optimal investments”, on the other hand it could make more difficult to define key contractual elements, in particular “price indexation”28 (Requillart, 2009).
Taking into account the above-mentioned experiences, it could be envisaged the possibility of developing, within a general framework outlined at EU level, a contractual model that provides the settlement of minimum standard conditions, although a right degree of flexibility has to be considered given the specificities characterizing each F&V product and region. This could be entrusted to an interbranch organisation which should draw up an interbranch agreement on contractualisation that, in order to avoid unfair commercial practices, allows to state guidelines and promote best practices as well as market transparency.
28 As this regard an interesting analysis has been developed by the French competition Authority (Autorité de la
concurrence, 2010).

The EU Fruit and Vegetables Sector
PE 460.043 83
Furthermore, it could be suggested an useful remark upon “pricing” element of contract in relation to the possible introduction of a price mechanism that can safeguard the economic sustainability of productions and then the return for all actors in the F&V chain. The suggestion regards the adoption of a price modality that provides for a mixed solution in which a share of price could be tied to incentives to product quality and/or quantity commitment.
As far as the interbranch device (organisation and agreements) is concerned29, it can lay down the necessary conditions for the market to function more efficiently (Bovet, Chappuis, 2001), with greater transparency and in accordance with a fairer division of risks and profitability from the production processes set up. It can strengthen the coordination and collaboration action between various stages of the supply chain, in order to counter and reduce opportunistic behaviour, while encouraging cooperative one, as well as restore balance in power relations on the market.
At the same time, interbranch device can play a fundamental part in helping individual producer associations to acquire a truly active role on the market and reach an effective level of concentration and control of supply, using the erga omnes tool (Petriccione, 2008). However, the issue of the extension of rules raises the problem of political choice, given that it has to be applied in accordance with certain conditions and with the guarantee of its compatibility with Community competition rules30 (see Annex 6 - Competition and regulation in agriculture).
4.3.4. The strategic role of POs in contractual relationships
The producer organisations are an important tool in governing agricultural production which, by means of functions such as aggregation and concentration of production as well as planning and enhancing supply, enables producers to regain strategic levers (differentiation and recognisability of products, information, etc.) and the chance to put themselves on the market in a more competitive condition, and therefore acquire a greater share in the added value generated along the supply chain. The importance of these functions is obvious, not only because they fulfil the need to counteract the contractual strength of the large-scale retail, but they also make it possible to govern the market and play a part, through production planning, in an effective preventive action against crises in the market (Petriccione, 2009). Planning supply constitutes a strong market tool since it meets the aim of greater stability in prices and therefore income for producers; an important aim, especially in the current context of growing market instability affecting agricultural companies as a result of decreased income support decreed by the new CAP.
The collective action arising from the producer organisations is obviously a source of economic advantage (critical mass of the product, planning supply to meet the needs of demand, better and more economic use of market information, drawing on better
29 As defined by Article 123 of the Single CMO Regulation, interbranch organisation is made up of representatives
of economic activities linked to the production of, trade in, and/or processing of products in a number of sectors. It carries out two or more of the following activities in the interestof all or some of the subjects which constitute it : (i) improving knowledge and market transparency ; (ii) drawing up standard forms of contract compatible with Community rules ; (iii) laying down production and marketing rules ; (iv) promoting integrated production and other environmentally sound production methods, and so on.
For an in-depth analysis on the role and definition of the interbranch organisation see: Coronel and Liagre (2006); Giacomini, Arfini and de Roest (2010). With this regard, it is worth mentioning the interesting French experience of interbranch organisation and agreements, recognized as the most consolidated one at international level.
30 It shoul be noted that there is no European legal body that delineates the range of action of an interbranch organisation, even if the Single CMO recognizes its legitimacy by Member States on the basis of their national laws.

Policy Department B: Structural and Cohesion Policies
PE 460.043 84
conditions for access to credit and collective buying for input, making collective investments) which allow farmers to acquire, although indirectly, strength in the market that would not be possible by acting individually; a strength that is fundamental to contractual relations. In the current setup of market relationships, the collective contract constitutes an important coordination tool in the supply chain, based on a system of rules agreed upon by the economic actors.
The relevant experience of European fruit and vegetables shows a process of growth and reorganisation of the production system, encouraged by the last two reforms of the CMO for fruit and vegetables, involving Member States in different ways in terms of dynamics and characteristics (see paragraph 2.1). Nonetheless, empirical evidence shows that the path undertaken to encourage F&V producer organisations - and with them the achievement of the aims of aggregation and concentration of supply - has proven to be anything but straightforward.
The current situation features the presence of a more advanced, organised component which, in response to a "market mission", is more suitably fulfilling the functions of product enhancement and over the last few years has been able to exploit the possibilities for growth and renewal offered by the F&V CMO. Aside from this, however, there is a significant number of POs especially located in certain areas of Southern EU, which, mainly in response to the idea of aggregation, perform functions that are very strictly limited to service function, that is merely placing members' products on the market (Agrosynergie, 2008a; Bertazzoli and Petriccione, 2006). These are bodies which are generally of a minor economic dimension in character and pay less attention to market development; to date they have demonstrated difficulty in the aggregation process, which has been unable to transform itself into an adequate concentration and programming of supply.
Obviously in the EU there are excellent examples that confirm the validity of the association model, even if with nonetheless undeniable contradictions, but which for the most part share a common feature in boasting a consolidated experience on the cooperative front.
The last reform of the CMO for fruit and vegetables has, compared to previous legislation, provided essential elements to reinforce regulation of supply by an organised component, effectively giving strategic functions to the POs to improve competitive capacity in the sector. If this is a necessary condition for raising both the quantitative and qualitative level of the path of development undertaken by the POs towards greater concentration of production, it may prove to be insufficient, as far as certain situation of F&V production are concerned.
The new competitive strategies require the adoption of an organisational model which, in the current setup of agro-food markets, moves towards more and more stringent forms of integration, based on the high contractual strength applied by large-scale retail. The consequence of this is a change in power relations on the market with agriculture in an evident position of weakness, caused by the fact that growing concentration applied by large-scale retail is in contrast with the persistent fragmentation of agricultural production. This puts the great problem of coordination of relations within the supply chain at the heart of the question (Raynaud, Valceschini, 2007).
Summarizing, producer organisations can constitute a valid and useful counterweight by taking up a strategic role in restoring balance to market relationships, acting as a contractual power and for redistributing added value, while contributing towards transforming forms of economic dominion into models of cooperative behaviour. However, only in certain territorial or productive areas, producer organisations have managed to take

The EU Fruit and Vegetables Sector
PE 460.043 85
on the role required by the market, albeit with great difficulty (Agrosynergie, 2008a ; Bertazzoli and Petriccione, 2006). The CAP has always intervened focusing on the organisation and concentration of agricultural supply. This is particularly true for the CMO for F&V, where the concentration of production is defined as an "economic necessity" to consolidate the farmers' position on the market and help them face future challenges which the CAP itself has bet on.
For this reason and in consideration of the opinions of most interviewed POs in INEA survey as well as of the other stakeholders, we agree on the need of maintaining POs’ framework and their relevant tool, as operational programmes, however introducing some adjustments in functioning rules, for example through their major simplification.
Furhermore, a suggestion could be the introduction of a top-up on the Community aid as a form of premium for commercialisation of quality products.
On the other hand encouraging sizeable POs, able to cope with large-scale retail, put a problem in terms of competition rules, around which an intense debate has developed.
4.4. Competition policy and regulation of F&V market relationships
4.4.1. EU competition rules and their implications for the agricultural sector
The agricultural sector is subject to the EU's competition rules with, however, a special regime applicable to agricultural products (see Annex 6). Article 42 of Treaty on the Functioning of the European Union (TFEU) provides that EU rules on competition shall apply to production of and trade in agricultural products only to the extent determined by the European Parliament and the Council within the framework of Article 43(2) TFEU, which itself provides for the adoption of a common market organisation for agricultural products.
In light of this provision, two Regulations adopted by the Council and governing the application of competition rules to the agriculture sector are currently in force:
1. Council Regulation (EC) No. 1234/2007 (Single CMO Regulation), which establishes a common organisation of the markets for certain sectors included in Annex I to the TFEU;
2. Council Regulation (EC) No. 1184/2006, which applies certain rules of competition to the production of, and trade in, agricultural products, listed in Annex I to the TFEU with the exception of the products covered by the Single CMO Regulation.
Both the Single CMO Regulation and Regulation (EC) No. 1184/2006 provide for the same substantive competition rules applicable to the agricultural sector.
Article 175 of the Single CMO Regulation provides for the general application of anti-trust competition rules to the agricultural sector subject to three exceptions in Article 176(1)31. These three exceptions only concern Article 101 of the TFEU. Article 102 of the TFEU (abuse of a dominant position) therefore remains fully applicable to the agricultural sector.
31 These three exemptions refer to:
(1) Agreements which are an integral part of internal market organisations; (2) Agreements necessary for the attainment of the objectives of the CAP (Article 39 TFEU); (3) Agreements between farmers, farmers’ associations and associations of farmers’ associations concerning
the production or sale of agricultural products or the use of joint facilities for the storage, treatment or processing of agricultural products.

Policy Department B: Structural and Cohesion Policies
PE 460.043 86
The application of the EU competition rules may be summarised as the following scheme drawn from Desai et al. (2010). Applicability of the EU competition prohibitions
Agricultural Products Any Other Food
To the production of or trade in...
Abuse of dominance
Anti-competitive agreements unless:
Art. 39 Lisbon Treaty
National market Organisation
Farmers
Abuse of dominance
Anti-competitive agreements
Any other activity related to... Abuse of dominance
Anti-competitive Agreements
Abuse of dominance
Anti-competitive agreements
Source: Desai et al., 2010.
4.4.2. Competition policy outside the EU: the cases of Switzerland and USA
In Switzerland (OECD, 2004) the Federal Act on Cartels and Other Restraints of Competition (Act on Cartels) aims at hindering anti-competitive agreements and the abuses of dominant position, as well as monitoring undertakings’ concentration. Although the Act on Cartel considers the abuse of both seller and buyer power, the latter is an important topic in Swiss competition policy. In the agro-food sector, the issues concerning the dominant position first regard the retail sector.
Joint-activity organisations32 play a key role in the Swiss agricultural policy. Most farmer products or product groups are represented by joint-activity organisations33.
The Swiss agricultural law in connection with article 3 of the Act on Cartels contains antitrust exemptions for joint-activity organisations, as follow: (1) joint-activity organisations are allowed to take measures that improve the product quality or increase the quantity sold; (2) they can promote measures that "adjust the offer to the needs of the market"; and (3) they can publish recommended prices, modulated on the basis of quality level. The application of these recommended prices is voluntary for the suppliers. Consumer prices are excluded from this regulation.
Some measures of the agricultural law bear potential conflicts with the aims pursued by the Act on Cartels.
Although there are exemptions for several activities of joint-activity organisations, there are no such exemptions for joint selling.
32 It “would include both farmer-run cooperatives and government-operated sales organisations and rules, such as
marketing orders and market organizations as well as collective bargaining organizations.” (OECD, 2004, p. 19). 33 Antitrust concerns with respect to joint-activity organisations arose in the cheese market some years ago.

The EU Fruit and Vegetables Sector
PE 460.043 87
In the United Stated (OECD, 1998; 2004) the Sherman Act, enacted in 1890, is still the primary legal discipline which prohibits anticompetitive practices. The early years of Sherman Act enforcement addressed a number of agriculture markets.
In agriculture-related cases, antitrust enforcement may be subject to a special competition regime: the Capper-Volstead Act or the Agriculture Marketing Agreement Act of 1937.
The Capper-Volstead Act, enacted in 1922, authorizes agricultural producers to organise into cooperatives to collectively process, prepare for market, handle, and market their products without being subject to antitrust scrutiny. The authorization covers only cooperatives composed entirely of producers of agricultural product, and its protection does not extend to predatory or coercive conduct, or to mergers or collaborations with non-covered entities.
The Agriculture Marketing Agreement Act of 1937 authorizes the Department of Agriculture to issue marketing orders governing permissible conduct in marketing certain agricultural commodities, including milk. fruits, vegetables, and tobacco.
In enacting the Capper-Volstead Act, Congress did not place any limit on the permissible size of an agricultural cooperative. It is also worth noting that cooperative activity can lead to economic efficiencies, particularly if procurement transaction cost savings and procurement economies are present.
Cooperatives organised in accordance with the Capper-Volstead Act and marketing orders issued pursuant to the Agriculture Marketing Agreement Act of 1937 are authorized by statute and are immunized from antitrust scrutiny, and do not involve consultation with U.S. competition authorities. Applicable law regarding agricultural cooperatives and agricultural marketing orders area has not changed recently.
The exemption from antitrust review for agricultural cooperatives arguably makes it easier for cooperatives to form, to enter the market, and potentially to vertically integrate forward in competition with processors, if individual farmers perceive that processors are exercising monopsony power.
In United States competition rules, unlike those in EU, seem to have a more pragmatic view of the agricultural agreement issue, because farmers, by means of cooperatives and marketing orders, may act as cartel for fixing quantities and/or indicative price (Crespi, Sexton, 2003).
4.4.3. The terms of the debate at political and scientific level
In these last years the food sector is being an increasing object of attention by the European competition authorities, following the requirement of understanding the possible malfunctions of the European food supply chain that the unprecedented price hikes of 2007-2008 highlighted. In this context much of the political debate focused on two key issues: (a) the overall high prices of food; and (b) potential price stickiness in the food supply chain.
European Commission’s communications on issues relating to rising food prices and functioning of the EU food supply chain (2008; 2009a; 2009b; 2009c; 2009d) identified an increasingly expressed view about the existence of market failures in the food sector, due to: (1) asymmetry of bargaining power along the supply chain, (2) a decreasing share of

Policy Department B: Structural and Cohesion Policies
PE 460.043 88
the wealth generated by the sector and obtained by farmers, (3) lack of price transparency, and (3) the regulatory framework and rules surrounding the food sector.
At the same time in the USA the Department of Justice and the Department of Agriculture decided to explore competition and regulatory issues affecting the agricultural sector in the 21st Century. In particular, they “resolved to explore a number of different commodities and to tackle a number of important issues, including concentration in processing, buyer power, and vertical integration” (Varney, 2010). For this purpose a series of high profile workshops on competitiveness issues relating to the food sector scheduled took place in 201034.
The major complexity of the relations between the actors along the supply chain has contributed to highlight the controversial relationship between competition rules and agricultural policy, on which a wide debate at political and scientific level has developed (European Commission, 2010a; VV.AA., 2003; Desai et al., 2010). In particular, the debate focuses on the issue of agricultural exemptions to competition rules and on the need to adapt competition rules to the specificities of the agricultural sector.
Several inquiries of European and National Competition Authorities show that these exemptions are very rarely recognized, because of a very strict interpretation of competition rules35. An opinion on this regard coming out of a scientific debate (VV.AA., 2003) suggested that competition rules focus too much on those factors strictly related to agreements as price and quantities, leaving out other strategic fields as products’ quality. However, relations between agricultural product quality policy and competition rules are also rather strained.
Within the public debate on competition policy two issues seem to be particularly relevant: the increase of bargaining power of large retailers and their contractual relations with the upstream actors. There is no doubt that the retailers who hold a major bargaining power, also hold a big power to negotiate the contractual clauses with the upstream subjects. These relations put the question of legitimacy of certain contractual practices and of regulation that could set a limit to certain abuses of the retailers towards a fragmented agricultural supply. In this context, the issue of the role of POs and other forms of farmers’ associations to increase the bargaining power of farmers is one of the key points analysing the interface between agricultural and competition rules (Cesarini, 2009; European Commission, 2010a; VV.AA., 2003). Although competition law impose restrictions to farmers’ agreements, there is however the opportunity for producer organisations to operate as cooperative organisations, recognised by European Courts as pro-competitive structures, which may collectively negotiate. EU competition rules view such agreements favourably if the farmers involved in these forms of cooperation do not collectively hold a level of market power such as to restrict competition in the market to the detriment of consumers. As this regard, the recent “Milk Package” (see the box below) has proposed a quantitative limit (market share) which would allow negotiations between producer organisations, ensuring at the same time market competition.
34 See www.justice.gov/atr/public/workshops/ag2010/index.html 35 It is interesting, as this regard, the opinion of Spain’s Competition Commission in a recent report, in response
to debate on how to make the agricultural sector more economically viable following the economic downturn.. It found insufficient justification for exempting the agricultural sector from competition law. The commission maintained that exemption from competition rules can only be justified when it is necessary to ‘correct market failures that are inherent in the operating of the sector.’ Despite existing market failures in the agricultural sector, such as fluctuating market prices and a fall in demand for products, the commission found that it is possible for companies to compete freely (Global Competition Review, 2010).

The EU Fruit and Vegetables Sector
PE 460.043 89
In conclusion, considering the weak bargaining power of the F&V producers, current competition rules are too unfavourable towards them. As this regard it is worth highlighting that the Single CMO Regulation provides not only the concern about the abuse of common rules, but also the “dominant position” concern.
Within the public and scientific debate it seems to be a common agreement on the need of a development of competition rules, more addressed to rebalance farmers’ bargaining power towards a sole large retailer.
Box: The recent “Milk Package” proposal
The High Level Group on Milk (HLG) conclusions focussed on the extent to which farmers could collectively negotiate prices with processors under current competition law. The HLG chair took away three keys points:
(1) It is possible to negotiate a uniform price if the share in the relevant market is less than 5% and turnover does not exceed EUR 40 million. Beyond that a case-by-case analysis would be required, which would not necessarily be problematic.
(2) It is possible to negotiate a uniform price under two conditions: if the buyer wants a single supply price (so this is in the processor's hands) and the market share is less than 15%.
(3) If farmers form a joint venture with common assets such as trucks, tanks or storage facilities, they could negotiate a common price provided that the market share is less than 20%.
The market share is evaluated on the "relevant market" and the discussions showed that it is not easy to assess what the relevant market is.
Responding to the HLG recommendations on contractual relations, bargaining power of producers and interbranch organisations, the European Commission’s proposal for a regulation regarding contractual relations in the milk and milk products sector (COM(2010) 728) provides for a legal basis in agricultural law that, in order to rebalance bargaining power, would allow farmers to negotiate contract terms, including the price, collectively, via producer organisations. Thus, because these possibilities are limited in the absence of shared processing facilities and there is a lack of legal certainty. A size limit is proposed, even if it does not affect dairy cooperatives, to the extent that they consist of vertical integration of farmers together with processing facilities.
The proposal regards: (1) a limit of 3,5% of EU milk production which would allow negotiations between producer organisations of approximately the same size as major dairy processors; (2) a limit of 33% of national production which would ensure competition in the supply of raw milk at national level; (3) a limit of 33% of the total combined national production of all the Member States covered by such negotiations by that producer organisation.

Policy Department B: Structural and Cohesion Policies
PE 460.043 90

The EU Fruit and Vegetables Sector
PE 460.043 91
5. EXPLORING WAYS TO ADDRESS TRADE AGREEMENTS AND SAFETY STANDARDS
5.1. EU F&V industry and trade partners: is further liberalization possible?
Liberalization of EU’s F&V trade is an ongoing process stemming from overlapped results of MFN liberalization in the WTO arena and preferential liberalization in the context of the wide array of agreements and unilateral concessions linking the EU to many preferential partners.
The Euro-Mediterranean Roadmap for agriculture was adopted on 28 November 2005, by the Ministers for Foreign Affairs at the Euro-Mediterranean conference, for the acceleration of liberalisation of trade in agricultural products, processed agricultural products, fish and fishery products. F&V products – including the selected group of products highlighted in this study – are at the very heart of EU’s trade concessions to MPCs. The process involves also Turkey, which already enjoys full preferences in the levels of custom duty, though it faces the MFN levels of protection for EPs. Imports from the Mercosur area are also important. EU-Mercosur negotiations were re-launched in May 2010 targeting an EU-Mercosur Free Trade Agreement.
While EU preferential policy deepens, in the multilateral arena the current Doha Development Agenda might determine further moves towards world-wide trade liberalization and determine both preference erosion and/or further changes in EU trade policy for F&V. Doha Round negotiations will probably affect the level of EP and MTE.
5.1.1. The WTO perspective
As far as the Doha round is concerned, three relevant scenarios could be foreseen at multilateral level:
a) A significant reduction of the bound tariffs. The Chair of the Committee on Agriculture Chair drafted in late 2008 a proposal that foresees tariff concessions that will be allocated according to a band system, with tariff reductions of 50% or higher. That percent reduction could be applied to the maximum tariff equivalent (MTE) or specific tariff to be applied in case of import prices fall below entry prices. If the procedure adopted in the previous Uruguay Round (UR) negotiations is adopted, the entry price will be reduced of an amount based on the value generated by the MTE cut. Note that these reductions will be significantly higher than those agreed in the UR.
b) The hypothesis of the products involved being considered as sensitive products36. This could involve, according to the Chair’s draft, tariff cuts of one third of the normal cut and increase in TRQ. This is a possibility that could be applied to a very limited number of F&V and possibly can only be defended in those products where the entry price is still effective (see section 2.2). Note that the sensitive products
36 The Dec. 2008 draft set up, for developed countries, a threshold of 4% of tariff lines (about 80 lines at 6 digit
level of HS) to be eligible as “sensitive products”.

Policy Department B: Structural and Cohesion Policies
PE 460.043 92
will be able to keep considerable protection but in turn market access will have to increase significantly through TRQs of a size up to 6% of the domestic consumption.
c) The phasing out of the entry price system. This considers the elimination of the corresponding supplementary tariffs associated to the existence of entry prices, the ad valorem duties remaining at current levels.
Table 5. 1.: Scenarios for external protection of selected F&V in the Doha Round of multilateral negotiations
Current Hp. A Hp. B Hp. C
Tariff
(%)
EP level
(€/t)
MTE
(€/t)
Tariff
(%)
EP level
(€/t)
MTE
(€/t)
Tariff
(%)
EP level
(€/t)
MTE
(€/t)
Tariff
(%)
EP level
(€/t)
MTE
(€/t)
Clementines 16.0 649 106 8.0 596 53 13.3 631 88 16.0 - -
Lemons 6.4 462-558 256 6.4 334-430 128 5.3 419-515 213 6.4 - -
Mandarins 16.0 286 106 8.0 233 53 13.3 268 88 16.0 - -
Oranges 3.2-16.0 354 71 1.6-8.0 318,5 35.5 2.7-13.3 342 59 3.2-16.0 - -
Peaches/
nectarines 17.6 600-883 130 8.8 535-818 65 14.7 578-861 108 17.6 - -
Table grapes 8.0-17.6 476-546 96 4.0-8.8 428-498 48 6.7-14.7 476-546 80 8.0-17.6 - -
Source: WTO IDB notifications. WTO Committee on Agriculture, Chair’s draft (Dec. 2008). Authors’ calculations
Table 5.1. summarizes tariff and EPS variations in the three scenarios for selected F&V products of interest for this study. At a first glance, the reduction of the level of protection appears to be significant for scenarios A and C. In principle, there would be a certain room for a scenario B for selected products whose EP still show some stabilizing effects. However, studies reviewed in Sec. 2.2 suggest that only for some products/months/partners the EP is effective in stabilizing domestic prices, mainly in the cases of artichokes, courgettes, cucumbers, lemons, plums and tomatoes. Moreover, trade data show that the bulk of EU’s F&V imports comes either from off-season trading partners (when EPs are usually inactive) or from “preferred” Mediterranean countries engaged in deepening their integration with EU.
The perspective of tariffs and EPs/MTEs dismantling as a result of the Doha Round negotiations should therefore be assessed in the wake of the actual profile of EU’s trade partners – where the EPS is of lesser importance for off-season providers, while on the Mediterranean scene EPs and preferential quotas can still be useful tools for their (limited and selective) property of stabilizing domestic prices, as well as for easing integration between Southern EU and North African agricultures by monitoring integration patterns and smoothing the process. For these reasons, the EU could argue in favor of the maintaining the system, not only on the sake of protecting the EU F&V sector, but also on considering the risk of preference erosion against Mediterranean partner countries. Moreover, the EU could pursue the selection of sensitive products/months/partners as a driving criterion for the negotiating strategy in the WTO, ensuring that protection is granted to those products that are considered sensitive until a careful impact analysis. This would make room for an outcome of the Doha round hovering in the middle between scenarios B and C and supported also by the MPCs, as substantially derived from carefully crafted preferential agreements with them – which would also be in line with the traditional EU approach to trade policy for the F&V sector.

The EU Fruit and Vegetables Sector
PE 460.043 93
5.1.2. Adjustments to the EPS and capacity building for increased competition
Still restricting the discussion to trade policy issues, the recent protocols with Morocco (see Annex 4) could provide a model to follow in the new generation’s agreement of the Rabat Roadmap. Among the features of the last deal with Morocco those that best fit the current needs for the deepening of Mediterranean liberalization are: a) a refinement of the treatment of sensitive products, perhaps reducing the number of products, but also improving border controls; b) a slow expansion of preferential tariff quotas for sensitive products, in order to smooth the adjustment process for EU producers; c) a strengthening of safeguard measures to be used in case of serious price imbalances / import surges in the EU domestic market.
In connection to the contents of the new protocol with Morocco, and with the perspective of having “Med solutions” to sell in the WTO context, useful recommendations could be37:
a) the maintenance of a flexible EPS, restricted, by product, to those periods of the marketing year when occurrences of import prices below the trigger EP are most recurrent;
b) the improvement of the predictability of the functioning of the EPS, by smoothing daily SIVs fluctuations, which can be relevant and result in a destabilizing effect on operators’ decision making processes. This could be obtained by weekly (or twice-weekly) publication of the average of daily SIVs. This should not modify the daily data collection of prices and volumes on representative markets which represents, at present, a useful market monitoring instrument.
c) the deepening of the analytical capacity to assess market prices and volumes. This in order to provide knowledge necessary for:
- “finer tuning” of the EPS
- selection of sensitive F&V products to shield from rapid liberalization
- improvement of the monitoring of import prices
d) however, knowledge of market prices and volumes should be a complement of a deepened investigation of opportunities and threats along the value chains for F&V products. The perspective of increased openness of the EU F&V sector and the ongoing changes in the value chain of these products would make appropriate turning to improving support to POs engaging in transnational global sourcing to best fit the need of the modern retail sector in the EU (see 4.3).
As a whole, improvements in technical capacity of managing components of EU protection are not only a way of monitoring foreign markets, but are also assets helping the implementation of the FTAs and supporting EU negotiating positions in the WTO. 37 Part of these recommendations are derived from Agrosynergie’s (2008) report on the functioning of the EPS.
Along with them, it is worth recalling some other technical recommendations of the mentioned report, targeting the methodological shortcomings of SIVs calculation. The "standard import values" (SIVs) are fundamental for the functioning of the EPS (see Sec. 2.2 and Annex 2) and are based on wholesale prices from representative markets as established by Commission Regulation No 3223/94. SIVs calculation does not consider that, over time, some of those markets/entry points have lost their relevance; also, estimates of import prices do not consider changes that have occurred in prevalent marketing channels of F&V (increasing share of large retailer chains) and in transportation and insurance costs.

Policy Department B: Structural and Cohesion Policies
PE 460.043 94
5.1.3. Dealing with trade preferences and Mediterranean issues
Links between liberalization processes
The progressive opening of EU markets for F&V will probably proceed on a preferential basis, with WTO multilateral discipline providing a consistent framework. Although F&V trade and trade preferences are of interest for a wide set of partners of the EU, the hot issue is mainly the Mediterranean one. This is due to the peculiar features of the protection system, which imposes to off-seasons providers from South Africa and Latin America, as well as few other non-Med developing countries, just relatively low tariff protection and EPs either idle for off-season trade flows or with negligible protective effects in the seasons overlapped with EU production. As far as these non-Med trade partners are concerned, trade liberalization will go on with a slow pace of tariff dismantling, which is already set up in the framework of agreements such as those with South Africa and Chile. Also the trade deals of the recently re-launched EU-Mercosur negotiations will probably follow the same path, although recent proposals from the Europan Parliament suggest the need of a careful treatment, based on accurate impact assessments, of relevant sources of competitive advantages based upon differences in regulations such as safety standards, animal welfare, quality and environmental standards38.
Rather more challenging are the policy issues relevant for Mediterranean trade in F&V. On the one hand, MPCs are the only partners, among the major F&V providers to the EU, with whom it turned out to be necessary lowering EPs in the aftermath of the Uruguay Round of the WTO. They are also the only relevant trading partners placed in a perspective of deep integration without becoming part of the EU, which clearly implies further moves towards preferential trade liberalization. Finally they can claim – based on the Rabat Roadmap and the conclusions of the 2005 EuroMed Conference in Barcelona – commitments on the acceleration of liberalization in agricultural products, including non-tariff elements of protections and issues potentially related to trade, such as rural development, agricultural productivity, quality and sustainable development.
On the other hand, it seems difficult that Southern Europe's F&V-growing regions will cope with competition in a fully liberalized market. Based upon EU Regio DB, about 30 regions of the EU, almost entirely located in Southern Europe, show a composition of agricultural GDP where the weight of Mediterranean products hover between 40% and 50%. For those regions trade liberalization is clearly a process to be furthered while setting up appropriate competitive measures and compensations39.
Also MPCs face global competition and will be surely affected by the trade liberalization processes involving the EU and other regions in the planet. This also supports the argument of the EU ensuring protection in the seasons when overlapping is possible with production in EU and MPCs areas, which includes the selection of sensitive products40.
38 European Parliament resolution of 8 March 2011 on EU agriculture and international trade (P7 TA(2011)0083). 39 It is significant that, also in the case of the recent agreement with Morocco (see Annex 4), the Committee on
Agriculture and Rural Development of the European Parliament has recently issued a Proposal requesting not to ratify the new agricultural protocols (Meeting 14/03/2011 - pe456.662). The request is based upon the existence of relevant differences in costs related to compliance with regulations on safety, labour, quality and environmental standards.
40 The analysis of the current system of trade protection and preferences, developed in Sec. 2.2, makes clear that a sort of protection, through preferences, has been granted to the competitive advantage of MPCs on the EU market.

The EU Fruit and Vegetables Sector
PE 460.043 95
The EESC and other European organisation included COPA-COGECA, have stated the need for the EU to respect certain basic principles in negotiations. They include the concept of sensitive products, the entry price for certain fruit and vegetables, the reinforcement of customs inspections to prevent fraud, the establishment of an effective plant health monitoring system, and the respect for product seasonality (EESC, 2008 and 2010).
A strategic view
More than the risk of preference erosion coming from multilateral negotiation in Geneva (which, in our view, as far as F&V are concerned, are to be considered a complement of preferential Meditarranean deals) it is the need of deepening the agricultural content of the Mediterranean FTA that makes up the context for refining policy solutions for the Mediterranean scene. This involves not only trade policy and preferential concessions, but also the functioning and the endowment of the EU CMO in F&V, its Producer Organizations, as well as the functioning and the endowment of rural development and international cooperation programs. Going beyond trade policy is a necessary step in order to smooth the process of liberalization, reduce losses for Mediterranean producers on the EU side, help both EU and MPC producers getting the most from economic integration in the Mediterranean (Garcia-Alvarez-Coque, 2002; dell’Aquila-Salvatici, 2005; Kalaitzis et al., 2007). A strategic, long-term view of Mediterranean agriculture would allow for synergies between both shores of the Mediterranean. Until recently, agriculture was not a priority among the policies of Mediterranean countries outside the EU41, which in opinion of the EESC (2010) reveals a short-term outlook that has undermined agricultural development in these countries.
5.2. Safety and quality standards: implementation and effects on the third countries’ growing areas
Regulations on F&V safety affect both domestic production and international trade. Technical regulations, conformity assessments and labeling standards play a variety of useful roles: for consumers, ensuring that theirs are protected from health risks and for producers, because goods production subjected to recognized standards could achieve economies of scale and reduce costs. Standards also may reduce transaction costs in business by increasing the transparency of product information between producers and consumers.
However, since consumer preferences and government regulations may differ from country to country, there are added complications for international trade that can lead to potential conflict. In fact, many countries have disciplined food (and F&V specifically) safety on different regimes, thousands of different products are regulated, often with incompatible laws. Differences in trade regulations can put either domestic or foreign firms at a competitive disadvantage in selling their products. Trade conflicts are frequently produced when countries enact different types of regulations, have different desired levels of food safety, or have different costs in complying with regulations. Based on these assumptions, we can say that non-harmonized standards are main barriers in international trade, especially for many producers of developing countries. Discussion of food safety standards, and their discriminatory use also with Sanitary and Phytosanitary Agreement (SPS) and Technical Barriers to trade (TBT), is in the rise in dispute settlement cases on these issues at the WTO. 41 Of all the MEDA funds granted to Mediterranean partner countries, only 5% was earmarked for agriculture and
rural development.

Policy Department B: Structural and Cohesion Policies
PE 460.043 96
Given this context, food safety standards and technical regulations are increasingly prominent part of international trade policy debate. In fact, considered that traditional trade barriers have failed, non-tariff barriers have become a concern to firms in developing countries. Increasing demands for food safety by developed countries have raised concerns about likely food regulatory impacts on international trade, particularly in the case of developing countries. Part of the economic literature (Otsuki et al., 2001) recognize that developing countries are likely to have difficulties in meeting requirements associated with implementation of high level technical regulation and standards. Otsuki, Wilson, Sewadeh (2001) identify as the implementation of some standards in the EU would have a relevant negative impact on the poorest countries exports. EU inspectors are often dispatched to the country of origin to inspect the facilities to ensure that EU sanitary and phytosanitary standards are met. Indeed, there are very few large trading companies in the EU that dominate EU trade in fruits and vegetables and frequently have multi-year contracts with Mediterranean exporters. These EU trading companies are instrumental ensuring that produce destined for EU markets meets all EU standards.
On the basis of the above mentioned, compliance with requirements in EU markets needs for developing countries increase production costs. Compliance costs include onetime investments such as the upgrade of laboratories, installation of equipment, redesign of products and processes, and recurrent costs such as costs of maintenance, testing and certification. High cost of compliance with food standards is another argument in the literature about why standards may act as barriers to trade. In particular, Uganda’s fixed investment to comply with EU’s requirements was about 6-8 percent of export value, while Tanzania’s investment on the processing sector was 7 percent of export value, the cost of compliance in Morocco, for example, with SPS measures is average 3% of the total cost of export tomato production (Maertens and Swinnen, 2008; Cato, et al., 2005; Henson and Mitullah, 2004, Jaffee, 2003).
Most importers of fruits and vegetables in Europe sell their products directly to retailers (75–80 percent). These importers source tropical fruit and vegetables from producers in developing countries, often on a contractual basis. Food safety and quality inspections take place at different levels in the food supply chain. When fresh products arrive from developing countries to the EU, they are controlled by different public and private entities (wholesalers, national control agencies, and retailers) at different points of the supply chain.
5.3. Trade and development of the EU F&V sector
The prospective profile of both traditional trade policy tools (tariffs and the EPS) and emerging non-tariffs barriers (SPS and quality standards) must be complemented by the trade-related elements of a strategy combining increased openness and strengthened competitiveness of EU F&V sector. Significant local impacts of agricultural trade liberalization on the Mediterranean agriculture cannot be denied. Therefore, the temptation to blame the MPC agro-exporting sector for the structural problems of the Southern European production would be really high.
Elements that become particularly relevant when moving the F&V sector towards a more open trading environment are mainly: a) changes in strategic components of Mediterranean F&V supply chains; b) requirements for Producer Organizations in order to fit the new competitive environment; c) coordination of agricultural and rural policies targeting problems common to all shores of the Mediterranean.

The EU Fruit and Vegetables Sector
PE 460.043 97
As a matter of fact, the debate on opportunities and threats for Southern EU producers of F&V has been partially distorted by the lack of understanding about the real problems of rural areas in Southern Europe. We have to identify what should not be observed as problems, but as normal challenges related to the rapid changes in the international economy. The new rural economies are not exempt of challenges, in many cases due to the aged labor force, the weak entrepreneurship, and the environmental effects related to the preservation of landscape and the management of territory. Most of these effects can be managed through territorial policies equipped with adequate instruments. The standard approach of agricultural policies, which has been based on a large subsidy component to farming (including the CAP single payment scheme), might be helpful to soften the social impacts of adjustments, but it is less effective to guarantee a sustainable development in rural areas. Territorial policies supporting organization, business oriented practices, knowledge creation towards sustainable practices keep being advisable in the F&V sector.
5.3.1. Ongoing changes in Mediterranean F&V supply chains
As discussed extensively in Sec. 1, since the 1980s, EU sellers of fresh produce have been facing changes in their market conditions largely explained by (i) dramatic shifts in the consumption patterns; (ii) stronger competition at the international level; and (iii) growing relevance of the negotiating power of food retailers.
Given the strong competition among sellers in the F&V market, retailers can impose stricter requirements and demand larger volumes from fewer (“preferred”) suppliers. Retailers are able to switch volumes between suppliers and force them to accept low prices in order to get volume growth and to comply with EurepGap and other private standards. The result of this process is to introduce a bias towards large farmers. The problem is accentuated in the case of fresh F&V markets, where instability is associated with variable agro climatic conditions, lagged response of supply when assets are specific, lack of production flexibility, and the perishable nature of the products.
Also most MPCs have already started facing similar developments. On the one hand modern retail chains have started finding room in the structure of distribution of major MPCs. The share of modern distribution chains in domestic sales, according to Ciheam (2010) estimates, reaches 33% in Turkey, 14% in Egypt and 8,5% in Morocco. On the other hand a high percentage of F&V exports from MPCs is handled by specialized (mostly private and co-operative owned) buying/packing business in the most important export trading countries (Turkey, Morocco, Israel and Egypt). Those firms are more suitable to integrate in large European supply chain and to fulfill their high food safety standards, the requirements concerning certification and application of tracking and tracing techniques, as well as marketing and logistical needs (Kalaitzis et al., 2007). Also on the Southern shore of the Mediterranean, however, the wider supply chain shows a number of independent commissioners, operating on a consignment basis and on spot markets (central wholesale markets), that will face increasing difficulties to apply the modern supply chain management methods necessary to access European and local big retailer chains.
Some new investments in meeting EU standards have been made in most Mediterranean countries (with EU assistance mainly through MEDA funds) and activities to reform and improve food control systems have been carried out in many of them42 (Kalaitzis et al
42 National Strategy for food control (Morocco, Tunisia), draft new food legislation according to international
requirements (Egypt, Jordan, Lebanon, Morocco), review and update food standards and regulations (Syria). Most countries use Codex as a base to develop their food standards, concerning good manufacturing and quality assurance systems (Tunisia), and risk management systems (Egypt, Jordan, Morocco). There is

Policy Department B: Structural and Cohesion Policies
PE 460.043 98
2007), although there is consensus about difficulties – discussed in par. 4.2 – faced by producers when it comes to enforce European health legislation and make available scientific, technical and financial resources necessary to overcome structural problems (small scale farming, low education and domestic market orientation) (EESC, 2008).
Ongoing changes in the Mediterranean region as a whole would suggest to reconsider policies targeting MPCs integration in the wider Euro-Mediterranean region, making it more consistent with the F&V market regime in the EU, perhaps heading towards creations of either producer organisations or other suitable institutions that could link up and participate to the vertically co-ordinated supply chains with wholesale and retail organisation in Europe (Garcia-Alvarez-Coque 2002; Kalaitzis et al 2007).
5.3.2. What role for EU POs in the trade liberalization process?
Survey results
The Italian share of the survey carried out for this study is wide enough to represent an orientation of relevant national structures of F&V organized production in Southern Europe (see Sec. 3). Answers synthesized in Tab. 5.3.1 reproduce the predictable orientation to consider the current protection as ineffective and further liberalization as a threat. Out of the 61 POs answering the questionnaire, 70,5% of them considers trade protection not effective for the purpose of stabilizing prices or income, 65,6 % do not consider POs able to gain from trade liberalization and 83,6 % feels that dismantling what is left of the EPS could imply import surges and domestic price instability. Among the reasons displayed for motivating these answers the major role is played by “unfair” competitive advantages of competitors exploiting differences in labour, sanitary, quality and environmental standards.
Beyond this general political message coming from organized production, policy makers could consider the analysis developed in the previous pages showing that only for some products, partners and seasons the protection system show an actual effectiveness and define negotiating strategies in the WTO and with preferential partners where concessions on traditional trade barriers could have a very limited impact (if any), while being compensated by strengthening borders controls on EPS, sanitary and other quality standards.
growing acceptance and increasing use of Good Manufacturing Practices (GMP), good agricultural practices (GAP) and Hazard Analysis Critical Control Point (HACCP) throughout the Region. In a number of countries, many industries apply HACCP on a voluntary basis. Some countries, such as Lebanon and Morocco, already have or are developing legislation and guidelines on GMP and the HACCP system.

The EU Fruit and Vegetables Sector
PE 460.043 99
Table 5. 2.: Opinions of Italian POs on current F&V trade policy measures and perspectives of further liberalization POs
Numb
Are EU trade policy measures effective in keeping imports
in line with the need of stable
domestic prices and producers income?
Are POs able to gain from liberalization
in F&V trade?
Do you feel that the phasing out of quotas and entry prices could
imply a surge of imports or domestic
price instability?
YES NO NA YES NO NA YES NO NA
All POs 61 23,0 70,5 6,6 27,9 65,6 6,6 83,6 11,5 4,9
by dimension1
big 4 25,0 75,0 0,0 50,0 50,0 0,0 75,0 25,0 0,0
medium 14 21,4 71,4 7,1 50,0 35,7 14,3 78,6 21,4 0,0
small 43 23,3 69,8 7,0 18,6 76,7 4,7 86,0 7,0 7,0
by link with big retail2
very strong 22 27,3 63,6 9,1 22,7 68,2 9,1 90,9 0,0 9,1
significant 12 16,7 83,3 0,0 41,7 58,3 0,0 83,3 16,7 0,0
weak 21 28,6 66,7 4,8 28,6 61,9 9,5 71,4 23,8 4,8
by importance of sales on foreign markets3
very important 23 26,1 69,6 4,3 39,1 56,5 4,3 82,6 13,0 4,3
significant 16 37,5 56,3 6,3 37,5 56,3 6,3 75,0 18,8 6,3
absent 19 10,5 78,9 10,5 5,3 84,2 10,5 89,5 5,3 5,3
1. Dimension: Big: VMP ≥ 100 Meuro ; Medium: 20 < VMP < 100 Meuro; Small: VMP < 20 Meuro 2. Link with big retail: Very strong: % sales to o. r. ≥ 60%; Significant: 60% > % sales to o. r. ≥ 30%; Weak:
% sales to o. r. < 30%. 3. Importance of foreign sales: Very important: % foreign sales > 20% + Big POs with 20% ≥ % f. s. ≥ 5%;
Significant: 20% ≥ % f. s. ≥ 5% + Big POs with 4% ≥ % f. s. ≥ 1; Absent: 4% ≥ % sales > 0%
Source: Authors’ field survey
Moreover, if we split the sample in different classe of POs (by dimension, links with modern distribution and share of sales abroad) some further indications can be derived. Concerns of POs about trade liberalization are higher that the average in the case of small POs and, above all, in the case of POs not engaged in export practices, while big/medium POs and POs with important shares of foreign sales perform better than the average.
Interestingly enough, the differentiation of POs by marketing channel provides a picture where POs most engaged in a role of supplier to big retailers are also those most concerned about possible dismantiling of trade protections, while POs with no or weak links with modern distribution are less concerned that di average about further liberalization. The latters, by selling almost all their products to wholesale markets, small retail stores and processors, have a less strong perception of the precence of foreign competitiors than those POs struggling to stay in the procurement list of big retail chains that have a global sight on procurement.

Policy Department B: Structural and Cohesion Policies
PE 460.043 100
POs and trade liberalization
Coordination and organisation are key words when policies tailored to the F&V sector are considered. These words have been recognised by the recently approved Common Market Organisation (CMO) in F&V, reformed in June, 2007. The CMO draws its support to horticultural farmers on the creation and enhancement of Producer Organisations (POs). These can be seen as engines to concentrate production, given the low level of sales per farm cooperatives in Italy, Spain and other Southern European countries in comparison with other countries in Northern Europe. But supply concentration is not enough. Producer organizations should be considered as an effective way to increase collaboration between growers and other members of the supply chain and should keep being encouraged as such.
As recalled in par. 1.1, modern global value chain analysis puts emphasis on relationships among actors as a way of reducing uncertainty, improving access to key resources and increasing chain efficiency. Coordination is considered a key source of competitiveness, sometimes referred to as “collaborative advantage” or the “competitive advantage of partnerships” (Fischer et al. 2007). All stakeholders share interests in cost reduction, quality upgrading and risk management. If this is recognized, there is a need for policies orientated to undertake collective action approaches within supply chain agribusiness. There is also scope for economists to identify alternative pathways for smallholder cooperation in response to specific supply chain challenges. The new market conditions require improved coordination among farmers, packers, wholesalers and distributors and, as a matter of fact, collective action among individual farmers is often a necessary step to undertake contractual or co-ownership arrangements in order to successfully collaborate with large retailers. POs well oriented to chain coordination and partnership are in the best position to gain from liberalization by taking the lead in the competition for entering the most dynamic retail segment in the EU market.
However, the productive and commercial structure of the F&V industry in the EU is not adapting well to the changing market conditions, requiring different products and improved guarantees of quality and environmental standards (Garcia Alvarez-Coque et al. 2007). Nevertheless, situation varies among EU Member States. For instance, the Netherlands and Spain illustrate two different situations. Nowadays, 92% of horticultural production in the Netherlands is sold through 22 producer organizations, the largest being “The Greenery” with total sales of 1.7 billion euro in 2007. By contrast, in Spain there are 625 producer organizations that only account for 44% of Spanish fruit and vegetable production, and none of the sales of the existing producer organizations are more than 450 million euros.
In fact, although most fruit and vegetables cooperatives were created to solve problems related to moral hazard and asymmetric information, lack of trust remains a factor in both the relationship between farmers and cooperatives, and between individual cooperatives and the second-tier cooperatives. This implies that an agency relationship between the growers and the cooperative firm exists. By selling through contract mediation, the outcome is (partly) dependent on the effort of the sales agent, and this applies in both the individual cooperative and the federations of coops. While normally the cooperative was a solution to the information asymmetry problem, this can re-emerge within a cooperative when there is a lack of trust between the members and the management of the cooperative firm.

The EU Fruit and Vegetables Sector
PE 460.043 101
In some Member States, POs are becoming “preferred suppliers”. In others, levels of organization remain weak. The CMO provides additional support (60 percent Community co-financing rather than 50 percent) in areas where production marketed through producer organizations is less than 20 percent, as well as in the new Member States. There is also extra support for mergers of producer organizations and associations of them, while extra support is also set up to POs operating in a trans-national scheme or on an inter-professional basis (e.g., coordination schemes with processors and traders). What remains to be answered is if these measures are enough to encourage a culture of collective action in producing zones. The behavior of many cooperatives does not contribute to strengthening their negotiating power vis-à-vis retailers. Among the reasons for this situation is the lack of professional management in cooperatives, which leads to “supply oriented” strategies, strong competition among cooperatives, and lack of transparency in the decision-making process within the cooperatives. The CMO should pursue in the support to POs, but resources and programs should be defined in a way they promote a culture of management and business orientation within POs. 5.3.3. A shared agenda for the Mediterranean
By closing its markets the EU hardly contributes to help MPCs in their escape from poverty. At the same time, it does not seem that the MPCs can immediately profit from the trading advantages implied in a substantial opening of the European F&V markets. Growers in this part of the Mediterranean region also suffer from lack of market power and transparency similarly to what we have mentioned about Southern European farmers. Why then not talk about a common agenda for Mediterranean agriculture including its Northern and Southern shores? Farmers in both sides of the Mediterranean basin are affected by common problems, with different intensities but needing similar approaches. Some of these problems are of a special concern, such as the water scarcity, the opportunity for improving quality and the lack of adequate organisation to face the market power of supermarket and the big distribution. Biodiversity of Mediterranean production systems and the corresponding food habits are severely challenged by the culture of uniformity that would result in a drastic trade liberalisation without accompanying policies.
These policies would include measures such as:
development of geographical indications,
labelling of Mediterranean food,
promotion of international cooperation between farmers and their organisation of different areas of the Mediterranean,
support to professional associations assisting farmers,
improvement of human capacities to improve territorial competitiveness.
Policies must address the specificities of the F&V supply chain, which relate to risk management, quality assurance, human capital, logistics and information technology and other characteristics that cannot be tackled through traditional subsidies. Actions on those issues, also by means of jointly submitted operational plans, could be encouraged, stimulating collaboration between F&V producer groups from the EU and MPCs. Such a policy could contribute to the formation of integrated Euro-Mediterranean producer organizations capable of offering high quality produce, with a more competitive cost

Policy Department B: Structural and Cohesion Policies
PE 460.043 102
structure and year round availability, in the most important Mediterranean products (Garcia-Alvarez-Coque, 2002; Kalaitzis et al 2007).
A practical way to approach this shared role for agriculture in development of the different shores of the Mediterranean basin is to arrive at a common view of non-distorting or Green Box payments. Northern and Southern Mediterranean countries should together be able to provide clear guidelines for other WTO members for this type of agricultural support, guidelines that would allow the EU to keep non-trade agriculture products at the desired level, while simultaneously enabling Southern Mediterranean countries to provide their farmers with the required support to improve their quality of life and restructure their farms, and to meet the other needs of their agricultural populations.

The EU Fruit and Vegetables Sector
PE 460.043 103
6. CONCLUSIONS AND POLICY RECOMMENDATIONS
6.1. F&V market and supply chain dynamics
6.1.1. Market dynamics
The F&V sector is a key sector in EU agriculture, with a weight of about 18% of EU agricultural production, almost equally shared between vegetables and fruit (including citrus). EU F&V production is highly geographically concentrated, as the two main producing countries, Italy and Spain, gather 40% of vegetable production and more than 50% of fruit (including citrus). Citrus produce basically comes from Italy, Spain and Greece, that originate more than 95% of EU production.
The dynamic of EU production suggests that, in global terms, the sector has been slowly shrinking over the last decade, with fruit (excl. citrus) most affected (-5.1%), followed by vegetables (-2.3%) and citrus fruit (-0.9%). This dynamic is confirmed also in the worldwide picture, where the weight of EU production witnesses some 3% decline in the last decade. Main EU producing countries show some differences in the long term dynamics: Italy remains the largest European F&V producing country with a greater variability of output, while Spain and Greece are characterized by a greater price volatility. Among the new Members from Eastern Europe, Poland has shown the most relevant growth in F&V production over the last decade.
Still in terms of trends, F&V producer prices show a general pattern not too different from production in the last decade. The trend for prices is stable or slightly declining, with a stronger tendency to decline for fruit (excl. citrus), at least until 2007. However, price data suggest also that, in the shorter run, sharp declines in prices usually follow phases of growth in production and anticipate downward turns of it. Production variability and price fluctuations, therefore, have to understood in two different dimensions: in the short run, they are typical features of the functioning of the F&V sector, mostly due to weather variability and some structural characteristics of sector, such as products perishability, or the high concentration of production in few regions influencing the whole European market. Perishability is capable to make market unbalances potentially very onerous to producers because it fuels an high responsiveness of producer prices to the quantity being sold. In a longer run, a declining trend in production and prices depends on several structural determinants of change in the functioning of F&V world markets and supply chains.
Effects of structural changes can be detected also when observing changes in the trade pattern of EU F&V sector. A decline of the share of Intra-EU imports (from 70.3% to 68% in the last decade) and an increase of the structural unbalance between Extra-EU import and export (-7.3 billion euro for EU27 in 2009) suggest a gradual increase in openness to external trade and a slow process of substitution of EU suppliers incapable of meeting demand and retail requirements stemming from globalized supply chains.
“Substitutes” in supply of vegetables are mainly from the Mediterranean area, but also from Central-South America and some African countries, while Central and South America prevails for fruit (also because of the role played by tropical and off-seasons F&V products), although with a significant role of Mediterranean countries for some products, such as citrus. Survival of traditional marketing channels in the EU market, structural backwardness

Policy Department B: Structural and Cohesion Policies
PE 460.043 104
of non-EU suppliers, and EU trade policy devices, converge in determining a relatively slow pace of inclusion of external F&V suppliers in the EU-based supply chains for F&V.
Final demand for F&V is generally more stable than supply and relatively inelastic in price, with changes occurring over longer periods of time. Available data on consumption suggests a trend of slow increase in consumption of F&V in the EU, particularly for those countries starting from lower levels of per capita consumption. However, consumer behavior is still not homogenous in the European market, not only in terms of amount of fresh F&V consumption in Member States, but also in terms of marketing channels. Within an heterogeneous framework of cultures and lifestyles, the trend to development of fast food, supermarkets and high concentration and vertical co-coordination in supply chains is stronger in northern regions of the EU, while in the South F&V markets show a still relevant presence of street markets and an higher level of dispersion of specialized grocery stores. Moreover, differences in consumption patterns exist even at regional and local levels.
6.1.2. Supply chain dynamics and producers’ income
The current difficult situation of the European F&V sector arises mainly from long-term changes in the structure of the global F&V supply chain. The dynamics of income of horticulture and fruit specialist farms shows a long time span of steady growth until 2004, when it became apparent the negative impact of over-production and tendency to price decrease on F&V farms incomes.
More than producer price volatility, is the dynamic of production costs and marketing margins that should be investigated in order to gain a better understanding of negative income dynamics. Producers prices have usually been volatile for fresh F&V and are declining in trend in the last few years, while retail prices are either constant or increasing, indicating either increasing rents being captured by downstream actors or increasing levels of value added generated at downstream stages of the supply chains.
The tendency to weakening of prices and margins for F&V producers is only one of several broad themes underlying and explaining the long-term changes in the structure of the global F&V sector. Other relevant dimensions can be referred to:
- global consumers, who are becoming more affluent, discerning and cautious about their consumption choices, increasingly demanding services, including convenience in food purchasing and preparation (fresh cut fruit and vegetable), taste, and variety, and increasingly concerned for food safety and quality;
- global sales, that are increasingly being controlled by fewer and fewer retailers, with a growing bargaining power, which in turn contributes to fuel a tendency to concentration and consolidation also in upstream stages of supply chains;
- the role of the WTO and bilateral negotiations, that are becoming more important in widening competition, due to ongoing trade liberalization and domestic policies reforms related to trade liberalization;
- multinational agribusiness, that is becoming more important due to upgrading of logistics, communication and information technology, transport enabling fresh products to be transported from many origins and due to related increase of trade and investment, consolidation, and foreign direct investment (FDI) in many countries (often developing countries) that are providers of the EU market.

The EU Fruit and Vegetables Sector
PE 460.043 105
Concentration and consolidation underway in the F&V supply chains, along with changes in consumer choices, will continue to shape the future of the F&V economy in the EU and will deepen as the sector becomes more globalized and interconnected. The process is driven by large retailers which are building up long term relationships with key suppliers – either producers or wholesalers - capable to meet the requirements necessary to respond to the increased consumer interest for purchasing fresh fruit and vegetable products from supermarkets. Suppliers are in turn required to make larger investments deemed to be worthwhile if they can get on a retail chain procurement list. As long as producers are unable to meet these requirements their share of the total value added will remain low and declining.
These complex structural changes materialize a bias against small farms and fuels forms of association at farm level stage. This is the major challenge for small F&V farmers, either from the EU or other supplying areas: how to be part of modern EU-based chains where the retail stage coordinate the other actors. Collective action at producer level and effective coordination within the chain appear to be pre-conditions for any successful strategy in coping with declining relative producer prices and the gap between farm and retail prices. Moreover, forms of producer organization should keep to be encouraged as an effective way to increase collaboration between growers and other members of the supply chain and develop partnerships around shared interests in cost reduction, quality upgrading and risk management. As a matter of fact, both phenomena are a function of the increasing productivity at farm level, increasing services delivered between farm and retail stages, and the increased concentration of the retail business.
6.2. Current features and possible changes of EU domestic support for F&V producers
The political debate on the CAP reform has been the occasion of starting an extensive discussion on the future of the CMO for F&V, in which many stakeholders as well as some institutional subjects have been involved. Many key issues have been focused, arising from the need of understanding whether the set of existing instruments for the F&V sector is still relevant and adequate to face the increasing market competition and its volatility, as well as to bring the F&V sector to the post-2013 CAP scenario.
In other words, a key question is whether the F&V CMO with its specificity is still consistent with the ongoing CAP reform. On this subject many stakeholders have expressed a great concern about the future of the F&V CMO, asserting that it would be more suitable to maintain the specificity of the F&V CMO within the CAP reform and the EU budget resources devoted to the sector as well. Measures and tools that could be envisaged for the F&V sector in the post-2013 CAP scenario still have to hover around the fundamental role of POs and the need of strengthening their role and improving consistency of the CMO to the wider orientation of the future CAP towards price and income stabilization at farm level. Policy recommendations can be raised related to both modifying existing policy instruments as well as to introduce new ones.
Market risks and crisis management
As far as market risk and crisis management is concerned, the first general conclusion this study highlights is that the joining of POs may be deemed as an effective tool of crisis prevention that F&V producers may adopt. However this requires the fulfillment of a preliminary condition on the organization of the POs in which both market sales and the

Policy Department B: Structural and Cohesion Policies
PE 460.043 106
planning of production activities at the farm level should be centrally managed. Therefore larger POs, with a better structured internal organization and a stronger orientation of their sales toward large retailing are potentially more successful in market risks and prevention.
As a consequence, the easing of conditions for the recognition of POs that have been introduced in the CMO, requiring lower values of marketable production, does not match the need to improve risk management capability in the EU F&V industry. Therefore, although it is meaningful to aim at the improvement of the share of organized production, particularly in areas where it is not adequate, it is also necessary to shape incentives to POs in such a way to make them effective in this sense.
Regarding the tools currently enclosed within the CMO (market withdrawals; green harvesting or non-harvesting of fruit and vegetables; promotion and communication; training measures; harvest insurance; support for the administrative costs of setting up mutual funds) only some of them have been implemented by National Strategies and subsequently used by POs. Green harvesting or non-harvesting, training measures and support to mutual funds are the tools not implemented, apparently because their access and contents are not clearly stated but also because they are deemed as not effective tools.
Market withdrawals and harvest insurance have been used only to a very limited extent (Spain didn’t even introduce harvest insurance in its National Strategy). The little interest for market withdrawals seems related to their low indemnities, while support to insurance looks not suitable within the CMO, because of the limited availability of resources within the operational funds of POs as well as the possibility to finance it with other CAP measures. Therefore it would be appropriate narrowing the support to insurance only to the covering of POs risks related to the reduction of product marketed by their members.
Promotion and communication are the most widely adopted measures of risk and crises management. However, it is necessary a clearer definition of its contents as well as of its implementation modalities within the contest of market crisis, and the relationship of this instrument with other similar measures that can be implemented within the operational program in a standard way.
A critical issue related to market crises measures introduced within the CMO is related to financial rigidity of their endowment in the operational fund, as it is constant overtime as for other type of measures. Such feature doesn’t fit well with the nature of market crises whose appearance and, therefore, income effects on producers are not uniform overtime. Therefore, it would be useful to introduce arrangements allowing a wider intertemporal flexibility of financial limits to the implementation of such measures, according the real needs of intervention. Of course, any improvement in the possibility of modulation of financial resource for crisis measures would require the introduction of arrangements aimed at avoiding a recurrent use of this type of measures.
Although measures for the implementation of mutual funds didn’t get very much attention, the role of saving/credit in transferring risk overtime should be enhanced. At this aim it would be useful to analyze the conditions for the introduction of security funds within POs, working with an approach similar to the Agristability program implemented in Canada. This could be obtained defining ranges of farmers revenues calculated on the last three year average, for example -30% and +20%. When revenues are above the upper limit of the range, the exceeding revenues could be saved in a fund with a matching quota from the operational fund (or from EAGF). This money could be invested in EU state bonds earning interest paid. In the case the revenues fall below the lower limit the POs have the possibility to withdraw money from the security fund to cover losses exceeding -30%. Such

The EU Fruit and Vegetables Sector
PE 460.043 107
an instrument could also help in making more stable overtime financial resources needed by POs for risk and crises management.
Enhancing market transparency
Beside the existing risk and crisis management tools, a possible further instrument for their prevention is the implementation of market intelligence activities. The monitoring of F&V markets through the collection, elaboration and analysis of relevant data on prices, consumer preferences and behaviours, product supply and meteorological trends and their spreading among POs may help in anticipating possible temporary or structural crisis that could be better managed and prevented with timely intervention.
The setting up of a market observatory for F&V sector at Member State level could be envisaged for the purpose of enhancing market transparency not only as a monitoring tool, but also by contributing to better understand how prices evolve both on the F&V market and at each stage in the chain.
The implementation of this activity is not easy and would require a certain degree of centralization in agencies capable to serve associations of POs or the totality of POs in a country. Moreover, this could be a very difficult exercise because of the complex process of price formation along the F&V chain, which depends on several factors embodied in the relational frameworks and structural inefficiencies existing inside the chain.
The observatory could be entrusted to an institutional subject (for instance, interbranch organisation, if any, or otherwise some other suitable established body) which, in collaboration with national statistic services and national institutions of public research, would furthermore have the task of making analyses and reports supporting the decisions of economic actors and policy makers.
Contractual arrangements
The recent proposal of European Commission regarding contractual relations in the milk sector provides for optional written contracts between farmers and processors to be drawn up in advance for deliveries of raw material, which would include the key aspects of price, the timing and volume of deliveries, and the duration of contract. Member States can make these contracts compulsory. In order to take into account the specific nature of cooperatives, these are not required to subscrive contracts on the condition that their statutes provide for rules addressing the same objectives.
It is worth pointing out a recent experience in France where the Government has decided, for milk and F&V sectors, to make the contractualisation between producers and their buyers compulsory. The commitments for fresh F&V regard the duration of contract of at least three years, as well as the specification of some relevant elements such as the volume and quality characteristics of delivered products, the modality of produce collection and delivery, the criterion of price determination for each product and so on.
The French Government’s decision has arisen a wide debate involving F&V stakeholders. In particular, opposite voices to compulsory contractualisation have been expressed by the French agricultural world which is, on the contrary, in favour of a contractualisation developed within an interbranch organisation, that is, in an official concerted view that involves all actors of F&V chain.

Policy Department B: Structural and Cohesion Policies
PE 460.043 108
Another crucial aspect refers to the duration of contract, because if, on the one hand, a longer contract allows farmers to decide for “optimal investments”, on the other hand it could make more difficult to define key contractual elements, in particular “price indexation”.
Taking into account the above-mentioned experiences, it could be envisaged the possibility of developing, within a general framework outlined at EU level, a contractual model that provides the settlement of minimum standard conditions, although a right degree of flexibility has to be considered given the specificities characterizing each F&V product and region. This could be entrusted to an interbranch organisation which should draw up an interbranch agreement on contractualisation that, in order to avoid unfair commercial practices, allows to state guidelines and promote best practices as well as market transparency.
Furthermore, it could be suggested an useful remark upon “pricing” element of contract in relation to the possible introduction of a price mechanism that can safeguard the economic sustainability of productions and then the return for all actors in the F&V chain. The suggestion regards the adoption of a price modality that provides for a mixed solution in which a share of price could be tied to incentives to product quality and/or quantity commitment.
Strengthening the role of producer organisations
EU experience in F&V sector has shown the key role played by producer organisations in rebalancing bargaining power and stabilising prices and income, through the concentration and the planning of F&V supply. Thanks to the two last reforms of the CMO, the European F&V sector has been object of an extended process of growth and reorganisation of the production system, involving Member States in different ways in terms of dynamics and characteristics. Nonetheless, empirical evidence shows that the path undertaken to encourage F&V POs has proven to be anything but straightforward. The POs’ development dynamics differ not only among Member States, but also among products. These differences can be explained by several factors, that could be identified as internal to the CMO scheme (unlike Member States’ implementation decisions) and external ones as well (structural factors, and historical and cultural factors). The result of these different paths is a strong heterogeneity among Member States’ organisation rate, especially between Northern and Southern countries in the EU, as well as between new and old Member States. At average EU level the rate of organization in F&Vs is about 34% (EU-25), very far from the objective of 60% established by the CMO.
Moreover, empirical evidence shows how only in certain territorial or productive areas, POs have managed to take on the role required by the market, albeit with great difficulty. It above all happens in those areas with a strong cooperation ground and characterized by the spreading of more competitive and more export-oriented undertakes than other areas.
In order to further improve the attractiveness of POs, the last CMO’s reform of 2007 provided to make them more flexible in their operation by introducing some new elements (product range of a producer organisation; the extent of direct sales permitted and the extension of rules to non-members; permitting associations of producer organizations to carry out any of the activities of their members and permitting the outsourcing of activities). At the same time it provided for a wide range of tools for crisis prevention and management to be carried out through POs, as well as more incentives to mergers of POs

The EU Fruit and Vegetables Sector
PE 460.043 109
and associations of them, and to those regions with a particularly low level of organisation rate, etc.
Notwithstanding several difficulties in the POs’ development path, the EU experience however confirms the validity of the association model, as maintained by COPA-COGECA, in which opinion “the intervention of F&V POs on the market does not only benefit their associated producers, but all producers in the sector”.
INEA survey suggests that the strategic role of POs has been particularly effective in coordinating, within the operational programme, the actions aimed at planning of production, improving product quality and marketing as well, and environmental actions. Product quality, private standards and other certification, as well as other component of the marketing-mix are differentiation strategies that aim at increasing the economic value of products and may lead to gain a position of advantage in the market, which means that POs have to take the behaviour of buyers into account.
The new competitive strategies require the adoption of an organisational model which, in the current setup of agro-food markets, moves towards more and more stringent forms of integration, based on the high contractual strength applied by large-scale retail. The consequence of this is a change in power relations on the market with agriculture in an evident position of weakness, caused by the fact that growing concentration applied by large-scale retail is in contrast with the persistent fragmentation of agricultural production. This puts the great problem of coordination within the supply chain at the heart of the question.
Summarizing, producer organisations can constitute a valid and useful counterweight by taking up a strategic role in restoring balance to market relationships, acting as a contractual power and for redistributing added value, while contributing towards transforming forms of economic dominion into models of cooperative behaviour. For this reason and in consideration of the opinions of most interviewed POs in INEA survey as well as of the other stakeholders, we agree on the need of maintaining POs’ framework and their relevant tool, as operational programmes, however introducing some adjustments in functioning rules, for example through their major simplification.
Furhermore, a suggestion could be the introduction of a top-up on the Community aid as a form of premium for commercialisation of quality products.
On the other hand encouraging sizeable POs, able to cope with large-scale retail, put a problem in terms of competition rules, around which an intense debate has developed.
Competition rules
The agricultural sector is subject to the EU's competition rules under a special regime for agricultural products. The major complexity of the relations between actors along the supply chain has contributed to highlight the controversial relationship between competition rules and agricultural policy, on which a wide debate at political and scientific level has developed. In particular, the debate focuses on the issue of agricultural exemptions to competition rules and on the need to adapt competition rules to the specificities of the agricultural sector. Within the public debate on competition policy two issues seem to be particularly relevant: the increase of bargaining power of large retailers and their contractual relations with the upstream actors.

Policy Department B: Structural and Cohesion Policies
PE 460.043 110
Although competition law impose restrictions to farmers’ agreements, there is however the opportunity for POs to operate as cooperative organisations, recognised by European Courts as pro-competitive structures, which may collectively negotiate. EU competition rules view such agreements favourably if the farmers involved in these forms of cooperation do not collectively hold a level of market power such as to restrict competition in the market to the detriment of consumers. As this regard, the recent “Milk Package” has proposed a quantitative limit (market share) which would allow negotiations between producer organisations, ensuring at the same time market competition. The market share is evaluated on the “relevant market” and the discussions showed that it is not easy to assess what the relevant market is.
Considering the weak bargaining power of the F&V producers, current competition rules are too unfavourable towards them. As this regard it is worth highlighting that the Single CMO Regulation provides not only the concern about the abuse of common rules, but also the “dominant position” concern. This concern differs from other experiences abroad where only the abuse of dominant position is hindered.
Within the public and scientific debate there seems to be a common agreement on the need of a development of competition rules, better addressed to rebalance farmers’ bargaining power towards a sole large retailer.
6.3. Current features and possible changes of EU external protection for F&V producers
The EU trade regime for F&V is rather complex and its measures are set differently according to products, partner countries and seasonality. This is also the outcome of different - and sometime conflicting - objectives stated in the EU trade policy for the sector: protection and stabilization of revenues of EU producer of F&V; large and differentiated supply of F&V products to EU consumers at reasonable price; integration of the import regime within the international relationships that the EU is promoting, particularly with developing and neighboring countries.
Export refunds (ER) for F&V have been phased out in 2007. This move made EU’s support to export competitiveness in line with WTO recommendations and has had impacts on EU’s F&V export that are as limited as support was. Impact on the overall EU domestic market should be of some relevance only for oranges and lemons, which absorbed, respectively, more than 58% and more that 17% of overall expenditure for ER.
External protection remains a cornerstone of the set of measures supporting EU F&V producers and it is mainly based on tariffs and an entry price system (EPS). The EPS works by adding surcharges (MTE) to the normal tariff whenever the import price is detected to be below a defined level (triggering entry price - TEP). Tariffs, TEPs and MTEs change during the year according the seasonality of EU production. Also tariff rate quotas, covering preferential agreements with several countries, and sanitary and fitosanitary measures are relevant for the purpose of external protection.
In the current scenario, while tariffs are already fairly low if compared with other agricultural products, the amount of MTEs is high enough that they can be seen as prohibitive tariffs, capable to make still effective the entry price as a minimum import price. However, the functioning of such a protective system is weakened by the methodologies adopted for monitoring of compliance with entry prices – which often allow organized importers to avoid to bump into the TEP and avoid the payment of the MTE – and also by preferential agreements with several countries.

The EU Fruit and Vegetables Sector
PE 460.043 111
Trade preferences are very relevant in F&V trade of the EU, in terms of both import flows and concessions on tariff and non-tariff measures, although preferential treatments are sometimes bound by tariff quotas restricting concessions to predetermined quantities. The major preferential trade concessions for fresh F&V relate to agreements with Mediterranean partner countries (MPC), most relevant due to both overlapping production calendars with EU domestic production and weight of import flows. Trade concessions normally consist of reduced or zero tariffs, often bounded within TRQs, for a set of products defined for each country. Lower entry prices occur only in favour of few F&V products coming from some MPCs. Preferential conditions are also granted to African, Caribbean, and Pacific countries (Cotonou agreements), other developing countries involved in the GSP, as well as fr/Yugoslavian countries.
After the phasing out of export subsidies, and considering the relatively low level of tariff protection, the main issues related to F&V trade policy consist of potential changes in the EPS and preferential quotas. Assessing future changes in the EPS as a result of the Doha Round, as well as of the deepening of bilateral agreements, needs to take into account the actual profile of EU’s trade partners. The EPS is of lesser importance for off-season providers, while on the Mediterranean scene entry prices and tariff-rate quotas can still be useful tools for stabilizing domestic prices, as well as for easing integration between Southern EU and Mediterranean Partner Countries (MPCs).
The inclusion of improvements of political-diplomatic relationships with several developing countries among the objectives of EU trade policy for F&V implies that a sort of protection, through preferences, has been granted to the competitive advantage of these countries on the EU market. Therefore, although the EPS, as a non-tariff barrier, is certainly going to be seriously challenged in the current round of WTO negotiations, the EU could argue in favor of the maintaining of the system also in the view of preserving preferences to MPCs from the risk of erosion, a position that could be defined in the context of wider deals between the EU and MPCs.
Another important guideline for WTO negotiations could be the pursuit of a careful selection of sensitive products/months/partners as a guideline for the trade deal. Studies reviewed suggest that only in some cases entry prices are effective in influencing the trade pattern and stabilizing domestic prices. Most studies agree on showing that the EPS is relevant for the import of artichokes, courgettes, cucumbers, lemons, plums and tomatoes, while the impact would be lower for apples, clementines and pears; and least relevant for apricots, mandarins, oranges, peaches and nectarines and table grapes. This might make room for reductions, or even phasing outs, for products where the impact of the EPS is negligible, while the EU should ensure that protection is granted to those products that are considered sensitive – that is, where the system actually helps to stabilize prices and avoid import surges – until a careful impact analysis. This would particularly hold for those seasons where overlapping exists for production in Southern EU regions and MPCs areas. These principles are also in line with previous recommendations made by the EESC and COPA-COGECA.
It is also worth recalling that both the “finer tuning” of the EPS and the necessary improvement of border controls for managing the most sensitive liberalization issues would also call for a deepening of the analytical capacity to assess market prices and volumes. More generally, as far as border controls are concerned, a last recommendation relevant in the WTO context is the need of an effective use of the mechanisms foreseen in the WTO agreements to defend the competitive position of EU produce while careful moving towards trade liberalization. Such measures include (i) antidumping and safeguards, from the defensive point of view, and (ii) the resort to the SPS and TBT agreements when unjustified barriers are applied in third partners.

Policy Department B: Structural and Cohesion Policies
PE 460.043 112
However, as also the discussion on WTO perspectives suggests, the progressive opening of EU markets for F&V will mainly proceed on the basis of preferential deals, with WTO multilateral discipline providing a consistent framework. As far as preferences are concerned, although those ones referred to F&V are of interest for a wide set of partners of the EU, the hot issues are mainly on the Mediterranean side. Trade deals with non-Med partners will go on with the slow pace of tariff dismantling which is already set up in the framework of the agreements with South Africa and Chile and will be embodied in the agreements coming out from the recently re-launched EU-Mercosur negotiations, while the Mediterranean scene will need both more care and a strategic view on many policy dimensions.
Here, both historical trading and political ties, as well as ongoing troublesome political changes, call for a strategic, long-term view of Mediterranean agriculture allowing for developing synergies between both shores of the Mediterranean. This long-term view certainly includes trade policy issues, but also lines of CAP reform, including the single payment scheme. On the trade side, suggestions previously summarized for the WTO context particularly hold in the Mediterranean context: insuring a slow expansion of tariff rate quotas, maintaining a preference margin for MPCs, accurately selecting products to be handled as “sensitive”, keeping the EPS in place for sensitive products - and, just as a device of statistical surveillance, also for other F&V products - improving border controls, monitoring of prices and quantities, and the use of safeguard clauses.
Although a successful Euro-Mediterranean integration calls also for appropriate trade measures, the process of coordination and economic integration with MPCs will require attention to domestic policies too. The CAP’s single payment scheme might have been (and might be) helpful to soften the social impacts of adjustments to a more open trading environment, but it is less effective to guarantee a sustainable development in rural areas. Territorial policies supporting organization, business oriented practices, knowledge creation towards sustainable practices, keep being advisable in the F&V sector, as the main weaknesses of F&V producers and, often, of their POs lie in the capability of entering the most dynamic EU-based retail segments.
The strategic view to strengthening the EU competitive position through continuing support to POs is based also on the understanding that POs are an effective way to increase collaboration between growers and other members of the supply chain. This puts POs well oriented to partnership with the most dynamic retail segment in the best position to gain from liberalization. The specific aid regime for F&V should therefore be maintained with a better orientation of resources and programs towards the promotion of a culture of management, business orientation and the achievement of larger POs. In such a policy context cooperation of POs with marketing and producing organizations in MPCs could be further encouraged.

The EU Fruit and Vegetables Sector
PE 460.043 113
REFERENCES
Advisory Group on Fruit and Vegetable (2010), Resolution on “Present and future situation of the fruit and vegetable sector”, Brussels.
Agrosynergie (2006), évaluation des measures concernant agrumes, Rapport final, Contrat cadre n° 30-CE-0035027/00-37, Octobre.
Agrosynergie (2006), évaluation des measures concernant les péches, les nectarines et les poires, Rapport final, Contrat cadre n° 30-CE-0035027/00-37, Octobre.
Agrosynergie (2007), Evaluation of withdrawals and crisis management in fruit and vegetables sector, Final deliverable, Framework contract No. 30-CE-0035027/00-37, March.
Agrosynergie (2008a), Évaluation des measures concernant les organisations de producteurs dans le secteur des fruits et légumes, Rapport final, Contrat cadre n° 30-CE-0159637/00-04, Novembre.
Agrosynergie (2008b), Evaluation of the system of entry prices and export refunds in the fruit and vegetables sector, Final deliverable, Framework contract No. 30-CE-0035027/00-37, April.
Agrosynergie (2010), Évaluation des effets sur les marchés du découplage partiel, Contrat cadre n° 30-CE-0223110/00-78, Octobre.
Allain M.L., Chambolle C. (2003), Approches théoriques des rapports de force entre producteurs et distributeurs, Économie Rurale, 277-278, Septembre-décembre.
Appeltans P. (2010), Priorities, Challenges and Instruments of the Post-2013 Aid Regime for F&V, VBT Congres « L’avenir de l’OCM Fruit et Légumes », Bruxelles, 21 et 22 octobre.
AND International, Normes de commercialisation dans le secteur des fruits et legumes - Agri 2009 - Rapport final, 16 Septembre 2010.
Arfini F., Donati M., Petriccione G., Solazzo R. (2011), An impact assessment of the future CAP reform on the Italian tomato sector in Sorrentino A., Henke R., Severini S. (eds.), « The Common Agricultural Policy After the Fischler Reform: National Implementations, Impact Assessment and the Agenda for Future Reforms », Ashgate Publishing (Forthcoming).
Authorité de la concurrence (2010), Avis n° 10-A-28 du 13 décembre 2010 relatif a deux projets de décret imposant la contractualisation dans des secteurs agricoles.
Bazoche P., Giraud-Héraud E., Soler L.G. (2005), Premium private labels, supply contracts, market segmentation, and spot prices, Journal of Agricultural and Food Industrial Organization (USA), vol. 3, n. 1, 1-28.
Bertazzoli A., Petriccione G. (eds.) (2006), L’OCM ortofrutta e i processi di adattamento delle Organizzazioni di produttori: materiali e metodi per la valutazione, Collana Studi & Ricerche INEA, Napoli, ESI
Boudoukh J., Richardson M., Shen Y., Whitelaw R.F. (2007). Do asset prices reflect fundamentals? Freshly squeezed evidence from the OJ market. Journal of Financial Economics. 83 (2): 397-412.
Bovet C., Chappuis J.M. (2001), Interprofessions et concurrence, Agrarwirtschaft und Agrarsoziologie, 2, pp. 131-159.
Buckwell A. (2009), Elements of the post 2013 CAP, European Parliament – Directorate General for Internal Policies, Brussels.

Policy Department B: Structural and Cohesion Policies
PE 460.043 114
Bureau J.C., Mahé L.P. (2008), CAP reform beyond 2013: an idea for a longer view, Notre Europe, Studies and Research n. 64. www.notre-europe.eu.
Bureau J.C., Witzke H.P. (eds) (2010), The single payment scheme after 2013: new approach – new targets, Directorate-General for Internal Policies, European Parliament, Brussels.
Cafiero C., Capitanio F., Cioffi A. and Coppola A. (2007), Risk and Crisis Management in the Reformed European Agricultural Policy, Canadian Journal of Agricultural Economics/Revue Canadienne d’agroeconomie, Special Issue December, 55 (4): 399-590.
Camanzi, L., Malorgio G., García Azcárate T. (2009), The role of Producer Organizations in supply concentration and marketing: a comparison between European Countries in the fruit and vegetables sector, paper prepared for presentation at the 113th EAAE Seminar “A resilient European food industry and food chain in a challenging world”, Chania, Crete, Greece, September 3 - 6, 2009.
Cato, C.J., Otwell, S.W., and Coze, A.S., (2005), Nicaragua’s Shrimp Subsector: Developing a Production Capacity and Export Market During Rapidly Changing Worldwide Safety and Quality Regulations”, Agricultural and Rural Development Discussion Paper, Washington D.C., The World Bank.
Centre for the Promotion of Imports from developing countries (CBI) (2009) - market survey - the fresh fruit and vegetables market in the EU.
Cesaretti, G.P., Green R. (2006), Organizzazione della filiera ortofrutticola. Esperienze internazionali a confronto, Franco Angeli, Milano.
Cesarini P. (2009), Ensuring a well functioning food supply chain in Europe: recent Commission initiatives and the role of Competition Authorities, European Commission, DG Competition, Jornada sobre Competencia en el Sector Agroalimentario, Madrid, December 10th.
CFEPSR (2009), Feasibility Study on Introducing a Security Fund in the Fruit and Vegetables Sector - Final Report, 05 March 2009.
Chatellier V. (2009), The Reform of Market Regulation Mechanisms, Note European Parliament, Directorate–General for Internal Policies, Policy Department B: Structural and Cohesion Policies, Brussels.
Ciheam (2010), Atlas of Mediterranean agriculture, food, fisheries and rural areas, Annual Report Mediterra, available at http://www.ciheam.org/index.php/en/publications/atlas-mediterra, downloaded February 2011.
Cioffi, A., dell’Aquila C. (2004), The effects of trade policies for fresh fruit and vegetables of the European Union, Food Policy, Vol. 29/2 pp. 169-185 ISSN: 0306-9192.
Cioffi, A., (2007), Le preferenze tariffarie dell’UE agli ortofrutticoli freschi dei paesi terzi del Mediterraneo: articolazione ed effetti sulle importazioni, AgriregioniEuropa, Anno 3, Numero 10, Settembre.
Cioffi A., Coppola A. (2009), Il ruolo delle Organizzazioni di Produttori nel settore ortofrutticolo: un’analisi delle possibilità di sviluppo nello scenario di riforma della PAC, Economia e diritto agroalimentare, XIV (1). pp. 99-117.
Cioffi, A., Santeramo F.G., Vitale C.D. (2010), The Price Stabilisation Effects of the EU entry price scheme for fruit and vegetables, Agricultural economics, July 2010.
Copa-Cogeca (2010), Fruit and Vegetable Producer Organisations in the EU : Overview and Prospects.
Coronel C., Liagre L. (2006), Les interprofessions agroalimentaires en France, Ministère Français des Affaires Etrangères – DGCID DCT/EPS IRAM/REDEV.

The EU Fruit and Vegetables Sector
PE 460.043 115
Council of the European Union (2010) Market management measures post 2013, Agriculture Council of 15 February 2010, Brussels, Presidency Paper and Questionnaire (doc. 6063/10); Council Conclusions (doc. 7451/1/10 REV 1).
Crespi J. M., Sexton R. J. (2003), Concurrence, coopératives de producteurs et Marketing Orders aux Etats Unis, Économie rurale, 277-278, Septembre-décembre.
De Figueredo Tavares MF. (2008), Mercado futuro e físico de SLCC: conhecimento e uso no agronegócio citrícola do Brasil, Revista Brasileira de Fruticultura, 30 (4): 925-930.
De Wulf L., Maliszewska M. (eds.), (2009), Economic Integration in the Euro-Mediterranean Region, Final Report, September 2009, Center for Social and Economic Research, CEPS, Brussels.
dell’Aquila C., L. Salvatici (2005), Il negoziato WTO e gli accordi mediterranei, in Rassegna Economica, n.2, Dec. 2005, Studi e Ricerche per il Mezzogiorno, Banco di Napoli, Giannini, Napoli, Italy.
Desai K.S., Schmidt J.P., Sproul G., Jalabert-Doury N. (2010), The Food Sector: The Competitive Environment May Be to Blame, Mayer Brown International LLP, Brussels Office.
EESC (2008), Opinion on Health security of agricultural and food imports (CESE 1672/2008).
EESC (2010), Opinion on Agriculture in Euromed (including the importance of women's work in the agricultural sector and the role of cooperatives), REX/272 Agriculture in Euromed, Brussels, 18 February 2010.
Emlinger, C., Jacquet, F., Lozza, E. C., 2008. Tariffs and other trade costs: assessing obstacles to Mediterranean countries' access to EU-15 fruit and vegetable markets. European Review of Agricultural Economics. 35: 409-438.
Euromed Summit, 2005, Five Year Work Programme. Final Text, 10th Anniversary Euromediterranean Summit, Barcellona 27-28 November 2005, on line document downloaded Dec. 2005, (http://europa.eu.int/comm/external_relations/euromed/summit1105/five_years.pdf).
European Commission, (1999). Note interprétative concernent le règlement (CE) 3223/94, portant modalités d’application du régime à l’importation de certains fruits et légumes frais, Direction Generale Agriculture, Bruxelles.
European Commission (2005), Green Paper. Promoting healthy diets and physical activity : a European dimension for the prevention of overweight, obesity and chronic diseases, COM (2005) 637 final.
European Commission (2007), White Paper on A Strategy for Europe on Nutrition, Overweight and Obesity related health issues, COM (2007) 279 final.
European Commission (2008), Food prices in Europe, Communication from the Commission to the European Parliament, the Council, the European Economic and Social Committee and the Committee of the Regions, COM(2008) 821 final.
European Commission (2009a), A better functioning food supply chain in Europe, Communication from the Commission to the European Parliament, the Council, the European Economic and Social Committee and the Committee of the Regions, COM(2009) 591 final.
European Commission (2009b), Outcomes of the High-Level Group on the Competitiveness of the Agro-Food Industries. Proposal to increase the efficiency and competitiveness of the EU food supply chain, Accompanying document to the Communication from the Commission to the European Parliament, the Council, the European Economic and Social Committee and the Committee of the Regions “ A better functioning food supply chain in Europe” Commission Staff Working Document, SEC (2009) 1448.

Policy Department B: Structural and Cohesion Policies
PE 460.043 116
European Commission (2009c), Competition in the food supply chain, Accompanying document to the Communication from the Commission to the European Parliament, the Council, the European Economic and Social Committee and the Committee of the Regions “A better functioning food supply chain in Europe”, Commission Staff Working Document, SEC (2009) 1449.
European Commission (2009d), Analysis of price transmission along the food supply chain in the EU, Accompanying document to the Communication from the Commission to the European Parliament, the Council, the European Economic and Social Committee and the Committee of the Regions “A better functioning food supply chain in Europe”, Commission Staff Working Document, SEC (2009) 1450.
European Commission (2010a), The interface between EU competition policy and the Common Agriculture Policy (CAP): competition rules applicable to cooperation agreements between farmers in the dairy sector, Working Paper DG Competition, Brussels, 16 February.
European Commission (2010b), The EU Budget Review, Communication from the Commission to the European Parliament, the Council, the European Economic and Social Committee, the Committee of the Regions and the National Parliaments, COM(2010) 700 final, 19 October, Brussels.
European Commission (2010c), The CAP towards 2020: Meeting the food, natural resources and territorial challenges of the future, Communication from the Commission to the European Parliament, the Council, the European Economic and Social Committee and the Committee of the Regions, COM(2010) 672 final, 18 November, Brussels.
European Commission (2010d), Proposal for a Regulation of the European Parliament and of the Council amending Council Regulation (EC) No 1234/2007 as regards contractual relations in the milk and milk products sector, COM(2010) 728, Brussels, 9 December.
European Court of Auditors (2009), Information provision and promotion measures for agricultural products, Special Report n. 10.
European Union Directorate-General for Agriculture and Rural Development (2010) - Agriculture in the european union statistical and economic information 2009.
Fearne, A. and Hughes D. (1998), Success Factors in the Fresh Produce Supply Chain: Some Examples from the UK. Executive Summary. London, Wye College.
Fernandez Izquierdo M. A., Munoz Torres M. J. (1998), Análisis del mercado de futuros en Cítricos FC&M desde el punto de vista del potencial operador, Revista de treball, economia i societat, ISSN 1137-0874, Nº. 10, 1998 , 23-28.
Fischer, C, Gonzalez M., Henchion M., and Leat P. (2007), Trust and economic relationships in selected European agri-food chains, Food Economics, 4 (1): 40-49.
Garcia Alvarez-Coque J.M. (2002), Agricultural trade and the Barcelona process. Is full liberalisation possible?, European Review of Agricultural Economics 29, 399-422.
Garcia Alvarez-Coque J.M. (2007), Present and future of Southern European Agriculture, Politica Agricola Internazionale n.3, July-Sept. 2007, available at http://www.informatoreagrario.it/ita/riviste/Pagri/, downloaded January 2011;
García Álvarez-Coque J.M., Compés López R., Amparo Baviera Puig (2007), The Reform of the CMO in Fruits and Vegetables: A Holistic Approach, Paper prepared for presentation at the I Mediterranean Conference of Agro-Food Social Scientists. 103rd EAAE Seminar ‘Adding Value to the Agro-Food Supply Chain in the Future Euromediterranean Space’. Barcelona, Spain, April 23rd - 25th.
Garcia-Alvarez-Coque J.M., Jordán Galduf J.M., Martínez Gomez V. (2008), El modelo europeo de agricultura y los acuerdos internacionales, Papeles de Economía Española nº 117: 227.243.

The EU Fruit and Vegetables Sector
PE 460.043 117
Garcia-Alvarez-Coque J.M., Martinez-Gomez V., Villanueva M. (2009), A trade model to evaluate the impact of trade liberalisation on EU tomato imports, Spanish Journal of Agricultural Research 2009 7(2).
Garcia-Alvarez-Coque J.M., Martinez-Gomez V., Villanueva M. (2010), Seasonal protection of F&V imports in the EU: impacts of the entry price system, Agricultural Economics 41 (2010) 205–218.
Giacomini C., Arfini F., de Roest K. (2010), Interprofession and typical products: the case of Parmigiano Reggiano cheese, Paper prepared for the 116th EAAE Seminar “Spatial Dynamics in Agri-Food Systems: Implications for Sustaynability and Consumer Welfare”, Parma, 27-30 October.
Goetz L., Grethe H. (2009), The EU entry price system for fresh fruits and vegetables – Paper tiger or powerful market barrier?, Food Policy, 34: 81-93.
Green R., Schaller B. (1996), La dimension logistique de la rationalisation productive et commerciale, Agroalimentaria, N. 3. Diciembre.
Grethe H., Tangermann S. (1998), The EU import regime for fresh fruit and vegetables after Implementation of the results of the Uruguay Round, Paper prepared for the Commodities and Trade Division FAO Economic and Social Department, reprinted as Discussion Paper 9902, Institute of Agricultural Economics, University of Göttingen.
Henson J.S, Mitullah W. (2004), Kenyan Exports of Nile Perch: Impact of Food safety Standards on Export-Oriented Supply Chain, Discussion Paper, The World Bank.
High Level Group on the Competitiveness of the Agro-Food Industry (2009), Final Recommendations.
High Level Group on Milk (2010), Report, final version of 15 June.
Ierugan A. (2010), Development of citrus in the EU (fresh market), European Commission-DG Agriculture and Rural Development (DG AGRI),Bruxelles, 26th April.
INEA (2002), L’Unione Europea e i Paesi Terzi del Mediterraneo. Accordi commerciali e scambi agroalimentari, INEA, Rome. Abridged English version: dell’Aquila C., B.E. Velazquez, The European Union and Southern-Eastern Mediterranean Countries. Preferential trading agreements and agricultural trade relations, available at http://www.inea.it/pdf/filespdf.cfm.
INEA (2010), Annuario dell’Agricoltura Italiana, volume LXIII, 2009.
OIV (2008) - World Vitivinicultural Statistics 2007.
Jacquin E. (2010), Aid regime for the fruit & vegetables sector in the EU: state of play, Bruxelles, 21 October.
Jaffee S. (2003), From Challenge to Opportunity: Transforming Kenya’s Fresh Vegetable Trade in the context if Emerging Food Safety and Other standards in Europe, Agricultural and Rural Development Paper, Washington D.C., The World Bank.
Jean S., Laborde D. (2008), The Consequences of WTO Revised Draft Modalities for Agricultural market access in the European Union, Draft Agriculture Modalities for the Doha Round: Taking Stock of the Trade and Development Implications, WMO, Geneva, Switzerland, 12 March 2008. http://www.ictsd.org/dlogue/2008-03-12/2008-03-12-doc.htm (dowloaded May 2008).
Kalaitzis P., van Dijk G., Baourakis G. (2007), Euro-Mediterranean supply chain developments and trends in trade structures, in the fresh fruit and vegetable sector, Paper prepared for presentation at the I Mediterranean Conference of Agro-Food Social Scientists, 103rd EAAE Seminar ‘Adding Value to the Agro-Food Supply Chain in the Future Euromediterranean Space’, Barcelona, Spain, April 23rd - 25th.

Policy Department B: Structural and Cohesion Policies
PE 460.043 118
Kaplinsky R., Morris M. (2002), A handbook for value chain research, Institute of Development Studies, on line material dowloaded from http://www.ids.ac.uk/ids/global/pdfs/VchNov01.pdf in Jan 2011.
Koontz S. R. (2000), Concentration, Competition, and Industry Structure in Agriculture, Department of Agricultural and Resource Economics, Colorado State University.
Ligon E. (2009), Risk Management in the Cooperative Contract, American Journal of Agricultural Economics, 91 (5). 1211-1217.
MacDonald J.M., Korb P. (2011), Agricultural Contracting Update : Contracts in 2008, EIB-72, U.S. Dept. of Agriculture, Economic Research Service, February.
Marette S., Raynaud E. (2003), Applications du droit de la concurrence au secteur agroalimentaire, Économie rurale, 277-278, Septembre-décembre.
Maertens M., Swinnen J. (2008), Standards as barriers and catalysts for trade, growth and poverty reduction, Journal of International Trade and Development, 4: pp. 47-61.
Martinez-Palou A., Rohner-Thielen E. (2008)- Agriculture and fisheries Statistics in focus - Fruit and vegetables: fresh and healthy on European tables.
Ménard C. (2003), Économie néo-institutionnelle et politique de la concurrence : les cas des formes organisationnelles hybrides, Économie rurale, 277-278, Septembre-décembre.
Milgrom P., Roberts J. (1992), Economics, Organization and Management, London, Prentice Hall Inc.
OECD (1998), United States – The Role of Competition Policy in Regulatory Reform, Country Studies.
OECD (2005), Competition and Regulation in Agriculture: Monopsony Buying and Joint Selling, DAF/COMP (2005) 44.
Otsuki T., Wilson J., Sewadeh M. (2001), Saving two in a billion: quantifying the trade effect of European food safety standards on African exports, Food Policy, 26, 495–514.
Petriccione G. (2008), Le Organizzazioni dei produttori nella riforma dell’OCM ortofrutta, Agriregionieuropa, n. 12, marzo.
Petriccione G. (2009), L’associazionismo come strumento strategico di governo del mercato agroalimentare, Agriregionieuropa, n. 18, settembre.
Prodromos van Dijk K,G., Baourakis G. (2007), Euro-Mediterranean supply chain developments and trends in trade structures, in the fresh fruit and vegetable sector - Paper prepared for presentation at the I Mediterranean Conference of Agro-Food Social Scientists. 103rd EAAE Seminar ‘Adding Value to the Agro-Food Supply Chain in the Future Euromediterranean Space’. Barcelona, Spain, April 23rd - 25th.
Rabboni T. (2011), Relazione introduttiva al Convegno Nuova PAC ed Ortofrutta : la posizione italiana, Bologna, 31 gennaio.
Raynaud E., Valceschini E. (2007), Creation and Capture of Value in Sectors of the Agri-food Industry : Strategy and Governance, OECD Working Party on Agricultural Policies and Markets, TAD/CA/APM/WP (2007) 16, 9-11 May.
Requillart V. (2009), Contribution to the analysis of farmers and processors relationships, High Level Expert Group on Milk, Brussels, 8 December.
Sans P., Coquart D. (1998), Grande distribution alimentaire et changements organisationnels, Économie rurale, N.245-246, pp. 111-118.
Schwartz A. (2002), “Contract theory and theories of contract regulation”, in E. Brousseau and J.M. Glachant (eds), The Economics of Contracts, Cambridge (UK), Cambridge University Press.

The EU Fruit and Vegetables Sector
PE 460.043 119
Swinbank A., Ritson C. (1995), The impact of Gatt agreement on fruit and vegetable policy, Food Policy, 20, 4.
Swinnen J.F.M. (2009), On the future of Direct Payments, paper presentato al Workshop BEPA on “Reflections on the Common Agricultural Policy from a long-run perspective”, Brussels, 26th of February.
Tangermann S. (1996), Access to EU markets for agricultural products after the Uruguay Round and export interests of the Mediterranean countries, UNCTAD study, Gottingen.
Taric, (2010). Integrated tariff of the European Communities, on line document, http://ec.europa.eu/taxation_customs/common/databases/index_en.htm.
USDA (2008a), EU-27 Fresh Deciduous Fruit. Annual 2008, GAIN Report, No. E48136.
USDA (2008b), Dairy Product Mandatory Reporting, Federal Register, Vol.73, No. 117, June 17.
Varney C. A. (2010), Joint DOJ and USDA Agriculture Workshops: Concluding Remarks, Washington D.C., December 8.
Vavra P. (2009), "Role, Usage and Motivation for Contracting in Agriculture", OECD Food, Agriculture and Fisheries Working Papers, No. 13, OECD publishing,
Vorley, B. (2003). Food, Inc.: Corporate Concentration from Farm to Consumer. London, UK Food Group and International Institute for Environment and Development.
VV.AA. (2003), Marchés et politique de la concurrence, Économie rurale, 277-278, Septembre-décembre.
WHO (2003), Diet, Nutrition and the prevention of chronic diseases. Report of a Joint WHO/FAO Expert consultation, WHO Technical Report Series 916, Geneva.
WTO (2008), WTO Committee on Agriculture, Chair’s draft (Dec. 2008).
Wu S. (2006), Contract theory and agricultural policy analysis: a discussion and survey of recent developments., The Australian Journal of Agricultural and Resource Economics, 50.
Zahrnt V. (2009), The budgetary aspects of the new CAP payments, European Parliament – Directorate General for internal Policies, Bruxelles.


DIRECTORATE GENERAL FOR INTERNAL POLICIES
POLICY DEPARTMENT B: STRUCTURAL AND COHESION POLICIES
AGRICULTURE AND RURAL DEVELOPMENT
THE EU FRUIT AND VEGETABLES SECTOR: OVERVIEW AND POST 2013
CAP PERSPECTIVE
ANNEXES

This document was requested by the European Parliament's Committee on Agriculture and Rural Development AUTHORS Ms Gaetana Petriccione (project manager), Mr Crescenzo dell’Aquila (project leader), Ms Maria Angela Perito, Mr Roberto Solazzo, INEA (Istituto Nazionale di Economia Agraria) Mr Antonio Cioffi, University of Naples Federico II Mr José-Maria Garcia-Alvarez-Coque, University of Valencia RESPONSIBLE ADMINISTRATOR Mr Albert Massot Policy Department Structural and Cohesion Policies European Parliament B-1047 Brussels E-mail: [email protected] EDITORIAL ASSISTANCE Mrs Catherine Morvan LINGUISTIC VERSIONS Original: EN ABOUT THE EDITOR To contact the Policy Department or to subscribe to its monthly newsletter please write to: [email protected] Manuscript completed in April 2011. Brussels, © European Parliament, 2011. This document is available on the Internet at: http://www.europarl.europa.eu/studies DISCLAIMER The opinions expressed in this document are the sole responsibility of the author and do not necessarily represent the official position of the European Parliament. Reproduction and translation for non-commercial purposes are authorized, provided the source is acknowledged and the publisher is given prior notice and sent a copy.

DIRECTORATE-GENERAL FOR INTERNAL POLICIES
POLICY DEPARTMENT B: STRUCTURAL AND COHESION POLICIES
AGRICULTURE AND RURAL DEVELOPMENT
THE EU FRUIT AND VEGETABLES SECTOR: OVERVIEW AND POST 2013
CAP PERSPECTIVE
ANNEXES
Abstract: This study provides an overview of recent economic and policy developments of the EU F&V sector, considering ongoing changes in supply chains and market dynamics and current profiles of domestic and trade policies. Findings suggest that current difficulties for EU producers, particularly for small farming, arises mainly from long-term changes at different levels of the global F&V sector: consumers, retail and multinational agribusiness. The preliminary assessment of the 2007 reformed CMO, derived from both National Strategies and a survey targeting POs of Italy, Spain and France, validate the cornerstones of the current EU policy schemes for the F&V sector. However plausible improvements are envisaged for support and trade protection measures in the framework of the CAP after 2013. Main proposals focus a strengthened role of POs, selecting and increasing effectiveness of crises and risk management measures, rebalancing bargaining power of POs in the supply chain, reducing fluctuations in producers’ income, refining trade policy solutions in a context of increased trading openness and further integration with Mediterranean Partner Countries.
IP/B/AGRI/IC/2010-045 April 2011
PE 460.043 EN


The EU Fruit and Vegetable Sector: Overview and Post 2013 CAP Perspective _____________________________________________________________________________________________
PE 460.043 3
CONTENTS
ANNEX 1 - TABLES AND FIGURES 5
ANNEX 2 - IMPORT REGIME 45
1. The evolution of the EU import regime for fresh fruit and vegetables 45
2. Import measures 46
3. Functioning mechanism for the entry price system 49
ANNEX 3 - TRADE PREFERENCES SYSTEM 53
1. Overview 53
2. Agreements with Mediterranean Countries 53
3. Other agreements 55
ANNEX 4 – EU–MOROCCO AGRICULTURAL PROTOCOL 57
ANNEX 5 – INEA SURVEY 59
ANNEX 6 - COMPETITION AND REGULATION IN AGRICULTURE 69

Policy Department B: Structural and Cohesion Policies ___________________________________________________________________________________
PE 460.043 4

The EU Fruit and Vegetable Sector: Overview and Post 2013 CAP Perspective _____________________________________________________________________________________________________________________________________________
PE 460.043 5
ANNEX 1- TABLES AND FIGURES Table A1.1 - Production of fresh F&V in the EU-27 (thousand tons), and share (%) on the value of total agricultural output (producer price), 2000-2009
item 2000 2001 2002 2003 2004 2005 2006 2007 2008 2009Vegetables&Melons 64,007 62,797 60,868 63,816 66,395 62,825 60,981 59,872 58,583 60,266Fruit (excl citrus fruit) 58,562 55,470 52,310 52,132 56,938 52,835 53,499 48,844 50,660 50,001Citrus Fruit 10,127 10,479 10,822 10,778 10,783 10,457 12,082 10,103 11,603 10,845EU-27- Total F&V 132,697 128,746 124,000 126,726 134,115 126,117 126,561 118,819 120,846 121,112F&V/Agricultural output 17.2 17.3 17.8 19.4 18.1 18.5 19.7 18.3 17.6 18.2
Source: FAOSTAT and Eurostat
Table A1.2 - Share (%) of fresh fruit, vegetables and citrus fruit in total EU-27 F&V production,2000-2009
item 2000 2001 2002 2003 2004 2005 2006 2007 2008 2009Vegetables&Melons 48.2 48.8 49.1 50.4 49.5 49.8 48.2 50.4 48.5 49.8Fruit (excl citrus fruit) 44.1 43.1 42.2 41.1 42.5 41.9 42.3 41.1 41.9 41.3Citrus Fruit 7.6 8.1 8.7 8.5 8.0 8.3 9.5 8.5 9.6 9.0EU-27- Total F&V 100 100 100 100 100 100 100 100 100 100 Source: FAOSTAT
Table A1.3 - Share (%) of EU-27 fresh F&V production in World production, 2000-2009
item 2000 2001 2002 2003 2004 2005 2006 2007 2008 2009Vegetables&Melons 9.2 8.6 8.0 8.1 8.4 7.8 7.3 7.1 6.8 6.9Fruit excl citrus fruit 15.9 15.0 13.9 13.4 13.9 12.6 12.3 11.0 11.1 10.8Citrus Fruit 9.6 10.0 10.1 10.2 9.6 9.5 10.4 8.5 9.3 8.7EU-27- Total F&V 11.3 10.7 10.0 9.9 10.2 9.4 9.1 8.5 8.4 8.3
Source: FAOSTAT

Policy Department B: Structural and Cohesion Policies ____________________________________________________________________________________________________________________________
PE 460.043 6
Figure A1.1 - Production of fresh F&V in the EU-27 (thousand tons), 2000-2009
0
20.000
40.000
60.000
80.000
100.000
120.000
140.000
2000 2001 2002 2003 2004 2005 2006 2007 2008 2009
Citrus Fruit
Fruit (excl citrus f ruit)
Vegetables&Melons
Source: FAOSTAT

The EU Fruit and Vegetable Sector: Overview and Post 2013 CAP Perspective _____________________________________________________________________________________________________________________________________________
PE 460.043 7
Figure A1.2 – Percentage distribution of farms specialized in horticulture and fruit by size classes (ha of UAA) and MS, 2007
0%
10%
20%
30%
40%
50%
60%
70%
80%
90%
100%
EU-27 EU-15 IT ES EL FR DE PT NL PL RO HU
AA>= 100 ha
50<= AA < 100 ha
20 ha <= AA <50 ha
5 ha <= AA <20 ha
AA <5 ha
Source: Eurostat

Policy Department B: Structural and Cohesion Policies ____________________________________________________________________________________________________________________________
PE 460.043 8
Figure A1.3 - Price indices of agricultural products, output: base 2000=100 – Fresh Vegetables, 2001-2008 (quarterly)
-40,0
-20,0
0,0
20,0
40,0
60,0
80,0
Spain France Italy
Source: Eurostat

The EU Fruit and Vegetable Sector: Overview and Post 2013 CAP Perspective _____________________________________________________________________________________________________________________________________________
PE 460.043 9
Figure A1.4 - Price indices of agricultural products, output: base 2000=100– Fresh fruit (excluding citrus fruit and grapes), 2001-2008
(quarterly)
-40,0
-30,0
-20,0
-10,0
0,0
10,0
20,0
30,0
40,0
50,0
60,0
2001Q1
2001Q2
2001Q3
2001Q4
2002Q1
2002Q2
2002Q3
2002Q4
2003Q1
2003Q2
2003Q3
2003Q4
2004Q1
2004Q2
2004Q3
2004Q4
2005Q1
2005Q2
2005Q3
2005Q4
2006Q1
2006Q2
2006Q3
2006Q4
2007Q1
2007Q2
2007Q3
2007Q4
2008Q1
2008Q2
2008Q3
2008Q4
Spain France Italy
Source: Eurostat

Policy Department B: Structural and Cohesion Policies ____________________________________________________________________________________________________________________________
PE 460.043 10
Table A1.4 - Production of fresh Vegetables by EU Member States (thousand tons), 2000-2009
Member States 2000 2001 2002 2003 2004 2005 2006 2007 2008 2009Austria 403 416 443 425 463 417 431 457 458 455Belgium 1,526 1,568 1,632 1,729 1,810 1,749 1,759 1,721 1,720 750Bulgaria 1,361 1,075 945 1,346 966 498 815 549 521 480Cyprus 130 140 142 135 128 132 125 119 102 104Czech Republic 383 336 273 253 256 234 232 209 208 182Denmark 200 204 198 206 201 202 197 200 200 200Estonia 59 60 43 63 59 61 59 69 62 69Finland 222 214 217 218 213 239 217 223 213 229France 5,973 5,925 6,039 5,838 5,835 5,532 4,990 4,894 5,041 4,735Germany 3,563 3,469 3,410 3,366 3,481 3,284 3,407 3,281 3,071 3,100Greece 4,098 4,064 3,773 3,902 4,052 3,780 3,542 3,451 3,275 3,287Hungary 1,383 1,714 1,729 1,907 1,984 1,475 1,685 1,677 1,734 1,514Ireland 213 219 213 207 233 228 222 216 216 0Italy 15,949 14,582 13,729 14,781 15,947 15,435 14,335 14,170 13,293 11,951Latvia 98 152 135 220 166 156 161 140 114 141Lithuania 315 302 270 523 350 351 219 271 289 312Luxembourg 1 1 1 1 1 1 1 1 1 1Malta 78 76 73 70 78 74 78 76 78 71Netherlands 2,792 2,866 2,903 2,963 3,221 3,159 3,162 3,224 3,242 0Poland 5,269 5,025 4,237 4,533 4,874 4,904 4,807 5,142 4,770 5,078Portugal 2,158 2,216 2,056 2,084 2,380 2,264 2,154 2,427 2,380 1,629Romania 3,099 3,436 3,561 4,334 4,441 3,261 3,753 2,794 3,426 3,524Slovakia 394 371 292 317 306 313 326 286 306 286Slovenia 74 57 66 60 76 82 75 62 72 79Spain 11,229 11,289 11,734 11,865 12,346 12,385 11,776 11,876 11,523 11,550Sweden 245 273 279 284 304 295 310 274 268 287United Kingdom 2,791 2,746 2,477 2,186 2,224 2,313 2,146 2,064 1,999 0EU-27 64,007 62,797 60,868 63,816 66,395 62,825 60,981 59,872 58,583 60,266World 697,684 727,669 758,735 787,089 792,851 807,027 835,148 842,253 859,502 868,835
Source: FAOSTAT

The EU Fruit and Vegetable Sector: Overview and Post 2013 CAP Perspective _____________________________________________________________________________________________________________________________________________
PE 460.043 11
Table A1.5 – Share (%) of fresh Vegetable production by EU member countries, 2000-2009
Member States 2000 2001 2002 2003 2004 2005 2006 2007 2008 2009Austria 0.6 0.7 0.7 0.7 0.7 0.7 0.7 0.8 0.8 0.8Belgium 2.4 2.5 2.7 2.7 2.7 2.8 2.9 2.9 2.9 1.2Bulgaria 2.1 1.7 1.6 2.1 1.5 0.8 1.3 0.9 0.9 0.8Cyprus 0.2 0.2 0.2 0.2 0.2 0.2 0.2 0.2 0.2 0.2Czech Republic 0.6 0.5 0.4 0.4 0.4 0.4 0.4 0.3 0.4 0.3Denmark 0.3 0.3 0.3 0.3 0.3 0.3 0.3 0.3 0.3 0.3Estonia 0.1 0.1 0.1 0.1 0.1 0.1 0.1 0.1 0.1 0.1Finland 0.3 0.3 0.4 0.3 0.3 0.4 0.4 0.4 0.4 0.4France 9.3 9.4 9.9 9.1 8.8 8.8 8.2 8.2 8.6 7.9Germany 5.6 5.5 5.6 5.3 5.2 5.2 5.6 5.5 5.2 5.1Greece 6.4 6.5 6.2 6.1 6.1 6.0 5.8 5.8 5.6 5.5Hungary 2.2 2.7 2.8 3.0 3.0 2.3 2.8 2.8 3.0 2.5Ireland 0.3 0.3 0.4 0.3 0.4 0.4 0.4 0.4 0.4 0.0Italy 24.9 23.2 22.6 23.2 24.0 24.6 23.5 23.7 22.7 19.8Latvia 0.2 0.2 0.2 0.3 0.2 0.2 0.3 0.2 0.2 0.2Lithuania 0.5 0.5 0.4 0.8 0.5 0.6 0.4 0.5 0.5 0.5Luxembourg 0.0 0.0 0.0 0.0 0.0 0.0 0.0 0.0 0.0 0.0Malta 0.1 0.1 0.1 0.1 0.1 0.1 0.1 0.1 0.1 0.1Netherlands 4.4 4.6 4.8 4.6 4.9 5.0 5.2 5.4 5.5 0.0Poland 8.2 8.0 7.0 7.1 7.3 7.8 7.9 8.6 8.1 8.4Portugal 3.4 3.5 3.4 3.3 3.6 3.6 3.5 4.1 4.1 2.7Romania 4.8 5.5 5.8 6.8 6.7 5.2 6.2 4.7 5.8 5.8Slovakia 0.6 0.6 0.5 0.5 0.5 0.5 0.5 0.5 0.5 0.5Slovenia 0.1 0.1 0.1 0.1 0.1 0.1 0.1 0.1 0.1 0.1Spain 17.5 18.0 19.3 18.6 18.6 19.7 19.3 19.8 19.7 19.2Sweden 0.4 0.4 0.5 0.4 0.5 0.5 0.5 0.5 0.5 0.5United Kingdom 4.4 4.4 4.1 3.4 3.3 3.7 3.5 3.4 3.4 0.0EU-27 100.0 100.0 100.0 100.0 100.0 100.0 100.0 100.0 100.0 100.0EU-27/World 9.2 8.6 8.0 8.1 8.4 7.8 7.3 7.1 6.8 6.9
Source: FAOSTAT

Policy Department B: Structural and Cohesion Policies ____________________________________________________________________________________________________________________________
PE 460.043 12
Table A1.6 - Production of fresh Fruit by EU Member States (thousand tons), 2000-2009
Member States 2000 2001 2002 2003 2004 2005 2006 2007 2008 2009Austria 1,092 1,026 1,061 1,109 1,148 1,031 1,118 1,179 1,204 1,156Belgium 786 474 571 546 641 590 680 682 683 3Bulgaria 740 639 554 612 540 384 444 500 477 409Cyprus 283 251 244 248 295 235 230 206 182 181Czech Republic 556 417 508 448 526 389 295 284 326 72Denmark 55 50 48 58 71 73 71 71 71 71Estonia 27 27 28 10 8 17 6 7 5 9Finland 18 20 18 15 15 17 17 16 17 19France 11,265 10,952 10,653 9,584 11,064 10,297 10,143 9,313 8,502 8,984Germany 5,291 3,713 3,448 2,777 2,766 2,818 2,656 2,956 2,802 2,696Greece 4,142 4,318 3,955 3,169 3,634 3,760 3,680 3,410 3,213 3,208Hungary 1,727 1,735 1,211 1,322 1,840 1,225 1,397 1,282 1,466 1,493Ireland 25 25 24 23 32 52 49 52 52 0Italy 17,989 17,961 16,086 15,262 18,073 18,216 18,015 16,806 17,646 18,041Latvia 54 56 66 48 21 58 50 40 36 15Lithuania 113 170 95 115 47 121 126 57 90 70Luxembourg 34 24 35 23 35 24 28 23 28 28Malta 8 8 8 8 10 9 13 9 11 11Netherlands 711 531 575 569 698 608 640 709 603 0Poland 2,247 3,413 3,010 3,291 3,505 2,954 3,251 1,731 3,881 3,677Portugal 1,922 1,738 2,018 1,816 2,007 1,855 1,977 1,685 1,653 1,402Romania 2,596 2,474 2,029 3,166 2,975 2,147 2,399 1,959 2,195 2,247Slovakia 253 212 177 207 169 170 146 127 156 96Slovenia 298 211 301 237 321 260 260 271 235 240Spain 16,114 15,138 16,082 17,939 16,949 15,584 17,428 15,114 16,278 13,990Sweden 38 33 32 35 34 36 42 39 40 40United Kingdom 308 333 296 271 295 364 422 420 412 0EU-27 68,689 65,950 63,132 62,910 67,721 63,293 65,581 58,947 62,263 60,846World 473,082 475,249 482,244 495,498 520,706 528,765 550,090 561,069 579,926 587,670
Source: FAOSTAT

The EU Fruit and Vegetable Sector: Overview and Post 2013 CAP Perspective _____________________________________________________________________________________________________________________________________________
PE 460.043 13
Table A1.7 - Share (%) of fresh Fruit production by EU Member States, 2000-2009
Member States 2000 2001 2002 2003 2004 2005 2006 2007 2008 2009Austria 1.6 1.6 1.7 1.8 1.7 1.6 1.7 2.0 1.9 1.9Belgium 1.1 0.7 0.9 0.9 0.9 0.9 1.0 1.2 1.1 0.0Bulgaria 1.1 1.0 0.9 1.0 0.8 0.6 0.7 0.8 0.8 0.7Cyprus 0.4 0.4 0.4 0.4 0.4 0.4 0.4 0.3 0.3 0.3Czech Republic 0.8 0.6 0.8 0.7 0.8 0.6 0.4 0.5 0.5 0.1Denmark 0.1 0.1 0.1 0.1 0.1 0.1 0.1 0.1 0.1 0.1Estonia 0.0 0.0 0.0 0.0 0.0 0.0 0.0 0.0 0.0 0.0Finland 0.0 0.0 0.0 0.0 0.0 0.0 0.0 0.0 0.0 0.0France 16.4 16.6 16.9 15.2 16.3 16.3 15.5 15.8 13.7 14.8Germany 7.7 5.6 5.5 4.4 4.1 4.5 4.0 5.0 4.5 4.4Greece 6.0 6.5 6.3 5.0 5.4 5.9 5.6 5.8 5.2 5.3Hungary 2.5 2.6 1.9 2.1 2.7 1.9 2.1 2.2 2.4 2.5Ireland 0.0 0.0 0.0 0.0 0.0 0.1 0.1 0.1 0.1 0.0Italy 26.2 27.2 25.5 24.3 26.7 28.8 27.5 28.5 28.3 29.7Latvia 0.1 0.1 0.1 0.1 0.0 0.1 0.1 0.1 0.1 0.0Lithuania 0.2 0.3 0.1 0.2 0.1 0.2 0.2 0.1 0.1 0.1Luxembourg 0.0 0.0 0.1 0.0 0.1 0.0 0.0 0.0 0.0 0.0Malta 0.0 0.0 0.0 0.0 0.0 0.0 0.0 0.0 0.0 0.0Netherlands 1.0 0.8 0.9 0.9 1.0 1.0 1.0 1.2 1.0 0.0Poland 3.3 5.2 4.8 5.2 5.2 4.7 5.0 2.9 6.2 6.0Portugal 2.8 2.6 3.2 2.9 3.0 2.9 3.0 2.9 2.7 2.3Romania 3.8 3.8 3.2 5.0 4.4 3.4 3.7 3.3 3.5 3.7Slovakia 0.4 0.3 0.3 0.3 0.3 0.3 0.2 0.2 0.3 0.2Slovenia 0.4 0.3 0.5 0.4 0.5 0.4 0.4 0.5 0.4 0.4Spain 23.5 23.0 25.5 28.5 25.0 24.6 26.6 25.6 26.1 23.0Sweden 0.1 0.0 0.1 0.1 0.0 0.1 0.1 0.1 0.1 0.1United Kingdom 0.4 0.5 0.5 0.4 0.4 0.6 0.6 0.7 0.7 0.0EU-27 100 100 100 100 100 100 100 100 100 100EU-27/World 14.5 13.9 13.1 12.7 13.0 12.0 11.9 10.5 10.7 10.4
Source: FAOSTAT

Policy Department B: Structural and Cohesion Policies ____________________________________________________________________________________________________________________________
PE 460.043 14
Table A1.8 - Production of Citrus fruit by EU Member States (thousand tons), 2000-2009
Member States 2000 2001 2002 2003 2004 2005 2006 2007 2008 2009Cyprus 128 123 138 126 147 143 137 123 112 116France 29 27 30 25 29 25 32 22 28 35Greece 1,185 1,433 1,500 1,211 866 1,154 1,104 1,029 1,016 1,014Italy 3,103 2,895 2,789 2,781 3,336 3,518 3,654 3,368 3,866 3,917Malta 3 4 3 3 2 3 3 3 3 3Portugal 312 283 347 353 325 290 307 270 255 278Spain 5,367 5,717 6,014 6,278 6,077 5,324 6,846 5,288 6,323 5,426EU-27 10,127 10,479 10,822 10,778 10,783 10,457 12,082 10,103 11,603 10,845World 105,288 104,889 107,064 105,617 112,320 109,923 116,092 118,211 124,578 124,414
Source: FAOSTAT
Table A1.9 - Share (%) of Citrus production by EU Member States, 2000-2009
Member States 2000 2001 2002 2003 2004 2005 2006 2007 2008 2009Cyprus 1.3 1.2 1.3 1.2 1.4 1.4 1.1 1.2 1.0 1.1France 0.3 0.3 0.3 0.2 0.3 0.2 0.3 0.2 0.2 0.3Greece 11.7 13.7 13.9 11.2 8.0 11.0 9.1 10.2 8.8 9.3Italy 30.6 27.6 25.8 25.8 30.9 33.6 30.2 33.3 33.3 36.1Malta 0.0 0.0 0.0 0.0 0.0 0.0 0.0 0.0 0.0 0.0Portugal 3.1 2.7 3.2 3.3 3.0 2.8 2.5 2.7 2.2 2.6Spain 53.0 54.6 55.6 58.2 56.4 50.9 56.7 52.3 54.5 50.0EU-27 100 100 100 100 100 100 100 100 100 100EU-27/World 9.6 10.0 10.1 10.2 9.6 9.5 10.4 8.5 9.3 8.7
Source: FAOSTAT

The EU Fruit and Vegetable Sector: Overview and Post 2013 CAP Perspective _____________________________________________________________________________________________________________________________________________
PE 460.043 15
Table A1.10 - EU import of F&V 2000-2009 (value in € million, volume in thousand tons)
VALUE QUANTITY VALUE QUANTITY VALUE QUANTITY VALUE QUANTITYINTRA-EU 15,726 21,329 18,782 22,924 21,291 25,182 22,247 26,183EXTRA-EU 6,656 9,144 8,244 10,672 9,687 12,099 10,377 12,671Total EU 22,382 30,473 27,026 33,597 30,978 37,280 32,625 38,853
2000 2003 2006 2009
Source: EUROSTAT Comext
Table A1.11 - EU export of F&V 2000-2009 (value in € million, volume in thousand tons)
VALUE QUANTITY VALUE QUANTITY VALUE QUANTITY VALUE QUANTITYINTRA-EU 15,525 21,558 18,905 23,014 21,011 24,919 22,652 26,313EXTRA-EU 1,542 2,475 1,978 2,798 2,578 3,585 3,035 4,329Total EU 17,067 24,033 20,882 25,812 23,589 28,504 25,687 30,643
2000 2003 2006 2009
Source: EUROSTAT Comext
Table A1.12 - EU import of fresh Vegetables 2000-2009 (value in € million, volume in thousand tons)
VALUE QUANTITY VALUE QUANTITY VALUE QUANTITY VALUE QUANTITYINTRA-EU 7,014 8,416 8,441 9,737 9,697 10,585 9,872 11,187EXTRA-EU 852 839 1,118 1,249 1,525 1,480 1,773 1,825Total EU 7,866 9,255 9,559 10,987 11,222 12,065 11,646 13,012
2000 2003 2006 2009
Source: EUROSTAT Comext

Policy Department B: Structural and Cohesion Policies ____________________________________________________________________________________________________________________________
PE 460.043 16
Table A1.13 - EU export of fresh Vegetables 2000-2009 (value in € million, volume in thousand tons)
VALUE QUANTITY VALUE QUANTITY VALUE QUANTITY VALUE QUANTITYINTRA-EU 6,666 8,367 8,425 9,627 9,156 10,198 9,894 10,961EXTRA-EU 618 869 877 1,160 986 1,256 1,097 1,513Total EU 7,284 9,236 9,302 10,788 10,141 11,454 10,990 12,474
2000 2003 2006 2009
Source: EUROSTAT Comext
Table A1.14 - EU import of Fruit 2000-2009 (value in € million, volume in thousand tons)
VALUE QUANTITY VALUE QUANTITY VALUE QUANTITY VALUE QUANTITYINTRA-EU 8,712 12,913 10,341 13,187 11,594 14,596 12,375 14,995EXTRA-EU 5,804 8,305 7,126 9,423 8,162 10,619 8,604 10,845Total EU 14,516 21,218 17,467 22,610 19,756 25,215 20,979 25,841
2000 2003 2006 2009
Source: EUROSTAT Comext
Table A1.15 - EU export of Fruit 2000-2009 (value in € million, volume in thousand tons)
VALUE QUANTITY VALUE QUANTITY VALUE QUANTITY VALUE QUANTITYINTRA-EU 8,859 13,191 10,480 13,387 11,855 14,721 12,758 15,352EXTRA-EU 924 1,606 1,100 1,637 1,592 2,329 1,938 2,816Total EU 9,783 14,797 11,580 15,024 13,448 17,050 14,696 18,168
2000 2003 2006 2009
Source: EUROSTAT Comext

The EU Fruit and Vegetable Sector: Overview and Post 2013 CAP Perspective _____________________________________________________________________________________________________________________________________________
PE 460.043 17
Table A1.16 - EU imports of Citrus fruit, intra-EU and extra-EU (thousand tons), 2000-2009
PARTNER 2000 2003 2006 2009INTRA-EU 4,201 4,265 4,332 4,469EXTRA-EU 1,757 1,924 2,045 2,046Total EU 5,959 6,189 6,377 6,515 Source: Eurostat
Table A1.17 - Share (%) of Citrus imports, intra-EU and extra-EU, 2000-2009
PARTNER 2000 2003 2006 2009INTRA-EU 70.5 68.9 67.9 68.6EXTRA-EU 29.5 31.1 32.1 31.4Total EU 100 100 100 100 Source: Eurostat

Policy Department B: Structural and Cohesion Policies ____________________________________________________________________________________________________________________________
PE 460.043 18
Figure A1.5 - EU imports of fresh Vegetables from leading suppliers (Million EUR), 2000-2009
0
100
200
300
400
500
600
2000 2003 2006 2009
MOROCCO ISRAEL TURKEY KENYA PERU EGYPT
Source: EUROSTAT Comext

The EU Fruit and Vegetable Sector: Overview and Post 2013 CAP Perspective _____________________________________________________________________________________________________________________________________________
PE 460.043 19
Figure A1.6 - EU imports of fresh Fruit from leading suppliers (Million EUR), 2000-2009
0
200
400
600
800
1000
1200
2000 2003 2006 2009
SOUTH AFRICA COSTA RICA COLOMBIA CHILE ECUADOR BRAZIL
Source: EUROSTAT Comext

Policy Department B: Structural and Cohesion Policies ____________________________________________________________________________________________________________________________
PE 460.043 20
Table A1.18 - EU imports of Vegetables from MPCs (Value in Million EUR), 2000-2009
PARTNER 2000 2001 2002 2003 2004 2005 2006 2007 2008 2009MOROCCO 186.6 205.8 287.7 280.5 304.6 388.4 373.5 701.6 499.2 537.1ISRAEL (GAZA and JERICHO->1994) 82.4 100.3 91.5 92.2 126.0 151.1 180.8 280.1 178.3 206.2TURKEY 66.9 84.4 98.4 114.0 97.0 134.3 121.4 183.4 181.1 191.6EGYPT 28.4 33.1 39.6 48.8 55.9 69.8 84.6 97.7 81.0 91.4TUNISIA 4.0 2.9 3.5 3.7 4.1 6.1 6.5 11.0 11.2 16.4JORDAN 5.2 3.5 4.3 6.1 3.7 4.7 7.7 10.2 12.5 13.1SYRIAN ARAB REPUBLIC (SYRIA) 1.4 1.3 1.9 1.9 2.8 4.8 6.2 11.1 2.6 4.8ALGERIA 0.0 0.0 0.0 0.2 0.1 0.2 0.6 1.7 2.7 3.4LEBANON 0.2 0.1 0.1 0.1 0.1 0.3 0.2 0.4 0.4 0.2LIBYAN ARAB JAMAHIRIYA (LIBYA) 0.0 0.0 0.0 0.0 0.0 0.0 0.0 0.0 0.1 0.0MPCs TOTAL 375.0 431.3 527.0 547.5 594.3 759.7 781.5 1297.2 969.1 1064.2
Source: EUROSTAT Comext
Table A1.19 - EU imports of Citrus fruit from leading suppliers (thousand tons), 2000-2009
PARTNER 2000 2003 2006 2009SOUTH AFRICA (incl. NA ->1989) 450 473 468 527ARGENTINA 199 359 331 308TURKEY 215 203 338 290MOROCCO 309 289 229 180EGYPT 13 40 119 137ISRAEL (GAZA and JERICHO->1994) 159 88 95 116URUGUAY 50 95 115 104CHINA (PEOPLE'S REPUBLIC OF) 0 0 17 75BRAZIL 76 89 96 73UNITED STATES 112 108 56 63
Source: Eurostat

The EU Fruit and Vegetable Sector: Overview and Post 2013 CAP Perspective _____________________________________________________________________________________________________________________________________________
PE 460.043 21
Table A1.20 - EU imports of fresh or dried Oranges from leading suppliers (thousand tons), 2000-2009
PARTNER 2000 2003 2006 2009SOUTH AFRICA (incl. NA ->1989) 291 313 297 334EGYPT 12 38 115 135MOROCCO 176 171 142 91ARGENTINA 32 68 82 82URUGUAY 27 56 65 59TURKEY 22 34 55 31ISRAEL (GAZA and JERICHO->1994) 56 24 19 23TUNISIA 25 17 19 20BRAZIL 65 53 48 17ZIMBABWE (RHODESIA ->1980) 28 33 13 14
Source: Eurostat
Table A1.21 - EU imports of Citrus fruit from MPCs (thousand tons), 2000-2009
PARTNER_LAB 2000 2001 2002 2003 2004 2005 2006 2007 2008 2009TURKEY 215 267 290 203 251 334 338 255 233 290MOROCCO 309 257 226 289 248 245 229 180 233 180EGYPT 13 17 30 40 76 122 119 112 115 137ISRAEL 158 143 95 88 93 124 94 117 105 114TUNISIA 25 22 22 17 19 18 19 17 27 20Others MPC Countries 0 0 1 1 1 2 0 2 4 0Total MPC Countries 720 707 663 639 687 846 798 681 718 742
Source: Eurostat

Policy Department B: Structural and Cohesion Policies ____________________________________________________________________________________________________________________________
PE 460.043 22
Table A1.22 - Share (%) of EU-27 imports of Citrus fruit from MPCs, 2000-2009
PARTNER_LAB 2000 2001 2002 2003 2004 2005 2006 2007 2008 2009TURKEY 29.8 37.8 43.8 31.8 36.5 39.5 42.3 37.4 32.5 39.1MOROCCO 42.9 36.4 34.0 45.3 36.2 29.0 28.7 26.5 32.5 24.3EGYPT 1.8 2.4 4.6 6.3 11.0 14.5 14.9 16.4 16.0 18.5ISRAEL (GAZA and JERICHO->199 22.0 20.3 14.3 13.7 13.5 14.6 11.8 17.1 14.7 15.4TUNISIA 3.4 3.1 3.3 2.7 2.7 2.2 2.4 2.4 3.8 2.7Others MPC Countries 0.1 0.1 0.1 0.2 0.2 0.3 0.0 0.2 0.6 0.0Total MPC Countries 100 100 100 100 100 100 100 100 100 100
Source: Eurostat

The EU Fruit and Vegetable Sector: Overview and Post 2013 CAP Perspective _____________________________________________________________________________________________________________________________________________
PE 460.043 23
Figure A1.7 - EU imports of Citrus fruit from MPCs (thousand tons), 2000-2009
0
100
200
300
400
500
600
700
800
900
2000 2001 2002 2003 2004 2005 2006 2007 2008 2009
39.1%
24.3%
18.5%
15.4%
Others MPC Countries
TUNISIA
ISRAEL
EGYPT
MOROCCO
TURKEY
Source: Eurostat

Policy Department B: Structural and Cohesion Policies ____________________________________________________________________________________________________________________________
PE 460.043 24
Figure A1.8 - Gross human apparent consumption (availability for human consumption) of Vegetables, EU-15 Member States (Kg per head)
Minimum and maximum levels (either end of vertical line), median share (circle)
EL ELEL
EL
EL
FI FI FI IE FI79,4 87,395,6 102 97,8
0
50
100
150
200
250
300
350
1995 1998 2001 2004 2007
Maximum
minimum
median share
Source: Eurostat

The EU Fruit and Vegetable Sector: Overview and Post 2013 CAP Perspective _____________________________________________________________________________________________________________________________________________
PE 460.043 25
Figure A1.9 - Gross human apparent consumption (availability for human consumption) of Vegetables, EU-12 New Member States (Kg per head)
Minimum and maximum levels (either end of vertical line), median share (circle)
CY
MTMT
MT MT
EESI SI CZ BG
86,497,9 105,3 108,1 101,7
0
50
100
150
200
250
300
350
1995 1998 2001 2004 2007
Maximum
minimum
median share
Source: Eurostat

Policy Department B: Structural and Cohesion Policies ____________________________________________________________________________________________________________________________
PE 460.043 26
Figure A1.10 - Gross human apparent consumption (availability for human consumption) of Fruit, EU-15 Member States (Kg per head)
Minimum and maximum levels (either end of vertical line), median share (circle)
NLEL
LULU
LU
FIIR
BE
BE BE94 96,6
103,8
120,5 117,9
0
50
100
150
200
250
1995 1998 2001 2004 2007
Maximum
minimum
median share
Source: Eurostat

The EU Fruit and Vegetable Sector: Overview and Post 2013 CAP Perspective _____________________________________________________________________________________________________________________________________________
PE 460.043 27
Figure A1.11 - Gross human apparent consumption (availability for human consumption) of Fruit, EU-12 New Member States (Kg per head)
Minimum and maximum levels (either end of vertical line), median share (circle)
MT
CY
SI
SI
SI
LTLV
BGBG
PL55,2
69,3 65,673,22 74,4
0
50
100
150
200
250
1995 1998 2001 2004 2007
Maximum
minimum
median share
Source: Eurostat

Policy Department B: Structural and Cohesion Policies ____________________________________________________________________________________________________________________________
PE 460.043 28
Table A1.23 - Harmonized indices of consumer prices (HICP) (2005=100) - Vegetables - Annual average index, 1996-2010
GEO/TIME 1996 1997 1998 1999 2000 2001 2002 2003 2004 2005 2006 2007 2008 2009European Union (27 countries) 77.57 81.29 85.69 86.96 87.24 91.87 97.27 100.51 98.72 100.00 105.60 110.24 112.56 113.91European Union (15 countries) 85.00 83.61 86.89 88.96 88.75 94.49 98.91 101.05 99.44 100.00 103.89 : : :Belgium 86.14 86.18 88.97 92.17 88.77 96.22 100.23 101.24 98.07 100.00 110.06 111.58 108.62 108.40Bulgaria : 68.38 80.74 72.58 80.40 79.04 85.75 86.57 88.73 100.00 106.59 114.86 120.22 119.51Czech Republic : : : : 102.30 104.00 109.10 108.90 107.60 100.00 111.60 118.70 111.10 108.70Denmark 108.20 105.20 104.20 101.50 94.80 93.60 97.10 103.60 98.70 100.00 103.10 114.00 120.30 119.40Germany (including former GDR from 1991) 102.70 101.90 102.30 102.30 101.40 106.40 105.10 103.60 99.90 100.00 108.20 111.50 110.40 105.70Estonia 79.65 76.84 89.39 85.42 74.66 79.90 106.55 100.79 98.02 100.00 110.64 126.60 128.85 111.50Ireland 76.00 74.30 88.80 96.70 93.70 104.20 106.90 106.80 101.70 100.00 103.30 106.70 107.00 102.10Greece 69.58 78.55 83.52 87.44 90.36 94.12 105.47 112.29 102.45 100.00 100.57 98.51 98.04 105.11Spain 67.60 66.87 72.03 74.60 76.80 80.98 89.51 93.13 98.00 100.00 103.17 110.07 113.72 113.55France 84.63 84.55 86.80 89.37 90.24 95.17 100.92 103.32 98.04 100.00 104.18 107.08 107.88 108.23Italy 76.60 75.80 76.80 80.10 81.80 86.80 96.10 100.70 102.00 100.00 100.50 102.50 105.30 107.60Cyprus 82.02 91.36 90.91 78.64 93.23 95.40 96.93 102.34 99.75 100.00 108.79 119.16 131.71 128.66Latvia 55.54 51.53 55.36 56.49 56.91 61.87 76.88 82.79 85.14 100.00 114.93 131.27 138.47 126.59Lithuania 118.25 109.44 126.66 118.65 104.23 107.08 118.49 104.18 92.34 100.00 117.86 134.09 137.57 123.76Luxembourg 74.13 71.21 77.09 81.54 84.28 89.73 98.10 94.80 97.80 100.00 104.90 110.50 109.55 109.30Hungary : : : : : 80.19 89.89 111.21 103.86 100.00 142.85 166.89 158.79 171.11Malta 96.74 88.85 92.39 89.55 88.09 96.35 94.62 106.78 96.80 100.00 101.92 106.16 116.95 134.08Netherlands 82.52 82.41 87.42 93.13 89.56 98.38 103.50 105.89 99.47 100.00 109.87 115.60 117.69 117.70Austria 93.12 90.76 93.38 93.12 92.54 95.50 99.17 100.13 98.30 100.00 102.38 108.16 110.73 111.81Poland 91.70 83.20 92.10 94.10 100.50 96.70 103.00 98.70 97.20 100.00 114.30 117.50 113.10 122.20Portugal 71.92 75.06 89.07 86.49 88.58 104.91 102.79 103.58 102.86 100.00 107.82 114.09 108.44 104.15Romania : : : : : 54.57 70.87 96.85 91.48 100.00 111.73 112.13 124.27 126.34Slovenia : : : : 89.74 94.62 99.91 108.42 101.76 100.00 111.59 129.21 124.27 121.36Slovakia 81.58 82.85 92.02 94.13 97.86 94.55 101.60 102.29 100.24 100.00 124.14 136.52 132.73 126.85Finland 87.78 87.66 93.50 93.31 92.49 96.17 103.28 102.48 103.55 100.00 102.55 111.45 113.46 113.82Sweden 89.29 86.24 89.12 95.46 92.20 99.70 103.76 104.83 101.97 100.00 101.61 105.22 109.38 111.03United Kingdom 93.30 85.20 91.20 92.00 88.70 97.00 96.30 97.80 97.00 100.00 102.20 111.20 120.80 128.50
Source: Eurostat

The EU Fruit and Vegetable Sector: Overview and Post 2013 CAP Perspective _____________________________________________________________________________________________________________________________________________
PE 460.043 29
Table A1.24 - Harmonized indices of consumer prices (HICP) (2005=100) - Fruit - Annual average index, 1996-2010
GEO/TIME 1996 1997 1998 1999 2000 2001 2002 2003 2004 2005 2006 2007European Union (27 countries) 75.75 80.38 83.63 84.15 84.13 90.99 95.23 99.13 99.60 100.00 101.33 105.03European Union (15 countries) 81.14 82.02 85.03 85.06 85.16 91.84 96.30 100.18 100.31 100.00 101.04 :Belgium 77.62 83.23 85.20 82.67 83.07 89.75 95.78 100.41 100.08 100.00 101.25 103.72Bulgaria : 66.99 78.14 79.74 83.85 90.01 93.66 87.20 90.84 100.00 108.70 119.73Czech Republic : : : : 84.30 95.30 92.50 93.60 96.30 100.00 93.80 100.80Denmark 89.90 94.50 95.30 95.00 93.20 100.00 102.60 103.60 101.70 100.00 105.70 107.70Germany (including former GDR from 1991) 90.80 92.10 94.80 91.70 91.60 99.20 99.10 97.90 97.80 100.00 102.40 104.80Estonia 92.08 87.38 85.31 84.13 83.85 88.11 92.91 91.94 98.62 100.00 110.73 120.52Ireland 81.60 86.10 90.50 91.70 94.40 96.00 100.10 100.90 101.20 100.00 101.90 106.20Greece 73.47 79.20 84.92 83.67 82.91 93.80 108.09 123.77 110.90 100.00 98.54 104.23Spain 66.24 64.39 66.29 70.61 70.14 74.29 80.69 88.91 95.67 100.00 100.83 104.70France 80.97 83.43 86.57 83.83 85.44 94.68 98.85 104.77 101.05 100.00 102.35 105.24Italy 82.60 81.30 85.10 85.60 85.00 89.30 96.60 102.00 105.60 100.00 97.50 102.50Cyprus 84.71 91.61 89.34 92.37 99.44 108.45 110.03 111.42 105.94 100.00 107.07 113.70Latvia 68.19 58.39 56.42 60.43 60.11 68.37 71.03 83.45 90.62 100.00 113.48 136.57Lithuania 119.21 107.31 99.37 94.87 83.67 87.73 87.75 86.75 92.85 100.00 114.25 126.89Luxembourg 74.60 75.34 78.76 79.31 80.86 86.64 93.70 97.00 101.61 100.00 100.58 104.46Hungary : : : : : 83.09 95.12 89.12 94.22 100.00 109.76 125.72Malta 90.15 90.36 89.40 86.28 84.28 91.31 92.68 91.92 97.33 100.00 103.73 109.32Netherlands 82.25 86.13 88.26 89.48 91.60 100.77 108.23 107.94 103.32 100.00 101.83 104.04Austria 68.46 73.49 82.18 80.42 92.96 99.84 102.75 105.04 103.78 100.00 100.22 104.66Poland 53.00 74.70 78.90 88.20 87.50 89.40 86.40 93.30 95.30 100.00 102.30 110.30Portugal 76.91 77.43 81.58 89.11 81.72 87.71 92.20 98.37 101.75 100.00 100.45 103.56Romania : : : : : 63.42 80.31 89.96 92.30 100.00 103.28 110.90Slovenia : : : : 81.55 91.54 91.72 94.93 94.98 100.00 97.49 108.64Slovakia 85.78 84.74 85.58 88.42 86.57 98.24 96.73 96.02 96.50 100.00 104.02 107.12Finland 74.44 75.96 82.30 81.63 79.86 86.78 96.02 96.97 98.28 100.00 101.71 104.41Sweden 82.59 83.09 84.93 86.25 84.52 92.74 97.30 95.66 97.90 100.00 104.88 108.12United Kingdom 88.20 90.50 91.80 91.00 91.30 99.30 100.40 101.70 98.80 100.00 100.80 102.20
Source: Eurostat

Policy Department B: Structural and Cohesion Policies ____________________________________________________________________________________________________________________________
PE 460.043 30
Figure A1.12 - Farm Net Income / FWU - Specialist horticulture farms (EUR)
0
5000
10000
15000
20000
25000
30000
35000
40000
45000
50000
1989 1990 1991 1992 1993 1994 1995 1996 1997 1998 1999 2000 2001 2002 2003 2004 2005 2006 2007 2008
(ELL) Greece (ESP) Spain (FRA) France (ITA) Italy Total EU
Source: FADN

The EU Fruit and Vegetable Sector: Overview and Post 2013 CAP Perspective _____________________________________________________________________________________________________________________________________________
PE 460.043 31
Figure A1.13 - Farm Net Income / FWU - Specialist orchards/ fruits farms (EUR)
0
5000
10000
15000
20000
25000
30000
35000
1989 1990 1991 1992 1993 1994 1995 1996 1997 1998 1999 2000 2001 2002 2003 2004 2005 2006 2007 2008
(ELL) Greece (ESP) Spain (FRA) France (ITA) Italy Total EU
Source: FADN

Policy Department B: Structural and Cohesion Policies ____________________________________________________________________________________________________________________________
PE 460.043 32
Table A1.25 - Production of Citrus fruit by products (thousand tons), 2000-2009
Member States item 2000 2001 2002 2003 2004 2005 2006 2007Italy Oranges 1,876 1,724 1,724 1,734 2,105 2,261 2,346 2,197
Tangerines, mandarins, clem 593 593 548 497 611 617 690 592Lemons and limes 613 547 486 520 583 603 573 556Citrus fruit, nes 16 26 26 24 29 29 37 15Grapefruit (inc. pomelos) 4 5 4 7 7 7 8 7
Total Italy 3,103 2,895 2,789 2,781 3,336 3,518 3,654 3,368Spain Oranges 2,616 2,898 2,963 3,052 2,767 2,376 3,397 2,740
Tangerines, mandarins, clem 1,802 1,758 2,068 2,060 2,460 1,957 2,508 1,987Lemons and limes 915 1,024 934 1,130 810 945 877 507Citrus fruit, nes 11 9 18 11 10 13 21 13Grapefruit (inc. pomelos) 23 26 31 25 30 33 42 41
Total Spain 5,367 5,717 6,014 6,278 6,077 5,324 6,846 5,288Greece Oranges 946 1,112 1,193 952 698 936 899 816
Tangerines, mandarins, clem 119 130 130 105 91 127 109 119Lemons and limes 110 179 166 144 68 84 88 86Citrus fruit, nes 3 3 3 3 2 1 1 1Grapefruit (inc. pomelos) 7 8 8 7 7 6 7 7
Total Greece 1,185 1,433 1,500 1,211 866 1,154 1,104 1,029European Union Oranges 5,738 5,995 6,205 6,059 5,869 5,843 6,925 5,998
Tangerines, mandarins, clem 2,614 2,585 2,869 2,776 3,288 2,820 3,434 2,811Lemons and limes 1,672 1,786 1,621 1,827 1,497 1,665 1,568 1,176Citrus fruit, nes 32 40 49 39 43 45 60 31Grapefruit (inc. pomelos) 71 73 79 77 86 84 94 87
Total European Union 10,127 10,479 10,822 10,778 10,783 10,457 12,082 10,103World Oranges 63,812 60,117 62,004 59,608 64,833 62,927 65,540 65,295
Tangerines, mandarins, clem 18,303 20,824 21,358 22,035 23,417 23,750 25,894 27,804Lemons and limes 11,209 11,980 12,057 12,362 12,073 12,118 13,165 13,058Citrus fruit, nes 6,559 6,808 6,739 6,799 7,015 7,082 7,133 7,440Grapefruit (inc. pomelos) 5,404 5,160 4,907 4,814 4,983 4,045 4,361 4,614
Total World 105,288 104,889 107,064 105,617 112,320 109,923 116,092 118,211 Source: Eurostat

The EU Fruit and Vegetable Sector: Overview and Post 2013 CAP Perspective _____________________________________________________________________________________________________________________________________________
PE 460.043 33
Table A1.26 - Production of Peaches and Nectarines by EU Member States (thousand tons), 2000-2009
Member States 2000 2001 2002 2003 2004 2005 2006 2007 2008 2009Austria 10 8 7 7 9 8 9 8 8 9Bulgaria 42 13 10 17 22 15 22 19 15 17Cyprus 4 3 4 4 4 4 4 4 4 5Czech Republic 11 5 9 9 8 5 4 3 4 0France 481 458 455 347 397 403 395 365 301 310Germany 1 1 1 0 1 1 1 1 1 1Greece 950 943 687 228 876 864 768 816 734 734Hungary 64 57 22 32 83 48 68 41 48 61Italy 1,655 1,679 1,587 1,176 1,710 1,693 1,665 1,630 1,589 1,638Malta 1 0 1 1 1 1 2 1 1 1Poland 2 4 3 12 14 10 6 4 12 13Portugal 64 27 60 57 52 52 50 53 50 54Romania 18 17 13 18 20 30 17 17 16 17Slovakia 5 2 3 4 5 4 3 1 3 0Slovenia 12 5 11 6 14 13 11 9 7 10Spain 1,130 1,082 1,276 1,271 988 1,261 1,246 1,221 1,299 1,226Euopean Union 4,449 4,305 4,147 3,189 4,204 4,412 4,269 4,193 4,092 4,100World 13,355 14,021 14,811 14,836 16,707 17,691 18,009 17,813 18,429 18,579
Source: FAOSTAT

Policy Department B: Structural and Cohesion Policies ____________________________________________________________________________________________________________________________
PE 460.043 34
Table A1.27 - Share (%) of production of Peaches and Nectarines by EU Member States, 2000-2009
Member States 2000 2001 2002 2003 2004 2005 2006 2007 2008 2009Austria 0.2 0.2 0.2 0.2 0.2 0.2 0.2 0.2 0.2 0.2Bulgaria 0.9 0.3 0.2 0.5 0.5 0.3 0.5 0.4 0.4 0.4Cyprus 0.1 0.1 0.1 0.1 0.1 0.1 0.1 0.1 0.1 0.1Czech Republic 0.3 0.1 0.2 0.3 0.2 0.1 0.1 0.1 0.1 0.0France 10.8 10.6 11.0 10.9 9.4 9.1 9.2 8.7 7.4 7.6Germany 0.0 0.0 0.0 0.0 0.0 0.0 0.0 0.0 0.0 0.0Greece 21.4 21.9 16.6 7.1 20.8 19.6 18.0 19.5 17.9 17.9Hungary 1.4 1.3 0.5 1.0 2.0 1.1 1.6 1.0 1.2 1.5Italy 37.2 39.0 38.3 36.9 40.7 38.4 39.0 38.9 38.8 40.0Malta 0.0 0.0 0.0 0.0 0.0 0.0 0.0 0.0 0.0 0.0Poland 0.0 0.1 0.1 0.4 0.3 0.2 0.1 0.1 0.3 0.3Portugal 1.4 0.6 1.4 1.8 1.2 1.2 1.2 1.3 1.2 1.3Romania 0.4 0.4 0.3 0.6 0.5 0.7 0.4 0.4 0.4 0.4Slovakia 0.1 0.0 0.1 0.1 0.1 0.1 0.1 0.0 0.1 0.0Slovenia 0.3 0.1 0.3 0.2 0.3 0.3 0.3 0.2 0.2 0.2Spain 25.4 25.1 30.8 39.8 23.5 28.6 29.2 29.1 31.7 29.9European Union 100 100 100 100 100 100 100 100 100 100European Union/World 33.3 30.7 28.0 21.5 25.2 24.9 23.7 23.5 22.2 22.1
Source: FAOSTAT

The EU Fruit and Vegetable Sector: Overview and Post 2013 CAP Perspective _____________________________________________________________________________________________________________________________________________
PE 460.043 35
Table A1.28 - Trade of Peaches and Nectarines intra-EU and extra-EU (thousand tons), 2000-2009
PARTNER 2000 2001 2002 2003 2004 2005 2006 2007 2008 2009EXPORT EXTRA-EU 105 118 112 72 117 151 164 194 196 208
INTRA-EU 844 828 907 789 789 950 979 941 964 999EXPORT Total EU-27 950 946 1,020 861 906 1,101 1,143 1,135 1,160 1,206IMPORT EXTRA-EU 16 24 21 31 32 41 40 42 43 36
INTRA-EU 833 872 888 776 810 971 985 958 989 968IMPORT Total EU-27 849 896 909 807 842 1,012 1,025 1,000 1,031 1,004 Source: Eurostat
Table A1.29 – Share (%) of Peaches and Nectarines trade intra-EU and extra-EU 2000-2009 PARTNER 2000 2001 2002 2003 2004 2005 2006 2007 2008 2009
EXPORT EXTRA-EU 11 12 11 8 13 14 14 17 17 17INTRA-EU 89 88 89 92 87 86 86 83 83 83
EXPORT Total EU-27 100 100 100 100 100 100 100 100 100 100IMPORT EXTRA-EU 2 3 2 4 4 4 4 4 4 4
INTRA-EU 98 97 98 96 96 96 96 96 96 96IMPORT Total EU-27 100 100 100 100 100 100 100 100 100 100
Source: Eurostat
Table A1.30 - EU imports of table Grapes, intra-EU and extra-EU (thousand tons), 2000-2009
PARTNER 2000 2001 2002 2003 2004 2005 2006 2007 2008 2009EXPORT INTRA-EU 939 1,029 787 881 840 994 898 866 1,037 884
EXTRA-EU 88 115 87 94 93 113 124 129 147 117EXPORT Totale EU-27 1,027 1,144 874 975 933 1,107 1,022 994 1,184 1,001IMPORT INTRA-EU 900 897 765 879 882 993 932 955 1,100 983
EXTRA-EU 348 346 395 426 474 555 605 612 649 616IMPORT Totale EU-27 1,249 1,243 1,159 1,305 1,356 1,548 1,537 1,566 1,749 1,600
Source: Eurostat
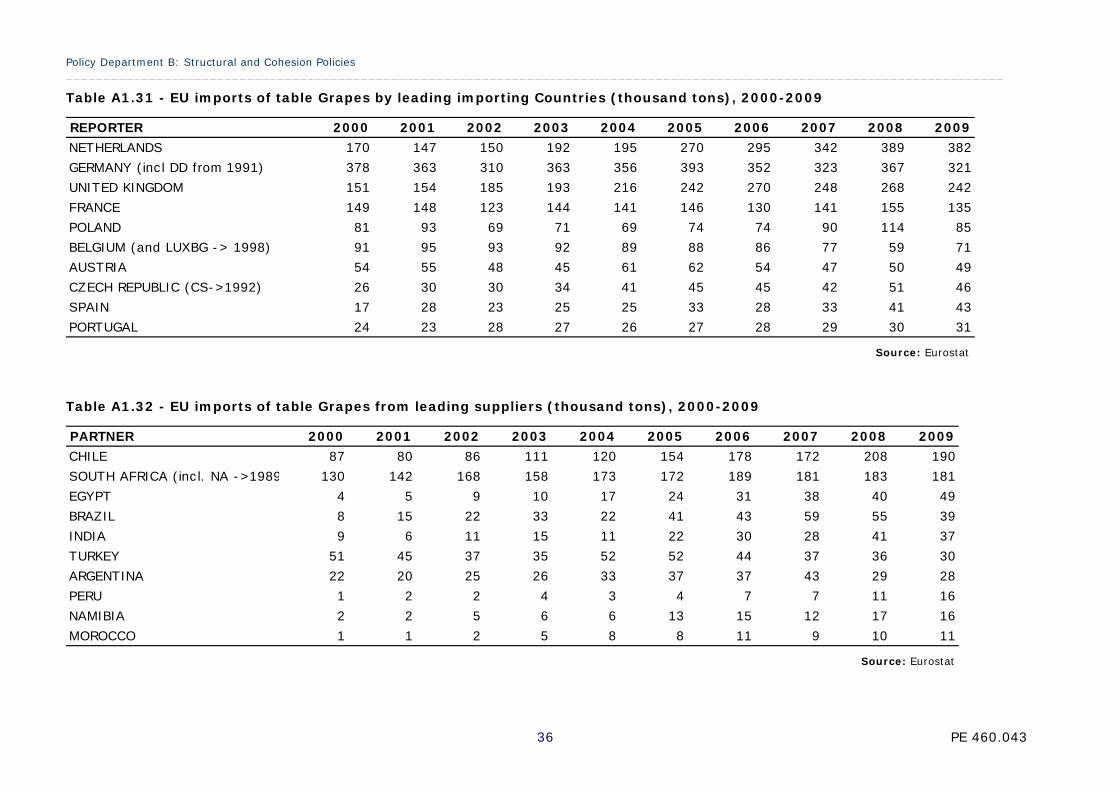
Policy Department B: Structural and Cohesion Policies ____________________________________________________________________________________________________________________________
PE 460.043 36
Table A1.31 - EU imports of table Grapes by leading importing Countries (thousand tons), 2000-2009
REPORTER 2000 2001 2002 2003 2004 2005 2006 2007 2008 2009NETHERLANDS 170 147 150 192 195 270 295 342 389 382GERMANY (incl DD from 1991) 378 363 310 363 356 393 352 323 367 321UNITED KINGDOM 151 154 185 193 216 242 270 248 268 242FRANCE 149 148 123 144 141 146 130 141 155 135POLAND 81 93 69 71 69 74 74 90 114 85BELGIUM (and LUXBG -> 1998) 91 95 93 92 89 88 86 77 59 71AUSTRIA 54 55 48 45 61 62 54 47 50 49CZECH REPUBLIC (CS->1992) 26 30 30 34 41 45 45 42 51 46SPAIN 17 28 23 25 25 33 28 33 41 43PORTUGAL 24 23 28 27 26 27 28 29 30 31
Source: Eurostat
Table A1.32 - EU imports of table Grapes from leading suppliers (thousand tons), 2000-2009
PARTNER 2000 2001 2002 2003 2004 2005 2006 2007 2008 2009CHILE 87 80 86 111 120 154 178 172 208 190SOUTH AFRICA (incl. NA ->1989 130 142 168 158 173 172 189 181 183 181EGYPT 4 5 9 10 17 24 31 38 40 49BRAZIL 8 15 22 33 22 41 43 59 55 39INDIA 9 6 11 15 11 22 30 28 41 37TURKEY 51 45 37 35 52 52 44 37 36 30ARGENTINA 22 20 25 26 33 37 37 43 29 28PERU 1 2 2 4 3 4 7 7 11 16NAMIBIA 2 2 5 6 6 13 15 12 17 16MOROCCO 1 1 2 5 8 8 11 9 10 11
Source: Eurostat

The EU Fruit and Vegetable Sector: Overview and Post 2013 CAP Perspective _____________________________________________________________________________________________________________________________________________
PE 460.043 37
Table A1.33 – Consumption of Citrus fruit in Italy (tons), 2004-2009
2004 2005 2006 2007 2008 2009Oranges 659,516 613,056 626,452 627,002 624,909 608,931Clementine 310,741 278,233 300,821 328,796 331,397 323,710Lemons 253,445 247,050 242,133 249,797 290,152 289,441Mandarins 115,417 90,694 83,866 83,637 89,790 97,723Grapefruit 42,239 56,670 51,396 56,654 30,697 27,394 Source: Cso processing on GFK data
Table A1.34 – Purchases of Oranges in Italy (tons), 2000-2009
2000 2001 2002 2003 2004 2005 2006 2007 2008 2009Hypermarkets 48,849 52,401 43,686 51,276 56,508 60,460 61,283 59,389 68,862 66,342Supermarkets 154,580 146,626 153,273 153,273 158,589 141,774 166,228 194,148 188,488 188,861Discount stores 22,273 20,219 18,928 27,251 29,406 29,908 32,820 37,704 37,070 39,172Superettes 23,378 21,378 20,011 19,561 13,896 13,008 18,377 15,195 17,532 16,808Costers 316,741 314,247 288,244 271,690 253,051 224,393 203,905 186,506 178,050 162,407Traditional retailers 13,024 13,867 14,553 14,604 8,016 4,660 9,578 14,534 15,399 12,596Specialist retailers 134,142 124,833 131,982 122,419 123,616 127,973 126,887 113,914 114,462 119,267Other 10,901 16,966 19,537 24,907 16,443 10,906 7,374 5,618 5,048 3,477Total 723,888 710,530 690,212 684,978 659,516 613,056 626,452 627,002 624,909 608,931
Source: Cso processing on GFK data

Policy Department B: Structural and Cohesion Policies ____________________________________________________________________________________________________________________________
PE 460.043 38
Table A1.35 – Purchases of Clementines in Italy (tons), 2004-2009
2004 2005 2006 2007 2008 2009SUPERMARKETS 59,909 57,686 75,364 82,260 84,493 90,668TRADITIONAL SHOPS 3,493 2,648 4,793 6,111 5,054 6,304COSTERS 78,342 79,966 72,273 67,757 62,141 57,028OTHER SHOPS 7,106 7,974 7,770 8,245 8,767 8,822DISCOUNT STORES 8,866 11,633 11,985 14,847 15,295 14,528HYPERMARKETS 20,267 23,169 23,016 27,368 27,808 32,667TRADITIONAL RETAILERS 46,955 44,132 47,149 46,594 48,723 50,921Total 224,938 227,208 242,350 253,182 252,281 260,938
Source: Cso processing on GFK data
Table A1.36 – Purchases of Lemons in Italy (tons), 2004-2009
2004 2005 2006 2007 2008 2009SUPERMARKETS 60,433 59,823 65,559 69,125 69,913 72,636TRADITIONAL SHOPS 3,103 2,655 2,794 3,528 4,190 4,787COSTERS 50,216 47,927 61,255 48,031 38,656 35,241OTHER SHOPS 12,160 10,382 7,791 7,319 7,333 7,641DISCOUNT STORES 14,831 11,299 13,201 13,396 13,974 16,362HYPERMARKETS 25,998 24,584 17,772 23,435 24,454 23,834TRADITIONAL RETAILERS 34,243 35,745 31,627 31,300 28,085 26,264Total 200,984 192,415 199,999 196,134 186,605 186,765
Source: Cso processing on GFK data

The EU Fruit and Vegetable Sector: Overview and Post 2013 CAP Perspective _____________________________________________________________________________________________________________________________________________
PE 460.043 39
Table A1.37 – Purchases of Mandarins in Italy (tons), 2004-2009
2004 2005 2006 2007 2008 2009SUPERMARKETS 19,119 12,348 16,091 14,676 13,683 13,438TRADITIONAL SHOPS 1,370 1,191 862 1,528 1,808 1,248COSTERS 39,021 30,423 30,633 24,560 21,962 31,306OTHER SHOPS 5,630 3,572 2,338 2,407 1,813 2,381DISCOUNT STORES 988 977 1,261 1,865 2,329 2,372HYPERMARKETS 2,244 2,920 4,138 6,914 8,358 6,184TRADITIONAL RETAILERS 20,901 19,945 15,085 18,544 17,569 16,326Total 89,273 71,376 70,408 70,494 67,522 73,255
Source: Cso processing on GFK data
Table A1.38 – Purchases of Grapefruit in Italy (tons), 2004-2009
2004 2005 2006 2007 2008 2009SUPERMARKETS 15,932 16,802 17,243 16,689 11,626 10,021TRADITIONAL SHOPS 215 197 140 613 248 141COSTERS 3,365 2,755 3,805 5,280 2,724 1,810OTHER SHOPS 876 781 683 1,226 1,318 1,160DISCOUNT STORES 584 821 2,362 1,649 941 856HYPERMARKETS 4,038 5,174 3,283 5,507 3,100 3,379TRADITIONAL RETAILERS 2,712 3,067 2,983 2,634 2,014 1,822Total 27,722 29,597 30,500 33,598 21,972 19,190
Source: Cso processing on GFK data

Policy Department B: Structural and Cohesion Policies ____________________________________________________________________________________________________________________________
PE 460.043 40
Table A1.39 – Purchases of Peaches in Italy (tons), 2000-2009
2000 2001 2002 2003 2004 2005 2006 2007 2008 2009Costers 134,986 121,541 126,260 111,801 107,541 92,762 88,140 83,454 75,569 82,091Hypermarkets 13,611 17,004 16,752 14,774 19,273 21,166 22,647 21,714 25,588 23,886Supermarkets 53,593 50,714 54,531 46,669 44,209 51,191 57,791 67,070 70,352 73,215Discount Stores 8,943 7,040 7,990 6,559 9,072 10,035 12,218 10,773 14,419 14,422Superettes 6,772 9,255 5,932 6,137 8,333 4,676 5,563 5,304 5,084 5,544Traditional retailers 7,367 6,807 6,584 5,311 4,622 3,366 4,768 5,408 6,547 5,191Specialist retailers 49,445 60,545 53,485 57,000 55,490 54,900 54,127 52,652 57,326 51,679Other 12,710 4,303 7,264 6,310 5,387 1,987 1,312 1,567 1,784 2,040Total 287,427 277,209 278,798 254,561 253,927 240,082 246,566 247,944 256,669 258,068
Source: Cso processing on GFK data
Table A1.40 – Purchases of Nectarines in Italy (tons), 2004-2009
2000 2001 2002 2003 2004 2005 2006 2007 2008 2009Costers 29,970 26,666 32,030 31,617 30,659 27,497 26,068 25,601 23,618 25,522Hypermarkets 7,756 9,535 7,725 10,124 9,630 10,822 14,174 12,104 16,477 16,910Supermarkets 24,064 26,338 28,312 30,518 26,904 30,667 36,203 38,346 41,898 41,889Discount Stores 2,691 4,721 4,077 6,350 7,801 6,613 7,011 7,473 8,193 8,678Superettes 2,044 3,150 2,428 2,025 3,095 2,509 2,811 1,827 2,429 2,521Traditional retailers 3,516 3,515 6,215 1,731 1,721 1,333 1,120 1,597 1,963 1,826Specialist retailers 16,394 15,160 10,428 12,881 20,379 19,502 18,091 16,694 13,937 11,830Other 3,602 3,056 2,130 1,148 846 2,364 386 524 829 811Total 90,225 92,146 93,354 96,394 101,035 101,307 105,864 104,167 109,344 109,987
Source: Cso processing on GFK data

The EU Fruit and Vegetable Sector: Overview and Post 2013 CAP Perspective _____________________________________________________________________________________________________________________________________________
PE 460.043 41
Table A1.41 – Purchases of table Grapes in Italy (tons), 2000-2009
2000 2001 2002 2003 2004 2005 2006 2007 2008 2009Costers 95,761 91,174 82,042 73,737 54,209 53,373 48,895 45,675 42,077 36,858Hypermarkets 17,574 17,360 18,854 14,196 14,086 19,211 20,919 19,207 22,393 23,245Supermarkets 51,599 53,744 53,375 53,733 48,422 51,487 57,947 65,445 59,155 64,255Discount Stores 4,526 11,804 7,239 11,633 8,856 6,472 7,954 8,962 10,589 9,830Superettes 7,492 6,945 6,305 5,222 3,638 2,780 4,931 4,657 3,948 3,244Traditional retailers 7,253 8,556 7,642 4,095 2,234 2,629 3,242 3,375 4,469 4,578Specialist retailers 40,787 50,263 41,977 36,043 37,062 31,882 28,916 32,273 32,215 30,491Other 7,803 7,630 8,486 4,967 4,303 2,971 1,752 1,317 2,491 756Total 232,795 247,476 225,920 203,626 172,810 170,804 174,556 180,911 177,337 173,257
Source: Cso processing on GFK data
Table A1.42 – Purchases of table Grapes in Italy (thousand euros), 2000-2009
2000 2001 2002 2003 2004 2005 2006 2007 2008 2009Costers 116,283 116,203 113,307 104,397 83,674 71,828 75,280 73,850 77,714 66,790Hypermarkets 27,469 27,766 34,198 24,918 22,968 29,893 36,336 34,778 45,877 46,755Supermarkets 83,650 91,189 100,465 98,481 84,280 85,265 106,703 121,776 129,462 132,631Discount Stores 6,667 22,682 11,309 18,086 12,755 9,956 12,744 14,833 19,791 17,198Superettes 12,058 11,598 11,976 9,095 6,025 4,460 9,218 9,026 8,480 6,602Traditional retailers 11,788 13,551 17,437 8,224 4,180 4,789 6,425 6,773 11,231 9,987Specialist retailers 57,921 72,519 65,006 61,151 60,886 49,119 49,131 55,262 62,406 58,153Other 6,348 7,837 8,989 5,877 5,189 4,273 2,974 2,499 6,372 1,624Total 322,184 363,345 362,687 330,229 279,957 259,583 298,811 318,797 361,333 339,740
Source: Cso processing on GFK data

Policy Department B: Structural and Cohesion Policies ____________________________________________________________________________________________________________________________
PE 460.043 42
Table A1.43 – Consumption of Fruit in France (tons), 2003-2009
2003 2004 2005 2006 2007 2008 2009Peaches and Nectarines 165,688 168,941 171,056 187,018 175,031 186,048 182,414Table Grapes 114,229 107,560 106,979 98,168 105,761 111,085 98,373Lemons 51,149 51,783 47,294 44,814 41,890 39,494 46,225Mandarins and clementines 203,733 197,308 227,999 224,353 240,935 207,864 210,465Oranges 295,156 320,247 261,033 263,318 295,498 287,957 279,246Grapefruit 90,225 91,089 79,647 77,625 91,295 94,571 91,310Other citrus fruit 5,458 4,614 3,694 3,545 3,464 3,762 3,978 Source: KANTAR Worldpanel
Table A1.44 – Consumer price index, Fruit - France (EUR/KG), 2003-2009
2003 2004 2005 2006 2007 2008 2009Peaches and Nectarines 2.76 2.21 2.00 2.22 2.13 2.40 2.06Table Grapes 2.22 2.11 2.17 2.27 2.35 2.35 2.26Lemons 2.04 1.99 2.23 2.07 2.32 3.40 2.48Mandarins and clementines 1.84 1.78 1.68 1.67 1.70 1.82 1.87Oranges 1.32 1.35 1.35 1.38 1.35 1.45 1.29Grapefruit 1.60 1.44 1.60 1.67 1.60 1.59 1.49Other citrus fruit 3.05 2.97 3.58 3.34 3.37 3.92 3.66 Source: KANTAR Worldpanel

The EU Fruit and Vegetable Sector: Overview and Post 2013 CAP Perspective _____________________________________________________________________________________________________________________________________________
PE 460.043 43
Table A1.45 – Purchases of Citrus fruit in Spain (tons), 2004-2009
2004 2005 2006 2007 2008 2009Specialist retailers 387,830 372,488 413,733 440,338 421,875 447,064Costers 252,166 253,882 247,908 270,335 250,414 228,417Discount Stores 60,394 55,199 58,932 59,895 57,131 66,741Hypermarkets 104,742 96,902 107,008 109,879 106,295 101,095Supermarkets 263,107 261,382 276,193 294,055 264,945 293,411Other 112,488 105,759 107,339 139,311 145,623 164,976Total 1,180,727 1,145,613 1,211,113 1,313,814 1,246,284 1,301,704 Source: Cso processing on MAPA data
Table A1.46 – Consumer price index, Citrus fruit - Spain (EUR/KG), 2004-2009
2004 2005 2006 2007 2008 2009Specialist retailers 0.94 0.99 0.97 0.99 1.08 1.00Costers 0.91 0.92 0.93 0.94 1.03 0.94Discount Stores 0.93 0.95 0.97 1.01 1.18 1.00Hypermarkets 1.04 1.08 1.06 1.08 1.24 1.07Supermarkets 1.02 1.07 1.06 1.09 1.22 1.07Other 0.85 0.89 0.92 0.94 1.04 0.96Total 0.95 0.99 0.98 1.01 1.11 1.00 Source: Cso processing on MAPA data

Policy Department B: Structural and Cohesion Policies ____________________________________________________________________________________________________________________________
PE 460.043 44
Table A1.47 – Purchases of table Grapes in Spain (tons), 2004-2009
2004 2005 2006 2007 2008 2009Specialist retailers 28,686 27,789 29,227 27,666 27,699 31,193Costers 18,071 16,181 16,905 14,284 15,407 15,611Discount Stores 4,564 4,392 4,617 4,636 4,336 4,748Hypermarkets 8,084 8,631 8,118 7,497 6,773 6,637Supermarkets 22,187 20,192 19,617 16,340 16,762 19,404Other 14,456 25,233 23,341 16,747 14,960 19,176Total 96,048 102,417 101,825 87,169 85,938 96,769
Source: Cso processing on MAPA data
Table A1.48 – Purchases of Peaches in Spain (tons), 2004-2009
2004 2005 2006 2007 2008 2009Specialist retailers 72,214 76,241 79,333 80,628 82,536 78,993Costers 49,702 52,322 49,212 45,787 43,673 37,631Discount Stores 6,185 6,969 8,841 9,765 9,648 10,961Hypermarkets 19,973 18,592 19,102 16,373 16,581 16,289Supermarkets 46,739 53,099 49,941 44,937 42,510 44,121Other 12,749 19,461 18,755 19,734 15,924 22,696Total 207,562 226,684 225,185 217,224 210,872 210,691
Source: Cso processing on MAPA data

The EU Fruit and Vegetable Sector: Overview and Post 2013 CAP Perspective _____________________________________________________________________________________________
PE 460.043 45
ANNEX 2 - IMPORT REGIME1
1. The evolution of the EU import regime for fresh fruit and vegetables
Council Regulation 1035/72 of 18 May 1972 on the common organization of the fruit and vegetables (F&V) market codified for the first time basic provisions on the organization of the F&V market and contained a number of separate regulations, drawn up at different times and amended several times since their adoption.
The Regulation defined the production of F&V as a substantial factor in agricultural income and stated that an essential objective must be the achievement of a balance between supply and demand at fair prices to the producer, account being taken of trade with non-EU countries.
The establishment of a single Community F&V market required the introduction of a single trading system at the external frontiers of the Community. The application of Common Customs Tariff duties should suffice, as a rule, to stabilize the Community market by preventing the price level in non-EU countries and relative fluctuations from having repercussions on prices within the Community.
Furthermore, Council Regulation No 1035/72 stated that disturbances in the Community market arising from supplies at abnormal prices from non-EU countries must be avoided. To this end, provisions should be made for the fixing of reference prices and the levying of a countervailing charge in addition to customs duty for F&V when the entry price of imported products is below the reference price.
After the 1994 GATT Uruguay round of multilateral trade negotiations (URAA) the import regime for F&V was modified (Uruguay Round of Multilateral Trade Negotiations (1986-1994) OJ L 336, 1994). The Agreement required the abolition of non-tariff barriers (Ntb) such as variable import levies and other measures and import charges provided for at the time under the market organization. This meant the conversion of all measures restricting imports of agricultural products into customs duties (“tariffication”) and the prohibition of such measures in the future. However, for certain product groups such as cereals, rice, wine and F&V, the introduction of supplementary or other trade mechanisms (such as the entry price system for F&V) not involving the collection of fixed customs duties required the adoption of rules providing for derogations to basic regulations (as stated in Council Regulation No 3290/1994, art. 23).
The reasons for the partial exception to “tariffication” for F&V trade are linked to technical problems of monitoring cif prices of imports and to the economic impacts of using proxies such as wholesale domestic prices or cif prices from non EU markets to calculate the price gap between internal EU prices and external reference prices (Swinbank-Ritson (1995); Grethe-Tangermann (1998)). Therefore, while the countervailing charges where somehow “tariffied” and bound in the WTO schedule, the EU had to keep some import price threshold in place.
As a result, the specific objective of “stabilizing the Community market by preventing the price level in non-EU countries and fluctuations thereof from having repercussions on prices within the Community”, as defined by Council Regulation No 1035/72, has not changed after the URAA in 1994, as well as some fundamental characteristics of non-tariff protection in F&V trade.
1 Information in this Annex is mainly derived from AgroSynergie (2008).

Policy Department B: Structural and Cohesion Policies ___________________________________________________________________________________
PE 460.043 46
2. Import measures
Within the current framework of the F&V Common Market Organization (CMO), EU import measures include:
a) tariffs
b) entry price system;
c) import licences system;
d) special agricultural safeguard clause;
e) tariff rate quotas;
f) sanitary and phytosanitary measures.
a) Tariffs
All products covered by the F&V CMO (as listed in Article 1(2) of Council Regulation No 2200/96) are subjected to the common customs tariff (CCT). All customs duty rates and Community rules applicable to the Community's external trade are comprised within the TARIC (Integrated Tariff of the European Communities)2.
b) Entry price system (EPS)
Within the CCT, for a certain group of products, in certain periods (listed in the Annex of Commission Regulation No 3223/94) a specific scheme (EPS) is applied. Technicalities on EPS are reported below (see par. 3), while the products/periods concerned are reported in the following Table A2.1
c) Import licences
Imports of any of the products listed in Article 1 (2) of Council Regulation (EEC) No 1035/72 and in the same Article of the Council Regulation 2200/96 can be subject to the presentation of an import or export licence (AGRIM/AGREX). See also Art. 22 of Council Regulation (EEC) No 3290/1994.
According to Commission Regulation No 1556/96, licences are issued by Member States to any applicant, irrespective of its place of establishment within the Community. Such a Regulation introduced a system of import licences for certain F&V products imported from non-EU countries and set the list of products covered in the F&V sector. An import licence system was introduced to gain a better knowledge of trade flows from non-EU countries for certain sensitive products.
2 See Council Regulation (EEC) No 2658/87 of 23 July 1987 on the tariff and statistical nomenclature and on the
Common Customs Tariff. Member States develop their automated goods clearance system on the basis of TARIC. Every year the Commission adopts a Regulation reproducing a complete version of the Combined Nomenclature (CN) and Common Customs Tariff duty rates, taking Council and Commission amendments into account. The Regulation is published in the Official Journal by no later than 31 October, and applies as from 1 January of the following year. See http://ec.europa.eu/taxation_customs/dds2/taric

The EU Fruit and Vegetable Sector: Overview and Post 2013 CAP Perspective _____________________________________________________________________________________________
PE 460.043 47
Table A2.1 - List of products under the EP scheme
PART A
(as established by the Annex to the consolidated version of Commission Regulation (EC) n.3223/1994)
N. CN codes Description Period of application 1 ex 0702 00 00 Tomatoes From 1 January to 31December 2 ex 0707 00 05 Cucumbers(1) From 1 January to 31December 3 ex 0709 10 00 Artichokes From 1 November to 30 June 4 0709 90 70 Courgettes From 1 January to 31 December 5 ex 0805 10 20 Sweet oranges, fresh From 1 December to 31 May 6 ex 0805 20 10 Clementines From 1 November to end of
February 7 ex 0805 20 30
ex 0805 20 50 ex 0805 20 70 ex 0805 20 90
Mandarins (including tangerines and satsumas); wilking and similar citrus hybrids
From 1 November to end of February
8 ex 0805 50 10 Lemons (Citrus limon, Citrus limonum) From 1 June to 31 May 9 ex 0806 10 10 Table grapes From 21 July to 20 November 10 ex 0808 10 80 Apples From 1 July to 30 June 11 ex 0808 20 50 Pears From 1 July to 30 April 12 ex 0809 10 00 Apricots From 1 June to 31 July 13 ex 0809 20 95 Cherries, other than sour cherries From 21 May to 10 August 14 ex 0809 30 10
ex 0809 30 90 Peaches, including nectarines From 11 June to 30 September
15 ex 0809 40 05 Plums From 11 June to 30 September
(1) Other than cucumbers referred to in Part B of this Annex
PART B
N. CN codes Description Period of application 16 ex 0707 00 05 Cucumbers intended for processing From 1 May to 31 October 17 ex 0809 20 05 Sour cherries (Prunus cerasus) From 21 May to 10 August
In 1997 and 1998 Commission Regulation No 1556/96 was amended by gradually abolishing the licence requirement for products covered by the import licences system (over time the annex listing the products covered was replaced eight times). Finally the Regulation was repealed with Commission Regulation (EC) No 2623/98 and replaced by a direct system of surveillance managed by DG TAXUD. At present, within the fresh F&V sector licences are required only for garlic – NC 07032000 and "other (i.e. excluding onions, shallots and leeks) alliaceous vegetables – CN ex 0703 90 00". For apples – NC 08081080 according to Reg. EC 179/2006 licences are required only for statistical surveys.
Commission Regulation No 341/2007 opened and provided for the administration of tariff quotas (see following point e) and introduced a system of import licences and certificates of origin for garlic imported from non-EU countries. The Regulation laid down rules for issuing licences, for categories of importers (traditional and new) and licences (A and B), amount of securities, etc.
d) Special Agricultural Safeguard Clause (SSG)
According to the Special Agricultural Safeguard (SSG), a provision of the URAA, an additional customs duty can be imposed on agricultural products if their import volume exceeds defined trigger levels or if prices fall below specified trigger levels3. This is designed to prevent
3 The special agricultural safeguard clause is an alternative to the general safeguard provisions in the General Agreement on Tariffs and Trade (GATT), and is much easier to invoke because it does not require a test of injury.

Policy Department B: Structural and Cohesion Policies ___________________________________________________________________________________
PE 460.043 48
disruption on domestic markets due to import surges or abnormally low import prices, and can apply only to imports that exceed tariff-quota volumes (see following point e). No additional duty may be imposed on products which enjoy preferences in respect of the entry price, insofar as their tariff classification does not entail application of the highest specific duty (MTE) (see following Par. 3 and Annex 3-trade preferences).
The trigger periods and trigger level (tons) are fixed several times during each year with updates of Commission Regulation No 1555/96.
Commission Regulation No 1242/2006 of 17 August 2006 (amending Reg. No 1555/96 on rules of application for additional import duties on F&V) introduced some changes, which appear to provide greater flexibility in the triggering mechanism of the safeguard. Specifically, in Article 3.1, the trigger condition has been modified. Under Commission Reg. No 1555/96, “If it is found that the quantity imported (…) exceeded (…) the trigger level (…), the Commission shall impose an additional duty.” Under the new provisions of Commission Regulation No 1242/2006, “If it is found that, for one of the products (…) the quantity put into free circulation exceeds the corresponding triggering volume the Commission shall levy an additional duty unless the imports are unlikely to disturb the Community market, or the effects would be disproportionate to the intended objective.” This amendment allows for the possibility of not implementing the safeguard measures even though a trigger volume has been exceeded.
e) Tariff rate quotas (TRQs)
Within TRQs, a predetermined volume of goods originating in a specified country can benefit from imports into the EU having a more favorable rate of duty than the MFN duty mentioned in the combined nomenclature. In the case of F&V, tariffs as well as trigger entry prices (see TEP in the following Par. 3) are modified within the framework of several agreements that the EU entered into with third countries or within the framework of autonomous preferential concessions. For some beneficiary countries, such preferences are limited to a predetermined quantity. This kind of preferences are called ‘preferential tariff quotas’ (see Commission Regulation (EC) No 3223/94 and subsequent amendments; see also Annex 3-trade preferences).
Entitlement to benefit from preferential tariff quotas is of course subject to presentation of the necessary evidence of origin. Commission Regulation No 1831/96 of 23 September 1996, opened and provided for the administration of Community tariff quotas bound under GATT for certain fresh and processed F&V products from 1996. In particular, the Regulation includes the following fresh products of F&V CMO: CN 07061000, ex 07096010, ex 0802 1190, 08021290, 0805 10 20, 0805 20 90, 08055010, 0809 1000.
Importers wishing to benefit from tariff quotas must make a claim in accordance with Community and national requirements.
In accordance with Community provisions, the customs services register the date when they accept each customs declaration. Management of tariff quotas is on a first-come first-served basis. This means that, when more than one claim for the same tariff quota is being considered, priority is given to the claim which results from the customs declaration(s) accepted first. Claims which have the same priority are given equal treatment. This is usually done at the time of import when the Tariff Quota number is declared on the import declaration. Notification about the success of the claim is not immediately available because all the requests received throughout the EC are processed (collated and apportioned) by the European Commission and allocated two working days after receipt. According to art. 34 of Council Regulation No 2200/1996, TRQs may be administered by applying one of the following methods or a combination thereof:

The EU Fruit and Vegetable Sector: Overview and Post 2013 CAP Perspective _____________________________________________________________________________________________
PE 460.043 49
(a) a method based on the chronological order in which applications are lodged (‘first come, first served’ basis);
(b) a method of allocating quotas in proportion to quantities requested when applications are lodged (using the ‘simultaneous examination’ method);
(c) a method based on taking traditional trade flows into account (using the ‘traditional importers/new arrivals’ method).
Recently, in order to simplify and improve the effectiveness and usefulness of the administration and control mechanisms, the Commission Regulation No 1301/2006 introduced common conditions for the administration of import tariff quotas subject to an import licensing system. According to this Regulation two methods are foreseen: the ‘simultaneous examination method’ according to which licences are allocated in proportion to the overall quantities requested, or a method of import based on documents “to be issued by third countries”. Where an import tariff quota is administered using a method based on a document issued by a third country, such document shall be presented to the competent issuing body of the Member State, together with the application for the import licence to which that document relates.
In many instances, instead of TRQs, reference quantities (RQs), or the right to impose RQs, are defined, so that the Commission has the option to submit a product to TRQ. RQs are imposed on many fresh F&V, some dried or processed ones, nuts, and fresh and preserved tropical fruit. It implies that 100% exemption with no quotas can be agreed with a preferential agreement, but the imported quantities have to be checked periodically by the EC to make sure they do not affect local products in EU. In this case the EU sets out reference quantities for products, and if quantities rise above them, full or reduced duties payment for certain periods can be levied.
In the system of import licences RQs can also be fixed as the maximum quantities of a certain product imported per calendar year by a traditional importer during one of the last three calendar years.
f) Sanitary and phytosanitary measures (SPS)
SPS are designed to protect human, animal or plant life or health. Measures which fall into this category include, among others, standards on additives, disease-causing organisms and residues of pesticides in food and feedstuffs. SPS are deepened in Sec. 2.3 and 5.2.
3. Functioning mechanism for the entry price system
With the purpose of understanding the mechanism of the EPS and differences compared with the situation before its implementation, it is helpful to briefly describe the “reference price system” which was applied until June 30th, 1995 according to Council Regulation No 1035/72.
In the previous scheme the EC fixed reference prices for the products concerned each year. Representative wholesale prices of imported produce in the EU were monitored by origin of the import concerned at the level of individual EU Member States and reported to the Commission.
The scheme based on the “reference price” worked in such a way that when the wholesale price of a product from any third country, less a marketing margin and the MFN tariff of the EU, fell significantly below the reference price for a period of two successive days or for two

Policy Department B: Structural and Cohesion Policies ___________________________________________________________________________________
PE 460.043 50
days out of five, a so-called countervailing charge was applied on all subsequent supplies of this product from the country concerned.
The countervailing charge was equal to the difference between the reference price and the arithmetic mean of the last two entry prices available for that exporting country (average entry price) minus all import charges and margins. It was removed only when the reference price had been respected for two market days.
Therefore the reference price system is administered on country–by-country level. This means that all shipments originating from the same country were subject to the countervailing charge, regardless of the price at which a given shipment was landed in the EU, once a certain quantity from that country had entered the EU market at a price which was too low if compared to the reference price.
When it came to the implementation of the results of the URAA, EU has converted the countervailing charges into tariffs by calculating, for each fruit and vegetable concerned, a price gap between the highest reference price (among the seasonally variable reference prices) and an EU internal price (to substitute for the missing c.i.f. unit value). This price gap has been bound as a specific tariff which is also called "maximum tariff equivalent" (MTE). At the same time the EU has established, by adding footnotes for the products concerned to its GATT schedule, two tariff lines for each product where entry prices are applied.
One applies to imports at or above a trigger entry price (TEP) level and the second to imports below this TEP. Only the "normal" ad valorem tariff (i.e. the tariff which already existed under the reference price regime) is charged on imports whose entry price (EP) is at or above TEP. The ad valorem customs duty is fixed as a variable percentage of the value of the goods. The percentage can vary for periods during the year, but it remains fixed, with some exceptions, regardless of the value of import goods.
If the EP is 8% lower than the TEP, in addition to the ad valorem duty, a specific duty is levied (Euro/100 kg) and its amount is substantially the difference between the TEP and the EP. The system works for intermediary EP values in terms that if the EP of a specific consignment is 2, 4, 6, 8% the specific duty shall be 2, 4, 6, 8% of TEP.
If the EP is less than 92% of TEP the MTE duty plus the ad valorem tariff will be charged.
The EPS differs in some important aspects from its predecessor: first of all it is administered on a shipment-by-shipment level instead of a country-by-country level. Under the new system the additional specific tariff is charged per individual shipment. If the c.i.f. price of one shipment undercuts the entry price, this does not affect subsequent shipments from the same country. This aspect clearly reduces the protective effect of the new system.
The implementation of the new system has also involved important changes in procedures (Commission Regulation No 3223/94). Most F&V trade is on a consignment basis, and no agreed c.i.f. price exists at the time of importation. Consequently compliance with entry prices cannot really be monitored on the basis of c.i.f. prices. Therefore price formation is monitored on the domestic EU market, where wholesale prices are still monitored by origin. Based on these prices, the Commission calculates "standard import values" (SIVs) on a daily basis for each country that actually exports to the EU4.
4 Each working day the EC fixes a SIV for each product under the entry price scheme and for the periods set out in
the Annex of the same regulation and for each origin. SIVs are equal to the weighted average of representative prices less a standard amount of ECU 5/100 kg and ad valorem customs duties. SIVs are published daily in the Official Journal. MSs communicates (only for fresh F&V listed in part A of the Annex to Commission Regulation No 3223/1994): a) the average representative prices of products in “representative markets” (as listed in Art. 3 of

The EU Fruit and Vegetable Sector: Overview and Post 2013 CAP Perspective _____________________________________________________________________________________________
PE 460.043 51
As established by Commission Regulation No 3223/94, importers can choose from three methods to declare the EP: invoice, deductive, entry price-standard import value (SIV) comparison.
With the invoice method (Art. 5 paragraph 1.a) importers choose the EP equal to the fob price plus the costs of insurance and freight up to the borders of the Community at the time the declaration of release of products for free circulation is made. The importer must lodge the security where the aforementioned prices are more than 8% greater than the SIV applicable to the product in question at the time the declaration of release for free circulation is made.
With the deductive method (Art. 5 paragraph 1.b) the customs value is calculated in accordance with art. 30 paragraph 2 (c) of Council Regulation No 2913/92. In that case the customs value is “the value based on the unit price at which the imported goods for identical or similar imported goods are sold within the Community in the greatest aggregate quantity to persons not related to the sellers”. According to art. 29 to 31 of Council Regulation No 2913/92, the deductive method should be used only in the absence of sale.
The entry price-SIV comparison method (Art. 5 paragraph 1.c) is simply based on the Entry price-SIV comparison for all imports coming from a given country, with no investigation of the single consignment’s price, as in the old “reference price” system. The third system in not applicable for F&V listed in part B of the Annex of implementing Commission Regulation No 3223/1994.
Another important difference compared with the former system is that imports from countries that enjoy a tariff preference can now sell at lower prices on the EU market than those from MFN suppliers5.
With regard to the security, importers must lodge one corresponding to the amount of the duty they would have paid if the classification of products had been made on the basis of SIV applicable to the lot. Importers can ask for a partial or total rebate of the sum by proving, through invoices or other customs documentation, that the actual sale price of their consignment was such that a lower duty was to be paid. The security lodged is released to the extent that proof of the conditions of disposal is provided to the satisfaction of the customs authorities. Otherwise the security is forfeited by way of payment of the import duties.
The European Commission explanatory note concerning Commission Regulation No 3223/94 [D(99) 01/10/1999] gives a technical definition for each case and combination when the ad valorem tariff, the specific tariff and the security have to be calculated.
Commission Regulation No 3223/1994) imported from non-EU countries and sold in the representative import markets, and b) total quantities relating to the prices referred. Representative prices are recorded for each product listed, for all available varieties and sizes, at the importer-wholesaler or wholesaler-retailer (if the former is not available) stage. In the latter case they are reduced by 9% to take account of the wholesaler's trade margin and by € 0.7245 per 100 kg to take account of the costs of handling and market taxes and charges. These prices are reduced by the marketing margin of 15% for the marketing centres of London, Milan and Rungis and 8% for other marketing centres, and the costs of transport and insurance within the customs territory.
5 Under the old system wholesale prices minus the full MFN tariffs and a marketing margin were compared to the reference prices. As a result imports from all countries had to accept the same minimum wholesale prices, regardless of tariffs applied to the individual country. Trade preferences are dealt with in Sec 2.2 and Sec. 5.

Policy Department B: Structural and Cohesion Policies ___________________________________________________________________________________
PE 460.043 52

The EU Fruit and Vegetable Sector: Overview and Post 2013 CAP Perspective _____________________________________________________________________________________________
PE 460.043 53
ANNEX 3 - TRADE PREFERENCES SYSTEM
1. Overview
Trade preferences are granted by the EU to many non-EU countries under various agreements. The comprehensive system of EU trade concessions is the result of the Common Commercial Policy and the Development Policy on behalf of the External Relations common framework6. These Community policies are also to be considered within the global framework of World Trade Organizations (WTO) commitments.
Preferential origin confers certain benefits on goods traded between particular countries, namely entry at a reduced or zero rate of duty. In order to have preferential origin goods must meet the relevant conditions laid down in the origin protocol to the agreement of whichever country is concerned or in the origin rules of the autonomous concessions.
While the provisions of individual concessions may vary in certain details, most preferential origin arrangements have a number of common provisions, related not only to trade concessions, but also to other institutional, political and economic dimensions of the deal.
EU preferential treatments can be grouped in two clusters (some countries may benefit from more than one arrangement). The main ones are7:
Preferential Agreements
EFTA/EEA countries;
Western Balkan countries;
Mediterranean Countries;
Other countries and territories: ACP (Africa, the Caribbean and the Pacific) countries, South Africa, Mexico, Chile.
Autonomous preferential concessions
Overseas Countries and Territories (OCT);
Generalised System of Preferences (GSP).
2. Agreements with Mediterranean Countries With Mediterranean Partner Countries (MPCs) the agreements may be dated back to the 1970s EU “global Mediterranean policy”. Revised in the late 1980s after the enlargement of the EU to include Greece, Spain and Portugal, the current Euro-Med Association Agreements (EMAA) are being re-launched within the framework of the Union for the Mediterranean (2008) and the wider European Neighbourhood Policy8: reciprocal trade liberalisation, as well
6 This Annex partially derives from AgroSynergie (2008). 7 See http://trade.ec.europa.eu/doclib/docs/2006/december/tradoc_111588.pdf for a list of agreements in force,
and http://ec.europa.eu/taxation_customs/customs/customs_duties/rules_origin/introduction/article_403_en.htm for a list of applicable arrangements for each non-EU countries.
8 See http://eeas.europa.eu/euromed/index_en.htm.

Policy Department B: Structural and Cohesion Policies ___________________________________________________________________________________
PE 460.043 54
as EU technical co-operation and financial support, are seen as major threads driving development and integration in the whole area (INEA, 2002; De Wulf-Maliszewska, 2009).
Table A3.1 – EuroMed Agreements. Products to which a reduced entry price applies.
Source: Agrosynergie (2008)
The EuroMed Partnership includes, besides EU members, nine countries (Algeria, Egypt, Israel, Jordan, Lebanon, Morocco, Palestinian Authority, Syria and Tunisia). With these MPCs the grid of EMAAs has been completed. Association Agreements are in force between the EU

The EU Fruit and Vegetable Sector: Overview and Post 2013 CAP Perspective _____________________________________________________________________________________________
PE 460.043 55
and Tunisia (since 1998), Israel (2000), Morocco (2000), Jordan (2002), Egypt (2004), Algeria (2005), Lebanon (2006), and on an interim basis with the Palestinian Authority (1997). The EMAA with Syria has been initialed in 2008 and the EU formally agreed to proceed with signature on 27 October 2009. Syria's agreement to sign is pending. The other MPC, Turkey, is a candidate country for EU membership, engaged in accession negotiations since 2005. With Turkey the EU signed first generation association agreements in the 1960s. As a result of this a customs union with the EU came into force on 1 January 1996 enabling goods which are in free circulation in the EU to be regarded as being in free circulation in Turkey, and vice versa.
EMAA establish relevant preferential trade concessions for fresh F&V. The provisions governing bilateral relations vary from one MPC to another. Agreements normally regard tariff concessions (zero tariff import quotas and TRQs) and non-tariff concessions (preferential TEPs - and entry prices quotas – EPQs) for products defined for each country. Table A3.1 summarizes the concessions on entry prices.
As far as Turkey is concerned, agricultural products enter the customs union with limitations. For agricultural products the EC-Turkey trade agreement results from Decision No 1/98 of the Association Council entered into force on 25.02.19989. The preferential regime envisages widespread extensions of ad valorem duties and preferential measures on specific duties for certain products, which roughly cover 93% of traditional exports to the EU. For many fresh and processed fruit and vegetables tariff exemptions or reductions are to be bound by TRQs and import calendars. The EU enjoys preferential treatment on 33% of its exports to Turkey, with lower to zero TRQs for several products.
3. Other agreements
Preferential Agreements: ACP «Cotonou» Agreement
The «Cotonou» Agreement is a preferential trade agreement between the EU and 71 African, Caribbean and Pacific (ACP) States. Preferential trade provisions are reciprocal and based on the principle of free access to the EU market for products originating in ACP States, with special provisions for agricultural products. Under the ACP Agreement, certain products may be admitted into the EU at preferential (either reduced or zero) duty rates. For particular goods, preferential rates are granted only within the limits of tariff quotas or ceilings.
Autonomous preferential concessions: Generalized System of Preferences
The EU's common commercial policy is to be consistent with and consolidate the objectives of development policy, in particular the eradication of poverty and the promotion of sustainable development and good governance in developing countries. Many countries have in place systems of generalized preferences towards developing countries, consistently with WTO requirements and in particular with the GATT Enabling clause of 1979.
Since 1971, the Community has granted trade preferences to developing countries, within the framework of its GSP (Generalised System of Preferences) scheme. The EU's GSP grants products imported from GSP beneficiary countries either duty-free access or a tariff reduction, depending on which of the GSP arrangements a country enjoys. The EU's GSP is implemented following cycles of ten years, for which general guidelines are drawn up. The main features of the early schemes were quotas and ceilings for individual countries and products. Since 1995,
9 Decision No 1/98 has been amended by Decision No 3/2006 of the EC-Turkey Association Council of 19.12.2006.

Policy Department B: Structural and Cohesion Policies ___________________________________________________________________________________
PE 460.043 56
the EU's GSP has done away with any quantitative limitations. Instead, it provides for tariff preferences which vary according to the sensitivity of products on the EU market.
Guidelines for the period 2006-2015 were adopted in 2004. Based on the guidelines of 2004, new GSP schemes have been adopted through Council regulations, the last of which applies from 1 January 2009 to 31 December 2011 (EC Reg. No 732/2008 of 22 July 2008). Beneficiaries are 176 developing countries listed in Annex 1 to the Reg. 732/2008.
Products are divided into two categories: sensitive products and non-sensitive products. Sensitivity is determined in relation to the effect that imports into the EU could have on EU products. Product listed as “non-sensitive” are duty-free (about 3200 tariff lines). Sensitive products enjoy tariff reductions by specified amounts below normal MFN tariff rates (in case of ad valorem duties: by 3.5% points or 20% for Section XI; in case of specific duties: by 30%). Agricultural products are listed as “sensitive”. For the period 01.01.2009 to 31.12.2011, there are three types of arrangements in place for beneficiary countries:
- all beneficiary countries enjoy the benefit of the general arrangement;
- the special incentive concession for sustainable development and good governance (the "GSP+") provides additional benefits for countries implementing certain international standards in human and labour rights, environmental protection, the fight against drugs and good governance. From 01.01.2009 to 31.12.2011 16 beneficiary countries have qualified to receive the additional preferences (see Commission Decision of 9 December 2008);
- "EBA Regulation” (Council Regulation No 416/2001), granting duty-free access to imports of all products from LDCs without any quantitative restrictions, except for arms and munitions. At present, 49 developing countries belong to the category of LDCs. The provisions of the EBA Regulation have been incorporated into the GSP Regulation. Only imports of fresh bananas, rice and sugar were not fully liberalized immediately. Duties on those products have been gradually reduced until duty free access has been granted for bananas (2006) and sugar and rice (2009). Only for sugar, for the period from 1 October 2009 to 30 September 2012, the importer of sugar shall undertake to purchase such products at a minimum price not lower than 90 % of the reference price.
Under certain circumstances various beneficiary countries have been grouped together for the purposes of cumulation of origin under GSP. Cumulation is a term used to indicate the basis upon which a product may enjoy originating status, even though the normal origin rules would not confer origin on the basis of work performed in the country of last processing. Regional cumulation applies to three separate groups of beneficiary countries that benefit from GSP:
- the Association of South-East Asian Nations (ASEAN) consisting of Brunei-Darussalam, Indonesia, Laos, Malaysia, Philippines, Singapore, Thailand, Vietnam and Cambodia.
- the Andean Community – Central American Common Market and Panama Permanent Joint Committee on Origin, consisting of Bolivia, Columbia, Costa Rica, Ecuador, El Salvador, Guatemala, Honduras, Nicaragua, Panama, Peru, Venezuela.
- the South Asian Association for Regional Co-operation (SAARC) consisting of Bangladesh, Bhutan, India, Maldives, Nepal, Pakistan and Sri Lanka.

The EU Fruit and Vegetable Sector: Overview and Post 2013 CAP Perspective _____________________________________________________________________________________________
PE 460.043 57
ANNEX 4 – EU–MOROCCO AGRICULTURAL PROTOCOL10
The Council of EU Agriculture Ministers and Morocco agreed on December 13, 2010 on the new protocol regulating their reciprocal liberalisation measures on agricultural products. The agreement took the form of an exchange of letters of intent. It would however not take effect before the 2011 season at least, provided that the European Parliaments votes the ratification. The agreement opens the way to larger Moroccan F&V exports to the EU. The EU Commissioner for Agriculture Dacian Ciolos stated during a press conference that the agreement "protects" EU producers as there are measures to "avoid negative consequences". Ciolos also called on the responsibility of Member States responsible for border controls. On the other hand, the Moroccan minister of Agriculture, Aziz Ajenouch, revealed he still considered "too high" the custom tariff for Moroccan fruits and vegetables exported into the EU and manifested his concern that “these protective measures for the European market are too strict".
On the date of entry into force of the Protocol, customs duties applicable on imports into the European Union of agricultural products, processed agricultural products, fish and fishery products originating in Morocco shall be eliminated, except for a number of exceptions.
Tomato keeps being the most controversial product because its sensitive character in EU markets. For fresh or chilled tomatoes the preferential treatment will keep restricted by tariff quota, increasing them in five years from 233,000 to 285,000 tons.
For certain products originating in Morocco listed in the Annex to the Protocol, duty elimination is restricted by tariff quotas. For the products to which an entry price applies, the elimination applies only to the ad valorem part of the duty. For certain products, the agreed entry price level from which specific duties will be reduced to zero during the periods indicated are set at a reduced level.
The situation for the products highlighted in the present study is the following:
Agreed entry price below the MFN entry price (€/t)
Period for agreed reduced entry price
TRQ (t)
Sweet oranges 264 01.12 – 31.05 Unlimited Clementine 484 01.11 – 28.02 175,000 Mandarins No reduction Unlimited Lemons No reduction Unlimited Table grapes 358 21.07 – 20.11 Unlimited Peaches and nectarines 491 11.06 – 30.09 Unlimited
If, given the particular sensitivity of the agricultural markets, there are such increased quantities of imports of products from Morocco, which are the subject of concessions granted under this Protocol that they cause serious disturbance to Community markets and/or serious disturbance to the production sector, both Parties shall hold consultations immediately to find an appropriate solution. Pending such solution, the importing Party is authorised to take the measures it deems necessary. The safeguard measures, taken pursuant to the previous
10 Source: European Commission (2009), Proposal for a COUNCIL DECISION on the conclusion of an Agreement in
the form of an Exchange of Letters between the European Union and the Kingdom of Morocco concerning reciprocal liberalisation measures on agricultural products, processed agricultural products, fish and fishery products, the replacement of Protocols 1, 2 and 3 and their Annexes and amendments to the Euro-Mediterranean Agreement establishing an association between the European Communities and their Member States, of the one part, and the Kingdom of Morocco, of the other part. Brussels, 16.9.2010 COM(2010) 485 final 2010/0248 (NLE).

Policy Department B: Structural and Cohesion Policies ___________________________________________________________________________________
PE 460.043 58
paragraph, may only be applied for a maximum duration of one year, which may be renewed just once on the decision of the Association Committee.

The EU Fruit and Vegetable Sector: Overview and Post 2013 CAP Perspective _____________________________________________________________________________________________
PE 460.043 59
ANNEX 5 – INEA SURVEY QUESTIONNAIRE
Section 1 – Principal information on Producer organisation Name of the PO ..................... Identification number ......................... Contact person …………………………………. Phone number …………………………………. E-mail address ……………………………….. Date of recognition of the PO………………………………………... The PO belongs to an association of producer organizations (APOs)? YES NO If the answer is “YES”, specify the name of the APO .......................................................................... Basis on which the organisation was formed?
New constitution Recognition of a single existing organisation (association, cooperative, ……..) Recognition of a several existing organisations (associations, cooperatives, ……..) Merger of several POs
Number of members of the PO a) Natural persons ………… b) Legal persons ………… Main products and marketing channels
Products Average quantity (2008-2009-2010)
(t)
% on total Processing (%)
Large-scale retail (%)
Wholesale market
(%) 1. 2. 3. 4. 5.

Policy Department B: Structural and Cohesion Policies ___________________________________________________________________________________
PE 460.043 60
Main products and market destination Products % domestic market Main foreign markets 1. 2. 3. 4. 5. Value of marketed production, amount and share of EU support in total VMP VMP (mio €) EU aid (mio €) EU aid/VMP
2006 2007 2008 2009 2010
Section 2 – Impact of the fruit and vegetable CMO measures and trade agreement policy Theme 1: Implementation of the F&V CMO in the EU The reformed CMO for fruit and vegetables, that is in place as from 1 January 2008, has introduced some elements, aimed at: - improving the competitiveness and market orientation of the EU fruit and vegetable sector; - reducing producers’ income fluctuations resulting from crises; - promoting F&V consumption, thus contributing to improve public health; - enhancing environmental safeguards.
In order to further improve the attractiveness of producer organisations (POs), the reformed CMO has provided to make them more flexible in their operation through the following elements: product range of a producer organisation; the extent of direct sales permitted and the extension of rules to non-members; permitting associations of producer organisations to carry out any of the activities of their members and permitting the outsourcing of activities. As well more incentives to mergers of POs, associations of producer organisations (APOs), to those regions where the level of concentration of the supply through POs is particularly low, etc.

The EU Fruit and Vegetable Sector: Overview and Post 2013 CAP Perspective _____________________________________________________________________________________________
PE 460.043 61
1. In which measure the pursuit of the following objectives (a., b., c., d., e.) of the CMO has been positively affected by such provisions?11:
a. improve the attractiveness of POs.
1 2 3 4 Comments............................................................................................................................................................................................................................................................
b. increase and/or stabilize producers’ income. 1 2 3 4 Comments...........................................................................................................................................................................................................................................................
c. increase the concentration of the fruit and vegetable supply on the EU market or contribute more effectively than the previous CMO.
1 2 3 4 Comments............................................................................................................................................................................................................................................................
d. improve the competitiveness in the fruit and vegetable sector. 1 2 3 4 Comments……………………………………………………………………………………….....................................................................................................................
e. strengthen producers’ negotiating ability on the EU market. 1 2 3 4 Comments……………………………………………………………………………
11 1) no, they haven’t, 2) weakly, 3) significantly, 4) very strongly.

Policy Department B: Structural and Cohesion Policies ___________________________________________________________________________________
PE 460.043 62
f. which provisions among the following ones have been more effective in contributing to achieve the strategic objectives of the reformed CMO, according to your experience?
product range of a producer organisation.
1 2 3 4
the extent of direct sales permitted.
1 2 3 4
the extension of rules to non-members.
1 2 3 4
permitting associations of producer organisations to carry out any of the activities of their members.
1 2 3 4
permitting the outsourcing of activities.
1 2 3 4
more incentives to mergers of POs, associations of producer
organisations (APOs), etc.
1 2 3 4
more incentives to those regions where the level of concentration of the
supply through POs is particularly low.
1 2 3 4
Comments…………………………………………………………………………………………...................................................................................................................
2. In which measure in the POs’ operational programmes, according to you, the actions have been more effective in contributing to achieve the above mentioned strategic objectives of the reformed CMO?

The EU Fruit and Vegetable Sector: Overview and Post 2013 CAP Perspective _____________________________________________________________________________________________
PE 460.043 63
actions aimed at planning of production (3.2.1)
1 2 3 4
actions aimed at improving or maintaining product quality (3.2.2)
1 2 3 4
actions aimed at improving marketing (3.2.3)
1 2 3 4
research and experimental production (3.2.4)
1 2 3 4
training types of actions (other than in relation to crisis prevention and
management) and actions aimed at promoting access to advisory services (3.2.5)
1 2 3 4
crisis prevention and management measures (3.2.6)
1 2 3 4
environmental types of actions (3.2.7)
1 2 3 4
other types of actions (3.2.8)
1 2 3 4
Comments....................................................................................................................…………………………………………………………………………………………………………….
3. In particular, in relation to crisis prevention and management measures provided by the
F&V CMO (market withdrawal, green harvesting or non harvesting of F&V, promotion and communication, training measures, harvest insurance, support for the administrative costs of setting up mutual funds):

Policy Department B: Structural and Cohesion Policies ___________________________________________________________________________________
PE 460.043 64
a. have you been utilizing the additional EU support (0.5%) to operational
programmes? YES NO how, in which measure?........................................................................................ …………………………………………………………………………………
b. which kind of measures, among those considered, have you implemented? And which has been the percentage of their utilization in each year (2008, 2009 and 2010)?
Measures % of utilization
2008 % of utilization
2009 % of utilization
2010 Market withdrawal Green harvesting / non harvesting Promotion and communication Training measures Harvest insurance Support for setting up mutual funds Total 100.00 100.00 100.00
c. which is your opinion about the effectiveness and the adequacy of the current measures to cope with the increased risks of price volatility and the effects of climate change? ………………………………………………………………………………………………………………………………………………………………………………
d. what has been their impact on the producers’ income in terms of stabilization as well as coping with market crisis? ……………………………………………………………………………………………………………………………………………………………………………
4. In these last years the fruit and vegetable consumption in EU-27 is decreasing or, at best,
stagnating. However it remains below WHO recommendation in half of the EU Member States.
a. do you retain that the recent institutional promotion measures (School Fruit Scheme, etc.) are effective and adequate to stimulate F&V consumption?
1 2 3 4
Comments…………………………………………………………………………………………...................................................................................................................
5. As regards the single payment scheme,

The EU Fruit and Vegetable Sector: Overview and Post 2013 CAP Perspective _____________________________________________________________________________________________
PE 460.043 65
a. on the basis of your experience, which kind of impact has this scheme had on farmers’ behaviour (production choices) and then on concerned supply chain? ……………………………………………………………………………………………………………………………………………………………………………………
b. which kind of impact has the introduction of simple payment scheme had on the farmers’ economic results? ……………………………………………………………………………………………………………………………………………………………….…………………..
c. in your opinion, how the simple payment scheme affects the supply of the processing industry? ……………………………………………………………………………………………………………………………………………………………………………………
Theme 2: Trading arrangements and preferential agreements regarding the F&V sector The core of external protection to EU producers of all F&V products is made of tariffs and, for the main products, by policy devices meant to operate as minimum import prices (entry prices). The EU has traditionally managed such a system looking at protection and stabilisation of revenues of EU producer of F&V, but also at availability of large and differentiated supply of F&V products to EU consumers at reasonable price, and also at integration in the import regime of the supply of developing and neighbouring countries. 1. Do you consider current trade policy measures effective in keeping imports in line with the
need of having stable domestic prices and producers income? YES NO
why? ……………………………………………………….....................…… In a scenario of further trade liberalization: 2. Do you consider your PO able to gain from liberalization in F&V trade?
YES NO
why? ……………………………………………………….....................…… 3. Could list the conditions for POs to gain from trade liberalization (transnational structure
of PO, supply consolidation, involvement in cross-country investments, etc.)? ……………………………………………………….....................………………………… ………………………………………………………………………………………………..
4. Do you feel that the phasing out of quotas and entry prices could imply a surge of imports
or domestic price instability? YES NO
why? ………………………………………………………..........................................……

Policy Department B: Structural and Cohesion Policies ___________________________________________________________________________________
PE 460.043 66
5. Could you list the F&V products that, in your opinion, should be kept apart form the liberalization process? ……………………………………………………………………………………………………………………………………………………………………………………………………
6. Why should they be treated as exception in the WTO context?
……………………………………………………………………………………………………………………………………………………………………………………………….…..
Theme 3: The issues relating to product and process standards 1. Have you developed a strategy aimed at improving the quality of the F&V products? YES NO If the answer is “YES”, specify which kind of strategy: Certifications and public standards of quality: …………………………
Private standards of quality: …………………………………………… Environmentally friendly standards: ………………………………… Organic: …………………………………… Others (specify): ……………………………
2. Which opportunities have you derived from the adaptation of your products to the public standards? .................................................... ...............................................................................................
3. Which difficulties? …………………………………………………………………………………………………
4. Which opportunities have you derived from the adaptation of your products to the private
standards? .............................................................................................................................................
5. Which difficulties? …………………………………………………………………………………………………
Section 3 – New aid scheme for the fruit and vegetable sector

The EU Fruit and Vegetable Sector: Overview and Post 2013 CAP Perspective _____________________________________________________________________________________________
PE 460.043 67
1. How to improve the use of existing tools and measures in order to make the fruit and vegetable supply chain functioning better? ........................................................................................................................................................................................................................................................................................................
2. Which is your opinion about carrying on with the following instruments of EU support in
the Post 2013 CMO for fruit and vegetables? :
a. Single payment scheme carrying on reduction removal why……………………………………………………………………………………
b. Operational funds and programmes carrying on reduction removal why………………………………………………………………………………….
c. Crisis prevention and management scheme carrying on reduction removal why ………………………………………………………………………………….
3. Do you deem that the operational programme is an adequate instrument to pursue F&V
CMO’s objectives? 1 2 3 4
Comments ..................................................................................................................................................................................................................................................................................
4. In order to improve the concentration of the F&V supply, do you deem necessary to maintain or increase the current additional support (Community co-financing) to mergers of POs, associations of producer organisations (APOs), to those regions where the level of concentration of the supply through POs is particularly low, etc.? specify........................................................................................................................................
5. In relation to crisis prevention and management scheme, do you deem necessary a review of the current tools?

Policy Department B: Structural and Cohesion Policies ___________________________________________________________________________________
PE 460.043 68
YES NO
a. If yes, why? ………………………………………………………………………… b. which kind of changes would you propose?
.......................................................................................................................................
.......................................................................................................................................
...
c. in order to address more severe market crises, do you deem necessary to create an additional and complementary tool outside POs’ operational programme, aimed at guaranteeing a safety net for all F&V producers?
YES NO
d. on the basis of your experience which could be your proposal on this matter? ...............................................................................................................................................................................................................................................................................
e. do you deem necessary to increase Community financial endowment? YES NO
If yes, in which measure?............................................................................................... If yes, could you suggest measures or area of CAP agricultural budget that should be reduced in order to make room for an increased crisis management scheme? …………………………………………………………………………………………………………………………………………………………………………

The EU Fruit and Vegetable Sector: Overview and Post 2013 CAP Perspective _____________________________________________________________________________________________
PE 460.043 69
ANNEX 6 - COMPETITION AND REGULATION IN AGRICULTURE12
Main aspects of general EU competition rules applicable to the agricultural sector
EU anti-trust competition law, in Articles 101-106 of Treaty on the Functioning of the European Union (TFEU), is a fundamental aspect of the functioning of the internal market. The agricultural chapter of the TFEU in Article 40(1) underlines that common rules on competition are the basis for a common market organisation.
EU anti-trust competition law in Article 101(1) TFEU prohibits certain anti-competitive practices, such as direct or indirect price fixing, market partitioning and production controls. It only applies, however, to practices which may affect trade between Member States, so that minor issues fall only under national competition law, which varies between Member States. The application of Article 101(1) TFEU to any cooperation agreements between farmers requires therefore as a pre-condition that such agreements are capable of appreciably affecting trade between Member States. A case-by-case analysis is necessary in order to determine if this condition is fulfilled, taking account of the particular characteristics of the agreements and markets at issue.
Article 101(3) TFEU provides for a waiver making some practices acceptable if they contribute to improving the production or distribution of goods, or to promoting technical or economic progress, whilst allowing consumers a fair share of the resulting benefits and do not eliminate competition in respect of a substantial part of the products concerned.
With respect to those agreements between farmers capable of appreciably affecting trade between Member States and therefore subject to EU competition law, the analysis under Article 101(1) and (3) should be made under the general competition rules applicable to horizontal agreements between competitors.
As far as the assessment of cooperation agreements between farmers in the framework of producer organisations or other forms of farmers’ associations is concerned, two main categories of agreements could be distinguished depending on the aims pursued and the level of integration of activities between farmers: joint production agreements and commercialisation agreements.
As regards joint production agreements, EU competition rules recognise the substantial economic benefits stemming from this type of agreements and provide for a flexible approach when assessing such forms of cooperation between competitors. Joint production, whatever its scope and form, always involves an integration of economic activities, capacities or assets between participating companies.
European Courts have expressly recognised cooperative organisations13 as pro-competitive structures which contribute to the modernization and rationalization of the agricultural sector
12 Information in this Annex is mainly derived from European Commission (2010a) and High Level Group on Milk
(2010). 13 The DG Competition of European Commission (2010a) asserted, in its Working Paper The interface between EU
competition policy and the Common Agriculture Policy (CAP): Competition rules applicable to cooperation agreements between farmers in the dairy sector, that the same type of favourable treatment may be extended to POs or other farmers’ associations, as entities which may entail a certain level of integration of activities and contribute to modernize and rationalize the supply chain. More specifically, “this would be the case for instance

Policy Department B: Structural and Cohesion Policies ___________________________________________________________________________________
PE 460.043 70
by enabling a large number of small producers to participate in the economic process on a wider geographical basis. However, EU competition rules view such agreements favourably if the farmers involved in these forms of cooperation do not collectively hold a level of market power such as to restrict competition in the market to the detriment of consumers.
Market share thresholds should be taken into account when assessing the market power of a cooperative: EU competition rules would very likely allow farmers to jointly decide on sales targets and product prices, if market shares are not exceeding 20% in the relevant market. Above that limit a case by case analysis is necessary.
EU competition rules recognise the efficiency gains stemming from the integration of product collecting activities, which may imply an overall favourable assessment. However, previously mentioned limitations based on market power of the agreements apply.
As regards joint commercialisation agreements, that is cooperation agreements between competitors in the selling, distribution or promotion of their products, a distinction must be made based on price fixing. Whether commercialisation agreements do not involve any price fixing, they are only subject to Article 81(1) EC if the parties have a degree of market power above 15%. In this case the agreement is not presumed to be illegal, but a case-by-case assessment is necessary. Joint commercialisation agreements are instead accepted if it does not exceed such a market share threshold. Whether commercialisation agreements involve price fixing, they fall under Article 81(1) EC irrespective of the market power of the parties. This would normally be considered as a form of cartel prohibited by EU competition rules.
Nevertheless, price fixing may be exempted under Article 81(3) if the cooperation involves a certain level of integration of marketing functions which generate substantial efficiencies and for which price fixing is indispensable. Such exceptions arise in two cases: (1) when large buyers reluctant to deal with a multitude of prices request a single supply price; (2) when creation of a common brand requires that all aspects of marketing, including price, are standardized. In any case, such exceptions apply only if the collective entity does not have a significant market power (market share below 15%).
Specific EU competition rules applicable to the agricultural sector
The agricultural sector is subject to the EU’s competition rules with a specific regime applicable to such products. Article 42(1) TFEU provides that EU rules on competition shall apply to production and trade in agricultural products only to the extent determined by the European Parliament and the Council within the framework of Article 43(2) TFEU, which itself provides for the adoption of a common market organisation for agricultural products, and taking into account the objectives of the CAP set out in Article 39 TFEU.
In light of this provision, two Regulations adopted by the Council and governing the application of competition rules to the agriculture sector are currently in force:
1. Council Regulation (EC) No. 1234/2007 (Single CMO Regulation), which establishes a common organisation of the markets for certain sectors included in Annex I to the TFEU;
for joint [product] collection, which may involve efficiency enhancing effects to the extent that it allows small farmers to group together their individual [product] outputs in larger quantities, thereby meeting the needs of large buyers who may not want to deal with a wide number of suppliers.” (ibidem, p. 16).

The EU Fruit and Vegetable Sector: Overview and Post 2013 CAP Perspective _____________________________________________________________________________________________
PE 460.043 71
2. Council Regulation (EC) No. 1184/2006, which applies certain rules of competition to the production of, and trade in, agricultural products, listed in Annex I to the TFEU with the exception of the products covered by the Single CMO Regulation.
Both the Single CMO Regulation and Regulation (EC) No. 1184/2006 provide for the same substantive competition rules applicable to the agricultural sector.
Article 175 of the Single CMO Regulation provides for the general application of anti-trust competition rules to the agricultural sector subject to three exceptions in Article 176(1). These three exceptions only concern Article 101 of the TFEU. Article 102 of the TFEU (abuse of a dominant position) therefore remains fully applicable to the agricultural sector. In accordance with Article 176(2) of the Single CMO Regulation the Commission has sole power to determine which agreements, decisions and practices fulfil the conditions required by the above exceptions. The Commission shall undertake such determination either on its own initiative or at the request of a competent authority of a Member State or of an interested undertaking or association of undertakings.
On this point the DG Competition of European Commission (2010a, p. 7) highlighted that “from the outset their potential application to a PO or farmers' cooperation agreement only becomes relevant when the agreement at issue may fall under the scope of application of Article 101(1) (that is, when it may actually or potentially affect trade between Member States). If such is not the case (because, for instance, the PO or farmers' association has a limited geographical scope in the territory of a Member State), a derogation from Article 101(1) would not ultimately make sense since the agreement would not be capable in any event of triggering the potential application of this provision.”
As regards the first exception, this one concerns agreements which are an integral part of national market organisations. It has a very limited importance, since the majority of products (including fruit and vegetables) are now covered by a single CMO.
The second exception applies to agreements necessary for the attainment of the objectives of the CAP as set out by Article 39 of the TFEU14. Since it is not possible to achieve these objectives simultaneously, they “can be met if there are sufficient efficiencies or productivity gains that are passed onto consumers in the form of reasonable prices, while entailing higher farming incomes.” (ibidem, p. 9).
The third exception requires three cumulative conditions:
a) The agreements must be concluded between farmers, farmers' associations or associations of farmers' associations belonging to a single Member State.
b) The agreements must concern the production or sale of agricultural products or the use of joint facilities for the storage, treatment or processing of agricultural products, and under which there is no obligation to charge identical prices.
14 These objectives are the following: "(a) to increase agricultural productivity by promoting technical progress and by ensuring the rational
development of agricultural production and the optimum utilisation of the factors of production, in particular labour;
(b) thus to ensure a fair standard of living for the agricultural community, in particular by increasing the individual earnings of persons engaged in agriculture;
(c) to stabilise markets; (d) to assure the availability of supplies; (e) to ensure that supplies reach consumers at reasonable prices."

Policy Department B: Structural and Cohesion Policies ___________________________________________________________________________________
PE 460.043 72
c) The agreements may not exclude competition or jeopardize the objectives of the CAP.
The requirement that there be no obligation to charge identical prices would appear to make this exception inapplicable to collective bargaining for an identical price.
Competition rules applicable to interbranch organisations (IPOs)
Currently in the CAP there is explicit provision in several sectors, including in particular F&V, for the recognition of IPOs under a EU statute. IPOs may be also recognised under national statutes in other sectors under Article 124 of the Single CMO Regulation.
The role of IPOs is set out in Article 123 of the single CMO. In this regard, it could be worth recalling the Annex 3 of the HLG ‘s Report (2010) on “current activities allowed for IPOs in the fruit and vegetable sector under Article 123 of the Single CMO Regulation”:
Carrying out, in the case of the fruit and vegetable sector, two or more, of the following activities in one or more regions of the EU, taking into account the interests of consumers:
- Improving knowledge and the transparency of production and the market; - Helping to coordinate better the way the products of the fruit and vegetable sector are
placed on the market, in particular by means of research and market studies; - Drawing up standard forms of contract compatible with EU rules; - Exploiting to a fuller extent the potential of the fruit and vegetables produced; - Providing the information and carrying out the research necessary to adjust production
towards products more suited to market requirements and consumer tastes and expectations, in particular with regard to product quality and protection of the environment;
- Seeking ways of restricting the use of plant-health products and other inputs and ensuring product quality and soil and water conservation;
- Developing methods and instruments for improving product quality at all stages of production and marketing;
- Exploiting the potential of organic farming and protecting and promoting such farming as well as designations of origin, quality labels and geographical indications;
- Promoting integrated production or other environmentally sound production methods;
With regard to the fruit and vegetable sector, laying down rules, as regards the following production and marketing rules, which are stricter than EU or national rules:
Production rules
- choice of seed to be used according to intended destination (fresh market/industrial processing);
- thinning in orchards.
Marketing rules
- specified dates for commencement of cropping, staggering of marketing; - minimum quality and size requirements; - preparation, presentation, packaging and marking at first marketing stage; - indication of product origin.
As regards competition rules applicable to IPOs, given the Article 176 of Single CMO Regulation relating to the exemptions, in absence of any specific derogation contained in other provisions of such a legal framework, Article 101 TFEU applies to IPOs. Consequently,

The EU Fruit and Vegetable Sector: Overview and Post 2013 CAP Perspective _____________________________________________________________________________________________
PE 460.043 73
the agreements or concerted practices taken by an IPO would have to be analysed under Article 101(1) and any possible efficiency enhancing effects under 101(3).
In this respect it is interesting to recall the European Courts’ conclusion, following the case law on the application of Article 81(3): an agreement that would have a horizontal and vertical dimension bringing together operators at various steps of the supply chain, having an effect on inter-State trade, and leading to a price fixing agreement deprived of any efficiencies would be prohibited. Such an agreement would be regarded as a hardcore restriction of competition and would not likely benefit from an exception under Article 101(3) (European Commission, 2010a). Furthermore, the European Courts ruled that ensuring a fair standard of living for the agricultural community is not sufficient to justify a price fixing agreement and that fixing minimum prices cannot be regarded as neutral in relation to the objective of Article 39 that supplies reach consumers at reasonable prices.
For the F&V sector there is an explicit provision in Article 176a of the single CMO exempting agreements and practices of IPOs carrying out these activities from Article 101(1) TFEU provided that: they are notified to the Commission, and that the Commission does not find them incompatible with Community rules. Certain anti-competitive agreements and practices are explicitly declared incompatible, namely those which may lead to the partitioning of markets, affect the sound operation of the market organisation, create distortions of competition, entail the fixing of prices or create discrimination or eliminate competition in respect of a substantial proportion of the products in question.
Relating to the IPOs an important focus of attention regards the so-called extension of rules. The rules for which extension to other operators may be requested shall have one of the following aims:
a) production and market reporting; b) stricter production rules than those laid down in Community or national rules; c) drawing up of standard contracts which are compatible with Community rules; d) rules on marketing; e) rules on protecting the environment; f) measures to promote and exploit the potential of products; g) measures to protect organic farming as well as designations of origin, quality labels
and geographical indications.
Such rules shall have been in force for at least one marketing year, may be made binding for no more than three marketing years, and shall not cause any damage to other operators in the Member State concerned or the Community.
Furthermore, the Member State which has granted recognition to the IPO may decide that individuals or groups which are not members of the IPO but which benefit from those activities shall pay the organisation all or part of the financial contributions paid by its members to the extent that such contributions are intended to cover costs directly incurred as a result of pursuing the activities in question (the so-called "financial contribution of non-members principle").