Two-Dimensional Real-Space Analysis of Optical Excitations in Acceptor-Substituted Carotenoids

2009;18:1730-1739. Published online June 8, 2009.Cancer Epidemiol Biomarkers Prev Jung Eun Lee, Satu Männistö, Donna Spiegelman, et al. Cancer Risk: A Pooled Analysis of 13 Prospective StudiesIntakes of Fruit, Vegetables, and Carotenoids and Renal Cell
Updated Version 10.1158/1055-9965.EPI-09-0045doi:
Access the most recent version of this article at:
Cited Articles http://cebp.aacrjournals.org/content/18/6/1730.full.html#ref-list-1
This article cites 50 articles, 13 of which you can access for free at:
Citing Articles http://cebp.aacrjournals.org/content/18/6/1730.full.html#related-urls
This article has been cited by 2 HighWire-hosted articles. Access the articles at:
E-mail alerts related to this article or journal.Sign up to receive free email-alerts
SubscriptionsReprints and
[email protected] Department atTo order reprints of this article or to subscribe to the journal, contact the AACR
To request permission to re-use all or part of this article, contact the AACR Publications
American Association for Cancer Research Copyright © 2009 on May 10, 2011cebp.aacrjournals.orgDownloaded from
DOI:10.1158/1055-9965.EPI-09-0045

Intakes of Fruit, Vegetables, and Carotenoids and Renal CellCancer Risk: A Pooled Analysis of 13 Prospective Studies
Jung Eun Lee,1 Satu Männistö,6 Donna Spiegelman,3,5 David J. Hunter,1,3,4 Leslie Bernstein,7
Piet A. van den Brandt,8 Julie E. Buring,2,3 Eunyoung Cho,1,4 Dallas R. English,9 Andrew Flood,10
Jo L. Freudenheim,12 Graham G. Giles,9 Edward Giovannucci,1,3,4 Niclas Håkansson,14
Pamela L. Horn-Ross,15 Eric J. Jacobs,16 Michael F. Leitzmann,17 James R. Marshall,13
Marjorie L. McCullough,16 Anthony B. Miller,18 Thomas E. Rohan,19 Julie A. Ross,11
Arthur Schatzkin,20 Leo J. Schouten,8 Jarmo Virtamo,6 Alicja Wolk,14 Shumin M. Zhang,2
and Stephanie A. Smith-Warner3,4
1Channing Laboratory, and 2Division of Preventive Medicine, Department of Medicine, Brigham and Women's Hospital and Harvard MedicalSchool; 3Departments of Epidemiology, 4Nutrition, and 5Biostatistics, Harvard School of Public Health, Boston, Massachusetts; 6National Institute forHealth and Welfare, Helsinki, Finland; 7City of Hope Comprehensive Cancer Center and Beckman Research Institute, City of Hope NationalMedical Center, Duarte, California; 8Department of Epidemiology, GROW-School for Oncology and Developmental Biology, University Maastricht,Maastricht, the Netherlands; 9Cancer Epidemiology Centre, The Cancer Council Victoria, Melbourne, Australia; 10Division of Epidemiology andCommunity Health, School of Public Health, and 11Division of Epidemiology and Clinical Research, Department of Pediatrics, University ofMinnesota, Minneapolis, Minnesota; 12Department of Social and Preventive Medicine, University at Buffalo, State University of New York; 13RoswellPark Cancer Institute, Buffalo, New York; 14Division of Nutritional Epidemiology, National Institute of Environmental Medicine, KarolinskaInstitute, Stockholm, Sweden; 15Northern California Cancer Center, Fremont, California; 16Epidemiology and Surveillance Research, AmericanCancer Society, Atlanta, Georgia; 17Institute of Epidemiology and Preventive Medicine, University of Regensburg, Regensburg, Germany; 18DallaLana School of Public Health, University of Toronto, Toronto, Ontario, Canada; 19Department of Epidemiology and Population Health, AlbertEinstein College of Medicine, Bronx, New York; and 20Division of Cancer Epidemiology and Genetics, National Cancer Institute, NIH, Departmentof Health and Health Services, Bethesda, Maryland
Abstract
Fruit and vegetable consumption has been hypothe-sized to reduce the risk of renal cell cancer. We con-ducted a pooled analysis of 13 prospective studies,including 1,478 incident cases of renal cell cancer (709women and 769 men) among 530,469 women and244,483 men followed for up to 7 to 20 years. Partici-pants completed a validated food-frequency question-naire at baseline. Using the primary data from eachstudy, the study-specific relative risks (RR) were calcu-lated using the Cox proportional hazards model andthen pooled using a random effects model. We foundthat fruit and vegetable consumption was associatedwith a reduced risk of renal cell cancer. Compared with<200 g/d of fruit and vegetable intake, the pooled mul-tivariate RR for ≥600 g/d was 0.68 [95% confidence
interval (95% CI) = 0.54-0.87; P for between-studies het-erogeneity = 0.86; P for trend = 0.001]. Compared with<100 g/d, the pooled multivariate RRs (95% CI) for ≥400g/d were 0.79 (0.63-0.99; P for trend = 0.03) for total fruitand 0.72 (0.48-1.08; P for trend = 0.07) for total vegeta-bles. For specific carotenoids, the pooled multivariateRRs (95% CIs) comparing the highest and lowest quin-tiles were 0.87 (0.73-1.03) for α-carotene, 0.82 (0.69-0.98)for β-carotene, 0.86 (0.73-1.01) for β-cryptoxanthin, 0.82(0.64-1.06) for lutein/zeaxanthin, and 1.13 (0.95-1.34) forlycopene. In conclusion, increasing fruit and vegetableconsumption is associated with decreasing risk of renalcell cancer; carotenoids present in fruit and vegetablesmay partly contribute to this protection. (Cancer Epide-miol Biomarkers Prev 2009;18(6):1730–9)
Introduction
Fruit and vegetable intakes have long been studied fortheir potential roles in reducing cancer risk. An interna-tional review panel sponsored by the World Cancer Re-search Fund concluded that the evidence thatconsuming fruit and vegetables may reduce the riskof renal cell cancer was limited (1). Few epidemiologicstudies have examined associations between renal cell
cancer and nutrients abundant in fruit and vegetablessuch as dietary fiber (2), individual carotenoids (3-8),and flavonoids (8-10).
To further evaluate whether intakes of fruit and vege-tables and specific carotenoids are associated with renalcell cancer risk, we examined these associations in apooled analysis of 13 prospective studies. This pooledanalysis included eight prospective studies that had notpreviously reported associations for renal cell cancerand five (8, 11-13) prospective studies that had previouslyexamined the association between fruit and vegetableconsumption and renal cell cancer risk.
Materials and Methods
Study Population. The Pooling Project of ProspectiveStudies of Diet and Cancer (referred to as the Pooling
Received 1/15/09; revised 3/11/09; accepted 3/18/09; published online 6/8/2009.Grant support: The Pooling Project is supported by National Cancer Institute grantCA55075. The content is solely the responsibility of the authors and does notnecessarily represent the official views of the National Cancer Institute or the NIH.Requests for reprints: Jung Eun Lee, Channing Laboratory, Brigham and Women'sHospital and Harvard Medical School, 181 Longwood Avenue, Boston, MA 02115.Phone: 617-525-2042; Fax: 617-525-2008. E-mail: [email protected] © 2009 American Association for Cancer Research.doi:10.1158/1055-9965.EPI-09-0045
Cancer Epidemiol Biomarkers Prev 2009;18(6). June 2009
1730
American Association for Cancer Research Copyright © 2009 on May 10, 2011cebp.aacrjournals.orgDownloaded from
DOI:10.1158/1055-9965.EPI-09-0045

Project) has been described elsewhere (14). For the renalcell cancer analyses, the study inclusion criteria were asfollows: at least one publication on a diet and cancer as-sociation, identification of at least 25 incident renal cellcancer cases, assessment of long-term dietary intake,and validation of the dietary assessment method or aclosely related instrument (14). Studies including bothmen and women were treated as two separate cohorts(one of men and one of women) and the inclusion criteriawere applied to each sex-specific cohort. When we ana-lyzed β-carotene intake, we included only participantsin the placebo group of the Alpha-Tocopherol, Beta-Carotene Cancer Prevention Study (15) and participantswho did not receive β-carotene supplements in the Wo-men's Health Study (16). Each of the 13 studies includedhere was reviewed and approved by the institutional re-view board of the institution at which the study wasconducted.
Case Ascertainment. Cases were ascertained byfollow-up questionnaires and subsequent review of med-ical records (13, 16), linkage to cancer registries (8, 11, 12,17-20), or both (15, 21, 22). Some studies also used linkageto mortality registries (8, 11, 13, 15-19, 21, 22). We definedrenal cell cancer cases as those with histologically con-firmed renal cell cancer (ICD-O-2 code = C64.9; ICD-9 =189.0) using histologic codes based on the InternationalClassification of Diseases for Oncology (23), InternationalClassification of Diseases (24), or the morphologic classi-fication provided by the study investigators.
Assessment of Dietary Intake. Each study assessedbaseline dietary intake using a validated food-frequencyquestionnaire (FFQ) or diet history. Each study providedbaseline fruit and vegetable intake data as either gramsper day or the number of servings per day (intake wasconverted to grams per day based on the frequency re-ported and study-specific serving sizes). We examinedthe associations between total fruit (fruits and fruit juice),total vegetables (vegetables and vegetable juice), and totalfruit and vegetables combined and renal cell cancer risk.We excluded mature beans and potatoes from the vegeta-ble group because of their high protein content and highstarch content, respectively (25). We also examined asso-ciations for botanically defined fruit and vegetable groups(26). Individual fruits and vegetables were examined ifmore than half the studies assessed them as separate fooditems. Daily consumption of the major carotenoids andother nutrients was calculated by each study using foodcomposition databases specific to its population. Intakesof each carotenoid and other nutrients were adjusted fortotal energy intake using the residual method (27).
Each study in this analysis conducted a validationstudy of their diet assessment method or a closely relatedinstrument (14). However, the validity of fruit and vege-table consumption was assessed only in the Alpha-Tocopherol Beta-Carotene Cancer Prevention Study [cor-relation coefficients (r) of 0.69 for total fruits and 0.58 fortotal vegetables; ref. 28], the Cancer Prevention Study IINutrition Cohort (r = 0.62-0.75 for total fruits/fruit juiceand r = 0.52-0.62 for total vegetables; ref. 29), Health Pro-fessionals Follow-up Study (r = 0.71 for total fruits and r =0.19 for total vegetables; ref. 30), and the NetherlandsCohort Study (r = 0.60 for total fruits and r = 0.38 for totalvegetables; ref. 31). In the Nurses' Health study (32), theaverage correlation coefficients comparing intakes esti-
mated from the FFQ versus multiple 7-d diet records were0.8 for intakes of individual fruits and 0.5 for intakes ofindividual vegetables. The validation results for caroteneor β-carotene were reported in only a few of the valida-tion studies (29, 33, 34).
Assessment of Nondietary Factors. Age, height,weight, and, among women, parity and age at first birth,were collected using self-administered questionnaires atbaseline by all studies; body mass index [BMI, weight(kg)/height (m2)] was calculated from height and weight.Most studies assessed information on smoking habits (12studies) and history of hypertension (9 studies). When weexcluded data from the one study that did not collect in-formation on smoking habits, the results were similar (da-ta not shown).
Statistical Analysis. After applying the exclusion crite-ria that were specified by each study, we further excludedparticipants if they consumed an implausible energyintake (beyond 3 SD from the study-specific loge-trans-formed mean energy intake) or had a history of cancer (ex-cluding nonmelanoma skin cancer) at baseline. Each studywas analyzed using the Cox proportional hazards model(35). Person-years of follow-up time were calculated fromthe date of the baseline questionnaire until the date of renalcell cancer diagnosis, death, loss to follow-up (if applica-ble), or end of follow-up,whichever came first. Age at base-line and the year the baseline questionnaire was returnedwere used as stratification variables, thereby creating atime metric that simultaneously accounted for age, calen-dar time, and time since entry into the study.
In the multivariate analyses, we further adjusted forBMI (continuous), history of hypertension (yes/no),pack-years of smoking (continuous), total energy intake(continuous), alcohol intake (continuous), and, for wom-en, parity and age at first birth (age at first birth <25 y andparity of 1 or 2; age at first birth ≥25 y and parity of 1 or 2,or nulliparous; age at first birth <25 y and parity of ≥3;and age at first birth ≥25 y and parity of ≥3). For eachcovariate, an indicator variable was used for missing re-sponses, if needed, within each study.
For our primary analyses, we categorized fruit andvegetable intake using either study-specific quintiles oruniform absolute intake cutoff points across studies. Totest for trend, participants were assigned the median val-ue of their intake category, and this variable was enteredas a continuous term in the model, the coefficient forwhich was evaluated by the Wald test. We also conductedseparate analyses in which we modeled intakes usingcontinuous variables. After calculating study- and sex-specific relative risks (RR), we combined the loge RRs,weighted by the inverse of their variances, using a ran-dom effects model (36). We tested for heterogeneity be-tween studies using the Q statistic (36). Two-sided 95%confidence intervals (95% CI) were calculated.
To assess whether the association was linear, we exam-ined nonparametric regression curves using restricted cu-bic splines (37, 38). To test for nonlinearity, the model fit,including the linear and cubic spline terms selected by astepwise regression procedure, was compared with themodel fit with only the linear term using the likelihoodratio test and by visual inspection. For these analyses,all studies were combined into a single data set (the ag-gregated data set). To reduce the influence of extremevalues, individuals reporting extremely high intakes
Cancer Epidemiol Biomarkers Prev 2009;18(6). June 2009
1731Cancer Epidemiology & Biomarkers Prevention
American Association for Cancer Research Copyright © 2009 on May 10, 2011cebp.aacrjournals.orgDownloaded from
DOI:10.1158/1055-9965.EPI-09-0045
(top 1% of participants in each study) were excluded fromthe spline analysis.
We examined whether associations varied by sex, me-dian age at diagnosis (<68, ≥68 y), and smoking status(never, past, current smoker) using a mixed-effectsmeta-regression model (14, 39). To evaluate whetherBMI (<25, ≥25 kg/m2), history of hypertension (yes,no), alcohol intake (nondrinkers, drinkers), and multivita-min use (user, nonuser) modified the associations, weused a Wald test based on the pooled cross-product termas a continuous variable of the main exposure, with themodifier variable modeled as a dichotomous variable.
All statistical tests were two-sided, and P < 0.05 wasconsidered statistically significant.
Results
During follow-up of 530,469 women and 244,483 men forperiods of 7 to 20 years across studies, 1,478 incident
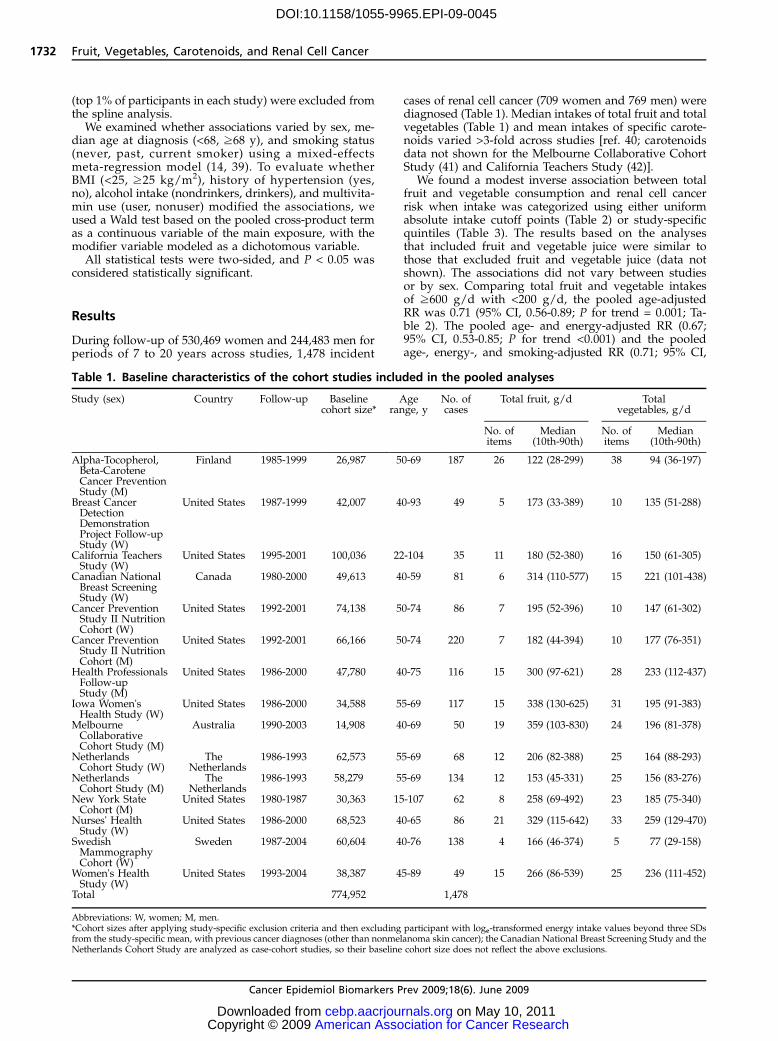
cases of renal cell cancer (709 women and 769 men) werediagnosed (Table 1). Median intakes of total fruit and totalvegetables (Table 1) and mean intakes of specific carote-noids varied >3-fold across studies [ref. 40; carotenoidsdata not shown for the Melbourne Collaborative CohortStudy (41) and California Teachers Study (42)].
We found a modest inverse association between totalfruit and vegetable consumption and renal cell cancerrisk when intake was categorized using either uniformabsolute intake cutoff points (Table 2) or study-specificquintiles (Table 3). The results based on the analysesthat included fruit and vegetable juice were similar tothose that excluded fruit and vegetable juice (data notshown). The associations did not vary between studiesor by sex. Comparing total fruit and vegetable intakesof ≥600 g/d with <200 g/d, the pooled age-adjustedRR was 0.71 (95% CI, 0.56-0.89; P for trend = 0.001; Ta-ble 2). The pooled age- and energy-adjusted RR (0.67;95% CI, 0.53-0.85; P for trend <0.001) and the pooledage-, energy-, and smoking-adjusted RR (0.71; 95% CI,
Table 1. Baseline characteristics of the cohort studies included in the pooled analyses
Study (sex) Country Follow-up Baselinecohort size*
Agerange, y
No. ofcases
Total fruit, g/d Totalvegetables, g/d
No. ofitems
Median(10th-90th)
No. ofitems
Median(10th-90th)
Alpha-Tocopherol,Beta-CaroteneCancer PreventionStudy (M)
Finland 1985-1999 26,987 50-69 187 26 122 (28-299) 38 94 (36-197)
Breast CancerDetectionDemonstrationProject Follow-upStudy (W)
United States 1987-1999 42,007 40-93 49 5 173 (33-389) 10 135 (51-288)
California TeachersStudy (W)
United States 1995-2001 100,036 22-104 35 11 180 (52-380) 16 150 (61-305)
Canadian NationalBreast ScreeningStudy (W)
Canada 1980-2000 49,613 40-59 81 6 314 (110-577) 15 221 (101-438)
Cancer PreventionStudy II NutritionCohort (W)
United States 1992-2001 74,138 50-74 86 7 195 (52-396) 10 147 (61-302)
Cancer PreventionStudy II NutritionCohort (M)
United States 1992-2001 66,166 50-74 220 7 182 (44-394) 10 177 (76-351)
Health ProfessionalsFollow-upStudy (M)
United States 1986-2000 47,780 40-75 116 15 300 (97-621) 28 233 (112-437)
Iowa Women'sHealth Study (W)
United States 1986-2000 34,588 55-69 117 15 338 (130-625) 31 195 (91-383)
MelbourneCollaborativeCohort Study (M)
Australia 1990-2003 14,908 40-69 50 19 359 (103-830) 24 196 (81-378)
NetherlandsCohort Study (W)
TheNetherlands
1986-1993 62,573 55-69 68 12 206 (82-388) 25 164 (88-293)
NetherlandsCohort Study (M)
TheNetherlands
1986-1993 58,279 55-69 134 12 153 (45-331) 25 156 (83-276)
New York StateCohort (M)
United States 1980-1987 30,363 15-107 62 8 258 (69-492) 23 185 (75-340)
Nurses' HealthStudy (W)
United States 1986-2000 68,523 40-65 86 21 329 (115-642) 33 259 (129-470)
SwedishMammographyCohort (W)
Sweden 1987-2004 60,604 40-76 138 4 166 (46-374) 5 77 (29-158)
Women's HealthStudy (W)
United States 1993-2004 38,387 45-89 49 15 266 (86-539) 25 236 (111-452)
Total 774,952 1,478
Abbreviations: W, women; M, men.*Cohort sizes after applying study-specific exclusion criteria and then excluding participant with loge-transformed energy intake values beyond three SDsfrom the study-specific mean, with previous cancer diagnoses (other than nonmelanoma skin cancer); the Canadian National Breast Screening Study and theNetherlands Cohort Study are analyzed as case-cohort studies, so their baseline cohort size does not reflect the above exclusions.
Cancer Epidemiol Biomarkers Prev 2009;18(6). June 2009
1732 Fruit, Vegetables, Carotenoids, and Renal Cell Cancer
American Association for Cancer Research Copyright © 2009 on May 10, 2011cebp.aacrjournals.orgDownloaded from
DOI:10.1158/1055-9965.EPI-09-0045

Table 3. Pooled RRs and 95% CIs of renal cell cancer associated with quintiles of intakes of fruit and vegetables
Quintile 1 Quintile 2 Quintile 3 Quintile 4 Quintile 5 P for trend P for between-studiesheterogeneity*
P for between-studiesheterogeneity due to sex*
Total fruits and vegetablesAge adjusted 1.00 0.92 (0.75-1.11) 0.92 (0.76-1.10) 0.84 (0.70-1.00) 0.78 (0.66-0.92) 0.005 0.66 0.62Multivariate† 1.00 0.92 (0.76-1.13) 0.93 (0.77-1.11) 0.84 (0.69-1.02) 0.76 (0.64-0.91) 0.002 0.65 0.38
Total fruitsAge adjusted 1.00 0.92 (0.79-1.08) 0.94 (0.80-1.10) 0.85 (0.72-1.00) 0.79 (0.67-0.93) 0.01 0.91 0.93Multivariate† 1.00 0.94 (0.80-1.10) 0.96 (0.82-1.13) 0.87 (0.73-1.02) 0.80 (0.67-0.95) 0.01 0.86 0.90
Total vegetablesAge adjusted 1.00 0.91 (0.76-1.09) 0.89 (0.73-1.08) 0.92 (0.79-1.09) 0.88 (0.71-1.09) 0.24 0.08 0.40Multivariate† 1.00 0.93 (0.77-1.12) 0.90 (0.74-1.10) 0.94 (0.80-1.11) 0.87 (0.69-1.08) 0.13 0.09 0.53
*For the highest category.†Multivariable models were adjusted for history of hypertension (yes/no), BMI (continuous), pack-years of smoking (continuous), combination of parity and age at first birth (age at first birth <25 and parity of 1 or2; age at first birth ≥25 y and parity of 1 or 2, or nulliparous; age at first birth <25 y and parity of ≥3; and age at first birth ≥25 y and parity of ≥3), alcohol intake (continuous), and total energy intake (continuous).Age and year of questionnaire return were adjusted as stratification variables.
Table 2. Pooled RRs and 95% CIs of renal cell cancer associated with categories of intakes of fruit and vegetables
Intake (g/d) P for trend P for between-studies
heterogeneity*
P for between-studies
heterogeneitydue to sex*
Total fruit and vegetables <200 200-<300 300-<400 400-<500 500-<600 ≥600No. of cases (W, M) (124, 162) (114, 141) (112, 157) (101, 112) (80, 82) (178, 115)Age adjusted 1.00 0.82 (0.69-0.98) 0.88 (0.73-1.05) 0.78 (0.63-0.96) 0.83 (0.65-1.05) 0.71 (0.56-0.89) 0.001 0.85 0.90Multivariate† 1.00 0.83 (0.70-1.00) 0.90 (0.74-1.09) 0.79 (0.64-0.98) 0.83 (0.65-1.06) 0.68 (0.54-0.87) 0.001 0.86 0.97
Total fruit <100 100-<200 200-<300 300-<400 ≥400No. of cases (W, M) (130, 208) (173, 223) (155, 150) (109, 90) (142, 98)Age adjusted 1.00 0.88 (0.76-1.02) 0.84 (0.71-0.99) 0.82 (0.67-1.01) 0.80 (0.64-0.99) 0.02 0.96 0.87Multivariate† 1.00 0.90 (0.77-1.04) 0.87 (0.73-1.03) 0.83 (0.68-1.02) 0.79 (0.63-0.99) 0.03 0.95 0.78
Total vegetables <100 100-<200 200-<300 300-<400‡ ≥400‡,§No. of cases (W, M) (189, 203) (256, 305) (143, 171) (73, 55) (46, 35)Age adjusted 1.00 0.91 (0.77-1.07) 0.81 (0.68-0.97) 0.79 (0.61-1.04) 0.78 (0.53-1.15) 0.15 0.12 0.75Multivariate † 1.00 0.93 (0.78-1.10) 0.82 (0.68-0.98) 0.76 (0.57-1.02) 0.72 (0.48-1.08) 0.07 0.12 0.58
*For the highest category.†Multivariable models were adjusted for history of hypertension (yes/no), BMI (continuous), pack-years of smoking (continuous), combination of parity and age at first birth (age at first birth <25 and parity of 1 or2; age at first birth ≥25 y and parity of 1 or 2, or nulliparous; age at first birth <25 y and parity of ≥3; and age at first birth ≥25 y and parity of ≥3), alcohol intake (continuous), and total energy intake (continuous).Age and year of questionnaire return were adjusted as stratification variables.‡The Netherlands Cohort Study-women did not include any cases with ≥300 g/d of total vegetable intake. The participants in this category in these studies were included in the next highest category.§The Alpha-Tocopherol, Beta-Carotene Cancer Prevention Study and the Swedish Mammography Cohort did not include any cases with ≥400 g/d of total vegetable intake. The participants in the highestcategories in these studies were included in the next highest category.
Can
cerEp
idem
iolBiomarkers
Prev2009;18(6).
June2009
1733Can
cerEp
idem
iology&
Biomarkers
Preventio
n
American Association for Cancer Research Copyright © 2009 on May 10, 2011cebp.aacrjournals.orgDownloaded from
DOI:10.1158/1055-9965.EPI-09-0045

0.56-0.90; P for trend = 0.003) were similar. The RRs didnot change substantially after further adjustment forother renal cell cancer risk factors (Table 2). When weadditionally adjusted for total fat and protein intake,the results did not appreciably change (data notshown). We conducted additional analyses to evaluatethe effect of controlling for smoking habits using differ-ent parameterizations. The results (data not shown)were similar when we controlled for smoking habitsusing (a) smoking status only (never, past, current),and (b) smoking status, smoking duration among pastsmokers (<30, ≥30 years), and smoking dose amongcurrent smokers (<15, 15-<25, ≥25 cigarettes/d) to re-place the categorization we used for the main multivar-iate models.
Total fruit intake and total vegetable intake were eachassociated with a 21% to 28% lower risk of renal cellcancer, comparing intakes of ≥400 g/d with <100 g/d(Table 2). The pooled multivariate RRs (95% CIs) were0.81 (0.64-1.02) for total fruit intake of ≥400 g/d com-pared with <100 g/d when we additionally adjustedfor total vegetable intake (continuous), and 0.75 (0.49-1.14) for total vegetable intake of ≥400 g/d comparedwith <100 g/d when we additionally adjusted for totalfruit intake (continuous). We still found an inverse asso-ciation for total fruit and vegetable consumption whenwe categorized participants into quintiles; the pooledmultivariate RR (95% CI) was 0.76 (0.64-0.91; P for trend
= 0.002) comparing the highest and lowest quintiles. Theresult for total fruit intake in the quintile analyses wassimilar to that observed in the absolute cutoff point anal-yses (Table 3). Although we observed a weaker associa-tion for total vegetables in the quintile analysescompared with that from the absolute cutoff point anal-yses, the results for total vegetables in the absolute cutoffpoints analyses were similar to those reported using awider contrast in total vegetable intake by comparingthe highest and lowest deciles (pooled multivariate RR,0.72; 95% CI, 0.54-0.95).
To avoid a potential influence of preclinical symptomson diet, we conducted analyses in which cases diag-nosed during the first 4 years of follow-up were exclud-ed (444 cases were excluded). The results (data notshown) were similar to those observed when all caseswere included.
The nonparametric regression curves and formal testsof nonlinearity showed that the relations between intakesof total fruit and vegetables, total fruit, and total vegeta-bles and renal cell cancer risk were consistent with linearassociations (P for curvature >0.05, for each group). Whenintake was modeled as a continuous variable and after ex-cluding participants reporting extremely high intakes (top1% of participants in each study), the pooled multivariateRRs (95% CIs) for an increment of intake (1 SD) were 0.88(0.82-0.95; Fig. 1) for a 280 g/d increment of total fruit andvegetables, 0.89 (0.82-0.95) for a 200 g/d increment of to-tal fruit, and 0.95 (0.87-1.03) for a 130 g/d increment oftotal vegetables.
We examined fruit and vegetable groups based on bo-tanical taxonomy (26). The pooled multivariate RRs (95%CIs; per 1 SD) for an increment of intake were 0.94 (0.89-1.00; 30 g/d) for Compositae (e.g., lettuce, endive), 0.97(0.91-1.03; 30 g/d) for Cruciferae (e.g., broccoli, cabbage),1.03 (0.98-1.09; 40 g/d) for Cucurbitaceae (e.g., melons,squash), 1.01 (0.94-1.09; 30 g/d) for Leguminosae(e.g., beans, peas), 0.98 (0.93-1.04; 80 g/d) for Rosaceae(e.g., apples, peaches), 0.97 (0.92-1.03; 120 g/d) for Ruta-ceae (e.g., grapefruits, oranges), 1.01 (0.92-1.11; 90 g/d)for Solanaceae (e.g., potatoes, tomatoes), and 0.95 (0.90-1.01; 20 g/d) for Umbelliferae (e.g., carrots, celery). Be-cause of a previous report of an inverse association(43), we also examined the association for root vegetableintake (carrots and beets). The pooled multivariate RR inour study was 0.94 (0.89-0.99) for a 20 g/d increment inroot vegetable intake.
We further examined associations with 7 specific fruitsand 11 specific vegetables. We found statistically signifi-cant inverse associations for broccoli and carrots(Table 4). The pooled multivariate RRs (95% CIs; per1/2 cup) were 0.60 (0.41-0.89) for a 78 g/d incrementof broccoli and 0.82 (0.68-0.99) for a 57 g/d incrementof carrots.
The associations between intakes of total fruit andvegetables, total fruit, and total vegetables and renalcell cancer risk were not modified by BMI, smoking ha-bits, and history of hypertension (Table 5). Age at diag-nosis, alcohol intake, or multivitamin use did notmodify the associations (P for interaction >0.2; datanot shown).
For the specific carotenoids evaluated, we observed a18% lower risk of renal cell cancer comparing the highestand lowest quintiles of β-carotene intake (Table 6). Similarbut nonsignificant inverse associations were observed for
Figure 1. Study-specific and pooled multivariate RRs and95% CIs of renal cell cancer for a 280 g/d increment of totalfruit and vegetable intake. The RRs were adjusted for the samecovariates listed in Table 2. Black squares, study-specific RRs;horizontal lines, 95% CIs. The area of the black squares reflectsthe study-specific weights (inverse of the variance). The dashedline represents the pooled RR and the diamond represents the95% CI for the pooled RR. CTS, California Teachers Study;BCDDP, Breast Cancer Detection Demonstration ProjectFollow-up Study; NLCS, Netherlands Cohort Study; CPS II,Cancer Prevention Study II Nutrition Cohort; NYS, New YorkState Cohort; WHS, Women's Health Study; SMC, SwedishMammography Cohort; ATBC, Alpha-Tocopherol, Beta-Caro-tene Cancer Prevention Study; CNBSS, Canadian NationalBreast Screening Study; MCCS, Melbourne Collaborative Co-hort Study; NHS, Nurses' Health Study; HPFS, Health Profes-sionals Follow-up Study; IWHS, Iowa Women's Health Study;M, men; W, women.
Cancer Epidemiol Biomarkers Prev 2009;18(6). June 2009
1734 Fruit, Vegetables, Carotenoids, and Renal Cell Cancer
American Association for Cancer Research Copyright © 2009 on May 10, 2011cebp.aacrjournals.orgDownloaded from
DOI:10.1158/1055-9965.EPI-09-0045

Table 4. Pooled multivariable RRs and 95% CIs of renal cell cancer associated with intakes of individual fruits and vegetables
Food item (servings) No. ofstudies
No. ofcases
Reference Oneserving (g/d)
RR (95% CI) for anincrement of 1 serving/d
P for between-studies
heterogeneity*
P for between-studiesheterogeneitydue to sex*
Women Men Both
FruitsApples, pears, applesauce 13 1,467 1 or 1/2 cup 138 0.88 (0.74-1.05) 0.98 (0.83-1.16) 0.93 (0.83-1.05) 0.93 0.39Bananas†,‡ 11 1,102 1 114 0.84 (0.65-1.08) 0.89 (0.66-1.20) 0.87 (0.72-1.04) 0.64 0.70Cantaloupe§,∥,¶,**,†† 8 796 1/4 melon 134 1.41 (0.82-2.43) 0.98 (0.35-2.77) 1.31 (0.81-2.11) 0.81 0.54Grapefruit§,∥,†† 10 1,062 1/2 fruit 120 0.96 (0.77-1.18) 0.74 (0.54-1.02) 0.88 (0.74-1.05) 0.82 0.20Oranges§,∥,†† 10 1,058 1 131 0.99 (0.75-1.30) 0.85 (0.68-1.07) 0.91 (0.76-1.08) 0.92 0.41Peaches, apricots, plums†,‡,§,¶,†† 8 587 1 or 1/2 cup 87 1.18 (0.93-1.50) 0.79 (0.52-1.19) 1.07 (0.87-1.31) 0.53 0.10Strawberries†,‡,∥,**,†† 8 830 1/2 cup 75 1.13 (0.68-1.88) 0.91 (0.51-1.61) 1.03 (0.70-1.50) 0.64 0.57
VegetablesBroccoli¶,†† 11 1,136 1/2 cup 78 0.70 (0.42-1.16) 0.37 (0.19-0.74) 0.60 (0.41-0.89) 0.27 0.08Brussels sprouts†,‡,††,‡‡,§§ 8 895 1/2 cup 78 0.75 (0.29-1.95) 0.94 (0.16-5.62) 0.97 (0.46-2.03) 0.66 0.40Cabbage∥, §§ 11 1,324 1/2 cup 68 1.02 (0.66-1.58) 1.35 (0.92-1.97) 1.20 (0.90-1.60) 0.90 0.35Carrots 13 1,468 1/2 cup 57 0.87 (0.69-1.11) 0.70 (0.47-1.03) 0.82 (0.68-0.99) 0.47 0.41Cauliflower†,‡,∥,††,‡‡ 8 863 1/2 cup 62 0.68 (0.31-1.48) 0.98 (0.47-2.03) 0.87 (0.51-1.46) 0.21 0.32Lettuce, salad 13 1,469 1 cup 56 0.85 (0.72-1.01) 0.92 (0.78-1.09) 0.89 (0.79-1.00) 0.85 0.51Peas, lima beans†,‡,¶,††,§§ 8 730 1/2 cup 80 1.56 (0.66-3.69) 0.49 (0.20-1.18) 1.04 (0.52-2.09) 0.05 0.04String beans†,‡,**,††,§§ 8 870 1/2 cup 68 1.30 (0.89-1.88) 0.45 (0.04-4.66) 1.19 (0.73-1.92) 0.07 0.87Spinach§§ 12 1,409 1/2 cup 73 0.78 (0.51-1.20) 0.82 (0.29-2.31) 0.84 (0.57-1.23) 0.39 0.60Tomatoes 13 1,467 1 122 1.18 (0.96-1.46) 1.06 (0.70-1.60) 1.12 (0.92-1.37) 0.27 0.48Yams§,∥,¶,**,††,§§ 7 752 1/2 cup 128 0.51 (0.11-2.40) 0.71 (0.16-3.16) 0.60 (0.21-1.78) 0.72 0.75Mature beans and lentils§ 12 1,286 1/2 cup 131 0.93 (0.45-1.93) 0.88 (0.49-1.57) 0.93 (0.59-1.47) 0.16 0.55Potatoes 13 1,477 1 202 1.13 (0.83-1.53) 0.83 (0.53-1.29) 0.98 (0.75-1.27) 0.03 0.20
NOTE: Individual fruits and vegetables were not presented if more than 7 studies did not assess them. One serving size is based on Pennington et al. (27). Because apples, pears, and applesauce; oranges andtangerines; lettuce and salad; peas and lima beans; mature beans and lentils were asked on a single line on the FFQ in some studies, these foods were analyzed together.Multivariable models were adjusted for history of hypertension (yes/no), BMI (continuous), pack-years of smoking (continuous), combination of parity and age at first birth (age at first birth <25 and parity of 1 or2; age at first birth ≥25 y and parity of 1 or 2, or nulliparous; age at first birth <25 y and parity of ≥3; and age at first birth ≥25 y and parity of ≥3), alcohol intake (continuous), and total energy intake (continuous).Age and year of questionnaire return were adjusted as stratification variables.*For the highest category.†The Breast Cancer Detection Demonstration Project was excluded.‡The Cancer Prevention Study II Nutrition Cohort was excluded.§The Alpha-Tocopherol, Beta-Carotene Cancer Prevention Study was excluded.∥The Canadian National Breast Screening Study was excluded. For cabbage and cauliflower, one question on consumption of cabbage and cauliflower was asked.¶The Netherlands Cohort Study was excluded.**The New York State Cohort Study was excluded.††The Swedish Mammography Cohort was excluded.‡‡The California Teachers Study was excluded because one question on consumption of cauliflower and brussels sprouts was asked.§§The Melbourne Collaborative Cohort Study was excluded. For cabbage and brussels sprouts, one question on consumption of cabbage and brussels sprouts was asked. For string beans and peas, one question onconsumption of green beans and peas was asked.
Can
cerEp
idem
iolBiomarkers
Prev2009;18(6).
June2009
1735Can
cerEp
idem
iology&
Biomarkers
Preventio
n
American Association for Cancer Research Copyright © 2009 on May 10, 2011cebp.aacrjournals.orgDownloaded from
DOI:10.1158/1055-9965.EPI-09-0045

α-carotene, β-cryptoxanthin, and lutein/zeaxanthin. Thepooled multivariate RRs (95% CIs) comparing the highestand lowest quintiles were 0.87 (0.73-1.03) for α-carotene,0.86 (0.73-1.01) for β-cryptoxanthin, and 0.82 (0.64-1.06)for lutein/zeaxanthin. No association was observed forlycopene intake (pooled multivariate RR, 1.13; 95% CI,0.95-1.34, comparing the highest and lowest quintiles).Nonparametric regression curves and formal tests of non-linearity showed that the relations between intakes ofeach carotenoid and renal cell cancer risk were consistentwith linear associations (P for curvature >0.05). When in-take was modeled as a continuous variable, the pooledmultivariate RRs (95% CIs; per 1 SD) for an incrementof intake were 0.93 (0.88-0.99; 660 μg/d) for α-carotene,0.91 (0.85-0.97; 2,700 μg/d) for β-carotene, 0.99 (0.96-1.02; 100 μg/d) for β-cryptoxanthin, 0.91 (0.85-0.97;2,700 μg/d) for lutein/zeaxanthin, and 1.03 (0.98-1.09;5,400 μg/d) for lycopene.
The associations for each carotenoid were not modifiedby BMI, history of hypertension, age at diagnosis, alcoholintake, or multivitamin use (P for interaction >0.08; datanot shown). The association for α-carotene was modifiedby smoking habits; the pooled multivariate RRs (95% CIs)for a 660 μg/d increment of α-carotene were 0.89 (0.79-1.00) for never smokers, 0.94 (0.81-1.10) for past smokers,and 1.06 (0.94-1.21) for current smokers (P for interaction =0.02). Smoking habits did not modify the associations forthe other carotenoids evaluated (P for interaction >0.05;data not shown).
Discussion
In our pooled analysis of 1,478 renal cell cancer casesfrom 13 prospective studies, we found that fruit andvegetable consumption was inversely associated withrenal cell cancer risk. There was no statistically signifi-cant heterogeneity between studies or by sex in the as-sociations for intakes of total fruit, total vegetables, ortotal fruit and vegetables. Among specific fruit and veg-etable groups and individual fruits and vegetables, sta-
tistically significant inverse associations were observedonly for intakes of root vegetables, broccoli, and carrots(the primary contributor to intake of root vegetables).The inverse association for root vegetable intake ob-served in a previous prospective study (43) suggeststhat the inverse association for carrots in our studymay not be a chance finding. Intakes of α-carotene, β-carotene, and lutein/zeaxanthin were each associatedwith a lower risk of renal cell cancer. Intakes of β-cryp-toxanthin and lycopene were not significantly associatedwith renal cell cancer risk.
Although the results for fruits and vegetables fromcase-control studies of renal cell cancer have been incon-sistent (3-5, 44-50), the largest case-control studies (eachincluded >500 renal cell cancer cases) have shown moreconsistent inverse associations for total fruit (5), total ve-getables (5, 49, 50), and subgroups of vegetables (3, 4, 50).Two prospective studies [refs. 43, 51; the Adventist HealthStudy and the European Prospective Investigation intoCancer and Nutrition (EPIC)] were not included in ouranalysis because the former did not meet our inclusioncriteria of having at least 25 cases of renal cell cancerand the latter is ongoing concurrently with ours. In theEPIC study of 306 renal cell cancer cases identified duringan average of 6.2 years of follow-up, the multivariate RRs(95% CIs) were 1.02 (0.93-1.11) for an 80 g/d increment oftotal fruit and vegetables, 1.03 (0.97-1.08) for a 40 g/d in-crement of total fruit, and 0.97 (0.85-1.11) for a 40 g/d in-crement of total vegetables (43). For comparison, usingthe same increments as the EPIC study, our pooled mul-tivariate RRs (95% CIs) were 0.97 (0.94-0.99) for total fruitand vegetables, 0.98 (0.96-0.99) for total fruit, and 0.98(0.96-1.01) for total vegetables. Differences in the typesof fruit commonly consumed by the study populations,measurement error structure in intake, the length offollow-up, and/or the number of cases in these studiesmay have contributed to the different findings observedby the two studies for total fruit intake and total fruitand vegetable intake.
Several components of fruit and vegetables may playa role in the prevention of renal cell cancer. Carotenoids
Table 5. Pooled multivariate RRs and 95% CIs of renal cell cancel for intakes of fruits and vegetables by otherfactors
Variable (no. of cases) Total fruits andvegetables
(per 280 g/d)
P for interaction Total Fruits(per 200 g/d)
P for interaction Totalvegetables
(per 130 g/d)
P for interaction
BMI (kg/m2)<25 (n = 548) 0.87 (0.77-0.98) 0.60 0.88 (0.78-0.99) 0.55 0.94 (0.84-1.05) 0.95≥25 (n = 898) 0.91 (0.83-1.00) 0.93 (0.85-1.01) 0.95 (0.87-1.03)
Smoking habitNever smokers*,† (n = 447) 0.86 (0.75-0.98) 0.69 0.83 (0.74-0.94) 0.14 0.91 (0.81-1.02) 0.34Past smokers*,† (n = 458) 0.91 (0.78-1.05) 0.95 (0.84-1.08) 0.92 (0.81-1.04)Current smokers† (n = 392) 0.93 (0.78-1.10) 0.94 (0.80-1.11) 1.06 (0.84-1.34)
History of hypertension‡No (n = 696) 0.87 (0.77-0.98) 0.23 0.90 (0.81-1.00) 0.45 0.90 (0.79-1.03) 0.13Yes (n = 434) 0.92 (0.81-1.05) 0.93 (0.82-1.05) 0.98 (0.87-1.09)
NOTE: Multivariable models were adjusted for history of hypertension (yes/no), BMI (continuous), pack-years of smoking (continuous), combination ofparity and age at first birth (age at first birth <25 and parity of 1 or 2; age at first birth ≥25 y and parity of 1 or 2, or nulliparous; age at first birth <25 y andparity of ≥3; and age at first birth ≥25 y and parity of ≥3), alcohol intake (continuous), and total energy intake (continuous). Age and year of questionnairereturn were adjusted as stratification variables.*The Alpha-Tocopherol, Beta-Carotene Cancer Prevention Study was excluded because participants were current smokers.†The Swedish Mammography Cohort was excluded because smoking status was not assessed.‡The Breast Cancer Detection Demonstration Project, the Canadian National Breast Screening Study, the New York State Cohort Study, and the SwedishMammography Cohort were excluded because history of hypertension was not assessed.
Cancer Epidemiol Biomarkers Prev 2009;18(6). June 2009
1736 Fruit, Vegetables, Carotenoids, and Renal Cell Cancer
American Association for Cancer Research Copyright © 2009 on May 10, 2011cebp.aacrjournals.orgDownloaded from
DOI:10.1158/1055-9965.EPI-09-0045

including α-carotene, β-carotene, and lutein/zeaxanthinare one group of compounds that could contribute to theinverse association observed for fruit and vegetable in-take. Carotenoids inhibit oxidative damage to DNA, mu-tagenesis, tumor growth, and malignant transformationand enhance cell-cell communication, thereby protectingcells against cancer (52). Evidence for specific carote-noids and renal cell cancer risk is limited. Of the fewcase-control studies that have reported associations forβ-carotene, all have found nonsignificant inverse asso-ciations (4-7). However, studies based on the earlier foodcomposition data measured multiple carotenoids in β-carotene equivalents (53), rather than β-carotene itself.Statistically significant inverse associations were ob-served for α-carotene, β-cryptoxanthin, and lutein by aU.S. case-control study (3), but not by an Italian case-control study (7). No association was observed for lyco-pene by these two studies (3, 7).
This pooled analysis has limitations. Because we usedonly baseline measures of food intake and other risk fac-tors for renal cell cancer, we could not investigate the ef-fects of changes in fruit, vegetable, and carotenoidconsumption, or in other variables during follow-up, orconsumption during earlier age periods or over the life-time. Because the FFQs were designed in their study-specific populations, there were differences in the dietaryassessment method across studies. To minimize the influ-ence of these differences, we modeled fruit and vegetableintake using study-specific quantiles. However, this ap-proach does not take into account true differences in in-takes across studies. Therefore, we also performedanalyses in which we categorized fruit and vegetable in-take using uniform absolute intake cutoff points. Regard-less of the approach used, the results were similar.Because most of studies did not assess intakes of fruitand vegetables in their validation studies, we were notable to correct the RRs for measurement error.
The inverse association that we observed is not likely tobe fully explained by residual or unmeasured confound-ing. Unmeasured but known risk factors for renal cell can-cer include family history of renal cell cancer andmedications such as phenacetin. For these variables tolead to strong confounding, they would need to be bothcommon and strongly associated with fruit and vegetableconsumption. However, the prevalence of these factorshas been reported to be low in populations (54-56) similarto those included in our study. In addition, we found noappreciable change in the associations after adjusting forvarious measured risk factors and a slightly stronger in-verse association among never smokers and participantswho did not have a history of hypertension. These sug-gest that residual confounding by risk factors such assmoking and hypertension does not explain the inverseassociation observed here.
Our analysis has several strengths. Because of the pro-spective design of the studies and high rates of follow-up(14), recall and selection bias do not account for our find-ings. In addition, this is the largest prospective study offruit and vegetable consumption and renal cell cancer todate. The large number of cases in our study allowed usto examine the wide range of fruit and vegetable con-sumption. Because we analyzed the primary data fromeach study, we were able to model the main exposuresand confounding factors uniformly across studies to re-move potential sources of heterogeneity.Ta
ble6.PooledRRsand95%CIsofrenalcellcancerforcarotenoidintakes
Quintile
1Quintile
2Quintile
3Quintile
4Quintile
5Pfortrend
Pforbetw
een-stud
ies
heterogene
ity*
Pforbetw
een-stud
ies
heterogene
itydue
tosex*
α-Caroten
eAge
adjusted
1.00
0.93
(0.79-1.09)
0.92
(0.78-1.08)
0.89
(0.75-1.04)
0.86
(0.73-1.01)
0.24
0.45
0.77
Multiva
riate†
1.00
0.92
(0.78-1.09)
0.93
(0.79-1.09)
0.89
(0.75-1.05)
0.87
(0.73-1.03)
0.30
0.44
0.79
β-Caroten
e‡Age
adjusted
1.00
0.91
(0.76-1.08)
0.94
(0.80-1.12)
0.83
(0.70-0.99)
0.82
(0.69-0.98)
0.01
0.72
0.95
Multiva
riate†
1.00
0.92
(0.77-1.09)
0.96
(0.81-1.14)
0.84
(0.70-1.00)
0.82
(0.69-0.98)
0.01
0.73
0.79
β-Cryptox
anthin
Age
adjusted
1.00
1.00
(0.86-1.18)
0.90
(0.77-1.06)
0.91
(0.77-1.07)
0.85
(0.72-1.00)
0.19
0.98
0.84
Multiva
riate†
1.00
1.02
(0.87-1.20)
0.94
(0.79-1.10)
0.93
(0.79-1.09)
0.86
(0.73-1.01)
0.18
0.97
0.63
Lutein/
zeaxan
thin
Age
adjusted
1.00
0.94
(0.75-1.18)
1.03
(0.87-1.21)
1.06
(0.89-1.26)
0.81
(0.63-1.05)
0.04
0.01
0.40
Multiva
riate†
1.00
0.96
(0.76-1.21)
1.06
(0.89-1.25)
1.09
(0.92-1.30)
0.82
(0.64-1.06)
0.04
0.02
0.50
Lycope
ne§
Age
adjusted
1.00
0.96
(0.82-1.14)
0.97
(0.79-1.19)
1.01
(0.86-1.20)
1.12
(0.95-1.32)
0.39
0.49
0.57
Multiva
riate†
1.00
0.98
(0.83-1.16)
0.99
(0.80-1.23)
1.03
(0.88-1.22)
1.13
(0.95-1.34)
0.40
0.37
0.56
*For
thehigh
estcatego
ry.
†Multiva
riab
lemod
elsweread
justed
forhistoryof
hype
rtension
(yes/no
),BMI(continuo
us),pa
ck-years
ofsm
oking(con
tinu
ous),com
bina
tion
ofpa
rity
andag
eat
firstb
irth
(age
atfirstb
irth
<25
andpa
rity
of1or
2;ag
eat
firstb
irth
≥25
yan
dpa
rity
of1or
2,or
nullipa
rous;age
atfirstb
irth
<25
yan
dpa
rity
of≥3;an
dag
eat
firstb
irth
≥25
yan
dpa
rity
of≥3),alcoh
olintake
(con
tinu
ous),and
totalenergyintake
(con
tinu
ous).
Age
andyear
ofqu
estion
nairereturn
weread
justed
asstratification
variab
les.
‡Weinclud
edon
lypa
rticipan
tsin
theplacebogrou
pof
theAlpha
-Tocop
herol,Beta-CaroteneCan
cerPrevention
Stud
yan
dpa
rticipan
tswho
did
notreceiveβ-carotenesupp
lementsin
theWom
en'sHealthStud
y.§ Inad
ditiona
lan
alysis,w
einclud
edon
lystud
iesthat
hadassessed
theconsum
ptionof
tomatosauce,
theprim
arysource
ofbioa
vaila
blelycope
ne(n
=758casesin
theBreastCan
cerDetection
Dem
onstration
Project,theCaliforniaTeachers
Stud
y,theCan
cerPrevention
Stud
yIINutrition
Coh
ort,HealthProfession
alsFo
llow-upStud
y,IowaWom
en'sHealthStud
y,Nurses'HealthStud
y,an
dWom
en'sHealthStud
y).W
efoun
daRRof
0.96
forthehigh
estqu
intile
versus
lowestqu
intile
(95%
CI,0.77-1.21;
Pfortrend=0.44).
Cancer Epidemiol Biomarkers Prev 2009;18(6). June 2009
1737Cancer Epidemiology & Biomarkers Prevention
American Association for Cancer Research Copyright © 2009 on May 10, 2011cebp.aacrjournals.orgDownloaded from
DOI:10.1158/1055-9965.EPI-09-0045

In conclusion, our results provide evidence that theintakes of fruit and vegetables are associated with areduction in renal cell cancer risk. Multiple bioactivecompounds, including carotenoids, may contribute to thisinverse association.
Disclosure of Potential Conflicts of InterestNo potential conflicts of interest were disclosed.
AcknowledgmentsThe costs of publication of this article were defrayed in part by thepayment of page charges. This article must therefore be herebymarked advertisement in accordance with 18 U.S.C. Section 1734solely to indicate this fact.
We thank Walter C. Willett, M.D., at Harvard School of PublicHealth for critical revision of the manuscript for important intel-lectual content, and Ruifeng Li, M.S., and Shiaw-Shyuan Yaun,M.S., at Harvard School of Public Health for assistance in datamanagement.
References1. World Cancer Research Fund, and American Institute for Cancer Re-
search. Food, nutrition, physical activity, and the prevention of cancer:a global perspective. Washington (DC): American Institute for CancerResearch; 2007.
2. Lindblad P, Wolk A, Bergstrom R, Adami HO. Diet and risk of renalcell cancer: a population-based case-control study. Cancer EpidemiolBiomarkers Prev 1997;6:215–23.
3. Yuan JM, Gago-Dominguez M, Castelao JE, Hankin JH, Ross RK, YuMC. Cruciferous vegetables in relation to renal cell carcinoma. Int JCancer 1998;77:211–6.
4. Hu J, Mao Y, White K. Diet and vitamin or mineral supplements andrisk of renal cell carcinoma in Canada. Cancer Causes Control 2003;14:705–14.
5. Wolk A, Gridley G, Niwa S, et al. International renal cell cancer study.VII. Role of diet. Int J Cancer 1996;65:67–73.
6. Maclure M, Willett W. A case-control study of diet and risk of renaladenocarcinoma. Epidemiol 1990;1:430–40.
7. Bosetti C, Scotti L, Maso LD, et al. Micronutrients and the risk ofrenal cell cancer: a case-control study from Italy. Int J Cancer 2007;120:892–6.
8. Nicodemus KK, Sweeney C, Folsom AR. Evaluation of dietary, med-ical and lifestyle risk factors for incident kidney cancer in postmeno-pausal women. Int J Cancer 2004;108:115–21.
9. Bosetti C, Rossi M, McLaughlin JK, et al. Flavonoids and the riskof renal cell carcinoma. Cancer Epidemiol Biomarkers Prev 2007;16:98–101.
10. Hirvonen T, Virtamo J, Korhonen P, Albanes D, Pietinen P. Flavonoland flavone intake and the risk of cancer in male smokers (Finland).Cancer Causes Control 2001;12:789–96.
11. Rashidkhani B, Lindblad P, Wolk A. Fruits, vegetables and risk of re-nal cell carcinoma: a prospective study of Swedish women. Int J Can-cer 2005;113:451–5.
12. van Dijk BA, Schouten LJ, Kiemeney LA, Goldbohm RA, van denBrandt PA. Vegetable and fruit consumption and risk of renal cell car-cinoma: results from the Netherlands cohort study. Int J Cancer 2005;117:648–54.
13. Lee JE, Giovannucci E, Smith-Warner SA, Spiegelman D, Willett WC,Curhan GC. Intakes of fruits, vegetables, vitamins A, C, and E, andcarotenoids and risk of renal cell cancer. Cancer Epidemiol BiomarkersPrev 2006;15:2445–52.
14. Smith-Warner SA, Spiegelman D, Ritz J, et al. Methods for poolingresults of epidemiologic studies. Am J Epidemiol 2006;163:1053–64.
15. Mahabir S, Leitzmann MF, Virtanen MJ, et al. Prospective study ofalcohol drinking and renal cell cancer risk in a cohort of finnish malesmokers. Cancer Epidemiol Biomarkers Prev 2005;14:170–5.
16. Lin J, Zhang SM, Cook NR, et al. Dietary intakes of fruit, vegetables,and fiber, and risk of colorectal cancer in a prospective cohort of wom-en (United States). Cancer Causes Control 2005;16:225–33.
17. Bernstein L, Allen M, Anton-Culver H, et al. High breast cancer inci-dence rates among California teachers: results from the California Tea-chers Study (United States). Cancer Causes Control 2002;13:625–35.
18. Bandera EV, Freudenheim JL, Marshall JR, et al. Impact of losses to
follow-up on diet/alcohol and lung cancer analyses in the New YorkState Cohort. Nutr Cancer 2002;42:41–7.
19. Giles GG, English DR. The Melbourne Collaborative Cohort Study.IARC Sci Publ 2002;156:69–70.
20. Rohan TE, Jain M, Howe GR, Miller AB. A cohort study of dietarycarotenoids and lung cancer risk in women (Canada). Cancer CausesControl 2002;13:231–7.
21. Calle EE, Rodriguez C, Jacobs EJ, et al. The American Cancer SocietyCancer Prevention Study II Nutrition Cohort: rationale, study design,and baseline characteristics. Cancer 2002;94:500–11.
22. Flood A, Velie EM, Chaterjee N, et al. Fruit and vegetable intakes andthe risk of colorectal cancer in the Breast Cancer Detection Demonstra-tion Project follow-up cohort. Am J Clin Nutr 2002;75:936–43.
23. Percy C, Van Holten V, Muir C. International classification of diseasesfor oncology. Geneva, Switzerland: World Health Organization; 1990.
24. Puckett CD. The educational annotation of ICD-9-CM. Reno, NV:Channel Publishing, Ltd.; 1986.
25. Pennington JAT. Bowes and Church's food values of portions com-monly used. New York: Lippincott-Raven; 1998.
26. Smith SA, Campbell DR, Elmer PJ, Martini MC, Slavin JL, Potter JD.The University of Minnesota Cancer Prevention Research Unit vege-table and fruit classification scheme (United States). Cancer CausesControl 1995;6:292–302.
27. Willett W, Stampfer M. Implications of total energy intake for epide-miologic analysis. In: Willett W, editor. Nutritional epidemiology. NewYork: Oxford University Press; 1998;273–301.
28. Pietinen P, Hartman AM, Haapa E, et al. Reproducibility and validityof dietary assessment instruments. I. A self-administered food usequestionnaire with a portion size picture booklet. Am J Epidemiol1988;128:655–66.
29. Flagg EW, Coates RJ, Calle EE, Potischman N, Thun MJ. Validation ofthe American Cancer Society Cancer Prevention Study II NutritionSurvey Cohort food frequency questionnaire. Epidemiology 2000;11:462–8.
30. Newby PK, Hu FB, Rimm EB, et al. Reproducibility and validity of theDiet Quality Index Revised as assessed by use of a food-frequencyquestionnaire. Am J Clin Nutr 2003;78:941–9.
31. Goldbohm RA, van den Brandt PA, Brants HA, et al. Validation of adietary questionnaire used in a large-scale prospective cohort studyon diet and cancer. Eur J Clin Nutrit 1994;48:253–65.
32. Feskanich D, Rimm EB, Giovannucci EL, et al. Reproducibility andvalidity of food intake measurements from a semiquantitative foodfrequency questionnaire. J Am Diet Assoc 1993;93:790–6.
33. Feskanich D, Marshall J, Rimm EB, Litin LB, Willett WC. Simulatedvalidation of a brief food frequency questionnaire. Ann Epidemiol1994;4:181–7.
34. Rimm EB, Giovannucci EL, Stampfer MJ, Colditz GA, Litin LB, WillettWC. Reproducibility and validity of a expanded self-administeredsemiquantitative food frequency questionnaire among male healthprofessionals. Am J Epidemiol 1992;135:1114–26.
35. Cox DR. Regression models and life-tables. J Royal Stat Soc 1972;34:187–220.
36. DerSimonian R, Laird N. Meta-analysis in clinical trials. ControlledClin Trials 1986;7:177–88.
37. Smith PL. Splines as a useful and convenient statistical tool. Am Stat1979;33:57–62.
38. Durrleman S, Simon R. Flexible regression models with cubic splines.Stat Med 1989;8:551–61.
39. Stram DO. Meta-analysis of published data using a linearmixed- effects model. Biometrics 1996;52:536–44.
40. Mannisto S, Yaun SS, Hunter DJ, et al. Dietary carotenoids and risk ofcolorectal cancer in a pooled analysis of 11 cohort studies. Am J Epi-demiol 2007;165:246–55.
41. Hodge AM, English DR, McCredie MR, et al. Foods, nutrients andprostate cancer. Cancer Causes Control 2004;15:11–20.
42. Horn-Ross PL, Hoggatt KJ, West DW. Recent diet and breast cancerrisk: the California Teachers Study (USA). Cancer Causes Control2002;13:407–15.
43. Weikert S, Boeing H, Pischon T, et al. Fruits and vegetables and renalcell carcinoma: findings from the European prospective investigationinto cancer and nutrition (EPIC). Int J Cancer 2006;118:3133–9.
44. McLaughlin JK, Gao YT, Gao RN, et al. Risk factors for renal-cell can-cer in Shanghai, China. Int J Cancer 1992;52:562–5.
45. Negri E, La Vecchia C, Franceschi S, D'Avanzo B, Parazzini F. Vegeta-ble and fruit consumption and cancer risk. Int J Cancer 1991;48:350–4.
46. De Stefani E, Fierro L, Mendilaharsu M, et al. Meat intake, “mate”drinking and renal cell cancer in Uruguay: a case-control study. Br JCancer 1998;78:1239–43.
47. Yu MC, Mack TM, Hanisch R, Cicioni C, Henderson BE. Cigarettesmoking, obesity, diuretic use, and coffee consumption as risk factorsfor renal cell carcinoma. J Natl Cancer Inst 1986;77:351–6.
Cancer Epidemiol Biomarkers Prev 2009;18(6). June 2009
1738 Fruit, Vegetables, Carotenoids, and Renal Cell Cancer
American Association for Cancer Research Copyright © 2009 on May 10, 2011cebp.aacrjournals.orgDownloaded from
DOI:10.1158/1055-9965.EPI-09-0045

48. Talamini R, Baron AE, Barra S, et al. A case-control study of risk factorfor renal cell cancer in northern Italy. Cancer Causes Control 1990;1:125–31.
49. Bravi F, Bosetti C, Scotti L, et al. Food groups and renal cell carcinoma:a case-control study from Italy. Int J Cancer 2007;120:681–5.
50. Hsu CC, Chow WH, Boffetta P, et al. Dietary risk factors for kid-ney cancer in Eastern and Central Europe. Am J Epidemiol 2007;166:62–70.
51. Fraser GE, Phillips RL, Beeson WL, et al. Hypertension, antihyperten-sive medication and risk of renal carcinoma in California Seventh-DayAdventists. Int J Epidemiol 1990;19:832–8.
52. Krinsky NI. Carotenoids and cancer: basic research studies. In: Frei B,
editor. Natural antioxidants in human health and disease. San Diego(CA): Academic Press; 1994;239–61.
53. Mangels AR, Holden JM, Beecher GR, Forman MR, Lanza E. Caroten-oid content of fruits and vegetables: an evaluation of analytic data.J Am Diet Assoc 1993;93:284–96.
54. Kreiger N, Marrett LD, Dodds L, Hilditch S, Darlington GA. Risk fac-tors for renal cell carcinoma: results of a population-based case-controlstudy. Cancer Causes Control 1993;4:101–10.
55. Negri E, Foschi R, Talamini R, et al. Family history of cancer and the riskof renal cell cancer. Cancer Epidemiol Biomarkers Prev 2006;15:2441–4.
56. Lipworth L, Tarone RE, McLaughlin JK. The epidemiology of renal cellcarcinoma. J Urol 2006;176:2353–8.
Cancer Epidemiol Biomarkers Prev 2009;18(6). June 2009
1739Cancer Epidemiology & Biomarkers Prevention
American Association for Cancer Research Copyright © 2009 on May 10, 2011cebp.aacrjournals.orgDownloaded from
DOI:10.1158/1055-9965.EPI-09-0045
Copyright © 2022 FDOKUMEN