Nutritional Significance of Fruit and Fruit Products in ... - MDPI
18
nutrients Article Nutritional Significance of Fruit and Fruit Products in the Average Polish Diet Krystyna Rejman , Hanna Górska-Warsewicz * , Joanna Kaczorowska and Waclaw Laskowski Citation: Rejman, K.; Górska-Warsewicz, H.; Kaczorowska, J.; Laskowski, W. Nutritional Significance of Fruit and Fruit Products in the Average Polish Diet. Nutrients 2021, 13, 2079. https:// doi.org/10.3390/nu13062079 Academic Editor: Rosa Casas Received: 1 May 2021 Accepted: 16 June 2021 Published: 17 June 2021 Publisher’s Note: MDPI stays neutral with regard to jurisdictional claims in published maps and institutional affil- iations. Copyright: © 2021 by the authors. Licensee MDPI, Basel, Switzerland. This article is an open access article distributed under the terms and conditions of the Creative Commons Attribution (CC BY) license (https:// creativecommons.org/licenses/by/ 4.0/). Department of Food Market and Consumer Research, Institute of Human Nutrition Sciences, Warsaw University of Life Sciences, 07-787 Warsaw, Poland; [email protected] (K.R.); [email protected] (J.K.); [email protected] (W.L.) * Correspondence: [email protected] Abstract: The aim of the present study was to analyze the supply of energy, 19 nutrients, free sugars, and dietary fiber in the average Polish diet from fruit and fruit products. Our analysis is based on 2016 data from the national representative household budget survey conducted on a sample of 36,886 households, yielding a population of 99,230 individuals. Fruit and fruit products provided 3.12% of energy to the average diet in Poland with the highest share of bananas and apples. The highest significance of this food group was found for vitamin C (23.65%), including citrus fruits providing 8.03% of vitamin C, berries (5.97%), other fruits (3.45%), and apples (3.13%). The share of fruit and their products in the supply of free sugars is equally high and amounts to 23.52%. This means that apples provide 6.34% of free sugars, while other fruits also have a high supply of free sugars, including berries 3.68%, stone fruits 3.06%, bananas 2.56%, and citrus fruits 2.54%. The proportion of supply exceeding the percentage of energy (which was 3.12%) was obtained for carbohydrate (5.79%), and fiber (13.66%). The food group studied was particularly important (more than 5% share) in providing four minerals: potassium (8.59%), iron (5.07%), magnesium (5.51%), copper (8.81%), and three vitamins: vitamin C (23.65%), vitamin B6 (5.74%), and vitamin E (5.53%). The influence of sociodemographic and economic characteristics of households on the structure of energy and nutrient supply from fruit and fruit products was assessed using cluster analysis. There were four clusters characterized by different energy, nutrient, and fiber supply. The factors with the highest statistical significance on the supply of energy, nutrients, and fiber from fruit and fruit products were month of study, income, degree of urbanization, education, size of town, and land use. The obtained results concerning energy and nutrient supply from fruits and fruit products are important for the Polish society from the public health point of view, as indicated in the discussion of results and conclusions. Keywords: fruit and products; energy sources; fiber sources; bananas; apples; sources of vitamins; sources of minerals; sources of carbohydrates 1. Introduction It is recognized that fruit and fruit products consumption is associated with protec- tive effects against various chronic diseases [1], particularly cardiovascular diseases [2,3], hypertension [4], type 2 diabetes [5], different types of cancer [2,6–8], asthma [9], obe- sity [10], cognitive impairment [11], and depression [12,13]. Fruits and vegetables are the cornerstone for a healthy and sustainable diet i.e., with low environmental impacts which contribute to food and nutrition security, and to healthy life for present and future generations [14]. According to various expert bodies, the greatest benefits to human and planetary health can be achieved by consuming a minimum of 400 g of fruit and vegetables per person each day, which in dietary practice means five servings including a higher proportion of vegetables [15–18]. However, due to a number of factors, such as availability, affordability or lack of knowledge and awareness, the typical daily fruit intake among many people around the world is far below the recommended level [19,20]. Nutrients 2021, 13, 2079. https://doi.org/10.3390/nu13062079 https://www.mdpi.com/journal/nutrients
-
Upload
khangminh22 -
Category
Documents
-
view
2 -
download
0
Transcript of Nutritional Significance of Fruit and Fruit Products in ... - MDPI

nutrients
Article
Nutritional Significance of Fruit and Fruit Products in theAverage Polish Diet
Krystyna Rejman , Hanna Górska-Warsewicz * , Joanna Kaczorowska and Wacław Laskowski
�����������������
Citation: Rejman, K.;
Górska-Warsewicz, H.; Kaczorowska,
J.; Laskowski, W. Nutritional
Significance of Fruit and Fruit
Products in the Average Polish Diet.
Nutrients 2021, 13, 2079. https://
doi.org/10.3390/nu13062079
Academic Editor: Rosa Casas
Received: 1 May 2021
Accepted: 16 June 2021
Published: 17 June 2021
Publisher’s Note: MDPI stays neutral
with regard to jurisdictional claims in
published maps and institutional affil-
iations.
Copyright: © 2021 by the authors.
Licensee MDPI, Basel, Switzerland.
This article is an open access article
distributed under the terms and
conditions of the Creative Commons
Attribution (CC BY) license (https://
creativecommons.org/licenses/by/
4.0/).
Department of Food Market and Consumer Research, Institute of Human Nutrition Sciences,Warsaw University of Life Sciences, 07-787 Warsaw, Poland; [email protected] (K.R.);[email protected] (J.K.); [email protected] (W.L.)* Correspondence: [email protected]
Abstract: The aim of the present study was to analyze the supply of energy, 19 nutrients, free sugars,and dietary fiber in the average Polish diet from fruit and fruit products. Our analysis is based on2016 data from the national representative household budget survey conducted on a sample of 36,886households, yielding a population of 99,230 individuals. Fruit and fruit products provided 3.12%of energy to the average diet in Poland with the highest share of bananas and apples. The highestsignificance of this food group was found for vitamin C (23.65%), including citrus fruits providing8.03% of vitamin C, berries (5.97%), other fruits (3.45%), and apples (3.13%). The share of fruit andtheir products in the supply of free sugars is equally high and amounts to 23.52%. This meansthat apples provide 6.34% of free sugars, while other fruits also have a high supply of free sugars,including berries 3.68%, stone fruits 3.06%, bananas 2.56%, and citrus fruits 2.54%. The proportionof supply exceeding the percentage of energy (which was 3.12%) was obtained for carbohydrate(5.79%), and fiber (13.66%). The food group studied was particularly important (more than 5% share)in providing four minerals: potassium (8.59%), iron (5.07%), magnesium (5.51%), copper (8.81%),and three vitamins: vitamin C (23.65%), vitamin B6 (5.74%), and vitamin E (5.53%). The influenceof sociodemographic and economic characteristics of households on the structure of energy andnutrient supply from fruit and fruit products was assessed using cluster analysis. There were fourclusters characterized by different energy, nutrient, and fiber supply. The factors with the higheststatistical significance on the supply of energy, nutrients, and fiber from fruit and fruit productswere month of study, income, degree of urbanization, education, size of town, and land use. Theobtained results concerning energy and nutrient supply from fruits and fruit products are importantfor the Polish society from the public health point of view, as indicated in the discussion of resultsand conclusions.
Keywords: fruit and products; energy sources; fiber sources; bananas; apples; sources of vitamins;sources of minerals; sources of carbohydrates
1. Introduction
It is recognized that fruit and fruit products consumption is associated with protec-tive effects against various chronic diseases [1], particularly cardiovascular diseases [2,3],hypertension [4], type 2 diabetes [5], different types of cancer [2,6–8], asthma [9], obe-sity [10], cognitive impairment [11], and depression [12,13]. Fruits and vegetables arethe cornerstone for a healthy and sustainable diet i.e., with low environmental impactswhich contribute to food and nutrition security, and to healthy life for present and futuregenerations [14]. According to various expert bodies, the greatest benefits to human andplanetary health can be achieved by consuming a minimum of 400 g of fruit and vegetablesper person each day, which in dietary practice means five servings including a higherproportion of vegetables [15–18]. However, due to a number of factors, such as availability,affordability or lack of knowledge and awareness, the typical daily fruit intake amongmany people around the world is far below the recommended level [19,20].
Nutrients 2021, 13, 2079. https://doi.org/10.3390/nu13062079 https://www.mdpi.com/journal/nutrients
Nutrients 2021, 13, 2079 2 of 18
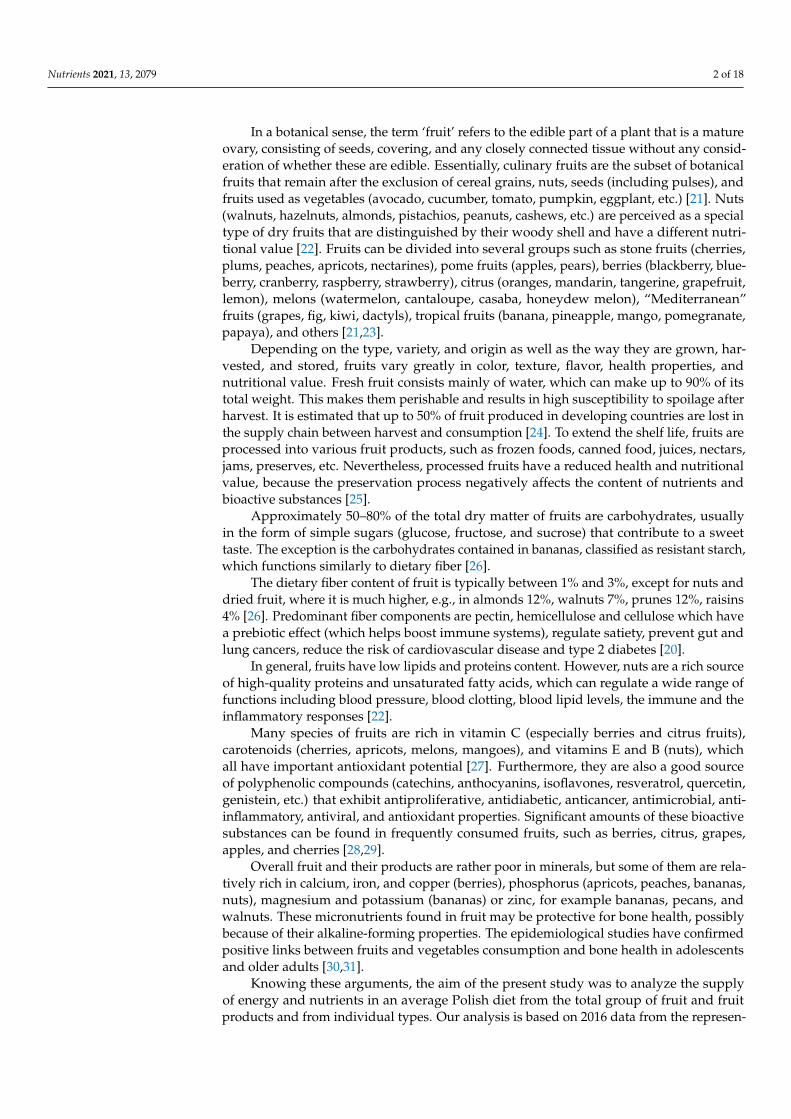
In a botanical sense, the term ‘fruit’ refers to the edible part of a plant that is a matureovary, consisting of seeds, covering, and any closely connected tissue without any consid-eration of whether these are edible. Essentially, culinary fruits are the subset of botanicalfruits that remain after the exclusion of cereal grains, nuts, seeds (including pulses), andfruits used as vegetables (avocado, cucumber, tomato, pumpkin, eggplant, etc.) [21]. Nuts(walnuts, hazelnuts, almonds, pistachios, peanuts, cashews, etc.) are perceived as a specialtype of dry fruits that are distinguished by their woody shell and have a different nutri-tional value [22]. Fruits can be divided into several groups such as stone fruits (cherries,plums, peaches, apricots, nectarines), pome fruits (apples, pears), berries (blackberry, blue-berry, cranberry, raspberry, strawberry), citrus (oranges, mandarin, tangerine, grapefruit,lemon), melons (watermelon, cantaloupe, casaba, honeydew melon), “Mediterranean”fruits (grapes, fig, kiwi, dactyls), tropical fruits (banana, pineapple, mango, pomegranate,papaya), and others [21,23].
Depending on the type, variety, and origin as well as the way they are grown, har-vested, and stored, fruits vary greatly in color, texture, flavor, health properties, andnutritional value. Fresh fruit consists mainly of water, which can make up to 90% of itstotal weight. This makes them perishable and results in high susceptibility to spoilage afterharvest. It is estimated that up to 50% of fruit produced in developing countries are lost inthe supply chain between harvest and consumption [24]. To extend the shelf life, fruits areprocessed into various fruit products, such as frozen foods, canned food, juices, nectars,jams, preserves, etc. Nevertheless, processed fruits have a reduced health and nutritionalvalue, because the preservation process negatively affects the content of nutrients andbioactive substances [25].
Approximately 50–80% of the total dry matter of fruits are carbohydrates, usuallyin the form of simple sugars (glucose, fructose, and sucrose) that contribute to a sweettaste. The exception is the carbohydrates contained in bananas, classified as resistant starch,which functions similarly to dietary fiber [26].
The dietary fiber content of fruit is typically between 1% and 3%, except for nuts anddried fruit, where it is much higher, e.g., in almonds 12%, walnuts 7%, prunes 12%, raisins4% [26]. Predominant fiber components are pectin, hemicellulose and cellulose which havea prebiotic effect (which helps boost immune systems), regulate satiety, prevent gut andlung cancers, reduce the risk of cardiovascular disease and type 2 diabetes [20].
In general, fruits have low lipids and proteins content. However, nuts are a rich sourceof high-quality proteins and unsaturated fatty acids, which can regulate a wide range offunctions including blood pressure, blood clotting, blood lipid levels, the immune and theinflammatory responses [22].
Many species of fruits are rich in vitamin C (especially berries and citrus fruits),carotenoids (cherries, apricots, melons, mangoes), and vitamins E and B (nuts), whichall have important antioxidant potential [27]. Furthermore, they are also a good sourceof polyphenolic compounds (catechins, anthocyanins, isoflavones, resveratrol, quercetin,genistein, etc.) that exhibit antiproliferative, antidiabetic, anticancer, antimicrobial, anti-inflammatory, antiviral, and antioxidant properties. Significant amounts of these bioactivesubstances can be found in frequently consumed fruits, such as berries, citrus, grapes,apples, and cherries [28,29].
Overall fruit and their products are rather poor in minerals, but some of them are rela-tively rich in calcium, iron, and copper (berries), phosphorus (apricots, peaches, bananas,nuts), magnesium and potassium (bananas) or zinc, for example bananas, pecans, andwalnuts. These micronutrients found in fruit may be protective for bone health, possiblybecause of their alkaline-forming properties. The epidemiological studies have confirmedpositive links between fruits and vegetables consumption and bone health in adolescentsand older adults [30,31].
Knowing these arguments, the aim of the present study was to analyze the supplyof energy and nutrients in an average Polish diet from the total group of fruit and fruitproducts and from individual types. Our analysis is based on 2016 data from the represen-

Nutrients 2021, 13, 2079 3 of 18
tative household budget survey. This is another study on understanding the importanceof specific food groups as sources of energy and nutrients in the average Polish diet. Todate, research has been published on the nutritional importance of the following foodgroups: meat, meat products and seafood [32], cereals and cereal products [33], milk anddairy products [34], nonalcoholic beverages [35], butter, margarine, vegetable oils andolive oils [36], vegetables, potatoes and their products [37]. Our study also presented foodsources of protein and amino acids [38] and potassium [39] in the average Polish diet.
2. Materials and Methods2.1. Study Description
The aim of our study was to analyze sources of energy and nutrients to the averagediets in Poland from fruit and fruit products, divided into nine product subgroups. Wepresented the contribution of energy, macronutrients (protein, fat, carbohydrates), fiber,minerals, and vitamins. We presented the results in Section ‘Results’ in the following order:
Supply of energy, macronutrients, and dietary fiber.Supply of minerals i.e., calcium, phosphorus, sodium, potassium, iron, magnesium, zinc,and copper.Supply of vitamins, i.e., thiamine, riboflavin, niacin, folate, vitamins: B6, C, A, and E.Supply of energy and nutrients according to household characteristics.
2.2. Data Collection and Analysis
Our study is based on data from the national representative Household Budget Survey(HBS). The survey was conducted by national statistical office Statistics Poland, whichensures representativeness by drawing households in a two-stage procedure (first researchareas, then households) and allows generalizing the results to the entire population ofPoland. In 2016, the survey was conducted on a sample of 36,886 households, yielding apopulation of 99,230 individuals [40]. This method of obtaining information on consump-tion levels is being improved [41–44]. The details of the technical way of conducting thesurvey, including the sampling and randomization method, the method of supervision,how to record information in the “Household Budget Diary” and “Household StatisticsSheet”, how to record the amount of food items consumed have been presented in ourprevious studies [32–34,38].
The unit data present the monthly consumption of 91 food items in each household.The data have been converted into energy, 19 nutrients and dietary fiber using the latestedition of the Polish food composition and nutritional value tables [45]. The next step wasto calculate average values for energy and nutrient supply, first in weight units and thenin percentage terms. The final step was to determine the effect of economic and sociode-mographic factors on energy and nutrient supply. We publish calculations for specificfood categories because of their nutritional importance to public health. The researchprocess involved seven steps and is described in one of our previous publications [34]. Forfree sugars only, we adopted the WHO (World Health Organization) definition and thecalculation method derived from the difference between total and individual carbohydratesupply [46].
We used R program v 3.0.2 (Copyright (C) 2018, The R Foundation for StatisticalComputing, Vienna, Austria), a statistical computing system and environment includingmatrix and vector operations [47,48], to recalculate intake data from 36,886 householdsfor 99,230 individuals across 91 food subgroups and energy, nutrients and dietary fiber.For a more detailed analysis, we determined the influence of 14 demographic, social,and economic factors on the level and structure of energy and nutrient supply from fruitand fruit preparations. Among the factors considered are education, income (quintilegroup), socioeconomic affiliation of the household, degree of urbanization, size of villageor city, region, stage of family life, land use, self-assessed material situation, self-assessednutritional status, age, gender, month of participation in the study, and number of personsin the household. The influence of individual factors was determined by the Cramer

Nutrients 2021, 13, 2079 4 of 18
correlation index. We conducted cluster analysis [49,50] and identified four clusters forthe study households using the Neural Networks module in Statistica 13.3 (Copyright1984-2917, TIBCO Software Inc., Palo Alto, CA, USA) and Kohonen Neural Network [51].For the four clusters, we presented the characteristics of the factors for which the value ofthe Cramer correlation index was significant (p < 0.05).
2.3. Food Grouping
Data from the HBS survey allowed us to identify nine generic subgroups of fruit,nuts, and fruit products. When making this division, we did not consider the botanicalclassification, but the customary perception of fruits by consumers and their place in Polisheating habits [44,52]. These are:
(1) citrus fruits—lemons, oranges, mandarins, grapefruits, pineapples;(2) bananas;(3) apples;(4) berries—strawberries, raspberries, blueberries, cranberries, white-, red- and blackcur-
rants, blackberries, gooseberries, wild strawberries;(5) stone fruits—plums, cherries, sour cherries, apricots, peaches, nectarines;(6) other fruits—for example, mangoes, kiwis, grapes, figs, dactyls, papayas;(7) frozen fruits—all single types and mixed;(8) dried fruits and nuts—all kinds of dried fruit, nuts, including salted and roasted nuts,
almonds, edible seeds (e.g., poppy seeds, pumpkin seeds, sunflower seeds);(9) fruit products—pasteurized fruit, canned fruit, pickled fruit, fruit salads.
3. Results3.1. Supply of Energy, Macronutrients, and Dietary Fiber
In the energy value of the average daily food consumption in Poland, equal to2261 kcal per person, fruits and fruit products contributed 70.5 kcal (Table 1). Their sharewas therefore 3.1%. The two species, apples, and bananas had almost identical and largestshares of 0.6% each, and the third source was the dried fruit and nuts subgroup, con-tributing just over 0.5%. Frozen fruits and fruit products were of minimal importance inproviding energy.
Table 1. Supply of energy, macronutrients and dietary fiber from fruit and fruit products.
Specification Energy Protein Fat Carbohydrates Fiber Free Sugars
Average Daily Supply 2261.00 kcal 77.90 g 96.91 g 270.37 g 17.64 g 30.70 g
Daily Supply from Fruitand Fruit Products
Share (%) in Average Daily Diet
70.54 kcal 1.03 g 1.10 g 15.65 g 2.41 g 7.22 g
3.12% 1.32% 1.13% 5.79% 13.66% 23.52%
List of Fruit and Fruit Products by Supply (in %) 1/:
Citrus fruits 0.34 0.17 0.04 0.72 1.90 2.54Bananas 0.62 0.18 0.05 1.27 1.43 2.56Apples 0.63 0.15 0.13 1.29 3.19 6.34Berries 0.31 0.17 0.06 0.66 3.05 3.68
Stone fruits 0.28 0.13 0.04 0.54 0.92 3.06Other fruits 0.26 0.10 0.14 0.46 1.06 2.39Frozen fruits 0.01 0.00 0.00 0.01 0.07 0.07
Dried fruits and nuts 0.55 0.39 0.64 0.63 1.89 2.67Fruit products 0.11 0.02 0.03 0.21 0.15 0.22
1/ 100% is taken to be the total energy or nutrient supply in the diet, e.g., citrus fruits provide 0.34% of the total energy in an average Polishdiet (0.34% of 2261 kcal).
Carbohydrates were the main macronutrient provided in the diet by the food group.Almost 16 g of carbohydrates, or 5.8% of the total dietary supply of this nutrient, came fromfruit and fruit products. The supply of the other two macronutrients at about 1 g per day(and 1% contribution) was virtually negligible. As with energy, apples and bananas stoodout in carbohydrate provision at nearly 1.3%, but citrus fruits came in third (0.7%). Two
Nutrients 2021, 13, 2079 5 of 18
more subgroups—berries and nectarines—contributed more than 0.5%. Some importanceof dried fruits and nuts was revealed in the provision of fat and protein, as they had 0.6%and 0.4% of their daily supply from the analyzed food group.
Dietary fiber is the food component that determines the role of fruit in a healthy diet.Their presence in the Polish average diet means an intake of 2.4 g of fiber per day per personand this is 13.7% of the total fiber intake. Apples and berries stand out in providing fiberwith more than 3%, and citrus fruits and dried fruits and nuts stand out with nearly 2%.
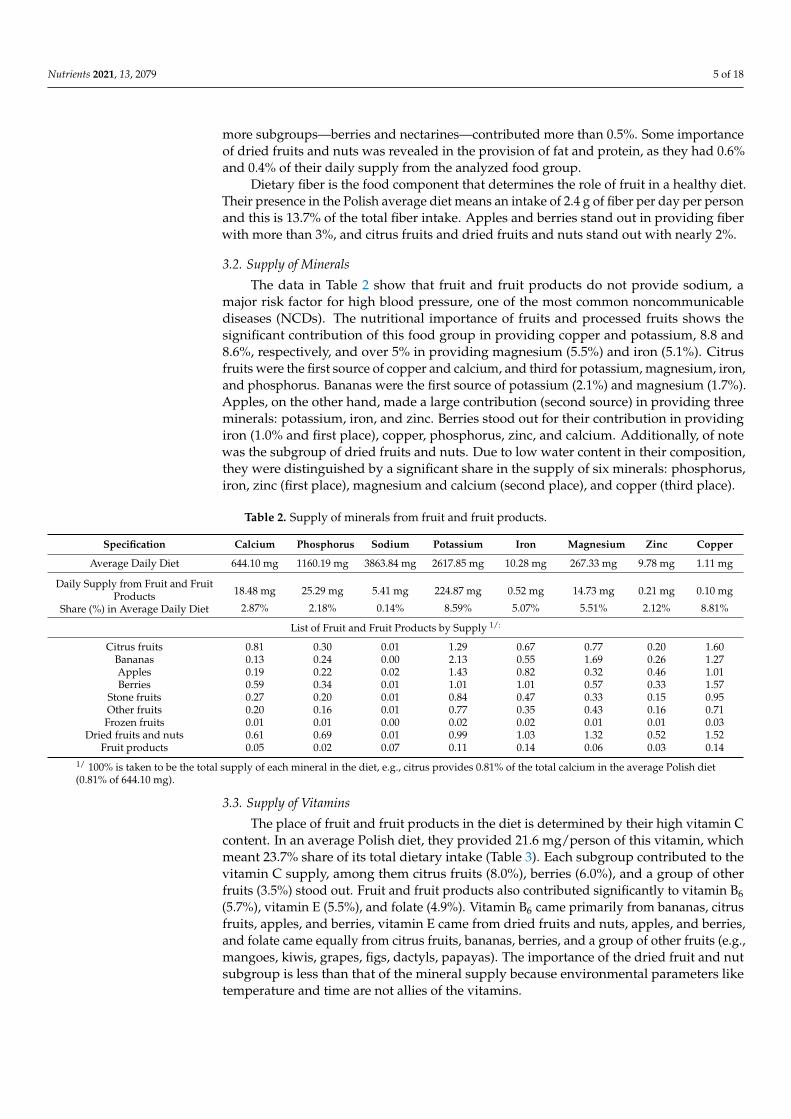
3.2. Supply of Minerals
The data in Table 2 show that fruit and fruit products do not provide sodium, amajor risk factor for high blood pressure, one of the most common noncommunicablediseases (NCDs). The nutritional importance of fruits and processed fruits shows thesignificant contribution of this food group in providing copper and potassium, 8.8 and8.6%, respectively, and over 5% in providing magnesium (5.5%) and iron (5.1%). Citrusfruits were the first source of copper and calcium, and third for potassium, magnesium, iron,and phosphorus. Bananas were the first source of potassium (2.1%) and magnesium (1.7%).Apples, on the other hand, made a large contribution (second source) in providing threeminerals: potassium, iron, and zinc. Berries stood out for their contribution in providingiron (1.0% and first place), copper, phosphorus, zinc, and calcium. Additionally, of notewas the subgroup of dried fruits and nuts. Due to low water content in their composition,they were distinguished by a significant share in the supply of six minerals: phosphorus,iron, zinc (first place), magnesium and calcium (second place), and copper (third place).
Table 2. Supply of minerals from fruit and fruit products.
Specification Calcium Phosphorus Sodium Potassium Iron Magnesium Zinc Copper
Average Daily Diet 644.10 mg 1160.19 mg 3863.84 mg 2617.85 mg 10.28 mg 267.33 mg 9.78 mg 1.11 mg
Daily Supply from Fruit and FruitProducts
Share (%) in Average Daily Diet
18.48 mg 25.29 mg 5.41 mg 224.87 mg 0.52 mg 14.73 mg 0.21 mg 0.10 mg
2.87% 2.18% 0.14% 8.59% 5.07% 5.51% 2.12% 8.81%
List of Fruit and Fruit Products by Supply 1/:
Citrus fruits 0.81 0.30 0.01 1.29 0.67 0.77 0.20 1.60Bananas 0.13 0.24 0.00 2.13 0.55 1.69 0.26 1.27Apples 0.19 0.22 0.02 1.43 0.82 0.32 0.46 1.01Berries 0.59 0.34 0.01 1.01 1.01 0.57 0.33 1.57
Stone fruits 0.27 0.20 0.01 0.84 0.47 0.33 0.15 0.95Other fruits 0.20 0.16 0.01 0.77 0.35 0.43 0.16 0.71Frozen fruits 0.01 0.01 0.00 0.02 0.02 0.01 0.01 0.03
Dried fruits and nuts 0.61 0.69 0.01 0.99 1.03 1.32 0.52 1.52Fruit products 0.05 0.02 0.07 0.11 0.14 0.06 0.03 0.14
1/ 100% is taken to be the total supply of each mineral in the diet, e.g., citrus provides 0.81% of the total calcium in the average Polish diet(0.81% of 644.10 mg).
3.3. Supply of Vitamins
The place of fruit and fruit products in the diet is determined by their high vitamin Ccontent. In an average Polish diet, they provided 21.6 mg/person of this vitamin, whichmeant 23.7% share of its total dietary intake (Table 3). Each subgroup contributed to thevitamin C supply, among them citrus fruits (8.0%), berries (6.0%), and a group of otherfruits (3.5%) stood out. Fruit and fruit products also contributed significantly to vitamin B6(5.7%), vitamin E (5.5%), and folate (4.9%). Vitamin B6 came primarily from bananas, citrusfruits, apples, and berries, vitamin E came from dried fruits and nuts, apples, and berries,and folate came equally from citrus fruits, bananas, berries, and a group of other fruits (e.g.,mangoes, kiwis, grapes, figs, dactyls, papayas). The importance of the dried fruit and nutsubgroup is less than that of the mineral supply because environmental parameters liketemperature and time are not allies of the vitamins.

Nutrients 2021, 13, 2079 6 of 18
Table 3. Supply of vitamins from fruit and fruit products.
Specification Thiamin Riboflavin Niacin Vitamin B6 Folate Vitamin C Vitamin A Vitamin E
Average Daily Diet 1.32 mg 1.59 mg 16.21 mg 1.84 mg 275.02 µg 91.40 mg 1.194.55 µg 13.45 mg
Daily Supply from Fruit and FruitProducts
Share (%) in Average Daily Diet
0.05 mg 0.05 mg 0.40 mg 0.11 mg 13.39 µg 21.62 mg 29.15 µg 0.74 mg
3.75% 3.15% 2.46% 5.74% 4.87% 23.65% 2.44% 5.53%
List of Fruit and Fruit Products by Supply 1/:
Citrus fruits 0.76 0.29 0.19 0.61 1.14 8.03 0.41 0.77Bananas 0.45 0.88 0.47 2.78 1.14 1.50 0.11 0.34Apples 0.74 0.47 0.31 0.47 0.62 3.13 0.11 1.19Berries 0.44 0.40 0.25 0.47 0.73 5.97 0.08 0.82
Stone fruits 0.40 0.36 0.40 0.28 0.22 1.06 0.75 0.48Other fruits 0.35 0.26 0.30 0.56 0.67 3.45 0.49 0.37Frozen fruits 0.01 0.01 0.01 0.01 0.01 0.17 0.00 0.02
Dried fruits and nuts 0.56 0.44 0.49 0.51 0.32 0.22 0.43 1.45Fruit products 0.05 0.04 0.04 0.04 0.03 0.11 0.05 0.11
1/ 100% is taken to be the total supply of each vitamin in the diet, e.g., citrus fruits provide 0.76% of the total thiamine in the average Polishdiet (0.76% of 1.32 mg).
3.4. Supply of Energy and Nutrients According to Household Characteristics
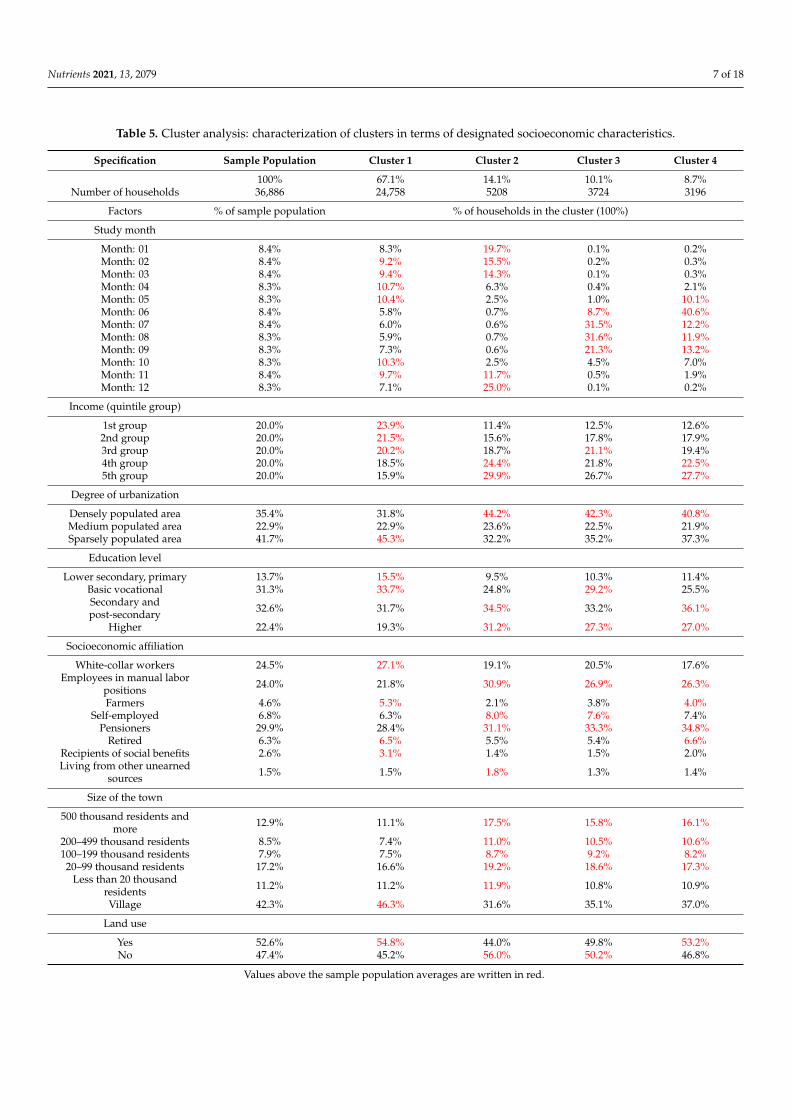
To determine the influence of economic and sociodemographic characteristics ofthe household on the level and structure of energy and nutrient supply from fruit andfruit products, we conducted a cluster analysis. First, we determined that month ofstudy, income expressed in quintile groups, degree of urbanization, level of education,socioeconomic affiliation of household, size of the town, and land use were the factors withthe greatest influence on the supply of energy and nutrients from fruit and fruit products(Table 4). We then divided the study population into four clusters based on p < 0.05. Table 5shows the characteristics of the clusters including the criteria with the highest significance,at p < 0.05.
Table 4. Cluster analysis: impact of sociodemographic and economic factors on the supply of energyand nutrients from fruit and fruit products in the average Polish diet.
Factors Cramer Correlations
Study month 0.418Income (quintile group) 0.113Degree of urbanization 0.084
Education level 0.080Socioeconomic affiliation 0.078
Size of the town 0.077Land use 0.076
Number of people in a household 0.066Assessment of the financial situation 0.060
Family life phase 0.055Gender 0.047
Assessment of nutrition 0.044Age 0.040
Region 0.037The most important factors are written in bold.
Nutrients 2021, 13, 2079 7 of 18
Table 5. Cluster analysis: characterization of clusters in terms of designated socioeconomic characteristics.
Specification Sample Population Cluster 1 Cluster 2 Cluster 3 Cluster 4
100% 67.1% 14.1% 10.1% 8.7%Number of households 36,886 24,758 5208 3724 3196
Factors % of sample population % of households in the cluster (100%)
Study month
Month: 01 8.4% 8.3% 19.7% 0.1% 0.2%Month: 02 8.4% 9.2% 15.5% 0.2% 0.3%Month: 03 8.4% 9.4% 14.3% 0.1% 0.3%Month: 04 8.3% 10.7% 6.3% 0.4% 2.1%Month: 05 8.3% 10.4% 2.5% 1.0% 10.1%Month: 06 8.4% 5.8% 0.7% 8.7% 40.6%Month: 07 8.4% 6.0% 0.6% 31.5% 12.2%Month: 08 8.3% 5.9% 0.7% 31.6% 11.9%Month: 09 8.3% 7.3% 0.6% 21.3% 13.2%Month: 10 8.3% 10.3% 2.5% 4.5% 7.0%Month: 11 8.4% 9.7% 11.7% 0.5% 1.9%Month: 12 8.3% 7.1% 25.0% 0.1% 0.2%
Income (quintile group)
1st group 20.0% 23.9% 11.4% 12.5% 12.6%2nd group 20.0% 21.5% 15.6% 17.8% 17.9%3rd group 20.0% 20.2% 18.7% 21.1% 19.4%4th group 20.0% 18.5% 24.4% 21.8% 22.5%5th group 20.0% 15.9% 29.9% 26.7% 27.7%
Degree of urbanization
Densely populated area 35.4% 31.8% 44.2% 42.3% 40.8%Medium populated area 22.9% 22.9% 23.6% 22.5% 21.9%Sparsely populated area 41.7% 45.3% 32.2% 35.2% 37.3%
Education level
Lower secondary, primary 13.7% 15.5% 9.5% 10.3% 11.4%Basic vocational 31.3% 33.7% 24.8% 29.2% 25.5%Secondary andpost-secondary 32.6% 31.7% 34.5% 33.2% 36.1%
Higher 22.4% 19.3% 31.2% 27.3% 27.0%
Socioeconomic affiliation
White-collar workers 24.5% 27.1% 19.1% 20.5% 17.6%Employees in manual labor
positions 24.0% 21.8% 30.9% 26.9% 26.3%
Farmers 4.6% 5.3% 2.1% 3.8% 4.0%Self-employed 6.8% 6.3% 8.0% 7.6% 7.4%
Pensioners 29.9% 28.4% 31.1% 33.3% 34.8%Retired 6.3% 6.5% 5.5% 5.4% 6.6%
Recipients of social benefits 2.6% 3.1% 1.4% 1.5% 2.0%Living from other unearned
sources 1.5% 1.5% 1.8% 1.3% 1.4%
Size of the town
500 thousand residents andmore 12.9% 11.1% 17.5% 15.8% 16.1%
200–499 thousand residents 8.5% 7.4% 11.0% 10.5% 10.6%100–199 thousand residents 7.9% 7.5% 8.7% 9.2% 8.2%
20–99 thousand residents 17.2% 16.6% 19.2% 18.6% 17.3%Less than 20 thousand
residents 11.2% 11.2% 11.9% 10.8% 10.9%
Village 42.3% 46.3% 31.6% 35.1% 37.0%
Land use
Yes 52.6% 54.8% 44.0% 49.8% 53.2%No 47.4% 45.2% 56.0% 50.2% 46.8%
Values above the sample population averages are written in red.

Nutrients 2021, 13, 2079 8 of 18
The most numerous cluster (cluster no. 1) is characterized by the lowest energy supplyfrom fruit and fruit products (2.4% with a mean value for the entire study populationof 3.12%) (Table 6, Figure 1). The supply of energy from fruit and fruit products in theremaining clusters is above 5%. The supply of vitamin C varies from 17.78% in clusterno. 1 to 45.92% in cluster no. 4 with the average value of 23.65%. The supply of freesugars varies from 18.61% in cluster no. 1 to 38.05% in cluster no. 4 (mean value for thewhole study population 23.52%). Additionally, in the case of fiber the lowest supply wasrecorded in cluster no. 1 (10.41%), the highest in cluster no. 4 (28.77%) with the averagevalue of 13.66%.
Table 6. Cluster analysis: supply (in %) of energy and nutrients from fruit and fruit products.
Specification Sample Population Cluster 1 Cluster 2 Cluster 3 Cluster 4
Energy 3.12 2.40 5.06 5.04 5.27
Protein 1.32 0.95 2.22 2.19 2.55Fat 1.13 0.92 1.97 1.66 1.57
Carbohydrates 5.79 4.48 9.55 9.25 9.99Fiber 13.66 10.41 20.70 19.51 28.77
Simple sugars 23.52 18.61 30.54 35.22 38.05
Calcium 2.87 2.00 5.59 4.33 6.46Phosphorus 2.18 1.58 3.73 3.46 4.44
Sodium 0.14 0.11 0.22 0.16 0.15Potassium 8.59 6.50 14.28 13.35 14.70
Iron 5.07 3.64 7.94 7.94 11.17Magnesium 5.51 4.17 9.69 7.49 8.78
Zinc 2.12 1.61 3.32 3.20 4.27Cooper 8.81 6.27 14.74 13.92 17.72
Thiamin 3.75 2.73 6.79 6.12 6.66Riboflavin 3.15 2.33 4.68 5.48 5.97
Niacin 2.46 1.72 3.68 5.06 4.66Vitamin B6 5.74 4.40 9.78 7.93 8.84
Folate 4.87 3.53 9.12 6.48 8.91Vitamin C 23.65 17.78 42.15 28.96 45.94Vitamin A 2.44 1.47 3.70 6.76 4.03Vitamin E 5.53 4.16 9.23 8.57 10.82
Nutrients 2021, 13, x FOR PEER REVIEW 9 of 19
Phosphorus 2.18 1.58 3.73 3.46 4.44 Sodium 0.14 0.11 0.22 0.16 0.15
Potassium 8.59 6.50 14.28 13.35 14.70 Iron 5.07 3.64 7.94 7.94 11.17
Magnesium 5.51 4.17 9.69 7.49 8.78 Zinc 2.12 1.61 3.32 3.20 4.27
Cooper 8.81 6.27 14.74 13.92 17.72 Thiamin 3.75 2.73 6.79 6.12 6.66
Riboflavin 3.15 2.33 4.68 5.48 5.97 Niacin 2.46 1.72 3.68 5.06 4.66
Vitamin B6 5.74 4.40 9.78 7.93 8.84 Folate 4.87 3.53 9.12 6.48 8.91
Vitamin C 23.65 17.78 42.15 28.96 45.94 Vitamin A 2.44 1.47 3.70 6.76 4.03 Vitamin E 5.53 4.16 9.23 8.57 10.82
Figure 1. Cluster analysis: supply (in %) of energy and nutrients from fruit and fruit products.
4. Discussion In this section, we compare our results showing the nutritional importance of fruit,
nuts and processed fruit products in the average diet in Poland with the corresponding results of dietary studies in other countries (United States [53,54], Australia [55], New Zealand [56], UK [57], The Netherlands [58], and Spain [59]). It is worth noting here that some limitations in these comparisons result from differences in methodological assumptions of research on average food consumption in individual countries. The discrepancies concern the different classification of food groups and separation of population groups. We then discuss the results obtained in the context of dietary guidelines and public health.
0
5
10
15
20
25
30
35
40
45
50
ener
gy
prot
ein fat
carb
ohyd
rate
s
fibre
free
suga
rs
calci
um
phos
phor
us
sodi
um
pota
ssiu
m
iron
mag
nesiu
m
zinc
coop
er
thiam
in
ribof
lavin
niac
in
vitam
in B6
fola
te
vitam
ic C
vitam
in A
vitam
in E
Perc
enta
ge o
f sup
ply
(%)
cluster 1 cluster 2 cluster 3 cluster 4
Figure 1. Cluster analysis: supply (in %) of energy and nutrients from fruit and fruit products.

Nutrients 2021, 13, 2079 9 of 18
4. Discussion
In this section, we compare our results showing the nutritional importance of fruit,nuts and processed fruit products in the average diet in Poland with the correspondingresults of dietary studies in other countries (United States [53,54], Australia [55], NewZealand [56], UK [57], The Netherlands [58], and Spain [59]). It is worth noting here thatsome limitations in these comparisons result from differences in methodological assump-tions of research on average food consumption in individual countries. The discrepanciesconcern the different classification of food groups and separation of population groups.We then discuss the results obtained in the context of dietary guidelines and public health.
4.1. Energy, Free Sugars, and Dietary Fiber
Our study indicated that fruit and fruit products contributed 3.12% of energy to theaverage diet in Poland, with apples (0.63%), bananas (0.62%), and dried fruits and nuts(0.55%) contributing the most. Similarly, in the average US diet for adults ≥ 51 years, fruitand products provided 3.17% of energy [53]. The average data for the whole US populationis lower indicating that fruit contributes 2.3% of energy [54]. In the average Australian diet,a similar result was obtained for men. Fruit products and dishes provided 3.0% of energyfor men and 4.4% of energy for women, with pome fruit contributing the most (0.8% and1.2%) [55]. Higher results for fruit energy supply were obtained in the case of the Dutchand New Zealand diets. According to the Dutch National Food Survey fruits, nuts andolives provided 5% of energy [58], whereas in the average New Zealand diet accordingto the New Zealand Adult Nutrition Food Survey fruits provided 5.4% and nut seeds1.2% [56]. A slightly lower energy value for fruit was reported in the average English diet;according to results from 7/8 combined program of National Diet and Nutrition Survey,fruit provided 3.6% and nuts and seeds 1.5% of energy in the average diet of people aged19–64 years. However, in the 65–74 and over 75 age group, fruits provided 4.6% and 3.8%,respectively, while nuts and seeds provided 1.3% and 1.1% [57].
In this set of results two groups of countries clearly stand out. In the first one therewere Poland, US, and Australia, where the share of energy from the analyzed food groupwas 3.0–4.4%. Only Poland included nuts in this food group. In the second group ofcountries with a higher share of fruit, nuts and vegetables in dietary energy were theNetherlands, New Zealand, and England. New Zealand is the record holder here, with apercentage of 6.6%. However, the Dutch diet also included olives, a fruit unique for its highfat content, 15 g in 100 g of product, in this food group [60]. However, it is nuts among thesubcategories discussed that bring fat into the diet. The fat content per 100 g of nuts rangesfrom less than 50 g for pistachios, cashews, and peanuts (44.4, 46.4, and 49.2, respectively)to more than 70 g for macadamia nuts and pecans (75.8 and 72.0) [61]. After vegetable oils,nuts are the second richest plant food in fat. Furthermore, the fatty acid composition ofnuts is beneficial to health, as the content of saturated fatty acids is low, ranging from 7.4%of total fatty acids in hazelnuts to 22.7% in brazil nuts. The same is true for protein as nutsare also an excellent source of protein (approximately 25% of their energy value). In theaverage Polish diet, the subgroup of dried fruit and nuts provides the most protein in theanalyzed food group.
The provision of energy from fruit and fruit products is therefore linked to the contentof carbohydrates, especially free sugars. In the average Polish diet, these products provided5.79% of carbohydrates, including apples (1.29%), bananas (1.29%), and citrus fruits (0.72%).Higher carbohydrate intake from fruit and fruit products was reported in Australian,English, Dutch, and New Zealand diets. In the average Australian diet, fruit products anddishes provided 6.1% of carbohydrates for men and 8.6% for women, including pome fruit(1.8% and 2.5%, respectively) and tropical fruit 1.8% and 2.8% [55]. In the UK averagediet of people aged 19–64 years, fruit provided 6.5% and nuts and seeds 0.4%. In contrast,in the diets of older people aged 65–74 and over 75 years, the proportion of fruits was8.3% and 7.1%, and nuts and seeds was 0.2% for both age groups [57]. In the averageDutch diet, fruits, nuts and olives contributed 6% of the carbohydrate supply [58], while in

Nutrients 2021, 13, 2079 10 of 18
the average New Zealand diet, fruits contributed 8.9%, and nuts and seeds contributed0.3% [56]. Only in the case of the American diet, the share of fruit in the carbohydratessupply was shaped at the level of 4.8% [54]. Compared to the New Zealand diet, this isalmost twice the proportion.
The importance of fruit and fruit products in nutrition is shown by their 13.66% shareof dietary fiber in the average Polish diet, with apples (3.2%), berries (3.1%), citrus fruits(1.9%), and dried fruits and nuts (1.9%) contributing the most. In all comparable diets,fruits and processed fruits provided less fiber. For example, in the average Americandiet, fruit provided 10.2% [54], whereas in the diet of people over 51 years, fruit provided11.7% [53]. Similar values were obtained for the average Dutch diet, according to the DutchNational Food Survey fruit, nuts and olives provided 11% of fiber [58]. For New Zealand,higher values were obtained, fruit provided 11.5% of dietary fiber, while nut and seedsprovided 1.3% [56]. Lower values for fiber from fruit and fruit products were indicatedin the average Australian diet. Fruit products and dishes provided 10.6% fiber for menand 13.8% fiber for women, including pome fruit (3.3% and 4.2%, respectively), citrus fruit(1.5% and 1.8%), stone fruit (1.1% and 1.6%), tropical fruit (2.5% and 3.4%), other fruit (0.9%and 1.3%) [55]. In the average English diet of 19–64 year old’s, fruit provided 8.4% of fiberand nuts and seeds provided 1.8%, in the diet of 65–74 year old’s these values were 11.6%and 1.6%, and in the diet of 75+ year old’s these values were 9.2% and 1.4% [57].
The almost 14% share of the analyzed food group in the provision of dietary fiber inthe Polish diet was determined by the generic structure of consumption and the importantplace of apples in the dietary traditions and fruit production in Poland. Apples are eaten inthe largest quantity of any fruit species consumed in households. They are a good sourceof fiber, containing on average 2 g of fiber in 100 g, including 1.5 g of soluble fiber, mainlypectin [45]. Citrus fruits also provide fiber in the form of pectin, while nuts and berries aremainly insoluble fiber. Nuts are a nutrient-dense food and a good source of dietary fiber.Its content ranges from 4 to 11 g per 100 g, and in standard serving satisfy 5–10% of thedaily fiber requirements [61].
4.2. Minerals and Vitamins
Potassium, iron, magnesium, and copper are minerals provided in the average Polishdiet by the analyzed food group in an amount exceeding 5% of the total intake.
Fruit and fruit products provided potassium in the average Polish diet at level of8.59%, with bananas contributing the most, at 2.13%, apples (1.43%), and citrus fruits(1.29%). Higher values were recorded in the average New Zealand diet, with fruits provid-ing 9.8% of potassium and nut seeds providing 0.9% [56]. In the Australian diet potassiumwas contributed by fruit products and dishes at 7.0% (men) and 9.6% (women), includ-ing pome fruit (1.2% and 1.6%, respectively), and tropical fruit (2.5 and 3.5%) [55]. InEngland, on the other hand, fruit provided 7.2% of the potassium in the average diet of19–64-year old’s, 8.6% in the diet of 65–74-year old’s, and 7.1% in the diet of those over 75.Nuts and seeds provided potassium at 1.2%, 1.0%, and 0.8%, respectively [57]. A lowerpotassium supply than in Poland was reported in the average Dutch and American diet.According to the Dutch National Food Survey, fruits, nuts, and olives contributed 7% ofpotassium [58], whereas in the US 5.8% in the average diet of adults [54] and 7.18% in thediet of adults ≥ 51 years [53]. A similar level of supply as for potassium from fruit andfruit products was recorded for copper. Fruit and fruit products provided 8.81% of thecopper, with citrus fruits (1.6%), berries (1.57%), dried fruits and nuts (1.52%), and bananas(1.27%) contributing the most. Of the diets analyzed, only the Dutch diet reported coppersupply. Fruits, nuts, and olives provided 9% of the copper [58].
Iron in the average Polish diet was provided by fruit and fruit products in the amountof 5.07%, including berries—1.01%, apples—0.82%, and citrus fruits—0.67%. Only inthe average New Zealand diet fruit and nut seeds provided a total of 5.6% iron [56].The other comparable diets had lower values: 4% of iron was provided by fruits, nutsand olives according to the Dutch National Food Survey [58], 1.72% in the total US diet,

Nutrients 2021, 13, 2079 11 of 18
adults ≥51 years [53], and 2.9% and 4.0% of iron from fruit products and dishes in theaverage Australian diet of men and women [55]. Differences were also noted in a nationallyrepresentative sample of the Spanish population: fruit provided 4.6% in men’s and 5.7% inwomen’s diets [59]. In the average English diet of people aged 19–64 years, fruit contributed2.9% of the iron, while nuts and seeds provided 1.5%. For those aged 65–74 and over 75,these values were 4.0% and 1.3% and 3.8% and 1.2%, respectively [57].
In the average Polish diet, fruit and fruit products provided 5.51% of the total magne-sium supply. Higher values were obtained in the Dutch National Food Survey, where fruits,nuts and olives accounted for 7% of magnesium supply [58]. On the other hand, accordingto the UK National Diet and Nutrition Survey, fruits provided 5.3% (19–64-year-olds), 6.1%(65–74-year-olds), and 5.2% (75+-year-olds) of magnesium, respectively. Nuts and seeds,on the other hand, accounted for a supply of 3.1%, 2.3%, and 2.2%, respectively [57]. Alower magnesium supply was found in the average diet of Americans over 51 years ofage (4.2%) [53] and Australians. According to the Australian National Food Survey, fruitproducts and dishes provided 3.7% of magnesium in the diet of men and 5.1% in the dietof women, including tropical fruit (1.4% and 2.1%) [55].
The nutritional significance of fruit and fruit products in the Polish diet is also relatedto the provision of vitamins. Here, vitamin C is the most important, with its share of almost25%, as well as vitamins B6 and E with less than 6%. Citrus fruits (8.0%), berries (6.0%),other fruits (3.5%), and apples (3.1%) contributed the most to the vitamin C supply. Allthe diets included in the comparison had a lower vitamin C intake from fruit and fruitproducts. For example, in the average Spanish diet, fruit provided 20.05% of vitamin C [62],in total US diet, adults ≥ 51 years—18.22% [53], and in the New Zealand diet 22.4% [56].According to the Dutch National Food Survey, fruits, nuts and olives provided 16% ofvitamin C [59], and according to the Australian National Food Survey, fruit products anddishes accounted for a supply of 16.9% of vitamin C in the diets of men and 21.1% in thediets of women, including pome fruit (1.5% and 1.8%), citrus fruit (7.6% and 8.3%), tropicalfruit (3.4% and 4.5%), and other fruit (2.3% and 3.6%) [55].
The supply of vitamin B6 from fruit and fruit products in Poland was 5.53% with thehighest contribution from bananas (2.78%). In an average Dutch diet, fruit contributed12.5% and nut seeds 0.6% [56], whereas in an average Spanish diet fruit provided 8.8%. [63].A comparable vitamin B6 supply from the group of fruit and fruit products was obtainedin the total US diet, adults ≥ 51 years—5.92% [53].
Vitamin E from fruit and fruit products was provided to the average Polish diet inthe amount of 5.53%, the largest shares were provided by apples (1.19%), and dried fruitsand nuts (1.45%). Two studies reported lower vitamin E intake, i.e., 4.81% in the averageSpanish diet [62] and 2.63% in the total US diet, adults ≥ 51 years [53]. However, in theaverage Dutch diet, fruits, nuts and olives provided 6% vitamin E [59], whereas in the NewZealand diet, fruits provided 7.2% vitamin E, nuts and seeds 2.4% [56].
Comparing the results of our own study with the nutritional value of diets in othercountries did not show a clear differentiation, as the contribution of a food group to thenutritional value of a diet depends on the consumption pattern, both in terms of quantityand variety.
4.3. Fruit and Fruit Products in the Polish Diet and Public Health Issues
The cluster analysis showed that more than 2/3 of the population was in Cluster no. 1with the lowest consumption of fruit and fruit products. This group was dominated byhouseholds with low and average income (66%), the largest number of households (almosthalf) represented the two lowest levels of education, and the largest number in relationto the other clusters were white-collar workers, farmers, and recipients of social benefits.The consumption pattern in Polish households is strongly determined by income situationand sociodemographic characteristics [64–66]. The coefficient of income elasticity of fruitconsumption is high, so an improvement in the material situation of households wouldcontribute to an increase in fruit consumption [67,68]. Data from 2016 HBS [40] show that

Nutrients 2021, 13, 2079 12 of 18
fruit and fruit products consumption in the fifth income group of households (the seconddeterminant in the cluster analysis) is 2.3-fold higher than in the first quintile group. Byassortment group, the differences range from 3.6 times for processed fruits, 2.8 times forberries, 2.5 times for citrus fruits and bananas (together) to 1.6 times for apples. The thirdfactor was the degree of urbanization, and, in this case, consumption was highest in thelargest cities, 40% higher than in the villages, where it was paradoxically lowest.
In the households of Cluster no. 1, fruit is eaten mainly in autumn and winter when itis relatively cheap, but even so, the average daily intake of all analyzed nutrients, energyand fiber was lowest here. The highest indices generally applied to households fromCluster no. 4 (high income and education level), and the differences between these clustersin the intake of nutrients from fruit and its products were more than double or even 3-fold (calcium and iron). In these households (also from Cluster no. 3) fruit consumptiondominates in the spring and summer months, which was related to the appearance ofvarious types of berries on the market in the following months.
A survey among young adult Poles (18–35 years old, equal proportions of both sexes)showed that almost half eat fruit at most once a day and only 7.5% eat it 4–5 times a day.It also found that men ate significantly less fruit and fewer vegetables than women [69].The results of the national survey on fruit and vegetable consumption conducted in 2020–2021 [70] showed that almost all respondents (98%) know that vegetables and fruit areworth eating. Half of those surveyed know their health benefits (they provide vitamins,minerals, and antioxidants), 37% appreciate their taste and know that they are the basisof a healthy diet, and 30% believe they have a beneficial effect on health, well-being, andappearance. At the same time 3
4 do not know how much fruit and vegetables one shouldeat. Half of the respondents eat very little fruit and vegetables because the stereotypethat preparing fruit and vegetables is difficult and time-consuming is repeated. Mostrespondents have a specific set of vegetables and fruit that must be at home. It is worthnoting, however, that vegetables and fruit are often bought on impulse, when they appealor are spotted while shopping. Fruit and vegetables are rarely treated as a main meal towhich other ingredients are chosen. Studies have shown that meals eaten throughout theday contain practically no dishes in which fruit and vegetables are the leading ingredient.The opposite is true—they are usually only a decorative addition and may even be absent.
These facts reflect the two main characteristics of the consumption of fruit and fruitproducts in Poland—low levels and high seasonality. For years, Poland has had a kindof fruit paradox, with very high production and very low consumption. Our country isthe largest producer of apples in the EU and the third largest in the world (after Chinaand the USA). We also lead Europe in the production of sour cherries, some berry fruits(currants, raspberries, gooseberries), and we are second in the production of strawberriesand blueberries. With a share exceeding 50%, Poland is also the leading producer offrozen fruit and concentrated juices from soft fruit [71]. Despite this high fruit production,consumption has for years remained at one of the lowest levels in the EU. The averagemonthly household consumption was 3.66 kg/person, or 122 g/person per day, including36 g of apples, 19 g of bananas, and 22 g of citrus fruit (in 2016). This is therefore on average1.5 portions, calculated according to the generally accepted standards suggested by theWHO. Consumption data at the level of food balances are not optimistic either—in 2016 itwas 54 kg per year [72], or an average of 148 g per day, which amounts to 1.85 portions.This includes the additional amount of fruit eaten outside the home (in food service sector),but also the loss and waste of fruit in the supply chain. In 2019, balance data show a 7%increase (58 kg/person or 159 g/person/day), achieving two portions of fruit available forconsumption. With this level of consumption, Poland is at the bottom of the EU countries.Fruit and nuts consumption is higher in all countries whose data we confront with theresults of our analysis. The FAOSTAT database [73] in 2016 for Poland reports a fruit supplyof 56.61 kg/person and a nut supply of 0.96 kg/person. The highest supply of fruit wasreported in the Netherlands, 110.24 kg/person, and nuts in Spain, 7.14 kg/person.

Nutrients 2021, 13, 2079 13 of 18
The largest seasonal variations (own calculations, 2016 data) are found in the consump-tion of berries: the relative amplitude of variation (showing the spread of consumptionlimits) was 35.4, the average relative deviation (showing how many percent each month ofthe year deviates from the monthly average) was 79%. Slightly lower variations are foundin the consumption of citrus fruits (ratios of 8.9 and 61%, respectively) and apples (3.2and 21%), and the lowest for bananas (1.4 and 8%). The occurrence of seasonality in thegenerally low intake of fruit means that the supply of vitamins, especially vitamin C andbioactive compounds from fruit may be inadequate during the autumn and winter months.The role of these foods in the provision of vitamin C cannot be overestimated. In the Polishdiet it is the second source of this vitamin (23.7%), after vegetables with preserves (37.7%)and before potatoes (14.1%) [37]. Vitamin C must be supplied with food, because due to thelack of L-gulonolactone oxidase in humans, the synthesis of L-ascorbic acid is not possible.In addition, it is one of the most labile vitamins, sensitive to increased temperature, oxygen,certain enzymes, and metal ions [74]. Representative population studies do not providedata on the intake of non-nutritive bioactive compounds contained in fruit, which showbeneficial effects on many human body functions. The state of current scientific knowledgegives strong evidence that eating fruit and vegetables, as well as wholegrains and fiber,play a crucial role in protecting against certain cancers, as well as weight gain, overweightand obesity [75].
The health monitoring of British adults examined the associations between dietaryfiber intake and sources from food and four measures of body composition (body massindex, body composition, waist circumference, C-reactive protein). Fruit fiber was theonly source of fiber that was consistently inversely associated with all measures of bodycomposition, while whole grain sources of fiber were inversely associated with three, andvegetables (including pulses) with two [76]. In the average Polish diet, fruit is the thirdsource of fiber (13.7% of total intake), after cereal products (48.5%) [33] and vegetables(22.7%) and before potatoes (9.1%) [37]. The fiber content of food is rather low, so it mustbe collected from a wide variety of dietary fiber sources, both relatively high-fiber and low-fiber foods [77]. Recommendations for adults in different countries indicate a fiber intakeof 18–38 g/day, and WHO/FAO [78] in its recommendations for the world population setthe intake at 25 g/day. Fiber in the Polish diet is a deficient component (17.6 g/person/dayaccording to our calculations), which is common in highly developed countries.
The demand to increase fruit consumption for health reasons may bring the risk ofincreasing the intake of free sugars from fruit and fruit products. Current recommenda-tions focus on limiting the intake of free sugars, which include sugars naturally present inhoney, syrups, fruit juices, and fruit juice concentrates, together with monosaccharides anddisaccharides added to foods and beverages by the manufacturer, cook or consumer [79].Excessive consumption of fructose in humans and animals have been associated withadverse metabolic effects. However, only some fruits, pears, and apples, are rich in fructose.Fructose, as commonly consumed in mixed-carbohydrate sources, does not exert specificmetabolic effects that could account for weight gain [80]. The consumption of fruit issometimes wrongly associated with a risk of overweight or obesity, since eating fruit is es-sential for providing beneficial micronutrients, fiber, and many bioactive compounds withhigh antioxidant activity. The health benefits argue for an increase in fruit consumption,especially those low in free sugars, and a reduction in fruit juices, which can make up oneportion of the five recommended.
Among the dietary mistakes most frequently made by Poles, too little intake ofvegetables, fruit, and nuts is indicated. That is why, among others, the dietary guidelinesfor the Polish population have undergone significant changes in 2020, in terms of graphics(changing the pyramid to a plate of healthy nutrition) and content [81]. It is recommendedthat vegetables and fruit should constitute half of the weight of food consumed per day (halfof the plate). For the first time, it has been quantitatively indicated that 400 g of fruit andvegetables is the daily minimum, with more vegetables than fruit, and the more the better.The health benefits of eating different colored fruit and vegetables were also highlighted.

Nutrients 2021, 13, 2079 14 of 18
For health and environmental reasons (the first verbal reference to environmental aspects)it was recommended to eat pulses and nuts instead of meat. Therefore, in our opinion, nutsand seeds should be a separate group in the HBS methodology so that changes in theirconsumption can be tracked.
In the context of the high proportion of free sugars from fruit and fruit products in thecurrent diet, it should be noted that the recommended increase in fruit intake should beone of many changes in dietary structure. In the context of public health, both dimensionsof diet—quantitative and qualitative—are important.
4.4. Strengths and Limitations of Our Study
The advantage of our research is the sample size of 2016 HBS (the largest researchsample in Poland), the highest number of listed products and product groups (91), constantapproach to the methodology implemented for many years and improved, as well asrepresentative sample selection. Household surveys are conducted using a random samplewithin a representative survey method that allows for generalizability of the results. TheHBS records monthly consumption; each household participates in the survey and recordsthe quantity (and cost) of all food products obtained for consumption in the household fora period of one month.
However, there are some limitations in the survey methodology. The self-recordingof consumption information in the diary can lead to under and/or overestimation of thedata, even though HBS has well-developed procedures to control all records. Controlshave increased in recent years due to the move to an electronic-only system for monitoringconsumption and making records. Another limitation may relate to the quality of the foodconsumption table. We used the current edition of the “Food Composition and NutritionalValue Tables” (2017) as a nutritional database to convert 91 products and product groupsinto energy and nutrients. This version of the tables is significantly revised, incorporatingnew products and technological modifications. This may affect the difficulty in comparingcurrent results with data from earlier years. In addition, our calculations are based onhousehold food consumption and do not consider eating out.
The limitations of survey methods listed above are common and typical. However,household budget surveys are the only such comprehensive and representative method ofcollecting data on food consumption and other living conditions of the Polish population.Owing to this and the analyses of subsequent food groups undertaken, our results mayserve to develop or verify dietary recommendations and educational programs from thepoint of view of public health.
5. Conclusions
Poland is a country with an under-consumption of fruit, both in terms of dietaryrecommendations and health benefits, and in relation to its harvest and supply. Despitethis, our research has shown the importance of fruit and fruit products, including nuts,in the average Polish diet. They are the second source of vitamin C and the third sourceof dietary fiber, and provide over 5% of some minerals (potassium, iron, magnesium,copper), as well as vitamin B6 and vitamin E. Eating fruit of any kind, regardless of tastepreferences, has health significance in the prevention of chronic diet-related diseases. Thegreater the variety, the higher the health benefits. Therefore, current dietary guidelines inmany countries, including Poland, focus on plant-based diets to eat complex carbohydrate-containing foods, including grains, vegetables, fruits, pulses, nuts, and seeds to providethe body with fiber, micronutrients, and bioactive compounds. Our research has revealedimportant barriers to increasing fruit consumption. These are mainly the seasonality ofsupply, which affects the seasonality of fresh fruit consumption and household income.This knowledge is worth using in programmes to promote an increase in the level andvariety of fruit consumption. An appropriate message, including culinary fruit workshops,should be targeted at all population groups.

Nutrients 2021, 13, 2079 15 of 18
Author Contributions: K.R. and H.G.-W. were responsible for the article design, literature review,result description, and discussion; J.K. contributed to introduction and literature review W.L. wasresponsible for all calculations based on the primary 2016 HBS. All authors have read and agreed tothe published version of the manuscript.
Funding: The project was financed by the Polish Ministry of Science and Higher Education within fundsof Institute of Human Nutrition, Warsaw University of Life Sciences (WULS) for scientific research.
Institutional Review Board Statement: The data we used are obtained each year from the statisticaloffice in Poland (Statistics Poland), based on annual agreements signed between the Institute ofHuman Nutrition, Warsaw University of Life Sciences and Statistics Poland in Warsaw.
Informed Consent Statement: Statistics Poland is legally, ethically, technically and organizationallyresponsible for the proper conduct of the survey. The scope of the survey has its legal basis, namely:Act of 29 June 1995 on public statistics (Journal of Laws 2016, item 1068) and annual regulations ofthe Polish Council of Ministers on the program of official statistical survey.
Data Availability Statement: Data are available at the Department of Food Market and Consumptionresearch due to annual agreements signed between the Institute of Human Nutrition, WarsawUniversity of Life Sciences and Statistics Poland in Warsaw.
Acknowledgments: The authors are grateful to the Statistics Poland due to official agreement relatedto the 2016 HBS.
Conflicts of Interest: The authors declare no conflict of interest.
References1. Fardet, A.; Richonnet, C.; Mazur, A. Association between consumption of fruit or processed fruit and chronic diseases and their
risk factors: A systematic review of meta-analyses. Nutr. Rev. 2019, 77, 376–387. [CrossRef]2. He, F.J.; Nowson, C.A.; Lucas, M.; MacGregor, G.A. Increased consumption of fruit and vegetables is related to a reduced risk of
coronary heart disease: Meta-analysis of cohort studies. J. Hum. Hypertens. 2007, 21, 717–728. [CrossRef] [PubMed]3. Aune, D.; Giovannucci, E.; Boffetta, P.; Fadnes, L.T.; Keum, N.N.; Norat, T.; Greenwood, D.C.; Riboli, E.; Vatten, L.J.; Tonstad, S.
Fruit and vegetable intake and the risk of cardiovascular disease, total cancer and all-cause mortality-A systematic review anddose-response meta-analysis of prospective studies. Int. J. Epidemiol. 2017, 46, 1029–1056. [CrossRef]
4. Li, B.; Li, F.; Wang, L.; Zhang, D. Fruit and Vegetables Consumption and Risk of Hypertension: A Meta-Analysis. J. Clin. Hypertens.2016, 18, 468–476. [CrossRef]
5. Mamluk, L.; O’Doherty, M.G.; Orfanos, P.; Saitakis, G.; Woodside, J.V.; Liao, L.M.; Sinha, R.; Boffetta, P.; Trichopoulou, A.; Kee, F.Fruit and vegetable intake and risk of incident of type 2 diabetes: Results from the consortium on health and ageing network ofcohorts in Europe and the United States (CHANCES). Eur. J. Clin. Nutr. 2017, 71, 83–91. [CrossRef]
6. Wang, T.; Cai, H.; Sasazuki, S.; Tsugane, S.; Zheng, W.; Rin Cho, E.; Ha Jee, S.; Michel, A.; Pawlita, M.; Xiang, Y.-B.; et al. Fruit andVegetable Consumption, Helicobacter pylori Antibodies, and Gastric Cancer Risk: A Pooled Analysis of Prospective Studies inChina, Japan and Korea. Int. J. Cancer 2017, 140, 591–599. [CrossRef]
7. Koushik, A.; Hunter, D.J.; Spiegelman, D.; Beeson, W.L.; Van Den Brandt, P.A.; Buring, J.E.; Calle, E.E.; Cho, E.; Fraser, G.E.;Freudenheim, J.L.; et al. Fruits, vegetables, and colon cancer risk in a pooled analysis of 14 cohort studies. J. Natl. Cancer Inst.2007, 99, 1471–1483. [CrossRef]
8. Vieira, A.R.; Abar, L.; Vingeliene, S.; Chan, D.S.M.; Aune, D.; Navarro-Rosenblatt, D.; Stevens, C.; Greenwood, D.; Norat, T. Fruits,vegetables and lung cancer risk: A systematic review and meta-analysis. Ann. Oncol. 2016, 27, 81–96. [CrossRef] [PubMed]
9. Hosseini, B.; Berthon, B.S.; Wark, P.; Wood, L.G. Effects of fruit and vegetable consumption on risk of asthma, wheezing andimmune responses: A systematic review and meta-analysis. Nutrients 2017, 9, 341. [CrossRef] [PubMed]
10. Schwingshackl, L.; Hoffmann, G.; Kalle-Uhlmann, T.; Arregui, M.; Buijsse, B.; Boeing, H. Fruit and vegetable consumption andchanges in anthropometric variables in adult populations: A systematic review and meta-analysis of prospective cohort studies.PLoS ONE 2015, 10, e0140846. [CrossRef] [PubMed]
11. Jiang, X.; Huang, J.; Song, D.; Deng, R.; Wei, J.; Zhang, Z. Increased consumption of fruit and vegetables is related to a reducedrisk of cognitive impairment and dementia: Meta-analysis. Front. Aging Neurosci. 2017, 9, 18. [CrossRef]
12. Głabska, D.; Guzek, D.; Groele, B.; Gutkowska, K. Fruit and vegetable intake and mental health in adults: A systematic review.Nutrients 2020, 12, 115. [CrossRef]
13. Liu, X.; Yan, Y.; Li, F.; Zhang, D. Fruit and vegetable consumption and the risk of depression: A meta-analysis. Nutrition 2016, 32,296–302. [CrossRef] [PubMed]
14. Burlingame, B.; Dernini, S. Sustainable Diets and Biodiversity Directions and Solutions for Policy, Research and Action; Burlingame, B.,Dernini, S., Eds.; Nutrition and Consumer Protection Division FAO: Rome, Italy, 2012; ISBN 9789251072882.
15. WHO. Promoting Fruit and Vegetable Consumption around the World. Available online: https://www.who.int/dietphysicalactivity/fruit/en/ (accessed on 26 April 2021).

Nutrients 2021, 13, 2079 16 of 18
16. Eat Well–NHS. Available online: https://www.nhs.uk/live-well/eat-well/ (accessed on 21 January 2021).17. Vegetables. MyPlate. Available online: https://www.myplate.gov/eat-healthy/vegetables (accessed on 28 April 2021).18. Willett, W.; Rockström, J.; Loken, B.; Springmann, M.; Lang, T.; Vermeulen, S.; Garnett, T.; Tilman, D.; DeClerck, F.; Wood, A.; et al.
Food in the Anthropocene: The healthy diets from sustainable food systems. Summ. Rep. EAT-Lancet Comm. 2019, 393, 447–492.19. Fruits and Vegetables Crucial for Healthy Lives, Sustainable World: Guterre. UN News. Available online: https://news.un.org/
en/story/2020/12/1080492 (accessed on 28 April 2021).20. Dreher, M.L. Whole fruits and fruit fiber emerging health effects. Nutrients 2018, 10, 1833. [CrossRef]21. IARC. IARC Handbooks of Cancer Prevention. Fruit and Vagetables; IARC: Lyon, France, 2003; ISBN 978-92-832-3008-3.22. Aune, D.; Keum, N.N.; Giovannucci, E.; Fadnes, L.T.; Boffetta, P.; Greenwood, D.C.; Tonstad, S.; Vatten, L.J.; Riboli, E.; Norat, T.
Nut consumption and risk of cardiovascular disease, total cancer, all-cause and cause-specific mortality: A systematic review anddose-response meta-analysis of prospective studies. BMC Med. 2016, 14, 207. [CrossRef]
23. Gawecki, J.; Hryniewiecki, L.; Berger, S. Human Nutrition; PWN: Warsaw, Poland, 2008; ISBN 978-83-01-13947-6/978-83-01-13954-4.24. FAO—News Article: FAO Launches the UN’s International Year of Fruits and Vegetables 2021. Available online: http://www.fao.
org/news/story/en/item/1364762/icode/ (accessed on 28 April 2021).25. Barrett, D.M.; Lloyd, B. Advanced preservation methods and nutrient retention in fruits and vegetables. J. Sci. Food Agric. 2012,
92, 7–22. [CrossRef] [PubMed]26. Vincente, A.R.; Manganaris, G.A.; Ortiz, C.M.; Sozzi, G.O.; Crisosto, C.H. Nutritional Quality of Fruits and Vegetables. In
Postharvest Handling: A Systems Approach; Elsevier Inc.: Amsterdam, The Netherlands, 2014; pp. 69–122. ISBN 9780124081376.27. Cardoso, P.C.; Tomazini, A.P.B.; Stringheta, P.C.; Ribeiro, S.M.R.; Pinheiro-Sant’Ana, H.M. Vitamin C and carotenoids in organic
and conventional fruits grown in Brazil. Food Chem. 2011, 126, 411–416. [CrossRef]28. Wolfe, K.L.; Kang, X.; He, X.; Dong, M.; Zhang, Q.; Liu, R.H. Cellular antioxidant activity of common fruits. J. Agric. Food Chem.
2008, 56, 8418–8426. [CrossRef]29. Dhalaria, R.; Verma, R.; Kumar, D.; Puri, S.; Tapwal, A.; Kumar, V.; Nepovimova, E.; Kuca, K. Bioactive Compounds of Edible
Fruits with Their Anti-Aging Properties: A Comprehensive Review to Prolong Human Life. Antioxidants 2020, 9, 1123. [CrossRef]30. McGartland, C.P.; Robson, P.J.; Murray, L.J.; Cran, G.W.; Savage, M.J.; Watkins, D.C.; Rooney, M.M.; Boreham, C.A. Fruit and
vegetable consumption and bone mineral density: The Northern Ireland Young Hearts Project. Am. J. Clin. Nutr. 2004, 80,1019–1023. [CrossRef]
31. Prynne, C.J.; Mishra, G.D.; O’Connell, M.A.; Muniz, G.; Laskey, M.A.; Yan, L.; Prentice, A.; Ginty, F. Fruit and vegetable intakesand bone mineral status: A cross-sectional study in 5 age and sex cohorts. Am. J. Clin. Nutr. 2006, 83, 1420–1428. [CrossRef]
32. Laskowski, W.; Górska-Warsewicz, H.; Kulykovets, O. Meat, Meat Products and Seafood as Sources of Energy and Nutrients inthe Average Polish Diet. Nutrients 2018, 10, 1412. [CrossRef]
33. Laskowski, W.; Górska-Warsewicz, H.; Rejman, K. How Important are Cereals and Cereal Products in the Average Polish Diet?Nutrients 2019, 11, 679. [CrossRef] [PubMed]
34. Górska-Warsewicz, H.; Rejman, K.; Laskowski, W.; Czeczotko, M. Milk and Dairy Products and Their Nutritional Contribution tothe Average Polish Diet. Nutrients 2019, 11, 1771. [CrossRef]
35. Rejman, K.; Górska-Warsewicz, H.; Czeczotko, M.; Laskowski, W. Nonalcoholic Beverages as Sources of Nutrients in the AveragePolish Diet. Nutrients 2020, 12, 1262. [CrossRef]
36. Górska-Warsewicz, H.; Rejman, K.; Laskowski, W. Butter, Margarine, Vegetable Oils, and Olive Oil in the Average Polish Diet.Nutrients 2019, 11, 2935. [CrossRef]
37. Górska-Warsewicz, H.; Rejman, K.; Kaczorowska, J.; Laskowski, W. Vegetables, Potatoes and Their Products as Sources of Energyand Nutrients to the Average Diet in Poland. Int. J. Environ. Res. Public Health 2021, 18, 3217. [CrossRef] [PubMed]
38. Górska-Warsewicz, H.; Laskowski, W.; Kulykovets, O.; Kudlinska-Chylak, A.; Czeczotko, M.; Rejman, K. Food Products asSources of Protein and Amino Acids—The Case of Poland. Nutrients 2018, 10, 1977. [CrossRef]
39. Górska-Warsewicz, H.; Rejman, K.; Laskowski, W.; Kowalcze, K. Food sources of potassium in the average Polish diet. Nutrients2019, 11, 2905. [CrossRef] [PubMed]
40. CSO. Household Budget Surveys in 2016; Central Statistical Office: Warsaw, Poland, 2017; ISSN 0208-9793.41. Kowrygo, B.; Górska-Warsewicz, H.; Berger, S. Evaluation of eating patterns with different methods: The Polish experience.
Appetite 1999, 32, 86–92. [CrossRef] [PubMed]42. CSO. Household Budget Surveys in 2006; Central Statistical Office: Warsaw, Poland, 2007.43. CSO. Household Budget Survey in 2013; Central Statistical Office: Warsaw, Poland, 2013; ISSN 0208-9793.44. CSO. Methodology of Household Survey; Barlik, M., Siwiak, K., Eds.; Central Statistical Office, Zakład Wydawnictw Statystycznych:
Warsaw, Poland, 2011. (In Polish)45. Kunachowicz, H.; Przygoda, B.; Nadolna, I.; Iwanow, K. Nutritive Tables for Foods and Meals, 4th ed.; PZWL Wydawnictwo
Lekarskie: Warsaw, Poland, 2017; ISBN 9788320053111. (In Polish)46. World Health Organization. The Science behind the Sweetness in Our Diets. Available online: https://www.who.int/bulletin/
volumes/92/11/14-031114.pdf (accessed on 1 June 2021).47. Lang, M. Efficient R Programming. J. Stat. Softw. 2017, 80. [CrossRef]48. Fox, J.; Leanage, A. R and the Journal of Statistical Software. J. Stat. Softw. 2016, 73, 1–13. [CrossRef]49. Dubes, R.; Jain, A.K. Clustering Methodologies in Exploratory Data Analysis. Adv. Comput. 1980, 19, 113–228. [CrossRef]
Nutrients 2021, 13, 2079 17 of 18
50. Wilks, D.S. Cluster Analysis. Int. Geophys. 2011, 100, 603–616.51. Rojas, R. 15 Kohonen Networks 15.1. In Neural Networks; Springer: Berlin, Germany, 1996; pp. 391–412. ISBN 9783540605058.52. Groele, B.; Głabska, D.; Gutkowska, K.; Guzek, D. Mother’s fruit preferences and consumption support similar attitudes and
behaviors in their children. Int. J. Environ. Res. Public Health 2018, 15, 2833. [CrossRef]53. Papanikolaou, Y.; Fulgoni, V. Grains Contribute Shortfall Nutrients and Nutrient Density to Older US Adults: Data from the
National Health and Nutrition Examination Survey, 2011–2014. Nutrients 2018, 10, 534. [CrossRef]54. O’Neil, C.E.; Keast, D.R.; Fulgoni, V.L.; Nicklas, T.A. Food sources of energy and nutrients among adults in the US: NHANES
2003-2006. Nutrients 2012, 4, 2097–2120. [CrossRef]55. McLennan, W.; Podger, A. National Nutrition Survey Nutrient Intakes and Physical Measurements; Australian Bureau of Statistics:
Canberra, Australia, 1998; ISBN 0642257248.56. A Focus on Nutrition: Key Findings from the 2008/09 NZ Adult Nutrition Survey. Ministry of Health NZ. Available online: https:
//www.health.govt.nz/publication/focus-nutrition-key-findings-2008-09-nz-adult-nutrition-survey (accessed on 30 June 2019).57. Roberts, C.; Steer, T.; Maplethorpe, N.; Cox, L.; Meadows, S.; Nicholson, S.; Page, P.; Swan, G. National Diet and Nutrition Survey:
Results from Years 7 and 8 (Combined) of the Rolling Programme (2014/2015–2015/2016); Public Health England: London, UK, 2018.58. Van Rossum, C.T.M.; Fransen, H.; Verkaik-Kloosterman, J.; Buurma-Rethans, E.J.M.; Ocké, M.C. Dutch National Food
Consumption Survey 2007–2010. Diet of Children and dults Aged 7 to 69 Years; Ministry of Health, Welfare and Sport:The Hague, The Netherlands, 2011.
59. Samaniego-Vaesken, L.; Partearroyo, T.; Olza, J.; Aranceta-Bartrina, J.; Gil, Á.; González-Gross, M.; Ortega, R.M.; Serra-Majem, L.;Varela-Moreiras, G. Iron Intake and Dietary Sources in the Spanish Population: Findings from the ANIBES Study. Nutrients 2017,9, 203. [CrossRef]
60. Nutrition Facts for Olives, Green, Canned or Bottled, Pickled, Recommended Daily Values and Analysis. Available online:https://www.nutritionvalue.org/Olives%2C_green%2C_canned_or_bottled%2C_pickled_nutritional_value.html (accessed on30 April 2021).
61. Ros, E. Health Benefits of Nut Consumption. Nutrients 2010, 2, 652–682. [CrossRef]62. Olza, J.; Aranceta-Bartrina, J.; González-Gross, M.; Ortega, R.M.; Serra-Majem, L.; Varela-Moreiras, G.; Gil, Á. Reported dietary
intake and food sources of zinc, selenium, and vitamins a, e and c in the spanish population: Findings from the anibes study.Nutrients 2017, 9, 697. [CrossRef]
63. Mielgo-Ayuso, J.; Aparicio-Ugarriza, R.; Olza, J.; Aranceta-Bartrina, J.; Gil, Á.; Ortega, R.; Serra-Majem, L.; Varela-Moreiras, G.;González-Gross, M. Dietary Intake and Food Sources of Niacin, Riboflavin, Thiamin and Vitamin B6 in a Representative Sampleof the Spanish Population. The Anthropometry, Intake, and Energy Balance in Spain (ANIBES) Study. Nutrients 2018, 10, 846.[CrossRef] [PubMed]
64. Rejman, K. Food Consumption and Nutritional Behaviour among Low-Income Population in Poland and Implications for Nutrition Policy;WULS: Warsaw, Poland, 2011; ISBN 978-83-7583-211-2.
65. Gałazka, M. Wpływ społeczno-demograficznych determinantów kształtowania sie wydatków na zywnosc i napoje bezalkoholowew gospodarstwach domowych w Polsce. Rocz. Ekon. Kujawsko-Pomorskiej Szk. Wyzszej w Bydgoszczy 2012, 5, 223–239.
66. Kułyk, P.; Michałowska, M. Uwarunkowania i kierunki zmian z spozyciu zywnosci w województwie lubuskim. Rocz. Nauk. Ekon.Rol. i Rozw. Obsz. Wiej. 2017, 104, 83–94. [CrossRef]
67. Kwasek, M. Dochodowa elastycznosc popytu na zywnosc. Wiadomosci Stat. 2008, 53, 39–51.68. Stanisławska, J.; Wysocki, F. Dochodowa elastycznosc wydatków na artykuły zywnosciowe w gospodarstwach domowych
rolników według grup dochodowych. Roczniki Naukowe Stowarzyszenia Ekonomistów Rolnictwa i Agrobiznesu 2011, 13, 315–319.69. Maciejewska, D.; Czerwinska, M.; Banaszczak, M.; Ryterska, K.; Łukomska, A.; Budrewicz, S.; Skowronek, M.; Stachowski, A.;
Stachowska, E. Fruit and vegetable consumption among the young Polish population. Pomeranian J. Life Sci. 2016, 62, 57–61.[CrossRef] [PubMed]
70. National Association of Fruit and Vegetable Producer Groups. Vegetables and Fruit in the Polish Diet; National Research ofVegetable and Fruit Consumption. Available online: https://www.producencipapryki.pl/files/news/2020/BADANIA%2027.02.2020.pdf (accessed on 20 April 2021).
71. Rolnictwo i Gospodarka Zywnosciowa w Polsce—Ministerstwo Rolnictwa i Rozwoju Wsi—Portal Gov.pl. Available online:https://www.gov.pl/web/rolnictwo/rolnictwo-i-gospodarka-zywnosciowa-w-polsce (accessed on 1 May 2021).
72. CSO. Statistical Yearbook of the Republic of Poland 2018; Central Statistical Office: Warsaw, Poland, 2019.73. FAOSTAT. Food Balance Sheets, Data for 2018. Available online: http://www.fao.org/faostat/en/#data/FBS (accessed on
6 February 2021).74. Agostoni, C.; Berni Canani, R.; Fairweather-Tait, S.; Heinonen, M.; Korhonen, H.; La Vieille, S.; Marchelli, R.; Martin, A.; Naska,
A.; Neuhäuser-Berthold, M.; et al. Scientific Opinion on Dietary Reference Values for vitamin C. EFSA J. 2013, 11, 3418–3420.75. Diet, Nutrition, Physical Activity and Cancer: A Global Perspective. About the Third Expert Report. Available online: https:
//www.wcrf.org/dietandcancer/about (accessed on 26 March 2020).76. Gibson, R.; Eriksen, R.; Chambers, E.; Gao, H.; Aresu, M.; Heard, A.; Chan, Q.; Elliott, P.; Frost, G. Intakes and food sources of
dietary fibre and their associations with measures of body composition and inflammation in UK adults: Cross-sectional analysisof the airwave health monitoring study. Nutrients 2019, 11, 1839. [CrossRef] [PubMed]

Nutrients 2021, 13, 2079 18 of 18
77. Krusinska, B.; Kowalkowska, J.; Wadolowska, L.; Wuenstel, J.W.; Slowinska, M.A.; Niedzwiedzka, E. Fibre-related dietarypatterns: Socioeconomic barriers to adequate fibre intake in Polish adolescents. A short report. Nutrients 2017, 9, 590. [CrossRef][PubMed]
78. WHO. Diet, Nutrition and the Prevention of Chronic Diseases; Report of a Joint WHO/FAO Expert Consultation; WHO: Geneva,Switzerland, 2003; ISBN 924120916X.
79. World Health Organization Guideline: Sugars intake for adults and children. World Heal. Organ. 2018, 57, 1716–1722. [CrossRef]80. Van Buul, V.J.; Tappy, L.; Brouns, F.J.P.H. Misconceptions about fructose-containing sugars and their role in the obesity epidemic.
Nutr. Res. Rev. 2014, 27, 119–130. [CrossRef] [PubMed]81. National Center for Nutrition Education Recommendations for Healthy Eating. Available online: https://ncez.pl/abc-zywienia-
/zasady-zdrowego-zywienia/talerz-zdrowego-zywienia (accessed on 20 April 2021). (In Polish).