Improving the Sensory, Nutritional and Physicochemical ...
114
Edited by Improving the Sensory, Nutritional and Physicochemical Quality of Fresh Meat Paulo Eduardo Sichetti Munekata Printed Edition of the Special Issue Published in Foods www.mdpi.com/journal/foods
-
Upload
khangminh22 -
Category
Documents
-
view
1 -
download
0
Transcript of Improving the Sensory, Nutritional and Physicochemical ...

Edited by
Improving the Sensory, Nutritional and Physicochemical Quality of Fresh Meat
Paulo Eduardo Sichetti Munekata
Printed Edition of the Special Issue Published in Foods
www.mdpi.com/journal/foods

Improving the Sensory, Nutritionaland Physicochemical Quality ofFresh Meat


Improving the Sensory, Nutritionaland Physicochemical Quality ofFresh Meat
Editor
Paulo Eduardo Sichetti Munekata
MDPI • Basel • Beijing • Wuhan • Barcelona • Belgrade • Manchester • Tokyo • Cluj • Tianjin
Editor
Paulo Eduardo Sichetti
Munekata
Meat Technology Center of
Galicia
Spain
Editorial Office
MDPI
St. Alban-Anlage 66
4052 Basel, Switzerland
This is a reprint of articles from the Special Issue published online in the open access journal Foods
(ISSN 2304-8158) (available at: https://www.mdpi.com/journal/foods/special issues/sensory
nutritional quality fresh meat).
For citation purposes, cite each article independently as indicated on the article page online and as
indicated below:
LastName, A.A.; LastName, B.B.; LastName, C.C. Article Title. Journal Name Year, Volume Number,
Page Range.
ISBN 978-3-0365-2287-6 (Hbk)
ISBN 978-3-0365-2288-3 (PDF)
© 2021 by the authors. Articles in this book are Open Access and distributed under the Creative
Commons Attribution (CC BY) license, which allows users to download, copy and build upon
published articles, as long as the author and publisher are properly credited, which ensures maximum
dissemination and a wider impact of our publications.
The book as a whole is distributed by MDPI under the terms and conditions of the Creative Commons
license CC BY-NC-ND.
Contents
About the Editor . . . . . . . . . . . . . . . . . . . . . . . . . . . . . . . . . . . . . . . . . . . . . . vii
Preface to ”Improving the Sensory, Nutritional and Physicochemical Quality of Fresh Meat” . ix
Paulo E. S. Munekata
Improving the Sensory, Nutritional and Physicochemical Quality of Fresh MeatReprinted from: Foods 2021, 10, 2060, doi:10.3390/foods10092060 . . . . . . . . . . . . . . . . . . . 1
Noemı Echegaray, Ruben Domınguez, Vasco A. P. Cadavez, Roberto Bermudez, Laura
Purrinos, Ursula Gonzales-Barron, Ettiene Hoffman and Jose M. Lorenzo
Influence of the Production System (Intensive vs. Extensive) at Farm Level on ProximateComposition and Volatile Compounds of Portuguese Lamb MeatReprinted from: Foods 2021, 10, 1450, doi:10.3390/foods10071450 . . . . . . . . . . . . . . . . . . . 3
Clement Burgeon, Alice Markey, Marc Debliquy, Driss Lahem, Justine Rodriguez, Ahmadou
Ly and Marie-Laure Fauconnier
Comprehensive SPME-GC-MS Analysis of VOC Profiles Obtained FollowingHigh-Temperature Heating of Pork Back Fat with Varying Boar Taint IntensitiesReprinted from: Foods 2021, 10, 1311, doi:10.3390/foods10061311 . . . . . . . . . . . . . . . . . . . 27
Mohamed F. Eshag Osman, Abdellatif A. Mohamed, Mohammed S. Alamri, Isam Ali
Mohamed Ahmed, Shahzad Hussain, Mohamed I. Ibraheem and Akram A. Qasem
Quality Characteristics of Beef Patties Prepared with Octenyl-Succinylated (Osan) StarchReprinted from: Foods 2021, 10, 1157, doi:10.3390/foods10061157 . . . . . . . . . . . . . . . . . . . 45
Christina Bakker, Keith Underwood, Judson Kyle Grubbs and Amanda Blair
Low-Voltage Electrical Stimulation of Beef Carcasses Slows Carcass Chilling Rate and ImprovesSteak ColorReprinted from: Foods 2021, 10, 1065, doi:10.3390/foods10051065 . . . . . . . . . . . . . . . . . . . 61
Kazem Alirezalu, Milad Yaghoubi, Leila Poorsharif, Shadi Aminnia, Halil Ibrahim Kahve,
Mirian Pateiro, Jose M. Lorenzo and Paulo E. S. Munekata
Antimicrobial Polyamide-Alginate Casing Incorporated with Nisin and ε-PolylysineNanoparticles Combined with Plant Extract for Inactivation of Selected Bacteria in Nitrite-FreeFrankfurter-Type SausageReprinted from: Foods 2021, 10, 1003, doi:10.3390/foods10051003 . . . . . . . . . . . . . . . . . . . 71
Yong Geum Shin, Dhanushka Rathnayake, Hong Seok Mun, Muhammad Ammar Dilawar,
Sreynak Pov and Chul Ju Yang
Sensory Attributes, Microbial Activity, Fatty Acid Composition and Meat Quality Traits ofHanwoo Cattle Fed a Diet Supplemented with Stevioside and Organic SeleniumReprinted from: Foods 2021, 10, 129, doi:10.3390/foods10010129 . . . . . . . . . . . . . . . . . . . 85
v


About the Editor
Paulo Eduardo Sichetti Munekata (Ph.D.) is a postdoctoral researcher at the Centro Tecnologico
de la Carne de Galicia, Ourense, Spain. He obtained his Ph.D. degree in Science of Food Engineering
(University of Sao Paulo/Brazil) in 2016. His main areas of interest are centered in Food Science and
Technology: Meat Science, Meat Processing, and Development of Healthier and Functional Foods.
He is editorial board member in the journals Foods, Antioxidants, and Frontiers in Animal Science. He
has published more than 200 scientific publications in peer-reviewed international journals, book
chapters, and communications in national and international congresses. He also co-edited 5 books
for international publishers and has h-index 29 in Scopus.
vii

Preface to ”Improving the Sensory, Nutritional and
Physicochemical Quality of Fresh Meat”
Advances in the current meat chain are necessary in our society due to the increasing demand
that require high quality foods. Consequently, meat producers and researchers are facing new and
complex challenges to attend the demand, produce high quality meat, and develop strategies to
increase its preservation. In this context, scientific advances are necessary to improve the knowledge
about key factors of the meat chain that are comprised of production systems, diet composition,
carcass management, volatile composition, microbial quality, and sensory analysis of fresh meat, as
well as meat processing. The e-book and Special Issue titled “Improving the Sensory, Nutritional and
Physicochemical Quality of Fresh Meat” is composed of six original papers about recent advances in the
area of Meat Science about these key factors.
Paulo Eduardo Sichetti Munekata
Editor
ix

foods
Editorial
Improving the Sensory, Nutritional and PhysicochemicalQuality of Fresh Meat
Paulo E. S. Munekata
���������������
Citation: Munekata, P.E.S.
Improving the Sensory, Nutritional
and Physicochemical Quality of Fresh
Meat. Foods 2021, 10, 2060. https://
doi.org/10.3390/foods10092060
Received: 24 August 2021
Accepted: 31 August 2021
Published: 1 September 2021
Publisher’s Note: MDPI stays neutral
with regard to jurisdictional claims in
published maps and institutional affil-
iations.
Copyright: © 2021 by the author.
Licensee MDPI, Basel, Switzerland.
This article is an open access article
distributed under the terms and
conditions of the Creative Commons
Attribution (CC BY) license (https://
creativecommons.org/licenses/by/
4.0/).
Centro Tecnológico de la Carne de Galicia, Rúa Galicia n◦ 4, Parque Tecnológico de Galicia, San Cibrao das Viñas,32900 Ourense, Spain; [email protected]
This Special Issue titled “Improving the Sensory, Nutritional and PhysicochemicalQuality of Fresh Meat” is comprised of six studies that explored different strategies toimprove the quality of fresh meat, as well as some aspects related to its further processing.
The increasing demand for high quality meat has pushed the professionals andresearchers of the meat production area to face new challenges. Consequently, advancescovering different stages of the meat production chain process and factors have been madeto increase the knowledge and develop strategies to produce and improve the preservationof high quality meat [1–3]. Therefore, studying the effect of production systems, dietcomposition, carcass management, volatile composition of fresh meat related to sensoryproperties and further processing are topics of interest in attempts to increase knowledgeabout meat quality and pave the way for strategic changes in the meat industry.
The meat production chain has many stages, starting with the rearing of animalsusing different systems and diets with optimized composition to favor the animal devel-opment and the production of meat with characteristics that are aligned with consumerpreferences [3]. Regarding the influence of the production system, Echegaray et al. [4]evaluated the composition and volatile composition of lamb meat produced in an intensiveor extensive system. Significant increases in intramuscular fat and protein content inlongissimus thoracis et lumborum were obtained from animals reared in an extensive systemin comparison to animals produced in an intensive system. The extensive system alsoled to a bigger accumulation of volatile composition in meat in relation to the intensivesystem. Interestingly, the authors also discussed the relation of intramuscular fat with thecomposition and content of lipid-derived volatile fraction, wherein these differences wereattributed to the presence of specific compounds in each diet (natural antioxidants, forinstance) and lipid fraction composition (unsaturated fatty acids and their susceptibilityto oxidation).
Another experiment in the context of animal production was carried out by Shin et al. [5]to characterize the effect of stevioside (bioactive compound naturally found in the leavesof Stevia rebaudiana) and organic selenium (a crucial component for the endogenous an-tioxidant system in humans and animals) on the quality of Hanwoo meat. These authorsobserved significant improvements in animal performance (especially in weight gain and fi-nal weight) by using these supplements. The characteristics of meat obtained from animalswith the supplemented diet was also improved due to the increase in protein, moisture,PUFA contents, redness, and oxidative stability, and the simultaneous reduction in totalcholesterol content, shear force, and drip loss. No major effects in sensory attributes offresh meat or microbial growth during storage were reported.
Moving forward in the meat production chain, the adequate processing of carcass isa necessary action in order to obtain high-quality meat [1]. In this sense, the experimentconducted by Bakker et al. [6] reported significant improvements in the tenderness andcolor of beef due to low-voltage electric stimulation of beef carcasses. Moreover, theauthors of this study also reported a non-significant impact in cooking loss between themeat control and electrically stimulated carcasses.
Foods 2021, 10, 2060. https://doi.org/10.3390/foods10092060 https://www.mdpi.com/journal/foods
1

Foods 2021, 10, 2060
The characteristics of meat, especially the sensory attributes, play a central role whenconsumers judge the acceptance of sensory attributes and the whole eating experience [7].One of the main factors in this context is the accumulation of unpleasant volatile com-pounds. This context was considered in the study carried out by Burgeon et al. [8], whoevaluated the formation of volatile compounds associated with the perception of boartaint (strong smell found in uncastrated male pigs associated with the presence of ska-tole and androstenone) in cooked pork. The authors observed higher concentrations ofandrostenone as the temperature was increased, which indicated a temperature depen-dence effect. However, the same effect was not reported for skatole. Additionally, studieswith further processing of meat were also included in order to explore healthier [9] andfunctional [10] meat-based foods.
The advances reported in these studies can be seen as meaningful contributions to thegeneration of knowledge of fresh meat quality and assist, to some extent, in the strategicdevelopment of meat production considering the consumer preferences and market trends.Finally, I would like to thank the authors for their submissions; express my sincere gratitudeto the reviewers for their time, effort, and insightful suggestions and comments duringthe reviewing process; and acknowledge the supportive, thoughtful, and expert assistanceof the associated editors of Foods throughout the preparation and management of thisSpecial Issue.
Funding: This research received no external funding.
Institutional Review Board Statement: Not applicable.
Informed Consent Statement: Not applicable.
Conflicts of Interest: The author declares no conflict of interest.
References
1. Pophiwa, P.; Webb, E.C.; Frylinck, L. A review of factors affecting goat meat quality and mitigating strategies. Small Rumin. Res.2020, 183, 106035. [CrossRef]
2. Tomasevic, I.; Djekic, I.; Font-i-Furnols, M.; Terjung, N.; Lorenzo, J.M. Recent advances in meat color research. Curr. Opin. FoodSci. 2021, 41, 81–87. [CrossRef]
3. Borgogno, M.; Favotto, S.; Corazzin, M.; Cardello, A.V.; Piasentier, E. The role of product familiarity and consumer involvementon liking and perceptions of fresh meat. Food Qual. Prefer. 2015, 44, 139–147. [CrossRef]
4. Echegaray, N.; Domínguez, R.; Cadavez, V.A.P.; Bermúdez, R.; Purriños, L.; Gonzales-Barron, U.; Hoffman, E.; Lorenzo, J.M.Influence of the production system (Intensive vs. extensive) at farm level on proximate composition and volatile compounds ofportuguese lamb meat. Foods 2021, 10, 1450. [CrossRef]
5. Shin, Y.G.; Rathnayake, D.; Mun, H.S.; Dilawar, M.A.; Pov, S.; Yang, C.J. Sensory attributes, microbial activity, fatty acidcomposition and meat quality traits of Hanwoo cattle fed a diet supplemented with stevioside and organic selenium. Foods 2021,10, 129. [CrossRef] [PubMed]
6. Bakker, C.; Underwood, K.; Grubbs, J.K.; Blair, A. Low-voltage electrical stimulation of beef carcasses slows carcass chilling rateand improves steak color. Foods 2021, 10, 1065. [CrossRef] [PubMed]
7. Khan, M.I.; Jo, C.; Tariq, M.R. Meat flavor precursors and factors influencing flavor precursors—A systematic review. Meat Sci.2015, 110, 278–284. [CrossRef] [PubMed]
8. Burgeon, C.; Markey, A.; Debliquy, M.; Lahem, D.; Rodriguez, J.; Ly, A.; Fauconnier, M.L. Comprehensive SPME-GC-MS analysisof voc profiles obtained following high-temperature heating of pork back fat with varying boar taint intensities. Foods 2021,10, 1311. [CrossRef] [PubMed]
9. Alirezalu, K.; Yaghoubi, M.; Poorsharif, L.; Aminnia, S.; Kahve, H.I.; Pateiro, M.; Lorenzo, J.M.; Munekata, P.E.S. Antimicrobialpolyamide-alginate casing incorporated with nisin and ε-polylysine nanoparticles combined with plant extract for inactivation ofselected bacteria in nitrite-free frankfurter-type sausage. Foods 2021, 10, 1003. [CrossRef] [PubMed]
10. Eshag Osman, M.F.; Mohamed, A.A.; Alamri, M.S.; Ali, I.; Hussain, S.; Ibraheem, M.I.; Qasem, A.A. Quality characteristics of beefpatties prepared with octenyl-succinylated (Osan) starch. Foods 2021, 10, 1157. [CrossRef] [PubMed]
2
foods
Article
Influence of the Production System (Intensive vs. Extensive) atFarm Level on Proximate Composition and Volatile Compoundsof Portuguese Lamb Meat
Noemí Echegaray 1, Rubén Domínguez 1,*, Vasco A. P. Cadavez 2, Roberto Bermúdez 1, Laura Purriños 1,
Ursula Gonzales-Barron 2, Ettiene Hoffman 3 and José M. Lorenzo 1,4
���������������
Citation: Echegaray, N.; Domínguez,
R.; Cadavez, V.A.P.; Bermúdez, R.;
Purriños, L.; Gonzales-Barron, U.;
Hoffman, E.; Lorenzo, J.M. Influence
of the Production System (Intensive
vs. Extensive) at Farm Level on
Proximate Composition and Volatile
Compounds of Portuguese Lamb
Meat. Foods 2021, 10, 1450. https://
doi.org/10.3390/foods10071450
Academic Editor: Alaa El-Din
A. Bekhit
Received: 10 May 2021
Accepted: 18 June 2021
Published: 22 June 2021
Publisher’s Note: MDPI stays neutral
with regard to jurisdictional claims in
published maps and institutional affil-
iations.
Copyright: © 2021 by the authors.
Licensee MDPI, Basel, Switzerland.
This article is an open access article
distributed under the terms and
conditions of the Creative Commons
Attribution (CC BY) license (https://
creativecommons.org/licenses/by/
4.0/).
1 Centro Tecnológico de la Carne de Galicia, Avd. Galicia No 4, Parque Tecnológico de Galicia, San Cibrao das Viñas,32900 Ourense, Spain; [email protected] (N.E.); [email protected] (R.B.);[email protected] (L.P.); [email protected] (J.M.L.)
2 Centro de Investigação de Montanha (CIMO), Instituto Politécnico de Bragança, 5300-253 Bragança, Portugal;[email protected] (V.A.P.C.); [email protected] (U.G.-B.)
3 Faculty of Management, Canadian University Dubai, Dubai 117781, United Arab Emirates;[email protected]
4 Área de Tecnología de los Alimentos, Facultad de Ciencias de Ourense, Universidad de Vigo, 32004 Ourense, Spain* Correspondence: [email protected]
Abstract: Today’s society demands healthy meat with a special emphasis on integrated animalhusbandry combined with the concern for animal welfare. In this sense, the raising of lambs inan extensive system has been one of the most common practices, which results in meats with highnutritional value. However, both the production system and the diet play a fundamental role in thechemical composition of the meat, which has a direct impact on the content of volatile compounds.Thus, the aim of this study was to determine the effect of two production systems (intensive andextensive) on the chemical composition and volatile profile of lamb meat. Twenty-eight lambs of theBordaleira-de-Entre-Douro-e-Minho (BEDM) sheep breed were raised for meat production underthe intensive or extensive system and were fed with concentrate and pasture, respectively. Allanimals were carried out in the muscle longissimus thoracis et lumborum. Results evidenced that all thecomposition parameters were affected by the production system. Extensively-reared lambs producedmeat with the highest fat and protein contents, while these animals had the lowest percentages ofmoisture and ash. Similarly, the total content of volatile compounds was affected (p < 0.05) by theproduction system and were higher in the meat of lambs reared extensively. Furthermore, the contentof total acids, alcohols, aldehydes, esters, ethers, furans and sulfur compounds as well as most ofthe individual compounds were also affected (p < 0.05) by the production system, whereas totalhydrocarbons and ketones were not affected (p > 0.05). As a general conclusion, the productionsystem had very high influence not only in proximate composition but also in the volatile compounds.
Keywords: Bordaleira-de-Entre-Douro-e-Minho; rearing system; pasture; concentrate; volatile compounds
1. Introduction
The meat quality is an essential factor in ensuring consumer satisfaction [1] and isrelated to several parameters such as visual appearance, quality and distribution of the fat,texture, juiciness as well as flavor [2]. Specifically, in lamb meat, the odor and flavor aretwo of the most important eating quality attributes since the meat of these animals have aunique aroma [3–5]. In this manner, lamb meat is characterized by a typical species-relatedflavor that is denominated as “mutton flavor”, which could seriously affect the acceptabilityof consumers [6,7].
On the other hand, in response to consumer demand, the sheep farming sector isincreasingly concerned with incrementing the added value of its products through sus-tainability, animal welfare and conservation of ancient autochthonous genetic types [8,9].
Foods 2021, 10, 1450. https://doi.org/10.3390/foods10071450 https://www.mdpi.com/journal/foods
3

Foods 2021, 10, 1450
In this regard, the use of autochthonous breeds for meat production is of special interestdue to the promotion of the valorization, protection and conservation of the zoogeneticheritage [10]. This is the case of the Portuguese native breed, named Bordaleira-de-Entre-Douro-e-Minho (BEDM), which can also contribute to the diversity of production systemsdue to its particular characteristics such as local adaptation, resistance to diseases andhigh fertility [11,12]. These qualities allow the use of natural pastures in lamb rearing [13].Nevertheless, the characteristics generated by extensive rearing can sometimes result invarious unwanted modifications in the organoleptic quality of the lamb meat with respectto intensive commercial farming. This is the case of the volatile profile, which in additionto being influenced by the animal’s genetics, slaughter age and management practices isstrongly influenced by the diet supplied [6,14,15]. In fact, previous studies have linkedcertain volatile compounds with a specific diet [16,17]. Thus, volatile substances such as ter-penoids [14,18], phenols [19] and the diketone 2,3-octanedione [14,18,20] were related withpasture-based diets; while lactones [20,21], branched fatty acids [6,20,22] and compoundssuch as 2,3-butanedione [23] and furan, 2-pentyl [24] have been linked to grain-based diets.
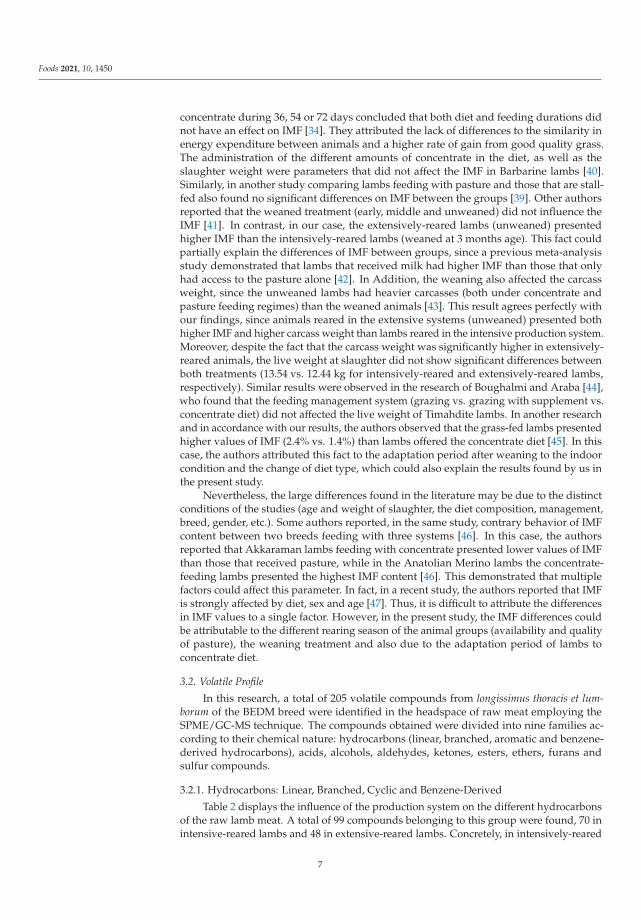
Therefore, the overall purpose of the present experiment was to evaluate the influenceof the production system (intensive and extensive) on the chemical composition and thevolatile profile in the muscle longissimus thoracis et lumborum of BEDM breed lambs.
2. Materials and Methods
2.1. Lamb Rearing and Feeding
In the present study, 28 lambs (males) of the Bordaleira-de-Entre-Douro-e-Minho(BEDM) sheep breed were raised for meat production in the Atlantic bioregion of Ponte deLima (at Ponte Lima Agrarian School) under two different exploitation regimes: intensiveand extensive system. Lambs were randomly selected from the flock and all of themwere born and raised single. The weight of the lambs reared in the intensive productionsystem at birth was 2.57 ± 0.28 kg, while those reared in the extensive regiment was2.45 ± 0.27 kg, with no significant differences (p = 0.278) in the initial weights at thebeginning of the experiment. In both farms, the feeding system was based on semi-naturalpastures improved by sowing perennial ryegrass (Lolium perenne). The pastures weremainly constituted by grasses (54.3%) and legumes (28.9%). Specifically, 15 BEDM lambswere reared in the fall of 2018 under the intensive system and 13 BEDM lambs were rearedin the spring of 2019 in the extensive system. Animals reared under the intensive systemremained with the mothers and had ad libitum access to natural grass hay from birth to3 months of age. After weaning (3 months), the lambs continued to be fed natural grasshay, in addition to 300 g/day of commercial compound feed supplied in two intakesper day (9:00 a.m. and 5:00 p.m.). The commercial compound feed used in the diet ofintensively-reared lambs of the present research was supplied by Alimentação AnimalNanta S.A. (Marco de Canaveses, Portugal) and it was composed (in unknown proportions)of barley, wheat bran, extruded dehulled soy meal, dry beet pulp, brewers’ dried grains,soy hulls, beet molasses, wheat germ, calcium carbonate, sunflower seed meal (extracted),soy oil, sodium chloride and a vitamins and minerals mix. Its chemical compositionwas the following: protein: 15.5%; ether extract: 4.5%; fiber: 8.2%; ash: 8.2%; calcium:1.1%; phosphorous: 0.40%; sodium: 0.37%. All the information on the composition andingredients of the commercial compound feed can be found in Supplementary Table S1. Onthe other hand, the lambs reared under the extensive system had access to their mother’smilk (unweaned) and they went out to graze (ad libitum) with the herd from morninguntil dark during the entire experiment (from birth to slaughter; about 4 months). Upondarkness, the lambs were sheltered in stables where they also had access to meadowhay and water ad libitum. The growth test was carried out for 4 months and so thephenological status of the pasture was very varied. This test aimed to characterize theproduction systems in a holistic perspective; thus, the animals’ feed was the one usuallyused in the farms.
4

Foods 2021, 10, 1450
2.2. Lamb Meat Samples
The trial planned to slaughter the animals at 4 months of age. Thus, the age at slaughtervaried between 4 and 4.5 months and the births were not synchronized, which translatedinto the variation in the age at slaughter. With this in mind, at 4–4.5 months old, thelambs were transported to a commercial abattoir of Portugal. The animals were handled inbatches ranging from 5 to 12 lambs and they were slaughtered according to the conditionspreviously reported [9]. Lambs reared in an intensive production system had a live weightof 13.54 ± 1.48 Kg (5.93 ± 1.02 Kg hot carcass weight), while those reared in an extensiveproduction system had a live weight of 12.44 ± 2.65 kg (8.29 ± 1.77 Kg hot carcass weight).The live weight between both groups did not show significant differences (p = 0.176, whilecarcass weight of extensively-reared animals was significantly higher (p < 0.01) than thosereared in the intensive production system. After cooling, the longissimus thoracis et lumborummuscles were removed from the sixth to the thirteenth vertebrae of lamb carcasses (a totalof 56 pieces, 2 muscles, left and right and for each carcass). All muscle pieces were vacuumpacked, refrigerated and transported to the CTC lab for the analysis. The left side wasused for proximate composition analysis (72 h post-slaughter), while volatile analysis werecarried out in the right muscle after refrigerated storage (4 ± 1 ◦C for 15 days). Before theanalysis, a steak of each muscle (about 80 g) was conveniently chopped and homogenizedin order to obtain a representative sample of each animal.
2.3. Analysis of Chemical Composition
Moisture [25], protein (Kjeldahl N × 6.25) [26] and ash [27] were determined andexpressed as percentage following the ISO recommended standards, while intramuscu-lar fat was quantified according to the American Oil Chemistry Society (AOCS) officialprocedure [28].
2.4. Volatile Compounds Analysis
For the volatile compound analysis, Headspace-Solid phase microextraction (HS-SPME)technique was used for the volatile extraction and concentration, while the separation andidentification of each volatile was carried out using gas chromatography coupled with massspectrometry (GC-MS) (Agilent Technologies, Santa Clara, CA, USA) equipped with theDB-624 capillary column (30 m, 250 μm i.d., 1.4 μm film thickness; J&W Scientific, Folsom,CA, USA). All analysis steps, chromatographic and mass spectrometer conditions and dataprocessing were previously reported [29]. The results were expressed as area units of theextracted ion chromatogram from the quantifier ion (m/z) per gram of sample (AU × 104/gof sample). The Linear Retention Index (LRI) was calculated for the aforementionedcapillary column (DB-624). Both LRI and m/z values are presented in all volatile tables asadditional information to the volatile analysis.
2.5. Statistical Analysis
A total of 56 samples (28 for the chemical analysis and 28 for the volatile compoundsdetermination) were analyzed in triplicate for each parameter. Normal distribution andvariance homogeneity had been previously tested (Shapiro-Wilk). The influence of theproduction system on the chemical composition and volatile compounds was evaluatedwith one-way analysis of variance (one-way ANOVA) using the SPSS package version23.0 (IBM SPSS, Chicago, IL, USA). Significant differences were indicated at p < 0.05,p < 0.01 and p < 0.001. Furthermore, the Pearson’s linear coefficient was employed todetermine correlations between the intramuscular fat and volatile content using the samestatistical software.
3. Results and Discussion
3.1. Chemical Composition
The proximate composition of the BEDM lamb meat from the different productionsystems is shown as percentage in Table 1.
5

Foods 2021, 10, 1450
Table 1. Effects of the production system on the proximate composition of BEDM lamb longissimusthoracis et lumborum muscle.
Intensive Extensive SEM Sig.
Moisture (%) 78.00 75.91 0.290 ***
Intramuscular fat (%) 0.49 1.51 0.132 ***
Protein (%) 19.32 20.92 0.234 ***
Ash (%) 1.37 1.20 0.022 ***
SEM: Standard error of the mean. Sig.: Significance. *** (p < 0.001).
The values found for the proximate composition parameters agree with those reportedby other authors. In this regard, a recent study comparing three different lamb breeds foundvalues for fat (about 1.6%), protein (19–21%), moisture (75–77%) and ash (1.06–1.22%) andare similar to those described in this study [30]. Similarly, an investigation studying theinfluence of five different breeds and three (intensive, semi-extensive and extensive) pro-duction systems [9] or the influence of different slaughtered ages also showed comparablevalues for all proximate parameters.
As it can be observed, the production system significantly (p < 0.001) affected all thecomposition parameters. Concretely, the extensive production system provided lambswith a significantly (p < 0.001) higher intramuscular fat (IMF) and protein content thanthe intensive production system (1.51 vs. 0.49% and 20.92% vs. 19.32%, respectively).In contrast, intensively-reared lambs showed significantly (p < 0.001) higher amounts ofmoisture and ash (78.00 vs. 75.91% and 1.37 vs. 1.20%, respectively). Our results agree withthose reported by other authors who observed that lamb meat with the highest moisturecontent presented the lowest IMF and protein contents [31]. Thus, inverse correlationbetween the moisture and IMF contents previously described in the lamb meat [9,31]explain our findings. However, these differences do not remain constant throughout theliterature. Other studies found that grass-fed lambs decreased intramuscular fat [32,33] andprotein content [34] while the moisture percentage was increased [34]. Several authors evenobserved that not all composition parameters were affected by the diet [35–37]. Amongall proximate composition parameters, intramuscular fat is an important parameter thatinfluenced the lamb meat quality. However, there is controversy about the influence ofmultiple factors on this content. In this regard, a recent study demonstrated that rearingseason had an important effect on IMF content [38]. Sheep reared in spring presentedhigher IMF content than those reared in autumn. This fact could partially explain the resultsobtained by us, since the lambs reared in the extensive system (spring of 2019) presentedhigher values of IMF than those reared in the intensive system (fall of 2018). The differencesin the availability and the quality of pasture could be an important factor that could explainthe fact that animals reared in spring presented higher IMF than those reared during theautumn, since the two main peaks in lamb feeding change are in winter and spring [38].Additionally, the better quality of the pasture also results in a better milk productionby the mothers characterized by a high fat content due to a diet rich in fiber, which isundoubtedly related to the higher IMF content in the animals raised in the extensive system(unweaned) than those raised in the intensive production system (weaned). In line withthe aforementioned elements, another important factor that influences IMF content is thediet. Generally speaking, the lambs feeding with concentrate presented higher IMF thanthose feeding with pasture or silage. This fact was corroborated by Cadavez et al. [9],who reported that the lambs reared in intensive production systems had higher IMF thanthose reared in semi-extensive or extensive systems. This is related with the fact thatfeedlot lambs had lower energy expenditure for grazing than lambs reared in the extensivesystem [39]. However, as reported in the Material and Methods section, in the presentstudy both groups of animals graze and, thus, in our study we expect similar expenditurefor grazing in animals from both production systems. Contrary to the results reportedby Cadavez et al. [9], a study in which lambs received silage, silage + concentrate or
6
Foods 2021, 10, 1450
concentrate during 36, 54 or 72 days concluded that both diet and feeding durations didnot have an effect on IMF [34]. They attributed the lack of differences to the similarity inenergy expenditure between animals and a higher rate of gain from good quality grass.The administration of the different amounts of concentrate in the diet, as well as theslaughter weight were parameters that did not affect the IMF in Barbarine lambs [40].Similarly, in another study comparing lambs feeding with pasture and those that are stall-fed also found no significant differences on IMF between the groups [39]. Other authorsreported that the weaned treatment (early, middle and unweaned) did not influence theIMF [41]. In contrast, in our case, the extensively-reared lambs (unweaned) presentedhigher IMF than the intensively-reared lambs (weaned at 3 months age). This fact couldpartially explain the differences of IMF between groups, since a previous meta-analysisstudy demonstrated that lambs that received milk had higher IMF than those that onlyhad access to the pasture alone [42]. In Addition, the weaning also affected the carcassweight, since the unweaned lambs had heavier carcasses (both under concentrate andpasture feeding regimes) than the weaned animals [43]. This result agrees perfectly withour findings, since animals reared in the extensive systems (unweaned) presented bothhigher IMF and higher carcass weight than lambs reared in the intensive production system.Moreover, despite the fact that the carcass weight was significantly higher in extensively-reared animals, the live weight at slaughter did not show significant differences betweenboth treatments (13.54 vs. 12.44 kg for intensively-reared and extensively-reared lambs,respectively). Similar results were observed in the research of Boughalmi and Araba [44],who found that the feeding management system (grazing vs. grazing with supplement vs.concentrate diet) did not affected the live weight of Timahdite lambs. In another researchand in accordance with our results, the authors observed that the grass-fed lambs presentedhigher values of IMF (2.4% vs. 1.4%) than lambs offered the concentrate diet [45]. In thiscase, the authors attributed this fact to the adaptation period after weaning to the indoorcondition and the change of diet type, which could also explain the results found by us inthe present study.
Nevertheless, the large differences found in the literature may be due to the distinctconditions of the studies (age and weight of slaughter, the diet composition, management,breed, gender, etc.). Some authors reported, in the same study, contrary behavior of IMFcontent between two breeds feeding with three systems [46]. In this case, the authorsreported that Akkaraman lambs feeding with concentrate presented lower values of IMFthan those that received pasture, while in the Anatolian Merino lambs the concentrate-feeding lambs presented the highest IMF content [46]. This demonstrated that multiplefactors could affect this parameter. In fact, in a recent study, the authors reported that IMFis strongly affected by diet, sex and age [47]. Thus, it is difficult to attribute the differencesin IMF values to a single factor. However, in the present study, the IMF differences couldbe attributable to the different rearing season of the animal groups (availability and qualityof pasture), the weaning treatment and also due to the adaptation period of lambs toconcentrate diet.
3.2. Volatile Profile
In this research, a total of 205 volatile compounds from longissimus thoracis et lum-borum of the BEDM breed were identified in the headspace of raw meat employing theSPME/GC-MS technique. The compounds obtained were divided into nine families ac-cording to their chemical nature: hydrocarbons (linear, branched, aromatic and benzene-derived hydrocarbons), acids, alcohols, aldehydes, ketones, esters, ethers, furans andsulfur compounds.
3.2.1. Hydrocarbons: Linear, Branched, Cyclic and Benzene-Derived
Table 2 displays the influence of the production system on the different hydrocarbonsof the raw lamb meat. A total of 99 compounds belonging to this group were found, 70 inintensive-reared lambs and 48 in extensive-reared lambs. Concretely, in intensively-reared
7
Foods 2021, 10, 1450
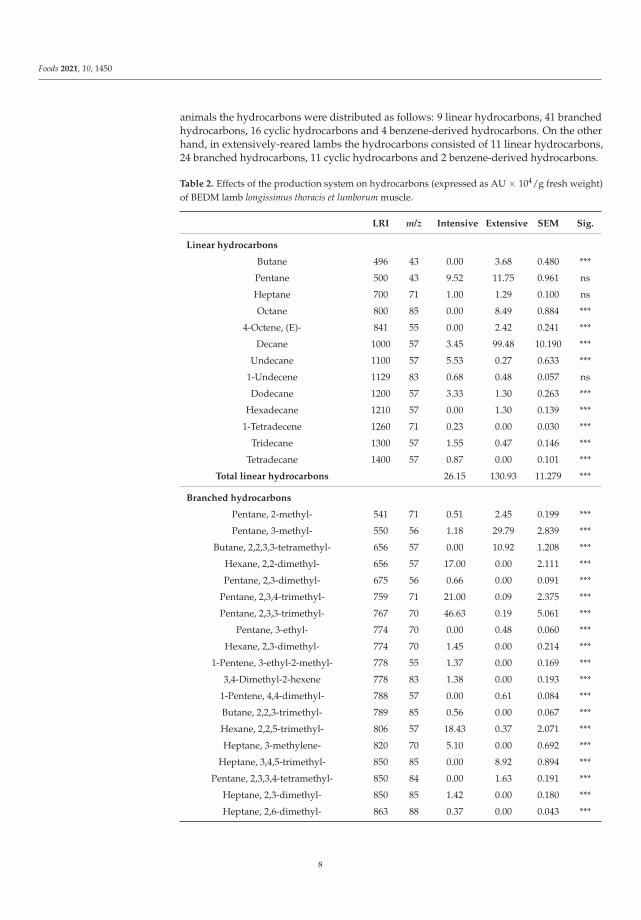
animals the hydrocarbons were distributed as follows: 9 linear hydrocarbons, 41 branchedhydrocarbons, 16 cyclic hydrocarbons and 4 benzene-derived hydrocarbons. On the otherhand, in extensively-reared lambs the hydrocarbons consisted of 11 linear hydrocarbons,24 branched hydrocarbons, 11 cyclic hydrocarbons and 2 benzene-derived hydrocarbons.
Table 2. Effects of the production system on hydrocarbons (expressed as AU × 104/g fresh weight)of BEDM lamb longissimus thoracis et lumborum muscle.
LRI m/z Intensive Extensive SEM Sig.
Linear hydrocarbons
Butane 496 43 0.00 3.68 0.480 ***
Pentane 500 43 9.52 11.75 0.961 ns
Heptane 700 71 1.00 1.29 0.100 ns
Octane 800 85 0.00 8.49 0.884 ***
4-Octene, (E)- 841 55 0.00 2.42 0.241 ***
Decane 1000 57 3.45 99.48 10.190 ***
Undecane 1100 57 5.53 0.27 0.633 ***
1-Undecene 1129 83 0.68 0.48 0.057 ns
Dodecane 1200 57 3.33 1.30 0.263 ***
Hexadecane 1210 57 0.00 1.30 0.139 ***
1-Tetradecene 1260 71 0.23 0.00 0.030 ***
Tridecane 1300 57 1.55 0.47 0.146 ***
Tetradecane 1400 57 0.87 0.00 0.101 ***
Total linear hydrocarbons 26.15 130.93 11.279 ***
Branched hydrocarbons
Pentane, 2-methyl- 541 71 0.51 2.45 0.199 ***
Pentane, 3-methyl- 550 56 1.18 29.79 2.839 ***
Butane, 2,2,3,3-tetramethyl- 656 57 0.00 10.92 1.208 ***
Hexane, 2,2-dimethyl- 656 57 17.00 0.00 2.111 ***
Pentane, 2,3-dimethyl- 675 56 0.66 0.00 0.091 ***
Pentane, 2,3,4-trimethyl- 759 71 21.00 0.09 2.375 ***
Pentane, 2,3,3-trimethyl- 767 70 46.63 0.19 5.061 ***
Pentane, 3-ethyl- 774 70 0.00 0.48 0.060 ***
Hexane, 2,3-dimethyl- 774 70 1.45 0.00 0.214 ***
1-Pentene, 3-ethyl-2-methyl- 778 55 1.37 0.00 0.169 ***
3,4-Dimethyl-2-hexene 778 83 1.38 0.00 0.193 ***
1-Pentene, 4,4-dimethyl- 788 57 0.00 0.61 0.084 ***
Butane, 2,2,3-trimethyl- 789 85 0.56 0.00 0.067 ***
Hexane, 2,2,5-trimethyl- 806 57 18.43 0.37 2.071 ***
Heptane, 3-methylene- 820 70 5.10 0.00 0.692 ***
Heptane, 3,4,5-trimethyl- 850 85 0.00 8.92 0.894 ***
Pentane, 2,3,3,4-tetramethyl- 850 84 0.00 1.63 0.191 ***
Heptane, 2,3-dimethyl- 850 85 1.42 0.00 0.180 ***
Heptane, 2,6-dimethyl- 863 88 0.37 0.00 0.043 ***
8

Foods 2021, 10, 1450
Table 2. Cont.
LRI m/z Intensive Extensive SEM Sig.
Heptane, 3-ethyl- 917 57 1.50 0.00 0.166 ***
Nonane, 3,7-dimethyl- 925 57 1.08 0.00 0.129 ***
Heptane, 2,2,4-trimethyl- 933 57 1.99 1.20 0.168 *
Heptane, 3,3,5-trimethyl- 947 71 0.00 0.46 0.048 ***
Octane, 3,3-dimethyl- 947 71 1.95 0.00 0.218 ***
Hexane, 2,3,4-trimethyl- 948 57 0.00 0.43 0.046 ***
Pentane, 2,2-dimethyl- 948 57 1.29 0.00 0.141 ***
3-Ethyl-2-methyl-1-heptene 996 84 0.89 0.00 0.100 ***
Heptane, 3-ethyl-5-methylene- 998 70 0.00 1.94 0.226 ***
2,3-Dimethyl-1-hexene 1037 55 1.80 0.00 0.191 ***
Pentane, 3,3-dimethyl- 1046 71 3.01 0.00 0.349 ***
1-Hexene, 3-methyl- 1062 70 3.04 0.00 0.386 ***
(Z)-4-Methyl-2-hexene 1072 98 0.89 0.00 0.096 ***
2,2,4,4-Tetramethyloctane 1078 57 146.91 17.31 16.485 ***
1-Hexene, 5,5-dimethyl- 1090 57 0.00 58.12 6.290 ***
Nonane, 5-butyl- 1097 127 1.45 0.00 0.172 ***
Nonane, 5-(2-methylpropyl)- 1097 71 7.01 0.00 0.868 ***
Heptane, 2,3,4-trimethyl- 1097 57 0.00 57.47 6.317 ***
Dodecane, 2,6,10-trimethyl- 1097 57 14.27 0.00 1.805 ***
Heptane, 2,2-dimethyl- 1101 57 0.93 0.00 0.141 ***
Decane, 6-ethyl-2-methyl- 1104 57 0.00 83.25 8.323 ***
Heptane, 3,3,4-trimethyl- 1135 71 0.00 0.50 0.060 ***
Nonane, 2-methyl- 1136 57 0.69 0.00 0.084 ***
Hexane, 1-(hexyloxy)-3-methyl- 1147 57 2.34 0.00 0.275 ***
2-Undecene, 9-methyl-, (Z)- 1152 98 2.66 0.00 0.286 ***
4-Undecene, 5-methyl- 1165 168 0.30 0.00 0.036 ***
Pentane, 3,3-diethyl- 1181 98 0.34 0.00 0.036 ***
2-Undecene, 3-methyl-, (Z)- 1203 70 0.60 0.00 0.065 ***
Octane, 2,4,6-trimethyl- 1210 71 0.00 0.86 0.089 ***
5-Ethyl-1-nonene 1224 83 0.32 0.00 0.039 ***
1-Decene, 2,4-dimethyl- 1224 70 0.42 0.00 0.052 ***
Hexane, 2-methyl-4-methylene- 1227 71 0.00 0.42 0.046 ***
Heptadecane, 8-methyl- 1227 71 1.12 0.00 0.142 ***
Undecane, 5-ethyl- 1242 57 1.09 0.00 0.157 ***
Dodecane, 2-methyl- 1257 57 0.22 0.00 0.029 ***
1-Undecene, 8-methyl- 1260 97 0.34 0.00 0.046 ***
Tridecane, 3-methyl- 1331 57 0.00 0.39 0.039 ***
Heptane, 2,4-dimethyl- 1349 71 0.00 0.35 0.036 ***
5,5-Dibutylnonane 1358 71 0.00 0.36 0.037 ***
Total branched hydrocarbons 315.54 278.51 15.461 ns
9

Foods 2021, 10, 1450
Table 2. Cont.
LRI m/z Intensive Extensive SEM Sig.
Cyclic hydrocarbons
Cyclopentane, 1,2-dimethyl-, cis- 666 56 0.49 3.39 0.336 ***
Cyclohexane, methyl- 720 83 0.00 5.77 0.628 ***
Bicyclo[3.2.0]hepta-2,6-diene 810 91 15.94 12.09 0.788 *
Cyclopentane, 1,2,3-trimethyl- 820 56 0.62 0.00 0.083 ***
Cyclooctane 822 70 0.00 2.75 0.275 ***
Cyclohexane, 1,3-dimethyl-, cis- 840 97 2.02 0.00 0.228 ***
Cyclohexane, 1,3-dimethyl- 840 97 0.49 0.00 0.059 ***
Cyclobutane, 1,1,2,3,3-pentamethyl- 938 70 1.69 0.00 0.173 ***
Cyclopropane, 1-methyl-2-pentyl- 942 55 0.34 0.00 0.037 ***
Bicyclo[3.1.1]hept-2-ene, 3,6,6-trimethyl- 992 93 2.74 0.00 0.289 ***
Cyclopentane, 1,2,3,4,5-pentamethyl- 996 69 0.86 0.00 0.094 ***
Cyclohexane, butylidene- 1042 67 0.00 0.72 0.078 ***
Cyclodecene, (Z)- 1042 67 3.64 0.00 0.371 ***
Cyclopropane 1063 41 3.04 0.00 0.318 ***
Cyclohexane, 1,2-diethyl-1-methyl- 1075 125 0.52 0.00 0.057 ***
Cyclopentane, pentyl- 1084 68 1.87 0.00 0.193 ***
D-Limonene 1085 93 0.00 0.90 0.099 ***
Cyclooctane, methyl- 1129 55 0.00 0.74 0.115 ***
Cyclopentane, 1-ethyl-1-methyl- 1143 83 0.00 2.05 0.216 ***
Butane, 2-cyclopropyl- 1165 70 0.98 0.00 0.116 ***
Cyclododecane 1249 83 0.62 0.00 0.072 ***
Heptylcyclohexane 1322 82 0.95 0.78 0.094 ns
Cyclopropane, 1,1,2,3-tetramethyl- 1374 71 0.00 0.46 0.051 ***
Cyclohexane, octyl- 1444 82 0.00 0.24 0.024 ***
Total cyclic hydrocarbons 36.81 29.89 0.980 ***
Benzene-derived hydrocarbons
Ethylbenzene 928 91 0.82 0.00 0.087 ***
Benzene, 1,3-dimethyl- 937 106 2.54 1.58 0.177 **
Benzene, n-butyl- 1118 91 0.91 0.00 0.097 ***
Benzene, (1,1-dimethylethoxy)- 1137 94 3.24 0.54 0.286 ***
Total benzene-derived hydrocarbons 7.50 2.12 0.590 ***
TOTAL HYDROCARBONS 386.00 441.44 18.278 ns
SEM: Standard error of the mean. Sig.: Significance. * (p < 0.05); ** (p < 0.01); *** (p < 0.001); ns: no significant difference.
As can be observed, the production system did not significantly affect the total hy-drocarbon content, although this was slightly higher in lambs produced under extensiveconditions (441.44 vs. 386.00 AU × 104/g fresh meat). However, the total value of familiesof linear, cyclic and benzene-derived hydrocarbons were significantly (p < 0.001) affectedby the production system. Specifically, lambs reared in the extensive system presentedhigher amounts of total linear hydrocarbons (130.93 vs. 26.15 AU × 104/g fresh meat). Onthe contrary, lambs reared intensively had significantly (p < 0.001) higher concentrationsof total cyclic hydrocarbons (36.81 and 29.89 AU × 104/g fresh meat for intensive and ex-
10

Foods 2021, 10, 1450
tensive systems, respectively) and benzene-derived hydrocarbons (7.50 AU × 104/g freshmeat for intensive and 2.12 AU × 104/g fresh meat for extensive and 2.12). Numericallybut not significantly, the branched hydrocarbons from intensively-reared animals were alsohigher (315.54 and 278.51 AU × 104/g fresh meat for intensive and extensive productionsystems, respectively).
Most individual hydrocarbons were significantly (p < 0.05) affected by the productionsystem apart from pentane, heptane, 1-undecene and heptylcyclohexane. Differences involatile compounds attributed to the production system may arise from the origin of theanimal feed, since some of these volatile compounds, such alkanes of more than 10 carbons,can be stored in fatty tissues through diet [48,49]. However, the individual trends varieddepending on the substance in question. Thus, in intensively-reared lambs, the linearhydrocarbon that was found in the highest concentration was pentane (9.52 AU × 104/gfresh meat), while for extensively-reared lambs it was decane (99.48 AU × 104/g fresh meat).In the case of branched hydrocarbons, the highlights were 2,2,4,4-tetramethyloctane, with aconcentration of 146.91 AU × 104/g fresh meat, and heptadecane, with a concentration of83.25 AU × 104/g fresh meat, for intensive-raised and extensive-raised lambs, respectively.Moreover, for both production systems, the cyclic hydrocarbon with the highest presencewas the same (namely bicyclo[3.2.0]hepta-2,6-diene) and shoed concentrations of 15.94and 12.09 10 AU × 104/g fresh meat for lambs reared in intensive and extensive systems,respectively. Within this group of hydrocarbons, it is also worth highlighting the presenceof the terpene D-limonene in grass-fed lambs (0.90 AU × 104/g fresh meat) and its absencein lambs fed with concentrate.
Additionally, it should be noted that benzene-derived hydrocarbons did show thesame trend since all the compounds belonging to this group (namely ethylbenzene; ben-zene, 1,3-dimethyl-; benzene, n-butyl-; benzene, (1,1-dimethylethoxy)-) were found insignificantly (p < 0.01) higher concentrations in lambs fed under the intensive productionsystem. These results are in disagreement with those obtained by various authors whoreported that benzene-derived hydrocarbons were produced to a greater extent in lambsfed by grazing than by concentrate [6,17,50]. This discrepancy is difficult to explain sincenormally benzene-derived hydrocarbons are related to the consumption of grass and, morespecifically, to the carotenoids present in green plants [51] or even with the contaminantsretained by these vegetables [52,53].
On the other hand, hydrocarbons constituted the largest family of volatile com-pounds detected in intensive and extensive systems (59.78% and 54.76%, respectively),with branched hydrocarbons being the volatile compounds most abundant in both diets(48.87% for lambs reared in intensive production system and 34.55% for animals reared inextensive production system) and benzene-derivatives being the least abundant ones (1.16and 0.26% for intensively-reared and extensively-reared lambs, respectively) (Figure 1).In spite of the distributions of these percentages, linear hydrocarbons (which represent4.05 and 16.24% in intensively-reared and extensively-reared lamb meat, respectively)and cyclic hydrocarbons (5.70% for intensively-reared and 3.71% for extensively-rearedlambs) taken together with branched ones, in general, are not particularly important incontributing to the aroma of meat as they have high odor thresholds [29,54–56]. On thecontrary, benzene-derived hydrocarbons, even those possessing a low percentage of thetotal volatile content, could have a significant contribution to the volatile pattern of lambmeat due to their low odor threshold [48,56,57].
3.2.2. Acids
Seven acids were identified in the meat of BEDM lambs, four in samples from theintensive production system and six from the extensive system. Moreover, the productionsystem significantly (p < 0.05) affected both the total amount of acids and that of eachindividual compound (Table 3). Specifically, extensively-reared lambs showed a higherconcentration of all the acids determined with the exception of hexanoic acid, whichappeared in intensively-reared lambs (1.33 AU × 104/g fresh meat) while it was not
11

Foods 2021, 10, 1450
detected in extensive farming lambs. In addition, the total amount of acids was alsosignificantly (p < 0.001) higher in the lambs reared extensively (8.87 vs. 2.51 AU × 104/gfresh meat).
Figure 1. Volatile families of BEDM lamb longissimus thoracis et lumborum muscle (expressed as percentages) affected by theproduction system.
Table 3. Effects of the production system on acids and alcohols (expressed as AU × 104/g freshweight) of BEDM lamb longissimus thoracis et lumborum muscle.
LRI m/z Intensive Extensive SEM Sig.
Acids
Acetic acid 696 60 0.05 0.45 0.044 ***
2-Propenoic acid 709 55 0.00 3.64 0.393 ***
Butanoic acid 929 60 1.10 1.91 0.164 *
Pentanoic acid 1101 60 0.00 1.67 0.204 ***
Hexanoic acid 1102 60 1.33 0.00 0.158 ***
Pentanoic acid, 2-methyl-, anhydride 1157 99 0.04 0.95 0.106 ***
Nonanoic acid 1314 60 0.00 0.26 0.031 ***
Total acids 2.51 8.87 0.678 ***
Alcohols
Glycidol 499 44 2.10 90.02 12.230 ***
1-Propanol 570 59 0.20 1.05 0.100 ***
1-Butanol 709 56 2.01 29.94 3.053 ***
1-Butanol, 3-methyl- 814 55 0.22 1.89 0.199 ***
1-Butanol, 2-methyl- 818 57 0.00 4.70 0.506 ***
1-Pentanol 855 55 0.00 33.61 3.542 ***
Cyclobutanol, 2-ethyl- 875 56 1.03 0.00 0.130 ***
2-Octen-1-ol, (Z)- 875 67 0.72 0.00 0.098 ***
2,3-Butanediol, [S-(R*,R*)]- 929 45 3.44 0.00 0.408 ***
12

Foods 2021, 10, 1450
Table 3. Cont.
LRI m/z Intensive Extensive SEM Sig.
DL-2,3-Butanediol 931 45 0.00 0.73 0.084 ***
1-Butanol, 3-methyl-, acetate 952 55 0.05 1.37 0.306 *
1-Hexanol 967 55 3.70 7.84 0.632 ***
1-Heptanol 1062 70 4.66 5.29 0.449 ns
1-Octen-3-ol 1068 57 39.65 33.11 3.525 ns
Ethanol, pentamethyl- 1079 59 0.00 0.72 0.074 ***
2,3,4-Trimethyl-1-pentanol 1099 71 6.45 0.00 0.795 ***
1-Hexanol, 2-ethyl- 1113 57 4.91 2.62 0.371 ***
1-Hexanol, 5-methyl-2-(1-methylethyl)- 1128 71 0.94 0.00 0.109 ***
1-Undecanol 1129 69 0.00 0.32 0.035 ***
4-Ethylcyclohexanol 1130 81 0.24 0.41 0.052 ns
Benzyl alcohol 1145 108 0.27 0.00 0.030 ***
5-Methyl-1-heptanol 1143 70 1.11 2.70 0.220 ***
1-Octanol 1147 56 3.25 3.95 0.289 ns
2-Octen-1-ol, (E)- 1148 57 1.62 1.94 0.203 ns
3-Octen-2-ol, (E)- 1148 67 0.00 1.02 0.117 ***
3-Octen-1-ol, (Z)- 1149 81 0.69 0.00 0.116 **
1-Butanol, 2-methyl-, trifluoroacetate 1152 70 3.35 0.00 0.361 ***
1,8-Octanediol 1168 55 0.00 4.04 0.562 ***
6-Undecanol 1183 55 0.00 0.78 0.093 ***
4-Methyl-5-decanol 1184 83 0.42 0.00 0.066 ***
1-Butanol, 3,3-dimethyl- 1189 56 0.00 0.37 0.038 ***
1,9-Nonanediol 1224 55 0.00 0.20 0.021 ***
1-Nonanol 1224 56 0.21 0.15 0.014 *
1-Butanol, 2-methyl-, propanoate 1349 57 0.00 0.52 0.053 ***
2,4-Di-tert-butylphenol 1456 191 2.52 0.00 0.353 ***
Total alcohols 83.76 229.30 16.597 ***
SEM: Standard error of the mean. Sig.: Significance. * (p < 0.05); ** (p < 0.01); *** (p < 0.001); ns: no significant difference.
Within this group, branched chain fatty acids, such as 4-methyloctanoic, 4-ethyloctanoicand 4-methylnonanoic acids, are of special interest because they are related to the specificaroma of lamb meat, contributing to the mutton-like aroma [6,58,59]. However, noneof these compounds were detected in the lambs analyzed regardless of the productionsystem employed.
The contribution of acids on the total volatile compounds was very low. Indeed,this family has been the least abundant in intensively-reared lambs and the second withthe least presence in extensively-reared lambs. More concretely, total acids represented0.39 and 1.10% of the total volatile substances in lambs reared in intensive and extensiveproduction systems, respectively (Figure 1). This weak presence may be due to the factthat some acids, such as branched chain, are found mainly in adipose tissue since they arediminished in muscle tissue [58]. Furthermore, since branched fatty acids tend to increasewith the age of the animals and are associated with older lambs of over two years [60],their presence in our study was limited due to the young age of the lambs (~4 months).
13

Foods 2021, 10, 1450
3.2.3. Alcohols
In this study, 35 different alcohols (24 in animals from the intensive production systemand 25 in animals from the extensive production system) were detected in the BEDM lambsmeat (Table 3). As can be observed, all these compounds were significantly (p < 0.05)affected by the production system except for 1-heptanol, 1-octen-3-ol, 4-ethylcyclohexanol,1-octanol and 2-octen-1-ol, (E)-, although in different manners. Nevertheless, it can begenerally observed that the extensive production system tends to provide BEDM lamb meatwith a higher presence of alcohols, since 20 of the compounds identified in this group werefound in significantly (p < 0.05) higher concentrations compared to their intensively-rearedcounterparts. Moreover, BEDM lambs reared in the extensive production system showed atotal content of alcohols significantly (p < 0.001) higher than those reared in the intensivesystem (229.30 and 83.76 AU × 104/g fresh meat, respectively). This occurrence couldbe due to the fact that some alcohols, such as 1-pentanol and 1-hexanol, are related tothe degradation of their homologous aldehydes during lipid oxidation [61,62]. In thisregard, a previous study demonstrated that the BEDM lambs reared extensively havevery high contents of polyunsaturated fatty acids (specially n-3 PUFA) [9], which aremore susceptible to oxidation [63] and can explain the results observed on the lipid-derived volatile compounds behavior. Thus, in our study, 1-pentanol alone has beenidentified in extensively-reared lambs (33.61 AU × 104/g fresh meat) and 1-heptanolhas shown a concentration of 7.84 AU × 104/g fresh meat in extensively-reared lambscompared to 3.70 AU × 104/g in intensively-reared lambs. Nevertheless, the greater levelsof 1-hexanol in extensively-reared lambs contrasts with the fact that this alcohol comesfrom the autoxidation of linoleic acid [63,64], which is typically present in concentratesmade from grains [65]. Despite these observations, other studies have also found thatgrass-raised ewes showed higher amounts of 1-hexanol in meat than intensively-rearedewes [18]. In addition, 1-pentanol and 1-hexanol could positively affect the aroma of lambmeat since 1-pentanol is characterized by its pleasant, sweet or fruity odor, while 1-hexanolhas a herbal and fatty odor [29,48,66]. Furthermore, the lambs reared in the extensiveproduction system displayed a concentration of 1-butanol that is significantly higher thanthat of the lambs reared intensively (29.94 vs. 2.01 AU × 104/g fresh meat). These resultsagree with the fact that meat from BDEM lambs reared in extensive system presented highamounts of linoleic acid [9], which is the main precursor of this volatile compound (derivedfrom oxidation reactions) [63].
On the other hand, two alcohols (namely benzyl alcohol and 2,4-di-tert-butylphenol)have been identified, which could be related to the diet based on grass as they are phenoliccompounds [19]. However, in the meat of BEDM lambs reared in extensive productionsystem (fed with grass) none of these two compounds were identified, while in those fedwith concentrate (intensive production system) values of 0.27 and 2.52 AU × 104/g freshmeat were obtained for benzyl alcohol and 2,4-di-tert-butylphenol, respectively. Theseresults are similar to those indicated by other authors, which suggest that not all phenoliccompounds are related to grass [14,67].
Regarding the 1-octanol, this alcohol was not significantly affected (p > 0.05) bybreeding, obtaining very similar values for both types of lambs (3.25 and 3.95 AU × 104/gfresh meat for intensively-reared and extensively-reared lambs, respectively). Similarly,1-octen-3-ol has not been significantly (p > 0.05) affected by the production system, sinceboth lambs showed concentrations in the same range (39.65 and 33.1 AU × 104/g forintensively- and extensively-reared lambs, respectively). This could be due to the fact that1-octen-3-ol is a compound that arises from several pathways [48]; it is a volatile substancederived from lipid oxidation that is frequently reported in meat and meat products [63,68].These facts are in agreement with those obtained by Sivadier et al. [17] who observed that1-octen-3-ol content did not depend on the diet supplied. In addition, although they arenormally of lower molecular weight, there are various alcohols that are considered to be ofmetabolic origin; thus, they are not affected by the diet provided [69].
14
Foods 2021, 10, 1450
With respect to the contribution of alcohols over the total volatile content, this familyis the second most abundant in both production systems. Specifically, this group represents12.97 and 28.44% in the lambs reared intensively and extensively, respectively (Figure 1).Despite this, alcohols have a debatable high odor threshold and their contribution tovolatile flavor is less than that of other compounds such as aldehydes [70]. However,various alcohols, such as 1-pentanol, may contribute to the lamb aroma on account of theirlow odor threshold and their mild, fruit and balsamic aroma [66,71].
3.2.4. Aldehydes
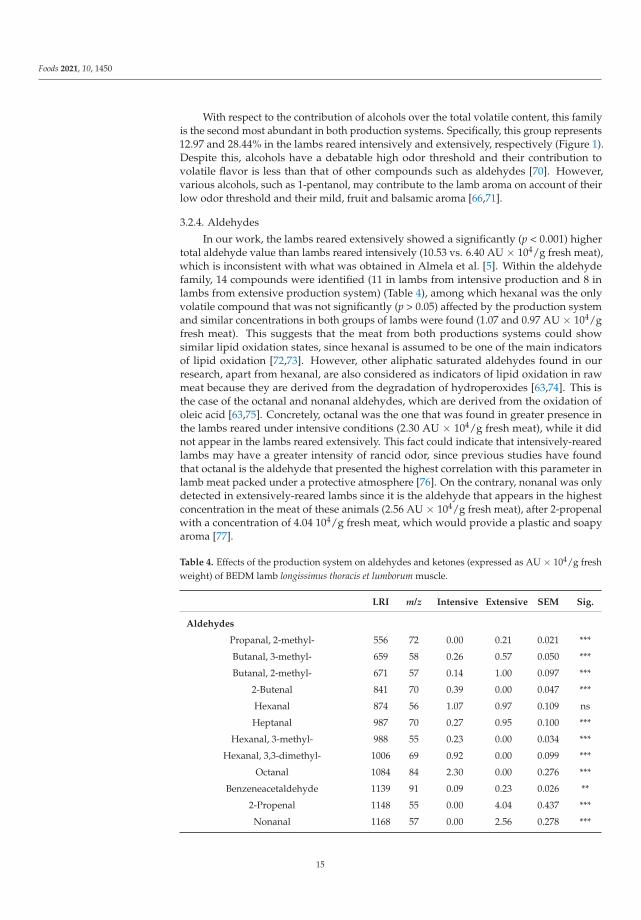
In our work, the lambs reared extensively showed a significantly (p < 0.001) highertotal aldehyde value than lambs reared intensively (10.53 vs. 6.40 AU × 104/g fresh meat),which is inconsistent with what was obtained in Almela et al. [5]. Within the aldehydefamily, 14 compounds were identified (11 in lambs from intensive production and 8 inlambs from extensive production system) (Table 4), among which hexanal was the onlyvolatile compound that was not significantly (p > 0.05) affected by the production systemand similar concentrations in both groups of lambs were found (1.07 and 0.97 AU × 104/gfresh meat). This suggests that the meat from both productions systems could showsimilar lipid oxidation states, since hexanal is assumed to be one of the main indicatorsof lipid oxidation [72,73]. However, other aliphatic saturated aldehydes found in ourresearch, apart from hexanal, are also considered as indicators of lipid oxidation in rawmeat because they are derived from the degradation of hydroperoxides [63,74]. This isthe case of the octanal and nonanal aldehydes, which are derived from the oxidation ofoleic acid [63,75]. Concretely, octanal was the one that was found in greater presence inthe lambs reared under intensive conditions (2.30 AU × 104/g fresh meat), while it didnot appear in the lambs reared extensively. This fact could indicate that intensively-rearedlambs may have a greater intensity of rancid odor, since previous studies have foundthat octanal is the aldehyde that presented the highest correlation with this parameter inlamb meat packed under a protective atmosphere [76]. On the contrary, nonanal was onlydetected in extensively-reared lambs since it is the aldehyde that appears in the highestconcentration in the meat of these animals (2.56 AU × 104/g fresh meat), after 2-propenalwith a concentration of 4.04 104/g fresh meat, which would provide a plastic and soapyaroma [77].
Table 4. Effects of the production system on aldehydes and ketones (expressed as AU × 104/g freshweight) of BEDM lamb longissimus thoracis et lumborum muscle.
LRI m/z Intensive Extensive SEM Sig.
Aldehydes
Propanal, 2-methyl- 556 72 0.00 0.21 0.021 ***
Butanal, 3-methyl- 659 58 0.26 0.57 0.050 ***
Butanal, 2-methyl- 671 57 0.14 1.00 0.097 ***
2-Butenal 841 70 0.39 0.00 0.047 ***
Hexanal 874 56 1.07 0.97 0.109 ns
Heptanal 987 70 0.27 0.95 0.100 ***
Hexanal, 3-methyl- 988 55 0.23 0.00 0.034 ***
Hexanal, 3,3-dimethyl- 1006 69 0.92 0.00 0.099 ***
Octanal 1084 84 2.30 0.00 0.276 ***
Benzeneacetaldehyde 1139 91 0.09 0.23 0.026 **
2-Propenal 1148 55 0.00 4.04 0.437 ***
Nonanal 1168 57 0.00 2.56 0.278 ***
15

Foods 2021, 10, 1450
Table 4. Cont.
LRI m/z Intensive Extensive SEM Sig.
2-Decenal, (E)- 1298 83 0.40 0.00 0.039 ***
2-Decenal, (Z)- 1299 70 0.32 0.00 0.040 ***
Total aldehydes 6.40 10.53 0.555 ***
Ketones
2,3-Butanedione 589 86 15.54 0.00 1.711 ***
2-Butanone 593 72 0.72 1.93 0.138 ***
2-Pentanone 724 86 0.23 0.66 0.047 ***
3-Pentanone 735 57 6.65 0.00 0.909 ***
2,3-Pentanedione 739 100 0.00 0.79 0.097 ***
1,5-Heptadien-4-one, 3,3,6-trimethyl- 779 83 0.00 0.99 0.115 ***
Cyclobutanone, 2,2,3-trimethyl- 815 70 0.00 2.90 0.306 ***
3-Heptanone 973 57 0.32 2.32 0.258 ***
2-Heptanone 980 58 1.68 8.67 0.851 ***
Pyrolo[3,2-d]pyrimidin-2,4(1H,3H)-dione 1057 151 9.83 8.21 0.456 ns
3-Ethylcyclopentanone 1058 83 0.00 0.37 0.042 ***
4-Octanone, 5-hydroxy-2,7-dimethyl- 1059 69 0.00 2.49 0.283 ***
Butyrolactone 1061 86 2.71 0.00 0.283 ***
4-Hexen-3-one, 5-methyl- 1062 83 0.41 0.00 0.050 ***
3-Heptanone, 5-methyl- 1069 99 3.28 0.00 0.395 ***
5-Hepten-2-one, 6-methyl- 1073 68 0.74 0.49 0.059 *
2-Octanone 1077 58 2.16 4.08 0.334 *
2(3H)-Furanone, dihydro-5-methyl- 1095 56 0.00 8.53 1.108 ***
5-Hexen-3-one 1151 98 0.90 1.24 0.076 *
3-Nonanone 1155 72 0.61 0.57 0.050 ns
2-Nonanone 1161 58 0.86 0.65 0.039 **
2(3H)-Furanone, 5-ethyldihydro- 1179 85 0.48 0.56 0.040 ns
2-Undecanone 1310 58 0.36 0.00 0.038 ***
2(3H)-Furanone, dihydro-5-pentyl- 1400 85 0.00 0.36 0.037 ***
Total ketones 47.48 45.81 10.626 ns
SEM: Standard error of the mean. Sig.: Significance. * (p < 0.05); ** (p < 0.01); *** (p < 0.001); ns: no significant difference.
Another important aldehyde is heptanal, which is usually an indicator of animal dietsrich in linoleic acid, since it is an aldehyde that appears after the oxidation of this fattyacid [64]. In this manner, it would be expected that the lambs reared in the intensive systemwould obtain higher concentrations of heptanal than those reared extensively becauselinoleic acid is typically present at high quantities in cereal grains [65]. Conversely, in ourresearch, lambs from extensive production system displayed significantly (p < 0.001) higheramounts of heptanal than intensive-reared lambs (0.95 vs. 0.27 AU × 104/g fresh meat).It is important to highlight that in a previous study, the BDEM lambs reared in extensivesystem also presented high amounts of this fatty acid, which explains our findings [9].These results are consistent with those shown by Vasta et al. [18], who found that milkfrom grass-fed ewes had higher concentrations of heptanal than those fed a grain-baseddiet. Therefore, it is not easy to unambiguously link an aldehyde compound with a lambfeeding or production system [14].
16

Foods 2021, 10, 1450
On the other hand, the fraction corresponding to the group of aldehydes with respectto the total volatiles was very low in both groups (0.99 and 1.31%, for intensive-reared andextensive-reared lambs, respectively) (Figure 1). Specifically, it is the second and third groupof volatile compounds that are the less abundant of the nine divisions in lambs produced inintensive and extensive systems, respectively. This fact is in disagreement with the resultsreported by other authors who found that the aldehyde family generally represents themain contributors to the volatile fraction extracted from ruminant meat [18,78]. Despitethis discrepancy, aldehydes remain one of the most important volatile compounds becausethey are the main indicators of rancidity in meat due to their low odor threshold [79,80].
3.2.5. Ketones
A total of 24 ketones were identified in the BEDM lamb meat (17 in intensively-rearedand 18 in extensively-reared lambs). As shown in Table 4, the production system did notsignificantly (p > 0.05) affect the total amount of ketones, although it was slightly higherin extensively-reared lambs (47.48 vs. 45.81 AU × 104/g fresh meat). Despite the factthat the total content of this family was not affected by production system, each individ-ual ketone showed significant (p < 0.05) differences according to the production systememployed, with the exception of pyrolo[3,2-d]pyrimidin-2,4(1H,3H)-dione; 3-nonanoneand 2(3H)-furanone, 5-ethyldihydro-, also known as γ-hexalactone, which could be re-lated to the metabolism of the ruminants since certain ketones are considered to be ofmetabolic origin [69]. Conversely, there are ketones that are derived from the diet [18].This is the case of 2,3-octanedione, which has been considered by several studies as atypical compound present in grass-fed animals meat [18,20]. However, the results obtainedby Resconi et al. [81] and Gravador et al. [68] did not identify 2,3-octanedione in lambsregardless of their diet.
On the other hand, 2,3-butanedione (diacetyl), was linked with grain diets [23]. Thisevent is in agreement with the results obtained in our work, since it has been observedthat only lambs reared in the intensive system had 2,3-butanedione (15.54 AU × 104/gfresh meat), while this diketone was not identified in extensively-reared animals. In fact,2,3-butanedione also stands out for being the ketone that appears in greater abundance inlambs fed with concentrate. Additionally, the presence of 2-heptanone and 2-butanone areassociated with grain-based diets [16,65]. Despite this, in our study, it was found that lambsreared extensively presented significantly (p < 0.001) higher amounts of 2-heptanone, 2-octanoneand 2-butanone (8.67 vs. 1.68 AU × 104/g fresh meat for 2-heptanone; 4.08 vs. 2.16 AU × 104/gfresh meat for 2-octanone; and 1.93 vs. 0.72 AU × 104/g fresh meat for 2-butanone) and even2-heptanone, which is the ketone that was detected in greater abundance in these lambs.These unexpected outcomes are consistent with those obtained by Vasta et al. [18] who didnot observe significant differences in this 2-ketones, yet did find slightly higher amountsin lambs fed with grass than with concentrate. Additionally, the high proportion of theseketones in animals reared in the extensive production system could be due to 2-ketonesbeing derived from lipid oxidation [63] and BEDM lambs that are extensively-reared hadthe highest amounts of PUFA [9], which promotes their formation. Contrary, 2-nonanonewas identified in a significantly higher concentration (p < 0.01) in intensively-reared lambs(0.86 and 0.65 AU × 104/g fresh meat for intensively-reared and extensively-reared animals,respectively). Although the value of 2-nonane is significant higher in lambs from intensivesystems than in lambs from extensive production system, it is important to mention thatthe difference of content between both groups of animals was less than those describedfor the aforementioned 2-ketones. This ketone (2-nonanone) possesses a “fatty, oily, fruity”odor and has previously been associated with a lamb flavor [82,83], which could indicatethat lambs reared in intensive production system could show a stronger flavor linked tothis compound.
Furthermore, it should be noted that up to four different lactones were identified inthe lamb meat, namely butyrolactone; 2(3H)-furanone, dihydro-5-methyl-; 2(3H)-furanone,5-ethyldihydro-; and 2(3H)-furanone, dihydro-5-pentyl. It has been previously pointed out
17
Foods 2021, 10, 1450
that this type of lactones have been linked to grain-based diets [20,21] due to its highercontent of oleic and linoleic acids compared to pasture [84]. This is because lactonesarise from the corresponding hydroxy-fatty acids [85], which in turn are formed in therumen by the oxidation of dietary oleic and linoleic acids [86]. However, in our work,only butyrolactone seemed to follow the trend expected, since it was found in intensively-reared lambs (2.71 AU × 104/g fresh meat) and not in extensively-reared lambs. On thecontrary, 2(3H)-furanone, dihydro-5-methyl- and 2(3H)-furanone, dihydro-5-pentyl- wereonly identified in lambs produced in extensive systems and obtained concentrations of8.53 and 0.36 AU × 104/g fresh meat in these lambs, respectively. Finally, 2(3H)-furanone,5-ethyldihydro- was not significantly (p > 0.05) affected by the production system.
Regarding the contribution of ketones on the total volatile compounds, this fam-ily represented 7.35 and 5.68% of the total volatile substances in intensively-reared andextensively-reared lambs, respectively (Figure 1). This percentage was slightly lower thanthat reported by Krvavica et al. [87], who observed ketone values of around 9% in lamb ofthe Lika breed. Despite this, the percentage of ketones is relatively high, since this group isthe fourth most abundant family for intensively-reared lambs and the third for extensively-reared lambs within the nine groups. This occurrence combined with the fact that ketoneshave a low perception threshold [56,82] renders this group a notable contributor to themeat flavor [73].
3.2.6. Esters, Ethers, Furans and Sulfur Compounds
Sixteen different esters were detected in BEDM lambs meat (8 in intensively-rearedand 11 in extensively-reared lambs), which were significantly (p < 0.001) affected by theproduction system except for a single compound, namely 2-butenoic acid, 2-methyl-,2-methylpropyl ester, which did not suffer significant (p > 0.05) variations (Table 5). Ingeneral, esters were found to a greater extent in lambs reared in extensive systems since10 of the 16 compounds obtained significantly (p < 0.001) higher concentrations in theseanimals. In addition, the total content of esters was also significantly (p < 0.05) higherin the lambs reared in extensive systems compared to those reared in intensive systems(28.30 vs. 21.62 AU × 104/g fresh meat). These differences could be related to the possiblevariability of the fatty acid profile of lambs [88] because the main origin of esters is theesterification of carboxylic acids [89]. Despite the differences, previous studies have shownthat the contribution of esters to the aromatic profile of lamb meat may be low [68];several authors did not even detect these compounds [17,81,90,91] or detected a lownumber of esters [37,76,87,88]. Therefore, although the fraction of esters to the total volatilecompounds was relatively high (3.35 in intensively-reared lambs and 3.51% for lambsreared under extensive conditions) (Figure 1), their presence may not contribute to theoverall aroma of the lamb meat.
Regarding the ethers group, only three different compounds were identified (Table 5).Two were found in intensively-reared lambs (namely, ether, 2-ethylhexyl tert-butyl anddecyl heptyl ether) and one in lambs raised extensively (namely, ether, 3-butenyl pentyl).All these individual compounds as well as their total content were significantly (p < 0.001)affected by the production system. Specifically, the lambs fed under the intensive dietshowed significantly (p < 0.001) higher amounts of this group (30.83 vs. 4.69 AU × 104/gfresh meat). In addition, ethers represented 4.77% of the total volatile content in lambsfrom the intensive system and occupies the fifth position of the nine families, while thisgroup only accounted for 0.58% of the total volatile content in lambs from the extensivesystem and is the family that appears in the lowest presence (Figure 1). The literatureconsulted did not frequently find these compounds in lamb meat and, in some cases, werenon-existent in many investigations [18,34,91,92]. Furthermore, it was observed that etherswere not relevant compounds in the aroma of lambs [93] and some of these substancescould be found in lamb due to their possible use as insecticides, acaricides and fumigantsfor the soil [48].
18

Foods 2021, 10, 1450
Table 5. Effects of the production system on esters, ethers, furans and sulfur compounds (expressedas AU × 104/g fresh weight) of BEDM lamb longissimus thoracis et lumborum muscle.
LRI m/z Intensive Extensive SEM Sig.
Esters
Acetic acid, methyl ester 537 74 0.18 0.46 0.044 ***
Ethyl Acetate 598 43 0.64 4.17 0.439 ***
Formic acid, ethenyl ester 708 43 0.00 11.24 1.193 ***
Butanoic acid, ethyl ester 856 70 1.51 0.00 0.158 ***
Formic acid, heptyl ester 1062 56 0.00 5.69 0.599 ***
Sulfurous acid, 2-ethylhexyl nonyl ester 1086 57 15.82 0.00 1.848 ***
Formic acid, octyl ester 1147 55 0.00 3.78 0.431 ***
Propanoic acid, 2-methyl-, 2-propenylester 1177 71 0.00 0.55 0.070 ***
Butanoic acid, 2-propenyl ester 1183 71 0.00 0.63 0.080 ***
2-Butenoic acid, 2-methyl-,2-methylpropyl ester 1183 83 0.31 0.45 0.039 ns
2-Propenoic acid, 2-methyl-,(tetrahydro-2-furanyl)methyl ester 1297 71 1.00 0.00 0.103 ***
Sulfurous acid, hexyl nonyl ester 1298 85 1.70 0.00 0.182 ***
Sulfurous acid, 2-ethylhexyl hexyl ester 1331 85 0.00 0.45 0.049 ***
Propanoic acid, 2-methyl-,2-methylpropyl ester 1384 71 0.00 0.38 0.046 ***
Sulfurous acid, 2-ethylhexyl isohexylester 1412 57 0.46 0.00 0.054 ***
Pentanoic acid, 5-hydroxy-,2,4-di-t-butylphenyl esters 1454 191 0.00 0.49 0.060 ***
Total esters 21.62 28.30 1.509 *
Ethers
Ether, 3-butenyl pentyl 1046 55 0.00 4.69 0.532 ***
Ether, 2-ethylhexyl tert-butyl 1090 57 28.67 0.00 3.068 ***
Decyl heptyl ether 1169 57 2.15 0.00 0.271 ***
Total ethers 30.83 4.69 2.849 ***
Furans
Furan, 2-ethyl- 706 81 0.90 4.75 0.468 ***
Furan, 2,3-dihydro- 806 70 0.00 1.76 0.228 ***
2-n-Butyl furan 956 81 0.33 0.47 0.042 ns
Furan, 2-pentyl- 1054 81 17.49 6.41 1.331 ***
Total furans 18.73 13.38 1.059 **
Sulfur compounds
Dimethyl sulfide 528 62 0.43 1.67 0.211 **
Carbon disulfide 532 76 47.57 21.34 4.129 ***
Dimethyl sulfone 1090 79 0.30 0.81 0.091 **
Total sulfur compounds 48.30 23.81 4.010 **
SEM: Standard error of the mean. Sig.: Significance. * (p < 0.05); ** (p < 0.01); *** (p < 0.001); ns: no significant difference.
19
Foods 2021, 10, 1450
On the other hand, four furans were identified in both lambs (Table 5), except forfuran, 2,3-dihydro-, which was only found in lambs reared in extensive systems at a concen-tration of 1.76 AU × 104/g fresh meat. Specifically, the furan that appeared in the highestconcentration was furan, 2-pentyl in both production systems, which has been frequentlyidentified in lamb meat [76,83,87,92] and related with lipid oxidation [29,75,83], green beanand butter flavors [66]. According to Fruet et al. [94], feeding with grass provided animalswith significantly (p < 0.001) lower concentrations of furan, 2-pentyl (6.41 AU × 104/gfresh meat compared to the 17.49 AU × 104/g fresh meat of lambs reared intensively).This fact could reveal that the grass-based diet has a higher content of α-tocopherol, sincethe formation of furan, 2-pentyl is negatively correlated with said antioxidant [24]. Onthe contrary, the rest of furans were found in a higher concentration in lambs reared inthe extensive range, being significant (p < 0.001) in the case of furan, 2-ethyl- and furan,2,3-dihydro-. Despite this, the total content of furans remained significantly (p < 0.01)higher in intensively-reared lambs (18.13 vs. 13.38 AU × 104/g fresh) due to their highercontribution of furan, 2-pentyl. Additionally, the furan group represented a percentageof 2.90 and 1.66% of the total volatile compounds found in intensive and extensive lambs,respectively (Figure 1). These fractions are not very high, since furans represent the sixthand seventh family in lambs reared extensively and intensively, respectively. However,their occurrence can be very important, since these compounds are potential contributorsto the rancid aroma of meat [76].
Finally, in the present research three sulfur compounds were identified in bothintensively-reared and extensively-reared lambs, which were significantly (p < 0.01) af-fected by the production system (Table 5). Specifically, intensively-reared lambs produceda significantly (p < 0.01) higher concentration for the total content of these substances(48.30 vs. 23.81 AU × 104/g fresh). In disagreement with these findings, several studiesdisplayed that sulfur compounds were present at higher concentration in grass-feed ani-mals compared to animals fed with concentrates [6,14]. However, the higher content inour research can be related to the amount of the carbon disulfide, since it turned out to bethe only sulfurous compound found in high levels in lambs reared intensively (45.75 vs.21.34 AU × 104/g fresh). Despite this difference, disulfide carbon was the most abundantsulfur compound detected in both production systems. This substance can be derivedfrom the enzymatic proteolysis of sulfur-containing amino acids [95] and/or from dithio-carbamate fungicides employed in agriculture [96]. Disulfide carbon could be importantin the aromatic profile of lamb as it has been found to contribute to the overall aromaof packed meat [95] and possess a pleasant, sweet or ether-like odor [48]. Furthermore,Karabagias [48] concluded that carbon disulfide could be considered as a typical volatilecompound of raw lamb meat. Contrary, dimethyl sulfide and dimethyl sulfone havebeen detected in significantly (p < 0.01) higher amounts in extensively-reared animals.These compounds are important because they can create adverse flavors in extensively-reared lambs. In this respect, dimethyl sulfone has been associated with unfavorablesensory descriptors [6]. Regarding the contribution of sulfur compounds on the volatileprofile, this family represented 7.48 and 2.95% of the total volatile compounds in the lambsreared intensively and extensively, respectively. This presence can be considered importantsince, in addition to being the third and fifth most abundant family in intensively-fed andextensively-fed lambs, sulfur compounds contribute to the general aroma of meat [95].
A further consideration on the overall meat aroma profile is that lambs fed extensivelydisplayed a significantly (p < 0.001) higher concentration of total volatile compounds(806.13 vs. 645.13 AU × 104/g fresh meat). This difference could suggest that extensively-reared lambs may have a higher flavor intensity than intensively-reared lambs. Further-more, these outcomes are in line with those encountered by other studies, which found agreater flavor intensity in the meat of animals fed with pasture [15,18] or whose motherswere grazing at a pasture [18,97] in comparison to meat from animals fed with concen-trates. This occurrence could be due to the fact that extensively-reared lambs contain asignificantly (p < 0.001) higher fat content than intensively-reared lambs (Table 1), which
20

Foods 2021, 10, 1450
can generate a greater amount of volatile compounds. In our study no significant (p > 0.05)correlations were found between intramuscular fat and total volatile content for eitherof the two production systems analyzed (r = 0.030; p > 0.05, for intensively-reared lambs;and r = 0.127; p > 0.05, for extensively-reared lambs). Similarly, the correlations betweenintramuscular fat and the different families of volatile compounds were low (r < 0.450) andnot significant (p > 0.05) in any case (except for the correlation found in extensively-rearedlambs for total ethers, where a significant correlation was observed (r = 0.634; p < 0.05)).However, when the individual volatile compounds were analyzed, a significant correla-tion (both positive and negative, depending on the volatile substance) between IMF and180 compounds was detected. Among these compounds, it is important to highlight thatstrong, significant and positive correlations (r > 0.6 and p < 0.01) between IMF and the mostimportant lipid-derived compounds, such as 1-propanol (r = 0.708; p < 0.01), 1-pentanol(r = 0.642; p < 0.01), 1-hexanol (r = 0.633; p < 0.01), nonanal (r = 0.639; p < 0.01), 2-butanone(r = 0.654; p < 0.01), 2-pentanone (r = 0.645; p < 0.01) and 2-heptanone (r = 0.684; p < 0.01)was observed. This fact confirms that the influence of the production system on the lipidcontent and that the lipid composition could likely be one of the main important factorsfor the release of characteristic volatile compounds that mainly consists of lipid-derivedcompounds, which, generally speaking, have a high impact on meat aroma due to theirlow odor thresholds.
4. Conclusions
The use of two different production systems (intensive and extensive) significantlyaffected the proximate composition of the BEDM lamb meat. Animals reared in an extensiveproduction system presented the highest values of IMF and protein, while it demonstratedthe lowest values for moisture and ash. In the same manner, the total concentration ofvolatile compounds was also affected, being higher in lambs reared in extensive regime,although it did not seem related to intramuscular fat content. However, the intramuscularfat content had a strong effect on the most individual volatile content derived from lipidreactions (lipolysis, lipid oxidation, etc.). Furthermore, most of the individual volatilecompounds were also influenced by the production system, which could be related to both,and specific compounds linked to the diet or the variation of lipid fraction (lipid contentand fatty acids), which highly influenced the release of lipid-derived volatile compounds.
Supplementary Materials: The following are available online at https://www.mdpi.com/article/10.3390/foods10071450/s1, Table S1: Chemical composition, ingredients and amounts of mineral andvitamin mix used in the diet of intensively-reared lambs.
Author Contributions: Conceptualization, V.A.P.C. and J.M.L.; formal analysis, N.E., R.B. and L.P.;writing—original draft preparation, N.E. and R.D.; writing—review and editing, R.D., U.G.-B., E.H.and J.M.L. All authors have read and agreed to the published version of the manuscript.
Funding: This research was funded by the EU ERA-NET programme (project “EcoLamb–Holistic Pro-duction to Reduce the Ecological Footprint of Meat”), grant number SusAn/0002/2016 through thePortuguese Foundation for Science and Technology (FCT) and the Agencia Estatal de Investigación(Acciones de Programación Conjunta Internacional) grant number PCIN-2017-053.
Institutional Review Board Statement: Ethical review and approval were waived for this study dueto the compliance with national and/or European Regulations on animal husbandry and slaughter.
Informed Consent Statement: Not applicable.
Data Availability Statement: No new data were created or analyzed in this study. Data sharing isnot applicable to this article.
Acknowledgments: Noemí Echegaray acknowledges Consellería de Cultura, Educación e Orde-nación Universitaria (Xunta de Galicia) for granting with a predoctoral scholarship (Grant numberIN606A-2018/002). Rubén Domínguez, Laura Purriños, Roberto Bermúdez and José M. Lorenzoare members of the HealthyMeat network and funded by CYTED (ref. 119RT0568). CIMO au-thors are grateful to FCT and FEDER under Programme PT2020 for the financial support to CIMO
21

Foods 2021, 10, 1450
(UIDB/00690/2020). Gonzales-Barron acknowledges the national funding by FCT, P.I., through theInstitutional Scientific Employment Programme contract.
Conflicts of Interest: The authors declare no conflict of interest.
References
1. Font-i-Furnols, M.; Guerrero, L. Consumer preference, behavior and perception about meat and meat products: An overview.Meat Sci. 2014, 98, 361–371. [CrossRef]
2. Glitsch, K. Consumer perceptions of fresh meat quality: Cross-national comparison. Br. Food J. 2000, 102, 177–194. [CrossRef]3. Watkins, P.J.; Frank, D.; Singh, T.K.; Young, O.A.; Warner, R.D. Sheepmeat flavor and the effect of different feeding systems: A
review. J. Agric. Food Chem. 2013, 61, 3561–3579. [CrossRef] [PubMed]4. Young, O.A.; Berdagué, J.L.; Viallon, C.; Rousset-Akrim, S.; Theriez, M. Fat-borne volatiles and sheepmeat odour. Meat Sci. 1997,
45, 183–200. [CrossRef]5. Almela, E.; Jordán, M.J.; Martínez, C.; Sotomayor, J.A.; Bedia, M.; Bañón, S. Ewe’s diet (pasture vs grain-based feed) affects
volatile profile of cooked meat from light lamb. J. Agric. Food Chem. 2010, 58, 9641–9646. [CrossRef] [PubMed]6. Young, O.A.; Lane, G.A.; Priolo, A.; Fraser, K. Pastoral and species flavour in lambs raised on pasture, lucerne or maize. J. Sci.
Food Agric. 2003, 83, 93–104. [CrossRef]7. Sañudo, C.; Alfonso, M.; Sanchez, A.; Berge, P.; Dransfield, E.; Zygoyiannis, D.; Stamataris, C.; Thorkelsson, G.; Valdimarsdottir,
T.; Piasentier, E.; et al. Meat texture of lambs from different European production systems. Aust. J. Agric. Res. 2003, 54, 551–560.[CrossRef]
8. De-Arriba, R.; Sánchez-Andrés, A. Production and Productivity in Eastern and Western European Sheep Farming: A ComparativeAnalysis. Available online: http://www.lrrd.org/lrrd26/4/arri26066.htm (accessed on 3 July 2020).
9. Cadavez, V.A.P.; Popova, T.; Bermúdez, R.; Osoro, K.; Purriños, L.; Bodas, R.; Lorenzo, J.M.; Gonzales-Barron, U. Compositionalattributes and fatty acid profile of lamb meat from Iberian local breeds. Small Rumin. Res. 2020, 193, 106244. [CrossRef]
10. Ruano, Z.M.; Cortinhas, A.; Carolino, N.; Gomes, J.; Costa, M.; Mateus, T.L. Gastrointestinal parasites as a possible threat to anendangered autochthonous Portuguese sheep breed. J. Helminthol. 2019, 94, e103. [CrossRef]
11. Mendelsohn, R. The challenge of conserving indigenous domesticated animals. Ecol. Econ. 2003, 45, 501–510. [CrossRef]12. Paim, T.d.P.; Da Silva, A.F.; Martins, R.F.S.; Borges, B.O.; Lima, P.d.M.T.; Cardoso, C.C.; Esteves, G.I.F.; Louvandini, H.; McManus,
C. Performance, survivability and carcass traits of crossbred lambs from five paternal breeds with local hair breed Santa Inêsewes. Small Rumin. Res. 2013, 112, 28–34. [CrossRef]
13. Cruz, B.C.; Cerqueira, J.; Araújo, J.P.; Gonzales-Barron, U.; Cadavez, V. Study of growth performance of Churra-Galega-Bragançana and Bordaleira-de-Entre-Douro-e- Minho lamb breeds. In Proceedings of the XVIII Jornadas sobre ProducciónAnimal, Zaragoza, Spain, 7–8 May 2019; pp. 66–68.
14. Vasta, V.; Priolo, A. Ruminant fat volatiles as affected by diet. A review. Meat Sci. 2006, 73, 218–228. [CrossRef] [PubMed]15. Priolo, A.; Micol, D.; Agabriel, J. Effects of grass feeding systems on ruminant meat colour and flavour. A review. Anim. Res. 2001,
50, 185–200. [CrossRef]16. Vasta, V.; Ratel, J.; Engel, E. Mass spectrometry analysis of volatile compounds in raw meat for the authentication of the feeding
background of farm animals. J. Agric. Food Chem. 2007, 55, 4630–4639. [CrossRef]17. Sivadier, G.; Ratel, J.; Engel, E. Latency and persistence of diet volatile biomarkers in lamb fats. J. Agric. Food Chem. 2009, 57,
645–652. [CrossRef]18. Vasta, V.; D’Alessandro, A.G.; Priolo, A.; Petrotos, K.; Martemucci, G. Volatile compound profile of ewe’s milk and meat of their
suckling lambs in relation to pasture vs. indoor feeding system. Small Rumin. Res. 2012, 105, 16–21. [CrossRef]19. Naczk, M.; Shahidi, F. Extraction and analysis of phenolics in food. J. Chromatogr. A 2004, 1054, 95–111. [CrossRef]20. Sebastiàn, I.; Viallon, C.; Berge, P. Analysis of the volatile fraction and the flavour characteristics of lamb: Relationships with the
type of feeding. Sci. Aliment. 2003, 23, 497–511. [CrossRef]21. Suzuky, J.; Bailey, M.E. Direct sampling capillary GLC analysis of flavor volatiles from ovine fat. J. Agric. Food Chem. 1985, 33,
343–347. [CrossRef]22. Vlaeminck, B.; Fievez, V.; Van Laar, H.; Demeyer, D. Rumen odd and branched chain fatty acids in relation to in vitro rumen
volatile fatty acid productions and dietary characteristics of incubated substrates. J. Anim. Physiol. Anim. Nutr. 2004, 88, 401–411.[CrossRef] [PubMed]
23. Raes, K.; Balcaen, A.; Dirinck, P.; De Winne, A.; Claeys, E.; Demeyer, D.; De Smet, S. Meat quality, fatty acid composition andflavour analysis in belgian retail beef. Meat Sci. 2003, 65, 1237–1246. [CrossRef]
24. Vasta, V.; Luciano, G.; Dimauro, C.; Röhrle, F.; Priolo, A.; Monahan, F.J.; Moloney, A.P. The volatile profile of longissimus dorsimuscle of heifers fed pasture, pasture silage or cereal concentrate: Implication for dietary discrimination. Meat Sci. 2011, 87,282–289. [CrossRef]
25. ISO (International Organization for Standardization). Determination of moisture content, ISO 1442:1997 standard. In InternationalStandards Meat and Meat Products; International Organization for Standardization: Genève, Switzerland, 1997.
26. ISO (International Organization for Standardization). Determination of nitrogen content, ISO 937:1978 standard. In InternationalStandards Meat and Meat Products; International Organization for Standardization: Genève, Switzerland, 1978.
22

Foods 2021, 10, 1450
27. ISO (International Organization for Standardization). Determination of ash content, ISO 936:1998 standard. In InternationalStandards Meat and Meat Products; International Organization for Standardization: Genève, Switzerland, 1998.
28. AOCS. AOCS Official Procedure Am5-04. Rapid Determination of Oil/Fat Utilizing High Temperature Solvent Extraction; American OilChemists Society: Urbana, IL, USA, 2005.
29. Domínguez, R.; Purriños, L.; Pérez-Santaescolástica, C.; Pateiro, M.; Barba, F.J.; Tomasevic, I.; Campagnol, P.C.B.; Lorenzo, J.M.Characterization of Volatile Compounds of Dry-Cured Meat Products Using HS-SPME-GC/MS Technique. Food Anal. Methods2019, 12, 1263–1284. [CrossRef]
30. Gonzales-Barron, U.; Popova, T.; Bermúdez Piedra, R.; Tolsdorf, A.; Geß, A.; Pires, J.; Domínguez, R.; Chiesa, F.; Brugiapaglia, A.;Viola, I.; et al. Fatty acid composition of lamb meat from Italian and German local breeds. Small Rumin. Res. 2021, 200, 106384.[CrossRef]
31. Polidori, P.; Pucciarelli, S.; Cammertoni, N.; Polzonetti, V.; Vincenzetti, S. The effects of slaughter age on carcass and meat qualityof Fabrianese lambs. Small Rumin. Res. 2017, 155, 12–15. [CrossRef]
32. Cividini, A.; Levart, A.; Žgur, S.; Kompan, D. Fatty acid composition of lamb meat from the autochthonous Jezersko-Solcavabreed reared in different production systems. Meat Sci. 2014, 97, 480–485. [CrossRef] [PubMed]
33. Velasco, S.; Cañeque, V.; Pérez, C.; Lauzurica, S.; Díaz, M.T.; Huidobro, F.; Manzanares, C.; González, J. Fatty acid composition ofadipose depots of suckling lambs raised under different production systems. Meat Sci. 2001, 59, 325–333. [CrossRef]
34. Gkarane, V.; Brunton, N.P.; Allen, P.; Gravador, R.S.; Claffey, N.A.; Diskin, M.G.; Fahey, A.G.; Farmer, L.J.; Moloney, A.P.; Alcalde,M.J.; et al. Effect of finishing diet and duration on the sensory quality and volatile profile of lamb meat. Food Res. Int. 2019, 115,54–64. [CrossRef]
35. Aurousseau, B.; Bauchart, D.; Faure, X.; Galot, A.L.; Prache, S.; Micol, D.; Priolo, A. Indoor fattening of lambs raised on pasture.Part 1: Influence of stall finishing duration on lipid classes and fatty acids in the longissimus thoracis muscle. Meat Sci. 2007, 76,241–252. [CrossRef]
36. Joy, M.; Ripoll, G.; Delfa, R. Effects of feeding system on carcass and non-carcass composition of Churra Tensina light lambs.Small Rumin. Res. 2008, 78, 123–133. [CrossRef]
37. Wilches, D.; Rovira, J.; Jaime, I.; Palacios, C.; Lurueña-Martínez, M.A.; Vivar-Quintana, A.M.; Revilla, I. Evaluation of the effect ofa maternal rearing system on the odour profile of meat from suckling lamb. Meat Sci. 2011, 88, 415–423. [CrossRef]
38. Belhaj, K.; Mansouri, F.; Sindic, M.; Fauconnier, M.-L.; Boukharta, M.; Serghini Caid, H.; Elamrani, A. Effect of Rearing Season onMeat and Intramuscular Fat Quality of Beni-Guil Sheep. J. Food Qual. 2021, 2021, 1–9. [CrossRef]
39. Hajji, H.; Joy, M.; Ripoll, G.; Smeti, S.; Mekki, I.; Gahete, F.M.; Mahouachi, M.; Atti, N. Meat physicochemical properties, fatty acidprofile, lipid oxidation and sensory characteristics from three North African lamb breeds, as influenced by concentrate or pasturefinishing diets. J. Food Compos. Anal. 2016, 48, 102–110. [CrossRef]
40. Majdoub-Mathlouthi, L.; Saïd, B.; Say, A.; Kraiem, K. Effect of concentrate level and slaughter body weight on growth perfor-mances, carcass traits and meat quality of Barbarine lambs fed oat hay based diet. Meat Sci. 2013, 93, 557–563. [CrossRef]
41. Cañeque, V.; Velasco, S.; Díaz, M.; Pérez, C.; Huidobro, F.; Lauzurica, S.; Manzanares, C.; González, J. Effect of weaning age andslaughter weight on carcass and meat quality of Talaverana breed lambs raised at pasture. Anim. Sci. 2001, 73, 85–95. [CrossRef]
42. Popova, T.; Gonzales-Barron, U.; Cadavez, V. A meta-analysis of the effect of pasture access on the lipid content and fatty acidcomposition of lamb meat. Food Res. Int. 2015, 77, 476–483. [CrossRef]
43. Ekiz, B.; Demirel, G.; Yilmaz, A.; Ozcan, M.; Yalcintan, H.; Kocak, O.; Altinel, A. Slaughter characteristics, carcass quality andfatty acid composition of lambs under four different production systems. Small Rumin. Res. 2013, 114, 26–34. [CrossRef]
44. Boughalmi, A.; Araba, A. Effect of feeding management from grass to concentrate feed on growth, carcass characteristics, meatquality and fatty acid profile of Timahdite lamb breed. Small Rumin. Res. 2016, 144, 158–163. [CrossRef]
45. Nuernberg, K.; Nuernberg, G.; Ender, K.; Dannenberger, D.; Schabbel, W.; Grumbach, S.; Zupp, W.; Steinhart, H. Effect of grassvs. concentrate feeding on the fatty acid profile of different fat depots in lambs. Eur. J. Lipid Sci. Technol. 2005, 107, 737–745.[CrossRef]
46. Ates, S.; Keles, G.; Demirci, U.; Dogan, S.; Kirbas, M.; Filley, S.J.; Parker, N.B. The effects of feeding system and breed on theperformance and meat quality of weaned lambs. Small Rumin. Res. 2020, 192, 106225. [CrossRef]
47. Ye, Y.; Schreurs, N.M.; Johnson, P.L.; Corner-Thomas, R.A.; Agnew, M.P.; Silcock, P.; Eyres, G.T.; Maclennan, G.; Realini, C.E.Carcass characteristics and meat quality of commercial lambs reared in different forage systems. Livest. Sci. 2020, 232, 103908.[CrossRef]
48. Karabagias, I.K. Volatile profile of raw lamb meat stored at 4 ± 1 ◦C: The potential of specific aldehyde ratios as indicators oflamb meat quality. Foods 2018, 7, 40. [CrossRef] [PubMed]
49. Meynier, A.; Novelli, E.; Chizzolini, R.; Zanardi, E.; Gandemer, G. Volatile compounds of commercial Milano salami. Meat Sci.1999, 51, 175–183. [CrossRef]
50. Sivadier, G.; Ratel, J.; Bouvier, F.; Engel, E. Authentication of meat products: Determination of animal feeding by parallel GC-MSanalysis of three adipose tissues. J. Agric. Food Chem. 2008, 56, 9803–9812. [CrossRef] [PubMed]
51. Rios, J.J.; Fernández-García, E.; Mínguez-Mosquera, M.I.; Pérez-Gálvez, A. Description of volatile compounds generated by thedegradation of carotenoids in paprika, tomato and marigold oleoresins. Food Chem. 2008, 106, 1145–1153. [CrossRef]
52. Binnie, J.; Cape, J.N.; Mackie, N.; Leith, I.D. Exchange of organic solvents between the atmosphere and grass—The use of opentop chambers. Sci. Total Environ. 2002, 285, 53–67. [CrossRef]
23

Foods 2021, 10, 1450
53. Smith, K.E.C.; Jones, K.C. Particles and vegetation: Implications for the transfer of particle-bound organic contaminants tovegetation. Sci. Total Environ. 2000, 246, 207–236. [CrossRef]
54. Franke, E.N. Recent advances in the chemistry of rancidity of fats. In Recent Advances in the Chemistry of Meat; The Royal Societyof Chemistry: London, UK, 1984; pp. 87–118.
55. Flores, M. Understanding the implications of current health trends on the aroma of wet and dry cured meat products. Meat Sci.2018, 144, 53–61. [CrossRef]
56. Insausti, K.; Beriain, M.; Gorraiz, C.; Purroy, A. Volatile compounds of raw beef from 5 local spanish cattle breeds stored undermodified atmosphere. Sens. Nutr. Qual. Food 2002, 67, 1580–1589. [CrossRef]
57. Mottram, D.S. Flavour formation in meat and meat products: A review. Food Chem. 1998, 62, 415–424. [CrossRef]58. Ha, J.K.; Lindsay, R.C. Volatile alkylphenols and thiophenol in species-related characterizing flavors of red meats. J. Food Sci.
1991, 56, 1197–1202. [CrossRef]59. Erasmus, S.W.; Muller, M.; Hoffman, L.C. Authentic sheep meat in the European Union: Factors influencing and validating its
unique meat quality. J. Sci. Food Agric. 2017, 97, 1979–1996. [CrossRef]60. Watkins, P.J.; Kearney, G.; Rose, G.; Allen, D.; Ball, A.J.; Pethick, D.W.; Warner, R.D. Effect of branched-chain fatty acids,
3-methylindole and 4-methylphenol on consumer sensory scores of grilled lamb meat. Meat Sci. 2014, 96, 1088–1094. [CrossRef][PubMed]
61. Garcia, C.; Berdagué, J.J.; Antequera, T.; López-Bote, C.; Córdoba, J.J.; Ventanas, J. Volatile components of dry cured Iberian ham.Food Chem. 1991, 41, 23–32. [CrossRef]
62. Barbieri, G.; Bolzoni, L.; Parolari, G.; Virgili, R.; Buttini, R.; Careri, M.; Mangia, A. Flavor compounds of dry-cured ham. J. Agric.Food Chem. 1992, 40, 2389–2394. [CrossRef]
63. Domínguez, R.; Pateiro, M.; Gagaoua, M.; Barba, F.J.; Zhang, W.; Lorenzo, J.M. A comprehensive review on lipid oxidation inmeat and meat products. Antioxidants 2019, 8, 429. [CrossRef]
64. Elmore, J.S.; Cooper, S.L.; Enser, M.; Mottram, D.S.; Sinclair, L.A.; Wilkinson, R.G.; Wood, J.D. Dietary manipulation of fatty acidcomposition in lamb meat and its effect on the volatile aroma compounds of grilled lamb. Meat Sci. 2005, 69, 233–242. [CrossRef]
65. Morand-Fehr, P.; Tran, G. La fraction lipidique des aliments et les corps gras utilisés en alimentation animale. Prod. Anim. 2001,14, 285–302. [CrossRef]
66. Calkins, C.R.; Hodgen, J.M. A fresh look at meat flavor. Meat Sci. 2007, 77, 63–80. [CrossRef]67. Lane, G.A.; Fraser, K. A comparison of phenol and indole flavour compounds in fat, and of phenols in urine of cattle fed pasture
or grain. N. Zeal. J. Agric. Res. 1999, 42, 289–296. [CrossRef]68. Gravador, R.S.; Serra, A.; Luciano, G.; Pennisi, P.; Vasta, V.; Mele, M.; Pauselli, M.; Priolo, A. Volatiles in raw and cooked meat
from lambs fed olive cake and linseed. Animal 2015, 9, 715–722. [CrossRef] [PubMed]69. Coppa, M.; Martin, B.; Pradel, P.; Leotta, B.; Priolo, A.; Vasta, V. Milk volatile compounds to trace cows fed a hay-based diet or
different grazing systems on upland pastures. J. Agric. Food Chem. 2011, 59, 4947–4954. [CrossRef] [PubMed]70. Selli, S.; Cayhan, G.G. Analysis of volatile compounds of wild gilthead sea bream (Sparus aurata) by simultaneous distillation-
extraction (SDE) and GC-MS. Microchem. J. 2009, 93, 232–235. [CrossRef]71. Argemí-Armengol, I.; Villalba, D.; Tor, M.; Pérez-Santaescolástica, C.; Purriños, L.; Lorenzo, J.M.; Álvarez-Rodríguez, J. The extent
to which genetics and lean grade affect fatty acid profiles and volatile compounds in organic pork. PeerJ 2019, 7, e7322. [CrossRef]72. Maggiolino, A.; Lorenzo, J.M.; Marino, R.; della Malva, A.; Centoducati, P.; De Palo, P. Foal meat volatile compounds: Effect of
vacuum ageing on semimembranosus muscle. J. Sci. Food Agric. 2019, 99, 1660–1667. [CrossRef] [PubMed]73. Van, H.; Hwang, I.; Jeong, D.; Touseef, A. Principle of Meat Aroma Flavors and Future Prospect. In Latest Research into Quality
Control; Akyar, I., Ed.; IntechOpen: London, UK, 2012; pp. 145–176.74. Frankel, E.N. Lipid Oxidation, 2nd ed.; Oily Press: Dundee, Scotland, 1998.75. DeMan, J.H. Lipids. In Principles of Food Chemistry; Reinhold, V.N., Ed.; Springer: New York, NY, USA, 1990.76. Ortuño, J.; Serrano, R.; Bañón, S. Use of dietary rosemary diterpenes to inhibit rancid volatiles in lamb meat packed under
protective atmosphere. Animal 2016, 10, 1391–1401. [CrossRef]77. Marco, A.; Navarro, J.L.; Flores, M. Quantitation of selected odor-active constituents in dry fermented sausages prepared with
different curing salts. J. Agric. Food Chem. 2007, 55, 3058–3065. [CrossRef]78. Larick, D.K.; Tuener, B.E. Headspace volatiles and sensory characteristics of ground beef from forage- and grain-fed heifers. J.
Food Sci. 1990, 55, 649–654. [CrossRef]79. Du, X. Determination of flavor substances in fermented pork by GC-MS. Meat Res. 2012, 26, 34–36.80. Elmore, J.S.S.; Mottram, D.S.D.S.; Enser, M.; Wood, J.D.J.D. Effect of the polyunsaturated fatty acid composition of beef muscle on
the profile of aroma volatiles. J. Agric. Food Chem. 1999, 47, 1619–1625. [CrossRef] [PubMed]81. Resconi, V.C.; Campo, M.M.; Montossi, F.; Ferreira, V.; Sañudo, C.; Escudero, A. Relationship between odour-active compounds
and flavour perception in meat from lambs fed different diets. Meat Sci. 2010, 85, 700–706. [CrossRef] [PubMed]82. Caporaso, F.; Sink, J.D.; Dimick, P.S.; Mussinan, C.J.; Sanderson, A. Volatile flavor constituents of ovine adipose tissue. J. Agric.
Food Chem. 1977, 25, 1230–1234. [CrossRef]83. Gkarane, V.; Brunton, N.P.; Harrison, S.M.; Gravador, R.S.; Allen, P.; Claffey, N.A.; Diskin, M.G.; Fahey, A.G.; Farmer, L.J.;
Moloney, A.P.; et al. Volatile profile of grilled lamb as affected by castration and age at slaughter in two breeds. J. Food Sci. 2018,83, 2466–2477. [CrossRef]
24

Foods 2021, 10, 1450
84. Manner, W.; Maxwell, R.J.; Williams, J.E. Effects of dietary regimen and tissue site on bovine fatty acid profiles. J. Anim. Sci. 1984,59, 109–121. [CrossRef]
85. Gargouri, M.; Drouet, P.; Legoy, M.D. Synthesis of a novel macrolactone by lipase-catalyzed intra-esterification of hydroxy-fattyacid in organic media. J. Biotechnol. 2002, 92, 259–266. [CrossRef]
86. Urbach, G. Effect of feed on flavor in dairy foods. J. Dairy Sci. 1990, 73, 3639–3650. [CrossRef]87. Krvavica, M.; Bradaš, M.; Rogošic, J.; Jug, T.; Vnucec, I.; Marušic Radovcic, N. Volatile aroma compounds of Lika lamb. MESO
2015, 3, 469–476.88. Osorio, M.T.; Zumalacárregui, J.M.; Cabeza, E.A.; Figueira, A.; Mateo, J. Effect of rearing system on some meat quality traits and
volatile compounds of suckling lamb meat. Small Rumin. Res. 2008, 78, 1–12. [CrossRef]89. Petricevic, S.; Marušic Radovcic, N.; Lukic, K.; Listeš, E.; Medic, H. Differentiation of dry-cured hams from different processing
methods by means of volatile compounds, physico-chemical and sensory analysis. Meat Sci. 2018, 137, 217–227. [CrossRef]90. Vasta, V.; Jerónimo, E.; Brogna, D.M.R.; Dentinho, M.T.P.; Biondi, L.; Santos-Silva, J.; Priolo, A.; Bessa, R.J.B. The effect of grape
seed extract or Cistus ladanifer L. on muscle volatile compounds of lambs fed dehydrated lucerne supplemented with oil. FoodChem. 2010, 119, 1339–1345. [CrossRef]
91. Zhang, C.; Zhang, H.; Liu, M.; Zhao, X.; Luo, H. Effect of breed on the volatile compound precursors and odor profile attributesof lamb meat. Foods 2020, 9, 1178. [CrossRef]
92. Del Bianco, S.; Natalello, A.; Luciano, G.; Valenti, B.; Monahan, F.; Gkarane, V.; Rapisarda, T.; Carpino, S.; Piasentier, E. Influenceof dietary cardoon meal on volatile compounds and flavour in lamb meat. Meat Sci. 2020, 163, 108086. [CrossRef]
93. Bueno, M.; Resconi, V.C.; Campo, M.M.; Cacho, J.; Ferreira, V.; Escudero, A. Gas chromatographic-olfactometric characterisationof headspace and mouthspace key aroma compounds in fresh and frozen lamb meat. Food Chem. 2011, 129, 1909–1918. [CrossRef]
94. Fruet, A.P.B.; Trombetta, F.; Stefanello, F.S.; Speroni, C.S.; Donadel, J.Z.; De Souza, A.N.M.; Rosado Júnior, A.; Tonetto, C.J.;Wagner, R.; De Mello, A.; et al. Effects of feeding legume-grass pasture and different concentrate levels on fatty acid profile,volatile compounds, and off-flavor of the M. longissimus thoracis. Meat Sci. 2018, 140, 112–118. [CrossRef] [PubMed]
95. Saraiva, C.; Oliveira, I.; Silva, J.A.; Martins, C.; Ventanas, J.; García, C. Implementation of multivariate techniques for the selectionof volatile compounds as indicators of sensory quality of raw beef. J. Food Sci. Technol. 2015, 52, 3887–3898. [CrossRef] [PubMed]
96. Kontou, S.; Tsipi, D.; Tzia, C. Stability of the dithiocarbamate pesticide maneb in tomato homogenates during cold storage andthermal processing. Food Addit. Contam. 2004, 21, 1083–1089. [CrossRef] [PubMed]
97. Maiorano, G.; Kowaliszyn, B.; Martemucci, G.; Breeding, G.A.; Amendola, G. The effect of production system information onconsumer expectation and acceptability of Leccese lamb meat. Ann. Food Sci. Technol. 2010, 11, 9–13.
25


foods
Article
Comprehensive SPME-GC-MS Analysis of VOC ProfilesObtained Following High-Temperature Heating of Pork BackFat with Varying Boar Taint Intensities
Clément Burgeon 1,*, Alice Markey 1, Marc Debliquy 2, Driss Lahem 3, Justine Rodriguez 2, Ahmadou Ly 3
and Marie-Laure Fauconnier 1
���������������
Citation: Burgeon, C.; Markey, A.;
Debliquy, M.; Lahem, D.; Rodriguez,
J.; Ly, A.; Fauconnier, M.-L.
Comprehensive SPME-GC-MS
Analysis of VOC Profiles Obtained
Following High-Temperature Heating
of Pork Back Fat with Varying Boar
Taint Intensities. Foods 2021, 10, 1311.
https://doi.org/10.3390/foods10061311
Academic Editor: Paulo Eduardo
Sichetti Munekata
Received: 21 May 2021
Accepted: 1 June 2021
Published: 7 June 2021
Publisher’s Note: MDPI stays neutral
with regard to jurisdictional claims in
published maps and institutional affil-
iations.
Copyright: © 2021 by the authors.
Licensee MDPI, Basel, Switzerland.
This article is an open access article
distributed under the terms and
conditions of the Creative Commons
Attribution (CC BY) license (https://
creativecommons.org/licenses/by/
4.0/).
1 Laboratory of Chemistry of Natural Molecules, Gembloux Agro-Bio Tech, Université de Liège,Passage des Déportés 2, 5030 Gembloux, Belgium; [email protected] (A.M.);[email protected] (M.-L.F.)
2 Service de Science des Matériaux, Faculté Polytechnique, Université de Mons, Rue de l’Epargne 56,7000 Mons, Belgium; [email protected] (M.D.); [email protected] (J.R.)
3 Materia Nova ASBL, Materials R&D Centre, Parc Initialis, Avenue Nicolas Copernic 3, 7000 Mons, Belgium;[email protected] (D.L.); [email protected] (A.L.)
* Correspondence: [email protected]
Abstract: Boar taint detection is a major concern for the pork industry. Currently, this taint ismainly detected through a sensory evaluation. However, little is known about the entire volatileorganic compounds (VOCs) profile perceived by the assessor. Additionally, many research groupsare working on the development of new rapid and reliable detection methods, which include theVOCs sensor-based methods. The latter are susceptible to sensor poisoning by interfering moleculesproduced during high-temperature heating of fat. Analyzing the VOC profiles obtained by solidphase microextraction gas chromatography–mass spectrometry (SPME-GC-MS) after incubation at150 and 180 ◦C helps in the comprehension of the environment in which boar taint is perceived.Many similarities were observed between these temperatures; both profiles were rich in carboxylicacids and aldehydes. Through a principal component analysis (PCA) and analyses of variance(ANOVAs), differences were highlighted. Aldehydes such as (E,E)-nona-2,4-dienal exhibited higherconcentrations at 150 ◦C, while heating at 180 ◦C resulted in significantly higher concentrations in fattyacids, several amide derivatives, and squalene. These differences stress the need for standardizedparameters for sensory evaluation. Lastly, skatole and androstenone, the main compounds involvedin boar taint, were perceived in the headspace at these temperatures but remained low (below 1ppm). Higher temperature should be investigated to increase headspace concentrations providedthat rigorous analyses of total VOC profiles are performed.
Keywords: back fat; boar taint; entire male pig; GC-MS; lipid oxidation; meat quality; pork meat;SPME; VOC
1. Introduction
Nowadays, a top priority for the pork industry is being able to correctly discriminatetainted from untainted boar carcasses. In fact, boar taint is a strong and unpleasant smellfound in the meat of some uncastrated male pigs. This smell appears upon cooking ofboar tainted meat and is due to the release of a complex mixture of molecules. The majormolecules responsible for this smell are the steroid androstenone (5-α-androst-16-en-3-one)and the tryptophan metabolite skatole (3-methylindole), which are well-known for theirurine and fecal smell, respectively [1,2].
To prevent the development of such molecules, surgical castration without painrelief has often been used worldwide given that it is a fast, cheap, and handy castrationtechnique for farmers. However, this practice has been criticized for the pain and stressthat it inflicts to piglets. Hence, alternatives to surgical castration have been suggested and
Foods 2021, 10, 1311. https://doi.org/10.3390/foods10061311 https://www.mdpi.com/journal/foods
27

Foods 2021, 10, 1311
are now being promoted [3]. Out of all, two castration techniques appear more realistic:immunocastration (i.e., testicular functions are deactivated through the neutralization of thehypothalamic–pituitary–gonadal axis hormones [4]) and rearing of entire males. Whether itis to discriminate tainted uncastrated male pigs or simply to ensure that immunocastrationhas functioned correctly, the detection of tainted carcasses is an essential step in theslaughtering process.
Currently, many research studies are taking place to develop new detection methodsthat are ideally low cost (less than 1.30 euro/analysis), fast (less than 10 s/analysis), 100%specific and sensitive (no false negatives and no false positives), and automated [5]. Thesecriteria are essential for methods to be used on the slaughter line.
Several detection principles have been investigated throughout the years [6]. Massspectrometry-based methods have recently been examined and have shown interestingresults. Rapid evaporative ionization mass spectrometry (REIMS) provided highly accurateclassification of tainted and untainted samples at a fast speed and has shown its potentialto be used for online applications given its hand-held sampling tool and estimated lowcost [7]. Laser diode thermal desorption–tandem mass spectrometry (LDTD-MS/MS) hasalso been thoroughly investigated [8–10]. This method achieved good validation criteria,fast analysis (once sample preparation has been performed, analysis in itself takes less than10 s/sample), and is currently being tested in a Danish slaughterhouse [11]. However, bothmethods would require substantial investment (expensive instruments and need for skilledstaff), which could lead to reluctance in their application.
Other methods recently tested and presenting lower investment cost are devices basedon Raman spectroscopy [12,13] and a new specific sensor system based on screen-printedcarbon electrodes [14,15]. Additionally, these techniques are easy to use given the hand-held measuring tool. However, both still need further validation given high predictionerrors for Raman spectroscopy and the absence of real slaughterhouse testing with thesensor system.
The rapid detection of boar taint through volatile organic compounds (VOCs) detec-tion has also been widely studied. Some researchers have tried using gas chromatographymass spectrometry (GC-MS) for this purpose [16,17]. However, the high initial investmentand long (i.e., minimum 3.5 min [16]) analysis time remained two main drawbacks ofGC-MS methods.
Boar taint detection through the use of e-noses has been extensively studied someyears ago [18–22]. An e-nose is composed of an array of sensors for which a response isinduced when gases, and in this case VOCs, are perceived at their surface. In a recent reviewby Burgeon et al. (2021) [6], the great potential of new sensor material for skatole andandrostenone has been discussed, and this review concluded that sensor-based methodsmight be a solution for the rapid slaughterhouse detection of boar taint provided that itis able to detect low headspace concentrations of skatole and androstenone in a VOCs-rich environment. This working environment is due to the extraction conditions used tovolatilize skatole and androstenone.
In fact, skatole and androstenone are lipophilic molecules with low vapor pressure(7.3 × 10⁻⁴ kPa and 1.3 × 10⁻⁶ kPa at 25 ◦C, respectively); hence, fat must be heatedat high temperatures to allow the volatilization of these molecules. This heating leadsto the release of a variety of molecules. Most of these molecules are products of lipidsdegradation (oxidation of fatty acids starting at 70 ◦C [23]). Lipids can oxidize in threemain ways: autoxidation, enzymatic-catalyzed oxidation, and photo-oxidation. However,the most probable oxidation mechanism during fat heating remains autoxidation wherethe unsaturated fatty acids react with oxygen, which is activated by temperature in thiscase, to produce free radicals. These free radicals are unstable and therefore decomposeto form various molecules, including acids, alcohols, esters, ketones hydrocarbons, andaldehydes. The latter are present in significant quantities in products that underwentoxidation processes [24].
28
Foods 2021, 10, 1311
Such a VOCs-rich environment can quickly lead to sensor poisoning, i.e., binding ofVOCs to the sensor’s surface, and in turn lead to temporal sensor drift. Such drift is definedas the gradual deviation of the sensor’s response when exposed to the same molecule in thesame environment [25]. Understanding the VOCs environment in which the volatilizationof skatole and androstenone takes place is primordial, as this could help in creating newdrift-reduction solutions, which are physical solutions (such as filters) aiming to reduceinterfering VOCs present in the headspace but also creating more robust drift correctionmodels taking such environments into account.
Until now, none of the above-mentioned methods have stood out compared to theothers, and that is why current slaughterhouse boar taint detection is still performed eitherthrough a colorimetric method [26] or mainly by sensory evaluation [27].
Hence, the objective of this research was to examine elevated temperature VOCprofiles to facilitate new sensor development, gain the understanding of VOCs perceivedduring boar taint sensory evaluations, and lastly help in understanding which VOCsperceived by the consumers during the cooking of pork meat are lipid-derived. The 150and 180 ◦C temperatures were used in the current study, as they are frequently encounteredfor sensory evaluation in the frame of boar taint detection [28–32] and appear in the rangeof temperatures used for cooking by consumers [33].
Rius et al. (2005) [34] have already analyzed VOCs produced when heating fat at atemperature of 120 ◦C. However, only back fat with low concentrations in skatole andandrostenone was analyzed, and comparisons of heating temperatures were not performed.
To the best of our knowledge, our study is the first providing a thorough understand-ing and comparisons of VOC profiles obtained following the heating of sow fat as wellas tainted and untainted boar fat at two elevated temperatures (150 and 180 ◦C) and sam-pling and analysis by solid phase microextraction gas chromatography–mass spectrometry(SPME-GC-MS).
2. Materials and Methods
2.1. Samples
Sow back fat (n = 6), tainted (n = 7) and untainted boar fat (n = 7) were collected from alocal slaughterhouse. Sow fat was randomly selected. Tainted and untainted boar fat, on theother hand, were selected after these had been checked for boar taint by a trained assessorthrough an online human nose detection method (soldering iron). The collected sampleswere frozen at −20 ◦C at the slaughterhouse, transported in a cooler, and stored again at−20 ◦C. The presence or absence of boar taint was confirmed through the quantification ofskatole and androstenone in fat by high-performance liquid chromatography fluorescencedetection (HPLC-FD), which is described later in this section.
2.2. Chemicals
Methanol (CAS n◦ 67-56-1, HPLC grade, Sigma-Aldrich, Darmstadt, Germany), dan-sylhydrazine (CAS n◦ 33008-06-9, Sigma-Aldrich, Darmstadt, Germany ), boron trifluoride(BF3) at 20% in methanol v/v (CAS n◦ 373-57-9, VWR, Darmstadt, Germany), phospho-ric acid (H3PO4) (CAS n◦ 7664-38-2, Sigma-Aldrich, Darmstadt, Germany), acetonitrile(CAS n◦ 75-05-8, HPLC grade, Supelco, Darmstadt, Germany), tetrahydrofuran (CAS n◦109-99-9, HPLC grade, Supelco, Darmstadt, Germany), liquid nitrogen (CAS n◦ 7727-37-9,Nippon Gases, Schoten, Belgium), 2,3-dimethylindole (CAS n◦91-55-4, Sigma Aldrich,Darmstadt, Germany), skatole (CAS n◦ 83-34-1, Sigma Aldrich, Darmstadt, Germany), andandrostenone (CAS n◦ 18339-16-7, Sigma Aldrich, Darmstadt, Germany ) were used inthis experiment.
2.3. Skatole and Androstenone Quantification in Back Fat
This analysis allowed quantifying the skatole and androstenone content in both taintedand untainted boar fat samples. Boar fat is considered tainted if skatole concentrationsare above the thresholds of 200 ng g−1 of fat and/or above 1000 ng g−1 for androstenone.
29

Foods 2021, 10, 1311
These thresholds were selected given that the commonly accepted threshold generallyrange from 200 to 250 ng g−1 of fat for skatole and 500 to 1000 ng g−1 for androstenone [35].Quantification of these molecules in back fat was performed on the basis of a methodby Hansen-Moller (1994) [36], which consists of a methanolic extraction of the molecules,derivatization of androstenone, and analysis by high-performance liquid chromatographyfluorescence detection (HPLC-FD). This protocol was slightly adapted as described inthis section.
2.3.1. Extraction of Androstenone and Skatole
Two mL of methanol was added to 0.50 g of back fat cut into pieces (0.5 cm square).The sample was homogenized by an Ultra-Turrax T25 (Janke & Kunkel, Straufen, Germany)for 30 s at 13,500 rpm. Then, 500 μL of methanol was added, and the sample was homog-enized again for 30 s with the Ultra-Turrax; finally, 500 μL of methanol was added andhomogenized for 1 min with the Ultra-Turrax. The sample was ultrasonicated for 5 minand placed in an ice bath for 15 min before centrifugation at 7700 rpm at 4 ◦C. Then, thesupernatant was passed through a 0.45 μm filter paper (Whatmann, Darmstadt, Germany),and 140 μL was put in vial for analysis.
2.3.2. Derivatization
The autosampler was programmed to mix 30 μL of 2% dansylhydrazine in methanol,4.4 μL of water, and 10 μL of 20% v/v BF3 with 140 μL of methanolic extract. A reactiontime of 5 min was observed; then, 20 μL of the incubated sample was injected into HPLC.
2.3.3. High-Performance Liquid Chromatography Fluorescence Detection (HPLC-FD)
The analysis was performed by HPLC (1260 Infinity, Agilent Technologies, Santa Clara,CA, USA) with a kinetex column EVO C18 100 A (150 × 3.0 mm × 5 μm, Phenomenex,Utrecht, Belgium) and a precolumn AJO-9297, EVO C18 (Phenomenex, Utrecht, Belgium).The solutions for the mobile phase are prepared as follows: (A) H3PO4/deionized water(1:1000 v/v); (B) acetonitrile; (C) THF/deionized water (99:1 v/v). The elution gradientprofile runs as presented in Table 1. The mobile phase was pumped at a flow rate of0.5 mL min−1 throughout the process.
Table 1. Elution gradient for the separation of skatole and androstenone on an High-PerformanceLiquid Chromatography Fluorescence Detection (HPLC) system.
Time (min)H3PO4/DeionizedWater (1:1000 v/v)
AcetonitrileTHF/DeionizedWater (99:1 v/v)
0 73 0 27
5.3 73 0 27
7.3 42 24 34
13 42 24 34
13.3 10 0 90
18 10 0 90
24 73 0 27
28 73 0 27
The detection with a fluorescence detector (FD) (Agilent Infinity 1260) was performedwith an excitation wavelength of 285 nm and emission wavelength of 340 nm for skatoleand 346 nm for excitation and 521 nm for emission of androstenone. The wavelengthchange takes place after 12 min of elution.
30
Foods 2021, 10, 1311
2.3.4. Quantification of Skatole and Androstenone
Quantification of skatole and androstenone was made possible with matrix-matchedcalibration curves. These were prepared with sow fat (very low concentrations in skatoleand absence of androstenone) that had been previously spiked with standards solutions.Calibrations curves were prepared for concentrations ranging from 45 to 500 ng/g forskatole and from 240 to 5000 ng/g for androstenone.
2.4. Analysis of VOCs Found in the Headspace of Heated Back Fat Samples
VOC profiles were established following 6 different analyses (i.e., 6 modalities): heat-ing of sow fat at 150 ◦C, untainted boar fat at 150 ◦C, tainted boar fat at 150 ◦C, sow fatat 180 ◦C, untainted boar fat at 180 ◦C, and tainted boar fat at 180 ◦C. The analyses wereperformed as described in this section.
2.4.1. Sample Preparation
First, 2.5 g of back fat was cut and then cooled by adding liquid nitrogen (−196 ◦C).The sample is ground for 5 s with an A11 basic IKA analytical grinder. Before recovering1.0 g of sample in a vial, liquid nitrogen is added to the sample to freeze it. The sample isstored at −20 ◦C until analysis.
2.4.2. SPME-GC-MS VOCs Analysis
Before proceeding to the headspace solid phase microextraction GC-MS analysis (HS-SPME-GC-MS), 1 μL of 2,3-dimethylindole at 125 μg mL−1 in methanol is added on theinside of the 20 mL vial, which is immediately sealed with a magnetic screw cap with aPTFE septum (Sigma-Aldrich, Darmstadt, Germany).
Incubation of the sample takes place at 150 ◦C (for the first analysis) or 180 ◦C (for thesecond analysis) for 20 min in a heated agitator (Gerstel, Mülheim an der Ruhr, Germany).Then, sampling of VOCs was achieved with a divinylbenzene/carboxen/polydimethylsiloxane(DVB/CAR/PDMS, 50/30 μm) SPME fiber (Supelco, Darmstadt, Germany) through a5 min exposition in the headspace. The vials were shaken at 250 rpm (agitator on/offtime: 10 s/1 s) during incubation and extraction. Desorption of the extracted and capturedVOCs takes place for 2 min. Injection was performed in splitless mode at 270 ◦C. Thefiber was conditioned for 20 min at injection temperature. Analyses were performed byGC-MS (7890A-5975C, Agilent Technologies, Santa Clara, CA, USA ) equipped with anHP-5 MS capillary column (30 m × 250 μm × 0.25 μm, Agilent Technologies, Santa Clara,CA, USA). Helium was used as a carrier gas at a flow rate of 1.2 mL/min. The oventemperature program was as follows: starting at 40 ◦C with a hold for 3 min; then, there isan increase of 5 ◦C/min up to 300 ◦C with a hold for 5 min. The mass spectrometer wasset to have a temperature of 230 ◦C at the ion source and 150 ◦C at the quadrupole. Themass spectrometer was programmed with a SCAN/SIM acquisition mode. In SIM mode,the targeted ions were (quantitative ions in bold): 77, 103, and 130 for skatole; 130 and144 for 2,3-dimethyl-indole; and lastly, 239, 257, and 272 for androstenone. The SIM modeallowed for semi-quantification of skatole and androstenone in the headspace using thefollowing formula:
Target (ppb) = (area target quant. ion/area I.S. quant. ion) × mass of I.S. × (1/vial volume) × correction factor. (1)
The correction factor corresponds to 2.5 for skatole and 1/34 for androstenone; IScorresponds to the internal standard, i.e., 2,3-dimethylindole in this case.
In SCAN mode, mass spectra were scanned from 35 to 500 amu. Then, componentidentification was performed by comparison of the obtained spectra with mass spectra in areference database (NIST17). Additionally, experimental retention indices (RI) were calcu-lated following the injection of a mixture of n-alkanes C8-C30 (Sigma Aldrich, Darmstadt,Germany) under the same chromatographic conditions as those previously mentioned.This allowed the comparison of these RI to literature RI. Lastly, pure standards were in-
31
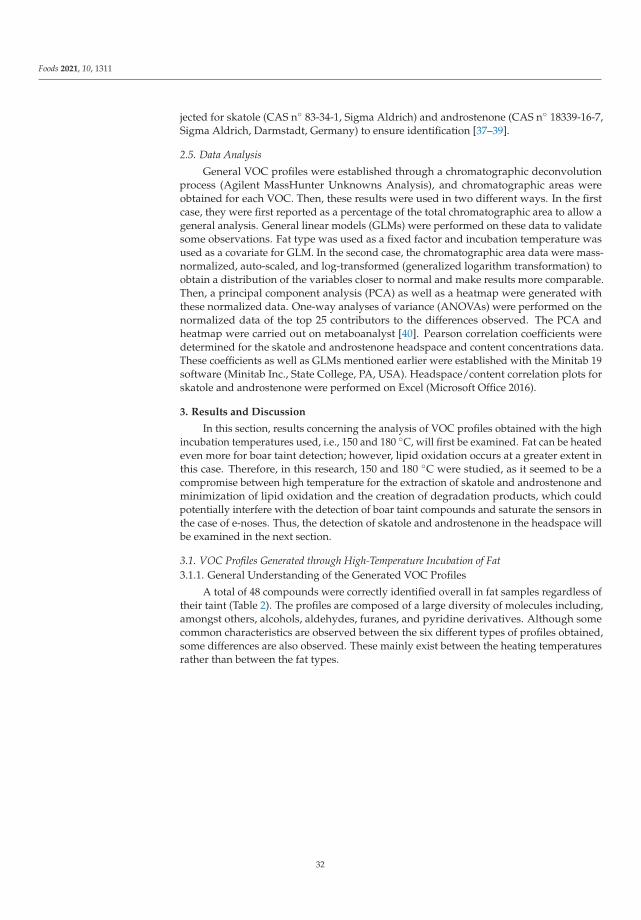
Foods 2021, 10, 1311
jected for skatole (CAS n◦ 83-34-1, Sigma Aldrich) and androstenone (CAS n◦ 18339-16-7,Sigma Aldrich, Darmstadt, Germany) to ensure identification [37–39].
2.5. Data Analysis
General VOC profiles were established through a chromatographic deconvolutionprocess (Agilent MassHunter Unknowns Analysis), and chromatographic areas wereobtained for each VOC. Then, these results were used in two different ways. In the firstcase, they were first reported as a percentage of the total chromatographic area to allow ageneral analysis. General linear models (GLMs) were performed on these data to validatesome observations. Fat type was used as a fixed factor and incubation temperature wasused as a covariate for GLM. In the second case, the chromatographic area data were mass-normalized, auto-scaled, and log-transformed (generalized logarithm transformation) toobtain a distribution of the variables closer to normal and make results more comparable.Then, a principal component analysis (PCA) as well as a heatmap were generated withthese normalized data. One-way analyses of variance (ANOVAs) were performed on thenormalized data of the top 25 contributors to the differences observed. The PCA andheatmap were carried out on metaboanalyst [40]. Pearson correlation coefficients weredetermined for the skatole and androstenone headspace and content concentrations data.These coefficients as well as GLMs mentioned earlier were established with the Minitab 19software (Minitab Inc., State College, PA, USA). Headspace/content correlation plots forskatole and androstenone were performed on Excel (Microsoft Office 2016).
3. Results and Discussion
In this section, results concerning the analysis of VOC profiles obtained with the highincubation temperatures used, i.e., 150 and 180 ◦C, will first be examined. Fat can be heatedeven more for boar taint detection; however, lipid oxidation occurs at a greater extent inthis case. Therefore, in this research, 150 and 180 ◦C were studied, as it seemed to be acompromise between high temperature for the extraction of skatole and androstenone andminimization of lipid oxidation and the creation of degradation products, which couldpotentially interfere with the detection of boar taint compounds and saturate the sensors inthe case of e-noses. Thus, the detection of skatole and androstenone in the headspace willbe examined in the next section.
3.1. VOC Profiles Generated through High-Temperature Incubation of Fat3.1.1. General Understanding of the Generated VOC Profiles
A total of 48 compounds were correctly identified overall in fat samples regardless oftheir taint (Table 2). The profiles are composed of a large diversity of molecules including,amongst others, alcohols, aldehydes, furanes, and pyridine derivatives. Although somecommon characteristics are observed between the six different types of profiles obtained,some differences are also observed. These mainly exist between the heating temperaturesrather than between the fat types.
32

Foods 2021, 10, 1311
Ta
ble
2.
GC
-MS
resu
lts
ofV
OC
sfo
und
inth
ehe
adsp
ace
ofhe
ated
fat.
Res
ult
sar
eex
pre
ssed
inre
lati
veab
und
ance
(%,m
ean±
s.d
.).Fo
rea
chm
olec
ule
,gen
eral
info
rmat
ion
such
asth
em
atch
fact
orof
the
mol
ecu
lew
hen
com
pare
dto
the
dat
abas
e,it
sC
AS
num
ber,
asw
ella
sth
eca
lcu
late
dR
Iand
liter
atu
reR
I(N
IST
17)a
regi
ven.
Fina
lly,r
elat
ive
abun
danc
e(%
)is
give
nfo
rth
esi
xm
odal
ities
test
ed:s
owba
ckfa
thea
ted
at15
0◦ C
(S15
0◦ C
)and
180◦ C
(S18
0◦ C
),un
tain
ted
back
fath
eate
dat
150◦ C
(UT
150◦ C
)and
180◦ C
(UT
180◦ C
),as
wel
las
tain
ted
back
fath
eate
dat
150◦ C
(T15
0◦ C
)and
at18
0◦ C
(T18
0◦ C
).
Ma
tch
Fa
cto
rC
AS
Ca
lcu
late
dR
IL
itt.
RI
S1
50◦ C
(n=
6)
S1
80◦ C
(n=
6)
UT
15
0◦ C
(n=
7)
UT
18
0◦ C
(n=
7)
T1
50◦ C
(n=
7)
T1
80◦ C
(n=
7)
Alc
ohol
Pent
-1-e
n-3-
ol87
616-
25-1
712
671
0.00
±0.
000.
31±
0.38
0.2±
0.22
0.07
±0.
180.
32±
0.3
0.08
±0.
14Pe
ntan
-1-o
l91
71-4
1-0
769
761
0.14
±0.
230.
24±
0.46
0.69
±0.
250.
35±
0.43
0.93
±0.
50.
45±
0.63
Hep
tan-
1-ol
8611
1-70
-696
896
00.
06±
0.09
0.37
±0.
570.
07±
0.08
0.00
±0.
000.
04±
0.12
0.06
±0.
15O
ct-1
-en-
3-ol
9333
91-8
6-4
978
969
0.25
±0.
290.
05±
0.11
0.6±
0.23
0.00
±0.
000.
54±
0.48
0.29
±0.
75O
ctan
-1-o
l90
111-
87-5
1070
1059
0.47
±0.
290.
31±
0.62
0.43
±0.
210.
11±
0.3
0.34
±0.
270.
00±
0.00
Tota
lalc
ohol
0.91
1.28
1.99
0.53
2.17
0.87
Ald
ehyd
es3-
Met
hylb
utan
al92
590-
86-3
701
650
0.00
±0.
000.
00±
0.00
0.00
±0.
000.
09±
0.17
0.05
±0.
090.
16±
0.27
Pent
anal
9411
0-62
-371
970
70.
71±
0.34
0.26
±0.
640.
88±
0.34
0.57
±0.
730.
67±
0.57
0.31
±0.
82(E
)-2-
Met
hylb
ut-2
-ena
l86
1115
-11-
375
969
20.
11±
0.17
0.00
±0.
000.
2±
0.17
0.00
±0.
000.
23±
0.21
0.00
±0.
00H
exan
al98
66-2
5-1
795
806
2.22
±1.
321.
26±
1.89
2.47
±1.
10.
49±
0.67
3.28
±1.
372.
32±
1.86
(E)-
Hex
-2-e
nal
9567
28-2
6-3
848
814
0.14
±0.
230.
07±
0.18
0.26
±0.
430.
00±
0.00
0.12
±0.
220.
13±
0.25
Hep
tana
l96
111-
71-7
898
905
0.25
±0.
290.
92±
2.03
0.4±
0.29
0.17
±0.
220.
45±
0.31
0.22
±0.
28(E
)-H
ept-
2-en
al95
1882
9-55
-5
954
913
4.45
±1.
532.
2±
1.62
3.59
±1.
060.
99±
1.27
3.76
±1.
410.
68±
0.89
Benz
alde
hyde
9110
0-52
-795
798
21.
95±
1.19
0.45
±0.
620.
6±
0.84
0.31
±0.
380.
81±
0.51
0.58
±0.
76(E
,E)-
Hep
ta-2
,4-d
iena
l93
4313
-03-
599
592
112
.14±
4.58
3.13
±3.
988.
06±
2.32
6.48
±5.
57.
78±
1.6
6.21
±4.
47O
ctan
al91
124-
13-0
1001
1005
0.15
±0.
371.
07±
2.62
0.35
±0.
40.
14±
0.24
0.41
±0.
390.
38±
0.53
5-Et
hylc
yclo
pent
-1-
enec
arbo
xald
ehyd
e83
3643
1-51
-3
1027
1020
0.07
±0.
160.
00±
0.00
0.12
±0.
210.
00±
0.00
0.05
±0.
120.
12±
0.31
Benz
enea
ceta
ldeh
yde
9012
2-78
-110
4210
810.
16±
0.1
0.01
±0.
030.
13±
0.07
0.08
±0.
110.
09±
0.09
0.07
±0.
1(E
)-O
ct-2
-ena
l81
2548
-87-
010
5710
131.
52±
0.7
0.00
±0.
001.
51±
0.6
0.37
±0.
451.
43±
0.36
1.71
±3.
53N
onan
al97
124-
19-6
1102
1104
2.16
±0.
861.
71±
1.87
2.16
±0.
711.
96±
1.51
2.48
±0.
691.
85±
1.34
(E)-
Non
-2-e
nal
9618
829-
56-
611
5911
120.
52±
0.47
0.26
±0.
40.
56±
0.25
0.83
±0.
790.
4±
0.29
0.00
±0.
00
(E,E
)-N
ona-
2,4-
dien
al93
5910
-87-
212
1311
200.
73±
0.31
0.00
±0.
000.
64±
0.35
0.00
±0.
000.
36±
0.27
0.00
±0.
00
(E)-
Dec
-2-e
nal
9739
13-8
1-3
1261
1212
4.26
±1.
773.
47±
2.87
3.56
±1.
281.
9±
3.33
2.88
±0.
962.
16±
4.7
(E,E
)-D
eca-
2,4-
dien
al97
2515
2-84
-5
1316
1220
16.3
4±
3.29
4.38
±4.
2715
.59±
4.76
3.14
±2.
4410
.47±
3.51
6.09
±4.
18
(E)-
Und
ec-2
-ena
l97
2463
-77-
613
6313
117.
12±
2.74
0.17
±0.
416.
03±
2.58
1.58
±1.
344.
4±
1.71
3.83
±5.
07H
exad
ecan
al96
629-
80-1
1814
1800
0.00
±0.
000.
03±
0.06
0.26
±0.
410.
00±
0.00
0.00
±0.
000.
00±
0.00
Tota
lald
ehyd
es55
.00
19.3
747
.37
19.0
940
.09
26.8
1
Alk
anes
n-H
epta
ne88
142-
82-5
719
717
0.00
±0.
000.
00±
0.00
0.00
±0.
000.
14±
0.24
0.00
±0.
000.
36±
0.62
Tota
lalk
anes
0.00
0.00
0.00
0.14
0.00
0.36
33
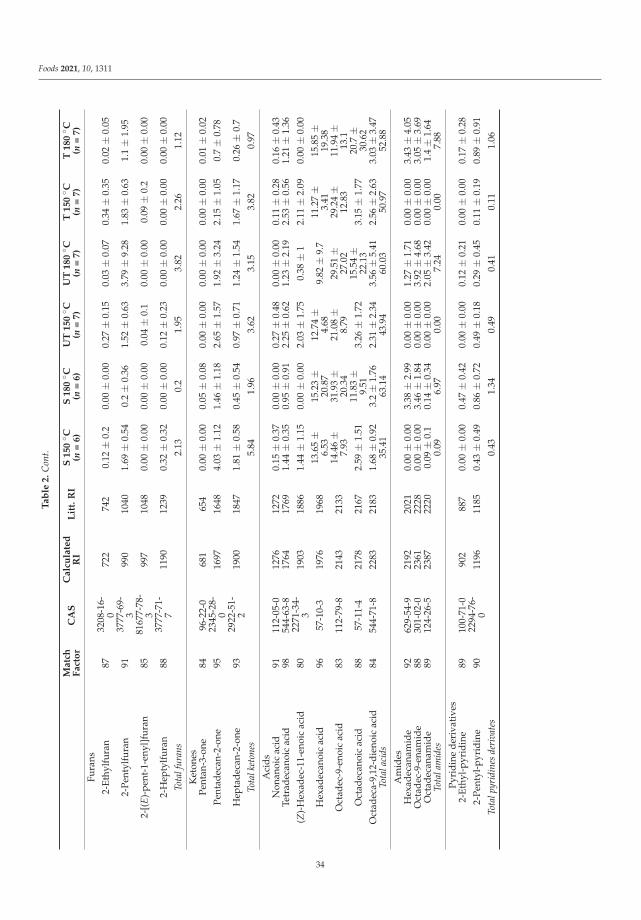
Foods 2021, 10, 1311
Ta
ble
2.
Con
t.
Ma
tch
Fa
cto
rC
AS
Ca
lcu
late
dR
IL
itt.
RI
S1
50◦ C
(n=
6)
S1
80◦ C
(n=
6)
UT
15
0◦ C
(n=
7)
UT
18
0◦ C
(n=
7)
T1
50◦ C
(n=
7)
T1
80◦ C
(n=
7)
Fura
ns2-
Ethy
lfur
an87
3208
-16-
072
274
20.
12±
0.2
0.00
±0.
000.
27±
0.15
0.03
±0.
070.
34±
0.35
0.02
±0.
05
2-Pe
ntyl
fura
n91
3777
-69-
399
010
401.
69±
0.54
0.2±
0.36
1.52
±0.
633.
79±
9.28
1.83
±0.
631.
1±
1.95
2-[(
E)-p
ent-
1-en
yl]f
uran
8581
677-
78-
399
710
480.
00±
0.00
0.00
±0.
000.
04±
0.1
0.00
±0.
000.
09±
0.2
0.00
±0.
00
2-H
epty
lfur
an88
3777
-71-
711
9012
390.
32±
0.32
0.00
±0.
000.
12±
0.23
0.00
±0.
000.
00±
0.00
0.00
±0.
00To
talf
uran
s2.
130.
21.
953.
822.
261.
12
Ket
ones
Pent
an-3
-one
8496
-22-
068
165
40.
00±
0.00
0.05
±0.
080.
00±
0.00
0.00
±0.
000.
00±
0.00
0.01
±0.
02Pe
ntad
ecan
-2-o
ne95
2345
-28-
016
9716
484.
03±
1.12
1.46
±1.
182.
65±
1.57
1.92
±3.
242.
15±
1.05
0.7±
0.78
Hep
tade
can-
2-on
e93
2922
-51-
219
0018
471.
81±
0.58
0.45
±0.
540.
97±
0.71
1.24
±1.
541.
67±
1.17
0.26
±0.
7To
talk
eton
es5.
841.
963.
623.
153.
820.
97
Aci
dsN
onan
oic
acid
9111
2-05
-012
7612
720.
15±
0.37
0.00
±0.
000.
27±
0.48
0.00
±0.
000.
11±
0.28
0.16
±0.
43Te
trad
ecan
oic
acid
9854
4-63
-817
6417
691.
44±
0.35
0.95
±0.
912.
25±
0.62
1.23
±2.
192.
53±
0.56
1.21
±1.
36(Z
)-H
exad
ec-1
1-en
oic
acid
8022
71-3
4-3
1903
1886
1.44
±1.
150.
00±
0.00
2.03
±1.
750.
38±
12.
11±
2.09
0.00
±0.
00
Hex
adec
anoi
cac
id96
57-1
0-3
1976
1968
13.6
5±
6.53
15.2
3±
20.8
712
.74±
4.68
9.82
±9.
711
.27±
3.41
15.8
5±
19.3
8O
ctad
ec-9
-eno
icac
id83
112-
79-8
2143
2133
14.4
6±
7.93
31.9
3±
20.3
421
.08±
8.79
29.5
1±
27.0
229
.24±
12.8
311
.94±
13.1
Oct
adec
anoi
cac
id88
57-1
1-4
2178
2167
2.59
±1.
5111
.83±
9.51
3.26
±1.
7215
.54±
22.1
33.
15±
1.77
20.7±
30.6
2O
ctad
eca-
9,12
-die
noic
acid
8454
4-71
-822
8321
831.
68±
0.92
3.2±
1.76
2.31
±2.
343.
56±
5.41
2.56
±2.
633.
03±
3.47
Tota
laci
ds35
.41
63.1
443
.94
60.0
350
.97
52.8
8
Am
ides
Hex
adec
anam
ide
9262
9-54
-921
9220
210.
00±
0.00
3.38
±2.
990.
00±
0.00
1.27
±1.
710.
00±
0.00
3.43
±4.
05O
ctad
ec-9
-ena
mid
e88
301-
02-0
2361
2228
0.00
±0.
003.
46±
1.84
0.00
±0.
003.
92±
4.68
0.00
±0.
003.
05±
3.69
Oct
adec
anam
ide
8912
4-26
-523
8722
200.
09±
0.1
0.14
±0.
340.
00±
0.00
2.05
±3.
420.
00±
0.00
1.4±
1.64
Tota
lam
ides
0.09
6.97
0.00
7.24
0.00
7.88
Pyri
dine
deri
vati
ves
2-Et
hyl-
pyri
dine
8910
0-71
-090
288
70.
00±
0.00
0.47
±0.
420.
00±
0.00
0.12
±0.
210.
00±
0.00
0.17
±0.
282-
Pent
yl-p
yrid
ine
9022
94-7
6-0
1196
1185
0.43
±0.
490.
86±
0.72
0.49
±0.
180.
29±
0.45
0.11
±0.
190.
89±
0.91
Tota
lpyr
idin
esde
riva
tes
0.43
1.34
0.49
0.41
0.11
1.06
34

Foods 2021, 10, 1311
Ta
ble
2.
Con
t.
Ma
tch
Fa
cto
rC
AS
Ca
lcu
late
dR
IL
itt.
RI
S1
50◦ C
(n=
6)
S1
80◦ C
(n=
6)
UT
15
0◦ C
(n=
7)
UT
18
0◦ C
(n=
7)
T1
50◦ C
(n=
7)
T1
80◦ C
(n=
7)
Oth
ers
Unk
now
nA
662
0.00
±0.
000.
00±
0.00
.01
0.00
±0.
000.
00±
0.00
0.02
±0.
050.
01±
0.02
Unk
now
nB
1714
0.00
±0.
001±
1.56
0.00
±0.
001.
14±
1.65
0.00
±0.
003.
78±
2.6
Unk
now
nC
1868
0.2±
0.28
0.31
±0.
60.
44±
0.25
0.06
±0.
170.
38±
0.27
0.2±
0.38
gam
ma-
Palm
itol
acto
ne90
730-
46-1
2104
1980
0.00
±0.
000.
00±
0.00
0.2±
0.54
3.47
±5.
320.
19±
0.5
2.85
±3.
82de
lta-
hexa
deca
lact
one
8573
70-4
4-7
2133
2000
0.00
±0.
004.
16±
10.1
80.
00±
0.00
0.76
±2.
020.
00±
0.00
1.04
±2.
76Sq
uale
ne89
111-
02-4
2830
2914
0.00
±0.
000.
27±
0.3
0.00
±0.
000.
15±
0.19
0.00
±0.
000.
18±
0.24
Tota
loth
ers
0.2
5.74
0.64
5.59
0.58
8.06
Tota
l10
0.00
100.
0010
0.00
100.
0010
0.00
100.
00
35

Foods 2021, 10, 1311
In fact, it can be observed from Table 2 that the major group of compounds identifiedis not the same at 150 and 180 ◦C. Aldehydes are the most abundant at 150 ◦C rangingfrom 40.09% of the total profile for tainted fats to 55.00% for sow fats compared to muchlower percentages of aldehydes at 180 ◦C, ranging from 19.09% for untainted fat to 26.81%for tainted fats (effect of temperature: p-value < 0.05). Amongst these aldehydes, someare present in much greater quantities compared to others. These include (E)-Dec-2-enal,(E)-Undec-2-enal, (E,E)-Hepta-2,4-dienal, and (E,E)-Deca-2,4-dienal, the latter accountingfor up to 16.34% of the total profile in the case of sow fat.
On the other hand, the fatty acids group is the most present at 180 ◦C, making up52.88% to 63.14% of the total profile at this temperature. Three fatty acids stand out:octadec-9-enoic acid (up to 31.93% of the total profile), hexadecanoic acid (up to 15.85%),and lastly, octadecanoic acid (up to 20.7%). Finding these three molecules as the mostabundant fatty acids is in accordance with what has been found by Zhao et al. (2017) [41],who analyzed VOCs of stewed pork broth by solvent-assisted flavor evaporation (SAFE)combined with GC-MS.
Additionally, observing octadec-9-enoic acid and hexadecanoic acid as two of thethree major fatty acids in the VOCs profile corresponds to the actual fatty acids content ofback fat. In fact, several studies have analyzed the fatty acid composition of back fat andhave found that the most abundant was octadec-9-enoic acid followed by hexadecanoicacid [42,43]. The hydrolysis of triglycerides into free fatty acids (FFAs) and glycerol is con-trolled by two main lipolytic enzymes: adipose triacylglycerol lipase (ATGL) regulating thehydrolysis of triacylglycerols into diacylglycerols and FFAs and hormone-sensitive lipase(HSL) regulating that of diacylglycerols into monoacylglycerols, FFAs, and glycerols [44].Therefore, this explains the presence of FFAs in back fat.
Regarding their presence in the headspace, one must remember that such long-chainfatty acids possess low vapor pressures (e.g., octadec-9-enoic acid has a vapor pressureof 5.46 × 10⁻⁷ mm Hg at 25 ◦C [45]); therefore, greater incubation temperatures lead togreater headspace concentrations of these FFAs. With temperatures increasing from 150 to180 ◦C, it can be seen from the data that the total acids found in the headspace increase forall three fat types (p < 0.05).
Serra et al. (2004) [42] and Rius et al. (2005) [34] who have also analyzed VOCsobtained following incubation of fat observed that aldehydes were the most abundantclass of molecules, making up respectively 37.1% and 69.61% of the total VOC profiles.However, lower incubation temperatures (60 and 120 ◦C) were used in their study, whichcould explain the smaller volatilization of FFAs and hence the smaller relative abundanceof these in their VOC profiles. Seeing that the total aldehydes percentage in the 180 ◦Cprofiles is lower is simply due to the fact that more volatiles are being released at 180 ◦Ccompared to 150 ◦C.
As observed in Table 2, the majority of aldehydes present are unsaturated, which isexplained by the higher proportions of unsaturated fatty acids than saturated fatty acids inpork back fat [46]. The most abundant aldehydes are (E,E)-deca-2,4-dienal and (E,E)-hepta-2,4-dienal, which are VOCs produced following the oxidation of linoleic acid and linolenicacid, respectively, and which are known to have a fatty and fried smell [24,41,47,48].Benzaldehyde has also been found to originate from linolenic acid degradation [49].
In smaller proportions are ketones and alcohol. The alcohols detected at these temper-atures correspond to those that have been found by Rius et al. (2005) [34] at 120 ◦C. On theother hand, two of the three ketones (pentadecan-2-one and heptadecan-2-one) observedin our study have not been observed by the latter. However, Zhao et al. (2017) [41] havefound pentadecan-2-one as part of the VOCs found in pork broth.
Furans have also been found in the profiles. Furans are well-known to be responsiblefor the characteristic odor of fried foodstuffs. These molecules are found in a multitude offood products, including meat products [50,51].
36
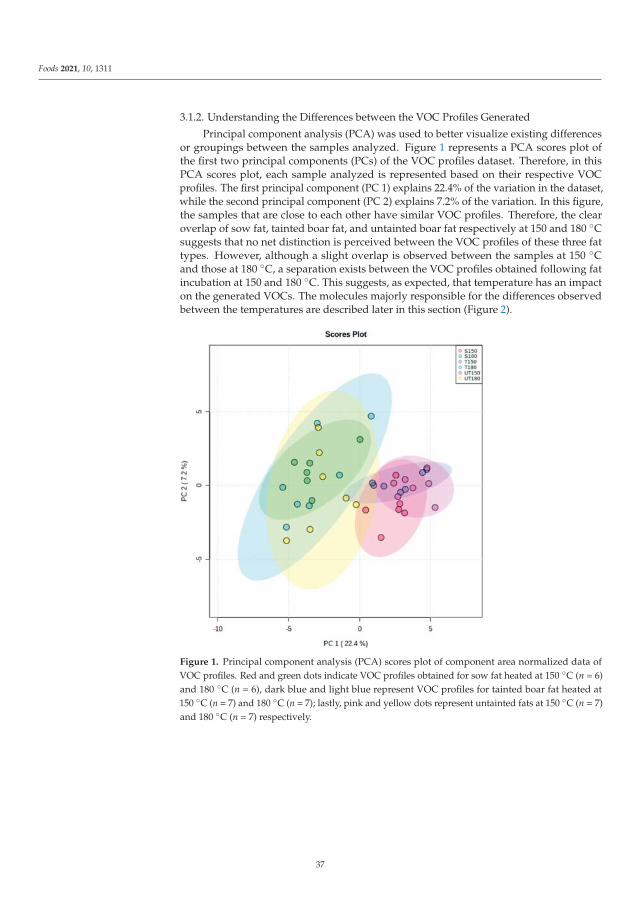
Foods 2021, 10, 1311
3.1.2. Understanding the Differences between the VOC Profiles Generated
Principal component analysis (PCA) was used to better visualize existing differencesor groupings between the samples analyzed. Figure 1 represents a PCA scores plot ofthe first two principal components (PCs) of the VOC profiles dataset. Therefore, in thisPCA scores plot, each sample analyzed is represented based on their respective VOCprofiles. The first principal component (PC 1) explains 22.4% of the variation in the dataset,while the second principal component (PC 2) explains 7.2% of the variation. In this figure,the samples that are close to each other have similar VOC profiles. Therefore, the clearoverlap of sow fat, tainted boar fat, and untainted boar fat respectively at 150 and 180 ◦Csuggests that no net distinction is perceived between the VOC profiles of these three fattypes. However, although a slight overlap is observed between the samples at 150 ◦Cand those at 180 ◦C, a separation exists between the VOC profiles obtained following fatincubation at 150 and 180 ◦C. This suggests, as expected, that temperature has an impacton the generated VOCs. The molecules majorly responsible for the differences observedbetween the temperatures are described later in this section (Figure 2).
Figure 1. Principal component analysis (PCA) scores plot of component area normalized data ofVOC profiles. Red and green dots indicate VOC profiles obtained for sow fat heated at 150 ◦C (n = 6)and 180 ◦C (n = 6), dark blue and light blue represent VOC profiles for tainted boar fat heated at150 ◦C (n = 7) and 180 ◦C (n = 7); lastly, pink and yellow dots represent untainted fats at 150 ◦C (n = 7)and 180 ◦C (n = 7) respectively.
37
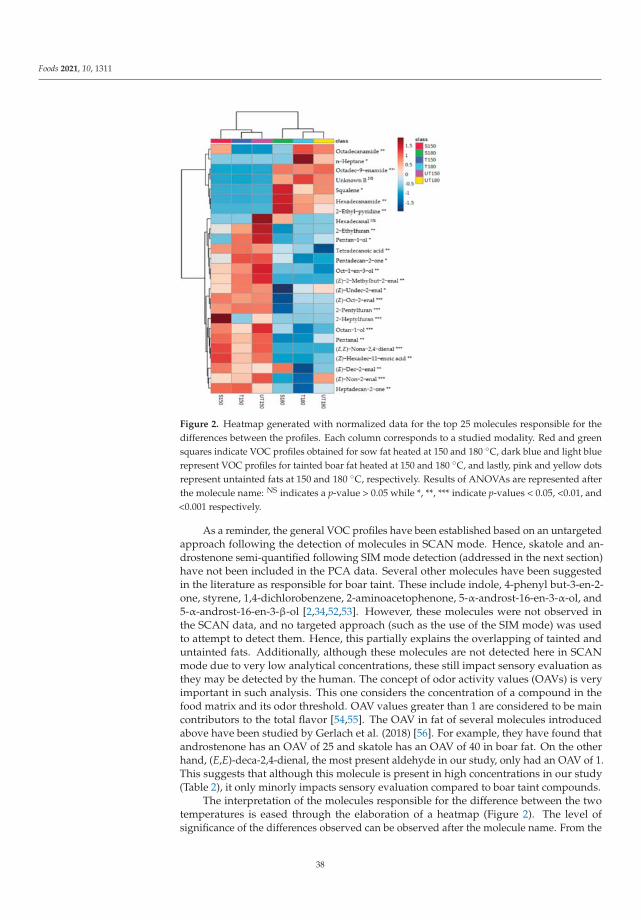
Foods 2021, 10, 1311
Figure 2. Heatmap generated with normalized data for the top 25 molecules responsible for thedifferences between the profiles. Each column corresponds to a studied modality. Red and greensquares indicate VOC profiles obtained for sow fat heated at 150 and 180 ◦C, dark blue and light bluerepresent VOC profiles for tainted boar fat heated at 150 and 180 ◦C, and lastly, pink and yellow dotsrepresent untainted fats at 150 and 180 ◦C, respectively. Results of ANOVAs are represented afterthe molecule name: NS indicates a p-value > 0.05 while *, **, *** indicate p-values < 0.05, <0.01, and<0.001 respectively.
As a reminder, the general VOC profiles have been established based on an untargetedapproach following the detection of molecules in SCAN mode. Hence, skatole and an-drostenone semi-quantified following SIM mode detection (addressed in the next section)have not been included in the PCA data. Several other molecules have been suggestedin the literature as responsible for boar taint. These include indole, 4-phenyl but-3-en-2-one, styrene, 1,4-dichlorobenzene, 2-aminoacetophenone, 5-α-androst-16-en-3-α-ol, and5-α-androst-16-en-3-β-ol [2,34,52,53]. However, these molecules were not observed inthe SCAN data, and no targeted approach (such as the use of the SIM mode) was usedto attempt to detect them. Hence, this partially explains the overlapping of tainted anduntainted fats. Additionally, although these molecules are not detected here in SCANmode due to very low analytical concentrations, these still impact sensory evaluation asthey may be detected by the human. The concept of odor activity values (OAVs) is veryimportant in such analysis. This one considers the concentration of a compound in thefood matrix and its odor threshold. OAV values greater than 1 are considered to be maincontributors to the total flavor [54,55]. The OAV in fat of several molecules introducedabove have been studied by Gerlach et al. (2018) [56]. For example, they have found thatandrostenone has an OAV of 25 and skatole has an OAV of 40 in boar fat. On the otherhand, (E,E)-deca-2,4-dienal, the most present aldehyde in our study, only had an OAV of 1.This suggests that although this molecule is present in high concentrations in our study(Table 2), it only minorly impacts sensory evaluation compared to boar taint compounds.
The interpretation of the molecules responsible for the difference between the twotemperatures is eased through the elaboration of a heatmap (Figure 2). The level ofsignificance of the differences observed can be observed after the molecule name. From the
38
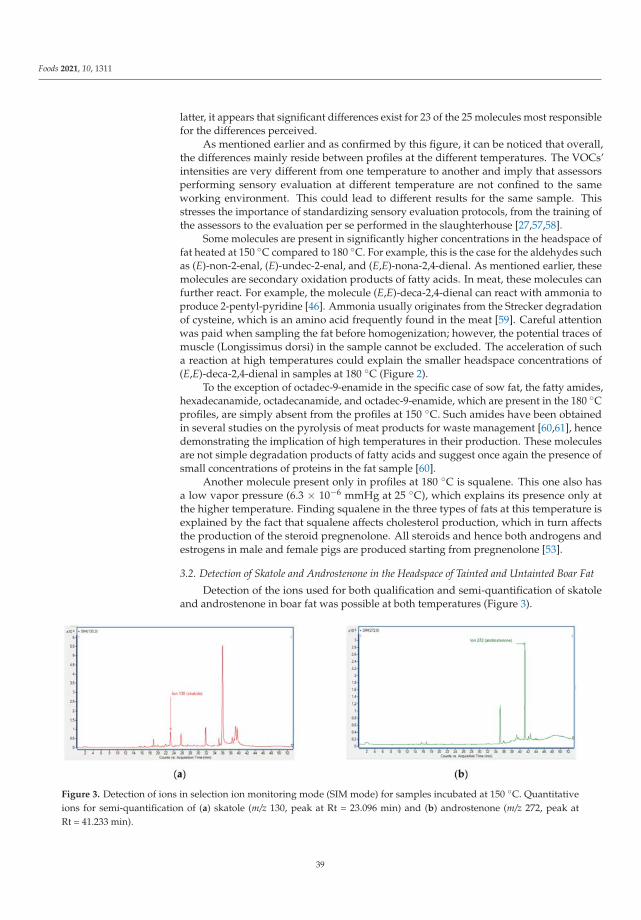
Foods 2021, 10, 1311
latter, it appears that significant differences exist for 23 of the 25 molecules most responsiblefor the differences perceived.
As mentioned earlier and as confirmed by this figure, it can be noticed that overall,the differences mainly reside between profiles at the different temperatures. The VOCs’intensities are very different from one temperature to another and imply that assessorsperforming sensory evaluation at different temperature are not confined to the sameworking environment. This could lead to different results for the same sample. Thisstresses the importance of standardizing sensory evaluation protocols, from the training ofthe assessors to the evaluation per se performed in the slaughterhouse [27,57,58].
Some molecules are present in significantly higher concentrations in the headspace offat heated at 150 ◦C compared to 180 ◦C. For example, this is the case for the aldehydes suchas (E)-non-2-enal, (E)-undec-2-enal, and (E,E)-nona-2,4-dienal. As mentioned earlier, thesemolecules are secondary oxidation products of fatty acids. In meat, these molecules canfurther react. For example, the molecule (E,E)-deca-2,4-dienal can react with ammonia toproduce 2-pentyl-pyridine [46]. Ammonia usually originates from the Strecker degradationof cysteine, which is an amino acid frequently found in the meat [59]. Careful attentionwas paid when sampling the fat before homogenization; however, the potential traces ofmuscle (Longissimus dorsi) in the sample cannot be excluded. The acceleration of sucha reaction at high temperatures could explain the smaller headspace concentrations of(E,E)-deca-2,4-dienal in samples at 180 ◦C (Figure 2).
To the exception of octadec-9-enamide in the specific case of sow fat, the fatty amides,hexadecanamide, octadecanamide, and octadec-9-enamide, which are present in the 180 ◦Cprofiles, are simply absent from the profiles at 150 ◦C. Such amides have been obtainedin several studies on the pyrolysis of meat products for waste management [60,61], hencedemonstrating the implication of high temperatures in their production. These moleculesare not simple degradation products of fatty acids and suggest once again the presence ofsmall concentrations of proteins in the fat sample [60].
Another molecule present only in profiles at 180 ◦C is squalene. This one also hasa low vapor pressure (6.3 × 10⁻⁶ mmHg at 25 ◦C), which explains its presence only atthe higher temperature. Finding squalene in the three types of fats at this temperature isexplained by the fact that squalene affects cholesterol production, which in turn affectsthe production of the steroid pregnenolone. All steroids and hence both androgens andestrogens in male and female pigs are produced starting from pregnenolone [53].
3.2. Detection of Skatole and Androstenone in the Headspace of Tainted and Untainted Boar Fat
Detection of the ions used for both qualification and semi-quantification of skatoleand androstenone in boar fat was possible at both temperatures (Figure 3).
Figure 3. Detection of ions in selection ion monitoring mode (SIM mode) for samples incubated at 150 ◦C. Quantitativeions for semi-quantification of (a) skatole (m/z 130, peak at Rt = 23.096 min) and (b) androstenone (m/z 272, peak atRt = 41.233 min).
39

Foods 2021, 10, 1311
Additionally, positive correlation coefficients higher than 0.77 are observed betweenthe content (Table S1 for skatole and androstenone back fat content) and headspace concen-trations of skatole and androstenone at both 150 and 180 ◦C (Figure 4).
(a) (b)
Figure 4. Correlation plots between headspace concentrations (ppb) and content concentrations (ng/g) of skatole (a) andandrostenone (b) respectively at 150 ◦C (in blue, n = 7) and 180 ◦C (in orange, n = 7). For the content, values below thelinearity range were set at 0 arbitrarily. Pearson correlation coefficients as well as their significance levels are represented onthe graph. **, and *** indicate p-values < 0.01, and <0.001, respectively.
It can be observed from the skatole correlation plots that trends between contentand emissions are similar at 150 and 180 ◦C, which therefore suggests that the skatoleextraction yield and subsequently the concentrations perceived in the headspace are thesame at these temperatures. To increase the headspace concentrations in skatole, severalsolutions exist. Amongst these solutions, a large increase in temperature, a reductionof the headspace volume, or simply the heating of bigger samples (that hence have agreater absolute quantity in skatole) could be considered. However, as mentioned earlier,in both cases, the VOCs profile will be rich in many other molecules, which might affectthe response of the boar taint detection method used (saturation of the assessor’s nose inthe case of sensory evaluation and sensor drift for sensor-based methods).
Different results appear for androstenone correlation plots. In fact, it can be seen fromFigure 4b that more androstenone is emitted with increasing temperature. This can in partbe explained by the fact that androstenone has a lower vapor pressure and hence a smallertendency to volatilize compared to skatole, thus leading to better androstenone extractionsat higher temperatures.
Low headspace concentrations (maximum below 250 ppb for skatole and 700 ppbfor androstenone) could in part be explained by the strong matrix effects observed withboar fat. Given the lipophilic character of skatole and androstenone, an efficient extractionprocess is often used prior to analytical determinations of skatole and androstenone. Samplepreparation usually begins with a heating or homogenization step followed by an extractionand purification step prior to analysis. Additionally, measurements are often performedbased on liquefied fat from which connective tissues have been removed (only 60% of theadipose tissue is constituted of fat per se) [62]. Various methods have been developed inthe last decade to quantify skatole and androstenone content based on headspace analysis.As it is the case in our study, these researchers have only incubated fat at high temperaturesprior to quantification of the boar taint compound. However, to compensate for matrixeffects and subsequent low analyte extraction, internal standards were spiked directly inthe liquefied fat [63,64]. This procedure was not performed in our study, as we wantedto determine real headspace concentrations of skatole and androstenone, justifying theinjection of the internal standard 2,3-dimethylindole directly in the headspace of the vial. Itis important to note that what is perceived by the sensory assessor in the slaughterhouse or
40

Foods 2021, 10, 1311
by the consumer when eating pork are compounds that are present in gaseous form in theheadspace. In fact, VOCs can reach the nasal cavity either through orthonasal olfaction(direct inhalation in front of the nose) or through the throat while chewing (retronasalolfaction) [65].
The positive and significant Pearson correlation coefficients between the headspaceconcentration and the content for skatole and androstenone indicate that what is foundin the headspace at both temperatures is a good representation of boar taint in the fat.Although extraction is similar for skatole at 150 and 180 ◦C (typical cooking temperaturesof pork), the greater headspace concentrations for androstenone at 180 ◦C imply that highertemperatures allow a better representation of boar taint. One must remember that boartaint is a complex smell composed of a large variety of molecules. Only 33% of boar taintis explained by skatole alone, while 50% of the taint is explained by the combination ofskatole and androstenone [66]. Whether it is for sensory evaluation or for sensor-basedmethods focusing on the detection of skatole and androstenone, using higher temperaturesto detect greater amounts of androstenone should allow a better visualization of boar taintas a whole. Lastly, the headspace concentrations are low for sensor-based methods (whichoften operate in up to the ppm [67]) and hence emphasize the importance of testing evenhigher temperatures.
4. Conclusions
To the best of our knowledge, this study is the first analyzing VOCs emitted by backfat samples when heated at elevated temperatures. The aim of this study was to perform ageneral analysis of VOC profiles obtained with fat presenting different boar taint intensities,but being an exploratory study, it did not intend to rigorously compare the impact ofdifferent taint combinations on the emitted VOCs. As a reminder, the comprehension ofthe VOC profiles at these typical cooking temperatures was primordial to understand whatcomposes the exact smell perceived during the sensory evaluation of boar taint at thesetemperatures and secondly understand whether VOCs sensor-based methods for boar taintdetection at these temperatures can be developed.
Great differences were observed between the VOC profiles depending on the incu-bation temperature. Different VOC profiles might result in differences in classification ofthe same tainted and untainted fats when heated at different temperatures. Therefore, thisstresses the need to develop and use a standardized method for the sensory evaluation ofboar taint.
VOCs sensors for skatole and androstenone detection could be developed for incuba-tion temperatures of 150 and 180 ◦C given that both molecules are found in the headspace.However, the low headspace concentration observed for both these molecules shouldencourage further research into higher incubation temperatures. Analyses of the generalVOCs headspace should always complement research into skatole and androstenone detec-tion as the complexity of the VOCs profile might increase with temperature. The impactof fatty acids and aldehydes (as these are the most abundant in the VOC profiles at bothtemperatures) should be tested on sensor material to determine the rate at which sensordrift occurs to elaborate more robust drift correction algorithms and finally determine afterhow many analyses the sensors should be disposed of. Solutions to reduce the developmentof products from lipid oxidation, such as working in a closed and controlled environment,should be further looked into for sensor development.
Supplementary Materials: The following are available online at https://www.mdpi.com/article/10.3390/foods10061311/s1, Table S1: Quantification of skatole and androstenone in fat determined byHPLC-FD. The mention < LR indicates that the content is below the linearity range (45 to 500 ng/gfor skatole and 240 to 5000 ng/g for androstenone).
Author Contributions: Conceptualization, C.B., A.M. and M.-L.F.; methodology, C.B., A.M. andM.-L.F.; software, C.B., A.M. and M.-L.F.; validation, C.B., A.M., M.D., D.L., J.R., A.L. and M.-L.F.;formal analysis, C.B., A.M. and M.-L.F.; investigation, C.B. and A.M.; resources, C.B., A.M. and
41
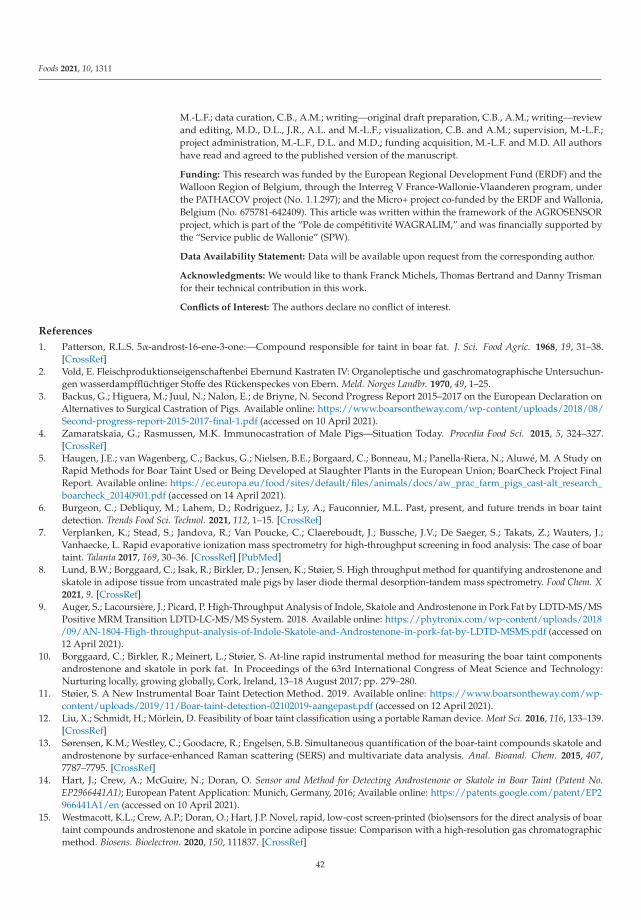
Foods 2021, 10, 1311
M.-L.F.; data curation, C.B., A.M.; writing—original draft preparation, C.B., A.M.; writing—reviewand editing, M.D., D.L., J.R., A.L. and M.-L.F.; visualization, C.B. and A.M.; supervision, M.-L.F.;project administration, M.-L.F., D.L. and M.D.; funding acquisition, M.-L.F. and M.D. All authorshave read and agreed to the published version of the manuscript.
Funding: This research was funded by the European Regional Development Fund (ERDF) and theWalloon Region of Belgium, through the Interreg V France-Wallonie-Vlaanderen program, underthe PATHACOV project (No. 1.1.297); and the Micro+ project co-funded by the ERDF and Wallonia,Belgium (No. 675781-642409). This article was written within the framework of the AGROSENSORproject, which is part of the “Pole de compétitivité WAGRALIM,” and was financially supported bythe “Service public de Wallonie” (SPW).
Data Availability Statement: Data will be available upon request from the corresponding author.
Acknowledgments: We would like to thank Franck Michels, Thomas Bertrand and Danny Trismanfor their technical contribution in this work.
Conflicts of Interest: The authors declare no conflict of interest.
References
1. Patterson, R.L.S. 5α-androst-16-ene-3-one:—Compound responsible for taint in boar fat. J. Sci. Food Agric. 1968, 19, 31–38.[CrossRef]
2. Vold, E. Fleischproduktionseigenschaftenbei Ebernund Kastraten IV: Organoleptische und gaschromatographische Untersuchun-gen wasserdampfflüchtiger Stoffe des Rückenspeckes von Ebern. Meld. Norges Landbr. 1970, 49, 1–25.
3. Backus, G.; Higuera, M.; Juul, N.; Nalon, E.; de Briyne, N. Second Progress Report 2015–2017 on the European Declaration onAlternatives to Surgical Castration of Pigs. Available online: https://www.boarsontheway.com/wp-content/uploads/2018/08/Second-progress-report-2015-2017-final-1.pdf (accessed on 10 April 2021).
4. Zamaratskaia, G.; Rasmussen, M.K. Immunocastration of Male Pigs—Situation Today. Procedia Food Sci. 2015, 5, 324–327.[CrossRef]
5. Haugen, J.E.; van Wagenberg, C.; Backus, G.; Nielsen, B.E.; Borgaard, C.; Bonneau, M.; Panella-Riera, N.; Aluwé, M. A Study onRapid Methods for Boar Taint Used or Being Developed at Slaughter Plants in the European Union; BoarCheck Project FinalReport. Available online: https://ec.europa.eu/food/sites/default/files/animals/docs/aw_prac_farm_pigs_cast-alt_research_boarcheck_20140901.pdf (accessed on 14 April 2021).
6. Burgeon, C.; Debliquy, M.; Lahem, D.; Rodriguez, J.; Ly, A.; Fauconnier, M.L. Past, present, and future trends in boar taintdetection. Trends Food Sci. Technol. 2021, 112, 1–15. [CrossRef]
7. Verplanken, K.; Stead, S.; Jandova, R.; Van Poucke, C.; Claereboudt, J.; Bussche, J.V.; De Saeger, S.; Takats, Z.; Wauters, J.;Vanhaecke, L. Rapid evaporative ionization mass spectrometry for high-throughput screening in food analysis: The case of boartaint. Talanta 2017, 169, 30–36. [CrossRef] [PubMed]
8. Lund, B.W.; Borggaard, C.; Isak, R.; Birkler, D.; Jensen, K.; Støier, S. High throughput method for quantifying androstenone andskatole in adipose tissue from uncastrated male pigs by laser diode thermal desorption-tandem mass spectrometry. Food Chem. X2021, 9. [CrossRef]
9. Auger, S.; Lacoursière, J.; Picard, P. High-Throughput Analysis of Indole, Skatole and Androstenone in Pork Fat by LDTD-MS/MSPositive MRM Transition LDTD-LC-MS/MS System. 2018. Available online: https://phytronix.com/wp-content/uploads/2018/09/AN-1804-High-throughput-analysis-of-Indole-Skatole-and-Androstenone-in-pork-fat-by-LDTD-MSMS.pdf (accessed on12 April 2021).
10. Borggaard, C.; Birkler, R.; Meinert, L.; Støier, S. At-line rapid instrumental method for measuring the boar taint componentsandrostenone and skatole in pork fat. In Proceedings of the 63rd International Congress of Meat Science and Technology:Nurturing locally, growing globally, Cork, Ireland, 13–18 August 2017; pp. 279–280.
11. Støier, S. A New Instrumental Boar Taint Detection Method. 2019. Available online: https://www.boarsontheway.com/wp-content/uploads/2019/11/Boar-taint-detection-02102019-aangepast.pdf (accessed on 12 April 2021).
12. Liu, X.; Schmidt, H.; Mörlein, D. Feasibility of boar taint classification using a portable Raman device. Meat Sci. 2016, 116, 133–139.[CrossRef]
13. Sørensen, K.M.; Westley, C.; Goodacre, R.; Engelsen, S.B. Simultaneous quantification of the boar-taint compounds skatole andandrostenone by surface-enhanced Raman scattering (SERS) and multivariate data analysis. Anal. Bioanal. Chem. 2015, 407,7787–7795. [CrossRef]
14. Hart, J.; Crew, A.; McGuire, N.; Doran, O. Sensor and Method for Detecting Androstenone or Skatole in Boar Taint (Patent No.EP2966441A1); European Patent Application: Munich, Germany, 2016; Available online: https://patents.google.com/patent/EP2966441A1/en (accessed on 10 April 2021).
15. Westmacott, K.L.; Crew, A.P.; Doran, O.; Hart, J.P. Novel, rapid, low-cost screen-printed (bio)sensors for the direct analysis of boartaint compounds androstenone and skatole in porcine adipose tissue: Comparison with a high-resolution gas chromatographicmethod. Biosens. Bioelectron. 2020, 150, 111837. [CrossRef]
42
Foods 2021, 10, 1311
16. Verplanken, K.; Wauters, J.; Van Durme, J.; Claus, D.; Vercammen, J.; De Saeger, S.; Vanhaecke, L. Rapid method for thesimultaneous detection of boar taint compounds by means of solid phase microextraction coupled to gas chromatography/massspectrometry. J. Chromatogr. A 2016, 1462, 124–133. [CrossRef]
17. Sørensen, K.M.; Engelsen, S.B. Measurement of boar taint in porcine fat using a high-throughput gas chromatography-massspectrometry protocol. J. Agric. Food Chem. 2014, 62, 9420–9427. [CrossRef] [PubMed]
18. Berdague, J.; Talou, T. Examples of semiconductor gas sensors applied to meat products. Sci. Aliment. 1993, 13, 141–148.19. Bourrounet, B.; Talou, T.; Gaset, A. Application of a multi-gas-sensor device in the meat industry for boar-taint detection. Sens.
Actuators B Chem. 1995, 27, 250–254. [CrossRef]20. Annor-Frempong, I.E.; Nute, G.R.; Wood, J.D.; Whittington, F.W.; West, A. The measurement of the responses to different odour
intensities of “boar taint” using a sensory panel and an electronic nose. Meat Sci. 1998, 50, 139–151. [CrossRef]21. Di Natale, C.; Pennazza, G.; Macagnano, A.; Martinelli, E.; Paolesse, R.; D’Amico, A. Thickness shear mode resonator sensors for
the detection of androstenone in pork fat. Sens. Actuators B Chem. 2003, 91, 169–174. [CrossRef]22. Vestergaard, J.S.; Haugen, J.E.; Byrne, D.V. Application of an electronic nose for measurements of boar taint in entire male pigs.
Meat Sci. 2006, 74, 564–577. [CrossRef]23. Ladikos, D.; Lougovois, V. Lipid Oxidation in Muscle Foods: A Review. Food Chem. 1990, 35, 295–314. [CrossRef]24. Domínguez, R.; Pateiro, M.; Gagaoua, M.; Barba, F.J.; Zhang, W.; Lorenzo, J.M. A comprehensive review on lipid oxidation in
meat and meat products. Antioxidants 2019, 8, 429. [CrossRef]25. Vergara, A.; Vembu, S.; Ayhan, T.; Ryan, M.A.; Homer, M.L.; Huerta, R. Chemical gas sensor drift compensation using classifier
ensembles. Sens. Actuators B Chem. 2012, 166–167, 320–329. [CrossRef]26. Mortensen, A.B.; Sørensen, S.E. Relationship between boar taint and skatole determined with a new analysis method. In
Proceedings of the 30th International Congress of Meat Science and Technology, Bristol, England, 9–14 September 1984; pp.394–396.
27. Trautmann, J.; Meier-Dinkel, L.; Gertheiss, J.; Mörlein, D. Boar taint detection: A comparison of three sensory protocols. Meat Sci.2016, 111, 92–100. [CrossRef] [PubMed]
28. Whittington, F.M.; Zammerini, D.; Nute, G.R.; Baker, A.; Hughes, S.I.; Wood, J.D. Comparison of heating methods and the use ofdifferent tissues for sensory assessment of abnormal odours (boar taint) in pig meat. Meat Sci. 2011, 88, 249–255. [CrossRef]
29. Byrne, D.V.; Thamsborg, S.M.; Hansen, L.L. A sensory description of boar taint and the effects of crude and dried chicory roots(Cichorium intybus L.) and inulin feeding in male and female pork. Meat Sci. 2008, 79, 252–269. [CrossRef] [PubMed]
30. Hansen, L.L.; Stolzenbach, S.; Jensen, J.A.; Henckel, P.; Hansen-Møller, J.; Syriopoulos, K.; Byrne, D.V. Effect of feeding fermentablefibre-rich feedstuffs on meat quality with emphasis on chemical and sensory boar taint in entire male and female pigs. Meat Sci.2008, 80, 1165–1173. [CrossRef]
31. Parunovic, N.; Petrovic, M.; Matekalo-Sverak, V.; Parunovic, J.; Radovic, C. Relationship between carcass weight, skatole leveland sensory assessment in fat of different boars. Czech. J. Food Sci. 2010, 28, 520–530. [CrossRef]
32. Bekaert, K.M.; Aluwé, M.; Vanhaecke, L.; Heres, L.; Duchateau, L.; Vandendriessche, F.; Tuyttens, F.A.M. Evaluation of differentheating methods for the detection of boar taint by means of the human nose. Meat Sci. 2013, 94, 125–132. [CrossRef]
33. Font-i-Furnols, M. Consumer studies on sensory acceptability of boar taint: A review. Meat Sci. 2012, 92, 319–329. [CrossRef]34. Rius, M.A.; Hortós, M.; García-Regueiro, J.A. Influence of volatile compounds on the development of off-flavours in pig back fat
samples classified with boar taint by a test panel. Meat Sci. 2005, 71, 595–602. [CrossRef]35. Bonneau, M. Use of entire males for pig meat in the European union. Meat Sci. 1998, 49, 257–272. [CrossRef]36. Hansen-Møller, J. Rapid high-performance liquid chromatographic method for simultaneous determination of androstenone,
skatole and indole in back fat from pigs. J. Chromatogr. B Biomed. Sci. Appl. 1994, 661, 219–230. [CrossRef]37. Nea, F.; Tanoh, E.A.; Wognin, E.L.; Kenne Kemene, T.; Genva, M.; Saive, M.; Tonzibo, Z.F.; Fauconnier, M.L. A new chemotype of
Lantana rhodesiensis Moldenke essential oil from Côte d’Ivoire: Chemical composition and biological activities. Ind. Crops Prod.2019, 141, 111766. [CrossRef]
38. Tanoh, E.A.; Boué, G.B.; Nea, F.; Genva, M.; Wognin, E.L.; Ledoux, A.; Martin, H.; Tonzibo, Z.F.; Frederich, M.; Fauconnier, M.L.Seasonal effect on the chemical composition, insecticidal properties and other biological activities of zanthoxylum leprieurii guill.& perr. essential oils. Foods 2020, 9, 550. [CrossRef]
39. Werrie, P.; Burgeon, C.; Jean, G.; Goff, L.; Hance, T. Biopesticide Trunk Injection Into Apple Trees: A Proof of Concept for theSystemic Movement of Mint and Cinnamon Essential Oils. Front. Plant. Sci. 2021, 12, 1–13. [CrossRef] [PubMed]
40. Pang, Z.; Chong, J.; Li, S.; Xia, J. MetaboAnalystR 3.0: Toward an Optimized Workflow for Global Metabolomics. Metabolites.2020, 10, 186. [CrossRef] [PubMed]
41. Zhao, J.; Wang, M.; Xie, J.; Zhao, M.; Hou, L.; Liang, J.; Wang, S.; Cheng, J. Volatile flavor constituents in the pork broth ofblack-pig. Food Chem. 2017, 226, 51–60. [CrossRef] [PubMed]
42. Serra, A.; Buccioni, A.; Rodriguez-Estrada, M.T.; Conte, G.; Cappucci, A.; Mele, M. Fatty acid composition, oxidation status andvolatile organic compounds in “Colonnata” lard from Large White or Cinta Senese pigs as affected by curing time. Meat Sci. 2014,97, 504–512. [CrossRef]
43. Mörlein, D.; Tholen, E. Fatty acid composition of subcutaneous adipose tissue from entire male pigs with extremely divergentlevels of boar taint compounds—An exploratory study. Meat Sci. 2014, 99, 1–7. [CrossRef]
43

Foods 2021, 10, 1311
44. Li, Y.; Zheng, X.; Liu, B.; Yang, G. Regulation of ATGL expression mediated by leptin in vitro in porcine adipocyte lipolysis. Mol.Cell. Biochem. 2010, 121–128. [CrossRef]
45. Oleic Acid|C18H34O2—PubChem. Available online: https://pubchem.ncbi.nlm.nih.gov/compound/Oleic-acid#section=Vapor-Pressure (accessed on 14 April 2021).
46. Mottram, D.S. Flavour formation in meat and meat products: A review. Food Chem. 1998, 62, 415–424. [CrossRef]47. Schaich, K.M. Challenges in Elucidating Lipid Oxidation Mechanisms: When, Where, and How Do Products Arise? In Lipid
Oxidation: Challenges in Food Systems; AOCS Press: Champaign, IL, USA, 2013; pp. 1–52. ISBN 9780988856516.48. Zang, M.; Wang, L.; Zhang, Z.; Zhang, K.; Li, D.; Li, X.; Wang, S.; Chen, H. Changes in flavour compound profiles of precooked
pork after reheating (warmed-over flavour) using gas chromatography–olfactometry–mass spectrometry with chromatographicfeature extraction. Int. J. Food Sci. Technol. 2020, 55, 978–987. [CrossRef]
49. Elmore, J.S.; Mottram, D.S. The role of lipid in the flavour of cooked beef. Dev. Food Sci. 2006, 43, 375–378. [CrossRef]50. Yu, A.N.; Sun, B.G.; Tian, D.T.; Qu, W.Y. Analysis of volatile compounds in traditional smoke-cured bacon(CSCB) with different
fiber coatings using SPME. Food Chem. 2008, 110, 233–238. [CrossRef]51. Roldán, M.; Ruiz, J.; del Pulgar, J.S.; Pérez-Palacios, T.; Antequera, T. Volatile compound profile of sous-vide cooked lamb loins at
different temperature-time combinations. Meat Sci. 2015, 100, 52–57. [CrossRef] [PubMed]52. Fischer, J.; Gerlach, C.; Meier-Dinkel, L.; Elsinghorst, P.W.; Boeker, P.; Schmarr, H.G.; Wüst, M. 2-Aminoacetophenone—A hepatic
skatole metabolite as a potential contributor to boar taint. Food Res. Int. 2014, 62, 35–42. [CrossRef]53. Brooks, R.I.; Pearson, A.M. Steroid hormone pathways in the pig, with special emphasis on boar odor: A review. J. Anim. Sci.
1986, 62, 632–645. [CrossRef] [PubMed]54. Han, D.; Zhang, C.H.; Fauconnier, M.L. Effect of seasoning addition on volatile composition and sensory properties of stewed
pork. Foods 2021, 10, 83. [CrossRef]55. Han, D.; Zhang, C.H.; Fauconnier, M.L.; Jia, W.; Wang, J.F.; Hu, F.F.; Xie, D.W. Characterization and comparison of flavor
compounds in stewed pork with different processing methods. LWT 2021, 144, 111229. [CrossRef]56. Gerlach, C.; Leppert, J.; Santiuste, A.C.; Pfeiffer, A.; Boeker, P.; Wüst, M. Comparative Aroma Extract Dilution Analysis (cAEDA)
of Fat from Tainted Boars, Castrated Male Pigs, and Female Pigs. J. Agric. Food Chem. 2018, 66, 2403–2409. [CrossRef]57. Heyrman, E.; Janssens, S.; Buys, N.; Vanhaecke, L.; Millet, S.; Tuyttens, F.A.M.; Wauters, J.; Aluwé, M. Developing and
understanding olfactory evaluation of boar taint. Animals 2020, 10, 1684. [CrossRef]58. Font-i-Furnols, M.; Martín-Bernal, R.; Aluwé, M.; Bonneau, M.; Haugen, J.E.; Mörlein, D.; Mörlein, J.; Panella-Riera, N.; Škrlep,
M. Feasibility of on/at line methods to determine boar taint and boar taint compounds: An overview. Animals 2020, 10, 1886.[CrossRef]
59. Farmer, L.J.; Mottram, D.S. Interaction of lipid in the maillard reaction between cysteine and ribose: The effect of a triglycerideand three phospholipids on the volatile products. J. Sci. Food Agric. 1990, 53, 505–525. [CrossRef]
60. Leon, M.; Garcia, A.N.; Marcilla, A.; Martinez-Castellanos, I.; Navarro, R.; Catala, L. Thermochemical conversion of animalby-products and rendering products. Waste Manag. 2018, 73, 447–463. [CrossRef] [PubMed]
61. Berruti, F.M.; Ferrante, L.; Briens, C.L.; Berruti, F. Pyrolysis of cohesive meat and bone meal in a bubbling fluidized bed with anintermittent solid slug feeder. J. Anal. Appl. Pyrolysis 2012, 94, 153–162. [CrossRef]
62. Haugen, J.E.; Brunius, C.; Zamaratskaia, G. Review of analytical methods to measure boar taint compounds in porcine adiposetissue: The need for harmonised methods. Meat Sci. 2012, 90, 9–19. [CrossRef] [PubMed]
63. Fischer, J.; Elsinghorst, P.W.; Bücking, M.; Tholen, E.; Petersen, B.; Wüst, M. Development of a candidate reference method for thesimultaneous quantitation of the boar taint compounds androstenone, 3α-androstenol, 3β-androstenol, skatole, and indole in pigfat by means of stable isotope dilution analysis-headspace solid-phase micro. Anal. Chem. 2011, 83, 6785–6791. [CrossRef]
64. Fischer, J.; Haas, T.; Leppert, J.; Schulze Lammers, P.; Horner, G.; Wüst, M.; Boeker, P. Fast and solvent-free quantitation of boartaint odorants in pig fat by stable isotope dilution analysis-dynamic headspace-thermal desorption-gas chromatography/time-of-flight mass spectrometry. Food Chem. 2014, 158, 345–350. [CrossRef] [PubMed]
65. Genva, M.; Kemene, T.K.; Deleu, M.; Lins, L.; Fauconnier, M.L. Is it possible to predict the odor of a molecule on the basis of itsstructure? Int. J. Mol. Sci. 2019, 20, 3018. [CrossRef]
66. Hansson, K.-E.; Lundström, K.; Fjelkner-Modif, S.; Persson, J. The importance of androstenone and skatole for boar taint. SwedishJ. Agric. Res. 1980, 10, 167–173.
67. Spinelle, L.; Gerboles, M.; Kok, G.; Persijn, S.; Sauerwald, T. Review of portable and low-cost sensors for the ambient airmonitoring of benzene and other volatile organic compounds. Sensors 2017, 17, 1520. [CrossRef] [PubMed]
44

foods
Article
Quality Characteristics of Beef Patties Prepared withOctenyl-Succinylated (Osan) Starch
Mohamed F. Eshag Osman, Abdellatif A. Mohamed *, Mohammed S. Alamri, Isam Ali Mohamed Ahmed,
Shahzad Hussain, Mohamed I. Ibraheem and Akram A. Qasem
���������������
Citation: Eshag Osman, M.F.;
Mohamed, A.A.; Alamri, M.S.;
Ahmed, I.A.M.; Hussain, S.;
Ibraheem, M.I.; Qasem, A.A. Quality
Characteristics of Beef Patties
Prepared with Octenyl-
Succinylated (Osan) Starch. Foods
2021, 10, 1157. https://doi.org/
10.3390/foods10061157
Academic Editor: Paulo
Eduardo Sichetti Munekata
Received: 27 April 2021
Accepted: 19 May 2021
Published: 21 May 2021
Publisher’s Note: MDPI stays neutral
with regard to jurisdictional claims in
published maps and institutional affil-
iations.
Copyright: © 2021 by the authors.
Licensee MDPI, Basel, Switzerland.
This article is an open access article
distributed under the terms and
conditions of the Creative Commons
Attribution (CC BY) license (https://
creativecommons.org/licenses/by/
4.0/).
Department of Food Science and Nutrition, King Saud University, Riyadh 1145, Saudi Arabia;[email protected] (M.F.E.O.); [email protected] (M.S.A.); [email protected] (I.A.M.A.);[email protected] (S.H.); [email protected] (M.I.I.); [email protected] (A.A.Q.)* Correspondence: [email protected]
Abstract: Octenyl-succinylated corn starch (Osan) was used to improve the physicochemical proper-ties of ground beef patties. The study involved incorporation of 5 and 15% Osan and storage for 30or 60 days at −20 ◦C. The tested parameters included cooking loss, microstructure image, firmness,color, and sensory evaluation of the prepared patties. Along with Osan, native corn starch was usedas control and considered the patties with added animal fat. The data showed that Osan reducedthe cooking loss and dimensional shrinkage significantly (p < 0.05), whereas the moisture retention,firmness and color of beef patties were improved. The sensory evaluation indicated enhanced ten-derness and juiciness without significant alteration of flavor, color, and overall acceptability of thecooked patties. Microstructure images of cooked patties indicated uniform/cohesive structures withsmall pore size of patties shaped with Osan. Obviously, good storability of the uncooked patties wasreflected on the physiochemical, textural, color, and sensory evaluation of the cooked patties, whichpoints to the benefit of using Osan in frozen patties and signifies possible use in the meat industry.The overall sensory acceptability scores were given to cooked patties containing Osan starch as wellas the native starch, whereas 15% animal fat was favored too.
Keywords: beef patties; corn starch; Osan; tenderness; cooking loss
1. Introduction
Meat patties are considered the most popular ready to eat food, due to its desirablesensory and mouth feel. This qualifies its consumption to be considered as a good partof human diet in the past few decades, in addition to its nutritional value which includesessential amino acids, vitamins, and minerals [1]. In processed meat, animal fat is aprincipal ingredient, found in lumps and plays a central functional and sensory rolesuch as a binding and flavoring agent [2]. However, fat content is a critical obstaclethat needs to be addressed especially at high levels. Specifically, fat has been associatedwith chronic deceases, such as obesity and high cholesterol which leads to hypertensionand cardiovascular diseases [3]. Therefore, reducing fat turned into a current trend forthe meat-processing industry to meet the consumer demands [4]. Heretofore, countlessefforts have been devoted to address this concern in terms of preparing healthy productswithout reducing the characteristics of the final full fat product such as the physicalappearance and sensory qualities. Carbohydrate-based fat replacers, such as inulin, gums,cellulose derivatives, and starches are wildly considered as fat replacer and/or fat substituteapplied in low fat meat products [5,6], because of its abundancy, superior functionality,and cost-effectiveness [7,8]. Among these carbohydrates, starch exhibited extremely goodfunctional properties improving viscosity, solubility, and water-holding capacity, as well as,adaptability [9].
Because of its poor water solubility and high retrogradation, native starches utilizationis limited. This presented the need for physical, chemical, or enzymatic modifications of
Foods 2021, 10, 1157. https://doi.org/10.3390/foods10061157 https://www.mdpi.com/journal/foods
45

Foods 2021, 10, 1157
native starches so as to expand its utilization [10]. Starch modification can improve itsfunctionality such as viscosity, become more tolerant to various processing conditions suchas extreme pH, high temperatures, and shear. For instance, chemically modified starchesexhibit significant change in its functional properties compared to physical or enzymemodifications. One of the common chemically modified starches is octenyl-succinylation(Osan) which accrues by esterification of some OH groups by octenyl molecules [11].To overcome the hydrophilic nature of the abundant hydroxyl groups, various starchmodifications by introduction of hydrophobic moiety have been reported. Therefore,amphiphilic modification of starch is one of the methods widely used to improve theirhydrophobicity, because amphiphilic starches have a wide range of applications, mainly inemulsification and encapsulation. The amphiphilicity of octenyl succinic anhydride (OSA)-modified starch is improved due to the introduction of dual functional hydrophilic andhydrophobic groups [12]. The obtained Osan starch was utilized in various applicationranging from pharmaceutical to food products, such as, puddings, sauces, and babyfoods [13]. The use of sodium octenyl succinate starch in a methacrylate/polysaccharidesblends, introduced good flowability, surface-active, smoother particle surface, and low-viscosity to spray dried emulsion of the blends [14]. In addition, Osan starch has beenused as a fat substitute because it enhances the firmness and high palatability of somemeat products [15]. In contrast, octenyl-modified waxy maize starch was used successfullyin low fat mayonnaise at substitution level up to 75%, where the product exhibited greatsensory quality such as texture and aroma [13]. In baked products, Osan starch improveddough machinability and handling as well as the loaf volume [16].
The objective of this work is to compare the quality characteristics of beef pattiesprepared with starch to those with animal fat. Therefore, ocetinyle succenylated and nativecorn starch as fat replacement in beef patties was utilized. This work includes the effect ofstorability at −20 ◦C on the quality characteristics of the patties (microstructure, cookingproperties, moisture retention, texture, color, and sensory characteristics of the producedpatties).
2. Materials and Methods
2.1. Materials
Lean beef meat and animal fat (Beef) were purchased from a central meat market(Al-Taamir Market, Riyadh, Saudi Arabia). Ground lean meats were selected from animalsof the same age, breed, and feeding protocol (aldanon farm). While, fresh fat was obtainedfrom Riyadh slaughterhouse (Riyadh, Saudi Arabia). Corn starch was purchased fromMiddle East Food Solutions Company (Riyadh, Saudi Arabia). Black paper, white paper,onion powder, garlic powder, were purchased from Panda Retail Company (Riyadh, SaudiArabia). Analytical grade reagents, HCL, 2-Octen-1-yl succinic anhydride, NaOH werepurchased from Sigma-Aldrich Chemical Co. (St. Louis, MO, USA).
2.2. Methods2.2.1. Octenyl-Succinylation of Corn Starch (Osan)
Osan corn starch was synthesized via esterification according to the method of [17]with slight modification. Starch, (500 g) was suspended in 1125 mL of distill water. The pHof the slurry was adjusted to 8.5–9 using 1% NAOH, followed by the addition of Osan (4%based on starch dry weight). The 2-Octen-1-yl succinic anhydride was added slowly withcontinuous agitation at 35 ◦C, while maintaining the pH around 8.5–9.0 the reaction wasallowed to continue for one hour and the final pH was adjusted to 6.5 using 1.0 N HCL.The obtained mixture was centrifuged at (4000× g) for 10 min, washed twice with distillwater and once with acetone. The product was dried at room temperature for two days,ground, sieved through 250 μm sieve and stored for further use. This product is consideredas food grade according to the followed preparation method.
46
Foods 2021, 10, 1157
2.2.2. Fourier Transform Infrared Spectroscopy (FT-IR)
The stretching vibrational mode of the functional group (Osan) on the modified starchwas detected by FTIR spectrophotometer (Bruker, ALPHA, Hanau Germany). One gram ofdry sample was placed on the FT-IR cell and scanned between 4000 and 500 cm−1.
2.2.3. Preparation and Processing of Beef Patties
Beef patties were prepared and processed as described by Alejandre et al. [18] withslight modification. Round beef cut was sliced to small pieces and the intramuscular fatwas removed. The obtained lean meat was ground to passed through a 5-mm plate meatgrinder EMG-1600R ELEKTA ltd, Elekta (Hong Kong, China). Simultaneously, the beef caulfat was melted for 5 min in the microwave oven (sharp, 1200 W output, (Osaka, Japan). Sixformulations with the following common ingredients g/100 g addition based on groundlean meat weight (100 g), where 1.0 g of the following ingredients were added salt, hotpepper, white pepper, dry powdered garlic, dry onion powder, and 0.35 g of vinegar, inaddition to 20 g of ice water. The experimental design included two treatments and threesubsamples; two levels of caul fat, two levels of native corn starch, and two levels of Osancorn starch, hence, the one level included 5% and the second was 15%. Samples withcaul fat are considered the control and the melted caul fat was added to the spiced leanground beef drop-wise with constant hand mixing, but in the starch-containing formulationthe caul fat was totally replaced by modified or native starch which was added in smallamounts while mixing using a Stephan UM 12 mixer (Stephan U. Sohner GmbH and Co.,Gackenbach, Germany). Patties (100 g) were prepared using a patty-making machine(Expro. Co., Shanghai, China). The compressed patties, 100 mm diameter and 10 mmthick, were packaged in vacuumed plastic bags and stored at −20 ◦C for 0, 30, and 60 days.Before analysis, frozen un-cooked patties were placed at room temperature for 1.5 h. Theraw patties were cooked in two steps; the first step was to prepare precooked patties bysteaming for 20 min to stabilize the diameter, whereas the second step was the final cookingusing the electric hot plate (Stilfer model, 0040, Genova, Italy) for a total of 10 min with5 min on each side at 180 ± 1 ◦C. The internal temperature of the patty was 75 ◦C measuredat the geometrical center of the patties using digital thermocouple probe (Ecoscan TempJKT, Eutech instruments, Pte Ltd., Keppel Bay, Harbour Front, Singapore) The sensoryevaluation of the cooked products was carried out directly after cooking.
2.2.4. Scanning Electron Microscopy (SEM)
Microstructures of the obtained cooked patties was examined using JEOL-6360A SEM(Jeol Ltd., Tokyo, Japan). Samples were cut into small pieces 5 × 5 × 1 mm, mountedon the pin stubs using copper tape before coating with gold using an automated sputtercoater JFC-1600 Auto Fine Coater (Jeol Ltd., Tokyo, Japan) for 5 min at 2.5 kV operationenergy. Subsequently, four fields of each sample were spotted and the selected images werecaptured at magnifications ranging from 100× to 1000×.
2.2.5. Measurement of Cooking ParametersCooking Loss
The cooking loss of patties was determined by weighing before and after cooking asrecommended by Hollenbeck et al. [19] using the following equation:
Cooking loss = ((un − cooked patties weight)− (cooked patties weight))/(un − cooked patties weight) ∗ 100
Moisture Content
The moisture contents of un-cooked and cooked patties were determined based onthe AOAC Method 950.46 [20].
47

Foods 2021, 10, 1157
Moisture Retention
The moisture retention, was determined as the amount of moisture retained in thecooked product per 100 g of raw sample. This value was calculated according to thefollowing equation described by [21,22], where the weight of the patties was recordedbefore and after cooking, and the cooking yield was calculated by dividing the weight ofcooked patties by the weight of uncooked patties and expressed in as reported by [23].
Moisture retention = cooking yield × moisture in coocked pattiesmoisture in un-cooked patties
Cooking yield = weight before cooking − cooked weight
Patties Diameter, Thickness, and Shrinkage
Change in beef patties’ diameter was determined before and after cooking usingDigital Electric Caliper (Pen Tools Co., Maplewood, NJ, USA) by employing the followingequations.
Diameter =(un-cooked patties diameter )− (cooked patties diameter)
un-cooked patties diameter× 100
Thickness =(un-cooked patties thickness )− (cooked patties thickness)
un-cooked patties thickness× 100
Dimensional shrinkage =(Raw thickness − cooked thickness) + (Raw diameter − cooked diameter)
Raw thickness − raw diameter× 100
Firmness
The firmness of cooked beef patties was determined using a texture analyzer (TA XTExpress, Micro Systems Ltd., Surrey, UK). Samples (60 mm diameter and 10 mm thickness)were pressed using aluminum cylinder probe (SMS P/20 mm diameter, TA XT Plus MicroSystems Ltd., Surrey, UK) operated at 1 mm/s. Samples were compressed to 8 mm distancewith 10% strain, where the needed force is expressed in Newton (N). The shear forcecorresponds to maximum peak force, expressed in Newton (N). The test was performed atroom temperature (25 ± 1 ◦C).
pH
The pH was measured using a portable pH-meter (Model pH 211, Hanna Instruments,Woonsocket, RI, USA) by injecting the probe in 25 g of meat patty and held for 10 s toobtain the pH value.
Surface Color Measurement
The surface color characteristics of un-cooked and cooked patties were determinedafter the specified storage time (0, 30, or 60) days. The measurements included, lightness(L*), redness (a*), and yellowness (b*), assessed using a portable colorimeter (KonicaMinolta, CR-400-Japan; Measuring aperture: 8 mm; Illuminant: CIE D65; Observer angle:CIE 2◦ Standard Observer). Five color measurements were done, where each patty wasseparated into four quarters one measurement on the surface of each quarter was takenand the fifth was done in the middle.
2.2.6. Sensory Evaluation of Meat Patties
The sensory test was performed using a 9 points hedonic test (Affective Tests), whichincludes scale from 1 (dislike extremely) to 9 (like extremely) in a single session. Thistest is useful for evaluating the acceptance of new products. The sensory evaluation teamincluded trained students and King Saud University staff average age between 22 and
48
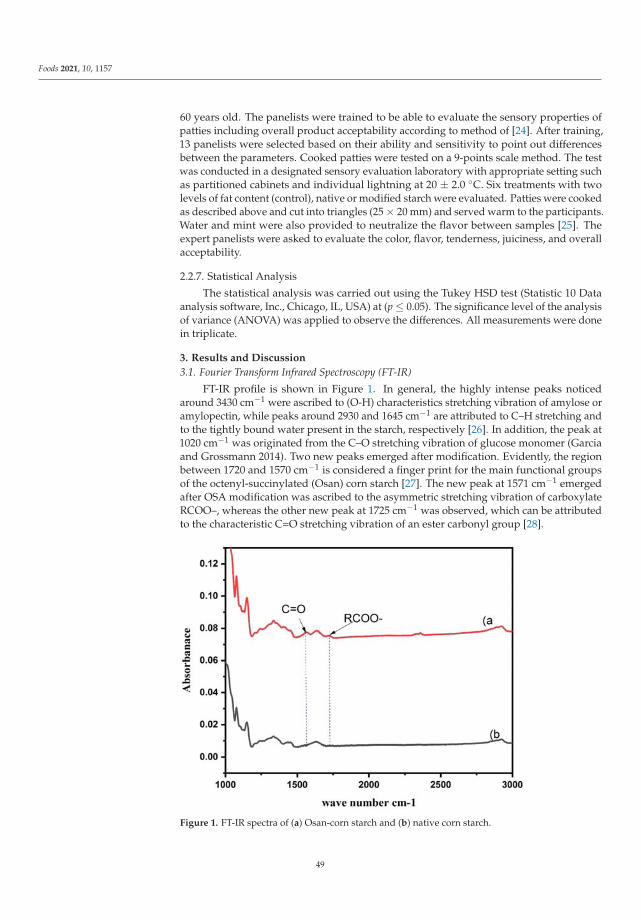
Foods 2021, 10, 1157
60 years old. The panelists were trained to be able to evaluate the sensory properties ofpatties including overall product acceptability according to method of [24]. After training,13 panelists were selected based on their ability and sensitivity to point out differencesbetween the parameters. Cooked patties were tested on a 9-points scale method. The testwas conducted in a designated sensory evaluation laboratory with appropriate setting suchas partitioned cabinets and individual lightning at 20 ± 2.0 ◦C. Six treatments with twolevels of fat content (control), native or modified starch were evaluated. Patties were cookedas described above and cut into triangles (25 × 20 mm) and served warm to the participants.Water and mint were also provided to neutralize the flavor between samples [25]. Theexpert panelists were asked to evaluate the color, flavor, tenderness, juiciness, and overallacceptability.
2.2.7. Statistical Analysis
The statistical analysis was carried out using the Tukey HSD test (Statistic 10 Dataanalysis software, Inc., Chicago, IL, USA) at (p ≤ 0.05). The significance level of the analysisof variance (ANOVA) was applied to observe the differences. All measurements were donein triplicate.
3. Results and Discussion
3.1. Fourier Transform Infrared Spectroscopy (FT-IR)
FT-IR profile is shown in Figure 1. In general, the highly intense peaks noticedaround 3430 cm−1 were ascribed to (O-H) characteristics stretching vibration of amylose oramylopectin, while peaks around 2930 and 1645 cm−1 are attributed to C–H stretching andto the tightly bound water present in the starch, respectively [26]. In addition, the peak at1020 cm−1 was originated from the C–O stretching vibration of glucose monomer (Garciaand Grossmann 2014). Two new peaks emerged after modification. Evidently, the regionbetween 1720 and 1570 cm−1 is considered a finger print for the main functional groupsof the octenyl-succinylated (Osan) corn starch [27]. The new peak at 1571 cm−1 emergedafter OSA modification was ascribed to the asymmetric stretching vibration of carboxylateRCOO–, whereas the other new peak at 1725 cm−1 was observed, which can be attributedto the characteristic C=O stretching vibration of an ester carbonyl group [28].
Figure 1. FT-IR spectra of (a) Osan-corn starch and (b) native corn starch.
49
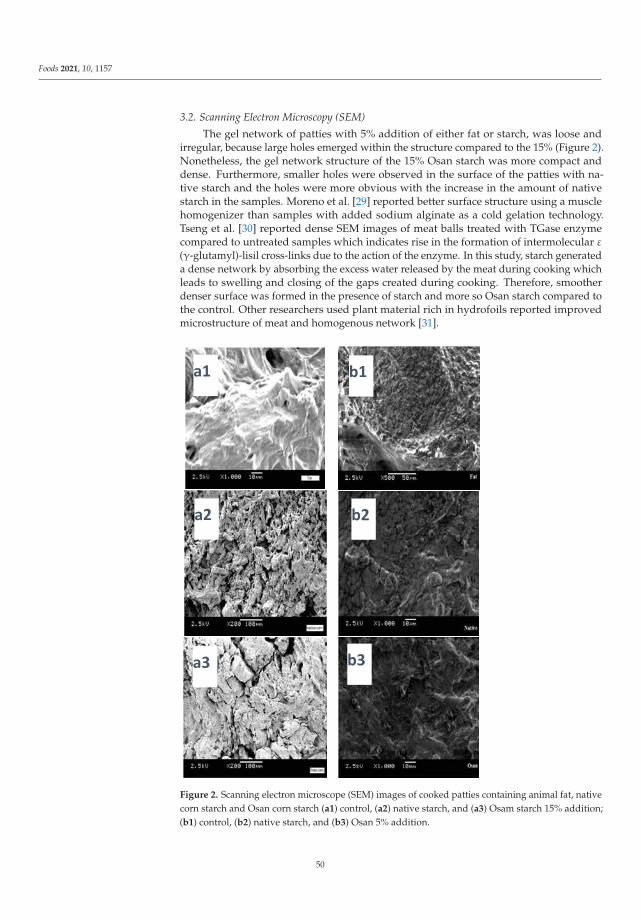
Foods 2021, 10, 1157
3.2. Scanning Electron Microscopy (SEM)
The gel network of patties with 5% addition of either fat or starch, was loose andirregular, because large holes emerged within the structure compared to the 15% (Figure 2).Nonetheless, the gel network structure of the 15% Osan starch was more compact anddense. Furthermore, smaller holes were observed in the surface of the patties with na-tive starch and the holes were more obvious with the increase in the amount of nativestarch in the samples. Moreno et al. [29] reported better surface structure using a musclehomogenizer than samples with added sodium alginate as a cold gelation technology.Tseng et al. [30] reported dense SEM images of meat balls treated with TGase enzymecompared to untreated samples which indicates rise in the formation of intermolecular ε(γ-glutamyl)-lisil cross-links due to the action of the enzyme. In this study, starch generateda dense network by absorbing the excess water released by the meat during cooking whichleads to swelling and closing of the gaps created during cooking. Therefore, smootherdenser surface was formed in the presence of starch and more so Osan starch compared tothe control. Other researchers used plant material rich in hydrofoils reported improvedmicrostructure of meat and homogenous network [31].
Figure 2. Scanning electron microscope (SEM) images of cooked patties containing animal fat, nativecorn starch and Osan corn starch (a1) control, (a2) native starch, and (a3) Osam starch 15% addition;(b1) control, (b2) native starch, and (b3) Osan 5% addition.
50

Foods 2021, 10, 1157
3.3. Physical Properties of Beef Patties3.3.1. Cooking Properties
The cooking properties of the patties prepared with Osan-corn starch, native corn, andcontrol are presented in Table 1. The addition of Osan-corn starch at 5 or 15%, significantly(p ≤ 0.05) altered the cooking loss, moisture retention, thickness, diameter, and dimensionalshrinkage of the patties. These parameters were compared to the raw patties. The datapresented here are in agreement with the literature reports on the effectivity of corn starchto retain moisture of the cooked bologna [10,32,33]. The firmness of patties prepared withnative starch was significantly higher than Osan starch which can be attributed to theamylose retrogradation which is less in Osan starch, thereby, patties with more starchexhibited firmer texture (Table 1) [34]. The firmness of the control was much higher at5% fat content compared to 15% indicating softer texture due to higher fat content but, itremains significantly higher than those with either type of starch, especially Osan starch.This could be accredited to the incapacity of fat to retain moisture during cooking comparedto the starch, which is in line with the water retention property difference of the pattiesstated in Table 1 [35]. The pH values of the patties were stable throughout the process,therefore, the use of starch did not affect the pH of the patties during storage or aftercooking. The percent diameter reduction after cooking was 18.3 for the 5% fat content(control) and 23.5 for the 15% fat content, whereas for the Osan starch patties it was 7.7and 8.6%, while the native starch exhibited reduction as 13.4 and 16.45%, respectively.This shows significantly lower diameter reduction of Osan starch patties compared to thecontrol and the native starch. Thereby, the stability of the patties network structure dueto Osan starch swelling and the formation of a semi solid gel that stabilized the diameter,is evident (Table 1). This can be attributed to the amphiphilic (hydrophilic-hydrophobicnature) property of the Osan starch. The control exhibited the greatest diameter loss aftercooking by virtue of increased animal fat content. Park et al. [36] reported diameter andthickness reduction for pork patties decreased with increase in the content of black ricepowder (rice powder is about 75% starch). The dimensional shrinkage followed the sametrend as the diameter reduction. Consequently, the score of the cooking loss, moistureretention, diameter reduction, and dimensional reduction favored Osan over native starch.Cornejo-Ramírez et al. [37] reported that water absorption, swelling power, and viscosityof Osan starch is superior to native starch. The high moisture retention of Osan starchlead to highly viscous gel with emulsifying power capable of holding fat and water andform a gel with little un-noticeable pores (space within the structure) and improve thesensory characteristics of the patties [33]. On the other hand, the control beef pattiesexhibited poor binding, limited protein network structure, or entrapments of ingredientsas shown by the sizable pores in the protein network. These results are in agreementwith [38–41]. The thickness of the control increased at higher fat content, but with nativestarch, significantly lower thickness was observed at high starch content. Osan starchpatties exhibited significantly higher thickness compared to the control and the nativestarch, since the thickness was almost twice as much (Table 1).
51
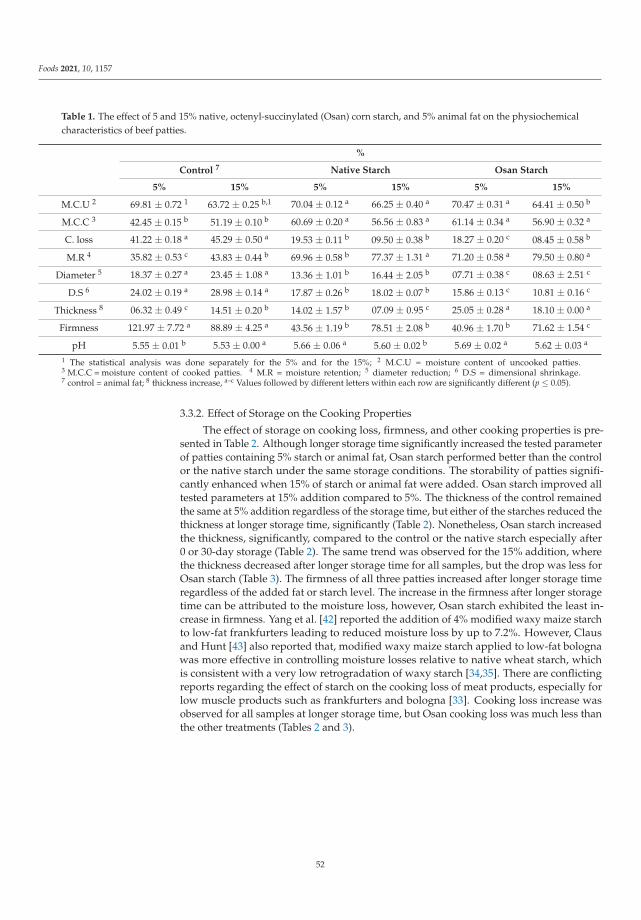
Foods 2021, 10, 1157
Table 1. The effect of 5 and 15% native, octenyl-succinylated (Osan) corn starch, and 5% animal fat on the physiochemicalcharacteristics of beef patties.
%
Control 7 Native Starch Osan Starch
5% 15% 5% 15% 5% 15%
M.C.U 2 69.81 ± 0.72 1 63.72 ± 0.25 b,1 70.04 ± 0.12 a 66.25 ± 0.40 a 70.47 ± 0.31 a 64.41 ± 0.50 b
M.C.C 3 42.45 ± 0.15 b 51.19 ± 0.10 b 60.69 ± 0.20 a 56.56 ± 0.83 a 61.14 ± 0.34 a 56.90 ± 0.32 a
C. loss 41.22 ± 0.18 a 45.29 ± 0.50 a 19.53 ± 0.11 b 09.50 ± 0.38 b 18.27 ± 0.20 c 08.45 ± 0.58 b
M.R 4 35.82 ± 0.53 c 43.83 ± 0.44 b 69.96 ± 0.58 b 77.37 ± 1.31 a 71.20 ± 0.58 a 79.50 ± 0.80 a
Diameter 5 18.37 ± 0.27 a 23.45 ± 1.08 a 13.36 ± 1.01 b 16.44 ± 2.05 b 07.71 ± 0.38 c 08.63 ± 2.51 c
D.S 6 24.02 ± 0.19 a 28.98 ± 0.14 a 17.87 ± 0.26 b 18.02 ± 0.07 b 15.86 ± 0.13 c 10.81 ± 0.16 c
Thickness 8 06.32 ± 0.49 c 14.51 ± 0.20 b 14.02 ± 1.57 b 07.09 ± 0.95 c 25.05 ± 0.28 a 18.10 ± 0.00 a
Firmness 121.97 ± 7.72 a 88.89 ± 4.25 a 43.56 ± 1.19 b 78.51 ± 2.08 b 40.96 ± 1.70 b 71.62 ± 1.54 c
pH 5.55 ± 0.01 b 5.53 ± 0.00 a 5.66 ± 0.06 a 5.60 ± 0.02 b 5.69 ± 0.02 a 5.62 ± 0.03 a
1 The statistical analysis was done separately for the 5% and for the 15%; 2 M.C.U = moisture content of uncooked patties.3 M.C.C = moisture content of cooked patties. 4 M.R = moisture retention; 5 diameter reduction; 6 D.S = dimensional shrinkage.7 control = animal fat; 8 thickness increase, a–c Values followed by different letters within each row are significantly different (p ≤ 0.05).
3.3.2. Effect of Storage on the Cooking Properties
The effect of storage on cooking loss, firmness, and other cooking properties is pre-sented in Table 2. Although longer storage time significantly increased the tested parameterof patties containing 5% starch or animal fat, Osan starch performed better than the controlor the native starch under the same storage conditions. The storability of patties signifi-cantly enhanced when 15% of starch or animal fat were added. Osan starch improved alltested parameters at 15% addition compared to 5%. The thickness of the control remainedthe same at 5% addition regardless of the storage time, but either of the starches reduced thethickness at longer storage time, significantly (Table 2). Nonetheless, Osan starch increasedthe thickness, significantly, compared to the control or the native starch especially after0 or 30-day storage (Table 2). The same trend was observed for the 15% addition, wherethe thickness decreased after longer storage time for all samples, but the drop was less forOsan starch (Table 3). The firmness of all three patties increased after longer storage timeregardless of the added fat or starch level. The increase in the firmness after longer storagetime can be attributed to the moisture loss, however, Osan starch exhibited the least in-crease in firmness. Yang et al. [42] reported the addition of 4% modified waxy maize starchto low-fat frankfurters leading to reduced moisture loss by up to 7.2%. However, Clausand Hunt [43] also reported that, modified waxy maize starch applied to low-fat bolognawas more effective in controlling moisture losses relative to native wheat starch, whichis consistent with a very low retrogradation of waxy starch [34,35]. There are conflictingreports regarding the effect of starch on the cooking loss of meat products, especially forlow muscle products such as frankfurters and bologna [33]. Cooking loss increase wasobserved for all samples at longer storage time, but Osan cooking loss was much less thanthe other treatments (Tables 2 and 3).
52

Foods 2021, 10, 1157
Table 2. Effect of 5% octenyl-succinylated (Osan) corn starch, native starch, and animal fat on thephysiochemical characteristics of meat patties after storage at −20 ◦C for 0, 30, and 60 days.
Days
Parameter 0 30 60
Cooking loss
Control 6 41.22 ± 0.18 c,1 51.85 ± 0.50 b 57.80 ± 0.62 a
Native 19.53 ± 0.11 c 28.17 ± 1.35 b 36.10 ± 0.14 a
Osan 18.27 ± 0.20 c 27.39 ± 0.23 b 33.58 ± 1.33 a
Diameter 2
Control 18.37 ± 0.27 b 20.71 ± 0.58 a 21.70 ± 0.54 a
Native 13.36 ± 1.01 b 15.62 ± 0.04 a 16.66 ± 0.14 a
Osan 07.71 ± 0.38 b 09.99 ± 1.66 a,b 11.75 ± 0.75 a
D. S 3
Control 24.02 ± 0.19 c 26.08 ± 0.08 b 27.79 ± 0.21 a
Native 17.87 ± 0.26 b 21.25 ± 0.16 a 22.36 ± 1.07 a
Osan 15.86 ± 0.13 b 16.38 ± 0.38 a,b 16.54 ± 0.48 a
Thickness 4
Control 06.32 ± 0.49 a 05.80 ± 0.45 a 05.61 ± 0.98 a
Native 14.02 ± 1.57 a 08.25 ± 0.07 b 06.13 ± 0.47 b
Osan 25.05 ± 0.28 a 12.20 ± 0.67 b 07.47 ± 0.00 c
Firmness 5
Control 121.97 ± 7.72 c 209.57 ± 4.05 b 307.19 ± 0.81 a
Native 43.56 ± 1.19 c 92.93 ± 7.40 b 127.84 ± 8.59 a
Osan 40.96 ± 1.70 c 82.73 ± 0.05 b 112.61 ± 3.84 a
pH
Control 05.63 ± 0.07 a 05.39 ± 0.05 b 05.35 ± 0.02 b
Native 5.66 ± 0.06 a 5.39 ± 0.00 b 5.34 ± 0.02 b
Osan 05.69 ± 0.02 a 05.33 ± 0.02 b 05.36 ± 0.01 b
1 Values followed by different letters (a–c) within each row are significantly different (p ≤ 0.05); 2 diameterreduction; 3 D.S = dimensional shrinkage; 4 thickness increase; 5 firmness in Newton; 6 control = animal fat.
Table 3. Effect of 15% octenyl-succinylated (Osan) corn starch, native starch, and animal fat on thephysiochemical characteristics of meat patties after storage at −20 ◦C for 0, 30, and 60 days.
Days
Parameter 0 30 60
Cooking loss
Control 6 45.29 ± 0.50 b,1 53.43 ± 1.65 a 55.08 ± 0.67 a
Native 09.50 ± 0.38 c 20.45 ± 1.97 b 23.67 ± 1.32 a
Osan 08.45 ± 0.58 c 17.86 ± 0.15 b 21.15 ± 1.39 a
Diameter 2
Control 22.63 ± 0.18 a 23.23 ± 1.33 a 24.51 ± 0.31 a
Native 14.03 ± 0.13 c 16.63 ± 0.04 b 18.68 ± 0.71 a
Osan 05.43 ± 0.30 b 09.59 ± 0.06 a 10.87 ± 0.97 a
D. S 3
Control 28.98 ± 0.14 a 29.93 ± 1.96 a 30.60 ± 0.30 a
Native 18.02 ± 0.07 b 20.85 ± 1.22 a 22.53 ± 0.99 a
Osan 10.81 ± 0.16 b 14.84 ± 0.50 a 15.33 ± 1.10 a
Thickness 4
Control 14.51 ± 0.20 a 07.45 ± 0.70 b 02.72 ± 0.00 c
Native 07.09 ± 0.95 a 05.21 ± 0.09 a,b 04.12 ± 0.45 b
Osan 18.10 ± 0.00 a 14.39 ± 0.60 b 10.18 ± 0.00 c
Firmness 5
Control 88.89 ± 4.25 c 163.63 ± 9.22 b 278.68 ± 14.65 a
Native 78.50 ± 2.08 b 137.84 ± 6.30 a 158.23 ± 16.32 a
Osan 71.62 ± 1.54 c 100.37 ± 8.98 b 127.81 ± 8.63 a
pH
Control 05.53 ± 0.00 a 05.43 ± 0.00 b 05.19 ± 0.00 c
Native 05.60 ± 0.02 a 05.32 ± 0.00 b 05.07 ± 0.01 c
Osan 05.58 ± 0.04 a 05.38 ± 0.05 b 05.12 ± 0.05 c
1 Values followed by different letters (a–c) within each row are significantly different (p ≤ 0.05); 2 diameterreduction; 3 D.S = dimensional shrinkage; 4 thickness increase; 5 firmness in Newton; 6 control = animal fat.
53

Foods 2021, 10, 1157
3.3.3. Sensory Attributes of Cooked Beef Meat Patties
The sensory evaluation results are presented in Table 4. The incorporation of nativeor Osan starches at 5% did not have any significant effect on the juiciness, flavor, color, oracceptability of the patties, but the tenderness was improved significantly (p ≤ 0.05). Theaddition of 15% of either starches significantly improved the juiciness, flavor and, the over-all acceptability of the patties, whereas the tenderness and the color were slightly improvedmore with Osan starch. After storage, the sensory evaluation showed superior performanceof Osan over the control and the native starch, whereas longer storage appeared to havenegative effect on the parameter of samples containing native starch (Table 5). Once again,samples with 15% Osan starch scored higher than those with 5%. Nonetheless, storage at−20 ◦C for 60 days appeared to have limited effect on the overall acceptability of the patties,but Osan starch patties scored higher. Higher starch content facilitates stable protein-starchmatrices, where hydrogen and covalent bonding and charge-charge interactions occur [44].
Table 4. The effect of different levels of octenyl-succinylated (Osan) corn starch, native starch, and animal fat on the sensorycharacteristics of meat patties. The test was based on a 9 points hedonic.
Sensory Characteristics Control 2 Native Starch Osan Starch
5% 15% 5% 15% 5% 15%
Tenderness 7.30 ± 0.26 a,b,1 6.43 ± 1.08 b,1 7.53 ± 1.12 b 7.53 ± 1.05 a 8.30 ± 0.65 a 8.03 ± 0.87 a
Juiciness 6.53 ± 1.26 a 5.96 ± 0.82 c 7.07 ± 1.18 a 6.80 ± 1.21 b 7.53 ± 1.26 a 8.23 ± 0.83 a
Flavor 7.23 ± 1.36 a 6.61 ± 1.19 b 7.53 ± 1.19 a 7.23 ± 1.23 a,b 7.84 ± 0.98 a 7.89 ± 0.95 a
Color 7.92 ± 0.95 a 7.48 ± 1.12 a 7.38 ± 1.26 a 7.59 ± 1.02 a 7.84 ± 0.80 a 7.92 ± 0.93 a
Acceptability 6.42 ± 1.22 a 6.50 ± 1.13 b 7.50 ± 1.32 a 7.61 ± 1.24 a 7.61 ± 1.30 a 7.78 ± 1.08 a
1 The statistical analysis was done separately for the 5% and for the 15%; (a–c) values followed by different letters within each row andaddition percent are significantly different (p ≤ 0.05); 2 control = animal fat; the statistical analysis was done for the 5%, separate fromthe 15%.
Table 5. Effects of different levels of octenyl succinylated (Osan) corn starch, native starch, and animal fat on the sensorycharacteristics of meat patties after storage at −20 for different days.
Days
0 30 60
Parameter 5% 15% 5% 15% 5% 15%
Tenderness
Control 1 7.30 ± 0.94 a,1 1 6.43 ± 1.08 a 6.30 ± 1.31 b 6.38 ± 1.19 a 6.53 ± 0.96 a,b 6.46 ± 0.96 a
Native 7.53 ± 1.12 a 7.53 ± 1.05 a,b 7.46 ± 1.26 a 7.84 ± 0.98 a 7.15 ± 1.28 a 6.65 ± 1.12 b
Osan 8.38 ± 0.65 a 8.03 ± 0.87 a 7.92 ± 1.18 a,b 8.07 ± 1.03 a 7.46 ± 0.87 b 7.84 ± 1.28 a
Juiciness
Control 6.38 ± 1.12 a 5.96 ± 0.82 a 6.38 ± 1.04 a 6.34 ± 1.06 a 6.46 ± 0.96 a 5.92 ± 0.86 a
Native 7.07 ± 1.18 a 6.80 ± 1.2 b 7.84 ± 0.84 a 8.00 ± 0.81 a 6.92 ± 1.25 a 6.94 ± 1.19 a,b
Osan 7.53 ± 1.26 a 8.23 ± 0.83 a 7.53 ± 1.05 a 7.53 ± 1.05 a 7.53 ± 0.66 a 7.38 ± 0.96 a
Flavor
Control 7.46 ± 1.12 a 6.61 ± 1.19 a 7.00 ± 1.29 a 6.92 ± 1.03 a 6.69 ± 1.10 a 9.92 ± 1.18 a
Native 7.53 ± 1.19 a 7.23 ± 1.23 a 8.16 ± 0.83 a 7.53 ± 0.96 a 7.53 ± 0.96 a 6.92 ± 1.32 a
Osan 7.84 ± 0.98 a 7.89 ± 0.95 a 7.00 ± 1.15 a 7.46 ± 1.05 a 7.07 ± 1.32 a 7.00 ± 0.91 a
Color
Control 7.92 ± 0.95 a 7.48 ± 1.12 a 7.23 ± 1.36 a 7.23 ± 1.16 a 7.15 ± 1.28 a 7.46 ± 1.05 a
Native 7.38 ± 1.26 a 7.59 ± 1.02 a 7.84 ± 1.14 a 7.92 ± 0.95 a 7.69 ± 1.18 a 7.34 ± 1.14 a
Osan 7.84 ± 0.80 a 7.92 ± 0.93 a 7.69 ± 0.94 a 8.23 ± 0.72 a 7.92 ± 1.11 a 7.42 ± 1.18 a
Acceptability
Control 6.77 ± 0.95 a 6.50 ± 1.13 a 6.65 ± 1.23 a 6.95 ± 1.09 a 6.76 ± 1.05 a 6.81 ± 1.06 a
Native 7.50 ± 1.32 a 7.61 ± 1.24 a 7.64 ± 0.96 a 7.73 ± 1.06 a 7.12 ± 1.20 a 7.18 ± 0.89 a
Osan 7.73 ± 1.11 a 7.78 ± 1.08 a 7.69 ± 1.02 a 7.63 ± 1.20 a 7.45 ± 0.81 a 7.20 ± 1.04 a
1 Control = animal fat; (a–c) values followed by different letters within each row and addition percent are significantly different (p ≤ 0.05);the statistical analysis was done for the 5% separate from the 15%.
54
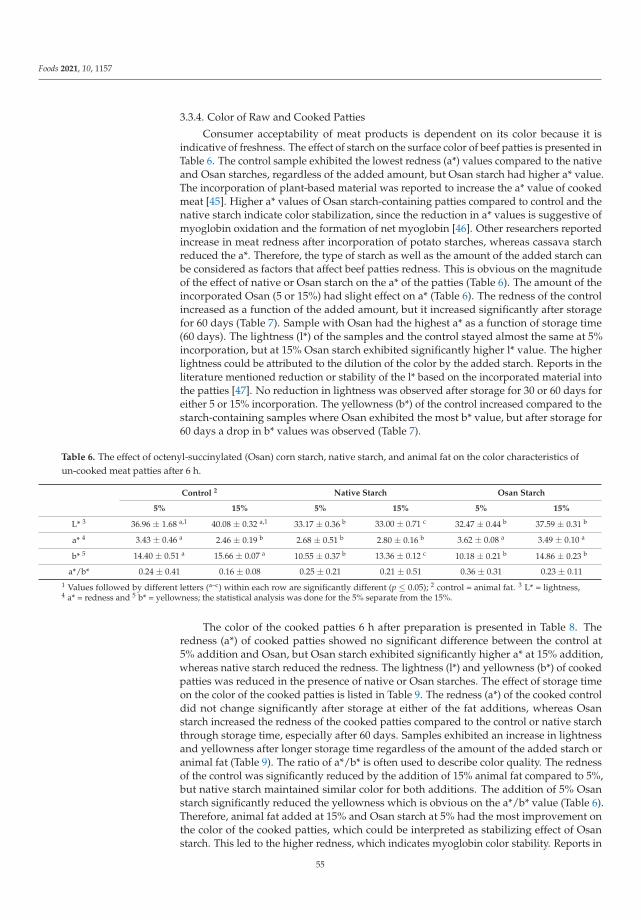
Foods 2021, 10, 1157
3.3.4. Color of Raw and Cooked Patties
Consumer acceptability of meat products is dependent on its color because it isindicative of freshness. The effect of starch on the surface color of beef patties is presented inTable 6. The control sample exhibited the lowest redness (a*) values compared to the nativeand Osan starches, regardless of the added amount, but Osan starch had higher a* value.The incorporation of plant-based material was reported to increase the a* value of cookedmeat [45]. Higher a* values of Osan starch-containing patties compared to control and thenative starch indicate color stabilization, since the reduction in a* values is suggestive ofmyoglobin oxidation and the formation of net myoglobin [46]. Other researchers reportedincrease in meat redness after incorporation of potato starches, whereas cassava starchreduced the a*. Therefore, the type of starch as well as the amount of the added starch canbe considered as factors that affect beef patties redness. This is obvious on the magnitudeof the effect of native or Osan starch on the a* of the patties (Table 6). The amount of theincorporated Osan (5 or 15%) had slight effect on a* (Table 6). The redness of the controlincreased as a function of the added amount, but it increased significantly after storagefor 60 days (Table 7). Sample with Osan had the highest a* as a function of storage time(60 days). The lightness (l*) of the samples and the control stayed almost the same at 5%incorporation, but at 15% Osan starch exhibited significantly higher l* value. The higherlightness could be attributed to the dilution of the color by the added starch. Reports in theliterature mentioned reduction or stability of the l* based on the incorporated material intothe patties [47]. No reduction in lightness was observed after storage for 30 or 60 days foreither 5 or 15% incorporation. The yellowness (b*) of the control increased compared to thestarch-containing samples where Osan exhibited the most b* value, but after storage for60 days a drop in b* values was observed (Table 7).
Table 6. The effect of octenyl-succinylated (Osan) corn starch, native starch, and animal fat on the color characteristics ofun-cooked meat patties after 6 h.
Control 2 Native Starch Osan Starch
5% 15% 5% 15% 5% 15%
L* 3 36.96 ± 1.68 a,1 40.08 ± 0.32 a,1 33.17 ± 0.36 b 33.00 ± 0.71 c 32.47 ± 0.44 b 37.59 ± 0.31 b
a* 4 3.43 ± 0.46 a 2.46 ± 0.19 b 2.68 ± 0.51 b 2.80 ± 0.16 b 3.62 ± 0.08 a 3.49 ± 0.10 a
b* 5 14.40 ± 0.51 a 15.66 ± 0.07 a 10.55 ± 0.37 b 13.36 ± 0.12 c 10.18 ± 0.21 b 14.86 ± 0.23 b
a*/b* 0.24 ± 0.41 0.16 ± 0.08 0.25 ± 0.21 0.21 ± 0.51 0.36 ± 0.31 0.23 ± 0.111 Values followed by different letters (a–c) within each row are significantly different (p ≤ 0.05); 2 control = animal fat. 3 L* = lightness,4 a* = redness and 5 b* = yellowness; the statistical analysis was done for the 5% separate from the 15%.
The color of the cooked patties 6 h after preparation is presented in Table 8. Theredness (a*) of cooked patties showed no significant difference between the control at5% addition and Osan, but Osan starch exhibited significantly higher a* at 15% addition,whereas native starch reduced the redness. The lightness (l*) and yellowness (b*) of cookedpatties was reduced in the presence of native or Osan starches. The effect of storage timeon the color of the cooked patties is listed in Table 9. The redness (a*) of the cooked controldid not change significantly after storage at either of the fat additions, whereas Osanstarch increased the redness of the cooked patties compared to the control or native starchthrough storage time, especially after 60 days. Samples exhibited an increase in lightnessand yellowness after longer storage time regardless of the amount of the added starch oranimal fat (Table 9). The ratio of a*/b* is often used to describe color quality. The rednessof the control was significantly reduced by the addition of 15% animal fat compared to 5%,but native starch maintained similar color for both additions. The addition of 5% Osanstarch significantly reduced the yellowness which is obvious on the a*/b* value (Table 6).Therefore, animal fat added at 15% and Osan starch at 5% had the most improvement onthe color of the cooked patties, which could be interpreted as stabilizing effect of Osanstarch. This led to the higher redness, which indicates myoglobin color stability. Reports in
55

Foods 2021, 10, 1157
the literature showed how the addition of processed plant leaf materials can reduce thea*/b* of beef patties which means lower redness [48].
Table 7. The effect of octenyl-succinylated (Osan) corn starch, native starch, and animal fat on the color characteristics ofun-cooked meat patties at −20 for different days.
0 30 60
5% 15% 5% 15% 5% 15%
L* 3
Control 2 1 36.96 ± 1.68 a 1 40.08 ± 0.32 a 36.84 ± 0.52 a 34.76 ± 0.69 c 38.26 ± 0.30 a 36.29 ± 0.54 b
Native 33.17 ± 0.36 b 33.00 ± 0.71 b 35.24 ± 0.20 a 36.85 ± 0.85 a 35.30 ± 0.52 a 37.18 ± 0.10 a
Osan 32.47 ± 0.44 b 37.59 ± 0.31 b 37.82 ± 1.27 a 39.40 ± 0.69 a 38.14 ± 0.40 a 38.95 ± 0.56 a,b
a* 4
Control 3.43 ± 0.18 a 2.46 ± 0.19 b 3.00 ± 0.18 a 3.28 ± 0.04 a 3.20 ± 0.19 a 3.39 ± 0.32 a
Native 2.68 ± 0.46 b 2.80 ± 0.16 b 3.72 ± 0.33 b 4.88 ± 0.10 a 5.50 ± 0.45 a 4.49 ± 0.30 a
Osan 3.62 ± 0.08 b 3.49 ± 0.10 c 3.72 ± 0.33 b 4.89 ± 0.30 b 4.62 ± 0.12 a 6.80 ± 0.77 a
b* 5
Control 14.40 ± 0.51 a 15.66 ± 0.07 a 12.81 ± 0.89 a 13.21 ± 0.49 b 15.68 ± 0.16 a 13.57 ± 1.51 b
Native 10.55 ± 0.37 c 13.36 ± 0.12 b 14.67 ± 0.25 b 14.90 ± 0.89 a 15.68 ± 0.09 a 16.15 ± 0.15 a
Osan 10.18 ± 0.21 c 14.86 ± 0.23 b 14.67 ± 0.59 b 15.19 ± 0.57 b 15.69 ± 0.59 a 16.70 ± 0.15 a
1 Values followed by different letters (a–c) within each row are significantly different (p ≤ 0.05); 2 control = animal fat. 3 L* = lightness,4 a* = redness and 5 b* = yellowness; the statistical analysis was done for the 5% separate from the 15%.
Table 8. The effect of octenyl-succinylated (Osan) corn starch, native starch, and animal fat on the color characteristics ofcooked meat patties after 6 h.
2 Control Native Starch Osan Starch
5% 15% 5% 15% 5% 15%
L* 3 1 31.46 ± 1.68 a 1 30.46 ± 0.32 a 32.17 ± 0.36 b 32.38 ± 0.71 c 31.49 ± 0.44 b 38.50 ± 0.31 b
a* 4 9.52 ± 0.46 a 9.69 ± 0.19 b 10.30 ± 0.51 b 10.91 ± 0.16 b 11.42 ± 0.08 a 11.66 ± 0.10 a
b* 5 8.72 ± 0.51 a 8.32 ± 0.07 a 9.65 ± 0.37 b 11.77 ± 0.12 c 9.96 ± 0.21 b 11.88 ± 0.23 b
a*/b* 1.09 ± 0.41 1.16 ± 0.08 1.01 ± 0.21 0.93 ± 0.51 1.15 ± 0.31 0.98 ± 0.111 Values followed by different letters (a–c) within each row are significantly different (p ≤ 0.05); 2 control = animal fat. 3 L* = lightness,4 a* = redness and 5 b* = yellowness; the statistical analysis was done for the 5% separate from the 15%.
Table 9. The effect of octenyl-succinylated (Osan) corn starch, native starch and animal fat on the color characteristics ofcooked meat patties at −20 for different days.
0 30 60
5% 15% 5% 15% 5% 15%
L* 3
Control 2 31.46 ± 1.68 b,1 1 30.46 ± 0.32 b 32.45 ± 0.52 b 36.47 ± 0.69 a 34.89 ± 0.30 a 37.27 ± 0.54 a
Native 32.86 ± 0.36 b 32.38 ± 0.71 c 40.82 ± 0.20 a 42.64 ± 0.85 b 36.41 ± 0.52 b 45.63 ± 0.10 a
Osan 31.49 ± 0.44 b 38.50 ± 0.31 b 36.96 ± 1.27 a 45.52 ± 0.69 a 38.09 ± 0.40 a 46.43 ± 0.56 a
a* 4
Control 8.27 ± 0.18 a 9.69 ± 0.19 a 8.79 ± 0.18 a 10.02 ± 0.04 a 9.06 ± 0.19 a 8.28 ± 0.32 b
Native 9.65 ± 0.46 b 10.91 ± 0.16 a 13.38 ± 0.33 a 9.83 ± 0.10 a 12.22 ± 0.45 a 9.90 ± 0.30 a,b
Osan 9.96 ± 0.08 b 11.66 ± 0.10 a 11.75 ± 0.33 a,b 11.80 ± 0.30 a 12.65 ± 0.12 a 10.67 ± 0.77 a
b* 5
Control 9.52 ± 0.51 a 8.32 ± 0.07 b 8.64 ± 0.89 a 10.72 ± 0.49 a 7.91 ± 0.16 a 10.52 ± 1.51 a
Native 10.30 ± 0.37 a,b 11.77 ± 0.12 c 9.83 ± 0.25 b 14.42 ± 0.89 b 10.76 ± 0.09 a 15.48 ± 0.15 a
Osan 11.24 ± 0.21 a 11.88 ± 0.23 b 10.17 ± 0.59 b 15.40 ± 0.57 a 10.78 ± 0.59 a,b 15.43 ± 0.15 a
1 Values followed by different letters (a–c) within each row are significantly different (p ≤ 0.05); 2 control = animal fat. 3 L* = lightness,4 a* = redness and 5 b* = yellowness; the statistical analysis was done for the 5% separate from the 15%.
56

Foods 2021, 10, 1157
4. Conclusions
In this study we examined the quality parameters of patties prepared from ground beefand processed with the addition of Osan starch consequently revealing varying positivechanges in the quality properties of the final product. The addition of Osan starch didnot alter the pH level or the organoleptic standards of the product. The most notablechange was manifested by the increase in textural and microstructural properties and thesignificant improvement of the cooking characteristics such as: yield, moisture retention,patties redness, thickness, and decrease in cooking loss. Scanning electron microscope(SEM) images of the samples confirmed the rise of intermolecular interaction between theproteins and the Osan starch, which resulted in small pores on the surface of the patties.
Author Contributions: Conceptualization, A.A.M., M.S.A. and I.A.; methodology, M.F.E.O.; software,M.F.E.O.; validation, I.A.M.A., and A.A.M.; formal analysis, S.H. and M.I.I.; investigation, S.H.;resources, M.I.I.; data curation, A.A.Q.; writing—original draft preparation, A.A.M.; writing—reviewand editing, A.A.M.; visualization, S.H.; supervision, A.A.M.; project administration, A.A.M.; fundingacquisition, A.A.Q. All authors have read and agreed to the published version of the manuscript.
Funding: Deanship of Scientific Research at King Saud University for funding this work throughresearch group no RGP-114.
Institutional Review Board Statement: Not applicable.
Data Availability Statement: Data will be available upon request from the corresponding author.
Acknowledgments: The authors extend their appreciation to the Deanship of Scientific Research atKing Saud University for funding this work through research group no RGP-114.
Conflicts of Interest: The authors declare no conflict of interest.
References
1. Udomkun, P.; Ilukor, J.; Mockshell, J.; Mujawamariya, G.; Okafor, C.; Bullock, R.; Nabahungu, N.L.; Vanlauwe, B. What are thekey factors influencing consumers’ preference and willingness to pay for meat products in Eastern DRC? Food Sci. Nutr. 2018, 6,2321–2336. [CrossRef] [PubMed]
2. Domínguez, R.; Pateiro, M.; Agregán, R.; Lorenzo, J.M. Effect of the partial replacement of pork backfat by microencapsulated fishoil or mixed fish and olive oil on the quality of frankfurter type sausage. J. Food Sci. Technol. 2017, 54, 26–37. [CrossRef] [PubMed]
3. Wu, J.H.; Micha, R.; Mozaffarian, D. Dietary fats and cardiometabolic disease: Mechanisms and effects on risk factors andoutcomes. Nat. Rev. Cardiol. 2019, 16, 581–601. [CrossRef] [PubMed]
4. Asioli, D.; Varela, P.; Hersleth, M.; Almli, V.L.; Olsen, N.V.; Naes, T. A discussion of recent methodologies for combining sensoryand extrinsic product properties in consumer studies. Food Qual. Prefer. 2017, 56, 266–273. [CrossRef]
5. Li, K.; Liu, J.Y.; Fu, L.; Li, W.J.; Zhao, Y.Y.; Bai, Y.H.; Kang, Z.L. Effect of gellan gum on functional properties of low-fat chickenmeat batters. J. Texture Stud. 2019, 50, 131–138. [CrossRef] [PubMed]
6. Yemenicioglu, A.; Farris, S.; Turkyilmaz, M.; Gulec, S. A review of current and future food applications of natural hydrocolloids.Int. J. Food Sci. Technol. 2020, 55, 1389–1406. [CrossRef]
7. Akbari, M.; Eskandari, M.H.; Davoudi, Z. Application and functions of fat replacers in low-fat ice cream: A review. Trends FoodSci. Technol. 2019, 86, 34–40. [CrossRef]
8. Babu, A.S.; Parimalavalli, R.; Mohan, R.J. Effect of modified starch from sweet potato as a fat replacer on the quality of reducedfat ice creams. J. Food Meas. Charact. 2018, 12, 2426–2434. [CrossRef]
9. Alcázar-Alay, S.C.; Meireles, M.A.A. Physicochemical properties, modifications and applications of starches from differentbotanical sources. Food Sci. Technol. 2015, 35, 215–236. [CrossRef]
10. Barbut, S. Effects of regular and modified potato and corn starches on frankfurter type products prepared with vegetable oil. Ital.J. Food Sci. 2018, 30, 802–808.
11. Tesch, S.; Gerhards, C.; Schubert, H. Stabilization of emulsions by OSA starches. J. Food Eng. 2002, 54, 167–174. [CrossRef]12. He, G.-Q.; Song, X.-Y.; Ruan, H.; Chen, F. Octenyl succinic anhydride modified early indica rice starches differing in amylose
content. J. Agric. Food Chem. 2006, 54, 2775–2779. [CrossRef] [PubMed]13. Bajaj, R.; Singh, N.; Kaur, A. Properties of octenyl succinic anhydride (OSA) modified starches and their application in low fat
mayonnaise. Int. J. Biol. Macromol. 2019, 131, 147–157. [CrossRef] [PubMed]14. Partheniadis, I.; Zarafidou, E.; Litinas, K.E.; Nikolakakis, I. Enteric Release Essential Oil Prepared by Co-Spray Drying
Methacrylate/Polysaccharides—Influence of Starch Type. Pharmaceutics 2020, 12, 571. [CrossRef]15. Rezler, R.; Krzywdzinska-Bartkowiak, M.; Piatek, M. The influence of the substitution of fat with modified starch on the quality
of pork liver pâtés. LWT 2021, 135, 110264. [CrossRef]
57
Foods 2021, 10, 1157
16. Balic, R.; Miljkovic, T.; Ozsisli, B.; Simsek, S. Utilization of modified wheat and tapioca starches as fat replacements in breadformulation. J. Food Process. Preserv. 2017, 41, e12888. [CrossRef]
17. Han, J.-A.; BeMiller, J.N. Preparation and physical characteristics of slowly digesting modified food starches. Carbohydr. Polym.2007, 67, 366–374. [CrossRef]
18. Alejandre, M.; Passarini, D.; Astiasarán, I.; Ansorena, D. The effect of low-fat beef patties formulated with a low-energy fatanalogue enriched in long-chain polyunsaturated fatty acids on lipid oxidation and sensory attributes. Meat Sci. 2017, 134, 7–13.[CrossRef]
19. Hollenbeck, J.J.; Apple, J.K.; Yancey, J.W.; Johnson, T.M.; Kerns, K.N.; Young, A.N. Cooked color of precooked ground beef pattiesmanufactured with mature bull trimmings. Meat Sci. 2019, 148, 41–49. [CrossRef]
20. AOAC. Official Methods of Analysis, 18th ed.; Association of Official Analytical Chemists: Washington, DC, USA, 2007.21. El-Magoli, S.B.; Laroia, S.; Hansen, P. Flavor and texture characteristics of low fat ground beef patties formulated with whey
protein concentrate. Meat Sci. 1996, 42, 179–193. [CrossRef]22. Heydari, F.; Varidi, M.J.; Varidi, M.; Mohebbi, M. Study on quality characteristics of camel burger and evaluating its stability
during frozen storage. J. Food Meas. Charact. 2016, 10, 148–155. [CrossRef]23. Naveena, B.; Muthukumar, M.; Sen, A.; Babji, Y.; Murthy, T. Improvement of shelf-life of buffalo meat using lactic acid, clove oil
and vitamin C during retail display. Meat Sci. 2006, 74, 409–415. [CrossRef] [PubMed]24. Meilgaard, M.; Civille, G.; Carr, B. Selection and training of panel members. Sens. Eval. Tech. 1999, 3, 174–176.25. Stone, H.; Sidel, J.L. Introduction to sensory evaluation. In Sensory Evaluation Practices, 3rd ed.; Academic Press: San Diego, CA,
USA, 2004; pp. 1–19.26. Luo, F.-X.; Huang, Q.; Fu, X.; Zhang, L.-X.; Yu, S.-J. Preparation and characterisation of crosslinked waxy potato starch. Food
Chem. 2009, 115, 563–568. [CrossRef]27. Nagaoka, S.; Tobata, H.; Takiguchi, Y.; Satoh, T.; Sakurai, T.; Takafuji, M.; Ihara, H. Characterization of cellulose microbeads
prepared by a viscose-phase-separation method and their chemical modification with acid anhydride. J. Appl. Polym. Sci. 2005,97, 149–157. [CrossRef]
28. Simsek, S.; Ovando-Martinez, M.; Marefati, A.; Sjöö, M.; Rayner, M. Chemical composition, digestibility and emulsificationproperties of octenyl succinic esters of various starches. Food Res. Int. 2015, 75, 41–49. [CrossRef]
29. Moreno, H.M.; Carballo, J.; Borderías, A.J. Use of microbial transglutaminase and sodium alginate in the preparation ofrestructured fish models using cold gelation: Effect of frozen storage. Innov. Food Sci. Emerg. Technol. 2010, 11, 394–400. [CrossRef]
30. Tseng, T.-F.; Liu, D.-C.; Chen, M.-T. Evaluation of transglutaminase on the quality of low-salt chicken meat-balls. Meat Sci. 2000,55, 427–431. [CrossRef]
31. Kumar, Y.; Kairam, N.; Ahmad, T.; Yadav, D.N. Physico chemical, microstructural and sensory characteristics of low-fat meatemulsion containing aloe gel as potential fat replacer. Int. J. Food Sci. Technol. 2016, 51, 309–316. [CrossRef]
32. Rasaei, S.; Hosseini, S.E.; Salehifar, M.; Behmadi, H. Effect of modified starch on some physico-chemical and sensory properties oflow fat Hamburger. Iran. J. Vet. Med. 2012, 6, 89–94.
33. Pietrasik, Z.; Soladoye, O. Use of native pea starches as an alternative to modified corn starch in low-fat bologna. Meat Sci. 2021,171, 108283. [CrossRef] [PubMed]
34. Copeland, L.; Blazek, J.; Salman, H.; Tang, M.C. Form and functionality of starch. Food Hydrocoll. 2009, 23, 1527–1534. [CrossRef]35. Joly, G.; Anderstein, B. Starches. In Ingredients in Meat Products; Springer: Berlin/Heidelberg, Germany, 2009; pp. 25–55.36. Park, S.-Y.; Lee, J.-W.; Kim, G.-W.; Kim, H.-Y. Effect of black rice powder on the quality properties of pork patties. Korean J. Food
Sci. Anim. Resour. 2017, 37, 71. [CrossRef]37. Cornejo-Ramírez, Y.I.; Martínez-Cruz, O.; Del Toro-Sánchez, C.L.; Wong-Corral, F.J.; Borboa-Flores, J.; Cinco-Moroyoqui, F.J. The
structural characteristics of starches and their functional properties. CyTA-J. Food 2018, 16, 1003–1017. [CrossRef]38. Lin, K.; Keeton, J.; Gilchrist, C.; Cross, H. Comparisons of carboxymethyl cellulose with differing molecular features in low-fat
frankfurters. J. Food Sci. 1988, 53, 1592–1595. [CrossRef]39. Mittal, G.; Barbut, S. Effects of various cellulose gums on the quality parameters of low-fat breakfast sausages. Meat Sci. 1993, 35,
93–103. [CrossRef]40. Ruusunen, M.; Vainionpää, J.; Puolanne, E.; Lyly, M.; Lähteenmäki, L.; Niemistö, M.; Ahvenainen, R. Physical and sensory
properties of low-salt phosphate-free frankfurters composed with various ingredients. Meat Sci. 2003, 63, 9–16. [CrossRef]41. Schuh, V.; Allard, K.; Herrmann, K.; Gibis, M.; Kohlus, R.; Weiss, J. Impact of carboxymethyl cellulose (CMC) and microcrystalline
cellulose (MCC) on functional characteristics of emulsified sausages. Meat Sci. 2013, 93, 240–247. [CrossRef]42. Yang, A.; Keeton, J.; Beilken, S.; Trout, G. Evaluation of some binders and fat substitutes in low-fat frankfurters. J. Food Sci. 2001,
66, 1039–1046. [CrossRef]43. Claus, J.; Hunt, M. Low-fat, high added-water bologna formulated with texture-modifying ingredients. J. Food Sci. 1991, 56,
643–647. [CrossRef]44. Schmitt, C.; Sanchez, C.; Desobry-Banon, S.; Hardy, J. Structure and technofunctional properties of protein-polysaccharide
complexes: A review. Crit. Rev. Food Sci. Nutr. 1998, 38, 689–753. [CrossRef] [PubMed]45. Shah, M.A.; Bosco, S.J.D.; Mir, S.A. Plant extracts as natural antioxidants in meat and meat products. Meat Sci. 2014, 98, 21–33.
[CrossRef] [PubMed]46. Mancini, R.; Hunt, M. Current research in meat color. Meat Sci. 2005, 71, 100–121. [CrossRef] [PubMed]
58

Foods 2021, 10, 1157
47. Muthukumar, M.; Naveena, B.; Vaithiyanathan, S.; Sen, A.; Sureshkumar, K. Effect of incorporation of Moringa oleifera leavesextract on quality of ground pork patties. J. Food Sci. Technol. 2014, 51, 3172–3180. [CrossRef]
48. Al-Juhaimi, F.; Ghafoor, K.; Hawashin, M.D.; Alsawmahi, O.N.; Babiker, E.E. Effects of different levels of Moringa (Moringa oleifera)seed flour on quality attributes of beef burgers. CyTA-J. Food 2016, 14, 1–9. [CrossRef]
59


foods
Article
Low-Voltage Electrical Stimulation of Beef Carcasses SlowsCarcass Chilling Rate and Improves Steak Color
Christina Bakker, Keith Underwood, Judson Kyle Grubbs * and Amanda Blair
���������������
Citation: Bakker, C.; Underwood, K.;
Grubbs, J.K.; Blair, A. Low-Voltage
Electrical Stimulation of Beef
Carcasses Slows Carcass Chilling Rate
and Improves Steak Color. Foods 2021,
10, 1065. https://doi.org/10.3390/
foods10051065
Academic Editor: Paulo Eduardo
Sichetti Munekata
Received: 1 April 2021
Accepted: 8 May 2021
Published: 12 May 2021
Publisher’s Note: MDPI stays neutral
with regard to jurisdictional claims in
published maps and institutional affil-
iations.
Copyright: © 2021 by the authors.
Licensee MDPI, Basel, Switzerland.
This article is an open access article
distributed under the terms and
conditions of the Creative Commons
Attribution (CC BY) license (https://
creativecommons.org/licenses/by/
4.0/).
Department of Animal Science, South Dakota State University, Brookings, SD 57007, USA;[email protected] (C.B.); [email protected] (K.U.); [email protected] (A.B.)* Correspondence: [email protected]
Abstract: Electrical stimulation (ES) is used in beef slaughter plants to improve tenderness; however,varying levels of low-voltage ES have not been well characterized. The objective was to evaluate theinfluence of two levels of low-voltage ES on temperature decline, pH, glycolytic potential, and meatquality. Forty-two beef carcasses were chosen from a commercial packing facility. One side of eachcarcass received either 40 or 80 volts of ES for 60 s at 45 min postmortem. The paired side of eachcarcass did not receive ES (Control). Temperature loggers were placed in the sirloin of 12 carcassesto record temperature decline. Longissimus muscle pH was measured at 1, 12, and 24 h, and 3 dpostmortem. Strip steaks were fabricated for determination of meat quality. A treatment by timeinteraction was observed for carcass temperature decline (p < 0.001) where ES sides stayed warmerlonger than Control sides. A treatment by time interaction was observed for pH decline with Controlsides exhibiting an increased pH at 1 h postmortem (p < 0.001). Instrumental color values wereincreased for ES compared to Control sides (p < 0.001). These results indicate ES slows carcasstemperature decline, hastens initial pH decline, and improves instrumental color. Similar resultswere observed between the ES treatments indicating either ES level may be used to achieve similarquality characteristics.
Keywords: beef; electrical stimulation; glycolytic potential; quality; temperature decline
1. Introduction
Electrical stimulation (ES) is a postmortem intervention utilized to enhance beefquality traits including color, tenderness, and flavor. Electrical stimulation is proposedto improve tenderness by reducing cold shortening [1], disrupting muscle structure [2],and increasing proteolytic activity [3]. Extra low-voltage ES is used on beef carcasses tofacilitate the removal of blood from carcasses shortly after exsanguination, while low- andhigh-voltage ES is used to improve the tenderness and color of beef [4–6]. However, thereare discrepancies among reports regarding the influence of varying levels of ES on beefquality traits. In a review by Adeyemi and Sazili [7], these discrepancies caused by varyinglevels of ES on beef quality are highlighted, with some authors reporting positive effectsincluding improvements in tenderness and lean maturity, some reporting negative effectssuch as reduced color stability and water holding capacity, and others reporting no effectof ES on meat quality, thus concluding the need to further study the effective application ofthis technology. Throughout the beef industry in the United States, few plants utilize ESin the same manner. Some plants utilize extra low-voltage ES to facilitate blood removal,others apply low- or high-voltage ES to improve tenderness and lean maturity scores,some apply different ES voltage levels throughout the slaughter process, and yet othersdo not use ES at all. Thus, additional research is necessary to optimize ES applicationsto ensure beneficial effects are captured and deleterious effects are minimized. Therefore,the objective of this study was to evaluate the influence of two levels of low-voltageelectrical stimulation applied at 45 min postmortem on temperature decline, muscle pH,instrumental color, glycolytic potential, and instrumental tenderness. We hypothesized the
Foods 2021, 10, 1065. https://doi.org/10.3390/foods10051065 https://www.mdpi.com/journal/foods
61
Foods 2021, 10, 1065
ES treatments would increase carcass temperature, decrease muscle pH, increase glycolyticpotential, improve tenderness, and increase instrumental L* and a* values compared to thenon-stimulated sides, with the 80 V ES treatment having a greater impact on these traitsthan the 40 V treatment.
2. Materials and Methods
2.1. Carcass Selection and Electrical Stimulation Treatments
Cattle were shipped from feedlots to a commercial slaughter facility and held in lairagefollowing normal plant operating guidelines and United States Department of AgricultureFood Safety Inspection Service regulations for beef slaughter. Source and history of thecattle is unknown. Carcasses (n = 42) were selected for comparison in this study. Threecollections were conducted throughout the course of the production day (11 carcasses at0900 h, 16 carcasses at 1200 h, and 15 carcasses at 1500 h). Carcasses were harvested usingstandard industry methods. Prior to chilling, paired sides were identified to compare theinfluence of 2 levels of ES. The left side of the carcasses were subjected to one of two EStreatments, (1) 80 V (ES80; n = 20) and (2) 40 V (ES40; n = 22), 45 min after exsanguination.The right side of each carcass was used as an unstimulated control. For both ES40 and ES80treatments, the ES was administered through the carcass trolly as it moved over a sectionof electrically charged rail. Electrical stimulation was applied over a 60 s period where thecarcasses received a 4 s pulse of electricity with approximately 2 s between each pulse. Theremaining side of each carcass served as a negative control and did not receive ES (Control;n = 42).
2.2. Carcass Temperature and pH
Following application of ES treatments, all carcasses were placed on the same railin a cooler set to hold at approximately 3 ◦C for 48 h. Carcass temperature decline wasmonitored from the timepoint the carcasses entered the cooler on paired sides by inserting atemperature probe (Temprecord Multitrip, Sensitech Inc. Beverly, MA, USA) into the sirloinof both sides of the first 4 carcasses selected at each of the 3 collection time points. Oncethe cooler was filled with carcasses, the spray chill system was activated to spray water for1 min every 15 min for 24 h. Upon completion of the 48-h holding period, carcasses wereribbed and allowed to bloom for approximately 30 min before standard carcass data werecollected. Longissimus muscle pH was recorded on the medial side of the muscle at the12th rib position at 1 h postmortem, at the 11th rib at 12 h postmortem, and at the 10th ribat 24 h postmortem to establish a pH decline through the completion of rigor mortis. ThepH recordings were taken at different locations on the muscle to avoid influence on pH byutilizing the same probe site.
2.3. Carcass Characteristics and Sample Collection
Fat thickness at the 12th rib (BF) and ribeye area (REA) were measured on both sides ofeach carcass by South Dakota State University (SDSU) personnel. Fat thickness at the 12thrib and REA measurements of the two sides were averaged and used to calculate USDAYield Grade. Hot carcass weight (HCW) was recorded from each side and added togetherfor a total hot carcass weight for the carcass. Boneless striploins (IMPS #180) were collected,transported under refrigerated conditions to SDSU, and fabricated into 2.54 cm steaks.Steaks were fabricated in a set order. The first anterior steak was immediately frozen, 3 dpostmortem, and used for glycolytic potential (GP) analysis. The second through fourthsteaks were aged for 3, 7, or 14 d, respectively, and utilized for Warner–Bratzler shear force(WBSF) and cook loss determination. The second anterior steak was also used to measureultimate pH, 3 d postmortem. The seventh steak was used to evaluate instrumental leancolor for each loin.
62
Foods 2021, 10, 1065
2.4. Glycolytic Potential
Glycolytic potential was determined as described by McKeith et al. [8] with minormodifications. Briefly, steaks designated for GP analysis were minced, snap frozen inliquid nitrogen and powdered using a Waring commercial blender (Model 51BL32, WaringProducts Division, New Hartford, CT, USA) to produce a homogenous sample. Three gof powdered sample was weighed into a 50 mL plastic conical tube, allowed to thaw, andthen homogenized for 75 s in 0.6 N perchloric acid. Samples were then digested usingamyloglucosidase and 5.4 N potassium hydroxide and incubated for 3 h, inverting thetubes every 20 min to mix. Upon completion of the incubation step, 3N perchloric acidwas added and samples were centrifuged at 4.4 ◦C for 5 min at 10,000× g. Supernatantwas collected and stored for analysis. Glucose levels were determined using a glucoseassay kit (Glucose (HK) Assay Kit GAHK20, Millipore-Sigma, St. Louis, MO, USA) andabsorbance was read at 340 nm (SpectraMax 190, Molecular Devices, San Jose, CA, USA).Lactate levels were determined by adding NAD+ in a glycine buffer to sample aliquots toform NADH. Samples were then read at 340 nm (SpectraMax 190, Molecular Devices, SanJose, CA, USA). Glycolytic potential of each sample was then calculated with the followingequation: GP = 2(Glucose absorbance * 111.882) + (Lactate absorbance * 173.22).
2.5. Warner–Bratzler Shear Force and Cook Loss
Steaks utilized for WBSF were thawed at approximately 4 ◦C for 24 h prior to cooking.Steaks were cooked on a clamshell grill (George Foreman Indoor/Outdoor Grill modelGGR62, Lake Forest, IL, USA) to an internal peak temperature of 71 ◦C as indicated bya temperature probe inserted to the geometric center of the steak (Atkins AquaTuff NSFSeries Model 351, Middlefield, CT, USA). Steaks were then stored at approximately 4 ◦Covernight. Four h prior to evaluating shear force values, steaks were placed at roomtemperature and allowed to equilibrate. Six cores were removed parallel to the directionof the muscle fibers and then sheared once using a Warner–Bratzler shear machine (G-RElectric Manufacturing Company, Manhattan, KS, USA) equipped with a BFG 500 N basicforce gauge (Mecmesin Ltd., West Sussex, UK) and peak shear force was recorded for eachcore. An average shear force value was calculated and recorded for each steak.
Cook loss was determined on steaks designated for WBSF. Raw steak weight wasrecorded with a balance (MWP, Cas Corporation, Seoul, South Korea) and after cooking,steaks were allowed to equilibrate to room temperature and weighed again. Cook losswas determined using the following equation: cook loss % = ((raw weight − cookedweight)/raw weight) × 100.
2.6. Instrumental Color
Steaks designated for color determination were allowed to bloom for 30 min priorto evaluation. L*, a*, and b* values were recorded at two locations (medial portion of thesteak and lateral portion of the steak) using a handheld colorimeter (Chroma Meta CR-410,Konica Minolta, Ramsey, NJ, USA) equipped with a 50 mm aperture, 0◦ viewing angle,2◦ standard observer, pulsed xenon lamp light source, and calibrated with a white tile(L* = 97.38, a* = 0.06, b* = 1.82). Measurements were averaged between both locations foreach steak.
2.7. Statistical Analysis
The experiment utilized both sides of 42 carcasses in a completely randomized design.The data analysis was conducted using the MIXED model of SAS software (SAS InstituteInc., Cary, NC, USA) with fixed effect of treatment, random effect of carcass, and Toeplitzcovariate structure. Hot carcass weights for both sides of each carcass were added together,and REA and BF measurements were averaged between sides. As HCW from both sidesare needed to calculate USDA yield grades, carcass data were analyzed by ES treatmentwith data reported as ES40 or ES80 treatments. Contrast statements were used to compareControl vs. ES40 and ES80 sides (Control vs. ES), and ES40 vs. ES80 (ES Level). Peak
63

Foods 2021, 10, 1065
internal cooking temperature was used as a covariate for cook loss and WBSF data. Temper-ature decline, WBSF, cook loss, and pH were considered repeated measures. Interactions oftreatment and time were evaluated where appropriate and are reported when significant.Significance was determined when p < 0.05.
3. Results
3.1. Carcass Characteristics
Carcass characteristics are reported in Table 1. Hot carcass weight did not differbetween ES40 and ES80 treatments (p = 0.7200). No differences were observed in REA(p = 0.6172). Fat thickness measured at the 12th rib was similar between the two treatments(p = 0.9482). The lack of differences in HCW, REA, and BF contributed to the absence ofdifferences in overall USDA yield grade (p = 0.5000). The absence of differences in carcasscharacteristics between ES treatments indicates that carcass characteristics likely did notimpact carcass chilling or meat quality data.
Table 1. Least square means for carcass characteristics of carcasses subjected to 40 or 80 V of electricalstimulation for 60 s in 4 s on, 2 s off intervals prior to chilling.
Treatment 1
Variable ES40 ES80 SEM 3 p-Value
Hot carcass weight, kg 427.25 424.30 8.16 0.7200Ribeye area 4, cm2 85.06 87.44 4.71 0.6172
12th rib fat thickness 4, cm 1.62 1.61 0.14 0.9482USDA YG 5 3.86 3.70 0.23 0.5000
1 ES40 = 40 V of electrical stimulation, ES80 = 80 V of electrical stimulation. 3 Standard error of means. 4 Carcassdata measured between the 12th and 13th rib according to USDA standards. 5 USDA Yield Grade.
3.2. Carcass Temperature and PH
An ES by chilling time interaction was observed for temperature decline (p < 0.0001;Figure 1). Sides treated with ES prior to chilling had similar temperatures to non stimulatedsides at the onset of chilling. By 30 min of chilling, ES sides had increased temperaturescompared to sides that did not receive ES, regardless of ES level. This difference persisteduntil 24 h postmortem when temperature data loggers were removed from the carcasses. Nodifferences in temperature between ES treatments were observed at any time point (p > 0.05).
0
5
10
15
20
25
30
35
40
45
1 60 120
180
240
300
360
420
480
540
600
660
720
780
840
900
960
1020
1080
1140
1200
1260
1320
1380
1440
Tempe
rature,
Minutes of Chilling
Control ES40 ES80
Treatment*Time p < 0.0001
Figure 1. Temperature decline of carcass submitted to low-voltage electrical stimulation (ES) prior tochilling. Data are depicted as least square means ± SEM. Treatments are as follows: Control = no ES,ES40 = 40 V of ES, ES80 = 80 V of ES. Electrical stimulation was applied for 60 s in 4 s on, 2 s off intervals.
64

Foods 2021, 10, 1065
An ES treatment by chilling time interaction was observed for pH decline (p < 0.0001;Figure 2). At 1 h postmortem, the ES80 carcasses achieved the lowest pH, ES40 intermediate,and Control sustaining the highest pH value. The pH values measured at 12 and 24 hpostmortem, as well as ultimate pH, did not differ among treatments (p > 0.05).
Figure 2. pH decline in beef carcasses subjected to low-voltage electrical stimulation prior to chill-ing. Data are depicted as least square means ± SEM. Treatments are as follows: Control = no ES,ES40 = 40 V of ES, ES80 = 80 V of ES. Electrical stimulation was applied for 60 s in 4 s on, 2 s offintervals. Measurements were taken at 1, 12, and 24 h postmortem in addition to ultimate pH.a–f Means with different subscripts differ (p < 0.05).
3.3. Glycolytic Potential
Glucose, lactate, and GP data are reported in Table 2. Glucose concentration did notdiffer between Control and ES sides (p = 0.5825) or between ES treatments (p = 0.7308).Additionally, no differences were observed between Control and ES sides (p = 0.9557) orbetween ES levels (p = 0.5655) for lactate concentration. Unsurprisingly, based on glucoseand lactate results, GP did not differ between Control and ES sides (p = 0.6760), or betweenES treatments (p = 0.5784).
Table 2. Warner–Bratzler shear force (WBSF), cook loss, glucose, lactate, and glycolytic potential (GP)of beef carcasses subjected to low-voltage electrical stimulation for 60 s in 4 s on, 2 s off intervalsprior to chilling 1,2.
Treatment 3 Contrast p-Value
Variable Control ES40 ES80 Control vs. ES 4 ES Level 5
Glucose, μmol/g 0.19 ± 0.006 0.19 ± 0.008 0.18 ± 0.008 0.5825 0.7308Lactate, μmol/g 0.20 ± 0.005 0.20 ± 0.006 0.19 ± 0.006 0.9557 0.5655
GP, μmol/g 76.10 ± 1.66 76.02 ± 2.18 74.26 ± 2.28 0.6760 0.5784WBSF, kg 3.84 ± 0.08 3.69 ± 0.10 3.64 ± 0.11 0.0220 0.7332
Cook loss, % 17.94 ± 0.28 18.34 ± 0.38 18.24 ± 0.39 0.3753 0.85361 Least square means ± standard error of means. 2 No interaction was observed for aging day and electricalstimulation treatment (effect of aging day is reported in Table 3). 3 Carcasses subjected to 0 (Control), 40 (ES40), or80 (ES80) V of electrical stimulation. 4 Control vs. ES contrast statement compares Control carcasses vs. 40 and80 V treatments. 5 ES Level contrast statement compares 40 vs. 80 V treatments
65

Foods 2021, 10, 1065
Table 3. Least square means for Warner–Bratzler Shear Force (WBSF) and cook loss values of beefsteaks aged 3, 7, or 14 d 1 (n = 42/day).
Days Postmortem 1
Variable 3 7 14 SEM 2 p-Value
WBSF, kg 3.70 a 3.84 b 3.63 a 0.08 0.0021Cook loss, % 17.38 a 18.69 b 18.45 b 0.34 0.0127
1 No interaction was observed for aging day and electrical stimulation treatment (effect of electrical stimulationtreatment is reported in Table 2). 2 Standard error of means. a,b Means with different subscripts indicate adifference within row (p < 0.05).
3.4. Warner–Bratzler Shear Force and Cook Loss
Steaks from ES sides exhibited decreased shear force values compared to the Controlsides (p < 0.0220; Table 2). However, when evaluating WBSF data between ES treatments,no differences were observed (p = 0.7332). Moreover, an aging day effect was observed forWBSF. Steaks aged 7 d had a greater shear force value compared to steaks aged for 3 or14 d postmortem (p = 0.0021; Table 3).
The percentage of weight lost during cooking did not differ between Control and ES-treated sides (p = 0.3753; Table 2) nor were differences observed between sides treated withdifferent ES levels (p = 0.8536). An aging day effect was observed for cook loss (p = 0.0127;Table 3) with steaks aged 3 d demonstrating less cook loss than steaks aged 7 or 14 d.
3.5. Instrumental Color
Steaks from ES sides were lighter (p < 0.0001; Table 4), redder (p < 0.0001; Table 4), andmore yellow (p < 0.0001; Table 4) than control steaks. No differences were observed betweenES treatments for lightness (p = 0.4582), redness (p = 0.9460), or yellowness (p = 0.7079).
Table 4. Instrumental color values of longissimus muscle from beef carcasses subjected to low-voltageelectrical stimulation for 60 s in 4 s on, 2 s off intervals prior to chilling 1.
Treatment 2 Contrast p-Value
Variable Control ES40 ES80 Control vs. ES 3 ES Level 4
L* 40.38 ± 0.34 42.28 ± 0.46 42.77 ± 0.48 <0.0001 0.4582a* 24.94 ± 0.30 26.08 ± 0.33 26.06 ± 0.38 <0.0001 0.9460b* 10.14 ± 0.27 11.30 ± 0.29 11.19 ± 0.34 <0.0001 0.7079
1 Least square means ± standard error of means. 2 Carcasses subjected to 0 (Control), 40 (ES40), or 80 (ES80) V ofelectrical stimulation. 3 Control vs. ES contrast statement compares Control carcasses vs. 40 and 80 V treatments.4 ES Level contrast statement compares 40 vs. 80 V treatments
4. Discussion
Previous research has shown temperature decline trends similar to the current datawith ES reported to increase carcass temperature. Bowker et al. [9] measured the temper-ature decline of the longissimus dorsi in pigs electrically stimulated (six pulses, 60 Hz,500 V, 1 s on and 2 s off) at 3 min postmortem, and observed an increase in temperature ofES-treated carcasses over the monitoring duration of 56 min. In both cases, the increase intemperature was likely caused by the heat generated by the muscle contractions caused bythe ES treatment [9]. Conversely, Wiklund et al. [10] evaluated the temperature decline inthe longissimus muscle of red deer carcasses stimulated with 90–95 V of ES for 55 s at thetime of exsanguination, and found no differences compared to non-stimulated carcasses.Additionally, Kim et al. [11] evaluated the impact of low-voltage ES (100 V for 30 s) 90 minafter exsanguination of beef carcasses, and also observed no differences in the temperaturedecline of the longissimus dorsi compared to non-stimulated sides. The conflicting resultsof Wiklund et al. [10] and Kim et al. [11] compared to the current study could be due todifferences in species (beef vs. red deer) or time post exsanguination of the stimulation.
66

Foods 2021, 10, 1065
Electrical stimulation can cause an increase in the rate of postmortem muscle pHdecline by increasing metabolic activity. McKenna et al. [12] observed differences in earlypH measurements with ES sides showing decreased pH values compared to non-stimulatedsides until 6 h postmortem when pH was similar, until cessation of pH measurementsat 24 h postmortem. Moreover, Nichols and Cross [13] noted a similar trend in pH withES sides displaying a rapid pH decline in the first 6 h postmortem. Kim et al. [11] noteda more dramatic decrease in longissimus muscle pH decline, with non-stimulated sidesdisplaying an increased pH until 24 h postmortem. The rapid pH decline observed waslikely caused by the increase in postmortem glycolysis, which resulted in a buildup oflactic acid in muscle at a faster rate than would occur without ES, but resulted in similarultimate pH values [14,15].
Similar to the current study, Ding et al. [16] observed no differences in glucose orGP values for bison meat from carcasses stimulated with 400 V of ES compared to anon-stimulated control. Conversely, Ding et al. [16] did observe a difference in lactateconcentrations; however, the samples were taken from carcasses prior to chilling and rigormortis. The lack of differences in GP observed in this study was ideal as we could concludethe animals used in this study were at similar metabolic states prior to slaughter. Further,we can conclude that pre-harvest handling did not impact the ability of carcasses in thisstudy to experience a normal rigor processes, such as pH decline, and the differences inpH observed in the present study were likely the result of the ES treatments.
There are several mechanisms by which ES is proposed to improve tenderness [17].It has been reported that ES disrupts muscle structure at the Z-disk and I-band, causesformation of contraction nodes, and disrupts the integrity of the sarcoplasmic reticulumcausing minor separation of myofibrils [2,18,19]. Electrical stimulation has also beenproposed to inhibit cold shortening by preventing the temperature of the carcass fromdeclining too rapidly [1,20]. Others hypothesize that improvements in tenderness followingES is caused by the activation of lysosomal enzymes and increased proteolysis while carcasstemperature is still increased [2,3,10]. However, some studies have found little or no effectsof ES on beef tenderness. Discrepancies between studies could be related to the levelof voltage applied, duration of stimulation, or timing of ES after exsanguination [11,21].However, most studies agree that tenderness development is a complex process that likelyinvolves more than one of the previously discussed mechanisms [2,7,14].
It is unclear why steaks aged for 7 d had increased shear force values compared tosteaks aged 3 d, when most normal aging curves would show a decrease in WBSF value asaging day increased during the first few weeks of aging. The steaks utilized for shear forcewere taken consecutively from the anterior end of the strip loin. Previous research suggeststhat steaks from those locations should have similar shear force values, likely eliminatingthe impact of steak location on tenderness [22,23]. The WBSF values for each aging periodare below the established threshold for tenderness (4.6 kg) as perceived by consumers asoutlined by Shackelford et al. [24]. Additionally, the difference among days is within the0.5 kg of force described by Miller et al. [25] as the difference in shear force detectable byconsumers preparing steak in their own home, indicating that the differences in shear forcebased on aging day are likely not detectable by the average consumer.
Cook loss was not impacted by treatment in the current study. These data are similarto the impact of high-voltage ES on cook loss of beef steaks [5,12] or bison steaks [16].Additionally, Wiklund et al. [10] observed no effect of ES on drip loss of steaks fromred deer. However, when evaluating treatment of beef carcasses with 100 V of ES at 1 hpostmortem Savell et al. [26] observed increased cook loss for ES vs. control carcasses.However, cook loss in the current study was impacted by aging day. Similar results wereobserved by Shanks et al. [27] when evaluating cook loss over 35 d postmortem. Increasesin cook loss over time may be the result of damage to cellular membranes, which wouldenable a greater amount of water to leak out of the muscle during cooking [27].
Steaks from ES sides in the current study were lighter, more red, and more yellow thansteaks from Control sides. Similar results were observed in beef [5,6,26,28] and in bison [16].
67

Foods 2021, 10, 1065
The increased color values can be attributed to the increased oxygen permeability of themeat as a result of the damaged muscle fibers. Weakened muscle structure caused by theintense contractions that occurred during the ES treatment can allow oxygen to penetratedeeper into the muscles, resulting in a thicker layer of oxymyoglobin formation comparedto non-stimulated carcasses [6,29,30].
5. Conclusions
The goal of this study was to evaluate the effects of varying levels of low-voltage ESon beef quality traits. Collectively, these results demonstrate that low-voltage ES can be aneffective means to improve the tenderness and instrumental color scores of beef carcasseswithout increasing cook loss, potentially improving consumer satisfaction. Within thisstudy the only differences observed between the ES40 and ES80 treatments were the earlypostmortem pH levels. Thus, beef processing facilities that implement low-voltage ESimmediately before carcass chilling may be able to reduce the ES voltage levels to 40 Vwithout detrimentally impacting the meat quality characteristics expected with increasedvoltages. Additionally, these data show that the desired appearance and palatabilitybenefits of high-voltage ES may be attainable using decreased voltages.
Author Contributions: Conceptualization, C.B., J.K.G., K.U. and A.B.; methodology, C.B. and A.B.;validation, C.B., J.K.G., K.U. and A.B.; formal analysis, C.B. and A.B.; investigation, C.B., J.K.G., K.U.and A.B.; resources, J.K.G., K.U. and A.B.; data curation, C.B., J.K.G., K.U. and A.B.; writing—originaldraft preparation, C.B.; writing—review and editing, C.B., J.K.G., K.U. and A.B.; visualization, C.B.and A.B.; supervision, A.B.; project administration, A.B.; funding acquisition, J.K.G., K.U. and A.B.All authors have read and agreed to the published version of the manuscript.
Funding: This research was supported by state and federal funds appropriated to South DakotaState University including support from the U.S. Department of Agriculture National Institute ofFood and Agriculture, through the Hatch Act (Accession number 1005460).
Data Availability Statement: The data presented in this study are available on request from thecorresponding author. The data are not publicly available due to privacy restrictions.
Acknowledgments: The authors express their gratitude to DemKota Ranch Beef (Aberdeen, SD) fortheir assistance in data collection and support of this project.
Conflicts of Interest: The authors declare no conflict of interest. The funders had no role in the designof the study; in the collection, analyses, or interpretation of data; in the writing of the manuscript, orin the decision to publish the results.
References
1. Chrystall, B.B.; Hagyard, C. Electrical stimulation and lamb tenderness. N. Z. J. Agric. Res. 1976, 19, 7–11. [CrossRef]2. Dutson, T.R.; Yates, D.L.; Smith, G.C.; Carpenter, Z.L.; Hostetler, R.L. Rigor onset before chilling. In Proceedings of the Reciprocal
Meat Conference, Auburn, AL, USA, 12–15 June 1997; pp. 79–86.3. Locker, R.H.; Daines, G.J. Tenderness in relation to the temperature of rigor onset in cold shortened beef. J. Sci. Food Agric. 1976,
27, 193–196. [CrossRef]4. McKeith, F.K.; Smith, G.C.; Savell, J.W.; Dutson, T.R.; Carpenter, Z.L.; Hammons, D.R. Effects of Certain Electrical Stimulation
Parameters on Quality and Palatability of Beef. J. Food Sci. 1981, 46, 13–18. [CrossRef]5. Roeber, D.L.; Cannell, R.C.; Belk, K.E.; Tatum, J.D.; Smith, G.C. Effects of a unique application of electrical stimulation on
tenderness, color, and quality attributes of the beef longissimus muscle. J. Anim. Sci. 2000, 78, 1504–1509. [CrossRef]6. Li, C.; Li, J.; Li, X.; Hviid, M.; Lundström, K. Effect of low-voltage electrical stimulation after dressing on color stability and water
holding capacity of bovine longissimus muscle. Meat Sci. 2011, 88, 559–565. [CrossRef]7. Adeyemi, K.D.; Sazili, A.Q. Efficacy of Carcass Electrical Stimulation in Meat Quality Enhancement: A Review. Asian-Australas. J.
Anim. Sci. 2014, 27, 447–456. [CrossRef] [PubMed]8. McKeith, F.K.; Ellis, M.; Miller, K.D.; Sutton, D.S. The effect of RN genotype on pork quality. In Proceedings of the Reciprocal
Meat Conference, Storrs, CT, USA, 12 May 1998; pp. 118–124.9. Bowker, B.; Wynveen, E.; Grant, A.; Gerrard, D. Effects of electrical stimulation on early postmortem muscle pH and temperature
declines in pigs from different genetic lines and halothane genotypes. Meat Sci. 1999, 53, 125–133. [CrossRef]10. Wiklund, E.; Stevenson-Barry, J.; Duncan, S.; Littlejohn, R. Electrical stimulation of red deer (Cervus elaphus) carcasses—Effects
on rate of pH-decline, meat tenderness, colour stability and water-holding capacity. Meat Sci. 2001, 59, 211–220. [CrossRef]
68

Foods 2021, 10, 1065
11. Kim, Y.; Lonergan, S.; Grubbs, J.; Cruzen, S.; Fritchen, A.; Della Malva, A.; Marino, R.; Huff-Lonergan, E. Effect of low voltageelectrical stimulation on protein and quality changes in bovine muscles during postmortem aging. Meat Sci. 2013, 94, 289–296.[CrossRef] [PubMed]
12. McKenna, D.; Maddock, D.; Savell, J. Water-holding capacity and color characteristics of beef from electrically stimulatedcarcasses. J. Muscle Foods 2003, 14, 33–49. [CrossRef]
13. Nichols, J.E.; Cross, H.R. Effects of Electrical Stimulation and Early Postmortem Muscle Excision on pH Decline, SarcomereLength and Color in Beef Muscles. J. Food Prot. 1980, 43, 514–519. [CrossRef]
14. Hwang, I.; Devine, C.; Hopkins, D. The biochemical and physical effects of electrical stimulation on beef and sheep meattenderness. Meat Sci. 2003, 65, 677–691. [CrossRef]
15. Simmons, N.; Daly, C.; Cummings, T.; Morgan, S.; Johnson, N.; Lombard, A. Reassessing the principles of electrical stimulation.Meat Sci. 2008, 80, 110–122. [CrossRef] [PubMed]
16. Ding, C.; Rodas-González, A.; López-Campos, Ó.; Galbraith, J.; Juárez, M.; Larsen, I.; Jin, Y.; Aalhus, J. Effects of electricalstimulation on meat quality of bison striploin steaks and ground patties. Can. J. Anim. Sci. 2016, 96, 79–89. [CrossRef]
17. Dutson, T.; Smith, G.; Savell, J.; Carpenter, Z. Possible mechanisms by which electrical stimulation improves meat tenderness. InProceedings of the 26th European Meeting of Meat Research Workers, Brno, Czechoslovakia, 12 May 1980; pp. 84–87.
18. Savell, J.; Dutson, T.; Smith, G.; Carpenter, Z. Structural Changes in Electrically Stimulated Beef Muscle. J. Food Sci. 1978, 43,1606–1607. [CrossRef]
19. Ho, C.Y.; Stromer, M.H.; Robson, R.M. Effect of electrical stimulation on postmortem titin, nebulin, desmin, and troponin-Tdegradation and ultrastructural changes in bovine longissimus muscle. J. Anim. Sci. 1996, 74, 1563–1575. [CrossRef] [PubMed]
20. Juárez, M.; Basarab, J.A.; Baron, V.S.; Valera, M.; Óscar, L.-C.; Larsen, I.L.; Aalhus, J.L. Relative contribution of electrical stimulationto beef tenderness compared to other production factors. Can. J. Anim. Sci. 2016, 96, 104–107. [CrossRef]
21. Hopkins, D.; Thompson, J. Inhibition of protease activity 2. Degradation of myofibrillar proteins, myofibril examination anddetermination of free calcium levels. Meat Sci. 2001, 59, 199–209. [CrossRef]
22. Wheeler, T.L.; Shackelford, S.D.; Koohmaraie, M. Beef longissimus slice shear force measurement among steak locations andinstitutions1,2,3. J. Anim. Sci. 2007, 85, 2283–2289. [CrossRef]
23. Derington, A.; Brooks, J.; Garmyn, A.; Thompson, L.; Wester, D.; Miller, M. Relationships of slice shear force and Warner-Bratzlershear force of beef strip loin steaks as related to the tenderness gradient of the strip loin. Meat Sci. 2011, 88, 203–208. [CrossRef]
24. Shackelford, S.; Morgan, J.; Cross, H.; Savell, J. Identification of Threshold Levels for Warner-Bratzler Shear Force in Beef TopLoin Steaks. J. Muscle Foods 1991, 2, 289–296. [CrossRef]
25. Miller, M.F.; Hoover, L.C.; Cook, K.D.; Guerra, A.L.; Huffman, K.L.; Tinney, K.S.; Ramsey, C.B.; Brittin, H.C.; Huffman, L.M.Consumer Acceptability of Beef Steak Tenderness in the Home and Restaurant. J. Food Sci. 1995, 60, 963–965. [CrossRef]
26. Savell, J.; Smith, G.C.; Carpenter, Z.L. Beef quality and palatability as affected by electrical stimulation and cooler aging. J. FoodSci. 1978, 43, 1666–1668. [CrossRef]
27. Shanks, B.C.; Wulf, D.M.; Maddock, R.J. Technical note: The effect of freezing on Warner-Bratzler shear force values of beeflongissimus steaks across several postmortem aging periods. J. Anim. Sci. 2002, 80, 2122–2125. [CrossRef] [PubMed]
28. McKeith, F.K.; Savell, J.W.; Smith, G.C. Tenderness Improvement of the Major Muscles of the Beef Carcass by Electrical Stimulation.J. Food Sci. 1981, 46, 1774–1776. [CrossRef]
29. Sleper, P.S.; Hunt, M.C.; Kropf, D.H.; Kastner, C.L.; Dikeman, M.E. Electrical Stimulation Effects on Myoglobin Properties ofBovine Longissimus Muscle. J. Food Sci. 1983, 48, 479–483. [CrossRef]
30. Zhang, Y.; Ji, X.; Mao, Y.; Luo, X.; Zhu, L.; Hopkins, D.L. Effect of new generation medium voltage electrical stimulation on themeat quality of beef slaughtered in a Chinese abattoir. Meat Sci. 2019, 149, 47–54. [CrossRef]
69


foods
Article
Antimicrobial Polyamide-Alginate Casing Incorporated withNisin and ε-Polylysine Nanoparticles Combined with PlantExtract for Inactivation of Selected Bacteria in Nitrite-FreeFrankfurter-Type Sausage
Kazem Alirezalu 1,*, Milad Yaghoubi 2, Leila Poorsharif 2, Shadi Aminnia 3, Halil Ibrahim Kahve 4,
Mirian Pateiro 5, José M. Lorenzo 5,6 and Paulo E. S. Munekata 5,*
���������������
Citation: Alirezalu, K.; Yaghoubi, M.;
Poorsharif, L.; Aminnia, S.; Kahve,
H.I.; Pateiro, M.; Lorenzo, J.M.;
Munekata, P.E.S. Antimicrobial
Polyamide-Alginate Casing
Incorporated with Nisin and
ε-Polylysine Nanoparticles
Combined with Plant Extract for
Inactivation of Selected Bacteria in
Nitrite-Free Frankfurter-Type
Sausage. Foods 2021, 10, 1003.
https://doi.org/10.3390/foods
10051003
Academic Editor: Salam A. Ibrahim
Received: 24 March 2021
Accepted: 1 May 2021
Published: 4 May 2021
Publisher’s Note: MDPI stays neutral
with regard to jurisdictional claims in
published maps and institutional affil-
iations.
Copyright: © 2021 by the authors.
Licensee MDPI, Basel, Switzerland.
This article is an open access article
distributed under the terms and
conditions of the Creative Commons
Attribution (CC BY) license (https://
creativecommons.org/licenses/by/
4.0/).
1 Department of Food Science and Technology, Ahar Faculty of Agriculture and Natural Resources,University of Tabriz, Tabriz 51666, Iran
2 Department of Food Science and Technology, Faculty of Agriculture, University of Tabriz,Tabriz 5166616471, Iran; [email protected] (M.Y.); [email protected] (L.P.)
3 Department of Fisheries, Urmia University, Urmia 5756151818, Iran; [email protected] Department of Food Engineering, Faculty of Engineering, Aksaray University, Aksaray 68100, Turkey;
[email protected] Centro Tecnológico de la Carne de Galicia, Parque Tecnológico de Galicia, Avda. Galicia n 4,
San Cibrao das Viñas, 32900 Ourense, Spain; [email protected] (M.P.); [email protected] (J.M.L.)6 Área de Tecnología de los Alimentos, Facultad de Ciencias de Ourense, Universidad de Vigo,
32004 Ourense, Spain* Correspondence: [email protected] (K.A.); [email protected] (P.E.S.M.)
Abstract: The effects of combining a polyamide-alginate casing incorporated with nisin (100 ppmand 200 ppm) and ε-polylysine (500 ppm and 1000 ppm) nanoparticles and a mixed plant extractas ingredient in sausage formulation (500 ppm; composed of olive leaves (OLE), green tea (GTE)and stinging nettle extracts (SNE) in equal rates) were studied to improve the shelf life and safety offrankfurter-type sausage. The film characteristics and microbiological properties of sausage sampleswere evaluated. Sausage samples were packaged in polyethylene bags (vacuum condition) andanalysed during 45 days of storage at 4 ◦C. Control sausages were also treated with 120 ppm sodiumnitrite. Polyamide-alginate films containing 100 ppm nisin and 500 ε-PL nanoparticles had the highestultimate tensile strength compared to other films. However, 100 ppm nisin and 500 ε-PL nanoparti-cles decreased water vapour permeability of films. The results also revealed that nisin nanoparti-cles had significantly (p < 0.05) low inhibitory effects against Escherichia coli, Staphylococcus aureus,molds and yeasts and total viable counts compared to control and ε-PL nanoparticles. Furthermore,1000 ppm ε-PL nanoparticles displayed the highest antimicrobial activity. Based on the obtainedresults, the films containing ε-PL nanoparticle could be considered as a promising packaging forfrankfurter-type sausages.
Keywords: polyamide-alginate film; nanoparticle; nisin; ε-polylysine; frankfurter; plant extract;active packaging
1. Introduction
Frankfurter-type sausages are a kind of emulsified meat products, which because oftheir high techno-functional components (bioavailable vitamins (B), essential amino acids,fatty acids, zinc, and heme-iron), ready to eat (RTE) product status, flavour acceptanceand low cost, are widely consumed [1–3]. However, contamination in meat products likesausages, especially by foodborne bacteria, is the main concern of meat producers [4].Moreover, frankfurter-type sausages with high fat content are sensitive to oxidation whichleads to a reduction in quality (flavour and texture) during storage [5,6], hence researchers
Foods 2021, 10, 1003. https://doi.org/10.3390/foods10051003 https://www.mdpi.com/journal/foods
71

Foods 2021, 10, 1003
endeavour to reduce contamination in sausages using natural antimicrobials and antioxi-dants [7–9].
Increasing the safety of RTE products like sausages could be achieved using antimi-crobial packaging [10–14]. Using natural antimicrobial compounds in packaging structuresdisplays higher efficacy in comparison to direct use in the food matrix as an ingredient. Thehigher efficacy of active antimicrobial packaging may be attributed to the exposure of thefood surface (where the risk of contamination is high) to antimicrobial compounds [15–17].
Polysaccharides like alginate due to their special colloidal properties such as film-forming, thickening, emulsion stabilizing agent, and gel producing are widely used as abiopolymer film or coating compounds [18]. For instance, sodium alginate has receivedgreat consideration due to promising properties in combination with calcium ions asdelivery systems for active compounds [19–23]. In this regard, the U.S. Food and DrugsAdministration (FDA) has indicated that alginate polymer has the Generally RecognizedAs Safe (GRAS) status for food use [24]. Furthermore, Surendhiran et al. [25] revealed thatphlorotannin encapsulated in a alginate/poly(ethylene oxide) composite film inactivatedSalmonella spp. and increased the shelf life of chicken meat.
Nisin is a nontoxic and stable bacteriocin produced from Lactococcus lactis with autho-rized use in food [26]. Nisin has strong antimicrobial properties against several spoilagebacteria in meat and meat products such as Clostridia and Bacilli spores [27,28]. In thisregard, Churklam et al. [29] evaluated effects of carvacrol in combination with nisin onsliced Bologna sausage and they noticed that nisin and carvacrol inhibited microbial growthcompared to control samples. Furthermore, other authors have reported similar results fornisin in ready-to-eat Yao meat products [30], pork loin [31], frankfurter-type sausage [6]and fresh sausage [32].
ε-Polylysine (ε-PL) is one of the most well-known natural components with highantimicrobial properties against a wide spectrum of bacteria like Gram-positive, Gram-negative bacteria (Clostridium perfringens, Staphylococcus aureus and E. coli), and yeast andmolds [33]. ε-PL has high thermo-stability and is widely utilized in meat industry productslike chilled beef [34], and frankfurter type sausage [35] as preservative. Furthermore,antimicrobial efficacy of ε-PL could be increased in combination with plant extracts [35].Natural plant extracts like olive leaves (OLE), green tea (GTE) and stinging nettle (SNE) ex-tracts are a good source of phenolic compounds with strong antimicrobial and antioxidantproperties [36–38]. In OLE, the major polyphenols are oleuropein, oleuropein, hydroxy-tyrosol, tyrosol, luteolin-7-O-glucoside, apigenin-7-O-glucoside, p-coumaric acid, ferulicacid [39]. In the case of GTE the main polyphenols are catechin and its derivatives areepicatechin gallate, epigallocatechin gallate, and epigallocatechin [40]. The phenolic compo-sition of SNE is comprised of flavonoids (kaempferol, rutin, isorhamnetin, and quercetin,)and phenolic acids (p-coumaric acid and ferulic acid) [41], making these plant materials richsources of bioactive and nutrients compounds with potential ability as nitrite substitutes infrankfurter-type sausages [36].
The antimicrobial effect of combined ε-polylysine and nisin with natural antioixdantsin frankfurter-type sausage has been reported [6]. To the best of our knowledge, there areno previous studies on the effect of active packaging containing ε-polylysine nanoparticles(ε-PLN) and nisin nanoparticles (NN) on the quality properties and stability of frankfurter-type sausage during storage. The aim of present study was thus to evaluate the effect ofactive polyamide-alginate films containing nisin and ε-PL nanoparticles in combinationwith plant extracts on quality and shelf life of frankfurter-type sausages.
2. Materials and Methods
2.1. Materials
All chemical components and microbial media were of analytical grade (purity>99%) and purchased from Merck (Darmstadt, Germany). Food-grade nisin (Nisaplin,5000 IU/mL, and ε-polylysine powder (5000 IU/mL,) were purchased from Danisco(Copenhagen, Denmark) and FoodChemand (Shanghai, China), respectively. The high
72
Foods 2021, 10, 1003
molecular mass chitosan powder (molecular weight 3.1 × 10⁵ g mol−1; 95% deacetylationdegree) was also purchased from Sigma-Aldrich (Saint Louis, MO, USA). The polyamidefilm was acquired from Besharat Company (Tabriz, Iran).
2.2. Preparation of Plant Extract
The olive leaves (OLE), green tea (GTE) and stinging nettle (SNE) extracts wereobtained following the procedure described by Ebrahimzadeh et al. [42] with some modi-fications. Plant leaves firstly dried in an oven (40 ◦C) for 48 h and sifted through sieveswith 14-inch mesh. Then, 50 g of dried powder and 500 mL of ethanol solution (95%)in Erlenmeyer flask were mixed by magnetic stirrer at room temperature for 48 h. Theethanol in mixture was evaporated at 40 ◦C in a rotary evaporator after filtering the mixturethrough a Whatman No 1 filter paper. Equal amounts of GTE, SNE and OLE were preparedfor further use in frankfurter-sausage samples.
2.3. Preparation of ε-Polylysine Nanoparticle (ε-PLN) and Nisin Nanoparticle (NN)
The stock solution of nisin and ε-PL were prepared according to method describedby Alirezalu et al. [35] as follows: 2 g from each of these compounds were separatelysolubilized in 2% glacial acetic acid solution (200 mL) at 60 ◦C and filtered through 0.45 μmmembrane filter (for sterilization) (Minisart NML, Sartorius, New York, NY, USA). Thenanoparticles of nisin and ε-PL were produced according to the method described byDas et al. [43], and Bernela et al. [44] with some modifications. Calcium chloride and ε-PLsolution (1:20, v/v) were mixed together. Then, this solution was mixed with 58.75 mLof sodium alginate (0.63 mg/mL), 12.5 mL of chitosan solution, and 6.25 mL of PluronicF-68 (1 mg/mL). The final mixture was shaken slowly for 3.5 h (at room temperature).The nanoparticles of ε-PL were obtained after centrifugation (15,000× g) (at 4 ◦C for0.5 h) and freeze-drying process. The similar technique was utilized for preparation ofnisin nanoparticles.
2.4. Preparation of Active Antimicrobial Film
The polyamide-alginate films were produced according to the procedures describedin [24,45]. Mechanical stirring was used to dissolve 3 g of sodium alginate in 200 mL ofsterile deionised water for 30 min (70 ◦C). After that, for improving films characteristics(increase flexibility and decrease brittleness), glycerol (0.44 g/g of alginate) as a plasticizerwas added. Mechanical stirring was utilized for dissolving glucono δ-lactone (5.4 g/gcalcium carbonate) with calcium carbonate (0.03 g/g alginate) in 50 mL of distilled water.Then, for calcium alginate films production, the solution was dispersed at 150 mL sodiumalginate solution. The ε-PLN (500 and 1000 ppm) and NN (100 and 200 ppm) were added tothe mixture and homogenized for 3 min (13,500 rpm at 25 ◦C) and for integrate absorptionof water and gelation of alginate, the attained solution was mixed slowly for 12 h by usingmechanical stirring. After that, Petri dishes (10 cm in diagonal) were filled with 10 mL ofthe solution and dried in an oven (12 h at 45 ◦C). The Petri dishes were held in desiccatorsbefore peeling the films. Finally, polyamide and calcium alginate films were attachedtogether to polyamide-alginate films.
2.5. Mechanical Properties
Mechanical properties of calcium alginate films including tensile strength (TS) andelongation at break (%E) were analysed following the ASTM procedure D882-91 [46]. Thefilms were cut into 6 × 0.5 cm and were conditioned by saturated solution of calcium nitrite(RH = 55%) inside a desiccator for 24 h at room temperature. Initial grip separation with50 mm and cross-head speed with 2 mm/min was used at this study with five replicatesfor mechanical analysis from each film samples.
73
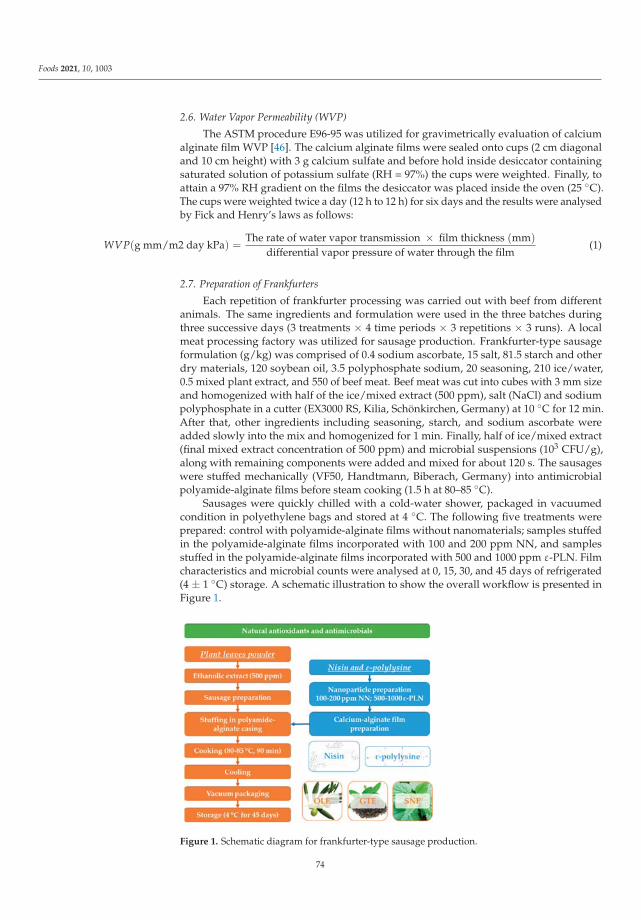
Foods 2021, 10, 1003
2.6. Water Vapor Permeability (WVP)
The ASTM procedure E96-95 was utilized for gravimetrically evaluation of calciumalginate film WVP [46]. The calcium alginate films were sealed onto cups (2 cm diagonaland 10 cm height) with 3 g calcium sulfate and before hold inside desiccator containingsaturated solution of potassium sulfate (RH = 97%) the cups were weighted. Finally, toattain a 97% RH gradient on the films the desiccator was placed inside the oven (25 ◦C).The cups were weighted twice a day (12 h to 12 h) for six days and the results were analysedby Fick and Henry’s laws as follows:
WVP(g mm/m2 day kPa) =The rate of water vapor transmission × film thickness (mm)
differential vapor pressure of water through the film(1)
2.7. Preparation of Frankfurters
Each repetition of frankfurter processing was carried out with beef from differentanimals. The same ingredients and formulation were used in the three batches duringthree successive days (3 treatments × 4 time periods × 3 repetitions × 3 runs). A localmeat processing factory was utilized for sausage production. Frankfurter-type sausageformulation (g/kg) was comprised of 0.4 sodium ascorbate, 15 salt, 81.5 starch and otherdry materials, 120 soybean oil, 3.5 polyphosphate sodium, 20 seasoning, 210 ice/water,0.5 mixed plant extract, and 550 of beef meat. Beef meat was cut into cubes with 3 mm sizeand homogenized with half of the ice/mixed extract (500 ppm), salt (NaCl) and sodiumpolyphosphate in a cutter (EX3000 RS, Kilia, Schönkirchen, Germany) at 10 ◦C for 12 min.After that, other ingredients including seasoning, starch, and sodium ascorbate wereadded slowly into the mix and homogenized for 1 min. Finally, half of ice/mixed extract(final mixed extract concentration of 500 ppm) and microbial suspensions (103 CFU/g),along with remaining components were added and mixed for about 120 s. The sausageswere stuffed mechanically (VF50, Handtmann, Biberach, Germany) into antimicrobialpolyamide-alginate films before steam cooking (1.5 h at 80–85 ◦C).
Sausages were quickly chilled with a cold-water shower, packaged in vacuumedcondition in polyethylene bags and stored at 4 ◦C. The following five treatments wereprepared: control with polyamide-alginate films without nanomaterials; samples stuffedin the polyamide-alginate films incorporated with 100 and 200 ppm NN, and samplesstuffed in the polyamide-alginate films incorporated with 500 and 1000 ppm ε-PLN. Filmcharacteristics and microbial counts were analysed at 0, 15, 30, and 45 days of refrigerated(4 ± 1 ◦C) storage. A schematic illustration to show the overall workflow is presented inFigure 1.
Figure 1. Schematic diagram for frankfurter-type sausage production.
74

Foods 2021, 10, 1003
2.8. Microbiological Properties
Microbiological properties of sausage packaged in polyamide alginate films wereanalysed as follows: 225 mL of 0.1% (w/v) peptone water and 25 g of samples were homog-enized using sterile lab-blender (Paddle Lab Blender, Neutec, Farmingdale, NY, USA) for3 min. 0.1% of sterile peptone water was also used for serial dilution production. BrilliantGreen agar (BGA, Merck, Darmstadt, Germany), Plate Count agar (PCA, Merck) and SulfitePolymyxin Sulfadizine (SPS) agar (Merck) were used for enumeration of E. coli, total viablecount, and Clostridium perfringens, respectively, by pour-plate technique. Incubation timeand temperature for E. coli, total viable count, and Clostridium perfringens were 24–47 hat 37 ◦C, 48–72 h at 30 ◦C and 24 h at 37 ◦C, respectively. Staphylococcus aureus and yeastand molds were enumerated on Baird Parker agar (BPA, Merck) and Dichloran Rose-Bengal Chloramphenicol (DRBC) agar (Merck) following incubation for 48 h at 30 ◦C and5 days at 25 ◦C, respectively. The microbiological results were reported as Log10 CFU/g ofsausage samples.
2.9. Statistical Analysis
The experimental data resulted from 3 treatments × 4 time periods × 3 repetitions× 3 runs were analysed using the statistical software SAS (v.9, SAS Institute Inc., Cary,NC, USA). Normal distribution and variance homogeneity had been previously tested(Shapiro-Wilk). Random block design was utilized for evaluation of microbiological data,considering a mixed linear model, including replication as a random effect, and differenttreatments and storage period as fixed impacts. One-way ANOVA was also utilizedfor mechanical properties and WVP, and Tukey’s test for means comparison (statisticalsignificance at p < 0.05 value) and results were expressed as mean values ± standard errorin all figures and tables.
3. Results and Discussion
3.1. Mechanical Properties
The mechanical properties of calcium alginate films including elongation at break (E%)and tensile strength (TS) are shown at Table 1. The results showed that tensile strengthof calcium alginate films ranged between 63–67 MPa. Added NN and ε-PLN affectedsignificantly (p < 0.05) the tensile strength of films. Pranoto et al. [47] showed that tensilestrength of calcium alginate films could decrease by adding garlic oil which may be causedby its hydrophobic properties. In our experiment, tensile strength in calcium alginate filmsincorporated with 500 ppm ε-PLN was higher than other films (Table 1). Conversely, ε-PLN(500 ppm ε-PLN and 1000 ppm ε-PLN) could significantly (p < 0.05) decrease the tensilestrength of the films. This fact could be due to the high ε-PLN content, which can reducetensile strength of the films. Benavides et al. [48] also reported similar results.
Table 1. Mechanical properties of active calcium alginate films.
Treatments (ppm)
Properties Control 100 NN 200 NN 500 ε-PLN 1000 ε-PLN p-Value
σ (MPa) 64.12 ± 2.38 b 66.59 ± 1.37 a 63.15 ± 0.81 b 67.08 ± 2.54 a 63.28 ± 1.78 b 0.03E (%) 208.34 ± 2.34 a 206.54 ± 1.27 ab 207.65 ± 1.74 ab 205.47 ± 2.65 b 206.35 ± 2.73 ab 0.05
σ: Ultimate tensile strength (CV: 0.54); E: Elongation at break (CV: 1.71). a–c In each row with different letters differ significantly, (p < 0.05).
The results also showed that elongation at break (E%) in control films were higherthan other films. Incorporating nanoparticles decreased the flexibility of the films, therefore,elongation at break were also decreased in the films. Moreover, link between alginate,calcium and chitosan decreased the flexibility and E% of the films. The results of this studyare in agreement with those reported by Guiga et al. [49] in polyamide films. The authorsindicated that added nisin in polyethylene and polyamide films could decrease E% of thefilms from 271% to 130%. The appearance of the active films used are presented in Figure 2.
75

Foods 2021, 10, 1003
Figure 2. Calcium alginate films and polyamide-alginate film incorporated with NN and ε-PLN.(A) Calcium alginate film, (B) Calcium alginate film + 100 ppm NN, (C) Calcium alginate film +200 ppm NN, (D) Calcium alginate film + 500 ppm ε-PLN, (E) Calcium alginate film + 1000 ppmε-PLN, (F) Polyamide-alginate film.
3.2. Water Vapor Permeability (WVP)
The effects of nanoparticles in WVP of calcium alginate films are shown in Figure 3.According to Barzegaran et al. [50], calcium alginate films have lower water vapour perme-ability (6.16 × 10⁻⁷ g/m.s.Pa) in comparison to other polymers. Therefore, for productionof films with antimicrobial activities with low water vapour permeability, calcium alginatefilms were produced. The results showed that adding 100 ppm of NN in calcium alginatefilms decreased WVP of the films, whereas incorporating 200 ppm of NN increased theWVP of the films.
Figure 3. Water vapour permeability of calcium alginate films incorporated with nisin and ε-PLnanoparticles. a–d Mean values among films not followed by a common letter differ significantly(p < 0.05).
Sodium alginate films can be considered as an edible casing because of its hydrophilicproperties (low resistant against moisture) and mechanical stability [51]. Therefore, favour-ing the gel consistency in films (by adding calcium) can improve water vapour permeabilityof the films [52].
WVP of the alginate films were decreased by adding 500 ppm ε-PLN. The interactionbetween amines (chitosan) and carboxyl components (alginate) may be the main reason forthe lower WVP in films. Intermolecular gaps and porous microstructure of films matrixsignificantly affect the permeability of the films. Turhan and Sahbaz [53] showed that
76

Foods 2021, 10, 1003
plasticizers can increase water vapour permeability of the films by increasing intermoleculargaps. As shown in Figure 3, WVP of films incorporated with 1000 ppm ε-PLN and 200 ppmNN were significantly increased whereas the WVP of films with 500 ppm ε-PLN and100 ppm NN were decreased. These results may be caused by increasing and decreasingintermolecular gaps, respectively.
3.3. Microbiological Properties
Total viable count in all sausage samples (p < 0.05) increased during storage. Thepolyamide-alginate films incorporated with 1000 ppm ε-PLN and 200 ppm NN showed(p < 0.05) higher inhibitory effects against TVC. Furthermore, polyamide-alginate filmsincorporated with ε-PLN presented higher antimicrobial effects compared to polyamide-alginate films with NN. The antimicrobial effects of ε-PL against wide spectrum of microor-ganisms (Gram-positive, Gram-negative, and fungus) compared to nisin may be the mainreason that explains the higher antimicrobial properties of ε-PLN.
TVC of frankfurter sausages packaged in polyamide-alginate films with 500 ppmε-PLN and 100 ppm NN ranged between 5.54 and 5.87 Log CFU/g at the end of storageperiod (Figure 4). It is worth mentioning that the borderline for microbiological accept-ability in meat products (especially due to odour changes) is around 6 Log CFU/g [54,55].Conversely, TVC in sausage samples packaged in films with 1000 ppm ε-PLN and 200 ppmNN reached 4.22 Log CFU/g and 4.53 Log CFU/g, respectively. Therefore, the resultsshowed that polyamide-alginate films incorporated with 500 and 1000 ppm ε-PLN could(p < 0.05) can increase the shelf life of the frankfurter-type sausages (Figure 4). In this regard,Feng et al. [56] indicated that ε-PL with rosemary extract could significantly decrease TVCand improve sensory properties of chicken breast muscle. Additionally, Alirezalu et al. [35]also indicated that ε-PLN displayed significantly higher inhibitory activity against TVC incomparison ε-PL (free form) in frankfurter-type sausage.
Figure 4. Total viable count of sausage samples packaged in polyamide-alginate films duringrefrigerated storage. A–D Mean values among treatments not followed by a common letter differsignificantly (p < 0.05). a–c Mean values during storage not followed by a common letter differsignificantly (p < 0.05).
Conversely, de Barros et al. [57] evaluated effects of natural casing incorporated withnisin in vacuum packaged sausage for the control of spoilage microorganisms, and reportedan inhibitory effects of nisin against TVC. Similar results supporting the antimicrobialactivity of nisin were also reported by Neetoo and Mahomoodally [58] on cold smoked
77
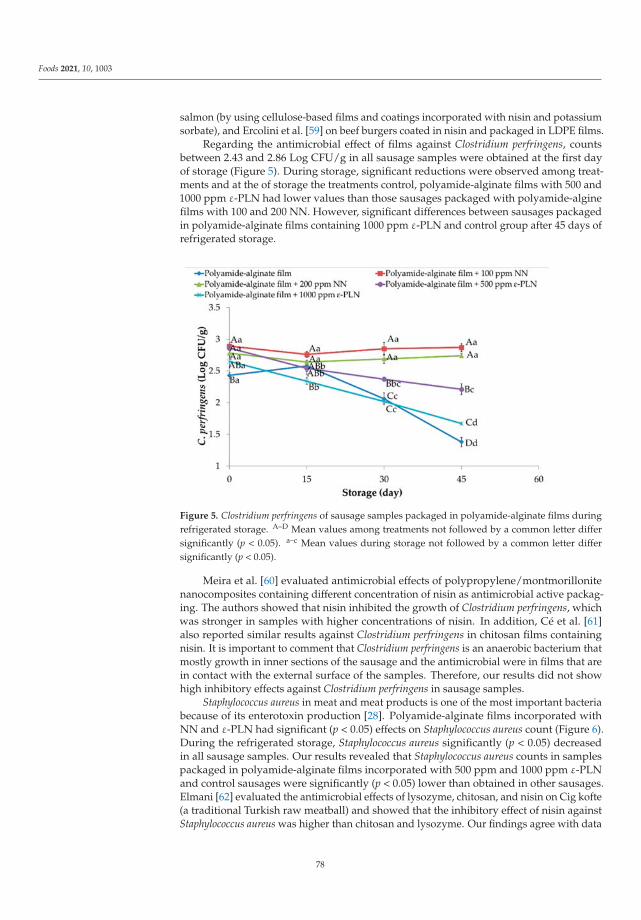
Foods 2021, 10, 1003
salmon (by using cellulose-based films and coatings incorporated with nisin and potassiumsorbate), and Ercolini et al. [59] on beef burgers coated in nisin and packaged in LDPE films.
Regarding the antimicrobial effect of films against Clostridium perfringens, countsbetween 2.43 and 2.86 Log CFU/g in all sausage samples were obtained at the first dayof storage (Figure 5). During storage, significant reductions were observed among treat-ments and at the of storage the treatments control, polyamide-alginate films with 500 and1000 ppm ε-PLN had lower values than those sausages packaged with polyamide-alginefilms with 100 and 200 NN. However, significant differences between sausages packagedin polyamide-alginate films containing 1000 ppm ε-PLN and control group after 45 days ofrefrigerated storage.
Figure 5. Clostridium perfringens of sausage samples packaged in polyamide-alginate films duringrefrigerated storage. A–D Mean values among treatments not followed by a common letter differsignificantly (p < 0.05). a–c Mean values during storage not followed by a common letter differsignificantly (p < 0.05).
Meira et al. [60] evaluated antimicrobial effects of polypropylene/montmorillonitenanocomposites containing different concentration of nisin as antimicrobial active packag-ing. The authors showed that nisin inhibited the growth of Clostridium perfringens, whichwas stronger in samples with higher concentrations of nisin. In addition, Cé et al. [61]also reported similar results against Clostridium perfringens in chitosan films containingnisin. It is important to comment that Clostridium perfringens is an anaerobic bacterium thatmostly growth in inner sections of the sausage and the antimicrobial were in films that arein contact with the external surface of the samples. Therefore, our results did not showhigh inhibitory effects against Clostridium perfringens in sausage samples.
Staphylococcus aureus in meat and meat products is one of the most important bacteriabecause of its enterotoxin production [28]. Polyamide-alginate films incorporated withNN and ε-PLN had significant (p < 0.05) effects on Staphylococcus aureus count (Figure 6).During the refrigerated storage, Staphylococcus aureus significantly (p < 0.05) decreasedin all sausage samples. Our results revealed that Staphylococcus aureus counts in samplespackaged in polyamide-alginate films incorporated with 500 ppm and 1000 ppm ε-PLNand control sausages were significantly (p < 0.05) lower than obtained in other sausages.Elmani [62] evaluated the antimicrobial effects of lysozyme, chitosan, and nisin on Cig kofte(a traditional Turkish raw meatball) and showed that the inhibitory effect of nisin againstStaphylococcus aureus was higher than chitosan and lysozyme. Our findings agree with data
78

Foods 2021, 10, 1003
reported by Millette et al. [63] who reported alginate films containing 1000 IU/mL of nisincould decrease 2 Log CFU/cm2 of Staphylococcus aureus in beef meat after 7 days of storage.
Figure 6. Staphylococcus aureus of sausage samples packaged in polyamide-alginate films duringrefrigerated storage. A–C Mean values among treatments not followed by a common letter differsignificantly (p < 0.05). a–d Mean values during storage not followed by a common letter differsignificantly (p < 0.05).
ε-PLN significantly (p < 0.05) affected E. coli in sausage samples (Figure 7). E. colicounts continuously decreased in all packaged sausages during storage except for samplespackaged with NN (p > 0.05) due to lower antimicrobial effects of nisin against Gram-negative bacteria.
Figure 7. E. coli of sausage samples packaged in polyamide-alginate films during refrigerated storage.A–D Mean values among treatments not followed by a common letter differ significantly (p < 0.05).a–d Mean values during storage not followed by a common letter differ significantly (p < 0.05).
The presence of chitosan in nisin nanoparticles’ structure leads to low inhibitory effectsof polyamide-alginate films containing nisin against E. coli. Our outcomes agree with thosereported by Cé et al. [61] who observed that higher concentrations of chitosan had weaker
79

Foods 2021, 10, 1003
inhibitory effects against E. coli. Furthermore, Elmali [62] evaluated the antimicrobial effectsof lysozyme, chitosan, and nisin on Cig kofte and reported there were any inhibitory effectsagainst E. coli in samples treated with nisin after 72 h of storage. Polyamide-alginate filmscontaining ε-PLN decreased (p < 0.05) E. coli in sausage samples during the storage time.
Our results showed that E. coli count in sausages packaged in films containing1000 ppm ε-PLN reached 0 Log CFU/g after 45 days of storage. The high antimicro-bial effects of ε-PLN against E. coli were also reported by Sun et al. [64] who evaluated theantimicrobial effects of nano-crystalline cellulose films containing ε-PL on fish meat.
At day 1, sausage samples packaged in polyamide-alginate films with NN andε-PLN presented (p < 0.05) lower content of molds and yeasts in comparison to con-trol group (Figure 8). During storage, molds and yeasts increased in all sausage samples.At the end of storage time, sausage samples packaged in films containing 100 ppm NNshowed the highest counts of molds and yeasts. Our findings agree with data reported byGuerra et al. [65] who evaluated the antimicrobial effects of cellophane containing nisinand reported that bioactive cellophane packaging could be used for controlling microbialgrowth in chopped meat. Packaged sausage samples in polyamide-alginate containingε-PLN (500 and 1000 ppm) decreased (p < 0.05) the rate on molds and yeasts growth duringrefrigerated storage. Furthermore, in control samples (with 120 ppm sodium nitrite) moldsand yeasts counts until day 30 were within the standard range.
Figure 8. Molds and yeasts of sausage samples packaged in polyamide-alginate films during refriger-ated storage. A–D Mean values among treatments not followed by a common letter differ significantly(p < 0.05). a–d Mean values during storage not followed by a common letter differ significantly(p < 0.05).
Alirezalu et al. [6] also reported similar results in frankfurter sausages. These authorsevaluated the antimicrobial effects of nisin, ε-PL and chitosan and reported a similarinhibitory effect against molds and yeasts in meat products. Moreover, catechins in GTE asa phenolic compound not only can inhibit activity of intracellular enzymes and synthesis offatty acid and protein but also can damage membrane compounds of molds and yeasts [66].
4. Conclusions
Our outcomes showed that polyamide-alginate casing incorporated with ε-PLN andNN with mixed plant extract (same rates of green tea, stinging nettle, and olive leaves ex-tracts) could be potentially used for increasing frankfurter-type sausage shelf life. Sausageswith 1000 ppm ε-PLN had significantly higher inhibitory effects against molds and yeasts,
80

Foods 2021, 10, 1003
E. coli, Staphylococcus aureus, and total viable counts. Therefore, polyamide-alginate filmincorporated with ε-PLN and NN with mixed plant extract could be used usefully forimproving frankfurter type sausage quality and shelf life.
Author Contributions: Conceptualization, K.A., M.Y. and H.I.K.; writing—original draft preparation,K.A. and L.P.; writing—review and editing, K.A., M.Y., S.A., H.I.K., M.P., J.M.L., and P.E.S.M. Allauthors have read and agreed to the published version of the manuscript.
Funding: This research received no external funding.
Data Availability Statement: The data presented in this study are available on request from thecorresponding author.
Acknowledgments: Thanks to GAIN (Axencia Galega de Innovación) for supporting this review(grant number IN607A2019/01). José M. Lorenzo, Paulo E. S. Munekata and Mirian Pateiro aremembers of the HealthyMeat network, funded by CYTED (ref. 119RT0568).
Conflicts of Interest: The authors declare no conflict of interest.
References
1. Novakovic, S.; Djekic, I.; Klaus, A.; Vunduk, J.; Djordjevic, V.; Tomovic, V.; Šojic, B.; Kocic-Tanackov, S.; Lorenzo, J.M.;Barba, F.J.; et al. The effect of Cantharellus cibarius addition on quality characteristics of frankfurter during refrigerated stor-age. Foods 2019, 8, 635. [CrossRef]
2. Franco, D.; Martins, A.J.; López-Pedrouso, M.; Purriños, L.; Cerqueira, M.A.; Vicente, A.A.; Pastrana, L.M.; Zapata, C.;Lorenzo, J.M. Strategy towards replacing pork backfat with a linseed oleogel in frankfurter sausages and its evaluation onphysicochemical, nutritional, and sensory characteristics. Foods 2019, 8, 366. [CrossRef] [PubMed]
3. Henck, J.M.M.; Bis-Souza, C.V.; Pollonio, M.A.R.; Lorenzo, J.M.; Barretto, A.C.S. Alpha-cyclodextrin as a new functional ingredientin low-fat chicken frankfurter. Br. Poult. Sci. 2019, 60, 716–723. [CrossRef] [PubMed]
4. Fougy, L.; Desmonts, M.H.; Coeuret, G.; Fassel, C.; Hamon, E.; Hézard, B.; Champomier-Vergès, M.C.; Chaillou, S. Reducingsalt in raw pork sausages increases spoilage and correlates with reduced bacterial diversity. Appl. Environ. Microbiol. 2016, 82,3928–3939. [CrossRef] [PubMed]
5. Domínguez, R.; Pateiro, M.; Agregán, R.; Lorenzo, J.M. Effect of the partial replacement of pork backfat by microencapsulated fishoil or mixed fish and olive oil on the quality of frankfurter type sausage. J. Food Sci. Technol. 2017, 54, 26–37. [CrossRef] [PubMed]
6. Alirezalu, K.; Hesari, J.; Nemati, Z.; Munekata, P.E.S.; Barba, F.J.; Lorenzo, J.M. Combined effect of natural antioxidants andantimicrobial compounds during refrigerated storage of nitrite-free frankfurter-type sausage. Food Res. Int. 2019, 120, 839–850.[CrossRef]
7. Lorenzo, J.M.; González-Rodríguez, R.M.; Sánchez, M.; Amado, I.R.; Franco, D. Effects of natural (grape seed and chestnutextract) and synthetic antioxidants (buthylatedhydroxytoluene, BHT) on the physical, chemical, microbiological and sensorycharacteristics of dry cured sausage “chorizo”. Food Res. Int. 2013, 54, 611–620. [CrossRef]
8. de Carvalho, F.A.L.; Munekata, P.E.S.; Lopes de Oliveira, A.; Pateiro, M.; Domínguez, R.; Trindade, M.A.; Lorenzo, J.M.Turmeric (Curcuma longa L.) extract on oxidative stability, physicochemical and sensory properties of fresh lamb sausage with fatreplacement by tiger nut (Cyperus esculentus L.) oil. Food Res. Int. 2020, 136, 109487. [CrossRef]
9. Fernandes, R.P.P.; Trindade, M.A.; Lorenzo, J.M.; de Melo, M.P. Assessment of the stability of sheep sausages with the addition ofdifferent concentrations of Origanum vulgare extract during storage. Meat Sci. 2018, 137, 244–257. [CrossRef]
10. Gómez, M.; Lorenzo, J.M. Effect of packaging conditions on shelf-life of fresh foal meat. Meat Sci. 2012, 91, 513–520. [CrossRef]11. Domínguez, R.; Barba, F.J.; Gómez, B.; Putnik, P.; Bursac Kovacevic, D.; Pateiro, M.; Santos, E.M.; Lorenzo, J.M. Active packaging
films with natural antioxidants to be used in meat industry: A review. Food Res. Int. 2018, 113, 93–101. [CrossRef]12. Umaraw, P.; Munekata, P.E.S.; Verma, A.K.; Barba, F.J.; Singh, V.P.; Kumar, P.; Lorenzo, J.M. Edible films/coating with tailored
properties for active packaging of meat, fish and derived products. Trends Food Sci. Technol. 2020, 98, 10–24. [CrossRef]13. Horita, C.N.; Baptista, R.C.; Caturla, M.Y.R.; Lorenzo, J.M.; Barba, F.J.; Sant’Ana, A.S. Combining reformulation, active packaging
and non-thermal post-packaging decontamination technologies to increase the microbiological quality and safety of cookedready-to-eat meat products. Trends Food Sci. Technol. 2018, 72, 45–61. [CrossRef]
14. Pateiro, M.; Domínguez, R.; Bermúdez, R.; Munekata, P.E.S.; Zhang, W.; Gagaoua, M.; Lorenzo, J.M. Antioxidant active packagingsystems to extend the shelf life of sliced cooked ham. Curr. Res. Food Sci. 2019, 1, 24–30. [CrossRef] [PubMed]
15. Pateiro, M.; Munekata, P.E.S.; Sant’Ana, A.S.; Domínguez, R.; Rodríguez-Lázaro, D.; Lorenzo, J.M. Application of essential oils asantimicrobial agents against spoilage and pathogenic microorganisms in meat products. Int. J. Food Microbiol. 2021, 337, 108966.[CrossRef]
16. Pateiro, M.; Vargas, F.C.; Chincha, A.A.I.A.; Sant’Ana, A.S.; Strozzi, I.; Rocchetti, G.; Barba, F.J.; Domínguez, R.; Lucini, L.;do Amaral Sobral, P.J.; et al. Guarana seed extracts as a useful strategy to extend the shelf life of pork patties: UHPLC-ESI/QTOFphenolic profile and impact on microbial inactivation, lipid and protein oxidation and antioxidant capacity. Food Res. Int. 2018,114, 55–63. [CrossRef]
81

Foods 2021, 10, 1003
17. Nikmaram, N.; Budaraju, S.; Barba, F.J.; Lorenzo, J.M.; Cox, R.B.; Mallikarjunan, K.; Roohinejad, S. Application of plant extractsto improve the shelf-life, nutritional and health-related properties of ready-to-eat meat products. Meat Sci. 2018, 145, 245–255.[CrossRef]
18. Mohamed, S.A.A.; El-Sakhawy, M.; El-Sakhawy, M.A.M. Polysaccharides, protein and lipid-based natural edible films in foodpackaging: A review. Carbohydr. Polym. 2020, 238, 116178. [CrossRef] [PubMed]
19. Acevedo-Fani, A.; Salvia-Trujillo, L.; Rojas-Graü, M.A.; Martín-Belloso, O. Edible films from essential-oil-loaded nanoemulsions:Physicochemical characterization and antimicrobial properties. Food Hydrocoll. 2015, 47, 168–177. [CrossRef]
20. Rezaei, F.; Shahbazi, Y. Shelf-life extension and quality attributes of sauced silver carp fillet: A comparison among direct addition,edible coating and biodegradable film. LWT Food Sci. Technol. 2018, 87, 122–133. [CrossRef]
21. Kristam, P.; Eswarapragada, N.M.; Bandi, E.R.; Tumati, S.R. Evaluation of edible polymer coatings enriched with green tea extracton quality of chicken nuggets. Vet. World 2016, 9, 685–692. [CrossRef] [PubMed]
22. Aluani, D.; Tzankova, V.; Kondeva-Burdina, M.; Yordanov, Y.; Nikolova, E.; Odzhakov, F.; Apostolov, A.; Markova, T.; Yoncheva,K. Evaluation of biocompatibility and antioxidant efficiency of chitosan-alginate nanoparticles loaded with quercetin. Int. J. Biol.Macromol. 2017, 103, 771–782. [CrossRef] [PubMed]
23. Cai, L.; Cao, A.; Bai, F.; Li, J. Effect of ε-polylysine in combination with alginate coating treatment on physicochemical andmicrobial characteristics of Japanese sea bass (Lateolabrax japonicas) during refrigerated storage. LWT Food Sci. Technol. 2015, 62,1053–1059. [CrossRef]
24. Rhim, J.W. Physical and mechanical properties of water resistant sodium alginate films. LWT Food Sci. Technol. 2004, 37, 323–330.[CrossRef]
25. Surendhiran, D.; Cui, H.; Lin, L. Encapsulation of Phlorotannin in Alginate/PEO blended nanofibers to preserve chicken meatfrom Salmonella contaminations. Food Packag. Shelf Life 2019, 21, 100346. [CrossRef]
26. Correa, J.P.; Molina, V.; Sanchez, M.; Kainz, C.; Eisenberg, P.; Massani, M.B. Improving ham shelf life with a polyhydroxybu-tyrate/polycaprolactone biodegradable film activated with nisin. Food Packag. Shelf Life 2017, 11, 31–39. [CrossRef]
27. Krivorotova, T.; Cirkovas, A.; Maciulyte, S.; Staneviciene, R.; Budriene, S.; Serviene, E.; Sereikaite, J. Nisin-loaded pectinnanoparticles for food preservation. Food Hydrocoll. 2016, 54, 49–56. [CrossRef]
28. Lorenzo, J.M.; Munekata, P.E.S.; Dominguez, R.; Pateiro, M.; Saraiva, J.A.; Franco, D. Main Groups of Microorganisms ofRelevance for Food Safety and Stability: General Aspects and Overall Description. In Innovative Technologies for Food PreservationInactivation of Spoilage and Pathogenic Microorganisms; Barba, F.J., Sant’Ana, A.S., Orlie, V., Koubaa, M., Eds.; Academic Press:London, UK, 2017; pp. 53–107, ISBN 9780128110324.
29. Churklam, W.; Chaturongakul, S.; Ngamwongsatit, B.; Aunpad, R. The mechanisms of action of carvacrol and its synergism withnisin against Listeria monocytogenes on sliced bologna sausage. Food Control 2020, 108, 106864. [CrossRef]
30. Liu, Q.; Zhang, M.; Bhandari, B.; Xu, J.; Yang, C. Effects of nanoemulsion-based active coatings with composite mixture of staranise essential oil, polylysine, and nisin on the quality and shelf life of ready-to-eat Yao meat products. Food Control 2020, 107,106771. [CrossRef]
31. Cao, Y.; Warner, R.D.; Fang, Z. Effect of chitosan/nisin/gallic acid coating on preservation of pork loin in high oxygen modifiedatmosphere packaging. Food Control 2019, 101, 9–16. [CrossRef]
32. Araújo, M.K.; Gumiela, A.M.; Bordin, K.; Luciano, F.B.; de Macedo, R.E.F. Combination of garlic essential oil, allyl isothiocyanate,and nisin Z as bio-preservatives in fresh sausage. Meat Sci. 2018, 143, 177–183. [CrossRef]
33. Pandey, A.K.; Kumar, A. Improved microbial biosynthesis strategies and multifarious applications of the natural biopolymerepsilon-poly-l-lysine. Process Biochem. 2014, 49, 496–505. [CrossRef]
34. Alirezalu, K.; Movlan, H.S.; Yaghoubi, M.; Pateiro, M.; Lorenzo, J.M. ε-polylysine coating with stinging nettle extract for freshbeef preservation. Meat Sci. 2021, 176, 108474. [CrossRef] [PubMed]
35. Alirezalu, K.; Hesari, J.; Yaghoubi, M.; Khaneghah, A.M.; Alirezalu, A.; Pateiro, M.; Lorenzo, J.M. Combined effects of ε-polylysineand ε-polylysine nanoparticles with plant extracts on the shelf life and quality characteristics of nitrite-free frankfurter-typesausages. Meat Sci. 2021, 172, 108318. [CrossRef] [PubMed]
36. Alirezalu, K.; Pateiro, M.; Yaghoubi, M.; Alirezalu, A.; Peighambardoust, S.H.; Lorenzo, J.M. Phytochemical constituents,advanced extraction technologies and techno-functional properties of selected Mediterranean plants for use in meat products. Acomprehensive review. Trends Food Sci. Technol. 2020, 100, 292–306. [CrossRef]
37. Lorenzo, J.M.; Munekata, P.E.S. Phenolic compounds of green tea: Health benefits and technological application in food. AsianPac. J. Trop. Biomed. 2016, 6, 709–719. [CrossRef]
38. Sahin, S.; Samli, R.; Birteks Z Tan, A.S.; Barba, F.J.; Chemat, F.; Cravotto, G.; Lorenzo, J.M. Solvent-free microwave-assistedextraction of polyphenols from olive tree leaves: Antioxidant and antimicrobial properties. Molecules 2017, 22, 1056. [CrossRef][PubMed]
39. Hayes, J.E.; Allen, P.; Brunton, N.; O’Grady, M.N.; Kerry, J.P. Phenolic composition and in vitro antioxidant capacity of fourcommercial phytochemical products: Olive leaf extract (Olea europaea L.), lutein, sesamol and ellagic acid. Food Chem. 2011, 126,948–955. [CrossRef]
40. Zhao, C.N.; Tang, G.Y.; Cao, S.Y.; Xu, X.Y.; Gan, R.Y.; Liu, Q.; Mao, Q.Q.; Shang, A.; Li, H. Bin Phenolic profiles and antioxidantactivities of 30 tea infusions from green, black, oolong, white, yellow and dark teas. Antioxidants 2019, 8, 215. [CrossRef]
82

Foods 2021, 10, 1003
41. Komes, D.; Belšcak-Cvitanovic, A.; Horžic, D.; Rusak, G.; Likic, S.; Berendika, M. Phenolic composition and antioxidant propertiesof some traditionally used medicinal plants affected by the extraction time and hydrolysis. Phytochem. Anal. 2011, 22, 172–180.[CrossRef]
42. Ebrahimzadeh, M.A.; Pourmorad, F.; Hafezi, S. Antioxidant activities of Iranian corn silk. Turkish J. Biol. 2008, 32, 43–49.43. Das, R.K.; Kasoju, N.; Bora, U. Encapsulation of curcumin in alginate-chitosan-pluronic composite nanoparticles for delivery to
cancer cells. Nanomed. Nanotechnol. Biol. Med. 2010, 6, 153–160. [CrossRef] [PubMed]44. Bernela, M.; Kaur, P.; Chopra, M.; Thakur, R. Synthesis, characterization of nisin loaded alginate-chitosan-pluronic composite
nanoparticles and evaluation against microbes. LWT Food Sci. Technol. 2014, 59, 1093–1099. [CrossRef]45. Ingar Draget, K.; Østgaard, K.; Smidsrød, O. Homogeneous alginate gels: A technical approach. Carbohydr. Polym. 1990, 14,
159–178. [CrossRef]46. ASTM ASTM E96/E96M-16, standard test methods for water vapor transmission of materials. In Annual Book of American Standard
Testing Methods; American Society for Testing and Materials: West Conshohocken, PA, USA, 2016; pp. 719–725.47. Pranoto, Y.; Salokhe, V.M.; Rakshit, S.K. Physical and antibacterial properties of alginate-based edible film incorporated with
garlic oil. Food Res. Int. 2005, 38, 267–272. [CrossRef]48. Benavides, S.; Villalobos-Carvajal, R.; Reyes, J.E. Physical, mechanical and antibacterial properties of alginate film: Effect of the
crosslinking degree and oregano essential oil concentration. J. Food Eng. 2012, 110, 232–239. [CrossRef]49. Guiga, W.; Galland, S.; Peyrol, E.; Degraeve, P.; Carnet-Pantiez, A.; Sebti, I. Antimicrobial plastic film: Physico-chemical
characterization and nisin desorption modeling. Innov. Food Sci. Emerg. Technol. 2009, 10, 203–207. [CrossRef]50. Barzegaran, A.; Jokar, M.; Dakheli, M.J. Effects of Green Tea Extract on Physicochemical and Antioxidant Properties of Polyamide
Packaging Film. J. Chem. Heal. Risks 2014, 4, 41–48. [CrossRef]51. Han, J.H.; Aristippos, G. Edible films and coatings. A review. In Innovations in Food Packaging; Han, J.H., Ed.; Elsevier Ltd.:
San Diego, CA, USA, 2005; pp. 239–262. ISBN 9780123116321.52. Pavlath, A.E.; Gossett, C.; Camirand, W.; Robertson, G.H. Ionomeric Films of Alginic Acid. J. Food Sci. 1999, 64, 61–63. [CrossRef]53. Turhan, K.N.; Sahbaz, F. Water vapor permeability, tensile properties and solubility of methylcellulose-based edible films. J. Food
Eng. 2004, 61, 459–466. [CrossRef]54. Food Safety Authority of Ireland. Available online: https://www.fsai.ie/food_businesses/micro_criteria/guideline_micro_
criteria.html (accessed on 5 March 2021).55. Dainty, R.H.; Mackey, B.M. The relationship between the phenotypic properties of bacteria from chill-stored meat and spoilage
processes. J. Appl. Bacteriol. 1992, 73, 103s–114s. [CrossRef] [PubMed]56. Feng, L.; Shi, C.; Bei, Z.; Li, Y.; Yuan, D.; Gong, Y.; Han, J. Rosemary Extract in Combination with ε-Polylysine Enhance the
Quality of Chicken Breast Muscle during Refrigerated Storage. Int. J. Food Prop. 2016, 19, 2338–2348. [CrossRef]57. de Barros, J.R.; Kunigk, L.; Jurkiewicz, C.H. Incorporation of nisin in natural casing for the control of spoilage microorganisms in
vacuum packaged sausage. Braz. J. Microbiol. 2010, 41, 1001–1008. [CrossRef]58. Neetoo, H.; Mahomoodally, F. Use of antimicrobial films and edible coatings incorporating chemical and biological preservatives
to control growth of Listeria monocytogenes on cold smoked salmon. Biomed Res. Int. 2014, 2014. [CrossRef]59. Ercolini, D.; Ferrocino, I.; La Storia, A.; Mauriello, G.; Gigli, S.; Masi, P.; Villani, F. Development of spoilage microbiota in beef
stored in nisin activated packaging. Food Microbiol. 2010, 27, 137–143. [CrossRef] [PubMed]60. Meira, S.M.M.; Zehetmeyer, G.; Jardim, A.I.; Scheibel, J.M.; de Oliveira, R.V.B.; Brandelli, A. Polypropylene/montmorillonite
nanocomposites containing nisin as antimicrobial food packaging. Food Bioprocess Technol. 2014, 7, 3349–3357. [CrossRef]61. Cé, N.; Noreña, C.P.Z.; Brandelli, A. Antimicrobial activity of chitosan films containing nisin, peptide P34, and natamycin. CyTA J.
Food 2012, 10, 21–26. [CrossRef]62. Elmalı, M. Effects of different concentration of nisin, lysozyme, and chitosan on the changes of microorganism profile in produced
Çig Köfte (Turkish traditional meat product; raw meatball) during the production stage. MANAS J. Eng. 2014, 2, 30–45.63. Millette, M.; Le Tien, C.; Smoragiewicz, W.; Lacroix, M. Inhibition of Staphylococcus aureus on beef by nisin-containing modified
alginate films and beads. Food Control 2007, 18, 878–884. [CrossRef]64. Sun, X.; Guo, X.; Ji, M.; Wu, J.; Zhu, W.; Wang, J.; Cheng, C.; Chen, L.; Zhang, Q. Preservative effects of fish gelatin coating
enriched with CUR/βCD emulsion on grass carp (Ctenopharyngodon idellus) fillets during storage at 4 ◦C. Food Chem. 2019, 272,643–652. [CrossRef]
65. Guerra, N.P.; Macias, C.L.; Agrasar, A.T.; Castro, L.P. Development of a bioactive packaging cellophane using NisaplinR asbiopreservative agent. Lett. Appl. Microbiol. 2005, 40, 106–110. [CrossRef] [PubMed]
66. Reygaert, W.C. The antimicrobial possibilities of green tea. Front. Microbiol. 2014, 5, 434. [CrossRef] [PubMed]
83


foods
Article
Sensory Attributes, Microbial Activity, Fatty Acid Compositionand Meat Quality Traits of Hanwoo Cattle Fed a DietSupplemented with Stevioside and Organic Selenium
Yong Geum Shin, Dhanushka Rathnayake, Hong Seok Mun, Muhammad Ammar Dilawar, Sreynak Pov
and Chul Ju Yang *
���������������
Citation: Shin, Y.G.; Rathnayake, D.;
Mun, H.S.; Dilawar, M.A.; Pov, S.;
Yang, C.J. Sensory Attributes,
Microbial Activity, Fatty Acid
Composition and Meat Quality Traits
of Hanwoo Cattle Fed a Diet
Supplemented with Stevioside and
Organic Selenium. Foods 2021, 10,
129. https://doi.org/
10.3390/foods10010129
Received: 25 December 2020
Accepted: 7 January 2021
Published: 8 January 2021
Publisher’s Note: MDPI stays neu-
tral with regard to jurisdictional clai-
ms in published maps and institutio-
nal affiliations.
Copyright: © 2021 by the authors. Li-
censee MDPI, Basel, Switzerland.
This article is an open access article
distributed under the terms and con-
ditions of the Creative Commons At-
tribution (CC BY) license (https://
creativecommons.org/licenses/by/
4.0/).
Animal Nutrition and Feed Science Laboratory, Department of Animal Science and Technology,Sunchon National University, Suncheon 57922, Korea; [email protected] (Y.G.S.);[email protected] (D.R.); [email protected] (H.S.M.); [email protected] (M.A.D.);[email protected] (S.P.)* Correspondence: [email protected]; Tel.: +82-61-750-3235
Abstract: This study examined the effects of stevioside (S) and organic selenium (O-Se) supplemen-tation on the sensory attributes, microbial activity, fatty acid composition, and meat quality traitsof Hanwoo cattle (Korean native cattle). Twenty-four Hanwoo cattle (663 ± 22 kg body weight)were assigned to two dietary treatments for 8 months: control diet and 1% stevioside with 0.08%organic selenium supplemented diet. S and O-Se inclusion in the diet enhanced the final body weight,weight gain, and carcass crude protein (p < 0.05). Moreover, supplementation with S and O-Se hada significant effect on lowering the drip loss and shear force and enhanced the a* (redness) of thelongissimus dorsi muscle (p < 0.05). The inclusion of dietary S and O-Se improved the sum of thepolyunsaturated fatty acid (ΣPUFAs) content of the meat, and the oxidative status (TBARS) valuesduring second week of storage decreased by 42% (p < 0.05). On the other hand, the microbial counttended to decrease (7.62 vs. 7.41 log10 CFU), but it was not significant (p > 0.05), and all sensoryattributes were enhanced in the S and O-Se supplemented diet. Overall, these results suggest thatsupplementation of the ruminant diet with stevioside and organic selenium improves the growthperformance, carcass traits, and meat quality with enriched PUFAs profile and retards the lipidoxidation during the storage period in beef.
Keywords: stevioside; organic selenium; Hanwoo cattle; fatty acid profile; oxidative status; sen-sory attributes
1. Introduction
High meat quality characteristics of Hanwoo beef enhanced the consumer’s preferencecompared to the other imported beef, such as Holstein steer and Australian Angus [1].Moreover, lower subcutaneous fat contents and higher ossification scores, marbling scores,and loin protein content were also observed in the Hanwoo carcasses compared to Aus-tralian Angus carcasses [2]. Since dietary management has an important role in the beefindustry, the implementation of promising feeding strategies and supplementation withadditives is an essential factor that can determine the physiochemical qualities of the meat.Natural and healthy feed additives have gained particular interest in the global livestocksector since the ban on antibiotic growth promoters (AGP) in animal feed [3].
Many beneficial organic bioactive molecules are derived from plants because of theirnormal metabolic reactions [4]. The mode of action of plant-based feed additives is in-creasing the digestibility and absorption by modulating the beneficial intestinal micro-biota [5]. The Stevia genus comprises approximately 200 species of various herbs andshrubs [6]. Stevia rebaudiana Bertoni is an herbaceous perennial plant belonging to theAsteraceae family that is native to Paraguay but has also been cultivated in China, Taiwan,
Foods 2021, 10, 129. https://doi.org/10.3390/foods10010129 https://www.mdpi.com/journal/foods
85

Foods 2021, 10, 129
Korea, Malaysia, Canada, the United States, and some European countries. Stevioside(13-[2-O-beta-D-glucoprransyl-alpha-D-glucopy-ranosyl)oxy]kaur-16-en-18-oic acid-beta-D-glucopyranosyl) is the prominent steviol glycoside obtained from the leaves of S. re-baudiana; it is noncaloric and is stable at high temperatures over a wide range of pH [7].Previous studies [8,9] reported that the stevioside exhibits numerous immunoregulationactivities and has antibacterial properties, anti-inflammation properties, and maintenanceof the blood lipid content. Previous studies showed that the stevia extract contains aminoacids, polyphenols, and flavonoids and has antioxidant properties [10–13]. A few studieshave been conducted on nonruminants, including pigs and poultry [14,15]. S. rebaudianahas been used as a sweetener and a feed additive because of the presence of variousbioactive compounds.
A selenium deficiency has negative impacts on the health of animals and humans.Therefore, selenium is considered a vital component in diets. [16]. Selenium acts as anantioxidant against reactive oxygen species (ROS) through the glutathione peroxidaseactivity, a vital enzyme in the detoxification process [17,18]. Organic selenium is absorbedin the GI tract through active transmission and during the protein synthesis process andis deposited in tissues to fulfill the selenium requirements in organs and tissues [19]. Incontrast, the utilization of organic selenium is more beneficial than inorganic seleniumbecause of lower excretion via feces and urines. The antioxidant activity of selenium hasbeen investigated in cattle [20,21], pigs [22,23], and poultry [24]. Nevertheless, no studyhas evaluated the combination of both stevioside (S) and organic selenium (O-Se) in thelivestock sector.
This study examined the effects of S and O-Se as feed additives on the sensory at-tributes, fatty acid profiles, microbial activity, and meat quality traits of Hanwoo cattle.
2. Materials and Methods
2.1. Animal Ethics
The experimental protocol was approved by the Ministry for Agriculture, Forestryand Fishery in Korea, 2008 (SCNU-2017-1102).
2.2. Management of the Animals, Diets, and Experimental Design
A feeding trial was conducted for 8 months at the Animal Experimental Station,Sunchon National University, Suncheon, Korea. Briefly, 24 Korean native cattle (Hanwoo),aged 26 months and weighing approximately 663 ± 22 kg initial body weight, wereenrolled in a completely randomized design. All animals were housed individually inraised cages maintained under environmentally controlled conditions, with an ambienttemperature of 30 ◦C and average relative humidity of 70%. The cages were designed toenable the separate collection of feces and urine. At the end of the experimental period,all animals were slaughtered at the local abattoir to assess the carcass traits and meatquality parameters.
The animals were allotted randomly to two dietary treatments, with 12 animals pertreatment group: control (basal diet) and treatment diet (basal diet + 1% stevioside, 0.08%organic selenium). A commercially available total mixed ration was used as the basaldiet, and each Hanwoo animal was fed 12 kg per day. The treatment diet was preparedseparately by incorporating 1% stevioside and 0.08% organic selenium on a weight: weightratio basis. Table 1 lists the ingredients and chemical composition of the basal diets. Thecattle were fed twice daily, divided into two feeding times (9:00 a.m. and 6:00 p.m.).The animals were given access to water ad libitum, and ventilation, lighting, and othermanagement practices were implemented according to general practices. The CTC BioTech. Co. Ltd. Company, Seoul, Korea, provided the white-colored stevioside powderextracted from the Stevia rebaudiana leaves and organic Se. The purity of the extract wasevaluated by high-performance liquid chromatography (HPLC) analysis of the steviosidesample and was determined to be 97%.
86

Foods 2021, 10, 129
Table 1. Feed ingredients and chemical composition of experimental diet for Hanwoo cattle.
Composition Amount
Ingredient (%, as-fed basis)Corn grain 43.28
Corn gluten feed 11.81Wheat 10.47
Palm kernel expeller 9.03Coconut meal 8.29
Lupin 5.91Tapioca 3.41
Molasses 3.05Rapeseed meal 2.06
Wheat flour 1.97Soybean meal 0.50
Vitamin mineral premix A 0.22Chemical composition (%DM)
Total digestible nutrients (TDN) 74.12Crude protein 12.50
Crude fat 3.61Crude fiber 6.70Crude ash 5.48Calcium 0.84
Phosphorus 0.36Neutral detergent fiber (NDF) 21.70
Acid detergent fiber (ADF) 10.70A Premix providing following nutrients per kg of diet: vitamin (Vit.) A, 9,000,000 IU; Vit. D3, 2,100,000 IU; Vit.E, 15,000 IU; Vit. K, 2000 mg; Vit. B1, 1500 mg; Vit. B2, 4000 mg; Vit. B6, 3000 mg; Vit. B12, 15 mg; Pan acid-Ca,8500 mg; niacin, 20,000 mg; biotin, 110 mg; folic acid, 600 mg; Co, 300 mg; Cu, 3500 mg; Mn, 55,000 mg; Zn,40,000 mg; I, 600 mg; Se, 130 mg.
2.3. Growth Performances and Slaughtering
The body-weight gain was measured as the difference between the initial and finalbody weights. The initial body weight was measured at study commencement. Thesubsequent average weight gain (AWG) of Hanwoo cattle during the experimental periodwas determined using the live weight obtained monthly. The feed intake was measureddaily. At the end of the experiment (8 months), all animals were slaughtered after 24 hof starvation. The animals were stunned, and the carcasses were exsanguinated andimmediately eviscerated. Approximately 2.5 cm steaks of Longissimus dorsi muscle wereobtained from the 13th rib. For each subsequent analysis, triplicate samples were obtainedfrom each carcass after being stored at 4 ◦C for 24 h in a chilling room, as reported byBostami et al. [25].
2.4. Proximate Composition, Carcass Traits, and Cholesterol Analysis
The proximate compositions of the muscles, fat, and connective tissues were deter-mined by removing them manually and ground. An Ultra-Turrax homogenizer (IKAWerke, GMBH & Co. KG, Staufen, Germany) was used for the homogenization process.The moisture (930.15), crude protein (990.03), crude fat (991.36), and crude ash (942.05)compositions were evaluated according to the guidelines set up of AOAC [26].
The meat quality grade was scored as 1++, 1+, 1, 2, and 3, according to the Korean beefquality grading system [27]. The main evaluated parameters were the marbling score, meatcolor, fat color, texture, and maturity. The marbling score was determined on a 7-point scale(7 = abundant and 1 = trace). A 7-point scale was used for scoring meat color (7 = dark redand 1 = bright red), and fat color (7 = yellowish and 1 = creamy white). A scale of 1 to 3 wasused to score the texture (1 = firm and 3 = soft) and maturity (3 = mature and 1 = youthful).
The cholesterol content of the Longissimus dorsi muscle was determined using themethod described by King et al. [28]. Briefly, 5 g of the meat sample was saponified using achloroform and methanol mixture (2:1 vol:vol) [29]. The saponified samples were analyzed
87

Foods 2021, 10, 129
by gas chromatography (GC, DS 6200, Donam Co., Seongnam, Gyeonggi-do, Korea) with aflame ionization detector and a Hewlett Packard HP-5 capillary column (J and W Scientific,Folsom, CA, USA) with a 0.32 internal diameter, 30 m length, and 0.25 μm polyethyleneglycol-film thickness. The initial temperature of the setup was 250 ◦C for 2 min and wasincreased gradually to 290 ◦C at a rate of 15 ◦C/min. The final temperature was increased to310 ◦C at 10 ◦C/min, and held at that temperature for 10 min. The other chromatographicconditions were as follows: injector and detector temperatures of 280 ◦C, split ratio of 50:1,and injected sample volume of 2 μL.
2.5. Meat Quality Analysis (Meat Color, Drip Loss, Cooking Loss, Water Holding Capacity(WHC), and Shear Force)
The meat color of the meat samples (in triplicate) was measured using a Chroma meter(Model CR-410, Konica Minolta Sensing Inc., Osaka, Japan). According to the CommissionInternational de I’Eclairage (CIE) system, the color was classified by the CIE L* (lightness),CIE a* (redness), and CIE b* (yellowness) values. Cooking loss (in triplicate) is expressed asthe percentage of weight loss and was evaluated by placing 1.5 cm-thick steaks of about80 g in a polythene zipper bag, heating them in a water bath at 75 ◦C for 30 min, coolingthem to room temperature, and holding them for 30 min. The cooked samples were cut(0.5 cm × 4.0 cm). The shear force was determined in each cooked meat sample using aWarner-Bratzler shear blade set (Lloyd Instruments Ltd., Hampshire, UK) by applying thefollowing operating parameters: load cell of 50 kg, cross-head speed of 200 mm/min, andtrigger force of 0.01 kgf. The drip loss (in triplicate) was determined as the weight lossduring the suspension of a standardized sample (2 × 2 × 1 cm) sealed in a polythene bagat 4 ◦C after 7 days of storage. The water holding capacity (WHC) was determined usingthe method described by Grau et al. [30]. Briefly, 300 mg of the Longissimus dorsi musclewas placed in a filter-press device and compressed for approximately 2 min. The WHCwas then calculated from triplicate meat samples, as a ratio of the meat film area to thetotal area using an area-line meter (Super PLANIX-a, Tamaya Technics Inc., Tokyo, Japan).
2.6. pH Value and Oxidative Stability of Meat
To determine the pH, approximately 5 g of Longissimus dorsi muscle (in triplicate) wascut into small pieces and homogenized with 45 mL distilled water for 60 s in an Ultra-Turrax (Janke and Kunkel, T25, Staufen Germany). Immediately after homogenization,the pH was measured using a digital pH meter (Docu-pH + meter, Sartorius, Columbus,OH, USA).
The thiobarbituric acid reactive substances (TBARS) were evaluated (in triplicate)using the procedure described by Witte et al. [31]. Briefly, 5 g of meat samples were mixedwith 25 mL of 20% trichloroacetic acid (TCA) and homogenized for 30 s. Distilled waterwas added to prepare 50 mL of homogenate samples for centrifugation (3000× g, 4 ◦C,and 10 min). The supernatant was filtered through filter paper (Hyundai Co., Ltd., Seoul,Korea). Then, 5 mL of the filtrate was kept at room temperature for 15 h, and the absorbancewas determined using a UV/VIS spectrophotometer (M2e, Molecular Devices, Sunnyvale,CA, USA). The TBARS value is expressed as micromoles of MDA/kg of meat.
2.7. Fatty Acid Analysis
The fatty acid composition of longissimus dorsi muscle samples (in triplicate) wasevaluated using a direct method for the fatty acid methyl ester (FAME), as suggested byO’Fallon et al. [32] with a slight modification. Briefly, 1 g of minced meat sample wasplaced into a 15 mL Falcon tube and 0.7 mL of 10 N KOH in water and 6.3 mL of methanolwere added. The tube was kept in a water bath (55 ◦C; 1.5 h), allowing proper permeation,hydrolyzation, and dissolution by vigorous shaking for 10 s every 30 min. After placingin a cold tap water bath, 0.58 mL of 24 N H2SO4 was added to precipitate K2SO4. Theprecipitated sample was placed again in a water bath (55 ◦C; 1.5 h) with strong shakingfor 10 s every 30 min. After FAME synthesis, 3 mL of hexane was added and subjected tocentrifugation for 5 min at 3000 rpm (Hanil, Combi-514R, Gimpo, Korea). The top hexane
88
Foods 2021, 10, 129
layer, which contained FAME, was dehydrated by passing through the anhydrous Na2SO4.The extracted and dehydrated hexane was placed into a GC vial and concentrated to 1.5 mLfor analysis.
The fatty acid composition of the FAME was determined using an Agilent gas chro-matography system (6890 N, Agilent Technologies, Santa Clara, CA, USA). Briefly, fat wasextracted from minced meat using a chloroform-methanol (2:1 v/v) solution [28]. Accord-ing to the AOAC [26] procedure, the prepared fatty acid methyl esters were dissolved inhexane before injection; 1 μL of the prepared sample was injected into the GC; the set-upinjector temperature was maintained at 250 ◦C with a 100:1 split ratio, using a WCOT-fusedsilica capillary column (100 m × 0.25 m i.d., 0.20 μm film thickness; Varian Inc., PaloAlto, CA, USA) with helium flow. The oven conditions were 150 ◦C/1 min, 150–200 ◦Cat 7 ◦C/min, 200 ◦C/5 min, 200–250 ◦C at 5 ◦C/min, and 250 ◦C/10 min. The setupdetector temperature was 275 ◦C. Fatty acid peaks were evaluated using the retention timeof fatty acid standards (47015-U, Sigma-Aldrich Corp., LLC., St. Lois, MO, USA). Theproportion (%) against the total peak area was calculated from the peak area of each fattyacid identified.
2.8. Meat Microbial Analysis and Sensory Evaluation
Triplicates of longissimus dorsi muscle from each group were taken for the meat micro-bial analysis. A 25 g sample of meat was homogenized using 225 mL of a NaCl solution(0.85% W/V). Subsequently, 20 μL was obtained from 10-fold diluted solution and trans-ferred into tryptic soy agar plates (Becton, Dickinson, and Company, Sparks, MD 21152,USA) using a sterilized triangle spreader for microbial enumeration. The colonies werecounted immediately after incubation. The microbial number was determined as follows:number of colonies × 10 dilution value × (100/20) = multiplied value = log (multipliedvalue). The ultimate count was expressed as log10 CFU/g.
Ten samples from both treatment groups were examined by 10 members, all well-trained experts of the sensory panel at the Department of Animal Science and Technology,Sunchon National University, Suncheon, Korea. Moreover, individual testing booths and acontrolled lighting facility were provided during the sensory evaluation process [33]. Eachsteak was cooked at approximately 150 ◦C and until the internal temperature reached 70 ◦C,which was determined by inserting a digital thermometer in the steak. Before evaluationby the panelists, the steaks were wrapped in an aluminum foil and kept under 65 ◦C in anoven. The flavor, tenderness, and juiciness were then evaluated by the panelists. A 7-pointhedonic scale was used to express the value of each characteristic: 7 indicated desirableflavor, extremely tender, reddish color, high palatability, and good juiciness, while 1 wasindicative of undesirable favor, extremely tough, pale color, low palatability, and extremelydry. The average value of the 10 panelists determined the color, flavor, tenderness, juiciness,and palatability of the cut.
2.9. Statistical Analysis
The data were analyzed using the General Linear Model (GLM) method of the Statis-tics Package Program (SAS, 2003, Version 9.1, SAS Institute, Cary, NC, USA). For thegrowth performance parameters, a group of two cattle served as the experimental unit.Individual animals served as the experimental unit for the carcass traits, the meat qualityparameters, cholesterol content, fatty acid profile, pH, TBARS, microbial analysis, andsensory evaluation.
Yij = μ + αi + eij. (1)
where Yij is the response variable, μ is the general mean value, αi is the effect of dietarysupplementation, and eij is the random error. The mean values were compared using astudent’s t-test. The level of significance considered for the tests was p < 0.05.
89

Foods 2021, 10, 129
3. Results
3.1. Growth Performance, Proximate Analysis, and Cholesterol Content
Over the entire experimental period, the final body weight and body weight gain weresignificantly higher (p < 0.05) in the S and O-Se supplemented diet. On the other hand, thefeed intake did not have a significant effect but was higher in the S- and O-Se-supplementeddiet (Table 2).
Table 2. Effect of stevioside and organic selenium on growth performances of Hanwoo cattle(experimental period: 243 days).
Item CON (1) TRT (2) SEM p-Value
Initial BW 647.00 652.00 22.01 0.32Final BW 717.79 b 751.93 a 31.47 0.04
Weight gain (kg) 0.30 b 0.42 a 0.14 0.03Feed intake (kg/Day) 11.32 11.43 0.22 0.51
a,b Means in the same row with different superscripts are significantly different; SEM = standard error of mean.(1) CON: control diet with no added stevioside and organic selenium; (2) TRT: treatment (basal diet + 1% stevioside+ 0.08% organic selenium).
Proximate analysis revealed a significantly higher crude protein content, lower crudefat (p < 0.05), and a numerically lower meat cholesterol amount due to S and O-Se supple-mentation even if it is not significantly different (Table 3).
Table 3. Effect of stevioside and organic selenium on proximate analysis and cholesterol contents inthe meats of Hanwoo cattle.
Item CON (1) TRT (2) SEM p-Value
Moisture (%) 56.83 b 63.89 a 1.23 0.01Crude protein (%) 22.48 b 25.26 a 0.80 0.03
Crude fat (%) 16.62 a 12.45 b 0.95 0.01Crude ash (%) 1.18 1.29 0.05 0.14
Cholesterol (mg/100 g) 50.27 49.74 0.04 0.92a,b Means in the same row with different superscripts are significantly different; SEM = standard error of mean; (1)
CON: control diet with no added stevioside and organic selenium; (2) TRT: treatment (basal diet + 1% stevioside +0.08% organic selenium).
3.2. Carcass Traits
Although the S- and O-Se-supplemented diet increases the carcass yield, back-fatthickness, and loin area, the changes were not significant (p > 0.05). Moreover, the changesin the meat quality were also not significant, including the marbling score, meat color, fatcolor, texture, and maturity (Table 4).
3.3. Meat Quality Analysis (Meat Color, Drip Loss, Cooking Loss, WHC, and Shear Force)
Considering the changes in the meat color, the redness (a*) was enhanced significantlyin the S- and O-Se-supplemented diet (p < 0.05). On the other hand, no significant differencein surface lightness (L*) and yellowness (y*) was observed between the two treatments.Although S and O-Se addition did not affect the cooking loss and water holding capacity(WHC) (p > 0.05), the drip loss and shear force decreased significantly (p < 0.05) (Table 5).
3.4. pH Value and Oxidative Stability of Meat
The pH in both treatments decreased gradually up to the second week of storage,with a subsequent increase at the end of the third week. On the other hand, no significantdifference was observed between the control and S- and O-Se-added diet (Figure 1). Theaddition of S and O-Se resulted in significantly lower TBARS values during second weekof storage (p < 0.05) (Figure 2).
90

Foods 2021, 10, 129
Table 4. Effect of stevioside and organic selenium supplementation on carcass traits of Hanwoo cattle.
Items CON (1) TRT (2) SEM p-Value
Yield traitsCarcass weight (kg) 446.68 449.57 20.46 0.87
Loin area (cm2) 100.50 103.33 4.42 0.67Back fat thickness (mm) 16.67 18.33 2.81 0.68
Quality traitsMarbling score (3) 4.83 6.33 0.78 0.20
Meat color (4) 4.83 4.83 0.17 1.00Fat color (5) 3.17 2.83 0.19 0.18Texture (6) 1.17 1.00 0.08 0.34
Maturity (7) 2.00 1.89 0.16 0.21Quality grade 0:3:1:2:0 2:1:3:0:0 – –Meat point (8) 3.17 3.83 0.40 0.26
SEM = standard error of mean; (1) CON: control diet with no added stevioside and organic selenium; (2) TRT:treatment (basal diet + 1% stevioside + 0.08% organic selenium); (3) Marbling score: 7 = abundant, 1 = trace;(4) meat color: 1 = bright red and 7 = dark red; (5) fat color: 1 = creamy white and 7 = yellowish.; (6) texture:1 = firm and 3 = soft.; (7) maturity: 1 = young and 3 = youthful; (8) meat point: 1++: 5 point, 1+: 4 Point, 1: 3 Point,2: 2 Point, and 3: 1 Point.
Table 5. Effect of stevioside and organic selenium on meat quality of Longissimus dorsi muscle fromHanwoo cattle.
Item CON (1) TRT (2) SEM p-Value
Meat colorCIE L* 29.04 29.21 0.73 0.87CIE a* 14.94 b 18.45 a 0.81 0.03CIE b* 3.58 5.87 0.70 0.07
Drip loss (%) 21.14 a 16.48 b 0.75 0.00Cooking loss (%) 15.81 16.30 0.71 0.70
WHC (%) 12.81 13.30 1.26 0.78Shear force (kg) 5.38 a 3.93 b 0.35 0.01
a,b Means in the same row with different superscripts are significantly different; SEM = standard error of mean;(1) CON: control diet with no added stevioside and organic selenium; (2) TRT: treatment (basal diet + 1% stevioside+ 0.08% organic selenium).
Figure 1. Effect of stevioside and organic selenium on the pH values in meats of Hanwoo cattle.
3.5. Fatty Acid Analysis
Monounsaturated fatty acids (MUFA) had the highest proportion. They constitutedmore than 50% of the total fatty acid composition, followed by saturated fatty acids (SFA)
91

Foods 2021, 10, 129
and polyunsaturated fatty acids (PUFA), accounting for 37–39% and 0.6–0.9%, respec-tively. Oleic acid (C8:1, 47%) was the predominant fatty acid among MUFA, followedby palmitoleic acid (C16:1, 5%), while palmitic acid (C16:0, 24–26%, stearic acid (C18:0,8%) and myristic acid (C14:0, 3%) were predominant among SFA. On the other hand,the decrease in SFAs content was not significant in the S- and O-Se-supplemented diet.Moreover, the nervonic monounsaturated fatty acid content and linoleic, di homo-gammalinolenic, and arachidonic PUFAs contents were also higher in the animals fed the S- andO-Se-supplemented diet (p < 0.05) (Table 6).
Figure 2. Effect of stevioside and organic selenium on the TBARS values in meats of Hanwoo cattle.Data presented as the mean ± s.e. bars at a specific time point with different letters show a significantdifference (p < 0.05).
Table 6. Fatty acid profile of Longissimus dorsi muscle from Hanwoo cattle fed diets containingstevioside and organic selenium.
Items CON (1) TRT (2) SEM p-Value
C10:0 0.03 0.04 0.00 0.08C12:0 0.08 0.08 0.00 0.69C14:0 3.35 3.39 0.11 0.80C15:0 0.20 b 0.25 a 0.01 0.008C16:0 26.65 a 24.05 b 0.60 0.04C17:0 0.92 a 0.15 b 0.03 <0.0001C18:0 8.33 8.67 0.15 0.13C20:0 0.08 a 0.07 b 0.00 0.004C14:1 0.30 a 0.25 b 0.02 0.04C16:1 5.92 a 5.62 b 0.06 0.007C18:1 47.19 46.09 0.58 0.24C24:1 0.06 b 0.08 a 0.00 0.01C18:2 0.06 b 0.10 a 0.01 0.004C18:3 0.22 b 0.36 a 0.04 0.008C20:3 0.13 b 0.16 a 0.01 0.04C20:4 0.20 b 0.26 a 0.01 0.03
ΣSFA (3) 39.69 36.75 0.72 0.16ΣMUFA (4) 53.46 52.04 0.58 0.13ΣPUFA (5) 0.63 b 0.88 a 0.05 0.04
ΣPUFA/SFA 0.015 0.024 0.04 0.14a,b Means in the same row with different superscripts are significantly different; SEM = standard error of mean;(1) CON: control diet with no added stevioside and organic selenium; (2) TRT: treatment (basal diet + 1% steviosidesupplementation + 0.08% organic selenium); (3) SFA: saturated fatty acid; (4) MUFA: monounsaturated fatty acid;(5) PUFA: polyunsaturated fatty acid.
92

Foods 2021, 10, 129
3.6. Microbial Analysis and Sensory Evaluation
The average meat microbial content was numerically lower, but not significant (7.62 vs.7.41 log10 CFU) in the S- and O-Se-supplemented diet compared to the control treatmentafter the 3-week refrigerated storage period (Figure 3).
Figure 3. Effect of stevioside and organic selenium on the microbial content in meats of Hanwoo cattle.
Although no significant impact (p > 0.05) was observed for color, flavor, tenderness,juiciness, and palatability, the S- and O-Se-supplemented diet had a positive tendency onthe sensory parameters (Figure 4).
Figure 4. Effect of stevioside and organic selenium on meat sensory attributes of Hanwoo cattle.
4. Discussion
The incorporation of feed additives has gained popularity because of their benefits tohuman and animal health [34,35]. In particular, phytochemicals have biochemical proper-ties, including antioxidant, antimicrobial, antistress, and nutrigenomic influences on thedevelopment of immunity and improved productivity [36,37]. Moreover, the incorporationof organic selenium can improve nutrient utilization by preventing the pro-oxidant effectson the gut system and has an antioxidant defense role against oxidative stress [38].
In the present study, 1% stevioside and 0.08% organic selenium supplementationsignificantly increased the weight gain and final body weight and enhanced the feed intake(FI). The palatability of the feed was enhanced because of the sweetness of the stevioside,
93

Foods 2021, 10, 129
and the animals increased their voluntary feed intake, resulting in increased body weight.In contrast, stevioside derivatives can stimulate the taste receptors (TASIR2/TASIR3) [39,40]and K+ channels in pancreatic β-cells [41], which can increase the stimulation of appetiteand voluntary FI. Similar to the present findings, Han et al. 2019 [42] reported a linearincrease in FI in goats given diets supplemented with 270 and 541 mg/kg stevioside. Incontrast, Cho et al. [43] reported that the dietary intake of Hanwoo steers is not influencedby the inclusion of 65 mg/kg stevioside as an essential oil to the feed with 0.1% of dietsupplemented rate. Furthermore, previous studies reported improved production parame-ters in pigs [44], layers [45], broilers [46], and cattle [47] owing to O-Se supplementation.The enhanced production performance may be associated with the developed antioxidantcapacity and decrease in microbial pathogen colonization in the gut system because of thesynergistic action of S and O-Se supplementation.
No studies have evaluated the effects of the dietary inclusion of S and O-Se on thecarcass traits, meat quality, and sensory evaluation of cattle. A Se deficiency increasesthe susceptibility to various degenerative diseases in humans [48]. The incorporation ofSe into animal feed has great potential to obtain Se-enriched meat that can alleviate Sedeficiencies [49]. Dietary S and O-Se supplementation increased the moisture and crudeprotein content with a concomitant reduction in the crude fat content in meat taken fromHanwoo cattle. The lower crude fat content in meat might be associated with the lipolyticmechanism owing to the presence of polyphenols and flavonoids compounds in S. rebaudi-ana [50]. The increase in moisture content is caused by the inverse relationship between themeat fat and moisture content, which affects the meat tenderness and juiciness [51]. Thecholesterol content was lower in the S and O-Se-included treatment, probably due to thecooperative mechanism of flavonoids in stevioside and glutathione peroxidase activity inorganic Se [52], which can convert cholesterol to bile acids through the induced stimulationof enzymes activity. Consequently, it is catabolized and eliminated from the body.
Genetics and environmental factors, including the feeding strategies, affect the carcassquality traits directly [53]. Although no significant difference was observed in back-fatthickness of both treatments, Zhang et al. [54] stated that O-Se can provide some vitamins,amino acids, protein, and other nutrients for the body and can cause subsequent increasein fat accumulation. Similar to that, Choi et al. [55] also reported significant differences inthe carcass length and back-fat thickness of pork meat obtained from animals fed steviaand charcoal-supplemented diets. Nevertheless, 0.3% stevia and charcoal inclusion did notsignificantly enhance the marbling, firmness, and color scores in pigs compared to the controltreatment. Therefore, further investigations will be needed to determine the impact on thecarcass traits based on different concentrations of stevioside and organic Se application.
The meat color and brightness are considered important visual factors that affect theconsumer’s preference and purchasing decisions [56]. In the current study, the redness(a*) value was enhanced by the inclusion of S and O-Se in the cattle diet. The increase inmeat redness may be associated with the reduced metmyoglobin (MMG) formation byantioxidants in both S and O-Se by delaying meat oxymyoglobin (OMG) oxidation. Choiet al. [55] also reported higher L*, a*, and b* values in pork meat supplemented with 0.3%stevioside and charcoal. The WHC was not significant in the two treatments, but the driploss and shear force values were significantly lower in the S- and O-Se-supplemented group.The meat pH and lipid peroxidation affected meat drip loss [57]. Therefore, in the currentstudy, the reduced lipid oxidation caused by S and O-Se supplementation may affect thelower drip loss value. Moreover, the S and O-Se supplemented diet had no adverse effecton the meat quality parameters.
High accumulated lactic acid content due to the metabolism of the glycogen reservesand releasing of H+ from ATP hydrolysis will lead lower muscle pH. Therefore, the carcasspH has a significant influence on the meat quality traits. During the 3 weeks in the S- andO-Se-included diet, the high pH of the meat probably affected the glutathione peroxidaseenzyme activity, which can break down H2O2 to H2O and O2 [58] and facilitate an increasein meat pH. Moreover, in the current study, the TBARS value during the second week
94

Foods 2021, 10, 129
of the storage periods was 42% lower in the S- and O-Se-supplemented diet group thanthe control group. In addition to acting as a sweetener, previous studies reported theantioxidant properties of stevioside [59–61]. Moreover, plant polyphenolic compounds canprevent the oxidation activities in unsaturated fatty acids by scavenging free radicals [62] orsinglet-oxygen quenching ability [63]. The glutathione peroxidase family (GPx) in organicSe can also delay the lipid oxidation reactions [64]. Overall, the synergistic effects of both Sand O-Se reduced the average TBARS value owing to the presence of antioxidants.
The meat fatty acids composition depends on the lipogenesis activities in adiposetissues and the ruminal biohydrogenation process [65]. The dietary SFA has a directcorrelation with cholesterol level and subsequent cardiovascular diseases. Nevertheless,PUFA positively exerts a lower cholesterol content and a significant reduction in humanhealth risks [66]. In the present study, the PUFA content was significantly higher in theS- and O-Se-supplemented diet. This contrasts with a previous study [67], which noted ahigher linoleic content in fattening steers fed a diet containing O-Se, possibly because of areduction in biohydrogenation process and subsequent increase in the intestinal absorptionof PUFA. A previous study [24] reported a lower MUFA and a higher PUFA proportionin the O-Se-supplemented group owing to the presence of antioxidants. Moreover, phyto-chemicals in plants indirectly performed their antioxidants activities against the depletionof PUFA from microbial biohydrogenation and enhanced the UFA concentration in themuscles [68]. Therefore, the combination of S and O-Se has a positive impact on the PUFAcontent in the meat.
A combination of microbes and endogenous enzymes leads to the deterioration ofmeat protein and consequently accelerates meat spoilage [69]. Synthetic preservatives arethe main approach to inhibit microbial growth. On the other hand, preservatives need to bereplaced by harmless natural compounds to avoid harmful effects on human health [70]. Inthe present study, the average microbial count tended to decrease in S and O-Se treatmentduring the refrigerated storage period, possibly because the GSH-Px enzymatic activitycan eradicate harmful lipid peroxide and H2O2 from organisms, resulting in less favorablereproductive conditions for microbes. Hence, the microbial population tends to decreasegradually [54]. Moreover, antioxidant molecules in stevioside can scavenge free radicalsthat influence the retarded muscle oxidation process and reduce the microbial flora contentin meat. In our study, the supplementation of S and O-Se did not modify the meat microbialcount significantly. Hence, the incorporation of different concentrations of S and O-Se incattle diets requires further study.
The sensory evaluation helps determine the consumer preference or acceptabilityof meat through an evaluation via sight, aroma, taste, and touch. In the present study,the supplementation of S and O-Se tend to positively influence color, flavor, tenderness,juiciness, and palatability of meat. Lipid peroxidation influences the deterioration ofthe above sensory properties of meat and the optimal quality of meat products [54,71].Therefore, the antioxidant properties of S [72] and O-Se probably helps reduce the lipidoxidation process of meat and helps enhance the sensory properties. Interestingly, Zouet al. [70] reported that O-Se could retard the oxidation of OMG and lipids, resulting in ahigher meat color score and meat stability. Furthermore, previous studies confirmed thatthe O-Se-incorporated diet in the animal feed improves the meat quality by preventingexcessive dehydration and protects the meat sensory attributes [73]. Consistently, thisstudy indicated that the synergism of S and O-Se in the cattle diet led to an improvementin the meat sensory attributes.
5. Conclusions
The addition of S and O-Se in the cattle diet enhanced the final body weight (FBW) andweight gain (WG). In addition, the carcass protein and moisture contents were improved,and the cholesterol content was reduced. Both S and O-Se inclusion improved the meatredness (a*) and reduced the meat drip loss and shear force value. The average TBARSvalue in S and O-Se supplemented diet during the second week was decreased by 42%
95

Foods 2021, 10, 129
and showed a higher meat ΣPUFA content than the control group. In this study, allsensory attributes tended to increase numerically and microbial flora contents also tendedto decrease due to the S- and O-Se-incorporated diet. These results indicated that thesupplementation of natural stevioside and organic selenium could be carried out to enhancethe productive performance and the quality of meat in the livestock sector. Nevertheless,further studies will be needed to determine if different concentrations could provide morebenefit in ruminant diets.
Author Contributions: Conceptualization, C.J.Y. and H.S.M.; methodology, Y.G.S. and D.R.; soft-ware, M.A.D. and S.P.; validation, C.J.Y. and H.S.M.; formal analysis, C.J.Y.; investigation, H.S.M.;resources, Y.G.S.; data curation, D.R. and S.P.; writing—original draft preparation, Y.G.S., D.R., andM.A.D.; writing—review and editing, D.R. and Y.G.S.; supervision, C.J.Y.; project administration,H.S.M.; funding acquisition, H.S.M. All authors have read and agreed to the published version ofthe manuscript.
Funding: This study was supported by the CTC Bio Tech. Co. Ltd. Company, Seoul, Korea (GrantNo. 2016-0301).
Institutional Review Board Statement: The experimental protocol was approved by the Ministryfor Agriculture, Forestry and Fishery in Korea, 2008 (SCNU-2017-1102).
Informed Consent Statement: Not applicable.
Data Availability Statement: The data presented in this study are available in the article.
Conflicts of Interest: The authors declare no conflict of interest.
References
1. Hwang, Y.H.; Kim, G.-D.; Jeong, J.Y.; Hur, S.J.; Joo, S.T. The relationship between muscle fiber characteristics and meat qualitytraits of highly marbled Hanwoo (Korean native cattle) steers. Meat Sci. 2010, 86, 456–461. [CrossRef] [PubMed]
2. Jo, C.; Cho, S.H.; Chang, J.; Nam, K.C. Keys to production and processing of Hanwoo beef: A perspective of tradition and science.Anim. Front. 2012, 2, 32–38. [CrossRef]
3. Kamel, C. Natural Plant Extracts: Classical Medies Bring Modern Animal Production Solutions. Available online: https://agris.fao.org/agris-search/search.do?recordID=QC2001600008 (accessed on 28 November 2008).
4. Suresh, G.; Das, R.K.; Brar, S.K.; Rouissi, T.; Ramirez, A.; Chorfi, Y.; Godbout, S. Alternatives to antibiotics in poultry feed:Molecular perspectives. Crit. Rev. Microbiol. 2017, 44, 318–355. [CrossRef]
5. Ahmed, S.T.; Hossain, M.E.; Kim, G.M.; Hwang, J.A.; Ji, H.; Yang, C.J. Effects of Resveratrol and Essential Oils on GrowthPerformance, Immunity, Digestibility and Fecal Microbial Shedding in Challenged Piglets. Asian Australas. J. Anim. Sci. 2013, 26,683–690. [CrossRef] [PubMed]
6. Yadav, A.K.; Singh, S.; Dhyani, D.; Ahuja, P.S. A review on the improvement of stevia [ Stevia rebaudiana (Bertoni)]. Can. J. PlantSci. 2011, 91, 1–27. [CrossRef]
7. Puri, M.; Sharma, D.; Tiwari, A.K. Downstream processing of stevioside and its potential applications. Biotechnol. Adv. 2011, 29,781–791. [CrossRef]
8. Takasaki, M.; Konoshima, T.; Kozuka, M.; Tokuda, H.; Takayasu, J.; Nishino, H.; Miyakoshi, M.; Mizutani, K.; Lee, K.-H. Cancerpreventive agents. Part 8: Chemopreventive effects of stevioside and related compounds. Bioorganic Med. Chem. 2009, 17, 600–605.[CrossRef]
9. Pariwat, P.; Homvisasevongsa, S.; Muanprasat, C.; Chatsudthipong, V. A Natural Plant-Derived Dihydroisosteviol PreventsCholera Toxin-Induced Intestinal Fluid Secretion. J. Pharmacol. Exp. Ther. 2008, 324, 798–805. [CrossRef]
10. Abou-Arab, A.E.; Abou-Arab, A.A.; Abu-Salem, M.F. Physico-chemical assessment of natural sweeteners steviosides producedfrom Stevia rebaudiana Bertoni plant. Afr. J. Food Sci. 2010, 4, 269–281. [CrossRef]
11. Muanda, F.N.; Soulimani, R.; Diop, B.; Dicko, A. Study on chemical composition and biological activities of essential oil andextracts from Stevia rebaudiana Bertoni leaves. LWT Food Sci. Technol. 2011, 44, 1865–1872. [CrossRef]
12. Shukla, S.; Mehta, A.; Bajpai, V.K.; Shukla, S. In vitro antioxidant activity and total phenolic content of ethanolic leaf extract ofStevia rebaudiana Bert. Food Chem. Toxicol. 2009, 47, 2338–2343. [CrossRef] [PubMed]
13. Tadhani, M.B.; Patel, V.H.; Subhash, R. In vitro antioxidant activities of Stevia rebaudiana leaves and callus. J. Food Compos. Anal.2007, 20, 323–329. [CrossRef]
14. Munro, P.J.; Lirette, A.; Anderson, D.M.; Ju, H.Y. Effects of a new sweetener, Stevia, on performance of newly weaned pigs. Can. J.Anim. Sci. 2000, 80, 529–531. [CrossRef]
15. Paredes-López, D.; Robles-Huaynate, R.; Carrión-Molina, M. Effect of Stevia rebaudiana Bertonni Leaves powder on Lipid Profilesand Productive Parameters of Laying Hens. Sci. Agropecu 2019, 10, 275–282. [CrossRef]
96

Foods 2021, 10, 129
16. Alfthan, G.; Eurola, M.; Ekholm, P.; Venäläinen, E.-R.; Root, T.; Korkalainen, K.; Hartikainen, H.; Salminen, P.; Hietaniemi, V.;Aspila, P.; et al. Effects of nationwide addition of selenium to fertilizers on foods, and animal and human health in Finland: Fromdeficiency to optimal selenium status of the population. J. Trace Elem. Med. Biol. 2015, 31, 142–147. [CrossRef]
17. Albanes, D.; Till, C.; Klein, E.A.; Goodman, P.J.; Mondul, A.M.; Weinstein, S.J.; Taylor, P.R.; Parnes, H.L.; Gaziano, J.M.; Song, X.;et al. Plasma Tocopherols and Risk of Prostate Cancer in the Selenium and Vitamin E Cancer Prevention Trial (SELECT). CancerPrev. Res. 2014, 7, 886–895. [CrossRef]
18. Speckmann, B.; Grune, T. Epigenetic effects of selenium and their implications for health. Epigenetics 2015, 10, 179–190. [CrossRef]19. Schrauzer, G.N. The nutritional significance, metabolism and toxicology of selenomethionine. Adv. Food Nutr. Res. 2003, 47,
73–112. [CrossRef]20. Taylor, J.B.; Marchello, M.J.; Finley, J.W.; Neville, T.L.; Combs, G.F.; Caton, J.S. Nutritive value and display-life attributes of
selenium-enriched beef-muscle foods. J. Food Compos. Anal. 2008, 21, 183–186. [CrossRef]21. Cozzi, G.; Prevedello, P.; Stefani, A.L.; Piron, A.; Contiero, B.; Lante, A.; Gottardo, F.; Chevaux, E. Effect of dietary supplementation
with different sources of selenium on growth response, selenium blood levels and meat quality of intensively finished Charolaisyoung bulls. Animal 2011, 5, 1531–1538. [CrossRef] [PubMed]
22. Svoboda, M.; Saláková, A.; Fajt, Z.; Ficek, R.; Buchtová, H.; Drábek, J. Selenium from Se-enriched lactic acid bacteria as a new Sesource for growing-finishing pigs. Pol. J. Vet. Sci. 2009, 12, 355–361. [PubMed]
23. Zhan, X.; Wang, M.; Zhao, R.; Li, W.; Xu, Z. Effects of different selenium source on selenium distribution, loin quality andantioxidant status in finishing pigs. Anim. Feed Sci. Technol. 2007, 132, 202–211. [CrossRef]
24. Biazik, E.; Straková, E.; Suchý, P. Effects of Organic Selenium in Broiler Feed on the Content of Selenium and Fatty Acid Profile inLipids of Thigh Muscle Tissue. Acta Vet. Brno 2013, 82, 277–282. [CrossRef]
25. Rubayet Bostami, A.B.M.; Mun, H.S.; Yang, C.J. Loin eye muscle physico-chemical attributes, sensory evaluation and proximatecomposition in Korean Hanwoo cattle subjected to slaughtering along with stunning with or without pithing. Meat Sci. 2018, 145,220–229. [CrossRef] [PubMed]
26. Association of Official Analytical Chemists (AOAC). Official Methods of Analysis of AOAC International, 17th ed.; AOAC Interna-tional: Gaithersburg, MD, USA, 2000.
27. KAPE 2012. ‘The beef carcass grading.’ (Korea Institute for Animal Products Quality Evaluation, Gunposi, Gyungki-do, SouthKorea). Available online: http://www.ekape.or.kr/view/eng/system/beef.asp (accessed on 15 May 2012).
28. King, A.J.; Paniangvait, P.; Jones, A.D.; German, J.B. Rapid Method for Quantification of Cholesterol in Turkey Meat and Products.J. Food Sci. 1998, 63, 382–385. [CrossRef]
29. Folch, J.; Lees, M.; Stanley, G.S. A simple method for the isolation and purification of total lipids from animal tissues. J. Biol. Chem.1957, 226, 497–509. [CrossRef]
30. Grau, R.; Hamm, G. A simple method for determining water binding in muscles. Diet Nat. 1953, 40, 29–30.31. Witte, V.C.; Krause, G.F.; Bailey, M.E. A new extraction method for determining 2-thiobarbituric acid values of pork and beef
during storage. J. Food Sci. 1970, 35, 582–585. [CrossRef]32. O’Fallon, J.V.; Busboom, J.R.; Nelson, M.L.; Gaskins, C.T. A direct method for fatty acid methyl ester synthesis: Application to
wet meat tissues, oils, and feedstuffs. J. Anim. Sci. 2007, 85, 1511–1521. [CrossRef]33. Meilgaard, M.C.; Carr, B.T.; Civille, G.V. Sensory Evaluation Techniques; CRC Press: Boca Raton, FL, USA, 2006; pp. 25–28.
ISBN 978-1-00-304072-9.34. Geetha, V.; Chakravarthula, S.N. Chemical composition and anti-inflammatory activity of Boswellia ovalifoliolata essential oils
from leaf and bark. J. For. Res. 2018, 29, 373–381. [CrossRef]35. Dhama, K.; Karthik, K.; Khandia, R.; Munjal, A.; Tiwari, R.; Rana, R.; Khurana, S.K.; Sana Ullah, K.R.; Alagawany, M.; Farag,
M.R.; et al. Medicinal and therapeutic potential of herbs and plant metabolites/extracts countering viral pathogens-Currentknowledge and future prospects. Curr. Drug Metab. 2018, 19, 236–263. [CrossRef] [PubMed]
36. Golestan, I. Phytogenics as new class of feed additive in poultry industry. J. Anim. Vet. Adv. 2010, 9, 2295–2304.37. Krause, D.O.; House, J.D.; Nyachoti, C.M. Alternatives to antibiotics in swine diets: A molecular approach. Proc. Manit. Swine
Sem. 2005, 19, 57–66.38. Surai, P.F.; Kochish, I.I.; Fisinin, V.I.; Velichko, O.A. Selenium in Poultry Nutrition: From Sodium Selenite to Organic Selenium
Sources. Jpn. Poult. Sci. 2018, 55, 79–93. [CrossRef]39. Hellfritsch, C.; Brockhoff, A.; Stähler, F.; Meyerhof, W.; Hofmann, T. Human Psychometric and Taste Receptor Responses to
Steviol Glycosides. J. Agric. Food Chem. 2012, 60, 6782–6793. [CrossRef]40. Ahmed, J.; Preissner, S.; Dunkel, M.; Worth, C.L.; Eckert, A.; Preissner, R. Super Sweet—A resource on natural and artificial
sweetening agents. Nucleic Acids Res. 2010, 14, 39.41. Abudula, R.; Matchkov, V.V.; Jeppesen, P.B.; Nilsson, H.; Aalkjaer, C.; Hermansen, K. Rebaudioside A directly stimulates insulin
secretion from pancreatic beta cells: A glucose-dependent action via inhibition of ATP-sensitive K + -channels*. Diabetes Obes.Metab. 2008, 10, 1074–1085. [CrossRef]
42. Han, X.; Chen, C.; Zhang, X.; Wei, Y.; Tang, S.; Wang, J.; Tan, Z.; Xu, L. Effects of Dietary Stevioside Supplementation on FeedIntake, Digestion, Ruminal Fermentation, and Blood Metabolites of Goats. Animals 2019, 9, 32. [CrossRef]
97
Foods 2021, 10, 129
43. Cho, S.; Mbiriri, D.T.; Shim, K.; Lee, A.L.; Oh, S.J.; Yang, J.; Ryu, C.; Kim, Y.H.; Seo, K.S.; Chae, J.I.; et al. The influence of feedenergy density and a formulated additive on rumen and rectal temperature in hanwoo steers. Asian Australas. J. Anim. Sci. 2014,27, 1652–1662.
44. Quesnel, H.; Renaudin, A.; Le Floc’h, N.; Jondreville, C.; Père, M.C.; Taylor-Pickard, J.A.; Le Dividich, J. Effect of organic andinorganic selenium sources in sow diets on colostrum production and piglet response to a poor sanitary environment afterweaning. ANM 2008, 2. [CrossRef] [PubMed]
45. Tufarelli, V.; Ceci, E.; Laudadio, V. 2-Hydroxy-4-Methylselenobutanoic Acid as New Organic Selenium Dietary Supplement toProduce Selenium-Enriched Eggs. Biol. Trace Elem. Res. 2016, 171, 453–458. [CrossRef] [PubMed]
46. Surai, P.F.; Fisinin, V.I. Selenium in poultry breeder nutrition: An update. Anim. Feed Sci. Technol. 2014, 191, 1–15. [CrossRef]47. Khalili, M.; Chamani, M.; Amanlou, H.; Nikkhah, A.; Sadeghi, A. The effect of feeding inorganic and organic selenium sources on
the performance and content of selenium in milk of transition dairy cows. Acta Sci. Anim. Sci. 2019, 41, 44691. [CrossRef]48. Gromadzinska, J.; Reszka, E.; Bruzelius, K.; Wasowicz, W.; Åkesson, B. Selenium and cancer: Biomarkers of selenium status and
molecular action of selenium supplements. Eur. J. Nutr. 2008, 47, 29–50. [CrossRef]49. Zhang, W.; Xiao, S.; Samaraweera, H.; Lee, E.J.; Ahn, D.U. Improving functional value of meat products. Meat Sci. 2010, 86, 15–31.
[CrossRef]50. Gaweł-Beben, K.; Bujak, T.; Nizioł-Łukaszewska, Z.; Antosiewicz, B.; Jakubczyk, A.; Karas, M.; Rybczynska, K. Stevia Rebaudiana
Bert. Leaf Extracts as a Multifunctional Source of Natural Antioxidants. Molecules 2015, 20, 5468–5486. [CrossRef]51. Callow, E.H. Comparative studies of meat. II. The changes in the carcass during growth and fattening, and their relation to the
chemical composition of the fatty and muscular tissues. J. Agric. Sci. 1948, 38, 174–199. [CrossRef]52. Mehdi, Y.; Clinquart, A.; Hornick, J.-L.; Cabaraux, J.-F.; Istasse, L.; Dufrasne, I. Meat composition and quality of young growing
Belgian Blue bulls offered a fattening diet with selenium enriched cereals. Can. J. Anim. Sci. 2015, 95, 465–473. [CrossRef]53. Waldenstedt, L. Nutritional factors of importance for optimal leg health in broilers: A review. Anim. Feed Sci. Technol. 2006, 126,
291–307. [CrossRef]54. Zhang, S.; Xie, Y.; Li, M.; Yang, H.; Li, S.; Li, J.; Xu, Q.; Yang, W.; Jiang, S. Effects of Different Selenium Sources on Meat Quality
and Shelf Life of Fattening Pigs. Animals 2020, 10, 615. [CrossRef]55. Choi, J.S.; Lee, J.H.; Lee, H.J.; Jang, S.S.; Lee, J.J.; Choi, Y.I. Effect of stevia and charcoal as an alternative to antibiotics on carcass
characteristics and meat quality in finishing pigs. Food Sci. Anim. Resour. 2012, 32, 835–841. [CrossRef]56. Smith, G.C.; Belk, K.E.; Sofos, J.N.; Tatum, J.D.; Williams, S.N. Economic implications of improved color stability in beef.
In Antioxidants in Muscle Foods: Nutritional Strategies to Improve Quality; Decker, E.A., Faustman, C., Lopez-Bote, C.J., Eds.; WileyInterscience: New York, NY, USA, 2000; pp. 397–426.
57. Macit, M.; Aksakal, V.; Emsen, E.; Aksu, M.I.; Karaoglu, M.; Esenbuga, N. Effects of vitamin E supplementation on performanceand meat quality traits of Morkaraman male lambs. Meat Sci. 2003, 63, 51–55. [CrossRef]
58. Boiago, M.M.; Borba, H.; Leonel, F.R.; Giampietro-Ganeco, A.; Ferrari, F.B.; Stefani, L.M.; Souza, P.A. de Sources and levels ofselenium on breast meat quality of broilers. Cienc. Rural 2014, 44, 1692–1698. [CrossRef]
59. Boonkaewwan, C.; Burodom, A. Anti-inflammatory and immunomodulatory activities of stevioside and steviol on colonicepithelial cells: Anti-inflammatory and immunomodulatory activities of stevia compounds. J. Sci. Food Agric. 2013, 93, 3820–3825.[CrossRef] [PubMed]
60. Chatsudthipong, V.; Muanprasat, C. Stevioside and related compounds: Therapeutic benefits beyond sweetness. Pharmacol. Ther.2009, 121, 41–54. [CrossRef] [PubMed]
61. Ruiz, J.C.R.; Ordoñez, Y.B.M.; Basto, Á.M.; Campos, M.R.S. Antioxidant capacity of leaf extracts from two Stevia rebaudiana Bertonivarieties adapted to cultivation in Mexico. Nutr. Hosp. 2015, 31, 1163–1170. [CrossRef]
62. Zheng, G.; Xu, L.; Wu, P.; Xie, H.; Jiang, Y.; Chen, F.; Wei, X. Polyphenols from longan seeds and their radical-scavenging activity.Food Chem. 2009, 116, 433–436. [CrossRef]
63. Mukai, K.; Nagai, S.; Ohara, K. Kinetic study of the quenching reaction of singlet oxygen by tea catechins in ethanol solution.Free Radic. Biol. Med. 2005, 39, 752–761. [CrossRef]
64. Brigelius-Flohé, R.; Maiorino, M. Glutathione peroxidases. Biochim. Biophys. Acta 2013, 1830, 3289–3303. [CrossRef]65. Berchielli, T.T.; Vaz Pires, A.; Oliveira, S.G. Nutrição de Ruminantes. Jaboticabal Funep 2006, 1, 200–583.66. Richard, D.; Bausero, P.; Schneider, C.; Visioli, F. Polyunsaturated fatty acids and cardiovascular disease. Cell. Mol. Life Sci. 2009,
66, 3277–3288. [CrossRef] [PubMed]67. Netto, A.S.; Zanetti, M.A.; Claro, G.R.D.; de Melo, M.P.; Vilela, F.G.; Correa, L.B. Effects of Copper and Selenium Supplementation
on Performance and Lipid Metabolism in Confined Brangus Bulls. Asian Australas. J. Anim. Sci. 2014, 27, 488–494. [CrossRef][PubMed]
68. Lourenço, M.; Cardozo, P.W.; Calsamiglia, S.; Fievez, V. Effects of saponins, quercetin, eugenol, and cinnamaldehyde on fattyacid biohydrogenation of forage polyunsaturated fatty acids in dual-flow continuous culture fermenters1. J. Anim. Sci. 2008, 86,3045–3053. [CrossRef]
69. Li, Z.T.; Lin, T.; Shen, J.X.; Chen, W.Y.; Sun, C. Effect of rosemary on antibacterial and freshness of cold meat. Food Res. Dev. 2017,38, 181–186.
70. Zhou, G.H.; Xu, X.L.; Liu, Y. Preservation technologies for fresh meat—A review. Meat Sci. 2010, 86, 119–128. [CrossRef]
98
Foods 2021, 10, 129
71. Kostadinovic, L.; Levic, J.; Popovic, S.T.; Cabarkapa, I.; Puvaca, N.; Djuragic, O.; Kormanjoš, S. Dietary inclusion of Artemisiaabsinthium for management of growth performance, antioxidative status and quality of chicken meat. Eur. Poult. Sci. 2015, 79.[CrossRef]
72. Hes, M. Protein-lipid interactions in different meat systems in the presence of natural antioxidants—A review. Polish J. Food Nutr.Sci. 2017, 67, 5–18. [CrossRef]
73. Mikulski, D.; Jankowski, J.; Zdun Czyk, Z.; Wróblewska, M.; Sartowska, K.; Majewska, T. The effect of selenium source onperformance, carcass traits, oxidative status of the organism, and meat quality of turkeys. J. Anim. Feed Sci. 2009, 18, 518–530.[CrossRef]
99

MDPISt. Alban-Anlage 66
4052 BaselSwitzerland
Tel. +41 61 683 77 34Fax +41 61 302 89 18
www.mdpi.com
Foods Editorial OfficeE-mail: [email protected]
www.mdpi.com/journal/foods


MDPI
St. Alban-Anlage 66
4052 Basel
Switzerland
Tel: +41 61 683 77 34
Fax: +41 61 302 89 18
www.mdpi.com ISBN 978-3-0365-2288-3