Physicochemical properties and baking qualities of baked ...
Upload
independentCategory
view
2download
0
International Journal of Pharmaceutics, 68 (1991) 25-33 © 1991 Elsevier Science Publishers B.V. (Biomedical Division) 0378-5173/91/$03.50 ADONIS 037851739100070E
25
IJP 02250
Some physicochemical properties of glassy felodipine
J. K e r 6 1, S. SrEiE 2, M. M o h a r 1 a n d J. S m i d - K o r b a r 2
1 Department of Research and Development, Lek, Pharmaceutical and Chemical Works, Ljubljana (Yugoslavia) and 2 Department of Pharmacy, University of Ljubljana, Ljubljana (Yugoslavia)
(Received 23 March 1990) (Modified version received 23 June 1990)
(Accepted 10 July 1990)
Key words: Felodipine; Glassy state; Glass transition; Crystallization; Differential scanning calorimetry; X-ray analysis; Scanning electron microscopy; Dissolution rate
Summary
Felodipine, a normally crystalline and very slightly soluble Ca-antagonist was prepared in glassy form and some of its physicochemical properties were determined. The glassy state was confirmed by X-ray diffraction method, scanning electron microscopy (SEM) and differential scanning calorimetry (DSC). The influence of the cooling rate of the melt and the heating rate of the glass formed on the glass transition temperature was examined. The jump of the heat capacity, the area under the anomalous endothermic peak and the activation energy of the glass transition were calculated. The influence of the heating rate of the glassy felodipine on its crystallization was studied and the kinetic data of the crystallization were obtained. Dissolution tests were carried out and differences were established.
Introduction
The glassy state may improve bioavailability of drugs if it increases the dissolution rate and hence the absorpt ion of drugs. There have been numer- ous reports on the glassy state of high-molecular compounds , but the nature of the glassy state of low-molecular compounds has been less well in- vestigated. The glass behaviour and glass proper- ties of some pure low-molecular-weight com- pounds have been investigated thermodynamical ly (Suga and Seki, 1974; Haida et al., 1977).
Several drugs have been reported to form glasses with citric acid, and various barbiturates have also
Correspondence: S. SrEi~, Dept. of Pharmacy, University of Ljubljana, Ljubljana, Yugoslavia.
been reported to be capable of the glass format ion (Chiou and Riegelman, 1971; Summers, 1978). However, the description of the glass transit ion process and the glassy state are more or less empirical in nature. The properties of solids formed by cooling the melts have been reported by several authors (Borka, 1974; Ford and Rubin- stein, 1978; Imaizumi et al., 1980). Borka (1974) reported that indomethacin solidified after melt- ing as a brittle, glassy amorphous mass which remained uncrystallized for at least two months at room temperature.
Well-established methods to s tudy the kinetics of reactions are based on the determinat ion of the amount of reactant decomposed after various time intervals. These experiments are usually carried out isothermally at a range of temperatures and are therefore rather t ime-consuming (Ker6 et al.,
26
1989). The DSC technique has the advantage of being very rapid and versatile. A single, tempera- ture programmed DSC experiment can be used to compute the Arrhenius preexponential factor, A, activation energy, E a, and order of the reaction, n, (Schlichenmaier and Widmann, 1977).
However, there is much confusion in the litera- ture about the kinetic constants obtained through DSC experiments (Ford and Timmuns, 1989). Large discrepancies were found between the re- sults of various kinetic methods based on DSC. Some authors (Borchardt and Daniels, 1957; Free- man and Carrol, 1958; Carroll and Manche, 1972) preferred the heat evolution method, which is based on the shape of a single DSC curve, whereas others (Duswalt, 1974; Ozawa, 1975) found an approach using a series of DSC experiments at various heating rates to be much more satisfac- tory.
In the present work, glassy felodipine was pre- pared by cooling the melt and the glassy state was confirmed by the X-ray diffraction method, scan- ning electron microscopy (SEM) and differential scanning calorimetry (DSC). The glassy felodipine was prepared at different cooling rates of the melt and the glass transition temperature, Tg, jump of the heat capacity, Acp, anomalous endothermic peak (relaxation enthalpy), A Hre I .... crystallization kinetic constants and melting enthalpies were de- termined by the DSC experiments at various heat- ing rates.
The dissolution rate of different types of glassy felodipine was also studied in the present investi- gation. Felodipine is a slightly water-soluble drug. Thus the dissolution rate could be the rate limiting process in the absorption of felodipine from a solid dosage form. Since the therapeutic dose of the drug is relatively large (10 mg), the poor aqueous solubility would result in dissolution and bioavailability problems on peroral dosing. Numerous attempts were conducted so as to de- velop an increased dissolution rate.
Experimental
Materials Felodipine, a vasodilatory substance, is chem-
ically a dihydropyridine derivative (Fig. 1). Crys-
H3COOC~[~ H3C
Fig. 1. Chemical structure of felodipine.
talline felodipine with a melting point of 143°C (Kofler method) was used. The average diameter of crystalline felodipine particles was 10/zm.
Preparation of glassy felodipine For DSC studies, the crystalline felodipine was
melted in an aluminium sample pan above melting temperature and the melts were solidified by cool- ing to 2 9 3 K at various rates. For dissolution studies, SEM and X-ray diffraction studies, the crystalline felodipine was melted in a glass pot and the melt was solidified either by cooling slowly at room temperature or by quenching in liquid nitrogen, thereafter being dried in a vacuum drier.
X-ray diffraction studies (Guinier powder method) An Enraf Nonius instrument (Evershed-Enraf,
Delft, The Netherlands) equipped with X-ray film as a detector was used for these studies. Powdered samples of a mixed size range were mounted on adhesive tape and the X-ray diffraction patterns were determined using CuK~ radiation.
Every experiment was carried out under follow- ing conditions: target, Cu; voltage, 36 kV; current, 16 mA; exposure time, 1.5 h. Evaluation of X-ray films was carried out using transmission densime- try.
Scanning electron microscopy The shape and the surface appearance of crys-
talline and glassy felodipine were observed with a scanning electron microscope (SEM, JSM-U2; JEOL, Tokyo, Japan). The samples were prepared by shadowing with carbon and gold/pal ladium and observed with the secundar electron tech- nique. ~L
Thermal analysis A Perkin Elmer DSC-4 (Perkin-Elmer, Norwalk,
CT, U.S.A.) was used. All thermal analysis mea- surements were performed in a dynamic nitrogen atmosphere (40 ml/min). The sample sizes were in the range of 2 -4 mg. The glass transition was observed as a discontinuity due to an increase in heat capacity of felodipine on the ordinate of the DSC curve, as shown in Fig. 2. The Tg is evident as a small endothermic rise, represented by the midpoint of the rise measured from the extension of the pre- and post-transition baselines, i.e. when the transition assumes half the value of this change.
The area under the anomalous endothermic peak is determined by extrapolating the post-tran- sition baseline. The absorbed or evolved energy of the samples was calculated by measuring the peak area with a Perkin-Elmer Thermal Analysis Data Station 3700.
The Arrhenius pre-exponential factor, A, activation energy, Ea, and the order of crystalliza- tion, n, of the glassy felodipine were calculated through temperature-programmed DSC experi- ments according to a published method (Torfs et al., 1984).
The activation energy of crystallization was also calculated according to a previous method which examines exothermic peak maximum temperatures at different heating rates (Ozawa, 1975).
E
I..U Gross Recrystottisotion
tronsition exotherm
Melting endotherm
TEMPERATURE Fig. 2. DSC scan of glassy felodipine, showing glass, recrys-
tallization and melting transitions; scan rate: 40 K/re.in.
27
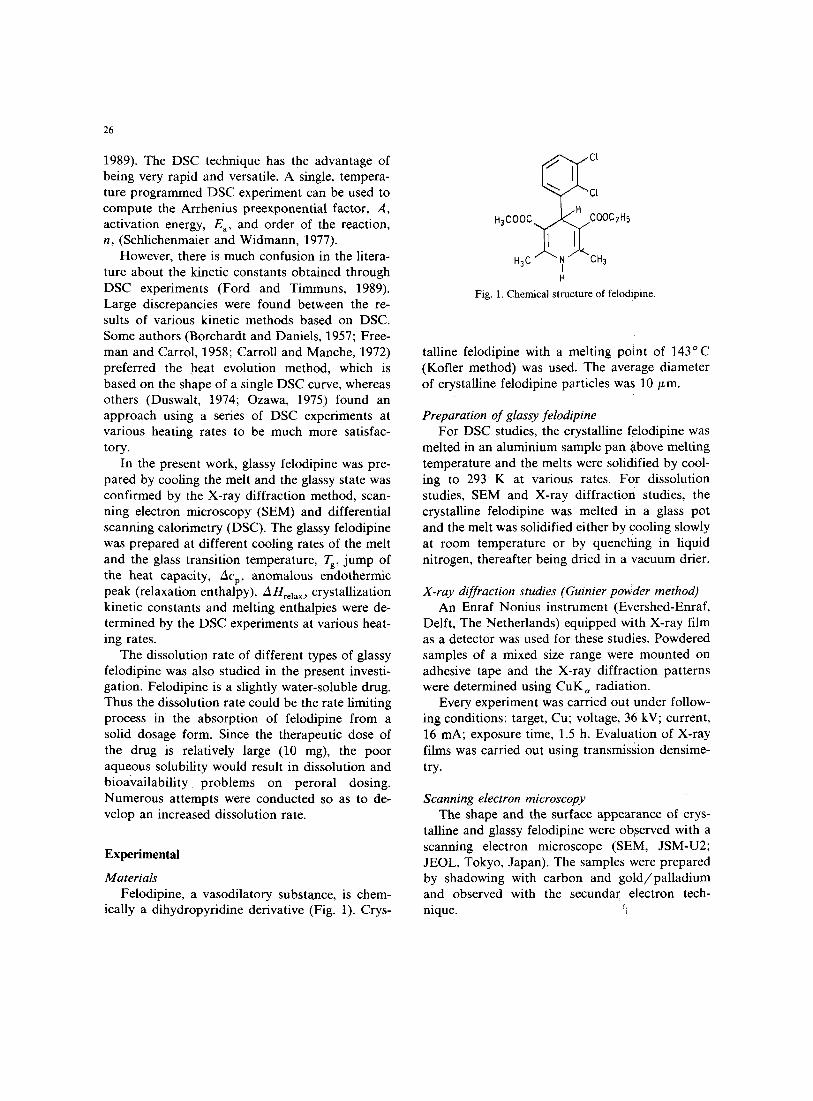
Fig. 3. X-ray diffraction patterns of crystalline and glassy felodipine. (A) Crystalline felodipine; (B) glassy felodipine prepared by cooling at room conditions; (C) glassy felodipine
prepared by quenching in liquid nitrogen.
Dissolution studies The dissolution studies were conducted in dis-
tilled water-ethanol (7 : 3, v /v ) medium. The drug stability was satisfactory in this dissolution media after 2 h of exposure at 37 ° C.
The USP Paddle method (USP XXI, 1985) was used to determine the dissolution rate of the sam- pies: 1000 ml of dissolution medium, 37 ° C, 100 rpm.
Accurately weighted drug samples (10 mg) were spread over the dissolution medium surface. Aliquots of the dissolution medium were with- drawn periodically and passed through a 0.45/xm membrane filter. The absorbance was determined spectrophotometrically at X = 346 nm using Hewlett-Packard 8451A spectrophotometer.
Immediately after withdrawing an aliquot, an equal quantity of dissolution medium was added to maintain a constant volume. Cumulative cor-
28
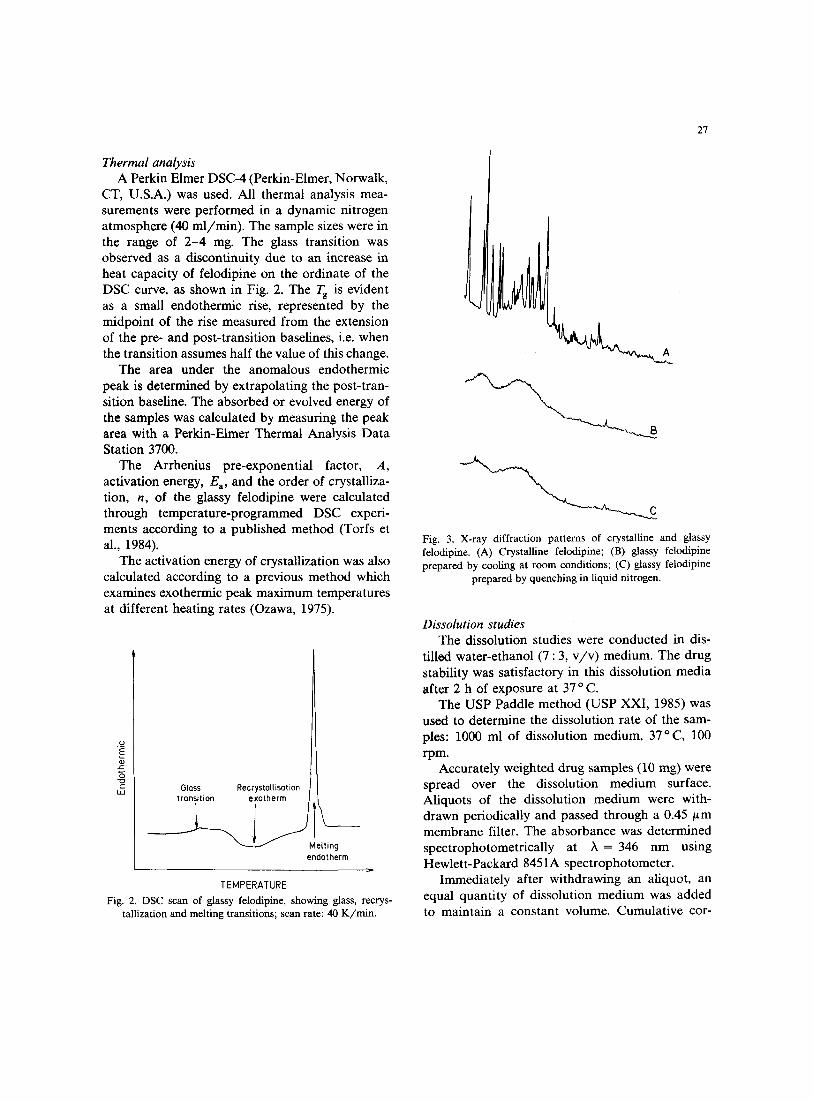
Fig. 4. Scanning electron micrographs of felodipine: (a) crystalline felodipine; (b) glassy felodipine, prepared by quenching in liquid nitrogen; (c) glassy felodipine, prepared by cooling under room conditions; (d) glassy felodipine, prepared by cooling under room
conditions and pulverised in mortar.
rections were made for the previously withdrawn aliquots in calculating the total amount of felodi- pine dissolved.
Results and Discussion
Confirmation of the amorphous state of solidified melt by X-ray diffraction method and scanning elec- tron microscopy
Fig. 3 shows X-ray diffraction patterns of the crystalline felodipine and felodipine, immediately after solidification of the melt at room conditions or in liquid nitrogen. In the case of solidified melt, no characteristic peaks were observed on the X-ray diffraction patterns: the solidified melt was in amorphous state.
Scanning electron micrographs of the crystal- line and glassy felodipine particles are shown in Fig. 4. Irrespective of the method of solidification (slow or fast cooling), the solidified melt was a transparent and brittle glassy mass.
Thermal analysis Influence of the cooling rate during glass ,pre-
paration on the glass transition. It is generally accepted that glass formation depends on the cool- ing rate of the melt. To examine the effect Of the cooling rate on the glass formation, glassy felodi- pine was prepared at various cooling rates and the glasses thus obtained were reheated with the rate of 10 K/min . In DSC thermograms, the jump of the heat capacity and the anomalous endothermic
29
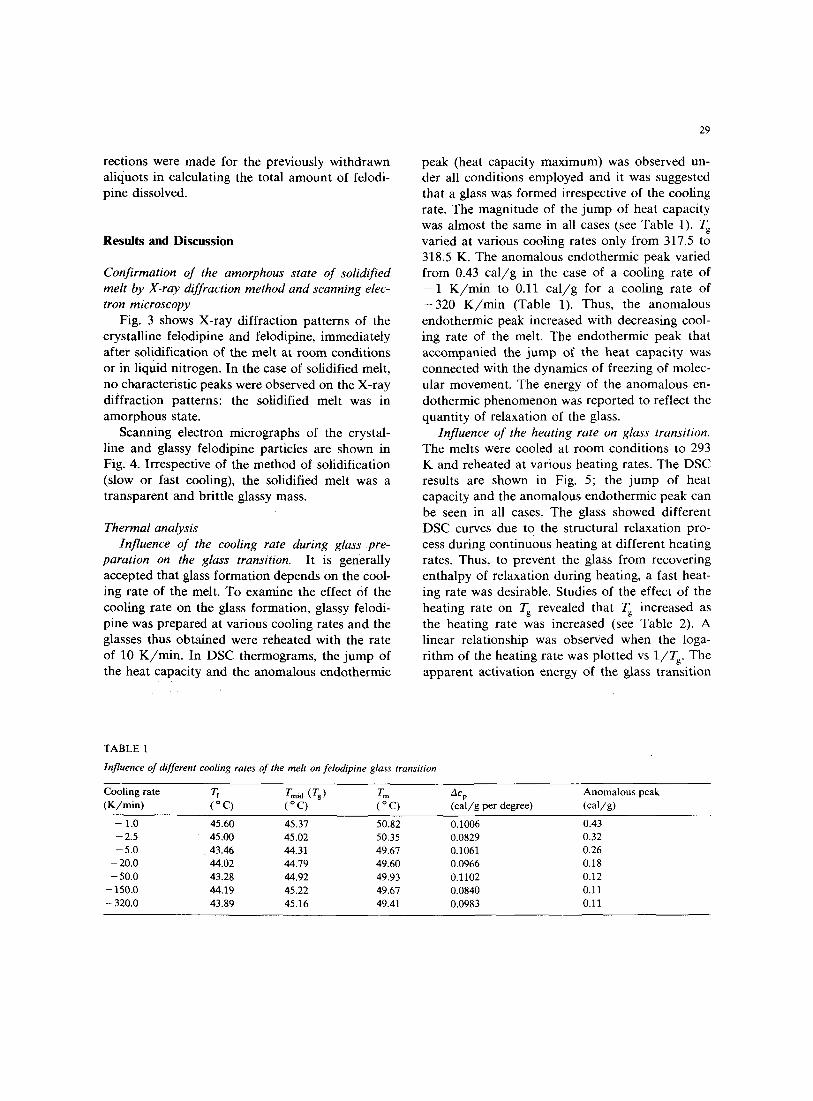
peak (heat capacity maximum) was observed un- der all conditions employed and it was suggested that a glass was formed irrespective of the cooling rate. The magnitude of the jump of heat capacity was almost the same in all cases (see Table 1). Tg varied at various cooling rates only from 317.5 to 318.5 K. The anomalous endothermic peak varied from 0.43 ca l /g in the case of a cooling rate of - 1 K / r a in to 0.11 ca l /g for a cooling rate of - 3 2 0 K / m i n (Table 1). Thus, the anomalous endothermic peak increased with decreasing cool- ing rate of the melt. The endothermic peak that accompanied the jump of the heat capacity was connected with the dynamics of freezing of molec- ular movement. The energy of the anomalous en- dothermic phenomenon was reported to reflect the quantity of relaxation of the glass.
Influence of the heating rate on glass transition. The melts were cooled at room conditions to 293 K and reheated at various heating rates. The DSC results are shown in Fig. 5; the jump of heat capacity and the anomalous endothermic peak can be seen in all cases. The glass showed different DSC curves due to the structural relaxation pro- cess during continuous heating at different heating rates. Thus, to prevent the glass from recovering enthalpy of relaxation during heating, a fast heat- ing rate was desirable. Studies of the effect of the heating rate on Tg revealed that Tg increased as the heating rate was increased (see Table 2). A linear relationship was observed when the loga- rithm of the heating rate was plotted vs 1/Tg. The apparent activation energy of the glass transition
T A B L E 1
Influence of different cooling rates of the melt on felodipine glass transition
C o o l i n g ra t e Tf Tmi d (Tg) T m Acp A n o m a l o u s p e a k ( K / r a i n ) ( ° C) ( o C) ( ° C) ( c a l / g pe r degree) ( c a l / g )
- 1.0 45 .60 45.37 50.82 0 .1006 0.43
-- 2.5 45 .00 45 .02 50.35 0 .0829 0.32
-- 5.0 43 .46 44.31 49 .67 0.1061 0.26
- 20.0 44.02 44 .79 49 .60 0 .0966 0.18
-- 50.0 43.28 44.92 49.93 0 .1102 0.12
- 150 .0 44 .19 45.22 49.67 0 .0840 0.11
- 320.0 43 .89 45.16 49.41 0 .0983 0.11

30
A
O
L____~J
-- 71. 813 323 333 3i3 353 T (K )
Fig. 5. Variation of Tg with heating rate of glassy felodipine. Heating rate: (A) 80.0; (B) 40.0, (C) 20.0; (D) 10.0 K / mi n .
was calculated to be 31.6 kcal /mol according to Eqn 1 derived by Barton (1969).
E a log ~ = RTg (1)
Influence of the heating rate on glassy felodipine Crystallization. Heat evolution method: If sam- ples are not too large (below 20 mg), the heat flow signal is as a good approximation directly propor- tional to the instantaneously evolved heat. Accordingly, the instantaneous reaction rate can be derived from the measured heat flow. Under these conditions the reaction rate constant, k, at
A ~ . f f b o s e l i n e Htotol
0 ~ - - - I klA Z tZ3 . . . . . . . . . . . . . . . . . / . . . . .
g r ,
I
Ti TENPERATURE
Fig. 6. DSC curve for glassy felodipine crystallization; the area between the curve and the broken baseline represents the heat of reaction, Z~Htot, and the fraction of felodipine, which has
not yet crystallized at temperature Ti, is related to AHr~st.
any temperature, Ti, may be calculated from Eqn 2 (Carroll and Manche, 1972; Torfs et al., 1984).
d H 1 k = d--7 ( ~ '~o s , / ° (2)
AHtott AH, ot ]
In Eqn 2, d H / d t is the heat flow (more exactly the flow deviation from the base line), A Hto t is the total heat of reaction evolved, which can be derived from the integral area of the reaction exotherm in Fig. 6, AHrest is the reaction heat evolved above the temperature T i (Fig. 6), and n is the order of the reaction. The reaction rate constant, k, is computed using Eqn 2 for n = 0, 1, 2 and 3. This yields a number of Arrhenius plots of which the one corresponding to the true reac- tion order should be linear. Fig. 7 is an example of such a plot of In k vs reciprocal temperature for
TABLE 2
Influence of the heating rate on felodipine glass transition (sample: glassy felodipine, prepared by cooling the melt under room conditions)
Heating rate T r Tmi e (Tg) T m Acp Anomalous peak (K/min ) ( '~ C) ( ° C) ( ° C) (cal /g per degree) (cal/g)
10.0 40.40 40.49 48.24 0.0893 0.26 20.0 44.40 44.41 52.53 0.0760 0.82 40.0 49.28 50.38 56.71 0.0840 0.42 80.0 52.26 53.12 61.35 0.0934 1.26
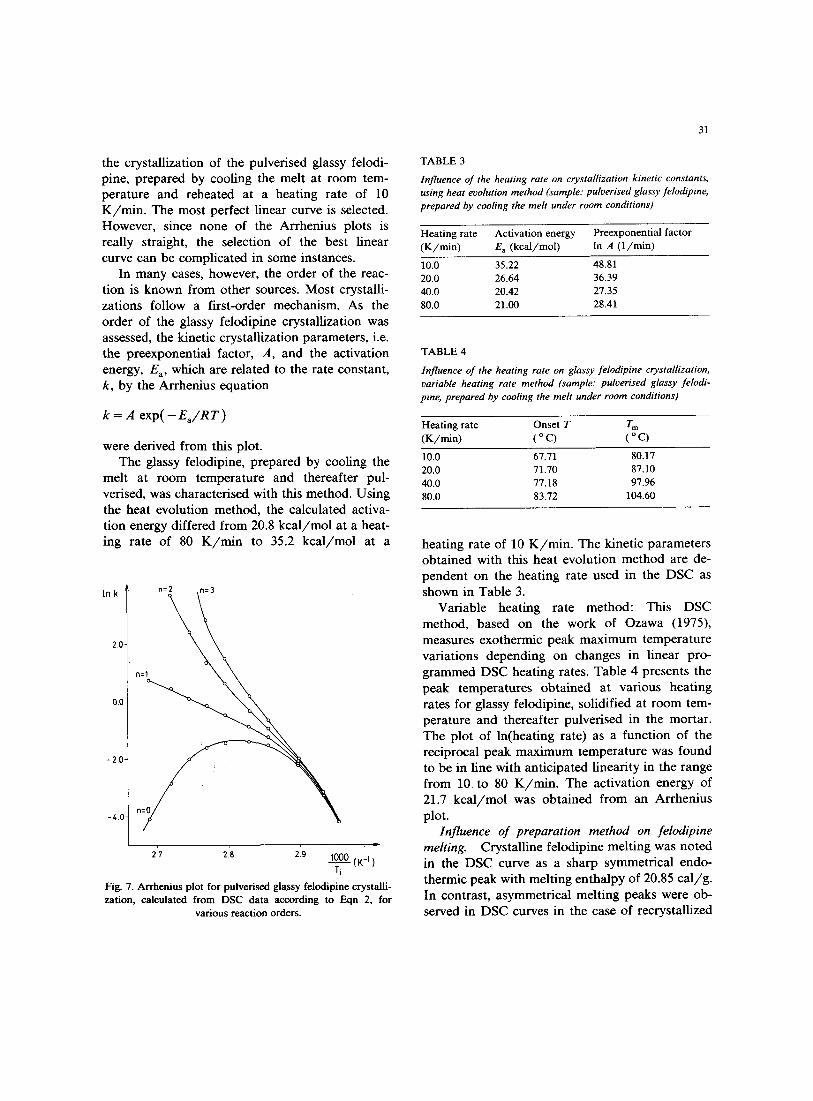
lnk
the crystallization of the pulverised glassy felodi- pine, prepared by cooling the melt at room tem- perature and reheated at a heating rate of 10 K /min . The most perfect linear curve is selected. However, since none of the Arrhenius plots is really straight, the selection of the best linear curve can be complicated in some instances.
In many cases, however, the order of the reac- tion is known from other sources. Most crystalli- zations follow a first-order mechanism. As the order of the glassy felodipine crystallization was assessed, the kinetic crystallization parameters, i.e. the preexponential factor, A, and the activation energy, Ea, which are related to the rate constant, k, by the Arrhenius equation
k = A exp( - E a / R T )
were derived from this plot. The glassy felodipine, prepared by cooling the
melt at room temperature and thereafter pul- verised, was characterised with this method. Using the heat evolution method, the calculated activa- tion energy differed from 20.8 kca l /mol at a heat- ing rate of 80 K / m i n to 35.2 kcal /mol at a
20'
n:2 ,n:3
n
0.O
- 2 0
- t , . 0 -
31
2;7 28 219 1000 (K_I) Ti
Fig. 7. Arrhenius plot for pulverised glassy felodipine crystalli- zation, calculated from DSC data according to Eqn 2, for
various reaction orders.
TABLE 3
Influence of the heating rate on crystallization kinetic constants, using heat evolution method (sample." puloerised glassy felodipine, prepared by cooling the melt under room conditions)
Heating rate Activation energy Preexponential factor (K/ ra in ) E a (kcal /mol) In A (1 /min )
10.0 35.22 48.81 20.0 26.64 36.39 40.0 20.42 27.35 80.0 21.00 28.41
TABLE 4
Influence of the heating rate on glassy felodipine crystallization, variable heating rate method (sample," pulverised glassy felodi- pine, prepared by cooling the melt under room conditions)
Heating rate Onset T Trn (K/re.in) ( o C) ( o C)
10.0 67.71 80.17 20.0 71.70 87.10 40.0 77.18 97.96 80.0 83.72 104.60
heating rate of 10 K/min . The kinetic parameters obtained with this heat evolution method are de- pendent on the heating rate used in the DSC as shown in Table 3.
Variable heating rate method: This DSC method, based on the work of Ozawa (1975), measures exothermic peak maximum temperature variations depending on changes in linear pro- grammed DSC heating rates. Table 4 presents the peak temperatures obtained at various heating rates for glassy felodipine, solidified at room tem- perature and thereafter pulverised in the mortar. The plot of In(heating rate) as a function of the reciprocal peak maximum temperature was found to be in line with anticipated linearity in the range from 10 to 80 K /m in . The activation energy of 21.7 kcal /mol was obtained from an Arrhenius plot.
Influence of preparation method on felodipine melting. Crystalline felodipine melting was noted in the DSC curve as a sharp symmetrical endo- thermic peak with melting enthalpy of 20.85 cal /g . In contrast, asymmetrical melting peaks were ob- served in DSC curves in the case of recrystallized
32
glassy felodipine. Melting enthalpies for recrystal- lized glassy felodipine, prepared by solidification at room conditions or in liquid nitrogen were established to be 9.34 or 15.18 cal/g, respectively.
Dissolution studies It is recommended that the dissolution rate can
be determined under so-called 'sink conditions'; this term has been interpreted to mean that the concentration of the drug in the dissolution fluid must not exceed 10-20% of the saturation con- centration (Moiler, 1981). The use of dissolution tests has been questioned in the case of lipophilic drugs of extremely low water solubility. Felodi- pine is practically insoluble in water, the solubility at 37 °C being about 1 mg/1. Difficulties associ- ated with the dissolution testing of lipophilic drugs became evident during the formulation process of a tablet that contained 10 mg felodipine. A method based on pure water as a dissolution medium would have required about 30 1 of medium to ensure sink conditions. The handling of such a large volume is by no means practical.
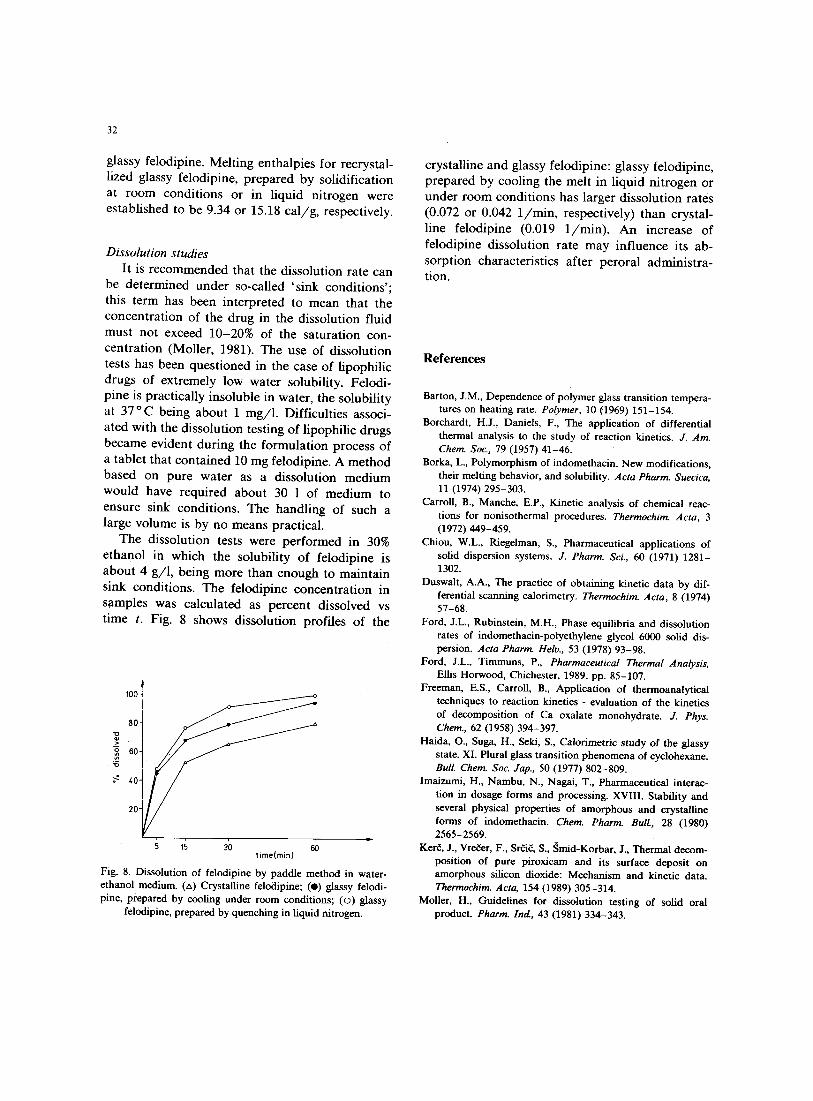
The dissolution tests were performed in 30% ethanol in which the solubility of felodipine is about 4 g/I , being more than enough to maintain sink conditions. The felodipine concentration in samples was calculated as percent dissolved vs time t. Fig. 8 shows dissolution profiles of the
'°° l
: ,0ti / 2 0 ~ '/ :~
5 15 30 60 tirne(min)
Fig. 8. Dissolution of felodipine by paddle method in water- ethanol medium. (t,) Crystalline felodipine; (O) glassy felodi- pine, prepared by cooling under room conditions; (o) glassy
felodipine, prepared by quenching in liquid nitrogen.
crystalline and glassy felodipine: glassy felodipine, prepared by cooling the melt in liquid nitrogen or under room conditions has larger dissolution rates (0.072 or 0.042 1/min, respectively) than crystal- line felodipine (0.019 1/min). An increase of felodipine dissolution rate may influence its ab- sorption characteristics after peroral administra- tion.
References
Barton, J.M., Dependence of polymer glass transition tempera- tures on heating rate. Polymer, 10 (1969) 151-154.
Borchardt, H.J., Daniels, F., The application of differential thermal analysis to the study of reaction kinetics. J. Am. Chem. Soc., 79 (1957) 41-46.
Borka, L., Polymorphism of indomethacin. New modifications, their melting behavior, and solubility. Acta Pharm. Suecica, 11 (1974) 295-303.
Carroll, B., Manche, E.P., Kinetic analysis of chemical reac- tions for nonisothermal procedures. Thermochim. Acta, 3 (1972) 449-459.
Chiou, W.L., Riegelman, S., Pharmaceutical applications of solid dispersion systems. J. Pharm. Sci., 60 (1971) 1281- 1302.
Duswalt, A.A., The practice of obtaining kinetic data by dif- ferential scanning calorimetry. Thermochim. Acta, 8 (1974) 57-68.
Ford, J.L., Rubinstein, M.H., Phase equilibria and dissolution rates of indomethacin-polyethylene glycol 6000 solid dis- persion. Acta Pharm. Heir., 53 (1978) 93-98.
Ford, J.L., Timmuns, P., Pharmaceutical Thermal Analysis, Ellis Horwood, Chichester, 1989, pp. 85-107.
Freeman, E.S., Carroll, B., Application of thermoanalytical techniques to reaction kinetics - evaluation of the kinetics of decomposition of Ca oxalate monohydrate. J. Phys. Chem., 62 (1958) 394-397.
Haida, O., Suga, H., Seki, S., Calorimetric study of the glassy state. XI. Plural glass transition phenomena of cyclohexane. Bull. Chem. Soc. Jap., 50 (1977) 802-809.
Imaizumi, H., Nambu, N., Nagai, T., Pharmaceutical interac- tion in dosage forms and processing. XVIII. Stability and several physical properties of amorphous and crystalline forms of indomethacin. Chem. Pharm. Bull., 28 (1980) 2565-2569.
Ker~, J., Vre~er, F., Sr~i~, S., Smid-Korbar, J., Thermal decom- position of pure piroxicam and its surface deposit on amorphous silicon dioxide: Mechanism and kinetic data. Thermochim. Acta, 154 (1989) 305-314.
Moller, H., Guidelines for dissolution testing of solid oral product. Pharm. lnd, 43 (1981) 334-343.

Ozawa, T.J., Critical investigation of methods for kinetics analysis of thermoanalytical data. J. Therm. Anal., 7 (1975) 601-617.
Schlichenmaier, V., Widmann, G., Experiences with the kineti- cal evaluation of calorimetric differential thermal analysis traces. Thermochim. Acta, 21 (1977) 39-45.
Suga, H., Seki, S., Thermodynamic investigation on glassy states of pure simple compounds. J. Non-Cryst. Solids, 16 (1974) 171-194.
33
Summers, M.P., Glass formation in barbiturates and solid dispersion systems of barbiturates with citric acid. J. Pharm. Sci., 67 (1978) 1606-1610.
Torfs, J.C.M., Deij, L., Dorrepaal, A.J., Heijens, J.C., De- termination of Arrhenius kinetic constants by differential scanning calorimetry. Anal Chem., 56 (1984) 2863-2867.
USP XXI, United States Pharmacopeial Convention Inc., RockviUe MD, 1985, pp. 1243-1244.
Copyright © 2022 FDOKUMEN