The origin of electrooptical sensitivity of glassy materials: crystal motifs in glasses
16
The origin of electrooptical sensitivity of glassy materials: crystal motifs in glasses A.A. Lipovskii a, * , D.K. Tagantsev b , B.V. Tatarintsev b , A.A. Vetrov b a St.-Petersburg State Technical University, Polytechnicheskaja 29, St.-Petersburg, 195251 Russia b S. I. Vavilov State Optical Institute, Babushkina 36-1, St.-Petersburg, 193171 Russia Received 10 December 2001; received in revised form 16 July 2002 Abstract The results of studying electrooptical Kerr sensitivity in heavy metal silicate and phosphate glasses and glass- ceramics are presented. A niobium–lithium-silicate glass demonstrating a record Kerr coefficient (266 10 16 m/V 2 ) has been formed. Formation of the transparent glass-ceramics containing electrooptical sodium niobate microcrystals has been studied, and glass-ceramics demonstrating Kerr coefficients higher than 6000 10 16 m/V 2 have been elaborated. On the base of the effective medium approximation, it is shown that the Kerr coefficient of these glass-ceramics depends on the volume fraction of sodium niobate microcrystals, v c as a linear function of v c ð1 v c Þ 2 A conception of the origin of electrooptical sensitivity of glasses is proposed. This conception is based on the hypothesis that in glasses there exist regions with exactly crystalline ordering within 2–3 coordination spheres, with these regions having no phase bound- aries. These regions are named the crystal motifs (CM). Due to the highly effective mechanism of nuclear polarizability of the electrooptical crystals, the motifs with the symmetry of such crystals are responsible for high permittivity and Kerr sensitivity of the glasses, and they play a role of pre-nuclei while electrooptical glass-ceramics are forming under glass heat treatment. It has been found that synthesized barium-titanate-silicate and niobium–lithium-phosphate glasses demonstrate extremely low Kerr coefficients, and they do not form transparent glass-ceramics with any electrooptical precipitates. This contradicts literature data and is explained by the difference in the conditions of glass synthesis, which are supposed to be responsible for the formation of proper CMs. Ó 2002 Elsevier Science B.V. All rights reserved. 1. Introduction There is no need to refer to the fact that most crystals of ABO 3 group, like LiNbO 3 , BaTiO 3 , and others, are widely used as electrooptical/non-linear optical media. Such crystals are produced in great amounts by industry nowadays. At the same time, however advanced the technology of those crystals is, many publications devoted to the study of electrooptical/non-linear optical properties of glasses [1–7], poled glasses [8–18] and glass- ceramics [1,6,7,13,19–27] constantly appear up today. Of all the reasons of those studies, the first one is a hope to replace crystalline materials with glassy ones because they are cheaper in production, more flexible in properties and allow substrates of unlimited size and shape. Generally, electrooptical and non-linear optical phenomena are the same * Corresponding author. Fax: +7-812 552 7954. E-mail address: [email protected] (A.A. Lipovskii). 0022-3093/03/$ - see front matter Ó 2002 Elsevier Science B.V. All rights reserved. doi:10.1016/S0022-3093(02)01891-4 Journal of Non-Crystalline Solids 318 (2003) 268–283 www.elsevier.com/locate/jnoncrysol
Transcript of The origin of electrooptical sensitivity of glassy materials: crystal motifs in glasses

The origin of electrooptical sensitivity of glassymaterials: crystal motifs in glasses
A.A. Lipovskii a,*, D.K. Tagantsev b, B.V. Tatarintsev b, A.A. Vetrov b
a St.-Petersburg State Technical University, Polytechnicheskaja 29, St.-Petersburg, 195251 Russiab S. I. Vavilov State Optical Institute, Babushkina 36-1, St.-Petersburg, 193171 Russia
Received 10 December 2001; received in revised form 16 July 2002
Abstract
The results of studying electrooptical Kerr sensitivity in heavy metal silicate and phosphate glasses and glass-
ceramics are presented. A niobium–lithium-silicate glass demonstrating a record Kerr coefficient (266� 10�16 m/V2) has
been formed. Formation of the transparent glass-ceramics containing electrooptical sodium niobate microcrystals has
been studied, and glass-ceramics demonstrating Kerr coefficients higher than 6000� 10�16 m/V2 have been elaborated.
On the base of the effective medium approximation, it is shown that the Kerr coefficient of these glass-ceramics depends
on the volume fraction of sodium niobate microcrystals, vc as a linear function of vcð1� vcÞ�2 A conception of the origin
of electrooptical sensitivity of glasses is proposed. This conception is based on the hypothesis that in glasses there exist
regions with exactly crystalline ordering within 2–3 coordination spheres, with these regions having no phase bound-
aries. These regions are named the crystal motifs (CM). Due to the highly effective mechanism of nuclear polarizability
of the electrooptical crystals, the motifs with the symmetry of such crystals are responsible for high permittivity and
Kerr sensitivity of the glasses, and they play a role of pre-nuclei while electrooptical glass-ceramics are forming under
glass heat treatment. It has been found that synthesized barium-titanate-silicate and niobium–lithium-phosphate glasses
demonstrate extremely low Kerr coefficients, and they do not form transparent glass-ceramics with any electrooptical
precipitates. This contradicts literature data and is explained by the difference in the conditions of glass synthesis, which
are supposed to be responsible for the formation of proper CMs.
� 2002 Elsevier Science B.V. All rights reserved.
1. Introduction
There is no need to refer to the fact that most
crystals of ABO3 group, like LiNbO3, BaTiO3, and
others, are widely used as electrooptical/non-linear
optical media. Such crystals are produced in great
amounts by industry nowadays. At the same time,
however advanced the technology of those crystals
is, many publications devoted to the study of
electrooptical/non-linear optical properties of
glasses [1–7], poled glasses [8–18] and glass-
ceramics [1,6,7,13,19–27] constantly appear up
today. Of all the reasons of those studies, the first
one is a hope to replace crystalline materials with
glassy ones because they are cheaper in production,more flexible in properties and allow substrates of
unlimited size and shape. Generally, electrooptical
and non-linear optical phenomena are the same
*Corresponding author. Fax: +7-812 552 7954.
E-mail address: [email protected] (A.A. Lipovskii).
0022-3093/03/$ - see front matter � 2002 Elsevier Science B.V. All rights reserved.
doi:10.1016/S0022-3093(02)01891-4
Journal of Non-Crystalline Solids 318 (2003) 268–283
www.elsevier.com/locate/jnoncrysol

by nature [28], and this allows evaluating potentialsuitability of materials for electrooptics on the
base of knowledge on their non-linearity and vice
versa. As to the electrooptical properties of glassy
materials, their essential deficiency is insufficiently
high response to the applied electric field. It is due
to the glassy media being isotropic and demon-
strating only Kerr electrooptical phenomenon,
that is, a change of their refractive index underapplied electric field, with this change linearly de-
pending on the square of the field intensity. Kerr
sensitivity of optical materials is characterized by
Kerr coefficient, B, which can be experimentally
determined by measuring the electric-field-induced
birefringence, Dn ¼ ðnk � n?Þ, which for isotropic
optical media does not depend on the sample ori-
entation and is equal to
Dn ¼ kBE2; ð1Þwhere k is the light wavelength, and E is the dc
electric field applied across the direction of the
light beam propagation. For the best glasses the
value of their Kerr coefficients achieves about
10�14 m/V2 [1–3,7,27]. Glass crystallization can
increase the Kerr coefficient of the medium up to
about 10�12 m/V2 (it is a result of the present
work), but it is not yet such a value that couldmeet application requirements. 1
Most works on the optical non-linearity or
electrooptical sensitivity of glassy materials are
dedicated to the studies of the second-order non-
linearity in poled 2 or crystallized glasses [8,10,13,
14,17,21,23–26,29–32]. From those studies it fol-
lows that the non-linearity of the glassy materials
though produced comes from the optical aniso-tropy resulting from either the oriented crystal
growth (in crystallized glasses) [13,23,33] or the
existence of structure singularities, which are sup-
posed to present themselves the regions with
crystal-like symmetry (structural motifs [25,32,34],clustering of NbO6 octahedra [35], groupings
[22,36,37], ferrons [38], and pseudocrystalline mi-
croheterogeneities related to the ferroelectric
crystal lattice [39]). However, among all these
works, there are practically no studies on electro-
optical Kerr sensitivity of as-prepared glasses
(glasses, which do not undergo any treatments), in
which only Kerr non-linearity can be revealed, aswell as studies of changes in electrooptical Kerr
coefficient in transferring glasses to glass-ceramics
during heat treatment. An exclusion is several
works [1,3–5,7,20,27], which do not allow under-
standing this topic completely. In spite of a small
value of glass and glass-ceramics Kerr coefficients,
a study of Kerr non-linearity of these materials has
rather basic meaning because it could help us tounderstand the nature of the vitreous state. In our
opinion, the data on Kerr non-linearity of glasses
containing the components, which are the same as
of known electrooptical crystals, like LiNbO3,
keep information about their microinhomoge-
neous structure, which appears to inherit the
structure of these crystals and to condition high
electrooptical sensitivity of the glasses.In this work, a study of Kerr sensitivity of sev-
eral glass-forming systems, including well studied
before alkali-niobium-silicate systems, as well as
barium-titanate-silicate, and alkali-niobate-phos-
phate systems, was carried out by direct measure-
ments of the Kerr coefficients of the glasses and
glass-ceramics. The most comprehensive study was
performed in the sodium–niobium-silicate systems,including systematic heat treatments of the glasses
resulting in glass-ceramics with the highest Kerr
sensitivity. In parallel, the crystallization process
was studied by differential thermal analysis (DTA),
X-ray diffraction (XRD), small-angle X-ray scat-
tering (SAXS), densitometry, permittivity mea-
surements, and others. This study showed that
Kerr optical non-linearity of the investigated glassysystems was not directly dependent on the content
of high-polarizable heavy ions, like Ba, Ti, and Nb,
as was in the majority of the existing works on the
topic involved. At the end of the article, reasons
of Kerr optical non-linearity is discussed on the
base of the obtained data and with allowance
for other interpretations collected by the authors.
1 For a material to be used in any optoelectronic chips, Kerr
coefficient must exceed 10�10 m/V2.2 Another way to increase electrooptical response of glassy
materials is to pole them under heating that results in the poled
glasses and glass-ceramics demonstrating linear electrooptic
effect (Pockels phenomenon) and typical for non-centersym-
metric media second harmonic generation [8,11–17,29,30].
Electrooptical sensitivity of those poled materials allows their
usage in optical modulators [18].
A.A. Lipovskii et al. / Journal of Non-Crystalline Solids 318 (2003) 268–283 269

In the discussion we try to find evidences thatthe fluctuation microinhomogeneities peculiar to
as-prepared glasses are the regions with exact
crystalline symmetry, and that just those regions
are the pre-nuclei of the crystallites, which form
in glass-ceramics in heat treatment. Having the
composition and the symmetry of some known
electrooptical crystal, these regions appear to con-
dition high Kerr sensitivities of both the glasses andthe glass-ceramics formed from these glasses.
2. Experimental
2.1. Glasses
The compositions of the glasses studied in thiswork are presented in Table 1 where all of them
are sorted by series. Glass compositions werechosen in such a way that they would contain
components (oxides of alkaline metals, niobium,
etc.) necessary to compose a certain electrooptical
crystal, namely: BaTiO3, LiNbO3, NaNbO3,
KNbO3. Because crystals containing different
heavy metals can demonstrate either positive or
negative electrooptical Kerr sensitivity, which due
to the compensation effect could result in zeroelectrooptical response [3], we did not use com-
positions consisting of the mixtures of heavy
metals, for example, Ti and Pb. All the glasses are
synthesized using only chemically pure and high-
purity grade reagents.
The composition of the glasses of S-series can
be formalized as xNb2O5 � (66�x)SiO2 � 19Na2O �11K2O � 2B2O3 � 2BaO with x ranging from 5 to 37.The glasses were produced by melting an appro-
Table 1
Compositions (in mol%) and Kerr coefficient of studied glasses
Glass SiO2 P2O5 Al2O3 Nb2O5 TiO2 BaO Na2O Li2O K2O CdO La2O3 B2O3 B� 1016
(m/V2)
S-series S35 61 5 19 11 2 2 <0.5
S34 56 10 19 11 2 2 1.5
S33 51 15 19 11 2 2 9
S32 46 20 19 11 2 2 26
S31 41 25 19 11 2 2 71
S1 37 29 19 11 2 2 105
S2 35 31 19 11 2 2 117
S3 33 33 19 11 2 2 149
S4 31 35 19 11 2 2 169
S5 29 37 19 11 2 2 198
LiS-series LiS35 61 5 19 11 2 2 <0.5
LiS34 56 10 19 11 2 2 4
LiS33 51 15 19 11 2 2 39
LiS32 46 20 19 11 2 2 61
LiS31 41 25 19 11 2 2 110
LiS1 37 29 19 11 2 2 156
LiS2 35 31 19 11 2 2 195
LiS3 33 33 19 11 2 2 215
LiS4 31 35 19 11 2 2 266
BT-series BT7 30.2 15.6 19.3 35.0 <0.5
BT9 25.2 12.6 24.8 37.4 <0.5
BT11 20.1 10.0 30.0 40.0 <0.5
BT13 14.7 7.3 35.4 42.7 <0.5
P-series P1 66.7 5.6 5.6 22.2 <0.5
P2 56.3 12.5 12.5 18.7 <0.5
P3 50 16.7 16.7 16.7 1
P4 42.9 21.4 21.4 14.3 1.5
270 A.A. Lipovskii et al. / Journal of Non-Crystalline Solids 318 (2003) 268–283

priate 180-g batch in platinum crucible at 1450 �Cfor 2 h with stirring. The melts were poured onto a
pre-heated brass plate, and each resultant glass
was annealed for 2 h at the temperature corre-
sponding to the glass viscosity equal to 1012�0:5
Pa s. For this series the anneal temperatures varied
from 495 �C (for glass S35) to 585 �C (for glass
S4). The study of Kerr optical non-linearity of
similar glasses with x ranging from 29 to 35 andglass-ceramics produced from them is also de-
scribed in Ref. [1]. Within the frames of the present
work the lithium analogies of S glasses were syn-
thesized as well, and they differ from the glasses of
S-series only in containing lithium instead of so-
dium. These lithium analogies belong to the glasses
of LiS-series.
The compositions of the glasses of BT7, BT9,BT11, and BT13 belonging to BT-series can be
formalized as xBaTiO3 � (100� x)(BaO þAl2O3 þ2SiO2) with x equal to 45, 55, 65 and 75. The
glasses were produced by melting an appropriate
180-g batch in cristobalite crucible at 1500 �C for 2
h with stirring. The melts were also poured onto a
massive brass plate, and resultant glasses were
annealed for 2 h at temperature range 600–650 �C.The study of glass-ceramics formation in similar
glass-forming system was already carried out by
other researches and reported in Ref. [40].
The glasses of P-series are lithium–lanthanum-
niobate-phosphate ones. The glasses were synthe-
sized in a platinum crucible at about 1400 �C for 2
h with stirring and in the amount of 180 g.
2.2. Differential thermal analysis and X-ray diffrac-
tion
The glasses and glass-ceramics were studied by
DTA using derivatograph Q-1500 D (MOM,
Hungary, System: F. Paulik, J. Paulik, and L.
Erdey). Heating rate was equal to 5 K/min within
the temperature range 20–950 �C. The weight ofthe probes was equal to 0:7� 0:05 g.
As-prepared glasses, probes after DTA, and
glass-ceramics formed at different temperatures
were studied by XRD powder analysis. This
analysis was performed using X-ray diffractometer
DRON-2 with Cu ðKaÞ X-ray source and Ni filter.
XRD analysis did not show any crystallinephases in all the as-prepared glasses. It should be
noted that to be convinced that as-prepared
glasses were free of any crystalline phase, they
were selectively (generally, the glasses with high
percentage of heavy metal ions) studied by SAXS
[41]. This test confirmed the results of XRD
analysis; only density fluctuations typical for
multicomponent glasses (10–20 �AA [42]) were re-vealed indeed.
2.3. Heat treatments
Heat treatments of the glasses were to produce
glass-ceramic materials of high Kerr sensitivity due
to precipitating grains of known electrooptical
crystals. Heat treatment temperatures were chosenon the base of the DTA data (with heating inter-
rupted at different temperatures) of as-prepared
glasses and the XRD analysis of the probes ob-
tained after DTA experiments. As an example,
both DTA curves of several glasses of S series,
with heating up to 950 �C, and XRD patterns of
the probes resulting from DTA experiments are
presented in Fig. 1. One can see that DTA curvesof the glasses with a high content of niobium
(glasses S4-S31) have two exothermal maxima,
which move toward one another while niobium
content (or Nb2O5/SiO2 ratio) decreases, and then
they form one broad maximum or plateau (glasses
S33 and S34). The XRD data show (Fig. 1(b)) that
the glasses with low niobium content (S33-S35)
crystallize with the only phase precipitating,namely: quasicubic sodium niobate, and in the
glasses with high niobium content (S5-S31) more
than one phase precipitate with sodium niobate
being dominant. Those other phases were not
identified. No potassium niobate crystals, in par-
ticular, in ferroelectric form were revealed in the
glasses of S series in DTA heating in spite of 11
mol% of K2O contained in the glasses. The XRDanalysis of the probes of the S-series glasses re-
sulting from the DTA heating interrupted at
temperatures corresponding to the ends of the
high-temperature shoulder of the first (low tem-
perature) DTA peak (arrows in Fig. 1(a)) showed
that this peak was related to the precipitation of
A.A. Lipovskii et al. / Journal of Non-Crystalline Solids 318 (2003) 268–283 271

quasicubic sodium niobate only (Fig. 1(b)). Thisallowed us to choose heat treatment temperatures
to form monophase glass-ceramics (glass-ceramics
with only one crystalline phase) and to study ki-
netics of sodium niobate formation as well as, in
parallel, kinetics of other accompanying proper-
ties, such as Kerr coefficient, permittivity, density,
and others. The most comprehensive study of
glass-ceramics formation was performed for S2and S4 glasses. Heat treatments of these glasses
were performed in air in the furnace with electrical
heater on isothermal conditions at temperatures
655, 630, and 610 �C. Duration of the treatments
was varied from 1 to 328 h.
2.4. Electrical (permittivity) and Kerr measure-
ments
The permittivity of the as-prepared and heat-
treated glasses was measured by the standard
technique of capacity measurements at 10 kHz
using copper electrodes deposited on the two op-
posite faces of glass or glass-ceramic samples. Thesamples were 20–30 mm long (and wide) and 2–3
mm thick. The same samples with polished end-
faces were used in Kerr measurements.
The measurements of electrooptical Kerr coef-
ficients of the glasses and glass-ceramics were
performed with a specially designed apparatus at
He–Ne laser wavelength k ¼ 0:63 lm [43]. The
radiation going through the sample was modu-lated by ac voltage (5 kHz, up to 3.0 kV) applied to
the electrodes of the sample. The samples were
placed between two crossed polarizers, and ac-
cording to the quadratic character of electroopti-
cal phenomenon the response of this modulator
was measured at the second harmonic of the in-
put frequency, i.e., at 10 kHz. To improve the
accuracy of the measurement a highly sensitivecalibrated electrooptical modulator was placed
between the input polarizer and the sample under
study. The comparison of the voltages providing
the same output signals for the modulator and for
the sample gave the information about Kerr co-
efficient B, and this allowed us to avoid measuring
sample transparency, calibrating the circuit of the
photoreceiver, etc. This scheme gave rather highsensitivity due to the measurements taking place at
the frequency range free from typical noises, which
resulted in high signal selectivity. Besides, this al-
lowed compensating electrically the initial bire-
fringence, which appeared in all the experimental
samples of laboratory as-prepared glasses. The
accuracy of the measurements was proved by the
experiment with liquid cell filled with commercialnitrobenzene. The measured value of Kerr coeffi-
cient coincided with literary data to within �0.5%.The accuracy was about �5% for BP 10�14 m/V2,
and it was �50% at lower limit of sensitivity
(B � 0:5� 10�16 m/V2), that was �5� 10�5 of Bvalue of nitrobenzene and �10�4 of B value of our
best glass-ceramics. Lower accuracy of the mea-
surements for the synthesized samples compared
Fig. 1. DTA curves of several glasses of S-series (a), and XRD
patterns of the probes of the same glasses obtained after such
DTA experiments for glasses S5, S3, S1, S33, S34 and after
DTA heating interrupted at temperatures corresponding to the
end of the first DTA peak of each glass (b); in (a) these tem-
peratures are marked by vertical arrows and they are 680 �C for
glass S4, 720 �C for glass S2, and 755 �C for glass S31.
272 A.A. Lipovskii et al. / Journal of Non-Crystalline Solids 318 (2003) 268–283

with one of nitrobenzene was due to the possiblenon-uniformity and, sometimes, light scattering.
2.5. Viscosity and density measurements
Glass viscosity was measured by the beam-
bending method, with the bending base being 26.7
mm. The typical sample size was 30� 6� 2 mm3.
The measurements were performed on isothermalconditions, with the accuracy of temperature
control being to within �0.5�. Glass and glass-
ceramics density was determined at 20 �C using the
Archimed principle with toluene as a reference
liquid. The accuracy was equal to �0.001 g/cm3.
2.6. Glass structure stabilization
Glass structure stabilization was performed by
annealing the glass samples at temperatures where
their viscosity was equal to about 1014�0:1 Pa s, andKerr coefficients of these stabilized glasses were
measured and compared with ones measured for
the as-prepared glasses, for which anneal temper-
atures corresponded to the viscosity equal to about
1012�0:5 Pa s. These heat treatments endured tillglass viscosity ceased to change, which took about
10 days. Unchangeable in time viscosity indicated
that structure relaxation was completed and glass
structure was stabilized, that is, the structure had
achieved metastable thermodynamic equilibrium
at this temperature. The structure of the glasses
though stabilized had the structural (fictive) tem-
perature equal to the anneal temperature. Then,these glasses were quenched from the temperature
corresponding to viscosity 1012 Pa s, and Kerr co-
efficients were measured again. The glass viscosity
was monitored by the beam-bending technique
using a separate sample, and the glass sample
under annealing was placed adjacent to that sep-
arate sample just in the measurement cell of the
viscometer furnace.
3. Results
3.1. As-prepared glasses
In Table 1 the results of Kerr measurements of
the glasses are presented. Comparing different
glass-forming systems, one can see that there is notany correlation between heavy metal content and
Kerr coefficient. The glasses of S-, LiS-, BT-, and
P-series containing the same amount of corre-
sponding heavy metal oxide (about 20 mol%)
demonstrate Kerr coefficients equal to 26� 10�16,61� 10�16, <0:5� 10�16, and 1:5� 10�16 m/V2,
correspondingly. 3 However, within each separate
glass-forming system Kerr coefficient either in-creases with a rise in heavy metal content (for
glasses of S- and LiS-series, see Fig. 2) or remains
constant to within the measurement accuracy
(glasses of BT- and P-series, see Table 1). Kerr
coefficient of all the studied glasses correlates with
their permittivity; for S- and LiS-glasses this cor-
relation is presented in Fig. 3, where parabolic
fitting is used as the most appropriate one.DTA data combined with XRD ones showed
that, the same way as was in the glasses of S-series
(see Fig. 1), in the glasses of LiS-series the domi-
nate phase precipitating was electrooptical, namely:
microcrystals of lithium niobate. In Fig. 4 the ex-
amples of this study are presented. Asterisks over
DTA peaks in Fig. 4(a) designate the temperatures
of lithium niobate precipitation that was deter-mined from XRD patterns (Fig. 4(b)) of the LiS-
glasses heated in DTA cell up to the temperatures
marked by arrows in Fig. 4(a). The results of the
DTA and XRD experiments with BT and P glasses
are not presented here because X-ray analysis of
the probes of these glasses obtained after DTA
heating up to 950 �C did not show any ferroelectric
phases.Two glasses, namely; S1 and S5, underwent the
structural stabilization at temperatures where their
viscosity was equal to about 1014�0:1 Pa s. These
temperatures were 559 and 557 �C for S1 and S5
glasses, correspondingly. The progress in the vis-
cosity change during heat treatment of S1 glass is
shown in Fig. 5. After the stabilization at these
temperatures, Kerr coefficients of the glasses in-creased by about 45% for S1 glass (from
105� 10�16 to 150� 10�16 m/V2) and by 30% for
3 For glasses S2, LiS2, and BT11, each containing about 30
mol% of corresponding heavy metal oxides, this tendency looks
more evident. Kerr coefficients of these glasses are equal to
117� 10�16, 195� 10�16, and <0:5� 10�16 m/V2.
A.A. Lipovskii et al. / Journal of Non-Crystalline Solids 318 (2003) 268–283 273

S5 glass (from 195� 10�16 to 250� 10�16 m/V2).
Then, S1 glass was quenched from 580 �C that
corresponded to viscosity 1012 Pa s, and, after
quenching, Kerr coefficient of the glass proved to
be 120� 10�16 m/V2.
3.2. Glass-ceramics
As mentioned above, the most comprehensive
study of glass-ceramics formation has been per-
formed on the base of the glasses of S-series. The
glass-ceramics made of the glasses of S-series with
Fig. 3. Kerr coefficient of S- and LiS-glasses via their permit-
tivity (dash line corresponds to parabolic fitting).
Fig. 2. Dependences of Kerr coefficient of S- and LiS-glasses on
Nb2O5 concentration. In inset: the same dependences, where
Kerr coefficient is presented as a function of c=ð1� cÞ2 with cbeing Nb2O5 molar concentration.
Fig. 5. The progress in the viscosity change of S1 glass during
the glass structure stabilization. Glass structure stabilization at
the viscosity equal to 1013:9 Pa s increased Kerr coefficient of the
glass by 45%. The same experiment with S5 glass led to 30%
increase in its Kerr coefficient.
Fig. 4. DTA curves of several glasses of LiS-series (a), and
XRD patterns of the probes of the same glasses obtained after
DTA heating up to the temperatures marked in DTA curves by
arrows (b). The dominant phase precipitating is ferroelectric
crystals of lithium-niobate (black points).
274 A.A. Lipovskii et al. / Journal of Non-Crystalline Solids 318 (2003) 268–283
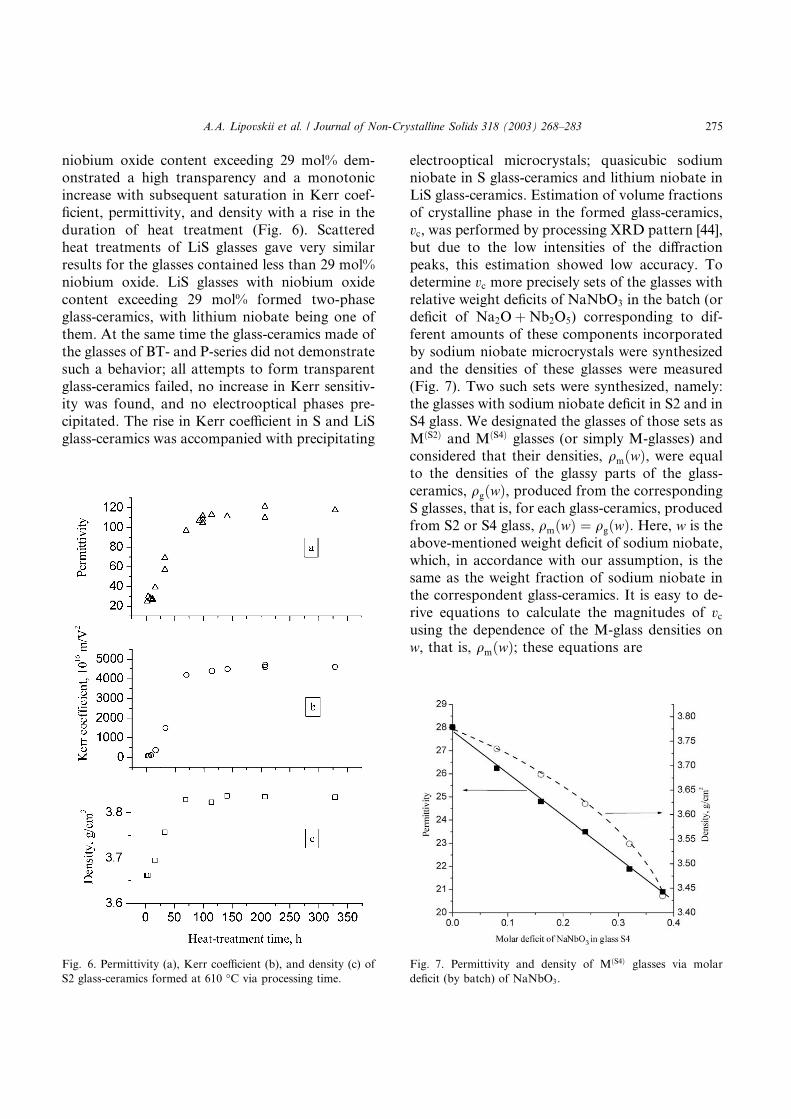
niobium oxide content exceeding 29 mol% dem-onstrated a high transparency and a monotonic
increase with subsequent saturation in Kerr coef-
ficient, permittivity, and density with a rise in the
duration of heat treatment (Fig. 6). Scattered
heat treatments of LiS glasses gave very similar
results for the glasses contained less than 29 mol%
niobium oxide. LiS glasses with niobium oxide
content exceeding 29 mol% formed two-phaseglass-ceramics, with lithium niobate being one of
them. At the same time the glass-ceramics made of
the glasses of BT- and P-series did not demonstrate
such a behavior; all attempts to form transparent
glass-ceramics failed, no increase in Kerr sensitiv-
ity was found, and no electrooptical phases pre-
cipitated. The rise in Kerr coefficient in S and LiS
glass-ceramics was accompanied with precipitating
electrooptical microcrystals; quasicubic sodiumniobate in S glass-ceramics and lithium niobate in
LiS glass-ceramics. Estimation of volume fractions
of crystalline phase in the formed glass-ceramics,
vc, was performed by processing XRD pattern [44],
but due to the low intensities of the diffraction
peaks, this estimation showed low accuracy. To
determine vc more precisely sets of the glasses withrelative weight deficits of NaNbO3 in the batch (ordeficit of Na2OþNb2O5) corresponding to dif-
ferent amounts of these components incorporated
by sodium niobate microcrystals were synthesized
and the densities of these glasses were measured
(Fig. 7). Two such sets were synthesized, namely:
the glasses with sodium niobate deficit in S2 and in
S4 glass. We designated the glasses of those sets as
MðS2Þ and MðS4Þ glasses (or simply M-glasses) andconsidered that their densities, qmðwÞ, were equalto the densities of the glassy parts of the glass-
ceramics, qgðwÞ, produced from the corresponding
S glasses, that is, for each glass-ceramics, produced
from S2 or S4 glass, qmðwÞ ¼ qgðwÞ. Here, w is the
above-mentioned weight deficit of sodium niobate,
which, in accordance with our assumption, is the
same as the weight fraction of sodium niobate inthe correspondent glass-ceramics. It is easy to de-
rive equations to calculate the magnitudes of vcusing the dependence of the M-glass densities on
w, that is, qmðwÞ; these equations are
Fig. 6. Permittivity (a), Kerr coefficient (b), and density (c) of
S2 glass-ceramics formed at 610 �C via processing time.
Fig. 7. Permittivity and density of MðS4Þ glasses via molar
deficit (by batch) of NaNbO3.
A.A. Lipovskii et al. / Journal of Non-Crystalline Solids 318 (2003) 268–283 275

w ¼ ðqmðwÞ � qÞqcðqmðwÞ � qcÞq
; vc ¼ wqqc
; ð2Þ
where qmðwÞ is the polynomial approximation of
the M-glass density (see Fig. 7, dash line), q is the
measured glass-ceramics density, qc is the densityof crystalline sodium niobate. This calculation
gave an overestimate of value w (and vc) that en-sued from the maximal possible weight fractions of
sodium niobate crystals, which could form in ac-
cordance with the glass batches. It was likely to be
due to the glassy part of glass-ceramics, which
includes �glass–crystal� interfaces, having density
lower as compared with the density of the glassesof the same composition, which are synthesized by
conventional melting. The absolute values of vcwere corrected by normalizing the saturated values
of vc to the ones, which could be maximally
achieved in accordance with the weight composi-
tions of the initial glasses.
The saturation times could be identified not
only through the time dependences of Kerr coef-ficient, permittivity, and density, but also by DTA
of the glass-ceramics formed for different times
(Fig. 8(a)). This DTA monitored just saturation in
the crystallization process rather than in the glass-
ceramics properties. Note, that the height of DTA
peak in the region of 680 �C, which is responsible
for sodium niobate precipitation, decreases with
the heat treatment time the same way as an in-crease in Kerr coefficient, permittivity, and density
(Fig. 8(b)). This actually proves that the changes in
all these characteristics are exclusively caused by
the sodium niobate precipitates, and the contri-
bution of the glassy part to the non-linear prop-
erties of the glass-ceramics is negligible. The
correctness of our estimations of values vc was also
Fig. 8. DTA of S2 glass-ceramics formed at 610 �C for different
times (a). The decrease in the height of the peak in the vicinity
of 680 �C, which corresponds to the precipitation of sodium
niobate microcrystals, and its disappearance evidence that the
glassy part of glass-ceramics is exhausted with niobium ions (see
inset in (a), where H is the relative height of the peak and t isthe time of glass-ceramics formation). At the same time, the
properties of the glass-ceramics are similarly related to the
height of this DTA peak (b), and this corroborates that it is
sodium niobate precipitates, which actually are the only cause
responsible for all the properties of these glass-ceramics. The
motion of the DTA peak at 680 �C towards low temperatures is
explained by decreasing the viscosity of the glassy part of glass-
ceramics resulting from decreasing niobium content in the
course of crystal phase formation.
Fig. 9. Kerr coefficient of the glass-ceramics produced from S4
(1,2) and S2 (3,4) glasses at 630 �C (1,3) and 610 �C (2,4) for
different time of heat treatment via volume fraction of crystal-
line sodium niobate. Solid line corresponds to the effective
medium approximation. In inset: Glass-ceramics density via
volume fraction of sodium-niobate microcrystals.
276 A.A. Lipovskii et al. / Journal of Non-Crystalline Solids 318 (2003) 268–283

confirmed by the relation between these values andthe glass-ceramics densities (Fig. 9, inset).
4. Discussion
Let us use the effective medium approximation
[45] (in its simplest formulation) to understand the
increase of Kerr coefficient with heat treatmenttime, quantitatively. In accordance with the ap-
proximation the average (microscopic) electric
field in a continuous heterogeneous medium con-
sisting of two dielectrics, which in case of glass-
ceramics are glassy matrix and microcrystals
embedded into this matrix, can be written as
E ¼Xi
viEi ¼ vcEc þ vgEg; ð3Þ
where vc and vg are the volume fractions of the
crystalline and glassy parts of the medium and Ec
and Eg are the electric fields in those parts. The
difference of the electric fields in the crystalline andglassy parts is caused by the difference of their
permittivities. The electric field E is the average
field applied to the material, which in case of a
plate sample is equal to U=D, where U is the ap-
plied voltage and D is the sample thickness. Al-
lowing for the relation vg þ vc ¼ 1 and the
electrical induction (eE) of a medium being con-
stant, that is, ecEc ¼ egEg where ec and eg are thepermittivities of the microcrystals and the glassy
part of the glass-ceramics, from Eq. (3) it follows
that
UD
¼ vc
�þ ecegð1� vcÞ
�Ec: ð4Þ
In Kerr measurements, the monitored signal is
proportional to the product BE2L, where B is the
Kerr coefficient of glass-ceramics, E is the electric
field applied to the sample (equal to U=D), and L isthe sample length or the path, which light passesthrough the sample. If the contribution to the Kerr
sensitivity of the glass-ceramics related to the
glassy part of the material is neglected, and this
sensitivity is due to the sodium niobate micro-
crystals only, it is possible to represent the signal
through Kerr coefficient of the crystalline phase,
that is, Kerr coefficient of polycrystalline sodium
niobate (Bc), the electric field applied to the crys-
tals Ec and the effective length of the crystalline
phase of the glass-ceramics sample, which, in case
of a parallelepiped sample, is obviously equal to
vcL. Thus, we can write that BE2L ¼ BcðEcÞ2vcL,and then, using Eq. (4), express B through
the volume fraction of the crystalline phase vc asfollows: B ¼ Bcvc½aþ vcð1� aÞ��2. If a � 1 wehave
B ¼ Bc
a2vc
1� vcð Þ2" #
; ð5Þ
where a ¼ ec=eg. In case eg is known this depen-
dence allows estimating value Bc or Kerr coeffi-
cient of dense sodium niobate ceramics, which is
the same. In general, value eg is not a constant andit depends on vc because when microcrystals form,
the glassy part of the material is exhausted with
niobium, which is responsible for the glass per-
mittivity (see Table 1). Variations of eg were de-termined from the measurements of permittivities
of the M-glasses (see Fig. 7 for MðS4Þ glasses), andthey proved to be described by the linear depen-
dence eg ¼ e� 18vc for the glass-ceramics formed
from both S2 glass and S4 one. Here e is the per-mittivity of the glasses S2 or S4, which is equal to
29� 2 for both glasses. Taking for sodium niobate
ec ¼ 80, we got Bc � 60000� 10�16 m/V2, whichwas consistent with the data reported in Ref. [20].
The assumption a � 1 gave an error, which could
not exceed 30% of the determined magnitude of Bc
From Fig. 9, one can see that the same curve suits
all the glass-ceramics formed, and this corrobo-
rates the validity of this deduction, for this curve
should be the same indeed, if the crystalline phase
precipitating in heat treatments is the same fordifferent glasses of about the same permittivity.
Thus, Kerr sensitivity of electrooptical glass-
ceramics is uniquely related to the volume fraction
of electrooptical crystalline phase only, which,
generally speaking, is consisted of ordered regions
with crystalline symmetry. This result can be used
to interpret the origin of Kerr sensitivity of the
initial glasses as follows.From the data on Kerr measurements it follows
that electrooptical sensitivity of the S and LiS
glasses increases with niobium content (Fig. 2),
A.A. Lipovskii et al. / Journal of Non-Crystalline Solids 318 (2003) 268–283 277

and at the same time such a correlation is absentfor the glasses of BT- and P-series (Table 1), where
independently on the glass composition Kerr
coefficient remained unchangeably small. Kerr
coefficients of the glasses of these series differ by
one–two orders in spite of these glasses containing
about equivalent and high amounts of ions with
high polarizability. It should be noted here that
our data on Kerr sensitivity of the glasses of BT-series and glass-ceramics produced from these
glasses contradict literature data. The authors of
Ref. [3] reported a high Kerr sensitivity of Ti-
contained glasses, and the author of Ref. [40] re-
ported BaTiO3 microcrystals precipitating in heat
treatment of the glasses of the same compositions
as the glasses of BT-series. In accordance with our
data, these glasses demonstrate extremely low Kerrsensitivity and can be crystallized only at temper-
atures higher 850 �C, with the crystalline phase notbeing barium titanate. 4 The same results were
obtained for the glasses of P-series, that is, low
Kerr sensitivity and incapacity of forming elec-
trooptical sodium niobate crystals under heat
treatment.
Such behavior cannot be understood if Kerrsensitivity is caused by the electronic polarizability
only, which in case of the glasses under study can
mainly result from the high content of such ions as
Ti4þ, Ba2þ, and Nb5þ. As was mentioned above,
the glasses of S-, LiS-, BT-, and P-series containing
the same amounts (20 mol%) of the corresponding
heavy metal oxide demonstrate Kerr coefficients
equal to 26� 10�16, 61� 10�16, <0:5� 10�16
(measurement accuracy), and 1:5� 10�16 m/V2,
correspondingly. However, within each separate
glass-forming system Kerr coefficient either in-
creases with a rise in heavy metal content (glasses
of S- and LiS-series) or remains constant to within
the measurement accuracy (glasses of BT- and
P-series). To explain this behavior of different
glass-forming systems, we have used the crystallitehypothesis [46] and accumulated modern knowl-
edge about glass structure [42,47–49] and gener-
alized several conceptions of the origin of theelectrooptical sensitivity of glasses, which are in-
dependently developed by the authors of this ar-
ticle [6,7,27] and other authors (conceptions of
structural motifs [32,34], clustering of NbO6 oc-
tahedra [35], groupings [22,36,37], ferrons [38], and
microheterogeneities with pseudocrystalline sym-
metry [39]). Our conception is based on the fol-
lowing statements and inferences:
1. High polarizability of a medium gives rise to its
high optical non-linearity and, therefore, elec-
trooptical sensitivity, which in glassy materials,
due to their isotropy, can reveal itself only in
Kerr electrooptical effect. In particular, the rela-
tion between polarizability and non-linearity
comes from Fig. 3, where one can see that Kerrcoefficient increases with a rise in glass permit-
tivity, which, in its turn, directly related to the
medium polarizability.
2. We suggest the fluctuation density inhomogene-
ities peculiar to the glasses to be the ordered re-
gions with exactly crystalline symmetry, the
regions having no phase boundaries. Specific
size of these ordered regions corresponds tothe characteristic scale of the density fluctua-
tions (10–20 �AA), which, in the case under con-
sideration, averages 2–3 coordination spheres
in accordance with the size of the elementary
unit cell of sodium niobate, that is, 3.9 �AA [50].
However, the results obtained in [34] allow
thinking that glasses can inherit not only the
short-range order from the crystal, but alsothe intermediate-range one, which means that
specific size of the ordered regions can achieve
50–100 �AA. The existence of such ordered regionsensues from the data on light [42], X-ray
[51], and small-angle X-ray [52] scattering, on
Raman and absorption spectroscopy [35], on
disturbance of Newton character of the glass
viscosity at extra low loading, at which the glassbehaves like Bingham rheological body [53] as
well as on the analysis of thermodynamic func-
tions of glasses at 0 K [47], and others [54–57].
We will call these regions the crystal motifs
(CM).
3. The electronic contribution to the polarizabil-
ity is exclusively related to the deformation of
4 We discuss this contradiction below. In our experiments
several crystalline phases precipitated in heat treatments at
about 900 �C for 2 h, and those phases could not be identified.
278 A.A. Lipovskii et al. / Journal of Non-Crystalline Solids 318 (2003) 268–283

electron shells of the atoms comprising glassy
matrix, and, in the materials involved, its value
is very small, because the glasses containing the
same amounts of high-polarizable heavy metals,
for example Nb, demonstrated Kerr coefficients
differing by one–two orders. However, if the
structure (composition and symmetry) of the
motifs corresponds to the structure of any elec-trooptical (ferroelectric) crystal, the main con-
tribution to the polarization is caused by the
effective mechanism of nuclear (ionic) polariz-
ability of the medium through the deformation
of the ionic lattice of CMs. This, in its turn, en-
sures a high value of Kerr coefficient of the
glass. Theoretical calculations of the local elec-
tric field (Lorenz field) in ferroelectric crystalswith allowance for their local structure (the
exact positions of atoms in the unit cell) argues
in favour of the conception of CMs. These cal-
culations predict the high polarizability of fer-
roelectric crystals being revealed only due to
their specific symmetry (perovskite structure),
for which the local field at the central atom of
the unit cell can exceed the one calculated in ac-cordance with the macroscopic approximation
of isotropic medium by one order and more.
According to Slater [58], this is the essential rea-
son of the ferroelectricity of perovskite-like
crystals. For example, he showed that the Lo-
renz field at titanium atoms in ferroelectric bar-
ium titanate lattice was equal to ð30þ 4p=3ÞPrather than 4pP=3 (where P is the polarization)coming from the macroscopic approximation of
isotropic medium, and that weak divergences
from the crystal symmetry led to a dramatic de-
crease in the local field. 5 Taking into account
that the macroscopic electric field within some
inclusions of permittivity notably exceeding
one of their surrounding is essentially weakened
(see Eq. (4)), this result looks like one having agreat importance for the problems discussed
here because, in our conception, the corre-
sponding CMs (in case of as-quenched glasses)
and nano- or microcrystals (in case of glass-
ceramics) should be regarded just as such inclu-
sions. Therefore, an appreciable electrooptical
response of the medium can be revealed only
if those inclusions possess crystalline symmetry
of known electrooptical crystals, where this sup-
pressed and weakened macroscopic field could
cause rather high medium polarization due to
the high local field. 6 The importance of thelocal factor to explain the origin of the third
order non-linear susceptibility of the niobium-
contained glasses is also emphasized in Ref.
[35].
4. It is known that, due to the clamping, crystal-
line inclusions in an elastic medium can stay
in non-equilibrium, relatively to a free large
crystal, state, and their phase transition temper-atures (including Curie temperature) may be
shifted by more than 100 K [59]. It means that
both in glass formation by quenching and in
cooling crystallized glasses, contrary to expecta-
tions, the crystalline inclusions (CMs or micro-
crystals) can be in the phase different from the
equilibrium one, and, therefore, this can appre-
ciably change electrooptical sensitivity of thematerial. For instance, to explain a high Kerr
sensitivity of sodium niobate glass-ceramics at
room temperature the authors of Ref. [1] con-
cluded that NaNbO3 microcrystals were in fer-
roelectric phase in spite of free NaNbO3
crystals being non-ferroelectric. Additionally,
it was found that, BaTiO3 crystallites precipitat-
ing in glass 15BaO–15TiO2–70TeO2 was in para-electric cubic phase rather than ferroelectric
tetragonal one [60] and that in the formation
of glass-ceramics from PbO–BaO–TiO2–B2O3
glass, the lattice strain between glass matrix
and precipitated cubic PbTiO3 crystallites re-
stricted the phase transition of lead titanate
crystal into ferroelectric phase [61]. Thus, the
clamping should be allowed for in choosingglass compositions and conditions of heat treat-
ments to form a highly sensitive electrooptical
glassy material.
5 Within the frames of the ferrons conception [38], which
looks like most prospective, the local field is considered equal to
4pP=3.
6 In [3] it was assumed that in glass-ceramic materials the
local and external fields were equal. If it were correct, why
would different uniform glasses with the same content of highly
polarizable ions show different Kerr sensitivity?
A.A. Lipovskii et al. / Journal of Non-Crystalline Solids 318 (2003) 268–283 279

5. An increase in the total volume fraction of the
ordered regions with a proper crystalline sym-
metry (like one of ferroelectric crystals) leads
to an increase in the electrooptical sensitivity
of the material. In this work and other ones,
for example [1,7,20,24,39,62], this was demon-
strated by the experiments on glass crystalliza-
tion, and, in our opinion, was due to theeffective nuclear mechanism of polarization
dominating all the other ones. However, in ac-
cordance with the modern view on the structure
of vitreous state, there must be another way to
increase Kerr sensitivity of glasses. Following
this view [47,48,63], the lower structural (fictive)
temperature of the glass, the higher extent of
the glass structure ordering. This ensues fromthe fact that configuration contributions to the
free energy and the entropy of any glass must
be vanished in approaching glass structure to-
wards the one corresponding to the Kauzmann
temperature [49]. It means that the stabilization
of glass structure by long anneals at tempera-
tures below the glass transition temperature
should increase the total volume fraction ofCMs resulting in an increase in Kerr coefficient
of the glass. It is that increase in Kerr coefficient
that is revealed after low-temperature stabiliza-
tion of S1 and S5 glasses (Fig. 5). That it is not
crystallization is confirmed by the reversibility
of Kerr coefficients of the glasses in stabiliza-
tion-quenching circles. Unfortunately, this way
to increase Kerr sensitivity is restricted by thefact that the state, when the glass structure
has the fictive temperature equal to the Kauz-
mann one and thermodynamically is equivalent
to the crystal structure (in our terms, this means
volume fraction of CMs being equal to 1), is not
allowed by the thermodynamics [49] and by the
phase transition theory, which forbids smooth
phase transitions between structures with differ-ent space dimensions (fractal in glasses and dis-
crete in crystals) [64].
6. CMs should be considered as crystal pre-nuclei
because the structure of CMs is already or-
dered, so that the balance between surface and
bulk free energies to form stable nuclei is
achieved faster and seems to be shifted towards
lower temperatures, and, therefore, the forma-
tion of stable nuclei is facilitated. From this as-
sumption it follows that the composition of the
expected crystalline phase, which precipitates in
heat treatment, should be the same as general
composition of the CMs. If this composition co-
incides with one of electrooptical crystals and,
therefore, Kerr coefficient of the glass is rather
high, one can expect a high sensitive electroop-tical glass-ceramics to form, with the microcrys-
tals being of the same composition, which CMs
had. Our experiments corroborate this infer-
ence. Indeed, the glasses of S- and LiS-series
demonstrated highest Kerr sensitivity, and after
crystallization they formed high effective elec-
trooptical glass-ceramics with electrooptical
phases of NaNbO3 and LiNbO3. However, noelectrooptical phases were found after crystalli-
zation of the glasses of BT- and P-series, which
initially demonstrated extremely low Kerr coef-
ficients as well. In accordance with the proposed
conception, this indicates that in BT- and P-
glasses the CMs did not have a proper symme-
try. The structure of CMs appearing to form in
quenching and melting processes strongly de-pends on the thermal-temporal conditions of
glass synthesis. The latter appears to explain
the difference in the result obtained in the pre-
sent research and the ones reported in [3,40],
where electrooptical titanate glasses and glass-
ceramics with barium titanate microcrystals as
precipitates were formed. The explanation pro-
posed in [3], where authors did not receive highKerr coefficients in mixed Ti–Pb glasses due to
the compensation effect (positive and negative
sign of Kerr coefficient for titanate and lead
structural entities), is valid as well. In terms of
the proposed conception, the lack of Kerr sensi-
tivity in those glasses seemed to be caused by
the fact that two types of crystalline motifs,
which actually gave opposite contributions tothe electrooptical sensitivity of the material,
were formed indeed.
In brief, in our opinion, glasses contain specific
structural entities, which possess the exactly crys-
talline symmetry within 2–3 (and maybe more)
coordination spheres, with these entities having no
phase boundaries. We call these entities the CMs,
280 A.A. Lipovskii et al. / Journal of Non-Crystalline Solids 318 (2003) 268–283

and consider them to be responsible for Kerrsensitivity of glasses, if their compositions and
structure coincide with one of known electroopti-
cal crystals. This approach can give us only qual-
itative explanation of the origin of Kerr sensitivity
of glasses because today there is not clear percep-
tion of the structure and role of the interfaces
between CMs and surrounding amorphous glassy
matrix.However, looking at Figs. 2 and 9, one can see
that the characters of the dependences of Kerr
coefficient on the niobium content in the glass and
on the volume fraction of sodium niobate crys-
talline phase in the glass-ceramics are similar, that
is, both curves demonstrate acceleration in the rise
of Kerr coefficient. Being presented as a function
of variable A ¼ c=ð100� cÞ2 where c is the molarpercentage of niobium oxide in the glasses, Kerr
coefficient of S and LiS glasses demonstrates a
linear increase with A (see the inset in Fig. 2). 7
These linear dependences suggest applying the ef-
fective medium approximation to describe elec-
trooptical behavior of the glasses, the same way as
was in case of the glass-ceramics. The only thing
which one has to do is to replace vc in Eq. (5) withc. This qualitative consideration implies that value
c for these glasses plays the same role as value vcfor glass-ceramics, and that the volume fraction of
sodium niobate CMs is a linear function of the
niobium oxide content. All this allows the glasses
to be treated as a continuous heterogeneous me-
dium (mixture) consisting of two dielectrics, one of
them being the amorphous network and anotherone being CMs. Thus, the CMs conception looks
like the external reality.
5. Conclusion
Sets of niobate sodium and lithium-silicate,
barium-titanate-silicate and niobium–lithium-
phosphate glasses were synthesized, and composi-
tion dependences of density, permittivity and Kerr
coefficient of all these glasses were studied. The
niobium alkaline glasses demonstrated highestpermittivity and Kerr sensitivity. The lithium sili-
cate glasses demonstrated record Kerr coefficients
(266� 10�16 m/V2). It was shown that Kerr coef-
ficient of niobium alkaline silicate glasses increased
with a rise in niobium content, and that the
barium-titanate-silicate and niobium–lithium-
phosphate glasses did not possess any appreciable
Kerr sensitivity.Kinetics of the formation of transparent
monophase glass-ceramics with electrooptical so-
dium-niobate microcrystals were studied. Kerr
coefficient higher than 6000� 10�16 m/V2 was
obtained for sodium-niobate glass-ceramics pro-
duced from the glass containing 35 mol% of
Nb2O5. Using the effective medium approxima-
tion, it was shown that Kerr coefficient of theseglass-ceramics depended on the volume fraction of
sodium-niobate microcrystals precipitated as a
linear function of vcð1� vcÞ�2 where vc was the
volume fraction. The relation between glass-
ceramics Kerr coefficient and permittivity appears
to be parabolic.
A conception of the origin of electrooptical
sensitivity of glasses is proposed. The conception isbased on the hypothesis that in glasses there are
regions with exactly crystalline ordering within 2–3
coordination spheres, with these regions having no
phase boundaries. These regions were called the
CMs. The motifs with the symmetry of some
electrooptical crystal caused high Kerr sensitivity
of the glasses, and they play a role of pre-nuclei
while electrooptical glass-ceramics are forming byglass heat treatment. In accordance with the pro-
posed conception, low-temperature stabilization
of the glasses should lead to the development of
the CMs resulting in an increase in Kerr coeffi-
cient of the glass, and this has been corroborated
experimentally, when after glass stabilization Kerr
coefficient of sodium niobate glasses increased by
30–45%.
7 That these linear dependences start only from 11 mol%
Nb2O5 is explained by the presence of potassium oxide in the
glasses. In accordance with our data on Raman spectroscopy of
these glasses [65], potassium ions are the first ones, which
occupy niobium ions forming no electrooptical CMs, so that
the S and LiS glasses containing up to 11 mol% Nb2O5 do not
contain an essential quantity of electrooptical sodium niobate
CMs. Moreover, the non-electrooptical nature (composition
and symmetry) of CMs containing both potassium and niobium
is corroborated by the data on XRD and the data on glass-
ceramics formation, where neither ferroelectric KNbO3 nor
other electrooptical potassium contained phases were found.
A.A. Lipovskii et al. / Journal of Non-Crystalline Solids 318 (2003) 268–283 281

Synthesized barium-titanate-silicate and nio-bium–lithium-phosphate glasses did not form
transparent glass-ceramics with any electrooptical
precipitates. This contradicts literature data and is
explained by the difference in the conditions of
glass synthesis, which are supposed to be respon-
sible for the formation of proper CMs.
Acknowledgements
The research has been supported by Interna-
tional Science and Technology Center (Grant
#979). The authors appreciate Dr V. Golubkov for
SAXS characterization of the glasses.
References
[1] G.O. Karapetyan, Yu.G. Korolyov, L.V. Maksimov, S.V.
Nemilov, Fiz. Khim. Stekla (Rus) 12 (5) (1986) 598.
[2] N.F. Borrelli, W.H. Dumbaugh, Electro- and magneto-
optic effects in heavy metal oxide glasses, Proc. SPIE, vol.
843, 1987, p. 6.
[3] N.F. Borrelli, B.G. Aitken, M.A. Newhous, D.W. Hall, J.
Appl. Phys. 70 (5) (1991) 2774.
[4] T. Hashimoto, H. Uchida, I. Takagi, H. Nasu, K. Kamiya,
J. Non-Cryst. Solids 253 (1–3) (1999) 30.
[5] S. Smolorz, I. Kang, F. Wise, B.G. Aitken, N.F. Borrelli,
J. Non-Cryst. Solids 256&257 (1–3) (1999) 310.
[6] A.A. Zhilin, G.O. Karapetyan, A.A. Lipovskii, L.V.
Maksimov, G.T. Petrovsky, D.K. Tagantsev, Glass Phys.
Chem. 26 (3) (2000) 242.
[7] G.O. Karapetyan, A.A. Lipovskii, V.V. Loboda, L.V.
Maksimov, D.V. Svistunov, D.K. Tagantsev, B.V. Tata-
rintsev, A.A. Vetrov, Electrooptic glasses and glass-ceram-
ics for elements controlling laser radiation, Proc. SPIE, vol.
4353, 2001, p. 23.
[8] S. Horinouchi, H. Imai, G.J. Zhang, K. Mito, K. Sasaki,
Appl. Phys. Lett. 68 (25) (1996) 3552.
[9] G. Bonfrate, V. Pruneri, P.G. Kazansky, P. Tapster, J.G.
Rarity, Appl. Phys. Lett. 75 (16) (1999) 2356.
[10] S. Montant, A. Le Calvez, E. Freysz, A. Ducasse, V.
Nazabal, E. Fargin, G. Le Flem, Appl. Phys. Lett. 74 (18)
(1999) 2623.
[11] V. Pruneri, G. Bonfrate, P.G. Kazansky, H. Takebe, K.
Morinaga, M. Kohno, K. Kuwasaki, T. Takeuchi, Appl.
Phys. Lett. 74 (18) (1999) 2578.
[12] A. Narazaki, K. Tanaka, K. Hirao, N. Soga, J. Appl. Phys.
85 (4) (1999) 2046.
[13] A. Narazaki, K. Tanaka, K. Hirao, Appl. Phys. Lett. 75
(21) (1999) 3399.
[14] V. Nazabal, E. Fargin, C. Labrugere, G. Le Flem, J. Non-
Cryst. Solids 270 (1–3) (2000) 223.
[15] L.C. Triques, M.B. Cordeiro, V. Balestrieri, B. Lesche, W.
Margulis, C.S. Carvalho, Appl. Phys. Lett. 76 (18) (2000)
2496.
[16] Z. Xu, L. Liu, Y. Fei, P. Yang, Z. Hou, L. Xu, W. Wang,
Appl. Phys. Lett. 77 (1) (2000) 70.
[17] J. Arentoft, K. Pedersen, S.I. Bozhevolnyi, M. Kristensen,
P. Yu, C.B. Nielsen, Appl. Phys. Lett. 76 (1) (2000) 25.
[18] X.-C. Long, S.R.J. Brueck, IEEE Photon. Technol. Lett. 9
(6) (1997) 767.
[19] N.F. Borrelli, A. Herczog, R.D. Maurer, Appl. Phys. Lett.
7 (5) (1965) 117.
[20] N.F. Borrelli, M.M. Layton, J. Non-Cryst. Solids 6 (1971)
197.
[21] Y. Ding, Y. Miura, A. Osaka, J. Mater. Res. 11 (2) (1996)
495.
[22] E.B. de Araujo, J.A.C. de Paiva, J.A. Freitas Jr., A.S.B.
Sombra, J. Phys. Chem. Solids 59 (5) (1998) 689.
[23] Y. Ding, Y. Miura, S. Nakaoka, T. Nanba, J. Non-Cryst.
Solids 259 (1–3) (1999) 132.
[24] P. Pernice, A. Aronne, V.N. Sigaev, P.D. Sarkisov, V.I.
Molev, S.Yu. Stefanovich, J. Am. Ceram. Soc. 82 (12)
(1999) 3447.
[25] P. Pernice, A. Aronne, V.N. Sigaev, M.V. Kupriyanova,
J. Non-Cryst. Solids 275 (3) (2000) 216.
[26] Y. Takahashi, Y. Benino, V. Dimitrov, T. Komatsu, J.
Non-Cryst. Solids 260 (1–2) (1999) 155.
[27] A.A. Lipovskii, D.K. Tagantsev, B.V. Tatarintsev,
A.A.Vetrov, Formation of sodium niobate glass-ceramics,
Electroceramics VII-2000, International Conference on
Electroceramics and their Applications, Portoroz, Slove-
nia, 3–6 September 2000, Abstract Book, 2000, p. 96.
[28] A. Yariv, P. Yeh, Optical Waves in Crystals, Wiley, New
York, 1984.
[29] T.G. Alley, S.R.J. Brueck, M. Wiedenbeck, J. Appl. Phys.
86 (12) (1999) 6634.
[30] V. Pruneri, F. Samoggia, G. Bonfrate, P.G. Kazansky,
G.M. Yang, Appl. Phys. Lett. 74 (17) (1999) 2423.
[31] M.V. Shankar, B.R. Varma, J. Non-Cryst. Solids 243 (2–3)
(1999) 192.
[32] V.N. Sigaev, Glass Phys. Chem. 24 (4) (1998) 295.
[33] K. Gerth, C. Russel, R. Keding, P. Schleevoigt, H.
Dunken, Phys. Chem. Glasses 40 (3) (1999) 135.
[34] E.N. Smelyanskaya, V.N. Sigaev, A.A. Volkov, V.V.
Voitsekhovskii, G.A. Komandin, V.D. Shigorin, A.A.
Kaminskii, Glass Phys. Chem. 23 (4) (1997) 303.
[35] T. Cardinal, E. Fargin, G. Le Flem, S. Leboiteux, J. Non-
Cryst. Solids 222 (1997) 228.
[36] E.B. de Araujo, J.A.C. de Paiva, A.S.B. Sombra, J. Phys.:
Condens. Matter 7 (1995) 9723.
[37] J.S. de Andrade, A.G. Pinheiro, I.F. Vasconcelos, M.A.B.
de Araujo, M.A. Valente, A.S.B. Sombra, J. Phys. Chem.
Solids 61 (6) (2000) 899.
[38] Y. Xu, J.D. Mackenzie, J. Non-Cryst. Solids 246 (1999)
136.
[39] M.M. Layton, A. Herczog, J. Am. Ceram. Soc. 50 (7)
(1967) 369.
[40] A. Herczog, J. Am. Ceram. Soc. 47 (3) (1964) 107.
282 A.A. Lipovskii et al. / Journal of Non-Crystalline Solids 318 (2003) 268–283

[41] E.A. Porai-Koshits, N.S. Andreyev, J. Soc. Glass Technol.
43 (213) (1959) 235T.
[42] G.O. Karapetyan, L.V. Maksimov, O.V. Yanush, Glass
Phys. Chem. 18 (6) (1992) 412.
[43] A.A. Vetrov, A.A. Lipovskii, D.K. Tagantsev, Instrum.
Exp. Techn. 45 (4) (2002) 550.
[44] A.A. Zhilin, T.I. Chuvaeva, M.P. Shepilov, Glass Phys.
Chem. 26 (1) (2001) 20.
[45] L.D. Landau, E.M. Lifshitz, P. Pitaevski, Electrodynamic
of Continuous Media, Pergamon, Oxford, 1984.
[46] A.A. Lebedev, Writings GOI (Trudy GOI) 2 (1921) 1.
[47] S.V. Nemilov, Fiz. Khim. Stekla (Rus) 8 (1) (1982) 11.
[48] S.V. Nemilov, Thermodynamic and Kinetic Aspects of the
Vitreous State, CRC, Boca Raton, FL, 1995.
[49] S.V. Nemilov, Glass Phys. Chem. 25 (5) (1999) 377.
[50] S.P. Solov�ev, Yu.N. Venevtsev, G.S. Zhdanov, Kris-
tallografija (Rus) 6 (2) (1961) 217.
[51] E. Rat, M. Foret, E. Courtens, R. Vacher, M. Arai, Phys.
Rev. Lett. 83 (7) (1999) 1355.
[52] V.V. Golubkov, E.A. Porai-Koshits, Fiz. Khim. Stekla
(Rus) 7 (3) (1981) 278.
[53] G.M. Berteniev, A.S. Eremeeva, Vysokomolec. Soedin.
(Rus) 3 (1961) 740.
[54] V.N. Sigaev, E.N. Smelyanskaya, V.G. Plotnichenko, V.V.
Koltashev, A.A. Volkov, P. Pernice, J. Non-Cryst. Solids
248 (2–3) (1999) 141.
[55] S.P. Zhdanov, B.T. Kolomiest, V.M. Lyubin, V.K. Mal-
inovsky, Phys. Stat. Sol. (a) 59 (1979) 621.
[56] S.P. Zhdanov, V.K. Malinovsky, Pis�ma ZhTF (Rus) 3
(1977) 943.
[57] D.K. Tagantsev, Fiz. Khim. Stekla (Rus) 13 (6) (1987)
839.
[58] J.C. Slater, Phys. Rev. 78 (6) (1950) 748.
[59] N.A. Pertsev, K.H. Salje, Phys. Rev. B 61 (2) (2000) 902.
[60] K. Tanaka, H. Kuroda, A. Narazaki, K. Hirao, N. Soga,
J. Mater. Sci. Lett. 17 (13) (1998) 1063.
[61] S.M. Lynch, J.E. Shelby, J. Am. Ceram. Soc. 67 (1984)
424.
[62] J.D. Jain, IETE Tech. Rev. 2 (7) (1985) 238.
[63] S.V. Nemilov, Fiz. Khim. Stekla (Rus) 7 (5) (1981) 575.
[64] L.D. Landau, E.M. Lifshitz, Statistical Physics, Nauka
(Rus), Moscow, 1964.
[65] A.A. Lipovskii, D.K. Tagantsev, A.A. Vetrov, O.V.
Yanush, Raman spectroscopy and the origin of electroop-
tical Kerr phenomenon in niobium alkali-silicate glasses,
Opt. Mater. (2002) in press.
A.A. Lipovskii et al. / Journal of Non-Crystalline Solids 318 (2003) 268–283 283