Polynary silicon tellurium glasses - Scholars' Mine
103
Scholars' Mine Scholars' Mine Masters Theses Student Theses and Dissertations 1972 Polynary silicon tellurium glasses Polynary silicon tellurium glasses Henry Edward Anthonis Follow this and additional works at: https://scholarsmine.mst.edu/masters_theses Part of the Ceramic Materials Commons Department: Department: Recommended Citation Recommended Citation Anthonis, Henry Edward, "Polynary silicon tellurium glasses" (1972). Masters Theses. 3535. https://scholarsmine.mst.edu/masters_theses/3535 This thesis is brought to you by Scholars' Mine, a service of the Missouri S&T Library and Learning Resources. This work is protected by U. S. Copyright Law. Unauthorized use including reproduction for redistribution requires the permission of the copyright holder. For more information, please contact [email protected].
-
Upload
khangminh22 -
Category
Documents
-
view
0 -
download
0
Transcript of Polynary silicon tellurium glasses - Scholars' Mine

Scholars' Mine Scholars' Mine
Masters Theses Student Theses and Dissertations
1972
Polynary silicon tellurium glasses Polynary silicon tellurium glasses
Henry Edward Anthonis
Follow this and additional works at: https://scholarsmine.mst.edu/masters_theses
Part of the Ceramic Materials Commons
Department: Department:
Recommended Citation Recommended Citation Anthonis, Henry Edward, "Polynary silicon tellurium glasses" (1972). Masters Theses. 3535. https://scholarsmine.mst.edu/masters_theses/3535
This thesis is brought to you by Scholars' Mine, a service of the Missouri S&T Library and Learning Resources. This work is protected by U. S. Copyright Law. Unauthorized use including reproduction for redistribution requires the permission of the copyright holder. For more information, please contact [email protected].

POLYNARY SILICON TELLURIUH GLASSES
By
Henry Edward Anthonis, 1944-
A
THESIS
Presented to the Faculty of the Graduate School of the
UNIVERSITY OF MISSOURI-ROLLA
In Partial Fulfillment of the Requirements for the Degree
MASTER OF SCIENCE IN CERAMIC ENGINEERING
1972
Approved by
__ )_l/1;_11 f4_f_J_IJ._~-c_, o/-1--__ ( Advisor)
T2831 103 pages c.l
65

ii
ABSTRACT
The introduction of Ag into Si-As-Te glasses permits
the incorporation of Se, otherwise volatile and/or degrad
able as a constituent in Si-containing chalcogenide glasses.
Si-As-Ag-Te-Se glasses exhibit much higher softening ranges
and glass transition temperatures than encountered in known
chalcogenide systems. A glass si 35As 15Ag 10Te 20se 20 had the
viscosity log n=l3 at about S00°C, as compared to 370°C for
the base glass si35As 25Te 40 , the viscosity of log n=9.8 at
about 560°C, as compared to 442°C for the base glass si 35As 25
Te 40 . Phase separation occurs in the system Si-As-Ag-Te-Se
and becomes manifest in two glass transitions indicated by
changes in the slopes of the expansion curves and breaks in
the softening point-composition curves. The existence and
behavior of Si-As-Ag-Te-Se glasses suggests the possible
development of higher Tg infrared transparencies and higher
Tg low band gap semiconductor glasses than described so far.

iii
Acknowledgements
The author wishes to express his appreciation for the
aid and advice given by Dr. N. J. Kreidl, major advisor.
Gratitude is also expressed for the technical assistance
provided by Dr. Lubomir Karmazin, Dr. Werner Ratzenbock,
Dr. Harlan Anderson and Mrs. Clair Ratzenbock. Additionally
the financial support provided by the Office of Naval
Research under grant number N00014-69-A-0141-0003 is very
much appreciated.

iv
TABLE OF CONTENTS
Page
ABSTRACT ..... ii
ACKNOWLEDGEMENTS .. iii
LIST OF ILLUSTRATIONS . vi
LIST OF TABLES .... viii
I. INTRODUCTION . 1
II. GLASS FORMATION AND STRUCTURE IN THE FIELD Si-As-Te . . . . . . . . . • . 4
III. EXPERIMENTAL 8
A. Fabrication. 8
B. Evaluation Procedures .. 11
IV. RESULTS. . . . 16
A. Relative Chemical Stability .. 16
B. Softening Point Analysis ... 17
C. Extrapolated and Dilatometric Glass Transition Data ..... . 22
D. Devitrification Analysis . 23
E. Phase Separation . 24
F. Density. 25
G. Infrared Transmission. 26
v. DISCUSSION . 28
VI. CONCLUSIONS. 33
REFERENCES. . 59
VITA. . . . 62
APPENDICES. 63
A. Abbreviations and Calculations . 64

B.
c.
Recommendations .. . . . . . . . . . . Electron Transmission Photomicrographs
Page
67
69
v

vi
LIST OF ILLUSTRATIONS
Figures Page
1 Si-As-Te ternary including binary crystalline compositions, bare glass compositions and glass formation field. . . . . . . . . . . . . . . 42
2 Rocking furnace for glass sample fabrication . 43
3 Quench rate ... • • • 4 4
4 Viscosity temperatures for National Bureau of Standards Glass #712 . . . . . . . . . . 45
5 Stability limits for the Ag-Se doped si 35As 25 _%Ag Te 40-%Se glasses . . . . . . . ...... 46
6 A and B softening temperatures for the Ag doped si 35As 20 Te 40 glasses . . . . . . . . . . . . . 47
7 A and B softening temperatures for the Se doped Ag 2si 35As 18Te 40-%Se glasses. . . .. 48
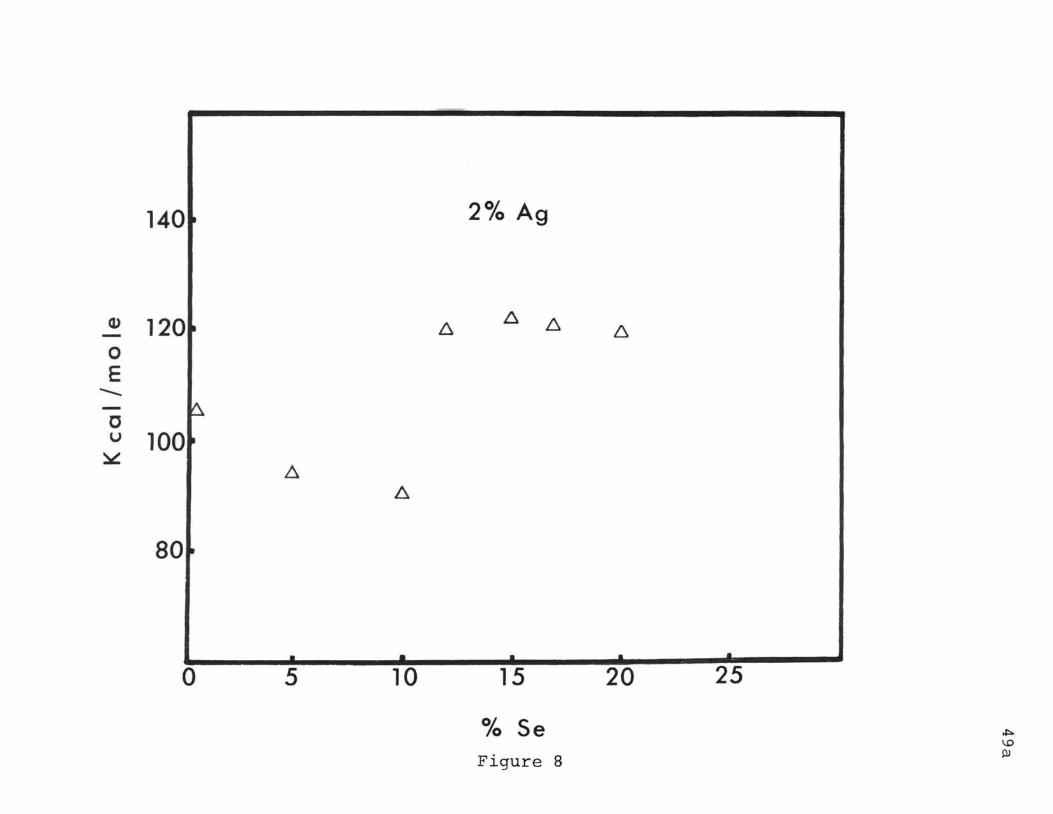
8 Extrapolated energy of activation for viscous flow for the Se doped Ag 2si 35As 18Te 40-%Se glasses. 49
9 A and B softening temperatures for the Se doped Ag 5si 35As 20 Te 40-%Se glasses. . . ..... 50
10 Extrapolated energy of activation for viscous flow for the Se doped Ag 5si35As 20 Te 40-%Se glasses. 51
11 A and B softening temperatures for the Se doped Ag 8si 35As 17Te 40-%Se glasses. . . . . . . . . . 52
12 Extrapolated energy of activation for viscous flow for the Se doped Ag 8se 35As 17Te 40-%Se glasses. 53
13 A and B softening temperatures for the Se doped Ag 10si 35As 15Te 40-%Se glasses . . . . . . . . 54
14 Extrapolated energy of activation for viscous flow for the Se doped Ag10si 35As 15Te 40 _%Se glasses 55
15 Extrapolated annealing point temperatures for the Se doped Ag10si 35As 15Te 40-%Se glasses. 56
16 Dilatometer break point temperatures for the se doped Ag 10si 35As 15Te 40- %Se glasses . . . 57
Molar volume for the Ag-Se doped S1' As 35 25-%Ag Te 40-%Se glasses . . . . . . . . . . . 5B
17

vii
LIST OF ILLUSTRATIONS (Cont.)
Figures Page
APPENDIX C
1 Electron transmission photomicrographs of base glass and 2% Ag series. . . . . . . . . . . . . 70
2 Electron transmission photomicrographs of 5% Ag glass series . . . . . . . . . . . . . . . . 71
3 Electron transmission photomicrographs of 8% Ag glass series . . . . . . . . . . . . . . . . 72
4 Electron transmission photomicrographs of 10% Ag glass series . . . . . . . . . . . . . . . . 73

LIST OF TABLES
Tables
I. Ag-Se Doped Si-As-Te Glasses ....... .
II. Parameters for Explorat·ory Compositions
III. Dilatometric Break Points •...•..
Page
34
37
41
viii

I. INTRODUCTION
The ternary system Si-As-Te has been explored in
connection with the development of glasses with high
temperature softening ranges for transparencies operating
between 3 and 14~m and for low band gap amorphous
semiconductors. Some Si-As-Te glasses are characterized
by the highest softening temperatures among the many
simple chalcogenide glasses investigated (HILTON)d, if
1
S glasses are excluded because of their limited transmittance
above lO~m. However, in practice Ge-As-Se glasses have been
preferred because Si appears associated with an interfering
absorption band attributable to Si-0 bonds. Since in other
infrared transmitting chalcogenide glasses advanced
preparation methods have elminated oxygen impurity and
because of the potential import of the Si-As-Te system in
the field of amorphous semiconductors Si-Te glasses were
chosen for further study from a technological as well as
scientific viewpoint (KREIDL) .
From first principles one may expect that chalcogenide
glasses containing Si and Se would have still higher glass
transition temperatures and softening ranges than those
with optimized compositions containing Si and Te, or Ge and
Se (HILTON)b, and that they would still have sufficient
longwave infrared transmittance. Unfortunately, experimental
evidence reveals that Si-Se glasses decompose either during
preparation or after fabrication in moist air, giving off Se
vapors (HILTONe, SHOLNIKOV). Our own experience showed that

2
decomposition also takes place if Se is added to, or
substituted into Si-As-Te glasses, or if Ge-Sb-Se or Ge-As-Se
glasses are blended with Si-As-Te glasses (KREIDL). The
main objective of the present investigation was the
formulation of higher viscosity vitreous infrared
transparencies. Considerable effort had first been spent
on the exploration of polynary glasses based on the ternary
Si-As-Te, with fourth or fifth components designed to
contribute strong bonds without impairing ir transmission.
This approach was often thwarted by crystallization.
More recently, the search has focused on understanding
and influencing the rejection or acceptance of Se in glass
forming melts containing substantial amounts of Si. In
this direction was seen (KREIDL) the only reasonable hope
for significantly increased softening ranges, possibly on
the basis of copolymeric structures in which the stronger
bonds became manifest.
One hypothesis underlying experiments aimed at the
promotion of Se acceptance was that the addition of group
I elements might make incompatible groups more compatible
and contribute to the lowering of the liquidus, facilitating
vitrification of copolymers with inherently high bond
strength. This hypothesis is loosely based on past experience
with oxide glasses in which, for instance, the addition of
alkali oxide permits one to obtain excellent glasses
starting from incompatible or less compatible oxide pairs
such as cao-sio 2 , CaO-B 2o 3 , BaO-Si0 2 , Al 2o 3-sio2 , etc.

3
Because of the high reactivity of elemental alkalis,
Ag was first introduced with rewarding results. Pb was also
chosen, both alone and with Ag, because its particular
electronic configuration has been associated with wide
ranges of oxide glass formation (MYDLAR et al.), and because,
during the period of our exploration, MONYHAN et al. and
AGGARWAL et al. reported interesting biphasic structures,
with one of the two glass transition temperatures fairly
high, in the Ge-As-Pb-Se field. In what follows, the
emphasis is on the behavior of glasses in the system
Si-As-Ag-Te-Se in which the highest softening ranges were
attained.

II. GLASS FORMATION AND STRUCTURE IN THE FIELD Si-As-Te
In contrast to S and Se, elemental Te does not form
a glass. In general glass formation within group VI has
been found to increase from 0 through S to Se, then to
decrease to Te (KOKORINA). In the binary Ge-Te, glasses can
be obtained starting from about Ge 5Te 95 and, more easily as
one approaches the eutectic near Ge 20Te 80 . The glass
transition temperature of binary Ge-Te glasses increases
to a maximum for the composition GeTe 2 (DeNEUFVILLE) just
as in the case of Gese 2 (NEMILOV) , strongly suggesting
ordered cross-linked structures somewhat similar to those
established for Sio2 (DeNEUFVILLE) . This ordering is based
on the preference for Ge-Te over Ge-Ge and Te-Te bonds.
The glasses containing more Te than in GeTe 2 as well as
those containing more Ge are softer.
4
In the latter glasses, as one approaches the composition
GeTe, a different ordering scheme appears, however, not
being the structure of crystalline GeTe (coordination of
Ge=6) (EVIMOV), but rather another one with lower (Ge=4,
or 3) coordination, characteristic of the glasses only
(BIENENSTOCK 1970), (BETTS 1972) (see also earlier
exploratory ir and x ray interpretations by HILTON and
JONESc) . In this range phase separation and sequential
crystallization may occur. It may be assumed that conditions
in the binary Si-Te start similarly. Indeed between si15Te85
and si25
Te75
HILTON and JONES (m21) obtained glasses quite
readily, but SiTe2 structures are less likely. There is no

glass formation in the binary Si-As.
In the binary Te-As the glass transition temperature
rises, but smoothly, not indicating any ordering nor any
tendency to "saturate" at the stoichiometric composition,
As 2Te 3 (DeNEUFVILLE) . As a matter of fact, a glass of the
composition As 2Te 3 can -in contrast to the classical glass
As 2s 3- form only under extreme quenching conditions and its
structure differs entirely from that of crystalline (mono
clinic) As 2Te 3 (VAIPOLIN et al., FITZPATRICK et al.). The
As atoms show 6 and 3 coordination, bonded to zigzag Te
chains. In the glass As and Te have coordinations 3 and 2
respectively, most likely due to an arrangement of covalent
linkages just as in both crystalline As 2s 3 (orpiment) and
vitreous As 2s 3 (MYERS-FELTY).
We should like to assume that this disordered
orpiment structure is encouraged also when some Ge or Si
is present. Similarly, As 2Te 3 cooperates as a glass former
as soon as As 2se 3 or As 2s 3 is added, but does not combine
with Sb2Te
3, and only poorly with Sb 2se 3 (GORIUNOVA et al.).
The region of glass formation in the ternary Si-As-Te
is large (HILTON)a. This wealth of glass compositions can
be related to the occurrence of compounds in the three
binaries (Figure 1), using classical experience in oxide
glasses. In the Si-As system SiAs was first described by
WADSTENa and the crystal structure determined by BECK et
al. WADSTENb also first described SiAs 2 and determined
its crystal structure.
5

In the Si-Te system WEISS et al. and SMIROUS et al.
claimed the existence of SiTe and SiTe 2 . Later this finding
could not be verified by KLEIN-HANEVELD et al. and BREBRICK,
who claim that the only stable compound is si 2Te 3 . Finally
It was in the As-Te system there is one compound, As 2Te 3 .
described by CARRON. Glass formation in this and many
other systems was estimated with some success by KOKORINA
who calculated possible arrangements of groups with
6
tehradedral hybrid and others with trigonal single p electron
bonds. The area of glass formation in the ternary Si-As-Te
is indicated (after HILTON)c in Figure 1. The highest
softening ranges , and concomitant glass transition
temperatures, are found near si 40As 20Te 40 on the pseudo
binary joint SiTe-As. Very recently, in his yet
unpublished paper before the Michigan Conference on
. d b amorphous sem1con uctors, DeNEUFVILLE proposes an average
three fold coordination arrangement involving Si-As bonds
along this join, connecting average five electron per
atom groupsings. It is interesting to note, pending
verification of this attractive suggestion, that good
glasses have been prepared by DEMBOVSKI with average five
electron per atom combinations like T1Asx 2 , AsXI (X=chalcogen).
For related germanium glasses, structures have been
extensively and lucidly discussed by KREBS and his associates
(see for instance, KREBS, SUCHET). A significant point made
by KREBS in this connection is that, for example, As and GeTe
are electronically isostructural. Observations indicate

7
significant differences between the Si-Te and Ge-Te binaries.
While GeTe 2 structures in glasses are made plausible by Tg
maxima, SiTe-X structures appear to prevail over SiTe2
structures in the ternary glasses, making DeNEUFVILLE's
and KREBS' concepts even more applicable.
The well-behaved, high softening range base glass
chosen for our starting point in the development of higher
softening range polynary Si-Te glasses happens to lie signi
ficantly close to the join singled out by DeNEUFVILLE:
si 35As 25Te 40 (Figure 1) .
Phase separation tends to enter the quaternaries from
the binary regions Ge-Te, Si-Te, for instance in glasses
Sil2.6Gel0As30Te47.4' Sill.1Ge8.9As20Te60' and Si8.4Ge6.6
As 5 . 0Te 80 (BUNTON); and in many of the polynary glasses
developed in the present study it is further enhanced as
might be expected when so many phases are involved (MORRAL,
DeNEUFVILLE) .
The accomodation of what happens through phase separa
tion may permit one to look at some of the high softening
point glasses as having the major phase close to the five
electron join. But copolymerization details as well as
microstructure will have to considered, when more data are
available, for a more fruitful interpretation. Polymer
theory, as exercised for organic glasses, will be found in
creasingly useful as progress is made in the structural
and compositional analysis of complex phase separated ma
terials (DAS et al., CHEN et al.).

III. EXPERIMENTAL
A. Fabrication
1. Introduction
Glass samples were, essentially as previously reported,
produced in sealed silica type vials which had been
evacuated to a pressure of five microns Hg. The vials were
reacted in a rocking furnace and air quenched.
2. Raw Materials
8
The raw materials utilized were of five 9's or better
purity when received from the chemical suppliers. Elemental
As tends to absorb oxygen on its surface and must be further
purified with hydrogen gas. This process consists of placing
a quantity of As in an open ended tube through which H2 gas
is routed and subsequently raising and lowering the temperature
of this system through a maximum of 350°C. Selenium reacts
with atmospheric oxygen and must also be further purified
before it can be used. This purification is carried out
in a sealed pyrex container that is evacuated and subsequently
heated to 4QQOC. A portion of the container is maintained
at a much lower temperature during the purification and it
is in this region that the oxides are removed by condensation.
The other elements used in the majority of the sample
fabrications were Si, Te, and Ag. These were used as received.
Additionally, any elements incorporated during explorations
were also used as received.

3. Vials
The silica vials were cleaned with HF, distilled H2o
and acetone. Prior to being filled with raw materials the
vials were dried and evacuated. During evacuation they
were heated with a gas torch to aid in liberating any
residual moisture. After being filled the vials were necked
down above the sample containing region for a length of
about three centimeters. This smaller diameter section was
then bent into a "Z" shape to be used as a trap system for
oxide gases. For the fabrication of samples, totaling six
grams in weight, tubing of seven millimeters ID was
employed.
4. Weighing
All components were weighed to a precision of + 0.002
grams. The elements were weighed and stacked in the order:
Ag-Si-Se-Te-As. For samples containing no Se or (neither
Se nor Ag) the sequence for weighing was Ag-Si-Te-As and
Si-Te-As respectively. Arsenic should always be last so
that it will be in a position for final purification that
will interfere least with the total sample purity.
5. Sealing
9
After the filled vials were bent into the trap configura
tion they were evacuated using a diffusion pump system. A
pressure of five microns of Hg was established and held
for from twenty to thirty minutes. At this time H2 gas was
routed through silica gel for drying and admitted into the
vials. Heat from a gas torch was then applied near the As

to aid in reacting the H2 with the o2 that had been adsorbed
during weighing. The entire sample-containing region was
then heated. The oxide gases released during this process
were driven through the trap into the cooler region of the
upper, empty vial portion. This action allowed any gas
tending to migrate downward to be trapped on the walls of
the reduced diameter region.
After final purification a pressure of five microns
Hg was reestablished and held for thirty minutes. The
vials were then heated above the sample-containing portion
until the walls sag and sealing was accomplished.
6. Reaction
The sealed vials were reacted in a rocking-type
10
furnace as depicted in Figure 2. The furnace pivots through
an angle of fifteen degrees and oscillates at fifteen
revolutions per minute. Initially the reaction schedule
temperatures and times for Ag-Se modified glasses were
chosen so as to increase with increasing Ag and Se content.
However, this technique introduced variations in thermal
history and was determined to be disadvantageous. Therefore
a standard reaction schedule was adopted. This schedule
consisted of placing the sample vials in the furnace
preheated to 975oc, reacting for 24 hours at 975°C and
removing the vials at 975°C.
7. Quenching
The quenching procedure used was to withdraw the sample

vials from the hot furnace (975°C) and hold them in air
until a dark red color was attained. At this point the
vials were placed in a container composed of insulating
material. Data obtained by positioning a thermocouple on
the outer surface of the sample vial showed that the
initial quench during the first minute was about 600°C.
The entire quench from 975°C to 80°C is shown in Figure 3.
8. Sample Appearance
The glass samples obtained were cylindrical in shape
with a metallic luster. They were opaque to visible light
and appeared black in color.
B. Evaluation Procedures
1. Stability
The stability of selenium-substituted Si-As-Te glasses
was assessed by a combination of two observations. First,
samples were classified as unstable if they gave off
noxious vapors believed to be H2Se or if the glass vials
in which they were stored acquired a red-brown residue,
presumably SeO. Additionally, samples were classified as
unstable if, after heating near 500°C, they exhibited the
above phenomena.
2. Softening Point Analysis
The indentation system utilized for measuring
11
relative softening points was described in detail in Technical
Report #1 (KREIDL) and was designed to approximate a similar
device used by JONES and HAFNER. Calibration of this system

was accomplished with NBS #712 glass as was the JONES and
HAFNER device. The calibration samples were cut and ground
into sections one millimeter in thickness and heated at a
rate of 8 to 10 degrees centigrade per minute. The
temperature at which indentations of 0.002 and 0.018 inches
were recorded, respectively, as the 'A' and 'B' softening
point. These temperature points along with the ASTM
softening point (Log n=7.6, 528°C), anneal point (Log
n=l3.0, 386°C) and strain point (Log n=l4.6, 352°C) were
plotted in Figure 4. From the linear relation between
the ASTM softening point, anneal point, and the strain
point as Log viscosity versus l/T°K the 'A' and 'B'
viscosities can be determined. The results obtained indi-
h t 'A' d t . . f 10 9 · 8 . cate t a correspon s o a v1scos1ty o po1se
and 'B' to a viscosity of 10 8 • 4 poise. This is in good
agreement with the calibration results of JONES and HAFNER
who obtained viscosities for 'A' and 'B' equal to 1010
·2
poise and 10 8 · 8 poise respectively.
The linear relationship cited applies for non-oxide
glasses in a similar viscosity range. Thus the two data
points obtained from a softening analysis can be converted
into an estimate of the activation energy for viscous
12
flow, strain point and annealing point through extrapolation
(Appendix A) .
3. Phase Separation
Phase separation was observed directly using transmission
electron microscopy. The instrument used was a Hitachi HU-llA

with a cold stage accessory. The cold stage lowers the
temperature of the sample area to 120°K. Its use is
necessary because of the low conductivity and the relatively
low melting point of the glass (compared with metal).
Samples are prepared for analysis by chipping
fragments from the bulk glass with a diamond file. These
fragments are then placed between two 75 mesh copper grids.
The resulting grid-glass sandwich is then positioned on a
standard compression type specimen holder.
The magnification used for this study was 43,000
13
as determined from a collodion standard. All micrographs
obtained represent electron transmission through thin edges.
Initial investigations on Ge-Sb-Se glasses were attempted
with etched fragments. This was necessary because of
the similarity in electron density of the three constituents.
In the Si-As-Te system, however, the large electron density
difference allows analysis without recourse to etchants.
4. Infrared Transmission
Infrared analysis was carried out on small lenses
produced by grinding and polishing opposite sides of bulk
samples to flat parallel surfaces. The lens thickness
ranged between .8 and 2.0 rom. A Perkin-Elmer #137
spectrophotometer with a range of 3-15~ was used for
analysis. A standard lens composed of the base glass
(Si 35As 25Te 40 ) was employed to calibrate the instrument
for each series of sample analyses. Calibration consisted
of obtaining a .25 absorbance at 6~m. This procedure

allows comparison of data obtained at different periods
of the investigation.
5. Dilatometry
The dilatometer used to obtain expansion data on
selected compositions consisted of a tube furnace, sample
container, signal transfer rod, transformer and core, and
electronic recording equipment. The sample container and
transfer rod were both silica. The core was mounted on
the transfer rod and situated in the transformer. As the
sample expands the core moves up in the transformer.
The amount of expansion was recorded versus time and the
heating rate was controlled at 2.3°C/minute. The data
obtained in this manner were plotted as expansion versus
temperature, and different rates of expansion for various
temperature ranges were observed. Breaks in the expansion
curve were considered related to glass transition
temperatures.
6. Density
Density measurements were made utilizing the
Archimedes principle. The glass samples were weighed in
air and then in xylene. The weight in xylene was obtained
by suspending the sample on a platform made of aluminum
which was contained in a beaker. Effects due to surface
tension and temperature variation were disregarded provided
the ambient was between 23 and 26°C. The formula used for
transforming the weight data into density was
14

15
p sample = wtin air x p xylene (wt. . - wt.
1 ) 1n a1r 1n xy ene
A density determination of xylene showed it to be .862 gm/cc
in the temperature range listed above. Average density
was determined after numerous measurements on selected
compositions. Any data point deviating in a negative
manner from normal values obtained was invariably traced
to air bubbles and subsequently disregarded.
Density data determined in this manner were converted
into molar volume by dividing the normalized formula weight
by the density.
7. Crystallization
Samples were tested for devitrification by x-ray
analysis using a G.E. XRD-5 diffractometer. The specimens
were powdered and scanned at a rate of 20/minute from 10
to sao 28. The radiation used was Cm<a with the appropriate
Ni filter.

IV. RESULTS
A. Relative Chemical Stability
In the previous work by HILTON and by SHOLNIKOV
chalcogenide glasses containing Si in conjunction with
Se were found chemically unstable. In the present
investigation modifiers to improve the chemical stability
of such glasses were to be found, because they were
expected to have a significantly higher softening range.
Initial investigations in the system Si-As-Se showed
that a sample containing approximately equal amounts
of the three constituents seemed to behave normally while
hot (900°C) and in the liquid state. Under these
conditions it was contained in less than half the vial
volume. However, upon removal from the furnace the melt
expanded and filled the entire vial. The resulting
product consisted of flakes that decomposed emitting what
e appeared to be H2se (see also HILTON) .
HILTON also demonstrated that while the system
Si-Sb-Se contains glasses with relatively high softening
points they were also unstable.
In the present investigation the base glass
si35As 25Te 40 , having a high softening, range was chosen
16
as a starting point. Experiments showed that substitutions
of only up to 5% Se for Te without any other compositional
modification resulted in stable glasses. Modifications
involving, as one might first be inclined to try, elements

conducive from first principles to strong bonding while
still expected to maintain infrared transmission in the
desired range, lead to minimal success. These elements
included Ge, P, B, Bi, and particularly Pb. The latter
may yet be further investigated, particularly in combination
with more successful modifications.
17
Next, group I elements were considered for modification,
with the aim of increasing the compatibility of Te and Se
groupings in the planned copolymer, as discussed in Section 2.
Because of the reactivity of alkali elements, Ag was chosen
as a model and first constituent. It was with Ag that
significant stabilization of Si-Te glasses containing Se
was achieved. Increasing amounts of Se substituted for
Te were accommodated in stable glasses (by the criteria
described in Section 3) with substitutions of Ag for As
in Si 35As 25Te40 glasses (Table I, Figure 5).
B. Softening Point Analysis
1. Ternary Si-As-Te Glasses
All samples fabricated during this investigation were
analyzed for the 'A' softening point. Samples in the
Ge-Sb-Se system and related derivations were analyzed for
both the 'A' and 'B' softening points (as defined in Section 3).
The results obtained are listed in Table I and II.
The data taken in the ternary system Si-As-Te correspond
well with HILTON's.d Two compositions of particular interest
in this system are si37
As 30Te 33 and si 35As 25Te 40 . The 'A'
18
softening point for the first glass was 490°C and represents
the highest attainable in the system. However, this
composition lies in the region of the glass field that
tends toward devitrification. The second composition had
an 'A' softening point of 442°C, but has the ability to
resist temperatures of 300°C or more. This glass was there-
fore chosen as a base for modification without undue risk
of devitrification.
2. Modifications by Sb, P, Ge, Al, Bi, Pb and Zn
Modifications of Si-As-Te glasses involving about
5% of these elements had generally lower softening points.
In higher concentrations devitrification interfered
frequently (Section 4.4). Ge, Sb, P, Zn could be
substituted in slightly larger amounts than 5%, yielding
good glasses. In only two cases was a somewhat elevated
softening range attained:
(1) si 35Ge 5As 20Te 35se 5 with a softening point A
at 482°C, log n=l3 at 452°C, log n=l4.6 at 433°C
and
(2) si30
Ge5
As 20 P5
Te 35se 5 with a softening point A
at 463°C.
3. Si-As-Ag-Te-Se Glasses
As soon as it had been realized that increasing
amounts of Ag stabilize Se in modified Si-As-Te glasses,
a systematic series of Ag and Se substitutions for As and
Te respectively in si 35As 25Te 40 glass was analyzed for A
and B softening points.

Silver substituting for arsenic, without any
substitution of Se, decreases these softening points by
about 7°C/atomic % Ag (Figure 6) . Such a decrease might
have been expected, but was to be compensated by the
additional substitution of Se for Te.
Samples containing 2% Ag substituted for As exhibited
a moderate improvement of softening characteristics with
an increasing replacement of Se for Te up to 17%. Beyond
this, additional Se was detrimental to the softening
characteristics of the 2% Ag glass. This was believed
to be related to the quenched state instability of glass
compositions in the 2% Ag series containing more than 15%
Se. Glasses in this series containing 12 or 15% Se showed
instability only after softening analysis. The
softening behavior of the 2% Ag series can be seen in
Figure 7. The energy of activation for viscous flow showed
an increase of about 20 Kcal/mole. near 12% Se. This trend
is illustrated in Figure 8.
A series of glasses containing 5% Ag substituted
19
for As and various Se contents replacing Te showed increasing
softening characteristics with increasing Se. This relation
is seen in Figure 9. In the vicinity of 17% Se a break in
the data trend is evident. Additionally a reanalysis of
the 17% Se glass in this series resulted in a rise of the
A and B softening points from 485°C and536°C to 510°C and
542°c respectively. This reevaluation was accomplished by
testing a previously analyzed sample piece. Therefore,
this second analysis was carried out on a moderately heat

treated sample. The energy of activation for viscous flow
in this series shows a break near 12% Se of about 30
Kcal/mol. The data points for 17% Se are the results of
the first and second analysis of this sample and are so
labeled. This series represents the first indication of
a possible change in glass structure within a fixed Ag
percentage series. This effect is registered in the plot
of activation energies (Figure 10) .
Samples prepared with 8% Ag substituted for As
20
exhibited further increased softening points with
progressive replacements of Se for Te. The highest softening
points A and B measured were 551°C and 576°C in a stable
20% Se glass, and 569°C and 597°C in the highest (25%)
Se glass (Figure 11) . Here again a break in the data
was observed. The location of the break was centered
near 15% Se instead of 17% Se. A rerun of this sample
resulted in a change in the A and B softening points from
494°C and 545°C to 532oc and 559°C respectively. A plot
of the estimated activation energy for viscous flow shows
a discontinuity of 12% Se of about 40 Kcal/mol. This can
be seen in Figure 13. The two data points at 15% Se corres
pond to the first and second run and are so labeled.
Glass compositions containing 10% Ag substituted
for As again show increased softening points as Te is
systematically replaced by Se. The overall behavior is
illustrated in Figure 13. The highest softening points A
and B were 5600C and 588oc in the stable 20% Se glass and

588°C and 625°C in the highest 30% Se glass. Furthermore,
the break now occurs between 12 and 15% Se. No composition
possessing a double set of softening characteristics was
produced. The activation energy for viscous flow again
shows a break at 12% Se of about 40 Kcal/mol. (Figure 14).
Additional explorations with 13, 15, and 20% Ag
substituted for As were conducted with 25 and 30% Te
replaced by Se. Some of these glasses exhibited exceedingly
high softening characterisitcs as shown in Table I.
However, all samples were highly reactive with the
atmosphere.
4. Glasses containing Pb
Lead-modified Si-As-Te glass, as already stated,
possess reduced softening characteristics. However, 3%
Pb in conjunction with 5% Ag substituted for As, produced
systematic changes in viscosity properties when various
percentages of Te were replaced by Se. The data are listed
in Table II. In this system both anneal point (log n=l3)
and activation energy peak at 10% Se. The high 'B'
softening point in these glasses causes the low activation
energy. x-ray investigation show that these glasses de
vitrified during softening point analysis. The possibility
exists that high 'B' softening point is related to the
devitrification kinetics. Additional Pb modified glasses
containing 7 and 10% Ag were fabricated. All contained
more than 20% Se and were partly crystallized as quenched.
Their high softening points may have been related to their
21
crystallinty.
C. Extrapolated and Dilatometric Glass Transition Data
The estimation of the temperatures for viscosities
1014 • 6 ("strain point") and 1013 ("annealing point") may
provide an estimate for the glass transition temperature
pending direct evaluations. Such direct evaluations have
been proven of great value for the understanding of the
relations between composition, structure, and properties
of chalcogenide glasses (DeNEUFVILLE, FLETZ).
One estimation was made by the extrapolation of the
(admittedly close) log viscosity temperatures at 9.8 and
8.4 to 13.0 and 14.6. The increase in the "glass
transition temperature" with Se content is indicated in
the trend registered in Figure 15 for the 10% Ag glass.
The value for the ternary base glass si35As 25Te40 is listed
in Table I. One can see that the high Se content glasses
have remarkably high "glass transition temperatures." The
extrapolated values go from 370°C for the Si35As 25Te 40
base down to about 332°C for the 10% Ag substituted glass
up to above 518°C for the high selenium glasses . These
data were compared with temperatures at the breaking points
of the dilatometric curves. All but one sample, which
contained greater than 5% Se, exhibited two breaks in their
expansion characteristics (Figure 16). These breaks are
believed to correspond closely to the glass transition
temperature of the participating phases.
22

Glass containing 0 and 5% Se and the base glass
exhibited one low temperature "glass transition." Other
compositions ranging from 10 to 15% Se produced a high
23
and a low temperature "glass transition." Samples containing
17 and 20% Se show either one high temperature or two high
temperature transitions.
Glass compositions exhibiting a high and low
temperature "glass transition" are in the vicinity of the
softening point breaks as cited in Section 4.23. In
addition a glass composition containing 8% Ag with 15%
Se was tested and it also produced a high and low
temperature "glass transition." This composition also
lies at the softening break point. Table III lists this
and other data collected through dilatometer experiments.
These few dilatometric experiments do not permit
an extensive interpretation, but are indicative of the
appearance and dominance of a stronger grouping in the
approach to the 10% Ag 15% Se glass, just where the
rheological gain is so large.
D. Devitrification Analysis
Quenched samples, as well as specimens anlayzed for
softening characterisitics, were subjected to x-ray
diffraction to determine the extent, if any, of devitrifica
tion. In general it can be said that the base glass
(Si 35As 25Te 40 ) and Ag-Se modified glasses showed no signs
of crystallization. In contrast all samples containing
Pb in conjunction with Se or Te devitrified during

softening analysis.
The crystalline phase in the Pb modified Si-As-Te
base glass was identified as PbTe. Identification of
the crystalline phase in the Pb-Ag-Se doped glasses was
not accomplished.
Other elements investigated to achieve an increase
of the softening point directly or by increasing the
compatibility with Se, were Ge, B, Sb, P, Pb, Bi, and
Zn. Among these additives, Bi showed the highest
24
tendency towards crystallization. In effect, no composition
containing Bi, alone or with Pb, showed glass formation.
With up to 2.5% Pb and 2.5 Se a good lass was obtained.
Higher amounts invariably resulted in crystallization.
The tendency towards crystallization was not as
pronounced when boron was introduced, however, the sta
bility upon Se substitution for Te decreased. Glasses
in which Ge, Sb, P, or Zn were introduced did not devitrify.
E. Phase Separation
Electron transmission microscopy has revealed phase
separation of varying degree and size in the Ag-Se
modified Si-As-Te glass system. This separation appeared
to vary with both Ag and Se content. The base glass
(Si35
As 25Te 40 ) did not appear to be phase separated. Electron
transmission micrographs can be seen in Appendix C.
Glass compositions containing two and five percent
Ag substituted for As were mono-phasic. Compositions
containing 8 and 10% Ag substituted for As exhibited moderate

separation. All Ag substituted compositions produced
selected areas of moderate to large separated phases when
five percent Te was replaced by Se. Increasing substitu
tions of Se for Te in the four Ag modified systems revealed
a trend toward larger phase size. Additionally this same
systematic increase in substitutions (Ag for As and Se for
Te) increased the percent of areas observed on any sample
exhibiting separation. In the 8 and 10% Ag glass systems
a change in phase motif appeared to exist near the
compositions centered near the softening point data breaks.
Compositions in the 5, 8, and 10% Ag series
extending beyond the stability limit of Se substitution
appeared to possess voids. These voids correspond in size
to the non-continuous phases present.
F. Density
The density data obtained during this investigation
yielded the most readily interpreble information when
converted to molar volume. A plot of molar volume versus
percent selenium for the four silver systems is shown in
Figure 17. This illustrates that no sharp breaks in the
data occurred for the ranges of selenium tested. However,
a tailing off of the data for the 8 and 10 percent silver
systems is apparent. It is interesting to note that this
phenomenon occurs near the stability limits of these
systems.
Density data for all measured compositions are listed
in Table I.
25

G. Infrared Transmission
Infrared analysis of Si-As-Te glasses showed that
transmission characteristics for these samples were in good
d agreement with data published by HILTON . The parasitic
oxygen bands at 10.4 and 14.0 microns identified by HILTONc
and SAVAGE and NIELSEN as Si-0 and Te-O vibrations
respectively, were present. Substitutions of Ag and Se in
the manner previously described brought about the appearance
26
of an additional oxygen absorption band at 13.6 microns . This
band was believed to be attributable to Se-0 vibrations
(SAVAGE and NIELSEN) . In the region of the spectrum between
3 and 9 microns, where no absorption bands were present,
transmission remained good for all compositions contained up
to 8 percent Ag. However, samples analyzed showed a deepening
of the Si-0 band with increasing Se content. This was
believed to be caused by oxygen spoiled Se introduced during
fabrication which subsequently reacted with the Si.
Compositions containing 10 percent Ag in conjunction
with various amounts of Se appeared to approach a
transmission quality maximum near 15 percent selenium.
Selenium contents either greater than or less than 15 percent
showed reduced transmission in both the short wavelength and
long wavelength region. Lead modified glasses showed good
transmission when incorporated in a sample containing 5
percent Ag. Higher concentrations of Ag in conjunction with
Pb rendered the glass opaque to infrared. All pb modified
glasses which were subjected to heat treatments were opaque.

The percent transmission at 6 microns for selected
glasses can be seen in Tables I.
27

28
V. DISCUSSION
In principle bonds formed between Si and Se should be
stronger than those formed between Si and Te or Ge and Se.
This prediction is based on the fact that a Si-Se pair pos-
sesses both a smaller average atomic radius and a greater
electronatively difference than the other two pairs.
A monophasic Si-As-Se glass would be ideal for both
infrared transmission and thermal strength. However,
instability in this system excludes such glasses unless a
modifier is found which allows incorporation of maximum
percentages of Se in a Si-As-Te glass. This investigation
has demonstrated that Ag has the ability to act as this
modifier. Additionally, selected Ag-Se modified Si-As-Te
glasses exhibit dual viscosity characteristics and are
biphasic. The fact that such glasses, when high in Se and
Ag, exhibit extrapolated anneal points (n=l0 13 ) up to about
150°C higher than that attributable to the base glass
si35
As 25Te 40 appears to be related to this rheology. Since
glass transition temperatures (Tg) are usually not too far
d . t n--1013 , h · · from temperatures correspon lng o t ese composltlons
also will have Tg's about 150°C higher than a Si-As-Te base.
The analysis of softening characteristics of the 5% Ag
system modified with increasing amounts of Se (Section 4.21)
demonstrates a considerable increase in softening points A
and B above 17% Se. At 17% a discontinuity in softening char-
acteristics is apparent, and paralleled by phase separation
of increasing extent and particle size (Section 4.5). A

29
modest increase in softening points can be observed already
in the 2% Ag system, but the discontinuity in the activation
energy of viscosity observed at 12% Se, is small. Phase
separation in these glasses appears less pronounced. It
seems plausible that concentrations substantially below 5%
Ag in conjunction with Se are insufficient to allow a
second high temperature phase to gain the extent necessary
to allow some predomination of viscosity properties.
The 8% Ag modified series exhibits viscosity properties
similar to those of the 5% Ag glasses. The discontinuity now
occurs near 15% Se and the softening points beyond this
concentration show larger increases. Additionally, the
activation energies for the high viscosity temperature glass
compositions are greater. At this point it appears plausible
that the strong glass phase is possibly controlled by Ag and
Se in conjunction with Si.
Further evidence for this possibility is seen in the 10%
Ag glass system. Here the general behavior of the 5 and 8%
Ag glasses is repeated, but now the discontinuity in the
viscosity plot occurs between 1 2 and 15% Se and the
activation energy increases by 40 Kcal/mole. Also the phase
separation motif appears to be changing. The additional
information gained through dilatometry experiments lends
support to the contention that these glasses are controlled
in their viscosity characteristics by two indistinct phases.
This model, involving gradual changes in phase
concentrations as the medhanism for attaining increased

30
thermal strength, is complemented by molar volume data
(Section F) • The four silver series show continual decreases
in molar volume as the Se content increases with a slight
break in the data near 12% Se. This break becomes more
apparent with increasing Ag content. This would seem to
imply that the structure of these glasses within the two
phases remains essentially the same. Only in the 8 and 10%
series for high selenium concentrations beyond the stability
limit does the molar volume show obvious deviations from the
previously defined trend. This could be a possible
indication of a gross structural change in one of the glass
phases with the result that bonding between the phases is
weakened. It is interesting to note that in the unstable
glasses containing too little Ag or too much Se the two
phases appear to be incompatible or the one high in Se very
volatile, as evidence by the fact that voids similar in size
and shape to one of the phases are present.
In many respects this specific evidence supports certain
generalizations regarding the development of maximum thermal
strength in sufficiently infrared transmitting chalcogenide
glasses, i.e., those free of S.
The maximum thermal strength in terms of maximum
softening temperatures in the simple ternaries Ge-As-Se and
Si-As-Te are about equal and found near the pseudobinary
joines GeSe-As and SiTe-As. The castable glasses like the
base glass he~e selected (Si35As25Te 40 ) appear slightly on
the Te side of this join. The simplest explanation of the

31
improved thermal strength ·of the Se-substituted glasses is,
of course, the one introducing this section: the
expectation of a stronger bond between Si and Te, the former
possessing the smaller average atomic radius and the larger
difference in electronegativity.
The necessary condition for this is the introduction of
Se into a stable glass. The working hypothesis underlying
the proposed introduction of group I alkali elements,
somewhat simulated by the less reactive Ag, still holds in
part. Other additions tried may have permitted the stable
incorporation of selenium, too, for instance Pb or Bi.
However, such glasses crystallize easily. Silver would be
expected, as group I elements would, to decrease the liquidus
temperature relative to average bond strength which is an
important prerequisite for glass formation. This is best
presented in the form of t he TURNBULL-COHEN' or UHLMANN's
criteria. This combination of the acceptability of Se in an
Ag-modified Si-As-Te glass and the specific effect of Se
concentration on average bond strength is a primary
explanation for the high viscosity glasses obtained.
It is interesting and encouraging to note that
GORIUNOVA finds the largest glass forming regions in As-Se-Z
glasses for Z=Tl, Ge and Ag, much larger than for Hg, Cu,
Pb, and Au.
However, the observation of breakds in viscosity-
composition relations and the concomitant observations of
phase separation make this explanation a necessary, but not
32
sufficient, one. The increasing separation and viscosity of
the Se-rich phase in this systeni supplements the conditions
for maximum thermal strength chalcogenide glasses in the
system studied.
It will be necessary to devote attention to the
composition and evolution of these phases and their Tg's
using, e.g. the techniques of scanning microscopy. Ahead
of these required studies, it is interesting to return to
DEMBOVSKY's mention of "5 electron" glasses other than the
DeNEUFVILLE SiTe-As family, namely the TlGeX2 (X=
chalcogenide) and AsXi glass phases. In the long run,
however, the concept of copolymerization (DAS et al . ), based
on x-ray and supporting evidence, will prove more pertinent
for successful interpretation of the structures and properties
of complex chalcogenide glass.
VI. . CONCLUSIONS
(1) Chalcogenide glasses with significantly high
softening ranges than those known to date exist and can be
exemplified by glasses in th~ system Si-As-Ag-Te-Se based
on the simultaneous partial substitution of Ag for As, and
Se for Te.
(2) Among the glasses with highest softening ranges,
the relative gain is 120°C for a si35As15Ag10Te 20se20 glass
if compared to si35As 25Te 40 C442°C).
(3) Selenium retention in Si-As-Ag-Te-Se glasses is
conditioned by silver doping.
(4) Phase separation tends to increase with increasing
selenium content in these Si-As-Ag-Te-Se glasses, until it
seems to impair transmittance. Two Tgs (as estimated from
selected expansivity data) become apparent because of this
separation.
33
(5) If one accounts for this phase separation, the
glasses may still be considered lying the average threefold
coordination area postulated for highest Tgs by DeNEUFVILLE
(i.e. they may be considered polynary derivatives of
compositions on the SiTe-As joint of the ternary. More
properly, the glasses can be considered cross-linked polymers.
(6) The reported experiments demonstrate that the
limitations imposed on the simple design of compositions from
basic atomic arrangements can be overcome by the formulation
of complex components capable of inducing copolymerisation
and microstructure.

TABLE I*
Ag-Se Doped Si-As-Te Glasses
Ag Se Si As Te Stab. Stab. SP"A" SP"B" ~E(vis) n=l013.0 n=1014.6 IR Density %Area Phase b SP a SP oc oc Kca1/m. oc oc g/cc Separated
37 30 33 +++ +++ 490 523 118 424 395 4.22 0
(Base )3 5 25 40 +++ +++ 442 478 95 372 348 56 4.33 0
2 35 23 40 +++ +++ 434 466 104 370 343 51 4.20 0
2 5 35 23 35 +++ +++ 445 482 94 372 343 4.34 20-30
2 1 0 35 23 30 +++ ++ 460 500 91 383 352 4.26 50-60
2 12 35 23 38 +++ ++ 468 499 118 405 379 4.20 80-90
2 15 35 23 25 +++ ++ 479 510 122 416 389 4.17 90
2 17 35 23 23 +++ + 483 515 119 420 391 4.13 90
2 20 35 23 20 47 5 510 118 406 386 4.10
5 35 20 40 +++ +++ 425 452 120 370 345 4.55 0
5 5 35 20 35 +++ +++ 442 469 126 387 363 55 4.45 20-30
5 10 35 20 30 +++ +++ 454 482 126 397 372 54 4 .3 6 40 -50
5 12 35 20 28 +++ +++ 462 487 143 411 387 53 4. 34 80-90
5 15 35 20 25 +++ ++ 478 504 144 424 401 50 4.28 80-90 w ~
5 17 35 20 23 +++ ++ 485 536 78 389 354 4.25 80-90

TABLE I (Cant.)
Ag Se Si As Te Stab. Stab. SP"A" SP"B" ~E (vis) n=1013.0 n=1014.6 IR Dens i ty %Area Phase b SP a SP oc oc Kca1/rn. oc oc g/cc Separated
(Softening Point rerun) 510 542 128 446 420
5 20 35 20 20 +++ ++ 530 558 152 472 447 4.22 90
5 22 35 20 18 +++ + 538 567 150 478 452 4.15
8 35 17 40 +++ +++ 399 425 116 346 323 37 4.71 10-30
8 5 35 17 35 +++ +++ 424 454 108 364 338 56 4.58 20-40
8 10 35 17 30 +++ +++ 458 484 137 405 380 56 4.47 40-50
8 12 35 17 28 +++ +++ 470 492 105 424 402 56 4.43 90
8 15 35 17 25 +++ +++ 494 545 80 399 362 56 4.41 90
(Softening Point rerun) 532 559 159 477 451
8 17 35 17 23 +++ +++ 531 556 170 479 455 4.38 90
8 20 35 17 20 +++ ++ 544 572 158 486 461 56 4.28 95
8 22 35 17 18 +++ ++ 555 582 168 499 476 4.26 99
8 25 35 17 15 +++ + 569 597 168 511 486 4.25
10 35 15 40 +++ +++ 387 414 107 332 308 4.87 10-30
10 5 35 15 35 +++ +++ 421 447 123 368 344 4.72 30-40 w Vl

TABLE I (Cont.)
Ag Se Si As Te Stab. Stab. SP"A" SP"B" 11E(vis) n=1013.0 n=1014.6 IR Density %Area Phase b SP a SP oc oc Kca1/m. oc oc g/cc Separated
10 10 35 15 30 +++ +++ 454 480 135 401 377 28 4.61 40-50
10 12 35 15 28 +++ +++ 468 490 164 422 401 4.55 50-60
10 15 35 15 25 +++ +++ 537 564 161 481 456 56 4.49 80-90
10 17 35 15 23 +++ +++ 545 573 158 487 461 4.45 80-90
10 20 35 15 20 +++ +++ 560 588 164 502 476 35 4.39 90
10 22 35 15 18 +++ ++ 567 593 178 513 490 36 4.36
10 25 35 15 15 + 578 607 166 518 492 34 4.33 90
10 30 35 15 10 588 625 134 514 483 4.27
13 30 35 12 10 596 630 148 527 498
15 25 35 10 15 574 616 115 492 456 36
15 30 35 10 10 604 649 115 516 478
20 25 35 5 15
20 30 35 5 10
w
*Se e Appendix A fo r abbre via t ion e xp lanation. m

TABLE II*
Parameters For Exploratory Compositions
Si As Te Se Ge B p Sb Bi Pb Ag Zn Al Stab. SP"A" SP"B" X-ray X-ray b SP oc oc b SP a SP
25 45 30 +++ 442 glass d. cryst.
30 30 40 +++ 416 glass glass
35 15 50 +++ 437 glass d. cryst.
35 25 40 +++ 442 478 glass glass
35 35 30 +++ 442 482 glass d. cryst.
35 30 35 +++ 474 507 glass d. cryst.
37 30 33 +++ 490 523 glass d. cryst.
40 · 20 40 +++ 467 glass glass
45 25 30 +++ 500 glass d. cryst.
35 30 25 10 488 glass
30 20 30 20 430 glass
30 30 30 5 5 ++ 463 490 glass
35 20 35 5 5 ++ 483 509 glass
30 25 35 5 5 +++ 440 487 glass w ....J
20 15 20 25 20 379 glass

TABLE II (Cont.) Si As Te Se Ge B p Sb Bi Pb Ag Zn Al Stab. SP"A" SP"B" x-ray X-ray
b SP .oc oc . b . sp a SP
15 20 40 5 5 +++ 397 420 glass
30 20 35 5 5 +++ 463 487 glass
30 30 25 5 5 5 +++ 440 478 cryst.
30 25 30 5 5 5 +++ 447 475 cryst.
15 15 20 25 20 5 360 glass
20 35 30 5 5 5 +++ 450 476 glass
25 20 40 5 5 +++ 397 420 glass
30 20 35 5 5 5 +++ 463 487 glass
30 20 45 5 +++ 398 421 glass
30 20 35 5 5 5 +++ 441 470 cryst.
30 20 40 5 5 +++ 407 431 cryst.
35 20 40 5 + 407 438 glass
30 15 45 5 5 +++ 388 glass
35 20 35 10 +++ 465 494 glass
30 15 30 20 5 436 glass
35 20 35 5 5 + 476 506 glass
25 15 30 20 10 glass w 00
35 25 38 2 + cryst.

TABLE II (Cont.) Si As Te Se Ge B p Sb Bi Pb Ag Zn Al Stab. SP"A" SP"B" X-ray x-ray
... b. SP . ·oc . oc b Sl? a SP
35 25 30 5 3 2 +++ cryst.
33 24 38 5 +++ 419 443 glass d. cryst.
30 30 30 10 +++ cryst.
35 20 35 10 +++ cryst.
35 25 35 3 2 +++ 452 470 cryst.
35 20 40 3 2 +++ 435 456 glass
35 25 30 5 5 +++ cryst.
35 20 25 10 10 cryst.
30 20 25 10 5 10 . cryst.
35 17 40 3 5 +++ 371 394 glass glass
35 17 35 5 3 5 +++ 555 626 glass d. cryst.
35 17 30 10 3 5 +++ 575 618 glass d. cryst.
35 17 25 15 3 5 +++ 574 630 glass d. cryst.
35 17 20 20 3 5 ++ 535 614 glass d. cryst.
35 15 20 20 3 7 +++ 566 cryst.
35 15 15 25 3 7 + 572 598 cryst.
35 12 10 30 3 10 cryst. w \,0
30 30 28 7 5 ++ cryst.

TABLE II (Cont.) Si As Te Se Be B p Sb Bi Pb A<J Zn Al Stab. SP"A" SP"B" x-ray X-ray
.. b SP . .. oc oc b SP a SP
55 28 12 5 +++ cryst.
12 55 28 5 +++ 346 366 cryst.
35 20 40 5 +++ 426 458 glass
44 30 25 1 +++ 510 540 glass d. cryst.
*See Appendix A for explanation of abbreviations.

TABLE III
Dilatometric Break Points
Ag Se Si As Te 1st Dilatometer 2nd Di1atometer Log n=13.0 Break Point °C Break Point 0 c oc
37 30 33 395 424
35 25 40 354 372
10 35 15 40 327 332
10 5 35 15 35 340 368
10 10 35 15 30 355 462 401
10 12 35 15 28 382 457 422
10 15 35 15 25 375 450 481
10 17 35 15 23 None 449 487
10 20 35 15 20 440 472 502
8 15 35 17 25 387 463 399 & 477

42
Figure 1. Si-As-Te ternary including binary crystal
line compositions, bare glass compositions
and glass formation field.

Si
Figure 1

43
Figure 2. Rocking furnace for glass sample fabrica
tion.

--- ...... -.... ., .... .... --- .... -
-- ---- ----- I -- I --l
Figure 2

44
Figure 3. Quench rate~

. a. E Q)
..... 400
200
0 1 2 3 4 5 6 7 8 9
Time (Minutes)
Figure 3

45
Figure 4. Viscosity temperatures for National
Bureau of Standards Glass #712.

16
14
~ 12 V)
0 u V)
> 10
C)
0 ....I 8
6
NBS# 712
1.3 1.4 1.5 1.6
Figure 4

46
Figure 5. Stability limits for the Ag-Se doped si 35
As 2S-%AgTe 40-%Se glasses.

12
10
8
Stable Glass 0>
<( 6
4
Unstable Glass
2
0 5 10 15 20 25
% Se Figure 5

47
Figure 6. A and B softening temperatures for the Ag
doped si 35As 20Te 40 glasses.

. a. E (I) t-
475
450
425
400
0 2 4 6 8 10
~o Ag Figure 6

48
Figure 7. A and B softening temperatures for the Se
doped Ag 2si 35As 18Te 40-%Se glasses.

600 2 o/o Ag
u ---~ 0 .
Q. 500 E Q)
-~ 1-
400
0 5 10 15 20 25
% Se Figure 7

49
Figure 8. Extrapolated energy of activation for vis-
cous flow for the Se doped Ag 2si 35As18
Te 40 os glasses. -~ e
140 ~ 2o/o Ag
(I) 120• ~ ~ -0 E --0
~
u 100• ~
80•
• • . • •
0 5 10 15 20 25
% Se Figure 8

50
Figure 9. A and B softening temperatures for the Se
doped Ag 5si 35As 20Te 40 _%Se glasses.

600
0 5 10
5% Ag
/
15
I
, ,
Figure 9
/ /
, /
/
r_y-0
20 25
Ul 0 PJ

51
Figure 10. Extrapolated energy of activation for
viscous flow for the Se doped Ag 5si 35As20
Te 40-%Se glasses.

0 0
0 0 140 II
0 0 0 Q)
120 0 Run 2 -0 E
-.......
0 u 5%Ag ~ 100"
so~ 0 Run 1
• • • • • 0 5 10 15 20 25
% Se U1 1--J PJ
Figure 10

52
Figure 11. A and B softening temperatures for the
se doped Ag 8si 35As 17Te 40-%Se glasses.

600
. a.. E 500 Q)
1--
400
I
0 5 10
I
8% Ag
/ /
/
/
15
% Se Figure 11
20 25

53
Figure 12. Extrapolated energy of activation for
viscous flow for the Se doped Ag 8se 35
As 17Te 40-%Se glasses.

180~
0 0 D 0
160 ~ 0 0
Run 2 4)
140 ~ -0 0 E
-.._
c 120 ~ 8% Ag u ~ ~
D
100.
80 ~ 0
Run 1
• _._ • • . 0 5 10 15 20 25
% Se F igure 12 Ul
w Ill

54
Figure 13. A and B softening temperatures for the
Se doped Ag 10si 35As 15Te 40-%Se glasses.

600
. a. E 500 Q)
t-
400
0 5 10
10% Ag
I I I
I I
I I
I I
I I I
I
I
15
%Se
Figure 13
20 25

55
Figure 14. Extrapolated energy of activation for
viscous flow for the Se doped Ag10
si35
As 15Te 40-%Se glasses.

160 ~
Q) 140 ~ -0 E
............
0 10% Ag u 120 ~ ~
t7
100 ~
• • - . •
0 5 10 15 20 25
Figure 14
56
Figure 15. Extrapolated annealing point temperatures
for the Se doped Ag10si 35As 15Te 40-%Se
glasses.

500 I 10% Ag
ou 450 I
. a. E Q)
1- 400 •
350~
• • • • • 0 5 10 15 20 25
% Se
Figure 15

57
Figure 16. Dilatometer break point temperatures for
the Se doped Ag 10si 35As 15Te 40 _%Se glasses.

500~ 10% Ag
\1 \1 450 ~ v \1
ou .
c.. E <I>
400 t- ~
350 ~
• • • • 0 5 10 15 20 25
% Se Figure 16

58
Figure 17. Molar volume for the Ag-Se doped si35
As 25 _%AgTe 40-%Se glasses.

~ ~- 20fo Ag 0-5% Ag
18 1- 0- 8% Ag p \l-10%Ag
0 ~ 6.
Cl) 0 ~ E D 1::::. :l 0
0 0 0 0 ~ > 0
17 D 0
~ ~ D 0 0 \l \1 0 - \1 0 0 ~ \1
'1 \l
0
" 16 o ~------~5------~,o~----~1·~5------2·o----~2~s~--~;~o
Figure 17

59
REFERENCES
I.D. Aggarwal, C.T. Moynihan, P.B. Macedo, J.J. Mecholsky, and G.R. Srinivasan, ONR Technical Report #21 Contract No. N00014-69-A-0506-002, December 1971, J. Am. Cer. Soc. 1972, 55 (7) 366.
C.G. Beck and R. Stickler, J. Appl. Physics, 37 (13) 4683-7 (1966) .
F. Betts, A. Bienenstock, D.T. Keating, and J.P. DeNeufvi1le, J. Non Cr. Sol., ]__ (4) 417-432 (1972).
A. Bienenstock, F. Betts, and S.R. Ovshinsky, J. Non Cryst. Sol., ~ 347-357 (1970).
R.F. Brebrick, J. Chern. Physics, 49 (6) 2584 (1968).
G.V. Bunton, J. Non Cr. Sol.,~ 72-82 (1971).
H.S. Chen and D. Turnbull, J. Appl. Phys., 40 4221 (1969).
C.J. Conran, Acta Cryst., 16 388 (1963).
C. Das, M. Bever, D. Uhlmann, and S . C. Moss, J. Non Cr. Sol, 7 (3) 251 (1972).
S.A. Dernbovskii, Neorg. Mat., ~ (3) 463-471 (1969).
J.P. DeNeufville, aSerni-Annual Technical Report Contract DAHC 15-70-C-0187, CARPA 1570-0DlO, 18 May 1970-18 May 1972. b4th Inter. Con£. Amorph. Liquid Semicon., Ann Arbor 1971, to be publ. in J. Non Cryst. Solids, 8-9-72. Cpaper #2-55, Annual Meeting Am. Cer. Soc., 1972.
A.M. Efirnov and B.F. Kokorina, Stekloobraznoe Sostoyanie (Proc. VAll Union Congress 1969), Publ. Nauka (1971), p.92.
J.R. Fitzpatrick and c. Maghrabi, Phys. Chern. Gl., 12 (4) 105-108 (1971).
W.A. Fraser, J. Opt. Soc. Am., 43 823 (1953).
N.A. Goriunova and B.T. Kolomiets, asov. Phys. Tech. Phys., 3 1766-1775 (1958). band V.P. Shilo, Sov. Phys. Sol.

60
State, 2 258-261 (1960). cProc. All Union Con£. on Glassy State III, Vol. II, p. 410, Leningrad (1959).
A.R. Hilton, aJ. Non Cr. Sol., ~ 28-39 (1970). bTI Report No. 08-65-121 ONR Contract 3810 (00), 30 September 1965. cc.E. Jones, R.D. Dobbott, H.M. Klein, A.M. Bryant, and T.D. George, Phys. Chern. Gl., 7 (4) 114, 116-126 (1966). dand M. Brau, Infrared Phys., · 3 69-76 (1963}. eHilton, Jones, and Brau, IR Physics., 4-213-221 (1964). fHilton, Applied Optics, ~ (12) · (1966)-:-
M. Imaoka and T. Yamazaki, Seisan Kenkyu, 19 (9) 261-262 (1967) .
A.J. Klein Haneveld, W.V.D. Veer, and F. Jellineek, Re. Trav. Chirn Pays-Bas, 87 (3) 255 (1968).
B.F. Kokorina, Stekloobraznoe Sostoyanie (Proc. VAll-Union Congress 1969, Publ. "Nauka," 1971) 95-97.
H. Krebs, aAngew. Chern., 65 293-299. b·b ' d 1. 1. • ' 70 615-625.
N.J. Kreidl, Technical Report #1, ONR Contract, N00014-69-A-0141-0003, 31 August 1971.
J.E. Morral, Ph.D. Thesis, Dept. Metall. Mat. Sci., MIT, Cambridge, MA (1968).
C.T. Moynihan, P.B. Macedo, I.D. Aggarwal, and U.E. Schnaus, J. Non Cryst. Sol., .§_ (4) 322 (1971).
M. F. Mydlar, N.J. Kreidl, J. K. Hendren, and G.T. Clayton, Phys. Chern. Gl., 11 (6) 196-204 (1970).
M. Myers and E. Felty, Mat. Res. Bull.,~ 535 (1967).
A.V. Pasin and S.U. Borisova, Stekloobraznoe Sostoyanie (Proc. V., All Union Congress) Publ. "Nauka" 95-97 (1971).
E.R. Plumat, aSilicates Ind., 32 (1) 5-13 (1967), "II" ibid. (2) 57-66, "III" ibid., (3) 103-111. bJ. Am. Cer. Soc., 51 (9) 499 - 507 (1968).
H. Rawson, Ac. Press, London-New York, 253-254 (1967).

61
J.A. Savage and S. Nielsen, aPhys. Chern. G1., 5 82-86 (1964). brnfrared Phys., ~ 195-204 (1965}.
E.V. Sholnikov, avestnik Leningr. Univ., 4 115-120 (1965). bibid.' 120-127.
J.P. Suchet, Mat. Res. Bull., ~ 491 (1971).
K. Sunrous, L. Stovrac, and J. Bednar, Czech, J. Phys., 7 120 (1957).
D. Turnbull and M.H. Cohen, J. Chern. Phys., 34 120 (1961).
D.R. Uhlmann, J. Non Cr. Sol., 7 (4) 337 (1972).
A. Vaipol i n and E . Porai-Koshits, Soviet Physics Solid State 5 186, 247, 256 (1963).
T. Wadsten, aActa Chern. Scand., 19 1232 (1965). bActa Chern. Scand., 21 (2) 593 (1967).
A. Weiss and A. Weiss, z. Anorg. Chern., 273 124-8 (1953).

62
VITA
Henry Edward Anthonis III was born on August 9, 1944,
in St. Louis, Missouri. He received his primary and secon
dary education in St. Louis. He received his college
education at the University of Missouri - Rolla and was
granted a Bachelor of Science degree in Ceramic Engineering
in January of 1968.
From 1968 to 1970 he served in the U.S. Army. Upon
completion of his military obligation he enrolled in the
Graduate School of the University of Missouri - Rolla.
He held an Office of Naval Research assistanceship
from May 1970 to August 1972.

63
APPENDICES

64
APPENDIX A
Abbreviations and Calculations
The following description of the abbreviations used in
Table I and II include evaluation of activation energy,
strain point and annealing point introduced on page 12.
Stab. b SP
This refers to the stability of a glass specimen before it
is analyzed for softening point.
Stab. a SP
This refers to the stability of a glass specimen after it is
analyzed for softening point.
The stability is rated from +++ to These symbols
are interpreted as follows:
+++ no signs of reaction with atmosphere
++ initial instability, stability after one hour
+ initial instability, stability after one day
- very slow continuous deterioration
rapid deteriation
sample too unstable to handle
SP"A" and SP"B" oc oc
These abbreviatio ns correspond to the "A" softening point
temperature at log viscosity equal to 9.8 and the "B" soften-

ing point temperature at log viscosity equal to 8.4.
&E (vis} Kcal/mole
65
This refers to the energy of activation for viscous flow in
kilocalories per mole. It is extrapolated from the "A" and
"B" softening points through the following equation:
AE(vis) = 2.3 (Log nA- .Lo.g. nB)
(l/T°KA - l/T° KB) X
1.987 cal
Mole Degree
This. is the extrapolated s·train point temperature. It is
obtained through the following equation:
Strain point = (4. 43
TOKA
1
3. 4 3)
n.=l013. 0 oc
This is the extrapolated annealing point temperature. It is
obtained through the following equation:
Annealing point = 1
IR
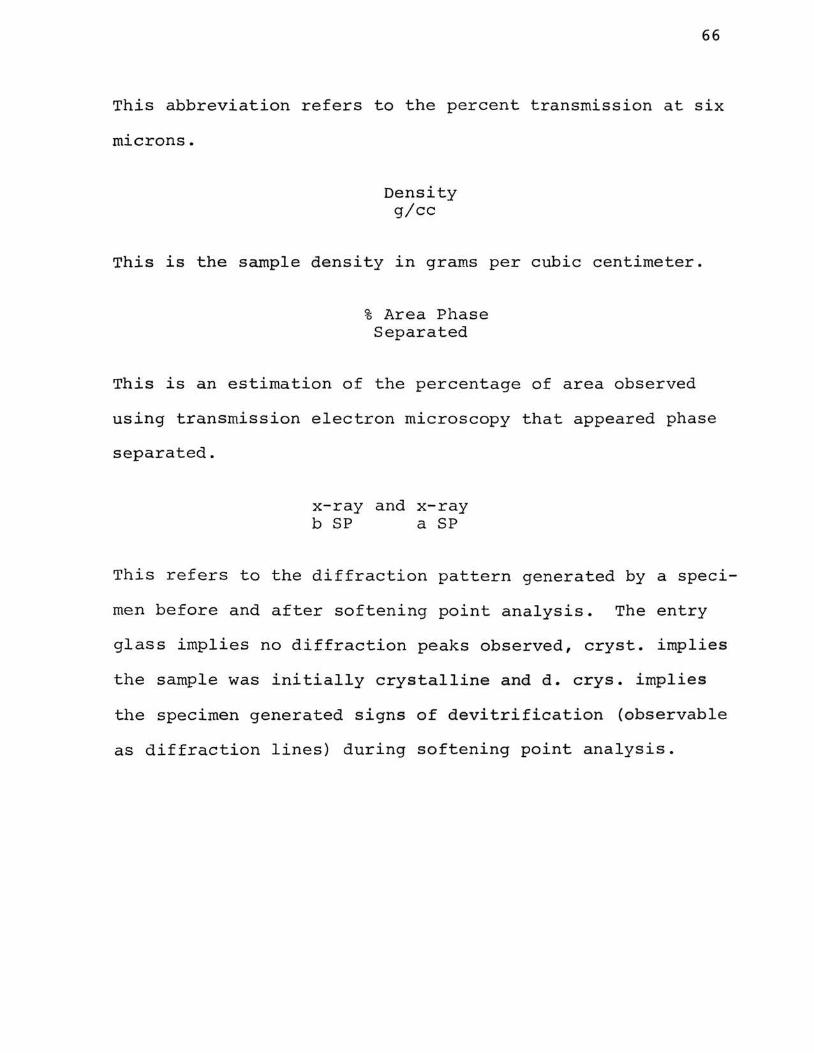
66
This abbreviation refers to the percent transmission at six
microns.
Density g/cc
This is the sample density in grams per cubic centimeter.
% Area Phase Separated
This is an estimation of the percentage of area observed
using transmission electron microscopy that appeared phase
separated.
x-ray and x-ray b SP a SP
This refers to the diffraction pattern generated by a speci-
men before and after softening point analysis. The entry
glass implies no diffraction peaks observed, cryst. implies
the sample was initially crystalline and d. crys. implies
the specimen generated signs of devitrification (observable
as diffraction lines) during softening point analysis.

APPENDIX B
Recommendations
67
(1) The study should be extended at a reasonable rate
of effort with the objective of finding and describing addi
tional high Tg glasses. There is a very good chance of suc
cess.
(2) Scanning electron microscopy should be used to
determine the Ag and Se content of the microphases detected
in the high viscosity Si-As-Ag-Te-Se glasses, to evaluate
models for the large effect of Ag + Se on stability, Tg and
phase separation.
(3) The high temperature ir transmission and band gap
of Si-As-Ag-Te-Se glasses should be determined to evaluate
their direct applicability to ir transparency and semicon
ductor design.
(4) Ag and Se should be replaced systematically by the
alkali selenides to be synthesized from available pure sele
nites. These selenides can be incorporated in Si-As-Te base
mixtures avoiding the reactivity of elemental Li, Na, K, Rb,
cs, while potentially capable of effects related to those
found for Ag.
(5) The highest Tg glasses bred in our continual study
should be investigated in regard to cause and removal of SiO
absorption.
(6) An exploration may lead to the possibility to dope
Ge-As-Se glass with Si, so far unattainable, just as it had

68
been possible to dope Si-As-Te with Se in the present study.
(7) The use of Pb together with Li, Na, K, Cs, and Ag
may further extend the area of good high Tg ir transparencies
and semiconductors. Our preliminary experiments indicate a
high chance of success. Tl might be considered also.
(8) Phase diagrams for the chalcogenide systems invol
ving at least Si, Ge, As, Sb should be worked out, with a
complete mapping of Tg as achieved with particular success
by FELTZ and DeNEUFVILLE, both reporting first at the
Michigan Conference (papers to be published soon in the
Journal of Non Crystalline Solids). Our project should have
scanning calorimetry available.
(9) In this connection, structural diffraction work on
polynary chalcogenide crystals should be undertaken, n- and
x-ray diffraction work on selected glasses is no longer be
yond reach of contemporary skill (WARREN, BIENENSTOCK, BETTS).
(10) The abandoned work on loss mechanism in chalcogenide
glasses should be resumed, even if at a lower priority or
under contracts concerned with transport phenomena, parti
cularly internal friction, with chalcogenide glasses con
taining silver and, or alkali.

69
APPENDIX C
Electron Transmis.sion l?hotomicrographs
Electron transmission analysis was carried out as des
cribed in Section 3.23. All photomicrographs presented in
Figures 1, 2, 3, and 4 are 43,000x.

70
Figure 1. Electron transmission photomicrographs of base
glass and 2% Ag series.
A) Si 35As 25Te 40
B) Ag 2si 35As 23Te 40
C) Ag 2si 35As 23Te 35se 5
D) Ag 2si 35As 23Te 30se10
E) Ag 2si 35As 23Te 28se12
F) Ag 2si 35As 23Te 25se15
G) Ag 2si 35As 23Te 23se17

70a
O.Sllm
Figure 1

71
Figure 2. Electron transmission photomicrographs of 5%
Ag glass series.
A) Ag 5si 35As 20Te 40
B) Ag 5si 35As 20Te 35se5
C) Ag5Si35As20Te30Sel0
D) Ag5Si35As20Te28Sel2
E) Agssi35As20Te25sel5
F) Ag5Si35As20Te23Sel7
G) Ag5Si35As20Te20Se20

7la
O.Sllm
Figure 2

72
Figure 3. Electron transmission photomicrographs of 8%
Ag glass series.
A) Ag8Si35Asl7Te40
B) Ag 8si35As 17Te 35se5
C) Ag8Si35Asl7Te30Sel0
D) Ag8Si35Asl7Te28Sel2
E) Ag 8si 35As 17Te~5se 15 F) Ag8Si35Asl7Te25Sel5
G) Ag8Si35Asl7Te23Sel7
H) Ag8Si35Asl7Te20Se20
I) Ag8Si35Asl7Tel8Se22

72a
O.Sllm
Figure 3

73
Figure 4. Electron transmission photomicrographs of 10%
Ag glass series.
A) Agl0Si35Asl5Te40
B) Agl0Si35Asl5Te35Se5
C) Agl0 8 i35Asl5Te30 8 elO
D) Agl0Si35Asl5Te28Sel2
E) Agl0Si35Asl5Te25Sel5
F) Agl0Si35Asl5Te238 el7
G) Agl0Si35Asl5Te20Se20
H) Agl0Si35Asl5Tel8Se22
I) Agl0Si35Asl5Tel5Se25

73a
0.5\.lm
Figure 4