Motifs Insights from Engineering Systems Architectures
14
Motifs Insights from Engineering Systems Architectures A. S. Shaja Research Scientist, Department of Aerospace Engineering, IIT Bombay, Mumbai, India - 400076 [email protected] K. Sudhakar Professor, Department of Aerospace Engineering, IIT Bombay, Mumbai, India - 400076. [email protected] ‘Network Motifs’ is a research area in ‘Network Science’ which has captured the attention of many researchers. Complex biological and social networks have displayed presence of some triad motifs far in excess (or short) of their expected values. Some of these over(under) represented motifs have explained the basic functionality of systems, eg. in sensory transcription networks of biology overrepresented motifs are shown to perform signal processing tasks. This suggests purposeful, selective retention of these motifs in the studied biological systems. Another interesting feature is the high correlation of triad motif significance profiles of all systems that belong to a family of naturally grouped systems, thereby suggesting that all systems in a family have same function to perform and hence the correlation. Engineering systems also display over(under) represented motifs. The motif significance profiles of a family of naturally grouped engineering systems show high correlation. Unlike biological and social networks, engineering systems are designed by humans and offer opportunity for investigation based on known design rules. We show that over(under) represented motifs in engineering systems are not purposefully retained/avoided to perform functions but are a natural consequence of design by decomposition. We also discover that naturally grouped systems have remarkably correlated in(out) degree distribution across nodes resulting in high correlation in motif significance profile. Therefore, we argue that the idea of ‘network motifs’ has no significance in engineering systems (unlike biological and other evolutionary systems) and we caution the engineering research community to be careful while drawing upon conclusions based on ‘network motifs’. We report a remarkable correlation of in(out) degree distribution of systems within a family of engineering systems. We further show that biological and social networks also display signs of decomposition. They also show high correlation of in-out degree distribution of nodes for systems within a family. This opens up interesting opportunity to investigate these systems through their observed decomposition. Key words : motif, motif significance profiles, synthesis by decomposition, degree distribution 1
Transcript of Motifs Insights from Engineering Systems Architectures

Motifs Insights from Engineering SystemsArchitectures
A. S. ShajaResearch Scientist, Department of Aerospace Engineering, IIT Bombay, Mumbai, India - 400076 [email protected]
K. SudhakarProfessor, Department of Aerospace Engineering, IIT Bombay, Mumbai, India - 400076. [email protected]
‘Network Motifs’ is a research area in ‘Network Science’ which has captured the attention of many researchers.
Complex biological and social networks have displayed presence of some triad motifs far in excess (or short)
of their expected values. Some of these over(under) represented motifs have explained the basic functionality
of systems, eg. in sensory transcription networks of biology overrepresented motifs are shown to perform
signal processing tasks. This suggests purposeful, selective retention of these motifs in the studied biological
systems. Another interesting feature is the high correlation of triad motif significance profiles of all systems
that belong to a family of naturally grouped systems, thereby suggesting that all systems in a family
have same function to perform and hence the correlation. Engineering systems also display over(under)
represented motifs. The motif significance profiles of a family of naturally grouped engineering systems show
high correlation. Unlike biological and social networks, engineering systems are designed by humans and offer
opportunity for investigation based on known design rules. We show that over(under) represented motifs in
engineering systems are not purposefully retained/avoided to perform functions but are a natural consequence
of design by decomposition. We also discover that naturally grouped systems have remarkably correlated
in(out) degree distribution across nodes resulting in high correlation in motif significance profile. Therefore,
we argue that the idea of ‘network motifs’ has no significance in engineering systems (unlike biological and
other evolutionary systems) and we caution the engineering research community to be careful while drawing
upon conclusions based on ‘network motifs’. We report a remarkable correlation of in(out) degree distribution
of systems within a family of engineering systems. We further show that biological and social networks also
display signs of decomposition. They also show high correlation of in-out degree distribution of nodes for
systems within a family. This opens up interesting opportunity to investigate these systems through their
observed decomposition.
Key words : motif, motif significance profiles, synthesis by decomposition, degree distribution
1
2
Introduction
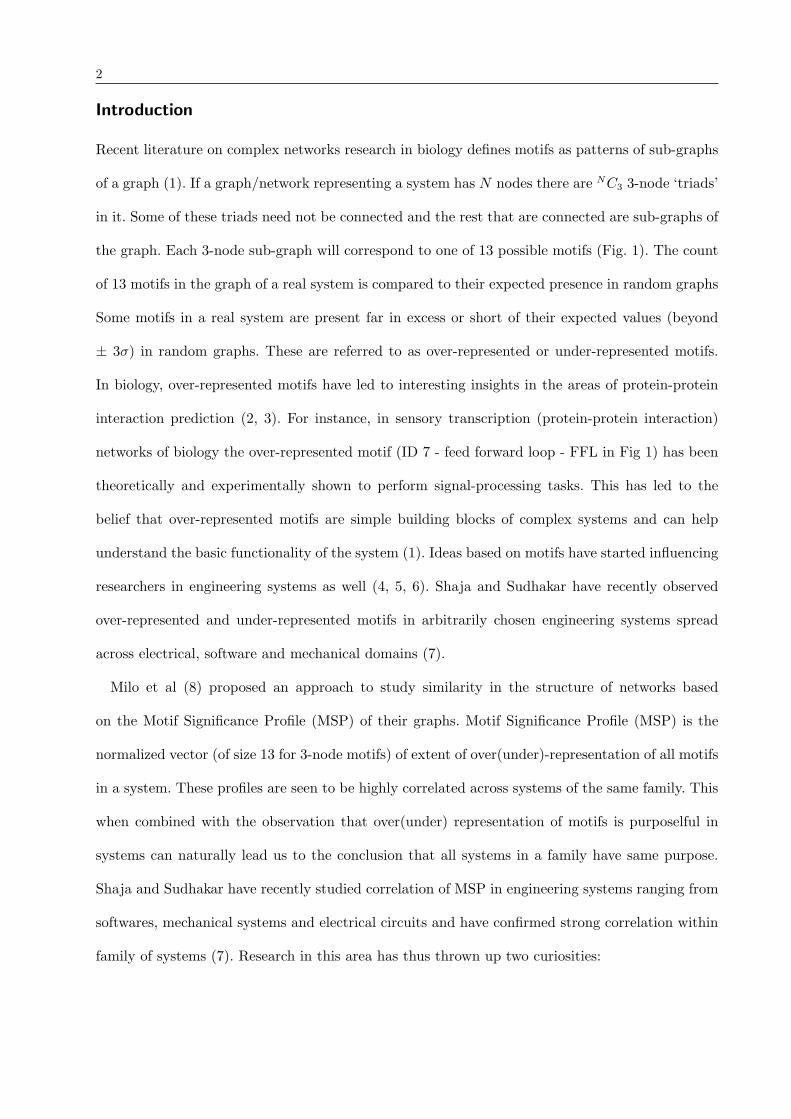
Recent literature on complex networks research in biology defines motifs as patterns of sub-graphs
of a graph (1). If a graph/network representing a system has N nodes there are NC3 3-node ‘triads’
in it. Some of these triads need not be connected and the rest that are connected are sub-graphs of
the graph. Each 3-node sub-graph will correspond to one of 13 possible motifs (Fig. 1). The count
of 13 motifs in the graph of a real system is compared to their expected presence in random graphs
Some motifs in a real system are present far in excess or short of their expected values (beyond
± 3σ) in random graphs. These are referred to as over-represented or under-represented motifs.
In biology, over-represented motifs have led to interesting insights in the areas of protein-protein
interaction prediction (2, 3). For instance, in sensory transcription (protein-protein interaction)
networks of biology the over-represented motif (ID 7 - feed forward loop - FFL in Fig 1) has been
theoretically and experimentally shown to perform signal-processing tasks. This has led to the
belief that over-represented motifs are simple building blocks of complex systems and can help
understand the basic functionality of the system (1). Ideas based on motifs have started influencing
researchers in engineering systems as well (4, 5, 6). Shaja and Sudhakar have recently observed
over-represented and under-represented motifs in arbitrarily chosen engineering systems spread
across electrical, software and mechanical domains (7).
Milo et al (8) proposed an approach to study similarity in the structure of networks based
on the Motif Significance Profile (MSP) of their graphs. Motif Significance Profile (MSP) is the
normalized vector (of size 13 for 3-node motifs) of extent of over(under)-representation of all motifs
in a system. These profiles are seen to be highly correlated across systems of the same family. This
when combined with the observation that over(under) representation of motifs is purposelful in
systems can naturally lead us to the conclusion that all systems in a family have same purpose.
Shaja and Sudhakar have recently studied correlation of MSP in engineering systems ranging from
softwares, mechanical systems and electrical circuits and have confirmed strong correlation within
family of systems (7). Research in this area has thus thrown up two curiosities:
3
Figure 1 All 13 patterns (motifs) for 3 node sub-graphs
1. What causes over(under)-represented motifs? Most of the systems studied, including engineer-
ing systems, display over(under)-represented motifs. Such motif counts represent highly improbable
events. In naturally evolving biological or social systems such motif presence can be attributed to
deliberate retention to create useful functionality. But engineering systems are designed and the
design process does not address functionality through motifs. So, why do over(under)-represented
motifs appear in engineering systems?
2. Why are MSPs of same family of systems correlated? MSP of systems of same family display
high degree of similarity. Correlation coefficient defined to capture this similarity takes values close
to unity for most systems within a family? Why should for example two software systems, xmms
(9) a music player and Linux (9) an OS, offering widely differing functionality end up with MSPs
that are highly correlated?
Present study addresses these two curiosities.
What causes over-represented motifs?
Engineering systems are designed by humans and offer opportunity for investigation based on
known design rules. Designers of engineering systems do not explicitly retain/avoid any motif for
the purpose of meeting system design requirements or system design objective. This will imply that
design rules are indirectly responsible for over(under) represented motifs in engineering systems.
Yael Artzy-Randrup et al (10) have argued that motifs can arise by mechanisms other than evolu-
tionary selective retention. They showed that a rule like “the probability of preferential connection
to other nodes falling off with the physical distance between nodes” can explain the over-represented
4
motif in neural-connectivity map of a nematode Caenorhabditis elegans. But that design rule was
unable to reproduce the full motif significance profiles (11).
One major design rule in complex engineering systems is ‘design by decomposition’ that is
invoked to conquer complexity. Systems are decomposed into sub-systems (and recursively so for
very complex systems) such that nodes within each sub-system are densely inter-connected and
nodes from across sub-systems are sparsely inter-connected. We investigate impact of design by
decomposition on motif counts in engineering systems.
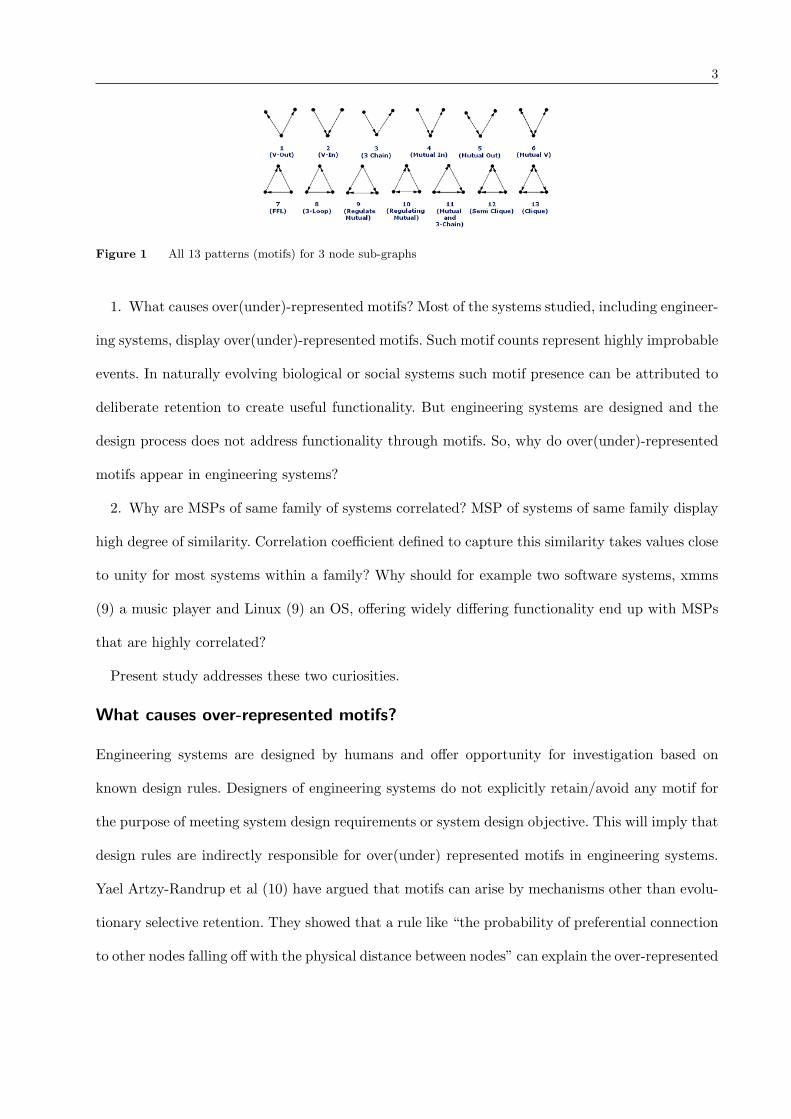
Consider an arbitrarily chosen engineering system - digital fractional multiplier s832 (12). It has
N = 512 nodes with each node having specific in-degree and out-degree and has a motif count
vector of n, i.e. n= {ni , i= 1,13} is the count of 13 motifs in s832.
We first study expected motif counts of random graphs synthesized monolithically, ie. without
decomposition, from these 512 nodes. This is referred to as single cluster configuration and des-
ignated by c = 1. Large numbers of such randomized graphs are created by inter-connecting all
node pairs such that the degree distribution of nodes and the count of 2 node sub-graphs as in
the real network are retained in the random graphs. A vector of means of motif counts, µ1 = {µ1,i,
i = 1 to 13} and a vector of standard deviations, σ1 = {σ1,i , i = 1 to 13} are defined. Here the
subscript 1 in µ1 and σ1 refers to c = 1. The motif significance profile (MSP) (8) defined as,
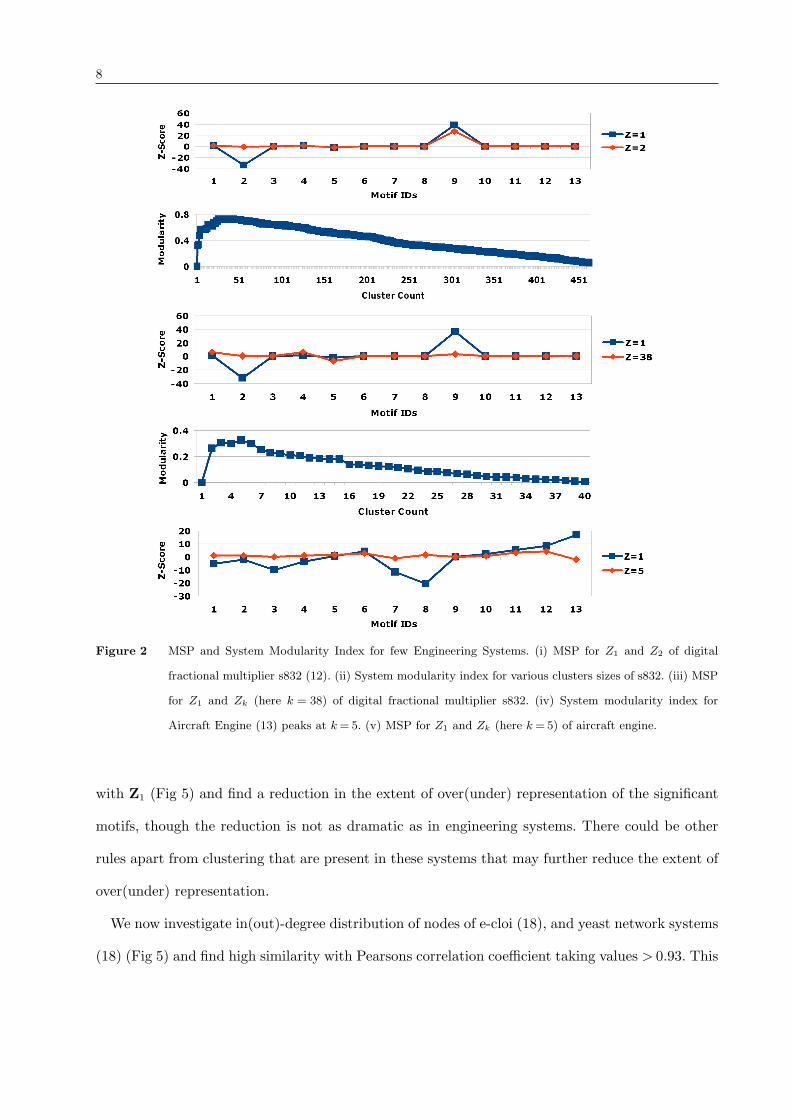
Z1 = (n − µ1)/σ1 is computed. Some elements of Z1 have values outside of ±3 (From Fig 2 it
can be seen that Z1,2 <−3 is under-represented and Z1,9 >+3 is over-represented). With regard
to these over(under) represented motifs we can take a stand that a rare event is being witnessed.
But such a stand becomes not justifiable when similar rare events are witnessed for all systems. So
we take the alternate stand, that the event witnessed does not belong to configuration c= 1 and
proceed to investigate other configurations.
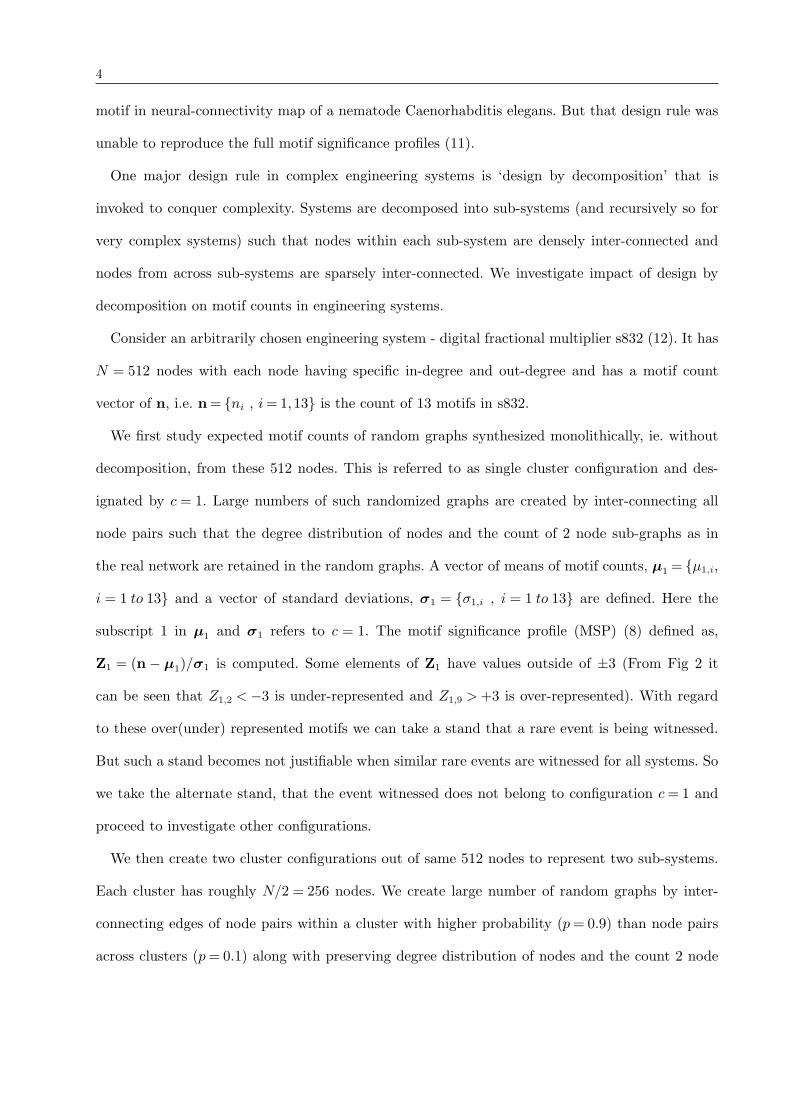
We then create two cluster configurations out of same 512 nodes to represent two sub-systems.
Each cluster has roughly N/2 = 256 nodes. We create large number of random graphs by inter-
connecting edges of node pairs within a cluster with higher probability (p= 0.9) than node pairs
across clusters (p= 0.1) along with preserving degree distribution of nodes and the count 2 node

5
sub-graphs as in the real network (Methods are available in supplementary material). This ran-
domization truly mimics the process by which the real system is synthesized. Vector of means
of motif count, µ2 and vector of standard deviations, σ2 are estimated. We now define MSP as
Z2 = (n−µ2)/σ2 for this c= 2 configuration. One can observe significant differences in Z2 for c= 2
from Z1 for c= 1 with respect to motif id =2.
We similarly study cluster numbers c= 3,4,5, etc and observe a clear dependence of motif sig-
nificance profile vector, Zc to clustering. Let us assume that the real system is synthesized by the
designer with k sub-systems (c= k). Since k for the real system is not known we use the following
approach: We first use Walktrap Community Detection algorithm by Pascal Pons and Matthieu
Latapy (14) to find the best possible sub systems grouping for a given k, from k = 1 to k = n. In
order to choose the best k out of this, we use the system modularity index proposed by Newman
and Girvan (15). The modularity index calculates how modular a given division of a graph into
subgraphs is. The system modularity index for clusters c= 1 to c=N is computed and shown in
Fig 2.
When c= 1 all nodes are in one cluster and have same probability to be connected to each other.
When c =N each node is a separate cluster and has same probability to get connected to each
other node. The similarity of modularity index for c= 1 and c=N is explained. Modularity index
is highest for c= 38 suggesting that s832 is designed with k = 38 sub-systems. We show MSP for
c= 38 as Z38 = (n−µ38)/σ38, in comparison with Z1 in Fig 2 . Z38 has no over(under)-represented
motifs and hence no rare events.
We now repeat the process for aircraft engine (13) for which N = 54. The number of clusters
present is discovered using Walktrap Community Detection approach (14) and Modularity Index
(15) as k= 5 (Fig 2). Manuel E. Sosa et al (13) have reported the number of modular sub-systems
in aircraft engine as 6, which is close to what we discover here. Z1, Z5 are computed for aircraft
engine and compared in Fig 2. It can be seen that extent of over(under)-represented motifs in Z5
has reduced significantly compared to Z1.

6
Authors have repeated this exercise for other engineering systems to confirm the above observa-
tion (refer supplementary material). We conclude that if motif counts in the real system synthesized
by decomposition are compared to mean motif counts of random networks synthesized monolithi-
cally one may wrongly conclude that they are highly improbable events. But if motif counts in the
real system are compared to mean motif counts of random networks synthesized by decomposition
they appear as highly probable events. Randomization does not try to mimic exact nodes that go
into each cluster or even exact number of nodes in each cluster, but has roughly equal number of
nodes randomly picked in each cluster. But such randomization still shows remarkable likeness in
motif count to real system.
Why are MSPs of super-families correlated?
We have shown that if a real system with N nodes has motif counts n and has k sub-systems,
then randomized networks using the same nodes with k clusters does not show up over(under)-
represented motifs. The question why must Z1 of one system correlate with Z1 of another system
belonging to the same family of systems now remains to be answered? Systems in the same family
are built with different number of nodes, and even different number of sub-systems, but they all
have Z1 highly correlated. We proceed to unravel this mystery in two steps. We first investigate
the similarity in the in-degree, out-degree distribution of all systems. We find that systems from a
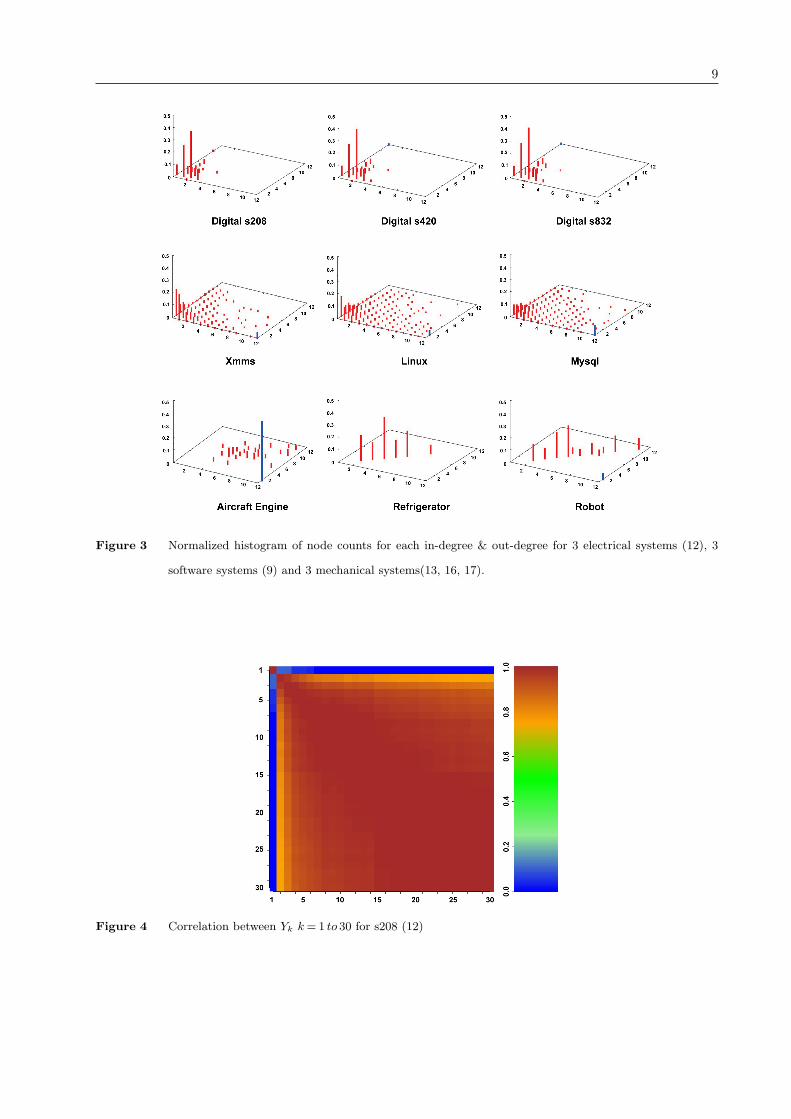
super-family show remarkably similar in-degree, out-degree distribution. The Fig 3 is a normalized
histogram of node counts for each in-degree & out-degree in different systems.
Very few nodes have in(out) degree exceeding 11 and hence all nodes having excess of 11 in(out)
degree are clubbed and shown at 12. Pearsons correlation of the 169 elements defined by the 13
by 13 matrix representing the degree distribution of each system is able to group all systems
into super-families. Authors have no explanation for this remarkable similarity of in(out) degree
distribution of systems of a family. Fig 3 shows only 3 digital systems, 3 software systems and 3
mechanical systems though similarity extends to other systems from these families. There are also
systems, though very few, that have not fallen in line. For example the histogram for aircraft engine
7
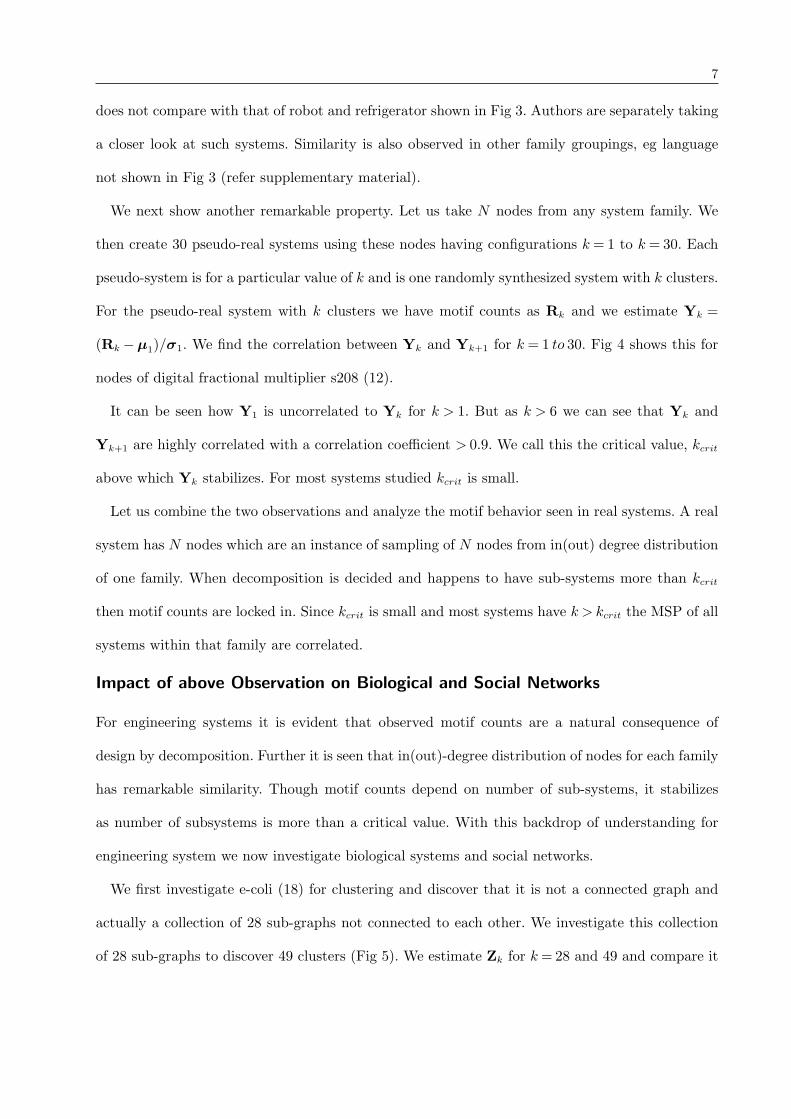
does not compare with that of robot and refrigerator shown in Fig 3. Authors are separately taking
a closer look at such systems. Similarity is also observed in other family groupings, eg language
not shown in Fig 3 (refer supplementary material).
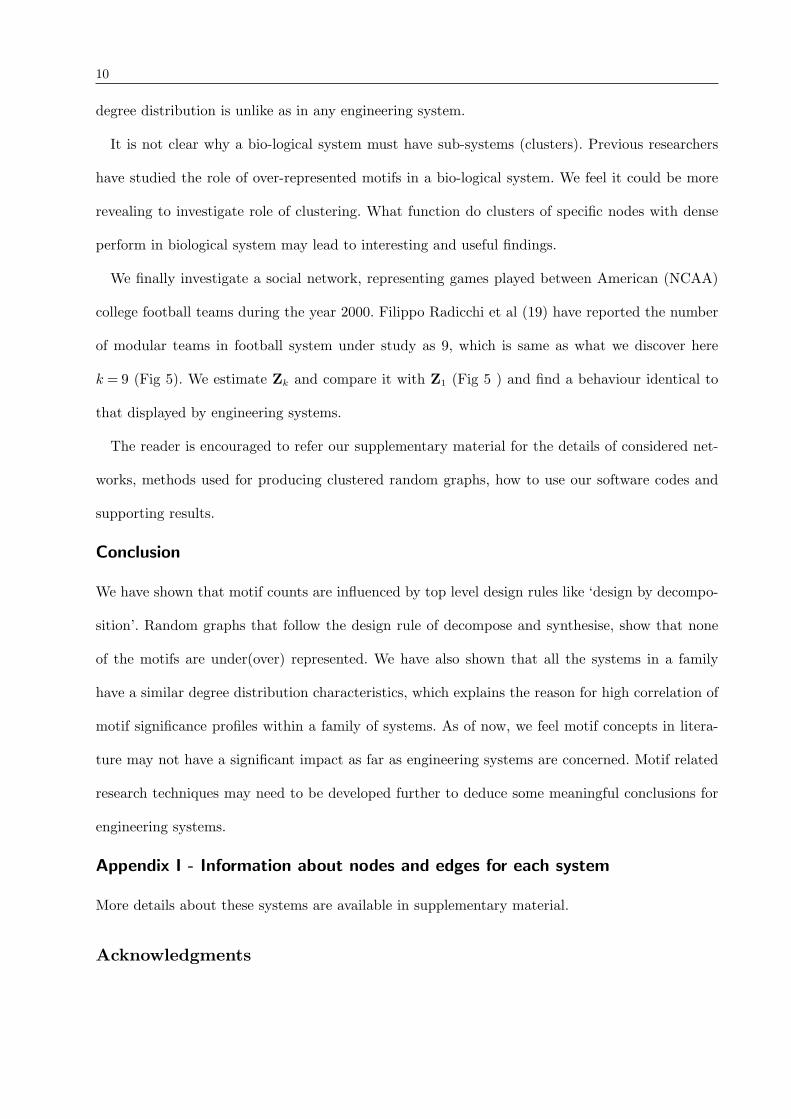
We next show another remarkable property. Let us take N nodes from any system family. We
then create 30 pseudo-real systems using these nodes having configurations k = 1 to k = 30. Each
pseudo-system is for a particular value of k and is one randomly synthesized system with k clusters.
For the pseudo-real system with k clusters we have motif counts as Rk and we estimate Yk =
(Rk −µ1)/σ1. We find the correlation between Yk and Yk+1 for k = 1 to 30. Fig 4 shows this for
nodes of digital fractional multiplier s208 (12).
It can be seen how Y1 is uncorrelated to Yk for k > 1. But as k > 6 we can see that Yk and
Yk+1 are highly correlated with a correlation coefficient > 0.9. We call this the critical value, kcrit
above which Yk stabilizes. For most systems studied kcrit is small.
Let us combine the two observations and analyze the motif behavior seen in real systems. A real
system has N nodes which are an instance of sampling of N nodes from in(out) degree distribution
of one family. When decomposition is decided and happens to have sub-systems more than kcrit
then motif counts are locked in. Since kcrit is small and most systems have k > kcrit the MSP of all
systems within that family are correlated.
Impact of above Observation on Biological and Social Networks
For engineering systems it is evident that observed motif counts are a natural consequence of
design by decomposition. Further it is seen that in(out)-degree distribution of nodes for each family
has remarkable similarity. Though motif counts depend on number of sub-systems, it stabilizes
as number of subsystems is more than a critical value. With this backdrop of understanding for
engineering system we now investigate biological systems and social networks.
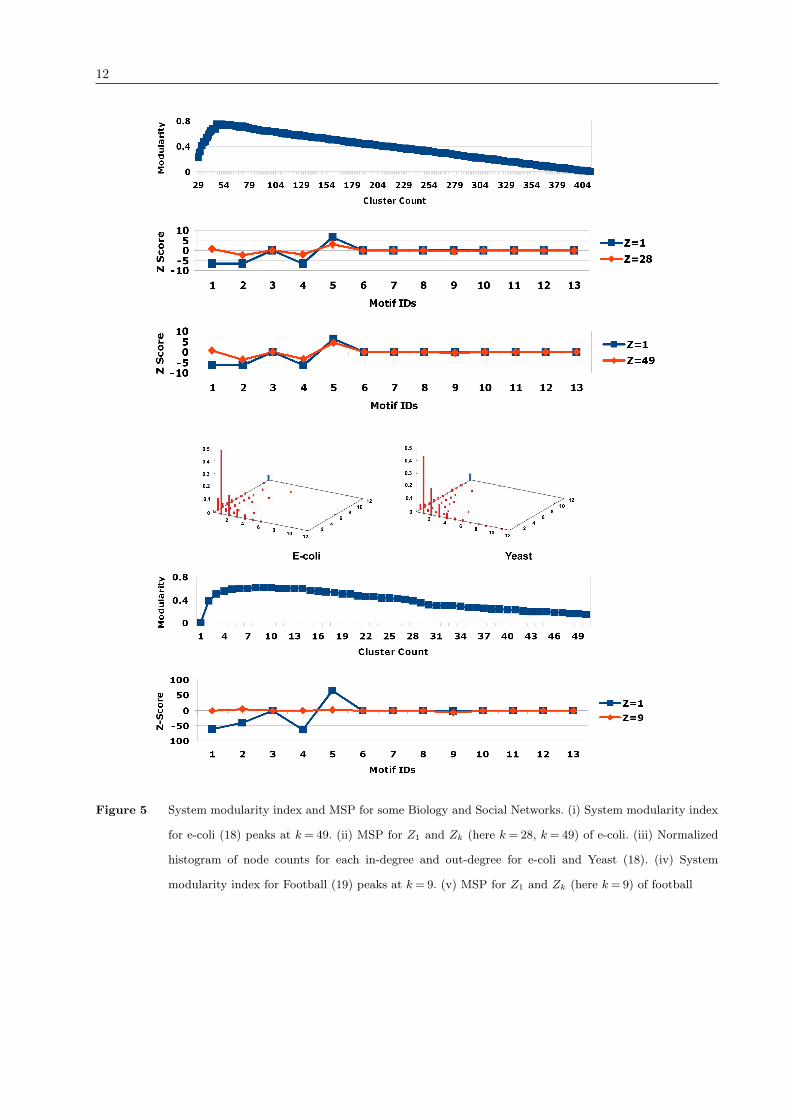
We first investigate e-coli (18) for clustering and discover that it is not a connected graph and
actually a collection of 28 sub-graphs not connected to each other. We investigate this collection
of 28 sub-graphs to discover 49 clusters (Fig 5). We estimate Zk for k= 28 and 49 and compare it
8
Figure 2 MSP and System Modularity Index for few Engineering Systems. (i) MSP for Z1 and Z2 of digital
fractional multiplier s832 (12). (ii) System modularity index for various clusters sizes of s832. (iii) MSP
for Z1 and Zk (here k = 38) of digital fractional multiplier s832. (iv) System modularity index for
Aircraft Engine (13) peaks at k= 5. (v) MSP for Z1 and Zk (here k= 5) of aircraft engine.
with Z1 (Fig 5) and find a reduction in the extent of over(under) representation of the significant
motifs, though the reduction is not as dramatic as in engineering systems. There could be other
rules apart from clustering that are present in these systems that may further reduce the extent of
over(under) representation.
We now investigate in(out)-degree distribution of nodes of e-cloi (18), and yeast network systems
(18) (Fig 5) and find high similarity with Pearsons correlation coefficient taking values > 0.93. This
9
Figure 3 Normalized histogram of node counts for each in-degree & out-degree for 3 electrical systems (12), 3
software systems (9) and 3 mechanical systems(13, 16, 17).
Figure 4 Correlation between Yk k= 1 to 30 for s208 (12)
10
degree distribution is unlike as in any engineering system.
It is not clear why a bio-logical system must have sub-systems (clusters). Previous researchers
have studied the role of over-represented motifs in a bio-logical system. We feel it could be more
revealing to investigate role of clustering. What function do clusters of specific nodes with dense
perform in biological system may lead to interesting and useful findings.
We finally investigate a social network, representing games played between American (NCAA)
college football teams during the year 2000. Filippo Radicchi et al (19) have reported the number
of modular teams in football system under study as 9, which is same as what we discover here
k = 9 (Fig 5). We estimate Zk and compare it with Z1 (Fig 5 ) and find a behaviour identical to
that displayed by engineering systems.
The reader is encouraged to refer our supplementary material for the details of considered net-
works, methods used for producing clustered random graphs, how to use our software codes and
supporting results.
Conclusion
We have shown that motif counts are influenced by top level design rules like ‘design by decompo-
sition’. Random graphs that follow the design rule of decompose and synthesise, show that none
of the motifs are under(over) represented. We have also shown that all the systems in a family
have a similar degree distribution characteristics, which explains the reason for high correlation of
motif significance profiles within a family of systems. As of now, we feel motif concepts in litera-
ture may not have a significant impact as far as engineering systems are concerned. Motif related
research techniques may need to be developed further to deduce some meaningful conclusions for
engineering systems.
Appendix I - Information about nodes and edges for each system
More details about these systems are available in supplementary material.
Acknowledgments
11
Table 1 Systems along with their domains and related information
Domain Nodes Edges
Electronic Circuits Gate Current Flow
Bilogy System Genes Direct transcription interac-tions
Software System Class Collaboration relationshipbetween classes
Mechanical System Physical com-ponents
Exchange of energy, materialor signal
Language System Word Word adjacency
Social Network College footballteams
Match played between teams
We thank Aeronautics Research and Development Board (ARDB), India for this project grant. We thank
CASDE, IIT Bombay for an excellent working environment. We are also thankful to Mr. R Mahesh for his
support in plotting the graphs.
References
[1] R. Milo, Shen-Orr, S. Itzkovitz, N. Kashtan, D. Chklovskii and Alon, Network Motifs: Simple Building
Blocks of Complex Networks, Science, 298(2002), pp. 824-827, doi:10.1126/science.298.5594.824.
[2] L. Albert and R. Albert, Conserved Network Motifs Allow Protein-Protein Interaction Prediction, Bioin-
formatics, 18(2004) pp. 3346-3352, doi:10.1093/bioinformatics/bth402.
[3] M. Ronen, R. Rosenberg, B. I. Shraiman and U. Alon, Assigning Numbers to the Arrow: Parameter-
izing a Gene Regulation Network by Using Accurate Expression Kinetics, Proceedings of the National
Academy of Sciences, 99(2002), pp. 10555-10560, doi:10.1073/pnas.152046799.
[4] S. Wernicke, Efficient Detection of Network Motifs, IEEE/ACM Transactions on Computational Biology
and BioInformatics, 3(2006), pp. 347-355.
[5] C.-Y. Cheng, C.-Y. Huang and C.-T. Sun, Mining Bridge and Brick Motifs From Complex Biological
Networks for Functionally and Statistically Significant Discovery, IEEE Transactions on Systems, Man
and Cybernetics, 38 (2008), pp. 117-127.
[6] L. M. A. Bettencourt, V. Gintautas and M. I. Ham, Identification of Functional Information Subgraphs
in Complex Networks, Phy Review Letters, 100(2008).
[7] A. S. Shaja and K. Sudhakar (2009) Overrepresented and Underrepresented Patterns in System Architec-
tures across Diverse Engineering Systems, 19th Annual INCOSE International Symposium, Singapore.
12
Figure 5 System modularity index and MSP for some Biology and Social Networks. (i) System modularity index
for e-coli (18) peaks at k = 49. (ii) MSP for Z1 and Zk (here k = 28, k = 49) of e-coli. (iii) Normalized
histogram of node counts for each in-degree and out-degree for e-coli and Yeast (18). (iv) System
modularity index for Football (19) peaks at k= 9. (v) MSP for Z1 and Zk (here k= 9) of football

13
[8] R. Milo, S. Itzkovitz, N. Kashtan, R. Levitt, S. Shen-Orr, I. Ayzenshtat, M. Sheffer and
U. Alon, Superfamilies of evolved and designed networks, Science, 303(2004), pp. 1538-1542,
doi:10.1126/science.1089167.
[9] Software graph data for specified software systems:
http://www.tc.cornell.edu/%7Emyers/ Data/SoftwareGraphs/index.htm
[10] Y. Artzy Randrup, S. J. Fleishman, N. Ben Tal and L. Stone, Comment on ”Network Motifs: Simple
Building Blocks of Complex Networks” and ”Superfamilies of Evolved and Designed Networks”, Science,
305(2004), pp.1107c, doi:10.1126/science.1099334.
[11] R. Milo, S. Itzkovitz, N. Kashtan, R. Levitt, U. Alon, Response to Comment on ”Network Motifs: Simple
Building Blocks of Complex Networks” and ”Superfamilies of Evolved and Designed Networks”, Science,
305(2004), pp.1107d, doi:10.1126/science.1100519.
[12] ISCAS’89 benchmark data :
http://www.pld.ttu.ee/%7Emaksim/benchmarks/iscas89/bench/
[13] M. E. Sosa, S. D. Eppinger and C. M. Rowles, Identifying Modular and Integrative Systems and
Their Impact on Design Team Interactions, Journal of Mechanical Design, 125(2003), pp. 240-252,
doi:10.1115/1.1564074.
[14] P. Pons and M. Latapy, Computing Communities in Large Networks Using Random Walks, J. Graph
Algorithms Appl 10(2006), pp. 191-218.
[15] M. Newman and M. Girvan, Finding and evaluating community structure in networks, Physical Review
E, 69(2004), pp.026113.
[16] T. U. Pimmler and S. D. Eppinger (1994) Integration analysis of product decompositions,ASME Design
Theory and Methodology Conference Minneapolis.
[17] A. M. Farid and D. C. McFarlane, An Approach to the Application of the Design Structure Matrix for
Assessing, Reconfigurability of Distributed Manufacturing Systems, Proceedings of the IEEE Workshop
on Distributed Intelligent Systems: Collective Intelligence and Its Applications 1633429(2006), pp. 121-
126, doi:10.1109/DIS.2006.10.
[18] Datasets for Bacteria e-coil, yeast S. cerevisiae and language networks :
http://www.weizmann.ac.il/mcb/UriAlon/groupNetworksData.html.

14
[19] F. Radicchi, C. Castellano, F. Cecconi, V. Loreto and D. Parisi, Defining and identifying communities in
networks, Proceedings of the National Academy of Sciences of the United States of America 101(2004),
pp. 2658-2663.