studies on the physicochemical parameters of utility water ...
92
STUDIES ON THE PHYSICOCHEMICAL PARAMETERS OF UTILITY WATER SUPPLIES IN NSUKKA TOWN OF ENUGU STATE BY NDEFO, CHINEDUM JOSEPH (PG/MSc/03/34746) DEPARTMENT OF BIOCHEMISTRY UNIVERSITY OF NIGERIA NSUKKA MAY, 2008.
-
Upload
khangminh22 -
Category
Documents
-
view
1 -
download
0
Transcript of studies on the physicochemical parameters of utility water ...

STUDIES ON THE PHYSICOCHEMICAL PARAMETERS
OF UTILITY WATER SUPPLIES IN NSUKKA TOWN OF
ENUGU STATE
BY
NDEFO, CHINEDUM JOSEPH
(PG/MSc/03/34746)
DEPARTMENT OF BIOCHEMISTRY
UNIVERSITY OF NIGERIA
NSUKKA
MAY, 2008.

i
TITLE
STUDIES ON THE PHYSICOCHEMICAL PARAMETERS OF UTILITY
WATER SUPPLIES IN NSUKKA TOWN OF ENUGU STATE
A DISSERTATION SUBMITTED IN PARTIAL FULFILMENT OF THE
REQUIREMENTS FOR AWARD OF DEGREE OF MASTER OF
SCIENCE (M.Sc) IN MEDICAL BIOCHEMISTRY, UNIVERSITY OF
NIGERIA, NSUKKA
BY
NDEFO, CHINEDUM JOSEPH
(PG/MSc/03/34746)
DEPARTMENT OF BIOCHEMISTRY
UNIVERSITY OF NIGERIA
NSUKKA
SUPERVISOR: DR. E. O. ALUMANAH
MAY, 2008
ii
CERTIFICATION
NDEFO, Chinedum Joseph, a postgraduate student of the Department of Biochemistry with the Reg.
No PG/ MSc/03/34746, has satisfactorily completed the requirement of research work, for the degree
of Master of Science (M.Sc.) in Medical Biochemistry. The work embodied in this project
(dissertation) is original and has not been submitted in part or full for any other diploma or degree of
this or any other university.
DR E. O. ALUMANAH PROF I. N. E. ONWURAH (Supervisor) (Head of Department)
EXTERNAL EXAMINER

iii
DEDICATION
This work is dedicated to the Holy Spirit, who is my mentor, source of inspiration and teacher.
iv
ACKNOWLEDGEMENTS
There are people who have the compassion and the desire to better the lots of others. They will
go any length to encourage and beautify the lives of others.
To such people who I met in my academic career especially during my Master‟s degree
pursuit, I pray that the good Lord will reward them abundantly in Jesus Name. Amen.
Nevertheless, I wish to appreciate the following lecturers: my friend and able supervisor, Dr. E.
O. Alumanah, my friend and very good brother, Prof. I. N. E. Onwurah, the current Head of
Biochemistry Department, our able and versatile Prof. O. U. Njoku, current Dean of Faculty of
Biological Sciences. I equally wish to extend my gratitude to other erudite and respectable lecturers in
the department: Prof. F. C. Chilaka, Dr. O. F. C. Nwodo, Dr. B. C. Nwanguma, Dr. V. N. Ogugua,
Prof. L. U. S. Ezeanyika, Prof. P. N. Uzoegwu and Dr. (Mrs) C. Ezeokonkwo. From all these lecturers,
I received a good academic watering from their wells of knowledge and experiences.
I am also indebted to my good friends and faithful brothers Deacon Parker Elijah Joshua and
Francis Awah, for their numerous contributions to this project. God will also reward others who have
helped me in some ways to the successful completion of this research work. To God be the glory for
His everlasting kindness to us all in Jesus name. Amen.
NDEFO, CHINEDUM JOSEPH.

v
ABSTRACT
Most of our water resources are gradually becoming polluted due to the addition of foreign materials from the
surroundings. These include organic matter of plant and animal origin, land surface washing, and industrial and
sewage effluents (Karnataka State Pollution Control Board, 2002). Rapid urbanization, and industrialization
with improper environmental planning often lead to discharge of industrial and sewage effluents into water
bodies. (Pruss et al, 2002).
The problem of environmental pollution due to toxic metals has begun to cause concern now in most
major metropolitan cities. Nsukka environs have been plagued with perennial problem of water
supplies round the year and a better understanding of its water physicochemically status will help to
address this daunting problem and issues of human health.
The analysis carried out was on the utility water supplies in Nsukka area. Thirteen sampling areas
consisting of four boreholes, six dugwells and three springs were chosen for this research work. A
total of 26 water samples were taken from the sampling areas during the dry season and another 26
samples during the wet season. Water samples were collected from these sampling areas and
refrigerated at 40C for processing. Concentrations of lead, cadmium, nickel, arsenic and zinc were
determined in each sample by spectrophotometric method. Harch Model C50 digital multirange meter
was used to measure pH, and total dissolved solid. Complexiometric titration was employed in the
determination of total hardness of water samples. Other chemical parameters like nitrate, chloride, and
sulphate were also determined by spectrophotometric method. Bacteriological analysis of the water
samples were carried out to ascertain whether there was faecal contamination by the use of multiple
tube/most probable number techniques.
Results Sulphate concentration of water sample from spring sources increased significantly (P<0.05) during
dry season when compared with that of wet season. it was observed that total suspended solid
concentration of water samples from dugwell sources was found to have significant increase (P<0.05)
when compared with the water samples from the samples obtained from borehole and spring sources
during both dry and rainy seasons. Total dissolved solid concentration was found to be significantly
higher (P<0.05) in the water sample from dugwell sources when compared with the total dissolved
solid concentration in the water samples from both borehole and spring sources during both dry and
rainy seasons. Arsenic, nickel, lead and cadmium were not detected in all the water samples from
borehole, dugwell and springs taken during the wet and dry seasons. No significant difference
(P>0.05) exists in the concentration of zinc compared to all other test samples. There was no
significant difference (P<0.05) between the nitrate concentration of borehole and dugwell during the
dry and wet seasons However, significant increase (P<0.05) was observed in the water samples of
borehole and dugwell compared to the water sample of spring source especially during rainy season.
Water sample from dugwell sources had showed significant increase (P<0.05) in the level of total
hardness as compared with water samples from borehole and spring sources during dry and rainy
seasons. Also, there was significant increase (P<0.05) in the level of total hardness of water sample
from borehole sources when compared with the spring sources during dry and rainy seasons. The
chloride (mg/L) concentration of all test samples from all the three water sources (borehole, dugwell
and spring) were found to be no significant (P>0.05) during both seasons. Though slight increase was
observed in the level of chloride concentration in the water sample from borehole sources during dry
and rainy seasons but was considered non-significant (P>0.05). Therefore, from the foregoing, it could
be concluded that these boreholes, springs and dugwells water tested in Nsukka town are
physicochemically good for human consumption as all the physicochemical parameters tested
conformed to WHO, SON and NAFDAC water quality standards except Iyi-adoro spring water which
might not be very good for consumption during rainy season because of possible bacteria
contamination.

vi
TABLE OF CONTENTS
PAGE
Title Page .. .. .. .. .. .. .. .. .. .. i
Certification .. .. .. .. .. .. .. .. .. .. ii
Dedication .. .. .. .. .. .. .. .. .. .. iii
Acknowledgements .. .. .. .. .. .. .. .. .. iv
Abstract .. .. .. .. .. .. .. .. .. .. v
Table of Contents .. .. .. .. .. .. .. .. .. vi
List of Figures .. .. .. .. .. .. .. .. .. .. x
List of Tables .. .. .. .. .. .. .. .. .. .. xi
CHAPTER ONE: INTRODUCTION AND LIETERATURE REVIEW
1.1 Introduction … … … … … … … … 1
1.2 Water, water wells and water Contamination … … … … 2
1.2.1 Understanding the hydrologic cycle … … … … … 2
1.2.2 Surface and Groundwater Supplies … … … … … … 3
1.2.3 How are Surface and Groundwater Related? … … … … … 7
1.2.4 Water Utilization … … … … … … … … 7
1.2.5 Water Well Components … … … … … … … 7
1.2.5.1 Well Casing … … … … … … … … 7
1.2.5.2 Well Screen … … … … … … … … 8
1.2.5.3 Well Termination … … … … … … … … 8
1.2.6. Disinfection … … … … … … … … 9
1.2.7 Sources of Surface and Groundwater Contamination … … … 9
1.2.7.1 Domestic Sources … … … … … … … … 9
1.2.7.2 Agricultural … … … … … … … … 10
1.2.7.3 Urban … … … … … … … … … 11
1.2.7.4 Industrial … … … … … … … … … 11
1.2.8 Protecting Surface Water Supplies … … … … … … 11
1.2.8.1 Ponds … … … … … … … … … 12
1.2.9 Protecting Groundwater Supplies … … … … … … 13
1.2.10 What Individuals Can Do … … … … … … … 14
1.3 Water Pollution … … … … … … … … 14
1.3.1 Point Source pollution … …… … … … … 15
vii
1.3.2 Non-point source pollution … … … … … … … 15
1.3.3 Ground water pollution … … … … … … … 16
1.3.4 Materials and Phenomena Contributing to Water Pollution … … … 16
1.3.4.1 Chemical and other contaminants … … … … … 17
1.3.5 Measurement of Water Pollution … … … … … … 18
1.3.5.1Sampling … … … … … … … … … 18
1.3.5.2 Physical testing … … … … … … … … 19
1.3.5.3 Chemical testing … … … … … … … … 19
1.3.5.4 Biological Testing … … … … … … … … 19
1.3.5.4.1 Alkalinity … … … … … … … … 20
1.3.5.4.2 Aluminium … … … … … … … … 21
1.3.5.4.3 Arsenic … … … … … … … … 21
1.3.5.4.4 Barium … … … … … … … … 22
1.3.5.4.5 Cadmium … … … … … … … … 22
1.3.5.4.6 Chloride … … … … … … … … 22
1.3.5.4.7 Chromium … … … … … … … … 23
1.3.5.4.8 Colour … … … … … … … … 23
1.3.5.4.9 Copper … … … … … … … … 23
1.3.5.4.10 Cyanide … … … … … … … … 24
1.3.5.4.11 Escherichia coli … … … … … … … 24
1.3.5.4.12 Faecal Coliform … … … … … … … 24
1.3.5.4.13 Fluoride … … … … … … … 25
1.3.5.4.14 Heterotrophic Plate Count … … … … … … 25
1.3.5.4.15 Iron … … … … … … … … 25
1.3.5.4.16 Lead … … … … … … … … 26
1.3.5.4.17 Manganese … … … … … … … … 27
1.3.5.4.18 Mercury … … … … … … … … 27
1.3.5.4.19 Nitrate … … … … … … … … 27
1.3.5.4.20 pH … … … … … … … … 28

viii
1.3.5.4.21 Selenium … … … … … … … … 28
1.3.5.4.22 Sodium … … … … … … … … 29
1.3.5.4.23 Sulphate … … … … … … … … 29
1.3.5.4.24 Total Hardness … … … … … … … 30
1.3.5.4.25 Total Dissolved Acids … … … … … … 30
1.3.5.4.26 Turbidity … … … … … … … 31
1.3.5.4.27 Trihalomethanes … … … … … … … 31
1.3.5.4.28 Uranium … … … … … … … 31
1.3.5.4.29 Zinc … … … … … … … 32
1.3.5.4.30 Physicochemical Combined Standards … … … … … … 32
CHAPTER TWO: MATERIALS AND METHODS
2.1 Materials… … … … … … …… … … … 35
2.1.1 Water Sampling Sources … … … … … … … 35
2.1.2 Chemicals/Reagents/Samples … … … … … … 35
2.2 Methods … … … … … … … … … 35
2.2.1 Experimental Design … … … … … … … 35
2.2.2 Sampling Areas … … … … … … … … 36
2.2.3 Heavy Metals‟ Determination … … … … … … 39
2.2.4 Cations and Anions Determination … … … … … 41
2.2.5 Organic Compounds … … … … … … … 42
2.2.6 Alkalinity, Acidity, Chlorides and Hardness … … … … 42
2.2.7 Bacteriological Examination … … … … … … 43
2.2.7.1 Membrane Filtration … … … … … … … 43
2.2.7.2 Multiple tube/Most Probable Number (MPU) … … … … 43
2.2.7.3 Choice of Techniques … … … … … … … 44
2.2.8 Sampling Techniques and Preservation … … … … … 44
2.2.9 Physicochemical Parameters … … … … … … 46
2.2.9.1 Appearance … … … … … … … … 46
2.2.9.2 Determination of pH value … … … … … … 46
2.2.9.3 Conductivity … … … … … … … … 47
2.2.9.4 Total hardness … … … … … … … … 47

ix
2.2.9.5 Total Dissolved Solids (TDs) … … … … … … 49
2.2.9 Nitrate … … … … … … … … … 50
2.2.10 Heavy Metals … … … … … … … … 51
2.2.10.1 Determination of Lead Colorimetric Sulphide Method … … … 51
2.2.10.2 Determination of cadmium … … … … … … … 51
2.2.10.3 Determination of Arsenic … … … … … … … 52
2.2.10.4 Determination of Zinc … … … … … … … 53
CHAPTER THREE: RESULTS
3.1 Effect of pH on different water sources compared
to WHO and NAFDAC … … … … … … … 55
3.2 Effect of Sulphate Concentration on Different Water Sources Compared
to WHO and NAFDAC … … … … … … … 57
3.3 Effect of Total Suspended solid on Different water sources compared
to WHO and NAFDAC … … … … … … … 59
3.4 Effect of Zinc concentration on different water sources compared
to WHO and NAFDAC … … … … … … … 61
3.5 Effect of Total dissolved solid on different water sources compared
to WHO and NAFDAC … … … … … … … 63
3.6 Effect of Total hardness on different water sources compared
to WHO and NAFDAC … … … … … … … 65
3.7 Effect of Chloride concentration on different water sources compared
to WHO and NAFDAC … … … … … … … 67
3.8 Effect of Nitrate concentration on different water sources compared
to WHO and NAFDAC … … … … … … … 69
3.9 Effect of Most Probable Number of Coliform on Different Water
Sources Compared with WHO and NAFDAC … … … … 71
CHAPTER FOUR: DISCUSSION
4.1 Discussion … … … … … … … … 73
4.2 Conclusion … … … … … … … … 79
REFERENCES … … … … … … … … … 80
x
LIST OF FIGURES
PAGE
Fig. 1.1 The hydrologic cycle … … … … … … … 3
Fig. 1.2 Confined and unconfined aquifers … … … … … 5
Fig. 1.3 Showing the supply chain of drinking water for each household … … 20
Fig. 2.1 Map of Nsukka showing the location of sampled areas … … … 37
Fig. 3.1 pH at 20OC of different water sources in Nsukka
compared with WHO and NAFDAC standards … … … … 56
Fig. 3.2 Sulphate concentration of different water sources in Nsukka
compared with WHO and NAFDAC standards … … … … 58
Fig. 3.3 Total suspended solid of different water sources in Nsukka
compared with WHO and NAFDAC standards … … … … 60
Fig. 3.4 Zinc concentration of different water sources in Nsukka
compared with WHO and NAFDAC standards … … … … 62
Fig. 3.5 Total dissolved solid of different water sources in Nsukka
compared with WHO and NAFDAC standards … … … … 64
Fig. 3.6 Total hardness of different water sources in Nsukka
compared with WHO and NAFDAC standards … … … … 66
Fig. 3.7 Chloride concentration of different water sources in Nsukka
compared with WHO and NAFDAC standards … … … … 68
Fig. 3.8 Nitrate concentration of different water sources in Nsukka
compared with WHO and NAFDAC standards … … … … 70
Fig. 3.9 Most probable number of coliform of different water sources in Nsukka
compared with WHO and NAFDAC standards … … … … 72

xi
LIST OF TABLES
PAGES
Table 1: Physicochemical combined standards of WHO, SON and NAFDAC … 32
Table 2.1 Sampling areas description table … … … … … 38
Table 2.2 Alpha-AWWA-NPCF requirements for sampling and
handling/preservation … … … … … … 46
1
CHAPTER ONE
INTRODUCTION/LITERATURE REVIEW
THE problem of environmental pollution due to toxic metals has begun to cause concern
now in most major metropolitan cities. The toxic heavy metals entering the ecosystem may lead
to geoaccumulation, bioaccumulation and biomagnification. Heavy metals like Fe, Cu, Zn, Ni
and other trace elements are important for proper functioning of biological systems and their
deficiency or excess could lead to a number of disorders (Ward, 1995). Food chain
contamination by heavy metals has become a burning issue in recent years because of their
potential accumulation in biosystems through contaminated water, soil and air. Therefore, a
better understanding of heavy metal sources, their accumulation in the soil and the effect of their
presence in water and soil on plant systems seem to be particularly important issues of present-
day research on risk assessments (Rajesh et al., 2004). The main sources of heavy metals to
vegetable crops are their growth media (soil, air, nutrient solutions) from which these are taken
up by the roots or foliage (Ward, 1995).
Most of our water resources are gradually becoming polluted due to the addition of
foreign materials from the surroundings. These include organic matter of plant and animal origin,
land surface washing, and industrial and sewage effluents (Karnataka State Pollution Control
Board, 2002). Rapid urbanization and industrialization with improper environmental planning
often lead to discharge of industrial and sewage effluents into lakes. The lakes have a complex
and fragile ecosystem, as they do not have selfcleaning ability and therefore readily accumulate
pollutants. Bellandur Lake, the largest one in Bangalore urban area, recently attracted a lot of
public attention because of the formation of froth during rainy season due to chemicals (soaps,
detergents, etc.) and biosurfactants. For the last few decades, the treated, partially treated and
untreated wastewater has been discharged to this lake and the lake water is being used for
farming purposes (Pruss et al., 2002).
Individual rural homeowners are often responsible for providing and protecting their own
water supplies. Where safety of these sources is concerned, no “short-cuts” can be taken.
Protecting the quality of individual water supplies is a combination of controlling land use
around the supplies and using proper water treatment techniques where necessary. Rural
homeowners must assume responsibility for protecting their families from contaminated drinking

2
water. Assistance in this regard can be obtained from a number of agencies (Ward, 1995). Local
health authorities can answer questions relating to applicable local regulations; health hazards
posed by contaminated water, and suggested procedures for sampling and analyzing drinking
water for contaminants. In some cases, local health officials will analyze individuals‟ water
samples for common pollutants at no cost or for a nominal charge. Complete well water analysis
is the homeowner‟s responsibility and is not free. State regulatory agencies charged with water
resource management can answer questions regarding water use. They usually also have
information regarding the availability and suitability of water sources in the State. Such agencies
usually administer safety regulations for dams as well (Ward, 1995).
1.2 Water, Water Wells, and Water Contamination
1.2.1 Understanding the Hydrologic Cycle
Water is constantly moving. As rain or snow (precipitation) falls to earth, some of it
collects to form lakes, streams, and other bodies of water. The remaining water enters the soil in
a process called infiltration. Some of this water evaporates back into the air and some is used by
growing plants. The remainder seeps d o w n w a rd through the soil, until it accumulates at some
depth and becomes groundwater (Wright et al., 2004).
Downward movement of water thro u g h the soil is percolation. This water eventually
makes its way into a zone of soil where the space around each soil particle is completely filled
with water (saturated). Water in this space is called groundwater, and its upper boundary is
called the water table. Groundwater is located in underground formations called aquifers at
various depths beneath the ground surface, and is generally available for human use. It can move
laterally as groundwater flow to replenish surface water supplies. Groundwater constantly moves
through the soil and reappears on the lowland surface as lakes, streams, swamps, or springs
(Ward, 1995).
Although water is in constant motion, it seems to be stored in lakes, bays, oceans, and
glaciers, as well as in underground supplies as discussed below, because the rate of movement in
these vast bodies is relatively slow. Surface waters constantly evaporate into the air and produce

3
clouds and later precipitation. Thus, water changes constantly from precipitation, to surface
water, to groundwater, back to surface water, to atmospheric moisture, and back to rain or snow.
This cycle of water movement is called the hydrologic cycle (Wright et al., 2004).
Fig. 1.1: The hydrologic cycle (Wright et al., 2004).
1.2.2 Surface and Groundwater Supplies
What Is Surface Water? Surface supplies of water are quite familiar to most of us. They
include rivers and streams, ponds and lakes (reservoirs), and cisterns or other controlled
catchments. For purposes of this discussion, springs are also considered surface supplies
although, strictly speaking, springs originate from groundwater and occur where the water table
intersects the land surface. Each of these sources has different characteristics. Ponds and lakes
occur where nature has created an obstruction to the normal flow of surface runoff or where a
natural waterholding depression has formed. People can also create such supplies by building
dams. Controlled catchments are areas from which nearly 100 percent of precipitation is
collected as run off. Rooftops are the most easily recognized type of controlled catchment.
However, larger areas of land can be manipulated to maximize run off and subsequent collection
(for example, by paving with concrete or asphalt). Springs and seeps occur at the land surface
where water from underground sources appears. Because springs appear at the ground surface,
4
they must be treated differently than groundwater to adequately protect their quality (Clasen and
Bastable, 2003).
What Is Groundwater? Groundwater, water that lies hidden beneath the earth‟s surface, is
an important resource. Although it makes up only 4 percent of the total amount of water on earth,
it constitutes 95 percent of the fresh water that is suitable for human consumption (Wright et al.,
2004).
Groundwater and the way it moves is not as easy to understand or visualize as surface
water simply because we cannot see it. People often imagine that groundwater exists in vast
buried lakes and rivers. However, only in certain soluble deposits, such as limestone, do water-
filled cavern s or channels resemble underground lakes and rivers. Unfortunately, the “hidden”
nature of groundwater has resulted in a “out of sight, out of mind” sentiment and therefore
contributed to its being considered out of danger. We now know that this is not so; too many
cases of groundwater pollution are known. Groundwater occurs beneath the earth‟s surface in
geologic formations called aquifers. In aquifers, all the spaces around individual soil particles
and cracks within rocks are completely filled with water. Aquifers can be relatively small in area
or they can stretch for several thousand s q u a re miles. Aquifers vary in thickness from a few
feet to several thousand feet. Unconfined aquifers have no impermeable layers overlaying them
and usually a re found close to the surface of the land. As shown in Figure 1.2, precipitation
percolates through the soil until it reaches the unconfined aquifer‟s upper boundary, the water
table. Only a very small portion of the water ever filters down to the confined aquifers.
Unconfined aquifers, due to their proximity to people‟s activities on the soil surface, and the fact
that the soil material above them transmits water readily, are especially susceptible to pollution.
A confined aquifer is bounded on the top and bottom by relatively impermeable layers of clay or
solid rock through which only very small amounts of water can pass. Precipitation can enter
these deeper aquifers directly through regions called recharge areas where an aquifer is exposed
to the earth‟s surface (Fig. 1.2). In the Coastal Plains especially, several aquifers might overlie
each other (Wright et al., 2004).

5
Fig. 1.2: Confined and unconfined aquifers. (Wright et al., 2004).
Only about 1 inch of this precipitation ever reaches the deeper aquifers. Most
groundwater is later returned to the surface as base flow; that is, water discharged continuously
into perennially flowing streams. Within an aquifer, groundwater travels along fractures in the
rock, through the pores in sand and gravel, or along chananels carved out of soluble rock, such as
limestone. The direction and rate of this movement are very diff e rent from that of surface
water. Whereas surface water moves at the rate of tens or even hundreds of feet per minute,
groundwater moves at the rate of inches per day or less. Once water enters an aquifer, it can
remain there for centuries. Therefore, if contaminated, it might take aquifers just as long to
cleanse themselves naturally. Though the soil above aquifers might filter some materials
transported by percolating water, these substances can continue to be leached if they are not
degraded in the soil by microbial and/or chemical processes.
Natural water quality in the Coastal Plain aquifers is generally good, but varies with the
type of aquifer material. Some elevation in dissolved mineral content (hardness) is always
present, but is elevated in formations derived from fossilized material and limestone. The content
of total dissolved solids in Coastal Plain groundwater varies widely, making some groundwater
too bitter to drink. Although iron content is generally low, it can be very high in localized areas.
Fractured bedrock formations present unique problems in both locating and protecting

6
groundwater. Because fractures occur randomly and are generally discontinuous, it is very
difficult to predict where adequate supplies of groundwater will be located. Yet, in certain areas,
fractures can extend to the soil surface, providing a direct conduit through which pollutants can
enter the aquifer. Such problems are prevalent in limestone areas where percolating water has
dissolved the limestone, forming caverns underground and, sometimes, sinkholes at the ground
surface. Though the cavernous channels can be productive aquifers from a quantity standpoint,
they are susceptible to pollution from materials that can enter sinkholes with run off, or be placed
there intentionally by people. Unfortunately, it is still possible to find sinkholes being used as
private garbage dumps. Many contaminants exist that cannot be smelled, seen, or tasted. Some of
these substances are believed to be health hazards in very low concentrations, sometimes at
levels of a few parts per billion. (One part per billion would be equivalent to one ounce dissolved
in a pool of water the size of a football field and 27 feet deep.) Although it might be
technologically feasible in some cases to pump and treat contaminated groundwater to remove a
pollutant, such a solution could take many years and a great deal of money. Unfortunately, it
sometimes takes years to discover that groundwater has become polluted by contamination. All
of these facts make it imperative to recognize the importance of groundwater to society, and to
understand what it is, how it moves, and how to protect it. Clearly, the wisest and most
economical approach is prevention and protection, rather than treatment (Trevett et al., 2005).
1.2.3 How are Surface and Groundwater Related?
Groundwater and surface water are intimately connected. Water in streams and lakes is,
in most cases, directly linked to groundwater. For example, the surface of water flowing in most
streams is actually a continuation of the water table (Figure 1.1). During drought periods,
groundwater moves out of the aquifer and into the s t ream to supplement stream flow. During
floods, water can flow from the stream into the surrounding aquifer. Hence, at times, streams
have the potential to pollute groundwater and, at other times, groundwater can pollute surface
water (Wright et al., 2004).
1.2.4 Water Utilization

7
Municipal water supplies meet Federal, State, and local guidelines. These requirements
vary somewhat both with the size of the municipality and the region. Approximately 50 percent
of the State‟s drinking water is supplied by municipalities. Most of the water on the Eastern
Shore and much of the water to many rural homes is supplied by groundwater. If you are on an
individual well or one that supplies only a few homes, you are pro b ably responsible for your
own water quality. Since you more than likely obtain your water from a well, the following is a
discussion of how groundwater is delivered (Lokhande and Kelkar, 1999).
1.2.5 Water Well Components
A well consists of two main elements. One element is the hole, or bore, through which
water flows upward to the pump intake. This bore is commonly lined with a pipe or casing. The
second element is the intake section where water enters the well. The intake usually is a screen at
the bottom of the casing in a sand stratum, or it can be the open bore hole in a rock formation
(Wright et al., 2004).
1.2.5.1 Well Casing
A drilled or driven well in unconsolidated material (such as sands, gravels, and unstable
clays) must have a permanent well casing the full depth of the well, and a well screen. In
unconsolidated material, soil usually packs tightly against the casing, providing a good seal. W h
e re rock or other stable material overlays water-bearing sand or gravel, the upper part of the well
must be sealed artificially on the outside of the casing to prevent contaminated water from
moving through this upper layer along the outside of the pipe and down into the aquifer. Sealing
usually is done with grout (a cement mix) or other sealants. Steel pipe has been used extensively
for well casing even in soils or waters that are somewhat corrosive. Where abnormally corrosive
conditions exist, a casing material of corrosion - resistant metal, such as brass or stainless steel,
might be used. Plastic pipe can be used for well casings, but only when special methods can be
employed to install the pipe without structural damage (Shivashankara et al., 1999).
1.2.5.2 Well Screen
A well screen fitted to the bottom of the casing allows water to enter the well freely, but
prevents the entrance of coarse sand. The selection of the screen material usually is based on the
cost of the material and the chemical character of the water. In some instances, where the

8
waterbearing strata contain fine sands or silts, the well can be gravel-packed. The gravel pack
acts as a primary filter and is held in place by the screen. Without the gravel pack the bottom of
the bore hole would erode and cave in, while continually passing sand and silt to the pump
(Wright et al., 2004).
1.2.5.3 Well Termination
The upper end of the casing pipe of the well can terminate on a pump house floor,
platform, or soil surface. The casing should extend at least 8 inches above this surface. The
entrance of any pump pipes, cable, air lines, or other device into the well casing must be
effectively sealed with an approved sealing device to maintain well sanitation. Where the pump
is mounted directly over the well, a sanitary well seal should be used. If the pump is offset from
the well, the seal should consist of a watertight expandable seal that fits into the casing and at the
same time seals the drop pipes, cables, and air line. If the pump is offset from the casing with
pipes buried below the soil surface, a sealing device, called a pitless adapter, is used. In this case,
the top of the casing still projects above the soil level and is fitted with a protective cap (Clesceri,
1998).
1.2.6 Disinfection
For drinking water, the well and pumping equipment should be disinfected before being
placed in service. Disinfection should be with a chlorine solution poured into the well at a rate
dependent on well size and water storage capacity. After 8 or more hours, the water is then
pumped until the amount of chlorine has been reduced sufficiently. This water might burn shrubs
and grasses and should be disposed of where damage will be minimal (Lark et al., 2002).
1.2.7 Sources of Surface and Groundwater Contamination
There are many sources of contamination for both surface and groundwater. Potentially,
any substance that is placed in the air, in surface water, in soil, on the land, or below ground, can
become a water pollutant. In addition, substances that occur naturally (such as minerals, soil
particles, and decaying leaves) can also contaminate water. Pollutants can originate in both rural
and urban settings. In rural, unsewered areas, effluent from septic tank disposal fields can pose a
9
significant threat to groundwater. Bacteria, nitrogen, and other inorganic and organic substances
can leach downward to the water table of an unconfined aquifer. Agrochemicals used in food
production can pose similar threats to groundwater. In urban areas, pollutants can originate from
a variety of sources, such as gasoline service stations, municipal and industrial wastewater
treatment facilities, and homeowners‟ lawns. Pollutant sources over which people have control,
and can be managed effectively, include domestic, agricultural, urban, and industrial. Each
category can pollute both surface and groundwater. Contaminants include a variety of physical,
chemical, and biological substances (such as eroded soil, dissolved nutrients, and bacteria).
However, because the soil can physically filter most undissolved substances from percolating
water, generally only dissolved contaminants and bacteria actually reach groundwater supplies.
Both dissolved and undissolved substances can reach surface supplies (Ward, 1995).
1.2.7.1 Domestic Sources
Contaminants that originate around the home include chemicals used on lawns and
gardens and, conceivably, pesticides used around foundations. Probably the greatest potential
domestic source of groundwater contamination is from septic tanks. Though not a surface
contaminant, effluent from septic systems can contaminate surface water supplies if improper
design and/or maintenance maintenance procedures are followed, or if the surface supplies are
located too closely to septic systems. Septic systems are used in
20 mill ion (29 percent) households throughout the country. Nitrate from these systems moves
readily through soil and can reach groundwater in significant amounts. Nitrate is a major nutrient
problem for the Chesapeake Bay. Household chemicals, such as paints and paint thinner,
degreasers, polishes, cleaning solvents, and even waste oil from home car oil changes, are also
potential threats to groundwater. Many of these products are disposed of improperly by being
flushed down the toilet. If the sewage water goes to a wastewater treatment plant, the pollutants
are not removed by the treatment processes (Wright et al., 2004).
When poured down the drain, the substances make their way to the drain field of the
onsite disposal system, where they can leach into the groundwater. Septic tank cleaners are of
particular concern, since many of these contain toxic organic chemicals that can leach through
the soil. Household chemicals and waste oil can also move readily through the soil even if they
have been spread on the soil surface. In most cases, only small quantities of these materials in a

10
water supply can cause severe contamination. Faecal wastes from both domestic and wild
animals (for example, bird droppings on rooftops) and eroded soil are the major contaminants of
surface water (Rajesh et al., 2004).
1.2.7.2 Agricultural
The major contributors of water pollution from agriculture are eroded soil, animal wastes,
fertilizers, and other agrochemicals. By volume, eroded soil is the largest agricultural pollutant of
surface water supplies. Nevertheless, pesticides, nutrients (especially phosphorus attached to
eroded soil), and animal waste applied to the land can be transported to surface supplies by
runoff. Storage and application of manures and fertilizers also have contributed to increased
nitrate levels in groundwater nationwide. In many areas, nitrate levels re above drinking water
standards for “safe” water. Improper storage of manures and overapplication of manures and
fertilizers have a significant impact especially in areas of the Coastal Plain and in glacial
deposits. Waste storage ponds and lagoons also have the potential to contribute to groundwater
pollution (Lark et al., 2002).
1.2.7.3 Urban
Urban areas can contribute the same contaminants to surface run off as rural domestic
areas. In addition, run off from urbanized areas can carry any number of organic and inorganic
chemicals washed from streets and parking lots. Construction activities in urban areas contribute
large amounts of sediment. Sewage treatment plants discharge treated wastewater directly to
rivers and streams. Urban areas also can contribute to groundwater pollution from landfills,
wastewater treatment plants, storm water collection basins, and leaking sewer pipes. A wide
variety of pollutants are associated with these activities. Many active and inactive landfills
throughout the country a re unlined and not monitored to determine if leachate is moving from
the landfills. Storm water catchments collect runoff during rainfall events and “dispose” of the
run off by having it infiltrate into the soil. If the storm water contains dissolved contaminants, the
soil will provide only slight treatment and the contaminants can percolate to the groundwater
supply (Wright et al., 2004).
1.2.7.4 Industrial
11
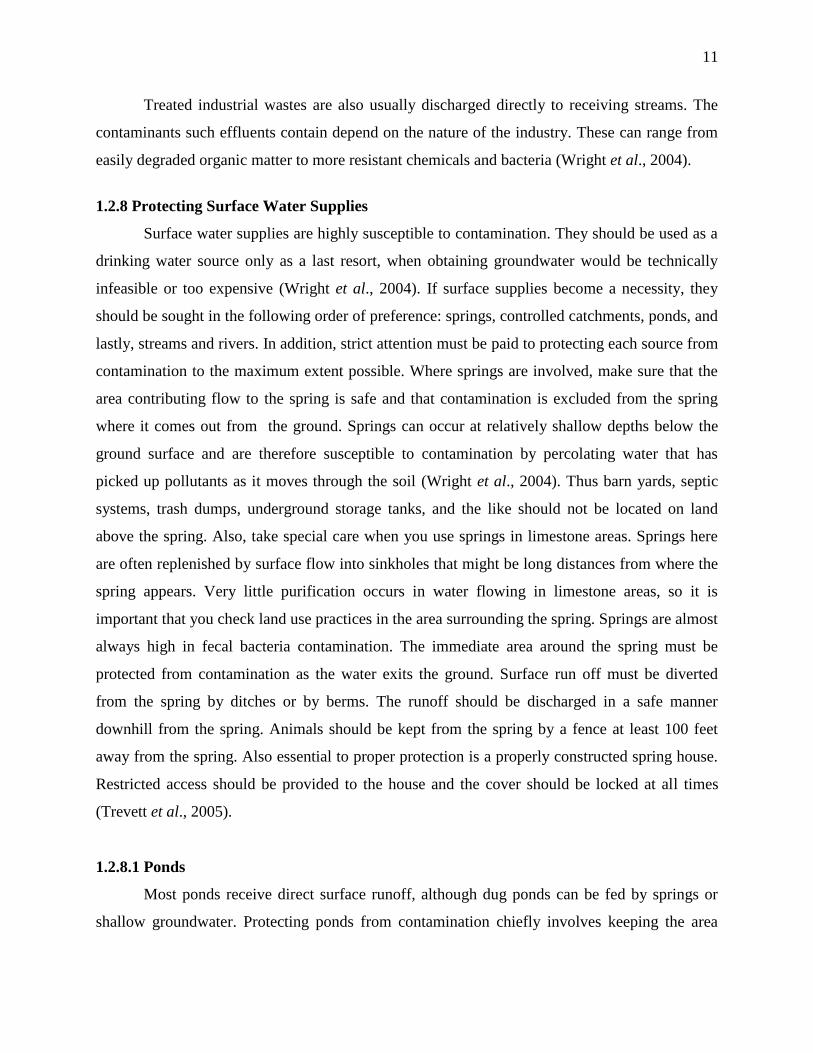
Treated industrial wastes are also usually discharged directly to receiving streams. The
contaminants such effluents contain depend on the nature of the industry. These can range from
easily degraded organic matter to more resistant chemicals and bacteria (Wright et al., 2004).
1.2.8 Protecting Surface Water Supplies
Surface water supplies are highly susceptible to contamination. They should be used as a
drinking water source only as a last resort, when obtaining groundwater would be technically
infeasible or too expensive (Wright et al., 2004). If surface supplies become a necessity, they
should be sought in the following order of preference: springs, controlled catchments, ponds, and
lastly, streams and rivers. In addition, strict attention must be paid to protecting each source from
contamination to the maximum extent possible. Where springs are involved, make sure that the
area contributing flow to the spring is safe and that contamination is excluded from the spring
where it comes out from the ground. Springs can occur at relatively shallow depths below the
ground surface and are therefore susceptible to contamination by percolating water that has
picked up pollutants as it moves through the soil (Wright et al., 2004). Thus barn yards, septic
systems, trash dumps, underground storage tanks, and the like should not be located on land
above the spring. Also, take special care when you use springs in limestone areas. Springs here
are often replenished by surface flow into sinkholes that might be long distances from where the
spring appears. Very little purification occurs in water flowing in limestone areas, so it is
important that you check land use practices in the area surrounding the spring. Springs are almost
always high in fecal bacteria contamination. The immediate area around the spring must be
protected from contamination as the water exits the ground. Surface run off must be diverted
from the spring by ditches or by berms. The runoff should be discharged in a safe manner
downhill from the spring. Animals should be kept from the spring by a fence at least 100 feet
away from the spring. Also essential to proper protection is a properly constructed spring house.
Restricted access should be provided to the house and the cover should be locked at all times
(Trevett et al., 2005).
1.2.8.1 Ponds
Most ponds receive direct surface runoff, although dug ponds can be fed by springs or
shallow groundwater. Protecting ponds from contamination chiefly involves keeping the area

12
draining into the pond as free from contamination as possible. To accomplish this, strict control
must be exercised over land use in the watershed. Water quality from forested areas is usually
considered to be among the highest that occurs in nature. Runoff from grassed areas is also of
relatively high quality. Therefore, the area that contributes water to a pond used for a domestic
water supply should be maintained in one of these land uses. Obviously, the watershed should be
free of barn yards, septic systems, and other onsite wastewater systems. Fencing should be used
to exclude animals from the watershed. Best management practices should be employed to
control erosion and loss of nutrients. Agricultural chemicals should not be used in the watershed.
These re commendations apply regardless of the type of pond used (Wright et al., 2004).
1.2.9 Protecting Groundwater Supplies
The best way to protect groundwater used for human or animal consumption involves
proper location of the well, coupled with proper well construction. All wells should be located
safe distances from sources of contamination. However, because many factors affect the
movement of contaminants into groundwater, it is impractical to set a fixed distance between
well location and contaminant contaminant source that would be applicable in all cases. There is
NO safe distance between contaminant source and an improperly constructed well (Wright et al.,
2004).
In general, unconsolidated materials typical of Coastal Plain aquifers provide better
“filtration” of percolating water than do consolidated fractured rock aquifers, typical in the
central and western part of the State. Most experts agree that even under the best conditions (for
example, when soil and aquifer conditions retard the movement of contaminants), the separation
distance should be no less than 50 feet. For an added safety measure, many local ordinances
often consider 100 feet to be the minimum separation distance. Since the safety of a groundwater
source depends mainly on geological and soil
conditions, and well construction practices, these variables must be considered in determining
the separation distance between well and contaminant source. Wherever possible, wells should
always be placed “up-gradient” of any source of contamination. In many cases, groundwater
gradients (tendency for flow) follow surface topography, therefore wells should be located uphill
from any contamination source. The direction of groundwater flow does not always follow the
slope of the land surface, however. Therefore, well siting should be done by a person with

13
sufficient training and experience to evaluate the various factors involved. Groundwater
contamination can continue for long periods before any problem is discovered. The volume of
polluted water by then can be large and the source of contamination far removed from the site of
the discovery (Wright et al., 2004).
1.2.10 What Individuals Can Do
Individuals can help protect our groundwater resources by recognizing that activities on
the soil surface and upper profile can, and do, affect groundwater. We need to manage our
activities accordingly. Like many public issues, however, awareness of problems and solutions is
not enough. Often, we as individuals acknowledge that a problem might exist, but deny that we
contribute to it. Even to a greater extent than with surface water, groundwater is shared by all
users, and all users similarly share in its contamination.
Here are some key things that individuals can do to protect groundwater:
• Keep a close watch on the inventory of liquids in underground tanks to detect possible losses
caused by leakage. If a buried tank is more than 15 years old it has a good chance of leaking.
Have it checked.
• Use agrochemicals and lawn and garden chemicals wisely, following re commended
application rates, timing, and methods.
• Manage septic tank systems to prolong their life and maximize their efficiency in removing
pollutants.
• Support legislation at the local level that will encourage the use of state-of-the-art technology in
solid waste management and waste water treatment.
1.3 Water Pollution
Water pollution is a major problem in the global context. It has been suggested that it is
the leading worldwide cause of deaths and diseases (Cohen, 1996; CDC, 1995) and that it
accounts for the deaths of more than 14,000 people daily (CDC, 1995). In addition to the acute
problems of water pollution in developing countries industrialized countries continue to struggle
with pollution problems as well. In the most recent national report on water quality in the United

14
states, 45 percent of assessed stream miles, 47 perent of assessed ladke acres, and 32 percent of
assessed bay and estuarine square miles were clssified as polluted (Rose, 1993).water qualitya in
the United States, 45 percent of assessed stream miles, 47 percent of assessed lake acres, and 32
percent of assessed bay and estuarine square miles were classified as polluted (Rose, 1993).
Water is typically referred to as polluted when it is impaired by anthropogenic
contaminants and either does not support a human use, like serving as drinking water, and/or
undergoes a marked shift in its ability to support its constituent biotic communities, such as fish.
Natural phenomena such as volcanoes, algae blooms, storms, and earthquakes also cause major
changes in water quality and the ecological status of water. Water pollution has many causes and
characteristics (Trevett et al., 2005).
Surface water and groundwater have often been studied and managed as separate resources,
although they are interrelated (Payment, 1991). Sources of surface water pollution are generally
grouped into two categories based on their origin (Trevett et al., 2005).
1.3.1 Point source pollution
Point source pollution refers to contaminants that enter a waterway through a discrete
conveyance, such as a pipe or ditch. Examples of sources in this category include discharges
from a sewage treatment plant, a factory, or a city storm drain. The U.S. Clean Water Act
(CWA) defines point source for regulatory enforcement purposes (Wiles, 1994).
1.3.2 Non-point source pollution
Non-point source (NPS) pollution refers to diffuse contamination that does not originate
from a single discrete source. NPS pollution is often a cumulative effect of small amounts of
contaminants gathered from a large area. Nutrient runoff in stormwater from "sheet flow" over
an agricultural field or a forest are sometimes cited as examples of NPS pollution. Contaminated
stormwater washed off of parking lots, roads and highways, called urban runoff, is sometimes
included under the category of NPS pollution. However, this runoff is typically channeled into

15
storm drain systems and discharged through pipes to local surface waters, and is a point source.
The CWA definition of point source was amended in 1987 to include municipal storm sewer
systems, as well as industrial stormwater, such as from construction sites (Olson, 1995).
1.3.3 Groundwater pollution
Interactions between groundwater and surface water are complex. Consequently,
groundwater pollution, sometimes referred to as groundwater contamination, is not as easily
classified as surface water pollution ((Payment, 1991). By its very nature, groundwater aquifers
are susceptible to contamination from sources that may not directly affect surface water bodies,
and the distinction of point vs. nonpoint source may be irrelevant. A spill of a chemical
contaminant on soil, located away from a surface water body, may not necessarily create point
source or non-point source pollution, but nonetheless may contaminate the aquifer below.
Analysis of groundwater contamination may focus on soil characteristics and hydrology, as well
as the nature of the contaminant itself (Payment, 1991).
1.3.4 Materials and Phenomena Contributing to Water Pollution
The specific contaminants leading to pollution in water include a wide spectrum of
chemicals, pathogens, and physical or sensory changes such as elevated temperature and
discoloration. While many of the chemicals and substances that are regulated may be naturally
occurring (calcium, sodium, iron, manganese, etc.) the concentration is often the key in
determining what is a natural component of water, and what is a contaminant. Oxygen-depleting
substances may be natural materials, such as plant matter (e.g. leaves and grass) as well as man-
made chemicals. Other natural and anthropogenic substances may cause turbidity (cloudiness)
which blocks light and disrupts plant growth, and clogs the gills of some fish species (Reilly,
1990).
Many of the chemical substances are toxic. Pathogens can produce waterborne diseases
in either human or animal hosts. Alteration of water's physical chemistry include acidity (change
in pH), electrical conductivity, temperature, and eutrophication. Eutrophication is the fertilization
of surface water by nutrients that were previously scarce (Pruss et al., 2002).
16
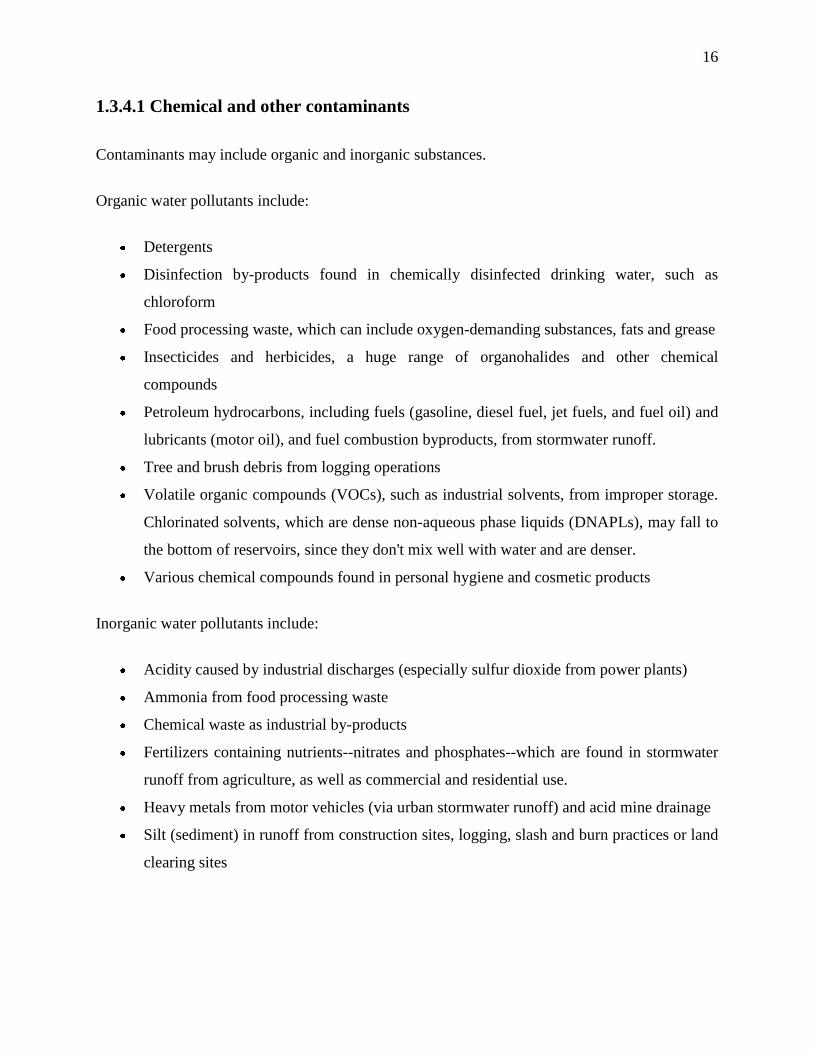
1.3.4.1 Chemical and other contaminants
Contaminants may include organic and inorganic substances.
Organic water pollutants include:
Detergents
Disinfection by-products found in chemically disinfected drinking water, such as
chloroform
Food processing waste, which can include oxygen-demanding substances, fats and grease
Insecticides and herbicides, a huge range of organohalides and other chemical
compounds
Petroleum hydrocarbons, including fuels (gasoline, diesel fuel, jet fuels, and fuel oil) and
lubricants (motor oil), and fuel combustion byproducts, from stormwater runoff.
Tree and brush debris from logging operations
Volatile organic compounds (VOCs), such as industrial solvents, from improper storage.
Chlorinated solvents, which are dense non-aqueous phase liquids (DNAPLs), may fall to
the bottom of reservoirs, since they don't mix well with water and are denser.
Various chemical compounds found in personal hygiene and cosmetic products
Inorganic water pollutants include:
Acidity caused by industrial discharges (especially sulfur dioxide from power plants)
Ammonia from food processing waste
Chemical waste as industrial by-products
Fertilizers containing nutrients--nitrates and phosphates--which are found in stormwater
runoff from agriculture, as well as commercial and residential use.
Heavy metals from motor vehicles (via urban stormwater runoff) and acid mine drainage
Silt (sediment) in runoff from construction sites, logging, slash and burn practices or land
clearing sites
17
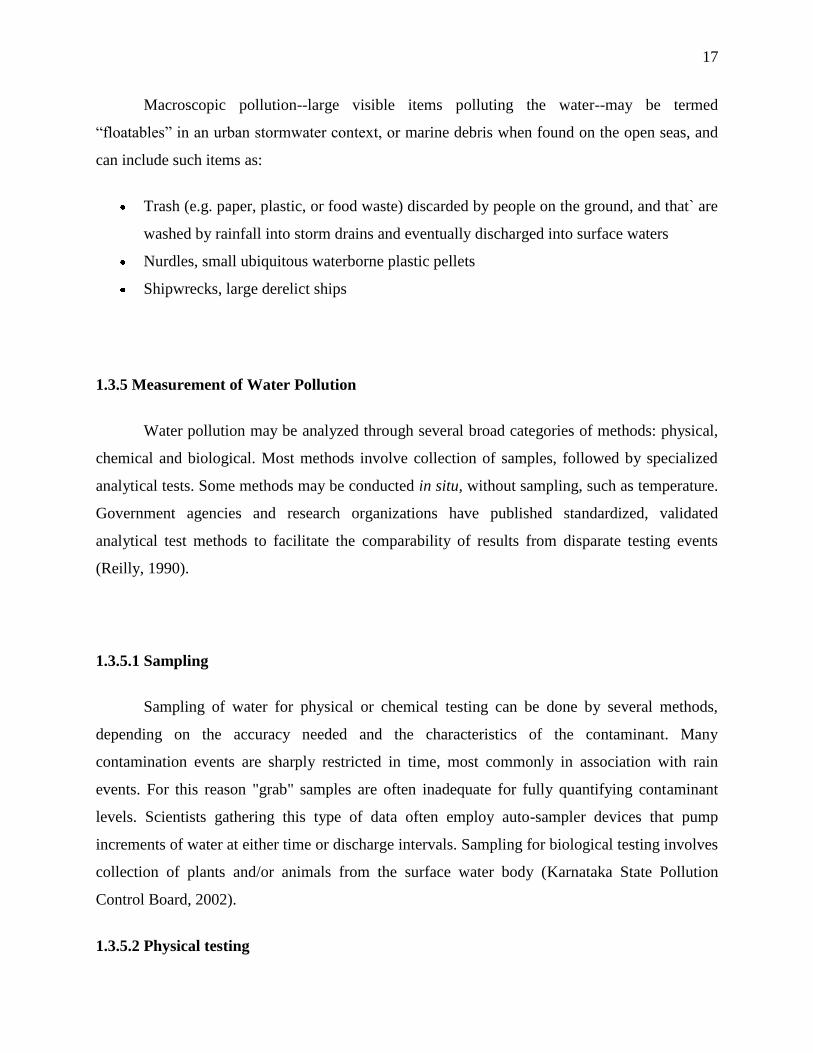
Macroscopic pollution--large visible items polluting the water--may be termed
“floatables” in an urban stormwater context, or marine debris when found on the open seas, and
can include such items as:
Trash (e.g. paper, plastic, or food waste) discarded by people on the ground, and that` are
washed by rainfall into storm drains and eventually discharged into surface waters
Nurdles, small ubiquitous waterborne plastic pellets
Shipwrecks, large derelict ships
1.3.5 Measurement of Water Pollution
Water pollution may be analyzed through several broad categories of methods: physical,
chemical and biological. Most methods involve collection of samples, followed by specialized
analytical tests. Some methods may be conducted in situ, without sampling, such as temperature.
Government agencies and research organizations have published standardized, validated
analytical test methods to facilitate the comparability of results from disparate testing events
(Reilly, 1990).
1.3.5.1 Sampling
Sampling of water for physical or chemical testing can be done by several methods,
depending on the accuracy needed and the characteristics of the contaminant. Many
contamination events are sharply restricted in time, most commonly in association with rain
events. For this reason "grab" samples are often inadequate for fully quantifying contaminant
levels. Scientists gathering this type of data often employ auto-sampler devices that pump
increments of water at either time or discharge intervals. Sampling for biological testing involves
collection of plants and/or animals from the surface water body (Karnataka State Pollution
Control Board, 2002).
1.3.5.2 Physical testing

18
Common physical tests of water include temperature, solids concentration and turbidity.
1.3.5.3 Chemical testing
Water samples may be examined using the principles of analytical chemistry. Many
published test methods are available for both organic and inorganic compounds. Frequently-used
methods include pH, biochemical oxygen demand (BOD), chemical oxygen demand (COD),
nutrients (nitrate and phosphorus compounds), metals (including copper, zinc, cadmium, lead
and mercury), oil and grease, total petroleum hydrocarbons (TPH), and pesticides (Pruss et al.,
2002).
1.3.5.4 Biological Testing
Biological testing involves the use of plant, animal, and/or microbial indicators to
monitor the health of an aquatic ecosystem. Diarrhoeal diseases account for 4.3% of the total
global disease burden (62.5 million DALYs). An estimated 88% of this burden is attributable to
unsafe drinking water supply, inadequate sanitation, and poor hygiene. These risk factors are
second, after malnutrition, in contributing to the global burden of disease (Pruss et al., 2002).
Target #10 of the Millennium Development Goal for water (number 7) is to “Reduce by
half the proportion of people without sustainable access to safe drinking water.” Because many
developing countries have little or no water quality monitoring, particularly in rural areas, the
organisations responsible for assessing progress towards this target (UNICEF and WHO) have
adopted the following indicator as a modified version of the target (United Nations, 2005):
“Indicator 30. Proportion of population with sustainable access to an improved water source,
urban and rural.” This modified version implies an equivalence between „safe‟ water and water
from an „improved‟ source. The justification for this equivalence is not provided on the
referenced webpage. In rural areas of most developing countries, women and children collect
water from a communal source, often located several hundred metres from the home. The
sources themselves may be unimproved (hand dug wells, unprotected springs, rivers), with low
and seasonal flow rates, or improved (public taps, boreholes or pumps, protected wells, protected
springs or harvested rainwater). A systematic review of 57 studies published before 2002 by
Wright et al. (2004) showed that water contamination occurs between source and point-of-use.

19
This pattern has been confirmed by subsequent studies of water contamination in rural Sierra
Leone (Clasen and Bastable, 2003) and rural Honduras (Trevett et al., 2005). However, it is
unclear exactly when this contamination takes place.
Fig. 1.3: Showing the supply chain of drinking water for each household. (Trevett et al., 2005).
1.3.5.4.1 Alkalinity
Alkalinity is an index of the buffering capacity of water. It is closely linked to hardness.
For the most part, alkalinity is produced by anions or molecular species of weak acids, mainly
hydroxide, bicarbonate and carbonate; other species such as borates, phosphates, silicates and
organic acids may also contribute to a small degree. Alkalinity is expressed in terms of an
equivalent quantity of calcium carbonate. As the alkalinity of most Canadian surface waters is
due to the presence of carbonates and bicarbonates, their alkalinity is close to their hardness
(Pruss et al., 2002).
1.3.5.4.2 Aluminum
Neither a health-based guideline (MAC) nor an aesthetic objective (AO) has been
established for aluminum in drinking water. Aluminum is the most abundant metal on Earth –
about 8% of the Earth‟s crust. It is found in a variety of minerals. Aluminum is chiefly mined as
“Flamed
” “Unflamed” Vessel Cu
p
TRANSPORT POINT-OF-USE
IN HOUSEHOLD
COLLECTION
FROM SOURCE
Intrinsic Accessible Stored Consumed
20
bauxite, a mineral containing 40–60% aluminum oxide (alumina). Aluminum is also found as a
normal constituent of soil, plants and animal tissues. As a precaution, water treatment plants
using aluminum-based coagulants should optimize their operations to reduce residual aluminum
levels in treated water to the lowest extent possible. For plants using aluminum-based
coagulants, recommended values are less than 0.1 mg/L total aluminum for conventional
treatment plants and less than 0.2 mg/L total aluminum for other types of treatment systems (e.g.,
direct or in-line filtration plants, lime softening plants). These values are based on a 12-month
running average of monthly samples (Trevett et al., 2005).
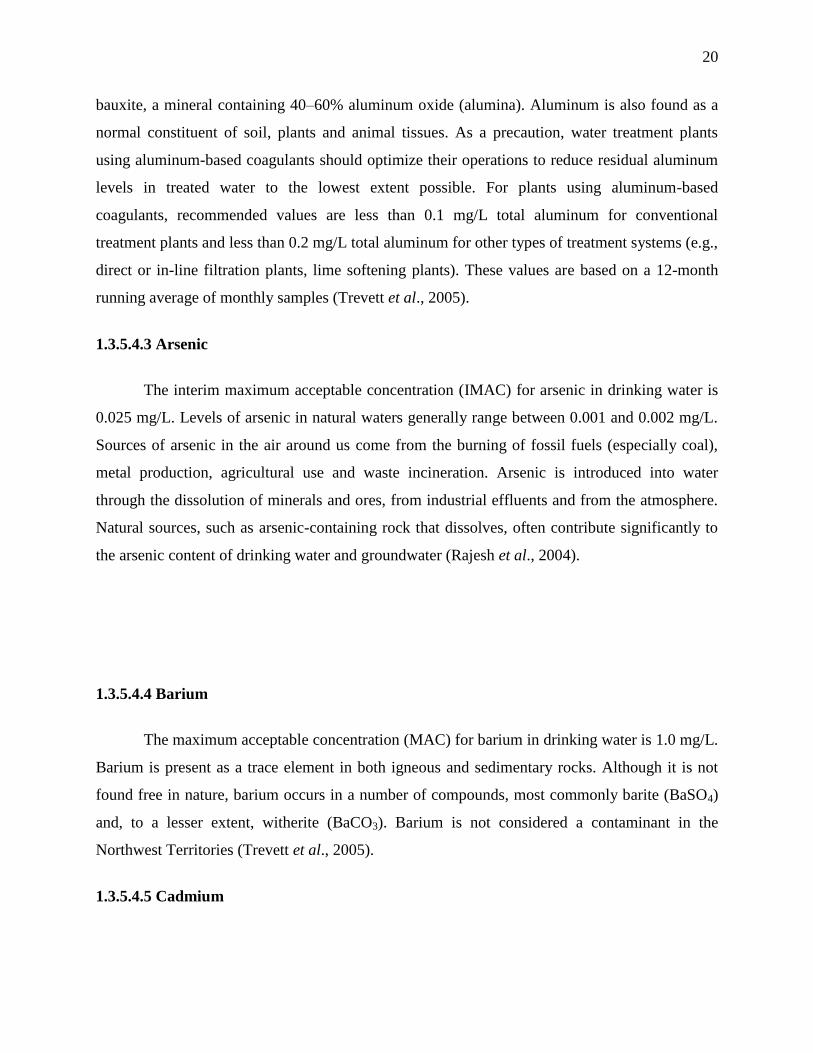
1.3.5.4.3 Arsenic
The interim maximum acceptable concentration (IMAC) for arsenic in drinking water is
0.025 mg/L. Levels of arsenic in natural waters generally range between 0.001 and 0.002 mg/L.
Sources of arsenic in the air around us come from the burning of fossil fuels (especially coal),
metal production, agricultural use and waste incineration. Arsenic is introduced into water
through the dissolution of minerals and ores, from industrial effluents and from the atmosphere.
Natural sources, such as arsenic-containing rock that dissolves, often contribute significantly to
the arsenic content of drinking water and groundwater (Rajesh et al., 2004).
1.3.5.4.4 Barium
The maximum acceptable concentration (MAC) for barium in drinking water is 1.0 mg/L.
Barium is present as a trace element in both igneous and sedimentary rocks. Although it is not
found free in nature, barium occurs in a number of compounds, most commonly barite (BaSO4)
and, to a lesser extent, witherite (BaCO3). Barium is not considered a contaminant in the
Northwest Territories (Trevett et al., 2005).
1.3.5.4.5 Cadmium

21
The maximum acceptable concentration (MAC) of 0.005 mg/L for cadmium in drinking
water was set based on health considerations. Cadmium is a silvery-white, lustrous, but
tarnishable metal that closely resembles zinc. It is soft and ductile and has a relatively high
vapour pressure. Cadmium is not considered a contaminant of concern in the Northwest
Territories (Rajesh et al., 2004).
1.3.5.4.6 Chloride
The aesthetic objective (AO) for chloride in drinking water is 250 mg/L. At
concentrations above the AO, chloride makes water, and drinks made from water, taste bad. It
may also cause corrosion in the distribution system (Morris, 1992). Chloride is widely
distributed in nature, generally as sodium (NaCl) and potassium (KCl) salts. By far the greatest
amount of chloride found in the environment is in the oceans. Chloride in drinking water sources
can come from dissolving salt deposits, salting of highways to control ice and snow, effluents
from chemical industries, oil well operations, sewage, irrigation drainage, refuse leachates, sea
spray and seawater intrusion in coastal areas. Chloride is generally present at low concentrations
in natural surface waters in Canada. Concentrations are normally less than 10 mg/L and often
less than 1 mg/L (Wright et al., 2004).
1.3.5.4.7 Chromium
The maximum allowable concentration (MAC) of 0.05mg/L for chromium in drinking water was
set based on health considerations.
Trivalent chromium, the most common natural state of chromium, is essential in humans and
animals for efficient lipid, glucose and protein metabolism. It is considered to be non-toxic.
However, if it is present in raw water, it may be oxidized to hexavalent chromium during
chlorination. Concentrations of total chromium in drinking water are usually well below the
22
MAC. Chromium is not considered a contaminant of concern in the Northwest Territories
(Trevett et al., 2005).
1.3.5.4.8 Colour
The aesthetic objective (AO) for colour is 15 TCU (total colour units). Colour is not a
health-related parameter. Colour in drinking water may be due to the presence of coloured
organic substances, metals such as iron, manganese and copper or highly coloured industrial
wastes. Although presence of colour in drinking water is not directly related to health, experience
has shown that consumers may turn to alternative, possibly unsafe, sources, if their drinking
water is highly coloured (Wright et al., 2004).
1.3.5.4.9 Copper
The aesthetic objective (AO) for copper in drinking water is 1.0 mg/L. This was set to
ensure the water tastes okay and to minimize staining of laundry and plumbing fixtures. Copper
is an essential element in human metabolism, and deficiencies result in a variety of clinical
disorders, including nutritional anemia in infants. Although large doses of copper may result in
adverse health effects, the levels at which this occurs are much higher than the aesthetic
objective (AO). Copper occurs in nature as a metal and in minerals. Copper is not a contaminant
of concern in the Northwest Territories (Rajesh et al., 2004).
1.3.5.4.10 Cyanide
Cyanide is toxic to humans, and the maximum acceptable concentration (MAC) for free
cyanide in drinking water is 0.2 mg/L. Cyanides may be released into the aquatic environment
through waste effluents from various industries such as gold mining. Representative data suggest
that Canadian drinking water has very low concentrations of cyanide. Contamination through
industrial spillage or transport accidents could result in high cyanide levels in raw water supplies.
Cyanide is not considered a contaminant of concern in the Northwest Territories (Rajesh et al.,
2004).

23
1.3.5.4.11 Escherichia coli (E. coli)
Of all contaminants in drinking water, human and animal feces present the greatest
danger to public health. E. coli are naturally occurring fecal coliforms found in human and
animal intestines. While the strain of E. coli known as E. coli 0157:H7, which contaminated the
water in Walkerton, Ontario, is very harmful and potentially deadly, most strains of E. coli are
relatively harmless. The reason E. coli is relied on so heavily as a measure is that it is a good
indicator of the bacteriological safety of drinking water. It is the only species in the coliform
group that is exclusively found in the intestinal tract of humans and other warm-blooded animals
and it is excreted in large numbers in feces. If E. coli is found in the water, it means that the
water has been contaminated by human or animal feces that can harbour a number of other
pathogenic, or disease causing, organisms. The maximum acceptable concentration (MAC) of E.
coli in drinking water is zero (Trevett et al., 2005).
1.3.5.4.12 Faecal Coliforms
Faecal coliforms, otherwise known as thermotolerant coliforms, are a type of coliform
bacteria generally found in the intestines of healthy humans and animals. Coliform bacteria can
be found everywhere in the environment, and most coliforms, including most faecal coliforms
are relatively harmless, naturally occurring organisms. Faecal coliforms, which include E. coli
and a few other species, are an indicator of faecal contamination. Faecal coliform testing has
been replaced by E. coli testing in most jurisdictions as more specific tests for E. coli have
become routinely available. The maximum acceptable concentration (MAC) of faecal coliforms
in drinking water is zero. If fecal coliforms are found in treated drinking water, a boil water
advisory is generally issued right away (Rajesh et al., 2004).
1.3.5.4.13 Fluoride
The maximum acceptable concentration (MAC) for fluoride in drinking water is 1.5
mg/L. Fluoride-containing compounds are added to drinking water to help prevent dental
cavities. Fluoride can occur naturally in surface waters. Groundwater can also contain high

24
concentrations of fluoride due to leaching from rocks. Fluoride can be present in plant and
animal tissues. Fluoride is not considered a contaminant of concern in the Northwest Territories.
Some communities, such as Yellowknife, add fluoride to the water to help prevent tooth decay
(Wright et al., 2004).
1.3.5.4.14 Heterotrophic Plate Count
The heterotrophic plate count (HPC), formerly known as the standard plate count (SPC),
is an indicator of the general bacteriological content of the water. High HPC levels are not
associated with waterbourne disease outbreaks. Proper chlorine disinfection can generally reduce
HPC levels to less than 10 cfu/mL. HPC levels above 500 cfu/mL should be investigated, but
would not normally result in a boil water advisory (Trevett et al., 2005).
1.3.5.4.15 Iron
The aesthetic objective (AO) for iron in drinking water is 0.3 mg/L. At concentrations
above the AO, iron can make water taste bad and can cause staining of laundry and plumbing
fixtures. Iron is an essential element in human nutrition, and deficiencies can result in impaired
mental development in children, reduced work performance in adults and, in severe cases,
anemia or impaired oxygen delivery. Iron is the fourth most abundant element in the earth‟s crust
and the most abundant heavy metal. It is present in the environment mainly as Fe(II) or Fe(III).
The concentrations of iron in Canadian surface waters are generally below 10 mg/L. Iron is
generally present in surface waters as salts containing Fe(III) when the pH is above 7. Most of
those salts are insoluble and settle out or are adsorbed onto surfaces Therefore, the concentration
of iron in well-aerated waters is seldom high. Under reducing conditions, which may exist in
some groundwaters, lakes or reservoirs, and in the absence of sulphide and carbonate, high
concentrations of soluble Fe(II) may be found. The presence of iron in natural waters can be
attributed to the weathering of rocks and minerals, acidic mine water drainage, landfill leachates,
sewage effluents and iron-related industries (Rajesh et al., 2004).
1.3.5.4.16 Lead

25
The maximum acceptable concentration (MAC) for lead in drinking water is 0.010 mg/L.
Lead is a poison that can negatively affect the central nervous system. Pregnant women, infants
and children up to 6 years of age are most vulnerable. Lead is present in tap water as a result of
dissolution from natural sources or from old household plumbing systems containing lead in
pipes, solder or househould service connections. The amount of lead from the plumbing system
that may be dissolved depends upon several factors, including the acidity (pH), water softness
and standing time of the water.
Lead has not been used in drinking water distribution systems or in household plumbing since
1945. People living in older homes in particular, should run the water for a few minutes to clear
out the water that has been sitting in the pipes before drinking it. Faucets should also be flushed
before water samples are taken for testing. Lead is generally not a concern in the Northwest
Territories, where there are few older houses or distribution systems (Trevett et al., 2005).
1.3.5.4.17 Manganese
The aesthetic objective (AO) for manganese in drinking water is 0.05 mg/L. Manganese
in drinking water supplies can cause a number of problems. At concentrations above 0.15 mg/L,
manganese stains plumbing fixtures and laundry and produces undesirable taste in drinks.
Manganese may cause microbial growths in the distribution system. Even at concentrations
below 0.05 mg/L, manganese may form black coatings on water distribution pipes. The element
manganese is present in over 100 common salts and mineral complexes that are widely
distributed in rocks, in soils and on the floors of lakes and oceans. Manganese is most often
present as the dioxide, carbonate or silicates. Manganese is most often a concern for systems that
use a groundwater source (Rajesh et al., 2004).
1.3.5.4.18 Mercury
26
Mercury is a toxic element and provides no benefit to humans. The maximum acceptable
concentration (MAC) for mercury in drinking water is 0.001 mg/L. Mercury is a concern because
organic mercury accumulates in fish. Elevated mercury levels have been found in freshwater fish
taken from areas with suspected mercury contamination and frequently render the fish unsafe to
eat. Long-term daily intake of approximately 0.25 mg of mercury as methyl mercury has caused
the onset of neurological symptoms; however, even in heavily polluted Canadian waters,
mercury concentrations rarely exceed 0.03 mg/L. The MAC for mercury, therefore, provides a
considerable margin of safety. Mercury levels in both surface water and tap water are generally
well below the maximum acceptable concentration. Mercury is not considered a contaminant of
concern in the Northwest Territories (Trevett et al., 2005).
1.3.5.4.19 Nitrate
The maximum acceptable concentration (MAC) for nitrate in drinking water is 45 mg/L.
In cases where nitrite is measured separately from nitrate, the concentration of nitrite should not
exceed 3.2 mg/L. The most commonly reported toxic effect of nitrate-contaminated drinking
water is methaemoglobinaemia, which results in reduced oxygen transfer to body tissues. Infants
up to 3 months of age are most vunerable. Nitrate (NO3‾) and nitrite (NO2‾) are naturally
occurring ions that are found everywhere in the environment (Wright et al., 2004).
Both are products of the oxidation of nitrogen (which comprises roughly 78% of the atmosphere)
by micro-organisms in plants, soil or water and, to a lesser extent, by electrical discharges such
as lightning. Nitrate is the more stable form of oxidized nitrogen but can be reduced by microbial
action to nitrite, which is moderately reactive chemically. Sources of nitrates in water
(particularly groundwater) include decaying plant or animal material, agricultural fertilizers,
manure, domestic sewage, or geological formations containing soluble nitrogen compounds.
Nitrate is not considered a contaminant of concern in the Northwest Territories, as there is very
little commercial agriculture (Trevett et al., 2005).
1.3.5.4.20 pH

27
An acceptable range for drinking water pH is from 6.5 to 8.5. Water with a pH below 6.5
is considered acidic and may cause corrosion. Water with a pH above 8.5 is considered basic,
and may result in incrustation and scaling problems. As pH increases, there is a progressive
decrease in the efficiency of the chlorine disinfection process (Rajesh et al., 2004).
1.3.5.4.21 Selenium
The maximum acceptable concentration (MAC) for selenium in drinking water is 0.01
mg/L based on health considerations. Food is the main source of selenium for people who are not
occupationally exposed; thus, toxic effects have most often been associated with food. A safe
and adequate range of selenium intake of 0.05 to 0.2 mg per person per day has been
recommended for adults, with correspondingly lower ranges for infants and children. Drinking
water containing selenium at the MAC would be the source of between 10 and 25 percent of total
selenium intake; the MAC provides a reasonable factor of safety from adverse effects of
selenium. Selenium is not considered a contaminant of concern in the Northwest Territories
(Rajesh et al., 2004).
1.3.5.4.22 Sodium
The aesthetic objective (AO) for sodium in drinking water is 200 mg/L. Drinking water
generally tastes bad at sodium concentrations above the AO. Sodium is not considered a toxic
element. Adults normally consume up to 5 grams of sodium a day. Although the average intake
of sodium from drinking water is only a small fraction of that consumed in a normal diet, the
intake from this source could be significant for people suffering from hypertension or congestive
heart failure who may require a sodium-restricted diet. Sodium is the most abundant of the alkali
elements and makes up 2.6% of the Earth's crust. Sodium compounds are widely distributed in
nature. Sodium is a soft, silvery-white, highly reactive metal. It is never found in nature in the
uncombined state and has a strong tendency to exist in the ionic form. In biological systems and
even in solids such as sodium chloride, sodium remains distinctly separate as the sodium ion
(Wright et al., 2004).
28
1.3.5.4.23 Sulphate
The aesthetic objective (AO) for sulphate in drinking water is 500 mg/L, based on taste.
Because of the possibility of adverse physiological effects at higher concentrations, health
authorities should be notified if drinking water sulphate concentrations exceed 500 mg/L.
Sulphur is a non-metallic element. Sulphur, principally in the form of sulphuric acid, is one of
the most widely used chemicals in industrialized society. Most sulphur is converted into
sulphuric acid. Sulphates or sulphuric acid products are also used in the manufacture of
numerous chemicals, dyes, glass, paper, soaps, textiles, fungicides, insecticides, astringents and
emetics. They are also used in the mining, pulping, metal and plating industries. Aluminum
sulphate (alum) is used as a sedimentation agent in the treatment of drinking water, and copper
sulphate has been used for the control of blue-green algae in both raw water and public water
supplies in the United States. Sulphate is not considered a contaminant of concern in the
Northwest Territories (Trevett et al., 2005).
1.3.5.4.24 Total Hardness
Although hardness may have significant aesthetic effects, a maximum acceptable level
has not been established because public acceptance of hardness may vary considerably according
to the local conditions. Water supplies with a hardness greater than 200 mg/L are considered
poor, but have been tolerated by consumers; those in excess of 500 mg/L are unacceptable for
most domestic purposes. Higher levels are generally associated with groundwater sources. Water
hardness is a traditional measure of the capacity of water to react with soap. Hard water requires
a considerable amount of soap to produce a lather, and it also leads to scaling of hot water pipes,
boilers and other household appliances. Water hardness is caused by dissolved polyvalent
metallic ions. In fresh waters, the principal hardness-causing ions are calcium and magnesium;
strontium, iron, barium and manganese ions also contribute (Rajesh et al., 2004).
1.3.5.4.25 Total Dissolved Acids (TDS)

29
An aesthetic objective (AO) for total dissolved solids (TDS) in drinking water is 500
mg/L. At higher levels, excessive hardness, poor taste, mineral deposition and corrosion may
occur. At low levels, however, TDS contributes to the good taste of water. Total dissolved solids
(TDS) include inorganic salts and small amounts of organic matter that are dissolved in water.
The principal constituents are usually the cations calcium, magnesium, sodium and potassium
and the anions carbonate, bicarbonate, chloride, sulphate and, particularly in groundwater, nitrate
(from agricultural use). Total dissolved solids in water supplies originate from natural sources,
sewage, urban and agricultural runoff and industrial wastewater (Trevett et al., 2005).
1.3.5.4.26 Turbidity
Turbidity is a measure of the relative clarity or cloudiness of water. Turbidity in water is
caused by suspended and colloidal matter, such as clay, silt, finely divided organic and inorganic
matter, and plankton and other microscopic organisms (Wright et al., 2004). Turbidity is not a
direct measure of particles suspended in the water. It is, rather, a measure of the scattering effect
that such particles have on light. A beam of light remains relatively undisturbed when it shines
through absolutely pure water, but if there are particles in the water, the light will bounce off the
particles and scatter in different directions. Turbidity is considered a health-related parameter
because the particles can shelter bacteria from chlorine disinfection and act as a food source for
micro-organisms. Water with high turbidity may increase the amount of chlorine required for
disinfection and the possibility of water-borne illness (Wright et al., 2004).
1.3.5.4.27 Trihalomethanes (THMs)
The interim maximum acceptable concentration (IMAC) for total
trihalomethanes(THMs) in drinking water is 0.1mg/L. THMs are the by-products that result
when chlorine is mixed with organic particles. If raw water has a lot of organic material, THMs
can be produced during disinfection. Drinking water with a lot of THMs over a very long period
of time may be linked to cancer, but drinking water that is not disinfected with chlorine is a
much bigger health risk (Rajesh et al., 2004).

30
1.3.5.4.28 Uranium
The interim maximum acceptable concentration (IMAC) for uranium in drinking water is
0.02 mg/L. Uranium is present in water supplies as a result of leaching from natural deposits,
release from mill tailings, emissions from the nuclear industry, and the combustion of coal and
other fuels. Phosphate fertilizers may also contribute to the uranium content of groundwater.
Uranium is not considered to be a contaminant of concern in the Northwest Territories (Trevett
et al., 2005).
1.3.5.4.29 Zinc
The aesthetic objective (AO) for zinc is 5.0 mg/L. Zinc is an essential element is
generally considered to be non-toxic. Drinking water is not considered an important nutritional
source of this element. Water containing zinc at concentrations above 5.0 mg/L tends to be
opalescent, develops a greasy film when boiled, and has an undesirable astringent taste. Zinc is
an abundant element. The most common zinc mineral is sphalerite (ZnS), which is often
associated wth the sulphides of other metallic elements, such as lead, copper, cadmium, and iron.
Zinc is not considered to be a contaminant of concern in the Northwest Territories (Wright et al.,
2004).
1.3.5.4.30 Table 1: Physicochemical Combined Standards of WHO, SON AND NAFDAC
(IPAN, 2005)
S/No. Parameter NAFDAC MAXIMUM
ALLOWED LIMITES
SON
STANDARD
Highest Desirable
1. Color 3.0TCU 3.0 TCU 3.0TCU 15.0TCU
2. Odour Unobjectionable Unobjectionable Unobjectionable Unobjectionable
3. Taste Unobjectionable Unobjectionable Unobjectionable Unobjectionable
Maximum
permissible
WHO STANDARDS
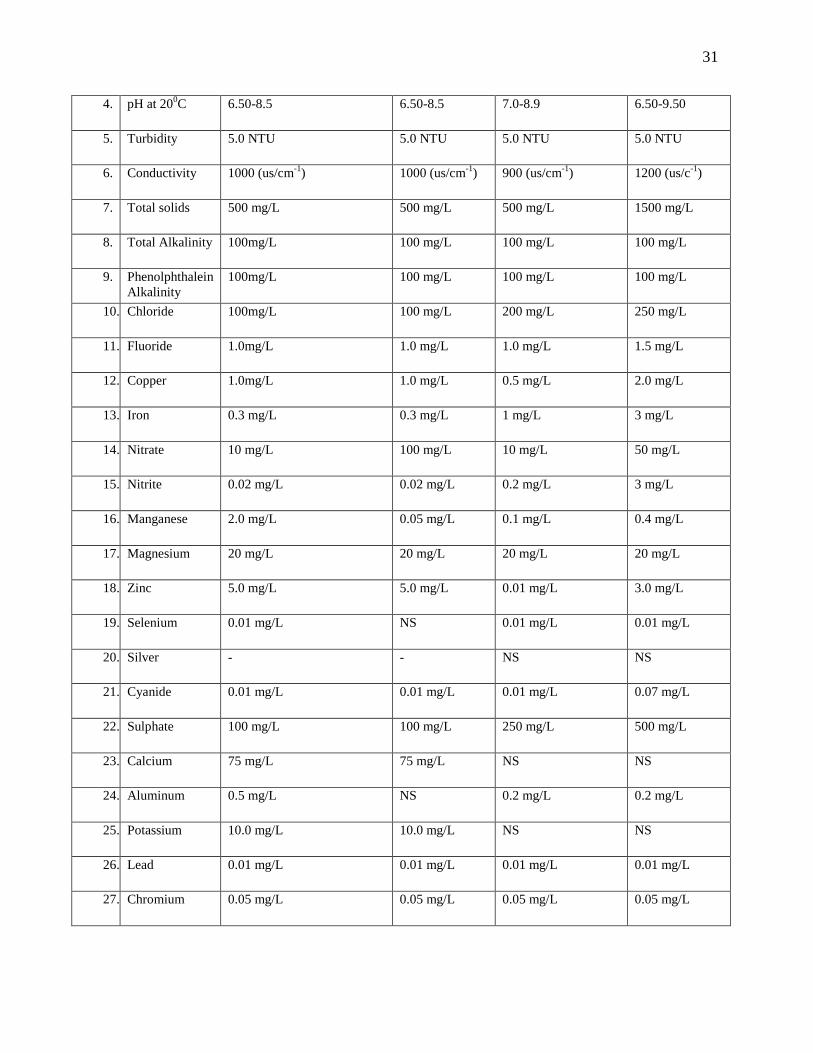
31
4. pH at 200C 6.50-8.5 6.50-8.5 7.0-8.9 6.50-9.50
5. Turbidity 5.0 NTU 5.0 NTU 5.0 NTU 5.0 NTU
6. Conductivity 1000 (us/cm-1
) 1000 (us/cm-1
) 900 (us/cm-1
) 1200 (us/c-1
)
7. Total solids 500 mg/L 500 mg/L 500 mg/L 1500 mg/L
8. Total Alkalinity 100mg/L 100 mg/L 100 mg/L 100 mg/L
9. Phenolphthalein
Alkalinity
100mg/L 100 mg/L 100 mg/L 100 mg/L
10. Chloride 100mg/L 100 mg/L 200 mg/L 250 mg/L
11. Fluoride 1.0mg/L 1.0 mg/L 1.0 mg/L 1.5 mg/L
12. Copper 1.0mg/L 1.0 mg/L 0.5 mg/L 2.0 mg/L
13. Iron 0.3 mg/L 0.3 mg/L 1 mg/L 3 mg/L
14. Nitrate 10 mg/L 100 mg/L 10 mg/L 50 mg/L
15. Nitrite 0.02 mg/L 0.02 mg/L 0.2 mg/L 3 mg/L
16. Manganese 2.0 mg/L 0.05 mg/L 0.1 mg/L 0.4 mg/L
17. Magnesium 20 mg/L 20 mg/L 20 mg/L 20 mg/L
18. Zinc 5.0 mg/L 5.0 mg/L 0.01 mg/L 3.0 mg/L
19. Selenium 0.01 mg/L NS 0.01 mg/L 0.01 mg/L
20. Silver - - NS NS
21. Cyanide 0.01 mg/L 0.01 mg/L 0.01 mg/L 0.07 mg/L
22. Sulphate 100 mg/L 100 mg/L 250 mg/L 500 mg/L
23. Calcium 75 mg/L 75 mg/L NS NS
24. Aluminum 0.5 mg/L NS 0.2 mg/L 0.2 mg/L
25. Potassium 10.0 mg/L 10.0 mg/L NS NS
26. Lead 0.01 mg/L 0.01 mg/L 0.01 mg/L 0.01 mg/L
27. Chromium 0.05 mg/L 0.05 mg/L 0.05 mg/L 0.05 mg/L

32
28. Cadmium 0.003 mg/L 0.003 mg/L 0.003 mg/L 0.003 mg/L
29. Arsenic 0.01 mg/L 0.01 mg/L 0.01 mg/L 0.01 mg/L
30. Barium 0.05 mg/L 0.05 mg/L 0.05 mg/L 0.07 mg/L
31. Mercury 0.001 mg/L 0.001 mg/L 0.001 mg/L 0.001 mg/L
32. Antimony NS NS - 0.02 mg/L
33. Tin - - - 1.2 g/L
34. Nickel - - - 0.02 mg/L
35. Total Hardness
(CaCO3)
100 mg/L 100 mg/L 100 mg/L 500 mg/L
36. Vinyl chloride 0 mg/L 0 mg/L 0 mg/L 0003 mg/L
(IPAN, 2005)
NAFDAC - NATIONAL AGENCY FOR FOOD AND DRUG ADMINISTRATION AND
CONTROL.
SON - STANDARDS ORGANIZATION OF NIGRIA
WHO – WORLD HEALTH ORGANIZATION
IPAN – INSTITUTE OF PUBLIC ANALYSTS OF NIGERIA.
33
CHAPTER TWO
MATERIALS AND METHODS
2.1 Materials
2.1.1 Water Sampling Sources
Thirteen sampling areas consisting of four boreholes, six dug wells and three springs
were chosen for this research work. A total of 26 samples were taken during the dry season and
another 26 during the wet season. The sampling was carried in Nsukka (Fig. 2.1) and were
sampled seasonally as follows: dry season (January, 2004); and rainy season proper (August,
2004). All were equipped with headwall and cover, and some had a cemented surrounding. The
analyses carried out were on the utility water supplies in Nsukka area. Water samples were
collected from these sampling areas and refrigerated at 4OC for processing.
2.1.2 Chemicals/Reagents/Samples
All chemicals used in this study were of analytical grade and products of May and Baker,
England; BDH, England and Merck, Darmstadt, Germany.
2.2 Methods
Spectrophotometric and complexiometric methods were employed in the work.
2.2.1 Experimental Design
The analyses carried out were on the utility water supplies in Nsukka area. Five sampling
stations consisting of four bore holes, six dug wells and three springs were chosen for this
research work. A total of 26 samples were taken during the dry season and another 26 during the
wet season. Water samples were collected from these sampling stations and refrigerated at 4OC
for processing. Concentrations of lead, cadmium, nickel, arsenic and zinc were determined in
each sample by spectrophotometric method. Complexiometric titration method was employed in
the determination of acidity and total hardness of water samples, while Harch Model C50 digital
multirange meter was used to measure pH, electrical conductivity and total dissolved solids.
Other chemical parameters like nitrate, chloride and sulphate were also determined by
spectrophotometric method. Bacteriological analysis of the water samples were carried out to
34
ascertain whether there was faecal contamination by the use of multiple tube/most probable
number techniques.
2.2.2 Sampling Areas
The analyses carried out were on the utility water supplies in the University Campus of
Nsukka town. The Sampling areas are shown on the sampling map. The sampling areas consists
four boreholes, two of which are located in University of Nigeria, Nsukka Campus, they are
Franco Hostel borehole and the UNN water works borehole. The other two boreholes are found
in Nsukka town, they include Work and Pay borehole near Peace Mass Transit Motor Park, and
the Nsukka water scheme borehole. Sampling areas also include six dug wells and three springs.
The dug wells are found, one at No 4 Saint Theresa Road one at No 95 New Anglican Road, one
at Amaozala village, three at Eburu Mmili village after Saint Cyprian‟s college.
The three springs are Asho spring off Ugwuawarawa/Onuiyi Road. Ajie spring behind
El-rina hostels limited, and Iyi- Adoro at Alo-uno village. These are utility water supplies in
Nsukka town and environs. Contamination of these water sources will result in epidemic
outbreak or health problems in the Nsukka populace.

35
Fig. 2.1: Map of Nsukka showing the location of sampled areas

36
Table 2.1 Sampling points description table
Sampling points Description and location
UNN water works
borehole
The UNN water scheme borehole is located near the gate leading to
Owerre-Eze-Orba village. The University of Nigeria, Nsukka
Campus receives greater supply of water from this borehole.
Occasionally water is pumped to the surface and aerated before
storage. Currently there is a major work going on around the place
to upgrade it.
Franco borehole This is the second borehole from which the University Community
receives her supply of water. It is about 700ft deep and it is
surrounded by small farm land. The inhoff sewage treatment plant is
about 350-450 meters away.
Nsukka water scheme
borehole
Sample of water was collected from the overhead pipe feeding the
water-tankers that collect water for sale and distribution to Nsukka
inhabitants.
It has a dept of 725ft, and is located behind peace mass transit. It
belongs to Mr. Augustine Madueke of No 23c Amaeze Lane
Nsukka.
Saint Theresa‟s Road
Dug well ( Mr.
Vincent Ezeh)
This is located at No 47 Saint Theresa‟s road, behind Bishop
Shanahan Hospitals, Nsukka. It has a dept of about 30ft.
New Anglican Road
(Mr. N.E. Ogboso)
Dug well
This is situated at No 95 New Anglican Road, Nsukka. It is about
60ft. They use water pumping machine to pump out water
hygienically
Amaozala village. Dug
well
The well is about 28ft deep with clean surroundings. It is cited along
the road off New Anglican Road to Aku.
Mr. Francis Ukwueze
of Eburu Mmili
village. Dug well
Mr. Francis Ukwueze‟s dugwell in Eburu Minili village is about 32ft
deep. The surrounded well is by shruba.
Mrs. Mercy Onah of
Eburu-Minili
Mrs. Mercy‟s dugwell in Eburu-Minili village is about 40ft deep. It
is surrounded by farm lands.
Work and pay
borehole

37
village.dug well
Mr. Victor
Ugwuanyi‟s dug well
Mr. Victor Ugwuanyi dugwell located in front of his house is about
38ft deep. The surroundings is relatively clean.
Asho spring water This is off Ugwuawarawa /Onuiyi Road just after Tochukwu motor
depot as one goes to Odenigbo roundabout. The water is channeled
through a pipe as it descends the forested steep hill of the area
Ajie spring water This is located right behind Elrina Hotels limited. The water is also
channeled through a pipe.
Iyi-adoro spring water This is located at Alo-Uno village. It is on a think forested hill just
as one passes the Adoro shrine. The water perculates from the rocks
and it is exposed to dust and fallen leaves as it collects in a trough of
the rocks.
2.2.3 Heavy metals determination
There are some methods employed in the determination of heavy metals in water.
A) Spectrophometry method
This technique employs the use of ultraviolet, infrared and fluorescent methods of
chemical analysis in the detection and measurement of toxic substances in body tissues and
fluids. Absorption curves for most substances enable accurate quantitative and qualitative data to
be obtained.
The spectrophotometer instrument works by comparing the intensities of two differently
coloured light sources by resolving their light into spectra and measuring the relative intensities
of those spectra, wavelength by wavelength.
(i) Atomic Absorption spectrometry (AAS)
This depends on the absorption of characteristic electromagnetic radiation by vapourized
metal atoms in a flame. The extent of absorption of the radiation is proportional to the
concentration of the metal atom in solution. The use of organic solvents in the presence of
reducing flame such as oxyhydrogen or nitrous oxide acetylene flame enables the determination
of refractory metal oxides.

38
(ii) Colorimetric Determinations
The basis of colorimetry is the variation of the colour of a system with change in the
concentration of some components. Quantitation in colorimetric analysis is based on Bar-
Lambert‟s law, and the fundamental equation of colorimetry. Spectrophotometry often referred
to as Beer-Lambert‟s equation is given as:
acltI
Icl
TA
t
0log
1log
Where A or (a) = absorbance, T = transmittance
E = molar absorptivity, C = concentration
I = path length of radiation
The relationship between absorbance and concentration for the system is determined
to ascertain the range over which Beer‟s law applies. This kind of plot is called standard or
calibration curve. A number of researches have been successfully accomplished with the use of
colorimetric method of analysis. For instance, the International Institute of Tropical Agriculture
(IITA) used the colorimetric technique immensely in their manual for heavy metals and nitrate
determination.
B) Chromatographic method
This is a method of separating two or more chemical compounds in solution by taking
advantage of the fact that they are removed from the solution at different rates when the latter is
percolated down a column of a powdered absorbent or passed across the surface of an absorbent
paper. These include gas chromatography (GC), High performance liquid chromatography
(HPLC) and thin layer chromatography (TLC) to mention but a few. Chromatographic methods
have great application in chemical analysis, sometimes in conjunction with other analytic
instruments. Marina et al. () used Reversed Phase HPLC with UV detection to determine Fe, Cr,
Ni, Cu, Mn, Pb as EDTA complexes.
C) Polarography
39
This is a method of chemical analysis depending upon variations in the potential curve
observed when the given substance is electrolyzed, employing a dropping mercury electrode.
There are various types of this technique; pulse polarography, differential pulse
voltammetry, and differential pulse anodic stripping voltammetry. Polarography is useful for the
determination of heavy metals and their speciation in water and waste water. Thesemethods are
recommended by STM and vogel for analysis of heavy metals.
D) The Ionic Heavy Metal Test (IHMT)
The IHMT is a simple, fast and inexpensive method to detect ionic or heavy metals and
free radical producing metals (copper, zinc, iron, lead, mercury, cadmium etc) in the body and
our environment. The IHMT does not detect chelated metals. The IHMT assesses the chelation
ability of a person from a small urine sample. (i.e. how well someone copes with ionic,
electromagnetically active and free radical producing metals. The chelation ability in turn
determines (besides other influences) how many free radicals are produced.
Apart from urine IHMT can also show the presence of electrically active ionic heavy
metals in saliva, water, dust, paint, soil, fruit vegetables etc. If the test is positive in urine sample
we know that the system suffers from an ionic metal overload and that the body cannot cope with
ionic metals.
2.2.4 Cations and Anions Determination
A variety of analytical methods are available for this determination. In the separation and
determination of cations and anions, inorganic and organic ions, the “Ion Exchanged
Techniques” can be applied. Moreover, the rapid estimation of certain constituents in water
could be done by “Selective Ion Electrode Method”. These methods can be applied to remove
interfering ions, determine total ion content, indicate approximate volume of sample for certain
gravimetric determination and concentrate trace quantities of anions for analysis. These methods
are not only recommended by the standard method (STM) but have also been employed
successfully by some researchers.
2.2.5 Organic Compounds

40
Analytical methods used for the determination of organics involve an extraction and
concentration process followed by separation and detection with laboratory equipment. The
techniques employed include. Thin Layer Chromatography (TLC), Gas Chromatography (GC)
coupled with Flame Ionization Detection (FID) Election Capture Detection (ECD), Nitrogen
Phosphorus Detection (NPD), Flame Photometric Detection (FPD), Mass Spectrometry (MS) or
Atomic Absorption Spectrometry (AAS), and High Performance Liquid Chromatography
(HPLC) as well as Reverse Phase HPLC.
2.2.6 Alkalinity, Acidity, Chlorides and Hardness
These parameters are usually determined by titrimetric techniques of analysis. This
traditional method of analysis involves a volumetric reaction between the substance to be
measured and solution of a reagent of known concentration. When the amount of the reagent
added equals chemically with the substance being determined, the equivalent point or theoretical
endpoint (or stoichiometric endpoint) has been reached. This endpoint is identified by an
indicator, by way of a colour change. At this point the weight of the substance can be calculated
usually from the volume and concentration of the standard solution. The titrimetric method,
though an old method of chemical analysis is very reliable if all the conditions are well observed.
Probably, the most broadly applicable approach to making chemical measurement is
titrimetry or litrimetric analysis, sometimes called volumetric analysis, the wide adoption of
titrimetric methods is a result of their several practical advantages. They are highly precise,
accurate and rapid and often require only simple and inexpensive equipment.
Acidity and alkalinity of water samples are titrimetrically determined by neutralization
reactions of acids with alkalis which involve the following reaction .
OHH H20
The carbonates and bicarbonates exist in equilibrium with carbon-dioxide in accordance
with the following equation.
23
2
3COHCOCO
In natural waters alkalinity is estimated by titrating with standard acid to the bicarbonate
equivalence point of pH 8.3. On the other hand, acid pollutants entering a water supply in
sufficient quantity will disturb the carbonate-bicarbonate-carbon dioxide equilibrium shown

41
above. The extent of this disturbance can be estimated by titrating with standard alkali to the
endpoint range of pH 4.5 and pH 8.3.
The determination of halides (e.g. chloride ions) in water and the hardness of water
require the use of precipitation and complexometric methods.
2.2.7 Bacteriological Examination
The bacteriological analysis of water can confirm whether a water supply has been
faecally contaminated. The E. coli count is the most useful test for detecting faecal
contamination of water supplies in water quantity analysis. Two principal techniques are
available for counting faecal coliforms.
2.2.7.1 Membrane filtration
In this technique, a 100ml water sample or a diluted sample is filtered through a
membrane filter. The membrane with the coliform organisms on it is then cultured on a pad of
sterile selective broth containing lactose and an indicator. After incubation, the number of
coliform colonies can be counted. This gives the presumptive number of E. coli in the 100ml
water sample.
2.2.7.2 Multiple tube/Most Probable Number (MPU)
In this technique, a 100ml water sample is distributed (five 10ml amounts and one 50ml
amount) in bottles of sterile selective culture broth containing lactose and an indicator. After
incubation, lactose fermentation with acid and gas production has occurred are counted. The
lactose is fermented by the coliform in the water. By reference to probability tables, the most
probable number of coliforms in the 100 water sample can be estimated.
2.2.7.3 Choice of Technique
The membrane filtration technique is recommended for its accuracy, speed of result and
because it can be performed in the field. The membrane technique is significantly more accurate
than the multiple tube technique and this may be important when attempting to decide whether a

42
slightly contaminated unchlorinated water source is fit for consumption. The multiple tube
technique, an E. coli colony count can be obtained in 12 – 18 hours and does not depend on the
use of probability tables. The multiple tube/MPN technique requires up to 48 hours to obtain a
presumptive E. coli count and biochemical confirmation may be required. The multiple
tube/MPN technique is less expensive than the membrane technique; although large quantities of
culture media and glassware are required and also a relatively large capacity autoclave. For the
filtration technique, smaller amounts of media and other laboratory wares are required. The
membrane filtration technique is not suitable for turbid water samples due to membrane
clogging.
2.2.8 Sampling techniques and preservation
A total of 26 samples were taken during the dry season of January and another 26 during
the wet season of August. Water samples were collected by drawing water out of the well with a
rubber bag fastened to a long rope. The water samples obtained were poured into five white
plastic containers of 100 mls each. The samples from boreholes were obtained by collecting the
water samples through taps nearest to the source. Spring water samples were collected from the
sources which are channeled by the help of pipes inserted into the issuing holes for Asho and
Ajie springs. Samples from Iyi-Adoro were collected directly from the water trough after
clearing the water surface of dead leaves.
The sample was used to rinse the plastic containers on the sampling site before collecting
the ones to be analysed to ensure the collection of a clean uncontaminated sample. These
containers were labeled appropriately from numbers one to thirteen, with each number
representing the sources of collection. The plastic water containers for heavy metal analysis were
additionally rinsed with HNO.
The appearance of the water was recorded and the environmental conditions of the wells
were also noted. The dept of the wells were also obtained from the owners. Within the
limitations of the facility available, samples were as strictly as possible handled and preserved as
recommended by standard methods by APHA-AWWA-NPCF (reenberg, 1992).

43
Table 2.2: Alpha-AWWA-NPCF requirements for sampling and handling/preservation
(Greenberg, 1992).
Parameter Container Sample
size
Preservation Maximum
storage
pH Plastic, glass Not stated
in cited
reference
Analysed
immediately
2hrs
/immediately
Nitrate Plastic, glass 25 Add H2SO4 to pH <
2, refrigerate
None /28 days
Chloride Plastic, glass 50 Analyse immediately Not stated in
cited reference
Hardness Plastic, glass 100 Add HNO3 to pH < 2 6 months /6m
Suspended
solid
Plastic, glass 100 Immediately Not stated in
cited reference
Total dissolved
solid
Plastic, glass 100 Analysed
immediately
Not stated in
cited reference
Heavy metals Plastic, glass
rinsed with
HNO3
Not stated
in cited
reference
Add HNO3 to pH < 2 6 months /6m
2.2.9 Physicochemical parameters
2.2.9.1 Appearance
Water for most applications should be clear, free of particulate. A first step towards the
assessment of the quality of a water sample is to visually inspect it for colour and suspended
matter. Presence of particles may suggest microbial growth.
2.2.9.2 Determination of pH value
Principle:
The pH of an aqueous solution is defined by the expression.
][log10
HpH

44
Where [H+] is the mole concentration of hydrogen ion in the solution. The pH of water is
one of the most important water quality parameters it is a measure of acidity or alkalinity of
water. An optimal pH range is necessary to ensure clarification, disinfection and minimize
corrosion of pipes. The pH of most natural water falls within the range of 4 to 9. The pH values
outside the limit can result in the contamination of the water and adverse effect on the taste,
odour and appearance.
Procedure
The glass electrode of pH determination is the standard technique used in this
investigation. The pH meter was standardized using pH 4 and pH 7 of buffer solutions at 20oC.
The pH knobs were switched off and the glass electrode was also removed from the buffer
solution. The electrode was rinsed with distilled water and tip of the electrode was dried with
soft tissue paper. The clean and dried glass electrode was inserted into the water sample, the pH
Knob was switched on, and the pH value was read directly from the scale (Greenberg, 1992).
2.2.9.3 Conductivity
This is the property of a solution to conduct electricity. The larger the number of ionic
constituents in a sample of water, the larger is its conductivity. Conductivities are measured in
the field and at the laboratory using conductivities meter and it is commonly expressed on
Siemens per centimeter (Scm-1
) or micro Siemens per centimeter (Uscm-1
). The meter was
standardized with 0.01m KCl. The Harch Model C50 digital multirange meter was used.
2.2.9.4 Total hardness
Principle
Originally water hardness was understood to be a measure of the capacity of water to
precipitate soap, but in conformity with current practice, total hardness is defined as the sun of
the calcium and magnesium concentrations, both expressed as calcium carbonate in milligrams
per litre (mg /l). The significance of this analysis is to check if the water is hard, so as to know
the kind of treatment the water will be subjected to.
Reagent

45
1) Buffer solution (pH 10)
This was prepared by missing 16.9g of ammonium chloride (NH4Cl) in 143ml of NH40H,
plus 1.79g of disodium salt of EDTA, and 0.780g MgS04.7H20 mixed in 50ml distilled water.
This solution was them distilled to 250ml with distilled water.
2) Standard calcium solution
About 1g calcium carbonate (CaCO3) was placed in a 500ml Erlenmeyer flask, 1.1 HCl
was added through a funnel until all the CaCO3 dissolved. About 200ml of distilled water was
added and boiled for a few minutes to expel all the CO2. The solution was cooled and a few
drops of methyl red indicator added, the intermediate methyl orange colour was adjusted by the
addition of a few drops of 3N NH40H solution. The solution was transferred to a 1 litre flask and
made up to mark. This solution was used to standardize the EDTA solution according to the
procedure below (Welcher, 1965).
Procedure
About 50ml of sample was placed in Erhenmeyer flask, 1ml of buffer added to it and 2
drops of indicator, (Eriochromic Black 1) was added and titrated with EDTA solution within 5
minutes (for standardization, 25ml of calcium solution was diluted to 5ml). The endpoint is
indicated by the change from reddish tinge to blue-green colour.
Calculation
sampleml
xBxALCaComgasEDTAHardness
1000/)(
3
Where A = ml titration for sample
B = mg CaCo3 equivalent to 1ml EDTA titrant
2.2.9.5 Total Dissolved Solids (TDs)
Principle:
It is the expression used to describe the total amount of minerals dissolved in a water
sample. TDS is commonly expressed in ppm (part per million or mg/l). Water with high

46
dissolved solid greater than 500ppm often have a laxative effect upon people whose bodies are
not adjusted to them.
Anions
Chloride
Reagents
1) Potassium chromate indicator solution. This was prepared by dissolving 50g of K2CO4 in
a little distilled water, AgNO3 solution was added to it until definite red, precipitate was
formed. It was left to stand for about 12hours; it was then filtered and diluted to 1litre.
2) Standard AgNO3 (0.014) solution. This was prepared by dissolving 2.395g AgNO3 in
distilled water and then diluted to1litre
3) Standard sodium chloride prepared by dissolving 0.824g NaCl (previously dried at
140oC) in distilled water and then diluted to 1 litre.
4) 0.1N sodium hydroxide solution standardization of silver nitrate (AgNO3) solution 25ml
of the NaCl solution was diluted to 50ml, 1ml of 0.1N NaOH added to it to being the
sample to pH 7-10, 1ml of K2CrO4 indicator solution was added and titrated against
AgNO3 solution to pinkish-yellow coloration end-point.
Procedure
About 50ml of the sample was taken in a conical flask and was titrated as the standard
above. A blank titration was also determined as the standard.
47
Calculation
sampleml
xBALClMg
450,35/
Where
A = ml titrant for sample
B = ml titrant for blank
N = normality of AgNo3
Note: (Mg–NaCl / L = Mg – Cl /L x 1.65) (Haris et al, 1981).
2.2.9 Nitrate
Colormetric determination of nitrate using the phenoldisudphonic acid method (Michael,
1991).
Reagents
1) Magnesium oxide (MgO)
2) Phenoldisulphonic acid reagent
This is prepared by dissolving 25g of prea while phenol in 150cm3 of 95% H2SO4 and 75cm
3 of
fuming H2SO4. Mixed and heated at 95 to 100oC for about 2 hours.
3) Ammonium citrate
This is prepared by taking 220cm conc. NH4OH and adding 5g ammonium citrate to it
then diluted to 1 litre with distilled water.
Procedure
MgO (0.029) was added to the simple (about 10-25mls) and was evaporated to dryness in
a beaker containing about ½ inch of clean sand, which was heated gently. The dried sample was
added about 0.5cm3 phenoldis sulphonic acid reagent. The tube was rotated in order to wet the
entire residue with the reagent, and it was placed on boding water for 10 minutes.
On cooling the tube, about 9.5cm of dilute solution of ammonium citrate was added to it.
The intensity of the yellow colour developed was measured in a photoelectric colorimeter of 410
nm using a blue fitter of 470/420 Erma filter range standard curve.

48
Standard solutions of nitrate containing 0, 2.5, 5, 10, 15 and 20 ppm NO3 was prepared
and dispensed into test-tubes accordingly, 2cm3 of each was pippetted into a test-tube, and 0.02g
of MgO was added to develop the colour.
Calculation
443/
/
3xNnitrateLMgNOLMg
sampleml
NnitrateNnitrateLMg
2.2.10 Heavy Metals
2.2.10.1 Determination of Lead colorimetric sulphide method (Baldwin et al 1999).
Reagents:
10% tartaric acid-for blank and control
1:2 Ammonium citrate
10% sodium sulphide
Lead standard 0.160g Pb (NO3)2
(10cm3 was diluted to 100cm
3 = 0.1mg /cm
3.
Procedure
To 10cm3 Tartaric acid, add aliquot of sample 5cm
3 to 10cm
3, add 1cm
3 of 10% KCN,
add 10-25cm3 of 1:2 Ammonia and mix well, add 0.5cm
3 10% Na2S and make up volume to
50cm3 with distilled water. Keep for 10 minutes.
Read at 430nm, using blank to zero.
Prepare a calibration curve with standard Pb (NO3)2 solution.
Readings are extrapolated from the curve.
2.2.10.2 Determination of cadmium using xylenol orange as indicator and read colour at
510nm (Baldwin et al 1999).
Reagents
EDTA – 0.05m
Xylenol orange indicator
49
Cadmium ion solution about 0.05m
Weigh out accurately 3.21g of cadmium
Sulphate (3 Cel SO4.8H20) and dissolve it in 250cm3 of distilled water in volume five flask.
Procedure
Dilute 25cm3 (suitable aliquot) of the cadmium ion solution with 50cm
3 of d-H20. Add 3
drops of the indicator, 1 drop of dilute H2SO4; the solution turns yellow. Add powdered
Hexamine with agitation until the colour is deep red. Titrate with standard EDTA, slowly near
the end-point to a colour change from red to yellow.
Calculation 1cm3 0.05m EDTA = 5.621mg
Factor 1cm3 of 0.15N EDTA = 0.8431mg.
2.2.10.3 Determination of Arsenic in sodium Arsenite solution (Baldwin et al 1999).
This is an example of iodometric determination of reducing agents. This determination is
based on the reaction.
HIASOOHIASO
OR
HIASONaOHIASONa
22
2
4223
432233
Na3 ASO3 solution is usually prepared by dissolution of AS2O3 in NaOH.
OHASONaNaOHOAS23232
326
Procedure
Put the arsenic solution into a 250cm3 conical flask, dilute with about 70-100cm
3 d-H2O
and neutralize it with 2N H2SO4 in the presence of 2 drops of phenolphthalein indicator until the
pink colour vanisshes. Then add 4-5gm solid NaHCO3 into the solution in flask, shake or stir to
get NaHCO3 dissolved. An aliquot arsenic solution may be used for titration. Add 1-2cm3 of 1%
starch solution. Titrate the solution with standardize iodine solution to a stable blue end-point.
Calculation

50
Remember that trivalent arsenic is oxidized, yielding two electrons, the gram equivalent
of arsenic is:
gAsegg 46.372
92.74
2.2.10.4 Determination of zinc using Zincon method (Baldwin et al 1999).
Reagents
Std zinc solution: 1ml = 10ug Zinc.
Sodium ascorbate
Potassium cyanide solution: 1g of KCN dissolved in 50ml D-H2O and diluted to 100ml.
Buffer solution: 1N NaOH
Zincon reagent: 130mg Zincon powder dissolved in 100ml methyl alcohol.
Chloral hydrate solution: 10g chloral hydrate dissolved in 50ml D-H2O and diluted to
100ml
Hydrochloric acid (Conc)
Sodium Hydroxide 6N.
Procedure
Colorimetric standards were prepared serially from 2.5mg – 50μg in Erlenmeyer flasks,
each 10ml volume. To each flask 0.5g sodium ascorbate was added, followed by 1ml KCN
solution in sequence, 5ml buffer solution and 3ml zincon solution. The flask was thoroughly
mixed after each addition. Chloral hydrate (3ml) was added and time noted. The absorance at
620nm exactly 5 min after adding the chloral hydrate solution was carried out.
Calculation:
Zn (Mg/l) = Sampleml
Zng
Reagents
Standard nickel sulphate solution im = 100mg Ni.
Hydrochloric acid (IN)
51
Bromine water.
Ammonium hydroxide (NH4OH) Conc
Heptoxime reagent 0.1g heptoxime dissolved in 100ml, 95% ethyl alcohol.
Ethyl alcohol 95%
Chloroform (CHCl3)
Sodium Tartrate solution (10g Na2C4H4O6.2H2O) in 90ml D-H2O.
Procedure
Portions of the standard nickle sulphate solutions were pipetted into 100ml volumetric
flasks. The series cover from 50 - 250μg Ni, 25ml IN HCl and 5ml bromine water were added.
After cooling under running tap water, 10ml conc. NH4OH was added, and to it 20ml heptoxime
reagent and 20ml ethyl alcohol were added and mixed.
Absorbance at 445nm, 20 mins after addition of the reagent was taken using of course a
reagent blank as reference.
CHAPTER THREE
RESULTS
3.1 Effect of pH on Different Water Sources Compared to WHO and NAFDAC
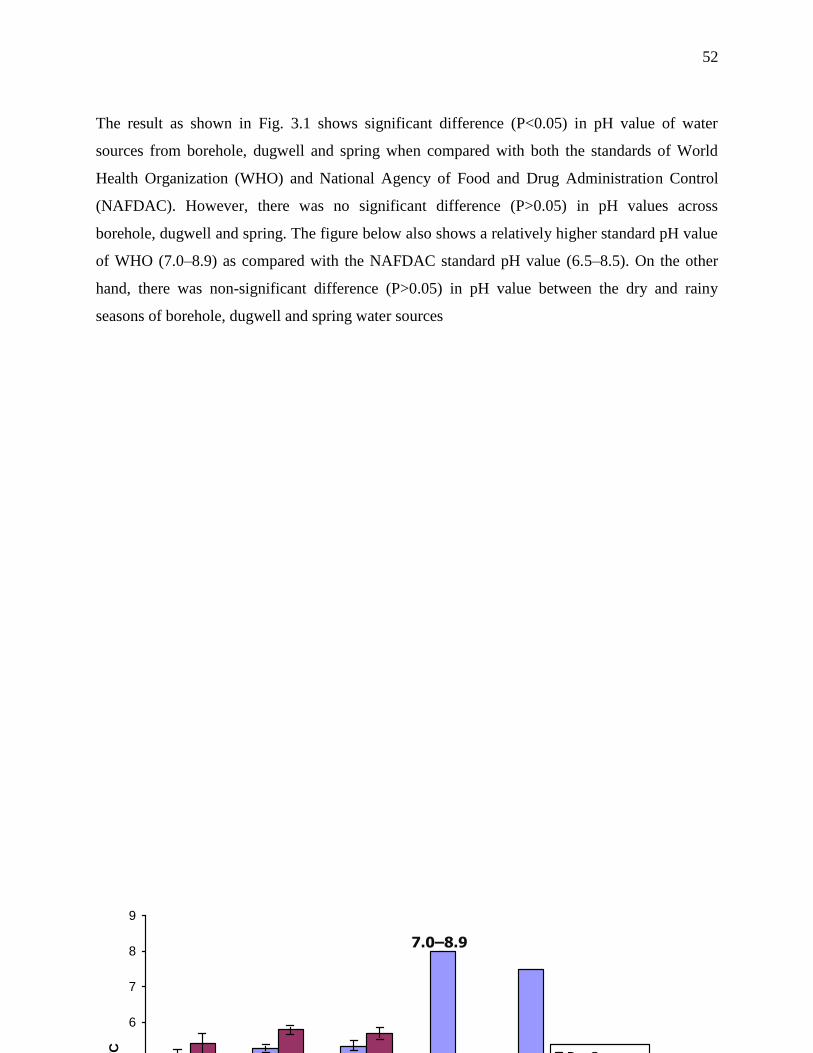
52
The result as shown in Fig. 3.1 shows significant difference (P<0.05) in pH value of water
sources from borehole, dugwell and spring when compared with both the standards of World
Health Organization (WHO) and National Agency of Food and Drug Administration Control
(NAFDAC). However, there was no significant difference (P>0.05) in pH values across
borehole, dugwell and spring. The figure below also shows a relatively higher standard pH value
of WHO (7.0–8.9) as compared with the NAFDAC standard pH value (6.5–8.5). On the other
hand, there was non-significant difference (P>0.05) in pH value between the dry and rainy
seasons of borehole, dugwell and spring water sources
7.0–8.9
0
1
2
3
4
5
6
7
8
9
Borehole Dugw ell Spring WHO NAFDAC
pH
at
20o
C
Dry Season
Rainy Season

53
Fig. 3.1: pH levels of different water samples in various sampling areas in Nsukka compared
with WHO and NAFDAC Standards
6.5 – 8.5
54
3.2 Effect of Sulphate Concentration on Different Water Sources Compared to WHO and
NAFDAC
The result in Fig. 3.2 shows no significant difference (P>0.05) in the sulphate
concentrations between water sample from borehole sources and water sample from dugwells
sources during both dry and rainy seasons. Significant increase (P<0.05) was observed in the
sulphate concentration of water sample from spring sources compared to water samples from
both borehole and dugwell sources during dry season. But there was no significant difference
(P>0.05) in the sulphate concentrations of water sample from spring sources compared to the
sulphate concentration of both boreholes and dugwells water sources during rainy season. In
comparison with WHO and NAFDAC standards, it was observed that there was significant
difference (P<0.05) in the sulphate concentration between WHO standard (250mg/L) and water
samples from the three test samples (borehole, dugwell and spring sources) during both dry and
rainy seasons. Also significant difference (P<0.05) exists in the sulphate level between
NAFDAC standard value (100mg/L) and all other test samples (borehole and dugwell sources)
with the exception of spring water sample which shows no significant difference (P>0.05) in the
sulphate concentration when compared with the NAFDAC standard.

55
Fig. 3.2: Sulphate concentration of different water sources in Nsukka compared with WHO and
NAFDAC Standards
250mg/L
100mg/L

56
3.3 Effect of Total Suspended Solid on Different Water Sources Compared to WHO And
NAFDAC
Total suspended solid concentration of water samples from dugwell sources was found to
have significant increase (P<0.05) when compared with the water samples from the other test
water samples from borehole and spring sources during both dry and rainy seasons (as shown in
Fig. 3.3). There was no significant (P>0.05) difference in the total suspended solid level between
the dry season and rainy season of all test samples when considering different seasons. Likewise,
the water samples from borehole and spring sources showed no significant difference (P>0.05) in
the level of total suspended solid as shown in Fig. 3.3. The levels of total suspended solid in the
two standards (WHO and NAFDAC) are found to be relatively higher than the three test samples
(borehole, dugwell and spring).

57
Fig. 3.3: Total suspended solid (mg/L) concentration of different water sources in Nsukka
compared with WHO and NAFDAC Standards
0
5
10
15
20
25
30
35
Borehole Dugwell Spring WHO NAFDAC
To
tal
Su
sp
en
de
d S
oli
d (
mg
/L)
Dry Season
Rainy Season
30mg/L 30mg/L
58
3.4 Effect of Zinc on Different Water Sources Compared to WHO And NAFDAC
Fig. 3.4 shows a relatively low concentration of zinc in all the test water samples from all
the water sources (borehole, dugwell and spring). In other words, there was no significant
difference (P>0.05) in the concentration of zinc when carrying out comparison in all the test
samples. There was significant difference (P<0.05) in the level of zinc concentration between the
two standards (WHO and NAFDAC) and water samples from the three test samples as shown in
Fig. 3.4.

59
Fig. 3.4: Zinc (mg/L) concentration of different water sources in Nsukka compared with WHO
and NAFDAC Standards
3mg/L
5mg/L

60
3.5 Effect of Total Dissolved Solid Concentration on Different Water Sources Compared to
WHO and NAFDAC
Total dissolved solid concentration, as shown in Fig. 3.5, was found to be significantly
higher (P<0.05) in the water sample from dugwell sources when compared with the total
dissolved solid concentration in the water samples from both borehole and spring sources during
both dry and rainy seasons. In terms of seasonal comparison, the total dissolved solid
concentration of water sample from spring source during rainy season was observed to be
relative higher than that observed during the dry season. However, significant difference
(P<0.05) was also observed between the two standards and the test water samples from the three
sources (borehole, dugwell and spring) during both dry and seasons. Comparatively, Fig. 3.5
shows that the two reference standards (WHO and NAFDAC) have the same value (500mg/L) of
total dissolved solid.
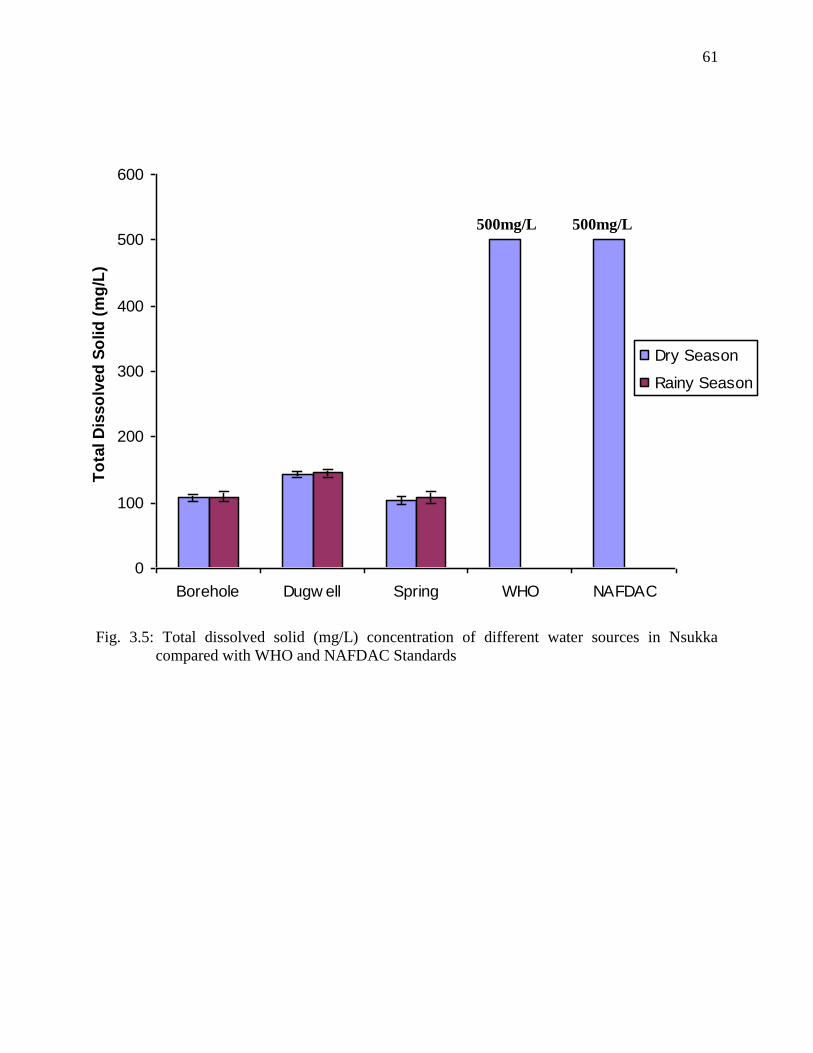
61
Fig. 3.5: Total dissolved solid (mg/L) concentration of different water sources in Nsukka
compared with WHO and NAFDAC Standards
0
100
200
300
400
500
600
Borehole Dugw ell Spring WHO NAFDAC
To
tal D
isso
lved
So
lid
(m
g/L
)
Dry Season
Rainy Season
500mg/L 500mg/L

62
3.6 Effect of Total Hardness Concentration on Different Water Sources Compared to
WHO and NAFDAC
Fig. 3.6 shows significant increase (P<0.05) in the level of total hardness in the water
sample obtained from dugwell sources as compared with water samples from borehole and
spring sources during dry and rainy seasons. Also, there was significant increase (P<0.05) in the
level of total hardness of water sample from borehole sources when compared with the spring
sources during dry and rainy seasons. There was no significant difference (P>0.05) in the level of
total hardness when comparing between the dry and rainy seasons across the test water samples
from the three test sources (borehole, dugwell and spring). The standards (WHO and NAFDAC)
had relatively higher values (100mg/L each) of total hardness compared to the test samples. But
the two reference standards (WHO and NAFCON) have the same level of total hardness as
shown in Fig. 3.6 above.

63
Fig. 3.6 Total hardness (mg/L) concentration of different water sources in Nsukka compared
with WHO and NAFDAC Standards
0
20
40
60
80
100
120
Borehole Dugw ell Spring WHO NAFDAC
To
tal H
ard
ness (
mg
/L)
Dry Season
Rainy Season
100mg/L 100mg/L

64
3.7 Effect of Chloride Concentration on Different Water Sources Compared to WHO and
NAFDAC
The chloride (mg/L) concentration of all test samples from all the three water sources
(borehole, dugwell and spring) were found to be no significant (P>0.05) during both seasons.
Though slight increase was observed in the level of chloride concentration in the water sample
from borehole sources during dry and rainy seasons but was considered non-significant (P>0.05).
On the other hand, chloride concentration was observed to be relatively higher in WHO standard
(200mg/L) compared to NAFDAC standard (100mg/L); indicating that the chloride
concentration in WHO doubles that of NAFDAC as shown in Fig. 3.7. There was significant
difference (P<0.05) in the level of chloride concentration when comparing the standards (WHO
and NAFDAC) and the test samples (borehole, dugwell and spring).
0
50
100
150
200
250
Borehole Dugwell Spring WHO NAFDAC
Ch
lori
de (
mg
/L)
Dry Season
Rainy Season

65
Fig. 3.7: Chloride (mg/L) concentration of different water sources in Nsukka compared with
WHO and NAFDAC Standards
200mg/L
100mg/L

66
3.8 Effect of Nitrate Concentration on Different Water Sources Compared To WHO and
NAFDAC
Fig. 3.8 shows no significant difference (P>0.05) in the level of nitrate concentration
when carrying out comparison between the two reference standards (WHO and NAFDAC) and
water samples from borehole and dugwell sources during both dry and rainy seasons. Borehole
and dugwell water sources had nitrate concentrations that were found to be significantly higher
(P<0.05) than nitrate concentrations obtained in the water sample from spring sources during dry
and rainy seasons. Nitrate concentrations in the water samples of dugwell and spring sources
during dry season were found to be relatively lower than the nitrate concentrations in the water
samples of dugwell and spring during rainy season; though no significant (P>0.05). The nitrate
concentration of water sample from spring sources had significant decrease (P<0.05) as
compared with the two reference standards (WHO and NAFDAC).
0
2
4
6
8
10
12
Borehole Dugw ell Spring WHO NAFDAC
Nitra
te (
mg/L
)
Dry Season
Rainy Season

67
Fig. 3.8: Nitrate (mg/L) concentration of different water sources in Nsukka compared with WHO
and NAFDAC Standards
3.9 Effect of most Probable Number of Coliform on Different Water Sources Compared to
WHO and NAFDAC
10mg/L 10mg/L

68
Most probable number of coliform was found to be significantly higher (P<0.05) in the
three test water samples (borehole, dugwell and spring) during the rainy seasons as compared
with the dry season. The most probable number of coliform in the water sample of spring sources
during rainy season showed significant increase (P<0.05) as compared with the two reference
standards (WHO and NAFDAC). Both WHO and NAFDAC had relatively the same range of
most probable number of coliform range of values (1 – 10 npm). The standards (WHO and
NAFDAC) had most probable number of coliform count to be significantly higher (P<0.05) than
that of the water samples from the test sources with the exception of most probable number of
coliform count obtained in water samples from spring sources during rainy season.
0
2
4
6
8
10
12
14
16
Borehole Dugw ell Spring WHO NAFDAC
Mo
st
Pro
bab
le N
um
ber
of
Co
lifo
rm /100m
l
Dry Season
Rainy Season

69
Fig. 3.9: Most probable number of coliform of different water sources in Nsukka compared with
WHO and NAFDAC Standards
CHAPTER FOUR
4.1 Discussion
1 – 10 mpn 1 – 10 mpn
70
The heightened concern for reduction of environmental pollution (especially water) that
has been occurring over the past 20–25 years has stimulated active continuing research and
literature on the toxicology of heavy metals. While the toxic effect of these substances is a
widespread concern in the modern industrial context, man has succeeded in poisoning himself
with them repeatedly throughout recorded history. Virtually all metals can produce toxicity when
ingested in sufficient quantities, but there are several which are especially important because
either they are so pervasive, or produce toxicity at such low concentrations. In general heavy
metals produce their toxicity by forming complexes or "ligands" with organic compounds. These
modified biological molecules lose their ability to function properly, and result in malfunction or
death of the affected cells. The most common groups involved in ligand formation are oxygen,
sulfur, and nitrogen. When metals bind to these groups they make inactive important enzyme
systems, or affect protein structure.
Various physico-chemical parameters were studied and are given in the different figures
in Chapter three. Different physical parameters studied are total suspended solids and total
dissolved solids. Different chemical parameters studied are pH, alkalinity, total hardness, zinc,
chloride and sulphate with extension to the number of coliforms. The values were compared with
the WHO and NAFDAC standard values which are given in the same figures (Figures 3.1 to
3.9). The results indicate that the quality of water considerably varies from location to location.
Water quality in Nsukka area of Enugu State of Nigeria is spatially variable and has been
impacted by some contaminants which are mostly organic. The result as shown in Fig. 3.1 shows
that all the water samples from all samples sources/locations were found to fall below 7.0. The
most acidic among the water sources was found to be water samples from borehole sources (pH
of 5.0) during dry season. Interestingly, the result as shown in Fig. 3.1 also indicated relative low
pH values of water samples from all water sources during dry season. Water samples from
dugwell sources had (pH of 5.8) during rainy season. This was closely followed by water sample
from spring sources (pH of 5.7) during rainy season. However, there was no significant
difference (P>0.05) in pH values across borehole, dugwell and spring. In comparing the pH
value of WHO (7.0–8.9) with that of NAFDAC standard (6.5–8.5), it was discovered that all

71
water samples from all sources had closer values to NAFDAC. It could be deduced that since the
pH values in the result indicated pH values below 7, the water could be corrosive to plumbing,
resulting in lead leaching into tap water.
Sulphate concentration of water sample from spring sources increased significantly
(P<0.05) during dry season when compared with that of dry season. This may be attributed some
sulphur-containing contaminants in the environment during dry season. Also, the concentration
of sulphur increased (though not significant) during dry season in dugwell when compared with
the sulphur concentration during rainy reason. Generally, dugwells are at higher risk of
contamination than drilled wells because they obtain water from shallow groundwater aquifers,
and contaminants are more likely to be found closer to the surface, especially during dry season.
However, in comparison with WHO and NAFDAC standards, it was observed that there was
significant difference (P<0.05) in the sulphate concentration between WHO standard (250mg/L)
and water samples from the three test samples (borehole, dugwell and spring sources) during
both dry and rainy seasons. Levels of sulfate in rainwater and surface water correlate with
emissions of sulfur dioxide from anthropogenic sources (Keller and Pitblade, 1986; WHO,
2004). WHO (2003) in its documentary tiltled „Background document for preparation of WHO
Guidelines for drinking-water quality‟stated that sulphates occur naturally in numerous minerals
and are used commercially, principally in the chemical industry. They are discharged into water
in industrial wastes and through atmospheric deposition; however, the highest levels usually
occur in groundwater and are from natural sources. In general, the average daily intake of sulfate
from drinking-water, air and food is approximately 500mg, food being the major source.
However, in areas with drinking-water supplies containing high levels of sulfate, drinking-water
may constitute the principal source of intake.
The replacement of forestland with impervious surfaces during urbanization can have
significant effects on watershed hydrology and the quality of stormwater runoff. One component
of water quality, total suspended solids (TSS), is both a significant part of physical and aesthetic
degradation and a good indicator of other pollutants, particularly nutrients and metals that are
carried on the surfaces of sediment in suspension. A TSS turbidity relationship can be affected
by water colour from dissolved organic compounds which can absorb more light than inorganics
(Packman et al., 1999). In Fig. 3.5, it was observed that total suspended solid concentration of

72
water samples from dugwell sources was found to have significant increase (P<0.05) when
compared with the water samples from the other test water samples obtained from borehole and
spring sources during both dry and rainy seasons. Total Suspended Solids (TSS) are solids in
water that can be trapped by a filter. TSS can include a wide variety of material, such as silt,
decaying plant and animal matter, industrial wastes, and sewage. High concentrations of
suspended solids can cause many problems for stream health and aquatic life. This could also be
attributed to the fact that dugwells are at higher risk of contamination than drilled wells because
they obtain water from shallow groundwater aquifers, and contaminants are more likely to be
found closer to the surface. There was no significant (P>0.05) difference in the total suspended
solid level between the dry season and rainy season of all test samples when considering
different seasons.
Total dissolved solids (TDS) is the term used to describe the inorganic salts and small
amounts of organic matter present in solution in water (WHO, 1996). Water with extremely low
concentrations of TDS may also be unacceptable because of its flat, insipid taste (WHO, 1996).
Total dissolved solid concentration was found to be significantly higher (P<0.05) in the water
sample from dugwell sources when compared with the total dissolved solid concentration in the
water samples from both borehole and spring sources during both dry and rainy seasons. This
may be attributed to the principal constituents which are usually calcium, magnesium, sodium,
and potassium cations and carbonate, hydrogencarbonate, chloride, sulfate, and nitrate anions, as
outlined by WHO (1996), found in the surrounding environmental sources where the dugwells
are located. The result as shown in Fig. 3.5 showed that concentration threshold of total
dissolved solids (TDS) fell below 300 mg/litre. This is consistent with the findings of WHO
(1996) which stated that the palatability of drinking water has been rated by panels of tasters in
relation to its TDS level as follows: excellent, less than 300 mg/litre; good, between 300 and 600
mg/litre; fair, between 600 and 900 mg/litre; poor, between 900 and 1200 mg/litre; and
unacceptable, greater than 1200 mg/litre.
Stone and Droppo (1994) suggest suspended solids probably act as the primary transport
mechanism for pollutants and nutrients in streams through flocculation, adsorption and colloidal
action.
Zinc concentration was found to be in trace amount (almost absent) which indicates
relatively low concentration of zinc metal in all the test water samples from all the water sources
73
(borehole, dugwell and spring). This indicates that non-significant difference (P>0.05) exists in
the concentration of zinc when carrying out comparison in all the test samples. In natural surface
waters, the concentration of zinc is usually below 10 μg/litre, and in groundwaters, 10–40
μg/litre (Elinder, 1986). In tapwater, the zinc concentration can be much higher as a result of the
leaching of zinc from piping and fittings (Nriagu, 1980). The most corrosive waters are those of
low pH, high carbon dioxide content, and low mineral salts content. In a Finnish survey of 67%
of public water supplies, the median zinc content in water samples taken upstream and
downstream of the waterworks was below 20 μg/litre; much higher concentrations were found in
tapwater, the highest being 1.1 mg/litre (WHO, 1986). Even higher zinc concentrations (up to 24
mg/litre) were reported in a Finnish survey of water from almost 6000 wells (WHO, 1986).
Drinking water high in nitrate is potentially harmful to human and animal health. Nitrate
(NO3) is a naturally occurring form of nitrogen (N) which is very mobile in water. It is essential
for plant growth and is often added to soil to improve productivity. In this way, nitrate enters the
water supplies of many homeowners who use wells or springs. It is estimated that about three
percent of residential wells in North Carolina contain nitrate at levels exceeding the safe drinking
water standard (Jennings et al., 1996). Nitrate concentration was found to be non-significant
difference (P>0.05) when carrying out comparison between water samples from borehole and
dugwell sources during both dry and rainy seasons. However, significant increase (P<0.05) was
observed in the water samples of borehole and dugwell as compared to the water sample of
spring source especially during rainy season. This may be due water moving down through soil
after rainfall or irrigation carries dissolved nitrate with it to ground water (Jennings et al., 1996).
Water sample from dugwell sources had showed significant increase (P<0.05) in the level
of total hardness as compared with water samples from borehole and spring sources during dry
and rainy seasons. Also, there was significant increase (P<0.05) in the level of total hardness of
water sample from borehole sources when compared with the spring sources during dry and
rainy seasons. Geetha et al (2008) attributed total hardness contamination on the probable
effluent effect, though it affects the ground water, and it has no adverse effect on human health.
In most of the samples, total hardness value exceeds the tolerance limit; this may be due to
industrial discharge of the effluents on to the land.
The chloride (mg/L) concentration of all test samples from all the three water sources
(borehole, dugwell and spring) were found to be non-significant (P>0.05) during both dry

74
seasons. Though slight increase was observed in the level of chloride concentration in the water
sample from borehole sources during dry and rainy seasons but was considered non-significant
(P>0.05). On the other hand, chloride concentration was observed to be relatively higher in
WHO standard (200mg/L) as compared with NAFDAC standard (100mg/L); indicating that the
chloride concentration in WHO doubles that of NAFDAC as shown in Fig. 3.7. There was
significant difference (P<0.05) in the level of chloride concentration when comparing the
standards (WHO and NAFDAC) and the test samples (borehole, dugwell and spring).
The sample collected from borehole was found to have relatively higher, though non-
significant (P>0.05), chloride concentration when compared with water samples from dugwell
and spring. It may be due to the presence of soluble chlorides from rocks/hills as Nsukka is
known for its hilly nature. This is consistent with findings of Jain and Bhatia (1988) and Geetha
et al. (2008) who attributed slight increase of chloride concentrations from rocky and hilly
sources.
The research findings as indicated in Fig. 3.8 showed non-significant difference (P>0.05)
in the level of nitrate concentration between water samples from borehole and dugwell sources
during both dry and rainy seasons. But significant increase (P<0.05) of nitrate concentration was
observed when carrying out comparison between water samples from borehole and dugwell, and
water samples from spring water source. This may be attributed to the fact that nitrite/nitrate
being a chemical, could have seeped into the drinking water from sources such as fertilizer,
sewage, feed lots and other geological elements in the surrounding environment. It should also
be noted that nitrate of over 10 ppm (or more than 50 milligrams per liter nitrate-nitrogen) has
the potential to reduce the amount of oxygen available to the fetus in pregnant women causing
"Blue Baby Syndrome" (methemoglobulinemia) (Feig, 1981). However, there was no significant
difference (P>0.05) in nitrate concentration found in samples from borehole and dugwell sources
when compared with the standard values of WHO (10 mg/L) and NAFDAC (10 mg/L). Hence, it
could be deduced that water sources from Nsukka environ are safe to drink in terms of nitrate
concentration.
In terms of seasonal variation, the result x-rayed the fact that most probable number of
coliform was found to be significantly higher (P<0.05) in all the three test water samples
(borehole, dugwell and spring) during the rainy seasons as compared with the dry season. The
most probable number of coliform in the water sample of spring sources was found to have the

75
highest significant increase (P<0.05) during the rainy season. This may be as a result of possible
contamination of spring water sources with sewage from immediate surroundings of Nsukka
environ. The coliform group is an indicator bacteria to evaluate the quality of drinking water and
any presence of coliforms indicates the contact of water with sewage or inadequate
treatment/post treatment contamination. In unpiped water supplies, sometimes up to 10
coliforms/100 ml are as allowed per WHO standards for tropical countries but this should not
occur repeatedly; if occurrence is frequent and sanitary conditions cannot be improved, an
alternative source must be found if possible (Geetha et al., 2008).
4.2 CONCLUSION
Therefore, from the foregoing, it could be concluded that these boreholes, springs and
drugwells water samples tested in Nsukka town are physicochemically good for human
consumption as all the physicochemical parameters tested conformed to WHO, SON, and
NAFDAC water quality standards, although Iyi-adoro spring water might not be very good for
consumption during the rainy season because of possible bacteria contamination.

76
REFERENCES
Anton Paar (1998). Microwave Sample Preparation System – Instruction Handbook, Anton Paar
GmbH, Austria, p. 128.
Baldwin D.R., Marshall W.J., (1991) Heavy metal poisoning and its laboratory investigation
(review article). Annals of Chemical Biohemistry V. 36 pp 267-300.
Centers for Disease Control, "CDC (1995). EPA Issue Drinking Water Guidance for People with
Weakened Immune Systems -- Press Advisory".
Clasen, T. F. and Bastable, A. (2003). „Faecal contamination of drinking water during collection
and household storage: the need to extend protection to the point of use‟. Journal of
Water and Health, 1(2):1-7.
Clesceri, L. S. (1998). Standard methods for the examination of water and waste water. In
Collection and Preservation of Samples and Metals (eds Arnold, E., Greenbergy and
Eaton, A. D.), APHA, AWWA, WEF, Washington, DC, pp. 1-27–1-35; 3-1–3-21.
Cohen, B. (1996). Just Add Water: Violations of Federal Health Standards in Tap Water 1994-
1995, Environmental Working Group, Natural Resources Defense Council,
Environmental Information Center.
Elinder, C. G. (1986). Zinc. In: Friberg, L., Nordberg, G. F., Vouk, V. B. eds. Handbook on the
toxicology of metals, 2nd ed. Amsterdam, Elsevier Science Publishers, 664-679.
77
Feig, S. (1981). Methemoglobinemia. In: Hematology of infancy and childhood, ed. D.G. Nathan
and F. A. Oski. W. B. Saunders Co., Philadelphia.
Geetha, A., Palanisamy, P. N., P. Sivakumar, P., Ganesh Kumar, P. and Sujatha, M. (2008).
Assessment of underground water contamination and effect of textile effluents on Noyyal
River Basin in and around Tiruppur Town, Tamilnadu. E-Journal of Chemistry, 5(4): 696
– 705.
Green, A. (1992) Standard method for the examination of water and waste, 18th
ed apha-
AWWA-WEF. Washington D.C. P38.
Haris E.W., Kratochvil B. (1981). An introduction to chemical analysis. Saunder College
Publishers, New York P. 20.
IPAN (2005) Pre-Admission Training Workshop on Food, Drugs, Cosmetics, Medical Devices,
Water, Environment and Petroleum, Appendix II. March, 2005.
Jain, C. K. and Bhatia, K. K. S. (1988). Physico-chemical analysis of water and wastewater,
U.M-26, National Institute of Hydrology, Roorkee.
Jennings, G. D. and Ronald E. Sneed, R. E. (1996). Nitrate in Drinking Water. North Carolina
Cooperative Extension Service. AG 473-4.
Karnataka State Pollution Control Board. (2001). Water quality monitoring of lakes in and
around Bangalore city, Bangalore, vol. 1, p. 139.
Karnataka State Pollution Control Board. (2002). Water quality monitoring of lakes in and
around Bangalore city, Bangalore, Vol. 2, pp. 1–8.
Keller, W. and Pitblade, J. R. (1986). Water quality changes in Sudbury area lakes: a comparison
of synoptic surveys in 1974–1976 and in 1981–1983. Water, Air and Soil Pollution,
29:285.
Lark, B. S., Mahajan, R. K. and Walia, T. P. S. (2002). Determination of metals of toxicological
significance in sewage irrigated vegetables by using atomic absorption spectrometry and
anodic stripping voltammetry. Indian J. Environ. Health, 44: 164–167.

78
Lokhande, R. S. and Kelkar, N. (1999). Studies on heavy metals in water of Vasai Creek,
Maharashtra. Indian J. Environ. Protect., 19: 664–668.
Michael H. (1991). Nitrate and nitrites in food and water. Elis Horwood Ltd. New York, P 34.
Ming, C. and Ma, L. Q. (2001). Comparison of three aqua regia digestion methods for twenty
florida soils. Soil Sci. Soc. Am. J., 65: 491–499.
Morris, R. (1992). "Chlorination, Chlorination By-Products, and Cancer: A Meta-Analysis," Am.
J. Pub. Heal., 82(7), 955-963.
Morris, R. and R. Levin (1995). "Estimating the Incidence of Waterborne Infectious Disease
Related to Drinking Water in the United States," Assessing and Managing Health Risks
From Drinking Water Contamination, E. Richard, ed., International Association of
Hydrological Sciences, Great Britain.
Nriagu, J. O. (1980). Zinc in the environment. Part I, Ecological cycling. New York, NY, John
Wiley.
Olson, E. (1995). You Are What You Drink. Natural Resources Defense Council, June.
Olson, E. and Cameron, D. (1995). The Dirty Little Secret About our Drinking Water, Natural
Resources Defense Council, February.
Packman, J. J., Comings K. J. and Booth, D. B. (1999). Using turbidity to determine total
suspended solids in urbanizing streams in the Puget Lowlands: in Confronting
Uncertainty: Managing Change in Water Resources and the Environment, Canadian
Water Resources Association annual meeting, Vancouver, BC, 27–29 October 1999, p.
158–165.
Payment, P. (1991). "A Randomized Trial to Evaluate the Risk of Gastrointestinal Disease Due
to Consumption of Drinking Water Meeting Current Microbial Standards," American
Journal of Public Health, vol. 81, no. 6, pp. 703-708.
Pruss, A. Kay, D. Fewtrell, L. and Bartram, J. (2002). „Estimating the burden of disease from
water, sanitation and hygiene at a global level‟. Environ. Heal. Perspectives, 110 (5):
537-542.

79
Rajesh, K. S., Madhoolika, A. and Marshall, F. M. (2004). Effects of waste water irrigation on
heavy metal accumulation in soil and plants. Paper presented at a National Seminar,
Bangalore University, Bangalore, Abst. no. 7, p. 8.
Reilly, W. (1990). "Aiming Before We Shoot: The Quiet Revolution in Environmental Policy,"
U.S. EPA Administrator, speech, September 26, 1990.
Rose, J. (1993). "Water-borne Pathogens: Assessing the Health Risks," Heal. Environ. Digest,
7(3), 1-3.
Shivashankara, G. P., Ranga, K., R. and Manamohan R. (1999). Characteristics of bulk
precipitation in industrial areas of Bangalore city. Indian J. Environ. Health, 41, 229–
238.
Stone, M. and Droppo, I. G. (1994). In-Channel Surficial Fine-Grained Sediment Laminae (Part
II): Chemical Characteristics and Implications for Contaminant Transport by Fluvial
Sediments. Hydrological Processes, 8(2): 113-124.
Trevett, A. F., Carter, R. C. and Tyrrel, S. F. (2005). „The importance of domestic water quality
management in the context of faecal-oral disease transmission.‟ Journal of Water and
Health, 3 (3): 221-228.
Ward, N. I., (1995). Environmental analytical chemistry. In Trace Elements (eds Fifield, F. W.
and Haines, P. J.), Blackie Academic and Professional, UK, pp. 320–328.
Welecher, E.J. (1965) Standard methods o chemical analysis 6th
ed. Van Nostrand Company Inc.
New York p. 40.
WHO (1996). Total dissolved solids in Drinking-water. Background document for development
of WHO Guidelines for Drinking-water Quality. Originally published in Guidelines for
drinking-water quality, 2nd ed. Vol. 2. Health criteria and other supporting information.
World Health Organization, Geneva.
WHO (1996). Zinc in Drinking Water. Background document for development of WHO
Guidelines for Drinking-water Quality. Originally published in Guidelines for drinking-

80
water quality, 2nd ed. Vol. 2. Health criteria and other supporting information. World
Health Organization, Geneva.
WHO (2003) Styrene in drinking-water. Background document for preparation of WHO
Guidelines for drinking-water quality. Geneva, World Health Organization
(WHO/SDE/WSH/03.04/27).
WHO (2004). Sulfate in Drinking Water: Background document for development of WHO
Guidelines for Drinking-water Quality. Published on behalf of the World Health
Organization and the United Nations Environment Programme. Oxford, Alden Press.
Wiles, R. (1994). Tap Water Blues: Herbicides in Drinking Water, Environmental Working
Group, p. 12.
Wright, J. A., Gundry, S. W. and Conroy, R. (2004). „Household drinking water in developing
countries: a systematic review of microbiological contamination between source and
point-of use‟. Tropical Medicine and International Health, 9 (1): 106-117.