Physicochemical Studies on Interacting Some Cardiovascular ...
15
J. Adv. Biomed. & Pharm. Sci. J. Adv. Biomed. & Pharm. Sci. 3 (2020) 135- 149 Physicochemical Studies on Interacting Some Cardiovascular Drug Pairs M. M. El-Mahdy 1* , H. Y. Safwat Raslan 2 , A. M. Hassan 3 , A. K. M. 4 , T. H. El faham 1 1 Department of Pharmaceutics, Faculty of Pharmacy, Assuit University, 71526 Assiut, Egypt 2 Department of Drug information center, Faculty of Pharmacy, Assuit University, 71526 Assiut, Egypt 3 Department of Medicinal chemistry, Faculty of Pharmacy, Assuit University, 71526 Assiut, Egypt 4 Department of Cardio Vascular, Faculty of Medicine, Assuit University, 71526 Assiut, Egypt Received: March 24, 2020; revised: April 20, 2020; accepted: April 20, 2020 Abstract Are increasingly seen to be important, some drugs, can undergo direct physical or chemical interaction with other drugs and render both drugs inactive. In the light of the above, this study aims to examine some pharmaceutical studies of physicochemical drug interactions including solubility and adsorption studies of selected cardiovascular drugs which are commonly involved in potential drug-drug interaction (pDDIs) in the cardiovascular department in order to pave the path for preventing or at least reducing the incidence of pDDIs. To reach this objective, study encountered some practical consequences of the physical chemistry of drugs, especially their interactions with each other, or with various pharmaceutical adsorbents. The solubility of three cardiovascular drugs was tested in the presence of other drugs using the shake-flask method. Those drugs were: aspirin, furosemide and amiodarone. Our results showed that spironolactone can affect the hydrolysis of aspirin if co-administered at equivalent clinical doses, and therefore might reduce the efficacy of protective low-dose aspirin. Moreover, the solubility of furosemide decreased in the presence of gentamicin. .The solubility of amiodarone decreased in presence of warfarin, theophylline and lidocaine. In the adsorption experiments, aspirin and furosemide were selected as adsorbates: aspirin and furosemide. The adsorbents used were: activated charcoal, cholestyramine, kaolin, sodium hydroxide and sodium alginate. The experimental adsorption data were fitted to four isotherm models by both linear and non-linear regression analyses. Freundlich isotherm provided the best fit for most adsorption data followed by Temkin and Langmuir isotherms. The highest adsorption capacity of activated charcoal and cholestyramine was for furosemide. Key words Physicochemical interaction, cardiovascular drugs, adsorption isotherm 1. Introduction Are increasingly seen to be important Drug interactions may occur inside the body and are called a drug-drug interaction (DDI) or outside the body and are known as a drug incompatibility. These interactions could result in favorable, toxic or no clinical effects [1-3]. Physicochemical incompatibilities are generally given little attention during inpatient care. They are, nevertheless, potential sources of drug interactions [4]. In particular settings, the consequences of drug incompatibilities can be severe. For example, physical changes to the solution may lead to precipitate formation that can cause some drugs, because of their physical or chemical properties, can undergo direct interaction with other drugs. Direct physical and chemical interactions usually render both drugs inactive. Direct drug interactions may not always leave visible evidence [5, 6]. Hence simple visual inspection is not enough to reveal all direct interactions. Because drugs can interact in solution, it is essential to consider and verify drug incompatibilities when ordering medications [6, 7]. Since solubility of a drug can be affected by mixing with other drugs or agents, it is vital to understand the way in which drugs dissolve in solution and the factors that maintain solubility or cause drugs to precipitate. Interactions that interfere with drug absorption as a result of chemical or physical reactions between drugs are called pharmaceutical drug interactions. Most of these occur during release or absorption after drug administration, such as in the stomach when two oral drugs are given concurrently [1]. Adsorption interactions are nonspecific and arise when molecules of a drug physically bind to the surface of another solid that acts as an adsorbent, reducing the concentration of drug available for absorption [8-9]. Adsorption at the solid– liquid interface plays a significant role in many fields including medicine and pharmacy with applications in drug formulation, antidotes and haemo perfusion for treating cases of severe drug overdoses [4, 10]. The present study is a contributing aimed at the proper understanding and studying of possible interactions in solution between selected cardiovascular drugs administered via the same route: By examining the solubility of a drug in the presence of another drug. Further insight into the drug -drug interactions, per se, necessities the undertaking of a parallel investigation and characterization of possible adsorbate- adsorbent interactions. Cardiovascular drugs were tested with different adsorbents and dietary fibers utilizing in vitro adsorption tests under simulated in vivo adsorption condition. Journal of Advanced Biomedical and Pharmaceutical Sciences Journal Homepage: http://jabps.journals.ekb.eg * Correspondence: Mona. M. El Mahdy Tel.: +2 01006262088; Fax: +20 882141269 Email Address: [email protected]
-
Upload
khangminh22 -
Category
Documents
-
view
4 -
download
0
Transcript of Physicochemical Studies on Interacting Some Cardiovascular ...

J. Adv. Biomed. & Pharm. Sci.
J. Adv. Biomed. & Pharm. Sci. 3 (2020) 135- 149
Physicochemical Studies on Interacting Some Cardiovascular Drug Pairs M. M. El-Mahdy
1*, H. Y. Safwat Raslan
2, A. M. Hassan
3, A. K. M.
4, T. H. El faham
1
1 Department of Pharmaceutics, Faculty of Pharmacy, Assuit University, 71526 Assiut, Egypt 2 Department of Drug information center, Faculty of Pharmacy, Assuit University, 71526 Assiut, Egypt 3 Department of Medicinal chemistry, Faculty of Pharmacy, Assuit University, 71526 Assiut, Egypt 4 Department of Cardio Vascular, Faculty of Medicine, Assuit University, 71526 Assiut, Egypt
Received: March 24, 2020; revised: April 20, 2020; accepted: April 20, 2020
Abstract
Are increasingly seen to be important, some drugs, can undergo direct physical or chemical interaction with other drugs and render
both drugs inactive. In the light of the above, this study aims to examine some pharmaceutical studies of physicochemical drug
interactions including solubility and adsorption studies of selected cardiovascular drugs which are commonly involved in potential
drug-drug interaction (pDDIs) in the cardiovascular department in order to pave the path for preventing or at least reducing the
incidence of pDDIs. To reach this objective, study encountered some practical consequences of the physical chemistry of drugs,
especially their interactions with each other, or with various pharmaceutical adsorbents. The solubility of three cardiovascular
drugs was tested in the presence of other drugs using the shake-flask method. Those drugs were: aspirin, furosemide and
amiodarone. Our results showed that spironolactone can affect the hydrolysis of aspirin if co-administered at equivalent clinical
doses, and therefore might reduce the efficacy of protective low-dose aspirin. Moreover, the solubility of furosemide decreased in
the presence of gentamicin. .The solubility of amiodarone decreased in presence of warfarin, theophylline and lidocaine.
In the adsorption experiments, aspirin and furosemide were selected as adsorbates: aspirin and furosemide. The adsorbents used
were: activated charcoal, cholestyramine, kaolin, sodium hydroxide and sodium alginate. The experimental adsorption data were
fitted to four isotherm models by both linear and non-linear regression analyses. Freundlich isotherm provided the best fit for most
adsorption data followed by Temkin and Langmuir isotherms. The highest adsorption capacity of activated charcoal and
cholestyramine was for furosemide.
Key words
Physicochemical interaction, cardiovascular drugs, adsorption isotherm
1. Introduction
Are increasingly seen to be important Drug interactions
may occur inside the body and are called a drug-drug interaction
(DDI) or outside the body and are known as a drug
incompatibility. These interactions could result in favorable,
toxic or no clinical effects [1-3]. Physicochemical
incompatibilities are generally given little attention during
inpatient care. They are, nevertheless, potential sources of drug
interactions [4]. In particular settings, the consequences of drug
incompatibilities can be severe. For example, physical changes
to the solution may lead to precipitate formation that can cause
some drugs, because of their physical or chemical properties,
can undergo direct interaction with other drugs. Direct physical
and chemical interactions usually render both drugs inactive.
Direct drug interactions may not always leave visible evidence
[5, 6]. Hence simple visual inspection is not enough to reveal all
direct interactions. Because drugs can interact in solution, it is
essential to consider and verify drug incompatibilities when
ordering medications [6, 7].
Since solubility of a drug can be affected by mixing with other
drugs or agents, it is vital to understand the way in which drugs
dissolve in solution and the factors that maintain solubility or
cause drugs to precipitate. Interactions that interfere with drug
absorption as a result of chemical or physical reactions between
drugs are called pharmaceutical drug interactions. Most of these
occur during release or absorption after drug administration,
such as in the stomach when two oral drugs are given
concurrently [1].
Adsorption interactions are nonspecific and arise when
molecules of a drug physically bind to the surface of another
solid that acts as an adsorbent, reducing the concentration of
drug available for absorption [8-9]. Adsorption at the solid–
liquid interface plays a significant role in many fields including
medicine and pharmacy with applications in drug formulation,
antidotes and haemo perfusion for treating cases of severe drug
overdoses [4, 10].
The present study is a contributing aimed at the proper
understanding and studying of possible interactions in solution
between selected cardiovascular drugs administered via the
same route: By examining the solubility of a drug in the
presence of another drug. Further insight into the drug -drug
interactions, per se, necessities the undertaking of a parallel
investigation and characterization of possible adsorbate-
adsorbent interactions. Cardiovascular drugs were tested with
different adsorbents and dietary fibers utilizing in vitro
adsorption tests under simulated in vivo adsorption condition.
Journal of Advanced Biomedical and Pharmaceutical Sciences
Journal Homepage: http://jabps.journals.ekb.eg
* Correspondence: Mona. M. El Mahdy Tel.: +2 01006262088; Fax: +20 882141269
Email Address: [email protected]

636
J. Adv. Biomed. & Pharm. Sci.
El-Mahdy et al.
2. EXPERIMENTAL
2.1. Materials
Amiodarone hydrochloride and theophylline were kindly
provided by T3A Pharma Group, Giza, Egypt. Aspirin and
Lidocaine hydrochloride: kindly provided by PHARCO.
Pharmaceuticals, Alexandria, Egypt., furosemide, gentamicin
sulfate and warfarin were kindly donated by GÜTEMED, USA..
Spironolactone: kindly provided by SEDICO Pharmaceuticals
Company, Cairo, Egypt. Cholestyramine: by Bristol‐Myers
Squibb, England. Kaolin (aluminum silicate hydroxide
Al2Si2O5 (OH) 4): ISO‐CHEM Fine Chemicals, Egypt. Sodium
alginate (sodium polymannuronate): Oxford Laboratory.
Reagent, Oxford Lab Chem, India. Activated charcoal, acetic
acid, sodium acetate, hydrochloric acid, methanol, aluminum
hydroxide and sodium hydroxide: ADWIC; by El‐ Nasr
Pharmaceutical Chemicals Co., Cairo, Egypt.
2.2. METHODS
2.2.1. Solubility measurement of drugs
The effect of the presence of certain drugs on the solubility of
amiodarone, aspirin and furosemide in water was studied using
the shake flask method as follows: Amiodarone hydrochloride (
Amiodarone HCL + lidocaine HCL), (amiodarone HCL +
theophylline), (amiodarone HCL + warfarin) , Aspirin (Aspirin
+ spironolactone) and Furosemide (Furosemide + gentamicin
sulphate).
The UV spectra were run for all eight drugs, in order to exclude
the spectral overlap of the tested drug pairs at the selected λmax
where amiodarone (λmax 345), aspirin (λmax 278) and
furosemide (λmax 271). Known excess of each of these drugs
was shaken horizontally with 5 or 10 mL of distilled water in
ten screw capped cylindrical glass vials. Vials were immersed in
a thermostatically controlled shaking water bath (GFL® 1083,
Germany) at a temperature of 37±0.5 °C and a speed of about
50 rpm. At specified time intervals (0.25, 0.5, 1, 2, 4, 6, 8, 12,
24 and 48 hrs), one vial was withdrawn and contents were
filtered through a 0.45 μm disk filter. Filtrate was properly
diluted with distilled water for spectrophotometric measurement
((Jenway, UV‐6305, Staffordshire, UK) at the respective
wavelength of maximum absorption to measure drug
concentration, against blank solutions prepared in the same
manner. Each measurement was performed thrice.
To determine the effect of the presence of other drugs on the
solubility of tested drugs, a parallel run of ten more vials were
prepared following the same procedure but with adding a
specified weight of the interacting drug which was determined
based on the dose ratio used of both drugs in clinical practice.
Each interacting drug was tested alone at the same concentration
to confirm no or negligible UV absorbance at the λmax of the
drug tested for solubility. (Table 1) shows the amounts of
drugs tested for interactions. The pH of solutions containing one
or two drugs was measured using a Jenway digital pH meter
after 24 hrs.
2.2.2. Fourier-Transform infrared spectroscopy (FT-IR)
To help interpret solubility results, separate FT-IR spectra for
single drugs and physical mixtures of drug pairs at a weight
ratio of 1:1, were recorded using Shimadzu IR-470
spectrophotometer, at a range of 4000-400 cm-1. Potassium
bromide (KBr) disc method was used. The samples were
ground, mixed thoroughly with KBr and compressed into discs
using the IR compression machine.
2.2.3. Statistical analysis of solubility studies
Experimental solubility data were statistically analyzed using
IBM Statistical package for Social Science (SPSS) version 22.0
(SPSS Inc., Chicago, IL, USA). Assumptions of different
statistical tests were first checked to ensure the model goodness-
of-fit and validation of the model results. Statistical tests that
were used for analysis were independent t-test which applied to
determine if the presence of a possibly interacting drug had a
statistically significant effect on solubility and the Mann–
Whitney U non-parametric test which used for comparisons
when the t-test did not meet the usual assumptions (normality,
absence of significant outliers and homoscedasticity).
2.2.4. Adsorption studies
Equilibrium adsorption runs were carried out in 25 mL screw-
capped cylindrical glass vials containing a final volume of 10
mL of the stock solution and the corresponding solvent. Stock
solution of Aspirin and Furosemide were prepared in the
appropriate solvent with determined pH. Specified volumes of
the stock were added to the vials to produce suitable final
working concentrations. A constant weight of adsorbents was
added to all vials (Table 2).
Five adsorbents were used in the study namely; activated
charcoal, kaolin, cholestyramine, aluminum hydroxide and
sodium alginate. Each drug at a constant concentration was
initially tested for adsorption on all five adsorbents. The
adsorbents that have shown the highest capacity for each drug
were used for further analysis and isotherm modelling. Both
appropriate working dilutions of tested drugs and adsorbent
weights were determined by preliminary experiments
Table 1: Amounts of interacting drugs used in solubility studies
Interacting
drugs
Tested drug (weight/volume)
Amiodarone
(10 mg/ 10 mL)
Aspirin
(87.5 mg/ 5 mL)
Furosemide
(5 mg/ 10 mL)
Gentamicin - - 10 mg, 20 mg
Lidocaine 10 mg - -
Theophylline 10 mg - -
Spironolactone - 25 mg, 25 μg -
Warfarin 1 mg - -
637
J. Adv. Biomed. & Pharm. Sci.
El-Mahdy et al.
considering solubility limits of each drug. A blank for the
adsorbing materials was also prepared in the same way without
the drug. In addition, a vial containing the same volume (10
mL) of the drug solution of known concentration without the
adsorbent was prepared and treated in the same manner. This
solution was used as a control to check for any change in drug
stability. The screw-capped vials were then placed in a
thermostatically controlled shaking water bath at temperature of
37±0.5 °C and agitated horizontally at 75 rpm over night to
assure equilibrium was attained. In experiments concerning
aspirin, the vials were left for only 2 hours at a temperature
25±0.5 °C to avoid hydrolysis of the drug. At the end of this
time, the content of each vial was filtered through a Double
Rings® filter paper (qualitative No. 102).
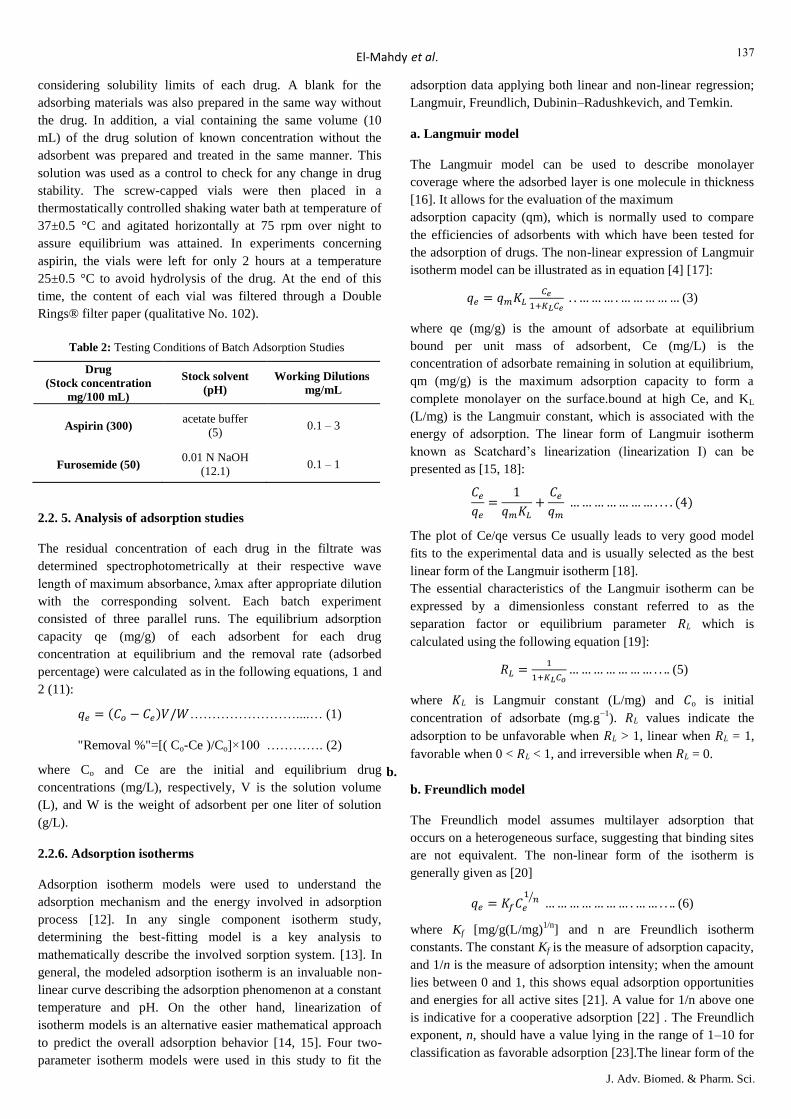
2.2. 5. Analysis of adsorption studies
The residual concentration of each drug in the filtrate was
determined spectrophotometrically at their respective wave
length of maximum absorbance, λmax after appropriate dilution
with the corresponding solvent. Each batch experiment
consisted of three parallel runs. The equilibrium adsorption
capacity qe (mg/g) of each adsorbent for each drug
concentration at equilibrium and the removal rate (adsorbed
percentage) were calculated as in the following equations, 1 and
2 (11):
( ) ……………………....… (1)
"Removal %"=[( Co-Ce )/Co]×100 …………. (2)
where Co and Ce are the initial and equilibrium drug
concentrations (mg/L), respectively, V is the solution volume
(L), and W is the weight of adsorbent per one liter of solution
(g/L).
2.2.6. Adsorption isotherms
Adsorption isotherm models were used to understand the
adsorption mechanism and the energy involved in adsorption
process [12]. In any single component isotherm study,
determining the best-fitting model is a key analysis to
mathematically describe the involved sorption system. [13]. In
general, the modeled adsorption isotherm is an invaluable non-
linear curve describing the adsorption phenomenon at a constant
temperature and pH. On the other hand, linearization of
isotherm models is an alternative easier mathematical approach
to predict the overall adsorption behavior [14, 15]. Four two-
parameter isotherm models were used in this study to fit the
adsorption data applying both linear and non-linear regression;
Langmuir, Freundlich, Dubinin–Radushkevich, and Temkin.
a. Langmuir model
The Langmuir model can be used to describe monolayer
coverage where the adsorbed layer is one molecule in thickness
[16]. It allows for the evaluation of the maximum
adsorption capacity (qm), which is normally used to compare
the efficiencies of adsorbents with which have been tested for
the adsorption of drugs. The non-linear expression of Langmuir
isotherm model can be illustrated as in equation [4] [17]:
(3)
where qe (mg/g) is the amount of adsorbate at equilibrium
bound per unit mass of adsorbent, Ce (mg/L) is the
concentration of adsorbate remaining in solution at equilibrium,
qm (mg/g) is the maximum adsorption capacity to form a
complete monolayer on the surface.bound at high Ce, and KL
(L/mg) is the Langmuir constant, which is associated with the
energy of adsorption. The linear form of Langmuir isotherm
known as Scatchard’s linearization (linearization I) can be
presented as [15, 18]:
( )
The plot of Ce/qe versus Ce usually leads to very good model
fits to the experimental data and is usually selected as the best
linear form of the Langmuir isotherm [18].
The essential characteristics of the Langmuir isotherm can be
expressed by a dimensionless constant referred to as the
separation factor or equilibrium parameter 𝑅𝐿 which is
calculated using the following equation [19]:
𝑅
(5)
where 𝐿 is Langmuir constant (L/mg) and o is initial
concentration of adsorbate (mg.g−1
). 𝑅𝐿 values indicate the
adsorption to be unfavorable when 𝑅𝐿 > 1, linear when 𝑅𝐿 = 1,
favorable when 0 < 𝑅𝐿 < 1, and irreversible when 𝑅𝐿 = 0.
b.
b. Freundlich model
The Freundlich model assumes multilayer adsorption that
occurs on a heterogeneous surface, suggesting that binding sites
are not equivalent. The non-linear form of the isotherm is
generally given as [20]
⁄ (6)
where Kf [mg/g(L/mg)1/n
] and n are Freundlich isotherm
constants. The constant Kf is the measure of adsorption capacity,
and 1/n is the measure of adsorption intensity; when the amount
lies between 0 and 1, this shows equal adsorption opportunities
and energies for all active sites [21]. A value for 1/n above one
is indicative for a cooperative adsorption [22] . The Freundlich
exponent, n, should have a value lying in the range of 1–10 for
classification as favorable adsorption [23].The linear form of the
Table 2: Testing Conditions of Batch Adsorption Studies
Drug
(Stock concentration
mg/100 mL)
Stock solvent
(pH)
Working Dilutions
mg/mL
Aspirin (300) acetate buffer
(5) 0.1 – 3
Furosemide (50) 0.01 N NaOH
(12.1) 0.1 – 1
638
J. Adv. Biomed. & Pharm. Sci.
El-Mahdy et al.
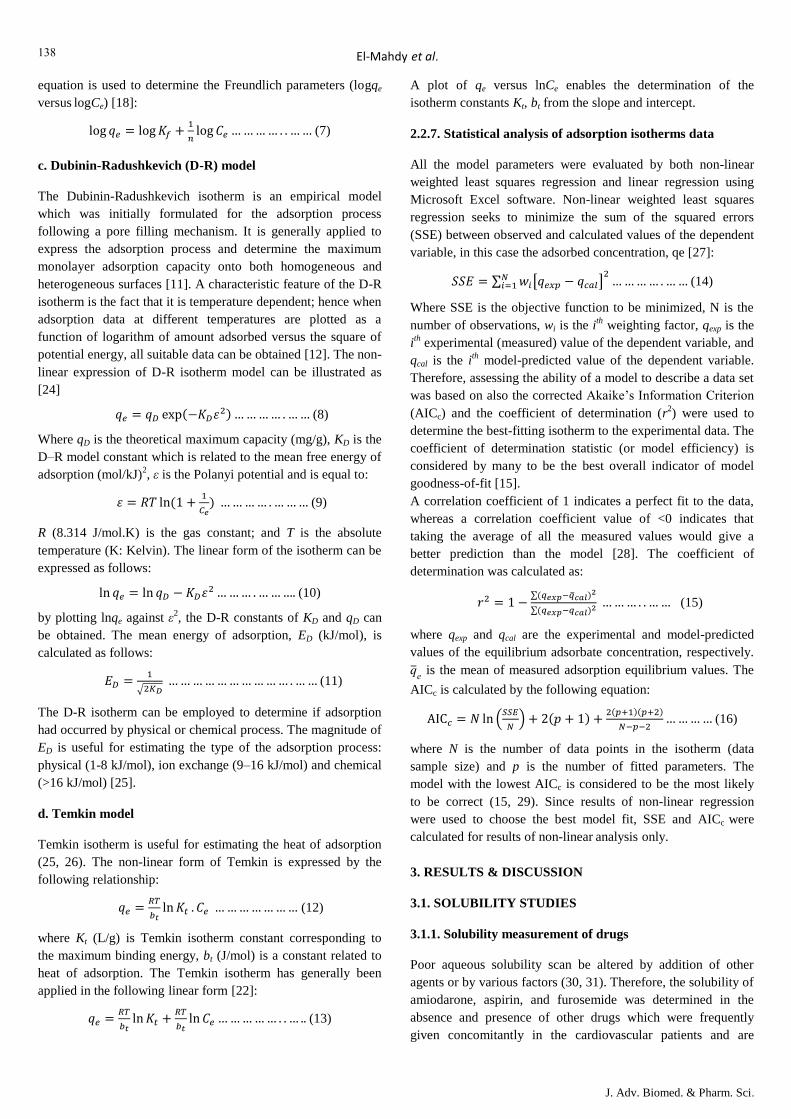
equation is used to determine the Freundlich parameters (logqe
versus logCe) [18]:
(7)
c. Dubinin-Radushkevich (D-R) model
The Dubinin-Radushkevich isotherm is an empirical model
which was initially formulated for the adsorption process
following a pore filling mechanism. It is generally applied to
express the adsorption process and determine the maximum
monolayer adsorption capacity onto both homogeneous and
heterogeneous surfaces [11]. A characteristic feature of the D-R
isotherm is the fact that it is temperature dependent; hence when
adsorption data at different temperatures are plotted as a
function of logarithm of amount adsorbed versus the square of
potential energy, all suitable data can be obtained [12]. The non-
linear expression of D-R isotherm model can be illustrated as
[24]
( ) (8)
Where qD is the theoretical maximum capacity (mg/g), KD is the
D–R model constant which is related to the mean free energy of
adsorption (mol/kJ)2, ε is the Polanyi potential and is equal to:
𝑅 (
) (9)
R (8.314 J/mol.K) is the gas constant; and T is the absolute
temperature (K: Kelvin). The linear form of the isotherm can be
expressed as follows:
(10)
by plotting lnqe against ε2, the D-R constants of KD and qD can
be obtained. The mean energy of adsorption, ED (kJ/mol), is
calculated as follows:
√ (11)
The D-R isotherm can be employed to determine if adsorption
had occurred by physical or chemical process. The magnitude of
ED is useful for estimating the type of the adsorption process:
physical (1-8 kJ/mol), ion exchange (9–16 kJ/mol) and chemical
(>16 kJ/mol) [25].
d. Temkin model
Temkin isotherm is useful for estimating the heat of adsorption
(25, 26). The non-linear form of Temkin is expressed by the
following relationship:
(12)
where Kt (L/g) is Temkin isotherm constant corresponding to
the maximum binding energy, bt (J/mol) is a constant related to
heat of adsorption. The Temkin isotherm has generally been
applied in the following linear form [22]:
(13)
A plot of qe versus lnCe enables the determination of the
isotherm constants Kt, bt from the slope and intercept.
2.2.7. Statistical analysis of adsorption isotherms data
All the model parameters were evaluated by both non-linear
weighted least squares regression and linear regression using
Microsoft Excel software. Non-linear weighted least squares
regression seeks to minimize the sum of the squared errors
(SSE) between observed and calculated values of the dependent
variable, in this case the adsorbed concentration, qe [27]:
∑ [ ]
(14)
Where SSE is the objective function to be minimized, N is the
number of observations, wi is the ith
weighting factor, qexp is the
ith
experimental (measured) value of the dependent variable, and
qcal is the ith
model-predicted value of the dependent variable.
Therefore, assessing the ability of a model to describe a data set
was based on also the corrected Akaike’s Information Criterion
(AICc) and the coefficient of determination (r2) were used to
determine the best-fitting isotherm to the experimental data. The
coefficient of determination statistic (or model efficiency) is
considered by many to be the best overall indicator of model
goodness-of-fit [15].
A correlation coefficient of 1 indicates a perfect fit to the data,
whereas a correlation coefficient value of <0 indicates that
taking the average of all the measured values would give a
better prediction than the model [28]. The coefficient of
determination was calculated as:
∑( )
∑( ) (15)
where qexp and qcal are the experimental and model-predicted
values of the equilibrium adsorbate concentration, respectively.
is the mean of measured adsorption equilibrium values. The
AICc is calculated by the following equation:
(
) ( )
( )( )
(16)
where N is the number of data points in the isotherm (data
sample size) and p is the number of fitted parameters. The
model with the lowest AICc is considered to be the most likely
to be correct (15, 29). Since results of non-linear regression
were used to choose the best model fit, SSE and AICc were
calculated for results of non-linear analysis only.
3. RESULTS & DISCUSSION
3.1. SOLUBILITY STUDIES
3.1.1. Solubility measurement of drugs
Poor aqueous solubility scan be altered by addition of other
agents or by various factors (30, 31). Therefore, the solubility of
amiodarone, aspirin, and furosemide was determined in the
absence and presence of other drugs which were frequently
given concomitantly in the cardiovascular patients and are

639
J. Adv. Biomed. & Pharm. Sci.
El-Mahdy et al.
known to cause potential pharmacological DDIs. (Table 3)
shows the measured pH of solutions.
a. Aspirin + Spironolactone
From the obtained data displayed in (Table 4), it can be
observed that the solubility profile of aspirin in presence of 25
mg spironolactone was completely different as compared to
aspirin’s solubility profile alone although change in the extent
of solubility was statistically insignificant. A Fourier-transform
infrared (FT-IR) spectrum was run to interpret solubility results.
(Figure 1) shows the FT-IR spectrum of aspirin, spironolactone
and a 1:1 physical mixture of both. There was no change in the
fingerprint region of either drug.
Once administered, aspirin (acetyl salicylic acid) is readily
absorbed and rapidly hydrolyzed to salicylic acid, which is the
active agent responsible for its main therapeutic effects [32, 33].
This could explain the erratic solubility behavior of aspirin. The
presence of an insoluble clinically equivalent concentration of
spironolactone (25 mg/ 5mL) prevented this behavior and
aspirin reached solubility equilibrium after about 4 hours. While
at a lower soluble concentration of spironolactone (25 μg/5mL),
the solubility profile of aspirin was almost unchanged. An
infrared (IR) spectrum was run between a 1:1 physical mixture
of aspirin and spironolactone to exclude the formation of a new
complex. The presence of spironolactone did not alter the pH of
the solution. As shown in the IR spectra in figure 1, the effect of
spironolactone was not a result of complex formation.
Consequently, such solubility profile might be explained by
physical interactions between both drugs where insoluble
spironolactone physically reduced the hydrolysis of aspirin. So
spacing administration of both aspirin and spironolactone could
be considered. In general, there is no need to avoid concurrent
use, but if the diuretic response to spironolactone is less than
expected this interaction should be considered as a cause [34,
35].
b. Furosemide + Gentamicin
The solubility of furosemide in presence of gentamicin was
reduced (Table 5). However, this decrease in solubility was not
statistically significant. FT-IR spectra in (Figure 2), shows that
both drugs did not form any complexes when physically mixed.
Variable compatibility results have been reported for the IV
combination of furosemide and gentamicin possibly due to
differing drug concentrations and/or testing methodologies [35,
36]. Since furosemide is a weak acid (reported acidic pKa 3.48),
with a carboxylic acid functional group, its aqueous solubility
increases as a function of medium pH [37]. Furosemide is
soluble in alkaline solutions and is prepared as a mildly buffered
alkaline product. It can usually be mixed with infusion solutions
that are neutral or weakly basic (pH 7 to 10) and with some
weakly acidic solutions that have a low buffer capacity. It
should not be mixed with acidic solutions having a pH below
5.5 [38]. In the current study, the addition of gentamicin sulfate
to furosemide in distilled water slightly raised the pH of the
solution. However, the reduction in furosemide solubility was
statistically insignificant. In this case, the solubility reduction
was probably due to a salting out effect by gentamicin sulfate
which is soluble in water and not a result of alteration in pH.
Salting out of weak electrolytes may result from the removal of
water molecules that can act as solvent because of competing
hydration of the added more soluble ion [1].
Concurrent use should be avoided systemically as it may result
in increased gentamicin plasma and tissue concentrations and
additive ototoxicity and/or nephrotoxicity. It is generally
advised that aminoglycosides should not be used with other
drugs that may cause ototoxicity or nephrotoxicity, such as
etacrynic acid
Table 3: pH of tested drug solutions after 24 hs
Drugs in solution pH
Amiodarone 10 mg 3.38
Amiodarone 10 mg + Lidocaine 10 mg 3.70
Amiodarone 10 mg + Theophylline 10 mg 3.49
Amiodarone 10 mg + Warfarin 1 mg 3.34
Aspirin 87.5 mg 2.47
Aspirin 87.5 mg + Spironolactone 25 mg 2.47
Aspirin 87.5 mg + Spironolactone 25 mcg 2.45
Furosemide 5 mg 3.45
Furosemide 5 mg + Gentamicin 10mg 3.75
Furosemide 5 mg + Gentamicin 20mg 3.85
Table 4. Solubility of aspirin in absence and presence of spironolactone
Solubility of Aspirin ± SD (mg/mL) (n=3)
Time (hs) Alone +25mg
Spironolactone
+25mcg
Spironolactone
0.25 6.72 ± 1.21 5.48 ± 0.95 7.22 ± 1.07
0.50 7.98 ± 0.97 6.94 ± 0.82 9.42 ± 1.05
1 9.57 ± 0.57 8.61 ± 0.82 4.77 ± 0.85
2 6.46 ± 0.36 9.35 ± 0.65 7.08 ± 1.55
4 6.25 ± 1.09 11.25 ± 0.77 7.22 ± 1.18
6 10.85 ± 0.35 11.40 ± 0.55 8.49 ± 0.85
8 11.10 ± 0.51 11.40 ± 0.65 10.50 ± 1.23
12 8.62 ± 0.75 11.40 ± 0.54 11.90 ± 0.91
24 13.64 ± 1.17 12.36 ± 0.61 13.56 ± 1.05
48 15.30 ± 1.57 12.40 ± 0.61 12.00 ± 1.51

641
J. Adv. Biomed. & Pharm. Sci.
El-Mahdy et al.
Figure 1: FT-IR of aspirin, spironolactone and 1:1 physical mixture of aspirin and spironolactone
Figure 2: FT-IR of furosemide, gentamicin and 1:1 physical mixture of furosemide and gentamicin.
Table 5: Solubility of Furosemide in absence and presence of gentamicin
Solubility of Furosemide ± SD (mcg/mL) (n=3)
Time (hs) Alone + 10 mg Gentamicin + 20 mg Gentamicin
0.25 113.1 ± 8.35 163.1 ± 9.22 73.0 ± 10.50
0.50 181.9 ± 11.12 208.2 ± 12.97 161.9 ± 9.23
1 224.5 ± 12.33 213.6 ± 12.24 207.2 ± 14.05
2 196.3 ± 12.03 231.4 ± 10.55 186.9 ± 11.23
4 222.5 ± 13.12 238.9 ± 11.05 174.5 ± 12.13
6 232.4 ± 10.87 225.3 ± 9.11 198.3 ± 10.56
8 226.9 ± 11.11 237.8 ± 13.33 199.1 ± 10.33
12 235.9 ± 13.04 245.7 ± 12.31 207.2 ± 11.12
24 294.3 ± 10.31 269.6 ± 10.45 241.8 ± 10.17
48 294.3 ± 11.07 277.9 ± 9.43 241.5 ± 11.32

646
J. Adv. Biomed. & Pharm. Sci.
El-Mahdy et al.
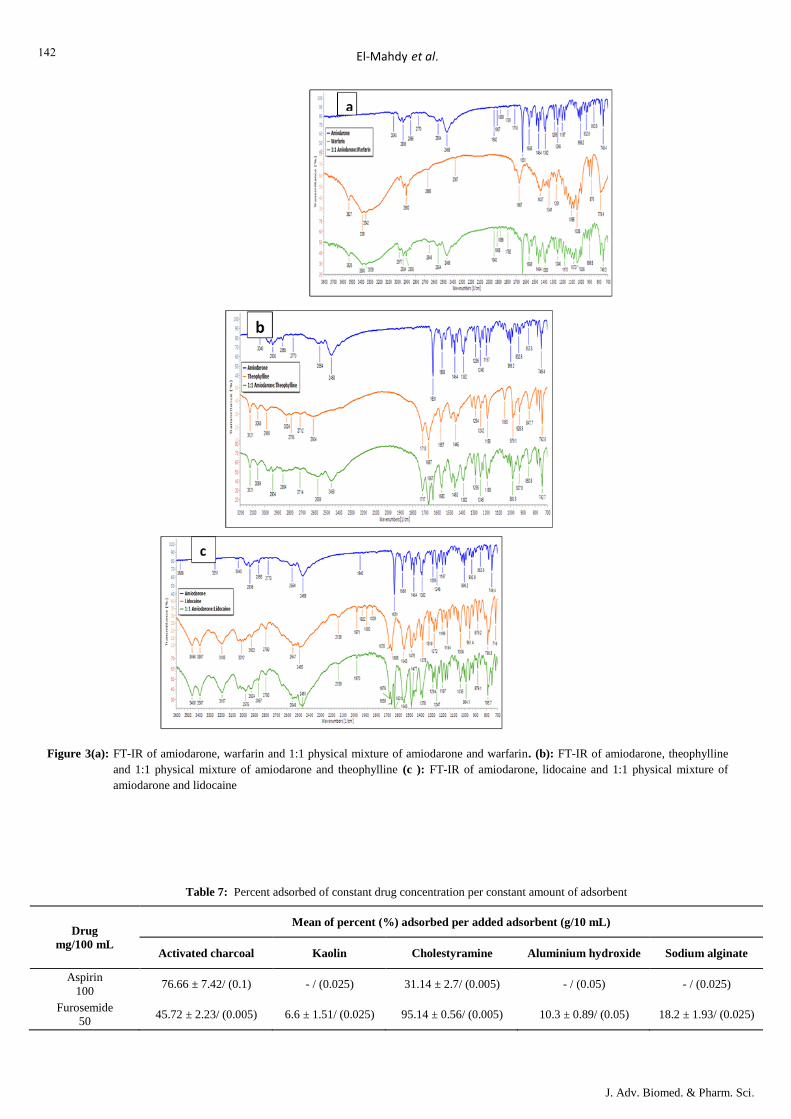
c. Amiodarone + Warfarin/ Theophylline/ Lidocaine
As evident in (Table 6) amiodarone exhibited lower water
solubility at tested time intervals in the presence of all tested
drugs; lidocaine, theophylline and warfarin. FT-IR spectra of
amiodarone alone and in physical mixtures with all other three
drugs indicate no complex formation (Figures 3 (a, b, c)).
Lower amiodarone solubility in the presence of warfarin was
statistically insignificant but was statistically significant in
presence of theophylline and lidocaine. Scores of amiodarone
solubility alone (mean rank=13.1) were significantly higher than
for its solubility in presence of theophylline (mean rank=7.9),
U=24, z=-1.97, p=0.049. Similarly, the scores of amiodarone
solubility alone (mean rank=15.2) were significantly higher than
for its solubility in presence of lidocaine (mean rank=5.8), U=3,
z=-3.55, p<0.001.
Amiodarone has become the most widely prescribed
antiarrhythmic because of its wide spectrum of efficacy and
relative safety in patients with structural heart disease [39].
Although amiodarone can slow the ventricular response in atrial
fibrillation, it should be used only after digoxin, beta-blockers,
and calcium channel antagonists are ineffective,
contraindicated, or not tolerated [40, 41]. Amiodarone may
produce drug interactions with warfarin, digoxin, procainamide,
and quinidine [42]. It has been suggested that the dosage of
these drugs be reduced empirically by 50% when amiodarone is
added and that QT and QRS intervals be monitored for
excessive prolongation [40]. Concurrent use of amiodarone and
theophylline may result in theophylline toxicity (nausea,
vomiting, palpitations, and seizures). Theophylline serum
concentrations should be closely monitored when amiodarone is
added discontinued, or when dosing changes occur. Amiodarone
may also increase the serum concentration of lidocaine through
inhibition of CYP3A4 isozymes. Due to the long-half-life of
amiodarone, this interaction is possible even after
discontinuation of amiodarone. If coadministration is required, a
reduced lidocaine dose should be initially used and toxicity
carefully monitored [35].
Amiodarone is very slightly soluble in water (0.7 in 1 of water)
[21]. All three tested drugs had little effect on the pH of the
solution however; lidocaine increased the pH by 0.32 points.
Theophylline is a weak basic drug with a pKa of 8.81 [43]
which is higher than that of amiodarone, 6.56. Theophylline is
reported to have a water solubility that is ten times (7.36 mg/ml)
that of amiodarone (0.7 mg/ml) at 25 °C .As the pH of
amiodarone solution was only slightly increased by the addition
of theophylline, this suggests that reduced solubility is a result
of a salting out mechanism. The significant reduction of
amiodarone’s solubility after addition of lidocaine
hydrochloride could be explained by the salting out effect of
lidocaine hydrochloride. Solubility of lidocaine hydrochloride is
reported to be 0.68 g/ml in water at 25 °C [44]. Few studies
examined the parenteral compatibility of amiodarone
hydrochloride with theophylline which reported both drugs to
be physically compatible [33].
3.2. ADSORPTION STUDIES
3.2.1. Analysis of adsorption data
The adsorption of selected drugs of aspirin and furosemide on
commercial activated charcoal, a bile-binding resin, an
antidiarrheal, an antacid and a dietary fiber have been studied.
(Table 7) shows the percent of the drug adsorbed (constant
initial concentration) per the specified amount of added
adsorbent. Results recorded are the average of the triplicate
adsorption runs. Under the adsorption conditions of the study,
activated charcoal considerably adsorbed all the tested drugs.
3.2.2. Adsorption isotherms and parameters
Linear and non-linear fitting plots of Langmuir, Freundlich,
Dubinin -Radushkevich and Temkin isotherm models for
different adsorbents Non-linear regression plots compared
different non-linear mathematical expressions of isotherms with
experimental data for tested drugs on corresponding adsorbents.
Table 6: Solubility of amiodaone in absence and presence of lidocaine, theophylline and warfarin
Solubility of Amiodarone ± SD (mcg/mL)
Time (hs) Alone + 1 mg Warfarin + 10 mg Theophylline + 10 mg Lidocaine
0.25 198.53 ± 12.11 157.94 ± 9.47 199.71 ± 11.17 104.41 ± 8.97
0.50 312.65 ± 13.21 201.5 ± 12.02 241.5 ± 9.51 165.59 ± 10.23
1 316.2 ± 10.37 200.88 ± 13.76 240.9 ± 12.31 157.35 ± 10.53
2 352.1 ± 12.34 222.65 ± 10.65 311.5 ± 11.15 166.76 ± 10.23
4 413.24 ± 12.55 315 ± 12.01 312.1 ± 11.25 129.71 ± 9.07
6 436.76 ± 12.03 336.18 ± 11.33 296.2 ± 12.03 170.88 ± 9.66
8 376.18 ± 12.98 360.88 ± 11.51 315.7 ± 10.67 191.47 ± 11.24
12 437.94 ± 13.22 359.71 ± 11.12 336.8 ± 13.44 237.35 ± 10.07
24 512 ± 11.32 410.88 ± 10.15 398.53 ± 11.43 237.35 ± 10.15
48 570.3 ± 13.77 484.4 ± 12.58 448.53 ± 10.11 202.06 ± 11.01
641
J. Adv. Biomed. & Pharm. Sci.
El-Mahdy et al.
Figure 3(a): FT-IR of amiodarone, warfarin and 1:1 physical mixture of amiodarone and warfarin. (b): FT-IR of amiodarone, theophylline
and 1:1 physical mixture of amiodarone and theophylline (c ): FT-IR of amiodarone, lidocaine and 1:1 physical mixture of
amiodarone and lidocaine
Table 7: Percent adsorbed of constant drug concentration per constant amount of adsorbent
Drug
mg/100 mL
Mean of percent (%) adsorbed per added adsorbent (g/10 mL)
Activated charcoal Kaolin Cholestyramine Aluminium hydroxide Sodium alginate
Aspirin
100 76.66 ± 7.42/ (0.1) - / (0.025) 31.14 ± 2.7/ (0.005) - / (0.05) - / (0.025)
Furosemide
50 45.72 ± 2.23/ (0.005) 6.6 ± 1.51/ (0.025) 95.14 ± 0.56/ (0.005) 10.3 ± 0.89/ (0.05) 18.2 ± 1.93/ (0.025)
643
J. Adv. Biomed. & Pharm. Sci.
El-Mahdy et al.
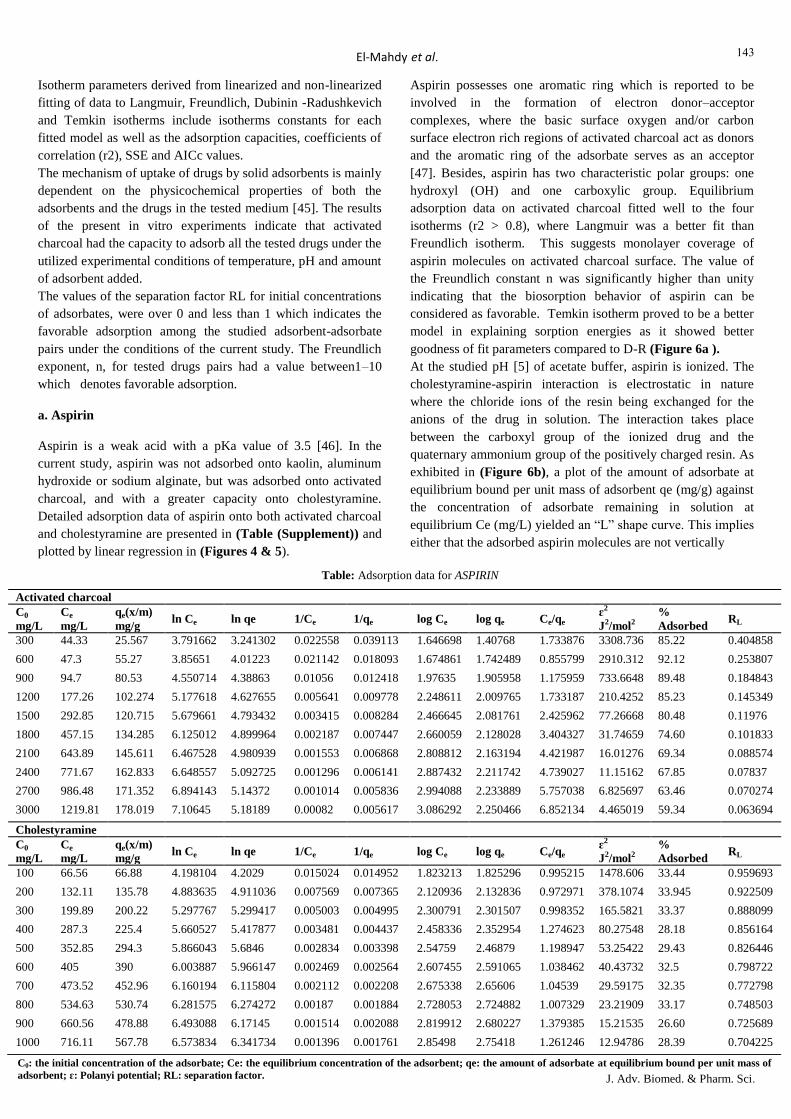
Isotherm parameters derived from linearized and non-linearized
fitting of data to Langmuir, Freundlich, Dubinin -Radushkevich
and Temkin isotherms include isotherms constants for each
fitted model as well as the adsorption capacities, coefficients of
correlation (r2), SSE and AICc values.
The mechanism of uptake of drugs by solid adsorbents is mainly
dependent on the physicochemical properties of both the
adsorbents and the drugs in the tested medium [45]. The results
of the present in vitro experiments indicate that activated
charcoal had the capacity to adsorb all the tested drugs under the
utilized experimental conditions of temperature, pH and amount
of adsorbent added.
The values of the separation factor RL for initial concentrations
of adsorbates, were over 0 and less than 1 which indicates the
favorable adsorption among the studied adsorbent-adsorbate
pairs under the conditions of the current study. The Freundlich
exponent, n, for tested drugs pairs had a value between1–10
which denotes favorable adsorption.
a. Aspirin
Aspirin is a weak acid with a pKa value of 3.5 [46]. In the
current study, aspirin was not adsorbed onto kaolin, aluminum
hydroxide or sodium alginate, but was adsorbed onto activated
charcoal, and with a greater capacity onto cholestyramine.
Detailed adsorption data of aspirin onto both activated charcoal
and cholestyramine are presented in (Table (Supplement)) and
plotted by linear regression in (Figures 4 & 5).
Aspirin possesses one aromatic ring which is reported to be
involved in the formation of electron donor–acceptor
complexes, where the basic surface oxygen and/or carbon
surface electron rich regions of activated charcoal act as donors
and the aromatic ring of the adsorbate serves as an acceptor
[47]. Besides, aspirin has two characteristic polar groups: one
hydroxyl (OH) and one carboxylic group. Equilibrium
adsorption data on activated charcoal fitted well to the four
isotherms (r2 > 0.8), where Langmuir was a better fit than
Freundlich isotherm. This suggests monolayer coverage of
aspirin molecules on activated charcoal surface. The value of
the Freundlich constant n was significantly higher than unity
indicating that the biosorption behavior of aspirin can be
considered as favorable. Temkin isotherm proved to be a better
model in explaining sorption energies as it showed better
goodness of fit parameters compared to D-R (Figure 6a ).
At the studied pH [5] of acetate buffer, aspirin is ionized. The
cholestyramine-aspirin interaction is electrostatic in nature
where the chloride ions of the resin being exchanged for the
anions of the drug in solution. The interaction takes place
between the carboxyl group of the ionized drug and the
quaternary ammonium group of the positively charged resin. As
exhibited in (Figure 6b), a plot of the amount of adsorbate at
equilibrium bound per unit mass of adsorbent qe (mg/g) against
the concentration of adsorbate remaining in solution at
equilibrium Ce (mg/L) yielded an “L” shape curve. This implies
either that the adsorbed aspirin molecules are not vertically
Table: Adsorption data for ASPIRIN
Activated charcoal
C0
mg/L
Ce
mg/L
qe(x/m)
mg/g
ln Ce ln qe 1/Ce 1/qe log Ce log qe Ce/qe ɛ2
J2/mol2
%
Adsorbed RL
300 44.33 25.567 3.791662 3.241302 0.022558 0.039113 1.646698 1.40768 1.733876 3308.736 85.22 0.404858
600 47.3 55.27 3.85651 4.01223 0.021142 0.018093 1.674861 1.742489 0.855799 2910.312 92.12 0.253807
900 94.7 80.53 4.550714 4.38863 0.01056 0.012418 1.97635 1.905958 1.175959 733.6648 89.48 0.184843
1200 177.26 102.274 5.177618 4.627655 0.005641 0.009778 2.248611 2.009765 1.733187 210.4252 85.23 0.145349
1500 292.85 120.715 5.679661 4.793432 0.003415 0.008284 2.466645 2.081761 2.425962 77.26668 80.48 0.11976
1800 457.15 134.285 6.125012 4.899964 0.002187 0.007447 2.660059 2.128028 3.404327 31.74659 74.60 0.101833
2100 643.89 145.611 6.467528 4.980939 0.001553 0.006868 2.808812 2.163194 4.421987 16.01276 69.34 0.088574
2400 771.67 162.833 6.648557 5.092725 0.001296 0.006141 2.887432 2.211742 4.739027 11.15162 67.85 0.07837
2700 986.48 171.352 6.894143 5.14372 0.001014 0.005836 2.994088 2.233889 5.757038 6.825697 63.46 0.070274
3000 1219.81 178.019 7.10645 5.18189 0.00082 0.005617 3.086292 2.250466 6.852134 4.465019 59.34 0.063694
Cholestyramine
C0
mg/L
Ce
mg/L
qe(x/m)
mg/g ln Ce ln qe 1/Ce 1/qe log Ce log qe Ce/qe
ɛ2
J2/mol2
%
Adsorbed RL
100 66.56 66.88 4.198104 4.2029 0.015024 0.014952 1.823213 1.825296 0.995215 1478.606 33.44 0.959693
200 132.11 135.78 4.883635 4.911036 0.007569 0.007365 2.120936 2.132836 0.972971 378.1074 33.945 0.922509
300 199.89 200.22 5.297767 5.299417 0.005003 0.004995 2.300791 2.301507 0.998352 165.5821 33.37 0.888099
400 287.3 225.4 5.660527 5.417877 0.003481 0.004437 2.458336 2.352954 1.274623 80.27548 28.18 0.856164
500 352.85 294.3 5.866043 5.6846 0.002834 0.003398 2.54759 2.46879 1.198947 53.25422 29.43 0.826446
600 405 390 6.003887 5.966147 0.002469 0.002564 2.607455 2.591065 1.038462 40.43732 32.5 0.798722
700 473.52 452.96 6.160194 6.115804 0.002112 0.002208 2.675338 2.65606 1.04539 29.59175 32.35 0.772798
800 534.63 530.74 6.281575 6.274272 0.00187 0.001884 2.728053 2.724882 1.007329 23.21909 33.17 0.748503
900 660.56 478.88 6.493088 6.17145 0.001514 0.002088 2.819912 2.680227 1.379385 15.21535 26.60 0.725689
1000 716.11 567.78 6.573834 6.341734 0.001396 0.001761 2.85498 2.75418 1.261246 12.94786 28.39 0.704225
C0: the initial concentration of the adsorbate; Ce: the equilibrium concentration of the adsorbent; qe: the amount of adsorbate at equilibrium bound per unit mass of
adsorbent; ɛ: Polanyi potential; RL: separation factor.

644
J. Adv. Biomed. & Pharm. Sci.
El-Mahdy et al.
oriented or that there is no strong competition from the solvent
[36]. Isotherm analysis shows that the equilibrium data was best
represented by the Freundlich equation which suggests a
multilayer coverage with a maximum adsorption capacity of
about 578 mg/g as calculated by the D-R isotherm .The
extremely high maximum adsorption capacity obtained by the
Langmuir isotherm indicated that this isotherm was unsuitable
for describing the adsorption process.
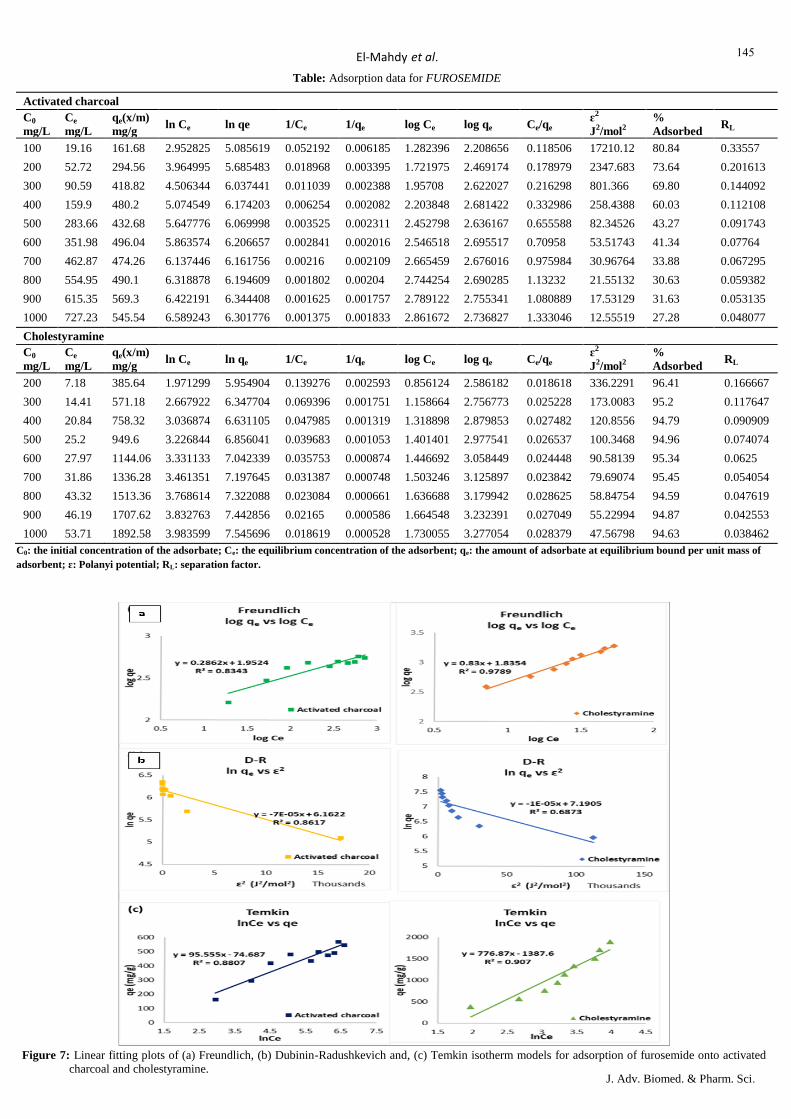
b. Furosemide
Furosemide, a widely used loop diuretic is a weak acid with an
acidic pKa value of 3.9 and is slightly soluble in water [32, 46].
It possesses a carboxylic acid functional group and its aqueous
solubility increases as a function of medium pH [37]. The
highest adsorption capacity of furosemide was onto
cholestyramine followed by activated charcoal as manifested in
(Table (supplement)). Linear curves onto both these adsorbents
are shown in (Figures 7, 8).
Figure 4: Plots of (a) amount adsorbed vs initial concentration, (b)
Langmuir linearization I (c) Langmuir linearization II
isotherm models for adsorption of aspirin onto activated
charcoal and cholestyramine.
Figure 5: Linear fitting plots of (a) Freundlich, (b) Dubinin-
Radushkevich and, (c) Temkin isotherm models for
adsorption of aspirin onto activated charcoal and
cholestyramine.
Figure 6: (a). Equilibrium isotherms for the adsorption of aspirin onto
activated charcoal, (b). Equilibrium isotherms for the
adsorption of aspirin onto cholestyramine
645
J. Adv. Biomed. & Pharm. Sci.
El-Mahdy et al.
Table: Adsorption data for FUROSEMIDE
Activated charcoal
C0
mg/L
Ce
mg/L
qe(x/m)
mg/g
ln Ce ln qe 1/Ce 1/qe log Ce log qe Ce/qe ɛ2
J2/mol2
%
Adsorbed RL
100 19.16 161.68 2.952825 5.085619 0.052192 0.006185 1.282396 2.208656 0.118506 17210.12 80.84 0.33557
200 52.72 294.56 3.964995 5.685483 0.018968 0.003395 1.721975 2.469174 0.178979 2347.683 73.64 0.201613
300 90.59 418.82 4.506344 6.037441 0.011039 0.002388 1.95708 2.622027 0.216298 801.366 69.80 0.144092
400 159.9 480.2 5.074549 6.174203 0.006254 0.002082 2.203848 2.681422 0.332986 258.4388 60.03 0.112108
500 283.66 432.68 5.647776 6.069998 0.003525 0.002311 2.452798 2.636167 0.655588 82.34526 43.27 0.091743
600 351.98 496.04 5.863574 6.206657 0.002841 0.002016 2.546518 2.695517 0.70958 53.51743 41.34 0.07764
700 462.87 474.26 6.137446 6.161756 0.00216 0.002109 2.665459 2.676016 0.975984 30.96764 33.88 0.067295
800 554.95 490.1 6.318878 6.194609 0.001802 0.00204 2.744254 2.690285 1.13232 21.55132 30.63 0.059382
900 615.35 569.3 6.422191 6.344408 0.001625 0.001757 2.789122 2.755341 1.080889 17.53129 31.63 0.053135
1000 727.23 545.54 6.589243 6.301776 0.001375 0.001833 2.861672 2.736827 1.333046 12.55519 27.28 0.048077
Cholestyramine
C0
mg/L
Ce
mg/L
qe(x/m)
mg/g ln Ce ln qe 1/Ce 1/qe log Ce log qe Ce/qe
ɛ2
J2/mol2
%
Adsorbed RL
200 7.18 385.64 1.971299 5.954904 0.139276 0.002593 0.856124 2.586182 0.018618 336.2291 96.41 0.166667
300 14.41 571.18 2.667922 6.347704 0.069396 0.001751 1.158664 2.756773 0.025228 173.0083 95.2 0.117647
400 20.84 758.32 3.036874 6.631105 0.047985 0.001319 1.318898 2.879853 0.027482 120.8556 94.79 0.090909
500 25.2 949.6 3.226844 6.856041 0.039683 0.001053 1.401401 2.977541 0.026537 100.3468 94.96 0.074074
600 27.97 1144.06 3.331133 7.042339 0.035753 0.000874 1.446692 3.058449 0.024448 90.58139 95.34 0.0625
700 31.86 1336.28 3.461351 7.197645 0.031387 0.000748 1.503246 3.125897 0.023842 79.69074 95.45 0.054054
800 43.32 1513.36 3.768614 7.322088 0.023084 0.000661 1.636688 3.179942 0.028625 58.84754 94.59 0.047619
900 46.19 1707.62 3.832763 7.442856 0.02165 0.000586 1.664548 3.232391 0.027049 55.22994 94.87 0.042553
1000 53.71 1892.58 3.983599 7.545696 0.018619 0.000528 1.730055 3.277054 0.028379 47.56798 94.63 0.038462
C0: the initial concentration of the adsorbate; Ce: the equilibrium concentration of the adsorbent; qe: the amount of adsorbate at equilibrium bound per unit mass of
adsorbent; ɛ: Polanyi potential; RL: separation factor.
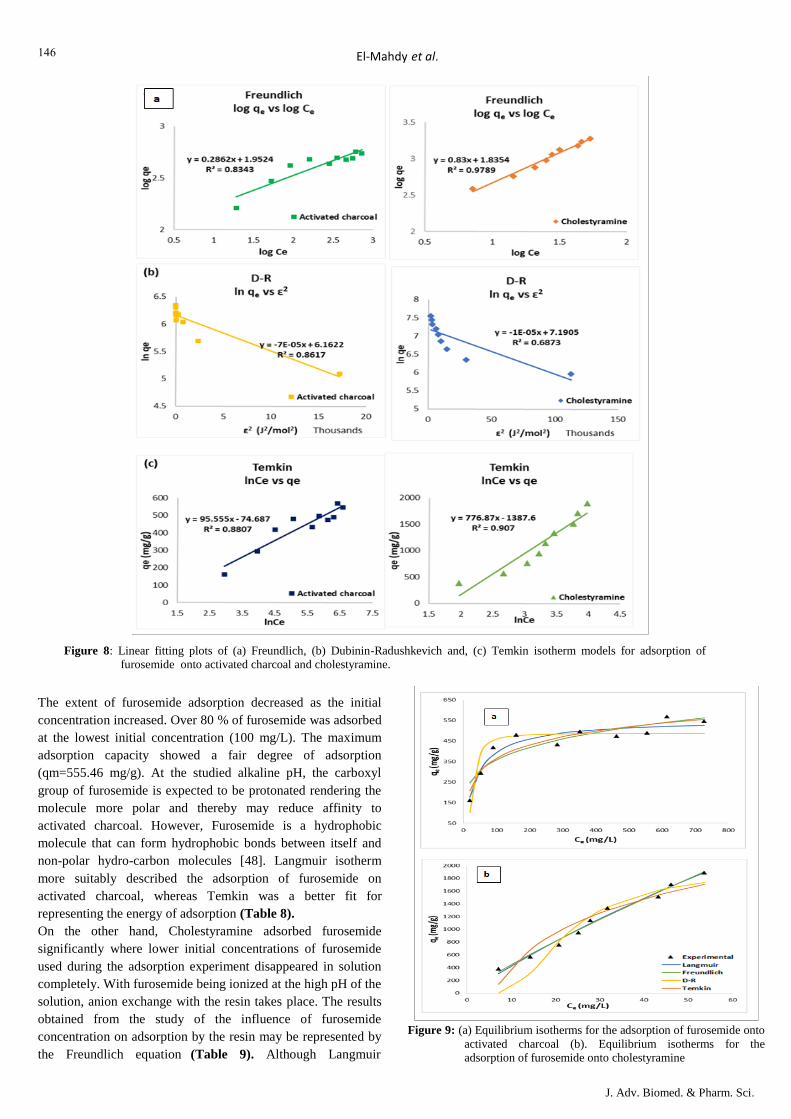
Figure 7: Linear fitting plots of (a) Freundlich, (b) Dubinin-Radushkevich and, (c) Temkin isotherm models for adsorption of furosemide onto activated
charcoal and cholestyramine.
646
J. Adv. Biomed. & Pharm. Sci.
El-Mahdy et al.
The extent of furosemide adsorption decreased as the initial
concentration increased. Over 80 % of furosemide was adsorbed
at the lowest initial concentration (100 mg/L). The maximum
adsorption capacity showed a fair degree of adsorption
(qm=555.46 mg/g). At the studied alkaline pH, the carboxyl
group of furosemide is expected to be protonated rendering the
molecule more polar and thereby may reduce affinity to
activated charcoal. However, Furosemide is a hydrophobic
molecule that can form hydrophobic bonds between itself and
non-polar hydro-carbon molecules [48]. Langmuir isotherm
more suitably described the adsorption of furosemide on
activated charcoal, whereas Temkin was a better fit for
representing the energy of adsorption (Table 8).
On the other hand, Cholestyramine adsorbed furosemide
significantly where lower initial concentrations of furosemide
used during the adsorption experiment disappeared in solution
completely. With furosemide being ionized at the high pH of the
solution, anion exchange with the resin takes place. The results
obtained from the study of the influence of furosemide
concentration on adsorption by the resin may be represented by
the Freundlich equation (Table 9). Although Langmuir
Figure 8: Linear fitting plots of (a) Freundlich, (b) Dubinin-Radushkevich and, (c) Temkin isotherm models for adsorption of
furosemide onto activated charcoal and cholestyramine.
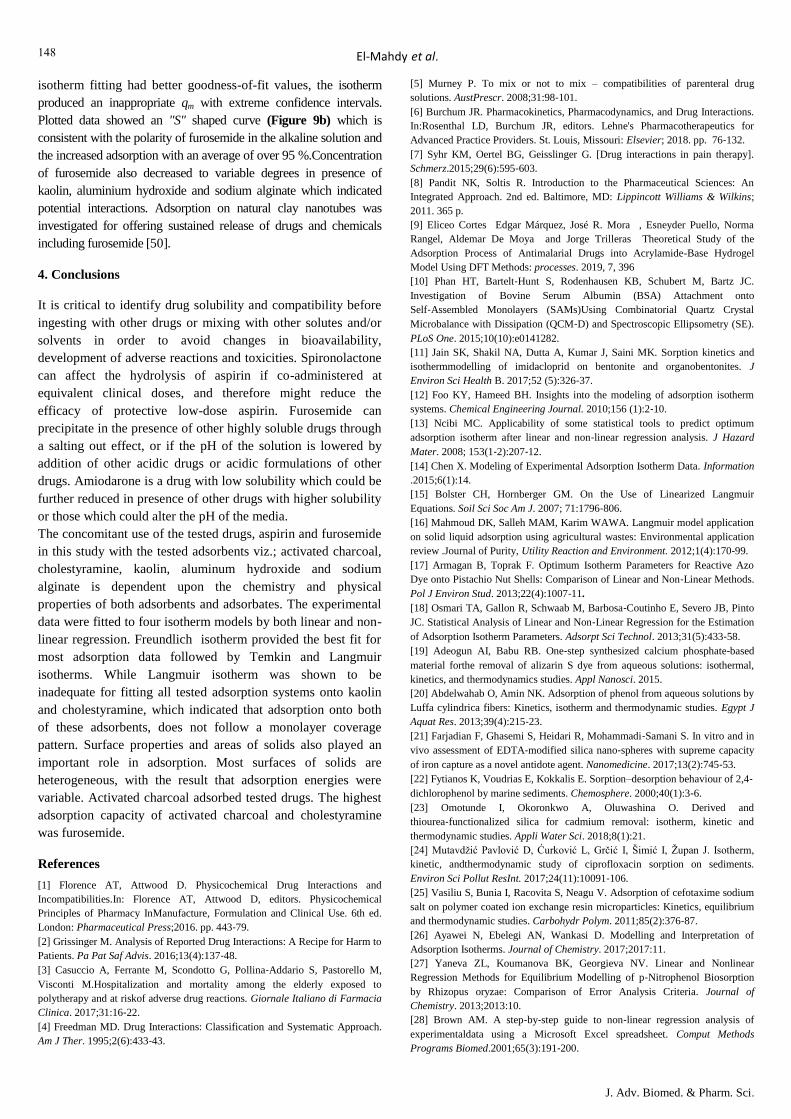
Figure 9: (a) Equilibrium isotherms for the adsorption of furosemide onto
activated charcoal (b). Equilibrium isotherms for the
adsorption of furosemide onto cholestyramine

647
J. Adv. Biomed. & Pharm. Sci.
El-Mahdy et al.
Table 8: Isotherm Parameters for Adsorption of Furosemide onto Activated charcoal Obtained by Linearized and non-Linearized fitting of Data
Isotherm Linear Non-linear
Langmuir
qe (mg/g)
KL (L/mg)
r2
SSE
AICc
555.55
1.98E-02
0.9853
555.46
2.4E-02
0.9200
1.1E+04
79.92
Freundlich
n
Kf [mg/g(L/mg)1/n]
r2
SSE
AICc
3.49
89.62
0.8343
4.39
125.36
0.8297
2.32E+04
87.49
Dubinin-Radushkevich
qD (mg/g)
KD (mol/kJ)2
ED (kJ/mol)
r2
SSE
AICc
474.47
7E-05
0.1
0.8617
487.07
9.06E-05
0.074
0.8021
2.78E+04
89.29
Temkin
KT (L/g)
bT (J/mol)
r2
SSE
AICc
26.99
0.42
0.8807
26.98
0.46
0.8807
1.61E+04
83.86
qe: the maximum adsorption capacity; KL: Langmuir isotherm constant, RL: separation factor; n, Kf: Freundlich isotherm constants; qD: the theoretical
maximum capacity; KD: D-R isotherm constant; ED: mean energy of adsorption; KT, bT: Temkin isotherm constants; r2: coefficient of determination; SSE:
sum of squared errors; AICc: corrected Akaike’s Information Criterion.
Table 9: Isotherm Parameters for Adsorption of Furosemide onto Cholestyramine Obtained by Linearized and non-Linearized fitting of Data
Isotherm Linear Non-linear
Langmuir
qe (mg/g)
KL (L/mg)
r2
SSE
AICc
3333.33*
0.017*
0.9604*
8980.89
0.0049
0.9827
3.74E+04
85.79
Freundlich
n
Kf [mg/g(L/mg)1/n]
r2
SSE
AICc
1.20
68.45
0.9789
1.16
61.51
0.9825
3.75E+04
85.81
Dubinin-Radushkevich
qD (mg/g)
KD (mol/kJ)2
ED (kJ/mol)
r2
SSE
AICc
1326.77
1.E-05
0.224
0.6873
1994
6.12E-05
0.0904
0.8732
2.72E+05
103.6
Temkin
KT (L/g)
bT (J/mol)
r2
SSE
AICc
0.168
3.32
0.9070
0.168
3.32
0.9070
1.99E+05
100.83 qe: the maximum adsorption capacity; KL: Langmuir isotherm constant, RL: separation factor; n, Kf: Freundlich isotherm constants; qD: the theoretical
maximum capacity; KD: D-R isotherm constant; ED: mean energy of adsorption; KT, bT: Temkin isotherm constants; r2: coefficient of determination; SSE:
sum of squared errors; AICc: corrected Akaike’s Information Criterion. *Parameters computed by fitting data to Linearization II of Langmuir.
648
J. Adv. Biomed. & Pharm. Sci.
El-Mahdy et al.
isotherm fitting had better goodness-of-fit values, the isotherm
produced an inappropriate qm with extreme confidence intervals.
Plotted data showed an "S" shaped curve (Figure 9b) which is
consistent with the polarity of furosemide in the alkaline solution and
the increased adsorption with an average of over 95 %.Concentration
of furosemide also decreased to variable degrees in presence of
kaolin, aluminium hydroxide and sodium alginate which indicated
potential interactions. Adsorption on natural clay nanotubes was
investigated for offering sustained release of drugs and chemicals
including furosemide [50].
4. Conclusions
It is critical to identify drug solubility and compatibility before
ingesting with other drugs or mixing with other solutes and/or
solvents in order to avoid changes in bioavailability,
development of adverse reactions and toxicities. Spironolactone
can affect the hydrolysis of aspirin if co-administered at
equivalent clinical doses, and therefore might reduce the
efficacy of protective low-dose aspirin. Furosemide can
precipitate in the presence of other highly soluble drugs through
a salting out effect, or if the pH of the solution is lowered by
addition of other acidic drugs or acidic formulations of other
drugs. Amiodarone is a drug with low solubility which could be
further reduced in presence of other drugs with higher solubility
or those which could alter the pH of the media.
The concomitant use of the tested drugs, aspirin and furosemide
in this study with the tested adsorbents viz.; activated charcoal,
cholestyramine, kaolin, aluminum hydroxide and sodium
alginate is dependent upon the chemistry and physical
properties of both adsorbents and adsorbates. The experimental
data were fitted to four isotherm models by both linear and non-
linear regression. Freundlich isotherm provided the best fit for
most adsorption data followed by Temkin and Langmuir
isotherms. While Langmuir isotherm was shown to be
inadequate for fitting all tested adsorption systems onto kaolin
and cholestyramine, which indicated that adsorption onto both
of these adsorbents, does not follow a monolayer coverage
pattern. Surface properties and areas of solids also played an
important role in adsorption. Most surfaces of solids are
heterogeneous, with the result that adsorption energies were
variable. Activated charcoal adsorbed tested drugs. The highest
adsorption capacity of activated charcoal and cholestyramine
was furosemide.
References
[1] Florence AT, Attwood D. Physicochemical Drug Interactions and
Incompatibilities.In: Florence AT, Attwood D, editors. Physicochemical
Principles of Pharmacy InManufacture, Formulation and Clinical Use. 6th ed.
London: Pharmaceutical Press;2016. pp. 443‐79.
[2] Grissinger M. Analysis of Reported Drug Interactions: A Recipe for Harm to
Patients. Pa Pat Saf Advis. 2016;13(4):137‐48.
[3] Casuccio A, Ferrante M, Scondotto G, Pollina‐Addario S, Pastorello M,
Visconti M.Hospitalization and mortality among the elderly exposed to
polytherapy and at riskof adverse drug reactions. Giornale Italiano di Farmacia
Clinica. 2017;31:16‐22.
[4] Freedman MD. Drug Interactions: Classification and Systematic Approach.
Am J Ther. 1995;2(6):433‐43.
[5] Murney P. To mix or not to mix – compatibilities of parenteral drug
solutions. AustPrescr. 2008;31:98‐101.
[6] Burchum JR. Pharmacokinetics, Pharmacodynamics, and Drug Interactions.
In:Rosenthal LD, Burchum JR, editors. Lehne's Pharmacotherapeutics for
Advanced Practice Providers. St. Louis, Missouri: Elsevier; 2018. pp. 76‐132.
[7] Syhr KM, Oertel BG, Geisslinger G. [Drug interactions in pain therapy].
Schmerz.2015;29(6):595‐603.
[8] Pandit NK, Soltis R. Introduction to the Pharmaceutical Sciences: An
Integrated Approach. 2nd ed. Baltimore, MD: Lippincott Williams & Wilkins;
2011. 365 p.
[9] Eliceo Cortes Edgar Márquez, José R. Mora , Esneyder Puello, Norma
Rangel, Aldemar De Moya and Jorge Trilleras Theoretical Study of the
Adsorption Process of Antimalarial Drugs into Acrylamide-Base Hydrogel
Model Using DFT Methods: processes. 2019, 7, 396
[10] Phan HT, Bartelt‐Hunt S, Rodenhausen KB, Schubert M, Bartz JC.
Investigation of Bovine Serum Albumin (BSA) Attachment onto
Self‐Assembled Monolayers (SAMs)Using Combinatorial Quartz Crystal
Microbalance with Dissipation (QCM‐D) and Spectroscopic Ellipsometry (SE).
PLoS One. 2015;10(10):e0141282.
[11] Jain SK, Shakil NA, Dutta A, Kumar J, Saini MK. Sorption kinetics and
isothermmodelling of imidacloprid on bentonite and organobentonites. J
Environ Sci Health B. 2017;52 (5):326‐37.
[12] Foo KY, Hameed BH. Insights into the modeling of adsorption isotherm
systems. Chemical Engineering Journal. 2010;156 (1):2‐10.
[13] Ncibi MC. Applicability of some statistical tools to predict optimum
adsorption isotherm after linear and non‐linear regression analysis. J Hazard
Mater. 2008; 153(1‐2):207‐12.
[14] Chen X. Modeling of Experimental Adsorption Isotherm Data. Information
.2015;6(1):14.
[15] Bolster CH, Hornberger GM. On the Use of Linearized Langmuir
Equations. Soil Sci Soc Am J. 2007; 71:1796‐806.
[16] Mahmoud DK, Salleh MAM, Karim WAWA. Langmuir model application
on solid liquid adsorption using agricultural wastes: Environmental application
review .Journal of Purity, Utility Reaction and Environment. 2012;1(4):170‐99.
[17] Armagan B, Toprak F. Optimum Isotherm Parameters for Reactive Azo
Dye onto Pistachio Nut Shells: Comparison of Linear and Non‐Linear Methods.
Pol J Environ Stud. 2013;22(4):1007‐11.
[18] Osmari TA, Gallon R, Schwaab M, Barbosa‐Coutinho E, Severo JB, Pinto
JC. Statistical Analysis of Linear and Non‐Linear Regression for the Estimation
of Adsorption Isotherm Parameters. Adsorpt Sci Technol. 2013;31(5):433‐58.
[19] Adeogun AI, Babu RB. One‐step synthesized calcium phosphate‐based
material forthe removal of alizarin S dye from aqueous solutions: isothermal,
kinetics, and thermodynamics studies. Appl Nanosci. 2015.
[20] Abdelwahab O, Amin NK. Adsorption of phenol from aqueous solutions by
Luffa cylindrica fibers: Kinetics, isotherm and thermodynamic studies. Egypt J
Aquat Res. 2013;39(4):215‐23.
[21] Farjadian F, Ghasemi S, Heidari R, Mohammadi‐Samani S. In vitro and in
vivo assessment of EDTA‐modified silica nano‐spheres with supreme capacity
of iron capture as a novel antidote agent. Nanomedicine. 2017;13(2):745‐53.
[22] Fytianos K, Voudrias E, Kokkalis E. Sorption–desorption behaviour of 2,4‐
dichlorophenol by marine sediments. Chemosphere. 2000;40(1):3‐6.
[23] Omotunde I, Okoronkwo A, Oluwashina O. Derived and
thiourea‐functionalized silica for cadmium removal: isotherm, kinetic and
thermodynamic studies. Appli Water Sci. 2018;8(1):21.
[24] Mutavdžić Pavlović D, Ćurković L, Grčić I, Šimić I, Župan J. Isotherm,
kinetic, andthermodynamic study of ciprofloxacin sorption on sediments.
Environ Sci Pollut ResInt. 2017;24(11):10091‐106.
[25] Vasiliu S, Bunia I, Racovita S, Neagu V. Adsorption of cefotaxime sodium
salt on polymer coated ion exchange resin microparticles: Kinetics, equilibrium
and thermodynamic studies. Carbohydr Polym. 2011;85(2):376‐87.
[26] Ayawei N, Ebelegi AN, Wankasi D. Modelling and Interpretation of
Adsorption Isotherms. Journal of Chemistry. 2017;2017:11.
[27] Yaneva ZL, Koumanova BK, Georgieva NV. Linear and Nonlinear
Regression Methods for Equilibrium Modelling of p‐Nitrophenol Biosorption
by Rhizopus oryzae: Comparison of Error Analysis Criteria. Journal of
Chemistry. 2013;2013:10.
[28] Brown AM. A step‐by‐step guide to non‐linear regression analysis of
experimentaldata using a Microsoft Excel spreadsheet. Comput Methods
Programs Biomed.2001;65(3):191‐200.

649
J. Adv. Biomed. & Pharm. Sci.
El-Mahdy et al.
[29] Dávila‐Jiménez MM, Elizalde‐González MP, García‐Díaz E,
González‐Perea M, Guevara‐Villa MRG. Using Akaike Information Criterion to
Select the Optimal Isotherm Equation for Adsorption from Solution. Adsorption
Science & Technology. 2014;32(7):605‐22.
[30] Riekes MK, Tagliari MP, Granada A, Kuminek G, Silva MAS, Stulzer HK.
Enhanced solubility and dissolution rate of amiodarone by complexation with
β‐cyclodextrin through different methods. Materials Science and Engineering
C. 2010;30(7):1008‐ 13.
[31] Dai W‐G. In vitro methods to assess drug precipitation. Int J Pharm. 2010;
393(1):1‐16.
[32] Moffat AC, Osselton MD, Widdop B, Watts J. Clarke's Analysis of Drugs
and Poisons:In Pharmaceuticals, Body Fluids and Postmortem Material. 4th ed.
London:Pharmaceutical Press; 2011. 2736 p.
[33] Florey K. Aspirin. In: Florey K, editor. Analytical Profiles of Drug
Substances. 8. NewYork: Academic Press; 1979. pp. 1‐46.
[34] Baxter K. Stockley's drug interactions: A source book of interactions, their
mechanisms, clinical importance and management. 9th ed. London:
Pharmaceutical Press; 2010. 1792 p.
[35] Lexicomp‐Online®. Lexicomp® Interactions Module. Hudson, Ohio:
Lexi‐Comp, Inc.;[cited Sept 2018]. Available from:
http://online.lexi.com/lco/action/interact.
[36] Gahart BL, Nazareno AR, Ortega MQ. Gahart's 2018 Intravenous
Medications: AHandbook for Nurses and Health Professionals. 34th ed. St.
Louis, Missouri :Elsevier; 2017. 1394 p.
[37] Devara konda B, Otto D, Judefeind A, A Hill R, De Villiers M. Effect of
pH on the solubility and release of furosemide from polyamidoamine
(PAMAM) dendrimer complexes. Int. J. Pharm. 2008;345(1‐2):142‐53
[38] American Society of Health‐System Pharmacists®. ASHP's Interactive
Handbook on Injectable Drugs [Internet]. 2018 [cited Sept 2018]. Available
from:http://www.interactivehandbook.com.
[39] Ng TMH, Sims JJ, Gill MA. Cardiac Arrhythmias. In: Helms RA, Quan
DJ, Herfindal ET, Gourley DR, editors. Textbook of Therapeutics: Drug and
Disease Management. 8th ed. Philadelphia: Lippincott Williams & Wilkins;
2006. pp. 534‐75.
[40] Epstein AE, Olshansky B, Naccarelli GV, Kennedy JI, Murphy EJ,
Goldschlager N.Practical Management Guide for Clinicians Who Treat Patients
with Amiodarone.Am J Med. 2016;129(5):468‐75.
[41] Porter RS. Arrhythmias and Conduction Disorders. In: Porter RS, editor.
The MerckManual of Diagnosis and Therapy. 19th ed. Whitehouse Station, NJ:
Merck Sharp &Dohme Corp.; 2011. pp. 2293‐317.
[42] Matsumoto K, Ueno K, Nakabayashi T, Komamura K, Kamakura S,
Miyatake K. Amiodarone Interaction Time Differences with Warfarin and
Digoxin. J PharmTechnol. 2003;19(2):83‐90.
[43] Kim S, Thiessen PA, Bolton EE, Chen J, Fu G, Gindulyte A, Han L, He J,
He S,Shoemaker BA, Wang J, Yu B, Zhang J, Bryant SH. PubChem Identifier:
CID 2153.PubChem Substance and Compound databases. Nucleic Acids
Res.2016;44(D1):D1202‐13.
[44] Gröningsson K, Lindgren JE, Lundberg E, Sandberg R, Wahlén A.
Lidocaine Base andHydrochloride. In: Florey K, editor. Analytical Profiles of
Drug Substances. 14:Academic Press; 1985. pp. 207‐43.
[45] Mutavdžić Pavlović D, Ćurković L, Grčić I, Šimić I, Župan J. Isotherm,
kinetic, and thermodynamic study of ciprofloxacin sorption on sediments.
Environ Sci Pollut ResInt. 2017;24 (11):10091‐106.
[46] Prankerd RJ. Appendix A. In: Brittain HG, Prankerd RJ, editors. Profiles of
DrugSubstances, Excipients and Related Methodology. 33. London: Academic
Press;2007. pp. 35‐424.
[47] Rakić V, Rac V, Krmar M, Otman O, Auroux A. The adsorption of
pharmaceuticallyactive compounds from aqueous solutions onto activated
carbons. J Hazard Mater.2015;282:141‐9.
[48] Giles CH, MacEwan TH, Nakhwa SN, Smith D. Studies in adsorption. Part
XI. A system of classification of solution adsorption isotherms, and its use in
diagnosisof adsorption mechanisms and in measurement of specific surface
areas of solids.J Chem Soc. 1960(0):3973‐93.
[49] Yang W, de Villiers MM. Aqueous solubilization of furosemide by
supramolecular complexation with 4‐sulphonic calix[n] arenes. J Pharm
Pharmacol.2004;56(6):703‐8.
[50] Lvov Y, Aerov A, Fakhrullin R. Clay nanotube encapsulation for
functional biocomposites. Adv Colloid Interface Sci. 2014;207:189‐98.