Energy Drinks and Sports Performance, Cardiovascular Risk ...
Upload
khangminh22Category
view
2download
0
Cardiovascular risk in diabetes:What the Cardiologist Needs to Know
Hani Sabbour MD FACC FHRS

0
1
2
3
CV death All-cause
mortality
Hazard
ratio (
95%
CI)
(dia
bete
s v
s.
no d
iabete
s)
CVD is the leading cause of death among people with diabetes
*Information on diabetes type (i.e. type 1 or 2) was generally not available; although, the age of the participants suggests that the large majority with diabetes would have type 2 CI, confidence interval; CV, cardiovascular; CVD, cardiovascular disease.1. Seshasai SR et al. N Engl J Med 2011;364:829–841; 2. Centers for Disease Control and Prevention. National Diabetes Fact Sheet 2011. Available at: http://www.cdc.gov/diabetes/pubs/pdf/ndfs_2011.pdf; 3. International Diabetes Federation. IDF Diabetes Atlas, 7th edn. Brussels, Belgium: International Diabetes Federation, 2015. Available at: http://www.diabetesatlas.org.
Mortality risk associated with diabetes (n=820,900)1
0
7
6
5
4
3
2
1
040 50 60 70 80 90
Age (years)
Years
of
life
lost
Men
7
6
5
4
3
2
1
0
40 50 60 70 80 900
Age (years)
Women
Non-vascular deaths
Vascular deaths
Heart disease is the cause of death in more than two-thirds of people with diabetes aged 65 years or older2
Years of life lost in people with diabetes* compared with non-diabetes peers1
In high-income countries, up to 91% of adults with diabetes have type 2 diabetes3

Diabetes is associated with an increased risk of CV death whether or not the individual has had a prior MI
2
16 15
43
0
5
10
15
20
25
30
35
40
45
50
No MI MI No MI MI
Num
ber
of patients
(%
)7-year incidence of myocardial infarction (%)
Without diabetes (n=1373)With diabetes (n=1059)
MI, myocardial infarction.Adapted from: Hafner SM. N Engl J Med 1998;339:229–342.

MRFIT: Impact of diabetes on cardiovascular mortality
Mort
ality
per
10,0
00
Number of risk factors*
*Risk factors analysed: smoking, hypercholesterolemia and hypertension.MRFIT, multiple risk factor intervention trialStamler J, et al. Diabetes Care 1993; 16(2):434-44
612
22
47
31
59
91
125
0
20
40
60
80
100
120
140
None One only Two only All three
Non-diabetes (n=342,815) Diabetes (n=5,163)
20-30 31-40 41-45 46-50 51-55 56-60 61-65 66-70 71-75 76-80 81-85
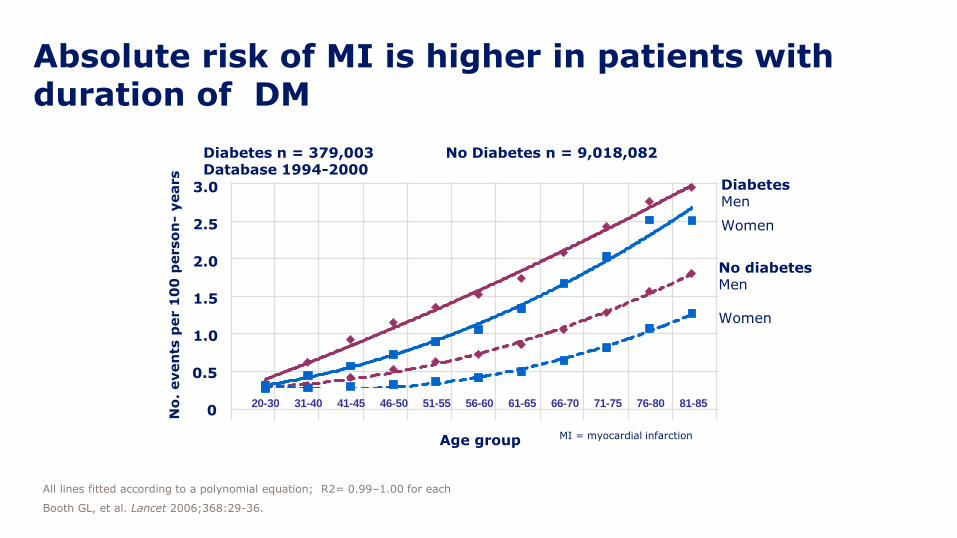
Absolute risk of MI is higher in patients with duration of DM
Age group
0.5
1.0
1.5
2.0
2.5
3.0
0No
. even
ts p
er 1
00
perso
n-
years
All lines fitted according to a polynomial equation; R2= 0.99–1.00 for each
Booth GL, et al. Lancet 2006;368:29-36.
MI = myocardial infarction
Diabetes n = 379,003 No Diabetes n = 9,018,082 Database 1994-2000
No diabetesMen
Women
DiabetesMen
Women

Risk of myocardial infarction is associated with multiple risk factors: The INTERHEART study
Factor Odds Ratio 99% CI
Smoking (1) 2.87 2.58 – 3.19
Diabetes mellitus (2) 2.37 2.07 – 2.71
Hypertension (3) 1.91 1.74 – 2.10
Obesity 1.62 1.45 – 1.80
1 + 2 + 3 13.0 10.7 – 15.8
1 + 2 + 3 + Obesity 21.0 —
CI, confidence intervalYusuf S, et al. Lancet. 2004;364:937–952; Yusuf S, et al. Lancet. 2005;366:1640-1649.

Meta-analysis of different interventions over 5 years
-12.5
-8.2
-2.9
-14
-12
-10
-8
-6
-4
-2
0
Per 4 mmHg lower SBP Per 1 mmol/L lower LDL-C Per 0.9% lower HbA1c
CV, cardiovascular; HbA1c, glycosylated haemoglobin; LDL-C low-density lipoprotein-cholesterol; SBP, systolic blood pressureSattar N. Diabetologia 2013;56:686–695.
Benefit of different interventions:HbA1c, SBP and LDL-C
Change in C
V d
eath
rate
(%
)

UKPDS
Patients were randomised to conventional glucose control (diet) or intensive glucose control (SU or insulin, or metformin if >120% of ideal body weight)CV, cardiovascular; MI, myocardial infarction; SU, sulphonylurea; UKPDS, UK Prospective Diabetes StudyHolman et al. N Engl J Med 2008;359:1577–1589.
CV benefits of tight glycaemic control – 10 years
No. at riskNo. at risk
SU/insulin: 2729 2488 2097 1459 577 66Conventional: 1138 1013 857 578 221 20 Conventional: 411 360 311 213 95 4
Metformin: 342 317 274 214 106 16
1.0
0.8
0.6
0.4
0.2
0.0
0 5 10 15 20 25
p=0.01
Conventional therapy
Sulphonylurea-insulin
1.0
0.8
0.6
0.4
0.2
0.0
0 5 10 15 20 25
p=0.005
Conventional therapy
Metformin
Years since randomisation
Pro
port
ion w
ith M
I
Pro
port
ion w
ith M
I

UKPDS 2008 –The “legacy effect” of early glucose control
End of randomised intervention1
1997
End of 10-year observational
follow-up2
2007
Any diabetes-related endpoint RRR
p-value
12%0.029
9%0.040
Microvascular disease RRR
p-value
25%0.0099
24%0.001
Myocardial infarction RRR
p-value
16%0.052, ns
15%0.014
All-cause mortality RRR
p-value
6%0.44, ns
13%0.007
RRR = relative risk reduction associated with intensive glucose control1UKPDS Group. Lancet 1998;352:837–853.
2Holman R, et al. N Engl J Med 2008;359:1577–1589.
UKPDS 2008 – The “legacy effect”The cardiovascular benefit of intensive glucose control may be greater,
if initiated early in the development of diabetes!

Part
icip
ants
wit
h
hyp
ogl
ycae
mia
eve
nts
(%
)
1 2 3 4 5 6 70
5
10
15
20
0
p<0.001
n=538
n=179
Follow-up years
Intensive glycaemia control
Standard glycaemia control
Total n=10,209
Miller et al. BMJ 2010;340:b5444 doi: 10.1136/bmj.b5444
ACCORD study Effect of glycaemic control on the risk of severe hypoglycaemia

Schramm TK et al., Eur Heart J 2011: 32(15):1900-8.
Mortality and CV risk in T2DM treated with Metformin vs.
Sulfonylureas: a nationwide Danish study
All-cause death and MACE were all significantly increased for:
Glimeperide +20-30%Glibenclamide +12-47%Glipizide +17-53%Tolbutamide +25-47%
compared to Metformin.
Gliclazide showed no negative signal.

Who will benefit from intensive glycaemic control ?
RRR of glycemic control
2
1
0
Time since type 2 diabetes diagnosis (yrs)
3 6 9 12 15 18 21
CV risk
CV benefit
0
VADT risk model: Benefit of early vs late glycaemic intervention
Adapted from VADT data presented at ADA June 2008.
ADVANCE
ACCORD
VADT
UKPDS

• Avoid Hypoglycaemias
• Avoid Treatment-related Weight Gain
• Reconstitute Beta-cell function and
stop Beta cell loss
• Provide stringent and safe
glycemic control early after diagnosis
What are the choices?
How to treat Type 2 Diabetes in 2016 ?

Heart failure and diabetes
• Data from The Framingham Study1 from 1974 suggest that “diabetes is another discrete cause of congestive heart failure and that some form of cardiomyopathy is associated with diabetes, as a result of either small vessel disease or metabolic disorders.”
HF, heart failure1. Kannel WB et al. Am J Cardiol 1974;34:29–34; 2. Gilbert RE, Krum H. Lancet 2015;385:2107–2121; 3. Bauters C et al. Cardiovasc Diabetol 2003;2:1.
Prevale
nce r
ate
per 1
00
0
400
350
300
250
200
250
100
50
45–54 55–64 65–74 75–84 85–94
Individuals with diabetesIndividuals without diabetes
Age at baseline (years)
0
<45
Age-associated prevalence of heart failure2
Diabetes is a predictor of poor clinical outcomes in HF patients3
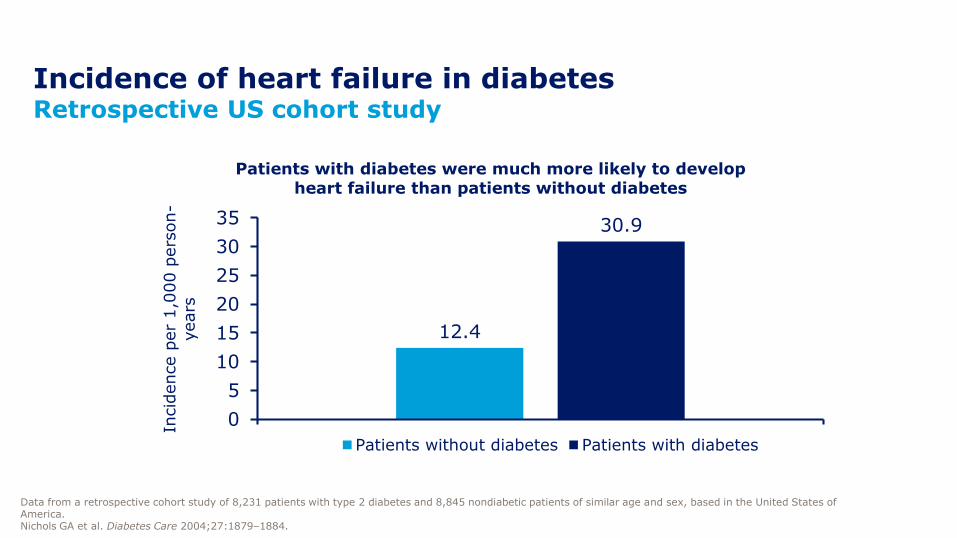
Incidence of heart failure in diabetesRetrospective US cohort study
Data from a retrospective cohort study of 8,231 patients with type 2 diabetes and 8,845 nondiabetic patients of similar age and sex, based in the United States of America.Nichols GA et al. Diabetes Care 2004;27:1879–1884.
12.4
30.9
0
5
10
15
20
25
30
35
All
Incid
ence p
er
1,0
00 p
ers
on-
years
Patients with diabetes were much more likely to develop heart failure than patients without diabetes
Patients without diabetes Patients with diabetes

Diabetic cardiomyopathy
Rubler S, et al. Am J Cardiol 1972;30:595– 602.
A distinct entity characterized by the
presence of abnormal myocardial
performance or structure in the absence of
epicardial coronary artery disease,
hypertension and significant valvular disease.

• Diabetes frequently precedes HTN, CAD and CKD which are major risk factors for HF
• Hypertension: pressure overload
• IHD: diabetes accelerates the appearance and progression of coronary atherosclerosis
• Diabetic nephropathy: fluid retention and eventually volume overload
• Lipotoxicity due to accumulation of FFA in heart muscle
From diabetes to heart failureMechanisms of heart failure in diabetes
CAD, coronary artery disease; CKD, chronic kidney disease; FFA, free fatty acids; HF, heart failure; HTN, hypertension; IHD, ischaemic heart disease
Goyal BR, Mehta AA. Hum Exp Toxicol 2013; 32: 571-590. Voulgari C, et al. Vasc Health Risk Manag 2010; 6: 883-903.
2D ECHO
•Preserved LV ejection fraction.
• Reduced early diastolic filling.
• Prolongation of isovolumetric relaxation and increased atrial filling.
• Pre – ejection period(PEP) increased.
• LV ejection time(LVET)decreased.
• PEP/LVET increased.
ECHO HALLMARKS – DIASTOLIC DYSFUNCTION

Myocardial fibrosis and myocyte hypertrophy in diabetic cardiomyopathy
Perivascular fibrosis (A) and fibrosis between myocytes (B) in a patient with
diabetes mellitus at autopsy

• In asymptomatic T2DM, TDI revealed LV diastolic dysfunction in 63%, while abnormal transmitral LV filling pattern was detected in 46%
• Overt HF and compromised LV systolic function occurs in advanced stages of HF
• Forward HF
• Weakness, fatigue, angina, syncope
• Backward HF (very late symptoms)
• Dyspnoea, raised jugular vein pressure, lower extremity oedema, hepatomegaly
TDI, tissue Doppler imaging
Boyer JK, et al. Am J Cardiol. 2004; 93: 870-875.
Clinical presentation and diagnostic approach

• Aggressive glycaemic control• Decreases FFA oxidation by myocardial cells and increases glucose utilisation
• Is intensive glycaemic control associated with better cardiovascular outcomes?• May depend on how you achieve it
• ACEi – HOPE (Heart Outcomes Prevention Evaluation) study• Decreased cardiovascular morbidity and mortality in diabetic patients
• 33% reduction in rate of development of new HF
• Greater benefit in diabetic than non-diabetic patients
• ARBs – additive effects on haemodynamic measurements, neurohormonalactivity and LV remodelling with ACE inhibitors
Treatment
ACEi, angiotensin converting enzyme inhibitor; ARB, angiotensin receptor blocker; FFA, free fatty acid; HF, heart failure; LV, left ventricular
HOPE study investigators. Lancet 2000;355(9200):253-9.

All patients Diabetic patients
Death from cardiovascular causes 26% 37%
MI 20% 22%
Stroke 32% 33%
All-cause mortality 16% 24%
Revascularisation 15% 17%
Cardiovascular morbidity and mortality in the HOPE study
MI, myocardial infarction
HOPE study investigators. Lancet 2000;355(9200):253-9.

• HF and diabetes frequently co-exist in a bidirectional relationship
• Several pathophysiological connections have been proposed
• Both diabetes and HF are characterised by high morbidity and mortality
• Treatment must target an overall improvement as diabetes treatment can decompensate HF and vice versa
• Diabetes drugs should be used with caution in HF
Conclusions
HF, heart failure

• Metabolic Syndrome
• Increased Free Fatty Acids cause endothelial dysfunction and are proinflammatory
• Oxidative Stress is increased by multiple cardiovascular risk factors
Mechanisms of Vascular Injury in Diabetes
Dyslipidaemia
HDL
Triglycerides
Hypertension
Obesity
Hyperglycaemia
HDL, high-density lipoprotein

Clinical Manifestations of Insulin Resistance
Insulin Resistance
Glucotoxicity; Lipotoxicity; Adiponectin
Atherosclerosis
HDL, high-density lipoprotein; hs-CRP, high-sensitivity C-reactive protein; LDL, low-density lipoprotein; PAI-1, plasminogen activator inhibitor-1
Visceral Adiposity
Type 2 Diabetes
Glycaemic Disorders
Dyslipidemia
-Low HDL
-Small, dense LDL
-Hypertriglyceridemia
-Hypertension
-Endothelial dysfunction/ inflammation (hs-CRP)
-Impaired thrombolysis
(PAI-1)

Development of CVD in people with T2DM
Early endothelial dysfunctionand vascular inflammation
Monocyte recruitment andfoam cell formation
Development of fatty streaks
Atherosclerotic plaque formation
Occlusive thrombus formation (myocardial infarction/stroke)
Pro
gre
ssio
n o
f CVD
Time
CVD, cardiovascular disease; T2DM, type 2 diabetes mellitus.Ryden L et al. Eur Heart J 2013;34:3035–3087.
EARLY INTERVENTION

How is cardiovascular risk managed in type 2 diabetes?

Treatment for T2DM should aim to reduce CV risk
ADA, American Diabetes Association; AHA, American Heart Association; CV, cardiovascular; CVD, cardiovascular disease; EASD, European Association for the Study of Diabetes; ESC, European Society of Cardiology; T2DM, type 2 diabetes mellitus.1. Rydén L et al. Eur Heart J 2013;34:3035–3087; 2. Fox CS et al. Diabetes Care 2015;38:1777–1803; 3. Piepoli MF et al. Eur Heart J 2016; May 23 [Epub ahead of print]: pii ehw106.
ESC/E
ASD
1
AH
A/A
DA
2
The ESC have also published a 2016 guideline on CVD prevention including a section on diabetes3

CV, cardiovascular; T2DM, type 2 diabetes mellitus.1. Rydén L et al. Eur Heart J 2013;34:3035–3087; 2. Fox CS et al. Diabetes Care 2015;38:1777–1803; 3. Piepoli MF et al. Eur Heart J 2016; [Epub ahead of print]: pii ehw106.
How do we modify CV risk in T2DM?
Lifestyle modification Glycaemic control
Multifactorial approach
Blood pressure control
Platelet inhibition
Management of dyslipidaemia

• Action to Control Cardiovascular Risk in Diabetes (ACCORD)
• Action in Diabetes and Vascular Disease: Preterax and Diamicron MR
Controlled Evaluation (ADVANCE)
• VA Diabetes Trial (VADT)
• The pathophysiologic effect of glucose on vascular injury remains to be
determined
• Effects are long-term, so glucose control should be started early, perhaps in
the “prediabetes” stage
• Hypoglycaemia should be avoided
Major clinical trials had shown that intensive glucose control does not decrease CV events. Until recently…Paradigm shift in CV outcome with LEADER and EMPAREG
The Action to Control Cardiovascular Risk in Diabetes Study Group. N Engl J Med. 2008;358:2545–2559. | ADVANCE Collaborative Group. N Engl J Med.2008;358:2560–5572. | Duckworth W, et al. N Engl J Med. 2008;360:129–139.

Glycaemic control
ADA, American Diabetes Association; AHA, American Heart Association; CVD, cardiovascular disease; EASD, European Association for the Study of Diabetes; ESC, European Society of Cardiology; HbA1c, glycosylated haemoglobin; SGLT-2i, sodium glucose co-transporter-2 inhibitor; T2DM, type 2 diabetes mellitus1. Rydén L et al. Eur Heart J 2013;34:3035–3087; 2. Fox CS et al. Diabetes Care 2015;38:1777–1803; 3. Piepoli MF et al. Eur Heart J 2016; [Epub ahead of print]: pii ehw106.
• Treatment
• Metformin is recommended as first line therapy, if tolerated and not contra-indicated, following evaluation of renal function
• The latest ESC guidelines recommend the use of an SGLT2 inhibitor early in the course of the disease in patients with T2DM and CVD, with a view to reducing cardiovascular and total mortality3
ESC/EASD1, AHA/ADA2 and ESC3
• HbA1c treatment targets
• Generally <7.0% (53 mmol/mol)
• On an individual basis <6.5–6.9% (48–52 mmol/mol) or above 7%
ESC/EASD1, AHA/ADA2 and ESC3

BP, blood pressure; CI, confidence interval; UKPDS, United Kingdom Prospective Diabetes StudyUKPDS Study Group. BMJ 1998; 317:703-13.
50
40
30
20
10
0
Years from randomisation
Patients
with e
vents
(%
)
0 1 2 3 4 5 6 7 8 9
Less tight control (mean BP 154/87 mmHg)
Tight control (mean BP 144/82 mmHg)
Hypertension in Diabetes UKPDS
Tight BP control:24% reduction of events
(95% CI 8-38)
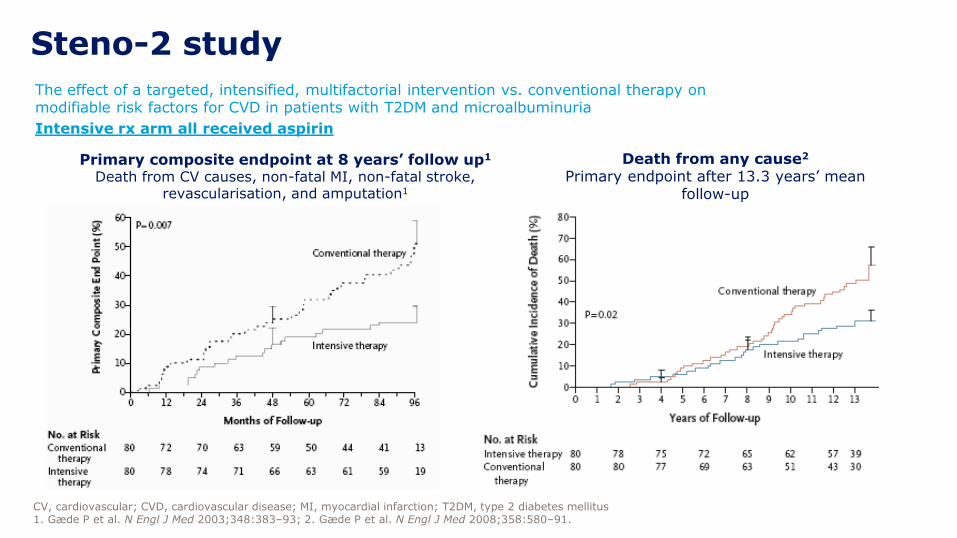
The effect of a targeted, intensified, multifactorial intervention vs. conventional therapy on modifiable risk factors for CVD in patients with T2DM and microalbuminuria
Intensive rx arm all received aspirin
CV, cardiovascular; CVD, cardiovascular disease; MI, myocardial infarction; T2DM, type 2 diabetes mellitus1. Gæde P et al. N Engl J Med 2003;348:383‒93; 2. Gæde P et al. N Engl J Med 2008;358:580‒91.
Steno-2 study
Primary composite endpoint at 8 years’ follow up1
Death from CV causes, non-fatal MI, non-fatal stroke, revascularisation, and amputation1
Death from any cause2
Primary endpoint after 13.3 years’ mean follow-up

• Many factors contribute to an increased cardiovascular risk in T2DM
• A multifactorial approach to treating T2DM is recommended to address these risk factors, including:
• Lifestyle modification
• Glycaemic control
• Blood-pressure control
• Management of dyslipidaemia
• Platelet inhibition
• Treatment targets and therapy should be individualised depending on individual circumstances and level of CVD risk
Summary
CVD, cardiovascular disease; T2DM, type 2 diabetes mellitus.

Experience with rosiglitazone
Nissen SE et al. N Engl J Med 2007;156:2457–2471.
“Rosiglitazone was associated with a significant
increase in the risk of myocardial infarction and
with an increase in the risk of death from cardiovascular causes that had borderline
significance.”

Weight Risk ratio (95% CI) Risk ratio (95% CI)
Rosiglitazone trials 46.2% 2.41 (1.61–3.61)
Pioglitazone trials 53.8% 1.32 (1.04–1.68)
Total 100.0% 1.74 (0.97–3.14)
Test for overall effect: Z = 1.85 (p = 0.07)
Meta-analysis showed increased risk for congestive
heart failure with both pioglitazone and rosiglitazone
69
Lago et al. Lancet 2007;370:1129–36.
• In a meta-analysis of 20,191 patients with pre-diabetes or T2D, the
increased risk for congestive heart failure with TZDs did not differ
between rosiglitazone and pioglitazone (p = 0.07)
Increased riskDecreased risk
Comparison of risk of congestive heart failure
0.1 0.2 0.5 1 2 5 10

Adverse CV events led the FDA to require demonstration
of CV safety for new glucose-lowering drugs
1. Nissen. Ann Intern Med 2012;157:671–2. 2. Nissen et al. JAMA 2005;294:2581–6. 3. Nissen et al. N Engl J Med 2007;356:2457–71.
4. ACCORD Study Group. N Engl J Med 2008;358:2545–59. 5. http://www.fda.gov/downloads/drugs/guidancecomplianceregulatoryinformation/%20guidances/ucm071627.pdf
6. http://www.ema.europa.eu/docs/en_GB/document_library/Scientific_guideline/2012/06/WC500129256.pdf
7.http://www.fda.gov/Safety/MedWatch/SafetyInformation/SafetyAlertsforHumanMedicalProducts/ucm376683.htm?source=govdelivery&utm_medium=email&utm_source=govdelivery
UGDP trial: tolbutamide discontinued due to
increased CV mortality vs other treatment groups1
• Sponsor withdrew
application1
• Withdrawn in the EU1
• Use restricted in US1*
*In 2013, FDA panel voted to reduce
safety restrictions on rosiglitazone7
1961
2005
2007
2008
20082012
Muraglitazar found to potentially increase CV
risk during FDA assessment2
Rosiglitazone associated with increased risk
for MI and CV-related death3
ACCORD trial: intensive glucose lowering was
associated with increased all-cause mortality4
HR 1.22 (95% CI 1.01‒1.46); p = 0.04New FDA requirements5
New EMA requirements6
New diabetes drugs should demonstrate CV safety
with meta-analysis and a CV outcome trial (CVOT)
70

Satisfying FDA requirements for CV safetyNumber of CV events needed to satisfy 1.3 non-inferiority margin
73
Geiger et al. Ther Innovation Reg Science 2014;1–15.
Assuming relative risk of 1.0 and 90% power, adjudicated CV events needed to
satisfy the CI upper limits for non-inferiority:
– 122 events for the 1.8 risk margin
0.80.65 0.7 0.75 0.85 0.9 0.95 1 1.05 1.151.10
200
400
600
800
1000
1200
1400
1600
Num
ber
of
events
Assumed true relative risk
80% power
90% power
110 139 179233
311428
611
1507
9221126
689
457
233320
134 17410482
– 611 events for the 1.3 risk margin

CVOTs designed to assess effects of a specific drug
or of a treatment strategy (e.g. glucose lowering)
1. UKPDS 33. Lancet 1998;352:837–53. 2. UKPDS 34. Lancet 1998;352:854–65. 3. Duckworth et al. N Engl J Med 2009;360:129–39.
4. ACCORD. N Engl J Med 2008;358:2545–59. 5. ADVANCE. N Engl J Med 2008;358:2560–72. 6. Dormandy et al. Lancet 2005;366:1279–89. 7. Mahaffey et al.
Am Heart J 2013;166:240–9.e1. 8. Scirica et al. N Engl J Med 2013;369:1317–26. 9. White et al. N Engl J Med 2013;369:1327–35. 10. Bentley-Lewis et al. Am
Heart J 2015;0:1–8.e7. 11. Bethel et al. Diabetes Obes Metab 2015;17:1395–402. 12. Zinman et al. Cardiovasc Diabetol 2014;13:102.
Treatment strategy trials (intensive vs
standard glucose lowering)Compound-specific trials
UKPDS1,2 FPG < 6 vs < 15 mmol/L Also assessed metformin vs SU + insulin2
VADT3 HbA1c ≤ 6% vs 8–9%
ACCORD4 HbA1c < 6% vs 7–7.9%
ADVANCE5 HbA1c < 6.5% vs SOC Also assessed gliclazide + other drugs in
intensive arm vs standard care arm
PROactive6 Pioglitazone vs placebo
RECORD7 Rosiglitazone + metformin or SU vs metformin +
SU
SAVOR-TIMI 538 Saxagliptin vs placebo
EXAMINE9 Alogliptin vs placebo
ELIXA10 Lixisenatide vs placebo
TECOS11 Sitagliptin vs placebo
EMPA-REG OUTCOME®12 Empagliflozin vs placebo
75
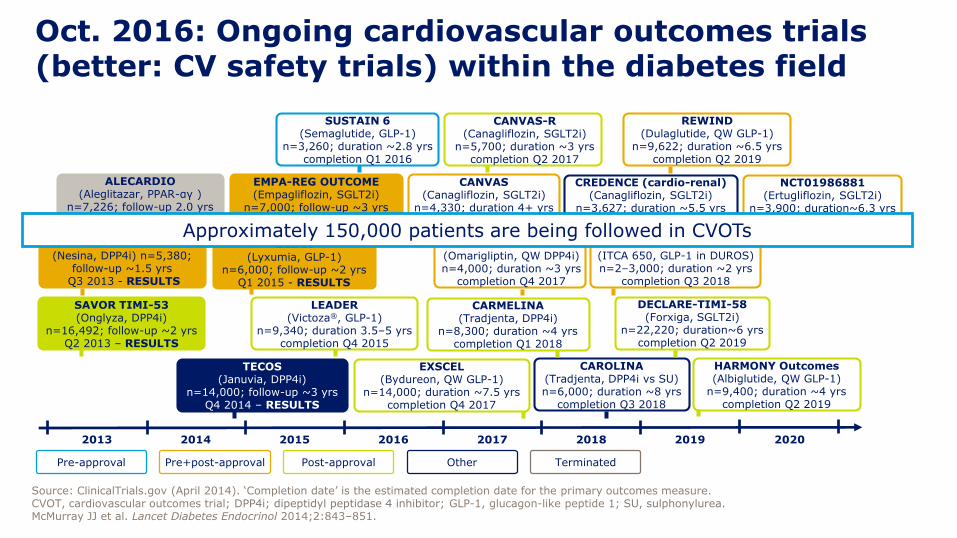
FREEDOM (ITCA 650, GLP-1 in DUROS)n=2–3,000; duration ~2 yrs
completion Q3 2018
Oct. 2016: Ongoing cardiovascular outcomes trials (better: CV safety trials) within the diabetes field
TECOS(Januvia, DPP4i)
n=14,000; follow-up ~3 yrsQ4 2014 – RESULTS
CAROLINA(Tradjenta, DPP4i vs SU)n=6,000; duration ~8 yrs
completion Q3 2018
CANVAS(Canagliflozin, SGLT2i)
n=4,330; duration 4+ yrscompletion Q1 2017
ELIXA(Lyxumia, GLP-1)
n=6,000; follow-up ~2 yrsQ1 2015 - RESULTS
REWIND(Dulaglutide, QW GLP-1)
n=9,622; duration ~6.5 yrscompletion Q2 2019
SUSTAIN 6(Semaglutide, GLP-1)
n=3,260; duration ~2.8 yrscompletion Q1 2016
Pre-approval Post-approvalPre+post-approval Other
LEADER(Victoza®, GLP-1)
n=9,340; duration 3.5–5 yrscompletion Q4 2015
DECLARE-TIMI-58(Forxiga, SGLT2i)
n=22,220; duration~6 yrscompletion Q2 2019
SAVOR TIMI-53(Onglyza, DPP4i)
n=16,492; follow-up ~2 yrs Q2 2013 – RESULTS
CARMELINA(Tradjenta, DPP4i)
n=8,300; duration ~4 yrs completion Q1 2018
EXAMINE(Nesina, DPP4i) n=5,380;
follow-up ~1.5 yrsQ3 2013 - RESULTS
NCT01703208(Omarigliptin, QW DPP4i)n=4,000; duration ~3 yrs
completion Q4 2017
EMPA-REG OUTCOME(Empagliflozin, SGLT2i)
n=7,000; follow-up ~3 yrs Q3 2015 - RESULTS
20192015 20202013 2014 2016 2017 2018
EXSCEL(Bydureon, QW GLP-1)
n=14,000; duration ~7.5 yrscompletion Q4 2017
CANVAS-R(Canagliflozin, SGLT2i)
n=5,700; duration ~3 yrscompletion Q2 2017
NCT01986881(Ertugliflozin, SGLT2i)
n=3,900; duration~6.3 yrscompletion Q2 2020
Terminated
ALECARDIO(Aleglitazar, PPAR-αγ )
n=7,226; follow-up 2.0 yrsTermin. Q3 2013 RESULTS
CREDENCE (cardio-renal)(Canagliflozin, SGLT2i)
n=3,627; duration ~5.5 yrs completion Q1 2019
Source: ClinicalTrials.gov (April 2014). ‘Completion date’ is the estimated completion date for the primary outcomes measure.CVOT, cardiovascular outcomes trial; DPP4i; dipeptidyl peptidase 4 inhibitor; GLP-1, glucagon-like peptide 1; SU, sulphonylurea.McMurray JJ et al. Lancet Diabetes Endocrinol 2014;2:843–851.
HARMONY Outcomes(Albiglutide, QW GLP-1)
n=9,400; duration ~4 yrscompletion Q2 2019
Approximately 150,000 patients are being followed in CVOTs
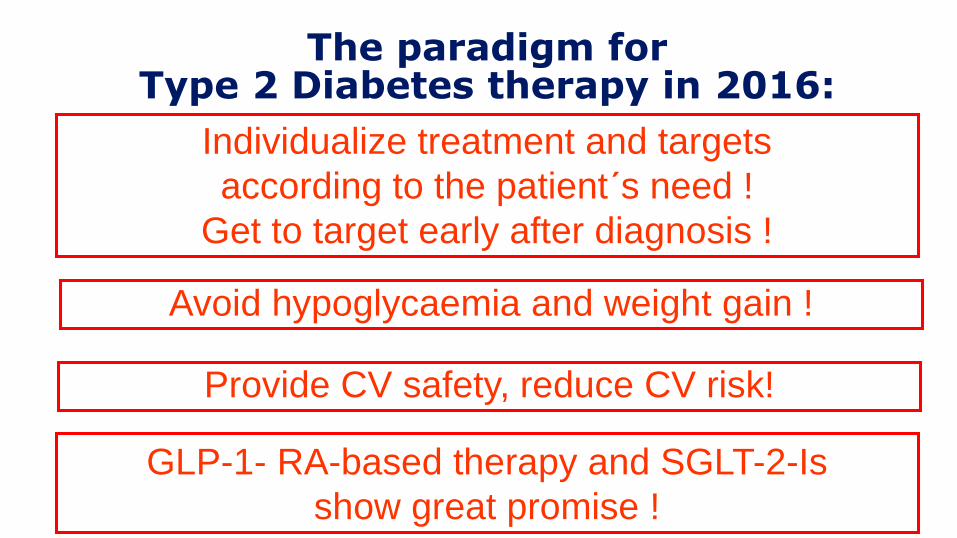
The paradigm for Type 2 Diabetes therapy in 2016:
Individualize treatment and targets
according to the patient´s need !
Get to target early after diagnosis !
Avoid hypoglycaemia and weight gain !
GLP-1- RA-based therapy and SGLT-2-Is
show great promise !
Provide CV safety, reduce CV risk!

Incretin-based therapies affect multiple CV risk factors
Endothelial dysfunction
GLP-1 or incretin-based
therapy
MyocardialIR injury
GLP-1R-dependent and –independent mechanisms
Dyslipidaemia
Blood pressure
Heart rate
Weight
Hyperglycaemia
Low hypoglycaemia risk
CV, cardiovascular; DPP-4, dipeptidyl peptidase 4; GLP-1R, glucagon-like peptide-1 receptor; IR, ischaemia reperfusion.Petrie JR. Cardiovasc Diabetol 2013;12:130; Monami M et al. Diabetes Obes Metab 2014;16:38–47.

Identified potential and novel pathways associated with CV effects of SGLT-2 inhibitors based on clinical and mechanistic studies
Copyright © by SAGE PublicationsAdapted from Inzucchi SE et al. Diabetes Vascr Dis Res 2015;12:90-100
Blood pressure
Arterial stiffness
Albuminuria
Uric acid
LDL-cholesterol
HDL-cholesterol
Triglycerides
Glucose
Insulin
Oxidative stress
Weight
Visceral adiposity
SNS activity (?)
Novel pathways
(?)

Postulated changes in myocardium fuel metabolism before and after SGLT-2 inhibitor therapy
Mudaliar S, Alloju S, Henry RR. Diabetes Care 2016 Jul;39(7):1115-22

Cardiovascular actions of GLP-1 in T2D
Tate M et al. Br J Pharmacol. 2015; 172(3): 721–736.
GLP-1
METABOLIC BENEFITS Insulin secretion
Β-cell function
Insulin sensitivity
Gastric emptyingGlucose output Appetite
CARDIOVASCULAR RISK FACTORS
Hypertension
Dyslipidaemia
Obesity
DIRECT CARDIOVASCULAR
BENEFITS
INDIRECT CARDIOVASCULAR
BENEFITSInflammation
Cell apoptosis
Cardiac/vascular function
Endothelial dysfunction
ECM remodelling
Angiogenesis
HEART FAILURE
Myocardial infarction
Cardiac remodelling
CARDIOVASCULAR DISEASE
Hypertension
Atherosclerosis

Direct and Indirect Actions of GLP-1 in the Heart and Blood Vessels
Drucker DJ. Cell Metab 2016;24(1):15-30.
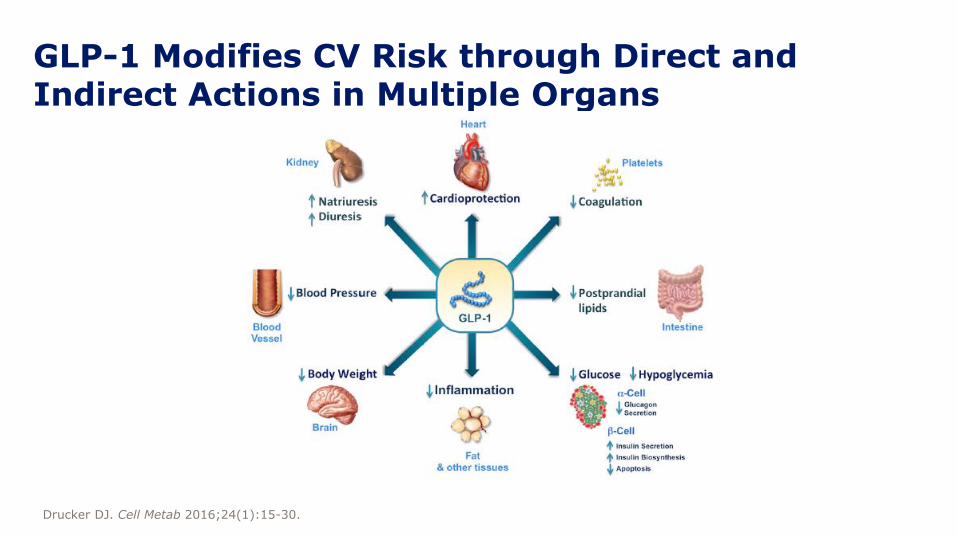
GLP-1 Modifies CV Risk through Direct and Indirect Actions in Multiple Organs
Drucker DJ. Cell Metab 2016;24(1):15-30.

SAVOR TIMI 53: Study design
Saxagliptin (2.5 or 5 mg/day*) + standard of care
Placebo + standard of care
Duration: 2–3 years
Randomisation (1:1) End of treatment
Key secondary endpoint
• Primary composite endpoint plus hospitalisation for heart failure, coronary revascularisation or unstable angina
Primary endpoint
• Composite of cardiovascular death, non-fatal myocardial infarction, or non-fatal ischaemic stroke
*Determined by eGFR (5 mg/day for eGFR >50 mL/min and 2.5 mg/day for eGFR ≤50 mL/min).CV, cardiovascular; DPP-4i, dipeptidyl peptidase-4 inhibitor; eGFR, estimated glomerular filtration rate; GLP-1RA, glucagon-like peptide-1 receptor agonist; HbA1c, glycosylated haemoglobin; OADs, oral antidiabetic drugs; T2DM, type 2 diabetes mellitus.Scirica BM, et al. N Engl J Med 2013;369:1317-1326.
16,492 patients• T2DM• HbA1c >6.5% and <12%• Antidiabetic drug-naïve;
1 OADs; or insulin
(± OADs), excludingGLP-1RA and DPP-4i
• High-risk CV profile
Similar trial population to LEADER

Saxagliptin CV outcomes
CI, confidence interval; CV, cardiovascular; MACE, major adverse cardiac event; MI, myocardial infarction.FDA. Briefing document. Available at: www.fda.gov/downloads/AdvisoryCommittees/CommitteesMeetingMaterials/ Drugs/EndocrinologicandMetabolicDrugsAdvisoryCommittee/UCM148109.pdf; Frederich R et al. Postgrad Med 2010;122:16–27.
Primary MACE
Secondary MACE
Acute CV events
Cox hazard ratio
Incidence rate ratio
Incidence ratio
Cox hazard ratio
Incidence rate ratio
Incidence ratio
Cox hazard ratio
Incidence rate ratio
Incidence ratio
0.0 0.2 0.4 0.6 0.8 1.0 1.2 1.4
Ratio of saxagliptin to control
0.24 0.44 0.82
0.83
0.90
0.450.24
0.26 0.49
0.25 0.45 0.81
0.820.460.25
0.27 0.49 0.88
1.000.590.35
0.36 0.61 1.02
0.650.39 1.09
Saxagliptin better Control better
MACE analysis
10
8
14
12
2
0
6
4
0 180 360 540 720 900
Patients
with e
ndpoin
t (%
)
Saxagliptin
Placebo
SAVOR TIMI 53
Days
CV death, non-fatal MI or non-fatal ischaemic stroke
Hazard ratio (95% CI) 1.00 (0.89; 1.12)p<0.001 for noninferiorityp=0.99 for superiority

SAVOR TIMI 53: Hospitalisation for heart failure over time
Kaplan-Meier estimates and corresponding HR are presented at 6 months, 12 months, and 2 years
Over 2 years of follow-up, more patients in the saxagliptin group (3.5%) were hospitalised for heart failure vs placebo (2.8%)
CI, confidence interval; HR, hazard ratio.Scirica BM et al. Circulation 2014;130:1579–1588.
Saxagliptin
Placebo
Ho
sp
italisati
on
fo
rh
eart
failu
re (
%)
Days from Randomisation
0 180
1.1%
1.9%
3.5%
1.3%
0.6%
2.8%
360 540 720
3
2
0
4
1
HR 1.80(1.29–2.55)
p=0.001
HR 1.46(1.15–1.88)
p=0.002
HR 1.27(1.07–1.51)
p=0.007
Placebo 8212 8036 7856 7389 4959
Saxagliptin 8280 8064 7867 7375 4978

EXAMINE: Study design
Alogliptin (6.25, 12.5 or 25 mg/day*) + standard of care
Placebo + standard of care
Duration: up to 4.5 years
Randomisation (1:1) End of treatment
Key secondary endpoint
• Primary composite endpoint plus urgent revascularisation due to unstable angina within 24 hours after hospital admission
Primary endpoint
• Composite of death from cardiovascular causes, non-fatal myocardial infarction, or non-fatal stroke
*Determined by eGFR (6.25 mg/day for eGFR <30 mL/min/1.73m2, 12.5 mg/day for eGFR of 30 to <60 mL/min/1.73 m2, and 25 mg/day for eGFR ≥60 mL/min/1.73 m2).ACS, acute coronary syndrome; eGFR, estimated glomerular filtration rate; HbA1c, glycosylated haemoglobin; T2DM, type 2 diabetes mellitus.White WB et al. Am Heart J 2011;162(4):620–626; White WB et al. N Engl J Med 2013;3;369(14):1327–1335.
5380 patients• T2DM• ACS within 15 to 90 days• HbA1c >6.5% and <11%
(HbA1c >7% and <11% if on an antidiabetic regimen that includes insulin)

EXAMINE: CV death, non-fatal MI or non-fatal ischaemic stroke
MonthsNo. at risk
Placebo 2679 2299 1891 1375 805 286
Alogliptin 2701 2316 1899 1394 821 296
• After a median exposure of 18 months, the rates of primary composite endpoints were similar in the alogliptin and placebo groups (11.3% and 11.8%, respectively)
24
0
12
6
18
0 6 12 3018 24
Alogliptin (N=2701)
Placebo (N=2679)
Cum
ula
tive incid
ence o
f prim
ary
endpoin
t events
(%
) HR=0.96 (upper boundary of the one-sided repeated CI, 1.16)
CV, cardiovascular; HR, hazard ratio; MI, myocardial infarction.Adapted from White WB et al. N Engl J Med 2013;3;369:1327–1335.
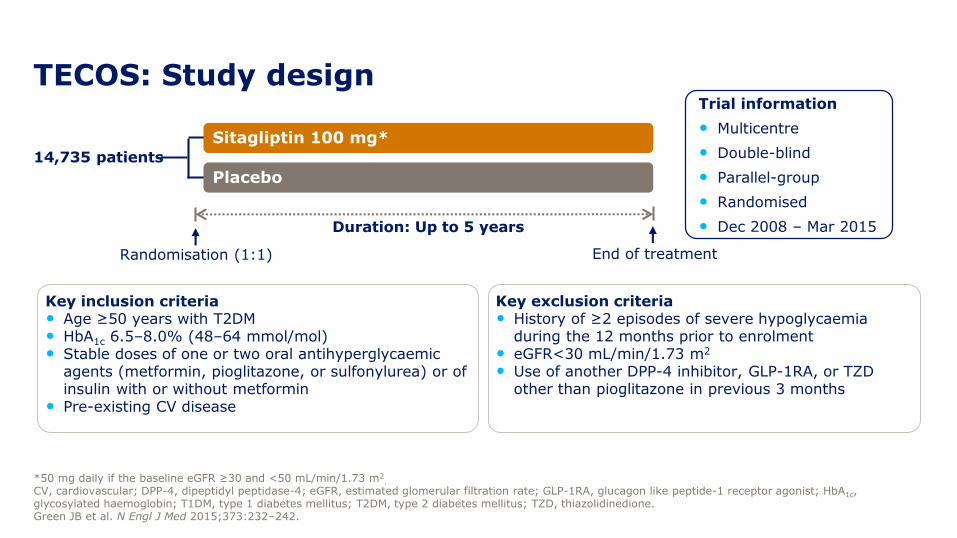
14,735 patients
TECOS: Study design
*50 mg daily if the baseline eGFR ≥30 and <50 mL/min/1.73 m2.
CV, cardiovascular; DPP-4, dipeptidyl peptidase-4; eGFR, estimated glomerular filtration rate; GLP-1RA, glucagon like peptide-1 receptor agonist; HbA1c, glycosylated haemoglobin; T1DM, type 1 diabetes mellitus; T2DM, type 2 diabetes mellitus; TZD, thiazolidinedione.Green JB et al. N Engl J Med 2015;373:232–242.
Trial information
• Multicentre
• Double-blind
• Parallel-group
• Randomised
• Dec 2008 ‒ Mar 2015
Sitagliptin 100 mg*
Placebo
Duration: Up to 5 years
End of treatmentRandomisation (1:1)
Key inclusion criteria• Age ≥50 years with T2DM• HbA1c 6.5‒8.0% (48‒64 mmol/mol)• Stable doses of one or two oral antihyperglycaemic
agents (metformin, pioglitazone, or sulfonylurea) or of insulin with or without metformin
• Pre-existing CV disease
Key exclusion criteria• History of ≥2 episodes of severe hypoglycaemia
during the 12 months prior to enrolment• eGFR<30 mL/min/1.73 m2
• Use of another DPP-4 inhibitor, GLP-1RA, or TZD other than pioglitazone in previous 3 months

TECOS: Primary composite endpoint
The primary composite endpoint was a composite of CV death, nonfatal MI, nonfatal stroke, and hospitalisation for unstable angina.CI, confidence interval; CV, cardiovascular; HR, hazard ratio; ITT, intention-to-treat; MI, myocardial infarction.Green JB et al. N Engl J Med 2015;373:232–242.
ITT analysis for superiority
100
80
60
40
20
0
0 4 8 12 18 24 30 36 42 48
0 4 8 12 18 24 30 36 42 48
0
5
10
15Sitagliptin
Placebo
HR (95% CI): 0.98 (0.89; 1.08)p=0.65
MonthNo. at risk:
Sitagliptin 7332 7131 6937 6777 6579 6386 4525 3346 2058 1248
Placebo 7339 7146 6902 6751 6512 6292 4411 3272 2034 1234
Pati
en
ts w
ith
even
t (%
)
ITT HR (95% CI) 0.98 (0.89; 1.08) p=0.65

*Adjusted for history of heart failure at baseline.CI, confidence interval; HR, hazard ratio; ITT, intention-to-treat. Green JB et al. N Engl J Med 2015;373:232–242.
ITT analysis
TECOS: Hospitalisation for heart failure*
100
80
60
40
20
0
0 4 8 12 18 24 30 36 42 48
0 4 8 12 18 24 30 36 42 48
0
5
10
15HR=1.00; 95% CI (0.83; 1.20)
p=0.98
Month
Pati
en
ts w
ith
even
t (%
)
No. at risk:
Sitagliptin 7332 7189 7036 6917 6780 6619 4728 3515 2175 1324
Placebo 7339 7204 7025 6903 6712 6549 4599 3443 2131 1315
Sitagliptin
Placebo
ITT HR (95% CI) 1.00 (0.83; 1.20) p=0.98

ELIXA: Study design
Bentley-Lewis R et al. AHJ 2015;169:631–638.e7; Oral presentation 3-CT-SY28. Presented at the American Diabetes Association 75th Annual Scientific Sessions, Boston, MA, 8 June 2015.
Trial information
• Multi-centre
• Double-blind
• Parallel-group
• Event-driven
• Randomised
Lixisenatide, 20 μg maximum dose
Placebo
203±1 weeks
End of treatmentRandomisation (1:1)
2 weeks1 week
Placebo
Run-in Titration
Lixisenatide
10 μg
Placebo
Run-in period
• Patients were trained in self-administration of daily subcutaneous volume-matched placebo
Titration
• Lixisenatide or matching placebo (1:1)
• Initial dose 10 μg/day
• Down- or up-titration permitted to maximum of 20 μg/day
• Glucose control was managed by site investigators’ judgement

• Time to first occurrence of the primary CV event: CV death, non-fatal MI, non-fatal stroke or hospitalisation for unstable angina1
ELIXA: Primary composite endpoint
CV, cardiovascular; MI, myocardial infarction.1. Clinicaltrials.gov. Available at https://clinicaltrials.gov/ct2/show/NCT01147250. Accessed October 2015;Oral presentation 3-CT-SY28. Presented at the American Diabetes Association 75th Annual Scientific Sessions, Boston, MA, 8 June 2015.
Pati
en
ts w
ith
even
t (%
)
0
0 12 24 36
5
10
15
20
Lixisenatide: 406/3034 = 13.4%Placebo: 399/3034 = 13.2%
HR (95% CI)1.02 (0.89; 1.17)
Months
30343034
27592785
15661558
476484
Number at riskPlacebo
Lixisenatide
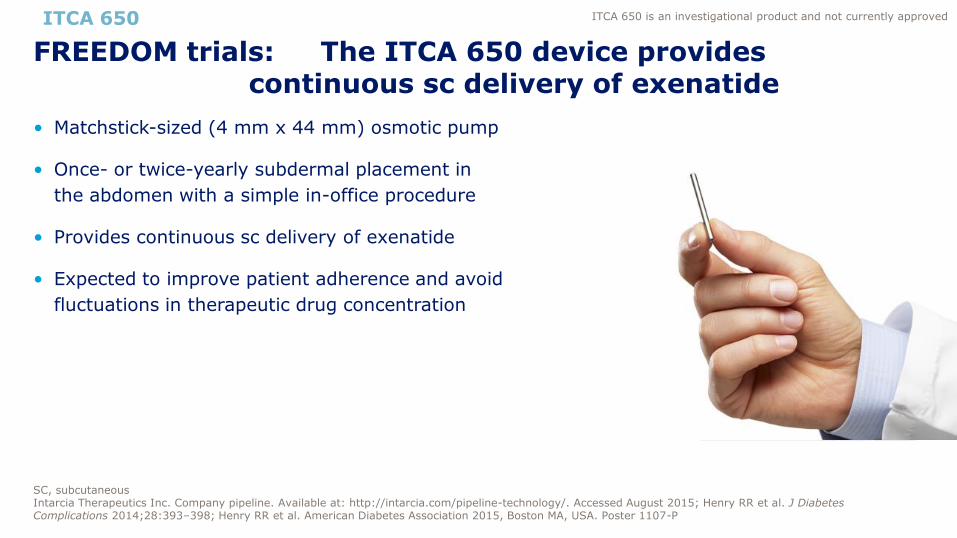
• Matchstick-sized (4 mm x 44 mm) osmotic pump
• Once- or twice-yearly subdermal placement in
the abdomen with a simple in-office procedure
• Provides continuous sc delivery of exenatide
• Expected to improve patient adherence and avoid
fluctuations in therapeutic drug concentration
FREEDOM trials: The ITCA 650 device provides continuous sc delivery of exenatide
SC, subcutaneousIntarcia Therapeutics Inc. Company pipeline. Available at: http://intarcia.com/pipeline-technology/. Accessed August 2015; Henry RR et al. J Diabetes Complications 2014;28:393–398; Henry RR et al. American Diabetes Association 2015, Boston MA, USA. Poster 1107-P
ITCA 650 ITCA 650 is an investigational product and not currently approved

-1.50
-0.8
-2.0
-1.6
-1.2
-0.8
-0.4
0.0
Hb
A1
cch
an
ge f
rom
baseli
ne
(%
)
ITCA 650 device: FREEDOM-2Change in HbA1c and body weight at Week 52
AE, adverse event; GLP-1, glucagon-like peptide-1; HbA1c, glycosylated haemoglobinIntarcia Therapeutics Inc. Press release 18 August 2015. Available at: http://intarcia.com/media/press-releases/2015-aug-18-freedom2.html. Accessed September 2016. Rosenstock J et al. American Diabetes Association 2015, Boston, MA, USA. Oral presentation 276-OR
-4.0
-1.3
-5.0
-4.0
-3.0
-2.0
-1.0
0.0
Bod
y w
eig
ht
ch
an
ge f
rom
baseli
ne (
kg
)
p<0.001
ITCA 650 60 µg
Sitagliptin 100 mg
ITCA 650
p<0.001
ITCA 650 60 µg
Sitagliptin 100 mg
HbA1c Body weight
Adverse-event profile
• The most common AEs were gastrointestinal events consistent with the GLP-1 class
• Low rate of AEs leading to discontinuation
ITCA 650 is an investigational product and not currently approved

EMPA-REG OUTCOME: Empagliflozin (SGLT-2i) CVOTRandomised, double-blind, placebo-controlled CVOT
N=7028
Key inclusion criteria• Type 2 diabetes• Age ≥18 years
≥20 years in Japan ≤65 years in India
• Established CV disease• Drug naïve and HbA1c ≥7.0 to ≤9.0% or
stable background antidiabetes therapy* and HbA1c ≥7.0 to ≤10.0%
• BMI ≤45.0 kg/m2
• eGFR ≥30 mL/min/1.73m2
*Except pioglitazone in Japan.Background glucose-lowering therapy unchanged in first 12 weeks, then adjusted at the investigator’s discretion to achieve desired glycaemic control.BMI, body mass index; CV, cardiovascular; CVOT, cardiovascular outcome trial; eGFR, estimated glomerular filtration rate; EMPA, empagliflozin; HbA1c, glycosylated haemoglobin.Zinman B et al. Cardiovasc Diabetol 2014;13:102; Zinman B et al. N Engl J Med 2015;doi: 10.1056/NEJMoa1504720. [Epub ahead of print].
EMPA 25 mg once daily (n=2342)
EMPA 10 mg once daily (n=2345)
Placebo once daily (n=2333)
Screening Placebo run-in
End of study Randomisation +30 days
Follow-up
Treatment periodMedian duration: 2.6 years
Median observation time: 3.1 years

EMPA-REG OUTCOME: Primary endpoint
Month
0 6 12 18 3024 4236 48
20
10
5
0
15
HR=0.8695.02% CI (0.74–0.99)p=0.04 for superiority
Pati
en
ts w
ith
even
t (%
)
Empagliflozin Placebo
Number at risk
Empagliflozin 4687 4580 4455 4328 3851 2821 2359 1534 370
Placebo 2333 2256 2194 2112 1875 1380 1161 741 166CI, confidence interval; HR, hazard ratio.Zinman B et al. N Engl J Med 2015; doi: 10.1056/NEJMoa1504720. [Epub ahead of print].
• Death from cardiovascular causes, nonfatal myocardial infarction, or nonfatal stroke
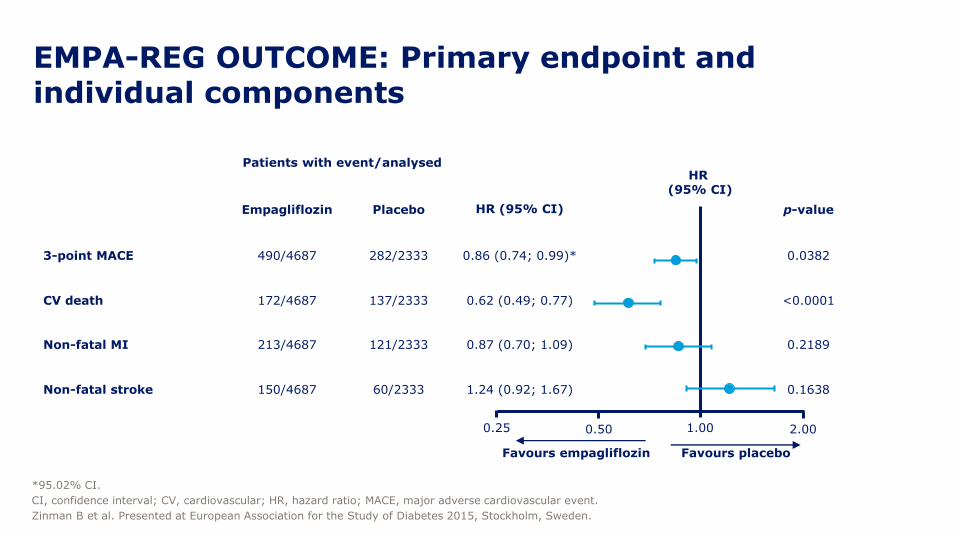
EMPA-REG OUTCOME: Primary endpoint and individual components
Patients with event/analysed
Empagliflozin Placebo HR (95% CI) p-value
3-point MACE 490/4687 282/2333 0.86 (0.74; 0.99)* 0.0382
CV death 172/4687 137/2333 0.62 (0.49; 0.77) <0.0001
Non-fatal MI 213/4687 121/2333 0.87 (0.70; 1.09) 0.2189
Non-fatal stroke 150/4687 60/2333 1.24 (0.92; 1.67) 0.1638
0.25 1.00
Favours empagliflozin Favours placebo
HR (95% CI)
*95.02% CI.
CI, confidence interval; CV, cardiovascular; HR, hazard ratio; MACE, major adverse cardiovascular event.
Zinman B et al. Presented at European Association for the Study of Diabetes 2015, Stockholm, Sweden.
0.50 2.00
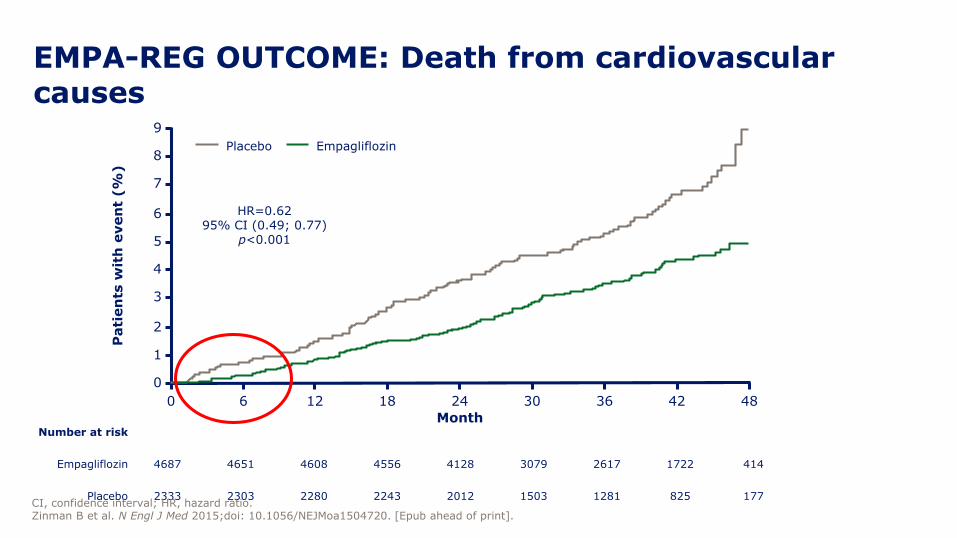
EMPA-REG OUTCOME: Death from cardiovascular causes
0 6 12 18 3024 4236 48
Pati
en
ts w
ith
even
t (%
)9
7
6
0
8
5
3
2
4
1
Month
HR=0.6295% CI (0.49; 0.77)
p<0.001
Empagliflozin Placebo
Number at risk
Empagliflozin 4687 4651 4608 4556 4128 3079 2617 1722 414
Placebo 2333 2303 2280 2243 2012 1503 1281 825 177CI, confidence interval; HR, hazard ratio.Zinman B et al. N Engl J Med 2015;doi: 10.1056/NEJMoa1504720. [Epub ahead of print].

CVOTs of type 2 diabetes therapiesNon-inferiority
boundaryHR 1.8
Non-inferiority boundaryHR 1.3
Hazard ratio
Trial Drug Primary endpoint
EXAMINE1 Alogliptin MACE
SAVOR-TIMI-532 Saxagliptin MACE
TECOS3 Sitagliptin MACE + UA
ELIXA4 Lixisenatide MACE + UA
EMPA-REG5 Empagliflozin MACE + UA
Reduced CV risk vs comparator
CVOT, cardiovascular outcomes trial; HR, hazard ratio; MACE, major cardiovascular endpoint; T2DM, type 2 diabetes; UA, unstable angina.1. White et al. N Engl J Med 2013;369(14):1327–1335; 2. Scirica et al. N Engl J Med 2013;369(14):1317–1326; 3. Green et al. N Engl J Med 2015;16;373(3):232–242; 4. https://dxlink.ca/ADAReport/; 5. Zinman et al. N Engl J Med 2015 [Epub ahead of print].
0.8 1.0 1.2 1.4 1.6 1.8 2.0
Increased CV risk vs comparator
0.6
0 6 1 2 1 8 2 4 3 0 3 6 4 2 4 8 5 4
0
5
1 0
1 5
2 0
L ira g lu t id e
P la ce b o
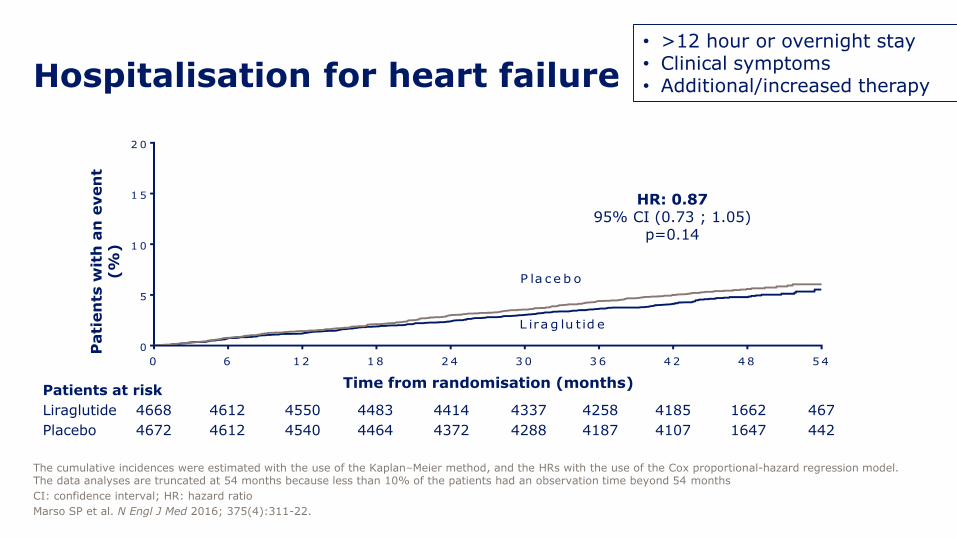
Hospitalisation for heart failure
The cumulative incidences were estimated with the use of the Kaplan–Meier method, and the HRs with the use of the Cox proportional-hazard regression model. The data analyses are truncated at 54 months because less than 10% of the patients had an observation time beyond 54 months
CI: confidence interval; HR: hazard ratio
Marso SP et al. N Engl J Med 2016; 375(4):311-22.
Patients at risk
Liraglutide
Placebo
4668
4672
4612
4612
4550
4540
4483
4464
4414
4372
4337
4288
4258
4187
4185
4107
1662
1647
467
442
Pati
en
ts w
ith
an
even
t (%
)
Time from randomisation (months)
HR: 0.8795% CI (0.73 ; 1.05)
p=0.14
• >12 hour or overnight stay • Clinical symptoms • Additional/increased therapy
CVOTs and their implications on treatment
decision-making in diabetes

Empagliflozin and liraglutide
CI, confidence interval; CV, cardiovascular; HR, hazard ratio; MI, myocardial infarction.1. Zinman B et al. N Engl J Med 2015;373:2117–2128; 2. Marso SP et al. N Eng J Med 2016; DOI: 10.1056/NEJMoa1603827
0 6 12 18 3024 4236 48
20
10
5
0
15
Pati
en
ts w
ith
an
even
t (%
)
Time from randomisation (months)
Placebo
Empagliflozin
Patients at risk
Empagliflozin
Placebo
4687
2333
4455
2194
4328
2112
3851
1875
2821
1380
2359
1161
1534
741
370
166
4580
2256
HR 0.8695.02% CI: 0.74; 0.99
Pati
en
ts w
ith
an
even
t (%
)
Patients at risk
Liraglutide
Placebo
4668
4672
4593
4588
4496
4473
4400
4352
4280
4237
4172
4123
4072
4010
3982
3914
1562
1543
424
407
0 6 12 18 24 30 36 42 48 54
0
5
10
15
20
Placebo
Liraglutide
HR 0.8795% CI: 0.78; 0.97
EMPA-REG OUTCOME1 LEADER2
CV death, non-fatal MI, or non-fatal stroke CV death, non-fatal MI, or non-fatal stroke
p<0.001 for non-inferiorityp=0.01 for superiority
p<0.001 for non-inferiorityp=0.04 for superiority

Expanded MACECV death, non-fatal MI, non-fatal stroke, coronary revascularisation, or hospitalisation for unstable angina pectoris or heart failure
The cumulative incidences were estimated with the use of the Kaplan–Meier method, and the HRs with the use of the Cox proportional-hazard regression model. The data analyses are truncated at 54 months because less than 10% of the patients had an observation time beyond 54 months
CI: confidence interval; CV: cardiovascular; HR: hazard ratio; MACE: major adverse cardiovascular event; MI: myocardial infarction
Marso SP et al. N Engl J Med 2016; 375(4):311-22.
Patients at risk
Liraglutide
Placebo
4668
4672
4515
4506
4356
4336
4221
4157
4063
4002
3914
3857
3793
3697
3682
3581
1452
1410
395
366
Pati
en
ts w
ith
an
even
t (%
)
Time from randomisation (months)
0 6 1 2 1 8 2 4 3 0 3 6 4 2 4 8 5 4
0
5
1 0
1 5
2 0
2 5
L ira g lu t id e
P la ce b o
HR: 0.8895% CI (0.81 ; 0.96)
p=0.005
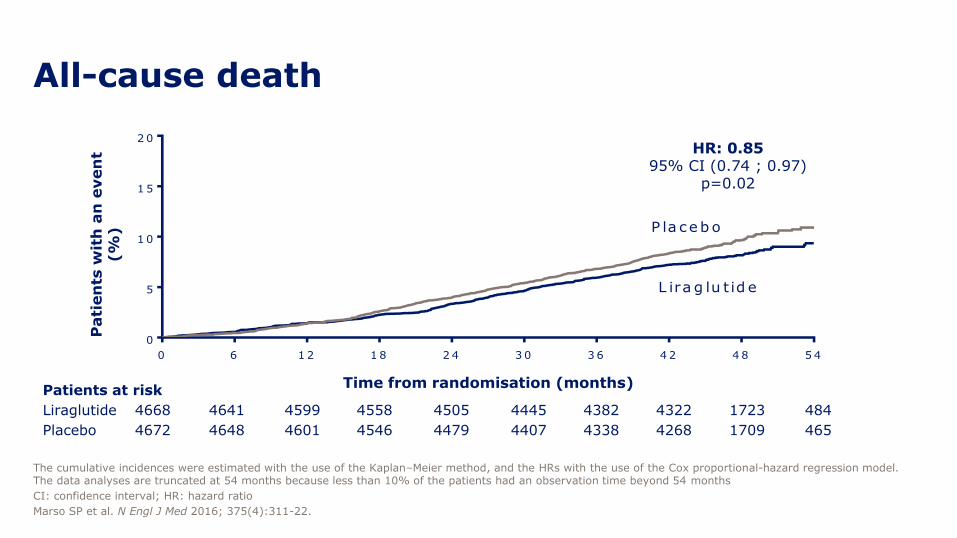
All-cause death
The cumulative incidences were estimated with the use of the Kaplan–Meier method, and the HRs with the use of the Cox proportional-hazard regression model. The data analyses are truncated at 54 months because less than 10% of the patients had an observation time beyond 54 months
CI: confidence interval; HR: hazard ratio
Marso SP et al. N Engl J Med 2016; 375(4):311-22.
Patients at risk
Liraglutide
Placebo
4668
4672
4641
4648
4599
4601
4558
4546
4505
4479
4445
4407
4382
4338
4322
4268
1723
1709
484
465
Pati
en
ts w
ith
an
even
t (%
)
Time from randomisation (months)
0 6 1 2 1 8 2 4 3 0 3 6 4 2 4 8 5 4
0
5
1 0
1 5
2 0
L ira g lu t id e
P la ceb o
HR: 0.8595% CI (0.74 ; 0.97)
p=0.02

Hospitalisation for heart failure or all-cause death
Full analysis set. The cumulative incidences of time to EAC-confirmed first hospitalisation for heart failure or all-cause death were estimated with the use of the Kaplan–Meier method, and the hazard ratios with the use of the Cox proportional-hazard regression model. The data analyses are truncated at 48 months, because less than 10% of the patients had an observation time beyond 48 months
CI: confidence interval; EAC: event adjudication committee; HR: hazard ratio
Presented at 52nd EASD Annual Meeting, 14 September 2016, Munich, Germany
Su
bje
cts
wit
h a
n e
ven
t (%
)
Time since randomisation (months)
Placebo
Liraglutide
20
15
10
5
0
100 20 30 40 50
HR: 0.8795% CI (0.77 – 0.97)
Patients at risk
Liraglutide
Placebo
4668
4672
4563
4560
4470
4470
4337
4288
4209
4132
1016
976

Number needed to treat to prevent one…
MACE All-cause death
for 3 years
66 98
MACE, major adverse cardiovascular event. Marso SP et al. N Engl J Med 2016. DOI: 10.1056/NEJMoa1603827.

Individual components of the primary endpoint
CI, confidence interval; CV, cardiovascular; HR, hazard ratio; MI, myocardial infarction.1. Zinman B et al. N Engl J Med 2015;373:2117–2128; 2. Marso SP et al. N Eng J Med 2016; DOI: 10.1056/NEJMoa1603827

EMPA-REG OUTCOME and LEADER: effects on HbA1c
CI, confidence interval; ETD, estimated treatment difference; HbA1c, glycated haemoglobin.1. Zinman B et al. N Engl J Med 2015;373:2117–2128; 2. Marso SP et al. N Eng J Med 2016; DOI: 10.1056/NEJMoa1603827
ETD at Week 94 EMPA 10 mg vs. placebo -0.42%EMPA 25 mg vs. placebo -0.47%

• These trials do not provide knowledge on the mode of action
• From the observed effects, different mechanisms for empagliflozin and liraglutide are possible
• The observed benefit in EMPA-REG OUTCOME may be more closely linked to haemodynamic changes; whereas in the LEADER trial, the observed benefits appear later and are perhaps more compatible with a more “generalised” effect on the pathogenesis of atherosclerotic vascular disease
LEADER and EMPA-REG OUTCOME comparison:
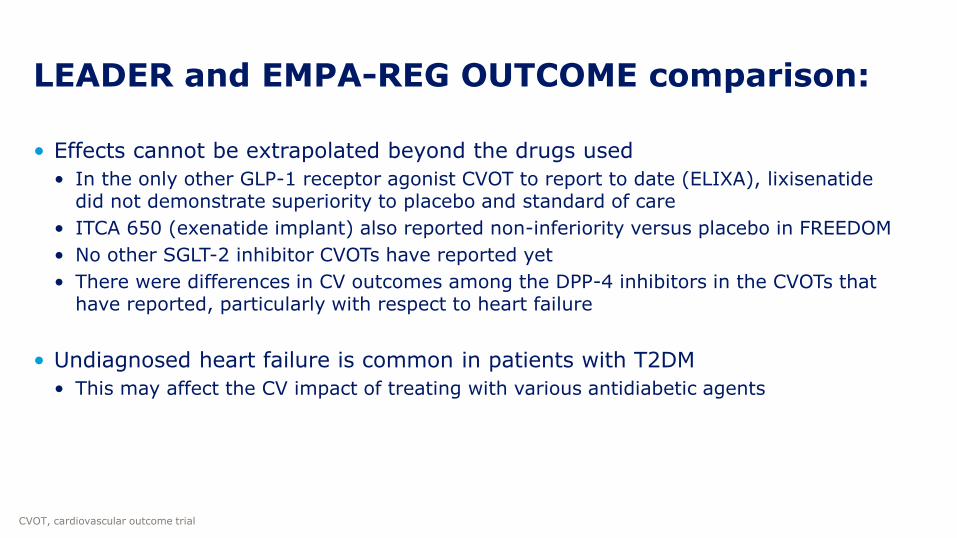
• Effects cannot be extrapolated beyond the drugs used
• In the only other GLP-1 receptor agonist CVOT to report to date (ELIXA), lixisenatidedid not demonstrate superiority to placebo and standard of care
• ITCA 650 (exenatide implant) also reported non-inferiority versus placebo in FREEDOM
• No other SGLT-2 inhibitor CVOTs have reported yet
• There were differences in CV outcomes among the DPP-4 inhibitors in the CVOTs that have reported, particularly with respect to heart failure
• Undiagnosed heart failure is common in patients with T2DM
• This may affect the CV impact of treating with various antidiabetic agents
LEADER and EMPA-REG OUTCOME comparison:
CVOT, cardiovascular outcome trial
Copyright © 2022 FDOKUMEN