PHYSICOCHEMICAL ANALYSIS OF WATER RESOURCES ...
8
International Journal of Innovation and Scientific Research ISSN 2351-8014 Vol. 10 No. 1 Oct. 2014, pp. 171-178 © 2014 Innovative Space of Scientific Research Journals http://www.ijisr.issr-journals.org/ Corresponding Author: Eyankware Moses Oghenenyoreme 171 PHYSICOCHEMICAL ANALYSIS OF WATER RESOURCES IN SELECTED PART OF OJI RIVER AND ITS EVIRONS, ENUGU STATE SOUTHEASTERN NIGERIA Eyankware Moses Oghenenyoreme and Obasi Philip Njoku Department of Geology, Faculty of Science, Ebonyi State University, Abakaliki, P.M.B O53, Ebonyi State, Nigeria Copyright © 2014 ISSR Journals. This is an open access article distributed under the Creative Commons Attribution License, which permits unrestricted use, distribution, and reproduction in any medium, provided the original work is properly cited. ABSTRACT: Oji River and its environs is located few kilometres from Enugu, the capital city of Enugu state. Geographically, the study area is bounded by latitudes 6 o 14 ' N-6 o 17'N and longitudes 7 o 17 ' E-7 o 19 I E. The study area is underlain by the Ajali Sandstone and Nsukka Formation. The area has abundant water resources. A total of ten (10) water samples were collected at various locations for hydrochemical analysis. The result shows that the water resources for (WS 2, 4-10) are safe for domestic, industrial and agricultural uses as the chemical constituents are below (WHO,2011) permissible limit. Except for WS 1-Oji wonderful river where nitrite (NO 2+ ) and Fluoride (F) value were observed to be higher than (WHO, 2011) permissible limit (8.2 and 2.5mg/l) respectively. This indicate that nitrite and fluoride treatment is required for WS 1-Oji wonderful river while for WS3-Ogba spring were copper value (11.0mg/l) were observed to also be higher than (WHO, 2011) permissible and as such requires copper treatment. KEYWORDS: Groundwater, Surface water, Physical parameters, Chemical parameters and domestic purpose. 1 BACKGROUND The study area is located in Enugu State, south eastern Nigeria, the Villages in the area include; Ojinator, Ugwuoba, Achi, Egbagu, Upkata and Agbalengi. Since water is necessary for the daily activities of animals and humans, however increase in population has led to increase in demand for portable water; inhabitants of the area depend solely on surface and groundwater for domestic and other uses. The presence of objectionable tastes, odour, colour as well as harmful substances in such water no matter how abundant it is, renders it unsuitable for domestic and industrial [10.]. The physicochemical property of water is an important parameters as it may directly or indirectly affect its quality. Suitability of groundwater for domestic use is determined by its geochemistry. However geochemical data also gives important clues to the geologic history of rocks and indications of groundwater recharge, movement and storage [14]. Water quality depends on number of factors, such as general geology, degree of chemical weathering of prevailing lithology, quality of recharge water and inputs from sources other than water-rock interaction [1], [12], [3], [4] and [8] noted that agricultural inputs and wastes, domestic and industrial wastes commonly find their way into groundwater as leachates through the soil. All these affect the quality of water resources in the area. Most houses and industries channel their waste directly to the river channels. Hence, the need to access the physicochemical constituents of water resources from available surface water and groundwater sources in Oji River and environs. This work seeks to compare result of the analysis with the World Health Organization [15] standard for drinking water. It will also proffer recommendations on the best option on management/utilization of water resources in the area. 2 PHYSIOGRAPHY, CLIMATE AND VEGETATION The study area is characterized by gently sloping topography, the nature and slope of the area makes it vulnerable to erosion. The total annual rainfall ranges from 1600m to more than 2000m, the inversion in the tropical air mass causes
-
Upload
khangminh22 -
Category
Documents
-
view
0 -
download
0
Transcript of PHYSICOCHEMICAL ANALYSIS OF WATER RESOURCES ...

International Journal of Innovation and Scientific Research ISSN 2351-8014 Vol. 10 No. 1 Oct. 2014, pp. 171-178 © 2014 Innovative Space of Scientific Research Journals http://www.ijisr.issr-journals.org/
Corresponding Author: Eyankware Moses Oghenenyoreme 171
PHYSICOCHEMICAL ANALYSIS OF WATER RESOURCES IN SELECTED PART OF OJI RIVER AND ITS EVIRONS, ENUGU STATE SOUTHEASTERN NIGERIA
Eyankware Moses Oghenenyoreme and Obasi Philip Njoku
Department of Geology, Faculty of Science, Ebonyi State University, Abakaliki, P.M.B O53, Ebonyi State, Nigeria
Copyright © 2014 ISSR Journals. This is an open access article distributed under the Creative Commons Attribution License, which permits unrestricted use, distribution, and reproduction in any medium, provided the original work is properly cited.
ABSTRACT: Oji River and its environs is located few kilometres from Enugu, the capital city of Enugu state. Geographically, the
study area is bounded by latitudes 6o14
' N-6
o17'N and longitudes 7
o17
'E-7
o19
IE. The study area is underlain by the Ajali
Sandstone and Nsukka Formation. The area has abundant water resources. A total of ten (10) water samples were collected at various locations for hydrochemical analysis. The result shows that the water resources for (WS 2, 4-10) are safe for domestic, industrial and agricultural uses as the chemical constituents are below (WHO,2011) permissible limit. Except for WS 1-Oji wonderful river where nitrite (NO
2+) and Fluoride (F) value were observed to be higher than (WHO, 2011)
permissible limit (8.2 and 2.5mg/l) respectively. This indicate that nitrite and fluoride treatment is required for WS 1-Oji wonderful river while for WS3-Ogba spring were copper value (11.0mg/l) were observed to also be higher than (WHO, 2011) permissible and as such requires copper treatment.
KEYWORDS: Groundwater, Surface water, Physical parameters, Chemical parameters and domestic purpose.
1 BACKGROUND
The study area is located in Enugu State, south eastern Nigeria, the Villages in the area include; Ojinator, Ugwuoba, Achi, Egbagu, Upkata and Agbalengi. Since water is necessary for the daily activities of animals and humans, however increase in population has led to increase in demand for portable water; inhabitants of the area depend solely on surface and groundwater for domestic and other uses. The presence of objectionable tastes, odour, colour as well as harmful substances in such water no matter how abundant it is, renders it unsuitable for domestic and industrial [10.]. The physicochemical
property of water is an important parameters as it may directly or indirectly affect its quality. Suitability of groundwater for domestic use is determined by its geochemistry. However geochemical data also gives important clues to the geologic history of rocks and indications of groundwater recharge, movement and storage [14]. Water quality depends on number of factors,
such as general geology, degree of chemical weathering of prevailing lithology, quality of recharge water and inputs from sources other than water-rock interaction [1], [12], [3], [4] and [8] noted that agricultural inputs and wastes, domestic and
industrial wastes commonly find their way into groundwater as leachates through the soil. All these affect the quality of water resources in the area. Most houses and industries channel their waste directly to the river channels.
Hence, the need to access the physicochemical constituents of water resources from available surface water and groundwater sources in Oji River and environs. This work seeks to compare result of the analysis with the World Health Organization [15] standard for drinking water. It will also proffer recommendations on the best option on
management/utilization of water resources in the area.
2 PHYSIOGRAPHY, CLIMATE AND VEGETATION
The study area is characterized by gently sloping topography, the nature and slope of the area makes it vulnerable to erosion. The total annual rainfall ranges from 1600m to more than 2000m, the inversion in the tropical air mass causes

PHYSICOCHEMICAL ANALYSIS OF WATER RESOURCES IN SELECTED PART OF OJI RIVER AND ITS EVIRONS, ENUGU STATE SOUTHEASTERN NIGERIA
ISSN : 2351-8014 Vol. 10 No. 1, Oct. 2014 172
convectional rainfall. The area falls within the tropical rainforest belt of Nigeria with temperature ranges from 300c to 32
0c as
shown in Figure 1. It is characterized by two seasons, the dry and rainy season. The climate is favourable for farming. The dry season is usually from (November-March), it is marked by an average rainfall of about 60mm. The highest annual rainfall in south eastern Nigeria is received around the eastern highlands due to the convectional and orographic nature of the rains received [6]. According to [6], variations in the amount, seasonal distribution and annual rainfall variability affect peasant
farming within communities adversely. The rainfall pattern which is controlled by the movement of the Inter-tropical Convergence Zone (ITCZ) is characterised by a long wet season from April to July, with a short dry season in August, followed by a short wet season from September to October [6] .
The vegetation is characterised by grassland though some plant species of low land rainforest such as (Elacies geineenus) oil palm tree is found, the area is composed of short and tall grasses and shrubs that are found on the highland and for the forest area in lowland along the stream channels [9.]. The change in vegetation is due to lithological variation with the study
areas.
Figure 1: Map Showing Climate and Vegetative Zones of Southeastern Nigeria (Modified after) [5].
3 GEOLOGY OF THE STUDY AREA
The study area lies across two geological formation; Ajali Formation and Nsukka Formation. The Nsukka Formation (Upper Maastrichtian) covers 25% of the study area. It lies conformably on top of the Ajali Sandstone (Maastrichtian), covers a total of 65% of the study area. The Ajali formation has a thickness of about 45-50meters and consists of thin band of white mudstone and shale occurring at interval and increasing in number toward the base. The Nsukka Formation was first described by [13] as the ‘upper coal measure’ it consist of intense ferroginisation of well bedded blue clays, carbonaceous
shale and thin band of limestone resulted in ironstone which exist in formation. [7] used sedimentological evidence to suggest
that the Nsukka Formation represented a phase of fluvio-deltaic sedimentation that began close to the end of the maastrichtian and continued during the Paleocene.
4 HYDROGEOLOGY OF THE STUDY AREA
The study area is with springs, streams and rivers. This includes the popular Oji wonderful river, Dodo River, Ezu River and Ozom River while the streams are Nwangele and Izele stream.

Eyankware Moses Oghenenyoreme and Obasi Philip Njoku
ISSN : 2351-8014 Vol. 10 No. 1, Oct. 2014 173
Figure 2: Geological Map and Water Samples Collection Sites
5 METHODOLOGY
Ten water samples were collected from different rivers traversing different communities in the study area as shown in a Fig. 2. In-situ measurements of temperature (°C), electrical conductivity (EC), and total dissolved solids (TDS) were carried out in the field while samples were collected in clean new white plastic bottles (1.5 L) which were first rinsed with part of the water samples to avoid contamination. While Conductivity Meter Bridge was used for turbidity measurement and pH meter used to determine the acidity of the water samples. Total dissolved solids were determined by evaporation; weighing 100 ml of water sample and then subtracting the weight of the residue from the weight of water before evaporation. The EC was measured using a WPACMD 400 m which can measure conductivity over the range of 10-2 to10-6 μ Siemens/cm2 with an accuracy of 0.1 μ S/cm2. The coordinates (longitude, latitude and elevation/altitude) of each sample location in the study area was taken using the GARMIN GPSmap76CSx. These samples were labelled WS I- 10 (Table 1). All the water samples were preserved in a refrigerator to exclude microbial activity and unwanted chemical reaction. The determinations of other

PHYSICOCHEMICAL ANALYSIS OF WATER RESOURCES IN SELECTED PART OF OJI RIVER AND ITS EVIRONS, ENUGU STATE SOUTHEASTERN NIGERIA
ISSN : 2351-8014 Vol. 10 No. 1, Oct. 2014 174
physicochemical properties of the water samples were performed within two days of sampling. HACH DR 2800 Spectrophotometer was used in the determination of different hydro geochemical properties such as Na
+, K
+, HCO3
-, Cl
-, NO
2-,
SO4-
, Fe+, Mn
2+, NO3
-,SO4
2-, Nacl, Mg
2+ CO3
2-, Mn, Ca
2+, PO4
2-, Cu
2+. Analytical water test tablets prescribed for HACH DR
Spectrophotometer 2800 using procedures 2outlined in the HACH DR 2800 Spectrophotometer manual were used for the examination of the water quality. Other analyses such as the determination of Mg and Ca concentrations were done by complexometric titration method.
6 RESULTS AND DISCUSSION
From the physicochemical analysis carried out for carbonate, total hardness, salinity (Nacl), silica (SiO2), total alkalinity, total dissolved solid (TDS), values ranges from (9.6-41.5mg/l, 0.0-21.6, 0.0-11.3, 0.0-28.0, 0.0-1.5, 22.4-28.2mg/l) respectively, for carbonate, total hardness, salinity and total dissolved solid values falls below the [15] permissible water
quality limit. While silica (Sio2) and total alkalinity has no WHO guideline, they occur in drinking-water at concentrations well below those at which toxic effect. [17]
For the parameters like pH, turbidity and conductivity their values ranges from (6.0-6.9, 1.3-2.0, 0.5-2.9NTU, 34.7-60.2µs), respectively their value falls below the [14] permissible water quality limit. For the cations calcium (Ca
+), magnesium (Mg) and
potassium (K) their value ranges from (4.2-12.3, 1.2-3.5 and 0.9-2.1mg/l) respectively. Their values falls below the [16]
permissible water quality limit as shown in Figure 3. While that of anions nitrite (NO2), Nitrate (NO3), phosphate (PO2).
Sulphate (SO23-
), Chloride (Cl), bicarbonate (HCO3) and fluoride (F) their values ranges from (0.0-8.2, 0.0-26.0, 0.0-0.1, 2.1-12.2, 1.4-17.6, 30.8 - 66.7 and 0.0-2.5mg/l) respectively. As for nitrate, sulphate, bicarbonate and phosphate their values fall within below the [15] permissible water quality limit as shown in Figure. 4. Except for nitrite (NO
2-) which its value (8.2mg/l)
was observed to be above the [16], permissible water quality limit at WS1 Oji wonderful river. Nitrite infiltrates into water
bodies from fertilizers and manure [8]. Nitrite is source for concern in infants under six months of age as it causes
methemoglobinema. In general, the most important source of human exposure to nitrate and nitrite is through vegetables (nitrite and nitrate) and through meat in the diet. Nitrite is used as a preservative in many cured meats, [15]. And fluoride
value (2.5mg/l) is above the [16] guideline value at WS1 Oji wonderful river which is as a result of natural system "weathering
and rain water"[2], these implies that WS1 require treatment. Fluoride dissolved into groundwater as it moves through pore
spaces between rocks. It also infiltrate into groundwater through discharge from fertilizer or aluminium factories as shown in Figure 4. For trace element iron (Fe), manganese (Mn), chlorine (Cl) and copper (Cu) values ranges from (0.0-0.1, 0.0-0.0, 0.0-0.8 and 0.0-11.0mg/l) respectively as shown in Figure 5. Their values fall below the [16], permissible limit. Except copper(Cu)
its value (11.0mg/l) for WS3 0gba spring the value of copper is above the of [16], guideline value .The sources of copper in
both surface and groundwater is from industrial waste and domestic waste and mining activities within the study area. Copper is essential trace element but toxic to plants and algae at moderate levels. Copper can cause stomach and intestinal distress, liver and kidney damage. In high doses, it results in bad taste and significant staining in cloths fixtures.

Eyankware Moses Oghenenyoreme and Obasi Philip Njoku
ISSN : 2351-8014 Vol. 10 No. 1, Oct. 2014 175
Figure 3. Major Cations in the analyzed samples expressed as a bar chart.
Figure. 4. Major Anions in the analyzed samples expressed as a bar chart

PHYSICOCHEMICAL ANALYSIS OF WATER RESOURCES IN SELECTED PART OF OJI RIVER AND ITS EVIRONS, ENUGU STATE SOUTHEASTERN NIGERIA
ISSN : 2351-8014 Vol. 10 No. 1, Oct. 2014 176
Figure. 5. Trace element analyzed expressed in bar chart.
Table 1. Result of Physiochemical Analysis of Water Sample of Oji River compared with [16] standard
Constitutes W.H.O
Standard 2011
WS1 Oji
wounderful River
WS2 Nwangele
Stream
WS3 Ogba Spring
WS4 Ago
Spring
WS5 State
Government Borehole
WS6 Izele
Stream
WS7 Ozom
Stream
WS8 Oji
wounderful River
WS9 Oji
wounderful River
WS10 Oji
Wounderful River
PH 6.5-8.5 6 6.4 6.4 6.5 6.5 6.3 6.9 6.0 6.2 6.0 Temp oC 24 25 24 27 24 28 24 29 27 23 24 Apperance Cloudy Cloudy Clear Clear Clear Clear Clear Clear Clear Clear Colour (units AP.CO Std) 15 2.0 1.6 1.8 4.6 1.9 1.6 1.7 1.5 1.3 1.3 Turbidity (NTU) 5 2.0 0.9 0.9 0.8 0.9 0.8 0.5 1.5 2.3 2.9 Conductivity �S 1000 56.0 43.8 50.2 43.8 46.5 52.5 49.1 52.4 60.2 34.7 Calcium mg/Lca2- 75 11.3 12.6 9.6 11.2 10.8 11.7 10.1 4.2 9.6 12.3 Magnesium mg/Lmg+ 250 1.2 2.0 2.0 1.6 1.5 1.3 1.3 3.2 2.4 3.5 Sodium mg/L Na+ 200 0.0 0.0 0.0 0.0 0.3 0.0 0.0 0.0 0.0 0.0 Potassium mg/L K+ 200 1.3 1.6 1.9 2.6 1.9 1.7 2.1 1.4 1.9 0.9 Sulphate mg/L So42 250 2.4 2.4 2.4 2.1 2.2 2.7 2.4 12.2 2.1 2.5 Chloride mg/L CL 250 1.4 8.6 8.5 12.5 10.8 14.3 13.7 14.6 17.6 16.6 Bicarbonate mg/L HCO3 500 62.0 65.0 44.0 30.8 60.0 60.0 56.4 66.7 32.4 48.3 Carbonate mg/ L CO3
2 500 12.0 16.0 16.0 9.6 20.0 33.2 41.5 17.2 22.6 19.3 Nitrate mg/L NO2
- 50 26.0 0.0 0.0 0.0 0.4 1.8 0.9 0.6 0. 0.0
Nitrite mg/L NO3- 3 8.2 0.0 0.0 0.0 0.0 0.0 0.0 0.0 0.4 2.6 Phosphate mg/L PO4
2- 10 0.0 0.0 0.0 0.0 0.0 0.0 0.0 0.0 0.1 0.0 Fluoride mg/L 1.5 2.5 0.0 0.0 0.0 0.0 0.0 0.0 0.0 0.2 0.3 Free Chlorine mg/L CL 5 0.8 0.0 0.0 0.0 0.0 0.0 0.0 0.0 0.0 0.4 Iron mg/L 0.3 0.00 0.0 0.1 0.0 0.0 0.0 0.0 0.0 0.0 0.0 Manganese mg/L Ma2+ 0.4 0.0 0.0 0.0 0.0 0.0 0.0 0.0 0.0 0.0 0.0 Copper mg/ L Cu2+ 2 0.0 0.0 11.0 0.0 0.0 0.0 0.0 0.0 0.0 0.0 Total Hardness mg/L CaCo3
500 0.0 14.6 11.6 12.8 12.3 19.5 21.6 21.6 24.3 19.2
Salinity mg/ L Nacl 600 11.3 0.0 0.0 0.0 0.0 0.0 0.0 0.0 0.7 1.6 Total Dissolved Solid Mg/ L
500 28.0 26.9 25.1 24.2 23.3 28.3 31.6 28.2 22.4 31.5
Total alkalinity mg/L 1.5 0.0 0.0 0.0 0.0 0.0 0.0 0.0 0.1 1.3
Eyankware Moses Oghenenyoreme and Obasi Philip Njoku
ISSN : 2351-8014 Vol. 10 No. 1, Oct. 2014 177
7 CONCLUSION
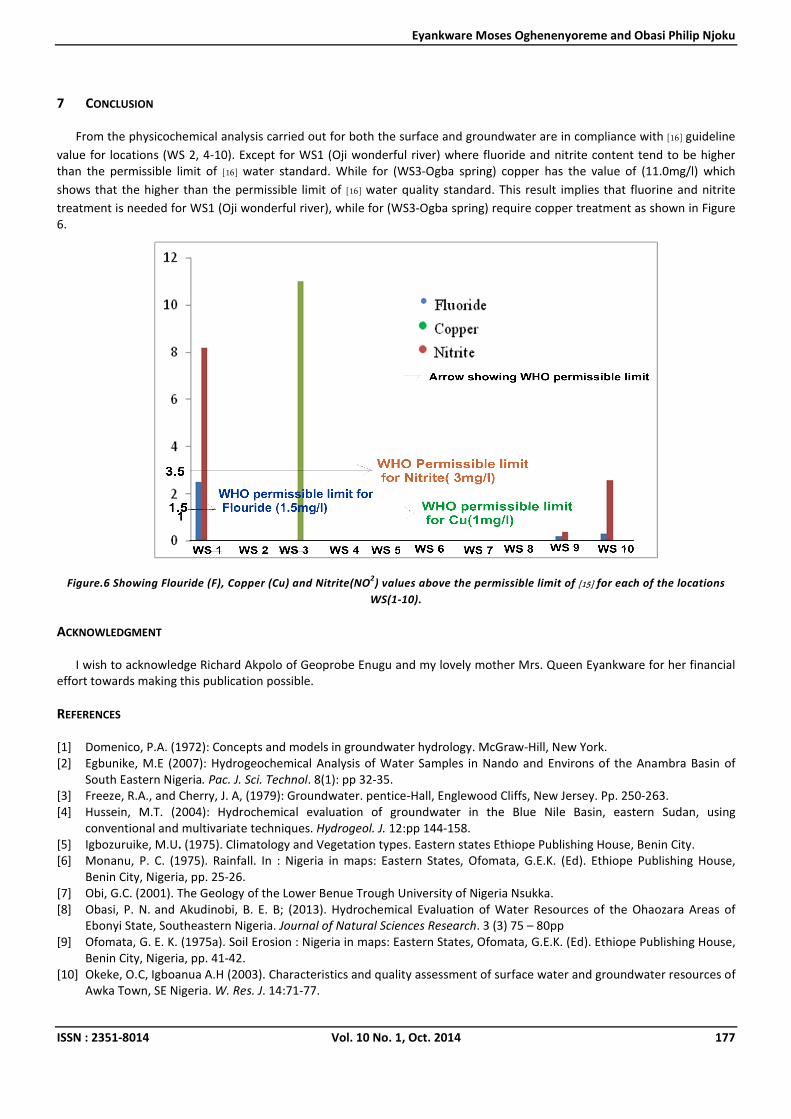
From the physicochemical analysis carried out for both the surface and groundwater are in compliance with [16] guideline
value for locations (WS 2, 4-10). Except for WS1 (Oji wonderful river) where fluoride and nitrite content tend to be higher than the permissible limit of [16] water standard. While for (WS3-Ogba spring) copper has the value of (11.0mg/l) which
shows that the higher than the permissible limit of [16] water quality standard. This result implies that fluorine and nitrite
treatment is needed for WS1 (Oji wonderful river), while for (WS3-Ogba spring) require copper treatment as shown in Figure 6.
Figure.6 Showing Flouride (F), Copper (Cu) and Nitrite(NO2) values above the permissible limit of [15] for each of the locations
WS(1-10).
ACKNOWLEDGMENT
I wish to acknowledge Richard Akpolo of Geoprobe Enugu and my lovely mother Mrs. Queen Eyankware for her financial effort towards making this publication possible.
REFERENCES
[1] Domenico, P.A. (1972): Concepts and models in groundwater hydrology. McGraw-Hill, New York. [2] Egbunike, M.E (2007): Hydrogeochemical Analysis of Water Samples in Nando and Environs of the Anambra Basin of
South Eastern Nigeria. Pac. J. Sci. Technol. 8(1): pp 32-35. [3] Freeze, R.A., and Cherry, J. A, (1979): Groundwater. pentice-Hall, Englewood Cliffs, New Jersey. Pp. 250-263. [4] Hussein, M.T. (2004): Hydrochemical evaluation of groundwater in the Blue Nile Basin, eastern Sudan, using
conventional and multivariate techniques. Hydrogeol. J. 12:pp 144-158. [5] Igbozuruike, M.U. (1975). Climatology and Vegetation types. Eastern states Ethiope Publishing House, Benin City. [6] Monanu, P. C. (1975). Rainfall. In : Nigeria in maps: Eastern States, Ofomata, G.E.K. (Ed). Ethiope Publishing House,
Benin City, Nigeria, pp. 25-26. [7] Obi, G.C. (2001). The Geology of the Lower Benue Trough University of Nigeria Nsukka. [8] Obasi, P. N.
and Akudinobi, B. E. B; (2013). Hydrochemical Evaluation of Water Resources of the Ohaozara Areas of
Ebonyi State, Southeastern Nigeria. Journal of Natural Sciences Research. 3 (3) 75 – 80pp [9] Ofomata, G. E. K. (1975a). Soil Erosion : Nigeria in maps: Eastern States, Ofomata, G.E.K. (Ed). Ethiope Publishing House,
Benin City, Nigeria, pp. 41-42. [10] Okeke, O.C, Igboanua A.H (2003). Characteristics and quality assessment of surface water and groundwater resources of
Awka Town, SE Nigeria. W. Res. J. 14:71-77.

PHYSICOCHEMICAL ANALYSIS OF WATER RESOURCES IN SELECTED PART OF OJI RIVER AND ITS EVIRONS, ENUGU STATE SOUTHEASTERN NIGERIA
ISSN : 2351-8014 Vol. 10 No. 1, Oct. 2014 178
[11] Richards, L.A., (1954). Diagenesis and improvement of saline and alkali soils. Agric. Handbooks 60, U.S. Dept. Agric. Washington, D.C. Pp. 160.
[12] Shah, T., Molden, D., Sakthivadivel, R. and Seckler, D. (2000). The global ground water situation: overview of opportunity and challenges. International Water Management Institute.
[13] Tattam, C.W. 1960: A review of Nigerian stratigraphy. Annual Report of the Geological Survey of Nigeria, Kaduna. Pp. 65-67.
[14] Walton, W.C. 1970. Groundwater resources evaluation. McGraw Hill Book Co., New York. Pp. 417. [15] WHO (World Health Organization). (2008). Guideline for drinking water quality Recommendations, 3
rd Edition. Vol 1
Genus, Switzerland. Pp 417-419. [16] WHO (World Health Organization). (2011). Guideline for drinking water quality Recommendations, 4
th Edition. Vol 1. Pp
219-230. [17] Water sanitation Health Drinking Water Quality
[online] available. (www.who.int/water_sanitation_health/dwq/guidelines/en).