Water Resources Data Florida Water Year 2002 - USGS.gov
419
U.S. Department of the Interior U.S. Geological Survey Water Resources Data Florida Water Year 2002 Volume 1A. Northeast Florida Surface Water Water-Data Report FL-02-1A Prepared in cooperation with the State of Florida and with other agencies or cooperators
-
Upload
khangminh22 -
Category
Documents
-
view
0 -
download
0
Transcript of Water Resources Data Florida Water Year 2002 - USGS.gov

U.S. Department of the InteriorU.S. Geological Survey
Water Resources DataFloridaWater Year 2002
Volume 1A. Northeast Florida Surface Water
Water-Data Report FL-02-1A
Prepared in cooperation with the State of Floridaand with other agencies or cooperators

UNITED STATES DEPARTMENT OF THE INTERIOR
GALE A. NORTON, Secretary
U.S. GEOLOGICAL SURVEY
Charles G. Groat, Director
Prepared in cooperation with the State of Florida
and with other agencies as listed under cooperation
For additional information write to Chief, Hydrologic Records Section
U.S. Geological Survey 224 West Central Parkway, Suite 1006
Altamonte Springs, Florida 32714
2003

iii WATER RESOURCES DATA FOR FLORIDA, 2002 Volume 1A: Northeast Florida Surface Water
PREFACE
This volume of the annual hydrologic data report of Florida is one of a series of annual reports
that document hydrologic data gathered from the U.S. Geological Survey's surface- and ground
water data-collection networks in each State, Puerto Rico, and the Trust Territories. These records
of streamflow, ground-water levels, and quality of water provide the hydrologic information needed
by State, local, and Federal agencies, and the private sector for developing and managing our
Nation's land and water resources. Hydrologic data for Florida are contained in four volumes:
Volume 1. Northeast Florida
Volume 2. South Florida
Volume 3. Southwest Florida
Volume 4. Northwest Florida
This report was prepared for publication by S.M. Dickerson under the supervision of
Donna M. Schiffer and Howard G. George. The following individuals contributed significantly to
the collection, processing and tabulation of the data:
Altamonte Springs Subdistrict Office
S. Anderson E.J. Duffy S. Kinnaman J. Pollender
L.L. Braley C. Engstrom W.J. McDevitt J. Shelton
T.C. Coates R.S. Greenwood R. Medina E.P. Simonds
Jose Cruz W.D. Hyde A.P. Nazarian G.F. Taylor
T.P. Curran R.E. Jones J.A. O’Brien D.J. Walsh
D.B. Dale J.L. Kelly M. J. Orr S.M. Wicklein
Jacksonville Field Headquarters
R.A. Broxton D. Huntt C.V. Phillips, Jr. M.J. Savarino
Larry B. Thomas J.A. Willard D.K. Williams
This report was prepared in cooperation with the State of Florida and with other agencies under
the general supervision of Carl Goodwin, District Chief, Florida.

REPORT DOCUMENTATION PAGE Form Approved OMB No. 0704-0188
Public reporting burden for this collection of information is estimated to average 1 hour per response, including the time for reviewing instructions, searching existing data sources, gathering and maintaining the data needed, and completing and reviewing the collection of information. Send comments regarding this burden estimate or any other aspect of this collection of information, including suggestions for reducing this burden, to Washington Headquarters Services, Directorate for Information Operations and Reports, 1215 Jefferson Davis Highway, Suite 1204, Arlington, VA 22202-4302, and to the Office of Management and Budget, Paperwork Reduction Project (0704-0188), Washington, DC 20503.
1. AGENCY USE ONLY (Leave blank)
17. SECURITY CLASSIFICATION
NSN 7540-01-280-5500
2. REPORT DATE
May 5, 2003 A
3. REPORT TYPE AND DATES COVEREDnnual - Oct. 1, 2001 to Sept. 30, 2002
5. FUNDING NUMBERS 4. TITLE AND SUBTITLEWater Resources Data - Florida, Water Year 2002 Volume 1A: Northeast Florida - Surface Water
6. AUTHOR(S)
8. PERFORMING ORGANIZATION
7. PERFORMING ORGANIZATION NAME(S) AND ADDRESS(ES)U.S. Geological Survey 224 West Central Parkway, Suite 1006 Altamonte Springs, FL 32714
REPORT NUMBER
USGS/WDR-FL-02-1A
10. AGENCY REPORT NUMBER SPONSORING / MONITORING
9. SPONSORING / MONITORING AGENCY NAME(S) AND ADDRESS(ES)U.S. Geological Survey 224 West Central Parkway, Suite 1006 Altamonte Springs, FL 32714
USGS/WDR-FL-02-1A
11. SUPPLEMENTARY NOTES
Prepared in cooperation with the State of Florida and other agencies.
12a. DISTRIBUTION / AVAILABILITY STATEMENT
No restriction on distribution. This report may be purchased from: National Technical Information Center Springfield, VA 22161
12b. DISTRIBUTION CODE
13. ABSTRACT (Maximum 200 words)
Water resources data for the 2002 water year in Florida consist of continuous or daily discharge for 392 streams, periodic discharge for 15 streams, continuous or daily stage for 191 streams, periodic stage for 13 streams, peak stage and discharge for 33 streams; continuous or daily elevations for 14 lakes, periodic elevations for 49 lakes; continuous ground-water levels for 418 wells, periodic ground-water levels for 1,287 wells; quality-of-water data for 116 surface-water sites and 291 wells.
The data for northeast Florida include continuous or daily discharge for 155 streams, periodic discharge for 7 streams, continuous or daily stage for 61 streams, periodic stage for 0 streams; peak stage and discharge for 0 streams; continuous or daily elevations for 10 lakes, periodic elevations for 20 lakes; continuous ground water levels for 53 wells, periodic groundwater levels for 589 wells; quality-of-water data for 44 surface-water sites and 86 wells.
These data represent the National Water Data System records collected by the U.S. Geological Survey and cooperating local, State and Federal agencies in Florida.
5
6.
14. SUBJECT TERMS
*Florida, *Hydrologic data, *Surface water, *Ground water, *Water quality, Flow rate, Gaging stations, Lakes, Reservoirs, Chemical analyses, Sediments, Water temperatures, Sampling sites, Water levels, Water analyses, Elevations, Water wells.
1
1
18. SECURITY CLASSIFICATION 19. SECURITY CLASSIFICATION
20StandPresc298-1
. NUMBER OF PAGES
419
.
r0
PRICE CODE
LIMITATION OF ABSTRACT
OF REPORTUNCLASSIFIED OF THIS PAGE OF ABSTRACT
UNCLASSIFIED
ard Form 298 (Rev. 2-89) ibed by ANSI Std 239-18 2

v WATER RESOURCES DATA FOR FLORIDA, 2002 Volume 1A: Northeast Florida Surface Water
87° 86° 85° 84° 83° 82° 81° 80°
31°
30°
29°
28°
27°
26°
25°
G U L F
OF
ME
XI
C O
AT
LA
NT
IC
OC
EA
N
A L A B A M A
G E O R G I A
0
VOLUME 4 NORTHWEST
FLORIDA
VOLUME 3 SOUTHWEST
FLORIDA
VOLUME 2 SOUTH FLORIDA
VOLUME 1
NORTHEAST FLORIDA
EXPLANATION
AREA COVERED BY THIS REPORT
20 40 60 80 100 MILES
0 20 40 60 80 100 KILOMETERS
Figure 1.--Geographic area covered by this report.

vi

WATER RESOURCES DATA FOR FLORIDA, 2002 viiVolume 1A: Northeast Florida Surface Water
CONTENTS
________
Page
Preface . . . . . . . . . . . . . . . . . . . . . . . . . . . . . . . . . . . . . . . . . . . . . . . . . . . . . . . . . . . . . . . . . . . . . . . . . . . . . . . . . . . . . . . . . . . . . . . . . . iiiList of stream and lake gaging stations, in downstream order, for which records are published in this volume . . . . . . . . . . . . . . . . . ixList of discontinued surface-water discharge or stage-only stations . . . . . . . . . . . . . . . . . . . . . . . . . . . . . . . . . . . . . . . . . . . . . . . . . . . xivIntroduction . . . . . . . . . . . . . . . . . . . . . . . . . . . . . . . . . . . . . . . . . . . . . . . . . . . . . . . . . . . . . . . . . . . . . . . . . . . . . . . . . . . . . . . . . . . . . . 1Cooperation . . . . . . . . . . . . . . . . . . . . . . . . . . . . . . . . . . . . . . . . . . . . . . . . . . . . . . . . . . . . . . . . . . . . . . . . . . . . . . . . . . . . . . . . . . . . . . 1Summary of hydrologic conditions . . . . . . . . . . . . . . . . . . . . . . . . . . . . . . . . . . . . . . . . . . . . . . . . . . . . . . . . . . . . . . . . . . . . . . . . . . . . 2Special networks and programs . . . . . . . . . . . . . . . . . . . . . . . . . . . . . . . . . . . . . . . . . . . . . . . . . . . . . . . . . . . . . . . . . . . . . . . . . . . . . . . 3Explanation of the records 5
Station identification numbers . . . . . . . . . . . . . . . . . . . . . . . . . . . . . . . . . . . . . . . . . . . . . . . . . . . . . . . . . . . . . . . . . . . . . . . . . . . . 5Downstream order system . . . . . . . . . . . . . . . . . . . . . . . . . . . . . . . . . . . . . . . . . . . . . . . . . . . . . . . . . . . . . . . . . . . . . . . . . . . 5Latitude-longitude system . . . . . . . . . . . . . . . . . . . . . . . . . . . . . . . . . . . . . . . . . . . . . . . . . . . . . . . . . . . . . . . . . . . . . . . . . . . 5
Records of stage and water discharge . . . . . . . . . . . . . . . . . . . . . . . . . . . . . . . . . . . . . . . . . . . . . . . . . . . . . . . . . . . . . . . . . . . . . . 6Data collection and computation . . . . . . . . . . . . . . . . . . . . . . . . . . . . . . . . . . . . . . . . . . . . . . . . . . . . . . . . . . . . . . . . . . . . . . 6Data presentation . . . . . . . . . . . . . . . . . . . . . . . . . . . . . . . . . . . . . . . . . . . . . . . . . . . . . . . . . . . . . . . . . . . . . . . . . . . . . . . . . . 7
Data table of daily mean values . . . . . . . . . . . . . . . . . . . . . . . . . . . . . . . . . . . . . . . . . . . . . . . . . . . . . . . . . . . . . . . . . . . 8Statistics of monthly mean data . . . . . . . . . . . . . . . . . . . . . . . . . . . . . . . . . . . . . . . . . . . . . . . . . . . . . . . . . . . . . . . . . . . 8Summary statistics . . . . . . . . . . . . . . . . . . . . . . . . . . . . . . . . . . . . . . . . . . . . . . . . . . . . . . . . . . . . . . . . . . . . . . . . . . . . . 8
Identifying estimated daily discharge . . . . . . . . . . . . . . . . . . . . . . . . . . . . . . . . . . . . . . . . . . . . . . . . . . . . . . . . . . . . . . . . . . 10Accuracy of the records . . . . . . . . . . . . . . . . . . . . . . . . . . . . . . . . . . . . . . . . . . . . . . . . . . . . . . . . . . . . . . . . . . . . . . . . . . . . . 10Other records available . . . . . . . . . . . . . . . . . . . . . . . . . . . . . . . . . . . . . . . . . . . . . . . . . . . . . . . . . . . . . . . . . . . . . . . . . . . . . 10
Records of surface-water quality . . . . . . . . . . . . . . . . . . . . . . . . . . . . . . . . . . . . . . . . . . . . . . . . . . . . . . . . . . . . . . . . . . . . . . . . . . 10Classification of records . . . . . . . . . . . . . . . . . . . . . . . . . . . . . . . . . . . . . . . . . . . . . . . . . . . . . . . . . . . . . . . . . . . . . . . . . . . . 10Arrangement of records . . . . . . . . . . . . . . . . . . . . . . . . . . . . . . . . . . . . . . . . . . . . . . . . . . . . . . . . . . . . . . . . . . . . . . . . . . . . . 11Onsite measurements and sample collection . . . . . . . . . . . . . . . . . . . . . . . . . . . . . . . . . . . . . . . . . . . . . . . . . . . . . . . . . . . . . 11Water temperature . . . . . . . . . . . . . . . . . . . . . . . . . . . . . . . . . . . . . . . . . . . . . . . . . . . . . . . . . . . . . . . . . . . . . . . . . . . . . . . . . 12Sediment . . . . . . . . . . . . . . . . . . . . . . . . . . . . . . . . . . . . . . . . . . . . . . . . . . . . . . . . . . . . . . . . . . . . . . . . . . . . . . . . . . . . . . . . 12Dissolved Trace Element Concentrations . . . . . . . . . . . . . . . . . . . . . . . . . . . . . . . . . . . . . . . . . . . . . . . . . . . . . . . . . . . . . . . 12Laboratory measurements . . . . . . . . . . . . . . . . . . . . . . . . . . . . . . . . . . . . . . . . . . . . . . . . . . . . . . . . . . . . . . . . . . . . . . . . . . . 12Data presentation . . . . . . . . . . . . . . . . . . . . . . . . . . . . . . . . . . . . . . . . . . . . . . . . . . . . . . . . . . . . . . . . . . . . . . . . . . . . . . . . . . 13Remark codes. . . . . . . . . . . . . . . . . . . . . . . . . . . . . . . . . . . . . . . . . . . . . . . . . . . . . . . . . . . . . . . . . . . . . . . . . . . . . . . . . . . . . 14Rounding Clarification . . . . . . . . . . . . . . . . . . . . . . . . . . . . . . . . . . . . . . . . . . . . . . . . . . . . . . . . . . . . . . . . . . . . . . . . . . . . . 14
Access to USGS WATER DATA . . . . . . . . . . . . . . . . . . . . . . . . . . . . . . . . . . . . . . . . . . . . . . . . . . . . . . . . . . . . . . . . . . . . . . . . . . . . . 14Definition of terms. . . . . . . . . . . . . . . . . . . . . . . . . . . . . . . . . . . . . . . . . . . . . . . . . . . . . . . . . . . . . . . . . . . . . . . . . . . . . . . . . . . . . . . . . 15Techniques of water-resources investigations . . . . . . . . . . . . . . . . . . . . . . . . . . . . . . . . . . . . . . . . . . . . . . . . . . . . . . . . . . . . . . . . . . . . 32Stage, discharge, and water quality of streams . . . . . . . . . . . . . . . . . . . . . . . . . . . . . . . . . . . . . . . . . . . . . . . . . . . . . . . . . . . . . . . . . . . 37
Discharge at miscellaneous sites . . . . . . . . . . . . . . . . . . . . . . . . . . . . . . . . . . . . . . . . . . . . . . . . . . . . . . . . . . . . . . . . . . . . . . . . . . 353Elevation of lakes. . . . . . . . . . . . . . . . . . . . . . . . . . . . . . . . . . . . . . . . . . . . . . . . . . . . . . . . . . . . . . . . . . . . . . . . . . . . . . . . . . . . . . . . . . 360Index to
Introductory text . . . . . . . . . . . . . . . . . . . . . . . . . . . . . . . . . . . . . . . . . . . . . . . . . . . . . . . . . . . . . . . . . . . . . . . . . . . . . . . . . . . . . . 397Surface-water sites . . . . . . . . . . . . . . . . . . . . . . . . . . . . . . . . . . . . . . . . . . . . . . . . . . . . . . . . . . . . . . . . . . . . . . . . . . . . . . . . . . . . . 400

viii WATER RESOURCES DATA FOR FLORIDA, 2002Volume 1A: Northeast Florida Surface Water
________
________
_____
ILLUSTRATIONS _____
PageFigure 1. Geographic area covered by this report. . . . . . . . . . . . . . . . . . . . . . . . . . . . . . . . . . . . . . . . . . . . . . . . . . . . . . . . . . . . . . . . v
2. NAWQA stations in the State of Florida . . . . . . . . . . . . . . . . . . . . . . . . . . . . . . . . . . . . . . . . . . . . . . . . . . . . . . . . . . . . . . 43. System for numbering miscellaneous sites (latitude and longitude) . . . . . . . . . . . . . . . . . . . . . . . . . . . . . . . . . . . . . . . . . 5
4-10. Location of stream gaging stations in the:4. St. Marys River basin and the coastal area between the St. Marys and St. Johns Rivers. . . . . . . . . . . . . . . . . . . . . . . . . . 385. St. Johns River basin above the Ocklawaha River . . . . . . . . . . . . . . . . . . . . . . . . . . . . . . . . . . . . . . . . . . . . . . . . . . . . . . . 486. Ocklawaha River basin . . . . . . . . . . . . . . . . . . . . . . . . . . . . . . . . . . . . . . . . . . . . . . . . . . . . . . . . . . . . . . . . . . . . . . . . . . . . 1187. St. Johns River basin below the Ocklawaha River basin . . . . . . . . . . . . . . . . . . . . . . . . . . . . . . . . . . . . . . . . . . . . . . . . . . 1608. Coastal area between the St. Johns and St. Lucie Rivers . . . . . . . . . . . . . . . . . . . . . . . . . . . . . . . . . . . . . . . . . . . . . . . . . . 2049. Kissimmee River basin, the Taylor Creek basin and inflow to Lake Okeechobee from the
north, and Fisheating Creek basin and inflow to Lake Okeechobee from the northwest . . . . . . . . . . . . . . . . . . . . . . . 238 10. Manatee, Little Manatee, Alafia, and Hillsborough
River basins, and Tampa Bay and coastal areas . . . . . . . . . . . . . . . . . . . . . . . . . . . . . . . . . . . . . . . . . . . . . . . . . . . . . . . 30411. Withlacoochee River basin and coastal areas . . . . . . . . . . . . . . . . . . . . . . . . . . . . . . . . . . . . . . . . . . . . . . . . . . . . . . . . . . . 308
12-15. Location of lake gaging stations in the:12. Ocklawaha River basin . . . . . . . . . . . . . . . . . . . . . . . . . . . . . . . . . . . . . . . . . . . . . . . . . . . . . . . . . . . . . . . . . . . . . . . . . . . . 36213. Kissimmee River basin, the Taylor Creek basin and inflow to Lake Okeechobee from the
north, and Fisheating Creek basin and inflow to Lake Okeechobee from the northwest . . . . . . . . . . . . . . . . . . . . . . . 37014. Peace and Myakka River basins, Charlotte Harbor and coastal area . . . . . . . . . . . . . . . . . . . . . . . . . . . . . . . . . . . . . . . . . 38615. Withlacoochee River basin and coastal areas . . . . . . . . . . . . . . . . . . . . . . . . . . . . . . . . . . . . . . . . . . . . . . . . . . . . . . . . . . . 390
TABLES
Table 1. Mean annual discharge for the 2002 water year and long term base periods . . . . . . . . . . . . . . . . . . . . . . . . . . . . . . . . . . . 2

WATER RESOURCES DATA FOR FLORIDA, 2002 ixVolume 1A: Northeast Florida Surface Water
____________________________________________________________________________________________________________________
____________________________________________________________________________________________________________________
STREAM AND LAKE GAGING STATIONS, IN DOWNSTREAM ORDER, FOR WHICH RECORDS ARE PUBLISHED IN THIS VOLUME
The following list shows the surface water sites where streamflow, stage, lake elevation, or water quality data are collected.
[Letters after station name designate type of data published: (d) discharge, (c) chemical, (t) water temperature, (e) elevation, gage heights, or contents.]
Station number Page
03070204 ST. MARYS RIVER BASIN
North Prong St. Marys River at Moniac, GA (d) . . . . . . . . . . . . . . . . . . . . . . . . . . . . . 02228500 . . . . . . . . . . . . 39Middle Prong St. Marys River near Taylor (d,e) . . . . . . . . . . . . . . . . . . . . . . . . . . . 02229250 . . . . . . . . . . . . 40
St. Marys River near Macclenny (d,e) . . . . . . . . . . . . . . . . . . . . . . . . . . . . . . . . . . 02231000 . . . . . . . . . . . . 41
03070205 COASTAL AREA BETWEEN ST. MARYS AND ST. JOHNS RIVERS
Mills Creek near Italia:Alligator Creek at Callahan (d) . . . . . . . . . . . . . . . . . . . . . . . . . . . . . . . . . . . . 02231268 . . . . . . . . . . . . 43Thomas Creek near Crawford (d) . . . . . . . . . . . . . . . . . . . . . . . . . . . . . . . . . . . 02231280 . . . . . . . . . . . . 44
Nassau River near Hedges (d,e) . . . . . . . . . . . . . . . . . . . . . . . . . . . . . . . . . . . . . 02231289 . . . . . . . . . . . . 45
03080101 ST. JOHNS RIVER BASIN ABOVE OCKLAWAHA RIVER
St. Johns Headwaters:Fort Drum Creek at Sunshine State Parkway near Fort Drum (d) . . . . . . . . . . . . . . . . . . . 02231342 . . . . . . . . . . . . 49
Lake Jesup:
Wekiva River:
Lake Dexter (continuation of St. Johns River):Lake Woodruff (head of Tick Island Creek):Spring Garden Lake (head of Spring Garden Creek):
St. Johns River:Bull Creek:Blue Cypress Creek near Fellsmere (d) . . . . . . . . . . . . . . . . . . . . . . . . . . . . . . . . 02231396 . . . . . . . . . . . . 50Sixmile Creek near Kenansville (d) . . . . . . . . . . . . . . . . . . . . . . . . . . . . . . . . . 02231454 . . . . . . . . . . . . 51Wolf Creek near Kenansville (d) . . . . . . . . . . . . . . . . . . . . . . . . . . . . . . . . . . . 02231458 . . . . . . . . . . . . 52Jane Green Creek near Deer Park (d) . . . . . . . . . . . . . . . . . . . . . . . . . . . . . . . . . 02231600 . . . . . . . . . . . . 53
St. Johns River near Melbourne (d,e) . . . . . . . . . . . . . . . . . . . . . . . . . . . . . . . . . . 02232000 . . . . . . . . . . . . 54Pennywash Creek near Deer Park (d) . . . . . . . . . . . . . . . . . . . . . . . . . . . . . . . . . 02232155 . . . . . . . . . . . . 56Wolf Creek near Deer Park (d) . . . . . . . . . . . . . . . . . . . . . . . . . . . . . . . . . . . . 02232200 . . . . . . . . . . . . 57
St. Johns River near Cocoa (d,e,c,t) . . . . . . . . . . . . . . . . . . . . . . . . . . . . . . . . . . . 02232400 . . . . . . . . . . . . 58Taylor Creek near Cocoa (d) . . . . . . . . . . . . . . . . . . . . . . . . . . . . . . . . . . . . . 02232415 . . . . . . . . . . . . 65
St. Johns River near Christmas (d,e,c,t) . . . . . . . . . . . . . . . . . . . . . . . . . . . . . . . . . 02232500 . . . . . . . . . . . . 66Little Econlockhatchee River near Union Park (d) . . . . . . . . . . . . . . . . . . . . . . . . . 02233200 . . . . . . . . . . . . 73Little Econlockhatchee River Tributary at Banner Dam at Union Park (d) . . . . . . . . . . . . . 02233460 . . . . . . . . . . . . 74Little Econlockhatchee River at University Boulevard near Union Park (d) . . . . . . . . . . . . 02233473 . . . . . . . . . . . . 75Little Econlockhatchee River near State Highway 434 near Oviedo (d) . . . . . . . . . . . . . . 02233475 . . . . . . . . . . . . 76
Econlockhatchee River near Oviedo (d) . . . . . . . . . . . . . . . . . . . . . . . . . . . . . . . 02233484 . . . . . . . . . . . . 77Econlockhatchee River near Chuluota (d) . . . . . . . . . . . . . . . . . . . . . . . . . . . . . . 02233500 . . . . . . . . . . . . 78
St. Johns River above Lake Harney, near Geneva (d,e) . . . . . . . . . . . . . . . . . . . . . . . . . 02234000 . . . . . . . . . . . . 79
Howell Creek near Altamonte Springs (d) . . . . . . . . . . . . . . . . . . . . . . . . . . . . . 02234308 . . . . . . . . . . . . 81Howell Creek near Slavia (d) . . . . . . . . . . . . . . . . . . . . . . . . . . . . . . . . . . . 02234324 . . . . . . . . . . . . 82Howell Creek at State Highway 434 near Oviedo (d) . . . . . . . . . . . . . . . . . . . . . . . 02234344 . . . . . . . . . . . . 83Soldier Creek near Longwood (d) . . . . . . . . . . . . . . . . . . . . . . . . . . . . . . . . . 02234384 . . . . . . . . . . . . 84Gee Creek near Longwood (d) . . . . . . . . . . . . . . . . . . . . . . . . . . . . . . . . . . 02234400 . . . . . . . . . . . . 85
Lake Jesup Outlet near Sanford (d) . . . . . . . . . . . . . . . . . . . . . . . . . . . . . . . . . 02234435 . . . . . . . . . . . . 86St. Johns River near Sanford (d,e,c,t ) . . . . . . . . . . . . . . . . . . . . . . . . . . . . . . . . . . 02234500 . . . . . . . . . . . . 87
Wekiva Springs near Apopka (d) . . . . . . . . . . . . . . . . . . . . . . . . . . . . . . . . . . . 02234600 . . . . . . . . . . . . 94Rock Springs near Apopka (d) . . . . . . . . . . . . . . . . . . . . . . . . . . . . . . . . . . . . 02234610 . . . . . . . . . . . . 95Wekiva River near Apopka (d) . . . . . . . . . . . . . . . . . . . . . . . . . . . . . . . . . . . . 02234635 . . . . . . . . . . . . 96
Little Wekiva River near Altamonte Springs (d) . . . . . . . . . . . . . . . . . . . . . . . . . . 02234990 . . . . . . . . . . . . 97Little Wekiva River near Longwood (d) . . . . . . . . . . . . . . . . . . . . . . . . . . . . . . 02234998 . . . . . . . . . . . . 98
Wekiva River at Old RR Crossing near Sanford (d) . . . . . . . . . . . . . . . . . . . . . . . . . . 022349993 . . . . . . . . . . . . 99Wekiva River near Sanford (d,c,t) . . . . . . . . . . . . . . . . . . . . . . . . . . . . . . . . . . 02235000 . . . . . . . . . . . . 100
Black Water Creek near Cassia (d,c,t) . . . . . . . . . . . . . . . . . . . . . . . . . . . . . . . 02235200 . . . . . . . . . . . . 102Blue Springs near Orange City (d,c,t) . . . . . . . . . . . . . . . . . . . . . . . . . . . . . . . . 02235500 . . . . . . . . . . . . 104
St. Johns River near De Land (d,e,c,t) . . . . . . . . . . . . . . . . . . . . . . . . . . . . . . . . . . 02236000 . . . . . . . . . . . . 108
St. Johns River at Astor (d,e) . . . . . . . . . . . . . . . . . . . . . . . . . . . . . . . . . . . . . . 02236125 . . . . . . . . . . . . 115
03080102 OCKLAWAHA RIVER BASIN
Green Swamp Run near Eva (d) . . . . . . . . . . . . . . . . . . . . . . . . . . . . . . . . . . . . . 02236350 . . . . . . . . . . . . 119Big Creek near Clermont (d) . . . . . . . . . . . . . . . . . . . . . . . . . . . . . . . . . . . . . . 02236500 . . . . . . . . . . . . 120Little Creek near Clermont (d) . . . . . . . . . . . . . . . . . . . . . . . . . . . . . . . . . . . . . 02236700 . . . . . . . . . . . . 121
Lake Minnehaha at Clermont (e) . . . . . . . . . . . . . . . . . . . . . . . . . . . . . . . . . . . 02236840 . . . . . . . . . . . . 363Palatlakaha River at Cherry Lake Outlet, near Groveland (d,e) . . . . . . . . . . . . . . . . . . . . . 02236900 . . . . . . . . . . . . 122

x WATER RESOURCES DATA FOR FLORIDA, 2002 Volume 1A: Northeast Florida Surface Water
____________________________________________________________________________________________________________________
____________________________________________________________________________________________________________________
STREAM AND LAKE GAGING STATIONS, IN DOWNSTREAM ORDER, FOR WHICH RECORDS ARE PUBLISHED IN THIS VOLUME--Continued
Station number Page
03080102 OCKLAWAHA RIVER BASIN--Continued
Palatlakaha River below spillway at Cherry Lake Outlet, near Groveland (e) . . . . . . . . . . . . . . . . . . . . . . . . . . . . . . . . . . . . . . 02236901 . . . . . . . . . . . . 124
Palatlakaha River near Mascotte (e) . . . . . . . . . . . . . . . . . . . . . . . . . . . . . . . . . . . 02237000 . . . . . . . . . . . . 125 Palatlakaha River below Spillway, near Mascotte (e) . . . . . . . . . . . . . . . . . . . . . . . . . . 02237001 . . . . . . . . . . . . 126 Palatlakaha River at Structure M-6 near Mascotte (e) . . . . . . . . . . . . . . . . . . . . . . . . . . 02237010 . . . . . . . . . . . . 127 Palatlakaha River below Structure M-6 near Mascotte (e) . . . . . . . . . . . . . . . . . . . . . . . . 02237011 . . . . . . . . . . . . 128 Palatlakaha River at Structure M-5 near Okahumpka (e) . . . . . . . . . . . . . . . . . . . . . . . . . 02237050 . . . . . . . . . . . . 129 Palatlakaha River below Structure M-5 near Okahumpka (e) . . . . . . . . . . . . . . . . . . . . . . 02237051 . . . . . . . . . . . . 130 Palatlakaha River at Structure M-4 near Okahumpka (e) . . . . . . . . . . . . . . . . . . . . . . . . . 02237206 . . . . . . . . . . . . 131 Palatlakaha River below Structure M-4 near Okahumpka (e) . . . . . . . . . . . . . . . . . . . . . . 02237207 . . . . . . . . . . . . 132 Palatlakaha River at Structure M-l near Okahumpka (d,e) . . . . . . . . . . . . . . . . . . . . . . . . 02237293 . . . . . . . . . . . . 133 Little Lake Harris (part of Lake Harris):
Church Lake near Groveland (e) . . . . . . . . . . . . . . . . . . . . . . . . . . . . . . . . . . . 02237370 . . . . . . . . . . . . 364 Lake Eustis:
Apopka-Beauclair Canal: Apopka-Beauclair Canal near Astatula (d,e) . . . . . . . . . . . . . . . . . . . . . . . . . . . . . 02237700 . . . . . . . . . . . . 135 Apopka-Beauclair Canal below dam, near Astatula (e) . . . . . . . . . . . . . . . . . . . . . . . . 02237701 . . . . . . . . . . . . 137
Wolf Branch at FCRR near Mount Dora (d) . . . . . . . . . . . . . . . . . . . . . . . . . . . . 02237734 . . . . . . . . . . . . 138 Lake Dora:
West Crooked Lake near Eustis (e) . . . . . . . . . . . . . . . . . . . . . . . . . . . . . . . . 02237753 . . . . . . . . . . . . 365 Lake Umatilla at Umatilla (e) . . . . . . . . . . . . . . . . . . . . . . . . . . . . . . . . . . . 02237865 . . . . . . . . . . . . 366
Haines Creek (continuation of Palatlakaha River) at Lisbon (d,e) . . . . . . . . . . . . . . . . . . . . 02238000 . . . . . . . . . . . . 139 Haines Creek below Burrell Dam at Lisbon (e) . . . . . . . . . . . . . . . . . . . . . . . . . . . . . 02238001 . . . . . . . . . . . . 141 Lake Griffin:
Holly Lake near Umatilla (e) . . . . . . . . . . . . . . . . . . . . . . . . . . . . . . . . . . . . . 02238180 . . . . . . . . . . . . 367 Ocklawaha River above Moss Bluff Dam, at Moss Bluff (e) . . . . . . . . . . . . . . . . . . . . . . . 02238499 . . . . . . . . . . . . 142 Ocklawaha River at Moss Bluff (d,e) . . . . . . . . . . . . . . . . . . . . . . . . . . . . . . . . . . 02238500 . . . . . . . . . . . . 143 Lake Weir at Ocklawaha (e) . . . . . . . . . . . . . . . . . . . . . . . . . . . . . . . . . . . . . . . 02238800 . . . . . . . . . . . . 368
Lake Weir Outlet: Silver Springs (head of Silver River) near Ocala (d,e,c,t) . . . . . . . . . . . . . . . . . . . . . . . 02239500 . . . . . . . . . . . . 145
Ocklawaha River near Conner (d,e) . . . . . . . . . . . . . . . . . . . . . . . . . . . . . . . . . . . 02240000 . . . . . . . . . . . . 148 Ocklawaha River at Eureka (d) . . . . . . . . . . . . . . . . . . . . . . . . . . . . . . . . . . . . . 02240500 . . . . . . . . . . . . 150
Prairie Creek near Gainesville (d,e) . . . . . . . . . . . . . . . . . . . . . . . . . . . . . . . . . 02240902 . . . . . . . . . . . . 151 Camps Canal (connection of Prairie Creek to River Styx):
Paynes Prairie Hogtown Creek near Arredondo (d) . . . . . . . . . . . . . . . . . . . . . . . . . . . . . . . 02240954 . . . . . . . . . . . . 153 Haile Sink near Arredondo (e) . . . . . . . . . . . . . . . . . . . . . . . . . . . . . . . . . 02240956 . . . . . . . . . . . . 154
Camps Canal near Rochelle (d,e) . . . . . . . . . . . . . . . . . . . . . . . . . . . . . . . . . . . 02241000 . . . . . . . . . . . . 155 Orange Lake: Orange Creek at Orange Springs (d) . . . . . . . . . . . . . . . . . . . . . . . . . . . . . . . . . 02243000 . . . . . . . . . . . . 157
Ocklawaha River at Rodman Dam, near Orange Springs (d,e) . . . . . . . . . . . . . . . . . . . . . . 02243960 . . . . . . . . . . . . 158
03080103 ST. JOHNS RIVER BASIN BELOW OCKLAWAHA RIVER
St. Johns River below Ocklawaha River: Cross-Florida Barge Canal at Buckman Lock, near Palatka (d) . . . . . . . . . . . . . . . . . . . . 02244032 . . . . . . . . . . . . 161
St. Johns River at Buffalo Bluff, near Satsuma (d,c,t) . . . . . . . . . . . . . . . . . . . . . . . . . . 02244040 . . . . . . . . . . . . 162 Crescent Lake (head of Dunns Creek):
Haw Creek: Middle Haw Creek near Korona (d) . . . . . . . . . . . . . . . . . . . . . . . . . . . . . . . 02244320 . . . . . . . . . . . . 166 Little Haw Creek: Little Haw Creek near Seville (d) . . . . . . . . . . . . . . . . . . . . . . . . . . . . . . . . 02244420 . . . . . . . . . . . . 167
Haw Creek at Mouth near Seville (d) . . . . . . . . . . . . . . . . . . . . . . . . . . . . . . . . . 292349081254200 . . . . . . . . 168 Dunns Creek near Satsuma (d,e) . . . . . . . . . . . . . . . . . . . . . . . . . . . . . . . . . . . 02244440 . . . . . . . . . . . . 169 Rice Creek near Springside (d) . . . . . . . . . . . . . . . . . . . . . . . . . . . . . . . . . . . . 02244473 . . . . . . . . . . . . 171
Etonia Creek: Lake Johnson:
Etonia Creek at Bardin (d) . . . . . . . . . . . . . . . . . . . . . . . . . . . . . . . . . . . . . . 02245050 . . . . . . . . . . . . 172 Simms Creek near Bardin (d) . . . . . . . . . . . . . . . . . . . . . . . . . . . . . . . . . . 02245140 . . . . . . . . . . . . 173
St. Johns River at Dancy Point near Spuds (c,t) . . . . . . . . . . . . . . . . . . . . . . . . . . . . . 294213081345300 . . . . . . . . 174 Deep Creek near Hastings (d) . . . . . . . . . . . . . . . . . . . . . . . . . . . . . . . . . . . . 02245255 . . . . . . . . . . . . 178 Deep Creek at Spuds (d) . . . . . . . . . . . . . . . . . . . . . . . . . . . . . . . . . . . . . . . 02245260 . . . . . . . . . . . . 179 South Fork Black Creek (head of Black Creek) near Penney Farms (d) . . . . . . . . . . . . . . . . 02245500 . . . . . . . . . . . . 180
North Fork Black Creek near Middleburg (d) . . . . . . . . . . . . . . . . . . . . . . . . . . . 02246000 . . . . . . . . . . . . 181 North Fork Black Creek at Middleburg (e) . . . . . . . . . . . . . . . . . . . . . . . . . . . . 02246010 . . . . . . . . . . . . 182

xi WATER RESOURCES DATA FOR FLORIDA, 2002 Volume 1A: Northeast Florida Surface Water
____________________________________________________________________________________________________________________
____________________________________________________________________________________________________________________
STREAM AND LAKE GAGING STATIONS, IN DOWNSTREAM ORDER, FOR WHICH RECORDS ARE PUBLISHED IN THIS VOLUME--Continued
Station number Page
03080103 ST. JOHNS RIVER BASIN BELOW OCKLAWAHA RIVER --Continued
Julington Creek: Big Davis Creek at Bayard (d) . . . . . . . . . . . . . . . . . . . . . . . . . . . . . . . . . . . . 02246150 . . . . . . . . . . . . 183
St. Johns River at Buckman Bridge at Jacksonville (c,t) . . . . . . . . . . . . . . . . . . . . . . . . . 301124081395901 . . . . . . . . 184 Ortega River at Jacksonville (d) . . . . . . . . . . . . . . . . . . . . . . . . . . . . . . . . . . . 02246300 . . . . . . . . . . . . 189 Ortega River at Kirwin Road near Jacksonville (d) . . . . . . . . . . . . . . . . . . . . . . . . . . 02246318 . . . . . . . . . . . . 190 Fishing Creek at Wesconnet Blvd. at Jacksonville (c,t) . . . . . . . . . . . . . . . . . . . . . . . . 02246435 . . . . . . . . . . . . 191 Fishing Creek at 110th Street at Jacksonville (c,t) . . . . . . . . . . . . . . . . . . . . . . . . . . 02246437 . . . . . . . . . . . . 192 South Branch Big Fishweir Creek at Cassat Avenue at Jacksonville (c,t) . . . . . . . . . . . . . . . 02246465 . . . . . . . . . . . . 193 South Branch Big Fishweir Creek at Blanding Blvd. at Jacksonville (c,t) . . . . . . . . . . . . . . . 02246467 . . . . . . . . . . . . 194
St. Johns River at Jacksonville (d,e,c,t) . . . . . . . . . . . . . . . . . . . . . . . . . . . . . . . . . 02246500 . . . . . . . . . . . . 195 Pablo Creek (merges with Intracoastal Waterway) at Jacksonville (d) . . . . . . . . . . . . . . . . 02246828 . . . . . . . . . . . . 203
03080201 COASTAL AREA BETWEEN ST. JOHNS RIVER AND PONCE DE LEON INLET
San Sebastian River at St. Augustine (d) . . . . . . . . . . . . . . . . . . . . . . . . . . . . . . . 02246895 . . . . . . . . . . . . 205 Moultrie Creek at Moultrie (d) . . . . . . . . . . . . . . . . . . . . . . . . . . . . . . . . . . . . 02247015 . . . . . . . . . . . . 206 Moses Creek near Moultrie (d) . . . . . . . . . . . . . . . . . . . . . . . . . . . . . . . . . . . . 02247027 . . . . . . . . . . . . 207
Halifax River (Intracoastal Waterway): Lehigh Canal near Flagler Beach (d) . . . . . . . . . . . . . . . . . . . . . . . . . . . . . . . . . 02247258 . . . . . . . . . . . . 208 Tomoka River:
Tiger Bay Canal near Daytona Beach (d) . . . . . . . . . . . . . . . . . . . . . . . . . . . . . 02247480 . . . . . . . . . . . . 209 Thayer Canal near Daytona Beach (d) . . . . . . . . . . . . . . . . . . . . . . . . . . . . . . . 02247496 . . . . . . . . . . . . 210
Eleventh Street Canal at Holly Hill (d) . . . . . . . . . . . . . . . . . . . . . . . . . . . . . . . . 02247509 . . . . . . . . . . . . 211 Tomoka River near Holly Hill (d) . . . . . . . . . . . . . . . . . . . . . . . . . . . . . . . . . . 02247510 . . . . . . . . . . . . 212 Tomoka River near Ormond Beach (d) . . . . . . . . . . . . . . . . . . . . . . . . . . . . . . . . 02247598 . . . . . . . . . . . . 213 Spruce Creek near Samsula (d) . . . . . . . . . . . . . . . . . . . . . . . . . . . . . . . . . . . . 02248000 . . . . . . . . . . . . 214 Reed Canal at South Daytona (d) . . . . . . . . . . . . . . . . . . . . . . . . . . . . . . . . . . . 02248025 . . . . . . . . . . . . 215 Halifax Canal near Harbor Oaks (d) . . . . . . . . . . . . . . . . . . . . . . . . . . . . . . . . . 02248030 . . . . . . . . . . . . 216 Spruce Creek near New Smyrna Beach (d) . . . . . . . . . . . . . . . . . . . . . . . . . . . . . . 02248053 . . . . . . . . . . . . 217 Turnbull Creek near New Smyrna Beach (d) . . . . . . . . . . . . . . . . . . . . . . . . . . . . . 02248060 . . . . . . . . . . . . 218
03080202 COASTAL AREA BETWEEN PONCE DE LEON INLET AND SEBASTIAN INLET
Indian River (Intracoastal Waterway): Haulover Canal near Mims (d,c,t) . . . . . . . . . . . . . . . . . . . . . . . . . . . . . . . . . . 02248380 . . . . . . . . . . . . 219 Eau Gallie River at Heather Glen circle at Melbourne(d) . . . . . . . . . . . . . . . . . . . . . . . 02249007 . . . . . . . . . . . . 222 Crane Creek at Babcock Street at Melbourne (d) . . . . . . . . . . . . . . . . . . . . . . . . . . . 02249510 . . . . . . . . . . . . 223 Crane Creek at U.S. Highway 1 at Melbourne (d) . . . . . . . . . . . . . . . . . . . . . . . . . . . 02249518 . . . . . . . . . . . . 224 Turkey Creek at Palm Bay (d,e) . . . . . . . . . . . . . . . . . . . . . . . . . . . . . . . . . . . 02250030 . . . . . . . . . . . . 225
03080203 COASTAL AREA BETWEEN SEBASTIAN INLET AND ST. LUCIE RIVER
Indian River (Intracoastal Waterway): South Prong Saint Sebastian River near Sebastian (d) . . . . . . . . . . . . . . . . . . . . . . . 02251000 . . . . . . . . . . . . 227 North Prong Saint Sebastian River near Micco (d) . . . . . . . . . . . . . . . . . . . . . . . . . 02251500 . . . . . . . . . . . . 228 Fellsmere Canal near Micco (d) . . . . . . . . . . . . . . . . . . . . . . . . . . . . . . . . . . 02251767 . . . . . . . . . . . . 229 Saint Sebastian River at RR Bridge (c,t) . . . . . . . . . . . . . . . . . . . . . . . . . . . . . . 275017080295600 . . . . . . . . 230
Indian River at Wabasso (e) . . . . . . . . . . . . . . . . . . . . . . . . . . . . . . . . . . . . . . . 02251800 . . . . . . . . . . . . 233 North Canal near Vero Beach (d) . . . . . . . . . . . . . . . . . . . . . . . . . . . . . . . . . . . 02252500 . . . . . . . . . . . . 235 Main Canal at Vero Beach (d) . . . . . . . . . . . . . . . . . . . . . . . . . . . . . . . . . . . . 02253000 . . . . . . . . . . . . 236 South Canal near Vero Beach (d) . . . . . . . . . . . . . . . . . . . . . . . . . . . . . . . . . . . 02253500 . . . . . . . . . . . . 237
03090103 FISHEATING CREEK BASIN AND INFLOW TO LAKE OKEECHOBEE FROM NORTHWEST
Fisheating Creek at Palmdale (d) . . . . . . . . . . . . . . . . . . . . . . . . . . . . . . . . . . . . 02256500 . . . . . . . . . . . . 239 Fisheating Creek near Lakeport (d) . . . . . . . . . . . . . . . . . . . . . . . . . . . . . . . . . . . 02257000 . . . . . . . . . . . . 240 Harney Pond Canal near Lakeport (d) . . . . . . . . . . . . . . . . . . . . . . . . . . . . . . . . . . 02258000 . . . . . . . . . . . . 242
03090101 KISSIMMEE RIVER BASIN
Kissimmee River headwaters: Alligator Lake near Ashton (e) . . . . . . . . . . . . . . . . . . . . . . . . . . . . . . . . . . . . . 02260800 . . . . . . . . . . . . 371 East Lake Tohopekaliga:
Boggy Creek near Taft (d) . . . . . . . . . . . . . . . . . . . . . . . . . . . . . . . . . . . . . . 02262900 . . . . . . . . . . . . 244 Lake Tohopekaliga:
Shingle Creek: C-2 Canal near Vineland (d) . . . . . . . . . . . . . . . . . . . . . . . . . . . . . . . . . . . 02263130 . . . . . . . . . . . . 245 Lake Bryan near Vineland (e) . . . . . . . . . . . . . . . . . . . . . . . . . . . . . . . . . . . 02263776 . . . . . . . . . . . . 372
Shingle Creek at Airport, near Kissimmee (d) . . . . . . . . . . . . . . . . . . . . . . . . . . . . 02263800 . . . . . . . . . . . . 246 Bonnet Creek Headwaters:

xii WATER RESOURCES DATA FOR FLORIDA, 2002 Volume 1A: Northeast Florida Surface Water
____________________________________________________________________________________________________________________
____________________________________________________________________________________________________________________
STREAM AND LAKE GAGING STATIONS, IN DOWNSTREAM ORDER, FOR WHICH RECORDS ARE PUBLISHED IN THIS VOLUME--Continued
Station number Page
03090101 KISSIMMEE RIVER BASIN --Continued
Bay Lake near Vineland (e) . . . . . . . . . . . . . . . . . . . . . . . . . . . . . . . . . . . 02263850 . . . . . . . . . . . . 373 South Lake near Vineland (e) . . . . . . . . . . . . . . . . . . . . . . . . . . . . . . . . . . 02263868 . . . . . . . . . . . . 374
Bonnet Creek: South Lake Outlet at S-15 near Vineland (d) . . . . . . . . . . . . . . . . . . . . . . . . . . 02263869 . . . . . . . . . . . . 247 Lake Butler at Windermere (e) . . . . . . . . . . . . . . . . . . . . . . . . . . . . . . . . . 02263900 . . . . . . . . . . . . 375 Cypress Creek at Vineland (d,c,t) . . . . . . . . . . . . . . . . . . . . . . . . . . . . . . . . 02264000 . . . . . . . . . . . . 248 Cypress Creek Canal at S-103A near Vineland (e) . . . . . . . . . . . . . . . . . . . . . . . . 02264003 . . . . . . . . . . . . 253 Black Lake Outlet at S-101A at Lake Buena Vista (d) . . . . . . . . . . . . . . . . . . . . . . 02264051 . . . . . . . . . . . . 254 Lateral 101 at S-101 near Lake Buena Vista (d) . . . . . . . . . . . . . . . . . . . . . . . . . 02264060 . . . . . . . . . . . . 255
Bonnet Creek near Vineland (d,c,t) . . . . . . . . . . . . . . . . . . . . . . . . . . . . . . . . 02264100 . . . . . . . . . . . . 256 Bonnet Creek near Kissimmee (e,c,t) . . . . . . . . . . . . . . . . . . . . . . . . . . . . . . . 02264140 . . . . . . . . . . . . 261
Shingle Creek at Campbell (d) . . . . . . . . . . . . . . . . . . . . . . . . . . . . . . . . . . . . 02264495 . . . . . . . . . . . . 263 Cypress Lake:
Reedy Creek at S-46 near Vineland (d) . . . . . . . . . . . . . . . . . . . . . . . . . . . . . . 02266025 . . . . . . . . . . . . 264 Whittenhorse Creek near Vineland (d) . . . . . . . . . . . . . . . . . . . . . . . . . . . . . 02266200 . . . . . . . . . . . . 265 Whittenhorse Creek at S-411 near Doctor Phillips (d) . . . . . . . . . . . . . . . . . . . . . . 02266205 . . . . . . . . . . . . 270
Trout Lake near Clermont (e) . . . . . . . . . . . . . . . . . . . . . . . . . . . . . . . . . 02266239 . . . . . . . . . . . . 376 Lateral 405 at S-405A, near Doctor Phillips (d) . . . . . . . . . . . . . . . . . . . . . . . . 02266291 . . . . . . . . . . . . 271 Lateral 405 below S-405, near Vineland (c,t) . . . . . . . . . . . . . . . . . . . . . . . . . . 02266294 . . . . . . . . . . . . 272 Lateral 410 at S-410 near Vineland (d) . . . . . . . . . . . . . . . . . . . . . . . . . . . . . 02266295 . . . . . . . . . . . . 273
Reedy Creek above U.S. Highway 192 near Vineland (c,t) . . . . . . . . . . . . . . . . . . . . . 02266298 . . . . . . . . . . . . 274 Reedy Creek near Vineland (d,c,t) . . . . . . . . . . . . . . . . . . . . . . . . . . . . . . . . 02266300 . . . . . . . . . . . . 276 Davenport Creek near Loughman (d,c,t) . . . . . . . . . . . . . . . . . . . . . . . . . . . . . . 02266480 . . . . . . . . . . . . 281 Reedy Creek at S-40 near Loughman (e,c,t) . . . . . . . . . . . . . . . . . . . . . . . . . . . . 02266495 . . . . . . . . . . . . 284 Reedy Creek below S-40 near Loughman (d) . . . . . . . . . . . . . . . . . . . . . . . . . . . 02266496 . . . . . . . . . . . . 287 Reedy Creek near Loughman (d,c,t) . . . . . . . . . . . . . . . . . . . . . . . . . . . . . . . . 02266500 . . . . . . . . . . . . 288 Reedy Creek at State Highway 531 near Poinsianna (d) . . . . . . . . . . . . . . . . . . . . . . 02266550 . . . . . . . . . . . . 291
Cypress Lake near St. Cloud (e) . . . . . . . . . . . . . . . . . . . . . . . . . . . . . . . . . . . 02266600 . . . . . . . . . . . . 377 Lake Hatchineha:
Lake Marion near Haines City (e) . . . . . . . . . . . . . . . . . . . . . . . . . . . . . . . . 02266650 . . . . . . . . . . . . 378 Lake Pierce near Waverly (e) . . . . . . . . . . . . . . . . . . . . . . . . . . . . . . . . . . . 02266900 . . . . . . . . . . . . 379 Catfish Creek near Lake Wales (d) . . . . . . . . . . . . . . . . . . . . . . . . . . . . . . . . 02267000 . . . . . . . . . . . . 292
Lake Kissimmee: Lake Weohyakapka at Indian Lake Estates (e) . . . . . . . . . . . . . . . . . . . . . . . . . . 02268400 . . . . . . . . . . . . 380 Lake Rosalie near Lake Wales (e) . . . . . . . . . . . . . . . . . . . . . . . . . . . . . . . . 02268600 . . . . . . . . . . . . 381 Lake Marian near Kenansville (e) . . . . . . . . . . . . . . . . . . . . . . . . . . . . . . . . 02268800 . . . . . . . . . . . . 382
Kissimmee River at S-65 near Lake Wales (d,e) . . . . . . . . . . . . . . . . . . . . . . . . . . . . . 02268903 . . . . . . . . . . . . 293 Kissimmee River below S-65, near Lake Wales (e) . . . . . . . . . . . . . . . . . . . . . . . . . . . 02268904 . . . . . . . . . . . . 295 Kissimmee River near Lorida (e) . . . . . . . . . . . . . . . . . . . . . . . . . . . . . . . . . . . . 02269148 . . . . . . . . . . . . 296
Lake Arbuckle near Avon Park (e) . . . . . . . . . . . . . . . . . . . . . . . . . . . . . . . . . . 02269600 . . . . . . . . . . . . 383 Arbuckle Creek (continuation of Livingston Creek) near De Soto City (d) . . . . . . . . . . . . . . 02270500 . . . . . . . . . . . . 297 Lake Istokpoga near De Soto City (e) . . . . . . . . . . . . . . . . . . . . . . . . . . . . . . . . 02271700 . . . . . . . . . . . . 384
Kissimmee River at S-65E, near Okeechobee (d,e) . . . . . . . . . . . . . . . . . . . . . . . . . . . 02273000 . . . . . . . . . . . . 298 Kissimmee River below S-65E, near Okeechobee (e) . . . . . . . . . . . . . . . . . . . . . . . . . . 02273001 . . . . . . . . . . . . 300 Taylor Creek at HGS-6, near Okeechobee (d,e) . . . . . . . . . . . . . . . . . . . . . . . . . . . . . 02275503 . . . . . . . . . . . . 301
03090201 LAKE OKEECHOBEE
Lake Okeechobee (e) . . . . . . . . . . . . . . . . . . . . . . . . . . . . . . . . . . . . . . . . . . 02276400 . . . . . . . . . . . . 385
03100101 PEACE RIVER BASIN
Peace River: Lake Hancock:
Lake Arietta near Auburndale (e) . . . . . . . . . . . . . . . . . . . . . . . . . . . . . . . . . 02294298 . . . . . . . . . . . . 387 Lake Whistler near Auburndale (e) . . . . . . . . . . . . . . . . . . . . . . . . . . . . . . . . 02294300 . . . . . . . . . . . . 388 Ariana Lake at Auburndale (e) . . . . . . . . . . . . . . . . . . . . . . . . . . . . . . . . . . 02294303 . . . . . . . . . . . . 389
03100205 HILLSBOROUGH RIVER BASIN
Hillsborough River: Fox Branch near Socrum (d,e,c,t) . . . . . . . . . . . . . . . . . . . . . . . . . . . . . . . . . . 02301900 . . . . . . . . . . . . 305

xiii WATER RESOURCES DATA FOR FLORIDA, 2002 Volume 1A: Northeast Florida Surface Water
____________________________________________________________________________________________________________________
____________________________________________________________________________________________________________________
STREAM AND LAKE GAGING STATIONS, IN DOWNSTREAM ORDER, FOR WHICH RECORDS ARE PUBLISHED IN THIS VOLUME--Continued
Station number Page
03100208 WITHLACOOCHEE RIVER BASIN
Lake Mattie (head of Withlacoochee River): Lake Juliana near Polk City (e) . . . . . . . . . . . . . . . . . . . . . . . . . . . . . . . . . . . . 02310760 . . . . . . . . . . . . 391 Pony Creek:
Lake Helene near Polk City (e) . . . . . . . . . . . . . . . . . . . . . . . . . . . . . . . . . 02310850 . . . . . . . . . . . . 392 Green Swamp East WMA Marsh near Cumpressco (c,t) . . . . . . . . . . . . . . . . . . . . . . . . . 282114082100100 . . . . . . . . 309 Withlacoochee River near Cumpressco (d,e,c,t) . . . . . . . . . . . . . . . . . . . . . . . . . . . . . 02310947 . . . . . . . . . . . . 310
Lake Deeson near Lakeland (e) . . . . . . . . . . . . . . . . . . . . . . . . . . . . . . . . . . 02310950 . . . . . . . . . . . . 393 Withlacoochee-Hillsborough overflow near Richland (d,e) . . . . . . . . . . . . . . . . . . . . . . 02311000 . . . . . . . . . . . . 312
Withlacoochee River near Dade City (d,e) . . . . . . . . . . . . . . . . . . . . . . . . . . . . . . . . 02311500 . . . . . . . . . . . . 315 Clear Lake at San Antonio (e) . . . . . . . . . . . . . . . . . . . . . . . . . . . . . . . . . . . 02311600 . . . . . . . . . . . . 394
Dade City Canal near Dade City (d,e,c,t) . . . . . . . . . . . . . . . . . . . . . . . . . . . . . . . 02311700 . . . . . . . . . . . . 317 Withlacoochee River at Trilby (d,e) . . . . . . . . . . . . . . . . . . . . . . . . . . . . . . . . . . . 02312000 . . . . . . . . . . . . 318
Little Withlacoochee River: Bayroot Slough: Bayroot Slough Headwaters near Bay Lake (d) . . . . . . . . . . . . . . . . . . . . . . . . . . . 02312140 . . . . . . . . . . . . 321 Little Withlacoochee River near Tarrytown (d,c,t) . . . . . . . . . . . . . . . . . . . . . . . . . . 02312180 . . . . . . . . . . . . 322 Little Withlacoochee River at Rerdell (d,c,t) . . . . . . . . . . . . . . . . . . . . . . . . . . . . . 02312200 . . . . . . . . . . . . 324
Withlacoochee River at Croom (d,e,c,t) . . . . . . . . . . . . . . . . . . . . . . . . . . . . . . . . . 02312500 . . . . . . . . . . . . 326 Withlacoochee River near Floral City (d,e,c,t) . . . . . . . . . . . . . . . . . . . . . . . . . . . . . . 02312600 . . . . . . . . . . . . 329
Jumper Creek Canal near Bushnell (d,e,c,t) . . . . . . . . . . . . . . . . . . . . . . . . . . . . . . 02312640 . . . . . . . . . . . . 332 Shady Brook near Sumterville (d) . . . . . . . . . . . . . . . . . . . . . . . . . . . . . . . . . . 02312667 . . . . . . . . . . . . 334 Lake Panasoffkee:
Lady Lake near Lady Lake (e) . . . . . . . . . . . . . . . . . . . . . . . . . . . . . . . . . . 02312694 . . . . . . . . . . . . 395 Lake Panasoffkee near Lake Panasoffkee (e) . . . . . . . . . . . . . . . . . . . . . . . . . . . . . 02312698 . . . . . . . . . . . . 396 Outlet River at Panachoochee Retreats (d,e,c,t) . . . . . . . . . . . . . . . . . . . . . . . . . . . . 02312700 . . . . . . . . . . . . 335
Withlacoochee River at Wysong Dam, at Carlson (d,e) . . . . . . . . . . . . . . . . . . . . . . . . . 02312720 . . . . . . . . . . . . 337 Withlacoochee River near Inverness (d,e) . . . . . . . . . . . . . . . . . . . . . . . . . . . . . . . . 02312762 . . . . . . . . . . . . 340
Tsala Apopka outfall canal at S-353, near Hernando (d,e,c,t) . . . . . . . . . . . . . . . . . . . . . 02312975 . . . . . . . . . . . . 342 Tsala Apopka outfall canal below S-353, near Hernando (e,c,t) . . . . . . . . . . . . . . . . . . . . 02312976 . . . . . . . . . . . . 344
Withlacoochee River near Holder (d,e) . . . . . . . . . . . . . . . . . . . . . . . . . . . . . . . . . 02313000 . . . . . . . . . . . . 345 Rainbow Springs near Dunnellon (d . . . . . . . . . . . . . . . . . . . . . . . . . . . . . . . . . 02313100 . . . . . . . . . . . . 347
Withlacoochee River at Dunnellon (e,c,t) . . . . . . . . . . . . . . . . . . . . . . . . . . . . . . . . 02313200 . . . . . . . . . . . . 348 Withlacoochee River at Inglis Dam, near Dunnellon (d) . . . . . . . . . . . . . . . . . . . . . . . . . 02313230 . . . . . . . . . . . . 350 Withlacoochee River below Inglis Dam, near Dunnellon (e) . . . . . . . . . . . . . . . . . . . . . . . 02313231 . . . . . . . . . . . . 351 Withlacoochee River Bypass Channel, near Inglis (d) . . . . . . . . . . . . . . . . . . . . . . . . . . 02313250 . . . . . . . . . . . . 352 Discharge at miscellaneous sites . . . . . . . . . . . . . . . . . . . . . . . . . . . . . . . . . . . . . . . . . . . . . . . . . . . . . . . 353

xiv WATER RESOURCES DATA FOR FLORIDA, 2002 Volume 1A: Northeast Florida Surface Water
____________________________________________________________________________________________________________________
__________________________________________________________________________________________________________________
DISCONTINUED SURFACE-WATER DISCHARGE OR STAGE-ONLY STATIONS
The following continuous-record surface-water discharge or stage-only stations (gaging stations) in Florida have been discontinued. Daily streamflow or stage records were collected and published for the period of record, expressed in water years, shown for each station. Those stations with an asterisk (*) after the station number are currently operated as stations with periodic observations. Discontinued project stations with less than 3 years of record have not been included. Information regarding these stations may be obtained from the subdistrict office at the address given on the back side of the title page of this report.
[Letters after station name designate type of data collected: (d) discharge, (e) elevation (stage only)]
Drainage Period Station area of
Station name number (mi2) record
ST. MARYS RIVER BASIN
Ocean Pond at Olustee (e)Middle Prong St. Marys River at Taylor (d)South Prong St. Marys River near Sanderson (d)Turkey Creek at Macclenny (d)South Prong St. Marys River at Glen St. Mary (d)Little St. Marys River near Hilliard (d)St. Marys River near Gross (d)
02228700 13.1 1975-78 02229000 125 1955-01 02229500 57.8 1955-60 02230000 19.9 1955-77 02230500 156 1950-71 02231250 19.8 1965-67 02231253 1,360 1966-75, 1980-90
COASTAL AREA BETWEEN ST. MARYS AND ST. JOHNS RIVERS
Nassau Sound near Amelia City (e) 02231299 400 1983-85
ST. JOHNS RIVER BASIN ABOVE OCKLAWAHA RIVER
St. Johns Marsh near Fort Pierce (e)St. Johns Headwaters near Vero Beach (e)Cow Log Branch at Yeehaw Junction (d)Blue Cypress Lake near Fellsmere (e)Crabgrass Creek near Holopaw (d)Lake Washington near Eau Gallie (e)
Lake Poinsett near Cocoa (e)Taylor Creek above S-164, near Cocoa (e)Clear Lake near Cocoa (e)Jim Creek at Fish Hole Road near Christmas (d)Econlockhatchee River at Magnolia Ranch near Bithlo (d)Econlockhatchee Tributary near Bithlo (d)Lake Susannah near Orlando (e)
Lake Spier near Orlando (e)Lake Corrine near Orlando (e)Lake Catherine at Chuluota (e)Lake Geneva at Geneva (e)Deep Creek near Osteen (d)
Lake Winnemissett near Deland (e)Deep Creek Diversion Canal near Osteen (d)
Spring Lake at Orlando (e)
Lake Adair at Orlando (e)Park Lake at Orlando (e)Lake Concord at Orlando (e)
Lake Highland at Orlando (e)Lake Ivanhoe at Orlando (e)Lake Rowena at Orlando (e)Lake Sue at Orlando (e)Lake Charity near Maitland (e)Lake Faith at Maitland (e)
Lake Hope at Maitland (e)Lake Maitland at Winter Park (e)Lake Howell near Casselberry (e)Soldier Creek Headwaters at Lake Mary (d)Soldier Creek at Lake Mary (d)County Home Run near Lake Mary (e)Island Lake at Longwood (e)Lake Mary at Lake Mary (e)Lake Charm at Oviedo (e)Lake Jesup near Sanford (e)Lake Monroe near Sanford (e)
02231300 -- 1957-71 02231350 297 1942-93 02231390 20.5 1956-95 02231400 489 1956-68 02231565 30.2 1997-98 02232100 1,025 1942-92
02232300 1,272 1942-98 02232413 52.0 1969-75 02232420 0.26 1952-58 02232460 47.0 1997-98 02233001 32.9 1960-01 02233102 1.83 1976-89 02233445 0.60 1943-49
02233448 0.34 1943-49 02233450 2.09 1943-64 02233755 0.15 1975-79 02233900 0.46 1975-79 02234100 140 1965-66, 1981-92
1997-98 02234160 1.10 1965-98 02234180 70 1935, 1956,
1964-66, 1981-92 02234200 0.52 1943-56
02234205 1.27 1942-56 02234210 0.12 1942-56 02234215 2.10 1942-52
02234220 0.22 1942-56 02234225 3.27 1942-56 02234240 5.13 1942-45 02234261 6.34 1948-56 02234294 0.66 1971-79 02234296 0.71 1971-79
02234297 1.67 1971-79 02234300 20.6 1945-64 02234318 27.8 1975-79 02234365 7.86 1987-93 02234367 9.16 1987-93 02234386 0.45 1983-86 02234394 1.29 1970-79 02234414 0.88 1975-79 02234428 0.11 1975-98 02234434 156 1941-48, 1977-97 02234499 2,582 1920-95

xv WATER RESOURCES DATA FOR FLORIDA, 2002 Volume 1A: Northeast Florida Surface Water
____________________________________________________________________________________________________________________
_________________________________________________________________________________________________________________
DISCONTINUED SURFACE-WATER DISCHARGE OR STAGE-ONLY STATIONS --Continued
Drainage Period Station area of
Station name number (mi2) record
ST. JOHNS RIVER BASIN ABOVE OCKLAWAHA RIVER--Continued
St. Johns River near DeBary (e) 02234519 2,600 1987-89Lake Brantley near Forest City (e) 02234638 1.56 1975-79Lake Silver at Orlando (e) 02234800 0.51 1959-64Lake Fairview at Orlando (e) 02234810 3.73 1948-55Lake Wekiva near Maitland (e) 02234814 13.4 1969-95Lake Wekiva Outlet near Maitland (d) 02234815 13.4 1969-74Lake Herrick near Orlando (e) 02234900 1.94 1966-68
Lake Sherwood near Orlando (e)Bear Lake near Forest City (e)Lake Orienta at Altamonte Springs (e)Cranes Roost at Altamonte Springs (e)Eleventh Hole Pond at Altamonte Springs (e)Linden Lake at Lake Mary (e)
02234930 17.1 1966-68 02234942 1.59 1975-79 02234943 1.61 1970-79 02234988 2.89 1978-79 02234995 1.25 1971-79 02234999 0.62 1973-79
Lake Dorr near Altoona (headwaters of Black Water Creek) (e)Mount Plymouth Lake at Mount Plymouth (e)Pine Lake near Cassia (e)Alexander Springs Creek near Paisley (e)Lake Odom near DeLeon SpringsDeep Creek near Barberville (d)Price Creek near Pierson (d)Lake Delancy near Eureka (e)
02235150 26.5 1965-98 02235260 1.30 1983-98 02235900 1.79 1967-69 02236100 -- 1959-65 02236119 1.33 1981-90 02236120 35.4 1964-95 02236157 6.21 1979-82 02236190 30.0 1953-60
OCKLAWAHA RIVER BASIN
Lake Kerr near Eureka (e)Lake George near Salt Springs (e)Lake Lowery (head of Ocklawaha River) near Haines City (e)Little Creek at Cooper's Ranch near Clermont (d)
02236200 102 1936-98 02236210 3,721 1936-98 02236250 5.4 1960-95 02236600 9.90 1960-62
Lake Nellie near Clermont (e) 02236808 13.3 1979-89Lake Louisa (continuation of Big Creek) near Clermont (e) 02236820 121 1957-95
Lake Apshawa near Minneola (e) 02236860 1.48 1953-98Cherry Lake near Groveland (e) 02236880 165 1956-95Palatlakaha River near Mascotte (e) 02237000 182 1945-95
Palatlakaha River below spillway, near Mascotte (e)Pitts Pond near Okahumpka (e)Lake Harris at Leesburg (e)
02237001 182 1964-95 02237176 0.07 1967-69 02237520 357 1936-50, 1956-93
Dead River near Tavares (d) 02237522 420 1942-56, 1993-96Johns Lake at Oakland (e) 02237540 40.1 1959-98Lake Florence at Montverde (e) 02237561 0.63 1967-69Lake Apopka at Winter Garden (e) 02237600 128 1935-93
Lake Francis near Plymouth (e)Wolf Branch above State Road 46 near Mount (d)Lake Dicie at Eustis (e)
02237660* 0.67 1959-67 02237733 2.80 1991-94 02237752 0.11 1971-73
Lake Dora at Mount Dora (e) 02237800 236 1935-93 Lake Eustis at Eustis (e) 02237900 646 1935-93 Silver Lake near Leesburg (e) 02238020 1.50 1983-95
Nicotoon Lake near Altoona (e) 02238170 19.2 1967-69 Lake Yale at Grand Island (e) 02238200 67.6 1959-98 Lake Griffin at Leesburg (e) 02238300 775 1936-93 Ocklawaha River near Ocala (d) 02239000 1,018 1930-68 Silver River near Ocala (e) 02239501 -- 1969-72
Lake Bryant near Silver Springs (e) 02240200 9.86 1936-95 Hatchet Creek near Fairbanks (d) 02240783 34.7 1995-98 Little Hatchet Creek at Gainesville (d) 02240806 3.24 1995-98

xvi WATER RESOURCES DATA FOR FLORIDA, 2002 Volume 1A: Northeast Florida Surface Water
____________________________________________________________________________________________________________________
_________________________________________________________________________________________________________________
DISCONTINUED SURFACE-WATER DISCHARGE OR STAGE-ONLY STATIONS --Continued
Drainage Period Station area of
Station name number (mi2) record
OCKLAWAHA RIVER BASIN--Continued
Newnans Lake (head of Prairie Creek) near Gainesville (e) 02240900 114 1936-95 Paynes Prairie Inflow near Rochelle (e) 02240930 -- 1978-81 Lake Kanapaha at Arredondo (e) 02240958 8.65 1971-95 Tumblin Creek at Gainesville (d) 02240976 1.00 1997-98 Bivens Arm near Gainesville (e) 02240980 3.00 1965-67 Bivens Arm at Gainesville (d) 02240982 5.67 1997-98 Sweetwater Branch at Gainesville (e) 02240988 2.64 1997-98 Lochloosa Creek at Grove Park (d) 02241900 37.4 1995-98
ST. JOHNS RIVER BASIN BELOW OCKLAWAHA RIVER
Lochloosa Lake at Lochloosa (e) 02242400 88.0 1936-95 Orange Lake at Orange Lake (e) 02242450 1,012 1933-95 Orange Lake Outlet near Citra (d) 02242451 1,012 1941-95
Orange Creek near Island Grove (d) 02242460 1,010 1997-98 Lochloosa Slough near Lochloosa (d) 02242500 Indeterminate 1947-55, 1982-92 Little Orange Creek near Johnson (d) 02243300 42.6 1995-98
Ocklawaha River near Orange Springs (d) 02243500 2,657 1930-52 Deep Creek near Kenwood (d) 02243609 6.34 1995-98 Lake Ocklawaha near Orange Springs (e) 02243958 2.747 1969-95 Ocklawaha River at Riverside Landing near Orange Springs (d) 02244000 2,840 1943-68
Middle Haw Creek at Relay Station, near Bunnell (d) 02244300 54.6 1964-66 Lake Winona near Deland (e) 02244350 1.35 1965-98 Blue Pond Outlet near Keystone Heights (d) 02244551 2.32 1958-97
Sand Hill Lake near Keystone Heights (e) 02244600 11.0 1957-65, 1976-96 Sand Hill Lake Outlet near Keystone Heights (d) 02244601 11.5 1959-97 Magnolia Lake near Keystone Heights (e) 02244650 14.4 1958-98 Magnolia Lake Outlet near Keystone Heights (d) 02244651 14.4 1956-97
Alligator Creek near Keystone Heights (d) 02244690 15.0 1994-97 Loch Lommond near Keystone Heights (e) 02244700 0.90 1959-98 Brooklyn Lake at Keystone Heights(e) 02244750 17.4 1957-61, 1965-96 Crystal Lake near Keystone Heights (e) 02244760 3.42 1994-98 Lake Bedford near Keystone Heights (e) 02244766 5.0 1994-98 LakeGeneva at Keystone Heights (e) 02244800 35.5 1957-61, 1965-96
Pebble Lake near Keystone Heights (e) 02244850 0.19 1945-98 Lake Johnson (Little Lake) near Keystone Heights (e) 02244900 6.37 1945-98 Lake Johnson (Big Lake) near Keystone Heights (e) 02244905 6.37 1959-98 Spring Lake near Keystone Heights (e) 02244908 1.62 1994-98 Lake Grandin near Interlachen (e) 02244950 3.71 1957-95 St. Johns River at Palatka (e) 02244450 7,094 1970-82 Georges Lake near Florahome (e) 02245010 5.33 1982-95
Rice Creek near Palatka (e) 02245200 349 1970-73, 1994-97 Sixmile Creek near Picolata (d) 02245328 Indeterminate 1990-01 St. Johns River at Shands Bridge near Green Cove Springs (c,t) 295856081372301 Indeterminate 1995-01 South Fork Black Creek near Camp Blanding (d) 02245400 34.8 1957-60 Kingsley Lake (head of North Fork Black Creek) at Camp Blanding (e) 02245700 6.84 1945-95
Rowell Creek near Fiftone (d) 02245918 6.1 1992-95 Rowell Creek at Lake Fretwell Dam near Maxville (d) 02245922 8.1 1992-95 Site 2 Outflow Ditch near Maxville (d) 02245924 Indeterminate 1992-95
North Fork Black Creek near Highland (d) 02245800 50.5 1957-60 Yellow Water Creek near Maxville (e) 02245900 21.9 1975-77 Sal Taylor Creek near Maxville (d) 02245913 15.7 1992-95 Site 1 Outflow Ditch near Maxville (d) 02245925 Indeterminate 1992-95 Rowell Creek above Perimeter Road Bridge near Maxville (d) 02245926 Indeterminate 1992-95 Rowell Creek near Maxville (d) 02245927 8.7 1992-95 Cormorant Branch near Mandarin (e) 02246202 1.62 1976-81 Williamson Creek at Cedar Hills (d) 02246460 0.92 1971-86

xvii WATER RESOURCES DATA FOR FLORIDA, 2002 Volume 1A: Northeast Florida Surface Water
--
--
--
____________________________________________________________________________________________________________________
_________________________________________________________________________________________________________________
DISCONTINUED SURFACE-WATER DISCHARGE OR STAGE-ONLY STATIONS --Continued
Drainage Period Station area of
Station name number (mi2) record
ST. JOHNS RIVER BASIN BELOW OCKLAWAHA RIVER--Continued
McCoy Creek at Jacksonville (e) 02246497 3.51 1975-77, 1978-83
St. Johns River at Dames Point Bridge at Jacksonville (c,t) 302309081333001 Indeterminate 1996-01 Strawberry Creek near Arlington (d,e) 02246520 2.86 1989-95 Red Bay Branch Tributary at Jacksonville (d) 02246522 0.57 1975-86
Trout River at Dinsmore (e) 02246660 20.9 1975-77 Sixmile Creek at Pickettville (e) 02246645 12.1 1975-78 Cedar Swamp Creek at Jacksonville (d) 02246832 3.40 1974-92
COASTAL AREA BETWEEN ST. JOHNS RIVER AND PONCE DE LEON INLET
Moultrie Creek at State Highway 207, near St. Augustine (d) 02246900 19.8 1961-92 Moultrie Creek at St. Augustine (d) 02247000 11.2 1939-64 Bellevue Canal at Daytona Beach (d) 02247465 1982-85
Bayless Blvd. Canal at Daytona Beach (d) 02247493 1982-85 Wally Hoffmeyer Canal at Daytona Beach (d) 02247498 -- 1982-85 Williamson Blvd. Ditch at Daytona Beach (d) 02247499 -- 1983-85 Tomoka River near Daytona Beach (d) 02247500 76.2 1942-46, 1983-84 Eleventh Street Canal near Holly Hill(d) 02247508 1982-92 B-19 Canal at Willow Run Boulevard near Port Orange(d) 02248037 1988-92 B-19 Canal at Port Orange(d) 02248040 1982-92
COASTAL AREA BETWEEN PONCE DE LEON INLET AND SEBASTIAN INLET
County Line Road Ditch near Scottsmoor (d) 02248357 Indeterminate 1994-96 Addison Creek near Titusville (d) 02248510 4.1 1989-96 Horse Creek near Melbourne (d) 02248900 1.2 1989-92
Eau Gallie River near Eau Gallie (d) 02249000 2.69 1955-57 Crane Creek at Melbourne (d) 02249500 12.6 1951-68 C-1 Canal at Red Bug Circle near Palm Bay (d) 02249950 Indeterminate 1988-92
C-10 Canal at Malabar Road at Palm Bay (d) 02249970 Indeterminate 1988-92 C-69 Canal at Palm Bay Road at Palm Bay (d) 02249990 Indeterminate 1988-92 Turkey Creek near Palm Bay (d) 02250000 95.5 1956-68 Melbourne-Tillman Canal at Palm Bay (d) 02250005 100 1992-01
Goat Creek near Valkaria (d) 02250500 11.9 1989-96 Kid Creek at Valkaria (d) 02250600 0.70 1989-92 Trout Creek at Grant (d) 02250700 15.0 1989-96
COASTAL AREA BETWEEN SEBASTIAN INLET AND ST. LUCIE RIVER
Fellsmere Canal near Fellsmere (d) 02251765 78.4 1955-68
FISHEATING CREEK BASIN AND INFLOW TO LAKE OKEECHOBEE FROM NORTHWEST
Fisheating Creek near Venus (d) 02256000 311 1955-66 Harney Pond Canal at S-71 near Lakeport (d) 02257800 -- 1962-89 Indian Prairie Canal near Lakeport (d) 02259000 1931-33 Indian Prairie Canal at S-72, near Okeechobee (d) 02259200 -- 1962-89 Indian Prairie Canal near Okeechobee (d) 02259500 -- 1939-50 Lake Mary Jane near Narcoossee (e) 02261900 1,161 1949-01 East Lake Tohopekaliga at St. Cloud (e) 02263400 308 1941-68
St. Cloud Canal at S-59, near St. Cloud (d) 02263500 308 1942-68 Bay Lake Outlet at S-105A, near Vineland (d) 02263851 14.8 1968-71 Lake Tohopekaliga at Kissimmee (e) 02264900 620 1942-89
KISSIMMEE RIVER BASIN
Myrtle-Mary Jane Canal near Narcoossee (d) 02261500 111 1949-68 Lake Hart near Narcoossee (e) 02262200 166 1941-69 Lake Conway at Pinecastle (e) 02262800 12.7 1952-98 South Port Canal at S-61 near St. Cloud (d) 02265000 620 1942-68 Lake Gentry near St. Cloud (e) 02265400 44.6 1949-68

xviii WATER RESOURCES DATA FOR FLORIDA, 2002 Volume 1A: Northeast Florida Surface Water
----
--
--
----
____________________________________________________________________________________________________________________
_________________________________________________________________________________________________________________
DISCONTINUED SURFACE-WATER DISCHARGE OR STAGE-ONLY STATIONS --Continued
Drainage Period Station area of
Station name number (mi2) record
KISSIMMEE RIVER BASIN--Continued
Canoe Creek near St. Cloud (d)Horse Creek at Davenport (d)Lake Pierce near Waverly (e)Lake Hatchineha near Lake Wales (e)Kissimmee River near Lake Wales (d)Lake Kissimmee near Lake Wales (e)Kissimmee River Below Lake Kissimmee, near Lake Wales (d)
02266000 0226670002266900* 02267400 0226750002268900 02269000 02269149 02269100 02269500 02270000 022710000227158002271600022716200227200002272500
02273200 02273300 02274000 02274330022744950227450002275000
86.5 1949-59 22.8 1960-62
8.9 1947-71 1,162 1942-76
-- 1942-68 49.6 1929-89
1,607 1933-69 Indeterminate 1994-01 1,911 1941-67
60.9 1946-71 38.6 1954-66
44.0 1955-67 9.54 1951-63
11.7 1951-63 15.3 1955-60
-- 1933-68 2,709 1931-59,
1963-64 1964-89 1963-89
15.7 1955-89 62.2 1969-89 35.4 1964-89 98.7 1955-82 115 1932-33
2.93 1985-94 4.31 1969-94
14.7 1960-62 130 1958-93
9.50 1960-62 18 1970-92 30 1970-92 30 1970-92
3.07 1965-68
-- 1983-87 15.4 1979-81
28.6 1976-91 50.6 1979-91 12.4 1978-94 38 1959-60,
1963-66, 1978-92 49 1978-94
4.67 1970-73 38 1978-94
1,520 1962-88 - 1983, 1984-87
1984-86 -- 1983-86
Indeterminate 1957-92 Indeterminate 1957-92 Indeterminate 1936-50, 1957-92
1984-87 2,020 1964-91
1969-82 1967-91
Kissimmee River at C-38 near Lorida (e)Kissimmee River at Fort Kissimmee (e)Reedy Creek near Frostproof (d)Carter Creek near Sebring (d)Stearns Creek near Lake Placid (d)Lake Huntley near Lake Placid (e)Lake Clay near Lake Placid (e)Lake Apthorpe near Lake Placid (e)Istokpoga Canal near Cornwell (d)Kissimmee River near Basinger (e)
Canal 41A at S-68, near Lake Placid (d)Canal 41A at S-84, near Okeechobee (d)Taylor Creek near Basinger (d)Taylor Creek above S-1, near Okeechobee (e)Williamson Ditch at S-7, near Okeechobee (d)Taylor Creek above Okeechobee (d)Taylor Creek at Okeechobee (d)
Lake Alfred at Lake Alfred (e)Lake Gibson near Lakeland (e)
Lake Mattie near Polk City (e)Withlacoochee River near Eva (d)Pony Creek near Polk City (d)Big Gant Canal at Structure S-11, near Webster (e)Big Gant Canal at Structure WC-2, at Rerdell (e)Big Gant Canal below Structure at Rerdell (e)Lake Lindsey near Brooksville (e)
Withlacoochee River near Istachatta (e)Jumper Creek near Bevilles Corner (d)Jumper Creek Canal near Sumterville (d)Jumper Creek Canal near Wahoo (d)Lake Deaton near Wildwood (d)Chitty Chatty Creek near Wildwood (d)
Lake Okahumpka near Wildwood (e)Lady Lake near Lady Lake (e)Lake Miona near Oxford (e)
PEACE RIVER BASIN
02293461 02294224
WITHLACOOCHEE RIVER BASIN
0231078002310800 02310900 02312194 02312197 02312198 02312520
023125600231263202312635 02312645 02312688 02312690
02312691 02312694* 02312696 02312719 02312772*02312773 02312786*
02312800 02312900 02312950
02312877 02313229 02313251 02313265
Withlacoochee River above Wysong Dam at Carlson (e)Leslie Heifner Canal near Floral City (e)Leslie Heifner Canal below Control near Floral City (e)The Orange State Canal near Floral City (e)
Tsala Apopka Lake at Floral City (e)Tsala Apopka Lake at Inverness (e)Tsala Apopka Lake at Hernando (e)
Tsala Apopka Lake at Spivey Lake near Inverness (e)Lake Rousseau near Dunnellon (e)Withlacoochee River Bypass Channel below Structure, near Inglis (e) Withlocoochee River at Crackertown

1 WATER RESOURCES DATA FOR FLORIDA, 2002 Volume 1A: Northeast Florida Surface Water
INTRODUCTION
The Water Resources Division of the U.S. Geological Survey, in cooperation with State agencies, obtains a large amount of data pertaining to the water resources of Florida each water year. These data, accumulated during many water years, constitute a valuable data base for developing an improved understanding of the water resources of the State. To make these data readily available to interested parties outside the Geological Survey, the data are published annually in this report series entitled "Water Resources Data - Florida."
This report series includes records of stage, discharge, and water quality of streams, stage, contents, water quality of lakes and reservoirs, and water levels and water quality of ground-water wells. Volume 1A contains records for continuous or daily discharge for 150 streams, periodic discharge for 3 streams, continuous or daily stage for 22 streams, periodic stage for 0 streams, peak stage and discharge for 0 stream, continuous or daily elevations for 10 lakes, and periodic elevations for 20 lakes. The area encompassed in this report is shown in figure 1. The data presented here represent part of the National Water Data System collected by the U.S. Geological Survey and cooperating State and Federal agencies in Florida.
This series of annual reports for Florida began with the 1961 water year with a report that contained only data relating to the quantities of surface water. For the 1964 water year, a similar report was introduced that contained only data relating to water quality. Beginning with the 1975 water year, the report format was changed to present, in one volume, data on quantities of surface water, quality of surface and ground water, and ground-water levels.
Prior to introduction of this series and for several water years concurrent with it, water-resources data for Florida were published in U.S. Geological Survey Water-Supply Papers. Data on stream discharge and stage and on lake or reservoir contents and stage, through September 1960, were published annually under the title "Surface-Water Supply of the United States." For the 1961 through 1970 water years, the data were published in two 5-year reports. Data on chemical quality, temperature, and suspended sediment for the 1941 through 1970 water years were published annually under the title "Quality of Surface Waters of the United States," and water levels for the 1935 through 1974 water years were published under the title "Ground-Water Levels in the United States." The above mentioned Water-Supply Papers may be consulted in the libraries of the principal cities of the United States and may be purchased from Distribution Branch, Text Products Section, U.S. Geological Survey, Books and Open-File Reports, Federal Center, Building 41, Box 25425, Denver, CO 80225.
Publications similar to this report are published annually by the Geological Survey for all States. These official Survey reports have an identification number consisting of the two-letter State abbreviation, the last two digits of the water year, and the volume number. For example, this volume is identified as "U.S. Geological Survey Water-Data Report FL-02-1A." For archiving and general distribution, the reports for l971-74 water years also are identified as water-data reports. These water-data reports are for sale in paper copy or in microfiche by the National Technical Information Service, U.S. Department of Commerce, Springfield, VA 22161.
Additional information, including current prices, for ordering specific reports may be obtained from the District Office at the address given on the back of the title page or by telephone (407) 865-7575.
COOPERATION
The U.S. Geological Survey and agencies of the State of Florida have had cooperative agreements for the collection of water-resource records since 1930. Organizations that assisted in collecting the data in this report through cooperative agreement with the Survey are:
U.S. Army Corps of Engineers, Jacksonville District City of Cocoa Florida Department of Environmental Protection City of Jacksonville St. Johns River Water Management District JEA South Florida Water Management District Lake County Water Authority Southwest Florida Water Management District Nassau County
Reedy Creek Improvement District Seminole County
Organizations that provided data are acknowledged in station descriptions.

2 WATER RESOURCES DATA FOR FLORIDA, 2002 Volume 1A: Northeast Florida Surface Water
_______________________________________________________________________________________________________________________________
_______________________________________________________________________________________________________________________________
_________________________________________________________________________________________________________________________
_________________________________________________________________________________________________________________________
_________________________________________________________________________________________________________________________
SUMMARY OF HYDROLOGIC CONDITIONS
RAINFALL: Rainfall during the 2002 water year was above normal. Based on rainfall data at six National Oceanic and Atmospheric Administration stations, the rainfall for the 12-month period, from October 2001 through September 2002, ranged from 11.30 in. above normal at Winter Haven to 2.91 in. below normal at Jacksonville. The departure from the 30-year average rainfall in 2002 for the six rainfall stations presented in the table below averaged 4.3 inches above normal. The change in average departure for these six rainfall stations from 2001 to 2002 was 3.3 inches (from an average surplus of 1.0 inch in 2001 to an average surplus of 4.3 inches in 2002 from the 30-year average). The following summary lists departure from the 30-year (1971-2000) normal for each of the stations.
Departure from the 30-year normal rainfall (1971-2000)
October-December January-March April-June July-September Water Year
Total Total Total Total Total
Station Rainfall Departure Rainfall Departure Rainfall Departure Rainfall Departure Rainfall Departure
Jacksonville AP 5.38 -3.46 9.68 -1.09 9.12 -2.87 25.25 4.51 49.43 -2.91
Ocala 3.88 -3.95 8.25 -2.43 16.46 2.93 21.38 3.74 49.97 .29
Daytona Beach 10.49 .27 6.28 -3.43 16.49 5.00 22.77 4.90 56.03 6.74
Orlando 3.17 -4.19 5.10 -3.22 16.68 3.17 25.92 6.76 50.87 2.52
Winter Haven 4.48 -2.82 7.70 -.62 22.81 10.01 26.53 4.73 61.52 11.30
Vero Beach 10.54 -1.17 8.70 -.78 23.75 9.85 20.24 -.25 63.23 7.65
SURFACE-WATER DISCHARGE: Data for the current year and period of record for 10 selected stream gaging sites are summarized in table 1.
Annual Means: After a year of above normal rainfall, discharges throughout the report area ranged from 80 percent below to 75 percent above the period-of-record mean at sites shown. Discharge at five sites was above the period-of-record mean: St. Johns River near Cocoa, St. Johns River near DeLand, Fisheating Creek at Palmdale, Reedy Creek near Vineland, and Kissimmee at S-65 near Lake Wales. Overall, flow at the ten selected sites averaged 0.1 percent above the means for the period of record, and 192 percent above the means for the previous water year (2001).
Seasonal Patterns: Generally, mean monthly discharges rise and fall in two cycles each year. An annual high in September or October is followed by a low in November or December which is followed by another high in March or April and an annual low in May or June. This semi-annual pattern is the result of convective and tropical storms in late summer and early fall, and continental frontal storms in late winter and early spring.
Extremes: New extremes were observed for the current year at two of the ten representative sites. A new minimum daily mean was observed at St. Marys River near Macclenny (02231000) and St. Johns River near Deland (02236000).
Generally, discharges of the 10 selected surface-water sites indicated an increase from 2001 levels. Of the 10 selected surface-water sites presented, discharges at 9 were above the previous water-year mean.
Table 1.--Mean discharge for the 2002 water year and mean annual discharges computed from base period discharges
Mean Departure from Change Long-term discharge long-term from
mean annual discharge 2002 mean annual previousStation Discharge water year discharge yearnumber Station name Base period (ft3/s) (ft3/s) (percent) (percent)
St. Marys River basin02231000 St. Marys River near Macclenny 1927-02 640 132 -80 17
St. Johns River basin02232400 St. Johns River near Cocoa 1954-02 1,013 1,746 75 13202236000 St. Johns River near De Land 1934-02 3,048 4,137 36 50002240000 Ocklawaha River near Conner 1931-46,
1978-02 1,062 561 -48 14
Fisheating Creek basin02256500 Fisheating Creek at Palmdale 1931-02 252 264 4.3 -18
Kissimmee River basin 02266300 Reedy Creek near Vineland 1966-02 40.5 54.6 36 12702268903 Kissimmee River at S-65, near Lake Wales 1970-02 916 1,355 50 332
Withlacoochee River basin02312000 Withlacoochee River at Trilby 1928-02 324 293 -9.6 15502312200 Little Withlacoochee River at Rerdell 1958-02 73.4 62.5 -15 34602313000 Withlacoochee River near Holder 1928-02 985 518 -48 308

3 WATER RESOURCES DATA FOR FLORIDA, 2002 Volume 1A: Northeast Florida Surface Water
SPECIAL NETWORKS AND PROGRAMS
Hydrologic Benchmark Network is a network of 50 sites in small drainage basins around the country whose purpose is to provide consistent data on the streamflow representative of undeveloped watersheds nationwide, and to provide analyses on a continuing basis to compare and contrast conditions observed in basins more obviously affected by human activities. At 10 of these sites, water-quality information is being gathered on major ions and nutrients, primarily to assess the effects of acid deposition on stream chemistry. Additional information on the Hydrologic Benchmark Program can be found at http:// water.usgs.gov/hbn/.
National Stream-Quality Accounting Network (NASQAN) monitors the water quality of large rivers within the Nation’s largest river basins. From 1995 through 1999, a network of approximately 40 stations was operated in the Mississippi, Columbia, Colorado, and Rio Grande basins. For the period 2000 through 2004, sampling was reduced to a few index stations on the Colorado and Columbia so that a network of 5 stations could be implemented on the Yukon River. Samples are collected with sufficient frequency that the flux of a wide range of constituents can be estimated. The objective of NASQAN is to characterize the water quality of these large rivers by measuring concentration and mass transport of a wide range of dissolved and suspended constituents, including nutrients, major ions, dissolved and sediment-bound heavy metals, common pesticides, and inorganic and organic forms of carbon. This information will be used (1) to describe the long-term trends and changes in concentration and transport of these constituents; (2) to test findings of the National Water-Quality Assessment Program (NAWQA); (3) to characterize processes unique to large-river systems such as storage and re-mobilization of sediments and associated contaminants; and (4) to refine existing estimates of off-continent transport of water, sediment, and chemicals for assessing human effects on the world’s oceans and for determining global cycles of carbon, nutrients, and other chemicals. Additional information about the NASQAN Program can be found at http://water.usgs.gov/nasqan/.
The National Atmospheric Deposition Program/National Trends Network (NADP/NTN) provides continuous measurement and assessment of the chemical constituents in precipitation throughout the United States. As the lead federal agency, the USGS works together with over 100 organizations to provide a long-term, spatial and temporal record of atmospheric deposition generated from a network of 225 precipitation chemistry monitoring sites. This long-term, nationally consistent monitoring program, coupled with ecosystem research, provides critical information toward a national scorecard to evaluate the effectiveness of ongoing and future regulations intended to reduce atmospheric emissions and subsequent impacts to the Nation’s land and water resources. Reports and other information on the NADP/NTN Program, as well as all data from the individual sites, can be found at http://bqs.usgs.gov/acidrain/.
The National Water-Quality Assessment (NAWQA) Program of the U.S. Geological Survey is a long-term program with goals to describe the status and trends of water-quality conditions for a large, representative part of the Nation’s ground- and surface-water resources; provide an improved understanding of the primary natural and human factors affecting these observed conditions and trends; and provide information that supports development and evaluation of management, regulatory, and monitoring decisions by other agencies.
Assessment activities are being conducted in 59 study units (major watersheds and aquifer systems) that represent a wide range of environmental settings nationwide and that account for a large percentage of the Nation’s water use. A wide array of chemical constituents will be measured in ground water, surface water, streambed sediments, and fish tissues. The coordinated application of comparative hydrologic studies at a wide range of spatial and temporal scales will provide information for decision making by water-resources managers and a foundation for aggregation and comparison of findings to address water-quality issues of regional and national interest.
Communication and coordination between USGS personnel and other local, State, and federal interests are critical components of the NAWQA Program. Each study unit has a local liaison committee consisting of representatives from key federal, State, and local water resources agencies, Indian nations, and universities in the study unit. Liaison committees typically meet semiannually to discuss their information needs, monitoring plans and progress, desired information products, and opportunities to collaborate efforts among the agencies. Additional information about the NAWQA Program can be found at http://water.usgs.gov/nawqa/.

4 WATER RESOURCES DATA FOR FLORIDA, 2002 Volume 1A: Northeast Florida Surface Water
ES
CA
MB
IA
HILLSBOROUGH
BR
EV
AR
D
JEFF
ERSO
N
OK
ALO
OS
A
SU
WA
NN
EE
CO
LUM
BIA
UNION
FLAGLER
SU
MTE
R
HIGHLANDSSARASOTA
OKEECHO
BEE
MO
NR
OE
PIN
ELL
AS
INDIANRIVER
LEE
ORANGE
PASCO
OSCEOLA
LAKE
BAKER
MARION
CLAY
DUVAL
NASSAU
PUTNAMALACHUA
SANTAROSA
WALTON
HOLMES
BAY
JACKSON
GADSDEN
GULF FRANKLIN
LIBERTY WAKULLA
LEON MADISON
HAMILTON
TAYLOR
DIXIE
LEVY
VOLUSIA
CITRUS
HERNANDO
SEMINOLE
POLK
HARDEE
DE SOTO
ST.LUCIE
MARTIN
MANATEE
GLADES
HENDRY PALM BEACH
BROWARD
COLLIER
DADE
CHARLOTTE
WASHIN
GTO
N
CALHOUN
LAFAYETTE GILC
HR
IST
BRADFORD
ST. JO
HN
S
100 MILES25 50 750
25 100 KILOMETERS50 750
A L A B A M A
G E O R G I A
31
30
29
28
27
26
25
87 86 85 84 83 82 81 80
ATLA
NTIC
OC
EA
N
GULF
OFM
EXICO
LAKEOKEECHOBEE
HYDROLOGIC BENCHMARK STATION
1 Hillsboro Canal at S-62 Cypress Park Well at Coconut Creek3 LUR-16 at Coral Springs4 LUR-3 at Tamarac5 LUR-9 at Plantation6 Markham Park S-2 Well7 LUR-13 at Cooper City8 LUR-5 at Pembroke Pines9 C-111 Canal 100 feet above S-177, near Homestead
10 Sopchoppy River near Sopchoppy
NAWQA STATIONS
EXPLANATION
1
10
23
67 8
9
54
SURFACE-WATER STATIONGROUND-WATER STATION
87 86 85 84 83 81 8082
31
30
29
28
27
26
25E
SC
AM
BIA
HILLSBOROUGH
BR
EV
AR
D
JEFF
ERSO
N
OK
ALO
OS
A
SU
WA
NN
EE
CO
LUM
BIA
UNION
FLAGLER
SU
MTE
R
HIGHLANDS SARASOTA
OKEECHO
BEE
MO
NR
OE
PIN
ELL
AS
INDIAN RIVER
LEE
ORANGE
PASCO
OSCEOLA
LAKE
BAKER
MARION
CLAY
DUVAL
NASSAU
PUTNAM ALACHUA
SANTA ROSA
WALTON
HOLMES
BAY
JACKSON
GADSDEN
GULF FRANKLIN
LIBERTY WAKULLA
LEON MADISON
HAMILTON
TAYLOR
DIXIE
LEVY
VOLUSIA
CITRUS
HERNANDO
SEMINOLE
POLK
HARDEE
DE SOTO
ST. LUCIE
MARTIN
MANATEE
GLADES
HENDRY PALM BEACH
BROWARD
COLLIER
DADE
CHARLOTTE
WASHIN
GTO
N
CALHOUN
LAFAYETTE GILC
HR
IST
BRADFORD
ST. JO
HN
S
10025 50 750
25 50 750
A L A B A M A
G E O R G I A
ATLA
NTIC
O
CE
AN
GULF
OF M
EXICO
LAKE OKEECHOBEE
1 Hillsboro Canal at S-6 2 3 4 5 LUR-9 at Plantation 6 7 LUR-13 at Cooper City 8 9
10
1
10
2 3
6 7 8
9
5 4
MILES
100 KILOMETERS
HYDROLOGIC BENCHMARK STATION
Cypress Park Well at Coconut Creek LUR-16 at Coral Springs LUR-3 at Tamarac
Markham Park S-2 Well
LUR-5 at Pembroke Pines C-111 Canal 100 feet above S-177, near Homestead
Sopchoppy River near Sopchoppy
NAWQA STATIONS
EXPLANATION
SURFACE-WATER STATION GROUND-WATER STATION
Figure 2. NAWQA stations in the State of Florida.

WATER RESOURCES DATA FOR FLORIDA, 2002 5
Volume 1A: Northeast Florida Surface Water
EXPLANATION OF THE RECORDS
The surface-water and ground-water records published in this report are for the 2002 water year that began October 1, 2001, and ended September 30, 2002. A calendar of the water year is provided on the inside of the front cover. The records contain streamflow data, stage and content data for lakes and reservoirs, water-quality data for surface and ground water, and ground-water-level data. The following sections of the introductory text are presented to provide users with a more detailed explanation of how the hydrologic data published in this report were collected, analyzed, computed, and arranged for presentation.
Station Identification Numbers
Each data station, whether streamsite or well, in this report is assigned a unique identification number. The number usually is assigned when a station is first established and is retained for that station indefinitely. The systems used by the U.S. Geological Survey to assign identification numbers for surface-water stations and for ground-water well sites differ, but both are based on geographic location. The "downstream order" system is used for regular surface-water stations and the "latitude-longitude" system is used for wells and for surface-water stations where only miscellaneous observations are made.
83
14"
38"
AB
C
DE
42’15”
30 42’13”
19’
39”
83 1
9’37
”
COORDINATES FOR MISCELLANEOUS SITES A (304213083193701 ) AND
Downstream Order System
Since October 1, 1950, the order of listing hydrologic-station records in Survey reports is in a downstream direction along the main stream. All stations on a tributary entering upstream from a mainstream station are listed before that station. A station on a tributary that enters between two mainstream stations is listed between them. A similar order is followed in listing stations on first rank, second rank, and other ranks of tributaries. The rank of any tributary with respect to the stream to which it is immediately tributary is indicated by an indention in the "List of Stations" in the front of this report. Each indention represents one rank. This downstream order and system of indention shows which stations are on tributaries between any two stations and the rank of the tributary on which each station is situated.
The station-identification number is assigned according to downstream order. In assigning station numbers, no distinction is made between partial-record stations and other stations; therefore, the station number for a partial-record station indicates downstream-order position in a list made up of both types of stations. Gaps are left in the series of numbers to allow for new stations that may be established; hence, the numbers are not consecutive. The complete 8-digit number for each station, such as 02228500, which appears just to the left of the station name, includes the 2-digit part number "02" plus the 6- to 12-digit downstream-order number "228500." The part number designates the major river basin; for example, part "02" is the South Atlantic Slope and eastern Gulf of Mexico basins.
Latitude-Longitude System
The identification numbers for wells are assigned according to the grid system of latitude and longitude. The number consists of 15 digits. The first six digits denote the degrees, minutes, and seconds of latitude, the next seven digits denote degrees, minutes, and seconds of longitude, and the last two digits (assigned sequentially) identify the wells or other sites within a 1-second grid. This site-identification number, once assigned, is a pure number and has no locational significance. In the rare instance where the initial determination of latitude and longitude are found to be in error, the station will retain its initial identification number; however, its true latitude and longitude will be listed in the LOCATION paragraph of the station description. (See figure below.)
COORDINATES FOR MISCELLANEOUS
30
SITES D (304213083193801) AND
B (304213083193702)
SITE C (304214083193701)
COORDINATES FOR MISCELLANEOUS
E (304213083193802)
Figure 3.--System for numbering miscellaneous sites (latitude and longitude)

6 WATER RESOURCES DATA FOR FLORIDA, 2002 Volume 1A: Northeast Florida Surface Water
Records of Stage and Water Discharge
Records of stage and water discharge may be complete or partial. Complete records of discharge are those obtained using a continuous stage-recording device through which either instantaneous or mean daily discharges may be computed for any time, or any period of time, during the period of record. Complete records of lake elevation, similarly, are those for which stage may be computed or estimated with reasonable accuracy for any time, or period of time. They may be obtained using a stage-recording device or daily or weekly observations, but need not be. Because daily mean discharges and lake elevations commonly are published for such stations, they are referred to as "daily stations."By contrast, partial records are obtained through discrete measurements without using a continuous stage-recording device and pertain only to a few flow characteristics, or perhaps only one. The nature of the partial record is indicated by table titles such as "Crest-stage partial records," or "Low- flow partial records." Records of miscellaneous discharge measurements or of measurements from special studies, such as low-flow seepage studies, may be considered as partial records, but they are presented separately in this report. Location of all complete-record and partial-record stations for which data are given in this report are shown in figures preceding each sub-basin.
Data Collection and Computation
The data obtained at a complete-record gaging station on a stream or canal consist of a continuous record of stage, individual measurements of discharge throughout a range of stages, and notations regarding factors that may affect the relationships between stage and discharge. These data, together with supplemental information, such as weather records, are used to compute daily mean discharges.
Continuous records of stage are obtained with electronic water-stage recorders at selected time intervals. Measurements of discharge are made with current meters using methods adopted by the Geological Survey as a result of experience accumulated since 1880. These methods are described in standard textbooks, Water-Supply Paper 2175, and the U.S. Geological Survey Techniques of Water-Resources Investigations (TWRI’s), Book 3, Chapter A1 through A19 and Book 8, Chapters A2 and B2. The methods are consistent with the American Society for Testing and Materials (ASTM) standards and generally follow the standards of the International Organization for standards (ISO).
In computing discharge records, results of individual measurements are plotted against the corresponding stages, and stage-discharge relation curves are then constructed. From these curves, rating tables indicating the approximate discharge for any stage within the range of the measurements are prepared. If it is necessary to define extremes of discharge outside the range of the current-meter measurements, the curves are extended using: (1) logarithmic plotting; (2) velocity-area studies; (3) results of indirect measurements of peak discharge, such as slope-area or contracted-opening measurements, and computations of flow over dams or weirs; or (4) step- backwater techniques.
Daily mean discharges are computed by applying the daily mean stages (gage heights) to the stage-discharge curves or tables. If the stage-discharge relation is subject to change because of frequent or continual change in the physical features that form the control, the daily mean discharge is determined by the shifting-control method, in which correction factors based on the individual discharge measurements and notes of the personnel making the measurements are applied to the gage heights before the discharges are determined from the curves or tables. This shifting-control method also is used if the stage-discharge relation is changed temporarily because of aquatic growth or debris on the control. For some stations, formation of ice in the winter may so obscure the stage-discharge relations that daily mean discharges must be estimated from other information such as temperature and precipitation records, notes of observations, and records for other stations in the same or nearby basins for comparable periods.
At some stream-gaging stations, the stage-discharge relation is affected by the backwater from reservoirs, tributary streams, or other sources. This necessitates the use of the slope method in which the slope or fall in a reach of the stream is a factor in computing discharge. The slope or fall is obtained by means of an auxiliary gage set at some distance from the base gage. At some stations the stage-discharge relation is affected by changing stage; at these stations the rate of change in stage is used as a factor in computing discharge.
In computing records of lake or reservoir contents, it is necessary to have available from surveys, curves or tables defining the relationship of stage and content. The application of stage to the stage-content curves or tables gives the contents from which daily, monthly, or yearly changes then are determined. If the stage-content relationship changes because of deposition of sediment in a lake or reservoir, periodic resurveys may be necessary to redefine the relationship. Even when this is done, the contents computed may become increasingly in error as the lapsed time since the last survey increases. Discharges over lake or reservoir spillways are computed from stage-discharge relationships much as other stream discharges are computed.

7 WATER RESOURCES DATA FOR FLORIDA, 2002 Volume 1A: Northeast Florida Surface Water
For some gaging stations, there are periods when no gage-height record is obtained, or the recorded gage height is so faulty that it cannot be used to compute daily discharge or contents. This happens when the recorder stops or otherwise fails to operate properly, intakes are plugged, the float is frozen in the well, or for various other reasons. For such periods, the daily discharges are estimated from the recorded range in stage, previous or following record, discharge measurements, weather records, and comparison with other station records from the same or nearby basins. Likewise, daily contents may be estimated from operator's logs, previous or following record, inflow-outflow studies, and other information. Information explaining how estimated daily-discharge values are identified in station records is included in the next two sections, "Data Presentation" (REMARKS paragraph) and "Identifying Estimated Daily Discharge."
Data Presentation
The records published for each gaging station consist of two parts, the manuscript or station description and the data table for the current water year. The manuscript provides, under various headings, descriptive information, such as station location; period of record; average discharge; historical extremes; record accuracy; and other remarks pertinent to station operation and regulation. The following information, as appropriate, is provided with each continuous record of discharge or lake content. The following comments clarify information presented under the various headings of the station description.
LOCATION.--Information on locations is obtained from the most accurate maps available. The location of the gage with respect to the cultural and physical features in the vicinity and with respect to the reference place mentioned in the station name is given. River mileages, given for only a few stations, were determined by methods given in "River Mileage Measurement," Bulletin 14, Revision of October 1968, prepared by the Water Resources Council or were provided by the U.S. Army Corps of Engineers.
DRAINAGE AREA.--Drainage areas are measured using the most accurate maps available. Because the type of maps available varies from one drainage basin to another, the accuracy of drainage areas likewise varies. Drainage areas are updated as better maps become available.
PERIOD OF RECORD.--This indicates the period for which there are published records for the station or for an equivalent station. An equivalent station is one that was in operation at a time that the present station was not, and whose location was such that records from it can reasonably be considered equivalent with records from the present station.
REVISED RECORDS.--Published records, because of new information, occasionally are found to be incorrect, and revisions are printed in later reports. Listed under this heading are all the reports in which revisions have been published for the station and the water years to which the revisions apply. If a revision did not include daily, monthly, or annual figures of discharge, that fact is noted after the year dates as follows: "(M)" means that only the instantaneous maximum discharge was revised; "(m)" that only the instantaneous minimum was revised; and "(P)" that only peak discharges were revised. If the drainage area has been revised, the report in which the most recently revised figure was first published is given.
GAGE.--The type of gage in current use, the datum of the current gage referred to National Geodetic Vertical Datum of 1929 (see Definition of Terms), and a condensed history of the types, locations, and datums of previous gages are given under this heading.
REMARKS.--All periods of estimated daily-discharge record will be flagged in the daily-discharge table. (See next section, "Identifying Estimated Daily Discharge.") The remarks paragraph is used to present information relative to the accuracy of the records, to special methods of computation, to conditions that affect natural flow at the station and, possibly, to other pertinent items. For reservoir stations, information is given on the dam forming the reservoir, the capacity, outlet works and spillway, and purpose and use of the reservoir.
COOPERATION.--Records provided by a cooperating organization or obtained for the Geological Survey by a cooperating organization are identified here.
EXTREMES OUTSIDE PERIOD OF RECORD.--Included here is information concerning major floods or unusually low flows that occurred outside the stated period of record. The information may or may not have been obtained by the U.S. Geological Survey.
REVISIONS.--If errors in published water-quality records are discovered after publication, appropriate updates are made in the U.S. Geological Survey’s distribution data system, NWIS, and subsequently to its web-based National data system, NWISWeb [http://water.usgs.gov/nwis/nwis]. Because of the unusual voluem of updates makes it impractical to document individual changes in the State data-report series or elsewhere, potential users of U.S. Geological Survey water-quality data are encouraged to obtain all required data from NWIS or NWISWeb to ensure the most recent updates. Updates to NWISWeb are currently made on an annual basis.
8 WATER RESOURCES DATA FOR FLORIDA, 2002 Volume 1A: Northeast Florida Surface Water
Although rare, occasionally the records of a discontinued gaging station may need revision. Because, for these stations, there would be no current or, possibly, future station manuscript published to document the revision in a "Revised Records" entry, users of data for these stations who obtained the record from previously published data reports may wish to contact the offices whose addresses are given on the back of the title page of this report to determine if the published records were ever revised after the station was discontinued. Of course, if the data were obtained by computer retrieval, the data would be current and there would be no need to check because any published revision of data is always accompanied by revision of the corresponding data in computer storage.
Manuscript information for lake or reservoir stations differs from that for stream stations in the nature of the "Remarks" and in the inclusion of a skeleton stage-capacity table when daily contents are given.
Headings for AVERAGE DISCHARGE, EXTREMES FOR PERIOD OF RECORD, AND EXTREMES FOR CURRENT YEAR have been deleted and the information contained in these paragraphs, except for the listing of secondary instantaneous peak discharges in the EXTREMES FOR CURRENT YEAR paragraph, is now presented in the tabular summaries following the discharge table or in the REMARKS paragraph, as appropriate. No changes have been made to the data presentations of lake contents.
Data table of daily mean values
The daily table for stream-gaging stations gives mean discharge for each day of the water year. In the monthly summary for the table, the line headed "TOTAL" gives the sum of the daily figures for each month; the line headed "MEAN" gives the average flow in cubic feet per second for the month, and the lines headed "MAX" and "MIN" give the maximum and minimum daily discharges, respectively, for the month. Discharge for the month also is usually expressed in cubic feet per second per square mile (line headed "CFSM"); or in inches (line headed "IN."); or in acre-feet (line headed "AC- FT"). Figures for cubic feet per second per square mile and runoff in inches or in acre-feet may be omitted if there is extensive regulation or diversion or if the drainage area includes large noncontributing areas. At some stations monthly and (or) yearly observed discharges are adjusted for reservoir storage or diversion, or diversion data or reservoir contents are given. These figures are identified by a symbol and corresponding footnote.
Statistics of monthly mean data
A tabular summary of the mean (line headed "MEAN"), maximum (line headed "MAX"), and minimum (line headed "MIN") of monthly mean flows for each month for a designated period is provided below the mean values table. The water years of the first occurrence of the maximum and minimum monthly flows are provided immediately below those figures. The designated period will be expressed as "FOR WATER YEARS _-_, BY WATER YEAR (WY)," and will list the first and last water years of the range of years selected from the PERIOD OF RECORD paragraph in the station manuscript. It will consist of all of the station record within the specified water years, inclusive, including complete months of record for partial water years, if any, and may coincide with the period of record for the station. The water years for which the statistics are computed will be consecutive, unless a break in the station record is indicated in the manuscript.
Summary statistics
A table titled "SUMMARY STATISTICS" follows the statistics of monthly mean data tabulation. This table consists of four columns, with the first column containing the line headings of the statistics being reported. The table provides a statistical summary of yearly, daily, and instantaneous flows, not only for the current year but also for the previous calendar year and for a designated period, as appropriate. The designated period selected, "WATER YEARS _-_ ,"will consist of all of the station record within the specified water years, inclusive, including complete months of record for partial water years, if any, and may coincide with the period of record for the station. The water years for which the statistics are computed will be consecutive, unless a break in the station record is indicated in the manuscript. All of the calculations for the statistical characteristics designated ANNUAL (see line headings below), except for the "ANNUAL 7-DAY MINIMUM" statistic, are calculated for the designated period using complete water years. The other statistical characteristics may be calculated using partial water years.
The date or water year, as appropriate, of the first occurrence of each statistic reporting extreme values of discharge is provided adjacent to the statistic. Repeated occurrences may be noted in the REMARKS paragraph of the manuscript or in footnotes. Because the designated period may not be the same as the station period of record published in the manuscript, occasionally the dates of occurrence listed for the daily and instantaneous extremes in the designated-period column may not be within the selected water years listed in the heading. When this occurs, it will be noted in the REMARKS paragraph or in footnotes. Selected stream-flow duration curve statistics and runoff data are also given. Runoff data may be omitted if there is extensive regulation or diversion of flow in the drainage basin.

9 WATER RESOURCES DATA FOR FLORIDA, 2002 Volume 1A: Northeast Florida Surface Water
The following summary statistics data, as appropriate, are provided with each continuous record of discharge. Comments to follow clarify information presented under the various line headings of the summary statistic table.
ANNUAL TOTAL.--The sum of the daily mean values of discharge for the year. At some stations the annual total discharge is adjusted for reservoir storage or diversion. The adjusted figures are identified by a symbol and corresponding footnotes.
ANNUAL MEAN.--The arithmetic mean of the individual daily mean discharges for the year noted or for the designated period. At some stations the yearly mean discharge is adjusted for reservoir storage or diversion. The adjusted figures are identified by a symbol and corresponding footnotes.
HIGHEST ANNUAL MEAN.--The maximum annual mean discharge occurring for the designated period.
LOWEST ANNUAL MEAN.--The minimum annual mean discharge occurring for the designated period.
HIGHEST DAILY MEAN.--The maximum daily mean discharge for the year or for the designated period.
LOWEST DAILY MEAN.--The minimum daily mean discharge for the year or for the designated period.
ANNUAL 7-DAY MINIMUM.--The lowest mean discharge for 7 consecutive days for a calendar year or a water year. Note that most low-flow frequency analyses of annual 7-day minimum flows use a climatic year (April 1-March 31). The date shown in the summary statistics table is the initial date of the 7-day period. (This value should not be confused with the 7-day 10-year low-flow statistic.)
MAXIMUM PEAK FLOW.--The maximum instantaneous peak discharge occurring for the water year or designated period. Occasionally the maximum flow for a year may occur at midnight at the beginning or end of the year, on a recession from or rise toward a higher peak in the adjoining year. In this case, the maximum peak flow is given in the table and the maximum flow may be reported in a footnote or in the REMARKS paragraph in the manuscript.
MAXIMUM PEAK STAGE.--The maximum instantaneous peak stage occurring for the water year or designated period. Occasionally the maximum stage for a year may occur at midnight at the beginning or end of the year, on a recession from or rise toward a higher peak in the adjoining year. In this case, the maximum peak stage is given in the table and the maximum stage may be reported in the REMARKS paragraph in the manuscript or a footnote. If the dates of occurrence of the maximum peak stage and maximum peak flow are different, the REMARKS paragraph in the mauscript or a footnote may be used to provide further information.
INSTANTANEOUS LOW FLOW.--The minimum instantaneous discharge occurring for the water year or for the designated period.
ANNUAL RUNOFF.--Indicates the total quantity of water in runoff for a drainage area for the year. Data reports may use any of the following units of measurement in presenting annual runoff data:
Acre-foot (AC-FT) is the quantity of water required to cover 1 acre to a depth of 1 foot and is equal to 43,560 cubic feet or about 326,000 gallons or 1,233 cubic meters.
Cubic feet per second per square mile (CFSM) is the average number of cubic feet of water flowing per second from each square mile area drained, assuming the runoff is distributed uniformly in time and area.
Inches (INCHES) indicates the depth to which the drainage area would be covered if all of the runoff for a given time period were uniformly distributed on it.
10 PERCENT EXCEEDS.--The discharge that has been exceeded 10 percent of the time for the designated period.
50 PERCENT EXCEEDS.--The discharge that has been exceeded 50 percent of the time for the designated period.
90 PERCENT EXCEEDS.--The discharge that has been exceeded 90 percent of the time for the designated period.
Data collected at partial-record stations follow the information for continuous-record sites. Data for partial-record discharge stations are presented in two tables. The first is a table of annual maximum stage and discharge at crest-stage stations, and the second is a table of discharge measurements at low-flow partial- record stations. The tables of partial-record stations are followed by a listing of discharge measurements made at sites other than continuous-record or partial-record stations. These measurements are generally made in times of drought or flood to give better areal coverage to those events. Those measurements and others collected for some special reason are called measurements at miscellaneous sites.

10 WATER RESOURCES DATA FOR FLORIDA, 2002 Volume 1A: Northeast Florida Surface Water
Identifying Estimated Daily Discharge
Estimated daily-discharge values published in the water-discharge tables of annual State data reports are identified either by flagging individual daily values with the letter symbol "e" and printing a table footnote, "e Estimated," or by listing the dates of the estimated record in the REMARKS paragraph of the station description.
Accuracy of the Records
The accuracy of streamflow records depends primarily on: (1) The stability of the stage-discharge relation or, if the control is unstable, the frequency of discharge measurements; and (2) the accuracy of measurements of stage, measurements of discharge, and interpretation of records.
The accuracy attributed to the records is indicated under "REMARKS." "Excellent" means that about 95 percent of the daily discharges are within 5 percent of their true values; "good," within 10 percent; and "fair," within 15 percent. Records that do not meet the criteria mentioned are rated "poor." Different accuracies may be attributed to different parts of a given record.
Daily mean discharges in this report are given to the nearest hundredth of a cubic foot per second for values less than 1 ft3/s; to the nearest tenth between 1.0 and 10 ft3/s; to whole numbers between 10 and 1,000 ft3/s; and to 3 significant figures for more than 1,000 ft3/s. The number of significant figures used is based solely on the magnitude of the discharge value. The same rounding rules apply to discharges listed for partial-record stations and miscellaneous sites.
Discharge at many stations, as indicated by the monthly mean, may not reflect natural runoff due to the effects of diversion, consumption, regulation by storage, increase or decrease in evaporation due to artificial causes, or to other factors. For such stations, figures of cubic feet per second per square mile and of runoff, in inches, are not published unless satisfactory adjustments can be made for diversions, for changes in contents of reservoirs, or for other changes incident to use and control. Evaporation from a reservoir is not included in the adjustments for changes in reservoir contents, unless it is so stated. Even at those stations where adjustments are made, large errors in computed runoff may occur if adjustments or losses are large in comparison with the observed discharge.
Other Records Available
Information used in the preparation of the records in this publication, such as discharge-measurement notes, gage-height records, temperature measurements, and rating tables is on file in the Altamonte Springs Subdistrict office of the Florida District. Also, most of the daily mean discharges are in computer-readable form and have been analyzed statistically. Information on the availability of the unpublished information or on the results of statistical analyses of the published records may be obtained from the offices whose addresses are given on the back of the title page of this report.
Records of Surface-Water Quality
Records of surface-water quality ordinarily are obtained at or near stream-gaging stations because interpretation of records of surface-water quality nearly always requires corresponding discharge data. Records of surface-water quality in this report may involve a variety of types of data and measurement frequencies.
Classification of Records
Water-quality data for surface-water sites are grouped into one of three classifications. A continuous-record station is a site where data are collected on a regularly scheduled basis. Frequency may be one or more times daily, weekly, monthly, or quarterly. A partial-record station is a site where limited water-quality data are collected systematically over a period of years. Frequency of sampling is usually less than quarterly. A miscellaneous sampling site is a location other than a continuing or par-tial-record station, where random samples are collected to give better areal coverage to define water-quality conditions in the river basin.
A careful distinction needs to be made between "continuous records" as used in this report and "continuous recordings," which refers to a continuous graph or a series of discrete values punched at short intervals on a paper tape or obtained via data collection platform. Some records of water quality, such as temperature and specific conductance, may be obtained through continuous recordings; however, because of costs, most data are obtained only monthly or less frequently.

11 WATER RESOURCES DATA FOR FLORIDA, 2002 Volume 1A: Northeast Florida Surface Water
Accuracy of the Records
One of four accuracy classifications is applied for measured physical properties at continuous-record stations on a scale ranging from poor to excellent. The accuracy rating is based on data values recorded before any shifts or corrections are made, as described by Wagner and others (2000). Additional consideration also is given to the amount of publishable record and to the amount of data that have been corrected or shifted.
Rating continuous water-quality records [<, less than or equal to; +, plus or minus value shown; oC, degree Celsius; >, greater than; %, percent; mg/L, milligram per liter; pH unit, standard pH unit]
Measured physical Ratings
property Excellent Good Fair Poor
Water temperature < + 0.2oC > + 0.2 to 0.5oC > + 0.5 to 0.8oC > + 0.8oC
Specific conductance < + 3% > + 3 to 10% > + 10 to 15% > + 15%
Dissolved oxygen < + 0.3 mg/L > + 0.3 to 0.5 mg/L > + 0.5 to 0.8 mg/L > + 0.8 mg/L
pH < + 0.2 unit > + 0.2 to 0.5 unit > + 0.5 to 0.8 unit > + 0.8 unit
Turbidity < + 5% > + 5 to 10% > + 10 to 15% > + 15%
Arrangement of Records
Water-quality records collected at a surface-water daily record station are published immediately following that record, regardless of the frequency of sample collection. Station number and name are the same for both records. Where a surface-water daily record station is not available or where the water quality differs significantly from that at the nearby surface-water station, the continuing water-quality record is published with its own station number and name in the regular downstream order sequence. Water-quality data for partial-record stations and for miscellaneous sampling sites appear in separate tables following the table of discharge measurements at miscellaneous sites.
On-site Measurements and Sample Collection
In obtaining water-quality data, a major concern needs to be assuring that the data obtained represent the in situ quality of the water. To assure this, certain measurements, such as water temperature, pH, and dissolved oxygen, need to be made onsite when the samples are taken. To assure that measurements made in the laboratory also represent the in situ water, carefully prescribed procedures need to be followed in collecting the samples, in treating the samples to prevent changes in quality pending analysis, and in shipping the samples to the laboratory. Procedures for onsite measurements and for collecting, treating, and shipping samples are detailed in the TWRI Book 1, Chapter D2; Book 3, Chapter C2; and Book 5, Chapters A1, A3, and A4. These references are listed in the PUBLICATIONS ON TECHNIQUES OF WATER-RESOURCES INVESTIGATIONS section of this report. These methods are consistent with ASTM standards and generally follow ISO standards.
One sample can define adequately the water quality at a given time if the mixture of solutes throughout the stream cross section is homogeneous. However, the concentration of solutes at different locations in the cross section may vary widely with different rates of water discharge, depending on the source of material and the turbulence and mixing of the stream. Some streams must be sampled through several vertical sections to obtain a representative sample needed for an accurate mean concentration and for use in calculating load. All samples obtained for the National Stream Quality Accounting Network (see definitions) are obtained from at least several verticals. Whether samples are obtained from the centroid of flow or from several verticals depends on flow conditions and other factors which must be evaluated by the collector.
Chemical-quality data published in this report are considered to be the most representative values available for the stations listed. The values reported represent water-quality conditions at the time of sampling as much as possible, consistent with available sampling techniques and methods of analysis. In the rare case where an apparent inconsistency exists between a reported pH value and the relative abundance of carbon dioxide species (carbonate and bicarbonate), the inconsistency is the result of a slight uptake of carbon dioxide from the air by the sample between measurement of pH in the field and determination of carbonate and bicarbonate in the laboratory.

12 WATER RESOURCES DATA FOR FLORIDA, 2002 Volume 1A: Northeast Florida Surface Water
For chemical-quality stations equipped with digital monitors, the records consist of daily maximum, minimum, and mean values for each constituent measured and are based upon hourly punches beginning at 0100 hours and ending at 2400 hours for the day of record. More detailed records (hourly values) may be obtained from the Geological Survey Florida office whose address is given on the back of the title page of this report.
Water Temperature
Water temperatures are measured at most of the water-quality stations. In addition, water temperatures are taken at time of discharge measurements for water-discharge stations. For stations where water temperatures are taken manually once or twice daily, the water temperatures are taken at about the same time each day. Large streams have a small diurnal temperature change; shallow streams may have a daily range of several degrees and may follow closely the changes in air temperature. Some streams may be affected by waste-heat discharges.
At stations where recording instruments are used, either mean temperatures or maximum and minimum temperatures for each day are published. Water temperatures measured at the time of water-discharge measurements are on file in the Florida Office.
Sediment
Suspended-sediment concentrations are determined from samples collected by using depth-integrating samplers. Samples usually are obtained at several verticals in the cross section, or a single sample may be obtained at a fixed point and a coefficient applied to determine the mean concentration in the cross sections.
During periods of rapidly changing flow or rapidly changing concentration, samples may have been collected more frequently (twice daily or, in some instances, hourly). The published sediment discharges for days of rapidly changing flow or concentration were computed by the subdivided-day method (time-discharge weighted average). Therefore, for those days when the published sediment discharge value differs from the value computed as the product of discharge times mean concentration times 0.0027, the reader can assume that the sediment discharge for that day was computed by the subdivided-day method. For periods when no samples were collected, daily discharges of suspended sediment were estimated on the basis of water discharge, sediment concentrations observed immediately before and after the periods, and suspended-sediment loads for other periods of similar discharge. Methods used in the computation of sediment records are described in the TWRI Book 3, Chapters C1 and C3. These methods are consistent with ASTM standards and generally follow ISO standards.
At other stations, suspended-sediment samples were collected periodically at many verticals in the stream cross section. Although data collected periodically may represent conditions only at the time of observations, such data are useful in establishing seasonal relations between quality and streamflow and in predicting long-term sediment-discharge characteristics of the stream.
In addition to the records of suspended-sediment discharge, records of the periodic measurements of the particle-size distribution of the suspended sediment and bed material are included for some stations.
Dissolved Trace Element Concentrations
Traditionally, dissolved trace-element concentrations have been reported at the microgram per liter (ug/L) level. Recent evidence, mostly from large rivers, indicates that actual dissolved-phase concentrations for a number of trace elements are within the range of 10's to 100's of nanograms per liter (ng/L). Data above the ug/L level should be viewed with caution. Such data may actually represent elevated environmental concentrations from natural or human causes; however, these data could reflect contamination introduced during sampling, processing, or analysis. To confidently produce dissolved trace-element data with insignificant contamination, the U.S. Geological Survey began using new trace-element protocols at some stations in water year 1994. Full implementation of the protocols will take place during the 1995 water year.
Laboratory Measurements
Samples for indicator bacteria and daily samples for specific conductance are analyzed in Tampa office. All other samples are analyzed in the Geological Survey laboratory in Arvada, Colorado and Ocala, Florida. Methods used to analyze sediment samples and to compute sediment records are described in the TWRI Book 5, Chapter C1. Methods used by the U.S. Geological Survey laboratories are given in the TWRI Book 1, Chapter D2; Book 3, Chapter C2; and Book 5, Chapter A1, A3, A4, and A5. These methods are consistent with ASTM standards and generally follow ISO standards.

13 WATER RESOURCES DATA FOR FLORIDA, 2002 Volume 1A: Northeast Florida Surface Water
In March 1989 the National Water-Quality Laboratory in Arvada, Colorado discovered a bias in the turbidimetric method for sulfate analysis, indicating that values below 75 mg/L have a median positive bias of 2 mg/L above the true value for the period between October 1982 and July 1989. Sulfate values for NASQAN stations (02301500) Alafia River at Lithia, FL and (02296750) Peace River at Arcadia, FL have not been corrected for this bias. Sulfate values for other stations in this report were determined in Ocala, Florida, and the turbidimetric method was not used.
Data Presentation
For continuing-record stations, information pertinent to the history of station operation is provided in descriptive headings preceding the tabular data. These descriptive headings give details regarding location, drainage area, period of record, type of data available, instrumentation, general remarks, cooperation, and extremes for parameters currently measured daily. Tables of chemical, physical, biological, radiochemical data, and so forth, obtained at a frequency less than daily are presented first. Tables of "daily values" of specific conductance, pH, water temperature, dissolved oxygen, and suspended sediment then follow in sequence.
In the descriptive headings, if the location is identical to that of the discharge gaging station, neither the LOCATION nor the DRAINAGE AREA statements are repeated. The following information, as appropriate, is provided with each continuous-record station. Comments that follow clarify information presented under the various headings of the station description.
LOCATION.--See Data Presentation under "Records of Stage and Water Discharge;" same comments apply.
DRAINAGE AREA.--See Data Presentation under "Records of Stage and Water Discharge;" same comments apply.
PERIOD OF RECORD.--This indicates the periods for which there are published water-quality records for the station. The periods are shown separately for records of parameters measured daily or continuously and those measured less than daily. For those measured daily or continuously, periods of record are given for the parameters individually.
INSTRUMENTATION.--Information on instrumentation is given only if a water- quality monitor temperature record, sediment pumping sampler, or other sampling device is in operation at a station.
REMARKS.--Remarks provide added information pertinent to the collection, analysis, or computation of the records.
COOPERATION.--Records provided by a cooperating organization or obtained for the Geological Survey by a cooperating organization are identified here.
EXTREMES.--Maximums and minimums are given only for parameters measured daily or more frequently. None are given for parameters measured weekly or less frequently, because the true maximums or minimums may not have been sampled. Extremes, when given, are provided for both the period of record and for the current water year.
REVISIONS.--If errors in published water-quality records are discovered after publication, appropriate updates are made in the U.S. Geological Survey’s distribution data system, NWIS, and subsequently to its web-based National data system, NWISWeb [http://water.usgs.gov/nwis/nwis]. Because of the unusual voluem of updates makes it impractical to document individual changes in the State data-report series or elsewhere, potential users of U.S. Geological Survey water-quality data are encouraged to obtain all required data from NWIS or NWISWeb to ensure the most recent updates. Updates to NWISWeb are currently made on an annual basis.
The surface-water-quality records for partial-record stations and miscellaneous sampling sites are published in separate tables following the table of discharge measurements at miscellaneous sites. No descriptive statements are given for these records. Each station is published with its own station number and name in the regular downstream-order sequence.

14 WATER RESOURCES DATA FOR FLORIDA, 2002 Volume 1A: Northeast Florida Surface Water
Remark Codes
The following remark codes may appear with the water-quality data in this section:
PRINT OUTPUT REMARK
E Value is estimated.
> Actual value is known to be greater than the value shown.
< Actual value is known to be less than the value shown.
M Presence of material verified, but not quantified.
N Presumptive evidence of presence of material.
U Material specifically analyzed for, but not detected.
A Value is an average.
V Analyte was detected in both the environmental sample and the associated blanks.
S Most probable value.
cl Value qualifier code for holding time exceeded by the laboratory.
Rounding Clarification
Values for some constituents analyzed by routine methods are tabulated with extraneous trailing zeros that are not significant digits. Extraneous zeros result because data obtained from low-level methods that have better (lower) detection limits are stored under the same parameter code as data obtained by routine analytical methods. Precision varies for different analytical methods used to determine the same constituent. The presence of trailing zeroes after the decimal in values printed in this report does not necessarily indicate that the method used for the determination is as precise as the level implied by the rightmost zero.
ACCESS TO USGS WATER DATA
The USGS provides near real-time stage and discharge data for many of the gaging stations equipped with the necessary telemetry and historic daily-mean and peak-flow discharge data for most current or discontinued gaging stations through the world wide web (WWW). These data may be accessed at:
http://water.usgs.gov
Some water-quality and ground-water data also are available through the WWW. In addition, data can be provided in various machine readable formats on magnetic tape or 3-1/2 inch floppy disk. Information about the availability of specific types of data or products, and user charges, can be obtained locally from each of the Water Resources Division Offices (See address on the back of the title page).

15 WATER RESOURCES DATA FOR FLORIDA, 2002 Volume 1A: Northeast Florida Surface Water
DEFINITION OF TERMS
Specialized technical terms related to streamflow, water-quality, and other hydrologic data, as used in this report, are defined below. Definitions of common terms such as algae, water level, and precipitation are given in standard dictionaries. Not all terms defined in this alphabetical list apply to every State. See also table for converting inch/pound units to International System (SI) units on the inside of the back cover.
Acid neutralizing capacity (ANC) is the equivalent sum of all bases or base-producing materials, solutes plus particulates, in an aqueous system that can be titrated with acid to an equivalence point. This term designates titration of an “unfiltered” sample (formerly reported as alkalinity).
Acre-foot (AC-FT, acre-ft) is a unit of volume, commonly used to measure quantities of water used or stored, equivalent to the volume of water required to cover 1 acre to a depth of 1 foot and equivalent to 43,560 cubic feet, 325,851 gallons, or 1,233 cubic meters. (See also “Annual runoff”)
Adenosine triphosphate (ATP) is an organic, phosphate-rich compound important in the transfer of energy in organisms. Its central role in living cells makes ATP an excellent indicator of the presence of living material in water. A measurement of ATP therefore provides a sensitive and rapid estimate of biomass. ATP is reported in micrograms per liter.
Algal growth potential (AGP) is the maximum algal dry weight biomass that can be produced in a natural water sample under standardized laboratory conditions. The growth potential is the algal biomass present at stationary phase and is expressed as milligrams dry weight of algae produced per liter of sample. (See also “Biomass” and “Dry weight”)
Alkalinity is the capacity of solutes in an aqueous system to neutralize acid. This term designates titration of a “filtered” sample.
Annual runoff is the total quantity of water that is discharged (“runs off”) from a drainage basin in a year. Data reports may present annual runoff data as volumes in acre-feet, as discharges per unit of drainage area in cubic feet per second per square mile, or as depths of water on the drainage basin in inches.
Annual 7-day minimum is the lowest mean value for any 7-consecutive-day period in a year. Annual 7-day minimum values are reported herein for the calendar year and the water year (October 1 through September 30). Most low-flow frequency analyses use a climatic year (April 1-March 31), which tends to prevent the low-flow period from being artificially split between adjacent years. The date shown in the summary statistics table is the initial date of the 7-day period. (This value should not be confused with the 7-day, 10-year low-flow statistic.)
Aroclor is the registered trademark for a group of poly-chlorinated biphenyls that were manufactured by the Monsanto Company prior to 1976. Aroclors are assigned specific 4-digit reference numbers dependent upon molecular type and degree of substitution of the biphenyl ring hydrogen atoms by chlorine atoms. The first two digits of a numbered aroclor represent the molecular type, and the last two digits represent the percentage weight of the hydrogen-substituted chlorine.
Artificial substrate is a device that is purposely placed in a stream or lake for colonization of organisms. The artificial substrate simplifies the community structure by standardizing the substrate from which each sample is collected. Examples of artificial substrates are basket samplers (made of wire cages filled with clean streamside rocks) and multiplate samplers (made of hardboard) for benthic organism collection, and plexiglass strips for periphyton collection. (See also “Substrate”)
Ash mass is the mass or amount of residue present after the residue from the dry mass determination has been ashed in a muffle furnace at a temperature of 500 ° C for 1 hour. Ash mass of zooplankton and phytoplankton is expressed in grams per cubic meter (g/m3), and periphyton and benthic organisms in grams per square meter (g/m2). (See also “Biomass” and “Dry mass”)
Aspect is the direction toward which a slope faces with respect to the compass.
Bacteria are microscopic unicellular organisms, typically spherical, rodlike, or spiral and threadlike in shape, often clumped into colonies. Some bacteria cause disease, whereas others perform an essential role in nature in the recycling of materials; for example, by decomposing organic matter into a form available for reuse by plants.

16 WATER RESOURCES DATA FOR FLORIDA, 2002 Volume 1A: Northeast Florida Surface Water
Bankfull stage, as used in this report, is the stage at which a stream first overflows its natural banks formed by floods with 1- to 3-year recurrence intervals.
Base discharge (for peak discharge) is a discharge value, determined for selected stations, above which peak discharge data are published. The base discharge at each station is selected so that an average of about three peak flows per year will be published. (See also “Peak flow”)
Base flow is sustained flow of a stream in the absence of direct runoff. It includes natural and human-induced streamflows. Natural base flow is sustained largely by ground-water discharge.
Bedload is material in transport that is supported primarily by the streambed. In this report, bedload is considered to consist of particles in transit from the bed to an elevation equal to the top of the bedload sampler nozzle (ranging from 0.25 to 0.5 foot) that are retained in the bedload sampler. A sample collected with a pressure-differential bedload sampler also may contain a component of the suspended load.
Bedload discharge (tons per day) is the rate of sediment moving as bedload, reported as dry weight, that passes through a cross section in a given time. NOTE: Bedload discharge values in this report may include a component of the suspended-sediment discharge. A correction may be necessary when computing the total sediment discharge by summing the bedload discharge and the suspended-sediment discharge. (See also “Bedload,” “Dry weight,” “Sediment,” and “Suspended-sediment discharge”)
Bed material is the sediment mixture of which a stream-bed, lake, pond, reservoir, or estuary bottom is composed. (See also “Bedload” and “Sediment”)
Benthic organisms are the group of organisms inhabiting the bottom of an aquatic environment. They include a number of types of organisms, such as bacteria, fungi, insect larvae and nymphs, snails, clams, and crayfish. They are useful as indicators of water quality.
Biochemical oxygen demand (BOD) is a measure of the quantity of dissolved oxygen, in milligrams per liter, necessary for the decomposition of organic matter by microorganisms, such as bacteria.
Biomass is the amount of living matter present at any given time, expressed as mass per unit area or volume of habitat.
Biomass pigment ratio is an indicator of the total proportion of periphyton that are autotrophic (plants). This is also called the Autotrophic Index.
Blue-green algae (Cyanophyta) are a group of phytoplankton organisms having a blue pigment, in addition to the green pigment called chlorophyll. Blue-green algae often cause nuisance conditions in water. Concentrations are expressed as a number of cells per milliliter (cells/mL) of sample. (See also “Phytoplankton”)
Bottom material (See “Bed material”)
Bulk electrical conductivity is the combined electrical conductivity of all material within a doughnut-shaped volume surrounding an induction probe. Bulk conductivity is affected by different physical and chemical properties of the material including the dissolved solids content of the pore water and lithology and porosity of the rock.
Cells/volume refers to the number of cells of any organism that is counted by using a microscope and grid or counting cell. Many planktonic organisms are multicelled and are counted according to the number of contained cells per sample volume, and are generally reported as cells or units per milliliter (mL) or liter (L).

17 WATER RESOURCES DATA FOR FLORIDA, 2002 Volume 1A: Northeast Florida Surface Water
Cells volume (biovolume) determination is one of several common methods used to estimate biomass of algae in aquatic systems. Cell members of algae are frequently used in aquatic surveys as an indicator of algal production. However, cell numbers alone cannot represent true biomass because of considerable cell-size variation among the algal species. Cell volume (µm3) is determined by obtaining critical cell measurements or cell dimensions (for example, length, width, height, or radius) for 20 to 50 cells of each important species to obtain an average biovolume per cell. Cells are categorized according to the correspondence of their cellular shape to the nearest geometric solid or combinations of simple solids (for example, spheres, cones, or cylinders). Representative formulae used to compute biovolume are as follows:
sphere 4/3 πr3 cone 1/3 πr2h cylinder πr2h.
pi (π) is the ratio of the circumference to the diameter of a circle; pi = 3.14159….
From cell volume, total algal biomass expressed as biovolume (µm3/mL) is thus determined by multiplying the number of cells of a given species by its average cell volume and then summing these volumes for all species.
Cfs-day (See “Cubic foot per second-day”)
Channel bars, as used in this report, are the lowest prominent geomorphic features higher than the channel bed.
Chemical oxygen demand (COD) is a measure of the chemically oxidizable material in the water and furnishes an approximation of the amount of organic and reducing material present. The determined value may correlate with BOD or with carbonaceous organic pollution from sewage or industrial wastes. [See also “Biochemical oxygen demand (BOD)”]
Clostridium perfringens (C. perfringens) is a spore-forming bacterium that is common in the feces of human and other warmblooded animals. Clostridial spores are being used experimentally as an indicator of past fecal contamination and presence of microorganisms that are resistant to disinfection and environmental stresses. (See also “Bacteria”)
Coliphages are viruses that infect and replicate in coliform bacteria. They are indicative of sewage contamination of water and of the survival and transport of viruses in the environment.
Color unit is produced by 1 milligram per liter of platinum in the form of the chloroplatinate ion. Color is expressed in units of the platinum-cobalt scale.
Confined aquifer is a term used to describe an aquifer containing water between two relatively impermeable bound-aries. The water level in a well tapping a confined aquifer stands above the top of the confined aquifer and can be higher or lower than the water table that may be present in the material above it. In some cases, the water level can rise above the ground surface, yielding a flowing well.
Contents is the volume of water in a reservoir or lake. Unless otherwise indicated, volume is computed on the basis of a level pool and does not include bank storage.
Continuous-record station is a site where data are collected with sufficient frequency to define daily mean values and variations within a day.
Control designates a feature in the channel that physically affects the water-surface elevation and thereby determines the stage-discharge relation at the gage. This feature may be a constriction of the channel, a bedrock outcrop, a gravel bar, an artificial structure, or a uniform cross section over a long reach of the channel.
Control structure, as used in this report, is a structure on a stream or canal that is used to regulate the flow or stage of the stream or to prevent the intrusion of saltwater.
Cubic foot per second (CFS, ft3/s) is the rate of discharge representing a volume of 1 cubic foot passing a given point in 1 second. It is equivalent to approximately 7.48 gallons per second or approximately 449 gallons per minute, or 0.02832 cubic meters per second. The term “second-foot” sometimes is used synonymously with “cubic foot per second” but is now obsolete.

18 WATER RESOURCES DATA FOR FLORIDA, 2002 Volume 1A: Northeast Florida Surface Water
Cubic foot per second-day (CFS-DAY, Cfs-day, [(ft3/s)/d]) is the volume of water represented by a flow of 1 cubic foot per second for 24 hours. It is equivalent to 86,400 cubic feet, 1.98347 acre-feet, 646,317 gallons, or 2,446.6 cubic meters. The daily mean discharges reported in the daily value data tables are numerically equal to the daily volumes in cfs-days, and the totals also represent volumes in cfs-days.
Cubic foot per second per square mile [CFSM, (ft3/s)/mi2] is the average number of cubic feet of water flowing per second from each square mile of area drained, assuming the runoff is distributed uniformly in time and area. (See also “Annual runoff”)
Daily mean suspended-sediment concentration is the time-weighted concentration of suspended sediment passing a stream cross section during a 24-hour day. (See also “Sediment” and “Suspended-sediment concentration”)
Daily-record station is a site where data are collected with sufficient frequency to develop a record of one or more data values per day. The frequency of data collection can range from continuous recording to periodic sample or data collection on a daily or near-daily basis.
Data collection platform (DCP) is an electronic instrument that collects, processes, and stores data from various sensors, and transmits the data by satellite data relay, line-of-sight radio, and/or landline telemetry.
Data logger is a microprocessor-based data acquisition system designed specifically to acquire, process, and store data. Data are usually downloaded from onsite data loggers for entry into office data systems.
Datum is a surface or point relative to which measurements of height and/or horizontal position are reported. A vertical datum is a horizontal surface used as the zero point for measurements of gage height, stage, or elevation; a horizontal datum is a reference for positions given in terms of latitude-longitude, State Plane coordinates, or UTM coordinates. (See also “Gage datum,” “Land-surface datum,” “National Geodetic Vertical Datum of 1929,” and “North American Vertical Datum of 1988”)
Diatoms are the unicellular or colonial algae having a siliceous shell. Their concentrations are expressed as number of cells per milliliter (cells/mL) of sample. (See also “Phytoplankton”)
Diel is of or pertaining to a 24-hour period of time; a regular daily cycle.
Discharge, or flow, is the rate that matter passes through a cross section of a stream channel or other water body per unit of time. The term commonly refers to the volume of water (including, unless otherwise stated, any sediment or other constituents suspended or dissolved in the water) that passes a cross section in a stream channel, canal, pipeline, etc., within a given period of time (cubic feet per second). Discharge also can apply to the rate at which constituents, such as suspended sediment, bedload, and dissolved or suspended chemicals, pass through a cross section, in which cases the quantity is expressed as the mass of constituent that passes the cross section in a given period of time (tons per day).
Dissolved refers to that material in a representative water sample that passes through a 0.45-micrometer membrane filter. This is a convenient operational definition used by Federal and State agencies that collect water-quality data. Determinations of “dissolved” constituent concentrations are made on sample water that has been filtered.
Dissolved oxygen (DO) is the molecular oxygen (oxygen gas) dissolved in water. The concentration in water is a function of atmospheric pressure, temperature, and dissolved-solids concentration of the water. The ability of water to retain oxygen decreases with increasing temperature or dissolved-solids concentration. Photosynthesis and respiration by plants commonly cause diurnal variations in dissolved-oxygen concentration in water from some streams.
Dissolved-solids concentration in water is the quantity of dissolved material in a sample of water. It is determined either analytically by the “residue-on-evaporation” method, or mathematically by totaling the concentrations of individual constituents reported in a comprehensive chemical analysis. During the analytical determination, the bicarbonate (generally a major dissolved component of water) is converted to carbonate. In the mathematical calculation, the bicarbonate value, in milligrams per liter, is multiplied by 0.4926 to convert it to carbonate. Alternatively, alkalinity concentration (as mg/L CaCO3) can be converted to carbonate concentration by multiplying by 0.60.

19 WATER RESOURCES DATA FOR FLORIDA, 2002 Volume 1A: Northeast Florida Surface Water
Diversity index (H) (Shannon index) is a numerical expression of evenness of distribution of aquatic organisms. The formula for diversity index is:
s nid − = ∑ ni log ,2 ni≈ 1 n
where ni is the number of individuals per taxon, n is the total number of individuals, and s is the total number of taxa in the sample of the community. Index values range from zero, when all the organisms in the sample are the same, to some positive number, when some or all of the organisms in the sample are different.
Drainage area of a stream at a specific location is that area upstream from the location, measured in a horizontal plane, that has a common outlet at the site for its surface runoff from precipitation that normally drains by gravity into a stream. Drainage areas given herein include all closed basins, or noncontributing areas, within the area unless otherwise specified.
Drainage basin is a part of the Earth’s surface that contains a drainage system with a common outlet for its surface runoff. (See “Drainage area”)
Dry mass refers to the mass of residue present after drying in an oven at 105 ° C, until the mass remains unchanged. This mass represents the total organic matter, ash and sediment, in the sample. Dry-mass values are expressed in the same units as ash mass. (See also “Ash mass,” “Biomass,” and “Wet mass”)
Dry weight refers to the weight of animal tissue after it has been dried in an oven at 65 °C until a constant weight is achieved. Dry weight represents total organic and inorganic matter in the tissue. (See also “Wet weight”)
Embeddedness is the degree to which gravel-sized and larger particles are surrounded or enclosed by finer-sized particles. (See also “Substrate embeddedness class”)
Enterococcus bacteria are commonly found in the feces of humans and other warmblooded animals. Although some strains are ubiquitous and not related to fecal pollution, the presence of enterococci in water is an indication of fecal pollution and the possible presence of enteric pathogens. Enterococcus bacteria are those bacteria that produce pink to red colonies with black or reddish-brown precipitate after incubation at 41 ° C on mE agar (nutrient medium for bacterial growth) and subsequent transfer to EIA medium. Enterococci include Streptococcus feacalis, Streptococcus feacium, Streptococcus avium, and their variants. (See also “Bacteria”)
EPT Index is the total number of distinct taxa within the insect orders Ephemeroptera, Plecoptera, and Trichoptera. This index summarizes the taxa richness within the aquatic insects that are generally considered pollution sensitive; the index usually decreases with pollution.
Escherichia coli (E. coli) are bacteria present in the intestine and feces of warmblooded animals. E. coli are a member species of the fecal coliform group of indicator bacteria. In the laboratory, they are defined as those bacteria that produce yellow or yel-low-brown colonies on a filter pad saturated with urea substrate broth after primary culturing for 22 to 24 hours at 44.5 °C on mTEC medium (nutrient medium for bacterial growth). Their concentrations are expressed as number of colonies per 100 mL of sample. (See also “Bacteria”)
Estimated (E) concentration value is reported when an analyte is detected and all criteria for a positive result are met. If the concentration is less than the method detection limit (MDL), an ‘E’ code will be reported with the value. If the analyte is qualitatively identified as present, but the quantitative determination is substantially more uncertain, the National Water Quality Laboratory will identify the result with an ‘E’ code even though the measured value is greater than the MDL. A value reported with an ‘E’ code should be used with caution. When no analyte is detected in a sample, the default reporting value is the MDL preceded by a less than sign (<).
Euglenoids (Euglenophyta) are a group of algae that are usually free-swimming and rarely creeping. They have the ability to grow either photosynthetically in the light or heterotrophically in the dark. (See also “Phytoplankton”)

20 WATER RESOURCES DATA FOR FLORIDA, 2002 Volume 1A: Northeast Florida Surface Water
Extractable organic halides (EOX) are organic compounds that contain halogen atoms such as chlorine. These organic compounds are semivolatile and extractable by ethyl acetate from air-dried streambed sediment. The ethyl acetate extract is combusted, and the concentration is determined by microcoulometric determination of the halides formed. The concentration is reported as micrograms of chlorine per gram of the dry weight of the streambed sediment.
Fecal coliform bacteria are present in the intestines or feces of warmblooded animals. They often are used as indicators of the sanitary quality of the water. In the laboratory, they are defined as all organisms that produce blue colonies within 24 hours when incubated at 44.5 ° C plus or minus 0.2 ° C on M-FC medium (nutrient medium for bacterial growth). Their concentrations are expressed as number of colonies per 100 mL of sample. (See also “Bacteria”)
Fecal streptococcal bacteria are present in the intestines of warmblooded animals and are ubiquitous in the environment. They are characterized as gram-positive, cocci bacteria that are capable of growth in brain-heart infusion broth. In the laboratory, they are defined as all the organisms that produce red or pink colonies within 48 hours at 35 ° C plus or minus 1.0 ° C on KF-streptococcus medium (nutrient medium for bacterial growth). Their concentrations are expressed as number of colonies per 100 mL of sample. (See also “Bacteria”)
Fire algae (Pyrrhophyta) are free-swimming unicells characterized by a red pigment spot. (See also “Phytoplankton”)
Flow-duration percentiles are values on a scale of 100 that indicate the percentage of time for which a flow is not exceeded. For example, the 90th percentile of river flow is greater than or equal to 90 percent of all recorded flow rates.
Gage datum is a horizontal surface used as a zero point for measurement of stage or gage height. This surface usually is located slightly below the lowest point of the stream bottom such that the gage height is usually slightly greater than the maximum depth of water. Because the gage datum itself is not an actual physical object, the datum usually is defined by specifying the elevations of permanent reference marks such as bridge abutments and survey monuments, and the gage is set to agree with the reference marks. Gage datum is a local datum that is maintained independently of any national geodetic datum. However, if the elevation of the gage datum relative to the national datum (North American Vertical Datum of 1988 or National Geodetic Vertical Datum of 1929) has been determined, then the gage readings can be converted to elevations above the national datum by adding the elevation of the gage datum to the gage reading.
Gage height (G.H.) is the water-surface elevation, in feet above the gage datum. If the water surface is below the gage datum, the gage height is negative. Gage height often is used interchangeably with the more general term “stage,” although gage height is more appropriate when used in reference to a reading on a gage.
Gage values are values that are recorded, transmitted, and/or computed from a gaging station. Gage values typically are collected at 5-, 15-, or 30-minute intervals.
Gaging station is a site on a stream, canal, lake, or reservoir where systematic observations of stage, discharge, or other hydrologic data are obtained.
Gas chromatography/flame ionization detector (GC/FID) is a laboratory analytical method used as a screening technique for semivolatile organic compounds that are extractable from water in methylene chloride.
Geomorphic channel units, as used in this report, are fluvial geomorphic descriptors of channel shape and stream velocity. Pools, riffles, and runs are types of geomorphic channel units considered for National Water-Quality Assessment (NAWQA) Program habitat sampling.
Green algae have chlorophyll pigments similar in color to those of higher green plants. Some forms produce algae mats or floating “moss” in lakes. Their concentrations are expressed as number of cells per milliliter (cells/mL) of sample. (See also “Phytoplankton”)
Habitat, as used in this report, includes all nonliving (physical) aspects of the aquatic ecosystem, although living components like aquatic macrophytes and riparian vegetation also are usually included. Measurements of habitat are typically made over a wider geographic scale than are measurements of species distribution.

21 WATER RESOURCES DATA FOR FLORIDA, 2002 Volume 1A: Northeast Florida Surface Water
Habitat quality index is the qualitative description (level 1) of instream habitat and riparian conditions surrounding the reach sampled. Scores range from 0 to 100 percent with higher scores indicative of desirable habitat conditions for aquatic life. Index only applicable to wadable streams.
Hardness of water is a physical-chemical characteristic that commonly is recognized by the increased quantity of soap required to produce lather. It is computed as the sum of equivalents of polyvalent cations (primarily calcium and magnesium) and is expressed as the equivalent concentration of calcium carbonate (CaCO3).
High tide is the maximum height reached by each rising tide. The high-high and low-high tides are the higher and lower of the two high tides, respectively, of each tidal day. See NOAA web site: http://www.co-ops.nos.noaa.gov/tideglos.html
Hilsenhoff’s Biotic Index (HBI) is an indicator of organic pollution that uses tolerance values to weight taxa abundances; usually increases with pollution. It is calculated as follows:
)(HBI = sum ( a n ) N
,
where n is the number of individuals of each taxon, a is the tolerance value of each taxon, and N is the total number of organisms in the sample.
Horizontal datum (See “Datum”)
Hydrologic index stations referred to in this report are continuous-record gaging stations that have been selected as representative of streamflow patterns for their respective regions. Station locations are shown on index maps.
Hydrologic unit is a geographic area representing part or all of a surface drainage basin or distinct hydrologic feature as defined by the former Office of Water Data Coordination and delineated on the State Hydrologic Unit Maps by the USGS. Each hydrologic unit is identified by an 8-digit number.
Inch (IN., in.), as used in this report, refers to the depth to which the drainage area would be covered with water if all of the runoff for a given time period were uniformly distributed on it. (See also “Annual runoff”)
Instantaneous discharge is the discharge at a particular instant of time. (See also “Discharge”)
Island, as used in this report, is a mid-channel bar that has permanent woody vegetation, is flooded once a year on average, and remains stable except during large flood events.
Laboratory reporting level (LRL) is generally equal to twice the yearly determined long-term method detection level (LTMDL). The LRL controls false negative error. The probability of falsely reporting a nondetection for a sample that contained an analyte at a concentration equal to or greater than the LRL is predicted to be less than or equal to 1 percent. The value of the LRL will be reported with a “less than” (<) remark code for samples in which the analyte was not detected. The National Water Quality Laboratory (NWQL) collects quality-control data from selected analytical methods on a continuing basis to determine LT-MDLs and to establish LRLs. These values are reevaluated annually on the basis of the most current quality-con-trol data and, therefore, may change. [Note: In several previous NWQL documents (NWQL Technical Memorandum 98.07, 1998), the LRL was called the nondetection value or NDV—a term that is no longer used.]
Land-surface datum (lsd) is a datum plane that is approximately at land surface at each ground-water observation well.
Latent heat flux (often used interchangeably with latent heat-flux density) is the amount of heat energy that converts water from liquid to vapor (evaporation) or from vapor to liquid (condensation) across a specified cross-sectional area per unit time. Usually expressed in watts per square meter.

22 WATER RESOURCES DATA FOR FLORIDA, 2002 Volume 1A: Northeast Florida Surface Water
Light-attenuation coefficient, also known as the extinction coefficient, is a measure of water clarity. Light is attenuated according to the Lambert-Beer equation:
e I I −λL ,= o
where Io is the source light intensity, I is the light intensity at length L (in meters) from the source, λ is the light-attenuation coefficient, and e is the base of the natural logarithm. The light-attenuation coefficient is defined as
1 Iλ − =L
loge I .
o
Lipid is any one of a family of compounds that are insoluble in water and that make up one of the principal components of living cells. Lipids include fats, oils, waxes, and steroids. Many environmental contaminants such as organochlorine pesticides are lipophilic.
Long-term method detection level (LT-MDL) is a detection level derived by determining the standard deviation of a minimum of 24 method detection limit (MDL) spike sample measurements over an extended period of time. LT-MDL data are collected on a continuous basis to assess year-to-year variations in the LT-MDL. The LT-MDL controls false positive error. The chance of falsely reporting a concentration at or greater than the LT-MDL for a sample that did not contain the analyte is predicted to be less than or equal to 1 percent.
Low tide is the minimum height reached by each falling tide. The high-low and low-low tides are the higher and lower of the two low tides, respectively, of each tidal day. See NOAA web site: http://www.co-ops.nos.noaa.gov/tideglos.html
Macrophytes are the macroscopic plants in the aquatic environment. The most common macrophytes are the rooted vascular plants that usually are arranged in zones in aquatic ecosystems and restricted in the area by the extent of illumination through the water and sediment deposition along the shoreline.
Mean concentration of suspended sediment (Daily mean suspended-sediment concentration) is the time-weighted concentration of suspended sediment passing a stream cross section during a given time period. (See also “Daily mean suspended-sedi-ment concentration” and “Suspended-sediment concentration”)
Mean discharge (MEAN) is the arithmetic mean of individual daily mean discharges during a specific period. (See also “Discharge”)
Mean high or low tide is the average of all high or low tides, respectively, over a specific period.
Mean sea level is a local tidal datum. It is the arithmetic mean of hourly heights observed over the National Tidal Datum Epoch. Shorter series are specified in the name; for example, monthly mean sea level and yearly mean sea level. In order that they may be recovered when needed, such datums are referenced to fixed points known as benchmarks. (See also “Datum”)
Measuring point (MP) is an arbitrary permanent reference point from which the distance to water surface in a well is measured to obtain water level.
Membrane filter is a thin microporous material of specific pore size used to filter bacteria, algae, and other very small particles from water.
Metamorphic stage refers to the stage of development that an organism exhibits during its transformation from an immature form to an adult form. This developmental process exists for most insects, and the degree of difference from the immature stage to the adult form varies from relatively slight to pronounced, with many intermediates. Examples of metamorphic stages of insects are egg-larva-adult or egg-nymph-adult.

23 WATER RESOURCES DATA FOR FLORIDA, 2002 Volume 1A: Northeast Florida Surface Water
Method detection limit (MDL) is the minimum concentration of a substance that can be measured and reported with 99-percent confidence that the analyte concentration is greater than zero. It is determined from the analysis of a sample in a given matrix containing the analyte. At the MDL concentration, the risk of a false positive is predicted to be less than or equal to 1 percent.
Methylene blue active substances (MBAS) are apparent detergents. The determination depends on the formation of a blue color when methylene blue dye reacts with synthetic anionic detergent compounds.
Micrograms per gram (UG/G, µg/g) is a unit expressing the concentration of a chemical constituent as the mass (micrograms) of the element per unit mass (gram) of material analyzed.
Micrograms per kilogram (UG/KG, µg/kg) is a unit expressing the concentration of a chemical constituent as the mass (micrograms) of the constituent per unit mass (kilogram) of the material analyzed. One microgram per kilogram is equivalent to 1 part per billion.
Micrograms per liter (UG/L, µg/L) is a unit expressing the concentration of chemical constituents in water as mass (micrograms) of constituent per unit volume (liter) of water. One thousand micrograms per liter is equivalent to 1 milligram per liter. One microgram per liter is equivalent to 1 part per billion.
Microsiemens per centimeter (US/CM, µS/cm) is a unit expressing the amount of electrical conductivity of a solution as measured between opposite faces of a centimeter cube of solution at a specified temperature. Siemens is the International System of Units nomenclature. It is synonymous with mhos and is the reciprocal of resistance in ohms.
Milligrams per liter (MG/L, mg/L) is a unit for expressing the concentration of chemical constituents in water as the mass (milligrams) of constituent per unit volume (liter) of water. Concentration of suspended sediment also is expressed in milligrams per liter and is based on the mass of dry sediment per liter of water-sediment mixture.
Minimum reporting level (MRL) is the smallest measured concentration of a constituent that may be reliably reported by using a given analytical method.
Miscellaneous site, miscellaneous station, or miscellaneous sampling site is a site where streamflow, sediment, and/or water-quality data or water-quality or sediment samples are collected once, or more often on a random or discontinuous basis to provide better areal coverage for defining hydrologic and water-quality conditions over a broad area in a river basin.
Most probable number (MPN) is an index of the number of coliform bacteria that, more probably than any other number, would give the results shown by the laboratory examination; it is not an actual enumeration. MPN is determined from the distribution of gas-positive cultures among multiple inoculated tubes.
Multiple-plate samplers are artificial substrates of known surface area used for obtaining benthic invertebrate samples. They consist of a series of spaced, hardboard plates on an eyebolt.
Nanograms per liter (NG/L, ng/L) is a unit expressing the concentration of chemical constituents in solution as mass (nanograms) of solute per unit volume (liter) of water. One million nanograms per liter is equivalent to 1 milligram per liter.
National Geodetic Vertical Datum of 1929 (NGVD of 1929) is a fixed reference adopted as a standard geodetic datum for elevations determined by leveling. It was formerly called “Sea Level Datum of 1929” or “mean sea level.” Although the datum was derived from the mean sea level at 26 tide stations, it does not necessarily represent local mean sea level at any particular place. See NOAA web site: http://www.ngs.noaa.gov/faq.shtml#WhatVD29VD88 (See “North American Vertical Datum of 1988”)
Natural substrate refers to any naturally occurring immersed or submersed solid surface, such as a rock or tree, upon which an organism lives. (See also “Substrate”)
Nekton are the consumers in the aquatic environment and consist of large free-swimming organisms that are capable of sustained, directed mobility.

24 WATER RESOURCES DATA FOR FLORIDA, 2002 Volume 1A: Northeast Florida Surface Water
Nephelometric turbidity unit (NTU) is the measurement for reporting turbidity that is based on use of a standard suspension of formazin. Turbidity measured in NTU uses nephelometric methods that depend on passing specific light of a specific wavelength through the sample.
North American Vertical Datum of 1988 (NAVD 1988) is a fixed reference adopted as the official civilian vertical datum for elevations determined by Federal surveying and mapping activities in the United States. This datum was established in 1991 by minimum-constraint adjustment of the Canadian, Mexican, and United States first-order terrestrial leveling networks.
Open or screened interval is the length of unscreened opening or of well screen through which water enters a well, in feet below land surface.
Organic carbon (OC) is a measure of organic matter present in aqueous solution, suspension, or bottom sediment. May be reported as dissolved organic carbon (DOC), particulate organic carbon (POC), or total organic carbon (TOC).
Organic mass or volatile mass of a living substance is the difference between the dry mass and ash mass and represents the actual mass of the living matter. Organic mass is expressed in the same units as for ash mass and dry mass. (See also “Ash mass,” “Biomass,” and “Dry mass”)
Organism count/area refers to the number of organisms collected and enumerated in a sample and adjusted to the number per area habitat, usually square meter (m2), acre, or hectare. Periphyton, benthic organisms, and macrophytes are expressed in these terms.
Organism count/volume refers to the number of organisms collected and enumerated in a sample and adjusted to the number per sample volume, usually milliliter (mL) or liter (L). Numbers of planktonic organisms can be expressed in these terms.
Organochlorine compounds are any chemicals that contain carbon and chlorine. Organochlorine compounds that are important in investigations of water, sediment, and biological quality include certain pesticides and industrial compounds.
Parameter code is a 5-digit number used in the USGS computerized data system, National Water Information System (NWIS), to uniquely identify a specific constituent or property.
Partial-record station is a site where discrete measurements of one or more hydrologic parameters are obtained over a period of time without continuous data being recorded or computed. A common example is a crest-stage gage partial-record station at which only peak stages and flows are recorded.
Particle size is the diameter, in millimeters (mm), of a particle determined by sieve or sedimentation methods. The sedimentation method utilizes the principle of Stokes law to calculate sediment particle sizes. Sedimentation methods (pipet, bottom-withdrawal tube, visual-accumulation tube, sedigraph) determine fall diameter of particles in either distilled water (chemically dispersed) or in native water (the river water at the time and point of sampling).
Particle-size classification, as used in this report, agrees with the recommendation made by the American Geophysical Union Subcommittee on Sediment Terminology. The classification is as follows:
Classification Size (mm) Method of analysis
Clay >0.00024 - 0.004 Sedimentation Silt >0.004 - 0.062 Sedimentation Sand >0.062 - 2.0 Sedimentation/sieve Gravel >2.0 - 64.0 Sieve Cobble >64 - 256 Manual measurement Boulder >256 Manual measurement

25 WATER RESOURCES DATA FOR FLORIDA, 2002 Volume 1A: Northeast Florida Surface Water
The particle-size distributions given in this report are not necessarily representative of all particles in transport in the stream. For the sedimentation method, most of the organic matter is removed, and the sample is subjected to mechanical and chemical dispersion before analysis in distilled water. Chemical dispersion is not used for native water analysis.
Peak flow (peak stage) is an instantaneous local maximum value in the continuous time series of streamflows or stages, preceded by a period of increasing values and followed by a period of decreasing values. Several peak values ordinarily occur in a year. The maximum peak value in a year is called the annual peak; peaks lower than the annual peak are called secondary peaks. Occasionally, the annual peak may not be the maximum value for the year; in such cases, the maximum value occurs at midnight at the beginning or end of the year, on the recession from or rise toward a higher peak in the adjoining year. If values are recorded at a discrete series of times, the peak recorded value may be taken as an approximation of the true peak, which may occur between the recording instants. If the values are recorded with finite precision, a sequence of equal recorded values may occur at the peak; in this case, the first value is taken as the peak.
Percent composition or percent of total is a unit for expressing the ratio of a particular part of a sample or population to the total sample or population, in terms of types, numbers, weight, mass, or volume.
Percent shading is a measure of the amount of sunlight potentially reaching the stream. A clinometer is used to measure left and right bank canopy angles. These values are added together, divided by 180, and multiplied by 100 to compute percentage of shade.
Periodic-record station is a site where stage, discharge, sediment, chemical, physical, or other hydrologic measurements are made one or more times during a year but at a frequency insufficient to develop a daily record.
Periphyton is the assemblage of microorganisms attached to and living upon submerged solid surfaces. Although primarily consisting of algae, they also include bacteria, fungi, protozoa, rotifers, and other small organisms. Periphyton are useful indicators of water quality.
Pesticides are chemical compounds used to control undesirable organisms. Major categories of pesticides include insecticides, miticides, fungicides, herbicides, and rodenticides.
pH of water is the negative logarithm of the hydrogen-ion activity. Solutions with pH less than 7.0 standard units are termed “acidic,” and solutions with a pH greater than 7.0 are termed “basic.” Solutions with a pH of 7.0 are neutral. The presence and concentration of many dissolved chemical constituents found in water are affected, in part, by the hydrogen-ion activity of water. Biological processes including growth, distribution of organisms, and toxicity of the water to organisms also are affected, in part, by the hydrogen-ion activity of water.
Phytoplankton is the plant part of the plankton. They are usually microscopic, and their movement is subject to the water currents. Phytoplankton growth is dependent upon solar radiation and nutrient substances. Because they are able to incorporate as well as release materials to the surrounding water, the phytoplankton have a profound effect upon the quality of the water. They are the primary food producers in the aquatic environment and commonly are known as algae. (See also “Plankton”)
Picocurie (PC, pCi) is one trillionth (1 x 10-12) of the amount of radioactive nuclide represented by a curie (Ci). A curie is the quantity of radioactive nuclide that yields 3.7 x 10¹⁰ radioactive disintegrations per second (dps). A picocurie yields 0.037 dps, or 2.22 dpm (disintegrations per minute).
Plankton is the community of suspended, floating, or weakly swimming organisms that live in the open water of lakes and rivers. Concentrations are expressed as a number of cells per milliliter (cells/mL) of sample.
Polychlorinated biphenyls (PCBs) are industrial chemicals that are mixtures of chlorinated biphenyl compounds having various percentages of chlorine. They are similar in structure to organochlorine insecticides.
Polychlorinated naphthalenes (PCNs) are industrial chemicals that are mixtures of chlorinated naphthalene compounds. They have properties and applications similar to polychlorinated biphenyls (PCBs) and have been identified in commercial PCB preparations.

26 WATER RESOURCES DATA FOR FLORIDA, 2002 Volume 1A: Northeast Florida Surface Water
Pool, as used in this report, is a small part of a stream reach with little velocity, commonly with water deeper than surrounding areas.
Primary productivity is a measure of the rate at which new organic matter is formed and accumulated through photo-synthetic and chemosynthetic activity of producer organisms (chiefly, green plants). The rate of primary production is estimated by measuring the amount of oxygen released (oxygen method) or the amount of carbon assimilated (carbon method) by the plants.
Primary productivity (carbon method) is expressed as milligrams of carbon per area per unit time [mg C/(m2/time)] for periphyton and macrophytes or per volume [mg C/(m3/time)] for phytoplankton. The carbon method defines the amount of carbon dioxide consumed as measured by radioactive carbon (carbon-14). The carbon-14 method is of greater sensitivity than the oxygen light and dark bottle method and is preferred for use with unenriched water samples. Unit time may be either the hour or day, depending on the incubation period. (See also “Primary productivity”)
Primary productivity (oxygen method) is expressed as milligrams of oxygen per area per unit time [mg O/(m2/time)] for periphyton and macrophytes or per volume [mg O/(m3/time)] for phytoplankton. The oxygen method defines production and respiration rates as estimated from changes in the measured dissolved-oxygen concentration. The oxygen light and dark bottle method is preferred if the rate of primary production is sufficient for accurate measurements to be made within 24 hours. Unit time may be either the hour or day, depending on the incubation period. (See also “Primary productivity”)
Radioisotopes are isotopic forms of elements that exhibit radioactivity. Isotopes are varieties of a chemical element that differ in atomic weight but are very nearly alike in chemical properties. The difference arises because the atoms of the isotopic forms of an element differ in the number of neutrons in the nucleus; for example, ordinary chlorine is a mixture of isotopes having atomic weights of 35 and 37, and the natural mixture has an atomic weight of about 35.453. Many of the elements similarly exist as mixtures of isotopes, and a great many new isotopes have been produced in the operation of nuclear devices such as the cyclotron. There are 275 isotopes of the 81 stable elements, in addition to more than 800 radioactive isotopes.
Reach, as used in this report, is a length of stream that is chosen to represent a uniform set of physical, chemical, and biological conditions within a segment. It is the principal sampling unit for collecting physical, chemical, and biological data.
Recoverable from bed (bottom) material is the amount of a given constituent that is in solution after a representative sample of bottom material has been digested by a method (usually using an acid or mixture of acids) that results in dissolution of readily soluble substances. Complete dissolution of all bottom material is not achieved by the digestion treatment and thus the determination represents less than the total amount (that is, less than 95 percent) of the constituent in the sample. To achieve comparability of analytical data, equivalent digestion procedures would be required of all laboratories performing such analyses because different digestion procedures are likely to produce different analytical results. (See also “Bed material”)
Recurrence interval, also referred to as return period, is the average time, usually expressed in years, between occurrences of hydrologic events of a specified type (such as exceedances of a specified high flow or nonexceedance of a specified low flow). The terms “return period” and “recurrence interval” do not imply regular cyclic occurrence. The actual times between occurrences vary randomly, with most of the times being less than the average and a few being substantially greater than the average. For example, the 100-year flood is the flow rate that is exceeded by the annual maximum peak flow at intervals whose average length is 100 years (that is, once in 100 years, on average); almost two-thirds of all exceedances of the 100-year flood occur less than 100 years after the previous exceedance, half occur less than 70 years after the previous exceedance, and about one-eighth occur more than 200 years after the previous exceedance. Similarly, the 7-day, 10-year low flow (7Q10) is the flow rate below which the annual minimum 7-day-mean flow dips at intervals whose average length is 10 years (that is, once in 10 years, on average); almost two-thirds of the nonexceedances of the 7Q10 occur less than 10 years after the previous nonexceedance, half occur less than 7 years after, and about one-eighth occur more than 20 years after the previous nonexceedance. The recurrence interval for annual events is the reciprocal of the annual probability of occurrence. Thus, the 100-year flood has a 1-per-cent chance of being exceeded by the maximum peak flow in any year, and there is a 10-percent chance in any year that the annual minimum 7-day-mean flow will be less than the 7Q10.
Replicate samples are a group of samples collected in a manner such that the samples are thought to be essentially identical in composition.

27 WATER RESOURCES DATA FOR FLORIDA, 2002 Volume 1A: Northeast Florida Surface Water
Return period (See “Recurrence interval”)
Riffle, as used in this report, is a shallow part of the stream where water flows swiftly over completely or partially submerged obstructions to produce surface agitation.
River mileage is the curvilinear distance, in miles, measured upstream from the mouth along the meandering path of a stream channel in accordance with Bulletin No. 14 (October 1968) of the Water Resources Council and typically is used to denote location along a river.
Run, as used in this report, is a relatively shallow part of a stream with moderate velocity and little or no surface turbulence.
Runoff is the quantity of water that is discharged (“runs off”) from a drainage basin during a given time period. Runoff data may be presented as volumes in acre-feet, as mean discharges per unit of drainage area in cubic feet per second per square mile, or as depths of water on the drainage basin in inches. (See also “Annual runoff”)
Sea level, as used in this report, refers to one of the two commonly used national vertical datums (NGVD 1929 or NAVD 1988). See separate entries for definitions of these datums.
Sediment is solid material that originates mostly from disintegrated rocks; when transported by, suspended in, or deposited from water, it is referred to as “fluvial sediment.” Sediment includes chemical and biochemical precipitates and decomposed organic material, such as humus. The quantity, characteristics, and cause of the occurrence of sediment in streams are affected by environmental and land-use factors. Some major factors are topography, soil characteristics, land cover, and depth and intensity of pre-cipitation.
Sensible heat flux (often used interchangeably with latent sensible heat-flux density) is the amount of heat energy that moves by turbulent transport through the air across a specified cross-sectional area per unit time and goes to heating (cooling) the air. Usually expressed in watts per square meter.
Seven-day, 10-year low flow (7Q10) is the discharge below which the annual 7-day minimum flow falls in 1 year out of 10 on the long-term average. The recurrence interval of the 7Q10 is 10 years; the chance that the annual 7-day minimum flow will be less than the 7Q10 is 10 percent in any given year. (See also “Annual 7-day minimum” and “Recurrence interval”)
Shelves, as used in this report, are streambank features extending nearly horizontally from the flood plain to the lower limit of persistent woody vegetation.
Sodium adsorption ratio (SAR) is the expression of relative activity of sodium ions in exchange reactions within soil and is an index of sodium or alkali hazard to the soil. Sodium hazard in water is an index that can be used to evaluate the suitability of water for irrigating crops.
Soil heat flux (often used interchangeably with soil heat-flux density) is the amount of heat energy that moves by conduction across a specified cross-sectional area of soil per unit time and goes to heating (or cooling) the soil. Usually expressed in watts per square meter.
Soil-water content is the water lost from the soil upon drying to constant mass at 105 ° C; expressed either as mass of water per unit mass of dry soil or as the volume of water per unit bulk volume of soil.
Specific electrical conductance (conductivity) is a measure of the capacity of water (or other media) to conduct an electrical current. It is expressed in microsiemens per centimeter at 25 ° C. Specific electrical conductance is a function of the types and quantity of dissolved substances in water and can be used for approximating the dissolved-solids content of the water. Commonly, the concentration of dissolved solids (in milligrams per liter) is from 55 to 75percent of the specific conductance (in microsiemens). This relation is not constant from stream to stream, and it may vary in the same source with changes in the composition of the water.
Stable isotope ratio (per MIL) is a unit expressing the ratio of the abundance of two radioactive isotopes. Isotope ratios are used in hydrologic studies to determine the age or source of specific water, to evaluate mixing of different water, as an aid in determining reaction rates, and other chemical or hydrologic processes.

28 WATER RESOURCES DATA FOR FLORIDA, 2002 Volume 1A: Northeast Florida Surface Water
Stage (See “Gage height”)
Stage-discharge relation is the relation between the water-surface elevation, termed stage (gage height), and the volume of water flowing in a channel per unit time.
Streamflow is the discharge that occurs in a natural channel. Although the term “discharge” can be applied to the flow of a canal, the word “streamflow” uniquely describes the discharge in a surface stream course. The term “streamflow” is more general than “runoff” as streamflow may be applied to discharge whether or not it is affected by diversion or regulation.
Substrate is the physical surface upon which an organism lives.
Substrate embeddedness class is a visual estimate of riffle streambed substrate larger than gravel that is surrounded or covered by fine sediment (<2mm, sand or finer). Below are the class categories expressed as the percentage covered by fine sediment:
0 no gravel or larger substrate 3 26-50 percent1 > 75 percent 4 5-25 percent2 51-75 percent 5 < 5 percent
Surface area of a lake is that area (acres) encompassed by the boundary of the lake as shown on USGS topographic maps, or other available maps or photographs. Because surface area changes with lake stage, surface areas listed in this report represent those determined for the stage at the time the maps or photographs were obtained.
Surficial bed material is the upper surface (0.1 to 0.2 foot) of the bed material that is sampled using U.S. Series Bed-Material Samplers.
Suspended (as used in tables of chemical analyses) refers to the amount (concentration) of undissolved material in a water-sed-iment mixture. It is defined operationally as the material retained on a 0.45-micrometer filter.
Suspended, recoverable is the amount of a given constituent that is in solution after the part of a representative suspended water-sediment sample that is retained on a 0.45-micrometer membrane filter has been digested by a method (usually using a dilute acid solution) that results in dissolution of only readily soluble substances. Complete dissolution of all the particulate matter is not achieved by the digestion treatment, and thus the determination represents something less than the “total” amount (that is, less than 95 percent) of the constituent present in the sample. To achieve comparability of analytical data, equivalent digestion procedures are required of all laboratories performing such analyses because different digestion procedures are likely to produce different analytical results. Determinations of “suspended, recoverable” constituents are made either by directly analyzing the suspended mate-rial collected on the filter or, more commonly, by difference, on the basis of determinations of (1) dissolved and (2) total recoverable concentrations of the constituent. (See also “Suspended”)
Suspended sediment is the sediment maintained in suspension by the upward components of turbulent currents or that exists in suspension as a colloid. (See also “Sediment”)
Suspended-sediment concentration is the velocity-weighted concentration of suspended sediment in the sampled zone (from the water surface to a point approximately 0.3 foot above the bed) expressed as milligrams of dry sediment per liter of water-sediment mixture (mg/L). The analytical technique uses the mass of all of the sediment and the net weight of the water-sedi-ment mixture in a sample to compute the suspended-sediment concentration. (See also “Sediment” and “Suspended sediment”)
Suspended-sediment discharge (tons/d) is the rate of sediment transport, as measured by dry mass or volume, that passes a cross section in a given time. It is calculated in units of tons per day as follows: concentration (mg/L) x discharge (ft3/s) x 0.0027. (See also “Sediment,” “Suspended sediment,” and “Suspended-sediment concentration”)
Suspended-sediment load is a general term that refers to a given characteristic of the material in suspension that passes a point during a specified period of time. The term needs to be qualified, such as “annual suspended-sediment load” or “sand-size sus-pended-sediment load,” and so on. It is not synonymous with either suspended-sediment discharge or concentration. (See also “Sediment”)

29 WATER RESOURCES DATA FOR FLORIDA, 2002 Volume 1A: Northeast Florida Surface Water
Suspended, total is the total amount of a given constituent in the part of a water-sediment sample that is retained on a 0.45-micrometer membrane filter. This term is used only when the analytical procedure assures measurement of at least 95 percent of the constituent determined. Knowledge of the expected form of the constituent in the sample, as well as the analytical methodology used, is required to determine when the results should be reported as “suspended, total.” Determinations of “suspended, total” constituents are made either by directly analyzing portions of the suspended material collected on the filter or, more commonly, by difference, on the basis of determinations of (1) dissolved and (2) total concentrations of the constituent. (See also “Suspended”)
Suspended solids, total residue at 105 °C concentration is the concentration of inorganic and organic material retained on a filter, expressed as milligrams of dry material per liter of water (mg/L). An aliquot of the sample is used for this analysis.
Synoptic studies are short-term investigations of specific water-quality conditions during selected seasonal or hydro-logic periods to provide improved spatial resolution for critical water-quality conditions. For the period and conditions sampled, they assess the spatial distribution of selected water-quality conditions in relation to causative factors, such as land use and contaminant sources.
Taxa (Species) richness is the number of species (taxa) present in a defined area or sampling unit.
Taxonomy is the division of biology concerned with the classification and naming of organisms. The classification of organisms is based upon a hierarchial scheme beginning with Kingdom and ending with Species at the base. The higher the classification level, the fewer features the organisms have in common. For example, the taxonomy of a particular mayfly, Hexagenia limbata, is the following:
Kingdom: Animal Phylum: Arthropoda Class: Insecta Order: Ephemeroptera Family: Ephemeridae Genus: Hexagenia Species: Hexagenia limbata
Thalweg is the line formed by connecting points of minimum streambed elevation (deepest part of the channel).
Thermograph is an instrument that continuously records variations of temperature on a chart. The more general term “temperature recorder” is used in the table descriptions and refers to any instrument that records temperature whether on a chart, a tape, or any other medium.
Time-weighted average is computed by multiplying the number of days in the sampling period by the concentrations of individual constituents for the corresponding period and dividing the sum of the products by the total number of days. A time-weighted average represents the composition of water resulting from the mixing of flow proportionally to the duration of the concentration.
Tons per acre-foot (T/acre-ft) is the dry mass (tons) of a constituent per unit volume (acre-foot) of water. It is computed by multiplying the concentration of the constituent, in milligrams per liter, by 0.00136.
Tons per day (T/DAY, tons/d) is a common chemical or sediment discharge unit. It is the quantity of a substance in solution, in suspension, or as bedload that passes a stream section during a 24-hour period. It is equivalent to 2,000 pounds per day, or 0.9072 metric tons per day.
Total is the amount of a given constituent in a representative whole-water (unfiltered) sample, regardless of the constituent’s physical or chemical form. This term is used only when the analytical procedure assures measurement of at least 95 percent of the constituent present in both the dissolved and suspended phases of the sample. A knowledge of the expected form of the constituent in the sample, as well as the analytical methodology used, is required to judge when the results should be reported as “total.” (Note that the word “total” does double duty here, indicating both that the sample consists of a water-suspended sediment mixture and that the analytical method determined at least 95 percent of the constituent in the sample.)

30 WATER RESOURCES DATA FOR FLORIDA, 2002 Volume 1A: Northeast Florida Surface Water
Total coliform bacteria are a particular group of bacteria that are used as indicators of possible sewage pollution. This group includes coliforms that inhabit the intestine of warmblooded animals and those that inhabit soils. They are characterized as aerobic or facultative anaerobic, gram-negative, nonspore-forming, rod-shaped bacteria that ferment lactose with gas formation within 48 hours at 35 ° C. In the laboratory, these bacteria are defined as all the organisms that produce colonies with a golden-green metallic sheen within 24 hours when incubated at 35 ° C plus or minus 1.0 ° C on M-Endo medium (nutrient medium for bacterial growth). Their concentrations are expressed as number of colonies per 100 milliliters of sample. (See also “Bacteria”)
Total discharge is the quantity of a given constituent, measured as dry mass or volume, that passes a stream cross section per unit of time. When referring to constituents other than water, this term needs to be qualified, such as “total sediment discharge,” “total chloride discharge,” and so on.
Total in bottom material is the amount of a given constituent in a representative sample of bottom material. This term is used only when the analytical procedure assures measurement of at least 95 percent of the constituent determined. A knowledge of the expected form of the constituent in the sample, as well as the analytical methodology used, is required to judge when the results should be reported as “total in bottom material.”
Total length (fish) is the straight-line distance from the anterior point of a fish specimen’s snout, with the mouth closed, to the posterior end of the caudal (tail) fin, with the lobes of the caudal fin squeezed together.
Total load refers to all of a constituent in transport. When referring to sediment, it includes suspended load plus bed load.
Total organism count is the number of organisms collected and enumerated in any particular sample. (See also “Organism count/volume”)
Total recoverable is the amount of a given constituent in a whole-water sample after a sample has been digested by a method (usually using a dilute acid solution) that results in dissolution of only readily soluble substances. Complete dissolution of all particulate matter is not achieved by the digestion treatment, and thus the determination represents something less than the “total” amount (that is, less than 95 percent) of the constituent present in the dissolved and suspended phases of the sample. To achieve comparability of analytical data for whole-water samples, equivalent digestion procedures are required of all laboratories performing such analyses because different digestion procedures may produce different analytical results.
Total sediment discharge is the mass of suspended-sediment plus bed-load transport, measured as dry weight, that passes a cross section in a given time. It is a rate and is reported as tons per day. (See also “Bedload,” “Bedload discharge,” “Sediment,” “Suspended sediment,” and “Suspended-sediment concentration”)
Total sediment load or total load is the sediment in transport as bedload and suspended-sediment load. The term may be qualified, such as “annual suspended-sediment load” or “sand-size suspended-sediment load,” and so on. It differs from total sediment discharge in that load refers to the material, whereas discharge refers to the quantity of material, expressed in units of mass per unit time. (See also “Sediment,” “Suspended-sediment load,” and “Total load”)
Transect, as used in this report, is a line across a stream perpendicular to the flow and along which measurements are taken, so that morphological and flow characteristics along the line are described from bank to bank. Unlike a cross section, no attempt is made to determine known elevation points along the line.
Turbidity is the reduction in the transparency of a solution due to the presence of suspended and some dissolved substances. The measurement technique records the collective optical properties of the solution that cause light to be scattered and attenuated rather than transmitted in straight lines; the higher the intensity of scattered or attenuated light, the higher the value of the turbidity. Turbidity is expressed in nephelometric turbidity units (NTU). Depending on the method used, the turbidity units as NTU can be defined as the intensity of light of a specified wavelength scattered or attenuated by suspended particles or absorbed at a method specified angle, usually 90 degrees, from the path of the incident light. Currently approved methods for the measurement of turbidity in the USGS include those that conform to U.S. EPA Method 180.1, ASTM D1889-00, and ISO 7027. Measurements of turbidity by these different methods and different instruments are unlikely to yield equivalent values.

31 WATER RESOURCES DATA FOR FLORIDA, 2002 Volume 1A: Northeast Florida Surface Water
Ultraviolet (UV) absorbance (absorption) at 254 or 280 nanometers is a measure of the aggregate concentration of the mixture of UV absorbing organic materials dissolved in the analyzed water, such as lignin, tannin, humic substances, and various aromatic compounds. UV absorbance (absorption) at 254 or 280 nanometers is measured in UV absorption units per centimeter of pathlength of UV light through a sample.
Unconfined aquifer is an aquifer whose upper surface is a water table free to fluctuate under atmospheric pressure. (See “Water-table aquifer”)
Vertical datum (See “Datum”)
Volatile organic compounds (VOCs) are organic compounds that can be isolated from the water phase of a sample by purging the water sample with inert gas, such as helium, and subsequently analyzed by gas chromatography. Many VOCs are human-made chemicals that are used and produced in the manufacture of paints, adhesives, petroleum products, pharmaceuticals, and refrigerants. They are often components of fuels, solvents, hydraulic fluids, paint thinners, and dry cleaning agents commonly used in urban settings. VOC contamination of drinking-water supplies is a human health concern because many are toxic and are known or suspected human carcinogens.
Water table is that surface in a ground-water body at which the water pressure is equal to the atmospheric pressure.
Water-table aquifer is an unconfined aquifer within which the water table is found.
Water year in USGS reports dealing with surface-water supply is the 12-month period October 1 through September 30. The water year is designated by the calendar year in which it ends and which includes 9 of the 12 months. Thus, the year ending September 30, 2002, is called the “2002 water year.”
WDR is used as an abbreviation for “Water-Data Report” in the REVISED RECORDS paragraph to refer to State annual hydro-logic-data reports. (WRD was used as an abbreviation for “Water-Resources Data” in reports published prior to 1976.)
Weighted average is used in this report to indicate discharge-weighted average. It is computed by multiplying the discharge for a sampling period by the concentrations of individual constituents for the corresponding period and dividing the sum of the products by the sum of the discharges. A discharge-weighted average approximates the composition of water that would be found in a reservoir containing all the water passing a given location during the water year after thorough mixing in the reservoir.
Wet mass is the mass of living matter plus contained water. (See also “Biomass” and “Dry mass”)
Wet weight refers to the weight of animal tissue or other substance including its contained water. (See also “Dry weight”)
WSP is used as an acronym for “Water-Supply Paper” in reference to previously published reports.
Zooplankton is the animal part of the plankton. Zooplankton are capable of extensive movements within the water column and often are large enough to be seen with the unaided eye. Zooplankton are secondary consumers feeding upon bacteria, phytoplankton, and detritus. Because they are the grazers in the aquatic environment, the zooplankton are a vital part of the aquatic food web. The zooplankton community is dominated by small crustaceans and rotifers. (See also “Plankton”)

32 WATER RESOURCES DATA FOR FLORIDA, 2002 Volume 1A: Northeast Florida Surface Water
TECHNIQUES OF WATER-RESOURCES INVESTIGATIONS OF THE U.S. GEOLOGICAL SURVEY
The USGS publishes a series of manuals titled the “Techniques of Water-Resources Investigations” that describe procedures for planning and conducting specialized work in water-resources investigations. The material in these manuals is grouped under major subject headings called books and is further divided into sections and chapters. For example, section A of book 3 (Applications of Hydraulics) pertains to surface water. Each chapter then is limited to a narrow field of the section subject matter. This publication format permits flexibility when revision or printing is required.
Manuals in the Techniques of Water-Resources Investigations series, which are listed below, are available online at http:// water.usgs.gov/pubs/twri/. Printed copies are available for sale from the USGS, Information Services, Box 25286, Federal Center, Denver, Colorado 80225 (an authorized agent of the Superintendent of Documents, Government Printing Office). Please telephone “1-888-ASK-USGS” for current prices, and refer to the title, book number, section number, chapter number, and mention the “U.S. Geological Survey Techniques of Water-Resources Investigations.” Other products can be viewed online at http:/ /www.usgs.gov/sales.html, or ordered by telephone or by FAX to (303)236-4693. Order forms for FAX requests are available online at http://mac.usgs.gov/isb/pubs/forms/. Prepayment by major credit card or by a check or money order payable to the “U.S. Geological Survey” is required.
Book 1. Collection of Water Data by Direct Measurement
Section D. Water Quality
1–D1. Water temperature—Influential factors, field measurement, and data presentation, by H.H. Stevens, Jr., J.F. Ficke, and G.F. Smoot: USGS–TWRI book 1, chap. D1. 1975. 65 p.
1–D2. Guidelines for collection and field analysis of ground-water samples for selected unstable constituents, by W.W. Wood: USGS–TWRI book 1, chap. D2. 1976. 24 p.
Book 2. Collection of Environmental Data
Section D. Surface Geophysical Methods
2–D1. Application of surface geophysics to ground-water investigations, by A.A.R. Zohdy, G.P. Eaton, and D.R. Mabey: USGS–TWRI book 2, chap. D1. 1974. 116 p.
2–D2. Application of seismic-refraction techniques to hydrologic studies, by F.P. Haeni: USGS–TWRI book 2, chap. D2. 1988. 86 p.
Section E. Subsurface Geophysical Methods
2–E1. Application of borehole geophysics to water-resources investigations, by W.S. Keys and L.M. MacCary: USGS–TWRI book 2, chap. E1. 1971. 126 p.
2–E2. Borehole geophysics applied to ground-water investigations, by W.S. Keys: USGS–TWRI book 2, chap. E2. 1990. 150 p.
Section F. Drilling and Sampling Methods
2–F1. Application of drilling, coring, and sampling techniques to test holes and wells, by Eugene Shuter and W.E. Teasdale: USGS–TWRI book 2, chap. F1. 1989. 97 p.
Book 3. Applications of Hydraulics
Section A. Surface-Water Techniques
3–A1. General field and office procedures for indirect discharge measurements, by M.A. Benson and Tate Dalrymple: USGS–TWRI book 3, chap. A1. 1967. 30 p.
3–A2. Measurement of peak discharge by the slope-area method, by Tate Dalrymple and M.A. Benson: USGS–TWRI book 3, chap. A2. 1967. 12 p.
3–A3. Measurement of peak discharge at culverts by indirect methods, by G.L. Bodhaine: USGS–TWRI book 3, chap. A3. 1968. 60 p.
3–A4. Measurement of peak discharge at width contractions by indirect methods, by H.F. Matthai: USGS-TWRI book 3, chap. A4. 1967. 44 p.

33 WATER RESOURCES DATA FOR FLORIDA, 2002 Volume 1A: Northeast Florida Surface Water
3–A5. Measurement of peak discharge at dams by indirect methods, by Harry Hulsing: USGS–TWRI book 3, chap. A5. 1967. 29 p.
3–A6. General procedure for gaging streams, by R.W. Carter and Jacob Davidian: USGS–TWRI book 3, chap. A6. 1968. 13 p.
3–A7. Stage measurement at gaging stations, by T.J. Buchanan and W.P. Somers: USGS–TWRI book 3, chap. A7. 1968. 28 p.
3–A8. Discharge measurements at gaging stations, by T.J. Buchanan and W.P. Somers: USGS–TWRI book 3, chap. A8. 1969. 65 p.
3–A9. Measurement of time of travel in streams by dye tracing, by F.A. Kilpatrick and J.F. Wilson, Jr.: USGS–TWRI book 3, chap. A9. 1989. 27 p.
3–Al0. Discharge ratings at gaging stations, by E.J. Kennedy: USGS–TWRI book 3, chap. A10. 1984. 59 p.
3–A11. Measurement of discharge by the moving-boat method, by G.F. Smoot and C.E. Novak: USGS–TWRI book 3, chap. A11. 1969. 22 p.
3–A12. Fluorometric procedures for dye tracing, Revised, by J.F. Wilson, Jr., E.D. Cobb, and F.A. Kilpatrick: USGS–TWRI book 3, chap. A12. 1986. 34 p.
3–A13. Computation of continuous records of streamflow, by E.J. Kennedy: USGS–TWRI book 3, chap. A13. 1983. 53 p.
3–A14. Use of flumes in measuring discharge, by F.A. Kilpatrick and V.R. Schneider: USGS–TWRI book 3, chap. A14. 1983. 46 p.
3–A15. Computation of water-surface profiles in open channels, by Jacob Davidian: USGS–TWRI book 3, chap. A15. 1984. 48 p.
3–A16. Measurement of discharge using tracers, by F.A. Kilpatrick and E.D. Cobb: USGS–TWRI book 3, chap. A16. 1985. 52 p.
3–A17. Acoustic velocity meter systems, by Antonius Laenen: USGS–TWRI book 3, chap. A17. 1985. 38 p.
3–A18. Determination of stream reaeration coefficients by use of tracers, by F.A. Kilpatrick, R.E. Rathbun, Nobuhiro Yotsukura, G.W. Parker, and L.L. DeLong: USGS–TWRI book 3, chap. A18. 1989. 52 p.
3–A19. Levels at streamflow gaging stations, by E.J. Kennedy: USGS–TWRI book 3, chap. A19. 1990. 31 p.
3–A20. Simulation of soluble waste transport and buildup in surface waters using tracers, by F.A. Kilpatrick: USGS–TWRI book 3, chap. A20. 1993. 38 p.
3–A21 Stream-gaging cableways, by C. Russell Wagner: USGS–TWRI book 3, chap. A21. 1995. 56 p.
Section B. Ground-Water Techniques
3–B1. Aquifer-test design, observation, and data analysis, by R.W. Stallman: USGS–TWRI book 3, chap. B1. 1971. 26 p.
3–B2. Introduction to ground-water hydraulics, a programed text for self-instruction, by G.D. Bennett: USGS–TWRI book 3, chap. B2. 1976. 172 p.
3–B3. Type curves for selected problems of flow to wells in confined aquifers, by J.E. Reed: USGS–TWRI book 3, chap. B3. 1980. 106 p.
3–B4. Regression modeling of ground-water flow, by R.L. Cooley and R.L. Naff: USGS–TWRI book 3, chap. B4. 1990. 232 p.
3–B4. Supplement 1. Regression modeling of ground-water flow—Modifications to the computer code for nonlinear regression solution of steady-state ground-water flow problems, by R.L. Cooley: USGS–TWRI book 3, chap. B4. 1993. 8 p.
3–B5. Definition of boundary and initial conditions in the analysis of saturated ground-water flow systems—An introduction, by O.L. Franke, T.E. Reilly, and G.D. Bennett: USGS–TWRI book 3, chap. B5. 1987. 15 p.
3–B6. The principle of superposition and its application in ground-water hydraulics, by T.E. Reilly, O.L. Franke, and G.D. Bennett: USGS–TWRI book 3, chap. B6. 1987. 28 p.

34 WATER RESOURCES DATA FOR FLORIDA, 2002 Volume 1A: Northeast Florida Surface Water
3–B7. Analytical solutions for one-, two-, and three-dimensional solute transport in ground-water systems with uniform flow, by E.J. Wexler: USGS–TWRI book 3, chap. B7. 1992. 190 p.
3–B8. System and boundary conceptualization in ground-water flow simulation, by T.E. Reilly: USGS–TWRI book 3, chap. B8. 2001. 29 p.
Section C. Sedimentation and Erosion Techniques
3–C1. Fluvial sediment concepts, by H.P. Guy: USGS–TWRI book 3, chap. C1. 1970. 55 p.
3–C2. Field methods for measurement of fluvial sediment, by T.K. Edwards and G.D. Glysson: USGS–TWRI book 3, chap. C2. 1999. 89 p.
3–C3. Computation of fluvial-sediment discharge, by George Porterfield: USGS–TWRI book 3, chap. C3. 1972. 66 p.
Book 4. Hydrologic Analysis and Interpretation
Section A. Statistical Analysis
4–A1. Some statistical tools in hydrology, by H.C. Riggs: USGS–TWRI book 4, chap. A1. 1968. 39 p.
4–A2. Frequency curves, by H.C. Riggs: USGS–TWRI book 4, chap. A2. 1968. 15 p.
4–A3. Statistical methods in water resources, by D.R. Helsel and R.M. Hirsch: USGS–TWRI book 4, chap. A3. 1991. Available only online at http://water.usgs.gov/pubs/twri/twri4a3/. (Accessed August 30, 2002.)
Section B. Surface Water
4–B1. Low-flow investigations, by H.C. Riggs: USGS–TWRI book 4, chap. B1. 1972. 18 p.
4–B2. Storage analyses for water supply, by H.C. Riggs and C.H. Hardison: USGS–TWRI book 4, chap. B2. 1973. 20 p.
4–B3. Regional analyses of streamflow characteristics, by H.C. Riggs: USGS–TWRI book 4, chap. B3. 1973.15 p.
Section D. Interrelated Phases of the Hydrologic Cycle
4–D1. Computation of rate and volume of stream depletion by wells, by C.T. Jenkins: USGS–TWRI book 4, chap. D1. 1970. 17 p.
Book 5. Laboratory Analysis
Section A. Water Analysis
5–A1. Methods for determination of inorganic substances in water and fluvial sediments, by M.J. Fishman and L.C. Friedman, editors: USGS–TWRI book 5, chap. A1. 1989. 545 p.
5–A2. Determination of minor elements in water by emission spectroscopy, by P.R. Barnett and E.C. Mallory, Jr.: USGS– TWRI book 5, chap. A2. 1971. 31 p.
5–A3. Methods for the determination of organic substances in water and fluvial sediments, edited by R.L. Wershaw, M.J. Fishman, R.R. Grabbe, and L.E. Lowe: USGS–TWRI book 5, chap. A3. 1987. 80 p.
5–A4. Methods for collection and analysis of aquatic biological and microbiological samples, by L.J. Britton and P.E. Greeson, editors: USGS–TWRI book 5, chap. A4. 1989. 363 p.
5–A5. Methods for determination of radioactive substances in water and fluvial sediments, by L.L. Thatcher, V.J. Janzer, and K.W. Edwards: USGS–TWRI book 5, chap. A5. 1977. 95 p.
5–A6. Quality assurance practices for the chemical and biological analyses of water and fluvial sediments, by L.C. Friedman and D.E. Erdmann: USGS–TWRI book 5, chap. A6. 1982. 181 p.
Section C. Sediment Analysis
5–C1. Laboratory theory and methods for sediment analysis, by H.P. Guy: USGS–TWRI book 5, chap. C1. 1969. 58 p.

35 WATER RESOURCES DATA FOR FLORIDA, 2002 Volume 1A: Northeast Florida Surface Water
Book 6. Modeling Techniques
Section A. Ground Water
6–A1. A modular three-dimensional finite-difference ground-water flow model, by M.G. McDonald and A.W. Harbaugh: USGS–TWRI book 6, chap. A1. 1988. 586 p.
6–A2. Documentation of a computer program to simulate aquifer-system compaction using the modular finite-difference ground-water flow model, by S.A. Leake and D.E. Prudic: USGS–TWRI book 6, chap. A2. 1991. 68 p.
6–A3. A modular finite-element model (MODFE) for areal and axisymmetric ground-water-flow problems, Part 1: Model Description and User’s Manual, by L.J. Torak: USGS–TWRI book 6, chap. A3. 1993. 136 p.
6–A4. A modular finite-element model (MODFE) for areal and axisymmetric ground-water-flow problems, Part 2: Derivation of finite-element equations and comparisons with analytical solutions, by R.L. Cooley: USGS–TWRI book 6, chap. A4. 1992. 108 p.
6–A5. A modular finite-element model (MODFE) for areal and axisymmetric ground-water-flow problems, Part 3: Design philosophy and programming details, by L.J. Torak: USGS–TWRI book 6, chap. A5. 1993. 243 p.
6–A6. A coupled surface-water and ground-water flow model (MODBRANCH) for simulation of stream-aquifer interaction, by Eric D. Swain and Eliezer J. Wexler: USGS–TWRI book 6, chap. A6. 1996. 125 p.
6–A7. User’s guide to SEAWAT: A computer program for simulation of three-dimensional variable-density ground-water flow, by Weixing Guo and Christian D. Langevin: USGS–TWRI book 6, chap. A7. 2002. 77 p.
Book 7. Automated Data Processing and Computations
Section C. Computer Programs
7–C1. Finite difference model for aquifer simulation in two dimensions with results of numerical experiments, by P.C. Trescott, G.F. Pinder, and S.P. Larson: USGS–TWRI book 7, chap. C1. 1976. 116 p.
7–C2. Computer model of two-dimensional solute transport and dispersion in ground water, by L.F. Konikow and J.D. Bredehoeft: USGS–TWRI book 7, chap. C2. 1978. 90 p.
7–C3. A model for simulation of flow in singular and interconnected channels, by R.W. Schaffranek, R.A. Baltzer, and D.E. Goldberg: USGS–TWRI book 7, chap. C3. 1981. 110 p.
Book 8. Instrumentation
Section A. Instruments for Measurement of Water Level
8–A1. Methods of measuring water levels in deep wells, by M.S. Garber and F.C. Koopman: USGS–TWRI book 8, chap. A1. 1968. 23 p.
8–A2. Installation and service manual for U.S. Geological Survey manometers, by J.D. Craig: USGS–TWRI book 8, chap. A2. 1983. 57 p.
Section B. Instruments for Measurement of Discharge
8–B2. Calibration and maintenance of vertical-axis type current meters, by G.F. Smoot and C.E. Novak: USGS–TWRI book 8, chap. B2. 1968. 15 p.

36 WATER RESOURCES DATA FOR FLORIDA, 2002 Volume 1A: Northeast Florida Surface Water
Book 9. Handbooks for Water-Resources Investigations
Section A. National Field Manual for the Collection of Water-Quality Data
9-A1. National Field Manual for the Collection of Water-Quality Data: Preparations for Water Sampling, by F.D. Wilde, D.B. Radtke, Jacob Gibs, and R.T. Iwatsubo: USGS–TWRI book 9, chap. A1. 1998. 47 p.
9-A2. National Field Manual for the Collection of Water-Quality Data: Selection of Equipment for Water Sampling, edited by F.D. Wilde, D.B. Radtke, Jacob Gibs, and R.T. Iwatsubo: USGS–TWRI book 9, chap. A2. 1998. 94 p.
9-A3. National Field Manual for the Collection of Water-Quality Data: Cleaning of Equipment for Water Sampling, edited by F.D. Wilde, D.B. Radtke, Jacob Gibs, and R.T. Iwatsubo: USGS–TWRI book 9, chap. A3. 1998. 75 p.
9-A4. National Field Manual for the Collection of Water-Quality Data: Collection of Water Samples, edited by F.D. Wilde, D.B. Radtke, Jacob Gibs, and R.T. Iwatsubo: USGS–TWRI book 9, chap. A4. 1999. 156 p.
9-A5. National Field Manual for the Collection of Water-Quality Data: Processing of Water Samples, edited by F.D. Wilde, D.B. Radtke, Jacob Gibs, and R.T. Iwatsubo: USGS–TWRI book 9, chap. A5. 1999, 149 p.
9-A6. National Field Manual for the Collection of Water-Quality Data: Field Measurements, edited by F.D. Wilde and D.B. Radtke: USGS–TWRI book 9, chap. A6. 1998. Variously paginated.
9-A7. National Field Manual for the Collection of Water-Quality Data: Biological Indicators, edited by D.N. Myers and F.D. Wilde: USGS–TWRI book 9, chap. A7. 1997 and 1999. Variously paginated.
9-A8. National Field Manual for the Collection of Water-Quality Data: Bottom-material samples, by D.B. Radtke: USGS– TWRI book 9, chap. A8. 1998. 48 p.
9-A9. National Field Manual for the Collection of Water-Quality Data: Safety in Field Activities, by S.L. Lane and R.G. Fay: USGS–TWRI book 9, chap. A9. 1998. 60 p.

37
STAGE, DISCHARGE, AND WATER QUALITY OF STREAMS

38 WATER RESOURCES DATA FOR FLORIDA, 2002Volume 1A: Northeast Florida Surface Water
0
0
10
10
20 MILES
20 KILOMETERS
82°00¢82°30¢ 81°30¢
31°00¢
30°00¢
30°30¢
p
p
p
p
p
p
02228500
02229250
02231280
02231268
02231289
02231000
p02228500
EXPLANATION
STREAM GAGING STATION
AND NUMBER
Figure 4.--Location of stream gaging stations in the St. Marys River basin and the coastal area between the St. Marys and St. Johns Rivers.

--- ---
--- --- --- ---
39 ST. MARYS RIVER BASIN
02228500 NORTH PRONG ST. MARYS RIVER AT MONIAC, GA
LOCATION.--Lat 30° 31'03", long 82° 13'50", in NW1⁄ 4 sec.8, T.1 N., R.21 E., Baker County, FL, Hydrologic Unit 03070204, near right bank at downstream side of bridge on State Highways 2 and 94, 0.2 mi upstream from Georgia Southern & Florida Railway bridge, 0.4 mi west of Moniac, 1.0 mi downstream from Moccasin Creek, and 122 mi upstream from mouth of St. Marys River.
DRAINAGE AREA.--160 mi2, approximately, includes part of watershed in Okefenokee Swamp which is indeterminate.
PERIOD OF RECORD.--January 1921 to December 1923 (published as St. Marys River at Moniac), January 1927 to June 1930, July 1932to June 1934, October 1950 to September 1989. October 1989 to July 1990 (discharge measurements only), August 1990 to current year.
REVISED RECORDS.--WSP 1234; Drainage area.
GAGE.--Water-stage recorder. Datum of gage is 89.40 ft above NGVD of 1929. Prior to June 30, 1934, nonrecording gage at site800 ft downstream at datum 3.22 ft higher. Oct. 3, 1950 to Oct. 17, 1988, water-stage recorder, Oct. 17, 1988 to Aug. 10, 1990, non-recording gage, at present site and datum.
REMARKS.--Records fair except for period of estimated daily discharge, which is poor.
DISCHARGE, CUBIC FEET PER SECOND, WATER YEAR OCTOBER 2001 TO SEPTEMBER 2002DAILY MEAN VALUES
DAY OCT NOV DEC JAN FEB MAR APR MAY JUN JUL AUG SEP
1 14 1.4 0.02 4.1 15 5.7 23 1.2 0.00 0.68 1.1 14 2 12 1.2 0.02 5.1 14 10 21 1.0 0.00 0.51 0.98 17 3 10 1.2 0.01 7.2 13 137 20 0.79 0.00 0.27 1.4 18 4 8.7 1.1 0.01 7.1 12 503 19 0.61 0.00 0.16 3.4 17 5 7.8 0.91 0.01 6.7 11 463 18 0.49 0.00 0.14 7.6 16
6 7.1 0.70 0.01 6.7 9.9 366 16 0.43 0.00 0.10 5.1 14 7 6.7 0.67 0.01 7.7 10 308 14 0.37 0.00 0.05 3.6 11 8 6.1 0.61 0.01 7.5 11 276 13 0.29 0.00 0.00 2.6 8.7 9 5.6 0.52 0.02 7.1 11 252 12 0.21 0.00 0.00 1.8 7.0 10 5.4 0.34 0.18 6.7 10 222 11 0.17 0.00 0.00 1.4 5.7
11 5.7 0.23 3.6 6.6 9.7 185 10 0.14 0.00 0.00 1.2 4.6 12 5.2 0.17 3.9 6.5 8.9 153 10 0.12 0.00 0.00 1.1 3.8 13 4.8 0.13 e3.4 7.8 8.2 130 15 0.10 0.00 0.00 1.0 4.3 14 4.6 0.13 e4.2 10 7.9 113 20 0.08 0.00 0.00 2.0 4.6 15 4.3 0.13 e4.9 21 7.8 97 21 0.07 0.00 0.00 3.7 10
16 3.9 0.11 e6.1 18 7.4 85 19 0.05 0.00 0.00 4.7 20 17 3.5 0.10 e6.9 15 6.9 75 16 0.05 0.00 0.00 4.3 22 18 3.1 0.09 e7.5 13 6.2 66 14 0.05 0.00 0.00 3.9 18 19 2.9 0.07 e9.1 12 5.9 58 12 0.04 0.00 0.00 3.6 15 20 2.6 0.06 e10 11 5.6 52 11 0.02 0.00 0.00 3.5 12
21 2.4 0.05 e10 17 5.5 47 9.0 0.00 0.00 0.00 7.4 10 22 2.2 0.05 e9.6 29 5.5 45 6.9 0.00 0.00 0.00 13 8.7 23 2.0 0.04 e9.4 24 6.3 41 5.2 0.00 0.00 0.00 12 7.2 24 1.9 0.04 e9.1 22 9.2 38 4.3 0.00 0.00 0.02 9.2 6.5 25 2.2 0.04 7.9 20 8.2 35 3.5 0.00 0.00 0.53 6.9 11
26 2.8 0.04 6.6 20 7.7 33 2.8 0.00 0.00 0.62 5.4 13 27 2.3 0.03 6.1 20 7.0 31 2.3 0.00 0.09 1.5 6.7 16 28 1.8 0.02 5.5 19 6.2 29 1.9 0.00 0.34 1.6 6.4 16 29 1.6 0.02 5.3 18 27 1.6 0.00 0.48 3.3 5.7 14 30 1.5 0.02 5.0 17 25 1.4 0.00 0.58 2.5 6.1 12 31 1.5 4.5 16 24 0.00 -- 1.6 14
TOTAL 146.2 10.22 138.90 408.8 247.0 3931.7 353.9 6.28 1.49 13.58 150.78 357.1 MEAN 4.716 0.341 4.481 13.19 8.821 126.8 11.80 0.203 0.050 0.438 4.864 11.90 MAX 14 1.4 10 29 15 503 23 1.2 0.58 3.3 14 22 MIN 1.5 0.02 0.01 4.1 5.5 5.7 1.4 0.00 0.00 0.00 0.98 3.8 CFSM 0.03 0.00 0.03 0.08 0.06 0.79 0.07 0.00 0.00 0.00 0.03 0.07 IN. 0.03 0.00 0.03 0.10 0.06 0.91 0.08 0.00 0.00 0.00 0.04 0.08
STATISTICS OF MONTHLY MEAN DATA FOR WATER YEARS 1921 - 2002, BY WATER YEAR (WY)
MEAN 143.9 53.50 90.22 167.6 230.6 236.2 188.1 66.90 82.65 111.9 172.7 192.2 MAX 914 520 498 583 1427 1203 2238 540 775 802 726 1592 (WY) 1951 1970 1977 1986 1998 1959 1973 1964 1957 1928 1971 1928 MIN 0.003 0.000 0.13 0.19 0.21 0.40 0.20 0.20 0.040 0.000 0.006 0.023 (WY) 1955 1955 1955 1934 1934 1955 1934 2002 1954 1954 1954 1954
SUMMARY STATISTICS FOR 2001 CALENDAR YEAR FOR 2002 WATER YEAR WATER YEARS 1921 - 2002
ANNUAL TOTAL 5284.22 ANNUAL MEAN 14.48 HIGHEST ANNUAL MEAN LOWEST ANNUAL MEAN HIGHEST DAILY MEAN 248 Mar 21 LOWEST DAILY MEAN 0.00 Many days ANNUAL SEVEN-DAY MINIMUM 0.00 May 27MAXIMUM PEAK FLOW MAXIMUM PEAK STAGEANNUAL RUNOFF (CFSM) 0.090 ANNUAL RUNOFF (INCHES) 1.2310 PERCENT EXCEEDS 2950 PERCENT EXCEEDS 7.690 PERCENT EXCEEDS 0.04
5765.9515.80 144.4
377 1973 15.8 2002
503 Mar 4 11400 Apr 5 19730.00 Many days 0.00 Most years0.00 May 21 0.00 Many days
540 Mar 4 11600 Apr 5 1973 10.44 Mar 4 22.98 Apr 5 1973 0.099 0.90 1.34 12.2621 390 4.6 44 0.00 1.3
e Estimated

--- --- ------ --- ---
--- --- --- --- --- --- --- --- ---
--- --- --- --- --- ---
--- --- ------ --- ------ --- ---
--- --- ------ --- ------ --- ------ --- ------ --- ---
--- --- ------ --- ---
--- --- --- ------ --- --- ------ --- --- ---
--- --- --- ------ --- ------ --- ------ --- ------ --- ---
--- --- ------ --- ------ --- ---
--- --- --- ------ --- --- ---
--- --- --- ---
--- --- ------ --- ------ --- ------ --- ---
40 ST. MARYS RIVER BASIN
02229250 MIDDLE PRONG ST. MARYS RIVER NEAR TAYLOR, FL
LOCATION.--Lat 30° 25'57", long 82° 13'52", in SW1⁄ 4 sec.5, T.1 S., R.21 E., Baker County, Hydrologic Unit 03070204, near left bank on downstream side of bridge on State Highway 127, 2.0 mi upstream from mouth, and 3.6 mi east of Taylor.
DRAINAGE AREA.--186 mi2.
PERIOD OF RECORD.--April 1997 to March 2002 (discontinued).
GAGE.--Water-stage recorder. Datum of gage is 68.80 ft above NGVD of 1929.
REMARKS.--Records fair.
EXTREMES FOR PERIOD OCTOBER 2001 TO MARCH 2002.--Maximum discharge, 431 ft3/s, Mar. 4, gage height, 7.34 ft; minimum discharge, 0.45 ft3/s, Dec. 6,7,8; minimum gage height, 1.53 ft, Oct. 26,28,30,31, Nov. 1,2,5-7,9.
DISCHARGE, CUBIC FEET PER SECOND, PERIOD OCTOBER 2001 TO MARCH 2002DAILY MEAN VALUES
DAY OCT NOV DEC JAN FEB MAR APR MAY JUN JUL AUG SEP
1 1.9 0.55 0.61 0.72 9.4 6.5 --- --- --- 2 1.8 0.58 0.57 0.96 9.4 8.4 --- --- --- 3 1.7 0.62 0.57 1.0 9.3 119 -- -- --4 1.5 0.64 0.57 1.2 8.9 387 -- -- --5 1.3 0.63 0.52 1.1 7.6 387 -- -- --
6 1.3 0.61 0.49 1.1 7.2 348 -- -- --7 1.1 0.64 0.49 1.1 7.3 330 -- -- --8 1.1 0.66 0.59 0.98 8.0 309 --- --- --- 9 0.95 0.64 0.59 0.90 8.2 296 --- --- --- 10 0.89 0.62 1.4 0.81 8.1 302 -- -- --
11 0.86 0.63 2.5 0.76 7.6 308 -- -- --12 0.81 0.62 2.9 0.72 7.0 -- -- -- --13 0.78 0.64 2.2 1.00 6.7 -- -- -- --14 0.82 0.90 1.7 2.0 6.1 -- -- -- --15 0.80 0.90 1.3 6.6 5.6 -- -- -- --
16 0.77 0.84 1.1 7.5 5.3 -- -- -- --17 0.71 0.91 1.1 5.5 5.2 -- -- -- --18 0.69 0.89 0.98 4.3 4.8 --- --- --19 0.69 0.82 0.82 3.5 4.5 --- --- --20 0.66 0.83 0.71 3.2 4.3 --- --- --
21 0.65 0.77 0.64 4.9 4.1 --- --- --22 0.66 0.70 0.58 13 3.9 --- --- --- --- 23 0.66 0.70 0.58 12 4.4 --- --- --- --- 24 0.67 0.72 1.1 11 5.9 --- --- --- --- 25 0.64 0.68 1.6 11 7.7 --- --- --- ---
26 0.60 0.68 1.7 12 7.5 --- --- --- --- 27 0.59 0.68 1.2 12 7.2 --- --- --- --- 28 0.60 0.70 1.1 11 6.9 --- --- --- --- 29 0.61 0.64 0.99 11 --- --- --- --- 30 0.58 0.62 0.90 10 --- --- --- --- 31 0.56 --- 0.81 9.8 --- --- --- --
TOTAL 27.95 21.06 32.91 162.65 188.1 -- -- -- -- MEAN 0.90 0.70 1.06 5.25 6.72 --- --- --- --- MAX 1.9 0.91 2.9 13 9.4 --- --- --- --- MIN 0.56 0.55 0.49 0.72 3.9 --- --- --- ---

41 ST. MARYS RIVER BASIN
02231000 ST. MARYS RIVER NEAR MACCLENNY, FL
LOCATION.--Lat 30° 21'31", long 82° 04'54", in NW1⁄ 4 sec.2, T.2 S., R.22 E., Baker County, Hydrologic Unit 03070204, on right bank 200 ft downstream from site of former Stokes Bridge, 1 mi downstream from confluence of North and South Prongs, 6 mi northeast of Macclenny, and 100 mi upstream from mouth.
DRAINAGE AREA.--700 mi2, approximately, includes part of watershed in Okefenokee Swamp, which is indeterminate.
PERIOD OF RECORD.--October 1926 to current year.
REVISED RECORDS.--WSP 1082: 1928(M), 1945(M). WSP 1142: 1928, 1945. WSP 1434: 1927. WSP 1905: Drainage area.
GAGE.--Water-stage recorder and data-collection platform. Datum of gage is 40.00 ft above NGVD of 1929 (levels by Mees and Mees). Prior to Feb. 21, 1939, nonrecording gage and Feb. 21, 1939 to Aug. 15, 1948, water-stage recorder, at site of former bridge 200 ft upstream, at same datum.
REMARKS.--Records fair.
DISCHARGE, CUBIC FEET PER SECOND, WATER YEAR OCTOBER 2001 TO SEPTEMBER 2002DAILY MEAN VALUES
DAY OCT NOV DEC JAN FEB MAR APR MAY JUN JUL AUG SEP
1 171 28 26 312 142 27 26 333 121 28 25 364 105 31 25 405 93 30 26 40
149 66 148 35 15 80 124 316135 69 144 33 15 92 148 343123 305 139 31 15 101 257 326112 1900 143 29 14 104 214 287103 2440 143 28 13 91 183 250
6 84 28 26 40 7 76 27 25 39 8 70 26 25 38 9 66 26 25 3610 61 26 29 35
97 2170 133 27 14 70 184 218 95 1820 123 26 20 54 162 186 97 1540 112 25 17 46 126 158 99 1310 101 24 18 55 101 133 97 1100 92 24 17 86 86 112
11 57 25 32 3512 54 25 38 3413 51 25 38 3514 48 29 36 4315 46 34 36 101
92 937 87 23 16 76 77 95 88 822 84 22 15 67 70 82 83 744 102 20 14 78 64 72 80 692 142 19 13 129 68 74 77 640 174 18 12 112 142 123
16 43 44 35 202 17 41 43 34 171 18 38 38 32 128 19 37 35 30 108 20 36 33 29 97
73 584 164 18 10 87 180 23770 529 144 19 9.6 67 128 30867 479 122 22 9.7 52 111 29065 432 104 22 11 42 106 244 62 389 91 21 18 39 102 206
21 35 31 28 117 22 35 30 28 250 23 33 30 27 312 24 33 30 31 253 25 32 30 33 208
60 353 81 19 24 52 92 17959 333 71 19 29 60 92 15761 315 65 18 30 64 104 13869 287 58 18 30 75 114 12881 260 53 18 32 70 109 136
26 31 29 36 197 27 29 28 38 20528 28 28 36 195 29 27 27 35 18030 28 26 33 176 31 28 --- 32 164
84 236 49 17 40 68 94 138 77 216 46 16 42 225 88 13770 198 42 16 38 257 117 139--- 183 39 15 61 276 184 130--- 168 38 15 110 240 198 117--- 155 --- 15 --- 166 271 --
TOTAL 1779 897 955 3579MEAN 57.39 29.90 30.81 115.5 MAX 171 44 38 312 MIN 27 25 25 31 MED 43 29 31 101 CFSM 0.08 0.04 0.04 0.16 IN. 0.09 0.05 0.05 0.19
2425 21672 3034 672 722.3 3081 4096 5459 86.61 699.1 101.1 21.68 24.08 99.39 132.1 182.0
149 2440 174 35 110 276 271 343 59 66 38 15 9.6 39 64 72 82 432 102 20 17 76 114 1480.12 1.00 0.14 0.03 0.03 0.14 0.19 0.26 0.13 1.15 0.16 0.04 0.04 0.16 0.22 0.29
STATISTICS OF MONTHLY MEAN DATA FOR WATER YEARS 1927 - 2002, BY WATER YEAR (WY)
MEAN 801.7 267.7 366.3 604.0 MAX 6240 4155 2470 2404(WY) 1948 1948 1948 1942 MIN 22.7 15.9 18.0 21.7(WY) 1932 1932 1932 1932
852.1 941.8 738.9 307.2 344.4 573.6 898.3 995.6 5940 4928 6564 3303 2642 2183 3296 63401998 1959 1973 1964 1957 1928 1945 1964 20.2 44.7 25.7 20.4 18.8 31.3 24.9 21.41934 1932 1935 1932 1935 1954 1954 1990
SUMMARY STATISTICS FOR 2001 CALENDAR YEAR FOR 2002 WATER YEAR WATER YEARS 1927 - 2002
ANNUAL TOTAL 38821 ANNUAL MEAN 106.4 HIGHEST ANNUAL MEAN LOWEST ANNUAL MEAN HIGHEST DAILY MEAN 1680LOWEST DAILY MEAN 13ANNUAL SEVEN-DAY MINIMUM 14MAXIMUM PEAK FLOW MAXIMUM PEAK STAGE INSTANTANEOUS LOW FLOWANNUAL RUNOFF (CFSM) 0.15ANNUAL RUNOFF (INCHES) 2.0610 PERCENT EXCEEDS 25750 PERCENT EXCEEDS 4490 PERCENT EXCEEDS 24
48371.3 132.5 640.0
2285 1948 90.1 1955
Sep 16 2440 Mar 5 27600 Sep 25 1947May 28,29 9.6 Jun 17 9.6 Jun 17 2002May 23 11 Jun 13 11 Jun 13 2002
2490 Mar 5 28100 Sep 25 1947 11.77 Mar 5 23.25 Sep 13 19649.5 Jun 17,18 9.5 Jun 17,18 2002 0.19 0.91 2.57 12.42
250 160067 21521 37

---
42 ST. MARYS RIVER BASIN
02231000 ST. MARYS RIVER NEAR MACCLENNY, FL--Continued
GAGE HEIGHT, in FEET, WATER YEAR OCTOBER 2001 TO SEPTEMBER 2002 DAILY MEAN VALUES
DAY OCT NOV DEC JAN FEB MAR APR MAY JUN JUL AUG SEP
1 3.06 1.27 1.20 1.28 2.75 1.80 2.82 1.43 1.08 2.06 2.58 4.28 2 2.78 1.26 1.20 1.32 2.61 1.84 2.78 1.39 1.09 2.21 2.81 4.47 3 2.56 1.27 1.19 1.37 2.49 3.72 2.73 1.36 1.07 2.32 3.82 4.35 4 2.39 1.30 1.19 1.43 2.37 10.29 2.77 1.33 1.06 2.35 3.45 4.06 5 2.25 1.30 1.20 1.43 2.27 11.70 2.77 1.31 1.05 2.20 3.16 3.76
6 2.13 1.27 1.20 1.42 2.19 11.09 2.67 1.30 1.07 1.93 3.17 3.48 7 2.03 1.25 1.19 1.41 2.17 10.16 2.56 1.29 1.19 1.72 2.96 3.19 8 1.95 1.23 1.19 1.39 2.19 9.41 2.44 1.27 1.13 1.60 2.59 2.92 9 1.89 1.23 1.19 1.37 2.22 8.71 2.32 1.25 1.14 1.73 2.32 2.67 10 1.82 1.22 1.25 1.35 2.19 8.04 2.22 1.25 1.12 2.14 2.14 2.44
11 1.76 1.21 1.29 1.34 2.14 7.48 2.15 1.23 1.11 2.01 2.02 2.25 12 1.71 1.21 1.40 1.33 2.08 7.04 2.12 1.21 1.09 1.89 1.93 2.08 13 1.68 1.20 1.40 1.35 2.03 6.73 2.33 1.18 1.07 2.03 1.85 1.97 14 1.63 1.27 1.37 1.47 1.98 6.48 2.76 1.16 1.03 2.63 1.91 1.99 15 1.59 1.34 1.37 2.21 1.94 6.22 3.07 1.15 1.00 2.44 2.75 2.55
16 1.55 1.49 1.35 3.26 1.90 5.93 2.97 1.15 0.98 2.15 3.13 3.64 17 1.50 1.47 1.33 2.96 1.86 5.63 2.78 1.16 0.96 1.89 2.62 4.22 18 1.47 1.39 1.31 2.54 1.81 5.34 2.56 1.21 0.97 1.68 2.43 4.08 19 1.45 1.34 1.28 2.32 1.78 5.06 2.36 1.21 1.01 1.53 2.37 3.71 20 1.43 1.31 1.25 2.19 1.75 4.78 2.20 1.19 1.13 1.49 2.33 3.37
21 1.41 1.29 1.23 2.41 1.72 4.54 2.07 1.17 1.25 1.68 2.21 3.12 22 1.40 1.27 1.23 3.66 1.70 4.40 1.95 1.16 1.34 1.80 2.21 2.91 23 1.38 1.27 1.22 4.18 1.73 4.27 1.86 1.15 1.35 1.85 2.35 2.72 24 1.37 1.26 1.28 3.70 1.84 4.06 1.78 1.15 1.35 2.00 2.47 2.62 25 1.36 1.26 1.31 3.31 1.99 3.84 1.70 1.14 1.37 1.94 2.41 2.70
26 1.33 1.25 1.37 3.20 2.02 3.64 1.64 1.12 1.51 1.90 2.23 2.72 27 1.31 1.24 1.39 3.28 1.94 3.47 1.59 1.11 1.54 3.52 2.16 2.71 28 1.28 1.23 1.37 3.19 1.86 3.31 1.54 1.10 1.47 3.82 2.49 2.73 29 1.27 1.22 1.34 3.04 --- 3.16 1.49 1.09 1.80 3.97 3.17 2.64 30 1.27 1.21 1.32 3.00 --- 3.01 1.47 1.09 2.42 3.67 3.31 2.50 31 1.27 --- 1.30 2.89 --- 2.89 --- 1.08 2.99 3.93 --
MEAN 1.72 1.28 1.28 2.28 2.05 5.74 2.28 1.21 1.23 2.23 2.62 3.10 MAX 3.06 1.49 1.40 4.18 2.75 11.70 3.07 1.43 2.42 3.97 3.93 4.47 MIN 1.27 1.20 1.19 1.28 1.70 1.80 1.47 1.08 0.96 1.49 1.85 1.97
CAL YR 2001 MEAN 2.08 MAX 9.71 MIN 0.95 WTR YR 2002 MEAN 2.26 MAX 11.70 MIN 0.96

43 COASTAL AREA BETWEEN ST. MARYS AND ST. JOHNS RIVERS
02231268 ALLIGATOR CREEK AT CALLAHAN, FL
LOCATION.--Lat 30° 33'59", long 81° 50'01", in NW1⁄ 4 sec. 29, T.2 N., R.25 E., Nassau County, Hydrologic Unit 03070205, on downstream side of bridge on U.S. Highway 1, 0.2 mi northwest of the intersection of U.S. Highway 1 and State Highway 200 at Callahan.
DRAINAGE AREA.--14.0 mi2.
PERIOD OF RECORD.--October 1981 to current year.
GAGE.--Water-stage recorder. Datum of gage is at NGVD of 1929.
REMARKS.--Records fair except for periods of estimated daily discharge, which are poor.
DISCHARGE, CUBIC FEET PER SECOND, WATER YEAR OCTOBER 2001 TO SEPTEMBER 2002DAILY MEAN VALUES
DAY OCT NOV DEC JAN FEB MAR APR MAY JUN JUL AUG SEP
1 2.0 e0.39 0.71 1.3 2.6 2.0 1.3 e0.00 e2.0 0.00 1.7 54 2 1.6 e0.43 0.78 1.8 2.3 4.0 1.3 e0.00 e0.98 0.16 3.9 30 3 1.3 e0.52 0.78 2.3 2.3 139 3.9 e0.00 e0.60 0.63 15 20 4 1.2 e0.73 0.78 2.7 2.1 329 6.3 e0.00 e0.31 0.57 18 14 5 1.0 e0.64 0.78 2.4 1.8 e208 6.7 e0.10 e0.23 0.20 35 12
6 0.94 e0.56 0.78 2.1 1.7 e142 3.9 e0.20 e0.17 0.05 25 9.9 7 0.87 e0.56 0.80 2.1 2.4 e71 2.6 e0.15 e0.12 0.00 9.9 7.7 8 0.83 0.56 0.88 2.1 2.9 e30 1.9 e0.04 e0.11 1.4 5.3 5.7 9 0.64 0.52 0.93 2.0 3.0 e18 1.5 e0.02 e0.10 1.4 3.9 4.510 0.66 0.45 1.7 1.9 2.8 e11 1.4 e0.00 e0.20 0.98 3.5 3.4
11 e0.72 0.42 1.7 1.8 12 e0.76 0.42 1.6 1.7 13 e0.69 0.42 1.5 2.5 14 e0.66 0.76 1.4 7.0 15 e0.66 1.1 1.4 16
2.7 e7.0 1.4 e0.00 e0.16 1.4 3.1 2.92.4 6.5 1.9 e0.00 e0.13 2.4 2.4 2.42.2 6.2 2.6 e0.00 e0.09 1.3 7.6 2.22.1 5.8 3.4 e0.00 e0.05 0.90 54 4.32.0 5.5 3.8 e0.00 e0.03 0.47 112 e20
16 e0.59 1.0 1.3 2217 e0.56 1.0 1.3 9.9 18 e0.54 0.99 1.2 5.6 19 e0.54 0.89 1.2 3.9 20 e0.56 0.84 1.2 3.0
2.0 4.8 2.7 e0.00 e0.01 0.21 41 322.0 4.3 1.8 e0.10 e0.00 0.03 25 361.9 3.4 1.4 e1.0 0.00 0.00 14 191.8 3.0 1.1 e0.85 0.24 0.00 9.6 131.7 2.7 0.74 e0.53 0.09 0.31 7.3 9.8
21 e0.53 0.78 1.1 5.9 22 e0.57 0.78 1.0 9.7 23 e0.59 0.78 1.0 1224 e0.63 0.78 2.0 7.2 25 e0.73 0.80 2.5 4.9
1.7 2.9 0.46 e0.42 1.6 0.24 6.0 7.51.7 3.2 0.24 e0.30 1.1 0.23 4.8 5.83.7 3.2 0.12 e0.22 0.18 0.59 4.1 4.25.9 3.0 0.07 e0.19 0.00 0.71 3.4 526.8 2.5 0.05 e0.16 0.60 0.48 2.7 204
26 e0.58 0.78 2.7 4.4 27 e0.47 0.78 2.1 4.0 28 e0.42 0.78 1.8 3.8 29 e0.41 0.72 1.6 3.4 30 e0.43 0.71 1.5 3.0 31 e0.40 --- 1.4 2.8
4.7 2.2 0.05 e0.11 0.58 2.3 2.2 e2263.4 1.9 0.02 e0.05 0.18 10 4.0 e842.4 1.6 0.00 e0.02 0.26 15 19 68--- 1.5 0.00 e0.01 0.23 8.5 45 52--- 1.4 0.00 e0.00 0.14 3.7 195 45--- 1.4 --- e0.20 --- 2.2 155 --
TOTAL 23.08 20.89 41.42 155.2MEAN 0.74 0.70 1.34 5.01 MAX 2.0 1.1 2.7 22 MIN 0.40 0.39 0.71 1.3 CFSM 0.05 0.05 0.10 0.36 IN. 0.06 0.06 0.11 0.41
75.0 1028.0 52.65 4.67 10.49 56.36 838.4 1051.32.68 33.2 1.75 0.15 0.35 1.82 27.0 35.06.8 329 6.7 1.0 2.0 15 195 2261.7 1.4 0.00 0.00 0.00 0.00 1.7 2.20.19 2.37 0.13 0.01 0.02 0.13 1.93 2.50 0.20 2.73 0.14 0.01 0.03 0.15 2.23 2.79
STATISTICS OF MONTHLY MEAN DATA FOR WATER YEARS 1982 - 2002, BY WATER YEAR (WY)
MEAN 16.6 4.58 9.82 18.8MAX 89.9 22.5 73.3 50.6(WY) 1997 1994 1998 1998 MIN 0.028 0.60 0.98 2.40(WY) 1982 1991 1991 2001
21.6 18.4 9.35 2.66 5.41 6.92 17.5 18.2 126 41.7 26.4 13.1 47.4 54.1 99.1 69.11998 1986 1983 1984 1991 1991 1998 1985 2.35 2.10 1.20 0.037 0.023 0.083 0.11 0.0862001 2000 2001 1995 1993 1993 1990 1990
SUMMARY STATISTICS FOR 2001 CALENDAR YEAR FOR 2002 WATER YEAR WATER YEARS 1982 - 2002
ANNUAL TOTAL 1872.90 ANNUAL MEAN 5.13 HIGHEST ANNUAL MEAN LOWEST ANNUAL MEAN HIGHEST DAILY MEAN 158 LOWEST DAILY MEAN 0.02 ANNUAL SEVEN-DAY MINIMUM 0.03MAXIMUM PEAK FLOW MAXIMUM PEAK STAGEANNUAL RUNOFF (CFSM) 0.37ANNUAL RUNOFF (INCHES) 4.9810 PERCENT EXCEEDS 1050 PERCENT EXCEEDS 1.590 PERCENT EXCEEDS 0.06
3357.46 9.20 12.5
36.9 19983.34 2000
Sep 14 329 Mar 4 878 Oct 8 1996 Jul 12 0.00 Many days 0.00 Some years May 30 0.00 Apr 28 0.00 Some years
386 Mar 4 931 Oct 8 1996 11.47 Mar 4 14.35 Oct 8 1996 0.66 0.89 8.92 12.0914 25 1.5 3.0 0.08 0.17
e Estimated

44 COASTAL AREA BETWEEN ST. MARYS AND ST. JOHNS RIVERS
02231280 THOMAS CREEK NEAR CRAWFORD, FL
LOCATION.--Lat 30° 27'39", long 81° 49'57", in NW1⁄ 4 sec.32, T.1 N., R.25 E., Duval County, Hydrologic Unit 03070205, on downstream side of bridge on Acree Road, 4.4 mi southeast of Crawford, 4.4 mi northwest of Dinsmore, 7.1 mi south of Callahan, and 24 mi upstream from mouth.
DRAINAGE AREA.--29.9 mi2.
PERIOD OF RECORD.--January 1965 to current year.
REVISED RECORDS.--WDR FL-76-1: Drainage area.
GAGE.--Water-stage recorder. Datum of gage is at NGVD of 1929.
REMARKS.--Records fair.
EXTREMES OUTSIDE PERIOD OF RECORD.--Flood in September 1950 reached a stage of 23.3 ft, from floodmark pointed out by local resident.
DISCHARGE, CUBIC FEET PER SECOND, WATER YEAR OCTOBER 2001 TO SEPTEMBER 2002DAILY MEAN VALUES
DAY OCT NOV DEC JAN FEB MAR APR MAY JUN JUL AUG SEP
1 15 6.6 7.1 8.6 2 13 6.8 7.2 123 12 7.7 7.2 184 11 8.1 7.3 155 10 7.7 7.3 12
18 6.5 4.9 1.8 4.6 28 17 278 16 9.5 4.8 1.7 2.8 10 89 21014 151 8.6 1.6 1.7 6.2 41 144 12 447 11 1.5 1.4 5.1 25 9411 275 8.6 1.5 1.3 7.3 30 71
6 9.9 7.2 7.3 127 10 6.9 7.3 128 10 6.6 7.3 11
9.8 161 6.6 1.7 1.3 8.5 24 5511 108 5.6 1.6 1.6 5.3 12 3613 77 4.8 1.5 1.8 5.8 7.1 23
9 9.8 6.5 9.8 10 12 57 4.3 1.4 1.8 24 5.2 1710 9.3 6.3 21 9.9 11 43 4.0 1.3 2.2 64 4.6 13
11 9.5 6.2 52 9.8 12 9.2 6.3 26 9.613 8.7 6.3 17 12 14 8.8 8.4 15 2115 8.6 17 13 115
10 33 4.2 1.3 1.7 44 4.6 119.3 24 6.1 1.2 1.4 13 3.9 9.7 8.5 23 6.4 1.2 1.2 11 5.7 35 8.1 22 5.7 1.1 1.1 11 104 867.7 18 4.9 1.1 0.98 7.2 153 153
16 8.0 15 12 10017 7.4 11 11 43 18 7.0 9.5 11 28 19 7.2 8.7 11 22 20 7.3 8.6 9.7 20
7.6 16 4.3 1.1 0.89 4.8 99 365 7.2 14 3.8 1.1 0.86 3.6 68 266 6.5 12 3.4 1.9 0.94 2.9 39 154 6.1 10 3.1 2.4 1.1 2.5 22 97 6.0 9.0 2.9 2.1 1.6 3.7 30 65
21 7.2 8.4 9.0 52 22 7.4 8.2 8.5 131 23 7.6 8.2 8.4 100 24 7.6 8.1 13 6125 8.5 7.9 16 44
6.0 12 2.6 1.7 4.6 6.2 46 43 5.9 20 2.5 1.5 16 6.0 27 29 8.4 15 2.3 1.5 16 9.9 16 2017 11 2.2 1.4 7.1 6.7 11 2214 9.2 2.1 1.3 4.7 5.7 8.3 85
26 7.8 7.7 13 4527 6.7 7.4 11 4428 6.3 7.4 10 3529 6.4 7.2 9.9 2830 6.5 7.2 9.5 23 31 6.4 --- 8.9 20
10 7.9 2.1 1.2 4.6 6.5 7.9 1188.4 7.0 2.0 1.1 11 26 26 1317.1 6.2 2.1 1.1 9.0 30 66 100--- 5.7 2.0 1.1 30 21 87 71 --- 5.3 1.9 1.1 49 7.5 144 60 --- 4.9 --- 1.2 --- 4.4 324 --
TOTAL 270.1 245.1 383.7 1083.9MEAN 8.71 8.17 12.4 35.0 MAX 15 17 52 131 MIN 6.3 6.2 7.1 8.6CFSM 0.29 0.27 0.41 1.17 IN. 0.34 0.30 0.48 1.35
281.6 1620.2 129.8 44.3 184.27 397.8 1547.3 2861.710.1 52.3 4.33 1.43 6.14 12.8 49.9 95.4 18 447 11 2.4 49 64 324 3655.9 4.9 1.9 1.1 0.86 2.5 3.9 9.70.34 1.75 0.14 0.05 0.21 0.43 1.67 3.19 0.35 2.02 0.16 0.06 0.23 0.49 1.93 3.56
STATISTICS OF MONTHLY MEAN DATA FOR WATER YEARS 1965 - 2002, BY WATER YEAR (WY)
MEAN 39.8 17.5 24.7 38.3 MAX 294 182 171 104(WY) 1993 1970 1998 1986 MIN 1.54 2.62 3.46 6.58(WY) 1982 1991 1991 1985
52.0 47.3 29.6 14.5 22.6 29.2 47.1 52.8280 170 254 92.6 109 169 185 2381998 1970 1973 1966 1973 1991 1968 1979 6.98 5.43 2.45 1.26 0.65 2.04 1.05 1.162001 2000 1968 2000 2000 1977 1999 1990
SUMMARY STATISTICS FOR 2001 CALENDAR YEAR FOR 2002 WATER YEAR WATER YEARS 1965 - 2002
ANNUAL TOTAL 7847.94 ANNUAL MEAN 21.5 HIGHEST ANNUAL MEAN LOWEST ANNUAL MEAN HIGHEST DAILY MEAN 1070LOWEST DAILY MEAN 0.63ANNUAL SEVEN-DAY MINIMUM 0.83 MAXIMUM PEAK FLOW MAXIMUM PEAK STAGE INSTANTANEOUS LOW FLOWANNUAL RUNOFF (CFSM) 0.72ANNUAL RUNOFF (INCHES) 9.7610 PERCENT EXCEEDS 3050 PERCENT EXCEEDS 7.290 PERCENT EXCEEDS 2.4
9049.7724.8 34.2
90.8 19709.85 2000
Sep 15 447 Mar 4 4000 Oct 4 1992Jun 7 0.86 Jun 17 0.00 Sep 26-28 1990Jun 2 1.0 Jun 13 0.21 May 31 2000
533 Mar 4 5350 Oct 4 1992 17.96 Mar 4 a21.30 Oct 4 19920.83 Jun 17 .00 Some years 0.83 1.1411.26 15.5364 76 8.6 9.7 1.6 2.6
a From floodmark

45 COASTAL AREA BETWEEN ST. MARYS AND ST. JOHNS RIVERS
02231289 NASSAU RIVER NEAR HEDGES, FL
LOCATION.--Lat 30° 34'28" long 81° 36'32", in land grant 47, T.2 N., R.27 E., Nassau County, Hydrologic Unit 03070205, near left bank on upstream side of bridge on U.S. Highway 17, 0.5 mi north of Halfmoon Island, 1.8 mi south of Hedges, and about 21 mi upstream from mouth.
DRAINAGE AREA.--274 mi2, approximately, does not include Inconstantion Creek.
PERIOD OF RECORD.--April 1983 to September 1985 and October 1986 to September 1988, October 1988 to September 1992 (gage heightsonly), October 1992 to September 1994 (gage heights and discharge measurements only), October 1994 to September 1996 (gageheights only), October 1996 to December 2000, July to September 2002.
GAGE.--Water-stage recorder, acoustic velocity meter, and data-collection platform. Datum of gage is 10.00 ft below NGVD of 1929. Prior to June 22, 1991 gage was at present site and datum. June 22, 1991 to August 22, 1996 at site 200 ft upstream atpresent datum. August 1985 to April 1998 auxiliary water-stage recorder about 5.0 mi downstream.
REMARKS.--Records poor. There is no record, Oct. 1, 2001 to July 19, 2002, due to bridge construction. Discharge represents net of much larger upstream and downstream discharge. The gage height record published is the high and low tide event for eachday. Maximum daily discharge, maximum daily reverse flow, and maximum peak stage may have been exceeded during periods of no record.
DISCHARGE, CUBIC FEET PER SECOND, WATER YEAR PERIOD JULY 2001 TO SEPTEMBER 2002DAILY MEAN VALUES
DAY OCT NOV DEC JAN FEB MAR APR MAY JUN JUL AUG SEP
1 --- --- --- --- 2 --- --- --- --- 3 --- --- --- --- 4 --- --- --- --- 5 --- --- --- ---
--- --- --- --- --- --- -91 92 --- --- --- --- --- --- -550 -251 --- --- --- --- --- --- -240 -1010 --- --- --- --- --- --- 341 -50 --- --- --- --- --- --- -159 990
6 --- --- --- --- 7 --- --- --- --- 8 --- --- --- --- 9 --- --- --- ---
10 --- --- --- ---
--- --- --- --- --- --- -672 -283 --- --- --- --- --- --- -1520 -498 --- --- --- --- --- --- 188 241 --- --- --- --- --- --- 751 756 --- --- --- --- --- --- 962 952
11 --- --- --- --- 12 --- --- --- --- 13 --- --- --- --- 14 --- --- --- --- 15 --- --- --- ---
--- --- --- --- --- --- 1230 920 --- --- --- --- --- --- 1150 199 --- --- --- --- --- --- 1270 130 --- --- --- --- --- --- 1010 99 --- --- --- --- --- --- 652 119
16 --- --- --- --- 17 --- --- --- --- 18 --- --- --- --- 19 --- --- --- --- 20 --- --- --- ---
--- --- --- --- --- --- 258 -326 --- --- --- --- --- --- 94 -841 --- --- --- --- --- --- 69 -1110 --- --- --- --- --- --- -214 -624 --- --- --- --- --- 15 -219 -105
21 --- --- --- --- 22 --- --- --- --- 23 --- --- --- --- 24 --- --- --- --- 25 --- --- --- ---
--- --- --- --- --- -530 -61 45 --- --- --- --- --- -286 38 113 --- --- --- --- --- 207 487 567 --- --- --- --- --- 694 617 1110 --- --- --- --- --- 713 450 2690
26 --- --- --- --- 27 --- --- --- --- 28 --- --- --- --- 29 --- --- --- --- 30 --- --- --- --- 31 --- --- --- ---
--- --- --- --- --- 1250 1060 2450 --- --- --- --- --- 1030 882 2830 --- --- --- --- --- 1120 1230 1320 --- --- --- --- --- 795 836 481 --- --- --- --- --- 584 660 -911 --- --- --- --- --- 326 402 --
TOTAL --- --- --- --- MEAN --- --- --- --- MAX --- --- --- --- MIN --- --- --- ---
--- --- --- --- --- 5918 10911 10095 --- --- --- --- --- 493 352 336 --- --- --- --- --- 1250 1270 2830 --- --- --- --- --- -530 -1520 -1110
STATISTICS OF MONTHLY MEAN DATA FOR WATER YEARS 1983 - 2002, BY WATER YEAR (WY)
MEAN 986 1398 1375 1679MAX 2465 4111 3587 3566(WY) 1998 1985 1997 1984MIN 416 340 432 484 (WY) 2001 1987 2001 1987
1508 1629 1274 823 1386 1196 1393 11683104 3908 4040 3191 4465 5826 7110 67801984 1984 1984 1985 1997 1997 1997 1997 412 398 191 116 191 -28.5 57.7 1401989 1989 1989 1988 1986 1986 2000 1998
SUMMARY STATISTICS FOR 2001 CALENDAR YEAR FOR 2002 WATER YEAR #WATER YEARS 1983 - 2002
ANNUAL TOTAL 26924ANNUAL MEAN 369HIGHEST ANNUAL MEANLOWEST ANNUAL MEANHIGHEST DAILY MEAN 2830LOWEST DAILY MEAN -1520 ANNUAL SEVEN-DAY MINIMUM -413MAXIMUM PEAK STAGE 13.27 10 PERCENT EXCEEDS 123050 PERCENT EXCEEDS 258 90 PERCENT EXCEEDS -594
13123966 1997 266 2000
Sep 27 11300 Sep 2 1985 Aug 7 -3370 May 26 1988 Aug 1 -692 Sep 21 2000 Aug 7 14.88 Oct 7 1996
3560 876 -306
Note.--Negative figures indicate reverse flow.# Includes partial year(s) of record

--- ------ ------ ------ ------ ---
--- ------ ------ ------ ------ ---
--- ------ ------ ------ ------ ---
--- ------ ------ ------ ------ ---
--- ------ ------ ------ ------ ---
--- ------ ------ ------ ------ ------ --- --- ---
--- ------ ---
46 COASTAL AREA BETWEEN ST. MARYS AND ST. JOHNS RIVERS
02231289 NASSAU RIVER NEAR HEDGES, FL--Continued
GAGE HEIGHT, FEET, PERIOD JULY TO SEPTEMBER 2002
DAY HIGH LOW HIGH LOW HIGH LOW HIGH LOW HIGH LOW HIGH LOW
APRIL MAY JUNE JULY AUGUST SEPTEMBER
1 --- --- --- --- --- --- 12.14 8.11 12.59 9.12 2 --- --- --- --- --- --- 12.39 8.56 12.70 9.12 3 --- --- --- --- --- --- 12.43 8.83 12.94 9.59 4 --- --- --- --- --- --- 12.47 8.60 12.95 9.65 5 --- --- --- --- --- --- 12.59 8.53 12.67 8.55
6 --- --- --- --- --- --- 12.80 8.85 12.78 8.32 7 --- --- --- --- --- --- 13.27 9.93 12.94 9.26 8 --- --- --- --- --- --- 13.17 10.09 12.92 9.77 9 --- --- --- --- --- --- 12.77 9.76 12.90 9.69 10 --- --- --- --- --- --- 13.04 9.54 12.73 9.28
11 --- --- --- --- --- --- 12.85 9.14 12.56 8.65 12 --- --- --- --- --- --- 12.67 8.91 12.54 8.17 13 --- --- --- --- --- --- 12.48 8.65 12.61 8.62 14 --- --- --- --- --- --- 12.40 8.23 12.35 8.33 15 --- --- --- --- --- --- 12.37 8.04 12.20 7.88
16 --- --- --- --- --- --- 12.26 7.87 12.16 7.60 17 --- --- --- --- --- --- 12.24 7.59 12.27 7.71 18 --- --- --- --- --- --- 12.22 7.32 12.45 8.25 19 --- --- --- --- --- --- 12.26 7.27 12.55 8.63 20 --- --- --- --- 12.19 7.18 12.26 7.55 12.58 9.03
21 --- --- --- --- 12.25 7.34 12.24 7.60 12.61 9.19 22 --- --- --- --- 12.28 7.60 12.27 7.79 12.61 9.47 23 --- --- --- --- 12.24 7.34 12.21 7.98 12.63 9.44 24 --- --- --- --- 12.20 7.63 11.93 7.77 12.64 9.30 25 --- --- --- --- 12.08 7.33 12.10 7.91 12.84 10.22
26 --- --- --- --- 11.63 7.72 12.15 8.23 12.74 9.83 27 --- --- --- --- 12.03 7.70 12.16 8.40 12.25 8.83 28 --- --- --- --- 11.96 7.43 12.13 8.24 12.40 8.55 29 --- --- --- --- 11.86 7.59 12.13 8.34 12.46 8.75 30 --- --- --- --- 11.68 7.34 12.27 8.23 12.89 10.11 31 --- --- --- --- 11.78 7.36 12.42 8.79
MAX --- --- --- --- --- --- 13.27 10.09 12.95 10.22 MIN --- --- --- --- --- --- 11.93 7.27 12.16 7.60

47

48 WATER RESOURCES DATA FOR FLORIDA, 2002 Volume 1A: Northeast Florida Surface Water
82° 00¢ 81° 00¢
29° 00¢
28° 00¢
0
0
10
10
p02233200 STREAM GAGING
AND NUMBER
p
SITE
p
p
p
p p
p p
p
p
p p
p p
p
p
p
p p
pp
p p
p
p
p
p
p
p
p
02236000
02236125
02235200
02235500
02235000
022349993
02234635
02234500
02234384
02234400 02234000
02233500
02234324
02233200
02234308
02233475
02232200
02232155
02231600
02231342
02231396
02231458
02231454
02232500
02232400
02232415
02232000
02234990
02234998
02234435 p
p
p 02234344
p p
02234600
02234610
p
p
p
p
p
p
p02233484
p02233473
p02233460
20 MILES
20 KILOMETERS
STATION
EXPLANATION
QW SAMPLING
Figure 5.--Location of stream gaging stations in the St. Johns River basin above the Ocklawaha River.

49 ST. JOHNS RIVER BASIN ABOVE OCKLAWAHA RIVER
02231342 FORT DRUM CREEK AT SUNSHINE STATE PARKWAY, NEAR FORT DRUM, FL
LOCATION.--Lat 27° 34'06", long 80° 47'47", in NE1⁄ 4 sec.35, T. 33 S., R.35 E., Okeechobee County, Hydrologic Unit 03080101, near center of downstream side of southbound bridge on Sunshine State Parkway, 2.7 mi southeast of the Fort Drum Service Plaza, and 3.0 mi north of Fort Drum.
DRAINAGE AREA.--52.6 mi2.
PERIOD OF RECORD.--July 1969 to July 1970 (discharge measurements only), June 1977 to current year.
REVISED RECORDS.--WDR FL-79-1: 1978 (M).
GAGE.--Water-stage recorder and data-collection platform. Datum of gage is at NGVD of 1929 (levels by Brevard Engineering Co.).
REMARKS.--Records fair.
DISCHARGE, CUBIC FEET PER SECOND, WATER YEAR OCTOBER 2001 TO SEPTEMBER 2002DAILY MEAN VALUES
DAY OCT NOV DEC JAN FEB MAR APR MAY JUN JUL AUG SEP
1 82 95 17 9.3 2 67 88 17 11 3 57 82 15 15 4 47 71 15 17 5 40 76 13 15
16 13 1.5 0.00 0.00 137 44 244 17 12 1.2 0.00 0.00 119 80 191 13 11 1.2 0.00 0.00 144 85 165 12 9.6 2.3 0.00 0.00 131 67 382 14 8.7 3.2 0.00 0.00 140 49 383
6 34 87 14 15 7 30 89 15 15 8 28 74 14 13 9 30 57 13 1310 35 47 13 12
13 7.8 2.9 0.00 0.00 171 40 287 12 8.6 2.0 0.00 0.00 391 33 210 12 8.2 1.6 0.00 0.02 530 29 145 11 7.0 1.2 0.00 0.38 405 27 98 20 6.3 0.87 0.00 0.20 485 21 69
11 38 39 13 1112 35 34 12 1113 31 34 12 1014 28 40 12 1015 25 41 12 30
37 5.7 0.63 0.00 0.06 738 26 53 25 5.5 1.7 0.00 0.00 761 29 46 20 5.3 3.4 0.00 0.35 629 25 40 20 4.4 4.1 0.00 6.3 490 23 34 20 4.1 12 0.00 13 338 20 30
16 22 38 12 3617 19 35 12 3418 17 32 11 3119 18 29 11 2920 18 28 9.9 27
18 3.9 11 0.00 67 248 17 26 16 3.4 7.4 0.00 64 198 14 21 15 2.9 5.2 0.00 44 169 13 23 13 2.5 3.8 0.00 34 136 14 64 13 2.2 2.9 0.00 37 106 20 189
21 19 26 9.3 25 22 29 24 8.9 2323 37 24 8.7 2224 53 24 8.7 2025 391 22 8.5 20
12 2.9 2.1 0.00 78 132 43 15013 3.4 1.7 0.00 134 180 93 13124 2.8 1.3 0.00 148 150 168 12834 2.2 0.90 0.00 136 121 198 165 30 1.9 0.63 0.00 243 90 149 325
26 889 21 9.9 1927 628 20 9.4 1728 379 19 9.1 17 29 248 18 8.9 16 30 174 17 8.3 15 31 120 --- 8.5 15
23 2.0 0.37 0.00 432 79 95 386 19 4.4 0.16 0.00 390 81 79 294 16 3.9 0.03 0.00 297 64 72 220 --- 2.9 0.00 0.00 195 53 59 164 --- 2.3 0.00 0.00 177 44 145 117 --- 2.0 --- 0.00 --- 39 262 --
TOTAL 3668 1331 361.1 573.3 MEAN 118 44.4 11.6 18.5 MAX 889 95 17 36 MIN 17 17 8.3 9.3 CFSM 2.25 0.84 0.22 0.35 IN. 2.59 0.94 0.26 0.41
508 162.8 77.29 0.00 2496.31 7499 2039 4780 18.1 5.25 2.58 0.000 83.2 242 65.8 159 37 13 12 0.00 432 761 262 386 11 1.9 0.00 0.00 0.00 39 13 210.34 0.10 0.05 0.00 1.58 4.60 1.25 3.03 0.36 0.12 0.05 0.00 1.77 5.30 1.44 3.38
STATISTICS OF MONTHLY MEAN DATA FOR WATER YEARS 1977 - 2002, BY WATER YEAR (WY)
MEAN 80.7 35.0 20.4 27.5 MAX 384 276 79.0 125 (WY) 2000 1988 1998 1979 MIN 0.017 0.42 0.027 0.72(WY) 1989 1981 1982 2001
30.8 41.8 16.0 11.6 39.6 74.0 80.9 109166 229 80.3 134 193 242 222 4671983 1998 1993 1979 1982 2002 1995 1979 0.18 0.26 0.009 0.000 0.000 0.096 2.69 1.832001 1999 1999 1981 1981 1981 1980 1980
SUMMARY STATISTICS FOR 2001 CALENDAR YEAR FOR 2002 WATER YEAR WATER YEARS 1977 - 2002
ANNUAL TOTAL 19849.50ANNUAL MEAN 54.4 HIGHEST ANNUAL MEAN LOWEST ANNUAL MEAN HIGHEST DAILY MEAN 889 LOWEST DAILY MEAN 0.00 ANNUAL SEVEN-DAY MINIMUM 0.00MAXIMUM PEAK FLOWMAXIMUM PEAK STAGEANNUAL RUNOFF (CFSM) 1.03ANNUAL RUNOFF (INCHES) 14.0410 PERCENT EXCEEDS 16750 PERCENT EXCEEDS 1490 PERCENT EXCEEDS 0.00
23495.8064.4 47.9
95.3 19956.14 1981
Oct 26 889 Oct 26 1330 Mar 21 1998 Many days 0.00 Many days 0.00 Most years Feb 14 0.00 Apr 29 0.00 Most years
942 Oct 26 1410 Sep 4 197937.88 Oct 26 38.50 Mar 21 1998 1.22 0.9116.62 12.38
175 12618 15 0.00 0.07

50 ST. JOHNS RIVER BASIN ABOVE OCKLAWAHA RIVER
02231396 BLUE CYPRESS CREEK NEAR FELLSMERE, FL
LOCATION.--Lat 27° 43'40", long 80° 48'19", in NW1⁄ 4 sec.2, T. 32 S., R.35 E., Indian River County, Hydrologic Unit 03080101, on private road 2 mi upstream from Blue Cypress Lake and 12.8 mi west of Fellsmere.
DRAINAGE AREA.--105 mi2.
PERIOD OF RECORD.--Water years 1969-70, 1985-90 (low flow measurements only), December 1995 to current year.
GAGE.--Water-stage recorder and data-collection platform. Datum of gage is at NGVD of 1929 (St. Johns River Water Management District bench mark). Prior to Oct. 1, 1999, at present site at datum 6.47 ft lower.
REMARKS.--Records fair.
DISCHARGE, CUBIC FEET PER SECOND, WATER YEAR OCTOBER 2001 TO SEPTEMBER 2002DAILY MEAN VALUES
DAY OCT NOV DEC JAN FEB MAR APR MAY JUN JUL AUG SEP
1 430 359 26 8.0 2 349 323 24 9.0 3 287 298 21 114 246 268 19 125 201 254 18 11
11 38 1.6 0.00 0.00 1960 131 88 10 35 1.5 0.00 0.00 1880 102 889.9 30 1.5 0.00 0.00 1680 79 1789.0 26 1.4 0.00 0.00 1480 69 2048.5 21 1.3 0.00 0.00 1180 56 255
6 179 238 17 107 157 219 18 9.98 137 201 20 9.79 120 176 18 9.310 103 155 17 8.7
7.6 17 1.2 0.00 0.00 1030 41 3197.4 15 0.98 0.00 0.00 867 40 3198.7 13 0.72 0.00 0.00 795 41 271 9.7 11 0.52 0.00 1.2 651 42 217 10 9.6 0.38 0.00 1.7 612 37 171
11 86 137 16 8.212 71 121 15 8.013 62 111 14 7.814 55 110 13 8.515 48 110 12 41
24 8.5 0.25 0.00 1.4 600 34 14729 7.8 0.34 0.00 1.2 602 34 12421 6.8 0.55 0.00 2.6 674 46 11117 6.3 0.89 0.00 8.0 671 138 10715 24 5.4 0.00 10 572 274 108
16 43 102 11 6117 40 93 11 64 18 37 79 11 53 19 35 71 11 42 20 34 66 10 37
13 67 12 0.00 16 483 264 99 11 55 7.9 0.00 48 619 245 80 9.3 24 5.0 0.00 73 697 208 65 8.4 11 3.8 0.00 100 643 163 71 7.8 7.3 3.1 0.00 178 502 135 86
21 36 60 9.6 32 22 50 52 8.9 30 23 91 47 8.6 2724 150 45 8.4 2525 262 42 8.3 21
7.1 5.2 2.4 0.00 291 477 122 89 7.6 4.1 1.9 0.00 472 386 93 7627 3.6 1.6 0.00 500 308 74 58 57 3.1 1.3 0.00 431 253 88 68 71 2.7 1.0 0.00 714 215 79 207
26 398 40 8.4 1927 554 36 8.3 1728 554 34 8.0 16 29 512 32 7.7 14 30 463 29 7.4 13 31 404 --- 7.5 12
69 2.6 0.72 0.00 1140 192 58 429 55 2.5 0.48 0.00 1250 155 45 344 44 2.4 0.30 0.00 1060 163 45 268 --- 2.2 0.14 0.00 893 160 46 218 --- 1.9 0.00 0.00 959 128 72 171 --- 1.7 --- 0.00 --- 111 85 --
TOTAL 6194 3908 413.1 655.1 MEAN 200 130 13.3 21.1 MAX 554 359 26 64 MIN 34 29 7.4 7.8CFSM 1.90 1.24 0.13 0.20 IN. 2.19 1.38 0.15 0.23
585.0 465.3 60.17 0.00 8151.10 20746 2986 5036 20.9 15.0 2.01 0.000 272 669 96.3 168 71 67 12 0.00 1250 1960 274 4297.1 1.7 0.00 0.00 0.00 111 34 580.20 0.14 0.02 0.00 2.59 6.37 0.92 1.60 0.21 0.16 0.02 0.00 2.89 7.35 1.06 1.78
STATISTICS OF MONTHLY MEAN DATA FOR WATER YEARS 1996 - 2002, BY WATER YEAR (WY)
MEAN 220 178 87.2 90.4 MAX 821 760 435 519 (WY) 2000 1998 1998 1998 MIN 10.9 0.36 0.24 1.02(WY) 2001 2001 2001 2001
110 92.1 23.3 4.28 77.5 154 200 199711 553 91.5 14.6 272 669 440 5141998 1998 1996 1997 2002 2002 1997 2001 0.55 0.016 0.13 0.000 0.000 3.23 19.6 38.22001 2001 1999 2002 2000 2000 2000 2000
SUMMARY STATISTICS FOR 2001 CALENDAR YEAR FOR 2002 WATER YEAR WATER YEARS 1996 - 2002
ANNUAL TOTAL 42483.22ANNUAL MEAN 116 HIGHEST ANNUAL MEAN LOWEST ANNUAL MEAN HIGHEST DAILY MEAN 1460 LOWEST DAILY MEAN 0.00 ANNUAL SEVEN-DAY MINIMUM 0.00 MAXIMUM PEAK FLOWMAXIMUM PEAK STAGE ANNUAL RUNOFF (CFSM) 1.11ANNUAL RUNOFF (INCHES) 15.0510 PERCENT EXCEEDS 35650 PERCENT EXCEEDS 1790 PERCENT EXCEEDS 0.00
49199.77 135 123
282 1998 64.8 1999
Sep 10 1960 Jul 1 3260 Oct 17 1999 Many days 0.00 Many days 0.00 Many days Feb 22 0.00 Apr 30 0.00 Many days
2150 Jul 1 3430 Oct 17 199928.57 Jul 1 a29.01 Nov 14 1997 1.28 1.1717.43 15.96
414 35230 18 0.00 0.00
a At present datum

51 ST. JOHNS RIVER BASIN ABOVE OCKLAWAHA RIVER
02231454 SIXMILE CREEK NEAR KENANSVILLE, FL
LOCATION.--Lat 27° 52'00", long 80° 48'18", in SE1⁄ 4 sec.15, T. 30 S., R.35 E., Brevard County, Hydrologic Unit 03080101, on left bank of levee at west edge of St. Johns Marsh, 11.6 mi east of Kenansville, 15 mi south of U.S. Highway 192, 19 mi west of Sebastian.
DRAINAGE AREA.--11.6 mi2.
PERIOD OF RECORD.--February 1995 to current year.
GAGE.--Water-stage recorder. Datum of gage is at NGVD of 1929.
REMARKS.--Records poor.
DISCHARGE, CUBIC FEET PER SECOND, WATER YEAR OCTOBER 2001 TO SEPTEMBER 2002DAILY MEAN VALUES
DAY OCT NOV DEC JAN FEB MAR APR MAY JUN JUL AUG SEP
1 74 32 2.3 0.802 72 30 2.2 0.853 70 31 2.0 0.944 68 29 2.0 0.935 63 25 1.9 0.92
2.2 6.0 0.29 0.00 0.00 64 2.3 112.3 5.7 0.28 0.00 0.00 56 2.7 7.62.3 5.3 0.26 0.00 0.00 41 3.1 122.3 4.7 0.26 0.00 0.00 30 3.6 6.82.3 4.2 0.25 0.00 0.00 24 4.3 4.3
6 58 22 1.9 0.957 52 18 1.9 0.958 45 16 1.9 0.929 37 13 1.7 0.9210 30 11 1.6 0.93
2.4 4.1 0.23 0.00 0.00 18 5.0 3.92.6 4.1 0.19 0.00 0.00 15 5.7 3.42.9 4.1 0.18 0.00 0.00 15 6.8 2.82.9 3.9 0.16 0.00 0.00 17 8.2 2.53.5 3.8 0.15 0.00 0.00 18 8.9 2.3
11 23 9.9 1.6 0.95 12 18 8.8 1.5 0.97 13 15 8.2 1.4 0.97 14 12 8.9 1.4 1.1 15 10 8.7 1.3 2.4
6.4 3.6 0.14 0.00 0.00 18 9.7 2.2 6.5 3.4 0.17 0.00 0.00 18 12 2.3 5.4 3.2 0.23 0.00 0.00 19 23 2.4 4.8 3.0 0.20 0.00 0.00 17 21 2.5 4.5 3.0 0.29 0.00 0.00 15 15 2.5
16 9.3 7.7 1.4 2.8 17 8.4 7.1 1.2 2.3 18 7.5 6.4 1.2 2.2 19 7.1 5.7 1.1 2.1 20 7.2 5.3 1.0 2.1
4.2 2.9 0.28 0.00 0.02 13 11 2.5 3.8 2.7 0.28 0.00 0.16 12 8.8 2.5 3.5 2.7 0.24 0.00 0.09 10 6.5 2.6 3.4 2.5 0.20 0.00 0.15 8.7 5.2 2.6 3.3 2.4 0.18 0.00 2.7 7.1 3.7 2.7
21 9.2 4.9 0.95 2.0 22 17 4.4 0.91 2.0 23 21 4.0 0.85 2.0 24 20 3.8 0.78 2.1 25 41 3.6 0.73 2.1
3.2 2.3 0.16 0.00 28 6.5 2.8 2.8 3.5 1.8 0.13 0.00 172 6.4 2.2 2.8 9.8 0.39 0.11 0.00 184 5.5 2.3 2.922 0.30 0.09 0.00 282 4.8 2.1 3.720 0.26 0.07 0.00 271 4.2 1.8 6.5
26 100 3.4 0.70 2.1 27 132 3.1 0.71 2.1 28 88 2.8 0.73 2.2 29 67 2.6 0.73 2.3 30 51 2.5 0.73 2.2 31 39 --- 0.74 2.2
13 0.25 0.06 0.00 184 3.6 1.5 27 9.5 0.35 0.05 0.00 135 3.1 1.4 25 7.2 0.35 0.04 0.00 70 2.6 1.9 12 --- 0.30 0.03 0.00 43 2.1 18 7.0 --- 0.28 0.02 0.00 39 1.7 24 5.5 --- 0.27 --- 0.00 --- 2.0 18 --
TOTAL 1271.7 338.8 41.06 50.30 MEAN 41.0 11.3 1.32 1.62 MAX 132 32 2.3 2.8 MIN 7.1 2.5 0.70 0.80
159.7 82.15 5.22 0.00 1411.12 478.3 242.5 176.6 5.70 2.65 0.17 0.000 47.0 15.4 7.82 5.89 22 6.0 0.29 0.00 282 64 24 27 2.2 0.25 0.02 0.00 0.00 1.7 1.4 2.2
STATISTICS OF MONTHLY MEAN DATA FOR WATER YEARS 1995 - 2002, BY WATER YEAR (WY)
MEAN 21.6 12.3 5.12 5.41 MAX 68.3 70.1 31.4 30.4(WY) 1996 1998 1998 1998MIN 0.77 0.000 0.000 0.000(WY) 1998 1997 1997 1997
4.44 3.37 2.69 0.23 7.42 6.53 11.0 20.1 22.5 16.7 8.87 0.80 47.0 24.0 42.4 81.11998 1998 1995 1995 2002 2001 2001 1995
0.000 0.000 0.000 0.000 0.000 0.006 0.26 0.0001997 1997 1997 1999 2000 1997 1997 1996
SUMMARY STATISTICS FOR 2001 CALENDAR YEAR FOR 2002 WATER YEAR WATER YEARS 1995 - 2002
ANNUAL TOTAL 5492.17 ANNUAL MEAN 15.0 HIGHEST ANNUAL MEAN LOWEST ANNUAL MEAN HIGHEST DAILY MEAN 132 LOWEST DAILY MEAN 0.00 ANNUAL SEVEN-DAY MINIMUM 0.00MAXIMUM PEAK FLOWMAXIMUM PEAK STAGE10 PERCENT EXCEEDS 5350 PERCENT EXCEEDS 2.590 PERCENT EXCEEDS 0.00
4257.5511.7 7.58
14.9 19980.18 1997
Oct 27 282 Jun 24 596 Nov 15 1997 Many days 0.00 Many days 0.00 Many days Jan 1 0.00 May 1 0.00 Many days
355 Jun 24 844 Nov 14 199723.21 Jun 24 25.07 Nov 14 199726 19 2.6 0.50 0.00 0.00

---
52 ST. JOHNS RIVER BASIN ABOVE OCKLAWAHA RIVER
02231458 WOLF CREEK NEAR KENANSVILLE, FL
LOCATION.--Lat 27° 53'39", long 80° 49'17", in NE1⁄ 4 sec.9, T. 30 S., R.35 E., Brevard County, Hydrologic Unit 03080101, on right bank at west edge of St. Johns Marsh, 10.7 mi east of Kenansville, 13 mi south of U.S. Highway 192, and 21 mi west of Sebastian.
DRAINAGE AREA.-- 8.6 mi2.
PERIOD OF RECORD.--February 1995 to current year.
GAGE.--Water-stage recorder. Datum of gage is at NGVD of 1929.
REMARKS.--Records poor.
DISCHARGE, CUBIC FEET PER SECOND, WATER YEAR OCTOBER 2001 TO SEPTEMBER 2002DAILY MEAN VALUES
DAY OCT NOV DEC JAN FEB MAR APR MAY JUN JUL AUG SEP
1 e7.0 38 4.5 1.5 2.2 3.1 0.63 0.38 0.96 49 1.2 9.9 2 e7.1 39 3.6 1.9 2.3 2.7 0.60 0.37 0.79 45 1.8 12 3 e7.4 43 3.0 3.2 2.3 2.4 0.56 0.36 0.69 41 2.5 13 4 e7.4 45 2.6 2.8 2.3 2.1 0.52 0.36 0.64 36 3.5 13 5 e7.0 44 2.2 2.6 2.3 1.9 0.49 0.37 0.59 32 4.9 13
6 e6.8 41 2.0 2.3 2.3 1.8 0.45 0.61 0.57 29 6.2 13 7 e6.2 37 2.1 2.2 2.4 1.7 0.42 0.75 0.70 26 7.8 13 8 e5.9 34 2.1 2.1 2.7 1.7 0.39 0.73 1.4 25 10 12 9 e5.5 30 2.1 2.0 2.6 1.6 0.36 0.71 1.5 24 12 12
10 e4.9 28 1.9 1.9 3.2 1.5 0.36 0.70 1.1 24 14 12
11 e4.2 25 1.7 1.9 5.9 1.5 0.36 0.68 0.97 22 17 12 12 e3.9 22 1.6 1.9 5.0 1.4 0.37 0.68 0.92 21 20 12 13 e3.9 20 1.5 1.9 4.2 1.4 0.39 0.64 1.1 20 23 13 14 e4.0 20 1.4 3.4 3.6 1.3 0.40 0.67 1.2 18 22 13 15 e4.2 18 1.3 8.9 3.2 1.3 0.42 0.76 1.1 16 19 12
16 e4.5 17 1.5 7.0 2.8 1.3 0.41 0.60 1.9 14 17 11 17 e5.3 14 1.7 5.7 2.6 1.2 0.42 0.58 3.1 12 14 10 18 e6.2 13 1.6 4.6 2.4 1.1 0.40 0.54 2.1 11 12 9.4 19 e7.9 11 1.5 3.7 2.3 1.1 0.39 0.83 10 9.0 9.4 8.7 20 e10 9.7 1.4 3.5 2.2 1.0 0.39 1.0 50 7.4 7.4 8.2
21 e16 9.5 1.6 3.2 2.2 0.99 0.39 0.84 53 6.1 5.8 7.7 22 e23 9.2 1.4 3.0 2.4 0.96 0.39 0.76 75 5.3 4.8 6.0 23 e25 8.6 1.3 2.8 8.6 0.93 0.39 0.75 76 4.3 5.4 5.0 24 e30 8.2 1.3 2.6 14 0.90 0.39 0.72 84 3.4 5.5 11 25 72 7.7 1.3 2.5 10 0.86 0.39 0.69 90 2.7 5.5 23
26 87 7.3 1.3 2.3 7.3 0.82 0.39 0.69 83 2.1 5.4 32 27 86 6.9 1.2 2.2 5.4 0.79 0.39 0.68 74 1.5 5.5 26 28 70 6.2 1.1 2.2 3.8 0.76 0.39 0.62 62 0.97 6.0 22 29 53 5.6 1.2 2.2 --- 0.73 0.39 0.62 53 0.45 7.3 20 30 46 5.1 1.2 2.2 --- 0.70 0.39 0.62 48 0.15 7.9 18 31 42 --- 1.2 2.2 --- 0.66 --- 0.77 0.60 8.9 --
TOTAL 669.3 623.0 55.4 92.4 112.5 42.20 12.63 20.08 779.33 508.97 292.7 402.9 MEAN 21.6 20.8 1.79 2.98 4.02 1.36 0.42 0.65 26.0 16.4 9.44 13.4 MAX 87 45 4.5 8.9 14 3.1 0.63 1.0 90 49 23 32 MIN 3.9 5.1 1.1 1.5 2.2 0.66 0.36 0.36 0.57 0.15 1.2 5.0 CFSM 2.51 2.41 0.21 0.35 0.47 0.16 0.05 0.08 3.02 1.91 1.10 1.56 IN. 2.90 2.69 0.24 0.40 0.49 0.18 0.05 0.09 3.37 2.20 1.27 1.74
STATISTICS OF MONTHLY MEAN DATA FOR WATER YEARS 1995 - 2002, BY WATER YEAR (WY)
MEAN 30.4 15.9 17.1 9.20 MAX 112 56.9 106 48.1(WY) 1996 1998 1998 1998 MIN 2.67 0.59 0.66 0.87(WY) 1997 2001 2001 2001
5.87 6.33 7.81 1.56 13.7 13.4 16.0 18.0 26.3 21.4 30.9 4.95 70.5 24.7 33.1 80.71998 1998 1995 1995 1999 1995 1995 1995 0.71 0.36 0.42 0.65 0.23 0.42 5.74 3.822001 1997 2002 2002 1998 1998 1998 1996
SUMMARY STATISTICS FOR 2001 CALENDAR YEAR FOR 2002 WATER YEAR WATER YEARS 1995 - 2002
ANNUAL TOTAL 3344.33 ANNUAL MEAN 9.16 HIGHEST ANNUAL MEAN LOWEST ANNUAL MEAN HIGHEST DAILY MEAN 87LOWEST DAILY MEAN 0.42 ANNUAL SEVEN-DAY MINIMUM 0.49MAXIMUM PEAK FLOWMAXIMUM PEAK STAGEANNUAL RUNOFF (CFSM) 1.07ANNUAL RUNOFF (INCHES) 14.4710 PERCENT EXCEEDS 3350 PERCENT EXCEEDS 2.090 PERCENT EXCEEDS 0.68
3611.41 9.89 12.8
26.8 19952.40 1997
Oct 26 90 Jun 25 220 Jun 18 1999Apr 28 0.15 Jul 30 *0.00 Apr 23 0.37 Apr 29 0.00 May 30 1995
91 Jun 24,25 250 Nov 14 199721.15 Jun 25 21.59 Oct 19 1995 1.15 1.4915.62 20.2127 36 2.8 2.4 0.57 0.47
e Estimated* Many days in 1995, 1998 water years.

53 ST. JOHNS RIVER BASIN ABOVE OCKLAWAHA RIVER
02231600 JANE GREEN CREEK NEAR DEER PARK, FL
LOCATION.--Lat 28° 04'27", long 80° 53'18", in SE1⁄ 4 sec.2, T.28 S., R.34 E., Osceola County, Hydrologic Unit 03080101, near right bank on upstream side of bridge on county road, 1.2 mi southeast of Deer Park, 2 mi downstream from confluence of Crabgrassand Bull Creeks, and 5.8 mi upstream from mouth.
DRAINAGE AREA.--248 mi2
PERIOD OF RECORD.--October 1953 to current year.
GAGE.--Water-stage recorder. Datum of gage is 18.55 ft above NGVD of 1929.
REMARKS.--Records fair. Since April 1990, flow regulated to some extent by flood control lift gates (S161A), approximately 1.5 mi upstream from the gage.
DISCHARGE, CUBIC FEET PER SECOND, WATER YEAR OCTOBER 2001 TO SEPTEMBER 2002DAILY MEAN VALUES
DAY OCT NOV DEC JAN FEB MAR APR MAY JUN JUL AUG SEP
1 426 150 47 13 2 383 153 46 13 3 347 157 44 13 4 314 163 43 13 5 280 157 41 12
29 63 9.8 0.77 0.00 925 691 307 28 73 9.2 0.64 0.00 959 644 286 26 79 8.9 0.51 0.00 991 604 279 24 81 8.4 0.36 0.00 978 556 301 22 79 7.8 0.24 0.00 952 562 465
6 247 153 40 12 7 224 150 41 12 8 204 147 42 12 9 177 144 41 1110 158 138 39 11
20 74 7.0 0.16 0.00 963 561 395 21 69 6.5 0.11 0.00 943 586 392 23 64 6.0 0.05 0.00 900 604 509 21 60 5.7 0.01 0.00 824 596 596 21 56 5.4 0.00 0.00 758 582 619
11 142 132 37 1112 128 126 35 1113 116 119 33 1114 106 119 30 12 15 96 114 29 19
24 53 5.2 0.00 0.00 680 562 600 23 49 5.7 0.00 0.00 679 526 561 21 46 5.8 0.00 0.00 747 501 528 20 42 5.6 0.00 0.00 779 503 48319 40 5.6 0.00 0.00 779 583 415
16 87 106 28 2017 79 98 27 1918 72 95 25 1919 66 90 24 2020 62 85 22 22
19 38 5.4 0.00 0.00 764 723 358 18 35 5.4 0.00 0.00 707 807 315 17 32 5.0 0.00 0.00 635 831 273 17 30 4.5 0.00 0.00 574 815 234 16 27 4.1 0.00 0.00 664 783 204
21 62 81 20 2422 65 77 19 2523 61 72 18 2724 60 68 18 2825 86 64 17 29
16 25 3.6 0.00 0.90 816 743 175 17 22 3.2 0.00 9.1 1030 736 149 23 20 2.7 0.00 22 1300 716 124 34 18 2.3 0.00 43 1400 681 110 38 16 2.0 0.00 96 1400 635 104
26 89 61 16 2827 86 58 15 2828 99 54 15 28 29 118 51 14 30 30 135 49 14 32 31 146 --- 13 32
39 15 1.7 0.00 323 1300 571 102 43 18 1.5 0.00 624 1180 512 100 50 15 1.3 0.00 787 1050 449 113 --- 13 1.1 0.00 861 937 401 114 --- 12 0.90 0.00 885 846 359 115 --- 11 --- 0.00 --- 773 343 --
TOTAL 4721 3231 893 597 MEAN 152 108 28.8 19.3 MAX 426 163 47 32 MIN 60 49 13 11CFSM 0.61 0.43 0.12 0.08 IN. 0.71 0.48 0.13 0.09
689 1275 147.30 2.85 3651.00 28233 18766 9326 24.6 41.1 4.91 0.092 122 911 605 311 50 81 9.8 0.77 885 1400 831 619 16 11 0.90 0.00 0.00 574 343 1000.10 0.17 0.02 0.00 0.49 3.67 2.44 1.25 0.10 0.19 0.02 0.00 0.55 4.23 2.81 1.40
STATISTICS OF MONTHLY MEAN DATA FOR WATER YEARS 1954 - 2002, BY WATER YEAR (WY)
MEAN 447 167 91.5 113 MAX 2930 1353 820 970(WY) 1957 1995 1998 1958 MIN 0.79 0.000 1.03 0.45(WY) 1981 1981 1994 2001
147 202 81.8 25.8 182 268 330 476 1148 1729 536 268 1857 1483 1432 23241966 1960 1973 1957 1968 1974 1964 1979 0.68 0.049 0.000 0.000 0.000 0.000 0.16 17.72001 2001 1956 1956 1956 1977 2000 1996
SUMMARY STATISTICS FOR 2001 CALENDAR YEAR FOR 2002 WATER YEAR WATER YEARS 1954 - 2002
ANNUAL TOTAL 56874.97ANNUAL MEAN 156 HIGHEST ANNUAL MEAN LOWEST ANNUAL MEAN HIGHEST DAILY MEAN 1710 LOWEST DAILY MEAN 0.00 ANNUAL SEVEN-DAY MINIMUM 0.00MAXIMUM PEAK FLOW MAXIMUM PEAK STAGEANNUAL RUNOFF (CFSM) 0.63ANNUAL RUNOFF (INCHES) 8.5310 PERCENT EXCEEDS 60950 PERCENT EXCEEDS 1090 PERCENT EXCEEDS 0.00
71532.15 196 211
726 1960 39.0 1981
Sep 17 1400 Jul 24,25 17000 Oct 17 1956 Many days 0.00 Many days 0.00 Many days Mar 10 0.00 May 10 0.00 Many days
1420 Jul 24,25 18400 Oct 17 19566.30 Jul 24,25 10.95 Oct 17 1956 0.79 0.8510.73 11.56
711 58441 39 0.00 0.00

54 ST. JOHNS RIVER BASIN ABOVE OCKLAWAHA RIVER
02232000 ST. JOHNS RIVER NEAR MELBOURNE, FL
LOCATION.--Lat 28° 05'04", long 80° 45'08", in NW1⁄ 4 sec.5, T.28 S., R.36 E., Brevard County, Hydrologic Unit 03080101, near center of span on upstream side of bridge on U.S. Highway 192, 1.1 mi downstream from Sawgrass Lake, 1.7 mi upstream from Lake Washington, 9.2 mi west of Melbourne, and 262 mi upstream from mouth.
DRAINAGE AREA.--968 mi2.
PERIOD OF RECORD.--October 1939 to current year. Monthly discharge only for October 1939, published in WSP 1304.
GAGE.--Water-stage recorder, acoustic velocity meter, and data-collection platform. Datum of gage is 11.22 ft above NGVD of 1929. Prior to July 26, 1940, nonrecording gage, and July 26, 1940 to Jan. 11, 1973, water-stage recorder at site 200 ftupstream at same datum. Oct. 1, 1969 to Oct. 5, 1972, and Oct. 1, 1982 to Sept. 30, 1983, water-stage recorder for LakeWashington near Eau Gallie (station 02232100) used as auxiliary gage for this station.
REMARKS.--Records poor.
DISCHARGE, CUBIC FEET PER SECOND, WATER YEAR OCTOBER 2001 TO SEPTEMBER 2002DAILY MEAN VALUES
DAY OCT NOV DEC JAN FEB MAR APR MAY JUN JUL AUG SEP
1 3120 1030 e580 e302 3150 1020 e540 e120 3 3100 1040 e490 1684 3090 e1090 e480 1805 3060 e1110 e440 169
139 58 68 93 20 e3350 3450 1840 112 73 70 48 36 e3420 3270 1790125 74 50 40 31 e3460 3180 1770 104 89 48 45 31 e3430 3180 1730 106 103 6.2 22 34 e3410 3130 1670
6 2990 e1120 e380 1317 2950 e1130 e350 1298 2820 e1100 337 153 9 2740 e1060 326 14910 2770 e1020 301 140
143 149 47 64 46 e3380 3070 1560 113 62 58 78 16 e3310 3070 1510 114 121 66 54 31 e3270 3050 1480152 100 52 47 6.0 3240 3050 1460 158 69 52 41 35 3240 2970 1400
11 2680 e980 274 14712 2650 e940 265 15213 2580 e970 250 12414 2440 e1070 238 166 15 2200 e1150 190 120
181 110 44 42 36 3210 2950 1500185 153 30 56 51 3130 2850 1520142 141 49 54 35 3200 2780 1590 155 79 74 8.3 55 3270 2760 1590 184 44 55 56 30 3330 2730 1470
16 2080 e1050 170 163 17 1840 e970 235 13718 1810 e890 166 18119 1710 e820 158 18820 1580 e780 65 132
138 64 68 61 38 3410 2620 1390 134 78 58 71 37 3470 2580 1330103 110 59 47 82 3500 2490 1220145 97 59 24 137 3460 2480 1110144 92 41 -21 143 3380 2460 1050
21 1390 e760 52 8522 1450 e750 23 6923 1490 e760 e15 3024 1500 e730 e10 -3425 1540 e700 e20 -31
115 86 40 27 143 3480 2660 963110 2.4 43 9.6 292 3520 2720 893 113 70 -2.4 42 465 3590 2580 834233 88 46 20 761 3760 2490 789 259 76 40 23 1160 3800 2440 824
26 1590 e710 e22 61 27 1580 e680 e17 18728 1490 e680 e17 17529 1560 e670 e20 16230 1500 e630 e25 166 31 1260 --- e30 151
-14 75 40 -5.1 1480 3830 2340 836 -17 80 45 30 1930 3820 2230 789 57 63 35 -13 2470 3730 2130 780--- 81 50 9.1 2830 3700 2070 757 --- 65 57 28 3190 3610 1920 734 --- 77 --- -4.1 --- 3520 1900 --
TOTAL 67710 27410 6486 3900MEAN 2184 914 209 126 MAX 3150 1150 580 188 MIN 1260 630 10 -34
3633 2629.4 1447.8 1096.8 15651.0 107230 83600 38179 130 84.8 48.3 35.4 522 3459 2697 1273259 153 74 93 3190 3830 3450 1840-17 2.4 -2.4 -21 6.0 3130 1900 734
STATISTICS OF MONTHLY MEAN DATA FOR WATER YEARS 1940 - 2002, BY WATER YEAR (WY)
MEAN 1655 978 550 412 MAX 6377 3062 2753 2338(WY) 1954 1995 1988 1998 MIN 87.7 31.7 21.9 9.44(WY) 1962 1962 1962 1962
416 465 353 162 323 661 893 1285 2782 2608 2161 852 3073 3459 2697 54241998 1960 1998 1993 1968 2002 2002 1953 4.68 1.03 0.000 -23.5 -32.7 10.9 15.8 75.01962 1962 1956 2000 1984 1981 1981 1950
SUMMARY STATISTICS FOR 2001 CALENDAR YEAR FOR 2002 WATER YEAR WATER YEARS 1940 - 2002
ANNUAL TOTAL 271742.66 ANNUAL MEAN 745 HIGHEST ANNUAL MEAN LOWEST ANNUAL MEAN HIGHEST DAILY MEAN 3440LOWEST DAILY MEAN -41ANNUAL SEVEN-DAY MINIMUM -18 MAXIMUM PEAK STAGE 10 PERCENT EXCEEDS 279050 PERCENT EXCEEDS 4590 PERCENT EXCEEDS -5.6
358973.0 983 681
1756 1960 93.9 1981
Sep 22 3830 Jul 26 18000 Oct 18 1956Apr 26 -34 Jan 24 -118 May 23 1984Apr 25 9.3 May 26 -78 Jun 18 1984
6.66 Aug 3 9.66 Sep 30 19603140 1770 185 30430 50
e Estimated Note.--Negative figures indicate reverse flow

---
ST. JOHNS RIVER BASIN ABOVE OCKLAWAHA RIVER 55
02232000 ST. JOHNS RIVER NEAR MELBOURNE, FL--Continued
GAGE HEIGHT, FEET, WATER YEAR OCTOBER 2001 TO SEPTEMBER 2002 DAILY MEAN VALUES
DAY OCT NOV DEC JAN FEB MAR APR MAY JUN JUL AUG SEP
1 6.44 4.84 3.61 3.03 2.94 3.15 2.62 2.42 2.36 5.32 6.48 5.31 2 6.38 4.81 3.58 3.02 2.94 3.08 2.61 2.44 2.35 5.48 6.50 5.25 3 6.34 4.78 3.55 3.04 2.92 3.07 2.59 2.45 2.34 5.59 6.54 5.19 4 6.30 4.75 3.53 3.03 2.91 3.09 2.60 2.45 2.33 5.70 6.53 5.16 5 6.25 4.73 3.50 3.00 2.89 3.08 2.61 2.47 2.31 5.77 6.51 5.16
6 6.21 4.70 3.47 2.98 2.84 3.02 2.58 2.47 2.30 5.85 6.46 5.13 7 6.18 4.65 3.50 2.99 2.84 3.02 2.54 2.46 2.30 5.89 6.41 5.09 8 6.14 4.59 3.53 2.97 2.91 3.01 2.50 2.45 2.35 6.00 6.37 5.05 9 6.07 4.54 3.51 2.95 2.90 3.00 2.48 2.44 2.36 6.09 6.31 5.02 10 5.98 4.49 3.48 2.93 2.90 3.00 2.48 2.44 2.35 6.15 6.24 4.97
11 5.90 4.43 3.46 2.92 2.98 2.98 2.48 2.43 2.35 6.19 6.19 4.92 12 5.84 4.38 3.43 2.90 2.99 2.96 2.53 2.41 2.35 6.24 6.17 4.87 13 5.77 4.35 3.40 2.90 3.01 2.93 2.56 2.41 2.38 6.33 6.13 4.83 14 5.68 4.36 3.36 2.91 3.01 2.92 2.57 2.42 2.42 6.39 6.09 4.81 15 5.59 4.37 3.34 3.09 2.99 2.90 2.58 2.40 2.42 6.42 6.05 4.77
16 5.51 4.33 3.32 3.12 2.99 2.87 2.59 2.37 2.44 6.44 5.99 4.71 17 5.43 4.27 3.29 3.14 2.97 2.85 2.59 2.38 2.52 6.48 5.94 4.66 18 5.31 4.21 3.28 3.16 2.96 2.82 2.58 2.40 2.58 6.49 5.89 4.58 19 5.21 4.15 3.25 3.14 2.91 2.79 2.56 2.46 2.71 6.48 5.85 4.50 20 5.14 4.09 3.23 3.13 2.88 2.75 2.54 2.54 2.95 6.47 5.82 4.42
21 5.08 4.03 3.21 3.11 2.87 2.73 2.52 2.51 3.09 6.49 5.81 4.35 22 5.07 3.97 3.18 3.11 2.89 2.75 2.50 2.47 3.23 6.50 5.82 4.27 23 5.02 3.91 3.16 3.09 3.01 2.71 2.50 2.43 3.39 6.52 5.79 4.18 24 4.98 3.85 3.15 3.06 3.12 2.68 2.47 2.39 3.62 6.56 5.76 4.14 25 5.06 3.81 3.14 3.05 3.15 2.67 2.44 2.38 3.83 6.59 5.71 4.13
26 5.16 3.78 3.14 3.04 3.17 2.66 2.43 2.37 4.07 6.60 5.64 4.08 27 5.14 3.75 3.10 3.02 3.19 2.71 2.42 2.35 4.32 6.61 5.59 4.06 28 5.08 3.70 3.08 3.01 3.18 2.70 2.41 2.35 4.54 6.60 5.54 4.03 29 5.02 3.67 3.06 2.99 --- 2.68 2.41 2.31 4.76 6.58 5.47 3.99 30 4.97 3.63 3.05 2.97 --- 2.65 2.41 2.30 5.04 6.55 5.42 3.95 31 4.91 --- 3.04 2.95 --- 2.63 --- 2.33 6.52 5.38 --
MEAN 5.59 4.26 3.32 3.02 2.97 2.87 2.52 2.42 2.95 6.25 6.01 4.65 MAX 6.44 4.84 3.61 3.16 3.19 3.15 2.62 2.54 5.04 6.61 6.54 5.31 MIN 4.91 3.63 3.04 2.90 2.84 2.63 2.41 2.30 2.30 5.32 5.38 3.95
CAL YR 2001 MEAN 3.06 MAX 6.50 MIN 0.81 WTR YR 2002 MEAN 3.91 MAX 6.61 MIN 2.30

56 ST. JOHNS RIVER BASIN ABOVE OCKLAWAHA RIVER
02232155 PENNYWASH CREEK NEAR DEER PARK, FL
LOCATION.--Lat 28° 10'54", long 80° 53'44", in NW1⁄ 4 sec.35, T.26 S., R.34 E., Osceola County, Hydrologic Unit 03080101, near center of span on downstream side of bridge on State Highway 419, 0.6 mi upstream from mouth, and 6.2 mi north of Deer Park.
DRAINAGE AREA.--17.2 mi2.
PERIOD OF RECORD.--1956, 1965, 1976 (miscellaneous discharge measurements only), August 1994 to current year.
GAGE.--Water-stage recorder. Datum of gage is at NGVD of 1929 (Florida Department of Transportation bench mark).
REMARKS.--Records good. Levees were constructed as part of the Jane Green Creek Reservoir and an interconnecting canal was dug joining the watershed areas of Taylor, Pennywash, Cox, and Wolf Creeks.
DISCHARGE, CUBIC FEET PER SECOND, WATER YEAR OCTOBER 2001 TO SEPTEMBER 2002DAILY MEAN VALUES
DAY OCT NOV DEC JAN FEB MAR APR MAY JUN JUL AUG SEP
1 13 7.9 3.5 2.1 2.2 6.1 0.69 0.15 0.29 113 22 462 10 7.6 3.4 2.2 2.1 5.3 0.67 0.12 0.18 105 27 463 8.2 7.8 3.3 3.2 2.2 4.4 0.61 0.10 0.08 89 38 344 6.9 7.3 3.2 2.9 2.5 3.6 0.60 0.08 0.03 81 37 915 5.9 9.9 3.1 2.5 2.4 3.1 0.50 0.06 0.00 72 31 387
6 5.2 17 2.9 2.4 2.3 2.7 0.44 0.06 0.00 81 21 172 7 4.8 14 3.5 2.4 2.5 2.5 0.37 0.06 0.05 68 20 848 5.1 9.8 5.3 2.3 3.9 2.4 0.34 0.04 0.12 64 46 509 5.5 7.7 5.1 2.0 3.3 2.3 0.31 0.03 0.10 84 45 36
10 5.2 6.5 5.0 1.9 3.0 2.1 0.29 0.02 0.04 116 29 29
11 4.8 5.7 4.5 1.7 12 4.3 5.1 3.9 1.7 13 3.8 6.4 3.6 1.7 14 3.4 20 3.3 2.2 15 3.2 24 3.0 13
3.2 1.9 0.27 0.02 0.01 197 21 23 3.0 1.8 0.43 0.01 0.00 417 19 19 2.7 1.7 0.49 0.01 0.04 367 36 17 2.6 1.4 0.58 0.02 0.12 217 119 15 2.5 1.2 0.82 0.03 0.12 113 164 13
16 3.1 19 2.9 12 17 2.8 14 2.7 7.818 2.5 12 2.7 6.219 2.1 11 2.5 5.2 20 2.3 9.7 2.3 4.6
2.3 1.2 2.5 0.01 0.50 70 102 12 2.0 1.1 2.0 0.02 1.4 48 63 9.91.8 0.97 1.1 0.05 1.5 38 46 8.6 1.7 0.90 0.71 0.50 7.2 172 39 7.6 1.6 0.81 0.43 0.54 46 107 33 6.9
21 3.0 8.4 2.0 4.3 22 5.6 7.3 1.9 4.1 23 5.6 6.3 1.9 3.824 7.4 5.8 2.2 3.525 60 5.4 2.3 3.1
1.5 0.74 0.33 0.29 43 74 107 6.2 2.5 0.74 0.33 0.20 108 73 175 5.615 0.58 0.31 0.16 130 71 213 5.441 0.55 0.27 0.10 238 58 105 1129 0.49 0.25 0.06 213 43 62 32
26 74 5.2 2.8 2.927 37 5.0 2.5 2.828 22 4.6 2.4 2.8 29 15 4.2 2.3 2.8 30 11 3.9 2.1 2.6 31 9.2 --- 2.1 2.4
16 0.59 0.23 0.04 118 33 40 3511 1.7 0.21 0.01 113 25 32 23 7.8 1.5 0.18 0.01 85 20 26 15 --- 0.99 0.16 0.00 54 16 23 11 --- 0.80 0.16 0.02 44 14 24 8.4 --- 0.71 --- 0.19 --- 12 32 --
TOTAL 351.9 278.5 94.2 115.1 MEAN 11.4 9.28 3.04 3.71 MAX 74 24 5.3 13 MIN 2.1 3.9 1.9 1.7
173.6 56.87 16.58 3.01 1203.78 3058 1797 1259.6 6.20 1.83 0.55 0.097 40.1 98.6 58.0 42.0 41 6.1 2.5 0.54 238 417 213 3871.5 0.49 0.16 0.00 0.00 12 19 5.4
STATISTICS OF MONTHLY MEAN DATA FOR WATER YEARS 1994 - 2002, BY WATER YEAR (WY)
MEAN 41.9 15.7 18.4 11.1 MAX 126 65.4 82.6 45.1(WY) 2000 1995 1998 1998 MIN 2.63 0.92 0.66 0.94(WY) 1999 2001 2001 2001
16.4 17.5 5.73 1.05 10.0 17.4 26.0 30.1 87.8 64.8 30.8 3.72 40.1 98.6 58.0 93.91998 1996 1996 1996 2002 2002 2002 1994 0.64 0.76 0.36 0.097 0.051 0.73 0.61 3.732001 2000 2000 2002 2000 1998 2000 1997
SUMMARY STATISTICS FOR 2001 CALENDAR YEAR FOR 2002 WATER YEAR WATER YEARS 1994 - 2002
ANNUAL TOTAL 3273.16 ANNUAL MEAN 8.97 HIGHEST ANNUAL MEAN LOWEST ANNUAL MEAN HIGHEST DAILY MEAN 209 LOWEST DAILY MEAN 0.18 ANNUAL SEVEN-DAY MINIMUM 0.20MAXIMUM PEAK FLOW MAXIMUM PEAK STAGE10 PERCENT EXCEEDS 1950 PERCENT EXCEEDS 2.490 PERCENT EXCEEDS 0.41
8408.4423.0 17.0
28.2 19956.18 1999
Sep 15 417 Jul 12 501 Oct 17 1999 Apr 25,29 0.00 Some days 0.00 Some years Apr 24 0.02 May 10 0.00 May 26 2000
494 Sep 5 613 Feb 20 1998 25.85 Sep 5 27.17 Nov 16 199471 38 3.6 3.2 0.12 0.35

57 ST. JOHNS RIVER BASIN ABOVE OCKLAWAHA RIVER
02232200 WOLF CREEK NEAR DEER PARK, FL
LOCATION.--Lat 28° 12'46", long 80° 54'40", in NW1⁄ 4 sec.22, T.26 S., R.34 E., Osceola County, Hydrologic Unit 03080101, near right bank on upstream side of bridge on State Highway 419, 2.9 mi upstream from mouth, and 8.5 mi north of Deer Park.
DRAINAGE AREA.--25.7 mi2.
PERIOD OF RECORD.--January 1956 to current year.
GAGE.--Water-stage recorder. Datum of gage is 19.35 ft above NGVD of 1929. Prior to July 13, 1967, at site 0.8 mi downstream at same datum.
REMARKS.--Records good. Since October 1970 flow regulated to some extent following the construction of Jane Green Reservoir; levees were constructed and an interconnecting canal was dug joining the watershed areas of Taylor, Pennywash, Cox, and Wolf Creeks.
DISCHARGE, CUBIC FEET PER SECOND, WATER YEAR OCTOBER 2001 TO SEPTEMBER 2002DAILY MEAN VALUES
DAY OCT NOV DEC JAN FEB MAR APR MAY JUN JUL AUG SEP
1 22 9.6 5.1 2.42 18 8.9 4.8 2.63 14 11 4.6 4.2 4 11 11 4.6 5.1
3.7 22 0.44 0.00 0.00 132 109 30 3.3 19 0.34 0.00 0.00 144 90 30 3.0 16 0.26 0.00 0.00 123 176 222.7 14 0.21 0.00 0.00 83 241 134
5 9.0 13 4.8 4.6 2.3 13 0.16 0.00 0.00 76 183 387
6 7.8 20 4.8 4.4 2.1 12 0.11 0.00 0.00 167 99 160 7 7.1 16 5.1 4.2 2.2 10 0.08 0.00 0.00 96 71 108 8 7.2 12 6.7 4.0 4.1 9.3 0.06 0.00 0.00 71 172 769 8.7 8.9 8.5 3.6 5.0 8.3 0.06 0.00 0.00 60 94 58
10 9.3 7.4 8.0 3.2 4.9 7.4 0.06 0.00 0.00 96 54 44
11 7.6 6.3 7.4 2.8 12 6.3 6.1 6.5 2.6 13 5.3 7.5 5.8 2.5 14 4.7 33 5.3 3.2 15 6.4 38 4.8 12
7.7 6.6 0.06 0.00 0.00 204 36 33 8.8 5.9 0.09 0.00 0.00 256 30 27 7.3 5.4 0.11 0.00 0.00 247 114 25 6.2 4.6 0.14 0.00 0.00 175 449 22 5.7 4.0 4.5 0.00 0.00 132 359 19
16 7.5 29 4.4 17 17 6.6 22 4.1 13 18 5.5 19 4.1 11 19 4.7 17 3.7 9.0 20 4.3 15 3.2 8.0
5.3 3.6 14 0.00 0.06 87 197 16 4.9 3.2 9.1 0.00 0.36 59 126 13 4.3 2.6 5.5 0.00 0.66 255 90 10 3.5 2.2 3.7 0.00 9.1 861 66 8.2 3.0 2.0 2.5 0.00 62 293 50 6.8
21 4.8 13 2.7 7.5 22 9.0 11 2.4 7.1 23 12 9.6 2.1 6.724 12 8.7 2.2 6.1 25 31 8.1 2.4 5.6
2.8 1.7 1.7 0.00 152 186 59 5.9 4.6 1.5 1.1 0.00 191 159 56 5.037 1.2 0.68 0.00 259 203 43 5.2
113 1.0 0.41 0.00 304 156 33 2195 0.87 0.25 0.00 189 109 25 102
26 55 7.6 2.9 5.127 44 7.2 3.1 4.728 29 6.4 2.9 4.629 20 5.8 2.6 4.6 30 16 5.4 2.4 4.5 31 12 --- 2.2 4.1
63 0.76 0.14 0.00 131 80 20 10042 1.1 0.08 0.00 119 59 18 6430 1.3 0.04 0.00 92 45 16 37 --- 1.2 0.01 0.00 63 36 17 23 --- 0.79 0.00 0.00 66 26 20 17 --- 0.57 --- 0.00 --- 25 27 --
TOTAL 417.8 393.5 134.2 180.0 MEAN 13.5 13.1 4.33 5.81MAX 55 38 8.5 17 MIN 4.3 5.4 2.1 2.4
477.4 183.09 45.89 0.00 1638.18 4701 3140 1609.1 17.1 5.91 1.53 0.000 54.6 152 101 53.6 113 22 14 0.00 304 861 449 3872.1 0.57 0.00 0.00 0.00 25 16 5.0
STATISTICS OF MONTHLY MEAN DATA FOR WATER YEARS 1956 - 2002, BY WATER YEAR (WY)
MEAN 48.4 20.2 15.8 19.7 MAX 396 252 156 76.5(WY) 1957 1988 1998 1964 MIN 0.29 0.47 0.71 1.39(WY) 1981 1997 1962 1985
25.0 30.3 10.9 7.09 31.6 38.2 46.7 64.4152 231 77.7 77.9 303 218 276 3761966 1959 1984 1966 1968 1974 1964 1960 0.76 0.15 0.011 0.000 0.000 0.020 0.23 1.401974 1974 1974 1967 2000 1981 1998 1980
SUMMARY STATISTICS FOR 2001 CALENDAR YEAR FOR 2002 WATER YEAR WATER YEARS 1956 - 2002
ANNUAL TOTAL 5071.42 ANNUAL MEAN 13.9 HIGHEST ANNUAL MEAN LOWEST ANNUAL MEAN HIGHEST DAILY MEAN 381 LOWEST DAILY MEAN 0.00 ANNUAL SEVEN-DAY MINIMUM 0.00MAXIMUM PEAK FLOWMAXIMUM PEAK STAGE 10 PERCENT EXCEEDS 3350 PERCENT EXCEEDS 4.690 PERCENT EXCEEDS 0.11
12920.1635.4 30.2
77.7 19607.97 1977
Sep 15 861 Jul 19 5850 Oct 16 1956 Many days 0.00 Many days 0.00 Many days Apr 19 0.00 Apr 30 0.00 Many days
1320 Jul 19 7700 Oct 16 1956 8.49 Jul 19 e10.20 Aug 28 1964
111 68 6.6 5.2 0.00 0.17
e Estimated

58 ST. JOHNS RIVER BASIN ABOVE OCKLAWAHA RIVER
02232400 ST. JOHNS RIVER NEAR COCOA, FL
LOCATION.--Lat 28° 22'10", long 80° 52'22", in SE1⁄ 4 sec.25, T.24 S., R.34 E., Brevard County, Hydrologic Unit 03080101, on upstream side of State Highway 520 bridge, 0.6 mi upstream from Taylor Creek, 0.7 mi downstream from outlet of Lake Poinsett, 8.8 mi west of Cocoa, and 232 mi upstream from mouth.
DRAINAGE AREA.--1,331 mi2. WATER-DISCHARGE RECORDS
PERIOD OF RECORD.--October 1953 to current year.
GAGE.--Water-stage recorder, acoustic velocity meter, and data-collection platform. Datum of gage is at NGVD of 1929. Prior to Oct. 1, 1959, nonrecording gage at site 3.7 mi east on north shore of Lake Poinsett at datum 5.06 ft higher.
REMARKS.--Records fair. Records include inflow from Taylor Creek.
DISCHARGE, CUBIC FEET PER SECOND, WATER YEAR OCTOBER 2001 TO SEPTEMBER 2002DAILY MEAN VALUES
DAY OCT NOV DEC JAN FEB MAR APR MAY JUN JUL AUG SEP
1 4750 3340 1650 592 2 4650 3230 1570 590 3 4450 3160 1470 507 4 4320 3070 1410 551 5 4410 2930 1350 497
290 605 105 96 50 1230 4520 3610314 463 94 60 38 1910 4670 3830298 321 127 63 31 2150 4660 3360341 428 89 91 12 2520 5220 3660230 321 33 107 4.3 2960 5430 4150
6 4560 3140 1380 4697 4630 3020 1300 448 8 4080 2760 1240 523 9 4350 2590 1250 469 10 4320 2620 1170 401
254 383 121 170 13 2800 5590 4300186 402 129 79 20 3010 5350 4040294 342 71 47 2.4 3160 5250 4040194 365 20 49 -50 3380 5270 3640218 395 73 47 -9.8 3700 5180 3730
11 4230 2630 1190 480 12 4050 2340 1070 400 13 4440 2320 1070 416 14 4060 2150 1080 386 15 3910 2400 1030 423
295 370 67 58 -13 4100 5020 3950314 302 111 83 -12 4810 4880 3570292 386 102 29 -49 5190 4910 3710261 305 152 -0.22 -26 5270 4830 3410 210 298 26 4.2 39 4860 4810 3210
16 3860 2540 994 39517 3540 2670 990 44318 3720 2710 970 42619 3820 2460 894 430 20 3530 2460 860 399
309 184 86 46 53 4960 4790 3040 260 203 138 -11 -28 4830 4670 2790241 250 121 21 -50 4530 4620 2730255 216 69 37 -95 4560 4520 2640 224 204 66 -16 -123 5220 4590 2710
21 3640 2290 838 42622 3250 2340 763 381 23 3640 2150 750 39624 3490 2110 799 34825 3550 1960 759 327
191 231 81 -36 -56 5450 4540 2620 235 212 49 -55 17 5080 4690 2600 188 238 119 35 78 5180 4400 2570179 215 164 27 143 5030 4060 2490233 140 37 33 354 5240 4040 2600
26 3320 1910 637 36927 3530 1920 654 39628 3530 1790 677 398 29 3700 1750 715 35130 3530 1750 666 30531 3640 --- 602 290
360 121 76 -27 754 5110 4270 2530325 223 128 33 865 4860 4700 2290 443 203 90 -49 1050 4760 4410 2090 --- 142 104 2.6 1260 4940 3980 1900--- 181 74 29 1170 4570 4020 1950 --- 151 --- 38 --- 4640 3960 --
TOTAL 122500 74510 31798 13232 MEAN 3952 2484 1026 427 MAX 4750 3340 1650 592 MIN 3250 1750 602 290 CFSM 2.97 1.87 0.77 0.32 IN. 3.42 2.08 0.89 0.37
7434 8800 2722 1090.58 5441.9 130010 145850 93760266 284 90.7 35.2 181 4194 4705 3125443 605 164 170 1260 5450 5590 4300179 121 20 -55 -123 1230 3960 19000.20 0.21 0.07 0.03 0.14 3.15 3.53 2.35 0.21 0.25 0.08 0.03 0.15 3.63 4.08 2.62
STATISTICS OF MONTHLY MEAN DATA FOR WATER YEARS 1954 - 2002, BY WATER YEAR (WY)
MEAN 2157 1536 1025 733 MAX 8873 4571 4364 3240(WY) 1954 2000 1988 1998 MIN 41.0 21.2 42.3 45.0(WY) 1981 1981 1981 2001
691 789 634 369 485 943 1196 1577 4000 4473 3100 1494 3710 4859 4705 50461998 1998 1998 1998 1968 1968 2002 1960 11.2 -27.4 24.9 15.9 4.41 7.47 10.9 65.72001 2001 1999 1999 2000 1981 1981 1980
SUMMARY STATISTICS FOR 2001 CALENDAR YEAR FOR 2002 WATER YEAR WATER YEARS 1954 - 2002
ANNUAL TOTAL 435347.2ANNUAL MEAN 1193 HIGHEST ANNUAL MEAN LOWEST ANNUAL MEAN HIGHEST DAILY MEAN 4760LOWEST DAILY MEAN -125ANNUAL SEVEN-DAY MINIMUM -61MAXIMUM PEAK STAGEANNUAL RUNOFF (CFSM) 0.90ANNUAL RUNOFF (INCHES) 12.1710 PERCENT EXCEEDS 366050 PERCENT EXCEEDS 7590 PERCENT EXCEEDS -8.7
637116.711746 1013
2462 1960 44.5 1981
Sep 26 5590 Aug 6 10700 Oct 11 1953Mar 18 -123 Jun 20 -125 Mar 18 2001Mar 15 -40 Jun 16 -61 Mar 15 2001
15.74 Jul 22 16.96 Oct 11 1953 1.31 0.7617.81 10.34
4640 2470 750 58834 86
Note.--Negative figures indicate reverse flow

---
ST. JOHNS RIVER BASIN ABOVE OCKLAWAHA RIVER 59
02232400 ST. JOHNS RIVER NEAR COCOA, FL--Continued
GAGE HEIGHT, FEET, WATER YEAR OCTOBER 2001 TO SEPTEMBER 2002 DAILY MEAN VALUES
DAY OCT NOV DEC JAN FEB MAR APR MAY JUN JUL AUG SEP
1 15.52 14.47 13.13 11.37 10.74 11.24 10.03 9.28 8.64 13.72 15.47 14.89 2 15.51 14.44 13.06 11.37 10.68 11.31 10.01 9.26 8.63 13.98 15.49 14.88 3 15.50 14.39 12.98 11.31 10.64 11.22 9.96 9.28 8.62 14.17 15.55 14.85 4 15.47 14.34 12.93 11.26 10.56 11.10 9.91 9.25 8.65 14.31 15.58 14.82 5 15.44 14.29 12.89 11.27 10.55 11.02 9.81 9.16 8.65 14.54 15.62 14.96
6 15.40 14.26 12.82 11.25 10.60 11.07 9.78 9.16 8.61 14.72 15.60 15.01 7 15.35 14.23 12.76 11.14 10.52 11.03 9.87 9.14 8.54 14.83 15.60 14.98 8 15.33 14.18 12.73 11.11 10.47 11.02 9.92 9.13 8.59 14.90 15.60 14.96 9 15.30 14.12 12.67 11.09 10.49 10.99 9.84 9.09 8.61 14.97 15.58 14.88
10 15.25 14.05 12.63 11.06 10.51 10.92 9.72 9.05 8.64 15.06 15.54 14.80
11 15.21 13.99 12.57 11.01 10.52 10.90 9.68 9.06 8.61 15.15 15.47 14.71 12 15.15 13.92 12.52 10.97 10.55 10.88 9.74 9.03 8.62 15.26 15.47 14.63 13 15.12 13.89 12.47 10.91 10.52 10.77 9.81 8.92 8.71 15.39 15.48 14.56 14 15.07 13.88 12.42 10.90 10.52 10.78 9.79 8.80 8.80 15.48 15.51 14.47 15 15.02 13.87 12.35 10.96 10.55 10.75 9.83 8.86 9.14 15.53 15.52 14.37
16 14.96 13.91 12.32 10.99 10.51 10.72 9.83 8.91 9.21 15.53 15.50 14.29 17 14.87 13.94 12.25 11.02 10.47 10.66 9.83 8.84 9.33 15.53 15.44 14.21 18 14.82 13.92 12.16 11.00 10.47 10.63 9.80 8.74 9.57 15.52 15.38 14.13 19 14.78 13.88 12.11 11.02 10.52 10.58 9.77 8.70 10.00 15.53 15.31 14.07 20 14.71 13.83 12.03 11.01 10.50 10.53 9.72 8.61 10.53 15.55 15.28 14.00
21 14.69 13.77 11.96 11.00 10.45 10.42 9.70 8.56 11.02 15.63 15.29 13.95 22 14.71 13.73 11.93 10.99 10.44 10.32 9.64 8.52 11.57 15.69 15.26 13.88 23 14.67 13.68 11.90 11.00 10.50 10.30 9.58 8.72 11.99 15.70 15.25 13.81 24 14.66 13.62 11.83 10.98 10.79 10.30 9.62 8.74 12.35 15.69 15.21 13.79 25 14.79 13.54 11.75 10.93 11.02 10.27 9.58 8.70 12.64 15.66 15.16 13.82
26 14.75 13.47 11.66 10.88 11.13 10.24 9.51 8.67 12.85 15.63 15.10 13.83 27 14.68 13.41 11.66 10.86 11.09 10.20 9.52 8.71 13.04 15.60 15.06 13.77 28 14.64 13.34 11.63 10.84 11.14 10.18 9.45 8.55 13.18 15.56 15.04 13.73 29 14.62 13.28 11.57 10.82 --- 10.19 9.34 8.53 13.27 15.52 15.04 13.68 30 14.57 13.21 11.52 10.82 --- 10.19 9.37 8.59 13.42 15.48 14.97 13.63 31 14.52 --- 11.44 10.81 --- 10.11 --- 8.63 15.46 14.92 --
MEAN 15.00 13.89 12.28 11.03 10.62 10.67 9.73 8.88 10.13 15.20 15.36 14.35 MAX 15.52 14.47 13.13 11.37 11.14 11.31 10.03 9.28 13.42 15.70 15.62 15.01 MIN 14.52 13.21 11.44 10.81 10.44 10.11 9.34 8.52 8.54 13.72 14.92 13.63
CAL YR 2001 MEAN 11.23 MAX 15.54 MIN 8.34 WTR YR 2002 MEAN 12.28 MAX 15.70 MIN 8.52

---
------
---
60 ST. JOHNS RIVER ABOVE OCKLAWAHA RIVER
02232400 ST. JOHNS RIVER NEAR COCOA, FL--Continued
WATER-QUALITY RECORDS
PERIOD OF RECORD.--Water years 1953-60, 1962-78, 1980-88, 2000 to 2002.
PERIOD OF DAILY RECORD.-- SPECIFIC CONDUCTANCE: August 2000 to September 2002 (discontinued). WATER TEMPERATURE: August 2000 to September 2002 (discontinued).
INSTRUMENTATION.--Water-quality monitor and data-collection platform.
EXTREMES FOR PERIOD OF DAILY RECORD.--SPECIFIC CONDUCTANCE: Maximum daily mean, 2,640 µS/cm @ 25 ° C, June 9, 2001; minimum daily mean, 317 µS/cm @ 25 ° C, Sept. 21,
2002. WATER TEMPERATURE: Maximum daily mean, 31.7 ° C, July 30, 2001; minimum daily mean, 8.8 ° C, Jan. 1, 2001.
EXTREMES FOR CURRENT YEAR.--SPECIFIC CONDUCTANCE: Maximum daily mean, 1,620 µS/cm @ 25 ° C, May 30; minimum daily mean, 317 µS/cm @ 25 ° C, Sept. 21. WATER TEMPERATURE: Maximum daily mean, 31.1 ° C, July 27,28; minimum daily mean, 11.3 ° C, Jan. 9.
SPECIFIC CONDUCTANCE (MICROSIEMENS/CM AT 25 DEG. C), WATER YEAR OCTOBER 2001 TO SEPTEMBER 2002DAILY MEAN VALUES
DAY OCT NOV DEC JAN FEB MAR APR MAY JUN JUL AUG SEP
1 393 377 438 551 834 924 1020 1200 1560 992 348 332 2 391 382 476 550 833 948 1020 1210 1530 937 352 338 3 378 375 483 566 852 955 1030 1220 --- 934 --- 336 4 374 367 486 573 907 957 1040 1230 --- 854 --- 345 5 367 383 484 577 937 978 1040 1250 --- 772 --- 344
6 370 416 447 571 939 1010 1050 1260 -- 713 -- 344 7 372 434 464 571 943 996 1060 1270 1590 655 -- 352 8 378 400 491 597 910 994 1070 1300 1560 610 -- 319 9 350 402 460 589 910 996 1060 1310 1540 561 -- 322 10 347 398 461 594 909 993 1060 1330 1540 546 347
11 366 405 478 602 904 991 1070 1350 1570 516 354 12 366 412 464 629 908 1000 1050 1370 1580 477 375 13 362 435 467 625 911 1010 1010 1380 873 452 342 354 14 381 424 485 621 910 1010 1000 1390 367 439 336 349 15 379 447 510 617 899 1010 1010 1390 1010 409 352 322
16 379 450 480 623 920 1010 1020 1410 568 400 326 337 17 378 400 482 638 929 985 1030 1430 322 395 332 342 18 361 409 506 652 925 993 1040 1440 820 390 351 348 19 350 407 508 658 925 982 1050 1430 1420 384 358 330 20 348 404 527 675 926 982 1070 1420 1160 378 350 326
21 350 433 572 678 927 980 1080 1420 873 363 346 317 22 347 434 604 690 923 984 1090 1450 708 357 326 331 23 355 434 575 695 916 986 1100 1470 627 355 325 357 24 360 428 548 722 959 988 1110 1500 393 347 320 358 25 360 452 564 728 952 998 1120 1520 708 346 325 354
26 366 455 576 751 966 1000 1130 1540 890 342 336 395 27 391 461 584 766 953 996 1150 1550 949 347 344 430 28 384 450 561 768 942 999 1160 1580 1000 349 349 369 29 369 445 552 791 --- 1020 1170 1600 1030 345 341 368 30 373 459 550 829 --- 1020 1180 1620 1040 347 339 376 31 363 --- 542 833 --- 1030 --- 1600 341 333 --
MEAN 368 419 510 656 917 991 1070 1400 --- 505 --- 349 MAX 393 461 604 833 966 1030 1180 1620 -- 992 -- 430 MIN 347 367 438 550 833 924 1000 1200 --- 341 --- 317
CAL YR 2001 MEAN 1290 MAX 2640 MIN 347

---
ST. JOHNS RIVER ABOVE OCKLAWAHA RIVER 61
02232400 ST. JOHNS RIVER NEAR COCOA, FL--Continued
TEMPERATURE, WATER (DEG. C), WATER YEAR OCTOBER 2001 TO SEPTEMBER 2002 DAILY MEAN VALUES
DAY OCT NOV DEC JAN FEB MAR APR MAY JUN JUL AUG SEP
1 24.9 21.3 22.9 15.7 24.1 15.4 25.8 28.6 27.7 27.6 30.3 29.3 2 24.3 22.3 22.9 15.3 23.9 17.3 26.3 28.8 29.1 27.4 30.0 29.3 3 24.6 23.1 22.8 14.8 22.9 20.0 26.2 29.1 30.6 28.0 29.7 29.3 4 25.1 23.3 22.9 11.8 21.5 19.1 25.3 29.5 31.0 28.4 29.9 29.1 5 25.8 22.7 22.8 11.4 18.5 15.7 25.4 29.4 30.3 27.9 29.9 28.7
6 26.4 21.7 23.0 13.0 18.3 16.4 23.3 28.9 30.1 28.4 30.1 28.9 7 26.5 21.3 23.2 13.1 19.1 17.5 22.4 27.9 29.3 29.2 29.7 29.3 8 26.1 21.5 23.4 11.7 17.9 18.8 21.9 28.5 27.7 29.2 29.2 29.3 9 24.8 21.2 23.7 11.3 18.0 21.3 22.9 28.1 27.8 28.6 28.9 29.5 10 24.1 21.1 23.9 12.2 19.8 22.8 23.7 28.2 27.9 28.4 28.5 29.7
11 24.1 20.9 24.0 13.5 20.1 22.4 23.9 28.4 28.6 28.3 28.3 29.0 12 24.7 20.8 24.3 14.4 19.8 22.9 23.2 27.9 29.1 28.1 28.4 28.4 13 25.1 20.5 24.3 15.5 19.2 23.0 23.3 28.2 28.3 27.9 28.1 28.3 14 25.6 20.8 24.6 15.6 17.9 22.6 24.3 28.1 27.2 28.6 28.2 28.6 15 26.0 20.6 24.9 16.5 18.0 23.7 24.4 25.6 26.9 29.1 28.6 29.1
16 25.9 20.3 24.7 16.2 19.6 25.4 26.4 25.2 26.8 29.6 29.1 29.9 17 24.8 20.6 23.7 17.3 18.7 26.1 26.7 26.5 26.4 30.1 29.7 30.1 18 23.7 21.2 23.2 18.7 17.4 26.3 27.4 27.9 25.4 30.4 30.3 29.9 19 24.0 21.2 22.0 18.8 17.4 26.1 27.4 27.4 24.8 30.2 30.2 30.1 20 24.7 21.3 20.7 19.9 18.5 25.7 27.4 25.2 24.8 30.1 29.8 29.9
21 25.0 21.3 18.9 20.6 20.2 25.3 28.2 24.1 24.8 29.2 29.5 29.7 22 25.0 21.5 18.1 21.4 20.9 24.4 28.6 23.6 24.9 29.1 29.3 29.4 23 25.3 21.8 18.5 22.4 19.6 22.1 28.8 24.2 24.9 29.7 29.5 29.2 24 25.7 22.3 19.2 22.8 17.4 22.4 27.6 25.1 25.0 30.1 29.7 29.1 25 25.6 22.9 18.2 23.1 17.8 24.1 26.8 25.4 26.3 30.4 30.1 28.9
26 24.9 23.3 16.4 23.4 19.5 25.4 27.0 26.0 26.4 30.8 29.7 28.6 27 22.4 23.4 14.4 22.9 18.9 25.3 27.9 27.0 26.9 31.1 29.2 28.8 28 20.4 23.3 14.7 23.1 15.8 25.5 27.6 27.9 28.3 31.1 29.0 29.4 29 19.8 23.3 16.1 23.6 --- 25.9 27.8 27.5 28.8 30.9 28.9 29.3 30 20.3 23.1 16.7 24.1 --- 25.8 27.8 28.2 28.5 30.8 29.2 29.1 31 20.7 --- 16.5 24.2 --- 25.9 --- 28.3 30.6 29.2 --
MEAN 24.4 21.8 21.1 17.7 19.3 22.6 25.9 27.2 27.5 29.3 29.4 29.2 MAX 26.5 23.4 24.9 24.2 24.1 26.3 28.8 29.5 31.0 31.1 30.3 30.1 MIN 19.8 20.3 14.4 11.3 15.8 15.4 21.9 23.6 24.8 27.4 28.1 28.3
CAL YR 2001 MEAN 24.1 MAX 31.7 MIN 8.8 WTR YR 2002 MEAN 24.6 MAX 31.1 MIN 11.3

62 ST. JOHNS RIVER ABOVE OCKLAWAHA RIVER
02232400 ST. JOHNS RIVER NEAR COCOA, FL--Continued
WATER-QUALITY DATA, WATER YEAR OCTOBER 2001 TO SEPTEMBER 2002
DIS SPE PH PH RESIDUE NITRO CHARGE, SPE CIFIC WATER WATER TOTAL GEN, INST. CIFIC CON WHOLE WHOLE COLOR AT 105 AMMONIA CUBIC CON DUCT- FIELD LAB TEMPER- TUR (PLAT OXYGEN, DEG. C, DIS FEET GAGE DUCT ANCE (STAND- (STAND ATURE BID INUM- DIS SUS SOLVED
Date Time PER HEIGHT ANCE LAB ARD ARD WATER ITY COBALT SOLVED PENDED (MG/L SECOND (FEET) (US/CM) (US/CM) UNITS) UNITS) (DEG C) (NTU) UNITS) (MG/L) (MG/L) AS N)
(00061) (00065) (00095) (90095) (00400) (00403) (00010) (00076) (00080) (00300) (00530) (00608)
OCT 10... 1130 4710 15.26 351 356 7.2 7.1 24.0 1.7 320 6.7 6 .10 24... 0950 4100 14.63 364 361 6.9 7.3 25.4 .27 240 4.5 3 .16 NOV 05... 1335 2780 14.27 403 387 7.4 7.8 22.7 .28 200 6.9 <1 .11 20... 1400 2000 13.82 394 402 7.6 7.3 21.5 1.6 240 7.7 <1 .05 DEC 05... 0949 1870 12.88 459 464 7.3 7.7 22.4 .93 200 6.9 <1 .10 18... 1255 1080 12.15 512 507 7.8 7.7 23.2 .95 200 7.5 <1 .11 JAN 03... 1015 431 11.24 558 552 7.3 7.9 14.9 2.6 240 8.7 1 .08 15... 1035 374 10.94 620 626 7.7 7.6 16.5 2.2 140 9.3 4 .03 29... 1215 -11 10.80 791 779 7.6 7.7 23.6 5.5 160 7.4 8 <.01 FEB 12... 1029 389 10.55 920 904 7.5 7.7 19.3 5.0 120 8.8 12 .04 27... 1050 410 11.01 948 947 7.8 7.7 18.8 4.5 120 9.0 7 .05 MAR 13... 1420 359 10.67 1020 1010 7.7 7.5 23.5 9.8 100 7.7 26 .05 27... 1058 244 10.21 1000 978 7.5 7.6 24.6 6.1 100 6.5 13 .01 APR 10... 1325 290 9.81 1050 1040 7.5 7.7 24.2 6.6 100 7.7 10 .03 24... 0858 -9.3 9.57 1090 1080 7.4 7.7 26.4 5.7 100 5.8 13 .07 MAY 07... 1128 100 9.16 1250 1250 7.9 7.8 29.0 5.2 100 6.3 10 .02 22... 0916 -346 8.54 1450 1440 7.3 7.5 22.7 11 80 7.5 28 .15 JUN 05... 1325 92 8.72 1550 1530 8.4 7.8 30.6 13 100 6.6 19 .02 18... 0950 -183 9.52 313 343 6.6 6.8 25.8 8.6 160 9.1 20 .19 JUL 01... 1032 1070 13.68 1020 976 7.8 7.5 27.7 5.0 100 6.0 10 .02 16... 0925 5970 15.52 396 392 6.1 7.1 29.3 1.1 320 1.1 4 .31 30... 0955 3800 15.48 349 354 6.8 7.3 30.4 2.7 240 .9 7 .16 AUG 13... 0918 4670 15.45 352 345 7.2 7.5 28.0 4.1 280 4.4 3 .23 28... 1245 3540 15.01 361 350 7.0 7.5 29.4 2.5 280 3.6 4 .18 SEP 10... 0955 4270 14.81 347 336 7.2 7.8 29.4 1.4 240 4.0 2 .19 25... 1155 2140 13.81 363 347 6.6 7.4 29.1 1.9 240 6.0 1 .19
< -- Less than Negative figures indicate reverse flow

63 ST. JOHNS RIVER ABOVE OCKLAWAHA RIVER
02232400 ST. JOHNS RIVER NEAR COCOA, FL--Continued
WATER-QUALITY DATA, WATER YEAR OCTOBER 2001 TO SEPTEMBER 2002
NITRO NITRO NITRO ORTHO NITRO GEN, GEN,AM- GEN, PHOS- CARBON, PHOS- HARD MAGNEGEN, NITRITE MONIA + NO2+NO3 PHOS PHATE, ORGANIC PHORUS NESS CALCIUM SIUM, SODIUM,
AMMONIA DIS ORGANIC DIS PHORUS DIS DIS SULFIDE ORTHO TOTAL DIS DIS DIS TOTAL SOLVED TOTAL SOLVED TOTAL SOLVED SOLVED TOTAL TOTAL (MG/L SOLVED SOLVED SOLVED
Date (MG/L (MG/L (MG/L (MG/L (MG/L (MG/L (MG/L (MG/L (MG/L AS (MG/L (MG/L (MG/L AS N) AS N) AS N) AS N) AS P) AS P) AS C) AS S) AS P) CACO3) AS CA) AS MG) AS NA) (00610) (00613) (00625) (00631) (00665) (00671) (00681) (00745) (70507) (00900) (00915) (00925) (00930)
OCT 10... .11 <.010 E1.9 <.02 .06 .05 42.0 3.0 .050 99 29.0 6.20 30.0 24... .16 <.010 E1.3 .03 E.06 .05 30.0 2.0 .050 100 29.0 6.40 30.0 NOV 05... .11 <.010 E1.7 .06 E.05 .04 33.0 1.0 .040 100 30.0 7.00 34.0 20... .06 <.010 E1.4 .08 E.04 .03 29.0 2.0 .030 110 31.0 7.20 34.0 DEC 05... .10 <.010 E1.5 .06 E.06 .04 28.0 2.0 .040 120 34.0 8.00 42.0 18... .11 <.010 1.9 .15 .06 .04 29.0 2.0 .040 130 38.0 8.80 46.0 JAN 03... .09 <.010 1.7 .24 .04 .02 30.0 2.0 .020 140 41.0 9.70 52.0 15... .05 <.010 1.8 .20 .05 .01 31.0 1.0 .010 160 44.0 11.0 58.0 29... .03 <.010 2.1 <.02 .03 <.01 28.0 1.0 .010 200 53.0 15.0 71.0 FEB 12... .06 <.010 1.9 <.02 .04 <.01 2.2 2.0 <.010 220 60.0 17.0 91.0 27... .12 <.010 1.6 .03 .06 .02 25.0 1.0 .020 230 64.0 17.0 92.0 MAR 13... .06 <.010 2.1 <.02 .06 <.01 24.0 <1.0 <.010 250 70.0 18.0 98.0 27... .04 <.010 1.7 <.02 .03 <.01 24.0 1.0 <.010 240 68.0 17.0 93.0 APR 10... .03 <.010 1.7 <.02 .05 <.01 25.0 2.0 .010 260 73.0 19.0 100 24... .09 <.010 1.8 <.02 .04 .01 24.0 1.0 .010 260 73.0 19.0 110 MAY 07... .04 <.010 2.1 <.02 .05 <.01 29.0 3.0 <.010 300 83.0 22.0 130 22... .18 <.010 3.0 .03 .08 <.01 29.0 1.0 .020 330 93.0 24.0 150 JUN 05... .02 <.010 2.0 <.02 .07 <.01 30.0 1.0 .010 370 100 27.0 160 18... .20 .010 1.7 .02 .09 .02 24.0 2.0 .030 82 23.0 5.80 33.0 JUL 01... .04 <.010 1.8 <.02 .05 <.01 19.0 <1.0 <.010 230 63.0 17.0 98.0 16... .31 .010 2.2 <.02 .42 .37 30.0 3.0 .390 110 31.0 6.80 33.0 30... E.20 .010 3.9 <.02 .24 .22 29.0 2.0 E.250 100 30.0 6.20 29.0 AUG 13... .22 .020 2.1 .03 .14 .11 28.0 2.0 .120 99 29.0 6.30 28.0 28... .19 .010 1.9 <.02 .12 .09 27.0 2.0 .100 100 30.0 6.50 29.0 SEP 10... .20 .010 1.7 .04 .12 .06 24.0 3.0 .060 95 28.0 5.90 28.0 25... .20 .020 1.7 .08 .06 .05 24.0 2.0 .060 98 29.0 6.10 29.0
< -- Less than E -- Estimated value

64 ST. JOHNS RIVER ABOVE OCKLAWAHA RIVER
02232400 ST. JOHNS RIVER NEAR COCOA, FL--Continued
WATER-QUALITY DATA, WATER YEAR OCTOBER 2001 TO SEPTEMBER 2002
ANC SOLIDS, CHLOR-A POTAS UNFLTRD CHLO- SILICA, RESIDUE PHYTO STRON IRON, SIUM, TIT 4.5 SULFATE RIDE, DIS AT 180 PLANK BROMIDE BARIUM, TIUM, TOTAL IRON, DIS LAB DIS DIS SOLVED DEG. C TON DIS DIS DIS RECOV DIS
SOLVED (MG/L SOLVED SOLVED (MG/L DIS CHROMO SOLVED SOLVED SOLVED ERABLE SOLVED Date (MG/L AS (MG/L (MG/L AS SOLVED FLUOROM (MG/L (UG/L (UG/L (UG/L (UG/L
AS K) CACO3) AS SO4) AS CL) SIO2) (MG/L) (UG/L) AS BR) AS BA) AS SR) AS FE) AS FE) (00935) (90410) (00945) (00940) (00955) (70300) (70953) (71870) (01005) (01080) (01045) (01046)
OCT 10... 3.70 E56 15.0 61.0 8.20 267 7.2 .3 20.0 750 496 335 24... 3.70 E54 16.0 63.0 7.60 267 <.1 .3 20.0 760 441 358 NOV 05... 3.80 E56 19.0 70.0 7.60 286 <.1 .4 20.0 830 399 332 20... 3.60 E56 19.0 73.0 7.00 287 <.1 .4 20.0 840 367 280 DEC 05... 3.60 E60 21.0 88.0 6.20 315 4.3 .4 21.0 940 360 296 18... 3.70 63 24.0 97.0 6.60 E344 5.2 .4 25.0 1050 374 273 JAN 03... 3.80 65 30.0 109 6.90 382 3.1 .4 27.0 1150 341 260 15... 3.70 64 44.0 124 6.30 421 <.1 .6 27.0 1330 330 249 29... 3.70 70 64.0 156 2.00 494 16.0 .8 35.0 1700 360 223 FEB 12... 4.30 71 85.0 183 .08 605 <.1 .7 40.0 2070 390 163 27... 4.00 66 103 187 1.10 649 13.0 .7 43.0 2100 318 131
MAR 13... 4.40 64 117 199 .50 676 19.0 .8 45.0 2370 540 106 27... 4.40 66 111 193 .27 610 15.0 .8 45.0 2310 280 95
APR 10... 4.70 72 111 212 .36 705 7.7 .8 47.0 2470 287 63 24... 4.70 71 118 220 .45 721 12.0 .9 51.0 2570 252 65
MAY 07... 5.30 81 128 258 .39 815 13.0 1.1 58.0 2930 183 42 22... 6.20 90 135 315 .86 918 38.0 1.2 64.0 3280 347 37
JUN 05... 6.40 90 142 340 1.10 1060 52.0 1.2 72.0 3670 333 20 18... 2.30 28 31.0 62.0 3.50 244 7.7 .2 18.0 510 573 295 JUL 01... 4.10 50 120 192 2.90 611 18.0 .6 46.0 2450 368 121 16... 5.00 57 23.0 67.0 8.10 285 8.7 .3 24.0 900 992 635 30... 5.10 66 12.0 58.0 10.0 277 26.0 .3 24.0 790 772 541 AUG 13... 4.60 68 11.0 54.0 11.0 260 13.0 .3 23.0 770 567 465 28... 4.10 68 11.0 57.0 11.0 254 12.0 .3 24.0 800 536 428 SEP 10... 3.60 61 12.0 54.0 9.70 238 <.1 .4 22.0 750 443 348 25... 3.30 60 13.0 57.0 9.20 244 <.1 .3 22.0 760 455 371
< -- Less than E -- Estimated value

65 ST. JOHNS RIVER BASIN ABOVE OCKLAWAHA RIVER
02232415 TAYLOR CREEK NEAR COCOA, FL
LOCATION.--Lat 28° 21'08", long 80° 55'43", in SW1⁄ 4 sec.33, T.24 S., R.34 E., Orange County, Hydrologic Unit 03080101, near right bank on downstream side of bridge on State Highway 532, 1.0 mi downstream from structure 164, 3.5 mi upstream from mouth, and 10.8 mi west of Cocoa.
DRAINAGE AREA.--55.1 mi2.
PERIOD OF RECORD.--1960, 1967, 1972, 1982, 1984, 1985, 1994 (one to five discharge measurements each year), January 1997 to September 2002 (discontinued).
GAGE.--Water-stage recorder and data-collection platform. Datum of gage is at NGVD of 1929 (Florida Department of Natural Resources bench mark).
REMARKS.--Records fair. Flow regulated by structure 164.
DISCHARGE, CUBIC FEET PER SECOND, WATER YEAR OCTOBER 2001 TO SEPTEMBER 2002DAILY MEAN VALUES
DAY OCT NOV DEC JAN FEB MAR APR MAY JUN JUL AUG SEP
1 199 232 1.3 1.6 2 196 228 1.3 1.8 3 194 226 1.2 2.6 4 161 221 1.4 2.1 5 102 221 2.1 2.0
1.4 1.2 0.78 0.74 0.72 469 244 216 1.4 1.3 0.75 0.68 0.61 459 234 211 1.4 1.2 0.75 0.64 0.55 453 239 203 1.3 1.2 0.77 0.64 0.51 434 241 200 1.1 1.2 0.75 0.65 0.54 407 235 217
6 100 215 2.3 1.97 98 162 2.3 1.88 104 5.8 2.3 1.7 9 103 2.2 2.5 1.610 100 1.8 2.4 1.6
1.1 1.2 0.70 0.69 0.56 418 221 2201.1 1.2 0.66 0.69 0.61 404 225 210 1.1 1.2 0.65 0.66 0.67 383 217 212 1.1 1.1 11 0.65 0.58 370 204 203 1.2 1.1 1.9 0.65 11 347 189 164
11 98 1.6 2.3 1.612 73 1.6 2.2 1.613 5.3 1.6 2.2 1.614 2.6 2.8 2.1 1.715 3.4 3.4 2.1 4.0
1.4 1.1 1.1 0.65 85 333 178 761.2 1.1 1.2 0.63 89 328 174 14 1.2 1.1 1.2 0.62 87 322 216 16 1.1 7.3 1.1 0.65 95 311 284 17 1.0 2.5 1.1 0.61 96 294 318 13
16 2.6 2.5 2.0 3.117 2.0 2.0 2.0 2.418 1.8 1.8 1.9 2.219 1.7 1.7 1.8 2.020 1.8 1.7 1.7 1.9
1.1 1.3 0.95 0.59 90 273 323 121.1 1.1 0.87 0.67 90 253 310 111.0 1.1 0.84 0.68 124 235 292 171.0 1.1 0.80 0.79 193 243 291 6.91.1 1.0 0.77 0.73 223 294 367 5.7
21 2.3 1.6 1.6 1.822 7.8 1.5 1.6 1.823 6.2 1.4 1.6 1.7 24 53 1.6 1.6 1.7 25 162 1.6 1.6 1.6
0.96 0.98 0.78 0.65 276 360 507 5.61.5 0.86 0.77 0.65 340 414 611 5.3
12 0.80 0.75 0.69 461 493 562 5.5 21 0.79 0.72 0.71 573 513 512 104.4 0.72 0.67 0.65 566 482 469 79
26 149 1.5 1.7 1.527 139 1.5 1.7 1.528 135 1.4 1.6 1.529 133 1.4 1.6 1.5 30 165 1.3 1.6 1.5 31 239 --- 1.6 1.4
1.3 0.73 0.73 0.61 556 441 426 1841.3 0.80 0.75 0.58 559 400 385 2341.2 0.78 0.74 0.55 522 360 358 282 --- 0.75 0.73 0.57 476 320 341 230 --- 0.76 0.75 0.57 459 287 286 105 --- 0.77 --- 0.71 --- 262 223 --
TOTAL 2740.5 1550.3 57.2 58.3 MEAN 88.4 51.7 1.85 1.88 MAX 239 232 2.5 4.0 MIN 1.7 1.3 1.2 1.4CFSM 1.63 0.95 0.03 0.03 IN. 1.88 1.06 0.04 0.04
67.06 39.34 36.03 20.25 5976.35 11362 9682 3385.0 2.40 1.27 1.20 0.65 199 367 312 113 21 7.3 11 0.79 573 513 611 282
0.96 0.72 0.65 0.55 0.51 235 174 5.30.04 0.02 0.02 0.01 3.67 6.75 5.75 2.08 0.05 0.03 0.02 0.01 4.09 7.78 6.63 2.32
STATISTICS OF MONTHLY MEAN DATA FOR WATER YEARS 1997 - 2002, BY WATER YEAR (WY)
MEAN 183 15.9 60.6 37.4 MAX 734 51.7 298 183 (WY) 2000 2002 1998 1998 MIN 0.053 0.28 0.28 0.11(WY) 1998 2001 2001 2001
59.1 37.3 3.58 9.34 47.3 91.9 86.5 52.4353 222 19.3 54.5 199 367 312 1131998 1998 1998 1998 2002 2002 2002 20020.000 0.000 0.000 0.000 0.000 0.18 0.18 0.0021997 1997 1997 1997 2000 1997 1997 1997
SUMMARY STATISTICS FOR 2001 CALENDAR YEAR FOR 2002 WATER YEAR WATER YEARS 1997 - 2002
ANNUAL TOTAL 16750.25ANNUAL MEAN 45.9 HIGHEST ANNUAL MEAN LOWEST ANNUAL MEAN HIGHEST DAILY MEAN 288 LOWEST DAILY MEAN 0.00 ANNUAL SEVEN-DAY MINIMUM 0.00MAXIMUM PEAK FLOW MAXIMUM PEAK STAGEANNUAL RUNOFF (CFSM) 0.85ANNUAL RUNOFF (INCHES) 11.4810 PERCENT EXCEEDS 21650 PERCENT EXCEEDS 0.2890 PERCENT EXCEEDS 0.00
34974.3395.8 63.7
95.8 2002 18.8 1999
Jul 15 611 Aug 22 1110 Dec 16 1997 Many days 0.51 Jun 4 0.00 Many days Mar 9 0.57 Jun 3 0.00 Many days
638 Aug 21,22 1170 Dec 15 1997 21.95 Aug 21,22 22.44 Dec 15 1997 1.76 1.1723.96 15.95
340 230 1.9 1.0 0.69 0.07

66 ST. JOHNS RIVER BASIN ABOVE OCKLAWAHA RIVER
02232500 ST. JOHNS RIVER NEAR CHRISTMAS, FL
LOCATION.--Lat 28° 32'34", long 80° 56'37", in SW1⁄ 4 sec.29, T.22 S., R.34 E., Orange County, Hydrologic Unit 03080101, on downstream side of bridge on State Highway 50, 0.3 mi upstream from Tootoosahatchee Creek, 2 mi upstream from Lake Cone, 4.5 mi east of Christmas, and 209 mi upstream from mouth.
DRAINAGE AREA.--1,539 mi2, includes that of Tootoosahatchee Creek.
WATER-DISCHARGE RECORDS
PERIOD OF RECORD.--October 1933 to current year. Prior to January 1934, monthly discharge only, published in WSP 1304.
GAGE.--Water-stage recorder, acoustic velocity meter, and data-collection platform. Datum of gage is 1.62 ft above NGVD of 1929. Prior to July 23, 1934, nonrecording gage at same site and datum.
REMARKS.--Records fair.
DISCHARGE, CUBIC FEET PER SECOND, WATER YEAR OCTOBER 2001 TO SEPTEMBER 2002DAILY MEAN VALUES
DAY OCT NOV DEC JAN FEB MAR APR MAY JUN JUL AUG SEP
1 4740 3720 2000 696 2 4750 3720 1910 683 3 4660 3660 1860 709 4 4380 3570 1860 713 5 4390 3470 1830 649
441 965 257 145 45 2010 4820 4430421 867 235 146 65 2400 5140 4430422 767 224 120 67 2930 5070 4360419 777 221 113 59 3130 5190 4550394 717 205 112 65 3170 5350 4550
6 4370 3430 1760 618 7 4360 3280 1650 605 8 4570 3120 1590 589 9 4650 3080 1530 572 10 4530 3050 1490 560
374 656 199 104 56 3240 5260 4620373 592 188 114 57 3350 5230 4610379 544 184 103 103 3380 5090 4690361 530 180 98 82 3430 5130 4620362 537 182 105 81 3610 5040 4560
11 4220 2940 1390 52512 4200 2890 1370 49313 4170 2820 1330 48114 3990 2850 1300 49615 3980 2860 1280 585
396 489 174 89 73 3610 5020 4430409 461 183 86 90 3730 5130 4230395 464 187 88 66 3940 5310 4230395 446 200 88 82 4130 5820 4110360 404 196 70 91 4300 6030 3950
16 3900 2870 1270 620 17 3880 2890 1210 587 18 3800 2900 1120 562 19 3770 2780 1110 548 20 3730 2720 1070 565
382 396 199 66 109 4370 6120 3770382 376 179 75 145 4530 5960 3650364 361 189 101 213 4540 5670 3570341 363 168 101 428 4460 5440 3450350 348 180 93 639 4530 5450 3270
21 3760 2750 1040 539 22 3930 2650 1010 523 23 3750 2630 954 529 24 3870 2630 914 501 25 4140 2480 911 512
350 354 179 83 745 4680 5520 3240369 343 195 71 933 4670 5630 3180 509 315 162 43 1200 4890 5580 3070 841 261 156 62 1500 5330 5390 3010 954 251 162 61 1630 5440 5120 3040
26 4350 2360 875 51327 4470 2290 845 48828 4450 2220 804 463 29 4210 2110 763 440 30 3970 2050 755 454 31 3920 --- 725 439
1060 262 161 65 1760 5360 4980 3160 1070 307 161 57 1910 5280 4870 3080 1040 273 149 51 1950 5210 4800 3180 --- 261 152 53 1850 5010 4750 3100 --- 247 138 44 1860 4890 4650 3000 --- 235 --- 47 --- 4850 4520 --
TOTAL 129860 86790 39526 17257 MEAN 4189 2893 1275 557 MAX 4750 3720 2000 713 MIN 3730 2050 725 439 MED 4200 2870 1270 548 CFSM 2.72 1.88 0.83 0.36 IN. 3.14 2.10 0.96 0.42
13913 14169 5545 2654 17954 128400 163080 115140497 457 185 85.6 598 4142 5261 3838
1070 965 257 146 1950 5440 6120 4690341 235 138 43 45 2010 4520 3000394 396 183 88 106 4370 5190 38600.32 0.30 0.12 0.06 0.39 2.69 3.42 2.49 0.34 0.34 0.13 0.06 0.43 3.10 3.94 2.78
STATISTICS OF MONTHLY MEAN DATA FOR WATER YEARS 1934 - 2002, BY WATER YEAR (WY)
MEAN 2725 1965 1304 989 MAX 10130 4928 4174 3949(WY) 1954 1957 1988 1998MIN 67.5 38.7 81.8 70.0(WY) 1981 1981 1962 1962
889 953 777 421 639 1210 1546 2113 4230 4739 4072 1715 5461 6809 5261 80621998 1960 1960 1998 1968 1968 2002 195366.4 16.4 -30.3 15.3 8.45 8.34 32.3 1712001 1939 1999 1981 2000 1981 1981 1950
SUMMARY STATISTICS FOR 2001 CALENDAR YEAR FOR 2002 WATER YEAR WATER YEARS 1934 - 2002
ANNUAL TOTAL 467940.24 ANNUAL MEAN 1282 HIGHEST ANNUAL MEAN LOWEST ANNUAL MEAN HIGHEST DAILY MEAN 5790LOWEST DAILY MEAN -2.7ANNUAL SEVEN-DAY MINIMUM 8.7 MAXIMUM PEAK FLOWMAXIMUM PEAK STAGE ANNUAL RUNOFF (CFSM) 0.83ANNUAL RUNOFF (INCHES) 11.3110 PERCENT EXCEEDS 397050 PERCENT EXCEEDS 15190 PERCENT EXCEEDS 36
7342882012 1296
2978 1960 84.4 1981
Sep 16 6120 Aug 16 11600 Oct 11 1953Jun 4 43 May 23 -137 Apr 24 1999Jun 4 52 May 26 -82 Apr 24 1999
11700 Oct 12 1953 8.94 Aug 15 10.81 Sep 28 1960 1.31 0.8417.75 11.44
4810 31101060 808 102 108
Note.--Negative figures indicate reverse flow

---
ST. JOHNS RIVER BASIN ABOVE OCKLAWAHA RIVER 67
02232500 ST. JOHNS RIVER NEAR CHRISTMAS, FL--Continued
GAGE HEIGHT, FEET, WATER YEAR OCTOBER 2001 TO SEPTEMBER 2002 DAILY MEAN VALUES
DAY OCT NOV DEC JAN FEB MAR APR MAY JUN JUL AUG SEP
1 8.59 7.74 6.55 4.47 3.47 5.05 2.55 1.63 0.98 6.63 8.24 8.37 2 8.59 7.69 6.49 4.46 3.43 4.91 2.49 1.58 0.95 6.77 8.30 8.37 3 8.56 7.65 6.42 4.54 3.37 4.74 2.42 1.53 0.92 6.96 8.37 8.33 4 8.52 7.59 6.39 4.50 3.30 4.59 2.37 1.50 0.89 7.06 8.41 8.36 5 8.46 7.54 6.34 4.43 3.23 4.45 2.32 1.47 0.88 7.13 8.50 8.43
6 8.41 7.51 6.28 4.34 3.17 4.32 2.24 1.44 0.87 7.17 8.49 8.42 7 8.35 7.46 6.21 4.27 3.13 4.17 2.17 1.39 0.93 7.21 8.47 8.42 8 8.36 7.39 6.16 4.21 3.17 4.08 2.13 1.36 1.27 7.27 8.47 8.42 9 8.34 7.33 6.10 4.12 3.14 3.99 2.13 1.33 1.28 7.35 8.46 8.40 10 8.27 7.27 6.05 4.05 3.12 3.90 2.12 1.30 1.19 7.45 8.43 8.36
11 8.21 7.22 5.99 3.98 3.18 3.82 2.08 1.27 1.14 7.51 8.42 8.31 12 8.15 7.16 5.93 3.92 3.18 3.73 2.07 1.25 1.12 7.59 8.49 8.24 13 8.12 7.13 5.87 3.85 3.16 3.67 2.13 1.22 1.06 7.69 8.60 8.17 14 8.07 7.16 5.81 3.82 3.14 3.62 2.14 1.21 1.03 7.79 8.79 8.09 15 8.03 7.14 5.75 4.01 3.12 3.53 2.17 1.19 1.13 7.85 8.91 7.99
16 7.98 7.16 5.71 4.13 3.10 3.45 2.17 1.11 1.33 7.89 8.91 7.90 17 7.93 7.18 5.64 4.12 3.09 3.39 2.20 1.16 1.53 7.92 8.87 7.80 18 7.89 7.16 5.57 4.07 3.06 3.32 2.19 1.28 1.99 7.94 8.81 7.70 19 7.85 7.14 5.51 4.04 3.02 3.24 2.15 1.34 2.96 7.95 8.76 7.61 20 7.81 7.11 5.42 4.01 2.99 3.17 2.11 1.36 3.85 7.98 8.75 7.53
21 7.83 7.08 5.34 3.98 2.98 3.09 2.06 1.20 4.39 8.04 8.79 7.48 22 7.89 7.05 5.26 3.95 3.11 3.02 2.01 1.05 4.85 8.13 8.83 7.40 23 7.88 7.00 5.18 3.91 3.68 2.90 1.96 0.95 5.39 8.26 8.83 7.32 24 7.88 6.96 5.09 3.86 4.67 2.80 1.90 0.91 5.86 8.35 8.79 7.31 25 7.97 6.90 5.02 3.82 5.01 2.74 1.85 0.94 6.11 8.38 8.72 7.32
26 8.01 6.85 4.95 3.77 5.21 2.70 1.84 0.94 6.26 8.38 8.64 7.34 27 8.03 6.80 4.89 3.71 5.22 2.76 1.83 0.92 6.35 8.35 8.56 7.32 28 8.02 6.74 4.79 3.66 5.17 2.77 1.78 0.90 6.38 8.31 8.49 7.32 29 7.97 6.68 4.70 3.61 --- 2.71 1.73 0.88 6.40 8.27 8.43 7.26 30 7.89 6.62 4.63 3.57 --- 2.65 1.68 0.83 6.45 8.22 8.37 7.20 31 7.82 --- 4.55 3.52 --- 2.60 --- 0.90 8.21 8.36 --
MEAN 8.12 7.18 5.63 4.02 3.52 3.54 2.10 1.20 2.86 7.74 8.59 7.88 MAX 8.59 7.74 6.55 4.54 5.22 5.05 2.55 1.63 6.45 8.38 8.91 8.43 MIN 7.81 6.62 4.55 3.52 2.98 2.60 1.68 0.83 0.87 6.63 8.24 7.20
CAL YR 2001 MEAN 4.07 MAX 8.72 MIN 0.86 WTR YR 2002 MEAN 5.22 MAX 8.91 MIN 0.83

---
---------------
---------------
---------------
------------
---
------
68 ST. JOHNS RIVER ABOVE OCKLAWAHA RIVER
02232500 ST. JOHNS RIVER NEAR CHRISTMAS, FL--Continued
WATER-QUALITY RECORDS
PERIOD OF RECORD.--Water years 1952-58, 1960-62, 1965-76, 1979-84, 2000 to 2002.
PERIOD OF DAILY RECORD.-- SPECIFIC CONDUCTANCE: August 2000 to September 2002 (discontinued). WATER TEMPERATURE: August 2000 to September 2002 (discontinued).
INSTRUMENTATION.--Water-quality monitor and data-collection platform.
EXTREMES FOR PERIOD OF DAILY RECORD.--SPECIFIC CONDUCTANCE: Maximum daily mean, 5,310 µS/cm @ 25 ° C, June 18, 2001; minimum daily mean, 315 µS/cm @ 25 ° C, Aug. 23,
2002. WATER TEMPERATURE: Maximum daily mean, 31.8 ° C, July 28,29, 2002; minimum daily mean, 9.7 ° C, Jan. 3, 2001.
EXTREMES FOR CURRENT YEAR.--SPECIFIC CONDUCTANCE: Maximum daily mean, 3,270 µS/cm @ 25 ° C, June 12; minimum daily mean, 315 µS/cm @ 25 ° C, Aug. 23. WATER TEMPERATURE: Maximum daily mean, 31.8 ° C, July 28,29; minimum daily mean, 10.5 ° C, Jan. 5.
SPECIFIC CONDUCTANCE (MICROSIEMENS/CM AT 25 DEG. C), WATER YEAR OCTOBER 2001 TO SEPTEMBER 2002DAILY MEAN VALUES
DAY OCT NOV DEC JAN FEB MAR APR MAY JUN JUL AUG SEP
1 410 430 576 818 1170 1220 1410 1510 2100 776 377 359 2 413 425 579 815 1170 1270 1410 1560 2130 768 371 360 3 396 423 584 829 1180 1270 1420 1590 2160 736 362 357 4 392 430 583 897 1190 1280 1420 1570 2180 714 365 359 5 -- 442 596 940 1190 1310 1410 1580 2150 738 363 352
6 -- 454 620 953 1220 1340 1440 1590 2130 768 370 341 7 -- 455 636 943 1240 1350 1480 1590 2170 775 376 332 8 -- 462 642 954 1250 1340 1510 1590 2290 755 378 330 9 -- 476 640 958 1300 1340 1470 1600 2580 722 371 334 10 492 640 960 1300 1340 1400 1630 3070 679 367 339
11 491 650 957 1310 1340 1390 1640 3070 639 368 338 12 486 657 953 1370 1350 1410 1650 3270 615 364 348 13 482 658 953 1380 1330 1420 1660 3210 586 352 355 14 476 666 969 1360 1340 1460 1670 3100 550 345 362 15 483 667 1010 1340 1360 1480 1660 3050 536 340 372
16 511 665 1210 1320 1360 1500 1680 2850 507 347 380 17 520 676 1270 1280 1350 1520 1760 2380 478 342 385 18 535 689 1230 1270 1340 1550 1840 1870 461 335 382 19 558 690 1190 1270 1330 1540 1800 2080 449 336 385 20 553 695 1150 1260 1320 1510 1780 1800 438 334 389
21 543 706 1130 1240 1310 1500 1890 1660 427 340 394 22 546 716 1120 1230 1300 1480 2020 1630 409 320 384 23 545 731 1110 1450 1310 1490 2100 1470 397 315 382 24 544 756 1110 1770 1320 1500 2200 1190 385 321 379 25 549 776 1100 1610 1310 1510 2220 1050 357 334 390
26 553 779 1100 1290 1300 1510 2240 970 344 342 404 27 553 786 1120 1150 1300 1480 2240 862 346 348 400 28 564 805 1130 1160 1390 1450 2210 793 349 351 404 29 569 815 1150 --- 1450 1490 2180 777 359 357 411 30 421 576 819 1160 --- 1450 1500 2140 788 366 356 428 31 427 --- 815 1170 --- 1430 --- 2110 374 356 --
MEAN 504 688 1040 1300 1330 1470 1820 2030 542 352 371 MAX 576 819 1270 1770 1450 1550 2240 3270 776 378 428 MIN --- 423 576 815 1150 1220 1390 1510 777 344 315 330

---
ST. JOHNS RIVER ABOVE OCKLAWAHA RIVER 69
02232500 ST. JOHNS RIVER NEAR CHRISTMAS, FL--Continued
TEMPERATURE, WATER (DEG. C), WATER YEAR OCTOBER 2001 TO SEPTEMBER 2002 DAILY MEAN VALUES
DAY OCT NOV DEC JAN FEB MAR APR MAY JUN JUL AUG SEP
1 24.2 21.7 22.5 15.5 24.0 14.4 26.1 28.7 27.4 26.7 30.4 29.3 2 23.8 22.5 22.7 15.2 23.8 17.0 26.1 28.8 28.2 26.7 29.6 29.7 3 24.4 23.1 22.5 14.4 22.7 20.5 26.4 29.2 29.2 27.5 29.0 30.2 4 25.1 23.3 22.5 10.7 21.3 19.6 25.6 29.8 30.4 28.1 29.3 29.2 5 25.6 22.4 22.3 10.5 18.1 14.8 25.4 30.0 30.3 27.7 29.9 28.4
6 26.5 21.1 22.4 12.8 17.6 15.3 23.5 29.4 30.2 28.5 30.4 28.5 7 26.8 20.7 22.9 13.8 18.7 17.3 22.9 28.4 29.6 29.4 30.0 28.8 8 26.1 21.1 23.3 11.6 17.7 19.0 22.5 28.3 28.7 28.9 28.8 29.1 9 24.5 21.3 23.8 11.2 17.5 21.5 23.0 28.3 28.2 28.1 28.4 29.4 10 24.0 21.3 24.0 12.0 19.3 22.8 23.6 28.5 28.4 28.0 28.4 29.7
11 24.4 21.3 24.0 13.4 20.3 22.5 24.3 28.6 28.0 28.6 27.9 29.1 12 25.1 21.0 24.2 14.8 20.1 22.9 23.9 28.5 28.4 28.3 27.9 28.0 13 25.5 20.4 24.1 16.0 19.1 23.3 23.6 28.1 28.6 28.0 28.0 28.1 14 25.7 20.4 24.3 16.2 17.7 22.8 24.1 28.1 29.2 28.8 28.0 28.5 15 26.1 20.1 24.6 17.0 17.6 23.6 24.2 26.6 28.9 30.1 28.4 29.1
16 26.0 19.9 24.4 16.4 19.1 24.9 25.0 25.9 28.9 31.0 29.0 29.9 17 24.4 20.4 23.3 17.5 18.5 25.9 25.8 26.1 28.2 31.5 29.8 30.2 18 22.8 21.3 22.8 18.9 17.5 26.4 26.9 26.7 27.1 31.5 30.4 30.2 19 23.4 21.3 21.3 19.0 17.3 26.4 27.1 27.2 26.1 31.6 30.2 30.0 20 24.3 21.7 19.7 20.1 18.5 25.9 27.2 25.8 25.8 30.9 29.5 29.5
21 24.6 21.7 17.6 20.9 20.0 25.5 27.9 24.4 25.7 29.0 29.3 29.2 22 24.8 21.5 17.2 22.1 21.4 24.7 28.8 23.6 25.3 28.6 29.0 28.8 23 25.2 21.8 17.8 22.6 19.7 22.4 29.0 23.9 25.4 29.5 29.0 28.5 24 25.7 22.2 18.9 22.9 16.4 22.0 28.1 24.6 26.1 30.0 29.6 28.6 25 26.0 22.8 18.0 23.0 17.2 23.4 27.2 25.5 26.5 30.4 29.9 28.7
26 25.1 23.1 15.5 23.6 18.9 25.0 27.7 26.0 26.8 31.0 30.0 28.4 27 21.7 23.1 13.3 22.8 18.6 25.4 28.3 26.7 27.3 31.5 29.8 28.6 28 19.4 22.8 13.5 22.5 14.5 25.3 28.0 27.4 27.9 31.8 29.5 29.3 29 19.4 22.9 15.8 23.1 --- 25.8 28.1 27.8 28.1 31.8 29.2 29.3 30 20.3 22.7 17.2 23.7 --- 26.1 28.3 28.0 27.6 31.7 29.3 29.3 31 21.0 --- 17.0 24.1 --- 26.2 --- 27.7 31.5 29.2 --
MEAN 24.3 21.7 20.8 17.7 19.0 22.5 26.0 27.3 27.9 29.6 29.3 29.1 MAX 26.8 23.3 24.6 24.1 24.0 26.4 29.0 30.0 30.4 31.8 30.4 30.2 MIN 19.4 19.9 13.3 10.5 14.5 14.4 22.5 23.6 25.3 26.7 27.9 28.0
CAL YR 2001 MEAN 24.0 MAX 31.4 MIN 9.7 WTR YR 2002 MEAN 24.6 MAX 31.8 MIN 10.5

70 ST. JOHNS RIVER ABOVE OCKLAWAHA RIVER
02232500 ST. JOHNS RIVER NEAR CHRISTMAS, FL--Continued
WATER-QUALITY DATA, WATER YEAR OCTOBER 2001 TO SEPTEMBER 2002
DIS SPE PH PH RESIDUE NITRO CHARGE, SPE CIFIC WATER WATER TOTAL GEN, INST. CIFIC CON WHOLE WHOLE COLOR AT 105 AMMONIA CUBIC CON DUCT- FIELD LAB TEMPER- TUR (PLAT OXYGEN, DEG. C, DIS FEET GAGE DUCT ANCE (STAND- (STAND ATURE BID INUM- DIS SUS SOLVED
Date Time PER HEIGHT ANCE LAB ARD ARD WATER ITY COBALT SOLVED PENDED (MG/L SECOND (FEET) (US/CM) (US/CM) UNITS) UNITS) (DEG C) (NTU) UNITS) (MG/L) (MG/L) AS N)
(00061) (00065) (00095) (90095) (00400) (00403) (00010) (00076) (00080) (00300) (00530) (00608)
OCT 10... 0845 4390 8.27 402 406 6.7 7.1 23.4 1.2 240 3.4 3 .09 24... 1305 3750 7.85 442 432 6.7 7.0 25.9 .23 200 1.0 5 .09 NOV 05... 1040 3370 7.53 430 426 6.7 7.6 22.5 .78 200 2.8 2 .08 20... 1020 2730 7.12 547 541 6.9 7.2 21.2 1.1 200 2.2 6 .04 DEC 05... 1235 1890 6.35 574 578 7.0 7.8 22.1 1.5 200 3.7 <1 .09 18... 1010 1050 5.55 677 650 7.2 7.9 22.3 4.0 200 4.6 E4 .10 JAN 03... 1245 784 4.53 822 805 7.2 7.8 14.6 6.8 200 8.1 8 .14 15... 1340 662 4.02 962 962 7.5 7.6 17.1 7.7 140 8.8 12 .11 29... 0945 408 3.61 1130 1100 7.4 7.5 22.4 13 160 6.6 17 .06 FEB 12... 1320 384 3.17 1340 1310 7.4 7.6 19.8 12 140 8.4 19 .08 27... 1430 1110 5.16 1120 1070 7.0 7.0 18.2 5.5 160 8.2 15 .06 MAR 13... 1043 455 3.69 1300 1280 7.5 7.5 22.7 6.0 100 7.5 13 .03 29... 1025 244 2.72 1420 1400 7.4 7.5 25.7 9.5 100 6.8 16 .02 APR 10... 1015 212 2.12 1360 1360 7.5 7.7 23.8 9.2 100 7.5 16 .06 24... 1127 115 1.91 1450 1450 7.4 7.8 28.3 9.1 100 7.0 18 <.01 MAY 10... 0948 54 1.30 1600 1560 7.6 7.9 27.9 9.4 100 6.0 20 .27 22... 1218 82 1.05 1950 1920 7.7 7.6 23.7 15 80 8.0 30 .05 JUN 05... 0935 100 .89 2100 2060 7.4 7.6 29.8 17 100 3.1 24 .02 18... 1520 140 1.97 1840 1790 7.2 7.3 27.3 12 120 - 30 .25 JUL 03... 1022 3300 6.94 722 708 6.1 6.6 26.6 6.1 240 .2 9 .03 16... 1300 4460 7.90 490 488 6.4 7.0 31.0 6.7 280 .1 13 .11 30... 1450 4950 8.22 355 360 6.9 7.0 31.9 2.8 240 .5 11 <.01 AUG 13... 1140 5180 8.54 353 348 6.9 7.7 28.1 2.2 280 1.0 2 .18 28... 0915 4700 8.48 364 346 6.7 7.2 29.1 1.2 240 1.3 4 .10 SEP 10... 1225 4630 8.36 340 336 7.0 7.3 29.6 2.0 240 1.4 7 .09 25... 0925 3000 7.32 395 383 6.3 7.2 28.3 3.5 240 2.7 4 .07
< -- Less than E -- Estimated value

71 ST. JOHNS RIVER ABOVE OCKLAWAHA RIVER
02232500 ST. JOHNS RIVER NEAR CHRISTMAS, FL--Continued
WATER-QUALITY DATA, WATER YEAR OCTOBER 2001 TO SEPTEMBER 2002
NITRO NITRO NITRO ORTHO NITRO GEN, GEN,AM- GEN, PHOS- CARBON, PHOS- HARD MAGNEGEN, NITRITE MONIA + NO2+NO3 PHOS PHATE, ORGANIC PHORUS NESS CALCIUM SIUM, SODIUM,
AMMONIA DIS ORGANIC DIS PHORUS DIS DIS SULFIDE ORTHO TOTAL DIS DIS DIS TOTAL SOLVED TOTAL SOLVED TOTAL SOLVED SOLVED TOTAL TOTAL (MG/L SOLVED SOLVED SOLVED
Date (MG/L (MG/L (MG/L (MG/L (MG/L (MG/L (MG/L (MG/L (MG/L AS (MG/L (MG/L (MG/L AS N) AS N) AS N) AS N) AS P) AS P) AS C) AS S) AS P) CACO3) AS CA) AS MG) AS NA) (00610) (00613) (00625) (00631) (00665) (00671) (00681) (00745) (70507) (00900) (00915) (00925) (00930)
OCT 10... .09 <.010 <.20 <.02 .06 .05 28.0 2.0 .050 100 29.0 7.00 37.0 24... E.13 .010 E1.3 <.02 E.08 .05 31.0 2.0 E.060 100 29.0 7.40 41.0 NOV 05... .08 <.010 E1.7 .04 E.07 .04 34.0 1.0 .040 100 29.0 7.50 42.0 20... .06 .010 E1.6 .08 E.05 .04 29.0 2.0 .050 120 34.0 9.40 53.0 DEC 05... .09 <.010 E1.5 .11 E.07 .05 28.0 2.0 .060 130 36.0 9.90 57.0 18... .13 <.010 2.0 .16 .08 .04 29.0 2.0 .060 160 42.0 12.0 67.0 JAN 03... .16 .010 1.8 .26 .05 .02 30.0 2.0 .010 180 47.0 14.0 84.0 15... .12 <.010 1.8 .25 .05 .02 28.0 1.0 .030 200 52.0 17.0 110 29... .09 .010 2.1 .09 .04 .01 27.0 2.0 .020 240 60.0 21.0 120 FEB 12... .13 .010 1.9 .07 .05 <.01 2.1 3.0 .010 280 68.0 25.0 150 27... .08 <.010 1.4 .07 .07 .02 26.0 1.0 .020 210 53.0 19.0 130 MAR 13... .09 <.010 1.7 .03 .05 <.01 24.0 <1.0 <.010 280 73.0 23.0 140 29... .04 <.010 1.9 .06 .06 <.01 24.0 <1.0 .020 290 76.0 24.0 150 APR 10... .07 .010 1.7 .07 .05 <.01 25.0 <1.0 .010 280 73.0 22.0 150 24... .02 <.010 1.3 <.02 .04 .01 23.0 2.0 .020 300 80.0 24.0 160 MAY 10... .25 <.010 1.7 .03 .05 <.01 28.0 1.0 .010 330 86.0 28.0 180 22... .07 <.010 2.3 .05 .07 <.01 27.0 1.0 .020 420 109 35.0 220 JUN 05... .05 <.010 2.2 <.02 .07 <.01 27.0 <1.0 .030 430 111 36.0 240 18... .26 .020 1.7 .10 .06 <.01 17.0 <1.0 <.010 340 83.0 32.0 220 JUL 03... .07 <.010 2.1 <.02 .13 .04 30.0 3.0 .060 150 39.0 12.0 73.0 16... .11 .010 2.1 <.02 .34 .19 32.0 3.0 .240 120 34.0 8.50 46.0 30... .02 .010 2.3 <.02 .26 .18 29.0 3.0 .130 94 27.0 6.20 33.0 AUG 13... .18 .020 2.0 <.02 .08 .08 28.0 2.0 .090 97 28.0 6.30 30.0 28... .11 .010 1.5 <.02 .09 .07 27.0 2.0 .070 89 25.0 6.20 33.0 SEP 10... .08 <.010 1.4 .03 .08 E.06 25.0 6.0 .060 90 26.0 5.90 30.0 25... .07 .010 1.5 .06 .06 .05 23.0 2.0 .060 98 28.0 6.60 35.0
< -- Less than E -- Estimated value

72 ST. JOHNS RIVER ABOVE OCKLAWAHA RIVER
02232500 ST. JOHNS RIVER NEAR CHRISTMAS, FL--Continued
WATER-QUALITY DATA, WATER YEAR OCTOBER 2001 TO SEPTEMBER 2002
ANC SOLIDS, CHLOR-A POTAS UNFLTRD CHLO- SILICA, RESIDUE PHYTO STRON IRON, SIUM, TIT 4.5 SULFATE RIDE, DIS AT 180 PLANK BROMIDE BARIUM, TIUM, TOTAL IRON, DIS LAB DIS DIS SOLVED DEG. C TON DIS DIS DIS RECOV DIS
SOLVED (MG/L SOLVED SOLVED (MG/L DIS CHROMO SOLVED SOLVED SOLVED ERABLE SOLVED Date (MG/L AS (MG/L (MG/L AS SOLVED FLUOROM (MG/L (UG/L (UG/L (UG/L (UG/L
AS K) CACO3) AS SO4) AS CL) SIO2) (MG/L) (UG/L) AS BR) AS BA) AS SR) AS FE) AS FE) (00935) (90410) (00945) (00940) (00955) (70300) (70953) (71870) (01005) (01080) (01045) (01046)
OCT 10... 3.70 E54 17.0 75.0 8.40 E282 <.1 .5 20.0 790 397 303 24... 3.90 53 19.0 82.0 7.70 309 <.1 .4 21.0 790 572 384 NOV 05... 3.90 E52 21.0 83.0 6.70 299 <.1 .5 20.0 800 563 400 20... 4.10 E58 28.0 109 6.50 373 <.1 .6 22.0 940 563 372 DEC 05... 4.50 E60 30.0 118 6.00 386 <.1 .5 23.0 990 578 345 18... 4.50 67 34.0 140 6.60 E427 <.1 .6 27.0 1130 613 382 JAN 03... 4.70 137 52.0 172 6.30 520 <.1 1.0 28.0 1360 618 308 15... 5.00 66 73.0 210 5.60 613 18.0 1.4 32.0 1580 662 316 29... 5.10 72 90.0 245 2.80 717 20.0 1.3 39.0 1890 861 283
FEB 12... 6.00 73 121 294 .72 824 14.0 1.1 45.0 2360 890 239 27... 5.10 30 121 247 3.10 740 11.0 .9 34.0 1570 739 310
MAR 13... 5.60 68 134 276 .60 820 23.0 1.0 45.0 2450 609 187 29... 6.00 70 141 296 1.00 862 24.0 1.2 49.0 2620 590 160
APR 10... 5.50 76 135 297 .89 869 17.0 1.2 46.0 2520 509 96 24... 6.30 76 132 321 1.00 934 28.0 1.3 53.0 2760 438 84
MAY 10... 6.70 84 150 351 .93 1000 19.0 1.4 59.0 3140 439 67 22... 8.30 85 196 443 .94 1220 53.0 1.5 66.0 3620 478 34
JUN 05... 8.90 97 182 487 1.50 1400 40.0 1.7 72.0 3880 635 21 18... 7.40 49 197 408 3.00 1060 35.0 1.4 53.0 2720 679 136
JUL 03... 4.40 37 76.0 140 5.80 458 <.1 .6 31.0 1290 1860 992 16... 4.90 52 35.0 92.0 7.90 345 16.0 .4 23.0 1010 1620 437 30... 4.60 59 12.0 63.0 10.0 284 32.0 .3 22.0 750 890 390 AUG 13... 4.50 60 11.0 58.0 11.0 250 11.0 .3 21.0 730 497 354 28... 3.50 57 11.0 61.0 9.50 244 <.1 .3 20.0 680 537 412 SEP 10... 3.30 57 11.0 57.0 9.60 246 <.1 .4 20.0 690 511 354 25... 3.30 58 15.0 67.0 9.30 263 <.1 .4 21.0 730 511 319
< -- Less than E -- Estimated value

73 ST. JOHNS RIVER BASIN ABOVE OCKLAWAHA RIVER
02233200 LITTLE ECONLOCKHATCHEE RIVER NEAR UNION PARK, FL
LOCATION.--Lat 28° 31'29", long 81° 14'39", in SW1⁄ 4 sec.32, T.22 S., R.31 E., Orange County, Hydrologic Unit 03080101, near right bank at Berry-Deese Road, 3,300 ft upstream from a tributary, 3 mi south of Union Park, 8.5 mi east of Orlando, and 13 mi upstream from mouth.
DRAINAGE AREA.--27.1 mi2.
PERIOD OF RECORD.--October 1959 to current year.
GAGE.--Water-stage recorder. Datum of gage is 56.19 ft above NGVD of 1929. Prior to Jan. 12, 1960, and Oct. 21, 1972 to Nov. 14, 1983, nonrecording gage at same site and datum.
REMARKS.--Records good except for periods of estimated daily discharge, which are poor.
DISCHARGE, CUBIC FEET PER SECOND, WATER YEAR OCTOBER 2001 TO SEPTEMBER 2002DAILY MEAN VALUES
DAY OCT NOV DEC JAN FEB MAR APR MAY JUN JUL AUG SEP
1 46 20 16 9.2 2 42 20 15 14 3 39 22 14 28 4 37 22 14 17 5 35 23 14 15
12 24 e9.2 11 7.3 88 69 290 12 23 e9.8 9.0 e6.3 100 58 282 11 22 e10 7.8 e5.4 128 58 183 11 23 e9.5 7.1 e5.4 104 110 1649.7 21 e8.8 6.7 e5.8 101 95 318
6 33 21 13 157 34 19 13 148 40 19 12 13 9 34 23 12 1310 31 25 12 12
9.0 19 e8.4 6.5 e7.0 86 72 1939.7 18 e8.0 6.2 e8.4 75 73 143
14 18 e7.7 6.0 e10 69 71 117e11 17 e7.3 5.8 e9.2 60 59 101e10 17 e7.0 5.7 e8.6 61 49 90
11 29 26 12 1212 28 23 12 1213 27 24 12 1214 26 41 12 1215 31 37 11 18
e11 16 e9.6 5.5 e9.4 68 43 82e11 15 12 5.4 e10 74 41 77e10 15 14 5.4 e11 105 56 77 e9.7 15 14 5.6 e12 110 95 75 e9.2 14 32 5.9 e11 90 119 69
16 27 32 11 1517 25 26 11 1518 24 23 12 1519 24 21 11 1720 29 20 11 18
e8.8 13 29 5.4 e12 74 128 64 e8.8 13 32 5.3 e17 67 119 99 e8.5 12 19 5.3 22 77 111 85 e8.6 11 16 8.4 23 71 99 718.7 11 13 9.0 60 100 115 67
21 31 19 9.9 1622 51 18 9.3 1523 40 17 9.4 14 24 34 21 9.7 1325 32 19 9.6 13
8.7 e10 11 7.0 51 165 93 70 20 e10 10 6.1 80 274 75 64 62 e10 9.2 5.7 101 136 64 6691 e9.6 8.9 5.4 84 100 57 7265 e9.8 8.9 5.4 84 79 49 74
26 29 19 10 1327 26 18 9.8 1328 23 18 9.4 13 29 22 17 9.6 12 30 21 17 9.6 12 31 21 --- 9.4 11
44 e12 8.1 5.1 73 64 50 72 33 e13 11 5.0 72 71 62 64 27 e12 9.0 5.0 87 59 73 57 --- e11 8.5 5.0 80 53 266 51 --- e9.7 8.1 4.9 79 66 569 47 --- e8.8 --- 7.5 --- 79 394 --
TOTAL 971 670 355.7 441.2 MEAN 31.3 22.3 11.5 14.2 MAX 51 41 16 28 MIN 21 17 9.3 9.2 CFSM 1.16 0.82 0.42 0.53 IN. 1.33 0.92 0.49 0.61
554.4 452.9 369.0 195.1 1051.8 2854 3392 3284 19.8 14.6 12.3 6.29 35.1 92.1 109 109 91 24 32 11 101 274 569 3188.5 8.8 7.0 4.9 5.4 53 41 470.73 0.54 0.45 0.23 1.29 3.40 4.04 4.04 0.76 0.62 0.51 0.27 1.44 3.92 4.66 4.51
STATISTICS OF MONTHLY MEAN DATA FOR WATER YEARS 1960 - 2002, BY WATER YEAR (WY)
MEAN 34.1 23.1 19.3 22.1 MAX 114 151 155 82.2(WY) 1970 1995 1998 1986 MIN 3.16 2.67 2.22 2.73(WY) 1971 1971 1961 1968
25.0 28.9 18.0 10.5 27.5 41.3 53.4 62.5128 193 86.5 71.5 137 174 169 1711998 1960 1991 1991 1968 1991 1995 1960 3.58 3.61 1.64 0.69 1.14 5.29 5.94 4.121968 1961 1961 1961 1962 1980 1980 1970
SUMMARY STATISTICS FOR 2001 CALENDAR YEAR FOR 2002 WATER YEAR WATER YEARS 1960 - 2002
ANNUAL TOTAL 11088.9 ANNUAL MEAN 30.4 HIGHEST ANNUAL MEAN LOWEST ANNUAL MEAN HIGHEST DAILY MEAN 433 LOWEST DAILY MEAN 4.0 ANNUAL SEVEN-DAY MINIMUM 4.5MAXIMUM PEAK FLOWMAXIMUM PEAK STAGE INSTANTANEOUS LOW FLOWANNUAL RUNOFF (CFSM) 1.12ANNUAL RUNOFF (INCHES) 15.2210 PERCENT EXCEEDS 6650 PERCENT EXCEEDS 1890 PERCENT EXCEEDS 5.9
14591.140.0 30.5
64.3 19957.41 1971
Jul 19 569 Aug 30 1570 Mar 17 1960 May 21 4.9 May 30 0.10 Jun 7 1961 May 15 5.1 May 24 0.20 Jun 3 1961
695 Aug 30 1640 Mar 17 1960 9.55 Aug 30 11.64 Mar 17 19604.7 May 29,30 0.10 Jun 6 1961 1.48 1.1220.03 15.2890 6918 15 7.9 3.7
e Estimated

--- --- --- --- ---
--- --- --- --- ---
--- --- ------ ---
--- --- --- --- ---
--- --- --- --- ---
--- --- --- --- --- ---
--- --- ---
--- --- --- --- ---
74 ST. JOHNS RIVER BASIN ABOVE OCKLAWAHA RIVER
02233460 LITTLE ECONLOCKHATCHEE RIVER TRIBUTARY AT BANNER DAM AT UNION PARK, FL
LOCATION.--Lat 28° 34'27", long 81° 16'12", in SE1⁄ 4 sec.13, T.22 S., R.30 E., Orange County, Hydrologic Unit 03080101, on left upstream wingwall of Banner Dam, 29 ft upstream from Harrell Road, 1.2 mi upstream from Little Econlockhatchee River, and 1.1 mi northeast of Union Park.
DRAINAGE AREA.--18 mi2.
PERIOD OF RECORD.--November 2001 to September 2002.
GAGE.--Water-stage recorder and data-collection platform. Datum of gage is at NGVD of 1929.
REMARKS.--Records fair.
DISCHARGE, CUBIC FEET PER SECOND, PERIOD NOVEMBER 2001 TO SEPTEMBER 2002DAILY MEAN VALUES
DAY OCT NOV DEC JAN FEB MAR APR MAY JUN JUL AUG SEP
1 -- 23 14 9.5 19 12 17 34 99 46 108 2 -- 23 52 11 17 15 18 41 84 50 96 3 -- 22 36 11 16 23 17 18 64 127 74 4 -- 23 16 11 23 17 17 4.3 68 135 95 5 -- 25 13 11 16 14 17 2.5 67 106 239
6 -- 25 13 11 14 14 16 1.8 55 70 128 7 -- 25 13 17 13 15 18 13 54 71 94 8 -- 26 13 14 12 14 16 19 64 59 76 9 -- 24 13 11 11 14 15 8.1 54 50 66
10 -- 27 13 13 11 10 15 4.3 54 44 58
11 -- 26 13 15 11 7.4 15 17 49 41 55 12 -- 22 12 13 10 17 15 19 80 55 51 13 --- 21 12 15 27 13 14 29 119 79 51 14 -- 22 18 15 14 15 15 20 95 81 49 15 31 21 29 14 12 27 15 34 64 139 46
16 26 19 14 13 11 32 15 18 54 95 91 17 23 19 13 13 10 25 15 30 51 75 146 18 24 21 12 13 9.7 17 19 36 47 65 75 19 24 18 11 13 9.2 12 33 25 44 79 57 20 24 13 9.9 7.6 8.2 10 26 26 43 113 79
21 23 14 11 4.4 10 9.9 21 28 75 87 82 22 23 15 11 42 12 10 17 77 76 64 79 23 24 15 11 79 11 11 16 99 57 55 90 24 21 14 10 78 11 11 16 99 50 50 104 25 20 15 10 48 11 11 15 82 46 45 73
26 20 15 11 37 15 19 14 54 53 42 61 27 21 13 11 27 16 34 13 53 90 42 54 28 20 14 11 22 13 14 12 45 99 88 50 29 20 13 11 -- 12 14 12 70 72 173 46 30 20 13 11 -- 12 15 13 77 67 165 43 31 --- 13 11 --- 12 --- 34 --- 52 122 --
TOTAL --- 364 599 458.9 588.5 409.1 472.3 531 1084.0 2046 2513 2416 MEAN 22.8 19.3 14.8 21.0 13.2 15.7 17.1 36.1 66.0 81.1 80.5 MAX 31 27 52 79 27 34 34 99 119 173 239 MIN 20 13 9.9 4.4 8.2 7.4 12 1.8 43 41 43
STATISTICS OF MONTHLY MEAN DATA FOR WATER YEARS 2002 - 2002, BY WATER YEAR (WY)
MEAN 22.8 19.3 14.8 21.0 13.2 15.7 17.1 36.1 66.0 81.1 80.5 MAX 22.8 19.3 14.8 21.0 13.2 15.7 17.1 36.1 66.0 81.1 80.5 (WY) 2002 2002 2002 2002 2002 2002 2002 2002 2002 2002 2002 MIN 22.8 19.3 14.8 21.0 13.2 15.7 17.1 36.1 66.0 81.1 80.5 (WY) 2002 2002 2002 2002 2002 2002 2002 2002 2002 2002 2002
SUMMARY STATISTICS #FOR 2002 WATER YEAR
ANNUAL TOTAL 11481.8 ANNUAL MEAN 35.9 HIGHEST DAILY MEAN 239 Sep 5 LOWEST DAILY MEAN 1.8 Jun 6 ANNUAL SEVEN-DAY MINIMUM 7.6 Jun 4 MAXIMUM PEAK FLOW 397 Sep 4 MAXIMUM PEAK STAGE 50.87 Sep 4 INSTANTANEOUS LOW FLOW 1.0 Jun 5-7 10 PERCENT EXCEEDS 81 50 PERCENT EXCEEDS 20 90 PERCENT EXCEEDS 11
# Includes partial year of record

--- --- --- --- --- --- --- --- --- --- --- --- --- --- ---
--- --- --- --- --- --- --- --- --- --- --- --- --- --- ---
--- --- --- --- --- --- --- --- --- --- --- --- --- --- ---
--- --- --- --- --- --- --- --- --- --- --- --- --- --- ---
--- --- --- --- --- --- --- --- --- --- --- --- --- --- ---
--- --- --- --- --- --- --- --- --- --- --- --- --- --- ------ --- ---
--- ------ --- --- --- --- --- --- --- ---
--- --- --- --- --- --- --- --- --- --- --- --- --- --- ---
75 ST. JOHNS RIVER BASIN ABOVE OCKLAWAHA RIVER
02233473 LITTLE ECONLOCKHATCHEE RIVER AT UNIVERSITY BOULEVARD NEAR UNION PARK, FL
LOCATION.--Lat 28° 35'49", long 81° 13'30", in NW1⁄ 4 sec.9, T.22 S., R.31 E., Orange County, Hydrologic Unit 03080101, near center span on upstream side of bridge on University Boulevard (SR436A), 1.6 mi east of State Highway 417, 2.0 mi north of Union Park, and 6.3 mi upstream from mouth.
DRAINAGE AREA.--71 mi2.
PERIOD OF RECORD.--September 2001 to February 2002 (discharge measurements only), March to September 2002.
GAGE.--Water-stage recorder and data-collection platform. Datum of gage is at NGVD of 1929.
REMARKS.--Records good.
DISCHARGE MEASUREMENTS, PERIOD SEPTEMBER 2001 TO FEBRUARY 2002
DISCHARGE, INST. CUBIC FEET
Date Time PER Date SECOND
DIS- DIS-CHARGE, CHARGE, INST. INST. CUBIC CUBIC FEET FEET
Time PER Date Time PER SECOND SECOND
SEP DEC FEB 17... 1020 572 19... 1015 37 14... 1100 38
DISCHARGE, CUBIC FEET PER SECOND, PERIOD MARCH TO SEPTEMBER 2002DAILY MEAN VALUES
DAY OCT NOV DEC JAN FEB MAR APR MAY JUN JUL AUG SEP
1 -- -- e92 32 27 35 299 201 769 2 -- -- 87 32 27 41 298 180 724 3 -- -- 81 34 24 26 334 260 584 4 -- -- 85 34 22 21 326 396 537 5 -- -- 78 31 20 18 324 378 1080
6 -- -- 70 28 20 17 295 305 787 7 -- -- 66 27 19 22 241 302 609 8 -- -- 63 27 19 58 249 304 486 9 -- -- 60 26 18 47 229 256 397
10 -- -- 57 26 17 32 200 212 330
11 -- -- 54 28 17 35 198 182 282 12 -- -- 52 34 17 43 206 183 256 13 -- -- 73 49 17 56 335 233 288 14 -- -- 63 40 16 36 350 303 256 15 -- -- 51 55 16 58 301 399 226
16 -- -- 49 82 16 44 239 429 207 17 -- -- 45 97 16 44 201 378 348 18 -- -- 43 71 17 76 224 403 288 19 -- -- 41 50 23 70 191 429 225 20 -- -- 39 42 28 71 193 482 212
21 -- -- 38 36 22 103 262 456 260 22 -- -- 38 33 19 181 540 367 226 23 -- -- 37 30 18 300 475 302 239 24 -- -- 35 28 17 326 363 252 285 25 -- -- 33 26 16 330 284 214 259
26 -- -- 36 27 16 260 228 188 229 27 -- -- 57 57 15 233 228 191 208 28 -- -- 47 35 15 228 310 255 186 29 -- -- 39 28 14 232 265 561 165 30 --- --- 35 27 15 263 230 1000 151 31 -- -- 34 -- 26 -- 213 887 --
TOTAL --- --- --- 1678 1172 589 3306 8631 10888 11099 MEAN -- -- 54.1 39.1 19.0 110 278 351 370 MAX -- -- 92 97 28 330 540 1000 1080 MIN -- -- 33 26 14 17 191 180 151
STATISTICS OF MONTHLY MEAN DATA FOR WATER YEARS 2002 - 2002, BY WATER YEAR (WY)
MEAN -- -- 54.1 39.1 19.0 110 278 351 370 MAX -- -- 54.1 39.1 19.0 110 278 351 370 (WY) -- -- 2002 2002 2002 2002 2002 2002 2002 MIN -- -- 54.1 39.1 19.0 110 278 351 370 (WY) -- -- 2002 2002 2002 2002 2002 2002 2002
SUMMARY STATISTICS #FOR 2002 WATER YEAR
ANNUAL TOTAL 37363 ANNUAL MEAN 175 HIGHEST DAILY MEAN 1080 Sep 5 LOWEST DAILY MEAN 14 May 29 ANNUAL SEVEN-DAY MINIMUM 15 May 24 MAXIMUM PEAK FLOW 1210 Sep 5 MAXIMUM PEAK STAGE 43.59 Sep 5 INSTANTANEOUS LOW FLOW 14 May 26-30 10 PERCENT EXCEEDS 387 50 PERCENT EXCEEDS 82 90 PERCENT EXCEEDS 19
e Estimated # Includes partial year of record

76 ST. JOHNS RIVER BASIN ABOVE OCKLAWAHA RIVER
02233475 LITTLE ECONLOCKHATCHEE RIVER AT STATE HIGHWAY 434 NEAR OVIEDO, FL
LOCATION.--Lat 28° 37'11", long 81° 12'29", in NW1⁄ 4 sec.34, T.21 S., R.31 E., Seminole County, Hydrologic Unit 03080101, on upstream side of bridge on State Highway 434, 3.5 mi south of Oviedo, and 3.8 mi upstream from mouth.
DRAINAGE AREA.--72.7 mi2.
PERIOD OF RECORD.--October 1996 to current year.
GAGE.--Water-stage recorder and data-collection platform. Datum of gage is at NGVD of 1929. (Levels by Seminole County).
REMARKS.--Records good except for period of estimated daily discharge, which is poor.
DISCHARGE, CUBIC FEET PER SECOND, WATER YEAR OCTOBER 2001 TO SEPTEMBER 2002DAILY MEAN VALUES
DAY OCT NOV DEC JAN FEB MAR APR MAY JUN JUL AUG SEP
1 174 69 52 37 2 150 69 52 47 3 137 87 50 139 4 124 78 50 91 5 114 69 50 64
40 124 47 43 45 321 188 879 40 110 46 41 48 336 168 828 37 103 48 39 39 364 223 668 40 103 49 36 33 380 437 577 38 101 47 35 27 376 416 1200
6 107 65 48 60 7 106 63 49 53 8 105 56 52 49 9 106 55 46 4610 100 59 46 45
32 95 44 33 27 342 339 930 37 89 42 32 28 260 326 715 47 85 42 35 62 e265 336 537 42 80 41 29 65 e245 270 43842 76 37 28 49 e225 213 360
11 90 58 47 4412 83 59 47 4313 78 58 45 4314 75 132 44 4515 106 133 43 68
50 73 37 27 43 e210 176 296 47 70 44 26 57 e290 177 252 42 84 59 25 68 e350 228 297 38 90 58 26 49 e365 317 262 37 72 67 25 64 e300 405 220
16 96 106 43 68 17 83 89 41 5718 72 77 42 5319 68 71 41 4920 72 70 40 51
36 67 94 26 58 e250 461 19437 63 120 25 51 202 413 33234 60 102 24 86 216 430 307 35 56 73 29 80 188 457 225 35 55 62 37 72 173 537 190
21 82 67 39 5222 132 58 38 5423 134 57 36 4824 118 59 36 4325 188 60 36 44
37 58 54 32 96 230 532 24369 54 49 28 148 547 417 215236 52 46 25 310 538 335 235385 50 41 25 374 407 263 306334 48 41 24 391 309 212 280
26 142 57 40 4127 103 57 43 4328 89 58 39 4629 75 55 38 4630 70 56 38 47 31 64 --- 38 46
250 49 40 24 284 224 181 230189 65 65 25 246 207 173 206147 66 56 24 226 325 233 183--- 56 44 20 214 284 536 158 --- 51 42 22 277 225 1070 138 --- 49 --- 33 --- 203 1000 --
TOTAL 3243 2107 1349 1662 MEAN 105 70.2 43.5 53.6 MAX 188 133 52 139 MIN 64 55 36 37CFSM 1.45 0.97 0.60 0.74 IN. 1.67 1.09 0.70 0.86
2433 2254 1637 903 3617 9157 11469 11901 86.9 72.7 54.6 29.1 121 295 370 397385 124 120 43 391 547 1070 1200 32 48 37 20 27 173 168 1381.20 1.01 0.76 0.40 1.67 4.09 5.12 5.49 1.25 1.16 0.84 0.47 1.86 4.72 5.91 6.13
STATISTICS OF MONTHLY MEAN DATA FOR WATER YEARS 1996 - 2002, BY WATER YEAR (WY)
MEAN 158 91.7 119 91.2 MAX 415 170 438 282 (WY) 2000 2000 1998 1998 MIN 64.5 45.2 37.3 37.2(WY) 1998 2001 2001 2001
111 99.6 50.0 38.9 123 226 218 256390 346 85.7 49.7 263 355 370 3971998 1998 1998 1999 1999 1997 2002 2002 38.9 28.7 29.7 21.3 33.5 80.0 76.6 98.12001 1999 1999 2000 1998 2000 2000 1997
SUMMARY STATISTICS FOR 2001 CALENDAR YEAR FOR 2002 WATER YEAR WATER YEARS 1996 - 2002
ANNUAL TOTAL 43855 ANNUAL MEAN 120 HIGHEST ANNUAL MEAN LOWEST ANNUAL MEAN HIGHEST DAILY MEAN 1310LOWEST DAILY MEAN 17ANNUAL SEVEN-DAY MINIMUM 21 MAXIMUM PEAK FLOWMAXIMUM PEAK STAGE INSTANTANEOUS LOW FLOWANNUAL RUNOFF (CFSM) 1.66ANNUAL RUNOFF (INCHES) 22.6010 PERCENT EXCEEDS 26750 PERCENT EXCEEDS 6290 PERCENT EXCEEDS 29
51732 142 132
201 1998101 2000
Jul 22 1200 Sep 5 1310 Jul 22 2001May 20 20 May 29 11 Apr 16 1999May 16 23 May 24 16 Apr 11 1999
1340 Sep 5 1480 Jul 22 200136.27 Sep 5 a36.49 15 May 30 10 Apr 16 1999 1.96 1.8326.65 24.86
337 34165 6436 30
e Estimated a Dec 27, 1997, Jul 22, 2001

--- --- --- --- --- --- --- ---
--- --- ---
------
--- --- --- --- ---
--- --- --- --- ---
------ --- ------
--- --- --- ---------
--- --- --- --- --- ---
--- --- --- --- ---
77 ST. JOHNS RIVER BASIN ABOVE OCKLAWAHA RIVER
02233484 ECONLOCKHATCHEE RIVER NEAR OVIEDO, FL
LOCATION.--Lat 28° 39'19", long 81° 10'12", in NE1⁄ 4 sec.24, T.21 S., R.31 E., Seminole County, Hydrologic Unit 03080101, on downstream side of bridge on State Highway 419, 0.1 mi downstream from Little Econlockhatchee River, 2.5 mi east of Oviedo, and 16.3 mi upstream from mouth.
DRAINAGE AREA.--228 mi2.
PERIOD OF RECORD.--December 2001 to September 2002.
GAGE.--Water-stage recorder and data-collection platform. Datum of gage is at NGVD of 1929 (Seminole County bench mark).
REMARKS.--Records fair except for period of estimated daily discharge, which is poor.
DISCHARGE, CUBIC FEET PER SECOND, PERIOD DECEMBER 2001 TO SEPTEMBER 2002DAILY MEAN VALUES
DAY OCT NOV DEC JAN FEB MAR APR MAY JUN JUL AUG SEP
1 -- 69 81 320 78 70 48 788 479 2020 2 -- 79 79 269 75 63 51 962 508 1740 3 -- 178 76 236 76 58 50 1190 655 1520 4 -- 111 205 74 222 78 51 42 1310 830 1380 5 -- 109 177 67 213 82 47 36 1400 832 2580
6 -- 106 154 63 197 73 45 34 1570 772 2690 7 -- 105 137 61 186 67 42 35 1450 827 1980 8 -- 106 123 72 176 65 43 52 1250 876 1580 9 --- 104 112 80 165 62 e44 72 1090 692 1310 10 -- 105 106 80 156 58 e35 64 965 568 1060
11 -- 108 100 94 149 55 e33 54 817 491 825 12 -- 108 94 93 141 61 e31 60 730 499 674 13 -- 106 91 87 144 75 e29 70 820 619 643 14 -- 102 92 82 159 86 e28 66 1160 774 643 15 -- 98 117 76 140 93 e26 68 1080 1420 578
16 -- 96 137 72 130 111 e25 77 945 1830 514 17 -- 92 128 72 123 137 e26 72 756 1690 500 18 -- 91 128 68 116 143 e30 99 617 1500 568 19 -- 89 118 64 108 115 e40 127 535 1460 502 20 -- 87 111 62 100 95 44 125 456 1630 455
21 --- 82 110 64 96 82 42 153 459 1720 484 22 -- 78 106 93 94 74 e36 222 807 1530 470 23 -- 74 101 270 87 66 e32 403 1340 1320 473 24 --- 72 93 466 82 61 e27 633 1410 1110 620 25 -- 72 92 537 84 57 e24 725 1340 900 653
26 -- 74 86 554 84 54 e23 735 1040 728 585 27 -- 78 82 501 101 71 e22 764 802 623 514 28 -- 75 82 394 107 77 e22 739 794 619 477 29 --- 73 81 --- 98 60 e26 626 736 1110 452 30 --- 71 81 --- 91 59 e32 652 613 2350 418 31 --- 70 81 --- 85 --- e40 --- 537 2420 --
TOTAL -- 2542 3451 4382 4459 2346 1136 6954 29769 33382 28908 MEAN -- 90.8 111 156 144 78.2 36.6 232 960 1077 964 MAX -- 111 205 554 320 143 70 764 1570 2420 2690 MIN -- 70 69 61 82 54 22 34 456 479 418 CFSM -- 0.40 0.49 0.70 0.64 0.35 0.16 1.03 4.27 4.79 4.28 IN. -- 0.42 0.57 0.72 0.74 0.39 0.19 1.15 4.92 5.52 4.78
STATISTICS OF MONTHLY MEAN DATA FOR WATER YEARS 2002 - 2002, BY WATER YEAR (WY)
MEAN -- 90.8 111 156 144 78.2 36.6 232 960 1077 964 MAX -- 90.8 111 156 144 78.2 36.6 232 960 1077 964 (WY) -- 2002 2002 2002 2002 2002 2002 2002 2002 2002 2002 MIN -- 90.8 111 156 144 78.2 36.6 232 960 1077 964 (WY) -- 2002 2002 2002 2002 2002 2002 2002 2002 2002 2002
SUMMARY STATISTICS #FOR 2002 WATER YEAR
ANNUAL TOTAL 117330 ANNUAL MEAN 390 HIGHEST DAILY MEAN 2690 Sep 6 LOWEST DAILY MEAN e22 May 27,28 ANNUAL SEVEN-DAY MINIMUM 25 May 23 MAXIMUM PEAK FLOW 3050 Sep 5 MAXIMUM PEAK STAGE 22.99 Sep 5 ANNUAL RUNOFF (CFSM) 1.73 ANNUAL RUNOFF (INCHES) 19.40 10 PERCENT EXCEEDS 1150 50 PERCENT EXCEEDS 108 90 PERCENT EXCEEDS 45
e Estimated # Includes partial year of record

78 ST. JOHNS RIVER BASIN ABOVE OCKLAWAHA RIVER
02233500 ECONLOCKHATCHEE RIVER NEAR CHULUOTA, FL
LOCATION.--Lat 28° 40'40", long 81° 06'51", in SW1⁄ 4 sec.10, T.21 S., R.32 E., Seminole County, Hydrologic Unit 03080101, near right bank on downstream side of bridge on State Highway 13, 2.6 mi northeast of Chuluota, and 10 mi upstream from mouth.
DRAINAGE AREA.--241 mi2.
PERIOD OF RECORD.--October 1935 to current year. Monthly discharge only for October 1935, published in WSP 1304.
GAGE.--Water-stage recorder. Datum of gage is 2.14 ft above NGVD of 1929 (U.S. Army Corps of Engineers bench mark). Nov. 6,1935, to May 17, 1939, and June 17, 1969, to July 21, 1971, nonrecording gage at same site and datum. Since Sept. 3, 1943, water-stage recorder for St. Johns River above Lake Harney near Geneva (station 02234000) used as auxiliary gage for this station.
REMARKS.--Records fair except for period of estimated daily discharge, which is poor. Records include some flow diverted fromLake Mary Jane in the Kissimmee River Basin through Disston Canal.
DISCHARGE, CUBIC FEET PER SECOND, WATER YEAR OCTOBER 2001 TO SEPTEMBER 2002 DAILY MEAN VALUES
DAY OCT NOV DEC JAN FEB MAR APR MAY JUN JUL AUG SEP
1 587 250 136 85 2 539 237 130 89 3 486 241 125 141 4 440 253 122 230 5 400 243 122 214
96 414 e79 e72 e53 842 553 239094 340 e77 e67 e56 930 605 200091 289 e77 e62 e55 1050 909 167088 259 e79 e56 e47 1140 970 147085 242 e83 e53 e42 1270 943 2300
6 367 235 117 185 7 344 221 112 163 8 332 214 112 144 9 324 205 110 133
10 304 196 107 125
82 224 e74 e50 e40 1350 889 300079 205 e70 e48 e41 1400 890 248082 192 e68 e49 e56 1310 952 188091 180 e65 e51 e73 1180 856 143091 167 e62 e53 e66 1110 703 1160
11 288 187 109 121 12 277 181 108 115 13 273 177 107 109 14 257 210 102 108 15 254 281 99 120
98 155 e60 e44 e57 1020 581 952 103 146 e65 e42 e62 932 549 78998 143 e77 e40 e70 924 684 70191 154 e86 e38 e67 1140 805 69086 147 e92 e36 e68 1160 1010 644
16 274 295 98 144 17 265 282 94 143 18 254 265 91 139 19 235 242 90 135 20 218 222 89 125
82 132 e110 e35 e75 1100 1520 56281 124 e140 e35 e70 984 1730 50279 e115 e148 e35 e94 825 1550 55276 e107 e114 e40 e122 681 1410 54374 e98 e94 e49 e116 570 1410 520
21 231 209 86 122 22 299 202 85 119 23 383 190 83 115 24 396 177 80 109 25 440 174 79 106
73 e95 e83 e48 e134 524 1670 58082 e93 e75 e46 e203 719 1590 530
207 e87 e69 e44 e432 1100 1380 488 466 e83 e64 e40 e674 1280 1160 643 587 e85 e61 e38 e702 1340 980 812
26 489 170 80 104 27 458 162 84 98 28 399 158 87 96 29 348 151 85 97 30 302 143 85 96 31 271 --- 84 96
624 e84 e59 e36 725 1220 837 738 618 e100 e73 e35 752 1000 715 624 522 e105 e78 e35 821 908 698 544 --- e96 e64 e35 749 856 956 496 --- e90 e63 e37 725 747 1840 451 --- e85 --- e42 --- 636 2640 --
TOTAL 10734 6373 3098 3926 MEAN 346 212 99.9 127 MAX 587 295 136 230 MIN 218 143 79 85 CFSM 1.44 0.88 0.41 0.53 IN. 1.66 0.98 0.48 0.61
4926 4836 2409 1391 7247 31248 33985 32141 176 156 80.3 44.9 242 1008 1096 1071 624 414 148 72 821 1400 2640 300073 83 59 35 40 524 549 451
0.73 0.65 0.33 0.19 1.00 4.18 4.55 4.450.76 0.75 0.37 0.21 1.12 4.82 5.25 4.96
STATISTICS OF MONTHLY MEAN DATA FOR WATER YEARS 1936 - 2002, BY WATER YEAR (WY)
MEAN 433 186 146 181 MAX 1668 1189 1324 948 (WY) 1957 1995 1998 1986 MIN 46.5 12.5 20.4 18.6 (WY) 1943 1943 1943 1939
192 238 159 69.8 210 391 487 6221018 1901 962 379 1510 2082 1253 21821998 1960 1987 1991 1968 1960 1992 196018.9 12.6 12.4 9.18 14.1 20.7 31.9 51.61939 1939 1945 1945 1948 1937 1950 1938
SUMMARY STATISTICS FOR 2001 CALENDAR YEAR FOR 2002 WATER YEAR WATER YEARS 1936 - 2002
ANNUAL TOTAL 108632 ANNUAL MEAN 298 HIGHEST ANNUAL MEAN LOWEST ANNUAL MEANHIGHEST DAILY MEAN 3910 LOWEST DAILY MEAN 30ANNUAL SEVEN-DAY MINIMUM 32MAXIMUM PEAK FLOW MAXIMUM PEAK STAGEANNUAL RUNOFF (CFSM) 1.23ANNUAL RUNOFF (INCHES) 16.7710 PERCENT EXCEEDS 87650 PERCENT EXCEEDS 12590 PERCENT EXCEEDS 44
142314 390 277
742 196078.6 1971
Sep 16 3000 Sep 6 10100 Mar 18 1960May 21 e35 May 16-18,27-29 *6.7 May 16 37 May 24 6.7 Jun 10 1945
3100 Sep 6 11000 Mar 18 196012.81 Sep 6 18.69 Mar 18 1960 1.62 1.15 21.97 15.60
1030 691 151 112 57 33
e Estimated* June 11-13,15, 1945

79 ST. JOHNS RIVER BASIN ABOVE OCKLAWAHA RIVER
02234000 ST. JOHNS RIVER ABOVE LAKE HARNEY, NEAR GENEVA, FL
LOCATION.--Lat 28° 42'50", long 81° 02'08", in NE1⁄ 4 sec.32, T.20 S., R.33 E., Seminole County, Hydrologic Unit 03080101, near center of channel on downstream side of bridge on State Highway 46, 0.9 mi downstream from Econlockhatchee River, 1 mi upstream from Lake Harney, 5.5 mi southeast of Geneva, and 190 mi upstream from mouth.
DRAINAGE AREA.--2,043 mi2.
PERIOD OF RECORD.--July 1941 to September 1981 (gage heights and miscellaneous discharge measurements only). October 1981 to current year.
REVISED RECORDS.--WRD FL 66-1: Drainage area.
GAGE.--Water-stage recorder, acoustic velocity meter, and data-collection platform. Datum of gage is at NGVD of 1929 (U.S. ArmyCorps of Engineers bench mark). Prior to Sept. 3, 1943, nonrecording gage, and Sept.3, 1943 to Oct. 8, 1959, water-stagerecorder at site 50 ft downstream at same datum.
REMARKS.--Records fair except those below 200 ft3/s, which are poor.
EXTREMES OUTSIDE PERIOD OF RECORD.--Flood in October 1924 reached a stage of 10.1 ft, from floodmark.
DISCHARGE, CUBIC FEET PER SECOND, WATER YEAR OCTOBER 2001 TO SEPTEMBER 2002DAILY MEAN VALUES
DAY OCT NOV DEC JAN FEB MAR APR MAY JUN JUL AUG SEP
1 6860 5570 3020 10902 6760 5230 3010 10903 6350 4950 2790 10404 6070 4910 3010 10805 6090 4390 3130 1030
718 1810 379 132 201 2760 4890 7100 722 1870 410 126 124 3030 5370 6670 645 1610 375 152 143 3620 5620 6320 532 1460 340 124 88 3650 5830 6760 622 1390 366 161 99 3650 5880 7030
6 5870 5440 2950 941 7 5730 5180 2890 9028 5840 4780 2800 9229 6530 4500 2510 892
10 6130 4280 2530 871
675 1330 383 166 62 3950 5850 6770 456 1180 310 98 19 4100 5740 6660 564 1180 252 78 91 4210 6120 6390 611 1120 209 85 184 4280 6260 6020 562 1100 195 85 174 4500 6090 5860
11 5800 4220 2340 875 12 5400 3940 2330 877 13 5600 4250 2240 881 14 5310 3210 2130 848 15 5140 3500 1930 889
564 1010 227 81 105 4510 6050 5770 635 924 204 93 78 4580 6190 5590 616 830 246 58 0.36 4510 6200 5690 715 860 299 77 31 4270 6620 5380 665 821 315 106 106 4510 6860 4870
16 5270 4600 2030 943 17 4860 4560 1940 895 18 5440 4260 1760 893 19 5220 4020 1710 850 20 5020 3800 1610 928
521 815 318 91 186 4750 6980 4670 527 783 407 50 200 4630 7280 4540 557 718 440 36 283 4800 7480 4440 595 662 461 92 434 4600 7130 4420 466 605 398 162 604 4910 6690 4510
21 5320 3640 1600 880 22 5360 3840 1630 985 23 5430 4020 1520 921 24 5580 3910 1440 857 25 5490 3540 1320 793
427 548 353 185 818 5150 6940 4480 558 562 335 107 1000 5150 7380 4300 731 709 327 154 1420 4930 6830 42901500 579 266 7.7 1670 5210 7070 40301710 496 162 -25 1950 5890 6960 4250
26 5190 3410 1310 866 27 5310 3540 1340 871 28 6050 3490 1250 804 29 5720 3450 1180 758 30 5620 3290 1120 748 31 5390 --- 1100 737
1750 421 169 14 2100 5560 6960 45001760 421 138 26 2330 5460 6610 41701830 409 114 35 2540 5460 6160 3960 --- 408 117 78 2700 5280 6090 4050 --- 406 186 47 2690 5150 6180 3770 --- 388 --- 191 --- 5150 7130 --
TOTAL 175750 125720 63470 27957 MEAN 5669 4191 2047 902 MAX 6860 5570 3130 1090MIN 4860 3210 1100 737 CFSM 2.78 2.05 1.00 0.44IN. 3.20 2.29 1.16 0.51
22234 27425 8701 2872.7 22430.36 142210 199440 157260 794 885 290 92.7 748 4587 6434 52421830 1870 461 191 2700 5890 7480 7100 427 388 114 -25 0.36 2760 4890 37700.39 0.43 0.14 0.05 0.37 2.25 3.15 2.570.40 0.50 0.16 0.05 0.41 2.59 3.63 2.86
STATISTICS OF MONTHLY MEAN DATA FOR WATER YEARS 1982 - 2002, BY WATER YEAR (WY)
MEAN 3304 2718 2161 1761MAX 7088 7703 7738 5642(WY) 1995 1995 1995 1995MIN 315 531 260 302 (WY) 1982 1982 1982 1982
1452 1352 1403 738 994 1653 2310 29185371 5868 4332 2306 3738 6207 6815 59181998 1998 1983 1998 1982 1982 1982 1995 168 135 87.6 24.5 1.06 117 212 4391982 2001 2000 2000 2000 2000 2000 1990
SUMMARY STATISTICS FOR 2001 CALENDAR YEAR FOR 2002 WATER YEAR WATER YEARS 1982 - 2002
ANNUAL TOTAL 695940.0ANNUAL MEAN 1907HIGHEST ANNUAL MEANLOWEST ANNUAL MEANHIGHEST DAILY MEAN 8280LOWEST DAILY MEAN -25ANNUAL SEVEN-DAY MINIMUM 26MAXIMUM PEAK FLOWMAXIMUM PEAK STAGEANNUAL RUNOFF (CFSM) 0.93ANNUAL RUNOFF (INCHES) 12.6710 PERCENT EXCEEDS 543050 PERCENT EXCEEDS 504 90 PERCENT EXCEEDS 143
975470.06 2673 1899
3784 1995 858 1999
Sep 17 7480 Aug 18 9880 Nov 22 1994Mar 13 -25 May 25 -77 Apr 25 2000Mar 10 26 May 24 -43 May 31 2000
*13800 Oct 7 1953 8.49 Sep 6,7 10.62 Oct 13 1953 1.31 0.9317.76 12.63
6090 49601710 1230 130 259
* Measured Note.--Negative figures indicate reverse flow

---
80 ST. JOHNS RIVER BASIN ABOVE OCKLAWAHA RIVER
02234000 ST. JOHNS RIVER ABOVE LAKE HARNEY, NEAR GENEVA, FL--Continued
GAGE HEIGHT, FEET, WATER YEAR OCTOBER 2001 TO SEPTEMBER 2002 DAILY MEAN VALUES
DAY OCT NOV DEC JAN FEB MAR APR MAY JUN JUL AUG SEP
1 8.24 6.81 5.73 2.66 1.20 2.49 0.89 0.70 1.22 3.97 7.11 8.38 2 8.20 6.78 5.63 2.66 1.18 2.51 0.89 0.68 1.21 4.24 7.15 8.38 3 8.15 6.78 5.52 2.76 1.14 2.49 0.92 0.62 1.16 4.47 7.28 8.34 4 8.11 6.73 5.41 2.75 1.15 2.48 0.94 0.52 1.06 4.63 7.40 8.32 5 8.05 6.66 5.31 2.72 1.14 2.44 0.97 0.44 0.98 4.88 7.49 8.43
6 7.98 6.60 5.21 2.68 1.10 2.42 0.98 0.36 0.92 5.12 7.51 8.47 7 7.91 6.55 5.12 2.65 1.11 2.37 0.99 0.35 0.92 5.30 7.60 8.49 8 7.83 6.49 5.02 2.59 1.17 2.32 0.96 0.37 0.97 5.48 7.65 8.47 9 7.76 6.42 4.92 2.49 1.15 2.25 0.93 0.35 0.96 5.64 7.66 8.41 10 7.70 6.35 4.82 2.42 1.14 2.18 0.90 0.32 0.98 5.79 7.65 8.32
11 7.63 6.28 4.70 2.34 1.15 2.09 0.85 0.24 1.04 5.91 7.63 8.22 12 7.56 6.19 4.60 2.22 1.13 2.00 0.83 0.16 1.15 5.98 7.64 8.13 13 7.50 6.14 4.50 2.12 1.13 1.93 0.83 0.11 1.21 6.08 7.72 8.05 14 7.43 6.22 4.41 2.04 1.11 1.86 0.82 0.13 1.27 6.23 7.91 7.97 15 7.42 6.34 4.32 2.02 1.08 1.78 0.84 0.09 1.31 6.34 8.03 7.86
16 7.35 6.39 4.20 1.96 1.07 1.70 0.84 0.03 1.28 6.44 8.12 7.77 17 7.25 6.42 4.11 1.91 1.09 1.61 0.84 0.03 1.26 6.49 8.19 7.66 18 7.17 6.44 4.01 1.86 1.12 1.51 0.82 0.06 1.28 6.54 8.23 7.55 19 7.11 6.45 3.91 1.82 1.08 1.41 0.79 0.17 1.30 6.57 8.25 7.44 20 7.06 6.45 3.80 1.78 1.06 1.31 0.74 0.24 1.41 6.57 8.31 7.39
21 7.03 6.42 3.71 1.73 1.04 1.24 0.68 0.34 1.56 6.60 8.39 7.36 22 7.04 6.39 3.60 1.67 1.10 1.19 0.64 0.48 1.74 6.70 8.43 7.26 23 7.01 6.34 3.50 1.61 1.34 1.10 0.61 0.54 2.10 6.81 8.45 7.16 24 7.00 6.31 3.40 1.55 1.76 1.03 0.54 0.67 2.44 6.89 8.43 7.16 25 7.04 6.24 3.30 1.49 2.02 1.00 0.50 0.82 2.73 6.97 8.39 7.25
26 7.03 6.17 3.22 1.45 2.22 0.99 0.53 0.93 2.96 7.04 8.32 7.24 27 6.97 6.11 3.12 1.39 2.36 1.02 0.60 0.96 3.15 7.09 8.26 7.16 28 6.94 6.01 3.03 1.35 2.44 1.01 0.62 0.99 3.36 7.11 8.22 7.07 29 6.92 5.92 2.96 1.32 --- 0.97 0.67 1.04 3.52 7.12 8.21 6.97 30 6.90 5.83 2.86 1.28 --- 0.93 0.71 1.10 3.71 7.12 8.17 6.88 31 6.87 --- 2.75 1.23 --- 0.88 --- 1.18 7.12 8.25 --
MEAN 7.42 6.37 4.22 2.02 1.31 1.69 0.79 0.48 1.67 6.10 7.94 7.79 MAX 8.24 6.81 5.73 2.76 2.44 2.51 0.99 1.18 3.71 7.12 8.45 8.49 MIN 6.87 5.83 2.75 1.23 1.04 0.88 0.50 0.03 0.92 3.97 7.11 6.88
CAL YR 2001 MEAN 2.90 MAX 8.61 MIN 0.21 WTR YR 2002 MEAN 4.00 MAX 8.49 MIN 0.03

81 ST. JOHNS RIVER BASIN ABOVE OCKLAWAHA RIVER
02234308 HOWELL CREEK NEAR ALTAMONTE SPRINGS, FL
LOCATION.--Lat 28° 37'56", long 81° 19'24", in NW1⁄ 4 sec.28, T.21 S., R.30 E., Orange County, Hydrologic Unit 03080101, on downstream side of bridge on Lake Howell Lane approximately 0.5 mi upstream from Lake Howell and 3.1 mi southeast of Altamonte Springs.
DRAINAGE AREA.--20.6 mi2.
PERIOD OF RECORD.--October 1996 to current year.
GAGE.--Water-stage recorder. Datum of gage is at NGVD of 1929. (Elevation furnished by Seminole County).
REMARKS.--Records fair.
DISCHARGE, CUBIC FEET PER SECOND, WATER YEAR OCTOBER 2001 TO SEPTEMBER 2002DAILY MEAN VALUES
DAY OCT NOV DEC JAN FEB MAR APR MAY JUN JUL AUG SEP
1 30 1.9 0.39 0.502 26 2.6 0.35 3.1 3 23 4.6 0.40 1.9 4 20 4.3 0.40 0.95 5 18 4.0 0.40 0.80
0.56 2.0 0.18 0.24 1.8 5.5 13 73 0.52 6.8 0.12 0.09 1.4 24 11 64 0.50 0.34 0.36 0.05 0.62 43 23 56 0.52 0.70 0.50 0.04 0.37 47 41 63 0.50 2.8 0.36 0.12 0.27 44 44 111
6 16 3.4 0.40 0.78 7 14 2.6 0.41 0.67 8 12 1.9 0.58 0.63 9 10 1.6 0.67 0.6010 8.3 1.3 0.51 0.56
0.44 1.1 0.30 0.10 0.22 41 39 96 0.50 0.30 0.21 0.07 1.3 38 39 78 0.48 0.28 0.24 0.06 1.1 39 42 66 0.74 0.28 0.23 0.03 0.50 40 39 58 0.69 0.28 0.20 0.03 0.38 38 37 52
11 7.0 1.1 0.42 0.5812 5.9 0.94 0.34 0.6013 4.5 0.94 0.34 0.5614 5.7 1.3 0.34 0.7415 11 1.8 0.34 1.2
0.74 0.26 0.20 0.03 0.37 39 33 51 0.67 0.24 0.33 0.08 1.1 39 36 49 0.61 0.24 0.34 0.07 2.3 45 52 47 0.62 0.23 0.37 0.07 1.4 56 69 49 0.52 0.35 0.33 0.06 1.4 47 102 44
16 12 1.9 0.34 0.8617 12 1.7 0.35 0.7418 9.4 1.6 0.46 0.6819 7.3 1.4 0.45 0.6320 6.1 1.4 0.47 0.61
0.44 0.35 1.2 0.05 0.77 40 95 44 0.40 0.41 0.67 0.05 3.5 34 73 78 0.40 0.77 0.35 0.06 4.6 29 61 78 0.37 0.54 0.27 0.12 2.4 23 63 67 0.35 0.34 0.22 0.08 2.2 19 88 61
21 5.8 1.4 0.45 0.6022 8.3 1.2 0.45 0.5223 9.3 1.1 0.43 0.6924 9.2 0.92 0.40 0.6925 12 0.83 0.40 0.60
0.46 0.16 0.18 0.06 3.9 23 73 56 2.1 0.20 0.14 0.04 8.1 27 58 55 4.3 0.35 0.11 0.04 18 27 47 53 5.1 0.51 0.07 0.04 16 22 40 50 2.2 0.34 0.08 0.04 15 18 35 47
26 13 0.74 0.40 0.5627 10 0.62 0.36 0.5628 6.8 0.53 0.31 0.5629 4.5 0.50 0.31 0.5730 3.7 0.45 0.34 0.5731 2.7 --- 0.38 0.56
1.8 0.21 0.35 0.04 8.4 17 31 44 1.5 0.24 0.57 0.04 5.5 25 28 40 1.2 0.28 0.45 0.02 3.2 24 30 36--- 0.21 0.41 0.06 2.4 25 56 34--- 0.06 0.35 0.12 2.7 23 83 31--- 0.07 --- 0.14 --- 18 84 --
TOTAL 343.5 50.57 12.59 24.17 MEAN 11.1 1.69 0.41 0.78 MAX 30 4.6 0.67 3.1 MIN 2.7 0.45 0.31 0.50CFSM 0.50 0.08 0.02 0.04 IN. 0.58 0.09 0.02 0.04
29.23 21.24 9.69 2.14 111.20 979.5 1565 1731 1.04 0.69 0.32 0.069 3.71 31.6 50.5 57.75.1 6.8 1.2 0.24 18 56 102 111
0.35 0.06 0.07 0.02 0.22 5.5 11 310.05 0.03 0.01 0.00 0.17 1.44 2.29 2.62 0.05 0.04 0.02 0.00 0.19 1.66 2.65 2.93
STATISTICS OF MONTHLY MEAN DATA FOR WATER YEARS 1997 - 2002, BY WATER YEAR (WY)
MEAN 19.6 7.36 9.89 6.64 MAX 54.1 23.5 44.8 34.1(WY) 2000 2000 1998 1998 MIN 0.17 0.11 0.099 0.11(WY) 2001 2001 2001 2001
7.65 8.19 1.92 0.40 1.51 12.9 14.7 35.4 41.2 42.7 8.27 1.04 3.71 31.6 50.5 64.61998 1998 1998 1997 2002 2002 2002 2001 0.13 0.19 0.14 0.069 0.066 0.63 0.22 1.092001 1999 1999 2002 2000 2000 1999 2000
SUMMARY STATISTICS FOR 2001 CALENDAR YEAR FOR 2002 WATER YEAR WATER YEARS 1997 - 2002
ANNUAL TOTAL 2743.00 ANNUAL MEAN 7.52 HIGHEST ANNUAL MEAN LOWEST ANNUAL MEAN HIGHEST DAILY MEAN 158 LOWEST DAILY MEAN 0.06 ANNUAL SEVEN-DAY MINIMUM 0.06MAXIMUM PEAK FLOWMAXIMUM PEAK STAGE INSTANTANEOUS LOW FLOWANNUAL RUNOFF (CFSM) 0.34ANNUAL RUNOFF (INCHES) 4.6410 PERCENT EXCEEDS 1550 PERCENT EXCEEDS 0.3390 PERCENT EXCEEDS 0.08
4879.8313.4 10.5
18.8 19986.43 2001
Sep 15 111 Sep 5 159 Sep 20 1999 May 15-18 0.02 May 28 0.02 Jun 7,8 1999 May 12 0.04 May 22 0.03 Jun 2 1999
121 Aug 15 204 Jul 21 200157.75 Aug 15 58.92 Jul 21 2001 b0.00 b0.00 0.61 0.48 8.25 6.5047 37 0.94 0.97 0.14 0.10
b May 4,9-11,28,2002

82 ST. JOHNS RIVER BASIN ABOVE OCKLAWAHA RIVER
02234324 HOWELL CREEK NEAR SLAVIA, FL
LOCATION.--Lat 28° 38'51", long 81° 15'53", in SE1⁄ 4 sec.24, T.21 S., R.30 E., Seminole County, Hydrologic Unit 03080101, on right bank 75 ft upstream from box culvert on Red Bug Road, 0.2 mi east of Tuskawilla Road, 2.1 mi west of Slavia, and 4.6 mi upstream from mouth.
DRAINAGE AREA.--29.2 mi2.
PERIOD OF RECORD.--February 1972 to September 1979, October 1980 to January 1981 (discharge measurements only), February 1981 to current year.
GAGE.--Water-stage recorder. Datum of gage is at NGVD of 1929 (Florida Department of Transportation bench mark). Prior to Oct. 1, 1980, at site 170 ft downstream at same datum. Oct. 1, 1980 to Mar. 20, 1992, at site 150 ft downstream at same datum.
REMARKS.--Records fair except for periods of estimated daily discharge, which are poor. Some regulation by retention ponds in urban areas upstream from station.
DISCHARGE, CUBIC FEET PER SECOND, WATER YEAR OCTOBER 2001 TO SEPTEMBER 2002DAILY MEAN VALUES
DAY OCT NOV DEC JAN FEB MAR APR MAY JUN JUL AUG SEP
1 25 4.5 11 2.8 2 22 7.5 12 8.6 3 34 15 12 14 4 51 13 10 12 5 33 17 8.9 11
e5.1 19 1.5 2.2 1.6 28 33 125 e6.5 17 1.9 1.5 1.6 30 42 116 e5.7 13 1.9 4.2 1.2 23 87 98 e5.3 3.9 1.7 1.8 1.1 21 71 123 e5.0 3.2 1.7 1.3 1.1 25 69 141
6 27 11 8.0 11 7 19 15 7.4 108 24 19 7.2 9.0 9 24 14 6.9 8.2 10 17 18 6.6 7.9
e4.8 3.0 1.5 1.3 1.1 21 56 132e16 3.0 1.4 1.3 1.8 33 56 117e17 2.8 1.4 2.9 2.0 53 70 101e16 2.6 1.3 1.8 1.5 39 49 90e15 2.5 2.2 1.3 1.4 27 53 80
11 20 18 6.3 7.312 17 13 5.8 7.0 13 17 11 5.3 7.0 14 27 11 5.1 7.615 39 11 4.8 11
e14 2.5 1.6 1.2 1.5 27 38 7312 2.4 1.7 1.2 1.4 41 64 6810 2.4 1.6 2.5 2.1 64 64 638.8 2.4 1.6 2.1 1.6 85 73 637.2 2.3 1.7 1.4 2.0 75 127 64
16 41 10 4.5 1117 29 11 4.3 9.9 18 38 10 4.7 9.419 30 12 4.4 8.420 25 14 4.1 6.6
3.0 2.2 1.8 1.4 1.8 64 118 802.7 2.1 1.6 1.4 2.4 54 102 862.6 2.0 1.5 1.2 4.2 e46 86 772.6 2.0 1.6 1.6 4.5 e38 98 802.8 2.0 1.5 1.6 4.3 e45 160 94
21 17 16 3.8 6.522 20 9.0 3.5 6.323 25 10 3.3 5.924 20 12 3.2 5.925 25 12 3.2 7.3
2.8 1.9 1.4 1.7 4.8 e49 135 87 7.4 1.9 1.5 2.1 16 e73 112 83 28 1.8 1.7 1.3 14 e68 99 122 38 1.7 1.4 1.6 16 e56 81 101 28 1.7 1.5 1.3 26 e43 68 80
26 23 14 3.2 7.227 15 12 3.1 6.728 12 11 2.9 6.329 9.6 10 2.8 5.930 6.1 12 2.8 5.531 4.8 --- 2.8 e5.3
30 1.9 4.1 1.1 29 e55 50 67 25 1.9 2.2 1.0 36 e94 25 64 21 1.8 1.5 1.0 38 e110 68 55--- 2.7 1.3 1.0 23 e80 99 45--- 2.1 1.5 1.0 19 e52 114 42--- 1.6 --- 1.4 --- 36 127 --
TOTAL 736.5 373.0 173.9 248.5 MEAN 23.8 12.4 5.61 8.02 MAX 51 19 12 14 MIN 4.8 4.5 2.8 2.8 CFSM 0.81 0.43 0.19 0.27 IN. 0.94 0.48 0.22 0.32
342.3 113.3 50.8 49.7 262.0 1555 2494 261712.2 3.65 1.69 1.60 8.73 50.2 80.5 87.2 38 19 4.1 4.2 38 110 160 1412.6 1.6 1.3 1.0 1.1 21 25 420.42 0.13 0.06 0.05 0.30 1.72 2.76 2.99 0.44 0.14 0.06 0.06 0.33 1.98 3.18 3.33
STATISTICS OF MONTHLY MEAN DATA FOR WATER YEARS 1972 - 2002, BY WATER YEAR (WY)
MEAN 33.6 21.9 19.7 21.3 MAX 86.2 91.5 71.0 62.2(WY) 2000 1995 1998 1986 MIN 3.35 1.45 1.38 1.25(WY) 2001 2001 2001 2001
20.6 19.9 18.6 11.5 21.5 45.3 47.9 52.5 61.9 78.8 74.9 49.5 83.1 156 144 1131998 1998 1987 1976 1996 1974 1995 1995 1.14 1.87 1.57 1.09 1.31 3.01 5.79 4.882001 2001 1999 2000 2000 1998 1999 2000
SUMMARY STATISTICS FOR 2001 CALENDAR YEAR FOR 2002 WATER YEAR WATER YEARS 1972 - 2002
ANNUAL TOTAL 5944.89 ANNUAL MEAN 16.3 HIGHEST ANNUAL MEAN LOWEST ANNUAL MEAN HIGHEST DAILY MEAN 218 LOWEST DAILY MEAN 0.83ANNUAL SEVEN-DAY MINIMUM 0.88MAXIMUM PEAK FLOWMAXIMUM PEAK STAGE INSTANTANEOUS LOW FLOWANNUAL RUNOFF (CFSM) 0.56ANNUAL RUNOFF (INCHES) 7.5710 PERCENT EXCEEDS 3450 PERCENT EXCEEDS 4.990 PERCENT EXCEEDS 1.1
9016.024.7 28.4
54.1 19959.55 1990
Sep 16 160 Aug 20 417 Jul 26 1995 May 19,20 1.0 May 27-30 0.66 Jun 3 2000May 16 1.1 May 25 0.69 May 28 2000
353 Aug 20 679 Jul 21 200134.22 Aug 20 37.98 Nov 25 19920.95 May 29,30 *0.64 0.85 0.9711.49 13.2080 6610 18 1.5 2.9
e Estimated * May 29, June 2-4, 2000

83 ST. JOHNS RIVER BASIN ABOVE OCKLAWAHA RIVER
02234344 HOWELL CREEK AT STATE HIGHWAY 434 NEAR OVIEDO, FL
(Formerly published as Howell Creek at State Highway 419 near Oviedo, FL)
LOCATION.--Lat 28° 41'23", long 81° 14'52", in SE1⁄ 4 sec.6, T.21 S., R.30 E., Seminole County, Hydrologic Unit 03080101, on headwall upstream side of culverts on State Highway 434, 1.0 mi upstream from mouth and 2.8 mi northwest of Oviedo.
DRAINAGE AREA.--52.0 mi2.
PERIOD OF RECORD.--May 1973 to August 1979 (discharge measurements only), June 1999 to current year.
GAGE.--Water-stage recorder and data-collection platform. Datum of gage is at NGVD of 1929.
REMARKS.--Records good. Some regulation from retention ponds upstream.
DISCHARGE, CUBIC FEET PER SECOND, WATER YEAR OCTOBER 2001 TO SEPTEMBER 2002DAILY MEAN VALUES
DAY OCT NOV DEC JAN FEB MAR APR MAY JUN JUL AUG SEP
1 83 37 33 17 2 75 37 33 38 3 74 55 33 70 4 95 48 31 45 5 79 49 29 36
19 45 13 18 12 112 116 342 24 42 12 14 11 138 151 354 21 40 13 12 9.0 126 309 266 17 37 15 13 8.0 97 356 254 16 31 21 9.5 7.5 156 239 594
6 68 46 28 34 7 63 41 27 33 8 61 47 27 30 9 62 42 26 2810 57 41 26 27
16 27 16 9.0 7.2 156 167 541 32 26 14 8.9 11 101 177 373 34 25 13 8.7 13 110 223 269 30 23 12 10 11 96 155 22427 22 11 8.2 9.4 83 136 203
11 54 44 25 2612 54 38 24 2613 49 37 23 2614 64 62 23 2915 94 60 22 46
27 21 12 7.8 12 75 107 183 25 20 14 7.5 18 74 181 173 23 21 16 8.4 28 135 413 190 22 21 14 7.8 17 329 431 199 20 20 14 7.7 20 214 444 173
16 85 50 22 3917 64 43 21 3418 70 42 22 3119 61 41 21 2920 58 44 20 26
17 18 17 7.0 14 141 360 190 16 17 15 7.2 18 113 258 335 15 16 13 7.3 31 93 237 242 14 16 12 9.5 33 74 266 197 14 15 11 9.0 28 86 494 229
21 73 43 19 2522 87 36 19 2423 74 40 18 24 24 65 54 19 2325 83 43 18 23
15 15 11 8.4 29 93 629 250 33 15 9.9 8.0 111 161 461 199 89 14 9.8 8.0 120 159 296 324 154 14 9.6 7.2 98 123 221 561 92 13 9.0 7.5 93 93 189 435
26 79 42 19 2327 59 39 18 2328 49 36 17 2229 46 34 17 2230 41 35 17 2131 39 --- 17 20
71 14 11 6.7 94 123 158 27259 21 19 6.6 103 251 124 20850 17 13 6.5 103 336 201 174--- 15 11 6.4 72 377 442 149--- 16 14 6.5 80 216 435 132 --- 14 --- 11 --- 143 413 --
TOTAL 2065 1306 714 920MEAN 66.6 43.5 23.0 29.7 MAX 95 62 33 70 MIN 39 34 17 17CFSM 1.28 0.84 0.44 0.57
992 671 395.3 273.3 1221.1 4584 8789 823535.4 21.6 13.2 8.82 40.7 148 284 274154 45 21 18 120 377 629 594 14 13 9.0 6.4 7.2 74 107 1320.68 0.42 0.25 0.17 0.78 2.84 5.45 5.28
STATISTICS OF MONTHLY MEAN DATA FOR WATER YEARS 1999 - 2002, BY WATER YEAR (WY)
MEAN 87.2 52.4 28.3 21.3 MAX 182 105 52.1 29.7(WY) 2000 2000 2000 2002 MIN 12.9 8.59 9.88 8.85(WY) 2001 2001 2001 2001
20.9 16.5 13.0 8.95 33.5 82.5 99.2 141 35.4 21.6 15.6 11.2 70.4 148 284 2742002 2002 2001 2001 1999 2002 2002 2002 8.54 12.3 10.3 6.84 10.4 23.3 21.2 16.92001 2000 2000 2000 2000 2000 1999 2000
SUMMARY STATISTICS FOR 2001 CALENDAR YEAR FOR 2002 WATER YEAR WATER YEARS 1999 - 2002
ANNUAL TOTAL 16679.1 ANNUAL MEAN 45.7 HIGHEST ANNUAL MEAN LOWEST ANNUAL MEAN HIGHEST DAILY MEAN 560 LOWEST DAILY MEAN 5.9ANNUAL SEVEN-DAY MINIMUM 6.1MAXIMUM PEAK FLOWMAXIMUM PEAK STAGE INSTANTANEOUS LOW FLOWANNUAL RUNOFF (CFSM) 0.8810 PERCENT EXCEEDS 9150 PERCENT EXCEEDS 2590 PERCENT EXCEEDS 7.5
30165.782.6 54.8
82.6 2002 37.1 2001
Jul 23 629 Aug 21 629 Aug 21 2002May 21 6.4 May 29 3.1 May 4 2000May 16 6.8 May 24 5.0 May 28 2000
770 Aug 20 *800 Jun 28 197410.57 Aug 20 10.57 Aug 20 20026.3 May 28-30 2.6 May 4 2000 1.59 1.05
232 15133 2111 7.9
* Measured.

84 ST. JOHNS RIVER BASIN ABOVE OCKLAWAHA RIVER
02234384 SOLDIER CREEK NEAR LONGWOOD, FL
LOCATION.--Lat 28° 43'07", long 81° 18'32", in SW1⁄ 4 sec.27, T.20 S., R.30 E., Seminole County, Hydrologic Unit 03080101, on left downstream side of culvert on State Highway 419, 50 ft upstream from CSX railroad bridge, 2.5 mi northeast of Longwood, and 1.2 mi upstream from mouth.
DRAINAGE AREA.--21.2 mi2.
PERIOD OF RECORD.--February 1972 to September 1975, October 1975 to September 1977 (discharge measurements only), October 1977to September 1979, October 1980 to September 1986 (discharge measurements only), October 1986 to current year.
GAGE.--Water-stage recorder. Datum of gage is at NGVD of 1929 (levels by Seminole County Engineer). Nov. 5, 1975 to July 26, 1977 and Oct. 1, 1980 to Sept. 30, 1986, nonrecording gage at same site and datum.
REMARKS.--Records fair. Since about 1980, some regulation by retention ponds in headwaters.
DISCHARGE, CUBIC FEET PER SECOND, WATER YEAR OCTOBER 2001 TO SEPTEMBER 2002DAILY MEAN VALUES
DAY OCT NOV DEC JAN FEB MAR APR MAY JUN JUL AUG SEP
1 29 8.1 3.7 2.62 25 8.8 3.6 233 22 9.9 3.5 23 4 20 8.2 3.3 155 18 9.6 3.1 13
2.9 9.5 0.50 2.2 1.9 36 27 26 2.7 9.0 0.47 1.2 1.7 26 61 36 2.5 8.9 0.42 0.96 1.6 23 77 292.0 16 5.1 0.72 1.5 20 52 34 1.9 8.5 5.9 0.59 1.5 30 36 48
6 16 8.5 3.1 147 16 6.9 3.2 128 17 6.5 3.2 9.29 16 5.1 3.2 7.8
10 15 5.3 3.2 6.7
1.9 6.0 1.9 0.57 1.7 25 29 37 2.6 5.6 1.1 0.55 5.0 19 39 29 2.8 5.3 0.92 0.51 3.6 28 28 25 1.8 5.1 0.63 0.45 2.5 34 25 22 1.8 4.8 0.57 0.41 2.2 29 23 19
11 14 4.5 3.1 5.6 12 13 4.7 3.0 5.0 13 12 5.2 3.0 4.2 14 15 17 2.9 9.2 15 19 14 2.9 13
2.4 4.6 0.52 0.40 3.4 23 21 17 2.1 4.1 1.5 0.40 2.6 31 30 16 1.5 4.2 1.0 0.40 12 58 66 27 1.5 3.6 2.3 0.40 12 63 71 29 1.5 3.5 2.3 0.40 11 39 107 22
16 16 10 2.8 8.417 14 9.5 2.9 7.1 18 13 9.4 3.3 6.4 19 13 7.4 2.9 5.9 20 14 7.0 3.0 5.7
1.8 3.1 4.8 0.43 7.2 33 58 22 1.7 2.7 4.2 0.48 16 29 44 23 1.3 2.1 2.3 0.55 13 25 36 18 1.5 1.9 1.4 1.3 11 22 31 15 1.3 1.9 1.1 1.1 9.7 27 30 16
21 18 6.9 2.9 5.6 22 18 6.8 2.7 5.4 23 15 6.4 2.6 5.124 14 6.2 2.8 4.425 14 6.7 2.8 4.1
1.1 1.5 0.71 1.0 12 38 28 15 4.3 1.4 0.52 0.93 25 32 23 1421 1.1 0.48 1.0 18 27 21 2725 1.1 0.48 0.87 19 25 18 4316 0.97 0.50 0.91 17 22 15 32
26 13 6.6 2.9 4.627 12 5.0 2.7 4.328 10 4.4 2.6 3.829 9.6 4.2 2.6 3.630 9.2 3.9 2.6 3.3 31 9.4 --- 2.6 3.2
14 0.89 3.3 0.91 14 20 15 23 12 0.80 5.4 0.91 21 20 14 19 10 0.71 2.4 0.95 17 42 21 15--- 0.75 1.4 0.96 41 39 24 13 --- 0.57 2.6 1.2 52 32 23 12 --- 0.50 --- 2.2 --- 30 22 --
TOTAL 479.2 222.7 92.7 244.2 MEAN 15.5 7.42 2.99 7.88 MAX 29 17 3.7 23 MIN 9.2 3.9 2.6 2.6CFSM 0.73 0.35 0.14 0.37 IN. 0.84 0.39 0.16 0.43
142.9 120.69 56.72 25.86 357.1 947 1115 7235.10 3.89 1.89 0.83 11.9 30.5 36.0 24.1 25 16 5.9 2.2 52 63 107 481.1 0.50 0.42 0.40 1.5 19 14 120.24 0.18 0.09 0.04 0.56 1.44 1.70 1.14 0.25 0.21 0.10 0.05 0.63 1.66 1.96 1.27
STATISTICS OF MONTHLY MEAN DATA FOR WATER YEARS 1972 - 2002, BY WATER YEAR (WY)
MEAN 12.6 10.2 8.88 10.7 MAX 46.3 51.0 35.2 31.5(WY) 1996 1995 1998 1996 MIN 1.73 1.25 0.63 0.83(WY) 1973 2001 2001 2001
9.94 11.5 6.03 3.77 8.20 17.7 17.6 22.7 41.8 48.0 25.1 28.5 35.3 56.7 43.8 71.91998 1998 1996 1991 1974 1978 1995 2001 1.13 1.50 1.30 0.60 0.51 1.94 1.20 1.321991 2000 2000 1990 1998 1972 1999 1990
SUMMARY STATISTICS FOR 2001 CALENDAR YEAR FOR 2002 WATER YEAR WATER YEARS 1972 - 2002
ANNUAL TOTAL 4101.65 ANNUAL MEAN 11.2 HIGHEST ANNUAL MEAN LOWEST ANNUAL MEAN HIGHEST DAILY MEAN 246 LOWEST DAILY MEAN 0.11 ANNUAL SEVEN-DAY MINIMUM 0.49MAXIMUM PEAK FLOWMAXIMUM PEAK STAGE INSTANTANEOUS LOW FLOWANNUAL RUNOFF (CFSM) 0.53ANNUAL RUNOFF (INCHES) 7.2010 PERCENT EXCEEDS 2850 PERCENT EXCEEDS 3.190 PERCENT EXCEEDS 0.94
4527.0712.4 11.9
21.7 19953.23 1990
Sep 14 107 Aug 15 411 Nov 16 1994 May 31 0.40 May 11-15 0.11 May 31 2001 May 30 0.41 May 10 0.23 May 29 1990
191 Aug 15 605 Nov 25 199210.47 Aug 15 14.41 Sep 13 19730.15 Apr 4 0.05 Jun 1 2001 0.59 0.56 7.94 7.6129 28 6.6 5.2 0.92 1.1

85 ST. JOHNS RIVER BASIN ABOVE OCKLAWAHA RIVER
02234400 GEE CREEK NEAR LONGWOOD, FL
LOCATION.--Lat 28° 42'14", long 81° 17'27", in SE1⁄ 4 sec.38, T.20 S., R.30 E., Seminole County, Hydrologic Unit 03080101, at center downstream side of box culverts on State Highway 419, 700 ft upstream from CSX railroad bridge, 1.0 mi upstream frommouth, and 3.5 mi east of Longwood.
DRAINAGE AREA.--12.8 mi2.
PERIOD OF RECORD.--February 1972 to September 1979, October 1980 to July 1985 (discharge measurements only), August 1985 to current year.
GAGE.--Water-stage recorder. Datum of gage is at NGVD of 1929 (levels by Seminole County Engineer). Apr. 11, 1978 to Sept. 30,1979 at site 400 ft upstream at same datum, Oct. 1, 1980 to Aug.11, 1985, nonrecording gage at present site and datum.
REMARKS.--Records fair.
DISCHARGE, CUBIC FEET PER SECOND, WATER YEAR OCTOBER 2001 TO SEPTEMBER 2002DAILY MEAN VALUES
DAY OCT NOV DEC JAN FEB MAR APR MAY JUN JUL AUG SEP
1 25 5.1 5.3 6.0 3.8 7.6 1.8 3.1 1.8 21 21 85 2 19 6.0 5.1 31 3.5 7.5 1.9 2.3 1.4 23 105 88 3 9.9 8.2 4.8 18 3.2 8.0 2.6 1.9 1.3 18 152 65 4 9.7 7.9 4.5 11 3.0 13 5.5 1.7 1.2 13 129 60 5 9.9 15 4.4 9.1 2.9 9.9 5.0 1.6 1.2 17 95 96
6 9.7 19 4.6 8.8 3.4 8.7 2.9 1.6 1.2 23 64 82 7 9.1 5.9 4.5 7.7 8 12 5.6 4.4 6.79 21 5.6 4.4 6.310 17 5.5 4.9 5.8
4.1 7.5 2.4 1.5 7.9 20 58 603.5 7.0 2.2 1.5 3.0 20 46 454.1 6.7 2.0 1.4 1.9 23 36 355.6 6.3 1.9 1.4 1.6 21 29 29
11 13 5.5 4.4 5.512 4.7 5.4 4.3 6.013 4.1 5.6 4.2 e9.014 14 16 4.3 e1115 24 25 4.2 14
4.1 5.7 1.9 1.3 4.6 17 24 263.5 5.2 3.0 1.3 2.6 14 37 243.2 5.0 2.7 1.3 4.3 31 73 262.9 4.4 4.7 1.3 7.7 73 79 283.0 4.0 3.2 1.2 6.1 48 87 24
16 24 8.0 4.1 11 17 10 6.6 4.2 8.918 10 6.6 4.1 7.819 14 6.5 3.9 7.220 16 6.9 3.6 6.7
3.0 3.7 2.6 1.2 3.2 33 72 29 2.8 3.4 2.5 1.2 13 23 62 382.6 3.1 2.2 1.3 7.4 17 55 282.6 3.1 2.0 2.0 9.3 14 73 23 2.5 2.9 1.9 1.5 11 17 142 24
21 25 6.7 3.5 6.4 22 27 6.6 3.3 6.1 23 23 6.7 3.4 5.8 24 20 7.2 3.5 5.525 19 6.9 3.8 5.3
7.9 6.5 1.8 1.3 14 50 134 30 e13 3.0 1.8 1.3 37 49 95 27 e19 2.5 1.9 1.3 46 38 69 49 e25 2.4 1.8 1.2 45 29 45 95 20 2.3 1.8 1.3 31 21 33 74
26 28 6.9 3.6 5.527 22 6.5 3.6 5.1 28 16 6.3 3.5 4.829 6.8 6.0 3.5 4.630 6.0 5.6 3.5 4.331 5.4 --- 3.5 4.0
16 2.3 6.2 1.2 18 19 26 53 11 2.2 5.4 1.2 32 29 21 38 8.9 2.1 2.7 1.2 25 52 34 29--- 2.0 2.3 1.2 18 53 67 23--- 1.9 3.6 1.3 16 37 66 19--- 1.8 --- 3.4 --- 28 62 --
TOTAL 474.3 241.3 126.9 254.9 MEAN 15.3 8.04 4.09 8.22 MAX 28 25 5.3 31 MIN 4.1 5.1 3.3 4.0 CFSM 1.20 0.63 0.32 0.64 IN. 1.38 0.70 0.37 0.74
188.1 151.7 84.2 47.5 373.7 891 2091 13526.72 4.89 2.81 1.53 12.5 28.7 67.5 45.1 25 13 6.2 3.4 46 73 152 962.5 1.8 1.8 1.2 1.2 13 21 190.52 0.38 0.22 0.12 0.97 2.25 5.27 3.52 0.55 0.44 0.24 0.14 1.09 2.59 6.08 3.93
STATISTICS OF MONTHLY MEAN DATA FOR WATER YEARS 1972 - 2002, BY WATER YEAR (WY)
MEAN 17.5 13.8 11.1 13.3MAX 47.4 67.1 43.3 34.8(WY) 1976 1995 1995 1986 MIN 2.05 1.64 1.83 1.85(WY) 1991 2001 1991 1991
11.8 13.3 8.73 5.47 13.2 23.7 25.1 30.362.2 57.1 41.3 35.6 47.9 103 72.6 64.41998 1998 1991 1991 1996 1978 1995 1979 1.82 1.42 1.43 0.85 1.09 1.88 2.01 1.581991 2000 1990 2000 1998 1998 1999 1990
SUMMARY STATISTICS FOR 2001 CALENDAR YEAR FOR 2002 WATER YEAR WATER YEARS 1972 - 2002
ANNUAL TOTAL 4021.35 ANNUAL MEAN 11.0 HIGHEST ANNUAL MEAN LOWEST ANNUAL MEAN HIGHEST DAILY MEAN e162 LOWEST DAILY MEAN e0.40 ANNUAL SEVEN-DAY MINIMUM 0.51MAXIMUM PEAK FLOW MAXIMUM PEAK STAGE INSTANTANEOUS LOW FLOWANNUAL RUNOFF (CFSM) 0.86ANNUAL RUNOFF (INCHES) 11.6910 PERCENT EXCEEDS 2550 PERCENT EXCEEDS 4.290 PERCENT EXCEEDS 1.4
6276.617.2 15.7
40.7 19854.63 1990
Sep 14 152 Aug 3 377 Nov 16 1994 May 22 1.2 Many days e0.35 Jun 6-8 2000 May 20 1.2 May 23 0.37 Jun 3 2000
316 Aug 2 459 Jul 25 1995 14.45 Aug 2 16.16 Jul 25 19951.1 Many days 1.34 1.2318.24 16.6848 37 6.6 8.0 1.8 2.0
e Estimated

86 ST. JOHNS RIVER BASIN ABOVE OCKLAWAHA RIVER
02234435 LAKE JESUP OUTLET NEAR SANFORD, FL
LOCATION (Revised).--Lat 28° 47'02", long 81° 10'53", in NW1⁄ 4 sec.1, T.20 S., R.31 E., Seminole County, Hydrologic Unit 03080101, on left bank of outlet, 1,300 ft upstream from bridge on State Highway 46, and 5.4 mi east of Sanford.
DRAINAGE AREA.--156 mi2.
PERIOD OF RECORD.--August 1941 to July 1948 (gage heights and discharge measurements only), January 1993 to current year.
GAGE.--Water-stage recorder, acoustic velocity meter, and data-collection platform. Datum of gage is at NGVD of 1929August 1941 to April 1943, nonrecording gage and September 1943 to July 1948, water-stage recorder at same site and datum, operated as daily stage for station 02234434, Lake Jesup near Sanford, January 1993 to June 2002, at site 1500 ft downstream at same datum.
REMARKS.--Records fair.
DISCHARGE, CUBIC FEET PER SECOND, WATER YEAR OCTOBER 2001 TO SEPTEMBER 2002DAILY MEAN VALUES
DAY OCT NOV DEC JAN FEB MAR APR MAY JUN JUL AUG SEP
1 396 120 388 372 114 2 389 -79 437 281 -150 3 352 -3.4 423 189 704 398 -43 508 353 -3785 384 -339 480 418 -342
-39 -230 333 -10 145 108 521 479 -50 188 229 429 359 468-121 -89 189 254 274 950 480-746 -44 318 195 362 724 511-315 -219 -74 70 333 389 772
6 210 423 462 464 7 201 289 443 122 8 128 241 401 520 9 272 195 369 56310 285 191 470 587
436 190 -258 -89 111 237 250 764111 137 -103 -105 -23 93 181 571
-335 273 215 -29 -40 6.8 310 486277 248 217 148 -165 22 273 518285 85 235 143 -270 40 237 400
11 306 215 410 56212 179 274 426 63013 219 191 400 51214 244 -935 410 599 15 190 -320 273 439
-81 310 120 153 -117 -48 240 393190 410 124 296 e-80 -286 328 293-60 185 69 266 e-30 93 281 38713 90 55 -342 e80 126 276 495134 215 30 -36 137 152 231 477
16 383 -37 380 426 17 245 -224 536 400 18 457 -203 345 295 19 395 -277 433 41420 370 -37 326 116
-165 330 177 116 380 149 306 532 -237 289 183 125 337 53 149 731 -145 310 185 91 146 31 135 698246 346 190 -427 152 99 24 644344 366 226 -520 -2.2 105 563 654
21 437 -96 457 32922 418 43 506 20223 240 178 546 377 24 180 213 325 30925 -34 169 395 26
45 147 199 -433 23 e140 826 616159 -323 32 -545 369 e130 628 656
-321 -154 -227 -244 565 121 511 753 131 -129 1.2 -130 420 -37 423 830 66 37 40 -138 345 -111 353 740
26 -144 276 377 4.627 7.6 297 500 8828 105 293 463 3229 193 322 461 3330 181 311 427 13131 148 --- 436 140
-131 140 -158 -175 322 -48 305 628 -721 -126 185 65 68 73 270 481 -308 -25 -130 -251 224 49 320 602--- 154 -132 -124 186 250 379 643--- 77 96 -56 33 187 604 581--- 40 --- -13 --- 135 603 --
TOTAL 7734.6 1647.6 13213 9933.6 MEAN 250 54.9 426 320 MAX 457 423 546 630 MIN -144 -935 273 4.6
-753 2880 939.2 -1300 3908.8 3304.8 11536 17325-26.9 92.9 31.3 -41.9 130 107 372 578436 479 235 333 565 429 950 830
-721 -746 -258 -545 -270 -286 24 293
STATISTICS OF MONTHLY MEAN DATA FOR WATER YEARS 1993 - 2002, BY WATER YEAR (WY)
MEAN 78.1 216 248 250 MAX 316 434 589 525 (WY) 1995 1996 1995 1995 MIN -442 54.9 -131 -59.4 (WY) 2000 2002 1998 1993
167 154 141 79.3 176 225 69.6 112395 579 514 356 667 779 519 5781996 1998 1998 1993 1993 1993 1994 2002-62.0 5.29 -89.6 -41.9 -24.5 -24.0 -264 -5801999 2001 1999 2002 1999 1997 2001 2001
SUMMARY STATISTICS FOR 2001 CALENDAR YEAR FOR 2002 WATER YEAR WATER YEARS 1993 - 2002
ANNUAL TOTAL 3755.74 ANNUAL MEAN 10.3 HIGHEST ANNUAL MEAN LOWEST ANNUAL MEAN HIGHEST DAILY MEAN 1060LOWEST DAILY MEAN e-2940ANNUAL SEVEN-DAY MINIMUM e-2340 MAXIMUM PEAK STAGE 10 PERCENT EXCEEDS 40750 PERCENT EXCEEDS 8190 PERCENT EXCEEDS -345
70369.6 193 159
*398 1994-49.9 2001
Jul 23 950 Aug 3 1890 Jul 26 1995Sep 18 -935 Nov 14 e-2940 Sep 18 2001Sep 15 -348 May 19 e-2340 Sep 15 2001
6.72 Sep 5 7.30 Nov 24 1994 511 502 193 183-144 -214
e Estimated * Highest annual mean based on partial water year record Note.--Negative figures indicate reverse flow.

87 ST. JOHNS RIVER BASIN ABOVE OCKLAWAHA RIVER
02234500 ST. JOHNS RIVER NEAR SANFORD, FL
LOCATION.--Lat 28° 50'16", long 81° 19'28", in SW1⁄ 4 sec.16, T.19 S., R.30 E., Seminole County, Hydrologic Unit 03080101, near center of channel on bridge pile under U.S. Highways 17 and 92, at outlet of Lake Monroe, 4 mi northwest of Sanford, and 161 mi upstream from mouth.
DRAINAGE AREA.--2,582 mi2. WATER-DISCHARGE RECORDS
PERIOD OF RECORD.--August 1941 to June 1956 (discharge measurement only), October 1964 to September 1968 (gage heights and miscellaneous discharge measurements only), May 1987 to September 1989, March 1995 to current year.
GAGE.--Water-stage recorder, acoustic velocity meter, and data-collection platform. Datum of gage is .09 ft below NGVD of 1929.
REMARKS.--Records fair.
EXTREMES OUTSIDE PERIOD OF RECORD.--Maximum gage height since at least 1871, 13.37 ft in the fall of 1880, from information by Fred T. Williams, former city engineer for Sanford. Since July 1941: Maximum daily gage height, 8.59 ft, Oct. 5-17, 1953;minimum daily, -0.43 ft, Apr. 5, 1945 (published as elevations for Lake Monroe near Sanford).
DISCHARGE, CUBIC FEET PER SECOND, WATER YEAR OCTOBER 2001 TO SEPTEMBER 2002DAILY MEAN VALUES
DAY OCT NOV DEC JAN FEB MAR APR MAY JUN JUL AUG SEP
1 8280 6360 5330 23302 8450 6440 5230 23003 8660 6290 5110 17704 8350 6150 4960 18205 8620 5640 4790 2070
1080 1690 -50 -36 12 2920 6380 9290 878 2390 -105 202 244 3030 6200 9280 451 1980 -238 662 576 3150 6640 8870-140 1060 61 857 640 3440 6970 893051 1220 -582 243 250 3650 7320 9370
6 8430 5700 4580 23107 8240 5840 4640 21508 8040 5820 4680 23509 7670 5670 4600 2650
10 7750 5790 4450 2800
973 1860 -665 -629 -109 3880 6780 9920 968 1970 -14 -640 -56 4140 6780 9950 171 2020 696 -304 30 4530 6970 100001050 1960 941 203 -692 4530 7120 96801050 1800 985 436 -734 4380 6770 9750
11 8170 5890 4210 2760 12 7950 5760 4150 2650 13 7850 5790 3980 2530 14 7480 5510 4150 2360 15 7540 5000 3930 1820
830 2070 793 537 -900 4410 6910 9390 961 2030 401 502 -798 5190 7290 9220 827 1540 462 -173 335 5000 7630 8740 693 1690 120 -680 221 5270 7830 8780 569 1810 397 37 901 5420 8140 8640
16 7380 5060 3830 1760 17 7040 5120 3750 171018 7030 5250 3350 1620 19 6840 5400 3280 1810 20 6740 5350 3210 1810
249 1850 786 -248 728 5470 8350 900020 1960 778 -497 612 5720 8270 8720
562 1870 762 -575 240 5680 8500 8620 899 1940 853 -875 338 5800 9280 85401150 1600 633 -1700 -81 5650 9340 8430
21 6880 5350 2990 1790 22 6740 5620 3130 1730 23 6640 5870 3230 1760 24 6660 5940 2950 1730 25 6720 5910 2710 1620
1220 1210 498 -1940 -28 5360 9340 83901140 487 6.2 -2160 775 5380 9690 806025 -114 -317 -1890 934 5850 9530 7920
544 482 4.9 -1750 1340 6020 9560 8110 932 772 -576 -1150 1680 5820 9580 8180
26 6410 5760 2450 1200 27 6340 5670 2660 928 28 6430 5800 2840 1010 29 6170 5740 2840 1130 30 6210 5540 2690 1330 31 6240 --- 2500 1370
1030 783 -702 -645 1760 5770 9500 8000 168 285 -323 -379 1760 5870 9230 78401120 432 -783 -706 2190 6320 9330 7630 --- 677 -935 -878 2300 6500 9600 7490 --- 794 127 -655 2440 6610 9470 7690 --- 614 --- -105 --- 6400 9280 --
TOTAL 227950 171030 117200 58978 MEAN 7353 5701 3781 1903MAX 8660 6440 5330 2800 MIN 6170 5000 2450 928 CFSM 2.85 2.21 1.46 0.74IN. 3.28 2.46 1.69 0.85
19471 42732 4014.1 -14936 16908 157160 253580 262430 695 1378 134 -482 564 5070 8180 87481220 2390 985 857 2440 6610 9690 10000 -140 -114 -935 -2160 -900 2920 6200 74900.27 0.53 0.05 -0.19 0.22 1.96 3.17 3.390.28 0.62 0.06 -0.22 0.24 2.26 3.65 3.78
STATISTICS OF MONTHLY MEAN DATA FOR WATER YEARS 1987 - 2002, BY WATER YEAR (WY)
MEAN 3861 3686 2762 2482MAX 7353 7981 4908 7189(WY) 2002 2000 2000 1998MIN 1344 1550 714 457 (WY) 2001 2001 2001 1997
1853 1874 1442 916 806 1532 2255 30776278 8408 5599 3016 1865 5070 8180 87481998 1998 1998 1998 1996 2002 2002 2002 214 -26.0 -383 -482 381 212 192 5171999 1997 1997 2002 2000 2000 2000 2000
SUMMARY STATISTICS FOR 2001 CALENDAR YEAR FOR 2002 WATER YEAR WATER YEARS 1987 - 2002
ANNUAL TOTAL 873568.78 ANNUAL MEAN 2393HIGHEST ANNUAL MEANLOWEST ANNUAL MEANHIGHEST DAILY MEAN 8660LOWEST DAILY MEAN -1370ANNUAL SEVEN-DAY MINIMUM -475MAXIMUM PEAK FLOWMAXIMUM PEAK STAGEANNUAL RUNOFF (CFSM) 0.93ANNUAL RUNOFF (INCHES) 12.5910 PERCENT EXCEEDS 652050 PERCENT EXCEEDS 105090 PERCENT EXCEEDS -137
1316517.1 3607 2163
3607 2002 951 1999
Oct 3 10000 Sep 8 10000 Sep 8 2002Mar 21 -2160 May 22 -2160 May 22 2002May 3 -1640 May 19 -1640 May 19 2002
*17500 Oct 14 1953 5.86 Sep 7 1.40 0.8418.97 11.38
8440 56902690 1510-107 30
* Measured Note.--Negative figures indicate reverse flow

---
88 ST. JOHNS RIVER BASIN ABOVE OCKLAWAHA RIVER
02234500 ST. JOHNS RIVER NEAR SANFORD, FL--Continued
GAGE HEIGHT, FEET, WATER YEAR OCTOBER 2001 TO SEPTEMBER 2002 DAILY MEAN VALUES
DAY OCT NOV DEC JAN FEB MAR APR MAY JUN JUL AUG SEP
1 5.73 4.58 3.98 2.04 1.04 1.74 1.11 0.93 1.56 2.73 4.16 5.57 2 5.72 4.58 3.91 2.07 1.02 1.72 1.13 0.87 1.50 2.86 4.22 5.59 3 5.70 4.60 3.84 2.10 1.03 1.69 1.15 0.81 1.42 2.93 4.35 5.59 4 5.67 4.58 3.77 2.12 1.06 1.73 1.15 0.72 1.37 2.95 4.44 5.60 5 5.63 4.54 3.71 2.14 1.17 1.77 1.18 0.65 1.34 3.01 4.49 5.72
6 5.58 4.50 3.64 2.09 1.23 1.79 1.29 0.72 1.32 3.06 4.54 5.79 7 5.54 4.48 3.59 1.99 1.17 1.75 1.38 0.79 1.34 3.08 4.65 5.81 8 5.50 4.45 3.54 1.92 1.20 1.73 1.38 0.79 1.33 3.12 4.71 5.81 9 5.47 4.40 3.49 1.83 1.20 1.70 1.28 0.74 1.35 3.17 4.74 5.80 10 5.41 4.36 3.44 1.74 1.16 1.66 1.19 0.65 1.44 3.22 4.77 5.77
11 5.36 4.31 3.39 1.63 1.15 1.61 1.14 0.59 1.52 3.25 4.79 5.74 12 5.30 4.26 3.33 1.52 1.13 1.56 1.12 0.52 1.60 3.33 4.82 5.72 13 5.26 4.22 3.28 1.42 1.10 1.50 1.14 0.45 1.66 3.43 4.95 5.74 14 5.22 4.30 3.22 1.38 1.09 1.48 1.12 0.46 1.61 3.55 5.15 5.74 15 5.21 4.28 3.17 1.39 1.13 1.44 1.12 0.48 1.60 3.61 5.27 5.68
16 5.15 4.30 3.12 1.39 1.17 1.38 1.11 0.49 1.53 3.65 5.35 5.62 17 5.08 4.35 3.04 1.37 1.20 1.31 1.08 0.46 1.49 3.66 5.37 5.56 18 5.03 4.38 2.96 1.33 1.23 1.23 1.03 0.45 1.53 3.68 5.40 5.49 19 4.98 4.41 2.90 1.30 1.25 1.15 0.97 0.45 1.57 3.67 5.45 5.41 20 4.95 4.41 2.81 1.25 1.20 1.05 0.89 0.61 1.64 3.66 5.54 5.34
21 4.93 4.41 2.74 1.18 1.13 0.99 0.83 0.84 1.74 3.68 5.58 5.31 22 4.92 4.39 2.67 1.14 1.10 1.00 0.77 1.02 1.95 3.77 5.59 5.23 23 4.88 4.37 2.59 1.11 1.16 1.08 0.80 1.22 2.15 3.84 5.59 5.17 24 4.85 4.35 2.52 1.09 1.42 1.18 0.86 1.36 2.26 3.88 5.57 5.20 25 4.86 4.32 2.46 1.04 1.52 1.17 0.86 1.42 2.33 3.91 5.54 5.22
26 4.81 4.27 2.37 1.02 1.58 1.15 0.90 1.41 2.33 3.94 5.52 5.22 27 4.73 4.22 2.34 1.05 1.59 1.13 0.98 1.38 2.35 4.05 5.50 5.18 28 4.67 4.17 2.29 1.09 1.72 1.14 0.98 1.39 2.37 4.08 5.49 5.14 29 4.63 4.11 2.21 1.11 --- 1.15 0.99 1.44 2.40 4.10 5.52 5.08 30 4.60 4.04 2.16 1.10 --- 1.15 0.97 1.51 2.55 4.12 5.56 5.01 31 4.60 --- 2.09 1.08 --- 1.12 --- 1.55 4.14 5.56 --
MEAN 5.16 4.36 3.05 1.48 1.22 1.40 1.06 0.88 1.74 3.52 5.10 5.50 MAX 5.73 4.60 3.98 2.14 1.72 1.79 1.38 1.55 2.55 4.14 5.59 5.81 MIN 4.60 4.04 2.09 1.02 1.02 0.99 0.77 0.45 1.32 2.73 4.16 5.01
CAL YR 2001 MEAN 2.13 MAX 5.83 MIN 0.36 WTR YR 2002 MEAN 2.88 MAX 5.81 MIN 0.45
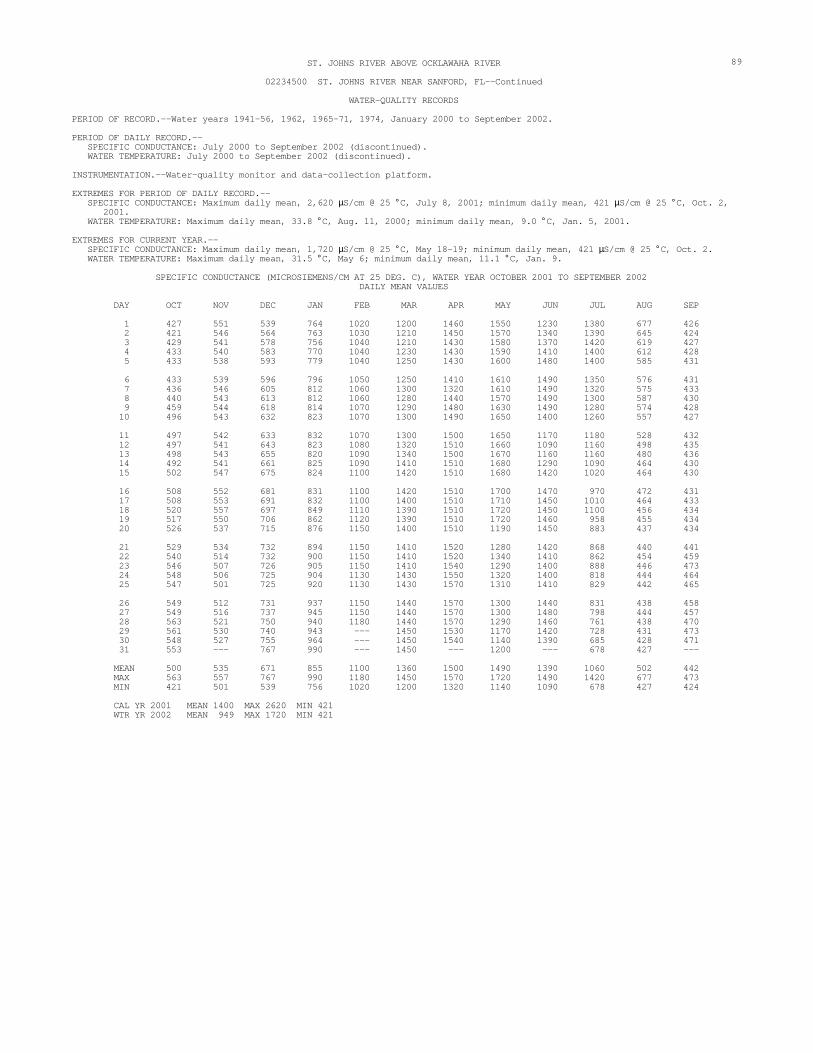
89 ST. JOHNS RIVER ABOVE OCKLAWAHA RIVER
02234500 ST. JOHNS RIVER NEAR SANFORD, FL--Continued
WATER-QUALITY RECORDS
PERIOD OF RECORD.--Water years 1941-56, 1962, 1965-71, 1974, January 2000 to September 2002.
PERIOD OF DAILY RECORD.-- SPECIFIC CONDUCTANCE: July 2000 to September 2002 (discontinued). WATER TEMPERATURE: July 2000 to September 2002 (discontinued).
INSTRUMENTATION.--Water-quality monitor and data-collection platform.
EXTREMES FOR PERIOD OF DAILY RECORD.--SPECIFIC CONDUCTANCE: Maximum daily mean, 2,620 µS/cm @ 25 ° C, July 8, 2001; minimum daily mean, 421 µS/cm @ 25 ° C, Oct. 2,
2001. WATER TEMPERATURE: Maximum daily mean, 33.8 ° C, Aug. 11, 2000; minimum daily mean, 9.0 ° C, Jan. 5, 2001.
EXTREMES FOR CURRENT YEAR.--SPECIFIC CONDUCTANCE: Maximum daily mean, 1,720 µS/cm @ 25 ° C, May 18-19; minimum daily mean, 421 µS/cm @ 25 ° C, Oct. 2. WATER TEMPERATURE: Maximum daily mean, 31.5 ° C, May 6; minimum daily mean, 11.1 ° C, Jan. 9.
SPECIFIC CONDUCTANCE (MICROSIEMENS/CM AT 25 DEG. C), WATER YEAR OCTOBER 2001 TO SEPTEMBER 2002DAILY MEAN VALUES
DAY OCT NOV DEC JAN FEB MAR APR MAY JUN JUL AUG SEP
1 427 551 539 764 2 421 546 564 763 3 429 541 578 756 4 433 540 583 770 5 433 538 593 779
1020 1200 1460 1550 1230 1380 677 426 1030 1210 1450 1570 1340 1390 645 424 1040 1210 1430 1580 1370 1420 619 427 1040 1230 1430 1590 1410 1400 612 428 1040 1250 1430 1600 1480 1400 585 431
6 433 539 596 796 7 436 546 605 812 8 440 543 613 812 9 459 544 618 81410 496 543 632 823
1050 1250 1410 1610 1490 1350 576 431 1060 1300 1320 1610 1490 1320 575 433 1060 1280 1440 1570 1490 1300 587 430 1070 1290 1480 1630 1490 1280 574 428 1070 1300 1490 1650 1400 1260 557 427
11 497 542 633 83212 497 541 643 82313 498 543 655 82014 492 541 661 82515 502 547 675 824
1070 1300 1500 1650 1170 1180 528 432 1080 1320 1510 1660 1090 1160 498 435 1090 1340 1500 1670 1160 1160 480 436 1090 1410 1510 1680 1290 1090 464 430 1100 1420 1510 1680 1420 1020 464 430
16 508 552 681 83117 508 553 691 83218 520 557 697 849 19 517 550 706 86220 526 537 715 876
1100 1420 1510 1700 1470 970 472 431 1100 1400 1510 1710 1450 1010 464 433 1110 1390 1510 1720 1450 1100 456 4341120 1390 1510 1720 1460 958 455 4341150 1400 1510 1190 1450 883 437 434
21 529 534 732 89422 540 514 732 90023 546 507 726 90524 548 506 725 90425 547 501 725 920
1150 1410 1520 1280 1420 868 440 4411150 1410 1520 1340 1410 862 454 4591150 1410 1540 1290 1400 888 446 4731130 1430 1550 1320 1400 818 444 4641130 1430 1570 1310 1410 829 442 465
26 549 512 731 93727 549 516 737 94528 563 521 750 94029 561 530 740 943 30 548 527 755 964 31 553 --- 767 990
1150 1440 1570 1300 1440 831 438 4581150 1440 1570 1300 1480 798 444 4571180 1440 1570 1290 1460 761 438 470 --- 1450 1530 1170 1420 728 431 473 --- 1450 1540 1140 1390 685 428 471 --- 1450 --- 1200 --- 678 427 --
MEAN 500 535 671 855 MAX 563 557 767 990 MIN 421 501 539 756
1100 1360 1500 1490 1390 1060 502 442 1180 1450 1570 1720 1490 1420 677 473 1020 1200 1320 1140 1090 678 427 424
CAL YR 2001 MEAN 1400 MAX 2620 MIN 421 WTR YR 2002 MEAN 949 MAX 1720 MIN 421

---
90 ST. JOHNS RIVER ABOVE OCKLAWAHA RIVER
02234500 ST. JOHNS RIVER NEAR SANFORD, FL--Continued
TEMPERATURE, WATER (DEG. C), WATER YEAR OCTOBER 2001 TO SEPTEMBER 2002 DAILY MEAN VALUES
DAY OCT NOV DEC JAN FEB MAR APR MAY JUN JUL AUG SEP
1 24.3 20.9 22.9 15.2 24.0 15.2 26.0 28.8 28.1 27.8 30.4 29.1 2 24.2 21.5 23.1 14.6 23.9 16.0 25.9 28.7 29.1 27.7 30.4 29.3 3 24.7 22.1 23.2 13.9 22.9 17.4 25.5 29.0 29.1 28.8 29.7 29.5 4 25.1 22.4 22.9 12.1 21.9 17.4 24.8 30.2 30.2 28.8 29.5 29.2 5 25.6 22.1 22.5 11.7 20.6 15.6 25.2 31.0 30.2 28.5 29.2 29.1
6 25.4 21.1 22.3 12.3 19.4 15.6 25.6 31.5 30.6 28.9 29.7 29.0 7 25.2 20.8 22.6 12.4 18.4 16.6 24.7 31.4 30.9 29.5 29.6 29.1 8 24.9 21.3 23.2 11.3 18.0 18.2 23.3 31.0 30.3 29.2 28.9 28.9 9 24.1 20.8 23.4 11.1 17.9 20.7 22.9 30.6 30.1 28.4 28.6 29.1 10 24.0 21.1 23.8 11.5 18.8 21.7 23.9 30.4 30.1 28.2 28.6 29.2
11 24.3 21.1 23.8 11.8 19.0 21.5 24.9 29.6 29.5 28.3 28.2 29.0 12 24.8 21.0 24.2 12.6 19.2 21.8 24.6 28.8 28.9 28.4 28.0 28.5 13 25.0 21.0 24.2 13.4 18.1 22.1 24.1 28.5 28.9 28.2 28.0 28.2 14 25.1 20.9 24.2 14.1 17.4 22.4 24.5 29.4 29.1 28.3 27.9 28.4 15 25.4 20.6 24.3 14.4 17.8 23.5 24.8 28.6 29.4 29.0 28.1 28.8
16 25.3 20.3 24.2 15.2 18.1 24.7 26.7 27.9 29.1 29.7 28.5 29.2 17 24.4 20.2 23.5 15.4 17.9 25.8 27.8 28.5 28.2 30.3 29.3 29.7 18 23.2 20.7 23.1 15.3 17.4 26.3 28.7 29.8 27.2 31.1 29.3 29.9 19 23.2 20.9 22.2 16.2 17.4 26.2 29.1 29.5 26.7 31.2 29.3 30.0 20 23.8 21.1 21.2 17.6 17.9 25.4 28.4 26.8 26.4 30.5 29.1 29.7
21 24.1 21.4 19.7 18.9 18.7 24.9 27.9 25.2 25.9 29.8 29.4 29.3 22 24.7 21.7 18.9 19.5 19.3 24.7 27.5 25.1 25.8 29.4 29.8 29.0 23 25.0 21.7 18.9 20.4 18.8 24.3 28.2 25.0 25.6 29.4 30.1 28.7 24 25.3 21.9 19.1 21.1 18.1 24.3 28.8 25.2 26.2 29.9 30.4 28.5 25 25.6 22.4 18.1 21.4 18.3 24.0 28.1 25.3 26.5 30.7 30.2 28.5
26 24.9 23.0 16.6 21.7 18.9 25.5 28.8 25.7 27.0 30.9 29.8 28.5 27 22.7 23.1 14.9 21.5 18.5 25.7 29.4 26.2 27.3 30.7 29.5 28.6 28 20.7 22.9 14.8 21.9 16.6 25.7 29.4 26.3 27.8 31.0 29.2 29.0 29 20.2 22.8 15.3 22.9 --- 25.9 29.4 26.6 28.0 30.6 29.1 29.3 30 19.8 22.8 15.9 23.4 --- 26.1 29.3 26.6 28.1 30.1 29.2 29.3 31 20.3 --- 15.7 23.6 --- 25.9 --- 27.7 30.2 29.1 --
MEAN 24.0 21.5 21.1 16.4 19.0 22.3 26.6 28.2 28.3 29.5 29.2 29.1 MAX 25.6 23.1 24.3 23.6 24.0 26.3 29.4 31.5 30.9 31.2 30.4 30.0 MIN 19.8 20.2 14.8 11.1 16.6 15.2 22.9 25.0 25.6 27.7 27.9 28.2
CAL YR 2001 MEAN 24.6 MAX 32.5 MIN 9.0 WTR YR 2002 MEAN 24.6 MAX 31.5 MIN 11.1

91 ST. JOHNS RIVER ABOVE OCKLAWAHA RIVER
02234500 ST. JOHNS RIVER NEAR SANFORD, FL--Continued
WATER-QUALITY DATA, WATER YEAR OCTOBER 2001 TO SEPTEMBER 2002
DIS SPE PH PH RESIDUE NITRO CHARGE, SPE CIFIC WATER WATER TOTAL GEN, INST. CIFIC CON WHOLE WHOLE COLOR AT 105 AMMONIA CUBIC CON DUCT- FIELD LAB TEMPER- TUR (PLAT OXYGEN, DEG. C, DIS FEET GAGE DUCT ANCE (STAND- (STAND ATURE BID INUM- DIS SUS SOLVED
Date Time PER HEIGHT ANCE LAB ARD ARD WATER ITY COBALT SOLVED PENDED (MG/L SECOND (FEET) (US/CM) (US/CM) UNITS) UNITS) (DEG C) (NTU) UNITS) (MG/L) (MG/L) AS N)
(00061) (00065) (00095) (90095) (00400) (00403) (00010) (00076) (00080) (00300) (00530) (00608)
OCT 09... 1215 9680 5.48 452 448 7.0 7.0 24.0 7.0 280 6.4 20 E.14 24... 0720 8730 4.86 546 537 6.7 7.2 24.9 1.2 280 4.0 5 .11 NOV 06... 1245 7380 4.44 521 516 7.5 7.7 21.1 1.4 240 6.4 2 .07 21... 0850 6600 4.41 533 520 7.5 7.3 20.9 1.3 240 7.1 4 E.05 DEC 04... 1145 4870 3.78 571 576 7.2 7.5 22.9 1.6 240 5.7 2 .07 17... 1505 4020 3.03 671 647 7.5 7.7 23.6 3.2 240 6.7 E4 .10 JAN 04... 1348 1640 2.15 776 759 7.8 7.7 11.8 2.9 200 9.7 8 .08 14... 1530 2540 1.39 823 821 7.8 7.6 14.1 2.7 160 10.0 2 <.01 30... 1145 1570 1.11 947 925 7.5 7.5 22.9 3.6 140 7.4 6 .08 FEB 14... 0923 854 1.09 1060 1060 7.6 7.8 16.8 3.4 120 9.2 5 .02 26... 1045 830 1.58 1120 1120 7.8 7.9 18.3 4.5 120 9.6 9 .01 MAR 12... 1406 2270 1.61 1300 1290 8.1 7.7 22.2 4.9 120 9.2 20 .02 28... 1348 -167 1.14 1420 1400 8.0 7.6 24.9 5.8 100 7.8 12 .01 APR 09... 1215 945 1.30 1460 1450 8.3 7.8 22.2 6.6 80 8.8 17 .02 25... 0950 -1060 .86 1520 1520 8.4 8.3 28.8 7.5 100 5.9 21 <.01 MAY 08... 1207 -688 .81 1520 1520 8.0 8.0 30.9 12 80 2.6 38 .04 21... 1220 -2250 .84 1280 1260 7.7 7.9 25.1 8.0 40 9.8 24 <.01 JUN 04... 1254 1270 1.38 1380 1350 8.5 8.2 30.4 4.6 50 7.2 15 .02 19... 1300 541 1.51 1430 1390 8.5 8.2 27.3 4.7 50 8.8 18 <.01 JUL 02... 1320 3280 2.86 1390 1370 7.7 7.7 28.0 36 50 7.7 118 .01 17... 1215 5480 3.67 973 938 6.2 7.2 30.0 2.4 240 4.4 7 .16 31... 1225 5720 4.08 678 654 6.3 7.2 30.2 2.2 240 2.2 6 .28 AUG 14... 1206 8270 5.15 456 445 6.6 7.3 28.2 2.6 240 4.6 2 .10 26... 1230 10000 5.51 431 420 7.2 7.2 30.0 5.1 240 2.9 18 .06 SEP 11... 1040 9940 5.74 421 414 7.0 7.6 28.9 2.2 240 3.6 8 <.01 24... 1205 8000 5.19 460 444 6.8 7.4 28.5 2.3 240 5.5 4 .08
< -- Less than E -- Estimated value Note.--Negative figures indicate reverse flow

-- --
92 ST. JOHNS RIVER ABOVE OCKLAWAHA RIVER
02234500 ST. JOHNS RIVER NEAR SANFORD, FL--Continued
WATER-QUALITY DATA, WATER YEAR OCTOBER 2001 TO SEPTEMBER 2002
NITRO NITRO NITRO ORTHO NITRO GEN, GEN,AM- GEN, PHOS- CARBON, PHOS- HARD MAGNEGEN, NITRITE MONIA + NO2+NO3 PHOS PHATE, ORGANIC PHORUS NESS CALCIUM SIUM, SODIUM,
AMMONIA DIS ORGANIC DIS PHORUS DIS DIS SULFIDE ORTHO TOTAL DIS DIS DIS TOTAL SOLVED TOTAL SOLVED TOTAL SOLVED SOLVED TOTAL TOTAL (MG/L SOLVED SOLVED SOLVED
Date (MG/L (MG/L (MG/L (MG/L (MG/L (MG/L (MG/L (MG/L (MG/L AS (MG/L (MG/L (MG/L AS N) AS N) AS N) AS N) AS P) AS P) AS C) AS S) AS P) CACO3) AS CA) AS MG) AS NA) (00610) (00613) (00625) (00631) (00665) (00671) (00681) (00745) (70507) (00900) (00915) (00925) (00930)
OCT 09... .15 E.070 E2.1 E.16 .17 E.13 30.0 2.0 .140 92 24.0 7.60 49.0 24... .10 .040 E1.6 .14 E.07 .07 32.0 2.0 .070 110 28.0 9.20 58.0 NOV 06... .06 .020 E1.7 .16 E.09 .06 33.0 2.0 .060 110 28.0 9.20 56.0 21... .07 E.020 E1.6 E.17 E.06 E.05 29.0 2.0 .050 110 28.0 9.00 55.0 DEC 04... .23 .020 E1.4 .12 E.07 .04 30.0 2.0 E.070 29.0 62.0 17... .10 .050 1.9 .20 .09 .07 28.0 1.0 .070 140 34.0 12.0 73.0 JAN 04... .09 .010 1.5 .23 .06 .05 30.0 2.0 .050 150 38.0 13.0 86.0 14... .04 <.010 1.6 .24 .07 .04 28.0 1.0 .040 160 39.0 14.0 95.0 30... .12 <.010 1.8 .15 .05 .03 25.0 1.0 .030 180 43.0 17.0 110 FEB 14... .03 <.010 1.6 .11 .04 .02 3.6 2.0 .020 190 46.0 19.0 130 26... .04 <.010 1.3 .03 .06 .02 22.0 1.0 .030 200 49.0 19.0 130 MAR 12... .04 <.010 1.4 <.02 .05 <.01 22.0 1.0 <.010 230 54.0 22.0 150 28... .02 <.010 1.4 <.02 .04 <.01 20.0 1.0 .010 250 58.0 24.0 170 APR 09... .02 <.010 1.8 <.02 .07 <.01 20.0 1.0 <.010 250 60.0 25.0 170 25... <.01 <.010 2.2 <.02 .07 <.01 19.0 1.0 .020 250 60.0 25.0 190 MAY 08... .04 <.010 2.5 <.02 .08 <.01 21.0 1.0 .020 270 64.0 26.0 190 21... <.01 <.010 1.2 .03 .06 .02 9.6 <1.0 .020 250 64.0 22.0 160 JUN 04... .02 <.010 1.1 <.02 .04 <.01 14.0 <1.0 <.010 260 66.0 23.0 160 19... .02 <.010 1.7 .17 .10 <.01 14.0 <1.0 .020 260 63.0 24.0 170 JUL 02... .01 <.010 2.5 <.02 .14 <.01 15.0 <1.0 <.010 240 56.0 23.0 170 17... .15 .020 1.8 .03 .09 .06 26.0 2.0 .070 170 41.0 17.0 120 31... .28 .060 1.9 .08 .21 .17 27.0 2.0 .190 130 33.0 11.0 75.0 AUG 14... .10 .040 1.6 .13 .22 .21 27.0 2.0 .220 96 25.0 7.90 48.0 26... .05 .040 1.8 .10 .20 .14 24.0 2.0 .150 94 25.0 7.40 44.0 SEP 11... .09 <.010 1.4 <.02 .13 <.01 23.0 2.0 .110 89 24.0 6.90 45.0 24... .07 .020 1.5 .09 .08 .09 23.0 2.0 .090 94 25.0 7.50 48.0
< -- Less than E -- Estimated value

--
--
--
----
--
----
----
--
--
--
----
----
--
--
----
----
----
93 ST. JOHNS RIVER ABOVE OCKLAWAHA RIVER
02234500 ST. JOHNS RIVER NEAR SANFORD, FL--Continued
WATER-QUALITY DATA, WATER YEAR OCTOBER 2001 TO SEPTEMBER 2002
ANC SOLIDS, CHLOR-A POTAS UNFLTRD CHLO- SILICA, RESIDUE PHYTO BARIUM, STRON IRON, SIUM, TIT 4.5 SULFATE RIDE, DIS AT 180 PLANK BROMIDE BARIUM, TOTAL TIUM, TOTAL IRON, DIS LAB DIS DIS SOLVED DEG. C TON DIS DIS RECOV DIS RECOV DIS
SOLVED (MG/L SOLVED SOLVED (MG/L DIS CHROMO SOLVED SOLVED ERABLE SOLVED ERABLE SOLVED Date (MG/L AS (MG/L (MG/L AS SOLVED FLUOROM (MG/L (UG/L (UG/L (UG/L (UG/L (UG/L
AS K) CACO3) AS SO4) AS CL) SIO2) (MG/L) (UG/L) AS BR) AS BA) AS BA) AS SR) AS FE) AS FE) (00935) (90410) (00945) (00940) (00955) (70300) (70953) (71870) (01005) (01007) (01080) (01045) (01046)
OCT 09... 4.20 E45 17.0 92.0 9.30 E304 6.1 .5 17.0 580 780 492 24... 3.80 51 21.0 113 9.50 372 3.4 .6 19.0 700 487 399 NOV 06... 4.40 E52 21.0 111 8.40 362 <.1 .6 18.0 700 479 358 21... 4.20 E50 22.0 111 7.00 350 <.1 .6 17.0 660 466 353 DEC 04... 4.30 E51 7.9 123 6.10 386 <.1 .5 18.0 18.0 680 493 367 17... 4.80 59 30.0 148 6.30 E427 <.1 .6 21.0 800 480 355 JAN 04... 5.30 66 36.0 168 6.30 473 <.1 .7 23.0 870 400 291 14... 5.40 67 38.0 183 5.90 503 11.0 1.5 21.0 880 350 275 30... 5.70 71 50.0 210 4.20 548 8.1 1.0 25.0 970 324 211 FEB 14... 6.20 70 62.0 244 .69 645 <.1 .9 27.0 1120 279 189 26... 6.00 70 68.0 258 .23 674 13.0 .9 28.0 1150 249 147 MAR 12... 6.80 68 88.0 302 .11 772 18.0 1.3 30.0 1380 236 122 28... 6.90 61 114 323 .23 871 27.0 1.3 34.0 1500 165 75 APR 09... 7.10 64 114 336 .37 878 50.0 1.3 33.0 1540 146 36 25... 7.20 64 120 360 1.20 938 92.0 1.4 33.0 1540 114 16 MAY 08... 7.20 70 121 358 3.00 929 46.0 1.4 34.0 1620 215 16 21... 5.80 105 88.0 273 6.30 707 35.0 1.0 23.0 1170 109 11 JUN 04... 6.20 91 100 308 4.60 822 33.0 1.1 32.0 1370 62 7 19... 6.80 80 103 320 5.20 845 41.0 1.2 34.0 1450 95 7 JUL 02... 6.80 68 101 322 5.80 815 28.0 1.2 35.0 1410 1400 22 17... 5.80 38 89.0 205 6.60 611 13.0 .8 26.0 1060 561 364 31... 5.10 52 43.0 134 8.90 459 <.1 .5 22.0 910 759 518 AUG 14... 4.50 52 17.0 87.0 9.30 305 <.1 .5 18.0 660 639 481 26... 4.30 53 15.0 81.0 9.40 285 <.1 .4 19.0 610 709 414 SEP 11... 3.80 51 14.0 81.0 8.30 278 <.1 .6 17.0 550 555 395 24... 3.80 54 15.0 88.0 7.80 290 <.1 .5 17.0 560 448 344
< -- Less than E -- Estimated value

94 ST. JOHNS RIVER BASIN ABOVE OCKLAWAHA RIVER
02234600 WEKIVA SPRINGS NEAR APOPKA, FL
LOCATION.--Lat 28° 42'43", long 81° 27'36", in NE1⁄ 4 sec.36, T.20 S., R.28 E., Orange County, Hydrologic Unit 03080101, at head of Wekiva River, 4.1 mi northeast of Apopka and 14 mi upstream from the mouth of Wekiva River.
DRAINAGE AREA.--Indeterminate.
PERIOD OF RECORD.--March 1932 to September 1999 (periodic discharge measurements only), October 1999 to September 2002 (discontinued).
GAGE.--Water-stage recorder. Datum of gage is at NGVD of 1929.
REMARKS.--Records poor.
EXTREMES FOR PERIOD MARCH 1932 TO SEPTEMBER 1999.--Maximum discharge measured, 91.7 ft3/s, Oct. 17, 1960; minimum measured, 51.6 ft3/s, May 25, 1990.
DISCHARGE, CUBIC FEET PER SECOND, WATER YEAR OCTOBER 2001 TO SEPTEMBER 2002DAILY MEAN VALUES
DAY OCT NOV DEC JAN FEB MAR APR MAY JUN JUL AUG SEP
1 40 e51 60 57 2 41 e51 60 62 3 40 e51 60 70 4 40 e53 60 66 5 41 e53 60 64
56 55 54 59 54 66 72 81 56 55 54 58 53 69 67 80 56 54 55 58 53 62 66 79 55 57 56 58 53 54 63 78 55 56 57 57 53 48 59 79
6 41 e56 60 63 7 41 e55 60 62 8 41 e55 61 61 9 42 e54 60 6010 42 e54 60 59
55 55 56 57 52 45 56 78 55 54 55 57 53 41 59 75 55 54 56 57 54 40 66 73 55 54 55 56 54 41 63 69 55 53 55 56 53 41 57 65
11 42 e54 60 5912 44 e54 60 5913 44 e59 60 5914 45 e65 60 6015 48 e67 60 63
55 53 56 56 54 40 51 62 55 54 56 55 54 40 49 60 54 55 58 55 54 45 56 59 54 54 58 55 56 66 67 57 54 54 59 54 56 69 74 54
16 47 e65 59 6217 46 e64 59 6118 46 e63 60 6019 47 e62 59 6020 49 e62 59 59
54 54 58 54 55 64 79 52 53 54 59 54 56 58 77 50 53 54 58 55 58 52 75 51 53 54 58 55 57 48 71 54 53 54 58 55 58 49 69 53
21 49 e62 59 5922 50 e61 58 5823 50 e61 58 5824 50 e61 58 5825 51 e61 58 57
53 54 58 55 61 67 68 51 54 54 57 55 62 73 65 48 58 54 58 54 64 73 62 47 66 53 58 54 65 68 60 50 64 54 57 54 67 62 57 65
26 52 e62 57 5727 e52 e62 57 5728 e51 e62 57 5729 e51 e62 57 5730 e51 e61 57 5631 e51 --- 57 57
61 54 58 53 60 60 57 71 57 54 60 53 49 54 64 68 55 54 58 53 40 53 60 64--- 54 58 53 e44 74 64 59--- 54 58 53 50 80 77 56--- 54 --- 54 --- 77 84 --
TOTAL 1425 1763 1830 1857MEAN 46.0 58.8 59.0 59.9 MAX 52 67 61 70 MIN 40 51 57 56
1559 1680 1711 1712 1652 1779 2014 188855.7 54.2 57.0 55.2 55.1 57.4 65.0 62.9 66 57 60 59 67 80 84 81 53 53 54 53 40 40 49 47
STATISTICS OF MONTHLY MEAN DATA FOR WATER YEARS 2000 - 2002, BY WATER YEAR (WY)
MEAN 64.1 61.7 59.6 58.7 MAX 88.4 72.6 67.1 64.2(WY) 2000 2000 2000 2000 MIN 46.0 53.8 52.6 52.1(WY) 2002 2001 2001 2001
58.8 57.2 55.4 52.3 54.3 56.1 60.7 58.9 65.8 63.9 58.6 55.2 56.1 57.4 65.0 62.92000 2000 2000 2002 2000 2002 2002 2002 54.8 53.5 50.4 47.3 51.8 55.0 56.6 53.92001 2001 2001 2001 2001 2000 2000 2001
SUMMARY STATISTICS FOR 2001 CALENDAR YEAR FOR 2002 WATER YEAR WATER YEARS 2000 - 2002
ANNUAL TOTAL 19577 ANNUAL MEAN 53.6 HIGHEST ANNUAL MEAN LOWEST ANNUAL MEAN HIGHEST DAILY MEAN e95 LOWEST DAILY MEAN 40 ANNUAL SEVEN-DAY MINIMUM 41 MAXIMUM PEAK STAGE10 PERCENT EXCEEDS 6150 PERCENT EXCEEDS 5390 PERCENT EXCEEDS 47
2087057.2 58.2
63.6 2000 53.7 2001
Sep 15 84 Aug 31 111 Oct 9 1999Sep 26-28 a40 b40 Sep 25 41 Oct 1 41 Sep 25 2001
14.02 Aug 31 14.31 Oct 9 199966 6757 5649 50
e Estimateda Oct 1,3,4, Jun 28, Jul 8,11,12b Sep 26-28, Oct 1,3,4, 2001, Jun 28, Jul 8,11,12, 2002

95 ST. JOHNS RIVER BASIN ABOVE OCKLAWAHA RIVER
02234610 ROCK SPRINGS NEAR APOPKA, FL
LOCATION.--Lat 28° 45'20", long 81° 29'58", in NE1⁄ 4 sec.15, T.20 S., R.28 E., Orange County, Hydrologic Unit 03080101, on left concrete retaining wall of spring pool, 750 ft downstream of head of springs, 5.7 mi north of Apopka, FL.
DRAINAGE AREA.--Indeterminate.
PERIOD OF RECORD.--February 1931 to September 1998 (discharge measurements only), October 1998 to September 2002 (discontinued).
GAGE.--Nonrecording gage. Datum of gage is 27.54 ft above NGVD of 1929 (St. Johns River Water Management District bench mark). Prior to February 3, 1997, several different reference points at same location at various datums.
REMARKS.--Records poor. Discharge computed from relation between artesian pressure at OR652 well and discharge at measuringsite. Artesian pressures are published as water levels for OR652 well (284634081262003) in Water Resources Data, Northeast Florida Volume 1B, Ground Water.
EXTREMES FOR PERIOD FEBRUARY 1933 TO SEPTEMBER 1998.--Maximum discharge measured, 83 ft3/s, Oct. 17, 1960; minimum measured, 48 ft3/s, May 22, 1991.
DISCHARGE, CUBIC FEET PER SECOND, WATER YEAR OCTOBER 2001 TO SEPTEMBER 2002DAILY MEAN VALUES
DAY OCT NOV DEC JAN FEB MAR APR MAY JUN JUL AUG SEP
1 55 55 55 532 55 55 55 533 55 56 54 534 55 56 54 535 55 56 54 53
e51 e52 50 50 42 45 49 53 e51 e52 50 50 43 46 49 54 e51 e52 50 49 42 46 49 54 e51 e53 50 49 42 46 49 54 e50 e52 51 48 42 46 50 54
6 55 56 54 547 55 56 54 548 54 55 54 539 55 55 54 53
10 55 55 54 53
e50 e52 51 48 41 47 50 54 e51 e52 50 48 41 46 50 54 e51 e52 50 47 41 47 50 54 e51 e52 50 47 41 46 50 54 e51 e52 50 46 41 47 50 54
11 55 55 54 53 12 55 55 54 53 13 55 55 54 53 14 55 56 54 53 15 55 56 54 e54
e51 e52 50 46 41 47 50 53 e51 e52 50 45 41 47 50 53 e51 e52 50 45 41 47 50 53 e50 e52 51 45 42 47 51 53 e51 52 51 44 42 48 51 53
16 55 56 53 e55 17 55 56 53 e55 18 55 56 54 e54 19 55 56 54 e54 20 55 56 53 e54
e50 52 51 44 42 48 51 53 e50 51 51 44 42 48 51 53 e50 51 51 44 42 47 51 53 e50 51 51 44 42 47 52 53 e50 51 51 44 42 47 52 53
21 55 56 53 e54 22 55 56 53 e53 23 56 56 53 e53 24 56 56 53 e53 25 55 55 53 e52
e50 51 51 44 43 47 52 54 e51 51 50 44 43 47 52 53 e53 51 50 43 44 48 52 53 e55 51 50 43 44 48 52 54 e54 50 50 43 44 48 51 54
26 55 55 54 e52 27 55 55 53 e52 28 55 55 53 e52 29 55 55 53 e52 30 55 55 53 e52 31 56 --- 53 e52
e53 51 49 43 45 48 51 54 e53 51 49 42 45 48 51 54 e52 50 49 43 45 48 52 54 --- 50 50 42 45 49 52 53 --- 50 50 42 45 49 52 53 --- 50 --- 42 --- 49 53 --
TOTAL 1707 1666 1663 1647MEAN 55.1 55.5 53.6 53.1MAX 56 56 55 55MIN 54 55 53 52
1433 1593 1507 1398 1276 1464 1575 160551.2 51.4 50.2 45.1 42.5 47.2 50.8 53.555 53 51 50 45 49 53 5450 50 49 42 41 45 49 53
STATISTICS OF MONTHLY MEAN DATA FOR WATER YEARS 1999 - 2002, BY WATER YEAR (WY)
MEAN 53.1 52.8 51.9 51.4MAX 57.4 57.5 56.3 55.1(WY) 1999 2000 2000 2000MIN 42.8 43.4 44.8 44.5(WY) 2001 2001 2001 2001
50.5 48.4 45.7 43.9 43.6 45.8 47.6 49.553.5 51.4 50.2 49.5 46.9 50.9 50.8 53.52000 2002 2002 1999 1999 1999 2002 200244.8 42.6 40.7 38.2 39.8 42.0 42.8 43.12001 2001 2001 2001 2001 2000 2000 2000
SUMMARY STATISTICS FOR 2001 CALENDAR YEAR FOR 2002 WATER YEAR WATER YEARS 1999 - 2002
ANNUAL TOTAL 16887 ANNUAL MEAN 46.3HIGHEST ANNUAL MEANLOWEST ANNUAL MEAN HIGHEST DAILY MEAN 56LOWEST DAILY MEAN 37ANNUAL SEVEN-DAY MINIMUM 37MAXIMUM PEAK STAGE10 PERCENT EXCEEDS 5550 PERCENT EXCEEDS 4590 PERCENT EXCEEDS 39
1853450.8 48.7
51.4 199943.5 2001
Sep 28 56 Many days *59May 18-28,31 41 Jun 6-13 37 May 18-28,31 2001May 18 41 Jun 6 37 May 18 2001
31.37 Sep 26 31.37 Sep 26 200255 5652 4944 42
e Estimated * Oct 1-8, 1998, Oct. 17,22,23, 1999

--- --- --- --- --- --- --- --- --- ---
--- --- --- --- --- --- --- --- --- ---
--- --- --- --- --- --- --- --- --- --- --- --- --- ---
--- --- --- --- --- --- --- --- --- --- --- --- --- --- ---
--- --- --- --- --- --- --- --- --- --- --- --- --- --- ---
--- --- --- --- --- --- --- --- --- --- --- --- --- --- --- --- --- ---
--- --- --- --- --- --- --- ---
96 ST. JOHNS RIVER BASIN ABOVE OCKLAWAHA RIVER
02234635 WEKIVA RIVER NEAR APOPKA, FL
LOCATION.--Lat 28° 42'48", long 81° 26'44", in SE1⁄ 4 sec.30, T.20 S., R.29 E., Seminole County, Hydrologic Unit 03080101, on downstream side of abandoned bridge located on eastern edge of Wekiva Springs State Park at Wekiva River Marina, 0.3 mi downstream from Rock Springs Run, 0.9 mi downstream from Wekiva Springs and 5.0 mi northeast of Apopka.
DRAINAGE AREA.--58.3 mi2.
PERIOD OF RECORD.--July 1995 to March 2002 (discontinued).
GAGE.--Water-stage recorder and data-collection platform. Datum of gage is 9.92 ft above NGVD of 1929 (levels by St. Johns River Water Management District).
REMARKS.--Records fair. Flow includes large ground-water inflow.
DISCHARGE, CUBIC FEET PER SECOND, PERIOD OCTOBER 2001 TO MARCH 2002DAILY MEAN VALUES
DAY OCT NOV DEC JAN FEB MAR APR MAY JUN JUL AUG SEP
1 152 133 131 124 125 135 -- -- -- --2 149 133 131 141 125 133 -- -- -- --3 147 137 131 163 125 133 -- -- -- --4 144 137 131 153 124 143 -- -- -- --5 143 140 130 146 124 141 -- -- -- --
6 142 137 131 141 123 138 -- -- -- --7 141 135 132 139 125 135 -- -- -- --8 141 133 131 135 127 135 -- -- -- --9 142 132 131 133 126 136 -- -- -- --
10 141 131 130 131 125 135 -- -- -- --
11 139 131 130 131 127 133 -- -- -- -- 12 138 131 130 129 126 -- -- -- -- 13 136 132 129 130 125 -- -- -- -- 14 140 141 129 133 125 -- -- -- -- 15 149 141 128 142 125 -- -- -- --
16 143 137 129 139 125 -- -- -- -- 17 140 136 128 136 125 -- -- -- -- 18 137 135 129 134 125 -- -- -- -- 19 138 134 128 132 124 -- -- -- -- 20 141 134 127 131 123 -- -- -- --
21 140 133 127 130 124 -- -- -- -- 22 140 133 126 130 127 -- -- -- -- 23 139 132 126 129 142 -- -- -- -- 24 138 132 126 127 166 -- -- -- -- 25 139 132 126 127 160 -- -- -- --
26 139 132 126 127 151 -- -- -- -- 27 135 132 125 127 143 -- -- -- -- 28 134 132 125 126 137 -- -- -- -- 29 134 131 125 126 -- -- -- -- -- 30 134 131 125 125 -- -- -- -- -- 31 133 -- 124 126 -- -- -- -- --
TOTAL 4348 4020 3977 4143 3649 1497 -- -- -- --MEAN 140 134 128 134 130 136 -- -- -- --MAX 152 141 132 163 166 143 -- -- -- --MIN 133 131 124 124 123 133 -- -- -- --
STATISTICS OF MONTHLY MEAN DATA FOR WATER YEARS 1995 - 2002, BY WATER YEAR (WY)
MEAN 175 151 155 164 MAX 239 180 188 247 (WY) 2000 1996 1996 1996MIN 126 118 115 109 (WY) 2001 2001 2001 2001
156 166 150 136 140 149 160 173 216 238 249 192 190 190 244 2331998 1996 1996 1996 1996 1996 1995 1995 106 113 107 96.5 99.8 116 121 1322001 2001 2000 2001 2001 2000 2000 2000
SUMMARY STATISTICS FOR 2001 CALENDAR YEAR #FOR 2002 WATER YEAR #WATER YEARS 1995 - 2002
ANNUAL TOTAL 44913 ANNUAL MEAN 123 HIGHEST ANNUAL MEANLOWEST ANNUAL MEANHIGHEST DAILY MEAN 235 LOWEST DAILY MEAN 90ANNUAL SEVEN-DAY MINIMUM 92MAXIMUM PEAK FLOWMAXIMUM PEAK STAGEINSTANTANEOUS LOW FLOW10 PERCENT EXCEEDS 15250 PERCENT EXCEEDS 11490 PERCENT EXCEEDS 100
156 205 1996 119 2001
Sep 15 166 Feb 24 *389 Mar 31 1996 May 24 123 Feb 6,20 90 May 24 2001 May 19 124 Feb 1 92 May 19 2001
395 Mar 31 1996 4.61 Mar 31 199689 May 24,25 2001
142 211 132 146 125 110
* Mar 31, Apr 1, 1996# Includes partial year(s) of record

97 ST. JOHNS RIVER BASIN ABOVE OCKLAWAHA RIVER
02234990 LITTLE WEKIVA RIVER NEAR ALTAMONTE SPRINGS, FL
LOCATION.--Lat 28° 41'13", long 81° 23'50", in SE1⁄ 4 sec.3, T.21 S., R.29 E., Seminole County, Hydrologic Unit 03080101, on left bank 50 ft downstream from bridge on State Highway 434, 200 ft upstream from Sanlando Springs outlet, 1.4 mi northeast ofPost Office in Altamonte Springs, and 5.5 mi upstream from mouth.
DRAINAGE AREA.--90.7 mi2.
PERIOD OF RECORD.--February 1972 to September 1979, February 1981 to September 1982 (gage heights and discharge measurementsonly), October 1982 to current year.
GAGE.--Water-stage recorder. Datum of gage is at NGVD of 1929 (levels by St. Johns River Water Management District). From Feb. 11, 1981 to Nov. 28, 1985, at site 75 ft downstream at same datum.
REMARKS.--Records fair. Flow includes occasional pumpage from Cranes Roost basin.
DISCHARGE, CUBIC FEET PER SECOND, WATER YEAR OCTOBER 2001 TO SEPTEMBER 2002DAILY MEAN VALUES
DAY OCT NOV DEC JAN FEB MAR APR MAY JUN JUL AUG SEP
1 44 17 9.0 13 2.22 43 21 5.9 26 2.93 34 23 5.6 18 1.74 31 18 11 24 1.75 30 23 16 14 2.7
19 2.4 5.3 e5.3 101 41 9315 3.0 4.7 e4.6 130 76 9812 3.4 5.5 e4.0 121 103 9517 5.6 5.7 e4.0 90 123 8220 5.0 5.1 e4.0 59 126 92
6 28 27 15 12 7 24 20 7.1 158 27 16 8.2 169 29 15 4.3 6.710 20 14 4.1 4.9
2.9 11 2.3 5.4 e5.8 39 121 103 1.2 9.7 2.0 e4.9 e11 28 137 910.28 12 1.8 e4.8 e5.7 27 134 79 2.1 8.5 1.9 e4.7 e4.6 20 132 75 0.53 6.3 1.4 e4.4 e4.4 18 104 57
11 18 11 13 4.312 19 10 4.0 3.713 17 17 3.9 2.514 21 16 4.3 4.815 27 13 6.2 8.0
0.74 6.4 1.1 e4.2 e6.0 13 73 48 1.9 6.5 4.3 e4.2 e5.5 31 72 48 1.7 8.1 2.5 e4.2 e6.5 59 82 60 0.59 5.7 8.0 e4.2 e9.5 60 76 62 0.59 5.9 5.6 e4.0 e8.5 37 96 54
16 30 18 3.8 3.2 17 22 9.9 3.8 2.918 21 9.1 12 3.319 21 12 3.9 4.420 21 15 3.6 2.5
0.69 5.7 11 e4.0 e7.5 34 101 540.66 5.1 5.0 e4.0 14 23 92 62 0.61 4.9 4.5 e4.2 17 18 84 51 0.59 4.5 4.8 e4.9 16 15 89 56 0.62 2.7 4.8 e4.4 19 45 134 63
21 20 10 4.3 2.322 22 7.8 7.1 6.6 23 26 7.5 3.9 2.3 24 20 9.6 4.3 2.225 21 6.8 13 2.2
1.0 3.0 4.5 e4.2 29 46 164 68 1.8 3.3 5.0 e4.2 34 90 156 62 11 2.3 5.3 e4.2 52 113 132 57 16 2.1 5.2 e4.1 86 97 99 6120 2.1 4.2 e4.1 86 77 81 54
26 24 7.0 4.1 3.627 23 15 3.4 2.028 20 6.1 4.9 1.9 29 21 5.7 6.4 3.1 30 27 5.7 3.4 2.9 31 18 --- 3.7 1.6
27 2.1 7.0 e4.0 75 62 82 6023 1.8 6.4 e4.0 93 63 67 59 19 2.5 3.8 e4.0 97 60 96 49 --- 1.6 4.2 e4.0 90 56 96 41 --- 1.4 5.0 e4.2 94 51 99 37 --- 1.5 --- e7.0 --- 40 90 --
TOTAL 769 406.2 203.2 219.9 MEAN 24.8 13.5 6.55 7.09 MAX 44 27 16 26 MIN 17 5.7 3.4 1.6
145.70 209.7 131.0 140.8 898.9 1723 3158 1971 5.20 6.76 4.37 4.54 30.0 55.6 102 65.7 27 20 11 7.0 97 130 164 103
0.28 1.4 1.1 4.0 4.0 13 41 37
STATISTICS OF MONTHLY MEAN DATA FOR WATER YEARS 1972 - 2002, BY WATER YEAR (WY)
MEAN 38.1 26.5 23.2 27.1 MAX 123 160 129 79.9(WY) 1996 1995 1998 1986 MIN 5.52 1.98 2.74 1.29(WY) 2001 2001 2001 2001
26.1 28.9 23.6 16.8 31.6 52.8 62.5 59.9137 108 89.8 57.4 113 157 171 1221998 1998 1987 1991 1994 1974 1994 1994 5.20 2.45 2.50 3.90 4.25 11.2 12.0 11.82002 2000 2000 2000 1998 2000 1999 1997
SUMMARY STATISTICS FOR 2001 CALENDAR YEAR FOR 2002 WATER YEAR WATER YEARS 1972 - 2002
ANNUAL TOTAL 8141.26 ANNUAL MEAN 22.3 HIGHEST ANNUAL MEAN LOWEST ANNUAL MEAN HIGHEST DAILY MEAN 290 LOWEST DAILY MEAN 0.13 ANNUAL SEVEN-DAY MINIMUM 0.21MAXIMUM PEAK FLOWMAXIMUM PEAK STAGE INSTANTANEOUS LOW FLOW10 PERCENT EXCEEDS 5050 PERCENT EXCEEDS 9.090 PERCENT EXCEEDS 1.3
9976.4027.3 35.1
60.4 1995 18.4 1990
Sep 16 164 Aug 21 638 Nov 16 1994 Jan 18 0.28 Feb 8 0.13 Jan 18 2001 Jan 12 0.62 Feb 14 0.21 Jan 12 2001
285 Aug 28 *1070 Nov 16 199427.64 Jul 13 *30.58 Nov 16 19940.14 Feb 8 0.10 Jun 3 199990 8011 20 2.3 6.6
e Estimated * From floodmark

--- --- --- --- --- --- --- --- --- ---
--- --- --- --- --- --- --- --- --- ---
--- ------ --- --- --- --- --- --- --- --- --- --- ---
--- --- --- --- --- --- --- --- --- --- --- --- --- --- ---
--- --- --- --- --- --- --- --- --- --- --- --- --- --- ---
--- --- --- --- --- --- --- --- --- --- --- --- --- --- --- --- --- ---
--- --- --- --- --- --- --- --- --- --- --- ---
98 ST. JOHNS RIVER BASIN ABOVE OCKLAWAHA RIVER
02234998 LITTLE WEKIVA RIVER NEAR LONGWOOD, FL
LOCATION.--Lat 28° 42'12", long 81° 23'32", in SW1⁄ 4 sec.35, T.20 S., R.29 E., Seminole County, Hydrologic Unit 03080101, on downstream side of bridge on Springs Landing Road, 0.4 mi west of Markham Woods Road, 1.0 mi north of State Highway 434, 3.1 mi west of Longwood, and 4.6 mi upstream from mouth.
DRAINAGE AREA.--94.1 mi2.
PERIOD OF RECORD.--June 1995 to March 2002 (discontinued).
GAGE.--Water-stage recorder and data-collection platform. Datum of gage is at NGVD of 1929 (levels by Seminole County Engineer).
REMARKS.--Records fair except for periods of estimated daily discharge, which are poor.
DISCHARGE, CUBIC FEET PER SECOND, PERIOD OCTOBER 2001 TO MARCH 2002DAILY MEAN VALUES
DAY OCT NOV DEC JAN FEB MAR APR MAY JUN JUL AUG SEP
1 148 67 55 50 44 71 -- -- -- --2 151 70 53 78 45 68 -- -- -- --3 132 84 51 55 42 60 -- -- -- --4 123 70 52 62 42 67 -- -- -- --5 117 74 57 51 42 70 -- -- -- --
6 115 80 57 49 45 60 -- -- -- --7 106 70 52 62 43 56 -- -- -- --8 114 63 54 74 41 57 -- -- -- --9 120 62 50 61 44 55 -- -- -- --10 97 64 48 69 40 50 --- --- --- --
11 92 59 52 74 41 47 --- --- --- -- 12 89 57 50 73 41 -- -- -- -- 13 90 63 50 70 44 -- -- -- -- 14 95 71 50 76 40 -- -- -- -- 15 108 61 50 85 40 -- -- -- --
16 112 67 50 69 40 -- -- -- -- 17 91 59 49 68 40 -- -- -- -- 18 86 56 49 71 39 -- -- -- -- 19 89 57 49 80 39 -- -- -- -- 20 88 63 48 74 42 -- -- -- --
21 84 59 47 72 44 -- -- -- -- 22 86 55 47 e72 48 -- -- -- -- 23 96 54 47 e70 69 -- -- -- -- 24 81 56 46 e65 79 -- -- -- -- 25 87 54 49 e55 73 -- -- -- --
26 80 54 48 e76 85 -- -- -- -- 27 83 60 47 e48 79 -- -- -- -- 28 74 54 45 e46 74 -- -- -- -- 29 75 53 49 e66 -- -- -- -- -- 30 88 53 46 e60 -- -- -- -- --31 74 --- 46 44 --- --- --- --- --
TOTAL 3071 1869 1543 2025 1385 -- -- -- --MEAN 99.1 62.3 49.8 65.3 49.5 -- -- -- --MAX 151 84 57 85 85 -- -- -- --MIN 74 53 45 44 39 -- -- -- --
STATISTICS OF MONTHLY MEAN DATA FOR WATER YEARS 1995 - 2002, BY WATER YEAR (WY)
MEAN 111 66.1 74.3 73.8 67.8 79.7 53.5 39.7 67.7 95.7 91.7 129 MAX 208 99.4 206 142 195 195 119 78.9 136 143 176 205 (WY) 1996 1996 1998 1998 1998 1998 1996 1996 1996 1996 1995 2001 MIN 25.7 22.9 23.7 21.1 19.6 22.5 21.9 17.9 30.1 34.1 33.0 40.6 (WY) 2001 2001 2001 2001 2001 2001 2001 2001 2001 2000 2000 2000
SUMMARY STATISTICS FOR 2001 CALENDAR YEAR #FOR 2002 WATER YEAR #WATER YEARS 1995 - 2002
ANNUAL TOTAL 20977 ANNUAL MEAN 57.5 77.9 HIGHEST ANNUAL MEAN 122 1996 LOWEST ANNUAL MEAN 45.8 2001 HIGHEST DAILY MEAN 151 Oct 2 648 Dec 29 1997 LOWEST DAILY MEAN 502 Sep 16 39 Feb 18,19 14 May 20,21,24 2001 ANNUAL SEVEN-DAY MINIMUM 14 May 20,21,24 40 Feb 14 15 May 18 2001 MAXIMUM PEAK FLOW 15 May 18 661 Dec 29 1997 MAXIMUM PEAK STAGE 22.47 Sep 18 1999 INSTANTANEOUS LOW FLOW 13 May 24 2001 10 PERCENT EXCEEDS 91 163 50 PERCENT EXCEEDS 60 57 90 PERCENT EXCEEDS 44 25
e Estimated# Includes partial year(s) of record

--- --- --- --- --- --- --- --- --- ---
--- --- --- --- --- --- --- --- --- ---
--- --- --- --- --- --- --- --- --- --- --- --- --- ---
--- --- --- --- --- --- --- --- --- --- --- --- --- --- ---
--- --- --- --- --- --- --- --- --- --- --- --- --- --- ---
--- --- --- --- --- --- --- --- --- --- --- --- --- --- --- --- --- ---
--- --- --- --- --- --- --- --- --- --- --- ---
99 ST. JOHNS RIVER BASIN ABOVE OCKLAWAHA RIVER
022349993 WEKIVA RIVER AT OLD R.R. CROSSING NEAR SANFORD, FL
LOCATION.--Lat 28° 47'33", long 81° 24'49", in SE1⁄ 4 sec.33, T.19 S., R.29 E., Lake County, Hydrologic Unit 03080101, near right bank, 40 ft upstream from abandoned railroad crossing, 0.4 mi west of Markham Woods Road, 2.5 mi downstream from Little Wekiva River, 8.3 mi upstream from mouth, and 8.5 mi southwest of Sanford.
DRAINAGE AREA.--185 mi2.
PERIOD OF RECORD.--July 1995 to March 2002 (discontinued).
GAGE.--Water-stage recorder and data-collection platform. Datum of gage is 6.75 ft above NGVD of 1929 (Seminole County bench mark).
REMARKS.--Records fair. Flow includes large ground-water inflow.
DISCHARGE, CUBIC FEET PER SECOND, PERIOD OCTOBER 2001 TO MARCH 2002DAILY MEAN VALUES
DAY OCT NOV DEC JAN FEB MAR APR MAY JUN JUL AUG SEP
1 218 e197 205 182 181 221 -- -- -- --2 211 e196 207 209 179 212 -- -- -- --3 206 e200 207 258 177 208 -- -- -- --4 205 e202 207 260 178 222 -- -- -- --5 199 e206 207 250 176 228 -- -- -- --
6 193 e202 207 238 177 221 -- -- -- --7 189 e200 207 230 177 213 -- -- -- --8 189 e198 207 220 181 205 -- -- -- --9 192 e195 206 214 182 202 -- -- -- --
10 193 e193 202 207 180 198 -- -- -- --
11 191 e196 200 204 181 192 -- -- -- -- 12 186 e198 201 203 181 -- -- -- -- 13 183 e206 201 202 181 -- -- -- -- 14 188 e230 200 203 182 -- -- -- -- 15 212 e228 200 221 180 -- -- -- --
16 214 e226 200 224 180 -- -- -- -- 17 212 224 198 219 180 -- -- -- -- 18 205 220 199 212 178 -- -- -- -- 19 199 215 200 205 176 -- -- -- -- 20 202 214 197 205 175 -- -- -- --
21 205 213 192 203 174 -- -- -- -- 22 211 213 189 198 178 -- -- -- -- 23 212 210 191 198 212 -- -- -- -- 24 212 208 187 192 261 -- -- -- -- 25 213 207 186 189 267 -- -- -- --
26 214 207 192 190 257 -- -- -- -- 27 209 205 187 190 241 -- -- -- -- 28 206 207 184 187 231 -- -- -- -- 29 201 206 184 186 -- -- -- -- -- 30 e199 205 184 185 -- -- -- -- -- 31 e197 -- 183 184 -- -- -- -- --
TOTAL 6266 6227 6117 6468 5403 -- -- -- --MEAN 202 208 197 209 193 -- -- -- --MAX 218 230 207 260 267 -- -- -- --MIN 183 193 183 182 174 -- -- -- --
STATISTICS OF MONTHLY MEAN DATA FOR WATER YEARS 1995 - 2002, BY WATER YEAR (WY)
MEAN 306 228 245 262 240 272 225 187 206 240 261 314 MAX 464 291 428 449 480 500 444 289 338 321 480 441 (WY) 1996 1996 1998 1996 1998 1998 1996 1996 1996 1996 1995 1995 MIN 172 147 147 136 129 147 149 130 141 154 162 197 (WY) 2001 2001 2001 2001 2001 2001 2001 2001 2000 2000 2000 2000
SUMMARY STATISTICS FOR 2001 CALENDAR YEAR #FOR 2002 WATER YEAR #WATER YEARS 1995 - 2002
ANNUAL TOTAL 70925 ANNUAL MEAN 194 248 HIGHEST ANNUAL MEAN 352 1996 LOWEST ANNUAL MEAN 2001 HIGHEST DAILY MEAN 968 Sep 16 267 Feb 25 1070 Apr 1 1996 LOWEST DAILY MEAN 120 May 25 174 Feb 21 120 May 25 2001 ANNUAL SEVEN-DAY MINIMUM 121 May 19 177 Feb 16 121 May 19 2001 MAXIMUM PEAK FLOW 1090 Apr 1 1996 MAXIMUM PEAK STAGE 4.98 Sep 15 2001 INSTANTANEOUS LOW FLOW 119 May 24,25 2001 10 PERCENT EXCEEDS 270 223 397 50 PERCENT EXCEEDS 172 202 213 90 PERCENT EXCEEDS 129 181 148
e Estimated # Includes partial year(s) of record

100 ST. JOHNS RIVER BASIN ABOVE OCKLAWAHA RIVER
02235000 WEKIVA RIVER NEAR SANFORD, FL
LOCATION.--Lat 28° 48'54", long 81° 25'10", in SE1⁄ 4 sec.21, T.19 S., R.29 E., Seminole County, Hydrologic Unit 03080101, near right bank at downstream side of bridge on State Highway 46, 4.5 mi downstream from Little Wekiva River, 6.7 mi upstream frommouth, and 8.9 mi west of Sanford.
DRAINAGE AREA.--189 mi2. WATER-DISCHARGE RECORDS
PERIOD OF RECORD.--October 1931 to September 1935 (discharge measurements only), October 1935 to current year.
GAGE.--Water-stage recorder and data-collection platform. Datum of gage is 4.96 ft above NGVD of 1929. Prior to Jan. 19, 1960, nonrecording gage at same site and datum.
REMARKS.--Records fair. Flow includes large ground-water inflow.
DISCHARGE, CUBIC FEET PER SECOND, WATER YEAR OCTOBER 2001 TO SEPTEMBER 2002DAILY MEAN VALUES
DAY OCT NOV DEC JAN FEB MAR APR MAY JUN JUL AUG SEP
1 304 262 243 216 2 295 263 240 248 3 286 272 238 292 4 280 277 235 294 5 272 284 234 285
240 267 194 193 207 554 555 658238 258 196 191 205 578 513 695237 253 196 190 200 555 491 655236 266 202 189 197 505 475 606236 267 212 189 194 458 459 611
6 265 281 235 274 7 260 277 234 267 8 263 276 231 261 9 263 276 227 257 10 262 275 221 253
237 260 207 188 192 418 437 575236 249 201 188 194 379 458 538240 242 197 190 195 370 492 515241 238 196 188 200 398 485 493240 233 195 186 199 394 463 462
11 261 274 219 25112 254 274 218 25113 250 271 215 25314 257 276 209 25915 283 282 207 279
241 228 195 188 196 353 433 438239 223 195 187 202 320 414 418239 223 202 186 205 351 431 414238 220 209 188 208 507 498 415237 217 215 189 211 516 559 405
16 282 283 204 28317 277 283 201 27918 270 280 204 27519 264 278 207 26920 269 273 204 264
236 215 216 188 208 490 580 391237 213 216 190 209 447 547 373235 210 210 190 230 403 526 360235 209 204 191 241 359 500 357233 207 200 193 246 327 479 359
21 272 272 202 26322 277 267 204 26023 278 261 205 25924 277 260 207 25325 281 258 210 250
233 207 198 196 250 367 463 355237 205 196 197 246 445 453 348264 205 195 193 258 503 449 353314 203 195 192 313 508 442 417323 202 192 192 311 489 426 472
26 280 254 215 25027 272 250 212 24928 266 251 212 24629 263 249 214 24430 263 244 215 24331 265 --- 214 242
314 201 192 191 311 455 413 471297 200 197 194 333 428 434 465279 200 198 194 325 427 433 443--- 198 195 195 372 513 427 418--- 197 193 198 481 610 468 390--- 195 --- 203 --- 611 596 --
TOTAL 8411 8083 6736 8069 MEAN 271 269 217 260 MAX 304 284 243 294 MIN 250 244 201 216
7012 6911 6009 5927 7339 14038 14799 13870250 223 200 191 245 453 477 462323 267 216 203 481 611 596 695233 195 192 186 192 320 413 348
STATISTICS OF MONTHLY MEAN DATA FOR WATER YEARS 1936 - 2002, BY WATER YEAR (WY)
MEAN 313 263 262 284 MAX 699 711 526 567 (WY) 1961 1995 1970 1970 MIN 200 182 177 169 (WY) 1982 1936 1991 1991
289 289 254 227 259 313 329 361583 681 506 324 514 654 578 10301998 1960 1996 1991 1968 1974 1969 1960164 165 165 158 160 174 181 2011991 1939 1938 1939 1950 1950 2000 1956
SUMMARY STATISTICS FOR 2001 CALENDAR YEAR FOR 2002 WATER YEAR WATER YEARS 1936 - 2002
ANNUAL TOTAL 88424 ANNUAL MEAN 242 HIGHEST ANNUAL MEAN LOWEST ANNUAL MEAN HIGHEST DAILY MEAN 1040LOWEST DAILY MEAN 150ANNUAL SEVEN-DAY MINIMUM 152MAXIMUM PEAK FLOW MAXIMUM PEAK STAGE 10 PERCENT EXCEEDS 32650 PERCENT EXCEEDS 20990 PERCENT EXCEEDS 169
107204 294 287
454 1960203 1981
Sep 16 695 Sep 2 2060 Sep 17 1945May 10 186 May 10,13 105 Jun 5-13 1939May 7 187 May 9 105 Jun 5 1939
707 Sep 2 2060 Sep 17 19453.29 Sep 2 6.09 Sep 12 1960
477 414 254 250 195 194

101 ST. JOHNS RIVER BASIN ABOVE OCKLAWAHA RIVER
02235000 WEKIVA RIVER NEAR SANFORD, FL--Continued
WATER-QUALITY RECORDS
PERIOD OF RECORD.--Water years 1932-35, 1954, 1965-71, 1973-77, 1980-84, 1993, 2000 to current year.
WATER-QUALITY DATA, WATER YEAR OCTOBER 2001 TO SEPTEMBER 2002
DIS SPE PH PH CHARGE, SPE CIFIC WATER WATERINST. CIFIC CON WHOLE WHOLE CUBIC CON DUCT- FIELD LAB TEMPER- TUR FEET GAGE DUCT ANCE (STAND- (STAND ATURE BID-
Date Time PER HEIGHT ANCE LAB ARD ARD WATER ITYSECOND (FEET) (US/CM) (US/CM) UNITS) UNITS) (DEG C) (NTU)
RESIDUE NITRO TOTAL GEN,
COLOR AT 105 AMMONIA (PLAT- OXYGEN, DEG. C, DISINUM- DIS- SUS- SOLVEDCOBALT SOLVED PENDED (MG/LUNITS) (MG/L) (MG/L) AS N)
(00061) (00065) (00095) (90095) (00400) (00403) (00010) (00076) (00080) (00300) (00530) (00608)
NOV 07... 1315 277 2.19 408 445 8.7 8.2 22.1 .75 20 10.7 <1 .02 FEB 14... 1140 239 1.83 452 546 8.1 8.2 17.9 .94 10 10.2 <1 .02 MAY 09... 0848 184 1.68 525 498 7.8 8.1 25.4 1.1 10 8.2 3 <.01 AUG 27... 0810 414 2.60 368 409 6.8 7.5 25.4 3.1 280 3.5 7 .02
NITRO NITRO NITRO ORTHO NITROGEN,
AMMONIA
GEN, NITRITE DIS-
GEN,AM- MONIA + ORGANIC
GEN,NO2+NO3 DIS
PHOS PHORUS
PHOS- PHATE, DIS
CARBON, ORGANIC DIS SULFIDE
PHOS- PHORUS ORTHO
HARDNESS TOTAL
CALCIUM DIS
MAGNE SIUM, DIS
SODIUM, DIS-
Date TOTAL (MG/L AS N) (00610)
SOLVED (MG/L AS N)
(00613)
TOTAL (MG/L AS N)(00625)
SOLVED (MG/L AS N) (00631)
TOTAL (MG/L AS P)
(00665)
SOLVED (MG/L AS P) (00671)
SOLVED(MG/L AS C)
(00681)
TOTAL (MG/L AS S) (00745)
TOTAL (MG/LAS P)
(70507)
(MG/L ASCACO3)
(00900)
SOLVED (MG/L AS CA) (00915)
SOLVED (MG/L AS MG)
(00925)
SOLVED (MG/L AS NA) (00930)
NOV 07... .03 <.010 E.40 .63 E.13 .11 8.7 <1.0 .110 160 44.0 12.0 26.0 FEB 14... .02 <.010 .40 .55 .07 .09 5.1 <1.0 .090 180 47.0 14.0 37.0 MAY 09... <.01 <.010 .30 .24 .09 .08 3.0 <1.0 .080 170 46.0 14.0 33.0 AUG 27... .02 <.010 1.5 .25 .16 .13 29.0 2.0 .130 150 41.0 11.0 27.0
ANC SOLIDS, CHLOR-A POTAS UNFLTRD CHLO- SILICA, RESIDUE PHYTO STRON IRON, SIUM, TIT 4.5 SULFATE RIDE, DIS AT 180 PLANK BROMIDE BARIUM, TIUM, TOTAL IRON, DIS LAB DIS DIS SOLVED DEG. C TON DIS DIS DIS RECOV DIS
SOLVED (MG/L SOLVED SOLVED (MG/L DIS- CHROMO SOLVED SOLVED SOLVED ERABLE SOLVEDDate (MG/L AS (MG/L (MG/L AS SOLVED FLUOROM (MG/L (UG/L (UG/L (UG/L (UG/L
AS K) CACO3) AS SO4) AS CL) SIO2) (MG/L) (UG/L) AS BR) AS BA) AS SR) AS FE) AS FE) (00935) (90410) (00945) (00940) (00955) (70300) (70953) (71870) (01005) (01080) (01045) (01046)
NOV 07... 2.40 E111 40.0 47.0 9.30 266 <.1 .2 9.4 400 49 28FEB 14... 2.20 114 54.0 69.0 8.40 321 6.1 .3 9.5 540 27 10MAY 09... 1.90 116 43.0 58.0 6.40 283 <.1 .3 9.5 460 21AUG 27... 2.30 90 38.0 47.0 9.60 299 <.1 .3 10.0 540 593 473
< -- Less than E -- Estimated value
4

102 ST. JOHNS RIVER BASIN ABOVE OCKLAWAHA RIVER
02235200 BLACK WATER CREEK NEAR CASSIA, FL
LOCATION.--Lat 28° 52'28", long 81° 29'23", in SW1⁄ 4 sec.35, T.18 S., R.28 E., Lake County, Hydrologic Unit 03080101, at bridge on State Highway 44, 1.5 mi southwest of Cassia, and 13 mi upstream from mouth.
DRAINAGE AREA.--126 mi2. WATER-DISCHARGE RECORDS
PERIOD OF RECORD.--Water years 1962-67, 1970-80 (annual maximum), August 1967 to September 1969, March 1981 to September 1985 (fragmentary), October 1985 to current year.
GAGE.--Water-stage recorder and data-collection platform. Datum of gage is 18.55 ft above NGVD of 1929 (Florida Department ofTransportation bench mark). Sept. 20, 1962 to Aug. 7, 1967, and Oct. 1, 1969 to Mar. 23, 1981, crest-stage gage; Aug. 7, 1967to Sept. 30, 1969 and Mar. 23, 1981 to June 10, 1983, water-stage recorder; June 10, 1983 to June 10, 1985, nonrecording gage at site 1,000 ft upstream at same datum.
REMARKS.--Records fair.
DISCHARGE, CUBIC FEET PER SECOND, WATER YEAR OCTOBER 2001 TO SEPTEMBER 2002DAILY MEAN VALUES
DAY OCT NOV DEC JAN FEB MAR APR MAY JUN JUL AUG SEP
1 260 81 69 31 2 240 81 68 34 3 223 88 66 39 4 211 89 64 39 5 199 96 61 38
50 45 32 14 7.3 49 70 173 49 44 31 14 7.1 88 70 168 48 44 30 13 6.8 94 81 159 47 54 30 13 6.5 81 88 155 45 58 30 12 6.2 69 87 173
6 188 97 59 38 7 181 95 57 37 8 178 92 56 36 9 177 88 54 3610 165 84 53 36
43 59 29 12 6.4 66 84 177 43 60 28 12 8.2 59 87 171 43 65 27 12 7.9 54 96 162 42 69 26 11 7.3 50 93 16041 72 25 11 6.6 46 88 155
11 154 80 52 3512 148 76 52 3513 142 74 50 3514 136 87 49 3715 135 95 47 42
41 73 24 10 6.3 42 83 15040 73 23 9.9 6.1 39 83 14540 74 24 9.7 5.9 41 96 14139 74 24 9.4 5.8 51 120 14038 71 26 9.0 5.6 54 158 135
16 135 93 46 4217 134 95 44 4218 130 97 43 4219 126 96 41 4120 129 95 40 42
38 68 25 8.7 5.4 55 188 12937 64 24 8.5 6.0 55 176 12336 61 23 8.4 6.6 55 162 11836 59 22 8.4 7.7 54 152 11135 56 21 8.4 8.8 55 145 105
21 125 94 39 4222 122 91 38 4323 120 88 37 4424 117 86 36 4625 115 84 36 47
35 53 20 8.1 11 65 139 10135 51 19 7.8 12 86 129 9940 48 19 7.5 15 83 123 10050 45 18 7.2 17 76 114 10951 43 18 7.0 20 71 107 131
26 117 82 35 4927 109 79 34 4928 102 76 33 4929 95 74 33 5030 90 72 33 5031 85 --- 32 50
50 41 17 7.0 20 72 100 13349 39 17 7.4 18 89 103 12647 38 16 8.3 16 93 111 121--- 36 15 7.7 23 88 132 117--- 34 14 7.3 34 82 156 114 --- 33 --- 7.2 --- 76 173 --
TOTAL 4588 2605 1457 1276 MEAN 148 86.8 47.0 41.2 MAX 260 97 69 50 MIN 85 72 32 31CFSM 1.17 0.69 0.37 0.33 IN. 1.35 0.77 0.43 0.38
1188 1704 697 296.9 320.5 2038 3594 4101 42.4 55.0 23.2 9.58 10.7 65.7 116 137 51 74 32 14 34 94 188 177 35 33 14 7.0 5.4 39 70 990.34 0.44 0.18 0.08 0.08 0.52 0.92 1.08 0.35 0.50 0.21 0.09 0.09 0.60 1.06 1.21
STATISTICS OF MONTHLY MEAN DATA FOR WATER YEARS 1967 - 2002, BY WATER YEAR (WY)
MEAN 83.3 55.8 51.0 66.5 MAX 269 278 203 261(WY) 1969 1995 1995 1998 MIN 3.15 2.28 2.28 3.94(WY) 1991 1991 1991 1991
63.7 72.0 59.5 24.2 27.2 37.4 53.6 106242 273 214 79.3 142 130 160 4181998 1998 1984 1991 1991 1991 1969 1968 4.68 8.27 9.52 4.84 2.66 4.60 5.06 3.311991 2001 1999 2000 2000 2000 1990 1990
SUMMARY STATISTICS FOR 2001 CALENDAR YEAR FOR 2002 WATER YEAR WATER YEARS 1967 - 2002
ANNUAL TOTAL 21632.4 ANNUAL MEAN 59.3 HIGHEST ANNUAL MEAN LOWEST ANNUAL MEAN HIGHEST DAILY MEAN 776 LOWEST DAILY MEAN 4.3ANNUAL SEVEN-DAY MINIMUM 4.4MAXIMUM PEAK FLOW MAXIMUM PEAK STAGE INSTANTANEOUS LOW FLOWANNUAL RUNOFF (CFSM) 0.47ANNUAL RUNOFF (INCHES) 6.3910 PERCENT EXCEEDS 12750 PERCENT EXCEEDS 1590 PERCENT EXCEEDS 5.6
23865.465.4 58.4
118 1995 15.7 1981
Sep 17 260 Oct 1 776 Sep 17 2001Jan 6,7 5.4 Jun 16 2.0 Nov 20-24 1990Jan 3 5.9 Jun 11 2.0 Nov 18 1990
270 Oct 1 783 Sep 17 20017.78 Oct 1 9.93 Sep 1 1968 5.4 Jun 16 0.52 0.46 7.05 6.30
137 14450 31 8.9 7.6

103 ST. JOHNS RIVER BASIN ABOVE OCKLAWAHA RIVER
02235200 BLACK WATER CREEK NEAR CASSIA, FL--Continued
WATER-QUALITY RECORDS
PERIOD OF RECORD.--Water years 1966-71, 1973-74, 1978-84, 2000 to current year.
WATER-QUALITY DATA, WATER YEAR OCTOBER 2001 TO SEPTEMBER 2002
DIS SPE PH PH RESIDUE NITRO CHARGE, SPE CIFIC WATER WATER TOTAL GEN, INST. CIFIC CON WHOLE WHOLE COLOR AT 105 AMMONIA CUBIC CON DUCT- FIELD LAB TEMPER- TUR (PLAT OXYGEN, DEG. C, DIS FEET GAGE DUCT ANCE (STAND- (STAND ATURE BID INUM- DIS SUS SOLVED
Date Time PER HEIGHT ANCE LAB ARD ARD WATER ITY COBALT SOLVED PENDED (MG/L SECOND (FEET) (US/CM) (US/CM) UNITS) UNITS) (DEG C) (NTU) UNITS) (MG/L) (MG/L) AS N)
(00061) (00065) (00095) (90095) (00400) (00403) (00010) (00076) (00080) (00300) (00530) (00608)
NOV 07... 0945 95 6.74 198 199 6.0 7.0 17.5 1.0 560 1.2 <1 .07 FEB 13... 1319 40 5.97 230 227 6.4 6.8 16.1 2.6 480 4.6 2 .05 MAY 09... 1028 11 5.10 271 272 7.0 7.3 24.2 3.9 480 4.9 2 <.01 AUG 27... 1105 105 6.92 179 174 5.4 6.7 24.3 4.8 640 2.9 4 .02
NITRO- NITRO- NITRO- NITRO- GEN, GEN,AM- GEN,GEN, NITRITE MONIA + NO2+NO3 PHOS
AMMONIA DIS- ORGANIC DIS- PHORUS TOTAL SOLVED TOTAL SOLVED TOTAL
Date (MG/L (MG/L (MG/L (MG/L (MG/L AS N) AS N) AS N) AS N) AS P)(00610) (00613) (00625) (00631) (00665)
ORTHO PHOS- CARBON, PHOS- HARD- MAGNE- PHATE, ORGANIC PHORUS NESS CALCIUM SIUM, SODIUM, DIS- DIS- SULFIDE ORTHO TOTAL DIS- DIS- DISSOLVED SOLVED TOTAL TOTAL (MG/L SOLVED SOLVED SOLVED (MG/L (MG/L (MG/L (MG/L AS (MG/L (MG/L (MG/L AS P) AS C) AS S) AS P) CACO3) AS CA) AS MG) AS NA)(00671) (00681) (00745) (70507) (00900) (00915) (00925) (00930)
NOV 07... E.13 <.010 E2.5 <.02 E.05 .03 73.0 4.0 E.050 93 27.0 6.00 7.5FEB 13... .04 .010 2.1 .09 .04 .04 47.0 <1.0 .020 100 29.0 6.90 7.9MAY 09... <.01 .010 1.9 .40 .05 .05 46.0 3.0 .050 120 36.0 8.00 8.3AUG 27... .02 .020 2.3 .03 .04 .02 60.0 5.0 .030 80 23.0 5.30 8.0
ANC SOLIDS, CHLOR-A POTAS- UNFLTRD CHLO- SILICA, RESIDUE PHYTO- STRON- IRON,SIUM, TIT 4.5 SULFATE RIDE, DIS- AT 180 PLANK- BROMIDE BARIUM, TIUM, TOTAL IRON,DIS- LAB DIS- DIS- SOLVED DEG. C TON DIS- DIS- DIS- RECOV- DIS
SOLVED (MG/L SOLVED SOLVED (MG/L DIS- CHROMO SOLVED SOLVED SOLVED ERABLE SOLVEDDate (MG/L AS (MG/L (MG/L AS SOLVED FLUOROM (MG/L (UG/L (UG/L (UG/L (UG/L
AS K) CACO3) AS SO4) AS CL) SIO2) (MG/L) (UG/L) AS BR) AS BA) AS SR) AS FE) AS FE) (00935) (90410) (00945) (00940) (00955) (70300) (70953) (71870) (01005) (01080) (01045) (01046)
NOV 07... 1.90 E25 39.0 13.0 11.0 281 <.1 .1 13.0 410 1670 1330FEB 13... 1.50 33 48.0 14.0 11.0 252 <.1 .1 15.0 410 1260 1010MAY 09... 1.60 45 56.0 15.0 13.0 272 <.1 .1 18.0 530 1190 848AUG 27... 1.40 28 25.0 15.0 13.0 256 <.1 .1 13.0 380 1580 1090
< -- Less than E -- Estimated value

104 ST. JOHNS RIVER BASIN ABOVE OCKLAWAHA RIVER
02235500 BLUE SPRINGS NEAR ORANGE CITY, FL
LOCATION.--Lat 28° 56'38", long 81° 20'24", in NE1⁄ 4 sec.8, T.18 S., R.30 E., Volusia County, Hydrologic Unit 03080101, on right bank of Blue Springs Run, 800 ft upsteam from St. Johns River, 0.2 mi downstream from head of springs, and 2.5 mi west of Orange City.
DRAINAGE AREA.--Indeterminate. WATER-DISCHARGE RECORDS
PERIOD OF RECORD.--March 1932 to September 1998 (discharge measurements only), November 1998 to current year.
GAGE.--Water-stage recorder, acoustic velocity meter, and data-collection platform. Datum of gage is at NGVD of 1929. Prior toDec. 7, 2001 at site 250 ft downstream at same datum. November 1998 to September 1999 at datum 0.74 ft lower. Prior toNovember 23, 1998, nonrecording gage at site 30 ft downstream at datum 0.74 ft lower.
REMARKS.--Records fair. Discharge affected by backwater from St. Johns River. Discharge record for Oct. 1 to Dec. 7, 2001 not published due to bad velocity-meter data.
DISCHARGE, CUBIC FEET PER SECOND, WATER YEAR OCTOBER 2001 TO SEPTEMBER 2002DAILY MEAN VALUES
DAY OCT NOV DEC JAN FEB MAR APR MAY JUN JUL AUG SEP
1 --- --- --- 161 2 --- --- --- 162 3 --- --- --- 158 4 --- --- --- 155 5 --- --- --- 156
166 159 154 152 141 135 140 148 166 158 e154 152 141 136 140 149 166 158 e154 153 140 136 140 148 166 157 e153 150 141 138 142 151 163 158 153 148 139 137 142 149
6 --- --- --- 161 7 --- --- --- 161 8 --- --- 162 159 9 --- --- 161 159
10 --- --- 162 164
164 158 150 148 139 136 143 148 167 158 150 148 140 137 140 149 165 159 151 147 146 137 139 148 165 157 153 147 146 136 138 148 164 157 153 145 145 138 141 151
11 --- --- 161 169 12 --- --- 160 170 13 --- --- 161 168 14 --- --- 161 168 15 --- --- 160 166
163 157 153 144 146 138 141 151 165 156 153 145 144 140 144 149 167 157 153 145 142 142 140 150 166 154 153 144 140 140 141 150 163 156 153 143 142 139 140 151
16 --- --- 161 168 17 --- --- 163 169 18 --- --- 163 166 19 --- --- 162 168 20 --- --- 162 167
164 156 153 142 141 140 140 149 163 155 154 143 139 141 141 151 163 156 153 144 135 140 142 150 164 156 155 141 130 140 148 149 167 158 155 140 129 139 148 151
21 --- --- 162 165 22 --- --- 161 163 23 --- --- 164 163 24 --- --- 164 164 25 --- --- 162 165
163 158 155 137 131 138 143 150 161 157 155 137 129 138 144 151 157 154 154 138 128 138 147 151 157 155 153 138 128 137 147 151 158 155 154 138 130 139 149 154
26 --- --- 162 167 27 --- --- 161 166 28 --- --- 165 166 29 --- --- 165 166 30 --- --- 163 167 31 --- --- 162 167
160 154 153 138 131 142 149 154 158 153 151 138 132 141 149 155 159 153 151 138 132 140 147 152 --- 154 151 139 134 141 147 150 --- 154 152 139 132 141 147 153 --- 154 --- 139 --- 142 147 --
TOTAL --- --- 3890 5094MEAN --- --- 162 164 MAX --- --- 165 170 MIN --- --- 160 155
4570 4841 4589 4440 4113 4302 4446 4511 163 156 153 143 137 139 143 150 167 159 155 153 146 142 149 155 157 153 150 137 128 135 138 148
STATISTICS OF MONTHLY MEAN DATA FOR WATER YEARS 1999 - 2002, BY WATER YEAR (WY)
MEAN 112 115 138 142 MAX 125 162 162 164 (WY) 2000 1999 2002 2002MIN 99.0 91.8 98.6 105 (WY) 2001 2001 2001 2001
142 141 148 127 129 128 127 131 163 158 155 143 137 139 143 1502002 2000 1999 2002 2002 2002 2002 2002 110 114 130 106 112 108 93.4 1012001 2001 2000 2000 2000 2000 2000 2000
SUMMARY STATISTICS FOR 2001 CALENDAR YEAR FOR 2002 WATER YEAR #WATER YEARS 1999 - 2002
ANNUAL TOTAL 13767 ANNUAL MEAN 121 HIGHEST ANNUAL MEANLOWEST ANNUAL MEANHIGHEST DAILY MEAN 165 LOWEST DAILY MEAN 83ANNUAL SEVEN-DAY MINIMUM 93MAXIMUM PEAK STAGE10 PERCENT EXCEEDS 16250 PERCENT EXCEEDS 11290 PERCENT EXCEEDS 94
44796 151 133
151 2002 103 2001
Dec 28 170 Jan 12 201 Nov 28 1998Feb 2 128 Jun 23,24 49 Nov 7 2000Jan 11 129 Jun 19 71 Nov 2 2000
4.56 Sep 13 4.65 Nov 2 1999 165 163 151 138 138 98
e Estimated# Includes partial year(s) record

5
10
15
20
25
30
--- ------ ------ ------ ------ ---
--- ------ ---
--- --- --- ------ --- --- ---
--- --- ---
--- --- ------ --- ------ --- ------ --- ---
--- --- --- ---
--- --- ------ --- ------ --- --- ------ --- --- ------ --- --- ---
--- --- --- ------ --- ------ --- ------ --- ------ --- ---
--- --- ------ --- ------ --- ------ --- ------ --- ------ --- --- ---
--- --- --- ------ --- --- ------ --- --- ---
105 ST. JOHNS RIVER BASIN ABOVE OCKLAWAHA RIVER
02235500 BLUE SPRINGS NEAR ORANGE CITY, FL
WATER-QUALITY RECORDS
PERIOD OF RECORD.--Water years 1960, 1964-94, 1998 to current year.
PERIOD OF DAILY RECORD.-- SPECIFIC CONDUCTANCE: December 1998 to current year. WATER TEMPERATURE: December 1998 to current year.
INSTRUMENTATION.--Water-quality monitor and data-collection platform.
EXTREMES FOR PERIOD OF DAILY RECORD.--SPECIFIC CONDUCTANCE: Maximum daily mean, 2,150 µS/cm @ 25 ° C, Sept. 18, 2001; minimum daily mean, 980 µS/cm @ 25 ° C, April 26,27, 2002.
WATER TEMPERATURE: Maximum daily mean, 23.5° C, April 17, 2000; minimum daily mean, 22.5° C, Dec. 20, 2000.
EXTREMES FOR CURRENT YEAR.--SPECIFIC CONDUCTANCE: Maximum daily mean, 1,660 µS/cm @ 25 ° C, Oct. 2; minimum daily mean, 980 µS/cm @ 25 ° C, Apr. 26,27. WATER TEMPERATURE: Maximum daily mean, 23.2 ° C, May 4; minimum daily mean, 22.9° C, Oct. 26-29, Nov. 6-10, 12,14,15,
May 22, 23.
REMARKS.--Extremes may have been exceeded during periods of missing record.
SPECIFIC CONDUCTANCE (MICROSIEMENS/CM AT 25 DEG. C), WATER YEAR OCTOBER 2001 TO SEPTEMBER 2002DAILY MEAN VALUES
DAY OCT NOV DEC JAN FEB MAR APR MAY JUN JUL AUG SEP
1 1580 1310 --- --- --- 1370 1310 1410 1320 --2 1660 1310 --- --- --- 1360 1310 1410 1310 --3 1640 1300 --- --- --- 1340 1310 1420 1300 --4 1620 1300 --- --- --- 1330 1310 1420 1290 --
1600 1300 --- --- --- 1300 1310 1420 1280 --
6 1590 1300 --- --- --- 1300 1320 1440 1280 --7 1560 1300 --- --- --- 1320 1310 1450 1280 --8 1540 1300 -- -- 1260 1320 1450 --9 1510 1290 -- -- 1240 1310 1450 --
1510 1290 --- --- --- 1250 1320 1410 --
11 1490 1290 --- --- --- 1200 1320 1390 --12 1480 1280 --- --- --- 1260 1320 1350 --13 1460 1270 --- --- --- 1340 1330 1370 --14 1450 1270 --- --- --- 1310 1330 1360 --
1450 1270 -- -- -- 1330 1350 --
16 1450 1270 -- -- 1420 -- 1330 1350 --17 1440 1270 -- -- 1410 -- 1330 1350 --18 1420 1270 -- -- 1390 -- 1340 --19 1420 1260 -- -- 1370 -- 1340 --
1400 1260 -- -- 1330 -- 1340 --
21 1390 1250 -- -- 1240 -- 1330 --22 1380 1250 --- --- 1180 1310 1340 --- --23 1370 1260 --- --- 1110 1310 1340 --- --24 1350 1260 --- --- 1080 1310 1360 --- --
1360 1250 --- --- 1020 1310 1360 --- --
26 1330 1250 --- --- 980 1310 1370 --- --27 1320 --- --- --- 980 1300 1370 --- --28 1320 --- --- --- 1150 1290 1370 --- --29 1320 --- --- --- 1390 1290 1390 --- --
1320 --- --- --- 1380 1310 1390 --- --31 1310 --- --- --- --- 1310 --- --
MEAN 1450 --- --- --- --- 1340 --- --MAX 1660 --- --- --- --- 1390 --- --MIN 1310 --- --- --- --- 1310 --- --

--- ------ ------ ------ ------ ---
--- ------ ---
--- --- --- ------ --- --- ---
--- --- ---
--- --- ------ --- ------ --- ------ --- ---
--- --- --- ---
--- --- ------ --- ------ --- --- ------ --- --- ------ --- --- ---
--- --- --- ------ --- ------ --- ------ --- ------ --- ---
--- --- ------ --- ------ --- ------ --- ------ --- ------ --- --- ---
--- --- --- ------ --- --- ------ --- --- ---
106 ST. JOHNS RIVER BASIN ABOVE OCKLAWAHA RIVER
02235500 BLUE SPRINGS NEAR ORANGE CITY, FL--Continued
TEMPERATURE, WATER (DEG. C), WATER YEAR OCTOBER 2001 TO SEPTEMBER 2002 DAILY MEAN VALUES
DAY OCT NOV DEC JAN FEB MAR APR MAY JUN JUL AUG SEP
1 23.0 23.0 --- --- --- 23.1 23.0 23.0 23.0 --2 23.0 23.0 --- --- --- 23.1 23.1 23.0 23.0 --3 23.1 23.1 --- --- --- 23.1 23.1 23.1 23.0 --4 23.1 23.0 --- --- --- 23.2 23.1 23.1 23.1 --5 23.1 23.0 --- --- --- 23.1 23.1 23.0 23.1 --
6 23.1 22.9 --- --- --- 23.0 23.1 23.1 23.1 --7 23.1 22.9 --- --- --- 23.0 23.1 23.1 23.1 --8 23.1 22.9 -- --- 23.1 23.0 23.1 --9 23.1 22.9 -- --- 23.1 23.1 23.1 --10 23.1 22.9 --- --- --- 23.1 23.1 23.0 --
11 23.1 23.0 --- --- --- 23.1 23.0 23.1 --12 23.1 22.9 --- --- --- 23.1 23.1 23.1 --13 23.1 23.0 --- --- --- 23.1 23.1 23.1 --14 23.1 22.9 --- --- --- 23.0 23.1 23.1 --15 23.1 22.9 -- -- --- 23.1 23.1 --
16 23.1 23.0 -- -- 23.0 --- 23.0 23.1 --17 23.0 23.0 -- -- 23.0 --- 23.0 23.1 --18 23.0 23.0 -- -- 23.0 --- 23.0 --19 23.1 23.0 -- -- 23.0 --- 23.0 --20 23.1 23.0 -- -- 23.1 --- 23.0 --
21 23.1 23.0 -- -- 23.1 --- 23.0 --22 23.1 23.0 --- --- 23.1 22.9 23.0 --- --23 23.1 23.0 --- --- 23.0 22.9 23.0 --- --24 23.1 23.0 --- --- 23.0 23.0 23.0 --- --25 23.1 23.0 --- --- 23.1 23.0 23.0 --- --
26 22.9 23.0 --- --- 23.1 23.0 23.1 --- --27 22.9 --- --- --- 23.1 23.0 23.0 --- --28 22.9 --- --- --- 23.1 23.0 23.0 --- --29 22.9 --- --- --- 23.0 23.0 23.1 --- --30 23.0 --- --- --- 23.1 23.1 23.0 --- --31 23.0 --- --- --- --- 23.1 --- --
MEAN 23.1 --- --- --- --- 23.0 --- --MAX 23.1 --- --- --- --- 23.1 --- --MIN 22.9 --- --- --- --- 23.0 --- --

--
--
107 ST. JOHNS RIVER BASIN ABOVE OCKLAWAHA RIVER
02235500 BLUE SPRINGS NEAR ORANGE CITY, FL--Continued
WATER-QUALITY DATA, WATER YEAR OCTOBER 2001 TO SEPTEMBER 2002
DIS PH NITRO CHARGE, SPE WATER NITRO NITRO- GEN,AM- NITROINST. CIFIC WHOLE COLOR GEN, GEN, MONIA + GEN, PHOS CUBIC CON FIELD TEMPER- (PLAT OXYGEN, AMMONIA NITRITE ORGANIC NO2+NO3 PHORUS FEET GAGE DUCT- (STAND- ATURE INUM DIS TOTAL TOTAL TOTAL TOTAL TOTAL
Date Time PER HEIGHT ANCE ARD WATER COBALT SOLVED (MG/L (MG/L (MG/L (MG/L (MG/L SECOND (FEET) (US/CM) UNITS) (DEG C) UNITS) (MG/L) AS N) AS N) AS N) AS N) AS P)
(00061) (00065) (00095) (00400) (00010) (00080) (00300) (00610) (00615) (00625) (00630) (00665)
DEC 18... 1215 168 1280 7.3 23.0 <5 .3 .02 <.01 <.20 .730 E.05 APR 15... 1403 156 .88 1430 7.1 23.2 <5 1.5 .03 <.01 <.20 .580 .04 JUN 05... 1230 142 1.03 1310 23.1 5 - .02 <.01 <.20 .520 .06 SEP 24... 1330 149 4.00 982 7.0 23.2 <5 -- <.01 <.01 <.20 .790 .04
ANC SOLIDS, PHOS- HARD- MAGNE- POTAS- UNFLTRD CHLO- FLUO- SILICA, RESIDUE STRONPHORUS NESS CALCIUM SIUM, SODIUM, SIUM, TIT 4.5 SULFATE RIDE, RIDE, DIS- AT 180 TIUM,ORTHO TOTAL DIS- DIS- DIS- DIS- LAB DIS- DIS- DIS- SOLVED DEG. C DIS TOTAL (MG/L SOLVED SOLVED SOLVED SOLVED (MG/L SOLVED SOLVED SOLVED (MG/L DIS- SOLVED
Date (MG/L AS (MG/L (MG/L (MG/L (MG/L AS (MG/L (MG/L (MG/L AS SOLVED (UG/L AS P) CACO3) AS CA) AS MG) AS NA) AS K) CACO3) AS SO4) AS CL) AS F) SIO2) (MG/L) AS SR)(70507) (00900) (00915) (00925) (00930) (00935) (90410) (00945) (00940) (00950) (00955) (70300) (01080)
DEC 18... E.070 240 63.0 21.0 150 6.30 141 46.0 290 <.1 8.30 E709 770APR 15... .070 250 62.0 22.0 170 6.80 139 53.0 330 <.1 8.30 784 800JUN 05... .080 240 61.0 21.0 160 6.20 138 47.0 300 <.1 8.20 728 780SEP 24... .060 200 57.0 15.0 110 4.80 140 33.0 200 <.1 7.90 553 620
< -- Less than E -- Estimated value

108 ST. JOHNS RIVER BASIN ABOVE OCKLAWAHA RIVER
02236000 ST. JOHNS RIVER NEAR DE LAND, FL
LOCATION (REVISED).--Lat 29° 00'29", long 81° 22'58", in land grant 38, T.17 S., R.29 E., Lake County, Hydrologic Unit 03080101, attached to fender pilings near center of channel under Francis P. Whitehair Bridge on State Highway 44 , 5 mi west of DeLand, and 142 mi upstream from mouth.
DRAINAGE AREA.--3,066 mi2. WATER-DISCHARGE RECORDS
PERIOD OF RECORD.--October 1933 to current year. Monthly discharge only prior to February 1934, published in WSP 1304.
REVISED RECORDS.--WDR FL-75-1: Drainage area, WDR FL-96-1A: 1995.
GAGE.--Water-stage recorder, acoustic velocity meter, and data-collection platform. Datum of gage is 0.09 ft below NGVD of 1929.Prior to May 28, 1936, nonrecording gage at site of former Crows Bluff Bridge about 1,000 ft downstream and May 28, 1936 toJuly 21, 1970, water-stage recorder at site 0.4 mi downstream at datum 1.11 ft lower. July 22, 1970 to Sept. 30, 1993,water-stage recorder at present site and datum. Oct. 1, 1993 to April 4, 2000, water-stage recorder near right bank 100 ft upstream. Oct. 1, 1959 to Sept. 30, 1975, Oct. 1, 1984 to Mar. 21, 1986, June 16 to Sept. 23, 1991, and Oct. 1, 1992 toSept. 30, 1993, water-stage recorder for St. Johns River near Sanford (station 02234500) used as auxiliary gage for this station.
REMARKS.--Records fair except for periods of estimated daily discharge, which are poor.
DISCHARGE, CUBIC FEET PER SECOND, WATER YEAR OCTOBER 2001 TO SEPTEMBER 2002DAILY MEAN VALUES
DAY OCT NOV DEC JAN FEB MAR APR MAY JUN JUL AUG SEP
1 10500 6880 6340 28302 9960 6990 6190 28803 9690 7180 6010 23304 9880 7150 5740 2360 5 9910 6700 5510 2910
1560 2370 633 726 337 e4060 e7340 e90701260 2930 571 1100 932 e4640 e7410 e9010 828 2640 666 1660 1320 e4890 e7630 e8890 -64 1490 912 1640 1270 e5020 e7670 e8710274 1940 -150 854 623 e5140 e7620 e8810
6 9890 6260 5400 32307 9920 6340 5350 30608 9800 6490 5370 33009 9830 6670 5380 3440
10 9710 6750 5250 3460
1290 2620 -403 -320 328 e5280 e7580 e88401330 2570 471 -367 420 e5410 e7560 e8850400 2700 1270 345 560 e5410 e7460 e8780
1520 2700 1710 849 -509 e5420 e7290 e87101560 2620 1580 1120 -851 e5500 e7180 e8520
11 9680 6610 5050 346012 9470 6550 4840 343013 9950 6280 4780 3070 14 9940 5920 4760 2940 15 9340 4670 4610 2500
1290 2670 1370 1160 -1140 e5560 e7050 e85001580 2710 991 1060 -682 e5880 e7060 e8490 638 2220 1060 637 689 e5890 e7160 e8630 804 2350 782 -500 1050 e6300 e7550 e8500 994 2450 1040 560 1510 e6380 e7900 e8480
16 8570 4120 4610 2520 17 8090 4490 4560 2380 18 7930 4800 4270 2140 19 7750 5250 4360 248020 7580 5650 4180 2440
603 2490 1410 501 1530 e6390 e8120 e8470 352 2520 1420 375 1350 e6390 e8260 e8430 943 2520 1380 411 1160 e6460 e8260 e84001330 2560 1440 -561 1190 e6460 e8590 e8380 1820 2260 1410 -2220 717 e6330 e8930 e8110
21 7450 5910 4010 245022 7590 6170 4050 224023 7590 6270 4010 2220 24 7750 6330 3820 2220 25 7750 6440 3570 2100
1810 1800 1380 -2350 e700 e6170 e9070 e80901580 1090 711 -2360 e1260 e6300 e9140 e7950 211 253 206 -2520 e1540 e6560 e9120 e7870 927 845 390 -2130 e1860 e6710 e9190 e79301560 1380 339 -891 e2180 e6710 e9180 e7880
26 7630 6550 3180 156027 7460 6500 3490 1350 28 7180 6450 3720 123029 6670 6390 3670 1500 30 6580 6420 3360 1720 31 6780 --- 3110 1750
1760 1370 -189 -314 e2300 e6660 e9170 e7820 591 1080 316 170 e2480 e6760 e9100 e76701730 1080 226 -562 e2790 e6940 e9150 e7660 --- 1220 -166 -1320 e3000 e7130 e9210 e7640 --- 1370 943 -650 e3220 e7190 e9180 e7560 --- 1330 --- e205 --- e7260 e9120 --
TOTAL 267820 185180 142550 77500 MEAN 8639 6173 4598 2500 MAX 10500 7180 6340 3460 MIN 6580 4120 3110 1230 CFSM 2.81 2.01 1.50 0.81 IN. 3.25 2.24 1.73 0.94
30481 62148 23719 -3692 33134 187200 254250 2506501089 2005 791 -119 1104 6039 8202 8355 1820 2930 1710 1660 3220 7260 9210 9070-64 253 -403 -2520 -1140 4060 7050 7560
0.35 0.65 0.26 -0.04 0.36 1.97 2.67 2.72 0.37 0.75 0.29 -0.04 0.40 2.27 3.08 3.04
STATISTICS OF MONTHLY MEAN DATA FOR WATER YEARS 1934 - 2002, BY WATER YEAR (WY)
MEAN 4903 4380 3295 2770MAX 15800 10680 8528 8509(WY) 1954 1954 1995 1998 MIN 446 251 234 763(WY) 1982 1981 1981 1939
2494 2551 2382 1521 1759 2950 3486 40477106 9912 9811 5170 7004 11750 10280 120601998 1998 1960 1983 1934 1968 1960 1960591 256 284 -119 229 316 234 4051982 2000 1999 2002 1962 2000 2000 1958
SUMMARY STATISTICS FOR 2001 CALENDAR YEAR FOR 2002 WATER YEAR WATER YEARS 1934 - 2002
ANNUAL TOTAL 1065345.8 ANNUAL MEAN 2919 HIGHEST ANNUAL MEAN LOWEST ANNUAL MEAN HIGHEST DAILY MEAN 11800 LOWEST DAILY MEAN -1150ANNUAL SEVEN-DAY MINIMUM 73 MAXIMUM PEAK STAGE ANNUAL RUNOFF (CFSM) 0.95ANNUAL RUNOFF (INCHES) 12.9110 PERCENT EXCEEDS 745050 PERCENT EXCEEDS 147090 PERCENT EXCEEDS 377
15109404140 3048
6433 1960743 1981
Sep 27,28 10500 Oct 1 17100 Oct 15 1953Mar 21 -2520 May 23 -3260 Sep 10 2000May 4 -1860 May 19 -2130 Sep 7 2000
4.11 Oct 2 6.06 Oct 11 1953 1.35 0.9918.31 13.49
8660 62603460 2430 366 819
e Estimated Note.--Negative figures indicate reverse flow

---------
--- ------
ST. JOHNS RIVER BASIN ABOVE OCKLAWAHA RIVER 109
02236000 ST. JOHNS RIVER NEAR DE LAND, FL--Continued
GAGE HEIGHT, FEET, WATER YEAR OCTOBER 2001 TO SEPTEMBER 2002 DAILY MEAN VALUES
DAY OCT NOV DEC JAN FEB MAR APR MAY JUN JUL AUG SEP
1 4.09 3.12 2.47 1.29 0.57 1.12 0.74 0.55 1.18 --- 2.40 3.47 2 4.10 3.11 2.42 1.30 0.58 1.03 0.76 0.49 1.09 1.73 2.44 3.51 3 4.07 3.12 2.38 1.41 0.63 1.03 0.79 0.38 1.01 1.74 2.51 3.55 4 4.02 3.09 2.37 1.47 0.72 1.22 0.76 0.26 0.96 1.73 2.60 3.61 5 3.98 3.08 2.37 1.42 0.80 1.23 0.83 0.23 0.98 1.75 2.68 3.72
6 3.91 3.10 2.37 1.30 0.81 1.15 0.95 0.38 0.98 1.77 2.75 3.78 7 3.85 3.09 2.35 1.19 0.74 1.08 1.01 0.45 0.98 1.76 2.87 3.81 8 3.82 3.05 2.30 1.07 0.81 1.05 0.97 0.44 0.97 1.79 2.97 3.82 9 3.79 2.98 2.25 0.93 0.74 1.05 0.87 0.35 1.02 1.84 3.06 3.83 10 3.75 2.92 2.22 0.81 0.72 1.05 0.74 0.25 1.12 1.88 3.13 3.84
11 3.71 2.85 2.20 0.72 0.73 0.98 0.72 0.19 1.21 1.89 3.18 3.82 12 3.68 2.79 2.19 0.59 0.70 0.93 0.72 0.14 1.28 1.88 3.21 3.80 13 3.61 2.77 2.19 0.55 0.66 0.92 0.75 0.10 1.27 1.92 3.32 3.79 14 3.54 2.94 2.16 0.56 0.66 0.89 0.74 0.12 1.22 2.00 3.45 3.81 15 3.55 3.09 2.12 0.69 0.74 0.83 0.72 0.12 1.14 2.05 3.48 3.76
16 3.51 3.23 2.05 0.72 0.80 0.76 0.69 0.14 1.07 2.09 3.50 3.70 17 3.48 3.27 2.00 0.72 0.84 0.68 0.66 0.14 1.04 2.09 3.50 3.63 18 3.48 3.28 1.96 0.70 0.84 0.59 0.59 0.11 1.09 2.10 3.51 3.56 19 3.46 3.26 1.89 0.64 0.84 0.51 0.52 0.15 1.15 2.10 3.48 3.49 20 3.45 3.22 1.81 0.57 0.73 0.46 0.46 0.48 1.25 2.12 3.47 3.48
21 3.44 3.15 1.75 0.49 0.64 0.46 0.40 0.76 -- 2.20 3.47 3.46 22 3.43 3.07 1.71 0.48 0.60 0.55 0.38 0.96 -- 2.26 3.47 3.41 23 3.41 3.00 1.65 0.49 0.75 0.72 0.43 1.12 -- 2.26 3.46 3.37 24 3.36 2.95 1.63 0.48 0.97 0.79 0.49 1.19 -- 2.27 3.44 3.39 25 3.28 2.89 1.62 0.44 1.06 0.76 0.52 1.16 -- 2.29 3.41 3.42
26 3.25 2.82 1.59 0.49 1.09 0.73 0.55 1.09 -- 2.34 3.38 3.44 27 3.21 2.77 1.54 0.59 1.16 0.73 0.64 1.04 -- 2.44 3.38 3.43 28 3.15 2.69 1.42 0.65 1.20 0.73 0.65 1.06 -- 2.42 3.36 3.39 29 3.13 2.61 1.34 0.65 --- 0.75 0.65 1.11 2.39 3.39 3.33 30 3.14 2.53 1.31 0.63 --- 0.76 0.58 1.17 2.38 3.42 3.28 31 3.15 --- 1.30 0.60 --- 0.73 --- 1.20 2.39 3.44 --
MEAN 3.57 2.99 1.97 0.79 0.79 0.85 0.68 0.56 -- 3.20 3.59 MAX 4.10 3.28 2.47 1.47 1.20 1.23 1.01 1.20 --- 3.51 3.84 MIN 3.13 2.53 1.30 0.44 0.57 0.46 0.38 0.10 --- 2.40 3.28
CAL YR 2001 MEAN 1.39 MAX 4.31 MIN 0.07

110 ST. JOHNS RIVER BASIN ABOVE OCKLAWAHA RIVER
02236000 ST. JOHNS RIVER NEAR DELAND, FL--Continued
WATER-QUALITY RECORDS
PERIOD OF RECORD.--Water years 1948, 1949, 1954, 1962, 1966-95, 2000 to 2002.
PERIOD OF DAILY RECORD.--SPECIFIC CONDUCTANCE: October 2000 to September 2002 (discontinued). WATER TEMPERATURE: October 2000 to September 2002 (discontinued).
INSTRUMENTATION.--Water-quality monitor and data-collection platform.
EXTREMES FOR PERIOD OF DAILY RECORD.--SPECIFIC CONDUCTANCE: Maximum daily mean, 2,010 µS/cm @ 25 ° C, July 10, 2001; minimum daily mean, 433 µS/cm @ 25 ° C, Sept. 20,21,2002.
WATER TEMPERATURE: Maximum daily mean, 30.7 ° C, July 31, 2001, Aug. 14, 2001; minimum daily mean, 11.6 ° C, Jan. 5, 2001.
EXTREMES FOR CURRENT YEAR.--SPECIFIC CONDUCTANCE: Maximum daily mean, 1,410 µS/cm @ 25 ° C, May 10; minimum daily mean, 433 µS/cm @ 25 ° C, Sept. 20,21. WATER TEMPERATURE: Maximum daily mean, 30.6 ° C, July 19; minimum daily mean, 16.8 ° C, Mar. 5.
SPECIFIC CONDUCTANCE (MICROSIEMENS/CM AT 25 DEG. C), WATER YEAR OCTOBER 2001 TO SEPTEMBER 2002DAILY MEAN VALUES
DAY OCT NOV DEC JAN FEB MAR APR MAY JUN JUL AUG SEP
1 483 576 564 --2 475 574 569 --3 466 565 584 --4 462 565 598 --5 464 562 609 --
--- --- 1250 1270 1290 1160 698 441--- 1070 1260 1160 1340 1150 678 442--- 1100 1260 1060 1310 1180 648 442--- 1110 1270 1190 1180 1210 627 442--- 1110 1280 1310 1180 1230 618 443
6 469 564 618 --7 469 565 629 --8 468 567 635 --9 466 568 --- --10 473 569 --- --
--- 1110 1280 1340 1210 1240 603 445--- 1130 1270 1340 1220 1240 588 444--- 1150 1270 1350 1250 1230 576 446--- 1170 1240 1380 1260 1230 578 446 --- 1180 1110 1410 1220 1200 576 445
11 490 569 --- --12 502 570 --- --13 511 571 --- --14 515 556 --- --15 513 552 --- --
--- 1190 1140 1260 1190 1170 566 442 --- 1210 1240 1230 1170 1140 553 440 --- 1210 1290 1290 1170 1100 527 440 --- 1220 1290 1310 1240 1080 486 438 --- 1220 1280 1320 1210 1020 477 438
16 519 559 --- --17 526 565 --- --18 530 569 --- --19 538 573 --- --20 541 572 --- --
--- 1250 1260 1360 1120 975 472 438 --- 1280 1200 1370 1110 960 479 439 --- 1290 1240 1380 1170 967 471 440 --- 1290 1280 1380 1210 1030 472 442 --- 1280 1300 1310 1240 966 476 433
21 546 569 --- --22 550 564 --- --23 556 558 --- --24 563 550 --- --25 566 547 --- --
--- 1280 1310 1270 1220 904 467 433 --- 1280 1310 1340 1230 866 465 443 --- 1270 1330 1310 1220 848 468 452 --- 1270 1330 1320 1210 864 468 456 --- 1280 1350 1320 1210 832 466 459
26 567 544 --- --27 570 546 --- --28 571 550 --- --29 577 553 --- --30 580 560 --- --31 577 --- --- --
--- 1190 1360 1320 1200 818 460 461 --- 1130 1350 1320 1200 771 455 464 --- 1210 1340 1320 1250 769 454 463 --- 1260 1340 1310 1260 753 449 468 --- 1250 1320 1300 1260 739 443 475 --- 1240 --- 1290 --- 714 441 --
MEAN 519 562 --- -- MAX 580 576 --- -- MIN 462 544 --- --
--- --- 1280 1300 1220 1010 523 447--- --- 1360 1410 1340 1240 698 475--- --- 1110 1060 1110 714 441 433

------ --- --- ---
--- --- ---
------
---------------
---------------
---------------
------------------ ---
--- ------ --- --- ---
ST. JOHNS RIVER BASIN ABOVE OCKLAWAHA RIVER 111
02236000 ST. JOHNS RIVER NEAR DELAND, FL--Continued
TEMPERATURE, WATER (DEG. C), WATER YEAR OCTOBER 2001 TO SEPTEMBER 2002 DAILY MEAN VALUES
DAY OCT NOV DEC JAN FEB MAR APR MAY JUN JUL AUG SEP
1 24.0 20.7 22.3 --- --- 25.7 27.8 26.6 26.7 29.5 28.3 2 23.4 21.3 22.4 --- 17.3 25.9 27.8 27.5 26.7 29.0 28.6 3 23.3 21.9 22.6 --- 17.6 25.5 28.2 27.8 27.1 28.7 28.7 4 23.7 22.2 22.7 --- 17.6 25.1 29.2 28.7 27.7 28.7 28.6 5 24.1 22.0 22.5 --- 16.8 24.9 29.7 29.2 28.0 28.9 28.5
6 24.7 21.2 22.3 --- 16.9 24.7 29.5 29.6 27.8 29.0 28.3 7 25.1 20.6 22.4 --- 17.1 24.4 29.3 29.8 28.4 29.0 28.3 8 24.7 20.4 22.8 --- 17.5 23.9 29.6 29.4 28.8 28.5 28.3 9 24.1 20.5 --- --- 18.7 23.8 29.2 29.3 28.4 28.0 28.3
10 23.8 20.5 --- --- 19.9 24.1 28.6 29.4 27.9 27.8 28.3
11 23.9 20.7 --- --- 21.1 24.4 28.7 29.5 27.9 27.6 28.3 12 24.1 20.6 --- --- 22.1 24.1 28.8 29.4 28.2 27.4 27.8 13 24.4 20.6 --- --- 22.4 24.0 29.1 29.6 27.8 27.1 27.6 14 24.7 20.6 --- --- 22.4 24.1 29.0 29.4 27.9 26.7 27.7 15 25.0 20.4 --- --- 22.6 24.3 28.5 29.1 28.4 27.1 28.0
16 24.9 20.2 --- --- 23.2 24.8 28.1 29.1 29.1 27.4 28.5 17 24.0 20.2 --- --- 24.2 25.2 27.9 28.7 29.9 28.0 28.7 18 22.9 20.5 --- --- 25.2 25.7 28.1 27.8 30.3 28.3 28.9 19 22.8 20.7 --- --- 25.8 26.7 27.7 27.4 30.6 28.6 29.0 20 23.3 21.0 --- --- 26.0 27.3 27.0 27.0 30.5 28.4 28.6
21 23.8 20.9 --- --- 25.8 28.0 25.9 26.6 29.6 28.3 28.4 22 24.2 20.8 --- --- 25.6 28.6 25.0 26.3 28.7 28.5 28.3 23 24.5 21.2 --- --- 24.9 28.4 24.1 25.8 28.7 28.7 28.1 24 25.0 21.6 --- --- 24.3 28.4 23.9 26.0 28.9 29.0 27.9 25 25.4 21.9 --- --- 24.0 28.1 24.3 26.0 29.5 29.2 27.9
26 24.8 22.1 --- --- 24.2 28.0 24.8 26.3 29.6 29.1 27.9 27 22.7 22.3 --- --- 24.4 28.5 25.2 26.7 29.2 28.7 28.2 28 20.8 22.4 --- --- 24.7 28.4 25.3 27.0 29.6 28.5 28.3 29 20.0 22.4 --- --- 25.1 28.3 25.6 27.1 29.9 28.3 28.5 30 19.7 22.3 --- --- 25.6 28.2 26.2 27.1 30.0 28.1 28.6 31 20.0 --- --- --- 25.8 --- 26.6 29.8 28.1 --
MEAN 23.6 21.2 --- --- 26.1 27.4 28.0 28.8 28.3 28.3 MAX 25.4 22.4 -- -- 28.6 29.7 29.8 30.6 29.5 29.0 MIN 19.7 20.2 -- -- 23.8 23.9 25.8 26.7 26.7 27.6

112 ST. JOHNS RIVER BASIN ABOVE OCKLAWAHA RIVER
02236000 ST. JOHNS RIVER NEAR DELAND, FL--Continued
WATER-QUALITY DATA, WATER YEAR OCTOBER 2001 TO SEPTEMBER 2002
DIS SPE PH PH RESIDUE NITRO CHARGE, SPE CIFIC WATER WATER TOTAL GEN, INST. CIFIC CON WHOLE WHOLE COLOR AT 105 AMMONIA CUBIC CON DUCT- FIELD LAB TEMPER- TUR (PLAT OXYGEN, DEG. C, DIS FEET GAGE DUCT ANCE (STAND- (STAND ATURE BID INUM- DIS SUS SOLVED
Date Time PER HEIGHT ANCE LAB ARD ARD WATER ITY COBALT SOLVED PENDED (MG/L SECOND (FEET) (US/CM) (US/CM) UNITS) UNITS) (DEG C) (NTU) UNITS) (MG/L) (MG/L) AS N)
(00061) (00065) (00095) (90095) (00400) (00403) (00010) (00076) (00080) (00300) (00530) (00608)
OCT 09... 0915 10100 3.78 456 457 6.6 7.0 24.0 2.0 320 1.7 7 .10 23... 0920 7540 3.40 547 546 6.7 7.3 24.2 .66 320 2.3 4 .06 NOV 06... 0945 5610 3.08 553 544 6.8 7.8 21.1 1.3 240 3.2 <1 .04 21... 1110 6190 3.14 559 555 7.0 7.7 20.7 .95 240 3.7 3 .05 DEC 04... 0930 5740 2.35 589 588 6.9 7.8 22.4 .90 240 3.3 <1 .06 17... 1145 4590 2.00 685 674 7.1 7.5 23.5 2.3 200 3.9 E2 .09 JAN 04... 1030 2330 1.48 802 792 7.4 7.8 13.7 2.2 140 7.5 <1 .09 14... 1245 3080 .55 846 848 7.4 7.7 14.2 3.5 160 8.6 4 .05 30... 0845 1290 .63 944 922 7.3 7.7 22.1 3.2 120 5.6 5 .08 FEB 13... 1113 816 .66 1020 1010 7.4 7.7 19.2 2.8 100 7.0 5 .05 26... 1440 2150 1.09 1050 1050 7.3 7.7 18.7 2.8 80 6.7 13 .06 MAR 12... 1005 2440 .88 1220 1220 7.4 7.6 21.6 5.2 100 7.3 8 .02 28... 1040 301 .76 1240 1210 7.1 7.5 24.3 2.5 80 5.1 5 .06 APR 09... 0855 826 .91 1300 1280 7.4 7.8 23.1 3.5 50 6.4 7 .02 25... 0742 -258 .49 1340 1340 7.3 7.8 27.7 5.4 100 4.4 16 .10 MAY 08... 0825 -44 .47 1350 1340 7.3 7.7 29.1 3.6 70 2.8 11 .15 21... 0935 -2510 .72 1250 1230 7.2 7.7 25.5 5.6 40 8.4 19 .01 JUN 04... 1002 1130 .95 1170 1170 7.5 8.0 28.4 3.2 30 7.1 10 .01 19... 0949 1580 1.11 1220 1210 7.7 7.8 27.2 2.9 40 5.4 12 <.01 JUL 02... 0959 E4640 1.80 1170 1150 7.0 7.5 26.5 7.1 100 4.4 16 .02 17... 0930 E6390 2.16 970 946 6.4 7.1 29.3 2.4 240 2.5 8 .16 31... 0920 E7260 2.45 727 703 6.4 7.1 29.4 3.2 240 2.0 6 .14 AUG 14... 0931 E7550 3.58 493 485 6.8 7.2 26.5 2.9 320 2.8 6 .04 26... 0940 E9170 3.38 465 454 6.5 7.3 29.0 2.4 280 1.5 7 .04 SEP 11... 0825 E8500 3.91 442 431 6.7 7.5 28.2 1.9 240 1.5 12 .04 24... 0900 E7930 3.38 460 451 6.3 7.3 27.6 1.7 240 2.2 2 .03
< -- Less than E -- Estimated value Note.--Negative figures indicate reverse flow

113 ST. JOHNS RIVER BASIN ABOVE OCKLAWAHA RIVER
02236000 ST. JOHNS RIVER NEAR DELAND, FL--Continued
WATER-QUALITY DATA, WATER YEAR OCTOBER 2001 TO SEPTEMBER 2002
NITRO NITRO NITRO ORTHO NITRO GEN, GEN,AM- GEN, PHOS- CARBON, PHOS- HARD MAGNEGEN, NITRITE MONIA + NO2+NO3 PHOS PHATE, ORGANIC PHORUS NESS CALCIUM SIUM, SODIUM,
AMMONIA DIS ORGANIC DIS PHORUS DIS DIS SULFIDE ORTHO TOTAL DIS DIS DIS TOTAL SOLVED TOTAL SOLVED TOTAL SOLVED SOLVED TOTAL TOTAL (MG/L SOLVED SOLVED SOLVED
Date (MG/L (MG/L (MG/L (MG/L (MG/L (MG/L (MG/L (MG/L (MG/L AS (MG/L (MG/L (MG/L AS N) AS N) AS N) AS N) AS P) AS P) AS C) AS S) AS P) CACO3) AS CA) AS MG) AS NA) (00610) (00613) (00625) (00631) (00665) (00671) (00681) (00745) (70507) (00900) (00915) (00925) (00930)
OCT 09... E.13 <.010 E1.7 <.02 .14 .05 30.0 2.0 E.130 99 26.0 8.00 49.0 23... .05 .020 E1.6 <.02 E.09 .11 35.0 2.0 .100 110 29.0 9.50 59.0 NOV 06... .04 <.010 E1.5 .12 E.09 .07 33.0 2.0 .070 110 29.0 9.80 63.0 21... .05 .010 E1.4 .10 E.07 .05 28.0 2.0 .050 120 30.0 9.80 61.0 DEC 04... .06 <.010 E1.3 .11 E.07 .05 28.0 4.0 .060 120 31.0 10.0 63.0 17... .09 .020 1.8 .17 .06 .06 26.0 1.0 .060 140 37.0 12.0 77.0 JAN 04... .10 .010 1.3 .32 .07 .05 26.0 2.0 .060 160 41.0 14.0 86.0 14... .06 <.010 1.4 .31 .08 .05 24.0 <1.0 .070 170 43.0 15.0 94.0 30... .09 <.010 1.4 .27 .06 .05 20.0 1.0 .060 200 48.0 18.0 100 FEB 13... .06 <.010 1.1 .23 .05 .04 1.6 2.0 .040 200 50.0 19.0 120 26... .07 <.010 .90 .27 .08 .05 16.0 <1.0 .050 220 56.0 19.0 110 MAR 12... .03 <.010 1.2 .06 .05 .02 19.0 <1.0 .020 230 55.0 21.0 140 28... .14 <.010 1.0 .15 .05 .03 16.0 <1.0 .040 230 57.0 22.0 140 APR 09... .04 <.010 .80 .16 .06 .02 9.0 <1.0 .030 240 60.0 22.0 150 25... .11 <.010 1.5 <.02 .09 .01 15.0 1.0 .020 250 60.0 23.0 160 MAY 08... .36 <.010 1.8 <.02 .07 <.01 16.0 2.0 .040 260 62.0 24.0 160 21... .03 <.010 .80 <.02 .03 .02 10.0 <1.0 .030 240 60.0 22.0 150 JUN 04... .03 <.010 .80 <.02 .03 <.01 13.0 <1.0 .010 240 62.0 20.0 130 19... .01 <.010 .90 <.02 .06 <.01 9.8 <1.0 .010 240 61.0 22.0 140 JUL 02... .03 <.010 1.2 .03 .07 <.01 17.0 <1.0 .020 220 55.0 20.0 140 17... .16 .020 1.5 .08 .10 .08 27.0 2.0 .090 180 45.0 17.0 120 31... .13 .060 1.8 .12 .16 .12 27.0 2.0 .130 140 37.0 12.0 78.0 AUG 14... .04 .030 1.5 .15 .19 .18 26.0 2.0 .190 110 28.0 8.50 52.0 26... .04 .020 1.4 .07 .18 .15 25.0 2.0 .160 100 28.0 8.20 48.0 SEP 11... .05 .010 1.2 .07 .14 .11 26.0 3.0 .120 96 26.0 7.50 45.0 24... .03 .010 1.4 .08 .09 .10 23.0 2.0 .110 100 27.0 7.80 48.0
< -- Less than E -- Estimated value

114 ST. JOHNS RIVER BASIN ABOVE OCKLAWAHA RIVER
02236000 ST. JOHNS RIVER NEAR DELAND, FL--Continued
WATER-QUALITY DATA, WATER YEAR OCTOBER 2001 TO SEPTEMBER 2002
ANC SOLIDS, CHLOR-A POTAS UNFLTRD CHLO- SILICA, RESIDUE PHYTO STRON IRON, SIUM, TIT 4.5 SULFATE RIDE, DIS AT 180 PLANK BROMIDE BARIUM, TIUM, TOTAL IRON, DIS LAB DIS DIS SOLVED DEG. C TON DIS DIS DIS RECOV DIS
SOLVED (MG/L SOLVED SOLVED (MG/L DIS CHROMO SOLVED SOLVED SOLVED ERABLE SOLVED Date (MG/L AS (MG/L (MG/L AS SOLVED FLUOROM (MG/L (UG/L (UG/L (UG/L (UG/L
AS K) CACO3) AS SO4) AS CL) SIO2) (MG/L) (UG/L) AS BR) AS BA) AS SR) AS FE) AS FE) (00935) (90410) (00945) (00940) (00955) (70300) (70953) (71870) (01005) (01080) (01045) (01046)
OCT 09... 4.10 E48 20.0 92.0 9.30 330 <.1 .5 15.0 570 535 407 23... 4.50 54 22.0 114 10.0 369 <.1 .7 18.0 680 503 375 NOV 06... 4.50 E57 23.0 116 9.00 366 <.1 .7 17.0 690 449 352 21... 4.20 E56 25.0 118 7.40 368 <.1 .6 17.0 680 410 318 DEC 04... 4.20 E56 7.9 125 6.20 382 <.1 .5 17.0 690 445 328 17... 4.60 66 32.0 148 6.50 E452 <.1 .6 20.0 790 423 318 JAN 04... 4.90 73 42.0 168 6.80 505 <.1 .6 21.0 850 326 236 14... 5.10 75 46.0 181 6.60 525 4.2 .9 20.0 880 340 235 30... 5.10 84 60.0 196 6.10 547 3.6 .9 21.0 930 239 162 FEB 13... 5.30 87 65.0 217 3.60 595 <.1 .9 22.0 990 204 131 26... 4.80 88 83.0 219 4.90 657 <.1 .9 20.0 1030 177 113 MAR 12... 6.00 76 87.0 273 1.80 727 18.0 1.1 26.0 1250 203 107 28... 5.90 81 96.0 267 3.30 713 9.8 1.0 26.0 1250 136 83 APR 09... 6.20 107 78.0 291 4.80 733 15.0 1.2 24.0 1060 83 28 25... 6.30 83 103 300 3.00 800 62.0 1.2 29.0 1320 96 25
MAY 08... 6.20 86 101 298 4.00 803 36.0 1.2 27.0 1340 87 20 21... 5.50 93 89.0 269 6.00 691 19.0 1.0 24.0 1150 75 12 JUN 04... 5.20 104 79.0 246 4.40 683 29.0 .9 20.0 1030 45 9 19... 5.60 93 90.0 263 5.00 693 37.0 1.0 24.0 1190 75 12 JUL 02... 5.50 63 105 252 6.30 681 19.0 .8 29.0 1230 292 98 17... 5.50 44 96.0 201 7.30 609 6.1 .7 25.0 1060 568 344 31... 4.80 53 54.0 142 8.90 491 <.1 .5 21.0 910 644 428 AUG 14... 4.30 58 25.0 94.0 9.30 329 <.1 .5 16.0 660 560 420 26... 4.20 58 20.0 87.0 9.90 309 <.1 .5 17.0 630 517 341 SEP 11... 3.80 56 17.0 82.0 8.90 288 <.1 .6 16.0 570 504 362 24... 3.80 57 16.0 87.0 8.10 303 <.1 .5 16.0 560 426 309
< -- Less than E -- Estimated value

115 ST. JOHNS RIVER BASIN ABOVE OCKLAWAHA RIVER
02236125 ST. JOHNS RIVER AT ASTOR, FL
LOCATION.--Lat 29° 10'00", long 81° 31'20", in NW1⁄ 4 sec. 29, T.15 S., R.28 E., Lake County, Hydrologic Unit 03080101, near center of channel on bridge pile under State Highway 40 Bridge over the St. Johns River, 6.6 mi west of U.S. Highway 17 and 127 mi upstream from mouth.
DRAINAGE AREA.--3,330 mi2.
PERIOD OF RECORD.--September 1931 to July 1934 (daily gage heights and miscellaneous discharge measurements only), February 1994to current year.
GAGE.--Water-stage recorder, acoustic velocity meter, and data-collection platform. Datum of gage is at NGVD of 1929.
REMARKS.--Records fair.
DISCHARGE, CUBIC FEET PER SECOND, WATER YEAR OCTOBER 2001 TO SEPTEMBER 2002DAILY MEAN VALUES
DAY OCT NOV DEC JAN FEB MAR APR MAY JUN JUL AUG SEP
1 7780 7540 7180 2920 1950 2710 710 1500 1050 6340 7400 9140 2 9050 7830 6900 3020 1420 3300 742 2020 2370 5930 6830 8540 3 9630 7890 6010 1640 693 2410 906 2540 2240 5410 6010 7400 4 9740 7520 5130 2840 -253 1960 1040 2720 1980 5350 5830 6380 5 9790 5330 5160 3490 145 3000 -908 464 1140 5370 5920 7960
6 10000 5900 5280 3790 2110 3310 -741 -471 517 5410 6010 9260 7 9720 6890 5790 3860 1030 2880 404 100 1060 5170 5910 9550 8 9210 7770 6120 4200 1110 3040 1760 1120 846 4820 4970 9280 9 8880 8160 5850 4030 1970 3080 2130 1810 -883 5010 4900 9060
10 8530 8070 5460 3980 1720 3060 1740 1900 -898 5430 5880 9410
11 8770 7680 4590 3990 1570 2970 1730 1830 -1580 5890 6470 9770 12 8900 7110 4530 3940 1920 2470 1200 1630 -508 6320 7040 9380 13 9250 5810 4740 2890 1440 2270 1290 810 1500 6110 7820 9670 14 9360 4080 5230 2790 721 2840 1330 247 2000 5660 8290 10100 15 8720 1360 5120 2510 819 2920 1590 577 2260 6250 9430 e9050
16 8290 3910 5190 2860 773 3060 1980 517 2400 6450 9740 9210 17 6650 5220 4960 2360 478 3050 2050 492 2030 6020 10700 9250 18 7190 6220 4800 2700 787 2830 2090 957 2310 5860 11100 9530 19 7250 7120 5530 2920 1600 2590 2070 -1070 1930 5830 11000 9090 20 7270 7890 4700 3110 2270 1870 1880 -3070 1870 5690 10900 9160
21 7750 8040 4550 2970 2170 1550 1800 -3010 1220 6620 10900 8600 22 8140 7920 4620 2480 2070 405 786 -3400 1660 7080 10700 e8350 23 8320 7720 4410 2300 -260 -427 260 -2670 2110 6680 10700 e8100 24 8630 7850 3820 2630 986 1160 939 -2140 3890 6700 10700 7860 25 8530 7990 3830 2650 1440 1410 388 -469 4250 6750 10500 7890
26 7960 7890 2800 1400 2080 1500 -5.5 268 4750 6890 e10500 8530 27 7200 7860 4330 1240 54 1110 307 680 5130 7430 10600 7680 28 6490 7820 4400 1640 2530 1320 345 -477 5310 7400 10600 7790 29 5730 7700 3880 1960 -- 1280 579 -1520 5870 7200 10700 7560 30 6650 7460 3540 2280 -- 1610 1590 -798 6240 7240 10400 7460 31 7190 --- 3010 1910 --- 1300 --- 667 --- 7380 9760 --
TOTAL 256570 207550 151460 87300 35343 67838 31981.5 3754 64064 191690 268210 260010 MEAN 8276 6918 4886 2816 1262 2188 1066 121 2135 6184 8652 8667 MAX 10000 8160 7180 4200 2530 3310 2130 2720 6240 7430 11100 10100 MIN 5730 1360 2800 1240 -260 -427 -908 -3400 -1580 4820 4900 6380
STATISTICS OF MONTHLY MEAN DATA FOR WATER YEARS 1994 - 2002, BY WATER YEAR (WY)
MEAN 5430 5600 4350 4217MAX 9026 8974 9206 9123(WY) 1996 2000 1995 1998MIN 1491 2293 1145 1174(WY) 2001 2001 2001 1997
2801 3013 2572 1336 1782 2980 3316 43426591 10760 7498 3601 2609 6184 8652 86671998 1998 1998 1998 1994 2002 2002 2002 785 695 291 42.9 661 547 664 9501999 2000 1999 1994 2000 2000 2000 2000
SUMMARY STATISTICS FOR 2001 CALENDAR YEAR FOR 2002 WATER YEAR WATER YEARS 1994 - 2002
ANNUAL TOTAL 978488ANNUAL MEAN 5233HIGHEST ANNUAL MEANLOWEST ANNUAL MEANHIGHEST DAILY MEAN 10100 LOWEST DAILY MEAN -5540ANNUAL SEVEN-DAY MINIMUM 356MAXIMUM PEAK STAGEINSTANTANEOUS LOW FLOW10 PERCENT EXCEEDS 890050 PERCENT EXCEEDS 498090 PERCENT EXCEEDS 1830
1625770.5 4454 3487
5211 19951706 1999
Sep 23,24,27 11100 Aug 18 11700 Mar 9 1998Sep 15 -3400 May 22 -6180 Sep 15 1999Jan 9 -2260 May 19 -2270 Sep 6 2000
3.17 Oct 1 3.91 Sep 17 2001 -6180 Sep 15 1999
9180 82004080 2780 517 317
e Estimated Note.--Negative figures indicate reverse flow.

---
116 ST. JOHNS RIVER BASIN ABOVE OCKLAWAHA RIVER
02236125 ST. JOHNS RIVER AT ASTOR, FL--Continued
GAGE HEIGHT, FEET, WATER YEAR OCTOBER 2001 TO SEPTEMBER 2002 DAILY MEAN VALUES
DAY OCT NOV DEC JAN FEB MAR APR MAY JUN JUL AUG SEP
1 3.14 2.22 1.47 0.90 0.35 0.83 0.58 0.35 1.03 0.89 1.17 2.15 2 3.08 2.17 1.45 0.93 0.37 0.72 0.62 0.27 0.91 0.97 1.29 2.25 3 2.98 2.15 1.47 1.11 0.44 0.72 0.63 0.13 0.81 0.99 1.46 2.37 4 2.90 2.14 1.57 1.12 0.56 0.95 0.60 0.01 0.79 0.99 1.62 2.52 5 2.81 2.26 1.63 1.00 0.65 0.90 0.71 0.08 0.83 1.00 1.70 2.64
6 2.71 2.33 1.64 0.84 0.63 0.78 0.84 0.25 0.84 0.99 1.77 2.66 7 2.63 2.29 1.60 0.69 0.54 0.73 0.88 0.34 0.82 0.99 1.99 2.63 8 2.63 2.16 1.53 0.52 0.62 0.73 0.80 0.29 0.81 1.06 2.20 2.65 9 2.65 2.02 1.49 0.37 0.53 0.71 0.67 0.19 0.93 1.12 2.33 2.70 10 2.66 1.92 1.50 0.26 0.53 0.66 0.54 0.07 1.05 1.11 2.38 2.69
11 2.61 1.87 1.55 0.14 0.52 0.62 0.53 0.01 1.14 1.03 2.39 2.63 12 2.54 1.85 1.58 0.04 0.47 0.60 0.55 -0.02 1.14 0.98 2.38 2.54 13 2.46 1.95 1.57 0.07 0.46 0.63 0.58 -0.04 1.09 1.00 2.38 2.51 14 2.38 2.26 1.51 0.12 0.47 0.60 0.59 -0.04 1.02 1.07 2.40 2.49 15 2.39 2.58 1.46 0.34 0.57 0.53 0.55 -0.02 0.90 1.09 2.37 2.44
16 2.40 2.74 1.41 0.37 0.66 0.44 0.50 0.02 0.84 1.08 2.33 2.35 17 2.51 2.74 1.36 0.38 0.67 0.35 0.45 0.03 0.80 1.09 2.26 2.26 18 2.53 2.69 1.32 0.35 0.66 0.24 0.40 -0.02 0.88 1.14 2.22 2.19 19 2.54 2.58 1.20 0.27 0.65 0.18 0.32 0.07 0.96 1.15 2.13 2.15 20 2.56 2.42 1.17 0.18 0.50 0.18 0.23 0.49 1.06 1.17 2.09 2.19
21 2.53 2.28 1.16 0.13 0.41 0.22 0.19 0.79 1.16 1.24 2.06 2.24 22 2.45 2.18 1.12 0.18 0.37 0.38 0.21 1.00 1.28 1.24 2.02 2.26 23 2.39 2.10 1.10 0.22 0.59 0.58 0.28 1.16 1.37 1.24 2.01 2.29 24 2.31 2.02 1.09 0.20 0.79 0.63 0.37 1.17 1.35 1.25 1.97 2.33 25 2.22 1.91 1.09 0.14 0.88 0.60 0.40 1.06 1.31 1.24 1.92 2.41
26 2.19 1.82 1.13 0.25 0.88 0.56 0.43 0.95 1.24 1.24 1.94 2.39 27 2.17 1.73 1.02 0.40 0.97 0.55 0.52 0.91 1.15 1.25 1.91 2.34 28 2.21 1.65 0.87 0.45 0.93 0.57 0.54 0.93 1.03 1.24 1.88 2.27 29 2.31 1.58 0.81 0.44 --- 0.60 0.49 1.00 0.92 1.22 1.90 2.20 30 2.33 1.51 0.82 0.40 --- 0.61 0.39 1.04 0.87 1.20 1.94 2.20 31 2.29 --- 0.86 0.37 --- 0.58 --- 1.06 1.16 2.03 --
MEAN 2.53 2.14 1.31 0.43 0.60 0.58 0.51 0.44 1.01 1.11 2.01 2.40 MAX 3.14 2.74 1.64 1.12 0.97 0.95 0.88 1.17 1.37 1.25 2.40 2.70 MIN 2.17 1.51 0.81 0.04 0.35 0.18 0.19 -0.04 0.79 0.89 1.17 2.15
WTR YR 2002 MEAN 1.26 MAX 3.14 MIN -0.04

117

118 WATER RESOURCES DATA FOR FLORIDA, 2002 Volume 1A: Northeast Florida Surface Water
82° 30¢ 82° 00¢ 81° 30¢
30° 00¢
29° 00¢
0
0
10
10
p p
p
p
p p
p
p
p
p
p p
p
p
p
p
p
p p
p
p02240000
02240954
02240902
02241000
02243000
02240500
02239500
02238500
02238000
02238001
02237293
02238499
02240956
02243960
02237700
02237734
02237206
02237050
02236900
02236500
02236350
02237010
02237701
02237207
02237051
02236700
02236901
p
02237000 02237001
p02240954 STREAM GAGING
AND NUMBER
20 MILES
20 KILOMETERS
02237011
STATION
EXPLANATION
Figure 6.--Location of stream gaging stations in the Ocklawaha River basin.

119 OCKLAWAHA RIVER BASIN
02236350 GREEN SWAMP RUN NEAR EVA, FL
LOCATION.--Lat 28° 18'39", long 81° 41'08", in NW1⁄ 4 sec.14, T.25 S., R.26 E., Polk County, Hydrologic Unit 03080102, on left bank, 20 ft downstream from culverts on Sand Mine Road, 1.1 mi west of U.S. Highway 27, 9.1 mi east of Eva, and 12.8 mi upstream from mouth.
DRAINAGE AREA.--43 mi2, approximately.
PERIOD OF RECORD.--July 1979 to current year.
GAGE.--Water-stage recorder. Datum of gage is 116.16 ft above NGVD of 1929.
REMARKS.--Records good except for period of estimated daily discharge, which is fair.
DISCHARGE, CUBIC FEET PER SECOND, WATER YEAR OCTOBER 2001 TO SEPTEMBER 2002DAILY MEAN VALUES
DAY OCT NOV DEC JAN FEB MAR APR MAY JUN JUL AUG SEP
1 15 0.24 0.00 0.002 14 0.18 0.00 0.003 12 0.23 0.00 0.004 11 0.20 0.00 0.00
0.00 0.01 0.00 0.00 e0.00 e4.0 e9.0 260.00 0.00 0.00 0.00 e0.00 e3.5 e8.5 260.00 0.00 0.00 0.00 e0.00 e2.8 e9.0 290.00 0.02 0.00 0.00 e0.00 e2.4 e9.8 29
5 9.8 0.26 0.00 0.00 0.00 0.02 0.00 0.00 e0.00 e2.2 e9.4 29
6 8.8 0.16 0.00 0.00 0.00 0.00 0.00 0.00 e0.00 e2.2 e12 297 7.8 0.08 0.00 0.00 0.00 0.00 0.00 0.00 e0.00 e2.5 e17 288 7.0 0.05 0.00 0.00 0.00 0.00 0.00 0.00 e0.00 e2.9 e14 279 6.3 0.03 0.00 0.00 0.00 0.00 0.00 0.00 e0.00 e3.8 e12 26
10 5.7 0.01 0.00 0.00 0.00 0.00 0.00 0.00 e0.00 e4.4 e11 24
11 5.1 0.00 0.00 0.00 12 4.6 0.00 0.00 0.00 13 4.1 0.00 0.00 0.00 14 3.7 0.00 0.00 0.00 15 3.5 0.00 0.00 0.00
0.00 0.00 0.00 0.00 e0.00 e5.6 e11 250.00 0.00 0.00 0.00 e0.00 e7.4 e10 260.00 0.00 0.00 0.00 e0.00 e8.2 e15 280.00 0.00 0.00 0.00 e0.00 e7.8 e13 330.00 0.00 0.00 0.00 e0.00 e7.6 e16 35
16 3.1 0.00 0.00 0.0017 2.8 0.00 0.00 0.00 18 2.5 0.00 0.00 0.00 19 2.2 0.00 0.00 0.0020 2.0 0.00 0.00 0.00
0.00 0.00 0.00 0.00 e0.00 e7.4 e12 380.00 0.00 0.00 0.00 e0.00 e7.2 e9.8 470.00 0.00 0.00 0.00 e0.00 e6.8 e10 510.00 0.00 0.00 0.00 e0.00 e6.0 e11 540.00 0.00 0.00 0.00 e0.00 e6.8 e9.6 51
21 1.8 0.00 0.00 0.00 22 2.1 0.00 0.00 0.00 23 2.0 0.00 0.00 0.00 24 1.8 0.00 0.00 0.00 25 1.7 0.00 0.00 0.00
0.00 0.00 0.00 0.00 e0.01 e6.5 9.0 490.00 0.00 0.00 0.00 e0.06 e6.2 8.8 500.01 0.00 0.00 0.00 e0.60 e7.0 7.9 530.10 0.00 0.00 0.00 e5.5 e7.8 7.3 570.08 0.00 0.00 0.00 e4.4 e8.2 6.9 62
26 1.5 0.00 0.00 0.00 27 1.3 0.00 0.00 0.00 28 0.96 0.00 0.00 0.0029 0.70 0.00 0.00 0.00 30 0.51 0.00 0.00 0.00 31 0.36 --- 0.00 0.00
0.06 0.00 0.00 0.00 e5.0 e7.9 9.0 630.05 0.00 0.00 0.00 e4.5 e7.4 8.3 610.03 0.00 0.00 0.00 e4.1 e7.2 8.0 58 --- 0.00 0.00 0.00 e4.5 e7.0 9.0 55 --- 0.00 0.00 e0.00 e5.0 e9.8 13 52 --- 0.00 --- e0.00 --- e9.5 22 --
TOTAL 145.73 1.44 0.00 0.00MEAN 4.70 0.048 0.000 0.000 MAX 15 0.26 0.00 0.00MIN 0.36 0.00 0.00 0.00CFSM 0.11 0.00 0.00 0.00IN. 0.13 0.00 0.00 0.00
0.33 0.05 0.00 0.00 33.67 186.0 338.3 1221 0.012 0.002 0.000 0.000 1.12 6.00 10.9 40.70.10 0.02 0.00 0.00 5.5 9.8 22 630.00 0.00 0.00 0.00 0.00 2.2 6.9 240.00 0.00 0.00 0.00 0.03 0.14 0.25 0.950.00 0.00 0.00 0.00 0.03 0.16 0.29 1.06
STATISTICS OF MONTHLY MEAN DATA FOR WATER YEARS 1979 - 2002, BY WATER YEAR (WY)
MEAN 14.1 8.96 9.95 11.7MAX 54.9 55.7 114 116 (WY) 1995 1983 1998 1998MIN 0.000 0.000 0.000 0.000 (WY) 1981 1981 1981 1981
11.8 14.9 13.2 2.13 3.66 8.08 12.0 13.2 122 158 60.7 15.7 34.6 42.3 69.0 48.41998 1998 1998 1987 1994 1982 1995 1982
0.000 0.000 0.000 0.000 0.000 0.000 0.000 0.0001981 1981 1981 1980 1980 1979 1980 1980
SUMMARY STATISTICS FOR 2001 CALENDAR YEAR FOR 2002 WATER YEAR WATER YEARS 1979 - 2002
ANNUAL TOTAL 667.77ANNUAL MEAN 1.83HIGHEST ANNUAL MEANLOWEST ANNUAL MEAN HIGHEST DAILY MEAN 51 Sep 17LOWEST DAILY MEAN 0.00 Many daysANNUAL SEVEN-DAY MINIMUM 0.00 Jan 1 MAXIMUM PEAK FLOWMAXIMUM PEAK STAGEANNUAL RUNOFF (CFSM) 0.043 ANNUAL RUNOFF (INCHES) 0.5810 PERCENT EXCEEDS 2.1 50 PERCENT EXCEEDS 0.0090 PERCENT EXCEEDS 0.00
1926.52 5.28 10.3
50.9 1998 0.11 1992
63 Sep 26 194 Dec 28,29 1997 0.00 Many days 0.00 Many days 0.00 Nov 11 0.00 Many days65 Sep 25 195 Dec 28 1997 4.84 Sep 25 5.78 Apr 9 1984 0.12 0.24 1.67 3.2614 35 0.00 0.18 0.00 0.00
e Estimated

120 OCKLAWAHA RIVER BASIN
02236500 BIG CREEK NEAR CLERMONT, FL
LOCATION.--Lat 28° 26'51", long 81° 44'25", in NE1⁄ 4 sec.31, T.23 S., R.26 E., Lake County, Hydrologic Unit 03080102, near left bank 40 ft downstream from log bridge, 1 mi upstream from mouth at Lake Louisa, and 7.5 mi southeast of Clermont.
DRAINAGE AREA.--68 mi2, approximately.
PERIOD OF RECORD.--July 1958 to current year.
GAGE.--Water-stage recorder. Datum of gage is 98.97 ft above NGVD of 1929.
REMARKS.--Records fair. Some interconnection at high stages with Little Creek and Withlacoochee River basin.
DISCHARGE, CUBIC FEET PER SECOND, WATER YEAR OCTOBER 2001 TO SEPTEMBER 2002DAILY MEAN VALUES
DAY OCT NOV DEC JAN FEB MAR APR MAY JUN JUL AUG SEP
1 0.84 0.08 0.00 0.00 0.02 0.31 0.00 0.00 0.00 13 40 174 2 0.68 0.07 0.00 0.00 0.00 0.31 0.00 0.00 0.00 13 39 188 3 0.59 0.08 0.00 0.07 0.00 0.32 0.00 0.00 0.00 11 38 186 4 0.51 0.08 0.00 0.29 0.00 0.52 0.00 0.00 0.00 9.8 39 178 5 0.44 0.08 0.00 0.26 0.00 0.55 0.00 0.00 0.00 8.7 38 169
6 0.39 0.07 0.00 0.22 0.00 0.50 0.00 0.00 0.00 7.6 36 161 7 0.35 0.06 0.00 0.21 0.00 0.41 0.00 0.00 0.00 6.3 51 150 8 0.33 0.06 0.00 0.15 0.00 0.38 0.00 0.00 0.00 5.4 65 140 9 0.26 0.06 0.00 0.12 0.00 0.33 0.00 0.00 0.00 7.4 61 12810 0.21 0.06 0.00 0.09 0.00 0.32 0.00 0.00 0.00 11 55 117
11 0.17 0.05 0.00 0.0912 0.13 0.05 0.00 0.0813 0.11 0.07 0.00 0.0814 0.10 0.13 0.00 0.0915 0.09 0.14 0.00 0.39
0.00 0.31 0.00 0.00 0.00 12 49 106 0.00 0.30 0.00 0.00 0.00 17 47 98 0.00 0.39 0.00 0.00 0.00 24 58 94 0.00 0.44 0.00 0.00 0.00 32 56 88 0.00 0.39 0.00 0.00 0.00 32 61 87
16 0.08 0.09 0.00 0.3917 0.07 0.07 0.00 0.2518 0.07 0.07 0.00 0.2119 0.07 0.06 0.00 0.1420 0.07 0.06 0.00 0.11
0.00 0.36 0.00 0.00 0.00 31 58 84 0.00 0.34 0.00 0.00 0.00 29 54 83 0.00 0.28 0.00 0.00 0.00 27 50 79 0.00 0.23 0.00 0.00 0.00 25 50 75 0.00 0.16 0.00 0.00 0.00 23 46 70
21 0.07 0.06 0.00 0.1022 0.36 0.05 0.00 0.1023 0.43 0.05 0.00 0.0924 0.36 0.04 0.00 0.09 25 0.33 0.03 0.00 0.08
0.00 0.11 0.00 0.00 0.08 24 42 64 0.00 0.12 0.00 0.00 0.27 23 39 59 0.01 0.08 0.00 0.00 0.80 22 34 58 0.63 0.04 0.00 0.00 4.8 22 31 640.52 0.0 0.00 0.00 9.0 29 29 74
26 0.24 0.02 0.00 0.0827 0.11 0.02 0.00 0.0728 0.08 0.00 0.00 0.07 29 0.08 0.00 0.00 0.07 30 0.08 0.00 0.00 0.06 31 0.08 --- 0.00 0.04
0.50 0.00 0.00 0.00 7.6 34 32 80 0.43 0.00 0.00 0.00 7.9 34 32 80 0.35 0.00 0.00 0.00 7.4 32 39 81 --- 0.00 0.00 0.00 6.9 30 69 81 --- 0.00 0.00 0.00 9.4 29 109 81 --- 0.00 --- 0.00 --- 40 147 --
TOTAL 7.78 1.76 0.00 4.09MEAN 0.25 0.059 0.000 0.13 MAX 0.84 0.14 0.00 0.39 MIN 0.07 0.00 0.00 0.00CFSM 0.00 0.00 0.00 0.00 IN. 0.00 0.00 0.00 0.00
2.46 7.50 0.00 0.00 54.15 664.2 1594 3177 0.088 0.24 0.000 0.000 1.80 21.4 51.4 106 0.63 0.55 0.00 0.00 9.4 40 147 188 0.00 0.00 0.00 0.00 0.00 5.4 29 580.00 0.00 0.00 0.00 0.03 0.32 0.76 1.56 0.00 0.00 0.00 0.00 0.03 0.36 0.87 1.74
STATISTICS OF MONTHLY MEAN DATA FOR WATER YEARS 1958 - 2002, BY WATER YEAR (WY)
MEAN 29.8 19.5 17.7 22.4MAX 238 112 147 177(WY) 1961 1960 1998 1998 MIN 0.000 0.000 0.000 0.000 (WY) 1981 1981 1994 1981
23.0 32.5 23.1 6.89 7.46 20.2 29.8 38.3 139 268 200 72.2 63.8 205 190 4131998 1960 1960 1959 1959 1959 1960 19600.000 0.000 0.000 0.000 0.000 0.000 0.002 0.0032001 1999 1994 1977 1981 1981 2001 2000
SUMMARY STATISTICS FOR 2001 CALENDAR YEAR FOR 2002 WATER YEAR WATER YEARS 1958 - 2002
ANNUAL TOTAL 54.50 ANNUAL MEAN 0.15 HIGHEST ANNUAL MEAN LOWEST ANNUAL MEAN HIGHEST DAILY MEAN 6.7 Sep 15 LOWEST DAILY MEAN 0.00 Many days ANNUAL SEVEN-DAY MINIMUM 0.00 Jan 1 MAXIMUM PEAK FLOW MAXIMUM PEAK STAGE ANNUAL RUNOFF (CFSM) 0.002 ANNUAL RUNOFF (INCHES) 0.0310 PERCENT EXCEEDS 0.1550 PERCENT EXCEEDS 0.0090 PERCENT EXCEEDS 0.00
5512.9415.1 22.6
137 19600.12 2001
188 Sep 2 684 Sep 13 19600.00 Many days 0.00 Many days0.00 Nov 28 0.00 Many days
189 Sep 2 691 Sep 13 19605.25 Sep 2 6.23 Sep 13 19600.22 0.33 3.02 4.5258 61 0.08 5.3 0.00 0.00

121 OCKLAWAHA RIVER BASIN
02236700 LITTLE CREEK NEAR CLERMONT, FL
LOCATION.--Lat 28° 27'39", long 81° 45'26", in NE1⁄ 4 sec.25, T.23 S., R.25 E., Lake County, Hydrologic Unit 03080102, at downstream side of culverts on Lake Nellie Road, 0.6 mi upstream from Lake Louisa, 2.3 mi east of State Highway 561, and 6.1 mi south of Clermont.
DRAINAGE AREA.--14.7 mi2.
PERIOD OF RECORD.--Water years 1945-47, 1952-56, 1966, 1967 (discharge measurements only), July 1958 to July 1960 (miscellaneous low-flow measurements only), July 1979 to current year.
GAGE.--Water-stage recorder. Datum of gage is 90.08 ft above NGVD of 1929. July 18, 1958 to July 5, 1960, non-recording gage atsame site at different datum.
REMARKS.--Records good. Some interconnection at high stages with Big Creek is possible.
DISCHARGE, CUBIC FEET PER SECOND, WATER YEAR OCTOBER 2001 TO SEPTEMBER 2002DAILY MEAN VALUES
DAY OCT NOV DEC JAN FEB MAR APR MAY JUN JUL AUG SEP
1 0.00 0.00 0.00 0.00 0.00 0.00 0.00 0.00 0.00 5.0 20 1372 0.00 0.00 0.00 0.00 0.00 0.00 0.00 0.00 0.00 8.0 22 1463 0.00 0.00 0.00 0.00 0.00 0.00 0.00 0.00 0.00 8.8 27 1474 0.00 0.00 0.00 0.00 0.00 0.00 0.00 0.00 0.00 7.4 36 1455 0.00 0.00 0.00 0.00 0.00 0.00 0.00 0.00 0.00 6.0 44 144
6 0.00 0.00 0.00 0.00 0.00 0.00 0.00 0.00 0.00 4.4 41 1417 0.00 0.00 0.00 0.00 0.00 0.00 0.00 0.00 0.00 3.0 51 1398 0.00 0.00 0.00 0.00 0.00 0.00 0.00 0.00 0.00 2.6 61 1389 0.00 0.00 0.00 0.00 0.00 0.00 0.00 0.00 0.00 3.1 60 136
10 0.00 0.00 0.00 0.00 0.00 0.00 0.00 0.00 0.00 5.7 58 130
11 0.00 0.00 0.00 0.00 12 0.00 0.00 0.00 0.00 13 0.00 0.00 0.00 0.00 14 0.00 0.00 0.00 0.00 15 0.00 0.00 0.00 0.00
0.00 0.00 0.00 0.00 0.00 6.8 55 1230.00 0.00 0.00 0.00 0.00 11 55 1200.00 0.00 0.00 0.00 0.00 14 66 1190.00 0.00 0.00 0.00 0.00 17 72 1170.00 0.00 0.00 0.00 0.00 16 76 117
16 0.00 0.00 0.00 0.00 17 0.00 0.00 0.00 0.0018 0.00 0.00 0.00 0.0019 0.00 0.00 0.00 0.0020 0.00 0.00 0.00 0.00
0.00 0.00 0.00 0.00 0.00 13 76 1180.00 0.00 0.00 0.00 0.00 10 71 1280.00 0.00 0.00 0.00 0.00 7.9 65 1280.00 0.00 0.00 0.00 0.00 6.5 63 1260.00 0.00 0.00 0.00 0.00 5.6 56 127
21 0.00 0.00 0.00 0.0022 0.00 0.00 0.00 0.0023 0.00 0.00 0.00 0.0024 0.00 0.00 0.00 0.0025 0.00 0.00 0.00 0.00
0.00 0.00 0.00 0.00 0.00 5.4 74 1180.00 0.00 0.00 0.00 0.00 4.9 84 1100.00 0.00 0.00 0.00 0.00 4.7 89 1070.00 0.00 0.00 0.00 0.00 4.4 99 1160.00 0.00 0.00 0.00 1.3 4.8 97 114
26 0.00 0.00 0.00 0.0027 0.00 0.00 0.00 0.00 28 0.00 0.00 0.00 0.0029 0.00 0.00 0.00 0.00 30 0.00 0.00 0.00 0.00 31 0.00 --- 0.00 0.00
0.00 0.00 0.00 0.00 4.2 5.5 58 1090.00 0.00 0.00 0.00 5.8 7.2 56 1050.00 0.00 0.00 0.00 4.1 11 53 101 --- 0.00 0.00 0.00 2.9 13 64 96 --- 0.00 0.00 0.00 3.1 16 105 92 --- 0.00 --- 0.00 --- 20 130 --
TOTAL 0.00 0.00 0.00 0.00MEAN 0.000 0.000 0.000 0.000 MAX 0.00 0.00 0.00 0.00MIN 0.00 0.00 0.00 0.00CFSM 0.00 0.00 0.00 0.00IN. 0.00 0.00 0.00 0.00
0.00 0.00 0.00 0.00 21.40 258.7 1984 3694 0.000 0.000 0.000 0.000 0.71 8.35 64.0 1230.00 0.00 0.00 0.00 5.8 20 130 1470.00 0.00 0.00 0.00 0.00 2.6 20 920.00 0.00 0.00 0.00 0.05 0.57 4.35 8.380.00 0.00 0.00 0.00 0.05 0.65 5.02 9.35
STATISTICS OF MONTHLY MEAN DATA FOR WATER YEARS 1979 - 2002, BY WATER YEAR (WY)
MEAN 14.9 9.63 12.7 18.2 MAX 88.3 42.8 123 154 (WY) 1996 1996 1998 1998MIN 0.000 0.000 0.000 0.000 (WY) 1981 1981 1981 1981
16.5 20.0 14.6 3.28 4.28 9.72 16.1 21.2119 127 87.8 15.2 41.8 64.0 110 1231998 1998 1987 1998 1991 1984 1984 2002
0.000 0.000 0.000 0.000 0.000 0.000 0.000 0.0001981 1981 1981 1981 1981 1981 1981 1980
SUMMARY STATISTICS FOR 2001 CALENDAR YEAR FOR 2002 WATER YEAR WATER YEARS 1979 - 2002
ANNUAL TOTAL 0.00ANNUAL MEAN 0.000 HIGHEST ANNUAL MEANLOWEST ANNUAL MEANHIGHEST DAILY MEAN 0.00 Jan 1LOWEST DAILY MEAN 0.00 Many daysANNUAL SEVEN-DAY MINIMUM 0.00 Jan 1 MAXIMUM PEAK FLOWMAXIMUM PEAK STAGEANNUAL RUNOFF (CFSM) 0.000 ANNUAL RUNOFF (INCHES) 0.0010 PERCENT EXCEEDS 0.0050 PERCENT EXCEEDS 0.0090 PERCENT EXCEEDS 0.00
5958.10 16.3 13.4
51.9 1998 0.000 2001
147 Sep 3 261 Sep 29 1979 0.00 Many days 0.00 Many days 0.00 Oct 1 0.00 Many days
148 Sep 2 850 Mar 18 1960 8.99 Sep 2 10.85 Mar 18 1960 1.11 0.9115.08 12.42 79 41 0.00 1.6 0.00 0.00
* From floodmark

122 OCKLAWAHA RIVER BASIN
02236900 PALATLAKAHA RIVER AT CHERRY LAKE OUTLET, NEAR GROVELAND, FL
LOCATION.--Lat 28° 35'33", long 81° 49'21", in NE1⁄ 4 sec.8, T.22 S., R.25 E., Lake County, Hydrologic Unit 03080102, near left bank 21 ft upstream from spillway at outlet of Cherry Lake, and 3 mi northeast of Groveland.
DRAINAGE AREA.--165 mi2.
PERIOD OF RECORD.--September 1956 to February 1957 (gage heights and discharge measurements only), March 1957 to current year.
REVISED RECORDS.--WDR FL-72-1: Drainage area.
GAGE.--Water-stage recorder. Datum of gage is at NGVD of 1929 (Gee and Jenson, Inc. bench mark). Auxiliary gage at downstream side of spillway structure.
REMARKS.--Records good. Since 1956, flow regulated by earthen dam and concrete spillway with radial lift gates at outlet.Discharge computed from relation between discharge, head, and gate openings. An undetermined amount of water is diverted at times through a gated culvert in dam for irrigation of citrus groves.
COOPERATION.--Gate-opening record provided by Lake County Water Authority.
DISCHARGE, CUBIC FEET PER SECOND, WATER YEAR OCTOBER 2001 TO SEPTEMBER 2002DAILY MEAN VALUES
DAY OCT NOV DEC JAN FEB MAR APR MAY JUN JUL AUG SEP
1 0.00 -0.19 0.00 0.002 -1.9 0.00 0.00 0.00 3 -2.8 0.00 0.00 0.00 4 -2.3 0.00 0.00 0.00 5 -2.1 0.00 0.00 0.00
0.00 0.00 0.00 0.00 0.00 0.00 0.00 0.00 0.00 0.00 0.00 0.00 0.00 0.00 0.00 0.00 0.00 0.00 0.00 0.00 0.00 0.00 0.00 0.00 0.00 0.00 0.00 0.00 0.00 0.00 0.00 0.00 0.00 0.00 0.00 0.00 0.00 0.00 0.00 0.00
6 -2.0 0.00 0.00 0.00 7 -2.0 0.00 0.00 0.00 8 -1.9 0.00 0.00 0.00 9 -1.7 0.00 0.00 0.00 10 -1.6 0.00 0.00 0.00
0.00 0.00 0.00 0.00 0.00 0.00 0.00 0.00 0.00 0.00 0.00 0.00 0.00 0.00 0.00 0.00 0.00 0.00 0.00 0.00 0.00 0.00 0.00 0.00 0.00 0.00 0.00 0.00 0.00 0.00 0.00 0.000.00 0.00 0.00 0.00 0.00 0.00 0.00 0.00
11 -1.5 0.00 0.00 0.0012 -1.4 0.00 0.00 0.0013 -1.4 0.00 0.00 0.0014 -1.4 0.00 0.00 0.0015 -1.4 0.00 0.00 0.00
0.00 0.00 0.00 0.00 0.00 0.00 0.00 0.000.00 0.00 0.00 0.00 0.00 0.00 0.00 0.000.00 0.00 0.00 0.00 0.00 0.00 0.00 0.000.00 0.00 0.00 0.00 0.00 0.00 0.00 0.000.00 0.00 0.00 0.00 0.00 0.00 0.00 0.00
16 -1.3 0.00 0.00 0.0017 -1.2 0.00 0.00 0.0018 -1.0 0.00 0.00 0.0019 -1.0 0.00 0.00 0.0020 -1.0 0.00 0.00 0.00
0.00 0.00 0.00 0.00 0.00 0.00 0.00 0.000.00 0.00 0.00 0.00 0.00 0.00 0.00 0.000.00 0.00 0.00 0.00 0.00 0.00 0.00 0.000.00 0.00 0.00 0.00 0.00 0.00 0.00 0.000.00 0.00 0.00 0.00 0.00 0.00 0.00 0.00
21 -1.0 0.00 0.00 0.0022 -1.3 0.00 0.00 0.0023 -1.3 0.00 0.00 0.0024 -1.3 0.00 0.00 0.0025 -1.3 0.00 0.00 0.00
0.00 0.00 0.00 0.00 0.00 0.00 0.00 0.000.00 0.00 0.00 0.00 0.00 0.00 0.00 0.000.00 0.00 0.00 0.00 0.00 0.00 0.00 0.000.00 0.00 0.00 0.00 0.00 0.00 0.00 0.000.00 0.00 0.00 0.00 0.00 0.00 0.00 0.00
26 -1.1 0.00 0.00 0.0027 -0.90 0.00 0.00 0.0028 -0.67 0.00 0.00 0.00 29 -0.52 0.00 0.00 0.00 30 -0.45 0.00 0.00 0.00 31 -0.45 --- 0.00 0.00
0.00 0.00 0.00 0.00 0.00 0.00 0.00 0.00 0.00 0.00 0.00 0.00 0.00 0.00 0.00 0.00 0.00 0.00 0.00 0.00 0.00 0.00 0.00 0.00 --- 0.00 0.00 0.00 0.00 0.00 0.00 0.00 --- 0.00 0.00 0.00 0.00 0.00 0.00 0.00 --- 0.00 --- 0.00 --- 0.00 0.00 --
TOTAL -41.19 -0.19 0.00 0.00 MEAN -1.33 -0.006 0.000 0.000 MAX 0.00 0.00 0.00 0.00MIN -2.8 -0.19 0.00 0.00 CFSM -0.01 0.00 0.00 0.00 IN. -0.01 0.00 0.00 0.00
0.00 0.00 0.00 0.00 0.00 0.00 0.00 0.000.000 0.000 0.000 0.000 0.000 0.000 0.000 0.000 0.00 0.00 0.00 0.00 0.00 0.00 0.00 0.000.00 0.00 0.00 0.00 0.00 0.00 0.00 0.00 0.00 0.00 0.00 0.00 0.00 0.00 0.00 0.00 0.00 0.00 0.00 0.00 0.00 0.00 0.00 0.00
STATISTICS OF MONTHLY MEAN DATA FOR WATER YEARS 1957 - 2002, BY WATER YEAR (WY)
MEAN 37.5 23.6 20.5 34.2 MAX 420 309 204 408 (WY) 1961 1961 1970 1998 MIN -1.33 -0.006 0.000 0.000 (WY) 2002 2002 1962 1963
33.1 49.8 45.4 22.6 14.6 21.0 33.9 42.5369 417 516 334 245 279 313 3371998 1998 1960 1960 1959 1959 1959 19590.000 0.000 0.000 0.000 0.000 0.000 0.000 -4.021962 1962 1962 1962 1961 1961 1961 1994
SUMMARY STATISTICS FOR 2001 CALENDAR YEAR FOR 2002 WATER YEAR WATER YEARS 1957 - 2002
ANNUAL TOTAL -41.38ANNUAL MEAN -0.11 HIGHEST ANNUAL MEAN LOWEST ANNUAL MEAN HIGHEST DAILY MEAN 0.00 Many daysLOWEST DAILY MEAN -2.8 Oct 3 ANNUAL SEVEN-DAY MINIMUM -2.1 Oct 2 MAXIMUM PEAK STAGEANNUAL RUNOFF (CFSM) -0.001ANNUAL RUNOFF (INCHES) -0.0110 PERCENT EXCEEDS 0.0050 PERCENT EXCEEDS 0.0090 PERCENT EXCEEDS 0.00
-41.38-0.11 31.3
238 1960 -0.31 1994
0.00 Many days 584 Apr 5 1960-2.8 Oct 3 -28 Sep 24 1994-2.1 Oct 2 -17 Sep 23 1994 91.61 Oct 2 98.15 Apr 22 1959-0.001 0.19-0.01 2.57 0.00 119 0.00 1.7 0.00 0.00
Note.--Negative figures indicate reverse flow.

--- --- --- --- ---
--- --- ---
--- --- --- --- ---
--- --- ------ --- ------ --- ------ --- ------ --- ---
--- --- ------ --- ------ --- ---
--- ------ ---
--- ------ ------ ------ ------ ---
--- ------ ------ ------ ------ ------ ---
--- --- --- --- --- ------ --- ---
OCKLAWAHA RIVER BASIN 123
02236900 PALATLAKAHA RIVER AT CHERRY LAKE OUTLET, NEAR GROVELAND, FL--Continued
GAGE HEIGHT, FEET, WATER YEAR OCTOBER 2001 TO SEPTEMBER 2002 DAILY MEAN VALUES
DAY OCT NOV DEC JAN FEB MAR APR MAY JUN JUL AUG SEP
1 91.37 91.26 90.96 --- 90.79 90.71 90.40 -- -- 90.49 90.88 2 91.47 91.25 90.95 --- 90.78 90.69 90.38 -- -- 90.50 90.87 3 91.50 91.25 90.94 --- 90.76 90.70 90.40 -- -- 90.51 90.86 4 91.46 91.25 90.93 --- 90.74 90.75 90.40 -- -- 90.53 90.85 5 91.45 91.23 90.92 --- 90.72 90.73 90.36 -- -- 90.53 90.86
6 91.45 91.19 90.91 --- 90.69 90.72 90.33 -- -- 90.54 90.87 7 91.45 91.17 90.90 --- 90.70 90.71 90.31 -- -- 90.55 90.85 8 91.45 91.16 90.89 --- 90.71 90.71 90.30 -- -- 90.55 90.84 9 91.44 91.15 90.89 --- 90.70 90.71 -- -- 90.55 90.82 10 91.42 91.14 90.89 90.70 90.70 --- --- 90.55 90.81
11 91.41 91.13 90.89 90.70 90.69 --- --- 90.54 90.79 12 91.40 91.12 90.88 90.69 90.68 --- --- 90.54 90.79 13 91.40 91.12 90.88 90.68 90.67 --- --- 90.57 90.78 14 91.39 91.12 90.87 90.67 90.66 --- 90.42 90.58 90.78 15 91.40 91.10 90.86 90.66 90.66 --- --- 90.59 90.80
16 91.39 91.09 90.86 90.65 90.65 --- --- 90.61 90.79 17 91.36 91.08 90.84 90.65 90.64 --- --- 90.60 90.79 18 91.34 91.08 --- 90.63 90.63 --- --- 90.61 90.78 19 91.33 91.07 --- 90.84 90.62 90.62 --- --- 90.67 90.80 20 91.33 91.06 --- 90.84 90.61 90.61 --- --- 90.66 90.79
21 91.34 91.05 --- 90.84 90.60 90.60 --- 90.49 90.65 90.78 22 91.37 91.04 --- 90.84 90.62 90.60 --- 90.47 90.65 90.76 23 91.37 91.03 --- 90.84 90.70 90.59 --- 90.45 90.63 90.75 24 91.37 91.03 --- 90.83 90.77 90.58 --- 90.42 90.62 90.78 25 91.37 91.02 --- 90.83 90.76 90.57 --- 90.40 90.61 90.86
26 91.36 91.01 --- 90.82 90.75 90.55 --- 90.41 90.61 90.86 27 91.32 91.00 --- 90.82 90.73 90.53 --- 90.46 90.62 90.84 28 91.29 90.99 --- 90.81 90.71 90.51 --- 90.42 90.61 90.84 29 91.27 90.98 --- 90.81 --- 90.50 --- 90.38 90.63 90.83 30 91.26 90.97 --- 90.80 --- 90.47 --- 90.40 90.75 90.82 31 91.26 -- --- 90.80 --- 90.43 -- 90.49 90.89 --
MEAN 91.38 91.10 -- 90.70 90.63 -- --- 90.60 90.82 MAX 91.50 91.26 --- 90.79 90.75 --- --- 90.89 90.88 MIN 91.26 90.97 --- 90.60 90.43 --- --- 90.49 90.75

--- ------ ------ ------ ------ ---
--- ------ ------ ------ ---
---
---------------
---------
---
---------------
------ ------ ------ ------ ------ ---
--- --- --- ------ ---
124 OCKLAWAHA RIVER BASIN
02236901 PALATLAKAHA RIVER BELOW SPILLWAY AT CHERRY LAKE OUTLET, NEAR GROVELAND, FL
LOCATION.--Lat 28° 35'32", long 81° 49'22", in NE1⁄ 4 sec.8, T.22 S., R.25 E., Lake County, Hydrologic Unit 03080102, near left bank 20 ft downstream from spillway at outlet of Cherry Lake, and 3 mi northeast of Groveland.
DRAINAGE AREA.--165 mi2.
PERIOD OF RECORD.--September 1956 to July 1957 (fragmentary), August 1957 to current year (gage heights only). Prior to October 1968, published as Palatlakaha Creek at Cherry Lake Outlet, near Groveland (auxiliary).
REVISED RECORDS.--WDR FL-72-1: Drainage area.
GAGE.--Water-stage recorder. Datum of gage is at NGVD of 1929 (Gee and Jenson, Inc. bench mark). Prior to Aug. 20, 1957, nonrecording gage at same site and datum.
EXTREMES FOR PERIOD OF RECORD.--Maximum gage height, 97.73 ft, Apr. 5, 1960; minimum unknown, below lowest recordable stage.
GAGE HEIGHT, FEET, WATER YEAR OCTOBER 2001 TO SEPTEMBER 2002DAILY MEAN VALUES
DAY OCT NOV DEC JAN FEB MAR APR MAY JUN JUL AUG SEP
1 92.24 91.64 91.36 91.02 91.12 91.08 90.01 89.11 91.39 93.14 2 92.15 91.64 91.35 91.11 91.12 91.07 89.98 89.09 91.47 93.13 3 91.98 91.64 91.34 91.24 91.10 91.08 89.95 89.07 91.57 93.10 4 91.91 91.63 91.33 91.22 91.08 91.13 89.91 89.04 91.64 93.07 5 91.88 91.63 91.32 91.21 91.06 91.12 89.88 89.02 91.68 93.05
6 91.87 91.61 91.30 91.21 91.04 91.11 89.85 88.99 91.70 93.05 7 91.86 91.60 91.29 91.19 91.05 91.10 89.82 89.00 91.72 93.02 8 91.85 91.58 91.29 91.18 91.07 91.09 89.79 --- 91.74 93.00 9 91.83 91.57 91.28 91.17 91.06 91.09 89.75 --- 91.73 92.98 10 91.82 91.56 91.27 91.16 91.05 91.08 --- 89.72 --- 91.71 92.97
11 91.80 91.55 91.27 91.15 91.05 91.06 --- 89.68 --- 91.69 92.96 12 91.79 91.54 91.27 91.14 91.04 91.05 --- 89.65 89.84 91.68 92.96 13 91.79 91.53 91.26 91.13 91.03 91.05 --- 89.61 --- 91.78 92.95 14 91.78 91.54 91.25 91.16 91.02 91.04 --- 89.58 --- 91.94 92.95 15 91.78 91.54 91.24 91.22 91.00 91.02 --- 89.54 89.99 92.05 92.97
16 91.77 91.52 91.23 91.22 91.00 91.01 --- 89.50 89.99 92.14 92.95 17 91.76 91.50 91.21 91.21 90.99 91.00 --- 89.48 89.98 92.17 92.95 18 91.74 91.49 91.21 91.21 90.97 90.98 --- 89.45 89.97 92.18 92.95 19 91.73 91.48 91.19 91.20 90.95 90.97 --- 89.47 89.24 89.96 92.28 92.96 20 91.73 91.48 91.17 91.19 90.94 90.95 --- 89.45 90.04 92.32 92.96
21 91.74 91.46 91.15 91.19 90.93 90.94 --- 89.41 90.34 92.30 92.94 22 91.77 91.45 91.14 91.19 90.95 90.93 90.33 89.37 90.53 92.28 92.94 23 91.77 91.44 91.12 91.19 91.06 90.90 90.29 89.33 90.66 92.26 92.99 24 91.77 91.43 91.12 91.18 91.16 90.88 90.25 89.30 90.76 92.25 93.02 25 91.77 91.42 91.10 91.17 91.16 90.87 90.21 89.27 90.83 92.23 93.11
26 91.75 91.42 91.09 91.17 91.15 90.87 90.17 89.24 90.90 92.24 93.11 27 91.72 91.41 91.07 91.16 91.13 90.14 89.21 91.01 92.29 93.10 28 91.69 91.40 91.06 91.16 91.10 90.11 89.19 91.05 92.29 93.08 29 91.67 91.39 91.05 91.15 --- 90.08 89.16 91.08 92.33 93.07 30 91.66 91.37 91.04 91.15 --- 90.04 89.13 91.14 92.63 93.05 31 91.66 --- 91.03 91.14 --- --- 89.12 91.32 93.02 --
MEAN 91.81 91.52 91.21 91.17 91.05 --- 89.54 --- 92.02 93.02 MAX 92.24 91.64 91.36 91.24 91.16 --- 90.01 --- 93.02 93.14 MIN 91.66 91.37 91.03 91.02 90.93 --- 89.12 --- 91.39 92.94

--- --- --- --- --- --- --- --- --- --- --- --- --- --- ---
--- --- --- --- --- --- --- --- --- --- --- --- --- ---
--- --- --- ---
--- --- --- ------ --- --- ------ --- --- ------ --- --- ------ --- --- ---
--- --- --- ------ --- --- ------ --- --- ------ --- --- ------ --- --- ---
--- --- --- ------ --- --- ------ --- ------ --- ------ --- ---
--- --- ------ --- ------ --- ------ --- ------ --- ------ --- ---
--- --- --- --- --- --- --- ------ --- --- ---
125 OCKLAWAHA RIVER BASIN
02237000 PALATLAKAHA RIVER NEAR MASCOTTE, FL
LOCATION.--Lat 28° 36'56", long 81° 51'53", in SW1⁄ 4 sec.36, T.21 S., R.24 E., Lake County, Hydrologic Unit 03080102, on left bank 260 ft upstream from spillway, 0.4 mi downstream from bridge on State Highway 565, 0.7 mi downstream from Lake Emma, and 3.2 mi northeast of Mascotte.
DRAINAGE AREA.--182 mi2.
PERIOD OF RECORD.--May 1945 to February 1956, April 1964 to September 1965, October 1965 to September 1995 (gage heights andperiodic discharge measurements only), January to September 2002 (gage heights only).
REVISED RECORDS.--WDR FL-72-1: Drainage area.
GAGE.--Water-stage recorder. Datum of gage is at NGVD of 1929. Prior to May 21, 1946, nonrecording gage and May 21, 1946 toMar. 20, 1956, water-stage recorder, at site 0.5 mi upstream at datum 89.54 ft higher. Since Apr. 6, 1964, auxiliary water-stage recorder on left bank 260 ft downstream from spillway.
REMARKS.--Since Dec. 4, 1963, flow regulated at station by manipulation of gates in spillway. From March 1956 to December 1963,flow was regulated through two box culverts with radial lift gates.
EXTREMES FOR PERIOD OF RECORD.--Maximum discharge, 458 ft3/s, Oct. 4,5, 1945; maximum gage height, 96.66 ft, former site, present datum, Oct. 11,12, 1953; gates closed and no flow or leakage only for many days in 1972-83, 2002; minimum gage height unknown, below lowest recordable stage.
GAGE HEIGHT, FEET, PERIOD JANUARY 2002 TO SEPTEMBER 2002DAILY MEAN VALUES
DAY OCT NOV DEC JAN FEB MAR APR MAY JUN JUL AUG SEP
1 -- --- 91.08 91.01 90.76 -- -- 91.38 92.79 2 -- --- 91.07 91.02 90.74 -- -- 91.44 92.84 3 -- --- 91.05 91.03 90.74 -- -- 91.57 92.87 4 -- --- 91.03 91.07 90.74 -- -- 91.65 92.89 5 -- --- 91.01 91.05 90.72 -- -- 91.66 92.92
6 -- --- 91.00 91.05 90.69 -- -- 91.66 92.94 7 -- --- 91.01 91.04 90.68 -- -- 91.68 92.94 8 -- --- 91.01 91.04 -- -- 91.69 92.93 9 -- --- 91.00 91.03 -- -- 91.68 92.92 10 --- --- 91.00 91.03 --- --- 91.67 92.91
11 --- --- 91.00 91.02 --- --- 91.66 92.91 12 --- --- 90.99 91.01 --- --- 91.66 92.90 13 --- --- 90.97 91.01 --- --- 91.71 92.90 14 --- --- 90.96 91.00 --- --- 91.80 92.90 15 --- --- 90.95 90.99 --- --- 91.89 92.90
16 --- --- 90.95 90.98 --- --- 91.95 92.90 17 --- --- 90.94 90.97 --- --- 91.98 92.91 18 --- --- 90.92 90.96 --- --- 92.01 92.90 19 --- --- 90.92 90.95 --- --- 92.11 92.92 20 --- --- 90.91 90.92 --- --- 92.15 92.92
21 --- --- 90.90 90.91 --- 90.84 92.18 92.91 22 --- --- 90.91 90.89 --- 90.93 92.19 92.90 23 --- --- 91.14 90.99 90.86 --- 90.99 92.20 92.94 24 --- --- 91.13 91.07 90.85 --- 91.03 92.20 92.96 25 --- --- 91.13 91.07 90.84 --- 91.06 92.19 93.04
26 --- --- 91.12 91.06 90.85 --- 91.11 92.20 93.05 27 --- --- 91.11 91.04 90.84 --- 91.19 92.26 93.05 28 --- --- 91.11 91.02 90.83 --- 91.20 92.26 93.04 29 --- --- 91.11 --- 90.81 --- 91.21 92.32 93.03 30 --- --- 91.10 --- 90.80 --- 91.23 92.55 93.01 31 --- --- 91.10 --- 90.78 --- 91.35 92.73 --
MEAN -- -- 90.99 90.95 -- --- 91.94 92.93 MAX --- --- 91.08 91.07 --- --- 92.73 93.05 MIN --- --- 90.90 90.78 --- --- 91.38 92.79

--- --- --- --- --- --- --- --- --- ---
--- --- --- --- --- --- --- ---
--- --- --- ---
--- --- --- ------ --- --- ------ --- --- ------ --- --- ------ --- --- ---
--- --- --- ------ --- --- ------ --- --- ------ --- --- ------ --- --- ---
--- --- --- ------ --- ------ --- ------ --- ------ --- ---
--- ------ ------ ------ ------ ------ --- ---
--- --- --- ------ --- --- ------ --- --- ---
126 OCKLAWAHA RIVER BASIN
02237001 PALATLAKAHA RIVER BELOW SPILLWAY, NEAR MASCOTTE, FL
LOCATION.--Lat 28° 36'57", long 81° 51'58", in SW1⁄ 4 sec.36, T.21 S., R.24 E., Lake County, Hydrologic Unit 03080102, on left bank 260 ft downstream from spillway, 0.4 mi downstream from bridge on State Highway 565, 0.7 mi downstream from Lake Emma, and 3.2 mi northeast of Mascotte.
DRAINAGE AREA.--182 mi2.
RPERIOD OF RECORD.--April 1964 to September 1995 and January 2002 to September 2002 (gage heights only).
EVISED RECORDS.--WDR FL-72-1: Drainage area.
GAGE.--Water-stage recorder. Datum of gage is at NGVD of 1929.
EXTREMES FOR PERIOD OF RECORD.--Maximum gage height, 93.00 ft, Oct. 1, 1979; minimum unknown, below lowest recordable stage.
GAGE HEIGHT, FEET, PERIOD JANUARY 2002 TO SEPTEMBER 2002DAILY MEAN VALUES
DAY OCT NOV DEC JAN FEB MAR APR MAY JUN JUL AUG SEP
1 -- --- 87.36 87.31 86.85 -- --- 87.06 88.46 89.48 2 -- --- 87.34 87.30 86.82 -- --- 87.14 88.49 89.50 3 -- --- 87.32 87.31 86.80 -- --- 87.18 88.56 89.52 4 -- --- 87.30 87.38 86.79 -- --- 87.21 88.75 89.52 5 -- --- 87.27 87.38 86.77 -- --- 87.24 --- 89.53
6 -- --- 87.24 87.36 86.74 -- --- 87.25 --- 89.56 7 -- --- 87.24 87.36 86.70 -- --- 87.25 --- 89.56 8 -- --- 87.26 87.36 86.66 -- --- 87.25 --- 89.55 9 -- --- 87.24 87.34 86.62 -- --- 87.24 88.72 89.54 10 --- --- 87.23 87.33 86.60 87.25 88.71 89.53
11 --- --- 87.23 87.31 86.57 87.25 88.69 89.53 12 --- --- 87.21 87.29 86.54 87.26 88.70 89.53 13 --- --- 87.19 87.28 86.53 87.30 88.80 89.54 14 --- --- 87.18 87.26 86.52 87.54 88.85 89.54 15 --- --- 87.15 87.23 86.52 87.58 88.93 89.54
16 --- --- 87.14 87.22 --- 87.61 88.96 89.54 17 --- --- 87.12 87.19 --- 87.61 88.96 89.56 18 --- --- 87.10 87.17 --- 87.60 88.96 89.54 19 --- --- 87.07 87.14 --- 87.59 88.97 89.54 20 --- --- 87.05 87.11 --- 87.59 89.00 89.52
21 --- --- 87.03 87.10 --- --- 88.99 89.52 22 --- --- 87.48 87.04 87.08 --- --- 88.98 89.50 23 --- --- 87.47 87.16 87.04 --- --- 88.97 89.50 24 --- --- 87.45 87.29 87.01 --- --- 88.95 89.52 25 --- --- 87.44 87.32 87.00 --- --- 88.94 89.60
26 --- --- 87.42 87.33 87.01 --- 86.53 88.40 88.93 89.62 27 --- --- 87.40 87.34 86.99 --- 86.58 88.46 88.94 89.62 28 --- --- 87.39 87.32 86.96 --- 86.67 88.46 88.94 89.61 29 --- --- 87.41 --- 86.94 --- 86.77 88.45 89.01 89.60 30 --- --- 87.40 --- 86.91 --- 86.89 88.44 89.27 89.59 31 --- --- 87.38 --- 86.88 --- 88.47 89.44 --
MEAN --- --- 87.22 87.18 --- --- --- 89.55 MAX --- --- 87.36 87.38 --- --- --- 89.62 MIN --- --- 87.03 86.88 --- --- --- 89.48

--- --- --- --- --- ---
--- --- --- --- --- --- --- --- --- --- --- ---
--- --- --- --- --- --- --- --- --- --- --- --- --- --- --- ---
--- --- --- ---
--- --- --- ------ --- --- ------ --- --- ------ --- --- ------ --- --- ---
--- --- --- ------ --- --- ------ --- --- ------ --- --- ------ --- --- ---
--- --- --- ------ --- --- ------ --- --- ------ --- --- ------ --- --- ---
--- --- --- ------ --- --- ------ --- --- ------ --- --- ------ --- --- ------ --- --- ---
--- --- --- --- --- --- --- ------ --- --- ---
127 OCKLAWAHA RIVER BASIN
02237010 PALATLAKAHA RIVER AT STRUCTURE M-6, NEAR MASCOTTE, FL
LOCATION.--Lat 28° 38'35", long 81° 52'21", in SE1⁄ 4 sec.23, T.21 S., R.24 E., Lake County, Hydrologic Unit 03080102, on right bank 50 ft upstream from control structure M-6, 1.5 mi west of State Highway 565, and 4.6 mi north of Mascotte.
DRAINAGE AREA.--186 mi2.
PERIOD OF RECORD.--May 1981 to current year (gage heights only).
GAGE.--Water-stage recorder. Datum of gage is at NGVD of 1929.
REMARKS.--Flow regulated at station by manipulation of gates in spillway.
EXTREMES FOR PERIOD OF RECORD.--Maximum gage height, 92.97 ft, Aug. 11, 1983; minimum unknown, below lowest recordable stage.
GAGE HEIGHT, FEET, WATER YEAR OCTOBER 2001 TO SEPTEMBER 2002 DAILY MEAN VALUES
DAY OCT NOV DEC JAN FEB MAR APR MAY JUN JUL AUG SEP
1 88.99 88.60 88.08 -- -- -- -- 88.62 89.68 2 88.97 88.58 88.06 -- -- -- -- 88.65 89.70 3 88.96 88.56 -- -- -- -- 88.79 89.71 4 88.94 88.55 -- -- -- -- 88.91 89.72 5 88.93 88.54 -- -- -- -- 88.92 89.74
6 88.91 88.52 -- -- -- -- 88.91 89.76 7 88.90 88.50 -- -- -- -- 88.93 89.76 8 88.88 88.48 -- -- -- -- 88.94 89.76 9 88.86 88.46 -- -- -- -- 88.93 89.75 10 88.84 88.44 --- --- --- --- 88.91 89.74
11 88.83 88.42 --- --- --- --- 88.89 89.74 12 88.81 88.40 --- --- --- --- 88.90 89.74 13 88.79 88.37 --- --- --- --- 89.00 89.74 14 88.78 88.37 --- --- --- --- 89.05 89.74 15 88.77 88.35 --- --- --- --- 89.12 89.74
16 88.76 88.33 --- --- --- --- 89.16 89.74 17 88.73 88.32 --- --- --- --- 89.16 89.76 18 88.71 88.30 --- --- --- --- 89.16 89.75 19 88.70 88.28 --- --- --- --- 89.17 89.74 20 88.69 88.27 --- --- --- --- 89.19 89.73
21 88.71 88.25 --- --- --- --- 89.19 89.72 22 88.76 88.23 --- --- --- 88.46 89.18 89.71 23 88.76 88.21 --- --- --- 88.51 89.17 89.70 24 88.75 88.23 --- --- --- 88.51 89.16 89.72 25 88.74 88.21 --- --- --- 88.50 89.14 89.80
26 88.71 88.19 --- --- --- 88.52 89.14 89.81 27 88.69 88.17 --- --- --- 88.62 89.15 89.82 28 88.66 88.15 --- --- --- 88.62 89.14 89.81 29 88.64 88.12 --- --- --- 88.62 89.21 89.81 30 88.62 88.10 --- --- --- 88.61 89.47 89.80 31 88.61 --- --- --- --- 88.63 89.64 --
MEAN 88.79 88.35 -- -- -- --- 89.06 89.75 MAX 88.99 88.60 --- --- --- --- 89.64 89.82 MIN 88.61 88.10 --- --- --- --- 88.62 89.68

--- ---
--- ------ ------ ------ ------ ---
--- ------ ------ ------ ------ ---
--- ------ ------ ---------
------------------ ---
--- ---
128 OCKLAWAHA RIVER BASIN
02237011 PALATLAKAHA RIVER BELOW STRUCTURE M-6, NEAR MASCOTTE, FL
LOCATION.--Lat 28° 38'38", long 81° 52'21", in SE1⁄ 4 sec.23, T.21 S., R.24 E., Lake County, Hydrologic Unit 03080102, on right bank 150 ft downstream from control structure M-6, 1.5 mi west of State Highway 565, and 4.6 mi north of Mascotte.
DRAINAGE AREA.--186 mi2.
PERIOD OF RECORD.--May 1981 to current year (gage heights only).
GAGE.--Water-stage recorder. Datum of gage is at NGVD of 1929.
EXTREMES FOR PERIOD OF RECORD.--Maximum gage height, 92.25 ft, Mar. 19, 1998; minimum unknown, below lowest recordable stage.
GAGE HEIGHT, FEET, WATER YEAR OCTOBER 2001 TO SEPTEMBER 2002DAILY MEAN VALUES
DAY OCT NOV DEC JAN FEB MAR APR MAY JUN JUL AUG SEP
1 87.63 87.25 86.86 86.34 86.71 86.80 86.39 85.41 --- 87.38 87.77 88.27 2 87.62 87.23 86.85 86.45 86.70 86.80 86.36 85.37 --- 87.48 87.85 88.26 3 87.60 87.22 86.83 86.62 86.68 86.81 86.34 85.32 --- 87.52 88.01 88.24 4 87.58 87.22 86.81 86.64 86.66 86.87 86.33 85.27 --- 87.54 88.03 88.23 5 87.57 87.23 86.79 86.66 86.63 86.88 86.31 85.23 --- 87.56 87.99 88.24
6 87.56 87.20 86.77 86.68 86.62 86.88 86.28 -- --- 87.57 87.94 88.25 7 87.55 87.18 86.76 86.69 86.62 86.88 86.24 -- --- 87.56 87.95 88.25 8 87.53 87.16 86.74 86.69 86.64 86.88 86.21 -- --- 87.55 87.93 88.25 9 87.51 87.14 86.73 86.69 86.63 86.88 86.17 -- --- 87.54 87.89 88.24 10 87.49 87.13 86.71 86.69 86.62 86.87 86.14 87.55 87.86 88.22
11 87.47 87.11 86.70 86.69 86.62 86.85 86.11 87.56 87.83 88.22 12 87.45 87.09 86.69 86.68 86.61 86.84 86.08 87.59 87.83 88.21 13 87.43 87.08 86.67 86.68 86.59 86.82 86.05 87.70 87.92 88.21 14 87.42 87.08 86.65 86.71 86.58 86.80 86.02 87.83 88.00 88.20 15 87.41 87.07 86.63 86.77 86.56 86.78 86.01 87.80 88.06 88.19
16 87.39 87.05 86.61 86.79 86.55 86.76 85.98 87.77 88.10 88.18 17 87.36 87.03 86.59 86.79 86.54 86.74 85.95 87.74 88.08 88.17 18 87.34 87.01 86.58 86.79 86.53 86.73 85.92 87.70 88.07 88.15 19 87.32 87.01 86.55 86.79 86.51 86.70 85.88 87.67 88.08 88.13 20 87.32 87.00 86.53 86.78 86.49 86.68 85.85 87.73 88.09 88.12
21 87.33 86.98 86.51 86.78 86.48 86.65 85.81 87.92 88.07 88.11 22 87.38 86.96 86.48 86.78 86.49 86.63 85.77 87.92 88.06 88.09 23 87.37 86.95 86.47 86.77 86.60 86.60 85.73 87.89 88.05 88.07 24 87.36 86.97 86.47 86.76 86.75 86.57 85.69 85.57 87.85 88.03 88.08 25 87.37 86.96 86.45 86.75 86.78 86.55 85.65 85.89 87.82 88.01 88.15
26 87.36 86.95 86.44 86.74 86.80 86.55 85.61 86.10 87.84 88.00 88.16 27 87.33 86.94 86.42 86.73 86.81 86.53 85.57 86.26 87.89 88.01 88.15 28 87.31 86.92 86.40 86.72 86.80 86.51 85.53 86.40 87.86 88.00 88.14 29 87.29 86.90 86.39 86.74 --- 86.48 85.48 86.64 87.82 88.06 88.13 30 87.28 86.88 86.38 86.74 --- 86.45 85.45 86.94 87.80 88.21 88.11 31 87.27 --- 86.36 86.73 --- 86.42 --- 87.79 88.29 --
MEAN 87.43 87.06 86.61 86.71 86.63 86.72 85.96 87.70 88.00 88.18 MAX 87.63 87.25 86.86 86.79 86.81 86.88 86.39 -- --- 87.92 88.29 88.27 MIN 87.27 86.88 86.36 86.34 86.48 86.42 85.45 -- --- 87.38 87.77 88.07

--- ---
--- ------ ------ ------ ------ ---
--- ------ ------ ------ ------ ---
--- ------ ------------
------------------ ---
--- ------ ------ ---
129 OCKLAWAHA RIVER BASIN
02237050 PALATLAKAHA RIVER AT STRUCTURE M-5, NEAR OKAHUMPKA, FL
LOCATION.--Lat 28° 40'43", long 81° 53'05", in NW1⁄ 4 sec.11, T.21 S., R.24 E., Lake County, Hydrologic Unit 03080102, on right bank 50 ft upstream from control structure M-5, 325 ft upstream from Bridges Road, 1.9 mi west of U.S. Highway 27, and 4.8 mi south of Okahumpka.
DRAINAGE AREA.--193 mi2.
PERIOD OF RECORD.--May 1981 to current year (gage heights only).
GAGE.--Water-stage recorder. Datum of gage is at NGVD of 1929.
REMARKS.--Flow regulated at station by manipulation of gates in spillway.
EXTREMES FOR PERIOD OF RECORD.--Maximum gage height, 90.59 ft, Aug. 14, 1983; minimum unknown, below lowest recordable stage.
GAGE HEIGHT, FEET, WATER YEAR OCTOBER 2001 TO SEPTEMBER 2002DAILY MEAN VALUES
DAY OCT NOV DEC JAN FEB MAR APR MAY JUN JUL AUG SEP
1 86.36 86.10 85.78 85.21 85.26 84.98 84.28 -- --- 85.54 86.96 88.24 2 86.36 86.09 85.76 85.32 85.24 84.98 84.24 -- --- 85.67 86.90 88.24 3 86.34 86.10 85.75 85.49 85.22 84.96 84.22 -- --- 85.76 86.80 88.24 4 86.33 86.11 85.73 85.48 85.19 85.00 84.21 -- --- 85.81 --- 88.23 5 86.32 86.11 85.71 85.48 85.16 84.99 84.17 -- --- 85.88 --- 88.25
6 86.32 86.10 85.69 85.48 85.14 84.97 84.11 -- --- 85.95 --- 88.25 7 86.31 86.08 85.68 85.47 85.14 84.95 84.05 -- --- 85.97 --- 88.25 8 86.30 86.07 85.66 85.46 85.13 84.94 84.00 -- --- 85.97 87.73 88.26 9 86.29 86.06 85.65 85.45 85.11 84.91 83.94 -- --- 85.97 87.72 88.25 10 86.28 86.04 85.63 85.44 85.10 84.89 83.89 85.99 87.72 88.23
11 86.26 86.03 85.62 85.42 85.08 84.86 83.84 86.01 87.71 88.22 12 86.25 86.02 85.60 85.41 85.06 84.83 83.79 86.11 87.72 88.22 13 86.24 86.01 85.58 85.41 85.04 84.81 83.75 86.27 87.82 88.22 14 86.23 86.00 85.57 85.43 85.01 84.77 83.74 86.55 87.91 88.21 15 86.22 86.00 85.55 85.48 84.99 84.74 83.75 86.58 87.96 88.20
16 86.21 85.98 85.53 85.47 84.98 84.71 83.73 86.59 88.03 88.19 17 86.19 85.97 85.51 85.46 84.96 84.68 --- 86.59 88.03 88.17 18 86.17 85.96 85.49 85.45 84.92 84.65 --- 86.58 88.03 88.16 19 86.16 85.95 85.47 85.44 84.90 84.61 --- 86.57 88.03 88.14 20 86.15 85.94 85.44 85.43 84.87 84.58 --- 86.57 88.04 88.12
21 86.17 85.92 85.42 85.42 84.84 84.55 --- --- 88.04 88.11 22 86.20 85.91 85.40 85.40 84.85 84.52 --- --- 88.04 88.09 23 86.20 85.90 85.38 85.39 84.95 84.47 --- 84.04 --- 88.05 88.08 24 86.20 85.90 85.37 85.37 85.07 84.43 --- 84.40 --- 88.03 88.09 25 86.20 85.88 85.35 85.36 85.08 84.42 --- 84.85 --- 88.02 88.16
26 86.19 85.86 85.33 85.34 85.06 84.50 --- 85.01 87.08 88.01 88.17 27 86.17 85.85 85.31 85.32 85.02 84.48 --- 85.07 87.02 88.01 88.16 28 86.14 85.83 85.29 85.31 85.00 84.45 --- 85.07 87.00 88.01 88.15 29 86.12 85.82 85.27 85.32 --- 84.41 --- 85.17 86.99 88.03 88.13 30 86.12 85.80 85.25 85.31 --- 84.37 --- 85.32 86.98 88.14 88.12 31 86.11 --- 85.23 85.28 --- 84.32 --- 86.96 88.23 --
MEAN 86.23 85.98 85.52 85.40 85.05 84.70 --- --- --- 88.19 MAX 86.36 86.11 85.78 85.49 85.26 85.00 --- --- --- 88.26 MIN 86.11 85.80 85.23 85.21 84.84 84.32 --- --- --- 88.08

---
130 OCKLAWAHA RIVER BASIN
02237051 PALATLAKAHA RIVER BELOW STRUCTURE M-5, NEAR OKAHUMPKA, FL
LOCATION.--Lat 28° 40'45", long 81° 53'05", in NW1⁄ 4 sec.11, T.21 S., R.24 E., Lake County, Hydrologic Unit 03080102, on right bank 150 ft downstream from control structure M-5, 125 ft upstream from Bridges Road, 1.9 mi west of U.S. Highway 27, and 4.8 mi south of Okahumpka.
DRAINAGE AREA.--193 mi2.
PERIOD OF RECORD.--May 1981 to current year (gage heights only).
GAGE.--Water-stage recorder. Datum of gage is at NGVD of 1929.
EXTREMES FOR PERIOD OF RECORD.--Maximum gage height, 88.06 ft, Mar. 20, 1998; minimum, 80.35 ft, June 21, 2001.
GAGE HEIGHT, FEET, WATER YEAR OCTOBER 2001 TO SEPTEMBER 2002DAILY MEAN VALUES
DAY OCT NOV DEC JAN FEB MAR APR MAY JUN JUL AUG SEP
1 83.88 83.52 83.13 82.61 83.00 82.97 82.64 81.73 80.71 83.09 83.92 84.08 2 83.85 83.51 83.12 82.75 82.98 82.97 82.61 81.69 80.69 83.16 83.95 84.05 3 83.84 83.51 83.10 82.99 82.96 82.97 82.60 81.62 80.66 83.19 84.01 84.03 4 83.83 83.50 83.09 83.01 82.94 83.05 82.60 81.57 80.64 83.21 --- 84.02 5 83.82 83.53 83.07 83.02 82.91 83.05 82.57 81.54 80.61 83.26 --- 84.03
6 83.81 83.50 83.05 83.03 82.89 83.05 82.54 81.48 80.60 83.29 --- 84.03 7 83.81 83.48 82.99 83.04 82.89 83.05 82.51 81.41 80.73 83.28 --- 84.01 8 83.79 83.46 82.94 83.04 82.90 83.04 82.47 81.38 80.88 83.28 83.99 83.99 9 83.78 83.44 82.94 83.03 82.89 83.04 82.44 81.35 80.86 83.29 83.97 83.97 10 83.77 83.42 82.93 83.02 82.87 83.03 82.41 81.29 80.85 83.31 83.95 83.94
11 83.75 83.41 82.93 83.01 82.86 83.01 82.39 81.21 80.85 83.33 83.93 83.93 12 83.74 83.39 82.91 83.01 82.85 83.00 82.36 81.17 80.85 83.43 83.96 83.92 13 83.73 83.37 82.90 83.01 82.83 82.99 82.33 81.13 80.86 83.62 84.11 83.91 14 83.71 83.39 82.89 83.03 82.81 82.97 82.33 81.10 80.83 83.97 84.13 83.90 15 83.70 83.38 82.87 83.10 82.79 82.95 82.36 81.06 80.85 83.92 84.11 83.89
16 83.69 83.37 82.86 83.10 82.78 82.93 82.35 81.03 80.84 83.88 84.10 83.88 17 83.67 83.35 82.84 83.10 82.77 82.91 82.32 81.00 80.93 83.86 84.06 83.86 18 83.65 83.34 82.83 83.10 82.75 82.89 82.28 80.98 81.13 83.83 84.03 83.85 19 83.63 83.33 82.81 83.09 82.72 82.86 82.25 80.98 81.16 83.81 84.00 83.83 20 83.63 83.31 82.79 83.08 82.70 82.84 82.21 80.96 81.21 83.86 84.00 83.82
21 83.63 83.29 82.77 83.07 82.68 82.80 82.18 80.94 81.19 83.97 83.97 83.81 22 83.67 83.27 82.75 83.06 82.69 82.76 82.14 80.90 81.28 83.95 83.96 83.80 23 83.67 83.25 82.73 83.05 82.81 82.70 82.05 80.87 81.55 83.94 83.94 83.79 24 83.66 83.24 82.73 83.05 82.96 82.68 81.96 80.85 81.88 83.92 83.92 83.82 25 83.65 83.22 82.72 83.03 82.98 82.63 81.91 80.82 82.25 83.90 83.90 83.94
26 83.64 83.21 82.70 83.02 82.99 82.73 81.88 80.80 82.50 83.95 83.90 83.93 27 83.61 83.19 82.68 83.01 82.99 82.74 81.85 80.79 82.64 84.02 83.93 83.92 28 83.58 83.18 82.67 83.01 82.97 82.73 81.82 80.78 82.75 84.00 83.91 83.90 29 83.56 83.17 82.65 83.03 --- 82.71 81.79 80.77 82.87 83.97 83.93 83.88 30 83.54 83.15 82.64 83.03 --- 82.69 81.76 80.75 82.98 83.95 84.05 83.86 31 83.53 -- 82.62 83.01 --- 82.66 --- 80.73 83.95 84.12 --
MEAN 83.70 83.36 82.86 83.02 82.86 82.88 82.26 81.12 81.29 83.66 --- 83.92 MAX 83.88 83.53 83.13 83.10 83.00 83.05 82.64 81.73 82.98 84.02 --- 84.08 MIN 83.53 83.15 82.62 82.61 82.68 82.63 81.76 80.73 80.60 83.09 --- 83.79

---
---
--- ------
131 OCKLAWAHA RIVER BASIN
02237206 PALATLAKAHA RIVER AT STRUCTURE M-4, NEAR OKAHUMPKA, FL
LOCATION.--Lat 28° 42'53", long 81° 53'04", in SW1⁄ 4 sec.26, T.20 S., R.24 E., Lake County, Hydrologic Unit 03080102, on right bank 50 ft upstream from control structure M-4, 1.4 mi west of U.S. Highway 27, and 2.3 mi south of Okahumpka.
DRAINAGE AREA.--208 mi2.
PERIOD OF RECORD.--May 1981 to current year (gage heights only).
GAGE.--Water-stage recorder. Datum of gage is at NGVD of 1929.
REMARKS.--Flow regulated at station by manipulation of gates in spillway.
EXTREMES FOR PERIOD OF RECORD.--Maximum gage height, 86.81 ft, Feb. 23, 1983; minimum unknown, below lowest recordable stage.
GAGE HEIGHT, FEET, WATER YEAR OCTOBER 2001 TO SEPTEMBER 2002DAILY MEAN VALUES
DAY OCT NOV DEC JAN FEB MAR APR MAY JUN JUL AUG SEP
1 82.96 82.58 82.25 81.79 81.89 81.62 81.21 80.29 78.61 81.66 83.27 83.86 2 82.95 82.57 82.24 --- 81.87 81.62 81.19 80.24 78.57 81.70 83.28 83.86 3 82.94 82.56 82.22 82.07 81.85 81.62 81.17 80.20 78.52 81.71 83.31 83.85 4 82.93 82.57 82.21 82.06 81.82 81.70 81.17 80.15 78.46 81.70 83.32 83.84 5 82.92 82.58 82.19 82.06 81.79 81.69 81.14 80.10 78.41 81.72 83.31 83.86
6 82.91 82.56 82.18 82.06 81.78 81.68 81.11 80.05 78.38 81.75 83.30 83.88 7 82.90 82.55 82.17 82.05 81.77 81.67 81.08 80.00 78.46 81.75 83.33 83.87 8 82.88 82.53 82.16 82.04 81.77 81.66 81.06 79.95 78.54 81.75 83.34 83.86 9 82.87 82.52 82.14 82.03 81.75 81.65 81.02 79.90 78.52 81.77 83.32 83.84 10 82.85 82.50 82.13 82.02 81.74 81.63 80.99 79.84 78.49 81.80 83.31 83.83
11 82.84 82.49 82.12 82.01 81.72 81.61 80.97 79.78 78.47 81.82 83.29 83.82 12 82.82 82.47 82.10 82.00 81.69 81.59 80.94 79.73 78.45 81.88 83.30 83.82 13 82.81 82.46 82.09 81.67 81.57 80.91 79.67 78.48 82.06 83.43 83.81 14 82.80 82.46 82.08 82.05 81.64 81.55 80.90 79.61 78.44 82.52 83.57 83.81 15 82.78 82.45 82.06 82.05 81.62 81.52 80.89 79.54 78.44 82.63 83.63 83.80
16 82.77 82.44 82.04 82.04 81.60 81.50 80.87 79.47 78.42 82.67 83.67 83.78 17 82.74 82.43 82.03 82.04 81.58 81.48 80.84 79.41 78.51 82.68 83.68 83.77 18 82.72 82.42 --- 82.03 81.55 81.46 80.81 79.35 79.16 82.68 83.68 83.75 19 82.71 82.41 --- 82.02 81.53 81.43 80.78 79.32 79.57 82.67 83.66 83.73 20 82.70 82.40 --- 82.01 81.51 81.40 80.75 79.27 79.65 82.73 83.66 83.72
21 82.70 82.39 --- 82.00 81.49 81.38 80.71 79.20 79.65 82.99 83.64 83.70 22 82.72 82.38 --- 81.99 81.50 81.35 80.67 79.12 79.76 83.10 83.62 83.68 23 82.71 82.37 --- 81.98 81.58 81.32 80.63 79.06 80.00 83.14 83.60 83.65 24 82.71 82.35 --- 81.97 81.68 81.30 80.59 79.00 80.27 83.14 83.58 83.68 25 82.71 82.34 --- 81.95 81.69 81.29 80.55 78.94 80.81 83.14 83.55 83.78
26 82.68 82.33 --- 81.94 81.68 81.37 80.51 78.88 81.19 83.18 83.55 83.79 27 82.66 82.31 81.87 81.93 81.65 81.35 80.47 78.83 81.33 83.27 83.58 83.77 28 82.63 82.30 81.86 81.92 81.63 81.32 80.43 78.77 81.43 83.28 83.59 83.75 29 82.61 82.29 81.84 81.94 --- 81.30 80.38 78.71 81.51 83.28 83.62 83.73 30 82.60 82.27 81.83 81.92 --- 81.27 80.34 78.66 81.57 83.28 83.69 83.70 31 82.59 -- 81.81 81.91 --- 81.24 --- 78.65 83.28 83.84 --
MEAN 82.78 82.44 -- 81.68 81.49 80.84 79.47 79.34 82.48 83.50 83.79 MAX 82.96 82.58 --- 81.89 81.70 81.21 80.29 81.57 83.28 83.84 83.88 MIN 82.59 82.27 --- 81.49 81.24 80.34 78.65 78.38 81.66 83.27 83.65

--- --- --- --- ---
--- --- ---
---
---------------
---
------ ---
--- --- --- ------ ---
132 OCKLAWAHA RIVER BASIN
02237207 PALATLAKAHA RIVER BELOW STRUCTURE M-4, NEAR OKAHUMPKA, FL
LOCATION.--Lat 28° 42'56", long 81° 53'03", in SW1⁄ 4 sec.26, T.20 S., R.24 E., Lake County, Hydrologic Unit 03080102, on right bank 150 ft downstream from control structure M-4, 1.4 mi west of U.S. Highway 27, and 2.3 mi south of Okahumpka.
DRAINAGE AREA.--208 mi2.
PERIOD OF RECORD.--May 1981 to current year (gage heights only).
GAGE.--Water-stage recorder. Datum of gage is at NGVD of 1929.
EXTREMES FOR PERIOD OF RECORD.--Maximum gage height, 85.00 ft, Feb. 17, 1998; minimum, 75.89 ft, June 21, 2001.
GAGE HEIGHT, FEET, WATER YEAR OCTOBER 2001 TO SEPTEMBER 2002 DAILY MEAN VALUES
DAY OCT NOV DEC JAN FEB MAR APR MAY JUN JUL AUG SEP
1 79.52 79.31 --- 79.22 79.19 79.17 78.74 77.63 79.30 79.65 79.76 2 79.51 79.32 --- 79.31 79.19 79.16 78.71 77.60 79.32 79.66 79.75 3 79.48 79.34 --- 79.29 79.19 79.17 78.68 77.58 79.32 79.68 79.75 4 79.48 79.35 --- 79.27 79.24 79.18 78.65 77.54 79.32 79.67 79.75 5 79.46 79.34 --- 79.30 79.20 79.18 78.61 77.50 79.33 79.69 79.76
6 79.47 79.31 --- 79.30 79.19 79.17 78.58 77.49 79.34 79.68 79.77 7 79.46 79.29 --- 79.34 79.20 79.16 78.54 77.53 79.32 79.69 79.76 8 79.47 79.26 --- 79.34 79.20 79.16 78.52 77.54 79.32 79.68 79.76 9 79.46 79.40 79.25 --- 79.34 79.19 79.15 78.48 77.57 79.33 79.67 79.75 10 79.45 79.39 79.30 79.34 79.18 79.14 78.44 77.59 79.34 79.65 79.75
11 79.45 79.38 79.32 79.33 79.18 79.13 78.41 77.60 79.31 79.62 79.74 12 79.44 79.39 79.33 79.34 79.17 79.12 78.37 77.62 79.32 79.62 79.74 13 79.45 79.40 79.32 79.33 79.18 79.11 78.34 77.66 79.38 79.66 79.74 14 79.44 79.41 79.28 79.31 79.18 79.11 78.30 77.66 79.42 79.67 79.73 15 79.43 79.41 79.27 79.31 79.18 79.11 78.25 77.68 79.42 79.67 79.73
16 79.42 79.38 79.26 79.23 79.30 79.19 79.12 78.20 77.69 79.44 79.67 79.71 17 79.42 79.33 --- 79.24 79.30 79.19 79.10 78.15 77.72 79.40 79.63 79.71 18 79.41 79.29 --- 79.23 79.29 79.19 79.09 78.11 77.91 79.38 79.67 79.70 19 79.40 79.26 --- 79.22 79.28 79.18 79.07 78.09 78.09 79.38 79.74 79.69 20 79.40 79.27 --- 79.20 79.26 79.17 79.04 78.05 78.20 79.42 79.77 79.68
21 79.39 79.28 --- 79.19 79.28 79.17 79.02 78.01 78.27 79.45 79.77 79.67 22 79.39 79.32 --- 79.18 79.23 79.19 78.99 77.97 78.38 79.50 79.77 79.66 23 79.39 79.35 --- 79.18 79.24 79.18 78.97 77.92 78.56 79.50 79.77 79.65 24 79.39 79.35 --- 79.18 79.24 79.17 78.94 77.88 78.88 79.52 79.77 79.66 25 79.40 79.36 --- 79.20 79.20 79.18 78.91 77.84 79.29 79.54 79.76 79.66
26 79.41 79.37 --- 79.20 79.18 79.21 78.88 77.80 79.29 79.59 79.76 79.65 27 79.40 79.36 --- 79.19 79.17 79.19 78.86 77.77 79.28 79.61 79.71 79.62 28 79.32 --- 79.19 79.18 79.19 78.83 77.73 79.28 79.63 79.71 79.60 29 79.40 79.31 --- 79.21 --- 79.18 78.80 77.69 79.28 79.63 79.76 79.58 30 79.31 --- 79.21 --- 79.18 78.78 77.66 79.28 79.64 79.76 79.57 31 -- --- 79.22 --- 79.17 --- 77.65 79.65 79.78 --
MEAN -- -- 79.28 79.19 79.05 78.20 78.11 79.43 79.70 79.70 MAX --- --- 79.34 79.24 79.18 78.74 79.29 79.65 79.78 79.77 MIN --- --- 79.17 79.17 78.78 77.65 77.49 79.30 79.62 79.57

133 OCKLAWAHA RIVER BASIN
02237293 PALATLAKAHA RIVER AT STRUCTURE M-1, NEAR OKAHUMPKA, FL
LOCATION.--Lat 28° 44'39", long 81° 52'22", in SE1⁄ 4 sec.14, T.20 S., R.24 E., Lake County, Hydrologic Unit 03080102, on left bank 150 ft upstream from structure M-1, 270 ft downstream from CSX Railroad bridge, 0.3 mi upstream from bridge on State Highway 48, and 1.4 mi east of Okahumpka.
DRAINAGE AREA.--221 mi2.
PERIOD OF RECORD.--January 1970 to July 1976, October 1976 to current year.
REVISED RECORDS.--WDR FL-72-1: Drainage area.
GAGE.--Water-stage recorder. Datum of gage is at NGVD of 1929.
REMARKS.--Records fair. Flow regulated by manipulation of gates in spillway. Discharge computed from relation between discharge, head, and gate openings.
COOPERATION.--Gate-opening record provided by the Lake County Water Authority.
DISCHARGE, CUBIC FEET PER SECOND, WATER YEAR OCTOBER 2001 TO SEPTEMBER 2002DAILY MEAN VALUES
DAY OCT NOV DEC JAN FEB MAR APR MAY JUN JUL AUG SEP
1 2.3 1.2 0.42 0.19 0.28 0.33 0.14 0.00 e0.00 e1.6 3.2 3.6 2 2.1 1.2 0.41 0.69 0.27 0.33 0.11 0.00 e0.00 e1.6 2.8 3.5 3 2.0 1.2 0.38 1.5 0.26 0.35 0.12 0.00 e0.00 e1.4 2.5 3.5 4 1.8 1.3 0.37 1.3 0.26 0.84 0.15 0.00 e0.00 e1.4 2.4 3.4 5 1.7 1.8 0.35 1.1 0.24 0.72 0.12 0.00 e0.00 e1.3 2.2 3.4
6 1.7 1.3 0.34 0.95 0.25 0.59 0.08 0.00 e0.00 e1.3 2.1 3.4 7 1.6 1.0 0.35 0.85 0.30 0.53 0.05 0.00 e0.00 e1.2 2.3 3.4 8 1.5 0.89 0.35 0.76 0.33 0.49 0.02 0.00 e0.00 e1.2 2.6 3.3 9 1.5 0.83 0.35 0.69 0.32 0.44 0.00 0.00 e0.00 e1.1 2.5 3.310 1.4 0.79 0.33 0.65 0.30 0.41 0.00 0.00 e0.00 e1.2 2.3 3.3
11 1.3 0.77 0.32 0.6112 1.3 0.76 0.30 0.5713 1.3 0.74 0.30 0.5514 1.2 0.77 0.30 0.6115 1.4 0.79 0.28 0.75
0.29 0.41 0.00 0.00 e0.00 e1.2 2.1 3.3 0.28 0.40 0.00 0.00 e0.00 e1.3 2.1 3.3 0.28 0.38 0.00 0.00 e0.00 1.5 2.9 3.3 0.27 0.36 0.00 e0.00 e0.00 3.2 3.4 3.3 0.26 0.35 0.00 e0.00 e0.00 3.2 3.4 3.3
16 1.4 0.76 0.27 0.5317 1.4 0.71 0.26 0.4218 1.3 0.68 0.27 0.3719 1.3 0.67 0.25 0.3320 1.4 0.66 0.24 0.33
0.26 0.32 0.00 e0.00 e0.00 3.0 3.4 3.2 0.25 0.29 0.00 e0.00 e0.00 2.9 3.2 3.2 0.22 0.27 0.00 e0.00 e0.00 2.5 3.2 3.1 0.20 0.25 0.00 e0.00 e0.00 1.9 3.2 2.9 0.19 0.23 0.00 e0.00 e0.00 1.9 3.4 2.8
21 1.4 0.62 0.22 0.3322 1.5 0.59 0.20 0.3223 1.5 0.56 0.21 0.3224 1.5 0.53 0.24 0.3025 1.5 0.51 0.24 0.30
0.18 0.23 0.00 e0.00 e0.00 3.1 3.4 2.7 0.22 0.21 0.00 e0.00 e0.00 3.5 3.3 2.8 0.48 0.20 0.00 e0.00 e0.00 3.4 2.9 2.9 0.73 0.19 0.00 e0.00 e0.00 3.4 2.5 3.1 0.60 0.22 0.00 e0.00 e0.00 3.3 2.3 3.6
26 1.4 0.51 0.24 0.3027 1.3 0.50 0.22 0.3028 1.2 0.48 0.22 0.3129 1.2 0.47 0.21 0.3430 1.2 0.44 0.20 0.3331 1.2 --- 0.20 0.30
0.52 0.38 0.00 e0.00 e0.10 3.4 2.4 3.4 0.44 0.31 0.00 e0.00 e0.49 3.6 2.9 3.3 0.35 0.25 0.00 e0.00 e0.77 3.5 2.9 3.2--- 0.22 0.00 e0.00 e1.2 3.4 3.3 3.1--- 0.19 0.00 e0.00 e1.4 3.4 3.7 2.9 --- 0.17 --- e0.00 --- 3.3 3.8 --
TOTAL 45.8 24.03 8.84 17.20 MEAN 1.48 0.80 0.29 0.55 MAX 2.3 1.8 0.42 1.5 MIN 1.2 0.44 0.20 0.19CFSM 0.01 0.00 0.00 0.00 IN. 0.01 0.00 0.00 0.00
8.83 10.86 0.79 0.00 3.96 73.2 88.6 96.80.32 0.35 0.026 0.000 0.13 2.36 2.86 3.23 0.73 0.84 0.15 0.00 1.4 3.6 3.8 3.6 0.18 0.17 0.00 0.00 0.00 1.1 2.1 2.70.00 0.00 0.00 0.00 0.00 0.01 0.01 0.01 0.00 0.00 0.00 0.00 0.00 0.01 0.01 0.02
STATISTICS OF MONTHLY MEAN DATA FOR WATER YEARS 1970 - 2002, BY WATER YEAR (WY)
MEAN 19.6 8.13 13.1 44.7 MAX 238 93.9 154 439(WY) 1996 1996 1998 1998 MIN 0.000 0.000 0.000 0.000 (WY) 1979 1979 1979 1981
46.2 59.2 48.2 8.45 6.15 18.1 18.3 24.7540 605 365 81.5 57.2 198 311 2011998 1998 1998 1970 1970 1983 1984 19950.000 0.000 0.000 0.000 0.000 0.000 0.000 0.0001981 1981 1981 1977 1977 1977 2000 1977
SUMMARY STATISTICS FOR 2001 CALENDAR YEAR FOR 2002 WATER YEAR WATER YEARS 1970 - 2002
ANNUAL TOTAL 127.77ANNUAL MEAN 0.35 HIGHEST ANNUAL MEAN LOWEST ANNUAL MEAN HIGHEST DAILY MEAN 4.8 Sep 15LOWEST DAILY MEAN 0.00 Many days ANNUAL SEVEN-DAY MINIMUM 0.00 Jan 1 MAXIMUM PEAK STAGEANNUAL RUNOFF (CFSM) 0.002 ANNUAL RUNOFF (INCHES) 0.0210 PERCENT EXCEEDS 1.450 PERCENT EXCEEDS 0.0090 PERCENT EXCEEDS 0.00
378.91 1.04 26.2
194 19700.13 2001
3.8 Aug 31 727 Feb 20 1998 0.00 Apr 9-Jun 25 0.00 Some years0.00 Apr 9 0.00 Some years
71.16 Aug 30,31 74.18 Apr 3 1970 0.005 0.12 0.06 1.61 3.3 54 0.44 2.2 0.00 0.00
e Estimated

---
---------------
---------------
------------------ ---
---
134 OCKLAWAHA RIVER BASIN
02237293 PALATLAKAHA RIVER AT STRUCTURE M-1, NEAR OKAHUMPKA, FL--Continued
GAGE HEIGHT, FEET, WATER YEAR OCTOBER 2001 TO SEPTEMBER 2002 DAILY MEAN VALUES
DAY OCT NOV DEC JAN FEB MAR APR MAY JUN JUL AUG SEP
1 70.72 70.47 70.24 70.14 70.19 70.21 70.12 69.51 68.57 70.56 70.95 71.08 2 70.67 70.46 70.24 70.30 70.19 70.21 70.11 69.47 68.54 70.55 70.82 71.06 3 70.64 70.47 70.23 70.55 70.18 70.22 70.11 69.44 68.53 70.52 70.75 71.03 4 70.61 70.50 70.22 70.49 70.18 70.37 70.12 69.40 68.49 70.51 70.73 71.01 5 70.59 70.60 70.22 70.43 70.17 70.34 70.11 69.37 68.47 70.50 70.70 71.02
6 70.57 70.48 70.21 70.40 70.18 70.30 70.09 69.33 68.46 70.48 70.66 71.02 7 70.56 70.41 70.22 70.37 70.20 70.28 70.07 69.30 68.52 70.46 70.70 71.00 8 70.54 70.39 70.22 70.35 70.21 70.26 70.05 69.26 68.55 70.46 70.77 70.98 9 70.52 70.37 70.22 70.33 70.21 70.25 70.02 69.23 68.55 70.44 70.74 70.97 10 70.51 70.36 70.21 70.32 70.20 70.24 70.00 69.19 68.51 70.46 70.72 70.96
11 70.50 70.35 70.21 70.30 70.20 70.24 69.99 69.11 68.47 70.48 70.68 70.98 12 70.49 70.35 70.20 70.29 70.19 70.23 69.97 69.05 68.44 70.49 70.68 70.97 13 70.48 70.34 70.20 70.28 70.19 70.23 69.96 69.02 68.45 70.53 70.85 70.95 14 70.48 70.35 70.20 70.30 70.19 70.22 69.97 68.98 68.45 70.95 71.02 70.96 15 70.51 70.36 70.19 70.34 70.18 70.22 69.99 68.42 70.94 71.01 70.96
16 70.51 70.35 70.19 70.28 70.18 70.21 69.97 68.40 70.89 71.00 70.95 17 70.51 70.33 70.18 70.24 70.18 70.20 69.95 68.47 70.83 70.95 70.92 18 70.50 70.32 70.19 70.22 70.16 70.19 69.93 68.69 70.75 70.92 70.89 19 70.50 70.32 70.18 70.21 70.15 70.18 69.90 68.83 70.62 70.94 70.84 20 70.51 70.32 70.17 70.21 70.14 70.17 69.88 68.87 70.63 71.01 70.81
21 70.52 70.31 70.16 70.21 70.14 70.17 69.84 68.87 70.92 71.00 70.79 22 70.55 70.30 70.15 70.21 70.16 70.16 69.81 68.98 71.03 70.96 70.81 23 70.55 70.29 70.15 70.20 70.26 70.15 69.78 69.15 71.01 70.83 70.84 24 70.54 70.28 70.17 70.20 70.34 70.15 69.74 69.27 70.99 70.75 70.90 25 70.53 70.27 70.17 70.20 70.30 70.16 69.70 69.62 70.97 70.72 71.07
26 70.51 70.27 70.17 70.20 70.27 70.23 69.67 70.07 71.00 70.72 71.02 27 70.49 70.27 70.16 70.20 70.25 70.20 69.64 70.26 71.07 70.84 70.97 28 70.47 70.26 70.16 70.20 70.22 70.17 69.61 70.35 71.03 70.83 70.94 29 70.47 70.26 70.16 70.21 --- 70.16 69.57 70.47 71.01 70.97 70.89 30 70.47 70.25 70.15 70.21 --- 70.15 69.54 70.53 70.99 71.13 70.84 31 70.47 --- 70.15 70.20 --- 70.13 --- 70.98 71.13 --
MEAN 70.53 70.36 70.19 70.28 70.20 70.21 69.91 68.94 70.74 70.85 70.95 MAX 70.72 70.60 70.24 70.55 70.34 70.37 70.12 -- 70.53 71.07 71.13 71.08 MIN 70.47 70.25 70.15 70.14 70.14 70.13 69.54 -- 68.40 70.44 70.66 70.79
CAL YR 2001 MEAN 68.80 MAX 71.21 MIN 67.04

135 OCKLAWAHA RIVER BASIN
02237700 APOPKA-BEAUCLAIR CANAL NEAR ASTATULA, FL
LOCATION.--Lat 28° 43'20", long 81° 41'06", in NW1⁄ 4 sec.26, T.20 S., R.26 E., Lake County, Hydrologic Unit 03080102, near left bank 80 ft upstream from lock and dam, 500 ft upstream from bridge on County Road 48, and 3.0 mi east of Astatula.
DRAINAGE AREA.--184 mi2.
PERIOD OF RECORD.--July 1942 to June 1948 (discharge measurements only at site 1.5 mi downstream), July 1958 to current year.
REVISED RECORDS.--WSP 1905: Drainage area.
GAGE.--Water-stage recorder and data-collection platform. Datum of gage is at NGVD of 1929. Prior to June 1948, nonrecordinggage at site 1.5 mi downstream at datum 60.68 ft higher. March to June 1958, nonrecording gage at present site and datum. Since July 1958, auxiliary water-stage recorder at downstream side of lock and dam at same datum.
REMARKS.--Records fair. Since May 1956, flow regulated at station by manipulation of gates in spillway. Discharge computed fromrelation between discharge, head, and gate openings.
COOPERATION.--Gate-opening record provided by St. Johns River Water Management District.
DISCHARGE, CUBIC FEET PER SECOND, WATER YEAR OCTOBER 2001 TO SEPTEMBER 2002DAILY MEAN VALUES
DAY OCT NOV DEC JAN FEB MAR APR MAY JUN JUL AUG SEP
1 20 20 17 132 21 20 16 143 22 19 15 134 22 18 14 135 21 15 16 16
15 17 6.9 0.00 0.00 1.1 6.0 1414 19 7.1 0.00 0.00 0.40 6.7 1414 18 6.9 0.00 0.00 0.40 8.0 1413 15 7.1 0.00 0.00 0.00 8.1 1313 15 6.3 0.00 0.00 0.00 7.4 15
6 21 17 15 177 20 18 16 148 20 19 16 14 9 22 18 16 16 10 21 18 15 16
16 15 6.9 0.00 0.00 0.40 6.5 15 18 15 7.9 0.00 0.00 2.3 7.4 14 9.5 16 9.2 0.00 0.00 7.1 8.1 14 15 16 8.8 0.10 0.00 4.0 8.3 1415 15 7.0 0.10 0.00 6.2 8.7 14
11 21 18 16 16 12 21 18 16 16 13 22 17 16 16 14 22 14 17 17 15 20 11 15 16
14 14 7.1 0.70 0.00 6.2 8.7 1415 11 8.1 0.60 0.00 3.0 9.1 1513 8.7 6.8 0.00 0.00 8.4 10 1513 9.8 6.3 0.00 0.00 7.1 11 1514 10 6.7 0.00 0.00 6.1 11 14
16 20 14 16 16 17 17 16 15 16 18 19 17 14 16 19 20 17 14 17 20 19 17 13 17
14 10 7.2 0.10 0.00 6.4 12 1413 11 7.3 0.00 0.00 4.0 11 1414 10 8.1 0.00 0.00 6.8 11 1415 11 6.1 0.00 0.00 6.4 10 1416 10 2.1 0.00 0.00 7.6 11 15
21 20 17 14 17 22 20 18 15 17 23 20 19 15 18 24 21 19 16 18 25 20 18 13 16
15 8.4 0.50 0.00 0.00 7.0 11 1514 7.6 0.00 0.00 1.0 7.5 11 14 8.9 7.8 0.00 0.00 0.10 7.0 12 1415 9.2 4.0 0.00 0.00 6.8 12 1517 9.0 4.0 0.00 0.50 6.9 12 16
26 18 18 3.8 15 27 15 18 14 16 28 16 18 14 16 29 16 18 15 16 30 17 18 14 17 31 19 --- 13 17
16 8.4 0.30 0.00 0.20 7.5 12 17 8.0 7.5 2.6 0.00 0.00 7.3 13 1615 7.6 3.3 0.00 0.00 6.9 13 15 --- 8.4 0.00 0.00 0.00 6.8 14 15 --- 10 0.00 0.00 0.40 6.4 14 15 --- 9.3 --- 0.00 --- 6.2 14 --
TOTAL 613 522 454.8 492 MEAN 19.8 17.4 14.7 15.9MAX 22 20 17 18MIN 15 11 3.8 13
392.4 359.7 154.60 1.60 2.20 160.20 318.0 43714.0 11.6 5.15 0.052 0.073 5.17 10.3 14.618 19 9.2 0.70 1.0 8.4 14 17
8.0 7.5 0.00 0.00 0.00 0.00 6.0 13
STATISTICS OF MONTHLY MEAN DATA FOR WATER YEARS 1958 - 2002, BY WATER YEAR (WY)
MEAN 66.2 48.6 54.7 82.7MAX 343 280 336 540 (WY) 1961 1970 1995 1998 MIN 0.000 0.000 0.000 0.000 (WY) 1972 1972 1972 1965
83.8 106 104 41.9 55.5 58.5 75.4 89.5 414 450 480 316 278 336 384 3441998 1983 1983 1959 1959 1968 1995 19680.000 0.065 0.10 0.052 0.000 0.000 0.000 0.0001968 1968 1968 2002 1971 1971 1971 1971
SUMMARY STATISTICS FOR 2001 CALENDAR YEAR FOR 2002 WATER YEAR WATER YEARS 1958 - 2002
ANNUAL TOTAL 4802.60ANNUAL MEAN 13.2HIGHEST ANNUAL MEANLOWEST ANNUAL MEAN HIGHEST DAILY MEAN 47LOWEST DAILY MEAN 0.00ANNUAL SEVEN-DAY MINIMUM 0.01MAXIMUM PEAK STAGE10 PERCENT EXCEEDS 2350 PERCENT EXCEEDS 1390 PERCENT EXCEEDS 0.70
3907.50 10.7 72.5
224 197010.7 2002
Sep 16 22 Oct 3,4,9,13,14 754 Mar 19 1960Jun 9 0.00 Apr 22 0.00 Some yearsJul 8 0.00 Apr 29 0.00 Some years
64.59 Sep 26 68.48 Oct 6 196018 251 13 30 0.00 7.0

---
---------------
---------------
---
---
---
136 OCKLAWAHA RIVER BASIN
02237700 APOPKA-BEAUCLAIR CANAL NEAR ASTATULA, FL--Continued
GAGE HEIGHT, FEET, WATER YEAR OCTOBER 2001 TO SEPTEMBER 2002 DAILY MEAN VALUES
DAY OCT NOV DEC JAN FEB MAR APR MAY JUN JUL AUG SEP
1 63.69 63.70 63.53 63.27 63.42 63.51 63.23 62.61 62.64 63.06 63.15 63.88 2 63.81 63.70 63.49 63.34 63.36 63.67 63.24 62.35 62.66 63.02 63.21 63.91 3 63.84 63.67 63.41 63.19 63.33 63.55 63.21 62.36 62.58 63.03 63.31 63.91 4 63.85 63.60 63.38 63.25 63.20 63.22 63.22 62.43 62.51 62.99 63.31 63.86 5 63.83 63.31 63.43 63.45 63.24 63.28 63.13 62.43 62.67 62.99 63.27 64.07
6 63.82 63.51 63.43 63.45 63.45 63.43 63.15 62.43 62.72 63.02 63.20 64.04 7 63.71 63.62 63.45 63.26 63.39 63.42 63.30 62.65 62.73 63.09 63.27 63.96 8 63.71 63.62 63.47 63.36 63.19 63.48 63.42 62.77 --- 63.12 63.31 63.93 9 63.84 63.61 63.44 63.44 63.39 63.47 63.37 62.80 --- 63.08 63.33 63.93 10 63.82 63.62 63.43 63.48 63.40 63.39 63.23 62.87 63.11 63.37 63.93
11 63.82 63.62 63.47 63.47 63.33 63.47 63.23 62.97 63.12 63.36 64.00 12 63.82 63.57 63.46 63.49 63.38 63.57 63.23 62.91 63.08 63.40 64.09 13 63.91 63.55 63.47 63.42 63.30 63.37 63.21 62.74 63.30 63.48 64.07 14 63.88 63.33 63.50 63.52 63.30 63.46 63.15 62.31 63.24 63.55 64.13 15 63.70 63.17 63.43 63.43 63.36 63.51 63.16 62.33 63.15 63.58 64.00
16 63.68 63.31 63.48 63.49 63.33 63.53 63.19 62.79 63.14 63.64 63.98 17 63.54 63.48 63.43 63.49 63.23 63.56 63.20 62.75 63.11 63.60 63.96 18 63.65 63.54 63.31 63.44 63.31 63.53 63.20 62.83 63.16 63.54 63.99 19 63.69 63.53 63.36 63.55 63.42 63.57 63.17 62.68 63.17 63.53 64.01 20 63.68 63.52 63.25 63.50 63.47 63.50 63.08 62.45 63.15 63.54 64.04
21 63.73 63.52 63.30 63.53 63.43 63.31 63.02 62.30 63.23 63.61 64.03 22 63.71 63.59 63.39 63.51 63.36 63.21 62.93 62.19 62.94 63.27 63.61 64.01 23 63.71 63.63 63.43 63.56 63.18 63.28 62.94 62.18 62.92 63.22 63.66 64.01 24 63.76 63.66 63.38 63.59 63.39 63.41 63.10 62.65 62.92 63.22 63.71 64.06 25 63.73 63.62 63.28 63.48 63.50 63.39 63.09 62.75 62.97 63.22 63.64 64.20
26 63.57 63.55 63.09 63.43 63.47 63.34 62.96 62.73 63.01 63.27 63.64 64.37 27 63.42 63.58 63.36 63.45 63.16 63.24 63.09 62.62 62.91 63.26 63.76 64.16 28 63.44 63.61 63.36 63.47 63.34 63.28 63.06 62.52 62.91 63.23 63.80 64.11 29 63.48 63.62 63.32 63.49 --- 63.34 62.82 62.38 62.88 63.22 63.90 64.07 30 63.52 63.57 63.32 63.53 --- 63.49 62.87 62.23 62.94 63.19 63.88 64.06 31 63.66 -- 63.29 63.55 --- 63.42 --- 62.33 63.18 63.94 --
MEAN 63.71 63.55 63.39 63.45 63.34 63.43 63.14 62.56 63.15 63.52 64.03 MAX 63.91 63.70 63.53 63.59 63.50 63.67 63.42 62.97 --- 63.30 63.94 64.37 MIN 63.42 63.17 63.09 63.19 63.16 63.21 62.82 62.18 --- 62.99 63.15 63.86
CAL YR 2001 MEAN 63.48 MAX 64.05 MIN 62.80

---
---------------
---------------
---
---
137 OCKLAWAHA RIVER BASIN
02237701 APOPKA-BEAUCLAIR CANAL BELOW DAM, NEAR ASTATULA, FL
LOCATION.--Lat 28° 43'22", long 81° 41'06", in NW1⁄ 4 sec.26, T.20 S., R.26 E., Lake County, Hydrologic Unit 3080102, near left bank at downstream end of lock, 300 ft upstream from bridge on County Road 48, and 3.0 mi east of Astatula.
DRAINAGE AREA.--184 mi2.
PERIOD OF RECORD.--January 1957 to current year (gage heights only). Prior to October 1967, published as Apopka-Beauclair Canal near Astatula (auxiliary).
GAGE.--Water-stage recorder and data-collection platform. Datum of gage is at NGVD of 1929. Prior to July 14, 1958, nonrecording gage at same site and datum.
EXTREMES FOR PERIOD OF RECORD.--Maximum gage height, 65.93 ft, Mar. 14, 1958; minimum, 59.71 ft, June 12-15, 17, 22, 2001.
GAGE HEIGHT, FEET, WATER YEAR OCTOBER 2001 TO SEPTEMBER 2002DAILY MEAN VALUES
DAY OCT NOV DEC JAN FEB MAR APR MAY JUN JUL AUG SEP
1 61.46 61.23 61.28 61.10 61.37 61.38 61.08 60.74 --- 61.58 61.72 62.36 2 61.44 61.20 61.34 61.25 61.34 61.45 61.08 60.72 --- 61.37 61.75 62.32 3 61.41 61.23 61.33 61.17 61.30 61.39 61.08 60.70 --- 61.29 61.80 62.27 4 61.38 61.20 61.31 61.16 61.22 61.31 61.09 60.69 --- 61.24 61.82 62.27 5 61.41 61.24 61.33 61.30 61.23 61.31 61.06 60.68 --- 61.21 61.80 62.32
6 61.42 61.27 61.32 61.30 61.33 61.39 61.04 60.64 --- 61.20 61.79 62.39 7 61.43 61.31 61.32 61.13 61.31 61.39 61.10 60.59 --- 61.18 61.85 62.35 8 61.43 61.29 61.34 61.19 61.23 61.41 61.16 60.57 --- 61.18 61.86 62.32 9 61.39 61.28 61.37 61.23 61.30 61.39 61.05 60.55 --- 61.17 61.84 62.30 10 61.33 61.28 61.42 61.26 61.25 61.35 60.97 60.54 61.17 61.87 62.27
11 61.31 61.27 61.39 61.22 61.23 61.33 60.99 60.57 61.13 61.83 62.27 12 61.29 61.26 61.35 61.24 61.27 61.21 60.99 60.55 61.13 61.83 62.26 13 61.28 61.25 61.34 61.25 61.19 61.21 60.98 60.49 61.39 61.87 62.25 14 61.27 61.29 61.34 61.34 61.18 61.21 60.92 60.49 61.75 62.21 62.26 15 61.39 61.23 61.32 61.33 61.23 61.20 60.95 60.52 61.44 62.24 62.36
16 61.41 61.25 61.36 61.34 61.19 61.19 61.01 60.53 61.41 62.19 62.41 17 61.38 61.27 61.31 61.33 61.11 61.21 61.02 60.64 61.40 62.15 62.42 18 61.36 61.27 61.21 61.29 61.19 61.20 60.97 60.69 61.41 62.12 62.41 19 61.33 61.26 61.22 61.34 61.26 61.22 60.93 60.60 61.37 62.10 62.37 20 61.31 61.24 61.15 61.35 61.28 61.20 60.90 60.58 61.40 62.13 62.37
21 61.29 61.22 61.15 61.36 61.24 61.18 60.90 60.54 60.66 61.76 62.20 62.37 22 61.39 61.21 61.21 61.37 61.21 61.20 60.89 60.50 60.67 61.82 62.18 62.34 23 61.37 61.20 61.23 61.42 61.23 61.19 60.87 60.52 60.65 61.71 62.09 62.33 24 61.32 61.20 61.17 61.46 61.42 61.19 60.91 60.54 60.77 61.71 62.04 62.35 25 61.36 61.19 61.11 61.42 61.38 61.17 60.87 60.53 60.94 61.68 62.06 62.39
26 61.34 61.29 61.03 61.38 61.36 61.15 60.79 60.56 61.00 61.71 62.11 62.40 27 61.28 61.35 61.16 61.40 61.22 61.11 60.82 60.58 61.05 61.72 62.14 62.41 28 61.27 61.32 61.16 61.41 61.27 61.16 60.82 60.58 61.00 61.72 62.23 62.42 29 61.26 61.31 61.14 61.41 --- 61.17 60.74 60.52 61.08 61.73 62.31 62.43 30 61.26 61.28 61.15 61.42 --- 61.15 60.74 60.48 61.42 61.71 62.26 62.42 31 61.25 -- 61.11 61.42 --- 61.13 --- 60.40 61.72 62.43 --
MEAN 61.35 61.26 61.26 61.31 61.26 61.25 60.96 60.58 61.46 62.03 62.35 MAX 61.46 61.35 61.42 61.46 61.42 61.45 61.16 60.74 --- 61.82 62.43 62.43 MIN 61.25 61.19 61.03 61.10 61.11 61.11 60.74 60.40 --- 61.13 61.72 62.25
CAL YR 2001 MEAN 60.69 MAX 62.21 MIN 59.72

138 OCKLAWAHA RIVER BASIN
02237734 WOLF BRANCH AT FCRR NEAR MOUNT DORA, FL
LOCATION.--Lat 28° 47'47", long 81° 36'29", in NW1⁄ 4 sec.34, T.19 S., R.27 E., Lake County, Hydrologic Unit 3080102, on right bank 50 ft downstream from culvert under Florida Central Railroad, 0.25 mi south of State Highway 46, 1.1 mi east of U.S. Highway 441, and 2.1 mi southeast of Mount Dora.
DRAINAGE AREA.--4.67 mi2.
PERIOD OF RECORD.--July to September 1991 (discharge measurements only), January 1992 to current year.
GAGE.--Water-stage recorder. Datum of gage is at NGVD of 1929 (St. Johns River Water Management District bench mark). Prior to Mar. 4, 1997, at datum 67.39 ft higher, and Mar. 4, 1997 to Mar. 26, 1998, at datum 76.00 ft higher.
REMARKS.--Records good.
DISCHARGE, CUBIC FEET PER SECOND, WATER YEAR OCTOBER 2001 TO SEPTEMBER 2002DAILY MEAN VALUES
DAY OCT NOV DEC JAN FEB MAR APR MAY JUN JUL AUG SEP
1 4.9 0.67 0.42 0.00 0.14 0.19 0.00 0.00 0.00 3.1 6.2 112 4.3 0.67 0.39 0.00 0.14 0.19 0.00 0.00 0.00 3.9 5.6 103 3.9 0.79 0.38 0.00 0.12 0.20 0.00 0.00 0.00 4.2 5.2 9.94 3.6 0.84 0.37 0.00 0.11 0.33 0.00 0.00 0.00 3.9 5.0 9.6 5 3.2 1.1 0.34 0.00 0.09 0.35 0.00 0.00 0.00 3.7 4.6 9.7
6 3.0 1.1 0.32 0.00 0.06 0.36 0.00 0.00 0.00 3.5 4.3 10 7 2.8 1.1 0.30 0.00 0.07 0.35 0.00 0.00 0.00 3.2 4.2 108 2.6 0.97 0.29 0.03 0.07 0.35 0.00 0.00 0.00 3.1 4.2 9.79 2.4 0.92 0.27 0.03 0.06 0.35 0.00 0.00 0.00 3.2 4.1 8.8
10 2.3 0.86 0.25 0.04 0.06 0.33 0.00 0.00 0.00 3.4 3.9 7.7
11 2.1 0.82 0.24 0.0412 1.9 0.77 0.22 0.0413 1.8 0.74 0.21 0.0514 1.6 0.88 0.20 0.0715 1.6 0.94 0.19 0.12
0.06 0.30 0.00 0.00 0.00 3.4 3.6 6.80.05 0.28 0.00 0.00 0.00 3.6 3.3 6.10.04 0.24 0.00 0.00 0.00 4.4 3.4 5.60.03 0.21 0.00 0.00 0.00 7.0 4.1 5.10.02 0.18 0.00 0.00 0.00 7.9 7.0 4.7
16 1.5 0.92 0.16 0.1617 1.3 0.88 0.13 0.1818 1.2 0.84 0.10 0.1919 1.1 0.82 0.07 0.2020 1.2 0.79 0.05 0.20
0.00 0.16 0.05 0.00 0.00 7.3 9.6 4.30.00 0.16 0.07 0.00 0.00 6.5 9.8 4.10.00 0.13 0.07 0.00 0.00 5.8 9.8 4.90.00 0.11 0.06 0.00 0.00 5.1 9.4 4.90.00 0.09 0.05 0.00 0.00 4.9 8.4 5.0
21 1.1 0.75 0.03 0.2322 1.1 0.71 0.00 0.2323 1.1 0.69 0.00 0.2324 1.1 0.64 0.00 0.2225 1.1 0.61 0.00 0.22
0.00 0.07 0.03 0.00 0.00 7.0 7.6 5.50.00 0.06 0.00 0.00 0.00 9.4 6.6 5.40.00 0.04 0.00 0.00 0.00 9.6 5.9 5.10.10 0.02 0.00 0.00 0.00 9.0 5.2 5.10.16 0.00 0.00 0.00 0.00 8.3 4.8 5.7
26 1.0 0.58 0.00 0.2227 0.93 0.55 0.00 0.2028 0.83 0.52 0.00 0.2029 0.75 0.49 0.00 0.19 30 0.70 0.47 0.00 0.17 31 0.69 --- 0.00 0.15
0.20 0.00 0.00 0.00 0.17 8.1 6.0 7.60.22 0.00 0.00 0.00 0.33 7.6 7.3 8.00.20 0.00 0.00 0.00 0.64 7.3 7.6 7.4 --- 0.00 0.00 0.00 1.2 8.2 7.5 6.6 --- 0.00 0.00 0.00 2.0 7.8 7.7 5.9 --- 0.00 --- 0.00 --- 6.9 10 --
TOTAL 58.70 23.43 4.93 3.61MEAN 1.89 0.78 0.16 0.12 MAX 4.9 1.1 0.42 0.23 MIN 0.69 0.47 0.00 0.00CFSM 0.41 0.17 0.03 0.02 IN. 0.47 0.19 0.04 0.03
2.00 5.05 0.33 0.00 4.34 180.3 191.9 210.2 0.071 0.16 0.011 0.000 0.14 5.82 6.19 7.01 0.22 0.36 0.07 0.00 2.0 9.6 10 11 0.00 0.00 0.00 0.00 0.00 3.1 3.3 4.10.02 0.03 0.00 0.00 0.03 1.25 1.33 1.50 0.02 0.04 0.00 0.00 0.03 1.44 1.53 1.67
STATISTICS OF MONTHLY MEAN DATA FOR WATER YEARS 1992 - 2002, BY WATER YEAR (WY)
MEAN 2.65 1.53 1.76 2.25 MAX 7.47 7.04 7.51 6.83(WY) 1996 1995 1995 1996 MIN 0.001 0.000 0.000 0.000 (WY) 1998 2001 2001 2001
1.47 1.65 0.87 0.19 0.60 1.98 2.15 3.61 6.17 7.80 4.25 1.45 2.04 5.82 9.01 7.301998 1998 1996 1996 1994 2002 1995 20010.000 0.000 0.000 0.000 0.000 0.000 0.004 0.0061992 1992 1992 1992 1992 2000 1992 1997
SUMMARY STATISTICS FOR 2001 CALENDAR YEAR FOR 2002 WATER YEAR WATER YEARS 1992 - 2002
ANNUAL TOTAL 332.94ANNUAL MEAN 0.91 HIGHEST ANNUAL MEAN LOWEST ANNUAL MEAN HIGHEST DAILY MEAN 26 LOWEST DAILY MEAN 0.00 ANNUAL SEVEN-DAY MINIMUM 0.00 MAXIMUM PEAK FLOW MAXIMUM PEAK STAGEANNUAL RUNOFF (CFSM) 0.20ANNUAL RUNOFF (INCHES) 2.6510 PERCENT EXCEEDS 1.850 PERCENT EXCEEDS 0.0090 PERCENT EXCEEDS 0.00
684.79 1.88 1.83
4.02 19950.44 1997
Sep 16 11 Sep 1 28 Nov 17 1994 Many days 0.00 Many days 0.00 Many days Jan 1 0.00 Dec 22 0.00 Many days
11 Sep 1 28 Nov 17 1994 76.51 Sep 1 77.34 Sep 16 2001 0.40 0.39 5.45 5.33 7.0 5.1 0.22 0.69 0.00 0.00

139 OCKLAWAHA RIVER BASIN
02238000 HAINES CREEK AT LISBON, FL
LOCATION.--Lat 28° 52'14", long 81° 47'02", in NW1⁄ 4 sec.2, T.19 S., R.25 E., Lake County, Hydrologic Unit 03080102, on right bank at upstream side of Burrell lock and dam, 900 ft upstream from bridge on State Highway 44, 0.2 mi south of Lisbon, and 7 mi northeast of Leesburg.
DRAINAGE AREA.--648 mi2.
PERIOD OF RECORD.--July 1942 to September 1978, October 1978 to September 1985 (gage heights only), October 1985 to current year.
REVISED RECORDS.--WDR FL-72-1: Drainage area.
GAGE.--Water-stage recorder. Datum of gage is at NGVD of 1929. Prior to Mar. 16, 1998 datum of gage at present site 0.30 ft lower. Prior to Aug. 22, 1956, nonrecording gage at site 1,000 ft downstream at datum 58.93 ft higher, and Aug. 22, 1956 to Mar. 5,1957, at present datum. Mar. 6 to Oct. 8, 1957, nonrecording gage at present site at datum 0.30 ft higher. Oct. 9, 1957 toSept. 30, 1996, water-stage recorder at present site at present datum. Mar. 6 to Oct. 8, 1957, auxiliary non-recording gage and Oct. 9, 1957 to Sept. 30, 1996, auxiliary water-stage recorder at downstream side of lock and dam at present datum. Since Oct. 1, 1996, auxiliary water-stage recorder at downstream side of lock and dam at datum, 0.30 ft lower.
REMARKS.--Records poor. Since Dec. 23, 1956, flow regulated at station by manipulation of gates in spillway. Discharge computedfrom relation between discharge, head, gate openings, and lockages. See WDR FL-91 for history of low flows and minimum gage heights.
COOPERATION.--Gate-opening record provided by St. Johns River Water Management District.
EXTREMES FOR OUTSIDE PERIOD OF RECORD.--Flood of 1926 reached a stage of about 65.3 ft, former site and present datum, from information by local residents.
DISCHARGE, CUBIC FEET PER SECOND, WATER YEAR OCTOBER 2001 TO SEPTEMBER 2002DAILY MEAN VALUES
DAY OCT NOV DEC JAN FEB MAR APR MAY JUN JUL AUG SEP
1 80 28 30 27 2 52 27 31 27 3 28 29 27 27 4 28 28 30 28 5 28 27 28 27
30 28 29 27 29 27 28 30 29 28 29 28 30 27 27 30 29 28 28 28 28 28 29 27 28 26 30 32 28 30 29 26 28 27 30 30 29 30 27 26
6 30 29 28 28 7 30 30 29 28 8 27 30 29 27 9 27 30 31 2810 27 30 28 29
29 29 31 28 28 30 26 27 27 29 31 28 28 31 26 28 27 31 29 29 30 27 27 30 30 33 30 28 30 27 28 26 31 31 30 28 28 27 30 26
11 28 29 30 3012 28 28 41 3013 32 29 56 2914 29 27 57 2715 27 28 57 27
29 29 29 31 28 28 29 26 29 30 28 29 28 28 26 26 29 30 29 27 28 28 27 26 28 31 30 28 28 30 27 28 30 31 29 28 29 28 27 30
16 28 28 56 2817 27 30 41 3018 27 30 27 3019 28 29 29 3220 29 30 27 30
29 33 30 28 30 28 28 26 29 33 28 27 27 28 30 28 28 30 29 30 26 27 30 27 29 30 29 27 28 28 26 27 30 32 32 27 27 31 27 27
21 28 29 27 2922 27 29 29 2923 27 31 30 2924 29 31 27 3025 28 32 27 30
30 30 31 28 26 29 27 29 27 30 29 28 27 27 27 30 26 32 28 27 28 27 27 27 30 32 30 28 26 28 30 26 30 30 29 31 27 28 32 26
26 27 29 28 2827 27 30 28 2928 28 29 30 3029 27 30 27 2930 28 28 28 3031 28 --- 27 30
31 30 30 32 26 28 26 26 26 31 32 31 27 30 26 27 27 31 31 28 28 30 26 29--- 31 28 28 29 28 27 30--- 32 28 27 29 27 26 26 --- 27 --- 28 --- 27 28 --
TOTAL 944 874 1020 892 MEAN 30.5 29.1 32.9 28.8 MAX 80 32 57 32 MIN 27 27 27 27
805 935 886 884 840 877 856 82328.8 30.2 29.5 28.5 28.0 28.3 27.6 27.4 31 33 32 32 30 31 32 30 26 26 28 27 26 27 26 26
STATISTICS OF MONTHLY MEAN DATA FOR WATER YEARS 1957 - 2002, BY WATER YEAR (WY)
MEAN 158 141 130 196 MAX 1128 1180 1009 1409(WY) 1961 1961 1961 1998 MIN 0.000 0.000 5.81 1.87(WY) 1957 1957 1957 1975
222 332 313 170 187 211 219 229 1397 1495 1210 1191 1073 1008 1057 9951998 1998 1987 1960 1960 1960 1960 1960 1.57 2.19 4.77 3.52 14.0 14.2 13.3 27.01975 1975 1968 1968 1957 1957 1967 2001
SUMMARY STATISTICS FOR 2001 CALENDAR YEAR FOR 2002 WATER YEAR WATER YEARS 1957 - 2002
ANNUAL TOTAL 8768.7ANNUAL MEAN 24.0 HIGHEST ANNUAL MEAN LOWEST ANNUAL MEAN HIGHEST DAILY MEAN 92 LOWEST DAILY MEAN 3.7 ANNUAL SEVEN-DAY MINIMUM 6.5 MAXIMUM PEAK STAGE10 PERCENT EXCEEDS 3150 PERCENT EXCEEDS 2590 PERCENT EXCEEDS 8.5
1063629.1 209
892 1960 23.0 2001
Sep 27 80 Oct 1 *1560 Feb 26 1998 Sep 15 26 Many days 0.00 Some years Mar 29 27 Jun 20 0.00 Some years
62.77 Sep 26 64.50 Apr 5,7,8 196031 79228 5427 22
* Feb 26, Mar 9, 1998

---------------
------------
------------------
--- ------
140 OCKLAWAHA RIVER BASIN
02238000 HAINES CREEK AT LISBON, FL--Continued
GAGE HEIGHT, FEET, WATER YEAR OCTOBER 2001 TO SEPTEMBER 2002 DAILY MEAN VALUES
DAY OCT NOV DEC JAN FEB MAR APR MAY JUN JUL AUG SEP
1 61.58 61.36 61.34 61.10 61.36 61.31 61.30 60.98 60.41 61.94 62.47 2 61.59 61.37 61.33 61.17 61.34 61.37 61.27 60.96 60.40 61.98 62.50 3 61.60 61.39 61.32 61.24 61.33 61.39 61.28 60.94 60.41 61.99 62.49 4 61.60 61.39 61.29 61.23 61.30 61.44 61.28 60.92 60.40 62.00 62.50 5 61.60 61.34 61.29 61.23 61.25 61.41 61.25 60.89 60.39 61.99 62.56
6 61.61 61.38 61.29 61.27 61.29 61.42 61.22 60.86 60.37 61.34 61.98 62.56 7 61.58 61.40 61.30 61.24 61.32 61.42 61.21 60.85 60.41 61.34 62.00 62.55 8 61.55 61.40 61.32 61.24 61.27 61.44 61.22 60.84 60.45 61.35 61.97 62.54 9 61.56 61.40 61.32 61.24 61.28 61.45 61.20 60.82 60.43 61.35 61.96 62.54 10 61.55 61.39 61.32 61.24 61.30 61.45 61.18 60.80 60.42 61.36 61.96 62.55
11 61.56 61.39 61.32 61.24 61.28 61.44 61.17 60.77 60.42 61.37 61.95 62.55 12 61.56 61.37 61.31 61.25 61.28 61.46 61.16 60.75 60.42 61.37 61.97 62.55 13 61.56 61.35 61.30 61.24 61.26 61.46 61.16 60.72 60.46 61.45 62.08 62.54 14 61.56 61.33 61.30 61.29 61.24 61.46 61.19 60.68 60.57 61.62 62.16 62.60 15 61.52 61.33 61.28 61.32 61.25 61.45 61.20 60.64 60.57 61.61 62.20 62.60
16 61.52 61.34 61.26 61.32 61.26 61.45 61.20 60.62 60.56 61.61 62.21 62.59 17 61.46 61.34 61.27 61.33 61.24 61.45 61.19 60.61 60.59 61.60 62.22 62.59 18 61.45 61.35 61.27 61.33 61.21 61.44 61.18 60.61 60.68 61.60 62.22 62.59 19 61.46 61.36 61.25 61.34 61.23 61.44 61.17 60.59 60.73 61.59 62.23 62.58 20 61.46 61.37 61.21 61.34 61.24 61.43 61.16 60.51 60.74 61.59 62.23 62.59
21 61.48 61.36 61.19 61.34 61.23 61.42 61.14 60.48 60.74 61.70 62.23 62.58 22 61.49 61.37 61.19 61.34 61.24 61.36 61.11 60.43 61.83 62.22 62.57 23 61.50 61.37 61.20 61.35 61.27 61.32 61.09 60.44 61.86 62.22 62.58 24 61.51 61.38 61.21 61.36 61.37 61.33 61.07 60.46 61.87 62.21 62.61 25 61.50 61.37 61.16 61.36 61.38 61.34 61.06 60.46 61.88 62.21 62.70
26 61.44 61.37 61.14 61.34 61.39 61.36 61.04 60.43 61.89 62.23 62.74 27 61.39 61.36 61.15 61.35 61.34 61.35 61.03 60.41 61.94 62.25 62.71 28 61.34 61.37 61.14 61.35 61.31 61.33 61.02 60.41 61.94 62.26 62.69 29 61.33 61.36 61.14 61.36 --- 61.32 60.99 60.40 61.96 62.28 62.67 30 61.33 61.35 61.13 61.36 --- 61.33 60.98 60.41 61.95 62.34 62.65 31 61.36 -- 61.12 61.37 --- 61.32 --- 60.42 61.94 62.46 --
MEAN 61.50 61.37 61.25 61.29 61.29 61.40 61.16 60.65 --- 62.13 62.58 MAX 61.61 61.40 61.34 61.37 61.39 61.46 61.30 60.98 --- 62.46 62.74 MIN 61.33 61.33 61.12 61.10 61.21 61.31 60.98 60.40 --- 61.94 62.47
CAL YR 2001 MEAN 60.81 MAX 61.67 MIN 59.85

--- ------ ------ ------ ------ ---
------------
------
------ ------ ------ ------ ---
--- ------ ------ ------ ------ ------ ---
--- --- --- ------ ---
141 OCKLAWAHA RIVER BASIN
02238001 HAINES CREEK BELOW BURRELL DAM, AT LISBON, FL
LOCATION.--Lat 28° 52'16", long 81° 47'04", in NW1⁄ 4 sec.2, T.19 S., R.25 E., Lake County, Hydrologic Unit 03080102, on left bank at downstream side of Burrell lock and dam, 750 ft upstream from bridge on State Highway 44, 0.2 mi south of Lisbon, and 7 mi northeast of Leesburg.
DRAINAGE AREA.--648 mi2.
PERIOD OF RECORD.--March 1957 to current year (gage heights only). Prior to October 1967, published as Haines Creek at Lisbon (auxiliary).
GAGE.--Water-stage recorder. Datum of gage is at NGVD of 1929. Prior to Oct. 9, 1957, nonrecording gage at present site at datum 0.30 ft higher. Oct. 10, 1957 to Sept. 30, 1996, water-stage recorder at present site at datum 0.30 ft higher.
EXTREMES FOR PERIOD OF RECORD.--Maximum gage height, 61.48 ft, Oct. 9, 1960; minimum observed, 52.90 ft, June 26,28, 1984, result of drawdown of Lake Griffin.
GAGE HEIGHT, FEET, WATER YEAR OCTOBER 2001 TO SEPTEMBER 2002DAILY MEAN VALUES
DAY OCT NOV DEC JAN FEB MAR APR MAY JUN JUL AUG SEP
1 57.59 57.04 56.89 57.21 57.18 57.22 57.02 56.31 57.96 58.74 2 57.56 57.04 56.95 57.21 57.21 57.21 56.99 56.31 58.00 58.78 3 57.53 57.01 57.04 57.20 57.25 57.22 56.95 56.30 58.07 58.78 4 57.52 56.99 57.01 57.20 57.41 57.21 56.93 56.28 58.07 58.80 5 57.52 56.98 56.99 57.13 57.37 57.19 56.88 56.26 58.09 58.81
6 57.53 56.97 57.04 57.15 57.36 57.17 56.84 56.26 57.28 58.09 58.82 7 57.51 56.97 57.04 57.20 57.38 57.14 56.83 56.25 57.25 58.11 58.80 8 57.49 56.98 57.02 57.17 57.37 57.12 56.80 56.24 57.25 58.11 58.79 9 57.47 56.97 57.00 57.17 57.38 57.12 56.78 56.22 57.26 58.09 58.78 10 57.47 --- 56.97 57.00 57.18 57.38 57.12 56.74 56.20 57.28 58.07 58.78
11 57.47 --- 56.97 57.01 57.18 57.36 57.12 56.70 56.20 57.28 58.06 58.77 12 57.46 --- 56.98 57.01 57.17 57.37 57.12 56.67 56.20 57.31 58.06 58.75 13 57.45 --- 57.00 57.02 57.16 57.39 57.13 56.67 56.24 57.40 58.13 58.74 14 57.46 --- 57.01 57.05 57.14 57.36 57.15 56.62 56.40 57.57 58.20 58.76 15 57.45 --- 57.01 57.13 57.14 57.35 57.16 56.56 56.39 57.55 58.21 58.77
16 57.44 --- 56.99 57.13 57.15 57.35 57.16 56.54 56.41 57.54 58.22 58.75 17 57.40 57.17 57.00 57.15 57.16 57.34 57.16 56.54 56.49 57.54 58.23 58.74 18 57.37 57.16 57.00 57.16 57.11 57.33 57.16 56.54 56.62 57.52 58.25 58.73 19 57.16 56.98 57.17 57.11 57.33 57.15 56.49 56.68 57.53 58.28 58.72 20 57.17 56.96 57.17 57.13 57.33 57.15 56.45 56.75 57.58 58.30 58.72
21 57.15 56.93 57.17 57.13 57.34 57.13 56.42 56.79 57.77 58.30 58.71 22 57.14 56.93 57.17 57.14 57.29 57.12 56.38 57.83 58.30 58.70 23 57.14 56.93 57.18 57.20 57.27 57.08 56.38 --- 58.30 58.69 24 57.13 56.95 57.19 57.27 57.26 57.06 56.38 --- 58.30 58.72 25 57.11 56.93 57.19 57.26 57.26 57.07 56.37 57.91 58.30 58.80
26 57.10 56.94 57.19 57.27 57.28 57.05 56.34 57.91 58.31 58.79 27 57.09 56.91 57.19 57.28 57.29 57.04 56.34 57.94 58.33 58.80 28 57.08 56.91 57.20 57.21 57.25 57.04 56.32 57.96 58.33 58.79 29 57.07 56.92 57.20 --- 57.25 57.02 56.33 57.98 58.39 58.78 30 57.06 56.91 57.21 --- 57.24 57.00 56.32 57.97 58.49 58.76 31 --- 56.91 57.20 --- 57.23 --- 56.31 57.96 58.70 --
MEAN -- 56.97 57.10 57.18 57.31 57.13 56.59 --- 58.21 58.76 MAX --- 57.04 57.21 57.28 57.41 57.22 57.02 --- 58.70 58.82 MIN --- 56.91 56.89 57.11 57.18 57.00 56.31 --- 57.96 58.69

---
142 OCKLAWAHA RIVER BASIN
02238499 OCKLAWAHA RIVER ABOVE MOSS BLUFF DAM, AT MOSS BLUFF, FL
LOCATION.--Lat 29° 04'52", long 81° 52'51", in SW1⁄ 4 sec.23, T.16 S., R.24 E., Marion County, Hydrologic Unit 03080102, at upstream side of spillway structure of Moss Bluff Dam, 0.3 mi upstream from bridge on State Highway 464, 0.4 mi southwest of Moss Bluff, 3.9 mi northeast of Ocklawaha, and 64.3 mi upstream from mouth.
DRAINAGE AREA.--879 mi2.
PERIOD OF RECORD.--October 1965 to June 1967, October 1969 to current year (gage heights only).
REVISED RECORDS.--WDR FL-74-1: Drainage area.
GAGE.--Water-stage recorder and data-collection platform. Datum of gage is 0.30 ft above NGVD of 1929. June 9, 1967 to Sept. 30,1970, at datum 0.30 ft lower. Prior to June 9, 1967 at datum 0.42 ft lower. This is the auxiliary gage for station 02238500 located at downstream side of spillway structure.
EXTREMES FOR PERIOD OF RECORD.--Maximum gage height, 59.66 ft, Mar. 13, 1993; minimum, 45.45 ft, Mar. 6, 1973, result of dike failure.
GAGE HEIGHT, FEET, WATER YEAR OCTOBER 2001 TO SEPTEMBER 2002DAILY MEAN VALUES
DAY OCT NOV DEC JAN FEB MAR APR MAY JUN JUL AUG SEP
1 57.07 56.86 56.64 56.46 56.83 56.81 56.82 56.60 55.88 56.88 57.59 58.33 2 57.13 56.85 56.61 56.54 56.77 56.96 56.81 56.58 55.88 56.88 57.63 58.38 3 57.14 56.85 56.59 56.55 56.77 56.91 56.83 56.54 55.87 56.89 57.70 58.38 4 57.14 56.80 56.55 56.55 56.76 56.92 56.83 56.52 55.86 56.89 57.70 58.36 5 57.13 56.64 56.55 56.59 56.67 56.93 56.72 56.42 55.85 56.88 57.70 58.46
6 57.16 56.79 56.55 56.71 56.84 56.95 56.73 56.41 55.82 56.89 57.70 58.44 7 57.04 56.84 56.58 56.58 56.87 56.96 56.74 56.40 55.82 56.85 57.71 58.41 8 57.05 56.84 56.60 56.59 56.71 56.98 56.79 56.41 55.79 56.85 57.69 58.39 9 57.04 56.84 56.59 56.60 56.78 57.00 56.78 56.40 55.74 56.87 57.67 58.39 10 57.06 56.82 56.60 56.61 56.81 56.96 56.75 56.36 55.74 56.91 57.68 58.41
11 57.08 56.81 56.59 56.61 56.75 56.97 56.69 56.30 55.72 56.92 57.67 58.43 12 57.08 56.75 56.57 56.63 56.77 57.03 56.74 56.29 55.75 56.93 57.70 58.42 13 57.09 56.70 56.58 56.60 56.72 57.01 56.74 56.29 55.82 57.03 57.78 58.38 14 57.10 56.61 56.60 56.66 56.69 56.98 56.76 56.16 56.00 57.16 57.85 58.42 15 57.00 56.61 56.56 56.72 56.74 56.97 56.78 56.14 55.98 57.12 57.82 58.39
16 57.02 56.68 56.55 56.74 56.76 56.97 56.76 56.13 56.02 57.12 57.84 58.39 17 56.90 56.70 56.60 56.75 56.72 56.96 56.77 56.15 56.09 57.12 57.84 58.37 18 56.92 56.71 56.57 56.74 56.67 56.95 56.76 56.19 56.18 57.14 57.86 58.36 19 56.94 56.75 56.57 56.82 56.75 56.96 56.76 56.01 56.26 57.13 57.88 58.34 20 56.94 56.77 56.51 56.76 56.81 56.96 56.74 55.91 56.28 57.21 57.92 58.33
21 56.97 56.74 56.50 56.80 56.76 56.96 56.72 55.91 56.30 57.41 57.93 58.31 22 56.98 56.76 56.53 56.75 56.74 56.82 56.71 55.79 56.48 57.49 57.91 58.31 23 57.02 56.78 56.59 56.81 56.67 56.83 56.64 55.93 56.59 57.50 57.91 58.30 24 57.04 56.77 56.55 56.85 56.85 56.87 56.65 55.98 56.67 57.53 57.92 58.34 25 57.00 56.74 56.49 56.83 56.88 56.88 56.68 55.97 56.74 57.57 57.92 58.45
26 56.88 56.72 56.47 56.75 56.90 56.89 56.61 55.89 56.82 57.55 57.93 58.52 27 56.83 56.71 56.53 56.78 56.77 56.86 56.63 55.89 56.80 57.55 57.99 58.48 28 56.74 56.71 56.53 56.80 56.79 56.84 56.67 55.84 56.80 57.58 57.98 58.42 29 56.74 56.70 56.52 56.82 --- 56.86 56.60 55.85 56.82 57.62 58.05 58.39 30 56.81 56.69 56.50 56.84 --- 56.89 56.59 55.88 56.87 57.61 58.10 58.36 31 56.86 -- 56.46 56.84 --- 56.88 --- 55.86 57.59 58.30 --
MEAN 57.00 56.75 56.56 56.70 56.77 56.93 56.73 56.16 56.17 57.18 57.83 58.39 MAX 57.16 56.86 56.64 56.85 56.90 57.03 56.83 56.60 56.87 57.62 58.30 58.52 MIN 56.74 56.61 56.46 56.46 56.67 56.81 56.59 55.79 55.72 56.85 57.59 58.30
CAL YR 2001 MEAN 56.17 MAX 57.16 MIN 55.26 WTR YR 2002 MEAN 56.93 MAX 58.52 MIN 55.72

143 OCKLAWAHA RIVER BASIN
02238500 OCKLAWAHA RIVER AT MOSS BLUFF, FL
LOCATION.--Lat 29° 04'52", long 81° 52'51", in SW1⁄ 4 sec.23, T.16 S., R.24 E., Marion County, Hydrologic Unit 03080102, at downstream side of spillway structure of Moss Bluff Dam, 0.3 mi upstream from bridge on State Highway 464, 0.4 mi southwestof Moss Bluff, 3.9 mi northeast of Ocklawaha, and 64.3 mi upstream from mouth.
DRAINAGE AREA.--879 mi2.
PERIOD OF RECORD.--February 1943 to September 1965 (discharge measurements only), October 1965 to September 1966 (dischargemeasurements and gage heights only), October 1966 to July 1967 (discharge measurements only), August 1967 to current year.
REVISED RECORDS.--WDR FL-74-1: Drainage area.
GAGE.--Water-stage recorder and data-collection platform. Datum of gage is at NGVD of 1929. Prior to Aug. 12, 1943, nonrecording gage, and Aug. 12, 1943 to Sept. 30, 1955, water-stage recorder at site 0.3 mi downstream at datum 0.12 ft lower; Nov. 1,1963 to Aug. 10, 1967, nonrecording gage at site 0.3 mi downstream at present datum; Aug. 11, 1967 to Sept. 30, 1969, water-stage recorder at site 0.3 mi downstream at present datum. Auxiliary gage at upstream side of spillway structure.
REMARKS.--Records poor. Flow regulated by manipulation of gates in spillway. Discharge computed from relation between discharge,gate openings, and lockages.
COOPERATION.--Gate-opening record provided by St. Johns River Water Management District.
DISCHARGE, CUBIC FEET PER SECOND, WATER YEAR OCTOBER 2001 TO SEPTEMBER 2002DAILY MEAN VALUES
DAY OCT NOV DEC JAN FEB MAR APR MAY JUN JUL AUG SEP
1 84 65 71 23 2 46 69 74 18 3 44 67 65 18 4 44 64 66 20 5 46 65 65 18
37 20 30 41 20 20 17 49 18 23 21 41 33 23 15 44 25 23 19 25 35 42 48 24 23 18 45 41 19 35 45 35 18 18 48 59 31 33 30 44
6 44 64 50 18 7 40 72 34 18 8 43 69 36 23 9 44 64 41 2510 35 75 41 20
23 25 64 35 30 57 34 36 18 20 60 39 25 46 14 45 20 24 30 48 31 23 30 38 19 38 30 23 36 18 40 26 33 47 32 28 29 33 50 21
11 48 74 36 2012 50 69 34 3213 55 64 42 2314 51 61 36 1815 44 68 46 18
20 27 26 30 34 18 50 55 29 29 19 30 37 20 15 60 19 20 26 27 12 20 12 67 18 41 39 55 17 56 12 79 38 39 45 62 42 28 12 55
16 48 62 36 2017 43 71 36 2318 44 67 36 2019 44 67 33 4820 54 64 23 28
29 69 40 51 33 36 17 56 30 42 26 31 33 36 28 57 24 49 24 26 12 34 31 57 31 46 43 20 28 37 14 55 22 53 57 29 12 44 13 71
21 46 67 36 2322 44 60 41 2023 44 85 36 2024 48 73 20 3825 48 95 18 20
23 31 55 29 14 26 15 66 18 24 41 28 12 33 14 55 18 29 31 13 21 30 17 57 34 48 36 14 18 32 24 55 23 31 40 34 18 35 48 52
26 47 76 20 2527 35 70 20 2828 42 60 35 3829 43 64 43 3830 35 64 36 3531 55 --- 24 39
23 26 41 40 20 17 29 32 18 23 55 40 18 29 24 31 19 38 56 13 25 47 24 46--- 42 38 16 22 39 31 50--- 39 39 18 27 33 33 29 --- 21 --- 40 --- 33 37 --
TOTAL 1438 2055 1230 775 MEAN 46.4 68.5 39.7 25.0 MAX 84 95 74 48 MIN 35 60 18 18
670 1023 1156 1026 744 1013 823 144723.9 33.0 38.5 33.1 24.8 32.7 26.5 48.2 38 69 64 62 42 57 50 79 18 18 19 13 12 17 12 21
STATISTICS OF MONTHLY MEAN DATA FOR WATER YEARS 1944 - 2002, BY WATER YEAR (WY)
MEAN 220 167 188 273 MAX 1085 1024 883 1396(WY) 1970 1970 1954 1998MIN 0.50 0.000 13.9 11.8(WY) 1975 1974 1979 1979
294 360 350 180 193 220 230 244 1446 1603 1380 539 891 859 735 8531998 1998 1970 1970 1991 1974 1995 196912.8 10.0 11.1 7.61 7.87 20.9 9.15 7.501979 1975 1975 1975 1975 1973 1972 1972
SUMMARY STATISTICS FOR 2001 CALENDAR YEAR FOR 2002 WATER YEAR WATER YEARS 1944 - 2002
ANNUAL TOTAL 10790 ANNUAL MEAN 29.6 HIGHEST ANNUAL MEAN LOWEST ANNUAL MEAN HIGHEST DAILY MEAN 95LOWEST DAILY MEAN 18ANNUAL SEVEN-DAY MINIMUM 18 MAXIMUM PEAK STAGE10 PERCENT EXCEEDS 5750 PERCENT EXCEEDS 2390 PERCENT EXCEEDS 18
1340036.7 243
777 1970 23.8 2001
Nov 25 95 Nov 25 2340 Feb 20 1983Jan 1 a12 *0.00Jan 1 16 Jun 20 *0.00
38.12 Sep 1 50.71 Sep 12 196064 67034 5918 22
* Many days 1973-74 water years a Jun 13,18,22, Aug 13-15

---
144 OCKLAWAHA RIVER BASIN
02238500 OCKLAWAHA RIVER AT MOSS BLUFF, FL--Continued
GAGE HEIGHT, FEET, WATER YEAR OCTOBER 2001 TO SEPTEMBER 2002 DAILY MEAN VALUES
DAY OCT NOV DEC JAN FEB MAR APR MAY JUN JUL AUG SEP
1 36.39 35.87 35.63 35.07 34.93 34.72 34.69 34.72 34.19 34.62 35.83 37.92 2 36.38 35.86 35.62 35.06 34.93 34.69 34.65 34.70 34.26 34.58 35.86 37.61 3 36.36 35.87 35.60 35.07 34.93 34.72 34.62 34.70 34.14 34.55 35.93 37.17 4 36.34 35.87 35.59 35.06 34.93 34.96 34.64 34.79 34.09 34.63 35.84 36.90 5 36.34 35.90 35.57 35.03 34.91 34.97 34.69 34.81 34.03 34.63 35.68 37.07
6 36.32 35.90 35.52 35.01 34.90 34.92 34.73 34.67 34.02 34.67 35.60 37.32 7 36.31 35.87 35.39 35.01 34.90 34.90 34.73 34.62 34.03 34.68 35.48 37.27 8 36.29 35.84 35.33 35.01 34.91 34.89 34.64 34.66 34.01 34.56 35.43 37.03 9 36.24 35.81 35.30 35.00 34.90 34.90 34.55 34.60 34.05 34.47 35.35 36.77 10 36.22 35.80 35.31 34.99 34.92 34.95 34.56 34.58 33.98 34.44 35.33 36.57
11 36.21 35.81 35.31 34.98 34.92 34.89 34.57 34.64 34.00 34.42 35.29 36.51 12 36.20 35.80 35.30 35.01 34.91 34.85 34.58 34.54 34.08 34.45 35.39 36.47 13 36.21 35.78 35.30 35.02 34.89 34.85 34.59 34.39 34.08 34.51 36.88 36.50 14 36.20 35.79 35.30 35.00 34.84 34.81 34.67 34.60 34.08 34.69 36.81 36.74 15 36.18 35.80 35.30 35.02 34.80 34.79 34.65 34.67 34.11 34.69 36.59 37.17
16 36.15 35.79 35.27 35.02 34.82 34.84 34.59 34.68 34.18 34.61 36.46 37.11 17 36.12 35.79 35.24 35.03 34.84 34.87 34.57 34.60 34.15 34.56 36.34 36.95 18 36.08 35.78 35.22 35.02 34.81 34.85 34.52 34.47 34.13 34.52 36.39 36.81 19 36.06 35.78 35.20 35.03 34.81 34.82 34.53 34.39 34.10 34.53 36.27 36.67 20 36.06 35.78 35.18 35.04 34.78 34.83 34.57 34.30 34.12 34.67 36.22 36.69
21 36.05 35.76 35.16 35.01 34.74 34.82 34.60 34.24 34.12 34.96 36.12 36.96 22 36.04 35.74 35.15 35.00 34.74 34.78 34.53 34.19 34.12 35.32 35.97 36.86 23 36.03 35.74 35.14 34.96 34.75 34.74 34.43 34.17 34.34 35.88 35.85 36.68 24 36.03 35.74 35.13 34.92 34.89 34.78 34.51 34.15 34.45 35.74 35.78 36.60 25 36.02 35.75 35.12 34.90 34.90 34.76 34.69 34.25 34.41 35.93 35.80 36.98
26 36.02 35.75 35.12 34.99 34.87 34.70 34.74 34.33 34.45 35.88 35.76 36.91 27 35.98 35.73 35.09 35.02 34.84 34.67 34.84 34.36 34.43 36.32 35.70 36.79 28 35.95 35.68 35.08 35.02 34.77 34.64 34.91 34.20 34.47 36.51 35.63 36.69 29 35.94 35.65 35.08 35.01 --- 34.63 34.80 34.13 34.60 36.53 35.61 36.61 30 35.92 35.64 35.07 34.98 --- 34.68 34.72 34.16 34.65 36.40 35.86 36.41 31 35.91 -- 35.07 34.94 --- 34.70 --- 34.14 36.05 37.31 --
MEAN 36.15 35.79 35.28 35.01 34.86 34.80 34.64 34.47 34.20 35.06 35.95 36.89 MAX 36.39 35.90 35.63 35.07 34.93 34.97 34.91 34.81 34.65 36.53 37.31 37.92 MIN 35.91 35.64 35.07 34.90 34.74 34.63 34.43 34.13 33.98 34.42 35.29 36.41
WTR YR 2002 MEAN 35.26 MAX 37.92 MIN 33.98

145 OCKLAWAHA RIVER BASIN
02239500 SILVER SPRINGS NEAR OCALA, FL
LOCATION.--Lat 29° 12'44", long 82° 03'15", in SE1⁄ 4 sec.1, T.15 S., R.23 E., Marion County, Hydrologic Unit 03080102, in canal at glass bottom boat docking shed, 1,400 ft downstream from head of springs, and 5.3 mi northeast of Ocala.
DRAINAGE AREA.--Indeterminate. WATER-DISCHARGE RECORDS
PERIOD OF RECORD.--May 1906 to December 1907 (gage heights only), October 1932 to September 1947 (monthly discharge only, priorto January 1933, published in WSP 1304), October 1947 to current year.
GAGE.--Water-stage recorder. Datum of gage is 38.96 ft above NGVD of 1929. Prior to Feb. 20, 1947, nonrecording gage at samesite and datum. Feb. 20, 1947 to May 23, 1974, at site 800 ft north at same datum.
REMARKS.--Records fair. Discharge measurements made 4 to 5 mi downstream from head of springs; surface inflow between head ofsprings and measuring site is subtracted when measurable. Prior to Nov. 20, 1959, measurements made at site 0.7 mi downstream from head of springs. Discharge computed from relation between artesian pressure at Sharpes Ferry Well and discharge at measuring site. Artesian pressures are published as water levels for Sharpes Ferry Well (291115081592501) in Water ResourcesData for Florida, Volume 1B, Ground Water.
DISCHARGE, CUBIC FEET PER SECOND, WATER YEAR OCTOBER 2001 TO SEPTEMBER 2002DAILY MEAN VALUES
DAY OCT NOV DEC JAN FEB MAR APR MAY JUN JUL AUG SEP
1 559 578 547 511 2 558 579 545 517 3 e560 579 543 5154 e565 582 e540 502 5 570 584 536 505
494 456 453 425 379 386 466 456491 474 451 421 378 391 469 505489 477 450 418 375 394 467 531489 466 450 413 370 395 467 544486 454 450 410 367 395 473 534
6 576 573 539 521 7 573 567 544 512 8 570 569 545 500 9 568 570 543 500 10 574 570 539 503
492 467 447 408 369 396 480 527497 474 444 411 371 395 480 551489 472 444 410 366 393 475 568488 470 443 407 365 398 475 581489 468 444 404 366 402 476 590
11 580 569 535 50312 583 566 533 50613 584 567 536 50514 584 574 537 50515 579 577 530 506
487 469 446 400 366 406 477 593487 475 449 402 368 408 480 593484 477 449 406 367 410 486 591482 472 449 407 365 407 487 585482 468 448 395 361 406 487 571
16 580 570 529 50117 577 564 534 50318 578 560 536 50219 582 561 529 50720 582 566 521 505
486 467 444 395 356 407 491 578480 465 443 398 357 409 498 593474 462 444 405 358 412 501 605472 464 441 400 356 411 487 614479 464 443 393 356 409 489 619
21 579 566 515 50122 583 559 516 49523 586 560 526 49724 583 559 530 50125 580 555 526 502
483 465 442 392 361 413 502 617482 459 439 389 365 418 511 620484 455 434 389 368 422 521 622473 458 430 385 366 427 527 621472 458 430 385 368 432 529 605
26 574 553 525 49827 572 551 517 49628 570 549 518 49729 570 549 519 49630 573 550 513 49331 578 --- 513 492
475 460 428 384 372 435 531 608470 460 425 385 374 442 533 618452 454 427 383 375 446 528 622--- 452 429 386 376 450 527 626--- 451 426 384 380 454 509 631--- 452 --- 381 --- 460 425 --
TOTAL 17830 16976 16459 15597 MEAN 575 566 531 503 MAX 586 584 547 521 MIN 558 549 513 492
13508 14385 13242 12371 11021 12829 15254 17519482 464 441 399 367 414 492 584497 477 453 425 380 460 533 631452 451 425 381 356 386 425 456
STATISTICS OF MONTHLY MEAN DATA FOR WATER YEARS 1933 - 2002, BY WATER YEAR (WY)
MEAN 834 820 794 776 MAX 1280 1229 1156 1088(WY) 1961 1961 1961 1961 MIN 474 450 438 428 (WY) 2001 2001 2001 2001
767 770 776 759 742 749 774 812 1050 1015 1148 1112 1053 1067 1189 12361961 1998 1960 1960 1960 1960 1960 1960411 413 422 386 358 362 411 4602001 2001 2001 2001 2001 2001 2001 2000
SUMMARY STATISTICS FOR 2001 CALENDAR YEAR FOR 2002 WATER YEAR WATER YEARS 1933 - 2002
ANNUAL TOTAL 162462ANNUAL MEAN 445 HIGHEST ANNUAL MEAN LOWEST ANNUAL MEAN HIGHEST DAILY MEAN 586 LOWEST DAILY MEAN 350ANNUAL SEVEN-DAY MINIMUM 354 MAXIMUM PEAK STAGE 10 PERCENT EXCEEDS 57050 PERCENT EXCEEDS 42090 PERCENT EXCEEDS 359
176991 485 781
1058 1960419 2001
Oct 23 631 Sep 30 *1290 Oct 7 1960Jun 27 356 Jun 16,19,20 350 Jun 27 2001Jun 14 358 Jun 15 354 Jun 14 2001
1.84 Sep 25,26 5.50 Sep 6 1933 579 979 486 772 385 610
e Estimated * Oct 7,13-17,20, 1960

---
146 OCKLAWAHA RIVER BASIN
02239500 SILVER SPRINGS NEAR OCALA, FL--Continued
GAGE HEIGHT, FEET, WATER YEAR OCTOBER 2001 TO SEPTEMBER 2002 DAILY MEAN VALUES
DAY OCT NOV DEC JAN FEB MAR APR MAY JUN JUL AUG SEP
1 1.15 1.03 0.82 0.57 0.37 0.19 0.07 -0.04 -0.26 0.05 0.50 1.71 2 1.16 1.04 0.81 0.57 0.36 0.20 0.06 -0.05 -0.27 0.05 0.53 1.57 3 1.16 1.04 0.80 0.56 0.35 0.21 0.06 -0.05 -0.28 0.06 0.54 1.49 4 1.15 1.04 0.78 0.54 0.35 0.22 0.06 -0.06 -0.29 0.07 0.54 1.46 5 1.15 1.03 0.78 0.54 0.34 0.21 0.06 -0.07 -0.30 0.07 0.55 1.57
6 1.15 1.02 0.77 0.53 0.33 0.20 0.05 -0.08 -0.28 0.08 0.56 1.66 7 1.14 1.00 0.76 0.52 0.34 0.20 0.04 -0.08 -0.29 0.08 0.56 1.59 8 1.14 1.00 0.74 0.51 0.33 0.19 0.04 -0.09 -0.30 0.09 0.57 1.53 9 1.14 0.99 0.75 0.50 0.32 0.19 0.03 -0.10 -0.31 0.09 0.56 1.51 10 1.14 0.98 0.81 0.49 0.31 0.19 0.03 -0.11 -0.31 0.10 0.56 1.49
11 1.14 0.98 0.80 0.48 0.30 0.18 0.03 -0.12 -0.32 0.11 0.57 1.48 12 1.14 0.97 0.78 0.48 0.29 0.18 0.03 -0.13 -0.32 0.13 0.59 1.48 13 1.14 0.96 0.77 0.48 0.29 0.18 0.03 -0.14 -0.32 0.14 0.70 1.50 14 1.13 0.97 0.76 0.48 0.28 0.17 0.06 -0.14 -0.30 0.16 0.74 1.56 15 1.13 0.97 0.75 0.50 0.27 0.16 0.07 -0.15 -0.30 0.17 0.75 1.69
16 1.12 0.96 0.74 0.48 0.26 0.16 0.05 -0.16 -0.32 0.17 0.77 1.73 17 1.11 0.94 0.73 0.47 0.25 0.15 0.04 -0.15 -0.30 0.17 0.79 1.70 18 1.11 0.93 0.72 0.46 0.25 0.15 0.03 -0.16 -0.27 0.18 0.81 1.66 19 1.10 0.93 0.71 0.45 0.24 0.14 0.03 -0.17 -0.27 0.19 0.92 1.64 20 1.10 0.92 0.70 0.45 0.23 0.13 0.02 -0.17 -0.26 0.20 0.97 1.63
21 1.10 0.91 0.68 0.44 0.23 0.14 0.02 -0.18 -0.26 0.23 0.92 1.66 22 1.10 0.90 0.67 0.43 0.22 0.13 0.01 -0.20 -0.20 0.28 0.90 1.65 23 1.10 0.89 0.67 0.42 0.23 0.12 0.00 -0.21 -0.11 0.31 0.89 1.64 24 1.09 0.89 0.66 0.41 0.23 0.12 -0.01 -0.21 -0.06 0.33 0.88 1.65 25 1.08 0.88 0.65 0.41 0.23 0.11 -0.01 -0.22 -0.03 0.36 0.89 1.79
26 1.07 0.87 0.63 0.42 0.22 0.11 -0.01 -0.23 -0.01 0.38 0.90 1.82 27 1.06 0.86 0.62 0.41 0.20 0.10 -0.02 -0.24 0.00 0.46 0.91 1.77 28 1.05 0.84 0.61 0.40 0.19 0.09 -0.02 -0.24 0.01 0.52 0.95 1.73 29 1.05 0.83 0.60 0.40 --- 0.08 -0.02 -0.25 0.02 0.54 0.99 1.69 30 1.04 0.83 0.59 0.39 --- 0.08 -0.03 -0.26 0.03 0.52 1.13 1.66 31 1.04 --- 0.58 0.38 --- 0.07 --- -0.26 0.50 1.66 --
MEAN 1.11 0.95 0.72 0.47 0.28 0.15 0.03 -0.15 -0.22 0.22 0.78 1.62 MAX 1.16 1.04 0.82 0.57 0.37 0.22 0.07 -0.04 0.03 0.54 1.66 1.82 MIN 1.04 0.83 0.58 0.38 0.19 0.07 -0.03 -0.26 -0.32 0.05 0.50 1.46
CAL YR 2001 MEAN 0.02 MAX 1.28 MIN -0.69 WTR YR 2002 MEAN 0.50 MAX 1.82 MIN -0.32

147 OCKLAWAHA RIVER BASIN
02239500 SILVER SPRINGS NEAR OCALA, FL--Continued
WATER-QUALITY RECORDS
PERIOD OF RECORD.--Water years 1956, 1960, 1962-79, 1981-85, 1989, 1991, 1998 to current year.
WATER-QUALITY DATA, WATER YEAR OCTOBER 2001 TO SEPTEMBER 2002
DIS PH NITRO CHARGE, SPE WATER NITRO NITRO- GEN,AM- NITROINST. CIFIC WHOLE COLOR GEN, GEN, MONIA + GEN, PHOS CUBIC CON FIELD TEMPER- (PLAT OXYGEN, AMMONIA NITRITE ORGANIC NO2+NO3 PHORUS FEET GAGE DUCT- (STAND- ATURE INUM DIS TOTAL TOTAL TOTAL TOTAL TOTAL
Date Time PER HEIGHT ANCE ARD WATER COBALT SOLVED (MG/L (MG/L (MG/L (MG/L (MG/L SECOND (FEET) (US/CM) UNITS) (DEG C) UNITS) (MG/L) AS N) AS N) AS N) AS N) AS P)
(00061) (00065) (00095) (00400) (00010) (00080) (00300) (00610) (00615) (00625) (00630) (00665)
DEC 20... 1502 521 1.71 480 7.4 21.8 <5 5.4 <.01 <.01 <.20 1.00 .03 APR 09... 0738 444 .03 466 7.4 23.1 <5 2.1 .01 <.01 <.20 .920 .04 AUG 14... 0810 486 .71 474 7.0 23.2 <5 2.8 .01 <.01 .90 1.00 .05 SEP 25... 0727 610 1.77 482 7.3 23.2 <5 2.0 .01 <.01 <.20 1.00 .04
ANC SOLIDS, PHOS- HARD- MAGNE- POTAS- UNFLTRD CHLO- FLUO- SILICA, RESIDUE STRONPHORUS NESS CALCIUM SIUM, SODIUM, SIUM, TIT 4.5 SULFATE RIDE, RIDE, DIS- AT 180 TIUM,ORTHO TOTAL DIS- DIS- DIS- DIS- LAB DIS- DIS- DIS- SOLVED DEG. C DIS TOTAL (MG/L SOLVED SOLVED SOLVED SOLVED (MG/L SOLVED SOLVED SOLVED (MG/L DIS- SOLVED
Date (MG/L AS (MG/L (MG/L (MG/L (MG/L AS (MG/L (MG/L (MG/L AS SOLVED (UG/L AS P) CACO3) AS CA) AS MG) AS NA) AS K) CACO3) AS SO4) AS CL) AS F) SIO2) (MG/L) AS SR)(70507) (00900) (00915) (00925) (00930) (00935) (90410) (00945) (00940) (00950) (00955) (70300) (01080)
DEC 20... .040 220 73.0 10.0 6.2 .70 168 53.0 10.0 .2 10.0 E273cl 650APR 09... .040 230 76.0 9.70 6.2 .60 188 41.0 10.0 .2 11.0 286 560AUG 14... .040 230 76.0 9.50 6.3 .60 189 43.0 10.0 .2 11.0 280 560SEP 25... .050 230 76.0 9.50 6.4 .60 182 46.0 10.0 .2 10.0 276 600
< -- Less than E -- Estimated value cl-- Holding time exceeded by the laboratory

148 OCKLAWAHA RIVER BASIN
02240000 OCKLAWAHA RIVER NEAR CONNER, FL
(Former national stream-quality accounting network station)
LOCATION.--Lat 29° 12'52", long 81° 59'10", in SW1⁄ 4 sec. 2, T.15 S., R.23 E., Marion County, Hydrologic Unit 03080102, on right bank 75 ft upstream from bridge on State Highway 40, 0.2 mi downstream from Silver River, 1.5 mi southwest of Conner, 8 mieast of Ocala, and 51.0 mi upstream from mouth.
DRAINAGE AREA.--1,196 mi2.
PERIOD OF RECORD.--February 1930 to September 1946, March 1963 to September 1977 (gage heights only), October 1977 to current year.
REVISED RECORDS.--WDR FL-74-1: Drainage area.
GAGE.--Water-stage recorder. Datum of gage is 31.79 ft above NGVD of 1929.
REMARKS.--Records good except for period of estimated daily discharge, which is poor.
DISCHARGE, CUBIC FEET PER SECOND, WATER YEAR OCTOBER 2001 TO SEPTEMBER 2002DAILY MEAN VALUES
DAY OCT NOV DEC JAN FEB MAR APR MAY JUN JUL AUG SEP
1 810 672 579 525 2 815 650 577 527 3 805 630 574 531 4 795 630 572 530 5 788 628 569 528
543 534 479 456 410 455 604 1070541 533 474 455 411 452 603 985540 541 470 454 410 448 609 896542 564 470 455 405 451 593 828541 561 471 457 403 452 579 e800
6 783 624 564 528 7 780 619 552 529 8 776 615 544 529 9 767 609 541 529 10 762 606 546 530
544 554 471 455 400 451 566 e775549 548 472 449 402 452 553 e740552 543 467 448 400 449 544 e730548 541 460 447 400 446 527 e690547 542 458 443 398 444 517 e675
11 758 608 549 53012 754 606 547 53113 754 603 544 53414 753 609 543 53715 747 612 542 554
547 538 458 443 397 442 512 e660545 531 459 442 399 443 526 e645545 530 457 435 401 447 711 e655540 524 461 437 400 455 724 e675537 520 465 441 400 458 696 e940
16 737 610 539 55217 728 606 534 54618 721 605 532 54319 717 604 528 54320 714 601 526 546
539 520 460 442 401 455 683 e990541 521 457 442 405 450 662 e940541 519 454 436 408 449 662 e890540 514 453 429 406 447 661 e840541 511 453 425 404 452 659 e785
21 712 598 526 54422 710 595 526 54123 708 596 527 53824 705 598 526 53725 703 598 525 536
538 509 454 420 403 470 646 e735535 504 452 417 416 509 623 e710541 497 445 415 438 575 605 e715556 497 443 413 445 576 591 e775561 497 454 414 444 607 585 866
26 698 597 523 54427 689 593 522 54828 685 588 523 54929 682 584 525 54630 680 581 525 54531 677 --- 524 543
557 491 458 417 445 615 591 925548 485 460 419 442 670 587 886540 481 466 416 441 705 581 849--- 479 464 410 450 717 581 818--- 479 459 408 454 695 631 789--- 481 --- 410 --- 646 932 --
TOTAL 22913 18275 16774 16673 MEAN 739 609 541 538 MAX 815 672 579 554 MIN 677 581 522 525 CFSM 0.62 0.51 0.45 0.45 IN. 0.71 0.57 0.52 0.52
15239 16089 13824 13450 12438 15783 19144 24277544 519 461 434 415 509 618 809561 564 479 457 454 717 932 1070535 479 443 408 397 442 512 6450.45 0.43 0.38 0.36 0.35 0.42 0.51 0.67 0.47 0.50 0.43 0.42 0.39 0.49 0.59 0.75
STATISTICS OF MONTHLY MEAN DATA FOR WATER YEARS 1930 - 2002, BY WATER YEAR (WY)
MEAN 1096 984 985 1074 MAX 1855 1584 1574 2494(WY) 1983 1946 1938 1998 MIN 496 480 466 437 (WY) 2001 2001 2001 2001
1059 1173 1174 956 978 1030 1073 1164 2826 3047 2553 1802 2062 2104 1867 19001998 1998 1987 1931 1982 1982 1934 1934433 496 461 434 415 437 483 5062001 2001 2002 2002 2002 2001 2001 2000
SUMMARY STATISTICS FOR 2001 CALENDAR YEAR FOR 2002 WATER YEAR WATER YEARS 1930 - 2002
ANNUAL TOTAL 192811ANNUAL MEAN 528 HIGHEST ANNUAL MEAN LOWEST ANNUAL MEAN HIGHEST DAILY MEAN 1400LOWEST DAILY MEAN e417ANNUAL SEVEN-DAY MINIMUM 426 MAXIMUM PEAK FLOW MAXIMUM PEAK STAGE ANNUAL RUNOFF (CFSM) 0.44ANNUAL RUNOFF (INCHES) 5.9810 PERCENT EXCEEDS 71350 PERCENT EXCEEDS 48890 PERCENT EXCEEDS 435
204879 561 1062
1654 1930491 2001
Sep 15 1070 Sep 1 4010 Apr 9 1982Jul 7 397 Jun 11 397 Jun 11 2002Feb 2 399 Jun 8 399 Jun 8 2002
1080 Aug 31 4430 Apr 9 19825.50 Sep 1 9.14 Sep 6 1933 0.47 0.89 6.35 12.03
738 1620 541 932 436 649
e Estimated

------------
---
------
OCKLAWAHA RIVER BASIN 149
02240000 OCKLAWAHA RIVER NEAR CONNER, FL--Continued
GAGE HEIGHT, FEET, WATER YEAR OCTOBER 2001 TO SEPTEMBER 2002 DAILY MEAN VALUES
DAY OCT NOV DEC JAN FEB MAR APR MAY JUN JUL AUG SEP
1 4.26 3.81 3.56 3.11 3.01 2.81 2.72 2.62 2.13 2.71 3.96 5.47 2 4.29 3.81 3.55 3.13 3.00 2.80 2.69 2.61 2.14 2.68 3.96 5.28 3 4.26 3.85 3.53 3.15 2.98 2.87 2.66 2.60 2.13 2.64 3.99 5.05 4 4.21 3.85 3.52 3.13 2.99 3.04 2.67 2.62 2.07 2.68 3.91 4.84 5 4.19 3.84 3.50 3.11 2.97 3.03 2.69 2.64 2.04 2.69 3.82 4.90
6 4.18 3.82 3.47 3.10 2.98 2.99 2.70 2.61 2.01 2.69 3.74 7 4.17 3.79 3.39 3.10 3.01 2.97 2.72 2.55 2.04 2.70 3.66 8 4.16 3.77 3.34 3.09 3.02 2.95 2.69 2.54 2.01 2.68 3.61 9 4.12 3.75 3.32 3.09 2.99 2.94 2.63 2.53 2.01 2.65 3.49 10 4.11 3.73 3.35 3.08 2.98 2.96 2.63 2.49 1.99 2.64 3.43 --
11 4.10 3.74 3.37 3.07 2.97 2.94 2.64 2.49 1.97 2.62 3.39 --12 4.09 3.73 3.35 3.08 2.95 2.90 2.66 2.48 2.01 2.63 3.49 --13 4.10 3.72 3.34 3.09 2.94 2.91 2.64 2.40 2.03 2.68 4.53 --14 4.10 3.74 3.33 3.11 2.90 2.87 2.68 2.42 2.03 2.77 4.60 --15 4.08 3.76 3.33 3.21 2.87 2.85 2.72 2.47 2.03 2.81 4.48 --
16 4.04 3.75 3.30 3.19 2.88 2.87 2.67 2.48 2.05 2.78 4.41 --17 4.01 3.73 3.27 3.15 2.88 2.89 2.63 2.48 2.10 2.73 4.29 --18 3.98 3.72 3.25 3.12 2.88 2.88 2.60 2.41 2.14 2.72 4.29 --19 3.96 3.72 3.23 3.11 2.86 2.86 2.59 2.34 2.12 2.71 4.28 --20 3.96 3.71 3.21 3.12 2.86 2.84 2.59 2.30 2.11 2.76 4.26 --
21 3.96 3.69 3.20 3.10 2.83 2.84 2.60 2.24 2.10 2.95 4.18 --22 3.95 3.67 3.20 3.07 2.81 2.81 2.58 2.20 2.24 3.26 4.06 --23 3.94 3.67 3.20 3.05 2.84 2.77 2.51 2.18 2.50 3.74 3.96 --24 3.94 3.69 3.18 3.03 2.93 2.78 2.49 2.16 2.57 3.75 3.88 --25 3.94 3.69 3.16 3.02 2.96 2.80 2.60 2.17 2.57 3.94 3.83 4.78
26 3.92 3.68 3.14 3.07 2.92 2.75 2.65 2.20 2.58 3.98 3.86 4.96 27 3.87 3.66 3.13 3.08 2.87 2.71 2.67 2.23 2.56 4.26 3.83 4.86 28 3.85 3.62 3.13 3.08 2.83 2.69 2.72 2.20 2.55 4.43 3.78 4.75 29 3.84 3.60 3.14 3.06 --- 2.68 2.70 2.12 2.65 4.49 3.78 4.65 30 3.84 3.58 3.13 3.04 --- 2.70 2.66 2.10 2.70 4.40 4.02 4.56 31 3.83 --- 3.12 3.02 --- 2.72 --- 2.12 4.16 5.14 --
MEAN 4.04 3.73 3.30 3.10 2.93 2.85 2.65 2.39 2.21 3.14 4.00 -- MAX 4.29 3.85 3.56 3.21 3.02 3.04 2.72 2.64 2.70 4.49 5.14 MIN 3.83 3.58 3.12 3.02 2.81 2.68 2.49 2.10 1.97 2.62 3.39

150 OCKLAWAHA RIVER BASIN
02240500 OCKLAWAHA RIVER AT EUREKA, FL
LOCATION.--Lat 29° 22'18", long 81° 54'07", in SW1⁄ 4 sec.9, T.13 S., R.24 E., Marion County, Hydrologic Unit 03080102, near right bank on upstream end of bridge pier on County Road 316 in Eureka, 3.1 mi downstream from Eaton Creek, and 33.1 mi upstream from mouth.
DRAINAGE AREA.--1,367 mi2.
PERIOD OF RECORD.--February 1930 to June 1934, September 1943 to December 1952, January 1981 to current year.
REVISED RECORDS.--WDR FL-81-1: Drainage area.
GAGE.--Water-stage recorder. Datum of gage is at NGVD of 1929 (U.S. Army Corps of Engineers bench mark). Feb. 13, 1930 to June 30, 1934, nonrecording gage, and Sept. 16, 1943 to Dec. 31, 1952, water-stage recorder near present site at datum 15.44 ft higher.
REMARKS.--Records good except for period of estimated daily discharge, which is fair.
DISCHARGE, CUBIC FEET PER SECOND, WATER YEAR OCTOBER 2001 TO SEPTEMBER 2002DAILY MEAN VALUES
DAY OCT NOV DEC JAN FEB MAR APR MAY JUN JUL AUG SEP
1 826 e765 e790 514 2 815 e760 e785 515 3 812 751 e780 521 4 811 761 e775 516 5 807 774 e770 514
592 594 501 514 434 602 846 1370589 591 505 506 434 584 840 1860585 603 503 505 437 563 829 1960582 688 507 505 441 548 815 1830577 685 524 510 444 544 815 1700
6 802 770 e765 514 7 800 763 e760 512 8 805 762 e750 509 9 e800 767 e740 514 10 e795 774 e735 521
577 664 527 516 447 539 805 1590592 649 532 511 462 532 792 1490616 636 533 503 470 535 781 1420612 621 531 498 474 544 764 1360604 608 531 493 478 562 748 1310
11 e790 781 e730 53012 e785 794 e720 54013 e780 812 e710 54214 e780 851 e695 55815 e775 882 e685 631
602 597 531 491 486 569 737 1270598 585 533 491 489 569 739 1220597 598 533 485 504 606 777 1200595 588 533 478 521 614 845 1220590 569 535 479 513 610 891 1380
16 e765 883 e675 62317 e765 878 e670 60118 e765 870 e650 588 19 e765 868 e645 57820 e765 e865 e640 576
588 554 538 475 516 602 932 1630588 549 539 471 528 593 977 1820 588 544 540 464 543 589 1010 1760 587 535 540 463 549 584 1010 1620587 527 535 463 564 597 978 1480
21 e765 e855 e638 577 22 e770 e850 655 57723 e767 e845 527 57424 e765 e840 525 56925 e765 e835 522 569
e585 522 528 454 570 641 961 1380585 523 522 449 588 696 928 1340600 514 522 443 612 725 908 1340647 507 522 434 620 740 885 1340643 506 519 430 648 759 865 1460
26 e765 e830 518 59227 e765 e825 513 59428 e765 e820 515 59329 e765 e810 517 61730 e765 e800 517 61031 e765 --- 517 598
631 504 523 431 695 787 852 1580618 499 524 433 730 809 844 1680602 494 516 434 693 809 839 1690--- 491 511 430 647 813 841 1630--- 493 513 423 621 838 901 1550 --- 498 --- 423 --- 847 1070 --
TOTAL 24230 24441 20434 17387 MEAN 782 815 659 561 MAX 826 883 790 631 MIN 765 751 513 509 CFSM 0.57 0.60 0.48 0.41 IN. 0.66 0.67 0.56 0.47
16757 17536 15751 14605 16158 19950 26825 45480598 566 525 471 539 644 865 1516647 688 540 516 730 847 1070 1960577 491 501 423 434 532 737 12000.44 0.41 0.38 0.34 0.39 0.47 0.63 1.11 0.46 0.48 0.43 0.40 0.44 0.54 0.73 1.24
STATISTICS OF MONTHLY MEAN DATA FOR WATER YEARS 1930 - 2002, BY WATER YEAR (WY)
MEAN 1234 1099 1088 1185 MAX 2131 1940 1847 2516(WY) 1950 1948 1950 1998 MIN 550 551 583 478 (WY) 2001 2001 1991 2001
1159 1281 1295 991 1053 1127 1183 1340 2912 3231 2763 1915 2743 2385 2174 26171998 1998 1987 1931 1982 1982 1934 1933451 566 525 471 462 488 489 6322001 2002 2002 2002 2001 2000 2000 1990
SUMMARY STATISTICS FOR 2001 CALENDAR YEAR FOR 2002 WATER YEAR WATER YEARS 1930 - 2002
ANNUAL TOTAL 224446ANNUAL MEAN 615 HIGHEST ANNUAL MEAN LOWEST ANNUAL MEAN HIGHEST DAILY MEAN 2160LOWEST DAILY MEAN 417ANNUAL SEVEN-DAY MINIMUM 428 MAXIMUM PEAK FLOW MAXIMUM PEAK STAGEINSTANTANEOUS LOW FLOWANNUAL RUNOFF (CFSM) 0.45ANNUAL RUNOFF (INCHES) 6.1110 PERCENT EXCEEDS 81050 PERCENT EXCEEDS 54090 PERCENT EXCEEDS 450
259554 711 1170
1829 1930569 2001
Sep 17 1960 Sep 3 6110 Apr 11 1982Jul 7 423 May 30,31 417 Jul 7 2001Jul 1 429 May 25 428 Jul 1 2001
1960 Sep 3 6230 Sep 7 1933 22.29 Sep 3 26.52 Apr 11 1982 417 May 31 411 Jul 7 2001 0.52 0.86 7.06 11.62
944 1890 606 1020 494 640
e Estimated

--- --- --- --- --- --- --- --- --- ---
--- --- --- --- --- --- --- --- --- ---
--- ------ ------ ------ ------ ---
--- ------ ------ ------ ------ ---
--- ------ ------ ------ ------ ---
--- ------ ------ ------ ------ ------ ---
--- --- --- --- --- --- --- --- --- --- --- ---
151 OCKLAWAHA RIVER BASIN
02240902 PRAIRIE CREEK NEAR GAINESVILLE, FL
LOCATION.--Lat 29° 36'38", long 82° 14'53", in NW1⁄ 4 sec.19, T.10 S., R.21 E., Alachua County, Hydrologic Unit 03080102, on downstream side of foot bridge (old railroad bridge), 100 ft downstream from State Highway 20, 150 ft downstream from control structure at outlet of Newnans Lake, 7 mi southeast of Gainesville, and 8.4 mi upstream from mouth.
DRAINAGE AREA.--114 mi2.
PERIOD OF RECORD.--1947-48, 1956, 1965-67 (miscellaneous discharge measurements and gage heights only), August 1978 to April 2002 (discontinued).
REVISED RECORDS.--WDR FL-79-1: Drainage area.
GAGE.--Water-stage recorder. Datum of gage is 61.79 ft above NGVD of 1929 (Florida Department of Transportation bench mark). Prior to Aug. 24, 1978, nonrecording gage at site 100 ft upstream at datum 0.50 ft higher. Aug. 24, 1978 to Mar. 9, 1999, at site 100 ft upstream at same datum.
REMARKS.--Records good. Some regulation by stoplogs in control structure at outlet of Newnans Lake.
DISCHARGE, CUBIC FEET PER SECOND, PERIOD OCTOBER 2001 TO APRIL 2002DAILY MEAN VALUES
DAY OCT NOV DEC JAN FEB MAR APR MAY JUN JUL AUG SEP
1 0.00 0.00 0.00 0.00 0.00 0.00 0.00 -- -- --2 0.00 0.00 0.00 0.00 0.00 0.00 0.00 -- -- --3 0.00 0.00 0.00 0.00 0.00 0.00 0.00 -- -- --4 0.00 0.00 0.00 0.00 0.00 0.00 0.00 -- -- --5 0.00 0.00 0.00 0.00 0.00 0.00 0.00 -- -- --
6 0.00 0.00 0.00 0.00 0.00 0.00 0.00 -- -- --7 0.00 0.00 0.00 0.00 0.00 0.00 0.00 -- -- --8 0.00 0.00 0.00 0.00 0.00 0.00 0.00 -- -- --9 0.00 0.00 0.00 0.00 0.00 0.00 0.00 -- -- --10 0.00 0.00 0.00 0.00 0.00 0.00 0.00 --- --- --
11 0.00 0.00 0.00 0.00 0.00 0.00 0.00 --- --- --12 0.00 0.00 0.00 0.00 0.00 0.00 0.00 --- --- --13 0.00 0.00 0.00 0.00 0.00 0.00 0.00 --- --- --14 0.00 0.00 0.00 0.00 0.00 0.00 0.00 --- --- --15 0.00 0.00 0.00 0.00 0.00 0.00 0.00 --- --- --
16 0.00 0.00 0.00 0.00 0.00 0.00 0.00 --- --- --17 0.00 0.00 0.00 0.00 0.00 0.00 0.00 --- --- --18 0.00 0.00 0.00 0.00 0.00 0.00 0.00 --- --- --19 0.00 0.00 0.00 0.00 0.00 0.00 0.00 --- --- --20 0.00 0.00 0.00 0.00 0.00 0.00 0.00 --- --- --
21 0.00 0.00 0.00 0.00 0.00 0.00 0.00 --- --- --22 0.00 0.00 0.00 0.00 0.00 0.00 0.00 --- --- --23 0.00 0.00 0.00 0.00 0.00 0.00 0.00 --- --- --24 0.00 0.00 0.00 0.00 0.00 0.00 e0.00 --- --- --25 0.00 0.00 0.00 0.00 0.00 0.00 e0.00 --- --- --
26 0.00 0.00 0.00 0.00 0.00 0.00 e0.00 --- --- --27 0.00 0.00 0.00 0.00 0.00 0.00 e0.00 --- --- --28 0.00 0.00 0.00 0.00 0.00 0.00 e0.00 --- --- --29 0.00 0.00 0.00 0.00 --- 0.00 e0.00 --- --- --30 0.00 0.00 0.00 0.00 --- 0.00 e0.00 --- --- --31 0.00 --- 0.00 0.00 --- 0.00 --- --- --- --
TOTAL 0.00 0.00 0.00 0.00 0.00 0.00 0.00 -- -- --MEAN 0.000 0.000 0.000 0.000 0.000 0.000 0.000 -- -- --MAX 0.00 0.00 0.00 0.00 0.00 0.00 0.00 -- -- --MIN 0.00 0.00 0.00 0.00 0.00 0.00 0.00 -- -- --CFSM 0.00 0.00 0.00 0.00 0.00 0.00 0.00 -- -- --IN. 0.00 0.00 0.00 0.00 0.00 0.00 0.00 -- -- --
STATISTICS OF MONTHLY MEAN DATA FOR WATER YEARS 1978 - 2002, BY WATER YEAR (WY)
MEAN 59.9 36.2 35.1 53.4 84.0 101 94.1 59.3 37.2 35.9 40.3 69.1 MAX 277 170 161 330 564 554 323 241 117 134 295 355 (WY) 1993 1986 1998 1998 1998 1998 1987 1983 1991 1996 1978 1985 MIN 0.000 0.000 0.000 0.000 0.000 0.000 0.000 0.000 0.000 0.027 0.010 0.085 (WY) 2001 2001 2001 2001 2001 2000 2000 2000 2001 2000 2000 2001
SUMMARY STATISTICS FOR 2001 CALENDAR YEAR #FOR 2002 WATER YEAR #WATER YEARS 1978 - 2002
ANNUAL TOTAL 21.84 ANNUAL MEAN 0.060 HIGHEST ANNUAL MEANLOWEST ANNUAL MEANHIGHEST DAILY MEAN 3.1 Jul 20LOWEST DAILY MEAN 0.00 Many daysANNUAL SEVEN-DAY MINIMUM 0.00 Jan 1 MAXIMUM PEAK FLOWMAXIMUM PEAK STAGEANNUAL RUNOFF (CFSM) 0.001 ANNUAL RUNOFF (INCHES) 0.0110 PERCENT EXCEEDS 0.0950 PERCENT EXCEEDS 0.0090 PERCENT EXCEEDS 0.00
0.00 0.000 58.8
177 1998 0.000 2002
0.00 1290 Feb 25 1998 0.00 0.00 Many days 0.00 Oct 1 0.00 Many days
1290 Feb 25 1998 1.58 Oct 1 8.77 Feb 25 1998 0.000 0.52 0.00 7.01 0.00 151 0.00 32 0.00 0.10
e Estimated* Includes partial year(s) record

--- ------ ------ ------ ------ ---
--- ------ ------ ------ ------ ---
--- ------ ------ ------ ------ ---
--- ------ ------ ------ ------ ---
--- ------ ------ ---
--- --- ------ --- ---
--- --- ------ --- ------ --- ---
--- --- ------ --- ------ --- ---
--- --- ------ --- ------ --- ---
152 OCKLAWAHA RIVER BASIN
02240902 PRAIRIE CREEK NEAR GAINESVILLE, FL--Continued
GAGE HEIGHT, FEET, WATER YEAR OCTOBER 2001 TO SEPTEMBER 2002 DAILY MEAN VALUES
DAY OCT NOV DEC JAN FEB MAR APR MAY JUN JUL AUG SEP
1 1.58 1.40 1.37 1.24 1.48 1.42 1.25 --- --- --- 2 1.57 1.40 1.37 1.24 1.47 1.43 1.23 --- --- --- 3 1.57 1.40 1.36 1.25 1.47 1.47 1.23 --- --- --- 4 1.57 1.40 1.36 1.24 1.46 1.50 1.22 --- --- --- 5 1.57 1.40 1.35 1.23 1.45 1.48 1.20 --- --- ---
6 1.56 1.40 1.34 1.24 1.44 1.47 1.18 --- --- --- 7 1.56 1.39 1.34 1.25 1.45 1.46 1.15 --- --- --- 8 1.56 1.39 1.34 1.24 1.45 1.46 1.12 --- --- --- 9 1.55 1.39 1.39 1.23 1.45 1.46 1.09 --- --- --- 10 1.54 1.39 1.43 1.23 1.45 1.46 1.07 --- --- ---
11 1.54 1.39 1.42 1.23 1.45 1.45 1.05 --- --- --- 12 1.53 1.39 1.40 1.22 1.45 1.45 1.02 --- --- --- 13 1.53 1.39 1.40 1.24 1.44 1.48 1.01 --- --- --- 14 1.52 1.42 1.39 1.34 1.44 1.45 1.06 --- --- --- 15 1.52 1.42 1.38 1.45 1.44 1.44 1.04 --- --- ---
16 1.52 1.42 1.38 1.42 1.44 1.43 1.01 --- --- --- 17 1.50 1.40 1.37 1.42 1.44 1.43 0.97 --- --- --- 18 1.49 1.40 1.38 1.42 1.44 1.42 0.94 --- --- --- 19 1.47 1.40 1.37 1.41 1.44 1.41 0.91 --- --- --- 20 1.47 1.40 1.36 1.41 1.44 1.40 0.87 --- --- ---
21 1.46 1.40 1.34 1.42 1.44 1.40 0.82 --- --- --- 22 1.46 1.39 1.33 1.45 1.44 1.39 0.76 --- --- --- 23 1.45 1.39 1.32 1.44 1.47 1.38 0.70 --- --- --- 24 1.45 1.39 1.31 1.44 1.47 1.37 -- -- --25 1.44 1.39 1.30 1.43 1.45 1.37 -- -- --
26 1.43 1.39 1.29 1.43 1.44 1.36 -- -- --27 1.42 1.39 1.28 1.43 1.44 1.35 -- -- --28 1.41 1.39 1.27 1.45 1.43 1.33 -- -- --29 1.40 1.38 1.26 1.50 --- 1.31 --- --- --30 1.40 1.38 1.26 1.49 --- 1.29 --- --- --31 1.40 --- 1.25 1.48 --- 1.27 --- --- --
MEAN 1.50 1.40 1.35 1.35 1.45 1.41 --- --- --- MAX 1.58 1.42 1.43 1.50 1.48 1.50 --- --- --- MIN 1.40 1.38 1.25 1.22 1.43 1.27 --- --- ---

153 OCKLAWAHA RIVER BASIN
02240954 HOGTOWN CREEK NEAR ARREDONDO, FL
LOCATION.--Lat 29° 38'17", long 82° 23'33", in NE1⁄ 4 sec.10, T.10 S., R.19 E., Alachua County, Hydrologic Unit 03080102, near right bank at downstream side of bridge on County Road 30, 2.5 mi northeast of Arredondo, and 4.2 mi west of Gainesville.
DRAINAGE AREA.--41.2 mi2.
PERIOD OF RECORD.--December 1971 to September 2002 (discontinued).
GAGE.--Water-stage recorder. Datum of gage is at NGVD of 1929.
REMARKS.--Records fair. Flow affected at times by backwater from Haile Sink.
DISCHARGE, CUBIC FEET PER SECOND, WATER YEAR OCTOBER 2001 TO SEPTEMBER 2002DAILY MEAN VALUES
DAY OCT NOV DEC JAN FEB MAR APR MAY JUN JUL AUG SEP
1 10 2.1 2.1 1.9 7.6 3.1 1.2 0.19 0.91 3.1 3.8 14 2 8.6 2.0 2.1 2.2 6.0 3.9 1.1 0.16 0.70 1.9 32 11 3 7.3 2.0 2.1 2.9 5.0 9.9 1.2 0.15 0.50 1.7 19 8.0 4 6.4 1.9 2.1 2.5 4.4 30 1.2 0.16 0.87 11 32 6.4 5 5.7 2.0 2.1 2.3 3.8 23 1.1 0.14 0.60 11 119 9.2
6 5.4 2.0 2.1 2.5 3.6 15 0.97 0.14 0.42 20 58 11 7 5.2 1.9 2.1 3.0 4.2 11 0.93 0.14 0.66 11 28 7.6 8 4.8 1.9 2.1 2.6 4.8 8.4 0.85 0.12 0.87 5.2 16 5.4 9 4.3 1.9 3.1 2.4 4.2 6.9 0.77 0.10 0.72 10 9.9 4.110 4.0 1.9 6.2 2.4 3.8 5.9 0.77 0.09 0.64 12 6.9 3.4
11 3.8 1.9 8.5 2.412 3.6 1.9 5.5 2.4 13 3.5 2.0 3.9 3.014 3.5 3.1 3.3 6.415 3.5 5.5 2.9 30
3.6 5.1 0.78 0.09 0.56 11 5.0 2.9 3.3 4.6 0.77 0.08 0.53 7.7 6.6 2.6 3.1 7.4 0.95 0.07 0.47 4.7 32 7.03.1 9.5 2.1 0.10 0.87 4.1 22 13 3.0 6.8 1.7 0.10 0.70 3.1 28 35
16 3.2 4.9 2.6 24 17 2.9 3.5 2.5 13 18 2.7 2.8 2.7 8.2 19 2.7 2.5 2.6 6.0 20 2.7 2.4 2.4 5.0
3.0 4.9 1.0 0.06 0.42 2.1 28 28 2.9 4.0 0.82 0.07 0.42 1.5 19 20 2.7 3.4 0.71 0.10 0.74 3.4 14 14 2.7 3.0 0.59 0.40 1.1 4.1 15 10 2.7 2.7 0.51 0.53 9.0 4.0 19 8.0
21 2.7 2.4 2.2 5.322 2.7 2.3 2.1 8.623 2.8 2.3 2.1 9.124 2.8 2.4 2.1 6.5 25 2.7 2.4 2.0 5.3
2.7 2.5 0.44 0.34 12 39 34 7.42.8 2.3 0.36 0.22 8.9 24 26 6.34.6 2.0 0.33 0.16 25 15 18 4.710 1.9 0.26 0.16 12 10 12 5.0 9.9 1.9 0.26 0.14 6.1 7.2 8.7 33
26 2.4 2.3 1.9 6.7 27 2.2 2.2 1.9 7.9 28 2.1 2.1 1.9 6.9 29 2.1 2.1 2.0 13 30 2.1 2.1 1.9 17 31 2.1 --- 1.9 10
5.7 1.8 0.26 0.11 5.9 7.3 6.7 36 4.1 1.8 0.24 0.17 6.7 8.8 7.1 27 3.3 1.8 0.23 0.31 4.6 8.1 9.5 18 --- 1.5 0.22 0.20 4.2 6.0 9.2 13 --- 1.4 0.22 0.20 4.6 3.9 11 10 --- 1.3 --- 0.41 --- 2.6 16 --
TOTAL 120.5 72.7 85.0 221.4 MEAN 3.89 2.42 2.74 7.14MAX 10 5.5 8.5 30 MIN 2.1 1.9 1.9 1.9CFSM 0.09 0.06 0.07 0.17 IN. 0.11 0.07 0.08 0.20
120.6 188.7 22.84 5.41 111.70 264.5 671.4 381.04.31 6.09 0.76 0.17 3.72 8.53 21.7 12.710 30 2.1 0.53 25 39 119 362.7 1.3 0.22 0.06 0.42 1.5 3.8 2.60.10 0.15 0.02 0.00 0.09 0.21 0.53 0.31 0.11 0.17 0.02 0.00 0.10 0.24 0.61 0.34
STATISTICS OF MONTHLY MEAN DATA FOR WATER YEARS 1972 - 2002, BY WATER YEAR (WY)
MEAN 14.0 9.37 14.8 19.4 MAX 54.0 27.8 92.3 43.8(WY) 1999 1986 1998 1979 MIN 0.89 2.42 2.74 2.61(WY) 1988 2002 2002 2001
24.2 24.2 19.8 8.78 18.4 19.7 26.1 24.4122 74.2 62.2 23.0 63.1 51.7 130 1031998 1988 1983 1983 1972 1996 1978 1988 4.09 4.67 0.76 0.17 1.21 1.83 4.99 3.511996 2000 2002 2002 1988 1988 1993 1995
SUMMARY STATISTICS FOR 2001 CALENDAR YEAR FOR 2002 WATER YEAR WATER YEARS 1972 - 2002
ANNUAL TOTAL 3331.9ANNUAL MEAN 9.13 HIGHEST ANNUAL MEAN LOWEST ANNUAL MEAN HIGHEST DAILY MEAN 159 LOWEST DAILY MEAN 1.4 ANNUAL SEVEN-DAY MINIMUM 1.6 MAXIMUM PEAK FLOW MAXIMUM PEAK STAGE INSTANTANEOUS LOW FLOWANNUAL RUNOFF (CFSM) 0.22ANNUAL RUNOFF (INCHES) 3.0110 PERCENT EXCEEDS 2250 PERCENT EXCEEDS 3.590 PERCENT EXCEEDS 2.1
2265.75 6.21 18.2
36.7 19986.21 2002
Jul 21 119 Aug 5 860 Sep 7 1988 Aug 29,30 0.06 May 16 0.06 May 16 2002 Aug 24 0.08 May 11 0.08 May 11 2002
136 Aug 5 1040 Sep 7 1988 57.78 Aug 5 60.53 Sep 7 19880.05 May 16 0.05 May 16 2002 0.15 0.44 2.05 6.0014 37 3.0 9.2 0.35 2.9

5
10
15
20
25
30
--- --- --- --- --- ------ --- --- --- --- ------ --- --- --- --- ------ --- --- --- --- ------ --- --- --- --- ---
--- --- --- --- --- ------ --- --- --- --- ------ --- --- --- --- ------ --- --- --- --- ------ --- --- --- --- ---
--- --- --- --- --- ------ --- --- --- --- ------ --- --- --- --- ------ --- --- --- --- ------ --- --- --- --- ---
--- --- --- --- --- ------ --- --- --- --- ------ --- --- --- --- ------ --- --- --- --- ------ --- --- --- --- ---
--- --- --- --- --- ------ --- --- --- --- ------ --- --- --- --- ------ --- --- --- --- ------ --- --- --- --- ---
--- --- --- --- --- ------ --- --- --- --- ------ --- --- --- --- ------ --- --- --- ------ --- --- --- --- ------ --- --- --- --- ---
--- --- --- --- --- ------ --- --- --- --- ------ --- --- --- --- ---
154 OCKLAWAHA RIVER BASIN
02240956 HAILE SINK NEAR ARREDONDO, FL
LOCATION.--Lat 29° 37'41", long 82° 24'40", in NE1⁄ 4 sec.16, T.10 S., R.19 E., Alachua County, Hydrologic Unit 03080l02, on northwest rim of sink, 1.6 mi north of Arredondo, and 5.2 mi west of Gainesville.
DRAINAGE AREA.--Indeterminate.
PERIOD OF RECORD.--December 1971 to September l977, February 1978 to September 2002 (gage heights only), discontinued.
GAGE.--Water-stage recorder. Datum of gage is at NGVD of 1929.
REMARKS.--Sink has no surface outlet.
EXTREMES FOR PERIOD OF RECORD.--Maximum gage height, 60.15 ft, Sept. 10,11, 1988; minimum, unknown; water level below lowestrecordable gage height for many days in most years.
EXTREMES FOR CURRENT YEAR.--Maximum gage height observed, 40.75 ft, Aug. 7; minimum observed, 36.68 ft, June 17.
GAGE HEIGHT, FEET, WATER YEAR OCTOBER 2001 TO SEPTEMBER 2002DAILY MEAN VALUES
DAY OCT NOV DEC JAN FEB MAR APR MAY JUN JUL AUG SEP
1 --- --- --- --- --- --- 2 --- --- --- --- --- --- 3 --- --- --- --- --- --- 4 --- --- --- --- --- ---
--- --- --- --- --- ---
6 --- --- --- --- --- --- 7 --- --- --- --- --- 40.75 8 --- --- --- --- --- --- 9 --- --- --- --- --- ---
-- -- -- -- -- --
11 -- -- -- -- -- --12 -- -- -- -- -- --13 -- -- -- -- -- --14 -- -- -- -- -- --
-- -- -- -- -- --
16 -- -- -- -- -- --17 -- -- -- -- 36.68 --18 -- -- -- -- -- --19 -- -- -- -- -- --
-- -- -- -- -- --
21 -- -- -- -- -- --22 -- -- -- -- -- --23 -- -- -- -- -- --24 -- -- -- -- -- --
-- -- -- -- -- --
26 -- -- -- -- -- --27 -- -- -- -- -- --28 -- -- -- -- -- --29 -- -- --- 37.16 -- -- --
-- -- -- -- -- --31 -- -- -- -- -- --
MEAN --- --- --- --- --- --- MAX --- --- --- --- --- --- MIN --- --- --- --- --- ---

155 OCKLAWAHA RIVER BASIN
02241000 CAMPS CANAL NEAR ROCHELLE, FL
LOCATION.--Lat 29° 34'33", long 82° 15'00", in SW1⁄ 4 sec.31, Moses Levy Land Grant, Alachua County, Hydrologic Unit 03080102, near left bank on downstream side of bridge on County Road 234, 2.2 mi southwest of Rochelle, and 5.0 mi upstream from Orange Lake.
DRAINAGE AREA.--775 mi2, includes Paynes Prairie, a diked sinkhole area of 650 mi2, approximately, which is noncontributing except by pumpage.
PERIOD OF RECORD.--March 1948 to November 1952 (discharge measurements only), August 1957 to September 1960, March 1978 to current year.
GAGE.--Water-stage recorder. Datum of gage is 53.44 ft above NGVD of 1929. Mar. 16, 1948 to Nov. 14, 1952, reference point atdatum 15.27 ft higher. Aug. 8, 1957 to Oct. 28, 1960, water-stage recorder at datum 5.00 ft higher.
REMARKS.--Records good. Seasonal diversion out of or into canal above station by drainage and/or pumpage for irrigation of pastures in Paynes Prairie.
DISCHARGE, CUBIC FEET PER SECOND, WATER YEAR OCTOBER 2001 TO SEPTEMBER 2002DAILY MEAN VALUES
DAY OCT NOV DEC JAN FEB MAR APR MAY JUN JUL AUG SEP
1 0.00 0.00 0.00 0.00 0.00 0.00 0.00 0.00 0.00 0.00 0.00 0.00 2 0.00 0.00 0.00 0.00 0.00 0.00 0.00 0.00 0.00 0.00 0.00 0.00 3 0.00 0.00 0.00 0.00 0.00 0.00 0.00 0.00 0.00 0.00 0.00 0.00 4 0.00 0.00 0.00 0.00 0.00 0.00 0.00 0.00 0.00 0.00 0.00 0.00 5 0.00 0.00 0.00 0.00 0.00 0.00 0.00 0.00 0.00 0.00 0.00 0.00
6 0.00 0.00 0.00 0.00 0.00 0.00 0.00 0.00 0.00 0.00 0.00 0.00 7 0.00 0.00 0.00 0.00 0.00 0.00 0.00 0.00 0.00 0.00 0.00 0.00 8 0.00 0.00 0.00 0.00 0.00 0.00 0.00 0.00 0.00 0.00 0.00 0.00 9 0.00 0.00 0.00 0.00 0.00 0.00 0.00 0.00 0.00 0.00 0.00 0.00 10 0.00 0.00 0.00 0.00 0.00 0.00 0.00 0.00 0.00 0.00 0.00 0.00
11 0.00 0.00 0.00 0.0012 0.00 0.00 0.00 0.0013 0.00 0.00 0.00 0.0014 0.00 0.00 0.00 0.0015 0.00 0.00 0.00 0.00
0.00 0.00 0.00 0.00 0.00 0.00 0.00 0.000.00 0.00 0.00 0.00 0.00 0.00 0.00 0.000.00 0.00 0.00 0.00 0.00 0.00 0.00 0.000.00 0.00 0.00 0.00 0.00 0.00 0.00 0.000.00 0.00 0.00 0.00 0.00 0.00 0.00 0.00
16 0.00 0.00 0.00 0.0017 0.00 0.00 0.00 0.0018 0.00 0.00 0.00 0.0019 0.00 0.00 0.00 0.0020 0.00 0.00 0.00 0.00
0.00 0.00 0.00 0.00 0.00 0.00 0.00 0.000.00 0.00 0.00 0.00 0.00 0.00 0.00 0.000.00 0.00 0.00 0.00 0.00 0.00 0.00 0.000.00 0.00 0.00 0.00 0.00 0.00 0.00 0.000.00 0.00 0.00 0.00 0.00 0.00 0.00 0.00
21 0.00 0.00 0.00 0.0022 0.00 0.00 0.00 0.0023 0.00 0.00 0.00 0.0024 0.00 0.00 0.00 0.0025 0.00 0.00 0.00 0.00
0.00 0.00 0.00 0.00 0.00 0.00 0.00 0.000.00 0.00 0.00 0.00 0.00 0.00 0.00 0.000.00 0.00 0.00 0.00 0.00 0.00 0.00 0.000.00 0.00 0.00 0.00 0.00 0.00 0.00 0.000.00 0.00 0.00 0.00 0.00 0.00 0.00 0.00
26 0.00 0.00 0.00 0.0027 0.00 0.00 0.00 0.0028 0.00 0.00 0.00 0.0029 0.00 0.00 0.00 0.00 30 0.00 0.00 0.00 0.00 31 0.00 --- 0.00 0.00
0.00 0.00 0.00 0.00 0.00 0.00 0.00 0.000.00 0.00 0.00 0.00 0.00 0.00 0.00 0.000.00 0.00 0.00 0.00 0.00 0.00 0.00 0.00 --- 0.00 0.00 0.00 0.00 0.00 0.00 0.00 --- 0.00 0.00 0.00 0.00 0.00 0.00 0.00 --- 0.00 --- 0.00 --- 0.00 0.00 --
TOTAL 0.00 0.00 0.00 0.00MEAN 0.000 0.000 0.000 0.000 MAX 0.00 0.00 0.00 0.00 MIN 0.00 0.00 0.00 0.00CFSM 0.00 0.00 0.00 0.00 IN. 0.00 0.00 0.00 0.00
0.00 0.00 0.00 0.00 0.00 0.00 0.00 0.00 0.000 0.000 0.000 0.000 0.000 0.000 0.000 0.000 0.00 0.00 0.00 0.00 0.00 0.00 0.00 0.00 0.00 0.00 0.00 0.00 0.00 0.00 0.00 0.000.00 0.00 0.00 0.00 0.00 0.00 0.00 0.00 0.00 0.00 0.00 0.00 0.00 0.00 0.00 0.00
STATISTICS OF MONTHLY MEAN DATA FOR WATER YEARS 1957 - 2002, BY WATER YEAR (WY)
MEAN 50.8 34.4 28.1 39.9 MAX 232 181 114 178 (WY) 1960 1986 1984 1984 MIN 0.000 0.000 0.000 0.000 (WY) 2001 2000 2000 2000
61.5 104 97.0 58.0 39.9 37.2 59.8 69.0273 504 426 221 276 221 385 3471998 1959 1959 1959 1959 1959 1978 19850.000 0.000 0.000 0.000 0.000 0.000 0.000 0.0002000 2000 2000 2000 1999 2000 2000 2000
SUMMARY STATISTICS FOR 2001 CALENDAR YEAR FOR 2002 WATER YEAR WATER YEARS 1957 - 2002
ANNUAL TOTAL 0.00ANNUAL MEAN 0.000 HIGHEST ANNUAL MEANLOWEST ANNUAL MEAN HIGHEST DAILY MEAN 0.00 Jan LOWEST DAILY MEAN 0.00 Jan ANNUAL SEVEN-DAY MINIMUM 0.00 Jan MAXIMUM PEAK FLOW MAXIMUM PEAK STAGE ANNUAL RUNOFF (CFSM) 0.000 ANNUAL RUNOFF (INCHES) 0.0010 PERCENT EXCEEDS 0.0050 PERCENT EXCEEDS 0.0090 PERCENT EXCEEDS 0.00
0.00 0.000 54.8
193 1959a0.000
1 0.00 1040 Mar 24 19591 0.00 0.00 Many days1 0.00 Oct 1 0.00 Many days
1040 Mar 24 19595.02 Oct 1 13.21 Mar 24 1959 0.000 0.071 0.00 0.96 0.00 157 0.00 22 0.00 0.00
a 2001,2002 water years

---
156 OCKLAWAHA RIVER BASIN
02241000 CAMPS CANAL NEAR ROCHELLE, FL--Continued
GAGE HEIGHT, FEET, WATER YEAR OCTOBER 2001 TO SEPTEMBER 2002 DAILY MEAN VALUES
DAY OCT NOV DEC JAN FEB MAR APR MAY JUN JUL AUG SEP
1 5.00 4.52 4.41 4.37 4.37 4.36 4.35 4.32 4.30 4.29 4.29 4.50 2 4.96 4.52 4.40 4.37 4.37 4.36 4.34 4.32 4.30 4.29 4.29 4.47 3 4.92 4.52 4.40 4.37 4.37 4.36 4.34 4.32 4.29 4.29 4.29 4.42 4 4.88 4.51 4.40 4.37 4.37 4.36 4.34 4.32 4.30 4.29 4.29 4.40 5 4.84 4.51 4.40 4.37 4.37 4.36 4.34 4.32 4.29 4.29 4.29 4.44
6 4.80 4.50 4.40 4.37 4.37 4.36 4.34 4.31 4.29 4.30 4.29 4.53 7 4.76 4.47 4.40 4.37 4.37 4.36 4.34 4.31 4.29 4.30 4.29 4.50 8 4.72 4.46 4.39 4.37 4.37 4.36 4.34 4.31 4.29 4.30 4.29 4.48 9 4.67 4.44 4.40 4.37 4.37 4.36 4.34 4.31 4.29 4.30 4.29 4.45 10 4.63 4.44 4.40 4.37 4.37 4.36 4.34 4.31 4.29 4.29 4.29 4.41
11 4.62 4.43 4.40 4.37 4.37 4.36 4.34 4.31 4.29 4.29 4.29 4.37 12 4.60 4.43 4.40 4.37 4.36 4.36 4.34 4.31 4.29 4.29 4.29 4.35 13 4.58 4.43 4.40 4.37 4.36 4.36 4.34 4.31 4.29 4.29 4.29 4.38 14 4.57 4.44 4.40 4.37 4.36 4.36 4.34 4.31 4.29 4.29 4.29 4.38 15 4.56 4.44 4.40 4.39 4.36 4.36 4.34 4.30 4.29 4.29 4.29 4.54
16 4.55 4.43 4.40 4.39 4.36 4.36 4.34 4.30 4.29 4.29 4.29 4.57 17 4.55 4.43 4.39 4.39 4.36 4.36 4.33 4.30 4.29 4.29 4.29 4.53 18 4.55 4.43 4.39 4.38 4.36 4.36 4.33 4.30 4.29 4.29 4.29 4.51 19 4.55 4.42 4.39 4.38 4.36 4.36 4.33 4.30 4.29 4.29 4.29 4.50 20 4.56 4.42 4.39 4.38 4.36 4.35 4.33 4.30 4.29 4.29 4.29 4.49
21 4.55 4.42 4.39 4.38 4.36 4.35 4.33 4.30 4.29 4.29 4.29 4.49 22 4.55 4.42 4.39 4.38 4.36 4.35 4.33 4.30 4.29 4.29 4.29 4.48 23 4.55 4.42 4.38 4.38 4.36 4.35 4.33 4.30 4.29 4.29 4.28 4.48 24 4.55 4.42 4.38 4.38 4.36 4.35 4.33 4.30 4.29 4.29 4.28 4.49 25 4.55 4.41 4.38 4.38 4.36 4.35 4.33 4.30 4.29 4.29 4.28 4.50
26 4.54 4.41 4.38 4.38 4.36 4.35 4.32 4.30 4.29 4.29 4.28 4.55 27 4.53 4.41 4.38 4.38 4.36 4.35 4.32 4.30 4.29 4.29 4.28 4.54 28 4.53 4.41 4.38 4.38 4.36 4.35 4.32 4.30 4.29 4.29 4.28 4.51 29 4.53 4.41 4.38 4.38 --- 4.35 4.32 4.30 4.29 4.29 4.33 4.50 30 4.53 4.41 4.38 4.38 --- 4.35 4.32 4.29 4.29 4.29 4.55 4.49 31 4.52 --- 4.37 4.37 --- 4.35 --- 4.29 4.29 4.52 --
MEAN 4.64 4.44 4.39 4.38 4.36 4.36 4.33 4.31 4.29 4.29 4.31 4.47 MAX 5.00 4.52 4.41 4.39 4.37 4.36 4.35 4.32 4.30 4.30 4.55 4.57 MIN 4.52 4.41 4.37 4.37 4.36 4.35 4.32 4.29 4.29 4.29 4.28 4.35
CAL YR 2001 MEAN 4.52 MAX 5.24 MIN 4.36 WTR YR 2002 MEAN 4.38 MAX 5.00 MIN 4.28

157 OCKLAWAHA RIVER BASIN
02243000 ORANGE CREEK AT ORANGE SPRINGS, FL
LOCATION.--Lat 29° 30'34", long 81° 56'47", in NE1⁄ 4 sec.25, T.11 S., R.23 E., Marion County, Hydrologic Unit 03080102, near right bank at downstream side of bridge on State Highway 21, 0.2 mi northwest of Orange Springs, and 0.45 mi upstream from Little Orange Creek.
DRAINAGE AREA.--1,119 mi2, includes Paynes Prairie, a diked sinkhole area of 650 mi2, approximately, which is noncontributing except by pumpage.
PERIOD OF RECORD.--November 1941 to June 1942 (discharge measurements only), July 1942 to December 1952, October 1955 to September 1971, October 1971 to April 1975 (discharge measurements only), May 1975 to current year.
REVISED RECORDS.--WDR FL-80-1: Drainage area.
GAGE.--Water-stage recorder. Datum of gage is 19.81 ft above NGVD of 1929. Prior to Oct. 18, 1955, and Oct. 13, 1971 to May 6, 1975, nonrecording gage at same site and datum. Feb. 4, 1980 to May 7, 1981, temporary gage 125 ft downstream at same datum.
REMARKS.--Records good except for period of estimated daily discharge, which is fair. Records include some flow diverted, during periods of high stages, from Santa Fe Lake in Suwannee River basin through Lochloosa Creek. Since April 1963, concrete dam at outlet of Orange Lake, 11 mi upstream from station.
EXTREMES OUTSIDE PERIOD OF RECORD.--Flood in October 1941 reached a stage of 10.6 ft, from information by local resident, discharge 2,400 ft3/s, from rating curve extended above 1,500 ft3/s.
DISCHARGE, CUBIC FEET PER SECOND, WATER YEAR OCTOBER 2001 TO SEPTEMBER 2002DAILY MEAN VALUES
DAY OCT NOV DEC JAN FEB MAR APR MAY JUN JUL AUG SEP
1 36 9.2 5.4 5.0 2 32 8.8 5.3 5.6 3 29 8.8 5.2 7.8 4 27 9.3 5.2 7.3 5 25 8.8 5.1 6.9
13 7.9 3.0 1.9 1.9 42 29 e32 12 7.8 2.9 1.8 1.5 34 27 e28 11 8.8 3.0 1.8 1.4 28 36 e27 10 11 5.5 1.6 1.4 26 44 e279.6 9.5 13 1.6 1.3 23 36 e28
6 23 8.1 5.0 7.47 22 7.6 5.0 7.58 21 7.4 5.1 7.19 19 7.2 19 6.7 10 18 6.9 28 6.6
9.2 8.8 7.9 1.7 1.4 26 29 e299.3 8.4 5.9 1.7 2.1 23 25 e279.5 8.1 4.8 1.6 2.1 19 e25 e259.0 7.8 4.3 1.5 1.9 18 e23 e238.7 7.3 4.3 1.3 1.8 21 e22 e23
11 17 6.8 18 6.512 16 6.9 14 6.413 16 6.7 12 7.314 15 8.8 11 1215 15 12 9.6 40
8.5 6.7 4.2 1.5 1.9 24 e20 e237.9 6.3 4.2 1.4 2.0 22 e25 e227.6 12 4.2 1.3 2.5 20 e50 e26 7.5 12 6.1 1.4 5.4 19 e41 e407.2 9.9 7.0 1.3 3.6 17 e46 e53
16 14 10 8.9 2617 13 8.9 8.3 21 18 12 8.3 7.8 17 19 11 8.1 7.3 15 20 11 7.6 7.0 14
7.0 8.8 5.2 1.3 2.6 14 e43 e46 6.7 7.8 4.2 1.4 2.8 12 e38 e40 6.3 6.8 3.7 1.4 3.7 11 e33 e34 6.0 6.0 3.3 1.6 5.4 12 e33 e28 5.9 5.4 3.0 1.7 5.8 15 e38 e27
21 10 6.9 6.6 13 22 9.9 6.4 6.3 14 23 9.8 6.4 6.2 1324 9.5 6.4 6.2 12 25 18 6.4 5.8 12
5.8 5.4 2.7 1.4 6.2 24 e52 e26 5.6 7.1 2.4 1.4 20 32 e45 e25 7.8 6.7 2.3 1.4 29 36 e35 e24 15 5.6 2.2 1.3 16 38 e32 e3013 5.0 2.1 1.3 14 33 e27 e53
26 19 6.1 5.6 1527 14 6.0 5.5 15 28 12 5.7 5.5 15 29 11 5.6 5.5 15 30 10 5.5 5.3 1431 9.7 --- 5.2 13
11 4.7 2.1 1.3 22 34 e26 e56 9.6 4.3 2.0 1.4 19 78 e27 e45 8.5 3.7 1.9 1.6 17 70 e28 e37 --- 3.6 1.9 1.4 26 59 e28 e33 --- 3.5 1.9 1.4 66 46 e30 e28--- 3.2 --- 1.5 --- 36 e34 --
TOTAL 524.9 227.6 255.9 384.1MEAN 16.9 7.59 8.25 12.4 MAX 36 12 28 40 MIN 9.5 5.5 5.0 5.0 CFSM 0.02 0.01 0.01 0.01 IN. 0.02 0.01 0.01 0.01
248.2 219.9 121.2 46.2 287.7 912 1027 9658.86 7.09 4.04 1.49 9.59 29.4 33.1 32.2 15 12 13 1.9 66 78 52 565.6 3.2 1.9 1.3 1.3 11 20 220.01 0.01 0.00 0.00 0.01 0.03 0.03 0.03 0.01 0.01 0.00 0.00 0.01 0.03 0.03 0.03
STATISTICS OF MONTHLY MEAN DATA FOR WATER YEARS 1942 - 2002, BY WATER YEAR (WY)
MEAN 163 116 97.7 112 MAX 934 652 536 522 (WY) 1965 1948 1948 1970 MIN 3.00 3.04 3.59 4.93(WY) 1991 1991 1991 2001
139 188 167 92.9 70.8 81.3 131 173 1003 1095 909 504 558 627 790 10011970 1998 1970 1959 1959 1959 1965 1964 5.09 4.83 4.04 1.49 2.31 3.44 2.52 2.591991 2000 2002 2002 2000 1992 1993 1990
SUMMARY STATISTICS FOR 2001 CALENDAR YEAR FOR 2002 WATER YEAR WATER YEARS 1942 - 2002
ANNUAL TOTAL 4927.7ANNUAL MEAN 13.5 HIGHEST ANNUAL MEAN LOWEST ANNUAL MEAN HIGHEST DAILY MEAN 265 Sep 15 LOWEST DAILY MEAN 1.4 May 25,27-29ANNUAL SEVEN-DAY MINIMUM 1.5 May 23MAXIMUM PEAK FLOWMAXIMUM PEAK STAGE INSTANTANEOUS LOW FLOWANNUAL RUNOFF (CFSM) 0.012 ANNUAL RUNOFF (INCHES) 0.1610 PERCENT EXCEEDS 2750 PERCENT EXCEEDS 6.890 PERCENT EXCEEDS 2.3
5219.714.3 129
500 19486.39 1990
78 Jul 27 1940 Sep 13 1964 a1.3 1.0 Jun 19 2000 1.4 May 10 1.3 Jun 16 200084 Jul 27 2170 Sep 13 1964 3.47 Jul 27 9.86 Sep 13 19641.2 Many days 0.013 0.12 0.17 1.5633 375 8.8 45 1.9 5.5
e Estimated a May 10,15,16,24-26, Jun 5

158 OCKLAWAHA RIVER BASIN
02243960 OCKLAWAHA RIVER AT RODMAN DAM, NEAR ORANGE SPRINGS, FL
LOCATION.--Lat 29° 30'30", long 81° 48'15", in NW1⁄ 4 sec.28, T.11 S., R.25 E., Putnam County, Hydrologic Unit 03080102, at downstream side of control structure of Rodman Dam, 8.4 mi east of Orange Springs, and 11.6 mi upstream from mouth.
DRAINAGE AREA.--2,747 mi2, includes Paynes Prairie, a diked sinkhole area of 650 mi2, approximately, which is noncontributing except for pumpage.
PERIOD OF RECORD.--October 1968 to current year.
REVISED RECORDS.--WDR FL-77-1: Drainage area.
GAGE.--Water-stage recorder. Datum of gage is at NGVD of 1929 (U.S. Army Corps of Engineers bench mark). Auxiliary gage atupstream side of control structure at same datum.
REMARKS.--Records fair. Flow regulated by manipulation of gates in spillway; dam completed and flow through spillway began on Sept. 30, 1968. Discharge computed from relation between discharge, head, and gate openings. Since November 1969, diversion above station from Lake Ocklawaha for boat lockages, through Cross-Florida Barge Canal (see station 02244032) to St. Johns River. Elevations published as Ocklawaha River below Rodman Dam previously published as Ocklawaha River at Rodman Dam.
COOPERATION.--Gate-opening record provided by Cross Florida Greenways and Trails.
DISCHARGE, CUBIC FEET PER SECOND, WATER YEAR OCTOBER 2001 TO SEPTEMBER 2002DAILY MEAN VALUES
DAY OCT NOV DEC JAN FEB MAR APR MAY JUN JUL AUG SEP
1 921 e652 e1790 925 995 840 518 483 449 1340 1230 1270 2 922 e652 e1780 1220 986 839 521 434 450 1190 1230 1540 3 922 e653 e1070 1430 981 856 526 434 450 973 1230 2010 4 922 e654 e1250 1190 975 1140 529 435 450 891 1230 2300 5 922 e655 e1670 834 962 1060 534 435 450 815 1230 2210
6 923 e656 e1760 719 846 910 537 435 451 777 1220 2150 7 922 e633 e1480 938 838 945 539 437 452 776 1220 2150 8 922 e619 e1920 1180 914 794 542 437 453 680 946 2140 9 921 e619 e2020 1010 810 469 545 437 453 629 814 1330
10 922 e620 e2150 883 818 481 548 437 453 629 815 e927
11 922 e621 e1840 1000 821 466 549 438 e454 630 815 e1130 12 923 e559 e2580 1010 821 427 550 439 e454 631 816 e1240 13 922 e467 e2220 969 820 414 552 441 e455 632 820 1400 14 923 e468 e1490 984 819 421 553 440 e456 634 822 1550 15 1010 e641 e2010 1110 821 428 555 439 e456 730 1010 1560
16 1070 e781 e1950 1270 825 437 557 440 e456 781 1160 2240 17 1070 e781 e1900 1270 826 444 560 441 608 779 1160 2560 18 1070 e781 e1850 1150 821 450 562 442 683 778 1160 2390 19 1070 e1140 e1790 1120 824 456 564 442 744 778 1160 2170 20 1070 e2340 e1730 1160 996 463 565 442 829 779 1170 2160
21 1060 e2650 e1650 1150 e1080 470 566 442 866 779 1170 1530 22 1060 e2390 e1310 940 e1070 473 567 442 1060 780 1160 1090 23 898 e2360 1030 807 e914 478 567 442 1140 780 1170 1090 24 763 e2160 1010 768 e856 483 568 443 1140 802 1170 1820 25 e770 e2030 1050 851 e914 488 571 444 1140 819 1050 2810
26 e765 e2000 1140 1010 e1100 494 571 444 1140 931 977 3130 27 e704 e1900 1000 1010 e1150 499 571 445 1280 1010 977 e2330 28 e650 e1830 615 1110 e897 502 572 446 1360 1010 880 1880 29 e651 e1810 719 1230 -- 506 573 446 1350 1010 791 1880 30 e652 e1790 792 1110 -- 510 566 447 1340 1150 757 1860 31 e645 -- 873 988 -- 508 -- 448 -- 1230 758 --
TOTAL 27887 35912 47439 32346 25500 18151 16598 13697 21922 26153 32118 55847 MEAN 900 1197 1530 1043 911 586 553 442 731 844 1036 1862 MAX 1070 2650 2580 1430 1150 1140 573 483 1360 1340 1230 3130 MIN 645 467 615 719 810 414 518 434 449 629 757 927 IN. 0.38 0.49 0.64 0.44 0.35 0.25 0.22 0.19 0.30 0.35 0.43 0.76
STATISTICS OF MONTHLY MEAN DATA FOR WATER YEARS 1969 - 2002, BY WATER YEAR (WY)
MEAN 1259 1100 1229 1436MAX 3288 2982 2871 4394(WY) 1970 1970 1970 1998MIN 384 310 478 423 (WY) 2001 2001 1994 1982
1450 1516 1451 1022 1083 1214 1329 14725004 5432 4518 2807 3765 3247 3182 36511970 1998 1970 1970 1982 1974 1978 1979 531 421 345 357 378 387 445 5541982 2001 1992 1985 2001 2001 1993 1993
SUMMARY STATISTICS FOR 2001 CALENDAR YEAR FOR 2002 WATER YEAR WATER YEARS 1969 - 2002
ANNUAL TOTAL 256558ANNUAL MEAN 703 HIGHEST ANNUAL MEANLOWEST ANNUAL MEANHIGHEST DAILY MEAN 3910LOWEST DAILY MEAN a291ANNUAL SEVEN-DAY MINIMUM 291MAXIMUM PEAK STAGEANNUAL RUNOFF (INCHES) 3.4710 PERCENT EXCEEDS 148050 PERCENT EXCEEDS 52590 PERCENT EXCEEDS 355
353570 969 1296
3245 1970 519 2001
Sep 15 3130 Sep 26 9560 Feb 5 1970 414 Mar 13 0.00 Many days
May 21 432 Mar 12 207 Jul 4 1969 6.00 Sep 26 9.64 Apr 12 1982 4.79 6.41
1820 2540 846 1040 449 448
e Estimated a May 21-28,30,31, July 8, 2001

---
OCKLAWAHA RIVER BASIN 159
02243960 OCKLAWAHA RIVER AT RODMAN DAM, NEAR ORANGE SPRINGS, FL--Continued
GAGE HEIGHT, FEET, WATER YEAR OCTOBER 2001 TO SEPTEMBER 2002 DAILY MEAN VALUES
DAY OCT NOV DEC JAN FEB MAR APR MAY JUN JUL AUG SEP
1 4.36 --- --- 3.53 3.92 3.37 1.22 1.59 1.94 4.40 4.01 3.69 2 4.30 --- --- 3.83 3.90 3.12 1.39 1.64 1.86 4.26 4.10 4.48 3 4.25 --- --- 4.57 3.87 2.99 1.41 1.49 1.79 3.97 4.17 4.81 4 4.20 --- --- 4.51 3.84 3.59 1.35 1.39 1.79 3.62 4.08 5.25 5 4.15 --- --- 3.99 3.77 3.99 1.37 1.32 1.83 3.46 4.06 5.39
6 4.10 --- --- 3.15 3.49 3.57 1.45 1.31 1.86 3.25 4.17 5.40 7 4.04 --- --- 3.16 3.16 3.50 1.52 1.68 1.90 3.15 4.13 5.35 8 4.00 --- --- 4.07 3.52 3.22 1.63 2.02 1.86 3.05 4.05 5.33 9 4.00 --- --- 4.12 3.39 2.20 1.70 1.90 1.88 2.89 3.70 4.84
10 4.01 --- --- 3.65 3.37 1.99 1.90 1.63 1.94 2.86 3.63 --
11 4.00 --- --- 3.60 3.40 1.97 2.23 1.36 2.11 2.85 3.58 --12 3.97 --- --- 3.74 3.48 1.93 2.26 1.24 2.25 2.91 3.52 --13 3.92 --- --- 3.47 3.46 1.77 2.27 1.45 2.24 2.97 3.55 4.37 14 3.88 --- --- 3.15 3.43 1.85 2.25 1.73 2.24 2.87 3.73 4.68 15 3.98 --- --- 3.71 3.42 1.69 1.89 1.82 2.11 2.95 3.91 4.80
16 4.22 --- --- 4.19 3.41 1.34 1.40 1.79 2.06 3.11 4.06 5.15 17 4.25 --- --- 4.17 3.38 1.23 1.28 1.70 2.42 3.12 4.20 5.74 18 4.26 --- --- 4.17 3.33 1.29 1.21 1.68 2.80 3.14 4.26 5.70 19 4.25 --- --- 4.02 3.31 1.41 1.73 1.65 2.89 3.18 4.22 5.43 20 4.24 --- --- 4.13 3.57 1.37 2.21 1.73 3.16 3.30 4.29 5.39
21 4.22 --- --- 4.07 --- 1.35 2.17 1.84 3.34 3.30 4.47 5.03 22 4.18 --- 4.89 3.76 --- 1.38 1.83 1.89 3.71 3.31 4.49 4.32 23 3.97 --- 4.39 3.33 --- 1.42 1.42 1.95 3.98 3.34 4.08 4.34 24 3.62 --- 4.10 3.19 --- 1.44 1.44 1.92 3.97 3.34 3.94 4.85 25 3.49 --- 4.07 3.25 --- 1.41 1.44 1.84 3.98 3.31 3.88 5.57
26 3.36 --- 4.14 3.68 --- 1.34 1.94 1.74 4.02 3.33 3.86 5.97 27 3.32 --- 4.14 3.60 --- 1.38 2.39 1.68 4.14 3.52 3.81 --28 3.39 --- 3.29 3.80 --- 1.47 2.38 1.77 4.33 3.54 3.60 5.18 29 3.41 --- 2.83 4.18 --- 1.45 1.97 1.90 4.38 3.51 3.41 5.09 30 3.44 --- 2.82 4.15 --- 1.44 1.50 1.95 4.41 3.72 3.14 5.04 31 3.45 --- 3.31 3.91 --- 1.40 --- 1.97 4.02 3.15 --
MEAN 3.94 --- --- 3.80 --- 2.03 1.74 1.70 2.77 3.34 3.91 --MAX 4.36 --- --- 4.57 --- 3.99 2.39 2.02 4.41 4.40 4.49 --MIN 3.32 --- --- 3.15 --- 1.23 1.21 1.24 1.79 2.85 3.14 --

160 WATER RESOURCES DATA FOR FLORIDA, 2002 Volume 1A: Northeast Florida Surface Water
82° 00¢ 81° 30¢ 81° 00¢
30° 00¢
29° 00¢
0
0
10
10
295856081372301
294213081345300
02245260
p
p
p
p
02246500
02246828
02246000
02245500
02245140
02245050
02244473
02244440
02244320 02244420
02245255
02246300
302309081333001
02246435
02246437
02246150
pp p
p p
p
p
p p
p
p
p
p
p
p
p p
p
p
02246010
02244040
02244032
p
p 292349081254200
p
02246465
02246467
p
p
02245255
02246500
STREAM GAGING
AND NUMBER
SITE
20 MILES
20 KILOMETERS
301124081395901
STATION
QW SAMPLING
EXPLANATION
Figure 7.--Location of stream gaging stations in the St. Johns River basin below the Ocklawaha River basin.

161 ST. JOHNS RIVER BASIN BELOW OCKLAWAHA RIVER
02244032 CROSS-FLORIDA BARGE CANAL AT BUCKMAN LOCK, NEAR PALATKA, FL
LOCATION.--Lat 29° 32'45", long 81° 43'35", in land grant 37, T.11 S., R.26 E., Putnam County, Hydrologic Unit 03080103, at downstream side of Buckman Lock, 1.7 mi upstream from mouth, and 9.0 mi southwest of Palatka.
DRAINAGE AREA.--Indeterminate.
PERIOD OF RECORD.--December 1969 to current year. Prior to October 1974, published as "at St. Johns Lock".
GAGE.--Nonrecording gage.
REMARKS.--Discharge at station is a diversion of flow, for boat lockages, from Lake Ocklawaha and Ocklawaha River into St. JohnsRiver and is computed using daily volume of water used for lockage. Boat lock was closed for maintenance for the entire water year.
COOPERATION.--Lockage record provided by Cross Florida Greenways and Trails.
DISCHARGE, CUBIC FEET PER SECOND, WATER YEAR OCTOBER 2001 TO SEPTEMBER 2002DAILY MEAN VALUES
DAY OCT NOV DEC JAN FEB MAR APR MAY JUN JUL AUG SEP
1 0.00 0.00 0.00 0.00 0.00 0.00 0.00 0.00 0.00 0.00 0.00 0.00 2 0.00 0.00 0.00 0.00 0.00 0.00 0.00 0.00 0.00 0.00 0.00 0.00 3 0.00 0.00 0.00 0.00 0.00 0.00 0.00 0.00 0.00 0.00 0.00 0.00 4 0.00 0.00 0.00 0.00 0.00 0.00 0.00 0.00 0.00 0.00 0.00 0.00 5 0.00 0.00 0.00 0.00 0.00 0.00 0.00 0.00 0.00 0.00 0.00 0.00
6 0.00 0.00 0.00 0.00 0.00 0.00 0.00 0.00 0.00 0.00 0.00 0.00 7 0.00 0.00 0.00 0.00 0.00 0.00 0.00 0.00 0.00 0.00 0.00 0.00 8 0.00 0.00 0.00 0.00 0.00 0.00 0.00 0.00 0.00 0.00 0.00 0.00 9 0.00 0.00 0.00 0.00 0.00 0.00 0.00 0.00 0.00 0.00 0.00 0.00 10 0.00 0.00 0.00 0.00 0.00 0.00 0.00 0.00 0.00 0.00 0.00 0.00
11 0.00 0.00 0.00 0.0012 0.00 0.00 0.00 0.0013 0.00 0.00 0.00 0.0014 0.00 0.00 0.00 0.0015 0.00 0.00 0.00 0.00
0.00 0.00 0.00 0.00 0.00 0.00 0.00 0.000.00 0.00 0.00 0.00 0.00 0.00 0.00 0.000.00 0.00 0.00 0.00 0.00 0.00 0.00 0.000.00 0.00 0.00 0.00 0.00 0.00 0.00 0.000.00 0.00 0.00 0.00 0.00 0.00 0.00 0.00
16 0.00 0.00 0.00 0.0017 0.00 0.00 0.00 0.0018 0.00 0.00 0.00 0.0019 0.00 0.00 0.00 0.0020 0.00 0.00 0.00 0.00
0.00 0.00 0.00 0.00 0.00 0.00 0.00 0.000.00 0.00 0.00 0.00 0.00 0.00 0.00 0.000.00 0.00 0.00 0.00 0.00 0.00 0.00 0.000.00 0.00 0.00 0.00 0.00 0.00 0.00 0.000.00 0.00 0.00 0.00 0.00 0.00 0.00 0.00
21 0.00 0.00 0.00 0.0022 0.00 0.00 0.00 0.0023 0.00 0.00 0.00 0.0024 0.00 0.00 0.00 0.0025 0.00 0.00 0.00 0.00
0.00 0.00 0.00 0.00 0.00 0.00 0.00 0.000.00 0.00 0.00 0.00 0.00 0.00 0.00 0.000.00 0.00 0.00 0.00 0.00 0.00 0.00 0.000.00 0.00 0.00 0.00 0.00 0.00 0.00 0.000.00 0.00 0.00 0.00 0.00 0.00 0.00 0.00
26 0.00 0.00 0.00 0.0027 0.00 0.00 0.00 0.0028 0.00 0.00 0.00 0.0029 0.00 0.00 0.00 0.00 30 0.00 0.00 0.00 0.00 31 0.00 --- 0.00 0.00
0.00 0.00 0.00 0.00 0.00 0.00 0.00 0.000.00 0.00 0.00 0.00 0.00 0.00 0.00 0.000.00 0.00 0.00 0.00 0.00 0.00 0.00 0.00 --- 0.00 0.00 0.00 0.00 0.00 0.00 0.00 --- 0.00 0.00 0.00 0.00 0.00 0.00 0.00 --- 0.00 --- 0.00 --- 0.00 0.00 --
TOTAL 0.00 0.00 0.00 0.00MEAN 0.000 0.000 0.000 0.000 MAX 0.00 0.00 0.00 0.00 MIN 0.00 0.00 0.00 0.00
0.00 0.00 0.00 0.00 0.00 0.00 0.00 0.00 0.000 0.000 0.000 0.000 0.000 0.000 0.000 0.000 0.00 0.00 0.00 0.00 0.00 0.00 0.00 0.00 0.00 0.00 0.00 0.00 0.00 0.00 0.00 0.00
STATISTICS OF MONTHLY MEAN DATA FOR WATER YEARS 1970 - 2002, BY WATER YEAR (WY)
MEAN 33.2 34.8 28.0 31.5 MAX 78.4 77.1 67.4 67.1(WY) 1988 1988 1988 1976 MIN 0.000 0.000 0.000 0.000 (WY) 2001 2001 2001 1996
50.3 51.9 46.4 48.8 40.1 32.2 27.9 29.1 87.9 89.7 90.5 98.2 93.5 62.7 56.8 73.11973 1985 1985 1997 1994 1988 1997 19870.000 0.000 0.000 0.000 0.000 0.000 0.000 0.0001996 1996 1996 2000 2000 2000 1985 1985
SUMMARY STATISTICS FOR 2001 CALENDAR YEAR FOR 2002 WATER YEAR WATER YEARS 1970 - 2002
ANNUAL TOTAL 0.00ANNUAL MEAN 0.000 HIGHEST ANNUAL MEANLOWEST ANNUAL MEAN HIGHEST DAILY MEAN LOWEST DAILY MEAN 0.00 Many days ANNUAL SEVEN-DAY MINIMUM 0.00 Jan 1 10 PERCENT EXCEEDS 0.0050 PERCENT EXCEEDS 0.0090 PERCENT EXCEEDS 0.00
0.00 0.000 37.9
65.4 1988a0.000430 Mar 15 1997
0.00 Many days 0.00 Many days0.00 Oct 1 0.00 Many days 0.00 92 0.00 28 0.00 0.00
a 2001,2002

162 ST. JOHNS RIVER BASIN BELOW OCKLAWAHA RIVER
02244040 ST. JOHNS RIVER AT BUFFALO BLUFF NEAR SATSUMA, FL
LOCATION.--Lat 29° 35'46", long 81° 41'00", in SE1⁄ 4 sec.27, T.10 S., R.26 E., Putnam County, Hydrologic Unit 03080103, near left bank, 400 ft upstream from CSX Transportation bridge, 2.4 mi downstream from Cross-Florida Barge Canal, 3.2 mi northwest of Satsuma, and 89 mi upstream from mouth.
DRAINAGE AREA.--6,580 mi2, approximately. Includes Paynes Prairie, a diked sinkhole area of about 650 mi2, which is noncontributing.
WATER-DISCHARGE RECORDS
PERIOD OF RECORD.--September 1943 to July 1948 (gage heights only), October 1992 to current year.
GAGE.--Water-stage recorder, acoustic velocity meter, and data-collection platform. Datum of gage is 11.00 ft below NGVD of 1929.
REMARKS.--Records fair. Discharge represents net of much larger upstream and downstream discharges.
DISCHARGE, CUBIC FEET PER SECOND, WATER YEAR OCTOBER 2001 TO SEPTEMBER 2002DAILY MEAN VALUES
DAY OCT NOV DEC JAN FEB MAR APR MAY JUN JUL AUG SEP
1 10300 10200 7620 1640 2 14500 9470 6610 -1170 3 14000 8600 3050 -1760 4 13700 7700 1350 52405 14600 -2090 4390 5470
2280 4760 1220 3860 3550 5280 6660 6040482 5660 1780 6410 5680 5420 2910 6540
-1820 7500 3620 7300 3870 6250 3260 4100-1960 2960 3810 5310 -229 6500 5060 2430-3150 6860 -3970 -3990 728 7520 6050 11400
6 15500 3780 6690 10000 7 10800 11900 8630 7870 8 6980 12900 8880 7140 9 7020 12100 8060 667010 10400 9850 5200 7630
3760 6860 -1040 -3180 1850 8100 4800 13900 4560 5210 1730 1010 3790 4550 331 11000 2880 5390 7090 2450 332 4260 -1470 7270 1680 6600 9450 4620 -5580 6380 2700 8730 2210 6470 6840 4250 -4360 8310 5930 11500
11 11400 8700 3770 698012 12200 5800 5410 5400 13 12400 -1360 7460 129014 12900 -4240 8590 202 15 7120 -9280 7950 177
2950 4730 2820 2620 -1430 10400 8040 14000 3700 5010 3030 535 689 8330 10500 148002070 3660 3080 1920 3410 6270 13600 12900 -557 6290 4120 -390 5430 6660 13900 13900 -3030 6690 4550 -1980 3610 7150 13100 14600
16 5820 190 6500 298017 1730 7030 7640 2540 18 6120 10000 7950 401019 6500 12100 8630 645020 8530 13600 5230 4400
1300 7260 4840 -259 3560 8360 14400 13900 2820 7800 4510 863 2940 5890 14900 13600-982 7180 4700 3450 2450 5670 14700 116004420 5530 5710 -8870 1850 7330 14800 101006850 3480 5920 -15200 1690 8120 14200 9950
21 11100 11600 3430 307022 12400 10400 4790 780 23 11400 12300 5730 145024 11600 13300 5210 2380 25 12400 12700 3450 4540
6590 2940 3720 -8710 -1330 9260 13500 9540 3830 -4020 2660 -11000 2010 9440 12300 7800-3190 -3420 -525 -6220 4580 7480 11400 7460 -1980 3180 -709 198 7640 8580 12300 85501600 5170 2640 3160 7990 9040 13200 9030
26 9050 11800 2020 -328027 6990 11600 7650 -166028 1720 10700 7250 109029 1310 9890 3410 243030 6540 9880 2190 3130 31 9300 --- 885 3180
4280 5330 515 2680 9650 9000 11900 147001140 2960 -1520 170 9620 8840 12600 15100 4860 2120 3200 -1840 10300 8980 11500 13600--- 964 4930 -4440 9880 9020 11700 11500 --- 3020 4700 -1690 8660 9460 9090 5040 --- 4270 --- 1080 --- 9500 7730 --
TOTAL 296330 241120 175625 100269MEAN 9559 8037 5665 3234 MAX 15500 13600 8880 10000 MIN 1310 -9280 885 -3280
47593 138414 93421 -15883 102830 235350 295591 3145801700 4465 3114 -512 3428 7592 9535 10490 6850 7800 9450 7300 10300 10400 14900 15100 -3190 -4020 -3970 -15200 -5580 4260 -1470 2430
STATISTICS OF MONTHLY MEAN DATA FOR WATER YEARS 1993 - 2002, BY WATER YEAR (WY)
MEAN 6381 7206 5627 5778MAX 12460 14270 14230 15230(WY) 1996 1995 1995 1995MIN 1027 227 1652 -278(WY) 1994 1994 1994 1994
4829 4876 3955 1874 3276 4558 3818 5862 13690 17290 10880 6302 7998 8414 9535 120501998 1998 1998 1998 1994 1994 2002 1995 952 1348 741 -512 545 756 317 7452001 2000 1997 2002 1993 2000 1993 1999
SUMMARY STATISTICS FOR 2001 CALENDAR YEAR FOR 2002 WATER YEAR WATER YEARS 1993 - 2002
ANNUAL TOTAL 1437833 ANNUAL MEAN 3939 HIGHEST ANNUAL MEAN LOWEST ANNUAL MEAN HIGHEST DAILY MEAN 17600 LOWEST DAILY MEAN -15100ANNUAL SEVEN-DAY MINIMUM -3300 MAXIMUM PEAK STAGE10 PERCENT EXCEEDS 1120050 PERCENT EXCEEDS 343090 PERCENT EXCEEDS -1370
20252405549 4800
8048 1995 2608 2001
Sep 20 15500 Oct 6 23400 Nov 28 1994Sep 15 -15200 May 20 -23900 May 20 1994Mar 6 -6660 May 19 -11600 Nov 21 1993
13.08 Oct 1 14.51 Oct 7 1996 12300 122005470 4460-818 -1590
Note.--Negative figures indicate reverse flow.

---
---
---
ST. JOHNS RIVER BASIN BELOW OCKLAWAHA RIVER 163
02244040 ST. JOHNS RIVER AT BUFFALO BLUFF NEAR SATSUMA, FL--Continued
GAGE HEIGHT, FEET, WATER YEAR OCTOBER 2001 TO SEPTEMBER 2002 DAILY MEAN VALUES
DAY OCT NOV DEC JAN FEB MAR APR MAY JUN JUL AUG SEP
1 12.65 11.80 11.05 10.75 10.36 10.75 10.78 10.45 11.09 10.65 10.84 11.75 2 12.49 11.74 11.07 10.96 10.40 10.78 10.81 10.27 10.89 11.17 11.16 11.88 3 12.37 11.70 11.21 11.11 10.61 10.70 10.76 10.06 10.84 10.74 11.35 12.05 4 12.32 11.68 11.41 10.86 10.67 10.70 10.67 10.02 10.99 10.73 11.42 12.23 5 12.16 11.99 11.43 10.77 10.76 10.57 11.02 10.36 11.05 10.71 11.45 12.16
6 11.94 12.10 11.36 10.50 10.71 10.56 11.13 10.64 10.96 10.73 11.56 12.03 7 11.94 11.84 11.24 10.22 10.59 10.60 11.11 10.56 10.86 10.86 11.89 12.08 8 12.17 11.58 11.18 10.12 10.41 10.64 10.90 -- 10.98 10.97 12.18 12.22 9 12.31 11.40 11.20 10.07 10.55 10.56 10.65 -- 11.29 10.93 12.20 12.25 10 12.23 11.42 11.33 9.93 10.58 10.48 10.49 10.13 11.38 10.84 12.18 12.16
11 12.13 11.44 11.44 9.85 10.48 10.55 10.58 10.14 11.36 10.67 12.10 11.99 12 12.01 11.50 11.40 9.84 10.41 10.63 10.71 10.21 11.29 10.65 12.00 11.81 13 11.93 11.89 11.34 9.98 10.45 10.67 10.71 10.12 11.20 10.87 11.89 11.86 14 11.85 12.22 11.27 10.16 10.54 10.53 10.67 10.09 11.03 10.83 11.81 11.78 15 11.90 12.58 11.13 10.36 10.84 10.43 10.61 10.25 10.92 10.74 11.72 11.63
16 12.02 12.58 11.16 10.29 10.79 10.34 10.54 10.31 10.90 10.69 11.59 11.55 17 12.18 12.43 11.15 10.30 10.61 10.24 10.51 10.27 10.91 10.81 11.46 11.43 18 12.17 12.25 10.95 10.23 10.75 10.18 10.46 10.13 10.97 10.88 11.34 11.54 19 12.24 12.04 10.84 10.12 10.66 10.24 10.38 10.53 11.06 10.86 11.25 11.61 20 12.18 11.75 10.83 10.07 10.50 10.35 10.26 11.08 11.15 10.83 11.26 11.71
21 12.05 11.69 10.94 10.12 10.34 10.36 10.28 11.16 11.34 10.80 11.30 11.76 22 11.92 11.76 10.96 10.22 10.34 10.65 10.37 11.31 11.48 10.84 11.30 11.89 23 11.91 11.61 10.97 10.27 10.65 10.88 10.49 11.38 11.38 10.88 11.34 11.95 24 11.82 11.46 10.86 10.34 10.95 10.76 10.71 11.22 11.20 10.85 11.27 12.03 25 11.63 11.31 10.87 10.08 10.97 10.65 10.62 11.13 11.07 10.85 11.16 12.12
26 11.62 11.24 10.92 10.42 10.87 10.57 10.69 10.98 11.02 10.82 11.27 12.01 27 11.59 11.14 10.68 10.55 10.85 10.61 10.91 11.02 10.84 10.81 11.25 11.76 28 11.80 11.16 10.59 10.49 10.73 10.70 10.76 11.10 11.06 10.81 11.24 11.61 29 11.97 11.14 10.66 10.43 --- 10.86 10.51 11.26 11.17 10.77 11.26 11.66 30 11.93 11.07 10.71 10.38 --- 10.83 10.44 11.29 10.81 10.73 11.33 11.90 31 11.88 -- 10.78 10.34 --- 10.75 --- 11.22 10.69 11.53 --
MEAN 12.04 11.72 11.06 10.33 10.62 10.58 10.65 11.08 10.81 11.51 11.88 MAX 12.65 12.58 11.44 11.11 10.97 10.88 11.13 -- 11.48 11.17 12.20 12.25 MIN 11.59 11.07 10.59 9.84 10.34 10.18 10.26 10.81 10.65 10.84 11.43
CAL YR 2001 MEAN 10.75 MAX 13.64 MIN 9.55

--- ---
---
164 ST. JOHNS RIVER BELOW OCKLAWAHA RIVER
02244040 ST. JOHNS RIVER AT BUFFALO BLUFF NEAR SATSUMA, FL--Continued
WATER-QUALITY RECORDS
PERIOD OF DAILY RECORD.-- SPECIFIC CONDUCTANCE: April 1995 to current year. WATER TEMPERATURE: April 1995 to current year. DISSOLVED OXYGEN: March 1996 to current year.
INSTRUMENTATION.--Water-quality monitor and data-collection platform.
REMARKS.--Extremes for current year and extremes for period of daily record are based on recorded values and may have been exceeded during periods of no record.
EXTREMES FOR PERIOD OF DAILY RECORD.--SPECIFIC CONDUCTANCE: Maximum daily mean, 1,520 µS/cm @ 25 ° C, Mar. 5, 2001; minimum daily mean, 360 µS/cm @ 25 ° C, Feb. 24,
1998. WATER TEMPERATURE: Maximum daily mean, 32.7 ° C, Aug. 1, 1999; minimum daily mean, 9.4 ° C, Jan. 5, 2001. DISSOLVED OXYGEN: Maximum daily mean, 11.8 mg/L, Nov. 1, 2001; minimum daily mean, 2.7 mg/L, Sept. 14, 2000.
EXTREMES FOR CURRENT YEAR.--SPECIFIC CONDUCTANCE: Maximum daily mean, 1,240 µS/cm @ 25 ° C, June 21; minimum daily mean, 460 µS/cm @ 25 ° C, Sept. 30. WATER TEMPERATURE: Maximum daily mean, 31.3 ° C, July 19; minimum daily mean, 11.2 ° C, Jan. 9,10. DISSOLVED OXYGEN: Maximum daily mean, 11.8 mg/L, Nov. 1; minimum daily mean, 3.8 mg/L, Sept. 20.
SPECIFIC CONDUCTANCE (MICROSIEMENS/CM AT 25 DEG. C), WATER YEAR OCTOBER 2001 TO SEPTEMBER 2002DAILY MEAN VALUES
DAY OCT NOV DEC JAN FEB MAR APR MAY JUN JUL AUG SEP
1 868 635 635 773 887 904 994 1110 1090 1130 989 742 2 905 643 662 785 887 909 988 1120 1100 1150 984 728 3 946 653 671 782 884 955 985 1160 1090 1070 971 717 4 974 640 671 791 879 970 984 1110 1110 1100 945 716 5 980 632 668 812 869 973 991 1110 1100 1150 890 705
6 955 635 655 791 860 969 930 1050 1110 1160 872 710 7 942 623 661 750 869 989 915 1040 1110 1170 917 698 8 939 601 652 738 847 989 946 -- 1120 1140 910 657 9 935 614 667 769 854 988 986 -- 1100 1080 917 648 10 923 638 665 805 869 989 1030 1090 1080 1110 928 641
11 905 641 665 791 875 999 1060 1110 1070 1120 909 639 12 874 649 658 804 873 967 1050 1130 1070 1160 1000 628 13 846 648 671 804 879 888 1070 1130 1070 1180 1040 580 14 841 639 693 802 873 874 1070 1150 1020 1150 1010 569 15 844 616 704 794 863 857 1070 1140 1010 1120 973 572
16 828 608 713 786 856 824 1110 1130 1030 1110 867 566 17 828 626 692 799 865 842 1120 1130 1030 1100 794 593 18 816 660 704 816 872 850 1150 1120 1060 1100 760 567 19 792 652 720 808 872 851 1180 1130 1050 1070 765 551 20 784 641 723 789 861 889 1190 1110 1150 1070 758 520
21 754 626 715 776 937 901 1170 1130 1240 1060 803 530 22 714 621 730 775 972 918 1130 1130 1120 1050 864 543 23 676 615 727 777 957 869 1130 1110 1050 1060 867 568 24 655 627 716 779 885 826 1100 1100 931 1050 881 600 25 645 648 719 797 880 833 1100 1110 1060 1040 889 580
26 654 639 725 809 918 877 1100 1110 1180 1050 877 520 27 657 630 768 785 937 926 1070 1110 1230 1040 879 500 28 672 616 787 798 936 961 1110 1110 1230 1030 845 491 29 668 617 775 836 972 1120 1080 1220 1020 806 461 30 649 615 761 855 970 1150 1080 1180 1000 779 460 31 646 --- 767 858 --- 987 --- 1090 997 758 --
MEAN 810 632 701 795 886 920 1070 --- 1100 1090 885 600 MAX 980 660 787 858 972 999 1190 --- 1240 1180 1040 742 MIN 645 601 635 738 847 824 915 --- 931 997 758 460

---
--- --- ---
---
--- ---
---
---------
ST. JOHNS RIVER BELOW OCKLAWAHA RIVER 165
02244040 ST. JOHNS RIVER AT BUFFALO BLUFF NEAR SATSUMA, FL--Continued
TEMPERATURE, WATER (DEG. C), WATER YEAR OCTOBER 2001 TO SEPTEMBER 2002 DAILY MEAN VALUES
DAY OCT NOV DEC JAN FEB MAR APR MAY JUN JUL AUG SEP
1 23.5 19.8 22.5 14.4 21.9 16.4 25.6 28.5 27.1 28.4 30.7 28.9 2 22.8 20.4 22.7 14.4 22.2 16.2 25.6 28.5 27.8 28.4 30.5 29.0 3 22.9 21.2 22.6 13.8 21.6 16.4 25.4 28.8 28.6 28.7 30.3 28.9 4 23.2 21.6 22.4 13.0 20.9 16.4 25.1 29.2 29.2 29.0 29.8 28.9 5 23.6 21.6 22.4 12.3 19.7 15.8 25.0 29.4 29.3 29.1 29.5 28.8
6 24.1 20.9 22.3 11.9 19.1 15.7 24.3 29.1 29.6 29.1 29.8 28.5 7 24.5 20.4 22.3 11.9 19.2 15.7 23.7 29.1 29.7 29.5 29.8 28.8 8 24.2 20.1 22.5 11.6 18.2 16.3 23.6 --- 29.5 29.6 29.3 28.7 9 23.9 20.0 22.9 11.2 17.7 17.1 23.8 --- 29.3 29.3 28.7 28.8 10 23.7 20.2 23.0 11.2 17.9 18.0 23.9 29.5 28.9 29.1 28.3 28.8
11 23.7 20.4 23.1 11.6 17.9 18.8 24.0 29.4 28.5 29.1 28.2 28.9 12 23.8 20.5 23.2 12.4 17.8 19.5 24.0 29.4 28.3 29.3 28.0 28.6 13 24.1 20.4 23.5 13.1 17.6 19.9 24.0 29.3 28.8 29.1 27.7 28.1 14 24.4 20.3 23.7 13.3 17.4 20.4 24.2 29.0 29.2 29.0 27.7 27.9 15 24.5 20.0 23.8 13.6 17.6 21.1 24.5 28.5 29.8 29.4 28.1 28.0
16 24.4 19.7 23.7 14.1 17.9 21.9 25.1 28.1 30.1 30.2 28.0 28.7 17 23.6 19.8 23.4 14.6 17.9 22.9 25.7 28.3 29.8 30.8 28.4 29.3 18 22.7 20.0 22.9 15.3 17.7 23.8 26.3 28.3 29.0 31.1 29.2 29.6 19 22.5 20.2 22.1 15.9 17.5 24.4 26.8 27.9 28.6 31.3 29.8 29.5 20 22.7 20.4 21.2 16.7 17.7 24.8 27.4 25.9 28.3 31.1 29.3 29.4
21 23.1 20.4 20.0 17.1 18.1 24.8 28.0 24.6 27.9 30.4 28.8 29.1 22 23.6 20.2 19.1 17.5 18.4 24.4 28.2 24.0 27.2 30.0 29.2 28.8 23 24.1 20.4 18.4 18.0 18.1 23.3 28.1 23.3 26.8 29.9 29.7 28.7 24 24.4 20.8 18.2 18.7 17.5 22.9 27.6 23.6 26.9 29.9 30.1 28.5 25 24.8 21.5 17.7 19.5 17.5 23.3 27.7 24.2 27.0 29.8 30.4 28.3
26 24.5 21.9 16.9 19.6 17.8 24.0 27.9 24.8 27.2 30.0 30.3 28.2 27 22.9 22.2 15.8 19.1 17.8 24.5 28.1 25.1 27.5 30.2 30.2 28.3 28 21.4 22.3 14.8 19.4 16.9 24.5 28.3 25.5 28.1 30.0 29.5 28.4 29 20.5 22.4 14.8 20.0 --- 24.6 28.3 26.0 28.8 30.2 29.1 28.6 30 19.9 22.5 14.9 20.7 --- 25.0 28.6 26.4 28.7 30.4 29.0 28.8 31 19.4 --- 14.8 21.3 --- 25.4 --- 26.7 30.6 28.9 --
MEAN 23.3 20.8 20.7 15.4 18.5 20.9 26.0 --- 28.5 29.7 29.2 28.7 MAX 24.8 22.5 23.8 21.3 22.2 25.4 28.6 --- 30.1 31.3 30.7 29.6 MIN 19.4 19.7 14.8 11.2 16.9 15.7 23.6 --- 26.8 28.4 27.7 27.9
OXYGEN DISSOLVED (MG/L), WATER YEAR OCTOBER 2001 TO SEPTEMBER 2002 DAILY MEAN VALUES
DAY OCT NOV DEC JAN FEB MAR APR MAY JUN JUL AUG SEP
1 --- 11.8 8.4 8.1 6.7 10.3 6.4 7.7 6.3 4.2 5.3 4.7 2 --- 11.7 8.1 8.0 6.7 10.7 6.3 8.2 6.6 5.0 5.4 4.7 3 --- 11.3 8.0 8.0 6.7 10.4 6.1 8.9 6.9 6.3 5.3 4.7 4 --- 10.9 7.9 8.0 6.7 10.2 6.2 8.5 6.7 6.1 5.2 4.7 5 4.3 10.4 7.7 8.3 7.1 10.5 6.2 8.0 6.4 6.3 5.0 4.8
6 4.7 9.6 7.7 8.5 7.5 10.8 6.3 7.3 6.4 6.4 5.3 5.3 7 4.9 10.1 7.1 8.6 7.6 11.1 6.5 7.5 6.1 6.4 5.3 5.2 8 4.8 10.8 6.0 8.5 7.9 11.3 6.7 --- 6.0 6.5 5.4 5.0 9 5.0 10.8 6.1 8.4 8.3 11.2 7.5 --- 6.3 6.4 5.5 5.1 10 5.7 10.7 6.0 8.3 8.4 10.9 8.6 7.3 5.9 6.5 5.2 5.3
11 6.3 10.4 5.7 8.1 8.5 10.7 9.0 7.3 5.7 7.2 5.4 5.3 12 6.6 10.1 5.5 7.9 8.6 10.1 9.1 7.1 5.7 7.0 5.7 5.3 13 6.7 9.4 5.3 7.7 8.5 9.9 6.7 6.5 6.2 5.7 5.4 14 7.1 9.1 5.5 7.4 8.4 9.5 6.6 7.4 6.2 5.9 4.3 15 6.9 9.6 5.5 7.2 8.5 8.6 6.8 7.8 7.3 5.9 4.6
16 6.2 9.7 5.7 --- 8.2 8.5 6.5 7.9 8.8 5.5 4.5 17 6.0 8.5 5.8 --- 8.0 8.1 9.2 6.4 7.5 9.5 5.4 4.5 18 6.5 9.6 6.1 8.5 8.0 7.7 9.2 6.2 7.4 9.8 5.6 4.4 19 7.2 10.5 6.4 8.5 8.1 7.6 8.9 5.3 7.6 9.1 5.5 4.1 20 8.0 10.6 6.8 8.5 8.4 8.6 8.4 4.9 7.0 8.2 5.3 3.8
21 8.5 10.4 7.1 8.4 9.2 --- 8.2 5.6 6.2 7.7 4.7 4.0 22 8.5 9.9 7.2 8.2 9.0 --- 8.1 6.0 6.0 7.7 4.3 4.0 23 8.3 9.7 7.4 8.1 8.8 --- 7.9 6.2 6.5 8.0 4.1 4.2 24 8.2 9.8 7.7 7.9 8.7 --- 7.5 6.3 7.6 8.0 4.1 3.9 25 8.2 9.6 7.8 7.7 8.9 --- 7.6 6.3 7.8 6.4 4.3 4.5
26 8.1 9.4 7.9 7.6 8.9 --- 7.7 6.3 7.3 5.3 4.5 5.2 27 8.5 9.1 8.2 7.5 9.1 --- 7.8 6.4 7.5 5.1 4.5 5.1 28 8.7 8.8 8.6 7.1 9.6 --- 7.5 6.4 7.5 4.8 4.6 4.9 29 8.8 8.6 8.6 6.9 6.3 7.7 6.4 6.8 4.9 4.6 5.5 30 9.6 8.6 8.5 6.8 6.4 7.4 6.4 6.1 5.5 4.7 5.6 31 11.2 --- 8.3 6.7 --- 6.4 --- 6.1 5.2 4.8 --
MEAN --- 10.0 7.1 --- 8.2 --- --- 6.8 6.7 5.1 4.8 MAX --- 11.8 8.6 --- 9.6 --- --- 7.9 9.8 5.9 5.6 MIN --- 8.5 5.3 --- 6.7 --- --- 5.7 4.2 4.1 3.8

166 ST. JOHNS RIVER BASIN BELOW OCKLAWAHA RIVER
02244320 MIDDLE HAW CREEK NEAR KORONA, FL
LOCATION.--Lat 29° 21'35", long 81° 18'42", in NW1⁄ 4 sec.19, T.13 S., R.30 E., Flagler County, Hydrologic Unit 03080103, near center of span on downstream side of bridge on State Highway 11, 1.2 mi north of Codys Corner and 7.7 mi southwest of Korona.
DRAINAGE AREA.--78.3 mi2.
PERIOD OF RECORD.--July 1975 to September 2002 (discontinued).
REVISED RECORDS.--WDR FL-78-1: 1977.
GAGE.--Water-stage recorder. Datum of gage is at NGVD of 1929.
REMARKS.--Records fair except for period of estimated daily discharge, which is poor.
DISCHARGE, CUBIC FEET PER SECOND, WATER YEAR OCTOBER 2001 TO SEPTEMBER 2002DAILY MEAN VALUES
DAY OCT NOV DEC JAN FEB MAR APR MAY JUN JUL AUG SEP
1 1060 55 142 12 132 913 51 130 11 123 729 48 119 11 124 592 48 111 11 115 496 46 102 11 11
17 7.1 0.03 0.00 431 252 17717 6.3 0.02 0.00 376 247 16118 5.6 0.00 0.00 337 271 14060 5.1 0.00 0.00 296 306 12271 4.5 0.00 0.00 258 307 117
6 423 43 95 107 369 40 87 108 329 38 80 9.9 9 296 36 73 9.810 269 34 67 9.7
9.9 68 3.8 0.00 0.00 229 272 1239.9 62 3.2 0.00 0.00 202 306 122
10 56 2.7 0.00 0.10 178 299 1149.7 51 2.2 0.00 0.04 168 259 1099.0 46 1.9 0.00 0.02 168 224 101
11 248 32 61 9.512 224 29 55 9.313 204 30 51 9.114 192 142 46 1015 181 370 43 19
8.3 43 1.8 0.00 0.04 175 196 907.6 41 1.7 0.00 0.03 190 178 827.2 40 1.6 0.00 0.02 223 170 786.8 38 1.6 0.00 0.01 e229 179 756.5 36 1.4 0.00 0.00 e363 206 80
16 167 411 39 2017 152 375 36 2218 137 363 33 2319 126 347 30 23 20 121 335 28 22
6.3 33 1.2 0.00 0.00 e545 233 826.1 31 1.1 0.00 0.02 e572 234 845.7 29 1.2 0.00 0.25 e566 222 90 5.3 27 0.98 0.00 0.74 e539 205 90 4.9 25 0.80 0.00 0.55 e588 264 93
21 115 324 26 20 22 109 310 24 19 23 104 294 22 18 24 100 274 21 1725 96 253 19 16
4.5 23 0.62 0.00 15 e566 333 102 4.5 23 0.40 0.00 150 e530 333 116 7.3 21 0.24 0.00 229 e488 297 12218 18 0.19 0.00 251 e455 258 12318 16 0.16 0.00 252 e428 221 124
26 88 230 17 1727 80 209 16 1728 73 190 15 1629 66 173 14 15 30 62 157 13 14 31 59 --- 12 14
19 15 0.08 0.00 269 e396 190 12820 13 0.05 0.00 351 e381 169 13419 11 0.03 0.00 439 e356 156 131 --- 9.8 0.02 0.00 460 e325 165 123 --- 8.9 0.03 0.00 476 309 174 115 --- 8.0 --- 0.00 --- 280 178 --
TOTAL 8180 5287 1627 455.3 MEAN 264 176 52.5 14.7MAX 1060 411 142 23 MIN 59 29 12 9.1 CFSM 3.37 2.25 0.67 0.19 IN. 3.89 2.51 0.77 0.22
282.5 975.7 57.60 0.05 2893.82 11147 7304 3348 10.1 31.5 1.92 0.002 96.5 360 236 112
20 71 7.1 0.03 476 588 333 1774.5 8.0 0.02 0.00 0.00 168 156 750.13 0.40 0.02 0.00 1.23 4.59 3.01 1.43 0.13 0.46 0.03 0.00 1.37 5.30 3.47 1.59
STATISTICS OF MONTHLY MEAN DATA FOR WATER YEARS 1975 - 2002, BY WATER YEAR (WY)
MEAN 134 65.4 43.4 70.4 MAX 374 435 232 239 (WY) 1996 1995 1998 1977MIN 0.37 0.017 0.000 0.001(WY) 1981 2001 2001 2001
62.9 68.2 53.6 12.1 49.9 63.2 78.0 169259 269 374 197 300 360 354 8581998 1978 1982 1979 1976 2002 1978 2001
0.007 0.060 0.043 0.000 0.000 0.022 0.033 0.292001 1985 1976 1978 1981 1993 1988 1989
SUMMARY STATISTICS FOR 2001 CALENDAR YEAR FOR 2002 WATER YEAR WATER YEARS 1975 - 2002
ANNUAL TOTAL 46185.89ANNUAL MEAN 127 HIGHEST ANNUAL MEAN LOWEST ANNUAL MEAN HIGHEST DAILY MEAN 3400 LOWEST DAILY MEAN 0.00 ANNUAL SEVEN-DAY MINIMUM 0.00 MAXIMUM PEAK FLOW MAXIMUM PEAK STAGEANNUAL RUNOFF (CFSM) 1.62ANNUAL RUNOFF (INCHES) 21.9410 PERCENT EXCEEDS 32650 PERCENT EXCEEDS 1990 PERCENT EXCEEDS 0.00
41557.97 114 71.8
125 1979 10.3 1981
Sep 16 1060 Oct 1 3400 Sep 16 2001 Many days 0.00 Many days 0.00 Many days Jan 1 0.00 May 3 0.00 Many days
1090 Oct 1 3720 Sep 15,16 2001 11.68 Oct 1 14.15 Sep 15,16 2001 1.45 0.9219.74 12.47
331 21938 12 0.00 0.00
e Estimated

167 ST. JOHNS RIVER BASIN BELOW OCKLAWAHA RIVER
02244420 LITTLE HAW CREEK NEAR SEVILLE, FL
LOCATION.--Lat 29° 19'20", long 81° 23'10", in SE1⁄ 4 sec.32, T.13 S., R.29 E., Flagler County, Hydrologic Unit 03080103, on right bank 600 ft downstream from bridge on State Highway 305, 1.4 mi downstream from Lake Disston, and 6.4 mi east of Seville.
DRAINAGE AREA.--93.0 mi2.
PERIOD OF RECORD.--January 1951 to September 2002 (discontinued).
REVISED RECORDS.--WDR FL-75-1: Drainage area.
GAGE.--Water-stage recorder. Datum of gage is 5.74 ft above NGVD of 1929. Prior to Jan. 5, 1953, water-stage recorder at site 600 ft upstream at same datum.
REMARKS.--Records fair.
DISCHARGE, CUBIC FEET PER SECOND, WATER YEAR OCTOBER 2001 TO SEPTEMBER 2002DAILY MEAN VALUES
DAY OCT NOV DEC JAN FEB MAR APR MAY JUN JUL AUG SEP
1 964 85 185 28 2 940 83 175 28 3 896 82 164 31 4 842 81 153 28 5 788 76 144 26
46 35 28 4.2 0.99 37 345 298 44 35 26 3.6 1.0 97 327 285 42 41 25 3.3 0.88 178 311 272 39 103 24 3.0 0.83 244 300 257 36 87 21 2.8 0.83 288 284 286
6 734 69 135 25 7 677 66 128 24 8 621 64 123 23 9 568 62 119 22 10 516 61 112 22
33 83 19 2.6 0.83 325 261 287 36 82 17 2.4 0.87 339 295 258 37 82 15 2.3 0.95 360 308 230 33 82 14 2.1 0.74 417 282 20733 81 13 2.0 0.66 461 259 189
11 471 59 106 2212 426 57 99 2213 381 62 92 22 14 345 148 87 3215 324 181 83 63
32 79 13 1.9 0.77 464 240 174 32 77 13 1.8 0.69 456 227 160 30 79 13 1.8 0.66 456 232 14829 77 18 1.6 0.60 464 259 16128 73 22 1.5 0.53 449 280 157
16 283 160 77 5717 248 158 71 5618 216 171 69 5519 200 193 64 5420 192 217 58 53
28 70 16 1.4 0.48 432 274 14927 67 14 1.4 0.58 412 259 14625 63 13 1.6 2.1 393 248 14424 59 12 1.7 2.2 377 288 13723 56 11 1.6 1.8 380 379 134
21 184 233 53 5322 177 238 49 5323 181 238 46 5224 174 238 44 5225 162 238 42 51
22 53 9.5 1.3 1.9 453 427 13624 52 8.5 1.1 2.8 510 422 12236 46 7.5 1.0 3.0 518 397 11453 42 6.6 0.95 5.0 505 363 11643 39 6.0 0.91 6.5 502 325 146
26 146 236 39 5827 126 227 35 5428 110 216 32 5229 99 205 32 50 30 93 194 31 49 31 90 --- 29 48
42 37 5.4 0.87 5.6 522 291 14040 44 5.1 0.94 6.4 494 266 14337 41 4.7 0.88 6.6 459 259 129
--- 37 4.1 0.84 8.0 426 270 115 --- 34 3.8 0.83 16 396 288 103 --- 31 --- 0.97 --- 369 286 --
TOTAL 12174 4398 2676 1265MEAN 393 147 86.3 40.8 MAX 964 238 185 63 MIN 90 57 29 22CFSM 4.22 1.58 0.93 0.44 IN. 4.87 1.76 1.07 0.51
954 1867 408.2 55.19 80.79 12183 9252 534334.1 60.2 13.6 1.78 2.69 393 298 178 53 103 28 4.2 16 522 427 298 22 31 3.8 0.83 0.48 37 227 1030.37 0.65 0.15 0.02 0.03 4.23 3.21 1.92 0.38 0.75 0.16 0.02 0.03 4.87 3.70 2.14
STATISTICS OF MONTHLY MEAN DATA FOR WATER YEARS 1951 - 2002, BY WATER YEAR (WY)
MEAN 161 74.0 51.9 70.2 MAX 635 433 290 347 (WY) 1970 1995 1998 1998 MIN 2.48 1.40 1.05 0.89(WY) 1987 1987 2001 2001
82.4 95.3 63.7 17.5 29.6 67.4 91.3 168334 539 379 131 338 393 348 8601998 1960 1982 1964 1991 2002 1978 1953 1.19 0.87 0.22 0.093 0.033 0.24 0.78 4.552001 1968 1968 1968 1962 1977 1999 1986
SUMMARY STATISTICS FOR 2001 CALENDAR YEAR FOR 2002 WATER YEAR WATER YEARS 1951 - 2002
ANNUAL TOTAL 46139.04ANNUAL MEAN 126 HIGHEST ANNUAL MEAN LOWEST ANNUAL MEAN HIGHEST DAILY MEAN 1810 LOWEST DAILY MEAN 0.65 ANNUAL SEVEN-DAY MINIMUM 0.73 MAXIMUM PEAK FLOW MAXIMUM PEAK STAGE INSTANTANEOUS LOW FLOWANNUAL RUNOFF (CFSM) 1.36ANNUAL RUNOFF (INCHES) 18.4610 PERCENT EXCEEDS 24250 PERCENT EXCEEDS 2090 PERCENT EXCEEDS 0.97
50656.18 139 80.9
185 19607.63 1981
Sep 16 964 Oct 1 1810 Sep 16 2001 Mar 12 0.48 Jun 16 0.00 Some years Mar 6 0.62 Jun 11 0.00 Some years
969 Oct 1 1840 Sep 15,16 20018.22 Oct 1 9.57 Sep 15,16 20010.44 Jun 16 0.44 Jun 16 2002 1.49 0.8720.26 11.82
380 23562 26 1.8 1.5

168 ST. JOHNS RIVER BASIN BELOW OCKLAWAHA RIVER
292349081254200 HAW CREEK AT MOUTH NEAR SEVILLE, FL
LOCATION.--Lat 29° 23'49", long 81° 25'42", in SE1⁄ 4 sec. 1, T.13 S., R.28 E., Volusia County, Hydrologic Unit 03080103, on left bank, 0.4 mi upstream from mouth, and 6.7 mi northeast of Seville.
DRAINAGE AREA.--230 mi2.
PERIOD OF RECORD.--February 2001 to current year (discharge measurements only).
EXTREMES FOR PERIOD OF RECORD.--Maximum discharge measured, 1,090 ft3/s, Aug. 20 2002; minimum measured, 9.8 ft3/s, Feb. 15, 2001.
DISCHARGE MEASUREMENTS, WATER YEAR OCTOBER 2001 TO SEPTEMBER 2002
DIS DIS CHARGE, CHARGE, INST. INST. CUBIC CUBIC FEET FEET
Date Time PER Date Time PER SECOND SECOND
(00061) (00061)
OCT APR 16... 0936 542 09... 0747 50 DEC JUN 27... 0929 139 25... 0749 333 FEB AUG 19... 0920 26 20... 0742 1090

169 ST. JOHNS RIVER BASIN BELOW OCKLAWAHA RIVER
02244440 DUNNS CREEK NEAR SATSUMA, FL
LOCATION.--Lat 29° 34'39", long 81° 37'35", in NE1⁄ 4 sec.1, T.11 S., R.27 E., Putnam County, Hydrologic Unit 03080103, on bridge pile near left bank of the U.S. Highway 17 bridge, 0.3 mi upstream from Murphy Creek, 0.8 mi upstream from mouth, 2.4 mi northeast of Satsuma, and 3.1 mi southwest of San Mateo.
DRAINAGE AREA.--585 mi2.
PERIOD OF RECORD.--January 1978 to current year.
REVISED RECORDS.--WDR FL-93-1A: Drainage area.
GAGE.--Water-stage recorder, acoustic velocity meter, and data-collection platform. Datum of gage is 10.00 ft below NGVD of 1929. Prior to July 21, 1987, at site 200 ft downstream at present datum.
REMARKS.--Records fair except for periods of estimated daily discharge, which are poor. Discharge represents net of much largerupstream and downstream discharges.
DISCHARGE, CUBIC FEET PER SECOND, WATER YEAR OCTOBER 2001 TO SEPTEMBER 2002DAILY MEAN VALUES
DAY OCT NOV DEC JAN FEB MAR APR MAY JUN JUL AUG SEP
1 2220 1110 1070 123 2 4190 1070 750 -992 3 4110 766 -365 -1280 4 3800 472 -870 1190 5 4130 -2210 -77 1150
424 687 -412 250 792 820 1070 116 -99 433 -389 1010 1350 605 -228 187 -928 785 186 1340 829 960 -266 -377 -768 420 318 792 -340 1040 249 -1080 -764 1380 -1890 -1670 -190 1300 877 1880
6 4560 -1240 527 27007 2740 1430 1180 20508 866 2530 1110 1790 9 521 2440 815 142010 1620 1200 25 1590
867 1110 -1160 -1870 308 1130 548 2280911 688 -221 -334 770 457 -635 909
1370 590 1320 689 -312 252 -1260 -343460 1020 1510 1130 -1830 874 40 -144410 983 1200 879 -1390 1490 970 693
11 2290 880 -116 134012 2550 31 464 96713 2630 -2140 729 -49 14 2370 -2750 1030 -71215 818 -3960 1340 -392
723 327 50 417 -411 1890 1440 1930809 75 -336 -282 302 1320 2050 2490 277 21 38 61 906 615 3190 1950-403 840 309 -278 1280 1120 3330 2350-1410 960 535 -811 984 1490 3320 2660
16 196 -886 685 47317 -1170 1500 698 35418 -297 2890 1310 824 19 -303 3980 1280 134020 463 4540 541 1060
-95 1040 571 -644 561 1330 3860 2940 716 1110 390 -285 409 812 3810 2090 -548 770 381 472 128 629 3370 928 842 168 515 -2650 65 982 2990 112 1490 -494 630 -4410 3.0 1230 2840 -38
21 1420 3170 -35 45122 1860 2140 252 4423 1520 3230 382 133 24 1910 3490 818 99625 2600 3290 243 1110
1280 -176 41 -2160 -952 1510 2290 -250636 -1840 -408 -2990 -95 1410 1890 -506
-1320 -1840 -947 -1910 667 1460 1430 -668-1000 120 -1130 103 1670 1780 1760 -336 -35 720 -149 1170 1960 1860 1940 -237
26 1210 2490 99 -85127 567 1880 1630 -44328 -1140 1780 1420 352 29 -1360 1480 405 67930 37 1470 126 79831 772 --- -339 594
696 716 -620 1150 2070 2550 1160 1590 -166 62 -1290 613 2230 2320 1280 2980 1070 -283 -3.3 91 2620 2220 945 2380--- -761 872 -946 1940 2250 969 1200 --- -144 736 -550 1750 2280 798 -828--- 146 --- 58 --- 2080 32 --
TOTAL 47700 36073 17127 18809 MEAN 1539 1202 552 607 MAX 4560 4540 1630 2700 MIN -1360 -3960 -870 -1280
5445 9633 646.7 -11565 18074.0 42066 46059 26858194 311 21.6 -373 602 1357 1486 895
1490 1380 1510 1340 2620 2550 3860 2980-1410 -1840 -1890 -4410 -1830 252 -1260 -1080
STATISTICS OF MONTHLY MEAN DATA FOR WATER YEARS 1978 - 2002, BY WATER YEAR (WY)
MEAN 654 736 469 847 MAX 3011 3035 2205 2823(WY) 1996 1995 1998 1983 MIN -241 86.3 -177 -217(WY) 1991 1991 1999 1991
729 575 288 -85.0 263 550 406 501 4431 2249 1670 265 931 1385 1486 32751983 1983 1996 1982 1991 1997 2002 2001 -184 -311 -576 -373 -195 -328 -749 -6001982 1995 1999 2002 1998 1999 1999 1978
SUMMARY STATISTICS FOR 2001 CALENDAR YEAR FOR 2002 WATER YEAR WATER YEARS 1978 - 2002
ANNUAL TOTAL 288591.0ANNUAL MEAN 791 HIGHEST ANNUAL MEAN LOWEST ANNUAL MEAN HIGHEST DAILY MEAN 10600 LOWEST DAILY MEAN e-7000ANNUAL SEVEN-DAY MINIMUM -1090MAXIMUM PEAK STAGE 10 PERCENT EXCEEDS 243050 PERCENT EXCEEDS 59090 PERCENT EXCEEDS -890
256925.7 704 552
975 1983 -128 1999
Sep 20 4560 Oct 6 10600 Sep 20 2001Sep 15 -4410 May 20 -8340 Sep 15 1999Nov 10 -1990 May 17 -3130 Aug 29 1999
13.32 Nov 15 *14.82 Sep 16 20012360 2140 716 433-859 -900
e Estimated * From floodmark Note.--Negative figures indicate reverse flow

---
170 ST. JOHNS RIVER BASIN BELOW OCKLAWAHA RIVER
02244440 DUNNS CREEK NEAR SATSUMA, FL--Continued
GAGE HEIGHT, FEET, WATER YEAR OCTOBER 2001 TO SEPTEMBER 2002 DAILY MEAN VALUES
DAY OCT NOV DEC JAN FEB MAR APR MAY JUN JUL AUG SEP
1 12.74 11.87 11.15 10.89 10.48 10.86 10.94 10.60 11.23 10.76 10.98 11.89 2 12.51 11.82 11.18 11.10 10.53 10.88 10.97 10.40 11.02 10.89 11.31 12.03 3 12.43 11.79 11.33 11.27 10.76 10.81 10.90 10.18 10.99 10.88 11.50 12.21 4 12.37 11.78 11.54 10.99 10.84 10.85 10.82 10.16 11.15 10.87 11.57 12.40 5 12.21 12.15 11.54 10.88 10.92 10.68 11.20 10.54 11.20 10.84 11.60 12.22
6 11.97 12.22 11.46 10.59 10.82 10.68 11.29 10.81 11.11 10.86 11.72 12.08 7 12.02 11.91 11.33 10.34 10.71 10.73 11.26 10.72 11.00 10.99 12.07 12.17 8 12.29 11.63 11.28 10.23 10.55 10.76 11.00 10.54 11.15 11.11 12.36 12.34 9 12.41 11.46 11.30 10.18 10.68 10.68 10.76 10.34 11.50 11.06 12.36 12.36 10 12.31 11.50 11.44 10.04 10.71 10.60 10.62 10.26 11.58 10.94 12.31 12.25
11 12.20 11.53 11.56 9.96 10.62 10.68 10.73 10.27 11.54 10.76 12.22 12.06 12 12.07 11.61 11.50 9.96 10.54 10.76 10.85 10.35 11.46 10.77 12.10 11.86 13 11.98 12.05 11.42 10.12 10.58 10.81 10.85 10.27 11.35 11.00 11.97 11.94 14 11.90 12.40 11.35 10.30 10.69 10.65 10.81 10.26 11.18 10.96 11.87 11.85 15 12.00 12.80 11.22 10.51 11.01 10.55 10.74 10.42 11.07 10.87 11.80 11.69
16 12.11 12.74 11.26 10.42 10.93 10.45 10.67 10.47 11.05 10.85 11.65 11.50 17 12.31 12.55 11.25 10.44 10.75 10.35 10.64 10.43 11.06 10.94 11.51 11.46 18 12.28 12.34 11.06 10.36 10.90 10.30 10.60 10.26 11.13 11.02 11.39 11.54 19 12.34 12.11 10.94 10.22 10.78 10.37 10.51 10.77 11.21 10.98 11.29 11.67 20 12.27 11.80 10.96 10.19 10.56 10.50 10.39 11.36 11.31 10.96 11.32 11.80
21 12.13 11.77 11.07 10.25 10.46 10.47 10.43 11.38 11.52 10.90 11.36 11.93 22 12.00 11.85 11.07 10.35 10.47 10.85 10.53 11.62 11.62 10.95 11.37 12.01 23 11.99 11.68 11.09 10.40 10.84 11.07 10.67 11.77 11.51 11.00 11.42 12.09 24 11.90 11.51 10.98 10.28 11.12 10.90 10.87 11.53 11.30 10.97 11.34 12.12 25 11.69 11.36 11.00 10.19 11.11 10.77 10.77 11.25 11.17 10.97 11.23 12.27
26 11.73 11.30 11.06 10.58 10.99 10.70 10.85 11.12 11.12 10.94 11.35 12.10 27 11.71 11.28 10.78 10.71 11.02 10.75 11.07 11.18 10.94 10.93 11.32 11.81 28 11.96 11.23 10.69 10.62 10.86 10.85 10.91 11.28 10.74 10.93 11.32 11.68 29 12.11 11.22 10.79 10.55 --- 11.01 10.65 11.45 10.66 10.89 11.34 11.76 30 12.04 11.16 10.84 10.49 --- 10.96 10.58 11.46 10.63 10.85 11.43 12.05 31 11.96 -- 10.92 10.49 --- 10.88 --- 11.37 10.81 11.66 --
MEAN 12.13 11.81 11.17 10.45 10.76 10.71 10.80 10.80 11.18 10.92 11.61 11.97 MAX 12.74 12.80 11.56 11.27 11.12 11.07 11.29 11.77 11.62 11.11 12.36 12.40 MIN 11.69 11.16 10.69 9.96 10.46 10.30 10.39 10.16 10.63 10.76 10.98 11.46
WTR YR 2002 MEAN 11.19 MAX 12.80 MIN 9.96

171 ST. JOHNS RIVER BASIN BELOW OCKLAWAHA RIVER
02244473 RICE CREEK NEAR SPRINGSIDE, FL
LOCATION.--Lat 29° 41'17", long 81° 44'32", in land grant 40, T.9 S., R.26 E., Putnam County, Hydrologic Unit 03080103, near left bank on downstream side of bridge on State Highway 100, 1.8 mi northwest of Springside, 5.9 mi northwest of Palatka, and 7.5 mi upstream from mouth.
DRAINAGE AREA.--43.2 mi2.
PERIOD OF RECORD.--October 1973 to current year.
GAGE.--Water-stage recorder and data-collection platform. Datum of gage is 1.04 ft above NGVD of 1929 (levels by Wardlin Engineering Associates).
REMARKS.--Records fair.
DISCHARGE, CUBIC FEET PER SECOND, WATER YEAR OCTOBER 2001 TO SEPTEMBER 2002DAILY MEAN VALUES
DAY OCT NOV DEC JAN FEB MAR APR MAY JUN JUL AUG SEP
1 125 5.2 6.3 5.7 2 99 5.2 6.2 5.9 3 78 5.3 6.2 7.2 4 59 5.4 6.2 7.2 5 45 5.5 6.3 6.8
39 12 3.8 2.5 2.0 26 18 27 28 12 3.8 2.3 1.9 25 33 24 22 14 13 2.2 1.8 18 27 20 19 20 17 2.1 1.7 16 32 15 16 19 14 2.1 1.7 13 62 14
6 33 5.3 6.2 7.0 7 25 5.1 6.2 7.2 8 21 4.9 6.3 7.0 9 18 4.9 8.2 6.710 15 4.8 12 6.7
14 15 11 2.1 1.8 11 64 13 14 13 8.8 2.0 2.4 8.7 52 10 15 12 7.2 2.1 5.6 7.5 38 8.6 14 11 6.1 2.0 7.1 12 25 7.6 13 11 5.7 1.9 4.6 15 20 6.7
11 13 4.9 12 6.6 12 12 4.9 10 6.513 11 4.9 9.3 7.414 10 8.3 8.5 1215 9.9 16 8.0 46
13 9.2 6.0 1.9 5.5 12 16 6.2 11 8.4 6.5 1.9 7.5 8.6 14 6.2 10 14 16 1.8 5.7 7.4 19 10 10 19 35 1.9 4.3 7.3 24 159.9 15 37 1.8 3.2 6.7 24 44
16 9.1 14 7.7 5517 8.1 11 7.4 3718 7.4 8.7 7.3 2419 7.0 7.9 7.0 1920 6.8 7.6 6.7 16
9.7 12 23 1.8 2.7 5.7 28 579.3 10 14 1.9 2.7 4.9 29 528.5 8.8 10 1.9 3.5 4.6 22 41 8.0 7.4 7.5 2.0 5.6 4.8 16 317.8 6.8 6.0 2.4 15 16 17 25
21 6.7 7.3 6.3 1422 6.8 7.0 6.0 1523 7.1 7.0 6.0 1524 7.4 7.4 6.1 1425 7.3 7.5 6.1 13
7.8 6.3 5.0 2.1 24 23 22 337.7 6.0 4.2 2.0 45 30 18 26
11 5.5 3.6 2.0 74 62 13 18 33 5.3 3.3 2.0 88 50 10 17 33 5.1 3.1 1.9 57 31 8.7 55
26 6.3 7.0 5.9 1727 5.3 6.7 5.7 1728 5.0 6.6 5.8 2029 5.0 6.4 5.9 8930 5.2 6.4 5.8 9931 5.2 --- 5.7 63
23 4.9 2.9 1.8 74 23 7.5 85 18 4.7 2.8 1.8 72 19 7.3 91 14 4.4 2.7 1.9 62 39 7.7 75--- 4.2 2.5 1.9 40 79 11 58--- 4.1 2.5 1.9 23 56 13 45--- 4.0 --- 1.9 --- 25 23 --
TOTAL 679.6 209.1 219.3 672.9MEAN 21.9 6.97 7.07 21.7 MAX 125 16 12 99 MIN 5.0 4.8 5.7 5.7 CFSM 0.51 0.16 0.16 0.50 IN. 0.59 0.18 0.19 0.58
438.7 304.1 284.0 61.8 645.3 667.2 721.2 936.315.7 9.81 9.47 1.99 21.5 21.5 23.3 31.2 39 20 37 2.5 88 79 64 917.7 4.0 2.5 1.8 1.7 4.6 7.3 6.20.36 0.23 0.22 0.05 0.50 0.50 0.54 0.72 0.38 0.26 0.24 0.05 0.56 0.57 0.62 0.81
STATISTICS OF MONTHLY MEAN DATA FOR WATER YEARS 1974 - 2002, BY WATER YEAR (WY)
MEAN 37.2 23.6 40.5 45.6 MAX 152 123 324 146 (WY) 1993 1998 1998 1998 MIN 3.50 5.57 6.83 7.12(WY) 1988 1979 1992 2001
60.5 57.1 35.0 13.3 32.9 37.6 57.2 68.0367 203 149 142 177 149 303 2671998 1987 1983 1979 1982 1994 1978 1979 8.61 6.74 4.45 1.99 2.86 3.11 2.61 3.352000 1976 1999 2002 1998 1988 1993 1990
SUMMARY STATISTICS FOR 2001 CALENDAR YEAR FOR 2002 WATER YEAR WATER YEARS 1974 - 2002
ANNUAL TOTAL 10617.1 ANNUAL MEAN 29.1 HIGHEST ANNUAL MEAN LOWEST ANNUAL MEAN HIGHEST DAILY MEAN 711 LOWEST DAILY MEAN 1.9 ANNUAL SEVEN-DAY MINIMUM 2.0MAXIMUM PEAK FLOW MAXIMUM PEAK STAGE INSTANTANEOUS LOW FLOWANNUAL RUNOFF (CFSM) 0.67ANNUAL RUNOFF (INCHES) 9.1410 PERCENT EXCEEDS 4950 PERCENT EXCEEDS 6.690 PERCENT EXCEEDS 3.1
5839.516.0 42.3
99.5 1998 15.6 1990
Sep 23 125 Oct 1 2000 Aug 2 1978May 28 1.7 Jun 4,5 1.7 Jun 10 2000 May 24 1.8 May 31 1.8 Jun 6 2000
138 Oct 1 a2990 Aug 1 19785.87 Oct 1 9.80 Aug 1 1978 1.7 Jun 4-6 *1.7 0.37 0.98 5.03 13.2939 110 8.5 12 2.4 4.0
a From rating curve extended above 1,130 ft3/s * Jun 10,11,21,2000, Jun 4-6,2002

172 ST. JOHNS RIVER BASIN BELOW OCKLAWAHA RIVER
02245050 ETONIA CREEK AT BARDIN, FL
LOCATION.--Lat 29° 43'00", long 81° 43'31", in NW1⁄ 4 sec.17, T.9 S., R.26 E., Putnam County, Hydrologic Unit 03080103, near left bank on downstream side of bridge on Bardin Road, 0.2 mi north of Bardin, 4.6 mi upstream from mouth, and 6.2 mi northwest of Palatka.
DRAINAGE AREA.--219 mi2.
PERIOD OF RECORD.--October 1973 to September 1990, June 1996 to current year.
GAGE.--Water-stage recorder and data-collection platform. Datum of gage is 7.60 ft above NGVD of 1929 (levels by Wardlin Engineering Associates).
REMARKS.--Records poor. Records include an appreciable amount of ground-water flow from Hudson Pulp and Paper Corporation production wells.
DISCHARGE, CUBIC FEET PER SECOND, WATER YEAR OCTOBER 2001 TO SEPTEMBER 2002DAILY MEAN VALUES
DAY OCT NOV DEC JAN FEB MAR APR MAY JUN JUL AUG SEP
1 48 22 26 21 2 42 22 19 20 3 37 23 18 21 4 34 22 18 21 5 31 21 18 20
27 18 18 28 26 69 55 83 24 18 29 24 35 78 229 146 22 18 23 24 39 61 492 135 21 20 20 24 31 49 481 91 20 21 18 24 29 40 365 68
6 30 21 18 20 7 29 21 18 20 8 28 21 18 20 9 27 23 18 2010 26 22 23 20
20 20 18 24 28 34 228 57 20 19 20 24 30 30 118 47 20 18 20 24 33 28 82 39 19 18 19 30 31 30 65 35 19 17 30 33 28 31 57 32
11 26 23 26 2012 25 22 24 2013 25 22 22 2014 24 28 21 2115 24 37 20 44
19 17 22 32 29 31 52 29 18 17 21 29 30 79 58 27 18 19 22 27 29 135 60 29 18 23 28 25 28 98 74 49 18 21 27 25 30 61 112 105
16 24 35 20 4217 23 29 19 3218 22 27 19 2619 22 25 19 2320 22 22 19 22
17 19 24 24 42 42 215 138 21 18 23 30 42 32 219 113 22 18 22 31 44 28 177 79 18 17 21 29 42 26 206 58 17 17 21 28 57 27 143 47
21 22 18 27 2122 22 18 27 2123 22 18 21 2124 22 18 20 2025 22 18 20 20
23 18 24 26 34 30 98 54 17 27 22 25 52 76 78 43 17 19 27 25 123 61 66 36 23 18 29 25 84 41 58 32 23 18 24 25 73 33 52 51
26 23 21 20 2327 23 20 20 2728 22 20 24 26 29 22 22 20 4030 22 19 20 3931 22 --- 21 33
20 18 24 36 95 30 47 74 19 22 28 33 84 54 46 95 18 26 31 28 78 142 46 71 --- 19 24 25 64 155 48 51--- 19 34 25 52 96 52 38 --- 19 --- 25 --- 65 60 --
TOTAL 813 680 643 764 MEAN 26.2 22.7 20.7 24.6 MAX 48 37 27 44 MIN 22 18 18 20
558 596 713 837 1422 1792 4139 1952 19.9 19.2 23.8 27.0 47.4 57.8 134 65.1 27 27 34 36 123 155 492 146 17 17 18 24 26 26 46 27
STATISTICS OF MONTHLY MEAN DATA FOR WATER YEARS 1974 - 2002, BY WATER YEAR (WY)
MEAN 77.8 66.7 93.8 96.0 MAX 263 142 382 232 (WY) 1997 1998 1998 1998 MIN 26.2 22.7 20.7 24.6(WY) 2002 2002 2002 2002
109 101 86.4 68.8 78.0 85.4 108 113393 227 204 220 279 175 291 3031998 1986 1997 1979 1982 1982 1978 1988 19.9 19.2 23.8 27.0 21.2 20.4 35.7 46.22002 2002 2002 2002 2001 2001 2000 1999
SUMMARY STATISTICS FOR 2001 CALENDAR YEAR FOR 2002 WATER YEAR WATER YEARS 1974 - 2002
ANNUAL TOTAL 13705 ANNUAL MEAN 37.5 HIGHEST ANNUAL MEAN LOWEST ANNUAL MEAN HIGHEST DAILY MEAN 711 LOWEST DAILY MEAN 17 ANNUAL SEVEN-DAY MINIMUM 18MAXIMUM PEAK FLOW MAXIMUM PEAK STAGE 10 PERCENT EXCEEDS 5150 PERCENT EXCEEDS 2890 PERCENT EXCEEDS 19
1490940.8 90.6
154 1998 40.8 2002
Sep 16 492 Aug 3 1780 Apr 28 1997Some days *17 a17 Jul 23 18 Mar 7 18 Mar 7 2002
545 Aug 3 2650 Apr 28 19975.51 Aug 3 8.41 Apr 28 199777 15425 6618 43
* Feb 16,20,22,23, Mar 10-12,19,20 a Several days in 2001, 2002 water years

173 ST. JOHNS RIVER BASIN BELOW OCKLAWAHA RIVER
02245140 SIMMS CREEK NEAR BARDIN, FL
LOCATION.--Lat 29° 44'07", long 81° 42'36", in NE1⁄ 4 sec.9, T.9 S., R.26 E., Putnam County, Hydrologic Unit 03080103, on right bank 0.4 mi downstream from bridge on Simms Creek Road, 1.7 mi northeast of Bardin, 2.7 mi upstream from Etonia Creek, and 6.7 mi northwest of Palatka.
DRAINAGE AREA.--47.3 mi2.
PERIOD OF RECORD.--October 1973 to September 1975, March 1976 to current year.
GAGE.--Water-stage recorder and data-collection platform. Datum of gage is at NGVD of 1929 (levels by Wardlin Engineering Associates). Prior to Feb. 26, 1976, at bridge 0.4 mi upstream at datum 7.26 ft higher.
REMARKS.--Records fair. Some artesian ground water inflow from well upstream from gage.
DISCHARGE, CUBIC FEET PER SECOND, WATER YEAR OCTOBER 2001 TO SEPTEMBER 2002DAILY MEAN VALUES
DAY OCT NOV DEC JAN FEB MAR APR MAY JUN JUL AUG SEP
1 46 12 15 11 2 39 12 15 12 3 33 14 14 13 4 29 16 15 13 5 26 15 14 13
36 16 9.4 6.6 5.3 128 62 300 30 16 10 6.3 5.0 102 93 211 27 17 15 6.2 4.8 93 186 161 24 23 14 6.0 4.6 62 274 118 22 e20 13 5.9 4.5 44 308 85
6 24 13 14 13 7 23 13 14 13 8 22 12 14 12 9 20 12 15 1210 19 12 22 12
20 e19 12 5.9 4.5 36 252 65 20 e19 11 5.8 5.5 30 174 50 20 e18 10 5.7 6.5 27 118 44 19 e17 9.5 5.6 6.4 31 75 4218 e16 9.1 5.5 7.4 33 58 37
11 18 12 26 1212 17 12 22 1213 16 12 19 1214 16 24 19 1515 16 59 17 55
18 e15 10 5.5 7.2 47 47 32 16 14 11 5.4 7.2 209 40 29 16 20 15 5.3 7.2 317 42 42 15 28 29 5.4 6.5 227 61 168 15 23 21 5.3 5.8 128 93 307
16 15 52 16 6817 15 36 15 4418 14 28 15 3419 14 24 14 2820 14 22 14 24
15 19 16 5.2 5.4 62 282 34614 17 14 5.2 5.4 39 286 28414 15 12 5.2 6.3 30 213 19413 14 11 5.4 7.8 25 190 138 13 13 9.7 6.1 11 24 202 123
21 13 20 13 2322 13 19 13 2223 14 18 13 2224 14 17 12 2025 14 16 12 19
13 13 9.1 5.8 12 67 235 170 13 12 8.4 5.4 122 87 164 11615 13 7.9 5.3 527 72 105 73 29 12 7.6 5.3 241 51 68 64 30 12 7.4 5.2 140 39 55 292
26 13 15 12 3327 12 15 12 4228 12 15 12 35 29 12 14 12 46 30 12 14 12 52 31 12 --- 11 42
24 11 7.3 5.2 311 31 46 387 20 11 7.1 5.0 427 109 44 276 18 11 7.1 5.5 258 284 43 196 --- 10 6.8 5.6 187 273 46 146 --- 11 6.7 5.4 141 180 170 105 --- 9.9 --- 5.3 --- 108 290 --
TOTAL 577 575 463 784 MEAN 18.6 19.2 14.9 25.3 MAX 46 59 26 68 MIN 12 12 11 11CFSM 0.39 0.41 0.32 0.53 IN. 0.45 0.45 0.36 0.62
547 484.9 337.1 172.5 2490.3 2995 4322 4601 19.5 15.6 11.2 5.56 83.0 96.6 139 153 36 28 29 6.6 527 317 308 387 13 9.9 6.7 5.0 4.5 24 40 290.41 0.33 0.24 0.12 1.75 2.04 2.95 3.24 0.43 0.38 0.27 0.14 1.96 2.36 3.40 3.62
STATISTICS OF MONTHLY MEAN DATA FOR WATER YEARS 1974 - 2002, BY WATER YEAR (WY)
MEAN 54.0 30.4 43.4 48.7 MAX 205 94.8 302 156 (WY) 1997 1998 1998 1998 MIN 8.55 10.2 11.2 10.9(WY) 1988 1991 1991 2001
61.0 56.7 36.2 19.4 35.1 48.1 67.5 77.4374 156 143 141 125 182 174 3451998 1986 1983 1979 1991 1994 1974 1979 12.9 10.4 8.49 5.56 6.91 6.49 7.95 6.641989 1976 1989 2002 2000 1988 1999 1990
SUMMARY STATISTICS FOR 2001 CALENDAR YEAR FOR 2002 WATER YEAR WATER YEARS 1974 - 2002
ANNUAL TOTAL 11865.5 ANNUAL MEAN 32.5 HIGHEST ANNUAL MEAN LOWEST ANNUAL MEAN HIGHEST DAILY MEAN 1470LOWEST DAILY MEAN 6.1 ANNUAL SEVEN-DAY MINIMUM 6.5MAXIMUM PEAK FLOWMAXIMUM PEAK STAGE INSTANTANEOUS LOW FLOWANNUAL RUNOFF (CFSM) 0.69ANNUAL RUNOFF (INCHES) 9.3310 PERCENT EXCEEDS 5450 PERCENT EXCEEDS 1390 PERCENT EXCEEDS 8.0
18348.850.3 48.5
106 1998 16.4 1990
Sep 15 527 Jun 23 2250 Oct 8 1996May 20 4.5 Jun 5,6 4.1 Jul 10 1988 May 15 4.9 May 31 4.3 Jul 5 1988
739 Jun 23 a2840 Oct 8 199612.77 Jun 23 a14.96 Oct 8 19964.5 Jun 4-6 4.0 Jul 10 1988 1.06 1.0214.43 13.92
169 11616 19 6.0 8.7
e Estimated a From floodmark
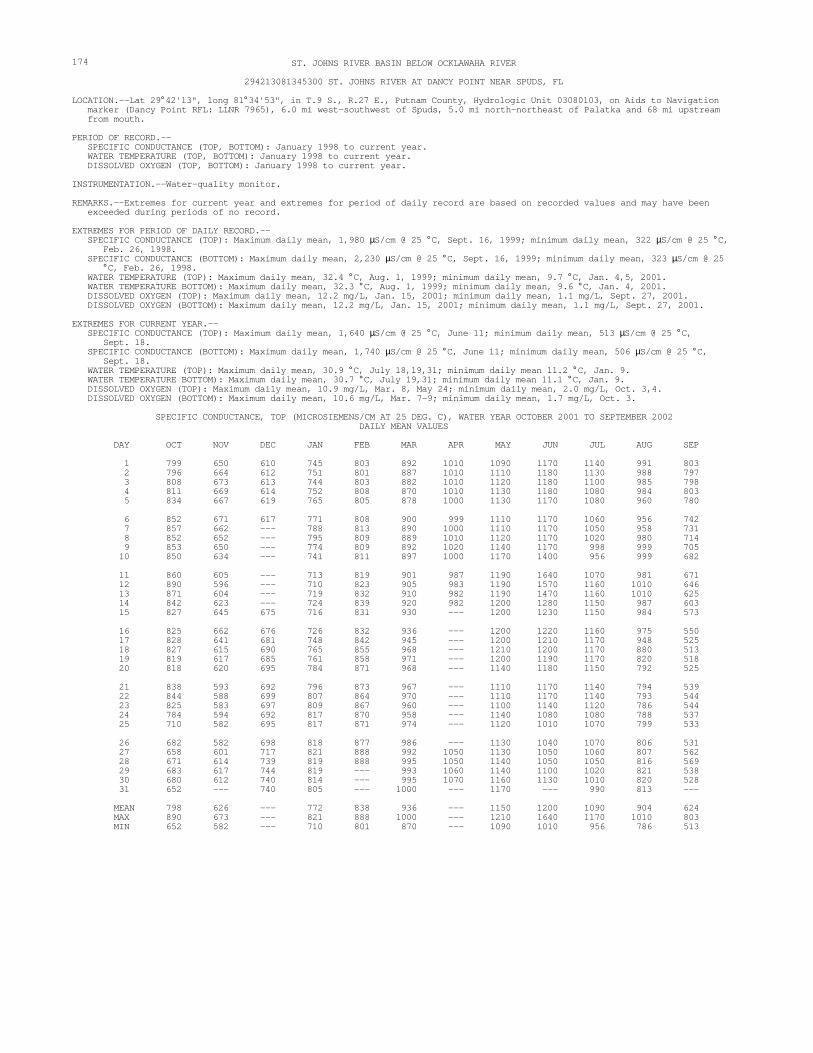
--- --- ---
--- ---
---
174 ST. JOHNS RIVER BASIN BELOW OCKLAWAHA RIVER
294213081345300 ST. JOHNS RIVER AT DANCY POINT NEAR SPUDS, FL
LOCATION.--Lat 29° 42'13", long 81° 34'53", in T.9 S., R.27 E., Putnam County, Hydrologic Unit 03080103, on Aids to Navigation marker (Dancy Point RFL: LLNR 7965), 6.0 mi west-southwest of Spuds, 5.0 mi north-northeast of Palatka and 68 mi upstream from mouth.
PERIOD OF RECORD.--SPECIFIC CONDUCTANCE (TOP, BOTTOM): January 1998 to current year. WATER TEMPERATURE (TOP, BOTTOM): January 1998 to current year.DISSOLVED OXYGEN (TOP, BOTTOM): January 1998 to current year.
INSTRUMENTATION.--Water-quality monitor.
REMARKS.--Extremes for current year and extremes for period of daily record are based on recorded values and may have been exceeded during periods of no record.
EXTREMES FOR PERIOD OF DAILY RECORD.--SPECIFIC CONDUCTANCE (TOP): Maximum daily mean, 1,980 µS/cm @ 25 ° C, Sept. 16, 1999; minimum daily mean, 322 µS/cm @ 25 ° C,
Feb. 26, 1998. SPECIFIC CONDUCTANCE (BOTTOM): Maximum daily mean, 2,230 µS/cm @ 25 ° C, Sept. 16, 1999; minimum daily mean, 323 µS/cm @ 25
° C, Feb. 26, 1998. WATER TEMPERATURE (TOP): Maximum daily mean, 32.4 ° C, Aug. 1, 1999; minimum daily mean, 9.7 ° C, Jan. 4,5, 2001. WATER TEMPERATURE BOTTOM): Maximum daily mean, 32.3 ° C, Aug. 1, 1999; minimum daily mean, 9.6 ° C, Jan. 4, 2001. DISSOLVED OXYGEN (TOP): Maximum daily mean, 12.2 mg/L, Jan. 15, 2001; minimum daily mean, 1.1 mg/L, Sept. 27, 2001. DISSOLVED OXYGEN (BOTTOM): Maximum daily mean, 12.2 mg/L, Jan. 15, 2001; minimum daily mean, 1.1 mg/L, Sept. 27, 2001.
EXTREMES FOR CURRENT YEAR.--SPECIFIC CONDUCTANCE (TOP): Maximum daily mean, 1,640 µS/cm @ 25 ° C, June 11; minimum daily mean, 513 µS/cm @ 25 ° C, Sept. 18.
SPECIFIC CONDUCTANCE (BOTTOM): Maximum daily mean, 1,740 µS/cm @ 25 ° C, June 11; minimum daily mean, 506 µS/cm @ 25 ° C, Sept. 18.
WATER TEMPERATURE (TOP): Maximum daily mean, 30.9 ° C, July 18,19,31; minimum daily mean 11.2 ° C, Jan. 9. WATER TEMPERATURE BOTTOM): Maximum daily mean, 30.7 ° C, July 19,31; minimum daily mean 11.1 ° C, Jan. 9.DISSOLVED OXYGEN (TOP): Maximum daily mean, 10.9 mg/L, Mar. 8, May 24; minimum daily mean, 2.0 mg/L, Oct. 3,4. DISSOLVED OXYGEN (BOTTOM): Maximum daily mean, 10.6 mg/L, Mar. 7-9; minimum daily mean, 1.7 mg/L, Oct. 3.
SPECIFIC CONDUCTANCE, TOP (MICROSIEMENS/CM AT 25 DEG. C), WATER YEAR OCTOBER 2001 TO SEPTEMBER 2002DAILY MEAN VALUES
DAY OCT NOV DEC JAN FEB MAR APR MAY JUN JUL AUG SEP
1 799 650 610 745 803 892 1010 1090 1170 1140 991 803 2 796 664 612 751 801 887 1010 1110 1180 1130 988 797 3 808 673 613 744 803 882 1010 1120 1180 1100 985 798 4 811 669 614 752 808 870 1010 1130 1180 1080 984 803 5 834 667 619 765 805 878 1000 1130 1170 1080 960 780
6 852 671 617 771 808 900 999 1110 1170 1060 956 742 7 857 662 788 813 890 1000 1110 1170 1050 958 731 8 852 652 795 809 889 1010 1120 1170 1020 980 714 9 853 650 774 809 892 1020 1140 1170 998 999 705 10 850 634 --- 741 811 897 1000 1170 1400 956 999 682
11 860 605 --- 713 819 901 987 1190 1640 1070 981 671 12 890 596 --- 710 823 905 983 1190 1570 1160 1010 646 13 871 604 --- 719 832 910 982 1190 1470 1160 1010 625 14 842 623 --- 724 839 920 982 1200 1280 1150 987 603 15 827 645 675 716 831 930 --- 1200 1230 1150 984 573
16 825 662 676 726 832 936 --- 1200 1220 1160 975 550 17 828 641 681 748 842 945 --- 1200 1210 1170 948 525 18 827 615 690 765 855 968 --- 1210 1200 1170 880 513 19 819 617 685 761 858 971 --- 1200 1190 1170 820 518 20 818 620 695 784 871 968 --- 1140 1180 1150 792 525
21 838 593 692 796 873 967 --- 1110 1170 1140 794 539 22 844 588 699 807 864 970 --- 1110 1170 1140 793 544 23 825 583 697 809 867 960 --- 1100 1140 1120 786 544 24 784 594 692 817 870 958 --- 1140 1080 1080 788 537 25 710 582 695 817 871 974 --- 1120 1010 1070 799 533
26 682 582 698 818 877 986 --- 1130 1040 1070 806 531 27 658 601 717 821 888 992 1050 1130 1050 1060 807 562 28 671 614 739 819 888 995 1050 1140 1050 1050 816 569 29 683 617 744 819 993 1060 1140 1100 1020 821 538 30 680 612 740 814 995 1070 1160 1130 1010 820 528 31 652 --- 740 805 --- 1000 --- 1170 990 813 --
MEAN 798 626 --- 772 838 936 --- 1150 1200 1090 904 624 MAX 890 673 --- 821 888 1000 --- 1210 1640 1170 1010 803 MIN 652 582 --- 710 801 870 --- 1090 1010 956 786 513

--- --- --- ---
--- ---
--- --- --- ---
--- ---
--- ------ --- --- --- --- ---
---
ST. JOHNS RIVER BASIN BELOW OCKLAWAHA RIVER 175
294213081345300 ST. JOHNS RIVER AT DANCY POINT NEAR SPUDS, FL--Continued
SPECIFIC CONDUCTANCE, BOTTOM (MICROSIEMENS/CM AT 25 DEG. C), WATER YEAR OCTOBER 2001 TO SEPTEMBER 2002 DAILY MEAN VALUES
DAY OCT NOV DEC JAN FEB MAR APR MAY JUN JUL AUG SEP
1 798 649 609 744 802 -- 1010 1100 1170 1080 998 734 2 796 664 610 749 800 -- 1010 1110 1170 1110 995 783 3 808 672 612 743 803 -- 1010 1130 1180 1060 994 778 4 807 669 613 751 807 -- 1010 1140 1180 1070 991 783 5 835 667 618 763 803 -- 1000 1140 1180 1030 973 758
6 853 671 617 770 805 899 998 1130 1180 1010 964 726 7 857 662 787 812 890 1000 1120 1180 1040 954 713 8 852 651 794 806 889 1010 1130 1190 995 970 704 9 852 649 770 806 892 1020 1140 1190 1100 990 699 10 849 633 740 810 897 1010 1160 1480 1100 985 675
11 860 605 --- 714 816 901 987 1180 1740 1160 963 662 12 890 595 --- 711 822 904 984 1180 1660 1200 981 637 13 870 604 --- 720 830 910 982 1180 1490 1200 979 611 14 842 623 --- 724 837 920 980 1180 1290 1180 955 593 15 828 646 675 716 828 928 --- 1180 1220 1180 957 561
16 826 663 675 727 829 934 --- 1190 1220 1180 949 541 17 829 641 681 750 838 943 --- 1200 1200 1190 931 511 18 828 615 688 764 847 965 --- 1210 1190 1170 873 506 19 821 617 684 762 855 970 --- 1200 1170 1160 807 510 20 817 618 694 785 869 969 --- 1150 1160 1160 776 518
21 838 593 688 797 871 967 --- 1130 1150 1140 779 533 22 844 588 698 807 862 971 --- 1120 1150 1130 779 537 23 823 582 697 809 855 960 --- 1110 1110 1110 770 538 24 783 593 690 816 --- 958 --- 1120 1060 1100 774 530 25 712 579 694 818 973 1130 989 1090 783 527
26 682 580 698 818 --- 985 --- 1130 1020 1090 789 525 27 657 599 718 821 992 1060 1130 1030 1080 790 551 28 676 613 738 819 995 1060 1140 1040 1070 801 559 29 684 616 742 819 992 1070 1150 1090 1040 810 528 30 681 611 739 812 994 1080 1160 1100 1020 808 517 31 652 --- 738 --- 1000 --- 1170 1010 712 --
MEAN 798 626 --- --- --- 1150 1210 1100 890 612 MAX 890 672 -- -- 1210 1740 1200 998 783 MIN 652 579 -- -- 1100 989 995 712 506
TEMPERATURE, WATER, TOP (DEG. C), WATER YEAR OCTOBER 2001 TO SEPTEMBER 2002 DAILY MEAN VALUES
DAY OCT NOV DEC JAN FEB MAR APR MAY JUN JUL AUG SEP
1 23.2 20.4 22.5 14.5 20.9 15.2 25.0 27.5 27.3 28.4 30.7 29.3 2 23.0 21.2 22.6 14.4 21.1 15.5 24.9 27.6 28.1 28.4 30.5 29.3 3 23.3 21.7 22.5 13.1 20.2 16.3 24.7 28.3 28.9 28.8 30.4 29.3 4 23.6 21.8 22.2 12.2 19.4 16.1 24.4 28.8 29.1 29.3 30.2 29.1 5 23.8 21.4 22.2 12.0 17.8 15.3 24.1 28.7 29.1 29.2 30.0 28.9
6 24.4 20.6 22.2 12.3 17.4 15.6 23.3 28.3 29.2 29.2 30.0 28.9 7 24.4 20.3 --- 12.6 17.6 15.9 22.7 28.1 29.2 29.6 29.8 28.9 8 23.8 20.2 --- 11.8 16.5 16.8 22.6 28.5 29.1 29.5 29.0 28.7 9 23.4 20.4 --- 11.2 16.5 17.8 22.9 28.8 28.6 29.1 28.5 28.8
10 23.3 20.4 --- 11.4 16.9 18.7 23.7 28.8 28.2 29.2 28.1 29.0
11 23.6 20.4 --- 12.1 17.3 18.9 23.8 28.7 28.0 29.6 28.0 28.9 12 23.9 20.4 --- 12.8 17.4 19.5 23.8 28.8 27.9 29.8 28.1 28.6 13 24.0 20.2 --- 13.2 17.2 20.1 23.8 28.7 28.2 29.6 27.9 28.3 14 24.1 20.0 --- 13.3 17.0 20.3 23.8 28.1 29.0 29.2 27.9 28.1 15 24.1 19.8 23.8 13.6 17.1 20.9 --- 27.2 29.3 29.5 28.1 28.2
16 24.1 19.4 23.3 13.8 17.5 21.3 --- 26.7 29.4 30.4 28.4 28.7 17 23.1 19.7 23.0 13.9 17.5 22.1 --- 27.0 29.2 30.8 28.7 29.1 18 22.4 19.9 22.7 14.7 16.7 23.0 --- 27.4 28.5 30.9 28.9 29.4 19 22.3 20.0 22.1 14.9 16.6 23.5 --- 26.5 27.8 30.9 29.0 29.7 20 22.8 20.4 21.1 15.8 17.0 23.8 --- 24.2 27.4 30.7 28.9 29.3
21 23.4 20.3 19.7 16.3 17.7 23.8 --- 23.0 27.0 30.1 29.3 29.1 22 23.8 20.3 19.3 16.8 18.1 23.2 --- 22.7 26.5 30.0 29.5 29.0 23 24.1 20.7 19.0 17.5 17.3 21.6 --- 22.5 26.3 30.1 29.7 28.8 24 24.4 20.9 19.0 18.3 16.4 21.5 --- 23.4 26.5 30.1 29.8 28.4 25 25.0 21.3 18.1 18.9 16.4 22.3 --- 24.3 27.2 30.0 30.0 28.3
26 24.4 21.6 16.7 18.7 17.3 23.2 --- 24.8 27.5 30.1 30.2 28.2 27 22.6 21.9 15.7 18.3 16.9 23.7 27.3 24.9 27.7 30.3 29.9 28.2 28 20.8 22.0 14.8 18.6 15.6 23.7 27.4 25.4 28.2 30.3 29.8 28.4 29 19.7 22.3 15.4 19.4 --- 23.8 27.4 26.1 28.8 30.6 29.8 28.8 30 19.5 22.4 15.4 20.0 --- 24.4 27.5 26.7 28.7 30.8 29.9 28.9 31 19.6 --- 15.2 20.3 --- 24.8 --- 26.8 30.9 29.4 --
MEAN 23.2 20.7 --- 15.1 17.5 20.4 --- 26.7 28.2 29.9 29.3 28.8 MAX 25.0 22.4 --- 20.3 21.1 24.8 --- 28.8 29.4 30.9 30.7 29.7 MIN 19.5 19.4 --- 11.2 15.6 15.2 --- 22.5 26.3 28.4 27.9 28.1

--- ---
--- ------ ------ ---
---
--- --- --- --- --- --- ---
--- ---
--- ------ --- ---
---
--- --- --- --- ---
---
---
---
--- ---
--- --- --- ---
--- --- ------ --- --- --- --- ---
176 ST. JOHNS RIVER BASIN BELOW OCKLAWAHA RIVER
294213081345300 ST. JOHNS RIVER AT DANCY POINT NEAR SPUDS, FL--Continued
TEMPERATURE, WATER, BOTTOM (DEG. C), WATER YEAR OCTOBER 2001 TO SEPTEMBER 2002 DAILY MEAN VALUES
DAY OCT NOV DEC JAN FEB MAR APR MAY JUN JUL AUG SEP
1 23.1 20.3 22.3 14.5 20.6 --- 24.9 27.6 26.9 28.3 30.5 29.2 2 22.8 21.2 22.5 14.3 21.1 --- 24.9 27.7 27.6 28.2 30.1 29.2 3 23.1 21.6 22.5 13.1 20.2 --- 24.7 28.2 28.3 28.5 30.3 29.2 4 23.3 21.8 22.2 12.2 19.5 --- 24.3 28.5 28.6 29.1 30.1 29.1 5 23.7 21.4 22.2 12.0 17.9 --- 24.1 28.7 28.9 29.1 29.8 28.8
6 24.3 20.6 22.1 12.3 17.3 15.5 23.2 28.3 29.0 28.7 29.8 28.8 7 24.4 20.2 --- 12.6 17.6 15.8 22.7 27.9 29.1 29.2 29.8 28.9 8 23.8 20.2 --- 11.8 16.4 16.3 22.6 28.2 29.0 29.4 28.9 28.7 9 23.4 20.3 --- 11.1 16.3 17.4 22.7 28.4 28.5 29.0 28.4 28.7
10 23.3 20.3 --- 11.4 16.8 18.5 23.5 28.7 28.2 28.8 28.0 28.8
11 23.5 20.3 --- 11.9 17.1 18.8 23.8 28.7 28.0 29.2 27.9 28.8 12 23.8 20.3 --- 12.7 17.2 19.3 23.7 28.7 27.9 29.5 28.1 28.5 13 24.0 20.2 --- 13.0 17.2 19.9 23.7 28.7 28.0 29.5 27.8 28.2 14 24.1 20.1 --- 13.2 17.0 20.0 23.7 28.1 28.7 29.2 27.6 28.0 15 24.1 19.8 23.8 13.6 16.9 20.5 --- 27.3 29.1 29.4 28.0 28.0
16 24.1 19.4 23.3 13.6 17.3 20.9 --- 26.7 29.1 29.8 28.0 28.3 17 23.1 19.6 22.9 13.8 17.5 21.6 --- 26.8 29.2 30.4 28.5 28.5 18 22.3 19.9 22.7 14.3 16.7 22.6 --- 27.4 28.4 30.5 28.6 29.0 19 22.2 20.0 22.1 14.8 16.5 23.1 --- 26.6 27.8 30.7 28.9 29.4 20 22.8 20.3 21.1 15.7 17.0 23.5 --- 24.3 27.4 30.4 28.9 29.2
21 23.4 20.3 19.6 16.3 17.6 23.8 --- 23.0 27.0 30.0 28.9 29.0 22 23.8 20.2 19.1 16.8 18.1 23.2 --- 22.7 26.4 29.7 29.1 28.9 23 24.0 20.6 19.0 17.2 17.3 21.5 --- 22.4 26.2 29.7 29.2 28.8 24 24.4 20.8 19.0 18.1 --- 21.2 --- 22.9 26.3 29.9 29.5 28.4 25 25.0 21.1 18.1 18.9 --- 22.0 --- 23.9 26.9 29.7 29.7 28.1
26 24.4 21.5 16.7 18.7 --- 22.9 --- 24.6 27.3 29.8 30.1 28.1 27 22.5 21.7 15.7 18.3 --- 23.6 27.2 24.8 27.6 30.1 29.9 28.1 28 20.7 21.9 14.8 18.5 --- 23.5 27.4 25.3 27.8 30.0 29.7 28.3 29 19.6 22.2 15.3 19.2 --- 23.3 27.4 26.0 28.4 30.2 29.6 28.6 30 19.5 22.3 15.4 19.6 --- 24.1 27.5 26.4 28.6 30.5 29.8 28.8 31 19.6 --- 15.1 --- 24.6 --- 26.7 30.7 29.4 --
MEAN 23.1 20.7 --- --- --- 26.6 28.0 29.6 29.1 28.7 MAX 25.0 22.3 --- --- --- 28.7 29.2 30.7 30.5 29.4 MIN 19.5 19.4 --- --- --- 22.4 26.2 28.2 27.6 28.0
OXYGEN DISSOLVED, TOP (MG/L), WATER YEAR OCTOBER 2001 TO SEPTEMBER 2002 DAILY MEAN VALUES
DAY OCT NOV DEC JAN FEB MAR APR MAY JUN JUL AUG SEP
1 5.4 7.6 5.0 7.9 7.2 9.6 7.6 8.5 --- 6.6 6.1 5.9 2 4.3 6.8 4.8 8.0 7.2 9.8 7.4 8.8 --- 6.6 5.4 5.9 3 2.0 6.7 4.8 9.1 7.3 9.7 7.2 9.8 --- 6.9 4.3 5.9 4 2.0 6.9 5.5 --- 7.7 9.6 7.2 9.7 --- 7.0 4.7 6.4 5 2.2 7.5 5.5 --- 8.2 9.8 7.5 9.0 --- 5.6 6.7
6 2.5 7.8 5.7 --- 8.5 10.2 7.9 8.7 -- 6.6 5.7 7 3.6 7.5 --- 8.5 10.6 8.0 8.9 -- 7.0 5.3 8 4.7 6.5 --- 8.7 10.9 8.1 8.8 -- 6.8 5.6 9 6.0 5.4 --- 8.8 10.8 8.3 9.3 -- 6.8 6.0 10 6.5 5.6 --- 8.8 10.6 8.2 8.0 --- 6.8 5.9
11 5.8 5.8 --- 8.8 10.2 7.9 7.2 --- 7.0 5.2 12 4.4 5.9 --- 8.8 9.8 7.7 7.7 5.6 7.3 7.0 5.0 13 4.0 6.6 --- 8.7 9.4 7.7 8.1 5.7 7.1 6.5 5.3 14 4.5 7.5 --- 8.6 9.1 7.8 8.3 6.7 7.2 6.3 5.2 15 5.0 8.2 5.2 --- 8.9 8.8 8.3 6.8 7.8 6.2 5.0
16 5.3 8.3 5.3 9.3 9.0 8.7 8.3 7.2 8.5 6.5 4.3 17 6.1 8.0 5.9 9.2 8.9 8.4 8.9 6.8 8.5 6.7 4.0 18 6.4 7.7 6.1 9.2 9.0 8.1 8.7 6.0 8.3 6.6 4.4 19 6.8 6.4 5.8 9.0 9.0 7.8 8.3 6.0 8.5 6.4 4.6 20 6.7 5.5 6.2 8.8 9.0 7.5 8.9 6.5 8.5 6.3 4.8
21 5.7 5.6 6.5 8.6 9.1 7.3 9.7 7.1 8.1 5.9 5.0 22 4.9 5.8 6.4 8.5 8.8 7.4 --- 10.0 7.7 8.8 5.5 5.1 23 4.7 5.8 6.5 8.4 8.8 7.9 --- 10.2 7.8 8.7 5.7 5.3 24 4.5 5.6 6.8 8.2 9.2 7.9 --- 10.9 8.2 8.2 5.5 4.9 25 4.4 5.4 6.9 8.0 9.2 7.7 --- 11.1 7.4 5.6 5.0
26 5.1 5.3 7.5 8.1 9.2 7.7 -- --- 7.1 5.6 5.4 27 6.0 5.3 7.8 8.1 9.2 7.7 8.1 -- --- 7.2 5.7 5.3 28 7.1 5.2 8.0 7.9 9.5 7.7 8.0 -- 6.9 7.0 5.8 4.8 29 8.2 5.2 7.7 7.8 7.8 8.3 -- 7.0 7.0 5.6 4.8 30 8.4 5.2 7.6 7.6 7.9 8.4 -- 6.6 7.1 5.7 5.2 31 8.3 7.7 7.4 7.6 -- --- 7.0 5.6
MEAN 5.2 6.4 --- 8.7 8.8 --- --- 6.1 5.3 MAX 8.4 8.3 --- 9.5 10.9 -- -- 7.0 6.7 MIN 2.0 5.2 --- 7.2 7.3 --- --- 4.3 4.0

---
--- --- ---
--- ---
--- ------ --- ---
---
--- --- --- --- ---
--- --- --- ---
--- --- --- --- --- --- --- --- ---
--- --- --- --- --- --- --- --- --- ---
--- --- --- ---
--- --- --- ------ --- --- ------ --- --- ---
ST. JOHNS RIVER BASIN BELOW OCKLAWAHA RIVER 177
294213081345300 ST. JOHNS RIVER AT DANCY POINT NEAR SPUDS, FL--Continued
OXYGEN DISSOLVED, BOTTOM (MG/L), WATER YEAR OCTOBER 2001 TO SEPTEMBER 2002 DAILY MEAN VALUES
DAY OCT NOV DEC JAN FEB MAR APR MAY JUN JUL AUG SEP
1 5.9 7.6 5.0 8.1 7.2 --- 7.5 --- 7.6 6.4 6.0 5.4 2 4.3 6.7 8.2 7.1 --- 7.4 --- 7.9 6.1 5.8 5.2 3 1.7 6.6 4.9 --- 7.3 --- 7.1 --- 7.8 6.3 5.6 5.3 4 1.8 6.8 5.6 --- 7.7 --- 7.2 --- 6.8 6.8 5.0 5.8 5 2.1 7.5 5.5 --- 8.3 --- 7.5 --- 6.8 6.2 4.6 5.8
6 2.4 7.9 5.8 --- 8.5 10.3 7.8 -- 6.2 6.5 5.5 5.1 7 3.5 7.5 --- 8.6 10.6 8.0 -- 5.5 7.0 6.6 4.8 8 4.7 6.5 --- 8.8 10.6 8.1 -- 5.3 7.1 6.7 5.1 9 6.0 5.3 --- 8.9 10.6 8.1 -- 5.6 7.7 6.5 5.5 10 6.5 5.6 --- 8.8 10.4 8.0 6.9 7.8 6.5 5.1
11 5.7 5.7 --- 8.8 10.0 7.8 6.9 7.9 6.7 4.8 12 4.2 5.9 --- 8.7 9.7 7.6 -- 6.0 7.7 6.8 4.4 13 3.9 6.6 --- 8.8 9.4 7.6 -- 5.6 7.8 6.3 4.6 14 4.5 7.5 --- 8.7 8.9 7.6 -- 6.1 8.1 5.9 4.7 15 5.0 8.2 5.2 --- 8.9 8.7 -- 6.2 8.9 5.6 4.7
16 5.3 8.4 5.3 9.3 8.9 8.5 -- 6.1 9.0 5.4 4.3 17 6.1 8.1 6.0 9.2 8.9 8.2 -- 6.0 9.3 5.5 4.1 18 6.6 7.8 6.2 9.2 9.1 7.9 -- 5.0 9.3 5.3 4.1 19 7.0 6.4 5.9 9.0 9.0 7.5 -- 4.8 9.7 4.6 4.3 20 6.7 5.4 6.3 8.8 9.0 7.4 -- 5.2 9.7 4.6 4.5
21 5.6 5.6 6.8 8.6 9.1 7.3 -- 5.7 4.8 4.7 22 4.9 5.8 6.5 8.5 8.8 7.5 -- 6.3 4.9 5.0 23 4.6 5.7 6.6 8.4 7.8 8.9 6.3 4.9 5.1 24 4.4 5.5 6.8 8.1 7.8 9.1 6.2 4.7 5.2 25 4.4 5.3 7.0 8.0 7.5 9.4 5.9 4.9 5.2
26 5.1 5.3 7.6 8.1 7.6 9.5 5.4 7.2 5.1 5.2 27 6.2 5.2 7.9 8.2 7.6 9.1 5.9 7.4 5.2 5.0 28 7.4 5.2 8.1 7.9 7.6 9.0 6.4 7.2 5.3 4.4 29 8.4 5.2 7.8 7.7 7.4 8.9 6.4 7.1 5.0 4.2 30 8.5 5.1 7.8 7.5 7.6 8.3 6.2 7.2 5.1 4.6 31 8.3 7.9 -- 7.6 7.6 --- 6.8 5.1
MEAN 5.2 6.4 --- --- --- 6.2 5.5 4.9 MAX 8.5 8.4 --- --- --- 7.9 6.8 5.8 MIN 1.7 5.1 --- --- --- 4.8 4.6 4.1

178 ST. JOHNS RIVER BASIN BELOW OCKLAWAHA RIVER
02245255 DEEP CREEK NEAR HASTINGS, FL
LOCATION.--Lat 29° 40'52", long 81° 26'56", in NW1⁄ 4 sec.35, T.9 S., R.28 E., St. Johns County, Hydrologic Unit 03080103, near right bank at downstream side of bridge on County Road, 1.3 mi upstream from Sixteenmile Creek, and 4.2 mi southeast of Hastings.
DRAINAGE AREA.--20.7 mi2.
PERIOD OF RECORD.--June 1975 to current year.
GAGE.--Water-stage recorder. Datum of gage is 6.99 ft above NGVD of 1929.
REMARKS.-- Records fair except for period of estimated daily discharge, which is poor.
DISCHARGE, CUBIC FEET PER SECOND, WATER YEAR OCTOBER 2001 TO SEPTEMBER 2002DAILY MEAN VALUES
DAY OCT NOV DEC JAN FEB MAR APR MAY JUN JUL AUG SEP
1 41 0.88 3.0 2.4 2 42 1.4 2.5 2.9 3 33 0.76 2.2 3.3 4 21 0.62 2.1 3.0 5 13 0.64 1.8 3.2
1.0 0.91 3.3 2.5 0.24 1.1 2.5 e15 1.1 0.87 3.7 2.3 0.21 1.4 3.0 e5.8 1.2 3.0 5.6 2.1 0.15 1.1 1.8 e2.8 1.1 17 5.6 2.4 0.13 0.77 1.5 e2.1 1.0 8.2 4.7 2.7 0.12 9.1 1.4 e1.7
6 8.1 0.63 1.6 3.6 0.75 4.8 3.7 2.7 0.13 15 1.1 e2.07 5.3 0.67 1.6 3.3 0.93 3.7 3.4 2.7 0.10 5.4 e1.0 e1.6 8 3.9 0.48 1.8 3.3 1.1 3.0 3.0 2.8 0.23 2.2 e15 e1.3 9 2.8 0.39 1.8 3.3 0.93 2.4 2.7 2.5 0.24 2.4 e18 e1.2 10 2.2 0.41 1.7 1.8 0.78 2.0 3.4 1.7 0.09 1.6 e8.0 e1.3
11 2.0 0.43 1.7 1.712 1.7 0.41 1.9 1.613 1.5 0.66 1.7 1.714 1.4 26 1.7 4.615 1.3 37 1.7 10
0.63 1.7 6.8 1.5 0.36 1.2 e5.0 e1.00.54 2.4 2.2 1.4 0.31 22 e4.0 e0.900.53 2.7 2.8 1.4 0.73 23 e4.7 e220.73 2.3 3.2 1.6 1.4 8.5 e4.5 e230.68 1.9 3.2 1.3 0.49 2.9 e6.0 e7.7
16 1.2 20 1.7 5.217 1.0 14 1.5 3.718 0.91 9.8 1.7 3.1 19 0.83 7.7 1.7 2.720 0.80 6.0 1.7 2.8
0.51 2.8 2.0 1.3 0.28 1.7 e10 e2.30.43 3.7 1.3 4.9 0.24 1.1 e13 e18 0.35 3.9 0.94 10 0.78 0.90 e5.0 e270.35 3.6 1.9 4.4 1.1 0.81 e5.4 e100.41 4.0 2.4 3.3 1.9 0.61 e4.9 e6.3
21 0.78 4.6 1.2 2.722 0.77 3.7 1.1 2.623 0.83 5.1 1.7 2.424 0.93 22 2.0 1.825 0.82 15 2.0 1.7
1.1 5.3 2.6 1.0 46 0.81 e13 e3.6 2.3 5.2 2.2 0.71 54 1.4 e16 e2.7 5.8 4.6 2.1 0.59 26 1.4 e4.8 e2.6 8.5 4.8 2.5 0.47 8.0 1.1 3.5 e2.4 3.3 4.4 2.7 0.32 3.6 1.1 e2.6 e13
26 0.64 10 2.0 2.227 0.59 7.5 1.7 2.028 0.63 5.5 1.9 1.8 29 0.68 4.3 2.0 1.6 30 0.73 3.6 2.0 1.4 31 0.74 --- 2.4 1.2
1.9 3.9 2.8 0.58 5.4 3.2 e2.3 e25 1.5 3.5 3.1 0.77 3.2 9.6 e2.0 e30 1.1 2.7 2.9 0.64 1.9 17 e1.8 e15 --- 2.6 2.7 0.41 1.3 19 e2.4 e5.4 --- 2.9 2.7 0.31 1.1 8.3 e3.0 e4.2 --- 3.1 --- 0.22 --- 3.8 e10 --
TOTAL 193.08 210.18 57.1 88.6MEAN 6.23 7.01 1.84 2.86MAX 42 37 3.0 10 MIN 0.59 0.39 1.1 1.2 CFSM 0.30 0.34 0.09 0.14 IN. 0.35 0.38 0.10 0.16
40.55 117.88 92.14 61.52 159.73 169.50 177.2 256.901.45 3.80 3.07 1.98 5.32 5.47 5.72 8.56 8.5 17 6.8 10 54 23 18 30 0.35 0.87 0.94 0.22 0.09 0.61 1.0 0.900.07 0.18 0.15 0.10 0.26 0.26 0.28 0.41 0.07 0.21 0.17 0.11 0.29 0.30 0.32 0.46
STATISTICS OF MONTHLY MEAN DATA FOR WATER YEARS 1975 - 2002, BY WATER YEAR (WY)
MEAN 13.5 6.63 9.18 8.48 MAX 61.3 43.2 80.2 28.3(WY) 1996 1995 1998 1998 MIN 0.082 0.093 0.42 0.34(WY) 1991 1991 1981 1981
11.1 11.6 7.22 3.09 7.31 5.79 9.58 22.6 78.4 36.6 25.7 8.42 53.7 23.6 51.9 1221998 1987 1997 1995 1982 1982 1985 2001 0.61 0.70 1.79 0.49 0.062 0.13 0.089 0.0901985 1985 1985 1990 1981 1990 1993 1990
SUMMARY STATISTICS FOR 2001 CALENDAR YEAR FOR 2002 WATER YEAR WATER YEARS 1975 - 2002
ANNUAL TOTAL 5050.34 ANNUAL MEAN 13.8 HIGHEST ANNUAL MEAN LOWEST ANNUAL MEAN HIGHEST DAILY MEAN 845 LOWEST DAILY MEAN 0.10 ANNUAL SEVEN-DAY MINIMUM 0.25MAXIMUM PEAK FLOWMAXIMUM PEAK STAGE ANNUAL RUNOFF (CFSM) 0.67ANNUAL RUNOFF (INCHES) 9.0810 PERCENT EXCEEDS 2050 PERCENT EXCEEDS 2.090 PERCENT EXCEEDS 0.45
1624.38 4.45 9.61
24.8 19951.22 1981
Sep 15 54 Jun 22 845 Sep 15 2001Jun 5 0.09 Jun 10 0.00 Many days May 31 0.15 Jun 4 0.00 Many days
112 Jun 21 1290 Sep 14 2001 6.70 Jun 21 9.52 Sep 14 2001 0.21 0.46 2.92 6.3010 23 2.2 2.3 0.62 0.28
e Estimated

179 ST. JOHNS RIVER BASIN BELOW OCKLAWAHA RIVER
02245260 DEEP CREEK AT SPUDS, FL
LOCATION.--Lat 29° 43'46", long 81° 29'13", in SW1⁄ 4 sec.9, T.9 S, R.28 E., St. Johns County, Hydrologic Unit 03080103, on right bank at abandoned Florida East Coast Railway crossing, 0.5 mi east of Spuds, and 3.9 mi upstream from mouth.
DRAINAGE AREA.--60.5 mi2.
PERIOD OF RECORD.--May 1992 to current year.
REVISED RECORDS.--WDR FL-95-1A: Discharge.
GAGE.--Water-stage recorder, acoustic velocity meter, and data-collection platform. Datum of gage is at NGVD of 1929.
REMARKS.--Records poor. Discharge represents net of much larger upstream and downstream discharges.
DISCHARGE, CUBIC FEET PER SECOND, WATER YEAR OCTOBER 2001 TO SEPTEMBER 2002DAILY MEAN VALUES
DAY OCT NOV DEC JAN FEB MAR APR MAY JUN JUL AUG SEP
1 79 16 12 14 2 77 17 9.0 1.7 3 55 8.8 0.76 8.6 4 41 -0.99 -4.3 225 45 -43 1.5 12
5.7 7.8 12 8.3 1.4 7.1 38 248 0.23 3.1 13 9.1 -3.0 8.3 32 170 3.8 9.5 24 6.2 -10 4.6 20 966.2 50 18 2.2 -14 2.4 28 66 0.83 45 -2.8 0.15 0.68 6.9 25 119
6 41 -6.2 5.4 17 10 28 10 3.7 0.44 45 13 95 7 4.8 40 11 15 12 17 20 10 1.6 33 0.92 33 8 -7.8 17 3.8 12 13 16 21 12 -8.1 13 14 2.0 9 4.1 6.5 10 13 9.5 19 18 10 -9.5 22 35 1510 25 -0.38 0.62 17 11 20 16 9.9 -2.8 26 22 21
11 31 8.9 13 1612 31 -2.1 14 1713 27 -17 13 1714 23 20 15 3315 7.5 62 11 64
12 16 31 10 2.3 16 16 3010 16 23 8.5 2.2 22 15 1912 20 19 12 18 105 39 72 6.5 16 16 10 19 124 81 151 5.7 14 12 7.8 1.2 91 98 125
16 1.9 84 5.2 4017 -5.5 77 5.2 2118 -3.6 52 12 9.4 19 -9.2 48 10 8.420 10 39 9.7 7.3
14 17 8.5 7.0 -4.5 58 94 9215 19 5.2 13 -7.5 25 90 51 8.0 18 4.4 34 -3.5 8.9 86 22 12 17 5.9 -9.2 -2.9 6.6 105 1411 15 6.7 -12 14 33 120 14
21 22 2.8 6.3 7.322 13 3.0 2.7 6.723 4.8 33 7.1 5.824 15 83 11 7.125 22 64 4.2 7.4
13 22 5.3 0.01 77 26 100 2.213 12 6.2 -19 166 17 97 -1619 14 3.7 0.26 178 20 66 -9.245 20 8.0 15 100 22 45 1136 21 12 5.8 60 31 25 431
26 21 45 24 6.027 4.6 34 16 1328 -4.3 25 16 1029 -2.0 19 13 1130 17 13 14 7.031 16 --- 13 11
24 21 9.0 1.1 41 51 16 423 16 16 5.4 7.0 27 104 24 42014 14 15 2.5 16 163 25 299--- 12 14 -8.3 12 156 27 168--- 14 10 -3.6 7.8 97 38 75 --- 12 --- 1.9 --- 61 179 --
TOTAL 606.3 748.33 285.18 457.7 MEAN 19.6 24.9 9.20 14.8 MAX 79 84 24 64 MIN -9.2 -43 -4.3 1.7
358.46 561.4 369.5 155.32 679.82 1405.8 1613.92 3259.012.8 18.1 12.3 5.01 22.7 45.3 52.1 109 45 50 31 34 178 163 179 431
0.23 3.1 -2.8 -19 -14 2.4 0.92 -16
STATISTICS OF MONTHLY MEAN DATA FOR WATER YEARS 1992 - 2002, BY WATER YEAR (WY)
MEAN 86.3 53.3 59.3 43.0 MAX 217 139 206 87.8(WY) 1996 1995 1998 1993 MIN 12.8 10.7 5.02 11.1(WY) 1998 2001 1999 2000
46.1 46.8 35.4 16.7 40.6 31.1 43.1 130203 128 98.2 38.4 80.3 56.1 104 2941998 1996 1997 1995 1997 1996 1995 2001 12.2 18.1 6.20 -11.2 4.12 2.78 1.47 21.31997 2002 1994 1994 1998 1999 1999 1997
SUMMARY STATISTICS FOR 2001 CALENDAR YEAR FOR 2002 WATER YEAR WATER YEARS 1992 - 2002
ANNUAL TOTAL 15482.55ANNUAL MEAN 42.4 HIGHEST ANNUAL MEAN LOWEST ANNUAL MEAN HIGHEST DAILY MEAN 1390LOWEST DAILY MEAN -43ANNUAL SEVEN-DAY MINIMUM -0.55 MAXIMUM PEAK STAGE 10 PERCENT EXCEEDS 8450 PERCENT EXCEEDS 1390 PERCENT EXCEEDS 1.6
10500.7328.8 57.2
88.1 1995 28.8 2002
Sep 15 431 Sep 25 1390 Sep 15 2001Nov 5 -43 Nov 5 -78 Jan 26 1993Aug 25 -5.6 Jun 3 -22 May 19 1994
4.28 Nov 15 7.58 Sep 15 200178 12714 28 0.55 3.8
Note.--Negative figures indicate reverse flow

180 ST. JOHNS RIVER BASIN BELOW OCKLAWAHA RIVER
02245500 SOUTH FORK BLACK CREEK NEAR PENNEY FARMS, FL
LOCATION.--Lat 29° 58'45", long 81° 51'08", in NE1⁄ 4 sec.13, T.6 S., R.24 E., Clay County, Hydrologic Unit 03080103, on right bank at upstream side of bridge on State Highway 16, 0.7 mi downstream from Greens Creek, 2.5 mi west of Penney Farms, 9.5 mi westof Green Cove Springs, and 24 mi upstream from mouth of Black Creek.
DRAINAGE AREA.--134 mi2.
PERIOD OF RECORD.--October 1939 to current year. Monthly discharge only for some periods, published in WSP 1304.
REVISED RECORDS.--WSP 1234: Drainage area.
GAGE.--Water-stage recorder and data-collection platform. Datum of gage is 9.82 ft above NGVD of 1929 (levels by U.S. Army Corps of Engineers). Prior to July 18, 1940, nonrecording gage at same site and datum.
REMARKS.--Records poor.
DISCHARGE, CUBIC FEET PER SECOND, WATER YEAR OCTOBER 2001 TO SEPTEMBER 2002DAILY MEAN VALUES
DAY OCT NOV DEC JAN FEB MAR APR MAY JUN JUL AUG SEP
1 e62 21 23 26 2 e54 22 23 27 3 e50 24 23 34 4 e47 24 23 32 5 e43 24 23 30
85 34 16 13 e12 316 127 982 67 38 17 e12 e11 175 538 910 58 98 47 e12 e10 116 914 589 52 191 44 e12 e8.9 85 724 e300 47 111 35 e12 e8.6 64 726 e230
6 e40 22 22 30 7 e37 21 22 30 8 e35 20 22 28 9 e34 20 46 2710 e34 19 219 27
43 74 27 e12 e10 48 402 e170 44 59 22 e12 14 37 e210 e120 49 52 19 e11 25 31 e140 e85 48 46 17 e11 26 43 e96 e70 43 41 15 e11 19 59 e83 e62
11 34 19 199 2912 32 19 113 2613 31 19 77 28 14 31 70 62 4615 31 122 54 227
41 37 27 e11 16 41 e72 e53 38 34 26 e10 21 49 e62 e46 35 64 71 e9.4 18 38 e65 e7535 80 119 e9.1 14 35 77 e125 34 62 84 e8.9 12 31 91 e320
16 28 74 49 16117 26 51 44 9918 25 41 43 7519 25 36 42 6320 25 34 39 57
33 50 57 e8.6 12 25 139 e490 31 42 42 e10 12 21 172 e430 29 37 33 15 12 18 385 e290 28 33 27 17 15 18 362 e200 28 30 23 17 69 68 242 e210
21 25 32 35 5922 25 30 33 7123 26 30 32 6424 26 28 31 5625 26 28 30 59
28 28 20 13 101 356 190 e13528 31 18 e12 194 231 124 e95 34 28 16 e12 323 139 85 e8068 26 15 e11 234 99 63 e175 61 24 14 e11 163 131 48 e460
26 23 26 29 8727 21 25 28 7628 20 24 28 8729 21 24 28 12830 21 23 27 12031 21 --- 26 122
50 22 13 e10 237 281 38 e320 42 22 13 e10 247 318 46 e205 36 22 13 e28 216 578 70 e150--- 20 13 19 143 572 188 e125--- 18 13 13 254 288 299 e105 --- 17 --- 13 --- 172 369 --
TOTAL 979 972 1495 2031MEAN 31.6 32.4 48.2 65.5 MAX 62 122 219 227 MIN 20 19 22 26CFSM 0.24 0.24 0.36 0.49 IN. 0.27 0.27 0.42 0.56
1215 1471 916 386.0 2457.5 4483 7147 760743.4 47.5 30.5 12.5 81.9 145 231 254 85 191 119 28 323 578 914 982 28 17 13 8.6 8.6 18 38 460.32 0.35 0.23 0.09 0.61 1.08 1.72 1.89 0.34 0.41 0.25 0.11 0.68 1.24 1.98 2.11
STATISTICS OF MONTHLY MEAN DATA FOR WATER YEARS 1940 - 2002, BY WATER YEAR (WY)
MEAN 164 87.0 121 138 MAX 633 484 859 442 (WY) 1948 1948 1998 1970 MIN 21.1 18.1 23.9 30.5(WY) 1978 1941 1991 1957
172 179 118 80.7 107 154 225 233808 666 563 747 334 530 885 7701998 1948 1997 1959 1965 1960 1953 1988 34.0 34.5 22.7 11.4 16.2 21.5 15.9 14.01957 1956 1968 2001 1955 1977 1993 1990
SUMMARY STATISTICS FOR 2001 CALENDAR YEAR FOR 2002 WATER YEAR WATER YEARS 1940 - 2002
ANNUAL TOTAL 22960.6 ANNUAL MEAN 62.9 HIGHEST ANNUAL MEAN LOWEST ANNUAL MEAN HIGHEST DAILY MEAN 1930LOWEST DAILY MEAN 8.8 ANNUAL SEVEN-DAY MINIMUM 8.9 MAXIMUM PEAK FLOWMAXIMUM PEAK STAGE ANNUAL RUNOFF (CFSM) 0.47ANNUAL RUNOFF (INCHES) 6.3710 PERCENT EXCEEDS 11750 PERCENT EXCEEDS 2890 PERCENT EXCEEDS 12
31159.585.4 148
302 1948 52.0 1990
Sep 15 982 Sep 1 10300 May 21 1959Jun 1 b8.6 b8.6Jun 1 9.6 May 11 8.9 Jun 1 2001
1240 Sep 1 a13900 Oct 19 194412.32 Sep 1 a26.33 Oct 19 1944 0.64 1.11 8.65 15.04
217 31035 6913 27
e Estimated a From floodmarks and rating curve extended above 11,000 ft3/s b May 16, Jun 5, 2002
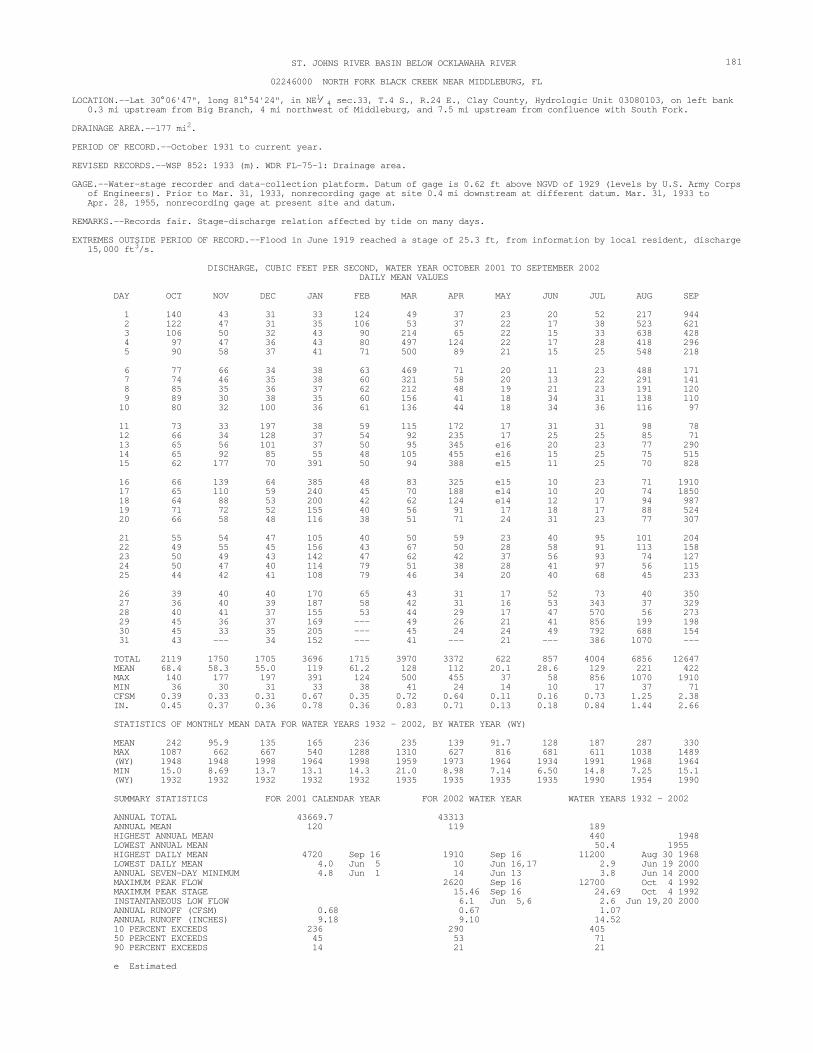
181 ST. JOHNS RIVER BASIN BELOW OCKLAWAHA RIVER
02246000 NORTH FORK BLACK CREEK NEAR MIDDLEBURG, FL
LOCATION.--Lat 30° 06'47", long 81° 54'24", in NE1⁄ 4 sec.33, T.4 S., R.24 E., Clay County, Hydrologic Unit 03080103, on left bank 0.3 mi upstream from Big Branch, 4 mi northwest of Middleburg, and 7.5 mi upstream from confluence with South Fork.
DRAINAGE AREA.--177 mi2.
PERIOD OF RECORD.--October 1931 to current year.
REVISED RECORDS.--WSP 852: 1933 (m). WDR FL-75-1: Drainage area.
GAGE.--Water-stage recorder and data-collection platform. Datum of gage is 0.62 ft above NGVD of 1929 (levels by U.S. Army Corps of Engineers). Prior to Mar. 31, 1933, nonrecording gage at site 0.4 mi downstream at different datum. Mar. 31, 1933 toApr. 28, 1955, nonrecording gage at present site and datum.
REMARKS.--Records fair. Stage-discharge relation affected by tide on many days.
EXTREMES OUTSIDE PERIOD OF RECORD.--Flood in June 1919 reached a stage of 25.3 ft, from information by local resident, discharge 15,000 ft3/s.
DISCHARGE, CUBIC FEET PER SECOND, WATER YEAR OCTOBER 2001 TO SEPTEMBER 2002DAILY MEAN VALUES
DAY OCT NOV DEC JAN FEB MAR APR MAY JUN JUL AUG SEP
1 140 43 31 332 122 47 31 353 106 50 32 43 4 97 47 36 43 5 90 58 37 41
124 49 37 23 20 52 217 944106 53 37 22 17 38 523 621 90 214 65 22 15 33 638 428 80 497 124 22 17 28 418 296 71 500 89 21 15 25 548 218
6 77 66 34 38 7 74 46 35 38 8 85 35 36 37 9 89 30 38 3510 80 32 100 36
63 469 71 20 11 23 488 171 60 321 58 20 13 22 291 141 62 212 48 19 21 23 191 120 60 156 41 18 34 31 138 110 61 136 44 18 34 36 116 97
11 73 33 197 38 12 66 34 128 3713 65 56 101 3714 65 92 85 5515 62 177 70 391
59 115 172 17 31 31 98 7854 92 235 17 25 25 85 7150 95 345 e16 20 23 77 290 48 105 455 e16 15 25 75 515 50 94 388 e15 11 25 70 828
16 66 139 64 38517 65 110 59 24018 64 88 53 20019 71 72 52 15520 66 58 48 116
48 83 325 e15 10 23 71 1910 45 70 188 e14 10 20 74 1850 42 62 124 e14 12 17 94 987 40 56 91 17 18 17 88 524 38 51 71 24 31 23 77 307
21 55 54 47 10522 49 55 45 15623 50 49 43 14224 50 47 40 11425 44 42 41 108
40 50 59 23 40 95 101 204 43 67 50 28 58 91 113 158 47 62 42 37 56 93 74 127 79 51 38 28 41 97 56 115 79 46 34 20 40 68 45 233
26 39 40 40 17027 36 40 39 18728 40 41 37 15529 45 36 37 16930 45 33 35 20531 43 --- 34 152
65 43 31 17 52 73 40 350 58 42 31 16 53 343 37 329 53 44 29 17 47 570 56 273--- 49 26 21 41 856 199 198--- 45 24 24 49 792 688 154 --- 41 --- 21 --- 386 1070 --
TOTAL 2119 1750 1705 3696 MEAN 68.4 58.3 55.0 119 MAX 140 177 197 391 MIN 36 30 31 33CFSM 0.39 0.33 0.31 0.67 IN. 0.45 0.37 0.36 0.78
1715 3970 3372 622 857 4004 6856 12647 61.2 128 112 20.1 28.6 129 221 422 124 500 455 37 58 856 1070 1910 38 41 24 14 10 17 37 710.35 0.72 0.64 0.11 0.16 0.73 1.25 2.38 0.36 0.83 0.71 0.13 0.18 0.84 1.44 2.66
STATISTICS OF MONTHLY MEAN DATA FOR WATER YEARS 1932 - 2002, BY WATER YEAR (WY)
MEAN 242 95.9 135 165 MAX 1087 662 667 540(WY) 1948 1948 1998 1964 MIN 15.0 8.69 13.7 13.1(WY) 1932 1932 1932 1932
236 235 139 91.7 128 187 287 3301288 1310 627 816 681 611 1038 14891998 1959 1973 1964 1934 1991 1968 1964 14.3 21.0 8.98 7.14 6.50 14.8 7.25 15.11932 1935 1935 1935 1935 1990 1954 1990
SUMMARY STATISTICS FOR 2001 CALENDAR YEAR FOR 2002 WATER YEAR WATER YEARS 1932 - 2002
ANNUAL TOTAL 43669.7 ANNUAL MEAN 120 HIGHEST ANNUAL MEAN LOWEST ANNUAL MEAN HIGHEST DAILY MEAN 4720LOWEST DAILY MEAN 4.0ANNUAL SEVEN-DAY MINIMUM 4.8MAXIMUM PEAK FLOW MAXIMUM PEAK STAGE INSTANTANEOUS LOW FLOWANNUAL RUNOFF (CFSM) 0.68ANNUAL RUNOFF (INCHES) 9.1810 PERCENT EXCEEDS 23650 PERCENT EXCEEDS 4590 PERCENT EXCEEDS 14
43313 119 189
440 1948 50.4 1955
Sep 16 1910 Sep 16 11200 Aug 30 1968Jun 5 10 Jun 16,17 2.9 Jun 19 2000Jun 1 14 Jun 13 3.8 Jun 14 2000
2620 Sep 16 12700 Oct 4 1992 15.46 Sep 16 24.69 Oct 4 19926.1 Jun 5,6 2.6 Jun 19,20 2000 0.67 1.07 9.10 14.52
290 40553 7121 21
e Estimated

---
182 ST. JOHNS RIVER BASIN BELOW OCKLAWAHA RIVER
02246010 NORTH FORK BLACK CREEK AT MIDDLEBURG, FL
LOCATION.--Lat 30° 04'31", long 81° 51'51", in SW1⁄ 4 sec.12, T.5 S., R.24 E., Clay County, Hydrologic Unit 03080103, at downstream side of upstream bridge on State Highway 21, 0.5 mi north of Middleburg, 1.5 mi upstream from confluence with South Fork, and 14 mi upstream from mouth of Black Creek.
DRAINAGE AREA.--197 mi2.
PERIOD OF RECORD.--October 1981 to current year (gage heights only).
GAGE.--Water-stage recorder. Datum of gage is 9.80 ft below NGVD of 1929. Prior to Feb. 28, 1986, at site 50 ft downstream at present datum.
REMARKS.--Stage affected by tide.
EXTREMES FOR PERIOD OF RECORD.--Maximum gage height, 22.37 ft, Oct. 4, 1992, from peak stage indicator; minimum, 9.34 ft, Dec. 23, 1981.
EXTREMES FOR CURRENT YEAR.--Maximum gage height, 14.14 ft, Nov. 16; minimum, 10.34 ft, Jan. 12.
GAGE HEIGHT, FEET, WATER YEAR OCTOBER 2001 TO SEPTEMBER 2002DAILY MEAN VALUES
DAY OCT NOV DEC JAN FEB MAR APR MAY JUN JUL AUG SEP
1 13.35 12.76 12.07 11.81 11.54 11.85 12.00 11.72 12.30 11.77 12.07 13.03 2 13.18 12.70 12.09 12.04 11.54 12.10 12.07 11.49 12.11 11.92 12.51 13.09 3 13.09 12.63 12.24 12.14 11.86 12.03 12.03 11.18 12.10 11.92 12.77 13.21 4 13.05 12.60 12.48 11.81 11.73 11.73 11.87 11.27 12.35 11.89 12.73 13.26 5 12.88 12.95 12.51 11.83 11.88 11.58 12.35 11.72 12.37 11.88 12.73 13.13
6 12.64 13.18 12.39 11.65 12.00 11.66 12.44 12.01 12.23 11.90 12.78 12.91 7 12.63 12.79 12.24 11.08 11.76 11.74 12.41 11.87 12.06 12.09 13.09 13.01 8 13.03 12.49 12.27 11.12 11.49 11.82 12.26 11.63 12.26 12.19 13.36 13.20 9 13.25 12.33 12.29 11.17 11.70 11.73 11.87 11.44 12.66 12.09 13.33 13.22 10 13.13 12.44 12.55 11.01 11.77 11.56 11.60 11.37 12.72 11.94 13.26 13.11
11 13.01 12.49 12.65 10.92 11.54 11.71 11.76 11.39 12.62 11.71 13.12 12.93 12 12.86 12.54 12.49 10.98 11.51 11.91 11.98 11.53 12.48 11.81 12.98 12.77 13 12.82 13.09 12.43 11.11 11.55 11.86 11.96 11.37 12.37 12.16 12.89 12.92 14 12.76 13.31 12.31 11.33 11.67 11.67 11.97 11.23 12.21 11.99 12.75 12.87 15 12.69 13.50 12.09 11.58 12.09 11.56 11.85 11.52 12.11 11.80 12.62 12.78
16 12.96 13.56 12.23 11.47 11.98 11.47 11.76 11.64 12.18 11.82 12.53 12.98 17 13.04 13.32 12.28 11.48 11.65 11.36 11.73 11.60 12.21 11.95 12.37 13.14 18 13.11 13.09 11.90 11.38 11.87 11.38 11.69 11.37 12.27 12.06 12.21 12.71 19 13.24 12.89 11.92 11.30 11.85 11.50 11.61 11.88 12.35 12.01 12.13 12.70 20 13.15 12.57 11.81 11.18 11.66 11.68 11.47 12.49 12.38 11.87 12.21 12.80
21 12.96 12.58 12.00 11.36 11.46 11.53 11.57 12.47 12.59 11.89 12.23 12.90 22 12.84 12.78 12.10 11.42 11.51 11.92 11.62 12.66 12.79 12.00 12.24 13.00 23 12.89 12.60 12.18 11.54 11.81 12.18 11.75 12.91 12.56 11.99 12.29 13.05 24 12.85 12.44 11.93 11.40 12.21 12.04 12.09 12.63 12.30 11.92 12.19 13.10 25 12.57 12.28 11.96 11.27 12.19 11.89 11.95 12.28 12.12 11.88 12.14 13.36
26 12.43 12.21 11.96 11.67 12.02 11.79 11.92 12.11 12.11 11.88 12.28 13.28 27 12.46 12.17 11.73 11.81 11.71 11.73 12.20 12.17 11.90 11.97 12.30 12.81 28 12.74 12.19 11.69 11.66 11.68 11.89 12.00 12.27 11.66 12.03 12.29 12.62 29 12.88 12.21 11.79 11.54 --- 12.14 11.61 12.48 11.59 12.07 12.34 12.71 30 12.86 12.13 11.78 11.50 --- 12.13 11.66 12.56 11.61 11.91 12.47 13.09 31 12.82 -- 11.83 11.55 --- 12.07 --- 12.47 11.81 12.81 --
MEAN 12.91 12.69 12.14 11.46 11.76 11.78 11.90 11.89 12.25 11.94 12.58 12.99 MAX 13.35 13.56 12.65 12.14 12.21 12.18 12.44 12.91 12.79 12.19 13.36 13.36 MIN 12.43 12.13 11.69 10.92 11.46 11.36 11.47 11.18 11.59 11.71 12.07 12.62
CAL YR 2001 MEAN 12.03 MAX 16.59 MIN 10.72 WTR YR 2002 MEAN 12.19 MAX 13.56 MIN 10.92

183 ST. JOHNS RIVER BASIN BELOW OCKLAWAHA RIVER
02246150 BIG DAVIS CREEK AT BAYARD, FL
LOCATION.--Lat 30° 09'05", long 81° 31'35", in land grant 37, T.4 S., R.28 E., Duval County, Hydrologic Unit 03080103, at downstream end of culvert on U.S. Highway 1, 0.8 mi northwest of Bayard, 2.0 mi upstream from mouth, and 14.8 mi southeast of Union Station in Jacksonville.
DRAINAGE AREA.--13.6 mi2.
PERIOD OF RECORD.--Water years 1964-66, 1970-74 (annual peak discharge), August 1966 to September 1969, June 1974 to current year.
GAGE.--Water-stage recorder. Datum of gage is at NGVD of 1929. Feb. 18, 1965 to Aug. 21, 1966, crest-stage gage at same site and datum.
REMARKS.--Records fair except for periods of estimated daily discharge, which are poor.
DISCHARGE, CUBIC FEET PER SECOND, WATER YEAR OCTOBER 2001 TO SEPTEMBER 2002DAILY MEAN VALUES
DAY OCT NOV DEC JAN FEB MAR APR MAY JUN JUL AUG SEP
1 11 e2.7 6.9 5.6 10 5.7 e4.9 1.6 1.9 6.5 2.4 100 2 9.6 e3.0 6.7 6.4 9.6 6.4 e5.0 1.5 1.8 5.5 2.5 71 3 8.6 e3.5 6.4 7.5 8.9 18 e4.8 1.5 1.7 4.6 3.3 54 4 7.9 3.9 6.3 6.9 8.4 43 e4.5 1.5 1.6 4.0 7.1 40 5 7.2 3.8 6.2 6.5 7.7 32 e4.0 1.5 1.7 3.6 9.6 34
6 6.7 3.4 6.1 6.3 7.3 23 3.2 1.6 1.6 3.3 5.8 28 7 6.5 3.1 6.0 6.2 7.7 17 3.1 1.5 1.7 3.2 7.8 22 8 6.1 2.9 8.2 5.9 7.6 14 2.9 1.5 1.7 3.0 5.2 18 9 5.6 2.8 17 5.6 7.2 12 2.7 1.5 2.3 3.0 4.0 1410 5.3 2.7 39 5.6 7.0 11 2.7 1.4 2.2 3.3 3.6 11
11 5.3 2.7 47 5.6 12 5.2 3.3 35 5.6 13 5.2 8.2 27 5.714 5.2 62 22 1115 5.0 92 19 33
6.9 9.8 3.4 1.4 2.2 3.0 3.1 9.56.6 9.1 3.9 1.4 2.5 2.7 2.8 8.16.3 16 4.5 1.4 2.9 2.8 3.3 166.1 15 4.1 1.5 2.4 3.3 4.7 345.9 12 3.5 1.4 2.1 3.3 4.7 43
16 4.7 51 16 2517 4.3 38 14 1818 4.0 30 13 1519 4.0 26 11 1320 3.9 22 10 12
5.9 10 3.2 1.4 1.9 2.8 5.1 355.6 9.2 3.2 1.5 1.8 2.5 5.4 285.3 8.3 3.4 2.0 2.0 2.4 5.1 225.1 7.4 2.9 2.5 2.6 2.2 20 175.0 6.6 2.6 2.3 3.4 2.6 51 13
21 3.9 19 9.4 14 22 4.0 16 8.6 17 23 4.1 14 8.1 1524 4.2 12 7.8 13 25 3.9 10 7.3 13
5.0 6.2 2.4 2.0 18 4.7 31 10 5.1 6.6 2.1 1.8 32 3.6 21 8.5 7.0 6.3 2.0 1.8 24 3.3 14 7.2 10 5.7 2.0 1.8 15 2.9 9.9 27 9.0 5.3 1.9 1.8 13 3.0 7.6 86
26 3.3 9.7 6.7 18 27 2.9 9.0 6.4 18 28 2.6 8.4 6.2 16 29 2.6 7.8 6.0 14 30 2.6 7.3 5.8 12 31 2.6 --- 5.7 11
7.8 4.9 1.9 1.7 11 3.9 9.6 77 7.0 4.8 1.8 1.9 14 3.5 12 66 6.2 4.6 1.8 2.3 e10 4.0 9.0 51 --- e4.6 1.7 2.1 e8.0 4.0 7.6 38 --- e4.7 1.7 2.0 7.0 3.3 9.8 29 --- e4.8 --- 2.0 --- 2.7 61 --
TOTAL 158.0 480.2 400.8 367.4 MEAN 5.10 16.0 12.9 11.9 MAX 11 92 47 33 MIN 2.6 2.7 5.7 5.6 CFSM 0.37 1.18 0.95 0.87 IN. 0.43 1.31 1.10 1.00
197.2 344.0 91.8 53.1 194.0 106.5 349.0 1017.37.04 11.1 3.06 1.71 6.47 3.44 11.3 33.9 10 43 5.0 2.5 32 6.5 61 1005.0 4.6 1.7 1.4 1.6 2.2 2.4 7.20.52 0.82 0.23 0.13 0.48 0.25 0.83 2.49 0.54 0.94 0.25 0.15 0.53 0.29 0.95 2.78
STATISTICS OF MONTHLY MEAN DATA FOR WATER YEARS 1966 - 2002, BY WATER YEAR (WY)
MEAN 19.3 8.67 9.55 10.6 MAX 74.3 44.9 57.3 30.8(WY) 1992 1995 1998 1994 MIN 0.78 1.44 1.36 1.66(WY) 1982 1991 1981 1981
12.4 11.7 6.70 5.08 8.73 8.95 14.1 22.4 48.6 31.0 21.3 37.5 47.7 40.5 69.6 68.91998 1986 1997 1979 1991 1975 1968 1979 3.39 2.72 1.22 0.47 0.57 0.29 0.56 0.931991 2000 1968 1981 1981 1977 1990 1980
SUMMARY STATISTICS FOR 2001 CALENDAR YEAR FOR 2002 WATER YEAR WATER YEARS 1966 - 2002
ANNUAL TOTAL 3903.6ANNUAL MEAN 10.7 HIGHEST ANNUAL MEAN LOWEST ANNUAL MEAN HIGHEST DAILY MEAN 336 LOWEST DAILY MEAN 1.9 ANNUAL SEVEN-DAY MINIMUM 2.0MAXIMUM PEAK FLOWMAXIMUM PEAK STAGE INSTANTANEOUS LOW FLOWANNUAL RUNOFF (CFSM) 0.79ANNUAL RUNOFF (INCHES) 10.6810 PERCENT EXCEEDS 2050 PERCENT EXCEEDS 4.390 PERCENT EXCEEDS 2.6
3759.310.3 11.5
22.0 19952.33 1981
Sep 15 100 Sep 1 735 Aug 31 1968 May 25 1.4 May 10-13,15,16 0.07 Jul 25 1977 May 21 1.4 May 10 0.13 Jul 21 1977
129 Nov 14 1170 Aug 29 1968 7.43 Nov 14 10.47 Aug 29 1968 1.3 May 11-13,15-17 *0.05 0.76 0.8410.28 11.4423 25 5.8 5.0 1.9 1.3
e Estimated* July 25, 1977, June 19, 1981

--- --- --- ---
--- ---
--- --- --- --- --- --- --- --- ---
---
---
------ --- ------ --- ------ ------ ---
--- ------ --- --- --- --- --- --- ---
--- ------ --- --- ------ --- --- ---
--- ---
------ --- ------ --- ---
184 ST. JOHNS RIVER BASIN BELOW OCKLAWAHA RIVER
301124081395901 ST. JOHNS RIVER AT BUCKMAN BRIDGE AT JACKSONVILLE, FL
LOCATION.--Lat 30° 11'24", long 81° 39'59",T.3 S., R.27 E., Duval County, Hydrologic Unit 03080103, below Buckman Bridge, Interstate Highway I-295, one piling east of boat fenders, on the north side, 2.7 mi northeast of Orange Park, and 36 mi upstream from mouth.
PERIOD OF DAILY RECORD.--SPECIFIC CONDUCTANCE (TOP, MIDDLE, BOTTOM): June 1995 to current year. WATER TEMPERATURE (TOP, MIDDLE, BOTTOM): June 1995 to current year.DISSOLVED OXYGEN (TOP, MIDDLE, BOTTOM): May 1996 to current year.
INSTRUMENTATION.--Water-quality monitor.
REMARKS--Extremes for current year and extremes for period of daily record are based on recorded values and may have beenexceeded during periods of no record.
EXTREMES FOR PERIOD OF DAILY RECORD.--SPECIFIC CONDUCTANCE (TOP): Maximum daily mean, 33,200 µS/cm @ 25 ° C, May 23, 2002; minimum daily mean, 318 µS/cm @ 25 ° C,
Mar. 9, 1998. SPECIFIC CONDUCTANCE (MIDDLE): Maximum daily mean, 38,500 µS/cm @ 25 ° C, May 3, 1999; minimum daily mean, 318 µS/cm @ 25 ° C,
Mar. 9, 1998. SPECIFIC CONDUCTANCE (BOTTOM): Maximum daily mean, 42,400 µS/cm @ 25 ° C, May 3, 1999; minimum daily mean, 318 µS/cm @ 25 ° C,
Mar. 9, 1998. WATER TEMPERATURE (TOP): Maximum daily mean, 32.2 ° C, Aug. 1, 2, 1999; minimum daily mean, 8.7° C, Jan. 9, 1996. WATER TEMPERATURE (MIDDLE): Maximum daily mean, 32.2 ° C, Aug. 1, 2, 1999; minimum daily mean, 8.3 ° C, Jan. 4, 2001. WATER TEMPERATURE (BOTTOM): Maximum daily mean, 32.2 ° C, Aug. 2, 1999; minimum daily mean, 8.4 ° C, Jan. 4,5, 2001.DISSOLVED OXYGEN (TOP): Maximum daily mean, 11.5 mg/L, Jan. 11, 2001; minimum daily mean, 2.9 mg/L, Sept. 8, 1998. DISSOLVED OXYGEN (MIDDLE): Maximum daily mean, 11.6 mg/L, Jan. 11, 2001; minimum daily mean, 2.7 mg/L, Sept. 8, 1998. DISSOLVED OXYGEN (BOTTOM): Maximum daily mean, 11.3 mg/L, Jan. 11, 2001; minimum daily mean, 2.7 mg/L, Sept. 8, 1998.
EXTREMES FOR CURRENT YEAR--SPECIFIC CONDUCTANCE (TOP): Maximum daily mean, 33,200 µS/cm @ 25 ° C, May 23; minimum daily mean, 626 µS/cm @ 25 ° C, Jan. 12. SPECIFIC CONDUCTANCE (MIDDLE): Maximum daily mean, 38,300 µS/cm @ 25 ° C, May 24; minimum daily mean, 627 µS/cm @ 25 ° C,
Jan. 12. SPECIFIC CONDUCTANCE (BOTTOM): Maximum daily mean, 40,700 µS/cm @ 25 ° C, May 24; minimum daily mean, 625 µS/cm @ 25 ° C,
Jan. 12. WATER TEMPERATURE (TOP): Maximum daily mean, 31.2 ° C, July 19; minimum daily mean, 11.8 ° C, Jan. 12. WATER TEMPERATURE (MIDDLE): Maximum daily mean, 31.1 ° C, July 19; minimum daily mean, 11.8 ° C, Jan. 12. WATER TEMPERATURE (BOTTOM): Maximum daily mean, 31.1 ° C, July 19; minimum daily mean, 11.8 ° C, Jan. 12.DISSOLVED OXYGEN (TOP): Maximum daily mean, 9.8 mg/L, Mar. 5-7; minimum daily mean, 5.6 mg/L, Sept. 20. DISSOLVED OXYGEN (MIDDLE): Maximum daily mean, 10.2 mg/L, Jan. 12; minimum daily mean, 5.0 mg/L, Sept. 26-28. DISSOLVED OXYGEN (BOTTOM): Maximum daily mean, 10.2 mg/L, Jan. 12; minimum daily mean, 4.8 mg/L, Sept. 26-28.
SPECIFIC CONDUCTANCE, TOP (MICROSIEMENS/CM AT 25 DEG. C), WATER YEAR OCTOBER 2001 TO SEPTEMBER 2002DAILY MEAN VALUES
DAY OCT NOV DEC JAN FEB MAR APR MAY JUN JUL AUG SEP
1 911 856 e712 -- 4990 7560 9940 25400 11100 1400 1810 2 896 859 e709 -- 4950 8110 8820 23800 11000 1460 1680 3 882 862 e712 -- 4030 7970 7320 23000 10600 1570 1680 4 877 861 e720 -- 3150 7230 7220 23500 10100 1710 1730 5 868 865 -- 2460 9630 8770 23300 9560 1780 1630
6 865 874 -- 2140 11300 11200 22700 9090 1880 925 7 855 871 -- 2040 12600 12500 21600 9090 2380 902 8 860 872 -- 1980 12100 11500 22100 9080 3670 911 9 867 870 -- 1730 10700 24000 8540 4890 912 10 866 870 --- --- 1440 --- 10200 24900 7760 5310 884
11 855 874 --- --- 1480 --- 10000 25100 6760 4500 832 12 842 873 --- 626 --- 1590 --- 10200 24800 6320 3640 795 13 838 881 --- 629 --- 1500 --- 9950 24400 6640 2490 789 14 835 908 --- 631 --- 1260 --- 9470 23000 5960 1460 778 15 833 1400 --- 630 --- 1100 --- 10400 e22500 5150 1160 764
16 840 2080 --- --- 1030 --- 11400 e22000 4730 1190 761 17 e844 1760 --- 953 11800 21800 4600 1210 752 18 845 1330 --- 910 10900 21600 4610 1180 749 19 845 968 --- 931 6060 13000 22400 4440 1160 748 20 840 853 -- 1010 5620 19400 23000 4000 1130 749
21 834 836 --- 986 5740 22300 23200 3550 1110 747 22 828 847 -- 1320 5960 27500 22700 3210 1070 742 23 832 794 -- 3020 6330 33200 20800 2810 1050 741 24 833 770 -- 5000 7960 29800 19200 2490 1040 721 25 830 746 -- 5300 8520 25300 17700 2200 1020 711
26 833 e736 --- 5210 9300 24600 16100 1940 1020 677 27 830 e733 -- 5420 11200 24600 14400 1770 1000 649 28 841 e728 --- 5930 11400 25300 12900 1630 984 635 29 836 e722 -- 6750 10000 26200 12100 1530 1580 641 30 844 e716 --- 7420 9590 26900 11400 1450 2010 654 31 849 --- --- --- 7670 --- 26500 1400 1990 --
MEAN 850 940 --- --- 3050 --- 16400 21200 5580 1900 923 MAX 911 2080 --- 7670 33200 25400 11100 5310 1810 MIN 828 716 --- 910 7220 11400 1400 984 635
e Estimated

---
------------ ------ ---
--- ------ ------ ---
--- ---
--- ------ ------ ------
--- --- ---
--- --- --- ---
---
------ --- --- ------ --- --- ---
185 ST. JOHNS RIVER BASIN BELOW OCKLAWAHA RIVER
301124081395901 ST. JOHNS RIVER AT BUCKMAN BRIDGE AT JACKSONVILLE, FL--Continued
SPECIFIC CONDUCTANCE, MIDDLE (MICROSIEMENS/CM AT 25 DEG. C), WATER YEAR OCTOBER 2001 TO SEPTEMBER 2002DAILY MEAN VALUES
DAY OCT NOV DEC JAN FEB MAR APR MAY JUN JUL AUG SEP
1 911 856 e712 --- 766 5160 8140 10400 27400 11200 1400 1830 2 896 859 e709 -- 777 5160 8610 9130 26300 11100 1460 1690 3 880 862 e713 -- 969 4190 8900 7640 25200 10700 1610 1710 4 874 861 e721 --- 1270 3170 7770 7510 24900 10200 1820 1760 5 864 864 --- 1760 2470 9910 9120 24400 9640 1870 1630
6 863 873 --- 3810 2160 13600 12700 24500 9180 1920 1530 7 855 870 --- 4560 2080 15600 16000 22900 9150 2410 1590 8 860 872 --- 2610 e1830 14700 14800 22600 9130 4160 1650 9 866 869 --- 3080 e1600 12200 24300 8600 6640 1600 10 866 870 --- e3080 e1500 10800 25700 7830 6720 1450
11 856 873 --- 2580 1510 10300 26300 6840 5250 1300 12 842 873 627 2400 1630 10400 25600 6390 3930 1280 13 838 881 629 2470 1510 10200 25200 6660 2620 1380 14 836 908 --- e631 2620 1280 --- 9610 23800 5970 1480 1620 15 833 1410 e630 4020 1110 10700 22500 5170 1180 3720
16 840 2180 --- 6430 1050 11800 22500 4740 1190 2630 17 845 2680 --- 4930 974 13000 22100 4640 1210 1740 18 842 1510 --- 4540 919 11600 21800 4630 1180 957 19 845 992 e636 5050 950 6230 13200 22600 4470 1160 918 20 841 861 --- 633 --- 1020 5810 19900 23200 --- 1130 968
21 834 839 634 985 5880 26800 23400 1110 999 22 829 850 --- e635 --- 1320 6020 29300 23000 --- 1070 996 23 831 793 --- 634 --- 4760 6380 36000 21100 --- 1050 969 24 832 769 --- 632 --- 8860 8450 38300 19400 e2490 1040 955 25 829 e743 --- e633 --- 8120 10300 35800 17800 2230 1020 949
26 831 e736 --- e638 --- 6400 10200 31100 16200 1950 1020 929 27 835 e732 720 5770 11800 26800 14500 1770 1000 912 28 841 e723 858 6190 12500 25800 13000 1630 983 889 29 844 e721 --- e835 --- 7300 10800 26500 12100 1520 1650 891 30 844 e719 --- e818 --- 8530 10100 27700 11400 1450 2070 928 31 849 --- --- 781 --- 8610 --- 28300 1390 2020 --
MEAN 850 982 --- --- 3490 --- 18200 21900 --- 2080 1410 MAX 911 2680 --- 8860 38300 27400 6720 3720 MIN 829 719 -- 919 7510 11400 983 889
e Estimated
SPECIFIC CONDUCTANCE, BOTTOM (MICROSIEMENS/CM AT 25 DEG. C), WATER YEAR OCTOBER 2001 TO SEPTEMBER 2002DAILY MEAN VALUES
DAY OCT NOV DEC JAN FEB MAR APR MAY JUN JUL AUG SEP
1 911 856 e712 --- 2 897 858 e709 --3 878 861 e713 --4 873 861 e722 --- 5 862 864 --- --
774 5290 8710 10800 29600 11200 1390 1850779 5330 8980 9480 28700 11200 1460 1710982 4430 9630 7830 26900 10800 1730 1730
1350 3180 8480 7660 25800 10300 2030 1790 1770 2520 10200 9400 25200 9710 1950 1660
6 861 873 --- --- 7 855 875 --- --- 8 860 875 --- --- 9 866 869 --- --- 10 866 870 --- ---
4930 2220 17100 14100 25400 9250 1980 1540 7840 2150 19600 21100 24000 9190 2440 1600 2820 2060 19400 18800 23100 9170 5290 1650 3180 1800 --- 14900 24500 8640 8820 1610 3330 1490 --- 11400 26300 7890 8910 1450
11 856 872 --- --- 12 842 873 --- 625 13 838 882 --- 629 14 835 913 --- 63115 833 1410 --- 630
2640 1530 --- 10400 27600 6910 5760 1300 2480 1660 --- 10600 26500 6430 4110 1280 2530 1540 --- 10300 25700 6700 2760 13802660 1290 --- 9680 24400 5990 1560 1620 4230 1130 --- 10800 22800 5190 1210 3910
16 840 2550 --- --- 17 844 4200 --- --- 18 846 1840 --- --- 19 845 1040 --- --- 20 840 880 --- 633
8460 1070 --- 12200 22700 4780 1200 2970 6050 989 --- 14200 22300 4670 1210 2310 4760 923 --- 12500 22000 4650 1180 985 5640 955 6340 13300 22800 4490 1160 935--- 1020 5890 21100 23500 4020 1130 971
21 833 843 --- 634 22 828 857 --- 63323 829 795 --- 63424 831 768 --- 632 25 828 e743 --- 632
--- 986 5960 32000 23500 3560 1100 997--- 1320 6030 32000 23200 3250 1070 995--- 7250 6410 38100 21200 2870 1050 968--- 13600 9070 40700 19600 2520 1040 955--- 12000 13100 39100 17900 2250 1020 949
26 831 e731 --- 63527 834 e727 --- 74728 841 e720 --- 946 29 844 e720 --- 95230 844 e719 --- 80031 846 --- --- 792
--- 7570 10900 33400 16400 1970 1020 928--- 6000 12200 27900 14500 1780 1000 912--- 6310 13700 26200 13100 1640 983 889--- 7680 11700 26700 12200 1530 1720 892--- 9540 10500 28300 11500 1440 2140 928 --- 9490 --- 30200 --- 1390 2060 --
MEAN 850 1060 --- --- MAX 911 4200 --- --- MIN 828 719 --- ---
--- 4010 --- 19500 22400 5660 2310 1460--- 13600 --- 40700 29600 11200 8910 3910--- 923 --- 7660 11500 1390 983 889
e Estimated

---------------
---------------
---
---------------
---------------
------------------ ---
---------
---
--- --- ------ ---
---
---
------------
---
---------
186 ST. JOHNS RIVER BASIN BELOW OCKLAWAHA RIVER
301124081395901 ST. JOHNS RIVER AT BUCKMAN BRIDGE AT JACKSONVILLE, FL--Continued
TEMPERATURE, WATER, TOP (DEG. C), WATER YEAR OCTOBER 2001 TO SEPTEMBER 2002 DAILY MEAN VALUES
DAY OCT NOV DEC JAN FEB MAR APR MAY JUN JUL AUG SEP
1 23.0 19.2 e21.9 --- 14.2 24.0 27.0 27.2 28.9 30.4 30.5 2 23.0 19.8 e22.0 --- 14.7 24.0 27.1 27.9 29.1 30.0 30.1 3 23.1 20.3 e21.5 --- 15.2 23.9 27.4 28.6 29.3 30.0 30.0 4 23.5 20.5 e21.0 --- 14.8 23.8 27.9 29.3 29.5 29.8 29.9 5 23.7 20.3 --- --- 13.8 23.5 27.6 29.4 29.6 29.8 30.2
6 24.3 19.6 --- --- 13.8 23.1 27.0 29.4 29.9 29.9 29.9 7 24.3 19.6 --- --- 14.5 22.6 27.2 29.3 30.0 29.8 30.1 8 23.5 19.7 --- --- 15.1 22.4 27.7 29.1 30.0 29.1 29.8 9 23.1 19.5 --- --- 16.1 --- 27.8 28.8 29.9 28.4 29.6
10 23.0 19.7 --- --- 17.0 --- 28.1 28.5 29.8 28.3 29.4
11 23.1 19.8 --- --- 17.3 --- 28.1 28.4 30.0 28.3 29.2 12 23.4 19.8 --- 11.8 --- 18.0 --- 28.2 28.5 30.2 28.2 28.8 13 23.5 19.7 --- 12.1 --- 18.5 --- 28.2 28.9 29.9 28.1 28.2 14 23.7 19.4 --- 12.2 --- 19.1 --- 27.9 29.2 29.6 28.1 27.2 15 23.6 19.0 --- 12.5 --- 19.6 --- 27.2 e29.6 29.8 28.2 25.5
16 23.6 18.8 --- --- 20.3 --- 26.9 e29.1 30.3 28.5 24.4 17 e22.6 18.9 --- --- 21.3 --- 27.0 29.1 30.6 29.0 24.4 18 21.6 18.9 --- --- 21.8 --- 27.0 28.5 31.0 29.3 24.6 19 21.6 19.2 --- --- 22.3 26.1 26.0 28.1 31.2 29.7 25.2 20 22.0 19.4 --- --- 22.8 26.4 23.9 27.9 30.9 29.5 25.6
21 22.4 19.5 --- --- 22.9 26.8 23.3 27.2 30.3 29.5 26.3 22 22.8 19.6 --- --- 22.2 26.9 23.0 26.6 30.0 29.8 26.5 23 23.6 19.7 --- --- 21.1 26.6 22.9 26.5 29.7 30.1 26.7 24 24.0 20.1 --- --- 21.1 26.4 23.4 26.9 29.7 30.1 26.9 25 24.4 20.6 --- --- 21.5 26.4 24.2 27.2 29.9 30.2 27.1
26 23.7 e21.1 --- --- 22.2 26.5 24.8 27.5 29.8 30.1 26.5 27 21.9 e21.3 --- --- 22.6 26.8 25.0 27.6 30.2 29.8 26.2 28 20.0 e21.5 --- --- 22.4 26.8 25.4 28.1 30.3 29.7 26.0 29 18.9 e21.6 --- --- 22.7 26.8 25.9 28.7 30.5 30.2 25.1 30 18.7 e21.7 --- --- 23.2 26.9 26.4 28.8 30.5 30.9 23.7 31 18.8 --- --- --- 23.7 --- 26.8 30.6 30.9 --
MEAN 22.7 19.9 --- --- 19.2 --- 26.3 28.3 30.0 29.5 27.5 MAX 24.4 21.7 --- --- 23.7 --- 28.2 29.6 31.2 30.9 30.5 MIN 18.7 18.8 --- --- 13.8 --- 22.9 26.5 28.9 28.1 23.7
e Estimated
TEMPERATURE, WATER, MIDDLE (DEG. C), WATER YEAR OCTOBER 2001 TO SEPTEMBER 2002 DAILY MEAN VALUES
DAY OCT NOV DEC JAN FEB MAR APR MAY JUN JUL AUG SEP
1 23.0 19.2 e21.9 -- 19.3 14.3 23.8 27.0 27.0 28.9 30.3 30.4 2 22.7 19.7 e21.9 -- 19.6 14.6 24.0 27.1 27.5 28.9 30.0 30.0 3 22.8 20.2 e21.5 -- 19.0 15.1 24.0 27.4 28.2 29.2 30.0 29.9 4 23.1 20.5 e21.1 -- 18.4 14.9 23.8 27.7 29.0 29.4 29.8 29.8 5 23.5 20.3 -- 16.7 13.8 23.5 27.6 29.3 29.5 29.8 29.9
6 24.2 19.6 -- 16.2 13.8 23.2 26.9 29.4 29.8 29.9 29.9 7 24.3 19.4 -- 16.4 14.4 22.8 26.9 29.4 30.0 29.8 29.8 8 23.5 19.4 --- 15.6 e15.4 22.5 27.3 29.2 30.0 29.2 29.8 9 23.1 19.5 -- 15.7 e16.4 27.6 28.8 29.8 28.5 29.6 10 23.0 19.6 --- e16.5 e17.0 --- 27.9 28.6 29.7 28.3 29.4
11 23.1 19.8 --- 16.5 17.3 --- 28.1 28.5 29.8 28.3 29.2 12 23.3 19.8 --- 11.8 16.5 17.9 --- 28.2 28.5 30.0 28.2 28.8 13 23.5 19.7 --- 12.1 16.3 18.5 --- 28.2 28.8 29.9 28.1 28.2 14 23.7 19.4 --- e12.2 16.1 18.9 --- 27.8 29.1 29.6 28.1 27.2 15 23.6 19.0 --- e12.6 16.2 19.3 --- 27.3 29.3 29.7 28.2 25.5
16 23.6 18.8 --- 16.6 20.0 --- 26.9 29.4 30.2 28.4 24.3 17 22.5 18.8 --- 16.5 20.9 --- 27.0 29.2 30.6 29.0 24.3 18 21.6 18.9 --- 15.8 21.5 --- 27.0 28.6 30.9 29.2 24.5 19 21.5 19.1 --- 15.7 22.2 26.0 26.0 28.1 31.1 29.6 25.1 20 22.0 19.3 --- 14.5 --- 22.7 26.3 23.9 27.9 --- 29.5 25.5
21 22.3 19.5 --- 14.8 --- 22.9 26.7 23.8 27.3 --- 29.4 26.0 22 22.7 19.6 --- e15.1 --- 22.3 26.9 23.2 26.7 --- 29.5 26.4 23 23.3 19.7 --- 15.6 --- 21.1 26.7 23.0 26.5 --- 29.8 26.7 24 23.9 20.1 --- 16.3 --- 20.9 26.4 23.3 26.8 e29.7 30.0 26.8 25 24.4 e20.6 --- e16.7 --- 21.2 26.4 23.8 27.2 29.7 30.1 27.0
26 23.7 e21.2 --- e16.6 --- 22.0 26.4 24.4 27.5 29.7 30.0 26.6 27 22.0 e21.3 --- 16.7 --- 22.5 26.6 24.9 27.6 29.9 29.8 26.2 28 20.0 e21.5 --- 16.9 --- 22.4 26.8 25.4 28.0 30.0 29.6 26.0 29 18.9 e21.6 --- e17.4 --- 22.6 26.8 25.9 28.5 30.1 30.2 25.2 30 18.6 e21.9 --- e18.4 --- 23.1 26.8 26.4 28.7 30.4 30.9 23.7 31 18.8 --- --- 18.7 --- 23.6 --- 26.6 30.5 30.8 --
MEAN 22.6 19.9 --- --- 19.1 --- 26.3 28.3 --- 29.4 27.4 MAX 24.4 21.9 --- --- 23.6 --- 28.2 29.4 --- 30.9 30.4 MIN 18.6 18.8 --- --- 13.8 --- 23.0 26.5 --- 28.1 23.7
e Estimated

---
--- --- ---
------
---
------------
---
---------
--- --- ------ --- ------ --- ------ --- ------ --- ---
--- --- ------ --- ------ --- ------ --- --- ------ --- --- ---
--- --- --- --- --- --- --- --- --- --- --- --- --- --- --- --- --- --- --- ---
--- --- --- --- --- --- --- --- --- --- --- --- --- --- --- --- --- ---
--- --- --- --- --- --- --- --- --- --- --- --- --- --- ---
--- --- --- --- --- --- --- --- --- --- --- --- --- --- --- --- --- --- --- ---
--- --- --- ------ --- --- ------ --- --- ---
ST. JOHNS RIVER BASIN BELOW OCKLAWAHA RIVER 187
301124081395901 ST. JOHNS RIVER AT BUCKMAN BRIDGE AT JACKSONVILLE, FL--Continued
TEMPERATURE, WATER, BOTTOM (DEG. C), WATER YEAR OCTOBER 2001 TO SEPTEMBER 2002 DAILY MEAN VALUES
DAY OCT NOV DEC JAN FEB MAR APR MAY JUN JUL AUG SEP
1 23.0 19.2 e21.8 -- 19.3 14.3 23.8 27.0 26.8 28.9 30.3 30.4 2 22.6 19.7 e21.9 -- 19.6 14.6 24.0 27.1 27.3 28.9 30.0 30.0 3 22.7 20.2 e21.6 -- 19.0 15.1 23.9 27.3 28.0 29.2 30.0 29.9 4 23.1 20.5 e21.0 -- 18.4 14.9 23.8 27.7 28.8 29.4 29.8 29.8 5 23.4 20.3 -- 16.8 13.7 23.6 27.6 29.2 29.5 29.8 29.8
6 24.1 19.6 -- 16.2 13.8 23.2 26.9 29.3 29.7 29.9 29.8 7 24.3 19.4 -- 16.4 14.4 22.9 26.7 29.4 29.9 29.9 29.7 8 23.5 19.4 -- 15.6 15.1 22.6 27.0 29.2 30.0 29.2 29.8 9 23.1 19.5 --- 15.7 16.0 --- 27.5 28.8 29.8 28.8 29.6
10 23.0 19.6 --- 16.2 17.0 --- 27.8 28.6 29.7 28.4 29.4
11 23.1 19.7 --- 16.5 17.3 --- 28.0 28.5 29.8 28.3 29.2 12 23.3 19.8 --- 11.8 16.5 17.9 --- 28.2 28.5 30.0 28.3 28.8 13 23.5 19.7 --- 12.1 16.3 18.5 --- 28.2 28.7 29.9 28.1 28.2 14 23.7 19.4 --- 12.2 16.1 18.8 --- 27.7 29.0 29.6 28.1 27.2 15 23.6 19.0 --- 12.5 16.2 19.3 --- 27.3 29.2 29.7 28.2 25.5
16 23.6 18.8 --- 16.5 20.0 --- 26.9 29.4 30.1 28.4 24.3 17 22.5 18.8 --- 16.4 20.8 --- 27.0 29.2 30.5 28.9 24.3 18 21.6 18.9 --- 15.8 21.5 --- 27.0 28.6 30.9 29.2 24.5 19 21.5 19.0 --- 15.6 22.2 25.9 26.1 28.1 31.1 29.6 25.0 20 22.0 19.3 --- 14.4 --- 22.6 26.2 24.1 27.9 30.9 29.4 25.5
21 22.3 19.4 --- 14.8 --- 22.9 26.6 24.3 27.3 30.2 29.4 26.0 22 22.7 19.5 --- 15.1 --- 22.2 26.8 23.5 26.7 29.8 29.5 26.4 23 23.3 19.7 --- 15.6 --- 21.2 26.6 23.1 26.5 29.7 29.7 26.7 24 23.8 20.1 --- 16.3 --- 20.7 26.4 23.3 26.8 29.6 29.9 26.8 25 24.3 e20.6 --- 16.8 --- 20.9 26.3 23.7 27.2 29.7 30.0 27.0
26 23.7 e21.3 --- 16.7 --- 21.8 26.4 24.2 27.5 29.7 30.0 26.5 27 22.0 e21.3 --- 16.7 --- 22.5 26.6 24.8 27.6 29.9 29.7 26.2 28 20.1 e21.5 --- 16.9 --- 22.4 26.7 25.3 28.0 29.9 29.5 26.0 29 18.9 e21.5 --- 17.4 --- 22.6 26.7 25.9 28.5 30.1 30.2 25.2 30 18.6 e21.9 --- 18.0 --- 23.0 26.8 26.3 28.7 30.3 30.8 23.7 31 18.8 --- --- 18.7 --- 23.5 --- 26.5 30.5 30.8 --
MEAN 22.6 19.9 --- --- 19.1 --- 26.3 28.2 29.9 29.4 27.4 MAX 24.3 21.9 --- --- 23.5 --- 28.2 29.4 31.1 30.8 30.4 MIN 18.6 18.8 --- --- 13.7 --- 23.1 26.5 28.9 28.1 23.7
e Estimated
OXYGEN DISSOLVED, TOP (MG/L), WATER YEAR OCTOBER 2001 TO SEPTEMBER 2002 DAILY MEAN VALUES
DAY OCT NOV DEC JAN FEB MAR APR MAY JUN JUL AUG SEP
1 --- --- 9.5 7.2 7.8 6.8 7.5 6.8 6.2 2 --- --- 9.6 7.1 7.9 6.8 7.3 6.7 6.4 3 --- --- 9.6 7.1 7.8 6.8 7.2 6.7 6.6 4 --- --- 9.5 7.2 7.5 6.5 7.0 6.6 6.8 5 --- --- 9.8 7.2 7.1 6.2 6.7 6.6 6.8
6 --- --- 9.8 7.4 6.8 6.2 6.7 7.0 6.7 7 --- --- 9.8 7.4 6.6 6.1 6.7 6.9 6.7 8 --- --- 9.7 7.6 6.7 6.0 6.6 7.0 6.8 9 --- --- 9.5 6.8 6.2 6.4 6.9 6.8 10 -- -- 9.3 6.7 6.4 6.4 6.7 6.8
11 -- -- 9.2 6.5 6.5 6.9 6.9 6.6 12 -- -- 9.1 6.5 6.6 6.8 6.7 6.5 13 -- -- 8.9 6.5 6.6 6.4 6.5 6.4 14 -- -- 8.8 6.5 6.8 6.4 6.4 6.4 15 -- -- 8.6 6.5 --- 6.7 6.4 6.4
16 -- -- 8.4 6.8 --- 7.0 6.6 6.2 17 -- -- 8.4 6.7 7.0 6.8 7.0 5.9 18 -- -- 8.2 6.6 6.8 6.8 7.1 5.8 19 -- -- 8.1 7.4 6.6 6.3 6.7 7.3 5.7 20 -- -- 8.0 7.4 7.1 6.1 6.5 6.8 5.6
21 -- -- 7.9 7.3 7.3 6.2 6.4 6.6 5.7 22 -- -- 7.9 7.3 7.2 6.2 6.7 6.6 5.8 23 -- -- 8.0 7.3 7.1 6.3 6.8 6.6 5.9 24 -- -- 7.9 7.3 7.5 6.5 6.9 6.5 5.9 25 -- -- 7.8 7.5 7.8 6.6 7.0 6.5 6.2
26 -- -- 7.7 7.5 7.7 6.6 6.9 6.4 6.2 27 -- -- 7.5 7.3 7.3 6.7 6.9 6.4 6.6 28 -- -- 7.5 7.6 6.9 7.0 6.8 6.4 6.6 29 -- -- 7.4 7.9 6.9 7.3 6.9 6.2 6.5 30 -- -- 7.3 7.9 6.9 7.4 7.0 6.0 6.6 31 -- -- 7.2 6.9 --- 7.2 5.9
MEAN --- --- 8.6 7.0 --- 6.8 6.6 6.3 MAX --- --- 9.8 7.9 --- 7.5 7.3 6.8 MIN --- --- 7.2 6.5 --- 6.4 5.9 5.6

--- ------ ------ ------ ------ ---
--- ------ ------ ------ --- ------ --- --- ---
--- --- --- ------------
--- --- --- --- --- --- --- --- --- --- --- --- --- --- ---
--- --- --- --- --- --- --- --- --- --- --- --- --- --- --- --- --- --- ---
--- --- --- --- --- --- --- --- --- --- --- --- --- --- --- --- --- --- --- ---
--- --- --- --- ------ --- --- --- ------ --- --- --- ---
--- ------ ------ ------ ------ ---
--- ------ ------ ------ --- ------ --- ---
--- --- --- ------
--- --- --- --- --- ---
--- --- --- --- --- --- --- --- --- --- --- --- --- ---
--- --- --- --- --- --- --- --- --- --- --- --- --- --- ---
--- --- --- --- --- --- --- --- --- --- --- --- --- --- --- --- --- --- --- ---
--- --- --- ------ --- --- ------ --- --- ---
188 ST. JOHNS RIVER BASIN BELOW OCKLAWAHA RIVER
301124081395901 ST. JOHNS RIVER AT BUCKMAN BRIDGE AT JACKSONVILLE, FL--Continued
OXYGEN DISSOLVED, MIDDLE (MG/L), WATER YEAR OCTOBER 2001 TO SEPTEMBER 2002 DAILY MEAN VALUES
DAY OCT NOV DEC JAN FEB MAR APR MAY JUN JUL AUG SEP
1 --- --- 8.3 9.4 7.1 7.6 6.4 7.3 6.7 5.8 2 --- --- 8.2 9.5 7.0 7.7 6.3 7.1 6.6 5.8 3 --- --- 8.3 9.5 6.9 7.6 6.3 7.0 6.6 5.9 4 --- --- 8.4 9.4 7.0 7.3 6.0 6.9 6.4 5.9 5 --- --- 8.9 9.7 7.1 6.9 5.9 6.5 6.5 5.9
6 --- --- 9.1 9.8 7.0 6.5 5.7 6.5 6.9 5.8 7 --- --- 9.0 9.7 7.0 6.1 5.7 6.6 6.8 5.8 8 --- --- 9.2 --- 7.3 6.0 5.8 6.5 6.9 5.8 9 --- --- 9.2 --- 6.3 6.0 6.2 6.5 5.8 10 -- -- 9.2 6.4 6.2 6.2 6.3 5.8
11 -- --- 9.1 9.1 6.3 6.2 6.7 6.5 5.8 12 --- --- 10.2 9.0 9.0 --- 6.3 6.4 6.5 6.5 5.9 13 --- --- 10.1 9.0 8.9 --- 6.3 6.3 6.3 6.3 6.2 14 --- --- 10.0 9.1 8.7 --- 6.4 6.5 6.3 6.3 6.5 15 --- --- 10.0 9.2 8.6 --- 6.4 6.6 6.5 6.3 7.2
16 -- --- 8.9 8.4 6.5 6.7 6.7 6.5 7.6 17 -- --- 9.0 8.2 6.5 6.8 6.7 6.9 7.4 18 -- --- 9.3 8.1 6.5 6.6 6.6 6.9 7.0 19 -- --- 9.4 8.0 7.3 6.5 6.2 6.6 7.1 6.8 20 -- 9.6 7.9 7.3 6.9 6.0 6.7 6.8
21 -- 9.5 7.8 7.2 6.7 6.1 6.4 6.8 22 -- -- 7.8 7.2 6.9 6.2 6.2 6.6 23 -- 9.3 7.8 7.2 6.9 6.2 6.2 6.3 24 -- 9.1 7.5 7.2 6.6 6.4 6.3 5.7 25 -- -- 7.5 7.2 6.7 6.5 6.8 6.2 5.3
26 -- -- 7.5 7.2 6.8 6.5 6.7 6.3 5.0 27 -- 9.0 7.4 7.1 7.0 6.6 6.7 6.2 5.0 28 -- 8.8 7.4 7.3 6.8 6.9 6.6 6.1 5.0 29 -- -- 7.3 7.6 6.8 7.1 6.6 6.1 6.4 30 -- -- 7.2 7.6 6.7 7.2 6.8 5.8 8.1 31 -- 8.4 7.1 6.5 --- 7.0 5.8
MEAN --- --- --- 6.7 6.3 6.4 6.2 MAX --- --- --- 7.7 7.2 7.1 8.1 MIN --- --- --- 6.0 5.7 5.8 5.0
OXYGEN DISSOLVED, BOTTOM (MG/L), WATER YEAR OCTOBER 2001 TO SEPTEMBER 2002 DAILY MEAN VALUES
DAY OCT NOV DEC JAN FEB MAR APR MAY JUN JUL AUG SEP
1 --- --- 8.1 9.3 6.9 7.3 5.8 7.0 6.6 5.6 2 --- --- 8.0 9.4 6.8 7.4 5.7 6.8 6.5 5.6 3 --- --- 8.1 9.4 6.7 7.3 5.8 6.8 6.4 5.7 4 --- --- 8.2 9.4 6.8 7.0 5.7 6.6 6.1 5.7 5 --- --- 8.7 9.6 6.9 6.7 5.6 6.3 6.2 5.5
6 --- --- 8.8 9.7 6.6 6.1 5.5 6.3 6.6 5.5 7 --- --- 8.6 9.6 6.4 5.2 5.4 6.4 6.7 5.4 8 --- --- 9.1 9.5 6.6 5.2 5.5 6.3 6.4 5.5 9 --- --- 9.1 9.3 5.6 5.8 6.1 5.7 5.5 10 -- --- 9.0 9.1 6.1 5.8 6.1 5.7 5.5
11 -- --- 8.9 9.0 6.1 5.7 6.5 6.2 5.5 12 --- --- 10.2 8.9 8.9 --- 6.1 6.0 6.4 6.3 5.7 13 --- --- 10.0 8.8 8.7 --- 6.2 6.0 6.1 6.2 6.0 14 -- 9.9 8.9 8.6 6.2 6.1 6.2 6.1 6.4 15 -- 9.9 9.0 8.5 6.2 6.3 6.3 6.2 6.9
16 -- --- 8.6 8.2 6.3 6.5 6.5 6.4 7.3 17 -- --- 8.7 8.0 6.1 6.5 6.5 6.7 7.1 18 -- --- 9.1 7.9 6.1 6.3 6.5 6.7 6.8 19 -- --- 9.2 7.8 7.1 6.3 6.0 6.4 6.8 6.6 20 -- 9.4 7.8 7.1 6.5 5.8 6.3 6.5 6.7
21 -- 9.3 7.7 7.0 5.8 6.0 6.2 6.2 6.7 22 -- 9.2 7.7 7.0 6.3 6.1 6.4 6.0 6.5 23 -- 9.1 7.5 7.0 6.5 6.0 6.6 5.7 6.1 24 -- 9.0 7.1 6.9 6.2 6.2 6.6 5.8 5.6 25 -- 8.9 7.1 6.5 6.2 6.4 6.7 5.7 5.0
26 -- 8.9 7.2 6.9 6.4 6.4 6.6 5.8 4.8 27 -- 8.8 7.3 6.8 6.6 6.4 6.5 5.7 4.8 28 -- 8.7 7.2 6.9 6.5 6.7 6.4 5.7 4.8 29 -- 8.5 7.1 7.2 6.5 6.9 6.4 5.9 6.2 30 -- 8.4 7.0 7.3 6.4 7.0 6.6 5.5 8.0 31 -- 8.2 6.9 6.1 --- 6.8 5.5
MEAN --- --- 8.3 6.3 6.1 6.5 6.1 6.0 MAX --- --- 9.7 7.4 7.0 7.0 6.8 8.0 MIN --- --- 6.9 5.2 5.4 6.1 5.5 4.8

189 ST. JOHNS RIVER BASIN BELOW OCKLAWAHA RIVER
02246300 ORTEGA RIVER AT JACKSONVILLE, FL
LOCATION.--Lat 30° 14'50", long 81° 47'49", in NW1⁄ 4 sec.15, T.3 S., R.25 E., Duval County, Hydrologic Unit 03080103, near center of span on downstream side of bridge on 103rd Street in Jacksonville, 15 mi upstream from mouth.
DRAINAGE AREA.--30.9 mi2.
PERIOD OF RECORD.--Water years 1928, 1956, 1958-60 (low-flow measurements only); January 1965 to July 1983, July 1984 to current year. Prior to October 1971, published as "near Jacksonville".
REVISED RECORDS.--WDR FL-75-1: Drainage area.
GAGE.--Water-stage recorder. Datum of gage is 0.02 ft above NGVD of 1929. Prior to Jan. 21, 1965, nonrecording gage at same site and datum.
REMARKS.--Records poor.
DISCHARGE, CUBIC FEET PER SECOND, WATER YEAR OCTOBER 2001 TO SEPTEMBER 2002DAILY MEAN VALUES
DAY OCT NOV DEC JAN FEB MAR APR MAY JUN JUL AUG SEP
1 e30 e6.2 e5.0 9.2 2 e23 e6.5 e5.0 11 3 e20 e6.7 e5.0 13 4 e19 e7.0 e5.0 13 5 e17 e6.5 e6.8 12
24 12 e8.0 2.7 0.40 17 46 31 24 16 e13 1.6 0.21 14 48 30 22 55 21 1.3 0.10 11 72 31 20 169 23 1.3 0.04 9.2 90 24 18 159 19 1.2 0.09 9.1 60 19
6 e16 e6.8 6.4 127 e16 e6.6 5.9 128 e15 e6.0 5.9 11 9 e15 e6.0 7.6 1010 e14 e6.0 49 12
17 119 15 1.3 0.30 11 34 1616 78 14 1.1 5.2 8.3 25 14 18 48 11 0.99 13 7.5 21 11 19 33 10 1.0 5.7 12 17 10 18 28 9.4 0.90 2.2 22 15 9.2
11 e14 e5.6 92 1212 e14 e5.5 59 1013 e13 e6.0 36 1114 e14 e30 28 2715 e13 e33 25 115
18 24 11 0.89 1.9 18 13 7.6 17 22 12 0.51 1.4 13 11 13 16 24 14 0.16 1.1 13 16 47 15 24 15 0.32 1.5 12 21 105 15 23 16 0.32 0.54 9.6 22 229
16 11 e21 22 124 17 9.8 e19 19 9118 9.3 e17 19 6119 8.7 e15 19 4020 8.5 e13 16 30
15 21 13 0.23 0.34 8.0 29 40814 19 12 0.26 1.4 6.2 26 33613 17 11 0.28 3.9 6.6 22 18813 18 9.4 0.58 3.0 10 30 11412 16 7.6 0.55 6.7 16 36 70
21 8.4 e12 14 3222 8.3 e10 13 5423 8.3 e9.5 12 7024 8.0 e9.0 12 5725 7.8 e8.0 13 43
11 17 6.3 0.37 23 19 37 41 11 17 5.3 0.26 54 19 28 31 12 15 4.6 0.21 54 30 19 22 17 13 4.3 0.19 30 29 15 57 18 12 4.0 0.20 19 98 12 277
26 6.9 e8.0 13 4327 6.2 e7.0 11 4028 5.9 e6.0 11 33 29 5.5 e6.0 10 31 30 e5.6 e5.2 10 29 31 e6.0 --- 9.6 27
16 12 3.5 0.19 38 167 9.3 249 14 e9.5 3.5 0.19 48 199 7.8 e200 13 e8.5 3.4 0.20 27 235 9.7 e132 --- e8.0 2.9 0.19 21 169 16 70 --- e8.0 2.9 0.22 21 e114 19 43 --- e8.0 --- 0.34 --- e67 24 --
TOTAL 377.2 310.1 565.2 1095.2MEAN 12.2 10.3 18.2 35.3 MAX 30 33 92 124 MIN 5.5 5.2 5.0 9.2CFSM 0.39 0.33 0.59 1.14 IN. 0.45 0.37 0.68 1.32
456 1053.0 305.1 20.05 384.02 1379.5 850.8 2834.816.3 34.0 10.2 0.65 12.8 44.5 27.4 94.5 24 169 23 2.7 54 235 90 408 11 8.0 2.9 0.16 0.04 6.2 7.8 7.60.53 1.10 0.33 0.02 0.41 1.44 0.89 3.06 0.55 1.27 0.37 0.02 0.46 1.66 1.02 3.41
STATISTICS OF MONTHLY MEAN DATA FOR WATER YEARS 1965 - 2002, BY WATER YEAR (WY)
MEAN 52.1 18.7 23.5 35.3 MAX 382 123 157 101 (WY) 1997 1970 1998 1994 MIN 1.52 1.45 2.36 2.31(WY) 1981 1991 1981 1981
57.9 46.8 26.6 16.8 34.4 36.5 49.3 73.9366 151 170 122 167 198 220 3781998 1970 1973 1979 1991 1991 1968 2001 6.35 7.97 1.96 0.65 0.89 0.98 3.41 1.221981 1985 1977 2002 2000 1977 2000 1990
SUMMARY STATISTICS FOR 2001 CALENDAR YEAR FOR 2002 WATER YEAR WATER YEARS 1965 - 2002
ANNUAL TOTAL 16510.65ANNUAL MEAN 45.2 HIGHEST ANNUAL MEAN LOWEST ANNUAL MEAN HIGHEST DAILY MEAN 1800 LOWEST DAILY MEAN 0.33 ANNUAL SEVEN-DAY MINIMUM 0.46MAXIMUM PEAK FLOW MAXIMUM PEAK STAGEANNUAL RUNOFF (CFSM) 1.46ANNUAL RUNOFF (INCHES) 19.8810 PERCENT EXCEEDS 5150 PERCENT EXCEEDS 1390 PERCENT EXCEEDS 5.5
9630.9726.4 39.0
69.8 19959.85 1981
Sep 15 408 Sep 16 3570 Oct 8 1996 May 27 0.04 Jun 4 0.00 Jun 8-11 1985 May 21 0.20 May 23 0.02 Jun 5 1985
442 Sep 16 4640 Oct 7 1996 36.03 Sep 16 40.37 Oct 7 1996 0.85 1.2611.59 17.1654 8913 12 1.3 2.2
e Estimated

--- --- --- --- --- --- --- --- --- --- --- --- --- --- --- --- --- --- --- ---
--- --- --- --- --- --- --- --- --- --- --- --- --- --- --- --- --- --- --- ---
--- --- --- --- --- --- --- --- --- --- --- --- --- --- --- --- --- --- --- ---
--- --- --- --- --- --- --- --- --- --- --- --- --- --- --- --- --- --- --- ---
--- --- --- --- --- --- --- --- --- --- --- --- --- --- ---
--- --- --- --- --- --- --- --- --- --- --- --- --- --- --- --- --- ---
--- --- --- --- --- --- --- --- --- --- --- ---
--- --- --- --- --- --- --- --- --- --- --- --- --- --- --- --- --- --- --- ---
190 ST. JOHNS RIVER BASIN BELOW OCKLAWAHA RIVER
02246318 ORTEGA RIVER AT KIRWIN ROAD NEAR JACKSONVILLE, FL
LOCATION.--Lat 30° 11'46", long 81° 46'07", in SE1⁄ 4 sec.35, T.3 S., R.25 E., Duval County, Hydrologic Unit 03080103, near left bank on upstream side of bridge on Kirwin Road (abandoned), 75 ft upstream from Argyle Forest Boulevard, 1.8 mi west of intersection of Interstate Highway 295 and State Highway 21, 11 mi upstream from mouth, and 11.5 mi southwest of Jacksonville.
DRAINAGE AREA.--45.5 mi2.
PERIOD OF RECORD.--February 1982 to May 1985 (miscellaneous discharge measurements), March to September 2002.
GAGE.--Water-stage recorder. Datum of gage is at NGVD of 1929 (levels by De Grove Surveyors, Inc., from St. Johns River Water Management District bench mark).
REMARKS.--Records fair.
DISCHARGE, CUBIC FEET PER SECOND, PERIOD MARCH TO SEPTEMBER 2002DAILY MEAN VALUES
DAY OCT NOV DEC JAN FEB MAR APR MAY JUN JUL AUG SEP
1 -- -- 19 8.5 8.6 43 94 69 2 -- -- 18 8.1 6.0 33 112 68 3 -- -- 30 7.5 4.2 26 98 67 4 -- -- 50 7.1 3.5 26 123 62 5 -- -- 40 7.0 3.3 21 136 54
6 -- -- 30 7.1 3.9 20 90 44 7 -- -- 25 6.7 14 18 67 37 8 -- -- 22 6.4 30 16 55 30 9 -- -- 19 6.1 23 32 45 30
10 -- -- 30 6.3 17 52 40 26
11 -- -- 49 5.8 19 43 34 22 12 -- -- 35 5.3 14 30 30 29 13 -- -- 40 5.2 18 22 32 126 14 -- -- 44 5.8 25 24 67 126 15 -- -- 97 5.5 12 25 61 274
16 -- -- 50 5.3 8.3 17 75 414 17 -- -- 38 5.3 6.7 13 67 399 18 -- -- 31 6.6 12 12 55 278 19 -- -- 27 8.7 11 18 61 177 20 -- -- 23 8.3 16 62 68 128
21 -- -- 40 19 6.6 32 74 75 94 22 -- -- 47 17 5.5 74 52 67 72 23 -- -- 37 15 5.0 88 87 52 58 24 -- -- 31 13 4.7 72 70 39 71 25 -- -- 28 13 4.6 54 78 32 273
26 -- -- 26 11 4.4 57 186 27 318 27 -- -- 31 11 4.3 101 403 23 247 28 -- -- 26 10 4.4 78 295 23 173 29 -- -- 23 9.7 4.8 56 325 36 125 30 -- -- 21 9.0 4.2 55 187 51 95 31 --- --- 20 --- 3.8 --- 127 59 --
TOTAL -- -- 330 844.7 184.9 922.5 2437 1894 3986 MEAN -- -- 30.0 28.2 5.96 30.8 78.6 61.1 133 MAX -- -- 47 97 8.7 101 403 136 414 MIN -- -- 20 9.0 3.8 3.3 12 23 22
STATISTICS OF MONTHLY MEAN DATA FOR WATER YEARS 2002 - 2002, BY WATER YEAR (WY)
MEAN -- --- 28.2 5.96 30.8 78.6 61.1 133 MAX -- --- 28.2 5.96 30.8 78.6 61.1 133 (WY) -- -- 2002 2002 2002 2002 2002 2002 MIN -- --- 28.2 5.96 30.8 78.6 61.1 133 (WY) -- -- 2002 2002 2002 2002 2002 2002
SUMMARY STATISTICS #FOR 2002 WATER YEAR
HIGHEST DAILY MEAN 414 Sep 16 LOWEST DAILY MEAN 3.3 Jun 5 ANNUAL SEVEN-DAY MINIMUM 4.4 May 25 MAXIMUM PEAK FLOW 539 Jul 27 MAXIMUM PEAK STAGE 10.76 Jul 27 INSTANTANEOUS LOW FLOW 3.0 Jun 5,6
# Includes partial year of record

191 ST. JOHNS RIVER BASIN BELOW OCKLAWAHA RIVER
02246435 FISHING CREEK AT WESCONNET BLVD. AT JACKSONVILLE, FL
LOCATION.--Lat 30° 14'10", long 81° 44'22", in SE1⁄ 4 sec.18, T.3 S., R.26 E., Duval County, Hydrologic Unit 03080103, at upstream side of culvert on Wesconnet Boulevard, 2.7 miles upstream from mouth.
DRAINAGE AREA.--0.76 mi2, revised.
GAGE.--Non-recording gage. Datum of gage is undetermined.
PERIOD OF RECORD.--February 2000 to September 2002 (discontinued).
WATER-QUALITY DATA, WATER YEAR OCTOBER 2001 TO SEPTEMBER 2002
DIS SPE PH PH NITRO NITRO NITRO NITRO CHARGE, SPE CIFIC WATER WATER GEN, GEN, GEN,AM- GEN, INST. CIFIC CON WHOLE WHOLE AMMONIA NITRITE MONIA + NO2+NO3 PHOS CUBIC CON DUCT FIELD LAB TEMPER OXYGEN, DIS DIS ORGANIC DIS PHORUS FEET DUCT- ANCE (STAND (STAND- ATURE DIS SOLVED SOLVED TOTAL SOLVED TOTAL
Date Time PER ANCE LAB ARD ARD WATER SOLVED (MG/L (MG/L (MG/L (MG/L (MG/L SECOND (US/CM) (US/CM) UNITS) UNITS) (DEG C) (MG/L) AS N) AS N) AS N) AS N) AS P)
(00061) (00095) (90095) (00400) (00403) (00010) (00300) (00608) (00613) (00625) (00631) (00665)
NOV 06... 0900 .14 257 - 6.4 -- 15.8 3.7 .07 <.010 E.80 <.02 E.13 FEB 26... 0845 .29 281 286 7.6 7.4 14.1 5.5 .02 <.010 .90 <.02 .07 SEP 25... 0815 12 131 - 7.0 -- 24.0 5.0 .02 <.010 1.5 .11 .09
ORTHO PHOS- HARD- MAGNE PHATE, NESS CALCIUM SIUM, SODIUM, DIS- TOTAL DIS- DIS- DIS- SOLVED (MG/L SOLVED SOLVED SOLVED
Date (MG/L AS (MG/L (MG/L (MG/L AS P) CACO3) AS CA) AS MG) AS NA)(00671) (00900) (00915) (00925) (00930)
ANC POTAS- UNFLTRD CHLO- FLUO- SILICA, MANGASIUM, TIT 4.5 SULFATE RIDE, RIDE, DIS- IRON, NESE,DIS- LAB DIS- DIS- DIS- SOLVED DIS- DIS-SOLVED (MG/L SOLVED SOLVED SOLVED (MG/L SOLVED SOLVED (MG/L AS (MG/L (MG/L (MG/L AS (UG/L (UG/L AS K) CACO3) AS SO4) AS CL) AS F) SIO2) AS FE) AS MN)(00935) (90410) (00945) (00940) (00950) (00955) (01046) (01056)
NOV 06... .10 -- -- -- -- -- -- -- -- -- -- -- -FEB 26... .04 110 33.0 6.10 13.0 3.50 76 23.0 25.0 <.1 6.50 356SEP 25... .05 -- -- -- -- -- -- -- -- -- -- -- -
< -- Less thanE -- Estimated value
11

192 ST. JOHNS RIVER BASIN BELOW OCKLAWAHA RIVER
02246437 FISHING CREEK AT 110th STREET AT JACKSONVILLE, FL
LOCATION.--Lat 30° 14'27", long 81° 43'54", in NE1⁄ 4 sec.18, T.3 S., R.26 E., Duval County, Hydrologic Unit 03080103, at downstream side of bridge on 110th Street, 1.9 miles upstream from mouth.
DRAINAGE AREA.--1.27 mi2, revised.
GAGE.--Non-recording gage. Datum of gage is undetermined.
PERIOD OF RECORD.--February 2000 to September 2002 (discontinued).
WATER-QUALITY DATA, WATER YEAR OCTOBER 2001 TO SEPTEMBER 2002
DIS SPE PH PH NITRO NITRO NITRO NITRO CHARGE, SPE CIFIC WATER WATER GEN, GEN, GEN,AM- GEN, INST. CIFIC CON WHOLE WHOLE AMMONIA NITRITE MONIA + NO2+NO3 PHOS CUBIC CON DUCT FIELD LAB TEMPER OXYGEN, DIS DIS ORGANIC DIS PHORUS FEET DUCT- ANCE (STAND (STAND- ATURE DIS SOLVED SOLVED TOTAL SOLVED TOTAL
Date Time PER ANCE LAB ARD ARD WATER SOLVED (MG/L (MG/L (MG/L (MG/L (MG/L SECOND (US/CM) (US/CM) UNITS) UNITS) (DEG C) (MG/L) AS N) AS N) AS N) AS N) AS P)
(00061) (00095) (90095) (00400) (00403) (00010) (00300) (00608) (00613) (00625) (00631) (00665)
NOV 06... 1030 .33 262 - 7.0 -- 16.1 4.5 .05 <.010 E.70 .03 E.09 FEB 26... 0945 .90 397 396 7.5 7.5 14.1 6.6 .13 .020 1.0 .18 .10 AUG 12... 1000 .28 280 291 7.4 7.4 23.8 4.7 .06 .010 1.0 .14 .13 SEP 25... 0915 15 152 - 7.0 -- 24.2 5.8 .04 .010 1.6 .13 .10
ORTHO PHOS- HARD- MAGNE PHATE, NESS CALCIUM SIUM, SODIUM, DIS- TOTAL DIS- DIS- DIS- SOLVED (MG/L SOLVED SOLVED SOLVED
Date (MG/L AS (MG/L (MG/L (MG/L AS P) CACO3) AS CA) AS MG) AS NA)(00671) (00900) (00915) (00925) (00930)
ANC POTAS- UNFLTRD CHLO- FLUO- SILICA, MANGASIUM, TIT 4.5 SULFATE RIDE, RIDE, DIS- IRON, NESE,DIS- LAB DIS- DIS- DIS- SOLVED DIS- DIS-SOLVED (MG/L SOLVED SOLVED SOLVED (MG/L SOLVED SOLVED (MG/L AS (MG/L (MG/L (MG/L AS (UG/L (UG/L AS K) CACO3) AS SO4) AS CL) AS F) SIO2) AS FE) AS MN)(00935) (90410) (00945) (00940) (00950) (00955) (01046) (01056)
NOV 06... .03 -- -- -- -- -- -- -- -- -- -- -- -FEB 26... .02 150 49.0 6.00 19.0 3.20 123 26.0 32.0 .1 10.0 324 23AUG 12... .04 120 38.0 5.70 12.0 3.50 105 11.0 20.0 .2 14.0 360 21SEP 25... .06 -- -- -- -- -- -- -- -- -- -- -- -
< -- Less thanE -- Estimated value

193 ST. JOHNS RIVER BASIN BELOW OCKLAWAHA RIVER
02246465 SOUTH BRANCH BIG FISHWEIR CREEK AT CASSAT AVE. AT JACKSONVILLE, FL
LOCATION.--Lat 30° 17'35", long 81° 43'51", in SW1⁄ 4 sec.29, T.2 S., R.26 E., Duval County, Hydrologic Unit 03080103, at upstream side of culvert on Cassat Avenue, 0.7 miles upstream from North Branch Big Fishweir Creek, 1.8 miles upstream from mouth.
DRAINAGE AREA.--0.43 mi2, revised.
GAGE.--Non-recording gage. Datum of gage is undetermined.
PERIOD OF RECORD.--February 2000 to September 2002 (discontinued).
WATER-QUALITY DATA, WATER YEAR OCTOBER 2001 TO SEPTEMBER 2002
DIS SPE PH PH NITRO NITRO NITRO NITRO CHARGE, SPE CIFIC WATER WATER GEN, GEN, GEN,AM- GEN, INST. CIFIC CON WHOLE WHOLE AMMONIA NITRITE MONIA + NO2+NO3 PHOS CUBIC CON DUCT FIELD LAB TEMPER OXYGEN, DIS DIS ORGANIC DIS PHORUS FEET DUCT- ANCE (STAND (STAND- ATURE DIS SOLVED SOLVED TOTAL SOLVED TOTAL
Date Time PER ANCE LAB ARD ARD WATER SOLVED (MG/L (MG/L (MG/L (MG/L (MG/L SECOND (US/CM) (US/CM) UNITS) UNITS) (DEG C) (MG/L) AS N) AS N) AS N) AS N) AS P)
(00061) (00095) (90095) (00400) (00403) (00010) (00300) (00608) (00613) (00625) (00631) (00665)
NOV 07... 1015 .07 559 - 6.8 -- 15.3 3.7 .06 <.010 E.40 .05 E.16 FEB 26... 1030 .20 603 610 7.2 7.6 15.5 6.5 .04 <.010 .60 .08 .15 MAY 07... 0930 .08 584 - 6.9 -- 21.7 2.1 .14 <.010 .60 .04 .16 AUG 12... 1200 .11 604 598 7.1 7.6 24.8 4.9 .06 .010 .80 .11 .22
ORTHO PHOS- HARD- MAGNE PHATE, NESS CALCIUM SIUM, SODIUM, DIS- TOTAL DIS- DIS- DIS- SOLVED (MG/L SOLVED SOLVED SOLVED
Date (MG/L AS (MG/L (MG/L (MG/L AS P) CACO3) AS CA) AS MG) AS NA)(00671) (00900) (00915) (00925) (00930)
ANC POTAS- UNFLTRD CHLO- FLUO- SILICA, MANGASIUM, TIT 4.5 SULFATE RIDE, RIDE, DIS- IRON, NESE,DIS- LAB DIS- DIS- DIS- SOLVED DIS- DIS-SOLVED (MG/L SOLVED SOLVED SOLVED (MG/L SOLVED SOLVED (MG/L AS (MG/L (MG/L (MG/L AS (UG/L (UG/L AS K) CACO3) AS SO4) AS CL) AS F) SIO2) AS FE) AS MN)(00935) (90410) (00945) (00940) (00950) (00955) (01046) (01056)
NOV 07... E.02 -- -- -- -- -- -- -- -- -- -- -- -FEB 26... .04 240 79.0 10.0 31.0 2.80 185 71.0 42.0 .2 17.0 117 52MAY 07... .08 -- -- -- -- -- -- -- -- -- -- -- -AUG 12... .05 250 84.0 9.40 27.0 3.30 204 56.0 37.0 .2 22.0 28 56
< -- Less thanE -- Estimated value

194 ST. JOHNS RIVER BASIN BELOW OCKLAWAHA RIVER
02246467 SOUTH BRANCH BIG FISHWEIR CREEK AT BLANDING BLVD. AT JACKSONVILLE, FL
LOCATION.--Lat 30° 17'35", long 81° 43'27", in SE1⁄ 4 sec.29, T.2 S., R.26 E., Duval County, Hydrologic Unit 03080103, at upstream side of culvert on Blanding Blvd., 0.2 miles upstream from North Branch Big Fishweir Creek, 1.8 miles upstream from mouth.
DRAINAGE AREA.--0.67 mi2, revised.
GAGE.--Non-recording gage. Datum of gage is undetermined.
PERIOD OF RECORD.--February 2000 to September 2002 (discontinued).
WATER-QUALITY DATA, WATER YEAR OCTOBER 2001 TO SEPTEMBER 2002
DIS SPE PH PH NITRO NITRO NITRO NITRO CHARGE, SPE CIFIC WATER WATER GEN, GEN, GEN,AM- GEN, INST. CIFIC CON WHOLE WHOLE AMMONIA NITRITE MONIA + NO2+NO3 PHOS CUBIC CON DUCT FIELD LAB TEMPER OXYGEN, DIS DIS ORGANIC DIS PHORUS FEET DUCT- ANCE (STAND (STAND- ATURE DIS SOLVED SOLVED TOTAL SOLVED TOTAL
Date Time PER ANCE LAB ARD ARD WATER SOLVED (MG/L (MG/L (MG/L (MG/L (MG/L SECOND (US/CM) (US/CM) UNITS) UNITS) (DEG C) (MG/L) AS N) AS N) AS N) AS N) AS P)
(00061) (00095) (90095) (00400) (00403) (00010) (00300) (00608) (00613) (00625) (00631) (00665)
NOV 07... 0915 .20 559 - 6.8 -- 15.5 3.7 .13 .020 E.70 E1.00 E.17 FEB 26... 1100 .76 574 580 7.5 7.6 15.1 6.0 .15 .030 .60 .70 .13 MAY 07... 1045 .12 587 - 7.0 -- 21.8 3.5 .15 .040 .90 .77 .16
ORTHO PHOS- HARD- MAGNE PHATE, NESS CALCIUM SIUM, SODIUM, DIS- TOTAL DIS- DIS- DIS- SOLVED (MG/L SOLVED SOLVED SOLVED
Date (MG/L AS (MG/L (MG/L (MG/L AS P) CACO3) AS CA) AS MG) AS NA)(00671) (00900) (00915) (00925) (00930)
ANC POTAS- UNFLTRD CHLO- FLUO- SILICA, MANGASIUM, TIT 4.5 SULFATE RIDE, RIDE, DIS- IRON, NESE,DIS- LAB DIS- DIS- DIS- SOLVED DIS- DIS-SOLVED (MG/L SOLVED SOLVED SOLVED (MG/L SOLVED SOLVED (MG/L AS (MG/L (MG/L (MG/L AS (UG/L (UG/L AS K) CACO3) AS SO4) AS CL) AS F) SIO2) AS FE) AS MN)(00935) (90410) (00945) (00940) (00950) (00955) (01046) (01056)
NOV 07... .12 -- -- -- -- -- -- -- -- -- -- -- -FEB 26... .06 230 75.0 10.0 27.0 3.00 182 67.0 35.0 .2 13.0 49MAY 07... .16 -- -- -- -- -- -- -- -- -- -- -- -
< -- Less thanE -- Estimated value
53

195 ST. JOHNS RIVER BASIN BELOW OCKLAWAHA RIVER
02246500 ST. JOHNS RIVER AT JACKSONVILLE, FL
LOCATION.--Lat 30° 19'20", long 81° 39'56", in land grant 44, T.2 S., R.26 E., Duval County, Hydrologic Unit 03080103, near center of channel under the Acosta Bridge at Jacksonville, 2.6 mi upstream from Arlington River, and 23.0 mi upstream from mouth.
DRAINAGE AREA.--8,850 mi2, includes Paynes Prairie, a diked sinkhole area of about 650 mi2, which is noncontributing except for pumpage.
WATER-DISCHARGE RECORDS
PERIOD OF RECORD.--February 1954 to September 1970 (volume of flow), October 1970 to September 1971 (gage heights only) October 1971 to September 1974, October 1974 to September 1980 (gage heights only), October 1980 to September 1981, October 1981 to June 1987 (gage heights only), July 1987 to September 1993, October 1993 to July 1996 (gage heights only), August 1996 to current year.
REVISED RECORDS.--WDR FL-92-1A: Drainage area.
GAGE.--Water-stage recorder and acoustic velocity meter. Datum of gage is 9.99 ft below NGVD of 1929. Apr. 13, 1966 to Sept. 30, 1971, at site 0.6 mi downstream at same datum. October 1971 to September 1986, water-stage and deflection meter recorder at site 200 ft upstream at same datum. October 1986 to July 1996, water-stage recorder 0.3 mi downstream at same datum. July 24,1984 to Mar. 13, 1996, auxiliary water-stage recorder about 5.4 mi downstream.
REMARKS.--Records fair. Discharge not published for some days, due to missing gage height record. Discharge represents the net of much larger upstream and downstream discharges. The stage record published is the maximum and minimum tide event for each calendar day.
DISCHARGE, CUBIC FEET PER SECOND, WATER YEAR OCTOBER 2001 TO SEPTEMBER 2002DAILY MEAN VALUES
DAY OCT NOV DEC JAN FEB MAR APR MAY JUN JUL AUG SEP
1 --- --- --- 10200 2 --- --- --- -11700 3 --- --- --- 18000 4 5590 --- --- 18500 5 --- --- 15600 10100
16300 7040 7230 11700 11100 -7730 -9900 -2470 3390 16400 3170 18600 7700 -1530 -10300 -3280-5000 30700 11400 14900 -5600 1880 -6370 -91107350 21700 -8460 -14000 -17300 4090 6220 -1590
-20700 7090 -33400 -35800 -5700 4260 970 26900
6 --- --- 17200 37600 7 --- --- 15100 18200 8 --- --- 6190 458 9 4600 --- 8970 9400
10 --- --- -11300 14500
1310 486 -8630 -14500 2830 -3400 -4890 22900 20500 -1470 207 1070 5490 -6920 -23300 4090 675 2130 10200 1670 -25900 2040 -7610 8280
-7550 7210 17800 6070 -15300 14500 10300 178007540 9770 10400 3750 -8270 22000 16400 26700
11 --- --- 10000 12100 12 --- --- 8760 694 13 --- --- 12500 1300 14 --- --- 24000 355 15 --- --- 20900 14800
14000 -7980 -7040 -1800 7420 24000 23300 327009830 -78 2310 -4160 12000 -3420 26800 200008570 16100 9060 18100 14900 10700 30800 11000
-9270 18300 8900 -978 21300 22600 24600 26000 -5540 16700 14500 -7230 11100 16800 19200 32300
16 --- --- 5550 14600 17 --- --- 20400 11700 18 --- --- 28200 20400 19 --- --- 13900 18100 20 --- --- 9110 8200
16300 18000 12600 3410 5510 -105 20100 26200 18400 18000 10400 14200 2280 -3180 20300 16700-10900 8580 13300 16200 -4760 -6090 19500 3670 17200 840 11200 -58400 -9050 3800 16000 6410 14600 4820 7490 -35700 -6550 9790 16500 8250
21 --- --- 639 3020 10600 7190 -11100 -20500 -14800 5740 18400 7520 22 --- --- 310 -3470 -6680 -30900 -7290 -55100 18600 6530 14900 4270 23 --- --- 4590 748 -27100 -10100 -25600 -17200 23600 16700 14800 9370 24 --- --- 16000 8590 -15600 461 -16000 8100 27300 16700 23800 11200 25 17900 --- -7050 3890 4780 1630 2990 13900 24000 21000 12500 19700
26 2340 --- 11100 -26000 27 -854 --- 15400 4550 28 --- --- 2730 11300 29 --- --- 5490 15300 30 --- --- 5830 15500 31 --- --- 7560 13700
11200 741 -11200 9770 31100 21600 14300 34700 18300 1980 -5910 3530 33000 17000 19800 440009510 -6730 21800 -1740 27500 19900 15300 16100 --- -450 21900 -11600 14500 18400 14100 4430 --- 11000 2390 -638 8980 15400 9830 -24500 --- 11700 --- 8830 --- 8240 -2240 --
TOTAL 29576 --- 267679 274635 102015 180860MEAN 5915 --- 9914 8859 3643 5834MAX 17900 --- 28200 37600 20500 30700 MIN -854 --- -11300 -26000 -27100 -30900
64617 -125546 196980 271295 344110 4002402154 -4050 6566 8751 11100 13340
21900 18600 33000 24000 30800 44000-33400 -58400 -25900 -7730 -23300 -24500
STATISTICS OF MONTHLY MEAN DATA FOR WATER YEARS 1972 - 2002, BY WATER YEAR (WY)
MEAN 10930 8457 8499 7366MAX 20260 18700 19680 19960 (WY) 1992 1992 1998 1992MIN 1667 266 -3475 -4023 (WY) 1973 1974 1993 1974
7452 5835 6787 4337 8505 8503 8872 9257 24320 23660 16550 19210 22490 28730 25520 178001998 1998 1992 1993 1993 1993 1974 1992
-1814 -4920 -1826 -10430 -8294 1030 874 -12081974 1974 1974 1973 1973 1997 2000 1981
SUMMARY STATISTICS FOR 2001 CALENDAR YEAR FOR 2002 WATER YEAR WATER YEARS 1972 - 2002
ANNUAL TOTAL 1851048 ANNUAL MEAN 6069HIGHEST ANNUAL MEANLOWEST ANNUAL MEANHIGHEST DAILY MEAN 58200 LOWEST DAILY MEAN -55300ANNUAL SEVEN-DAY MINIMUM -9780 MAXIMUM PEAK STAGE10 PERCENT EXCEEDS 2040050 PERCENT EXCEEDS 619090 PERCENT EXCEEDS -10400
20064616579 7879
15640 19924086 1973
Sep 17 44000 Sep 27 73500 Feb 18 1998Mar 19 -58400 May 19 -63400 Oct 16 1999Mar 5 -23600 May 19 -23600 May 19 2002
15.20 Sep 10 1964 21600 25400 8250 8350
-9980 -9550
Note.--Negative figures indicate reverse flow.

--- ------ ---
---
---
---------
---
--- ------
--- --------- ---
--- --- ------ ------ ------ ---
------ ------ --- --- ---
---
--- --- --- --- --- --- --- --- --- --- ---
--- ------ ---
196 ST. JOHNS RIVER BASIN BELOW OCKLAWAHA RIVER
02246500 ST. JOHNS RIVER AT JACKSONVILLE, FL--Continued
GAGE HEIGHT, FEET, WATER YEAR OCTOBER 2001 TO SEPTEMBER 2002
DAY HIGH LOW HIGH LOW HIGH LOW HIGH LOW HIGH LOW HIGH LOW
OCTOBER NOVEMBER DECEMBER JANUARY FEBRUARY MARCH
1 --- --- --- --- 11.57 9.49 11.42 9.39 11.56 9.47 2 12.25 --- --- --- 11.82 9.60 11.33 9.26 12.02 9.94 3 12.75 12.18 --- --- --- 11.76 9.88 11.64 9.98 11.68 9.57 4 12.74 11.19 12.18 --- --- --- 11.53 9.64 11.55 9.58 11.50 9.22 5 12.60 12.40 --- 12.18 10.41 11.54 9.82 11.46 9.93 11.10 9.32
6 12.41 --- --- 12.02 10.28 11.59 9.06 11.67 10.30 11.19 9.62 7 12.25 --- --- 11.86 10.18 10.75 8.71 11.61 9.97 11.31 9.80 8 12.61 --- --- 11.96 10.23 10.83 9.13 11.16 9.37 11.43 10.02 9 12.87 11.51 11.91 --- 11.91 10.23 10.96 8.97 11.44 9.52 11.45 9.84 10 12.83 --- --- 12.22 10.16 10.84 8.89 11.56 9.87 11.25 9.59
11 --- --- 12.28 10.55 10.80 8.72 11.21 9.60 11.48 9.55 12 12.60 12.08 --- 12.14 10.32 10.90 8.64 11.25 9.50 11.68 9.97 13 12.48 --- 12.15 10.21 10.96 8.65 11.29 9.53 11.61 9.89 14 10.74 12.67 --- 12.14 10.22 11.14 9.07 11.26 9.58 11.37 9.69 15 12.68 10.97 11.80 9.92 11.22 9.41 11.69 10.20 11.30 9.51
16 12.72 12.79 -- 11.94 9.95 11.11 9.37 11.66 10.05 11.18 9.41 17 --- --- 12.04 10.22 11.15 9.46 11.42 9.61 11.20 9.34 18 --- --- 11.48 9.75 11.08 9.37 11.37 9.94 11.19 9.46 19 --- --- 11.67 9.99 11.08 9.39 11.43 9.93 11.24 9.67 20 --- --- 11.41 9.80 10.84 9.33 11.33 9.70 11.44 9.87
21 12.46 --- --- 11.62 10.11 11.01 9.42 11.11 9.52 11.40 9.62 22 --- --- 11.78 10.31 11.00 9.59 11.10 9.64 11.56 9.91 23 -- -- 11.76 10.29 11.20 9.51 11.42 10.03 11.72 10.11 24 -- -- 11.63 9.80 11.17 9.70 11.85 10.03 11.68 10.27 25 12.04 10.58 --- --- 11.58 10.19 11.09 9.32 11.85 10.28 11.63 9.99
26 11.90 10.42 --- --- 11.69 10.03 11.50 9.31 11.81 9.99 11.57 9.77 27 12.12 --- --- 11.50 9.69 11.68 9.74 11.39 9.31 11.60 9.62 28 12.30 10.61 -- -- 11.48 9.54 11.55 9.52 11.54 9.25 11.91 9.63 29 12.33 -- -- 11.65 9.63 11.43 9.32 12.10 10.11 30 -- -- 11.53 9.50 11.40 9.22 11.97 10.10 31 -- -- 11.66 9.57 11.43 9.32 12.03 10.10
MAX --- --- --- --- 11.82 9.88 11.85 10.30 12.10 10.27 MIN --- --- --- --- 10.75 8.64 11.10 9.25 11.10 9.22

--- --- --- ---
ST. JOHNS RIVER BASIN BELOW OCKLAWAHA RIVER 197
02246500 ST. JOHNS RIVER AT JACKSONVILLE, FL--Continued
GAGE HEIGHT, FEET, WATER YEAR OCTOBER 2001 TO SEPTEMBER 2002
DAY HIGH LOW HIGH LOW HIGH LOW HIGH LOW HIGH LOW HIGH LOW
APRIL MAY JUNE JULY AUGUST SEPTEMBER
1 11.86 10.00 11.68 9.90 11.82 10.43 11.30 9.67 11.71 10.05 12.26 10.75 2 11.82 10.23 11.53 9.58 11.70 10.21 11.40 9.89 12.07 10.46 12.40 10.82 3 11.83 10.08 11.12 9.29 11.56 10.22 11.45 9.94 12.26 10.71 12.61 10.97 4 11.51 9.98 11.01 9.44 11.89 10.52 11.71 9.84 12.22 10.62 12.69 10.84 5 11.87 10.62 11.34 9.95 11.85 10.53 11.54 9.78 12.27 10.54 12.58 10.82
6 12.02 10.65 11.59 10.29 11.77 10.30 11.61 9.77 12.52 10.66 12.51 10.59 7 11.92 10.58 11.56 10.13 11.67 10.06 11.76 9.95 12.86 10.93 12.73 10.73 8 11.93 10.50 11.32 9.81 11.99 10.31 11.80 10.06 12.92 11.06 12.83 10.87 9 11.68 10.15 11.23 9.49 12.15 10.54 11.70 10.00 12.87 11.13 12.76 10.97 10 11.28 9.55 11.24 9.43 12.16 10.62 11.62 9.67 12.75 11.01 12.81 10.94
11 11.49 9.68 11.30 9.49 12.13 10.48 11.49 9.39 12.61 10.87 12.58 10.75 12 11.57 10.03 11.46 9.66 12.12 10.37 11.40 9.61 12.58 10.79 12.37 10.55 13 11.57 9.85 11.20 9.39 11.88 10.34 11.94 10.08 12.43 10.72 12.56 10.79 14 11.55 9.96 10.71 9.25 12.06 10.20 11.89 9.73 12.32 10.58 12.30 10.73 15 11.35 9.75 11.24 9.64 11.84 10.14 11.60 9.62 12.25 10.44 12.16 10.53
16 11.42 9.73 11.36 9.76 11.83 10.26 11.47 9.65 12.09 10.39 11.95 10.32 17 11.41 9.78 11.33 9.74 11.95 10.29 11.63 9.80 11.95 10.23 12.05 10.20 18 11.41 9.81 11.34 9.36 11.90 10.34 11.75 9.92 11.85 10.04 12.26 10.47 19 11.43 9.78 11.30 9.81 12.02 10.24 12.05 9.91 11.94 9.94 12.44 10.69 20 11.39 9.67 11.80 10.39 12.01 10.25 11.58 9.72 11.97 10.22 12.56 10.87
21 11.36 9.82 11.92 10.38 12.28 10.35 11.72 9.70 11.90 10.08 12.61 10.96 22 11.44 9.80 12.09 10.34 12.35 10.73 11.96 9.94 11.94 10.08 12.68 11.05 23 11.65 9.76 12.35 10.69 12.06 10.25 11.75 9.87 12.01 10.21 12.66 11.12 24 11.92 10.16 12.21 10.41 11.88 10.01 11.67 9.82 11.89 10.09 12.81 11.11 25 11.88 10.00 11.98 10.02 11.72 9.91 11.63 9.68 11.72 10.08 12.96 11.44
26 11.99 9.89 11.83 9.89 11.66 9.91 11.46 9.86 11.94 10.37 12.97 11.38 27 12.09 10.19 11.90 9.96 11.34 9.70 11.57 9.87 12.01 10.40 12.56 11.00 28 11.88 9.89 11.67 10.00 11.09 9.48 11.56 9.85 11.94 10.36 12.28 10.77 29 11.37 9.50 12.00 10.46 11.13 9.49 11.53 9.85 11.94 10.37 12.37 10.84 30 11.52 9.76 12.14 10.57 11.15 9.56 11.44 9.76 11.94 10.35 12.83 11.31 31 12.03 10.51 --- --- 11.37 9.73 12.10 10.54
MAX 12.09 10.65 12.35 10.69 12.35 10.73 12.05 10.08 12.92 11.13 12.97 11.44 MIN 11.28 9.50 10.71 9.25 11.09 9.48 11.30 9.39 11.71 9.94 11.95 10.20

198 ST. JOHNS RIVER BASIN BELOW OCKLAWAHA RIVER
02246500 ST. JOHNS RIVER AT JACKSONVILLE, FL--Continued
WATER-QUALITY RECORDS
PERIOD OF DAILY RECORD.--SPECIFIC CONDUCTANCE (TOP, MIDDLE, BOTTOM): May 1995 to current year. WATER TEMPERATURE (TOP, MIDDLE, BOTTOM): May 1995 to current year.DISSOLVED OXYGEN (TOP, MIDDLE, BOTTOM): March 1996 to current year.
INSTRUMENTATION.--Water-quality monitor.
REMARKS--Extremes for current year and extremes for period of daily record are based on recorded values and may have beenexceeded during periods of no record.
EXTREMES FOR PERIOD OF DAILY RECORD.--SPECIFIC CONDUCTANCE (TOP): Maximum daily mean, 51,100 µS/cm @ 25 ° C, May 23, 2002; minimum daily mean, 308 µS/cm @ 25 ° C,
Mar. 10, 1998. SPECIFIC CONDUCTANCE (MIDDLE): Maximum daily mean, 51,100 µS/cm @ 25 ° C, May 23, 2002; minimum daily mean, 309 µS/cm @ 25 ° C,
Mar. 10, 1998. SPECIFIC CONDUCTANCE (BOTTOM): Maximum daily mean, 51,100 µS/cm @ 25 ° C, May 23, 2002; minimum daily mean, 309 µS/cm @ 25 ° C,
Mar. 10, 1998. WATER TEMPERATURE (TOP): Maximum daily mean, 32.3 ° C, Aug. 1, 1999; minimum daily mean, 8.8 ° C, Jan. 4,5, 2001. WATER TEMPERATURE (MIDDLE): Maximum daily mean, 32.3 ° C, Aug. 1, 1999; minimum daily mean, 9.1 ° C, Jan. 10, 1996. WATER TEMPERATURE (BOTTOM): Maximum daily mean, 32.3 ° C, Aug. 1, 1999; minimum daily mean, 8.6 ° C, Jan. 5, 2001. DISSOLVED OXYGEN (TOP): Maximum daily mean, 13.5 mg/L, Mar. 7,8,9, 2002; minimum daily mean, 3.7 mg/L, July 16, 1998. DISSOLVED OXYGEN (MIDDLE): Maximum daily mean, 13.5 mg/L, Mar. 9, 2002; minimum daily mean, 3.0 mg/L, July 14, 1998. DISSOLVED OXYGEN (BOTTOM): Maximum daily mean, 13.4 mg/L, Mar. 7,8,9,10, 2002; minimum daily mean, 4.1 mg/L, Sept. 27,28,
2001.
EXTREMES FOR CURRENT YEAR--SPECIFIC CONDUCTANCE (TOP): Maximum daily mean, 51,100 µS/cm @ 25 ° C, May 23; minimum daily mean, 1,250 µS/cm @ 25 ° C,
Oct. 3, Aug. 25. SPECIFIC CONDUCTANCE (MIDDLE): Maximum daily mean, 51,100 µS/cm @ 25 ° C, May 23; minimum daily mean, 1,250 µS/cm @ 25 ° C,
Aug. 25. SPECIFIC CONDUCTANCE (BOTTOM): Maximum daily mean, 51,100 µS/cm @ 25 ° C, May 23; minimum daily mean, 1,030 µS/cm @ 25 ° C,
Oct. 25. WATER TEMPERATURE (TOP): Maximum daily mean, 31.0 ° C, July 19,20; minimum daily mean, 13.8 ° C, Mar. 5,6. WATER TEMPERATURE (MIDDLE): Maximum daily mean, 31.0 ° C, July 19,20; minimum daily mean, 13.8 ° C, Mar. 5,6. WATER TEMPERATURE (BOTTOM): Maximum daily mean, 31.0 ° C, July 19,20; minimum daily mean, 13.7 ° C, Mar. 5. DISSOLVED OXYGEN (TOP): Maximum daily mean, 13.5 mg/L, Mar. 7,8,9; minimum daily mean, 5.3 mg/L, Aug. 7. DISSOLVED OXYGEN (MIDDLE): Maximum daily mean, 13.5 mg/L, Mar. 9; minimum daily mean, 5.2 mg/L, Aug. 7. DISSOLVED OXYGEN (BOTTOM): Maximum daily mean, 13.4 mg/L, Mar. 7,8,9,10; minimum daily mean, 5.1 mg/L, Aug. 8.
SPECIFIC CONDUCTANCE, TOP (MICROSIEMENS/CM AT 25 DEG. C), WATER YEAR OCTOBER 2001 TO SEPTEMBER 2002DAILY MEAN VALUES
DAY OCT NOV DEC JAN FEB MAR APR MAY JUN JUL AUG SEP
1 4950 4900 --- --- 2 2130 3180 --- --- 3 1250 2300 --- --- 4 --- --- 7530 --- 5 --- 7100 8570 ---
--- 16600 20400 22900 37000 --- 4530 4550--- 17600 21600 20200 34100 --- 9230 5850--- 13400 20200 17000 33100 --- 11500 8440--- 10400 18600 17100 35200 --- 10300 10300--- 8930 27400 23800 35000 --- 10100 6420
6 --- 11900 --- --7 --- 5600 --- --- 8 --- 3360 3350 --- 9 5160 2190 --- --10 --- 2160 --- --
19800 8600 28700 29300 --- --- --- 2840--- 8840 27900 25100 --- --- 16600 2490--- 9440 23700 22200 --- --- 22300 3800 --- 8300 19400 20500 --- --- 20300 4180
15200 6890 16800 19600 --- 12900 17100 2940
11 --- 2400 --- --12 --- 3460 --- --13 --- 12000 --- --14 --- 16000 --- --15 --- 22500 --- --
12400 8150 17400 19800 --- 11100 14300 -- --- 9930 19200 21500 --- 10700 11600 --
12300 9430 18300 20800 --- 12400 9140 -- --- 7410 18000 20300 --- 11400 6550 -- --- 5980 16300 24300 --- 9820 4620 --
16 --- 23900 --- --17 4840 15300 --- --18 6290 9940 --- --19 7830 6440 --- --20 5730 3630 --- --
--- 4910 15300 26400 --- 9400 --- -- --- 3860 15000 24900 --- 10400 --- --
18800 3640 14700 22000 --- 11500 --- -- --- 4950 14000 30100 --- 10900 --- --13800 8030 13100 44300 --- 9280 --- --
21 2950 2580 --- --22 --- 2510 --- --- 23 --- 1650 6460 --- 24 --- --- --- --25 --- --- --- --
11400 8320 14500 46100 --- 7940 --- --12000 18200 16600 48800 --- 7640 --- ----- 23700 20500 51100 --- 6810 1390 4230--- 19500 25600 47300 --- 5950 1370 --
20900 16600 22700 39200 --- 5220 1250 --
26 --- --- --- --27 --- --- --- --28 6370 --- 3190 --29 11200 --- --- --- 30 10100 --- --- --- 31 7520 --- --- --
18400 16000 24100 36300 --- 4430 1390 --16700 16400 29300 36300 --- 3820 1520 --15800 19000 26100 36900 --- 3290 1530 ----- 22600 22400 40900 --- 2760 1540 ----- 21500 22000 41600 --- 2350 1680 -- --- 20400 --- 39700 --- 2360 2850 --
MEAN --- --- --- --- MAX --- --- --- --- MIN --- --- --- --
--- 12200 20300 30200 --- --- --- ----- 23700 29300 51100 --- --- --- ----- 3640 13100 17000 --- --- --- --

--- --- ------ --- ------ --- ---
--- --- --- ------ --- ---
--- --- --- --- --- ------ --- --- ---
--- ------ --- ---
--- --- ------ --- ---
--- --- ------ --- ------ --- ---
--- --- ------ ------ ------ ------ ---
--- ------ --- ------ --- ---
--- --- ------ --- ---
--- --- --- ------ --- --- ------ --- --- ------ --- --- ------ --- --- ---
--- ---
--- --- --- --- --- ------ --- --- --- --- ------ --- --- --- --- ---
--- --- ------ --- ------ --- ---
--- --- --- ------ --- ---
--- --- ------ --- --- ------ --- --- ---
--- ------ --- ---
--- --- ------ --- --- --- ---
--- --- ------ --- ------ --- ---
--- ------ ------ ------ ------ ---
--- ------ --- ------ ---
--- ------ ---
--- --- ------ ------ ---
--- --- ------ --- --- ---
--- ---
--- --- --- --- --- ------ --- --- --- --- ------ --- --- --- --- ---
ST. JOHNS RIVER BASIN BELOW OCKLAWAHA RIVER 199
02246500 ST. JOHNS RIVER AT JACKSONVILLE, FL--Continued
SPECIFIC CONDUCTANCE, MIDDLE (MICROSIEMENS/CM AT 25 DEG. C), WATER YEAR OCTOBER 2001 TO SEPTEMBER 2002 DAILY MEAN VALUES
DAY OCT NOV DEC JAN FEB MAR APR MAY JUN JUL AUG SEP
1 5130 5000 --- 16700 20600 --- 37200 4670 4840 2 2200 3260 --- 17800 21800 --- 34200 9870 6290 3 1260 2220 --- 13500 20500 --- 33200 12800 8840 4 --- --- 10500 18800 --- 35300 11000 10900 5 --- 7370 --- 8960 27800 --- 35200 10300 6580
6 -- 12900 -- 20400 8640 29500 -- -- -- 2880 7 --- 5970 --- 8900 25700 --- 17000 2540 8 --- 3370 --- 9520 22600 --- 22900 3840 9 5350 2200 --- --- 8360 19400 20700 --- 20800 4300
10 2190 --- 15400 6940 16900 19700 13000 17400 2990
11 2460 --- 12800 8190 17500 19900 11100 14500 --12 --- 3520 --- 10200 19300 21700 --- 10700 11700 13 12300 --- --- 9710 18500 20900 12500 9200 --14 16400 --- --- 7490 18100 20400 11500 6570 --15 22900 --- --- 6030 16400 24500 9850 4630 --
16 24300 --- --- 4950 15300 26200 9430 2990 --17 4950 15800 --- --- 3910 15100 25100 10400 1960 --18 6460 10000 --- 19000 3700 14700 22100 11600 1440 --19 8120 6470 --- --- 5040 14100 30200 11100 1340 --20 5970 3660 --- 14000 8370 --- 44400 9320 1330 --
21 3050 2590 --- 11500 8770 14600 46400 --- 1330 --22 --- 2570 --- 12100 18700 16800 48900 --- 1330 23 --- 1670 --- 25000 20600 51100 --- 1390 4390 24 --- --- --- 20500 26000 47600 --- 1370 --25 -- -- 21300 17100 22900 39500 -- 5270 1250
26 -- -- 18600 16200 36400 -- 4450 1400 27 -- -- 16700 16500 36400 -- 3840 1540 28 -- -- 15900 19100 37000 -- 3300 1560 29 -- -- 22900 22500 41000 -- 2760 1560 30 -- -- 21800 22100 41900 -- 2360 1710 31 7750 --- --- --- 20700 --- 40100 2390 2970 --
MEAN --- --- 12400 --- --- --- MAX --- --- 25000 --- --- --- MIN -- -- 3700 -- -- --
SPECIFIC CONDUCTANCE, BOTTOM (MICROSIEMENS/CM AT 25 DEG. C), WATER YEAR OCTOBER 2001 TO SEPTEMBER 2002 DAILY MEAN VALUES
DAY OCT NOV DEC JAN FEB MAR APR MAY JUN JUL AUG SEP
1 5380 5090 --- 16800 20800 23200 37300 4760 5150 2 2300 3320 --- 18000 22100 20500 34300 10600 6620 3 --- 2390 --- 13600 20800 17200 33300 13900 9180 4 --- --- 10600 19100 17200 35500 11800 11200 5 --- 7640 --- 8990 28000 24300 35400 10500 6690
6 -- 13600 -- 21200 8670 30300 30600 -- --7 --- 6450 --- 9000 26600 --- --- 2560 8 --- 3400 --- 9640 23000 --- 23500 3880 9 5590 2220 --- --- 8460 --- 20800 --- 21300 4370
10 2200 --- 15700 6990 --- 19800 --- 17700 3070
11 2500 --- --- 8280 --- 20000 --- 14600 --12 --- 3590 --- 10500 21800 --- 11800 13 12600 --- --- 9930 --- 21000 12500 9220 --14 16800 --- --- 7600 --- 20400 11500 6590 --15 23200 --- --- 6120 --- 24500 9850 4640 --
16 2610 24700 --- --- 4990 --- 26500 9440 3000 --17 5070 16200 --- --- 3940 --- 25200 10500 1960 --18 6650 10100 --- 19200 3760 --- 22300 11800 1440 --19 8320 6510 --- --- 5170 14200 30400 11200 1340 --20 6140 3680 --- 14400 8830 13200 44500 9360 1330 --
21 3130 2600 --- 11700 9220 14700 46600 8020 1330 --22 --- 2630 --- 19100 17000 48900 --- 7760 1330 23 1700 1790 --- 26100 20800 51100 --- 6900 1400 4550 24 1500 --- --- --- 21500 26300 47800 6020 1380 --25 1030 --- --- 21700 17600 23400 39800 5290 1260 --
26 -- -- 18900 16500 24400 36500 -- 4480 1410 27 1780 --- --- 16900 16600 30000 36500 3860 1560 --28 7030 --- --- 16000 19300 26600 37200 3310 1570 --29 12200 1210 --- 23100 22600 41100 --- 2770 1570 30 10800 --- 22100 22200 42000 --- 2360 1740 31 7960 --- --- --- 20900 --- 40200 2410 3050 --
MEAN --- --- 12600 30600 --- --- MAX --- --- 26100 51100 --- --- MIN -- -- 3760 17200 -- --

---------
--- ------ ---
--- ------ --- ---
--- ------ ---
---
--- ------ --- ------ ------ --- ------ --- ---
--- --- ------ --- ------ ------ --- ------ ---
--- ------ ---
------ --- ---
--- --- ---
--- --- ------ --- ------ ---
--- ------ ------ ---
--- --- --- ------ --- --- --- ------ --- --- --- ---
--- ------ ------ ---
--- --- --- --- --- ---
--- ------ --- ------ --- ---
--- ------
--- ------ --- ------ --- ------ --- ------ --- ---
--- --- ------ ---
--- ------ ------ ---
--- ------ --- ---
--- --- ------ --- ---
--- --- ---
--- --- ------ --- ------ --- ------ --- ------ --- ---
--- ---
--- --- --- ------ --- --- ------ --- --- ---
200 ST. JOHNS RIVER BASIN BELOW OCKLAWAHA RIVER
02246500 ST. JOHNS RIVER AT JACKSONVILLE, FL--Continued
TEMPERATURE, WATER, TOP (DEG. C), WATER YEAR OCTOBER 2001 TO SEPTEMBER 2002 DAILY MEAN VALUES
DAY OCT NOV DEC JAN FEB MAR APR MAY JUN JUL AUG SEP
1 23.4 19.6 --- --- 14.9 23.5 26.6 27.0 --- 30.2 28.8 2 22.8 20.0 --- --- 15.2 23.5 26.8 27.9 --- 29.8 28.8 3 22.9 20.3 --- --- 15.4 23.6 27.2 28.5 --- 29.7 28.8 4 --- 21.0 --- 14.8 23.6 27.5 28.8 --- 29.7 28.7 5 -- 20.4 20.8 --- 13.8 23.1 27.0 29.0 29.8 28.7
6 --- 19.7 --- 16.5 13.8 22.7 26.5 --- 30.0 29.0 7 -- 19.3 --- 14.3 22.3 27.1 --- 29.7 29.1 8 --- 19.4 21.4 --- 15.1 22.1 27.6 --- 28.9 29.0 9 23.3 19.4 --- --- 16.2 22.5 27.9 --- 28.1 29.0 10 --- 19.4 --- 16.5 17.3 22.9 28.1 --- 29.9 27.9 28.9
11 --- 19.6 --- 16.7 17.4 22.9 28.2 --- 30.2 28.0 12 -- 19.7 --- 18.0 22.8 28.3 -- 30.4 28.1 13 --- 19.6 --- 16.5 18.5 23.1 28.1 --- 30.0 28.1 14 -- 19.4 --- 19.0 23.3 27.9 -- 29.7 28.3 15 -- 19.2 --- 19.6 23.8 27.3 -- 29.8 28.6
16 --- 19.1 --- 20.2 24.4 26.9 --- 30.1 --- 17 22.9 18.9 --- 20.9 25.0 27.1 -- 30.4 --18 22.1 18.9 --- 16.1 21.6 25.5 27.1 --- 30.7 --- 19 22.1 19.0 --- 21.9 25.9 26.3 -- 31.0 --20 22.2 19.3 --- 16.1 22.1 26.3 24.7 --- 31.0 ---
21 22.3 19.3 --- 16.5 22.3 26.5 24.1 --- 30.4 --- 22 --- 19.2 --- 16.7 21.3 26.5 23.5 --- 30.2 --- 23 --- 19.5 18.5 --- 20.4 26.3 22.9 --- 30.0 30.3 29.3 24 --- --- --- 20.7 25.8 23.7 30.0 30.3 --25 -- -- 16.2 21.3 26.0 24.6 -- 30.1 30.4
26 -- -- 16.7 22.1 26.0 25.1 -- 30.1 30.3 27 -- -- 16.4 22.5 25.9 25.2 -- 30.2 30.0 28 21.2 14.7 -- 15.2 22.3 26.2 25.5 -- 30.1 29.7 29 20.3 --- --- --- 22.4 26.4 25.6 30.2 29.5 --30 19.7 --- --- --- 22.9 26.6 26.0 30.4 29.2 --31 19.5 --- --- --- 23.3 --- 26.4 30.5 28.9 --
MEAN --- --- --- 19.1 24.5 26.3 --- -- MAX -- --- 23.3 26.6 28.3 -- -- MIN -- --- 13.8 22.1 22.9 -- --
TEMPERATURE, WATER, MIDDLE (DEG. C), WATER YEAR OCTOBER 2001 TO SEPTEMBER 2002 DAILY MEAN VALUES
DAY OCT NOV DEC JAN FEB MAR APR MAY JUN JUL AUG SEP
1 23.4 19.6 --- --- 14.9 23.5 27.0 --- 30.2 28.8 2 22.9 19.9 --- --- 15.2 23.5 27.9 --- 29.8 28.8 3 22.9 20.3 --- --- 15.4 23.6 28.5 --- 29.7 28.8 4 -- 20.6 --- 14.8 23.6 --- 28.7 29.7 28.7 5 -- 20.4 --- 13.8 23.1 --- 28.9 29.8 28.7
6 --- 19.8 --- 16.5 13.8 22.7 --- --- 29.9 29.0 7 19.3 --- --- 14.3 --- 27.0 --- 29.6 29.1 8 19.4 --- --- 15.1 --- 27.5 --- 28.9 29.0 9 23.3 19.4 --- --- 16.2 22.5 27.8 --- 28.1 29.0 10 --- 19.4 --- 16.5 17.2 22.9 28.1 --- 29.9 27.9 28.9
11 --- 19.6 --- 16.8 17.4 22.9 28.2 --- 30.2 28.1 12 -- 19.7 --- 18.0 22.8 28.2 -- 30.4 28.1 13 -- 19.6 --- 18.5 23.0 28.1 -- 30.0 28.1 14 -- 19.4 --- 19.0 23.3 27.9 -- 29.7 28.2 15 -- 19.2 --- 19.5 23.8 27.3 -- 29.8 28.6
16 -- 19.1 --- 20.2 24.4 26.9 -- 30.2 28.7 17 22.9 18.9 --- --- 20.9 25.0 27.1 30.4 29.2 --18 22.1 18.9 -- 16.1 21.6 25.5 27.1 -- 30.7 29.6 19 22.1 19.0 --- --- 21.8 25.9 26.3 31.0 29.9 --20 22.2 19.3 --- 16.1 22.0 --- 24.7 31.0 29.8 --
21 22.3 19.3 --- 16.5 22.3 26.5 24.1 --- 29.9 --22 --- 19.2 --- 16.7 21.3 26.5 23.5 --- 30.1 23 19.5 --- --- 20.3 26.2 22.9 --- 30.3 29.3 24 --- --- --- 20.6 25.7 23.6 --- 30.3 --25 -- -- 16.2 21.2 25.9 24.6 -- 30.0 30.4
26 --- --- 16.7 22.0 --- 25.1 30.1 30.3 --27 --- --- 16.4 22.5 --- 25.2 30.2 30.0 --28 --- --- 15.2 22.2 --- 25.5 30.1 29.7 --29 --- --- --- 22.3 26.4 25.6 30.2 29.5 --30 --- --- --- 22.9 26.6 26.0 30.4 29.2 --31 19.5 --- --- --- 23.3 --- 26.4 30.4 28.9 --
MEAN --- --- --- 19.0 --- --- 29.4 --MAX --- --- --- 23.3 --- --- 30.4 --MIN --- --- --- 13.8 --- --- 27.9 --

---------------
--- --- ------ --- ------ ------ ------ ---
--- --- ------ --- ------ --- ------ --- ------ --- ---
--- ------ ------ ------ ---
--- ---
--- ------ ------ ------ ------ ---
--- ------ ------ ------ ------ ------ ---
--- --- --- ------ --- --- ------ --- --- ---
--- --- --- --- --- --- --- --- ---
--- --- --- --- ---
--- --- --- --- ---
--- --- --- --- --- ---
--- ------ --- ------ ------ --- ------ --- ---
--- --- ------ --- ------ ------ --- ------ ---
--- ------ ---
--- --- --- --- ------ --- ---
--- --- ------ --- ------ ------ --- --- ------ --- --- ------ --- --- --- ---
--- --- --- --- ------ --- --- --- ------ --- --- --- ---
ST. JOHNS RIVER BASIN BELOW OCKLAWAHA RIVER 201
02246500 ST. JOHNS RIVER AT JACKSONVILLE, FL--Continued
TEMPERATURE, WATER, BOTTOM (DEG. C), WATER YEAR OCTOBER 2001 TO SEPTEMBER 2002 DAILY MEAN VALUES
DAY OCT NOV DEC JAN FEB MAR APR MAY JUN JUL AUG SEP
1 23.4 19.7 --- --- 14.9 23.4 26.6 27.0 --- 30.2 28.8 2 22.8 20.0 --- --- 15.2 23.5 26.8 27.9 --- 29.8 28.8 3 22.9 20.4 --- --- 15.4 23.6 27.2 28.4 --- 29.7 28.8 4 23.3 --- --- --- 14.7 23.6 27.4 28.7 --- 29.6 28.7 5 23.8 20.4 --- --- 13.7 23.1 27.0 28.9 --- 29.8 28.7
6 24.2 19.8 -- 16.5 13.8 22.7 26.5 --- 29.9 7 24.1 19.3 --- --- 14.4 --- 26.9 --- 29.1 8 23.6 19.4 --- --- 15.1 --- 27.5 --- 28.9 29.0 9 23.3 19.4 --- --- 16.2 --- 27.8 --- 28.1 29.0
10 22.8 19.4 --- 16.5 17.2 --- 28.1 --- 27.9 28.9
11 19.6 --- --- 17.4 --- 28.2 --- 28.1 --12 19.7 --- --- 17.9 --- 28.2 --- 28.1 --13 19.6 --- --- 18.5 --- 28.1 30.0 28.1 --14 19.4 --- --- 19.0 --- 27.9 29.7 28.3 --15 19.3 --- --- 19.5 --- 27.3 29.8 28.6 --
16 23.7 19.1 --- --- 20.2 --- 26.9 30.1 28.7 --17 22.9 18.9 --- --- 20.9 --- 27.1 30.5 29.2 --18 22.1 18.9 --- 16.0 21.5 --- 27.1 30.7 29.6 --19 22.1 19.0 --- --- 21.8 25.9 26.3 31.0 29.9 --20 22.2 19.3 -- 16.1 22.0 26.3 24.7 -- 31.0 29.8
21 22.3 19.3 -- 16.5 22.2 26.5 24.1 -- 30.4 29.9 22 22.6 19.2 --- --- 21.3 26.5 23.5 30.2 30.1 --23 23.0 19.5 --- --- 20.3 26.2 22.9 30.0 30.3 29.2 24 23.6 --- --- --- 20.5 25.7 23.6 30.0 30.3 --25 24.2 --- --- 16.2 21.2 25.9 24.6 30.1 30.4 --
26 23.6 --- --- 16.7 22.0 26.0 25.0 30.1 30.3 --27 22.2 --- --- 16.3 22.4 25.8 25.2 30.2 30.0 --28 21.3 --- --- 15.2 22.2 26.2 25.5 30.1 29.7 --29 20.4 --- --- --- 22.3 26.4 25.6 30.2 29.5 --30 19.7 --- --- --- 22.8 26.5 26.0 30.4 29.2 --31 19.5 --- --- --- 23.3 --- 26.4 30.4 28.9 --
MEAN --- --- --- 19.0 --- 26.3 --- --MAX --- --- --- 23.3 --- 28.2 --- --MIN --- --- --- 13.7 --- 22.9 --- --
OXYGEN DISSOLVED, TOP (MG/L), WATER YEAR OCTOBER 2001 TO SEPTEMBER 2002 DAILY MEAN VALUES
DAY OCT NOV DEC JAN FEB MAR APR MAY JUN JUL AUG SEP
1 6.3 8.2 --- 11.3 7.2 7.4 7.1 6.4 6.2 2 7.6 8.4 --- 11.5 7.0 7.6 7.2 6.3 6.5 3 8.8 8.4 --- 12.0 7.1 7.8 7.0 6.3 6.5 4 --- 7.0 --- 12.5 7.2 7.6 6.7 6.5 6.5 5 --- 8.3 7.1 --- 13.1 6.9 7.1 6.6 6.3 7.3
6 --- 8.4 --- 8.0 13.3 7.1 6.5 -- 5.8 7.6 7 --- 8.8 --- 13.5 7.3 6.4 -- 5.3 7.6 8 --- 8.8 7.2 --- 13.5 7.6 6.6 -- 5.4 7.4 9 8.3 8.7 --- 13.5 7.9 6.6 -- 5.8 7.5 10 --- 8.7 --- 8.2 --- 7.9 6.5 --- 6.1 6.0 7.7
11 --- 8.6 --- 8.3 --- 7.6 6.3 --- 6.7 6.2 12 --- 8.6 -- --- 7.4 6.1 --- 6.7 6.3 13 --- 8.6 --- 8.1 --- 7.5 6.3 --- 6.6 6.3 14 --- 8.8 -- --- 7.5 6.2 --- 7.0 6.4 15 --- 8.8 -- --- 7.6 6.2 --- 7.4 6.5
16 --- 8.8 -- --- 7.6 6.5 --- 7.6 --17 8.4 9.0 -- --- 7.5 6.7 --- 7.6 --18 8.5 9.1 --- 8.1 --- 7.5 6.8 --- 7.5 --19 8.7 9.1 -- --- 7.5 6.2 --- 7.5 --20 8.9 8.9 --- 9.1 --- 7.4 6.2 --- 7.5 --
21 9.0 8.7 --- 9.3 --- 7.2 6.6 --- 7.5 --22 --- 8.7 --- 9.3 --- 7.3 6.8 --- 7.7 --23 --- 8.6 7.1 -- --- 7.1 7.1 --- 7.9 6.7 6.1 24 -- -- --- 7.1 7.6 --- 7.3 6.6 25 -- --- 9.8 --- 7.5 8.1 --- 6.8 6.6
26 --- --- 10.0 --- 7.4 8.0 --- 7.0 6.5 27 --- --- 10.4 --- 7.2 7.6 --- 7.1 6.5 28 8.8 8.2 --- 11.0 --- 7.4 7.2 --- 7.0 6.5 29 9.1 -- 7.1 7.5 7.0 --- 6.9 6.5 30 8.6 -- 7.3 7.3 7.0 --- 6.8 6.4 31 8.0 -- 7.3 7.1 --- 6.8 6.1
MEAN --- --- --- 7.4 6.9 --- --- MAX --- --- --- 7.9 8.1 --- --- MIN --- --- --- 6.9 6.1 --- ---

--- --- --- --- --- --- --- --- ---
--- --- --- --- --- --- ---
--- --- --- --- --- --- --- --- --- --- --- --- ---
--- --- ---
--- --- ------ --- ------ --- ------ --- ------ --- ---
--- --- ------ --- ------ ------ --- ------ --- ---
--- --- ------ --- ------ --- ---
--- --- --- --- ------ --- ---
--- --- --- ------ --- --- ------ --- --- ------ --- --- ------ --- --- ------ --- --- --- ---
--- --- --- --- --- ------ --- --- --- --- ------ --- --- --- --- ---
--- --- --- --- --- --- --- --- --- ---
--- --- --- --- --- --- ---
--- --- ------ --- --- --- --- --- --- --- --- --- --- ---
--- ---
--- --- ------ --- ---
--- --- --- --- --- --- --- --- ---
--- --- --- --- --- --- --- --- --- --- --- ---
--- ------ --- ------ ---
--- --- --- ------ --- ---
--- --- ------ --- ------ --- ---
--- --- ------ --- --- ------ --- --- --- ---
--- --- --- --- --- ------ --- --- --- --- ------ --- --- --- --- ---
202 ST. JOHNS RIVER BASIN BELOW OCKLAWAHA RIVER
02246500 ST. JOHNS RIVER AT JACKSONVILLE, FL--Continued
OXYGEN DISSOLVED, MIDDLE (MG/L), WATER YEAR OCTOBER 2001 TO SEPTEMBER 2002 DAILY MEAN VALUES
DAY OCT NOV DEC JAN FEB MAR APR MAY JUN JUL AUG SEP
1 6.2 8.2 --- 11.2 7.1 -- 6.8 6.4 6.1 2 7.6 8.3 --- 11.5 7.0 -- 6.8 6.1 6.3 3 8.7 8.4 --- 12.0 7.0 -- 6.7 6.1 6.3 4 -- --- 12.4 7.1 -- 6.4 6.3 6.4 5 --- 8.3 --- 13.0 6.8 -- 6.2 6.2 7.1
6 --- 8.2 --- 7.9 13.3 6.9 -- -- 5.7 7.5 7 --- 8.7 --- 13.4 6.3 -- 5.2 7.5 8 --- 8.7 --- 13.4 6.4 -- 5.3 7.3 9 8.2 8.7 --- 13.5 7.7 6.6 -- 5.7 7.3 10 8.6 --- 8.2 13.4 7.8 6.5 6.1 6.0 7.5
11 8.5 --- 8.2 13.3 7.5 6.2 6.7 6.2 --12 --- 8.5 -- --- 7.3 6.0 --- 6.7 6.2 13 --- 8.5 -- --- 7.4 6.2 --- 6.5 6.3 14 --- 8.6 -- --- 7.4 6.2 --- 6.9 6.4 15 --- 8.7 -- --- 7.5 6.0 --- 7.4 6.4
16 --- 8.7 -- --- 7.5 6.2 --- 7.6 6.3 17 8.3 8.9 -- --- 7.4 6.5 --- 7.5 6.5 18 8.4 9.0 --- 8.0 --- 7.5 6.5 --- 7.4 6.6 19 8.5 9.0 -- --- 7.4 6.0 --- 7.4 6.8 20 8.7 8.7 --- 9.0 -- 6.0 --- 7.5 6.8
21 8.9 8.6 --- 9.2 --- 7.2 6.3 -- 6.7 22 --- 8.5 --- 9.3 --- 7.2 6.6 -- 6.7 23 --- 8.4 -- --- 7.1 6.9 -- 6.6 6.0 24 -- -- --- 7.0 7.4 -- 6.6 25 -- --- 9.7 --- 7.4 7.9 --- 6.8 6.5
26 -- --- 9.9 -- 7.9 --- 6.9 6.4 27 --- --- 10.3 --- 7.4 --- 7.0 6.5 28 --- --- 10.9 7.2 7.0 --- 7.0 6.5 29 -- -- 7.0 7.5 6.7 --- 6.8 6.4 30 -- -- 7.2 7.3 6.7 --- 6.8 6.3 31 7.9 -- 7.2 6.8 --- 6.7 6.1
MEAN --- --- --- --- --- 6.3 MAX --- --- --- --- --- 6.8 MIN --- --- --- --- --- 5.2
OXYGEN DISSOLVED, BOTTOM (MG/L), WATER YEAR OCTOBER 2001 TO SEPTEMBER 2002 DAILY MEAN VALUES
DAY OCT NOV DEC JAN FEB MAR APR MAY JUN JUL AUG SEP
1 5.7 --- 11.2 7.0 7.3 6.7 6.3 6.0 2 7.3 8.2 --- 11.4 6.9 7.5 6.8 6.0 6.2 3 8.5 8.3 --- 11.9 6.9 7.6 6.6 6.0 6.2 4 8.3 --- 12.4 7.0 7.5 6.3 6.2 6.3 5 8.0 8.2 --- 12.9 6.8 7.0 6.2 6.2 7.0
6 7.8 8.1 --- 7.8 13.3 6.8 6.3 -- 5.6 7 7.7 8.6 --- 13.4 6.1 -- --- 7.4 8 7.8 8.7 --- 13.4 6.3 -- 5.1 7.2 9 8.1 8.6 --- 13.4 6.5 -- 5.6 7.2 10 8.5 8.6 --- 8.1 13.4 --- 6.4 --- 5.9 7.4
11 8.5 --- --- 13.2 --- 6.2 --- 6.1 7.4 12 8.5 --- --- 13.0 --- 5.9 --- 6.2 7.2 13 --- 8.4 -- -- 6.1 --- 6.5 6.3 6.9 14 --- 8.5 -- -- 6.2 --- 6.9 6.4 6.8 15 --- 8.6 -- -- 6.0 --- 7.4 6.4 6.8
16 8.2 8.6 -- -- 6.2 --- 7.6 6.3 6.6 17 8.2 8.8 -- -- 6.5 --- 7.5 6.5 6.4 18 8.3 8.9 --- 8.0 -- 6.5 --- 7.4 6.6 6.3 19 8.4 8.9 -- --- 7.3 6.0 --- 7.4 6.8 6.1 20 8.6 8.7 --- 9.0 --- 7.3 6.0 --- 7.5 6.8
21 8.8 8.5 --- 9.2 --- 7.1 6.3 --- 7.5 6.7 22 8.8 8.4 -- --- 7.1 6.6 --- 7.6 6.7 23 8.5 8.4 -- --- 7.0 6.9 --- 7.9 6.6 6.0 24 8.3 -- --- 7.0 7.4 --- 7.2 6.5 25 8.2 --- 9.6 --- 7.3 7.9 --- 6.8 6.5
26 8.2 --- 9.9 --- 7.3 7.8 --- 6.9 6.4 27 8.5 --- 10.3 --- 7.1 7.3 --- 7.0 6.4 28 8.5 --- 10.9 7.1 7.3 6.9 --- 6.9 6.4 29 8.7 7.4 -- 7.0 7.3 6.6 --- 6.8 6.4 30 8.2 -- 7.2 7.2 6.7 --- 6.7 6.3 31 7.9 -- -- 6.7 --- 6.7 6.0
MEAN --- --- --- 6.7 --- --- MAX --- --- --- 7.9 --- --- MIN --- --- --- 5.9 --- ---

203 ST. JOHNS RIVER BASIN BELOW OCKLAWAHA RIVER
02246828 PABLO CREEK AT JACKSONVILLE, FL
LOCATION.--Lat 30° 14'07", long 81° 28'42", in land grant 39, T.3 S., R.28 E., Duval County, Hydrologic Unit 03080103, near right bank on upstream side of culvert pipes on private road, 0.5 mi upstream from Cedar Swamp Creek, 4.8 mi upstream from mouth, and 12.5 mi southeast of Main Street Bridge in Jacksonville.
DRAINAGE AREA.--25.8 mi2.
PERIOD OF RECORD.--March 1974 to current year.
REVISED RECORDS.--WDR FL-75-1: 1974.
GAGE.--Water-stage recorder. Datum of gage is 0.14 ft above NGVD of 1929.
REMARKS.--Records poor.
DISCHARGE, CUBIC FEET PER SECOND, WATER YEAR OCTOBER 2001 TO SEPTEMBER 2002DAILY MEAN VALUES
DAY OCT NOV DEC JAN FEB MAR APR MAY JUN JUL AUG SEP
1 e22 17 40 e16 2 e20 19 38 e17 3 e19 22 37 e18 4 e18 30 36 e16 5 e17 41 36 e15
e16 21 22 6.5 6.6 e21 e5.5 e148e15 26 21 5.9 5.8 e19 e6.0 e130e14 87 20 5.6 5.1 e15 e6.5 e105e13 268 21 5.4 4.7 e14 e9.0 e65e13 229 20 5.6 4.7 e13 e19 e44
6 e16 37 35 e14 7 e15 30 35 e14 8 e15 25 36 e14 9 e15 22 53 e15 10 e16 20 e77 e15
e14 159 18 6.0 4.6 e12 e13 e40e13 116 16 5.5 4.7 e10 e15 e36e13 93 15 5.3 5.0 e9.0 e12 e25e12 79 14 5.1 5.2 e8.5 e8.0 e22e12 68 15 4.9 5.4 e8.0 e7.5 e19
11 e16 19 e125 e14 12 e17 19 e175 e14 13 e18 20 e220 e16 14 e21 142 e105 e28 15 e23 370 e50 e40
e12 58 23 4.8 6.2 e7.5 e7.2 e17e11 52 23 4.7 5.5 e7.0 e7.0 e16e11 61 22 4.8 5.2 e7.0 e12 e24e11 67 21 5.2 4.9 e7.5 e9.0 e36e11 61 18 4.8 4.5 e8.0 e35 e52
16 e26 293 e35 e34 17 27 205 e30 e2818 24 151 e26 e2419 25 122 e23 e21 20 24 104 e20 e20
e10 51 16 4.4 4.1 e7.8 e20 e47e10 44 15 4.5 3.9 e6.0 e13 e38e10 40 14 7.2 4.5 e5.5 e55 e29 e9.8 36 13 12 6.8 e5.5 e85 e25 e11 32 12 10 11 e6.8 e94 e20
21 23 90 e19 e22 22 23 78 e18 e26 23 25 72 e18 e22 24 25 66 e17 e19 25 25 59 e17 e22
18 34 11 7.9 35 e9.0 e65 e1519 42 10 6.7 e59 e7.0 e40 e1225 38 9.0 6.2 e65 e6.5 e30 e1140 33 8.6 5.9 e50 e6.3 e20 e6540 29 8.3 5.7 e33 e7.0 e15 e105
26 22 56 e16 e21 27 19 52 e15 e20 28 17 48 e15 e1929 16 45 e14 e1930 18 43 e14 e1831 17 --- e13 e17
33 27 7.8 5.2 e40 e7.8 e14 e9228 30 7.9 7.1 e38 e7.0 e35 e84 23 32 7.9 11 e30 e7.5 e20 e72--- 28 7.2 8.6 e25 e7.8 e13 e53--- 25 6.8 7.5 e23 e7.0 e50 e46 --- 23 --- 6.8 --- e6.0 e105 --
TOTAL 624 2317 1408 618 MEAN 20.1 77.2 45.4 19.9 MAX 27 370 220 40 MIN 15 17 13 14CFSM 0.78 2.99 1.76 0.77 IN. 0.90 3.34 2.03 0.89
467.8 1989 443.5 196.8 506.4 277.0 845.7 149316.7 64.2 14.8 6.35 16.9 8.94 27.3 49.8 40 268 23 12 65 21 105 1489.8 21 6.8 4.4 3.9 5.5 5.5 110.65 2.49 0.57 0.25 0.65 0.35 1.06 1.93 0.67 2.87 0.64 0.28 0.73 0.40 1.22 2.15
STATISTICS OF MONTHLY MEAN DATA FOR WATER YEARS 1974 - 2002, BY WATER YEAR (WY)
MEAN 62.2 31.9 30.1 36.7MAX 211 106 136 98.2(WY) 1997 1995 1998 1994 MIN 4.78 6.77 6.13 6.11(WY) 1982 1981 1981 1981
37.3 38.8 23.9 15.5 29.3 33.1 44.0 69.4 122 96.5 61.5 93.9 162 135 202 1811998 1983 1983 1979 1991 1991 1998 1979 11.4 7.16 5.26 1.96 2.62 2.92 4.03 5.332001 2000 2000 2000 1981 1977 1999 1980
SUMMARY STATISTICS FOR 2001 CALENDAR YEAR FOR 2002 WATER YEAR WATER YEARS 1974 - 2002
ANNUAL TOTAL 10219.6 ANNUAL MEAN 28.0 HIGHEST ANNUAL MEAN LOWEST ANNUAL MEAN HIGHEST DAILY MEAN 370 LOWEST DAILY MEAN 3.6 ANNUAL SEVEN-DAY MINIMUM 3.9MAXIMUM PEAK FLOW MAXIMUM PEAK STAGE INSTANTANEOUS LOW FLOWANNUAL RUNOFF (CFSM) 1.09ANNUAL RUNOFF (INCHES) 14.7410 PERCENT EXCEEDS 5250 PERCENT EXCEEDS 1690 PERCENT EXCEEDS 7.0
11186.230.6 37.2
69.6 19988.73 1981
Nov 15 370 Nov 15 1670 Oct 8 1996Jul 9 3.9 Jun 17 0.81 May 31 2000 Jul 7 4.7 Jun 12 0.90 Jun 4 2000
382 Nov 15 *2150 Oct 8 19967.29 Nov 15 9.53 Oct 8 19963.8 Jun 16-18 0.71 May 31 2000 1.19 1.4416.13 19.6065 7818 20 5.9 6.1
e Estimated * Result of levee failure.
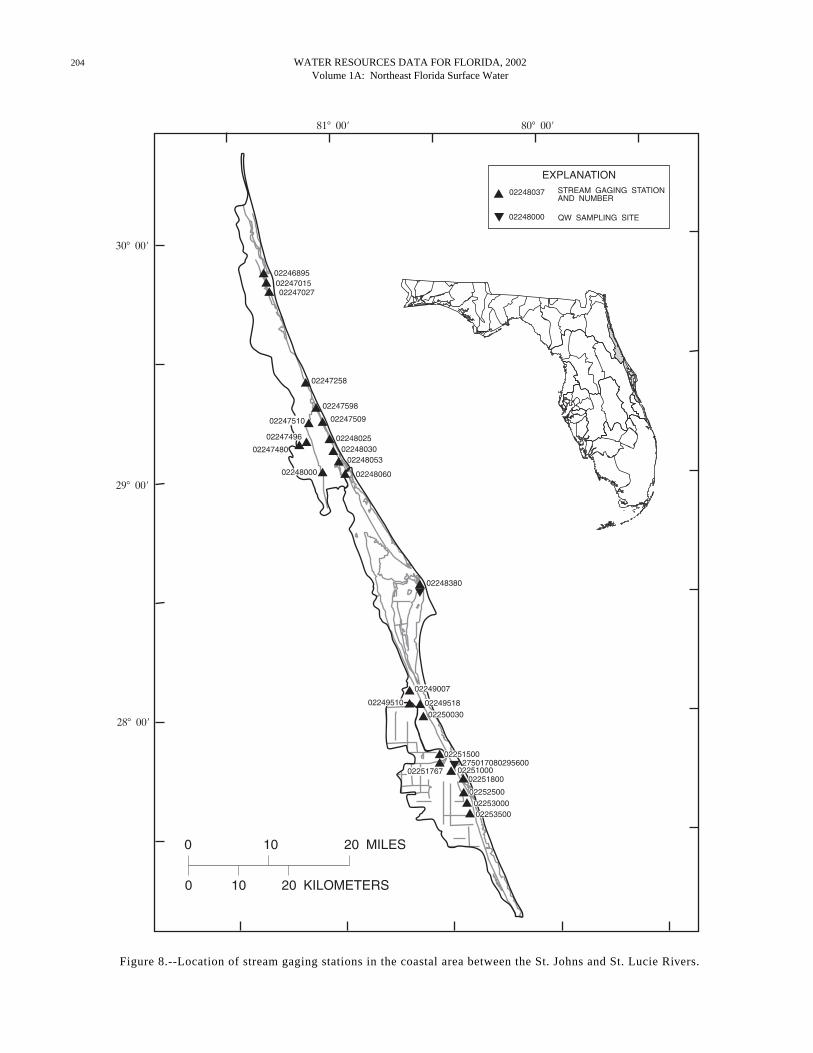
204 WATER RESOURCES DATA FOR FLORIDA, 2002 Volume 1A: Northeast Florida Surface Water
81° 00¢ 80° 00¢
30° 00¢
29° 00¢
28° 00¢
0
0
10
10
pp
p
p
p02253500
02253000p 02252500p
p02251800
02251000p
p p
02251767
02251500
p
pp
02250030
02249510 02249518
p02249007
p02248380
p p p
02246895
02247015
02247027
p02247258
p
02247480
02247510
02247496
02248000
p02247509
p02247598
p02248025
p02248030
p02248053
p02248060
p275017080295600
02248000
p02248037 STREAM GAGING
AND NUMBER
SITE
p
20 MILES
20 KILOMETERS
STATION
QW SAMPLING
EXPLANATION
Figure 8.--Location of stream gaging stations in the coastal area between the St. Johns and St. Lucie Rivers.

205 COASTAL AREA BETWEEN ST. JOHNS RIVER AND PONCE DE LEON INLET
02246895 SAN SEBASTIAN RIVER AT ST. AUGUSTINE, FL
LOCATION.--Lat 29° 53'31", long 81° 19'22", sec.4, T.7 S., R.30 E., St. Johns County, Hydrologic Unit 03080201, on upstream side of southbound bridge on U.S. Highway 1, 0.2 mi north of the intersection of King Street in St. Augustine, and 2.5 mi upstreamfrom the mouth.
DRAINAGE AREA.--16.5 mi2.
PERIOD OF RECORD.--April 1999 to current year.
GAGE.--Water-stage recorder, acoustic velocity meter, and data-collection platform. Datum of gage is at NGVD of 1929. Prior to Oct. 1, 2000 at datum 5.07 ft higher.
REMARKS.--Records poor. Discharge represents net of a much larger upstream and downstream discharge.
DISCHARGE, CUBIC FEET PER SECOND, WATER YEAR OCTOBER 2001 TO SEPTEMBER 2002DAILY MEAN VALUES
DAY OCT NOV DEC JAN FEB MAR APR MAY JUN JUL AUG SEP
1 560 666 680 6142 579 564 589 e5463 509 487 586 10004 583 515 e542 532 5 514 421 e823 e640
664 530 710 e260 382 317 230 393640 820 899 e320 353 369 252 361755 676 795 346 241 321 350 363736 665 568 213 278 316 327 422680 630 627 233 305 319 208 302
6 550 804 755 670 7 438 716 666 6408 676 739 702 557 9 727 742 708 60810 650 723 766 631
780 695 757 323 258 230 114 91570 354 656 283 210 166 -13 -33654 555 521 168 -37 190 162 92570 270 603 129 127 132 72 213811 502 408 78 122 50 87 407
11 673 787 781 59012 715 564 690 45913 451 829 585 54514 483 811 528 76315 199 757 503 519
543 567 367 51 73 1.1 140 429455 566 448 32 107 -218 375 382508 509 363 166 128 309 491 487256 542 390 -114 265 314 411 533626 443 340 59 199 355 346 318
16 380 1100 585 550 17 263 881 533 57918 273 768 449 58319 569 735 e371 707 20 763 682 493 464
605 499 428 189 354 282 301 299570 468 457 321 431 328 281 250403 487 488 285 373 330 249 201635 413 476 132 446 234 248 200624 584 522 416 237 186 157 201
21 746 674 647 49922 670 719 385 48423 632 750 674 572 24 649 e767 662 624 25 628 e534 610 589
621 549 546 310 471 142 137 133518 698 479 150 477 118 76 152727 608 543 296 347 49 163 291902 793 484 139 186 92 195 220790 676 397 -29 164 93 108 494
26 507 e994 e580 752 27 446 597 558 88828 566 597 644 65829 580 627 857 61830 613 641 659 53031 629 --- 714 586
795 875 141 -43 247 135 138 508552 568 206 -52 291 141 250 418624 603 455 -114 235 204 304 390--- 649 429 243 336 261 342 321--- 626 335 390 292 177 391 371--- 778 --- 466 --- 257 357 --
TOTAL 17221 21191 19325 18997 MEAN 556 706 623 613 MAX 763 1100 857 1000 MIN 199 421 371 459
17614 18198 14838 5646 7898 6200.1 7249 9209629 587 495 182 263 200 234 307902 875 899 466 477 369 491 533256 270 141 -114 -37 -218 -13 -33
STATISTICS OF MONTHLY MEAN DATA FOR WATER YEARS 1999 - 2002, BY WATER YEAR (WY)
MEAN 431 424 453 454 MAX 556 706 623 613 (WY) 2002 2002 2002 2002 MIN 327 281 300 291(WY) 2001 2000 2000 2000
398 405 344 198 183 200 245 414629 587 495 492 263 335 347 6082002 2002 2002 2001 2002 2001 2001 2001257 242 -163 -133 -111 -159 80.3 3072000 2000 1999 1999 1999 1999 1999 2002
SUMMARY STATISTICS FOR 2001 CALENDAR YEAR FOR 2002 WATER YEAR WATER YEARS 1999 - 2002
ANNUAL TOTAL 166805.6ANNUAL MEAN 457 HIGHEST ANNUAL MEAN LOWEST ANNUAL MEAN HIGHEST DAILY MEAN 1210LOWEST DAILY MEAN -140 ANNUAL SEVEN-DAY MINIMUM 129MAXIMUM PEAK STAGE10 PERCENT EXCEEDS 71450 PERCENT EXCEEDS 46790 PERCENT EXCEEDS 188
163586.1 448 336
448 2002 31.0 1999
Sep 15 1100 Nov 16 1210 Sep 15 2001Jul 21 -218 Jul 12 -532 Sep 11 1999 Jun 18 50 May 22 -270 May 11 1999
15.66 Nov 15 *16.42 740 635 476 348 136 19
e Estimated * Sep 15, 1999, Sep 14, 2001 Note.--Negative figures indicate reverse flow

206 COASTAL AREA BETWEEN ST. JOHNS RIVER AND PONCE DE LEON INLET
02247015 MOULTRIE CREEK AT MOULTRIE, FL
LOCATION.--Lat 29° 49'17", long 81° 19'22", in SW1⁄ 4 sec.48, T.8 S., R.30 E., St. Johns County, Hydrologic Unit 03080201, on east side of span on downstream side of northbound bridge on U.S. Highway 1, 0.3 mi north of Moultrie and 1.4 mi upstream from mouth.
DRAINAGE AREA.--42.1 mi2.
PERIOD OF RECORD.--April 1999 to September 2002 (discontinued).
GAGE.--Water-stage recorder, acoustic velocity meter, and data-collection platform. Datum of gage is 10.00 ft below NGVD of 1929(Florida Department of Transportation bench mark).
REMARKS.--Records poor. Discharge not published some days due to missing velocity record. Discharge represents net of much larger upstream and downstream discharge.
DISCHARGE, CUBIC FEET PER SECOND, WATER YEAR OCTOBER 2001 TO SEPTEMBER 2002DAILY MEAN VALUES
DAY OCT NOV DEC JAN FEB MAR APR MAY JUN JUL AUG SEP
1 --- 31 --- 632 --- 31 --- 273 --- 50 --- 714 --- --- --- 945 --- --- --- 145
77 61 44 51 142 77 -13 137 --- 86 70 --- 133 39 40 14852 83 81 --- 73 41 64 16461 57 41 --- 148 42 46 749.4 --- 21 --- 91 65 1.5 129
6 --- --- --- 127 7 --- --- --- 848 --- --- --- 107 9 --- --- --- 96
10 --- --- --- 67
51 --- 44 --- 99 38 -45 --55 68 36 --- 73 48 -129 --41 59 27 --- 37 67 -60 --56 74 36 --- 117 65 23 11591 33 18 68 94 1.9 66 204
11 --- --- --- 65 12 --- --- 50 44 13 --- --- 81 4414 --- --- 68 77 15 --- --- 80 70
29 11 17 106 115 -8.0 146 6443 32 38 88 101 -2.8 169 11353 25 36 99 142 61 190 102 4.6 30 71 73 162 142 151 23984 17 55 154 129 93 91 205
16 --- --- 77 82 17 --- --- 123 95 18 --- --- 72 87 19 --- --- 79 93 20 --- --- 118 74
67 18 54 215 141 79 120 19653 30 55 113 158 126 73 16630 62 64 141 56 89 79 15979 63 44 37 140 78 125 9261 54 28 124 59 46 30 83
21 --- --- 55 105 22 --- --- 104 60 23 --- --- 44 6024 --- --- 42 9125 --- --- 87 78
45 39 37 119 19 103 109 5937 37 30 -113 148 -29 61 2851 43 -16 17 112 94 110 1355 77 -17 139 116 110 53 5484 64 12 97 120 97 38 317
26 --- --- 89 51 27 -30 --- 125 81 28 -25 --- 105 88 29 3.1 --- 106 79 30 6.6 --- 96 93 31 18 --- 73 87
25 28 -17 97 88 105 -5.2 --34 13 27 174 101 24 118 --24 -21 50 93 143 47 27 291 --- 54 50 74 59 77 138 340 --- 60 54 84 75 67 104 256 --- 52 --- 72 --- 90 216 --
TOTAL -27.3 112 1674 2485MEAN -5.46 37.3 83.7 80.2MAX 18 50 125 145 MIN -30 31 42 27
1352.0 1309 1090 2122 3191 1972.1 2136.3 374850.1 45.1 36.3 92.3 106 63.6 68.9 15091 86 81 215 162 142 216 340
4.6 -21 -17 -113 19 -29 -129 13
STATISTICS OF MONTHLY MEAN DATA FOR WATER YEARS 1999 - 2002, BY WATER YEAR (WY)
MEAN 5.20 19.1 15.9 12.2MAX 36.4 39.0 83.7 80.2(WY) 2001 2001 2002 2002MIN -24.3 -2.53 -41.3 -75.2 (WY) 2000 2000 2000 2000
11.7 21.5 14.7 45.0 67.1 48.1 67.4 81.750.1 45.1 36.3 92.3 106 63.6 68.9 1972002 2002 2002 2002 2002 2002 2002 2001
-26.9 -11.9 -59.9 21.6 32.0 -6.80 62.0 -23.32000 2000 1999 2000 2000 1999 2000 1999
SUMMARY STATISTICS FOR 2001 CALENDAR YEAR FOR 2002 WATER YEAR WATER YEARS 1999 - 2002
ANNUAL TOTAL 12953.52ANNUAL MEAN 46.4HIGHEST ANNUAL MEANLOWEST ANNUAL MEANHIGHEST DAILY MEAN 1350LOWEST DAILY MEAN -33 ANNUAL SEVEN-DAY MINIMUM -10 MAXIMUM PEAK STAGE10 PERCENT EXCEEDS 9750 PERCENT EXCEEDS 3590 PERCENT EXCEEDS -5.9
21164.174.3 33.6
74.3 2002 -26.7 1999
Sep 15 340 Sep 29 1350 Sep 15 2001May 23 -129 Aug 7 -328 Dec 18 1999Feb 17 -14 Aug 3 -130 Jan 8 2000
15.81 Nov 15 16.79 Sep 15 1999 142 101 68 2918 -33
* Sep 15, 1999, Sep 14, 2001 Note.--Negative figures indicate reverse flow

207 COASTAL AREA BETWEEN ST. JOHNS RIVER AND PONCE DE LEON INLET
02247027 MOSES CREEK NEAR MOULTRIE, FL
LOCATION.--Lat 29° 46'28", long 81° 18'59", in NE1⁄ 4 sec.45, T.8 S., R.30 E., St. Johns County, Hydrologic Unit 03080201, near center of span on downstream side of northbound bridge on U.S. Highway 1, 1.2 mi north of intersection with State Highway 206, 3.1 mi south of Moultrie, and 4.2 mi upstream from mouth.
DRAINAGE AREA.--7.4 mi2.
PERIOD OF RECORD.--April to June 1958 (discharge measurements only), April 1999 to September 2002 (discontinued).
GAGE.--Water-stage recorder and data-collection platform. Datum of gage is 0.99 ft below North American Vertical Datum of 1988.
REMARKS.--Records fair.
DISCHARGE, CUBIC FEET PER SECOND, WATER YEAR OCTOBER 2001 TO SEPTEMBER 2002DAILY MEAN VALUES
DAY OCT NOV DEC JAN FEB MAR APR MAY JUN JUL AUG SEP
1 12 0.93 2.4 0.65 1.8 1.6 0.15 0.01 0.03 4.0 1.2 89 2 8.8 1.1 2.2 0.69 1.6 1.5 0.16 0.01 0.02 3.9 1.7 79 3 6.9 1.3 2.0 0.84 1.4 2.6 0.25 0.01 0.02 2.9 1.5 61 4 5.6 1.5 1.9 0.80 1.3 13 0.27 0.01 0.01 2.7 1.6 49 5 4.6 1.8 1.7 0.76 1.1 7.4 0.23 0.01 0.01 8.7 1.5 53
6 3.9 1.6 1.6 0.84 1.0 5.5 0.16 0.02 0.02 7.8 1.2 38 7 3.3 1.4 1.7 0.92 1.1 4.6 0.12 0.01 0.02 6.1 11 26 8 2.8 1.3 1.6 0.87 1.3 4.0 0.10 0.01 0.09 6.5 7.6 18 9 2.4 1.2 1.7 0.82 1.2 3.4 0.07 0.01 0.09 5.6 4.6 1610 2.0 1.1 1.7 0.81 1.1 2.8 0.07 0.01 0.07 4.1 3.9 13
11 1.8 1.1 1.9 0.8412 1.5 1.0 1.8 0.8613 1.4 1.5 1.6 1.1 14 1.4 24 1.6 2.3 15 1.3 43 1.5 7.1
1.1 2.3 0.18 0.01 0.06 2.8 2.6 9.3 0.96 1.9 0.23 0.01 0.07 2.1 2.0 8.6 0.89 3.2 0.28 0.01 0.08 2.1 4.2 380.89 2.9 0.27 0.01 0.06 3.1 12 1140.86 2.3 0.25 0.01 0.04 2.7 8.0 92
16 1.2 37 1.4 3.7 17 1.1 29 1.2 3.0 18 0.95 23 1.3 2.6 19 0.85 18 1.2 2.3 20 0.83 14 1.1 2.1
0.83 1.8 0.19 0.01 0.03 1.6 5.9 670.76 1.5 0.14 0.02 0.04 1.0 4.1 530.65 1.3 0.10 0.03 0.10 0.81 2.9 420.58 1.1 0.08 0.35 0.63 0.66 2.4 29 0.57 0.90 0.05 0.16 0.49 0.57 6.9 26
21 0.92 9.8 0.98 2.1 22 0.98 7.4 0.87 2.0 23 1.0 6.1 0.85 1.9 24 1.1 7.9 0.85 1.8 25 1.1 6.3 0.80 1.7
0.59 0.77 0.03 0.10 2.2 0.58 6.0 210.59 0.65 0.03 0.07 2.5 0.65 4.2 152.1 0.51 0.02 0.05 3.4 0.67 2.9 11 5.7 0.45 0.03 0.04 2.8 6.7 2.0 16 3.6 0.39 0.02 0.03 2.0 9.4 1.4 288
26 1.0 5.0 0.75 3.4 27 0.85 4.2 0.70 3.1 28 0.72 3.6 0.69 2.8 29 0.71 3.1 0.70 2.6 30 0.74 2.8 0.68 2.3 31 0.83 --- 0.67 2.0
2.9 0.33 0.02 0.03 1.4 6.7 1.5 287 2.3 0.32 0.02 0.03 9.0 5.5 1.3 197 1.9 0.28 0.02 0.06 13 4.5 1.5 126 --- 0.24 0.01 0.04 6.5 3.5 7.9 86 --- 0.21 0.01 0.03 4.5 2.4 21 60 --- 0.16 --- 0.03 --- 1.7 79 --
TOTAL 74.58 261.03 41.64 59.60 MEAN 2.41 8.70 1.34 1.92MAX 12 43 2.4 7.1 MIN 0.71 0.93 0.67 0.65CFSM 0.33 1.18 0.18 0.26 IN. 0.37 1.31 0.21 0.30
40.67 69.91 3.56 1.24 49.28 112.04 215.5 2027.9 1.45 2.26 0.12 0.040 1.64 3.61 6.95 67.6 5.7 13 0.28 0.35 13 9.4 79 288 0.57 0.16 0.01 0.01 0.01 0.57 1.2 8.60.20 0.30 0.02 0.01 0.22 0.49 0.94 9.13 0.20 0.35 0.02 0.01 0.25 0.56 1.08 10.19
STATISTICS OF MONTHLY MEAN DATA FOR WATER YEARS 1999 - 2002, BY WATER YEAR (WY)
MEAN 12.9 3.68 0.77 1.05 MAX 24.2 8.70 1.34 1.92(WY) 2000 2002 2002 2002 MIN 2.41 0.66 0.39 0.60(WY) 2002 2001 2000 2000
1.19 4.25 0.84 0.15 1.77 2.56 7.26 49.4 1.67 10.0 1.29 0.42 4.46 4.70 21.9 1082001 2001 1999 1999 1999 2001 2001 2001 0.46 0.45 0.12 0.023 0.24 0.28 0.076 9.322000 2000 2002 2000 2000 2000 1999 1999
SUMMARY STATISTICS FOR 2001 CALENDAR YEAR FOR 2002 WATER YEAR WATER YEARS 1999 - 2002
ANNUAL TOTAL 4884.59 ANNUAL MEAN 13.4 HIGHEST ANNUAL MEAN LOWEST ANNUAL MEAN HIGHEST DAILY MEAN 861 LOWEST DAILY MEAN 0.08 ANNUAL SEVEN-DAY MINIMUM 0.09MAXIMUM PEAK FLOWMAXIMUM PEAK STAGEANNUAL RUNOFF (CFSM) 1.81ANNUAL RUNOFF (INCHES) 24.5510 PERCENT EXCEEDS 2150 PERCENT EXCEEDS 1.190 PERCENT EXCEEDS 0.15
2956.95 8.10 8.35
13.5 20013.49 2000
Sep 15 288 Sep 25 861 Sep 15 2001 May 25-28 0.01 Many days 0.00 Many days May 23 0.01 Apr 29 0.00 May 17 2000
339 Sep 25 a992 Sep 15 200117.76 Sep 25 19.58 Sep 15 2001 1.09 1.1314.86 15.3313 14 1.4 0.66 0.03 0.04
a From rating curve extended above 330 ft3/s

208 COASTAL AREA BETWEEN ST. JOHNS RIVER AND PONCE DE LEON INLET
02247258 LEHIGH CANAL NEAR FLAGLER BEACH, FL
LOCATION.--Lat 29° 29'50", long 81° 11'23", in NW1⁄ 4 sec.4, T.12 S., R.31 E., Flagler County, Hydrologic Unit 03080201, near center of channel on upstream side of bridge on Old Kings Road, 0.7 mi upstream from mouth (at Graham Swamp), and 2.6 mi northwest of Flagler Beach.
DRAINAGE AREA.--21 mi2.
PERIOD OF RECORD.--April 1998 to current year.
GAGE.--Water-stage recorder. Datum of gage is 8.54 ft above NGVD of 1929 (Levitt & Sons Engineering Dept. bench mark).
REMARKS.--Records fair. Flow affected at times by operation of control structure 0.70 mi upstream.
DISCHARGE, CUBIC FEET PER SECOND, WATER YEAR OCTOBER 2001 TO SEPTEMBER 2002DAILY MEAN VALUES
DAY OCT NOV DEC JAN FEB MAR APR MAY JUN JUL AUG SEP
1 49 11 2.3 3.0 2 45 11 2.4 3.0 3 42 9.7 2.6 3.0 4 39 9.0 2.6 3.05 36 12 2.6 3.0
2.4 2.7 1.9 1.8 1.8 2.9 7.1 212.2 2.7 2.1 1.8 1.8 2.8 6.1 212.4 2.9 2.2 1.8 1.8 14 5.2 152.4 3.1 2.1 1.8 1.8 18 14 162.4 2.9 2.0 1.8 1.8 37 24 16
6 33 10 2.6 3.0 7 31 11 2.5 3.18 30 11 2.7 3.29 28 9.3 2.8 3.210 27 8.6 2.8 3.2
2.4 2.9 2.0 1.8 1.8 12 12 132.6 2.9 2.0 1.9 1.8 6.9 35 112.6 2.9 2.0 1.8 1.9 5.3 23 8.22.6 2.9 2.0 1.8 1.9 5.0 20 7.3 2.6 2.9 2.0 1.8 1.9 4.2 30 6.5
11 25 8.1 2.8 3.2 12 23 7.8 2.8 3.213 21 11 2.8 3.414 20 269 2.8 3.6 15 20 171 2.8 3.9
2.6 2.9 2.0 1.8 2.0 3.6 16 5.3 2.5 2.9 2.0 1.8 2.0 3.3 12 5.32.4 3.0 2.1 1.8 2.0 4.8 100 26 2.4 2.7 2.1 1.8 2.0 8.7 93 31 2.4 2.4 2.1 1.8 1.9 6.1 33 17
16 19 75 2.8 3.517 18 98 2.8 3.418 16 185 2.8 3.419 14 42 2.8 3.420 13 3.4 2.9 3.4
2.4 2.4 2.1 1.8 1.8 4.0 23 142.4 2.3 2.0 1.8 1.8 3.2 18 13 2.4 2.1 2.0 1.8 2.4 2.9 14 9.62.4 2.0 2.0 2.3 2.4 2.6 12 8.9 2.4 2.0 1.9 2.2 2.4 2.5 101 9.1
21 12 2.8 2.8 3.4 22 12 2.6 2.9 3.4 23 13 2.5 2.9 3.3 24 17 2.5 2.9 3.325 7.9 2.4 2.9 3.3
2.4 2.0 1.9 2.1 2.8 2.5 80 7.9 2.5 2.1 1.8 2.0 2.7 2.7 30 6.0 2.8 1.9 1.8 2.0 2.8 3.6 18 5.0 2.9 1.9 1.8 2.0 2.7 5.9 14 132.7 1.8 1.8 2.0 2.6 36 12 80
26 10 2.4 2.9 3.327 11 2.4 2.9 3.328 11 2.3 2.9 3.329 9.2 2.3 2.9 3.230 5.2 2.2 2.9 3.231 8.8 --- 3.0 2.9
2.6 1.8 1.8 2.0 2.6 11 10 732.6 1.9 1.8 1.9 2.8 23 11 352.6 1.9 1.8 1.9 2.7 46 11 23--- 1.9 1.8 1.9 2.6 23 15 18--- 1.9 1.8 1.8 3.0 12 10 15--- 1.9 --- 1.8 --- 9.8 12 --
TOTAL 666.1 997.3 85.9 101.0 MEAN 21.5 33.2 2.77 3.26 MAX 49 269 3.0 3.9 MIN 5.2 2.2 2.3 2.9 CFSM 1.02 1.58 0.13 0.16 IN. 1.18 1.77 0.15 0.18
70.0 74.5 58.7 58.4 66.3 325.3 821.4 550.12.50 2.40 1.96 1.88 2.21 10.5 26.5 18.32.9 3.1 2.2 2.3 3.0 46 101 802.2 1.8 1.8 1.8 1.8 2.5 5.2 5.00.12 0.11 0.09 0.09 0.11 0.50 1.26 0.87 0.12 0.13 0.10 0.10 0.12 0.58 1.46 0.97
STATISTICS OF MONTHLY MEAN DATA FOR WATER YEARS 1998 - 2002, BY WATER YEAR (WY)
MEAN 28.3 13.9 5.65 5.15 MAX 55.3 33.2 13.6 14.5(WY) 1999 2002 1999 1999 MIN 8.38 3.33 1.38 1.02(WY) 2000 2000 2000 2000
5.19 4.99 3.05 1.54 1.85 8.38 13.0 64.3 14.3 11.5 5.38 3.84 4.85 24.6 26.5 1561999 2001 2001 1998 2001 2001 2002 2001 1.31 0.78 1.96 0.16 0.018 0.071 0.015 3.272000 2000 2002 2000 2000 2000 2000 1999
SUMMARY STATISTICS FOR 2001 CALENDAR YEAR FOR 2002 WATER YEAR WATER YEARS 1998 - 2002
ANNUAL TOTAL 8736.8ANNUAL MEAN 23.9 HIGHEST ANNUAL MEAN LOWEST ANNUAL MEAN HIGHEST DAILY MEAN 897 LOWEST DAILY MEAN 1.1 ANNUAL SEVEN-DAY MINIMUM 1.2MAXIMUM PEAK FLOWMAXIMUM PEAK STAGE INSTANTANEOUS LOW FLOWANNUAL RUNOFF (CFSM) 1.14ANNUAL RUNOFF (INCHES) 15.48 10 PERCENT EXCEEDS 4250 PERCENT EXCEEDS 4.590 PERCENT EXCEEDS 1.7
3875.010.6 12.9
22.5 20017.98 2000
Sep 15 269 Nov 14 897 Sep 15 2001 Jan 30 1.8 Many days 0.00 Some years Jan 26 1.8 Apr 22 0.00 Some years
638 Nov 14 *1480 Sep 14 2001 7.66 Nov 14 9.46 Sep 14 2001 1.7 May 12,13,15,16 0.51 0.61 6.86 8.3323 23 2.9 2.9 1.8 0.15
* From rating curve extended above 574 ft3/s

209 COASTAL AREA BETWEEN ST. JOHNS RIVER AND PONCE DE LEON INLET
02247480 TIGER BAY CANAL NEAR DAYTONA BEACH, FL
LOCATION.--Lat 29° 09'58", long 81° 09'18", in SW1⁄ 4 sec.25, T.15 S., R.31 E., Volusia County, Hydrologic Unit 03080201, on downstream side of wooden bridge on Indian Lake Road, 2.4 mi north of its intersection with U.S. Highway 92, and 8 mi west of Daytona Beach.
DRAINAGE AREA.--29 mi2, approximately.
PERIOD OF RECORD.--January 1978 to September 2002 (discontinued).
GAGE.--Water-stage recorder. Datum of gage is at NGVD of 1929.
REMARKS.--Records fair. Since 1988 some ground-water diversion out of the basin for municipal water supply.
DISCHARGE, CUBIC FEET PER SECOND, WATER YEAR OCTOBER 2001 TO SEPTEMBER 2002DAILY MEAN VALUES
DAY OCT NOV DEC JAN FEB MAR APR MAY JUN JUL AUG SEP
1 154 17 38 7.0 2 137 17 35 7.1 3 123 18 33 7.5 4 109 20 31 7.3 5 97 21 29 7.0
2.8 5.5 5.0 0.00 0.00 57 74 73 2.5 5.4 4.6 0.00 0.00 72 68 63 2.3 5.7 4.3 0.00 0.00 76 71 552.1 9.4 3.9 0.00 0.00 71 106 48 1.8 11 3.5 0.00 0.00 65 122 47
6 84 21 27 6.8 7 74 21 26 6.5 8 69 20 23 6.1 9 67 19 22 5.7
10 64 18 21 5.3
1.6 11 3.1 0.00 0.00 61 118 47 1.5 11 2.5 0.00 0.00 58 113 43 1.5 10 2.0 0.00 0.00 56 105 41 1.3 9.8 1.4 0.00 0.00 53 92 39 1.3 9.4 0.84 0.00 0.00 55 81 36
11 60 18 21 5.0 12 55 16 21 4.7 13 50 17 20 4.5 14 47 42 20 4.8 15 49 110 19 5.7
1.2 9.0 0.24 0.00 0.00 54 70 33 1.1 8.6 0.00 0.00 0.00 54 65 31 1.1 8.5 0.00 0.00 0.00 58 71 53 1.0 8.2 0.00 0.00 0.00 67 124 86 1.0 7.8 0.00 0.00 0.00 70 136 86
16 52 131 18 6.0 17 48 128 17 5.9 18 43 124 18 5.7 19 39 118 18 5.4 20 36 114 17 5.0
1.1 7.5 0.00 0.00 0.00 67 135 76 1.1 7.3 0.00 0.00 0.00 61 127 79 1.0 7.0 0.00 0.00 0.00 54 115 90 1.0 6.6 0.00 0.00 0.00 47 103 92 1.0 6.3 0.00 0.00 0.00 41 92 87
21 34 107 16 4.7 22 34 99 14 4.4 23 32 90 13 4.0 24 30 82 13 3.8 25 28 74 12 3.5
1.0 6.2 0.00 0.00 0.00 39 76 88 1.1 6.0 0.00 0.00 0.00 46 66 81 1.8 5.7 0.00 0.00 0.00 60 59 70 3.2 5.6 0.00 0.00 0.00 66 52 63 4.6 5.5 0.00 0.00 0.00 60 46 69
26 26 66 11 3.6 27 24 57 9.8 3.5 28 22 51 9.1 3.5 29 20 46 8.4 3.4 30 19 42 7.9 3.2 31 18 --- 7.5 3.0
5.5 5.5 0.00 0.00 0.00 65 41 90 5.7 5.6 0.00 0.00 11 83 36 99 5.6 5.5 0.00 0.00 37 90 35 95 --- 5.5 0.00 0.00 44 105 54 87 --- 5.5 0.00 0.00 50 100 78 78 --- 5.3 --- 0.00 --- 86 82 --
TOTAL 1744 1724 595.7 159.6 MEAN 56.3 57.5 19.2 5.15MAX 154 131 38 7.5 MIN 18 16 7.5 3.0
57.8 226.9 31.38 0.00 142.00 1997 2613 20252.06 7.32 1.05 0.000 4.73 64.4 84.3 67.5 5.7 11 5.0 0.00 50 105 136 99 1.0 5.3 0.00 0.00 0.00 39 35 31
STATISTICS OF MONTHLY MEAN DATA FOR WATER YEARS 1978 - 2002, BY WATER YEAR (WY)
MEAN 34.8 18.0 13.8 19.5MAX 92.0 71.1 78.2 89.2(WY) 1980 1995 1998 1998MIN 0.000 0.000 0.000 0.000 (WY) 1988 1987 1991 1991
18.7 19.8 12.4 2.98 5.20 11.2 19.8 33.674.2 80.7 90.1 39.1 67.6 64.4 92.5 1621978 1979 1983 1979 1991 2002 1978 2001
0.000 0.000 0.000 0.000 0.000 0.000 0.000 0.0001991 1985 1985 1980 1981 1981 1981 1987
SUMMARY STATISTICS FOR 2001 CALENDAR YEAR FOR 2002 WATER YEAR WATER YEARS 1978 - 2002
ANNUAL TOTAL 9472.44 ANNUAL MEAN 26.0HIGHEST ANNUAL MEANLOWEST ANNUAL MEANHIGHEST DAILY MEAN 349 LOWEST DAILY MEAN 0.00ANNUAL SEVEN-DAY MINIMUM 0.00MAXIMUM PEAK FLOWMAXIMUM PEAK STAGE10 PERCENT EXCEEDS 8750 PERCENT EXCEEDS 0.0090 PERCENT EXCEEDS 0.00
11316.3831.0 17.0
37.1 1984 0.003 1994
Sep 15 154 Oct 1 349 Sep 15 2001Many days 0.00 Many days 0.00 Many daysJan 1 0.00 Apr 12 0.00 Many days
154 Oct 1 355 Sep 15 200132.17 Oct 1 32.94 Mar 7 197987 5711 1.4 0.00 0.00

210 COASTAL AREA BETWEEN ST. JOHNS RIVER AND PONCE DE LEON INLET
02247496 THAYER CANAL NEAR DAYTONA BEACH, FL
LOCATION.--Lat 29° 10'43", long 81° 07'14", in NW1⁄ 4 sec.29, T.15 S., R.31 E., Volusia County, Hydrologic Unit 03080201, on right bank 50 ft upstream from box culverts on 11th Street extension, 1.5 mi above mouth, and 2.2 mi northwest of the intersectionof Interstate Highway 95 and U.S. Highway 92, and 4.3 mi west of Daytona Beach.
DRAINAGE AREA.--33 mi2, approximately.
PERIOD OF RECORD.--December 1982 to September 1988 (gage heights and discharge measurements only). October 1988 to September 2002 (discontinued).
GAGE.--Water-stage recorder. Datum of gage is at NGVD of 1929. (Savage Engineering Co. bench mark).
REMARKS.--Records fair.
DISCHARGE, CUBIC FEET PER SECOND, WATER YEAR OCTOBER 2001 TO SEPTEMBER 2002DAILY MEAN VALUES
DAY OCT NOV DEC JAN FEB MAR APR MAY JUN JUL AUG SEP
1 93 12 46 8.7 2 85 11 43 8.93 79 10 39 104 74 9.9 36 9.65 70 10 33 8.9
4.8 2.9 0.71 0.00 0.00 8.5 76 684.6 3.3 0.64 0.00 0.00 27 79 664.4 3.9 0.57 0.00 0.00 40 88 604.1 10 0.52 0.00 0.00 49 97 543.8 11 0.46 0.00 0.00 55 94 51
6 66 12 31 8.67 63 11 29 8.38 61 11 28 7.89 60 11 27 7.410 57 10 25 7.0
3.5 9.7 0.41 0.00 0.00 57 106 463.4 9.2 0.36 0.00 0.00 50 99 423.4 8.9 0.33 0.00 0.00 47 92 393.2 8.6 0.29 0.00 0.00 45 86 363.0 7.9 0.26 0.00 0.00 46 80 33
11 54 9.9 24 6.7 12 51 9.4 23 6.413 48 10 23 6.414 45 42 22 6.815 46 71 22 8.7
2.8 7.3 0.24 0.00 0.00 47 75 30 2.5 6.6 0.24 0.00 0.00 46 75 292.3 6.2 0.26 0.00 0.21 48 82 462.1 5.6 0.31 0.00 0.17 51 92 542.0 5.0 0.33 0.00 0.12 51 91 64
16 43 67 21 8.317 42 68 20 7.718 39 68 20 7.519 37 68 19 7.220 35 67 17 7.1
1.9 4.4 0.29 0.00 0.09 52 93 691.8 4.0 0.27 0.00 0.07 52 96 721.7 3.6 0.25 0.00 0.24 49 96 681.6 3.2 0.23 0.00 0.46 45 99 701.5 2.8 0.22 0.00 0.61 41 109 72
21 33 66 16 7.022 33 65 15 6.8 23 31 64 14 6.6 24 30 63 14 6.3 25 27 62 13 5.9
1.4 2.5 0.22 0.00 0.78 36 95 72 1.5 2.3 0.21 0.00 1.0 37 84 70 2.3 2.1 0.19 0.00 1.5 44 74 67 3.6 1.8 0.18 0.00 1.7 64 66 65 3.4 1.6 0.17 0.00 2.2 59 58 61
26 23 60 12 6.3 27 19 58 11 6.1 28 16 55 11 5.8 29 14 52 10 5.5 30 13 49 9.7 5.3 31 13 --- 9.2 5.0
3.1 1.5 0.17 0.00 2.4 58 50 59 2.9 1.3 0.15 0.00 3.0 76 45 65 2.8 1.2 0.12 0.00 2.7 76 40 71 --- 1.0 0.07 0.00 2.7 81 36 71 --- 0.90 0.02 0.00 5.5 79 43 70 --- 0.81 --- 0.00 --- 76 62 --
TOTAL 1400 1182.2 682.9 224.6 MEAN 45.2 39.4 22.0 7.25 MAX 93 71 46 10MIN 13 9.4 9.2 5.0
79.4 141.11 8.69 0.00 25.45 1592.5 2458 1740 2.84 4.55 0.29 0.000 0.85 51.4 79.3 58.04.8 11 0.71 0.00 5.5 81 109 72 1.4 0.81 0.02 0.00 0.00 8.5 36 29
STATISTICS OF MONTHLY MEAN DATA FOR WATER YEARS 1989 - 2002, BY WATER YEAR (WY)
MEAN 22.1 14.4 11.1 11.9 MAX 47.7 39.6 47.7 65.3(WY) 1996 1995 1998 1998 MIN 0.000 0.000 0.000 0.000 (WY) 1994 1991 1989 1991
8.11 9.91 4.41 0.47 2.09 7.48 11.0 20.0 45.7 50.2 30.1 5.75 22.8 51.4 79.3 83.81998 1998 1996 1996 1991 2002 2002 20010.000 0.000 0.000 0.000 0.000 0.000 0.000 0.0001991 1997 1997 1994 1989 1989 2000 1990
SUMMARY STATISTICS FOR 2001 CALENDAR YEAR FOR 2002 WATER YEAR WATER YEARS 1989 - 2002
ANNUAL TOTAL 6471.91 ANNUAL MEAN 17.7 HIGHEST ANNUAL MEAN LOWEST ANNUAL MEAN HIGHEST DAILY MEAN 252 LOWEST DAILY MEAN 0.00 ANNUAL SEVEN-DAY MINIMUM 0.00MAXIMUM PEAK FLOWMAXIMUM PEAK STAGE10 PERCENT EXCEEDS 6450 PERCENT EXCEEDS 0.5390 PERCENT EXCEEDS 0.00
9534.8526.1 10.3
26.1 20020.024 1994
Sep 15 109 Aug 20 252 Sep 15 2001 Many days 0.00 Many days 0.00 Many days Jan 1 0.00 May 1 0.00 Many days
118 Aug 20 290 Sep 14 200125.18 Aug 20 27.50 Sep 14 200171 36 9.9 0.43 0.00 0.00

211 COASTAL AREA BETWEEN ST. JOHNS RIVER AND PONCE DE LEON INLET
02247509 ELEVENTH STREET CANAL AT HOLLY HILL, FL
LOCATION.--Lat 29° 14'44", long 81° 02'30", in SE1⁄ 4 sec.35, T.14 S., R.32 E., Volusia County, Hydrologic Unit 03080201, near center of span on upstream side of bridge on U.S. Highway 1, 50 ft south of the intersection with LPGA Boulevard in Holly Hill, 0.3 mi upstream from mouth.
DRAINAGE AREA.--12.7 mi2.
PERIOD OF RECORD.--December 2000 to current year.
GAGE.--Water-stage recorder and data-collection platform. Datum of gage is at NGVD of 1929 (Florida Department of Transportation bench mark). Acoustic velocity meter for Reed Canal at South Daytona (02248025) used as auxiliary gage for this station.
REMARKS.--Records poor. Discharge computed from gage-height record at 11th Street Canal and velocity record at Reed Canal. Flow is affected by tides in the Intracoastal Waterway.
DISCHARGE, CUBIC FEET PER SECOND, WATER YEAR OCTOBER 2001 TO SEPTEMBER 2002DAILY MEAN VALUES
DAY OCT NOV DEC JAN FEB MAR APR MAY JUN JUL AUG SEP
1 48 16 14 8.92 43 15 14 153 33 16 12 16 4 26 15 18 16 5 23 23 19 9.8
8.9 14 13 8.7 10 7.6 13 148.8 17 12 7.7 9.3 14 16 13
11 18 11 4.5 7.5 19 32 12 11 37 9.5 4.0 6.9 e23 21 23 10 15 9.6 5.7 7.7 e25 15 18
6 17 24 18 7.2 7 11 23 17 5.5 8 15 19 16 5.69 22 16 15 5.410 21 14 15 4.9
10 13 12 7.9 7.0 e30 15 16 10 13 9.9 7.5 6.6 e28 56 148.8 13 9.2 12 15 e25 26 168.5 11 8.8 7.8 11 e27 28 1610 8.5 6.6 4.3 10 e26 23 19
11 14 15 16 4.812 18 17 16 5.113 18 30 15 6.314 28 213 16 1215 22 188 13 13
8.8 9.6 5.8 3.9 14 e27 25 188.0 11 8.6 4.0 13 28 25 148.4 14 13 6.0 15 16 43 15 7.7 11 21 4.7 16 9.9 37 14 11 9.6 14 4.9 13 7.3 26 12
16 19 86 12 8.5 17 21 64 16 7.418 22 50 13 6.519 24 27 12 5.720 21 18 11 5.5
13 8.5 9.4 6.2 11 6.5 22 10 11 7.1 8.2 6.7 17 6.2 18 9.49.3 6.5 8.1 6.5 23 5.2 15 10 9.7 7.0 7.3 12 27 8.9 14 118.7 8.9 6.8 13 48 13 17 11
21 26 12 11 5.5 22 24 e11 11 5.723 16 e11 13 6.424 11 e10 12 6.325 7.2 e11 9.8 6.0
7.2 9.6 6.9 11 39 8.9 11 1110 10 8.4 7.9 45 9.8 7.8 13 26 12 8.0 12 47 21 13 16 31 11 9.7 13 30 23 9.9 1821 9.8 10 11 20 15 13 18
26 9.6 e12 6.0 1127 10 13 10 1128 15 17 8.7 9.529 16 17 9.1 8.830 17 16 9.2 8.1 31 11 --- 9.7 9.2
18 9.8 8.0 9.2 12 13 13 17 16 10 9.0 8.6 17 11 14 14 13 9.0 12 10 13 8.3 13 10--- 11 10 12 9.2 4.6 11 11 --- 13 7.4 13 11 3.6 12 4.2 --- 13 --- 12 --- 5.6 14 --
TOTAL 628.8 1019 407.5 256.6 MEAN 20.3 34.0 13.1 8.28 MAX 48 213 19 16 MIN 7.2 10 6.0 4.8
334.8 370.9 293.2 257.7 531.2 476.4 618.7 417.612.0 12.0 9.77 8.31 17.7 15.4 20.0 13.9 31 37 21 13 48 30 56 237.2 6.5 5.8 3.9 6.6 3.6 7.8 4.2
STATISTICS OF MONTHLY MEAN DATA FOR WATER YEARS 2001 - 2002, BY WATER YEAR (WY)
MEAN 20.3 34.0 10.1 5.50 MAX 20.3 34.0 13.1 8.28(WY) 2002 2002 2002 2002 MIN 20.3 34.0 3.79 2.73(WY) 2002 2002 2001 2001
7.43 11.2 7.79 6.57 12.1 12.5 14.6 26.7 12.0 12.0 9.77 8.31 17.7 15.4 20.0 39.52002 2002 2002 2002 2002 2002 2002 2001 2.91 10.5 5.80 4.83 6.46 9.65 9.34 13.92001 2001 2001 2001 2001 2001 2001 2002
SUMMARY STATISTICS FOR 2001 CALENDAR YEAR FOR 2002 WATER YEAR WATER YEARS 2001 - 2002
ANNUAL TOTAL 4837.84 ANNUAL MEAN 13.3 HIGHEST ANNUAL MEAN LOWEST ANNUAL MEAN HIGHEST DAILY MEAN 263 LOWEST DAILY MEAN 0.81ANNUAL SEVEN-DAY MINIMUM 1.8MAXIMUM PEAK STAGE 10 PERCENT EXCEEDS 2350 PERCENT EXCEEDS 7.490 PERCENT EXCEEDS 2.6
5612.415.4 12.9
15.4 20029.86 2001
Sep 14 213 Nov 14 263 Sep 14 2001Aug 13 3.6 Jul 30 0.81 Aug 13 2001Jan 1 4.9 May 10 1.8 Jan 1 2001
3.75 Nov 14 4.35 Sep 15 200125 2312 9.5 6.6 3.1
e Estimated

212 COASTAL AREA BETWEEN ST. JOHNS RIVER AND PONCE DE LEON INLET
02247510 TOMOKA RIVER NEAR HOLLY HILL, FL
LOCATION.--Lat 29° 13'02", long 81° 06'32", in NW1⁄ 4 sec.9, T.15 S., R.32 E., Volusia County, Hydrologic Unit 03080201, near center of span on downstream side of bridge on 11th Street extension, 0.3 mi southwest of Interstate Highway 95, 2 mi upstream from Priest Branch, 4.5 mi southwest of Holly Hill, and 12 mi upstream from mouth.
DRAINAGE AREA.--76.8 mi2.
PERIOD OF RECORD.--October 1964 to current year.
GAGE.--Water-stage recorder. Datum of gage is at NGVD of 1929 (Florida Department of Transportation bench mark).
REMARKS.--Records fair.
EXTREMES OUTSIDE PERIOD OF RECORD.--Flood of Sept. 11, 1964, reached a stage of 12.65 ft, from floodmarks, discharge, 2,170 ft3/s.
DISCHARGE, CUBIC FEET PER SECOND, WATER YEAR OCTOBER 2001 TO SEPTEMBER 2002DAILY MEAN VALUES
DAY OCT NOV DEC JAN FEB MAR APR MAY JUN JUL AUG SEP
1 406 42 96 18 2 345 34 87 20 3 293 33 77 27 4 260 32 70 24 5 231 32 66 22
15 15 5.3 2.1 2.2 106 143 126 18 16 5.7 2.0 1.9 132 181 116 16 18 5.1 2.1 1.6 130 272 109 16 74 4.9 3.0 1.4 125 527 101 14 73 4.4 2.5 1.4 276 362 104
6 208 38 65 21 7 185 43 60 20 8 173 36 53 19 9 180 32 50 1810 158 28 48 18
14 51 4.0 2.1 1.3 389 342 90 13 45 3.5 1.9 1.3 260 360 79 16 36 3.2 1.9 1.8 195 344 70 17 31 3.2 1.8 2.6 151 276 6212 28 3.0 1.8 1.6 134 229 56
11 141 26 47 1712 126 25 44 1613 112 37 41 1614 103 484 40 1915 105 1010 38 36
11 25 2.9 1.6 2.3 120 194 5210 26 3.2 1.5 3.4 118 170 509.7 22 4.6 1.4 7.4 202 215 839.2 20 10 1.3 20 229 559 1288.6 18 37 1.2 21 179 398 119
16 112 596 35 3917 100 403 34 2718 88 326 32 23 19 79 300 31 21 20 73 265 29 20
8.5 17 18 1.2 13 144 314 1208.1 15 11 1.3 12 121 288 129 7.5 14 8.1 1.3 21 106 404 133 6.9 13 6.8 3.9 30 93 345 125 6.7 12 5.8 6.2 41 82 395 119
21 76 248 28 20 22 118 222 26 1823 96 198 25 1724 87 178 25 1625 77 166 24 15
6.4 11 5.2 3.0 54 73 343 114 8.0 11 4.4 2.3 71 67 283 109 23 9.4 3.8 2.2 105 100 229 105 56 8.7 3.4 2.1 121 202 182 103 44 8.0 3.2 1.7 117 166 145 115
26 68 153 24 1827 57 140 28 1928 49 130 22 1729 41 118 20 17 30 38 107 19 17 31 39 --- 18 16
33 7.4 2.8 1.6 98 130 120 11123 7.0 2.8 2.3 91 134 106 10117 6.5 2.5 2.5 71 146 91 100 --- 6.1 2.3 2.6 53 148 79 98 --- 5.6 2.2 2.5 48 144 79 96 --- 5.3 --- 2.2 --- 139 109 --
TOTAL 4224 5482 1302 631MEAN 136 183 42.0 20.4 MAX 406 1010 96 39 MIN 38 25 18 15CFSM 1.77 2.38 0.55 0.27 IN. 2.05 2.66 0.63 0.31
447.6 655.0 182.3 67.1 1017.2 4741 8084 302316.0 21.1 6.08 2.16 33.9 153 261 101 56 74 37 6.2 121 389 559 1336.4 5.3 2.2 1.2 1.3 67 79 500.21 0.28 0.08 0.03 0.44 1.99 3.40 1.31 0.22 0.32 0.09 0.03 0.49 2.30 3.92 1.46
STATISTICS OF MONTHLY MEAN DATA FOR WATER YEARS 1965 - 2002, BY WATER YEAR (WY)
MEAN 96.7 51.1 37.6 49.2 MAX 401 205 238 204(WY) 1970 1995 1984 1979 MIN 2.35 2.63 1.97 2.05(WY) 1981 1991 1991 1981
46.9 46.9 30.6 12.4 37.2 46.1 64.8 98.6195 233 182 72.5 343 222 261 4601998 1996 1983 1966 1976 1966 2002 2001 2.50 2.65 0.47 0.52 0.30 0.94 1.43 3.652001 1985 1968 1981 1981 1977 1988 1993
SUMMARY STATISTICS FOR 2001 CALENDAR YEAR FOR 2002 WATER YEAR WATER YEARS 1965 - 2002
ANNUAL TOTAL 30258.81ANNUAL MEAN 82.9 HIGHEST ANNUAL MEAN LOWEST ANNUAL MEAN HIGHEST DAILY MEAN 2130LOWEST DAILY MEAN 0.70ANNUAL SEVEN-DAY MINIMUM 1.1MAXIMUM PEAK FLOWMAXIMUM PEAK STAGEINSTANTANEOUS LOW FLOWANNUAL RUNOFF (CFSM) 1.08ANNUAL RUNOFF (INCHES) 14.6610 PERCENT EXCEEDS 22550 PERCENT EXCEEDS 2090 PERCENT EXCEEDS 2.3
29856.281.8 51.5
99.6 19705.11 1981
Sep 15 1010 Nov 15 2130 Sep 15 2001Mar 12 1.2 May 15,16 *0.00Mar 6 1.3 May 12 0.00 Jun 26 1981
1160 Nov 14 2850 Sep 14 200111.44 Nov 14 13.27 Sep 14 2001 1.1 May 15 1.07 0.6714.46 9.11
218 13734 17 2.5 2.1
*Feb. 24,25,1968, June 26 to July 8, 1981

------ --- --- ---
---
213 COASTAL AREA BETWEEN ST. JOHNS RIVER AND PONCE DE LEON INLET
02247598 TOMOKA RIVER NEAR ORMOND BEACH, FL
LOCATION.--Lat 29° 20'26", long 81° 05'11", in NW1⁄ 4 sec.42, T.13 S., R.32 E., Volusia County, Hydrologic Unit 03080201, attached to pier on right bank in the south picnic area of Tomoka State Park, 1.0 mi upstream from mouth, and 4.8 mi north of the City Hall in Ormond Beach.
DRAINAGE AREA.--101 mi2.
PERIOD OF RECORD.--October 2000 to current year.
GAGE.--Water-stage recorder, acoustic velocity meter, and data collection platform. Datum of gage is undetermined.
REMARKS.--Records poor. Discharge not published some days, due to missing gage height record. Flow affected by tides in the Intracoastal Waterway.
DISCHARGE, CUBIC FEET PER SECOND, WATER YEAR OCTOBER 2001 TO SEPTEMBER 2002DAILY MEAN VALUES
DAY OCT NOV DEC JAN FEB MAR APR MAY JUN JUL AUG SEP
1 862 153 191 87 244 -33 146 170 -58 133 -23 2 520 160 141 -9.8 129 -19 25 160 -66 42 -140 3 424 140 76 64 -62 174 35 161 -149 2.0 -181 4 475 -6.3 71 11 24 125 -51 100 -217 340 -221 5 437 -371 -20 -126 -193 75 -111 -76 -121 251 338
6 379 -178 30 440 29 24 -135 -73 15 155 --- 321 7 99 240 45 125 287 38 -80 -46 -19 122 187 8 -172 203 -137 45 -38 -49 22 77 -198 181 157 131 9 31 126 65 127 -42 78 4.7 132 -248 288 268 275
10 262 -284 -97 258 83 44 -5.5 184 -137 245 245 65
11 286 -194 77 297 182 -93 -37 133 74 227 322 207 12 174 -216 33 309 162 -27 120 115 122 161 219 25 13 88 -571 28 220 60 50 173 164 216 187 362 145 14 321 683 175 179 24 143 187 146 72 294 352 457 15 66 1410 252 257 -212 215 161 -36 13 169 346 333
16 84 699 80 273 48 216 107 49 -33 -- 233 210 17 220 525 144 183 31 204 116 86 50 -- 211 95 18 204 503 258 204 -117 217 154 244 -71 -- 326 -31 19 149 290 117 332 76 178 151 -217 -53 --- 300 133 20 202 202 -0.32 136 52 64 59 -372 -18 -- 315 149
21 8.7 56 28 140 46 225 -53 -168 4.6 -- 392 100 22 -109 53 -25 61 -83 -129 -2.6 -543 251 --- 253 185 23 -175 211 -62 100 -90 -73 -95 -538 402 --- 157 263 24 68 164 48 168 -145 -12 -329 90 394 -- 186 425 25 165 171 -98 270 42 58 139 250 386 -- 159 53
26 -3.0 153 121 -83 8.4 -56 16 77 358 --- 195 356 27 -108 134 76 15 224 -6.9 6.8 47 237 --- 212 303 28 -305 142 -31 129 -11 23 238 69 346 --- 168 30 29 -191 158 55 157 --- -10 199 -117 221 --- 134 23 30 -81 205 157 200 -- 158 54 -55 211 -- 86 -252 31 123 --- 135 177 --- 115 --- -43 --- --- 17 --
TOTAL 4503.7 4960.7 1932.68 4745.2 758.4 1916.1 1214.4 170 1984.6 2797.0 5615 3961 MEAN 145 165 62.3 153 27.1 61.8 40.5 5.48 66.2 186 234 132 MAX 862 1410 258 440 287 225 238 250 402 340 392 457 MIN -305 -571 -137 -126 -212 -129 -329 -543 -248 2.0 17 -252
STATISTICS OF MONTHLY MEAN DATA FOR WATER YEARS 2001 - 2002, BY WATER YEAR (WY)
MEAN 58.3 165 50.4 137 MAX 145 165 62.3 153 (WY) 2002 2002 2002 2002MIN -28.6 165 38.5 121 (WY) 2001 2002 2001 2001
84.3 131 91.2 18.6 99.9 122 129 365 142 201 142 31.7 134 122 129 5972001 2001 2001 2001 2001 2001 2001 200127.1 61.8 40.5 5.48 66.2 122 129 1322002 2002 2002 2002 2002 2001 2001 2002
SUMMARY STATISTICS FOR 2001 CALENDAR YEAR #FOR 2002 WATER YEAR #WATER YEARS 2001 - 2002
ANNUAL TOTAL 60280.08ANNUAL MEAN 165 HIGHEST ANNUAL MEANLOWEST ANNUAL MEANHIGHEST DAILY MEAN 2830LOWEST DAILY MEAN -1000 ANNUAL SEVEN-DAY MINIMUM -99 MAXIMUM PEAK STAGE10 PERCENT EXCEEDS 33750 PERCENT EXCEEDS 14090 PERCENT EXCEEDS -94
34561.63 101 121
141 2001 101 2002
Sep 15 1410 Nov 15 2830 Sep 15 2001Mar 19 -571 Nov 13 -1000 Mar 19 2001Nov 7 -215 May 17 -248 Oct 18 2000
4.22 Nov 15 5.05 Sep 15 2001 307 309 104 116 -117 -117
# Includes partial year(s) of record Note.--Negative figures indicate reverse flow
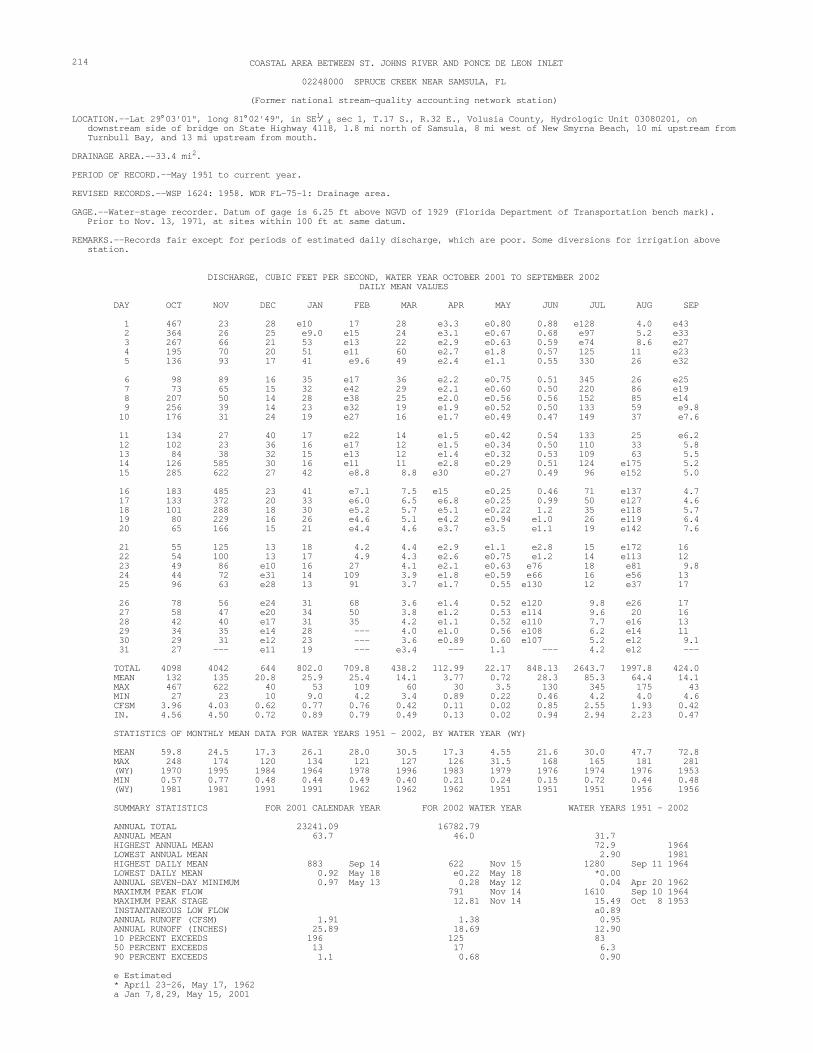
214 COASTAL AREA BETWEEN ST. JOHNS RIVER AND PONCE DE LEON INLET
02248000 SPRUCE CREEK NEAR SAMSULA, FL
(Former national stream-quality accounting network station)
LOCATION.--Lat 29° 03'01", long 81° 02'49", in SE1⁄ 4 sec 1, T.17 S., R.32 E., Volusia County, Hydrologic Unit 03080201, on downstream side of bridge on State Highway 4118, 1.8 mi north of Samsula, 8 mi west of New Smyrna Beach, 10 mi upstream from Turnbull Bay, and 13 mi upstream from mouth.
DRAINAGE AREA.--33.4 mi2.
PERIOD OF RECORD.--May 1951 to current year.
REVISED RECORDS.--WSP 1624: 1958. WDR FL-75-1: Drainage area.
GAGE.--Water-stage recorder. Datum of gage is 6.25 ft above NGVD of 1929 (Florida Department of Transportation bench mark). Prior to Nov. 13, 1971, at sites within 100 ft at same datum.
REMARKS.--Records fair except for periods of estimated daily discharge, which are poor. Some diversions for irrigation above station.
DISCHARGE, CUBIC FEET PER SECOND, WATER YEAR OCTOBER 2001 TO SEPTEMBER 2002DAILY MEAN VALUES
DAY OCT NOV DEC JAN FEB MAR APR MAY JUN JUL AUG SEP
1 467 23 28 e10 2 364 26 25 e9.03 267 66 21 534 195 70 20 515 136 93 17 41
17 28 e3.3 e0.80 0.88 e128 4.0 e43e15 24 e3.1 e0.67 0.68 e97 5.2 e33e13 22 e2.9 e0.63 0.59 e74 8.6 e27e11 60 e2.7 e1.8 0.57 125 11 e23 e9.6 49 e2.4 e1.1 0.55 330 26 e32
6 98 89 16 357 73 65 15 328 207 50 14 289 256 39 14 2310 176 31 24 19
e17 36 e2.2 e0.75 0.51 345 26 e25e42 29 e2.1 e0.60 0.50 220 86 e19e38 25 e2.0 e0.56 0.56 152 85 e14e32 19 e1.9 e0.52 0.50 133 59 e9.8e27 16 e1.7 e0.49 0.47 149 37 e7.6
11 134 27 40 1712 102 23 36 1613 84 38 32 1514 126 585 30 1615 285 622 27 42
e22 14 e1.5 e0.42 0.54 133 25 e6.2e17 12 e1.5 e0.34 0.50 110 33 5.8e13 12 e1.4 e0.32 0.53 109 63 5.5 e11 11 e2.8 e0.29 0.51 124 e175 5.2 e8.8 8.8 e30 e0.27 0.49 96 e152 5.0
16 183 485 23 4117 133 372 20 3318 101 288 18 3019 80 229 16 2620 65 166 15 21
e7.1 7.5 e15 e0.25 0.46 71 e137 4.7 e6.0 6.5 e6.8 e0.25 0.99 50 e127 4.6 e5.2 5.7 e5.1 e0.22 1.2 35 e118 5.7 e4.6 5.1 e4.2 e0.94 e1.0 26 e119 6.4 e4.4 4.6 e3.7 e3.5 e1.1 19 e142 7.6
21 55 125 13 1822 54 100 13 1723 49 86 e10 1624 44 72 e31 1425 96 63 e28 13
4.2 4.4 e2.9 e1.1 e2.8 15 e172 164.9 4.3 e2.6 e0.75 e1.2 14 e113 12
27 4.1 e2.1 e0.63 e76 18 e81 9.8109 3.9 e1.8 e0.59 e66 16 e56 13 91 3.7 e1.7 0.55 e130 12 e37 17
26 78 56 e24 3127 58 47 e20 3428 42 40 e17 3129 34 35 e14 28 30 29 31 e12 23 31 27 --- e11 19
68 3.6 e1.4 0.52 e120 9.8 e26 1750 3.8 e1.2 0.53 e114 9.6 20 1635 4.2 e1.1 0.52 e110 7.7 e16 13 --- 4.0 e1.0 0.56 e108 6.2 e14 11 --- 3.6 e0.89 0.60 e107 5.2 e12 9.1 --- e3.4 --- 1.1 --- 4.2 e12 --
TOTAL 4098 4042 644 802.0 MEAN 132 135 20.8 25.9 MAX 467 622 40 53 MIN 27 23 10 9.0 CFSM 3.96 4.03 0.62 0.77 IN. 4.56 4.50 0.72 0.89
709.8 438.2 112.99 22.17 848.13 2643.7 1997.8 424.025.4 14.1 3.77 0.72 28.3 85.3 64.4 14.1109 60 30 3.5 130 345 175 434.2 3.4 0.89 0.22 0.46 4.2 4.0 4.60.76 0.42 0.11 0.02 0.85 2.55 1.93 0.42 0.79 0.49 0.13 0.02 0.94 2.94 2.23 0.47
STATISTICS OF MONTHLY MEAN DATA FOR WATER YEARS 1951 - 2002, BY WATER YEAR (WY)
MEAN 59.8 24.5 17.3 26.1 MAX 248 174 120 134(WY) 1970 1995 1984 1964 MIN 0.57 0.77 0.48 0.44(WY) 1981 1981 1991 1991
28.0 30.5 17.3 4.55 21.6 30.0 47.7 72.8121 127 126 31.5 168 165 181 2811978 1996 1983 1979 1976 1974 1976 1953 0.49 0.40 0.21 0.24 0.15 0.72 0.44 0.481962 1962 1962 1951 1951 1951 1956 1956
SUMMARY STATISTICS FOR 2001 CALENDAR YEAR FOR 2002 WATER YEAR WATER YEARS 1951 - 2002
ANNUAL TOTAL 23241.09ANNUAL MEAN 63.7 HIGHEST ANNUAL MEAN LOWEST ANNUAL MEAN HIGHEST DAILY MEAN 883 LOWEST DAILY MEAN 0.92 ANNUAL SEVEN-DAY MINIMUM 0.97MAXIMUM PEAK FLOW MAXIMUM PEAK STAGE INSTANTANEOUS LOW FLOWANNUAL RUNOFF (CFSM) 1.91ANNUAL RUNOFF (INCHES) 25.8910 PERCENT EXCEEDS 19650 PERCENT EXCEEDS 1390 PERCENT EXCEEDS 1.1
16782.7946.0 31.7
72.9 19642.90 1981
Sep 14 622 Nov 15 1280 Sep 11 1964May 18 e0.22 May 18 *0.00 May 13 0.28 May 12 0.04 Apr 20 1962
791 Nov 14 1610 Sep 10 1964 12.81 Nov 14 15.49 Oct 8 1953
a0.89 1.38 0.9518.69 12.90
125 8317 6.3 0.68 0.90
e Estimated* April 23-26, May 17, 1962 a Jan 7,8,29, May 15, 2001

215 COASTAL AREA BETWEEN ST.JOHNS RIVER AND PONCE DE LEON INLET
02248025 REED CANAL AT SOUTH DAYTONA, FL
LOCATION.--Lat 29° 09'30", long 80° 59'43", in NE1⁄ 4 sec. 33, T. 15 S., R. 33 E., Volusia County, Hydrologic Unit 03080201, at center of span on upstream side of bridge on U.S. Highway 1, 50 ft south of the intersection with Reed Canal Road, in thetown of South Daytona, and 0.15 mi upstream from mouth.
DRAINAGE AREA.--3.75 mi2.
PERIOD OF RECORD.--December 2000 to current year.
GAGE.--Water-stage recorder, acoustic velocity meter, and data-collection platform. Datum of gage is at NGVD of 1929 (City of Daytona benchmark).
REMARKS.--Records fair except for periods of estimated daily discharge, which are poor. Flow affected by tides in the Intracoastal Waterway.
DISCHARGE, CUBIC FEET PER SECOND, WATER YEAR OCTOBER 2001 TO SEPTEMBER 2002DAILY MEAN VALUES
DAY OCT NOV DEC JAN FEB MAR APR MAY JUN JUL AUG SEP
1 62 18 19 5.4 2 58 18 16 16 3 43 19 11 174 33 19 19 24 5 30 31 21 10
12 14 9.7 6.3 1.9 0.08 15 8.6 12 19 8.4 8.5 2.6 14 18 3.19.5 27 7.6 3.2 -1.5 27 40 -0.34
12 57 8.1 3.1 -5.8 e20 20 208.0 26 1.6 -0.03 -4.5 e45 11 11
6 23 28 21 6.2 7 11 30 22 7.8 8 13 31 19 8.2 9 22 27 18 7.5 10 22 20 13 6.9
7.3 21 3.7 0.86 -4.7 e40 6.7 11 14 22 -0.45 1.9 -4.0 e35 81 4.9 12 21 0.11 17 16 e32 19 4.28.7 17 4.1 9.7 -1.5 e20 19 4.611 12 3.2 -0.08 -5.2 e18 14 10
11 12 19 13 6.8 12 20 23 14 7.6 13 20 36 13 1114 39 265 16 19 15 29 237 15 25
12 12 -0.55 -2.6 3.2 e28 20 129.4 12 2.5 -4.3 4.6 44 22 7.59.4 18 12 2.5 12 12 59 7.9 6.5 17 26 1.1 16 2.1 57 8.4 7.1 15 18 -2.8 11 -0.01 37 12
16 20 102 10 1417 22 79 17 12 18 25 65 19 1019 27 30 17 8.520 24 19 14 8.2
12 14 10 -0.33 5.5 -0.65 32 10 12 11 7.7 2.6 16 -2.4 26 8.4 5.7 9.9 7.9 6.0 29 -5.8 23 6.88.8 11 6.7 9.2 34 2.9 20 3.2
11 12 6.9 2.9 68 16 26 1.3
21 33 e20 11 7.8 22 33 e25 11 8.123 20 e25 13 8.524 9.6 e22 16 9.425 4.0 e20 8.3 9.6
11 16 4.3 -0.76 52 6.2 11 -0.52 17 11 5.5 -11 61 7.7 2.2 -0.12 47 8.7 0.65 -6.6 67 29 15 4.4 45 8.8 -1.2 -0.49 45 33 7.0 9.4 24 7.3 0.77 0.42 27 22 16 9.3
26 10 e18 8.1 1727 10 15 11 1228 17 25 7.6 1129 16 24 7.0 1230 19 23 7.3 10 31 8.1 --- 6.7 12
18 7.5 -2.3 -1.9 11 21 15 8.9 18 7.0 -3.3 -2.5 21 16 17 11 16 0.99 4.3 -0.59 15 8.0 17 4.2--- 2.6 8.4 0.79 8.5 e10 11 3.7 --- 5.7 3.8 4.1 10 e15 14 -2.6 --- 7.0 --- 3.3 --- e17 14 --
TOTAL 734.7 1333 434.0 348.5 MEAN 23.7 44.4 14.0 11.2 MAX 62 265 22 25 MIN 4.0 15 6.7 5.4
396.4 450.49 164.13 49.49 510.1 532.12 704.9 202.2214.2 14.5 5.47 1.60 17.0 17.2 22.7 6.74 47 57 26 17 68 45 81 205.7 0.99 -3.3 -11 -5.8 -5.8 2.2 -2.6
STATISTICS OF MONTHLY MEAN DATA FOR WATER YEARS 2001 - 2002, BY WATER YEAR (WY)
MEAN 23.7 44.4 12.7 10.1 MAX 23.7 44.4 14.0 11.2(WY) 2002 2002 2002 2002 MIN 23.7 44.4 10.0 8.95(WY) 2002 2002 2001 2001
12.0 19.9 11.1 6.35 17.5 21.3 23.0 37.5 14.2 25.2 16.6 11.1 18.1 25.4 23.3 68.22002 2001 2001 2001 2001 2001 2001 2001 9.90 14.5 5.47 1.60 17.0 17.2 22.7 6.742001 2002 2002 2002 2002 2002 2002 2002
SUMMARY STATISTICS FOR 2001 CALENDAR YEAR FOR 2002 WATER YEAR WATER YEARS 2001 - 2002
ANNUAL TOTAL 8777.87 ANNUAL MEAN 24.0 HIGHEST ANNUAL MEAN LOWEST ANNUAL MEAN HIGHEST DAILY MEAN 364 LOWEST DAILY MEAN 0.37ANNUAL SEVEN-DAY MINIMUM 7.2MAXIMUM PEAK STAGE 10 PERCENT EXCEEDS 4150 PERCENT EXCEEDS 1790 PERCENT EXCEEDS 8.1
5860.0516.1 18.8
22.3 2001 16.1 2002
Sep 14 265 Nov 14 364 Sep 14 2001Mar 10 -11 May 22 -11 May 22 2002Mar 6 -3.3 May 21 -3.3 May 21 2002
3.89 Nov 15 4.12 Sep 15 200130 3612 13 0.56 3.5
e Estimated Note.--Negative figures indicate reverse flow
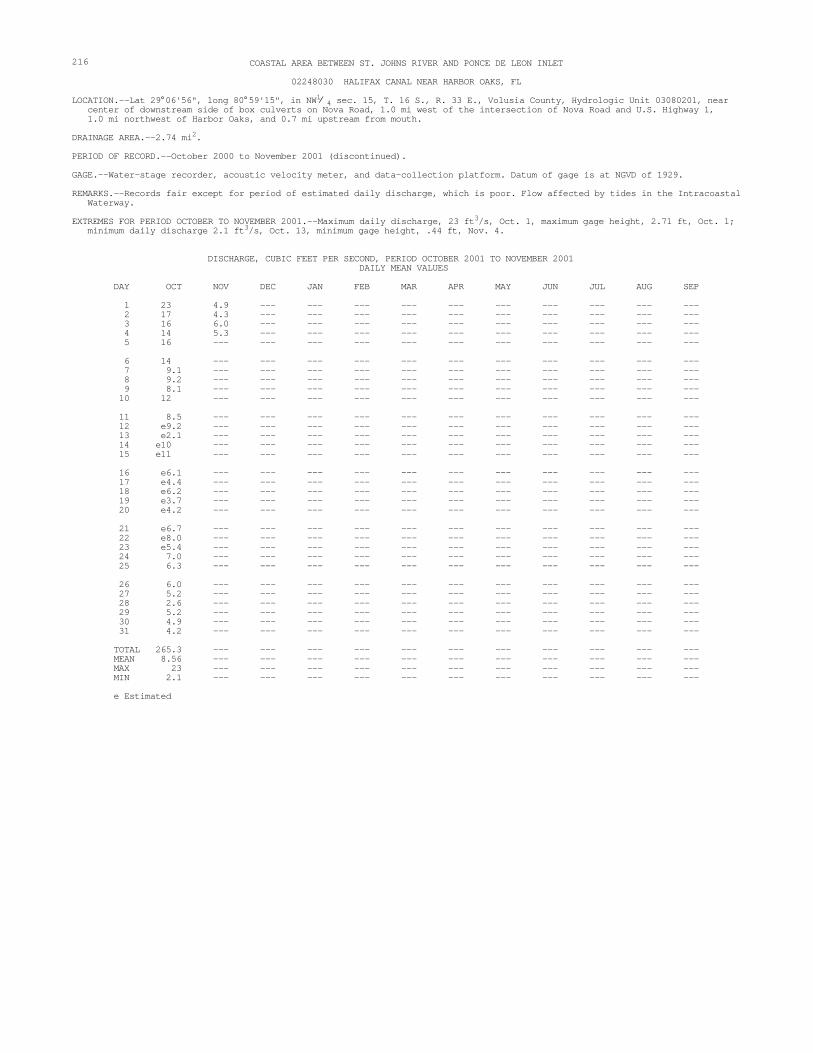
--- --- --- --- ------ --- --- --- ------ --- --- --- ------ --- --- --- ---
--- --- --- --- --- ---
--- --- --- --- --- ------ --- --- --- --- ------ --- --- --- --- ------ --- --- --- --- ---
--- --- --- --- ---
--- --- --- --- --- ------ --- --- --- ------ --- --- --- ---
--- --- --- --- --- ------ --- --- --- --- ---
--- --- --- --- ------ --- --- --- ------ --- --- --- ------ --- --- --- ------ --- --- --- ---
--- --- --- --- ------ --- --- --- ------ --- --- --- ---
--- --- --- --- --- ------ --- --- --- --- ---
--- --- --- --- --- ------ --- --- --- --- ------ --- --- --- --- ------ --- --- --- --- ------ --- --- --- --- ------ --- --- --- --- ---
--- --- --- --- --- ------ --- --- --- ---
--- --- --- --- --- ------ --- --- --- --- ---
216 COASTAL AREA BETWEEN ST. JOHNS RIVER AND PONCE DE LEON INLET
02248030 HALIFAX CANAL NEAR HARBOR OAKS, FL
LOCATION.--Lat 29° 06'56", long 80° 59'15", in NW1⁄ 4 sec. 15, T. 16 S., R. 33 E., Volusia County, Hydrologic Unit 03080201, near center of downstream side of box culverts on Nova Road, 1.0 mi west of the intersection of Nova Road and U.S. Highway 1, 1.0 mi northwest of Harbor Oaks, and 0.7 mi upstream from mouth.
DRAINAGE AREA.--2.74 mi2.
PERIOD OF RECORD.--October 2000 to November 2001 (discontinued).
GAGE.--Water-stage recorder, acoustic velocity meter, and data-collection platform. Datum of gage is at NGVD of 1929.
REMARKS.--Records fair except for period of estimated daily discharge, which is poor. Flow affected by tides in the Intracoastal Waterway.
EXTREMES FOR PERIOD OCTOBER TO NOVEMBER 2001.--Maximum daily discharge, 23 ft3/s, Oct. 1, maximum gage height, 2.71 ft, Oct. 1; minimum daily discharge 2.1 ft3/s, Oct. 13, minimum gage height, .44 ft, Nov. 4.
DISCHARGE, CUBIC FEET PER SECOND, PERIOD OCTOBER 2001 TO NOVEMBER 2001DAILY MEAN VALUES
DAY OCT NOV DEC JAN FEB MAR APR MAY JUN JUL AUG SEP
1 23 4.9 -- -- -- -- --2 17 4.3 -- -- -- -- --3 16 6.0 -- -- -- -- --4 14 5.3 -- -- -- -- --5 16 -- -- -- -- --
6 14 -- -- -- -- --7 9.1 --- --- --- --- --- 8 9.2 --- --- --- --- --- 9 8.1 --- --- --- --- --- 10 12 --- --- --- --- --- --
11 8.5 -- -- -- -- --12 e9.2 --- --- --- --- --- --13 e2.1 --- --- --- --- --- --14 e10 -- -- -- -- --15 e11 -- -- -- -- --
16 e6.1 --- --- --- --- --- --17 e4.4 --- --- --- --- --- --18 e6.2 --- --- --- --- --- --19 e3.7 --- --- --- --- --- --20 e4.2 --- --- --- --- --- --
21 e6.7 --- --- --- --- --- --22 e8.0 --- --- --- --- --- --23 e5.4 --- --- --- --- --- --24 7.0 -- -- -- -- --25 6.3 -- -- -- -- --
26 6.0 -- -- -- -- --27 5.2 -- -- -- -- --28 2.6 -- -- -- -- --29 5.2 -- -- -- -- --30 4.9 -- -- -- -- --31 4.2 -- -- -- -- --
TOTAL 265.3 --- --- --- --- --- MEAN 8.56 --- --- --- --- --- -- MAX 23 -- -- -- -- -- MIN 2.1 --- --- --- --- ---
e Estimated

217 COASTAL AREA BETWEEN ST. JOHNS RIVER AND PONCE DE LEON INLET
02248053 SPRUCE CREEK NEAR NEW SMYRNA BEACH, FL
LOCATION.--Lat 29° 04'21", long 80° 59'25", in NW1⁄ 4 sec. 34, T. 16 S., R. 33 E., Volusia County, Hydrologic Unit 03080201, near left bank, 0.5 mi upstream from railroad crossing at Strickland Bay, 2.5 mi upstream from mouth, and 4.6 mi northwest of the City Hall in New Smyrna Beach.
DRAINAGE AREA.--60.7 mi2.
PERIOD OF RECORD.--December 2000 to current year.
GAGE.--Water-stage recorder, acoustic velocity meter, and data-collection platform. Datum of gage is undetermined.
REMARKS.--Records fair. Flow affected by tides in the Intracoastal Waterway.
DISCHARGE, CUBIC FEET PER SECOND, WATER YEAR OCTOBER 2001 TO SEPTEMBER 2002DAILY MEAN VALUES
DAY OCT NOV DEC JAN FEB MAR APR MAY JUN JUL AUG SEP
1 899 -13 23 332 600 -52 18 683 402 26 -6.9 127 4 323 -47 20 170 5 257 -66 -3.5 118
246 -14 -33 130 -54 219 246 -17 176 181 37 190 3.1 150 196 -10 113 374 149 70 -14 96 215 -120 207 416 20 -6.4 -110 306 224 -61 -59 51 -118 -132 -118 801 116 -2.7
6 172 186 -9.6 256 7 -19 150 15 201 8 82 49 20 219 9 359 33 45 182
10 260 -1.9 -28 178
57 5.9 -156 -159 -123 1090 9.4 -135 239 49 -179 -105 -90 448 77 -15495 13 -104 -60 -194 262 191 -4052 49 -28 -43 -207 214 141 21
138 -39 39 -47 -161 227 141 51
11 169 -49 -8.0 206 12 85 -132 -42 187 13 7.2 -191 -37 51 14 104 1120 46 254 15 312 2180 45 136
112 -48 -67 -59 -85 181 148 5983 23 9.5 -115 -52 108 159 36
175 206 -75 155 0.43 242 292 23 -18 139 78 -77 90 282 654 1221 85 102 -158 84 180 441 65
16 273 1460 -99 224 17 124 1050 59 205 18 97 698 227 281 19 117 564 289 252 20 121 345 238 127
182 226 -18 -46 54 80 306 89 216 191 30 39 28 46 222 62 -71 144 44 142 -13 3.8 207 -6086 133 83 -17 -13 54 198 -123
168 274 157 -117 -18 157 608 -87
21 97 173 165 262 22 41 166 65 -22 23 22 98 141 114 24 33 75 234 207 25 60 28 143 256
144 202 92 -152 -27 156 445 -116 197 -59 98 -309 142 51 169 -8745 -7.9 -113 -117 453 100 90 -5289 -75 -162 -107 427 188 129 1839 -72 -62 -98 392 181 36 -18
26 -42 -0.33 76 101 27 -47 -31 100 108 28 -166 -48 81 93 29 -73 -16 114 83 30 -26 14 47 147 31 -28 --- 52 176
48 -17 -228 -181 273 216 49 60 157 -92 -94 -119 153 175 133 20740 -159 114 -112 98 176 148 169
--- -71 154 -81 4.4 177 55 23 --- 39 38 -13 151 266 27 -125 --- 63 --- e94 --- 229 -4.5 --
TOTAL 4615.2 7767.77 2029.0 5000MEAN 149 259 65.5 161 MAX 899 2180 289 281 MIN -166 -191 -99 -22
2977 2210.0 -192.5 -1610.4 1073.93 7061.8 6067.9 -312.7 106 71.3 -6.42 -51.9 35.8 228 196 -10.4246 416 157 190 453 1090 654 207 -71 -159 -228 -309 -207 3.8 -4.5 -154
STATISTICS OF MONTHLY MEAN DATA FOR WATER YEARS 2001 - 2002, BY WATER YEAR (WY)
MEAN 149 259 73.7 111 MAX 149 259 125 161 (WY) 2002 2002 2001 2002MIN 149 259 65.5 61.6(WY) 2002 2002 2002 2001
72.5 104 29.0 -44.2 71.8 187 188 290 106 137 64.4 -36.4 108 228 196 5902002 2001 2001 2001 2001 2002 2002 200138.7 71.3 -6.42 -51.9 35.8 146 180 -10.42001 2002 2002 2002 2002 2001 2001 2002
SUMMARY STATISTICS FOR 2001 CALENDAR YEAR FOR 2002 WATER YEAR WATER YEARS 2001 - 2002
ANNUAL TOTAL 53490.99ANNUAL MEAN 147 HIGHEST ANNUAL MEANLOWEST ANNUAL MEANHIGHEST DAILY MEAN 2770LOWEST DAILY MEAN -342ANNUAL SEVEN-DAY MINIMUM -182MAXIMUM PEAK STAGE10 PERCENT EXCEEDS 30450 PERCENT EXCEEDS 8290 PERCENT EXCEEDS -70
36687.00 101 119
143 2001 101 2002
Sep 15 2180 Nov 15 2770 Sep 15 2001Mar 19 -309 May 22 -342 Mar 19 2001May 1 -155 May 21 -182 May 1 2001
3.91 Nov 15 4.05 Sep 15 2001 262 273 65 78
-101 -89
e Estimated Note.--Negative figures indicate reverse flow.

218 COASTAL AREA BETWEEN ST. JOHNS RIVER AND PONCE DE LEON INLET
02248060 TURNBULL CREEK NEAR NEW SMYRNA BEACH, FL
LOCATION.--Lat 29° 03'03", long 80° 57'35", in SW1⁄ 4 sec. 40, T. 17 S., R. 33 E., Volusia County, Hydrologic Unit 03080201, near left bank, 75 ft upstream from Turnbull Bay Road, 1.9 mi northwest of the intersection of Turnbull Bay Road and U.S. Highway 1, 2.0 mi upstream from mouth, and 2.8 mi northwest of the City Hall in New Smyrna Beach.
DRAINAGE AREA.--11.3 mi2.
PERIOD OF RECORD.--October 2000 to current year.
GAGE.--Water-stage recorder, acoustic velocity meter, and data-collection platform. Datum of gage is undetermined.
REMARKS.--Records fair except for period of estimated daily discharge, which is poor. Flow affected by tides in the Intracoastal Waterway.
DISCHARGE, CUBIC FEET PER SECOND, WATER YEAR OCTOBER 2001 TO SEPTEMBER 2002DAILY MEAN VALUES
DAY OCT NOV DEC JAN FEB MAR APR MAY JUN JUL AUG SEP
1 432 72 25 64 7.5 2 274 56 23 76 -4.03 167 87 7.6 154 0.174 163 48 87 115 185 152 13 80 102 31
71 33 39 37 41 e33 9281 44 34 26 51 e27 6925 30 21 13 43 e26 7932 27 21 0.47 26 e19 18144 22 41 1.2 175 e9.0 121
6 128 288 63 52 317 48 157 45 27 -2.38 286 65 31 37 3.8 9 327 49 30 32 14
10 226 27 200 16 0.81
31 78 62 4.4 164 e5.2 2.4 9.5 59 25 -9.7 84 15 -28 8.3 38 -5.5 -69 66 155 45 3.9 30 -9.6 -30 85 158 113-7.8 11 -17 19 70 134 141
11 163 42 104 11 12 104 8.4 55 1.113 76 6.1 50 3.4 14 136 708 63 24 15 162 981 30 25
-11 -5.3 -8.3 -20 38 41 160 96-11 -12 15 -27 55 23 144 43 -7.6 21 25 0.29 59 72 107 30-16 4.8 28 -45 60 66 99 38 44 4.0 31 12 16 59 65 21
16 186 753 30 36 17 161 552 57 13 18 164 352 37 7.1 19 183 277 32 4.0 20 187 171 20 2.9
43 8.2 25 15 40 26 42 5.6 15 4.5 22 7.6 11 15 33 -3.5 22 0.08 26 -7.2 20 26 25 -22 43 -6.0 20 -57 16 19 5.9 -120.17 0.31 11 17 40 2.5 76 21
21 165 118 51 1.6 22 106 132 45 -0.39 23 104 95 33 5.1 24 101 74 20 -1.5 25 104 53 43 -0.32
-8.1 0.30 10 13 23 22 83 3.5-12 -7.0 7.4 -64 72 13 24 48 40 29 -18 70 55 e12 65 103 138 25 16 38 100 e16 96 107 71 5.9 31 4.8 79 e24 61 101
26 62 45 75 -17 27 62 20 73 1728 71 34 39 7.5 29 115 33 41 -2.4 30 133 28 42 -5.7 31 80 --- 55 4.5
19 -4.0 -24 -24 65 e23 57 103 6.1 -16 40 -3.4 63 e28 67 54
73 -29 69 -3.3 56 e23 50 15 --- 6.6 50 29 35 e21 43 38 --- 46 37 74 21 e21 50 28 --- 51 --- 60 --- e35 65 --
TOTAL 4828 5344.5 1586.6 810.89MEAN 156 178 51.2 26.2MAX 432 981 200 154 MIN 48 6.1 7.6 -17
548.55 425.29 785.1 300.69 916.37 1392.5 1999.1 1633.019.6 13.7 26.2 9.70 30.5 44.9 64.5 54.4 138 81 78 74 100 175 160 181 -16 -29 -24 -64 -69 2.5 5.2 -28
STATISTICS OF MONTHLY MEAN DATA FOR WATER YEARS 2001 - 2002, BY WATER YEAR (WY)
MEAN 113 99.7 26.6 4.92MAX 156 178 51.2 26.2(WY) 2002 2002 2002 2002MIN 69.4 21.3 1.96 -16.3(WY) 2001 2001 2001 2001
-1.09 22.1 10.7 8.47 17.3 36.1 52.4 15019.6 35.7 26.2 9.70 30.5 44.9 64.5 2462002 2001 2002 2002 2002 2002 2002 2001
-21.8 13.7 -4.82 7.23 -4.80 14.9 36.8 54.42001 2002 2001 2001 2001 2001 2001 2002
SUMMARY STATISTICS FOR 2001 CALENDAR YEAR FOR 2002 WATER YEAR WATER YEARS 2001 - 2002
ANNUAL TOTAL 19759.64ANNUAL MEAN 62.5HIGHEST ANNUAL MEANLOWEST ANNUAL MEANHIGHEST DAILY MEAN 981 LOWEST DAILY MEAN -65 ANNUAL SEVEN-DAY MINIMUM -34MAXIMUM PEAK STAGE10 PERCENT EXCEEDS 16450 PERCENT EXCEEDS 1490 PERCENT EXCEEDS -22
20570.5956.4 46.1
56.4 200234.3 2001
Nov 15 981 Nov 15 981 Nov 15 2001Feb 23 -69 Jun 8 -69 Jun 8 2002Feb 3 -18 May 8 -34 Feb 3 2001
14.70 Nov 15 14.70 Nov 15 2001 137 115 32 22-3.7 -18
e Estimated Note.--Negative figures indicate reverse flow

219 COASTAL AREA BETWEEN PONCE DE LEON INLET AND SEBASTIAN INLET
02248380 HAULOVER CANAL NEAR MIMS, FL
LOCATION.--Lat 28° 44'10", long 80° 45'18", in SE1⁄ 4 sec. 19, T. 20 S., R. 36 E., Brevard County, Hydrologic Unit 03080202, under the bridge on Kennedy Parkway, 8.7 mi south of the intersection of U.S. Highway 1 and Kennedy Parkway, and 7.3 mi northeast of Mims.
DRAINAGE AREA.--Indeterminate. WATER-DISCHARGE RECORDS
PERIOD OF RECORD.--August 1995 to current year.
GAGE.--Water-stage recorder, acoustic velocity meter, and data-collection platform. Datum of gage is at NGVD of 1929.
REMARKS.--Records poor.
DISCHARGE, CUBIC FEET PER SECOND, WATER YEAR OCTOBER 2001 TO SEPTEMBER 2002DAILY MEAN VALUES
DAY OCT NOV DEC JAN FEB MAR APR MAY JUN JUL AUG SEP
1 -4050 890 -1890 -2590 2 -1650 1040 -1450 -773 -131 -168 -2840 -25804 -839 -1730 -2950 -31605 254 -4020 -1310 -1380
-1130 1200 -1300 1050 -1140 1620 -865 -2370-2100 7460 -204 1310 1270 -361 -588 -1650 -2380 5390 805 2430 1180 1580 -512 -2700 -1790 -3280 -1660 2730 1340 583 351 312 -2970 1190 -3000 -557 330 -660 -1290 2600
6 1950 -4140 -308 38407 -2340 -1360 1020 -1030 8 -3530 732 2280 -9229 -2250 -196 -356 -21 10 2120 -474 1820 1280
3560 785 -3640 -2190 1850 557 -1590 246 4740 -1270 -198 1060 1130 792 -3570 -890-3320 -397 5000 2240 -1390 1260 -4000 -2360 -624 178 5760 2710 -2070 1820 -2380 -1980 2510 -1970 3800 2180 -935 2700 -1580 527
11 2330 -1020 -531 197 12 1770 -1720 555 944 13 4250 -2850 730 -729 14 4820 -3390 2580 99615 -3480 -5160 -792 -1170
-2070 -904 1590 2200 98 2990 -315 963 240 2460 2000 2640 1330 2080 3180 1800
-2080 88 2480 2630 3030 3960 1300 3650 -2630 -933 1230 -1220 1360 -339 2020 3540 -208 208 190 -1750 3010 962 3600 2240
16 -2580 -5000 -110 -126017 -4370 -4440 3890 376 18 -3170 -2330 246 -57319 -273 -931 72 2010 20 -2200 597 -1850 -157
-1570 2520 1680 2030 508 1080 3660 1710 -1580 647 1400 2380 1100 516 4010 1010 -2890 2140 963 2620 364 -333 1720 18 2750 1310 991 -1810 790 1650 1810 3324530 4210 2040 e-2000 1460 560 -18 610
21 682 -1210 -2690 98422 414 1100 390 -191023 659 2910 3040 283024 1980 3330 387 2940 25 1110 1620 -2320 931
3410 927 1710 e-2250 3100 1070 1190 -811 -748 -3730 428 e-2750 3710 255 76 -83-2830 -3490 -2160 -3090 2220 2730 -591 -21 -3830 -453 -635 -73 2270 2050 644 2230 -1390 821 4440 -225 3000 2300 2420 4390
26 -3570 444 -2520 -244027 -3540 1780 -495 -2490 28 -3740 1720 1630 -1310 29 -2250 2470 892 139 30 -1180 1800 -1510 1670 31 294 --- -2170 1720
1530 1410 68 -1150 3430 2780 1050 8890-1640 -1090 1690 1460 1700 1370 2220 4520-3310 -2000 1500 -2570 3350 1440 2100 -488--- 1340 -915 -2830 1960 1060 421 -1500 --- 3610 -328 -789 1210 139 450 -1100 --- 1570 --- 525 --- 41 -1420 --
TOTAL -22510 -19706 -6560 -2942 MEAN -726 -657 -212 -94.9 MAX 4820 3330 3890 3840 MIN -4370 -5160 -2950 -3160
-17820 19947 25725 6941 40565 38252 13503 23635 -636 643 858 224 1352 1234 436 788 4740 7460 5760 2730 3710 3960 4010 8890-3830 -3730 -3640 -3090 -2070 -660 -4000 -2700
STATISTICS OF MONTHLY MEAN DATA FOR WATER YEARS 1996 - 2002, BY WATER YEAR (WY)
MEAN -673 -547 -742 -367 MAX 939 571 506 144 (WY) 2000 1999 1996 1998MIN -1621 -1250 -1176 -901(WY) 2001 2000 1997 1997
-397 -71.0 383 180 579 679 180 668416 643 858 622 1352 1234 864 21391998 2002 2002 2000 2002 2002 2001 1996-824 -568 -67.7 -616 -1352 147 -576 -2751996 1996 1999 1998 1996 1998 1998 1999
SUMMARY STATISTICS FOR 2001 CALENDAR YEAR FOR 2002 WATER YEAR WATER YEARS 1996 - 2002
ANNUAL TOTAL 32575.2 ANNUAL MEAN 89.2 HIGHEST ANNUAL MEAN LOWEST ANNUAL MEAN HIGHEST DAILY MEAN 5910LOWEST DAILY MEAN -5160ANNUAL SEVEN-DAY MINIMUM -3560MAXIMUM PEAK STAGE 10 PERCENT EXCEEDS 242050 PERCENT EXCEEDS 29790 PERCENT EXCEEDS -2650
99030 271 10.4
271 2002 -247 1997
Jul 23 8890 Sep 26 9420 Sep 8 1996Nov 15 -5160 Nov 15 -7260 Mar 12 1996Nov 12 -3560 Nov 12 -4530 Mar 8 1996
1.71 Oct 14 2.32 Oct 17 19992960 2580 376 179
-2650 -2850
e Estimated Note.--Negative figures indicate reverse flow

---------------
------------
--- ---
--- ------ ------ ------ ------ ---
--- ---------------
------
---
--- --- --- --- --- --- --- --- --- --- --- ---
220 COASTAL AREA BETWEEN PONCE DE LEON INLET AND SEBASTIAN INLET
02248380 HAULOVER CANAL NEAR MIMS, FL
WATER-QUALITY RECORDS
PERIOD OF DAILY RECORD.-- SPECIFIC CONDUCTANCE: April 1998 to current year. WATER TEMPERATURE: April 1998 to current year.
INSTRUMENTATION.--Water-quality monitor (YSI-600R).
REMARKS.--Extremes for current year and extremes for period of daily record are based on recorded values and may have been exceeded during periods of no record.
EXTREMES FOR PERIOD OF DAILY RECORD.--SPECIFIC CONDUCTANCE: Maximum daily mean, 63,500 µS/cm @ 25 ° C, June 9, 2001; minimum daily mean, 30,400 µS/cm @ 25 ° C,
Apr. 9, 1998. WATER TEMPERATURE: Maximum daily mean, 32.3 ° C, July 31, 1999; minimum daily mean, 8.9 ° C, Jan. 5, 2001.
EXTREMES FOR CURRENT YEAR.--SPECIFIC CONDUCTANCE: Maximum daily mean, 53,700 µS/cm @ 25 ° C, June 10; minimum daily mean, 34,200 µS/cm @ 25 ° C, Sept. 27. WATER TEMPERATURE: Maximum daily mean, 32.1 ° C, July 18; minimum daily mean, 13.1 ° C, Dec. 27.
SPECIFIC CONDUCTANCE (MICROSIEMENS/CM AT 25 DEG. C), WATER YEAR OCTOBER 2001 TO SEPTEMBER 2002DAILY MEAN VALUES
DAY OCT NOV DEC JAN FEB MAR APR MAY JUN JUL AUG SEP
1 46200 36600 39900 37300 42100 43800 43100 53300 42600 40000 38600 2 45700 37400 39900 38200 --- 45100 43300 53500 43400 40000 39200 3 45800 38100 39400 39600 --- 44700 42700 53300 43200 39500 39900 4 45800 38700 --- 40300 --- 45400 42200 53000 42400 39200 38900 5 45800 39000 --- 40900 --- 46800 42600 52700 43200 39700 36300
6 45200 39100 --- 40600 --- 48200 44300 51900 43300 --- 37300 7 45700 38800 --- 37900 --- 47300 44400 50600 42600 --- 38600 8 45500 37900 --- 38900 --- 46600 43200 51500 42200 --- 39900 9 45200 37400 --- 39800 --- 43700 42200 52500 42000 --- 40700 10 45100 --- 37800 38100 42200 42800 41600 53700 41500 39900
11 43800 --- 37500 38600 42500 42800 41400 53600 40600 38400 12 43600 --- 37900 38600 41700 42400 41300 52100 39800 37600 13 43100 --- 37500 39200 41200 41400 41200 50600 39300 36800 14 42600 --- 36300 40800 42200 41000 42000 50900 40000 36000 15 43100 41700 36600 40500 42000 41900 44500 48900 40500 35800
16 44100 41700 37700 42000 41500 41000 43500 49400 39800 --17 44700 40200 36200 35800 41400 41300 40900 42900 48700 39300 36200 18 44700 39400 36200 36100 43400 40800 41300 42500 48900 40300 36900 19 43900 39600 37000 35400 42900 40400 41300 43600 47500 39200 37700 20 43200 38800 37700 35200 39800 39400 40500 46400 47600 39400 37000
21 43500 39200 38900 35300 39300 39000 40700 48500 46900 39500 38700 37900 22 43500 39600 39300 36300 39400 41300 41200 50100 45000 39600 38800 39300 23 43700 37400 37400 36100 40300 43800 42200 52100 44400 38900 39100 38300 24 43500 36700 36800 35400 41000 44200 43500 52800 -- 38800 39400 36500 25 42600 36200 38300 35100 41500 44500 42000 52200 43600 38600 38400 35200
26 43600 36700 39200 36400 38300 43600 42100 51600 43400 38700 38100 34700 27 43800 36300 38700 37200 39000 43100 42800 51500 43500 39000 37300 34200 28 43300 36200 36400 38100 41100 45100 42500 51800 42700 39100 36800 35600 29 --- 35900 37100 38300 45000 43600 53000 42700 39000 36400 36400 30 --- 35900 38200 37700 43100 44400 53500 42600 39800 36600 37400 31 -- 39200 36400 -- 43400 -- 53600 -- 40100 37300 --
MEAN -- 37800 40000 43100 46100 -- 40500 --MAX -- 39300 43400 48200 53600 -- 43400 --MIN -- 36200 37300 40500 41200 -- 38600 --

--- --- ------
------------
---
------------
--------- ---
---------
COASTAL AREA BETWEEN PONCE DE LEON INLET AND SEBASTIAN INLET 221
02248380 HAULOVER CANAL NEAR MIMS, FL--Continued
TEMPERATURE, WATER (DEG. C), WATER YEAR OCTOBER 2001 TO SEPTEMBER 2002 DAILY MEAN VALUES
DAY OCT NOV DEC JAN FEB MAR APR MAY JUN JUL AUG SEP
1 22.8 --- 23.3 15.1 24.0 15.0 25.3 28.1 28.6 27.8 30.7 30.1 2 22.9 23.5 15.2 23.5 -- 25.6 28.7 29.7 28.2 29.8 30.3 3 23.9 23.3 14.2 22.1 -- 25.4 29.3 30.4 28.8 29.2 30.0 4 24.9 22.9 --- 20.3 --- 25.3 29.3 30.3 28.5 29.9 28.7 5 26.0 22.4 --- 17.1 --- 24.5 28.9 30.2 28.5 30.5 27.9
6 27.0 22.7 --- 17.5 --- 22.4 28.2 29.9 29.1 30.8 28.6 7 27.4 23.4 --- 18.4 --- 21.9 28.2 29.5 29.8 30.0 28.8 8 26.0 23.8 --- 16.8 --- 21.5 27.8 29.1 29.7 28.1 28.9 9 23.9 24.2 --- 17.4 --- 22.2 27.6 28.4 28.8 27.9 29.1 10 23.6 --- 24.2 19.0 22.1 23.3 27.8 28.3 28.2 27.7 29.4
11 24.1 --- 24.1 19.1 21.2 24.0 27.9 28.2 28.3 27.1 29.1 12 24.8 --- 24.5 19.0 22.0 23.4 28.0 28.7 27.9 27.6 27.8 13 25.1 --- 24.3 18.2 22.4 23.6 27.8 29.2 27.8 27.4 28.0 14 25.4 --- 24.3 17.0 21.9 24.0 27.2 29.5 28.6 28.0 28.4 15 25.7 20.4 24.5 -- 17.7 22.5 24.8 24.6 28.5 30.0 28.6 29.0
16 25.6 20.3 24.3 -- 18.7 23.8 25.7 24.9 28.6 31.0 29.0 29.6 17 23.3 20.8 23.4 17.2 17.6 24.8 26.3 26.0 27.6 31.5 29.5 30.1 18 22.2 21.6 22.8 18.2 16.6 24.9 27.1 26.9 27.0 32.1 30.4 30.4 19 23.2 21.6 22.0 18.9 17.2 25.3 27.4 26.6 26.8 31.8 30.6 30.6 20 24.4 21.8 20.1 19.7 18.2 25.2 27.4 24.2 26.5 31.4 30.4 30.0
21 24.8 21.9 18.4 20.6 19.8 24.8 27.3 23.2 26.0 29.5 30.2 29.6 22 24.9 22.0 18.4 21.4 20.4 23.5 28.0 22.6 25.5 29.2 30.5 28.9 23 25.5 22.2 18.5 22.2 19.0 21.0 27.5 23.3 25.7 29.7 30.7 28.9 24 26.4 22.6 19.2 22.5 17.3 21.9 26.4 24.3 26.0 29.9 31.0 28.7 25 26.7 22.8 17.8 22.5 17.3 23.0 26.5 25.6 26.5 30.5 30.3 28.7
26 24.3 23.5 16.0 22.5 18.8 24.0 27.0 26.2 27.0 30.9 29.9 28.6 27 20.1 23.6 13.1 21.5 18.3 24.2 27.5 26.8 27.4 31.0 29.7 28.7 28 17.9 23.4 13.2 21.8 14.8 24.6 27.3 26.9 27.9 31.3 29.3 29.3 29 23.3 15.1 22.5 --- 24.9 27.6 27.3 28.2 31.4 28.8 29.2 30 23.1 16.0 23.2 --- 24.9 27.7 28.3 28.0 31.6 29.3 29.1 31 --- 16.1 23.6 --- 25.4 --- 28.3 31.4 29.7 --
MEAN --- 21.0 --- 18.6 --- 25.5 26.8 28.1 29.8 29.4 29.1 MAX --- 24.5 --- 24.0 --- 28.0 29.3 30.4 32.1 31.0 30.6 MIN --- 13.1 --- 14.8 --- 21.5 22.6 25.5 27.8 27.1 27.8

222 COASTAL AREA BETWEEN PONCE DE LEON INLET AND SEBASTIAN INLET
02249007 EAU GALLIE RIVER AT HEATHER GLEN CIRCLE AT MELBOURNE, FL
LOCATION.--Lat 28° 07'36", long 80° 38'49", in NW1⁄ 4 sec.20, T.27 S., R.37 E., Brevard County, Hydrologic Unit 03080202, on right bank, 0.2 mi upstream from concrete spillway, 0.7 mi north of Sarno Road, 1.7 mi upstream from mouth, and 3.8 mi northwest of Melbourne.
DRAINAGE AREA.--3.8 mi2.
PERIOD OF RECORD.--January 1991 to current year.
GAGE.--Water-stage recorder. Datum of gage is 10.00 ft below NGVD of 1929.
REMARKS.--Records poor.
DISCHARGE, CUBIC FEET PER SECOND, WATER YEAR OCTOBER 2001 TO SEPTEMBER 2002DAILY MEAN VALUES
DAY OCT NOV DEC JAN FEB MAR APR MAY JUN JUL AUG SEP
1 32 7.4 10 4.6 2 23 10 10 6.5 3 19 12 10 5.1 4 16 12 10 4.1 5 15 12 9.0 4.1
4.6 8.1 2.4 2.8 2.3 18 11 9.34.4 7.1 3.1 2.8 2.1 15 34 9.44.1 6.3 5.0 2.7 2.1 13 44 113.7 5.5 5.4 2.7 2.1 11 40 143.2 4.9 4.4 2.4 2.1 7.8 45 15
6 15 8.8 8.3 4.47 15 8.5 8.8 4.58 15 7.3 8.5 4.1 9 14 6.8 8.3 4.110 14 8.3 8.7 5.1
3.2 4.6 2.1 2.4 2.1 8.3 45 138.0 4.6 2.0 2.4 7.6 8.3 26 11 5.0 4.6 1.8 2.4 14 7.8 19 6.45.4 4.6 1.8 2.4 4.8 9.2 26 5.8
11 4.6 1.8 2.4 3.0 39 18 5.8
11 14 8.3 7.9 6.112 14 8.3 7.4 6.513 17 18 7.4 6.5 14 17 103 7.4 1315 15 67 6.5 40
12 4.0 1.9 2.4 3.4 27 20 5.95.6 3.6 42 2.4 3.3 55 66 7.05.0 4.0 19 2.4 3.2 36 39 6.54.8 4.1 12 2.3 4.4 23 41 6.74.3 4.8 16 2.1 11 19 37 6.4
16 17 30 7.4 1617 14 21 7.4 14 18 13 19 7.4 13 19 19 16 7.4 1120 14 14 4.6 9.3
4.1 5.7 7.1 2.1 6.1 16 27 5.8 4.7 4.8 3.4 2.4 16 e15 24 5.8 6.0 3.4 3.2 2.6 15 e10 21 6.4 5.8 3.2 3.2 9.6 19 e11 19 6.64.6 3.2 3.2 2.3 20 e10 17 7.3
21 18 12 4.6 6.922 18 13 5.4 4.623 15 12 5.5 4.424 30 12 5.2 4.325 82 11 5.0 4.6
3.4 3.2 3.2 2.0 17 e14 16 7.47.2 4.7 3.2 2.4 30 e16 19 7.0
21 4.5 3.6 2.5 39 e15 17 6.0 19 4.1 3.6 2.1 26 e14 15 9.9 11 3.8 3.4 2.1 18 e12 11 9.2
26 55 13 4.6 4.627 21 11 4.6 4.628 14 12 4.6 4.629 11 12 4.6 4.630 8.7 12 4.6 4.631 8.0 --- 4.6 4.6
10 5.6 3.4 2.0 15 e12 8.5 7.39.7 8.2 3.4 1.8 12 e11 10 6.78.9 4.0 2.9 2.0 12 e10 12 6.1--- 3.0 2.8 1.8 11 e9.5 11 4.9--- 2.4 3.5 2.1 19 e8.8 11 6.7--- 2.4 --- 4.0 --- e8.5 15 --
TOTAL 612.7 517.7 215.7 234.4MEAN 19.8 17.3 6.96 7.56 MAX 82 103 10 40 MIN 8.0 6.8 4.6 4.1
199.7 141.6 173.8 80.8 342.6 490.2 764.5 236.37.13 4.57 5.79 2.61 11.4 15.8 24.7 7.88 21 8.2 42 9.6 39 55 66 153.2 2.4 1.8 1.8 2.1 7.8 8.5 4.9
STATISTICS OF MONTHLY MEAN DATA FOR WATER YEARS 1991 - 2002, BY WATER YEAR (WY)
MEAN 21.6 12.4 7.47 8.65 MAX 45.0 33.5 20.6 24.8(WY) 2000 1995 1998 1998 MIN 8.15 4.72 3.19 2.83(WY) 1994 1996 2001 2001
8.33 9.55 7.19 6.59 11.9 15.4 19.7 22.3 27.6 19.7 10.6 14.8 23.6 30.5 52.5 41.81998 1998 1991 1991 1994 2001 1995 1999 2.90 4.57 3.53 2.61 3.34 3.35 4.24 7.692001 2002 1999 2002 1993 1993 1993 1993
SUMMARY STATISTICS FOR 2001 CALENDAR YEAR FOR 2002 WATER YEAR WATER YEARS 1991 - 2002
ANNUAL TOTAL 4960.0ANNUAL MEAN 13.6 HIGHEST ANNUAL MEAN LOWEST ANNUAL MEAN HIGHEST DAILY MEAN 156 LOWEST DAILY MEAN 1.5 ANNUAL SEVEN-DAY MINIMUM 1.6MAXIMUM PEAK FLOW MAXIMUM PEAK STAGE10 PERCENT EXCEEDS 3150 PERCENT EXCEEDS 7.490 PERCENT EXCEEDS 2.4
4010.011.0 12.6
17.7 19987.88 1993
Sep 14 103 Nov 14 a501 Aug 2 1995 Feb 19-21 b1.8 0.00 Aug 19 1996Feb 16 2.0 May 24 1.6 Feb 16 2001
258 Nov 14 14.67 Nov 14 16.70 Aug 2 199520 24 7.4 7.8 2.4 3.3
e Estimated a From rating curve extended above 298 ft3/s. b April 8-10, May 27,29

---
------
223 COASTAL AREA BETWEEN PONCE DE LEON INLET AND SEBASTIAN INLET
02249510 CRANE CREEK AT BABCOCK STREET AT MELBOURNE, FL
LOCATION.--Lat 28° 04'06", long 80° 37'17", in NW1⁄ 4 sec. 10, T. 28 S., R. 37 E., Brevard County, Hydrologic Unit 03080202, on downstream side of bridge on Babcock Street, 0.9 mi southwest of Melbourne City Hall, and 1.7 mi upstream from mouth.
DRAINAGE AREA.--15.5 mi2.
PERIOD OF RECORD.--January 1987 to current year.
GAGE.--Water-stage recorder. Datum of gage is 10.00 ft below NGVD of 1929 (U.S. Army Corps of Engineers benchmark).
REMARKS.--Stage affected by tides in the Indian River.
EXTREMES FOR PERIOD OF RECORD.--Maximum gage height, 18.78 ft, Aug. 2, 1995; minimum, 9.73 ft, June 16, 1989.
EXTREMES FOR CURRENT YEAR--Maximum gage height, 15.39 ft, Nov. 14; minimum, 9.93 ft, May 17.
GAGE HEIGHT, FEET, WATER YEAR OCTOBER 2001 TO SEPTEMBER 2002DAILY MEAN VALUES
DAY OCT NOV DEC JAN FEB MAR APR MAY JUN JUL AUG SEP
1 12.05 11.47 10.97 10.74 10.27 10.84 10.62 10.51 11.05 10.95 10.54 10.90 2 11.76 11.52 10.91 10.68 10.38 10.58 10.69 10.48 10.96 10.90 11.77 10.96 3 11.65 11.55 10.91 10.78 10.39 10.58 10.66 10.38 10.91 10.82 11.68 11.14 4 11.62 11.60 10.95 10.78 10.42 10.86 10.72 10.27 10.86 10.80 11.35 11.20 5 11.57 11.83 10.93 10.67 10.48 10.94 10.86 10.34 10.92 10.83 11.19 11.27
6 11.43 11.72 10.95 10.50 10.24 10.59 10.89 10.50 10.92 10.76 11.14 11.31 7 11.49 11.48 10.93 10.55 10.27 10.58 10.72 10.38 11.03 10.74 11.30 11.33 8 11.57 11.31 10.88 10.46 10.59 10.50 10.57 10.33 11.30 10.79 11.48 11.39 9 11.60 11.23 10.90 10.35 10.43 10.46 10.56 10.27 11.16 10.87 11.44 11.41 10 11.52 11.16 10.89 10.23 10.39 10.50 10.64 10.28 11.15 10.98 11.44 11.34
11 11.51 11.16 10.94 10.19 10.55 10.46 10.70 10.25 11.21 10.91 11.68 11.26 12 11.48 11.19 10.97 10.11 10.46 10.34 11.07 10.20 11.12 11.18 12.42 11.20 13 11.43 11.46 10.98 10.12 10.53 10.34 10.78 10.15 11.02 10.99 11.86 11.11 14 11.38 12.72 10.93 10.28 10.53 10.43 10.78 10.33 11.08 10.96 11.68 11.12 15 11.65 12.50 10.97 10.76 10.43 10.43 10.80 10.43 11.02 10.92 11.52 11.09
16 11.62 12.16 11.02 10.33 10.55 10.34 10.72 10.24 11.09 10.85 11.41 11.02 17 11.81 11.97 10.89 10.23 10.57 10.34 10.64 10.19 11.25 11.01 11.29 10.94 18 11.64 11.80 10.88 10.30 10.66 10.24 10.60 10.14 11.23 10.90 11.17 10.90 19 11.64 11.68 10.86 10.19 10.52 10.22 10.56 10.52 11.50 10.79 11.05 10.91 20 11.62 11.53 10.86 10.11 10.48 10.16 10.47 10.89 11.59 10.79 11.03 10.96
21 11.76 11.46 10.88 10.07 10.47 10.17 10.42 10.93 11.64 --- 10.94 11.06 22 11.84 11.33 10.78 10.14 10.60 10.53 10.45 10.95 11.64 --- 10.96 11.14 23 11.56 11.22 10.71 10.06 11.07 10.51 10.61 10.74 11.57 --- 10.94 11.24 24 11.78 11.16 10.78 10.05 11.11 10.38 10.58 10.65 11.46 --- 10.86 11.33 25 12.27 11.12 10.86 10.11 10.90 10.38 10.41 10.72 11.39 --- 10.74 11.38
26 12.34 11.10 10.88 10.18 10.83 10.42 10.54 10.82 11.36 --- 10.80 11.00 27 11.72 11.01 10.73 10.23 10.92 10.57 10.48 10.79 11.21 --- 10.73 11.16 28 11.59 10.98 10.66 10.25 10.98 10.61 10.54 10.93 11.03 --- 10.84 11.23 29 11.50 10.96 10.59 10.23 --- 10.52 10.64 10.94 10.92 --- 10.83 11.20 30 11.47 10.93 10.66 10.19 --- 10.45 10.60 10.91 11.03 --- 10.82 11.19 31 11.47 -- 10.72 10.16 --- 10.54 --- 11.10 10.51 10.91 --
MEAN 11.66 11.48 10.86 10.32 10.57 10.48 10.64 10.53 11.19 --- 11.22 11.16 MAX 12.34 12.72 11.02 10.78 11.11 10.94 11.07 11.10 11.64 12.42 11.41 MIN 11.38 10.93 10.59 10.05 10.24 10.16 10.41 10.14 10.86 10.54 10.90
CAL YR 2001 MEAN 10.89 MAX 14.21 MIN 10.00

224 COASTAL AREA BETWEEN PONCE DE LEON INLET AND SEBASTIAN INLET
02249518 CRANE CREEK AT U.S. HIGHWAY 1 AT MELBOURNE, FL
LOCATION.--Lat 28° 04'37", long 80° 36'09", in SW1⁄ 4 sec. 2, T.28 S., R.37 E., Brevard County, Hydrologic Unit 03080202, near center of channel on downstream side of bridge, 0.25 mi above mouth and 0.6 mi southeast of the City Hall in Melbourne.
DRAINAGE AREA.--18.1 mi2.
PERIOD OF RECORD.--February 1987 to current year.
GAGE.--Water-stage recorder. Datum of gage is 10.00 ft below NGVD of 1929. Auxiliary water-stage recorder at site 1.4 mi upstream.
REMARKS.--Records poor. Stage and discharge affected by tides in the Indian River. Discharge computed by one-dimensionalstreamflow model and daily figures represent the net of larger upstream and downstream discharges.
DISCHARGE, CUBIC FEET PER SECOND, WATER YEAR OCTOBER 2001 TO SEPTEMBER 2002DAILY MEAN VALUES
DAY OCT NOV DEC JAN FEB MAR APR MAY JUN JUL AUG SEP
1 149 46 22 -1.3 2 102 54 22 16 3 81 53 20 6.04 68 54 32 1.8 5 68 51 27 3.6
15 22 -8.1 -12 -11 63 e65 e21 17 22 -1.0 -7.9 -13 48 e86 e218.9 5.5 -6.8 -2.8 -14 44 e66 e21
-1.0 1.0 -6.3 -3.9 -15 42 e38 e208.0 10 -6.7 -11 -16 52 e39 e19
6 56 48 21 2.5 7 49 39 22 2.9 8 52 33 21 6.5 9 52 31 15 1310 39 28 22 16
13 21 0.80 -3.6 -15 38 e34 e18 28 26 6.1 -6.5 25 30 e32 e20 29 18 3.5 -6.5 38 24 e67 e14 12 13 3.2 -5.0 e29 35 e63 e14 12 11 -3.0 -6.0 e18 67 e106 e13
11 32 25 15 1612 17 19 11 1813 33 71 7.3 1714 10 392 8.3 3715 5.5 199 0.80 81
19 16 1.8 -2.2 e17 54 e152 e146.9 14 65 -3.1 e22 86 e117 e132.8 4.0 19 -3.5 e22 67 e74 e126.2 11 -2.6 -12 e23 44 e63 e146.3 14 8.0 2.1 e28 40 e51 e11
16 26 105 19 3617 34 92 6.7 3118 38 68 -2.8 36 19 64 55 0.10 3320 48 54 3.2 26
-1.1 20 3.0 -1.9 e35 33 e45 e11 -3.1 13 -4.3 5.7 e31 66 e63 e10 -1.2 19 -5.8 -9.0 36 48 e42 e9.5 4.1 16 -5.2 14 65 37 e35 e9.6 15 25 -4.7 -6.3 105 e75 e35 e9.6
21 110 54 6.8 2422 135 51 26 2323 83 42 24 2524 154 36 18 2225 287 29 -1.3 26
16 6.8 -6.7 -7.0 108 e119 e30 e1212 3.4 -6.9 -8.4 103 e105 e26 e9.5 61 6.8 -2.9 -2.4 78 e82 e24 e9.7 58 5.5 -5.0 -11 60 e66 e28 e12 29 4.3 -4.8 -15 74 e50 e24 e11
26 253 35 -1.6 18 27 117 29 -0.70 1828 84 26 1.9 1629 72 27 -0.30 1730 60 22 -1.2 1731 54 --- -2.2 16
19 14 -6.8 -14 90 e42 e29 e11 2.2 22 -5.8 -11 70 e52 e30 e11 15 5.4 -4.1 -17 55 e38 e35 e13--- 2.2 -13 -14 45 e37 e27 e11--- 1.6 -6.9 -13 65 e39 e24 e11 --- -1.0 --- 26 --- e35 e37 --
TOTAL 2432.5 1868 362.00 620.0MEAN 78.5 62.3 11.7 20.0 MAX 287 392 32 81 MIN 5.5 19 -2.8 -1.3
409.0 372.5 -7.00 -168.2 1158 1658 1587 405.914.6 12.0 -0.23 -5.43 38.6 53.5 51.2 13.5 61 26 65 26 108 119 152 21
-3.1 -1.0 -13 -17 -16 24 24 9.5
STATISTICS OF MONTHLY MEAN DATA FOR WATER YEARS 1987 - 2002, BY WATER YEAR (WY)
MEAN 78.4 51.2 28.3 30.7 MAX 248 169 74.4 67.5(WY) 2000 1988 1998 1998MIN 21.3 -3.10 1.92 2.87(WY) 1997 2001 2001 2001
30.4 35.4 24.5 21.2 35.3 56.4 68.1 70.7 66.0 89.5 40.6 82.1 74.5 123 224 1371998 1993 1987 1987 1992 2001 1995 20014.22 0.80 -0.23 -5.43 1.42 7.46 14.0 10.82001 2001 2002 2002 1998 1999 2000 1996
SUMMARY STATISTICS FOR 2001 CALENDAR YEAR FOR 2002 WATER YEAR WATER YEARS 1987 - 2002
ANNUAL TOTAL 16946.23ANNUAL MEAN 46.4 HIGHEST ANNUAL MEAN LOWEST ANNUAL MEAN HIGHEST DAILY MEAN 868 LOWEST DAILY MEAN -14ANNUAL SEVEN-DAY MINIMUM -8.1MAXIMUM PEAK STAGE10 PERCENT EXCEEDS 11850 PERCENT EXCEEDS 1890 PERCENT EXCEEDS -1.9
10697.7029.3 42.2
60.2 1988 29.3 2002
Sep 14 392 Nov 14 2150 Aug 2 1995Mar 13 -17 May 28 *-20 Apr 5 1995Mar 10 -14 May 24 -14 May 24 2002
12.47 Nov 15 13.85 Oct 16 199968 8120 30-5.1 3.2
e Estimated * May have been lower during period of no gage-height record, Apr. 6-21, 1995 Note.--Negative figures indicate reverse flow

225 COASTAL AREA BETWEEN PONCE DE LEON INLET AND SEBASTIAN INLET
02250030 TURKEY CREEK AT PALM BAY, FL
LOCATION.--Lat 28° 01'00", long 80° 35'46", in SE1⁄ 4 sec.26, T.28 S., R.37 E., Brevard County, Hydrologic Unit 03080202, near right bank on downstream side of bridge on Port Malabar Boulevard, 1.6 mi southwest of the intersection of U.S. Highway 1 and State Highway 516 in Palm Bay, and 2.0 mi upstream from mouth.
DRAINAGE AREA.--105 mi2, approximately.
PERIOD OF RECORD.--February 1981 to September 1983, October 1983 to December 1986 (gage heights only), January 1987 to September 1988 (fragmentary), October 1988 to current year.
GAGE.--Water-stage recorder, acoustic velocity meter, and data-collection platform. Datum of gage is 5.00 ft below NGVD of 1929. Prior to Oct. 1, 1986 at datum 5.00 ft higher.
REMARKS.--Records fair except for periods of estimated daily discharge, which are poor. Stage and discharge are affected by tides in the Indian River.
DISCHARGE, CUBIC FEET PER SECOND, WATER YEAR OCTOBER 2001 TO SEPTEMBER 2002DAILY MEAN VALUES
DAY OCT NOV DEC JAN FEB MAR APR MAY JUN JUL AUG SEP
1 514 316 116 60 2 479 278 103 54 3 351 268 92 61 4 e303 260 98 87 5 e415 242 96 81
38 e65 48 63 81 737 173 209 36 e75 46 73 97 808 282 196 39 e72 42 73 84 657 576 303 36 e61 43 62 83 558 561 280 19 e62 39 55 86 748 838 251
6 e415 249 130 71 7 e371 234 135 62 8 e430 223 142 65 9 e434 210 137 58 10 e322 201 131 59
19 e69 37 53 100 521 618 226 24 62 36 44 105 407 468 210 16 62 34 46 119 571 364 200 27 62 36 47 112 715 359 17829 57 33 50 95 612 321 173
11 e269 188 112 5512 e242 177 93 5413 e226 171 96 5314 e225 217 95 5315 e222 285 95 87
43 57 43 41 62 545 389 15952 59 51 30 91 506 563 156 48 59 51 34 106 651 487 148 43 55 64 54 117 495 544 144 40 51 75 43 118 396 516 139
16 e214 251 110 14317 e191 217 116 12318 e242 198 109 11419 e329 181 99 10720 e361 168 84 100
36 53 75 46 117 333 438 133 34 52 53 47 115 396 377 124 36 52 44 56 132 381 318 118 39 48 43 63 148 374 273 119 40 48 41 48 673 307 242 115
21 e365 175 66 8422 e430 160 65 6723 447 145 67 6824 378 145 73 6325 579 145 74 65
38 45 38 43 641 300 275 109 35 38 37 44 687 293 274 106 84 41 33 36 587 330 251 101148 42 31 30 578 251 230 122133 41 35 42 626 237 209 e204
26 1080 132 65 5827 774 130 61 6028 624 130 56 5729 466 115 42 5830 392 112 72 4031 398 --- 70 38
97 47 31 62 710 222 198 e11787 132 29 58 848 205 197 e105e66 76 33 57 893 195 186 e90--- 59 47 67 655 199 211 e76--- 58 66 75 447 184 212 e74 --- 51 --- 73 --- 206 224 --
TOTAL 12488 5923 2900 2205 MEAN 403 197 93.5 71.1 MAX 1080 316 142 143 MIN 191 112 42 38
1382 1811 1314 1615 9313 13340 11174 4685 49.4 58.4 43.8 52.1 310 430 360 156148 132 75 75 893 808 838 303 16 38 29 30 62 184 173 74
STATISTICS OF MONTHLY MEAN DATA FOR WATER YEARS 1981 - 2002, BY WATER YEAR (WY)
MEAN 310 181 103 114 MAX 877 544 474 481 (WY) 2000 1995 1998 1998 MIN 68.2 41.1 25.1 33.0(WY) 1982 2001 2001 2001
102 136 89.2 74.4 146 235 260 271426 369 188 125 473 642 725 6391998 1998 1993 1987 1994 2001 1995 1998 31.5 14.1 13.7 32.3 31.0 50.8 56.9 78.42001 2001 1999 2000 2000 1993 1993 1993
SUMMARY STATISTICS FOR 2001 CALENDAR YEAR FOR 2002 WATER YEAR WATER YEARS 1981 - 2002
ANNUAL TOTAL 79299.06ANNUAL MEAN 217 HIGHEST ANNUAL MEAN LOWEST ANNUAL MEAN HIGHEST DAILY MEAN 1900LOWEST DAILY MEAN -8.2ANNUAL SEVEN-DAY MINIMUM -4.2 MAXIMUM PEAK STAGE 10 PERCENT EXCEEDS 51050 PERCENT EXCEEDS 13090 PERCENT EXCEEDS 17
68150 187 168
303 1998 75.7 1981
Jul 20 1080 Oct 26 3530 Aug 3 1995Mar 25 16 Feb 8 -8.8 Nov 20 1994Mar 21 24 Feb 4 -4.2 Mar 21 2001
8.01 Oct 26 12.29 Aug 2 1995 482 376 107 9740 40
e Estimated Note.--Negative figures indicate reverse flow

---
------ ------ ---
226 COASTAL AREA BETWEEN PONCE DE LEON INLET AND SEBASTIAN INLET
02250030 TURKEY CREEK AT PALM BAY, FL--Continued
GAGE HEIGHT, FEET, WATER YEAR OCTOBER 2001 TO SEPTEMBER 2002 DAILY MEAN VALUES
DAY OCT NOV DEC JAN FEB MAR APR MAY JUN JUL AUG SEP
1 7.42 6.54 5.95 5.69 5.20 --- 5.57 5.49 6.03 6.68 5.50 5.92 2 7.06 6.53 5.88 5.66 5.33 --- 5.63 5.45 5.94 6.80 5.74 5.96 3 6.81 6.56 5.89 5.86 5.35 --- 5.61 5.32 5.89 6.47 6.30 6.25 4 6.71 6.60 5.90 5.80 5.42 --- 5.68 5.20 5.86 6.31 6.30 6.25 5 6.64 6.88 5.88 5.66 5.46 --- 5.88 5.31 5.91 6.70 6.89 6.27
6 6.48 6.78 5.91 5.45 5.14 --- 5.90 5.46 5.91 6.24 6.58 6.32 7 6.54 6.52 5.89 5.53 5.07 5.50 5.66 5.31 5.93 6.02 6.48 6.34 8 6.62 6.33 5.84 5.44 5.51 5.45 5.46 5.26 6.03 6.32 6.54 6.39 9 6.62 6.25 5.88 5.31 5.36 5.40 5.43 5.19 6.14 6.58 6.50 6.41 10 6.51 6.17 5.84 5.17 5.31 5.47 5.56 5.20 6.13 6.40 6.49 6.33
11 6.49 6.17 5.90 5.12 5.49 5.42 5.61 5.17 6.14 6.30 6.66 6.26 12 6.47 6.20 5.92 5.04 5.42 5.26 5.68 5.11 6.09 6.26 6.95 6.17 13 6.39 6.31 5.93 5.05 5.53 5.29 5.66 5.06 5.99 6.45 6.79 6.06 14 6.35 6.69 5.88 5.05 5.52 5.38 5.71 5.33 6.08 6.28 6.79 6.07 15 6.66 7.34 5.94 5.22 5.39 5.36 5.72 5.40 6.01 6.12 6.67 6.06
16 6.61 7.16 5.98 5.25 5.52 5.24 5.65 5.16 6.08 5.98 6.51 5.98 17 6.85 6.93 5.85 5.14 5.55 5.27 5.58 5.09 6.07 6.07 6.34 5.92 18 6.65 6.76 5.87 5.16 5.65 5.15 5.55 5.09 6.17 6.04 6.22 5.86 19 6.56 6.65 5.84 5.04 5.45 5.13 5.51 5.40 6.36 5.96 6.07 5.86 20 6.59 6.49 5.85 5.01 5.37 4.98 5.42 5.95 6.93 5.92 6.01 5.90
21 6.58 6.41 5.87 4.95 5.37 5.10 5.36 5.98 6.95 5.89 5.97 6.03 22 6.68 6.28 5.71 5.05 5.52 5.54 5.40 6.01 7.04 5.85 6.02 6.10 23 6.65 6.14 5.61 4.92 5.93 5.50 5.59 5.72 6.91 5.80 5.98 6.20 24 6.61 6.10 5.71 4.92 6.04 5.32 5.54 5.60 6.83 5.73 5.89 6.29 25 6.89 6.08 5.84 4.96 5.88 5.31 5.31 5.67 6.79 5.67 5.75 --
26 7.80 6.05 5.89 5.11 5.77 5.31 5.48 5.80 6.87 5.59 5.73 --27 7.27 5.96 5.71 5.17 5.90 5.51 5.41 5.74 7.07 5.58 5.71 --28 6.99 5.93 5.62 5.19 --- 5.59 5.47 5.93 7.05 5.54 5.70 --29 6.72 5.90 5.54 5.16 --- 5.45 5.61 5.94 6.55 5.52 5.80 --30 6.61 5.87 5.65 5.10 --- 5.35 5.57 5.90 6.22 5.50 5.80 --31 6.63 --- 5.72 5.06 --- 5.46 --- 5.96 5.49 5.88 --
MEAN 6.72 6.42 5.83 5.23 --- 5.57 5.49 6.33 6.07 6.21 -- MAX 7.80 7.34 5.98 5.86 -- 5.90 6.01 7.07 6.80 6.95 MIN 6.35 5.87 5.54 4.92 -- 5.31 5.06 5.86 5.49 5.50
CAL YR 2001 MEAN 5.91 MAX 8.98 MIN 4.92

227 COASTAL AREA BETWEEN SEBASTIAN INLET AND ST. LUCIE RIVER
02251000 SOUTH PRONG SAINT SEBASTIAN RIVER NEAR SEBASTIAN, FL
LOCATION.--Lat 27° 46'09", long 80° 30'22", in SW1⁄ 4, sec.23, T.31 S., R.38 E., Indian River County, Hydrologic Unit 03080203, on upstream side of bridge on State Highway 512, 2.5 mi east of Interstate Highway 95, 4 mi southwest of Sebastian, and 8.3 mi upstream from mouth.
DRAINAGE AREA.--35 mi2, approximately.
PERIOD OF RECORD.--October 1954 to May 1965 (discharge measurements only), May 1968 to August 1972 (annual peak discharge),August 1993 to current year.
GAGE.--Water-stage recorder and data-collection platform. Datum of gage is 10.00 ft below NGVD of 1929. Auxiliary water-stagerecorder at site 6.6 mi downstream.
REMARKS.--Records fair except those below 100 ft3/s and periods of estimated daily discharge, which are poor.
DISCHARGE, CUBIC FEET PER SECOND, WATER YEAR OCTOBER 2001 TO SEPTEMBER 2002DAILY MEAN VALUES
DAY OCT NOV DEC JAN FEB MAR APR MAY JUN JUL AUG SEP
1 524 123 36 312 315 156 34 343 159 101 34 364 131 90 35 395 116 86 34 42
53 43 27 18 33 1000 84 7061 51 27 18 31 910 213 7055 52 27 19 27 690 337 7249 44 38 22 24 620 163 7045 40 36 21 20 630 106 62
6 106 96 33 447 99 89 33 428 101 83 48 429 124 68 63 46
10 113 50 87 46
46 42 36 18 e19 500 113 5844 43 33 19 e35 420 88 5042 40 33 17 e40 390 85 4643 36 30 19 e25 510 243 4247 34 25 21 e23 620 238 39
11 108 47 78 42 12 100 44 70 4013 90 45 62 3914 90 74 49 3915 72 96 45 61
81 32 24 20 e25 615 295 3884 36 23 20 e26 657 605 4070 41 31 23 e37 514 498 3862 36 31 17 e50 452 303 3562 34 37 19 e70 364 247 33
16 59 105 43 73 17 59 96 41 6418 61 87 34 6119 56 78 60 56 20 58 62 66 52
59 36 38 18 e50 289 203 3354 35 35 17 e360 237 179 3248 36 34 22 770 204 167 3049 34 30 49 850 176 132 2847 32 26 53 1180 154 99 28
21 64 58 32 50 22 91 55 33 52 23 116 52 33 48 24 105 51 31 46 25 130 49 30 45
46 33 25 47 1440 227 81 2843 28 23 41 1150 528 66 2860 28 21 35 800 423 60 2882 28 19 29 650 308 56 2989 28 21 26 750 229 55 37
26 518 46 28 44 27 588 44 31 44 28 417 41 32 43 29 251 39 34 41 30 151 39 31 40 31 112 --- 30 39
81 29 21 23 800 163 63 3557 27 25 23 700 135 83 3743 25 27 21 590 116 92 36
--- 25 25 19 520 100 121 34 --- 29 21 18 500 97 87 38 --- 28 --- 27 --- 94 79 --
TOTAL 5084 2150 1330 1421MEAN 164 71.7 42.9 45.8MAX 588 156 87 73MIN 56 39 28 31
1602 1085 849 759 11595 12372 5241 124457.2 35.0 28.3 24.5 386 399 169 41.589 52 38 53 1440 1000 605 7242 25 19 17 19 94 55 28
STATISTICS OF MONTHLY MEAN DATA FOR WATER YEARS 1994 - 2002, BY WATER YEAR (WY)
MEAN 210 112 72.8 58.8MAX 469 428 221 122 (WY) 2000 1995 1995 1998MIN 33.8 21.3 28.5 33.8(WY) 1998 2001 2001 2001
69.1 68.7 53.2 38.4 117 145 170 197 206 188 126 66.5 386 399 319 4631998 1998 1996 1994 2002 2002 1997 199429.2 19.8 27.1 23.4 18.4 33.4 45.0 38.02001 1999 1999 2000 1998 1998 1996 1996
SUMMARY STATISTICS FOR 2001 CALENDAR YEAR FOR 2002 WATER YEAR WATER YEARS 1994 - 2002
ANNUAL TOTAL 40119.0 ANNUAL MEAN 110 HIGHEST ANNUAL MEANLOWEST ANNUAL MEANHIGHEST DAILY MEAN 925 LOWEST DAILY MEAN 9.0 ANNUAL SEVEN-DAY MINIMUM 13MAXIMUM PEAK FLOWMAXIMUM PEAK STAGE10 PERCENT EXCEEDS 29950 PERCENT EXCEEDS 4290 PERCENT EXCEEDS 23
44732 123 110
158 199577.2 1999
Sep 14 1440 Jun 21 2300 Nov 16 1994May 20 17 May 8,14,17 4.2 Nov 23 1993May 16 19 May 2 8.2 Sep 10 2000
1730 Jun 21 2560 Nov 16 199418.92 Jun 21 19.96 Nov 16 1994
362 248 47 4925 23
e Estimated

228 COASTAL AREA BETWEEN SEBASTIAN INLET AND ST. LUCIE RIVER
02251500 NORTH PRONG SAINT SEBASTIAN RIVER NEAR MICCO, FL
LOCATION.--Lat 27° 51'21", long 80° 31'28", in Fleming Land Grant, T.30 S., R.38 E., Brevard County, Hydrologic Unit 03080203, on right bank 15 ft downstream from bridge on Wildon Road, 1.9 mi upstream from mouth, and 2.2 mi southwest of Micco.
DRAINAGE AREA.--28.5 mi2.
PERIOD OF RECORD.--October 1954 to October 1958 (discharge measurements only), January 1987 to current year.
REVISED RECORDS.--WDR FL-90-1: Drainage area.
GAGE.--Water-stage recorder and data-collection platform. Datum of gage is at NGVD of 1929.
REMARKS.--Records good.
DISCHARGE, CUBIC FEET PER SECOND, WATER YEAR OCTOBER 2001 TO SEPTEMBER 2002DAILY MEAN VALUES
DAY OCT NOV DEC JAN FEB MAR APR MAY JUN JUL AUG SEP
1 210 47 28 23 2 162 50 27 23 3 134 49 27 27 4 115 54 26 24 5 95 88 26 23
30 24 14 7.5 9.4 270 40 28 35 19 12 7.2 10 431 51 35 25 19 12 6.9 10 320 98 53 24 18 11 6.8 7.4 243 95 52 23 18 11 6.9 7.2 232 153 46
6 86 85 26 23 7 77 65 26 23 8 73 56 26 23 9 71 51 26 2310 63 47 31 23
22 17 9.8 6.8 7.0 199 193 36 22 16 9.5 7.0 9.5 164 128 33 23 18 9.2 7.0 9.8 164 106 31 22 16 9.4 6.9 7.8 174 150 30 22 15 9.7 6.7 7.4 198 120 29
11 60 45 27 2312 56 42 26 2313 53 43 26 2214 50 52 26 2315 48 54 26 40
24 14 9.3 6.6 7.7 219 149 2823 14 18 6.4 7.7 284 276 2722 14 14 6.4 9.6 299 240 27 26 13 10 6.4 16 251 198 27 22 14 11 6.3 21 194 177 26
16 46 50 28 3817 43 44 27 3318 42 41 28 3219 42 42 27 3320 45 41 25 29
21 15 11 6.4 16 152 133 25 18 14 12 6.4 30 112 112 2515 14 11 6.3 105 90 94 24 14 13 11 14 237 100 76 24 14 12 9.5 15 202 97 62 24
21 44 39 25 2822 74 37 24 2623 159 35 24 2724 108 34 24 2625 101 32 23 25
13 12 9.1 12 404 100 57 2414 12 8.9 11 397 139 52 24 28 11 8.8 12 283 117 46 23 35 10 8.6 14 224 90 41 2631 10 8.5 9.6 255 69 36 28
26 119 34 23 2427 102 34 22 2428 73 33 22 2329 59 31 22 2330 53 29 23 2331 49 --- 23 27
29 11 8.6 9.1 343 58 32 3026 14 8.4 8.2 357 52 29 31 28 14 8.0 7.8 253 48 29 26--- 12 7.7 7.5 202 47 30 24--- 12 7.6 7.3 191 47 28 24 --- 11 --- 12 --- 44 30 --
TOTAL 2512 1384 790 807MEAN 81.0 46.1 25.5 26.0 MAX 210 88 31 40 MIN 42 29 22 22CFSM 2.84 1.62 0.89 0.91 IN. 3.28 1.81 1.03 1.05
651 446 308.6 260.4 3646.5 5004 3061 89023.2 14.4 10.3 8.40 122 161 98.7 29.7 35 24 18 15 404 431 276 53 13 10 7.6 6.3 7.0 44 28 230.82 0.50 0.36 0.29 4.26 5.66 3.46 1.04 0.85 0.58 0.40 0.34 4.76 6.53 4.00 1.16
STATISTICS OF MONTHLY MEAN DATA FOR WATER YEARS 1987 - 2002, BY WATER YEAR (WY)
MEAN 98.9 67.2 34.1 32.5 MAX 250 251 125 80.2(WY) 2000 1998 1998 1998 MIN 14.3 14.6 11.2 11.4(WY) 1989 1989 2001 2001
34.2 42.4 26.5 17.2 37.3 56.0 59.3 74.0150 105 77.8 32.8 122 216 152 2091998 1988 1996 1997 2002 2001 1994 2001 10.7 10.1 8.45 7.11 7.46 9.22 10.3 13.82001 2001 1999 1990 1989 1989 1993 1989
SUMMARY STATISTICS FOR 2001 CALENDAR YEAR FOR 2002 WATER YEAR WATER YEARS 1987 - 2002
ANNUAL TOTAL 24228.8 ANNUAL MEAN 66.4 HIGHEST ANNUAL MEAN LOWEST ANNUAL MEAN HIGHEST DAILY MEAN 770 LOWEST DAILY MEAN 6.6 ANNUAL SEVEN-DAY MINIMUM 6.8MAXIMUM PEAK FLOWMAXIMUM PEAK STAGE INSTANTANEOUS LOW FLOWANNUAL RUNOFF (CFSM) 2.33ANNUAL RUNOFF (INCHES) 31.6210 PERCENT EXCEEDS 17250 PERCENT EXCEEDS 2690 PERCENT EXCEEDS 9.1
19532.554.7 48.1
87.2 1995 15.6 1989
Sep 14 431 Jul 2 1740 Nov 16 1994Apr 28 6.3 May 15,18 a6.3Apr 23 6.4 May 12 6.4 May 12 2002
590 Jun 21 2060 Nov 14 1997 8.61 Jun 21 10.24 Nov 14 19975.7 May 18 3.8 Apr 1 1994 1.92 1.6925.50 22.94
154 10326 25 8.6 11
a Jun 20,21 1989, May 15,18, 2002

229 COASTAL AREA BETWEEN SEBASTIAN INLET AND ST. LUCIE RIVER
02251767 FELLSMERE CANAL NEAR MICCO, FL
LOCATION.--Lat 27° 49'49", long 80° 32'04", in Fleming Land Grant, T.29 S., R.38 E., Brevard County, Hydrologic Unit 03080203, on left bank 156 ft upstream from fixed crest steel sheet pile weir, 500 ft upstream from Canal 54, 4.5 mi south of Micco, and 6 mi northeast of Fellsmere.
DRAINAGE AREA.--Indeterminate.
PERIOD OF RECORD.--November 1991 to current year.
GAGE.--Water-stage recorder and data-collection platform. Datum of gage is at NGVD of 1929 (levels by St. Johns River Water Management District).
REMARKS.--Records fair except for period of estimated daily discharge, which is poor.
DISCHARGE, CUBIC FEET PER SECOND, WATER YEAR OCTOBER 2001 TO SEPTEMBER 2002DAILY MEAN VALUES
DAY OCT NOV DEC JAN FEB MAR APR MAY JUN JUL AUG SEP
1 546 88 46 69 2 290 99 46 69 3 188 101 45 75 4 156 64 49 95 5 138 78 59 91
61 104 37 31 49 318 75 75 70 87 39 31 45 497 83 69 57 56 38 28 43 309 112 81 51 50 33 26 46 211 93 82 46 43 35 27 36 180 100 89
6 117 85 57 88 7 107 73 58 84 8 101 68 57 75 9 102 65 57 5310 99 62 59 54
45 41 31 31 37 157 87 78 43 41 30 28 47 154 85 66 44 41 58 41 62 159 71 60 44 41 40 42 56 190 175 57 44 44 35 41 50 261 138 52
11 93 62 57 5812 95 61 50 6013 84 55 49 7214 81 88 46 7015 78 121 48 130
52 46 35 36 52 270 167 51 60 46 44 37 53 215 351 56 47 45 51 31 78 176 267 65 47 38 44 29 259 142 186 54 53 38 44 26 304 119 137 54
16 77 112 53 13217 95 67 57 9618 96 62 57 7619 89 61 60 6720 75 62 64 63
42 39 44 26 248 90 111 53 38 42 44 29 230 86 119 49 38 44 44 60 416 89 109 52 36 41 38 128 654 108 96 5440 39 36 232 831 e105 85 54
21 73 58 59 6522 117 57 89 7623 86 57 93 6924 93 55 89 5925 127 52 84 46
37 45 40 121 1130 e125 76 5640 48 41 73 998 e155 80 62 54 45 39 58 756 e145 83 60 86 44 36 50 554 e125 81 5559 43 40 45 595 e105 75 73
26 166 54 78 4427 148 54 54 4428 89 49 57 4629 75 46 62 5230 71 46 64 4731 72 --- 66 49
50 39 37 34 811 e92 68 77 44 35 32 33 522 e84 76 83 73 34 35 35 330 e82 83 66--- 34 37 37 242 e80 74 54--- 34 36 38 182 e79 77 50 --- 36 --- 46 --- 77 86 --
TOTAL 3824 2062 1869 2174 MEAN 123 68.7 60.3 70.1 MAX 546 121 93 132 MIN 71 46 45 44
1401 1403 1173 1530 9716 4985 3506 1887 50.0 45.3 39.1 49.4 324 161 113 62.9 86 104 58 232 1130 497 351 89 36 34 30 26 36 77 68 49
STATISTICS OF MONTHLY MEAN DATA FOR WATER YEARS 1992 - 2002, BY WATER YEAR (WY)
MEAN 147 90.7 61.1 61.8 MAX 380 260 147 112(WY) 2000 1995 1998 1998 MIN 33.2 38.0 31.8 29.3(WY) 1998 1992 1992 1992
57.0 71.2 58.4 47.7 110 121 128 145150 193 102 62.9 324 251 207 2731998 1993 1993 1994 2002 2001 2001 2001 29.5 27.0 31.9 30.2 40.1 51.1 39.0 62.91996 1997 1992 1995 1998 1993 1993 2002
SUMMARY STATISTICS FOR 2001 CALENDAR YEAR FOR 2002 WATER YEAR WATER YEARS 1992 - 2002
ANNUAL TOTAL 38993.0 ANNUAL MEAN 107 HIGHEST ANNUAL MEAN LOWEST ANNUAL MEAN HIGHEST DAILY MEAN 887 LOWEST DAILY MEAN 9.5 ANNUAL SEVEN-DAY MINIMUM 11MAXIMUM PEAK FLOWMAXIMUM PEAK STAGE INSTANTANEOUS LOW FLOW10 PERCENT EXCEEDS 21150 PERCENT EXCEEDS 5790 PERCENT EXCEEDS 33
3553097.3 91.3
112 1995 61.7 1992
Jul 16 1130 Jun 21 1780 Nov 16 1994Jun 20 26 May 4,15,16 9.5 Jun 20 2001 Jun 15 29 May 1 11 Jun 15 2001
1180 Jun 21 1900 Nov 16 1994 5.22 Jun 21 6.52 Nov 16 199423 May 4 *9.0
166 17360 5637 31
e Estimated* June 19,20,21, 2001
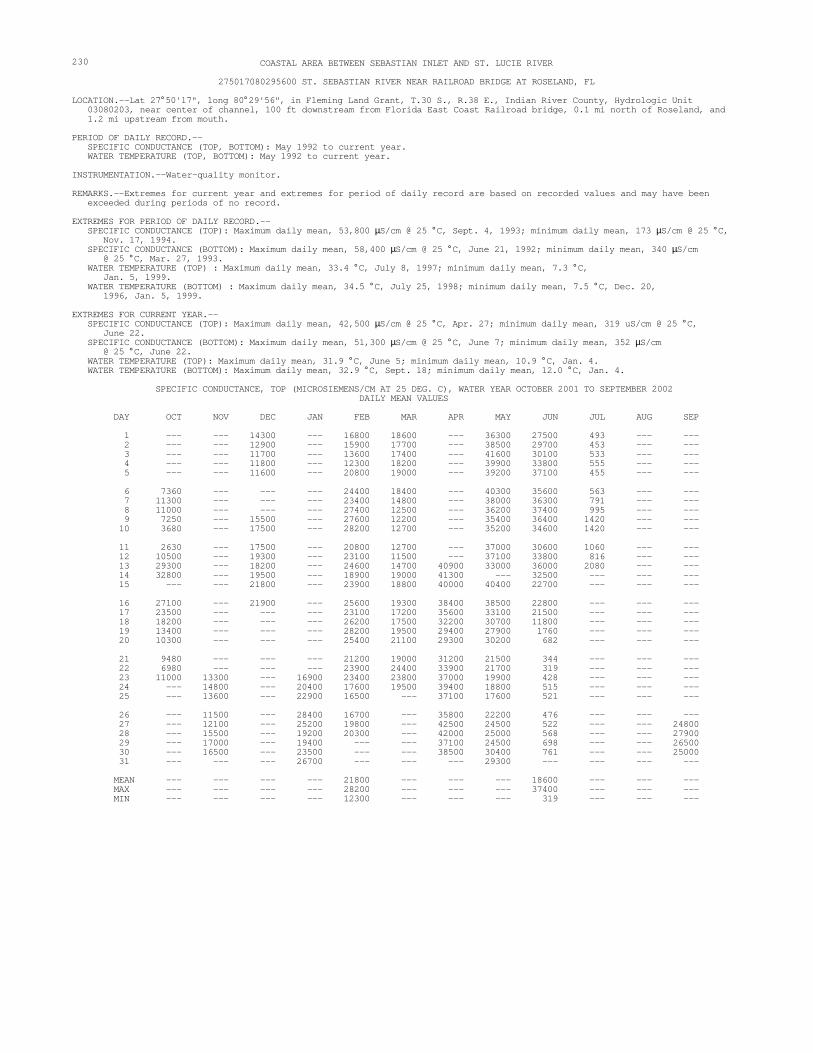
--- --- ------ --- ------ --- ------ --- ------ --- ---
--- --- --- ------ --- --- ------ --- --- ------ --- ------ --- ---
--- --- ------ --- ------ ------ --- ------ --- ---
--- --- ------ --- --- ------ --- --- ---
--- ------ --- --- ---
--- ------ ---
--- --- ------ --- ------ --- ---
--- --- ------ --- --- --- --- --- --- --- --- ---
--- --- --- --- --- ---
--- --- --- --- ------ --- --- --- ------ --- --- --- ---
230 COASTAL AREA BETWEEN SEBASTIAN INLET AND ST. LUCIE RIVER
275017080295600 ST. SEBASTIAN RIVER NEAR RAILROAD BRIDGE AT ROSELAND, FL
LOCATION.--Lat 27° 50'17", long 80° 29'56", in Fleming Land Grant, T.30 S., R.38 E., Indian River County, Hydrologic Unit 03080203, near center of channel, 100 ft downstream from Florida East Coast Railroad bridge, 0.1 mi north of Roseland, and 1.2 mi upstream from mouth.
PERIOD OF DAILY RECORD.--SPECIFIC CONDUCTANCE (TOP, BOTTOM): May 1992 to current year. WATER TEMPERATURE (TOP, BOTTOM): May 1992 to current year.
INSTRUMENTATION.--Water-quality monitor.
REMARKS.--Extremes for current year and extremes for period of daily record are based on recorded values and may have been exceeded during periods of no record.
EXTREMES FOR PERIOD OF DAILY RECORD.--SPECIFIC CONDUCTANCE (TOP): Maximum daily mean, 53,800 µS/cm @ 25 ° C, Sept. 4, 1993; minimum daily mean, 173 µS/cm @ 25 ° C,
Nov. 17, 1994. SPECIFIC CONDUCTANCE (BOTTOM): Maximum daily mean, 58,400 µS/cm @ 25 ° C, June 21, 1992; minimum daily mean, 340 µS/cm
@ 25 ° C, Mar. 27, 1993. WATER TEMPERATURE (TOP) : Maximum daily mean, 33.4 ° C, July 8, 1997; minimum daily mean, 7.3 ° C,
Jan. 5, 1999. WATER TEMPERATURE (BOTTOM) : Maximum daily mean, 34.5 ° C, July 25, 1998; minimum daily mean, 7.5 ° C, Dec. 20,
1996, Jan. 5, 1999.
EXTREMES FOR CURRENT YEAR.--SPECIFIC CONDUCTANCE (TOP): Maximum daily mean, 42,500 µS/cm @ 25 ° C, Apr. 27; minimum daily mean, 319 uS/cm @ 25 ° C,
June 22. SPECIFIC CONDUCTANCE (BOTTOM): Maximum daily mean, 51,300 µS/cm @ 25 ° C, June 7; minimum daily mean, 352 µS/cm
@ 25 ° C, June 22. WATER TEMPERATURE (TOP): Maximum daily mean, 31.9 ° C, June 5; minimum daily mean, 10.9 ° C, Jan. 4. WATER TEMPERATURE (BOTTOM): Maximum daily mean, 32.9 ° C, Sept. 18; minimum daily mean, 12.0 ° C, Jan. 4.
SPECIFIC CONDUCTANCE, TOP (MICROSIEMENS/CM AT 25 DEG. C), WATER YEAR OCTOBER 2001 TO SEPTEMBER 2002DAILY MEAN VALUES
DAY OCT NOV DEC JAN FEB MAR APR MAY JUN JUL AUG SEP
1 --- 14300 --- 16800 18600 36300 27500 493 --- 2 --- 12900 --- 15900 17700 38500 29700 453 --- 3 --- 11700 --- 13600 17400 41600 30100 533 --- 4 --- 11800 --- 12300 18200 39900 33800 555 --- 5 --- 11600 --- 20800 19000 39200 37100 455 ---
6 7360 -- 24400 18400 40300 35600 563 --7 11300 --- 23400 14800 38000 36300 791 --- 8 11000 --- 27400 12500 36200 37400 995 --- 9 7250 15500 -- 27600 12200 35400 36400 1420 --10 3680 17500 -- 28200 12700 35200 34600 1420 --
11 2630 17500 -- 20800 12700 37000 30600 1060 --12 10500 19300 --- 23100 11500 37100 33800 816 --- 13 29300 18200 --- 24600 14700 40900 33000 36000 2080 --- 14 32800 19500 -- 18900 19000 41300 -- 32500 --15 -- 21800 -- 23900 18800 40000 40400 22700 --
16 27100 21900 -- 25600 19300 38400 38500 22800 --17 23500 --- 23100 17200 35600 33100 21500 --- 18 18200 --- 26200 17500 32200 30700 11800 --- 19 13400 --- --- 28200 19500 29400 27900 1760 --- --20 10300 -- 25400 21100 29300 30200 682 --
21 9480 --- --- 21200 19000 31200 21500 344 --- --22 6980 --- --- 23900 24400 33900 21700 319 --- --23 11000 13300 16900 23400 23800 37000 19900 428 --24 -- 14800 20400 17600 19500 39400 18800 515 --25 -- 13600 22900 16500 -- 37100 17600 521 --
26 -- 11500 28400 16700 -- 35800 22200 476 --27 -- 12100 25200 19800 -- 42500 24500 522 -- 24800 28 -- 15500 19200 20300 -- 42000 25000 568 -- 27900 29 -- 17000 19400 -- 37100 24500 698 -- 26500 30 -- 16500 23500 -- 38500 30400 761 -- 25000 31 --- 26700 --- 29300 --- ---
MEAN --- --- 21800 --- --- 18600 --- MAX --- --- 28200 --- --- 37400 --- MIN --- --- 12300 --- --- 319 ---

------------
---------
------
------
------------------ ---
--- ------
---------------
--- --- ------ --- ------ --- ------ --- ---
--- ---
--- ------ ---
--- ------ ------ ---
--- ------ ------ ------ ------ ---
--- ------ ---
------ ---
--- --- ---
--- --- ------ --- --- ---
--- --- ------ --- ------ --- --- ---
--- --- --- ------ --- --- --- ------ --- --- --- ---
COASTAL AREA BETWEEN SEBASTIAN INLET AND ST. LUCIE RIVER 231
275017080295600 ST. SEBASTIAN RIVER NEAR RAILROAD BRIDGE AT ROSELAND, FL--Continued
SPECIFIC CONDUCTANCE, BOTTOM (MICROSIEMENS/CM AT 25 DEG. C), WATER YEAR OCTOBER 2001 TO SEPTEMBER 2002 DAILY MEAN VALUES
DAY OCT NOV DEC JAN FEB MAR APR MAY JUN JUL AUG SEP
1 --- 29000 33000 38000 34400 48900 46200 38400 536 32400 28200 2 --- 24300 32900 28500 34900 51000 46900 41100 499 33500 40500 3 --- 22400 35200 29900 40300 50200 46700 44400 587 20100 44200 4 --- 18700 29100 41500 33400 49900 44600 45500 720 23800 46800 5 5760 --- 17500 35800 37400 30500 46400 41600 48300 485 25600 49000
6 22100 15900 34600 36900 28600 43000 41300 47600 1060 25400 47400 7 24000 21800 35900 37200 24700 38500 40000 51300 3020 36800 40100 8 11800 36200 31100 36700 23000 38000 39100 48300 7290 33800 36000 9 7690 --- 42500 31100 37500 23000 43700 39700 41400 11800 26600 41300
10 3740 --- 40900 32000 41300 21800 46700 38300 42100 6680 10400 44900
11 5290 --- 44300 29500 39700 18900 47900 37600 40900 2160 24200 48600 12 31600 41200 29000 40300 23800 47000 38000 48900 2910 15400 49600 13 38700 41000 26500 37300 39000 48700 40600 51200 9370 12400 48500 14 40700 --- 43600 31200 32500 43200 48200 39300 48200 19200 25600 47200 15 38600 --- 44900 23400 37400 41500 47500 40100 44600 24000 30400 45500
16 33000 --- 37400 16400 37600 39600 45700 38600 48300 26700 33000 44200 17 24500 --- 37400 20600 37900 36200 43900 39400 46500 31500 29700 41700 18 18600 --- 47600 23200 36800 37200 41900 36100 29500 32300 28800 37100 19 14200 --- 45100 25800 36200 38000 40900 36200 2470 36600 31600 35300 20 16500 --- 40800 28500 41000 39000 41700 31300 770 38600 34200 36500
21 16900 --- 37000 29800 43900 40300 44300 22900 384 32100 33200 37300 22 15200 --- 33400 28400 46800 41200 46500 22400 352 23800 26600 40200 23 30200 31900 32300 29800 41900 36700 42500 20100 457 25700 19800 41600 24 33600 40300 33800 32900 32200 41600 21900 550 31900 26400 41600 25 34800 43300 38000 32600 35200 45200 25200 548 33300 32700 40700
26 32400 36900 36600 39400 41300 48800 28100 505 36200 40500 35600 27 30200 36900 30700 46500 40800 50800 28600 554 36800 42200 34300 28 33000 41200 31300 39800 36600 49800 27500 603 32800 41800 38000 29 35500 43900 28000 --- 40500 49000 33200 934 28900 38800 34100 30 36600 41800 32400 --- 44500 47100 40500 1140 27800 36800 30000 31 --- 35700 39500 --- 47200 --- 39500 29700 30400 --
MEAN -- 36000 30400 38000 35100 45800 35900 27200 19200 29100 40900 MAX --- 47600 39500 46800 47200 51000 46900 51300 38600 42200 49600 MIN --- 15900 16400 28500 18900 38000 20100 352 485 10400 28200
TEMPERATURE, WATER, TOP (DEG. C), WATER YEAR OCTOBER 2001 TO SEPTEMBER 2002 DAILY MEAN VALUES
DAY OCT NOV DEC JAN FEB MAR APR MAY JUN JUL AUG SEP
1 24.2 --- 23.6 16.6 24.3 17.8 --- 29.7 29.9 26.1 --2 24.1 --- 23.4 17.4 23.4 20.0 --- 30.3 31.2 26.4 --3 24.5 --- 23.4 15.4 23.0 22.2 --- 30.6 31.5 27.2 --4 25.2 --- 23.5 10.9 21.0 19.0 --- 29.8 31.7 27.6 --5 26.0 --- 23.0 12.7 18.9 16.4 --- 29.6 31.9 27.7 --
6 27.1 23.3 -- 20.5 18.8 29.6 31.7 28.3 --7 27.5 24.1 -- 20.6 19.9 29.8 31.4 28.9 --8 26.7 24.4 -- 18.9 21.6 29.2 30.2 27.8 --9 25.1 24.7 -- 20.3 23.7 29.2 29.0 26.9 --10 24.6 --- 25.0 21.5 23.7 --- 29.3 29.8 26.8 --
11 24.7 --- 25.3 20.5 23.5 --- 29.0 30.2 26.8 --12 25.0 --- 25.6 21.7 23.9 --- 28.9 30.7 27.2 --13 25.9 25.4 -- 20.7 23.8 25.7 28.9 29.8 27.6 --14 26.4 --- 25.2 18.5 23.0 26.6 28.7 29.4 --- --15 26.7 --- 25.3 20.2 25.1 26.9 26.8 28.2 --- --
16 27.3 --- 24.9 21.3 26.2 27.9 26.5 28.2 --- --17 25.2 --- 24.1 19.8 25.9 28.5 27.7 27.9 --- --18 23.9 --- --- 18.3 26.1 28.5 28.5 27.3 --- --19 24.7 --- --- 19.5 26.0 28.7 26.9 25.9 --- --20 26.1 --- --- 20.6 25.6 28.7 25.9 25.0 --- --
21 26.2 --- --- 21.4 25.3 28.9 25.2 24.6 --- --22 26.1 23.1 --- 21.7 24.0 29.0 24.8 24.9 --- --23 26.3 23.3 --- 23.4 20.1 22.9 28.7 25.7 25.8 --- --24 23.3 --- 23.5 18.7 23.8 27.9 26.0 26.5 --- --25 -- 23.8 23.4 19.9 -- 28.3 26.4 26.0 --
26 -- 24.6 23.7 21.4 -- 28.1 26.6 25.9 --27 -- 24.4 23.4 19.9 -- 28.9 27.9 26.3 -- 29.7 28 -- 24.2 24.1 16.2 -- 28.3 27.8 27.1 -- 30.4 29 24.1 --- 24.4 --- 28.2 28.8 28.2 --- 30.8 30 24.3 --- 25.1 --- 28.8 30.1 27.8 --- 29.9 31 --- --- 25.2 --- --- 29.3 --- --
MEAN --- --- 20.5 --- 28.2 28.5 --- -- MAX -- -- 24.3 --- 30.6 31.9 -- MIN -- -- 16.2 --- 24.8 24.6 --

--------- ---
------ ---
232 COASTAL AREA BETWEEN SEBASTIAN INLET AND ST. LUCIE RIVER
275017080295600 ST. SEBASTIAN RIVER NEAR RAILROAD BRIDGE AT ROSELAND, FL--Continued
TEMPERATURE, WATER, BOTTOM (DEG. C), WATER YEAR OCTOBER 2001 TO SEPTEMBER 2002 DAILY MEAN VALUES
DAY OCT NOV DEC JAN FEB MAR APR MAY JUN JUL AUG SEP
1 24.2 --- 24.2 18.9 25.5 18.6 26.8 30.0 30.0 26.1 32.1 31.5 2 24.0 --- 24.0 18.6 24.2 19.4 26.9 30.4 30.8 26.3 31.4 30.5 3 24.4 --- 23.8 16.5 23.7 21.7 26.9 30.9 31.4 27.0 30.3 30.2 4 25.1 --- 23.6 12.0 23.3 20.3 27.0 30.1 32.0 27.3 30.4 29.9 5 25.9 --- 23.0 15.1 21.4 17.1 25.9 29.9 32.4 27.6 30.8 29.7
6 26.6 --- 23.3 16.8 21.6 19.0 23.9 29.6 32.5 27.9 30.7 30.1 7 27.6 --- 24.0 16.2 20.8 20.1 23.1 30.2 31.5 28.6 30.3 30.9 8 26.7 --- 24.4 15.3 20.0 21.7 23.6 29.8 30.5 28.0 30.0 31.1 9 25.1 --- 24.8 15.5 20.3 23.6 24.3 29.6 29.5 27.4 30.1 30.9
10 24.6 --- 25.1 16.4 21.2 24.2 25.3 29.7 30.0 27.0 29.0 30.9
11 24.6 --- 25.4 17.3 21.4 23.6 26.4 29.3 30.8 26.8 28.1 30.2 12 24.9 --- 25.5 18.2 21.9 24.0 25.7 29.1 30.5 27.0 27.3 30.0 13 25.6 --- 25.6 18.1 21.5 23.5 25.8 29.6 30.0 27.6 27.6 29.9 14 26.1 --- 25.2 18.3 20.2 23.9 26.4 28.9 29.8 28.1 28.0 30.0 15 26.4 --- 25.3 18.9 20.7 25.3 27.0 26.8 29.0 28.8 28.6 30.2
16 27.1 --- 25.1 18.6 21.3 26.4 28.2 26.7 28.7 29.4 29.1 31.2 17 25.3 --- 24.4 19.7 21.2 27.1 29.2 27.8 28.9 30.2 29.7 32.3 18 24.0 --- 24.3 20.3 20.1 27.6 29.7 28.8 28.1 30.4 30.5 32.9 19 24.5 --- 24.2 20.7 20.2 27.5 30.1 27.9 25.9 30.3 30.8 32.6 20 25.8 --- 22.9 21.6 20.3 26.8 30.3 26.0 25.0 30.2 31.7 31.9
21 26.1 --- 21.2 22.8 20.9 25.9 29.6 25.2 24.6 29.6 31.9 31.9 22 26.2 23.1 20.8 23.4 21.3 24.5 29.3 24.8 24.9 28.9 32.3 31.4 23 26.2 23.4 20.9 24.1 20.7 23.1 29.1 25.7 25.8 29.1 32.3 30.8 24 -- 23.6 20.7 24.1 19.5 24.3 28.2 26.1 26.4 29.7 31.8 30.4 25 -- 23.8 21.0 23.9 20.4 25.6 28.7 26.7 26.0 30.4 31.5 30.1
26 -- 24.3 19.5 24.1 20.9 26.6 28.2 26.9 25.9 30.7 31.0 29.9 27 -- 24.5 18.1 23.6 20.9 27.1 29.1 27.9 26.3 31.0 30.5 29.4 28 -- 24.2 18.2 24.3 18.7 27.1 28.8 28.1 27.0 31.5 29.9 30.0 29 24.2 19.6 24.7 --- 27.4 28.4 28.7 27.9 32.0 30.5 30.8 30 24.3 20.1 25.3 --- 27.2 29.2 29.6 27.7 31.7 31.3 30.4 31 --- 19.7 25.8 --- 27.0 --- 29.5 31.9 31.8 --
MEAN --- 22.8 20.0 21.2 24.1 27.4 28.4 28.7 29.0 30.4 30.7 MAX -- 25.6 25.8 25.5 27.6 30.3 30.9 32.5 32.0 32.3 32.9 MIN -- 18.1 12.0 18.7 17.1 23.1 24.8 24.6 26.1 27.3 29.4

--- ---
233 COASTAL AREA BETWEEN SEBASTIAN INLET AND ST. LUCIE RIVER
02251800 INDIAN RIVER AT WABASSO, FL
LOCATION.--Lat 27° 45'15", long 80° 25'40", in SW1⁄ 4 sec.27, T.31 S., R.39 E., Indian River County, Hydrologic Unit 03080203, near the southwest end of bridge on State Highway 510 , and 0.5 mi east of Wabasso.
PERIOD OF RECORD.--November 1940 to current year (gage heights only).
GAGE.--Water-stage recorder. Datum of gage is at NGVD of 1929 (Florida Department of Transportation bench mark). Prior to June 26, 1970, at site 0.9 mi northeast at same datum.
REMARKS.--Stage affected by tide. The stage record published is the maximum and minimum tide event for each calendar day.
EXTREMES FOR PERIOD OF RECORD.--Maximum gage height, 4.76 ft, Sept. 22, 1948; minimum, -1.36 ft, Jan. 20, 1946.
EXTREMES FOR CURRENT YEAR.--Maximum gage height, 2.69 ft, Nov. 15; minimum, -.59 ft, Jan. 24.
GAGE HEIGHT, in FEET, WATER YEAR OCTOBER 2001 TO SEPTEMBER 2002
DAY HIGH LOW HIGH LOW HIGH LOW HIGH LOW HIGH LOW HIGH LOW
OCTOBER NOVEMBER DECEMBER JANUARY FEBRUARY MARCH
1 2.45 1.76 1.54 1.01 1.27 0.50 1.13 0.53 0.46 -0.19 0.92 0.23 2 1.93 1.37 1.50 0.83 1.17 0.53 1.03 0.14 0.57 0.02 0.61 -0.18 3 1.75 1.23 1.57 0.97 1.33 0.52 1.24 0.52 0.77 0.18 0.39 -0.14 4 1.69 1.10 1.62 1.08 1.27 0.47 1.22 0.66 0.82 0.35 0.95 0.59 5 1.68 1.13 2.46 1.45 1.16 0.56 1.05 0.27 0.95 0.44 1.18 0.57
6 1.45 0.90 2.42 1.61 1.13 0.55 0.70 -0.05 0.50 -0.04 0.80 0.08 7 1.55 1.04 1.96 1.08 0.95 0.47 0.71 0.30 0.20 -0.38 0.61 0.29 8 1.90 1.09 1.50 0.90 0.93 0.33 0.83 0.23 0.80 0.02 0.75 0.25 9 1.77 1.13 1.42 0.94 1.03 0.55 0.63 0.08 0.75 0.11 0.65 0.13 10 1.52 0.97 1.34 0.84 1.07 0.40 0.38 -0.16 0.47 -0.14 0.76 0.12
11 1.50 0.92 1.38 0.78 1.10 0.35 0.31 -0.20 0.77 0.14 0.79 0.21 12 1.49 1.02 1.58 0.82 1.12 0.54 0.29 -0.28 0.69 0.09 0.39 -0.05 13 1.42 0.78 1.64 1.06 1.10 0.49 0.39 -0.41 0.86 0.23 0.51 -0.06 14 1.39 0.66 2.43 1.06 1.12 0.42 0.28 -0.25 0.90 0.36 0.66 0.07 15 1.89 1.04 2.69 2.08 1.15 0.38 0.55 -0.36 0.88 0.16 0.52 0.01
16 1.99 1.26 2.63 1.98 1.12 0.50 0.56 0.02 0.92 0.27 0.26 -0.26 17 2.39 1.57 2.29 1.64 0.96 0.31 0.26 -0.28 1.00 0.40 0.35 -0.04 18 2.07 1.50 1.95 1.41 1.17 0.36 0.32 -0.14 1.02 0.50 0.28 -0.39 19 1.84 1.24 1.85 1.21 1.09 0.55 0.19 -0.37 0.77 -0.05 0.09 -0.36 20 1.84 1.22 1.63 1.13 1.21 0.59 0.02 -0.35 0.39 -0.16 0.11 -0.51
21 1.91 1.15 1.56 1.07 1.19 0.73 0.01 -0.38 0.35 0.04 0.10 -0.20 22 1.81 1.11 1.40 0.85 0.98 0.30 0.17 -0.10 0.72 0.28 0.92 0.49 23 1.61 1.08 1.20 0.77 0.61 0.24 0.12 -0.37 1.53 0.35 1.09 0.54 24 1.57 1.02 1.04 0.59 0.90 0.32 0.08 -0.59 1.50 0.86 0.66 0.14 25 1.50 1.02 1.08 0.55 1.18 0.60 0.08 -0.58 1.32 0.79 0.55 -0.01
26 2.05 1.58 1.15 0.76 1.30 0.71 0.29 -0.47 1.10 0.45 0.59 0.00 27 1.98 1.47 1.09 0.52 1.26 0.54 0.55 -0.02 1.23 0.43 0.74 0.01 28 1.93 1.48 1.00 0.40 0.90 0.28 0.51 -0.11 1.49 0.86 1.00 0.32 29 1.71 1.30 1.10 0.42 0.70 0.06 0.45 -0.20 --- --- 0.74 0.08 30 1.66 1.08 1.01 0.37 0.98 0.25 0.32 -0.33 --- --- 0.59 -0.10 31 1.61 1.09 --- --- 1.08 0.38 0.14 -0.36 0.57 -0.04
MAX 2.45 1.76 2.69 2.08 1.33 0.73 1.24 0.66 1.53 0.86 1.18 0.59 MIN 1.39 0.66 1.00 0.37 0.61 0.06 0.01 -0.59 0.20 -0.38 0.09 -0.51

---
--- ---
234 COASTAL AREA BETWEEN SEBASTIAN INLET AND ST. LUCIE RIVER
02251800 INDIAN RIVER AT WABASSO, FL--Continued
GAGE HEIGHT, in FEET, WATER YEAR OCTOBER 2001 TO SEPTEMBER 2002
DAY HIGH LOW HIGH LOW HIGH LOW HIGH LOW HIGH LOW HIGH LOW
APRIL MAY JUNE JULY AUGUST SEPTEMBER
1 0.66 0.13 0.56 0.07 1.16 0.72 --- --- 0.58 0.12 1.05 0.51 2 0.83 0.14 0.67 -0.08 1.14 0.47 --- --- 0.93 0.22 1.22 0.46 3 0.70 0.24 0.45 -0.44 0.98 0.50 --- --- 1.01 0.28 1.60 0.80 4 0.83 0.26 0.09 -0.45 --- --- --- --- 0.97 0.31 1.53 0.72 5 1.21 0.70 0.38 -0.16 --- --- --- --- 1.36 0.52 1.30 0.63
6 1.33 0.94 0.63 0.24 --- --- --- --- 1.39 0.68 1.37 0.66 7 0.96 0.48 0.49 0.05 --- --- --- --- 1.90 0.89 1.46 0.85 8 0.55 0.07 0.28 -0.14 --- --- --- --- 1.86 1.12 1.61 0.97 9 0.38 -0.06 0.24 -0.24 --- --- --- --- 1.60 0.85 1.57 1.00 10 0.57 0.01 0.17 -0.33 --- --- --- --- 1.50 0.86 1.64 0.82
11 0.62 0.08 0.15 -0.34 --- --- --- --- 1.69 1.03 1.44 0.83 12 0.70 0.19 0.15 -0.39 --- --- --- --- 1.67 0.78 1.17 0.56 13 0.58 0.14 0.11 -0.38 --- --- --- --- 1.47 0.98 0.92 0.37 14 0.72 0.16 0.15 -0.20 --- --- --- --- 1.47 0.81 0.92 0.40 15 0.82 0.20 0.78 0.02 --- --- --- --- 1.25 0.62 0.96 0.52
16 0.68 0.09 0.49 -0.27 --- --- --- --- 1.04 0.53 0.90 0.47 17 0.58 0.06 0.28 -0.44 --- --- --- --- 0.98 0.49 0.89 0.46 18 0.55 0.04 0.13 -0.26 --- --- --- --- 0.98 0.53 0.92 0.43 19 0.05 0.44 0.04 --- --- --- --- 0.89 0.34 0.94 0.44 20 0.56 -0.07 1.51 0.92 --- --- --- --- 0.99 0.28 0.97 0.42
21 0.50 0.11 1.61 1.10 --- --- --- --- 0.82 0.25 1.20 0.56 22 0.52 -0.08 1.67 1.02 --- --- --- --- 0.92 0.39 1.19 0.73 23 0.93 0.07 1.39 0.73 --- --- --- --- 0.98 0.46 1.34 0.76 24 0.93 0.34 1.00 0.40 --- --- --- --- 0.91 0.41 1.37 0.89 25 0.59 -0.03 0.99 0.33 --- --- --- --- 0.74 0.21 1.25 0.57
26 0.60 0.04 1.13 0.46 --- --- --- --- 0.76 0.19 0.81 0.43 27 0.59 -0.04 0.81 0.27 --- --- --- --- 0.67 0.17 1.13 0.52 28 0.55 -0.11 0.98 0.51 --- --- --- --- 0.60 0.16 1.28 0.73 29 0.62 0.12 1.40 0.70 --- --- --- --- 0.82 0.27 1.31 0.74 30 0.77 0.03 1.31 0.49 --- --- --- --- 0.73 0.26 1.42 0.77 31 --- --- 1.13 0.64 0.48 0.07 0.93 0.37 --- --
MAX 1.33 0.94 1.67 1.10 1.16 0.72 0.48 0.07 1.90 1.12 1.64 1.00 MIN 0.38 -0.11 0.09 -0.45 0.98 0.47 0.48 0.07 0.58 0.12 0.81 0.37
YEAR HIGH MAXIMUM 2.69 MINIMUM 0.01 LOW MAXIMUM 2.08 MINIMUM -0.59

235 COASTAL AREA BETWEEN SEBASTIAN INLET AND ST. LUCIE RIVER
02252500 NORTH CANAL NEAR VERO BEACH, FL
LOCATION.--Lat 27° 41'35", long 80° 25'46", in SW1⁄ 4 sec.15, T.32 S., R.39 E., Indian River County, Hydrologic Unit 03080203, on downstream side of concrete piling for sewer main, approximately 0.9 mi upstream from County Road 605, and 4.2 mi north of Vero Beach.
DRAINAGE AREA.--Indeterminate.
PERIOD OF RECORD.--November 1950 to current year.
GAGE.--Water-stage recorder. Datum of gage is at NGVD of 1929. Prior to Feb. 27, 1952, water-stage recorder located 550 ftupstream from County Road 605 at datum 0.81 ft lower. Feb. 27, 1952 to Nov. 5, 1957, water-stage recorder located at bridge on U.S. Highway 1 at present datum. Nov. 6, 1957 to Dec. 28, 1994, water-stage located 600 ft upstream from County Road 605at present datum. Dec. 29, 1994 to Aug. 8, 1995, water-stage recorder located on County Road 605 bridge at present datum.
REMARKS.--Records fair. Considerable pumping into canal for drainage above station. Since Sept. 7, 1954, flow regulated by control structure 1.1 mi upstream.
DISCHARGE, CUBIC FEET PER SECOND, WATER YEAR OCTOBER 2001 TO SEPTEMBER 2002DAILY MEAN VALUES
DAY OCT NOV DEC JAN FEB MAR APR MAY JUN JUL AUG SEP
1 67 133 27 24 2 35 51 26 25 3 44 43 26 28 4 49 41 26 28 5 49 49 25 27
34 34 17 13 31 504 39 52 41 33 17 14 27 406 41 55 37 31 66 13 25 173 57 45 33 29 65 13 23 136 57 41 30 26 38 13 22 157 38 41
6 48 25 24 27 7 44 28 25 27 8 57 31 34 26 9 87 34 127 24 10 63 35 20 24
28 26 31 14 21 97 46 29 28 25 27 15 20 74 48 20 26 25 25 15 23 118 45 20 25 24 23 14 23 256 42 24 112 23 22 12 22 241 37 26
11 52 34 29 2412 48 32 30 2313 44 33 30 2314 40 58 29 2315 38 61 29 35
116 22 20 12 21 282 277 25 31 22 21 12 22 341 299 27 37 24 23 11 23 165 137 25 39 22 22 12 116 139 98 24 38 20 22 11 89 93 72 23
16 36 52 29 3617 35 49 28 3318 33 44 27 3319 32 41 26 3120 35 40 25 29
36 19 22 11 75 56 55 23 33 18 21 13 149 32 85 23 31 17 19 13 258 34 55 24 29 16 18 21 279 37 40 24 29 16 17 28 433 37 23 24
21 37 38 24 2822 61 35 24 2723 47 34 23 2624 38 34 23 2525 204 33 23 24
28 16 16 25 650 211 22 24 28 16 15 21 361 267 25 23107 16 15 19 229 119 32 23 28 16 14 18 172 74 33 2435 16 14 17 261 40 33 29
26 480 33 24 2427 96 32 23 2328 55 30 22 2329 51 29 23 2230 51 28 22 2231 49 --- 23 21
37 17 14 16 312 25 156 24 34 18 15 15 322 28 75 23 33 18 15 15 152 31 29 23--- 18 15 14 114 33 151 23--- 18 14 15 119 37 68 24 --- 16 --- 29 --- 38 57 --
TOTAL 2105 1240 896 815 MEAN 67.9 41.3 28.9 26.3 MAX 480 133 127 36 MIN 32 25 20 21
1143 657 683 484 4394 4281 2272 83540.8 21.2 22.8 15.6 146 138 73.3 27.8116 34 66 29 650 504 299 55 25 16 14 11 20 25 22 20
STATISTICS OF MONTHLY MEAN DATA FOR WATER YEARS 1951 - 2002, BY WATER YEAR (WY)
MEAN 60.2 30.7 20.1 22.4 MAX 220 133 71.1 54.3(WY) 2000 1985 1995 1970 MIN 8.18 7.00 6.24 4.52(WY) 1959 1956 1962 1956
24.8 27.9 19.1 20.6 41.9 35.3 40.0 55.3100 136 65.9 68.3 226 138 119 2801991 1993 1951 1979 1968 2002 1981 1960 4.83 3.97 4.78 5.23 4.98 8.12 9.26 7.611956 1956 1963 1956 1964 1981 1958 1961
SUMMARY STATISTICS FOR 2001 CALENDAR YEAR FOR 2002 WATER YEAR WATER YEARS 1951 - 2002
ANNUAL TOTAL 14876 ANNUAL MEAN 40.8 HIGHEST ANNUAL MEAN LOWEST ANNUAL MEAN HIGHEST DAILY MEAN 522 LOWEST DAILY MEAN 13ANNUAL SEVEN-DAY MINIMUM 14 MAXIMUM PEAK STAGE10 PERCENT EXCEEDS 6650 PERCENT EXCEEDS 2390 PERCENT EXCEEDS 15
1980554.3 33.2
57.7 1991 13.1 1961
Sep 14 650 Jun 21 1580 Sep 24 1960Many days 11 May 13,15,16 0.60 Jun 27 1967Jun 17 12 May 10 2.3 May 13 1981
9.42 Jul 1 11.94 Oct 4 2000 118 6129 1816 7.6

236 COASTAL AREA BETWEEN SEBASTIAN INLET AND ST. LUCIE RIVER
02253000 MAIN CANAL AT VERO BEACH, FL
LOCATION.--Lat 27° 38'54", long 80° 24'10", in SE1⁄ 4 sec.35, T.32 S., R.39 E., Indian River County, Hydrologic Unit 03080203, on right bank 8 ft upstream from dam, 700 ft upstream from U.S. Highway 1, and 0.6 mi northwest of Vero Beach.
DRAINAGE AREA.--Indeterminate.
PERIOD OF RECORD.--January 1949 to current year. Monthly discharge only for some periods, published in WSP 1724.
GAGE.--Water-stage recorder and concrete dam. Datum of gage is at NGVD of 1929. Prior to Mar. 20, 1952, at datum 0.74 ft lower.Mar. 20, 1952 to Sept. 30, 1956, at datum 0.02 ft lower.
REMARKS.--Records good. Considerable pumping into canal for drainage upstream from station. Since Aug. 6, 1954, flow regulatedby control structure 1.5 mi upstream.
DISCHARGE, CUBIC FEET PER SECOND, WATER YEAR OCTOBER 2001 TO SEPTEMBER 2002DAILY MEAN VALUES
DAY OCT NOV DEC JAN FEB MAR APR MAY JUN JUL AUG SEP
1 73 212 33 262 12 103 33 283 37 76 32 36 4 52 73 32 34 5 54 81 28 37
54 39 28 18 28 410 54 5261 39 29 17 31 496 53 70 46 36 48 13 27 323 64 62 38 31 62 11 24 261 39 61 33 28 47 14 21 277 28 66
6 53 7.1 27 407 50 9.5 30 408 58 28 37 37 9 82 38 43 34 10 74 39 40 33
30 27 38 15 15 170 68 3529 27 33 15 15 141 67 4.8 25 26 30 15 37 143 89 4.2 23 27 29 14 33 287 222 4.2 129 27 27 10 26 502 53 4.2
11 65 39 39 32 12 61 37 37 3113 57 135 36 3014 53 199 35 3115 50 7.1 33 49
163 26 26 9.4 24 508 479 4.611 26 32 10 26 498 735 4.929 28 40 11 21 275 289 4.735 26 37 13 191 213 185 4.738 27 37 14 282 156 142 10
16 48 29 33 5017 44 44 32 4518 42 46 30 4119 48 45 29 3920 52 44 27 35
38 26 35 15 267 124 115 24 36 25 33 16 254 133 169 28 32 22 30 15 329 233 138 31 29 18 27 26 432 183 88 33 27 20 26 34 421 226 10 33
21 52 42 25 3422 240 40 24 32 23 69 39 24 3024 9.5 39 24 2925 112 38 24 27
26 22 24 31 697 303 6.7 3126 20 21 26 606 495 21 30
172 19 19 22 363 319 36 308.2 20 15 20 258 198 40 3729 19 11 19 326 144 41 24
26 448 37 26 2527 111 37 25 2528 13 35 23 2429 44 34 25 2230 53 34 25 2231 54 --- 26 24
37 20 10 18 499 135 174 8.232 31 20 17 603 73 127 21 28 32 19 16 381 11 12 29--- 28 18 14 250 35 298 32--- 24 17 14 209 49 118 32 --- 25 --- 22 --- 53 53 --
TOTAL 2270.5 1666.7 937 1022 MEAN 73.2 55.6 30.2 33.0 MAX 448 212 43 50 MIN 9.5 7.1 23 22
1264.2 811 868 524.4 6696 7374 4013.7 815.5 45.1 26.2 28.9 16.9 223 238 129 27.2172 39 62 34 697 508 735 708.2 18 10 9.4 15 11 6.7 4.2
STATISTICS OF MONTHLY MEAN DATA FOR WATER YEARS 1949 - 2002, BY WATER YEAR (WY)
MEAN 110 66.9 46.8 52.1 MAX 274 258 110 117 (WY) 1967 1985 1995 1970 MIN 23.4 5.69 5.39 21.3(WY) 1998 1956 1956 1990
58.2 64.1 46.8 53.4 94.7 87.3 94.6 116206 247 106 179 437 249 252 4401983 1993 1960 1979 1968 1968 1981 1960 16.0 20.7 16.3 9.14 24.4 14.7 28.9 27.22001 1990 1990 2000 2000 1997 1980 2002
SUMMARY STATISTICS FOR 2001 CALENDAR YEAR FOR 2002 WATER YEAR WATER YEARS 1949 - 2002
ANNUAL TOTAL 22555.1 ANNUAL MEAN 61.8 HIGHEST ANNUAL MEAN LOWEST ANNUAL MEAN HIGHEST DAILY MEAN 585 LOWEST DAILY MEAN 4.4ANNUAL SEVEN-DAY MINIMUM 10MAXIMUM PEAK STAGE10 PERCENT EXCEEDS 17550 PERCENT EXCEEDS 3290 PERCENT EXCEEDS 14
28263.077.4 74.3
137 1960 41.8 1950
Sep 14 735 Aug 12 1830 Sep 25 1963 Jul 27 4.2 Sep 8,9,10 0.00 Some yearsMar 6 4.5 Sep 8 1.9 Jan 2 1990
12.70 Aug 11 14.38 Sep 24 1963 224 16333 3815 14

237 COASTAL AREA BETWEEN SEBASTIAN INLET AND ST. LUCIE RIVER
02253500 SOUTH CANAL NEAR VERO BEACH, FL
LOCATION.--Lat 27° 36'11", long 80° 23'24", in SW1⁄ 4 sec.13, T.33 S., R.39 E., Indian River County, Hydrologic Unit 03080203, on right bank 1,000 ft upstream from bridge on State Highway 605, and 2.5 mi south of Vero Beach.
DRAINAGE AREA.--Indeterminate.
PERIOD OF RECORD.--October 1950 to current year.
GAGE.--Water-stage recorder. Datum of gage is at NGVD of 1929. Prior to Feb. 28, 1952, at downstream side of bridge 1,000 ft downstream at datum 1.26 ft lower. Feb. 28, 1952 to Nov. 6, 1957, 20 ft upstream from bridge at datum 0.46 ft lower. SinceOct. 1, 1997 water-stage recorder for Indian River at Wabasso (02251800) used as auxiliary gage for this station.
REMARKS.--Records fair. Considerable pumping into canal for drainage above station. Since Jan. 6, 1956, flow regulated by control structure upstream.
DISCHARGE, CUBIC FEET PER SECOND, WATER YEAR OCTOBER 2001 TO SEPTEMBER 2002DAILY MEAN VALUES
DAY OCT NOV DEC JAN FEB MAR APR MAY JUN JUL AUG SEP
1 23 131 15 13 52 28 14 15 20 187 38 76 2 7.9 39 15 21 3 11 30 14 23 4 15 26 15 17 5 15 14 14 21
50 34 12 14 21 182 38 75 36 31 15 15 18 174 167 54 29 20 29 16 18 107 328 48 26 15 19 15 17 95 27 127
6 17 5.6 14 29 7 12 8.6 16 26 8 20 14 19 24 9 29 18 21 26 10 26 18 22 27
31 23 12 13 15 70 37 129 32 22 15 15 14 59 29 82 23 21 19 16 33 126 24 92 23 22 19 16 27 283 24 87 144 20 17 16 23 378 24 85
11 22 18 19 26 12 20 15 18 2513 20 107 18 2414 19 87 19 2615 8.8 1.1 15 43
119 18 15 16 22 261 e450 8131 22 17 16 24 236 e700 9034 20 20 16 19 122 e390 64 36 19 17 15 142 94 e130 2236 20 16 14 101 73 115 20
16 7.9 1.8 16 4217 1.8 9.4 18 4018 6.0 13 16 3919 11 14 14 3720 10 15 13 34
33 19 18 17 93 44 94 22 30 19 18 18 96 22 165 2325 18 17 18 74 21 103 25 29 16 18 27 78 20 72 30 31 16 16 14 130 19 28 31
21 11 14 11 3322 149 16 15 3223 25 19 19 3024 9.2 21 16 2925 106 20 10 27
30 16 16 8.7 431 211 27 2726 11 15 7.2 282 290 26 26118 9.6 12 11 158 208 28 22 14 13 11 12 134 109 29 11122 14 14 12 231 46 32 127
26 113 18 8.9 2627 19 20 12 2528 5.8 21 15 2529 14 20 18 2430 18 20 15 2431 19 --- 13 25
29 14 14 11 202 23 148 22 23 15 14 11 175 24 56 1818 13 16 8.7 115 22 35 17--- 13 15 7.7 89 26 167 17--- 12 14 8.9 86 31 96 16 --- 12 --- 28 --- 32 68 --
TOTAL 791.4 774.5 483.9 863 MEAN 25.5 25.8 15.6 27.8 MAX 149 131 22 43 MIN 1.8 1.1 8.9 13
1130 565.6 484 448.2 2888 3595 3695 166640.4 18.2 16.1 14.5 96.3 116 119 55.5144 34 29 28 431 378 700 129 14 9.6 11 7.2 14 19 24 16
STATISTICS OF MONTHLY MEAN DATA FOR WATER YEARS 1951 - 2002, BY WATER YEAR (WY)
MEAN 69.5 36.0 22.7 25.2 MAX 200 177 91.2 74.5(WY) 1984 1985 1995 1993 MIN 6.01 7.18 5.43 4.21(WY) 1982 1962 1963 1962
25.8 30.3 21.7 27.7 54.6 42.8 51.8 68.3 90.6 138 86.8 118 267 143 208 2801966 1993 1951 1979 1992 1968 1981 1960 4.52 4.90 4.87 5.23 4.93 8.29 5.00 7.851962 1956 1956 1956 1956 1977 1956 1961
SUMMARY STATISTICS FOR 2001 CALENDAR YEAR FOR 2002 WATER YEAR WATER YEARS 1951 - 2002
ANNUAL TOTAL 13087.9 ANNUAL MEAN 35.9 HIGHEST ANNUAL MEAN LOWEST ANNUAL MEAN HIGHEST DAILY MEAN 453 LOWEST DAILY MEAN 1.1ANNUAL SEVEN-DAY MINIMUM 5.3 MAXIMUM PEAK STAGE 10 PERCENT EXCEEDS 8850 PERCENT EXCEEDS 1890 PERCENT EXCEEDS 8.1
17384.647.6 39.8
61.6 1960 15.2 1962
Sep 14 e700 Aug 12 1780 Sep 4 1979Nov 15 1.1 Nov 15 0.54 May 18 1978Mar 7 8.1 Oct 15 b1.1
a11.80 Oct 16 1999 120 8322 1712 6.4
e Estimated a Observedb May 21, 1978, Nov 15, 2001

238 WATER RESOURCES DATA FOR FLORIDA, 2002Volume 1A: Northeast Florida Surface Water
0
0
10
10
20 MILES
20 KILOMETERS
28° 00¢
27° 00¢
81° 00¢ 80° 00¢
02263130
02264100
02266298
282135081345500
02266300 pp
p
p
p
p
p02264000p
02264003p
02264060
02264051
pp
02263869p
p
02266291
02266025
p
p
02266295
p
0226620502266294
p02264140
02256500p
02273001 p
p
p
02270500
02269148
p02268903
02268904
p02267000
p02266550
p02266500
p02266480
0226649502266496
p
p02263800
02264495
p02262900
p
p
p
p
02273000
02266200
02258000p
p0225700
02275503
p
p02266500
p02263800 STREAM GAGING STATION
AND NUMBER
QW SAMPLING SITE
EXPLANATION
Figure 9.--Location of stream gaging stations in the Kissimmee River basin, the Taylor Creek basin and inflow to Lake Okeechobee from the north, and Fisheating Creek basin and inflow to Lake Okeechobee from the northwest.

239 FISHEATING CREEK BASIN AND INFLOW TO LAKE OKEECHOBEE FROM NORTHWEST
02256500 FISHEATING CREEK AT PALMDALE, FL
LOCATION.--Lat 26° 55'56", long 81° 18'54" in SW1⁄ 4 sec.3, T.41 S., R.30 E., Glades County, Hydrologic Unit 03090103, near right bank on downstream side of southbound bridge on U.S. Highway 27, 1.0 mi south of Palmdale, and 16 mi upstream from Lake Okeechobee.
DRAINAGE AREA.--311 mi2.
PERIOD OF RECORD.--April 1931 to current year.
REVISED RECORDS.--WRD FL-66-2: Drainage area.
GAGE.--Water-stage recorder and data-collection platform. Datum of gage is 27.19 ft above NGVD of 1929. Prior to Mar. 16, 1949, nonrecording gage and Mar. 16, 1949, to Jan. 23, 1956, water-stage recorder, at site 450 ft upstream at same datum.
REMARKS.--Records fair.
DISCHARGE, CUBIC FEET PER SECOND, WATER YEAR OCTOBER 2001 TO SEPTEMBER 2002DAILY MEAN VALUES
DAY OCT NOV DEC JAN FEB MAR APR MAY JUN JUL AUG SEP
1 789 558 27 14 2 895 506 26 14 3 914 510 25 15 4 805 496 24 15 5 686 494 23 15
15 47 4.0 0.00 0.00 1440 662 490 14 47 3.7 0.00 0.00 1420 616 554 14 43 3.4 0.00 0.00 1680 623 667 14 39 3.2 0.00 0.00 1960 613 821 13 38 3.0 0.00 0.00 1740 585 808
6 593 406 22 15 7 523 317 21 16 8 474 258 22 16 9 428 229 24 1610 381 217 26 16
13 29 2.6 0.00 0.00 1500 527 706 13 27 2.3 0.00 0.00 1390 533 717 13 26 2.1 0.00 0.24 1360 580 817 12 24 1.8 0.00 0.66 1300 522 881 12 21 1.6 0.00 0.69 1240 501 837
11 338 201 28 1612 295 175 29 16 13 255 148 28 15 14 224 125 28 1515 193 107 28 21
13 19 1.5 0.00 0.63 1280 474 775 13 18 1.7 0.00 0.87 1310 459 726 e13 16 2.5 0.00 1.4 1250 422 647 e25 15 3.1 0.00 1.5 1170 375 576 40 14 3.8 0.00 1.9 1030 339 536
16 163 93 27 2617 135 82 25 2318 110 72 24 2219 92 65 22 2220 79 59 21 21
62 13 4.4 0.00 2.5 948 337 503 67 12 4.1 0.00 6.9 974 409 49363 11 3.9 0.00 16 1050 494 526 55 10 3.7 0.00 29 993 485 52846 9.6 3.4 0.00 40 994 485 478
21 72 54 20 2222 77 49 19 2223 89 45 18 2124 99 42 17 2125 97 38 16 20
38 9.2 3.0 0.00 58 919 482 41932 8.5 2.6 0.00 81 1140 451 359 30 7.8 2.2 0.00 133 1130 396 323 30 7.1 1.8 0.00 171 1310 360 348 30 6.6 1.5 0.00 257 1620 394 308
26 118 36 16 1827 168 33 15 1828 305 31 15 1729 600 29 14 1630 713 28 14 1631 639 --- 14 15
33 6.3 1.2 0.00 471 1530 567 24937 5.9 0.87 0.00 951 1310 617 24158 5.5 0.62 0.00 1230 1050 648 363--- 5.1 0.39 0.00 1360 888 675 412--- 4.8 0.15 0.00 1400 840 620 387 --- 4.3 --- 0.00 --- 774 515 --
TOTAL 11349 5503 678 555 MEAN 366 183 21.9 17.9 MAX 914 558 29 26 MIN 72 28 14 14 MED 295 100 22 16CFSM 1.18 0.59 0.07 0.06 IN. 1.36 0.66 0.08 0.07
818 549.7 74.13 0.00 6214.29 38540 15766 16495 29.2 17.7 2.47 0.000 207 1243 509 550 67 47 4.4 0.00 1400 1960 675 881 12 4.3 0.15 0.00 0.00 774 337 241 28 13 2.6 0.00 2.2 1250 501 5270.09 0.06 0.01 0.00 0.67 4.00 1.64 1.77 0.10 0.07 0.01 0.00 0.74 4.61 1.89 1.97
STATISTICS OF MONTHLY MEAN DATA FOR WATER YEARS 1931 - 2002, BY WATER YEAR (WY)
MEAN 506 122 63.9 89.6MAX 3822 750 770 939(WY) 1952 1988 1998 1998 MIN 8.05 1.11 0.24 0.26(WY) 1973 1962 2001 1992
118 159 53.6 19.3 238 414 471 7551596 1234 505 362 1995 2525 1475 32531998 1970 1941 1958 1982 1974 1953 19470.082 0.000 0.000 0.000 0.000 0.000 0.34 16.11962 1956 1935 1935 1935 1935 1950 1996
SUMMARY STATISTICS FOR 2001 CALENDAR YEAR FOR 2002 WATER YEAR WATER YEARS 1931 - 2002
ANNUAL TOTAL 132217.94 ANNUAL MEAN 362 HIGHEST ANNUAL MEAN LOWEST ANNUAL MEAN HIGHEST DAILY MEAN 5150 LOWEST DAILY MEAN 0.00 ANNUAL SEVEN-DAY MINIMUM 0.00 MAXIMUM PEAK FLOW MAXIMUM PEAK STAGEANNUAL RUNOFF (CFSM) 1.16ANNUAL RUNOFF (INCHES) 15.8210 PERCENT EXCEEDS 128050 PERCENT EXCEEDS 1690 PERCENT EXCEEDS 0.00
96542.12 264 252
671 1960 13.6 1956
Sep 16 1960 Jul 4 30500 Oct 3 1951 Many days 0.00 Many days 0.00 Most years Feb 19 0.00 May 1 0.00 Most years
1980 Jul 4 *31400 Oct 3 19516.63 Jul 4 12.44 Oct 3 1951 0.85 0.8111.55 11.02
856 70429 40 0.00 0.00
e Estimated * From rating curve extended above 21,000 ft3/s

240 FISHEATING CREEK BASIN AND INFLOW TO LAKE OKEECHOBEE FROM NORTHWEST
02257000 FISHEATING CREEK NEAR LAKEPORT, FL
LOCATION.--Lat 26° 57'44", long 81° 07'05" in SE1⁄ 4 sec.28, T.40 S., R.32 E., Glades County, Hydrologic Unit 03090103, on right bank, 50 ft upstream from bridge on State Highway 78, 0.8 mi southeast of Lakeport, and 2 mi upstream from Lake Okeechobee.
DRAINAGE AREA.-- Indeterminate.
PERIOD OF RECORD.--May 1997 to current year.
GAGE.--Water-stage recorder, acoustic velocity meter, and data-collection platform. Datum of gage is at NGVD of 1929 (South Florida Water Management District bench mark). Nonrecording gage 1949-50, 1971-76 at same site.
REMARKS.--Records poor. Discharge not published for some periods due to missing velocity or gage height data.
DISCHARGE, CUBIC FEET PER SECOND, WATER YEAR OCTOBER 2000 TO SEPTEMBER 2001DAILY MEAN VALUES
DAY OCT NOV DEC JAN FEB MAR APR MAY JUN JUL AUG SEP
1 --- --- --- 292 --- --- --- 173 --- --- --- 6.9 4 --- --- --- 525 --- --- --- 34
33 41 57 19 21 52 2500 809 12 28 33 22 20 46 2290 6500.32 19 44 7.2 18 41 2160 e550
15 29 31 11 31 37 2060 e460 32 86 35 2.7 32 25 2050 e380
6 --- --- --- 317 --- --- --- 268 --- --- --- 8.8 9 --- --- 30 55
10 --- --- 30 16
32 77 32 15 36 29 2030 347 30 50 41 16 35 48 1970 340 24 29 51 6.2 36 36 1980 661 32 17 47 28 40 20 2060 916 35 32 49 26 29 21 2080 784
11 --- --- 39 39 12 --- --- 20 30 13 --- --- 40 36 14 --- --- 40 28 15 --- --- 41 37
28 29 47 18 25 22 1920 740 28 39 40 25 19 24 1790 929 31 8.3 36 23 24 9.5 1620 1910 32 29 36 33 29 21 1550 3020 44 21 27 29 51 30 1410 2870
16 --- --- 48 43 17 --- --- 49 31 18 --- --- 34 31 19 --- --- 44 27 20 --- --- 20 48
32 8.1 52 37 35 e63 1270 2940 45 28 38 26 35 e66 1140 3340-11 -7.7 5.9 26 43 e84 1090 3540 36 33 22 19 40 e230 982 3350 32 48 27 21 19 e515 829 3200
21 --- --- 28 25 22 --- --- 23 57 23 --- --- 16 70 24 --- --- -9.4 40 25 --- --- -29 41
43 66 20 26 36 e790 762 2950 32 46 20 21 35 e1100 758 2670 28 31 34 18 28 e1600 811 2530 32 45 36 32 30 1680 915 2320 39 36 23 16 30 1590 1260 2090
26 --- --- 22 29 27 --- --- 30 34 28 --- --- 29 31 29 --- --- 49 44 30 --- --- 56 38 31 --- --- 24 17
35 33 3.9 23 42 1600 1670 1870 36 18 10 25 26 2310 1640 1740 28 28 13 31 34 2750 1510 1830 --- 12 5.1 13 43 2800 1280 1990 --- 21 24 32 45 2650 1090 1960 --- 10 --- 17 --- 2490 919 --
TOTAL --- --- 673.6 1051.7MEAN --- --- 29.3 33.9MAX --- --- 56 70MIN --- --- -29 6.9
815.32 989.7 939.9 664.1 967 22779.5 47396 5368629.1 31.9 31.3 21.4 32.2 735 1529 179045 86 57 37 51 2800 2500 3540
-11 -7.7 3.9 2.7 18 9.5 758 340
STATISTICS OF MONTHLY MEAN DATA FOR WATER YEARS 1993 - 2001, BY WATER YEAR (WY)
MEAN 1013 386 249 396 MAX 1200 848 721 1420(WY) 1998 1999 1998 1998MIN 710 47.1 29.3 33.9(WY) 2000 1998 2001 2001
666 411 131 33.0 51.9 418 556 7842528 1508 409 73.8 151 955 1529 17901998 1998 1998 1998 1999 1999 2001 200129.1 30.2 27.0 4.82 5.37 6.49 8.30 45.32001 2000 2000 1997 2000 2000 2000 2000
SUMMARY STATISTICS FOR 2000 CALENDAR YEAR FOR 2001 WATER YEAR WATER YEARS 1993 - 2001
ANNUAL TOTAL 7626.8ANNUAL MEAN 25.7HIGHEST ANNUAL MEANLOWEST ANNUAL MEANHIGHEST DAILY MEAN 123 LOWEST DAILY MEAN -29ANNUAL SEVEN-DAY MINIMUM 4.0MAXIMUM PEAK STAGE10 PERCENT EXCEEDS 5550 PERCENT EXCEEDS 2090 PERCENT EXCEEDS 5.4
129962.82 439 406
697 1998 106 2000
Sep 23 3540 Sep 18 4620 Mar 26 1998Dec 25 -29 Dec 25 -29 Dec 25 2000Jun 8 10 Dec 20 1.6 May 26 1997
18.24 Sep 18 19.14 Mar 24 19981930 130035 6517 9.8
e Estimated Note.--Negative figures indicate reverse flow
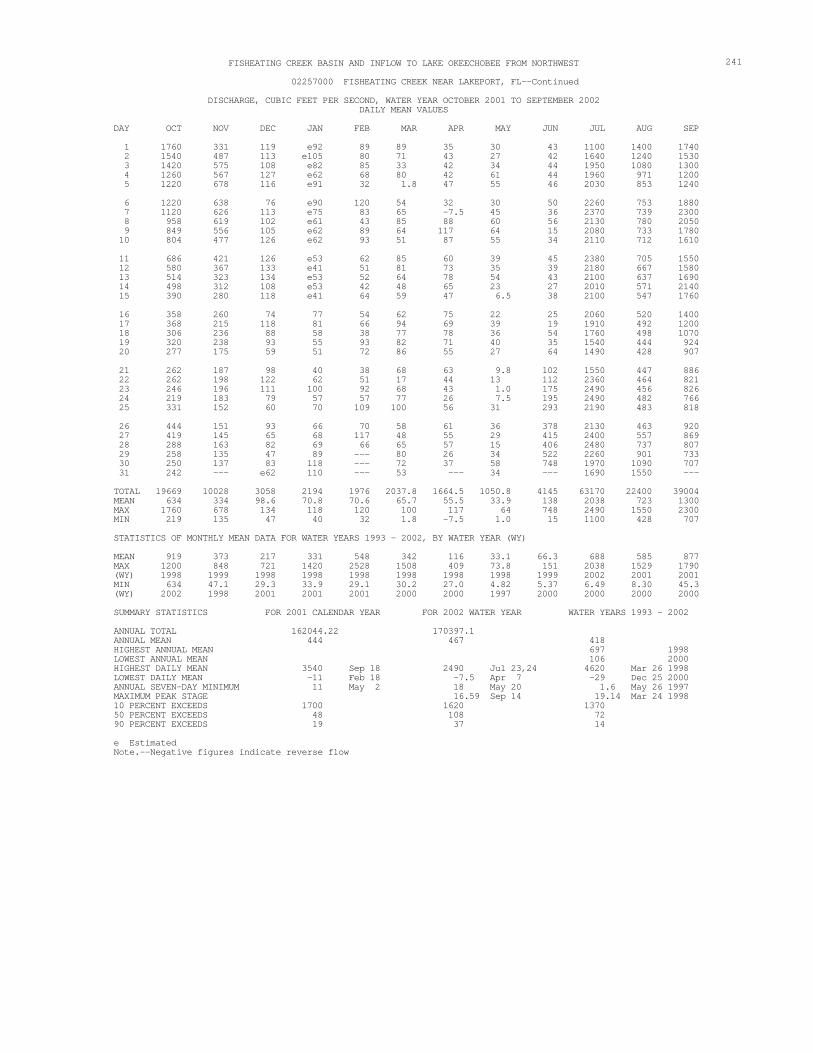
241 FISHEATING CREEK BASIN AND INFLOW TO LAKE OKEECHOBEE FROM NORTHWEST
02257000 FISHEATING CREEK NEAR LAKEPORT, FL--Continued
DISCHARGE, CUBIC FEET PER SECOND, WATER YEAR OCTOBER 2001 TO SEPTEMBER 2002DAILY MEAN VALUES
DAY OCT NOV DEC JAN FEB MAR APR MAY JUN JUL AUG SEP
1 1760 331 119 e922 1540 487 113 e1053 1420 575 108 e82 4 1260 567 127 e62 5 1220 678 116 e91
89 89 35 30 43 1100 1400 174080 71 43 27 42 1640 1240 1530 85 33 42 34 44 1950 1080 1300 68 80 42 61 44 1960 971 1200 32 1.8 47 55 46 2030 853 1240
6 1220 638 76 e907 1120 626 113 e75 8 958 619 102 e61 9 849 556 105 e6210 804 477 126 e62
120 54 32 30 50 2260 753 1880 83 65 -7.5 45 36 2370 739 2300 43 85 88 60 56 2130 780 2050 89 64 117 64 15 2080 733 1780 93 51 87 55 34 2110 712 1610
11 686 421 126 e5312 580 367 133 e4113 514 323 134 e5314 498 312 108 e5315 390 280 118 e41
62 85 60 39 45 2380 705 1550 51 81 73 35 39 2180 667 1580 52 64 78 54 43 2100 637 1690 42 48 65 23 27 2010 571 214064 59 47 6.5 38 2100 547 1760
16 358 260 74 7717 368 215 118 8118 306 236 88 5819 320 238 93 5520 277 175 59 51
54 62 75 22 25 2060 520 1400 66 94 69 39 19 1910 492 1200 38 77 78 36 54 1760 498 1070 93 82 71 40 35 1540 444 924 72 86 55 27 64 1490 428 907
21 262 187 98 4022 262 198 122 6223 246 196 111 100 24 219 183 79 5725 331 152 60 70
38 68 63 9.8 102 1550 447 886 51 17 44 13 112 2360 464 82192 68 43 1.0 175 2490 456 82657 77 26 7.5 195 2490 482 766109 100 56 31 293 2190 483 818
26 444 151 93 6627 419 145 65 6828 288 163 82 6929 258 135 47 8930 250 137 83 11831 242 --- e62 110
70 58 61 36 378 2130 463 920117 48 55 29 415 2400 557 86966 65 57 15 406 2480 737 807--- 80 26 34 522 2260 901 733--- 72 37 58 748 1970 1090 707 --- 53 --- 34 --- 1690 1550 --
TOTAL 19669 10028 3058 2194 MEAN 634 334 98.6 70.8 MAX 1760 678 134 118 MIN 219 135 47 40
1976 2037.8 1664.5 1050.8 4145 63170 22400 39004 70.6 65.7 55.5 33.9 138 2038 723 1300120 100 117 64 748 2490 1550 2300 32 1.8 -7.5 1.0 15 1100 428 707
STATISTICS OF MONTHLY MEAN DATA FOR WATER YEARS 1993 - 2002, BY WATER YEAR (WY)
MEAN 919 373 217 331MAX 1200 848 721 1420(WY) 1998 1999 1998 1998 MIN 634 47.1 29.3 33.9(WY) 2002 1998 2001 2001
548 342 116 33.1 66.3 688 585 8772528 1508 409 73.8 151 2038 1529 17901998 1998 1998 1998 1999 2002 2001 2001 29.1 30.2 27.0 4.82 5.37 6.49 8.30 45.32001 2000 2000 1997 2000 2000 2000 2000
SUMMARY STATISTICS FOR 2001 CALENDAR YEAR FOR 2002 WATER YEAR WATER YEARS 1993 - 2002
ANNUAL TOTAL 162044.22 ANNUAL MEAN 444 HIGHEST ANNUAL MEAN LOWEST ANNUAL MEAN HIGHEST DAILY MEAN 3540LOWEST DAILY MEAN -11ANNUAL SEVEN-DAY MINIMUM 11MAXIMUM PEAK STAGE10 PERCENT EXCEEDS 170050 PERCENT EXCEEDS 4890 PERCENT EXCEEDS 19
170397.1 467 418
697 1998106 2000
Sep 18 2490 Jul 23,24 4620 Mar 26 1998Feb 18 -7.5 Apr 7 -29 Dec 25 2000May 2 18 May 20 1.6 May 26 1997
16.59 Sep 14 19.14 Mar 24 19981620 1370 108 7237 14
e Estimated Note.--Negative figures indicate reverse flow

242 FISHEATING CREEK BASIN AND INFLOW TO LAKE OKEECHOBEE FROM NORTHWEST
02258000 HARNEY POND CANAL NEAR LAKEPORT, FL
LOCATION.--Lat 27° 00'58", long 81° 04'13" in NE1⁄ 4 sec.12, T.40 S., R.32 E., Glades County, Hydrologic Unit 03090103, near right bank of canal, 0.1 mi west of State Highway 721, 3.0 mi upstream from mouth and 3.8 mi northeast of Lakeport.
DRAINAGE AREA.-- Indeterminate.
PERIOD OF RECORD.--September 1948 to November 1950 (discharge measurements only); October 1993 to current year.
GAGE.--Water-stage recorder, acoustic velocity meter, and data-collection platform. Datum of gage is at NGVD of 1929 (South Florida Water Management District bench mark).
REMARKS.--Records fair. Discharge not published for some periods due to missing velocity or stage record.
DISCHARGE, CUBIC FEET PER SECOND, WATER YEAR OCTOBER 2000 TO SEPTEMBER 2001DAILY MEAN VALUES
DAY OCT NOV DEC JAN FEB MAR APR MAY JUN JUL AUG SEP
1 287 190 --- 33 -1222 234 164 --- 86 1163 120 201 --- -14 224 4 370 188 --- -135 195 200 139 838 -56 7.8
99 231 840 -66 -166 191 16-24 347 793 -122 -85 691 101 60 -179 842 -63 -7.9 769 7825 -126 858 -108 57 480 103 12 169 863 -132 -53 111 849
6 229 -51 80 567 352 23 145 -1458 228 --- -53 -1019 199 --- 48 -32
10 282 --- -24 29
-52 47 -24 864 -105 80 255 7189 63 -126 716 -157 103 548 219
122 53 -101 850 1.4 59 108 337 -45 11 -189 697 145 203 -34 1190 -20 164 -179 698 -45 337 -90 1520
11 294 --- -93 -135 12 270 --- 76 -67 13 254 --- -144 68 14 287 --- -28 9.2 15 273 --- -57 -104
34 -79 -126 730 -103 1400 198 1570 -81 -143 -159 -80 -50 1050 -75 1660-9.3 -78 -214 -62 -42 615 792 2260
-93 -34 250 -53 -52 948 -59 4130-1.7 677 -98 -118 -14 1040 810 3660
16 225 --- -177 -119 17 196 --- 66 8.6 18 274 --- 0.96 -30 19 127 --- 28 -236 20 71 --- 11 8.7
-43 780 630 165 125 510 46 264080 121 e670 -91 11 767 433 2080
231 280 707 -73 -104 617 905 1390 -22 73 710 -95 187 693 -46 1300 -34 -7.7 686 -154 171 218 36 1270
21 265 --- 162 27 22 196 --- 93 -18 23 163 --- 82 -65 24 176 --- 99 51 25 171 --- 84 -14
-39 713 178 -105 201 460 369 132055 695 122 -38 106 686 468 1260
134 631 -105 -40 114 1010 650 1130 -98 -44 -135 163 286 991 1250 827-126 -11 688 -113 177 483 608 497
26 208 --- 61 -41 27 198 --- -201 -3.1 28 36 --- -22 -36 29 82 --- 3.6 -205 30 212 --- -77 -6.6 31 136 --- -30 -171
-35 219 725 -8.3 186 234 530 695 -51 79 58 -31 104 74 662 127083 -60 736 -85 88 142 185 1070 --- -147 772 -135 -189 -34 -74 1100 --- 74 188 -59 -124 166 182 933 --- 1.9 --- 31 --- -171 -123 --
TOTAL 6615 854 971.56 -1357.2MEAN 213 122 36.0 -43.8 MAX 370 201 838 86MIN 36 -51 -201 -236
322.8 4250.2 6106 7769.7 426.4 12426.1 10776 3654611.5 137 204 251 14.2 401 348 1218 231 780 772 864 286 1400 1250 4130-126 -147 -214 -154 -189 -171 -123 16
STATISTICS OF MONTHLY MEAN DATA FOR WATER YEARS 1994 - 2001, BY WATER YEAR (WY)
MEAN 436 307 283 228 MAX 1131 654 463 527 (WY) 1996 1999 1998 1998MIN -73.0 122 36.0 -43.8 (WY) 1995 2001 2001 2001
217 253 246 264 299 369 401 563 753 782 631 545 679 791 629 12181998 1998 1996 1994 1994 1994 1998 200111.5 94.5 104 63.5 14.2 110 98.7 1382001 1997 1997 2000 2001 2000 2000 2000
SUMMARY STATISTICS FOR 2000 CALENDAR YEAR FOR 2001 WATER YEAR WATER YEARS 1994 - 2001
ANNUAL TOTAL 41233.01ANNUAL MEAN 125 HIGHEST ANNUAL MEANLOWEST ANNUAL MEANHIGHEST DAILY MEAN 838 LOWEST DAILY MEAN -201ANNUAL SEVEN-DAY MINIMUM -64 MAXIMUM PEAK STAGE10 PERCENT EXCEEDS 27150 PERCENT EXCEEDS 12590 PERCENT EXCEEDS -14
85706.56 254 329
445 1998 171 2000
Dec 5 4130 Sep 14 4130 Sep 14 2001Dec 27 -236 Jan 19 -257 Sep 29 1994Dec 10 -156 Apr 7 -156 Apr 7 2001
14.98 Sep 29 18.89 Oct 15 1999 840 744 82 233
-118 8.2
e Estimated Note.--Negative figures indicate reverse flow

243 FISHEATING CREEK BASIN AND INFLOW TO LAKE OKEECHOBEE FROM NORTHWEST
02258000 HARNEY POND CANAL NEAR LAKEPORT, FL--Continued
DISCHARGE, CUBIC FEET PER SECOND, WATER YEAR OCTOBER 2001 TO SEPTEMBER 2002DAILY MEAN VALUES
DAY OCT NOV DEC JAN FEB MAR APR MAY JUN JUL AUG SEP
1 178 1020 160 182 477 989 40 -6.03 123 966 139 -33 4 254 562 179 -9.55 468 623 52 84
105 112 209 74 107 1670 123 1680116 -254 -3.3 -26 22 1420 440 1480
-145 20 104 -104 32 1440 167 1260 28 -14 -0.42 -48 -66 1210 302 1490 17 132 133 43 -154 1100 1290 1550
6 727 627 148 407 913 304 266 188 792 590 327 779 981 324 245 81
10 645 522 193 82
-174 238 137 52 -33 789 1160 22903.4 122 -7.3 65 -93 1030 840 1950
75 99 -117 -15 56 800 918 1510 80 89 -124 -58 228 1010 415 1360 64 60 66 -66 -15 1220 143 889
11 158 370 331 136 12 323 433 409 148 13 71 132 447 19 14 135 661 130 45 15 443 549 215 304
691 -106 39 45 -54 1370 44 839235 -54 42 3.6 169 2110 281 828139 87 59 21 -121 1990 1380 677303 131 -16 236 121 1520 597 1190172 72 147 274 121 1530 568 612
16 452 419 86 471 17 847 339 107 428 18 912 88 82 434 19 596 59 16 319 20 146 -49 -20 270
57 -24 38 -34 175 1470 72 634-14 54 128 0.46 454 1310 248 581101 105 74 -10 207 1240 541 419-75 69 112 201 843 1050 555 669-99 -65 -21 213 423 887 614 321
21 130 -41 132 272 22 305 76 110 307 23 714 29 21 100 24 586 99 55 -93 25 709 81 18 86
-42 78 96 248 782 1310 861 386131 282 25 252 1430 1410 924 425 -0.26 1.3 36 253 1400 1320 952 190146 112 -42 129 1450 993 603 319170 91 -124 93 2270 978 614 449
26 1270 158 -34 118 27 1000 131 34 169 28 797 70 113 16 29 969 94 -1.3 36 30 846 86 157 -58 31 844 --- 113 43
167 141 -14 139 2310 724 633 375 45 -46 -73 89 1790 390 863 495152 25 -38 323 1500 410 903 237 --- 98 168 -183 1370 244 1120 584 --- -42 -62 -28 1120 545 1100 405 --- -59 --- 93 --- 442 1850 --
TOTAL 17811 10311 4269.7 3921.5MEAN 575 344 138 126 MAX 1270 1020 447 471 MIN 71 -49 -34 -93
2448.14 1554.3 970.98 2275.06 17844 34932 21121 2609487.4 50.1 32.4 73.4 595 1127 681 870 691 282 209 323 2310 2110 1850 2290-174 -254 -124 -183 -154 244 44 190
STATISTICS OF MONTHLY MEAN DATA FOR WATER YEARS 1994 - 2002, BY WATER YEAR (WY)
MEAN 454 312 263 216 MAX 1131 654 463 527 (WY) 1996 1999 1998 1998MIN -73.0 122 36.0 -43.8 (WY) 1995 2001 2001 2001
201 227 216 236 343 459 433 598 753 782 631 545 679 1127 681 12181998 1998 1996 1994 1994 2002 2002 200111.5 50.1 32.4 63.5 14.2 110 98.7 1382001 2002 2002 2000 2001 2000 2000 2000
SUMMARY STATISTICS FOR 2001 CALENDAR YEAR FOR 2002 WATER YEAR WATER YEARS 1994 - 2002
ANNUAL TOTAL 108987.7ANNUAL MEAN 299 HIGHEST ANNUAL MEANLOWEST ANNUAL MEANHIGHEST DAILY MEAN 4130LOWEST DAILY MEAN -236ANNUAL SEVEN-DAY MINIMUM -156MAXIMUM PEAK STAGE10 PERCENT EXCEEDS 88450 PERCENT EXCEEDS 11290 PERCENT EXCEEDS -104
143552.68 393 337
445 1998 171 2000
Sep 14 2310 Jun 26 4130 Sep 14 2001Jan 19 -254 Mar 2 -257 Sep 29 1994Apr 7 -34 Jun 2 -156 Apr 7 2001
16.49 Sep 25 18.89 Oct 15 19991210 794 160 229 -33 0.73
Note.--Negative figures indicate reverse flow.

244 KISSIMMEE RIVER BASIN
02262900 BOGGY CREEK NEAR TAFT, FL
LOCATION.--Lat 28° 22'16", long 81° 18'39", in NE1⁄ 4 sec.28, T.24 S., R.30 E., Orange County, Hydrologic Unit 03090101, on left bank 450 ft downstream from Boggy Creek Swamp, 0.2 mi upstream from bridge on Central Florida Greenway, 3.5 mi upstream from mouth, and 5.5 mi southeast of Taft.
DRAINAGE AREA.--83.6 mi2.
PERIOD OF RECORD.--September 1959 to current year.
GAGE.--Water-stage recorder. Datum of gage is 56.08 ft above NGVD of 1929 (U.S. Army Corps of Engineers bench mark). Nonrecording gage, Feb. 18, 1991 to Jan. 22, 1993. Auxiliary water-stage recorder on the south side of East Lake Tohopekaliga since Oct.1, 1973, and prior to July 19, 1968. From July 19, 1968, to Sept. 30, 1973, auxiliary water-stage recorder at St. Cloud Canal above S-59.
REMARKS.--Records good. Some diversion to ground water through drainage wells in lakes upstream from station.
DISCHARGE, CUBIC FEET PER SECOND, WATER YEAR OCTOBER 2001 TO SEPTEMBER 2002DAILY MEAN VALUES
DAY OCT NOV DEC JAN FEB MAR APR MAY JUN JUL AUG SEP
1 149 30 21 122 128 30 20 153 113 32 19 194 97 31 20 215 82 30 19 21
12 44 5.5 8.8 30 361 275 601 12 39 e5.6 8.8 35 385 223 66312 35 5.7 7.4 30 455 203 63012 32 6.4 5.8 24 359 215 51412 29 6.2 4.6 20 328 218 471
6 68 28 18 207 60 27 17 188 56 26 17 179 52 25 16 1610 49 24 16 15
11 28 5.4 3.8 17 290 195 48516 26 4.5 3.3 24 249 200 38920 24 4.2 2.7 34 211 212 29617 21 e4.0 2.2 35 190 201 23916 20 e3.9 1.7 29 180 178 209
11 46 24 16 1512 43 23 15 1413 41 23 15 1414 43 25 15 1515 51 30 14 23
17 18 e3.8 1.4 27 164 157 18216 17 4.1 1.1 31 162 143 16415 20 4.8 0.80 27 178 176 14915 19 7.2 0.66 23 221 227 13814 17 8.7 0.64 23 222 410 129
16 44 34 14 2117 40 32 14 2118 37 30 15 2019 37 29 15 1820 38 28 14 17
13 16 9.9 0.56 37 192 579 11612 15 8.3 0.52 77 199 511 12211 13 7.5 0.68 89 241 447 17111 12 7.2 2.3 98 198 338 17511 11 7.0 4.4 135 190 253 172
21 40 27 14 1722 45 26 13 1623 47 28 12 1624 48 31 14 1525 47 27 13 15
10 10 6.6 3.3 364 339 215 16414 9.7 6.1 2.9 540 734 199 17640 8.8 5.9 2.4 657 696 178 17686 8.1 5.7 1.7 636 574 157 178
109 7.6 5.4 1.3 680 474 140 183
26 42 26 15 14 27 39 24 14 1428 36 23 13 1429 34 22 12 13 30 33 22 12 13 31 31 --- 12 12
90 8.1 5.1 0.92 668 379 126 18168 14 5.6 0.64 600 288 112 16353 10 6.6 0.55 517 239 108 143
--- 8.3 9.8 0.43 463 226 149 123 --- 7.0 8.9 2.2 375 228 282 106 --- 6.0 --- 16 --- 306 562 --
TOTAL 1716 817 474 511 MEAN 55.4 27.2 15.3 16.5 MAX 149 34 21 23 MIN 31 22 12 12CFSM 0.66 0.33 0.18 0.20 IN. 0.76 0.36 0.21 0.23
745 553.6 185.6 94.50 6345 9458 7589 7608 26.6 17.9 6.19 3.05 212 305 245 254109 44 9.9 16 680 734 579 663 10 6.0 3.8 0.43 17 162 108 1060.32 0.21 0.07 0.04 2.53 3.65 2.93 3.03 0.33 0.25 0.08 0.04 2.82 4.21 3.38 3.39
STATISTICS OF MONTHLY MEAN DATA FOR WATER YEARS 1959 - 2002, BY WATER YEAR (WY)
MEAN 63.6 39.6 35.1 40.1 MAX 257 305 386 185 (WY) 1993 1995 1998 1998 MIN 3.84 3.12 2.60 3.50(WY) 1971 1971 1971 1971
47.2 55.7 35.1 15.4 51.6 94.9 99.5 118299 484 180 143 264 527 298 4671998 1960 1987 1991 1968 2001 1967 1960 4.30 3.75 1.61 0.38 3.19 5.81 5.96 7.341985 1975 1975 2000 1971 1969 1980 1970
SUMMARY STATISTICS FOR 2001 CALENDAR YEAR FOR 2002 WATER YEAR WATER YEARS 1959 - 2002
ANNUAL TOTAL 40400.0 ANNUAL MEAN 111 HIGHEST ANNUAL MEAN LOWEST ANNUAL MEAN HIGHEST DAILY MEAN 1790LOWEST DAILY MEAN 3.5 ANNUAL SEVEN-DAY MINIMUM 3.9MAXIMUM PEAK FLOWMAXIMUM PEAK STAGE INSTANTANEOUS LOW FLOWANNUAL RUNOFF (CFSM) 1.32ANNUAL RUNOFF (INCHES) 17.9810 PERCENT EXCEEDS 32950 PERCENT EXCEEDS 2790 PERCENT EXCEEDS 6.4
36096.7098.9 58.1
232 1959 15.4 1977
Jul 19 734 Jul 22 3400 Mar 17 1960Mar 3 0.43 May 29 *0.00 Feb 25 0.71 May 12 0.00 May 1 2000
774 Jul 22 a3680 Mar 18 1960 9.97 Jul 22 13.64 Mar 18 1960 1.9 May 15-18 1.18 0.7016.06 9.45
292 13924 25 5.5 4.9
e Estimated * Many days 1981, 1985, 2000 water years a From floodmarks

245 KISSIMMEE RIVER BASIN
02263130 C-2 CANAL NEAR VINELAND, FL
LOCATION.--Lat 28° 19'54", long 81° 32'28", in NW1⁄ 4 sec.8, T.25 S., R.28 E., Osceola County, Hydrologic Unit 03090101, on downstream side of culverts on Exit Ramp 25A, 0.45 mi east of Ramp entrance from eastbound lane of Interstate Highway 4 to eastbound lane of U.S. Highway 192, 1.5 mi west of Bonnet Creek, and 4.5 mi south of Vineland.
DRAINAGE AREA.--1.28 mi2.
PERIOD OF RECORD.--September 1993 to September 2002 (discontinued).
GAGE.--Water-stage recorder. Datum of gage is at NGVD of 1929.
REMARKS.--Records fair.
DISCHARGE, CUBIC FEET PER SECOND, WATER YEAR OCTOBER 2001 TO SEPTEMBER 2002DAILY MEAN VALUES
DAY OCT NOV DEC JAN FEB MAR APR MAY JUN JUL AUG SEP
1 2.3 0.97 0.83 0.66 0.75 1.1 0.89 0.70 0.55 15 3.7 3.7 2 2.2 1.1 0.83 1.1 0.74 1.1 0.89 0.67 0.53 11 3.4 3.33 2.2 1.0 0.83 0.83 0.73 1.0 0.91 0.64 0.50 8.6 3.3 3.04 2.1 0.99 0.82 0.76 0.73 1.1 0.92 0.63 0.48 7.1 3.0 3.05 2.1 0.97 0.80 0.75 0.74 1.0 0.91 0.62 0.45 6.7 2.8 3.1
6 2.0 0.95 0.79 0.77 0.74 1.0 0.90 0.63 0.44 5.9 2.6 2.87 1.8 0.95 0.79 0.75 0.83 1.0 0.89 0.63 0.54 6.5 3.2 2.78 1.8 0.94 0.80 0.71 0.79 0.99 0.87 0.63 0.75 6.6 3.2 2.59 1.8 0.94 0.79 0.71 0.77 0.99 0.87 0.61 0.61 6.0 3.0 2.3
10 1.8 0.92 0.78 0.70 0.84 1.00 0.89 0.59 0.59 5.7 2.8 2.2
11 1.8 0.92 0.75 0.7012 1.6 0.92 0.76 0.6813 1.6 0.96 0.76 0.6914 1.7 0.94 0.76 0.7715 1.5 0.94 0.76 0.81
0.84 0.99 0.86 0.58 1.2 5.0 2.6 2.10.82 0.97 0.92 0.58 0.74 4.6 5.3 2.10.80 1.1 0.91 0.55 0.69 4.8 7.9 2.00.80 0.99 0.94 0.62 2.2 4.8 9.8 2.20.81 0.98 0.96 0.61 1.7 4.2 9.2 2.1
16 1.4 0.92 0.75 0.7217 1.2 0.91 0.74 0.7218 1.2 0.91 0.76 0.7119 1.1 0.92 0.75 0.7020 1.1 0.90 0.75 0.71
0.82 0.97 0.92 0.59 2.8 3.8 7.0 2.30.82 0.95 0.88 0.58 2.8 3.4 5.6 2.90.82 0.95 0.84 0.73 2.1 3.3 4.8 3.30.82 0.94 0.83 1.0 2.0 3.4 4.3 3.50.82 0.93 0.81 0.71 5.8 3.5 4.4 3.8
21 1.2 0.92 0.73 0.7022 1.1 0.91 0.72 0.6923 1.1 0.90 0.70 0.6924 1.1 0.88 0.72 0.6925 1.1 0.86 0.71 0.71
0.81 0.96 0.79 0.66 3.1 4.9 4.2 4.02.3 0.93 0.78 0.62 5.7 5.3 4.3 3.52.1 0.91 0.77 0.60 9.4 4.8 4.5 4.11.5 0.92 0.78 0.59 14 4.2 4.2 5.71.2 0.91 0.75 0.57 11 5.6 3.8 5.6
26 1.0 0.86 0.74 0.7227 1.0 0.86 0.70 0.7228 1.0 0.86 0.68 0.7429 0.99 0.86 0.68 0.72 30 0.99 0.83 0.67 0.75 31 0.98 --- 0.67 0.76
1.1 0.95 0.78 0.54 13 6.6 3.7 4.71.1 0.95 0.76 0.55 12 5.8 3.6 3.91.1 0.90 0.71 0.55 10 5.7 3.5 3.5 --- 0.90 0.71 0.54 9.1 5.6 3.9 3.1 --- 0.91 0.69 0.56 14 4.5 4.4 2.9 --- 0.90 --- 0.60 --- 4.0 4.3 --
TOTAL 45.86 27.71 23.32 22.84MEAN 1.48 0.92 0.75 0.74 MAX 2.3 1.1 0.83 1.1 MIN 0.98 0.83 0.67 0.66
27.04 30.19 25.33 19.28 128.77 176.9 136.3 95.90.97 0.97 0.84 0.62 4.29 5.71 4.40 3.202.3 1.1 0.96 1.0 14 15 9.8 5.7
0.73 0.90 0.69 0.54 0.44 3.3 2.6 2.0
STATISTICS OF MONTHLY MEAN DATA FOR WATER YEARS 1994 - 2002, BY WATER YEAR (WY)
MEAN 1.87 1.31 2.39 1.50 MAX 4.09 4.38 8.26 3.26(WY) 1996 1995 2000 2000 MIN 0.34 0.12 0.13 0.19(WY) 2001 2001 2001 2001
1.37 1.28 0.94 0.62 1.57 2.02 2.45 2.84 4.13 3.99 2.18 1.03 4.29 5.71 7.49 6.091998 1998 1996 1998 2002 2002 1995 1994 0.11 0.17 0.17 0.040 0.10 0.29 0.40 0.662001 2001 2001 2000 2000 2000 2000 1999
SUMMARY STATISTICS FOR 2001 CALENDAR YEAR FOR 2002 WATER YEAR WATER YEARS 1994 - 2002
ANNUAL TOTAL 344.53ANNUAL MEAN 0.94 HIGHEST ANNUAL MEAN LOWEST ANNUAL MEAN HIGHEST DAILY MEAN 22LOWEST DAILY MEAN 0.00 ANNUAL SEVEN-DAY MINIMUM 0.00MAXIMUM PEAK STAGE INSTANTANEOUS LOW FLOW10 PERCENT EXCEEDS 2.450 PERCENT EXCEEDS 0.4990 PERCENT EXCEEDS 0.04
759.44 2.08 1.68
2.62 19950.73 2001
Sep 14 15 Jul 1 36 Nov 16 1994Many years 0.44 Jun 6 0.00 Many days May 8 0.50 Jun 1 0.00 Many days
82.05 Jun 26 83.03 Sep 28 19950.41 Jun 6 0.00 May 19 2000 4.8 3.6 0.94 0.98 0.67 0.26

246 KISSIMMEE RIVER BASIN
02263800 SHINGLE CREEK AT AIRPORT, NEAR KISSIMMEE, FL
LOCATION.--Lat 28° 18'14", long 81° 27'04", in NW1⁄ 4 sec.19, T.25 S., R.29 E., Osceola County, Hydrologic Unit 03090101, near center of span on downstream side of bridge on U.S. Highway 192, 1.0 mi northwest of Kissimmee Airport, 3 mi west ofKissimmee, and 5.6 mi upstream from mouth.
DRAINAGE AREA.--89.2 mi2.
PERIOD OF RECORD.--October 1958 to current year.
GAGE.--Water-stage recorder. Datum of gage is 60.66 ft above NGVD of 1929.
REMARKS.--Records fair.
DISCHARGE, CUBIC FEET PER SECOND, WATER YEAR OCTOBER 2001 TO SEPTEMBER 2002DAILY MEAN VALUES
DAY OCT NOV DEC JAN FEB MAR APR MAY JUN JUL AUG SEP
1 144 35 22 182 123 33 22 203 108 33 21 244 95 32 20 295 85 31 20 40
27 158 12 26 70 568 167 29825 130 11 23 73 529 149 33424 103 11 20 82 559 136 34223 84 11 15 97 514 126 34222 72 10 13 106 455 110 452
6 78 31 19 447 73 30 19 438 68 29 20 419 64 28 21 39
10 59 26 22 37
21 65 9.8 11 95 402 103 41325 60 9.6 9.8 75 347 111 37028 56 9.1 8.3 64 312 128 35027 51 8.1 7.0 68 262 133 33331 47 7.6 6.0 68 223 135 304
11 55 24 22 35 12 52 23 22 33 13 51 22 23 33 14 51 23 22 33 15 54 26 22 40
33 44 7.1 5.2 68 203 133 27133 40 7.4 4.5 66 186 132 23835 40 7.7 4.0 64 196 148 20236 40 8.1 3.8 59 219 181 17335 37 13 4.0 62 201 230 154
16 50 34 21 4017 48 38 21 4518 46 37 21 4819 44 35 20 4720 43 33 19 45
33 36 31 5.2 90 184 291 13830 35 29 12 145 171 342 15228 32 30 13 185 156 374 14426 29 29 14 203 136 386 13324 27 25 15 314 116 383 148
21 41 31 18 43 22 45 31 18 41 23 49 31 17 39 24 54 29 18 3825 57 28 18 36
23 25 21 14 625 127 358 16732 23 18 14 1070 147 342 17357 21 15 14 1410 208 346 18693 21 13 12 1460 296 331 215
117 19 10 10 1390 355 299 247
26 56 26 20 34 27 52 25 19 33 28 48 24 18 32 29 45 24 18 30 30 41 23 18 29 31 38 --- 18 29
155 19 9.2 8.4 1280 396 263 262 181 19 7.7 7.1 1120 339 234 270 178 17 9.6 6.1 873 270 200 269 --- 15 25 5.2 688 232 177 256 --- 14 29 17 612 205 184 236 --- 13 --- 67 --- 185 242 --
TOTAL 1917 875 619 1118MEAN 61.8 29.2 20.0 36.1MAX 144 38 23 48MIN 38 22 17 18CFSM 0.69 0.33 0.22 0.40IN. 0.80 0.36 0.26 0.47
1402 1392 444.0 394.6 12582 8699 6874 757250.1 44.9 14.8 12.7 419 281 222 252 181 158 31 67 1460 568 386 45221 13 7.1 3.8 59 116 103 133
0.56 0.50 0.17 0.14 4.70 3.15 2.49 2.830.58 0.58 0.19 0.16 5.25 3.63 2.87 3.16
STATISTICS OF MONTHLY MEAN DATA FOR WATER YEARS 1959 - 2002, BY WATER YEAR (WY)
MEAN 85.5 52.2 50.0 58.1MAX 268 323 451 228 (WY) 1970 1988 1998 1986MIN 1.36 2.90 3.12 6.23(WY) 1959 1968 1962 1962
63.2 80.6 47.9 25.7 74.2 112 138 155 308 506 259 150 419 369 354 5641998 1960 1987 1991 2002 1991 1966 196010.3 8.73 1.63 0.000 0.000 5.65 9.31 16.01968 2000 1963 1962 1961 1962 1961 1965
SUMMARY STATISTICS FOR 2001 CALENDAR YEAR FOR 2002 WATER YEAR WATER YEARS 1959 - 2002
ANNUAL TOTAL 39302.5 ANNUAL MEAN 108 HIGHEST ANNUAL MEANLOWEST ANNUAL MEANHIGHEST DAILY MEAN 1100LOWEST DAILY MEAN 5.1 ANNUAL SEVEN-DAY MINIMUM 6.3MAXIMUM PEAK FLOWMAXIMUM PEAK STAGEINSTANTANEOUS LOW FLOWANNUAL RUNOFF (CFSM) 1.21ANNUAL RUNOFF (INCHES) 16.3910 PERCENT EXCEEDS 30150 PERCENT EXCEEDS 3490 PERCENT EXCEEDS 10
43888.6 120 78.6
151 196016.4 1962
Sep 15 1460 Jun 24 3160 Mar 18 1960May 24 3.8 May 14 0.00 Many daysFeb 25 4.7 May 10 0.00 Many days
1460 Jun 24 3320 Mar 18 1960 9.52 Jun 24 11.00 Mar 18 1960 3.6 May 14 1.35 0.8818.30 11.98
321 193 40 4013 7.6

247 KISSIMMEE RIVER BASIN
02263869 SOUTH LAKE OUTLET AT S-15 NEAR VINELAND, FL
LOCATION.--Lat 28° 24'45", long 81° 32'17", in SW1⁄ 4 sec.8, T.24 S., R.28 E., Orange County, Hydrologic Unit 03090101, on right bank at upstream wingwall of control structure S-15, 300 ft south of natural lake shoreline, 1,600 ft west of State Highway 535, and 2.4 mi northwest of Vineland.
DRAINAGE AREA.--2.56 mi2.
PERIOD OF RECORD.--June 1972 to September 1982, October 1986 to current year.
REVISED RECORDS.--WDR FL-97-1: Drainage area.
GAGE.--Water-stage and gate-opening recorder. Datum of gage is at NGVD of 1929 (Reedy Creek Improvement District bench mark). Auxiliary water-stage recorder at downstream side of control structure since May 1970.
REMARKS.--Records fair except those below 1.0 ft3/s, which are poor. Flow from South Lake into South Lake outlet regulated by automatic gates in control structure 15. Discharge computed from relation between discharge and gate openings and does not include leakage, which is less than 1.0 ft3/s, around structure or gates. Gage heights are published as elevations for South Lake (station 02263868) in the section of this report entitled ELEVATION OF LAKES.
DISCHARGE, CUBIC FEET PER SECOND, WATER YEAR OCTOBER 2001 TO SEPTEMBER 2002DAILY MEAN VALUES
DAY OCT NOV DEC JAN FEB MAR APR MAY JUN JUL AUG SEP
1 0.00 0.00 0.00 0.00 0.00 0.00 0.00 0.00 0.00 0.00 0.00 0.002 0.00 0.00 0.00 0.00 0.00 0.00 0.00 0.00 0.00 0.00 0.00 0.003 0.00 0.00 0.00 0.00 0.00 0.00 0.00 0.00 0.00 0.00 0.00 0.004 0.00 0.00 0.00 0.00 0.00 0.00 0.00 0.00 0.00 0.00 0.00 0.005 0.00 0.00 0.00 0.00 0.00 0.00 0.00 0.00 0.00 0.00 0.00 0.00
6 0.00 0.00 0.00 0.00 0.00 0.00 0.00 0.00 0.00 0.00 0.00 0.007 0.00 0.00 0.00 0.00 0.00 0.00 0.00 0.00 0.00 0.00 0.00 0.008 0.00 0.00 0.00 0.00 0.00 0.00 0.00 0.00 0.00 0.00 0.00 0.009 0.00 0.00 0.00 0.00 0.00 0.00 0.00 0.00 0.00 0.00 0.00 0.00
10 0.00 0.00 0.00 0.00 0.00 0.00 0.00 0.00 0.00 0.00 0.00 0.00
11 0.00 0.00 0.00 0.00 12 0.00 0.00 0.00 0.00 13 0.00 0.00 0.00 0.00 14 0.00 0.00 0.00 0.00 15 0.00 0.00 0.00 0.00
0.00 0.00 0.00 0.00 0.00 0.00 0.00 0.000.00 0.00 0.00 0.00 0.00 0.00 0.00 0.000.00 0.00 0.00 0.00 0.00 0.00 0.00 0.000.00 0.00 0.00 0.00 0.00 0.00 0.00 0.000.00 0.00 0.00 0.00 0.00 0.00 0.00 2.5
16 0.00 0.00 0.00 0.00 17 0.00 0.00 0.00 0.00 18 0.00 0.00 0.00 0.00 19 0.00 0.00 0.00 0.00 20 0.00 0.00 0.00 0.00
0.00 0.00 0.00 0.00 0.00 0.00 0.00 0.000.00 0.00 0.00 0.00 0.00 0.00 0.00 0.000.00 0.00 0.00 0.00 0.00 0.00 0.00 2.5 0.00 0.00 0.00 0.00 0.00 0.00 0.00 2.5 0.00 0.00 0.00 0.00 0.00 0.00 0.00 2.5
21 0.00 0.00 0.00 0.00 22 0.00 0.00 0.00 0.00 23 0.00 0.00 0.00 0.0024 0.00 0.00 0.00 0.0025 0.00 0.00 0.00 0.00
0.00 0.00 0.00 0.00 0.00 0.00 0.00 2.5 0.00 0.00 0.00 0.00 0.00 0.00 0.00 4.5 0.00 0.00 0.00 0.00 0.00 0.00 0.00 8.5 0.00 0.00 0.00 0.00 0.00 0.00 0.00 120.00 0.00 0.00 0.00 0.00 0.00 0.00 16
26 0.00 0.00 0.00 0.0027 0.00 0.00 0.00 0.0028 0.00 0.00 0.00 0.0029 0.00 0.00 0.00 0.00 30 0.00 0.00 0.00 0.00 31 0.00 --- 0.00 0.00
0.00 0.00 0.00 0.00 0.00 0.00 0.00 170.00 0.00 0.00 0.00 0.00 0.00 0.00 160.00 0.00 0.00 0.00 0.00 0.00 0.00 14 --- 0.00 0.00 0.00 0.00 0.00 0.00 14 --- 0.00 0.00 0.00 0.00 0.00 0.00 12 --- 0.00 --- 0.00 --- 0.00 0.00 --
TOTAL 0.00 0.00 0.00 0.00MEAN 0.000 0.000 0.000 0.000 MAX 0.00 0.00 0.00 0.00MIN 0.00 0.00 0.00 0.00
0.00 0.00 0.00 0.00 0.00 0.00 0.00 126.50 0.000 0.000 0.000 0.000 0.000 0.000 0.000 4.220.00 0.00 0.00 0.00 0.00 0.00 0.00 170.00 0.00 0.00 0.00 0.00 0.00 0.00 0.00
STATISTICS OF MONTHLY MEAN DATA FOR WATER YEARS 1972 - 2002, BY WATER YEAR (WY)
MEAN 0.76 0.21 0.27 0.31MAX 7.84 2.61 2.90 2.87(WY) 1976 1989 1989 1998MIN 0.000 0.000 0.000 0.000 (WY) 1973 1973 1973 1973
0.48 0.51 0.34 0.047 0.015 0.019 0.29 1.2010.4 6.28 7.12 0.64 0.12 0.30 5.58 9.431998 1998 1987 1987 1995 1995 1974 1994
0.000 0.000 0.000 0.000 0.000 0.000 0.000 0.0001973 1973 1973 1973 1973 1972 1972 1972
SUMMARY STATISTICS FOR 2001 CALENDAR YEAR FOR 2002 WATER YEAR WATER YEARS 1972 - 2002
ANNUAL TOTAL 0.00ANNUAL MEAN 0.000 HIGHEST ANNUAL MEANLOWEST ANNUAL MEANHIGHEST DAILY MEAN 0.00 Many daysLOWEST DAILY MEAN 0.00 Jan 1ANNUAL SEVEN-DAY MINIMUM 0.00 Jan 1 MAXIMUM PEAK STAGE10 PERCENT EXCEEDS 0.0050 PERCENT EXCEEDS 0.0090 PERCENT EXCEEDS 0.00
126.50 0.35 0.37
1.57 1998 0.000 1977
17 Sep 26 48 Sep 10 1974 0.00 Many days 0.00 Many days 0.00 Oct 1 0.00 Many days94.31 Sep 24 94.85 Apr 6 1987 0.00 0.27 0.00 0.00 0.00 0.00
* 1977,1978,1981,1999-2001

248 KISSIMMEE RIVER BASIN
02264000 CYPRESS CREEK AT VINELAND, FL
LOCATION.--Lat 28° 23'25", long 81° 31'11", in NW1⁄ 4 sec.21, T.24 S., R.28 E., Orange County, Hydrologic Unit 03090101, at upstream side of culverts on State Highway 535, 1.0 mi west of Vineland.
DRAINAGE AREA.--29.3 mi2. WATER-DISCHARGE RECORDS
PERIOD OF RECORD.--August 1945 to current year.
REVISED RECORDS.--WDR FL-89-1: 1960(M), WDR FL-96-1: Drainage area.
GAGE.--Water-stage recorder. Datum of gage is 96.20 ft above NGVD of 1929. Prior to June 13, 1946, nonrecording gage at samesite and datum.
REMARKS.--Records fair except for periods of estimated daily discharge, which are poor. Some diversions by pumping above station for irrigation.
DISCHARGE, CUBIC FEET PER SECOND, WATER YEAR OCTOBER 2001 TO SEPTEMBER 2002DAILY MEAN VALUES
DAY OCT NOV DEC JAN FEB MAR APR MAY JUN JUL AUG SEP
1 2.6 0.32 e0.03 0.00 0.00 0.57 0.00 0.00 0.00 e9.4 1.7 5.82 2.2 0.31 e0.02 0.00 0.00 0.55 0.00 0.00 0.00 e9.0 1.6 4.93 1.9 0.31 e0.02 0.00 0.00 0.50 0.00 0.00 0.00 e7.6 1.7 4.44 1.7 0.29 e0.00 0.00 0.00 0.66 0.00 0.00 0.00 e7.3 1.8 4.25 1.5 0.30 e0.00 0.00 0.00 0.59 0.00 0.00 0.00 e7.1 1.5 8.1
6 1.5 0.26 e0.00 0.01 0.00 0.55 0.00 0.00 0.00 e6.6 1.2 117 1.3 0.23 e0.00 0.02 0.00 0.51 0.00 0.00 0.00 e5.8 1.9 8.28 1.2 0.21 e0.00 0.01 0.00 0.48 0.00 0.00 0.00 e6.1 2.3 6.79 1.2 0.19 e0.00 0.00 0.00 0.44 0.00 0.00 0.00 e6.1 1.9 5.6
10 1.1 0.18 e0.00 0.00 0.00 0.39 0.00 0.00 0.00 e5.6 1.6 4.8
11 0.95 0.16 e0.00 0.00 12 0.84 0.15 e0.00 0.00 13 0.75 0.19 e0.00 0.00 14 0.72 0.29 e0.00 0.01 15 0.74 0.27 e0.00 0.06
0.00 0.34 0.00 0.00 0.00 e5.2 1.4 e3.40.00 0.30 0.00 0.00 0.00 3.4 1.6 e2.70.00 0.30 0.00 0.00 0.00 3.9 3.1 e2.70.00 0.29 0.00 0.00 0.00 4.7 5.2 e3.20.00 0.26 0.00 0.00 0.00 3.7 8.8 e2.4
16 0.64 0.24 e0.00 0.06 17 0.58 0.20 e0.00 0.06 18 0.53 0.20 e0.00 0.06 19 0.50 0.19 0.00 0.0520 0.52 e0.17 0.00 0.04
0.00 0.23 0.00 0.00 0.00 3.0 7.8 e3.70.00 0.20 0.00 0.00 0.00 2.6 6.3 e7.60.00 0.16 0.00 0.00 0.00 2.3 5.2 e8.10.00 0.15 0.00 0.00 0.00 2.2 4.8 e6.90.00 0.12 0.00 0.00 0.32 2.4 5.4 e4.6
21 0.64 e0.17 0.00 0.0422 0.87 e0.15 0.00 0.0323 0.80 e0.13 0.00 0.0324 0.71 e0.12 0.00 0.0225 0.67 e0.10 0.00 0.01
0.00 0.11 0.00 0.00 0.96 3.1 7.8 e2.60.00 0.09 0.00 0.00 3.0 3.6 12 e2.90.38 0.08 0.00 0.00 4.7 3.3 8.8 e5.00.76 0.08 0.00 0.00 6.4 2.8 6.9 6.00.69 0.06 0.00 0.00 7.3 3.1 5.6 5.5
26 0.59 e0.07 0.00 0.0027 0.51 e0.07 0.00 0.0028 0.44 e0.05 0.00 0.0029 0.41 e0.05 0.00 0.00 30 0.38 e0.04 0.00 0.00 31 0.35 --- 0.00 0.00
0.71 0.05 0.00 0.00 7.6 4.2 4.6 4.80.67 0.04 0.00 0.00 8.0 3.5 4.0 4.20.61 0.03 0.00 0.00 6.3 3.0 3.6 3.6 --- 0.01 0.00 0.00 e6.4 2.7 4.1 3.2 --- 0.00 0.00 0.00 e7.0 2.3 5.4 2.9 --- 0.00 --- 0.00 --- 1.9 6.2 --
TOTAL 29.34 5.61 0.07 0.51MEAN 0.95 0.19 0.002 0.016 MAX 2.6 0.32 0.03 0.06MIN 0.35 0.04 0.00 0.00CFSM 0.03 0.01 0.00 0.00IN. 0.04 0.01 0.00 0.00
3.82 8.14 0.00 0.00 57.98 137.5 135.8 149.70.14 0.26 0.000 0.000 1.93 4.44 4.38 4.990.76 0.66 0.00 0.00 8.0 9.4 12 110.00 0.00 0.00 0.00 0.00 1.9 1.2 2.40.00 0.01 0.00 0.00 0.07 0.15 0.15 0.170.00 0.01 0.00 0.00 0.07 0.17 0.17 0.19
STATISTICS OF MONTHLY MEAN DATA FOR WATER YEARS 1945 - 2002, BY WATER YEAR (WY)
MEAN 11.6 5.47 4.74 5.44MAX 82.2 37.0 46.5 101 (WY) 1954 1954 1998 1998MIN 0.000 0.000 0.000 0.000 (WY) 1979 1973 1981 1968
5.20 7.13 4.82 1.66 1.88 4.40 9.02 13.482.0 83.4 51.9 19.5 24.4 48.4 74.4 1091998 1998 1960 1960 1947 1959 1959 1960
0.000 0.000 0.000 0.000 0.000 0.000 0.000 0.0001974 1974 1956 1962 1973 1973 1977 1980
SUMMARY STATISTICS FOR 2001 CALENDAR YEAR FOR 2002 WATER YEAR WATER YEARS 1945 - 2002
ANNUAL TOTAL 323.40ANNUAL MEAN 0.89HIGHEST ANNUAL MEANLOWEST ANNUAL MEANHIGHEST DAILY MEAN 19 Sep 15LOWEST DAILY MEAN 0.00 Many daysANNUAL SEVEN-DAY MINIMUM 0.00 Jan 1 MAXIMUM PEAK FLOWMAXIMUM PEAK STAGEANNUAL RUNOFF (CFSM) 0.030 ANNUAL RUNOFF (INCHES) 0.4110 PERCENT EXCEEDS 3.050 PERCENT EXCEEDS 0.0090 PERCENT EXCEEDS 0.00
528.47 1.45 6.12
40.6 1960 0.017 1981
12 Aug 22 276 Sep 11 1960 0.00 Many days 0.00 Many days 0.00 Dec 4 0.00 Many days16 Aug 21 309 Sep 11 1960 2.61 Aug 21 4.66 Sep 11 1960 0.049 0.21 0.67 2.84 5.5 17 0.12 0.80 0.00 0.00
e Estimated

--- ------ --- --- ------ --- --- ------ --- --- ------ --- --- ---
--- --- --- ------ --- --- ------ --- --- ------ --- --- ------ --- --- ---
--- --- --- --- ------ --- ------ --- --- ------ --- --- ------ --- --- ---
--- --- --- ------ --- --- ------ --- --- ---
--- --- ------ --- ---
--- --- ------ --- --- ------ --- ------ --- --- ---
--- --- --- --- --- --- --- --- --- --- --- --- --- --- --- --- --- --- --- --- ---
--- --- --- --- --- ------ --- --- --- --- ------ --- --- --- --- ---
249 KISSIMMEE RIVER BASIN
02264000 CYPRESS CREEK AT VINELAND, FL--Continued
WATER-QUALITY RECORDS
PERIOD OF RECORD.--Water years 1963, 1966, 1968-73, 1975-94, 1996-98, 2000 to current year.
PERIOD OF DAILY RECORD.-- SPECIFIC CONDUCTANCE: July 2001 to current year. WATER TEMPERATURE: July 2001 to current year. DISSOLVED OXYGEN: July 2001 to current year.
INSTRUMENTATION.--Water-quality monitor.
REMARKS.--Extremes for current year and extremes for period of daily record are based on recorded values and may have been exceeded during periods of of no record.
EXTREMES FOR PERIOD OF DAILY RECORD.--SPECIFIC CONDUCTANCE: Maximum daily mean, 527 µS/cm @ 25 ° C, July 13, 2001; minimum daily mean, 88 µS/cm @ 25 ° C, Sept. 6,
2002. WATER TEMPERATURE: Maximum daily mean, 26.2 ° C, July 17, 2002; minimum daily mean, 9.9 ° C, Jan. 9, 2002. DISSOLVED OXYGEN: Maximum daily mean, 6.0 mg/L, July 15,16, 2002; minimum daily mean, 0.2 mg/L, Jan. 23,24,26-28,31, 2002.
EXTREMES FOR CURRENT YEAR.--SPECIFIC CONDUCTANCE: Maximum daily mean, 226 µS/cm @ 25 ° C, Mar. 28,29; minimum daily mean, 88 µS/cm @ 25 ° C, Sept. 6. WATER TEMPERATURE: Maximum daily mean, 26.2 ° C, July 17; minimum daily mean, 9.9 ° C, Jan. 9. DISSOLVED OXYGEN: Maximum daily mean, 6.0 mg/L, July 15,16; minimum daily mean, 0.2 mg/L, Jan. 23,24,26-28,31.
SPECIFIC CONDUCTANCE (MICROSIEMENS/CM AT 25 DEG. C), WATER YEAR OCTOBER 2001 TO SEPTEMBER 2002DAILY MEAN VALUES
DAY OCT NOV DEC JAN FEB MAR APR MAY JUN JUL AUG SEP
1 118 155 --- 191 222 216 --- --- 125 97 2 120 155 --- 223 --- --- 126 98 3 124 156 --- 223 --- --- 125 99 4 127 157 174 220 --- --- 125 99 5 129 159 168 222 --- --- 129 93
6 131 160 158 222 --- --- 132 88 7 132 160 171 222 --- --- 125 89 8 133 160 178 221 --- --- 123 90 9 135 161 174 220 --- --- 124 92 10 136 161 170 220 -- -- 126 94
11 138 161 170 220 -- -- 127 12 139 161 165 199 220 -- -- 124 125 13 140 163 183 219 -- -- 122 118 14 142 169 175 223 -- -- 120 111 15 143 169 192 224 -- -- 120 103
16 143 168 183 224 -- -- 123 102 17 145 168 176 224 -- -- 126 103 18 146 169 188 219 -- -- 126 105 19 146 169 162 198 222 -- -- 127 106 20 146 169 165 193 223 -- -- 125 105
21 147 170 160 191 223 -- -- 123 100 22 149 168 190 222 -- -- 121 92 23 150 175 188 204 222 -- -- 121 94 24 150 168 186 210 222 -- -- 122 97 89 25 151 170 190 212 221 -- -- 121 99 89
26 152 170 189 213 220 -- 207 117 100 90 27 152 190 217 222 -- 190 118 102 91 28 153 189 220 226 -- 185 118 103 92 29 153 188 226 -- -- 120 101 93 30 155 190 223 -- -- 121 99 94 31 156 190 219 -- -- 123 97
MEAN 141 --- 222 --- --- 111 MAX 156 --- 226 --- --- 132 MIN 118 -- 219 -- -- 92

--- ------ --- ------ --- ---
--- ------ ---
--- ------ ------ ------ ------ ---
--- ------ ------ ------ ------ ---
--- ------ ------ ------ ------ ---
--- ------ ------ ------ ------ ---
------------ ------ ------ ---
--- --- ------ --- ------ --- ---
--- ------ --- --- ------ --- --- ------ --- --- ------ --- --- ---
--- --- --- ------ --- --- ------ --- --- ------ --- --- ------ --- --- ---
--- --- --- --- ------ --- ------ --- --- ------ --- --- ------ --- --- ---
--- --- --- ------ --- --- ------ --- --- ---
--- --- ------ --- ---
--- --- ------ --- --- ------ --- ------ --- ------ --- ---
--- --- --- --- --- --- --- --- --- --- --- --- --- --- --- --- --- --- --- --- ---
--- --- --- --- --- ------ --- --- --- --- ------ --- --- --- --- ---
250 KISSIMMEE RIVER BASIN
02264000 CYPRESS CREEK AT VINELAND, FL--Continued
TEMPERATURE, WATER (DEG. C), WATER YEAR OCTOBER 2001 TO SEPTEMBER 2002 DAILY MEAN VALUES
DAY OCT NOV DEC JAN FEB MAR APR MAY JUN JUL AUG SEP
1 21.0 20.7 --- 19.8 14.6 21.0 --- --- 25.1 25.3 2 20.4 21.2 --- --- 17.0 --- --- 24.9 25.7 3 20.8 21.5 --- --- 18.4 --- --- 24.4 25.8 4 21.4 21.7 --- 11.0 --- 16.6 --- --- 24.6 25.6 5 21.9 21.1 --- 10.7 --- 14.8 --- --- 24.8 25.3
6 22.7 20.0 --- 12.7 --- 15.5 --- --- 25.2 25.0 7 23.1 19.2 --- 13.3 --- 16.4 --- --- 25.1 25.2 8 23.1 19.0 --- 11.1 --- 17.5 --- --- 24.6 25.2 9 22.4 18.9 --- 9.9 --- 18.1 --- --- 24.3 25.3
10 22.4 18.5 --- 10.7 --- 18.6 --- --- 24.3 25.0
11 22.5 18.4 --- 11.5 --- 18.2 --- --- 24.2 --12 22.6 18.6 --- 12.8 17.0 18.7 --- 24.2 24.3 --13 22.7 19.1 --- 13.8 --- 19.0 --- 24.2 24.0 --14 23.2 19.7 --- 14.1 --- 18.5 --- 24.9 24.0 --15 23.2 19.8 --- 14.9 --- 18.5 --- 25.3 24.0 --
16 22.9 19.5 --- 14.0 --- 19.4 --- 25.8 24.5 --17 21.2 19.5 --- 14.9 --- 20.0 --- 26.2 25.2 --18 20.7 20.0 --- 15.8 --- 19.9 --- 26.0 25.0 --19 21.5 20.1 18.2 15.3 --- 20.1 --- 25.7 25.0 --20 22.4 19.7 17.4 16.3 --- 20.1 --- 25.5 24.5 --
21 22.6 19.1 16.0 17.3 --- 20.1 --- 24.5 24.3 --22 22.9 19.1 --- 17.9 --- 19.7 --- 24.3 24.2 --23 22.9 19.5 --- 18.5 17.6 18.0 --- 24.7 24.4 --24 23.3 19.9 --- 18.8 16.6 18.2 --- 25.3 24.7 25.0 25 23.6 20.1 --- 18.7 16.6 18.9 --- 25.3 24.9 25.2
26 22.0 19.9 --- 19.2 17.2 19.6 --- 23.6 25.0 24.8 25.4 27 19.3 --- --- 19.2 16.4 19.8 --- 23.8 25.4 24.8 25.6 28 18.4 --- --- 19.5 14.1 19.3 --- 24.0 25.5 24.9 25.3 29 19.0 --- --- 19.7 --- 19.4 --- 25.3 24.9 25.2 30 19.7 --- --- 19.6 --- 20.3 --- 25.1 24.7 25.3 31 20.1 --- --- 19.9 --- 20.8 --- 25.1 24.8 --
MEAN 21.8 --- --- --- 18.5 --- --- 24.6 --MAX 23.6 --- --- --- 20.8 --- --- 25.2 --MIN 18.4 --- --- --- 14.6 --- --- 24.0 --
OXYGEN DISSOLVED (MG/L), WATER YEAR OCTOBER 2001 TO SEPTEMBER 2002 DAILY MEAN VALUES
DAY OCT NOV DEC JAN FEB MAR APR MAY JUN JUL AUG SEP
1 2.3 2.1 --- 0.3 2.7 0.4 --- --- 2.5 3.1 2 2.5 2.0 --- 2.8 --- --- 2.6 2.8 3 2.6 2.2 --- 2.4 --- --- 2.4 3.0 4 2.4 2.3 --- 3.1 --- --- 2.5 2.7 5 2.4 2.4 --- 3.1 --- --- 2.2 3.7
6 2.4 2.4 --- 2.9 --- --- 2.0 3.4 7 2.3 2.4 --- 2.8 --- --- 2.7 3.2 8 2.3 2.4 --- 2.9 --- --- 2.6 3.5 9 2.2 2.3 --- 2.9 --- --- 2.6 3.2 10 2.3 2.4 -- 2.9 -- -- 2.4 2.7
11 2.3 2.4 -- 3.1 -- -- 2.3 12 2.3 2.3 --- 1.9 3.0 -- --- 2.4 2.7 13 2.3 2.3 -- 2.8 -- --- 2.3 3.0 14 2.2 2.5 -- 3.1 -- --- 2.1 3.7 15 2.3 2.4 -- 2.5 -- --- 6.0 4.1
16 2.1 2.4 -- 2.5 -- --- 6.0 4.8 17 2.2 2.4 -- 2.5 -- --- 4.3 4.2 18 2.4 2.4 2.9 2.2 -- --- 2.6 3.2 19 2.4 2.4 2.2 2.9 1.8 -- --- 2.6 2.9 20 2.4 2.3 3.1 2.4 2.2 -- --- 2.4 2.8
21 2.4 2.4 3.8 1.5 2.5 -- --- 2.8 3.6 22 2.5 2.3 0.3 3.3 -- --- 4.1 3.7 23 2.5 2.3 0.2 2.2 3.5 -- --- 3.4 3.9 24 2.4 2.1 0.2 2.2 3.2 -- --- 3.0 3.7 25 2.2 2.2 0.4 2.2 2.7 -- --- 2.8 3.6
26 2.5 2.1 0.2 2.3 2.2 -- 2.8 3.1 3.4 4.1 27 2.8 0.2 2.6 2.1 -- 2.5 2.8 3.2 4.0 28 3.0 0.2 3.0 1.5 -- 2.2 2.9 3.0 3.4 29 2.9 0.3 1.3 -- --- 2.6 3.2 3.2 30 2.7 0.3 0.8 -- --- 2.7 3.2 2.9 31 2.5 0.2 0.7 -- --- 2.6 2.9
MEAN 2.4 --- 2.5 --- --- 3.1 MAX 3.0 --- 3.5 --- --- 4.8 MIN 2.1 --- 0.7 --- --- 2.0

--
--
--
--
--
--
--
251 KISSIMMEE RIVER BASIN
02264000 CYPRESS CREEK AT VINELAND, FL--Continued
WATER-QUALITY DATA, WATER YEAR OCTOBER 2001 TO SEPTEMBER 2002
DIS PH NITRO NITRO CHARGE, SPE WATER GEN, NITRO GEN, NITROINST. CIFIC WHOLE COLOR AMMONIA GEN, NITRITE GEN, CUBIC CON FIELD TEMPER- TUR- (PLAT OXYGEN, DIS AMMONIA DIS NITRITE FEET GAGE DUCT- (STAND- ATURE BID INUM- DIS SOLVED TOTAL SOLVED TOTAL
Date Time PER HEIGHT ANCE ARD WATER ITY COBALT SOLVED (MG/L (MG/L (MG/L (MG/L SECOND (FEET) (US/CM) UNITS) (DEG C) (NTU) UNITS) (MG/L) AS N) AS N) AS N) AS N)
(00061) (00065) (00095) (00400) (00010) (00076) (00080) (00300) (00608) (00610) (00613) (00615)
OCT 23... 1200 .83 1.77 149 4.1 23.1 -- 2.5 .04 - .010 -NOV 20... 0900 .19 1.52 172 4.0 19.5 -- 2.2 .03 - .010 -DEC 18... 1045 .0 1.25 173 4.0 20.5 -- 2.2 .05 - .010 -JAN 15... 1115 .06 1.39 202 4.1 15.5 -- 2.1 <.01 -- <.010 -MAR 11... 1100 .31 1.63 225 3.6 18.9 -- 3.3 .02 -- <.010 -JUN 25... 1300 7.3 2.33 230 3.8 23.6 .36 560 2.2 <.01 <.01 .010 .02 JUL 30... 1000 2.3 2.03 121 4.0 24.8 -- 2.1 .10 - .030 -AUG 27... 0700 4.2 2.23 103 4.2 24.5 -- 2.0 .04 - .020 -
NITRO- NITRO-GEN,AM- NITRO- GEN,MONIA + GEN, NO2+NO3 PHOS- ORGANIC NO2+NO3 DIS- PHORUS TOTAL TOTAL SOLVED TOTAL
Date (MG/L (MG/L (MG/L (MG/L AS N) AS N) AS N) AS P)(00625) (00630) (00631) (00665)
ORTHO- ANCPHOS- PHOS- HARD- MAGNE- POTAS- UNFLTRDPHATE, CARBON, PHORUS NESS CALCIUM SIUM, SODIUM, SIUM, TIT 4.5DIS- ORGANIC ORTHO TOTAL DIS- DIS- DIS- DIS- LAB
SOLVED TOTAL TOTAL (MG/L SOLVED SOLVED SOLVED SOLVED (MG/L(MG/L (MG/L (MG/L AS (MG/L (MG/L (MG/L (MG/L ASAS P) AS C) AS P) CACO3) AS CA) AS MG) AS NA) AS K) CACO3)
(00671) (00680) (70507) (00900) (00915) (00925) (00930) (00935) (90410)
OCT 23... E1.7 -- <.02 E.03 .03 85.0 -- -- -- -- -- -- -NOV 20... E2.0 -- <.02 E.03 E.02 77.0 -- -- -- -- -- -- -DEC 18... 2.0 -- <.02 .03 .02 76.0 -- -- -- -- -- -- -JAN 15... 1.6 -- <.02 .02 <.01 70.0 -- -- -- -- -- -- -MAR 11... 1.6 -- <.02 <.02 <.01 50.0 -- -- -- -- -- -- -JUN 25... 1.7 <.020 <.02 <.02 .02 81.0 .010 37 4.60 6.20 15.0 4.00 <1JUL 30... 2.4 -- <.02 <.02 .03 87.0 -- -- -- -- -- -- -AUG 27... 1.6 -- <.02 <.02 .02 63.0 -- -- -- -- -- -- --
CHLOR-A BERYL- ALUM- CHRO- MANGACHLO- FLUO- PHYTO- LIUM, INUM, CADMIUM MIUM, COPPER, IRON, LEAD, NESE,
SULFATE RIDE, RIDE, PLANK- TOTAL TOTAL WATER TOTAL TOTAL TOTAL TOTAL TOTALDIS- DIS- DIS- TON ARSENIC RECOV- RECOV- UNFLTRD RECOV- RECOV- RECOV- RECOV- RECOV-SOLVED SOLVED SOLVED CHROMO TOTAL ERABLE ERABLE TOTAL ERABLE ERABLE ERABLE ERABLE ERABLE
Date (MG/L (MG/L (MG/L FLUOROM (UG/L (UG/L (UG/L (UG/L (UG/L (UG/L (UG/L (UG/L (UG/LAS SO4) AS CL) AS F) (UG/L) AS AS) AS BE) AS AL) AS CD) AS CR) AS CU) AS FE) AS PB) AS MN)(00945) (00940) (00950) (70953) (01002) (01012) (01105) (01027) (01034) (01042) (01045) (01051) (01055)
OCT 23... -- -- -- <.1 -- -- -- -- -- -- -- -- -NOV 20... -- -- -- <.1 -- -- -- -- -- -- -- -- -DEC 18... -- -- -- <.1 -- -- -- -- -- -- -- -- -JAN 15... -- -- -- <.1 -- -- -- -- -- -- -- -- -MAR 11... -- -- -- <.1 -- -- -- -- -- -- -- -- -JUN 25... 32.0 23.0 <.1 <.1 2 <1 342 <1.0 <1.0 <1.0 196 1 JUL 30... -- -- -- <.1 -- -- -- -- -- -- -- -- -AUG 27... -- -- -- <.1 -- -- -- -- -- -- -- -- -
< -- Less than E -- Estimated value
20

252 KISSIMMEE RIVER BASIN
02264000 CYPRESS CREEK AT VINELAND, FL--Continued
WATER-QUALITY DATA, WATER YEAR OCTOBER 2001 TO SEPTEMBER 2002
NICKEL, ZINC, MERCURY ALDRIN, LINDANE CHLOR TOTAL TOTAL SELE- TOTAL CHLOR DISUL TOTAL TOTAL DANE, RECOV RECOV NIUM, RECOV PYRIFOS FOTON IN BOT IN BOT TECH ERABLE ERABLE TOTAL ERABLE TOTAL UNFILT PHORATE DEF ALDRIN, LINDANE TOM MA TOM MA- NICAL
Date (UG/L (UG/L (UG/L (UG/L RECOVER RECOVER TOTAL TOTAL TOTAL TOTAL TERIAL TERIAL TOTAL AS NI) AS ZN) AS SE) AS HG) (UG/L) (UG/L) (UG/L) (UG/L) (UG/L) (UG/L) (UG/KG) (UG/KG) (UG/L) (01067) (01092) (01147) (71900) (38932) (39011) (39023) (39040) (39330) (39340) (39333) (39343) (39350)
JUN 25... <1.0 6 <1 <.1 <.01 <.10 <.02 <.02 <.01 <.006 <.2 <.2 <.1
CHLOR- P,P'- P,P'- P,P'- DI- ENDO DANE, DDD, DDE, DDT, ELDRIN, SULFAN ENDRIN, TOTAL P,P'- RECOVER RECOVER P,P'- RECOVER TOTAL ENDO- I TOTAL ENDRIN TOTALIN BOT- DDD IN BOT- P,P'- IN BOT- DDT IN BOT- DI- IN BOT- SULFAN IN BOT- WATER IN BOTTOM MA- UNFILT TOM MA- DDE, TOM MA- UNFILT TOM MA- ELDRIN TOM MA- I TOM MA- UNFLTRD TOM MA-
Date TERIAL RECOVER TERIAL TOTAL TERIAL RECOVER TERIAL TOTAL TERIAL TOTAL TERIAL REC TERIAL(UG/KG) (UG/L) (UG/KG) (UG/L) (UG/KG) (UG/L) (UG/KG) (UG/L) (UG/KG) (UG/L) (UG/KG) (UG/L) (UG/KG)(39351) (39360) (39363) (39365) (39368) (39370) (39373) (39380) (39383) (39388) (39389) (39390) (39393)
JUN 25... <3 <.007 <.5 <.006 E.2 <.009 <.5 <.006 <.2 <.02 <.2 <.01 <.2
TOXA- HEPTA- HEPTA- METHPHENE, CHLOR, CHLOR OXY- PCB,
TOTAL TOTAL HEPTA- EPOXIDE METH- CHLOR, TOTAL TOX- IN BOT- HEPTA- IN BOT- CHLOR TOT. IN OXY- TOT. IN IN BOT- MALA- PARA
ETHION, APHENE, TOM MA- CHLOR, TOM MA- EPOXIDE BOTTOM CHLOR, BOTTOM PCB, TOM MA- THION, THION,Date TOTAL TOTAL TERIAL TOTAL TERIAL TOTAL MATL. TOTAL MATL. TOTAL TERIAL TOTAL TOTAL
(UG/L) (UG/L) (UG/KG) (UG/L) (UG/KG) (UG/L) (UG/KG) (UG/L) (UG/KG) (UG/L) (UG/KG) (UG/L) (UG/L)(39398) (39400) (39403) (39410) (39413) (39420) (39423) (39480) (39481) (39516) (39519) (39530) (39540)
JUN 25... <.01 <1 <50 <.01 <.2 <.009 <.2 <.020 <2.5 <.1 <5 <.10 <.01
FONOFOS BI MIREX, CARBO- (DY- PHENYL,
METHYL TOTAL PHENO- FONATE) NONA DI- PARA- IN BOT- THION WATER CHLOROAZINON, THION, MIREX, TOM MA- WATER WHOLE SUR SCD
Date TOTAL TOTAL TOTAL TERIAL UNFLTRD TOT.REC 1325 (UG/L) (UG/L) (UG/L) (UG/KG) (UG/L) (UG/L) PERCENT (39570) (39600) (39755) (39758) (39786) (82614) (90575)
JUN25... <.02 <.02 <.006 -- <.02 <.01 54
< -- Less than E -- Estimated value

------------
------------
--- ---
---
---------
253 KISSIMMEE RIVER BASIN
02264003 CYPRESS CREEK CANAL AT S-103A NEAR VINELAND, FL
LOCATION.--Lat 28° 23'21", long 81° 31'31", in SW1⁄ 4 sec.20, T.24 S., R.28 E., Orange County, Hydrologic Unit 03090101, on upstream side of control structure S-103A, 200 ft northeast of Buena Vista Drive, 1,800 ft downstream from State Highway 535, and 1.3 mi west of Vineland.
DRAINAGE AREA.--29.5 mi2.
PERIOD OF RECORD.--October 1986 to current year (gage heights and discharge measurements only).
REVISED RECORDS.--WDR FL-96-1: Drainage area.
GAGE.--Water-stage recorder. Datum of gage is at NGVD of 1929 (Reedy Creek Improvement District bench mark). Auxilliary gage atdownstream side of control structure 103A.
EXTREMES FOR PERIOD OF RECORD.--Maximum daily gage height, 93.45 ft, Sept. 21, 1994; minimum daily recorded, 89.14 ft, May 9, 1990. Maximum discharge measured, 107 ft3/s, Sept. 22, 1994; unknown amount of leakage many days each year.
GAGE HEIGHT, FEET, WATER YEAR OCTOBER 2001 TO SEPTEMBER 2002DAILY MEAN VALUES
DAY OCT NOV DEC JAN FEB MAR APR MAY JUN JUL AUG SEP
1 92.56 90.56 89.87 89.62 89.94 91.17 89.70 89.62 89.54 93.16 92.28 92.95 2 92.46 90.54 89.84 89.82 89.91 91.10 89.68 89.60 89.53 93.14 92.22 3 92.35 90.60 89.82 90.25 89.88 91.05 89.68 89.59 89.52 93.12 92.26 4 92.17 90.59 89.82 90.18 89.83 91.53 89.68 89.58 89.51 93.10 92.43 5 92.01 90.62 89.81 90.12 89.79 91.41 89.67 89.58 89.50 93.09 92.09
6 91.90 90.50 89.79 90.11 89.77 91.20 89.65 89.57 89.48 93.02 91.76 7 91.84 90.41 89.81 90.11 89.90 91.10 89.63 89.57 89.48 92.89 92.44 8 91.70 90.33 89.81 90.02 90.12 91.02 89.61 89.56 89.58 92.84 92.76 9 91.53 90.26 89.85 89.95 90.06 90.92 89.60 89.55 89.71 92.78 92.46 10 91.43 90.24 89.85 89.95 90.04 90.82 89.60 89.54 89.70 92.84 92.35 --
11 91.42 90.20 89.83 89.95 90.13 90.72 89.60 89.52 89.72 92.74 92.08 --12 91.30 90.17 89.79 89.95 90.11 90.61 89.59 89.50 89.76 92.84 92.26 --13 91.24 90.27 89.78 89.99 90.04 90.62 89.60 89.49 89.74 92.95 93.02 92.80 14 91.22 90.76 89.79 90.09 89.98 90.56 89.62 89.50 89.75 93.03 93.07 93.11 15 91.46 90.80 89.74 90.54 89.93 90.44 89.67 89.53 89.95 92.91 93.10 93.12
16 91.25 90.69 89.73 90.48 89.92 90.38 89.69 89.58 89.91 92.80 93.09 93.10 17 91.17 90.55 89.72 90.34 89.91 90.32 89.69 89.59 89.91 92.62 93.07 93.12 18 91.03 90.48 89.71 90.27 89.80 90.26 89.68 89.60 89.85 92.65 93.06 93.16 19 91.01 90.47 89.66 90.24 89.73 90.24 89.67 89.64 89.94 92.68 93.05 93.15 20 91.10 90.50 89.61 90.21 89.72 90.15 89.65 89.64 90.95 92.86 93.08 93.14
21 91.32 90.45 89.55 90.20 89.71 90.06 89.64 89.62 92.96 92.95 93.05 93.13 22 91.91 90.38 89.54 90.19 90.33 90.01 89.63 89.59 93.03 93.02 93.09 93.12 23 91.78 90.30 89.53 90.18 91.65 89.95 89.62 89.57 93.08 92.97 93.07 93.14 24 91.64 90.21 89.59 90.15 92.76 89.90 89.60 89.55 93.08 92.81 93.06 93.14 25 91.47 90.13 89.59 90.11 92.44 89.87 89.59 89.54 93.04 92.92 --- 93.13
26 91.24 90.09 89.63 90.09 92.33 89.86 89.62 89.52 93.05 93.04 --- 93.12 27 90.95 90.04 89.60 90.07 91.76 89.84 89.68 89.51 93.11 93.03 --- 93.11 28 90.69 89.99 89.61 90.06 91.19 89.81 89.67 89.50 93.05 92.92 --- 93.10 29 90.58 89.94 89.62 90.04 89.78 89.65 89.49 93.03 92.81 --- 93.09 30 90.57 89.89 89.62 90.00 89.75 89.64 89.48 93.13 92.60 --- 93.08 31 90.56 -- 89.62 89.97 --- 89.72 --- 89.52 92.43 93.02 --
MEAN 91.45 90.37 89.71 90.10 90.38 90.46 89.64 89.56 90.85 92.89 --- MAX 92.56 90.80 89.87 90.54 92.76 91.53 89.70 89.64 93.13 93.16 --- MIN 90.56 89.89 89.53 89.62 89.71 89.72 89.59 89.48 89.48 92.43 ---

254 KISSIMMEE RIVER BASIN
02264051 BLACK LAKE OUTLET AT S-101A, AT LAKE BUENA VISTA, FL
LOCATION.--Lat 28° 22'28", long 81° 31'01", in NE1⁄ 4 sec.28, T.24 S., R.28 E., Orange County, Hydrologic Unit 03090101, on right upstream wingwall of drop culvert at Buena Vista Drive at Lake Buena Vista, and 1.7 mi upstream from Bonnet Creek.
DRAINAGE AREA.--0.69 mi2.
PERIOD OF RECORD.--October 1986 to current year.
REVISED RECORDS.--WDR FL-97-1: Drainage area.
GAGE.--Water-stage recorder, sharp-crested weir, and sluice gate. Datum of gage is at NGVD of 1929 (Reedy Creek ImprovementDistrict bench mark).
REMARKS.--Records good except for periods of estimated daily discharge and those below 5.0 ft3/s, which are poor. Flow can be regulated by manipulation of sluice gate.
DISCHARGE, CUBIC FEET PER SECOND, WATER YEAR OCTOBER 2001 TO SEPTEMBER 2002DAILY MEAN VALUES
DAY OCT NOV DEC JAN FEB MAR APR MAY JUN JUL AUG SEP
1 0.90 0.57 0.64 0.64 0.38 0.61 0.39 0.30 0.45 41 e1.3 e2.2 2 0.64 0.51 0.64 2.1 0.38 0.56 0.41 0.23 0.28 30 e0.26 e2.2 3 0.64 0.46 0.63 1.2 0.38 0.58 0.48 0.25 0.23 26 e0.89 e2.2 4 0.64 0.42 0.64 0.62 0.32 0.97 0.46 0.27 0.17 25 e1.7 e3.6 5 0.64 0.47 0.63 0.52 0.28 0.63 0.39 0.29 0.16 24 e0.72 e18
6 0.64 0.36 0.62 0.57 0.28 0.56 0.31 0.27 0.16 22 e0.26 e15 7 0.64 0.38 0.64 0.47 0.81 0.57 0.25 0.26 0.23 20 e5.3 e5.8 8 0.64 0.38 0.65 0.27 0.65 0.56 0.24 0.23 1.7 20 e2.2 e2.2 9 0.61 0.45 0.72 0.27 0.45 0.56 0.24 0.18 0.82 19 e2.2 e2.210 0.63 0.50 0.64 0.29 0.46 0.56 0.28 0.18 0.46 20 e2.2 e2.2
11 0.64 0.50 0.64 0.3312 0.64 0.51 0.63 0.3213 0.65 0.91 0.64 0.40 14 0.77 0.89 0.63 0.6315 0.76 0.63 0.64 0.92
0.56 0.54 0.28 0.18 0.77 20 e2.2 e2.2 0.47 0.52 0.35 0.16 0.63 20 e6.5 e2.2 0.39 0.69 0.38 0.16 0.41 22 e12 e2.20.41 0.59 0.79 0.38 1.7 24 e16 e4.90.46 0.51 0.71 e1.8 7.6 21 e20 e4.7
16 0.64 0.51 0.61 0.5317 0.62 0.44 0.51 0.4518 0.63 0.55 0.59 0.3819 0.75 0.64 0.50 0.3520 0.72 0.64 0.50 0.38
0.50 0.50 0.59 e1.8 6.4 19 e11 e2.20.46 0.49 0.51 0.00 4.1 19 e7.2 e4.30.42 0.49 0.51 0.00 2.9 19 e2.2 e6.1 0.39 0.50 0.48 0.00 14 19 e4.9 e5.0 0.38 0.46 0.47 0.16 36 21 e8.3 e4.5
21 0.91 0.59 0.49 0.3722 1.2 0.54 0.51 0.3823 0.86 0.54 0.60 0.3724 0.77 0.52 0.72 0.3425 0.67 0.54 0.63 0.32
0.33 0.54 0.42 0.19 29 24 e12 e2.2 6.0 0.52 0.41 0.15 33 24 e18 e5.211 0.38 0.41 0.14 30 21 e7.8 e13 6.3 0.39 0.37 0.15 30 19 e2.2 e14 1.6 0.41 0.40 0.16 24 23 e2.2 e11
26 0.61 0.58 0.69 0.3727 0.51 0.64 0.54 0.3828 0.49 0.63 0.50 0.38 29 0.54 0.64 0.50 0.39 30 0.59 0.64 0.63 0.40 31 0.63 --- 0.64 0.39
1.00 0.48 0.63 0.16 30 26 e2.2 e7.4 0.71 0.46 0.72 0.20 30 19 e2.2 e2.2 0.64 0.46 0.43 0.23 24 18 e3.0 e2.2 --- 0.43 0.34 0.16 26 18 e4.5 e2.2 --- 0.43 0.30 0.30 45 7.2 e11 e2.2 --- 0.38 --- 0.72 --- e2.2 e4.7 --
TOTAL 21.22 16.58 18.79 15.73MEAN 0.68 0.55 0.61 0.51 MAX 1.2 0.91 0.72 2.1 MIN 0.49 0.36 0.49 0.27
36.41 16.33 12.95 9.66 380.17 652.4 177.13 155.51.30 0.53 0.43 0.31 12.7 21.0 5.71 5.18 11 0.97 0.79 1.8 45 41 200.28 0.38 0.24 0.00 0.16 2.2 0.26 2.2
STATISTICS OF MONTHLY MEAN DATA FOR WATER YEARS 1987 - 2002, BY WATER YEAR (WY)
MEAN 2.35 1.61 1.37 1.13 MAX 11.7 7.02 7.71 3.25(WY) 2000 1988 1998 1996MIN 0.12 0.39 0.46 0.37(WY) 2001 2001 2001 2000
1.08 1.78 1.22 1.13 2.92 5.46 4.55 4.06 3.85 6.86 3.23 4.44 12.7 21.0 8.30 11.71998 1987 1992 1991 2002 2002 1995 19980.33 0.25 0.080 0.24 0.22 0.61 0.44 0.822000 2000 2000 2000 1998 1989 1989 1997
SUMMARY STATISTICS FOR 2001 CALENDAR YEAR FOR 2002 WATER YEAR WATER YEARS 1987 - 2002
ANNUAL TOTAL 852.46ANNUAL MEAN 2.34 HIGHEST ANNUAL MEAN LOWEST ANNUAL MEAN HIGHEST DAILY MEAN 35LOWEST DAILY MEAN 0.15ANNUAL SEVEN-DAY MINIMUM 0.26 MAXIMUM PEAK FLOWMAXIMUM PEAK STAGE10 PERCENT EXCEEDS 6.950 PERCENT EXCEEDS 0.6490 PERCENT EXCEEDS 0.33
1512.87 4.14 2.40
4.14 20021.11 1989
Aug 11 45 Jun 30 67 Nov 23 1988May 21 0.00 May 17-19 *0.00May 7 0.09 May 17 0.00 Jun 29 1998
127 Nov 23 198895.41 Jun 20 95.84 Nov 23 198819 5.7 0.63 0.82 0.28 0.28
e Estimated* Many days in water years 1995,1996,1998-2000
18

255 KISSIMMEE RIVER BASIN
02264060 LATERAL 101 AT S-101, NEAR LAKE BUENA VISTA, FL
LOCATION.--Lat 28° 22'15", long 81° 31'45", in NE1⁄ 4 sec.29, T.24 S., R.28 E., Orange County, Hydrologic Unit 03090101, on right bank at upstream side of control structure S-101, 0.1 mi north of Buena Vista Drive, 0.5 mi upstream from mouth, and 0.9 miwest of Lake Buena Vista.
DRAINAGE AREA.--32.5 mi2.
PERIOD OF RECORD.--October 1986 to current year.
REVISED RECORDS.--WDR FL-96-1: Drainage area.
GAGE.--Water-stage and gate-opening recorder. Datum of gage is at NGVD of 1929 (Reedy Creek Improvement District bench mark). Auxiliary gage at downstream side of control structure 101.
REMARKS.--Records poor. Flow regulated by operation of structure 101. Discharge computed from relation between discharge and gate openings and does not include leakage, which is less than 5.0 ft3/s, around structure or gates.
DISCHARGE, CUBIC FEET PER SECOND, WATER YEAR OCTOBER 2001 TO SEPTEMBER 2002DAILY MEAN VALUES
DAY OCT NOV DEC JAN FEB MAR APR MAY JUN JUL AUG SEP
1 0.04 0.00 0.00 0.00 0.00 0.00 0.00 0.00 0.00 70 0.00 4.9 2 1.1 0.00 0.00 0.00 0.00 0.00 0.00 0.00 0.00 35 0.00 6.8 3 3.4 0.00 0.00 0.00 0.00 0.00 0.00 0.00 0.00 19 0.00 2.7 4 3.3 0.00 0.00 0.00 0.00 0.00 0.00 0.00 0.00 20 0.00 2.6 5 1.7 0.00 0.00 0.00 0.00 0.00 0.00 0.00 0.00 15 0.00 56
6 1.7 0.00 0.00 0.00 0.00 0.00 0.00 0.00 0.00 7.7 0.00 45 7 1.7 0.00 0.00 0.00 0.00 0.00 0.00 0.00 0.00 7.5 14 23 8 1.7 0.00 0.00 0.00 0.00 0.00 0.00 0.00 0.00 6.7 5.3 18 9 1.0 0.00 0.00 0.00 0.00 0.00 0.00 0.00 0.00 4.5 1.3 8.610 0.00 0.00 0.00 0.00 0.00 0.00 0.00 0.00 0.00 6.5 0.74 0.00
11 0.00 0.00 0.00 0.0012 0.00 0.00 0.00 0.0013 0.00 0.00 0.00 0.0014 0.00 0.00 0.00 0.0015 0.00 0.00 0.00 0.00
0.00 0.00 0.00 0.00 0.00 5.6 0.00 6.7 0.00 0.00 0.00 0.00 0.00 1.7 15 3.8 0.00 0.00 0.00 0.00 0.00 4.0 39 2.0 0.00 0.00 0.00 0.00 0.00 15 46 1.7 0.00 0.00 0.00 0.00 24 1.8 68 4.7
16 0.04 0.00 0.00 1.2 17 0.00 0.00 0.00 0.4118 0.00 0.00 0.00 0.0019 0.00 0.00 0.00 0.0020 0.00 0.00 0.00 0.00
0.00 0.00 0.00 0.00 14 1.3 30 0.870.00 0.00 0.00 0.00 9.4 0.73 14 180.00 0.00 0.00 0.00 8.4 0.67 8.7 200.00 0.00 0.00 0.00 38 0.00 6.1 22 0.00 0.00 0.00 0.00 105 1.3 16 19
21 0.23 0.00 0.00 0.0022 1.7 0.00 0.00 0.0023 1.7 0.00 0.00 0.0024 1.7 0.00 0.00 0.0025 1.0 0.00 0.00 0.00
0.00 0.00 0.00 0.00 49 12 43 7.210 0.00 0.00 0.00 63 11 55 1430 0.00 0.00 0.00 46 4.8 20 20 14 0.00 0.00 0.00 54 3.6 9.8 23 1.7 0.00 0.00 0.00 32 10 7.4 15
26 0.00 0.00 0.00 0.0027 0.00 0.00 0.00 0.0028 0.00 0.00 0.00 0.00 29 0.00 0.00 0.00 0.00 30 0.00 0.00 0.00 0.00 31 0.00 --- 0.00 0.00
0.14 0.00 0.00 0.00 43 17 4.1 9.0 0.00 0.00 0.00 0.00 30 3.6 4.0 4.9 0.00 0.00 0.00 0.00 13 3.2 3.0 4.5 --- 0.00 0.00 0.00 20 3.6 8.0 1.1 --- 0.00 0.00 0.00 99 0.00 20 1.0 --- 0.00 --- 0.00 --- 0.00 15 --
TOTAL 22.01 0.00 0.00 1.61MEAN 0.71 0.000 0.000 0.052 MAX 3.4 0.00 0.00 1.2 MIN 0.00 0.00 0.00 0.00
55.84 0.00 0.00 0.00 647.80 292.80 453.44 366.071.99 0.000 0.000 0.000 21.6 9.45 14.6 12.2 30 0.00 0.00 0.00 105 70 68 56
0.00 0.00 0.00 0.00 0.00 0.00 0.00 0.00
STATISTICS OF MONTHLY MEAN DATA FOR WATER YEARS 1987 - 2002, BY WATER YEAR (WY)
MEAN 12.7 9.77 10.5 13.1 MAX 35.3 39.7 66.5 98.0(WY) 1992 1988 1998 1998 MIN 0.000 0.000 0.000 0.000 (WY) 2001 2001 2001 2000
11.0 15.2 10.3 4.66 8.19 12.5 16.9 18.4 91.1 103 35.9 17.2 21.6 30.1 39.4 44.51998 1998 1998 1991 2002 1991 1991 19950.000 0.000 0.000 0.000 0.000 0.61 0.000 3.172000 2000 2000 2000 1989 1989 1989 1989
SUMMARY STATISTICS FOR 2001 CALENDAR YEAR FOR 2002 WATER YEAR WATER YEARS 1987 - 2002
ANNUAL TOTAL 1323.07 ANNUAL MEAN 3.62 HIGHEST ANNUAL MEAN LOWEST ANNUAL MEAN HIGHEST DAILY MEAN 142 LOWEST DAILY MEAN 0.00 ANNUAL SEVEN-DAY MINIMUM 0.00MAXIMUM PEAK STAGE10 PERCENT EXCEEDS 1150 PERCENT EXCEEDS 0.0090 PERCENT EXCEEDS 0.00
1839.57 5.04 12.0
40.7 19983.56 2001
Sep 14 105 Jun 20 290 Nov 23 1988 Many days 0.00 Many days 0.00 Many days Jan 1 0.00 Oct 26 0.00 Many days
90.26 Jun 20 90.59 Nov 23 198816 31 0.00 5.1 0.00 0.00

256 KISSIMMEE RIVER BASIN
02264100 BONNET CREEK NEAR VINELAND, FL
LOCATION.--Lat 28° 19'30", long 81° 31'15", in SW1⁄ 4 sec.9, T.25 S., R.28 E., Osceola County, Hydrologic Unit 03090101, on upstream side of sheet-pile weir, about 0.5 mi upstream from Reedy Creek Swamp, and 5.0 mi south of Vineland.
DRAINAGE AREA.--44.7 mi2. WATER-DISCHARGE RECORDS
PERIOD OF RECORD.--Water years 1943, 1960, 1961, 1966 (miscellaneous discharge measurements), May 1966 to current year.
REVISED RECORDS.--WDR FL-96-1: Drainage area.
GAGE.--Water-stage recorder and steel sheet-pile weir with sluice gate. Datum of gage is at NGVD of 1929 (Florida Department of Transportation bench mark). Prior to June 1, 1999, at site 0.5 mi upstream at same datum; prior to Oct. 1, 1968, at datum 37.96 ft higher.
REMARKS.--Records poor. Since October 1968, flow regulated by automatic gates upstream and since December 1970, by controlstructure S-11. Natural flow of stream affected by canals and control structures above station which divert an undeterminedamount of water into the Reedy Creek basin. From Oct. 13, 1983 to Feb. 1, 1985 structure S-11 did not regulate the stream because of a washout of the bank around the structure.
EXTREMES OUTSIDE PERIOD OF RECORD.--Flood of Sept. 11, 1960, reached a stage of 42.5 ft, datum then in use, from floodmarks,discharge, 1,200 ft3/s.
DISCHARGE, CUBIC FEET PER SECOND, WATER YEAR OCTOBER 2001 TO SEPTEMBER 2002DAILY MEAN VALUES
DAY OCT NOV DEC JAN FEB MAR APR MAY JUN JUL AUG SEP
1 14 6.6 1.8 3.0 2 14 6.9 1.8 5.3 3 17 7.7 1.8 5.6 4 21 7.0 1.8 3.7 5 19 6.5 1.7 4.2
2.9 6.2 2.9 1.7 e0.14 204 23 80 3.4 5.4 2.6 1.5 e0.08 130 22 72 4.1 4.8 2.6 1.5 e0.05 96 20 62 4.4 4.0 2.6 1.5 e0.00 69 24 67 4.1 2.2 2.8 1.4 e0.00 56 29 127
6 18 6.5 1.7 4.07 18 6.5 1.6 3.78 18 6.2 1.6 3.8 9 17 5.2 1.7 3.4 10 13 4.7 2.1 3.1
4.5 1.9 4.0 1.4 0.00 56 26 12051 1.6 5.2 1.3 0.08 56 60 8517 1.8 3.8 1.3 0.83 52 64 76 0.62 2.7 2.9 e1.1 0.52 49 24 540.76 2.4 2.4 e1.0 0.45 51 19 28
11 11 4.7 2.1 2.912 11 4.7 2.4 3.113 12 4.7 2.4 3.214 14 5.7 2.4 3.615 14 6.3 2.6 3.5
1.1 2.2 2.4 e1.0 2.9 58 21 431.4 e2.2 2.4 e1.0 2.4 50 51 441.4 2.5 2.4 e1.0 1.1 49 142 531.2 e2.4 2.5 e1.2 2.2 85 173 55 1.3 1.9 3.1 e1.3 45 58 228 69
16 14 5.5 2.5 2.9 17 12 4.7 2.5 1018 11 4.4 2.8 2.919 10 4.0 3.1 2.1 20 10 4.0 2.8 1.7
1.3 1.8 2.7 e1.2 47 52 256 591.3 1.8 2.5 e1.0 31 45 241 78 1.6 1.9 2.2 e1.9 31 35 79 103 1.6 1.7 2.0 e2.1 53 32 77 1041.8 1.6 2.0 e2.0 204 29 86 115
21 13 3.8 2.4 1.622 14 3.4 2.6 1.5 23 15 3.4 2.9 1.3 24 18 3.4 3.2 1.2 25 15 3.2 3.8 1.5
1.8 1.6 1.7 e1.6 140 59 137 86 27 1.7 1.6 e1.5 167 64 195 93 83 1.9 1.7 e1.3 156 48 133 115 62 2.0 1.8 e1.2 182 44 101 139 19 2.0 1.6 e1.0 147 59 83 121
26 12 2.8 3.0 1.827 8.6 2.4 2.9 2.028 7.3 2.0 3.0 2.5 29 6.6 2.0 3.4 2.830 6.6 1.8 2.9 2.631 6.7 --- 3.1 2.8
15 2.5 1.6 e1.0 105 87 73 95 8.9 2.6 1.6 e0.84 133 49 63 80 7.7 3.6 1.5 e0.69 48 37 58 73--- 3.1 1.7 e0.53 60 49 71 66 --- 2.8 1.9 e0.37 212 32 98 62--- 2.9 --- e0.21 --- 26 98 --
TOTAL 410.8 140.7 76.4 97.3MEAN 13.3 4.69 2.46 3.14 MAX 21 7.7 3.8 10 MIN 6.6 1.8 1.6 1.2
331.18 79.7 72.7 37.64 1771.75 1866 2775 242411.8 2.57 2.42 1.21 59.1 60.2 89.5 80.8 83 6.2 5.2 2.1 212 204 256 139
0.62 1.6 1.5 0.21 0.00 26 19 28
STATISTICS OF MONTHLY MEAN DATA FOR WATER YEARS 1966 - 2002, BY WATER YEAR (WY)
MEAN 29.7 19.6 17.9 20.8 MAX 100 102 101 129(WY) 1995 1988 1998 1998 MIN 4.92 1.13 2.19 0.96(WY) 1968 1968 1967 1967
21.9 23.4 16.6 11.5 22.8 32.0 39.6 43.6143 143 56.1 37.8 78.9 77.8 111 1941998 1998 1987 1979 1994 1984 1995 1994 1.27 1.40 0.30 0.000 0.42 4.12 2.71 6.341968 1968 2000 2000 1967 1989 1989 1984
SUMMARY STATISTICS FOR 2001 CALENDAR YEAR FOR 2002 WATER YEAR WATER YEARS 1966 - 2002
ANNUAL TOTAL 6427.25 ANNUAL MEAN 17.6 HIGHEST ANNUAL MEAN LOWEST ANNUAL MEAN HIGHEST DAILY MEAN 428 LOWEST DAILY MEAN 0.00 ANNUAL SEVEN-DAY MINIMUM 0.03MAXIMUM PEAK FLOW MAXIMUM PEAK STAGE10 PERCENT EXCEEDS 5150 PERCENT EXCEEDS 3.490 PERCENT EXCEEDS 1.1
10083.1727.6 24.8
62.2 1998 10.1 2000
Sep 14 256 Aug 16 610 Nov 4 1987 May 18-21,24 0.00 Jun 4-6 0.00 Some years May 18 0.05 Jun 1 0.00 Some years
631 Jun 20 1230 Nov 23 1988 74.76 Jun 20 78.58 Nov 1 196985 53 4.0 15 1.3 3.3
e Estimated

--- ---
--- --- --- ---
257 KISSIMMEE RIVER BASIN
02264100 BONNET CREEK NEAR VINELAND, FL--Continued
WATER-QUALITY RECORDS
PERIOD OF RECORD.--Water years 1961, 1963, 1966, 1968-94, 1996 to current year.
PERIOD OF DAILY RECORD.--SPECIFIC CONDUCTANCE: July 5, 2001 to current year. WATER TEMPERATURE: July 5, 2001 to current year. DISSOLVED OXYGEN: July 5, 2001 to current year.
INSTRUMENTATION.--Water-quality monitor.
REMARKS.--Extremes for current year and extremes for period of of daily record are based on recorded values and may have been exceeded during period of no record.
EXTREMES FOR PERIOD OF DAILY RECORD.--SPECIFIC CONDUCTANCE: Maximum daily mean, 293 µS/cm @ 25 ° C, June 12, 2001; minimum daily mean, 131 µS/cm @ 25 ° C, Sept. 21, 23, 2002.
WATER TEMPERATURE: Maximum daily mean, 30.5 ° C, May 5, 2002; minimum daily mean, 12.9 ° C, Jan. 10, 2002. DISSOLVED OXYGEN: Maximum daily mean, 10.4 mg/L, March 8, 9, 2002; minimum daily mean, 0.3 mg/L, Dec. 8, 2001.
EXTREMES FOR CURRENT YEAR.--SPECIFIC CONDUCTANCE: Maximum daily mean, 293 µS/cm @ 25 ° C, June 12; minimum daily mean, 131 µS/cm @ 25 ° C, Sept. 21,23. WATER TEMPERATURE: Maximum daily mean, 30.5 ° C, May 5; minimum daily mean, 12.9 ° C, Jan. 10. DISSOLVED OXYGEN: Maximum daily mean, 10.4 mg/L, Mar. 8,9; minimum daily mean 0.3 mg/L, Dec. 8.
SPECIFIC CONDUCTANCE (MICROSIEMENS/CM AT 25 DEG. C), WATER YEAR OCTOBER 2001 TO SEPTEMBER 2002DAILY MEAN VALUES
DAY OCT NOV DEC JAN FEB MAR APR MAY JUN JUL AUG SEP
1 153 176 219 208 216 243 237 261 --- 157 176 136 2 156 192 217 208 217 247 241 265 --- 151 177 139 3 156 209 215 209 216 251 244 268 --- 152 179 139 4 145 212 210 206 214 253 243 270 --- 157 183 140 5 157 207 211 203 213 257 242 272 --- 157 182 138
6 161 204 212 202 215 258 241 272 --- 164 183 143 7 166 195 215 204 212 263 241 272 --- 163 183 145 8 166 196 218 205 207 265 244 273 --- 163 184 143 9 167 197 217 205 207 263 246 272 --- 164 184 145 10 174 199 215 206 208 221 247 274 -- 166 184 148
11 176 200 211 205 210 204 247 277 -- 171 191 151 12 173 202 206 204 212 219 247 280 293 173 186 148 13 176 213 208 206 214 223 247 283 291 171 171 148 14 176 218 207 207 219 224 247 285 283 173 173 145 15 174 218 211 206 224 224 249 289 246 177 156 145
16 174 220 206 207 229 225 250 282 246 177 148 145 17 178 219 207 208 232 227 250 274 250 185 191 139 18 180 214 207 207 235 231 250 284 236 195 217 143 19 186 210 207 208 238 231 250 285 232 194 211 147 20 189 208 212 208 243 230 252 288 211 195 194 134
21 197 222 209 209 245 231 250 285 188 190 172 131 22 196 217 208 212 238 236 252 283 182 184 137 133 23 188 214 209 210 224 240 252 283 182 186 133 131 24 185 213 210 210 228 239 254 281 174 182 -- 136 25 184 212 210 213 230 236 250 282 177 182 -- 140
26 190 210 208 218 231 237 250 -- 175 171 -- 136 27 191 210 210 221 234 240 248 -- 168 173 -- 138 28 188 212 210 219 238 240 251 -- 167 176 132 140 29 182 211 209 216 240 254 -- 171 173 137 142 30 178 218 208 214 239 261 -- 164 174 132 143 31 169 207 215 237 -- -- 175 133
MEAN 175 208 211 209 223 238 248 --- --- 173 171 141 MAX 197 222 219 221 245 265 261 --- --- 195 217 151 MIN 145 176 206 202 207 204 237 --- --- 151 132 131

--------- ---
---
--- --- --- --- ---
--- --- --- ---
---
--- --- ---
--- --- --- ---
--- --- --- --- ---
------ ---
258 KISSIMMEE RIVER BASIN
02264100 BONNET CREEK NEAR VINELAND, FL--Continued
TEMPERATURE, WATER (DEG. C), WATER YEAR OCTOBER 2001 TO SEPTEMBER 2002 DAILY MEAN VALUES
DAY OCT NOV DEC JAN FEB MAR APR MAY JUN JUL AUG SEP
1 24.2 21.0 21.1 16.5 22.4 16.7 25.4 28.5 --- 27.2 29.5 29.0 2 23.7 21.6 21.4 16.2 23.1 17.7 25.7 28.4 --- 27.1 28.7 29.1 3 23.7 22.2 21.9 15.5 23.1 19.4 25.0 28.9 --- 27.4 28.2 29.7 4 24.0 22.6 22.2 13.5 21.7 18.6 25.1 29.4 --- 27.6 28.2 29.3 5 24.2 22.2 22.1 13.3 19.5 16.5 25.5 30.5 --- 27.5 28.9 28.6
6 24.5 20.7 21.8 13.9 19.2 17.8 24.7 30.0 --- 27.5 29.5 29.1 7 25.2 20.7 21.9 14.3 19.4 17.7 24.0 29.4 --- 27.7 29.0 28.9 8 25.3 20.5 22.0 13.5 18.9 19.4 23.2 29.0 --- 27.6 29.0 28.7 9 24.6 20.5 22.3 13.6 19.1 20.0 23.6 28.7 --- 27.5 28.4 28.9 10 24.1 20.6 22.6 12.9 19.1 21.7 24.1 28.8 -- 27.2 28.6 28.2
11 24.2 20.6 22.5 13.5 19.9 21.7 24.5 28.8 -- 27.5 28.2 28.0 12 24.4 20.7 22.5 14.2 19.9 19.9 24.5 28.8 28.4 27.6 27.9 27.4 13 24.5 20.7 22.5 15.3 18.9 21.5 24.4 28.6 28.5 27.4 27.8 27.6 14 24.7 21.0 22.8 15.4 18.3 21.9 24.3 28.6 28.6 28.1 27.9 27.9 15 25.3 20.5 23.4 16.2 18.3 21.6 24.4 28.0 28.5 28.7 27.5 28.0
16 25.2 20.2 23.6 16.7 18.7 22.1 25.4 27.7 28.8 28.9 27.5 28.3 17 23.9 20.3 22.9 16.8 18.7 22.9 25.9 28.3 28.5 29.5 28.6 28.3 18 22.7 20.9 22.9 17.4 18.9 22.8 25.7 28.6 28.0 29.2 28.8 28.6 19 23.1 21.2 21.8 17.2 18.3 23.5 25.9 27.7 28.1 29.1 28.8 28.9 20 23.5 21.3 20.9 17.6 18.6 23.5 26.7 26.3 27.6 29.3 28.5 28.6
21 24.1 21.4 19.9 18.2 19.8 23.9 26.6 25.7 26.8 28.6 28.2 28.5 22 24.1 21.2 19.3 20.3 20.2 24.4 28.1 25.3 26.4 28.7 28.2 28.3 23 24.3 21.0 18.8 19.5 19.1 23.6 29.1 25.4 26.5 29.0 27.8 27.9 24 24.4 21.2 19.8 20.2 18.4 22.7 28.7 25.8 26.5 29.1 -- 27.8 25 24.7 21.5 18.3 20.9 18.4 22.5 27.5 26.2 26.7 29.5 -- 27.8
26 24.1 21.6 16.8 22.0 19.2 23.4 28.0 --- 26.7 29.3 --- 27.6 27 21.8 21.4 15.7 22.0 19.1 25.6 27.8 --- 27.2 29.7 --- 27.8 28 20.2 21.0 15.7 21.9 17.3 25.1 27.4 --- 27.4 29.8 27.8 27.9 29 19.9 21.2 17.2 21.4 --- 24.2 27.8 27.6 29.6 28.1 28.1 30 20.2 21.1 17.8 21.4 --- 24.4 28.4 27.5 29.4 28.4 27.9 31 20.8 --- 17.2 22.2 --- 24.9 --- 29.4 28.4 --
MEAN 23.7 21.1 20.7 17.2 19.5 21.7 25.9 --- --- 28.4 28.4 28.4 MAX 25.3 22.6 23.6 22.2 23.1 25.6 29.1 --- --- 29.8 29.5 29.7 MIN 19.9 20.2 15.7 12.9 17.3 16.5 23.2 --- --- 27.1 27.5 27.4
OXYGEN DISSOLVED (MG/L), WATER YEAR OCTOBER 2001 TO SEPTEMBER 2002 DAILY MEAN VALUES
DAY OCT NOV DEC JAN FEB MAR APR MAY JUN JUL AUG SEP
1 1.8 0.9 1.7 6.1 4.8 9.5 7.1 6.7 --- 6.0 --- 3.9 2 1.3 0.6 1.4 6.2 6.2 8.8 7.5 6.4 --- 5.1 --- 3.5 3 1.2 0.4 1.6 5.9 6.4 8.8 6.5 6.7 --- 4.7 --- 3.2 4 1.0 0.4 2.9 7.5 6.4 8.4 5.9 7.1 --- 4.0 --- 3.0 5 0.9 1.4 3.0 7.4 6.7 9.4 7.5 7.1 --- 3.9 --- 3.7
6 0.7 2.0 2.5 7.5 6.4 9.9 7.7 6.9 --- 3.6 --- 5.1 7 0.7 1.6 1.0 7.7 6.2 9.6 7.3 6.3 --- 3.8 --- 5.5 8 1.0 1.3 0.3 8.0 6.8 10.4 6.6 6.5 --- 4.0 --- 4.7 9 1.1 1.2 0.9 6.3 6.4 10.4 6.4 6.3 --- 3.7 --- 3.9 10 0.7 1.2 0.8 7.7 5.4 8.9 6.4 7.2 --- 3.9 --- 2.6
11 0.5 1.0 1.0 7.2 5.9 8.2 6.1 7.9 --- 4.0 --- 2.4 12 0.6 1.1 1.2 7.6 5.6 6.5 6.1 8.1 4.1 3.6 --- 2.3 13 0.6 1.3 1.4 7.7 6.1 8.4 5.3 7.9 3.8 3.5 --- 2.4 14 0.6 1.6 1.4 7.3 6.3 8.5 5.3 8.2 3.6 4.1 --- 2.7 15 0.6 2.4 2.0 7.1 5.9 7.2 5.2 7.6 3.2 --- 3.0
16 0.5 3.6 2.2 6.6 6.3 5.6 5.7 7.6 5.0 4.6 2.7 17 0.8 3.9 1.2 6.6 6.5 4.9 5.9 8.6 5.1 5.5 3.2 18 0.7 3.7 2.7 7.7 6.9 3.9 6.1 8.0 5.7 5.1 3.7 19 0.6 3.1 2.9 7.1 6.3 3.6 5.9 7.0 5.2 4.4 3.9 20 0.4 2.6 3.7 6.1 7.3 2.9 6.6 6.7 5.7 3.8 4.2
21 0.5 2.1 4.6 5.8 7.1 3.9 7.0 8.1 6.5 3.3 4.1 22 0.5 1.4 4.1 7.2 6.7 5.3 7.8 8.8 5.9 4.8 3.7 23 0.9 1.0 4.0 5.0 6.8 5.7 7.3 8.7 5.8 4.4 4.2 24 1.2 1.2 4.6 5.4 6.8 5.2 6.7 9.8 5.6 --- 4.4 25 1.7 1.1 4.3 5.8 6.7 4.7 6.6 10.1 5.2 --- 5.0
26 1.8 1.5 5.7 6.0 7.7 5.5 6.0 -- 4.5 --- 5.1 27 2.4 1.6 5.8 5.5 9.0 6.9 7.1 -- 5.2 --- 4.3 28 2.3 1.3 5.8 4.5 9.3 7.6 6.0 -- 3.5 2.9 3.7 29 2.7 1.7 6.1 3.9 6.2 5.7 -- 3.6 3.2 3.5 30 2.8 1.6 6.0 3.8 5.4 6.4 -- 4.8 3.6 3.1 31 1.8 5.4 4.3 5.5 -- -- 4.1
MEAN 1.1 1.7 3.0 6.4 6.6 7.0 6.5 --- --- --- 3.7 MAX 2.8 3.9 6.1 8.0 9.3 10.4 7.8 -- -- --- 5.5 MIN 0.4 0.4 0.3 3.8 4.8 2.9 5.2 --- --- --- 2.3

--
--
--
--
--
--
--
--
--
--
--
259 KISSIMMEE RIVER BASIN
02264100 BONNET CREEK NEAR VINELAND, FL--Continued
WATER-QUALITY DATA, WATER YEAR OCTOBER 2001 TO SEPTEMBER 2002
DIS PH NITRO NITRO CHARGE, SPE WATER GEN, NITRO GEN, NITROINST. CIFIC WHOLE COLOR AMMONIA GEN, NITRITE GEN, CUBIC CON FIELD TEMPER- TUR- (PLAT OXYGEN, DIS AMMONIA DIS NITRITE FEET GAGE DUCT- (STAND- ATURE BID INUM- DIS SOLVED TOTAL SOLVED TOTAL
Date Time PER HEIGHT ANCE ARD WATER ITY COBALT SOLVED (MG/L (MG/L (MG/L (MG/L SECOND (FEET) (US/CM) UNITS) (DEG C) (NTU) UNITS) (MG/L) AS N) AS N) AS N) AS N)
(00061) (00065) (00095) (00400) (00010) (00076) (00080) (00300) (00608) (00610) (00613) (00615)
OCT 24... 0930 18 72.97 191 6.3 24.2 - .5 .27 - .020 -NOV 20... 1000 4.0 72.86 208 6.6 21.0 -- 2.4 .10 - .020 -DEC 19... 1430 2.9 72.78 208 6.7 21.8 -- 3.8 .08 -- <.010 -JAN 15... 1640 3.4 72.81 207 7.0 16.9 -- 7.0 .04 -- <.010 -FEB 13... 1030 1.5 72.74 214 6.8 18.6 -- 5.8 .05 - .010 -MAR 12... 0900 2.0 72.80 220 6.8 19.8 -- 6.5 .07 -- <.010 -APR 10... 1000 2.4 72.79 247 7.0 23.6 -- 6.3 .02 -- <.010 -MAY 07... 1200 1.3 72.76 272 7.3 29.3 -- 7.9 <.01 -- <.010 -JUN 26... 1100 85 73.27 179 6.4 27.1 3.6 200 4.6 .17 .19 .010 .02 JUL 29... 1200 52 73.11 175 6.2 29.9 -- 3.0 .34 - .020 -AUG 27... 1400 77 73.16 133 5.6 28.2 -- 3.5 .43 - .020 -SEP 24... 0800 140 73.30 139 5.8 27.5 -- 4.2 .36 - .020 -
NITRO- NITRO-GEN,AM- NITRO- GEN,MONIA + GEN, NO2+NO3 PHOS- ORGANIC NO2+NO3 DIS- PHORUS TOTAL TOTAL SOLVED TOTAL
Date (MG/L (MG/L (MG/L (MG/L AS N) AS N) AS N) AS P)(00625) (00630) (00631) (00665)
ORTHO- ANCPHOS- PHOS- HARD- MAGNE- POTAS- UNFLTRDPHATE, CARBON, PHORUS NESS CALCIUM SIUM, SODIUM, SIUM, TIT 4.5DIS- ORGANIC ORTHO TOTAL DIS- DIS- DIS- DIS- LAB
SOLVED TOTAL TOTAL (MG/L SOLVED SOLVED SOLVED SOLVED (MG/L(MG/L (MG/L (MG/L AS (MG/L (MG/L (MG/L (MG/L ASAS P) AS C) AS P) CACO3) AS CA) AS MG) AS NA) AS K) CACO3)
(00671) (00680) (70507) (00900) (00915) (00925) (00930) (00935) (90410)
OCT 24... E1.5 -- .21 E.07 .05 43.0 -- -- -- -- -- -- -NOV 20... E1.2 -- .42 E.06 .05 29.0 -- -- -- -- -- -- -DEC 19... .90 -- .24 .06 .02 20.0 -- -- -- -- -- -- -JAN 15... .80 -- .21 .03 .01 16.0 -- -- -- -- -- -- -FEB 13... 1.0 -- .11 .03 <.01 4.6 -- -- -- -- -- -- -MAR 12... 1.0 -- .08 .03 <.01 11.0 -- -- -- -- -- -- -APR 10... .70 -- <.02 .05 <.01 10.0 -- -- -- -- -- -- -MAY 07... .90 -- <.02 <.02 <.01 14.0 -- -- -- -- -- -- -JUN 26... 1.2 .110 .11 .12 .10 24.0 .100 52 16.0 3.00 13.0 3.80 31JUL 29... 1.7 -- .09 .06 .04 32.0 -- -- -- -- -- -- -AUG 27... 2.2 -- .17 .13 .10 50.0 -- -- -- -- -- -- -SEP 24... 1.9 -- .11 .10 .09 43.0 -- -- -- -- -- -- -
< -- Less than E -- Estimated value

-- -- -- -- -- --
-- -- -- -- -- --
-- -- -- -- -- --
-- -- -- -- -- --
-- -- -- -- -- --
-- -- -- -- -- --
-- -- -- -- -- --
-- -- -- -- -- --
-- -- -- -- -- --
-- -- -- -- -- --
-- -- -- -- -- --
260 KISSIMMEE RIVER BASIN
02264100 BONNET CREEK NEAR VINELAND, FL--Continued
WATER-QUALITY DATA, WATER YEAR OCTOBER 2001 TO SEPTEMBER 2002
CHLOR-A BERYL ALUM- CHRO MANGACHLO- FLUO- PHYTO LIUM, INUM, CADMIUM MIUM, COPPER, IRON, LEAD, NESE,
SULFATE RIDE, RIDE, PLANK TOTAL TOTAL WATER TOTAL TOTAL TOTAL TOTAL TOTAL DIS DIS DIS TON ARSENIC RECOV RECOV UNFLTRD RECOV RECOV RECOV RECOV RECOVSOLVED SOLVED SOLVED CHROMO TOTAL ERABLE ERABLE TOTAL ERABLE ERABLE ERABLE ERABLE ERABLE
Date (MG/L (MG/L (MG/L FLUOROM (UG/L (UG/L (UG/L (UG/L (UG/L (UG/L (UG/L (UG/L (UG/L AS SO4) AS CL) AS F) (UG/L) AS AS) AS BE) AS AL) AS CD) AS CR) AS CU) AS FE) AS PB) AS MN) (00945) (00940) (00950) (70953) (01002) (01012) (01105) (01027) (01034) (01042) (01045) (01051) (01055)
OCT 24... -- 4.7 - - - - -NOV 20... -- 3.4 - - - - -DEC 19... -- 9.8 - - - - -JAN 15... -- <.1 - - - - -FEB 13... -- <.1 - - - - -MAR 12... - 13.0 - - - - -APR 10... - 22.0 - - - - -MAY 07... -- 3.6 - - - - -JUN 26... 12.0 22.0 <.1 7.3 5 <1 302 <1.0 <1.0 4.0 420 <1 19 JUL 29... - 13.0 - - - - -AUG 27... -- 4.9 - - - - -SEP 24... -- <.1 - - - - -
NICKEL, ZINC, MERCURY ALDRIN, LINDANE CHLOR TOTAL TOTAL SELE- TOTAL CHLOR- DISUL- TOTAL TOTAL DANE, RECOV- RECOV- NIUM, RECOV- PYRIFOS FOTON IN BOT- IN BOT- TECH ERABLE ERABLE TOTAL ERABLE TOTAL UNFILT PHORATE DEF ALDRIN, LINDANE TOM MA- TOM MA- NICAL
Date (UG/L (UG/L (UG/L (UG/L RECOVER RECOVER TOTAL TOTAL TOTAL TOTAL TERIAL TERIAL TOTAL AS NI) AS ZN) AS SE) AS HG) (UG/L) (UG/L) (UG/L) (UG/L) (UG/L) (UG/L) (UG/KG) (UG/KG) (UG/L)(01067) (01092) (01147) (71900) (38932) (39011) (39023) (39040) (39330) (39340) (39333) (39343) (39350)
JUN 26... <1.0 10 <1 <.1 <.01 <.10 <.02 <.02 <.01 <.006 <.2 <.2 <.1
CHLOR- P,P'- P,P'- P,P'- DI- ENDO DANE, DDD, DDE, DDT, ELDRIN, SULFAN ENDRIN, TOTAL P,P'- RECOVER RECOVER P,P'- RECOVER TOTAL ENDO- I TOTAL ENDRIN TOTALIN BOT- DDD IN BOT- P,P'- IN BOT- DDT IN BOT- DI- IN BOT- SULFAN IN BOT- WATER IN BOTTOM MA- UNFILT TOM MA- DDE, TOM MA- UNFILT TOM MA- ELDRIN TOM MA- I TOM MA- UNFLTRD TOM MA-
Date TERIAL RECOVER TERIAL TOTAL TERIAL RECOVER TERIAL TOTAL TERIAL TOTAL TERIAL REC TERIAL(UG/KG) (UG/L) (UG/KG) (UG/L) (UG/KG) (UG/L) (UG/KG) (UG/L) (UG/KG) (UG/L) (UG/KG) (UG/L) (UG/KG)(39351) (39360) (39363) (39365) (39368) (39370) (39373) (39380) (39383) (39388) (39389) (39390) (39393)
JUN 26... <3 <.007 <.5 <.006 <.2 <.009 <.5 <.006 <.2 <.02 <.2 <.01 <.2
TOXA- HEPTA- HEPTA- METHPHENE, CHLOR, CHLOR OXY- PCB,
TOTAL TOTAL HEPTA- EPOXIDE METH- CHLOR, TOTAL TOX- IN BOT- HEPTA- IN BOT- CHLOR TOT. IN OXY- TOT. IN IN BOT- MALA- PARA
ETHION, APHENE, TOM MA- CHLOR, TOM MA- EPOXIDE BOTTOM CHLOR, BOTTOM PCB, TOM MA- THION, THION,Date TOTAL TOTAL TERIAL TOTAL TERIAL TOTAL MATL. TOTAL MATL. TOTAL TERIAL TOTAL TOTAL
(UG/L) (UG/L) (UG/KG) (UG/L) (UG/KG) (UG/L) (UG/KG) (UG/L) (UG/KG) (UG/L) (UG/KG) (UG/L) (UG/L)(39398) (39400) (39403) (39410) (39413) (39420) (39423) (39480) (39481) (39516) (39519) (39530) (39540)
JUN 26... <.01 <1 <50 <.01 <.2 <.009 <.2 <.020 <2.5 <.1 <5 E.04 <.01
FONOFOS BI MIREX, CARBO- (DY- PHENYL,
METHYL TOTAL PHENO- FONATE) NONA DI- PARA- IN BOT- THION WATER CHLOROAZINON, THION, MIREX, TOM MA- WATER WHOLE SUR SCD
Date TOTAL TOTAL TOTAL TERIAL UNFLTRD TOT.REC 1325 (UG/L) (UG/L) (UG/L) (UG/KG) (UG/L) (UG/L) PERCENT (39570) (39600) (39755) (39758) (39786) (82614) (90575)
JUN26... <.02 <.02 <.006 <.2 <.02 <.01 62
< -- Less than E -- Estimated value

-- -- -- --
-- -- --
-- -- --
-- -- --
-- -- --
-- -- --
-- -- --
-- -- --
-- -- --
-- -- --
261 KISSIMMEE RIVER BASIN
02264140 BONNET CREEK NEAR KISSIMMEE, FL
LOCATION.--Lat 28° 18'28", long 81° 31'29", in NE1⁄ 4 sec.17, T. 25 S., R. 28 E., Osceola County, Hydrologic Unit 03090101, at culverts on east bank, 1.3 mi south of U.S. Highway 192, and 10 mi west of Kissimmee.
DRAINAGE AREA.--Indeterminate.
PERIOD OF RECORD.--Water years 1986-88, 2001 to current year.
WATER-QUALITY DATA, WATER YEAR OCTOBER 2001 TO SEPTEMBER 2002
PH NITRO NITRO NITROSPE WATER GEN, NITRO GEN, NITRO- GEN,AM-CIFIC WHOLE COLOR AMMONIA GEN, NITRITE GEN, MONIA + CON FIELD TEMPER TUR- (PLAT OXYGEN, DIS AMMONIA DIS NITRITE ORGANIC
GAGE DUCT- (STAND- ATURE BID INUM- DIS SOLVED TOTAL SOLVED TOTAL TOTAL Date Time HEIGHT ANCE ARD WATER ITY COBALT SOLVED (MG/L (MG/L (MG/L (MG/L (MG/L
(FEET) (US/CM) UNITS) (DEG C) (NTU) UNITS) (MG/L) AS N) AS N) AS N) AS N) AS N) (00065) (00095) (00400) (00010) (00076) (00080) (00300) (00608) (00610) (00613) (00615) (00625)
OCT 23... 1350 190 6.2 23.9 - .4 .04 <.010 E1.8 NOV 20... 1200 67.23 217 6.5 20.6 -- 3.4 .09 .010 E1.5 DEC 19... 1400 66.95 224 6.5 21.9 -- 2.7 .10 <.010 1.5 JAN 15... 1400 67.14 242 6.6 13.8 -- 6.7 .04 <.010 1.2 FEB 13... 1330 67.05 227 6.5 17.9 -- 4.8 .05 <.010 1.3 MAR 12... 1200 67.77 203 6.1 20.7 -- 3.5 .06 <.010 1.6 APR 10... 1200 66.70 231 6.6 23.9 -- 4.2 .07 <.010 1.2 JUN 26... 1000 69.29 227 5.9 25.1 1.2 320 1.6 .07 .08 .010 .02 1.9 JUL 29... 1100 69.21 161 6.0 27.0 - .3 .06 .020 1.8 AUG 27... 1300 69.08 145 5.9 26.9 - .9 .08 .010 1.7 SEP 24... 1000 69.76 134 5.8 27.1 -- 1.9 .12 .020 1.3
NITRO- ORTHO NITRO- GEN, PHOS- GEN, NO2+NO3 PHOS- PHATE,
NO2+NO3 DIS- PHORUS DIS TOTAL SOLVED TOTAL SOLVED
Date (MG/L (MG/L (MG/L (MG/L AS N) AS N) AS P) AS P)(00630) (00631) (00665) (00671)
ANC PHOS- HARD- MAGNE- POTAS- UNFLTRD
CARBON, PHORUS NESS CALCIUM SIUM, SODIUM, SIUM, TIT 4.5 SULFATE ORGANIC ORTHO TOTAL DIS- DIS- DIS- DIS- LAB DISTOTAL TOTAL (MG/L SOLVED SOLVED SOLVED SOLVED (MG/L SOLVED(MG/L (MG/L AS (MG/L (MG/L (MG/L (MG/L AS (MG/L AS C) AS P) CACO3) AS CA) AS MG) AS NA) AS K) CACO3) AS SO4) (00680) (70507) (00900) (00915) (00925) (00930) (00935) (90410) (00945)
OCT 23... -- .05 E.06 .06 54.0 -- -- -- -- -- -- -- -NOV 20... -- .17 E.07 .05 42.0 -- -- -- -- -- -- -- -DEC 19... -- .13 .07 .06 38.0 -- -- -- -- -- -- -- -JAN 15... -- .18 .03 .02 34.0 -- -- -- -- -- -- -- -FEB 13... -- .10 .04 .03 5.3 -- -- -- -- -- -- -- -MAR 12... -- .02 .03 <.01 37.0 -- -- -- -- -- -- -- -APR 10... -- <.02 .06 .02 25.0 -- -- -- -- -- -- -- -JUN 26... .030 .03 .05 .05 47.0 .040 73 21.0 5.00 15.0 3.20 20 34.0JUL 29... -- <.02 .07 .07 43.0 -- -- -- -- -- -- -- -AUG 27... -- .07 .07 .05 41.0 -- -- -- -- -- -- -- -SEP 24... -- .07 .10 .11 46.0 -- -- -- -- -- -- -- -
< -- Less than E -- Estimated value

-- -- -- -- --
-- -- -- -- --
-- -- -- -- --
-- -- -- -- --
-- -- -- -- --
-- -- -- -- --
-- -- -- -- --
-- -- -- -- --
-- -- -- -- --
-- -- -- -- --
262 KISSIMMEE RIVER BASIN
02264140 BONNET CREEK NEAR KISSIMMEE, FL--Continued
WATER-QUALITY DATA, WATER YEAR OCTOBER 2001 TO SEPTEMBER 2002
CHLOR-A BERYL ALUM- CHRO- MANGA CHLO FLUO- PHYTO LIUM, INUM, CADMIUM MIUM, COPPER, IRON, LEAD, NESE, NICKEL, RIDE, RIDE, PLANK TOTAL TOTAL WATER TOTAL TOTAL TOTAL TOTAL TOTAL TOTAL DIS DIS TON ARSENIC RECOV RECOV UNFLTRD RECOV RECOV RECOV RECOV RECOV RECOV SOLVED SOLVED CHROMO TOTAL ERABLE ERABLE TOTAL ERABLE ERABLE ERABLE ERABLE ERABLE ERABLE
Date (MG/L (MG/L FLUOROM (UG/L (UG/L (UG/L (UG/L (UG/L (UG/L (UG/L (UG/L (UG/L (UG/L AS CL) AS F) (UG/L) AS AS) AS BE) AS AL) AS CD) AS CR) AS CU) AS FE) AS PB) AS MN) AS NI) (00940) (00950) (70953) (01002) (01012) (01105) (01027) (01034) (01042) (01045) (01051) (01055) (01067)
OCT 23... - 2.8 - - - - - -NOV 20... - <.1 - - - - - -DEC 19... - <.1 - - - - - -JAN 15... - <.1 - - - - - -FEB 13... - 8.5 - - - - - -MAR 12... - 9.8 - - - - - -APR 10... -- 12.0 - - - - - -JUN 26... 27.0 <.1 <.1 3 <1 302 <1.0 <1.0 2.4 277 <1 21 <1.0 JUL 29... - <.1 - - - - - -AUG 27... - <.1 - - - - - -SEP 24... - <.1 - - - - - -
ZINC, MERCURY TOTAL SELE- TOTAL CHLOR- DISUL RECOV- NIUM, RECOV- PYRIFOS FOTON ERABLE TOTAL ERABLE TOTAL UNFILT PHORATE
Date (UG/L (UG/L (UG/L RECOVER RECOVER TOTAL AS ZN) AS SE) AS HG) (UG/L) (UG/L) (UG/L)(01092) (01147) (71900) (38932) (39011) (39023)
CHLOR ALDRIN, LINDANE CHLOR- DANE,TOTAL TOTAL DANE, TOTAL
IN BOT- IN BOT- TECH- IN BOT DEF ALDRIN, LINDANE TOM MA- TOM MA- NICAL TOM MATOTAL TOTAL TOTAL TERIAL TERIAL TOTAL TERIAL
(UG/L) (UG/L) (UG/L) (UG/KG) (UG/KG) (UG/L) (UG/KG) (39040) (39330) (39340) (39333) (39343) (39350) (39351)
JUN 26... 8 <1 <.1 <.01 <.10 <.02 <.02 <.01 <.006 <.2 <.2 <.1 <3
P,P'- P,P'- P,P'- DI- ENDO DDD, DDE, DDT, ELDRIN, SULFAN ENDRIN,
P,P'- RECOVER RECOVER P,P'- RECOVER TOTAL ENDO- I TOTAL ENDRIN TOTAL DDD IN BOT- P,P'- IN BOT- DDT IN BOT- DI- IN BOT- SULFAN IN BOT- WATER IN BOT UNFILT TOM MA- DDE, TOM MA- UNFILT TOM MA- ELDRIN TOM MA- I TOM MA- UNFLTRD TOM MA- ETHION,
Date RECOVER TERIAL TOTAL TERIAL RECOVER TERIAL TOTAL TERIAL TOTAL TERIAL REC TERIAL TOTAL (UG/L) (UG/KG) (UG/L) (UG/KG) (UG/L) (UG/KG) (UG/L) (UG/KG) (UG/L) (UG/KG) (UG/L) (UG/KG) (UG/L)(39360) (39363) (39365) (39368) (39370) (39373) (39380) (39383) (39388) (39389) (39390) (39393) (39398)
JUN 26... <.007 <.5 <.006 <.2 <.009 <.5 <.006 <.2 <.02 <.2 <.01 <.2 <.01
TOXA- HEPTA- HEPTA- METH-PHENE, CHLOR, CHLOR OXY- PCB, TOTAL TOTAL HEPTA- EPOXIDE METH- CHLOR, TOTAL
TOX- IN BOT- HEPTA- IN BOT- CHLOR TOT. IN OXY- TOT. IN IN BOT- MALA- PARA- DIAPHENE, TOM MA- CHLOR, TOM MA- EPOXIDE BOTTOM CHLOR, BOTTOM PCB, TOM MA- THION, THION, AZINON,
Date TOTAL TERIAL TOTAL TERIAL TOTAL MATL. TOTAL MATL. TOTAL TERIAL TOTAL TOTAL TOTAL (UG/L) (UG/KG) (UG/L) (UG/KG) (UG/L) (UG/KG) (UG/L) (UG/KG) (UG/L) (UG/KG) (UG/L) (UG/L) (UG/L)(39400) (39403) (39410) (39413) (39420) (39423) (39480) (39481) (39516) (39519) (39530) (39540) (39570)
JUN 26... <1 <50 <.01 <.2 <.009 <.2 <.020 <2.5 <.1 <5 E.01 <.01 <.02
FONOFOS BIMIREX, CARBO- (DY- PHENYL,
METHYL TOTAL PHENO- FONATE) NONAPARA- IN BOT- THION WATER CHLOROTHION, MIREX, TOM MA- WATER WHOLE SUR SCD
Date TOTAL TOTAL TERIAL UNFLTRD TOT.REC 1325(UG/L) (UG/L) (UG/KG) (UG/L) (UG/L) PERCENT
(39600) (39755) (39758) (39786) (82614) (90575)
JUN26... <.02 <.006 <.2 <.02 <.01 62
< -- Less than E -- Estimated value

263 KISSIMMEE RIVER BASIN
02264495 SHINGLE CREEK AT CAMPBELL, FL
LOCATION.--Lat 28° 16'01", long 81° 26'53", in SE1⁄ 4 sec.31, T.25 S., R.29 E., Osceola County, Hydrologic Unit 03090101, near left bank on downstream side of bridge on County Road, 100 ft downstream from CSX railroad bridge, 0.8 mi northeast of Campbell, and 2.5 mi upstream from Lake Tohopekaliga.
DRAINAGE AREA.--180 mi2, approximately, includes part of watershed in Reedy Creek Swamp.
PERIOD OF RECORD.--October 1968 to current year.
GAGE.--Water-stage recorder. Datum of gage is at NGVD of 1929. Water-stage recorder on Lake Tohopekaliga at Kissimmee used as auxiliary gage for this station.
REMARKS.--Records fair except for period of estimated daily discharge, which is poor. Natural flow of stream affected by several canals, levees, and control structures which divert an undetermined amount of water into Shingle Creek above station or into the Reedy Creek basin.
DISCHARGE, CUBIC FEET PER SECOND, WATER YEAR OCTOBER 2001 TO SEPTEMBER 2002DAILY MEAN VALUES
DAY OCT NOV DEC JAN FEB MAR APR MAY JUN JUL AUG SEP
1 327 71 59 54 2 273 71 59 55 3 234 73 61 61 4 208 73 60 60 5 182 75 59 61
62 412 44 23 93 1020 e370 577 65 345 42 24 80 982 e320 627 64 283 42 23 77 1000 e290 722 65 257 44 21 84 931 e262 666 69 225 60 24 104 871 e240 923
6 162 69 57 61 7 155 66 55 66 8 146 65 54 64 9 133 65 55 6410 118 63 54 62
56 190 59 23 108 821 e280 958 59 172 48 17 102 733 e330 827 77 160 42 16 84 694 e362 711 74 142 49 15 69 638 e405 644 70 135 52 15 65 586 e350 613
11 109 63 57 6112 102 61 56 59 13 95 64 55 6214 95 66 54 6015 109 66 56 69
76 124 50 14 65 543 e325 595 73 105 49 14 62 507 e364 53975 104 47 13 65 522 e400 49976 101 43 15 62 595 e440 47272 94 41 14 63 542 e480 479
16 101 68 59 6717 98 69 53 6618 91 68 55 6919 86 68 53 68 20 84 67 53 68
70 89 44 9.3 105 487 e540 434 69 86 44 7.1 205 445 e615 515 70 81 46 7.1 258 400 e675 518 60 77 45 7.7 261 377 e740 47554 71 43 13 455 313 e695 483
21 81 66 55 67 22 85 65 52 6923 84 64 48 66 24 84 63 51 63 25 95 63 53 61
55 63 41 12 928 e279 e652 53972 72 46 16 1180 e330 e635 512
177 67 40 4.0 1370 e390 e615 522 308 61 35 3.1 1420 e490 e635 585 314 55 31 5.0 1410 e580 e580 681
26 102 62 55 66 27 86 61 49 66 28 83 60 49 65 29 76 59 47 63 30 74 58 50 63 31 72 --- 51 64
349 57 31 18 1390 e720 e540 693 421 67 24 32 1370 e645 e498 674 437 60 28 35 1240 e575 e460 659 --- 53 28 30 1110 e525 e480 643 --- 48 24 55 1040 e470 e505 629 --- 42 --- 130 --- e410 526 --
TOTAL 3830 1972 1684 1970 MEAN 124 65.7 54.3 63.5 MAX 327 75 61 69 MIN 72 58 47 54
3489 3898 1262 655.3 14925 18421 14609 18414125 126 42.1 21.1 498 594 471 614437 412 60 130 1420 1020 740 958 54 42 24 3.1 62 279 240 434
STATISTICS OF MONTHLY MEAN DATA FOR WATER YEARS 1969 - 2002, BY WATER YEAR (WY)
MEAN 190 124 126 143 MAX 564 665 889 543 (WY) 1970 1988 1998 1998 MIN 18.4 10.5 8.39 14.0(WY) 1971 1971 1971 1971
145 141 107 56.5 128 210 242 292634 577 469 238 498 659 640 8091998 1998 1987 1991 2002 1991 1995 2001 24.4 19.7 4.89 11.7 14.5 13.7 54.5 36.92001 2000 2000 2000 1971 1969 1980 1980
SUMMARY STATISTICS FOR 2001 CALENDAR YEAR FOR 2002 WATER YEAR WATER YEARS 1969 - 2002
ANNUAL TOTAL 68092 ANNUAL MEAN 187 HIGHEST ANNUAL MEAN LOWEST ANNUAL MEAN HIGHEST DAILY MEAN 1370LOWEST DAILY MEAN 16ANNUAL SEVEN-DAY MINIMUM 17 MAXIMUM PEAK FLOW MAXIMUM PEAK STAGE10 PERCENT EXCEEDS 54350 PERCENT EXCEEDS 6590 PERCENT EXCEEDS 21
85129.3 233 159
306 1998 47.0 1971
Sep 15 1420 Jun 24 1980 Apr 1 1987Jan 5,6 3.1 May 24 3.1 May 9 1971Jan 1 8.7 May 19 3.4 May 7 1971
1420 Jun 24 2070 Apr 1 1987 59.93 Jun 26 60.78 Apr 1 1987 640 38772 8738 30
e Estimated * Maximum stage observed and discharge measured.

264 KISSIMMEE RIVER BASIN
02266025 REEDY CREEK AT S-46 NEAR VINELAND, FL
LOCATION.--Lat 28° 24'18", long 81° 36'42", in NE1⁄ 4 sec.16, T.24 S., R.27 E., Orange County, Hydrologic Unit 03090101, on right upstream wingwall of control structure 46, 6.6 mi west of Vineland.
DRAINAGE AREA.--25.4 mi2.
PERIOD OF RECORD.--June 1969 to September 1972 (gage heights only). October 1986 to current year.
REVISED RECORDS.--WDR FL-97-1: Drainage area.
GAGE.--Water-stage and gate-opening recorder. Datum of gage is at NGVD of 1929 (Reedy Creek Improvement District bench mark). Auxiliary gage at downstream side of control structure 46.
REMARKS.--Records fair. Flow regulated by operation of structure 46. At high stages interconnection exists between Reedy Creek, Whittenhorse Creek, and Boggy Creek.
DISCHARGE, CUBIC FEET PER SECOND, WATER YEAR OCTOBER 2001 TO SEPTEMBER 2002DAILY MEAN VALUES
DAY OCT NOV DEC JAN FEB MAR APR MAY JUN JUL AUG SEP
1 3.5 0.87 2.3 1.6 1.9 1.9 2.0 0.00 0.00 0.00 20 34 2 3.6 1.2 2.3 2.3 1.8 1.9 1.9 0.00 0.00 0.00 9.8 31 3 3.6 1.1 2.3 2.3 1.7 1.9 2.0 0.00 0.00 0.00 1.7 29 4 3.7 1.2 2.3 2.0 1.6 1.9 1.6 0.00 0.00 0.00 2.7 29 5 3.9 1.1 2.2 1.9 1.4 1.9 1.7 0.00 0.00 0.00 3.2 23
6 4.4 1.2 1.9 2.1 1.5 1.4 1.6 0.00 0.00 0.00 4.1 17 7 4.1 1.2 1.9 1.9 1.7 1.7 1.7 0.00 0.00 0.00 5.6 15 8 3.6 1.2 1.9 1.9 1.6 1.9 1.5 0.00 0.00 0.00 6.6 14 9 4.4 1.3 1.9 1.9 1.8 2.3 1.2 0.00 0.00 0.00 6.9 1410 6.7 1.5 1.9 1.9 1.8 2.1 0.81 0.00 0.00 0.00 7.1 14
11 7.3 1.6 1.9 1.9 12 7.4 1.6 1.9 2.213 6.9 1.7 1.9 2.114 6.8 1.9 1.9 2.615 6.4 1.8 1.8 2.7
1.8 2.0 0.26 0.00 0.00 0.00 7.3 13 1.7 2.3 0.00 0.00 0.00 0.00 22 13 1.6 2.0 0.00 0.00 0.00 0.00 38 13 1.6 2.5 0.07 0.00 0.00 0.00 39 14 1.6 2.7 0.00 0.00 0.00 0.00 40 14
16 6.0 1.8 1.7 2.717 5.8 1.7 1.8 2.718 4.6 1.6 1.9 2.519 4.2 1.3 1.7 2.320 3.7 1.2 1.6 2.3
1.4 2.7 0.00 0.00 0.00 0.00 40 16 1.1 2.7 0.00 0.00 0.00 0.00 40 22 0.96 2.5 0.00 0.00 0.00 0.00 39 21 0.93 2.3 0.00 0.00 0.00 0.00 39 21 0.52 2.2 0.00 0.00 0.00 0.00 38 21
21 3.5 1.3 1.6 2.122 2.5 1.4 1.7 1.9 23 2.5 1.6 1.6 1.924 1.3 1.7 1.8 1.925 0.05 1.8 1.9 1.9
0.61 2.2 0.00 0.00 0.00 0.00 21 21 1.7 2.3 0.00 0.00 0.00 0.00 7.6 21 2.3 2.5 0.00 0.00 0.00 0.00 12 21 2.0 2.5 0.00 0.00 0.00 0.00 14 26 1.7 2.3 0.00 0.00 0.00 0.00 13 32
26 0.68 1.9 1.7 1.927 1.0 2.1 1.6 1.928 0.74 2.3 1.6 1.929 0.41 2.3 1.6 1.930 0.57 2.3 1.6 1.931 0.92 --- 1.6 1.9
1.7 2.3 0.00 0.00 0.00 0.00 12 31 1.8 2.3 0.00 0.00 0.00 0.00 12 29 1.9 2.4 0.00 0.00 0.00 0.00 12 28--- 2.4 0.00 0.00 0.00 0.00 17 26--- 2.4 0.00 0.00 0.00 0.00 27 25--- 2.2 --- 0.00 --- 9.0 38 --
TOTAL 114.77 46.77 57.3 64.9 MEAN 3.70 1.56 1.85 2.09MAX 7.4 2.3 2.3 2.7 MIN 0.05 0.87 1.6 1.6
43.72 68.6 16.34 0.00 0.00 9.00 595.6 648 1.56 2.21 0.54 0.000 0.000 0.29 19.2 21.6 2.3 2.7 2.0 0.00 0.00 9.0 40 34 0.52 1.4 0.00 0.00 0.00 0.00 1.7 13
STATISTICS OF MONTHLY MEAN DATA FOR WATER YEARS 1987 - 2002, BY WATER YEAR (WY)
MEAN 2.85 2.85 2.55 3.97 MAX 10.2 10.8 20.6 49.2(WY) 1997 1995 1998 1998 MIN 0.000 0.000 0.000 0.000 (WY) 1987 1987 1987 1987
4.33 4.85 2.30 0.91 0.68 1.77 4.05 4.39 54.0 52.8 17.8 8.04 4.19 9.12 19.2 21.61998 1998 1998 1998 1998 1997 2002 20020.000 0.000 0.000 0.000 0.000 0.000 0.000 0.0001987 1990 1989 1989 1989 1990 1989 1989
SUMMARY STATISTICS FOR 2001 CALENDAR YEAR FOR 2002 WATER YEAR WATER YEARS 1987 - 2002
ANNUAL TOTAL 386.80ANNUAL MEAN 1.06 HIGHEST ANNUAL MEAN LOWEST ANNUAL MEAN HIGHEST DAILY MEAN 7.4 Oct 12 LOWEST DAILY MEAN 0.00 Many days ANNUAL SEVEN-DAY MINIMUM 0.00 Jan 1 MAXIMUM PEAK STAGE10 PERCENT EXCEEDS 3.350 PERCENT EXCEEDS 0.0090 PERCENT EXCEEDS 0.00
1665.00 4.56 2.95
19.0 19980.091 1990
40 Aug 15-17 e115 Feb 17 19980.00 Many days 0.00 Many days0.00 Apr 15 0.00 Many days96.55 Aug 30,31 96.55 Aug 30,31 200214 6.0 1.8 0.18 0.00 0.00
e Estimated

265 KISSIMMEE RIVER BASIN
02266200 WHITTENHORSE CREEK NEAR VINELAND, FL
LOCATION.--Lat 28° 23'05", long 81° 37'00", in NW1⁄ 4 sec.21, T.24 S., R.27 E., Orange County, Hydrologic Unit 03090101, near center of channel, 12 ft downstream from culverts on Hartzog Road, and 7 mi west of Vineland.
DRAINAGE AREA.--12.4 mi2. WATER-DISCHARGE RECORDS
PERIOD OF RECORD.--May 1966 to current year.
GAGE.--Water-stage recorder. Datum of gage is 7.23 ft above NGVD of 1929.
REMARKS.--Records fair except for periods of estimated daily discharge, which are poor.
DISCHARGE, CUBIC FEET PER SECOND, WATER YEAR OCTOBER 2001 TO SEPTEMBER 2002DAILY MEAN VALUES
DAY OCT NOV DEC JAN FEB MAR APR MAY JUN JUL AUG SEP
1 13 3.6 2.3 e1.2 0.60 3.5 0.35 0.04 0.00 e2.8 30 682 11 3.6 2.3 e1.2 0.66 3.4 0.36 0.01 0.00 e2.9 29 68 3 9.8 3.6 2.2 e0.96 0.69 3.3 0.38 0.00 0.00 e3.0 31 69 4 9.3 3.4 2.1 e0.71 0.70 3.2 0.38 0.00 0.00 e3.6 31 66 5 9.0 3.3 2.0 e0.74 0.72 3.2 0.36 0.00 0.00 e4.2 30 66
6 8.4 3.2 1.9 e0.74 0.70 3.2 0.35 0.00 0.00 e4.8 27 61 7 7.7 3.2 1.8 e0.76 0.79 3.3 0.37 0.00 0.00 e5.3 29 57 8 7.4 3.2 1.8 e0.79 0.83 3.2 0.35 0.00 0.00 e6.2 33 52 9 7.0 3.1 1.8 e0.79 1.1 2.9 0.31 0.00 0.00 7.0 31 47 10 6.2 3.0 1.8 e0.82 1.4 2.7 0.26 0.00 0.00 7.8 29 43
11 5.9 2.9 1.7 e0.8412 5.6 2.7 1.7 e0.8413 5.3 2.7 1.7 e0.8814 5.0 2.9 1.7 e0.8915 4.6 2.9 1.7 e0.89
1.4 2.4 0.21 0.00 0.00 8.3 25 401.4 2.2 0.19 0.00 0.00 8.2 23 381.4 2.1 0.17 0.00 0.00 9.0 23 37 1.4 2.0 0.21 0.00 0.00 11 24 36 1.4 1.8 0.26 0.00 0.00 12 28 38
16 4.2 2.8 1.8 e0.9417 4.0 2.8 1.8 e0.94 18 4.0 3.0 1.8 e0.9419 3.7 3.0 e1.7 e0.94 20 3.5 3.0 e1.6 e0.94
1.4 1.6 0.23 0.00 0.00 12 30 40 1.4 1.4 0.20 0.00 e0.01 11 28 561.3 1.3 0.15 0.00 0.06 9.9 26 57 1.2 1.2 0.12 0.00 e0.25 9.6 25 54 1.2 1.1 0.09 0.00 e0.45 9.6 24 51
21 3.5 3.1 e1.6 e0.94 22 3.8 3.1 e1.7 e0.94 23 4.0 3.1 e1.6 e0.94 24 4.0 3.0 e1.0 e0.77 25 4.0 2.9 e1.1 e0.52
1.1 1.0 0.07 0.00 e0.75 14 25 47 1.2 0.94 0.05 0.00 e1.5 21 28 44 2.1 0.90 0.03 0.00 e2.3 23 28 44 3.3 0.80 0.02 0.00 e2.4 24 25 51 3.6 0.73 0.00 0.00 e2.5 29 23 65
26 3.9 2.7 e1.1 e0.52 27 3.7 2.6 e1.1 e0.52 28 3.7 2.5 e1.1 e0.52 29 3.7 2.5 e1.1 e0.52 30 3.7 2.4 e1.2 0.5831 3.6 --- e1.2 0.59
3.6 0.62 0.02 0.00 e2.6 45 22 69 3.6 0.59 0.07 0.00 e2.8 46 20 66 3.6 0.66 0.08 0.00 e3.0 44 20 60--- 0.57 0.07 0.00 e2.9 39 29 55--- 0.46 0.06 0.00 e2.8 36 41 49--- 0.39 --- 0.00 --- 33 63 --
TOTAL 176.2 89.8 51.0 25.11 MEAN 5.68 2.99 1.65 0.81 MAX 13 3.6 2.3 1.2MIN 3.5 2.4 1.0 0.52CFSM 0.46 0.24 0.13 0.07 IN. 0.53 0.27 0.15 0.08
43.79 56.66 5.77 0.05 24.32 502.2 880 1594 1.56 1.83 0.19 0.002 0.81 16.2 28.4 53.13.6 3.5 0.38 0.04 3.0 46 63 690.60 0.39 0.00 0.00 0.00 2.8 20 360.13 0.15 0.02 0.00 0.07 1.31 2.29 4.28 0.13 0.17 0.02 0.00 0.07 1.51 2.64 4.78
STATISTICS OF MONTHLY MEAN DATA FOR WATER YEARS 1966 - 2002, BY WATER YEAR (WY)
MEAN 6.69 3.78 4.26 4.79 MAX 38.3 16.0 45.1 45.9(WY) 1996 1988 1998 1998 MIN 0.000 0.000 0.000 0.000 (WY) 1979 1968 1968 1968
4.84 5.29 3.43 1.11 1.68 5.20 7.46 8.46 37.5 43.0 23.0 11.9 20.2 31.6 38.0 53.11998 1998 1987 1991 1991 1991 1995 20020.000 0.000 0.000 0.000 0.000 0.000 0.000 0.0001968 1968 1968 1967 1967 1967 1973 1980
SUMMARY STATISTICS FOR 2001 CALENDAR YEAR FOR 2002 WATER YEAR WATER YEARS 1966 - 2002
ANNUAL TOTAL 703.01ANNUAL MEAN 1.93 HIGHEST ANNUAL MEAN LOWEST ANNUAL MEAN HIGHEST DAILY MEAN 27 LOWEST DAILY MEAN 0.00 ANNUAL SEVEN-DAY MINIMUM 0.00 MAXIMUM PEAK FLOWMAXIMUM PEAK STAGEANNUAL RUNOFF (CFSM) 0.16ANNUAL RUNOFF (INCHES) 2.1110 PERCENT EXCEEDS 4.150 PERCENT EXCEEDS 0.0090 PERCENT EXCEEDS 0.00
3448.90 9.45 4.68
17.2 19980.000 1981
Sep 16 69 Sep 3,26 96 Dec 29 1997 Many days 0.00 Many days 0.00 Many days Jan 1 0.00 May 3 0.00 Many days
70 Sep 2,25 97 Dec 29 199795.02 Sep 25 95.17 Dec 29 1997 0.76 0.3810.35 5.1336 14 2.1 0.77 0.00 0.00
e Estimated

--- --- --- ------ --- --- ------ --- --- ------ --- --- ------ --- --- ---
--- --- --- ------ --- --- ------ --- --- ------ --- ------ --- ---
--- --- --- --- --- --- --- --- --- --- --- --- --- --- ---
--- --- --- --- --- --- --- --- --- --- --- --- --- ---
--- --- --- --- --- --- --- --- --- ---
--- --- --- --- --- --- --- --- --- --- --- --- --- --- --- --- --- ---
--- --- --- ------ --- --- ------ --- --- ---
266 KISSIMMEE RIVER BASIN
02266200 WHITTENHORSE CREEK NEAR VINELAND, FL--Continued
WATER-QUALITY RECORDS
PERIOD OF RECORD.--Water years 1968-73, 1977, 1979-80, 1982-98, 2002.
PERIOD OF DAILY RECORD.-- SPECIFIC CONDUCTANCE: December 2001 to current year. WATER TEMPERATURE: December 2001 to current year. DISSOLVED OXYGEN: December 2001 to current year.
INSTRUMENTATION.--Water-quality monitor.
REMARKS.--Extremes for current year and extremes for period of of daily record are based on recorded values and may have been exceeded during period of no record.
EXTREMES FOR PERIOD OF DAILY RECORD.--SPECIFIC CONDUCTANCE: Maximum daily mean, 234 µS/cm @ 25 ° C, Jan. 19-21,23, Mar. 23, 2002; minimum daily mean, 73 µS/cm @
25 ° C, Sept. 17, 2002. WATER TEMPERATURE: Maximum daily mean, 27.9 ° C, July 17,18, 2002; minimum daily mean, 8.1 ° C, Jan. 9, 2002.DISSOLVED OXYGEN: Maximum daily mean, 3.6 mg/L, Jan. 9, 2002; minimum daily mean, 0.0 mg/L, July 10-13,15-17, 2002.
EXTREMES FOR CURRENT YEAR.--SPECIFIC CONDUCTANCE: Maximum daily mean, 234 µS/cm @ 25 ° C, Jan. 19-21,23, Mar. 23; minimum daily mean, 73 µS/cm @
25 ° C, Sept. 17. WATER TEMPERATURE: Maximum daily mean, 27.9 ° C, July 17,18; minimum daily mean, 8.1 ° C, Jan. 9.DISSOLVED OXYGEN: Maximum daily mean, 3.6 mg/L, Jan. 9; minimum daily mean 0.0 mg/L, July 10-13, 15-17.
SPECIFIC CONDUCTANCE (MICROSIEMENS/CM AT 25 DEG. C), WATER YEAR OCTOBER 2001 TO SEPTEMBER 2002DAILY MEAN VALUES
DAY OCT NOV DEC JAN FEB MAR APR MAY JUN JUL AUG SEP
1 --- 218 226 218 --- --- --- 94 2 --- 220 227 220 --- --- --- 92 3 --- 218 228 222 --- --- --- 87 4 --- 218 229 224 --- --- --- 80 5 --- 218 227 225 --- --- --- 78
6 --- 219 226 225 --- --- --- 77 7 --- 221 225 226 --- --- --- 78 8 --- 223 223 229 --- --- --- 78 9 --- 225 223 231 --- --- 132 --- 77 10 -- 227 225 231 -- -- 134 -- 75
11 -- 229 225 232 -- -- 136 -- 76 12 -- 230 224 224 -- -- 139 -- 78 13 -- 231 223 229 -- -- 145 -- 78 14 -- 232 223 231 -- -- 149 -- 79 15 -- 232 224 230 -- -- 155 -- 78
16 -- 230 224 229 -- -- 160 -- 76 17 -- 233 224 230 -- -- 165 102 73 18 -- 233 226 231 -- -- 165 100 75 19 -- 234 228 232 -- -- 161 100 79 20 -- 210 234 228 232 -- -- 156 105 84
21 -- 210 234 229 232 -- -- 145 108 83 22 -- 210 232 224 232 -- -- 139 112 81 23 -- 211 234 210 234 -- -- 142 113 82 24 -- 211 232 201 232 -- -- 143 111 80 25 -- 212 231 204 230 -- -- 140 110 79
26 -- 213 227 210 230 -- -- 130 108 77 27 -- 214 226 213 230 -- -- 129 103 79 28 -- 215 225 215 230 -- -- 130 99 80 29 -- 217 227 -- -- -- 126 97 79 30 -- 218 227 -- -- -- 95 77 31 -- 218 227 -- -- -- 93
MEAN --- 227 222 229 --- --- --- 80 MAX --- 234 229 234 --- --- --- 94 MIN --- 218 201 218 --- --- --- 73

--- --- --- --- --- --- --- --- --- --- --- --- --- --- --- ------ --- --- ---
--- --- --- --- --- --- --- --- --- --- --- ------ --- ------ --- ---
--- --- ------ --- --- --- --- --- --- --- --- --- --- ---
--- --- --- --- --- ------ --- ------ --- ---
--- ---
--- --- --- --- --- --- --- --- --- ---
--- --- --- --- --- --- --- --- ---
--- --- --- ------ --- --- ---
--- --- --- ------ --- --- --- --- --- --- ---
--- --- --- ------ --- --- ------ --- --- ------ --- --- ------ --- --- ---
--- --- --- ------ --- --- ------ --- --- ------ --- ------ --- ---
--- --- --- --- --- --- --- --- --- --- --- --- --- --- ---
--- --- --- --- --- --- --- --- --- --- --- --- --- ---
--- --- --- --- --- --- --- --- --- --- --- --- --- --- ---
--- --- --- --- --- --- --- --- --- --- --- --- --- --- --- --- --- --- --- --- --- ---
--- --- --- ------ --- --- ------ --- --- ---
KISSIMMEE RIVER BASIN 267
02266200 WHITTENHORSE CREEK NEAR VINELAND, FL--Continued
TEMPERATURE, WATER (DEG. C), WATER YEAR OCTOBER 2001 TO SEPTEMBER 2002 DAILY MEAN VALUES
DAY OCT NOV DEC JAN FEB MAR APR MAY JUN JUL AUG SEP
1 --- 12.6 20.3 12.2 -- -- -- 26.7 2 --- 12.9 20.1 15.0 -- -- -- 27.4 3 --- 11.8 19.3 17.2 -- -- -- 27.7 4 --- 8.5 16.8 15.1 --- --- --- 27.6 5 --- 9.0 14.8 12.4 --- --- --- 27.3
6 --- 11.6 15.9 13.1 -- -- -- 27.1 7 --- 11.0 16.8 14.3 -- -- -- 26.9 8 --- 8.9 14.3 15.8 --- --- --- 26.9 9 --- 8.1 14.8 17.0 --- --- 25.3 --- 27.0 10 --- 8.7 16.7 18.0 --- --- 25.2 --- 26.9
11 --- 9.5 16.8 17.6 --- --- 25.3 --- 26.5 12 --- 11.0 16.1 18.4 -- -- 25.4 -- 26.0 13 --- 12.1 14.9 19.1 -- -- 25.4 -- 26.1 14 --- 12.5 14.6 18.5 -- -- 26.1 -- 26.3 15 --- 13.9 14.8 18.5 -- -- 26.6 -- 26.6
16 --- 12.8 15.5 19.9 -- -- 27.3 -- 26.8 17 --- --- 13.7 14.5 21.0 --- 27.9 26.5 26.8 18 --- --- 14.4 13.8 21.0 --- 27.9 26.3 27.1 19 --- --- 14.7 14.0 21.5 --- 27.5 26.4 27.3 20 -- 16.0 16.4 15.2 21.3 -- -- 27.2 26.1 27.3
21 -- 14.5 17.6 17.4 21.1 -- -- 26.1 26.0 27.2 22 -- 14.2 18.3 17.8 20.3 -- -- 25.7 25.9 26.9 23 -- 15.1 19.3 16.4 18.3 -- -- 26.0 26.0 26.6 24 -- 16.7 19.3 14.9 18.5 -- -- 26.7 26.3 26.4 25 -- 14.3 19.3 14.7 19.6 -- -- 27.0 26.4 26.4
26 -- 12.1 19.9 15.4 20.6 -- -- 26.7 26.4 26.5 27 -- 10.9 19.6 14.8 20.7 -- -- 27.1 26.2 26.7 28 -- 11.9 20.2 12.0 20.2 -- -- 27.4 26.2 26.9 29 -- 14.3 20.6 -- -- -- 27.4 26.1 26.9 30 --- 14.5 20.5 --- --- --- 26.0 26.8 31 --- 14.0 20.7 --- --- --- 26.1 --
MEAN --- --- 14.5 15.8 18.1 --- --- 26.9 MAX --- 20.7 20.3 21.5 -- -- -- 27.7 MIN --- 8.1 12.0 12.2 --- --- --- 26.0
OXYGEN DISSOLVED (MG/L), WATER YEAR OCTOBER 2001 TO SEPTEMBER 2002 DAILY MEAN VALUES
DAY OCT NOV DEC JAN FEB MAR APR MAY JUN JUL AUG SEP
1 --- 1.4 0.4 2.3 --- --- --- 0.4 2 --- 1.9 0.5 1.5 --- --- --- 0.4 3 --- 2.0 0.5 1.1 --- --- --- 0.5 4 --- 3.0 0.7 2.1 --- --- --- 0.5 5 --- 2.9 0.7 2.9 --- --- --- 0.5
6 --- 2.4 0.7 2.5 --- --- --- 0.5 7 --- 2.6 0.7 2.1 --- --- --- 0.6 8 --- 3.2 1.1 1.9 --- --- --- 0.6 9 --- 3.6 1.2 1.7 --- --- 0.3 --- 0.6 10 -- 3.5 0.8 1.6 -- --- 0.0 --- 0.7
11 -- 3.5 0.9 1.6 -- --- 0.0 --- 0.6 12 -- 3.2 1.0 1.6 -- --- 0.0 --- 0.4 13 -- 2.8 1.1 1.4 -- --- 0.1 --- 0.3 14 -- 2.8 1.3 1.5 -- --- 0.1 --- 0.2 15 -- 2.0 1.3 1.5 -- --- 0.1 --- 0.2
16 -- 2.1 1.3 1.3 -- --- 0.0 --- 0.4 17 -- 1.8 1.6 1.2 -- --- 0.0 0.3 0.2 18 -- 1.8 1.9 1.3 -- --- 0.1 0.3 0.2 19 -- 1.7 1.9 1.3 -- --- 0.2 0.3 0.2 20 --- 0.4 1.1 1.8 1.3 -- --- 0.2 0.5 0.2
21 --- 0.6 0.9 1.3 1.2 -- -- 0.6 0.2 22 --- 0.5 0.7 1.1 1.5 -- -- 0.6 0.3 23 --- 0.6 0.5 1.8 1.0 -- -- 0.6 0.3 24 --- 0.3 0.5 1.7 0.8 -- -- 0.7 0.3 25 --- 0.5 0.5 1.6 1.3 -- -- 0.7 0.2
26 --- 1.3 0.5 1.5 1.1 -- -- 0.8 0.3 27 --- 1.7 0.6 2.1 0.7 -- -- 0.6 0.4 28 --- 1.7 0.5 2.7 0.6 -- -- 0.5 0.5 29 --- 1.2 0.5 -- -- -- 0.4 0.5 30 --- 1.2 0.5 -- -- -- 0.5 0.6 31 --- 1.2 0.5 -- -- -- 0.4
MEAN --- 1.8 1.3 1.5 --- --- --- 0.4 MAX --- 3.6 2.7 2.9 --- --- --- 0.7 MIN --- 0.5 0.4 0.6 --- --- --- 0.2

--
--
--
--
--
--
--
--
--
268 KISSIMMEE RIVER BASIN
02266200 WHITTENHORSE CREEK NEAR VINELAND, FL--Continued
WATER-QUALITY DATA, WATER YEAR OCTOBER 2001 TO SEPTEMBER 2002
DIS PH NITRO NITRO CHARGE, SPE WATER GEN, NITRO GEN, NITROINST. CIFIC WHOLE COLOR AMMONIA GEN, NITRITE GEN, CUBIC CON FIELD TEMPER- TUR- (PLAT OXYGEN, DIS AMMONIA DIS NITRITE FEET GAGE DUCT- (STAND- ATURE BID INUM- DIS SOLVED TOTAL SOLVED TOTAL
Date Time PER HEIGHT ANCE ARD WATER ITY COBALT SOLVED (MG/L (MG/L (MG/L (MG/L SECOND (FEET) (US/CM) UNITS) (DEG C) (NTU) UNITS) (MG/L) AS N) AS N) AS N) AS N)
(00061) (00065) (00095) (00400) (00010) (00076) (00080) (00300) (00608) (00610) (00613) (00615)
OCT 23... 0930 4.1 93.89 183 5.3 22.6 - .3 .53 -- <.010 -NOV 20... 1400 3.0 93.77 210 4.8 20.1 - .5 .78 - .010 -DEC 19... 1000 1.6 93.51 209 4.9 16.6 - .5 .48 - .010 -JAN 15... 1430 .89 93.34 231 4.6 14.8 -- 2.2 1.10 -- <.010 -FEB 12... 1300 1.4 93.36 220 4.5 16.6 -- 1.6 .41 - .020 -MAR 11... 1600 2.2 93.43 233 4.4 19.1 -- 2.0 .17 -- <.010 -APR 09... 1200 .30 93.09 237 4.5 20.2 -- 1.2 .20 - .010 -JUN 25... 1200 .19 93.25 219 5.1 24.5 1.7 640 1.1 .69 .70 .020 .02 JUL 30... 1300 36 94.52 126 5.0 28.2 - .4 .04 - .020 -AUG 27... 1000 21 94.34 98 5.2 25.9 - .4 .06 - .020 -
NITRO- NITRO-GEN,AM- NITRO- GEN,MONIA + GEN, NO2+NO3 PHOS- ORGANIC NO2+NO3 DIS- PHORUS TOTAL TOTAL SOLVED TOTAL
Date (MG/L (MG/L (MG/L (MG/L AS N) AS N) AS N) AS P)(00625) (00630) (00631) (00665)
ORTHO- ANCPHOS- PHOS- HARD- MAGNE- POTAS- UNFLTRDPHATE, CARBON, PHORUS NESS CALCIUM SIUM, SODIUM, SIUM, TIT 4.5DIS- ORGANIC ORTHO TOTAL DIS- DIS- DIS- DIS- LAB
SOLVED TOTAL TOTAL (MG/L SOLVED SOLVED SOLVED SOLVED (MG/L(MG/L (MG/L (MG/L AS (MG/L (MG/L (MG/L (MG/L ASAS P) AS C) AS P) CACO3) AS CA) AS MG) AS NA) AS K) CACO3)
(00671) (00680) (70507) (00900) (00915) (00925) (00930) (00935) (90410)
OCT 23... E4.2 -- <.02 E.18 .18 87.0 -- -- -- -- -- -- -NOV 20... E5.1 -- <.02 E.24 .20 83.0 -- -- -- -- -- -- -DEC 19... E13 -- <.02 .21 .15 83.0 -- -- -- -- -- -- -JAN 15... 4.9 -- <.02 .19 .17 81.0 -- -- -- -- -- -- -FEB 12... 4.6 -- <.02 .15 .14 1.3 -- -- -- -- -- -- -MAR 11... 3.4 -- <.02 .06 .04 51.0 -- -- -- -- -- -- -APR 09... 3.6 -- <.02 .07 .06 70.0 -- -- -- -- -- -- -JUN 25... 3.7 <.020 <.02 .16 .15 76.0 .160 41 8.80 4.70 20.0 7.90 10JUL 30... 2.5 -- <.02 .23 .20 56.0 -- -- -- -- -- -- -AUG 27... 2.3 -- <.02 .29 .27 55.0 -- -- -- -- -- -- -
< -- Less than E -- Estimated value

-- -- -- -- -- --
-- -- -- -- -- --
-- -- -- -- -- --
-- -- -- -- -- --
-- -- -- -- -- --
-- -- -- -- -- --
-- -- -- -- -- --
-- -- -- -- -- --
-- -- -- -- -- --
269 KISSIMMEE RIVER BASIN
02266200 WHITTENHORSE CREEK NEAR VINELAND, FL--Continued
WATER-QUALITY DATA, WATER YEAR OCTOBER 2001 TO SEPTEMBER 2002
CHLOR-A BERYL ALUM- CHRO MANGACHLO- FLUO- PHYTO LIUM, INUM, CADMIUM MIUM, COPPER, IRON, LEAD, NESE,
SULFATE RIDE, RIDE, PLANK TOTAL TOTAL WATER TOTAL TOTAL TOTAL TOTAL TOTAL DIS DIS DIS TON ARSENIC RECOV RECOV UNFLTRD RECOV RECOV RECOV RECOV RECOVSOLVED SOLVED SOLVED CHROMO TOTAL ERABLE ERABLE TOTAL ERABLE ERABLE ERABLE ERABLE ERABLE
Date (MG/L (MG/L (MG/L FLUOROM (UG/L (UG/L (UG/L (UG/L (UG/L (UG/L (UG/L (UG/L (UG/L AS SO4) AS CL) AS F) (UG/L) AS AS) AS BE) AS AL) AS CD) AS CR) AS CU) AS FE) AS PB) AS MN) (00945) (00940) (00950) (70953) (01002) (01012) (01105) (01027) (01034) (01042) (01045) (01051) (01055)
OCT 23... -- 9.8 - - - - -NOV 20... - 13.0 - - - - -DEC 19... -- <.1 - - - - -JAN 15... -- 8.8 - - - - -FEB 12... -- <.1 - - - - -MAR 11... -- <.1 - - - - -APR 09... -- <.1 - - - - -JUN 25... 12.0 37.0 <.1 <.1 1 <1 542 <1.0 1.5 4.1 744 1 23 JUL 30... -- 8.2 - - - - -AUG 27... -- 8.4 - - - - -
NICKEL, ZINC, MERCURY ALDRIN, LINDANE CHLOR TOTAL TOTAL SELE- TOTAL CHLOR- DISUL- TOTAL TOTAL DANE, RECOV- RECOV- NIUM, RECOV- PYRIFOS FOTON IN BOT- IN BOT- TECH ERABLE ERABLE TOTAL ERABLE TOTAL UNFILT PHORATE DEF ALDRIN, LINDANE TOM MA- TOM MA- NICAL
Date (UG/L (UG/L (UG/L (UG/L RECOVER RECOVER TOTAL TOTAL TOTAL TOTAL TERIAL TERIAL TOTAL AS NI) AS ZN) AS SE) AS HG) (UG/L) (UG/L) (UG/L) (UG/L) (UG/L) (UG/L) (UG/KG) (UG/KG) (UG/L)(01067) (01092) (01147) (71900) (38932) (39011) (39023) (39040) (39330) (39340) (39333) (39343) (39350)
JUN 25... 1.1 20 <1 <.1 <.01 <.10 <.02 <.02 <.01 <.006 <.2 <.2 <.1
CHLOR- P,P'- P,P'- P,P'- DI- ENDO DANE, DDD, DDE, DDT, ELDRIN, SULFAN ENDRIN, TOTAL P,P'- RECOVER RECOVER P,P'- RECOVER TOTAL ENDO- I TOTAL ENDRIN TOTALIN BOT- DDD IN BOT- P,P'- IN BOT- DDT IN BOT- DI- IN BOT- SULFAN IN BOT- WATER IN BOTTOM MA- UNFILT TOM MA- DDE, TOM MA- UNFILT TOM MA- ELDRIN TOM MA- I TOM MA- UNFLTRD TOM MA-
Date TERIAL RECOVER TERIAL TOTAL TERIAL RECOVER TERIAL TOTAL TERIAL TOTAL TERIAL REC TERIAL(UG/KG) (UG/L) (UG/KG) (UG/L) (UG/KG) (UG/L) (UG/KG) (UG/L) (UG/KG) (UG/L) (UG/KG) (UG/L) (UG/KG)(39351) (39360) (39363) (39365) (39368) (39370) (39373) (39380) (39383) (39388) (39389) (39390) (39393)
JUN 25... <3 <.007 <.5 <.006 <.2 <.009 <.5 <.006 <.2 <.02 <.2 <.01 <.2
TOXA- HEPTA- HEPTA- METHPHENE, CHLOR, CHLOR OXY- PCB,
TOTAL TOTAL HEPTA- EPOXIDE METH- CHLOR, TOTAL TOX- IN BOT- HEPTA- IN BOT- CHLOR TOT. IN OXY- TOT. IN IN BOT- MALA- PARA
ETHION, APHENE, TOM MA- CHLOR, TOM MA- EPOXIDE BOTTOM CHLOR, BOTTOM PCB, TOM MA- THION, THION,Date TOTAL TOTAL TERIAL TOTAL TERIAL TOTAL MATL. TOTAL MATL. TOTAL TERIAL TOTAL TOTAL
(UG/L) (UG/L) (UG/KG) (UG/L) (UG/KG) (UG/L) (UG/KG) (UG/L) (UG/KG) (UG/L) (UG/KG) (UG/L) (UG/L)(39398) (39400) (39403) (39410) (39413) (39420) (39423) (39480) (39481) (39516) (39519) (39530) (39540)
JUN 25... <.01 <1 <50 <.01 <.2 <.009 <.2 <.020 <2.5 <.1 <5 .00 <.01
FONOFOS BI MIREX, CARBO- (DY- PHENYL,
METHYL TOTAL PHENO- FONATE) NONA DI- PARA- IN BOT- THION WATER CHLOROAZINON, THION, MIREX, TOM MA- WATER WHOLE SUR SCD
Date TOTAL TOTAL TOTAL TERIAL UNFLTRD TOT.REC 1325 (UG/L) (UG/L) (UG/L) (UG/KG) (UG/L) (UG/L) PERCENT (39570) (39600) (39755) (39758) (39786) (82614) (90575)
JUN25... <.02 <.02 <.006 <.2 <.02 <.01 60
< -- Less than

270 KISSIMMEE RIVER BASIN
02266205 WHITTENHORSE CREEK AT S-411, NEAR VINELAND, FL
LOCATION.--Lat 28° 23'34", long 81° 36'40", in SE1⁄ 4 sec.16, T.24 S., R.27 E., Orange County, Hydrologic Unit 03090101, on upstream side of control structure S-411, 0.2 mi upstream from mouth, and 6.6 mi west of Vineland.
DRAINAGE AREA.--13 mi2, approximately.
PERIOD OF RECORD.--October 1986 to current year.
GAGE.--Water-stage and gate-opening recorder. Datum of gage is at NGVD of 1929 (Reedy Creek Improvement District bench mark). Auxiliary water-stage recorder at downstream side of control structure.
REMARKS.--Records fair. Flow regulated by operation of structure 411. At high stages interconnection exists between Reedy Creek, Whittenhorse Creek, and Boggy Creek.
DISCHARGE, CUBIC FEET PER SECOND, WATER YEAR OCTOBER 2001 TO SEPTEMBER 2002DAILY MEAN VALUES
DAY OCT NOV DEC JAN FEB MAR APR MAY JUN JUL AUG SEP
1 3.6 3.2 4.9 3.0 2.3 1.9 0.00 0.00 0.00 9.0 25 75 2 3.2 3.3 4.9 2.4 2.4 1.9 0.00 0.00 0.00 12 13 69 3 3.2 3.4 5.1 3.0 2.2 1.8 0.00 0.00 0.00 168 3.7 66 4 3.2 3.4 5.1 1.4 1.7 2.3 0.00 0.00 0.00 305 3.7 66 5 3.2 3.5 4.7 1.4 1.6 2.0 0.00 0.00 0.00 314 4.1 63
6 3.2 3.2 4.4 1.8 1.5 1.0 0.00 0.00 0.00 318 4.2 48 7 3.3 3.2 4.3 3.1 2.5 0.00 0.00 0.00 0.00 309 6.7 39 8 3.4 3.2 4.1 3.5 2.0 0.02 0.00 0.00 0.00 95 4.7 36 9 3.3 3.5 4.1 2.3 1.8 0.03 0.00 0.00 0.00 0.00 4.7 3210 3.3 3.6 3.8 2.3 1.3 0.36 0.00 0.00 0.00 0.00 5.0 28
11 3.2 3.6 3.6 2.512 3.4 3.9 3.4 2.713 3.6 4.6 3.3 3.014 3.6 5.0 3.2 3.915 3.5 4.9 3.2 3.4
1.2 0.74 0.00 0.00 0.00 0.00 5.4 25 0.91 0.84 0.81 0.00 0.00 0.00 21 18 0.60 0.59 1.2 0.00 0.00 0.00 40 15 0.22 0.74 0.00 0.00 0.00 0.00 41 14 0.09 0.84 0.00 0.00 0.00 0.00 43 16
16 3.4 4.7 3.0 2.917 3.5 4.8 2.4 2.718 3.6 5.2 2.4 2.819 3.7 5.1 2.3 3.220 3.9 5.1 2.7 3.2
0.31 0.79 0.00 0.00 0.00 13 42 29 0.43 0.70 0.00 0.00 0.42 18 41 46 0.43 0.52 0.00 0.00 1.5 18 40 45 0.42 0.27 0.00 0.00 1.1 19 40 46 0.50 0.16 0.00 0.00 2.7 19 40 45
21 5.6 5.1 2.8 3.222 5.7 5.1 2.7 3.223 5.1 5.2 2.8 3.224 4.1 5.6 2.9 2.925 2.4 5.3 3.4 2.7
0.52 0.17 0.00 0.00 3.1 22 24 38 2.8 0.08 0.00 0.00 4.2 19 7.7 33 5.0 0.30 0.00 0.00 4.4 22 10 39 3.9 0.36 0.00 0.00 5.7 19 10 52 2.6 0.11 0.00 0.00 4.8 20 10 75
26 2.2 5.2 3.3 3.127 2.3 5.0 3.2 2.928 2.5 4.9 3.2 2.7 29 2.7 5.1 3.0 2.6 30 3.0 4.9 3.1 2.431 3.2 --- 3.1 2.4
2.0 0.00 0.00 0.00 4.7 22 9.9 72 1.8 0.00 0.00 0.00 5.5 24 9.8 63 1.8 0.00 0.00 0.00 5.9 24 10 59 --- 0.00 0.00 0.00 4.6 24 15 54 --- 0.00 0.00 0.00 7.7 27 42 51--- 0.00 --- 0.00 --- 26 80 --
TOTAL 107.1 131.8 108.4 85.8MEAN 3.45 4.39 3.50 2.77 MAX 5.7 5.6 5.1 3.9 MIN 2.2 3.2 2.3 1.4
44.83 18.52 2.01 0.00 56.32 1866.00 656.6 13571.60 0.60 0.067 0.000 1.88 60.2 21.2 45.25.0 2.3 1.2 0.00 7.7 318 80 75
0.09 0.00 0.00 0.00 0.00 0.00 3.7 14
STATISTICS OF MONTHLY MEAN DATA FOR WATER YEARS 1987 - 2002, BY WATER YEAR (WY)
MEAN 9.10 5.30 4.92 8.45 MAX 66.1 22.2 23.5 71.8(WY) 1996 1995 1995 1996 MIN 0.000 0.000 0.000 0.000 (WY) 1998 1990 1990 1997
3.81 5.33 2.02 0.67 1.41 6.67 6.92 7.01 23.4 25.5 8.87 2.55 8.97 60.2 59.3 45.21998 1998 1987 1995 1991 2002 1995 20020.000 0.000 0.000 0.000 0.000 0.000 0.000 0.0002001 1997 1997 1996 1996 1996 1996 1996
SUMMARY STATISTICS FOR 2001 CALENDAR YEAR FOR 2002 WATER YEAR WATER YEARS 1987 - 2002
ANNUAL TOTAL 604.94ANNUAL MEAN 1.66 HIGHEST ANNUAL MEAN LOWEST ANNUAL MEAN HIGHEST DAILY MEAN 7.7 Sep 14 LOWEST DAILY MEAN 0.00 Many days ANNUAL SEVEN-DAY MINIMUM 0.00 Jan 24 MAXIMUM PEAK STAGE10 PERCENT EXCEEDS 4.150 PERCENT EXCEEDS 1.190 PERCENT EXCEEDS 0.00
4434.3812.1 5.16
17.9 19950.21 1990
318 Jul 6 318 Jul 6 20020.00 Many days 0.00 Many days0.00 Mar 26 0.00 Many days
96.98 Sep 16 97.21 Mar 3 199337 14 3.1 0.90 0.00 0.00

271 KISSIMMEE RIVER BASIN
02266291 LATERAL 405 AT S-405A, NEAR DOCTOR PHILLIPS, FL
LOCATION.--Lat 28° 25'37", long 81° 36'19" in SW1⁄ 4 sec.3, T.24 S., R.27 E., Orange County, Hydrologic Unit 03090101, on right upstream wingwall of control structure S-405A, 200 ft upstream from Lateral 407, and 6.4 mi west of Doctor Phillips.
DRAINAGE AREA.--19.6 mi2.
PERIOD OF RECORD.--June 1969 to September 1972 (gage heights and periodic discharge measurements only), October 1986 to current year.
REVISED RECORDS.--WDR FL-96-1: Drainage area.
GAGE.--Water-stage and gate-opening recorder. Datum of gage is at NGVD of 1929 (Reedy Creek Improvement District bench mark). Auxiliary water-stage recorder at downstream side of control structure.
REMARKS.--Records good. Flow regulated by operation of structure 405A. Discharge computed from relation between discharge and gate openings and does not include leakage, which is less than 5.0 ft3/s, around structure or gates.
DISCHARGE, CUBIC FEET PER SECOND, WATER YEAR OCTOBER 2001 TO SEPTEMBER 2002DAILY MEAN VALUES
DAY OCT NOV DEC JAN FEB MAR APR MAY JUN JUL AUG SEP
1 0.00 0.00 e0.00 0.00 0.00 0.00 0.00 2.7 0.00 1.8 e0.00 242 0.00 0.00 e0.00 0.00 0.00 0.00 0.00 2.7 0.00 1.8 e0.00 153 0.00 0.00 e0.00 0.00 0.00 0.00 0.00 1.8 0.00 1.8 e0.00 9.94 0.00 0.00 e0.00 0.00 0.00 0.00 0.00 1.8 0.00 1.8 e0.00 9.95 0.00 0.00 e0.00 0.00 0.00 0.00 0.00 1.8 0.00 1.8 e0.00 15
6 0.00 0.00 e0.00 0.00 0.00 0.00 0.00 1.8 0.00 1.8 e0.00 12 7 0.00 0.00 0.00 0.00 0.00 0.00 0.00 1.8 0.00 1.8 e0.00 9.0 8 0.00 0.00 0.00 0.00 0.00 0.00 0.00 1.8 0.00 1.8 e0.00 8.19 0.00 0.00 e0.00 0.00 0.00 0.00 0.00 1.8 0.00 1.8 e0.00 7.2
10 0.00 0.00 e0.00 0.00 0.00 0.00 0.90 1.8 0.00 1.8 e0.00 4.5
11 0.00 0.00 e0.00 0.0012 0.00 0.00 e0.00 0.0013 0.00 0.00 e0.00 0.0014 0.00 0.00 e0.00 0.0015 0.00 0.00 e0.00 0.00
0.00 0.00 0.90 1.8 0.00 1.8 e0.00 3.60.00 0.00 5.4 1.8 0.00 1.8 e0.00 0.000.00 0.00 6.3 1.8 0.00 1.8 e0.00 0.000.00 0.00 3.6 1.8 0.00 1.8 e0.00 0.000.00 0.00 3.6 1.8 0.00 1.8 e0.00 0.00
16 5.4 0.00 e0.00 0.0017 8.1 0.00 e0.00 0.0018 9.0 0.00 e0.00 0.0019 9.0 0.00 0.00 0.0020 9.0 0.00 0.00 0.00
0.00 0.00 3.6 1.8 0.00 1.8 e0.00 0.000.00 0.00 3.6 1.8 0.00 1.8 e0.00 5.40.00 0.00 3.6 1.8 0.00 1.8 e0.90 3.60.00 0.00 2.7 1.8 0.00 1.8 e0.90 3.60.00 0.00 2.7 1.8 1.8 1.8 e0.90 7.2
21 9.0 e0.00 0.00 0.0022 9.0 e0.00 0.00 0.0023 4.5 e0.00 0.00 0.0024 0.00 e0.00 0.00 0.0025 0.00 e0.00 0.00 0.00
0.00 0.00 2.7 1.8 1.8 1.8 e0.90 7.20.00 0.00 2.7 1.8 1.8 1.8 e0.90 6.30.00 0.00 2.7 1.8 1.8 1.8 e0.90 5.40.00 0.00 2.7 0.90 1.8 13 e0.90 4.50.00 0.00 2.7 0.90 1.8 14 e0.90 5.4
26 0.00 e0.00 0.00 0.0027 0.00 e0.00 0.00 0.0028 0.00 e0.00 0.00 0.0029 0.00 e0.00 0.00 0.00 30 0.00 e0.00 0.00 0.00 31 0.00 --- 0.00 0.00
0.00 0.00 2.7 0.90 1.8 9.9 e0.90 4.50.00 0.00 2.7 0.90 1.8 0.00 e0.90 4.50.00 0.00 2.7 0.90 1.8 0.00 0.90 4.5 --- 0.00 2.7 0.00 1.8 0.00 7.2 3.6 --- 0.00 2.7 0.00 1.8 e0.00 25 2.7 --- 0.00 --- 0.00 --- e0.00 36 --
TOTAL 63.00 0.00 0.00 0.00MEAN 2.03 0.000 0.000 0.000 MAX 9.0 0.00 0.00 0.00 MIN 0.00 0.00 0.00 0.00
0.00 0.00 63.90 47.70 19.80 78.30 78.10 186.60 0.000 0.000 2.13 1.54 0.66 2.53 2.52 6.22 0.00 0.00 6.3 2.7 1.8 14 36 24 0.00 0.00 0.00 0.00 0.00 0.00 0.00 0.00
STATISTICS OF MONTHLY MEAN DATA FOR WATER YEARS 1987 - 2002, BY WATER YEAR (WY)
MEAN 4.47 3.90 8.98 7.96MAX 14.2 17.0 104 73.9(WY) 1997 1998 1998 1998 MIN 0.000 0.000 0.000 0.000 (WY) 1990 1990 1999 1999
8.11 8.48 6.39 3.31 2.92 3.55 2.62 4.1185.0 74.5 29.5 22.1 28.0 22.6 17.1 17.71998 1998 1998 1991 1991 1991 1997 19940.000 0.000 0.000 0.000 0.000 0.000 0.000 0.0002000 1999 1990 1990 1989 1989 1989 1989
SUMMARY STATISTICS FOR 2001 CALENDAR YEAR FOR 2002 WATER YEAR WATER YEARS 1987 - 2002
ANNUAL TOTAL 73.43 ANNUAL MEAN 0.20 HIGHEST ANNUAL MEAN LOWEST ANNUAL MEAN HIGHEST DAILY MEAN 9.0 Oct 18-22 LOWEST DAILY MEAN 0.00 Many days ANNUAL SEVEN-DAY MINIMUM 0.00 Jan 1 MAXIMUM PEAK STAGE10 PERCENT EXCEEDS 0.0050 PERCENT EXCEEDS 0.0090 PERCENT EXCEEDS 0.00
537.40 1.47 5.39
32.7 19980.029 2001
36 Aug 31 e200 Dec 27 19970.00 Many days 0.00 Many days0.00 Oct 1 0.00 Many days
96.50 Aug 30,31 96.57 Dec 27 1997 4.0 11 0.00 1.5 0.00 0.00
e Estimated

272 KISSIMMEE RIVER BASIN
02266294 LATERAL 405 BELOW S-405, NEAR VINELAND, FL
LOCATION.--Lat 28° 23'39", long 81° 35'07", in SW1⁄ 4 sec.14, T. 24 S., R. 27 E., Orange County, Hydrologic Unit 03090101, at downstream side of structure S-405 on Bear Island Road, 1.7 mi south of Walt Disney World's Magic Kingdom, and 6 mi southwest of Windermere.
DRAINAGE AREA.--Indeterminate.
PERIOD OF RECORD.--Water years 1971-72, 1975-77, 1979-94, 1996 to current year.
WATER-QUALITY DATA, WATER YEAR OCTOBER 2001 TO SEPTEMBER 2002
PH SPE- WATERCIFIC WHOLE CON- FIELD TEMPER- DUCT- (STAND- ATURE
Date Time ANCE ARD WATER (US/CM) UNITS) (DEG C) (00095) (00400) (00010)
NITRONITRO- NITRO- GEN,AM- NITRO
COLOR GEN, GEN, MONIA + GEN, PHOS- CARBON,TUR- (PLAT- OXYGEN, AMMONIA NITRITE ORGANIC NO2+NO3 PHORUS ORGANIC BID- INUM- DIS- TOTAL TOTAL TOTAL TOTAL TOTAL TOTAL ITY COBALT SOLVED (MG/L (MG/L (MG/L (MG/L (MG/L (MG/L(NTU) UNITS) (MG/L) AS N) AS N) AS N) AS N) AS P) AS C)
(00076) (00080) (00300) (00610) (00615) (00625) (00630) (00665) (00680)
JUN 26... 1400 290 6.2 26.3 .99 400 2.8 .26 .02 1.7 .070 .30 30.0
PHOS- HARD- MAGNEPHORUS NESS CALCIUM SIUM, SODIUM,ORTHO TOTAL DIS- DIS- DIS- TOTAL (MG/L SOLVED SOLVED SOLVED
Date (MG/L AS (MG/L (MG/L (MG/L AS P) CACO3) AS CA) AS MG) AS NA)(70507) (00900) (00915) (00925) (00930)
ANC BERYL- ALUM POTAS- UNFLTRD CHLO- FLUO- LIUM, INUM,SIUM, TIT 4.5 SULFATE RIDE, RIDE, TOTAL TOTALDIS- LAB DIS- DIS- DIS- ARSENIC RECOV- RECOV
SOLVED (MG/L SOLVED SOLVED SOLVED TOTAL ERABLE ERABLE (MG/L AS (MG/L (MG/L (MG/L (UG/L (UG/L (UG/L AS K) CACO3) AS SO4) AS CL) AS F) AS AS) AS BE) AS AL)(00935) (90410) (00945) (00940) (00950) (01002) (01012) (01105)
JUN 26... .260 64 18.0 4.60 26.0 8.20 39 15.0 47.0 .1 20 <1 165
CHRO- MANGA- CADMIUM MIUM, COPPER, IRON, LEAD, NESE, NICKEL, ZINC, MERCURY WATER TOTAL TOTAL TOTAL TOTAL TOTAL TOTAL TOTAL SELE- TOTAL CHLOR- DISUL UNFLTRD RECOV- RECOV- RECOV- RECOV- RECOV- RECOV- RECOV- NIUM, RECOV- PYRIFOS FOTON TOTAL ERABLE ERABLE ERABLE ERABLE ERABLE ERABLE ERABLE TOTAL ERABLE TOTAL UNFILT PHORATE
Date (UG/L (UG/L (UG/L (UG/L (UG/L (UG/L (UG/L (UG/L (UG/L (UG/L RECOVER RECOVER TOTAL AS CD) AS CR) AS CU) AS FE) AS PB) AS MN) AS NI) AS ZN) AS SE) AS HG) (UG/L) (UG/L) (UG/L)(01027) (01034) (01042) (01045) (01051) (01055) (01067) (01092) (01147) (71900) (38932) (39011) (39023)
JUN 26... <1.0 <1.0 3.2 260 <1 30 1.0 13 <1 <.1 <.01 <.10 <.02
CHLOR- P,P'- P,P'- P,P'-ALDRIN, LINDANE CHLOR DANE, DDD, DDE, DDT, TOTAL TOTAL DANE, TOTAL P,P'- RECOVER RECOVER P,P'- RECOVER IN BOT IN BOT TECH- IN BOT DDD IN BOT P,P'- IN BOT DDT IN BOT
DEF ALDRIN, LINDANE TOM MA TOM MA- NICAL TOM MA- UNFILT TOM MA DDE, TOM MA UNFILT TOM MA Date TOTAL TOTAL TOTAL TERIAL TERIAL TOTAL TERIAL RECOVER TERIAL TOTAL TERIAL RECOVER TERIAL
(UG/L) (UG/L) (UG/L) (UG/KG) (UG/KG) (UG/L) (UG/KG) (UG/L) (UG/KG) (UG/L) (UG/KG) (UG/L) (UG/KG) (39040) (39330) (39340) (39333) (39343) (39350) (39351) (39360) (39363) (39365) (39368) (39370) (39373)
JUN 26... <.02 <.01 <.006 <.2 <.2 <.1 <3 <.007 <.5 <.006 <.2 <.009 <.5
DI- ENDO- TOXA- HEPTA- HEPTA ELDRIN, SULFAN ENDRIN, PHENE, CHLOR, CHLORTOTAL ENDO- I TOTAL ENDRIN TOTAL TOTAL TOTAL HEPTA- EPOXIDE
DI- IN BOT- SULFAN IN BOT- WATER IN BOT- TOX- IN BOT- HEPTA- IN BOT- CHLOR TOT. INELDRIN TOM MA- I TOM MA- UNFLTRD TOM MA- ETHION, APHENE, TOM MA- CHLOR, TOM MA- EPOXIDE BOTTOM
Date TOTAL TERIAL TOTAL TERIAL REC TERIAL TOTAL TOTAL TERIAL TOTAL TERIAL TOTAL MATL.(UG/L) (UG/KG) (UG/L) (UG/KG) (UG/L) (UG/KG) (UG/L) (UG/L) (UG/KG) (UG/L) (UG/KG) (UG/L) (UG/KG)(39380) (39383) (39388) (39389) (39390) (39393) (39398) (39400) (39403) (39410) (39413) (39420) (39423)
JUN 26... <.006 <.2 <.02 <.2 <.01 <.2 <.01 <1 <50 <.01 <.2 <.009 <.2
METH- FONOFOS BI-OXY- PCB, MIREX, CARBO- (DY- PHENYL,
METH- CHLOR, TOTAL METHYL TOTAL PHENO- FONATE) NONAOXY- TOT. IN IN BOT- MALA- PARA- DI- PARA- IN BOT- THION WATER CHLORO
CHLOR, BOTTOM PCB, TOM MA- THION, THION, AZINON, THION, MIREX, TOM MA- WATER WHOLE SUR SCDDate TOTAL MATL. TOTAL TERIAL TOTAL TOTAL TOTAL TOTAL TOTAL TERIAL UNFLTRD TOT.REC 1325
(UG/L) (UG/KG) (UG/L) (UG/KG) (UG/L) (UG/L) (UG/L) (UG/L) (UG/L) (UG/KG) (UG/L) (UG/L) PERCENT(39480) (39481) (39516) (39519) (39530) (39540) (39570) (39600) (39755) (39758) (39786) (82614) (90575)
JUN 26... <.020 <2.5 <.1 <5 E.07 <.01 <.02 <.02 <.006 <.2 <.02 <.01 58
< -- Less than E -- Estimated value

273 KISSIMMEE RIVER BASIN
02266295 LATERAL 410 AT S-410, NEAR VINELAND, FL
LOCATION.--Lat 28° 21'58", long 81° 35'55" in SE1⁄ 4 sec.27, T.24 S., R.27 E., Orange County, Hydrologic Unit 03090101, at upstream side of control structure S-410, 0.5 mi west of sewage treatment plant road, 3.0 mi southwest of EPCOT Center, and 6.2 mi southwest of Vineland.
DRAINAGE AREA.--7.53 mi2.
PERIOD OF RECORD.--October 1986 to current year.
REVISED RECORDS.--WDR FL-96-1: Drainage area.
GAGE.--Water-stage and gate-opening recorder. Datum of gage is at NGVD of 1929. Auxilliary gage at downstream side of control structure 410.
REMARKS.--Records good except for periods of estimated daily discharge, which are fair. Flow regulated by operation of structure410. Discharge computed from relation between discharge and gate openings and does not include leakage, which is less than 5.0 ft3/s, around structure or gates. At high stages interconnection exists between Reedy Creek, Whittenhorse Creek, and Boggy Creek.
DISCHARGE, CUBIC FEET PER SECOND, WATER YEAR OCTOBER 2001 TO SEPTEMBER 2002DAILY MEAN VALUES
DAY OCT NOV DEC JAN FEB MAR APR MAY JUN JUL AUG SEP
1 0.00 0.00 0.00 0.00 0.00 0.00 0.00 0.00 e0.00 e0.00 2.0 e38 2 0.00 0.00 0.00 0.00 0.00 0.00 0.00 0.00 e0.00 e0.00 2.0 e35 3 0.00 0.00 0.00 0.00 0.00 0.00 0.00 0.00 e0.00 e0.00 2.0 e32 4 0.00 0.00 0.00 0.00 0.00 0.00 0.00 0.00 e0.00 e0.00 2.0 e31 5 0.00 0.00 0.00 0.00 0.00 0.00 0.00 0.00 e0.00 e0.00 2.0 e26
6 0.00 0.00 0.00 0.00 0.00 0.00 0.00 0.00 e0.00 e0.00 2.0 e22 7 0.00 0.00 0.00 0.00 0.00 0.00 0.00 0.00 e0.00 e0.00 6.8 e20 8 0.00 0.00 0.00 0.00 0.00 0.00 0.00 0.00 e0.00 e0.00 12 e19 9 0.00 0.00 0.00 0.00 0.00 0.00 0.00 0.00 e0.00 e0.00 14 e1810 0.00 0.00 0.00 0.00 0.00 0.00 0.00 0.00 e0.00 e0.00 10 e17
11 0.00 0.00 0.00 0.0012 0.00 0.00 0.00 0.0013 0.00 0.00 0.00 0.0014 0.00 0.00 0.00 0.0015 0.00 0.00 0.00 0.00
0.00 0.00 0.00 0.00 e0.00 e0.00 8.1 e17 0.00 0.00 0.00 0.00 e0.00 e0.00 10 e16 0.00 0.00 0.00 0.00 e0.00 e0.00 17 e16 0.00 0.00 0.00 0.00 e0.00 e0.00 18 e18 0.00 0.00 0.00 0.00 e0.00 e0.00 23 e19
16 0.00 0.00 0.00 0.0017 0.00 0.00 0.00 0.0018 0.00 0.00 0.00 0.0019 0.00 0.00 0.00 0.0020 0.00 0.00 0.00 0.00
0.00 0.00 0.00 0.00 e0.00 e0.00 24 e21 0.00 0.00 0.00 0.00 e0.00 e0.00 23 e29 0.00 0.00 0.00 0.00 e0.00 e0.00 20 e26 0.00 0.00 0.00 0.00 e0.00 e0.00 18 e26 0.00 0.00 0.00 0.00 e0.00 e0.00 16 e26
21 0.00 0.00 0.00 0.0022 0.00 0.00 0.00 0.0023 0.00 0.00 0.00 0.0024 0.00 0.00 0.00 0.0025 0.00 0.00 0.00 0.00
0.00 0.00 0.00 0.00 e0.00 e0.00 16 e26 0.00 0.00 0.00 e0.00 e0.00 e0.00 18 e25 0.00 0.00 0.00 e0.00 e0.00 e0.00 22 e28 0.00 0.00 0.00 e0.00 e0.00 e0.00 22 e34 0.00 0.00 0.00 e0.00 e0.00 e0.00 20 e40
26 0.00 0.00 0.00 0.0027 0.00 0.00 0.00 0.0028 0.00 0.00 0.00 0.0029 0.00 0.00 0.00 0.0030 0.00 0.00 0.00 0.0031 0.00 --- 0.00 0.00
0.00 0.00 0.00 e0.00 e0.00 e0.00 19 e38 0.00 0.00 0.00 e0.00 e0.00 e0.00 19 e36 0.00 0.00 0.00 e0.00 e0.00 e0.00 19 e34--- 0.00 0.00 e0.00 e0.00 e0.00 23 e32--- 0.00 0.00 e0.00 e0.00 e0.00 32 e30 --- 0.00 --- e0.00 --- e0.00 41 --
TOTAL 0.00 0.00 0.00 0.00MEAN 0.000 0.000 0.000 0.000 MAX 0.00 0.00 0.00 0.00 MIN 0.00 0.00 0.00 0.00
0.00 0.00 0.00 0.00 0.00 0.00 482.9 795 0.000 0.000 0.000 0.000 0.000 0.000 15.6 26.5 0.00 0.00 0.00 0.00 0.00 0.00 41 40 0.00 0.00 0.00 0.00 0.00 0.00 2.0 16
STATISTICS OF MONTHLY MEAN DATA FOR WATER YEARS 1987 - 2002, BY WATER YEAR (WY)
MEAN 4.78 4.12 5.53 3.04 MAX 23.5 24.7 18.9 14.1(WY) 1993 1988 1989 1993 MIN 0.000 0.000 0.000 0.000 (WY) 1987 1987 1987 1987
2.67 4.90 4.75 2.19 2.54 5.09 7.05 8.35 10.4 23.4 19.8 11.2 19.3 26.2 31.4 26.51993 1993 1993 1991 1991 1991 1997 20020.000 0.000 0.000 0.000 0.000 0.000 0.000 0.0001987 1999 1999 1999 1998 1998 1998 1999
SUMMARY STATISTICS FOR 2001 CALENDAR YEAR FOR 2002 WATER YEAR WATER YEARS 1987 - 2002
ANNUAL TOTAL 194.80ANNUAL MEAN 0.53 HIGHEST ANNUAL MEAN LOWEST ANNUAL MEAN HIGHEST DAILY MEAN 22 LOWEST DAILY MEAN 0.00 ANNUAL SEVEN-DAY MINIMUM 0.00 MAXIMUM PEAK STAGE10 PERCENT EXCEEDS 0.0050 PERCENT EXCEEDS 0.0090 PERCENT EXCEEDS 0.00
1277.90 3.50 4.59
12.4 19930.14 2000
Sep 17 41 Aug 31 114 Apr 1 1987 Many days 0.00 Many days 0.00 Many days Jan 1 0.00 Oct 1 0.00 Many days
97.26 Oct 12 199519 15 0.00 1.8 0.00 0.00
e Estimated

--- --- --- ------ --- --- ------ --- --- ------ --- --- ------ --- --- ---
--- --- --- ------ --- --- ------ --- --- ------ --- --- ------ --- --- ---
--- --- --- ------ --- --- ------ --- --- ------ --- --- ------ --- --- ---
--- --- --- ------ --- --- ---
--- --- --- --- ------ --- --- --- ------ --- --- --- ---
--- --- --- --- ------ --- --- --- ------ --- --- --- ------ --- --- --- ------ --- --- --- ---
--- --- --- --- ------ --- --- --- ------ --- --- --- ------ --- --- --- ------ --- --- --- ---
--- --- --- --- --- ---
--- --- --- --- ------ --- --- --- ------ --- --- --- ---
274 KISSIMMEE RIVER BASIN
02266298 REEDY CREEK ABOVE U.S. HIGHWAY 192 NEAR VINELAND, FL
LOCATION.--Lat 28° 20'54", long 81° 34'53", in SE1⁄ 4 sec.35, T.24 S., R.27 E., Orange County, Hydrologic Unit 03090101, on right bank, 1.2 mi above State Highway 192, 5.8 mi southwest of Vineland, and 29 mi upstream from mouth.
PERIOD OF RECORD.--Water years 1983, 1986 to December 2002 (discontinued).
PERIOD OF DAILY RECORD.-- SPECIFIC CONDUCTANCE: November 1982 to December 2002 (discontinued). WATER TEMPERATURE: November 1982 to December 2002 (discontinued). DISSOLVED OXYGEN: November 1982 to December 2002 (discontinued).
INSTRUMENTATION.--Water-quality monitor.
REMARKS.--Extremes for current year and extremes for period of daily record are based on recorded values and may have been exceeded during periods of no record.
EXTREMES FOR PERIOD OF DAILY RECORD.--SPECIFIC CONDUCTANCE: Maximum daily mean, 766 µS/cm @ 25 ° C, Dec. 9, 2000; minimum daily mean, 77 µS/cm @ 25 ° C, Aug. 25,
1991. WATER TEMPERATURE: Maximum daily mean, 29.4 ° C, July 23, 1996, June 24, 1998; minimum daily mean, 4.4 ° C, Dec. 24, 1989. DISSOLVED OXYGEN: Maximum daily mean, 11.1 mg/L, Jan. 5, 2001; minimum daily mean, 0.4 mg/L, July 15, 1987.
EXTREMES FOR CURRENT YEAR.--SPECIFIC CONDUCTANCE: Maximum daily mean, 291 µS/cm @ 25 ° C, Dec. 16; minimum daily mean, 224 µS/cm @ 25 ° C, Oct. 1. WATER TEMPERATURE: Maximum daily mean, 24.9 ° C, Oct. 25; minimum daily mean, 18.4 ° C, Oct. 28. DISSOLVED OXYGEN: Maximum daily mean, 4.9 mg/L, Dec. 2; minimum daily mean, 2.2 mg/L, Oct. 25.
SPECIFIC CONDUCTANCE (MICROSIEMENS/CM AT 25 DEG. C), PERIOD OCTOBER TO DECEMBER 2001DAILY MEAN VALUES
DAY OCT NOV DEC JAN FEB MAR APR MAY JUN JUL AUG SEP
1 224 254 284 --- --- --- --- --- 2 229 257 283 --- --- --- --- --- 3 231 259 282 --- --- --- --- --- 4 234 260 282 --- --- --- --- --- 5 237 261 281 --- --- --- --- ---
6 239 264 283 --- --- --- --- --- 7 240 262 283 --- --- --- --- --- 8 239 263 283 --- --- --- --- --- 9 240 267 283 --- --- --- --- --- 10 240 270 284 -- -- -- -- --
11 242 273 285 -- -- -- -- --12 244 275 286 -- -- -- -- --13 245 276 286 -- -- -- -- --14 246 269 287 -- -- -- -- --15 245 268 289 -- -- -- -- --
16 242 265 291 -- -- -- -- --17 242 269 289 -- -- -- -- --18 246 267 -- -- -- -- --19 247 271 -- -- -- -- --20 248 276 -- -- -- -- --
21 246 276 -- -- -- -- --22 241 273 -- -- -- -- --23 237 273 -- -- -- -- --24 236 276 -- -- -- -- --25 238 278 -- -- -- -- --
26 242 279 -- -- -- -- --27 245 280 -- -- -- -- --28 248 282 -- -- -- -- --29 248 283 -- -- -- -- --30 249 283 -- -- -- -- --31 251 -- -- -- -- --
MEAN 241 270 --- --- --- --- --- MAX 251 283 --- --- --- --- --- MIN 224 254 --- --- --- --- ---

--- --- --- ------ --- --- ------ --- --- ------ --- --- ------ --- --- ---
--- --- --- ------ --- --- ------ --- --- ------ --- --- ------ --- --- ---
--- --- --- ------ --- --- ------ --- --- ------ --- --- ------ --- --- ---
--- --- --- ------ --- --- ---
--- --- --- --- ------ --- --- --- ------ --- --- --- ---
--- --- --- --- ------ --- --- --- ------ --- --- --- ------ --- --- --- ------ --- --- --- ---
--- --- --- --- ------ --- --- --- ------ --- --- --- ------ --- --- --- ------ --- --- --- ---
--- --- --- --- ---
--- --- --- --- ------ --- --- --- ------ --- --- --- ---
--- --- --- --- ------ --- --- ------ --- --- ------ --- --- ------ --- --- ---
--- --- --- ------ --- --- ------ --- --- ------ --- --- ------ --- --- ---
--- --- --- ------ --- --- ------ --- --- ------ --- --- ------ --- --- ---
--- --- --- ------ --- --- ---
--- --- --- --- ------ --- --- --- ------ --- --- --- ---
--- --- --- --- ------ --- --- --- ------ --- --- --- ------ --- --- --- ------ --- --- --- ---
--- --- --- --- ------ --- --- --- ------ --- --- --- ------ --- --- --- ------ --- --- --- ---
--- --- --- --- --- ---
--- --- --- --- --- ------ --- --- --- --- ------ --- --- --- --- ---
KISSIMMEE RIVER BASIN 275
02266298 REEDY CREEK ABOVE U.S. HIGHWAY 192 NEAR VINELAND, FL--Continued
TEMPERATURE, WATER (DEG. C), PERIOD OCTOBER TO DECEMBER 2001 DAILY MEAN VALUES
DAY OCT NOV DEC JAN FEB MAR APR MAY JUN JUL AUG SEP
1 22.2 21.3 20.1 --- --- --- --- --- 2 21.9 22.0 20.4 --- --- --- --- --- 3 22.4 22.4 20.7 --- --- --- --- --- 4 23.1 22.5 21.0 --- --- --- --- --- 5 23.5 21.6 20.8 --- --- --- --- ---
6 24.2 20.1 20.9 --- --- --- --- --- 7 24.7 19.5 21.5 --- --- --- --- --- 8 24.3 19.6 22.0 --- --- --- --- --- 9 23.5 19.4 22.1 --- --- --- --- --- 10 23.2 19.2 22.3 --- --- --- --- ---
11 23.5 18.9 22.1 --- --- --- --- --- 12 23.9 19.2 22.1 --- --- --- --- --- 13 23.9 19.6 21.7 --- --- --- --- --- 14 24.3 19.9 22.4 --- --- --- --- --- 15 24.5 19.8 22.4 --- --- --- --- ---
16 24.1 19.5 22.4 --- --- --- --- --- 17 22.2 19.9 21.8 --- --- --- --- --- 18 21.4 20.5 -- -- -- -- --19 22.3 20.5 -- -- -- -- --20 23.4 20.4 -- -- -- -- --
21 23.6 19.9 -- -- -- -- --22 23.7 19.6 -- -- -- -- --23 23.7 20.2 -- -- -- -- --24 24.4 20.7 -- -- -- -- --25 24.9 21.0 -- -- -- -- --
26 23.1 20.8 -- -- -- -- --27 19.7 20.4 -- -- -- -- --28 18.4 20.1 -- -- -- -- --29 19.1 20.3 -- -- -- -- --30 20.2 20.3 -- -- -- -- --31 20.7 --- --- --- --- --- --
MEAN 22.8 20.3 --- --- --- --- --- MAX 24.9 22.5 --- --- --- --- --- MIN 18.4 18.9 --- --- --- --- ---
OXYGEN DISSOLVED (MG/L), PERIOD OCTOBER TO DECEMBER 2001 DAILY MEAN VALUES
DAY OCT NOV DEC JAN FEB MAR APR MAY JUN JUL AUG SEP
1 3.5 4.8 --- --- --- --- --- 2 3.8 3.7 4.9 --- --- --- --- --- 3 3.9 3.6 4.8 --- --- --- --- --- 4 3.8 3.6 4.7 --- --- --- --- --- 5 3.8 3.8 4.7 --- --- --- --- ---
6 3.6 4.3 4.5 --- --- --- --- --- 7 3.4 4.7 4.4 --- --- --- --- --- 8 3.3 4.7 4.2 --- --- --- --- --- 9 3.6 4.7 4.0 --- --- --- --- --- 10 3.6 4.8 4.1 -- -- -- -- --
11 3.2 4.7 4.2 -- -- -- -- --12 3.2 4.3 4.2 -- -- -- -- --13 3.2 4.2 4.3 -- -- -- -- --14 3.1 3.5 4.0 -- -- -- -- --15 3.0 3.7 4.0 -- -- -- -- --
16 3.0 4.1 4.1 -- -- -- -- --17 3.4 4.8 4.4 -- -- -- -- --18 3.6 4.6 -- -- -- -- --19 3.5 4.5 -- -- -- -- --20 3.2 4.4 -- -- -- -- --
21 3.0 4.7 -- -- -- -- --22 2.8 4.8 -- -- -- -- --23 2.7 4.7 -- -- -- -- --24 2.5 4.6 -- -- -- -- --25 2.2 4.4 -- -- -- -- --
26 2.6 4.5 -- -- -- -- --27 3.5 4.6 -- -- -- -- --28 3.8 4.8 -- -- -- -- --29 3.8 4.7 -- -- -- -- --30 --- 4.7 -- -- -- -- --31 -- -- -- -- -- --
MEAN --- --- --- --- --- --- MAX --- --- --- --- --- --- MIN --- --- --- --- --- ---

276 KISSIMMEE RIVER BASIN
02266300 REEDY CREEK NEAR VINELAND, FL
LOCATION.--Lat 28° 19'57", long 81° 34'48", in NE1⁄ 4 sec.11, T.25 S., R.27 E., Osceola County, Hydrologic Unit 03090101, 100 ft downstream of bridge on U.S. Highway 192, about 2.5 mi upstream from bridge on Interstate Highway 4, 6.5 mi southwest of Vineland, and 28 mi upstream from mouth.
DRAINAGE AREA.--84.6 mi2. WATER-DISCHARGE RECORDS
PERIOD OF RECORD.--Water years 1960, 1962-66 (annual maximum), May 1966 to current year.
REVISED RECORDS.--WDR FL-96-1: Drainage area.
GAGE.--Water-stage recorder and data-collection platform. Datum of gage is 66.37 ft above NGVD of 1929. Sept. 26, 1962, to January 1966, crest-stage gage at site 200 ft upstream at same datum. May 1966 to July 29, 1999 at site 100 ft upstream at same datum.
REMARKS.--Records good. Natural flow of stream affected by several canals, levees, and control structures.
DISCHARGE, CUBIC FEET PER SECOND, WATER YEAR OCTOBER 2001 TO SEPTEMBER 2002DAILY MEAN VALUES
DAY OCT NOV DEC JAN FEB MAR APR MAY JUN JUL AUG SEP
1 46 20 15 4.32 41 20 15 9.13 38 22 15 494 35 21 16 425 34 21 15 19
7.9 24 2.8 0.62 0.00 251 56 2707.4 22 2.5 0.52 0.00 229 51 2377.0 21 2.5 0.45 0.00 165 46 2106.6 24 2.4 0.37 0.00 131 72 1936.1 24 2.4 0.31 0.00 106 54 226
6 32 20 15 147 31 19 15 138 32 18 15 11 9 31 18 16 9.110 29 17 15 7.4
5.7 21 2.1 0.28 0.00 90 38 2138.8 19 1.9 0.27 0.60 78 43 187
14 17 1.7 0.23 0.73 98 136 176 14 15 1.6 0.17 0.58 106 89 159 13 15 1.5 0.12 0.39 99 66 145
11 28 16 15 6.712 27 16 14 6.3 13 25 16 9.5 6.6 14 25 20 4.5 8.9 15 28 22 3.1 18
14 13 1.5 0.07 2.7 96 50 134 12 12 1.8 0.00 3.4 78 49 130 8.7 14 2.4 0.00 2.7 78 140 138 6.5 13 3.6 0.10 5.7 116 266 135 5.1 11 4.1 0.48 14 101 269 138
16 27 21 2.5 1817 27 19 2.4 1518 25 18 2.4 1419 23 18 2.3 13 20 23 19 2.4 12
4.6 11 5.1 0.24 37 73 248 1424.5 9.6 4.9 0.14 39 56 197 3334.2 8.9 3.7 0.78 45 53 167 301 3.7 8.1 3.2 1.1 36 71 140 247 3.4 7.8 2.2 1.0 52 65 134 267
21 23 19 2.3 12 22 29 17 2.3 1123 36 16 2.3 1124 35 15 2.5 9.7 25 32 15 2.7 9.1
3.4 6.8 1.3 0.89 139 87 153 23615 6.7 0.96 0.76 148 197 216 22966 5.8 0.59 0.68 220 133 197 278
151 5.8 0.42 0.61 246 93 120 329 135 5.4 0.40 0.51 290 107 105 410
26 29 15 3.3 8.927 25 15 3.5 8.9 28 22 15 3.9 8.729 21 15 4.1 8.9 30 21 15 4.1 8.8 31 21 --- 4.3 8.6
102 5.5 0.54 0.39 257 218 97 409 50 5.4 1.1 0.34 321 158 87 34828 3.9 0.80 0.36 190 111 85 276 --- 3.2 0.71 0.25 114 90 137 238 --- 3.1 0.65 0.09 126 75 192 211 --- 2.8 --- 0.00 --- 65 283 --
TOTAL 901 538 245.4 402.0 MEAN 29.1 17.9 7.92 13.0 MAX 46 22 16 49 MIN 21 15 2.3 4.3
707.6 364.8 61.37 12.13 2290.80 3474 3983 694525.3 11.8 2.05 0.39 76.4 112 128 232151 24 5.1 1.1 321 251 283 4103.4 2.8 0.40 0.00 0.00 53 38 130
STATISTICS OF MONTHLY MEAN DATA FOR WATER YEARS 1966 - 2002, BY WATER YEAR (WY)
MEAN 45.2 31.9 35.4 38.6 MAX 195 159 339 257(WY) 1996 1988 1998 1998 MIN 3.58 0.18 2.63 2.68(WY) 1968 1968 1968 1968
38.7 39.7 25.4 15.5 30.7 52.1 63.1 69.0278 271 109 75.7 108 151 198 2321998 1998 1987 1991 1991 1991 1995 2002 1.62 6.20 0.079 0.000 0.000 8.86 14.3 7.452001 1968 1967 1967 1967 1969 2000 1978
SUMMARY STATISTICS FOR 2001 CALENDAR YEAR FOR 2002 WATER YEAR WATER YEARS 1966 - 2002
ANNUAL TOTAL 10207.87ANNUAL MEAN 28.0 HIGHEST ANNUAL MEAN LOWEST ANNUAL MEAN HIGHEST DAILY MEAN 693 LOWEST DAILY MEAN 0.00 ANNUAL SEVEN-DAY MINIMUM 0.06MAXIMUM PEAK FLOWMAXIMUM PEAK STAGE10 PERCENT EXCEEDS 7350 PERCENT EXCEEDS 1190 PERCENT EXCEEDS 0.70
19925.1054.6 40.5
135 1998 15.9 1971
Sep 15 410 Sep 25 1110 Dec 28 1997 May 21,27 0.00 Many days 0.00 Many days May 16 0.00 May 31 0.00 Many days
424 Sep 25 *1910 Sep 11 196011.68 Sep 25 14.90 Sep 11 1960
192 9215 22 0.61 6.0
* From floodmark

---------------
---------------
--- --- --- --- --- --- ---
--- --- --- --- --- --- ---
--- --- --- ---
--- --- ---
--- --- ---
--- --- --- ---
--- --- --- ---
--- ------ ------ ---
277 KISSIMMEE RIVER BASIN
02266300 REEDY CREEK NEAR VINELAND, FL--Continued
WATER-QUALITY RECORDS
PERIOD OF RECORD.--Water years 1961-63, 1965-66, 1968-94, 1996 to current year.
PERIOD OF DAILY RECORD.-- SPECIFIC CONDUCTANCE: June 1977 to current year. pH: June 1977 to June 1986. WATER TEMPERATURE: June 1977 to current year. DISSOLVED OXYGEN: June 1977 to current year.
INSTRUMENTATION.--Water-quality monitor.
REMARKS.--Extremes for current year and extremes for period of daily record are based on recorded values and may have been exceeded during periods of of no record.
EXTREMES FOR PERIOD OF DAILY RECORD.--SPECIFIC CONDUCTANCE: Maximum daily mean, 823 µS/cm @ 25 ° C, Dec. 10, 2000; minimum daily mean, 50 µS/cm @ 25 ° C, Nov. 4,
1987. pH: Maximum daily mean, 7.4 units, Jan. 5, 1980, June 8, 1986; minimum daily mean, 4.9 units, July 21, 1978. WATER TEMPERATURE: Maximum daily mean, 28.8 ° C, Aug. 6, 1989; minimum daily mean, 5.5 ° C, Dec. 24 ,25, 1989.DISSOLVED OXYGEN: Maximum daily mean, 9.8 mg/L, Mar. 3, 1980; minimum daily mean, 0.1 mg/L, Sept. 5, 1979.
EXTREMES FOR CURRENT YEAR.--SPECIFIC CONDUCTANCE: Maximum daily mean, 324 µS/cm @ 25 ° C, Jan. 3; minimum daily mean, 130 µS/cm @ 25 ° C, Sept. 26. WATER TEMPERATURE: Maximum daily mean, 27.4 ° C, July 17; minimum daily mean, 9.5 ° C, Jan. 9. DISSOLVED OXYGEN: Maximum daily mean, 7.2 mg/L, Jan. 9; minimum daily mean, 1.1 mg/L, July 16,19,24,28, Aug. 1.
SPECIFIC CONDUCTANCE (MICROSIEMENS/CM AT 25 DEG. C), WATER YEAR OCTOBER 2001 TO SEPTEMBER 2002DAILY MEAN VALUES
DAY OCT NOV DEC JAN FEB MAR APR MAY JUN JUL AUG SEP
1 218 250 284 281 277 254 --- --- 163 191 152 2 220 253 283 277 276 256 --- --- 165 191 148 3 223 253 284 324 275 261 --- --- 182 191 146 4 231 257 288 321 273 258 --- --- 191 197 145 5 233 258 287 293 273 259 --- --- 198 198 144
6 232 261 288 284 273 262 --- --- 204 203 148 7 234 263 287 279 272 268 --- --- 206 199 147 8 234 262 288 280 271 270 --- --- 195 192 146 9 234 266 290 282 269 274 --- --- 198 189 146 10 232 268 296 283 272 277 -- -- 196 186 146
11 234 271 292 283 270 281 -- -- 199 187 148 12 241 274 291 284 283 -- -- 203 184 149 13 245 276 294 283 284 -- 358 202 173 149 14 248 274 296 282 287 305 -- 340 196 160 154 15 241 270 297 279 287 307 -- 368 199 153 156
16 243 268 295 277 289 304 -- 374 202 157 159 17 246 268 296 276 291 310 -- 316 217 161 137 18 245 269 294 274 290 309 -- 294 209 165 144 19 249 268 290 274 288 -- 298 195 164 148 20 247 274 287 274 290 -- 271 200 165 147
21 249 276 281 273 289 -- 218 199 164 147 22 243 275 277 273 289 -- 205 166 159 140 23 237 275 276 275 242 289 -- 181 183 158 137 24 233 276 277 278 225 289 -- 165 195 162 137 25 234 280 276 278 243 290 -- 205 188 162 132
26 238 280 273 278 254 291 -- 185 166 164 130 27 241 280 271 276 258 291 -- 164 169 164 132 28 245 281 269 274 254 294 -- 183 182 166 134 29 246 282 269 281 298 -- 209 188 167 135 30 246 284 273 280 302 -- 191 190 165 137 31 247 283 278 -- -- -- 191 158
MEAN 238 270 285 282 --- --- --- 192 174 144 MAX 249 284 297 324 --- --- --- 217 203 159 MIN 218 250 269 273 --- --- --- 163 153 130
CAL YR 2001 MEAN 276 MAX 416 MIN 161
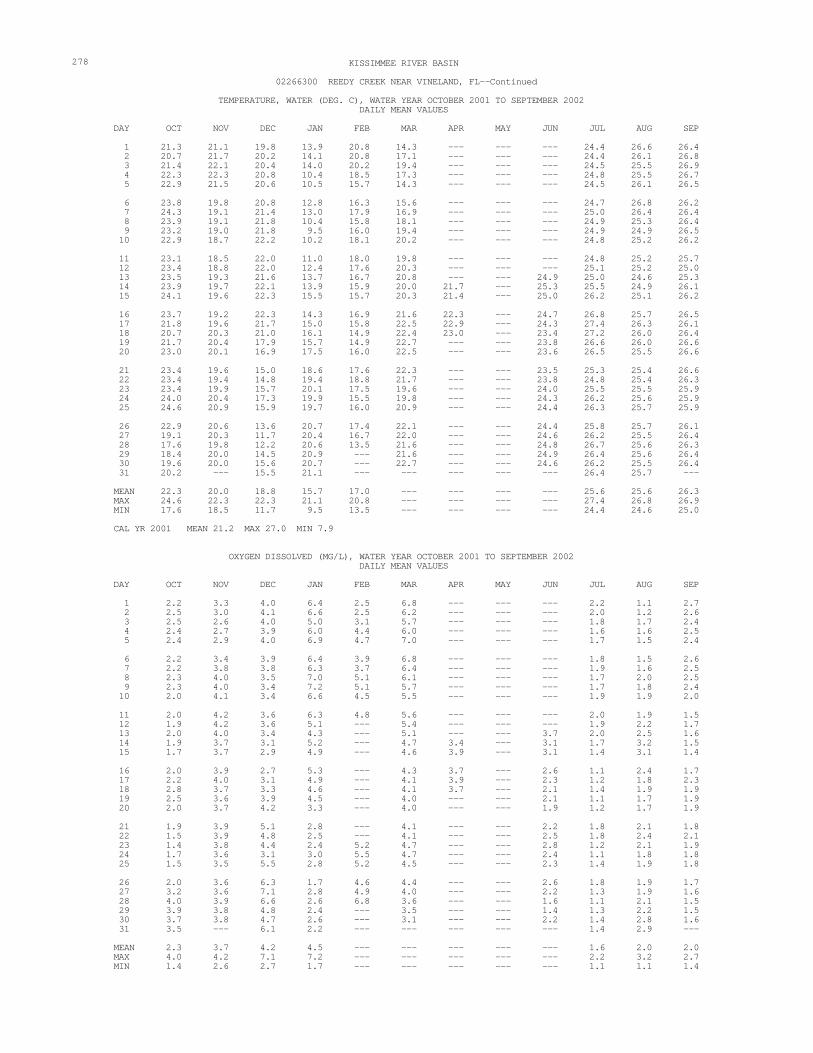
---------------
---------------
--- ---
---
------
---------------
---------------
--- --- ---
---------
---------------
---------------
--- --- --- --- --- --- ---
--- --- --- --- --- --- ---
--- --- --- ---
--- --- ---
--- --- ---
--- --- --- ---
--- --- --- ---
--- ------ ------ ---
278 KISSIMMEE RIVER BASIN
02266300 REEDY CREEK NEAR VINELAND, FL--Continued
TEMPERATURE, WATER (DEG. C), WATER YEAR OCTOBER 2001 TO SEPTEMBER 2002 DAILY MEAN VALUES
DAY OCT NOV DEC JAN FEB MAR APR MAY JUN JUL AUG SEP
1 21.3 21.1 19.8 13.9 20.8 14.3 --- --- 24.4 26.6 26.4 2 20.7 21.7 20.2 14.1 20.8 17.1 --- --- 24.4 26.1 26.8 3 21.4 22.1 20.4 14.0 20.2 19.4 --- --- 24.5 25.5 26.9 4 22.3 22.3 20.8 10.4 18.5 17.3 --- --- 24.8 25.5 26.7 5 22.9 21.5 20.6 10.5 15.7 14.3 --- --- 24.5 26.1 26.5
6 23.8 19.8 20.8 12.8 16.3 15.6 --- --- 24.7 26.8 26.2 7 24.3 19.1 21.4 13.0 17.9 16.9 --- --- 25.0 26.4 26.4 8 23.9 19.1 21.8 10.4 15.8 18.1 --- --- 24.9 25.3 26.4 9 23.2 19.0 21.8 9.5 16.0 19.4 --- --- 24.9 24.9 26.5 10 22.9 18.7 22.2 10.2 18.1 20.2 -- -- 24.8 25.2 26.2
11 23.1 18.5 22.0 11.0 18.0 19.8 -- -- 24.8 25.2 25.7 12 23.4 18.8 22.0 12.4 17.6 20.3 -- -- 25.1 25.2 25.0 13 23.5 19.3 21.6 13.7 16.7 20.8 --- 24.9 25.0 24.6 25.3 14 23.9 19.7 22.1 13.9 15.9 20.0 21.7 --- 25.3 25.5 24.9 26.1 15 24.1 19.6 22.3 15.5 15.7 20.3 21.4 --- 25.0 26.2 25.1 26.2
16 23.7 19.2 22.3 14.3 16.9 21.6 22.3 --- 24.7 26.8 25.7 26.5 17 21.8 19.6 21.7 15.0 15.8 22.5 22.9 --- 24.3 27.4 26.3 26.1 18 20.7 20.3 21.0 16.1 14.9 22.4 23.0 --- 23.4 27.2 26.0 26.4 19 21.7 20.4 17.9 15.7 14.9 22.7 --- 23.8 26.6 26.0 26.6 20 23.0 20.1 16.9 17.5 16.0 22.5 --- 23.6 26.5 25.5 26.6
21 23.4 19.6 15.0 18.6 17.6 22.3 --- 23.5 25.3 25.4 26.6 22 23.4 19.4 14.8 19.4 18.8 21.7 --- 23.8 24.8 25.4 26.3 23 23.4 19.9 15.7 20.1 17.5 19.6 --- 24.0 25.5 25.5 25.9 24 24.0 20.4 17.3 19.9 15.5 19.8 --- 24.3 26.2 25.6 25.9 25 24.6 20.9 15.9 19.7 16.0 20.9 --- 24.4 26.3 25.7 25.9
26 22.9 20.6 13.6 20.7 17.4 22.1 --- 24.4 25.8 25.7 26.1 27 19.1 20.3 11.7 20.4 16.7 22.0 --- 24.6 26.2 25.5 26.4 28 17.6 19.8 12.2 20.6 13.5 21.6 --- 24.8 26.7 25.6 26.3 29 18.4 20.0 14.5 20.9 --- 21.6 --- 24.9 26.4 25.6 26.4 30 19.6 20.0 15.6 20.7 --- 22.7 --- 24.6 26.2 25.5 26.4 31 20.2 --- 15.5 21.1 --- --- 26.4 25.7 --
MEAN 22.3 20.0 18.8 15.7 17.0 --- --- --- 25.6 25.6 26.3 MAX 24.6 22.3 22.3 21.1 20.8 --- --- --- 27.4 26.8 26.9 MIN 17.6 18.5 11.7 9.5 13.5 --- --- --- 24.4 24.6 25.0
CAL YR 2001 MEAN 21.2 MAX 27.0 MIN 7.9
OXYGEN DISSOLVED (MG/L), WATER YEAR OCTOBER 2001 TO SEPTEMBER 2002 DAILY MEAN VALUES
DAY OCT NOV DEC JAN FEB MAR APR MAY JUN JUL AUG SEP
1 2.2 3.3 4.0 6.4 2.5 6.8 --- --- 2.2 1.1 2.7 2 2.5 3.0 4.1 6.6 2.5 6.2 --- --- 2.0 1.2 2.6 3 2.5 2.6 4.0 5.0 3.1 5.7 --- --- 1.8 1.7 2.4 4 2.4 2.7 3.9 6.0 4.4 6.0 --- --- 1.6 1.6 2.5 5 2.4 2.9 4.0 6.9 4.7 7.0 --- --- 1.7 1.5 2.4
6 2.2 3.4 3.9 6.4 3.9 6.8 --- --- 1.8 1.5 2.6 7 2.2 3.8 3.8 6.3 3.7 6.4 --- --- 1.9 1.6 2.5 8 2.3 4.0 3.5 7.0 5.1 6.1 --- --- 1.7 2.0 2.5 9 2.3 4.0 3.4 7.2 5.1 5.7 --- --- 1.7 1.8 2.4 10 2.0 4.1 3.4 6.6 4.5 5.5 -- --- 1.9 1.9 2.0
11 2.0 4.2 3.6 6.3 4.8 5.6 -- --- 2.0 1.9 1.5 12 1.9 4.2 3.6 5.1 5.4 -- --- 1.9 2.2 1.7 13 2.0 4.0 3.4 4.3 5.1 -- 3.7 2.0 2.5 1.6 14 1.9 3.7 3.1 5.2 4.7 3.4 -- 3.1 1.7 3.2 1.5 15 1.7 3.7 2.9 4.9 4.6 3.9 -- 3.1 1.4 3.1 1.4
16 2.0 3.9 2.7 5.3 4.3 3.7 -- 2.6 1.1 2.4 1.7 17 2.2 4.0 3.1 4.9 4.1 3.9 -- 2.3 1.2 1.8 2.3 18 2.8 3.7 3.3 4.6 4.1 3.7 -- 2.1 1.4 1.9 1.9 19 2.5 3.6 3.9 4.5 4.0 -- 2.1 1.1 1.7 1.9 20 2.0 3.7 4.2 3.3 4.0 -- 1.9 1.2 1.7 1.9
21 1.9 3.9 5.1 2.8 4.1 -- 2.2 1.8 2.1 1.8 22 1.5 3.9 4.8 2.5 4.1 -- 2.5 1.8 2.4 2.1 23 1.4 3.8 4.4 2.4 5.2 4.7 -- 2.8 1.2 2.1 1.9 24 1.7 3.6 3.1 3.0 5.5 4.7 -- 2.4 1.1 1.8 1.8 25 1.5 3.5 5.5 2.8 5.2 4.5 -- 2.3 1.4 1.9 1.8
26 2.0 3.6 6.3 1.7 4.6 4.4 -- 2.6 1.8 1.9 1.7 27 3.2 3.6 7.1 2.8 4.9 4.0 -- 2.2 1.3 1.9 1.6 28 4.0 3.9 6.6 2.6 6.8 3.6 -- 1.6 1.1 2.1 1.5 29 3.9 3.8 4.8 2.4 3.5 -- 1.4 1.3 2.2 1.5 30 3.7 3.8 4.7 2.6 3.1 -- 2.2 1.4 2.8 1.6 31 3.5 6.1 2.2 -- -- --- 1.4 2.9
MEAN 2.3 3.7 4.2 4.5 --- --- --- 1.6 2.0 2.0 MAX 4.0 4.2 7.1 7.2 --- --- --- 2.2 3.2 2.7 MIN 1.4 2.6 2.7 1.7 --- --- --- 1.1 1.1 1.4
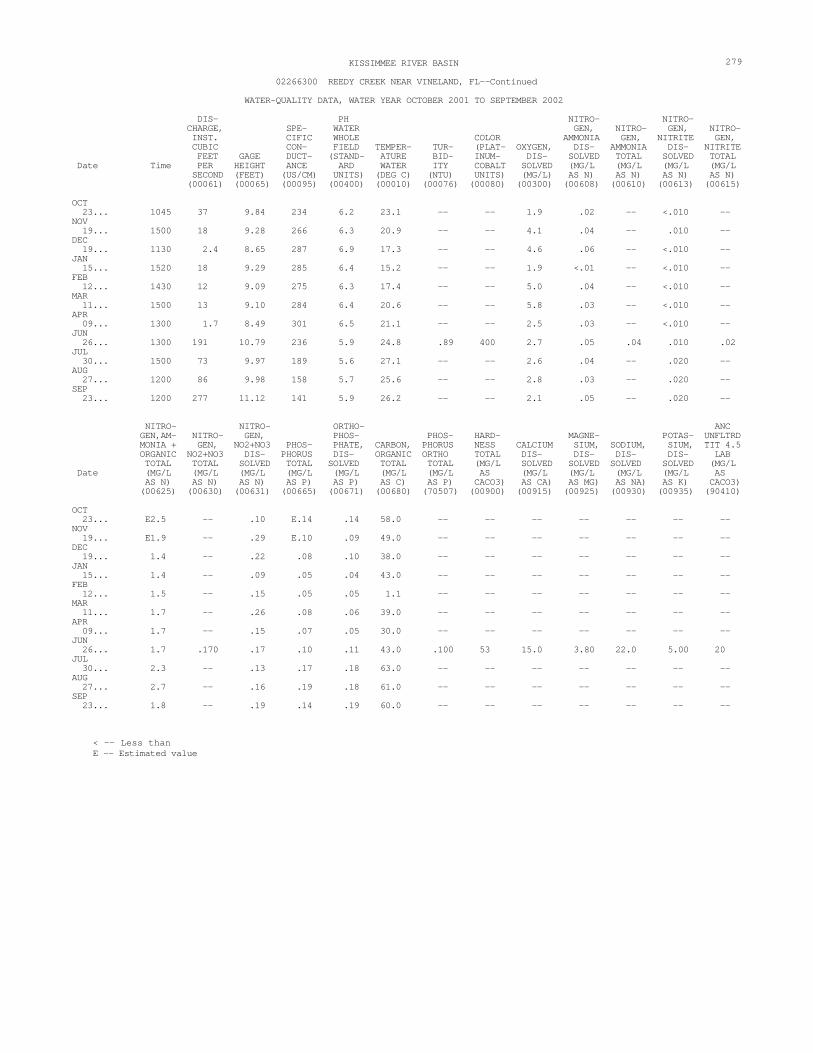
--
--
--
--
--
--
--
--
--
--
279 KISSIMMEE RIVER BASIN
02266300 REEDY CREEK NEAR VINELAND, FL--Continued
WATER-QUALITY DATA, WATER YEAR OCTOBER 2001 TO SEPTEMBER 2002
DIS PH NITRO NITRO CHARGE, SPE WATER GEN, NITRO GEN, NITROINST. CIFIC WHOLE COLOR AMMONIA GEN, NITRITE GEN, CUBIC CON FIELD TEMPER- TUR- (PLAT OXYGEN, DIS AMMONIA DIS NITRITE FEET GAGE DUCT- (STAND- ATURE BID INUM- DIS SOLVED TOTAL SOLVED TOTAL
Date Time PER HEIGHT ANCE ARD WATER ITY COBALT SOLVED (MG/L (MG/L (MG/L (MG/L SECOND (FEET) (US/CM) UNITS) (DEG C) (NTU) UNITS) (MG/L) AS N) AS N) AS N) AS N)
(00061) (00065) (00095) (00400) (00010) (00076) (00080) (00300) (00608) (00610) (00613) (00615)
OCT 23... 1045 37 9.84 234 6.2 23.1 -- 1.9 .02 -- <.010 -NOV 19... 1500 18 9.28 266 6.3 20.9 -- 4.1 .04 - .010 -DEC 19... 1130 2.4 8.65 287 6.9 17.3 -- 4.6 .06 -- <.010 -JAN 15... 1520 18 9.29 285 6.4 15.2 -- 1.9 <.01 -- <.010 -FEB 12... 1430 12 9.09 275 6.3 17.4 -- 5.0 .04 -- <.010 -MAR 11... 1500 13 9.10 284 6.4 20.6 -- 5.8 .03 -- <.010 -APR 09... 1300 1.7 8.49 301 6.5 21.1 -- 2.5 .03 -- <.010 -JUN 26... 1300 191 10.79 236 5.9 24.8 .89 400 2.7 .05 .04 .010 .02
JUL 30... 1500 73 9.97 189 5.6 27.1 -- 2.6 .04 - .020 -AUG 27... 1200 86 9.98 158 5.7 25.6 -- 2.8 .03 - .020 -SEP 23... 1200 277 11.12 141 5.9 26.2 -- 2.1 .05 - .020 -
NITRO- NITRO-GEN,AM- NITRO- GEN,MONIA + GEN, NO2+NO3 PHOS- ORGANIC NO2+NO3 DIS- PHORUS TOTAL TOTAL SOLVED TOTAL
Date (MG/L (MG/L (MG/L (MG/L AS N) AS N) AS N) AS P)(00625) (00630) (00631) (00665)
ORTHO- ANCPHOS- PHOS- HARD- MAGNE- POTAS- UNFLTRDPHATE, CARBON, PHORUS NESS CALCIUM SIUM, SODIUM, SIUM, TIT 4.5DIS- ORGANIC ORTHO TOTAL DIS- DIS- DIS- DIS- LAB
SOLVED TOTAL TOTAL (MG/L SOLVED SOLVED SOLVED SOLVED (MG/L(MG/L (MG/L (MG/L AS (MG/L (MG/L (MG/L (MG/L ASAS P) AS C) AS P) CACO3) AS CA) AS MG) AS NA) AS K) CACO3)
(00671) (00680) (70507) (00900) (00915) (00925) (00930) (00935) (90410)
OCT 23... E2.5 -- .10 E.14 .14 58.0 -- -- -- -- -- -- -NOV 19... E1.9 -- .29 E.10 .09 49.0 -- -- -- -- -- -- -DEC 19... 1.4 -- .22 .08 .10 38.0 -- -- -- -- -- -- -JAN 15... 1.4 -- .09 .05 .04 43.0 -- -- -- -- -- -- -FEB 12... 1.5 -- .15 .05 .05 1.1 -- -- -- -- -- -- -MAR 11... 1.7 -- .26 .08 .06 39.0 -- -- -- -- -- -- -APR 09... 1.7 -- .15 .07 .05 30.0 -- -- -- -- -- -- -JUN 26... 1.7 .170 .17 .10 .11 43.0 .100 53 15.0 3.80 22.0 5.00 20JUL 30... 2.3 -- .13 .17 .18 63.0 -- -- -- -- -- -- -AUG 27... 2.7 -- .16 .19 .18 61.0 -- -- -- -- -- -- -SEP 23... 1.8 -- .19 .14 .19 60.0 -- -- -- -- -- -- -
< -- Less than E -- Estimated value

280 KISSIMMEE RIVER BASIN
02266300 REEDY CREEK NEAR VINELAND, FL--Continued
WATER-QUALITY DATA, WATER YEAR OCTOBER 2001 TO SEPTEMBER 2002
CHLOR-A BERYL- ALUM- CHRO- MANGACHLO- FLUO- PHYTO- LIUM, INUM, CADMIUM MIUM, COPPER, IRON, LEAD, NESE,
SULFATE RIDE, RIDE, PLANK- TOTAL TOTAL WATER TOTAL TOTAL TOTAL TOTAL TOTALDIS- DIS- DIS- TON ARSENIC RECOV- RECOV- UNFLTRD RECOV- RECOV- RECOV- RECOV- RECOV-SOLVED SOLVED SOLVED CHROMO TOTAL ERABLE ERABLE TOTAL ERABLE ERABLE ERABLE ERABLE ERABLE
Date (MG/L (MG/L (MG/L FLUOROM (UG/L (UG/L (UG/L (UG/L (UG/L (UG/L (UG/L (UG/L (UG/LAS SO4) AS CL) AS F) (UG/L) AS AS) AS BE) AS AL) AS CD) AS CR) AS CU) AS FE) AS PB) AS MN)(00945) (00940) (00950) (70953) (01002) (01012) (01105) (01027) (01034) (01042) (01045) (01051) (01055)
OCT 23... -- -- -- <.1 -- -- -- -- -- -- -- -- -NOV 19... -- -- -- <.1 -- -- -- -- -- -- -- -- -DEC 19... -- -- -- <.1 -- -- -- -- -- -- -- -- -JAN 15... -- -- -- <.1 -- -- -- -- -- -- -- -- -FEB 12... -- -- -- <.1 -- -- -- -- -- -- -- -- -MAR 11... -- -- -- <.1 -- -- -- -- -- -- -- -- -APR 09... -- -- -- <.1 -- -- -- -- -- -- -- -- -JUN 26... 16.0 39.0 <.1 13.0 9 <1 352 <1.0 1.0 2.1 241 <1 8JUL 30... -- -- -- <.1 -- -- -- -- -- -- -- -- -AUG 27... -- -- -- <.1 -- -- -- -- -- -- -- -- -SEP 23... -- -- -- .0 -- -- -- -- -- -- -- -- -
NICKEL, ZINC, MERCURY ALDRIN, LINDANE CHLOR TOTAL TOTAL SELE- TOTAL CHLOR- DISUL- TOTAL TOTAL DANE, RECOV- RECOV- NIUM, RECOV- PYRIFOS FOTON IN BOT- IN BOT- TECH ERABLE ERABLE TOTAL ERABLE TOTAL UNFILT PHORATE DEF ALDRIN, LINDANE TOM MA- TOM MA- NICAL
Date (UG/L (UG/L (UG/L (UG/L RECOVER RECOVER TOTAL TOTAL TOTAL TOTAL TERIAL TERIAL TOTAL AS NI) AS ZN) AS SE) AS HG) (UG/L) (UG/L) (UG/L) (UG/L) (UG/L) (UG/L) (UG/KG) (UG/KG) (UG/L)(01067) (01092) (01147) (71900) (38932) (39011) (39023) (39040) (39330) (39340) (39333) (39343) (39350)
JUN 26... <1.0 6 <1 <.1 <.01 <.10 <.02 <.02 <.01 <.006 <.2 <.2 <.1
CHLOR- P,P'- P,P'- P,P'- DI- ENDO DANE, DDD, DDE, DDT, ELDRIN, SULFAN ENDRIN, TOTAL P,P'- RECOVER RECOVER P,P'- RECOVER TOTAL ENDO- I TOTAL ENDRIN TOTALIN BOT- DDD IN BOT- P,P'- IN BOT- DDT IN BOT- DI- IN BOT- SULFAN IN BOT- WATER IN BOTTOM MA- UNFILT TOM MA- DDE, TOM MA- UNFILT TOM MA- ELDRIN TOM MA- I TOM MA- UNFLTRD TOM MA-
Date TERIAL RECOVER TERIAL TOTAL TERIAL RECOVER TERIAL TOTAL TERIAL TOTAL TERIAL REC TERIAL(UG/KG) (UG/L) (UG/KG) (UG/L) (UG/KG) (UG/L) (UG/KG) (UG/L) (UG/KG) (UG/L) (UG/KG) (UG/L) (UG/KG)(39351) (39360) (39363) (39365) (39368) (39370) (39373) (39380) (39383) (39388) (39389) (39390) (39393)
JUN 26... <3 <.007 <.5 <.006 <.2 <.009 <.5 <.006 <.2 <.02 <.2 <.01 <.2
TOXA- HEPTA- HEPTA- METHPHENE, CHLOR, CHLOR OXY- PCB,
TOTAL TOTAL HEPTA- EPOXIDE METH- CHLOR, TOTAL TOX- IN BOT- HEPTA- IN BOT- CHLOR TOT. IN OXY- TOT. IN IN BOT- MALA- PARA
ETHION, APHENE, TOM MA- CHLOR, TOM MA- EPOXIDE BOTTOM CHLOR, BOTTOM PCB, TOM MA- THION, THION,Date TOTAL TOTAL TERIAL TOTAL TERIAL TOTAL MATL. TOTAL MATL. TOTAL TERIAL TOTAL TOTAL
(UG/L) (UG/L) (UG/KG) (UG/L) (UG/KG) (UG/L) (UG/KG) (UG/L) (UG/KG) (UG/L) (UG/KG) (UG/L) (UG/L)(39398) (39400) (39403) (39410) (39413) (39420) (39423) (39480) (39481) (39516) (39519) (39530) (39540)
JUN 26... <.01 <1 <50 <.01 <.2 <.009 <.2 <.020 <2.5 <.1 <5 E.01 <.01
FONOFOS BI MIREX, CARBO- (DY- PHENYL,
METHYL TOTAL PHENO- FONATE) NONA DI- PARA- IN BOT- THION WATER CHLOROAZINON, THION, MIREX, TOM MA- WATER WHOLE SUR SCD
Date TOTAL TOTAL TOTAL TERIAL UNFLTRD TOT.REC 1325 (UG/L) (UG/L) (UG/L) (UG/KG) (UG/L) (UG/L) PERCENT (39570) (39600) (39755) (39758) (39786) (82614) (90575)
JUN26... <.02 <.02 <.006 <.2 <.02 <.01 59
< -- Less than E -- Estimated value

281 KISSIMMEE RIVER BASIN
02266480 DAVENPORT CREEK NEAR LOUGHMAN, FL
LOCATION.--Lat 28° 16'15", long 81° 35'28", in NW1⁄ 4 sec.35, T.25 S., R.27 E., Osceola County, Hydrologic Unit 03090101, at downstream side of culverts on State Highway 545, 2.0 mi upstream from mouth, and 2.5 mi northwest of Loughman.
DRAINAGE AREA.--23.0 mi2. WATER-DISCHARGE RECORDS
PERIOD OF RECORD.--January 1969 to current year.
GAGE.--Water-stage recorder. Datum of gage is 77.69 ft above NGVD of 1929 (Florida Department of Transportation bench mark).
REMARKS.--Records fair.
DISCHARGE, CUBIC FEET PER SECOND, WATER YEAR OCTOBER 2001 TO SEPTEMBER 2002DAILY MEAN VALUES
DAY OCT NOV DEC JAN FEB MAR APR MAY JUN JUL AUG SEP
1 21 5.5 3.2 3.0 4.0 15 2.4 1.1 0.68 86 132 18 5.5 3.2 4.33 16 6.6 3.1 6.94 14 6.2 3.0 5.95 13 5.8 3.0 5.3
74 3.9 13 3.4 1.0 0.64 87 13 63 3.8 12 4.4 0.94 0.59 74 12 61 3.6 13 4.9 0.89 0.57 59 13 60 3.5 13 4.4 0.87 0.58 46 11 53
6 12 5.6 3.0 5.17 11 5.2 3.3 5.08 11 5.0 3.8 4.9
3.4 11 4.0 0.85 0.56 37 9.5 47 4.0 11 3.8 0.81 1.0 30 11 38 4.8 9.9 3.5 0.78 1.5 26 15 31
9 9.8 4.9 4.1 4.8 4.6 9.0 3.0 0.73 0.95 21 14 26 10 9.2 4.7 4.0 4.6 4.7 8.2 4.6 0.67 0.78 22 14 22
11 8.7 4.4 3.8 4.4 12 8.1 4.2 3.6 4.3 13 7.7 4.2 3.5 4.4 14 7.8 4.7 3.3 4.7 15 8.6 4.9 3.1 7.1
4.9 7.3 7.1 0.66 0.81 23 11 21 4.6 6.4 5.6 0.64 0.90 24 12 23 4.3 7.3 6.3 0.64 0.79 25 21 25 4.2 7.3 7.1 0.65 0.84 43 33 27 4.1 6.0 8.7 0.66 1.4 48 63 26
16 8.2 4.7 3.0 7.0 17 7.8 4.2 3.0 6.7 18 7.4 4.2 3.3 6.4 19 7.1 4.1 3.3 6.1 20 7.1 4.1 3.1 5.8
3.9 5.4 8.6 0.64 3.4 38 71 24 3.8 5.0 7.2 0.72 6.0 27 58 57 3.6 4.6 5.1 1.4 7.9 22 42 73 3.4 4.0 3.8 1.4 8.1 35 31 60 3.3 3.7 3.0 1.2 18 43 26 47
21 7.2 4.0 3.0 5.6 22 8.2 3.9 3.0 5.523 8.7 3.9 3.0 5.324 8.4 3.8 3.0 5.125 8.0 3.7 3.1 5.0
3.1 3.3 2.3 0.92 23 39 23 38 9.7 3.1 1.9 0.80 24 42 20 36 26 2.9 1.7 0.74 28 38 19 60 43 2.6 1.5 0.70 30 31 17 83 45 2.4 1.3 0.68 30 26 15 117
26 7.6 3.6 3.5 4.927 7.1 3.6 3.3 4.828 6.6 3.5 3.2 4.7 29 6.3 3.4 3.1 4.6 30 6.0 3.3 3.0 4.331 5.7 --- 3.0 4.2
35 2.7 1.3 0.66 29 35 14 147 24 3.4 1.8 0.67 37 39 14 135 18 2.7 1.5 0.66 39 30 14 112 --- 2.3 1.2 0.64 37 23 17 84 --- 2.1 1.2 0.66 48 18 25 68--- 1.9 --- 0.77 --- 15 59 --
TOTAL 293.3 135.4 100.9 160.7 MEAN 9.46 4.51 3.25 5.18 MAX 21 6.6 4.1 7.1 MIN 5.7 3.3 3.0 3.0CFSM 0.41 0.20 0.14 0.23 IN. 0.47 0.22 0.16 0.26
284.2 201.5 116.6 25.15 380.99 1152 730.5 173810.2 6.50 3.89 0.81 12.7 37.2 23.6 57.9 45 15 8.7 1.4 48 87 71 1473.1 1.9 1.2 0.64 0.56 15 9.5 210.44 0.28 0.17 0.04 0.55 1.62 1.02 2.52 0.46 0.33 0.19 0.04 0.62 1.86 1.18 2.81
STATISTICS OF MONTHLY MEAN DATA FOR WATER YEARS 1970 - 2002, BY WATER YEAR (WY)
MEAN 12.2 10.0 11.5 12.7 MAX 62.0 39.9 80.8 44.5(WY) 1970 1970 1998 1998 MIN 1.34 1.06 1.15 1.20(WY) 2001 2001 2001 2001
12.7 11.7 7.37 4.16 8.02 15.4 17.1 19.7 57.3 58.0 40.9 24.7 34.3 48.3 59.6 57.91998 1998 1984 1979 1982 1991 1995 2002 1.05 1.49 0.90 0.48 0.85 1.58 1.83 2.082001 1974 1981 1981 2001 2001 1989 2000
SUMMARY STATISTICS FOR 2001 CALENDAR YEAR FOR 2002 WATER YEAR WATER YEARS 1970 - 2002
ANNUAL TOTAL 2364.08 ANNUAL MEAN 6.48 HIGHEST ANNUAL MEAN LOWEST ANNUAL MEAN HIGHEST DAILY MEAN 139 LOWEST DAILY MEAN 0.53 ANNUAL SEVEN-DAY MINIMUM 0.60MAXIMUM PEAK FLOWMAXIMUM PEAK STAGE INSTANTANEOUS LOW FLOWANNUAL RUNOFF (CFSM) 0.28ANNUAL RUNOFF (INCHES) 3.8210 PERCENT EXCEEDS 1450 PERCENT EXCEEDS 1.690 PERCENT EXCEEDS 0.80
5319.2414.6 11.9
31.0 19703.90 1981
Sep 15 147 Sep 26 234 Oct 3 1969 Jun 13,14 0.56 Jun 6 0.37 May 19 1981 May 30 0.63 May 31 0.42 May 13 1981
149 Sep 26 498 Sep 22 1969 8.09 Sep 26 9.76 Sep 22 19690.51 Jun 5,6 0.32 May 19 1981 0.63 0.52 8.60 7.0139 30 5.4 5.5 0.93 1.6

--
--
--
--
--
--
--
--
--
--
--
--
282 KISSIMMEE RIVER BASIN
02266480 DAVENPORT CREEK NEAR LOUGHMAN, FL--Continued
WATER-QUALITY RECORDS
PERIOD OF RECORD.--Water years 1965, 1968-94, 1996 to current year.
WATER-QUALITY DATA, WATER YEAR OCTOBER 2001 TO SEPTEMBER 2002
DIS PH NITRO NITRO CHARGE, SPE WATER GEN, NITRO GEN, NITROINST. CIFIC WHOLE COLOR AMMONIA GEN, NITRITE GEN, CUBIC CON FIELD TEMPER- TUR- (PLAT OXYGEN, DIS AMMONIA DIS NITRITE FEET GAGE DUCT- (STAND- ATURE BID INUM- DIS SOLVED TOTAL SOLVED TOTAL
Date Time PER HEIGHT ANCE ARD WATER ITY COBALT SOLVED (MG/L (MG/L (MG/L (MG/L SECOND (FEET) (US/CM) UNITS) (DEG C) (NTU) UNITS) (MG/L) AS N) AS N) AS N) AS N)
(00061) (00065) (00095) (00400) (00010) (00076) (00080) (00300) (00608) (00610) (00613) (00615)
OCT 24... 0830 8.6 5.34 198 6.5 23.3 -- 5.2 .02 -- <.010 -NOV 19... 1400 4.2 5.00 186 6.8 20.9 -- 6.3 .02 -- <.010 -DEC 18... 1315 3.4 4.90 171 6.9 21.0 -- 6.4 .04 -- <.010 -JAN 15... 1315 7.4 5.22 201 6.7 16.5 -- 7.5 <.01 -- <.010 -FEB 12... 1145 4.7 5.00 198 6.7 17.5 -- 7.9 .01 -- <.010 -MAR 11... 1400 7.4 5.20 200 6.4 19.5 -- 7.1 .03 -- <.010 -APR 09... 1100 3.1 4.90 148 7.1 20.5 -- 7.8 .03 -- <.010 -MAY 07... 1000 .84 4.57 144 7.1 24.6 -- 7.6 <.01 -- <.010 -JUN 04... 1200 .60 4.53 132 7.0 25.8 -- 7.1 .02 -- <.010 - 25... 1000 31 6.39 280 5.8 23.6 1.0 480 4.9 .03 .04 .010 .02 JUL 30... 1200 18 5.89 134 5.8 25.2 -- 4.9 .04 - .020 -AUG 27... 0900 14 5.62 149 6.1 24.5 -- 5.1 .03 - .020 -SEP 24... 0700 78 7.42 122 6.0 24.7 -- 4.0 .02 - .030 -
NITRO- NITRO-GEN,AM- NITRO- GEN,MONIA + GEN, NO2+NO3 PHOS- ORGANIC NO2+NO3 DIS- PHORUS TOTAL TOTAL SOLVED TOTAL
Date (MG/L (MG/L (MG/L (MG/L AS N) AS N) AS N) AS P)(00625) (00630) (00631) (00665)
ORTHO- ANCPHOS- PHOS- HARD- MAGNE- POTAS- UNFLTRDPHATE, CARBON, PHORUS NESS CALCIUM SIUM, SODIUM, SIUM, TIT 4.5DIS- ORGANIC ORTHO TOTAL DIS- DIS- DIS- DIS- LAB
SOLVED TOTAL TOTAL (MG/L SOLVED SOLVED SOLVED SOLVED (MG/L(MG/L (MG/L (MG/L AS (MG/L (MG/L (MG/L (MG/L ASAS P) AS C) AS P) CACO3) AS CA) AS MG) AS NA) AS K) CACO3)
(00671) (00680) (70507) (00900) (00915) (00925) (00930) (00935) (90410)
OCT 24... E1.9 -- .22 E.06 .06 65.0 -- -- -- -- -- -- -NOV 19... E1.7 -- .35 E.04 .04 45.0 -- -- -- -- -- -- -DEC 18... 1.4 -- .43 .05 .05 38.0 -- -- -- -- -- -- -JAN 15... 1.6 -- .17 .05 .03 50.0 -- -- -- -- -- -- -FEB 12... 1.9 -- .26 .03 .03 4.7 -- -- -- -- -- -- -MAR 11... 2.3 -- .23 .03 .02 49.0 -- -- -- -- -- -- -APR 09... .50 -- .63 .03 .03 13.0 -- -- -- -- -- -- -MAY 07... .60 -- .53 <.02 .03 10.0 -- -- -- -- -- -- -JUN 04... .20 -- .55 .03 .04 4.3 -- -- -- -- -- -- - 25... 2.3 .090 .10 .02 .02 73.0 .020 120 33.0 8.40 12.0 2.20 16JUL 30... 3.4 -- .17 .23 .23 97.0 -- -- -- -- -- -- -AUG 27... 3.5 -- .22 .27 .25 88.0 -- -- -- -- -- -- -SEP 24... 3.0 -- .03 .19 .19 88.0 -- -- -- -- -- -- -
< -- Less than E -- Estimated value

-- -- -- -- -- --
-- -- -- -- -- --
-- -- -- -- -- --
-- -- -- -- -- --
-- -- -- -- -- --
-- -- -- -- -- --
-- -- -- -- -- --
-- -- -- -- -- --
-- -- -- -- -- --
-- -- -- -- -- --
-- -- -- -- -- --
-- -- -- -- -- --
283 KISSIMMEE RIVER BASIN
02266480 DAVENPORT CREEK NEAR LOUGHMAN, FL--Continued
WATER-QUALITY DATA, WATER YEAR OCTOBER 2001 TO SEPTEMBER 2002
CHLOR-A BERYL ALUM- CHRO MANGACHLO- FLUO- PHYTO LIUM, INUM, CADMIUM MIUM, COPPER, IRON, LEAD, NESE,
SULFATE RIDE, RIDE, PLANK TOTAL TOTAL WATER TOTAL TOTAL TOTAL TOTAL TOTAL DIS DIS DIS TON ARSENIC RECOV RECOV UNFLTRD RECOV RECOV RECOV RECOV RECOVSOLVED SOLVED SOLVED CHROMO TOTAL ERABLE ERABLE TOTAL ERABLE ERABLE ERABLE ERABLE ERABLE
Date (MG/L (MG/L (MG/L FLUOROM (UG/L (UG/L (UG/L (UG/L (UG/L (UG/L (UG/L (UG/L (UG/L AS SO4) AS CL) AS F) (UG/L) AS AS) AS BE) AS AL) AS CD) AS CR) AS CU) AS FE) AS PB) AS MN) (00945) (00940) (00950) (70953) (01002) (01012) (01105) (01027) (01034) (01042) (01045) (01051) (01055)
OCT 24... -- <.1 - - - - -NOV 19... -- <.1 - - - - -DEC 18... -- <.1 - - - - -JAN 15... -- <.1 - - - - -FEB 12... -- 4.3 - - - - -MAR 11... -- 5.3 - - - - -APR 09... -- <.1 - - - - -MAY 07... -- <.1 - - - - -JUN 04... -- <.1 - - - - - 25... 62.0 25.0 <.1 <.1 2 <1 388 <1.0 <1.0 1.4 422 <1 25 JUL 30... -- <.1 - - - - -AUG 27... -- <.1 - - - - -SEP 24... -- <.1 - - - - -
NICKEL, ZINC, MERCURY ALDRIN, LINDANE CHLOR TOTAL TOTAL SELE- TOTAL CHLOR- DISUL- TOTAL TOTAL DANE, RECOV- RECOV- NIUM, RECOV- PYRIFOS FOTON IN BOT- IN BOT- TECH ERABLE ERABLE TOTAL ERABLE TOTAL UNFILT PHORATE DEF ALDRIN, LINDANE TOM MA- TOM MA- NICAL
Date (UG/L (UG/L (UG/L (UG/L RECOVER RECOVER TOTAL TOTAL TOTAL TOTAL TERIAL TERIAL TOTAL AS NI) AS ZN) AS SE) AS HG) (UG/L) (UG/L) (UG/L) (UG/L) (UG/L) (UG/L) (UG/KG) (UG/KG) (UG/L)(01067) (01092) (01147) (71900) (38932) (39011) (39023) (39040) (39330) (39340) (39333) (39343) (39350)
JUN 25... <1.0 37 <1 <.1 <.01 <.10 <.02 <.02 <.01 <.006 <.2 <.2 <.1
CHLOR- P,P'- P,P'- P,P'- DI- ENDO DANE, DDD, DDE, DDT, ELDRIN, SULFAN ENDRIN, TOTAL P,P'- RECOVER RECOVER P,P'- RECOVER TOTAL ENDO- I TOTAL ENDRIN TOTALIN BOT- DDD IN BOT- P,P'- IN BOT- DDT IN BOT- DI- IN BOT- SULFAN IN BOT- WATER IN BOTTOM MA- UNFILT TOM MA- DDE, TOM MA- UNFILT TOM MA- ELDRIN TOM MA- I TOM MA- UNFLTRD TOM MA-
Date TERIAL RECOVER TERIAL TOTAL TERIAL RECOVER TERIAL TOTAL TERIAL TOTAL TERIAL REC TERIAL(UG/KG) (UG/L) (UG/KG) (UG/L) (UG/KG) (UG/L) (UG/KG) (UG/L) (UG/KG) (UG/L) (UG/KG) (UG/L) (UG/KG)(39351) (39360) (39363) (39365) (39368) (39370) (39373) (39380) (39383) (39388) (39389) (39390) (39393)
JUN 25... <3 <.007 <.5 <.006 E.2 <.009 <.5 <.006 <.2 <.02 <.2 <.01 <.2
TOXA- HEPTA- HEPTA- METHPHENE, CHLOR, CHLOR OXY- PCB,
TOTAL TOTAL HEPTA- EPOXIDE METH- CHLOR, TOTAL TOX- IN BOT- HEPTA- IN BOT- CHLOR TOT. IN OXY- TOT. IN IN BOT- MALA- PARA
ETHION, APHENE, TOM MA- CHLOR, TOM MA- EPOXIDE BOTTOM CHLOR, BOTTOM PCB, TOM MA- THION, THION,Date TOTAL TOTAL TERIAL TOTAL TERIAL TOTAL MATL. TOTAL MATL. TOTAL TERIAL TOTAL TOTAL
(UG/L) (UG/L) (UG/KG) (UG/L) (UG/KG) (UG/L) (UG/KG) (UG/L) (UG/KG) (UG/L) (UG/KG) (UG/L) (UG/L)(39398) (39400) (39403) (39410) (39413) (39420) (39423) (39480) (39481) (39516) (39519) (39530) (39540)
JUN 25... <.01 <1 <50 <.01 <.2 <.009 <.2 <.020 <2.5 <.1 <5 <.10 <.01
FONOFOS BI MIREX, CARBO- (DY- PHENYL,
METHYL TOTAL PHENO- FONATE) NONA DI- PARA- IN BOT- THION WATER CHLOROAZINON, THION, MIREX, TOM MA- WATER WHOLE SUR SCD
Date TOTAL TOTAL TOTAL TERIAL UNFLTRD TOT.REC 1325 (UG/L) (UG/L) (UG/L) (UG/KG) (UG/L) (UG/L) PERCENT (39570) (39600) (39755) (39758) (39786) (82614) (90575)
JUN25... <.02 <.02 <.006 <.2 <.02 <.01 61
< -- Less than E -- Estimated value

------
---
------------
------
------------------
--- ------
284 KISSIMMEE RIVER BASIN
02266495 REEDY CREEK AT S-40, NEAR LOUGHMAN, FL
LOCATION.--Lat 28° 16'32", long 81° 32'39" in SE1⁄ 4 sec.30, T.25 S., R.28 E., Osceola County, Hydrologic Unit 03090101, on right bank 15 ft upstream from spillway, 2.8 mi northeast of Loughman, and 22 mi upstream from mouth.
DRAINAGE AREA.--174 mi2.
GAGE-HEIGHT RECORDS
PERIOD OF RECORD.--October 1986 to current year (gage heights only).
REVISED RECORDS.--WDR FL-96-1: Drainage area.
GAGE.--Water-stage recorder. Datum of gage is at NGVD of 1929 (Reedy Creek Improvement District bench mark).
REMARKS.--Flow regulated at station by manipulation of spillway gates.
EXTREMES FOR PERIOD OF RECORD.--Maximum daily gage height, 71.91 ft, Dec. 29, 1997; minimum daily, 65.71 ft, June 7,2000.
GAGE HEIGHT, FEET, WATER YEAR OCTOBER 2001 TO SEPTEMBER 2002 DAILY MEAN VALUES
DAY OCT NOV DEC JAN FEB MAR APR MAY JUN JUL AUG SEP
1 69.34 67.98 67.48 67.23 67.39 68.69 67.18 66.86 66.71 69.38 69.49 2 69.26 67.95 67.46 67.29 67.38 68.65 67.16 66.83 66.68 69.29 69.60 3 69.19 67.97 67.44 67.50 67.36 68.60 67.14 66.81 66.65 70.48 69.19 69.70 4 69.14 67.95 67.44 67.56 67.34 68.58 67.16 66.79 66.63 70.41 69.10 69.72 5 69.08 67.92 67.46 67.65 67.32 68.54 67.13 66.77 66.61 70.33 69.00 69.76
6 69.03 67.89 67.43 67.68 67.30 68.50 67.10 66.75 66.59 70.23 68.90 69.82 7 68.98 67.85 67.43 67.65 67.43 68.46 67.07 66.74 --- 70.10 68.84 69.82 8 68.93 67.81 67.45 67.60 67.62 68.41 67.04 66.72 --- 69.99 68.82 69.80 9 68.88 67.77 67.47 67.56 67.51 68.36 67.01 66.70 --- 69.88 68.76 69.75 10 68.82 67.74 67.48 67.52 67.50 68.31 67.00 66.68 69.81 68.72 69.66
11 68.76 67.70 67.47 67.49 67.53 68.25 66.98 66.67 69.75 68.66 69.58 12 68.71 67.67 67.46 67.46 67.50 68.19 66.97 66.66 69.68 68.64 69.51 13 68.65 67.65 67.45 67.44 67.47 68.16 66.99 66.64 69.64 68.88 69.42 14 68.60 67.66 67.41 67.45 67.42 68.11 66.99 66.64 69.66 69.12 69.35 15 68.57 67.67 67.37 67.57 67.37 68.05 67.07 66.66 67.17 69.62 69.45 69.29
16 68.52 67.67 67.32 67.60 67.34 67.97 67.25 66.65 67.51 69.59 69.71 69.24 17 68.48 67.66 67.29 67.64 67.31 67.90 67.24 66.64 67.59 69.53 69.96 69.37 18 68.43 67.64 67.28 67.64 67.28 67.81 67.20 66.76 67.72 69.45 69.99 69.51 19 68.38 67.63 67.27 67.60 67.26 67.73 67.15 66.88 67.34 69.38 69.97 69.65 20 68.33 67.61 67.25 67.57 67.23 67.65 67.10 66.92 67.09 69.32 69.93 69.78
21 68.30 67.60 67.23 67.55 67.22 67.58 67.05 66.86 67.48 69.30 69.86 69.85 22 68.28 67.59 67.21 67.53 67.45 67.52 67.00 66.82 67.79 69.31 69.88 69.90 23 68.27 67.57 67.20 67.51 68.03 67.46 66.95 66.78 68.19 69.33 69.89 70.07 24 68.26 67.55 67.20 67.49 68.35 67.41 66.92 66.75 69.35 69.88 70.26 25 68.24 67.53 67.21 67.47 68.53 67.36 66.89 66.72 69.39 69.82 70.44
26 68.23 67.52 67.24 67.47 68.66 67.35 66.88 66.70 69.56 69.71 70.55 27 68.19 67.51 67.23 67.45 68.72 67.44 66.98 66.68 69.62 69.59 70.61 28 68.15 67.54 67.22 67.44 68.72 67.38 66.95 66.68 69.64 69.47 70.65 29 68.11 67.56 67.22 67.43 --- 67.31 66.91 66.68 69.62 69.37 70.60 30 68.07 67.51 67.22 67.42 --- 67.25 66.88 66.69 69.55 69.34 70.51 31 68.02 -- 67.22 67.41 --- 67.21 --- 66.72 69.47 69.41 --
MEAN 68.59 67.70 67.34 67.51 67.63 67.94 67.04 66.74 --- 69.37 69.84 MAX 69.34 67.98 67.48 67.68 68.72 68.69 67.25 66.92 --- 69.99 70.65 MIN 68.02 67.51 67.20 67.23 67.22 67.21 66.88 66.64 --- 68.64 69.24
CAL YR 2001 MEAN 67.70 MAX 70.78 MIN 66.47

---------
--- ---
--- --- --- ---
---------
285 KISSIMMEE RIVER BASIN
02266495 REEDY CREEK AT S-40, NEAR LOUGHMAN, FL--Continued
WATER-QUALITY RECORDS
PERIOD OF DAILY RECORD.--SPECIFIC CONDUCTANCE: January 1985 to January 1987, July 1990 to September 1993, October 1994 to current year. WATER TEMPERATURE: January 1985 to January 1987, July 1990 to current year. DISSOLVED OXYGEN: January 1985 to November 1986, October 1990 to current year.
INSTRUMENTATION.--Water-quality monitor.
REMARKS.--Extremes for current year and extremes for period of of daily record are based on recorded values and may have been exceeded during period of no record.
EXTREMES FOR PERIOD OF DAILY RECORD.--SPECIFIC CONDUCTANCE: Maximum daily mean, 389 µS/cm @ 25 ° C, Apr. 3, 2001; minimum daily mean, 74 µS/cm @ 25 ° C, Aug. 14,
1997. WATER TEMPERATURE: Maximum daily mean, 29.7 ° C, June 21, 2000; minimum daily mean, 6.8 ° C, Dec. 27, 1985. DISSOLVED OXYGEN: Maximum daily mean, 9.8 mg/L, Jan. 4,5, 2001; minimum daily mean, 0.0 mg/L, Sept. 10, 1985, June 15,16,
1991, Oct. 1-9, 2001.
EXTREMES FOR CURRENT YEAR.--SPECIFIC CONDUCTANCE: Maximum daily mean, 366 µS/cm @ 25 ° C, June 20; minimum daily mean, 116 µS/cm @ 25 ° C, Sept. 26, 27. WATER TEMPERATURE: Maximum daily mean, 26.3 ° C, May 6,7; minimum daily mean, 9.9 ° C, Jan. 10,11. DISSOLVED OXYGEN: Maximum daily mean, 6.1 mg/L, Jan. 11,12; minimum daily mean 0.0 mg/L, Oct. 1-9.
SPECIFIC CONDUCTANCE (MICROSIEMENS/CM AT 25 DEG. C), WATER YEAR OCTOBER 2001 TO SEPTEMBER 2002DAILY MEAN VALUES
DAY OCT NOV DEC JAN FEB MAR APR MAY JUN JUL AUG SEP
1 179 219 236 220 245 256 233 193 169 173 167 143 2 182 219 236 222 247 254 233 194 166 165 169 142 3 184 219 236 222 247 248 233 192 162 165 168 135 4 185 219 237 221 246 247 232 191 158 164 171 135 5 185 218 237 250 245 248 229 189 154 165 173 133
6 185 219 238 271 243 245 226 186 151 167 175 134 7 184 220 240 274 242 243 226 190 147 168 173 135 8 178 222 240 276 240 242 227 181 144 171 169 136 9 177 222 239 270 235 241 226 172 141 174 169 137 10 176 223 237 263 234 239 225 168 144 175 171 139
11 180 225 235 259 236 237 223 164 159 177 172 141 12 182 226 236 254 237 235 221 160 168 178 170 140 13 183 228 237 252 239 234 219 157 171 178 147 143 14 189 230 238 249 240 233 217 153 193 176 142 144 15 187 230 238 247 241 232 216 150 227 172 136 142
16 184 229 243 245 242 234 220 148 226 169 136 143 17 183 229 240 242 242 237 214 145 254 171 140 18 190 230 231 244 242 239 217 143 298 173 140 19 197 230 228 248 240 241 226 143 342 175 142 20 201 231 224 251 239 242 233 143 366 170 143 128
21 201 230 222 252 239 243 234 152 320 165 144 131 22 200 231 221 252 237 243 232 166 312 164 145 131 23 201 232 221 251 243 243 229 177 309 160 144 127 24 202 233 221 250 264 242 223 182 287 160 146 122 25 201 234 220 248 261 242 217 185 204 162 149 117
26 198 233 217 248 263 241 208 189 191 150 150 116 27 201 230 216 248 264 238 198 190 193 147 151 116 28 207 232 216 247 262 233 196 189 192 151 152 118 29 212 237 217 246 229 193 187 185 154 152 120 30 216 239 218 245 231 199 182 182 158 148 123 31 219 219 244 232 177 -- 164 142
MEAN 192 227 230 249 245 240 221 172 210 166 155 MAX 219 239 243 276 264 256 234 194 366 178 175 MIN 176 218 216 220 234 229 193 143 141 147 136
CAL YR 2001 MEAN 225 MAX 389 MIN 147

---
------
---
---------------
--- --- --- --- ---
---------
--- --- ---
--- --- --- ---
--- ------ ------ ---
286 KISSIMMEE RIVER BASIN
02266495 REEDY CREEK AT S-40, NEAR LOUGHMAN, FL--Continued
TEMPERATURE, WATER (DEG. C), WATER YEAR OCTOBER 2001 TO SEPTEMBER 2002 DAILY MEAN VALUES
DAY OCT NOV DEC JAN FEB MAR APR MAY JUN JUL AUG SEP
1 21.7 19.8 19.2 14.9 21.4 12.5 22.1 24.4 24.7 23.9 25.4 25.4 2 20.9 20.8 19.2 14.7 21.3 13.4 22.3 24.6 25.1 23.8 25.2 25.7 3 20.9 21.7 19.5 14.3 21.0 15.1 22.2 25.0 25.6 23.9 24.7 26.0 4 21.4 22.1 20.1 12.7 20.3 16.4 21.6 25.5 25.9 24.1 24.6 25.9 5 21.8 22.1 20.5 11.0 18.6 14.1 21.5 25.9 26.1 24.0 24.9 25.7
6 22.5 20.7 20.6 10.9 17.1 13.3 21.2 26.1 26.3 24.0 25.4 25.5 7 23.5 19.5 20.8 11.6 17.0 13.9 20.5 26.1 26.3 24.1 25.3 25.5 8 23.8 18.6 21.2 11.7 16.8 15.1 19.9 26.2 25.9 24.2 24.7 25.5 9 23.1 18.2 21.6 10.8 16.4 16.2 20.0 26.1 25.7 24.3 24.1 25.5 10 22.3 18.0 21.8 9.9 16.6 17.5 20.6 26.1 25.5 24.1 23.9 25.5
11 22.4 17.7 21.9 9.9 17.2 18.1 21.2 26.0 25.3 24.0 23.9 25.2 12 22.7 17.6 21.9 10.7 17.6 18.4 21.4 25.9 25.4 24.1 24.0 24.6 13 22.8 18.0 21.7 11.9 17.4 18.9 21.5 25.8 25.5 24.1 23.8 24.7 14 23.2 18.9 21.6 13.2 16.9 19.0 21.5 25.7 25.8 24.6 23.9 25.1 15 23.8 19.4 21.8 14.3 16.3 18.9 21.3 25.1 26.0 25.1 24.2 25.4
16 23.4 19.4 22.0 14.6 16.2 19.1 21.5 24.6 25.6 25.5 24.6 25.8 17 22.0 19.4 22.0 14.7 16.2 20.0 22.1 24.9 25.0 26.1 25.2 --18 20.0 19.6 21.6 15.3 15.9 20.8 22.4 25.3 24.1 26.1 25.2 --19 20.4 20.1 20.1 15.8 15.5 21.3 22.6 24.8 23.8 25.9 25.1 --20 21.6 20.2 18.4 16.4 15.6 21.5 22.8 24.0 23.5 25.7 25.0 26.0
21 22.8 19.9 16.8 17.3 16.5 21.5 23.0 23.3 23.1 24.9 25.0 25.9 22 23.2 19.3 15.6 18.6 17.6 21.4 23.3 22.8 23.1 24.3 24.9 25.8 23 23.4 19.1 15.3 19.6 18.1 20.7 23.6 22.7 23.2 24.5 24.9 25.4 24 23.6 19.6 15.9 20.2 16.2 19.7 23.7 22.7 23.3 25.1 25.0 25.2 25 24.2 20.1 16.2 20.3 15.0 19.5 23.8 22.7 23.5 25.5 25.1 25.3
26 23.7 20.3 15.5 20.5 15.3 20.1 23.9 22.8 23.6 25.0 25.0 25.5 27 20.3 20.1 13.9 20.8 15.9 20.7 24.1 23.0 23.8 25.0 24.9 25.8 28 17.6 19.7 12.9 21.0 13.6 20.9 24.2 23.5 24.1 25.4 25.0 25.8 29 17.0 19.5 13.1 21.1 --- 20.9 24.1 24.0 24.1 25.4 25.0 25.8 30 18.0 19.3 14.0 21.2 --- 21.2 24.2 24.4 24.1 25.3 24.9 25.8 31 19.0 --- 14.9 21.3 --- 21.8 --- 24.5 25.4 24.9 --
MEAN 21.8 19.6 18.8 15.5 17.1 18.4 22.3 24.7 24.8 24.8 24.8 -- MAX 24.2 22.1 22.0 21.3 21.4 21.8 24.2 26.2 26.3 26.1 25.4 MIN 17.0 17.6 12.9 9.9 13.6 12.5 19.9 22.7 23.1 23.8 23.8
CAL YR 2001 MEAN 21.2 MAX 26.8 MIN 8.7
OXYGEN DISSOLVED (MG/L), WATER YEAR OCTOBER 2001 TO SEPTEMBER 2002 DAILY MEAN VALUES
DAY OCT NOV DEC JAN FEB MAR APR MAY JUN JUL AUG SEP
1 0.0 2.5 3.3 4.9 3.1 1.9 3.0 4.6 4.1 1.0 1.0 0.8 2 0.0 2.3 3.2 4.6 3.2 2.1 2.9 4.8 4.3 0.7 3.2 1.3 3 0.0 1.7 3.2 5.3 3.3 2.1 2.7 4.5 3.8 0.6 3.4 2.0 4 0.0 1.5 3.1 5.6 3.4 2.0 2.8 4.0 3.0 0.4 1.9 1.5 5 0.0 1.7 3.1 6.1 3.8 1.8 3.0 3.5 2.4 4.1 1.4
6 0.0 2.0 3.1 6.0 4.8 2.0 3.7 2.9 2.9 3.3 1.0 7 0.0 2.1 3.0 5.8 5.0 2.0 4.1 2.8 3.2 0.7 1.0 8 0.0 2.4 2.8 5.6 4.7 1.9 4.5 3.5 2.8 0.4 1.0 9 0.0 2.6 2.7 5.7 4.6 1.7 4.8 4.5 3.5 0.4 0.9 10 0.1 2.9 2.7 6.0 4.8 1.5 5.2 5.2 4.2 0.7 0.6
11 0.1 3.0 2.7 6.1 4.5 1.2 4.9 5.1 3.5 0.7 0.5 12 0.1 3.2 2.6 6.1 4.3 1.7 5.0 4.6 3.1 1.0 0.3 13 0.1 3.3 2.6 6.0 4.3 2.1 4.0 3.7 3.6 1.7 0.7 14 0.1 3.3 2.8 5.6 4.4 1.9 3.7 2.9 3.6 1.3 2.6 15 0.1 3.2 2.8 5.3 4.9 2.5 3.4 2.8 3.1 1.9 4.2
16 0.1 3.1 2.5 4.9 4.8 2.7 3.5 3.2 3.2 0.4 1.4 5.2 17 0.1 3.1 2.4 4.7 4.7 2.7 3.6 3.2 3.8 0.5 1.2 18 0.1 3.1 2.5 4.6 4.8 2.6 3.4 2.9 3.5 1.7 1.0 19 0.3 3.0 2.8 4.5 5.1 2.4 3.4 2.6 2.9 1.7 1.0 20 0.7 2.9 3.2 4.5 5.3 2.4 3.4 3.5 2.5 2.7 0.9 0.7
21 0.6 2.9 3.8 4.0 5.0 2.8 3.4 4.0 2.2 0.4 0.6 0.6 22 0.4 3.2 4.2 4.0 4.3 2.8 3.3 4.6 1.4 0.4 0.7 0.7 23 0.3 3.2 4.4 3.9 4.4 2.8 3.2 4.3 1.1 0.7 0.6 0.8 24 0.4 3.1 4.5 3.7 3.4 3.4 3.0 4.3 1.0 0.4 0.5 1.0 25 0.3 3.0 4.6 3.7 2.1 3.8 3.1 4.9 1.3 0.8 0.5 1.0
26 0.2 2.9 4.7 3.7 1.7 4.1 3.0 4.6 1.3 1.3 0.5 0.7 27 0.6 2.7 5.0 3.3 1.7 3.7 3.3 3.7 1.1 0.8 1.1 0.6 28 1.5 2.9 5.3 3.5 1.8 3.3 3.5 3.5 1.0 0.8 4.1 0.6 29 2.1 3.1 5.6 3.4 3.1 4.1 4.0 0.9 0.6 5.2 0.5 30 2.4 3.2 5.4 3.2 3.3 4.3 4.1 1.1 0.5 1.3 31 2.6 5.3 3.2 3.3 3.9 --- 0.5 0.9
MEAN 0.4 2.8 3.5 4.8 4.0 2.5 3.6 3.9 2.6 1.5 MAX 2.6 3.3 5.6 6.1 5.3 4.1 5.2 5.2 4.3 5.2 MIN 0.0 1.5 2.4 3.2 1.7 1.2 2.7 2.6 0.9 0.4

287 KISSIMMEE RIVER BASIN
02266496 REEDY CREEK BELOW S-40, NEAR LOUGHMAN, FL
LOCATION.--Lat 28° 16'32", long 81° 32'39", in SE1⁄ 4 sec.30, T.25 S., R.28 E., Osceola County, Hydrologic Unit 03090101, on left bank 30 ft downstream from spillway, 2.8 mi northeast of Loughman, and 22 mi upstream from mouth.
DRAINAGE AREA.--174 mi2.
PERIOD OF RECORD.--October 1986 to September 1989 (gage heights only), October 1989 to September 1994, October 1996 to current year.
GAGE.--Water-stage recorder. Datum of gage is at NGVD of 1929 (Reedy Creek Improvement District bench mark).
REMARKS.--Records fair. Flow regulated by Structure 40.
DISCHARGE, CUBIC FEET PER SECOND, WATER YEAR OCTOBER 2001 TO SEPTEMBER 2002DAILY MEAN VALUES
DAY OCT NOV DEC JAN FEB MAR APR MAY JUN JUL AUG SEP
1 74 5.4 2.1 1.1 2 63 4.9 2.1 1.2 3 52 4.8 2.0 1.5 4 42 4.5 1.9 1.4 5 36 4.4 1.9 1.4
1.1 e1.4 1.2 1.2 1.3 e297 94 141 0.98 e1.6 1.1 1.1 1.3 e304 91 142 0.94 e2.0 1.1 1.1 1.3 288 88 147 0.89 e2.4 1.1 1.1 1.3 275 85 145 0.82 2.5 1.0 1.1 1.3 264 82 149
6 30 4.3 1.8 1.4 7 24 4.0 1.8 1.5 8 22 3.8 1.8 1.5 9 19 3.5 1.8 1.510 18 3.4 1.7 1.4
0.81 2.3 0.98 1.1 1.3 243 79 147 0.93 2.2 0.97 1.1 1.5 211 78 148 1.2 2.1 0.98 1.1 1.6 192 77 144 1.1 2.0 0.96 1.1 1.5 175 76 140 1.0 1.9 0.95 1.1 1.5 164 75 136
11 16 3.2 1.7 1.4 12 15 3.1 1.6 1.313 13 3.0 1.6 1.314 12 3.0 1.6 1.315 12 2.9 1.5 1.5
1.0 1.8 0.95 1.1 1.6 156 73 1360.97 1.7 0.96 1.1 1.7 146 73 1310.92 1.8 0.96 1.1 1.7 137 78 125 0.90 1.7 1.0 1.0 1.9 135 82 121 0.88 1.7 1.1 1.0 2.2 124 90 119
16 11 2.9 1.5 1.517 11 2.8 1.5 1.418 9.7 2.8 1.5 1.4 19 9.0 2.9 1.4 1.420 8.3 2.9 1.4 1.4
0.88 1.6 1.2 1.0 2.6 111 113 115 0.85 1.5 1.2 1.0 2.6 105 155 119 0.84 1.5 1.2 1.1 2.7 98 169 120 0.83 1.4 1.2 1.3 e2.9 95 171 126 0.80 1.4 1.2 1.3 e3.4 93 170 123
21 8.1 2.9 1.3 1.322 8.1 2.8 1.3 1.323 7.8 2.7 1.2 1.324 7.5 2.7 1.2 1.325 7.2 2.6 1.2 1.2
0.80 1.3 1.2 1.2 e4.5 92 166 125e1.4 1.3 1.1 1.2 e5.6 92 165 136e2.1 1.2 1.1 1.2 e7.8 91 165 166e2.6 1.1 1.1 1.2 e12 91 163 198e2.3 1.1 1.1 1.2 e32 94 160 281
26 7.2 2.5 1.2 1.227 7.1 2.3 1.2 1.228 7.1 2.3 1.2 1.329 6.2 2.3 1.2 1.2 30 5.6 2.2 1.1 1.1 31 5.5 --- 1.1 1.1
e2.1 1.2 1.1 1.1 e73 104 156 366e1.8 1.8 1.2 1.1 e117 108 150 347e1.6 1.6 1.2 0.95 e168 110 145 285 --- 1.4 1.2 1.1 e206 109 141 276 --- 1.3 1.2 1.2 e241 106 141 257 --- 1.2 --- 1.3 --- 100 143 --
TOTAL 574.4 97.8 47.4 41.3MEAN 18.5 3.26 1.53 1.33 MAX 74 5.4 2.1 1.5 MIN 5.5 2.2 1.1 1.1 CFSM 0.11 0.02 0.01 0.01 IN. 0.12 0.02 0.01 0.01
33.34 51.0 32.81 34.85 904.1 4710 3694 51111.19 1.65 1.09 1.12 30.1 152 119 1702.6 2.5 1.2 1.3 241 304 171 366
0.80 1.1 0.95 0.95 1.3 91 73 1150.01 0.01 0.01 0.01 0.17 0.87 0.68 0.98 0.01 0.01 0.01 0.01 0.19 1.01 0.79 1.09
STATISTICS OF MONTHLY MEAN DATA FOR WATER YEARS 1990 - 2002, BY WATER YEAR (WY)
MEAN 41.6 20.1 57.0 48.2 MAX 105 91.7 501 433 (WY) 1997 1998 1998 1998 MIN 1.70 1.10 1.35 1.17(WY) 2001 1990 1994 2001
44.0 50.3 20.1 10.4 25.3 72.1 75.8 89.5390 452 109 36.0 124 260 244 3161998 1998 1998 1993 1991 1991 1997 1994 0.79 1.34 1.09 0.87 1.49 2.11 2.01 2.102001 2001 2002 1994 2000 2001 2000 2000
SUMMARY STATISTICS FOR 2001 CALENDAR YEAR FOR 2002 WATER YEAR WATER YEARS 1990 - 2002
ANNUAL TOTAL 6406.57 ANNUAL MEAN 17.6 HIGHEST ANNUAL MEAN LOWEST ANNUAL MEAN HIGHEST DAILY MEAN 330 LOWEST DAILY MEAN 0.65 ANNUAL SEVEN-DAY MINIMUM 0.68MAXIMUM PEAK STAGEANNUAL RUNOFF (CFSM) 0.10ANNUAL RUNOFF (INCHES) 1.3710 PERCENT EXCEEDS 5250 PERCENT EXCEEDS 1.690 PERCENT EXCEEDS 0.99
15332.0042.0 46.3
179 19989.64 2000
Sep 17 366 Sep 26 1220 Dec 29,30 1997 Feb 18,19 0.80 Feb 20,21 0.55 May 27 1994 Feb 16 0.84 Feb 15 0.58 May 23 1994
68.92 Sep 27 70.30 Dec 30 1997 0.24 0.27 3.28 3.61
147 124 2.0 4.9 1.1 1.2
e Estimated

288 KISSIMMEE RIVER BASIN
02266500 REEDY CREEK NEAR LOUGHMAN, FL
LOCATION.--Lat 28° 15'48", long 81° 32'12", in SW1⁄ 4 sec.32, T.25 S., R.28 E., Osceola County, Hydrologic Unit 03090101, on left bank 100 ft upstream (revised) from bridge on U.S. Highways 17 and 92, 1.0 mi downstream from Reedy Creek ImprovementDistrict Structure 40, 2.5 mi northeast of Loughman, 3 mi downstream from Davenport Creek, and 21 mi upstream from mouth.
DRAINAGE AREA.--177 mi2, approximately, includes an indeterminate portion of the Reedy Creek Swamp watershed.
WATER-DISCHARGE RECORDS
PERIOD OF RECORD.--October 1939 to September 1959, July 1968 to current year.
REVISED RECORDS.--WDR FL-96-1: Drainage area.
GAGE.--Water-stage recorder. Datum of gage is 64.49 ft above NGVD of 1929. Prior to Aug. 20, 1940, nonrecording gage at samesite and datum.
REMARKS.--Records poor. Natural flow of stream affected by several canals, levees, and control structures which divert anundetermined amount of water into Reedy Creek above station or into the Shingle Creek basin. Since May 1970, flow regulatedby Reedy Creek Improvement District Structure 40.
DISCHARGE, CUBIC FEET PER SECOND, WATER YEAR OCTOBER 2001 TO SEPTEMBER 2002DAILY MEAN VALUES
DAY OCT NOV DEC JAN FEB MAR APR MAY JUN JUL AUG SEP
1 104 2.8 0.16 0.00 2 87 2.7 0.12 0.00 3 71 2.8 0.07 0.00 4 57 2.6 0.03 0.00 5 47 2.5 0.00 0.00
0.00 0.63 0.00 0.00 0.00 369 134 182 0.00 0.52 0.00 0.00 0.00 372 128 182 0.00 0.41 0.00 0.00 0.00 371 127 192 0.00 0.41 0.00 0.00 0.00 362 123 189 0.00 0.35 0.00 0.00 0.00 357 115 196
6 39 2.3 0.00 0.00 7 32 2.1 0.00 0.00 8 26 1.9 0.00 0.00 9 22 1.8 0.00 0.0010 19 1.7 0.00 0.00
0.00 0.27 0.00 0.00 0.00 346 108 194 0.00 0.20 0.00 0.00 0.00 317 108 193 0.00 0.15 0.00 0.00 0.00 292 106 191 0.00 0.09 0.00 0.00 0.00 267 103 186 0.00 0.04 0.00 0.00 0.00 251 101 183
11 16 1.5 0.00 0.0012 14 1.4 0.00 0.0013 12 1.3 0.00 0.0014 11 1.3 0.00 0.0015 9.9 1.2 0.00 0.00
0.00 0.01 0.00 0.00 0.00 236 97 183 0.00 0.00 0.00 0.00 0.00 221 100 180 0.00 0.00 0.00 0.00 0.00 211 109 173 0.00 0.00 0.00 0.00 0.00 205 108 167 0.00 0.00 0.00 0.00 0.00 190 119 161
16 8.9 1.1 0.00 0.0017 8.0 1.0 0.00 0.0018 7.3 0.95 0.00 0.0019 6.6 0.96 0.00 0.0020 6.1 0.91 0.00 0.00
0.00 0.00 0.00 0.00 0.00 171 130 156 0.00 0.00 0.00 0.00 0.01 156 165 162 0.00 0.00 0.00 0.00 0.07 144 199 157 0.00 0.00 0.00 0.00 0.18 138 221 161 0.00 0.00 0.00 0.00 0.71 136 225 164
21 5.8 0.86 0.00 0.0022 5.7 0.79 0.00 0.0023 5.4 0.72 0.00 0.0024 5.1 0.65 0.00 0.0025 5.0 0.58 0.00 0.00
0.00 0.00 0.00 0.00 1.4 137 215 1620.14 0.00 0.00 0.00 2.2 134 211 1730.92 0.00 0.00 0.00 4.0 129 210 206 1.6 0.00 0.00 0.00 5.7 128 207 244 1.5 0.00 0.00 0.00 21 136 202 308
26 4.8 0.49 0.00 0.00 27 4.4 0.39 0.00 0.0028 4.0 0.32 0.00 0.0029 3.5 0.27 0.00 0.00 30 3.3 0.20 0.00 0.00 31 3.1 --- 0.00 0.00
1.2 0.00 0.00 0.00 56 152 198 3980.96 0.00 0.00 0.00 106 148 194 4040.76 0.00 0.00 0.00 171 150 187 355 --- 0.00 0.00 0.00 232 151 184 331 --- 0.00 0.00 0.00 294 148 186 313 --- 0.00 --- 0.00 --- 142 189 --
TOTAL 653.9 40.09 0.38 0.00 MEAN 21.1 1.34 0.012 0.000 MAX 104 2.8 0.16 0.00 MIN 3.1 0.20 0.00 0.00
7.08 3.08 0.00 0.00 894.27 6667 4809 6446 0.25 0.099 0.000 0.000 29.8 215 155 2151.6 0.63 0.00 0.00 294 372 225 404
0.00 0.00 0.00 0.00 0.00 128 97 156
STATISTICS OF MONTHLY MEAN DATA FOR WATER YEARS 1940 - 2002, BY WATER YEAR (WY)
MEAN 92.3 49.3 53.4 58.4 MAX 326 217 497 492 (WY) 1970 1988 1998 1998MIN 1.12 0.040 0.000 0.000(WY) 2001 1974 1974 1974
54.2 59.8 47.7 18.2 30.8 80.9 101 121424 451 261 107 143 283 317 4111998 1998 1987 1979 1942 1991 1995 1953
0.000 0.099 0.000 0.000 0.000 0.000 0.000 1.901974 2002 1972 1972 1981 1989 1989 2000
SUMMARY STATISTICS FOR 2001 CALENDAR YEAR FOR 2002 WATER YEAR WATER YEARS 1940 - 2002
ANNUAL TOTAL 6115.20 ANNUAL MEAN 16.8 HIGHEST ANNUAL MEAN LOWEST ANNUAL MEAN HIGHEST DAILY MEAN 412 LOWEST DAILY MEAN 0.00 ANNUAL SEVEN-DAY MINIMUM 0.00MAXIMUM PEAK FLOWMAXIMUM PEAK STAGE 10 PERCENT EXCEEDS 2750 PERCENT EXCEEDS 1.090 PERCENT EXCEEDS 0.09
19520.8053.5 64.1
191 1998 10.6 2000
Sep 17 404 Sep 27 1080 Dec 30 1997 Jul 29-31 0.00 Many days 0.00 Many days Dec 5 0.00 Dec 5 0.00 Many days
418 Sep 27 1090 Dec 30 1997 3.33 Sep 27 4.25 Sep 24 1969
193 167 0.09 33 0.00 1.4

-- --
-- --
-- --
-- --
-- --
289 KISSIMMEE RIVER BASIN
02266500 REEDY CREEK NEAR LOUGHMAN, FL--Continued
WATER-QUALITY RECORDS
PERIOD OF RECORD.--Water years 1959, 1965, 1968-94, 1996 to current year.
WATER-QUALITY DATA, WATER YEAR OCTOBER 2001 TO SEPTEMBER 2002
DIS PH NITRO NITRO NITRO CHARGE, SPE WATER GEN, GEN, NITRO- GEN,AM-INST. CIFIC WHOLE COLOR AMMONIA NITRITE GEN, MONIA + CUBIC CON FIELD TEMPER- TUR (PLAT OXYGEN, DIS DIS NITRITE ORGANIC FEET GAGE DUCT- (STAND- ATURE BID INUM- DIS SOLVED SOLVED TOTAL TOTAL
Date Time PER HEIGHT ANCE ARD WATER ITY COBALT SOLVED (MG/L (MG/L (MG/L (MG/L SECOND (FEET) (US/CM) UNITS) (DEG C) (NTU) UNITS) (MG/L) AS N) AS N) AS N) AS N)
(00061) (00065) (00095) (00400) (00010) (00076) (00080) (00300) (00608) (00613) (00615) (00625)
OCT 24... 0730 5.2 1.37 216 6.1 23.5 - .2 .10 <.010 E2.4 NOV 19... 1130 .96 1.00 240 6.3 19.9 - .2 .08 .010 E1.8 JUN 25... 0900 16 1.74 407 5.6 23.5 .92 400 1.8 .10 .010 .02 2.5
JUL 30... 1100 150 2.38 164 5.7 25.2 - .6 .09 .020 2.7 AUG 27... 0800 196 2.61 154 5.9 24.9 - .4 .06 .020 2.5 SEP 23... 0900 202 2.74 135 5.8 25.4 - .3 .03 .020 2.2
NITRO- ORTHO NITRO- GEN, PHOS- GEN, NO2+NO3 PHOS- PHATE,
NO2+NO3 DIS- PHORUS DIS TOTAL SOLVED TOTAL SOLVED
Date (MG/L (MG/L (MG/L (MG/L AS N) AS N) AS P) AS P)(00630) (00631) (00665) (00671)
ANC PHOS- HARD- MAGNE- POTAS- UNFLTRD
CARBON, PHORUS NESS CALCIUM SIUM, SODIUM, SIUM, TIT 4.5 SULFATE ORGANIC ORTHO TOTAL DIS- DIS- DIS- DIS- LAB DISTOTAL TOTAL (MG/L SOLVED SOLVED SOLVED SOLVED (MG/L SOLVED(MG/L (MG/L AS (MG/L (MG/L (MG/L (MG/L AS (MG/L AS C) AS P) CACO3) AS CA) AS MG) AS NA) AS K) CACO3) AS SO4) (00680) (70507) (00900) (00915) (00925) (00930) (00935) (90410) (00945)
OCT 24... -- <.02 E.08 .08 63.0 -- -- -- -- -- -- -- -NOV 19... -- <.02 E.07 .06 46.0 -- -- -- -- -- -- -- -JUN 25... .040 .05 .04 .02 56.0 .020 160 47.0 11.0 16.0 2.60 12 130JUL 30... -- <.02 .09 .08 66.0 -- -- -- -- -- -- -- -AUG 27... -- <.02 .15 .13 64.0 -- -- -- -- -- -- -- -SEP 23... -- <.02 .14 .14 72.0 -- -- -- -- -- -- -- --
CHLOR-A BERYL- ALUM- MANGA CHLO- FLUO- PHYTO- LIUM, INUM, CADMIUM COPPER, IRON, LEAD, NESE, NICKEL, ZINC, RIDE, RIDE, PLANK- TOTAL TOTAL WATER TOTAL TOTAL TOTAL TOTAL TOTAL TOTAL DIS- DIS- TON ARSENIC RECOV- RECOV- UNFLTRD RECOV- RECOV- RECOV- RECOV- RECOV- RECOV SOLVED SOLVED CHROMO TOTAL ERABLE ERABLE TOTAL ERABLE ERABLE ERABLE ERABLE ERABLE ERABLE
Date (MG/L (MG/L FLUOROM (UG/L (UG/L (UG/L (UG/L (UG/L (UG/L (UG/L (UG/L (UG/L (UG/LAS CL) AS F) (UG/L) AS AS) AS BE) AS AL) AS CD) AS CU) AS FE) AS PB) AS MN) AS NI) AS ZN)(00940) (00950) (70953) (01002) (01012) (01105) (01027) (01042) (01045) (01051) (01055) (01067) (01092)
OCT 24... -- -- 3.1 -- -- -- -- -- -- -- -- -- -NOV 19... -- -- 5.5 -- -- -- -- -- -- -- -- -- -JUN 25... 27.0 <.1 <.1 2 <1 408 <1.0 1.7 217 <1 28 1.1 9JUL 30... -- -- <.1 -- -- -- -- -- -- -- -- -- -AUG 27... -- -- <.1 -- -- -- -- -- -- -- -- -- -SEP 23... -- -- <.1 -- -- -- -- -- -- -- -- -- -
< -- Less than E -- Estimated value

290 KISSIMMEE RIVER BASIN
02266500 REEDY CREEK NEAR LOUGHMAN, FL--Continued
WATER-QUALITY DATA, WATER YEAR OCTOBER 2001 TO SEPTEMBER 2002
CHLOR P,P'-ALDRIN, LINDANE CHLOR DANE, DDD,
SELE- CHLOR DISUL TOTAL TOTAL DANE, TOTAL P,P'- RECOVER NIUM, PYRIFOS FOTON IN BOT IN BOT TECH IN BOT DDD IN BOTTOTAL TOTAL UNFILT PHORATE DEF ALDRIN, LINDANE TOM MA- TOM MA- NICAL TOM MA- UNFILT TOM MA-
Date (UG/L RECOVER RECOVER TOTAL TOTAL TOTAL TOTAL TERIAL TERIAL TOTAL TERIAL RECOVER TERIAL AS SE) (UG/L) (UG/L) (UG/L) (UG/L) (UG/L) (UG/L) (UG/KG) (UG/KG) (UG/L) (UG/KG) (UG/L) (UG/KG) (01147) (38932) (39011) (39023) (39040) (39330) (39340) (39333) (39343) (39350) (39351) (39360) (39363)
JUN 25... <1 <.01 <.10 <.02 <.02 <.01 <.006 <.2 <.2 <.1 <3 <.007 E.5
P,P'- P,P'- DI- ENDO- TOXA DDE, DDT, ELDRIN, SULFAN ENDRIN, PHENE,
RECOVER P,P'- RECOVER TOTAL ENDO- I TOTAL ENDRIN TOTAL TOTALP,P'- IN BOT- DDT IN BOT- DI- IN BOT- SULFAN IN BOT- WATER IN BOT- TOX- IN BOT DDE, TOM MA- UNFILT TOM MA- ELDRIN TOM MA- I TOM MA- UNFLTRD TOM MA- ETHION, APHENE, TOM MA-
Date TOTAL TERIAL RECOVER TERIAL TOTAL TERIAL TOTAL TERIAL REC TERIAL TOTAL TOTAL TERIAL (UG/L) (UG/KG) (UG/L) (UG/KG) (UG/L) (UG/KG) (UG/L) (UG/KG) (UG/L) (UG/KG) (UG/L) (UG/L) (UG/KG)(39365) (39368) (39370) (39373) (39380) (39383) (39388) (39389) (39390) (39393) (39398) (39400) (39403)
JUN 25... <.006 .2 <.009 .7 <.006 <.2 <.02 <.2 <.01 <.2 <.01 <1 <50
HEPTA- HEPTA- METH-CHLOR, CHLOR OXY- PCB,TOTAL HEPTA- EPOXIDE METH- CHLOR, TOTAL METHYL
HEPTA- IN BOT- CHLOR TOT. IN OXY- TOT. IN IN BOT- MALA- PARA- DI- PARA CHLOR, TOM MA- EPOXIDE BOTTOM CHLOR, BOTTOM PCB, TOM MA- THION, THION, AZINON, THION, MIREX,
Date TOTAL TERIAL TOTAL MATL. TOTAL MATL. TOTAL TERIAL TOTAL TOTAL TOTAL TOTAL TOTAL(UG/L) (UG/KG) (UG/L) (UG/KG) (UG/L) (UG/KG) (UG/L) (UG/KG) (UG/L) (UG/L) (UG/L) (UG/L) (UG/L)(39410) (39413) (39420) (39423) (39480) (39481) (39516) (39519) (39530) (39540) (39570) (39600) (39755)
JUN 25... <.01 <.2 <.009 <.2 <.020 <2.5 <.1 <5 <.10 <.01 <.02 <.02 <.006
FONOFOS BI MIREX, CARBO- (DY- PHENYL, TOTAL PHENO- FONATE) NONAIN BOT- THION WATER CHLOROTOM MA- WATER WHOLE SUR SCD
Date TERIAL UNFLTRD TOT.REC 1325(UG/KG) (UG/L) (UG/L) PERCENT(39758) (39786) (82614) (90575)
JUN 25... <.2 <.02 <.01 59
< -- Less than E -- Estimated value

291 KISSIMMEE RIVER BASIN
02266550 REEDY CREEK AT STATE HIGHWAY 531 NEAR POINSIANNA, FL
LOCATION.--Lat 28° 08'59", long 81° 26'28", in SE1⁄ 4 sec.7, T.27 S., R.29 E., Osceola County, Hydrologic Unit 03090101, at bridge on State Highway 531, 1.6 mi upstream from Lake Russell, and about 9 mi southeast of Poinsianna.
DRAINAGE AREA.--170 mi2, approximately.
PERIOD OF RECORD.--October 1978 to current year (discharge measurements only).
EXTREMES FOR PERIOD OF RECORD.--Maximum discharge measured, 1,010 ft3/s, Aug. 26, 1991; no flow observed during most years.
WATER-QUALITY DATA, WATER YEAR OCTOBER 2001 TO SEPTEMBER 2002
DIS DIS CHARGE, CHARGE, INST. INST. CUBIC CUBIC FEET GAGE FEET GAGE
Date Time PER HEIGHT Date Time PER HEIGHT SECOND (FEET) SECOND (FEET) (00061) (00065) (00061) (00065)
NOV MAY 23... 0930 15 58.00 10... 1040 .00 58.04
JAN JUL 17... 1345 8.3 57.82 11... 1345 412 60.74
MAR SEP 12... 1340 24 58.20 19... 0910 218 59.19

292 KISSIMMEE RIVER BASIN
02267000 CATFISH CREEK NEAR LAKE WALES, FL
LOCATION.--Lat 27° 57'40", long 81° 29'48", in sec.14, T.29 S., R.28 E., Polk County, Hydrologic Unit 03090101, on left bank, 0.2 mi downstream from Lake Pierce, 7 mi northeast of city of Lake Wales, and 9.3 mi upstream from mouth.
DRAINAGE AREA.--58.9 mi2.
PERIOD OF RECORD.--October 1947 to current year.
GAGE.--Water-stage recorder. Datum of gage is 72.70 ft above NGVD of 1929 (U.S. Army Corps of Engineers bench mark).
REMARKS.--Records good.
DISCHARGE, CUBIC FEET PER SECOND, WATER YEAR OCTOBER 2001 TO SEPTEMBER 2002DAILY MEAN VALUES
DAY OCT NOV DEC JAN FEB MAR APR MAY JUN JUL AUG SEP
1 77 54 37 32 2 74 53 37 32 3 72 53 37 34 4 72 53 36 33 5 70 54 36 32
32 31 19 11 4.6 39 42 56 32 30 18 10 4.5 40 44 57 31 31 18 9.6 4.3 40 48 57 31 32 18 9.4 3.9 40 50 58 29 30 18 9.2 3.7 40 49 67
6 69 51 35 32 7 70 50 36 33 8 72 49 37 32 9 69 48 37 3210 68 47 37 32
28 29 17 8.6 3.5 40 48 73 29 29 16 8.0 3.8 39 47 72 29 29 15 7.5 4.6 38 47 71 28 29 15 7.0 4.4 38 45 7028 29 15 6.5 4.5 37 43 69
11 66 47 37 3212 65 46 36 3213 63 46 36 3214 62 47 36 3215 63 47 36 36
29 28 15 6.0 5.0 38 42 6829 28 15 5.6 4.9 40 42 6828 28 15 5.4 4.7 42 42 6728 27 15 5.1 4.7 43 41 6727 26 15 4.5 4.5 42 44 67
16 62 45 35 3617 61 44 35 3618 58 43 36 3619 57 43 35 3620 58 42 35 36
27 26 15 4.0 4.4 41 44 6627 25 15 4.0 4.5 41 44 6526 25 15 4.2 4.8 40 44 6325 24 14 6.7 5.5 39 44 6225 24 14 7.2 6.0 40 46 60
21 61 41 34 3622 62 41 33 3523 61 40 32 3524 62 40 33 3525 63 40 33 35
25 24 14 6.7 7.1 44 48 6027 23 13 6.4 8.5 47 47 59 32 22 13 5.8 11 46 46 57 34 21 12 5.5 16 46 46 57 33 21 12 5.2 17 45 45 61
26 63 39 34 3427 61 39 32 3428 59 38 32 3429 57 38 32 3330 56 38 32 3331 55 --- 32 32
33 21 11 5.0 22 45 44 62 34 21 11 4.7 29 45 43 62 32 20 11 4.6 30 44 42 61--- 19 11 4.4 32 43 44 60--- 19 10 4.3 34 43 51 58 --- 18 --- 4.6 --- 42 56 --
TOTAL 1988 1356 1081 1044MEAN 64.1 45.2 34.9 33.7 MAX 77 54 37 36 MIN 55 38 32 32CFSM 1.09 0.77 0.59 0.57 IN. 1.26 0.86 0.68 0.66
818 789 435 196.7 297.4 1287 1408 190029.2 25.5 14.5 6.35 9.91 41.5 45.4 63.3 34 32 19 11 34 47 56 73 25 18 10 4.0 3.5 37 41 560.50 0.43 0.25 0.11 0.17 0.70 0.77 1.08 0.52 0.50 0.27 0.12 0.19 0.81 0.89 1.20
STATISTICS OF MONTHLY MEAN DATA FOR WATER YEARS 1948 - 2002, BY WATER YEAR (WY)
MEAN 56.3 44.7 39.8 39.6MAX 190 119 129 102(WY) 1961 1954 1954 1954 MIN 10.4 7.17 11.6 10.1(WY) 1990 1990 1990 2001
39.2 38.5 32.8 23.8 26.7 38.9 46.7 56.1 100 113 120 79.0 86.1 107 142 1991998 1998 1960 1960 1959 1959 1960 1960 8.24 5.53 5.27 1.22 0.48 1.98 9.56 7.942001 2001 2000 1981 2000 2000 2000 1989
SUMMARY STATISTICS FOR 2001 CALENDAR YEAR FOR 2002 WATER YEAR WATER YEARS 1948 - 2002
ANNUAL TOTAL 7991.79 ANNUAL MEAN 21.9 HIGHEST ANNUAL MEAN LOWEST ANNUAL MEAN HIGHEST DAILY MEAN 84 LOWEST DAILY MEAN 0.38 ANNUAL SEVEN-DAY MINIMUM 0.45 MAXIMUM PEAK STAGE ANNUAL RUNOFF (CFSM) 0.37ANNUAL RUNOFF (INCHES) 5.0510 PERCENT EXCEEDS 6150 PERCENT EXCEEDS 9.990 PERCENT EXCEEDS 1.7
12600.134.5 40.3
104 19609.47 1990
Sep 24,25 77 Oct 1 235 Sep 17,18 1960 May 28,30 3.5 Jun 6 0.00 Jun 3-10 1985 May 25 4.0 Jun 3 0.00 Jun 3-10 1985
4.74 Oct 1 6.02 Sep 15 1960 0.59 0.68 7.96 9.2962 7135 36 6.0 12

293 KISSIMMEE RIVER BASIN
02268903 KISSIMMEE RIVER AT S-65, NEAR LAKE WALES, FL
LOCATION.--Lat 27° 48'14", long 81° 11'53", in NW1⁄ 4 sec.11, T.31 S., R.31 E., Osceola County, Hydrologic Unit 03090101, on right bank at upstream side of lock and control structure S-65, 0.1 mi downstream from bridge on State Highway 60, and 25 mi southeast of Lake Wales.
DRAINAGE AREA.--1,607 mi2 at State Highway 60, includes areas drained by Lake Weohyakapka and Lake Marian.
PERIOD OF RECORD.--October 1969 to current year. Prior to October 1969, published as Kissimmee River below Lake Kissimmee(records not equivalent to present site).
GAGE.--Water-stage recorder. Datum of gage is at NGVD of 1929 (levels by U.S. Army Corps of Engineers). Auxiliary water-stagerecorder at downstream side of lock and control structure 65.
REMARKS.--Records good. Since July 1964 flow regulated by operation of control structure 65 and by storage releases at several structures in headwaters. Discharge computed from relation between discharge, head, and gate openings. Structure with two additional gates put in use August 1999.
COOPERATION.--Gage-height record and gate-operation record provided by South Florida Water Management District.
DISCHARGE, CUBIC FEET PER SECOND, WATER YEAR OCTOBER 2001 TO SEPTEMBER 2002DAILY MEAN VALUES
DAY OCT NOV DEC JAN FEB MAR APR MAY JUN JUL AUG SEP
1 4220 860 588 4892 3760 863 582 482 3 3270 833 584 5064 2850 884 573 4875 2760 875 556 477
476 494 514 504 380 914 2900 4800 485 482 518 523 377 943 2900 4780483 486 528 515 376 1060 2890 4800482 496 510 511 368 1380 2890 4870482 498 526 512 359 1570 2910 4840
6 2480 887 541 4817 2330 858 544 4838 2290 833 560 4949 1980 869 574 48410 1800 864 564 479
470 526 528 513 357 1590 2900 4920470 538 513 505 350 1610 2890 5040477 547 513 474 358 1630 2900 5080469 544 508 431 359 1630 2930 4890 467 544 512 435 354 2030 2920 4830
11 1830 872 566 477 12 1810 866 568 462 13 1510 846 555 467 14 1410 810 598 480 15 1390 716 669 488
464 538 507 435 350 2270 2920 5150 463 530 507 439 348 2140 2890 5120 482 526 516 433 337 2250 2750 5250 480 543 518 426 343 2340 2960 4890 474 534 501 422 336 2380 3120 4960
16 1170 710 684 484 17 1080 696 743 479 18 1070 692 672 483 19 1040 681 573 482 20 1070 670 559 481
471 532 514 424 350 2350 3350 4760 477 524 517 410 365 2440 3360 4760 476 541 521 407 375 2540 3530 4560 466 520 511 403 268 2580 3890 4320 462 539 507 398 325 2560 4450 4270
21 1060 672 561 472 22 1030 684 565 475 23 1020 679 570 475 24 1000 658 571 47825 983 670 554 475
456 536 506 427 404 2560 4800 4260 468 548 511 394 409 2590 4830 4220 487 544 506 383 440 2560 4810 3970 486 535 496 379 644 2720 4790 3760483 522 498 372 644 2860 4800 3350
26 1040 672 567 484 27 1030 629 538 487 28 1020 588 493 47529 938 584 491 49530 881 588 488 48531 874 --- 495 476
495 521 497 374 578 2830 4780 3190 496 526 490 367 692 2790 4770 3210 499 518 486 369 914 2830 4710 3130--- 530 484 361 914 2880 4800 3070--- 526 494 373 904 2860 4940 2850--- 533 --- 363 --- 2900 4740 --
TOTAL 51996 22609 17746 14922 MEAN 1677 754 572 481 MAX 4220 887 743 506 MIN 874 584 488 462
13346 16321 15257 13282 13578 68587 115020 131900 477 526 509 428 453 2212 3710 4397499 548 528 523 914 2900 4940 5250456 482 484 361 268 914 2750 2850
STATISTICS OF MONTHLY MEAN DATA FOR WATER YEARS 1970 - 2002, BY WATER YEAR (WY)
MEAN 748 344 661 1188 MAX 5652 3598 5797 6868(WY) 1970 1995 1998 1998 MIN 0.000 0.000 0.000 0.000 (WY) 1984 1984 1985 1985
1394 1323 1386 897 233 542 1274 1024 5076 8652 4320 2364 1965 4352 4537 45541998 1998 1993 1984 1994 1974 1995 19950.000 0.000 0.000 0.000 0.000 0.000 0.000 0.0001985 1991 2001 2001 1977 1985 1987 1970
SUMMARY STATISTICS FOR 2001 CALENDAR YEAR FOR 2002 WATER YEAR WATER YEARS 1970 - 2002
ANNUAL TOTAL 203865.0ANNUAL MEAN 559 HIGHEST ANNUAL MEAN LOWEST ANNUAL MEAN HIGHEST DAILY MEAN e4220 LOWEST DAILY MEAN 0.00ANNUAL SEVEN-DAY MINIMUM 0.00 MAXIMUM PEAK STAGE10 PERCENT EXCEEDS 140050 PERCENT EXCEEDS 0.0090 PERCENT EXCEEDS 0.00
4945641355 916
2508 1998 21.0 1981
Sep 26 5250 Sep 13 12100 Feb 24 1988Many days 268 Jun 19 0.00 Many daysJan 1 337 Jun 14 0.00 Many days
52.18 Sep 10 54.07 Oct 8 19693920 2890 555 71 417 0.00
e Estimated

---
294 KISSIMMEE RIVER BASIN
02268903 KISSIMMEE RIVER AT S-65, NEAR LAKE WALES, FL--Continued
GAGE HEIGHT, FEET, WATER YEAR OCTOBER 2001 TO SEPTEMBER 2002 DAILY MEAN VALUES
DAY OCT NOV DEC JAN FEB MAR APR MAY JUN JUL AUG SEP
1 52.11 51.30 50.82 50.44 50.21 50.36 50.28 49.82 49.18 50.30 51.58 51.89 2 52.03 51.30 50.81 50.40 50.24 50.21 50.28 49.79 49.15 50.59 51.61 51.89 3 51.96 51.31 50.81 50.59 50.21 50.30 50.28 49.71 49.13 50.66 51.63 51.90 4 51.91 51.33 50.80 50.54 50.25 50.56 50.30 49.70 49.04 50.74 51.64 51.90 5 51.84 51.48 50.74 50.40 50.24 50.57 50.33 49.71 49.02 50.78 51.65 51.91
6 51.80 51.37 50.72 50.33 50.07 50.42 50.29 49.69 49.01 50.81 51.67 52.05 7 51.80 51.26 50.72 50.44 50.06 50.42 50.16 49.66 49.00 50.83 51.72 52.09 8 51.78 51.22 50.74 50.44 50.20 50.41 50.07 49.62 49.06 50.90 51.78 52.10 9 51.67 51.21 50.79 50.35 50.12 50.41 50.09 49.57 49.06 50.96 51.71 52.11 10 51.61 51.18 50.75 50.30 50.12 50.44 50.11 49.55 49.03 50.98 51.67 52.11
11 51.53 51.15 50.77 50.30 50.16 50.43 50.11 49.48 49.01 51.04 51.63 52.08 12 51.49 51.15 50.74 50.27 50.14 50.40 50.09 49.47 49.00 51.17 51.61 52.02 13 51.43 51.14 50.72 50.29 50.19 50.43 50.08 49.45 48.94 51.24 51.73 51.99 14 51.38 51.20 50.69 50.27 50.19 50.42 50.11 49.46 48.95 51.35 51.79 51.95 15 51.44 51.27 50.71 50.38 50.13 50.41 50.12 49.44 48.92 51.40 51.79 51.92
16 51.43 51.21 50.68 50.38 50.15 50.38 50.11 49.33 48.98 51.43 51.79 51.86 17 51.46 51.11 50.66 50.35 50.18 50.38 50.10 49.30 49.10 51.41 51.83 51.77 18 51.37 51.06 50.70 50.37 50.14 50.38 50.08 49.32 49.12 51.40 51.89 51.67 19 51.29 51.04 50.66 50.33 50.02 50.36 50.07 49.41 49.20 51.42 51.89 51.61 20 51.27 51.01 50.70 50.31 49.98 50.33 50.05 49.53 49.18 51.43 51.86 51.54
21 51.27 51.00 50.67 50.30 50.00 50.38 50.03 49.50 49.24 51.47 51.82 51.48 22 51.33 50.95 50.57 50.31 50.11 50.45 50.05 49.51 49.25 51.49 51.84 51.40 23 51.30 50.90 50.49 50.27 50.41 50.38 50.05 49.35 49.35 51.50 51.83 51.33 24 51.29 50.88 50.54 50.26 50.44 50.29 49.97 49.26 49.53 51.50 51.80 51.29 25 51.37 50.88 50.59 50.28 50.36 50.28 49.90 49.23 49.68 51.51 51.76 51.23
26 51.48 50.88 50.65 50.30 50.37 50.29 49.89 49.24 49.79 51.54 51.73 51.16 27 51.54 50.85 50.46 50.28 50.53 50.39 49.85 49.18 49.91 51.55 51.69 51.21 28 51.49 50.81 50.44 50.27 50.47 50.36 49.86 49.20 50.03 51.54 51.70 51.18 29 51.41 50.80 50.41 50.25 --- 50.30 49.89 49.17 50.09 51.57 51.68 51.13 30 51.39 50.80 50.42 50.22 --- 50.24 49.85 49.14 50.13 51.58 51.73 51.07 31 51.33 -- 50.43 50.19 --- 50.24 --- 49.16 51.58 51.85 --
MEAN 51.54 51.10 50.66 50.34 50.20 50.37 50.08 49.45 49.27 51.22 51.74 51.69 MAX 52.11 51.48 50.82 50.59 50.53 50.57 50.33 49.82 50.13 51.58 51.89 52.11 MIN 51.27 50.80 50.41 50.19 49.98 50.21 49.85 49.14 48.92 50.30 51.58 51.07
WTR YR 2002 MEAN 50.64 MAX 52.11 MIN 48.92

---
295 KISSIMMEE RIVER BASIN
02268904 KISSIMMEE RIVER BELOW S-65, NEAR LAKE WALES, FL
LOCATION.--Lat 27° 48'14", long 81° 11'53" in NW1⁄ 4 sec.11, T.31 S., R.31 E., Osceola County, Hydrologic Unit 03090101, on right bank at downstream side of lock and control structure S-65, 0.1 mi downstream from bridge on State Highway 60, and 25 mi southeast of Lake Wales.
DRAINAGE AREA.--1,607 mi2, at State Highway 60, includes areas drained by Lake Weohyakapka and Lake Marian.
PERIOD OF RECORD.--October 1969 to current year.
GAGE.--Water-stage recorder. Datum of gage is at NGVD of 1929 (levels by South Florida Water Management District).
REMARKS.--Gage heights partially regulated by operation of structure 65.
COOPERATION.--Gage-height record provided by South Florida Water Management District.
EXTREMES FOR PERIOD OF RECORD.--Maximum daily gage height, 51.44 ft, Oct. 10, 1969; minimum daily, 41.55 ft, Apr. 4, 1977 (result of drawdown of Lake Kissimmee).
GAGE HEIGHT, FEET, WATER YEAR OCTOBER 2001 TO SEPTEMBER 2002DAILY MEAN VALUES
DAY OCT NOV DEC JAN FEB MAR APR MAY JUN JUL AUG SEP
1 46.32 46.13 46.18 46.13 46.13 46.12 46.14 46.27 46.20 46.13 46.23 46.53 2 46.20 46.12 46.18 46.15 46.18 46.16 46.22 46.28 46.12 46.10 46.28 46.50 3 46.19 46.12 46.17 46.17 46.23 46.21 46.22 46.21 46.18 46.35 46.34 46.47 4 46.30 46.23 46.15 46.16 46.24 46.18 46.18 46.19 46.22 46.22 46.30 46.31 5 46.22 46.13 46.12 46.14 46.18 46.14 46.18 46.20 46.25 46.34 46.28 46.42
6 46.10 46.14 46.16 46.14 46.13 46.21 46.16 46.19 46.22 46.29 46.27 46.61 7 46.15 46.11 46.23 46.12 46.09 46.23 46.13 46.22 46.20 46.18 46.30 46.42 8 46.26 46.13 46.23 46.14 46.19 46.19 46.09 46.22 46.21 46.14 46.28 46.38 9 46.37 46.21 46.23 46.13 46.25 46.13 46.15 46.24 46.18 46.19 46.27 46.46 10 46.36 46.18 46.24 46.12 46.25 46.15 46.23 46.27 46.20 46.23 46.24 46.49
11 46.19 46.14 46.15 46.18 46.17 46.19 46.23 46.17 46.21 46.30 46.22 46.46 12 46.21 46.16 46.18 46.21 46.13 46.19 46.23 46.16 46.19 46.87 46.28 46.39 13 46.26 46.18 46.19 46.22 46.13 46.20 46.25 46.15 46.21 46.55 46.72 46.35 14 46.21 46.17 46.19 46.20 46.12 46.22 46.27 46.16 46.26 46.29 46.53 46.36 15 46.15 46.21 46.15 46.25 46.14 46.24 46.25 46.15 46.21 46.27 46.49 46.50
16 46.25 46.14 46.16 46.17 46.19 46.25 46.22 46.19 46.19 46.30 46.47 46.49 17 46.18 46.12 46.23 46.21 46.24 46.23 46.17 46.21 46.29 46.36 46.40 46.45 18 46.15 46.21 46.21 46.17 46.21 46.23 46.16 46.18 46.32 46.40 46.31 46.32 19 46.12 46.24 46.20 46.15 46.15 46.20 46.13 46.25 46.43 46.28 46.33 46.29 20 46.17 46.20 46.13 46.19 46.11 46.18 46.17 46.17 46.52 46.29 46.34 46.35
21 46.19 46.14 46.12 46.15 46.14 46.17 46.16 46.12 46.41 46.35 46.34 46.31 22 46.22 46.15 46.22 46.16 46.22 46.18 46.16 46.18 46.29 46.33 46.34 46.33 23 46.14 46.19 46.23 46.24 46.27 46.20 46.16 46.16 46.57 46.32 46.39 46.33 24 46.20 46.19 46.21 46.21 46.30 46.22 46.15 46.13 46.50 46.28 46.38 46.32 25 46.34 46.15 46.14 46.17 46.16 46.20 46.16 46.19 46.16 46.22 46.36 46.34
26 46.36 46.15 46.10 46.14 46.12 46.15 46.14 46.22 46.25 46.22 46.33 46.31 27 46.26 46.15 46.14 46.15 46.09 46.22 46.18 46.25 46.18 46.27 46.30 46.30 28 46.11 46.26 46.09 46.13 46.14 46.16 46.13 46.24 46.01 46.37 46.37 46.28 29 46.16 46.25 46.19 46.14 --- 46.16 46.11 46.15 46.11 46.31 46.46 46.30 30 46.14 46.17 46.18 46.21 --- 46.14 46.18 46.13 46.12 46.28 46.60 46.26 31 46.09 -- 46.15 46.22 --- 46.13 --- 46.26 46.29 46.63 --
MEAN 46.21 46.17 46.18 46.17 46.17 46.19 46.18 46.20 46.25 46.30 46.37 46.39 MAX 46.37 46.26 46.24 46.25 46.30 46.25 46.27 46.28 46.57 46.87 46.72 46.61 MIN 46.09 46.11 46.09 46.12 46.09 46.12 46.09 46.12 46.01 46.10 46.22 46.26
WTR YR 2002 MEAN 46.23 MAX 46.87 MIN 46.01

---
---------------
---------------
------
---
---
296 KISSIMMEE RIVER BASIN
02269148 KISSIMMEE RIVER NEAR LORIDA, FL
LOCATION.--Lat 27° 31'18", long 81° 12'40" in NE1⁄ 4 sec.15, T.34 S., R.31 E., Highlands County, Hydrologic Unit 03090101, on right bank of natural river channel, 1.8 mi upstream from control structure 65-B, 6.0 mi northeast of Lorida and about 34 mi upstream from mouth.
DRAINAGE AREA.--Indeterminate.
PERIOD OF RECORD.--July 1993 to current year (gage heights only).
GAGE.--Water-stage recorder and data-collection platform. Datum of gage is at NGVD of 1929 (U.S. Army Corps of Engineers bench mark).
EXTREMES FOR PERIOD OF RECORD.--Maximum gage height, 43.65 ft, Feb. 22, 1998; minimum, 34.03 ft, May 22, 2001.
GAGE HEIGHT, FEET, WATER YEAR OCTOBER 2001 TO SEPTEMBER 2002DAILY MEAN VALUES
DAY OCT NOV DEC JAN FEB MAR APR MAY JUN JUL AUG SEP
1 42.50 40.27 37.89 37.03 36.93 37.54 37.07 36.57 35.76 41.79 41.08 42.78 2 42.45 40.13 37.84 37.01 36.85 37.37 36.96 36.53 35.76 41.80 41.06 42.96 3 42.20 39.99 37.82 37.02 36.80 37.21 37.04 36.61 35.58 41.92 41.04 43.03 4 42.09 39.87 37.80 37.01 36.77 37.14 37.11 36.62 35.45 42.00 41.04 43.00 5 42.08 39.85 37.75 37.00 36.81 37.09 37.08 36.59 35.38 42.07 41.02 42.97
6 --- 39.78 37.64 36.99 36.84 37.02 37.08 36.57 35.43 42.08 40.98 43.16 7 --- 39.70 37.52 36.98 36.83 37.20 37.06 36.50 35.47 42.01 40.94 43.17 8 --- 39.59 37.62 36.96 36.77 37.38 37.00 36.43 35.51 41.85 40.90 43.05 9 --- 39.50 37.71 36.95 36.73 37.44 36.93 36.16 35.50 41.65 40.84 42.89 10 39.48 37.77 36.94 36.80 37.39 36.92 35.98 35.47 41.55 40.80 42.75
11 39.44 37.85 36.85 36.93 37.35 36.92 36.09 35.45 41.69 40.75 42.66 12 39.39 37.81 36.79 36.89 37.32 36.92 36.06 35.43 41.97 40.72 42.61 13 39.34 37.78 36.79 36.87 37.29 36.92 35.99 35.44 42.37 40.83 42.55 14 39.30 37.76 36.90 36.87 37.28 36.94 35.94 35.50 42.46 41.05 42.50 15 39.06 37.75 37.23 36.81 37.26 37.01 35.91 35.63 42.34 41.27 42.55
16 38.95 37.69 37.40 36.71 37.24 37.04 35.92 35.70 42.16 41.50 42.54 17 38.82 37.59 37.32 36.66 37.23 37.11 35.92 35.80 41.95 41.69 42.50 18 38.67 37.60 37.34 36.70 37.21 37.10 35.76 35.99 41.79 41.66 42.41 19 38.59 37.59 37.31 36.73 37.19 37.04 35.75 36.30 41.65 41.61 42.22 20 38.57 37.61 37.24 36.71 37.17 36.93 35.81 37.23 41.53 41.62 42.06
21 38.51 37.53 37.21 36.61 37.16 36.91 35.71 38.67 41.51 41.62 42.01 22 38.45 37.42 37.14 36.61 37.16 36.87 35.52 39.61 41.59 41.78 41.98 23 40.73 38.39 37.44 37.04 36.84 37.13 36.84 35.53 40.37 41.58 42.03 41.93 24 39.89 38.37 37.49 37.07 37.60 37.11 36.78 35.53 41.03 41.56 42.05 41.85 25 40.03 38.34 37.53 37.06 37.91 37.11 36.73 35.44 41.59 41.49 42.07 41.82
26 40.51 38.31 37.52 37.06 37.95 37.13 36.73 35.40 41.90 41.39 42.06 41.73 27 40.80 38.24 37.45 37.04 37.86 37.08 36.75 35.38 42.13 41.29 42.04 41.63 28 40.86 38.00 37.30 37.02 37.66 37.11 36.76 35.41 42.14 41.24 42.00 41.57 29 40.77 37.91 37.06 36.99 --- 37.12 36.74 35.49 42.03 41.22 42.03 41.53 30 40.58 37.94 37.02 36.89 --- 37.13 36.64 35.46 41.85 41.17 42.16 41.46 31 40.42 -- 37.02 36.90 --- 37.13 --- 35.54 41.12 42.45 --
MEAN 39.02 37.59 37.05 36.97 37.22 36.93 35.94 37.50 41.74 41.44 42.40 MAX --- 40.27 37.89 37.40 37.95 37.54 37.11 36.62 42.14 42.46 42.45 43.17 MIN --- 37.91 37.02 36.79 36.61 37.02 36.64 35.38 35.38 41.12 40.72 41.46

297 KISSIMMEE RIVER BASIN
02270500 ARBUCKLE CREEK NEAR DE SOTO CITY, FL
LOCATION.--Lat 27° 26'32", long 81° 17'51", in SE1⁄ 4 sec.11, T.35 S., R.30 E., Highlands County, Hydrologic Unit 03090101, on right bank 20 ft downstream from bridge on U.S. Highway 98, 1.3 mi upstream from mouth, and 7 mi east of De Soto City.
DRAINAGE AREA.--379 mi2, excludes area drained by Lake Weohyakapka and includes area drained by Lake Sebring.
PERIOD OF RECORD.--June 1939 to current year.
GAGE.--Water-stage recorder. Datum of gage is 35.51 ft above NGVD of 1929. Since June 7, 1967 auxiliary water-stage recorder at site 1.3 mi upstream. See WDR FL-82-2 for history of changes prior to June 7, 1967.
REMARKS.--Records fair except for periods of estimated daily discharge, which are poor. Records include small diversions intoLake Arbuckle from Lake Weohyakapka through Blue Jordan Swamp.
DISCHARGE, CUBIC FEET PER SECOND, WATER YEAR OCTOBER 2001 TO SEPTEMBER 2002DAILY MEAN VALUES
DAY OCT NOV DEC JAN FEB MAR APR MAY JUN JUL AUG SEP
1 1330 e1300 205 1542 1260 e1250 197 1503 1220 e1300 195 1604 1190 e1250 193 1575 1170 e1300 187 156
145 348 68 36 41 1010 e780 e800142 341 67 36 34 1070 e750 e900140 323 86 37 29 1230 e690 e1000130 291 77 36 28 1380 e680 1150122 267 79 35 27 1660 e675 1060
6 1130 e1200 183 1667 1100 e1150 188 1618 1090 e1100 197 1569 1070 e1000 208 15510 e1000 e960 211 153
126 247 76 33 26 1570 e620 1020139 226 70 33 37 1250 e660 960125 236 67 32 45 1110 e630 911126 212 66 32 46 1010 e595 835149 204 60 31 36 e940 e570 775
11 e950 e920 215 15312 e870 e820 216 151 13 e820 e720 214 14914 e750 e620 212 16915 e680 e590 216 224
178 180 58 31 38 e980 e530 730 177 164 140 29 52 e1010 e520 705 174 157 107 28 45 e950 e495 680188 143 94 27 43 e890 e460 704178 134 81 25 46 e840 e480 665
16 e620 e530 208 28317 e560 e470 200 25518 e510 e420 198 24019 e460 e380 191 22620 e420 363 191 224
157 129 83 26 44 e810 e520 646146 120 72 28 83 e850 e600 708137 109 70 29 185 e900 e690 656135 105 75 45 192 e860 e670 592 132 99 61 44 161 e870 e625 566
21 e380 338 186 208 22 e380 320 178 211 23 e410 306 170 208 24 e430 289 174 196 25 e420 293 169 194
126 94 58 31 174 e810 e620 532 138 90 53 30 365 e1000 e600 506 242 85 50 30 515 e990 e535 489 343 82 48 31 592 e1080 e560 492 343 81 46 35 741 e1220 e650 512
26 e430 265 165 183 27 e600 258 157 174 28 e850 245 171 175 29 e1450 225 157 15930 e1500 213 155 15231 e1300 --- 154 149
343 82 45 27 911 e1450 e690 598 330 81 42 27 974 e1350 e560 584 346 77 40 26 953 e1210 e450 564 --- 75 38 25 919 e1000 e500 546--- 73 37 31 910 e920 e600 544 --- 71 --- 57 --- e870 e700 --
TOTAL 26350 20395 5861 5651 MEAN 850 680 189 182 MAX 1500 1300 216 283 MIN 380 213 154 149
5157 4926 2014 1003 8292 33090 18705 21430184 159 67.1 32.4 276 1067 603 714346 348 140 57 974 1660 780 1150122 71 37 25 26 810 450 489
STATISTICS OF MONTHLY MEAN DATA FOR WATER YEARS 1939 - 2002, BY WATER YEAR (WY)
MEAN 591 265 176 181 MAX 2748 920 1013 988(WY) 1949 1998 1998 1998 MIN 56.3 38.7 32.4 27.5(WY) 1973 2001 2001 2001
201 226 164 95.5 231 405 488 683 1702 1659 841 566 1272 1491 1547 27871998 1998 1998 1957 1959 1974 1960 1948 11.8 6.86 9.38 3.26 11.3 32.5 70.1 92.32001 2001 1956 1981 1989 1977 1950 1972
SUMMARY STATISTICS FOR 2001 CALENDAR YEAR FOR 2002 WATER YEAR WATER YEARS 1939 - 2002
ANNUAL TOTAL 132415.28 ANNUAL MEAN 363 HIGHEST ANNUAL MEAN LOWEST ANNUAL MEAN HIGHEST DAILY MEAN 3030LOWEST DAILY MEAN 0.68ANNUAL SEVEN-DAY MINIMUM 0.80MAXIMUM PEAK FLOW MAXIMUM PEAK STAGE INSTANTANEOUS LOW FLOW10 PERCENT EXCEEDS 125050 PERCENT EXCEEDS 11590 PERCENT EXCEEDS 3.6
152874 419 308
772 1960 60.5 1956
Sep 15 1660 Jul 5 7180 Sep 23 1948Mar 18 25 May 15,29 a0.00 Mar 22 27 May 12 0.80 Mar 22 2001
1830 Jul 5 *7380 Sep 23 19486.15 Jul 5 8.71 Sep 23 19480.00 May 30
1010 717 216 16138 43
e Estimated a Nov 23,30, Dec. 28, 1986, May 17-19,1996. * From rating curve extended above 5300ft3/s.

298 KISSIMMEE RIVER BASIN
02273000 KISSIMMEE RIVER AT S-65E, NEAR OKEECHOBEE, FL
(Former national stream-quality accounting network station)
LOCATION.--Lat 27° 13'32", long 80° 57'46", in NE1⁄ 4 sec.30, T.37 S., R.34 E., Okeechobee County, Hydrologic Unit 03090101, at upstream side of lock and control structure S-65E, 1.8 mi downstream from State Highway 70, 8.2 mi upstream from mouth, and 8.5 mi west of Okeechobee.
DRAINAGE AREA.--Indeterminate.
PERIOD OF RECORD.--October 1928 to September 1962, October 1962 to September 1964 (elevations only), October 1964 to current year. Prior to October 1964, published as Kissimmee River near Okeechobee. Monthly discharges only for some periods, published in WSP l304.
GAGE.--Water-stage recorder. Datum of gage is at NGVD of 1929 (levels by U.S. Army Corps of Engineers). Prior to Apr. 28, 1949, nonrecording gage, and Apr. 28, 1949, to Sept. 30, 1964, water-stage recorder, 1.8 mi upstream at datum 1.37 ft lower.Auxiliary gage at downstream side of lock and control structure 65E.
REMARKS.--Records good. Flow regulated by operation of structure 65E beginning in October 1964. Discharge computed from relation between discharge, head, and gate openings. Records do not include diversions from Lake Istokpoga through control structure 68 on Canal 41A, which began July 1962.
COOPERATION.--Gate-opening record provided by South Florida Water Management District.
EXTREMES OUTSIDE PERIOD OF RECORD.--Flood in August 1928, resulting from hurricane, reached a stage of 28.9 ft, present datum, discharge, 20,000 ft3/s, from rating curve extended above 14,000 ft3/s.
DISCHARGE, CUBIC FEET PER SECOND, WATER YEAR OCTOBER 2001 TO SEPTEMBER 2002DAILY MEAN VALUES
DAY OCT NOV DEC JAN FEB MAR APR MAY JUN JUL AUG SEP
1 5040 2150 282 410 2 5070 1960 424 465 3 4860 1950 658 658 4 4600 1820 541 440 5 4220 1750 530 270
379 433 376 407 289 5190 3330 7830423 568 428 293 206 4640 3500 8120367 472 449 364 191 5190 3470 7990373 475 477 415 207 5600 3300 7600413 425 418 303 187 5990 3290 7560
6 3890 1620 551 507 7 3600 1430 558 433 8 3470 1370 534 464 9 3400 1520 568 466 10 3150 1630 682 406
369 418 394 324 195 5850 3200 7710368 508 391 369 195 6360 3150 8280427 778 389 369 196 6250 3230 7420361 467 388 339 161 5000 3150 7560448 563 357 269 159 4440 2950 6170
11 2650 1520 575 37712 2260 1460 527 36913 2260 1290 495 55514 2240 1160 681 44315 1930 892 601 494
447 395 350 155 185 4520 3060 6360449 437 453 258 146 5590 2940 5960399 499 374 281 146 6320 3050 5470432 466 351 292 221 6250 3170 5410 428 430 463 239 290 6710 3430 5380
16 1600 767 601 52017 1560 1060 601 46918 1620 1010 690 57419 1540 794 634 610 20 1250 843 609 502
422 454 460 273 315 6500 3910 5440360 418 404 283 396 5990 4410 5410333 505 440 233 325 5440 5320 5320 445 402 381 303 365 5040 5080 4860 403 454 430 380 220 4580 5050 4880
21 1190 1020 577 44522 1460 1090 454 50223 1550 794 450 523 24 1620 712 505 522 25 1700 716 615 527
421 419 475 233 631 4520 5320 4340454 364 439 219 996 4840 6210 4270 519 448 360 249 760 5130 6360 4270 455 491 269 118 917 3220 6280 3940 452 363 404 35 1470 4380 5900 4060
26 1900 862 533 558 27 2760 588 485 548 28 2590 356 484 408 29 2750 828 484 438 30 2910 922 449 486 31 2490 --- 445 462
464 402 415 128 2030 4550 5730 4170 501 428 356 146 2620 3950 5510 4200 484 429 357 168 3410 3320 5410 3600 --- 423 291 193 4470 3440 5080 3360 --- 486 336 134 3400 3400 5310 3370 --- 358 --- 264 --- 3520 6870 --
TOTAL 83130 35884 16823 14851 MEAN 2682 1196 543 479 MAX 5070 2150 690 658 MIN 1190 356 282 270
11796 14178 11875 8036 25299 155720 135970 170310421 457 396 259 843 5023 4386 5677519 778 477 415 4470 6710 6870 8280333 358 269 35 146 3220 2940 3360
STATISTICS OF MONTHLY MEAN DATA FOR WATER YEARS 1965 - 2002, BY WATER YEAR (WY)
MEAN 1577 698 738 1286 MAX 10000 4319 6539 7864(WY) 1970 1995 1998 1998MIN 36.4 0.000 0.000 0.000(WY) 1973 2001 1989 1985
1495 1579 1455 902 814 1518 2169 2069 6871 9326 4947 2362 4676 9670 7421 65481998 1998 1993 1984 1982 1974 1974 1995
0.000 0.000 0.000 0.000 0.65 0.80 13.6 1892001 1985 2001 2001 1981 1981 1977 1970
SUMMARY STATISTICS FOR 2001 CALENDAR YEAR FOR 2002 WATER YEAR WATER YEARS 1965 - 2002
ANNUAL TOTAL 324901.0ANNUAL MEAN 890 HIGHEST ANNUAL MEAN LOWEST ANNUAL MEAN HIGHEST DAILY MEAN 6870LOWEST DAILY MEAN 0.00ANNUAL SEVEN-DAY MINIMUM 0.00 MAXIMUM PEAK FLOW MAXIMUM PEAK STAGE10 PERCENT EXCEEDS 273050 PERCENT EXCEEDS 14090 PERCENT EXCEEDS 0.00
6838721874 1358
3304 1998124 1981
Sep 18 8280 Sep 7 23500 Oct 3 1969Many days 35 May 25 0.00 Many daysJan 1 132 May 24 0.00 Many days
27900 Oct 3 1969 21.97 Oct 27 27.00 Oct 3 19695390 3690 558 564 287 1.6

---
KISSIMMEE RIVER BASIN 299
02273000 KISSIMMEE RIVER AT S-65E, NEAR OKEECHOBEE, FL--Continued
GAGE HEIGHT, FEET, WATER YEAR OCTOBER 2001 TO SEPTEMBER 2002 DAILY MEAN VALUES
DAY OCT NOV DEC JAN FEB MAR APR MAY JUN JUL AUG SEP
1 21.01 21.03 20.55 20.96 20.97 21.01 21.01 20.94 21.01 21.02 20.98 21.17 2 21.04 21.06 21.28 21.07 20.98 20.99 20.97 20.90 21.00 20.96 21.01 21.24 3 21.02 21.08 21.12 21.03 20.95 20.90 21.00 21.02 20.96 20.97 21.04 20.86 4 21.00 21.02 21.03 20.88 20.98 20.92 21.01 20.88 20.94 20.97 21.00 21.02 5 20.99 21.11 21.03 20.99 21.00 20.95 20.93 20.90 20.92 20.98 21.01 21.13
6 21.07 21.14 21.04 21.03 21.03 20.98 20.95 21.01 20.96 20.97 21.05 21.23 7 21.05 21.14 20.98 20.96 20.96 21.02 20.94 20.96 20.93 21.02 21.02 21.07 8 21.09 21.12 21.00 21.01 20.89 21.00 20.96 20.91 20.97 20.98 21.05 20.96 9 21.00 21.06 21.14 20.91 20.95 20.95 20.92 20.88 20.98 20.90 21.01 21.27 10 21.01 21.03 21.03 20.95 21.01 20.90 20.87 20.92 21.03 20.97 20.99 20.90
11 20.97 21.01 21.11 21.00 20.98 20.88 20.98 21.01 20.98 21.00 21.04 21.21 12 20.88 21.00 21.07 21.02 20.94 21.01 21.03 21.00 20.97 21.02 21.03 20.82 13 20.90 21.04 21.05 21.02 20.99 20.96 20.89 21.02 21.01 21.11 21.08 20.90 14 21.00 21.02 21.01 20.95 21.00 20.89 20.97 21.01 21.03 21.00 21.03 20.87 15 20.96 20.91 21.01 21.03 21.00 21.01 21.04 21.03 21.00 20.95 21.09 20.89
16 20.88 21.04 21.01 20.97 20.99 20.90 20.92 21.04 20.92 20.97 21.05 21.15 17 20.90 21.12 21.02 21.00 20.93 20.97 21.00 20.94 20.90 20.95 21.07 21.07 18 20.91 20.89 21.04 21.04 21.02 21.00 20.97 20.94 20.88 20.97 21.11 20.97 19 21.02 20.97 20.93 20.93 21.06 20.88 20.91 21.04 20.91 21.03 21.03 20.87 20 21.08 20.96 21.02 20.94 20.92 21.01 21.03 21.03 20.98 21.00 21.07 21.24
21 21.12 20.98 20.96 20.98 21.05 20.94 20.92 20.97 21.03 21.05 21.03 20.88 22 21.12 21.02 21.02 21.00 21.00 21.00 20.89 20.89 20.94 21.00 21.09 20.97 23 20.94 20.94 21.05 20.95 20.98 21.03 20.86 20.95 20.94 21.04 21.07 20.91 24 20.91 20.99 21.01 20.94 20.94 20.92 21.03 20.97 21.09 20.99 21.02 20.88 25 21.06 21.02 21.03 20.99 20.94 20.92 21.10 21.02 21.00 21.07 20.95 21.01
26 21.06 21.04 20.98 21.04 20.96 21.01 20.95 21.01 21.01 21.04 20.94 20.99 27 21.23 20.78 20.96 20.95 20.97 21.00 20.92 21.02 20.95 20.98 20.95 20.97 28 20.67 21.24 20.97 20.91 20.90 20.96 20.90 21.04 21.02 21.04 20.92 20.80 29 20.89 21.09 21.02 21.06 --- 20.97 20.98 21.02 20.92 20.93 20.93 20.94 30 20.96 20.56 21.00 20.97 --- 20.89 21.17 21.02 20.94 21.06 21.30 21.02 31 21.00 -- 21.03 20.95 --- 20.87 --- 21.04 20.94 21.35 --
MEAN 20.99 21.01 21.02 20.98 20.97 20.96 20.97 20.98 20.97 21.00 21.04 21.01 MAX 21.23 21.24 21.28 21.07 21.06 21.03 21.17 21.04 21.09 21.11 21.35 21.27 MIN 20.67 20.56 20.55 20.88 20.89 20.87 20.86 20.88 20.88 20.90 20.92 20.80
WTR YR 2002 MEAN 20.99 MAX 21.35 MIN 20.55

---
300 KISSIMMEE RIVER BASIN
02273001 KISSIMMEE RIVER BELOW S-65E, NEAR OKEECHOBEE, FL
LOCATION.--Lat 27° 13'32", long 80° 57'46", in NE1⁄ 4 sec.30, T.37 S., R.34 E., Okeechobee County, Hydrologic Unit 03090101, at downstream side of lock and control structure S-65E, 1.8 mi downstream from State Highway 70, 8.2 mi upstream from mouth, and 8.5 mi west of Okeechobee.
DRAINAGE AREA.--Indeterminate.
PERIOD OF RECORD.--October 1964 to current year.
GAGE.--Water-stage recorder. Datum of gage is at NGVD of 1929 (levels by U.S. Army Corps of Engineers). Auxiliary gage for station 02273000 at upstream side of lock and control structure.
EXTREMES FOR PERIOD OF RECORD.--Maximum daily gage height, 18.56 ft, Mar. 25, 27, 28, 1998; minimum daily, 9.00 ft, May 24, 2001.
GAGE HEIGHT, FEET, WATER YEAR OCTOBER 2001 TO SEPTEMBER 2002DAILY MEAN VALUES
DAY OCT NOV DEC JAN FEB MAR APR MAY JUN JUL AUG SEP
1 13.83 14.64 14.71 14.42 14.46 14.28 13.75 12.86 11.73 12.78 14.33 15.13 2 13.99 14.68 14.68 14.57 14.39 14.43 13.75 12.86 11.73 12.84 14.38 15.17 3 14.07 14.67 14.66 14.37 14.39 14.32 13.66 12.87 11.72 12.97 14.45 15.19 4 14.10 14.62 14.67 14.28 14.21 13.96 13.62 12.80 11.71 13.03 14.45 15.28 5 14.14 14.54 14.69 14.42 14.20 13.82 13.47 12.69 11.66 13.10 14.44 15.38
6 14.17 14.63 14.68 14.56 14.43 14.11 13.41 12.62 11.58 13.21 14.37 15.37 7 14.13 14.72 14.73 14.39 14.37 14.16 13.51 12.57 11.56 13.31 14.33 15.36 8 14.10 14.80 14.77 14.27 14.18 14.17 13.59 12.54 11.51 13.46 14.30 15.37 9 14.06 14.80 14.76 14.41 14.26 14.17 13.60 12.52 11.40 13.53 14.36 15.42 10 14.19 14.79 14.77 14.45 14.33 14.09 13.48 12.44 11.46 13.65 14.31 15.48
11 14.19 14.81 14.74 14.46 14.31 14.09 13.44 12.40 11.51 13.65 14.32 15.50 12 14.22 14.78 14.75 14.46 14.36 14.17 13.42 12.33 11.58 13.77 14.40 15.57 13 14.28 14.75 14.74 14.43 14.27 14.16 13.40 12.34 11.62 13.89 14.40 15.56 14 14.32 14.77 14.79 14.49 14.21 14.10 13.40 12.12 11.59 13.86 14.50 15.54 15 14.20 14.74 14.71 14.50 14.37 14.11 13.38 11.99 11.84 13.91 14.57 15.50
16 14.20 14.64 14.71 14.47 14.33 14.11 13.36 12.10 11.64 13.97 14.55 15.49 17 13.87 14.72 14.72 14.53 14.23 14.10 13.34 12.16 11.76 13.98 14.58 15.49 18 13.98 14.76 14.68 14.50 14.18 14.08 13.35 12.09 11.83 14.02 14.59 15.50 19 14.19 14.79 14.63 14.54 14.36 14.06 13.32 12.13 11.75 14.04 14.62 15.53 20 14.18 14.81 14.53 14.55 14.38 14.11 13.31 11.94 11.89 14.00 14.65 15.54
21 14.21 14.79 14.44 14.54 14.36 14.01 13.31 11.81 12.06 14.10 14.69 15.54 22 14.33 14.82 14.55 14.54 14.28 13.77 13.32 11.76 12.05 14.18 14.65 15.57 23 14.39 14.86 14.63 14.59 14.13 13.77 13.15 11.96 12.09 14.22 14.71 15.58 24 14.48 14.85 14.59 14.60 14.20 13.88 13.13 12.01 12.13 14.24 14.77 15.67 25 14.53 14.81 14.42 14.54 14.31 13.87 13.19 11.97 12.29 14.29 14.81 15.83
26 14.29 14.81 14.31 14.53 14.35 13.83 13.15 11.91 12.42 14.33 14.85 15.82 27 14.20 14.82 14.54 14.51 14.12 13.79 13.12 11.96 12.48 14.36 14.85 15.73 28 14.28 14.82 14.58 14.50 14.04 13.72 13.06 11.83 12.53 14.38 14.90 15.65 29 14.49 14.80 14.62 14.50 --- 13.80 12.93 11.85 12.62 14.34 14.91 15.62 30 14.54 14.78 14.52 14.51 --- 13.84 12.90 11.89 12.69 14.37 15.01 15.59 31 14.59 -- 14.50 14.51 --- 13.82 --- 11.79 14.42 15.05 --
MEAN 14.22 14.75 14.64 14.48 14.29 14.02 13.36 12.23 11.88 13.81 14.58 15.50 MAX 14.59 14.86 14.79 14.60 14.46 14.43 13.75 12.87 12.69 14.42 15.05 15.83 MIN 13.83 14.54 14.31 14.27 14.04 13.72 12.90 11.76 11.40 12.78 14.30 15.13
WTR YR 2002 MEAN 13.98 MAX 15.83 MIN 11.40

301 KISSIMMEE RIVER BASIN
02275503 TAYLOR CREEK AT HGS-6, NEAR OKEECHOBEE, FL
LOCATION.--Lat 27° 12'24", long 80° 47'53", in SE1⁄ 4 sec.35, T.37 S., R.35 E., Okeechobee County, Hydrologic Unit 03090102, inside lock chamber of S-193 at HGS No. 6, 1,100 ft south of U.S. Highway 441-98, 2.7 mi east of Sherman, and 3.2 mi southeast of Okeechobee.
DRAINAGE AREA.--Indeterminate.
PERIOD OF RECORD.--October 1991 to August 1992 (gage heights only), September 1992 to current year.
GAGE.--Water-stage recorder, acoustic velocity meter, and data-collection platform. Datum of gage is at NGVD of 1929.
REMARKS.--Records poor. Discharge not published for some periods due to missing velocity or gage height record. Flow regulated by hurricane lock gates at Lake Okeechobee. Since gage height data at this site is affected by lockages, water level at the structure will at times differ from that of the lake. Negative flow is considered flow into the rim canal.
DISCHARGE, CUBIC FEET PER SECOND, WATER YEAR OCTOBER 2000 TO SEPTEMBER 2001DAILY MEAN VALUES
DAY OCT NOV DEC JAN FEB MAR APR MAY JUN JUL AUG SEP
1 --- --- --- -13 4.9 2 --- --- --- 57 423 --- --- --- -31 -17 4 --- --- --- 13 215 --- --- --- -44 -4.9
-12 1.7 --- --- 0.42 2.1 0.40-7.5 1.4 -3.3 e-1.4 -3.6 0.44 1.4
-47 -0.16 e-2.0 --- -1.1 -0.52 1.1 24 -0.53 e-0.24 --- 0.06 5.8 1.1 54 -0.41 --- --- -0.19 1.1 -0.26
6 --- --- --- 347 --- --- -13 -10 8 --- --- -0.92 3.19 --- --- -3.8 83
10 --- --- -9.6 -27
-25 41 -0.44 --- --- 0.03 -3.0 -2.625 -9.8 -0.29 --- --- 2.6 1.2 -3.7 -2.6 -15 -1.4 --- -0.14 2.9 2.8 4.2 -10 2.3 -0.35 --- 2.0 9.5 -0.26 189.7 15 0.29 e-3.9 -2.5 5.1 2.6 10
11 --- --- 0.30 -51 12 --- --- 15 43 13 --- --- -7.1 0.82 14 --- --- 13 -3115 --- --- 0.60 2.7
0.31 1.6 1.6 --- -2.4 2.2 1.4 6.3 -5.0 -27 -0.02 --- 1.2 3.1 1.4 19 -3.9 24 0.18 e-2.5 6.7 1.5 -1.3 32-24 -19 -1.8 --- 0.91 5.1 1.1 2.6 -6.6 -2.6 -3.4 e-2.1 -0.43 11 -0.49 -5.0
16 --- --- -39 -5.2 17 --- --- 117 -11 18 --- --- -67 -16 19 --- --- -25 -8.520 --- --- 67 125
-14 -0.96 1.8 --- 0.82 5.9 1.6 -4.4 79 -2.3 3.9 --- 2.3 3.3 0.44 4.7 9.6 2.2 --- --- 0.28 -1.2 3.4 10
-27 -1.9 e0.37 --- 6.3 2.4 0.88 6.8 -2.1 0.29 -2.9 --- 3.4 15 1.6 5.0
21 --- --- -32 4.9 22 --- --- 82 -4.2 23 --- --- -58 -18 24 --- --- 67 -12 25 --- --- -51 25
-8.3 0.14 -1.8 --- 4.5 2.4 -0.78 2.9 -2.0 1.3 -2.8 --- -1.3 0.62 1.0 2.5 36 -3.5 -2.1 --- 1.2 1.7 -2.3 4.6 -33 -3.4 -3.1 --- 3.3 2.5 0.07 -1.3 -5.7 -2.9 -4.7 --- 1.5 0.94 1.6 -1.9
26 --- --- -17 -5427 --- --- -22 6.3 28 --- --- 26 4.9 29 --- --- 20 -2.4 30 --- --- 15 -7.3 31 --- --- 3.6 4.9
-25 -1.3 --- --- 2.2 4.7 0.15 -2.7 -2.7 4.9 -1.5 --- 0.10 5.8 0.38 -2.0 54 1.2 -0.20 --- 5.9 1.8 -3.0 -4.1 --- 0.81 -1.1 --- -0.08 4.6 -2.6 -7.7 --- -1.1 -3.6 --- -0.55 -0.96 -2.3 -4.8 --- -1.00 --- --- --- 2.2 -0.66 --
TOTAL --- --- 81.08 62.02 MEAN --- --- 3.24 2.00MAX --- --- 117 125 MIN --- --- -67 -54
62.71 14.48 -21.36 -14.04 33.81 90.32 13.85 92.142.24 0.47 -0.76 -2.34 1.41 2.91 0.45 3.0779 54 3.9 -0.24 6.7 15 5.8 32
-33 -47 -4.7 -3.9 -2.5 -3.6 -3.0 -7.7
STATISTICS OF MONTHLY MEAN DATA FOR WATER YEARS 1992 - 2001, BY WATER YEAR (WY)
MEAN 6.04 6.29 8.12 3.54MAX 24.3 18.9 20.7 18.0(WY) 1995 1997 1998 1997MIN -29.5 -15.0 -15.9 -39.4 (WY) 2000 2000 1999 1993
6.66 3.98 9.47 0.24 10.1 9.65 8.36 6.6821.0 20.1 29.4 20.1 32.4 44.9 24.5 23.71998 1998 1997 1996 1999 1997 1995 1997
-29.0 -28.4 -21.0 -57.1 -28.2 -28.8 -33.2 -33.01993 1993 1993 1998 1993 1999 1999 1999
SUMMARY STATISTICS FOR 2000 CALENDAR YEAR FOR 2001 WATER YEAR WATER YEARS 1992 - 2001
ANNUAL TOTAL 333.97ANNUAL MEANHIGHEST ANNUAL MEANLOWEST ANNUAL MEANHIGHEST DAILY MEAN 117 LOWEST DAILY MEAN -156ANNUAL SEVEN-DAY MINIMUM -62MAXIMUM PEAK STAGE10 PERCENT EXCEEDS 2550 PERCENT EXCEEDS 0.0090 PERCENT EXCEEDS -18
415.01 6.4821.5 1997
-18.4 1993Dec 17 125 Jan 20 231 Jul 12 1997Sep 30 -67 Dec 18 -156 Sep 30 2000Sep 4 -9.7 Jan 13 -67 May 9 1998
15.16 Sep 14 19.50 Mar 9 199815 25 0.15 9.8
-14 -24
e Estimated Note.--Negative figures indicate reverse flow

302 KISSIMMEE RIVER BASIN
02275503 TAYLOR CREEK AT HGS-6, NEAR OKEECHOBEE, FL--Continued
DISCHARGE, CUBIC FEET PER SECOND, WATER YEAR OCTOBER 2001 TO SEPTEMBER 2002DAILY MEAN VALUES
DAY OCT NOV DEC JAN FEB MAR APR MAY JUN JUL AUG SEP
1 -14 -3.6 -3.0 -10 3.0 -9.1 -1.7 4.9 -20 92 -4.7 -7.82 -3.7 -5.7 -8.0 -12 -7.7 -0.12 -2.7 -20 -12 44 -0.98 4.53 3.4 -9.8 -11 -9.74 -4.2 -5.1 -6.8 -8.15 -4.0 -6.9 -2.4 -4.0
-0.70 1.1 2.4 -43 21 -18 -6.1 -5.4 -7.5 -9.2 -8.3 -2.4 4.9 40 -5.7 -6.2-15 -5.4 -7.1 38 6.7 -34 -5.4 -5.0
6 -2.8 -15 -3.4 -1.5 7 -3.8 -13 -8.9 -4.78 -2.0 -18 4.3 -9.59 -8.3 -18 -1.2 -8.5
10 -4.2 -12 -5.0 -4.4
-3.0 -4.8 -5.6 8.9 -4.9 40 -6.8 -2.3-4.3 -4.2 -2.8 -11 7.6 -25 -4.5 e-4.3-11 -2.7 -0.61 -38 55 -44 -7.3 e5.0 -5.6 -3.2 -4.1 -29 13 -36 -2.5 e-5.3 -3.3 -14 -3.8 45 -29 -27 -3.4 e-8.8
11 -4.8 -0.57 -9.5 -4.5 12 -7.1 -1.4 -2.4 7.9 13 -1.2 -1.5 -6.4 -5.5 14 -0.30 -5.6 -0.09 3.8 15 -1.9 -6.4 -6.4 -1.5
-2.7 -4.9 -2.6 -25 -38 58 -12 -7.7 -1.4 5.4 -18 -18 -79 -27 -5.8 -5.0 -8.0 -6.4 0.29 -74 59 46 -1.9 -3.7-10 0.27 19 114 -89 33 -3.7 -3.64.8 4.9 -16 -23 46 8.7 2.6 -6.2
16 -5.9 -5.7 -5.4 -2.8 17 -1.9 -7.5 -2.8 -2.3 18 -8.4 -5.1 -3.4 -0.78 19 -5.8 -8.6 -10 5.0 20 -2.6 -15 -7.6 8.0
-14 1.0 17 55 -10 2.1 -5.3 -8.8-12 2.9 2.1 -32 53 -1.6 -0.52 -3.8 -5.9 2.0 5.2 12 -20 0.20 -8.1 -7.2 -4.1 3.5 -16 95 48 2.8 -7.4 -2.3 -1.8 0.51 -41 75 -79 -1.7 -3.7 -6.1
21 -1.3 -8.9 -7.9 9.6 -1.7 22 -13 -6.5 -5.9 -12 -0.55 23 -5.2 -0.17 -2.7 -0.44 -11 24 2.1 -3.0 -0.97 4.0 -12 25 -2.8 -2.1 -7.0 -0.83 -11
-4.7 -43 60 -88 -2.2 -3.6 -5.5-6.0 -37 -17 44 -1.5 -5.3 -4.0-2.9 124 -44 -57 1.1 -3.8 -7.8-6.0 -32 -29 -16 -1.8 -2.2 -2.8-2.3 -100 3.1 -30 -5.9 -0.59 -6.5
26 -7.2 -0.37 -7.9 1.3 27 -7.7 -6.0 -13 -8.4 28 -14 -4.2 -1.1 -4.0 29 -6.9 -8.3 -2.1 2.6 30 -3.6 -0.53 -9.2 2.9 31 -4.7 --- -9.7 -1.6
-3.0 5.1 -25 14 -71 -2.1 -6.9 -13 -7.2 -1.8 30 -15 -21 -1.3 -6.6 -3.4-10 -5.3 -33 31 -56 -2.7 -6.7 -2.8 --- -4.2 70 -38 0.70 -5.7 -6.7 -2.7 --- -4.9 -44 7.6 -1.5 -1.4 -6.0 -10 --- -4.5 --- 31 --- -5.4 -5.6 --
TOTAL -147.80 -204.54 -166.86 -71.95MEAN -4.77 -6.82 -5.38 -2.32 MAX 3.4 -0.17 4.3 9.6 MIN -14 -18 -13 -12
-166.65 -79.94 -174.32 136.1 -362.50 123.60 -147.19 -148.5 -5.95 -2.58 -5.81 4.39 -12.1 3.99 -4.75 -4.95 4.8 5.4 124 114 59 92 2.6 5.0 -15 -14 -100 -74 -89 -44 -12 -13
STATISTICS OF MONTHLY MEAN DATA FOR WATER YEARS 1992 - 2002, BY WATER YEAR (WY)
MEAN 4.80 4.64 6.60 2.95MAX 24.3 18.9 20.7 18.0(WY) 1995 1997 1998 1997MIN -29.5 -15.0 -15.9 -39.4 (WY) 2000 2000 1999 1993
5.33 3.27 7.70 0.72 7.43 8.98 6.58 5.4521.0 20.1 29.4 20.1 32.4 44.9 24.5 23.71998 1998 1997 1996 1999 1997 1995 1997
-29.0 -28.4 -21.0 -57.1 -28.2 -28.8 -33.2 -33.01993 1993 1993 1998 1993 1999 1999 1999
SUMMARY STATISTICS FOR 2001 CALENDAR YEAR FOR 2002 WATER YEAR WATER YEARS 1992 - 2002
ANNUAL TOTAL -185.27 ANNUAL MEANHIGHEST ANNUAL MEANLOWEST ANNUAL MEANHIGHEST DAILY MEAN 125 LOWEST DAILY MEAN -54 ANNUAL SEVEN-DAY MINIMUM -13MAXIMUM PEAK STAGE10 PERCENT EXCEEDS 6.250 PERCENT EXCEEDS -1.290 PERCENT EXCEEDS -11
-1410.55-3.86 5.30
21.5 1997 -18.4 1993
Jan 20 124 Apr 23 231 Jul 12 1997Jan 26 -100 Apr 25 -156 Sep 30 2000Nov 4 -42 Jun 20 -67 May 9 1998
16.42 Sep 24,25 19.50 Mar 9 1998 7.7 25-4.5 6.0
-20 -24
e Estimated Note.--Negative figures indicate reverse flow

303

304 WATER RESOURCES DATA FOR FLORIDA, 2002Volume 1A: Northeast Florida Surface Water
Figure 10.--Location of stream gaging stations in the Manatee, Little Manatee, Alafia, and Hillsborough River basins, and Tampa Bay and coastal areas.
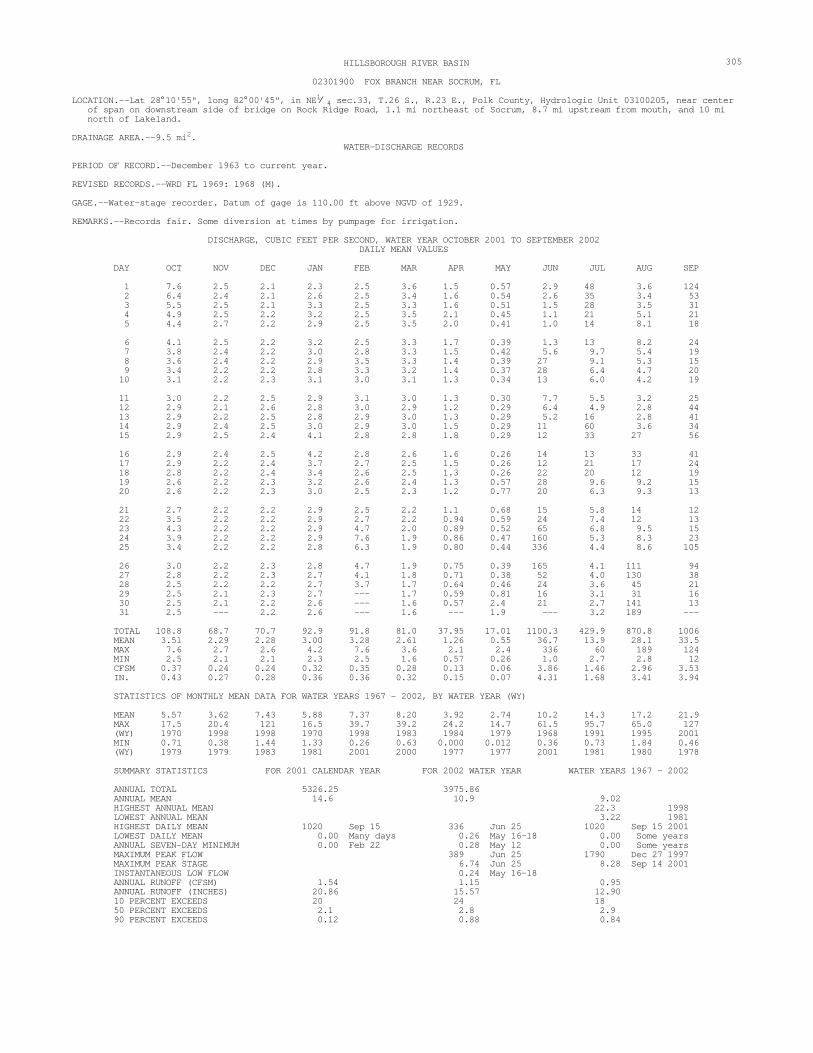
305 HILLSBOROUGH RIVER BASIN
02301900 FOX BRANCH NEAR SOCRUM, FL
LOCATION.--Lat 28° 10'55", long 82° 00'45", in NE1⁄ 4 sec.33, T.26 S., R.23 E., Polk County, Hydrologic Unit 03100205, near center of span on downstream side of bridge on Rock Ridge Road, 1.1 mi northeast of Socrum, 8.7 mi upstream from mouth, and 10 mi north of Lakeland.
DRAINAGE AREA.--9.5 mi2. WATER-DISCHARGE RECORDS
PERIOD OF RECORD.--December 1963 to current year.
REVISED RECORDS.--WRD FL 1969: 1968 (M).
GAGE.--Water-stage recorder. Datum of gage is 110.00 ft above NGVD of 1929.
REMARKS.--Records fair. Some diversion at times by pumpage for irrigation.
DISCHARGE, CUBIC FEET PER SECOND, WATER YEAR OCTOBER 2001 TO SEPTEMBER 2002DAILY MEAN VALUES
DAY OCT NOV DEC JAN FEB MAR APR MAY JUN JUL AUG SEP
1 7.6 2.5 2.1 2.3 2.5 3.6 1.5 0.57 2.9 48 3.6 124 2 6.4 2.4 2.1 2.6 2.5 3.4 1.6 0.54 2.6 35 3.4 53 3 5.5 2.5 2.1 3.3 2.5 3.3 1.6 0.51 1.5 28 3.5 31 4 4.9 2.5 2.2 3.2 2.5 3.5 2.1 0.45 1.1 21 5.1 21 5 4.4 2.7 2.2 2.9 2.5 3.5 2.0 0.41 1.0 14 8.1 18
6 4.1 2.5 2.2 3.2 2.5 3.3 1.7 0.39 1.3 13 8.2 24 7 3.8 2.4 2.2 3.0 2.8 3.3 1.5 0.42 5.6 9.7 5.4 19 8 3.6 2.4 2.2 2.9 3.5 3.3 1.4 0.39 27 9.1 5.3 15 9 3.4 2.2 2.2 2.8 3.3 3.2 1.4 0.37 28 6.4 4.7 2010 3.1 2.2 2.3 3.1 3.0 3.1 1.3 0.34 13 6.0 4.2 19
11 3.0 2.2 2.5 2.912 2.9 2.1 2.6 2.813 2.9 2.2 2.5 2.8 14 2.9 2.4 2.5 3.015 2.9 2.5 2.4 4.1
3.1 3.0 1.3 0.30 7.7 5.5 3.2 253.0 2.9 1.2 0.29 6.4 4.9 2.8 442.9 3.0 1.3 0.29 5.2 16 2.8 412.9 3.0 1.5 0.29 11 60 3.6 342.8 2.8 1.8 0.29 12 33 27 56
16 2.9 2.4 2.5 4.217 2.9 2.2 2.4 3.718 2.8 2.2 2.4 3.419 2.6 2.2 2.3 3.220 2.6 2.2 2.3 3.0
2.8 2.6 1.6 0.26 14 13 33 412.7 2.5 1.5 0.26 12 21 17 242.6 2.5 1.3 0.26 22 20 12 192.6 2.4 1.3 0.57 28 9.6 9.2 152.5 2.3 1.2 0.77 20 6.3 9.3 13
21 2.7 2.2 2.2 2.922 3.5 2.2 2.2 2.9 23 4.3 2.2 2.2 2.924 3.9 2.2 2.2 2.925 3.4 2.2 2.2 2.8
2.5 2.2 1.1 0.68 15 5.8 14 12 2.7 2.2 0.94 0.59 24 7.4 12 13 4.7 2.0 0.89 0.52 65 6.8 9.5 157.6 1.9 0.86 0.47 160 5.3 8.3 236.3 1.9 0.80 0.44 336 4.4 8.6 105
26 3.0 2.2 2.3 2.827 2.8 2.2 2.3 2.7 28 2.5 2.2 2.2 2.7 29 2.5 2.1 2.3 2.7 30 2.5 2.1 2.2 2.6 31 2.5 --- 2.2 2.6
4.7 1.9 0.75 0.39 165 4.1 111 94 4.1 1.8 0.71 0.38 52 4.0 130 38 3.7 1.7 0.64 0.46 24 3.6 45 21 --- 1.7 0.59 0.81 16 3.1 31 16 --- 1.6 0.57 2.4 21 2.7 141 13 --- 1.6 --- 1.9 --- 3.2 189 --
TOTAL 108.8 68.7 70.7 92.9MEAN 3.51 2.29 2.28 3.00 MAX 7.6 2.7 2.6 4.2 MIN 2.5 2.1 2.1 2.3 CFSM 0.37 0.24 0.24 0.32 IN. 0.43 0.27 0.28 0.36
91.8 81.0 37.95 17.01 1100.3 429.9 870.8 10063.28 2.61 1.26 0.55 36.7 13.9 28.1 33.57.6 3.6 2.1 2.4 336 60 189 1242.5 1.6 0.57 0.26 1.0 2.7 2.8 120.35 0.28 0.13 0.06 3.86 1.46 2.96 3.53 0.36 0.32 0.15 0.07 4.31 1.68 3.41 3.94
STATISTICS OF MONTHLY MEAN DATA FOR WATER YEARS 1967 - 2002, BY WATER YEAR (WY)
MEAN 5.57 3.62 7.43 5.88MAX 17.5 20.4 121 16.5(WY) 1970 1998 1998 1970 MIN 0.71 0.38 1.44 1.33(WY) 1979 1979 1983 1981
7.37 8.20 3.92 2.74 10.2 14.3 17.2 21.939.7 39.2 24.2 14.7 61.5 95.7 65.0 1271998 1983 1984 1979 1968 1991 1995 2001 0.26 0.63 0.000 0.012 0.36 0.73 1.84 0.462001 2000 1977 1977 2001 1981 1980 1978
SUMMARY STATISTICS FOR 2001 CALENDAR YEAR FOR 2002 WATER YEAR WATER YEARS 1967 - 2002
ANNUAL TOTAL 5326.25 ANNUAL MEAN 14.6 HIGHEST ANNUAL MEAN LOWEST ANNUAL MEAN HIGHEST DAILY MEAN 1020LOWEST DAILY MEAN 0.00 ANNUAL SEVEN-DAY MINIMUM 0.00MAXIMUM PEAK FLOWMAXIMUM PEAK STAGE INSTANTANEOUS LOW FLOWANNUAL RUNOFF (CFSM) 1.54ANNUAL RUNOFF (INCHES) 20.8610 PERCENT EXCEEDS 2050 PERCENT EXCEEDS 2.190 PERCENT EXCEEDS 0.12
3975.8610.9 9.02
22.3 19983.22 1981
Sep 15 336 Jun 25 1020 Sep 15 2001Many days 0.26 May 16-18 0.00 Some years Feb 22 0.28 May 12 0.00 Some years
389 Jun 25 1790 Dec 27 1997 6.74 Jun 25 8.28 Sep 14 20010.24 May 16-18 1.15 0.9515.57 12.9024 18 2.8 2.9 0.88 0.84

306 HILLSBOROUGH RIVER BASIN
02301900 FOX BRANCH NEAR SOCRUM, FL--Continued
WATER-QUALITY RECORDS
PERIOD OF RECORD.--Water years 1966-87, 1995 to current year.
WATER-QUALITY DATA, WATER YEAR OCTOBER 2001 TO SEPTEMBER 2002
DIS CHARGE, INST. CUBICFEET
Date Time PERSECOND(00061)
PHSPE- WATER CIFIC WHOLE CON- FIELD TEMPER- OXYGEN,
GAGE DUCT- (STAND- ATURE DISHEIGHT ANCE ARD WATER SOLVED(FEET) (US/CM) UNITS) (DEG C) (MG/L) (00065) (00095) (00400) (00010) (00300)
NOV19... 1615 2.2 3.41 340 6.7 20.0 3.4
JAN22... 1620 2.9 3.54 335 7.2 20.2 6.6
MAR13... 1030 3.1 3.57 330 6.8 19.9 4.8
MAY 06... 1515 .44 3.30 403 7.5 26.0 5.8
JUL09... 1433 6.2 3.97 244 6.7 25.5 4.5
SEP13... 0900 44 4.62 189 7.1 24.3 5.0

307

308 WATER RESOURCES DATA FOR FLORIDA, 2002 Volume 1A: Northeast Florida Surface Water
83° 00¢ 82° 00¢
29° 00¢
28° 00¢
p
p p
pp
pp
p
pp
pp
pp
p p
p
pp
p
pp
pp
pp
p
p p
p
p p
p 02313000
02312000
02312500
02312200
02313230
02313231 02312975
02313100
02313250
02312700
02312600
02312180
02312640
02312720
02312976
02313200
02310947
02312140
02312667
p
p
p
p
p 02312762
0
0
10
10
p02312600
p02312000 STREAM GAGING AND NUMBER
SITE
02311500 02311700
02311000
282114082100100
20 MILES
20 KILOMETERS
STATION
QW SAMPLING
EXPLANATION
Figure 11.--Location of stream gaging stations in the Withlacoochee River basin and coastal areas.

309 WITHLACOOCHEE RIVER BASIN
282114082100100 GREEN SWAMP EAST WMA MARSH NEAR CUMPRESSCO, FL
LOCATION.--Lat 28° 21’14", long 82° 01’01", in NW1/4 sec.33, T.24 S., R.23 E., Sumter County, Hydrologic Unit 03100208, 0.2 mi south of levee road, 3.0 mi east of main gate at County Road 471.
DRAINAGE AREA.--Indeterminate.
PERIOD OF RECORD.--November 2000 to July 2002.
WATER-QUALITY DATA, WATER YEAR OCTOBER 2000 TO SEPTEMBER 2002
PH ALKA- SOLIDS, WATER SPE- HARD- MAGNE- POTAS- LINITY CHLO- RESIDUE
WHOLE CIFIC NESS CALCIUM SIUM, SIUM, SODIUM, WAT.DIS RIDE, SULFATE AT 180 OXYGEN, FIELD CON- TOTAL DIS- DIS- DIS- DIS- GRAN T. DIS- DIS- DEG. C
DIS- (STAND- DUCT- (MG/L SOLVED SOLVED SOLVED SOLVED FIELD SOLVED SOLVED DIS Date Time SOLVED ARD ANCE AS (MG/L (MG/L (MG/L (MG/L (MG/L (MG/L (MG/L SOLVED
(MG/L) UNITS) (US/CM) CACO3) AS CA) AS MG) AS K) AS NA) CACO3) AS CL) AS SO4) (MG/L)(00300) (00400) (00095) (00900) (00915) (00925) (00935) (00930) (29802) (00940) (00945) (70300)
NOV 200008... 1200 8.3 3.9 73 13 3.50 1.10 .30 6.1 .0 9.00 .20 13208... 1230 9.2 4.1 58 16 3.90 1.50 .40 4.8 .6 7.00 .31 13808... 1300 9.2 3.8 61 14 3.30 1.30 .20 4.5 .0 7.70 <.20 116
APR 2001 16... 1230 6.7 5.0 80 13 2.90 1.40 2.40 5.9 1.2 9.60 .20 164 16... 1300 9.0 5.5 89 11 2.40 1.30 2.30 5.5 2.0 9.10 .44 145 16... 1330 8.1 3.9 86 12 2.70 1.30 1.80 5.6 1.0 9.20 .30 148
JUL 18... 1000 1.6 4.0 46 9 2.40 .80 .50 2.6 .6 4.30 .20 102 18... 1010 1.7 4.2 41 10 2.50 .90 .50 2.4 .3 3.70 1.3 95 18... 1020 1.3 5.2 48 15 4.70 .86 .80 3.3 5.5 5.00 .6 115 AUG 23... 1000 1.5 4.4 50 9 2.10 .92 .40 3.6 1.5 4.20 .7 119 NOV 07... 1100 5.8 5.0 40 7 1.50 .67 .30 2.2 3.8 3.10 <.20 89 MAR 2002 07... 1130 8.0 5.5 36 6 1.40 .58 .20 2.5 2.3 3.60 <.20 83 JUL 17... 1100 4.2 4.2 42 8 1.90 .82 .40 2.6 .5 3.80 1.00 90
NITRO- NITRO- NITRO- NITRO- NITRO GEN, GEN,AM- GEN,AM- GEN, GEN, PHOS- AMMONIA MONIA + MONIA + NO2+NO3 NITRITE PHORUS DIS- ORGANIC ORGANIC DIS- DIS- DISSOLVED DIS. TOTAL SOLVED SOLVED SOLVED
Date (MG/L (MG/L (MG/L (MG/L (MG/L (MG/L AS N) AS N) AS N) AS N) AS N) AS P)
(00608) (00623) (00625) (00631) (00613) (00666)
ORTHO PHOS- CARBON,PHATE, PHOS- ORGANIC IRON, DIS- PHORUS DIS- DIS-SOLVED TOTAL SOLVED SOLVED (MG/L (MG/L (MG/L (UG/L AS P) AS P) AS C) AS FE)(00671) (00665) (00681) (01046)
NOV 200008... .020 2.4 16 .005 .005 .007 <.001 .420 50.0 65108... .030 2.8 3.6 .005 .007 .009 <.001 .080 49.0 30208... .020 2.6 8.0 .003 .004 .010 <.001 .290 43.0 452
APR 200116... .040 3.8 4.7 .004 .006 .009 <.001 .040 54.0 59616... .040 3.3 7.9 .003 .004 .010 <.001 .230 50.0 61016... .040 3.3 6.7 <.002 .005 .006 <.001 .160 47.0 616
JUL 18... E.035 2.7 2.8 E.003 E.008 .021 <.001 .030 26.0 734 18... E.038 2.2 2.5 <.002 E.007 .004 <.001 .044 22.0 420 18... E.031 2.5 2.7 <.002 E.008 .018 <.001 .047 26.0 930
AUG 23... E.011 2.2 2.7 <.002 E.020 <.002 <.001 .014 36.0 1120
NOV 07... E.005 E1.7 E1.9 <.002 E.010 E.004 <.001 E.008 46.0 446
MAR 200207... .013 1.8 2.0 .006 .012 .008 .001 .050 32.0 248
JUL 17... .017 1.8 2.1 .009 .010 <.002 <.001 .007 37.0 609
< -- Less than E -- Estimated value

310 WITHLACOOCHEE RIVER BASIN
02310947 WITHLACOOCHEE RIVER NEAR CUMPRESSCO, FL
LOCATION.--Lat 28° 18'42", long 82° 03'22", in NE1⁄ 4 sec.13, T.25 S., R.22 E., Pasco County, Hydrologic Unit 03100208, near left bank on downstream side of bridge on State Highway 471, 0.6 mi upstream from Gator Creek, 3.4 mi south of Cumpressco, 5.8 mi east of Richland, and 120 mi upstream from mouth.
DRAINAGE AREA.--280 mi2, approximately.
WATER-DISCHARGE RECORDS
PERIOD OF RECORD.--January 1967 to current year.
GAGE.--Water-stage recorder. Datum of gage is 75.00 ft above NGVD of 1929 (Florida Department of Transportation bench mark). Prior to Aug. 3, 1978, at datum 5.00 ft higher.
REMARKS.--Records fair except for periods of estimated daily discharge, which are poor. Some interconnection with Gator Creek and some diversions to the north may exist during periods of extreme high water.
DISCHARGE, CUBIC FEET PER SECOND, WATER YEAR OCTOBER 2001 TO SEPTEMBER 2002DAILY MEAN VALUES
DAY OCT NOV DEC JAN FEB MAR APR MAY JUN JUL AUG SEP
1 360 30 7.2 2.8 2 315 28 7.0 4.0 3 280 27 6.8 7.14 249 25 6.4 7.25 223 25 6.0 6.1
7.4 16 0.70 0.00 0.00 12 133 e8807.3 15 0.63 0.00 0.00 63 127 e9706.8 14 0.65 0.00 0.00 100 130 e10705.8 15 0.75 0.00 0.00 144 129 e11705.4 15 0.69 0.00 0.00 178 130 e1260
6 196 23 5.4 6.37 181 22 5.2 7.58 174 20 5.0 7.69 157 19 4.9 7.010 136 18 5.0 6.4
5.1 13 0.55 0.00 0.00 204 139 e13405.2 12 0.30 0.00 0.00 209 179 e13305.7 11 0.18 0.00 0.00 208 247 e12705.6 10 0.11 0.00 0.00 204 264 e1200 5.4 9.3 0.09 0.00 0.00 205 268 e1130
11 118 17 5.1 6.0 12 104 16 4.7 5.7 13 90 15 4.5 5.7 14 82 15 4.5 6.9 15 75 15 4.5 10
5.7 8.8 0.09 0.00 0.00 206 263 e1010 5.8 7.8 0.09 0.00 0.00 210 248 806 5.4 8.4 0.12 0.00 0.00 214 237 770 5.2 7.8 0.10 0.00 0.00 236 261 744 5.0 6.6 0.20 0.00 0.00 259 442 751
16 68 14 4.5 11 17 62 13 4.7 11 18 56 13 4.8 11 19 50 12 4.6 11 20 47 12 4.3 11
4.8 5.6 0.19 0.00 0.00 301 502 715 4.6 5.0 0.12 0.00 0.00 354 566 806 4.4 4.6 0.08 0.00 0.00 382 590 827 4.1 4.2 0.05 0.00 0.00 377 606 898 3.5 3.9 0.02 0.00 0.00 359 584 803
21 44 11 4.1 10 22 44 10 3.9 9.4 23 42 9.4 3.8 9.1 24 39 9.3 3.6 9.125 44 8.9 3.6 8.9
3.1 3.4 0.00 0.00 0.00 331 530 716 3.5 3.4 0.00 0.00 0.00 322 462 643 7.3 3.0 0.00 0.00 0.00 314 399 59413 2.6 0.00 0.00 0.05 294 351 61113 2.4 0.00 0.00 0.02 e294 314 730
26 49 8.5 3.6 8.727 48 8.4 3.4 8.328 44 8.2 3.2 8.129 39 7.9 3.1 7.9 30 36 7.6 3.1 7.6 31 32 --- 3.0 7.5
15 2.1 0.00 0.00 0.09 e288 292 77518 1.9 0.00 0.00 0.18 e278 338 79218 1.3 0.00 0.00 0.06 e268 350 770 --- 1.1 0.00 0.00 0.06 e252 428 729 --- 0.91 0.00 0.00 0.19 e220 658 676 --- 0.80 --- 0.00 --- 142 e770 --
TOTAL 3484 468.2 143.5 245.9 MEAN 112 15.6 4.63 7.93 MAX 360 30 7.2 11MIN 32 7.6 3.0 2.8
199.1 215.91 5.71 0.00 0.65 7428 10937 26786 7.11 6.96 0.19 0.000 0.022 240 353 893 18 16 0.75 0.00 0.19 382 770 1340 3.1 0.80 0.00 0.00 0.00 12 127 594
STATISTICS OF MONTHLY MEAN DATA FOR WATER YEARS 1967 - 2002, BY WATER YEAR (WY)
MEAN 155 59.7 95.2 113 MAX 708 298 1638 1203(WY) 1980 1970 1998 1998 MIN 0.002 0.000 0.000 0.000 (WY) 2001 1979 2001 1981
129 157 91.3 14.8 46.7 162 261 321963 1076 867 132 505 913 670 10241998 1998 1987 1979 1968 1991 1995 19790.000 0.000 0.000 0.000 0.000 0.000 0.000 0.0062001 2001 1999 1967 1977 2000 2000 2000
SUMMARY STATISTICS FOR 2001 CALENDAR YEAR FOR 2002 WATER YEAR WATER YEARS 1967 - 2002
ANNUAL TOTAL 34477.43ANNUAL MEAN 94.5 HIGHEST ANNUAL MEAN LOWEST ANNUAL MEAN HIGHEST DAILY MEAN 2210 LOWEST DAILY MEAN 0.00 ANNUAL SEVEN-DAY MINIMUM 0.00 MAXIMUM PEAK STAGE 10 PERCENT EXCEEDS 25550 PERCENT EXCEEDS 0.0090 PERCENT EXCEEDS 0.00
49913.97 137 134
457 19988.60 1999
Sep 17 e1340 Sep 6 e3250 Dec 29 1997 Many days 0.00 Many days 0.00 Many days Jan 1 0.00 Apr 21 0.00 Many days
a14.06 Dec 31 1997 544 434 7.9 21 0.00 0.00
e Estimated a May have been higher during period of no record, Dec. 15-30, 1997.

-- --
--
--
311 WITHLACOOCHEE RIVER BASIN
02310947 WITHLACOOCHEE RIVER NEAR CUMPRESSCO, FL--Continued
WATER-QUALITY RECORDS
PERIOD OF RECORD.--Water years 1961, 1965, 1967 to current year.
WATER-QUALITY DATA, WATER YEAR OCTOBER 2001 TO SEPTEMBER 2002
DIS PH NITRO CHARGE, SPE WATER NITRO NITRO GEN,AM- NITRO PHOSINST. CIFIC WHOLE GEN, GEN, MONIA + GEN, PHOS- PHORUS CUBIC CON FIELD TEMPER- OXYGEN, AMMONIA NITRITE ORGANIC NO2+NO3 PHORUS ORTHO FEET GAGE DUCT- (STAND- ATURE DIS TOTAL TOTAL TOTAL TOTAL TOTAL TOTAL
Date Time PER HEIGHT ANCE ARD WATER SOLVED (MG/L (MG/L (MG/L (MG/L (MG/L (MG/L SECOND (FEET) (US/CM) UNITS) (DEG C) (MG/L) AS N) AS N) AS N) AS N) AS P) AS P)
(00061) (00065) (00095) (00400) (00010) (00300) (00610) (00615) (00625) (00630) (00665) (70507)
OCT 25... 1200 45 6.64 - 6.1 25.4 2.2 .09 .01 E2.7 .090 E.15 .160 NOV 27... 1155 8.1 5.71 217 6.4 19.7 3.4 .04 <.01 E2.7 .060 E.08 .050 DEC 19... 1200 4.3 5.56 232 6.7 18.1 3.4 .06 <.01 2.9 .060 E.08 .050 JAN 28... 1530 7.7 5.83 219 6.2 22.0 4.9 <.01 <.01 2.3 <.020 .05 .030 FEB 25... 1245 13 6.04 277 6.5 15.9 <.01 <.01 1.9 <.020 .03 .020 MAR 25... 1215 2.4 5.49 - -- .04 .01 2.1 .030 .04 .030 APR 22... 1045 .00 4.93 416 6.7 22.7 .9 .04 <.01 1.4 <.020 .05 .030 JUL 29... 1015 E252 107 5.6 25.9 4.3 .03 .02 .20 .050 .15 .160 AUG 26... 1140 286 8.23 90 6.0 25.1 4.1 .02 .02 2.7 .030 .17 .150 SEP 16... 0945 715 9.87 75 5.8 25.4 3.6 .02 .02 2.1 <.020 .19 .180
< -- Less than E -- Estimated value

312 WITHLACOOCHEE RIVER BASIN
02311000 WITHLACOOCHEE-HILLSBOROUGH OVERFLOW NEAR RICHLAND, FL
LOCATION.--Lat 28° 16'16", long 82° 05'53", in NW1⁄ 4 sec.34, T.25 S., R.22 E., Pasco County, Hydrologic Unit 03100208, on left bank, 20 ft downstream of bridge on U.S. Highway 98, 0.6 mi south of channel of Withlacoochee River, 2.9 mi east of Richland, 8.5 mi southeast of Dade City, and 55 mi upstream from mouth.
DRAINAGE AREA.--Indeterminate. WATER-DISCHARGE RECORDS
PERIOD OF RECORD.--February 1930 to September 1931; September 1950, July 1958 to March 1960 (discharge measurements only); April 1960 to current year. Published as supplement to Hillsborough River near Zephyrhills (station 02303000) July 1958 to September 1959.
GAGE.--Water-stage recorder. Datum of gage is 75.42 ft above NGVD of 1929 (Florida Department of Transportation bench mark).Prior to July 17, 1958, nonrecording gage at site about 1 mi downstream at different datum; July 17, 1958, to Apr. 24, 1960, nonrecording gage and crest-stage gage at present site and datum.
REMARKS.--Records good except for period of estimated daily discharge, which is poor. Flow is uncontrolled natural diversionfrom the Withlacoochee River basin to the Hillsborough River basin.
DISCHARGE, CUBIC FEET PER SECOND, WATER YEAR OCTOBER 2001 TO SEPTEMBER 2002DAILY MEAN VALUES
DAY OCT NOV DEC JAN FEB MAR APR MAY JUN JUL AUG SEP
1 90 0.00 0.00 0.00 2 65 0.00 0.00 0.00 3 45 0.00 0.00 0.00 4 31 0.00 0.00 0.00 5 21 0.00 0.00 0.00
0.00 0.00 0.00 0.00 0.00 0.00 0.00 251 0.00 0.00 0.00 0.00 0.00 0.00 0.00 347 0.00 0.00 0.00 0.00 0.00 0.00 0.00 388 0.00 0.00 0.00 0.00 0.00 0.00 0.00 409 0.00 0.00 0.00 0.00 0.00 0.00 0.00 423
6 14 0.00 0.00 0.00 0.00 0.00 0.00 0.00 0.00 0.00 0.00 4077 9.6 0.00 0.00 0.00 0.00 0.00 0.00 0.00 0.00 0.27 0.00 365 8 8.2 0.00 0.00 0.00 0.00 0.00 0.00 0.00 0.00 1.1 0.00 316 9 6.8 0.00 0.00 0.00 0.00 0.00 0.00 0.00 0.00 1.3 0.82 278 10 5.0 0.00 0.00 0.00 0.00 0.00 0.00 0.00 0.00 1.2 1.8 237
11 3.2 0.00 0.00 0.0012 1.9 0.00 0.00 0.0013 1.2 0.00 0.00 0.0014 0.45 0.00 0.00 0.0015 0.00 0.00 0.00 0.00
0.00 0.00 0.00 0.00 0.00 0.91 1.9 2060.00 0.00 0.00 0.00 0.00 0.89 1.7 1850.00 0.00 0.00 0.00 0.00 2.1 1.9 165 0.00 0.00 0.00 0.00 0.00 3.5 0.52 143 0.00 0.00 0.00 0.00 0.00 4.7 e1.3 144
16 0.00 0.00 0.00 0.0017 0.00 0.00 0.00 0.0018 0.00 0.00 0.00 0.0019 0.00 0.00 0.00 0.0020 0.00 0.00 0.00 0.00
0.00 0.00 0.00 0.00 0.00 7.2 e1.8 139 0.00 0.00 0.00 0.00 0.00 13 e3.7 149 0.00 0.00 0.00 0.00 0.00 20 e7.8 172 0.00 0.00 0.00 0.00 0.00 24 e14 208 0.00 0.00 0.00 0.00 0.00 23 e17 210
21 0.00 0.00 0.00 0.0022 0.00 0.00 0.00 0.0023 0.00 0.00 0.00 0.0024 0.00 0.00 0.00 0.0025 0.00 0.00 0.00 0.00
0.00 0.00 0.00 0.00 0.00 20 e14 179 0.00 0.00 0.00 0.00 0.00 17 e11 144 0.00 0.00 0.00 0.00 0.00 14 e8.9 116 0.00 0.00 0.00 0.00 0.00 12 e7.0 112 0.00 0.00 0.00 0.00 0.00 9.5 e5.6 163
26 0.00 0.00 0.00 0.0027 0.00 0.00 0.00 0.0028 0.00 0.00 0.00 0.00 29 0.00 0.00 0.00 0.0030 0.00 0.00 0.00 0.0031 0.00 --- 0.00 0.00
0.00 0.00 0.00 0.00 0.00 9.0 e3.9 188 0.00 0.00 0.00 0.00 0.00 9.4 e3.7 199 0.00 0.00 0.00 0.00 0.00 7.5 e5.4 193 --- 0.00 0.00 0.00 0.00 4.6 e8.4 174--- 0.00 0.00 0.00 0.00 2.0 52 149 --- 0.00 --- 0.00 --- 0.41 143 --
TOTAL 302.35 0.00 0.00 0.00MEAN 9.75 0.000 0.000 0.000 MAX 90 0.00 0.00 0.00 MIN 0.00 0.00 0.00 0.00
0.00 0.00 0.00 0.00 0.00 208.58 317.14 6759 0.000 0.000 0.000 0.000 0.000 6.73 10.2 225 0.00 0.00 0.00 0.00 0.00 24 143 423 0.00 0.00 0.00 0.00 0.00 0.00 0.00 112
STATISTICS OF MONTHLY MEAN DATA FOR WATER YEARS 1930 - 2002, BY WATER YEAR (WY)
MEAN 24.7 3.13 15.7 17.0 MAX 222 71.8 444 272 (WY) 1980 1989 1998 1998 MIN 0.000 0.000 0.000 0.000 (WY) 1962 1962 1961 1961
15.6 25.7 22.2 1.07 10.5 25.6 52.1 80.0192 214 268 21.8 271 305 372 5211998 1998 1930 1931 1930 1991 1960 19600.000 0.000 0.000 0.000 0.000 0.000 0.000 0.0001962 1961 1961 1961 1960 1969 1980 1970
SUMMARY STATISTICS FOR 2001 CALENDAR YEAR FOR 2002 WATER YEAR WATER YEARS 1930 - 2002
ANNUAL TOTAL 11008.25ANNUAL MEAN 30.2 HIGHEST ANNUAL MEAN LOWEST ANNUAL MEAN HIGHEST DAILY MEAN 959 LOWEST DAILY MEAN 0.00 ANNUAL SEVEN-DAY MINIMUM 0.00MAXIMUM PEAK FLOW MAXIMUM PEAK STAGE 10 PERCENT EXCEEDS 2150 PERCENT EXCEEDS 0.0090 PERCENT EXCEEDS 0.00
7587.0720.8 21.6
98.1 19980.005 2000
Sep 17 423 Sep 5 1270 Sep 14 1960 Many days 0.00 Many days 0.00 Many days Jan 1 0.00 Oct 15 0.00 Many days
431 Sep 5 1880 Mar 19 19604.87 Sep 5 6.87 Mar 19 196027 46 0.00 0.00 0.00 0.00
e Estimated

--- ------ ---
WITHLACOOCHEE RIVER BASIN 313
02311000 WITHLACOOCHEE-HILLSBOROUGH OVERFLOW NEAR RICHLAND, FL--Continued
GAGE HEIGHT, FEET, WATER YEAR OCTOBER 2001 TO SEPTEMBER 2002 DAILY MEAN VALUES
DAY OCT NOV DEC JAN FEB MAR APR MAY JUN JUL AUG SEP
1 3.66 2.63 2.43 2.23 2.51 2.59 2.00 0.70 --- 2.45 2.72 4.36 2 3.52 2.63 2.42 2.30 2.50 2.58 1.95 0.61 --- 2.47 2.70 4.67 3 3.39 2.63 2.42 2.42 2.50 2.57 1.94 0.57 --- 2.57 2.71 4.77 4 3.27 2.62 2.41 2.45 2.48 2.61 1.95 0.55 --- 2.62 2.70 4.82 5 3.17 2.61 2.40 2.46 2.47 2.59 1.93 0.54 --- 2.66 2.69 4.85
6 3.09 2.59 2.39 2.50 2.45 2.58 1.88 0.54 --- 2.72 2.67 4.82 7 3.03 2.58 2.39 2.51 2.47 2.57 1.82 0.54 --- 2.78 2.68 4.71 8 3.00 2.57 2.39 2.51 2.48 2.57 1.76 0.53 --- 2.81 2.72 4.58 9 2.98 2.56 2.38 2.51 2.48 2.55 1.70 --- --- 2.82 2.80 4.46 10 2.94 2.55 2.38 2.50 2.47 2.53 1.63 --- --- 2.82 2.84 4.31
11 2.89 2.54 2.37 2.50 2.48 2.52 1.59 --- --- 2.81 2.85 4.19 12 2.85 2.53 2.37 2.50 2.48 2.50 1.53 --- --- 2.81 2.84 4.10 13 2.82 2.52 2.36 2.52 2.47 2.52 1.54 --- --- 2.85 2.84 4.01 14 2.79 2.54 2.36 2.56 2.46 2.50 1.59 --- --- 2.90 2.87 3.91 15 2.76 2.54 2.35 2.65 2.45 2.48 1.78 --- --- 2.93 --- 3.92
16 2.74 2.53 2.35 2.66 2.44 2.47 1.79 --- --- 2.98 --- 3.89 17 2.71 2.53 2.34 2.65 2.44 2.45 1.77 --- --- 3.07 --- 3.94 18 2.70 2.52 2.34 2.64 2.42 2.42 1.74 --- --- 3.17 --- 4.04 19 2.69 2.51 2.33 2.62 2.40 2.40 1.69 --- --- 3.21 --- 4.19 20 2.68 2.51 2.32 2.61 2.40 2.37 1.63 --- 0.79 3.20 --- 4.20
21 2.69 2.50 2.30 2.60 2.38 2.36 1.57 --- 1.23 3.17 --- 4.07 22 2.69 2.49 2.29 2.59 2.41 2.35 1.49 --- 1.41 3.13 --- 3.91 23 2.68 2.49 2.28 2.58 2.55 2.32 1.39 --- 1.59 3.10 --- 3.78 24 2.68 2.48 2.28 2.58 2.70 2.29 1.30 --- 1.78 3.06 --- 3.76 25 2.68 2.47 2.28 2.57 2.70 2.27 1.19 --- 1.93 3.03 --- 4.00
26 2.67 2.47 2.28 2.56 2.67 2.24 1.11 --- 2.02 3.02 --- 4.11 27 2.67 2.46 2.27 2.55 2.64 2.20 1.07 --- 2.04 3.03 --- 4.16 28 2.66 2.45 2.26 2.54 2.61 2.17 0.97 --- 2.05 2.99 --- 4.13 29 2.66 2.44 2.26 2.54 2.13 0.85 --- 2.15 2.93 -- 4.04 30 2.65 2.44 2.25 2.53 --- 2.09 0.77 2.31 2.85 3.50 3.93 31 2.64 --- 2.24 2.52 --- 2.05 --- 2.78 3.92 --
MEAN 2.87 2.53 2.34 2.53 2.50 2.41 1.56 --- --- 2.89 --- 4.22 MAX 3.66 2.63 2.43 2.66 2.70 2.61 2.00 --- --- 3.21 --- 4.85 MIN 2.64 2.44 2.24 2.23 2.38 2.05 0.77 --- --- 2.45 --- 3.76

314 WITHLACOOCHEE RIVER BASIN
02311000 WITHLACOOCHEE-HILLSBOROUGH OVERFLOW NEAR RICHLAND, FL--Continued
WATER-QUALITY RECORDS
PERIOD OF RECORD.--Water years 1930-1931, 1950, 1958-61, 1963, 1966, 1969-85, 1989, 1991, 1993-98, 2001 to current year.
WATER-QUALITY DATA, WATER YEAR OCTOBER 2001 TO SEPTEMBER 2002
DIS- PH NITRO CHARGE, SPE- WATER NITRO- NITRO- GEN,AM- NITROINST. CIFIC WHOLE COLOR GEN, GEN, MONIA + GEN, PHOS CUBIC CON- FIELD TEMPER- (PLAT- OXYGEN, AMMONIA NITRITE ORGANIC NO2+NO3 PHORUS FEET GAGE DUCT- (STAND- ATURE INUM- DIS- TOTAL TOTAL TOTAL TOTAL TOTAL
Date Time PER HEIGHT ANCE ARD WATER COBALT SOLVED (MG/L (MG/L (MG/L (MG/L (MG/LSECOND (FEET) (US/CM) UNITS) (DEG C) UNITS) (MG/L) AS N) AS N) AS N) AS N) AS P)
(00061) (00065) (00095) (00400) (00010) (00080) (00300) (00610) (00615) (00625) (00630) (00665)
AUG 30... 0922 47 3.42 94 6.5 25.1 320 1.8 .07 .02 1.5 .040 .76
ANC SOLIDS, PHOS- HARD- MAGNE POTAS UNFLTRD CHLO- FLUO SILICA, RESIDUE
CARBON, PHORUS NESS CALCIUM SIUM, SODIUM, SIUM, TIT 4.5 SULFATE RIDE, RIDE, DIS AT 180 ORGANIC ORTHO TOTAL DIS DIS DIS DIS LAB DIS DIS DIS SOLVED DEG. C TOTAL TOTAL (MG/L SOLVED SOLVED SOLVED SOLVED (MG/L SOLVED SOLVED SOLVED (MG/L DIS-
Date (MG/L (MG/L AS (MG/L (MG/L (MG/L (MG/L AS (MG/L (MG/L (MG/L AS SOLVED AS C) AS P) CACO3) AS CA) AS MG) AS NA) AS K) CACO3) AS SO4) AS CL) AS F) SIO2) (MG/L) (00680) (70507) (00900) (00915) (00925) (00930) (00935) (90410) (00945) (00940) (00950) (00955) (70300)
AUG 30... 27.0 .730 44 15.0 1.60 2.4 2.30 32 2.70 4.70 .1 3.50 116
STRONTIUM,DIS
SOLVEDDate (UG/L
AS SR)(01080)
AUG 30... 29.0

315 WITHLACOOCHEE RIVER BASIN
02311500 WITHLACOOCHEE RIVER NEAR DADE CITY, FL
LOCATION.--Lat 28° 21'08", long 82° 07'34", in SE1⁄ 4 sec.32, T.24 S., R.22 E., Pasco County, Hydrologic Unit 03100208, on left bank 50 ft downstream from Lanier Bridge on River Road, 4 mi east of Dade City, and 110 mi upstream from mouth.
DRAINAGE AREA.--390 mi2, approximately.
PERIOD OF RECORD.--February 1930 to March 1933, July 1958 to October 1962 (discharge measurements only), water years 1959-62 (annual maximum), January 1964 to September 1983 (discharge measurements and gage heights only); October 1983 to current year.
REVISED RECORDS.--WRD FL 1962: Drainage area.
GAGE.--Water-stage recorder. Datum of gage is at NGVD of 1929. Feb. 11, 1930 to Mar. 31, 1933, and July 21 to Nov. 19, 1958,nonrecording gage, and Nov. 20, 1958 to Oct. 3, 1962, non-recording gage and crest-stage gage at same site at datum 64.29 fthigher. Jan. 21, 1964 to Oct. 8, 1987, nonrecording gage at same site and datum.
REMARKS.--Records fair. High-water diversion above station into Hillsborough River basin through Withlacoochee-HillsboroughOverflow near Richland (station 02311000).
DISCHARGE, CUBIC FEET PER SECOND, WATER YEAR OCTOBER 2001 TO SEPTEMBER 2002DAILY MEAN VALUES
DAY OCT NOV DEC JAN FEB MAR APR MAY JUN JUL AUG SEP
1 736 74 18 9.0 2 630 71 18 10 3 546 67 17 13 4 492 63 16 14 5 448 60 16 14
16 23 7.2 1.0 0.00 11 303 659 15 23 6.7 0.77 0.00 12 275 899 15 24 6.6 0.55 0.00 16 249 1110 14 27 6.7 0.35 0.00 22 236 1240 14 27 6.3 0.19 0.00 58 223 1320
6 412 55 15 15 7 384 51 15 15 8 361 47 15 15 9 336 44 14 14 10 318 42 14 14
13 27 5.8 0.05 0.00 118 208 1390 13 26 5.3 0.00 0.00 184 209 1380 14 26 4.8 0.00 0.00 244 221 1330 13 25 4.4 0.00 0.00 278 235 127013 24 4.0 0.00 0.00 292 269 1180
11 300 39 14 1312 280 38 14 1313 258 36 13 1314 231 37 13 1415 206 36 12 18
13 22 3.9 0.00 0.00 297 291 109013 21 3.6 0.00 0.00 308 303 103013 21 3.5 0.00 0.00 336 312 98412 20 3.5 0.00 0.00 363 332 90512 20 4.1 0.00 0.00 352 398 854
16 184 34 12 1917 165 32 12 2018 149 31 12 2019 135 30 12 1920 123 28 11 19
12 19 4.1 0.00 0.00 347 453 80312 18 3.9 0.00 0.00 357 519 101012 17 3.7 0.00 0.00 379 590 101011 16 3.3 0.00 0.00 409 644 96111 14 3.0 0.00 0.01 435 678 964
21 114 27 11 1922 108 26 11 1823 101 25 10 1824 96 23 10 1825 93 23 10 18
11 14 2.8 0.00 0.50 446 676 95611 13 2.5 0.00 1.8 449 651 89614 12 2.3 0.00 6.0 443 604 81718 12 2.0 0.00 14 428 546 77421 11 1.8 0.00 12 415 492 844
26 89 22 10 1827 84 21 9.8 1728 82 20 9.5 1729 81 20 9.5 17 30 80 19 9.4 16 31 78 --- 9.1 16
23 10 1.7 0.00 9.7 414 446 86323 9.8 1.9 0.00 8.2 413 409 87623 9.3 1.8 0.00 7.8 399 380 884
--- 8.7 1.5 0.00 8.7 384 373 871 --- 8.1 1.3 0.00 9.0 360 398 841 --- 7.6 --- 0.00 --- 331 486 --
TOTAL 7700 1141 392.3 493.0 MEAN 248 38.0 12.7 15.9 MAX 736 74 18 20 MIN 78 19 9.1 9.0
405 555.5 114.0 2.91 77.71 9300 12409 30011 14.5 17.9 3.80 0.094 2.59 300 400 1000 23 27 7.2 1.0 14 449 678 1390 11 7.6 1.3 0.00 0.00 11 208 659
STATISTICS OF MONTHLY MEAN DATA FOR WATER YEARS 1930 - 2002, BY WATER YEAR (WY)
MEAN 189 86.8 141 183 MAX 890 430 1746 1487(WY) 1996 1998 1998 1998 MIN 0.000 0.000 0.000 0.000 (WY) 2001 2001 2001 2001
133 179 201 34.8 76.0 158 256 369 1025 1262 1089 263 699 1022 897 11971998 1998 1987 1931 1930 1991 1995 19880.000 0.000 0.000 0.000 0.000 0.000 0.000 0.0002001 2001 2000 2000 1992 2000 2000 2000
SUMMARY STATISTICS FOR 2001 CALENDAR YEAR FOR 2002 WATER YEAR WATER YEARS 1930 - 2002
ANNUAL TOTAL 48264.3 ANNUAL MEAN 132 HIGHEST ANNUAL MEAN LOWEST ANNUAL MEAN HIGHEST DAILY MEAN e2680 LOWEST DAILY MEAN 0.00 ANNUAL SEVEN-DAY MINIMUM 0.00MAXIMUM PEAK FLOW MAXIMUM PEAK STAGE10 PERCENT EXCEEDS 37050 PERCENT EXCEEDS 0.0090 PERCENT EXCEEDS 0.00
62601.42 172 163
547 1998 10.4 2000
Sep 19 1390 Sep 6 3880 Dec 31 1997 Many days 0.00 Many days 0.00 Many days Jan 1 0.00 May 7 0.00 Many days
1390 Sep 6,7 *5900 Mar 21 1960 75.22 Sep 6,7 78.57 Mar 21 1960 614 45318 31 0.00 0.03
* From rating curve extended above 3,600 ft3/s e Estimated
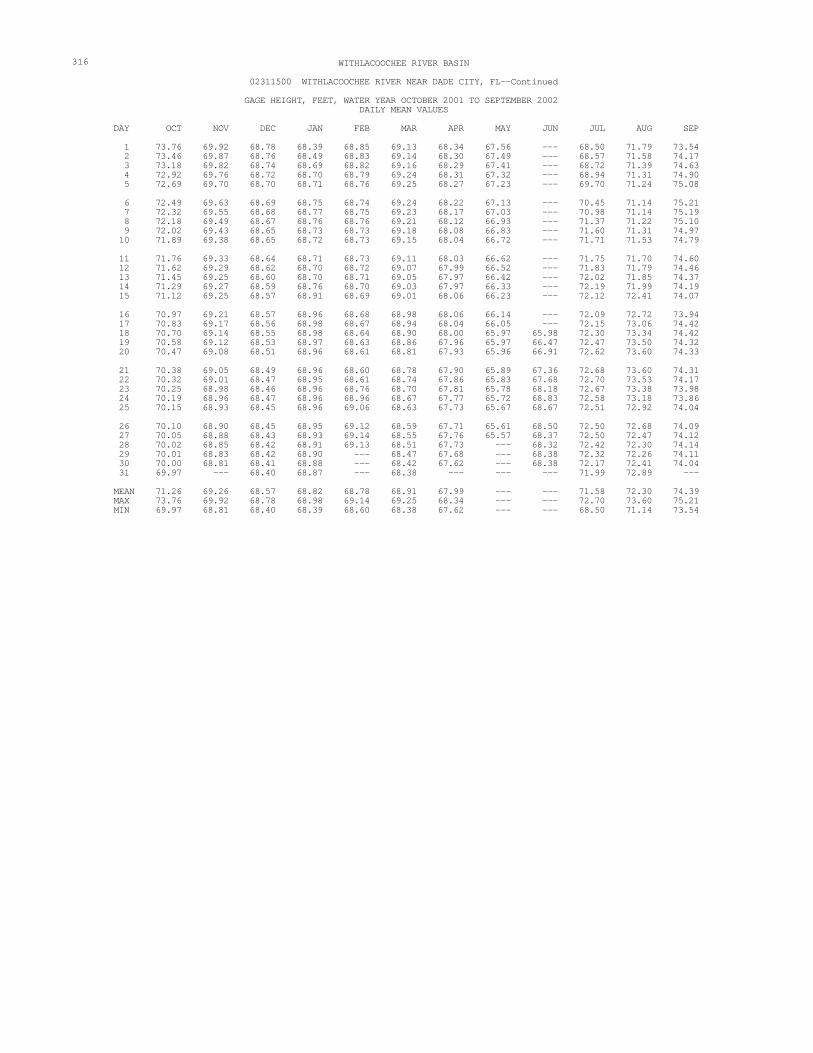
---
---------------
------
------------ ---
--- ---
316 WITHLACOOCHEE RIVER BASIN
02311500 WITHLACOOCHEE RIVER NEAR DADE CITY, FL--Continued
GAGE HEIGHT, FEET, WATER YEAR OCTOBER 2001 TO SEPTEMBER 2002 DAILY MEAN VALUES
DAY OCT NOV DEC JAN FEB MAR APR MAY JUN JUL AUG SEP
1 73.76 69.92 68.78 68.39 68.85 69.13 68.34 67.56 --- 68.50 71.79 73.54 2 73.46 69.87 68.76 68.49 68.83 69.14 68.30 67.49 --- 68.57 71.58 74.17 3 73.18 69.82 68.74 68.69 68.82 69.16 68.29 67.41 --- 68.72 71.39 74.63 4 72.92 69.76 68.72 68.70 68.79 69.24 68.31 67.32 --- 68.94 71.31 74.90 5 72.69 69.70 68.70 68.71 68.76 69.25 68.27 67.23 --- 69.70 71.24 75.08
6 72.49 69.63 68.69 68.75 68.74 69.24 68.22 67.13 --- 70.45 71.14 75.21 7 72.32 69.55 68.68 68.77 68.75 69.23 68.17 67.03 --- 70.98 71.14 75.19 8 72.18 69.49 68.67 68.76 68.76 69.21 68.12 66.93 --- 71.37 71.22 75.10 9 72.02 69.43 68.65 68.73 68.73 69.18 68.08 66.83 --- 71.60 71.31 74.97 10 71.89 69.38 68.65 68.72 68.73 69.15 68.04 66.72 71.71 71.53 74.79
11 71.76 69.33 68.64 68.71 68.73 69.11 68.03 66.62 71.75 71.70 74.60 12 71.62 69.29 68.62 68.70 68.72 69.07 67.99 66.52 71.83 71.79 74.46 13 71.45 69.25 68.60 68.70 68.71 69.05 67.97 66.42 72.02 71.85 74.37 14 71.29 69.27 68.59 68.76 68.70 69.03 67.97 66.33 72.19 71.99 74.19 15 71.12 69.25 68.57 68.91 68.69 69.01 68.06 66.23 72.12 72.41 74.07
16 70.97 69.21 68.57 68.96 68.68 68.98 68.06 66.14 72.09 72.72 73.94 17 70.83 69.17 68.56 68.98 68.67 68.94 68.04 66.05 72.15 73.06 74.42 18 70.70 69.14 68.55 68.98 68.64 68.90 68.00 65.97 65.98 72.30 73.34 74.42 19 70.58 69.12 68.53 68.97 68.63 68.86 67.96 65.97 66.47 72.47 73.50 74.32 20 70.47 69.08 68.51 68.96 68.61 68.81 67.93 65.96 66.91 72.62 73.60 74.33
21 70.38 69.05 68.49 68.96 68.60 68.78 67.90 65.89 67.36 72.68 73.60 74.31 22 70.32 69.01 68.47 68.95 68.61 68.74 67.86 65.83 67.68 72.70 73.53 74.17 23 70.25 68.98 68.46 68.96 68.76 68.70 67.81 65.78 68.18 72.67 73.38 73.98 24 70.19 68.96 68.47 68.96 68.96 68.67 67.77 65.72 68.83 72.58 73.18 73.86 25 70.15 68.93 68.45 68.96 69.06 68.63 67.73 65.67 68.67 72.51 72.92 74.04
26 70.10 68.90 68.45 68.95 69.12 68.59 67.71 65.61 68.50 72.50 72.68 74.09 27 70.05 68.88 68.43 68.93 69.14 68.55 67.76 65.57 68.37 72.50 72.47 74.12 28 70.02 68.85 68.42 68.91 69.13 68.51 67.73 68.32 72.42 72.30 74.14 29 70.01 68.83 68.42 68.90 --- 68.47 67.68 68.38 72.32 72.26 74.11 30 70.00 68.81 68.41 68.88 --- 68.42 67.62 68.38 72.17 72.41 74.04 31 69.97 --- 68.40 68.87 --- 68.38 --- 71.99 72.89 --
MEAN 71.26 69.26 68.57 68.82 68.78 68.91 67.99 71.58 72.30 74.39 MAX 73.76 69.92 68.78 68.98 69.14 69.25 68.34 -- --- 72.70 73.60 75.21 MIN 69.97 68.81 68.40 68.39 68.60 68.38 67.62 -- --- 68.50 71.14 73.54

317 WITHLACOOCHEE RIVER BASIN
02311700 DADE CITY CANAL NEAR DADE CITY, FL
LOCATION.--Lat 28° 22'55", long 82° 10'48", in SW1⁄ 4 sec.23, T.24 S., R.21 E., Pasco County, Hydrologic Unit 03100208, near center of span, on downstream side of bridge over Evans Canal immediately upstream from confluence with Pasco Beverage Company Canal, 1.0 mi downstream from Pasco Beverage Company at Dade City, and 4.0 mi upstream from Withlacoochee River.
DRAINAGE AREA.--35 mi2.
PERIOD OF RECORD.--February 1957 to October 1962 (discharge measurements for Pasco Beverage Company and Evans Canals only).November 1962 to current year (discharge measurements only). Prior to October 1985, published with station 02312000 Withlacoochee River at Trilby.
GAGE.--Nonrecording gage. Datum of gage is at NGVD of 1929. Prior to Aug. 16, 1961, nonrecording gage 150 ft upstream at different datum.
REMARKS.--Discharge measurements made near bridge over Dade City Canal, 30 ft downstream from confluence of Pasco Beverage Company and Evans Canals. Water is diverted from ground-water sources through canals to the Withlacoochee River.
EXTREMES FOR PERIOD OF RECORD.--Maximum discharge measured, 103 ft3/s, Feb. 24, 1967; no flow observed Dec. 2, 1964, Aug. 24, 1965, Oct. 1, 1979, Sept. 27, 2001.
DISCHARGE MEASUREMENTS AND WATER-QUALITY DATA, WATER YEAR OCTOBER 2001 TO SEPTEMBER 2002
DIS CHARGE, INST. CUBICFEET
Date Time PERSECOND(00061)
PHSPE- WATER CIFIC WHOLE CON- FIELD TEMPER- OXYGEN,
GAGE DUCT- (STAND- ATURE DISHEIGHT ANCE ARD WATER SOLVED(FEET) (US/CM) UNITS) (DEG C) (MG/L) (00065) (00095) (00400) (00010) (00300)
NOV14... 1545 14 69.20 485 6.8 22.0 2.2
JAN18... 1535 9.4 69.14 651 7.6 20.9 1.8
MAR11... 1705 5.2 68.76 593 6.8 21.7 1.1
MAY07... 1025 4.0 68.60 584 7.6 27.3 3.0
JUL09... 0956 8.6 69.08 580 6.6 27.5 1.4
AUG28... 1509 4.3 69.85 701 6.7 26.9 1.4

318 WITHLACOOCHEE RIVER BASIN
02312000 WITHLACOOCHEE RIVER AT TRILBY, FL
LOCATION.--Lat 28° 28'47", long 82° 10'40", in SE1⁄ 4 sec.14, T.23 S., R.21 E., Hernando County, Hydrologic Unit 03100208, on right bank at downstream side of bridge on U.S. Highway 301, 1.6 mi northeast of Trilby, 10 mi upstream from Little Withlacoochee River, and 93 mi upstream from mouth.
DRAINAGE AREA.--570 mi2, approximately. WATER-DISCHARGE RECORDS
PERIOD OF RECORD.--August 1928 to February 1929, February 1930 to current year.
REVISED RECORDS.--WDR FL-72-3: Drainage area.
GAGE.--Water-stage recorder and data-collection platform. Datum of gage is 49.27 ft above NGVD of 1929 (U.S. Army Corps ofEngineers bench mark). Prior to Oct. 1, 1938, nonrecording gage at site 1.5 mi downstream at datum 0.12 ft lower.
REMARKS.--Records fair. High-water diversion above station into Hillsborough River basin through Withlacoochee-Hillsborough Overflow near Richland (station 02311000). Records include water diverted from ground-water supplies through Dade City Canal(station 02311700) by citrus processing plants, in SW1⁄ 4 sec.23, T.24 S., R.21 E., 5 mi upstream from Withlacoochee River.
DISCHARGE, CUBIC FEET PER SECOND, WATER YEAR OCTOBER 2001 TO SEPTEMBER 2002DAILY MEAN VALUES
DAY OCT NOV DEC JAN FEB MAR APR MAY JUN JUL AUG SEP
1 2330 126 41 22 2 2140 123 40 30 3 1950 118 39 36 4 1760 115 38 37 5 1570 113 37 37
52 42 20 9.8 12 42 554 828 55 39 19 9.9 8.0 43 541 800 57 38 19 9.9 6.9 39 535 773 56 41 20 9.9 5.7 34 556 796 52 41 18 10 6.1 33 567 936
6 1390 108 37 36 7 1210 102 35 35 8 1050 96 35 34 9 912 91 35 3210 797 87 34 31
48 40 16 9.9 6.1 32 560 1060 48 38 14 9.9 5.9 29 532 1160 52 37 13 9.5 6.9 27 516 1280 55 36 12 9.4 6.7 27 501 141054 35 12 9.9 6.3 30 471 1530
11 701 83 34 2912 622 78 34 2813 554 74 34 2814 499 74 34 2915 449 72 34 34
53 34 11 9.6 6.1 57 430 163050 34 11 9.2 5.0 109 401 171048 36 12 9.0 4.5 163 385 181045 36 13 9.2 3.7 267 391 189042 37 14 9.1 5.6 307 497 1980
16 403 71 33 3817 360 68 33 4118 316 65 34 4219 278 62 34 4020 250 60 33 39
39 38 12 8.9 3.4 329 584 202037 37 12 9.0 6.7 353 626 200035 37 11 9.1 10 368 685 198032 36 11 13 5.7 376 726 193029 34 11 13 4.9 395 780 1870
21 231 58 32 4022 216 57 30 4023 204 55 29 4024 195 55 28 4125 186 53 27 43
27 33 11 11 3.4 417 840 181028 33 11 9.5 6.5 454 900 173034 32 10 9.1 e15 519 939 166046 31 9.8 8.9 e44 540 961 165052 31 9.7 8.2 e27 556 966 1880
26 176 50 27 4427 167 47 26 4528 158 45 25 45 29 150 44 23 46 30 141 43 23 47 31 133 --- 22 49
52 30 9.9 7.5 e24 575 956 199050 27 10 7.6 26 623 942 197046 25 10 7.8 30 618 928 1890
--- 24 9.7 6.9 39 601 899 1800 --- 22 9.8 7.1 34 582 862 1700 --- 21 --- 9.8 --- 568 842 --
TOTAL 21498 2293 1000 1158 MEAN 693 76.4 32.3 37.4 MAX 2330 126 41 49 MIN 133 43 22 22
1274 1055 381.9 290.6 375.1 9113 20873 47473 45.5 34.0 12.7 9.37 12.5 294 673 1582 57 42 20 13 44 623 966 2020 27 21 9.7 6.9 3.4 27 385 773
STATISTICS OF MONTHLY MEAN DATA FOR WATER YEARS 1928 - 2002, BY WATER YEAR (WY)
MEAN 515 204 170 223 MAX 2152 890 1850 2614(WY) 1929 1960 1998 1998 MIN 9.20 6.52 7.31 5.34(WY) 2001 2001 2001 2001
241 365 311 112 167 332 540 767 1291 3049 1945 790 3357 2191 2777 42551998 1960 1987 1959 1934 1934 1960 1933 4.88 5.24 5.01 2.64 1.64 3.56 11.2 5.572001 2001 2001 2001 2000 2001 1992 1999
SUMMARY STATISTICS FOR 2001 CALENDAR YEAR FOR 2002 WATER YEAR WATER YEARS 1928 - 2002
ANNUAL TOTAL 66094.21ANNUAL MEAN 181 HIGHEST ANNUAL MEAN LOWEST ANNUAL MEAN HIGHEST DAILY MEAN 2940LOWEST DAILY MEAN 0.71 ANNUAL SEVEN-DAY MINIMUM 1.1MAXIMUM PEAK FLOWMAXIMUM PEAK STAGE INSTANTANEOUS LOW FLOW10 PERCENT EXCEEDS 39850 PERCENT EXCEEDS 5.590 PERCENT EXCEEDS 2.4
106784.6 293 324
1211 1960 15.8 2000
Sep 26 2330 Oct 1 8840 Jun 21 1934Jun 13 3.4 Jun 16,21 0.07 Jun 10 2000 Jun 11 4.9 Jun 10 0.16 Jun 5 2000
2030 Sep 16 *8840 Jun 21 193413.91 Oct 1 *20.50 Jun 21 19342.9 Jun 16,17 0.00 Jun 10,11 2000
948 85840 123 9.5 23
e Estimated* Site and datum then in use.

---
WITHLACOOCHEE RIVER BASIN 319
02312000 WITHLACOOCHEE RIVER AT TRILBY, FL--Continued
GAGE HEIGHT, FEET, WATER YEAR OCTOBER 2001 TO SEPTEMBER 2002 DAILY MEAN VALUES
DAY OCT NOV DEC JAN FEB MAR APR MAY JUN JUL AUG SEP
1 13.70 2.40 1.19 1.06 2.10 2.50 2.00 1.37 0.93 1.43 6.95 8.58 2 13.31 2.34 1.18 1.23 2.18 2.46 1.96 1.36 0.80 1.44 6.86 8.44 3 12.89 2.28 1.17 1.38 2.23 2.46 1.96 1.35 0.75 1.37 6.81 8.29 4 12.44 2.23 1.16 1.40 2.23 2.55 1.96 1.33 0.70 1.27 6.97 8.41 5 11.97 2.20 1.15 1.42 2.18 2.57 1.90 1.32 0.69 1.25 7.04 9.09
6 11.48 2.13 1.14 1.40 2.13 2.57 1.84 1.31 0.68 1.24 7.00 9.55 7 10.94 2.04 1.12 1.39 2.14 2.57 1.79 1.29 0.66 1.17 6.79 9.92 8 10.42 1.96 1.12 1.37 2.24 2.56 1.75 1.26 0.67 1.13 6.66 10.30 9 9.87 1.88 1.13 1.35 2.31 2.56 1.72 1.25 0.65 1.12 6.55 10.66 10 9.30 1.81 1.13 1.33 2.32 2.57 1.69 1.24 0.62 1.21 6.31 10.98
11 8.76 1.75 1.14 1.30 2.32 2.56 1.66 1.22 0.61 1.70 5.97 11.24 12 8.28 1.67 1.14 1.29 2.30 2.56 1.65 1.19 0.58 2.53 5.67 11.45 13 7.83 1.61 1.15 1.30 2.28 2.57 1.67 1.17 0.56 3.39 5.51 11.68 14 7.41 1.61 1.16 1.34 2.24 2.57 1.67 1.16 0.53 4.96 5.57 11.89 15 7.01 1.59 1.16 1.44 2.21 2.58 1.68 1.14 0.60 5.37 6.52 12.08
16 6.57 1.57 1.16 1.52 2.18 2.57 1.63 1.11 0.52 5.56 7.16 12.17 17 6.11 1.54 1.16 1.60 2.16 2.56 1.60 1.10 0.62 5.75 7.43 12.12 18 5.64 1.49 1.19 1.62 2.14 2.54 1.56 1.09 0.73 5.86 7.79 12.08 19 5.22 1.45 1.20 1.62 2.10 2.50 1.54 1.16 0.60 5.88 8.03 11.97 20 4.81 1.43 1.20 1.62 2.06 2.45 1.53 1.16 0.57 6.03 8.33 11.84
21 4.43 1.41 1.18 1.65 2.04 2.43 1.52 1.07 0.52 6.19 8.64 11.68 22 4.13 1.39 1.15 1.67 2.07 2.41 1.50 1.03 0.62 6.47 8.95 11.50 23 3.89 1.37 1.13 1.70 2.22 2.38 1.48 1.00 e0.86 6.92 9.11 11.31 24 3.71 1.37 1.13 1.74 2.47 2.34 1.46 0.98 e1.47 7.03 9.20 11.29 25 3.51 1.35 1.12 1.78 2.61 2.32 1.44 0.94 e1.13 7.09 9.22 11.85
26 3.31 1.30 1.12 1.82 2.63 2.29 1.43 0.91 e1.07 7.15 9.18 12.11 27 3.11 1.26 1.10 1.86 2.60 2.22 1.42 0.89 1.11 7.41 9.12 12.05 28 2.91 1.24 1.09 1.89 2.55 2.17 1.41 0.88 1.20 7.38 9.07 11.88 29 2.74 1.22 1.07 1.93 --- 2.12 1.39 0.84 1.37 7.27 8.94 11.65 30 2.60 1.21 1.06 1.97 --- 2.08 1.38 0.83 1.26 7.15 8.76 11.43 31 2.48 --- 1.06 2.02 --- 2.04 --- 0.88 7.05 8.66 --
MEAN 7.12 1.67 1.14 1.55 2.26 2.44 1.64 1.12 0.79 4.41 7.57 10.98 MAX 13.70 2.40 1.20 2.02 2.63 2.58 2.00 1.37 1.47 7.41 9.22 12.17 MIN 2.48 1.21 1.06 1.06 2.04 2.04 1.38 0.83 0.52 1.12 5.51 8.29
CAL YR 2001 MEAN 2.11 MAX 14.85 MIN 0.28 WTR YR 2002 MEAN 3.57 MAX 13.70 MIN 0.52
e Estimated

320 WITHLACOOCHEE RIVER BASIN
02312000 WITHLACOOCHEE RIVER AT TRILBY, FL--Continued
WATER-QUALITY RECORDS
PERIOD OF RECORD.--Water years 1956, 1958-61, 1963, 1966-87, 1992, 1995 to current year.
WATER-QUALITY DATA, WATER YEAR OCTOBER 2001 TO SEPTEMBER 2002
DIS CHARGE, INST. CUBICFEET
Date Time PERSECOND(00061)
PHSPE- WATER CIFIC WHOLE CON- FIELD TEMPER- OXYGEN,
GAGE DUCT- (STAND- ATURE DISHEIGHT ANCE ARD WATER SOLVED(FEET) (US/CM) UNITS) (DEG C) (MG/L) (00065) (00095) (00400) (00010) (00300)
NOV14... 1120 81 1.62 332 6.5 19.9 3.0
JAN18... 1241 42 1.62 400 7.1 17.7 4.9
MAR11... 1343 34 2.56 376 6.4 21.3 5.2
MAY 07... 1448 9.4 1.28 456 7.5 28.0 9.6
JUL08... 1500 26 1.12 456 6.8 26.6 5.3
AUG 29... 1520 876 8.93 109 6.2 26.4 2.6

-- --
-- --
-- --
-- --
321 WITHLACOOCHEE RIVER BASIN
02312140 BAYROOT SLOUGH HEADWATERS NEAR BAY LAKE, FL
LOCATION.--Lat 28° 27'23", long 81° 55'14", in NW1⁄ 4 sec.28, T.23 S., R.24 E., Lake County, Hydrologic Unit 03100208, at bridge on State Highway 565, 0.1 mi upstream from James A. Van Fleet Trail, and 1.5 mi southwest of town of Bay Lake.
DRAINAGE AREA.--18 mi2, approximately.
PERIOD OF RECORD.--1960-61, October 1963 to current year (discharge measurements only).
REVISED RECORDS.--WDR FL-72-3: Drainage area.
REMARKS.--Discharge measurements made along the James A. Van Fleet Trail from 1.0 mi north to 0.8 mi south of State Highway 565, which includes Bayroot Slough, Bayroot Drain and Cam Slough.
EXTREMES FOR PERIOD OF RECORD.--Maximum discharge measured, 202 ft3/s, Sept. 14, 1960; no flow observed at times in most years.
WATER QUALITY RECORDS
PERIOD OF RECORD.--Water years 1959, 1963-64, 1966-80, 1982-83, 1986, 1994-99, 2001 to current year.
DISCHARGE AND WATER-QUALITY DATA, WATER YEAR OCTOBER 2001 TO SEPTEMBER 2002
DIS PH CHARGE, SPE WATER INST. CIFIC WHOLE CUBIC CON FIELD TEMPER OXYGEN, FEET GAGE DUCT (STAND ATURE DIS
Date Time PER HEIGHT ANCE ARD WATER SOLVED SECOND (FEET) (US/CM) UNITS) (DEG C) (MG/L) (00061) (00065) (00095) (00400) (00010) (00300)
NOV 20... 1215 .00 - - -
JAN 15... 1445 .00 - - -
MAR 14... 1130 .00 - - -
MAY 08... 1140 .00 - - -
JUL 10... 1050 2.3 99.53 109 4.0 24.8 .8
SEP 06... 0825 23.3 100.15 59 4.5 25.8 5.4

322 WITHLACOOCHEE RIVER BASIN
02312180 LITTLE WITHLACOOCHEE RIVER NEAR TARRYTOWN, FL
LOCATION.--Lat 28° 31'17", long 82° 03'18", in NE1⁄ 4 sec.1, T.23 S., R.22 E., Sumter County, Hydrologic Unit 03100208, near center of span on downstream side of bridge on State Highway 471, 2.3 mi south of Tarrytown, 3.1 mi southwest of Linden, and 14 mi upstream from mouth.
DRAINAGE AREA.--85 mi2, approximately. WATER-DISCHARGE RECORDS
PERIOD OF RECORD.--October 1966 to current year.
REVISED RECORDS.--WDR FL-72-3: Drainage area.
GAGE.--Water-stage recorder. Datum of gage is 80.00 ft above NGVD of 1929 (Florida Department of Transportation bench mark).
REMARKS.--Records fair. Above bankfull stage, discharge measurements are made along State Highway 471 and include all culvert flow from 2.3 mi north to 2.8 mi south of gaging station.
DISCHARGE, CUBIC FEET PER SECOND, WATER YEAR OCTOBER 2001 TO SEPTEMBER 2002DAILY MEAN VALUES
DAY OCT NOV DEC JAN FEB MAR APR MAY JUN JUL AUG SEP
1 115 2.9 0.00 0.002 105 2.5 0.00 0.183 97 2.4 0.00 0.574 88 2.2 0.00 0.345 80 2.2 0.00 0.30
0.24 1.5 0.00 0.00 0.00 1.2 17 1350.21 1.4 0.00 0.00 0.00 0.33 21 1230.16 1.5 0.00 0.00 0.00 0.05 35 2460.11 2.3 0.00 0.00 0.00 0.00 44 2480.04 2.4 0.00 0.00 0.00 0.40 37 315
6 71 1.9 0.00 0.317 63 1.5 0.00 0.338 55 1.3 0.00 0.289 48 1.1 0.00 0.23
10 38 0.96 0.00 0.19
0.00 2.2 0.00 0.00 0.00 0.76 33 2830.11 2.1 0.00 0.00 0.00 0.16 41 2420.29 1.8 0.00 0.00 0.00 0.00 54 1980.24 1.6 0.00 0.00 0.00 0.03 51 1650.23 1.4 0.00 0.00 0.00 0.09 48 138
11 33 0.88 0.00 0.15 12 29 0.77 0.00 0.11 13 25 0.68 0.00 0.12 14 22 0.74 0.00 0.41 15 19 0.81 0.00 1.0
0.26 1.1 0.00 0.00 0.00 0.02 44 1170.24 0.95 0.00 0.00 0.00 0.74 41 1070.21 0.98 0.00 0.00 0.00 2.0 54 1140.16 0.94 0.00 0.00 0.00 5.5 69 1450.13 0.83 0.00 0.00 0.00 3.9 87 154
16 17 0.73 0.00 1.1 17 15 0.59 0.00 0.99 18 13 0.48 0.00 0.92 19 10 0.41 0.00 0.8320 9.1 0.35 0.00 0.77
0.09 0.75 0.00 0.00 0.00 2.1 97 1370.05 0.64 0.00 0.00 0.00 1.2 124 1210.00 0.51 0.00 0.00 0.00 0.59 269 1120.00 0.38 0.00 0.00 0.00 1.3 244 98 0.00 0.31 0.00 0.00 0.00 3.5 228 84
21 8.2 0.31 0.00 0.67 22 8.1 0.27 0.00 0.69 23 7.7 0.24 0.00 0.66 24 7.4 0.20 0.00 0.60 25 7.2 0.15 0.00 0.52
0.00 0.26 0.00 0.00 0.00 5.1 170 700.00 0.23 0.00 0.00 0.00 27 135 610.81 0.11 0.00 0.00 0.00 44 111 592.3 0.01 0.00 0.00 0.00 33 94 902.4 0.06 0.00 0.00 0.10 24 77 156
26 6.5 0.13 0.00 0.46 27 5.7 0.07 0.00 0.43 28 4.9 0.02 0.00 0.3829 4.3 0.00 0.00 0.36 30 3.7 0.00 0.00 0.31 31 3.3 --- 0.00 0.27
2.2 0.36 0.00 0.00 0.31 24 71 1722.1 0.28 0.00 0.00 0.22 33 91 1651.7 0.25 0.00 0.00 0.15 29 91 159 --- 0.18 0.00 0.00 1.0 23 81 149 --- 0.05 0.00 0.00 1.8 19 94 138 --- 0.00 --- 0.00 --- 17 152 --
TOTAL 1019.1 26.79 0.00 14.48 MEAN 32.9 0.89 0.000 0.47MAX 115 2.9 0.00 1.1 MIN 3.3 0.00 0.00 0.00CFSM 0.39 0.01 0.00 0.01IN. 0.45 0.01 0.00 0.01
14.28 27.38 0.00 0.00 3.58 301.97 2805 45010.51 0.88 0.000 0.000 0.12 9.74 90.5 150 2.4 2.4 0.00 0.00 1.8 44 269 3150.00 0.00 0.00 0.00 0.00 0.00 17 590.01 0.01 0.00 0.00 0.00 0.11 1.06 1.770.01 0.01 0.00 0.00 0.00 0.13 1.23 1.97
STATISTICS OF MONTHLY MEAN DATA FOR WATER YEARS 1967 - 2002, BY WATER YEAR (WY)
MEAN 62.3 20.1 27.6 40.9MAX 354 159 386 386 (WY) 1996 1970 1998 1998MIN 0.000 0.000 0.000 0.000 (WY) 1981 1971 1971 1981
40.5 53.6 35.1 5.61 9.98 25.4 57.4 96.1 285 351 329 68.6 129 275 263 3621998 1998 1987 1987 1991 1991 1994 1994
0.000 0.000 0.000 0.000 0.000 0.000 0.000 0.0001981 1981 1968 1967 1971 1971 1987 1990
SUMMARY STATISTICS FOR 2001 CALENDAR YEAR FOR 2002 WATER YEAR WATER YEARS 1967 - 2002
ANNUAL TOTAL 5902.75ANNUAL MEAN 16.2HIGHEST ANNUAL MEANLOWEST ANNUAL MEANHIGHEST DAILY MEAN e756LOWEST DAILY MEAN 0.00ANNUAL SEVEN-DAY MINIMUM 0.00MAXIMUM PEAK FLOWMAXIMUM PEAK STAGEANNUAL RUNOFF (CFSM) 0.19ANNUAL RUNOFF (INCHES) 2.5810 PERCENT EXCEEDS 1450 PERCENT EXCEEDS 0.0090 PERCENT EXCEEDS 0.00
8713.58 23.9 39.5
130 1998 0.000 2000
Sep 16 315 Sep 5 1180 Mar 31 1987Many days 0.00 Many days 0.00 Many daysJan 1 0.00 Nov 29 0.00 Many days
323 Sep 5 1210 Mar 31 1987 5.58 Sep 5 6.58 Sep 28 1979 0.28 0.47 3.81 6.3297 127 0.33 1.4 0.00 0.00
e Estimated

323 WITHLACOOCHEE RIVER BASIN
02312180 LITTLE WITHLACOOCHEE RIVER NEAR TARRYTOWN, FL--Continued
WATER-QUALITY RECORDS
PERIOD OF RECORD.--Water years 1969-71, 1973, 1984, 1986-89, 1991, 1999, 2001 to current year.
WATER-QUALITY DATA, WATER YEAR OCTOBER 2001 TO SEPTEMBER 2002
DIS PH NITRO CHARGE, SPE WATER NITRO NITRO GEN,AM- NITROINST. CIFIC WHOLE GEN, GEN, MONIA + GEN, PHOS- CARBON, CUBIC CON FIELD TEMPER- OXYGEN, AMMONIA NITRITE ORGANIC NO2+NO3 PHORUS ORGANIC FEET GAGE DUCT- (STAND- ATURE DIS TOTAL TOTAL TOTAL TOTAL TOTAL TOTAL
Date Time PER HEIGHT ANCE ARD WATER SOLVED (MG/L (MG/L (MG/L (MG/L (MG/L (MG/L SECOND (FEET) (US/CM) UNITS) (DEG C) (MG/L) AS N) AS N) AS N) AS N) AS P) AS C)
(00061) (00065) (00095) (00400) (00010) (00300) (00610) (00615) (00625) (00630) (00665) (00680)
NOV 19... 1140 .42 3.48 108 4.6 19.8 2.3 .04 .01 E3.9 <.020 E.20 -JAN 15... 1040 1.1 3.59 101 6.2 14.6 4.1 <.01 <.01 2.5 <.020 .07 74.0 MAR 11... 1655 1.0 3.54 102 5.1 20.1 4.9 .02 <.01 2.4 <.020 .04 -JUL 10... 0910 .11 3.38 103 6.4 25.0 1.5 .06 .02 2.6 <.020 .05 73.0 AUG 29... 0820 78 4.80 63 5.2 24.4 2.6 .01 .02 2.0 <.020 .02 -
ANC SOLIDS, PHOS- HARD- MAGNE- POTAS- UNFLTRD CHLO- FLUO- SILICA, RESIDUE STRONPHORUS NESS CALCIUM SIUM, SODIUM, SIUM, TIT 4.5 SULFATE RIDE, RIDE, DIS- AT 180 TIUM,ORTHO TOTAL DIS- DIS- DIS- DIS- LAB DIS- DIS- DIS- SOLVED DEG. C DIS TOTAL (MG/L SOLVED SOLVED SOLVED SOLVED (MG/L SOLVED SOLVED SOLVED (MG/L DIS- SOLVED
Date (MG/L AS (MG/L (MG/L (MG/L (MG/L AS (MG/L (MG/L (MG/L AS SOLVED (UG/L AS P) CACO3) AS CA) AS MG) AS NA) AS K) CACO3) AS SO4) AS CL) AS F) SIO2) (MG/L) AS SR)(70507) (00900) (00915) (00925) (00930) (00935) (90410) (00945) (00940) (00950) (00955) (70300) (01080)
NOV 19... .210 -- -- -- -- -- -- -- -- -- -- -- -JAN 15... .070 39 12.0 2.10 6.3 1.50 9 4.20 13.0 <.1 1.20 184 24.0MAR 11... .020 -- -- -- -- -- -- -- -- -- -- -- -JUL 10... .060 54 19.0 1.70 4.9 .80 25 2.90 9.00 <.1 5.50 212 39.0AUG 29... .020 -- -- -- -- -- -- -- -- -- -- -- -
< -- Less than E -- Estimated value

324 WITHLACOOCHEE RIVER BASIN
02312200 LITTLE WITHLACOOCHEE RIVER AT RERDELL, FL
LOCATION.--Lat 28° 34'21", long 82° 09'20", in SE1⁄ 4 sec.13, T.22 S., R.21 E., Hernando County, Hydrologic Unit 03100208, near center of span on upstream side of bridge on U.S. Highway 301, 0.2 mi north of Rerdell, and 4.8 mi upstream from mouth.
DRAINAGE AREA.--145 mi2, approximately. WATER-DISCHARGE RECORDS
PERIOD OF RECORD.--July 1958 to current year.
REVISED RECORDS.--WDR FL-72-3: Drainage area.
GAGE.--Water-stage recorder. Datum of gage is 59.02 ft above NGVD of 1929.
REMARKS.--Records fair. Above bankfull stage, discharge measurements are made along U.S. Highway 301 and include all flowfrom 3.4 mi north to 1.8 mi south of gaging station.
DISCHARGE, CUBIC FEET PER SECOND, WATER YEAR OCTOBER 2001 TO SEPTEMBER 2002DAILY MEAN VALUES
DAY OCT NOV DEC JAN FEB MAR APR MAY JUN JUL AUG SEP
1 159 16 5.7 4.2 2 147 16 5.5 123 135 16 5.5 9.3 4 122 16 5.5 7.6 5 112 17 5.5 7.4
6.5 8.2 3.9 0.59 0.00 50 190 3476.5 7.9 3.9 0.43 0.00 60 175 3156.4 8.6 4.1 0.25 0.00 36 180 3746.2 15 4.2 0.18 0.00 37 168 4576.2 11 3.6 0.16 0.00 40 152 576
6 103 14 5.5 7.7 7 96 13 5.4 7.9 8 89 12 5.4 7.5 9 82 12 5.4 7.3
10 75 11 5.2 7.3
6.0 11 3.3 0.14 0.00 38 142 5906.5 11 3.2 0.12 0.00 34 137 5816.5 11 3.1 0.11 0.00 32 133 5086.1 10 2.8 e0.08 0.00 37 128 421 5.9 9.9 3.1 0.05 0.00 40 127 340
11 68 11 5.2 7.2 12 62 9.8 5.1 7.1 13 57 9.5 5.0 7.2 14 52 9.3 5.0 8.2 15 48 9.0 4.9 8.4
5.9 9.7 3.4 0.04 0.00 34 124 274 5.6 9.4 3.0 0.02 0.00 32 121 241 5.7 9.4 2.8 0.00 0.00 40 126 235 5.6 9.2 2.9 0.00 0.00 63 134 243 5.4 8.9 2.8 0.00 0.00 51 156 316
16 44 8.5 4.8 7.9 17 40 8.2 4.7 7.6 18 37 8.0 4.9 7.4 19 35 7.9 4.7 7.2 20 32 7.8 4.6 7.3
5.6 8.6 2.6 0.00 0.00 44 184 336 5.5 8.3 2.3 0.00 0.00 40 189 307 5.4 7.8 2.2 0.00 0.00 37 300 268 5.1 7.5 1.9 0.00 0.00 37 429 238 5.0 7.0 1.8 0.00 0.00 37 507 213
21 32 7.6 4.4 7.2 22 31 7.4 4.3 7.1 23 29 7.2 4.3 7.0 24 27 7.0 4.7 7.0 25 26 6.8 4.6 6.9
5.2 6.8 1.7 0.00 0.00 42 513 193 6.1 6.8 1.6 0.00 0.74 70 448 178 8.6 6.2 1.5 0.00 5.9 129 358 175 8.7 5.9 1.4 0.00 15 136 278 201 8.0 5.7 1.2 0.00 17 139 231 352
26 23 6.5 4.4 7.0 27 21 6.3 4.5 6.9 28 20 6.1 4.4 7.0 29 19 6.0 4.3 7.0 30 18 5.9 4.4 6.8 31 17 --- 4.2 6.7
8.0 5.7 1.1 0.00 12 137 211 396 7.9 5.2 1.0 0.00 18 194 245 392 8.2 4.9 0.90 0.00 28 220 226 360 --- 4.6 0.74 0.00 28 235 210 313 --- 4.2 0.67 0.00 35 214 205 271 --- 4.1 --- 0.00 --- 206 322 --
TOTAL 1858 298.8 152.0 230.3 MEAN 59.9 9.96 4.90 7.43MAX 159 17 5.7 12MIN 17 5.9 4.2 4.2 CFSM 0.41 0.07 0.03 0.05IN. 0.48 0.08 0.04 0.06
178.3 249.5 72.71 2.17 159.64 2541 7049 100116.37 8.05 2.42 0.070 5.32 82.0 227 334 8.7 15 4.2 0.59 35 235 513 590 5.0 4.1 0.67 0.00 0.00 32 121 1750.04 0.06 0.02 0.00 0.04 0.57 1.57 2.300.05 0.06 0.02 0.00 0.04 0.65 1.81 2.57
STATISTICS OF MONTHLY MEAN DATA FOR WATER YEARS 1958 - 2002, BY WATER YEAR (WY)
MEAN 98.3 34.4 38.8 66.5MAX 488 242 461 661 (WY) 1961 1970 1998 1998MIN 0.24 0.53 0.24 0.000 (WY) 1962 1962 2001 2001
77.3 124 73.5 18.2 26.1 55.8 108 158 518 1045 469 122 249 488 695 7071998 1960 1987 1959 1966 1959 1960 1960
0.000 0.000 0.000 0.000 0.000 0.000 0.021 0.0362001 1985 2000 1985 1981 1992 1997 1997
SUMMARY STATISTICS FOR 2001 CALENDAR YEAR FOR 2002 WATER YEAR WATER YEARS 1958 - 2002
ANNUAL TOTAL 7443.30 ANNUAL MEAN 20.4HIGHEST ANNUAL MEANLOWEST ANNUAL MEANHIGHEST DAILY MEAN 558 LOWEST DAILY MEAN 0.00ANNUAL SEVEN-DAY MINIMUM 0.00MAXIMUM PEAK FLOWMAXIMUM PEAK STAGEANNUAL RUNOFF (CFSM) 0.14ANNUAL RUNOFF (INCHES) 1.9110 PERCENT EXCEEDS 3350 PERCENT EXCEEDS 0.0090 PERCENT EXCEEDS 0.00
22802.4262.5 73.4
312 1960 1.79 2000
Sep 19 590 Sep 6 3380 Mar 19 1960Many days 0.00 Many days 0.00 Some yearsJan 1 0.00 May 13 0.00 Some years
600 Sep 7 3400 Mar 19 1960 7.49 Sep 7 12.32 Mar 19 1960 0.43 0.51 5.85 6.88
228 210 7.6 15 0.00 0.63
e Estimated

325 WITHLACOOCHEE RIVER BASIN
02312200 LITTLE WITHLACOOCHEE RIVER AT RERDELL, FL--Continued
WATER-QUALITY RECORDS
PERIOD OF RECORD.--Water years 1958 to current year.
WATER-QUALITY DATA, WATER YEAR OCTOBER 2001 TO SEPTEMBER 2002
DIS PH NITRO CHARGE, SPE WATER NITRO NITRO- GEN,AM- NITROINST. CIFIC WHOLE COLOR GEN, GEN, MONIA + GEN, PHOS CUBIC CON FIELD TEMPER- (PLAT OXYGEN, AMMONIA NITRITE ORGANIC NO2+NO3 PHORUS FEET GAGE DUCT- (STAND- ATURE INUM DIS TOTAL TOTAL TOTAL TOTAL TOTAL
Date Time PER HEIGHT ANCE ARD WATER COBALT SOLVED (MG/L (MG/L (MG/L (MG/L (MG/L SECOND (FEET) (US/CM) UNITS) (DEG C) UNITS) (MG/L) AS N) AS N) AS N) AS N) AS P)
(00061) (00065) (00095) (00400) (00010) (00080) (00300) (00610) (00615) (00625) (00630) (00665)
NOV 15... 1615 9.4 1.73 347 6.8 19.5 160 3.5 .26 .01 E1.5 .070 E.05 JAN 18... 0908 7.1 1.63 354 7.2 15.0 50 5.9 .09 .01 .80 .080 .04 MAR 18... 1152 7.9 1.51 350 7.2 23.2 70 4.0 .07 <.01 .60 .050 .02 JUL 10... 1525 39 2.66 327 6.8 26.2 100 3.4 .16 .01 1.1 .060 .05 AUG 29... 1040 212 4.88 165 6.6 25.8 400 1.7 .08 .01 1.9 .040 .12
ANC SOLIDS, PHOS- HARD- MAGNE- POTAS- UNFLTRD CHLO- FLUO- SILICA, RESIDUE
CARBON, PHORUS NESS CALCIUM SIUM, SODIUM, SIUM, TIT 4.5 SULFATE RIDE, RIDE, DIS- AT 180ORGANIC ORTHO TOTAL DIS- DIS- DIS- DIS- LAB DIS- DIS- DIS- SOLVED DEG. CTOTAL TOTAL (MG/L SOLVED SOLVED SOLVED SOLVED (MG/L SOLVED SOLVED SOLVED (MG/L DIS-
Date (MG/L (MG/L AS (MG/L (MG/L (MG/L (MG/L AS (MG/L (MG/L (MG/L AS SOLVED AS C) AS P) CACO3) AS CA) AS MG) AS NA) AS K) CACO3) AS SO4) AS CL) AS F) SIO2) (MG/L)(00680) (70507) (00900) (00915) (00925) (00930) (00935) (90410) (00945) (00940) (00950) (00955) (70300)
NOV 15... 22.0 .030 170 65.0 2.40 5.8 .70 E158 2.00 11.0 .1 6.70 244JAN 18... 14.0 <.010 170 66.0 2.40 6.0 .50 170 3.80 11.0 .1 5.00 223MAR 18... 14.0 .010 170 65.0 2.30 6.1 .30 160 3.90 12.0 .1 4.00 227JUL 10... 16.0 .050 160 61.0 2.30 5.6 .60 149 8.60 11.0 .1 7.40 224AUG 29... 37.0 .100 82 30.0 1.70 3.8 1.00 66 1.80 6.70 <.1 4.40 173
STRONTIUM,DIS
SOLVEDDate (UG/L
AS SR)(01080)
NOV 15... 75.0
JAN 18... 77.0
MAR 18... 78.0
JUL 10... 71.0
AUG 29... 37.0
< -- Less than E -- Estimated value

326 WITHLACOOCHEE RIVER BASIN
02312500 WITHLACOOCHEE RIVER AT CROOM, FL
LOCATION.--Lat 28° 35'33", long 82° 13'20", in NE1⁄ 4 sec.8, T.22 S., R.21 E., Hernando County, Hydrologic Unit 03100208, on left bank at upstream side of abandoned highway bridge, 0.4 mi northwest of Croom, 2.3 mi downstream from Little Withlacoochee River, 4.5 mi southeast of Nobleton, and 77 mi upstream from mouth.
DRAINAGE AREA.--810 mi2, approximately. WATER-DISCHARGE RECORDS
PERIOD OF RECORD.--October 1939 to current year. Monthly discharge only for some periods, published in WSP 1304.
REVISED RECORDS.--WDR FL-72-3: Drainage area.
GAGE.--Water-stage recorder. Datum of gage is 38.94 ft above NGVD of 1929 (U.S. Army Corps of Engineers bench mark). Prior to Feb. 2, 1940, nonrecording gage at railroad bridge 500 ft upstream at same datum.
REMARKS.--Records fair. Records include water diverted from ground-water supplies (see station 02311700). High-water diversion in headwaters (station 02311000).
EXTREMES OUTSIDE PERIOD OF RECORD.--Flood in June 1934 reached a stage of 15.2 ft, from floodmark, discharge not determined.
DISCHARGE, CUBIC FEET PER SECOND, WATER YEAR OCTOBER 2001 TO SEPTEMBER 2002DAILY MEAN VALUES
DAY OCT NOV DEC JAN FEB MAR APR MAY JUN JUL AUG SEP
1 2270 198 82 45 2 2140 190 81 56 3 2000 184 79 69 4 1860 178 77 67 5 1730 175 75 63
47 39 19 9.7 3.1 98 670 1080 47 38 18 8.9 3.0 104 647 1060 47 38 19 8.4 2.5 105 637 1050 46 52 20 8.2 2.1 100 630 1070 45 49 20 8.2 1.8 100 616 1170
6 1600 169 74 62 7 1470 162 72 61 8 1340 155 72 59 9 1230 149 71 5710 1110 143 70 55
44 46 19 7.7 1.5 98 605 1280 43 43 18 7.4 1.8 93 598 1340 43 43 17 7.0 3.0 89 582 1380 42 42 17 6.4 2.9 90 558 1400 41 41 16 6.0 2.5 91 539 1400
11 987 138 69 5412 879 133 67 5313 794 129 67 5214 717 127 65 5315 648 124 64 55
41 40 17 5.6 2.4 90 516 140041 39 18 5.0 2.0 88 503 141040 37 22 4.5 1.6 99 495 142038 36 22 4.1 1.3 131 478 146037 35 21 3.6 2.2 181 496 1520
16 586 120 63 5517 530 117 62 5518 484 114 61 5619 446 112 60 5620 414 109 58 56
36 34 20 3.4 2.1 218 561 157035 33 19 3.3 3.7 243 655 160034 32 18 3.2 8.7 263 767 159032 31 18 3.5 9.0 280 877 157031 29 17 3.5 8.3 301 995 1560
21 383 106 57 55 22 356 103 56 5423 332 100 55 5424 312 98 55 5325 295 96 53 52
30 28 17 3.2 7.2 330 1080 153031 26 17 2.9 11 352 1130 150037 24 16 2.5 16 401 1130 1480 41 23 15 2.3 22 455 1100 1480 41 22 14 2.1 36 498 1070 1540
26 278 93 52 5127 262 91 51 5128 246 88 49 51 29 231 86 48 51 30 219 84 47 49 31 208 --- 46 49
41 23 14 1.9 45 523 1040 1610 40 23 13 1.8 45 571 1040 1650 40 22 13 1.9 53 648 1040 1660 --- 20 12 1.8 74 696 1020 1640 --- 19 11 1.9 85 696 1020 1600 --- 19 --- 2.3 --- 682 1050 --
TOTAL 26357 3871 1958 1709MEAN 850 129 63.2 55.1MAX 2270 198 82 69 MIN 208 84 46 45
1111 1026 517 142.2 459.7 8714 24145 4302039.7 33.1 17.2 4.59 15.3 281 779 143447 52 22 9.7 85 696 1130 1660 30 19 11 1.8 1.3 88 478 1050
STATISTICS OF MONTHLY MEAN DATA FOR WATER YEARS 1940 - 2002, BY WATER YEAR (WY)
MEAN 660 292 253 317 MAX 2710 1050 1957 3234(WY) 1961 1960 1998 1998 MIN 13.0 6.64 4.39 1.71(WY) 2001 2001 2001 2001
333 484 404 166 160 355 664 894 1738 3633 2484 1015 1045 2091 3470 36911998 1960 1960 1959 1959 1959 1960 1950 1.69 0.20 0.19 0.000 0.000 0.000 8.31 26.12001 2001 2001 2001 2001 2001 1992 2000
SUMMARY STATISTICS FOR 2001 CALENDAR YEAR FOR 2002 WATER YEAR WATER YEARS 1940 - 2002
ANNUAL TOTAL 65185.30ANNUAL MEAN 179 HIGHEST ANNUAL MEAN LOWEST ANNUAL MEAN HIGHEST DAILY MEAN 2430LOWEST DAILY MEAN 0.00ANNUAL SEVEN-DAY MINIMUM 0.00MAXIMUM PEAK FLOW MAXIMUM PEAK STAGE 10 PERCENT EXCEEDS 37550 PERCENT EXCEEDS 1.290 PERCENT EXCEEDS 0.00
113029.9 310 415
1551 1960 24.9 2000
Sep 29 2270 Oct 1 8630 Mar 23 1960Many days 1.3 Jun 14 *0.00Apr 12 2.0 May 24 *0.00
1670 Sep 28 8650 Mar 23 19609.25 Oct 1 13.78 Mar 23 1960
1130 106057 193 4.8 41
* During 2000, 2001 water years

---
WITHLACOOCHEE RIVER BASIN 327
02312500 WITHLACOOCHEE RIVER AT CROOM, FL--Continued
GAGE HEIGHT, FEET, WATER YEAR OCTOBER 2001 TO SEPTEMBER 2002 DAILY MEAN VALUES
DAY OCT NOV DEC JAN FEB MAR APR MAY JUN JUL AUG SEP
1 9.18 3.67 2.31 1.77 1.80 1.67 1.21 0.78 0.43 2.30 6.39 7.42 2 9.03 3.59 2.29 1.93 1.79 1.66 1.20 0.75 0.42 2.39 6.31 7.39 3 8.86 3.53 2.26 2.13 1.79 1.67 1.20 0.73 0.38 2.41 6.28 7.36 4 8.68 3.47 2.24 2.09 1.78 1.87 1.22 0.72 0.34 2.36 6.25 7.41 5 8.49 3.44 2.21 2.04 1.77 1.83 1.20 0.71 0.31 2.36 6.20 7.60
6 8.31 3.38 2.19 2.03 1.75 1.77 1.18 0.68 0.28 2.34 6.16 7.78 7 8.11 3.30 2.17 2.01 1.74 1.74 1.15 0.66 0.30 2.28 6.13 7.89 8 7.91 3.23 2.16 1.98 1.73 1.73 1.13 0.64 0.41 2.24 6.07 7.95 9 7.71 3.16 2.15 1.95 1.72 1.72 1.11 0.62 0.40 2.25 5.97 7.96 10 7.49 3.10 2.14 1.92 1.71 1.71 1.10 0.60 0.38 2.28 5.90 7.96
11 7.26 3.05 2.12 1.90 1.71 1.69 1.10 0.58 0.37 2.27 5.80 7.95 12 7.02 2.99 2.10 1.88 1.71 1.67 1.11 0.55 0.34 2.23 5.74 7.96 13 6.80 2.94 2.09 1.87 1.69 1.65 1.19 0.53 0.32 2.37 5.70 7.98 14 6.59 2.91 2.07 1.89 1.66 1.63 1.16 0.50 0.29 2.79 5.61 8.04 15 6.37 2.87 2.05 1.92 1.65 1.61 1.15 0.48 0.40 3.35 5.70 8.14
16 6.15 2.83 2.04 1.92 1.63 1.59 1.12 0.46 0.39 3.72 5.98 8.24 17 5.94 2.79 2.02 1.92 1.61 1.57 1.10 0.44 0.50 3.95 6.32 8.28 18 5.73 2.75 2.01 1.93 1.59 1.54 1.08 0.44 0.74 4.13 6.69 8.26 19 5.53 2.72 1.99 1.93 1.57 1.51 1.06 0.46 0.77 4.27 6.99 8.23 20 5.33 2.68 1.97 1.93 1.55 1.48 1.04 0.46 0.76 4.44 7.25 8.19
21 5.14 2.64 1.95 1.92 1.53 1.45 1.04 0.44 0.72 4.67 7.43 8.13 22 4.97 2.60 1.94 1.91 1.55 1.41 1.01 0.41 0.84 4.83 7.52 8.06 23 4.80 2.57 1.92 1.90 1.65 1.38 0.97 0.39 0.97 5.16 7.53 8.00 24 4.65 2.54 1.92 1.88 1.71 1.35 0.95 0.37 1.10 5.50 7.47 8.00 25 4.51 2.50 1.90 1.87 1.70 1.33 0.93 0.35 1.34 5.73 7.41 8.13
26 4.38 2.47 1.87 1.86 1.70 1.33 0.90 0.33 1.49 5.84 7.34 8.29 27 4.25 2.44 1.85 1.86 1.69 1.32 0.89 0.32 1.49 6.03 7.34 8.38 28 4.11 2.40 1.83 1.85 1.69 1.29 0.87 0.33 1.62 6.32 7.35 8.40 29 3.98 2.37 1.81 1.85 --- 1.26 0.84 0.32 1.95 6.47 7.32 8.35 30 3.87 2.34 1.80 1.83 --- 1.24 0.80 0.33 2.10 6.47 7.30 8.26 31 3.76 --- 1.78 1.82 --- 1.23 --- 0.36 6.43 7.36 --
MEAN 6.29 2.91 2.04 1.92 1.68 1.55 1.07 0.51 0.74 3.88 6.61 8.00 MAX 9.18 3.67 2.31 2.13 1.80 1.87 1.22 0.78 2.10 6.47 7.53 8.40 MIN 3.76 2.34 1.78 1.77 1.53 1.23 0.80 0.32 0.28 2.23 5.61 7.36
CAL YR 2001 MEAN 1.24 MAX 9.36 MIN -1.78 WTR YR 2002 MEAN 3.11 MAX 9.18 MIN 0.28

328 WITHLACOOCHEE RIVER BASIN
02312500 WITHLACOOCHEE RIVER AT CROOM, FL--Continued
WATER-QUALITY RECORDS
PERIOD OF RECORD.--Water years 1956, 1960-61, 1963, 1966 to current year.
WATER-QUALITY DATA, WATER YEAR OCTOBER 2001 TO SEPTEMBER 2002
DIS PH NITRO CHARGE, SPE WATER NITRO NITRO- GEN,AM- NITROINST. CIFIC WHOLE COLOR GEN, GEN, MONIA + GEN, PHOS CUBIC CON FIELD TEMPER- (PLAT OXYGEN, AMMONIA NITRITE ORGANIC NO2+NO3 PHORUS FEET GAGE DUCT- (STAND- ATURE INUM DIS TOTAL TOTAL TOTAL TOTAL TOTAL
Date Time PER HEIGHT ANCE ARD WATER COBALT SOLVED (MG/L (MG/L (MG/L (MG/L (MG/L SECOND (FEET) (US/CM) UNITS) (DEG C) UNITS) (MG/L) AS N) AS N) AS N) AS N) AS P)
(00061) (00065) (00095) (00400) (00010) (00080) (00300) (00610) (00615) (00625) (00630) (00665)
NOV 15... 1150 129 2.87 309 6.3 20.0 320 3.4 .19 .01 E2.4 .600 E.10 JAN 17... 1530 51 1.92 370 7.7 15.8 100 8.4 .01 <.01 1.0 .440 .06 MAR 15... 1515 36 1.61 363 7.5 22.9 120 6.6 .03 <.01 .90 <.020 .04 MAY 08... 1007 6.7 .65 273 8.6 28.4 40 9.3 .14 <.01 1.4 <.020 <.02 JUL 10... 1104 84 2.28 316 6.7 28.2 70 5.5 .04 <.01 .80 <.020 .05 SEP 05... 1026 1170 7.60 106 6.4 29.1 480 3.0 .04 .02 2.2 .080 .13
ANC SOLIDS, PHOS- HARD- MAGNE- POTAS- UNFLTRD CHLO- FLUO- SILICA, RESIDUE
CARBON, PHORUS NESS CALCIUM SIUM, SODIUM, SIUM, TIT 4.5 SULFATE RIDE, RIDE, DIS- AT 180ORGANIC ORTHO TOTAL DIS- DIS- DIS- DIS- LAB DIS- DIS- DIS- SOLVED DEG. CTOTAL TOTAL (MG/L SOLVED SOLVED SOLVED SOLVED (MG/L SOLVED SOLVED SOLVED (MG/L DIS-
Date (MG/L (MG/L AS (MG/L (MG/L (MG/L (MG/L AS (MG/L (MG/L (MG/L AS SOLVED AS C) AS P) CACO3) AS CA) AS MG) AS NA) AS K) CACO3) AS SO4) AS CL) AS F) SIO2) (MG/L)(00680) (70507) (00900) (00915) (00925) (00930) (00935) (90410) (00945) (00940) (00950) (00955) (70300)
NOV 15... 42.0 .080 150 55.0 3.20 7.1 2.00 E106 25.0 11.0 .1 9.10 275JAN 17... 20.0 .030 180 67.0 3.30 6.6 .90 142 34.0 11.0 <.1 6.90 261MAR 15... 20.0 .020 180 66.0 3.10 6.8 .60 137 30.0 12.0 <.1 1.30 252MAY 08... 12.0 .020 140 50.0 2.80 4.8 <.10 131 10.0 9.60 .1 2.60 175JUL 10... 14.0 .030 160 58.0 2.60 5.5 .70 122 28.0 9.00 <.1 5.90 224SEP 05... 45.0 .100 52 18.0 1.60 4.6 1.30 36 1.20 7.20 <.1 4.40 158
STRONTIUM,DIS
SOLVEDDate (UG/L
AS SR)(01080)
NOV 15... 150
JAN 17... 190
MAR 15... 180
MAY 08... 170
JUL 10... 140
SEP 05... 44.0
< -- Less than E -- Estimated value

329 WITHLACOOCHEE RIVER BASIN
02312600 WITHLACOOCHEE RIVER NEAR FLORAL CITY, FL
LOCATION.--Lat 28° 44'36", long 82° 13'13", in SE1⁄ 4 sec.17, T.20 S., R.21 E., Citrus County, Hydrologic Unit 03100208, on left bank on upstream shoreward corner of pavillion at Trails End Camp, 1.1 mi downstream from diversions to Tsala Apopka Lake, 4.7 mi east of Floral City, and 62 mi upstream from mouth.
DRAINAGE AREA.--995 mi2, approximately. WATER-DISCHARGE RECORDS
PERIOD OF RECORD.--August 1958 to January 1965 (gage heights only), February 1965 to September 1983 (discharge measurements and gage heights only); October 1983 to current year.
REVISED RECORDS.--WDR FL-72-3: Drainage area.
GAGE.--Water-stage recorder. Datum of gage is at NGVD of 1929. Prior to Oct. 1, 1983, nonrecording gage at same site and datum.
REMARKS.--Records fair. Discharge published is for site at bridge on State Highway 48 about 2 mi upstream from gage and about 1 mi upstream from diversions to Tsala Apopka Lake through Leslie Heifner and Orange State Canals. High-water diversion in headwaters (station 02311000).
DISCHARGE, CUBIC FEET PER SECOND, WATER YEAR OCTOBER 2001 TO SEPTEMBER 2002DAILY MEAN VALUES
DAY OCT NOV DEC JAN FEB MAR APR MAY JUN JUL AUG SEP
1 1950 247 90 44 2 1940 234 89 50 3 1900 222 88 61 4 1860 210 87 61 5 1790 199 86 60
29 22 8.4 0.00 0.00 5.7 245 598 28 22 7.4 0.00 0.00 7.0 274 593 27 23 7.9 0.00 0.00 7.6 296 587 26 31 8.3 0.00 0.00 8.4 310 584 24 32 7.3 0.00 0.00 9.1 322 610
6 1730 190 86 60 7 1650 180 86 58 8 1560 171 86 55 9 1460 163 86 52 10 1360 155 86 50
23 32 6.7 0.00 0.00 8.8 316 625 24 32 5.8 0.00 0.00 8.0 313 645 23 32 5.2 0.00 0.00 8.4 309 669 22 31 4.6 0.00 0.00 9.3 300 69121 29 3.8 0.00 0.00 9.9 292 707
11 1260 148 87 4712 1150 142 85 4613 1050 135 83 4514 965 131 80 4615 893 128 77 50
20 28 3.2 0.00 0.00 9.4 280 71419 28 3.0 0.00 0.00 9.0 276 736 17 29 3.3 0.00 0.00 16 286 760 16 28 3.2 0.00 0.00 37 282 782 15 26 2.9 0.00 0.00 39 275 813
16 822 124 75 4917 753 119 74 4718 687 117 72 4519 631 114 69 4420 580 112 67 41
15 26 2.5 0.00 0.00 39 275 828 14 25 2.1 0.00 0.00 41 287 838 13 23 1.7 0.00 0.00 43 334 851 13 22 0.92 0.00 0.00 47 361 859 13 21 0.35 0.00 0.00 53 404 868
21 537 109 64 4122 499 107 62 3823 456 105 60 3824 423 102 59 3625 399 101 57 35
12 20 0.00 0.00 0.00 64 435 857 12 18 0.00 0.00 0.00 77 472 848 18 17 0.00 0.00 0.00 85 507 834 26 16 0.00 0.00 0.00 94 532 845 27 15 0.00 0.00 0.00 108 544 893
26 374 98 55 3427 349 96 53 3328 322 95 51 32 29 301 93 50 33 30 283 92 47 3231 265 --- 46 30
27 14 0.00 0.00 0.28 121 536 916 26 14 0.00 0.00 0.35 134 534 948 23 12 0.00 0.00 1.1 150 543 974 --- 11 0.00 0.00 3.1 174 543 996 --- 10 0.00 0.00 3.5 192 564 992--- 9.2 --- 0.00 --- 222 609 --
TOTAL 30199 4239 2243 1393 MEAN 974 141 72.4 44.9MAX 1950 247 90 61 MIN 265 92 46 30
573 698.2 88.57 0.00 8.33 1836.6 11856 23461 20.5 22.5 2.95 0.000 0.28 59.2 382 782
29 32 8.4 0.00 3.5 222 609 996 12 9.2 0.00 0.00 0.00 5.7 245 584
STATISTICS OF MONTHLY MEAN DATA FOR WATER YEARS 1984 - 2002, BY WATER YEAR (WY)
MEAN 513 258 292 445 MAX 1992 1033 1951 3979(WY) 1996 1996 1998 1998MIN 0.87 0.000 0.000 0.000(WY) 2001 2001 2001 2001
351 367 465 145 98.9 175 353 634 2075 2757 3175 769 361 1187 1652 23551998 1998 1987 1987 1991 1991 1991 1985
0.000 0.000 0.000 0.000 0.000 0.000 0.000 3.472001 2001 2001 2000 2000 2000 2000 2000
SUMMARY STATISTICS FOR 2001 CALENDAR YEAR FOR 2002 WATER YEAR WATER YEARS 1984 - 2002
ANNUAL TOTAL 52719.39ANNUAL MEAN 144 HIGHEST ANNUAL MEAN LOWEST ANNUAL MEAN HIGHEST DAILY MEAN 1950LOWEST DAILY MEAN 0.00ANNUAL SEVEN-DAY MINIMUM 0.00 MAXIMUM PEAK FLOWMAXIMUM PEAK STAGE INSTANTANEOUS LOW FLOW10 PERCENT EXCEEDS 38450 PERCENT EXCEEDS 0.0090 PERCENT EXCEEDS 0.00
76595.70 210 341
1180 1998 17.0 2000
Oct 1 1950 Oct 1 4900 Jan 8 1998Many days 0.00 Many days *0.00Jan 1 0.00 Apr 21 *0.00
1950 Oct 1 5010 Jan 8 199842.31 Oct 1 a45.24 Mar 25 19600.00 Apr 20 0.00 Apr 20 2002
723 81145 140 0.00 2.9
* During 1992, 2000-02 water years a Observed

---
330 WITHLACOOCHEE RIVER BASIN
02312600 WITHLACOOCHEE RIVER NEAR FLORAL CITY, FL--Continued
GAGE HEIGHT, FEET, WATER YEAR OCTOBER 2001 TO SEPTEMBER 2002 DAILY MEAN VALUES
DAY OCT NOV DEC JAN FEB MAR APR MAY JUN JUL AUG SEP
1 42.31 39.79 38.40 37.85 37.92 37.93 37.64 37.06 36.23 38.04 40.48 41.49 2 42.30 39.73 38.38 37.96 37.91 37.93 37.62 37.03 36.20 38.09 40.59 41.48 3 42.26 39.66 38.35 38.12 37.90 37.95 37.63 37.00 36.18 38.11 40.67 41.46 4 42.22 39.60 38.32 38.13 37.88 38.08 37.64 36.97 36.15 38.14 40.71 41.46 5 42.16 39.53 38.30 38.12 37.85 38.10 37.61 36.93 36.13 38.17 40.76 41.52
6 42.10 39.47 38.28 38.13 37.86 38.11 37.59 36.90 36.10 38.16 40.74 41.55 7 42.03 39.40 38.26 38.11 37.88 38.11 37.56 36.88 36.14 38.15 40.74 41.59 8 41.94 39.34 38.25 38.09 37.88 38.10 37.54 36.85 36.30 38.17 40.74 41.63 9 41.85 39.27 38.23 38.06 37.87 38.09 37.52 36.82 36.33 38.19 40.71 41.68 10 41.76 39.21 38.22 38.04 37.87 38.06 37.49 36.79 36.31 38.22 40.69 41.70
11 41.67 39.16 38.21 38.01 37.85 38.04 37.47 36.75 36.28 38.21 40.66 41.72 12 41.56 39.10 38.19 37.99 37.84 38.03 37.45 36.72 36.26 38.20 40.65 41.75 13 41.45 39.04 38.17 37.99 37.82 38.05 37.47 36.71 36.26 38.35 40.68 41.80 14 41.35 39.00 38.16 38.01 37.80 38.03 37.47 36.66 36.24 38.76 40.67 41.84 15 41.26 38.96 38.13 38.10 37.80 38.00 37.45 36.62 36.26 38.80 40.65 41.89
16 41.16 38.92 38.11 38.09 37.79 37.99 37.43 36.60 36.24 38.81 40.65 41.92 17 41.05 38.87 38.11 38.07 37.78 37.97 37.42 36.58 36.28 38.85 40.69 41.94 18 40.95 38.83 38.10 38.05 37.75 37.95 37.40 36.57 36.37 38.90 40.84 41.96 19 40.85 38.79 38.07 38.04 37.74 37.93 37.37 36.53 36.50 38.96 40.92 41.97 20 40.76 38.76 38.05 38.01 37.74 37.91 37.35 36.50 36.50 39.05 41.04 41.99
21 40.68 38.72 38.03 38.01 37.72 37.90 37.32 36.48 36.50 39.21 41.12 41.98 22 40.61 38.69 38.00 37.98 37.72 37.86 37.30 36.45 36.68 39.37 41.20 41.97 23 40.53 38.65 37.99 37.98 37.85 37.83 37.26 36.42 37.05 39.47 41.28 41.95 24 40.45 38.62 37.99 37.97 38.00 37.81 37.24 36.39 37.21 39.56 41.33 41.96 25 40.37 38.58 37.97 37.95 38.01 37.79 37.22 36.37 37.55 39.69 41.36 42.02
26 40.28 38.55 37.95 37.94 38.01 37.77 37.19 36.35 37.78 39.79 41.34 42.04 27 40.19 38.52 37.93 37.94 37.99 37.76 37.16 36.33 37.79 39.89 41.34 42.07 28 40.10 38.49 37.92 37.93 37.95 37.72 37.14 36.30 37.83 40.00 41.37 42.10 29 40.02 38.46 37.91 37.95 --- 37.70 37.11 36.27 37.93 40.14 41.37 42.12 30 39.94 38.43 37.88 37.94 --- 37.68 37.08 36.24 37.95 40.25 41.41 42.11 31 39.87 -- 37.87 37.93 --- 37.66 --- 36.24 40.39 41.50 --
MEAN 41.16 39.00 38.12 38.02 37.86 37.93 37.40 36.62 36.65 38.91 40.93 41.82 MAX 42.31 39.79 38.40 38.13 38.01 38.11 37.64 37.06 37.95 40.39 41.50 42.12 MIN 39.87 38.43 37.87 37.85 37.72 37.66 37.08 36.24 36.10 38.04 40.48 41.46
CAL YR 2001 MEAN 37.26 MAX 42.31 MIN 35.26 WTR YR 2002 MEAN 38.71 MAX 42.31 MIN 36.10

331 WITHLACOOCHEE RIVER BASIN
02312600 WITHLACOOCHEE RIVER NEAR FLORAL CITY, FL--Continued
WATER-QUALITY RECORDS
PERIOD OF RECORD.--Water years 1966 to 2000, 2002.
WATER-QUALITY DATA, WATER YEAR OCTOBER 2001 TO SEPTEMBER 2002
DIS PH NITRO CHARGE, SPE WATER NITRO NITRO- GEN,AM- NITROINST. CIFIC WHOLE COLOR GEN, GEN, MONIA + GEN, PHOS CUBIC CON FIELD TEMPER- (PLAT OXYGEN, AMMONIA NITRITE ORGANIC NO2+NO3 PHORUS FEET GAGE DUCT- (STAND- ATURE INUM DIS TOTAL TOTAL TOTAL TOTAL TOTAL
Date Time PER HEIGHT ANCE ARD WATER COBALT SOLVED (MG/L (MG/L (MG/L (MG/L (MG/L SECOND (FEET) (US/CM) UNITS) (DEG C) UNITS) (MG/L) AS N) AS N) AS N) AS N) AS P)
(00061) (00065) (00095) (00400) (00010) (00080) (00300) (00610) (00615) (00625) (00630) (00665)
OCT 24... 1122 422 40.45 148 6.5 24.9 480 .2 .65 <.01 E3.9 <.020 E.32 DEC 12... 1135 86 38.19 361 7.0 22.9 200 1.8 .08 <.01 E2.0 .060 E.09 FEB 15... 1330 15 37.80 451 7.6 18.3 80 6.7 .05 <.01 1.2 .030 .02 APR 18... 0942 1.2 37.40 376 8.2 28.4 80 9.9 .04 <.01 1.0 <.020 <.02
AUG 09... 1046 302 40.72 168 6.6 26.8 480 .2 .16 .02 <.20 <.020 .17 SEP 23... 1214 837 41.94 102 7.2 27.3 480 .3 .03 .02 1.9 .040 .12
ANC SOLIDS, PHOS- HARD- MAGNE- POTAS- UNFLTRD CHLO- FLUO- SILICA, RESIDUE
CARBON, PHORUS NESS CALCIUM SIUM, SODIUM, SIUM, TIT 4.5 SULFATE RIDE, RIDE, DIS- AT 180ORGANIC ORTHO TOTAL DIS- DIS- DIS- DIS- LAB DIS- DIS- DIS- SOLVED DEG. CTOTAL TOTAL (MG/L SOLVED SOLVED SOLVED SOLVED (MG/L SOLVED SOLVED SOLVED (MG/L DIS-
Date (MG/L (MG/L AS (MG/L (MG/L (MG/L (MG/L AS (MG/L (MG/L (MG/L AS SOLVED AS C) AS P) CACO3) AS CA) AS MG) AS NA) AS K) CACO3) AS SO4) AS CL) AS F) SIO2) (MG/L)(00680) (70507) (00900) (00915) (00925) (00930) (00935) (90410) (00945) (00940) (00950) (00955) (70300)
OCT 24... -- .270 74 26.0 2.30 5.1 2.50 E46 3.00 7.80 .1 7.20 E213DEC 12... -- .070 170 62.0 3.70 7.9 2.00 130 29.0 12.0 .1 6.90 E283FEB 15... -- .020 210 78.0 4.30 7.8 1.50 147 66.0 13.0 .1 1.10 326APR 18... 20.0 .020 180 66.0 3.90 8.5 .30 135 37.0 15.0 .1 1.10 266AUG 09... -- .120 84 30.0 2.10 5.5 1.40 63 4.00 9.30 .1 7.20 209SEP 23... 46.0 .140 51 18.0 1.50 4.0 1.40 35 1.10 6.30 .1 4.50 142
STRONTIUM,DIS
SOLVEDDate (UG/L
AS SR)(01080)
OCT 24... 71.0
DEC 12... 190
FEB 15... 250
APR 18... 220
AUG 09... 74.0
SEP 23... 44.0
< -- Less thanE -- Estimated value

332 WITHLACOOCHEE RIVER BASIN
02312640 JUMPER CREEK CANAL NEAR BUSHNELL, FL
LOCATION.--Lat 28° 41'45", long 82° 06'34", in NE1⁄ 4 sec.4, T.21 S., R.22 E., Sumter County, Hydrologic Unit 03100208, near center of span on downstream side of bridge on State Highway 475, 2.2 mi north of Bushnell, and 10 mi upstream from mouth.
DRAINAGE AREA.--40 mi2, approximately. WATER-DISCHARGE RECORDS
PERIOD OF RECORD.--October 1963 to current year.
REVISED RECORDS.--WDR FL-81-3: 1980 (m).
GAGE.--Water-stage recorder. Datum of gage is 55.00 ft above NGVD of 1929.
REMARKS.--Records fair. Diurnal fluctuation caused by mining operations upstream; daily flows are not affected appreciably.
DISCHARGE, CUBIC FEET PER SECOND, WATER YEAR OCTOBER 2001 TO SEPTEMBER 2002DAILY MEAN VALUES
DAY OCT NOV DEC JAN FEB MAR APR MAY JUN JUL AUG SEP
1 8.6 4.2 2.8 2.1 1.9 1.8 2.3 1.0 0.19 6.0 14 502 8.2 4.1 2.8 2.7 1.9 1.8 2.2 0.89 0.00 5.8 13 433 7.6 4.1 2.7 2.8 1.9 1.9 2.5 0.82 0.00 5.8 14 384 7.2 4.1 2.6 2.4 1.8 2.9 2.3 0.74 0.00 5.8 14 395 6.9 4.1 2.6 2.3 1.8 2.2 2.2 0.68 0.00 5.7 14 39
6 6.6 4.0 2.5 2.4 1.8 2.2 2.1 0.64 0.00 5.7 13 397 6.4 3.9 2.6 2.3 1.9 2.4 2.1 0.59 0.10 5.7 13 368 6.2 3.8 2.5 2.2 1.8 2.5 2.0 0.52 0.57 5.8 13 349 6.2 3.7 2.4 2.2 1.8 2.5 2.0 0.49 0.02 5.8 13 33
10 5.8 3.7 2.4 2.2 1.8 2.6 1.9 0.44 0.00 5.6 12 32
11 5.5 3.6 2.3 2.2 12 5.5 3.6 2.4 2.2 13 5.2 3.6 2.4 2.2 14 5.1 3.6 2.4 2.4 15 5.1 3.6 2.3 2.4
1.8 2.6 1.9 0.39 0.00 5.4 12 31 1.8 2.6 2.0 0.34 0.00 5.3 12 30 1.8 2.8 1.9 0.32 0.00 6.9 13 31 1.8 2.7 1.9 0.28 0.00 9.0 14 32 1.8 2.6 1.9 0.20 0.07 6.7 14 32
16 5.0 3.5 2.3 2.2 17 4.8 3.4 2.2 2.1 18 4.7 3.3 2.3 2.1 19 4.6 3.3 2.2 2.1 20 4.6 3.2 2.1 2.1
1.8 2.6 1.8 0.20 0.08 6.4 16 33 1.8 2.6 1.8 0.19 0.18 6.2 17 32 1.7 2.6 1.7 0.16 1.1 6.2 20 31 1.7 2.6 1.7 0.28 0.85 6.1 32 29 1.7 2.5 1.6 0.22 1.2 7.4 33 28
21 4.6 3.2 2.1 2.1 22 4.8 3.1 2.1 2.1 23 4.8 3.1 2.1 2.0 24 4.7 3.0 2.1 2.0 25 4.7 3.0 2.1 2.0
1.7 2.5 1.6 0.14 0.97 9.3 34 26 1.9 2.5 1.5 0.04 2.2 9.7 32 24 2.2 2.5 1.5 0.05 3.0 11 28 23 2.0 2.5 1.4 0.00 4.1 11 26 23 1.8 2.5 1.3 0.00 4.5 11 25 27
26 4.6 3.0 2.0 2.0 27 4.5 2.9 2.1 2.0 28 4.4 2.9 2.1 2.0 29 4.4 2.8 2.1 2.0 30 4.4 2.9 2.1 1.931 4.4 --- 2.1 1.9
1.8 2.6 1.2 0.00 4.7 11 24 29 1.8 2.5 1.2 0.00 4.9 12 25 29 1.8 2.4 1.2 0.01 5.3 14 27 26 --- 2.3 1.1 0.00 5.5 13 26 24 --- 2.3 1.1 0.00 5.8 13 28 23--- 2.3 --- 0.02 --- 13 42 --
TOTAL 170.1 104.3 71.8 67.6MEAN 5.49 3.48 2.32 2.18 MAX 8.6 4.2 2.8 2.8 MIN 4.4 2.8 2.0 1.9
51.1 75.9 52.9 9.65 45.33 251.3 633 9461.82 2.45 1.76 0.31 1.51 8.11 20.4 31.52.2 2.9 2.5 1.0 5.8 14 42 50 1.7 1.8 1.1 0.00 0.00 5.3 12 23
STATISTICS OF MONTHLY MEAN DATA FOR WATER YEARS 1964 - 2002, BY WATER YEAR (WY)
MEAN 22.7 19.8 19.4 21.7 MAX 59.8 43.3 54.6 64.4(WY) 1996 1970 1970 1970 MIN 0.000 0.000 0.000 0.000 (WY) 2001 2001 2001 2001
25.8 27.2 24.8 18.4 18.0 21.4 23.8 26.0104 102 70.2 57.2 45.7 67.5 57.3 69.01970 1998 1987 1983 1983 1966 1965 19640.000 0.000 0.000 0.000 0.000 0.000 0.001 0.0002001 2001 2000 2000 2000 1992 2000 2000
SUMMARY STATISTICS FOR 2001 CALENDAR YEAR FOR 2002 WATER YEAR WATER YEARS 1964 - 2002
ANNUAL TOTAL 629.66ANNUAL MEAN 1.73 HIGHEST ANNUAL MEAN LOWEST ANNUAL MEAN HIGHEST DAILY MEAN 24LOWEST DAILY MEAN 0.00ANNUAL SEVEN-DAY MINIMUM 0.00MAXIMUM PEAK FLOW MAXIMUM PEAK STAGE 10 PERCENT EXCEEDS 4.750 PERCENT EXCEEDS 0.0090 PERCENT EXCEEDS 0.00
2478.98 6.79 22.4
47.0 19700.37 2000
Sep 16 50 Sep 1 235 Feb 18 1998Many days 0.00 Many days *0.00Jan 1 0.00 May 24 *0.00
51 Sep 1 238 Feb 18 19984.96 Sep 1 7.21 Feb 18 199825 41 2.5 20 0.37 1.9
* During 1992, 2000-02 water years

333 WITHLACOOCHEE RIVER BASIN
02312640 JUMPER CREEK CANAL NEAR BUSHNELL, FL--Continued
WATER-QUALITY RECORDS
PERIOD OF RECORD.--Water years 1966-88, 1991, 1999 to current year.
WATER-QUALITY DATA, WATER YEAR OCTOBER 2001 TO SEPTEMBER 2002
DIS CHARGE, INST. CUBICFEET
Date Time PERSECOND
(00061)
PHSPE- WATERCIFIC WHOLE CARBON,CON- FIELD TEMPER- OXYGEN, ORGANIC
GAGE DUCT- (STAND- ATURE DIS- TOTALHEIGHT ANCE ARD WATER SOLVED (MG/L(FEET) (US/CM) UNITS) (DEG C) (MG/L) AS C)(00065) (00095) (00400) (00010) (00300) (00680)
NOV19... 1540 3.1 2.76 375 6.9 22.0 8.5 -
JAN14... 1315 2.4 2.26 312 7.5 15.2 9.1 13.0
MAR11... 1400 3.1 2.31 338 7.9 23.8 9.8 -
MAY07... 1330 .54 2.12 325 7.6 29.9 10.5 -
JUL09... 0850 11 2.85 395 8.4 25.1 8.1 4.6
AUG28... 0820 26 4.26 346 6.4 25.6 5.2 -

334 WITHLACOOCHEE RIVER BASIN
02312667 SHADY BROOK NEAR SUMTERVILLE, FL
LOCATION.--Lat 28° 46'12", long 82° 03'50", in NW1⁄ 4 sec.12, T.20 S., R.22 E., Sumter County, Hydrologic Unit 03100208, on right bank in Thompkins Park, 400 ft upstream from bridge on U.S. Highway 301, and 1.7 mi north of Sumterville.
DRAINAGE AREA.--8.0 mi2, approximately.
PERIOD OF RECORD.--1932-33, 1946, 1956, 1961, 1965-67, 1980-81 (miscellaneous discharge measurements), March 1982 to September1992, October 1993 to current year. Prior to November 1980, published as Panasoffkee River near Sumterville.
REVISED RECORDS.--WDR FL-95-1A: Datum.
GAGE.--Water-stage recorder. Datum of gage is 4.30 ft below NGVD of 1929 (levels by Southwest Florida Water Management District).
REMARKS.--Records good. Records include discharge from mining operations upstream.
DISCHARGE, CUBIC FEET PER SECOND, WATER YEAR OCTOBER 2001 TO SEPTEMBER 2002DAILY MEAN VALUES
DAY OCT NOV DEC JAN FEB MAR APR MAY JUN JUL AUG SEP
1 86 28 18 12 2 78 27 18 18 3 74 28 18 20 4 72 28 17 15 5 71 28 17 14
13 14 11 6.7 4.1 43 112 77 13 13 11 6.4 3.8 42 124 80 13 15 11 6.3 3.7 40 141 86 12 26 12 6.1 3.7 37 142 90 12 20 11 6.0 3.7 45 137 95
6 70 26 17 15 7 68 26 17 14 8 65 25 17 14 9 64 24 17 1310 62 24 16 13
12 19 10 5.9 3.6 50 128 96 13 19 9.9 5.8 4.1 47 124 94 13 19 9.7 5.7 4.7 42 121 90 13 20 9.5 5.6 4.1 40 115 8612 20 9.4 5.3 3.8 40 109 82
11 60 24 16 1312 58 23 15 1313 55 23 15 1314 53 24 15 1515 53 24 15 20
12 20 12 5.2 3.7 41 105 7712 19 14 5.1 3.6 41 99 7212 20 12 5.0 3.6 52 97 6912 20 12 5.0 3.4 98 94 6812 19 12 4.9 4.0 99 88 65
16 51 23 15 1717 47 23 14 1618 44 23 15 1519 43 23 14 1520 41 22 14 15
12 18 11 4.7 4.4 89 83 6112 17 10 4.8 5.5 85 79 59 12 16 9.7 4.8 7.7 90 75 59 11 15 9.3 4.9 7.3 97 73 59 11 15 8.9 4.9 8.2 119 77 59
21 40 22 14 14 22 39 21 14 1423 38 21 13 1424 36 21 14 1425 35 20 14 14
11 14 8.6 4.5 6.0 136 76 5912 14 8.3 4.5 21 136 73 5617 14 8.0 4.5 64 137 70 5419 13 7.7 4.4 52 126 68 5516 13 7.5 4.3 43 119 67 61
26 34 20 13 1427 32 20 13 1428 31 19 13 1429 31 19 13 14 30 30 19 13 13 31 30 --- 12 13
15 13 7.3 4.1 36 114 65 6115 13 7.1 4.1 31 124 62 5914 13 7.2 4.0 33 124 60 55
--- 12 7.1 3.9 38 123 57 54 --- 12 6.9 4.1 40 118 58 51 --- 11 --- 4.3 --- 115 75 --
TOTAL 1591 698 466 452 MEAN 51.3 23.3 15.0 14.6 MAX 86 28 18 20 MIN 30 19 12 12
363 506 291.1 155.8 454.7 2609 2854 208913.0 16.3 9.70 5.03 15.2 84.2 92.1 69.6 19 26 14 6.7 64 137 142 96 11 11 6.9 3.9 3.4 37 57 51
STATISTICS OF MONTHLY MEAN DATA FOR WATER YEARS 1982 - 2002, BY WATER YEAR (WY)
MEAN 36.2 28.2 27.4 37.3 MAX 133 71.2 73.7 118 (WY) 1983 1983 1984 1998 MIN 4.04 2.64 2.11 1.91(WY) 1994 1991 1991 1991
38.8 46.3 44.0 26.8 29.6 39.1 40.7 41.7121 158 168 125 135 207 159 1241998 1998 1983 1983 1982 1982 1982 1982 1.95 4.84 4.51 2.24 1.40 0.68 3.19 5.221991 1992 1992 1992 1992 1992 1992 1997
SUMMARY STATISTICS FOR 2001 CALENDAR YEAR FOR 2002 WATER YEAR WATER YEARS 1982 - 2002
ANNUAL TOTAL 6892.1ANNUAL MEAN 18.9 HIGHEST ANNUAL MEAN LOWEST ANNUAL MEAN HIGHEST DAILY MEAN 106 LOWEST DAILY MEAN 4.2 ANNUAL SEVEN-DAY MINIMUM 4.4MAXIMUM PEAK FLOWMAXIMUM PEAK STAGEINSTANTANEOUS LOW FLOW10 PERCENT EXCEEDS 4550 PERCENT EXCEEDS 1290 PERCENT EXCEEDS 5.3
12529.634.3 36.4
127 19825.39 1992
Sep 15 142 Aug 4 243 Jul 8 1982 Jun 17 3.4 Jun 14 0.38 Jul 27,30 1992 Jun 13 3.7 Jun 9 0.39 Jul 24 1992
163 Jul 20 340 Apr 23 198349.94 Jul 20 50.76 Apr 23 1983 3.2 Jun 14,15 *.3888 9017 22 5.2 4.7
* Jul 24, 25-31, 1992

335 WITHLACOOCHEE RIVER BASIN
02312700 OUTLET RIVER AT PANACOOCHEE RETREATS, FL
LOCATION.--Lat 28° 49'01", long 82° 08'40", in SE1⁄ 4 sec.19, T.19 S., R.22 E., Sumter County, Hydrologic Unit 03100208, on west shore of Lake Panasoffkee, 0.8 mi north of outlet, 1.3 mi north of Panacoochee Retreats, 2.0 mi upstream from mouth, and 5.1 mi northwest of town of Lake Panasoffkee.
DRAINAGE AREA.--420 mi2, approximately. WATER-DISCHARGE RECORDS
PERIOD OF RECORD.--October 1962 to current year. Prior to October 1967, published as Panasoffkee River near Lake Panasoffkee.
REVISED RECORDS.--WDR FL-72-3: Drainage area.
GAGE.--Water-stage recorder. Datum of gage is at NGVD of 1929 (Florida Department of Transportation bench mark). Prior to Dec. 18, 1962, nonrecording gage and Dec. 18, 1962, to Oct. 7, 1975, water-stage recorder at sites within 0.8 mi south at same datum.
REMARKS.--Records fair except for period of estimated daily discharge, which is poor. Discharge measurements made at bridge onState Highway 470, about 1 mi downstream from lake outlet. Flow affected at times by backwater from Withlacoochee River. Prior to 1962, flow partially controlled by small rock dams and at times during 1962-64 by a temporary sheet piling dam about 400 ftdownstream from bridge on State Highway 470. Flow partially controlled by sandbag dam June 6-10, 1992. Gage heights are published as elevations for Lake Panasoffkee (station 02312698)in the section of this report entitled "ELEVATIONS OF LAKES".
DISCHARGE, IN CUBIC FEET PER SECOND, WATER YEAR OCTOBER 2001 TO SEPTEMBER 2002 DAILY MEAN VALUES
DAY OCT NOV DEC JAN FEB MAR APR MAY JUN JUL AUG SEP
1 196 158 81 54 2 205 155 78 59 3 213 151 76 59 4 221 145 75 60 5 227 140 74 62
58 57 46 29 e7.0 112 293 246 57 58 45 28 e7.0 119 300 242 56 56 46 28 e6.0 122 312 240 53 60 45 27 e6.0 124 322 235 54 63 45 27 e3.0 127 325 235
6 232 137 73 61 7 235 134 71 59 8 239 131 70 60 9 242 128 69 6010 241 125 69 60
54 65 44 26 e1.5 129 323 232 53 65 44 25 e10 130 325 227 54 65 44 25 e15 129 321 222 55 64 40 24 16 128 315 21753 63 39 24 13 129 308 212
11 241 122 67 5912 240 118 67 5913 240 115 66 5914 237 111 65 6215 234 107 64 65
53 63 40 24 12 127 301 20752 62 43 23 13 127 295 20551 61 41 21 13 136 300 20251 62 41 19 13 161 300 21050 61 41 21 11 169 297 210
16 230 107 64 6617 225 107 63 6618 222 104 61 6519 217 102 61 6520 213 100 59 65
50 61 41 19 12 175 297 20749 61 40 19 18 177 290 20449 60 39 20 26 179 284 20050 60 39 e18 30 181 283 19751 58 37 e15 36 189 285 193
21 210 98 59 6422 206 97 59 6423 202 96 60 6324 198 94 58 6325 194 92 57 61
46 56 37 e14 34 213 280 18947 55 35 e13 46 235 282 18550 54 36 e13 63 250 281 18258 54 36 e12 69 257 275 18359 53 34 e12 77 261 266 193
26 185 89 54 6227 178 88 57 6128 173 87 57 6129 167 85 55 6130 163 82 56 6131 161 --- 54 61
58 52 33 e11 85 265 259 19453 49 33 e11 89 272 251 19055 49 32 e10 93 278 244 187--- 49 30 e10 101 286 238 184--- 49 31 e9.0 106 287 237 181--- 48 --- e8.0 --- 290 249 --
TOTAL 6587 3405 1999 1907 MEAN 212 114 64.5 61.5 MAX 242 158 81 66 MIN 161 82 54 54 CFSM 0.51 0.27 0.15 0.15 IN. 0.58 0.30 0.18 0.17
1479 1793 1177 585.0 1031.5 5764 8938 6211 52.8 57.8 39.2 18.9 34.4 186 288 207 59 65 46 29 106 290 325 246 46 48 30 8.0 1.5 112 237 181
0.13 0.14 0.09 0.04 0.08 0.44 0.69 0.49 0.13 0.16 0.10 0.05 0.09 0.51 0.79 0.55
STATISTICS OF MONTHLY MEAN DATA FOR WATER YEARS 1963 - 2002, BY WATER YEAR (WY)
MEAN 208 157 142 165 MAX 626 426 262 468 (WY) 1983 1996 1984 1998 MIN 31.6 19.3 18.6 22.0 (WY) 1964 1998 1998 2001
190 196 190 144 135 154 188 212 627 771 567 340 360 523 479 449 1998 1998 1998 1987 1982 1982 1965 1985 21.3 29.3 39.2 18.9 19.8 5.94 29.1 40.0 2001 2001 2002 2002 2001 1963 1963 1997
SUMMARY STATISTICS FOR 2001 CALENDAR YEAR FOR 2002 WATER YEAR WATER YEARS 1963 - 2002
ANNUAL TOTAL 23321.4 ANNUAL MEAN 63.9 HIGHEST ANNUAL MEAN LOWEST ANNUAL MEAN HIGHEST DAILY MEAN 242 LOWEST DAILY MEAN 7.7 ANNUAL SEVEN-DAY MINIMUM 11 MAXIMUM PEAK FLOW MAXIMUM PEAK STAGE ANNUAL RUNOFF (CFSM) 0.15 ANNUAL RUNOFF (INCHES) 2.07 10 PERCENT EXCEEDS 158 50 PERCENT EXCEEDS 44 90 PERCENT EXCEEDS 19
40876.5 112 173
360 198338.1 2001
Oct 9 325 Aug 5,7 820 Mar 23 1998 May 31 e1.5 Jun 6 *0.00 May 26 5.5 May 31 0.00 Jun 27 1963
328 Aug 4 a821 Jan 16 1998 39.89 Sep 26 a42.71 Jan 16 1998
0.27 0.41 3.62 5.61
249 318 65 149 22 56
e Estimated* Jun 27-Jul 15, 1963 temporary dam in place a From floodmark

-- -- --
-- -- --
-- -- -- --
-- -- --
336 WITHLACOOCHEE RIVER BASIN
02312700 OUTLET RIVER AT PANACOOCHEE RETREATS, FL--Continued
WATER-QUALITY RECORDS
PERIOD OF RECORD.--Water years 1908, 1966 to current year.
WATER-QUALITY DATA, WATER YEAR OCTOBER 2001 TO SEPTEMBER 2002
DIS PH NITRO CHARGE, SPE WATER NITRO NITRO- GEN,AM- NITROINST. CIFIC WHOLE COLOR GEN, GEN, MONIA + GEN, PHOS CUBIC CON FIELD TEMPER- (PLAT OXYGEN, AMMONIA NITRITE ORGANIC NO2+NO3 PHORUS FEET GAGE DUCT- (STAND- ATURE INUM DIS TOTAL TOTAL TOTAL TOTAL TOTAL
Date Time PER HEIGHT ANCE ARD WATER COBALT SOLVED (MG/L (MG/L (MG/L (MG/L (MG/L SECOND (FEET) (US/CM) UNITS) (DEG C) UNITS) (MG/L) AS N) AS N) AS N) AS N) AS P)
(00061) (00065) (00095) (00400) (00010) (00080) (00300) (00610) (00615) (00625) (00630) (00665)
OCT 24... 1624 206 39.13 390 8.2 26.5 9.2 - - -DEC 13... 1158 68 37.97 390 8.2 26.5 9.2 - - -APR 17... 1224 38 37.63 324 8.9 29.7 20 9.5 .04 <.01 .70 <.020 <.02 JUN 06... 1004 E1.5 271 8.3 30.4 9.2 - - -AUG 08... 1008 323 39.77 445 7.2 28.6 .5 - - -SEP 24... 0840 181 39.71 392 7.4 28.4 160 1.7 .48 <.01 2.5 <.020 .08
ANC SOLIDS, PHOS- HARD- MAGNE- POTAS- UNFLTRD CHLO- FLUO- SILICA, RESIDUE
CARBON, PHORUS NESS CALCIUM SIUM, SODIUM, SIUM, TIT 4.5 SULFATE RIDE, RIDE, DIS- AT 180ORGANIC ORTHO TOTAL DIS- DIS- DIS- DIS- LAB DIS- DIS- DIS- SOLVED DEG. CTOTAL TOTAL (MG/L SOLVED SOLVED SOLVED SOLVED (MG/L SOLVED SOLVED SOLVED (MG/L DIS-
Date (MG/L (MG/L AS (MG/L (MG/L (MG/L (MG/L AS (MG/L (MG/L (MG/L AS SOLVED AS C) AS P) CACO3) AS CA) AS MG) AS NA) AS K) CACO3) AS SO4) AS CL) AS F) SIO2) (MG/L)(00680) (70507) (00900) (00915) (00925) (00930) (00935) (90410) (00945) (00940) (00950) (00955) (70300)
APR 17... 9.1 <.010 150 48.0 6.80 6.6 <.10 54 91.0 11.0 .1 9.20 236SEP 24... 25.0 .050 190 69.0 4.00 6.0 1.60 160 20.0 10.0 .2 14.0 286
ALUM- MANGA-STRON- INUM, CADMIUM IRON, LEAD, NESE, MANGA- NICKEL, TIUM, TOTAL WATER COPPER, TOTAL IRON, TOTAL LEAD, TOTAL NESE, TOTAL ZINC,
ARSENIC DIS- RECOV- UNFLTRD DIS- RECOV- DIS- RECOV- DIS- RECOV- DIS- RECOV- DIS TOTAL SOLVED ERABLE TOTAL SOLVED ERABLE SOLVED ERABLE SOLVED ERABLE SOLVED ERABLE SOLVED
Date (UG/L (UG/L (UG/L (UG/L (UG/L (UG/L (UG/L (UG/L (UG/L (UG/L (UG/L (UG/L (UG/L AS AS) AS SR) AS AL) AS CD) AS CU) AS FE) AS FE) AS PB) AS PB) AS MN) AS MN) AS NI) AS ZN)(01002) (01080) (01105) (01027) (01040) (01045) (01046) (01051) (01049) (01055) (01056) (01067) (01090)
APR 17... <1 440 4 <1.0 <1.0 9 5 <1 <1 4 2 <1.0 <2SEP 24... 2 340 22 <1.0 <1.0 191 173 <1 <1 26 21 1.7 <2
< -- Less than E -- Estimated value

337 WITHLACOOCHEE RIVER BASIN
02312720 WITHLACOOCHEE RIVER AT WYSONG DAM, AT CARLSON, FL
LOCATION.--Lat 28° 49'23", long 82° 11'00", in NW1⁄ 4 sec.23, T.19 S., R.21 E., Sumter County, Hydrologic Unit 03100208, at downstream end of left wall of lock of Wysong Dam, at Carlson, 1.8 mi downstream from Outlet River, 2.7 mi southeast of Rutland, and 55 mi upstream from mouth.
DRAINAGE AREA.--1,520 mi2, approximately. WATER-DISCHARGE RECORDS
PERIOD OF RECORD.--August 1965 to September 1980, October 1980 to September 1981 (monthly mean discharge only), October 1981 to current year. Prior to October 1967, published as "at Carlson's Landing, near Lake Panasoffkee."
REVISED RECORDS.--WDR FL-72-3: Drainage area.
GAGE.--Water-stage recorder. Datum of gage is at NGVD of 1929 (Florida Department of Transportation bench mark).
REMARKS.--Records fair except for periods of estimated daily discharge, which are poor. Some diversions upstream from station at times into Tsala Apopka Lake. High-water diversion in headwaters (station 02311000). Inflatable fabri-dam removed June 27, 1988.
DISCHARGE, CUBIC FEET PER SECOND, WATER YEAR OCTOBER 2001 TO SEPTEMBER 2002DAILY MEAN VALUES
DAY OCT NOV DEC JAN FEB MAR APR MAY JUN JUL AUG SEP
1 1100 485 197 128 2 1140 462 194 138 3 1180 444 189 156 4 1220 426 187 159 5 1240 408 184 160
140 131 103 42 7.7 159 630 1110 136 131 101 41 6.8 162 692 1110 134 138 101 40 5.9 167 744 1100 129 160 100 38 5.0 163 797 1090 125 157 102 34 1.6 154 827 1110
6 1260 390 182 161 7 1280 371 181 161 8 1280 356 179 155 9 1270 343 178 152
10 1260 330 177 149
125 158 99 33 2.7 154 829 1110 130 158 96 31 11 153 829 1110 131 157 94 29 15 145 835 1100 128 155 91 26 12 139 823 1100 127 149 87 24 11 140 813 1100
11 1240 318 177 144 12 1220 306 175 142 13 1190 297 175 141 14 1160 293 172 147 15 1120 285 168 165
126 142 83 22 12 147 799 1100 123 141 84 22 11 147 795 1110 120 144 83 23 9.0 157 827 e1130 117 141 81 20 7.7 235 835 e1170 116 140 78 20 5.9 269 836 e1260
16 1080 275 165 160 17 1030 265 161 160 18 980 259 164 156 19 934 252 160 152 20 892 249 156 149
117 138 79 19 8.8 278 858 e1290 114 135 76 21 14 279 881 e1290 111 134 74 20 21 276 967 e1280 109 130 69 18 22 288 946 e1270 108 126 67 18 27 310 952 e1270
21 856 240 152 146 22 823 238 148 145 23 788 233 146 143 24 752 228 147 141 25 717 223 144 140
108 124 63 16 28 386 e930 e1270 110 122 58 15 46 455 e918 e1260 128 122 55 15 70 476 e940 e1260 145 121 54 14 80 485 1020 e1280 146 119 54 12 110 427 983 e1310
26 679 219 142 141 27 638 215 138 140 28 599 210 137 142 29 564 206 135 146 30 538 202 132 143 31 510 --- 131 140
146 121 50 10 127 469 981 e1330 142 118 48 10 140 522 983 e1340 134 113 48 10 135 538 981 e1350 --- 113 46 9.2 137 564 976 e1350 --- 111 44 8.5 142 575 1000 e1350 --- 106 --- 8.5 --- 597 1090 --
TOTAL 30540 9028 5073 4602MEAN 985 301 164 148 MAX 1280 485 197 165MIN 510 202 131 128
3525 4155 2268 669.2 1232.1 9416 27317 36310 126 134 75.6 21.6 41.1 304 881 1210 146 160 103 42 142 597 1090 1350 108 106 44 8.5 1.6 139 630 1090
STATISTICS OF MONTHLY MEAN DATA FOR WATER YEARS 1966 - 2002, BY WATER YEAR (WY)
MEAN 838 512 448 606 MAX 2906 1601 1476 4199(WY) 1980 1996 1970 1998MIN 55.8 37.1 31.2 31.0(WY) 2001 2001 2001 2001
647 716 668 389 326 490 676 8663326 4095 2469 1289 864 1651 1983 22831998 1998 1987 1983 1982 1966 1974 198530.2 38.9 44.2 21.5 27.4 37.7 42.4 61.22001 2001 2000 2001 2000 2000 2000 2000
SUMMARY STATISTICS FOR 2001 CALENDAR YEAR FOR 2002 WATER YEAR WATER YEARS 1966 - 2002
ANNUAL TOTAL 67308 ANNUAL MEAN 184 HIGHEST ANNUAL MEANLOWEST ANNUAL MEANHIGHEST DAILY MEAN 1280LOWEST DAILY MEAN 14ANNUAL SEVEN-DAY MINIMUM 15MAXIMUM PEAK STAGE10 PERCENT EXCEEDS 576 50 PERCENT EXCEEDS 6390 PERCENT EXCEEDS 22
134135.3 367 598
1510 199872.5 2001
Oct 7,8 e1350 Sep 28-30 4880 Jan 16 1998May 25 1.6 Jun 5 1.6 Jun 5 2002May 23 5.5 May 31 5.5 May 31 2002
41.54 Jan 16 19981110 1310 154 412 22 116
e Estimated

---
------
338 WITHLACOOCHEE RIVER BASIN
02312720 WITHLACOOCHEE RIVER AT WYSONG DAM, AT CARLSON, FL--Continued
GAGE HEIGHT, FEET, WATER YEAR OCTOBER 2001 TO SEPTEMBER 2002 DAILY MEAN VALUES
DAY OCT NOV DEC JAN FEB MAR APR MAY JUN JUL AUG SEP
1 38.00 36.60 35.47 35.15 35.33 35.38 35.28 34.88 34.46 35.67 37.25 38.19 2 38.07 36.53 35.44 35.20 35.32 35.39 35.28 34.87 34.44 35.69 37.40 38.19 3 38.14 36.48 35.42 35.30 35.31 35.42 35.28 34.86 34.42 35.71 37.52 38.17 4 38.20 36.42 35.40 35.31 35.29 35.53 35.27 34.84 34.41 35.69 37.63 38.15 5 38.25 36.36 35.38 35.32 35.27 35.52 35.29 34.79 34.32 35.65 37.69 38.19
6 38.29 36.30 35.37 35.33 35.27 35.53 35.27 34.78 34.37 35.66 37.69 38.20 7 38.31 36.23 35.36 35.33 35.31 35.53 35.25 34.77 34.51 35.65 37.69 38.19 8 38.32 36.18 35.35 35.31 35.31 35.52 35.24 34.74 34.57 35.62 37.71 38.18 9 38.31 36.13 35.33 35.30 35.31 35.51 35.23 34.71 34.53 35.59 37.68 38.18 10 38.28 36.08 35.33 35.28 35.30 35.49 35.21 34.69 34.51 35.60 37.66 38.17
11 38.25 36.04 35.32 35.27 35.30 35.46 35.18 34.66 34.53 35.63 37.63 38.17 12 38.20 35.99 35.30 35.26 35.29 35.46 35.19 34.67 34.52 35.63 37.63 38.19 13 38.15 35.95 35.30 35.26 35.28 35.47 35.18 34.67 34.49 35.68 37.69 --14 38.10 35.94 35.28 35.29 35.27 35.45 35.17 34.64 34.47 36.03 37.71 --15 38.03 35.90 35.28 35.38 35.26 35.45 35.16 34.64 34.44 36.16 37.71 --
16 37.96 35.86 35.26 35.37 35.27 35.45 35.17 34.62 34.49 36.19 37.75 --17 37.87 35.82 35.25 35.37 35.26 35.43 35.15 34.65 34.57 36.20 37.79 --18 37.77 35.79 35.27 35.35 35.24 35.43 35.13 34.63 34.68 36.19 37.95 --19 37.68 35.76 35.25 35.34 35.24 35.41 35.10 34.60 34.70 36.24 37.91 --20 37.59 35.73 35.24 35.33 35.24 35.39 35.08 34.61 34.75 36.32 37.92 --
21 37.52 35.70 35.22 35.32 35.23 35.38 35.05 34.59 34.76 36.56 37.33 --22 37.45 35.68 35.21 35.31 35.25 35.38 35.01 34.56 34.92 36.77 37.32 --23 37.38 35.66 35.20 35.31 35.36 35.38 34.99 34.57 35.14 36.83 37.81 --24 37.30 35.63 35.21 35.30 35.45 35.37 34.98 34.55 35.21 36.86 38.04 --25 37.22 35.61 35.20 35.30 35.45 35.37 34.98 34.52 35.40 36.69 37.98 --
26 37.13 35.59 35.19 35.31 35.45 35.38 34.95 34.49 35.49 36.81 37.97 --27 37.02 35.56 35.18 35.31 35.43 35.36 34.93 34.49 35.57 36.96 37.97 --28 36.92 35.54 35.17 35.33 35.40 35.33 34.93 34.49 35.54 37.01 37.97 --29 36.83 35.51 35.17 35.35 --- 35.33 34.92 34.48 35.56 37.08 37.96 --30 36.75 35.49 35.16 35.34 --- 35.33 34.89 34.47 35.58 37.11 38.01 -- 31 36.68 -- 35.15 35.33 --- 35.31 --- 34.47 37.16 38.15 --
MEAN 37.74 35.94 35.28 35.31 35.31 35.42 35.12 34.65 34.78 36.21 37.75 -- MAX 38.32 36.60 35.47 35.38 35.45 35.53 35.29 34.88 35.58 37.16 38.15 MIN 36.68 35.49 35.15 35.15 35.23 35.31 34.89 34.47 34.32 35.59 37.25

339 WITHLACOOCHEE RIVER BASIN
02312720 WITHLACOOCHEE RIVER AT WYSONG DAM, AT CARLSON, FL--Continued
WATER-QUALITY RECORDS
PERIOD OF RECORD.--Water years 1966-87, 1995 to current year.
WATER-QUALITY DATA, WATER YEAR OCTOBER 2001 TO SEPTEMBER 2002
DIS CHARGE, INST. CUBICFEET
Date Time PERSECOND
(00061)
PHSPE- WATERCIFIC WHOLE CARBON,CON- FIELD TEMPER- OXYGEN, ORGANIC
GAGE DUCT- (STAND- ATURE DIS- TOTALHEIGHT ANCE ARD WATER SOLVED (MG/L(FEET) (US/CM) UNITS) (DEG C) (MG/L) AS C)(00065) (00095) (00400) (00010) (00300) (00680)
OCT25... 1027 707 37.24 298 7.0 25.4 .7 -
APR17... 0934 78 35.16 460 7.7 27.1 6.3 14.0
AUG08... 1100 825 37.71 415 6.9 28.2 .4 -
SEP24... 1012 1220 38.43 190 6.8 27.2 .3 45.0

340 WITHLACOOCHEE RIVER BASIN
02312762 WITHLACOOCHEE RIVER NEAR INVERNESS, FL
LOCATION.--Lat 28° 54'43", long 82° 16'49", in NW1⁄ 4 sec.23, T.18 S., R.20 E., Citrus County, Hydrologic Unit 03100208, on left bank at Potts Preserve Campground, 0.4 mi upstream from Gum Slough, 8.5 mi northeast of Inverness, and 48 mi upstream from mouth.
DRAINAGE AREA.--1,700 mi2.
PERIOD OF RECORD.--October 2001 to September 2002.
GAGE.--Water-stage recorder. Datum of gage is undetermined.
REMARKS.--Records fair except for periods of estimated daily discharge, which are poor.
DISCHARGE, CUBIC FEET PER SECOND, WATER YEAR OCTOBER 2001 TO SEPTEMBER 2002DAILY MEAN VALUES
DAY OCT NOV DEC JAN FEB MAR APR MAY JUN JUL AUG SEP
1 e1100 597 243 155 2 e1140 573 237 166 3 e1190 561 232 182 4 e1220 537 227 183 5 e1240 513 223 184
184 187 118 51 16 262 e715 1220 182 185 112 49 15 264 e760 1210 179 198 112 49 13 256 e820 1200 176 230 112 48 11 269 e835 1190 173 225 106 47 12 307 e860 1210
6 e1260 489 218 186 7 e1290 467 214 188 8 e1300 448 212 185 9 e1280 430 210 183
10 e1260 414 208 181
170 219 102 44 11 304 e865 1230 172 216 100 40 17 e277 e880 1210 179 213 92 38 32 263 e855 1200 176 208 87 38 33 256 e888 1190 175 203 82 37 29 e252 e877 1180
11 e1240 399 204 178 12 e1220 387 201 176 13 e1190 376 198 176 14 e1160 372 194 186 15 e1120 363 191 223
174 197 83 34 29 e247 e870 1180 171 190 84 32 29 e241 e860 1180 169 190 88 29 27 e270 e870 1190 167 187 88 28 26 e300 e885 1220 164 181 79 26 27 e340 e900 1300
16 e1080 351 189 217 17 1080 339 185 209 18 1040 329 187 203 19 1010 320 183 198 20 980 311 179 195
165 179 72 24 26 e400 e910 1310 165 177 73 24 32 e395 e925 1310 163 169 71 26 42 e390 e990 1310 162 163 68 25 51 e400 e1010 1300 159 160 67 23 54 e455 e995 1290
21 952 304 174 192 22 928 296 171 190 23 898 291 169 187 24 867 285 168 184 25 837 279 167 184
157 157 67 21 49 e530 e990 1290 160 152 66 18 71 e540 966 1280 187 147 63 16 134 e545 943 1280 208 147 61 15 140 e540 979 1290 206 144 58 15 157 e535 1030 1340
26 801 272 164 196 27 761 266 161 193 28 722 260 160 190 29 686 254 159 191 30 654 249 159 190 31 625 --- 156 188
201 141 59 14 183 e550 1050 1350 196 141 59 14 198 e580 1060 1350 190 133 57 13 200 e595 1070 1350 --- 122 55 11 203 e620 1080 1350 --- 121 53 13 226 e660 1130 1340 --- 122 --- 15 --- e690 1190 --
TOTAL 32131 11332 5943 5839MEAN 1036 378 192 188 MAX 1300 597 243 223MIN 625 249 156 155 CFSM 0.61 0.22 0.11 0.11IN. 0.70 0.25 0.13 0.13
4930 5404 2394 877 2093 12533 29058 37850 176 174 79.8 28.3 69.8 404 937 1262 208 230 118 51 226 690 1190 1350 157 121 53 11 11 241 715 11800.10 0.10 0.05 0.02 0.04 0.24 0.55 0.740.11 0.12 0.05 0.02 0.05 0.27 0.64 0.83
STATISTICS OF MONTHLY MEAN DATA FOR WATER YEAR - 2002, BY WATER YEAR (WY)
MEAN 1036 378 192 188 MAX 1036 378 192 188 (WY) 2002 2002 2002 2002MIN 1036 378 192 188 (WY) 2002 2002 2002 2002
176 174 79.8 28.3 69.8 404 937 1262 176 174 79.8 28.3 69.8 404 937 12622002 2002 2002 2002 2002 2002 2002 2002 176 174 79.8 28.3 69.8 404 937 12622002 2002 2002 2002 2002 2002 2002 2002
SUMMARY STATISTICS FOR 2002 WATER YEAR
ANNUAL TOTAL 150384ANNUAL MEAN 412HIGHEST ANNUAL MEANLOWEST ANNUAL MEAN HIGHEST DAILY MEAN 1350 Sep 26-29 LOWEST DAILY MEAN 11 May 29, Jun 4,6 ANNUAL SEVEN-DAY MINIMUM 13 May 31 INSTANTANEOUS LOW FLOW 10 May 29, Jun 4,6 ANNUAL RUNOFF (CFSM) 0.24ANNUAL RUNOFF (INCHES) 3.2910 PERCENT EXCEEDS 119050 PERCENT EXCEEDS 198 90 PERCENT EXCEEDS 33
e Estimated

---
--- --- --- --- ---
--- --- --- --- ---
---
---
---------
WITHLACOOCHEE RIVER BASIN 341
02312762 WITHLACOOCHEE RIVER NEAR INVERNESS, FL--Continued
GAGE HEIGHT, FEET, WATER YEAR OCTOBER 2001 TO SEPTEMBER 2002 DAILY MEAN VALUES
DAY OCT NOV DEC JAN FEB MAR APR MAY JUN JUL AUG SEP
1 --- 21.99 20.43 19.93 20.10 20.12 19.90 19.57 19.16 20.53 --- 23.57 2 --- 21.90 20.40 19.99 20.09 20.11 19.87 19.56 19.14 20.54 --- 23.56 3 --- 21.86 20.37 20.09 20.07 20.18 19.88 19.56 19.10 20.50 --- 23.54 4 --- 21.77 20.34 20.10 20.06 20.36 19.88 19.55 19.06 20.56 --- 23.51 5 --- 21.68 20.32 20.10 20.04 20.33 19.86 19.54 19.06 20.76 --- 23.56
6 --- 21.58 20.29 20.12 20.02 20.31 19.84 19.51 19.03 20.74 --- 23.59 7 --- 21.49 20.27 20.12 20.03 20.29 19.84 19.48 19.09 20.60 --- 23.55 8 --- 21.41 20.26 20.11 20.07 20.28 19.80 19.46 19.26 20.54 --- 23.52 9 --- 21.33 20.25 20.09 20.06 20.26 19.78 19.46 19.27 20.50 --- 23.51 10 --- 21.26 20.24 20.08 20.05 20.23 19.76 19.44 19.21 --- 23.49
11 --- 21.19 20.22 20.07 20.05 20.20 19.78 19.42 19.20 --- 23.48 12 --- 21.13 20.20 20.05 20.03 20.17 19.79 19.40 19.19 --- 23.49 13 --- 21.08 20.18 20.06 20.01 20.17 19.81 19.37 19.15 --- 23.51 14 --- 21.06 20.16 20.11 20.00 20.16 19.82 19.36 19.13 --- 23.57 15 --- 21.02 20.14 20.32 19.99 20.14 19.78 19.34 19.13 --- 23.74
16 --- 20.97 20.13 20.29 19.99 20.13 19.74 19.31 19.10 --- 23.76 17 23.26 20.91 20.11 20.24 19.99 20.12 19.75 19.31 19.16 --- 23.76 18 23.19 20.86 20.12 20.21 19.98 20.09 19.75 19.34 19.25 --- 23.75 19 23.12 20.82 20.10 20.18 19.97 20.06 19.73 19.33 19.32 --- 23.74 20 23.04 20.78 20.07 20.16 19.95 20.05 19.72 19.30 19.34 --- 23.72
21 22.98 20.74 20.05 20.15 19.94 20.04 19.71 19.27 19.28 --- 23.72 22 22.92 20.70 20.02 20.14 19.96 20.02 19.71 19.24 19.44 --- 23.01 23.71 23 22.84 20.68 20.01 20.12 20.12 20.00 19.68 19.21 19.88 --- 22.95 23.70 24 22.77 20.64 20.01 20.11 20.24 20.00 19.66 19.20 19.90 --- 23.04 23.72 25 22.69 20.62 20.00 20.10 20.23 19.99 19.64 19.19 19.99 --- 23.15 23.83
26 22.60 20.58 19.98 20.17 20.20 19.98 19.65 19.19 20.12 --- 23.20 23.85 27 22.49 20.55 19.97 20.15 20.17 19.98 19.65 19.18 20.21 --- 23.23 23.85 28 22.39 20.52 19.96 20.13 20.14 19.95 19.63 19.16 20.21 --- 23.25 23.84 29 22.28 20.49 19.95 20.15 --- 19.90 19.61 19.13 20.22 --- 23.27 23.84 30 22.18 20.46 19.95 20.14 --- 19.90 19.60 19.14 20.34 --- 23.38 23.83 31 22.08 -- 19.94 20.13 --- 19.91 --- 19.15 --- 23.52 --
MEAN --- 21.07 20.14 20.13 20.06 20.11 19.75 19.34 19.43 --- 23.66 MAX --- 21.99 20.43 20.32 20.24 20.36 19.90 19.57 20.34 --- 23.85 MIN --- 20.46 19.94 19.93 19.94 19.90 19.60 19.13 19.03 --- 23.48

342 WITHLACOOCHEE RIVER BASIN
02312975 TSALA APOPKA OUTFALL CANAL AT S-353, NEAR HERNANDO, FL
LOCATION.--Lat 28° 57'19", long 82° 20'13", in NE1⁄ 4 sec.6, T.18 S., R.20 E., Citrus County, Hydrologic Unit 03100208, on left bank at control structure 353, on graded road 2.3 mi northeast of Hernando, and 2.8 mi upstream from mouth.
DRAINAGE AREA.--Indeterminate.
PERIOD OF RECORD.--July 1968 to current year.
GAGE.--Water-stage recorder. Datum of gage is at NGVD of 1929 (U.S. Army Corps of Engineers bench mark). Auxiliary gage atdownstream side of control structure.
REMARKS.--Records poor. Flow regulated by manipulation of gates in spillway. Discharge computed from relation between discharge, head, and gate openings and does not include leakage, which is less than 2.0 ft3/s, around structure or gates.
COOPERATION.--Gate-opening record provided by Southwest Florida Water Management District.
DISCHARGE, CUBIC FEET PER SECOND, WATER YEAR OCTOBER 2001 TO SEPTEMBER 2002DAILY MEAN VALUES
DAY OCT NOV DEC JAN FEB MAR APR MAY JUN JUL AUG SEP
1 0.00 0.00 0.00 0.00 0.00 0.00 0.00 0.00 0.00 0.00 0.00 0.00 2 0.00 0.00 0.00 0.00 0.00 0.00 0.00 0.00 0.00 0.00 0.00 0.00 3 0.00 0.00 0.00 0.00 0.00 0.00 0.00 0.00 0.00 0.00 0.00 0.00 4 0.00 0.00 0.00 0.00 0.00 0.00 0.00 0.00 0.00 0.00 0.00 0.00 5 0.00 0.00 0.00 0.00 0.00 0.00 0.00 0.00 0.00 0.00 0.00 0.00
6 0.00 0.00 0.00 0.00 0.00 0.00 0.00 0.00 0.00 0.00 0.00 0.00 7 0.00 0.00 0.00 0.00 0.00 0.00 0.00 0.00 0.00 0.00 0.00 0.00 8 0.00 0.00 0.00 0.00 0.00 0.00 0.00 0.00 0.00 0.00 0.00 0.00 9 0.00 0.00 0.00 0.00 0.00 0.00 0.00 0.00 0.00 0.00 0.00 0.00 10 0.00 0.00 0.00 0.00 0.00 0.00 0.00 0.00 0.00 0.00 0.00 0.00
11 0.00 0.00 0.00 0.0012 0.00 0.00 0.00 0.0013 0.00 0.00 0.00 0.0014 0.00 0.00 0.00 0.0015 0.00 0.00 0.00 0.00
0.00 0.00 0.00 0.00 0.00 0.00 0.00 0.000.00 0.00 0.00 0.00 0.00 0.00 0.00 0.000.00 0.00 0.00 0.00 0.00 0.00 0.00 0.000.00 0.00 0.00 0.00 0.00 0.00 0.00 0.000.00 0.00 0.00 0.00 0.00 0.00 0.00 0.00
16 0.00 0.00 0.00 0.0017 0.00 0.00 0.00 0.0018 0.00 0.00 0.00 0.0019 0.00 0.00 0.00 0.0020 0.00 0.00 0.00 0.00
0.00 0.00 0.00 0.00 0.00 0.00 0.00 0.000.00 0.00 0.00 0.00 0.00 0.00 0.00 0.000.00 0.00 0.00 0.00 0.00 0.00 0.00 0.000.00 0.00 0.00 0.00 0.00 0.00 0.00 0.000.00 0.00 0.00 0.00 0.00 0.00 0.00 0.00
21 0.00 0.00 0.00 0.0022 0.00 0.00 0.00 0.0023 0.00 0.00 0.00 0.0024 0.00 0.00 0.00 0.0025 0.00 0.00 0.00 0.00
0.00 0.00 0.00 0.00 0.00 0.00 0.00 0.000.00 0.00 0.00 0.00 0.00 0.00 0.00 0.000.00 0.00 0.00 0.00 0.00 0.00 0.00 0.000.00 0.00 0.00 0.00 0.00 0.00 0.00 0.000.00 0.00 0.00 0.00 0.00 0.00 0.00 0.00
26 0.00 0.00 0.00 0.0027 0.00 0.00 0.00 0.0028 0.00 0.00 0.00 0.0029 0.00 0.00 0.00 0.00 30 0.00 0.00 0.00 0.00 31 0.00 --- 0.00 0.00
0.00 0.00 0.00 0.00 0.00 0.00 0.00 0.000.00 0.00 0.00 0.00 0.00 0.00 0.00 0.000.00 0.00 0.00 0.00 0.00 0.00 0.00 0.00 --- 0.00 0.00 0.00 0.00 0.00 0.00 0.00 --- 0.00 0.00 0.00 0.00 0.00 0.00 0.00 --- 0.00 --- 0.00 --- 0.00 0.00 --
TOTAL 0.00 0.00 0.00 0.00MEAN 0.000 0.000 0.000 0.000 MAX 0.00 0.00 0.00 0.00 MIN 0.00 0.00 0.00 0.00
0.00 0.00 0.00 0.00 0.00 0.00 0.00 0.00 0.000 0.000 0.000 0.000 0.000 0.000 0.000 0.000 0.00 0.00 0.00 0.00 0.00 0.00 0.00 0.00 0.00 0.00 0.00 0.00 0.00 0.00 0.00 0.00
STATISTICS OF MONTHLY MEAN DATA FOR WATER YEARS 1968 - 2002, BY WATER YEAR (WY)
MEAN 17.0 2.54 5.17 9.69 MAX 162 61.0 144 180 (WY) 1996 1970 1970 1970 MIN 0.000 0.000 0.000 0.000 (WY) 1982 1973 1973 1973
11.0 23.5 21.3 8.51 9.18 24.6 16.9 25.3187 158 135 118 68.7 159 198 1861970 1970 1983 1984 1983 1984 1974 19820.000 0.000 0.000 0.000 0.000 0.000 0.000 0.0001973 1982 1982 1982 1982 1985 1993 1993
SUMMARY STATISTICS FOR 2001 CALENDAR YEAR FOR 2002 WATER YEAR WATER YEARS 1968 - 2002
ANNUAL TOTALANNUAL MEAN HIGHEST ANNUAL MEANLOWEST ANNUAL MEAN HIGHEST DAILY MEAN LOWEST DAILY MEAN 0.00 Many days ANNUAL SEVEN-DAY MINIMUM 0.00 Jan 1 MAXIMUM PEAK STAGE10 PERCENT EXCEEDS 0.0050 PERCENT EXCEEDS 0.0090 PERCENT EXCEEDS 0.00
14.2 76.7 1970*0.000410 Sep 4 1968
0.00 Many days 0.00 Many days0.00 Oct 1 0.00 Many days36.89 Sep 30 40.22 Feb 17 1998 0.00 24 0.00 0.10 0.00 0.00
* During 2000,2001,2002 water years

--- --- --- --- --- ------ --- --- --- --- ------ --- --- --- --- ------ --- --- --- --- ------ --- --- --- --- ---
--- --- --- --- --- ------ --- --- --- --- ------ --- --- --- --- ------ --- --- --- --- ------ --- --- --- --- ---
--- --- --- --- --- ------ --- --- --- --- ------ --- --- --- --- ------ --- --- --- --- ------ --- --- --- --- ---
--- --- --- --- --- ------ --- --- --- --- ------ --- --- --- --- --- --- --- --- --- --- --- --- --- ---
--- --- --- --- --- --- --- --- --- --- --- --- --- --- --- --- --- --- --- --- --- --- --- --- ---
--- --- --- --- --- --- --- --- --- --- --- --- --- --- --- --- --- --- --- --- --- --- --- --- --- --- --- --- --- --- ---
--- --- --- --- --- ------ --- --- --- --- ------ --- --- --- --- ---
WITHLACOOCHEE RIVER BASIN 343
02312975 TSALA APOPKA OUTFALL CANAL AT S-353, NEAR HERNANDO, FL--Continued
GAGE HEIGHT, FEET, WATER YEAR OCTOBER 2001 TO SEPTEMBER 2002 DAILY MEAN VALUES
DAY OCT NOV DEC JAN FEB MAR APR MAY JUN JUL AUG SEP
1 --- --- --- --- --- --- 2 --- --- --- --- --- --- 3 --- --- --- --- --- --- 4 --- --- --- --- --- --- 5 --- --- --- --- --- ---
6 --- --- --- --- --- --- 7 --- --- --- --- --- --- 8 --- --- --- --- --- --- 9 --- --- --- --- --- --- 10 -- -- -- -- -- --
11 -- -- -- -- -- --12 -- -- -- -- -- --13 -- -- -- -- -- --14 -- -- -- -- -- --15 -- -- -- -- -- --
16 -- -- -- -- -- --17 -- -- -- -- -- --18 -- -- -- -- -- --- 35.97 19 -- -- -- -- -- --- 36.02 20 -- -- -- -- -- --- 36.08
21 -- -- -- -- -- --- 36.14 22 -- -- -- -- -- --- 36.20 23 -- -- -- -- -- --- 36.26 24 -- -- -- -- -- --- 36.36 25 -- -- -- -- -- --- 36.51
26 -- -- -- -- -- --- 36.59 27 -- -- -- -- -- --- 36.67 28 -- -- -- -- -- --- 36.73 29 -- -- -- -- -- --- 36.79 30 -- -- -- -- -- --- 36.86 31 -- -- -- -- -- --
MEAN --- --- --- --- --- --- MAX --- --- --- --- --- --- MIN --- --- --- --- --- ---

---
344 WITHLACOOCHEE RIVER BASIN
02312976 TSALA APOPKA OUTFALL CANAL BELOW S-353, NEAR HERNANDO, FL
LOCATION.--Lat 28° 57'19", long 82° 20'13", in NE1⁄ 4 sec.6, T.18 S., R.20 E., Citrus County, Hydrologic Unit 03100208, on left bank at control structure 353, on graded road 2.3 mi northeast of Hernando, and 2.8 mi upstream from mouth.
DRAINAGE AREA.--Indeterminate.
PERIOD OF RECORD.--July 1968 to current year (gage heights only).
GAGE.--Water-stage recorder. Datum of gage is at NGVD of 1929 (U.S. Army Corps of Engineers bench mark).
EXTREMES FOR PERIOD OF RECORD.--Maximum gage height, 38.29 ft, Mar. 21, 1998; minimum, 27.34 ft, June 2, 1992.
GAGE HEIGHT, FEET, WATER YEAR OCTOBER 2001 TO SEPTEMBER 2002 DAILY MEAN VALUES
DAY OCT NOV DEC JAN FEB MAR APR MAY JUN JUL AUG SEP
1 30.73 29.87 28.39 28.07 28.15 28.15 27.76 27.68 27.80 28.53 30.23 32.05 2 30.91 29.76 28.36 28.13 28.12 28.12 27.73 27.68 27.81 28.59 30.31 32.11 3 31.09 29.74 28.32 28.28 28.11 28.23 27.73 27.68 27.80 28.57 30.42 32.11 4 31.28 29.62 28.29 28.26 28.09 28.53 27.77 27.69 27.76 28.62 30.54 32.09 5 31.45 29.51 28.27 28.26 28.04 28.45 27.75 27.68 27.76 28.90 30.68 32.13
6 31.61 29.42 28.25 28.32 28.03 28.37 27.72 27.66 27.80 28.93 30.80 32.22 7 31.75 29.35 28.23 28.33 28.11 28.32 27.70 27.69 27.81 28.77 30.90 32.19 8 31.85 29.29 28.24 28.31 28.13 28.27 27.67 27.71 27.83 28.64 30.97 32.12 9 31.91 29.23 28.26 28.29 28.13 28.23 27.70 27.73 27.84 28.56 31.01 32.07 10 31.95 29.17 28.27 28.29 28.15 28.18 27.71 27.74 27.84 28.48 31.03 32.04
11 31.99 29.11 28.28 28.28 28.16 28.10 27.70 27.73 27.84 28.38 31.02 32.03 12 32.01 29.06 28.27 28.27 28.15 28.07 27.71 27.75 27.84 28.35 31.03 32.03 13 32.01 29.01 28.27 28.27 28.14 28.13 27.76 27.80 27.86 28.59 31.13 32.06 14 31.99 29.03 28.27 28.31 28.12 28.10 27.79 27.80 27.82 29.42 31.15 32.11 15 31.94 29.01 28.26 28.55 28.10 28.06 27.80 27.77 27.78 29.35 31.22 32.36
16 31.86 28.95 28.24 28.45 28.08 28.03 27.79 27.77 27.70 29.30 31.38 32.50 17 31.77 28.88 28.25 28.35 28.07 28.00 27.79 27.83 27.78 29.24 31.42 32.53 18 31.65 28.82 28.28 28.29 28.01 27.98 27.83 27.86 27.80 29.19 31.44 32.52 19 31.52 28.77 28.26 28.24 27.98 27.92 27.82 27.87 27.82 29.20 31.48 32.50 20 31.42 28.73 28.26 28.19 27.97 27.90 27.83 27.84 27.83 29.34 31.51 32.47
21 31.33 28.69 28.22 28.15 27.98 27.89 27.82 27.81 27.79 29.94 31.50 32.44 22 31.26 28.65 28.19 28.10 27.95 27.85 27.82 27.77 27.94 30.33 31.42 32.42 23 31.18 28.62 28.17 28.09 28.07 27.80 27.78 27.73 28.17 30.29 31.18 32.41 24 31.08 28.59 28.19 28.09 28.26 27.77 27.73 27.73 28.20 30.28 31.07 32.43 25 30.95 28.56 28.18 28.14 28.27 27.77 27.74 27.73 28.11 30.24 31.13 32.58
26 30.81 28.53 28.18 28.37 28.28 27.80 27.72 27.72 28.09 30.22 31.24 32.66 27 30.64 28.50 28.13 28.29 28.29 27.82 27.71 27.73 28.07 30.19 31.34 32.70 28 30.49 28.47 28.12 28.22 28.22 27.79 27.71 27.74 28.10 30.18 31.41 32.72 29 30.32 28.44 28.13 28.19 --- 27.76 27.70 27.75 28.13 30.19 31.52 32.72 30 30.17 28.42 28.10 28.18 --- 27.74 27.68 27.79 28.20 30.22 31.70 32.72 31 30.02 -- 28.09 28.16 --- 27.75 --- 27.79 30.21 31.94 --
MEAN 31.32 28.99 28.23 28.25 28.11 28.03 27.75 27.75 27.90 29.33 31.13 32.33 MAX 32.01 29.87 28.39 28.55 28.29 28.53 27.83 27.87 28.20 30.33 31.94 32.72 MIN 30.02 28.42 28.09 28.07 27.95 27.74 27.67 27.66 27.70 28.35 30.23 32.03
CAL YR 2001 MEAN 28.45 MAX 32.01 MIN 27.55 WTR YR 2002 MEAN 29.10 MAX 32.72 MIN 27.66

345 WITHLACOOCHEE RIVER BASIN
02313000 WITHLACOOCHEE RIVER NEAR HOLDER, FL
LOCATION.--Lat 28° 59'19", long 82° 20'59", in NW1⁄ 4 sec.30, T.17 S., R.20 E., Marion County, Hydrologic Unit 03100208, near right bank on downstream side of bridge on State Highway 200, 4.5 mi northeast of Holder, and 38 mi upstream from mouth.
DRAINAGE AREA.--1,825 mi2, approximately.
PERIOD OF RECORD.--August 1928 to February 1929, August 1931 to current year.
REVISED RECORDS.--WDR-FL-72-3: Drainage area.
GAGE.--Water-stage recorder and data-collection platform. Datum of gage is 27.52 ft above NGVD of 1929 (levels by U.S. Army Corps of Engineers). Aug. 14, 1928 to Feb. 15, 1929, nonrecording gage at present site at datum 2.00 ft higher. Aug. 29,1931, to May 19, 1961, water-stage recorder at site 100 ft downstream at present datum.
REMARKS.--Records fair. High-water diversion in headwaters (station 02311000).
DISCHARGE, CUBIC FEET PER SECOND, WATER YEAR OCTOBER 2001 TO SEPTEMBER 2002DAILY MEAN VALUES
DAY OCT NOV DEC JAN FEB MAR APR MAY JUN JUL AUG SEP
1 938 788 325 221 2 995 750 317 237 3 1060 745 305 2734 1120 708 295 2715 1170 672 288 271
238 247 161 131 138 314 792 1360230 241 155 130 142 330 816 1380225 270 156 129 140 322 849 1380220 351 165 131 128 335 886 1370208 330 160 127 125 416 928 1390
6 1220 644 282 2887 1260 623 276 2908 1300 606 279 2849 1320 588 283 281
10 1330 567 287 281
204 308 154 121 136 426 965 1420224 294 151 127 140 376 997 1410 229 283 145 134 142 339 1020 1390 230 272 150 139 144 317 1030 1370 235 258 152 140 144 294 1030 1360
11 1340 550 286 278 12 1350 533 284 274 13 1360 517 283 275 14 1360 519 285 286 15 1350 514 278 351
236 239 149 140 142 264 1030 1350 235 232 150 143 141 254 1030 1350 230 250 163 153 145 323 1060 1360 228 241 172 151 135 560 1070 1380 223 230 173 144 122 540 1090 1470
16 1330 495 273 321 17 1310 475 275 294 18 1270 458 284 278 19 1240 443 279 264 20 1210 432 274 250
219 225 169 146 104 526 1150 1520 216 217 170 156 121 506 1160 1530 201 211 177 165 129 489 1160 1540 196 196 175 165 132 494 1180 1530 195 190 175 157 133 533 1180 1520
21 1190 418 266 241 22 1180 404 258 226 23 1160 398 252 224 24 1130 389 256 224 25 1100 379 250 238
194 190 174 148 122 712 1190 1510 187 177 171 137 160 833 1160 1500 219 165 160 127 221 818 1080 1490 271 158 150 126 228 814 1040 1500 275 162 150 127 203 802 1060 1560
26 1050 368 251 296 27 1010 360 240 276 28 964 352 237 257 29 919 342 238 249 30 877 335 231 247 31 835 --- 226 241
277 169 144 124 194 794 1100 1590 280 172 141 125 189 788 1130 1610 262 166 141 123 197 782 1160 1610 --- 160 134 128 205 781 1190 1620 --- 157 131 136 221 791 1250 1620 --- 159 --- 137 --- 787 1320 --
TOTAL 36248 15372 8443 8287MEAN 1169 512 272 267MAX 1360 788 325 351 MIN 835 335 226 221 CFSM 0.64 0.28 0.15 0.15 IN. 0.74 0.31 0.17 0.17
6387 6920 4718 4267 4623 16660 33103 43990 228 223 157 138 154 537 1068 1466 280 351 177 165 228 833 1320 1620187 157 131 121 104 254 792 13500.13 0.12 0.09 0.08 0.08 0.30 0.59 0.81 0.13 0.14 0.10 0.09 0.09 0.34 0.68 0.90
STATISTICS OF MONTHLY MEAN DATA FOR WATER YEARS 1928 - 2002, BY WATER YEAR (WY)
MEAN 1601 1024 785 839 MAX 6206 3068 2483 4414(WY) 1961 1961 1954 1998MIN 72.4 60.4 72.8 79.6(WY) 2001 2001 2001 2001
879 985 967 642 562 840 1218 1607 4176 4869 7096 2946 2240 5925 5415 52211998 1998 1960 1960 1959 1934 1960 196080.0 80.5 106 80.4 94.7 101 82.8 1002001 2001 2000 2000 2000 2000 2000 2000
SUMMARY STATISTICS FOR 2001 CALENDAR YEAR FOR 2002 WATER YEAR WATER YEARS 1928 - 2002
ANNUAL TOTAL 99937 ANNUAL MEAN 274 HIGHEST ANNUAL MEAN LOWEST ANNUAL MEAN HIGHEST DAILY MEAN 1360LOWEST DAILY MEAN 33ANNUAL SEVEN-DAY MINIMUM 43 MAXIMUM PEAK FLOW MAXIMUM PEAK STAGE INSTANTANEOUS LOW FLOWANNUAL RUNOFF (CFSM) 0.15ANNUAL RUNOFF (INCHES) 2.0410 PERCENT EXCEEDS 79350 PERCENT EXCEEDS 12790 PERCENT EXCEEDS 69
189018 518 985
3374 1960127 2001
Oct 13,14 1620 Sep 29,30 8660 Apr 5 1960Mar 12 104 Jun 16 33 Mar 12 2001Mar 8 123 Jun 15 43 Mar 8 2001
1630 Sep 28 8660 Apr 5 19605.33 Sep 28 13.28 Apr 5 1960
104 Jun 16 26 Jul 9 2000 0.28 0.54 3.86 7.35
1330 2080 278 683 140 240

---
346 WITHLACOOCHEE RIVER BASIN
02313000 WITHLACOOCHEE RIVER NEAR HOLDER, FL--Continued
GAGE HEIGHT, FEET, WATER YEAR OCTOBER 2001 TO SEPTEMBER 2002 DAILY MEAN VALUES
DAY OCT NOV DEC JAN FEB MAR APR MAY JUN JUL AUG SEP
1 3.30 2.44 0.96 0.64 0.73 0.73 0.34 0.27 0.39 1.11 2.80 4.62 2 3.48 2.32 0.93 0.69 0.70 0.71 0.32 0.27 0.40 1.17 2.89 4.69 3 3.68 2.31 0.89 0.83 0.68 0.81 0.31 0.27 0.39 1.15 2.99 4.68 4 3.86 2.19 0.86 0.83 0.66 1.09 0.35 0.28 0.36 1.20 3.11 4.67 5 4.03 2.07 0.84 0.83 0.62 1.02 0.33 0.27 0.35 1.48 3.25 4.71
6 4.19 1.98 0.82 0.89 0.61 0.94 0.30 0.25 0.39 1.51 3.37 4.80 7 4.33 1.92 0.80 0.89 0.69 0.89 0.28 0.27 0.40 1.35 3.48 4.77 8 4.43 1.86 0.82 0.87 0.71 0.84 0.26 0.30 0.42 1.22 3.56 4.71 9 4.49 1.80 0.83 0.86 0.71 0.80 0.28 0.32 0.43 1.14 3.59 4.65 10 4.53 1.74 0.84 0.86 0.73 0.75 0.29 0.33 0.43 1.07 3.60 4.62
11 4.56 1.68 0.85 0.85 0.73 0.68 0.29 0.33 0.43 0.96 3.60 4.61 12 4.59 1.63 0.84 0.84 0.73 0.65 0.29 0.34 0.43 0.93 3.61 4.61 13 4.58 1.57 0.84 0.84 0.71 0.71 0.34 0.39 0.44 1.17 3.71 4.64 14 4.57 1.59 0.85 0.89 0.69 0.68 0.38 0.38 0.40 1.99 3.73 4.69 15 4.52 1.57 0.83 1.12 0.67 0.64 0.39 0.36 0.36 1.93 3.80 4.94
16 4.44 1.51 0.82 1.01 0.66 0.62 0.37 0.37 0.29 1.88 3.96 5.07 17 4.34 1.44 0.82 0.92 0.65 0.58 0.38 0.41 0.36 1.81 4.00 5.11 18 4.22 1.39 0.85 0.86 0.59 0.56 0.41 0.45 0.39 1.77 4.02 5.11 19 4.10 1.34 0.84 0.81 0.56 0.50 0.41 0.45 0.41 1.78 4.06 5.09 20 3.99 1.30 0.82 0.76 0.56 0.48 0.41 0.42 0.42 1.91 4.08 5.06
21 3.91 1.26 0.79 0.73 0.56 0.47 0.41 0.39 0.37 2.51 4.08 5.03 22 3.84 1.22 0.76 0.67 0.53 0.42 0.40 0.35 0.52 2.91 4.00 5.01 23 3.76 1.19 0.75 0.67 0.64 0.38 0.36 0.31 0.75 2.87 3.76 5.00 24 3.66 1.16 0.76 0.67 0.83 0.35 0.32 0.32 0.78 2.85 3.65 5.02 25 3.53 1.13 0.74 0.72 0.84 0.36 0.33 0.32 0.69 2.82 3.71 5.17
26 3.38 1.10 0.75 0.94 0.85 0.38 0.31 0.31 0.67 2.79 3.82 5.26 27 3.21 1.07 0.71 0.87 0.85 0.40 0.30 0.32 0.65 2.78 3.92 5.29 28 3.05 1.04 0.69 0.80 0.79 0.37 0.30 0.32 0.68 2.76 3.99 5.30 29 2.89 1.02 0.70 0.77 --- 0.34 0.28 0.34 0.71 2.76 4.10 5.31 30 2.73 0.99 0.67 0.76 --- 0.33 0.27 0.37 0.78 2.80 4.28 5.31 31 2.59 --- 0.66 0.74 --- 0.33 --- 0.37 2.78 4.52 --
MEAN 3.90 1.56 0.80 0.82 0.69 0.61 0.33 0.34 0.48 1.91 3.71 4.92 MAX 4.59 2.44 0.96 1.12 0.85 1.09 0.41 0.45 0.78 2.91 4.52 5.31 MIN 2.59 0.99 0.66 0.64 0.53 0.33 0.26 0.25 0.29 0.93 2.80 4.61
CAL YR 2001 MEAN 1.03 MAX 4.59 MIN 0.13 WTR YR 2002 MEAN 1.68 MAX 5.31 MIN 0.25

347 WITHLACOOCHEE RIVER BASIN
02313100 RAINBOW SPRINGS NEAR DUNNELLON, FL
LOCATION.--Lat 29° 06'08", long 82° 26'16", in SE1⁄ 4 sec.12, T.16 S., R.18 E., Marion County, Hydrologic Unit 03100208, at head of springs, 3.9 mi north of Dunnellon, and 5.7 mi upstream from mouth.
DRAINAGE AREA.--Indeterminate.
PERIOD OF RECORD.--1899, 1905, 1907, 1917, 1929-30 (one discharge measurement each water year), October 1930 to November 1964 (discharge measurements only), January 1965 to current year. Prior to October 1940, published as Blue Springs near Dunnellon.
GAGE.--Nonrecording gage. Datum of gage is 28.34 ft above NGVD of 1929 (U.S. Army Corps of Engineers bench mark). Prior toNov. 19, 1948, at datum 1.63 ft higher. No gage prior to Oct. 8, 1930. July 22, 1931 to Apr. 1, 1933, water-stage recorder at present site. (April 1933 to March 1969, and since April 1971, nonrecording gage read at time of discharge measurements only.)
REMARKS.--Records good. Discharge measurements made approximately, 0.25 mi upstream of bridge on State Highway 484, 5.0 midownstream from head of springs; surface inflow between springs and measuring site is negligible except after heavy rains. Discharge computed from relation between artesian pressure at Rainbow Springs well and discharge at measuring site. Artesian pressures are published as water levels for Rainbow Springs Well (290514082270701) in Water Resources Data, Volume 1B, Northeast Florida Ground Water.
DISCHARGE, CUBIC FEET PER SECOND, WATER YEAR OCTOBER 2001 TO SEPTEMBER 2002DAILY MEAN VALUES
DAY OCT NOV DEC JAN FEB MAR APR MAY JUN JUL AUG SEP
1 625 632 610 586 2 628 630 608 587 3 630 631 607 588 4 634 631 605 586 5 636 630 604 587
568 553 528 505 487 500 558 579567 553 528 504 484 502 560 578566 552 527 503 484 503 562 577565 553 529 502 482 505 564 576565 553 528 498 478 510 564 580
6 639 628 604 588 7 640 627 604 585 8 642 629 605 585 9 642 628 603 584 10 642 629 605 583
565 552 526 498 480 512 566 582565 550 523 498 481 511 564 580565 549 523 496 484 512 565 577565 547 522 496 484 514 566 577563 545 521 496 484 513 566 577
11 644 627 604 58212 645 625 602 58113 647 626 603 57914 647 627 601 58115 647 629 600 583
563 544 521 495 486 513 564 576563 545 521 494 483 514 566 579561 546 522 496 484 518 568 581561 546 521 495 482 524 567 582561 544 520 492 483 530 568 584
16 647 627 598 58117 646 625 599 57918 647 623 600 57719 646 622 598 57720 645 622 596 574
560 542 520 492 480 534 570 585558 540 521 493 481 533 573 585557 539 522 493 484 535 573 584556 539 521 493 483 536 575 584555 538 520 495 485 538 576 584
21 646 620 595 57222 648 621 595 57123 650 620 595 57024 644 619 594 57025 642 616 594 570
555 538 517 493 485 539 574 583555 536 516 489 488 543 573 580555 535 515 489 491 546 573 581555 533 512 488 493 547 572 583556 533 510 487 493 548 569 586
26 641 615 591 57327 640 614 592 57328 637 612 591 57329 635 613 590 57230 635 611 586 57031 632 --- 586 569
556 533 510 485 493 548 571 587554 531 509 486 491 550 571 587553 531 507 489 491 551 572 586--- 530 508 486 493 556 573 586--- 529 507 487 494 557 576 587--- 528 --- 487 --- 557 579 --
TOTAL 19869 18709 18565 17936 MEAN 641 624 599 579 MAX 650 632 610 588 MIN 625 611 586 569
15688 16787 15575 15300 14571 16399 17638 17453560 542 519 494 486 529 569 582568 553 529 505 494 557 579 587553 528 507 485 478 500 558 576
STATISTICS OF MONTHLY MEAN DATA FOR WATER YEARS 1965 - 2002, BY WATER YEAR (WY)
MEAN 752 734 712 698 MAX 1023 953 907 934(WY) 1966 1966 1966 1998 MIN 525 537 532 520 (WY) 2001 2001 2001 2001
687 688 688 674 665 676 699 735 924 1016 957 925 914 879 993 10391998 1998 1998 1970 1970 1970 1965 1965514 514 514 491 480 487 537 5492001 2001 2001 2001 2001 2001 2000 2000
SUMMARY STATISTICS FOR 2001 CALENDAR YEAR FOR 2002 WATER YEAR WATER YEARS 1965 - 2002
ANNUAL TOTAL 198486ANNUAL MEAN 544 HIGHEST ANNUAL MEAN LOWEST ANNUAL MEAN HIGHEST DAILY MEAN 650 LOWEST DAILY MEAN a470ANNUAL SEVEN-DAY MINIMUM 473MAXIMUM PEAK FLOW MAXIMUM PEAK STAGE INSTANTANEOUS LOW FLOW10 PERCENT EXCEEDS 62950 PERCENT EXCEEDS 51990 PERCENT EXCEEDS 480
204490 560 701
897 1970521 2001
Oct 23 650 Oct 23 1060 Sep 19 1988 478 Jun 5 a470
Jun 15 482 Jun 2 473 Jun 15 2001 652 Oct 23 *1230 Oct 12 1964
2.48 Nov 5 5.90 Apr 6 1960475 Jun 5 *460 Jun 7 2000 629 862 565 683 492 566
* Measured a Jun 18,19, Jul 9, 2001
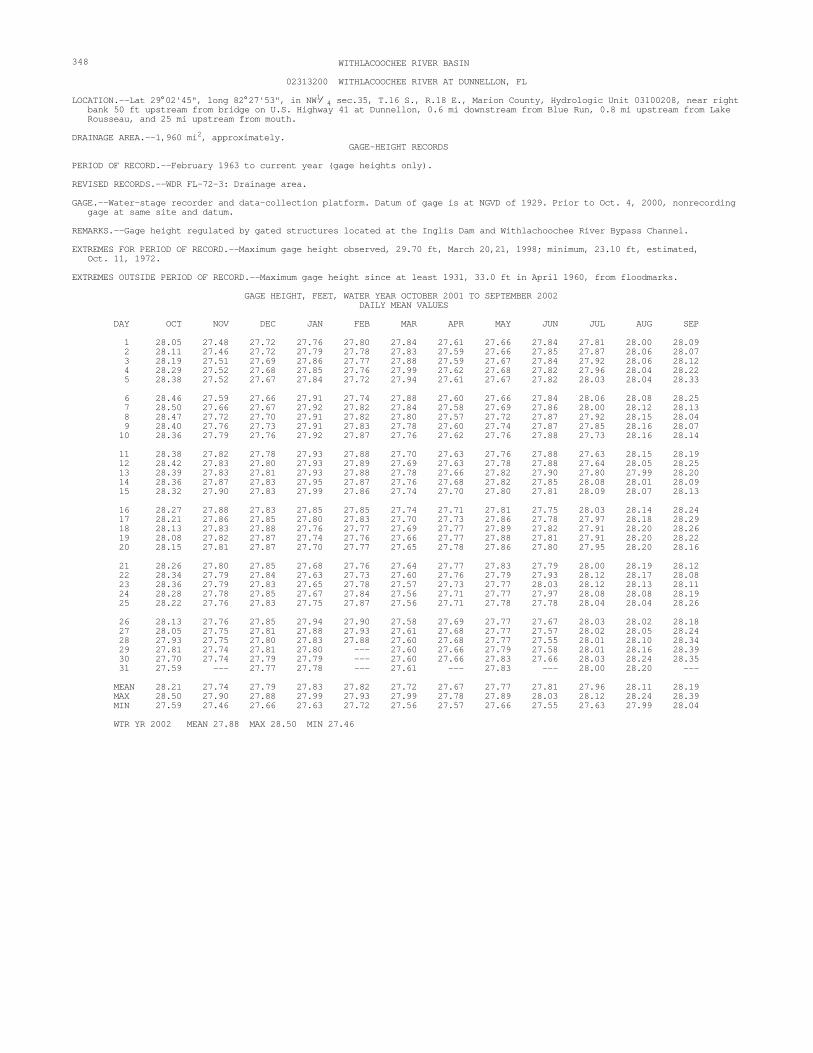
---
348 WITHLACOOCHEE RIVER BASIN
02313200 WITHLACOOCHEE RIVER AT DUNNELLON, FL
LOCATION.--Lat 29° 02'45", long 82° 27'53", in NW1⁄ 4 sec.35, T.16 S., R.18 E., Marion County, Hydrologic Unit 03100208, near right bank 50 ft upstream from bridge on U.S. Highway 41 at Dunnellon, 0.6 mi downstream from Blue Run, 0.8 mi upstream from Lake Rousseau, and 25 mi upstream from mouth.
DRAINAGE AREA.--1,960 mi2, approximately.GAGE-HEIGHT RECORDS
PERIOD OF RECORD.--February 1963 to current year (gage heights only).
REVISED RECORDS.--WDR FL-72-3: Drainage area.
GAGE.--Water-stage recorder and data-collection platform. Datum of gage is at NGVD of 1929. Prior to Oct. 4, 2000, nonrecording gage at same site and datum.
REMARKS.--Gage height regulated by gated structures located at the Inglis Dam and Withlachoochee River Bypass Channel.
EXTREMES FOR PERIOD OF RECORD.--Maximum gage height observed, 29.70 ft, March 20,21, 1998; minimum, 23.10 ft, estimated,Oct. 11, 1972.
EXTREMES OUTSIDE PERIOD OF RECORD.--Maximum gage height since at least 1931, 33.0 ft in April 1960, from floodmarks.
GAGE HEIGHT, FEET, WATER YEAR OCTOBER 2001 TO SEPTEMBER 2002DAILY MEAN VALUES
DAY OCT NOV DEC JAN FEB MAR APR MAY JUN JUL AUG SEP
1 28.05 27.48 27.72 27.76 27.80 27.84 27.61 27.66 27.84 27.81 28.00 28.09 2 28.11 27.46 27.72 27.79 27.78 27.83 27.59 27.66 27.85 27.87 28.06 28.07 3 28.19 27.51 27.69 27.86 27.77 27.88 27.59 27.67 27.84 27.92 28.06 28.12 4 28.29 27.52 27.68 27.85 27.76 27.99 27.62 27.68 27.82 27.96 28.04 28.22 5 28.38 27.52 27.67 27.84 27.72 27.94 27.61 27.67 27.82 28.03 28.04 28.33
6 28.46 27.59 27.66 27.91 27.74 27.88 27.60 27.66 27.84 28.06 28.08 28.25 7 28.50 27.66 27.67 27.92 27.82 27.84 27.58 27.69 27.86 28.00 28.12 28.13 8 28.47 27.72 27.70 27.91 27.82 27.80 27.57 27.72 27.87 27.92 28.15 28.04 9 28.40 27.76 27.73 27.91 27.83 27.78 27.60 27.74 27.87 27.85 28.16 28.07 10 28.36 27.79 27.76 27.92 27.87 27.76 27.62 27.76 27.88 27.73 28.16 28.14
11 28.38 27.82 27.78 27.93 27.88 27.70 27.63 27.76 27.88 27.63 28.15 28.19 12 28.42 27.83 27.80 27.93 27.89 27.69 27.63 27.78 27.88 27.64 28.05 28.25 13 28.39 27.83 27.81 27.93 27.88 27.78 27.66 27.82 27.90 27.80 27.99 28.20 14 28.36 27.87 27.83 27.95 27.87 27.76 27.68 27.82 27.85 28.08 28.01 28.09 15 28.32 27.90 27.83 27.99 27.86 27.74 27.70 27.80 27.81 28.09 28.07 28.13
16 28.27 27.88 27.83 27.85 27.85 27.74 27.71 27.81 27.75 28.03 28.14 28.24 17 28.21 27.86 27.85 27.80 27.83 27.70 27.73 27.86 27.78 27.97 28.18 28.29 18 28.13 27.83 27.88 27.76 27.77 27.69 27.77 27.89 27.82 27.91 28.20 28.26 19 28.08 27.82 27.87 27.74 27.76 27.66 27.77 27.88 27.81 27.91 28.20 28.22 20 28.15 27.81 27.87 27.70 27.77 27.65 27.78 27.86 27.80 27.95 28.20 28.16
21 28.26 27.80 27.85 27.68 27.76 27.64 27.77 27.83 27.79 28.00 28.19 28.12 22 28.34 27.79 27.84 27.63 27.73 27.60 27.76 27.79 27.93 28.12 28.17 28.08 23 28.36 27.79 27.83 27.65 27.78 27.57 27.73 27.77 28.03 28.12 28.13 28.11 24 28.28 27.78 27.85 27.67 27.84 27.56 27.71 27.77 27.97 28.08 28.08 28.19 25 28.22 27.76 27.83 27.75 27.87 27.56 27.71 27.78 27.78 28.04 28.04 28.26
26 28.13 27.76 27.85 27.94 27.90 27.58 27.69 27.77 27.67 28.03 28.02 28.18 27 28.05 27.75 27.81 27.88 27.93 27.61 27.68 27.77 27.57 28.02 28.05 28.24 28 27.93 27.75 27.80 27.83 27.88 27.60 27.68 27.77 27.55 28.01 28.10 28.34 29 27.81 27.74 27.81 27.80 --- 27.60 27.66 27.79 27.58 28.01 28.16 28.39 30 27.70 27.74 27.79 27.79 --- 27.60 27.66 27.83 27.66 28.03 28.24 28.35 31 27.59 -- 27.77 27.78 --- 27.61 --- 27.83 28.00 28.20 --
MEAN 28.21 27.74 27.79 27.83 27.82 27.72 27.67 27.77 27.81 27.96 28.11 28.19 MAX 28.50 27.90 27.88 27.99 27.93 27.99 27.78 27.89 28.03 28.12 28.24 28.39 MIN 27.59 27.46 27.66 27.63 27.72 27.56 27.57 27.66 27.55 27.63 27.99 28.04
WTR YR 2002 MEAN 27.88 MAX 28.50 MIN 27.46

--
349 WITHLACOOCHEE RIVER BASIN
02313200 WITHLACOOCHEE RIVER AT DUNNELLON, FL--Continued
WATER-QUALITY RECORDS
PERIOD OF RECORD.--Water years 1966-87, 1993, 1995 to current year.
WATER-QUALITY DATA, WATER YEAR OCTOBER 2001 TO SEPTEMBER 2002
PHSPE WATER CIFIC WHOLE CARBON, CON FIELD TEMPER OXYGEN, ORGANIC
GAGE DUCT- (STAND- ATURE DIS TOTAL Date Time HEIGHT ANCE ARD WATER SOLVED (MG/L
(FEET) (US/CM) UNITS) (DEG C) (MG/L) AS C) (00065) (00095) (00400) (00010) (00300) (00680)
FEB 12... 1538 27.89 357 7.9 8.4 -
APR 16... 1707 27.72 290 6.6 24.8 8.4 2.0
AUG 02... 1032 28.05 408 6.9 26.7 4.5 -
SEP 24... 1322 28.17 234 6.9 26.2 3.0 30.0

350 WITHLACOOCHEE RIVER BASIN
02313230 WITHLACOOCHEE RIVER AT INGLIS DAM, NEAR DUNNELLON, FL
LOCATION.--Lat 29° 00'35", long 82° 37'01", in SW1⁄ 4 sec.8, T.17 S., R.17 E., Levy County, Hydrologic Unit 03100208, on left bank at upstream side of control structure of Inglis Dam, 3.5 mi southeast of Inglis, 9.8 mi west of Dunnellon, and 11 mi upstream from mouth.
DRAINAGE AREA.--2,020 mi2, approximately.
PERIOD OF RECORD.--June 1964 to September 1969 (gage heights and discharge measurements only), October 1969 to current year.
REVISED RECORDS.--WDR FL-72-3: Drainage area.
GAGE.--Water-stage recorder. Datum of gage is at NGVD of 1929. Prior to July 20, 1971, water-stage recorder at site in forebay of powerhouse of the old Inglis Dam and July 20, 1971, to Aug. 23, 1972, at site in private boat basin on south shore of Lake Rousseau at same datum. Auxiliary gage at downstream side of control structure.
REMARKS.--Records good. Records include flow of springs, approximately 70 ft3/s just downstream from control structure; springflow is considered to be mostly leakage from Lake Rousseau. Flow regulated by manipulation of gates in spillway. Discharge computed from relation between discharge and gate openings. Since December 1969, entire flow diverted below station from old river channel into Cross-Florida Barge Canal, and diversions above station from Lake Rousseau, for boat lockages, through Cross-Florida Barge Canal (see station 02313237) and for maintaining flow in old river channel through Withlacoochee River Bypass Channel (see station 02313250).
COOPERATION.--Gate opening record provided by Southwest Florida Water Management District.
DISCHARGE, CUBIC FEET PER SECOND, WATER YEAR OCTOBER 2001 TO SEPTEMBER 2002DAILY MEAN VALUES
DAY OCT NOV DEC JAN FEB MAR APR MAY JUN JUL AUG SEP
1 70 232 70 70 2 70 70 70 70 3 70 70 70 70 4 70 70 70 70 5 205 70 70 70
70 70 70 70 70 70 70 752 70 70 70 70 70 70 129 613 70 70 70 70 70 70 190 396 70 70 70 70 70 70 190 437 70 70 70 70 70 111 120 960
6 290 70 70 70 7 429 70 70 70 8 624 70 70 70 9 624 70 70 7010 422 70 70 70
70 70 70 70 70 428 70 960 70 70 70 70 70 476 70 960 70 70 70 70 70 214 70 887 70 70 70 70 70 70 112 460 70 70 70 70 70 70 240 460
11 290 70 70 7012 390 70 70 7013 460 70 70 7014 460 70 70 7015 460 70 70 460
70 70 70 70 70 70 461 460 70 70 70 70 70 70 606 666 70 70 70 70 70 70 352 960 70 70 70 70 70 70 344 86070 70 70 70 70 70 344 524
16 460 70 70 326 17 460 70 70 7018 460 70 70 7019 249 70 70 7020 70 70 70 70
70 70 70 70 70 70 358 580 70 70 70 70 70 70 508 748 70 70 70 70 70 70 508 826 70 70 70 70 70 70 508 826 70 70 70 70 70 70 508 826
21 70 70 70 7022 196 70 70 7023 464 70 70 7024 559 70 70 7025 460 70 70 70
70 70 70 70 70 70 508 826 70 70 70 70 70 70 508 787 70 70 70 70 70 70 508 540 70 70 70 70 70 70 508 614 70 70 70 70 70 70 508 960
26 460 70 70 7027 460 70 70 7028 460 70 70 7029 460 70 70 7030 460 70 70 7031 460 --- 70 70
70 70 70 70 70 70 493 1690 70 70 70 70 70 70 344 540 70 70 70 70 70 70 344 566--- 70 70 70 70 70 344 792--- 70 70 70 70 70 670 953--- 70 --- 70 --- 70 960 --
TOTAL 11142 2262 2170 2816 MEAN 359 75.4 70.0 90.8 MAX 624 232 70 460 MIN 70 70 70 70
1960 2170 2100 2170 2100 3119 11453 22429 70.0 70.0 70.0 70.0 70.0 101 369 748 70 70 70 70 70 476 960 1690 70 70 70 70 70 70 70 396
STATISTICS OF MONTHLY MEAN DATA FOR WATER YEARS 1970 - 2002, BY WATER YEAR (WY)
MEAN 690 390 291 449 MAX 3175 2573 2035 4417(WY) 1980 1970 1970 1998 MIN 70.0 70.0 70.0 70.0(WY) 2001 1974 1974 1974
474 510 435 218 162 256 395 601 4390 5067 3353 1125 696 2058 1995 26751998 1998 1998 1987 1982 1982 1974 1982 70.0 70.0 70.0 70.0 70.0 70.0 70.8 71.01974 1974 1974 1973 1973 1973 1981 1981
SUMMARY STATISTICS FOR 2001 CALENDAR YEAR FOR 2002 WATER YEAR WATER YEARS 1970 - 2002
ANNUAL TOTAL 59242 ANNUAL MEAN 162 HIGHEST ANNUAL MEAN LOWEST ANNUAL MEAN HIGHEST DAILY MEAN 1300 LOWEST DAILY MEAN 70 ANNUAL SEVEN-DAY MINIMUM 70MAXIMUM PEAK STAGE10 PERCENT EXCEEDS 46050 PERCENT EXCEEDS 7090 PERCENT EXCEEDS 70
65891 181 406
1645 1998 78.8 1981
Sep 16 1690 Sep 26 6000 Mar 20-22 1998 Many days 70 Many days 70 Many days Jan 5 70 Nov 2 70 Many days
28.01 Jun 23 28.28 Jun 19 1982 508 104070 7070 70

---
351 WITHLACOOCHEE RIVER BASIN
02313231 WITHLACOOCHEE RIVER BELOW INGLIS DAM, NEAR DUNNELLON, FL
LOCATION.--Lat 29° 00'35", long 82° 37'01", in SW1⁄ 4 sec.8, T.17 S., R.17 E., Levy County, Hydrologic Unit 03100208, at downstream side of control structure of Inglis Dam, 3.5 mi southeast of Inglis, 9.8 mi west of Dunnellon, and 11 mi upstream from mouth.
DRAINAGE AREA.--Indeterminate.
PERIOD OF RECORD.--June 1964 to current year (gage heights only).
GAGE.--Water-stage recorder. Datum of gage is at NGVD of 1929. Prior to June 21, 1971, at downstream end of lock chamber offormer Inglis Dam at same datum. June 21, 1971, to Aug. 23, 1972, near left bank 1,500 ft downstream at same datum. This isthe auxiliary gage for station 02313230 located at upstream side of control structure.
REMARKS.--Stage affected by tide and manipulation of gates immediately above gage.
EXTREMES FOR PERIOD OF RECORD.--Maximum gage height, 15.73 ft, Sept. 13, 1964; minimum, 3.72 ft, below NGVD of 1929, Jan. 16, 1972.
GAGE HEIGHT, FEET, WATER YEAR OCTOBER 2001 TO SEPTEMBER 2002DAILY MEAN VALUES
DAY OCT NOV DEC JAN FEB MAR APR MAY JUN JUL AUG SEP
1 0.27 1.16 0.78 0.21 0.47 0.00 1.03 1.18 0.97 0.69 1.01 1.86 2 0.64 0.96 0.59 0.48 0.31 1.52 0.86 1.25 1.01 0.61 1.15 1.72 3 0.96 1.02 0.40 0.43 0.28 1.47 1.13 0.98 0.99 0.70 1.18 1.44 4 1.10 0.67 0.26 -0.44 0.07 -0.25 0.73 0.92 0.77 0.71 1.14 1.57 5 1.44 0.31 0.32 0.37 -0.63 -0.88 0.19 0.66 0.88 0.62 0.94 2.08
6 1.52 0.72 0.45 1.38 0.81 -0.31 0.15 0.49 0.95 0.85 0.97 2.57 7 1.37 0.94 0.59 -0.03 1.22 0.26 0.05 0.75 0.94 0.93 0.91 2.46 8 1.44 1.07 1.05 -0.38 0.02 0.35 0.78 0.86 0.84 0.58 0.55 2.03 9 1.36 1.01 0.82 0.03 0.20 0.35 1.10 1.09 0.60 0.83 0.62 1.34 10 1.21 0.93 0.85 0.35 0.39 -0.05 0.72 0.96 0.72 0.97 0.78 1.54
11 1.44 1.20 0.80 0.41 0.15 -0.07 0.59 0.83 0.66 1.16 1.23 1.66 12 1.97 0.88 0.61 0.56 0.28 0.75 0.65 0.94 1.10 1.25 1.52 2.15 13 2.39 0.38 0.71 0.46 0.16 0.78 0.79 1.25 1.29 1.78 1.31 2.37 14 2.48 0.05 0.90 0.61 0.04 0.51 0.78 0.98 1.48 1.31 1.21 2.15 15 1.67 0.35 0.71 0.83 0.26 0.49 0.77 0.37 1.56 0.98 1.10 1.48
16 1.81 0.38 0.45 0.45 0.59 0.63 0.66 0.46 1.17 0.81 1.00 1.44 17 1.31 0.16 1.08 0.24 0.39 0.55 0.69 0.90 1.32 0.87 1.20 1.80 18 1.29 0.29 0.89 0.31 -0.20 0.59 0.66 1.49 0.96 0.80 1.26 1.99 19 0.98 0.67 0.89 0.58 0.46 0.55 0.75 0.45 0.69 0.99 1.26 2.07 20 0.90 1.08 0.23 0.43 1.22 0.88 0.74 -0.10 0.36 0.82 1.36 2.17
21 0.90 1.05 -0.06 0.53 1.01 1.10 0.83 -0.21 0.27 0.88 1.34 2.31 22 1.19 1.11 0.45 0.18 0.70 -0.03 0.81 -0.57 0.81 0.98 1.28 2.14 23 1.65 1.15 1.34 0.34 -0.12 0.01 0.58 -0.01 0.90 0.93 1.24 1.76 24 1.92 1.23 1.05 0.60 0.15 0.45 0.49 0.77 0.95 0.96 1.40 1.91 25 1.65 0.92 0.51 0.56 0.39 0.71 0.95 1.05 0.96 0.92 1.45 2.74
26 0.53 0.75 0.38 0.17 0.80 0.67 0.86 1.05 1.02 0.90 1.36 4.44 27 0.29 0.87 0.47 0.19 0.58 0.66 0.91 0.86 0.99 0.90 1.57 2.26 28 0.22 0.89 0.95 0.29 -0.02 0.40 1.10 0.95 0.86 0.83 1.31 1.70 29 0.37 1.13 1.15 0.43 --- 0.50 1.18 1.11 0.80 1.01 1.13 2.02 30 0.72 1.07 0.55 0.40 --- 0.70 1.05 1.07 0.65 0.99 1.52 2.00 31 1.03 --- 0.42 0.54 --- 1.20 --- 1.04 1.00 2.13 --
MEAN 1.23 0.81 0.66 0.37 0.36 0.47 0.75 0.77 0.92 0.92 1.21 2.04 MAX 2.48 1.23 1.34 1.38 1.22 1.52 1.18 1.49 1.56 1.78 2.13 4.44 MIN 0.22 0.05 -0.06 -0.44 -0.63 -0.88 0.05 -0.57 0.27 0.58 0.55 1.34
CAL YR 2001 MEAN 0.80 MAX 2.86 MIN -0.68 WTR YR 2002 MEAN 0.88 MAX 4.44 MIN -0.88

352 WITHLACOOCHEE RIVER BASIN
02313250 WITHLACOOCHEE RIVER BYPASS CHANNEL NEAR INGLIS, FL
LOCATION.--Lat 29° 01'15", long 82° 38'17", in NE1⁄ 4 sec.12, T.17 S., R.16 E., Levy County, Hydrologic Unit 03100208, on right bank 1.3 mi upstream from control structure, 1.4 mi upstream from mouth, and 3.0 mi east of Inglis.
DRAINAGE AREA.--Indeterminate.
PERIOD OF RECORD.--January 1970 to current year.
GAGE.--Water-stage recorder. Datum of gage is at NGVD of 1929 (U.S. Army Corps of Engineers bench mark). Prior to July 16, 1971, water-stage recorder for Withlacoochee River at Inglis Dam, near Dunnellon (station 02313230) used as base gage for this station. Prior to Sept. 26, 1991, gage located 90 ft above control structure and 1.2 mi downstream from present site.
REMARKS.--Records good. Flow regulated by manipulation of gates in spillway; channel completed and flow through spillway beganDec. 17, 1969. Discharge computed from relation between discharge and gate openings. Discharge at station is the diversion from Lake Rousseau to maintain flow in the old river channel.
COOPERATION.--Gate-opening record provided by Southwest Florida Water Management District.
DISCHARGE, CUBIC FEET PER SECOND, WATER YEAR OCTOBER 2001 TO SEPTEMBER 2002DAILY MEAN VALUES
DAY OCT NOV DEC JAN FEB MAR APR MAY JUN JUL AUG SEP
1 1460 1540 869 7122 1460 1480 869 7123 1460 1420 869 7124 1460 1420 824 7125 1460 1220 791 712
672 670 554 419 358 610 1390 1540672 739 554 400 358 610 1390 1540672 691 545 400 358 632 1390 1540642 740 515 400 358 653 1390 1540623 790 515 400 358 674 1390 1540
6 1460 1030 791 7127 1490 1030 748 7128 1540 1030 712 6949 1540 1030 712 672 10 1540 1030 712 658
623 790 515 391 358 692 1390 1540623 790 515 334 358 692 1420 1540623 774 493 334 358 894 1460 1540623 751 476 334 358 1080 1480 1540623 751 476 334 358 1170 1500 1540
11 1540 1030 712 672 12 1540 1030 712 672 13 1540 1030 712 675 14 1540 991 712 774 15 1540 948 712 800
623 751 476 334 407 923 1500 1540 623 719 476 334 407 925 1500 1540 626 672 476 334 458 925 1500 1540 668 672 476 334 476 928 1500 1540 672 672 476 334 476 1070 1500 1540
16 1540 948 712 800 17 1540 948 712 800 18 1540 948 712 800 19 1540 948 712 800 20 1540 917 712 800
672 672 476 334 473 1120 1500 1540 672 672 476 334 455 1120 1500 1540 648 672 476 334 476 1120 1500 1540 633 672 476 359 476 1120 1520 1540 633 672 476 405 476 1120 1540 1540
21 1540 869 712 800 22 1540 869 712 716 23 1540 869 712 665 24 1540 869 712 665 25 1540 869 712 665
633 629 476 405 476 1120 1540 1540 633 606 476 405 524 1250 1540 1540 633 606 476 380 741 1450 1540 1540 633 606 476 358 1040 1480 1540 1540 633 577 476 358 1020 1390 1540 1540
26 1540 869 712 816 27 1540 869 712 863 28 1540 869 712 806 29 1540 869 712 712 30 1540 869 712 712 31 1540 --- 712 691
633 554 476 358 922 1390 1540 512 633 554 476 358 775 1390 1540 1500 655 554 456 358 641 1390 1540 1500 --- 554 436 358 610 1390 1540 1500 --- 554 436 358 610 1390 1540 1500 --- 554 --- 358 --- 1390 1540 --
TOTAL 47210 30658 22849 22712 MEAN 1523 1022 737 733 MAX 1540 1540 869 863MIN 1460 869 712 658
17952 20680 14578 11236 15519 33108 46200 45012641 667 486 362 517 1068 1490 1500672 790 554 419 1040 1480 1540 1540 623 554 436 334 358 610 1390 512
STATISTICS OF MONTHLY MEAN DATA FOR WATER YEARS 1970 - 2002, BY WATER YEAR (WY)
MEAN 1065 1035 1018 1018 MAX 1594 1566 1574 1549(WY) 1974 1980 1998 1989 MIN 265 240 436 435 (WY) 1973 1973 2001 2001
1057 1031 1024 946 940 1011 1080 1095 1502 1480 1574 1518 1551 1548 1557 15771989 1986 1984 1984 1984 1984 1984 1973442 470 463 362 364 442 364 5082001 2000 2001 2002 2000 2001 2001 2000
SUMMARY STATISTICS FOR 2001 CALENDAR YEAR FOR 2002 WATER YEAR WATER YEARS 1970 - 2002
ANNUAL TOTAL 223430ANNUAL MEAN 612 HIGHEST ANNUAL MEAN LOWEST ANNUAL MEAN HIGHEST DAILY MEAN *1540 LOWEST DAILY MEAN 187 ANNUAL SEVEN-DAY MINIMUM 299MAXIMUM PEAK STAGE10 PERCENT EXCEEDS 142050 PERCENT EXCEEDS 43690 PERCENT EXCEEDS 318
327714 898 1026
1488 1984454 2001
*1540 1840 Oct 1 1987 Jul 24 334 May 7-18 53 Oct 11 1972 Jul 24 334 May 7 86 Oct 9 1972
27.89 Jun 23 28.31 May 19 19771540 1500 712 1030 400 560
* Oct 8-Nov 1, Aug 20-Sep 25

353
DISCHARGE AT MISCELLANEOUS SITES

354 DISCHARGE AT PARTIAL-RECORD STATIONS AND MISCELLANEOUS SITES
_____________________________________________________________________________________________________________________________
_____________________________________________________________________________________________________________________________
As the number of streams on which streamflow information is likely to be desired far exceeds the number of stream-gaging stations feasible to operate at one time, the Geological Survey collects limited streamflow data at sites other than stream-gaging stations. When limited streamflow data are collected on a systematic basis over a period of years for use in hydrologic analyses, the site at which the data are collected is called a partial-record station. Data collected at these partial-record stations are usable in low-flow or flood-flow analyses, depending on the type of data collected. In addition, discharge measurements are made at other sites not included in the partial-record program. These measurements are generally made in times of drought or flood to give better areal coverage to those events. Those measurements and others collected for some special reason are called measurements at miscellaneous sites.
Discharge measurements made at miscellaneous sites during water year 2002
Measured Measurements Drainage previously Dis area (Water charge
Stream Tributary to Location (mi2) years) Date (ft3/s)
ST. JOHNS RIVER BASIN ABOVE OCKLAWAHA RIVER
02234650 Unnamed Creek Lat 28o42'36", long 81o26'34", in 1945,1960 05-24-02 4.1 Miami NE1/4 sec.31, T.20 S., R.29 E., 1973-2001 09-24-02 6.4 Springs Seminole County, Hydrologic Unit
03080101, at outlet of spring pool, 1,100 ft upstream from Wekiva River, and 5.9 mi west of Longwood.
02234991 Little Wekiva Lat 28o41'19", long 81o23'45", in 1942,1946 05-23-02 12 Sanlando River SE1/4 sec.3, T.21 S., R.29 E., 1954,1956 09-24-02 25 Springs Seminole County, Hydrologic Unit 1958,1961
03080101, at north outlet of 1972-2001 spring pool, 0.2 mi upstream from Little Wekiva River, and 3.0 mi west of Longwood.
02234996 Little Wekiva Lat 28o41'27", long 81o23'34", in 1942,1954 05-23-02 4.6 Palm Springs River NW1/4 sec.2, T.21 S., R.29 E., 1956,1961 09-24-02 7.3
Seminole County, Hydrologic Unit 1972-2001 03080101, at outlet of spring pool, 200 ft upstream from Little Wekiva River, and 2.9 mi west of Longwood.
02234997 Little Wekiva Lat 28o41'48", long 81o23'28", in 1944,1961 05-23-02 11 Starbuck River NW1/4 sec.2, T.21 S., R.29 E., 1972-2001 09-24-02 14 Spring Seminole County, Hydrologic
Unit 03080101, at outlet of spring pool, at edge of Little Wekiva River, and 2.7 mi west of Longwood.
02236095 St. Johns River Lat 29o04'50", long 81o34'30", in 1931,1933 05-17-02 111 Alexander Levy Land Grant, T.16 S., R.27 E., 1935-1936 09-17-02 121 Springs Lake County, Hydrologic Unit 1946,1956
03080101, at head of Alexander 1961 Springs Creek, 1.5 mi upstream 1966-1967 from bridge on State Highway 445, 1969,1972 and 6.5 mi southwest of Astor. 1977
1981-2001
02236110 Spring Garden Lat 29o08'02", long 81o21'47", in 1929,1932 05-20-02 22 Ponce DeLeon Creek land grant 42, T.16 S., R.29 E., 1946-1947 09-18-02 30 Springs Volusia County, Hydrologic Unit 1956,1961
03080101, at weir outlets to 1965-1980†
Spring Garden Lake, 1.8 mi 1981-2001 upstream from Deep Creek, and 8.1 mi northwest of De Land.

DISCHARGE AT PARTIAL-RECORD STATIONS AND MISCELLANEOUS SITES 355
_____________________________________________________________________________________________________________________________
_____________________________________________________________________________________________________________________________
Discharge measurements made at miscellaneous sites during water year 2002--Continued
Measured Measurements Drainage previously Dis-
area (Water charge Stream Tributary to Location (mi2) years) Date (ft3/s)
ST. JOHNS RIVER BASIN ABOVE OCKLAWAHA RIVER--Continued
02236130 Lake George Lat 29o11'01", long 81o42'45", in 1929 05-16-02 8.0 Juniper SE1/4 sec.17, T.15 S., R.26 E., 1935-1937 09-27-02 12 Springs Marion County, Hydrologic Unit 1946,1956
03080101, at head of Juniper 1961,1972 Creek, 4.3 mi west of the 1981-2001 intersection of State Highways 19 and 40, 9.3 mi upstream from Lake George, and 26.1 mi east of Ocala.
02236132 Juniper Creek Lat 29o11'00", long 81o42'29", in 1935-1937 05-16-02 12 Fern Hammock SE1/4 sec.17, T.15 S., R.26 E., 1946,1956 09-27-02 14 Springs a Marion County, Hydrologic Unit 1961,1972
03080101, 0.4 mi downstream from 1981-2001 Juniper Springs, 9.0 mi upstream from Lake George, and 26.3 mi east of Ocala.
02236147 Juniper Creek Lat 29o13'07" long 81o39'36", in 1981-2001 05-17-02 12 Sweetwater NE1/4 of F. M. Arredondo Grant, 09-27-02 16 Springs T.15 S., R.26 E., Marion County,
Hydrologic Unit 03080101, near left bank of Juniper Creek, 0.5 mi upstream from State Highway 19, and 7.2 mi north west of Astor Park.
02236160 Lake George Lat 29o14'40", long 81o38'34", in 1931-1933 05-23-02 143 Silver Glen SE1/4 sec.25, T.14 S., R.26 E., 1935-1936 08-01-02 135 Springs Marion County, Hydrologic Unit 1946,1956 09-19-02 152
03080101, 0.5 mi upstream from 1961,1972 Lake George, and 9.1 mi north- 1981-1982 west of Astor. 1984-2001
02236205 Lake George Lat 29o21'00", long 81o43'40", in 1929-1933 05-23-02 64 Salt Springs sec.42, Joseph M. Hernandez Grant, 1935-1936 09-20-02 84
T.13 S., R.26 E., Marion County, 1946,1956 Hydrologic Unit 03080101, 4.0 mi 1961 upstream from Lake George, and 1966-1967 10.9 mi east of Eureka. 1972
1981-2001

356 DISCHARGE AT PARTIAL-RECORD STATIONS AND MISCELLANEOUS SITES
_____________________________________________________________________________________________________________________________
_____________________________________________________________________________________________________________________________
Discharge measurements made at miscellaneous sites during water year 2002--Continued
Measured Measurements Drainage previously Dis area (Water charge
Stream Tributary to Location (mi2) years) Date (ft3/s)
ST. JOHNS RIVER BASIN ABOVE OCKLAWAHA RIVER--Continued
292258081381100 Atlantic Ocean Lat 29o22'58", long 81o38'11", in 05-29-02 -6650 St. Johns River at NE1/4 sec.39, T.13 S., R.26 E., -6240 Georgetown Putnam County, Hydrologic Unit -6460
03080101, near northern tip of -5940 Drayton Island, and 0.5 mi southeast -5790 of Georgetown. -4970
-4200 374
2210 4430 5690 6330 5790 5280 3920 3720 3350 148
-3260 -6260 -8690 -7760
292558081404000 Atlantic Ocean Lat 29o25'58", long 81o40'40", in 05-29-02 -15500 St. Johns River nr SE1/4 sec.22, T.12 S., R.26 E., -14500 Fruitland Putnam County, Hydrologic Unit -14800
03080101, about 0.6 mi downstream -15000 from powerline crossing, and 2.0 mi -13800 west of Fruitland. -13200
-9690 -8050 -7140 -5550 -4330 -2840
6.8 1660 3520 5100 7140 7940 8520 9610 9120 9780 9020 8740 7990 6200 5550 4880 4090 818
-1300 -4070 -6120 -7280 -9130
-13400 -14300 -15200 -16500 -16000 -17200 -16400

DISCHARGE AT PARTIAL-RECORD STATIONS AND MISCELLANEOUS SITES 357
_____________________________________________________________________________________________________________________________
_____________________________________________________________________________________________________________________________
Discharge measurements made at miscellaneous sites during water year 2002--Continued
Measured Measurements Drainage previously Dis-
area (Water charge Stream Tributary to Location (mi2) years) Date (ft3/s)
COASTAL AREA BETWEEN PONCE DE LEON INLET AND SEBASTIAN INLET
290209080542100 Atlantic Ocean Lat 29o02'09", long 80o54'21", in 05-20-02 15000 Indian River nr sec.9, T.17 S., R.34 E., 05-21-02 3800 New Smyrna Beach Volusia County, Hydrologic Unit 275
03080202, 900 ft north of bridge -5800 on State Highway 44, 1.7 mi northeast -10400 of the intersection with U.S. Highway 1 -11400 at New Smyrna Beach -12600
-14600 -15000 -14300 -13400 -11900 -10400 -9300 -7900 -6700 -3100
-800 1300 3800 6800 8700
13400 15700 17100 18700 20400 23200 24000 23500 22800 21400 19600 18600 17200 16000 13900 9300 7400 4900 3100 1070
283715080475200 Atlantic Ocean Lat 28o37'15", long 80o47'52", in 05-21-02 5800 Indian River at NE1/4 sec.34, T.21 S., R.35 E., 6990 Titusville Brevard County, Hydrologic Unit 7710
03080202, at bridge on Brewer Causeway 9110 (State Highway 402), 0.7 mi northeast 10400 of the intersection with U.S. Highway 1 at Titusville.

358 DISCHARGE AT PARTIAL-RECORD STATIONS AND MISCELLANEOUS SITES
_____________________________________________________________________________________________________________________________
_____________________________________________________________________________________________________________________________
Discharge measurements made at miscellaneous sites during water year 2002--Continued
Measured Measurements Drainage previously Dis area (Water charge
Stream Tributary to Location (mi2) years) Date (ft3/s)
COASTAL AREA BETWEEN PONCE DE LEON INLET AND SEBASTIAN INLET
283137080455500 Atlantic Ocean Lat 28o31'37", long 80o45'55", in 05-21-02 -7990 Indian River nr Delespine Grant, T.22 S., R.35 E., -4050 Titusville Brevard County, Hydrologic Unit -434
03080202, at bridge on NASA Causeway 3300 (State Highway 405), 1.5 mi east of the intersection with U.S. Highway 1, and 6.4 mi southeast of Titusville.
282408080440500 Atlantic Ocean Lat 28o24'08", long 80o44'05", in 05-21-02 13000 Indian River nr NW1/4 sec.16, T.24 S., R.36 E., 13700 Cocoa Brevard County, Hydrologic Unit 14000
03080202, at bridge on Bennett Causeway 14100 (State Highway 528), 1.1 mi east of the intersection with U.S. Highway 1, and 3.3 mi north of Cocoa.
282120080430600 Atlantic Ocean Lat 28o21'20", long 80o43'06", in 05-21-02 10600 Indian River at NW1/4 sec.34, T.24 S., R.36 E., 10700 Cocoa Brevard County, Hydrologic Unit 11800
03080202, at Hubert Humphrey bridge 12700 on State Highway 520, 0.9 mi east of the 13500 intersection with U.S. Highway 1 at Cocoa. 14200
281221080390000 Atlantic Ocean Lat 28o12'21", long 80o39'00", in 05-21-02 11500 Indian River nr SW1/4 sec.20, T.26 S., R.37 E., 9530 Eau Gallie Brevard County, Hydrologic Unit 10900
03080202, at bridge on Pineda Causeway 10400 (State Highway 404), 0.7 mi east of the 12300 intersection with U.S. Highway 1, and 5 mi 13200 north of Eau Gallie.
280756080370200 Atlantic Ocean Lat 28o07'56", long 80o37'02", in 05-21-02 4760 Indian River nr SW1/4 sec.15, T.27 S., R.37 E., 6290 Melbourne Brevard County, Hydrologic Unit 12000
03080202, at bridge on Eau Gallie Causeway 17600 (State Highway 511), 0.8 mi east of the intersection with U.S. Highway 1 at Eau Gallie.
280500080352900 Atlantic Ocean Lat 28o05'00", long 80o35'29", in 05-21-02 -835 Indian River at NE1/4 sec.2, T.28 S., R.37 E., -1140 Melbourne Brevard County, Hydrologic Unit -330
03080202, at bridge on U.S. Highway 192, 1720 0.8 mi northeast of the intersection with 13300 U.S. Highway 1 at Melbourne. 12700

DISCHARGE AT PARTIAL-RECORD STATIONS AND MISCELLANEOUS SITES 359
_____________________________________________________________________________________________________________________________
_____________________________________________________________________________________________________________________________
____________________________________________________________________________________________________________________________
Discharge measurements made at miscellaneous sites during water year 2002--Continued
Measured Measurements Drainage previously Dis-
area (Water charge Stream Tributary to Location (mi2) years) Date (ft3/s)
COASTAL AREA BETWEEN SEBASTIAN INLET AND ST. LUCIE RIVER
273909080222400 Atlantic Ocean Lat 27o39'09", long 80o22'24", in 05-21-02 271 Indian River at NW1/4 sec.31, T.32 S., R.40 E., 477 Vero Beach Indian River County, Hydrologic Unit 1380
03080203, 150 ft north of bridge on 2280 State Highway 60, 1.6 mi northeast 3810 of Vero Beach. 4470
5850 6460 7280 8070 8820 9950 9820
10700 11100 10300 8390 8040 7050 6830 7390
† Operated as a periodic station a Also known as "The Aquarium"
Note.--Negative figures indicate reverse flow in the St. Johns River and southerly flow in the Indian River

360

361
ELEVATION OF LAKES

362 WATER RESOURCES DATA FOR FLORIDA, 2002Volume 1A: Northeast Florida Surface Water
Figure 12.--Location of lake gaging stations in the Ocklawaha River basin.

--- --- --- ---
--- ---
--- --- ---
------
------------------ ---
--- ------ ------ ---
363 OCKLAWAHA RIVER BASIN
02236840 LAKE MINNEHAHA AT CLERMONT, FL
LOCATION.--Lat 28° 32'13", long 81° 47'02", in NW1⁄ 4 sec.26, T.22 S., R.25 E., Lake County, Hydrologic Unit 03080102, on northwest side of lake in Cypress Cove, on private pier, 500 ft east of State Highway 561, and 1.2 mi southwest of Clermont.
SURFACE AREA.--2,410 acres (3.77 mi2).
DRAINAGE AREA.--131 mi2.
PERIOD OF RECORD.--May 1945 to September 1995, October 1998 to current year.
REVISED RECORDS.--WDR FL-72-3: Drainage area, surface area.
GAGE.--Water-stage recorder. Datum of gage is at NGVD of 1929. Prior to June 5, 1946, nonrecording gage, and June 5, 1946, to Dec. 8, 1969, water-stage recorder, at site 1.8 mi east on north shore of lake. Gage at datum 91.32 ft higher May 31, 1945 to Aug. 20, 1955. Dec. 9, 1969 to Sept. 30, 1995, water-stage recorder at site 0.2 mi north at present datum.
REMARKS.--Lake is one of the Palatlakaha River headwaters chain of lakes. Since 1956, lake level partly controlled by earthen dam and concrete spillway with radial lift gates at outlet of Cherry Lake.
EXTREMES FOR PERIOD OF RECORD.--Maximum elevation, 99.04 ft, Apr. 5, 1960; minimum daily, 87.66 ft, June 2, 2002.
ELEVATION (FEET NGVD), WATER YEAR OCTOBER 2001 TO SEPTEMBER 2002DAILY MEAN VALUES
DAY OCT NOV DEC JAN FEB MAR APR MAY JUN JUL AUG SEP
1 --- 89.33 89.06 88.78 88.88 88.90 88.53 88.16 87.67 88.68 --- 89.38 2 --- 89.04 88.83 88.88 88.91 88.52 88.14 87.66 88.66 --- 89.39 3 --- 89.03 88.87 88.86 88.91 88.52 88.12 87.68 88.64 --- 89.40 4 --- 89.02 88.85 88.81 88.90 88.52 88.11 87.68 88.63 --- 89.42 5 --- 89.01 88.85 88.79 88.92 88.50 88.09 87.68 88.64 --- 89.47
6 --- 89.00 88.86 88.81 88.92 88.48 88.08 87.68 88.64 --- 89.50 7 --- 88.99 88.84 88.83 88.91 88.48 88.05 87.77 88.63 --- 89.54 8 --- 89.26 88.98 88.82 88.80 88.95 88.46 88.03 87.85 88.63 --- 89.58 9 --- 89.25 88.99 88.80 88.80 88.94 88.43 88.00 87.85 88.62 88.98 89.64 10 --- 89.24 88.99 88.83 88.83 88.95 88.41 87.98 87.87 88.61 --- 89.70
11 --- 89.23 89.00 88.86 88.85 88.87 88.43 87.97 87.91 88.62 --- 89.76 12 --- 89.23 89.00 88.87 88.84 88.80 88.43 87.94 87.90 88.62 --- 89.83 13 --- 89.22 88.99 88.81 88.82 88.79 88.41 87.89 87.93 88.68 --- 89.93 14 --- 89.22 88.98 88.84 88.81 88.74 88.41 87.87 88.04 88.73 --- 90.02 15 --- 89.21 88.97 88.88 88.85 88.74 88.45 87.86 88.04 88.72 --- 90.14
16 89.48 89.20 88.97 88.89 88.90 88.79 88.45 87.83 88.05 88.72 --- 90.25 17 --- 89.19 88.97 88.96 88.90 88.83 88.44 87.80 88.11 88.71 --- 90.38 18 --- 89.20 89.07 88.98 88.91 88.74 88.42 87.79 88.23 88.69 --- 90.49 19 --- 89.19 89.01 88.98 88.91 88.77 88.40 87.82 88.24 88.67 --- 90.60 20 --- 89.17 88.97 88.97 88.88 88.70 88.37 87.81 88.24 88.66 --- 90.70
21 --- 89.16 88.91 88.97 88.85 88.67 88.36 87.79 88.25 --- 90.80 22 --- 89.16 88.91 89.00 88.90 88.66 88.33 87.76 88.29 --- 90.91 23 --- 89.14 88.97 88.99 88.94 88.63 88.32 87.76 88.31 --- 91.01 24 89.14 88.99 88.99 88.94 88.62 88.31 87.75 88.40 --- 89.06 91.16 25 89.13 88.93 88.99 88.94 88.62 88.27 87.74 88.53 --- 89.05 91.38
26 89.12 88.85 88.98 88.96 88.62 88.26 87.72 88.53 88.74 89.09 91.53 27 89.11 88.82 88.96 88.90 88.61 88.26 87.72 88.57 --- 89.08 91.65 28 89.10 88.83 88.93 88.87 88.60 88.22 87.70 88.58 --- 89.08 91.79 29 89.08 88.83 88.92 --- 88.59 88.20 87.67 88.58 --- 89.10 91.93 30 89.06 88.80 88.90 --- 88.58 88.19 87.68 88.63 --- 89.20 92.05 31 -- 88.79 88.91 --- 88.55 --- 87.68 --- 89.36 --
MEAN --- 88.96 88.90 88.87 88.77 88.39 87.88 88.09 --- 90.38 MAX --- 89.07 89.00 88.96 88.95 88.53 88.16 88.63 --- 92.05 MIN --- 88.79 88.78 88.79 88.55 88.19 87.67 87.66 --- 89.38

--- --- --- --- --- --- --- --- --- ------ --- --- --- ------ --- --- --- --- ------ --- --- --- --- ---
--- --- --- --- --- ------ --- --- --- --- ------ --- --- --- --- --- --- --- --- --- ------ --- --- ---
--- --- --- --- --- ------ --- --- --- --- ------ --- --- --- --- ------ --- --- --- --- ------ --- --- --- ---
--- --- --- --- --- ------ --- --- --- --- ---
--- --- --- --- ------ --- --- --- ---
--- --- --- --- ---
--- --- --- --- ------ --- --- --- --- --- --- --- --- --- ------ --- --- --- --- ---
--- --- --- --- ---
--- --- --- --- --- ------ --- --- --- --- ------ --- --- --- --- ------ --- --- --- --- --- --- --- --- ------ --- --- --- --- ---
364 OCKLAWAHA RIVER BASIN
02237370 CHURCH LAKE NEAR GROVELAND, FL
LOCATION.--Lat 28° 38'40", long 81° 50'47", in SE1⁄ 4 sec.19, T.21 S., R.25 E., Lake County, Hydrologic Unit 03080102, on west shore of lake, 0.8 mi south of U.S. Highway 27, and 5.7 mi north of Groveland.
SURFACE AREA.--155 acres (0.24 mi2).
DRAINAGE AREA.--1.66 mi2.
PERIOD OF RECORD.--March 1970 to current year (weekly).
REVISED RECORD.--WDR FL-72-3: Drainage area, surface area.
GAGE.--Nonrecording gage. Datum of gage is at NGVD of 1929 (Florida Department of Transportation bench mark).
REMARKS.--There is some pumpage from lake for irrigation purposes.
EXTREMES FOR PERIOD OF RECORD.--Maximum elevation observed, 87.66 ft, Aug. 26, 1970; minimum observed, 77.96 ft, June 23, 2001.
EXTREMES FOR CURRENT YEAR.--Maximum elevation observed, 83.18 ft, Sept. 8; minimum observed, 80.48 ft, May 7.
ELEVATION (FEET NGVD), WATER YEAR OCTOBER 2001 TO SEPTEMBER 2002 DAILY INSTANTANEOUS VALUES
DAY OCT NOV DEC JAN FEB MAR APR MAY JUN JUL AUG SEP
1 -- -- -- -- --- 81.30 --- 83.10 2 --- --- --- --- --- --- 3 -- -- --- 81.20 -- -- --4 --- --- --- --- --- --- 5 --- --- --- --- --- ---
6 --- --- --- --- --- --- 7 --- --- --- 80.48 --- --- 8 -- -- -- -- -- --- 83.18 9 --- --- --- --- --- --- 10 -- -- --- 81.20 -- -- --- 83.14
11 -- -- 81.72 -- -- --12 -- -- -- -- -- --13 -- -- -- -- -- --14 -- -- -- -- -- --15 -- 81.98 -- -- -- --- 83.12
16 -- -- -- -- -- --17 -- -- -- -- -- --18 --- --- --- --- --- 82.80 --19 --- 82.17 -- -- -- -- --20 --- --- --- --- --- 82.78 --
21 -- -- --- 81.09 -- -- --22 -- -- -- -- -- --- 83.08 23 -- -- -- -- -- --24 -- -- -- -- -- --25 --- --- --- --- --- 82.75 --
26 -- -- -- -- -- --27 -- -- -- -- -- --28 -- -- -- -- -- --29 -- -- --- 81.08 -- -- --- 83.10 30 -- -- -- -- -- --31 -- -- -- -- -- --

--- --- --- --- ------ --- --- --- ------ --- --- --- --- ------ --- --- --- ------ --- --- --- --- ---
--- --- --- --- ------ --- --- ---
--- --- --- --- ------ --- --- --- --- ------ --- --- --- --- ---
--- --- --- ------ --- --- --- --- ------ --- --- --- --- ---
--- --- --- ------ --- --- ---
--- --- --- --- ------ --- --- --- --- ------ --- --- --- --- ------ --- --- --- --- ---
--- --- --- --- ---
--- --- --- ------ --- --- --- ---
--- --- --- --- --- --- --- --- --- ------ --- --- --- ---
--- --- --- --- ------ --- --- --- --- ------ --- --- --- --- ------ --- --- --- --- ---
--- --- --- --- --- --- ---
365 OCKLAWAHA RIVER BASIN
02237753 WEST CROOKED LAKE NEAR EUSTIS, FL
LOCATION.--Lat 28° 49'49", long 81° 40'20", in SW1⁄ 4 sec.13, T.19 S., R.26 E., Lake County, Hydrologic Unit 03080102, on east shore of southeast bay of lake, 1.7 mi southeast of Eustis.
SURFACE AREA.--107 acres (0.17 mi2).
DRAINAGE AREA.--0.67 mi2, includes East Crooked Lake.
PERIOD OF RECORD.--February 1970 to current year (weekly).
REVISED RECORDS.--WDR FL-72-3: Drainage area, surface area.
GAGE.--Nonrecording gage. Datum of gage is at NGVD of 1929.
REMARKS.--Lake is interconnected with East Crooked Lake above an elevation of about 69 ft.
EXTREMES FOR PERIOD OF RECORD.--Maximum elevation observed, 71.48 ft, Apr. 11, 1970; minimum observed, 58.16 ft, June 21, 2001.
EXTREMES OUTSIDE PERIOD OF RECORD.--An elevation of 74.74 ft was reached in 1960 from information by local resident.
EXTREMES FOR CURRENT YEAR.--Maximum elevation observed, 61.36 ft, Sept. 30; minimum observed, 58.84 ft, June 6.
ELEVATION (FEET NGVD), WATER YEAR OCTOBER 2001 TO SEPTEMBER 2002 DAILY INSTANTANEOUS VALUES
DAY OCT NOV DEC JAN FEB MAR APR MAY JUN JUL AUG SEP
1 -- -- -- -- --- 59.78 --2 --- 60.80 60.54 --- 58.92 --- 61.02 3 --- --- --- --- --- --- 4 -- --- 60.62 -- -- -- --5 --- --- --- --- --- ---
6 --- 60.84 --- --- --- 58.84 --- 7 --- 60.98 -- --- 60.26 59.50 -- --8 60.94 --- --- --- --- --- 61.16 9 --- --- 60.52 --- --- --- 10 60.93 60.72 --- --- --- ---
11 -- --- 60.56 60.56 -- --- 59.98 --12 -- -- -- -- -- --13 -- -- -- -- -- --14 --- 60.80 --- 60.54 --- 60.16 60.60 --15 --- 60.98 60.78 -- -- -- --- 61.16
16 60.94 -- --- 60.18 -- 58.86 --17 -- -- -- 59.26 -- --18 -- 60.76 -- -- -- --19 -- -- 60.44 -- -- --20 --- --- --- --- --- 60.70 --
21 -- --- 60.46 -- -- 59.08 60.30 --22 --- 60.78 --- 60.04 --- 60.76 --23 --- 60.94 -- -- -- -- --- 61.26 24 60.96 -- -- -- -- --25 -- --- 60.60 -- -- -- --
26 --- --- --- --- --- 60.80 --27 --- 60.70 --- 58.98 --- --- 28 -- -- -- -- 59.66 --29 -- -- -- -- -- --30 --- 60.92 60.76 -- --- 59.78 -- -- --- 61.36 31 60.94 -- -- -- --- 60.42 --

--- --- --- --- --- --- --- --- ---
--- --- --- --- ------ --- --- --- --- ------ --- --- --- --- ---
--- --- --- ------ --- --- --- --- ------ --- --- --- --- --- --- --- ---
--- --- --- --- ---
--- --- ------ --- --- --- --- ------ --- --- ------ --- --- --- --- ------ --- --- ---
--- --- --- ------ --- --- --- ---
--- --- --- --- --- ------ --- --- --- --- --- --- --- ---
--- --- --- --- --- ------ --- ---
--- --- --- --- --- ------ --- --- --- ------ --- --- --- --- ---
--- --- --- --- --- ------ --- --- --- ------ --- --- --- --- ------ --- --- ---
--- --- --- --- ------ --- --- --- --- ---
366 OCKLAWAHA RIVER BASIN
02237865 LAKE UMATILLA AT UMATILLA, FL
LOCATION.--Lat 28° 55'06", long 81° 39'44", in SE1⁄ 4 sec.13, T.18 S., R.26 E., Lake County, Hydrologic Unit 03080102, on south shore of lake, 0.8 mi south of Umatilla.
SURFACE AREA.--165 acres (0.26 mi2).
DRAINAGE AREA.--2.46 mi2.
PERIOD OF RECORD.--March 1970 to current year (weekly).
REVISED RECORDS.--WDR FL-72-3: Drainage area, surface area.
GAGE.--Nonrecording gage. Datum of gage is at NGVD of 1929. Prior to Feb. 4, 1983, at site 1,200 ft west at present datum.
REMARKS.--Lake is landlocked except above an elevation of about 70 ft, when there is overflow to the south into a swamp known as Eustis Meadows, thence through a canal into Lake Eustis.
EXTREMES FOR PERIOD OF RECORD.--Maximum elevation observed, 68.87 ft, Nov. 16, 1994; minimum observed, 64.20 ft, Dec. 18, 1981.
EXTREMES FOR CURRENT YEAR.--Maximum elevation observed, 67.96 ft, Sept. 8,29, minimum observed, 65.40 ft, May 25.
ELEVATION (FEET NGVD), WATER YEAR OCTOBER 2001 TO SEPTEMBER 2002 DAILY INSTANTANEOUS VALUES
DAY OCT NOV DEC JAN FEB MAR APR MAY JUN JUL AUG SEP
1 --- 66.60 -- -- -- 65.70 --- 67.80 2 --- --- 66.50 66.50 --- --- --- 3 --- 66.58 -- -- -- -- 67.20 4 --- --- --- --- --- --- 5 --- 66.48 --- --- --- ---
6 66.74 -- --- 66.34 -- --- 66.60 --7 --- --- --- --- --- --- 8 --- 66.58 -- -- -- 65.70 --- 67.96 9 --- --- 66.48 66.68 65.80 --- --- 10 --- 66.56 -- -- -- -- --
11 --- --- --- 66.66 --- 65.78 66.64 67.22 --12 -- -- -- -- -- --13 66.68 -- --- 66.28 -- --- 66.76 --14 -- -- -- -- -- --15 --- 66.60 -- -- 65.64 65.78 --- 67.90
16 --- 66.64 66.58 66.40 66.66 -- -- --17 66.60 --- --- --- --- 67.50 --18 -- -- -- -- -- --19 -- -- -- 65.58 -- --- 67.84 20 66.62 -- --- 66.20 -- --- 66.86 --
21 -- -- -- -- -- --22 --- 66.50 66.56 --- --- 66.12 --- 67.50 --23 -- -- 66.54 -- -- --24 -- --- 66.56 -- -- -- --25 -- -- -- 65.40 -- --
26 -- 66.58 -- -- -- --27 66.60 -- -- -- --- 67.02 --28 -- -- -- -- -- --29 --- 66.46 -- -- -- 66.58 --- 67.96 30 --- 66.60 -- 66.46 -- -- --31 -- -- -- -- -- --

--- --- --- --- ------ --- --- --- --- ------ --- --- --- ------ --- --- --- ------ --- --- --- --- ---
--- --- --- ------ --- --- --- --- ------ --- --- --- --- --- --- --- --- ------ --- --- --- --- ---
--- --- --- --- ------ --- --- --- ------ --- --- --- ---
--- --- --- --- ------ --- --- --- ---
--- --- ------ --- --- --- --- ------ --- --- --- --- ------ --- --- --- ------ --- --- --- ---
--- --- --- --- ------ --- ---
--- --- --- --- --- --- --- --- ------ --- --- --- --- ---
--- --- --- --- --- ------ --- --- ------ --- --- --- --- ---
--- --- ------ --- --- --- --- --- --- --- ---
367 OCKLAWAHA RIVER BASIN
02238180 HOLLY LAKE NEAR UMATILLA, FL
LOCATION.--Lat 28° 56'11", long 81° 43'04", in SW1⁄ 4 sec.9, T.18 S., R.26 E., Lake County, Hydrologic Unit 03080102, on south shore of lake, at county boat ramp on County Road 450, and 3.1 mi west of Umatilla.
SURFACE AREA.--96 acres (0.15 mi2).
DRAINAGE AREA.--0.78 mi2.
PERIOD OF RECORD.--October 1967 to October 1968 (thrice weekly); November 1968 to February 1970 (weekly); August 1982 to March 1983 (fragmentary); April 1983 to current year (weekly).
GAGE.--Nonrecording gage. Datum of gage is at NGVD of 1929.
REMARKS.--At high stages Holly, Ella, and Yale Lakes are interconnected and some natural diversion occurs northward to Nicotoon Lake.
EXTREMES FOR PERIOD OF RECORD.--Maximum elevation observed, 61.43 ft, July 31, 1984; minimum observed, 53.99 ft, June 12, 2001.
EXTREMES FOR CURRENT YEAR.--Maximum elevation observed, 56.41 ft, Sept. 8,30; minimum observed, 54.68 ft, May 29,31.
ELEVATION (FEET NGVD), WATER YEAR OCTOBER 2001 TO SEPTEMBER 2002 DAILY INSTANTANEOUS VALUES
DAY OCT NOV DEC JAN FEB MAR APR MAY JUN JUL AUG SEP
1 -- --- 55.82 -- -- -- --2 --- --- --- --- --- --- 3 --- 55.77 --- 55.68 --- --- --- 4 -- -- -- -- --- 55.43 --5 --- --- --- --- 54.77 ---
6 --- 56.01 55.92 -- -- -- -- --7 --- --- --- 55.09 --- --- 8 -- --- 55.79 55.96 -- -- 56.08 56.41 9 56.25 --- --- --- --- --- 10 -- 55.71 -- -- -- --
11 -- -- 55.96 -- --- 55.52 --12 -- -- --- 55.57 -- -- --13 --- 55.94 -- -- -- 54.73 --14 --- 56.06 -- -- -- -- --15 -- --- 55.71 55.90 54.90 -- --
16 56.19 56.02 --- 55.86 --- 55.56 --- 56.22 56.38 17 -- 55.86 -- -- -- --18 -- -- -- -- -- --19 -- -- -- -- --- 55.86 --20 --- 55.87 -- -- -- -- --
21 --- 55.99 -- -- -- 55.22 -- 22 -- -- --- 55.81 --- 54.69 --- 56.22 --23 56.12 -- --- 55.41 -- -- --- 56.32 24 -- -- -- -- --- 56.15 --25 -- 55.83 -- -- -- --
26 -- -- -- -- -- --27 --- 55.78 --- 55.79 -- -- -- --28 -- -- -- -- -- --29 55.98 --- --- 55.73 --- 54.68 --- 56.28 --30 55.97 -- --- 55.30 -- 55.57 --- 56.41 31 -- -- -- 54.68 --- 56.08 --

---
368 OCKLAWAHA RIVER BASIN
02238800 LAKE WEIR NEAR WEIRSDALE, FL
(Formerly published as Lake Weir at Ocklawaha)
LOCATION.--Lat 29° 00'13", long 81° 55'16", in NW1⁄ 4 sec. 21, T.17 S., R.24 E., Marion County, Hydrologic Unit 03080102, on southeast shore of lake, on private pier, 1.5 mi north of Weirsdale.
SURFACE AREA.--5,760 acres (9.00 mi2).
DRAINAGE AREA.--53.8 mi2.
PERIOD OF RECORD.--April 1936 to October 1942 (monthly means only), November 1942 to September 1997, October 2000 to current year.
REVISED RECORDS.--WDR FL-74-1: Surface area, drainage area.
GAGE.--Water-stage recorder and data-collection platform. Datum of gage is at NGVD of 1929 (levels by St. Johns River WaterManagement District). Prior to Oct. 1, 1997 at various locations on the north shore of the lake at different datums. See WDR FL-97-1 for the history of changes.
REMARKS.--Lake level partly controlled by broad-crested weir in outlet canal to the Ocklawaha River; elevation of fixed crest is57.4 ft. Canal dug and control built in April 1938.
EXTREMES FOR PERIOD OF RECORD.--Maximum monthly elevation, 59.6 ft, Jan. 1938; minimum daily, 51.49 ft, June 10, 2002.
ELEVATION (FEET NGVD), WATER YEAR OCTOBER 2001 TO SEPTEMBER 2002DAILY MEAN VALUES
DAY OCT NOV DEC JAN FEB MAR APR MAY JUN JUL AUG SEP
1 52.87 52.51 52.44 52.14 52.46 52.40 52.29 52.08 51.53 52.20 53.05 53.13 2 52.85 52.53 52.44 52.17 52.46 52.39 52.28 52.07 51.52 52.21 53.05 53.13 3 52.84 52.56 52.43 52.23 52.45 52.42 52.28 52.05 51.53 52.21 53.04 53.12 4 52.84 52.57 52.42 52.20 52.45 52.52 52.28 52.04 51.52 52.22 53.04 53.13 5 52.83 52.57 52.40 52.18 52.42 52.49 52.28 52.03 51.50 52.21 53.03 53.15
6 52.83 52.54 52.40 52.19 52.38 52.48 52.27 52.01 51.50 52.20 53.02 53.14 7 52.82 52.52 52.39 52.19 52.41 52.47 52.24 51.99 51.52 52.19 53.01 53.13 8 52.81 52.52 52.38 52.17 52.45 52.47 52.21 51.98 51.51 52.21 52.99 53.12 9 52.79 52.51 52.38 52.16 52.43 52.47 52.19 51.95 51.50 52.27 52.96 53.10 10 52.77 52.51 52.37 52.15 52.43 52.47 52.22 51.93 51.49 52.28 52.94 53.09
11 52.76 52.50 52.37 52.15 52.43 52.47 52.27 51.91 51.52 52.27 52.92 53.08 12 52.76 52.49 52.36 52.15 52.42 52.46 52.26 51.88 51.61 52.29 52.92 53.06 13 52.75 52.49 52.35 52.16 52.42 52.47 52.25 51.86 51.60 52.36 52.98 53.07 14 52.75 52.52 52.35 52.19 52.41 52.46 52.26 51.84 51.59 52.44 52.99 53.09 15 52.75 52.53 52.35 52.30 52.39 52.46 52.28 51.80 51.58 52.44 52.99 53.10
16 52.74 52.51 52.34 52.30 52.39 52.46 52.28 51.77 51.56 52.45 52.99 53.10 17 52.72 52.49 52.33 52.30 52.40 52.46 52.27 51.76 51.63 52.45 52.98 53.09 18 52.68 52.49 52.35 52.30 52.36 52.45 52.27 51.75 51.73 52.44 52.99 53.08 19 52.67 52.48 52.33 52.29 52.33 52.44 52.26 51.74 51.76 52.43 52.99 53.07 20 52.66 52.48 52.32 52.30 52.32 52.44 52.25 51.71 51.80 52.49 52.99 53.07
21 52.66 52.48 52.29 52.30 52.32 52.44 52.24 51.68 51.81 52.71 52.97 53.08 22 52.68 52.47 52.27 52.30 52.34 52.43 52.23 51.63 51.89 52.81 52.96 53.08 23 52.68 52.46 52.26 52.30 52.43 52.40 52.20 51.59 51.99 52.89 52.95 53.12 24 52.68 52.46 52.25 52.30 52.47 52.37 52.18 51.58 52.02 52.90 52.94 53.13 25 52.68 52.46 52.24 52.33 52.46 52.35 52.16 51.56 52.04 52.92 52.93 53.20
26 52.67 52.46 52.22 52.46 52.46 52.35 52.15 51.55 52.07 52.92 52.91 53.21 27 52.63 52.45 52.19 52.46 52.46 52.35 52.13 51.55 52.11 52.94 52.89 53.24 28 52.58 52.45 52.18 52.46 52.43 52.33 52.12 51.56 52.11 52.99 52.88 53.23 29 52.55 52.44 52.17 52.46 --- 52.31 52.10 51.55 52.13 53.06 52.88 53.22 30 52.53 52.44 52.16 52.46 --- 52.30 52.09 51.54 52.18 53.05 52.98 53.20 31 52.52 -- 52.16 52.46 --- 52.30 --- 51.54 53.04 53.14 --
MEAN 52.72 52.50 52.32 52.27 52.41 52.42 52.23 51.79 51.73 52.53 52.98 53.13 MAX 52.87 52.57 52.44 52.46 52.47 52.52 52.29 52.08 52.18 53.06 53.14 53.24 MIN 52.52 52.44 52.16 52.14 52.32 52.30 52.09 51.54 51.49 52.19 52.88 53.06
WTR YR 2002 MEAN 52.42 MAX 53.24 MIN 51.49

369

370 WATER RESOURCES DATA FOR FLORIDA, 2002 Volume 1A: Northeast Florida Surface Water
82°00¢ 81°00¢
02266239
28°00¢
27°00¢
£
£
££
£
£
££
£
£
£
£
£
£
£
02266650
02268400
02269600
02263850
02263900
02266900
02276400
02263868
02263776
02260800
02268600
02268800
02271700
02266600
GAGING STATION
EXPLANATION £02261900 LAKE
AND NUMBER
0 10 20 MILES
0 10 20 KILOMETERS
Figure 13.--Location of lake gaging stations in the Kissimmee River basin, the Taylor Creek basin and inflow to Lake Okeechobee from the north, and Fisheating Creek basin and inflow to Lake Okeechobee from the northwest.

------ ------
---
---
---
--- --- --- ------ --- ---
371 KISSIMMEE RIVER BASIN
02260800 ALLIGATOR LAKE NEAR ASHTON, FL
LOCATION.--Lat 28° 13'53", long 81° 11'20", in SW1⁄ 4 sec.11, T.26 S., R.31 E., Osceola County, Hydrologic Unit 03090101, on northeast shore of lake, at Alligator Lakeside Inn Fish Camp, 0.1 mi south of U.S. Highway 192, and 3.6 mi east of Ashton.
SURFACE AREA.--3,401 acres (5.31 mi2).
DRAINAGE AREA.--26.6 mi2.
PERIOD OF RECORD.--November 1941 to current year.
GAGE.--Water-stage recorder. Datum of gage is at NGVD of 1929. Prior to Feb. 19, 1975, at several sites at datum 60.74 ft higher.Feb. 19, 1975 to May 5, 1989, at several sites on the north side of lake at present datum. May 6, 1989 to Apr. 24, 1997,nonrecording gage at present site and datum.
REMARKS.--Lake is one of the Kissimmee River headwaters chain of lakes. Oct. 1, 2000 to Aug. 1, 2001 water level was below therecording gage and the elevations are observer daily staff gage readings. Subsequent to 1962, the improvement of canals and natural drains between these lakes and the construction of dams with gated controls has resulted in the partial regulation of lake elevations.
EXTREMES FOR PERIOD OF RECORD.--Maximum elevation observed, 66.81 ft, Sept. 25, 1960; minimum observed, 58.31 ft, May 31, 2001.
EXTREMES OUTSIDE PERIOD OF RECORD.--An elevation of 67.7 ft was reached in June 1934, from information by local resident.
ELEVATION (FEET NGVD), WATER YEAR OCTOBER 2001 TO SEPTEMBER 2002DAILY MEAN VALUES
DAY OCT NOV DEC JAN FEB MAR APR MAY JUN JUL AUG SEP
1 62.25 62.74 62.96 62.86 62.93 63.14 62.93 62.46 62.20 63.46 63.32 63.86 2 62.27 62.75 62.96 62.86 62.92 63.17 62.92 62.44 62.20 63.48 63.32 63.93 3 62.30 62.80 62.87 62.91 63.18 62.92 62.42 62.19 63.51 63.34 63.95 4 62.32 62.85 62.90 63.17 62.91 62.40 62.17 63.50 63.35 63.84 5 62.34 62.96 62.84 62.88 63.16 62.89 62.36 62.15 63.47 63.34 63.79
6 62.37 62.85 62.85 62.87 63.15 62.86 62.34 62.14 63.44 63.32 63.66 7 62.38 62.87 62.96 62.84 62.87 63.15 62.83 62.32 62.16 63.40 63.38 63.52 8 62.39 62.88 62.97 62.84 62.88 63.16 62.81 62.30 62.17 63.36 63.43 63.38 9 62.39 62.88 62.98 62.83 62.87 63.16 62.79 62.28 62.16 63.33 63.43 63.26 10 62.41 62.88 62.98 62.83 62.87 63.16 62.78 62.26 62.14 63.31 63.42 63.18
11 62.42 62.89 62.98 62.83 62.87 63.16 62.76 62.23 62.13 63.29 63.42 63.26 12 62.43 --- 62.98 62.83 62.87 63.16 62.74 62.21 62.13 63.28 63.45 63.31 13 62.44 62.88 62.98 62.82 62.87 63.17 62.74 62.19 62.11 63.29 63.59 63.35 14 62.45 62.91 62.98 62.84 62.85 63.15 62.74 62.17 62.15 63.29 63.73 63.37 15 62.46 62.92 --- 62.91 62.84 63.14 62.74 62.14 62.30 63.25 63.78 63.40
16 62.47 62.94 --- 62.92 62.84 63.13 62.73 62.13 62.33 63.21 63.78 63.42 17 62.46 --- 62.98 62.93 62.83 63.12 62.72 62.12 62.36 63.17 63.77 63.43 18 62.45 --- 62.98 62.93 62.81 63.12 62.70 62.10 62.38 63.26 63.74 63.44 19 62.46 62.94 62.98 62.94 62.80 63.11 62.69 62.17 62.41 63.26 63.71 63.45 20 62.48 62.96 62.93 62.94 62.80 63.10 62.67 62.18 62.44 63.23 63.68 63.46
21 62.51 62.96 62.91 62.94 62.79 63.09 62.66 62.16 62.50 63.32 63.64 63.47 22 62.56 --- 62.90 62.94 62.87 63.07 62.64 62.13 62.59 --- 63.61 63.48 23 62.58 62.97 62.90 62.95 63.01 63.04 62.62 62.12 62.70 --- 63.62 63.48 24 62.60 62.96 62.90 62.95 63.12 63.02 62.60 62.10 62.88 63.39 63.57 63.51 25 62.64 62.96 62.90 62.95 63.14 63.01 62.58 62.08 62.99 63.31 63.50 63.55
26 62.70 62.97 62.89 62.95 63.16 63.01 62.56 62.07 63.08 63.30 63.44 63.56 27 62.74 62.97 62.87 62.94 63.16 63.00 62.54 62.05 63.14 63.27 63.38 63.58 28 62.74 62.97 62.87 62.94 63.15 62.99 62.52 62.04 63.19 63.27 63.33 63.58 29 --- 62.87 62.94 --- 62.97 62.50 62.02 63.31 63.30 63.43 63.57 30 62.74 62.96 62.87 62.94 --- 62.96 62.47 62.04 63.40 63.33 63.67 63.57 31 62.74 -- 62.86 62.94 --- 62.95 --- 62.19 63.33 63.77 --
MEAN -- --- 62.89 62.92 63.10 62.72 62.20 62.47 --- 63.52 63.52 MAX --- 62.95 63.16 63.18 62.93 62.46 63.40 63.78 63.95 MIN --- 62.82 62.79 62.95 62.47 62.02 62.11 63.32 63.18

372 KISSIMMEE RIVER BASIN
02263776 LAKE BRYAN NEAR VINELAND, FL
LOCATION.--Lat 28° 21'46", long 81° 29'57", in SE1⁄ 4 sec.27, T.24 S., R.28 E., Orange County, Hydrologic Unit 03090101, on west shore of lake, 1.1 mi south of intersection of Interstate Highway 4 and State Highway 535, and 2.2 mi south of Vineland.
SURFACE AREA.--210 acres (0.33 mi2).
DRAINAGE AREA.--2.70 mi2.
PERIOD OF RECORD.--September 1969 to current year (fragmentary).
REVISED RECORDS.--WDR FL-72-2: Drainage area.
GAGE.--Nonrecording gage. Datum of gage is 90.00 ft above NGVD of 1929 (Florida Department of Transportation benchmark). Gagereadings have been reduced to elevations above NGVD of 1929. Prior to June 11, 1997 gage located about 50 ft south at datum 90.00 ft lower.
REMARKS.--Outflow from lake is to Shingle Creek.
EXTREMES FOR PERIOD OF RECORD.--Maximum elevation, 100.33 ft on or about Aug. 11, 1984, from floodmarks; minimum observed, 95.64 ft, May 8, 1981.
ELEVATION, WATER YEAR OCTOBER 2001 TO SEPTEMBER 2002
ELEV ATION ABOVE
Date Time NGVD (FEET)(72020)
OCT24... 0800 99.84
DEC19... 1008 98.65
FEB20... 1410 98.51
APR04... 1545 98.67
JUN12... 0825 98.85
AUG02... 1220 99.41

---
373 KISSIMMEE RIVER BASIN
02263850 BAY LAKE NEAR VINELAND, FL
LOCATION.--Lat 28° 24'48", long 81° 33'28", in NW1⁄ 4 sec.7, T.24 S., R.28 E., Orange County, Hydrologic Unit 03090101, on right bank at upstream wingwall of control structure 105A in lateral 105, 200 ft south of natural lake shore line, and 3.5 mi northwest of Vineland.
SURFACE AREA.--436 acres (0.68 mi2).
DRAINAGE AREA.--14.8 mi2.
PERIOD OF RECORD.--February 1967 to September 1969; October 1970 to current year.
GAGE.--Water-stage recorder. Datum of gage is at NGVD of 1929 (Walt Disney World bench mark). Prior to Feb. 7, 1969, on north shore of lake at datum 90.00 ft higher.
REMARKS.--Outflow from lake is through L-105 to Bonnet Creek since fall of 1968. In the fall of 1968, structure 105A wascompleted and became the control outlet of the lake. Draining of Bay Lake through S-105A began on Dec. 20, 1968. The headwater elevation at S-105A represented the lake level until Aug. 25, 1969, when a dike was constructed 200 ft upstreamfrom the control structure. The lake elevation was then independent of the headwater elevation at S-105A. The dike was removed in August 1970 as the lake refilled. Since August 1970, lake elevation regulated by pumpage from ground water.
EXTREMES FOR PERIOD OF RECORD.--Maximum daily elevation, 95.07 ft, Aug. 18, 1967; minimum daily, 85.30 ft, Aug. 23,25, 1969,except when lake was drained in 1970.
ELEVATION (FEET NGVD), WATER YEAR OCTOBER 2001 TO SEPTEMBER 2002DAILY MEAN VALUES
DAY OCT NOV DEC JAN FEB MAR APR MAY JUN JUL AUG SEP
1 94.42 93.99 93.79 93.62 93.79 93.91 93.66 93.44 93.28 94.56 94.50 94.60 2 94.39 93.99 93.79 93.65 93.79 93.90 93.66 93.42 93.28 94.57 94.49 94.58 3 94.38 93.98 93.78 93.71 93.79 93.91 93.66 93.41 93.28 94.57 94.54 94.57 4 94.37 93.98 93.77 93.69 93.78 93.93 93.66 93.40 93.28 94.55 94.58 94.57 5 94.35 93.97 93.76 93.68 93.74 93.90 93.65 93.39 93.27 94.54 94.56 94.58
6 94.35 93.94 93.75 93.70 93.74 93.88 93.62 93.37 93.27 94.53 94.54 94.58 7 94.33 93.93 93.74 93.70 93.75 93.87 93.60 93.36 93.28 94.53 94.59 94.57 8 94.32 93.92 93.74 93.69 93.76 93.88 93.58 93.35 93.31 94.54 94.64 94.55 9 94.30 93.92 93.74 93.68 93.74 93.87 93.57 93.34 93.32 94.53 94.61 94.53 10 94.27 93.90 93.73 93.68 93.74 93.87 93.56 93.33 93.35 94.54 94.58 94.51
11 94.26 93.89 93.73 93.68 93.75 93.86 93.56 93.32 93.39 94.53 94.56 94.49 12 94.25 93.88 93.72 93.68 93.74 93.85 93.56 93.29 93.39 94.53 94.56 94.48 13 94.23 93.89 93.72 93.69 93.73 93.86 93.55 93.28 93.39 94.54 94.65 94.49 14 94.22 93.93 93.73 93.70 93.72 93.84 93.55 93.29 93.39 94.57 94.74 94.49 15 94.22 93.92 93.73 93.75 93.72 93.84 93.55 93.29 93.46 94.54 94.84 94.50
16 94.21 93.90 93.73 93.75 93.73 93.83 93.55 93.27 93.57 94.51 94.72 94.50 17 94.18 93.89 93.73 93.75 93.73 93.83 93.54 93.27 93.64 94.48 94.22 94.53 18 94.16 93.88 93.73 93.75 93.72 93.82 93.54 93.27 93.71 94.46 94.20 94.55 19 94.14 93.87 93.72 93.75 93.71 93.81 93.53 93.30 93.75 94.44 94.20 94.57 20 94.13 93.87 93.71 93.75 93.70 93.79 93.53 93.30 93.84 94.43 94.21 94.64
21 94.15 93.86 93.69 93.77 93.71 93.79 93.52 93.27 93.96 94.48 94.31 94.62 22 94.19 93.86 93.69 93.77 93.77 93.77 93.52 93.24 94.03 94.52 94.52 94.61 23 94.18 93.85 93.68 93.77 93.90 93.74 93.50 93.23 94.09 94.53 94.51 94.64 24 94.17 93.84 93.68 93.78 93.98 93.72 93.48 93.22 94.16 94.53 94.49 94.67 25 94.15 93.84 93.67 93.78 93.97 93.71 93.47 93.21 94.28 94.54 94.48 94.68
26 94.13 93.83 93.67 93.79 93.97 93.70 93.47 93.20 94.31 94.63 94.46 94.67 27 94.09 93.83 93.65 93.78 93.97 93.70 93.50 93.20 94.32 94.60 94.45 94.65 28 94.06 93.82 93.64 93.78 93.92 93.69 93.49 93.20 94.32 94.58 94.45 94.63 29 94.03 93.81 93.64 93.78 --- 93.68 93.47 93.19 94.34 94.56 94.54 94.61 30 94.02 93.80 93.64 93.78 --- 93.67 93.46 93.19 94.45 94.54 94.58 94.58 31 94.00 -- 93.63 93.78 --- 93.66 --- 93.22 94.52 94.62 --
MEAN 94.21 93.89 93.71 93.73 93.79 93.81 93.55 93.29 93.69 94.53 94.51 94.57 MAX 94.42 93.99 93.79 93.79 93.98 93.93 93.66 93.44 94.45 94.63 94.84 94.68 MIN 94.00 93.80 93.63 93.62 93.70 93.66 93.46 93.19 93.27 94.43 94.20 94.48
WTR YR 2002 MEAN 93.94 MAX 94.84 MIN 93.19

--- ---
--- ------ ------ ------ ------ ---
---------------
---------------
------------------ ---
--- ---
374 KISSIMMEE RIVER BASIN
02263868 SOUTH LAKE NEAR VINELAND, FL
LOCATION.--Lat 28° 24'45", long 81° 32'17", in SW1⁄ 4 sec.8, T.24 S., R.28 E., Orange County, Hydrologic Unit 03090101, on right bank at upstream wingwall of control structure 15 in Canal No. 1, 300 ft south of natural lake shoreline, 1,600 ft west of State Highway 535, and 2.4 mi northwest of Vineland.
SURFACE AREA.--128 acres (0.20 mi2).
DRAINAGE AREA.--4.0 mi2, approximately.
PERIOD OF RECORD.--April 1969 to current year. Records for South Lake Outlet at S-15, near Vineland (station 02263869).
GAGE.--Water-stage recorder. Datum of gage is at NGVD of 1929 (Walt Disney World bench mark).
REMARKS.--Since January 1969, lake controlled by structure 15. Outflow is to Bonnet Creek through Canal No. 1.
EXTREMES FOR PERIOD OF RECORD.--Maximum daily elevation, 94.50 ft, Apr. 6, 1987; minimum observed, 88.98 ft, June 27, 2000.
ELEVATION (FEET NGVD), WATER YEAR OCTOBER 2001 TO SEPTEMBER 2002DAILY MEAN VALUES
DAY OCT NOV DEC JAN FEB MAR APR MAY JUN JUL AUG SEP
1 91.43 91.11 90.93 90.68 90.71 90.79 90.49 89.84 --- 91.32 91.49 93.40 2 91.41 91.10 90.92 90.71 90.70 90.79 90.48 89.80 --- 91.44 91.49 93.41 3 91.39 91.10 90.91 90.76 90.68 90.79 90.47 89.75 --- 91.52 91.53 93.41 4 91.37 91.09 90.90 90.75 90.67 90.82 90.48 89.71 --- 91.52 91.60 93.42 5 91.36 91.09 90.90 90.74 90.64 90.80 90.47 89.66 --- 91.51 91.61 93.52
6 91.34 91.07 90.89 90.74 90.62 90.79 90.43 89.61 --- 91.50 91.61 93.62 7 91.33 91.05 90.88 90.74 90.63 90.79 90.39 89.57 --- 91.47 91.67 93.62 8 91.32 91.05 90.88 90.73 90.65 90.79 90.36 89.52 --- 91.45 91.74 93.64 9 91.30 91.04 90.88 90.73 90.64 90.79 90.32 -- --- 91.42 91.75 93.65 10 91.28 91.03 90.88 90.72 90.64 90.78 90.29 91.42 91.74 93.65
11 91.27 91.02 90.88 90.72 90.64 90.77 90.26 91.42 91.73 93.64 12 91.25 91.01 90.87 90.71 90.64 90.76 90.23 91.43 91.75 93.65 13 91.24 91.01 90.86 90.71 90.63 90.75 90.20 91.44 91.88 93.73 14 91.24 91.04 90.85 90.72 90.62 90.74 90.19 91.49 92.10 93.76 15 91.26 91.05 90.85 90.76 90.61 90.73 90.20 91.46 92.36 93.82
16 91.24 91.04 90.84 90.76 90.61 90.72 90.18 89.81 91.44 92.44 93.83 17 91.22 91.02 90.83 90.76 90.60 90.71 90.16 89.94 91.40 92.48 93.90 18 91.19 91.02 90.82 90.76 90.58 90.70 90.14 90.07 91.38 92.50 94.05 19 91.19 91.01 90.81 90.76 90.57 90.69 90.11 90.11 91.34 92.54 94.08 20 91.18 91.01 90.80 90.75 90.56 90.67 90.08 90.21 91.32 92.60 94.23
21 91.20 91.00 90.77 90.75 90.56 90.66 90.06 90.35 91.36 92.70 94.25 22 91.22 91.00 90.76 90.75 90.60 90.64 90.02 90.43 91.44 93.02 94.27 23 91.22 90.99 90.75 90.75 90.73 90.61 89.99 90.50 91.46 93.10 94.30 24 91.22 90.98 90.74 90.75 90.83 90.60 89.95 90.60 91.46 93.13 94.30 25 91.21 90.98 90.73 90.74 90.83 90.59 89.92 90.72 91.48 93.13 94.30
26 91.19 90.97 90.72 90.74 90.83 90.58 89.91 90.79 91.54 93.14 94.28 27 91.17 90.96 90.71 90.73 90.82 90.57 89.99 90.88 91.55 93.15 94.26 28 91.14 90.95 90.71 90.72 90.80 90.56 89.96 90.90 91.54 93.16 94.25 29 91.12 90.95 90.70 90.72 --- 90.54 89.92 90.92 91.53 93.21 94.22 30 91.11 90.94 90.69 90.72 --- 90.52 89.88 91.07 91.51 93.29 94.20 31 91.11 --- 90.69 90.71 --- 90.50 --- 91.51 93.38 --
MEAN 91.25 91.02 90.82 90.74 90.67 90.69 90.18 91.45 92.36 93.89 MAX 91.43 91.11 90.93 90.76 90.83 90.82 90.49 -- --- 91.55 93.38 94.30 MIN 91.11 90.94 90.69 90.68 90.56 90.50 89.88 -- --- 91.32 91.49 93.40
CAL YR 2001 MEAN 90.31 MAX 91.79 MIN 89.34

--- --- --- --- ------ --- --- ------ --- --- --- --- --- --- --- --- ---
--- --- --- ---
--- --- --- --- ------ --- --- --- --- ------ --- --- ------ --- --- --- --- ------ --- --- ---
--- --- --- --- --- ------ --- --- ---
--- --- --- --- ------ --- --- ---
--- --- --- ---
--- --- --- --- ------ --- --- --- --- ------ --- --- --- ---
--- --- --- --- ------ --- --- --- ---
--- --- --- ------ --- --- ---
--- --- --- ------ --- ------ --- --- --- ---
--- --- --- --- --- ------ --- --- ---
--- --- --- --- --- ------ --- --- --- ---
--- --- ------ --- ---
375 KISSIMMEE RIVER BASIN
02263900 LAKE BUTLER AT WINDERMERE, FL
LOCATION.--Lat 28° 29'17", long 81° 32'01", in NW1⁄ 4 sec.17, T.23 S., R.28 E., Orange County, Hydrologic Unit 03090101, on east shore of lake at Windermere.
SURFACE AREA.--1,665 acres (2.60 mi2).
DRAINAGE AREA.--14.5 mi2.
PERIOD OF RECORD.--January 1933 to October 1941 (weekly); November 1941 to July 1976 (once daily); August 1976 to current year (weekly).
GAGE.--Nonrecording gage. Datum of gage is 90.00 ft above NGVD of 1929 ; gage readings have been reduced to elevations above sealevel. See WRD FL-99-1A for history of gage locations and datums prior to March 24, 1999.
REMARKS.--Lake is one of the Cypress Creek headwaters chain of lakes.
EXTREMES FOR PERIOD OF RECORD.--Maximum elevation observed, 101.78 ft, Sept. 13, 1960; minimum observed, 94.62 ft, July 21,29, 1981.
EXTREMES FOR CURRENT YEAR.--Maximum elevation observed, 98.72 ft, Sept. 29; minimum observed, 95.50 ft, May 24,31.
ELEVATION (FEET NGVD), WATER YEAR OCTOBER 2001 TO SEPTEMBER 2002 DAILY INSTANTANEOUS VALUES
DAY OCT NOV DEC JAN FEB MAR APR MAY JUN JUL AUG SEP
1 --- --- --- 96.00 --- 96.32 96.82 2 97.20 96.90 --- 96.64 -- -- -- 96.82 3 -- -- --- 96.45 -- -- --- 98.04 4 --- --- --- --- --- --- 5 --- 96.98 96.62 --- --- 95.52 96.90 98.12
6 97.18 --- 96.56 96.62 --- --- --- 7 --- --- --- 95.82 --- --- 8 -- --- 96.58 --- 96.40 -- -- --9 --- --- --- --- --- --- 10 --- 96.86 96.64 -- -- -- --- 98.22
11 97.12 --- --- --- 95.52 --- 12 --- --- --- --- 95.56 --- 97.02 98.28 13 -- -- 96.60 96.32 95.74 -- --14 96.96 --- 96.72 --- --- --- 97.22 --15 97.10 96.80 --- 96.54 -- -- 95.72 --
16 -- -- -- -- --- 96.56 --17 97.08 --- --- --- 95.86 --- 18 -- -- 96.58 96.20 -- -- --19 --- 96.78 --- --- --- 97.54 --20 -- --- 96.48 -- 95.54 95.92 --
21 97.10 96.76 -- -- -- --- 96.72 --22 --- 96.96 -- 96.54 -- -- --- 98.62 23 --- --- 96.72 --- --- --- 97.78 --24 97.10 --- 96.70 --- 96.14 95.50 96.19 96.80 --25 -- -- -- -- -- --- 98.70
26 -- -- -- -- -- --27 --- 96.92 -- -- -- 96.24 96.82 --28 -- -- -- -- -- --29 --- --- --- --- --- 97.86 98.72 30 97.00 96.90 96.60 -- 96.48 96.00 -- 96.32 -- 31 -- --- 96.74 -- --- 95.50 --- 98.00 --

--- --- --- --- --- ------ --- --- --- --- --- --- --- --- ------ --- --- --- --- ------ --- --- --- --- ---
--- --- --- --- --- ------ --- --- --- ---
--- --- --- --- ------ --- --- --- ------ --- --- --- ---
--- --- --- --- ------ --- --- --- --- ------ --- --- --- --- ------ --- --- --- ---
--- --- ---
--- --- --- --- --- --- --- --- ------ --- --- --- ------ --- --- --- --- ---
--- --- --- --- ---
--- --- --- --- ------ --- --- ---
--- --- --- --- --- --- --- --- ------ --- --- --- ---
--- --- --- --- --- ------ --- --- --- ---
--- --- --- --- ------ --- --- --- ---
--- --- --- --- --- ---
376 KISSIMMEE RIVER BASIN
02266239 TROUT LAKE NEAR CLERMONT, FL
LOCATION.--Lat 28° 27'04", long 81° 43'00", in SW1⁄ 4 sec.28, T.23 S., R.26 E., Lake County, Hydrologic Unit 03090101, on northwest shore of lake, 7.8 mi southeast of Clermont.
SURFACE AREA.--163 acres (0.25 mi2).
DRAINAGE AREA.--1.31 mi2.
PERIOD OF RECORD.--March 1970 to current year (weekly).
REVISED RECORDS.--WDR FL-81-1: Drainage area, surface area.
GAGE.--Nonrecording gage. Datum of gage is at NGVD of 1929.
REMARKS.--Lake is landlocked except at extremely high stages.
EXTREMES FOR PERIOD OF RECORD.--Maximum elevation observed, 98.78 ft, Apr. 9, 1998; minimum observed, 85.98 ft, Dec. 19,26, 1981.
EXTREMES FOR CURRENT YEAR.--Maximum elevation observed, 91.48 ft, Sept. 30, minimum observed, 87.10 ft, June 11.
ELEVATION (FEET NGVD), WATER YEAR OCTOBER 2001 TO SEPTEMBER 2002 DAILY INSTANTANEOUS VALUES
DAY OCT NOV DEC JAN FEB MAR APR MAY JUN JUL AUG SEP
1 --- --- --- --- --- --- 2 -- -- -- -- --- 88.38 --- 90.80 3 --- --- --- --- --- --- 4 --- --- --- --- --- --- 5 --- --- --- --- --- ---
6 --- --- --- --- --- --- 7 --- --- 88.18 --- --- 87.10 --- 8 --- 88.26 --- 88.24 87.62 --- 89.70 9 --- 88.18 --- 87.98 87.62 --- --- 10 --- 88.20 -- -- -- -- --
11 88.32 -- -- -- --- 88.40 --12 -- -- -- -- -- --13 -- -- 88.24 -- -- --14 -- --- 88.14 -- -- 87.82 --15 88.24 --- 88.26 --- 88.20 --- --- 89.62 --
16 -- 88.32 --- 87.92 87.64 -- --- 91.09 17 --- 88.18 -- -- -- -- --18 88.28 -- -- -- --- 88.52 --19 -- -- -- -- -- --20 --- 88.20 -- -- -- -- --
21 -- --- 88.22 -- -- 88.10 --22 88.22 --- --- 88.14 --- --- 89.74 --23 -- 88.28 --- 87.86 87.42 -- --- 91.32 24 88.22 88.14 -- -- -- -- --25 -- -- -- -- --- 88.78 --
26 -- -- -- -- -- --27 --- --- --- --- --- 89.80 --28 -- --- 88.24 -- -- -- --29 --- 88.20 -- -- -- -- --30 -- -- 88.10 87.76 -- 88.38 --- 91.48 31 88.18 --- 88.10 88.26 --- --- 87.20 88.96 90.60 --

---
377 KISSIMMEE RIVER BASIN
02266600 CYPRESS LAKE NEAR ST. CLOUD, FL
LOCATION.--Lat 28° 04'29", long 81° 18'07", in SW1⁄ 4 sec.2, T.28 S., R.30 E., Osceola County, Hydrologic Unit 03090101, on east shore of lake, near mouth of Canoe Creek, and about 12 mi south of St. Cloud.
SURFACE AREA.--4,085 acres (6.38 mi2).
DRAINAGE AREA.--1,162 mi2, combined drainage area of Cypress Lake and Lake Hatchineha.
PERIOD OF RECORD.--January 1942 to current year.
GAGE.--Water-stage recorder. Datum of gage is at NGVD of 1929 (U.S. Army Corps of Engineers bench mark). Prior to June 6, 1950, at site on northwest shore at datum 48.78 ft higher and June 6, 1950 to Dec. 13, 1973, at site 2.3 mi southwest at datum 48.78 ft higher. Dec. 13, 1973 to June 21, 1979, at site 2.3 mi southwest at present datum.
REMARKS.--Lake is one of the Kissimmee River headwaters chain of lakes. Stage is affected by operation of control structures upstream and downstream. Flow into Short Canal begins at about elevation 53.2 ft. Overflow over the south shore begins at a slightly higher stage.
EXTREMES FOR PERIOD OF RECORD.--Maximum daily elevation, 57.18 ft, Sept. 26, 1960; minimum daily, 47.60 ft, June 4, 1971.
ELEVATION (FEET NGVD), WATER YEAR OCTOBER 2001 TO SEPTEMBER 2002DAILY MEAN VALUES
DAY OCT NOV DEC JAN FEB MAR APR MAY JUN JUL AUG SEP
1 52.56 51.38 50.90 50.45 50.31 50.46 50.44 50.04 49.24 50.89 52.14 52.66 2 52.32 51.40 50.88 50.48 50.27 50.59 50.41 49.99 49.25 51.02 52.16 52.66 3 52.21 51.38 50.85 50.51 50.26 50.67 50.43 49.96 49.21 51.13 52.22 52.68 4 52.12 51.38 50.80 50.41 50.20 50.55 50.40 49.93 49.20 51.25 52.24 52.77 5 52.06 51.29 50.78 50.46 50.11 50.40 50.33 49.89 49.16 51.32 52.22 52.97
6 52.04 51.29 50.78 50.53 50.20 50.45 50.28 49.81 49.14 51.42 52.20 53.07 7 51.95 51.33 50.80 50.45 50.34 50.50 50.29 49.79 49.17 51.49 52.18 53.08 8 51.84 51.34 50.86 50.40 50.18 50.51 50.34 49.78 49.21 51.54 52.14 53.07 9 51.76 51.31 50.91 50.41 50.19 50.53 50.35 49.75 49.11 51.60 52.05 53.04 10 51.76 51.28 50.92 50.41 50.24 50.52 50.32 49.71 49.07 51.64 52.01 52.98
11 51.74 51.25 50.89 50.40 50.21 50.51 50.28 49.65 49.10 51.74 51.96 52.86 12 51.70 51.21 50.87 50.40 50.23 50.58 50.28 49.61 49.11 51.82 51.97 52.79 13 51.66 51.18 50.86 50.37 50.18 50.66 50.28 49.61 49.13 51.91 52.13 52.69 14 51.65 51.16 50.87 50.39 50.17 50.56 50.27 49.55 49.14 51.96 52.30 52.51 15 51.54 51.14 50.82 50.47 50.20 50.54 50.27 49.42 49.12 51.96 52.49 52.43
16 51.50 51.08 50.78 50.46 50.19 50.57 50.26 49.44 49.14 51.96 52.63 52.31 17 51.40 51.08 50.81 50.47 50.18 50.56 50.25 49.48 49.23 51.99 52.71 52.16 18 51.35 51.10 50.79 50.45 50.11 50.55 50.25 49.53 49.23 51.99 52.79 52.02 19 51.35 51.09 50.76 50.49 50.16 50.54 50.24 49.52 49.28 52.01 52.77 51.91 20 51.35 51.10 50.69 50.46 50.22 50.57 50.24 49.40 49.28 52.01 52.77 51.87
21 51.36 51.07 50.63 50.47 50.20 50.57 50.22 49.35 49.33 52.01 52.76 51.79 22 51.43 51.07 50.64 50.42 50.23 50.44 50.20 49.27 49.54 52.06 52.73 51.71 23 51.44 51.07 50.66 50.45 50.32 50.41 50.14 49.27 49.73 52.09 52.72 51.65 24 51.45 51.06 50.65 50.46 50.40 50.44 50.12 49.34 50.00 52.10 52.69 51.63 25 51.53 51.03 50.58 50.43 50.45 50.44 50.14 49.35 50.23 52.14 52.65 51.63
26 51.50 51.00 50.55 50.39 50.52 50.45 50.11 49.29 50.37 52.15 52.62 51.62 27 51.46 51.00 50.55 50.37 50.54 50.49 50.09 49.26 50.48 52.13 52.59 51.55 28 51.39 50.99 50.55 50.36 50.42 50.44 50.09 49.23 50.55 52.11 52.53 51.44 29 51.39 50.97 50.58 50.35 --- 50.46 50.03 49.21 50.63 52.13 52.49 51.36 30 51.38 50.96 50.52 50.35 --- 50.48 49.99 49.22 50.71 52.19 52.54 51.30 31 51.38 -- 50.49 50.34 --- 50.48 --- 49.23 52.15 52.64 --
MEAN 51.66 51.17 50.74 50.43 50.26 50.51 50.24 49.54 49.50 51.80 52.42 52.27 MAX 52.56 51.40 50.92 50.53 50.54 50.67 50.44 50.04 50.71 52.19 52.79 53.08 MIN 51.35 50.96 50.49 50.34 50.11 50.40 49.99 49.21 49.07 50.89 51.96 51.30
WTR YR 2002 MEAN 50.89 MAX 53.08 MIN 49.07

378 KISSIMMEE RIVER BASIN
02266650 LAKE MARION NEAR HAINES CITY, FL
LOCATION.--Lat 28° 05'56", long 81° 31'51", in SE1⁄ 4 sec.29, T.27 S., R.28 E., Polk County, Hydrologic Unit 03090101, on northeast shore of lake, 4.5 mi east of Haines City.
SURFACE AREA.--2,968 acres (4.64 mi2).
DRAINAGE AREA.--35.7 mi2.
PERIOD OF RECORD.--February to August 1958 (weekly); September 1958 to current year (once daily).
GAGE.--Nonrecording gage. Datum of gage is at NGVD of 1929 (South Florida Water Management District bench mark). July 21, 1959 toSept. 8, 1963, at site 500 ft north and Sept. 9, 1963 to Jan. 29, 1974, at present site, at datum 63.22 ft higher.
REMARKS.--Lake is in the headwaters of Kissimmee River. Outflow from lake is through Lake Marion Creek to Lake Hatchineha.
EXTREMES FOR PERIOD OF RECORD.--Maximum elevation observed, 67.52 ft, Sept. 12, 15, 1960; minimum observed, 64.45 ft, June 21, 2000.
ELEVATION (FEET NGVD), WATER YEAR OCTOBER 2001 TO SEPTEMBER 2002 DAILY INSTANTANEOUS VALUES
DAY OCT NOV DEC JAN FEB MAR APR MAY JUN JUL AUG SEP
1 67.00 --- 66.04 65.80 2 66.90 --- 66.04 65.80 3 66.90 66.44 66.04 65.804 66.90 66.40 66.04 65.805 66.90 66.40 66.04 65.80
65.84 65.90 65.60 65.30 65.35 66.18 66.24 66.4665.84 65.90 65.56 65.30 65.30 66.20 66.24 66.5265.84 65.90 65.56 65.26 65.40 66.20 66.28 66.7065.84 65.90 65.50 65.26 65.40 66.20 66.28 66.8065.84 65.90 65.50 65.22 65.40 66.20 66.28 66.90
6 66.84 66.36 66.04 65.807 66.80 66.32 66.00 65.808 66.76 66.32 66.00 65.809 66.76 66.32 66.00 65.8010 66.76 66.26 65.96 65.80
65.80 65.88 65.50 65.22 65.30 66.20 66.24 66.9065.80 65.88 65.46 65.22 65.40 66.20 66.24 66.8465.76 65.88 65.46 65.22 65.45 66.20 66.24 66.8065.76 65.88 65.42 65.20 65.50 66.20 66.24 66.78 65.76 65.88 65.42 65.20 65.50 66.20 66.20 66.78
11 66.72 66.26 65.96 65.80 12 66.70 66.26 65.90 65.80 13 66.70 66.26 65.90 65.80 14 66.60 66.20 65.90 65.88 15 66.60 66.20 65.90 65.94
65.76 65.84 65.42 65.16 65.55 66.20 66.20 66.74 65.74 65.84 65.42 65.16 65.60 66.20 66.20 66.74 65.70 65.80 65.42 65.12 65.60 66.20 66.20 66.74 65.70 65.80 65.42 65.12 65.55 66.20 66.20 66.70 65.70 65.80 65.42 65.00 65.65 66.16 66.20 66.66
16 66.60 66.18 65.90 65.94 17 66.56 66.18 65.86 66.00 18 66.54 66.18 65.86 66.00 19 66.54 66.18 65.86 66.00 20 66.54 66.18 65.82 65.90
65.70 65.80 65.42 65.00 65.60 66.16 66.24 66.62 65.70 65.78 65.42 65.00 65.70 66.12 66.24 66.62 65.70 65.78 65.40 65.00 65.65 66.12 66.28 66.56 65.70 65.74 65.40 65.10 65.70 66.20 66.30 66.50 65.70 65.74 65.40 65.10 65.75 66.20 66.30 66.50
21 66.50 66.12 65.80 65.90 22 66.50 66.12 65.80 65.90 23 66.50 66.10 65.80 65.90 24 66.50 66.10 65.80 65.90 25 66.50 66.10 65.80 65.90
65.66 65.70 65.40 65.14 65.75 66.20 66.30 66.46 65.74 65.70 65.36 65.14 65.80 66.30 66.36 66.46 65.80 65.70 65.36 65.10 65.70 66.30 66.36 66.50 65.86 65.66 65.32 65.10 65.65 66.30 66.36 66.52 65.90 65.66 65.30 65.10 65.75 66.30 66.36 66.54
26 66.50 66.10 65.80 65.90 27 66.50 66.10 65.80 65.84 28 66.50 66.10 65.80 65.84 29 66.50 66.04 65.80 65.84 30 66.50 66.04 65.80 65.84 31 66.50 --- 65.80 65.84
65.90 65.62 65.30 65.10 65.75 66.30 66.36 66.54 65.90 65.60 65.30 65.10 65.80 66.30 66.36 66.54 65.90 65.60 65.30 65.10 65.80 66.28 66.36 66.50 --- 65.60 65.30 65.10 65.85 66.28 66.40 66.46 --- 65.60 65.30 65.06 65.80 66.24 66.40 66.46 --- 65.60 --- 65.06 --- 66.24 66.40 --
MEAN 66.65 --- 65.90 65.86 MAX 67.00 --- 66.04 66.00 MIN 66.50 --- 65.80 65.80
65.78 65.77 65.41 65.14 65.60 66.22 66.29 66.6365.90 65.90 65.60 65.30 65.85 66.30 66.40 66.9065.66 65.60 65.30 65.00 65.30 66.12 66.20 66.46

379 KISSIMMEE RIVER BASIN
02266900 LAKE PIERCE NEAR WAVERLY, FL
LOCATION.--Lat 27° 58'37", long 81° 32'33", in NW1⁄ 4 sec.8, T.29 S., R.28 E., Polk County, Hydrologic Unit 03090101, on west shore of lake, at public boat landing, 4.5 mi east of Waverly, and 5.5 mi northeast of town of Lake Wales.
SURFACE AREA.--3,736 acres (5.84 mi2).
DRAINAGE AREA.--58.9 mi2.
PERIOD OF RECORD.--December 1947 to September 1971; October 1971 to current year (fragmentary). Prior to August 1959, recordsalso for Catfish Creek near Lake Wales (station 02267000).
GAGE.--Nonrecording gage. Datum of gage is at NGVD of 1929 (U.S. Army Corps of Engineers bench mark). Prior to Aug. 20, 1959, water-stage recorder on left bank of Catfish Creek 0.2 mi downstream from lake. Aug. 20, 1959, to Sept. 30, 1971, water-stage recorder, and Oct. 1, 1971, to July 13, 1981, nonrecording gage at present site at datum 72.13 ft higher.
REMARKS.--Outflow from lake is through Catfish Creek to Lake Hatchineha, one of the Kissimmee River headwater lakes. Theobserved reading made on March 26, 1998 has been changed to 77.90 ft.
EXTREMES FOR PERIOD OF RECORD.--Maximum daily elevation, 78.91 ft Sept. 17,18, 1960; minimum observed, 74.60 ft, June 22, 2000.
ELEVATION, WATER YEAR OCTOBER 2001 TO SEPTEMBER 2002
ELEV ATION ABOVE
Date Time NGVD (FEET)(72020)
NOV20... 1447 76.99
JAN17... 1723 76.50
MAR14... 0820 76.26
MAY06... 1215 74.8516... 1253 75.26
JUL01... 1214 76.79
AUG29... 0658 76.87

5
10
15
20
25
30
--- --- --- --- ------ --- --- ------ --- --- --- ------ --- --- --- --- ------ --- --- --- --- ---
--- --- --- --- --- ------ --- --- --- --- ------ --- --- --- --- ------ --- --- ------ --- --- --- ---
--- --- --- --- --- ------ --- --- --- --- ---
--- --- --- --- ------ --- --- --- --- ------ --- --- --- --- ---
--- --- --- ------ --- --- --- --- --- --- --- --- --- ------ --- --- --- --- ---
--- --- --- --- ---
--- --- --- --- --- ------ --- --- --- --- ------ --- --- ------ --- --- --- --- --- --- --- --- --- ---
--- --- --- --- --- ------ --- --- --- ---
--- --- --- --- --- ------ --- --- --- ---
--- --- --- ------ --- --- --- --- ---
380 KISSIMMEE RIVER BASIN
02268400 LAKE WEOHYAKAPKA AT INDIAN LAKE ESTATES, FL
LOCATION.--Lat 27° 48'50", long 81° 23'16", in NE1⁄ 4 sec.2, T.31 S., R.29 E., Polk County, Hydrologic Unit 03090101, on east shore of lake, on end of public pier at Indian Lake Estates, and 8.5 mi east of Babson Park.
SURFACE AREA.--7,555 acres (11.8 mi2).
DRAINAGE AREA.--93.5 mi2.
PERIOD OF RECORD.--February 1958 to September 1960 (weekly); October 1960 to September 1961 (fragmentary); October 1961 to current year (weekly).
GAGE.--Nonrecording gage. Prior to May 30, 2000, South Florida Water Management District bench mark, May 30, 2000 to present datum of gage is at NGVD of 1929 (Marion Engineer Associates, Inc. bench mark).
REMARKS.--Lake is at the headwater of Weohyakapka Creek.
EXTREMES FOR PERIOD OF RECORD.--Maximum elevation observed, 63.43 ft on or about Sept. 30, 1960, from floodmark; minimum observed, 58.90 ft, July 4, 25, 1981.
EXTREMES FOR CURRENT YEAR.--Maximum elevation observed, 62.22 ft, Aug. 13, Sept. 3; minimum observed, 60.40 ft, Apr. 30.
ELEVATION (FEET NGVD), WATER YEAR OCTOBER 2001 TO SEPTEMBER 2002 DAILY INSTANTANEOUS VALUES
DAY OCT NOV DEC JAN FEB MAR APR MAY JUN JUL AUG SEP
1 -- -- -- -- --- 62.04 --2 -- -- --- 61.20 -- --- 61.90 --3 --- --- --- 60.79 --- --- 62.22 4 --- --- --- --- 60.52 ---
--- --- --- --- --- ---
6 --- --- --- --- --- 62.04 7 --- --- --- 60.52 --- --- 8 --- --- --- --- --- --- 9 -- -- --- 60.94 -- --- 61.98 --
-- -- -- -- -- --- 62.14
11 -- -- -- -- 60.64 --12 -- -- -- -- -- --13 --- --- --- --- --- 62.22 --14 -- -- 61.42 -- -- --
-- -- -- -- -- --
16 -- -- --- 60.80 61.32 --- 62.14 --17 -- 61.53 -- -- -- --- 62.10 18 -- -- -- -- 60.72 --19 -- -- -- -- -- --
61.70 --- --- --- --- 62.16 --
21 -- -- -- 60.87 -- --22 -- -- -- -- -- --23 -- -- --- 60.70 -- --- 62.12 --24 -- -- -- -- -- --- 62.06
-- -- -- -- 61.60 --
26 -- -- -- -- -- --27 --- --- --- --- --- 62.18 --28 -- -- -- 60.60 -- --29 --- --- --- --- --- 61.97 --
-- -- --- 60.40 -- --- 62.02 --31 -- -- -- -- -- --

---
------
381 KISSIMMEE RIVER BASIN
02268600 LAKE ROSALIE NEAR LAKE WALES, FL
LOCATION.--Lat 27° 56'23", long 81° 25'14", in SE1⁄ 4 sec.21, T.29 S., R.29 E., Polk County, Hydrologic Unit 03090101, on west side of lake, in boat basin at Monroeí Trailer Park, 10.5 mi northeast of town of Lake Wales.
SURFACE AREA.--4,592 acres (7.18 mi2).
DRAINAGE AREA.--133 mi2.
PERIOD OF RECORD.--December 1941 to February 1942 (weekly); March to July 1942; August 1942 to August 1943 (fragmentary); March 1958 to April 1967 (weekly); May 1967 to current year (once daily).
GAGE.--Nonrecording gage. Datum of gage is at NGVD of 1929 (U.S. Army Corps of Engineers bench mark). Prior to Mar. 5, 1942, nonrecording gage at site 1.3 mi northeast at datum 53.19 ft higher. Mar. 5, 1942, to July 27, 1942, and Mar. 20, 1958, to Sept. 19, 1974, recording or nonrecording gages at several sites within 1.5 mi at datum 49.41 ft higher, and Sept. 19, 1974, to Oct. 17, 1979, nonrecording gage at site 400 ft west at present datum.
REMARKS.--Outflow from lake is through diversion canal to Lake Kissimmee, the most downstream of the Kissimmee River headwaterschain of lakes and also through Rosalie Creek to Tiger Lake, thence through Tiger Creek to Lake Kissimmee.
EXTREMES FOR PERIOD OF RECORD.--Maximum elevation observed, 55.93 ft, Oct. 3, 1960; minimum observed, 50.30 ft, June 2-4, 1967.
ELEVATION (FEET NGVD), WATER YEAR OCTOBER 2001 TO SEPTEMBER 2002 DAILY INSTANTANEOUS VALUES
DAY OCT NOV DEC JAN FEB MAR APR MAY JUN JUL AUG SEP
1 53.47 54.00 53.84 53.58 53.56 53.60 53.18 52.76 52.26 53.73 54.37 54.70 2 53.48 54.02 53.83 53.59 53.54 53.58 53.19 52.75 52.28 53.83 54.36 54.71 3 53.50 54.03 53.82 53.62 53.52 53.60 53.18 52.73 52.26 53.88 54.46 54.69 4 53.53 54.05 53.81 53.62 53.50 53.60 53.17 52.71 52.24 53.92 54.46 54.67 5 53.57 54.03 53.80 53.60 53.48 53.58 53.16 52.67 52.23 53.95 54.43 54.69
6 53.59 54.05 53.79 53.58 53.48 53.58 53.14 52.67 52.22 53.98 54.40 54.71 7 53.60 54.03 53.78 53.58 53.46 53.57 53.12 52.65 52.18 54.01 54.38 54.71 8 53.65 54.02 53.87 53.57 53.46 53.56 53.08 52.62 52.25 54.03 54.39 54.68 9 53.67 54.01 53.86 53.56 53.45 53.56 53.02 52.58 52.28 54.08 54.35 54.64 10 53.67 54.00 53.88 53.56 53.45 53.54 53.00 52.54 52.26 54.10 54.35 54.62
11 53.68 53.99 53.87 53.55 53.46 53.54 53.00 52.51 52.25 54.15 54.30 54.59 12 53.69 53.98 53.86 53.55 53.46 53.52 52.98 52.48 52.25 54.18 54.28 54.61 13 53.70 53.97 53.85 53.54 53.45 53.50 --- 52.46 52.25 54.21 54.40 54.50 14 53.70 53.99 53.84 53.56 53.43 53.49 --- 52.42 52.26 54.29 54.40 54.56 15 53.73 53.98 53.82 53.66 53.43 53.48 --- 52.41 52.26 54.31 54.39 54.60
16 53.73 53.96 53.82 53.66 53.41 53.46 --- 52.40 52.36 54.31 54.45 54.60 17 53.73 53.96 53.81 53.64 53.40 53.46 --- 52.36 52.56 54.31 54.45 54.55 18 53.72 53.95 53.81 53.64 53.38 53.44 --- 52.39 52.57 54.30 54.43 54.50 19 53.72 53.95 53.79 53.63 53.36 53.42 --- 52.48 52.66 54.30 54.42 54.48 20 53.73 53.95 53.76 53.64 53.35 53.40 52.89 52.46 52.69 54.28 54.39 54.58
21 53.79 53.94 53.74 53.64 53.34 53.39 52.87 52.39 52.72 54.30 54.40 54.65 22 53.96 53.94 53.72 53.63 53.41 53.38 52.84 52.36 52.83 54.36 54.40 54.65 23 53.98 53.94 53.70 53.63 53.51 53.36 52.82 52.34 52.86 54.41 54.38 54.62 24 53.99 53.93 53.70 53.62 53.65 53.34 52.80 52.30 53.13 54.43 54.36 54.60 25 54.02 53.92 53.68 53.62 53.66 53.32 52.78 52.28 53.32 54.45 54.32 54.60
26 54.04 53.90 53.68 53.62 53.66 53.30 52.76 52.28 53.40 54.45 54.30 54.58 27 54.02 53.90 53.66 53.61 53.64 53.29 52.73 52.26 53.52 54.43 54.28 54.58 28 54.00 53.88 53.64 53.60 53.61 53.28 52.71 52.22 53.56 54.41 54.26 54.56 29 53.99 53.86 53.62 53.60 --- 53.26 52.68 52.20 53.58 54.40 54.23 54.52 30 53.99 53.86 53.61 53.59 --- 53.24 52.66 52.20 53.58 54.40 54.35 54.48 31 54.00 -- 53.60 53.58 --- 53.23 --- 52.28 54.39 54.65 --
MEAN 53.76 53.97 53.77 53.60 53.48 53.45 --- 52.46 52.64 54.21 54.38 54.61 MAX 54.04 54.05 53.88 53.66 53.66 53.60 52.76 53.58 54.45 54.65 54.71 MIN 53.47 53.86 53.60 53.54 53.34 53.23 52.20 52.18 53.73 54.23 54.48

--- --- --- --- ------ --- --- --- ---
--- --- --- --- --- ------ --- --- --- --- ------ --- --- ---
--- --- --- --- --- --- --- --- --- ------ --- --- --- ---
--- --- --- ------ --- --- --- --- ---
--- --- --- --- --- ------ --- --- ------ --- --- --- --- --- --- --- --- ------ --- --- ---
--- --- --- --- ------ --- --- --- --- --- --- --- ---
--- --- ------ --- --- --- ---
--- --- --- --- ------ --- --- --- ---
--- --- --- --- ------ --- --- --- --- ------ --- --- --- --- ---
--- --- --- ------ --- --- --- --- --- --- --- --- ------ --- --- --- --- ---
--- --- --- --- ------ --- --- --- --- ---
--- --- --- --- --- ------ --- --- --- --- ---
382 KISSIMMEE RIVER BASIN
02268800 LAKE MARIAN NEAR KENANSVILLE, FL
LOCATION.--Lat 27° 52'22", long 81° 03'08", in NE1⁄ 4 sec.18, T.30 S., R.33 E., Osceola County, Hydrologic Unit 03090101, on northeast shore of lake in canal at county boat ramp, 4.5 mi west of Kenansville.
SURFACE AREA.--5,727 acres (8.95 mi2).
DRAINAGE AREA.--49.6 mi2.
PERIOD OF RECORD.--February 1958 to current year (weekly).
GAGE.--Nonrecording gage. Datum of gage is at NGVD of 1929 (South Florida Water Management District bench mark). Prior toNov. 16, 1972, at present site and other nearby sites at datum 57.02 ft higher. Nov. 16, 1972, to Oct. 28, 1980, at site 0.6 mi southeast at present datum.
REMARKS.--Lake is in the headwaters of the Kissimmee River. Outflow is through a canal to Lake Jackson, thence through Jackson Canal to Lake Kissimmee. During high water there is flow through Fodderstack Slough to Jackson Canal.
EXTREMES FOR PERIOD OF RECORD.--Maximum elevation observed, 61.63 ft, Sept. 27, 1960; minimum observed, 55.86 ft, May 18,25, 2001.
EXTREMES FOR CURRENT YEAR.--Maximum elevation observed, 60.70 ft, July 12; minimum observed, 58.28 ft, May 24.
ELEVATION (FEET NGVD), WATER YEAR OCTOBER 2001 TO SEPTEMBER 2002 DAILY INSTANTANEOUS VALUES
DAY OCT NOV DEC JAN FEB MAR APR MAY JUN JUL AUG SEP
1 --- --- 59.30 59.40 --- --- --- 2 --- 60.42 -- -- -- -- 60.06 3 --- --- --- 58.60 58.29 --- 4 --- 59.42 --- --- --- --- 5 60.08 -- --- 59.08 -- --- 59.90 --
6 -- -- -- -- -- --- 59.86 7 --- 59.76 --- --- --- 58.36 --- 8 --- --- 59.36 59.36 --- --- --- 9 --- 60.28 -- --- 58.91 -- -- 59.88 10 -- -- -- 58.50 -- --
11 -- 59.38 -- -- -- --12 59.80 --- 59.35 -- -- --- 60.70 --13 -- -- -- -- -- --- 59.80 14 --- 59.60 -- -- -- 58.34 --15 -- --- 59.30 59.30 58.90 -- -- --
16 --- --- --- --- --- 59.64 --17 --- 59.64 -- -- 58.32 -- --- 59.80 18 -- 59.48 -- -- --- 60.63 --19 --- 60.06 -- --- 58.86 -- --- 60.56 --20 -- -- -- -- -- --- 59.76
21 --- 59.58 -- -- -- 58.88 --22 59.88 --- 59.28 59.20 -- -- --23 59.94 --- --- --- --- 59.58 --24 59.98 --- --- 58.28 --- --- 25 -- -- -- -- -- --
26 60.28 -- --- 58.76 -- --- 60.22 --27 -- -- -- -- -- --- 59.80 28 --- 59.46 -- -- -- 59.58 --29 -- -- 59.12 -- -- --30 59.82 --- --- --- --- 59.70 --31 -- -- -- 58.30 -- --
MAX --- --- --- --- --- --- MIN --- --- --- --- --- ---

--- --- ------ --- ------ --- ------ --- ------ --- ---
--- --- ------ --- ------ --- ------ --- ---
--- ---
--- ------ ------ ------ ------ ---
--- ---------
--- ------ ---
--- ------ ------ ------ ------ ---
--- ------ --- ------ ------ ------ ------ --- ---
--- --- --- --- --- ------ --- ---
383 KISSIMMEE RIVER BASIN
02269600 LAKE ARBUCKLE NEAR AVON PARK, FL
LOCATION.--Lat 27° 39'55", long 81° 22'38", in SW1⁄ 4 sec. 25, T.32 S., R.29 E., Polk County, Hydrologic Unit 03090101, on U.S. Air Force recreation pier on south shore of lake, 9.5 mi northeast of Avon Park.
SURFACE AREA.--3,787 acres (5.92 mi2).
DRAINAGE AREA.--170 mi2.
PERIOD OF RECORD.--December 1941 to current year.
GAGE.--Water-stage recorder. Datum of gage is at NGVD of 1929. June 27, 1945, to Nov. 15, 1950, May 9, 1956, to June 15, 1962, and May 11, 1967, to Dec. 11, 1975, nonrecording gage at site 500 ft northwest near head of Arbuckle Creek at datum 51.53 ft higher.
REMARKS.--Lake is the most downstream of the Arbuckle Creek headwater lakes.
EXTREMES FOR PERIOD OF RECORD.--Maximum daily elevation, 58.3 ft, Sept. 24, 1948, from floodmark; minimum daily, 51.15 ft, June 10, 1985.
EXTREMES OUTSIDE PERIOD OF RECORD.--An elevation of 58.7 ft, was reached in 1926 and 1928, from information by local residents.
ELEVATION (FEET NGVD), WATER YEAR OCTOBER 2001 TO SEPTEMBER 2002DAILY MEAN VALUES
DAY OCT NOV DEC JAN FEB MAR APR MAY JUN JUL AUG SEP
1 56.04 --- --- 52.88 52.33 51.89 55.20 54.82 55.21 2 55.99 --- --- 52.85 52.30 51.88 55.25 54.79 55.24 3 55.95 --- --- 52.86 52.26 51.86 55.34 54.80 55.28 4 55.90 --- --- 52.88 52.24 51.82 55.34 54.80 55.27 5 55.85 --- --- 52.86 52.22 51.81 55.31 54.80 55.21
6 55.81 --- --- 52.83 52.19 51.81 55.25 54.78 55.17 7 55.78 --- --- 52.76 52.17 51.81 55.19 54.77 55.13 8 55.75 --- --- 52.71 52.14 51.84 55.13 54.78 55.09 9 55.68 --- --- 52.69 52.10 51.84 55.11 54.75 55.04 10 55.62 --- --- --- 52.68 52.08 51.86 55.13 54.70 55.00
11 55.57 --- --- --- 52.66 52.05 51.92 55.19 54.66 54.95 12 55.52 --- --- --- 52.65 52.02 51.95 55.25 54.63 54.90 13 55.46 --- --- --- 52.65 52.01 51.96 55.29 54.69 54.86 14 55.42 --- --- --- 52.64 52.00 52.00 55.30 54.73 54.83 15 55.39 --- --- --- 52.66 51.96 52.02 55.27 54.76 54.79
16 55.35 --- --- --- 52.66 51.92 52.04 55.21 54.79 54.77 17 55.31 --- --- 53.62 --- 52.68 51.91 52.23 55.14 54.83 54.75 18 55.24 --- --- 53.63 --- 52.66 51.95 52.40 55.11 54.97 54.70 19 55.20 --- --- --- 52.64 52.02 52.66 55.14 55.03 54.64 20 55.18 --- --- --- 52.61 52.08 52.85 55.12 55.05 54.62
21 55.22 --- --- --- 52.59 52.06 53.14 55.12 55.09 54.59 22 55.33 --- --- --- 52.58 52.04 53.57 55.17 55.18 54.55 23 55.33 --- --- --- 52.55 51.98 53.88 55.16 55.20 54.52 24 55.32 --- --- --- 52.51 51.94 54.16 55.14 55.17 54.49 25 55.34 --- --- --- 52.47 51.92 54.50 55.09 55.12 54.50
26 55.62 --- --- --- 52.46 51.91 54.78 55.05 55.06 54.55 27 --- --- --- 52.42 51.89 54.92 55.04 55.00 54.57 28 --- --- --- 52.99 52.40 51.89 55.04 55.01 54.98 54.56 29 --- --- --- 52.95 52.39 51.87 55.11 54.97 55.01 54.54 30 --- --- --- 52.91 52.36 51.85 55.15 54.92 55.01 54.53 31 --- --- --- 52.89 --- 51.89 54.87 55.17 --
MEAN -- -- -- 52.64 52.04 52.82 55.16 54.90 54.83 MAX --- --- --- 52.88 52.33 55.15 55.34 55.20 55.28 MIN --- --- --- 52.36 51.85 51.81 54.87 54.63 54.49

------
------------
---
------
384 KISSIMMEE RIVER BASIN
02271700 LAKE ISTOKPOGA NEAR DE SOTO CITY, FL
LOCATION.--Lat 27° 26'27", long 81° 15'42", in NE1⁄ 4 sec.18, T.35 S., R.31 E., Highlands County, Hydrologic Unit 03090101, in canal on northeast corner of lake, at Palm Estates Retirement Community, 0.6 mi southwest of town of Lorida, and 9.1 mi east of De Soto City.
SURFACE AREA.--27,500 acres (43.0 mi2).
DRAINAGE AREA.--607 mi2.
PERIOD OF RECORD.--August 1936 to current year. July 1965 to September 1989, records for Canal 41A at S-68 at Lake Istokpoga, near Lake Placid (station 02273200).
GAGE.--Water-stage recorder. Datum of gage is at NGVD of 1929 (levels by South Florida Water Management District). Prior to May 19, 1937, nonrecording gage at datum 40.54 ft higher and May 19, 1937, to Aug. 17, 1942, at datum 38.54 ft higher,at site on northwest shore of lake 4.0 mi southwest of mouth of Arbuckle Creek. Aug. 20, 1942, to July 6, 1965, water-stage recorder near mouth of Arbuckle Creek at datum 34.07 ft higher. July 7, 1965, to Nov. 27, 1973, water-stage recorder at site 7.5 mi south at datum 30.00 ft higher. Nov. 28, 1973, to Mar. 27, 1990, at present datum at site 7.5 mi south.
REMARKS.--Lake controlled by dam with removable stoplogs in Istokpoga Canal from June 1949 to July 1962. Since July 21, 1962,lake controlled by operation of structure 68 on Canal 41A on southeast shore of lake. Dam on Istokpoga Canal is still in place. Flow occurs at times in this canal.
EXTREMES FOR PERIOD OF RECORD.--Maximum daily elevation, 42.9 ft, estimated, Sept. 17, 1945; minimum daily, 35.40 ft, May 30, 1962.
ELEVATION (FEET NGVD), WATER YEAR OCTOBER 2001 TO SEPTEMBER 2002DAILY MEAN VALUES
DAY OCT NOV DEC JAN FEB MAR APR MAY JUN JUL AUG SEP
1 39.11 39.41 39.46 39.34 39.46 39.31 39.18 38.71 37.97 38.93 38.32 38.79 2 39.19 39.42 39.46 39.40 39.44 39.44 39.16 38.66 37.98 38.91 38.34 38.83 3 39.27 39.40 39.46 39.39 39.44 39.47 39.16 38.64 37.95 38.91 38.36 38.83 4 39.32 39.38 39.45 39.36 39.39 39.34 39.16 38.60 37.91 38.82 38.39 5 39.39 39.32 39.44 39.39 39.35 39.26 39.11 38.54 37.88 38.75 38.40
6 39.44 39.30 39.45 39.44 39.42 39.35 39.06 38.47 37.85 38.71 38.39 7 39.43 39.32 39.47 39.39 39.45 39.39 39.07 38.46 37.86 38.62 38.37 8 39.41 39.35 39.50 39.37 39.35 39.42 39.09 38.41 37.88 38.52 38.32 9 39.30 39.36 39.50 39.40 39.37 39.43 39.09 38.37 37.83 38.45 38.32 10 39.30 39.38 39.51 39.41 39.42 39.42 39.05 38.31 37.83 38.42 38.32 --
11 39.34 39.39 39.49 39.40 39.40 39.42 39.03 38.22 37.86 38.38 38.33 --12 39.38 39.37 39.47 39.41 39.34 39.46 39.02 38.20 37.92 38.48 38.42 --13 39.43 39.35 39.45 39.40 39.26 39.49 39.08 38.18 37.92 38.62 38.45 --14 39.48 39.34 39.44 39.43 39.20 39.44 39.09 38.13 37.95 38.62 38.48 --15 39.45 39.32 39.42 39.53 39.22 39.43 39.09 38.00 38.01 38.65 38.51 --
16 39.44 39.25 39.41 39.51 39.21 39.44 39.08 38.04 38.05 38.68 38.53 --17 39.30 39.22 39.44 39.51 39.19 39.42 39.07 38.08 38.11 38.68 38.59 --18 39.23 39.26 39.42 39.49 39.16 39.41 39.08 38.15 38.16 38.69 38.67 --19 39.23 39.29 39.41 39.48 39.21 39.40 39.05 38.20 38.14 38.67 38.69 --20 39.25 39.33 39.38 39.47 39.23 39.38 39.04 38.13 38.20 38.61 38.70 --
21 39.30 39.35 39.32 39.45 39.22 39.39 39.04 38.10 38.37 38.56 38.74 --22 39.38 39.38 39.34 39.42 39.22 39.26 39.00 38.03 38.67 38.56 38.76 --23 39.42 39.42 39.38 39.45 39.26 39.23 38.95 38.09 38.78 38.58 38.76 --24 39.44 39.42 39.37 39.47 39.30 39.23 38.90 38.10 38.88 38.52 38.76 --25 39.46 39.43 39.33 39.46 39.32 39.24 38.91 38.07 39.06 38.47 38.76 --
26 39.41 39.44 39.31 39.45 39.36 39.24 38.89 38.03 39.10 38.43 38.76 --27 39.34 39.45 39.34 39.45 39.32 39.25 38.84 38.02 39.10 38.42 38.74 --28 39.30 39.45 39.35 39.45 39.30 39.22 38.78 37.97 39.07 38.40 38.72 --29 39.33 39.47 39.40 39.45 --- 39.21 38.74 37.99 39.00 38.39 38.71 --30 39.36 39.48 39.36 39.46 --- 39.22 38.72 37.98 38.93 38.38 38.67 -- 31 39.40 -- 39.36 39.47 --- 39.20 --- 37.97 38.37 38.72 --
MEAN 39.35 39.37 39.42 39.44 39.31 39.35 39.02 38.22 38.27 38.59 38.55 -- MAX 39.48 39.48 39.51 39.53 39.46 39.49 39.18 38.71 39.10 38.93 38.76 MIN 39.11 39.22 39.31 39.34 39.16 39.20 38.72 37.97 37.83 38.37 38.32

---
385 LAKE OKEECHOBEE
02276400 LAKE OKEECHOBEE, FL
LOCATION.--Center of lake, lat 26° 57', long 80° 50', in southern Florida, Hydrologic Unit 03090201.
SURFACE AREA.--436,000 acres (681 mi2) at elevation 14 ft above sea level, from data provided by U.S. Army Corps of Engineers.
DRAINAGE AREA.--About 5,650 mi2.
PERIOD OF RECORD.--October 1931 to current year.
REVISED RECORDS.--WRD FL 1969: Surface area. WDR FL-77-1: capacity table.
GAGE.--Four water-stage recorders at various locations around the lake. From Oct. 1, 2000 to Mar. 14, 2001, ten water-stage recorders at various locations around the rim of the lake. Datum of gages is at NGVD of 1929 (levels by U.S. Army Corps of Engineers). See WDR FL-00-1A for history of changes prior to Oct. 1, 2000.
REMARKS.--Lake is diked to form a reservoir and is regulated by control structure gates at several outlets. It is used for navigation, municipal water supply, irrigation, and flood control. Total usable capacity is 2,860,000 acre-ft between elevations 10.5 and 17.5 ft. Daily elevations are an average of the gage readings from around the lake.
COOPERATION.--Records of elevations and capacity table provided by U.S. Army Corps of Engineers.
EXTREMES FOR PERIOD OF RECORD.--Maximum elevation observed, 18.77 ft, Nov. 2, 1947; minimum daily, 8.97 ft, May 23, 2001.
Capacity table, (elevation, in feet, and capacity, in acre-feet)
10.0 2,040,000 15.0 3,950,000 11.0 2,370,000 16.0 4,380,000 12.0 2,720,000 17.0 4,830,000 13.0 3,110,000 18.0 5,290,00014.0 3,530,000
ELEVATION (FEET NGVD), WATER YEAR OCTOBER 2001 TO SEPTEMBER 2002DAILY MEAN VALUES
DAY OCT NOV DEC JAN FEB MAR APR MAY JUN JUL AUG SEP
1 14.14 14.77 14.89 14.67 14.59 14.40 13.87 12.99 11.88 12.87 14.53 15.23 2 14.18 14.80 14.88 14.68 14.58 14.40 13.85 12.95 11.86 12.95 14.56 15.26 3 14.21 14.81 14.87 14.67 14.56 14.39 13.83 12.92 11.83 13.03 14.56 15.30 4 14.24 14.81 14.87 14.63 14.53 14.35 13.81 12.86 11.79 13.09 14.57 15.36 5 14.26 14.87 14.85 14.63 14.50 14.34 13.76 12.81 11.74 13.17 14.57 15.40
6 14.28 14.92 14.84 14.64 14.49 14.30 13.72 12.77 11.70 13.27 14.56 15.45 7 14.30 14.93 14.86 14.62 14.47 14.24 13.69 12.71 11.70 13.36 14.55 15.48 8 14.31 14.95 14.88 14.60 14.44 14.31 13.66 12.63 11.66 13.48 14.54 15.52 9 14.32 14.96 14.88 14.59 14.43 14.32 13.63 12.58 11.64 13.57 14.53 15.55 10 14.32 14.96 14.88 14.59 14.45 14.31 13.59 12.52 11.62 13.66 14.50 15.59
11 14.33 14.97 14.87 14.58 14.51 14.29 13.57 12.48 11.60 13.73 14.51 15.61 12 14.34 14.96 14.87 14.58 14.53 14.29 13.55 12.43 11.60 13.83 14.52 15.65 13 14.34 14.96 14.86 14.57 14.52 14.27 13.53 12.37 11.62 13.92 14.56 15.65 14 14.34 14.97 14.87 14.58 14.50 14.26 13.50 12.31 11.60 13.96 14.63 15.65 15 14.35 14.96 14.86 14.64 14.52 14.25 13.50 12.28 11.67 14.02 14.65 15.65
16 14.35 14.96 14.85 14.65 14.52 14.24 13.50 12.25 11.73 14.05 14.65 15.65 17 14.30 14.95 14.84 14.66 14.50 14.23 13.49 12.23 11.89 14.07 14.68 15.65 18 14.30 14.96 14.83 14.67 14.47 14.20 13.50 12.20 11.91 14.09 14.72 15.66 19 14.32 14.96 14.82 14.67 14.47 14.19 13.48 12.26 11.92 14.11 14.74 15.67 20 14.33 14.96 14.80 14.68 14.47 14.15 13.45 12.30 11.99 14.13 14.75 15.68
21 14.37 14.96 14.75 14.68 14.47 14.13 13.42 12.23 12.09 14.16 14.77 15.70 22 14.45 14.96 14.74 14.68 14.46 14.08 13.39 12.20 12.11 14.25 14.81 15.71 23 14.49 14.96 14.73 14.68 14.46 14.04 13.35 12.20 12.18 14.30 14.84 15.72 24 14.55 14.96 14.73 14.68 14.48 14.03 13.31 12.19 12.26 14.34 14.88 15.77 25 14.63 14.96 14.71 14.67 14.49 14.00 13.27 12.15 12.37 14.38 14.90 15.83
26 14.67 14.95 14.69 14.66 14.48 13.98 13.22 12.11 12.50 14.43 14.91 15.83 27 14.66 14.94 14.71 14.65 14.44 13.97 13.17 12.07 12.56 14.45 14.95 15.82 28 14.66 14.92 14.70 14.64 14.40 13.94 13.13 12.02 12.62 14.46 14.98 15.82 29 14.69 14.91 14.69 14.63 --- 13.93 13.08 11.99 12.69 14.49 15.03 15.80 30 14.72 14.91 14.68 14.62 --- 13.92 13.03 11.95 12.75 14.52 15.11 15.78 31 14.75 -- 14.68 14.61 --- 13.90 --- 11.90 14.53 15.18 --
MEAN 14.40 14.93 14.81 14.64 14.49 14.18 13.49 12.38 11.97 13.89 14.72 15.61 MAX 14.75 14.97 14.89 14.68 14.59 14.40 13.87 12.99 12.75 14.53 15.18 15.83 MIN 14.14 14.77 14.68 14.57 14.40 13.90 13.03 11.90 11.60 12.87 14.50 15.23
CAL YR 2001 MEAN 11.56 MAX 14.97 MIN 8.97 WTR YR 2002 MEAN 14.12 MAX 15.83 MIN 11.60

386 WATER RESOURCES DATA FOR FLORIDA, 2002Volume 1A: Northeast Florida Surface Water
Figure 14.--Location of lake gaging stations in the Peace and Myakka River basins, Charlotte Harbor and coastal area.

--- --- --- ------ --- --- --- --- ------ --- --- --- ---
--- --- --- --- ------ --- --- --- ---
--- --- --- --- ------ --- --- --- ---
--- --- --- --- ------ --- --- --- --- ------ --- --- --- ---
--- --- --- --- --- --- --- ---
--- --- --- ------ --- --- --- --- ---
--- --- --- --- ---
--- --- --- ------ --- --- --- ---
--- --- --- --- ------ --- --- --- ---
--- --- --- ---
--- --- --- --- ------ --- --- ---
--- --- --- --- --- ------ --- --- ---
--- --- --- --- ---
--- --- --- --- ------ --- --- --- ------ --- --- ------ --- --- --- ---
--- --- --- ------ --- ---
387 PEACE RIVER BASIN
02294298 LAKE ARIETTA NEAR AUBURNDALE, FL
LOCATION.--Lat 28° 05'43", long 81° 47'43", in NE1⁄ 4 sec.34, T.27 S., R.25 E., Polk County, Hydrologic Unit 03100101, on southeast shore of lake, 2.3 mi north of Auburndale.
SURFACE AREA.--764 acres (1.19 mi2).
DRAINAGE AREA.--3.70 mi2.
PERIOD OF RECORD.--August 1970 to September 1976 (once daily); October 1976 to September 1978 (thrice weekly); October 1978 to September 1992 (once daily); October 1992 to current year (weekly).
GAGE.--Nonrecording gage. Datum of gage is 100.00 ft above NGVD of 1929; gage readings have been reduced to elevations above NGVD of 1929. Prior to Nov. 21, 1972 at site nearby at datum 0.10 ft lower and Nov. 22, 1972 to Sept. 8, 1980 at several sites nearby at present datum.
REMARKS.--Lake is in the Saddle Creek Branch area of Peace River headwaters and level is controlled by structure P-3.
EXTREMES FOR PERIOD OF RECORD.--Maximum elevation observed, 143.66 ft, Jan. 2, 1998; minimum observed, 136.50 ft, May 25, 1977.
EXTREMES FOR CURRENT YEAR.--Maximum elevation observed, 139.86 ft, Sept. 30; minimum observed, 138.06 ft, June 5.
ELEVATION (FEET NGVD), WATER YEAR OCTOBER 2001 TO SEPTEMBER 2002 DAILY INSTANTANEOUS VALUES
DAY OCT NOV DEC JAN FEB MAR APR MAY JUN JUL AUG SEP
1 --- --- --- 138.72 --- --- 138.98 --- 2 --- 138.98 -- -- -- --3 --- --- --- --- --- --- 139.66 4 --- --- --- --- --- 139.36 --5 -- 139.08 --- 139.10 --- 138.06 --
6 --- --- 138.84 --- 138.46 --- --- 7 139.34 139.18 -- --- 138.40 -- --8 --- --- --- --- --- 138.96 --- 9 --- --- --- --- --- --- 10 --- 138.88 -- 138.78 -- -- --
11 -- --- 138.90 139.10 --- 139.00 139.40 139.72 12 --- --- --- --- 138.28 138.16 --- --13 139.26 --- --- --- 139.05 --- --- --14 -- -- -- -- -- --15 139.38 --- --- --- --- --- --
16 --- 139.16 --- --- 138.78 --- --- --- 17 -- 139.10 138.94 -- -- -- --18 --- --- --- 139.04 --- --- --19 --- --- --- --- 138.32 --- 139.80 20 --- 139.14 --- --- --- --- 139.08 ---
21 --- --- 138.80 --- --- --- --- 22 --- --- 138.95 --- --- 138.10 --- --23 -- -- -- -- -- --24 --- --- --- --- 138.76 --- 139.38 --25 --- --- 139.16 --- --- --- ---
26 --- 139.12 --- --- --- --- --- 27 --- --- --- 138.62 --- --- --- 28 --- 138.96 --- 139.14 --- --- --- --- 29 --- --- --- --- --- 139.26 --- 30 139.10 --- --- --- 138.92 --- 139.42 139.86 31 139.24 --- --- 138.94 --- --- 138.12 139.30 --
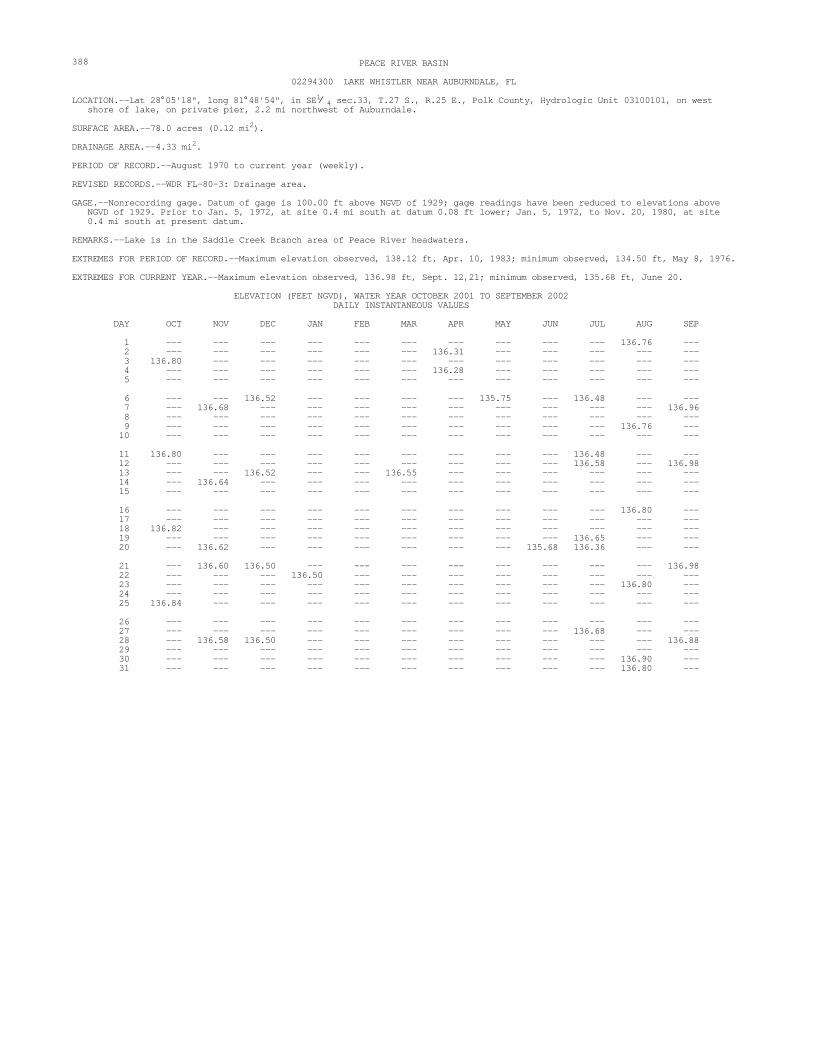
--- --- --- --- ------ --- --- --- ------ --- --- --- --- ------ --- --- --- ------ --- --- --- --- ---
--- --- --- ------ --- --- ---
--- --- --- --- --- ------ --- --- --- ---
--- --- --- --- --- ---
--- --- --- --- ------ --- --- ------ --- --- --- ---
--- --- --- --- ------ --- --- --- --- ---
--- --- --- --- ------ --- --- --- --- ---
--- --- --- --- ------ --- --- --- ---
--- --- --- ---
--- --- ------ --- --- --- ------ --- --- --- ---
--- --- --- --- --- ------ --- --- --- ---
--- --- --- --- --- ------ --- --- --- ---
--- --- ------ --- --- --- --- ---
--- --- --- --- ------ --- --- --- ---
388 PEACE RIVER BASIN
02294300 LAKE WHISTLER NEAR AUBURNDALE, FL
LOCATION.--Lat 28° 05'18", long 81° 48'54", in SE1⁄ 4 sec.33, T.27 S., R.25 E., Polk County, Hydrologic Unit 03100101, on west shore of lake, on private pier, 2.2 mi northwest of Auburndale.
SURFACE AREA.--78.0 acres (0.12 mi2).
DRAINAGE AREA.--4.33 mi2.
PERIOD OF RECORD.--August 1970 to current year (weekly).
REVISED RECORDS.--WDR FL-80-3: Drainage area.
GAGE.--Nonrecording gage. Datum of gage is 100.00 ft above NGVD of 1929; gage readings have been reduced to elevations above NGVD of 1929. Prior to Jan. 5, 1972, at site 0.4 mi south at datum 0.08 ft lower; Jan. 5, 1972, to Nov. 20, 1980, at site 0.4 mi south at present datum.
REMARKS.--Lake is in the Saddle Creek Branch area of Peace River headwaters.
EXTREMES FOR PERIOD OF RECORD.--Maximum elevation observed, 138.12 ft, Apr. 10, 1983; minimum observed, 134.50 ft, May 8, 1976.
EXTREMES FOR CURRENT YEAR.--Maximum elevation observed, 136.98 ft, Sept. 12,21; minimum observed, 135.68 ft, June 20.
ELEVATION (FEET NGVD), WATER YEAR OCTOBER 2001 TO SEPTEMBER 2002 DAILY INSTANTANEOUS VALUES
DAY OCT NOV DEC JAN FEB MAR APR MAY JUN JUL AUG SEP
1 --- --- --- --- --- 136.76 --2 --- --- --- 136.31 --- --- --- 3 136.80 -- -- -- -- --4 --- --- --- 136.28 --- --- --- 5 --- --- --- --- --- ---
6 --- 136.52 --- --- 135.75 --- 136.48 --- 7 --- 136.68 --- --- --- --- --- 136.96 8 --- --- --- --- --- --- 9 --- --- --- --- --- 136.76 --10 -- -- -- -- -- --
11 136.80 -- -- -- -- 136.48 --12 --- --- --- --- --- 136.58 --- 136.98 13 -- 136.52 --- 136.55 -- -- --14 --- 136.64 --- --- --- --- --- 15 -- -- -- -- -- --
16 --- --- --- --- --- 136.80 --17 -- -- -- -- -- --18 136.82 --- --- --- --- --- --19 --- --- --- --- --- 136.65 --- 20 --- 136.62 --- --- --- 135.68 136.36 ---
21 --- 136.60 136.50 --- --- --- --- --- 136.98 22 --- --- 136.50 --- --- --- --23 --- --- --- --- --- 136.80 --24 -- -- -- -- -- --25 136.84 --- --- --- --- --- --
26 -- -- -- -- -- --27 --- --- --- --- --- 136.68 --- 28 --- 136.58 136.50 --- --- --- --- --- 136.88 29 -- -- -- -- -- --30 --- --- --- --- --- 136.90 --31 --- --- --- --- --- 136.80 --

--- --- --- ------ --- --- --- ------ --- --- --- --- ---
--- --- --- --- ------ --- --- --- --- ---
--- --- --- --- ------ --- --- --- ------ --- --- --- ------ --- --- --- ---
--- --- --- ---
--- --- --- --- ------ --- --- --- ---
--- --- --- --- ------ --- --- ---
--- --- --- ---
--- --- --- --- ------ --- --- --- --- ---
--- --- --- ------ --- --- --- --- ---
--- --- --- --- ---
--- --- --- ------ --- --- ---
--- --- --- --- ------ --- --- --- --- ---
--- --- --- ---
--- --- --- --- --- ------ --- --- --- --- ------ --- --- --- ------ --- --- --- ---
--- ------ --- --- --- ---
389 PEACE RIVER BASIN
02294303 ARIANA LAKE AT AUBURNDALE, FL
LOCATION.--Lat 28° 05'16", long 81° 47'41", in SE1⁄ 4 sec.34, T.27 S., R.25 E., Polk County, Hydrologic Unit 03100101, on north shore of lake, 1,650 ft west of State Highway 559, and 1.7 mi north of Auburndale.
SURFACE AREA.--1,019 acres (1.59 mi2).
DRAINAGE AREA.--7.86 mi2.
PERIOD OF RECORD.--June 1945 to January 1948 (weekly); February 1958 to February 1960 (fragmentary); November 1971 to September 1992 (twice weekly); October 1992 to current year (weekly).
REVISED RECORDS.--WDR FL-80-3: Drainage area.
GAGE.--Nonrecording gage. Datum of gage is 100.00 ft above NGVD of 1929 (levels by Southwest Florida Water Management District);gage readings have been reduced to elevations above NGVD of 1929. Prior to Mar. 18, 1975, at site 1,000 ft east at datum 31.90 ft higher.
REMARKS.--Lake is in Saddle Creek Branch area of Peace River headwaters.
EXTREMES FOR PERIOD OF RECORD.--Maximum elevation observed, 137.90 ft, Aug. 28, 1946; minimum observed, 131.28 ft, May 6, 1976.
EXTREMES FOR CURRENT YEAR.--Maximum elevation observed, 133.80 ft, Sept. 29; minimum observed, 132.36 ft, May 1.
ELEVATION (FEET NGVD), WATER YEAR OCTOBER 2001 TO SEPTEMBER 2002 DAILY INSTANTANEOUS VALUES
DAY OCT NOV DEC JAN FEB MAR APR MAY JUN JUL AUG SEP
1 133.54 --- --- --- --- 132.36 --- --2 --- --- --- --- --- --- 133.40 3 --- --- --- --- --- --- 4 --- --- --- --- --- 133.10 --5 --- --- --- --- --- ---
6 -- --- 133.22 133.14 132.70 -- --7 --- --- 133.20 --- --- --- --- 8 -- 133.40 133.26 --- 132.40 -- --9 --- --- --- --- --- --- 133.58
10 133.68 --- --- --- --- 132.68 --- --
11 --- --- --- --- 132.90 133.22 --12 --- --- --- --- --- 132.89 --- 13 --- --- --- 133.40 --- --- --14 --- --- 133.18 133.20 133.02 --- --- --- 15 --- --- 133.30 --- --- 132.46 --- 133.76
16 --- 133.34 --- --- --- --- --- 17 -- -- -- -- -- --18 --- --- --- --- 132.74 132.92 133.32 --19 -- -- -- -- -- --20 --- 133.49 --- --- --- --- ---
21 133.54 --- --- 133.16 133.20 --- --- --22 --- --- 133.31 --- 132.88 132.58 --- 133.78 23 -- 133.38 133.30 -- -- -- --24 -- -- -- -- -- --25 --- --- --- --- 132.80 --- 133.30 --
26 -- -- -- -- -- --27 -- -- -- -- -- --28 -- -- 133.48 133.16 -- -- --29 --- --- --- --- --- --- 133.80 30 133.58 --- --- --- 132.80 132.60 132.86 --- 133.34 --31 -- 133.30 133.24 -- -- -- --

390 WATER RESOURCES DATA FOR FLORIDA, 2002Volume 1A: Northeast Florida Surface Water
Figure 15.--Location of lake gaging stations in the Withlacoochee River basin and coastal areas.

--- --- --- --- --- ------ --- --- --- ---
--- --- --- --- ------ --- --- --- --- ------ --- --- --- ---
--- --- ------ --- --- ------ --- --- --- ---
--- --- --- ------ --- --- --- ---
--- --- --- --- ------ --- --- --- ---
--- --- ------ --- --- --- ------ --- --- --- ---
--- --- --- ------ --- --- --- --- ---
--- --- --- ------ --- --- --- ---
--- --- --- ---
--- --- --- --- ------ --- --- --- ---
--- --- --- ------ --- --- --- --- ---
--- --- --- ---
--- --- --- --- ------ --- --- --- ---
--- --- --- --- ------ --- --- --- ---
--- --- --- ------ --- --- --- ---
391 WITHLACOOCHEE RIVER BASIN
02310760 LAKE JULIANA NEAR POLK CITY, FL
LOCATION.--Lat 28° 07'51", long 81° 47'45", in SE1⁄ 4 sec.15, T.27 S., R.25 E., Polk County, Hydrologic Unit 03100208, on east shore of lake, near concrete-walled pumping station, 4 mi southeast of Polk City.
SURFACE AREA.--919 acres (1.44 mi2).
DRAINAGE AREA.--5.4 mi2, approximately.
PERIOD OF RECORD.--December 1961 to September 1975 (once daily); October 1975 to current year (weekly).
GAGE.--Nonrecording gage. Datum of gage is 100.00 ft above NGVD of 1929; gage readings have been reduced to elevations above NGVD of 1929. Prior to June 8, 1984, at datum 26.49 ft higher.
REMARKS.--Lake is one of a group of lakes in the southern part of an extensive area of swampy flatlands and sandy ridges at arelatively high elevation, called the Green Swamp. Streams that flow into five major drainage systems originate in or near the Green Swamp area. Lake is connected to Lake Mattie by a canal which tends to equalize the lake elevations.
EXTREMES FOR PERIOD OF RECORD.--Maximum elevation observed, 134.10 ft, Mar. 21, 1998; minimum observed, 126.20 ft, May 7,14, 1976.
EXTREMES FOR CURRENT YEAR.--Maximum elevation observed, 130.46 ft, Sept. 28; minimum observed, 128.26 ft, May 29, June 8.
ELEVATION (FEET NGVD), WATER YEAR OCTOBER 2001 TO SEPTEMBER 2002 DAILY INSTANTANEOUS VALUES
DAY OCT NOV DEC JAN FEB MAR APR MAY JUN JUL AUG SEP
1 -- -- -- --- 128.29 --2 --- --- --- --- --- 129.50 --3 --- 129.51 --- 129.28 --- --- --- 4 -- -- --- 128.66 -- --5 --- --- --- --- --- 129.17 ---
6 129.41 --- --- 129.17 --- 129.03 128.60 --- --7 --- --- 129.17 --- --- --- --- 130.27 8 --- 129.32 --- --- --- 128.26 --- 9 --- --- 129.13 129.29 --- --- 129.57 --10 --- 129.46 --- --- --- --- ---
11 -- -- --- 128.49 -- 129.23 --12 --- --- --- --- --- 129.17 --- 13 129.47 --- --- 129.17 --- 129.20 128.92 --- --14 --- --- --- --- --- --- 130.37 15 -- 129.33 -- -- --- 128.28 --
16 --- --- 129.11 129.26 --- --- 129.60 --17 -- -- -- -- -- --18 --- 129.42 --- --- 128.36 --- 129.32 --- 19 --- --- --- --- --- 129.29 --- 20 129.53 129.42 129.22 -- 128.88 -- -- --
21 --- --- --- --- --- --- 130.41 22 -- 129.32 129.22 -- -- -- --23 --- --- --- 129.16 --- --- 129.59 --24 -- -- -- -- -- --25 --- 129.41 --- 129.36 --- --- --- ---
26 --- 129.22 -- -- -- 129.49 --27 --- --- --- 128.74 --- --- --- 28 129.56 --- --- --- --- --- 130.46 29 -- 129.17 -- --- 128.26 -- --30 129.37 --- --- 129.08 --- --- 129.85 --31 --- --- --- --- --- 129.99 --

--- --- --- ------ --- --- --- ---
--- ------ --- --- --- --- ---
--- ---
--- --- --- --- --- --- --- --- ---
--- --- ------ --- --- ---
--- --- ---
--- --- ------ --- ------ --- ---
--- --- --- ------ --- --- ---
--- --- ------ --- ---
--- --- --- ------ --- ---
--- ---
--- --- --- --- --- ------ ---
--- --- --- --- --- --- ---
--- --- ---
--- --- --- --- --- ---
--- --- --- ------ ---
--- --- --- ------ --- --- --- ---
392 WITHLACOOCHEE RIVER BASIN
O2310850 LAKE HELENE NEAR POLK CITY, FL
LOCATION.--Lat 28° 10'25", long 81° 48'21", in SW1⁄ 4 sec.34, T.26 S., R.25 E., Polk County, Hydrologic Unit 03100208, next to west shore of lake, on private pier at Camp Gilead, 1.3 mi southeast of Polk City.
SURFACE AREA.--54.4 acres (0.08 mi2).
DRAINAGE AREA.--0.42 mi2.
PERIOD OF RECORD.--March 1961 to April 1965; May 1965 to current year (thrice weekly).
REVISED RECORDS.--WRD FL 1962: Surface area.
GAGE.--Nonrecording gage. Datum of gage is 100.00 ft above NGVD of 1929; gage readings have been reduced to elevations above NGVD of 1929. Prior to Oct. 19, 1961, nonrecording gage, Oct. 19, 1961 to Apr. 13, 1965, water-stage recorder and since Apr. 13, 1965, nonrecording gage at same site at different datums.
REMARKS.--Lake is one of a group of lakes in the southern part of an extensive area of swampy flatlands and sandy ridges at arelatively high elevation, called the Green Swamp. Streams that flow into five major drainage systems originate in or near the Green Swamp area. Lake is landlocked.
EXTREMES FOR PERIOD OF RECORD.--Maximum elevation observed, 146.48 ft, Mar. 21, 1998; minimum observed, 137.40 ft, May 29, 2002.
EXTREMES OUTSIDE PERIOD OF RECORD.--Maximum elevation since 1948, 148.5 ft in September 1960, from information by local residents.
EXTREMES FOR CURRENT YEAR.--Maximum elevation observed, 139.63 ft, Sept. 26; minimum observed, 137.40 ft, May 29.
ELEVATION (FEET NGVD), WATER YEAR OCTOBER 2001 TO SEPTEMBER 2002 DAILY INSTANTANEOUS VALUES
DAY OCT NOV DEC JAN FEB MAR APR MAY JUN JUL AUG SEP
1 139.29 -- 138.73 --- 137.97 -- 138.46 --2 --- --- --- 138.46 --- --- --- 3 139.28 --- --- 138.70 --- 137.92 137.46 138.48 138.95 --4 --- --- --- --- --- --- 5 139.28 139.23 139.05 --- 138.80 138.44 --- 137.41 138.48 138.96
6 -- -- --- 137.86 -- -- 139.50 7 --- 139.23 139.03 138.85 --- --- --- 138.95 8 139.34 -- 138.66 -- 138.36 137.81 137.57 138.51 --9 --- 139.22 --- --- --- --- --- 139.49
10 --- 139.01 138.81 --- 138.33 137.77 137.53 --- --
11 --- --- 138.69 --- --- --- 138.56 --- 139.50 12 139.21 139.01 138.79 --- 138.73 --- 137.57 --- --13 --- --- --- 138.75 138.29 137.69 --- 138.98 139.55 14 139.30 139.19 138.84 138.64 -- -- -- --15 -- 139.01 --- 138.73 138.30 137.63 -- --
16 139.31 --- --- 138.87 138.62 --- --- 139.12 139.56 17 --- 139.01 --- 138.71 138.28 137.56 137.80 --- --18 --- 138.86 138.59 --- --- --- 138.68 --- 19 --- --- --- 138.69 --- 137.97 --- 139.16 --20 --- 139.17 --- 138.56 --- 137.63 --- 138.67 --- 139.56
21 -- -- -- -- -- --22 139.34 --- --- 138.84 138.72 138.19 137.57 138.00 --- --23 --- 138.85 -- -- -- 138.69 -- 139.58 24 139.35 --- --- --- 138.61 138.14 138.18 --- --25 --- --- 138.83 138.88 --- 137.51 --- 139.10 --
26 139.35 139.12 138.97 --- 138.57 138.09 --- 138.35 -- 139.63 27 --- --- --- --- 137.44 --- 139.16 --28 -- 139.11 138.80 138.83 138.52 -- -- --29 139.28 --- --- --- 138.03 137.40 138.37 138.97 139.20 --30 139.09 --- 138.76 --- --- --- 139.31 139.59 31 139.25 -- -- -- -- 138.96 --

--- --- --- --- ------ --- --- --- ------ --- --- --- --- ------ --- --- --- --- ------ --- --- --- ---
--- --- --- ------ --- ---
--- --- --- ------ --- --- --- ------ --- --- --- ---
--- --- --- --- --- ------ --- --- --- ---
--- --- --- ------ --- ---
--- --- --- ---
--- --- --- --- ------ --- --- --- ---
--- --- --- --- --- ------ --- --- --- --- ---
--- --- --- ---
--- --- --- ------ --- ---
--- --- --- --- ------ --- --- --- ---
--- --- --- --- --- ---
--- --- --- --- ------ --- --- --- ------ --- --- --- ------ --- --- ---
--- --- ------ --- --- --- ---
393 WITHLACOOCHEE RIVER BASIN
02310950 LAKE DEESON NEAR LAKELAND, FL
LOCATION.--Lat 28° 06'37", long 81° 55'51", in NW1⁄ 4 sec.29, T.27 S., R.24 E., Polk County, Hydrologic Unit 03100208, on south shore of lake, 5.0 mi northeast of intersection of U.S. Highways 92 and 98 in Lakeland.
SURFACE AREA.--116 acres (0.18 mi2).
DRAINAGE AREA.--0.96 mi2.
PERIOD OF RECORD.--July 1954 to March 1960 (fragmentary); May 1965 to June 1995; July 1995 to current year (weekly).
GAGE.--Nonrecording gage. Datum of gage is 116.00 ft above NGVD of 1929; gage readings have been reduced to elevations above NGVD of 1929. Prior to Nov. 16, 2000, gage at same site at datum 2.21 ft higher. Prior to Oct. 17, 1957, nonrecording gage at same site at datum 20.25 ft higher and Oct. 17, 1957 to March 1960, at datum 20.79 ft higher. May 1965 to June 1995, water-stage recorder at present site and datum.
REMARKS.--Lake is landlocked except at extreme high stages when flow is to the northeast to the headwaters of Gator Creek. SinceDec. 14, 1973, elevation of lake affected by pumpage into lake from nearby deep well.
EXTREMES FOR PERIOD OF RECORD.--Maximum elevation observed, 135.49 ft, Sept. 28, 1954; minimum elevation observed, 117.60 ft, July 7, 2001.
EXTREMES FOR CURRENT YEAR.--Maximum elevation observed, 123.66 ft, Sept. 30; minimum observed, 119.86 ft, May 30.
ELEVATION (FEET NGVD), WATER YEAR OCTOBER 2001 TO SEPTEMBER 2002 DAILY INSTANTANEOUS VALUES
DAY OCT NOV DEC JAN FEB MAR APR MAY JUN JUL AUG SEP
1 --- --- --- --- --- 121.30 --- 2 --- --- --- --- --- --- 122.94 3 --- --- --- --- --- --- 4 --- --- --- --- --- --- 5 --- --- --- 120.88 --- --- 121.90
6 120.70 --- --- --- --- 120.33 --- --7 --- 121.06 120.98 --- 121.10 --- 119.92 --- --8 --- 121.06 --- --- --- --- 121.34 --- 9 --- --- --- --- --- --- 123.08 10 --- --- --- --- --- 121.41 ---
11 -- -- -- -- -- --12 --- --- --- --- --- 121.92 --13 120.76 --- --- --- 121.10 --- --- --14 --- 121.06 120.98 120.92 --- 120.80 --- --- --- 15 -- 121.07 --- 121.08 119.96 -- 121.54 --
16 --- --- --- --- --- --- 123.36 17 --- --- --- --- 120.34 --- --18 -- -- -- -- -- --19 -- -- -- -- -- --20 121.07 --- 121.08 --- --- --- 122.16 --
21 120.72 121.02 -- 120.92 121.04 -- -- --22 --- 121.08 121.09 --- 120.78 --- --- 121.76 --- 23 --- --- --- --- 119.92 --- 123.36 24 --- --- --- --- 120.94 --- --25 -- -- -- -- -- --
26 --- --- --- --- --- 122.38 --27 --- --- --- 120.58 --- --- --- 28 --- 121.08 121.12 -- -- -- --29 --- 120.98 --- 120.86 --- --- 121.82 --- 30 121.08 --- --- --- 119.86 121.30 --- 122.58 123.66 31 121.02 --- --- --- --- --- --

--- --- --- --- ------ --- --- --- ---
--- --- --- --- ------ --- --- --- --- ------ --- --- --- --- ---
--- --- --- ------ --- --- --- --- --- --- --- --- ------ --- --- ---
--- --- --- --- ---
--- --- --- --- ------ --- --- ---
--- --- --- ------ --- --- ---
--- --- --- --- ---
--- --- --- --- ------ --- --- --- --- --- --- --- --- ---
--- --- --- --- ------ --- ---
--- --- --- --- ------ --- --- ---
--- --- --- --- ------ --- --- --- --- --- --- --- --- ---
--- --- --- --- ------ --- --- ------ --- --- --- ---
--- --- --- ------ --- --- --- ------ --- --- --- ---
394 WITHLACOOCHEE RIVER BASIN
02311600 CLEAR LAKE AT SAN ANTONIO, FL
LOCATION.--Lat 28° 20'20", long 82° 16'02", in SW1⁄ 4 sec.1, T.25 S., R.20 E., Pasco County, Hydrologic Unit 03100208, on southwest shore of lake, on public pier, 0.5 mi northeast of San Antonio, and 5.0 mi west of Dade City.
SURFACE AREA.--158 acres (0.25 mi2).
DRAINAGE AREA.--0.92 mi2.
PERIOD OF RECORD.--January 1965 to September 1966 (twice weekly); October 1966 to current year (weekly).
GAGE.--Nonrecording gage. Datum of gage is 95.00 ft above NGVD of 1929 (Florida Department of Transportation bench mark); gage readings have been reduced to elevations above NGVD of 1929. Mar. 31, 1971 to Mar. 13, 1991, at datum 2.00 ft higher. Prior to Mar. 31, 1971, at site 30 ft northwest at same datum.
REMARKS.--Lake has no surface outlet.
EXTREMES FOR PERIOD OF RECORD.--Maximum elevation observed, 128.36 ft, Feb. 21, 1998; minimum observed, 121.64 ft, June 8, 2002.
EXTREMES FOR CURRENT YEAR.--Maximum elevation observed, 124.88 ft, Sept. 28; minimum observed, 121.64 ft, June 8.
ELEVATION (FEET NGVD), WATER YEAR OCTOBER 2001 TO SEPTEMBER 2002 DAILY INSTANTANEOUS VALUES
DAY OCT NOV DEC JAN FEB MAR APR MAY JUN JUL AUG SEP
1 --- 123.12 --- --- --- 121.72 --- 2 --- --- 122.93 122.88 --- --- --- 3 --- 123.40 --- --- --- --- 123.71 4 -- -- --- 122.23 -- --5 --- 123.03 -- -- -- --
6 123.79 --- --- 122.57 --- --- 122.69 --- 7 -- -- --- 122.17 -- -- 124.70 8 --- 123.18 --- --- --- 121.64 --- 9 --- --- 122.85 122.84 --- --- 122.63 ---
10 123.32 -- -- -- -- 123.75 --
11 --- --- --- --- 122.09 --- --12 --- --- 123.01 --- 122.85 --- --- --13 123.73 --- --- 122.49 --- --- 123.01 --- 14 --- 123.38 --- --- --- --- --- 124.84 15 -- 123.16 -- -- --- 121.86 --
16 -- -- 122.84 122.80 -- -- -- 17 123.30 -- -- -- -- 124.33 --18 --- --- --- --- 122.05 --- --19 --- 123.09 -- -- -- 122.97 --20 123.65 123.38 --- --- 122.43 --- --- 122.99 ---
21 --- --- --- --- --- --- 124.80 22 --- 123.10 122.99 --- --- 121.98 --- --23 -- -- 122.94 122.68 -- -- -- 24 123.24 -- -- -- -- 124.31 --25 --- --- --- --- 121.70 --- --
26 --- --- 122.95 --- --- --- --27 123.57 --- --- 122.35 --- --- 123.57 --- 28 --- --- --- --- --- --- 124.88 29 --- 122.96 --- --- 122.58 --- 124.31 --30 --- --- --- 122.64 --- --- --31 --- --- --- --- --- 124.40 --

395 WITHLACOOCHEE RIVER BASIN
02312694 LADY LAKE NEAR LADY LAKE, FL
LOCATION.--Lat 28° 54'50", long 81° 53'43", in NE1⁄ 4 sec.22, T.18 S., R.24 E., Lake County, Hydrologic Unit 03100208, on south shore of lake, 1.5 mi east of town of Lady Lake.
SURFACE AREA.--190 acres (0.30 mi2).
DRAINAGE AREA.--4.67 mi2.
PERIOD OF RECORD.--February 1970 to September 1973 (weekly); October 1973 to current year (fragmentary).
REVISED RECORDS.--WDR FL-72-3: Drainage area, surface area.
GAGE.--Nonrecording gage. Datum of gage is at NGVD of 1929.
REMARKS.--Lake is landlocked. There is some pumpage from lake for irrigation purposes.
EXTREMES FOR PERIOD OF RECORD.--Maximum elevation observed, 66.60 ft, Apr. 16, 1984; minimum unknown, lake observed dry, July 2001.
ELEVATION (FEET NGVD), WATER YEAR OCTOBER 2001 TO SEPTEMBER 2002
ELEV ATION ABOVE
Date Time NGVD (FEET)(72020)
NOV16... 1108 61.42
JAN15... 1153 61.18
MAR15... 1450 61.24
JUL11... 1430 61.27
AUG22... 1130 62.78

------
---------------
------------------ ---
--- ---
396 WITHLACOOCHEE RIVER BASIN
02312698 LAKE PANASOFFKEE NEAR LAKE PANASOFFKEE, FL
LOCATION.--Lat 28° 49'01", long 82° 08'40", in SE1⁄ 4 sec.19, T.19 S., R.22 E., Sumter County, Hydrologic Unit 03100208, on west shore of lake, 0.8 mi north of outlet, 4.6 mi west of Coleman, and 5.1 mi northwest of town of Lake Panasoffkee.
SURFACE AREA.--4,821 acres (7.53 mi2).
DRAINAGE AREA.--420 mi2, approximately.
PERIOD OF RECORD.--April 1955 to November 1962 (about weekly); December 1962 to current year. Records for Outlet River at Panacoochee Retreats (station 02312700).
REVISED RECORDS.--WDR FL-72-3: Drainage area, surface area.
GAGE.--Water-stage recorder. Datum of gage is at NGVD of 1929 (Florida Department of Transportation bench mark). Prior to Dec. 18, 1962, nonrecording gage and Dec. 18, 1962, to Oct. 7, 1975, water-stage recorder at sites within 0.8 mi south at same datum.
REMARKS.--Outflow from lake is through Outlet River to Withlacoochee River; lake level affected at times by the stage ofWithlacoochee River. Prior to 1962, lake level partially controlled during low water by small rock dams and at times during 1962 to 1964 by a temporary sheet piling dam in Outlet River.
EXTREMES FOR PERIOD OF RECORD.--Maximum elevation observed, 44.28 ft, Apr. 5, 1960; minimum observed, 36.88 ft, May 31, 2001.
ELEVATION (FEET NGVD), WATER YEAR OCTOBER 2001 TO SEPTEMBER 2002DAILY MEAN VALUES
DAY OCT NOV DEC JAN FEB MAR APR MAY JUN JUL AUG SEP
1 39.14 38.81 38.11 37.82 37.87 37.86 37.72 37.42 --- 38.16 39.59 39.75 2 39.21 38.78 38.08 37.88 37.86 37.87 37.70 37.40 --- 38.22 39.63 39.74 3 39.28 38.75 38.07 37.87 37.84 37.84 37.71 37.39 --- 38.25 39.71 39.74 4 39.34 38.70 38.05 37.90 37.80 37.89 37.70 37.38 --- 38.26 39.77 39.72 5 39.39 38.65 38.04 37.92 37.81 37.93 37.70 37.37 --- 38.29 39.79 39.75
6 39.43 38.63 38.03 37.91 37.82 37.96 37.69 37.36 --- 38.30 39.78 39.75 7 39.46 38.60 38.02 37.88 37.81 37.95 37.69 37.34 36.96 38.31 39.78 39.73 8 39.49 38.57 38.01 37.89 37.82 37.95 37.69 37.33 37.09 38.30 39.77 39.71 9 39.51 38.54 38.00 37.89 37.83 37.94 37.64 37.31 37.05 38.28 39.74 39.69 10 39.51 38.51 38.00 37.89 37.81 37.93 37.62 37.30 37.01 38.29 39.72 39.67
11 39.51 38.49 37.98 37.88 37.80 37.93 37.63 37.30 36.99 38.27 39.69 39.66 12 39.50 38.45 37.98 37.88 37.79 37.92 37.67 37.28 37.00 38.26 39.67 39.65 13 39.50 38.42 37.97 37.87 37.78 37.91 37.65 37.25 37.00 38.34 39.72 39.66 14 39.48 38.39 37.96 37.91 37.78 37.92 37.66 37.21 36.99 38.58 39.74 39.74 15 39.45 38.34 37.95 37.96 37.77 37.91 37.65 37.23 36.95 38.66 39.75 39.76
16 39.42 38.34 37.95 37.97 37.77 37.91 37.65 37.21 36.97 38.71 39.77 39.76 17 39.38 38.34 37.93 37.97 37.75 37.91 37.63 37.19 37.05 38.72 39.74 39.76 18 39.35 38.32 37.90 37.96 37.76 37.89 37.62 37.20 37.17 38.74 39.72 39.75 19 39.31 38.30 37.91 37.96 37.77 37.89 37.61 37.23 38.75 39.73 39.74 20 39.28 38.28 37.88 37.95 37.74 37.87 37.58 37.30 38.81 39.77 39.73
21 39.25 38.27 37.88 37.94 37.72 37.84 37.57 37.28 39.01 39.76 39.72 22 39.22 38.26 37.88 37.94 37.73 37.83 37.55 37.42 39.19 39.79 39.71 23 39.19 38.25 37.89 37.93 37.77 37.82 37.55 37.65 39.30 39.81 39.70 24 39.15 38.23 37.87 37.93 37.87 37.82 37.55 37.72 39.34 39.79 39.74 25 39.12 38.22 37.86 37.91 37.88 37.80 37.52 37.80 39.37 39.75 39.84
26 39.05 38.19 37.82 37.92 37.87 37.79 37.50 37.90 39.39 39.71 39.87 27 38.99 38.18 37.85 37.91 37.80 37.76 37.50 37.93 39.45 39.68 39.85 28 38.94 38.17 37.85 37.90 37.83 37.76 37.47 37.97 39.48 39.64 39.85 29 38.89 38.15 37.83 37.91 --- 37.76 37.44 38.04 39.54 39.61 39.84 30 38.86 38.12 37.84 37.90 --- 37.75 37.45 38.09 39.55 39.63 39.83 31 38.84 --- 37.82 37.90 --- 37.74 --- 39.56 39.75 --
MEAN 39.27 38.41 37.94 37.91 37.80 37.87 37.61 38.76 39.73 39.75 MAX 39.51 38.81 38.11 37.97 37.88 37.96 37.72 -- --- 39.56 39.81 39.87 MIN 38.84 38.12 37.82 37.82 37.72 37.74 37.44 -- --- 38.16 39.59 39.65
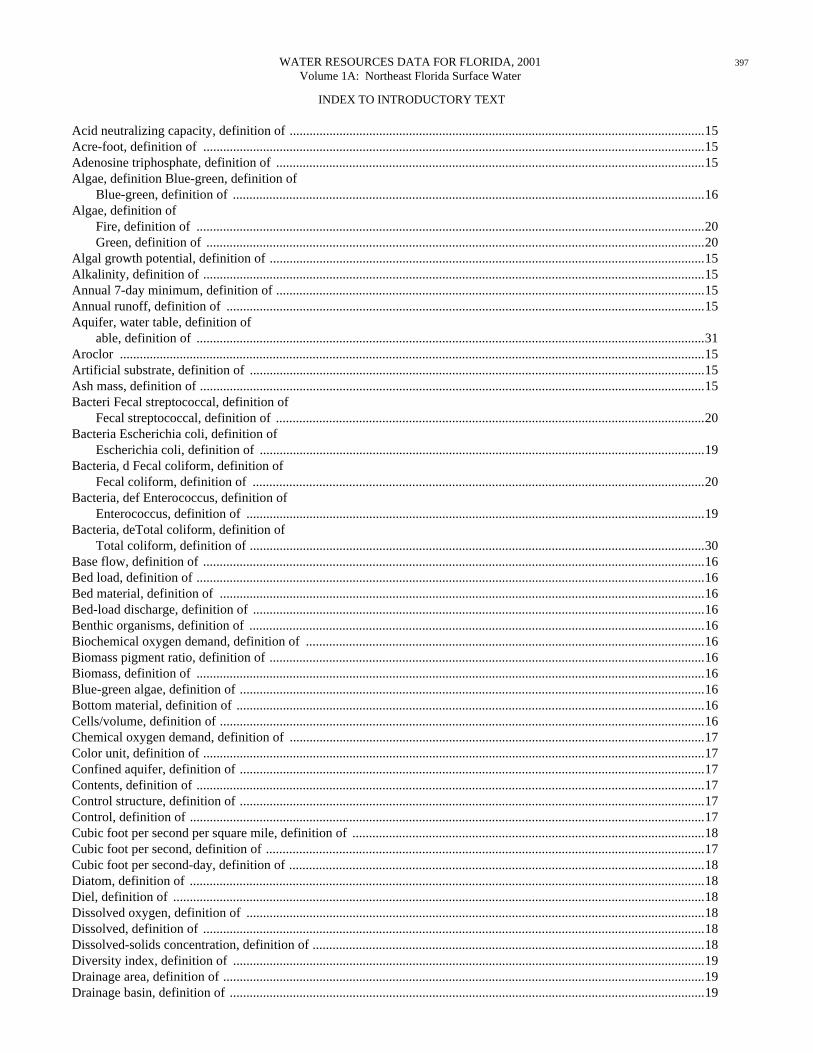
397 WATER RESOURCES DATA FOR FLORIDA, 2001 Volume 1A: Northeast Florida Surface Water
INDEX TO INTRODUCTORY TEXT
Acid neutralizing capacity, definition of .............................................................................................................................15Acre-foot, definition of .......................................................................................................................................................15Adenosine triphosphate, definition of .................................................................................................................................15Algae, definition Blue-green, definition of
Blue-green, definition of ..............................................................................................................................................16Algae, definition of
Fire, definition of .........................................................................................................................................................20Green, definition of ......................................................................................................................................................20
Algal growth potential, definition of ...................................................................................................................................15Alkalinity, definition of .......................................................................................................................................................15Annual 7-day minimum, definition of .................................................................................................................................15Annual runoff, definition of ................................................................................................................................................15Aquifer, water table, definition of
able, definition of .........................................................................................................................................................31Aroclor ................................................................................................................................................................................15Artificial substrate, definition of .........................................................................................................................................15Ash mass, definition of ........................................................................................................................................................15Bacteri Fecal streptococcal, definition of
Fecal streptococcal, definition of .................................................................................................................................20Bacteria Escherichia coli, definition of
Escherichia coli, definition of ......................................................................................................................................19Bacteria, d Fecal coliform, definition of
Fecal coliform, definition of ........................................................................................................................................20Bacteria, def Enterococcus, definition of
Enterococcus, definition of ..........................................................................................................................................19Bacteria, deTotal coliform, definition of
Total coliform, definition of .........................................................................................................................................30Base flow, definition of .......................................................................................................................................................16Bed load, definition of .........................................................................................................................................................16Bed material, definition of ..................................................................................................................................................16Bed-load discharge, definition of ........................................................................................................................................16Benthic organisms, definition of .........................................................................................................................................16Biochemical oxygen demand, definition of ........................................................................................................................16Biomass pigment ratio, definition of ...................................................................................................................................16Biomass, definition of .........................................................................................................................................................16Blue-green algae, definition of ............................................................................................................................................16Bottom material, definition of .............................................................................................................................................16Cells/volume, definition of ..................................................................................................................................................16Chemical oxygen demand, definition of .............................................................................................................................17Color unit, definition of .......................................................................................................................................................17Confined aquifer, definition of ............................................................................................................................................17Contents, definition of .........................................................................................................................................................17Control structure, definition of ............................................................................................................................................17Control, definition of ...........................................................................................................................................................17Cubic foot per second per square mile, definition of ..........................................................................................................18Cubic foot per second, definition of ....................................................................................................................................17Cubic foot per second-day, definition of .............................................................................................................................18Diatom, definition of ...........................................................................................................................................................18Diel, definition of ................................................................................................................................................................18Dissolved oxygen, definition of ..........................................................................................................................................18Dissolved, definition of .......................................................................................................................................................18Dissolved-solids concentration, definition of ......................................................................................................................18Diversity index, definition of ..............................................................................................................................................19Drainage area, definition of .................................................................................................................................................19Drainage basin, definition of ...............................................................................................................................................19

398 WATER RESOURCES DATA FOR FLORIDA, 2001 Volume 1A: Northeast Florida Surface Water
INDEX TO INTRODUCTORY TEXT---ContinuedDry mass, definition of ........................................................................................................................................................19Dry weight, definition of .....................................................................................................................................................19Enterococcus bacteria, definition of ....................................................................................................................................19Escherichia coli (E. coli), definition of ...............................................................................................................................19Euglenoids, definition of .....................................................................................................................................................19Fecal coliform bacteria, definition of ..................................................................................................................................20Fecal streptococcal bacteria, definition of ...........................................................................................................................20Fire algae, definition of .......................................................................................................................................................20Flow-duration percentiles, definition of ..............................................................................................................................20Gage height, definition of ....................................................................................................................................................20Gaging station, definition of ................................................................................................................................................20Gas chromatography/flame ionization detector, definition of
tion of ...........................................................................................................................................................................20Green algae, definition of ....................................................................................................................................................20Hardness, definition of ........................................................................................................................................................21High tide, definition of ........................................................................................................................................................21Hydrologic unit, definition of ..............................................................................................................................................21Land-surface datum, definition of .......................................................................................................................................21Light-attenuation coefficient, definition of .........................................................................................................................22Lipid, definition of ..............................................................................................................................................................22Low flow, 7-day 10-year, definition of ...............................................................................................................................27Low tide, definition of .........................................................................................................................................................22Macrophytes, definition of ..................................................................................................................................................22Mean discharge, definition of ..............................................................................................................................................22Measuring point, definition of .............................................................................................................................................22Membrane filter, definition of .............................................................................................................................................22Metamorphic stage, definition of ........................................................................................................................................22Methylene blue active substances, definition of .................................................................................................................23Micrograms per gram, definition of ....................................................................................................................................23Micrograms per kilogram, definition of ..............................................................................................................................23Micrograms per liter, definition of ......................................................................................................................................23Microsiemens per centimeter, definition of ........................................................................................................................23Milligrams per liter, definition of ........................................................................................................................................23Miscellaneous site, definition of .........................................................................................................................................23Most probable number (MPN), definition of ......................................................................................................................23Multiple-plate samplers, definition of .................................................................................................................................23Nanograms per liter, definition of .......................................................................................................................................23Natural substrate, definition of ............................................................................................................................................23Nekton, definition of ...........................................................................................................................................................23Nephelometric turbidity unit, definition of .........................................................................................................................24Open or screened interval, definition of ..............................................................................................................................24Organic carbon, definition of ..............................................................................................................................................24Organic mass, definition of .................................................................................................................................................24Organism count, definition of
Area, definition of ........................................................................................................................................................24Total, definition ............................................................................................................................................................30Volume, definition of ...................................................................................................................................................24
Organochlorine compounds, definition of ..........................................................................................................................24Parameter Code, definition of .............................................................................................................................................24Partial-record station, definition of .....................................................................................................................................24Particle size, definition of ....................................................................................................................................................24Particle-size classification, definition of .............................................................................................................................24Percent composition, definition of ......................................................................................................................................25Periodic station, definition of ..............................................................................................................................................25Periphyton, definition of .....................................................................................................................................................25Pesticides, definition of .......................................................................................................................................................25

399 WATER RESOURCES DATA FOR FLORIDA, 2001 Volume 1A: Northeast Florida Surface Water
INDEX TO INTRODUCTORY TEXT---ContinuedpH, definition of ..................................................................................................................................................................25Phytoplankton, definition of ................................................................................................................................................25Picocurie, definition of ........................................................................................................................................................25Plankton, definition of .........................................................................................................................................................25Polychlorinated biphenyls (PCB s), definition of ...............................................................................................................25Polychlorinated naphthalenes, definition of ........................................................................................................................25Primary productivity, definition of ......................................................................................................................................26
Carbon method, definition of .......................................................................................................................................26Oxygen method, definition of ......................................................................................................................................26
Radioisotopes, definition of ................................................................................................................................................26Recoverable, bottom material, definition of ........................................................................................................................26Recurrence interval, definition of ........................................................................................................................................26Replicate samples, definition of ..........................................................................................................................................26River mileage, definition of ................................................................................................................................................27Runoff, definition of ............................................................................................................................................................27Sea level, definition of ........................................................................................................................................................27Sediment, definition of ........................................................................................................................................................27Sodium adsorption ratio, definition of ................................................................................................................................27Specific conductance, definition of .....................................................................................................................................27Stable isotope ratio, definition of ........................................................................................................................................27Stage (see gage height) ........................................................................................................................................................28Stage-discharge relation, definition of ................................................................................................................................28Streamflow, definition of ....................................................................................................................................................28Substrate, artificial, definition of
ficial, definition of ........................................................................................................................................................15Substrate, definition of ........................................................................................................................................................28Substrate, natural, definition of ...........................................................................................................................................23Surface area, definition of ...................................................................................................................................................28Surficial bed material, definition of ....................................................................................................................................28Suspended sediment, definition of ......................................................................................................................................28Suspended, definition of ......................................................................................................................................................28
Recoverable, definition of ............................................................................................................................................28Total, definition of .......................................................................................................................................................29
Suspended-sediment concentration, definition of ...............................................................................................................28Suspended-sediment discharge, definition of ......................................................................................................................28Suspended-sediment load, definition of ..............................................................................................................................28Synoptic studies, definition of .............................................................................................................................................29Taxonomy, definition of ......................................................................................................................................................29Time-weighted average, definition of .................................................................................................................................29Tons per acre-foot, definition of .........................................................................................................................................29Total coliform bacteria, definition of ..................................................................................................................................30Total discharge, definition of ..............................................................................................................................................30Total length, definition of ....................................................................................................................................................30Total load, definition of .......................................................................................................................................................30Total organism count, definition of .....................................................................................................................................30Total recoverable, definition of ...........................................................................................................................................30Total sediment discharge, definition of ...............................................................................................................................30Total, bottom material, definition of ...................................................................................................................................30Total, definition of ...............................................................................................................................................................29Volatile organic compounds, definition of ..........................................................................................................................31Water table, definition of ....................................................................................................................................................31Water year, definition of 31Water-table aquifer, definition of ........................................................................................................................................31WDR, definition of ..............................................................................................................................................................31Weighted average, definition of ..........................................................................................................................................31Wet mass, definition of .......................................................................................................................................................31Wet weight, definition of ....................................................................................................................................................31WSP, definition of ...............................................................................................................................................................31Zooplankton, definition of ...................................................................................................................................................31

400 Index to Surface-Water Sites
Alligator Creek at Callahan ................................................43Alligator Lake near Ashton ..............................................371Apopka-Beauclair Canal below dam, near Astatula ......... 137Apopka-Beauclair Canal near Astatula ............................135Arbuckle Creek near De Soto City ...................................297Ariana Lake at Auburndale ..............................................389Bay Lake near Vineland ................................................... 373Bayroot Slough Headwaters near Bay Lake ..................... 321Big Creek near Clermont .................................................. 120Big Davis Creek at Bayard ...............................................183Black Lake Outlet at S-101A, at Buena Vista ..................254Black Water Creek near Cassia, FL ................................. 102Blue Cypress Creek near Fellsmere ...................................50Blue Springs near Orange City .........................................104Boggy Creek near Taft .....................................................244Bonnet Creek near Kissimmee .........................................261Bonnet Creek near Vineland ............................................256C-2 Canal near Vineland ..................................................245Camps Canal near Rochelle .............................................. 155Catfish Creek near Lake Wales ........................................292Church Lake near Groveland ............................................364Clear Lake at San Antonio ............................................... 394Crane Creek at Babcock Street at Melbourne ..................223Crane Creek at U.S. Highway 1 at Melbourne ................. 224Cross-Florida Barge Canal at Buckman Lock, near Palatka .....................................................................161Cypress Creek at Vineland ...............................................248Cypress Creek Canal at S-103A near Vineland ............... 253Cypress Lake near St. Cloud ............................................377Dade City Canal near Dade City ......................................317Davenport Creek near Loughman .................................... 281Deep Creek
at Spuds, FL ..............................................................179near Hastings ............................................................ 178
Dunns Creek near Satsuma ...............................................169Eau Gallie River at Heather Glen Circle at Melbourne .... 222Econlockhatchee River near Chuluota ...............................78Eleventh Street Canal at Holly Hill ..................................211Econlockhatchee River near Oviedo ..................................77Etonia Creek near Bardin ................................................. 172Fellsmere Canal near Micco ............................................. 229Fisheating Creek at Palmdale ........................................... 239Fisheating Creek near Lakeport ........................................240Fishing Creek at 110th Street at Jacksonville ................... 192Fishing Creek at Wesconnet Blvd. at Jacksonville .......... 191Fort Drum Creek at Sunshine State Parkway,near Fort Drum ...................................................................49Fox Branch near Socrum ..................................................305Gee Creek near Longwood .................................................85Green Swamp East WMA Marsh near Cumpressco ........ 309Green Swamp Run near Eva ............................................. 119Haile Sink near Arredondo ............................................... 154Haines Creek at Lisbon .................................................... 139Haines Creek below Burrell Dam, at Lisbon ....................141Halifax Canal near Harbor Oaks ...................................... 216Harney Pond Canal near Lakeport ................................... 242Haulover Canal near Mims ...............................................219Haw Creek at Mouth near Seville ....................................168
Hogtown Creek near Arredondo .......................................153Holly Lake near Umatilla .................................................367Howell Creek at State Highway 434 near Oviedo ..............83Howell Creek near Altamonte Springs ...............................81Howell Creek near Slavia ...................................................82Indian River at Wabasso ...................................................233Jane Green Creek near Deer Park .......................................53Jumper Creek Canal near Bushnell ...................................332Kissimee River below S-65, near Lake Wales .................295Kissimee River near Lorida ..............................................296Kissimmee River at S-65, near Lake Wales .....................293Kissimmee River at S-65E, near Okeechobee ................. 298Kissimmee River below S-65E, near Okeechobee ...........300Lady Lake near Lady Lake ...............................................395Lake Arbuckle near Avon Park ........................................383Lake Arietta near Auburndale ..........................................387Lake Bryan near Vineland ................................................372Lake Butler at Windermere ..............................................375Lake Deeson near Lakeland ..............................................393Lake Helene near Polk City ..............................................392Lake Istokpoga near De Soto City ....................................384Lake Jesup Outlet near Sanford ......................................... 86Lake Juliana near Polk City ..............................................391Lake Marian near Kenansville ..........................................382Lake Marion near Haines City ..........................................378Lake Minnehaha at Clermont ...........................................363Lake Okeechobee ..............................................................385Lake Panasoffkee near Lake Panasoffkee ........................396Lake Pierce near Waverly .................................................379Lake Rosalie near Lake Wales .........................................381Lake Umatilla at Umatilla, FL ..........................................366Lake Weir near Weirsdale, FL ..........................................368Lake Weohyakapaka at Indian Lake Estates ....................380Lake Whistler near Auburndale ........................................388Lateral 101 at S-101, near Lake Buena Vista ...................255Lateral 405 at S-405A, near Doctor Phillips ....................271Lateral 405 below S-405, near Vineland ..........................272Lateral 410 at S-410, near Vineland .................................273Lehigh Canal near Flagler Beach .....................................208Little Creek near Clermont ...............................................121Little Econlockhatchee River at State Highway 434 near Oviedo ........................................................................76Little Econlockhatchee River at University Boulevard near Union Park .................................................................75Little Econlockhatchee River near Union Park ..................73Little Econlockhatchee River Tributary at Banner Dam atUnion Park ..........................................................................74Little Haw Creek near Seville ...........................................167Little Wekiva River near Altamonte Springs .....................97Little Wekiva River near Longwood ..................................98Little Withlacoochee River
at Rerdell .................................................................. 324Little Withlacoochee River near Tarrytown .....................322Main Canal at Vero Beach ................................................236Middle Haw Creek near Korona .......................................166Middle Prong St. Marys River near Taylor ........................40Moses Creek near Moultrie ..............................................207Moultrie Creek at Moultrie ...............................................206

401 Index to Surface-Water Sites---Continued
Nassau River near Hedges .................................................. 45North Canal near Vero Beach ...........................................235North Fork Black Creek at Middleburg ............................ 182North Fork Black Creek near Middleburg ........................ 181North Prong Saint Sebastian River near Micco ................ 228North Prong St. Marys River at Moniac .............................39Ocklawaha River above Moss Bluff Dam, at Moss Bluff 142Ocklawaha River at Eureka .............................................. 150Ocklawaha River at Moss Bluff ....................................... 143Ocklawaha River at Rodman Dam, near Orange Springs 158Ocklawaha River near Conner .......................................... 148Orange Creek at Orange Springs ...................................... 157Ortega River at Jacksonville, FL ...................................... 189Ortega River at Kirwin Road near Jacksonville, FL ........ 190Outlet River at Panacoochee Retreats .............................. 335Pablo Creek at Jacksonville ..............................................203Palatlakaha River at Cherry Lake Outlet, near Groveland ................................................................. 122Palatlakaha River at Structure M-1, near Okahumpaka ...133Palatlakaha River at structure M-4, near Okahumpka ......131Palatlakaha River at structure M-5, near Okahumpka ......129Palatlakaha River at Structure M-6, near Mascotte .......... 127Palatlakaha River below spillway at Cherry Lake Outlet, nearGroveland .........................................................................124Palatlakaha River below spillway, near Mascotte ............126Palatlakaha River below structure M-4,near Okahumpka ............................................................... 132Palatlakaha River below structure M-5,near Okahumpka ............................................................... 130Palatlakaha River below structure M-6, near Mascotte ....128Palatlakaha River near Mascotte ...................................... 125Pennywash Creek near Deer Park ...................................... 56Prairie Creek near Gainesville ..........................................151Rainbow Springs near Dunnellon .....................................347Reed Canal at South Daytona ........................................... 215Reedy Creek above U.S. Highway 192 near Vineland ....274Reedy Creek at S-40, near Loughman ..............................284Reedy Creek at S-46 near Vineland ................................. 264Reedy Creek at State Highway 531 near Poinsianna .......291Reedy Creek below S-40, near Loughman ....................... 287Reedy Creek near Loughman ...........................................288Reedy Creek near Vineland .............................................. 276Rice Creek near Springside ..............................................171Rock Springs near Apopka .................................................95San Sebastian River at St. Augustine ...............................205Shady Brook near Sumterville ..........................................334Shingle Creek at Airport, near Kissimmee ....................... 246Shingle Creek at Campbell ............................................... 263Silver Springs near Ocala .................................................145Simms Creek near Bardin .................................................173Sixmile Creek near Kenansville ......................................... 51Soldier Creek near Longwood ............................................ 84South Branch Big Fishweir Creek at Blanding Blvd. at Jacksonville ..................................................................... 194South Branch Big Fishweir Creek at Cassat Ave. at Jacksonville ..................................................................... 193South Canal near Vero Beach ........................................... 237South Fork Black Creek near Penney Farms ....................180
South Lake near Vineland ................................................374South Lake Outlet at S-15 near Vineland .........................247South Prong Saint Sebastian River near Sebastian ...........227Spruce Creek near New Smyrna Beach ........................... 217Spruce Creek near Samsula ..............................................214St. Johns River above Lake Harney, near Geneva ..............79St. Johns River at Astor ....................................................115St. Johns River at Buckman Bridge at Jacksonville .........184St. Johns River at Buffalo Bluff near Satsuma .................162St. Johns River at Dancy Point near Spuds .......................174St. Johns River at Jacksonville .........................................195St. Johns River near Christmas ...........................................66St. Johns River near Cocoa .................................................58St. Johns River near De Land ...........................................108St. Johns River near Melbourne ..........................................54St. Johns River near Sanford ..............................................87St. Marys River near Macclenny ........................................41St. Sebastian River near Railroad Bridge, at Roseland......230Taylor Creek at HGS-6, near Okeechobee .......................301Taylor Creek near Cocoa ....................................................65Thayer Canal near Daytona Beach ...................................210Thomas Creek near Crawford .............................................44Tiger Bay Canal near Daytona Beach ..............................209Tomoka River near Holly Hill ..........................................212Tomoka River near Ormond Beach ..................................213Trout Lake near Clermont ............................................... 376Tsala Apopka Outfall Canal at S-353, near Hernando .....342Tsala Apopka Outfall Canal below S-353, near Hernando ..................................................................344Turkey Creek at Palm Bay ................................................225Turnbull Creek near New Smyrna Beach .........................218Wekiva River at Old R.R. Crossing near Sanford ..............99Wekiva River near Apopka ................................................96Wekiva River near Sanford ..............................................100Wekiva Springs near Apopka .............................................94West Crooked Lake near Eustis ........................................365Whittenhorse Creek at S-411, near Vineland ...................270Whittenhorse Creek near Vineland ...................................265Withlacoochee River at Croom ....................................... 326Withlacoochee River at Dunnellon ...................................348Withlacoochee River at Inglis Dam, near Dunnellon .......350Withlacoochee River at Trilby ..........................................318Withlacoochee River at Wysong Dam, at Carlson ...........337Withlacoochee River below Inglis Dam, near Dunnellon 351Withlacoochee River Bypass Channel near Inglis ............352Withlacoochee River near Cumpressco ............................310Withlacoochee River near Dade City ...............................315Withlacoochee River near Floral City ............................. 329Withlacoochee River near Holder ....................................345Withlacoochee River near Inverness ................................340Withlacoochee-Hillsborough Overflow near Richland ....312Wolf Branch at FCRR near Mount Dora ..........................138Wolf Creek near Deer Park .................................................57Wolf Creek near Kenansville ..............................................52