martin county, florida
80
MARTIN COUNTY, FLORIDA UTILITIES DEPARTMENT COMPREHENSIVE ANNUAL FINANCIAL REPORT FISCAL YEARS ENDED SEPTEMBER 30, 2012 AND 2011 An Enterprise Fund Department of the Martin County, Florida, Board of County Commissioners Prepared by the Finance Division of the Utilities Department of Martin County, Florida
-
Upload
khangminh22 -
Category
Documents
-
view
0 -
download
0
Transcript of martin county, florida

MARTIN COUNTY, FLORIDA UTILITIES DEPARTMENT
COMPREHENSIVE ANNUAL FINANCIAL REPORT
FISCAL YEARS ENDED SEPTEMBER 30, 2012 AND 2011
An Enterprise Fund Department of the Martin County, Florida, Board of County Commissioners
Prepared by the Finance Division of the Utilities Department of Martin County, Florida

MARTIN COUNTY, FLORIDAUTILITIES DEPARTMENT
COMPREHENSIVE ANNUAL FINANCIAL REPORTFiscal Years Ended September 30, 2012 and 2011
TABLE OF CONTENTS
INTRODUCTORY SECTION (unaudited)PAGE
Transmittal Letter...............................................................................................................................1
Principal Officials.............................................................................................................................. 12
Management Team.............................................................................................................................12
Organization Chart............................................................................................................................. 13
Service Area Map...............................................................................................................................14
FINANCIAL SECTION
Independent Auditors' Report............................................................................................................ 15
Management's Discussion and Analysis (unaudited).........................................................................17
FINANCIAL STATEMENTS
Statements of Net Assets........................................................................................................28
Statements of Revenues, Expenses and Changes in Net Assets............................................ 30
Statements of Cash Flows...................................................................................................... 31
Notes to Financial Statements................................................................................................33
STATISTICAL SECTION (unaudited)
Schedule of Net Assets by Component Last Ten Fiscal Years.......................................................... 46
Schedule of Changes in Net Assets Last Ten Fiscal Years................................................................47
Operating Revenues and Expenses Fiscal Years 2003-2012………………………………………. 48
Operating Income, Income Before Capital Contributions & Increase in Net Assets 2003-2012…. 48
Schedule of Revenues by Source Last Ten Fiscal Years................................................................... 49
Schedule of Operating Expenses by Function Last Ten Fiscal Years............................................... 50
Schedule of Annual Capital Contributions by Source Last Ten Fiscal Years…….……………….. 51
Schedule of Capital Disbursements Last Ten Fiscal Years............................................................... 52
Schedule of Number of Water and Sewer Customers by Type Last Ten Fiscal Years…………... 53
Schedule of Water and Sewer Rates.................................................................................................. 54
(continued)

TABLE OF CONTENTS
Continued
Percent of Meters by Dwelling Type as of September 30, 2012………………………………….. 55
Schedule of Average Residential Customer Billings Last Ten Fiscal Years..................................... 56
Schedule of Ten Largest Customers Current Year and Nine Years Ago……...................................57
Schedule of Residential Water/Wastewater Bill Comparisons as of 2012........................................ 58
Schedule of Meter Connections Last Ten Fiscal Years..................................................................... 59
Schedule of Assessed Value & Actual Value of Taxable Property Last Ten Fiscal Years............... 60
Schedule of Direct & Overlapping Property Tax Rates Last Ten Fiscal Years………………….. 61
Schedule of Demographic & Economic Statistics Last Ten Years....................................................62
Schedule of Principal Employers Current Year and Nine Years ago................................................ 63
Schedule of Property Tax Levies and Collections Last Ten Fiscal Years......................................... 64
Schedule of Debt Service Coverage Last Ten Fiscal Years…………………………………………65
Schedule of Ratio of Revenues Bonded Debt Outstanding: 2003-2012…………………………… 66
Schedule of Investment Per Equivalent Residential Connection (ERC) Last Ten Fiscal Years....... 67
Schedule of Statistical Operating Indicators Last Ten Fiscal Years…………………………………68
Schedule of Capital Asset Statistics Last Ten Fiscal Years…………………………………………68
Schedule of Capital Asset Statistics for the Fiscal Year Ended September 30, 2012........................69
Schedule of Authorized Full Time Equivalent Employees by Function Last Ten Fiscal Years……70
Independent Auditors' Report on Internal Control over Financial Reporting and on Compliance and Other Matters Based on an Audit of Financial Statements Performed in Accordance with Government Auditing Standards…………………………………………………………………….71

INTRODUCTORYSECTION


March 14, 2013
Honorable Martin County Board of Commissioners Taryn Kryzda, County Administrator Dear Ladies and Gentlemen: The Comprehensive Annual Financial Report (“CAFR”) of the Martin County Utilities Department (the “Department”) for the fiscal year ended September 30, 2012 is hereby submitted. The Department is an enterprise fund operation of the Martin County, Florida, (the “County”) Board of County Commissioners (the “Board”). The Department’s Financial Operations Division prepared the CAFR. The report consists of management’s representations concerning the finances of the Department. Consequently, management assumes full responsibility for the completeness and reliability of all information presented in this report. To provide a reasonable basis for making these representations, management of the Department has established a comprehensive internal control framework that is designed both to protect its assets from loss, theft, or misuse and to compile sufficient reliable information for the preparation of the Department’s financial statements in conformity with accounting principles generally accepted in the United States of America (“GAAP”). Because the cost of internal controls should not outweigh their benefits, the Department’s comprehensive framework of internal controls has been designed to provide reasonable, rather than absolute, assurance that the financial statements will be free from material misstatement. We believe that the data, as presented, is accurate in all material respects; that it is presented in a manner designed to fairly state the financial position and results of the operations of the Department. The Department’s financial statements have been audited by McGladrey L.L.P., a certified public accounting firm. The goal of the independent audit was to provide reasonable assurance that the financial statements of the Department for the fiscal year ended September 30, 2012 are free of material misstatement. The independent audit involved examining, on a test basis, evidence supporting the amounts and disclosures in the financial statements; assessing the accounting principles used and significant estimates made by management; and evaluating the overall financial statement presentation. The independent auditors’ report is presented as the first component of the financial section of this report.
DOUG SMITH Commissioner, District 1
ED FIELDING Commissioner, District 2
ANNE SCOTT Commissioner, District 3
SARAH HEARD Commissioner, District 4
JOHN HADDOX Commissioner, District 5
TARYN KRYZDA, CPM County Administrator
TELEPHONE 772-288-5400
WEB ADDRESS
http://www.martin.fl.us
MARTIN COUNTY BOARD OF COUNTY COMMISSIONERS UTILITIES & SOLID WASTE DEPARTMENT PO Box 9000 Stuart, FL 34995-9000
John E. Polley Director Phone (772) 221-1442 Fax (772) 221-1447

2
GAAP requires that management provide a narrative introduction, overview and analysis to accompany the basic financial statements in the form of Management’s Discussion and Analysis (“MD&A”). This letter of transmittal is designed to complement the MD&A and should be read in conjunction with it. The Department’s MD&A can be found immediately following the report of the independent auditors.
PROFILE OF THE DEPARTMENT History and purpose The Department was organized in conjunction with the purchase of Southern Gulf Utilities in 1981, which provided water to the Town of Sewall’s Point by wholesale purchase of water from the City of Stuart. In 1984 the Department constructed its first water treatment facility (North System Treatment Plant). Subsequent milestones in the growth of the Department’s utility system include the 1986 purchase of the Intercoastal Utilities water and wastewater system; the 1987 construction of the North County wastewater plant; the 1993 construction of the North System Reverse Osmosis Plant; the 1993 purchase of the Martin Downs Utility water and wastewater system; the 1994 construction of the Tropical Farms water and wastewater plant; and a major expansion of the Tropical Farms system which was completed in 2008. Today the Department’s utility system service area (“System”) encompasses a large portion of the unincorporated eastern section of the County where the majority of the population of the County resides. The System’s service area essentially surrounds and excludes the City of Stuart, the largest City in the County, which is serviced by its own municipally-owned water and wastewater system. As of September 30, 2012 the Department had approximately 34,436 water and wastewater connections, providing service to an estimated population of 88,147 customers.
The Department, as an operating unit of the Board, reports directly to the County Administrator. Martin County provides a full range of services and is a Non-Charter County established under the Constitution and the laws of the State of Florida. The legislative and governing body of the County is the five-member Board of County Commissioners. In accordance with State Statutes Chapter 28-12, the Clerk of the Circuit Court is the Clerk of the Commission and official custodian of the accounting records for the Department. The Accounting Department of the Clerk’s Office, and the Administrative Services Department, which report to the County Administrator, process accounting and budget entries generated by the Department. Budgetary control The Department’s budget is included in the County’s annual budget, which is prepared pursuant to Chapter 129, Florida Statutes. The Department’s budget is adopted on a basis consistent with accounting principles generally accepted in the United States of America (GAAP) with the exception that capital asset purchases are budgeted as capital outlay expenditures for control purposes. Activities of the operation accounts (Revenue; Operations and Maintenance; Sinking Fund Accounts, including Bond Interest, Bond Principal, Renewal and Replacement; and Capital Improvement) required by covenants securing the Department’s indebtedness are included in the annual budget.
3
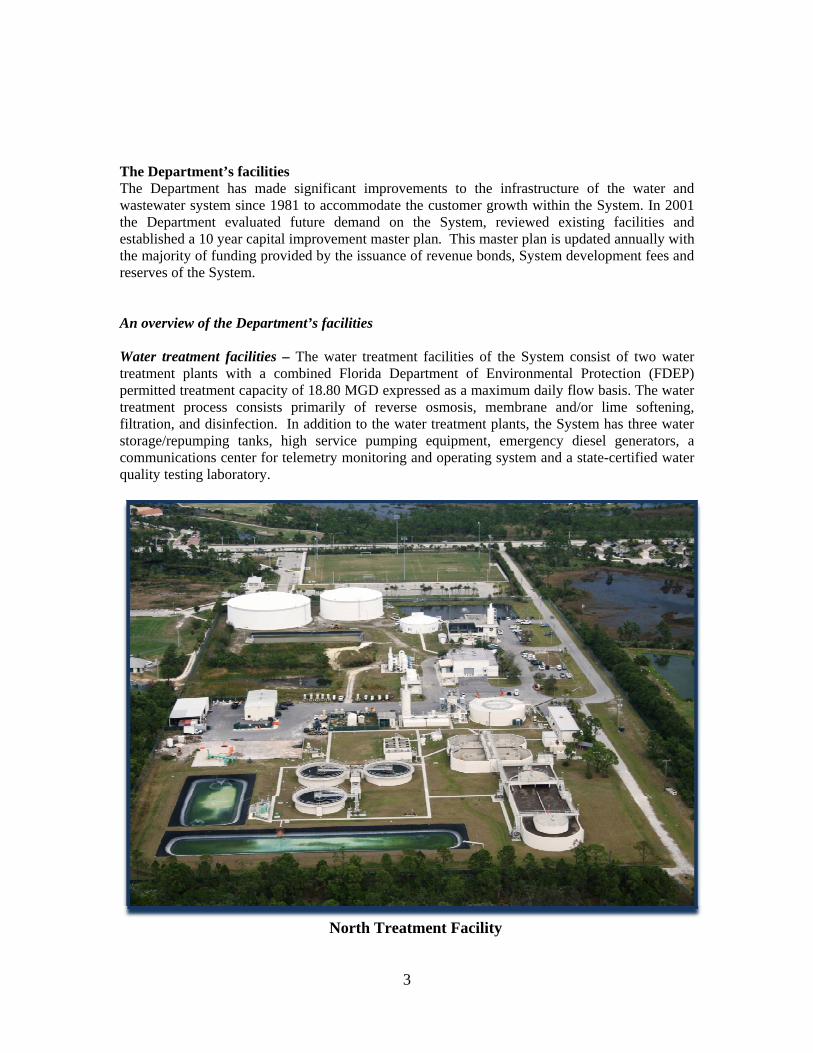
The Department’s facilities The Department has made significant improvements to the infrastructure of the water and wastewater system since 1981 to accommodate the customer growth within the System. In 2001 the Department evaluated future demand on the System, reviewed existing facilities and established a 10 year capital improvement master plan. This master plan is updated annually with the majority of funding provided by the issuance of revenue bonds, System development fees and reserves of the System. An overview of the Department’s facilities Water treatment facilities – The water treatment facilities of the System consist of two water treatment plants with a combined Florida Department of Environmental Protection (FDEP) permitted treatment capacity of 18.80 MGD expressed as a maximum daily flow basis. The water treatment process consists primarily of reverse osmosis, membrane and/or lime softening, filtration, and disinfection. In addition to the water treatment plants, the System has three water storage/repumping tanks, high service pumping equipment, emergency diesel generators, a communications center for telemetry monitoring and operating system and a state-certified water quality testing laboratory.
North Treatment Facility

4
Tropical Farms Treatment Facility The first phase of the Tropical Farms water plant expansion was completed in FY 2008 and consists of a 8.0 MGD reverse osmosis water treatment plant in addition to the original 2.0 MGD membrane softening plant, two new surficial wells and three floridan wells, iron treatment facility, a 5 million gallon storage tank and two 16” deep injection.
Injection Well #2 Tropical Farms

5
Control Room Tropical Farms Operations Building
Tropical Farms Reverse Osmosis Operations Building

6
Head Works and Odor Control Tropical Farms Wastewater Plant Well fields – The Department draws its raw water supply from 30 Surficial Aquifer wells and nine Floridian Aquifer wells with an additional consumptive use permits from South Florida Water Management for five additional Floridian wells. Permitted capacity for these wells is 6,423 MGY. The South Florida Water Management District regulates the raw water supply through a consumptive use permitting process. Wastewater treatment facilities – The wastewater treatment facilities of the System consist of two treatment plants with a combined FDEP permitted capacity of 7.76 MGD. In addition to the wastewater treatment plants, the System has three deep injection wells, water reuse and percolation ponds. The Department currently disposes of treated effluent through reuse lines for irrigation purposes or through permitted percolation ponds. Sludge is disposed of through dewatering, hauling and disposal at an approved FDEP landfill. The first phase of the Tropical Farms wastewater plant expansion from 0.94 MGD to 5.0 MGD, was completed in FY 2008. This expansion included two deep injection wells for disposal of reverse osmosis concentrate and wet weather disposal of effluent. In addition the design of the expansion of the North System wastewater treatment plant from 1.03 MGD to 2.76 MGD commenced in 2003 and was completed in FY 2006.
7
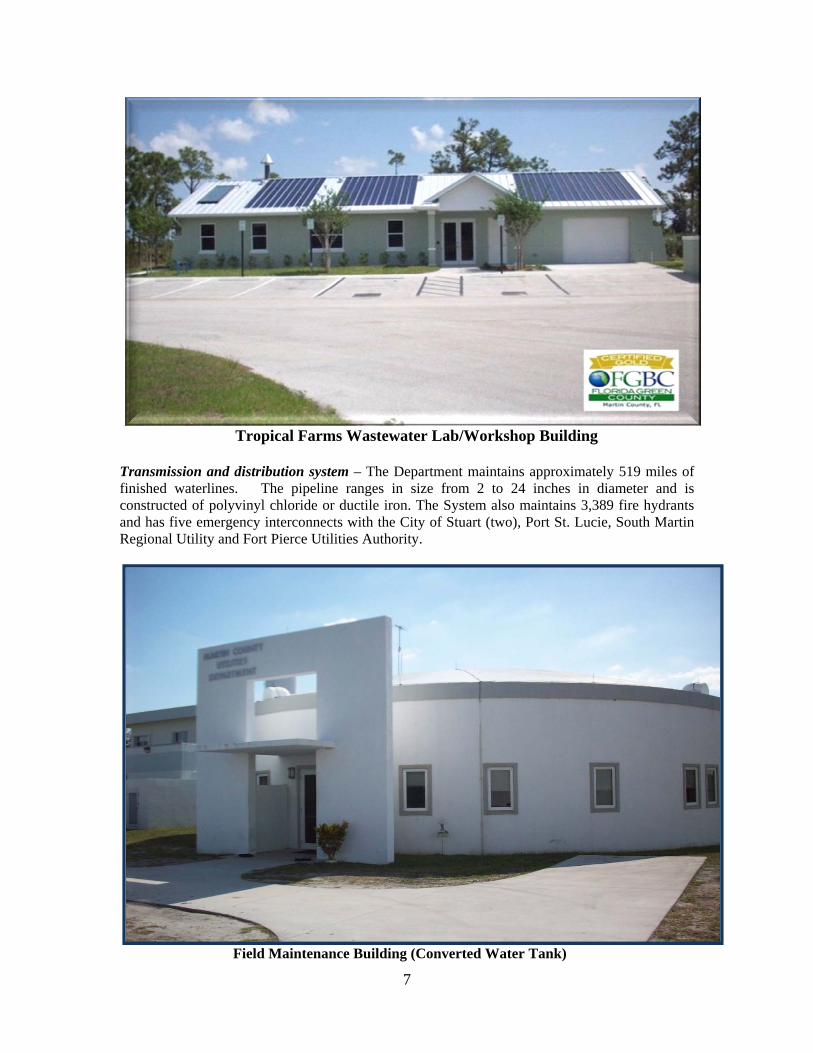
Tropical Farms Wastewater Lab/Workshop Building Transmission and distribution system – The Department maintains approximately 519 miles of finished waterlines. The pipeline ranges in size from 2 to 24 inches in diameter and is constructed of polyvinyl chloride or ductile iron. The System also maintains 3,389 fire hydrants and has five emergency interconnects with the City of Stuart (two), Port St. Lucie, South Martin Regional Utility and Fort Pierce Utilities Authority.
Field Maintenance Building (Converted Water Tank)

8
Collection system – The Department maintains collection and transmission facilities of over 364 miles of pipeline ranging in size from 2 to 20 inches in diameter, with 383 pump stations and 17 miles of vacuum sewers.
North River Shores Wastewater Vacuum Building Effluent reuse system – The Department maintains a wastewater reuse program which includes converting wastewater effluent into irrigation quality water (I.Q.) for use on golf courses, green spaces and some residential irrigation using 39 miles of I.Q. reuse water mains. During fiscal year 2012 approximately 61.3% of all wastewater effluent was processed into irrigation quality water. The use of I.Q. water is an important component of conserving water resources and wastewater management. The Department’s operations The Department’s operations are entirely related to providing water, wastewater and reuse (Irrigation Quality water) services. Technical Services operations division – This division is responsible for implementing the Department’s capital improvement master plan, coordinating and inspecting construction projects, designing in-house distribution and collection projects and maintaining the well field protection program, as well as maintaining drawings and records of the Department’s water and wastewater system. The division maintains utility system data on its Geographic Information System (GIS), a computer system that stores data based on physical geographic location. The
9
data includes the size and type of pipe, valves, fire hydrants and other system components as well as the date the component was installed and other relevant data. Financial management division – This division is responsible for all customer service and accounting activities, including customer billing, collection, meter reading and meter maintenance. The division is also responsible for preparation of all financial and budgetary documents, administering water, wastewater and solid waste assessment programs, as well as monitoring the daily financial operations of the Department for rate and bond covenant compliance. Water and wastewater plant operations division – This division is responsible for the operations of the water supply and treatment plants and the wastewater treatment and effluent disposal facilities. The Department strives to ensure that the water supply meets the highest quality standards possible for safety, aesthetics and taste. The Department employs staff that is certified in treatment, testing, monitoring and distribution of the water supply. Water is tested regularly, both prior to and after treatment, to ensure that it complies with or surpasses all federal and state water quality requirements. An annual consumer confidence report is provided to the Department’s customers by July 1st of each year. This division is also responsible for the operation, maintenance and regulatory reporting for the wastewater treatment facilities and operation and maintenance of the effluent disposal facilities. Field operations division – This division is responsible for the maintenance of water mains, gravity sewers, force mains and fire hydrants throughout the Department’s total utility service area. In addition, this division provides prompt repair and maintenance of leaks, major line breaks, new installations, correction of sewer backups, and all customer service fieldwork. This division is also responsible for maintaining the cross connection control program to detect and prevent cross-connections that may create a potential health hazard. A cross-connection is any physical connection between the water supply and any private piping arrangement that contains a foreign liquid or substance. Prevention requires the installation of an approved backflow prevention device. Plant maintenance operations division – This division is responsible for all maintenance and general routine upkeep of the water and wastewater treatment facilities and lift stations. These functions are performed by certified maintenance mechanics, instrument technicians and certified electricians. This division operates and monitors the supervisory control and data acquisition (SCADA) system that allows water and wastewater treatment operators to monitor and control pumping, treatment and discharge from their control panels, where automation can provide an extra level of efficiency. ECONOMIC CONDITION AND OUTLOOK The information presented in the financial statements is best understood when it is considered from the broader perspective of the specific environment within which the Department operates. Local economy and demand trends Martin County is located on the east coast of South/Central Florida in the area commonly referred to as the Treasure Coast. According to the Bureau of Business and Economic Research the population of the County has increased 12.79% from 2003 to 2012, and is currently ranked 31stin population and 25th in density among Florida’s 67 counties. The economy of the County is based upon retail trade and services, healthcare, construction, manufacturing and tourism. The

10
Department’s service area continues to reflect primarily residential and light businesses. Growth in the number of water connections increased 11.4% between fiscal years 2008 and 2012, or an average of 2.3% per year. A continued increase in population is projected through “build-out” which is expected to occur in 2025. Many residents are in the service area for only part of the year. The permanent year-around population of Martin County as of April 2012 was approximately 147,203 residents. The Department experiences monthly fluctuations in water consumption and wastewater services depending on seasonal demands due to the changes in seasonal and permanent population. The Department has year-around mandatory irrigation restrictions that prohibit irrigation between 9:00 a.m. and 5:00 p.m. and during FY 2009 mandatory restrictions by South Florida Management District permanently limited irrigation to three days a week. In addition there is a surcharge on potable water rates above 10,000, 15,000 and 25,000 gallons per month to discourage excessive use of water for irrigation. Long-range financial planning The Department’s capital improvement master plan is projected to require approximately $27 million over the next 10 years. These improvements include $1.7 million in transmission and distribution lines, $1.8 million for valve and fire hydrant replacement, $1.7 million in force mains and reuse lines, $3 million for sanitary sewer lining and $4.5 million for automatic meter retrofit or existing meters, $2.4 for membrane and sand filter replacement, $2.3 million for lift station construction and rehabilitation, $2.1 million for Tropical Farms water and wastewater plant improvements. The completion of the first phase of the expansion of Tropical Farms facilities in FY 2008 resulted in the regionalization of the water and wastewater plants and the elimination in FY 2009 of the Martin Downs water and wastewater plants, Dixie Park wastewater plant and the Vista Salerno water plant. The Martin Downs and Dixie Park facilities have been converted into master re-pump facilities for wastewater. The Department anticipates funding these improvements with existing cash reserves, future capital facility charges and any excess funds generated from rate revenue. During fiscal year 2009 the Board of County Commissioners approved automatically adjusting rates each year based on an amount equal to the prior year’s price index for water and wastewater published by the Florida Public Service Commission on or about March 31st or each year. Annual indexing will not be less than 0% or exceed 2.5% for the next five years. On October 1, 2011 the rates were indexed 0.56% and will be indexed 1.18% on October 1, 2012. Awards and acknowledgements The Government Finance Officers Association of the United States and Canada (GFOA) awarded a Certificate of Achievement for Excellence in Financial Reporting to the Department for its comprehensive annual financial report for the fiscal year ended September 30, 2011. This was the twelfth consecutive year that the Department achieved this prestigious award. In order to be awarded a Certificate of Achievement, a government must publish an easily readable and efficiently organized comprehensive annual financial report. This report must satisfy both generally accepted accounting principles and applicable legal requirements. A Certificate of Achievement is valid for a period of one year only. We believe that our current comprehensive annual financial report continues to meet the Certificate of Achievement Program’s requirements and we are submitting it to the GFOA to determine its eligibility for another certificate.


PRINCIPAL OFFICIALS
MARTIN COUNTY, FLORIDABOARD OF COUNTY COMMISSIONERS
AS OF SEPEMBER 30, 2012
EDWARD CIAMPICounty Commissioner
District #5
DOUG SMITH ED FIELDINGCounty Commissioner County CommissionerDistrict #1 District #2
PATRICK HAYES SARAH HEARDCounty Commissioner County CommissionerDistrict #3 District #4
TARYN KRYZDA
12
TARYN KRYZDACounty Administrator
UTILITIES DEPARTMENT
MANAGEMENT TEAM
JOHN POLLEYDirector
NANCY SHUTTS TED ROBBINSAdministrator AdministratorFinancial Management Technical Services
JIMMY MERCURIO DARREN BROTHERSOperations Administrator SuperintendentTreatment Maintenance
12
MARTIN COUNTY, FLORIDAUTILITIES DEPARTMENT
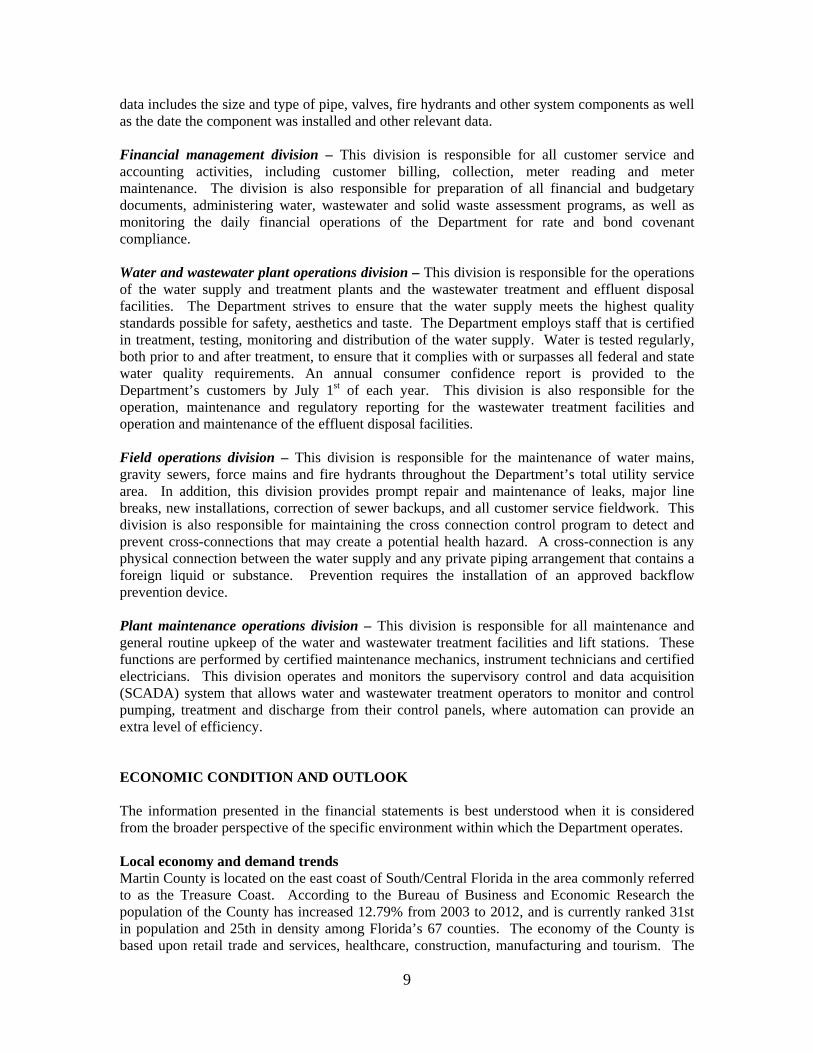
County Administrator
Financial Management Technical Service Field Operations Treatment Plant Maintenance
Directorof
Utilities
Billing/CollectionsFinancial PlanningAccounting/BudgetContract MeterReading
Division
ContractAdministrationConstructionInspectionFacilities
Division
WaterDistributionWastewaterCollectionCross
Division
Water TreatmentWastewaterTreatmentReuse/IQLaboratory
Division
Plant MaintenanceScada/InstrumentationHansen SystemCentralized Parts/
Inventory
Division
Reading FacilitiesPlanning/DesignEnvironmentalComplianceDevelopmentReview
CrossConnectionControl
Laboratory Inventory
13


FINANCIALSECTION
�

15
Independent Auditor’s Report The Honorable Board of County Commissioners Martin County, Florida We have audited the accompanying financial statements of the Martin County Utilities Department (the Department), an enterprise fund of Martin County, Florida, as of and for the year ended September 30, 2012, as listed in the table of contents. These financial statements are the responsibility of the Department's management. Our responsibility is to express an opinion on these financial statements based on our audit. The financial statements of the Department, as of September 30, 2011, were audited by other auditors whose report dated March 19, 2012 expressed an unqualified opinion on those statements. We conducted our audit in accordance with auditing standards generally accepted in the United States of America and the standards applicable to financial audits contained in Government Auditing Standards, issued by the Comptroller General of the United States. Those standards require that we plan and perform the audit to obtain reasonable assurance about whether the financial statements are free of material misstatement. An audit includes consideration of internal control over financial reporting as a basis for designing audit procedures that are appropriate in the circumstances, but not for the purpose of expressing an opinion on the effectiveness of the Department’s internal control over financial reporting. Accordingly, we express no such opinion. An audit includes examining, on a test basis, evidence supporting the amounts and disclosures in the financial statements. An audit also includes assessing the accounting principles used and significant estimates made by management, as well as evaluating the overall financial statement presentation. We believe that our audit provides a reasonable basis for our opinion. As discussed in note 1, the financial statements referred to above present only the Department and do not purport to, and do not, present fairly the financial position of Martin County, Florida, as of September 30, 2012 and 2011 and the changes in its financial position and where applicable, its cash flows for the years then ended in conformity with accounting principles generally accepted in the United States of America. In our opinion, the 2012 financial statements referred to above present fairly, in all material respects, the financial position of the Department as of September 30, 2012, and the respective changes in its financial position and its cash flows for the year then ended in conformity with accounting principles generally accepted in the United States of America. In accordance with Government Auditing Standards, we have also issued our report dated March 14, 2013 on our consideration of the Department’s internal control over financial reporting and our tests of its compliance with certain provisions of laws, regulations, contracts and grant agreements, and other matters. The purpose of that report is to describe the scope of our testing of internal control over financial reporting and compliance and the results of that testing, and not to provide an opinion on the internal control over financial reporting or on compliance. That report is an integral part of an audit performed in accordance with Government Auditing Standards and should be considered in assessing the results of our audit.

16
Accounting principles generally accepted in the United States of America require that the management’s discussion and analysis be presented to supplement the basic financial statements. Such information, although not a part of the basic financial statements, is required by the Governmental Accounting Standards Board who considers it to be an essential part of financial reporting for placing the basic financial statements in an appropriate operational, economic, or historical context. We have applied certain limited procedures to the required supplementary information in accordance with auditing standards generally accepted in the United States of America, which consisted of inquiries of management about the methods of preparing the information and comparing the information for consistency with management’s responses to our inquiries, the basic financial statements, and other knowledge we obtained during our audit of the basic financial statements. We do not express an opinion or provide any assurance on the information because the limited procedures do not provide us with sufficient evidence to express an opinion or provide any assurance. Our 2012 audit was conducted for the purpose of forming an opinion on the financial statements that collectively comprise the Department’s basic financial statements. The accompanying introductory section and statistical section are presented for purposes of additional analysis and are not a required part of the basic financial statements. The introductory section and statistical section have not been subjected to the auditing procedures applied in the audit of the basic financial statements and, accordingly, we express no opinion on them.
West Palm Beach, Florida March 14, 2013

Martin County, Florida Utilities Department
17
MANAGEMENT’S DISCUSSION AND ANALYSIS (unaudited)
Our discussion and analysis of the Department’s financial performance provides an overview of the Department’s financial activities for the fiscal years ended September 30, 2012 and 2011. Please read it in conjunction with the Department’s financial statements that begin on page 28.
HIGHLIGHTS Financial highlights
2012
Operating revenues increased slightly to $29.5 million or 0.6% which is attributable to new customer growth and the annual water and wastewater rate increase of 0.6%.
Operating expenses remained virtually the same as FY 2011 at $25.7 million. Operating expenses exclusive of indirect costs and depreciation was down $0.4 million and indirect costs were up $0.4 million.
The Department’s customer base increased by 367 customers or 1.14%. Connections from new construction are up slightly over last year.
2011
Operating revenues increased to $29.4 million or 6.2% which is attributable to new customer
growth mainly from assessments, including a full year of wastewater revenues from the North River Shores Assessment and the annual water and wastewater rate increase of 2.5%.
The Department received the remaining $2.0 million of the North River Shores wastewater system capital grant.
Operating expenses decreased to $25.7 million, or 1.5% in 2011, largely due to a decrease in retirement expense mid year from 10.7 % to 4.9% and a decrease in sludge removal (in FY 2010 there was a one-time expense cleaning digesters on plant decommissioning) and a decrease in chemicals relating to the discontinuance of certain chemicals used in treatment.
The Department’s customer base increased by 270 water and wastewater customers or 0.9% and an additional 264 wastewater customers from the North River Shores Assessment project that were already water customers. New connections from construction continue to be slow as a result of adverse economic conditions.

Martin County, Florida Utilities Department
18
Department highlights
2012 The Department completed construction on the Ocean Breeze Park master lift station and
connection of the Town of Ocean Breeze Park to the north wastewater reclamation facility. The Quail Trail West water assessment project was completed bringing water service to 22
residences. The Department replaced over 3,000 manual read water meters with automatic radio-read
meters as part of the long term capital improvement project to replace all the meters in the system with radio-read meters.
Completed two master lift stations and force mains under the Indian River Lagoon to connect Indian River Plantation customers to the Department’s north wastewater reclamation facility.
The Department issued the Utilities System Refunding Revenue Note, Series 2012 for $34.3 which was used to advance refund $32.2 million of the principal from the Utilities System Revenue Bonds, Series 2003, achieving an economic gain over the next twenty-one years of $5.2 million.
2011
The Department completed construction and was awarded First Green Building Certification
(FGBC) for the Tropical Farms Wastewater Treatment Plant laboratory building. The Department issued the Utilities System Refunding Revenue Note, Series 2010 for $16.9
which was used to advance refund $16.0 million of the principal from the Utilities System Revenue Bonds, Series 2001, achieving an economic gain over the next sixteen years of $2.3 million.
The Department completed the North River Shores wastewater assessment project, bringing service to 463 existing water customers.
The Department completed the Piper’s Landing and Rio East water assessment projects, bringing water service to 506 properties.
The Department completed the Phase I force main between Indian River Plantation to Ocean Blvd. under the inter-coastal waterway.
USING THIS ANNUAL REPORT Required financial statements The financial statements of the Department report information about the Department using accounting methods similar to those used by private sector companies. These statements offer short-term and long-term financial information about its activities. The Statement of Net Assets includes the entire Department’s assets and liabilities and provides information about the nature and amounts of investments in resources (assets) and obligations to creditors (liabilities). It also provides the basis for computing rate of return, evaluating the capital structure of the Department and assessing the liquidity and financial flexibility of the Department.

Martin County, Florida Utilities Department
19
The Statement of Revenues, Expenses and Changes in Net Assets includes all of the current year’s revenues and expenses. This statement measures the success of the Department’s operations over the past year and can be used to determine whether the Department has successfully recovered all its costs through its user fees and other charges, profitability, and credit-worthiness. The final required financial statement is the Statement of Cash Flows. The primary purpose of this statement is to provide information about the Department’s cash receipts and cash payments during the reporting period. The statement reports cash receipts, cash payments, and net changes in cash resulting from operations, investing and capital and noncapital financing activities and explains where the cash came from, what the cash was used for and what was the change in the cash balance during the reporting period.
FINANCIAL ANALYSIS OF THE DEPARTMENT AS A WHOLE One of the most important questions asked about the Department’s finances is “Is the Department, as a whole, better off or worse off as a result of the year’s activities?” The Statement of Net Assets and the Statement of Revenues, Expenses and Changes in Net Assets report information about the Department’s activities in a way that will help answer this question. These two statements report the net assets of the Department and the changes in them. You can think of the Department’s net assets, the difference between assets and liabilities, as one way to measure financial health or financial position. Over time, increases or decreases in the Department’s net assets are one indicator of whether its financial health is improving or deteriorating. However, you will need to also consider other nonfinancial factors such as changes in economic conditions, population growth, and new or changed legislation. The Department’s total net assets increased by $2.1 million in FY2012 and increased by $11 million in FY2011. Our analysis below focuses on the Department’s net assets (Table 1) and changes in net assets (Table 2) during the year.
Table 1
Net Assets
As of September
30, 2012 As of September
30, 2011 %
ChangeAs of September
30, 2010 %
Change
Capital assets $ 236,800,897
$ 239,608,575 (1.2) $ 238,265,185 0.6
Current and other assets 48,287,286
46,866,149 3.0 42,646,586 9.9
Total assets 285,088,183
286,474,724 (0.5) 280,911,771 2.0
Bonds and loans payable 85,683,725
88,624,650 (3.3) 91,596,770 (3.2)
Other liabilities 3,506,148
4,037,035 (13.2) 6,469,895 (37.6)
Total liabilities 89,189,873
92,661,685 (3.7) 98,066,665 (5.5)
Net assets:
Invested in capital assets, net of debt 150,111,208
149,380,517 0.5 146,666,415 1.9
Restricted 14,070,489
15,936,299 (11.7) 16,695,872 (4.5)
Unrestricted 31,716,613
28,496,223 11.3 19,482,819 46.3
Total net assets $ 195,898,310
$ 193,813,039 1.1 $ 182,845,106 6.0

Martin County, Florida Utilities Department
20
Net assets invested in capital assets, net of debt, increased $0.7 million or 0.5% for the fiscal year ended 2012 as compared to 2011, which was due to completed capital construction and the purchase of capital assets. Net assets invested in capital assets, net of debt, reflects an increase of $2.7 million or 1.9% for the fiscal year ended 2011 as compared to 2010, which was due to completed capital construction and the purchase of capital assets. Restricted net assets decreased 11.7% in fiscal year 2012 as compared to 2011 due to the decrease in cash balances of investments in the Capital Facility and Replacement and Renewal Fund. Restricted net assets decreased 4.5% in fiscal year 2011 as compared to 2010 due to the decrease in cash balances of investments in the Capital Facility and Replacement and Renewal Fund. Unrestricted net assets increased $3.2 million or 11.3% in fiscal year 2012 due to an increase in operating and non-operating income, principal payments on assessment loans and a decrease in restricted assets and $9.0 million or 46.3% in fiscal year 2011 due to an increase in operating income and capital contributions resulting from completed water and wastewater assessment projects. Long-term debt in fiscal year 2012 decreased $2.9 million or 3.3% due to annual principal payments on outstanding bonds and loans. In fiscal 2011year decreased $2.9 million or 3.2% due to annual principal payments on outstanding bonds and loans. The use of net assets reported above as restricted are limited to purposes specified by the Department’s various bond documents. Changes in the Department’s net assets can be determined by reviewing the following summary of Revenues, Expenses and Changes in Net Assets for the year.

Martin County, Florida Utilities Department
21
Table 2
Statement of Revenues, Expenses, and Change in Net Assets
FY 2012 FY 2011 %
Change FY 2010 %
ChangeOperating Revenues:
Water revenues $15,046,843 $15,311,585 (1.7) $14,278,309 7.2
Sewer revenues 12,297,237 12,093,494 1.7
11,344,357 6.6
Water service availability fees 366,781 361,989 1.3 420,030 (13.8)
Sewer service availability fees 347,173 350,479 (0.9) 355,277 (1.4)
Miscellaneous 1,491,010 1,253,467 19.0 1,253,158 0.0
Total operating revenues 29,549,044 29,371,014 0.6 27,651,131 6.2 Non-operating revenues:
Interest income 917,394 748,788 22.5 774,737 (3.3)
Gain on disposal of assets 41,293 5,865 604.1 4,485 30.8
Total non-operating revenues 958,687 754,653 27.0 779,222 (3.2)
Total Revenues 30,507,731 30,125,667 1.3 28,430,353 6.0 Operating expenses:
Administrative and general 4,806,477 4,740,726 1.4 5,066,052 (6.4)
Operating and maintenance 10,966,083 11,185,347 (2.0) 11,494,376 (2.7)
Depreciation and amortization 9,893,592 9,749,429 1.5 9,496,037 2.7
Total operating expenses 25,666,152 25,675,502 0.0 26,056,465 (1.5) Non-operating expenses:
Interest expense 3,832,787 4,024,138 (4.8) 4,599,194 (12.5)
Amortization of bond discounts/costs 647,683 519,857 24.6 419,550 23.9
Other expenses 117,307 - 100.0 -
Total non-operating expenses 4,597,777 4,543,995 1.2 5,018,744 (9.5)
Total expenses 30,263,929 30,219,497 0.1 31,075,209 (2.8)
Income before contributions
243,802
(93,830) (359.8)
(2,644,856) (96.5)Contributions 1,841,469 11,061,763 (83.4) 5,881,514 88.1
Changes in net assets 2,085,271 10,967,933 (81.0) 3,236,658 238.9
Net assets at beginning of year 193,813,039 182,845,106 6.0 179,608,448 1.8
Net assets at end of year $195,898,310 $193,813,039 1.1 $182,845,106 6.0
Martin County, Florida Utilities Department
22
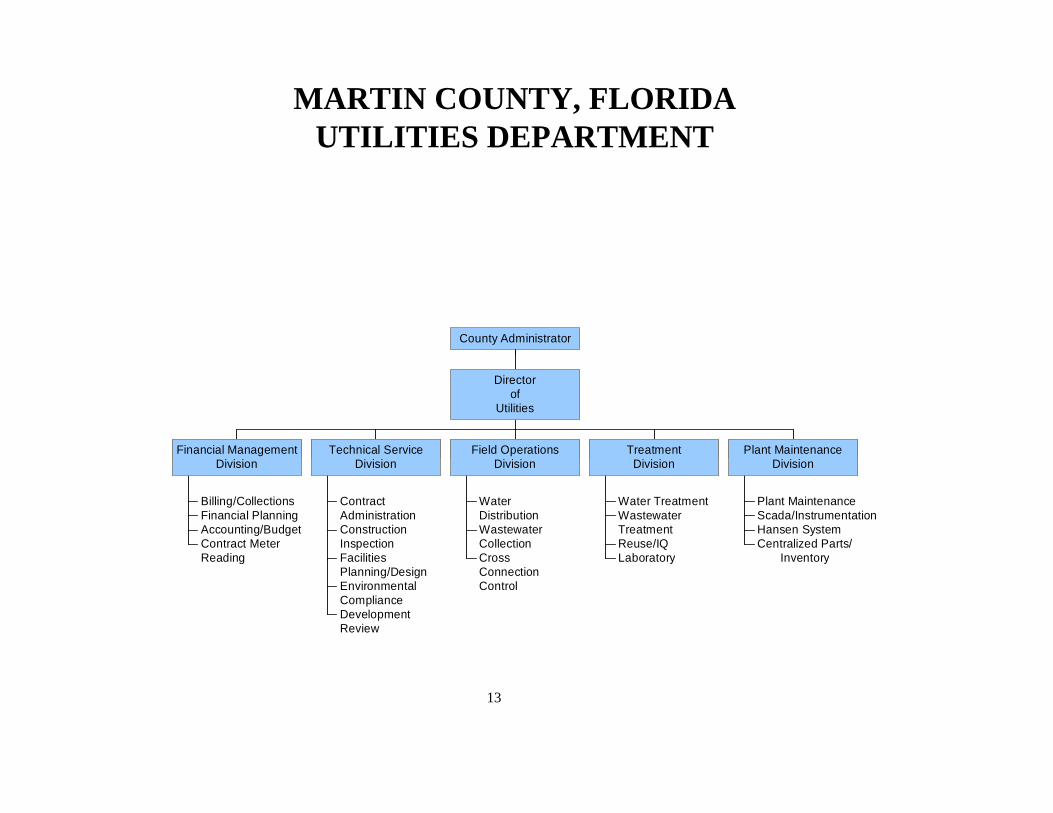
Operating Revenue Total operating revenues reflect a 0.6% increase in fiscal year 2012 compared to 2011 and an increase of 6.2% in fiscal year 2011 compared to 2010. The increase was the result of the addition of new customers and a rate increase of 0.5%. In fiscal year 2011 the increase was the result of the addition of new customers from completed water and wastewater assessments and a rate increase of 2.5%. Capital Contributions Capital contributions decreased 83.4% in fiscal year 2012 as compared to 2011 due to 98.7% decrease in completed special assessments and a 70.7% decrease in capital facility charges collected. Capital contributions increased 88.1% in fiscal year 2011 as compared to 2010 due to the completion of several large water and wastewater special assessment projects.
Operating Revenues Distribution Fiscal Year Ended September 30, 2012
Guaranteed Revenues
3%
Water Sales51%
Sewer Sales42%
Other5%
Martin County, Florida Utilities Department
23
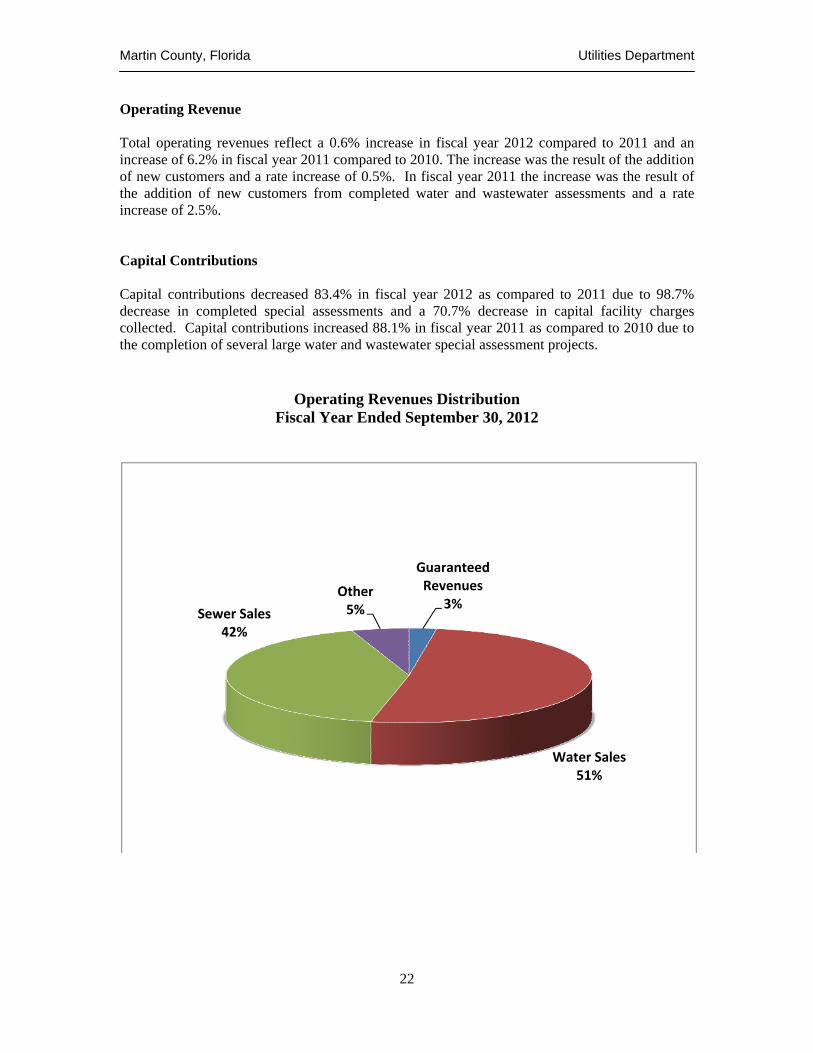
Operating Expenses Operating expenses, excluding depreciation and amortization, decreased by less than $0.2 million or 0.9% over fiscal year 2011 due to decrease in electric and chemical expenses. From fiscal year 2010 to 2009 operating expenses, excluding depreciation and amortization, decreased $0.6 million or 3.8% due to a decrease sludge removal and chemical expenses.
Operating Expenses Distribution Fiscal Year Ended September 30, 2012
Depreciation38%
Financial Operations
6%
Technical Services
5%
Field Operations Water4%
Field Operations Sewer6%
Water Treatment12%
Sewer Treatment14%
Maintenance Water4%
Maintenance Sewer3%
Indirect Allocation6% Administration
2%
Martin County, Florida Utilities Department
24
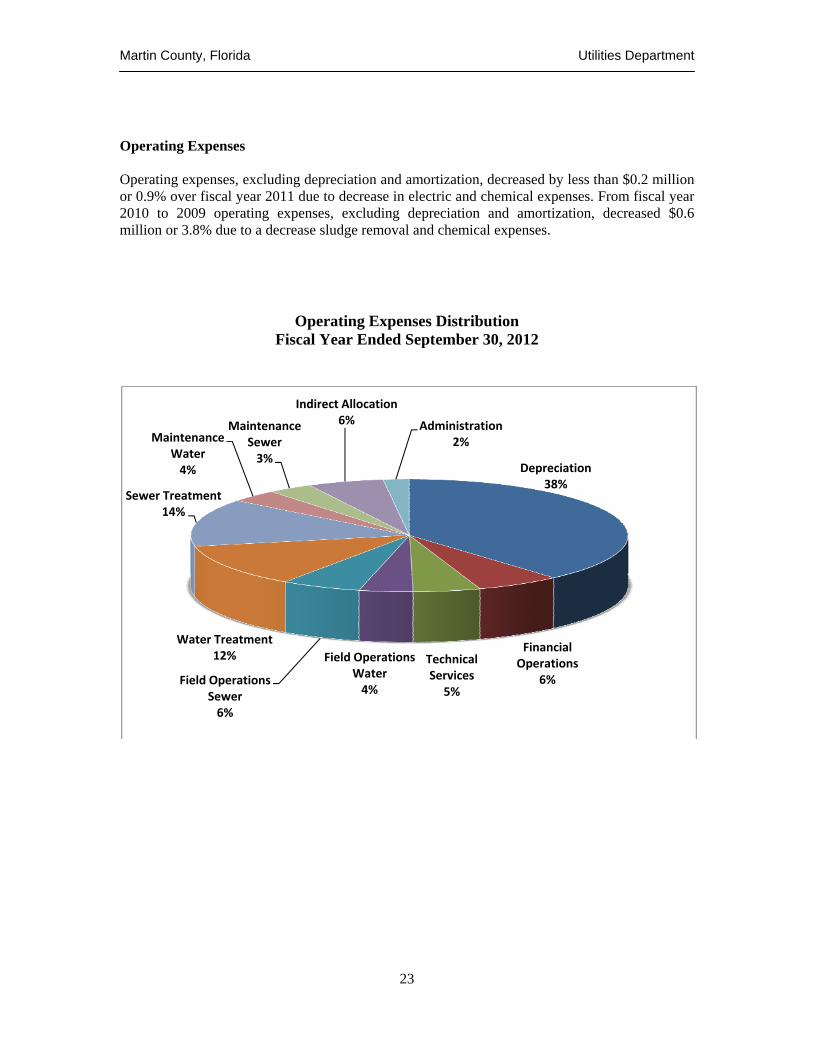
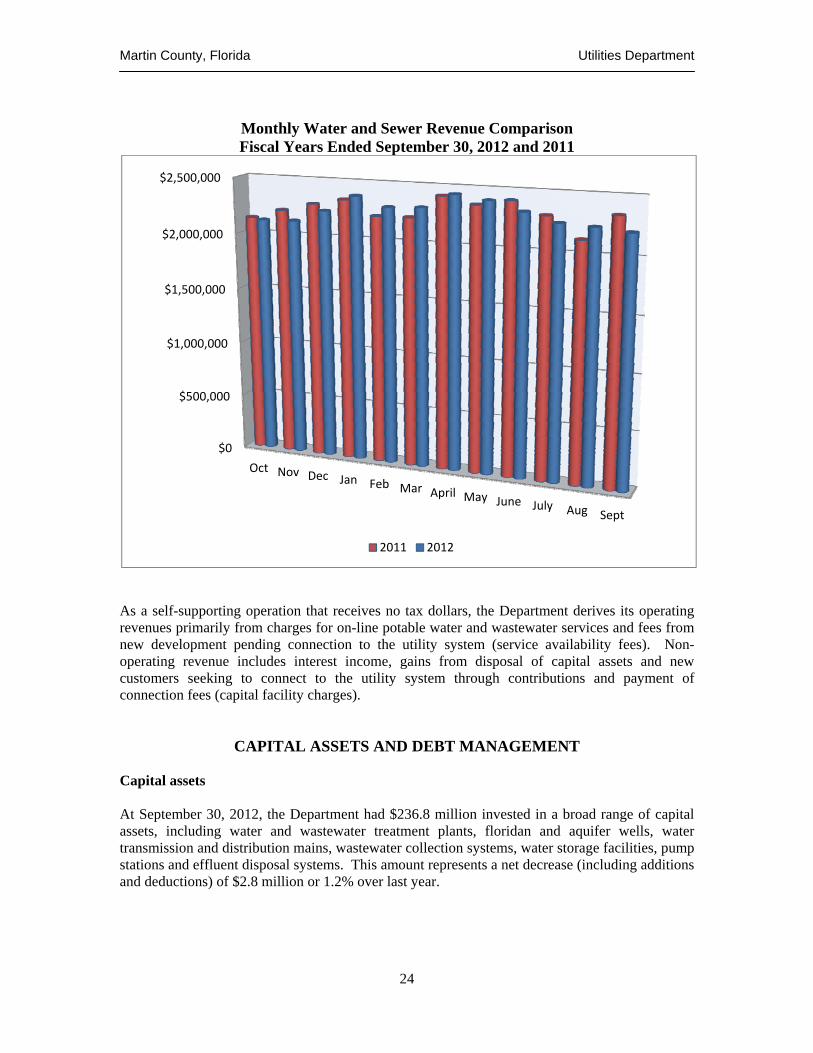
Monthly Water and Sewer Revenue Comparison Fiscal Years Ended September 30, 2012 and 2011
As a self-supporting operation that receives no tax dollars, the Department derives its operating revenues primarily from charges for on-line potable water and wastewater services and fees from new development pending connection to the utility system (service availability fees). Non-operating revenue includes interest income, gains from disposal of capital assets and new customers seeking to connect to the utility system through contributions and payment of connection fees (capital facility charges).
CAPITAL ASSETS AND DEBT MANAGEMENT
Capital assets At September 30, 2012, the Department had $236.8 million invested in a broad range of capital assets, including water and wastewater treatment plants, floridan and aquifer wells, water transmission and distribution mains, wastewater collection systems, water storage facilities, pump stations and effluent disposal systems. This amount represents a net decrease (including additions and deductions) of $2.8 million or 1.2% over last year.
$0
$500,000
$1,000,000
$1,500,000
$2,000,000
$2,500,000
Oct Nov Dec Jan Feb Mar April May June July Aug Sept
2011 2012

Martin County, Florida Utilities Department
25
The following table summarizes the Department’s capital assets, net of accumulated depreciation for the years ended September 30, 2012 and 2011.
Table 3 Capital Assets
2012 2011
Land $ 5,620,732 $ 5,620,732
Buildings 88,837,950 89,515,701
Wells 6,322,619 6,677,873
Water distribution system 54,820,440 55,456,787
Sewer collection system 71,879,773 71,269,744
Equipment and leasehold improvements 1,683,217 1,697,341
Intangible assets 6,370,985 6,543,948
235,535,716 236,782,126
Construction work in progress 1,265,181 2,826,449
Net utility plant $ 236,800,897 $ 239,608,575 The following table summarized the changes in capital assets. These changes are presented in detail in Note 5 to the financial statements.
Balance at beginning of year $ 239,608,575 $ 238,265,185
Additions 8,659,637 13,263,325
Retirements (394,517) (491,157)
Depreciation (9,893,592) (9,749,429)
Accumulated depreciation retired 382,062 490,687
Decrease (increase) in construction work in progress (1,561,268) (2,170,036)
$ 236,800,897 $ 239,608,575 The year’s major additions to the utility system included: Odor Control at Tropical Farms Plant $ 2.3 million Master Lift Station for IRP/Ocean Breeze Park $ 1.7 million Indian River Plantation/Ocean Breeze Park Forcemain $ 1.2 million Blower Piping at Tropical Farms Plant $ 0.2 million Indian Street Bridge Utility Accomodations $ 0.2 million S.E. Salerno Road Watermain $ 0.1 million Rio West Forcemain $ 0.1 million

Martin County, Florida Utilities Department
26
The Department’s 2013 budget plans for investing in capital projects, including the following: Tropical Farms reclaimed water storage $1.5 million Indian River Drive watermain extension $1.2 million North County Plant Expansion for treatment of sludge $0.3 million Murphy Road Bridge watermain $0.2 million Tropical Farms sound attenuation wall $0.2 million
These projects are budgeted to be funded from cash reserves, excess operating revenue, and capital facility charges. Debt At September 30, 2012, the Department had a total of $85.7 million in bonds and loans outstanding versus $88.6 million last year. During 2012 the Department issued $34,260,000 in a Utilities System Refunding Revenue Note to refund $32,210,000 in principal amount of the Department’s Utility System Revenue Bonds, Series 2003.
2012 2011 Utility System Refunding Revenue Bonds net of
premium, discount and deferred refunding charges $ 27,598,337 $ 28,416,094 Utility System Refunding Note net of refunding Charges 47,083,949 15,800,372 Utility System Revenue Bonds 9,016,483 42,297,601
State Revolving Fund Loan 1,984,956 2,110,582
Total Outstanding Debt $ 85,683,725 $ 88,624,649 The Department’s revenue bond rating is AA- insured and AA- underlying from S&P and AA insured and AA insured from Fitch rating services. All the revenue bonds are insured. More detailed information about the Department’s long-term debt is presented in Note 6 of the financial statements.
ECONOMIC FACTORS AND NEXT YEAR’S BUDGETS AND RATES
The Department’s service area continues to reflect primarily residential and light businesses. Growth in the number of water connections over the last five years has averaged 2.3%. Customer growth increased slightly due to the addition of new customers, the completion of special assessments, the acquisition of private utilities and new construction. New development is minimal and reflects the current economic environment. Water restrictions implemented by the South Florida Water Management District were made permanent in November 2009 and limit irrigation to three days a week. The growth in the number of accounts served has occurred primarily due to the in-fill of existing developments, special assessment projects for extension of water and wastewater lines, as well as new construction. The Department is in the process of implementing a septic tank elimination program. The first phase of this program was designed in 2003 for the Seagate Harbor/Lighthouse Point development. The Florida Department of Environmental Protection State Revolving Loan (SRF)

Martin County, Florida Utilities Department
27
funding was obtained for this project and property owners of the affected area were assessed for the cost of construction of the wastewater collection system. This project was completed in FY 2005. The SRF loan for this project was finalized in FY 2006 for $2.8 million. In FY 2011 the Department completed the North River Shores project to provide wastewater service though a special assessment and a South Florida Water Management grant with a total project cost of $4.8 million. During FY 2009 a financial feasibility and rate study was conducted to determine future revenue requirements. As a result of that study, the Board of County Commissioners approved rate indexing for the next five fiscal years, not to exceed 2.5% annually beginning on or after October 1, 2010. For fiscal year ending 2012, rates were increased 0.56% and will increase October 1, 2012 1.18%.
CONTACTING THE DEPARTMENT’S FINANCIAL MANAGEMENT
This financial report is designed to provide our citizens, customers and creditors with a general overview of the Department’s finances and to demonstrate the Department’s accountability for the money it receives. If you have any questions about this report or need additional information, contact the Department’s Financial Operations Administrator at P.O. Box 9000, Stuart, Florida 34995-9000.

MARTIN COUNTY, FLORIDAUTILITIES DEPARTMENT
STATEMENTS OF NET ASSETSSeptember 30, 2012 and 2011
ASSETS2012 2011
Current assets: Pooled cash and cash equivalents 1,164,551$ 460,682$
Pooled restricted cash and cash equivalents 119,582 124,923
Pooled investments 18,820,124 15,165,469
Accounts receivable 2,803,095 2,628,587
Special assessment notes receivable 818,987 804,007
Inventories 605,468 579,714
Total current assets 24,331,807 19,763,382
Noncurrent assets: Restricted assets: Pooled cash and cash equivalents 642,862 150,388
Accounts receivable - 10,723
Pooled investments 14,275,105 16,617,598
Special assessment notes receivable 1,906,343 2,166,637
Total restricted assets 16,824,310 18,945,346
Capital assets: Land 5,620,732 5,620,732
Buildings 127,092,066 124,323,914
Water distribution system 95,535,654 93,854,460
Sewer collection system 103,142,502 99,566,257
Equipment 5,029,542 4,906,033
Intangible assets 8,124,372 8,008,352
344,544,868 336,279,748
Less depreciation and amortization (109,009,152) (99,497,622)
235,535,716 236,782,126
Construction work in progress 1,265,181 2,826,449
Capital assets, net 236,800,897 239,608,575
Other noncurrent assets: Special assessment notes receivable, less current portion 6,387,547 7,077,084
Deferred bond issuance costs, net 743,622 1,080,337
Total other noncurrent assets 7,131,169 8,157,421
Total noncurrent assets 260,756,376 266,711,342
TOTAL ASSETS 285,088,183$ 286,474,724$
See accompanying notes to financial statements.
28

MARTIN COUNTY, FLORIDAUTILITIES DEPARTMENT
STATEMENTS OF NET ASSETSSeptember 30, 2012 and 2011
LIABILITIES AND NET ASSETS
2012 2011
LIABILITIESCurrent liabilities: Payable from current assets: Accounts payable 796,395$ 699,902$
Accrued wages payable 113,194 111,451
Accrued compensated absences 94,900 96,134
Accrued interest payable 27,117 28,834
Current portion of loans payable 1,295,844 1,330,626
2,327,450 2,266,947
Payable from restricted assets: Customer deposits 967,060 956,610
Contracts payable 1,005,964 1,603,409
Current portion of bonds, net 2,430,000 1,975,000
4,403,024 4,535,019
Total current liabilities 6,730,474 6,801,966
Long-term liabilities: Accrued compensated absences 501,518 540,695
Loans payable 50,554,112 17,589,956
Bonds payable, net 31,403,769 67,729,068
Total long-term liabilities 82,459,399 85,859,719
TOTAL LIABILITIES 89,189,873 92,661,685
NET ASSETSInvested in capital assets, net of related debt 150,111,208 149,380,517
Restricted:
Capital projects 14,070,489 15,936,299
Unrestricted 31,716,613 28,496,223 TOTAL NET ASSETS 195,898,310$ 193,813,039$
See accompanying notes to financial statements.
29

MARTIN COUNTY, FLORIDAUTILITIES DEPARTMENT
STATEMENTS OF REVENUES, EXPENSES AND
CHANGES IN NET ASSETSFor the Years Ended September 30, 2012 and 2011
2012 2011
Operating revenues:
Water revenues $ 15,046,843 $ 15,311,585
Sewer revenues 12,297,237 12,093,494
Water service availability fees 366,781 361,989
Sewer service availability fees 347,173 350,479
Engineering fees 59,428 37,549
Miscellaneous 1,431,582 1,215,918
Total operating revenues 29,549,044 29,371,014
Operating expenses:
Administrative and general 4,806,477 4,740,726
Operating and maintenance 10,966,083 11,185,347
Depreciation and amortization 9,893,592 9,749,429
Total operating expenses 25,666,152 25,675,502
Operating income 3,882,892 3,695,512
Nonoperating revenues (expenses):
Interest income 917,394 748,788
Interest expense (3,832,787) (4,024,138)
Amortization of bond discount and issue costs (647,683) (519,857)
Other expenses (117,307)
Gain (loss) on disposal of assets 41,293 5,865
Total nonoperating revenues (expenses), net (3,639,090) (3,789,342)
Income (loss) before contributions 243,802 (93,830) Capital contributions 1,841,469 11,061,763
Change in net assets 2,085,271 10,967,933
Net assets, beginning of year 193,813,039 182,845,106 Net assets, end of year $ 195,898,310 $ 193,813,039
See accompanying notes to financial statements.
30

MARTIN COUNTY, FLORIDAUTILITIES DEPARTMENT
STATEMENTS OF CASH FLOWSFor the Years Ended September 30, 2012 and 2011
2012 2011
Cash flows from operating activities:
Payments received from customers 29,385,259$ 29,314,812$
Deposits received from customers 500,275 499,415
Payments for salaries and benefits (4,845,145) (5,014,653)
Payments to suppliers for goods and services (10,895,344) (12,229,777) Refunds of customer deposits (489,825) (432,976)
Net cash provided by operating activities 13,655,220 12,136,821
Cash flows from capital and related financing activities:
Capital grants - 344,446
Proceeds from issuance of debt 34,260,000 16,900,000
Proceeds from special assessment fees 934,851 (6,732,307)
Capital contributions 846,742 10,257,156
Proceeds from sale of assets 53,747 6,334
Payments for utility plant (6,701,088) (9,120,827)
Debt obligation costs (2,113,572) (1,045,036)
Principal payments on bonds and loans (35,515,626) (19,157,262) Interest payments on bonds and loans (3,834,504) (4,025,807)
Net cash used by capital and related financing activities (12,069,450) (12,573,303)
Cash flows from investing activities:
Proceeds from sales and maturities of investments 5,292,962 5,908,031
Interest income 917,394 748,788 Purchase of investments (6,605,124) (6,441,577)
Net cash (used in) provided by investing activities (394,768) 215,242
Net increase (decrease) in cash and cash equivalents 1,191,002 (221,240) Pooled cash and cash equivalents at beginning of period 735,993 957,233
Pooled cash and cash equivalents at end of period 1,926,995$ 735,993$
Reconciliation to statement of net assets:
Pooled cash and cash equivalents - unrestricted 1,164,551 460,682 Pooled cash and cash equivalents - restricted 762,444 275,311
Pooled cash and cash equivalents - end of year 1,926,995$ 735,993$
See accompanying notes to financial statements.
(continued)
31

MARTIN COUNTY, FLORIDAUTILITIES DEPARTMENT
STATEMENTS OF CASH FLOWS (continued)For the Years Ended September 30, 2012 and 2011
2012 2011
Reconciliation of utility operating income to
net cash provided by operating activities: Operating income 3,882,892$ 3,695,512$
Adjustments to reconcile operating income to net cash
provided by operating activities:
Depreciation and amortization 9,893,592 9,749,429
(Increase) decrease in accounts receivable (163,785) (56,202)
Decrease in inventories (25,754) (61,735)
(Increase) decrease in other current assets - -
(Increase) decrease in accounts payable 96,493 (982,695)
Increase in accrued wages payable 1,743 (239,144)
Decrease in accrued compensated absences (40,411) (34,783) Decrease in customer deposits 10,450 66,439
Total adjustments 9,772,328 8,441,309
Net cash provided by operating activities 13,655,220$ 12,136,821$
Noncash investing, capital and financing activities:
During the years ended September 30, 2012 and 2011, the Department had system assets contributed in the
amount of $994,727 and $804,607, respectively.
See accompanying notes to financial statements.
32

MARTIN COUNTY, FLORIDA UTILITIES DEPARTMENT
NOTES TO FINANCIAL STATEMENTS For the Fiscal Years Ended September 30, 2012 and 2011
33
NOTE 1 - GENERAL The Martin County, Florida Utilities Department (the Department) operates as an enterprise fund of Martin County (the County). An enterprise fund is used to account for operations that are financed and operated in a manner similar to private business enterprises, where the intent of the governing body is that the costs of providing goods and services to the general public on a continuing basis be financed or recovered primarily through user charges. The Departments’ financial statements do not purport to reflect the financial position of Martin County, Florida and the changes in its financial position and cash flows of its proprietary fund types, in conformity with accounting principles generally accepted in the United States. The County is a political subdivision of the State of Florida, and operates as a noncharter government pursuant to Article VIII, Section (1)(f) of the Constitution of the State of Florida. The fiscal year of the County is from October 1 to September 30, as established in Section 218.33, Florida Statutes. NOTE 2 - SUMMARY OF SIGNIFICANT ACCOUNTING POLICIES Basis of Accounting and Financial Statement Presentation The Department functions as a self-supporting governmental enterprise fund of the County. An enterprise fund is used to account for the financing of services to the general public on a continuing basis with costs recovered primarily through user charges. The enterprise fund is reported using the economic resources measurement focus which is based upon determination of net income, financial position and changes in cash flows. Accounting principles in the United States of America (GAAP) for these funds are those applicable to similar businesses in the private sector and, thus, they are maintained on the accrual basis of accounting. Revenues are recognized when earned and expenses are recognized when a liability is incurred, regardless of the timing of the related cash flows. Grants and similar items are recognized when all eligibility requirements imposed by the provider are met. The Department issues a separate comprehensive annual financial report and its financial statements are combined in the County’s comprehensive annual financial report. The accompanying financial statements combine the accounts of both the Water and Wastewater Systems (collectively, “the System”) to provide meaningful information with respect to the Department, with all transactions of the Department accounted for as one enterprise fund. All significant inter-system accounts and transactions have been eliminated. Application of FASB Standards GASB Statement No. 20, Accounting and Financial Reporting for Proprietary Funds and Other Governmental Entities that use Proprietary Fund Accounting, offers the option of following all Financial Accounting Standards Board (FASB) standards issued after November 30, 1989, unless the latter conflict with or contradict GASB pronouncements, or not following FASB standards issued after such date. The Department elected the option not to follow FASB standards issued after such date.

MARTIN COUNTY, FLORIDA UTILITIES DEPARTMENT
NOTES TO FINANCIAL STATEMENTS For the Fiscal Years Ended September 30, 2012 and 2011
34
NOTE 2 - SUMMARY OF SIGNIFICANT ACCOUNTING POLICIES, continued Use of Estimates The preparation of financial statements in conformity with accounting principles generally accepted in the United States of America requires management to make estimates and assumptions which affect the reported amounts of assets and liabilities and disclosure of contingent assets and liabilities at the date of the financial statements and the reported amounts of revenues and expenses during the reporting period. Actual results could differ from those estimates. Pooled Cash and Cash Equivalents Amounts reported as pooled cash and cash equivalents include petty cash funds and restricted and unrestricted amounts deposited in interest-bearing demand deposit accounts. All highly liquid investments with a maturity of three months or less when purchased are considered to be cash equivalents. Investments in external investment pools, including the Local Government Surplus Funds Trust Fund and Florida Local Government Investment Trust, and money market funds are considered to be investments. The Local Government Surplus Funds Trust Fund consists of Florida PRIME and Fund B investments administered by the State Board of Administration. Pooled Investments
The Department participates in the County’s pooled cash system as required for all departments reporting to the Board. The Accounting Department of the Clerk of the Circuit Court manages the pooled cash and investments guided by the County’s Investment Policy. In accordance with GASB Statement No. 31, Accounting and Financial Reporting for Certain Investments and for External Investment Pools, investments are stated at fair value (quoted market price or best available estimate thereof), except for investments with remaining maturities of one year or less at time of purchase, which are stated at amortized cost and approximate fair value. Investments in Florida PRIME and Florida Local Government Investment Trust are recorded at their share price, which represents the fair value of the trusts’ underlying investments. Operating Revenues and Expenses The Department distinguishes operating revenues and expenses from non-operating items. Operating revenues and expenses generally result from providing services and producing and delivering goods in connection with the Department’s principal on-going operations. The principal operating revenues of the Department are charges to customers for water and wastewater services. The Department also recognizes as operating revenue service availability fees and tap fees intended to cover the cost of connecting new customers to the System. Operating expenses for the Department include the cost of producing water and wastewater services, administrative expenses, and depreciation on capital assets. All revenues and expenses not meeting this definition are reported as non-operating revenues and expenses. When both restricted and unrestricted resources are available for use, it is the Department’s policy to use restricted resources first, and then unrestricted resources as they are needed.

MARTIN COUNTY, FLORIDA UTILITIES DEPARTMENT
NOTES TO FINANCIAL STATEMENTS For the Fiscal Years Ended September 30, 2012 and 2011
35
NOTE 2 - SUMMARY OF SIGNIFICANT ACCOUNTING POLICIES, continued Accounts Receivable and Revenue Recognition Billings to water utility customers are based on metered consumption which is determined at various dates each month. An estimate of unbilled accounts receivable are accrued at September 30th to recognize the sales revenues earned between the last meter reading date and the end of the fiscal year. The accrual is based on the average consumption through September 30 for days of service that were not billed. The Department considers all receivables to be collectible and no allowance to doubtful accounts has been established. Special Assessments Receivable and Revenue Recognition A non-current special assessment receivable is recorded for contributed capital resulting from special assessment projects. A portion of the balance is reclassified as a current special assessment receivable. This current portion is estimated based on the actual tax billing by the Tax Collector. No allowance is recorded because liens are recorded against assessed property. Special assessments capital contribution revenue are recognized when the project has final acceptance and the amounts have been added to the tax roll.
Inventories Inventories are valued at cost using the first-in, first-out (FIFO) method. Inventories primarily consist of water meters, meter boxes, pumps, SCADA parts, pipe and hardware used in the operations of the Department. Restricted Assets Assets are restricted in accordance with provisions of County bond resolutions authorizing the issuance of Utilities System Revenue Bonds, and other applicable obligations.
Capital Assets The Department defines capital assets as assets with an initial, individual cost of $1,000 or more and an estimated useful life in excess of one year. Capital assets are recorded at cost. Assets contributed to the Department, such as from developers or special assessments, are recorded at estimated fair market value on the date contributed. Intangible plant assets relate to customer bases acquired from various purchased water systems. Dispositions and retirements and resulting gains and losses are reported in the year of disposal. Depreciation and amortization are provided using the straight-line method over the following estimated useful lives:
Classification Useful Life in Years Buildings 5–40 Water distribution systems 3–40 Wells 5–20 Sewer collection systems 3–40 Equipment and leasehold improvements 3–15 Intangible assets 10–40

MARTIN COUNTY, FLORIDA UTILITIES DEPARTMENT
NOTES TO FINANCIAL STATEMENTS For the Fiscal Years Ended September 30, 2012 and 2011
36
NOTE 2 - SUMMARY OF SIGNIFICANT ACCOUNTING POLICIES, continued Construction Work in Progress Construction work in progress represents costs accumulated for the replacement and new construction of sections of the Department’s transmission and distribution systems, plant expansions and rehabilitations, and other projects that were not completed at year-end. Deferred Bond Issuance Costs, net Costs associated with the issuance of bonds and state revolving loans have been deferred and are being amortized over the life of the bonds using a method which approximates the effective interest method. Bond Premium, Bond Discount and Accounting Loss on Bond Refunding Both the bond discount and the accounting loss on bond refunding are associated with the issuance of the Consolidated Utilities System Refunding and Improvement Revenue Bonds, Series 1994, and the Utilities System Refunding Revenue Bonds, Series 1998 and are being amortized over the life of the refunded bonds using a method which approximates the effective interest method. The bond premium associated with the issuance of the Utility System Revenue Bonds Series 2003 Bonds is being amortized over the life of the Series 2003 Bonds using a method which approximates the effective interest method. Compensated Absences Employees of the Department are entitled to various amounts of paid time off depending on length of service. The liability for accrued leave is based upon the actual unused accrued leave at the employee’s current rate of pay plus applicable benefits. The liability for unused sick leave balance is accrued at 50% for those employees with length of service of six years or more as employees are entitled to payment of 50% of the balance of their sick leave at time of retirement or termination. Net assets Equity in the Department’s statement of net assets is displayed in three categories: 1) invested in capital assets, net of related debt, (2) restricted, and 3) unrestricted. Net assets invested in capital assets, net of related debt consists of capital assets reduced by accumulated depreciation and by any outstanding debt incurred to acquire, construct or improve those assets, excluding unexpended proceeds. Net assets are reported as restricted when there are third party limitations (statutory, contractual or bond covenant) on their use. Unrestricted net assets consist of all net assets that do not meet the definition of either of the other two components. Reclassifications Certain 2011 balances have been reclassified to conform to the financial statement presentation used in 2012.

MARTIN COUNTY, FLORIDA UTILITIES DEPARTMENT
NOTES TO FINANCIAL STATEMENTS For the Fiscal Years Ended September 30, 2012 and 2011
37
NOTE 3 – POOLED CASH AND CASH EQUIVALENTS AND INVESTMENTS The Department participates in the County’s pooled cash system which is a highly liquid investment pool of approximately $145 million and $166 million as of September 30, 2012 and 2011, respectively. The equity in the County’s pooled cash system is available to the Department on a demand basis. The accounting department of the Clerk of the Circuit Court, as Clerk to the Board, performs all of the investing functions of the Department. Information regarding credit risk, custodial credit risk, concentration of credit risk, interest rate risk, and foreign currency risk for pooled cash and cash equivalents and investments can be found in the County’s footnotes to the financial statements included in the County’s Comprehensive Annual Financial Report. NOTE 4 - RESTRICTED ASSETS Restricted assets consist of the following amounts at September 30, 2012 and 2011, held in various accounts established in part by the Department’s bond documents. September 30, 2012
Cash and Cash Equivalents
Investments
Special Assessments Receivable
Total
Performance bonds $ - $ 36,903 $ - $ 36,903 Customer deposits - 967,060 - 967,060 Lend a hand deposits 28,362 - - 28,362 Debt reserve 184,117 - - 184,117 Renewal and replacement 2,846 5,714,430 - 5,717,276 Capital improvement account 547,119 7,556,712 1,906,343 10,010,174 $ 762,444 $ 14,275,105 $ 1,906,343 $ 16,943,892
September 30, 2011
Cash and Cash Equivalents
Investments
Special Assessments Receivable
Total
Performance bonds $ - $ 44,638 $ - $ 44,638 Customer deposits - 956,610 - 956,610 Lend a hand deposits 33,704 - - 33,704 Debt reserve 183,853 - - 183,853 Renewal and replacement 31,544 7,230,430 - 7,261,974 Capital improvement account 26,210 8,385,920 2,166,637 10,578,767 $ 275,311 $ 16,617,598 $ 2,166,637 $ 19,059,546

MARTIN COUNTY, FLORIDA UTILITIES DEPARTMENT
NOTES TO FINANCIAL STATEMENTS For the Fiscal Years Ended September 30, 2012 and 2011
38
NOTE 5 - CAPITAL ASSETS Changes in capital assets for the year ended September 30, 2012 and 2011 were as follows:
Balance Balance Balance 9/30/2010 Additions Deletions 9/30/2011 Additions Deletions 9/30/2012
Capital assets, not being depreciated: Land $ 5,620,732 $ –– $ –– $ 5,620,732 $ –– $ –– $ 5,620,732 Intangible assets, land use rights 30,143 76,912 –– 107,055 100,675 –– 207,730 Construction in progress 4,996,485 2,478,286 (4,648,322) 2,826,449 913,373 (2,474,641) 1,265,181
Total capital assets, not being depreciated: 10,647,360 2,555,198 (4,648,322) 8,554,236 1,014,048 (2,474,641) 7,093,643
Capital assets, being depreciated: Buildings 123,379,627 944,287 –– 124,323,914 2,768,152 – 127,092,066 Water distribution system 80,385,281 1,912,989 –– 82,298,270 1,548,888 – 83,847,158 Wells 11,510,071 46,119 –– 11,556,190 132,306 – 11,688,496 Sewer collection system 89,831,114 9,797,009 (61,866) 99,566,257 3,705,523 (129,278) 103,142,502 Equipment & leasehold improvements 4,860,096 475,227 (429,290) 4,906,033 388,748 (265,239) 5,029,542 Intangible assets 7,890,516 10,781 –– 7,901,297 15,345 –– 7,916,642
TTotal capital assets, being depreciated 317,856,705 13,186,412 (491,156) 330,551,961 8,558,962 (394,517) 338,716,406
Less depreciation and amortization for: Buildings (31,344,119) (3,464,094) –– (34,808,213) (3,445,903) –– (38,254,116) Water distribution system (24,629,694) (2,211,789) –– (26,841,483) (2,185,235) –– (29,026,718)
Wells (4,390,980) (487,337) –– (4,878,317) (487,560) –– (5,365,877) Sewer collection system (25,428,468) (2,929,912) 61,867 (28,296,513) (3,095,493) 129,277 (31,262,729) Equipment & leasehold improvements (3,268,663) (368,849) 428,820 (3,208,692) (390,418) 252,785 (3,346,325) Intangible assets (1,176,956) (287,448) –– (1,464,404) (288,983) –– (1,753,387) Total depreciation and amortization (90,238,880) (9,749,429) 490,687 (99,497,622) (9,893,592) 382,062 (109,009,152)
Total capital assets, being depreciated, net 227,617,825 3,436,983 (469) 231,054,339 (1,334,6301) (12,455) 229,707,254 Capital assets, net $238,265,185 $ 5,992,181 $ (4,648,791) $239,608,575 $ (320,5823) $ (2,487,096) $ 236,800,897
The Department has active construction projects as of September 30, 2012. The projects include construction of a major generator replacement, SR707 Forcemain, degasifier system, ammonia tank and header replacements, major lift station rehabilitation and perculation pond rehabilitation. At September 30, 2012, the Department’s commitments with contractors are as follows:
Spent to date
Remaining Commitment
SR 707 Forcemain $ 404,272 $ 2,060 Dixie Park Generator Replacement 283,314 33,609 Degasifier System 106,415 114,714 Lift Station 301/309 Rehabilitation 102,149 421,986 Martin Downs Perculation Ponds 88,800 124,860 HSP Header Replacement 35,851 277,839 Ammonia Tank Replacements 17,242 85,493 Wastewater Projects 89,387 3,867
Water Projects 137,751 13,080 Total $ 1,265,181 $ 1,077,508
The commitment for these projects is being financed by operating revenues and capital facility charges.

MARTIN COUNTY, FLORIDA UTILITIES DEPARTMENT
NOTES TO FINANCIAL STATEMENTS For the Fiscal Years Ended September 30, 2012 and 2011
39
NOTE 6 - LONG-TERM DEBT Changes in long-term liabilities for the years ended September 30, 2012 and 2011 were as follows: Balance Balance Balance Due in 9/30/2010 Additions Reductions 9/30/2011 Additions Reductions 9/30/2012 2013
Revenue Bonds
Series 1998 Bonds $ 3,550,000 $ –– $ (1,000,000) $ 2,550,000 $ –– $ (1,065,000) $ 1,485,000 $1,485,000
Series 2001 Bonds 17,065,000 –– (17,065,000) –– –– –– –– ––
Series 2003 Bonds 34,945,000 –– (800,000) 34,065,000 –– (33,120,000) 945,000 945,000
Series 2009A Bonds 7,990,000 –– –– 7,990,000 –– –– 7,990,000 ––
Series 2009B Bonds 27,610,000 –– –– 27,610,000 –– –– 27,610,000 ––
Plus (Less):
Unamortized premium 904,375 –– (67,049) 837,326 –– (324,805) 512,521 ––
Unamortized discount (614,818) –– 99,262 (515,556) –– 165,840 (349,716) ––
Deferred accounting
Loss on refunding (2,085,632) (1,108,256) 361,185 (2,832,703) (2,034,270) 507,937 (4,359,036) ––
Total revenue bonds 89,363,925 (1,108,256) (18,551.602) 69,704,067 (2,034,270) (33,836.028) 33,833,769 2,430,000
Series 2010 Refunding Note –– 16,900,000 (90,000) 16,810,000 –– (1,205,000) 15,605,000 880,000
Series 2012 Refunding Note –– –– –– –– 34,260,000 –– 34,260,000 285,000 State Revolving Fund Loan (WWG12063607P) 2,232,845 –– (122,263) 2,110,582 –– (125,626) 1,984,956 130,844
Total long-term debt 91,596,770 15,791,744 (18,763,865) 88,624,649 32,225,730 (35,166,654) 85,683,725 3,725,844
Other liabilities:
Compensated absences 671,612 651,478 (686,261) 636,829 412,027 (452,438) 596,418 94,900
Total long-term liabilities $92,268,382 $16,443,222 $(19,450,126) $89,261,478 $32,637,757 $ (35,619,092) $86,280,143 $ 3,820,744
Utilities System Refunding Revenue Bonds On June 1, 1998, the Department issued $39,670,000 of Utility System Refunding Bonds Series 1998 (Series 1998 Bonds) to provide funds for the purpose of (1) refunding (a) a portion of the Consolidated Utilities System Refunding and Improvement Revenue Bonds, Series 1994; (b) all of the Department’s outstanding Water and Wastewater System Revenue Bonds, Series 1996, (2) funding a portion of the Reserve Account through the purchase of a debt service reserve surety policy, and (3) paying certain expenses related to the issuance and sale of the Series 1998 Bonds. For the Series 1998 Bonds, interest is payable on April 1 and October 1 of each year and principal is payable on October 1 of each year. The interest rates on the outstanding bonds range from 4.0% to 5.0%; $15,075,000 are serial bonds, payable annually through 2015; $24,595,000 are term bonds, principal due annually from 2016 to 2024.

MARTIN COUNTY, FLORIDA UTILITIES DEPARTMENT
NOTES TO FINANCIAL STATEMENTS For the Fiscal Years Ended September 30, 2012 and 2011
40
NOTE 6 - LONG-TERM DEBT, continued On October 20, 2009, the Department issued $28,675,000 of Utility System Refunding Bonds Series 2009B (Series 2009B) to provide funds for the purpose of (1) refunding a portion of the Utilities System Revenue Bonds, Series 1998, (2) paying certain expenses related to the issuance and sale of the Series 2009B Bonds, and (3) paying a portion of the cost of purchasing a municipal bond insurance policy and debt service reserve surety policy. For the Series 2009B, interest is payable on April 1 and October 1 of each year and principal is payable on October 1 of each year. The interest rates on the outstanding bonds range from 2.0% to 5.0%; $16,945,000 are serial bonds, payable annually through 2020; $11,730,000 are term bonds, principal due annually from 2022 to 2024. Utilities System Revenue Bonds On October 1, 2001, the Department issued $25,000,000 of Utility System Revenue Bonds Series 2001 (Series 2001 Bonds) to provide funds for the purpose of (1) paying a portion of the cost of acquiring and construction additions, extensions and improvements to the Department’s combined water and wastewater utility system, (2) funding a deposit to the Reserve Account through the purchase of a debt service reserve surety policy, and (3) paying certain expenses related to the issuance and sale of the Series 2001 Bonds. These bonds were refunded during fiscal 2011 through the issuance of the Utilities System Refunding Revenue Note, Series 2010. On September 22, 2003, the Department issued $40,450,000 of Utility System Revenue Bonds Series 2003 (Series 2003 Bonds) to provide funds for the purpose of (1) construction of a new reverse osmosis water treatment plant, expansion of wastewater treatment plants and construction of extensions and improvements to the Department’s combined water and wastewater utility system, (2) funding a deposit to the Reserve Account through the purchase of a debt service reserve policy, and (3) paying certain expenses related to the issuance and sale of the Series 2003 Bonds. For the Series 2003 Bonds, interest is payable on April 1 and October 1 of each year and principal is payable on October 1 of each year. Interest rates on the outstanding bonds range from 2.0% to 5.0%; $20,495,000 are serial bonds, payable annually through 2023; $19,955,000 are term bonds, principal due annually from 2024 to 2033.
On October 20, 2009, the Department issued $7,990,000 of Utility System Revenue Bonds Series 2009A (Series 2009A Bonds) to provide funds for the purpose of (1) paying a portion of the costs of acquiring two existing water and wastewater systems (2) paying certain expenses related to the issuance and sale of the Series 2009A Bonds, and (3) paying a certain portion of the cost of purchasing a municipal bond insurance policy and debt service reserve surety policy. For the Series 2009A, interest is payable on April 1 and October 1 of each year and principal is payable on October 1 of each year. The interest rate on the outstanding bonds is 5.0%; and the Series 2009A are term bonds, principal due annually from 2027 to 2039. On November 17, 2010, the Department issued $16,900,000 in a Utilities System Refunding Revenue Note, Series 2010, with an interest rate of 2.91 percent, to advance refund the Utilities System Revenue Bonds, Series 2001. The Refunding Note was issued to refund the $16,020,000 princial amount of the Department’s Utilities System Revenue Bonds, Series 2001 that mature on or after October 1, 2011. The net proceeds of $16,850,581 (after payment of $45,152 in issuance costs) combined with the Department’s equity contribution of $102,253

MARTIN COUNTY, FLORIDA UTILITIES DEPARTMENT
NOTES TO FINANCIAL STATEMENTS For the Fiscal Years Ended September 30, 2012 and 2011
41
NOTE 6 - LONG-TERM DEBT, continued were placed in an irrevocable trust to call on October 1, 2011, all outstanding bonds and to pay all accrued interest and call premiums on the Utilities System Revenue Bonds, Series 2001. As a result, the $16,020,000 of the 2001 Series Bonds are considered to be in-substance defeased as of November 17, 2010. The refunding reduced its total debt service payments over the next sixteen years by $2,884,274 and to obtain an economic gain (difference between the present value of the debt service payments on the old and new debt) of $2,299,881. On October 15, 2009, the Department issued $28,675,000 in Utility System Refunding Bonds, Series 2009B, with an average interest rate of 4.38 percent, to advance refund a portion of the Utilities System Refunding Revenue Bonds, Series 1998. The Refunding Bonds are being issued to refund the $28,745,000 principal amount of the Department’s Utilities System Refunding Revenue Bonds, Series 1998 that mature on or after November 30, 2009. The net proceeds of $28,854,507 (after payment of $601,515 in underwriting fees, insurance and other issuance costs) combined with the Department’s equity contribution of $125,423 were placed in an irrevocable trust to call on November 30, 2009, the portion of the outstanding 1998 Series Bonds being refunded and to pay all associated accrued interest. As a result, a portion of the 1998 Series bonds are considered to be in-substance defeased and the liability for those bonds has been removed from the Department’s financial statements. The Series 1998 Utilities System Refunding Bonds were refunded to reduce its total debt service payments over the next fourteen years by approximately $1,954,556 and to obtain an economic gain (difference between the present value of the debt service payments on the old and new debt) of $1,436,853. On June 19, 2012, the Department issued $34,260,000 in a Utility System Refunding Revenue Note, Series 2012, with an interest rate of 2.9 percent, to advance refund the Utilities System Revenue Bonds, Series 2003. The refunding note was issued to refund the $32,210,000 principal amount of the Department’s Utilities System Revenue Bonds, Series 2003 that mature on or after October 1, 2014. The net proceeds of $34,544,400 (after payment of $117,307 in issuance costs) combined with the Department’s equity contribution of $402,661 were placed in an irrevocable trust to call on October 1, 2014, all outstanding bonds and to pay all accrued interest and call premiums on the Utilities System Revenue Bonds, Series 2003. As a result, the $32,210,000 of the 2003 Series Bonds are considered to be in-substance defeased as of June 19, 2012. The refunding reduced its total debt service payments over the next twenty-one years by $7,089,580 and to obtain an economic gain (difference between the present value of the debt service payments on the old and new debt) of $5,262,633. The Series 1998, 2003, and 2009A/B Bonds (collectively, “the Bonds”) are collateralized by 100% of (i) net revenues of the Department, (ii) certain Capital Facilities Charges collected with respect to the Department, (iii) special assessments, if any, and (iv) amounts on deposit in funds and accounts established by the bond resolutions, equal to remaining principal and interest requirements over the terms of respective bond agreements. The Bonds include restrictive covenants which require the establishment and maintenance of various reserve and bond service accounts and also govern the flow of funds with respect to such accounts. In addition, such covenants generally require the Department to establish rates and fees sufficient to provide net revenues and special assessments equal to 110% of the annual debt service requirements, or rates and fees sufficient to provide net revenues, capital facilities charges and special assessments equal to 120% of annual debt service requirements.

MARTIN COUNTY, FLORIDA UTILITIES DEPARTMENT
NOTES TO FINANCIAL STATEMENTS For the Fiscal Years Ended September 30, 2012 and 2011
42
NOTE 6 - LONG-TERM DEBT, continued Based on the interpretations of the Resolutions, the Department’s pledged revenues recognized in 2012 were approximately $17,495,781 with capital facilities charges and $16,499,501 exclusive of capital facilities charges, amounting to 249% and 235%, respectively, of principal and interest requirements. State Revolving Fund Loan In 2002, the Department entered into a loan agreement with the State of Florida, Department of Environmental Protection (FDEP) to fund the planning and design of wastewater collection systems for construction in Seagate Harbor, Lighthouse Point. The Seagate Harbor, Lighthouse Point project was finalized May 16, 2006. The outstanding principal due at September 30, 2012 and 2011 was $1,984,956 and $2,110,582, respectively. Interest rates on the outstanding loans range from 2.71% to 3.11%. The future principal maturity amounts and related interest costs for all long-term debt and the sinking fund requirements of the Series 1998, 2003 and 2009A and B bonds, the state revolving fund loan (WWG12063607P), and the Series 2010 and 2012 Refunding Notes are as follows: Bond/Loan Year Ended Sinking Fund September 30, Principal Interest Requirements 2013 $ 3,724,081 $ 3,271,865 $ 6,995,946 2014 3,897,632 3,115,910 7,013,542 2015 4,036,279 2,969,808 7,006,087 2016 4,190,028 2,818,320 7,008,348 2017 4,343,880 2,660,592 7,004,472 2018-2022 24,475,988 10,575,501 35,051,489 2023-2027 25,377,068 5,837,386 31,214,454 2028-2032 12,715,000 2,849,730 15,564,730 2033-2037 5,540,000 976,050 6,516,050 2038-2039 1,580,000 119,500 1,699,500 $ 89,879,956 $35,194,662 $125,074,618
NOTE 7 - CAPITAL CONTRIBUTIONS Capital contributions consist of monies received, capital assets contributed and special assessment revenue recognized for equipping and expanding capacity and facilities of the Department. Additions during fiscal year 2012 consisted of $776,145 in cash, $994,727 in capital assets and $70,597 of special assessment revenue recognized. Additions during fiscal year 2011 consisted of $2,654,669 in cash, $1,958,334 in capital grants, $807,607 in capital assets and $5,644,153 of special assessment revenue recognized.

MARTIN COUNTY, FLORIDA UTILITIES DEPARTMENT
NOTES TO FINANCIAL STATEMENTS For the Fiscal Years Ended September 30, 2012 and 2011
43
NOTE 8 - DEFINED BENEFIT PENSION PLAN Plan Description The Department, as an enterprise fund of the County, participates in the Florida Retirement System (”FRS”), a cost-sharing, multiple-employer, public employee retirement plan, which covers substantially all of the Department’s full-time employees. The FRS is a cost-sharing multiple-employer public retirement system administered by the State of Florida Department of Management Services. The FRS provides retirement and disability benefits, annual cost-of-living adjustments and death benefits to plan members and beneficiaries. The Florida Legislature established the FRS under Chapter 121, Florida Statutes, and has sole authority to amend benefits provisions. Each year the FRS issues a publicly available financial report that includes financial statements and required supplementary information. That report may be obtained by writing to the Florida Department of Management Services, Division of Retirement, P.O. Box 9000, Tallahassee, FL 32315-9000. Funding Policy Effective July 1, 2011, all employees, except those participating in the DROP program, are required to make a 3% contribution of their gross salary. The FRS is a defined benefit plan for all state, participating county, district school board, community college and university employees. Governmental employers are required to make contributions to the FRS based on statewide contribution rates. Accordingly, the actuarial information and related disclosures attributable to the Department’s employees are not determinable. The Department is required to contribute an actuarially determined rate. Contribution rates, expressed as a percentage of covered annual payrolls, in effect during the fiscal year for the following classes of memberships were:
10/01/11 - 07/01/12 - 06/30/12 09/30/12 Regular 4.91% 5.18% Senior Mangement 6.27% 6.30% DROP 4.42% 5.44%
Substantial changes were made to FRS during fiscal year 2011 affecting members enrolled on or after July 1, 2011 by extending the vesting requirement to eight years of credited service and increasing normal retirement to age 65 with at least eight years of credited service or 33 years of service regardless of age. Also, the final average compensation of these members will be based on the eight highest years of salary. A post-employment health insurance subsidy is also provided to eligible retired employees through the FRS in accordance with Florida Statutes. The contributions of the Department are established and may be amended by the State Legislature. The Department’s contributions to the FRS for the years ended September 30, 2012, 2011, and 2010 were $234,518, $446,472 and $527,851, respectively, each equal to the required contributions for the respective year.

MARTIN COUNTY, FLORIDA UTILITIES DEPARTMENT
NOTES TO FINANCIAL STATEMENTS For the Fiscal Years Ended September 30, 2012 and 2011
44
NOTE 8 - DEFINED BENEFIT PENSION PLAN, continued Drop Benefits The Deferred Retirement Option Program (DROP) is a program that provides an alternative method for payment of retirement benefits for a specified and limited period for members of the FRS, effective July 1, 1998. Under this program, the employee may retire and have their benefits accumulate in the Florida Retirement System Trust Fund, earning interest, while continuing to work for an FRS employer. The participation in the program does not change conditions of employment. When the DROP period ends, maximum of 60 months, employment must be terminated. At the time of termination, employees will receive payment of the accumulated DROP benefits, and begin receiving their monthly retirement benefit, in the same amount determined at retirement, plus annual cost-of-living increases. The FRS publishes an annual report that provides ten-year historical trend information about progress made in accumulating sufficient assets to pay benefits when due. This report may be obtained by writing to the Division of Retirement, Research, Education and Policy Section, P. O. Box 9000, Tallahassee, Florida 32315-9000, or by calling (850) 488-5706, or accessing their Internet site at http://dms.myflorida.com/human_resource_support/retirement . NOTE 9 – POSTEMPLOYMENT BENEFITS
Effective October 1, 2007, the County adopted the provisions of GASB Statement No. 45, Accounting and Financial Reporting by Employers for Postretirement Benefits Other Than Pensions. In conjunction with the implementation of GASB Statement 45, the Martin County Board of County Commissioners (the “Board”) engaged an actuarial firm to determine the County’s annual required contribution and unfunded obligation, which are the responsibility of the Board’s General Fund. The Department participates in the County administered single-employer defined benefit healthcare plan that provides postretirement medical and dental coverage to retirees, their eligible spouses and dependents. These benefits are currently funded on a pay-as-you go basis. No assets have been segregated and restricted to fund these benefits. Further information about OPEB is available in the County’s Comprehensive Annual Financial Report. NOTE 10 - RISK MANAGEMENT The Department is exposed to various risks of loss related to tort; theft of or damage to and destruction of assets, errors and omissions, injuries to employees; and natural disasters. As a department of the Board, coverage for employee health, property, general liability, automobile liability, workers’ compensation, public employee bond and comprehensive crime loss is covered through a comprehensive property and liability risk management program provided through Self-Insurance Internal Service Fund of the County. The self-insurance program is one whereby the Department is allocated a portion of the County’s annual contributions along with the other members of the program. The County is subject to a special assessment in the event of a deficiency, except to the extent that the deficiency results from a specific claim against a member in excess of the reinsurance available; such a deficiency is solely the responsibility of that member. As of September 30, 2012 there have been no special assessments. Settlements have not exceeded coverage for each of the past three years.

MARTIN COUNTY, FLORIDA UTILITIES DEPARTMENT
NOTES TO FINANCIAL STATEMENTS For the Fiscal Years Ended September 30, 2012 and 2011
45
NOTE 10 - RISK MANAGEMENT, continued Additionally, the County allocated to the Department certain department support costs which include insurance coverage, legal, administrative, fiscal, purchasing, personnel and internal audit charges. The total of such costs charged to expense was $1,444,780 for the year ended September 30, 2012 and $1,212,394 for the year ended September 30, 2011. Further information about the County-wide self insurance program is available in the County’s Comprehensive Annual Financial Report.
NOTE 11 - COMMITMENTS AND CONTINGENCIES The Department is contingently liable with respect to lawsuits and other claims incidental to the ordinary course of its operations. Claims covered by the self-insurance program are reviewed and losses are accrued when loss is probable. In the opinion of management, based on the advice of legal counsel, the ultimate disposition of these lawsuits and claims will not have a material adverse effect on the financial position of the Department.

STATISTICALSECTION
�

STATISTICAL SECTION
This part of Martin County Utilities Department's comprehensive annual financial report presentsdetailed information as a context for understanding what the information in the financialstatements, note disclosures, and required supplementary information reports about theDepartment's overall financial health.
Contents Page
Financial Trends These schedules contain trend information to help the reader understand how the Department's financial performance and well-being have changed over time. Schedule of Net Assets by Component 46 Schedule of Changes in Net Assets 47 Operating Revenue and Expenses Fiscal Years 2003-2012 48 Operating Income, Income Before Capital Contributions and Increase in Net Assets 48
Revenue Capacity These schedules present information to help the reader understand the revenue base, rates and principal payers. Schedule of Revenues by Source 49 Schedule of Operating Expenses by Function 50 Schedule of Annual Capital Contributions by Source 51 Schedule of Capital Disbursements 52 Schedule of Number of Water and Sewer Customers by Type 53 Schedule of Water and Sewer Rates 54 Schedule of Percent of Meters by Dwelling Type 55 Schedule of Average Residential Customer Billings 56 Schedule of Largest Customers 57
Demographic & Statistical Information These schedules present information to help the reader to understand the demographics of the customers we serve. Schedule of Residential Water/Wastewater Bill Comparisons 58 Schedule of Meter Connections Last Ten Years 59 Schedule of Assessed Value and Actual Value of Taxable Property 60 Schedule of Direct and Overlapping Property Tax Rates 61 Schedule of Demographic & Economic Statistics 62 Schedule of Principal Employers 63 Schedule of Property Tax Levies and Collections 64
Debt Capacity These schedules present information to help the reader assess the affordability of the Department's current levels of outstanding debt, as well as the Department's ability to issue additional debt in the future. Schedule of Debt Service Coverage 65 Schedule of Ratio of Revenues Bonded Debt Outstanding 2003 - 2012 66 Schedule of Investment Per Equivalent Residential Connection (ERC) 67
Operating Information These schedules contain service and infrastructure data to help the reader understand how the information in the Department's financial report relates to the services the Department provides and the activities it performs. Schedule of Statistical Operating Indicators 68 Schedule of Capital Asset Statistics 68 Detail Schedule of Capital Assets 69 Schedule of Authorized Full Time Equivalent Employees By Function 70

MARTIN COUNTY, FLORIDAUTILITIES DEPARTMENT
Schedule of Net Assets by ComponentLast Ten Fiscal Years
(unaudited)
Fiscal Year
2012 2011 2010 2009 2008 2007 2006 2005 2004 2003Components of Net Assets at Year-End
Invested in capital assets, net of related debt 150,111,208$ 149,380,517$ 146,666,415$ 139,310,726$ 142,688,331$ 138,345,047$ 124,491,318$ 111,599,051$ 98,593,917$ 93,925,683$ Restricted: Rate Stabilization - - - - - - - 1,500,000 1,500,000 Capital Projects 14,070,489 15,936,299 16,695,872 21,888,414 16,969,305 13,666,538 15,907,079 20,372,827 21,019,607 17,417,277 Unrestricted 31,716,613 28,496,223 19,482,819 18,409,308 22,989,757 24,424,801 17,496,761 12,969,859 10,467,469 9,208,407
Total Net Assets at Year-End 195,898,310$ 193,813,039$ 182,845,106$ 179,608,448$ 182,647,393$ 176,436,386$ 157,895,158$ 144,941,737$ 131,580,993$ 122,051,367$
Notes: 1. Accounting standards require that net assets be reported in three components in the financial statements: invested in capital assets, net of related debt; restricted; and unrestricted. Net assets are considered restricted when constraints placed on net asset use are either: (a) externally imposed by creditors (such as through debt covenants), grantors, contributors, or laws or regulations of other governments, or (b) imposed by law through constitutional provisions or enabling legislation.
Source: Department's financial records
46

MARTIN COUNTY, FLORIDAUTILITIES DEPARTMENT
Schedule of Changes in Net AssetsLast Ten Fiscal Years
(unaudited)
Fiscal Year
2012 2011 2010 2009 2008 2007 2006 2005 2004 2003 Operating Revenues: Metered water sales 15,046,843$ 15,311,585$ 14,278,309$ 13,253,601$ 12,467,630$ 13,334,616$ 13,297,035$ 12,482,503$ 12,403,642$ 11,247,216$ Sewer sales 12,297,237 12,093,494 11,344,357 10,825,316 10,357,544 10,521,801 10,407,006 9,945,645 9,587,198 8,745,693 Guaranteed revenue 713,954 712,468 775,307 910,650 948,148 1,000,507 1,132,301 930,390 616,756 701,134 Miscellaneous 1,431,582 1,215,918 1,172,685 1,085,491 939,723 1,039,807 981,542 959,803 1,086,251 643,403 Engineering fees 59,428 37,549 80,473 84,310 235,428 122,012 156,753 384,501 210,568 124,147 Total operating revenues 29,549,044 29,371,014 27,651,131 26,159,368 24,948,473 26,018,743 25,974,637 24,702,842 23,904,415 21,461,593
Operating Expenses: Administrative and general 4,806,477$ 4,740,726$ 5,066,052$ 4,651,397$ 4,637,217$ 5,307,238$ 4,843,176$ 4,089,513$ 3,782,359$ 3,253,654$ Operating and maintenance 10,966,083 11,185,347 11,494,376 11,579,049 11,295,598 10,309,513 10,461,426 9,207,286 8,452,730 7,412,306 Depreciation and amortization 9,893,592 9,749,429 9,496,037 9,189,290 8,296,285 7,205,658 6,735,327 6,732,057 6,430,860 6,091,556 Total operating expenses 25,666,152 25,675,502 26,056,465 25,419,736 24,229,100 22,822,409 22,039,929 20,028,856 18,665,949 16,757,516
Operating Income (Deficit) 3,882,892 3,695,512 1,594,666 739,632 719,373 3,196,334 3,934,708 4,673,986 5,238,466 4,704,077
Nonoperating Revenues (Expenses): Investment income 917,394$ 748,788$ 774,737$ 771,162$ 1,448,698$ 2,712,279$ 2,737,067$ 1,981,973$ 1,055,451$ 731,967$ Interest expense (3,832,787) (4,024,138) (4,599,194) (4,402,615) (2,899,179) (2,626,974) (2,864,588) (3,656,468) (4,257,138) (2,806,621) Grants - - - 49,300 2,063,900 1,793,000 182,758 159,698 - Amoritization of bond discount and issue costs (647,683) (519,857) (419,550) (308,410) (313,079) (317,565) (317,987) (319,002) (347,572) (316,200) Other income (expense) (76,014) 5,865 4,485 (64,779) (113,563) (71,672) (6,852) (394,449) (23,040) (17,072) Total nonoperating revenues (expenses) (3,639,090) (3,789,342) (4,239,522) (4,004,642) (1,827,823) 1,759,968 1,340,640 (2,205,188) (3,412,601) (2,407,926)
Income (Deficit) before Capital Contributions 243,802 (93,830) (2,644,856) (3,265,010) (1,108,450) 4,956,302 5,275,348 2,468,798 1,825,865 2,296,151 Special Item - - - (4,622,039) - - - - (1,071,407) - Capital Contributions 1,841,469 11,061,763 5,881,514 4,848,104 7,319,457 9,569,228 7,678,073 10,891,946 8,775,168 6,876,956
Increase in Net Assets 2,085,271 10,967,933 3,236,658 (3,038,945) 6,211,007 14,525,530 12,953,421 13,360,744 9,529,626 9,173,107
Net Assets, Beginning of Year 193,813,039$ 182,845,106$ 179,608,448$ 182,647,393$ 176,436,386$ 157,895,158$ 144,941,737$ 131,580,993$ 122,051,367$ 112,878,260$
Restatement - - - - - 4,015,698 - - - -
Net Assets, at Year-End 195,898,310$ 193,813,039$ 182,845,106$ 179,608,448$ 182,647,393$ 176,436,386$ 157,895,158$ 144,941,737$ 131,580,993$ 122,051,367$
Source: Department's financial records
47

MARTIN COUNTY, FLORIDAUTILITIES DEPARTMENT
Last Ten Fiscal Years(unaudited)
$-
$5,000
$10,000
$15,000
$20,000
$25,000
$30,000
$35,000
03 04 05 06 07 08 09 10 11 12
Th
ousa
nd
s
Operating Revenue and Expenses: 2003-2012
Operating Revenues
Operating Expenses
48
Note: Fiscal year 2009 includes the retirement of Martin Downs water and wastewater plant assetsSource: Department's financial records
$(5,000)
$-
$5,000
$10,000
$15,000
$20,000
03 04 05 06 07 08 09 10 11 12
Tho
usan
ds
Operating Income, Income Before Capital Contributions and Increase (Decrease) in Net Assets: 2003-2012
Increase (Decrease) in Net Assets
Operating Income
Income (Loss) Before Capital Contributions
48
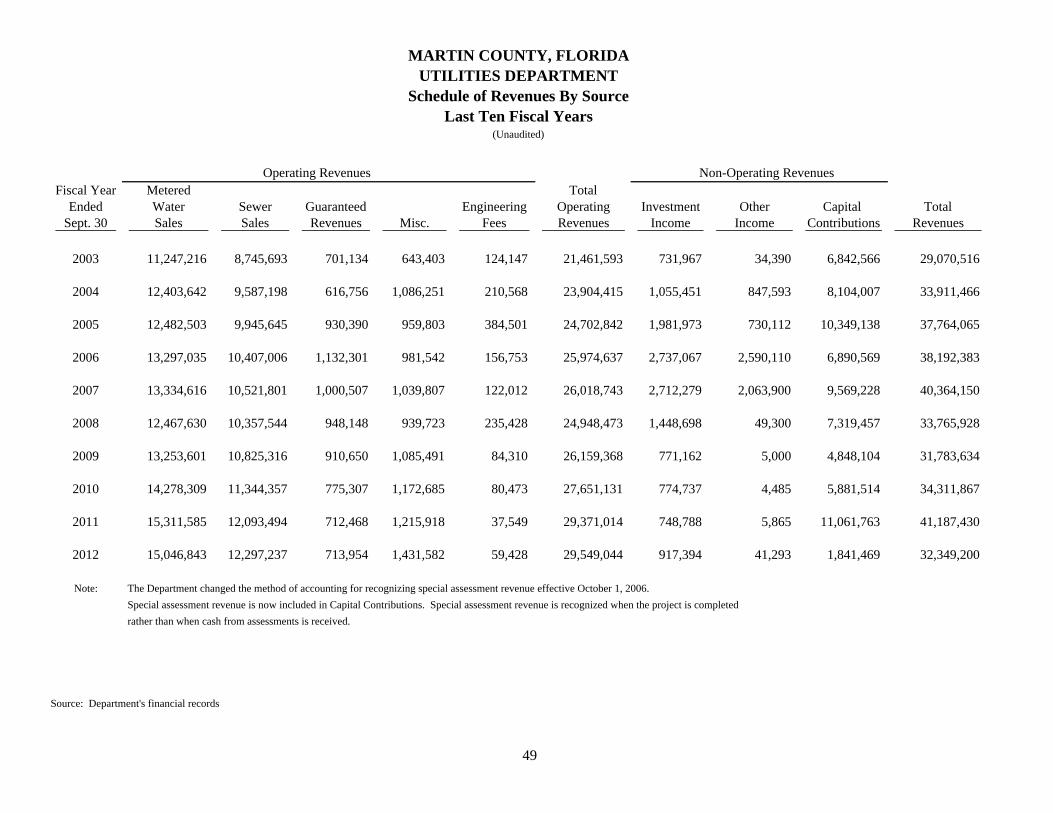
MARTIN COUNTY, FLORIDAUTILITIES DEPARTMENT
Schedule of Revenues By SourceLast Ten Fiscal Years
(Unaudited)
Operating Revenues Non-Operating RevenuesFiscal Year Metered Total
Ended Water Sewer Guaranteed Engineering Operating Investment Other Capital TotalSept. 30 Sales Sales Revenues Misc. Fees Revenues Income Income Contributions Revenues
2003 11,247,216 8,745,693 701,134 643,403 124,147 21,461,593 731,967 34,390 6,842,566 29,070,516
2004 12,403,642 9,587,198 616,756 1,086,251 210,568 23,904,415 1,055,451 847,593 8,104,007 33,911,466
2005 12,482,503 9,945,645 930,390 959,803 384,501 24,702,842 1,981,973 730,112 10,349,138 37,764,065
2006 13,297,035 10,407,006 1,132,301 981,542 156,753 25,974,637 2,737,067 2,590,110 6,890,569 38,192,383
2007 13,334,616 10,521,801 1,000,507 1,039,807 122,012 26,018,743 2,712,279 2,063,900 9,569,228 40,364,150
2008 12,467,630 10,357,544 948,148 939,723 235,428 24,948,473 1,448,698 49,300 7,319,457 33,765,928
2009 13,253,601 10,825,316 910,650 1,085,491 84,310 26,159,368 771,162 5,000 4,848,104 31,783,634
2010 14,278,309 11,344,357 775,307 1,172,685 80,473 27,651,131 774,737 4,485 5,881,514 34,311,867
2011 15,311,585 12,093,494 712,468 1,215,918 37,549 29,371,014 748,788 5,865 11,061,763 41,187,430
2012 15,046,843 12,297,237 713,954 1,431,582 59,428 29,549,044 917,394 41,293 1,841,469 32,349,200
Note: The Department changed the method of accounting for recognizing special assessment revenue effective October 1, 2006.
Special assessment revenue is now included in Capital Contributions. Special assessment revenue is recognized when the project is completed
rather than when cash from assessments is received.
Source: Department's financial records
49

MARTIN COUNTY, FLORIDA UTILITIES DEPARTMENT
Schedule of Operating Expenses by Function Last Ten Fiscal Years
(Unaudited)
Operating Expenses Non-Operating ExpensesFiscal Year Total Amortization
Ended Administrative Operating and Indirect Operating Interest of Bond Discount Other TotalSept. 30 and General Maintenance Costs Depreciation Expenses Expense and Issue Costs Expenses Expenses
2003 2,661,488 7,412,306 592,166 6,091,556 16,757,516 2,806,621 316,200 17,072 19,897,409
2004 3,149,359 8,452,730 633,000 6,430,860 18,665,949 4,257,138 347,572 1,111,181 24,381,840
2005 3,289,801 9,207,286 799,712 6,732,057 20,028,856 3,656,468 319,002 398,995 24,403,321
2006 3,889,953 10,461,426 953,223 6,735,327 22,039,929 2,864,588 317,987 16,458 25,238,962
2007 4,177,595 10,309,513 1,129,643 7,205,658 22,822,409 2,626,974 317,565 71,672 25,838,620
2008 3,446,276 11,295,598 1,190,941 8,296,285 24,229,100 2,899,179 313,079 113,563 27,554,921
2009 3,460,456 11,579,049 1,190,941 9,189,290 25,419,736 4,402,615 285,176 93,012 30,200,539
2010 3,853,658 11,494,376 1,212,394 9,496,037 26,056,465 4,599,194 419,550 - 31,075,209
2011 3,528,332 11,185,347 1,212,394 9,749,429 25,675,502 4,024,138 519,857 - 30,219,497
2012 3,361,697 10,966,083 1,444,780 9,893,592 25,666,152 3,832,787 647,683 117,307 30,263,929
Source: Department's financial records
50

MARTIN COUNTY, FLORIDAUTILITIES DEPARTMENT
SCHEDULE OF ANNUAL CAPITAL CONTRIBUTIONS BY SOURCELast Ten Fiscal Years
(Unaudited)
Water Sewer Developer Developer Fiscal Special Capital Capital Facility Capital Facility Infrastructure InfrastructureYear Assessments Grants Charges Charges Water Sewer Total
2003 - 2,108,323 1,838,702 1,179,178 1,716,363 6,842,566 2004 - 3,164,750 2,210,117 1,330,959 1,398,181 8,104,007 2005 - 3,015,521 3,366,279 1,525,323 2,442,015 10,349,138 2006 - 1,454,340 968,784 1,456,232 3,011,213 6,890,569 2007 968,786 1,167,856 1,172,612 2,014,230 4,245,744 9,569,228 2008 694,165 1,098,156 1,172,083 1,245,202 3,109,851 7,319,457 2009 1,776,670 166,380 839,055 239,796 654,638 1,171,565 4,848,104 2010 - 795,190 353,587 510,300 1,354,077 2,868,360 5,881,514 2011 5,644,154 1,958,334 1,096,555 1,558,114 422,794 381,812 11,061,763 2012 70,597 - 353,752 422,393 561,867 432,860 1,841,469
10,000,000
12,000,000
Annual Capital Contributions By Source
Capital Grants
Special Assessments
Developer Infra Sewer
Developer Infra Water
Sewer CFC
Source: Department's financial records
Note: The Department has changed the method of accounting for recognizing special assessment revenue effective October 1, 2006.
Special assessment revenue is now included in Capital Contributions rather than non-operating income as recorded prior to October 1, 2006.
Special assessment revenue is recognized when the project is completed rather than when cash from assessments is received.
-
2,000,000
4,000,000
6,000,000
8,000,000
2003 2004 2005 2006 2007 2008 2009 2010 2011 2012
Water CFC
51
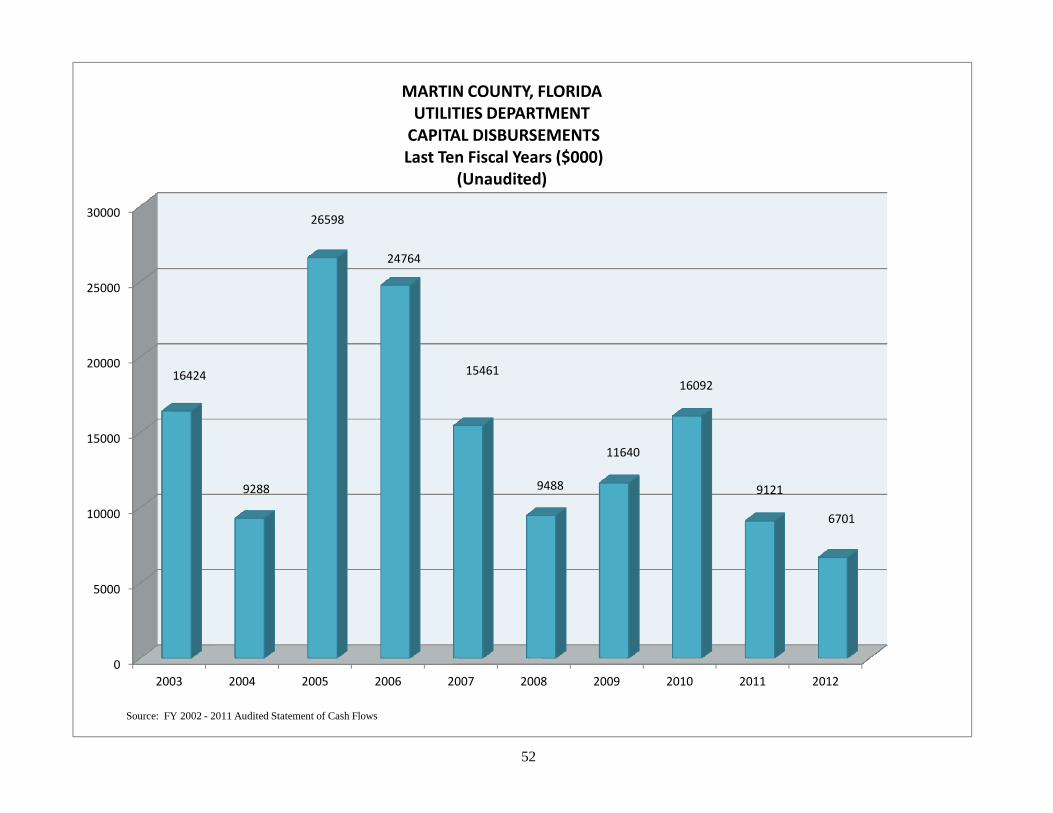
15000
20000
25000
30000
16424
26598
24764
1546116092
MARTIN COUNTY, FLORIDA UTILITIES DEPARTMENTCAPITAL DISBURSEMENTSLast Ten Fiscal Years ($000)
(Unaudited)
52
0
5000
10000
15000
2003 2004 2005 2006 2007 2008 2009 2010 2011 2012
9288 9488
11640
9121
6701
Source: FY 2002 - 2011 Audited Statement of Cash Flows

MARTIN COUNTY, FLORIDAUTILITIES DEPARTMENT
Schedule of Number of Water and Sewer Customers by TypeLast Ten Fiscal Years
(unaudited)
Fiscal Water Sewer TotalYear Residential Multi-Family Commercial Irrigation Other Residential Multi-Family Commercial I.Q Other Water Sewer
2003 22,665 210 1,204 143 266 16,205 92 824 2 98 24,488 17,221 2004 24,125 233 1,278 153 330 17,437 111 897 4 91 26,119 18,540 2005 25,266 245 1,313 160 371 18,175 121 934 5 115 27,355 19,350 2006 25,859 252 1,510 177 373 18,482 130 1,088 11 122 28,171 19,833 2007 26,495 262 1,558 202 436 19,050 138 1,149 12 114 28,953 20,463 2008 26,745 274 1,615 211 449 19,095 139 1,194 14 211 29,294 20,653 2009 27,174 332 1,647 239 472 19,296 201 1,208 17 226 29,864 20,948 2010 28,729 385 1,675 246 493 20,650 253 1,197 18 230 31,528 22,348 2011 29,081 389 1,693 245 473 21,071 261 1,251 18 238 31,881 22,839 2012 29,426 388 1,710 250 466 21,402 266 1,275 20 233 32,240 23,196
Notes: Information is from customer billing records from Sept 30 of every year. "Other" includes service availability customers, lift station maintenance accounts,fire service and temporary accounts.
Source: Department's financial records
-
5,000
10,000
15,000
20,000
25,000
30,000
35,000
2003 2004 2005 2006 2007 2008 2009 2010 2011 2012
Number of Water and Sewer Customers by Type
Water
Sewer
53
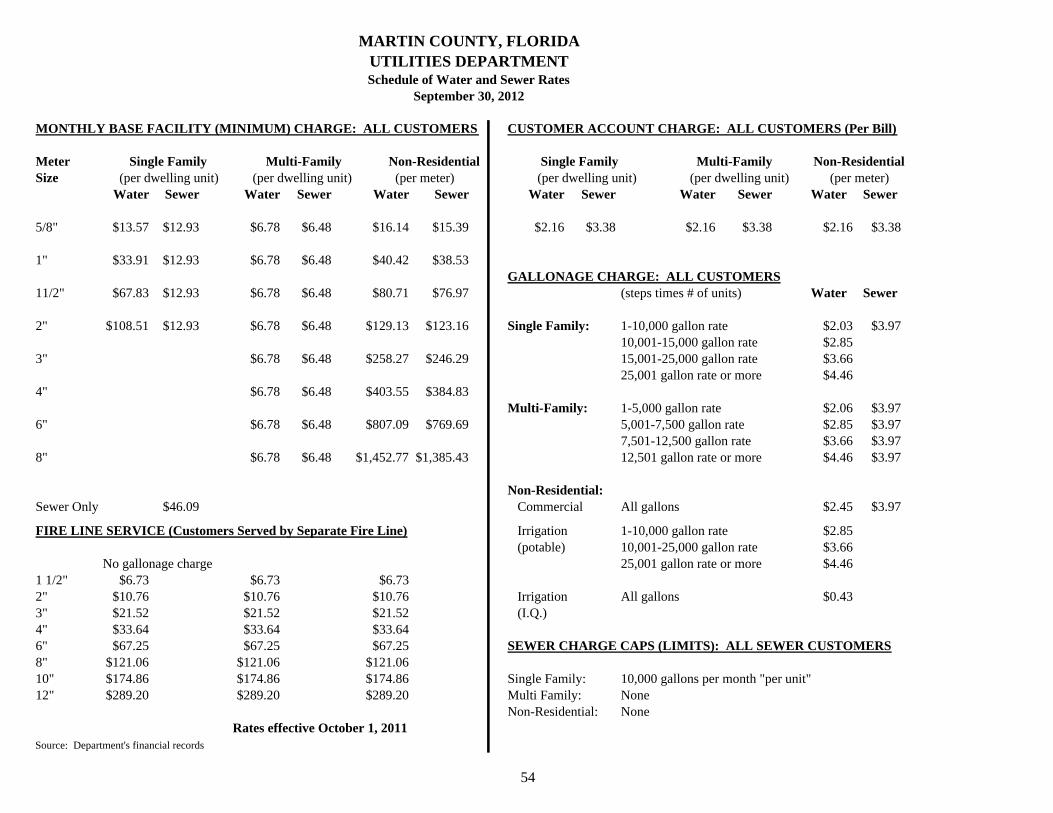
MARTIN COUNTY, FLORIDAUTILITIES DEPARTMENTSchedule of Water and Sewer Rates
September 30, 2012
MONTHLY BASE FACILITY (MINIMUM) CHARGE: ALL CUSTOMERS CUSTOMER ACCOUNT CHARGE: ALL CUSTOMERS (Per Bill)
Meter Single Family Multi-Family Non-Residential Single Family Multi-Family Non-ResidentialSize (per dwelling unit) (per dwelling unit) (per meter) (per dwelling unit) (per dwelling unit) (per meter)
Water Sewer Water Sewer Water Sewer Water Sewer Water Sewer Water Sewer
5/8" $13.57 $12.93 $6.78 $6.48 $16.14 $15.39 $2.16 $3.38 $2.16 $3.38 $2.16 $3.38
1" $33.91 $12.93 $6.78 $6.48 $40.42 $38.53 GALLONAGE CHARGE: ALL CUSTOMERS
11/2" $67.83 $12.93 $6.78 $6.48 $80.71 $76.97 (steps times # of units) Water Sewer
2" $108.51 $12.93 $6.78 $6.48 $129.13 $123.16 Single Family: 1-10,000 gallon rate $2.03 $3.97 10,001-15,000 gallon rate $2.85
3" $6.78 $6.48 $258.27 $246.29 15,001-25,000 gallon rate $3.66 25,001 gallon rate or more $4.46
4" $6.78 $6.48 $403.55 $384.83 Multi-Family: 1-5,000 gallon rate $2.06 $3.97
6" $6.78 $6.48 $807.09 $769.69 5,001-7,500 gallon rate $2.85 $3.97 7,501-12,500 gallon rate $3.66 $3.97
8" $6.78 $6.48 $1,452.77 $1,385.43 12,501 gallon rate or more $4.46 $3.97
Non-Residential: Sewer Only $46.09 Commercial All gallons $2.45 $3.97
FIRE LINE SERVICE (Customers Served by Separate Fire Line) Irrigation 1-10,000 gallon rate $2.85 (potable) 10,001-25,000 gallon rate $3.66
No gallonage charge 25,001 gallon rate or more $4.461 1/2" $6.73 $6.73 $6.732" $10.76 $10.76 $10.76 Irrigation All gallons $0.433" $21.52 $21.52 $21.52 (I.Q.)4" $33.64 $33.64 $33.646" $67.25 $67.25 $67.25 SEWER CHARGE CAPS (LIMITS): ALL SEWER CUSTOMERS8" $121.06 $121.06 $121.0610" $174.86 $174.86 $174.86 Single Family: 10,000 gallons per month "per unit"12" $289.20 $289.20 $289.20 Multi Family: None
Non-Residential: NoneRates effective October 1, 2011
Source: Department's financial records
54
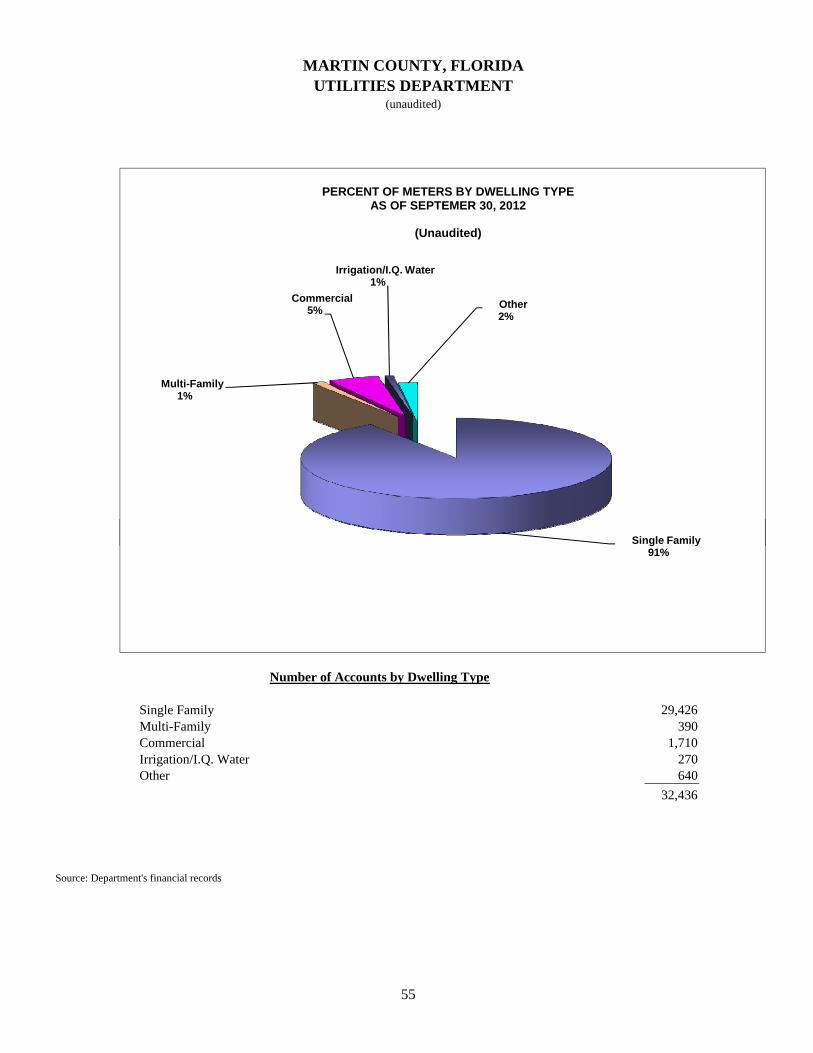
MARTIN COUNTY, FLORIDAUTILITIES DEPARTMENT
(unaudited)
Single Family
Multi-Family1%
Commercial5%
Irrigation/I.Q. Water1%
Other2%
PERCENT OF METERS BY DWELLING TYPE AS OF SEPTEMER 30, 2012
(Unaudited)
Number of Accounts by Dwelling Type
Single Family 29,426 Multi-Family 390 Commercial 1,710 Irrigation/I.Q. Water 270 Other 640
32,436
Source: Department's financial records
Single Family91%
55

MARTIN COUNTY, FLORIDA
UTILITIES DEPARTMENTSchedule of Average Residential Customer Billings
Last Ten Fiscal Years(Unaudited)
CUSTOMER BASE FACILITY COMMODITY TOTALFISCAL YEAR ACCOUNT CHARGE CHARGE FEE FEE % INCREASE
2003 5.25 25.10 39.76 70.11 0.0%2004 5.25 25.10 39.76 70.11 0.0%2005 5.25 25.10 39.76 70.11 0.0%2006 5.25 25.10 39.76 70.11 0.0%2007 5.25 25.10 39.76 70.11 0.0%2008 5.25 25.10 39.76 70.11 0.0%2009 5.38 25.71 40.74 71.83 2.5%2010 5.38 25.71 40.74 71.83 0.0%2011 5.52 26.35 41.79 73.66 2.5%2012 5.54 26.50 42.00 74.04 0.5%
NOTE: An average customer is defined as having combined service and using 7,000 gallons each month.
80.00
AVERAGE RESIDENTIAL CUTOMER'S MONTHLY BILLING(Unaudited)
56
Source: Department's financial records
40.00
45.00
50.00
55.00
60.00
65.00
70.00
75.00
80.00
2003 2004 2005 2006 2007 2008 2009 2010 2011 2012
Fiscal Years
(Unaudited)
56

MARTIN COUNTY, FLORIDAUTILITIES DEPARTMENT
SCHEDULE OF TEN LARGEST CUSTOMERSCurrent Year and Nine Years Ago
(Unaudited)
2012 2003PERCENTAGE PERCENTAGE
OF TOTAL OF TOTALOPERATING OPERATING
CUSTOMER REVENUES RANK REVENUES REVENUES RANK REVENUES
Piper's Landing HOA 171,072$ 1 0.58%
Martin Memorial Medical Center 159,210 2 0.54% 78,543 9 0.37%
St. Lucie Falls POA 152,611 3 0.52% 158,189 3 0.74%
Visiting Nurse Assoc. of Fla. Inc. 149,243 4 0.51%
South River POA 144,149 5 0.49% 138,127 5 0.64%
Vista Del Lago Association, Inc. 144,020 6 0.49% 159,706 2 0.74%
Willoughby Cove LLC 114,225 7 0.39% 140,993 4 0.66%
Portofino @ Jensen Beach 106,901 8 0.36%
Sandpebble/Joe's Point 105,169 9 0.36%
Life Care Services Corp. 87,928 10 0.30% 95,931 8 0.45% Palm Cove Golf & Yacht Club 169,626 1 0.79%
TRG-West/Knickerbocker Properties 137,564 6 0.64%
Coquina Cove Ltd. 103,127 7 0.48%
Sunshine Mobile Manor 75,251 10 0.35%
TOTAL 1,334,528$ 4.52% 1,257,057$ 5.86%
TOTAL OPERATING REVENUES 29,549,044$ 21,461,593$
Source: Department's financial records
57

$60.00
$80.00
$100.00
$120.00
$140.00
MARTIN COUNTY, FLORIDAUTILITIES DEPARTMENT
SCHEDULE OF RESIDENTIAL WATER/WASTEWATER BILL COMPARISONSSeptember 30, 2012
(Unaudited)
$0.00
$20.00
$40.00
Analysis based on 5/8" meters and 7,000 gallons per month consumption
Source: Public Resources Management Group, Inc.5858

1500
2000
25002064
1636
1239
822 779
1783
MARTIN COUNTY, FLORIDAUTILITIES DEPARTMENT
Schedule of Meter ConnectionsLast Ten Fiscal Years
(Unaudited)
Source: Department's financial records 59
0
500
1000
2003 2004 2005 2006 2007 2008 2009 2010 2011 2012
822
330
572
270 367
Fiscal Year Ended September 30,

Martin County, FloridaSchedule of Assessed Value and Actual Value of Taxable Property
Last Ten Fiscal Years(unaudited)
Fiscal Total Personal Assessed Assessed Homestead & Taxable DirectYear Residential Commercial Agricultural Other Real Property Property Property Value Other Exemptions Valuation Rate
2003 10,432,996,112$ 1,845,751,881$ 832,060,884$ 1,191,247,981$ 14,302,056,858$ 1,533,608,089$ 28,832,797$ 15,864,497,744$ 3,884,313,322$ 11,980,184,422$ 6.9183
2004 12,259,714,230 2,034,068,060 833,965,550 1,363,591,862 16,491,339,702 1,579,700,289 33,991,491 18,105,031,482 4,821,532,836 13,283,498,646 6.8963
2005 15,334,668,280 2,482,034,940 1,042,240,760 1,571,743,660 20,430,687,640 1,644,384,735 36,315,729 22,111,388,104 6,659,157,300 15,452,230,804 6.6780
2006 18,375,321,803 2,967,417,600 1,617,739,690 2,102,944,040 25,063,423,133 1,711,693,725 36,529,832 26,811,646,690 9,126,414,465 17,685,232,225 6.0487
2007 23,394,337,118 3,376,848,910 2,504,648,950 2,691,985,565 31,967,820,543 2,121,882,216 40,120,307 34,129,823,066 12,757,499,249 21,372,323,817 5.8142
2008 23,559,171,870 3,762,262,785 3,023,883,970 2,744,087,375 33,089,406,000 2,159,405,510 45,924,411 35,294,735,921 12,594,110,006 22,700,625,915 5.3496
2009 20,429,958,733 3,715,829,925 2,593,303,123 2,843,204,485 29,582,296,266 2,166,888,200 60,594,501 31,809,778,967 11,183,140,471 20,626,638,496 5.7267
2010 17,786,366,431 3,317,390,175 2,399,917,340 2,712,772,705 26,216,446,651 2,094,539,575 47,271,907 28,358,258,133 9,567,825,566 18,790,432,567 6.3228
2011 15,986,019,852 2,930,020,513 1,848,319,700 2,366,717,691 23,131,077,756 2,069,709,043 45,743,610 25,246,530,409 7,753,620,332 17,492,910,077 6.5686
2012 15,146,410,571 2,696,185,025 1,405,034,390 2,172,168,785 21,419,798,771 2,379,712,569 47,987,530 23,847,498,870 6,704,274,218 17,143,224,652 6.7340
Note: Assessed values approximate estimated actual values and tax rates are per $1,000 of assessed value.
Source: Martin County Property Appraiser's Office.
60

Martin County, FloridaSchedule of Direct and Overlapping Property Tax Rates
Per Thousand of Taxable ValueLast Ten Fiscal Years
(unaudited)
2003 2004 2005 2006 2007 2008 2009 2010 2011 2012County Direct Rates
General- CountywideGeneral Fund 5.3480 5.3950 5.2300 4.8950 4.9280 4.5480 4.8970 5.3090 5.5250 5.7336Bonds - General Obligation 0.2720 0.2340 0.2130 0.1960 0.0530 0.0590 0.0640 0.0694 0.0314 - Bonds - Lands For You 0.1460 0.1260 0.1150 0.1050 0.0290 0.0320 0.0340 0.0368 0.0167 - Bonds - FIT 0.0580 0.0520 0.0440 0.0240 0.0320 0.0310 0.0290 0.0320 0.0345 0.0368
Municipal Service Taxing Units¹ 1.0943 1.0893 1.0760 0.8287 0.7722 0.6796 0.7027 0.8756 0.9610 0.9636Total County Direct Rate 6.9183 6.8963 6.6780 6.0487 5.8142 5.3496 5.7267 6.3228 6.5686 6.7340
Overlapping Rates - Countywide
School Board 8.2790 8.2630 7.5920 7.3000 6.7440 6.6020 6.2520 6.7030 6.9560 6.6040Children's Services 0.3143 0.3155 0.3337 0.3337 0.3202 0.2972 0.3523 0.3523 0.3523 0.3693South Florida Water Management 0.6970 0.6970 0.6970 0.6970 0.6970 0.6240 0.6240 0.6240 0.6240 0.4363Florida Inland Navigation District 0.0385 0.0385 0.0385 0.0385 0.0385 0.0345 0.0345 0.0345 0.0345 0.0345
Overlapping Rates - Non-Countywide
City of Stuart 4.1539 4.1539 4.1539 5.4615 5.3442 4.5573 4.5788 4.6081 4.6436 4.6674Town of Jupiter Island 3.8190 3.6170 3.2540 3.0904 2.9994 2.9994 3.1400 3.2350 3.3841 5.0794Town of Ocean Breeze Park - - 2.8820 5.1949 3.4815 2.2911 2.4241 2.2459 2.6295 4.6799Town of Sewall's Point 1.8890 1.8890 1.8890 1.9410 2.4000 2.1690 2.2300 2.2300 2.1800 2.2896
Drainage Districts² 4.75-30.00/ac 7.63-36.25/ac 30-53.34/ac 15-56.63/ac 20-52.72/ac 4.44-66.25/ac 4.05-83.08/ac 4.42-68.63/ac 5.10-68.75/ac 5.10-68.75/ac
Note: Per Florida Statute (F.S.)200.081, no municipality can levy ad valorem taxes against real and tangible personal property in excess of 10 mills, except for voted levies. As defined in F.S. 192.001, a mill is one-thousandth of aUnited States dollar. So, a one mill tax rate would produce one dollar of taxes on each $1,000 of assessed property valuation.
¹ Municipal Services Taxing Units are special taxing units established by the Board of County Commissioners via an adopted ordinance. They are geographic areas defined by specific boundaries and are in the unincorporated areasof the County. These taxes are used within the boundaries of the taxing unit for services such as sidewalk/street repair, fire/rescue services, stormwater abatement, parks operations, and community redevelopment area operations. ² Drainage Districts are special districts that have governing boards with policy-making powers. They have the responsibility for providing irrigation, drainage, etc. for the land areas within the drainage district boundaires. The taxrates are assessed on a per acre basis and are only assessed on the land within the drainage district boundaries. The total tax levy for taxes payable in fiscal year 2012 is $994,946. This is .72% of the total original levy of $137,852,340.
Source: Martin County Tax Collector's Office.
Fiscal Year Taxes Are Payable
61

Martin County, FloridaSchedule of Demographic and Economic Statistics
Last Ten Years(unaudited)
Total Per Capita Unemployment MedianYear Population Personal Income² Personal Income Rate Age³
2003 134,491 5,703,412 42,248 5.2 48.60
2004 137,637 6,120,665 44,452 4.8 48.80
2005 141,059 6,962,997 49,992 3.6 48.80
2006 142,645 7,851,094 56,741 3.4 49.20
2007
143,737 8,586,709 61,868 4.4 49.50
2008 143,868 8,364,241 60,140 6.9 50.20
2009 143,856 8,207,593 58,712 11.1 50.50
2010 143,777 7,435,382 50,758 11.8 49.70
2011 146,689 7,787,403 52,798 10.8 50.00
2012 147,203 - - 9.0 3 -
1 Data for 2012 is not available.2 In thousands of dollars.3 This is a preliminary figure for 2012 and is subject to revision.
Sources: The personal income information is from the Bureau of Economic Analysis, U.S. Department of Commerce and the
2008-12 unemployment rate are from the State of Florida Agency for Workforce Innovation. All other information is
from the University of Florida Bureau of Economic & Business Research.
Personal Income¹
62

Martin County, FloridaSchedule of Principal Employers
Current Year and Nine Years Ago(unaudited)
Percentage of Percentage ofTotal County Total County
Employer Employees Rank Employment Employees Rank EmploymentMartin Health Systems 2,783 1 4.41% 2,483 2 4.06%Martin County School District 2,590 2 4.11% 2,554 1 4.18%Martin County Government 1,565 3 2.48% 1,664 3 2.72%State of Florida 580 4 0.92% 706 6 1.16%Triumph Group - Vought Aircraft Division 408 5 0.65% 400 8 0.65%TurboCombustor Technologies Inc. 396 6 0.63%Liberator Medical Holdings Inc. 340 7 0.54%Seacoast National Bank 294 8 0.47%Louis Dreyfus Commodities 250 9 0.40%Armellini Express Lines 223 10 0.35% 719 5 1.18%Publix Supermarkets 1,173 4 1.92%Winn - Dixie Stores 423 7 0.69%Home Depot 363 9 0.59%Scripps Treasure Coast Publishing 300 10 0.49%
2012 2003
63
Total 9,429 14.96% 10,785 17.65%
Note: The data presented in this list can include part time and full time employees. The labor force figure for 2012 and 2003 is 63,073 and 61,107, respectively. These numbers were used to calculate the percentage of total county employment. The 2012 figure is a preliminary average and is subject to change
Sources: The labor force figures are from the Florida Agency for Workforce Innovation. The Treasure Coast Magazine provided the 2003 employer dataand the 2012 employer data is from the Business Development Board of Martin County except for the governmental entities which provided their own data.The Business Development Board data includes information for only their targeted industries which may not include businesses that have been includedon this list in the past such as Lowes, Publix Winn-Diuxie, etc.. More information on their targeted industries can be found on their website http://bdbmc.org.
63

Martin County, FloridaSchedule of Property Tax Levies and Collections,
Last Ten Fiscal Years(unaudited)
Taxes LeviedFiscal Year for the Collections
Ended Fiscal Year Total Percentage of in Subsequent Percentage ofSeptember 30, (Original Levy) Adjustments Adjusted Levy Amount Original Levy Years Amount Adjusted Levy
2003 100,943,067$ (3,567,072)$ 97,375,995$ 97,024,680$ 96.12 % 212,242$ 97,236,922$ 99.86 %2004 111,843,984 (4,091,574) 107,752,410 107,619,105 96.22 100,444 107,719,549 99.972005 126,241,036 (4,722,263) 121,518,773 121,383,447 96.15 77,387 121,460,834 99.952006¹ 138,792,622 (5,876,538) 132,916,084 132,795,379 95.68 97,179 132,892,558 99.982007 160,732,307 (5,826,007) 154,906,300 154,759,193 96.28 108,141 154,867,334 99.972008 155,197,512 (5,521,908) 149,675,604 149,509,351 96.33 102,074 149,611,425 99.962009 149,178,832 (5,912,700) 143,266,132 142,885,561 95.78 59,189 142,944,750 99.782010 141,048,660 (5,111,839) 135,936,821 135,671,472 96.19 65,127 135,736,599 99.852011 137,569,894 (4,936,624) 132,633,270 132,313,569 96.18 112,173 132,425,742 99.842012 137,852,340 (4,934,930) 132,917,410 132,687,415 96.25 - 132,687,415 99.83
Note: The adjustments are discounts, errors and insolvencies. The errors and insolvencies could be errors in values, homestead omission, etc. Property tax levies become due and payable onNovember 1st of each year. A 4% discount is allowed if paid in November, with the discount decreasing by 1% each month. Thus, taxes paid in March will not receive any discount.
¹ For fiscal year 2006 only, additional early payment discounts were offered to taxpayers. A 4% discount was allowed for payments made by January 31, 2006, a 3% discount was allowed forpayments made by February 28, 2006, and a 2% discount was allowed for payments made by March 31, 2006.
Source: Martin County Tax Collector
Collected within theFiscal Year of the Levy Total Collections to Date
64

MARTIN COUNTY, FLORIDAUTILITIES DEPARTMENT
Schedule of Debt Service CoverageLast Ten Fiscal Years
(Unaudited)
2012 2011 2010 2009 2008 2007 2006 2005 2004 2003
PRIMARY DEBT SERVICE COVERAGE
Operating revenues 29,549,044$ 29,371,014$ 27,651,131$ 26,159,368$ 24,948,473$ 26,018,743$ 25,974,637$ 24,702,842$ 23,904,415$ 21,461,593$
General and administrative expenses (a) (14,327,780) (14,713,133) (15,347,488) (15,109,284) (14,757,562) (14,558,780) (14,367,837) (12,896,082) (11,641,863) (10,079,623)
Non-operating income (b) 673,537 558,104 624,889 619,237 1,028,230 1,638,364 1,988,350 1,362,992 984,021 371,459
Special assessment fees (c) 604,700 690,738 563,989 554,071 886,170 462,598 - - - -
Net revenues available for debt service 16,499,501$ 15,906,723$ 13,492,521$ 12,223,392$ 12,105,311$ 13,560,925$ 13,595,150$ 13,169,752$ 13,246,573$ 11,753,429$
Connection fees (d) 996,280 771,830 1,013,725 711,537 2,585,175 3,087,645 3,229,503 4,125,641 4,127,000 2,611,407
Net revenues & connection fees 17,495,781$ 16,678,553$ 14,506,246$ 12,934,929$ 14,690,486$ 16,648,570$ 16,824,653$ 17,295,393$ 17,373,573$ 14,364,836$
Debt service requirements (e) 7,022,218$ 7,106,186$ 7,296,289$ 7,065,799$ 7,062,209$ 7,066,689$ 7,065,974$ 7,066,874$ 7,069,202$ 4,473,120$
Actual coverage:
Excluding connection fees 2.35 2.24 1.85 1.73 1.71 1.92 1.92 1.86 1.87 2.63
Including connection fees 2.49 2.35 1.99 1.83 2.08 2.36 2.38 2.45 2.46 3.21
Required coverage:
Excluding connection fees 1.10 1.10 1.10 1.10 1.10 1.10 1.10 1.10 1.10 1.10
Including connection fees 1.20 1.20 1.20 1.20 1.20 1.20 1.20 1.20 1.20 1.20
STATE REVOLVING FUND LOAN DEBT SERVICE COVERAGE
Net revenues available for debt service 16,499,501$ 15,906,723$ 13,492,521$ 12,223,392$ 12,105,311$ 13,560,925$ 13,595,150$
Less: revenue required for primary debt
service coverage (f) 7,724,440 7,816,805 8,025,918 7,772,379 7,768,430 7,773,358 7,772,571
Less indirect costs 1,212,940 1,212,940 1,212,940 1,190,941 1,190,941 1,129,643 953,223
Adjusted net revenues 7,562,121$ 6,876,978$ 4,253,663$ 3,260,072$ 3,145,940$ 4,657,924$ 4,869,356$
Debt service requirements (g) 180,724$ 182,086$ 182,439$ 182,439$ 182,439$ 182,439$ 163,649$
Actual coverage 41.84 37.77 23.32 17.87 17.24 25.53 29.75
Required Coverage 1.15 1.15 1.15 1.15 1.15 1.15 1.15
a. Excludes depreciation, loss on disposal of assets, indirect costs to General Fund and includes other debt services costs exclusive of bond principal and interest.
b. Does not include interest income on project funds from bond proceeds or interest income on connection fees. For fiscal year 2008 interest on project funds and connection fees totaled $420,468.
c. Special assessment fees received in the fiscal year are included for purposes of debt service coverage in the calculation of net revenues per the bond covenants. On the Statement of Revenues, Expenses and
Changes in New Assets special assessment revenues are recognized when the project is completed and recorded as a capital contribution. This change was made in FY 2008 and restated for FY 2007 only.
d. Amounts shown reflect Capital Facility Charges and interest adjusted by the Capital Facility Charges Debt Service Component.
e. Total debt service includes bond principal and total interest expense. Amount reported as interest expense in the Statement of Revenues, Expenses and Changes in Net Assets is net of
capitalized interest and bond premiums.
f. Represents 110% of primary debt service requirements.
g. Represents debt service requirements on outstanding State Revolving Fund Loans for such fiscal year.
65

MARTIN COUNTY, FLORIDAUTILITIES DEPARTMENT
Schedule of Ratio of Revenues Bonded Debt Outstanding: 2003-2012(Unaudited)
Revenue Ratio of Revenue Estimated PercentageBonds/Loans Gross Debt to Population of Personal Debt
Year Outstanding (1) Revenues (2) Gross Revenue Served Income(3) Per Capita (4)
2003 101,366,275 26,174,975 3.87 71,852 3.34% 1,411 2004 99,208,897 31,182,326 3.18 75,031 2.97% 1,322 2005 96,853,897 33,796,727 2.87 77,446 2.50% 1,251 2006 96,817,859 33,724,928 2.87 81,778 2.09% 1,184 2007 94,186,212 32,381,265 2.91 77,759 1.96% 1,211 2008 91,342,642 29,868,516 3.06 77,768 1.95% 1,175 2009 91,226,836 28,201,138 3.23 79,475 1.96% 1,148 2010 93,392,845 30,008,067 3.11 86,894 - 1,075 2011 91,135,582 31,588,235 2.89 87,030 - 1,047 2012 89,879,956 32,108,711 2.80 88,147 - 1,020
(1) Details regarding outstanding debt can be found in the notes to the financial statements.(2) Gross Revenues are defined as operating revenues plus investment income plus gain on disposition of capital assets plus other income, capital contributions minus noncash capital contributions and special assessment cash.(3) See the schedule of demographic and economic statistics for personal income and population data. These ratios are calculated using personal income and population served by the utility for the calendar year.(4) Population estimates are utility water and wastewater customers only. Calculation was adjusted in FY 2007 to match BEBR (University of Florida Bureau of Economic & Business Research).
Note: Data for 2010 - 2011 is not available to calculate the percentage of personal income.
Source: Department's Financial Records
66
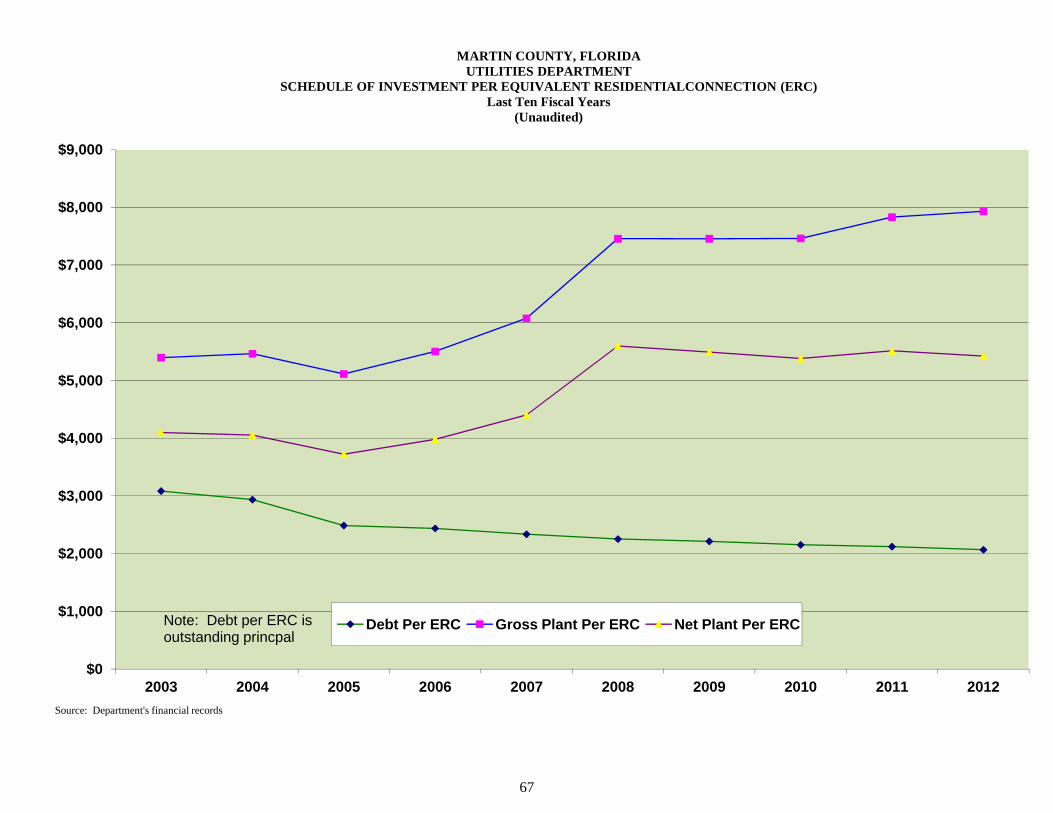
$5,000
$6,000
$7,000
$8,000
$9,000
MARTIN COUNTY, FLORIDAUTILITIES DEPARTMENT
SCHEDULE OF INVESTMENT PER EQUIVALENT RESIDENTIALCONNECTION (ERC)Last Ten Fiscal Years
(Unaudited)
67
$0
$1,000
$2,000
$3,000
$4,000
2003 2004 2005 2006 2007 2008 2009 2010 2011 2012
Debt Per ERC Gross Plant Per ERC Net Plant Per ERCNote: Debt per ERC is outstanding princpal
Source: Department's financial records

Martin County, FloridaUtilities Department
Schedule of Statistical Operating IndicatorsLast Ten Fiscal Years
(unaudited)
2003 2004 2005 2006 2007 2008 2009 2010 2011 2012Water New Connections 2,064 1,636 1,239 822 779 330 572 1,783 270 367 Average daily consumption (mgd) 7.582 8.802 9.011 9.271 8.814 7.994 8.515 8.699 9.098 9.296 Peak daily consumption (mgd) 8.424 10.226 10.217 10.999 10.275 10.027 9.867 9.345 12.742 13.939
Wastewater Average daily sewage treatment (mgd) 3.753 3.821 4.074 4.875 4.581 4.465 3.294 3.797 3.883 4.110
Martin County, Florida Utilities Department
Schedule of Capital Asset Statistics Last Ten Fiscal Years
(unaudited)
2003 2004 2005 2006 2007 2008 2009 2010 2011 2012
Water Water mains (miles) 369 395 425 451 468 474 504 512 518 519 Fire Hydrants 2207 2,349 2,575 2,746 2,860 3,011 3,078 3,283 3,363 3,389 Raw water wells (surficial) 27 30 30 30 30 30 30 30 30 30 Raw water wells (floridian) 4 4 4 9 9 9 9 9 9 9 Treatment capacity (mgd) 15.75 16.26 16.54 16.54 16.54 16.54 18.80 18.80 18.80 18.80 Storage capacity (mg) 19.70 19.70 19.70 19.70 19.70 19.70 19.70 16.00 16.00 16.00
Wastewater Force main and collection sewer 259 275 296 317 327 337 351 356 362 364 Pump stations 290 310 315 329 340 343 360 381 383 387 Reuse water mains 10 12 13 18 21 21 34 35 36 39 Treatment Capacity (mdg) 5.570 5.570 5.570 6.950 6.950 9.510 7.760 7.760 7.760 7.760
Soure: Department's financial records 68
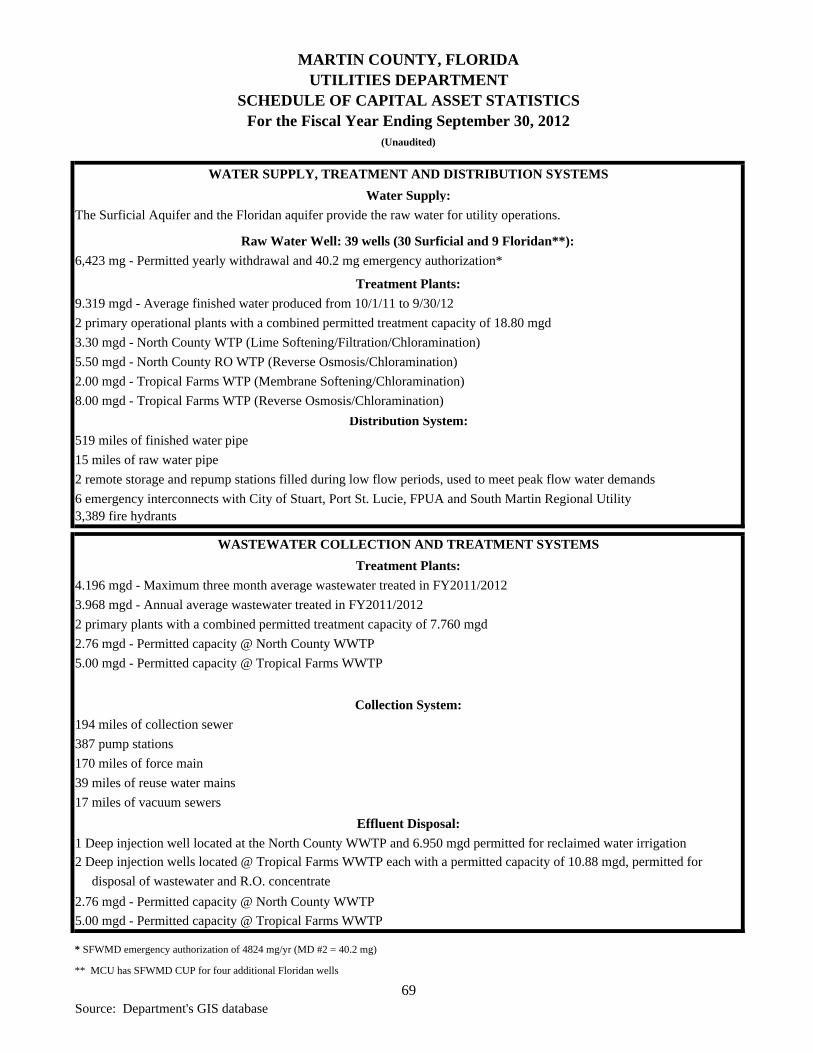
MARTIN COUNTY, FLORIDAUTILITIES DEPARTMENT
SCHEDULE OF CAPITAL ASSET STATISTICSFor the Fiscal Year Ending September 30, 2012
(Unaudited)
WATER SUPPLY, TREATMENT AND DISTRIBUTION SYSTEMS
Water Supply:
The Surficial Aquifer and the Floridan aquifer provide the raw water for utility operations.
Raw Water Well: 39 wells (30 Surficial and 9 Floridan**):
6,423 mg - Permitted yearly withdrawal and 40.2 mg emergency authorization*
Treatment Plants:
9.319 mgd - Average finished water produced from 10/1/11 to 9/30/12
2 primary operational plants with a combined permitted treatment capacity of 18.80 mgd
3.30 mgd - North County WTP (Lime Softening/Filtration/Chloramination)
5.50 mgd - North County RO WTP (Reverse Osmosis/Chloramination)
2.00 mgd - Tropical Farms WTP (Membrane Softening/Chloramination)
8.00 mgd - Tropical Farms WTP (Reverse Osmosis/Chloramination)
Distribution System:
519 miles of finished water pipe
15 miles of raw water pipe
2 remote storage and repump stations filled during low flow periods, used to meet peak flow water demands
6 emergency interconnects with City of Stuart, Port St. Lucie, FPUA and South Martin Regional Utility3,389 fire hydrants
WASTEWATER COLLECTION AND TREATMENT SYSTEMS
Treatment Plants:
4.196 mgd - Maximum three month average wastewater treated in FY2011/2012
3.968 mgd - Annual average wastewater treated in FY2011/2012
2 primary plants with a combined permitted treatment capacity of 7.760 mgd
2.76 mgd - Permitted capacity @ North County WWTP
5.00 mgd - Permitted capacity @ Tropical Farms WWTP
Collection System:
194 miles of collection sewer
387 pump stations
170 miles of force main
39 miles of reuse water mains
17 miles of vacuum sewers
Effluent Disposal:
1 Deep injection well located at the North County WWTP and 6.950 mgd permitted for reclaimed water irrigation2 Deep injection wells located @ Tropical Farms WWTP each with a permitted capacity of 10.88 mgd, permitted for
disposal of wastewater and R.O. concentrate
2.76 mgd - Permitted capacity @ North County WWTP
5.00 mgd - Permitted capacity @ Tropical Farms WWTP
* SFWMD emergency authorization of 4824 mg/yr (MD #2 = 40.2 mg)
** MCU has SFWMD CUP for four additional Floridan wells
Source: Department's GIS database 69

Martin County, FloridaUtilities Department
Schedule of Authorized Full Time Equivalent Employees By FunctionLast Ten Fiscal Years
(unaudited)
2003 2004 2005 2006 2007 2008 2009 2010 2011 2012Administration 2.9 2.9 3.8 3.2 3.6 3.6 2.6 1.9 2 2Financial Operations 10.4 10.4 11.1 14.6 14.9 14.9 14.9 12.2 12.9 11.9Technical Services 11.5 11.5 14.5 16.4 16.4 15.4 13.4 14.4 13.4 13.4Field Operations 12 18 19 19 19 20 20 20 19 22Treatment 26 27 27.3 29 30 29 29 30 29 27Maintenance 20 15 13 13 14 13 13 13 13 14
Total 82.8 84.8 88.7 95.2 97.9 95.9 92.9 91.5 89.3 90.3
Full Time Equivalent Employees
Source: Department's financial records
75
80
85
90
95
100
2003 2004 2005 2006 2007 2008 2009 2010 2011 2012
Full Time Equivalent Employees
70

71
Independent Auditor's Report on Internal Control Over Financial Reporting and on Compliance and Other Matters Based on an Audit of Financial Statements Performed in Accordance with
Government Auditing Standards The Honorable Board of County Commissioners Martin County, Florida We have audited the financial statements of the Martin County Utilities Department (the Department), an enterprise fund of Martin County, Florida (the County), as of and for the year ended September 30, 2012, and have issued our report thereon dated March 14, 2013. We conducted our audit in accordance with auditing standards generally accepted in the United States of America and the standards applicable to financial audits contained in Government Auditing Standards, issued by the Comptroller General of the United States. Internal Control over Financial Reporting Management of Martin County is responsible for establishing and maintaining effective internal control over financial reporting. In planning and performing our audit, we considered Martin County 's internal control over financial reporting as a basis for designing our auditing procedures for the purpose of expressing our opinion on the financial statements, but not for the purpose of expressing an opinion on the effectiveness of the Martin County 's internal control over financial reporting. Accordingly, we do not express an opinion on the effectiveness of the Department’s internal control over financial reporting. A deficiency in internal control exists when the design or operation of a control does not allow management or employees, in the normal course of performing their assigned functions, to prevent, or detect and correct misstatements on a timely basis. A material weakness is a deficiency, or combination of deficiencies, in internal control, such that there is a reasonable possibility that a material misstatement of the entity’s financial statements will not be prevented, or detected and corrected on a timely basis. Our consideration of internal control over financial reporting was for the limited purpose described in the first paragraph of this section and was not designed to identify all deficiencies in internal control over financial reporting that might be deficiencies, significant deficiencies or material weaknesses. We did not identify any deficiencies in internal control over financial reporting that we consider to be material weaknesses, as defined above. Compliance and Other Matters As part of obtaining reasonable assurance about whether the Department’s financial statements are free of material misstatement, we performed tests of its compliance with certain provisions of laws, regulations, contracts and grant agreements, noncompliance with which could have a direct and material effect on the determination of financial statement amounts. However, providing an opinion on compliance with those provisions was not an objective of our audit and, accordingly, we do not express such an opinion. The results of our tests disclosed no instances of noncompliance or other matters that are required to be reported under Government Auditing Standards.

72
This report is intended solely for the information and use of Members of the Board of County Commissioners, management, and others within the entity, and is not intended to be and should not be used by anyone other than those specified parties.
West Palm Beach, Florida March 14, 2013