florida department of education - Duval County Public Schools
152
-
Upload
khangminh22 -
Category
Documents
-
view
1 -
download
0
Transcript of florida department of education - Duval County Public Schools


FLORIDA DEPARTMENT OF EDUCATION SUPERINTENDENT’S ANNUAL FINANCIAL REPORT (ESE 145)
DISTRICT SCHOOL BOARD OF DUVAL COUNTY For the Fiscal Year Ended June 30, 2010
PAGE NUMBER CONTENTS: Minimum
Reporting
CAFR
ESE 145
Return completed form to: Department of Education Office of Funding and Financial Reporting 325 W. Gaines St., Room 824 Tallahassee, FL 32399-0400
Exhibit A-1 Management’s Discussion and Analysis ------------------------------------------------- 1 1 Exhibit B-1 Statement of Net Assets -------------------------------------------------------------------- 2 2 Exhibit B-2 Statement of Activities --------------------------------------------------------------------- 3 3 Exhibit C-1 Balance Sheet – Governmental Funds ---------------------------------------------------- 4 4 Exhibit C-2 Reconciliation of the Governmental Funds Balance Sheet to the Statement of
Net Assets ------------------------------------------------------------------------------------ 5 5 Exhibit C-3 Statement of Revenues, Expenditures, and Changes in Fund Balances –
Governmental Funds ------------------------------------------------------------------------ 6 6 Exhibit C-4 Reconciliation of the Statement of Revenues, Expenditures, and Changes in
Fund Balances of Governmental Funds to the Statement of Activities -------------- 7 7 Exhibit C-5 Statement of Net Assets – Proprietary Funds ------------------------------------------- 8 8 Exhibit C-6 Statement of Revenues, Expenses, and Changes in Fund Net Assets –
Proprietary Funds --------------------------------------------------------------------------- 9 9 Exhibit C-7 Statement of Cash Flows – Proprietary Funds ------------------------------------------ 10 10 Exhibit C-8 Statement of Fiduciary Net Assets -------------------------------------------------------- 11 11 Exhibit C-9 Statement of Changes in Fiduciary Net Assets ------------------------------------------ 12 12 Exhibit C-10 Combining Statement of Net Assets – Major and Nonmajor Component Units ---- 13 13 Exhibit C-11a-d Combining Statement of Activities – Major and Nonmajor Component Units ----- 14-17 14-17 Exhibit D-1 Notes to the Financial Statements --------------------------------------------------------- 18 18 Exhibit D-2 Schedule of Funding Progress ------------------------------------------------------------- 19 19 Exhibit E-1 Schedule of Revenues, Expenditures, and Changes in Fund Balances – Budget
and Actual – General Fund ---------------------------------------------------------------- 20 20 Exhibit E-2a-d Schedule of Revenues, Expenditures, and Changes in Fund Balances – Budget
and Actual – Major Special Revenue Funds --------------------------------------------- 21-24 21-24 Exhibit F-1a-d Combining Balance Sheet – Nonmajor Governmental Funds ------------------------- 25-28 Exhibit F-2a-d Combining Statement of Revenues, Expenditures, and Changes in Fund
Balances – Nonmajor Governmental Funds --------------------------------------------- 29-32 Exhibit G-1 Schedule of Revenues, Expenditures, and Changes in Fund Balances – Budget
and Actual – Nonmajor Special Revenue Funds ---------------------------------------- 33 Exhibit G-2 Schedule of Revenues, Expenditures, and Changes in Fund Balances – Budget
and Actual – Debt Service Funds --------------------------------------------------------- 34 Exhibit G-3 Schedule of Revenues, Expenditures, and Changes in Fund Balances – Budget
and Actual – Capital Projects Funds ------------------------------------------------------ 35 Exhibit G-4 Schedule of Revenues, Expenditures, and Changes in Fund Balances – Budget
and Actual – Permanent Funds ------------------------------------------------------------ 36 Exhibit H-1 Combining Statement of Net Assets – Nonmajor Enterprise Funds ------------------ 37 Exhibit H-2 Combining Statement of Revenues, Expenses, and Changes in Fund Net Assets
– Nonmajor Enterprise Funds ------------------------------------------------------------- 38 Exhibit H-3 Combining Statement of Cash Flows – Nonmajor Enterprise Funds ---------------- 39 Exhibit H-4 Combining Statement of Net Assets – Internal Service Funds ------------------------ 40 Exhibit H-5 Combining Statement of Revenues, Expenses, and Changes in Fund Net Assets
– Internal Service Funds ------------------------------------------------------------------- 41 Exhibit H-6 Combining Statement of Cash Flows – Internal Service Funds ----------------------- 42 Exhibit I-1 Combining Statement of Fiduciary Net Assets – Investment Trust Funds ---------- 43 Exhibit I-2 Combining Statement of Changes in Net Assets – Investment Trust Funds -------- 44 Exhibit I-3 Combining Statement of Fiduciary Net Assets – Private-Purpose Trust Funds ---- 45 Exhibit I-4 Combining Statement of Changes In Net Assets – Private-Purpose Trust Funds -- 46 Exhibit I-5 Combining Statement of Fiduciary Net Assets – Pension Trust Funds -------------- 47 Exhibit I-6 Combining Statement of Changes In Net Assets – Pension Trust Funds ------------ 48 Exhibit I-7 Combining Statement of Fiduciary Net Assets – Agency Funds --------------------- 49 Exhibit I-8a-d Combining Statement of Changes in Assets and Liabilities – Agency Funds------- 50-53 Exhibit J-1 Combining Statement of Net Assets – Nonmajor Component Units ----------------- 54

FLORIDA DEPARTMENT OF EDUCATION SUPERINTENDENT’S ANNUAL FINANCIAL REPORT (ESE 145)
DISTRICT SCHOOL BOARD OF DUVAL COUNTY For the Fiscal Year Ended June 30, 2010
PAGE NUMBER CONTENTS: Minimum
Reporting
CAFR
ESE 145
Return completed form to: Department of Education Office of Funding and Financial Reporting 325 W. Gaines St., Room 824 Tallahassee, FL 32399-0400
Exhibit J-2a-d Combining Statement of Activities – Nonmajor Component Units ------------------ 55-60 The Superintendent’s Annual Financial Report (ESE 145) for the fiscal year ended June 30, 2010, was submitted in accordance with Rule 6A-1.0071, F.A.C. (Section 1001.51(12)(b), F.S.). This report was approved by the school board on ____________________________, 2010. _______________________________________________ ________________ District Superintendent’s Signature Date

The District School Board of Duval County (the “District”) has prepared the following
discussion and analysis of financial activities for the fiscal year ended June 30, 2010. It is intended
to provide a broad overview using a short-term and long-term analysis of the District’s activities
based on information presented in the financial report and fiscal policies that have been adopted by
the School Board (the “Board”). The intent of this discussion and analysis is to (a) assist the reader
in focusing on significant financial issues, (b) provide an overview of the District’s financial
activities, (c) identify changes in the District’s financial position, (d) identify material deviations
from the approved budget, and (e) highlight significant issues in the individual funds.
The Management’s Discussion and Analysis (MD&A) is intended to highlight significant
transactions, events, and conditions, and should be considered in conjunction with the District’s
financial statements and notes to financial statements.
FINANCIAL HIGHLIGHTS
Key financial highlights for the 2009-10 fiscal year are as follows:
The District’s total assets exceeded its total liabilities at June 30, 2010, by $939,257,926 (net
assets).
The District’s net assets decreased by $11,855,085, which represents a 1.2 percent decrease
from the 2008-09 fiscal year. This is the second consecutive year that net assets have
decreased. This is a result of declining State and Local revenue.
The District’s total government-wide revenues of $1,156,222,817 were comprised of general
revenues of $1,089,615,721, or 94.2 percent of total revenues, and program specific revenues
from charges for services, operating grants and contributions, and capital grants and
contributions of $66,607,096 or 5.8 percent of total revenues. This compares to the prior
year with government-wide revenues of $1,145,588,846, which were comprised of general
revenues of $1,046,183,788, or, 91.3 percent of the total revenue, and charges for services,
operating grants and contributions, and capital grants and contributions of $99,405,058, or
8.7 percent of the total revenue. The change in program specific revenue is mainly due to
transportation funding becoming part of the Florida Education Finance Program (FEFP).
M A N A GEM EN T’ S D ISC USS IO N A ND A NA LYS IS F OR T HE Y EAR EN D I NG J U NE 30 , 2 0 10

DUVAL COUNTY PUBLIC SCHOOLS MANAGEMENT DISCUSSION AND ANALYSIS FOR THE FISCAL YEAR ENDED JUNE 30, 2010 The District’s total expenses for governmental activities of $1,168,077,901 were offset by
program specific revenues of $66,607,096. The remaining expenses were funded from
general revenues.
The District’s governmental funds reported combined ending fund balances of $321,527,835,
or an increase of $21,067,325 in the 2009-10 fiscal year in comparison with the prior year’s
balance of $300,460,510.
The unreserved fund balance of the General Fund, representing the net current financial
resources available for general appropriation by the Board, totaled $75,280,202 at June 30,
2010, or 8.7 percent of total General Fund expenditures. This is an increase of $17,249,256
or 29.7 percent over the prior fiscal year’s total of $58,030,946 in anticipation of continued
depressed State and Local revenues.
The General Fund total fund balance was $136,005,476 as of June 30, 2010, which represents
an increase of $13,155,643 or 10.7 percent as compared to the prior year’s balance of
$122,849,823. This increase reflects the District’s commitment to be fiscally sound by the
preservation of fund balance due to the uncertainty of near-term revenue streams. The
increase in total fund balance of the General Fund is partially attributed to $36,700,137 of
transfers from the Capital Projects Fund. These transfers covered expenses such as
transportation, minor maintenance, SAP technical upgrade, and the active directory upgrade
that have been paid for out of the General Fund, but qualified and are allowed to be paid for
out of capital outlay 2009-10 millage funding. General Fund expenditures decreased by
$63,670,713 as compared with the prior years’ expenditures.
The significant decrease in the State funded FEFP has been augmented by the Federal
American Recovery and Reinvestment Act (ARRA) Economic Stimulus funding. Also, the
Florida legislature allowed School Boards the flexibility in local funding to levy, by a
supermajority vote of Board Members, a critical needs millage of 0.250 mills for either the
General Fund or Capital Outlay Fund. The District’s School Board approved a 0.250 mill
Critical Operating Needs millage for the General Fund. Of immediate concern for the
District is that the ARRA funds were only approved and allocated for the 2009-10 and 2010-
11 school years, and the School Board can only approve the 0.250 mill critical operating
millage for the 2009-10 and 2010-11 school years. Future levies have to be approved by a
EXHIBIT A-1 PAGE 1-B

DUVAL COUNTY PUBLIC SCHOOLS MANAGEMENT DISCUSSION AND ANALYSIS FOR THE FISCAL YEAR ENDED JUNE 30, 2010
voter referendum. Without the extension of ARRA stimulus funds and/or major increases in
State and Local revenues, the District faces extremely significant shortfalls in revenue for the
2011-12 school year.
The District’s investment in capital assets (net of accumulated depreciation) increased by
$28,735,380, or 3.1 percent to $966,340,546. This is attributed to the construction of the new
Atlantic Coast High School.
During the current year, General Fund expenditures exceeded revenues by $17,730,031. This
may be compared to last year’s results in which General Fund expenditures exceeded
revenues by $54,790,294. The General Fund also received $30,885,674 in net transfers to
assist in covering the expenditures.
OVERVIEW OF THE FINANCIAL STATEMENTS
The District’s basic financial statements are comprised of three parts:
Government-Wide Financial Statements;
Fund Financial Statements;
Notes to Financial Statements.
In addition to the basic financial statements, this report also contains other required supplementary
information.
Government-Wide Financial Statements
The government-wide financial statements provide both short-term and long-term information
regarding the overall financial position of the District, in a manner similar to a private-sector
business. These include a statement of net assets and a statement of activities designed to provide
consolidated financial information about the activities of the primary government presented on the
accrual basis of accounting, specifically:
The Statement of Net Assets provides information about the government’s financial position,
its assets and liabilities, using an economic resources measurement focus. The difference
between the assets and liabilities, the net assets, is a measure of the financial health of the
District.
EXHIBIT A-1 PAGE 1-C

DUVAL COUNTY PUBLIC SCHOOLS MANAGEMENT DISCUSSION AND ANALYSIS FOR THE FISCAL YEAR ENDED JUNE 30, 2010 The Statement of Activities presents information about the change in the District’s net assets,
the results of operations, during the fiscal year. An increase or decrease in net assets is an
indicator of whether the District’s financial position is improving or deteriorating.
All of the District’s activities and services are reported in the government-wide financial
statements, including instruction, pupil personnel services, instructional support services,
administrative support services, facility maintenance, transportation, food services, and other
functions. Property taxes, State and Federal assistance, interest, and investment earnings finance
most of these activities. Additionally, all capital and debt financing activities are reported in these
statements. The District currently does not report any business-type activities, which would include
functions that are intended to recover all or a significant portion of their costs through user fees and
charges.
The government-wide financial statements include not only the District itself (the primary
government), but also report the combined activities of five legally separate charter schools (discrete
component units) for which the District is financially accountable. Financial information for these
discrete component units is reported separately from the financial information presented for the
primary government itself. Two charter schools have been determined to be component units of
other organizations, based on their financials and supportive dependence on the parent organizations
and are therefore not included in the District’s financial statements. Pathways Academy has been
determined to be a component unit of Florida State College at Jacksonville (FSCJ), and Tiger
Academy is a component unit of the Young Men’s Christian Association (YMCA). The Duval
School Board Leasing Corporation, although also legally separate, was formed to facilitate financing
for the acquisition of facilities and equipment. Due to the substantive economic relationship
between the District and the Leasing Corporation, the Leasing Corporation has been included as an
integral part of the primary government.
Fund Financial Statements
A fund is a grouping of related accounts that is used to maintain control over resources that
have been segregated for specific activities or objectives. The District uses fund accounting to
ensure and demonstrate compliance with finance-related legal requirements and prudent fiscal
management. All of the funds of the District can be classified into one of the following three
categories: governmental funds, proprietary funds, and fiduciary funds.
EXHIBIT A-1 PAGE 1-D

DUVAL COUNTY PUBLIC SCHOOLS MANAGEMENT DISCUSSION AND ANALYSIS FOR THE FISCAL YEAR ENDED JUNE 30, 2010 Governmental Funds Governmental funds are used to account for essentially the same functions
reported as governmental activities in the government-wide financial statements. However, unlike
the government-wide financial statements, governmental fund financial statements focus on near-
term inflows and outflows of spendable resources, as well as balances of spendable resources
available at the end of the fiscal year. Such information may be useful in evaluating a government’s
near-term financing requirements.
Because the focus of governmental funds is narrower than that of the government-wide
financial statements, it is useful to compare the information presented for governmental funds with
similar information presented for governmental activities in the government-wide financial
statements. By doing so, readers may better understand the long-term impact of the District’s near-
term financing decisions. Therefore, to facilitate this comparison, both the governmental funds
balance sheet and the governmental funds statement of revenues, expenditures, and changes in fund
balances provide a reconciliation of governmental funds and governmental activities.
The governmental funds balance sheet and statement of revenues, expenditures, and changes in
fund balances provide detailed information about the District’s most significant funds. The
District’s major funds for this fiscal year are the General Fund, American Recovery and
Reinvestment Act (ARRA) Economic Stimulus Fund, Special Revenue – Food Service, Debt Service
– Other Debt Service Fund, Debt Service – ARRA Economic Stimulus Debt Service, Capital
Projects – ARRA Economic Stimulus Capital Projects, Capital Projects – Local Capital
Improvement Fund, and Capital Projects – Other Capital Projects Fund. Data from other
governmental funds are aggregated into a single presentation.
The District adopts an annual appropriated budget for its governmental funds. A budgetary
comparison statement is provided for the General Fund, Special Revenue – Food Service, and the
ARRA Fund to demonstrate compliance with their budgets.
Proprietary Funds The District maintains proprietary funds for its Internal Service Funds. Internal
Service Funds are used to accumulate and allocate costs internally among the District’s various
functions. The District uses its Internal Service Funds to account for its self-insurance programs,
including health, workers' compensation, general liability, and automobile liability coverage, and the
District printing operations. The District’s Internal Service Funds are included within governmental
activities in the government-wide financial statements because the services predominantly benefit
the District’s governmental functions.
EXHIBIT A-1 PAGE 1-E

DUVAL COUNTY PUBLIC SCHOOLS MANAGEMENT DISCUSSION AND ANALYSIS FOR THE FISCAL YEAR ENDED JUNE 30, 2010 Fiduciary Funds Fiduciary funds are used to report assets held in a trustee or fiduciary capacity for
the benefit of external parties, such as school and activity funds, commonly called the school internal
funds, and trust funds. Fiduciary funds are not reflected in the government-wide financial statements
because the resources of those funds are not available to support the District’s own programs. In its
fiduciary capacity, the District is responsible for ensuring that the assets reported in these funds are
used only for their intended purposes. The District’s fiduciary funds are the Agency Funds used to
account for resources held for the school internal funds, and the Gear Up Scholarship Trust Fund.
Notes to Financial Statements The notes to the basic financial statements provide additional information that is essential to
understanding the data provided in the government-wide and fund financial statements.
GOVERNMENT-WIDE FINANCIAL ANALYSIS
Net assets may serve over time as a useful indicator of a government’s financial position. The
following is a summary of the District’s net assets as of June 30, 2010, compared to net assets as of
June 30, 2009:
PercentChange
2010 2009 2009-2010
Current and Other Assets 473,998,359$ 510,251,684$ -7.1%Capital Assets 966,340,546 937,605,166 3.1%
Total Assets 1,440,338,905 1,447,856,850 -0.5%
Long-Term Liabilities 419,930,273 357,358,340 17.5%Other Liabilities 81,150,706 139,385,499 -41.8%
Total Liabilities 501,080,979 496,743,839 0.9%
Net Assets:Invested in Capital Assets - Net of Debt 731,073,204 725,545,184 0.8%Restricted 163,780,083 169,795,110 -3.5%Unrestricted 44,404,639 55,772,717 -20.4%
Total Net Assets 939,257,926$ 951,113,011$ -1.2%
Net Assets, June 30,
GovernmentalActivities
A major portion of the District’s net assets (77.8 percent) reflect its investment in capital assets
(e.g., land, buildings, machinery, and equipment); less any related debt used to acquire those assets
EXHIBIT A-1 PAGE 1-F

DUVAL COUNTY PUBLIC SCHOOLS MANAGEMENT DISCUSSION AND ANALYSIS FOR THE FISCAL YEAR ENDED JUNE 30, 2010 that is still outstanding. The District uses these capital assets to provide education and related
services to the students of Duval County, Florida; consequently, these assets are not available for
future spending. Although the District’s investment in capital assets is reported net of related debt, it
should be noted that the resources needed to repay this debt are provided from other sources, since
the capital assets themselves are not to be used to liquidate these liabilities.
The restricted portion of the District’s net assets (17.4 percent) represents resources that are
subject to external restrictions on how they may be used. The District’s unrestricted net assets (4.8
percent) may be used to meet the District’s ongoing obligations to students, employees, and
creditors.
The District’s total net assets decreased by $11,855,085 during the 2009-10 fiscal year. The
decrease represents the degree to which ongoing expenses have exceeded ongoing revenues. Details
of the revenues and expenses composing the decrease are as follows:
PercentChange
6-30-10 6-30-09 2009-2010
Program Revenues: Charges for Services 24,377,116$ 26,793,833$ -9.0% Operating Grants and Contributions 33,615,282 48,694,522 -31.0% Capital Grants and Contributions 8,614,698 23,916,703 -64.0%General Revenues: Property Taxes Levied for Operational Purposes 365,687,203 365,289,998 0.1% Property Taxes Levied for Debt Service 69,868 -100.0% Property Taxes Levied for Capital Projects 90,267,326 109,260,092 -17.4% Grants and Contributions Not Restricted to Specif ic Programs 605,397,937 546,902,673 10.7% Unrestricted Investment Earnings 9,787,363 11,964,773 -18.2% Miscellaneous 18,475,891 12,696,384 45.5%
Total Revenues 1,156,222,816 1,145,588,846 0.9%
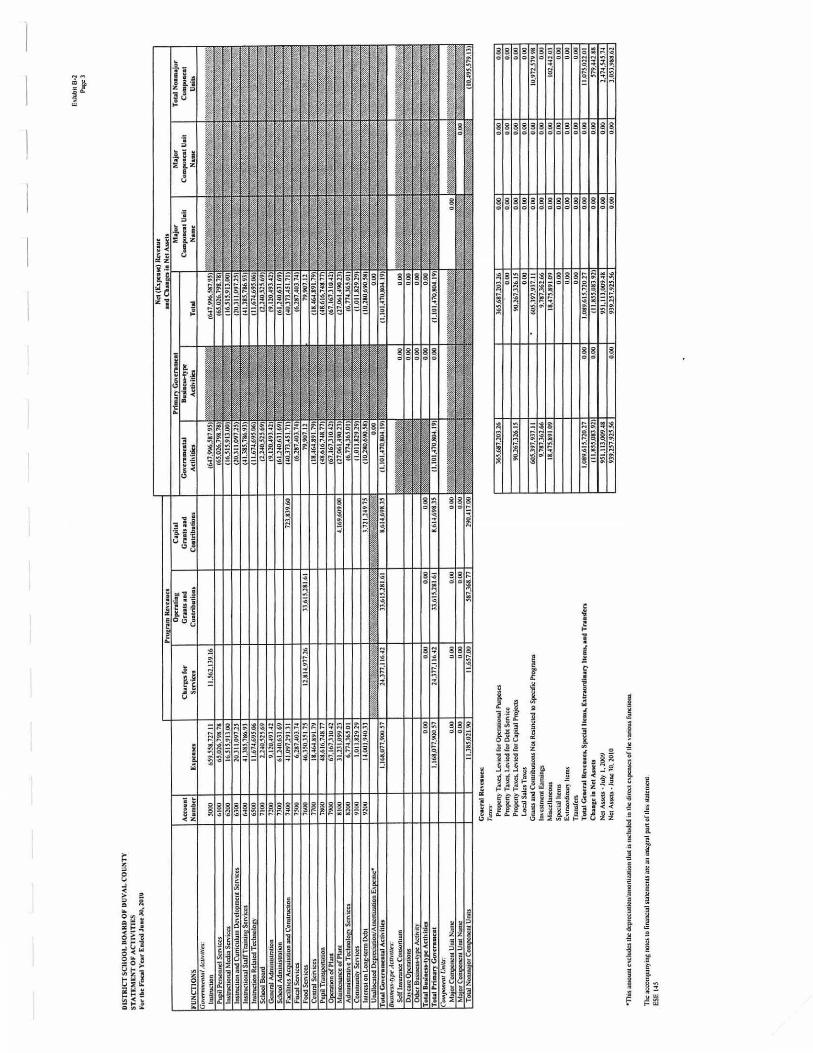
Functions/Program Expenses: Instruction 659,558,727 665,632,648 -0.9% Pupil Personnel Services 65,026,799 63,572,186 2.3% Instructional Media Services 16,515,913 17,374,411 -4.9% Instruction and Curriculum Development Services 20,311,097 18,635,571 9.0% Instructional Staff Training Sevices 41,385,787 39,551,353 4.6% Instruction Related Technology 11,674,695 8,766,767 33.2% Board of Education 2,240,526 1,887,237 18.7% General Administration 9,120,493 6,213,310 46.8% School Administration 61,240,631 60,741,577 0.8% Facilities Acquisition and Construction 41,097,291 45,758,548 -10.2% Fiscal Services 6,287,404 6,122,408 2.7% Food Services 46,350,352 44,161,346 5.0% Central Services 18,464,892 18,365,564 0.5% Pupil Transportation Services 48,616,749 48,210,174 0.8% Operation of Plant 67,167,310 66,812,174 0.5% Maintenance of Plant 31,231,099 31,113,118 0.4% Administrative Technology Services 6,774,365 8,724,254 -22.4% Community Services 1,011,829 1,205,819 -16.1% Interest on Long-Term Debt 14,001,940 14,152,689 -1.1%
Total Functions/Program Expenses 1,168,077,900 1,167,001,154 0.1%
Increase in Net Assets (11,855,084)$ (21,412,308)$ -44.6%
Operating Resultsfor the Fiscal Year Ended
GovernmentalActivities
EXHIBIT A-1 PAGE 1-G

DUVAL COUNTY PUBLIC SCHOOLS MANAGEMENT DISCUSSION AND ANALYSIS FOR THE FISCAL YEAR ENDED JUNE 30, 2010
The majority of the District’s revenues for current operations are provided through the State’s
Florida Education Finance Program (FEFP), State categorical educational programs, the ARRA
Economic Stimulus allocation, and local property taxes. These revenues, for the most part, are
included in general revenues, which provide about 94.2 percent of total revenues, whereas program
revenues provide only about 5.8 percent. The largest program revenues (87.7 percent) are from the
food services activities.
The District had a large change in the program revenue capital grants and contributions,
maintenance of plant reductions, and facilities acquisition and construction reduction during the
2009-10 fiscal year. A significant portion of the change is due to transportation funds, which had
previously been earmarked to the District as categorical revenue, is now part of the State’s basic
FEFP funding. Miscellaneous funding also increased due to increasing in receipts of federal indirect
costs, as well as increased grant funding such as the Driver’s Education grant and Truancy
Prevention grant from the City of Jacksonville.
$0
$100,000,000
$200,000,000
$300,000,000
$400,000,000
$500,000,000
$600,000,000
$700,000,000
2010 2009
$66,607,096$99,405,058
$455,954,529 $474,619,958
$605,397,938
$546,902,673
$28,263,254 $24,661,157
Revenues by Source - Governmental Activities
Program RevenuesGeneral Revenues Property TaxesGrants Not Restricted to Specific ProgramsUnrestricted Investment Earnings / Miscellaneous
EXHIBIT A-1 PAGE 1-H

DUVAL COUNTY PUBLIC SCHOOLS MANAGEMENT DISCUSSION AND ANALYSIS FOR THE FISCAL YEAR ENDED JUNE 30, 2010
Pupil Personnel Services
12.8% Instructional Media Services
3.2%
Instruction & Curriculum Dev.
Services4.0%
Instructional Staff Training Services
8.1%
Instructional Related Technology
2.3%
Board of Education0.5%
General Administration
1.9%
School Administration
12.0%Facilities Acquisition
and Construction8.1%
Fiscal Services1.2%Food Services
9.1%
Central Services3.6%
Pupil Transportation Services
9.6%
Operation of Plant13.2%
Maintenance of Plant6.1%
Administrative Technology Services
1.3%Community Services
0.2%
Interest on Long-Term Debt
2.8%
2010 Instructional Support Expenses - Governmental Activities
The FEFP funding formula is used to allocate State revenue sources for current District
operations and utilizing student enrollment data, is designed to maintain equity in funding across all
Florida school districts recognizing 1) varying local property tax bases; 2) varying education
program costs; 3) varying costs of living and 4) varying costs for equivalent educational programs
due to sparseness and dispersion of the student population. Student full time equivalency (FTE)
increased by 328 students, from 123,716 in the 2008-09 fiscal year to 124,044 in the 2009-10 fiscal
year. The District experienced a gain of $58,495,264 or 10.7 percent in Grants Not Restricted to
Specific Programs mainly due to ARRA Economic Stimulus funding received from the Federal
government. This funding has helped to make up for reductions in normal state funding, as well as a
3.9 percent decrease in Property Tax revenue and a 33 percent decrease in Program Revenues. The
continuing recession has reduced State and Local tax revenues, resulting in the reduction of funds
available for education in the State.
56.5%
43.5%
2010 Expenses - Governmental Activities
Instructional
Instructional Support
EXHIBIT A-1 PAGE 1-I

DUVAL COUNTY PUBLIC SCHOOLS MANAGEMENT DISCUSSION AND ANALYSIS FOR THE FISCAL YEAR ENDED JUNE 30, 2010
Instructional activities represent the majority of the District’s expenses, totaling approximately
56.5 percent of total governmental expenses in the 2009-10 fiscal year. Overall, total expenses
increased by $1,076,747 or 0.1 percent, as compared to total revenues which increased by
$10,577,282, or 0.9 percent.
FINANCIAL ANALYSIS OF THE DISTRICT’S FUNDS
As noted previously, the District uses fund accounting to ensure and demonstrate compliance
with finance-related legal requirements and prudent fiscal management.
Governmental Funds
The focus of the District’s governmental funds is to provide information on near-term inflows,
outflows, and balances of spendable resources. Such information is useful in assessing the District’s
financing requirements. In particular, unreserved fund balance may serve as a useful measure of a
government’s net resources available for spending at the end of the fiscal year.
As of June 30, 2010, the District’s governmental funds reported combined ending fund
balances of $321,527,835, or an increase of $21,067,325 in comparison with the prior year. Fund
balance increases were attributed to increased balances for the General Fund, Food Service, and the
ARRA Economic Stimulus Capital Projects Fund. Of the total combined ending fund balances,
$212,759,662, or 66.2 percent, constitutes unreserved fund balances which are generally available
for spending at the District’s discretion considering each fund’s established purpose. The remaining
fund balances of $108,768,173, or 33.8 percent, are reserved to indicate they are not available for
new spending. The reserved fund balances include: 1) $44,021,835 for liquidation of contracts and
outstanding purchase orders at year-end; 2) $47,560,142 for State categorical programs 3)
$13,949,566 for debt service and 4) $3,236,631 were for inventories purchased and available for
issuance. The District’s total governmental fund revenues increased by $11,722,585, or 1.0 percent
in comparison to the prior year, attributed to ARRA Economic Stimulus funding; the expenditures
decreased by $91,971,769 or 7.1 percent due to an overall effort by the District to reduce expenses,
as well as spend down on capital projects.
EXHIBIT A-1 PAGE 1-J

DUVAL COUNTY PUBLIC SCHOOLS MANAGEMENT DISCUSSION AND ANALYSIS FOR THE FISCAL YEAR ENDED JUNE 30, 2010 Major Governmental Funds
The General Fund is the chief operating fund of the District. At the end of the current fiscal
year, unreserved fund balance of the General Fund was $75,280,202, while total fund balance was
$136,005,476. As a measure of the General Fund’s liquidity, it may be useful to compare both
unreserved fund balance and total fund balance to total expenditures. Unreserved fund balance
represents 8.7 percent of total General Fund expenditures, while total fund balance represents 15.8
percent of total General Fund expenditures.
The District’s General Fund’s total fund balance for the 2009-10 fiscal year increased by
$13,155,643, or 10.7 percent, as compared to the prior fiscal year, despite a decrease in revenue of
$26,610,450. Key factors contributing to this increase are as follows:
A decrease in expenditures of $63,670,713. The majority of these expenditures were
absorbed by ARRA Economic stimulus funding. In addition, the District has strived to
conserve resources in order to reduce expenditures as much as possible without having a
significant impact on direct instructional activities.
Although total expenditures exceeded total revenues by $17,730,031, allowable transfers in
from other funds exceeded transfers out by $30,848,015, creating an overall increase in fund
balance. These transfers covered expenses such as transportation, minor maintenance, SAP
technical upgrade, and the active directory upgrade that had been paid for out of the General
Fund, but qualify and are allowed to be paid for out of 2009-10 Capital Outlay millage
funding.
American Recovery and Reinvestment Act (ARRA) Economic Stimulus Fund has a total fund
balance of zero. All Federal funds are paid on a reimbursement basis, with revenue being earned
when qualifying expenditures are made. For 2009-10, the ARRA fund had $68,485,025 in revenue
and expenditures. This correlates with the decrease in General Fund expenditures of $63,670,713.
Special Revenue Funds – Food Service has a total fund balance of $6,347,167 which is used for
the preparation and distribution of student and adult meals. The majority of the increase in Food
Service was due to a recalculation of the beverage contract revenue for the past three years to ensure
that the Food Service operation received their proportional share of the revenue. In addition, a
formal process of monthly monitoring was established and has improved operations.
EXHIBIT A-1 PAGE 1-K

DUVAL COUNTY PUBLIC SCHOOLS MANAGEMENT DISCUSSION AND ANALYSIS FOR THE FISCAL YEAR ENDED JUNE 30, 2010
Debt Service – Other Debt Service has a total fund balance of $11,051,743, which is used for the
tracking and payment of Certificates of Participation (COPs) issuances and other such long-term
debt. The revenues decreased by $480,219 due to a reduction in interest premiums. The prior year’s
expenses were abnormally high due to the payoff of COPs Series 2000, therefore expenditures
decreased by $34,941,694. The current year’s expenses consist of redemption of principal, interest,
and dues and fees.
Debt Service – ARRA Economic Stimulus has a total fund balance of $2,254,409 which is used
for the tracking and payment of Qualified School Construction Bonds (QSCB) issued December 16,
2009 related to Federal Stimulus spending. This is a new fund and did not have a fund balance for
the prior year.
The Capital Projects – Local Capital Improvement Fund has a total fund balance of $93,149,597,
a decrease of 16 percent over the 2008-09 balance of $110,865,229, all of which is restricted for the
acquisition, construction, and maintenance of capital assets. Local property tax revenues for capital
outlay projects decreased by $19,780,946 in comparison to the prior fiscal year. The decrease was
created by a legislated reduction in the millage rate from 1.750 mils to 1.500 mils. This is the
second consecutive year the millage rate was reduced by a 0.250 mill. There were also transfers to
the General Fund for $32,078,391. These transfers reimbursed for expenses that had been paid out
of General Fund, but are allowed to be paid for out of 2009-10 capital outlay millage funding.
Transfers in the amount of $20,080,088 were made to Debt Service in order to reimburse that fund
for payments on debt issued. These events contributed to a decrease in the fund balance of
$17,715,632, or 16.0 percent.
The Capital Projects – Other Capital Projects fund had a total fund balance of $42,077,987, a
decrease of $4,647,795 or 9.9 percent. This decrease is mainly due to a reduction in revenue of
$7,363,456 or 83.3 percent and spend down for capital projects.
The Capital Projects – ARRA Economic Stimulus had a total fund balance of $25,321,731,
which is used for tracking Qualified School Construction Bonds (QSCBs) related capital projects.
This is a new fund and did not have a fund balance for the prior year. The District issued Series
2009B QSCBs in December 2009 to take advantage of this Federal Capital Outlay allotment.
EXHIBIT A-1 PAGE 1-L

DUVAL COUNTY PUBLIC SCHOOLS MANAGEMENT DISCUSSION AND ANALYSIS FOR THE FISCAL YEAR ENDED JUNE 30, 2010 Proprietary Funds
The District’s proprietary funds provide the same type of information found in the
government-wide financial statements. The Internal Service Fund’s unrestricted net assets totaled
$48,632,648 at the end of the current fiscal year. The District experienced an increase in net assets
of $2,049,881, or 4.4 percent, in comparison to the prior fiscal year.
Fiduciary Funds
During 2008-09, the District created a private purpose trust fund for the Robert E. Lee High
School Gear Up Scholarships. The trust fund has net assets of $344,962.
The District also has Agency Funds which are used to account for resources that are held for
the school internal funds. The Agency Funds currently have assets of $6,975,817, a decrease of
$330,138 or 4.5%
GENERAL FUND BUDGETARY HIGHLIGHTS
Differences between the General Fund original budget and the final amended budget were of
concern for revenues; however the difference in expenditures was minor. Projected revenues
decreased by $5,966,854, or 7.1 percent, due in part to state revenue collections not meeting
projected amounts. Projected expenditures increased by $8,016,356, or .8 percent. Budget revisions
are necessary to adjust planned revenues and expenditures based on actual revenues and resource
needs. The continuing recession has caused budget shortfalls, despite the ARRA funding, to meet
incremental cost increases with State and local funding being decreased for 2009-10.
Actual General Fund revenues were $748,265 or .2 percent more than final budgeted amounts,
and actual expenditures were $93,755,899 or 10.9 percent less than anticipated. Considering the
continuing recession, and the reduction in State and local funds, the District has continued to cut
costs as much as possible in order to reduce the budget shortfall. The discrepancy between the
budgeted and actual expenditures is a reflection of the pro-active cost cutting that the District has
made. The actual ending fund balance exceeded the estimated fund balance in the final budget by
$94,418,673.
EXHIBIT A-1 PAGE 1-M

DUVAL COUNTY PUBLIC SCHOOLS MANAGEMENT DISCUSSION AND ANALYSIS FOR THE FISCAL YEAR ENDED JUNE 30, 2010
Land11.3% Land Improvements
0.2%
Construction in Progress
10.8%
Improvements - Not Buildings
5.8%
Buildings and Fixed Equipment
63.8%
Furniture, Fixtures, and Equip.
6.5%
Motor Vehicles0.2%
Computer Software1.4%
Capital Assets as of June 30, 2010
CAPITAL ASSETS AND LONG-TERM DEBT
Capital Assets
The District’s investment in capital assets (net of accumulated depreciation) as of June 30,
2010, totaled $966,340,546. The capital assets include land; land improvements; improvements
other than buildings; buildings and fixed equipment; furniture, fixtures and equipment; motor
vehicles; audio visual equipment; computer software; and construction in progress. The investment
in capital assets (net of accumulated depreciation) increased during the current fiscal year by
$28,735,380, or 3.1 percent.
Increase2009-10 2008-09 (Decrease)
Land 109,217,202$ 107,488,063$ 1,729,139$ Land Improvements 2,355,890 2,494,495 (138,605) Construction in Progress 104,313,451 149,609,572 (45,296,121) Improvements Other Than Buildings 55,645,209 46,012,968 9,632,241 Buildings and Fixed Equipment 616,840,116 562,600,720 54,239,396 Furniture, Fixtures, and Equipment 62,465,639 50,327,360 12,138,279 Motor Vehicles 2,077,955 1,505,116 572,839 Audio Visual Materials - 1,101 (1,101) Computer Software 13,425,084 17,565,771 (4,140,687)
Total Capital Assets, Net 966,340,546$ 937,605,166$ 28,735,380$
EXHIBIT A-1 PAGE 1-N

DUVAL COUNTY PUBLIC SCHOOLS MANAGEMENT DISCUSSION AND ANALYSIS FOR THE FISCAL YEAR ENDED JUNE 30, 2010
Major capital asset additions during the current fiscal year included new construction,
remodeling, renovations, and site improvements at several schools and other facilities, with budgeted
costs totaling $395,082,438. The schools included the new Atlantic Coast High School, as well as
Kernan Middle, Edward H. White High, Neptune Beach Elementary, Seabreeze Elementary,
Mandarin Middle, Frank H. Peterson Academies of Technology, Atlantic Beach Elementary, Samuel
W. Wolfson High, J.E.B Stuart Middle, and Southside Estates Elementary.
Additional information on the District’s capital assets is shown in Note 5 to the financial
statements.
Long-Term Debt
The District had total debt outstanding of $312,730,101 at the end of the current fiscal year.
The debt consisted of State School Bonds and Certificates of Participation, which include Qualified
Zone Academy Bonds (QZABs) and QSCBs, as shown below:
Increase2010 2009 (Decrease)
State School Bonds (1) 21,850,000$ 24,485,000$ (2,635,000)$ Certificates of Participation 256,978,101 220,989,003 35,989,098 Qualified School Construction Bonds 27,220,000 - 27,220,000 Qualified Zone Academy Bonds 6,682,000 6,682,000 -
Total Long-Term Debt 312,730,101$ 252,156,003$ 60,574,098$
Long-Term Debt Outstanding at June 30,
The District’s total debt increased 24.3 percent as a result of issuing new COPs debt. Changes
in long-term debt were comprised of debt issuance, scheduled principal payments and related
amortizations. Additional information on the District’s long-term debt is shown in Notes 6 through
9 to the financial statements.
OTHER MATTERS OF SIGNIFICANCE
The following factors were considered in preparing the District budget for the 2010-11 fiscal year:
The unemployment rate (seasonally adjusted) for the District (Duval County, Florida)
remained 10.6 percent, the same as the prior fiscal year. This compared unfavorably to the
State’s average unemployment rate of 10.5 percent, although the State’s overall
unemployment rose from 10.2% in 2009 while Duval County remained stable. The National
unemployment rate increased slightly from 9.4% in July 2009 to 9.5% in June 2010.
EXHIBIT A-1 PAGE 1-O

DUVAL COUNTY PUBLIC SCHOOLS MANAGEMENT DISCUSSION AND ANALYSIS FOR THE FISCAL YEAR ENDED JUNE 30, 2010 There are approximately 25 companies with headquarters in Jacksonville with greater than
500 employees for a total of 47,323 employees. Additionally, there are 32 various unions in
the area, with the largest membership in the public sectors, with approximately 28,508
members.
The Better Jacksonville Plan is a $2.25 billion comprehensive growth management strategy
initiative which encompasses public facilities, roads and infrastructure, environmental
projects and targeted economic development for Jacksonville. Approved by voters in
September of 2000, many of the projects covered by the plan have been completed, including
the new baseball grounds, certain road and infrastructure projects, the new main library, and
other library renovations. Remaining projects include various road construction projects,
environmental cleanup, and economic development budgeted at $367 million, and the new
county courthouse complex budgeted at $350 million, which is currently under construction.
Florida legislation requiring the reduction of class sizes at various grade configuration levels
over the next several years continues to have a strong impact on the District's budget and its
ability to provide elective courses and other services to the schools. For the 2009-10 fiscal
year, the requirements were at the school level. For the upcoming 2010-11 school year, each
individual classroom will be required to have a ratio of no more than 18:1 students per
teacher in elementary school, 22:1 for middle school and 25:1 for high school. For the 2009-
10 school year, the District was in compliance. The District faces potential Class Size
penalties unless the proposed legislative ballot amendment passes via voter referendum in
November 2010. This amendment will give some flexibility on class size.
The housing market within Duval County, as well as the market throughout the State, has
slowed. The federal government allowed an $8,000 tax credit for the purchase of a home
which helped to contribute to an increase in existing home sales by 21.2% during 2009-10;
however, median home prices fell by 15.6%. Also, the number of new homes permitted fell
sharply by 64.2%. This is comparable to the State’s percentages of 31.4% increase, 24.0%
decrease and 46.6% decrease respectively. Foreclosures continue to damage the housing
market. Florida is the fourth highest state for foreclosures, which increased by six percent
over the last year. Overall, 1 in every 171 homes is in foreclosure. Duval County has a
better rate, with 1 in every 213 homes in foreclosure.
EXHIBIT A-1 PAGE 1-P

DUVAL COUNTY PUBLIC SCHOOLS MANAGEMENT DISCUSSION AND ANALYSIS FOR THE FISCAL YEAR ENDED JUNE 30, 2010 The passing of Amendment One has had significant impact on the District. This amendment
limited the funding that local governments can collect on property taxes, which caused a
reduction in the tax base. The tax base decreased $3,167,319,020 from $65,401,744,384 in
2008-09 to $62,234,425,364 in 2009-10, a change of 5.1 percent due to Amendment One and
declining property values. The District relies heavily on local property taxes collected as a
major source of funding. To date, the legislature has not developed a replacement for the lost
funding, and the District has worked to cut administrative costs in order to absorb the funding
shortfall with as little impact on the schools as possible.
Year Certified Tax Roll Percent Change2009-10 62,234,425,364$ -5.1%2008-09 65,401,744,384 6.1%2007-08 61,436,184,809 15.4%2006-07 51,951,142,035 11.8%2005-06 45,840,730,147 11.4%
Change in Tax Base
The State legislature reduced the ceiling on capital outlay millage rate from 2.000 mil to
1.750 mils, which lowers the District’s borrowing capacity for Certificates of Participation
from 1.500 mil to 1.3125 mills during 2008-2009. The legislature made an additional
reduction for the 2009-10 fiscal year, changing the millage rate from 1.750 mil to 1.500 mil.
This caused a reduction in borrowing capacity from 1.3125 mil to 1.125 mil.
The District issued two Certificates of Participation (COPs) during 2009-10. Part of the
2009A Series ($15.8 million) was issued to finance the cost of renovating an existing school
and providing for the update of technology related equipment at various other schools. The
Series 2009B-QSCB was issued to finance the cost of construction, installation and
equipping new additions to five schools. In related subsequent events, the District issued two
other COPs in August of 2010 in order to finance the cost of acquisition, construction,
installation and equipping educational facilities and to take advantage of the District’s ARRA
capital projects allocation.
During the 2009-10 fiscal year, unreserved fund balance in the General Fund increased from
$58,030,946 to $75,280,202, or 8.7 percent of total General Fund revenues. The District has
maintained an unreserved fund balance of 3 to 5 percent of General Fund revenues in an effort to
ensure resources are available for unforeseen changes in economic factors. New legislation, Florida
EXHIBIT A-1 PAGE 1-Q
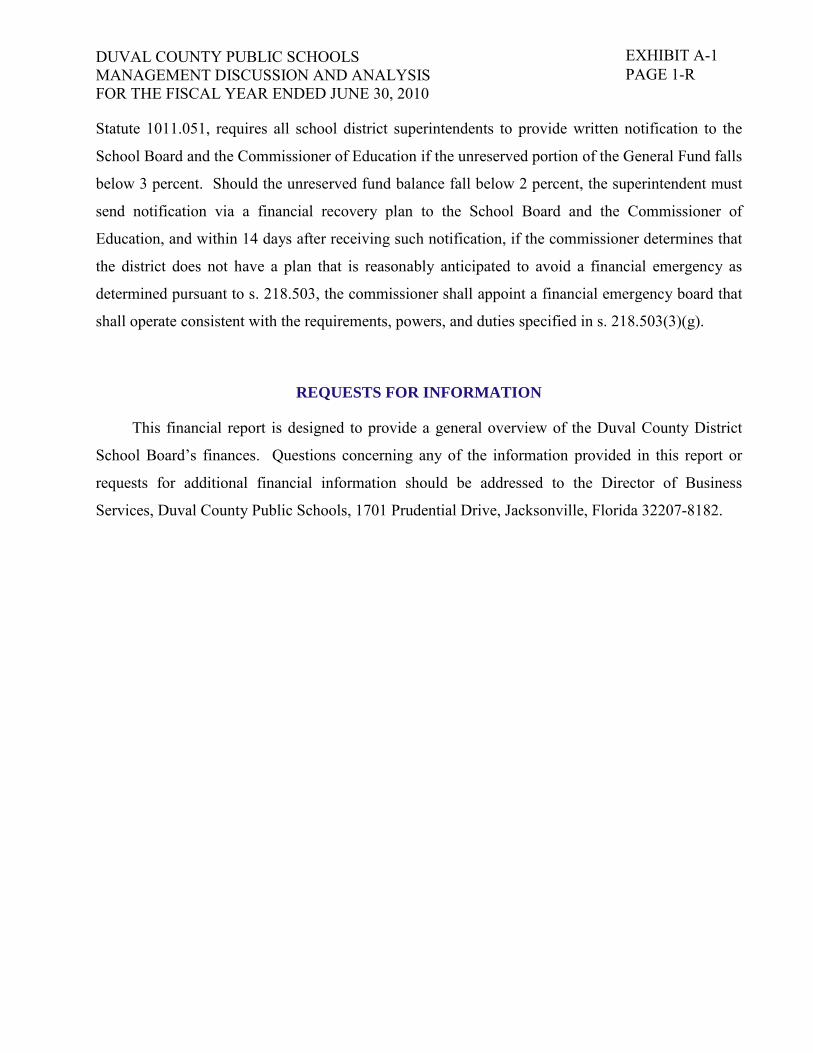
DUVAL COUNTY PUBLIC SCHOOLS MANAGEMENT DISCUSSION AND ANALYSIS FOR THE FISCAL YEAR ENDED JUNE 30, 2010 Statute 1011.051, requires all school district superintendents to provide written notification to the
School Board and the Commissioner of Education if the unreserved portion of the General Fund falls
below 3 percent. Should the unreserved fund balance fall below 2 percent, the superintendent must
send notification via a financial recovery plan to the School Board and the Commissioner of
Education, and within 14 days after receiving such notification, if the commissioner determines that
the district does not have a plan that is reasonably anticipated to avoid a financial emergency as
determined pursuant to s. 218.503, the commissioner shall appoint a financial emergency board that
shall operate consistent with the requirements, powers, and duties specified in s. 218.503(3)(g).
REQUESTS FOR INFORMATION
This financial report is designed to provide a general overview of the Duval County District
School Board’s finances. Questions concerning any of the information provided in this report or
requests for additional financial information should be addressed to the Director of Business
Services, Duval County Public Schools, 1701 Prudential Drive, Jacksonville, Florida 32207-8182.
EXHIBIT A-1 PAGE 1-R

DISTRICT SCllOOL BOARD Of DUVAL COUNTY STATEMENT Of NET ASSETS Juoe J0, 2010
ASSETS CJ.Sh :and C;uh Eoui,·JJcnu ln\c-stmcnts T:i.~c-s Rcoci\•3blc. Net Accoun~ Rccci\•3b1e, Net Jntcn:st Rcccn·3ble Due from Rcinsurcr lknnsl\s RccciV;lbfc Due rrom Other ARcnciu lntc:m3l lbl:inecs ln\·cntot\· Pn:D31d hem• Rt stnr1td Asstts:
C:ish '' 1lh Fisc:l.I Aucnt Dcftrrtd ChDr>:t J:
lssu:inoc Cosu Nom:u,,rnt Asstts.
Other Post-cmolo\'lnCnl Ocncfiu ObliR;1uon (:we:() Capua/ Asttll ·
Und L:uw:I Jmoro,·c-mcnu - Nondeon:ci.:iblc Constroction in Proa:n:n fmpro\·cmcnlJ Other Th3n Buildinas
less Accumul3ted [)(prcci3tion BuildinRJ 31\d Fixed EGuiomenl
Less Accumul3tcd O.:orcci::a.rion Furniture. f i'tturcS 3ftd Eauiomcnt
Leu Accumulated •-i31ion Motor Vehicles
less Accumul;ncd 0...""0rcei3tion Proocnv Under C@ital l.c3sc.s
Less Accumul:ucd Oct>n::cfation Audio Visual Materials
Less Accun1uJ3lcd Dci:ircci3rion ComPUtcr Sonw~
U.:n Acc:umul3tc-d AmoniUlion Tot.11 C!lnibl Asscu ni:t or Accum. Dco'n
Tolal Asx11 LIABILITIES AND NET ASSETS LIABILITIES Salaries Md Wucs Pov:ablc P:wroll Dcduc-1ions :ind Withholdinsu Accoun ts P:m1ble Jud~mcnls P1woblc Construction Conlroccs PJ\';lbfe Construction Con1racts Rcbin.:uz.c P3r:iblc: Ou.: to FiJ~ 1\ccnl Accru<d lnlcn:!lt P:iv:ible Dcoosits Pn;ible Due to Other Aa.c:ncics SalcsT:i.'< P:i.\':!iblc: Deferred Rc\·enLk: Estim31«d UnO>id Cl:Ums Eslim3lcd Li3bilitv for O~m1 Adjwtmcnt fatim:Jled li:lbilit\' for Albitrac Reb3tc Nonn1rnn1 /Jubll1tlts;
/'omon /)ire IYlthm On~ Ytor: Sccnon 101 1.13. FS .. NotesPl\°3blc No1cs P:miblc Oblur.3t1ons Under C3011a.l l..ascs Bonds Pnoablc Li:lbilit\' ror CompcnAted AbscncCJ Ccrufic.:ucs of Plt11c1o;i1ton P.n~blc Estin13tc:d Li:ibihl\' (or LonR·Tcrm CWms Other Pou~mnlo\mcnt Bc:ncfilS Oblicr3tion Es1ima1cd PECO 1\dv:incc: P<l\'ablc Esum:it~ Li:abilil\' for Arbitr:is:c: R-.:b.ltc
Jlo, tlon Dwt Aft" ()n~ t'tor. No1cs P.:w:able ObliR:llions Under C01i:iiul Lc;ucs Bonds P:n'3ble l1 Jb1llf\' for Com~nszucd Absences Cen1fi~c:s of P311icirio.1ion P3\':lblc Estim3tcd Lfabili1v (or lonR·Term Cl.lims O&hcr Po.n .... omoloHncnt Bcncfils Oblit:t3t1on E.11m>1cd PECO Aduncc l'>\nblc Esum3fcd Li3bilitv for Arbitnac Rc:batc
To1al Liabilitia NET ASSETS ln\cstcd 1n (3011.tl Auc:ts, Net of Rcl3tcd Debt Rc11rlcttd For
C31cl!Orie:i.I C:im'O\'Ct Pnv. r311u Food Service Debt Scn1cc C:io1t>l Proiccu O&hcr PurooSts. Emplo\'tC Benefits
Un~strided
Total Nt t Assets Total l.i:lbilitiu and Nd AsRb
Accoaal Nambtr
11 10 1160 1120 1130 1170 1180 1210 1220
llSO 1230
1114
1410
1310 1315 1360 1320 1329 1330 1339 1340 1349 13SO 13S9 1370 1379 1381 1388 1382 1389
2110 2170 2120 2130 2140 2150 2240 2210 2220 2230 2260 2410 2271 2272 2210
22SO 2310 231S 2320 2330 2340 23SO 2360 2370 2280
23IO 231S 2320 2330 2340 2350 2360 2370 2280
2770
2710 2780 27!0 2780 2780 2790
The :sccomJ>'Ul~ing notes to tirunc1al st~c:mcnu ill'C :in m1egr.il p3rt of this ~tcmcnt
ESE 14S
Priman CoYtramtal Covtramulal Uusiaeu-l)'pr
Acti,·iries Acrivities 15.7H.420 99
422.706.074.50 36.367.14
4.333.433 06
1.397.443.12
6.16U54.51
3.236.631.17 525.001.98
IS.837.273.87
3.322.157.80
109.2 17.202.10 2.3SS.1&9.69
104.313.4S US 131. 104.172.06 (7S.4Sl.962.721
1.262,ISI. 764. I 5 (646.011.648.J I) 161.215.631.14
1105.819.990.99) 9. 172.443.72
(7.094.489.09
40U64.59 (408.164.S9)
74.12 1,61S.6S (61.396,532.47) 966.340.546.18 0.00
l,440.338.90S.02 0.00
l4.3S7. l6K.70 6.313.494.47
45 7S0.370.25
1.139.142.27 I l.S22.690.S6
S4 00
1.997.786.36
2.Ms.000.00 7.0Sl.000 63 7.260.8 11.17 9. 795.4R2.00
19.IS5.000.00 49,176.860.66
2Bl.619l89.39 9.S61.129.00
31.608.000.00
501.080.979.46 0.00
731.073,203.77
47.560.140 91 6.347.167.01
13.949.566.3S 91.0IS.7lS.27 4.837.413.21
44.404.6)1.97 939.2S7.92S 56 0.00
l.440.338.90S 02 000
Major CompoHat Uait
Total N:amc 15.734A20.99 000
422.706.074 so 000 36.367.114 000
4.333.433.06 0.00 0.00 0.00
1.397.443.12 0.00 0.00 0.00
6.86US4.51 0.00 0.00 0.00
3.236.631. 17 0.00 S?S.001.98 0.00
IS.837l73.X7 0.00
3.322.8SUO 000
0.00 000
109.217l02. IO 0.00 2.355.889.69 0.00
104.313.4Sl.25 0.00 131.104.172.06 000 (75.458.962.72 0.00
1.262.158.764. IS 000 (646.018.641.) I) 0.00 161.285.631.14 0.00
llOS.119.990.99) 0.00 9.172.443.72 0.00
(7.094.489.09) 0.00 0.00 o.oo 0.00 000
408.864.59 0.00 (401.864.S9) 0.00
74.821.61S.6S 0.00 (61.396.S32.47) 0.00 966.340.S46. I 8 0.00
1.440.338.90S.02 000
14.357.168.70 0.00 6.313.494.47 o.oo
4S.7S0.370.2S U.00 0.00 0 .00 0 .00 000
1.139.142.27 000 J 1.522.690.56 000
0.00 0.00 0.00 000
S4 00 0.00 000 0.00
1.997.786.36 0,00 0.00 000 0.00 000 U.00 0.00
000 000 000 0.00 0.00 000
2.695.000.00 0 00 7.0S 1.000.63 000 7.260.111. 17 0.00 9. 795.482.00 0.00
000 0.00 000 000 0.00 0.00
0.00 000 0.00 000
19.ISS.000.00 o.oo 49, 176.860.66 0.00
283.619.289.39 0.00 9.S61.829.00 000
31.601.000.00 000 0.00 0.00 0.00 000
SOl.080.979 46 0.00
731.073.203.77 000
•7.560.140 91 000 6.347.167.0I 000
13.949.566 35 000 91.0IS.72S.27 000 4.837.413.21 0.00
44.4<M.638.97 000 939.2S7.92S.S6 000
1.440.338.905 02 000
~hjor
Compoanl Uail Na mt
0.00 0.00 0.00 0.00 000 0.00 0.00 0.00 000 0.00 0.00
0.00
0,00
0.00
0.00 000 0.00 0.00 0.00 0.00 0.00 0.00 0.00 0.00 0.00 0.00 000 0.00 0.00 0.00 0.00 0.00 0.00
0.00 0.00 0.00 000 000 000 0.00 0.00 0.00 000 0.00 0.00 0.00 000 0.00
u IJ()
000 000 000 0.00 0 00 0.00 0.00 0.00 0.00
U.00 000 0.00 000 000 0.00 000 000 0.00 0.00
000
0.00 0.00 000 0.00 000 0.00 0.00 0.00
E.'tl11b1t8-1 P:igc 2
To1al Nonmajor Compontal
Uaits 1.227.602.97
0.00 0.00
86.4S4.SO 0.00 0.00 0.00
2S.373.45 0.00 0.00
7. 199.63
0.00
0.00
000
000 0.00 0.00
282.613.00 !39.S87. IS)
I .64S.623.33 1267.610.77) 908.776.13
[434.696.90) 12S.171 27 (98,6 19.32)
8.S39.00 (5.124.00)
0.00 0.00
K3,391.28 (7S.017.00
2.083.3K8.87 3.430.019.72
20.000.00 19. 130 .80
237.87S.99 0.00 0.00 0.00 0.00 0.00 0.00 0.00 0.00
48.260.31 0 .00 0 .00 0 .00
000 000 000 0.00 000 0.00 0,00 000 000 000
4K.200.00 2.S64.00
0.00 000 000 0.00 000 000 0.00
376.03 1.10
1.935.5KY.16
uoo 000 000
522.093 93 SJ 1.579.96 M.72S.S7
3.053.98362 3.430.0 19.72
te !:'' . " .. ., v
~ ~ a
~
~ ~
~ ~
~
~ ~
~ !!
~ ~ ~ a~ H~ ~ ~ .... "'~
"'! ~ ~ ~ ~ : :
~
?Z ~ :@ ~
~
0 M ., "' % = i:'
fZ 2
~ ~ = ~ !i ~ M
~~ ~
"'! ~
~ ~ M - ~;;: §~ ~;;: ..
! ~ ~~~ ~~ ,.; ,..: "t ~~ = ;:i ~ § 0: ~ ~= ~s
a !! ~ ~ ~
.l! i
l ~ 6
~ ~
ii ~ ~
~ !
I e a. ~ e ~ .. !I ~ " I ;;
;! ~ M ';; ~ § 'ii
l M ~
~ 0
~ j l!
~ ·~ ~ 8.
~ e s~
~ ll :! i! ~ >-W

DIS
TR
ICT
SC
llO
OL
BO
AR
D O
F D
UV
AL
CO
UN
TY
B
AL
AN
CE
SH
EE
T
GO
VE
RN
ME
NT
AL
FU
ND
S Ju
no
JU, 2
010
AS
SE
TS
C
nsh
and
Co.
sh E
quiv
alen
ts
lnvc
stm
cnls
T
axes
Rcc
eivo
blc.
Net
A
ccou
nts
Re<
:civ
nblc
. Net
ln
1crc
st R
ccci
,·abl
c D
ue fr
om R
cins
urcr
D
epos
its
Rec
civu
blc
D11c
Fro
m O
ther
Fun
ds:
Bud~
etar
v F
unds
ln
tc-m
al F
unds
D
ue f
rom
Oth
er A
Acn
cies
In
vent
ory
Prct
>aid
Ite
ms
To
tal
Ass
et>
L
IAB
ILIT
IES
AN
D F
UN
D B
AL
AN
CE
S
LIA
BIL
ITIE
S S
olar
ies.
Ben
efit
s nn
d Po
yrol
l Tax
es P
avab
le
Pay
roll
Ded
ucti
ons
ond
Wit
hhol
drnA
s A
ccou
nts
Pay
able
Ju
dgm
ent>
Pay
able
Con~ructlon C
ontr
octs
Pav
ablc
C
onst
t\lc
tion
Con
trac
ts P
avab
lo-R
ctai
ncd Pe
rccn
ta~•
Mn1
urcd
Bon
ds P
ovab
le
Mnt
urcd
lnl
t."rC
St Pa
yabl
e D
ue to
Fisc
aJ A~cnl
Sal
es T
ax P
ayab
le
Ace
.rue
d In
tere
st ~vublc
tJto
nosi
ts P
avab
lc
Due
to O
ther
Ai:.
enc1
es
Due
10
01h
ctr F
rmd.
r:
Budt
!.t:E
arv
Fun
ds
Inte
rnal
Fun
ds
Def
erre
d Rcrtnu~:
UnC
3med
Rcv
cnu.
.: U
nava
ilab
le R
even
ue
Tot
ol
Li•
bili
ties
F
UN
D B
AL
AN
CE
S
Rac
rw:J
Fur
: E
ndo"
'mc.n
ls
S101
e R
equi
red
Car
rvov
cr P
row
ums
Enc
umbr
ance
s ln
vcnt
orv
Dcb
1 S
ervi
ce
Oth
er P
umos
cs
l111
n:se
rwd:
D
es1g
11a1
i:d fi1
r, rc
port
t:J m
: (S
p,-c
ifvl
IS
P<'C
lfYI
l/nJ.
:s1g
11a1
c:J. n
:p"r
1eJ
111:
Gen
eral
Fun
d S
peci
al R
even
ue F
unds
D
cbl S
ervi
ce F
unds
C
apit
ol P
roic
..:ts
Fu
nds
Pcr
mam
:nl
Fund
s T
otal
Fu
nd
Ual
a11c
6
Tot
ol L
iabi
li1
ies
and
Fu
nd
B•l
anrc
s
Acc
ount
N
umbe
r
1110
11
60
1120
11
30
1170
11
80
1210
1141
11
42
1220
11
50
1230
2110
21
70
2120
21
30
2140
2
150
218
0 21
90
2240
22
60
2210
22
20
2230
216
1 2
16'2
2410
2 4
10
2705
27
10
2720
27
30
2760
27
60
2760
27
60
2760
27
60
2760
27
00
The
acco
mpa
nyin
g no
1cs
to fi
nanc
ial s
1111
cmcn
ts a
rc a
n 1n
tcg.
raJ
part
oft
h•s
s1a1
emcn
1 E
SE
14
5
Food
G
ener
al
Ser
vice
10
0
410
16,0
79,3
83.1
1 0.
00
14
4,13
4,68
2,74
11
.399
,448
.21
36,3
67.8
4 0
.00
1.
225.
673
.30
2.12
,138
.41
1.14
0.64
0.6
9
0.0
0
0.0
0
0.0
0
0.0
0
0.00
0.0
0
0.0
0
0.0
0 0.
00
21
2.47
6.82
1.
674,
623.
10
2,22
8,35
0. 70
1.
008.
280.
47
525.
001.
98
0.0
0
165.
582.
577.
18
14,3
14,4
90.1
9
14,3
57,1
68.7
0 0
. 00
1.
546,
011
.26
0.00
13
.584
,015
. 12
6,05
8,62
9.15
0
.00
0
.00
00
0
0,0
0
0.0
0
0.0
0
0.0
0
0.00
0
.00
0.0
0
00
0
0.0
0
759.
86
0.
00
0.
00
0.
00
0.0
0
0.0
0 54
.00
0
.00
0.0
0
0.0
0 0.
00
0
.00
89.0
92. 4
0 1,
908,
693.
96
0.0
0 0.
00
29.5
77,1
01 3
4 7,
967,
323.
11
0.0
0 0.
00
47
.S60
.14
09
1 0.
00
10.9
36,7
81.9
3 77
2,86
9.63
2.
228,
350
70
1.00
8,28
0.47
0
.00
0
.00
0.
00
0
.00
00
0
0.0
0
0.0
0
00
0
75.2
80.2
02 3
0 0
.00
0.0
0
4.56
6.01
6.98
0
. 00
0.
00
0
00
0.
00
0
00
0.
00
136,
005.
475.
84
6.34
7.16
7.0
8
165,
582,
577
18
14.3
14.4
90.1
9
Oth
er
AR
RA
M
isce
llane
ous
Fed
eral
E
cono
mic
Stim
ulu
s S
peci
al
Pro
gram
s F
unds
R
even
ue
420
430
490
00
0
0.00
0
. 00
I,
136,
287 .
02
0.0
0 0.
00
0.
00
0.0
0
0.0
0
0.0
0
00
0
0.0
0 0.
00
0.
00
0.0
0
0.0
0 0.
00
0.0
0 0
.00
131,
914.
16
0. 0
0
0.00
0
. 00
0.
00
0
.00
1.26
8,20
1.18
0.0
0
0.00
0.
00
0
,00
0.0
0
1,26
8,20
1.18
0.
00
0
.00
0.0
0
O.OQ
. 0
00
0
.00
0.0
0
0.0
0 0
.00
0.0
0 0
.00
0.0
0
0.0
0
0.0
0
0.0
0
0.0
0
0.0
0 0.
00
0
.00
0.
00
0.0
0
0.0
0
0.0
0
0.0
0
0.0
0
0.0
0
0.0
0
0.0
0
0.0
0
1,26
8.20
1.18
0. 0
0
0.0
0
0.00
0.
00
0
.00
0.
00
0
.00
0.0
0
0.0
0 0.
00
0.0
0 0.
00
0.0
0
0.00
0.
00
0
.00
00
0
0.00
0.
00
0.
00
0.0
0
0.0
0
0.0
0
0.0
0
0.0
0 0.
00
0
.00
0.
00
0
.00
1.
268.
201.
18
SB
E/C
OB
I B
onds
21
0
0.0
0
0.00
0.
00
0
.00
0.
00
0.
00
0
.00
0
.00
0
.00
0
.00
0
.00
0.00
0
.00
0
.00
0.0
0
0.0
0
0.0
0
0.0
0 0
. 00
0.
00
0. 0
0
0.00
0
. 00
0.
00
0.0
0 0.
00
0.0
0 0.
00
0
00
0
.00
0
00
0.
00
0.0
0
0.0
0 0.
00
0
.00
0
00
0
.00
0.
00
0
.00
0.0
0
0.0
0 0.
00
0
.00
0
00
0
.00
0
00
0.
00
0
.00
0.
00
0
,00
0.00
0.00
0
.00
0
.00
0
.00
0.00
0
00
0.
00
0
.00
0.
00
0
.00
0.0
0
0.0
0
0.0
0
0.00
0
.00
0. 0
0
0.0
0 0.
00
0
.00
0.0
0
0.0
0
0.0
0
0.0
0 0.
00
0
.00
0.
00
0. 0
0
0.0
0
0.0
0
0.0
0 0
. 00
0
.00
0.
00
0
.00
0.0
0
0.0
0
00
0
0.0
0
00
0
0.0
0
Exh
ibit
C·I
P
ni;e
4
Spe
cial
A
ct
Bon
ds
220
0. 0
0
00
0
00
0
00
0
0.00
0
.00
0.0
0
00
0
00
0
00
0
0.0
0 0
00
0
00
00
0
0.0
0
00
0
0.0
0 0
00
0
00
0
00
0
.00
00
0
0.0
0
0.0
0
00
0
00
0
0.0
0
0.0
0
0,0
0
00
0
00
0
0.0
0
0.0
0
0.0
0
00
0
00
0
0.0
0
00
0
0.0
0
00
0
0.0
0
0.0
0
00
0
00
0
00
0
0.0
0

DIS
TR
ICT
SC
HO
OL
BO
AR
D O
F D
UV
AL
CO
UN
T\'
B
AL
AN
CE
Sil
EE
T
GO
VE
RN
ME
NT
AL
FU
ND
S Ju
nt
30, 2
010
AS
SE
TS
Cus
h an
d C
ash
EQuo
vnlc
nts
Inve
stm
ents
T
ruce
s R
ecei
vabl
e, N
et
Acc
ount
s R
ccc:
ivab
lc.
Net
In
tere
st R
ecei
vabl
e D
ue f
rom
Rci
ns.u
rcr
Oco
osits
Rec
eiva
ble
Due
Fro
m O
th"r
F11
1ub:
Bud~ctarv
Fun
ds
lntc
mnl
Fun
ds
Due
from
Oth
er A
c.cn
cies
In
vent
ory
Prep
aid
hem
s T
otal
Ass
ets
LIA
BIL
ITIE
S A
ND
FU
ND
BA
LA
NC
ES
L
IAB
ILIT
IES
S
nlw
ics.
Ben
efit
s an
d Pa
yrol
l T
axes
Pay
3blc
P
ayro
ll D
educ
tion
s an
d W
ithh
oldi
ni:s
A
ccou
nts
Paya
ble
Jud1
:men
ts P
ayab
le
Con
suuc
tion
Con
trac
ts P
ayab
le
Con
stru
ctio
n C
ontr
acts
Pav
ablc·
RC
:Cn.
incd
Pcr
ccn
tn!.!
.C
Mat
ured
Bon
ds P
avab
lc
Mat
ured
Inte
rest
Pay
able
D
ue to
Fis
cal A~cnl
Sal
es T
ax P
ayab
le
Acc
rued
Int
eres
t P
ayab
le
Dco
osit
s Pa
vabl
c D
ue to
Oth
er A
u.cn
c1cs
D
ut: r
u 01
hr:r
flmcl
s:
Bud
;tcto
.rv f
unds
ln
lcm
nl F
unds
D
t:ft
m:d
Rc,
-r:nu
.::
Une
arne
d R
even
ue
Una
vaila
ble
Rev
enue
T
ot•
I L
iab
Ulli
ts
FU
ND
BA
LA
NC
ES
R
esen
'f:.J
I-O
r: Endowmen
t~
Sta
le R
CQ
u1r
cd C
arr
yo
ve
r Pro~a.nu
Enc
umbr
ance
s ln
vcn1
ory
D
ebt S
ervi
ce
Olh
cr P
uroo
ses
U11
n:ur
wd:
J:k
sif:1
rot<
d fo
r. n:
pori
.W 11
r: (S
p,-c
ofl'
I !S
peci
fy]
U11J
cs1'g
11ol
t:d, n
:pur
tc:c
l in:
G
ener
al f
un
d
Spe
cial
Rev
enue
Fun
ds
Deb
i Ser
vice
fun
ds
Cap
ilal
Pro
1cct
s F
unds
Pe
rman
ent
Fund
s T
ola(
fu
n<l
Bal
anco
s
Tol
a( L
iabi
liti
es •
nd
Fun
d B
al•
n<tS
Acc
oun
t
Num
ber
1110
11
60
11
20
1130
11
70
1180
12
10
1141
11
42
1220
11
50
1230
2110
2
170
212
0 21
30
2140
21
50
218
0
219
0
2240
22
60
2210
22
20
2230
2161
21
62
2410
24
10
2705
27
10
2720
27
30
2760
27
60
2760
27
60
2760
27
60
2760
27
00
The
acc
ompa
nyon
s no
ics
to fo
nanc
inl
stai
c:rn
cnts
arc
an
intc
i;ral
pan
of t
his
s1at
en
ES
E
145
Sect
ion
~'lo
t or
1011
14/
101
1.15
V
ehic
lt F
.S.
Bon
ds
230
240
0.0
0
0.0
0 0.
00
0
.00
0.0
0
0.0
0
0.0
0
0.0
0
0.0
0
0.0
0
0.0
0 0
.00
0.
00
0.0
0
0.0
0
0.0
0
0.0
0
0,0
0
0.0
0
0.0
0
0.0
0
0.0
0 0.
00
0
.00
0.0
0
0.0
0
0.0
0
00
0
0.0
0
0.0
0
0.0
0 0.
00
0
.00
0.0
0
0.0
0
0.0
0
0.0
0
0.0
0
0.0
0
0.0
0
0.0
0
0.0
0 0.
00
0
.00
0.0
0
0.0
0
0.00
0.
00
0
.00
0.0
0
0.0
0
0.0
0
0.0
0 0.
00
0
.00
0.0
0
00
0
0.00
0.
00
0.0
0 0.
00
0
.00
0.0
0
0.0
0 0
.00
0
.00
0.0
0
0.0
0 0
. 00
0
.00
0
.00
00
0
0.0
0
0.0
0
0.0
0 0.
00
0
.00
0.0
0
0.0
0
0.0
0
0.00
0.
00
0.
00
0
.00
0.0
0
0.0
0
00
0
0.0
0 0.
00
0
.00
00
0
0.0
0
Oth
er
Dis
tric
t D
ebt
Bon
ds
Ser
vice
25
0 29
0
0.00
0.
00
0. 0
0
22.5
73,6
73.7
4 0.
00
0.
00
0.
00
0.
00
0.
00
0
.00
0
.00
0.
00
0.0
0
0.0
0
0.0
0
0.0
0 0
.00
0.0
0
0.00
0.
00
0.
00
0.0
0
0.00
0.
00
0.
00
22
.573
,673
.74
0.0
0
0.0
0
0.0
0
0.0
0 0
.00
0.0
0 0
.00
0.0
0 0
. 00
0.
00
0.0
0 0.
00
0.0
0 5.
050.
000.
00
0.00
6,
471
,930
.70
0
00
0.
00
0.
00
0.
00
0.
00
0.
00
0
.00
0.
00
0.0
0
0.00
0. 0
0
0.00
0
. 00
0
.00
0.00
0.
00
0. 0
0
0.00
0.
00
11,5
21,9
30.7
0
0.0
0
0.00
0.
00
0.
00
0.0
0
0.0
0
0.0
0
0.0
0
0.0
0
11,0
51,
743.
04
0.
00
0
.00
0.0
0
0.0
0
0.0
0
0.0
0
0. 0
0
0.00
0
.00
0.
00
0.00
0.
00
0.00
0.
00
0
.00
0.0
0
0.0
0 11
,05
1,74
3.04
0.00
22
,573
,673
.74
AR
RA
Eco
no
mic
C
apita
l O
utla
y St
imul
us D
ebt
Bon
d Is
sues
Se
rvic
e (C
OD
I)
299
310
0.0
0 2,
254,
408
.57
0. 0
0
0.00
0.
00
0.
00
0.
00
00
0
0.00
0
. 00
0
.00
0
.00
2,
254,
408
57
0. 0
0
0.0
0
0.0
0
00
0
0.0
0 0
. 00
0
.00
0
.00
0
00
0
.00
0.0
0
00
0
0.0
0
0.0
0
0.0
0
0.0
0
0.0
0
0.0
0
0. 0
0
0.0
0
0.0
0 0
.00
2,25
4,4
08 5
7
00
0
0.0
0
0.0
0
0.0
0
.. 0
00
0
.00
0.0
0 0
. 00
2,
254,
408
.57
2,25
4,40
8.57
0. 0
0
0.00
0
. 00
0
.00
0
.00
0.0
0
0.0
0
0.0
0
0.0
0
0.0
0
0.0
0
0.00
0
.00
0.0
0
0.00
0.
00
0
.00
0.
00
0.
00
0.
00
0
.00
0.0
0 0
. 00
0
00
0
,00
0.0
0
0.0
0
0.0
0
0.0
0
0.00
0.
00
0.0
0
0.0
0 0
.00
0.0
0 0
.00
0.00
0.0
0
0.0
0
0.0
0
0.0
0
0.00
0.
00
0.0
0
0.0
0
0.0
0
Exh
ibit
C-1
P
agc4
Spc
ci•I
A
ct
Bon
ds
320
00
0
0.0
0
0.0
0
0.0
0
0.0
0
0.0
0 0
.00
00
0
00
0
0.0
0
0.0
0
00
0
0.0
0
0.0
0
0.0
0 0
00
0
00
0.
00
0.
00
0
00
0.
00
0.
00
0
.00
0
.00
0
.00
0
.00
00
0
00
0
0.0
0
0.0
0
0.0
0
00
0
0.0
0
0.0
0
00
0
0,0
0
00
0
0.0
0
0.0
0
00
0
0.0
0
0.0
0
0.0
0
0.0
0
00
0
0.0
0

DIS
TR
ICT
SC
llO
OL
BO
AR
D O
F D
UV
AL
CO
UN
TY
B
AL
AN
CE
SH
EE
T
GO
VE
RN
ME
NT
AL
FU
ND
S
J un
e 30
, 20
!0
AS
SE
TS
C
ash
and
Cas
h Eq
u1vo
lcnt
s In
vest
men
ts
Tax
es R
ecei
vabl
e. N.~
Acc
ount
s R
ccci
\'abl
c, N
et
Inte
rest
Rec
eiva
ble
Due
from
Rci
nsun
.. "f' O
MM
lsits
Rec
eiva
ble
Due
Fro
m 0
1/u:
r F
imdt
: B
udge
tary
Fun
ds
Inte
rnal
Fun
ds
Due
from
Oth
er A
Atn
cics
ln
vcnt
orv
Prco
a.id
ht.."
ITIS
To11
1l A
sset
s L
IAB
ILIT
IES
AN
D F
UN
D B
AL
AN
CE
S
LIA
BIL
ITIE
S
Sol
oric
s. B
<.'T
lcfit
s ond
Pay
roll
Tax
es P
ayub
lc
Pavr
oll
Ded
ucti
ons
and
With
hold
inA
s A
ccou
nts
Pav
ablc
Ju
d<:ll
lcnt
s P
avab
lc
Con
stru
clio
n C
ontr
acts
Pay
able
C
onst
ruct
ion
Con
trac
ts P
ayab
le-R
etai
ned Pcn
:cnta~
c
Mnt
urcd
Bon
ds P
ayab
le
?\fo
turc
d In
tere
st P
ayab
le
Du
e to
Fis
cal
AA
cnt
Sol
es T
ax P
avab
lc
Acc
rued
Int
eres
t PB
vabl
e O
coos
its
Pav
ablc
D
ue to
Oth
er A
Acn
cics
/)
uc to
Oth
er F
lmd.
<:
Bud~
etar
y fu
nd
s ln
tcm
ol F
unds
O
.:fcr
rcJ
R<
l't:l
lU<
.'
Une
arne
d R
even
ue
Una
vail
able
Rcv~nuc
To
tal
Lia
bili
liu
F
UN
D B
AL
AN
CE.
'>
Ra~n"CJFor:
End
owm
cnls
S
late
Rea
uirc
d C
nrTV
ovcr
Pro
c.ra
ms
Enc
umbr
ance
s In
vent
ory
Deb
t Ser
vice
Q
1h.,
. P
uroo
scs
U11n
!Sen
'\!J:
/.J
es1g
11at
cd fi1
r, n:
purt
eJ in
: IS
pcc1
fyJ
ISoc
cifv
l U
11tli:
.s1gn
a1cJ
, n•p
ortc
J m
: G
ener
al F
und
Spe
cial
Rev
enue
Fun
ds
Deb
t Ser
vice
Fun
ds
Cao
ital P
roic
cls
Fund
s Pc
rman
cn1 F
unds
To
!MI
Fu
all
B•l
•n<
cs
To
tal
Liu
bili
tie>
an
d F
und
Bal
antc
s
Acc
ount
N
umbe
r
111
0 11
60
1120
11
30
1170
11
80
1210
1141
11
42
122
0
1150
12
30
2110
2
170
2120
21
30
2140
21
50
2180
2
190
2240
22
60
2210
22
20
2230
216
1 2
162
2410
24
10
270
5 27
10
2720
27
30
2760
27
60
2760
27
60
2760
27
60
2760
27
00
The
acc
ompa
nyin
g no
1cs
10 fi
nan
cial
suu
cmcn
ts a
rc a
n in
1cgr
al p
an o
fth1s
sune
n E
SE
14
5
Sec
tion
101
1 14
/ Pu
blic
Edu
crui
on
1011
.15
Cap
ital
Oul
lay
F.S
. L
oans
(P
EC
O)
330
340
0.0
0
0.00
0
,00
0.0
0
0.0
0 0.
00
0
00
0.
00
0.
00
0
.00
0.
00
0
.00
0.0
0
0.0
0
0.0
0
0.0
0 0
.00
0.00
0
.00
0.00
0
.00
0.
00
0.00
0.
00
0
.00
0.00
0.0
0
0.0
0 0.
00
0
.00
0.0
0
0.0
0 0.
00
0
.00
0.0
0
0.00
0.
00
0.
00
0.00
0.
00
0.00
0
.00
0
00
0.
00
0
.00
0.0
0
0.00
0.
00
00
0
0.0
0
0.0
0
0.00
0.0
0
0.0
0 0.
00
0
.00
00
0
0.0
0 0.
00
0
.00
0.0
0
0.0
0
0.0
0
0.0
0
0.0
0
0.0
0
0.0
0 0.
00
0
.00
0.0
0
0.0
0 0.
00
0
.00
0.0
0
0.0
0
0,0
0
0.00
0
.00
0.0
0
0.0
0 0.
00
0.00
0.
00
0.0
0
0,0
0 0.
00
0
.00
0.0
0
0.0
0 0.
00
00
0
0.0
0
Cap
itol
Out
lay
and
Cap
ital
Impr
ovem
ent
Dis
tric
t D
ebt S
ervi
ce F
unds
S
ecti
on 1
011.
71(2
) B
onds
(C
O&
OS
) F
.S
350
360
370
0.0
0
0.0
0 0
.00
0.0
0
0.0
0
96,8
99,0
27.4
4 0.
00
0
.00
0.
00
0
.00
0.
00
0
.00
0
.00
0
.00
0
00
0
.00
0.0
0
0.0
0
0.0
0 0.
00
0
.00
0.0
0
00
0
0.0
0
0.0
0
0.0
0
0.0
0
0.0
0
0.0
0
0.0
0 0.
00
0
.00
0.0
0 0.
00
0
.00
0.00
0.
00
0
.00
96
.899
,027
.44
0.0
0
0.00
0
00
0
.00
0.00
0
.00
0.0
0 0.
00
3.
232.
376
89
0.0
0
0.0
0
0.0
0
0.0
0
0.0
0
0.0
0
0.0
0
0.0
0
517.
053.
07
0.0
0
0.0
0
0.0
0 0.
00
0.
00
0.0
0 0.
00
0
.00
0.0
0
0.0
0
0.0
0
00
0
00
0
0.0
0
0.0
0
0.0
0 0,
00
0
00
0
.00
0.0
0
0.00
0.0
0 0.
00
0
.00
0
.00
0.0
0
0.0
0
0.0
0 0
,00
0
.00
0.
00
0
,00
0
.00
0.
00
0, 0
0
3.74
9,42
9.96
0.0
0
0.00
0.
00
0.
00
0.
00
0.0
0
0.00
0.
00
12,5
87,0
97.0
7 0
. 00
0.
00
0.
00
0.
00
0.
00
00
0
0.0
0
0.0
0
00
0
0.0
0 0
.00
0
00
0
.00
0
.00
0.
00
0.0
0
0.0
0
0.0
0
0.0
0
0.0
0
0.0
0 0.
00
0.0
0 0
.00
0.0
0
0.0
0 80
,562
.500
.41
0.0
0
0.0
0 0
.00
0.
00
0
.00
93,1
49,5
97.4
8
0.0
0
0.0
0
96,
899,
027
44
Vot
ed
Cap
ital
I mp
rovc
mcn
t
380
0. 0
0
0.0
0
0.0
0
0.0
0
0.00
0.
00
0
00
0.0
0
0,0
0
0.0
0
0.0
0
0.00
0
. 00
0.00
0.
00
0.
00
0.
00
0.
00
0.
00
0.
00
0.0
0
0.0
0
0.0
0 0
.00
0
.00
0
.00
0.0
0
0.0
0
0.0
0
0.0
0
0.0
0
0.0
0
0.0
0
0.0
0 0
.00
0.0
0 0
.00
0.0
0
0.0
0
0.00
0.
00
0
.00
0.0
0 0
.00
0. 0
0
0.0
0
Exh
ibit
C-1
~a
11e4
01hc
r C
apita
l Pr
ojec
ts
390
0.0
0 46
.521
.841
.87
0.0
0
0.0
0
00
0
0.0
0
0.0
0
0.0
0
0.0
0
0.0
0
0.0
0
0.00
46
.52
1.84
1 87
0.0
0 0
. 00
3.
924.
092.
22
0.0
0
0.0
0
519
,763
.07
0
00
0
00
0
00
0
00
0
00
0
.00
0. 0
0
0.0
0
00
0
0.0
0
00
0
4,44
3,85
5.2
9
0.0
0
0.0
0
13,6
86,6
27 5
4 0
00
0
00
0
00
0.0
0
0.0
0
00
0
0.0
0
0.0
0 28
,39
1,35
9.04
0
00
42.0
77,9
86.5
8 4
6,52
1,84
1 87

DIS
TR
ICT
SC
HO
OL
BO
AR
D O
F D
UV
AL
CO
UN
TY
B
AL
AN
CE
SH
EE
T
GO
VE
RN
ME
NT
AL
FU
ND
S Ju
ne
30, 2
010
AS
SE
TS
C
ash
ond
Cas
h E
quiv
alcn
1s
Inve
stm
ents
T
axes
Rec
eiva
ble.
Net
A
ccou
nts
Rec
eiva
ble.
Net
ln
1ere
s1 R
ecei
vabl
e D
ue fr
om R
cins
urcr
D
coos
i1s
Rec
eiva
ble
/)ue
Frt
1111
Oth
er F
111u
ls:
Bud~euuy f
un
ds
Inte
rnal
fu
nd
s D
ue fr
om 0
1hcr
A~cnc
ies
Inve
ntor
y P
repa
id 1
1em
s T
oln
l Ass
ets
LIA
DIL
ITIE
S A
ND
FU
ND
BA
LA
NC
ES
L
IAD
ILIT
IES
Sa
lari
es. B
enef
its
and
Payr
oll T
axes
Pay
able
P
avro
ll D
educ
tion
s an
d Withholdin~
Acc
oun1
s Pa
yabl
e Ju
dgm
ents
Pay
able
C
onst
ruct
ion
Con
trac
ts P
ayab
le
Con
stru
ctio
n C
ontr
acts
Pav
able
-Ret
aine
d Pe
rcen
ta~e
M
atur
ed B
onds
Pav
able
M
atur
ed I
nter
est
Pay
able
D
ue to
fis
cal
Age
nt
Sal
es T
ax P
ayab
le
Acc
rued
Int
eres
t P
avab
lc
Dco
osit
s P
ayab
le
Du
e to
Oth
er A
gen
cies
V
ue J
o 0
1/tcr
Fun
ds:
Budu
.cta
rv F
unds
ln
1crn
nl F
unds
/J
efcr
n:d
Rcl
'cm
u::
Une
arne
d R
even
ue
Una
vail
able
Rev
enue
T
otn
l Lin
bil
iliH
FU
ND
BA
LA
NC
ES
R
escn
·etl
/·Or:
E
ndow
men
ts
Stat
e R
equi
red
Car
ryov
er P
roc.
ram
s E
ncum
bran
ces
Inve
ntor
y D
ebt S
ervi
ce
01hc
r P
urpo
ses
llnre
sen-
e(/:
Des
igna
ted /
fir, r
epor
ted
in:
ISoe
cifv
l [S
peci
fy I
Und
csig
natc
cl.
rcpo
rtet
l in:
G
ener
al f
un
d So
ccia
l Rev
enue
Fun
ds
Deb
t Ser
vice
Fun
ds
Cao
ital
Pro
iccl
s F
unds
Pe
rman
ent
Fund
s T
oto!
Fu
nd B
nlon
ces
Tot
nl L
iabi
litie
s nn
d F
und
Bnl
ancr
s
Acc
ount
N
umbe
r
1110
11
60
11
20
11
30
117
0
1180
12
10
114
1 11
42
1220
11
50
1230
2110
21
70
212
0
2130
21
40
21 5
0 21
80
21 9
0
2240
22
60
2210
22
20
2230
2161
21
62
2410
24
10
2705
27
10
2720
27
30
2760
27
60
2760
27
60
2760
27
60
276
0 27
00
The
occ
ompa
nyin
g no
tes
to f
inan
cial
sta
tem
ents
are
an
inte
gral
par
t of t
his
stal
cn
ES
E
145
AR
RA
Eco
nom
ic
Stim
ulus
Cap
ital
Per
man
ent
Oth
er
Pro
ject
s fu
nd
G
ove
rnm
enta
l
399
00
0
fun
ds
0.0
0
0.0
0
0.0
0
25,4
75,0
00.1
5 0.
00
4,
857,
357.
42
0.0
0
0.00
0.
00
0.0
0
00
0
177,
408.
47
0.0
0
0.0
0
0.00
0.
00
0.
00
0.
00
0.
00
0.
00
0.
00
0.0
0
0.0
0
0.0
0 0.
00
0.
00
0.
00
0.0
0
0.0
0
4,12
7,92
9.59
0.
00
0.00
0
.00
0.0
0
0.0
0
0.0
0 25
,475
,000
.15
0.0
0
9, 1
62,6
95.4
8
0.0
0
0.0
0
0.0
0 0.
00
0.
00
0.0
0 10
3,87
0.89
0
.00
3. 79
0,04
2.31
0.
00
0
.00
0.00
0.
00
0
.00
0.0
0
49,3
98.6
4 0.
00
52,9
27.4
9 0
.00
0
.00
0.0
0
0.00
0.
00
0.0
0
0.0
0
0.00
0.
00
0.
00
0.0
0 0.
00
0
.00
0.00
0.
00
0.0
0 0
.00
0.
00
0
.00
0.
00
0.0
0
0.0
0 0
.00
0.0
0
0.0
0 0
00
0.
00
0.0
0 0.
00
0.0
0 0
. 00
0
,00
0.0
0 15
3,26
9.53
0.
00
3,84
2,96
9.80
0.00
0
.00
0
.00
0.
00
0.0
0
0.0
0 4.
367,
037.
58
0. 0
0
1,67
1,42
1.05
0
.00
0.
00
0
.00
0.00
0.
00
643,
414
.74
0.00
0
.00
0
.00
0.0
0 0.
00
0.
00
0.00
0.
00
0.
00
0.0
0 0
.00
0
.00
0
.00
0.0
0
0.0
0
0.00
0.
00
0.
00
20.9
54.6
93.0
4 0.
00
3.
004.
889.
89
0.00
0.
00
0
.00
25
,32
1. 7
30.6
2 0.
00
5,
319,
725.
68
25,4
75.
000
.15
0.0
0
9,16
2,69
5.48
Tot
al
Gov
ernm
enta
l F
unds
16,0
79,3
83.1
1 35
5,25
1,72
7.16
36
,367
.84
1.63
5.22
0.18
1.
140,
640.
69
0.0
0 0
.00
0.0
0 0
.00
6,14
6,94
3.6
7 3.
236.
631
.17
525.
001.
98
384,
051,
915
.80
14.3
57.1
68.7
0 J,
S46
.011
.26
31.9
61.2
27. 7
6
0.0
0
0.0
0
1,13
9.14
2.27
5,
050.
000.
00
6,4 7
1. 9
30. 7
0 0
.00
759.
86
0.0
0 0
.00
54.0
0
0.00
0.
00
1,99
7, 7
86.3
6 0.
00
62,5
24,0
80.9
1
0.0
0
47,5
60.1
40.9
1 44
.021
,834
. 80
3,23
6.63
1.17
13
,949
.566
.35
0.00
0.00
0
00
75,2
80.2
02.3
0 4,
566,
016
.98
0.0
0
132,
913,
442.
38
0.00
32
1,52
7,83
4.89
384.
051,
915
.80
Exh
ibit
C-1
Pa
ge4

DISTRICT SCHOOL BOARD OF DUVAL COUNTY RECONCILIATION OF THE GOVERNMENTAL FUNDS BALANCE SHEET TO THE GOVERNMENT-WIDE STATEMENT OF NET ASSETS For the Fiscal Year En~ed June 30, 2010
Amounts reported for governmental activities in the statement of net assets
are different because:
Total Fund Balances - Governmental Funds
Capital assets, net of accumulated depreciation, used in governmental activities are not financial resources and, therefore, are not reported as assets in the governmental funds.
Deferred charges are not available to liquidate liabilities in the governmental funds, but are accrued in governmental activities in the statement of net assets.
Internal service funds are used by management to charge the costs of certain activities such as insurance to individual funds. The assets and liabilities of the internal service funds are included in governmental activities in the statement of net assets.
Long-term liabilities are not due and payable in the current period and, therefore, are not reported as liabilities in the governmental funds. Long-term liabilities at current year-end consist of:
Bonds Payable Certificates of Participation Payable Compensated Absences Payable Other Post Employment Benefits
Total Net Assets - Governmental Activities
The notes to the basic financial statements are an integral part of this statement.
(21,850,000) (290,880, I 0 I)
(56,227,861) (31 ,608,000)
$
$
Exhibit C-2 Pages
321,527,835
966,340,547
3,322,858
48,632,648
( 400,565,962)
939,257,926

.. ~ ..
-. B c ~"' 0 f ~!; .....
~~~~!!~~!~~~~!~~~~ ..; 8 '!i
8888 t:J000
888 8 d 0 ci ci
88888 :;j d d 0 d
~!!~~~~!!!~§~~~2~~ g ~ '° - - ~ ~ ~5~
~ti ;i

888 OoO
8888 0000
8888 o' 0 =:; 0
888 OOo
8888 ooOO
g ~
11 ~ 0:
B .:i .g ·~ ~ I- ~
1 i c ~ ~ ,)! ~ 0: !:
~ ::> ::!
0: ~ . g H ~ ~ 2 ~ e ~
-.,, .~ " j I ! .~
b ::> . 1 li ~ g ,)! 1i ·~
B ~ 6~ 0 .. " ... u :~ < ~
!~j H j i:: c " ~ -Bi ~ ij ~
e '6 e c ! ,)! a JI ~
... I:. c::~Jl ~~ 8' ~ e ~ ::> ~ e: ~
§B~ !~ ~ H j ] ,t
~1 .~ ~ ~ :il.., ~ .u ·ii 'o <l ru l ~ ~ .2 H L j H ll 'o ~ ~1 .. r
] n ]~ l g '! ~ ~ ~ " -' ~
~ g .~ ! ~ ~i ~I ~ ~ ~ .~ ~ E 1~ ~ "'~ ... ·§ ,. I 55 ~ G] ] cil ' 6 • ~~i ~i
~8~ "' .q ~ ~~ "ii~ ~e: !h ~
'0-
~1 h e n~ 6H < n 0 g B a:J! 1!"' ii ~ .B ~ i ~ ,)! ~
~1 "'~ 2' - ... d
::! g H • {!. ~{!. ]e
1~H ~ . p ~2 ~ 9 "i!; H H·~ u~ ~cl! .. ~ g ~~~ ~ s g ~
l! 0 0 ,g 5 ~ ~ oil~ Q .!i cl! .g u Jlj •• ·~ ~ ii~ a B 9 I! ~ . o M - .3 s 11
i~ ~1 n fjq p 1j jg ~ ": _,.ii ~ ·~ H .; ~ ~ ~~~ 0 C! j .a
1!~ !~ ·id u ·g • ~]~ ~i ~~~ ~ .~ 12 j]j ]o _
~ w ~ dl ~ u g ~ ~
-u ~ii ii ll ] .. .. ~ ~ .t.S .B c:l ~ '3 ~~ .l! 0 ~~~ .:i ~ j
0 'fi • i! "3 ~~~ hl .... ti<.. - _JI .. 0 u .. ..... """' "' u .. j ... < ...

Dll
o•R
ICT
SC
HO
OL
BO
AR
D O
Y D
UV
AL
CO
UN
TY
S
TA
TE
"1£
NT
OF
RE
VE
NU
ES
. E.X
PE
ND
ITU
RE
S,A
ND
CH
AN
CE
S I
N I
G
OV
ER
NM
EN
TA
L F
UN
DS
fo
r ll
ac >
'be.
al Y
ear
Ead
cd J
Hc J
0, 2
010
RE
VE
NU
ES
F
a:kr
:llD
u't
a Fo
kr.1
11 T
lvou
1tb S
Uie
and
Loc
al
Sb!<
So
"'"'
IJ.
.oaJ S
a11r
ns.
Proo
cnv
Ta.\C
S L
c\•IC
CI ro
r ()p
traa.
on;a
l Pu-~
Proo
=nv
T:u
.n L
e\ k:
d ro
r De
b& S
en k
c Pl
"Ol)C
nv T
ax.cs
l..c
\icd
for
Cap
iLU
Pro
ject
s
Lo
QI S
a.Les
Ta.
\C.S
Ch
:ars::
:t:S fo
r Scn
'1CC:
.-f'O
od S
cn•JC
C lm
PX
t Fe
es
Otb
:r L
ocal
RC
\Cll
UC
Tot
al L
.oe:a
l sou
rces
11
'01.al
Rn
Tn
c•
EX
PE
ND
ITU
RE
S
C11~n1:
IBW
U;;
tJO
ft
PuPi
l Pm
oru
CI S
cn·..
:c,
lnst
rucl
t0~
Mcd
u S
cnic
cs
lnw
ucti
oa a
nd C
'um
culw
n O
a·do
pmcn
e Sc
n-.;c
:s
lm&NCUo~ SWTTr.:U~~ S
cn•k
:cs
Inst
ruct
ion
Rcb
lc:d
Tcc
hMkt
i.'Y
Sc
hool
&:u
d
Gcn
cr:tl
Adm
mis
11:1
uon
Scho
ol A
dnun
&w
::mon
F.
.:i1i
tics
AcQ
U15
1tM>
n a
nd C
onur
uctio
n F~lScn
•ICc
s
Food
Sct
\'ICC$
Cc
m.r.
al S
cn·io
e.s
Pup
il T
nnw
on.a
uon
Sc.n
•tcCJ
()
pcra
bon
or P
l.VII
Mii
nicm
na: o
f PbD
1 A
dn»N
stJa
U\ c
Tcc
hnol
os:.\
' Scn
•.ccs
C
omm
uai
t\' S
cn·IC
CS
!Xbt
Sc-
n1
tt.
,,.~ftn
dlOt
l 9~00)
Rctlr
c111
cte
of P
nn:lt
nl
lnlC
R$l
Du
a. F
ca a
nd lu
u.:a
ncc
COS&
s M
LKC
lbnc
ous
E.\l>
Cndll
UJ'C
$ ·c"
djHia
l OUi
iU.l-:
fa
cil.J
IJCI
" A
cqu1
wlJ
on a
nd C
onst
NC
Uon
O
thtt
C.:.p
ll:IJ
Oul
l:lr
:Tot
.a.1
l'.a
nu
dll
.ia
£
1c
oa
(Dd
kk
AC
)') u
r li
lcn
:Hu
On
r (U
•dtr
) £
.t.pe
lldll
U'U
O
Tll
ER
t1
NA
NC
INC
SO
UR
CE
S (U
SES)
L
ong·
Tcn
n B
ollii
s ls
.wed
Pn
:miw
u on
Sal
e or
Bon
ds
DtS
a>U
m o
n S:
.lc o
r Dor
ds 1F
unct
io11
. 9l9
9)
RcJwadu~ B
ond
s lu
ucd
Pr
emiu
m 0
11 R
dwxi
i111
t Bon
ds
Disc
ounr
. on
Rcf
wid
uui B
oods
(fu
nctio
n 91
99)
Ccr
uf1a
1cs o
f P:u
lidPi
llion
lu
ucd
P
mni
um o
n C
c:ru
flc::u
c.s o
r Pan
.ic
1~oon
OIK
Oul
\I on
Ccn
dic:
atc.s
or P
.ar11
C_l_P
3lio
o(Fu
ucuo
n 92
99)
Loa
ns
lncu
md
PJ
OCCC
d1 rr
ott'l
lhe
Sale
ofC
'ap1
L1I A
ucu
l.o
S5 R
.cco
,·cric
.s Pr
oc:c
c.ds
ofFo
rwar
d Su
ppl\•
C.O
nt.rx
l SD
CCial
Fx
iluic
:s: C
on.w
uctio
n A
.d\0
1nc;
cs
PJ\
'1U
Cl'U
IO R
cfw
ldcd
Bon
d E
lcro
w N
.,'C
DI.
(Fun
ctio
n 92
9'1)
IT
r.uu.
fus
In
tTam
!cn
Out
T
ula
l O
llacr t1
•••d
•i: S
cMltc
'CJI
(U1t
io)
SPEC
IAL
ITEM
S
EXTR
AO
RD
INA
RY
ITE
MS
Net
Cb
ui,:
c: J1
1 •·u
d U
alu
c:n
Fu
nd D
al:m
ccs,.
Juh
· I. 2
1XW
A
dJus
t1uc
ul to
Fun
d B
alan
ces
Fw>d
Bob
nec>
. IW
I< l
O. 2
01U
A"
oun
t N
uaib
cr
)10
0 32
00
))0
0
!Jll
J
.ill
U
l3
WI
mx
3•9
6
l.0
0
5000
61
00
62
00
63
00
6<
00
65
00
7100
72
00
7300
m
u
7500
76
00
7700
7I
OO
79
00
110
0 12
00
YIO
O
710
720
730
7<JO
7J?O
93
00
mo
3791
... l71
l 37
92
192
l7l0
1
79
] K
9l
3720
1
7)0
J7
JO
3760
17
70
760
3600
9
70
0
2ll0
0 2K
1 >I
1700
Tb
:xco
tup
.lny1
ng
nol
c:s
10 fi
Rlll
CLl
l Wtt
mc
tU a
rc ll
l tna
tgn
l p.i
n o
f1ht
.s s.
:i.:.;
,
ESE
Hl
Dill
rict
B
onds
)5
0
0.0
0
0.0
0
0.0
0
0.0
0
0.0
0
0.0
0 0
.00
0.00
U.
00
0
,00
0.0
0 0.
00
ouo
0.0
0
0.0
0
0.0
0
o.oo
0.0
0
0.0
0 0
.00
0.00
0.
00
0.0
0 0
.00
0.0
0
0.0
0
0.0
0
0.0
0
0.0
0
0.0
0
0.0
0
0.00
0.
00
0.0
0
0.0
0
0.0
0
0.00
0
.00
0.0
0
0.0
0
0.0
0
0.0
0
0.00
0
00
0.
00
0
.00
0
.00
0
.00
0.00
0
.00
0
.00
0
00
0
.00
0
,00
0
.00
0
.00
u.w
0.0
0 0
00
0
.00
0.0
0 0
.00
-CaP1
Ut1 O
UUa)·
and
Deb
t Scn
•.:c
Fund
s lC
O&
DS
) )6
0
0.0
0
0.0
0
0.0
0
0.0
0 0
.00
0.00
0.
00
0.00
0.
00
0.00
0
. 00
0
.00
0.00
0
.00
0
.00
0
.00
0.
00
0.00
0.
00
0.00
0.
00
0.0
0 0
.00
0.0
0
0.0
0
0.0
0
0.0
0
0.0
0
0.0
0
00
0
0.0
0
0.0
0 0
.00
0.0
0
0.00
0.
00
0.0
0 0
.00
00
0
0.00
0.
00
0.
00
0.00
0
.00
0
.00
0
.00
0.
00
0
.00
0
.00
0.
00
0.0
0
0.0
0
0.0
0
0.0
0
0.0
0
0.0
0
0.0
0
0.00
0.
00
0.
00
0.00
0
.00
Clpi
l.il l
a1Pr
o,·cm
c1u
Sccu
on 1
011.
71(2
> F.
S.
370
0.0
0
0.0
0
0.0
0
0.0
0 0
00
89
.J79
.1"'
6 ll
0,0
0 0
,00
0.0
0
3.6l
6.11
6.2Y
9
3.l
ll.2
62
62
93. I
3l.
262.
62
0.0
0
0.0
0
0.0
0
0.0
0 0
00
0
.00
0.00
0
00
0.
00
l7
.S91
.127
.4?
0.0
0
o.oo
0.0
0
0.0
0
00
0
0.0
0
0.0
0
0.0
0
0.0
0
0.0
0 0
.00
0.0
0
30.9
13.7
01.7
6 0.
00
lK.5
0l.
lll.
IK
J..l.
6:?9
.71
1 . .U
0.0
0
0.0
0
0.0
0
U.0
0
0.0
0
0.0
0
00
0
0.0
0
0,0
0
0.0
0
0.0
0
0.0
0
0.0
0
00
0
00
0
00
0
m.1
i1.<
79.6
6>
m.1
31.•
7966
>
o.oo
0.0
0
!17
.l2
5.7
'1 22
> I
I0.1
6l.2
2K.7
? 0.
00
93.3
36.J
llO l
7
Vote
d C
apita
l lm
pTO
'\cm
cnr.
llO
0.0
0
0.0
0
0.0
0
0.00
0
.00
0.0
0 0.
00
0.00
0.
00
0. 0
0
0.00
0.
00
0. 0
0
0.0
0
0.0
0
0.00
0
.00
0.
00
0.00
0.
00
0.00
0.
00
0.0
0
0.0
0
00
0
0.0
0
0.0
0
0.0
0
0.0
0
0.0
0
0.0
0
0.0
0
0.00
0
.00
0.00
0
.00
0
.00
0.0
0
0.0
0
0.0
0
0.0
0
0.0
0
0.00
0.
00
0.0
0
0,0
0
00
0
0.0
0
0.00
0
.00
0.0
0
0.00
0.
00
0
00
0
.00
0.0
0
0.00
0.0
0 0.
00
0.0
0 0
.00
0.0
0
01.h
:r
Cap
hal
Pro
ject
s 39
0
U.0
0 0
.00
1.
071.
6!3.
H
0. 0
0
0.0
0
0.0
0 0
.00
0.0
0 0,
00
•06.
716.
11
J06,
786.
ll
l.J7
1.Jl
9.l
l
0.0
0 0
.00
0
.00
0
.00
0
00
0
.00
0
.00
0.0
0 0
.00
U2
1.6
H.l
l 0
.00
o.oo
0.0
0 0
.00
0.
00
0.
00
0
.00
0
.00
0.0
0
0.0
0
0.0
0
0.0
0
39.9
07.9
,S.6
-4
0.0
0
JJ.6
29
.l9
Ul
IU.l
ll.
17<.
10)
0.0
0 0
.00
0
.00
0
00
0.
00
0
.00
JO
.Jll
O.l
JU7
0.0
0
0.0
0
0.0
0
370.
000.
00
0
.00
0
,00
0,0
0
0.0
0
0.0
0
(1.6
71.J
Ol.
lll
3Y.1
79.l
l3.1
2
ouo
0.0
0 (3
.972
.0J0
.91)
J6
.72l
.7ll
0.ll
0
.00
H.7
l3.7
39.l
lJ
AR
RA
Eco
nom
ic
Stim
ulus
Colp
ilal
Proj
ects
)9
9
0.0
0
0.0
0
0.0
0
0.0
0
0.0
0
00
0
0.0
0
0.0
0 0.
00
l&l.6
32.9
1 18
3.63
2, 9
1 11
3.61
2,9
1
00
0
0.0
0
00
0
0.0
0
0.0
0
U.0
0
0.0
0
0.0
0
0.00
0
.00
0.0
0 0.
00
0.00
0.
00
0.0
0
0.0
0
00
0
0.0
0
0.0
0 0
.00
0
.00
0
.00
1.66
6.0l
l.61
0
.00
1.
666.
0ll
.61
(1.J
l2.J
J8.7
0)
0.00
0
.00
0.0
0 0
.00
•o.oo
0.
00
26.ll
0<.1
79.3
2 0.
00
0
.00
0
00
0
.00
0
.00
0
00
0
.00
0.0
0
0.0
0
0.0
0
?6.IG
&.1
19.ll
0.0
0
0.0
0
?l.l
ll.7
30.
62
0.0
0 0
.00
2
5.l
ll.7
30
62
Pcmi
:inc::
nc
furW
00
0
0.0
0
0.00
0
.00
0.0
0
0.0
0
0.0
0 0
.00
0.00
0
.00
0.00
0.
00
0
,00
0.0
0
0.0
0
0.0
0
00
0
0.0
0 0
. 00
0
.00
0.
00
0.00
0
.00
0
.00
0.00
0
.00
0.0
0
0.0
0
0.0
0
00
0
0.00
0.0
0
0.0
0
0.00
0,
00
0. 0
0
0.0
0
0.00
0.
00
0.00
0
.00
0.00
0
.00
0.
00
0.0
0
0.00
0.
00
0.0
0
0.0
0
0.0
0
0.0
0
o_oo
0.0
0
0.0
0
0.0
0
0.0
0
0.0
0
0.0
0
0.0
0
0.0
0 0
.00
0.0
0
0.0
0
Oth
er
Go
\•cm
nte
rDI
Fund
s
1.l'l
'l.70
3.-1
6 1
1.0
ll.O
JHl
l.l<
l.ll
l.l9
0.00
0
00
0
00
0.
00
0.0
0 0
.00
7
UIU
2
1.-.•
1 ...
11
97.
Y76
... 3
.29
..... U
ll.<4
W.l
l l'
-3l3
.61
l.9
2 6
JJ.1
2l.
IO
9.l?
6."'
62.l
0 I
1.l2
6.63
9.72
70
.606
.JO
0
.00
2.50
0 . .0
6.6
9 I I
T.1
71.7
) 7A
29.2
73.B
l 77
.322
.)3
0
.00
)I
J.7
l6 l3
66
7.73
9.0
l 2.
•17
.17
0.0
0
0.0
0
ltJ.
Jll.
11
2.l7
0.00
0.0
0
1.21
0.66
3.26
10
.lll
.62
9
JJ.K
l2.9
1
2Al2
.928
.79
1.31
9.99
9.81
99
,T9K
.106
.U
0.1
21.6
9).
131
0.0
0
00
0
0.0
0
170.
00
00
0
12.7
12.6
l 0
00
0
.00
0
.00
0.0
0 0
.00
0
.00
0
.00
0.
00
0.00
0
00
l
l.1
9l0
1
12. 9
lO.l
JJ.0
01
(l,9
-16,
,]6
l'>
0.0
0
0,0
0
0.7
6K,1
29 ...
7)
9.0
"7.S
ll.l
l 0
.00
l.ll
9.7
2l.6
8
E•~l
bilC
"3
P•cc
•

DIS
TR
ICT
SC
HO
OL
BO
AR
D o•
· DU
VA
L C
OU
NT
Y
ST
AT
EM
EN
T O
F 1
1£
\ltN
Ul'S
, £X
P£
ND
ITU
Rl'S
, AN
D C
llA
NG
l'S IN
I
GO
VE
RN
ME
NT
AL
FU
ND
S
for
Ille
•1K
al Y
ear
E•c
kd J
Hc
Ju, J
:UIO
AC
CO
\lnl
Num
ber
RJ:
VE
NU
ES
Fc
d<r.l
l Ou
m
3100
Fcd<
r.ll T
hn>u
Rh
SL>
k an
d L
oc>I
12
00
Sw
c So
urtc
:5
HO
O
l.lx
;af S
nMrc
r..t:
Proo
cm T
a-\.C
.S L
a·1c
d fo
r Orr
r.t.1
iarc
l Pu
mr\
U'i
l•
ll
Pn:in
rn\
Ta.,c
:s l.
.aic
d fo
1 D
ebt S
cTY
icc
l-11
2 p
_ .. ,.
Tax-
(:$ L
C\-i
cd ro
r CaD
iul P
tott
is
J.ll
J L
oal
Sal
es Ta.~s
1 ...
.
Ch.
ln-r-
i. ro
t Ser
vice
· Foo
d Se
n ac
e H
5X
lm
rnct
Fee
s l.i
'Jr6
Oth
:r L
ocal
R~
·cnuc
Toi.a
l Loe
3J S
ow
tu
J.IO
O
Toc.al~CHO
EX
PE
ND
ITU
RJ:S
C
.1rr
rn1:
ln
stN
CU
Oll
lOO
O
PuPi
J Pc
:no1
u1d
Sc.n
-.c=:
:a 6
100
lnsu
uc:o
on.ll
.,_,aiu
Scn·
icu
62
00
l.mtrw
:t.ao
11 a
nd C
'um
culw
n O
c\ ...
......
llKlll
Sc:
nlC
cs
6JO
O
lrul
NC
dorW
Sui
J'T
r.tin
in.t
ScM
ccs
6'0
0
lnM
NC
t9on
Rtb
tcd
Tc:
choo
lo"-
\' 6.S
OO
Sch
ool O
o.vd
71
00
Gen
er.a
.I A
dnur
uw:a
tk>
ll
7200
Sch
ool
Ad
mu
usu
ati
on
73
00
FacW
1ac.s
Aco
uis.
uion
and
Con
suua
ion
7"10
F
iica
l Scn
•iccs
7.S
OO
Food
Sa'\
'ic~
7
60
0
(cw
;d S
cn'IC
C$
7700
Pu
Dll
T ...
llYV
lfut
ioa
Scn
·lcn
7¥
00
()p
cra
tt0
n o
f Pb
nl
7900
M
.an
i:a
an
cc o
r Pbn
c KI
OO
Ad!
Uil
u.sl
Dti
\C T
c:ct
uiok
>J!
\' S
er\ t
ees
1200
C
oma1
wuw
Sen
-ice
s 91
00
Ditb
1 S
n\·1
" (F
11nc
1lon
'JJO
OJ
Rcl
ftm
cnt o
r Pm
""',o
;a1
710
ln1e
rcs1
72
0 D
ua.
Fee
s :t
nd lw
aan.
:c C
ow-
73
0
MllC
Cll.
:11.
.:ous
fape:ndilu~
790
Cap
ital
Olli f
a)'.
F:ir
:1lJ
lki A
mu
wli
oh
:wd
CO
J\Slr\
ICU
Oll
1"'2
u 01
.htr
Do1
uJ O
utb
\' 9
300
To
tal
£.uu
dllt
11'C
I £
.icn
a (D
c:rk
itM
:y)o
l RC
'\cH
cs <
hcr
CV
9d
cr)
£1
.pu
dil
•rt.
t
OT
il£
R F
INA
NC
ING
SO
UR
CE
S (U
SE
S)
Lon~
·Tcm
1 B
onds
Iss
ued
HIU
Pr
cnuu
m o
n ~le o
r Dou
ds
)191
Dis
cov.
nl o
n S3
k: o
( 8oo
ds C
f unc
tion
9lW
I 19
1 R
cf •n
d>n•
Bon
ds b
sucd
3
715
Prc:
1niu
m o
n R
cfon
diP.
1: B
onds
l7
9l
Ouc
ount
on
Rcf
wdi
n •B
onds
ff u
nctio
n 92
99)
IS92
C
cnl.f
k.aa
ts o
( P:
utic
1rY
•hnn
Iss
ued
)75
0
Pra
ww
n on
Ccm
fgac
s o
( Pm
ic1o
ougn
J1
9J
Das
cow
ll o
n Ccntf~cs o
r P;a
ntan
o.tio
n tfW
lCU
OP
9299
} 89
1 Lo
ans:
Inc
urre
d 17
20
Pro
cccd
.s fr
om lh
c $;
tic
ofC
;ioi
uJ A
iSC
U
1730
L
oss
Rcc
o\'c:
rics
J7-IO
P
roo
xds
or F
oM·:i
n:l S
u ooh
· Con
cr...
:1
1700
S
pcc
gl F
.x.ll
UC
S C
onsu
ucllO
D A
d\'3
.J:S
:a
377
0 P;
i,,·m
cnu
lo R
d"un
dcd
Bon
d E
icro
w A
i:cn
l ffu
.nct
ion
92
"9)
760
Tr.
msf
tri I
n J6
0(l
Tr.
msf
er10
u1
9700
Tot
al O
chr
Fia
uci•
a.: .
SO
.Rn
(Uta
)
SP
EC
IAL
ITE
MS
EX
TR
AO
RD
INA
RY
ITEM
S
Net
Ch
•i:c
I•
t-"ua
d U
alu
cu
F
wtJ
Ba
bru
i. J
ul\"
I. W
OO
~¥00
Ad
"'"
"""U
S 10
fu
nJ 8"
)1.~
nccs
2191
Fun
d &
bn<
cs, J
ww
: J-0
. 201
0 27
00
n.:
occ:
ompa
D)1
ng n
otes
10
OR
Joc1
al il
.-.te
iucn
u :u
can
inic&
r.11 p
an o
rllu
i M.::
ilt
ES
E l4
l
Tow
G
o\cn
uncn
W
Fund
s
9..1
9?.7
61,
0I
1&2.
2<M
.09i
,01
•5
Ul 1
.0l7
. 92
36
2.l
OH
12.2
0 0
00
19
A19
.l-16
ll
U.00
1
2.l
i'.9
n.2
6
U.00
-IU
.7lS
.9S3
.99
SUS.
SJ3 .
.. K9.
7K
l.ll
l.16
1A06
.15
61'
),63
6,62
.. ,H
6
1.l
l2.0
J9.2
5 15
. 55
l.2
1B
9
19,<
Ml.C
HiC
U5
l9,U
3.S
Ul.
12
11.3
03.9
91.1
2 l.
19
... 0
)711
5 ll
.IS
l.11
0.60
)7
.199
.207
.l6
l.ll
l.79
2.22
5
.lll
MJl
lU
46
.0)5
.lll
.72
I 7.6
Jl.2
67.6
l U
,Sll
.17
1.12
66
.100
.907
.38
29.1
2l.2
51.l
2 6.
519.
913.
03
959.
601.
•3
7.62
U.O
UU
OU
ll.lll
.6l7
0J
1.29
1 • .0
1.0
) 9
4',1
12
.91
I IJ
A.0
7.lJ
M 61
..
. 162
.011
n
l.l0
0.l
.. R
.69X
h
!'7
... 7
.292
.031
0.0
0
00
0
00
0
17
0.0
00
00
82
.712
.65
0
.00
61
.52
UU
.71
0.0
0 0
00
00
0
370.
000.
00
50.9
54.1 )
1
0.0
0 U.
00
0
00
6
0.W
.ll2
A9
(6
2.61
2.3'
7.J
ll
61.l
lHIK
.12
0.0
0
0.0
0
21.0
67.l
l6•9
JO
O • .U
.U.lO
UO
0
. 00
lll.
l27
.DU
9
t:•b
lbh
C.J
P
aic
:6

DISTRJCT SCHOOL BOARD OF DUVAL COUNTY RECONCILIATION OF THE STATEMENT OF REVENUES, EXPENDITURES, AND CHANGES IN FUND BALANCES OF GOVERNMENTAL FUNDS TO THE GOVERNMENT-WIDE STATEMENT OF ACTIVITIES For the Fiscal Year Ended June 30, 2010
Amounts reported for governmental activities in the statement of activities are different because:
Net Change in Fund Balances - Governmental Funds
Capital outlays are reported in the governmental funds as expenditures. However, in the statement of activities, the cost of those assets is allocated over their estimated useful lives as depreciation expense. This is the amount of capital outlays in excess of depreciation expense in the current period.
Other Post Employment Benefits liabilities, which are long-term, are not due and payable in the current period and therefore are not reported in the funds.
Capital assets donated to the District increase net assets in the government-wide financial statements, but are not financial resources and, therefore, are not reported in the governmental funds.
The loss on disposal of capital assets during the current period is reported in the statement of activities. In the governmental funds, the cost of these assets was recognized as an expenditure in the year purchased. Thus, the change in net assets differs from the change in fund balances by the undepreciated cost of the disposed assets.
Repayment of long-term debt is an expenditure in the governmental funds, but the repayment reduces long-term liabilities in the statement of net assets. This is the amount of long-term debt that was repaid in the current period.
Governmental funds report the effect of premiums, discounts, and similar items in the year debt is issued, but these amounts are deferred and amortized over the life of the debt in the statement of activities.
In the statement of activities, the cost of compensated absences is measured by the amounts earned during the year, while in the governmental funds expenditures are recognized based on the amounts actually paid for leave used. This is the net amount of vacation and sick leave earned in excess of the amount paid in the current period.
Internal service funds are used by management to charge the cost of certain activities to individual funds. The net revenue of internal service funds is reported with governmental activities.
Change in Net Assets of Governmental Activities
The notes to the basic financial statements are an integral part of this statement.
Exhibit C-4 Page 7
$ 21,067,326
29,118,879
(9, I 08,000)
105,715
(489,214)
(60,703,565)
1,214,277
4,889,616
2,049,882
$ ( I 1,855,084)

.. II :.

s 0
!!888888888 cicioociddciciO

8888888 OOOoddci
8888888 OOOOOOC)
888 8 0 ci d ci
8888 dcidei
8888888 8888 0000000 i::toeici
8888888 8888 Oc::ioocioci CIOOO
8888888 dcidcidt:iO
8888888 ei d t:i d eidd
88 8 8888 dciei c:i cidci
8888888 eioocooo
8888888 cicidddciO
888888 8 ciOddciOd
8888888 oOeidoO :)
8888888 8888888 0000000 0000000
8888888 oddddcic"
8 ..
8 0
8 0
8888 OOOo
888888 0 d::;) 0 d ci
888888 ciOOddci

DIS
TR
ICT
SC
HO
OL
BO
AR
D O
F D
UV
AL
CO
UN
TY
S
TA
TE
ME
NT
OF
FID
UC
IAR
Y N
ET
AS
SE
TS
F
IDU
CIA
RY
FU
ND
S
Jun
e 30
, 201
0
AS
SE
TS
C
ash
and
Cas
h E
qui
vale
nts
Inve
stm
ents
A
ccou
nts
Rec
eiva
ble,
Net
In
tere
st R
ecei
vabl
e D
ue f
rom
Oth
er F
unds
-Bud
geta
ry
Inve
ntor
y D
ue f
rom
Oth
er A
genc
ies
Tot1
1I A
sset
s L
IAB
ILIT
IES
S
alar
ies,
Ben
efit
s an
d Pa
yrol
l Tax
es P
avab
le
Pay
roll
Ded
ucti
ons
and
Wit
hhol
ding
s A
ccou
nts
Pay
able
D
ue to
Oth
er A
Acn
cics
D
ue to
Oth
er F
unds
-Bud
geta
ry
Int e
rnal
Acc
ount
s P
ayab
le
To
till
Li1
1bili
tics
NE
T A
SS
ET
S
Ass
ets
Hel
d in
Tru
st f
or
Pen
sion
Ben
efit
s A
sset
s H
eld
in T
rust
for
Sch
olar
ship
s an
d O
ther
Pur
pose
s T
otal
Net
Ass
ets
Acc
ount
N
umbe
r
1110
11
60
1130
11
70
114
1 11
50
12
20
211
0 2
170
212
0 22
30
2161
22
90
The
acc
ompa
nyin
g no
tes
to f
inan
cial
sta
tem
ents
nrc
an
inte
gral
par
t of t
his
stat
emen
t. E
SE
145
Tot
al
Inve
stm
ent
Tru
st F
unds
84
X
0.00
0.
00
0.00
0.
00
0.00
0.00
0.
00
0.00
0.
00
0.0
0 0.
00
0.00
0.
00
0.00
0.00
0.
00
0.00
Tot
al
Tot
al
Priv
ate-
Pur
pose
Pe
nsio
n T
rust
Fun
ds
Tru
st F
unds
85
X
87X
344,
962.
12
0.00
0.
00
0.00
0.
00
~
'
0.00
34
4,96
2.12
0.00
0.
00
0.00
0.
00
0.00
0.
00
0.00
0.00
34
4,96
2.12
344,
962.
12
0.00
0.
00
0.00
0.
00
0.00
0.00
0.
00
0.00
0.
00
0.00
0.
00
0.00
0.
00
0.00
Tot
al
Ex
hibi
t C-8
P
age
11
Age
ncy
Fun
ds
89X
6,64
2,7
18. 9
6
333,
098.
05
0.00
0.
00
0.00
0.
00
0.00
6,
975,
817
.01
0.0
0 0.
00
16,6
64.8
4
a~~
0.00
6,
959,
152
.17
6,97
5,8
17.0
1
0.00. 0.00 ~ "'' ~~ ~ ~ "
'
0.00
1~
" ·~
-~

DIS
TR
ICT
SC
HO
OL
BO
AR
D O
F D
UV
AL
CO
UN
TY
S
TA
TE
ME
NT
OF
CH
AN
GE
S I
N F
IDU
CIA
RY
NE
T A
SS
ET
S
FID
UC
IAR
Y F
UN
DS
F
or
the
Fis
cal Y
eu
En
ded
Ju
ne
30, 2
010
AD
DIT
ION
S
Com
rib11
1io1
1s:
Em
ploy
er
Plan
Mem
bers
G
ifis
, G
rant
s an
d B
eque
sts
/11ve
s1me
111
Ear
ning
s:
Inte
rest
G
ain
on S
ale
of
Inve
stm
ents
N
et I
ncre
ase
(Dec
reas
e) in
lhe
Fui
r Val
ue o
f In
vest
men
ts
Tot
al I
nve
stm
ent
Eam
inJ!
.S
Les
s In
vest
men
t Exp
ense
N
et I
nves
tmen
t E
arni
ngs
To
tal
Add
itio
ns
DE
DU
CT
ION
S
Sal
arie
s E
mpl
oyee
Ben
efit
s P
urch
ased
Ser
vice
s O
ther
Exp
ense
s R
efun
ds o
f Con
trib
utio
ns
Adm
inis
trat
ive
Exp
ense
s T
ota
l D
educ
tion
s C
b11n
ge l
o N
et A
sset
s
Net
Ass
ets
-J u
lv I
. 200
9 N
et A
sset
s -
June
30,
20
10
Acc
ount
N
umbe
r
3440
3431
34
32
3433
100
200
300
700
2885
27
85
The
acc
ompa
nyin
g no
tes
to f
inan
cial
sta
tem
ents
are
an
inte
gral
par
t of t
his
stat
emen
t. E
SE
145
Tot
al
Tot
al
Inve
stm
ent
Private~
Purp
ose
Tru
st F
unds
T
rust
Fun
ds
84X
85
X
0.0
0 0
.00
0.0
0 0.
00
0.00
0
.00
0.0
0 9,
418
.25
0.0
0
0.0
0 0.
00
0.00
0.
00
9,4
18.2
5 0.
00
0.00
0.
00
9,41
8.2
5 0.
00
9,41
8.25
0.0
0 0.
00
0.0
0 0.
00
0.0
0 0.
00
0.00
12
3,56
0.00
0
.00
0
.00
0.0
0 0
.00
0.0
0
123
,560
.00
0.0
0
(114
,141
.75)
0.00
45
9,10
3.87
0.
00
344,
962.
12
Tot
al
Pen
sion
T
rust
Fun
ds
87X
0.00
0.
00
0.00
0.00
0.
00
0.0
0 0
. 00
0
.00
0.
00
0.00
0.00
0.
00
0.0
0 0.
00
0.0
0 0
.00
0.0
0
0.00
0.00
0.
00
Exh
ibit
C-9
P1
1gc
12

DISTRICT SCHOOL BOARD OF DUVAL COUNTY COMBINING STAT EM ENT OF NET ASSETS MAJOR AND NONMAJOR COMPONENT UNITS J une JO, 2010
ASSETS C:uh "'1d Co.sh Equivalents Invescments Tax~ Receivable, Net Accounts Receivable. Ne1 lntercst Receivable Due from Rcinsurer IJ.-nnsits Receivable Due from Other ARencics Jnrcmal BaJanc-es Jnvcn1orv Pr<Paid ltems Rr.s1ric1eJ Antis:
C:uh wnh focal A•ent Dcfcrrrd Charges:
Issuance Costs Nnnc11rrent AsJcfl.'
Other Pos1-emolovmen1 Benefits Obli c:auon (ilSseO Capila/ A1sc11:
Land • Land lmorovcments - Nondeorcci:i.ble
Construction in Progress lmorovemcnts Other Thnn BuildinRS
Less Accumulated Depreciation Buildina:s and Fixed Eouioment
less Accumulated Depreciation Furniture. Fixtures and Eouioment
Less Accumulated Dcoreci3rion Mo I or V chicles
Less Accumulated Deoreciarion Property Under C30ital Leases
Less Accumulated Dcorcciarion Audio Visual Mllterials
Less Accumularcd Depreciation Comouter Software
Less Accumulated Arnoniz.arion Tow Caoitol Assets net of Accum. Deo'n
Total Asnts LIABILITIES AND NET ASSETS LIABILITIES Sa.lnries ""d Wa•es Pavoble Payroll Deductions and Withholdinxs AccoWlts Payable J ud•ments Povoble Construction Contf3Cts Payable Construction Contracts Retainaac Pavable Due to Fiscal Ast;ent Accrued Interest Pavable Deoosits P3vable Due to Other Agencies Soles Tax Pavoble Deferred Revenue Estimated Unoaid Claims Estim3ted Li3bilitv for Claims Adiusrment Estimated Liabili ty for Arbitrage Rebate Nmrc11rnnt 1.iabilities:
/'onion /)11e Willrin 011e Year: Section 1011.13. F.S .• Notes Payable Notes Pavable Obli•ations Under Capitol Leases Bonds Pavable Liabi litv for Comoensated Absences Certificates of Participation P:iyabte Estimated lio.b1litv for Loni:?.-Term Clajms Other Post-emplovmc:nl DcnefilS Oblii::uion Estimated PECO Advance Poyable
Estimated Liabilitv for Arbitr.t•e Rebate Ponion Due After One Year
Notes Payable Obli l!alions Under C:ioiral Leases Bonds Pavable Liability for Comoens.lled Absences Cenificares of Parricioarion P:iv:JbJe EslimAted Liability for Lon~· Term Cloints Other Post-<.mployment Benefits Obhl!:trion Estimated PECO Adv,,,ce Povoble Estimated Li;ibilitv for Arbitrage Reh.lie
Total LlabiUtits NET ASSETS Invested m Caoit:tl Assets, Net of Related Debt lks1ric11:J For.
Cat .. orical Carryover Proyrams Food Service Debt Service C•oual Proiccts Other Pul)>OseS
Unrcstric1ed Total Net Assets Toral Liabilities nnd Net Asset.s
Account Number
1110 1160 1120 llJO 1170 1180 1210 1220
11 50 1230
1114
1410
1310 1315 1360 1320 1329 1330 1339 1340 1349 1350 1359 1370 1379 1381 1388 1382 1389
2110 2170 2120 2130 2140 2150 2240 2210 2220 2230 2260 2410 2271 2272 2280
2250 2310 2315 2320 2330 2340 2350 2360 2370 2280
2310 2315 2320 2330 2340 2350 ! 360 2370 2280
2770
2780 2780 2780 2780 2780 2790
The accomp:mymg notes to financial statements Me an mlegral part ofthiJ Sl31tmtnl. ESE 145
Major Component Unit
Name
0.00 0.00 0.00 0.00 0.00 0.00 0.00 0.00 0.00 QOO
0.00
0.00
o.oo
0.00
0.00 0.00 0.00 0.00 0.00 0.00 0.00 0.00 0.00 0.00 0.00 0.00 0.00 0.00 0.00 0.00 0.00 0.00 0.00
0.00 0.00 0.00 0.00 0.00 0.00 0.00 0.00 0.00 0.00 0.00 0.00 0.00 0.00 0 .00
0.00 0.00 0.00 0.00 0.00 0.00 0 .00 0.00 o.oo 0.00
0.00 000 0,00 0.00 0.00 0.00 0 .00 0.00 0.00 0.00
0.00
0.00 0.00 0.00 0.00 0.00 0.00 0.00 0.00
Major Tolal Nonm•Jor Componfnl Unit Componrnl
Name Uni ls
0.00 1.227.602.97 0.00 0.00 0.00 0.00 0.00 86.454.80 0.00 0.00 0.00 0.00 0.00 0.00 0.00 25,37J.45 0.00 0.00 0.00 0.00 0.00 7.199 63
0.00 0.00
0.00 0.00
0.00 0.00
0.00 0.00 0.00 0.00 0.00 0 .00 0.00 282.613,00 0.00 [39.587. U) 0.00 1.645.623.33 0.00 (267.680.77) 0.00 908.776. 13 0.00 1484.696.90) 0.00 125.17 1.27 0.00 (98,619.32) 0.00 8,539.00 0.00 (5. 124.00 0.00 0 .00 0.00 0.00 0.00 83.391.28 0.00 (75.017.00) 0.00 2.083.388.87 0.00 3,430,019.72
000 20.000.00 0.00 19.130.80 0.00 237,875.99 0.00 0.00 0.00 0.00 0.00 0.00 0.00 0.00 0.00 0.00 0.00 0.00 0.00 0.00 0.00 0.00 0.00 48.260.31 0.00 0.00 0.00 0.00 0.00 0 .00
0.00 0.00 0.00 0.00 0.00 0.00 0.00 0.00 0.00 0.00 0.00 0.00 0.00 0.00 0.00 0 .00 0.00 0.00 0.00 0.00
0.00 48.200.00 0.00 2.564.00 0.00 0.00 0.00 0.00 0.00 0.00 0 .00 0.00 0.00 0.00 0.00 0.00 0.00 0.00 0.00 376.03 1.10
0,00 l .93S.l89. 16
0.00 0.00 0.00 0.00 0.00 0.00 0.00 522,093.93 0.00 531.l79.96 000 64.725.57 0.00 J.053.988.62
0.00 3.4JO.Ol 9. 72
Total Component
Units
1.227,602.97 0.00 0.00
86.454.80 0.00 0.00 0.00
25.373.45 0.00 0.00
7.199.63
0.00
0.00
0.00
0.00 0.00 0.00
282.613.00 (39.587. 15
1.645,623.33 (267.680. 111 908.776.13
(484.696.90) 125.17127 (98.619.32
8.539.00 (5, 124.00)
0.00 0.00
83,391.28 (75,017.00)
2.083,388.87 3.430,0 19.72
20.000.00 19.130.80
237.875.99 0.00
• 0.00
0.00 0.00 0.00 0.00 0.00 0.00
48.260.3 I 0.00 000 0.00
0.00 0.00 0.00 0.00 000 0.00 0.00 0.00 0.00 0.00
48.200.00 2.564.00
0.00 0 .00 0.00 0.00 0.00 0.00 0.00
376,031.10
1.935.589. 16
0.00 000 0.00
522.093 9) 53 1.579.96
64.725. 57 J.053.988.62 l.~30.0 19.72
Exhibit C· 10 Page IJ

DIS
TR
ICT
SC
HO
OL
BO
AR
D O
F D
UV
AL
CO
UN
TY
C
OM
BIN
ING
ST
AT
EM
EN
T O
F A
Cl'
IVIT
IES
(C
ON
TIN
UE
D)
MA
JO
R A
ND
NO
NM
AJ
OR
CO
MP
ON
EN
T U
NIT
S
Maj
or
Co
mp
one
nt U
nit
Nam
e F
or
the
Fis
cal Y
e11r
End
ed J
un
e 30
, 20
10
FU
NC
TIO
NS
Co
111p
o11e
n1 U
11il
Ac1
ivi1
ies:
In
stru
ctio
n Pu
pil
Per
sonn
el S
ervi
ces
Inst
ruct
iona
l Med
ia S
ervi
ces
Inst
ruct
ion
and
Cur
ricu
lum
Dev
elop
men
t Ser
vice
s In
stru
ctio
nal S
taff
Tra
inin
g S
ervi
ces
Inst
ruct
ion
Rel
ated
Tec
hno
logy
S
choo
l B
oard
G
ener
al A
dmin
istr
atio
n S
choo
l A
dmin
istr
atio
n F
acil
itie
s A
cqui
siti
on a
nd C
onst
ruct
ion
Fisc
al S
ervi
ces
Food
Ser
vice
s C
entr
al S
erv
ices
P
upil
Tra
nspo
na1i
on S
erv
ices
O
pera
tion
of P
lant
M
aint
enan
ce o
f Pla
nt
Adm
inis
trat
ive
Tec
hnol
Ob'
Y S
ervi
ces
Com
mun
ity S
ervi
ces
Inte
rest
on
Long
-ter
m D
ebt
Una
lloc
ated
Dep
reci
atio
n/ A
mor
tiza
tion
Exp
ense
• T
ota
l Com
pon
ent
Uni
t A
ctiv
itie
s
Pro
l!.l".
lm R
even
ues
Op
era
tin
g C
apit
al
Acc
oun
t C
harg
es f
or
Gra
nts
and
Gra
nts
and
Num
ber
Exp
ense
s S
ervi
ces
Co
ntr
ibut
ion
s C
ontr
ibut
ions
5000
0.
00
0.0
0
610
0 0.
00
0.00
62
00
0.00
0.
00
6300
0.
00
0.00
64
00
0.00
0.
00
6500
0
. 00
0
.00
710
0 0.
00
0.00
-
• I
..
7200
0.
00
••• ,
7300
0.
00
.......
7400
0.
00 -~
·----
7500
a.
Clill
• ltwm1•~
7600
...
. a. ll
'll•
• •o
.oo
7700
-•
I.It
1--. ~ 0
.00
7800
•1
.11
• r
~ -
o.oo
7900
1 n
1u
a• '
O.oo
8
100
,, ... -
0.0
0
8200
0
.00
9
100
0.0
0
9200
0
.00
0
.00
0.0
0
Gen
er11I
Rev
enue
s:
Ta:;c
es:
Prop
erty
Tax
es, L
evie
d fo
r O
pera
tion
al P
urpo
ses
Prop
erty
Tax
es, L
evie
d fo
r D
ebt S
ervi
ce
Prop
erty
Tax
es,
Levi
ed fo
r C
apita
l P
roje
cts
Loca
l Sal
es T
axes
0.00
0.
00
0.0
0 0
.00
0.00
0.00
Gra
nts
and
Con
trib
utio
ns N
ot R
estr
icte
d to
Spe
cifi
c P
rogr
ams
Inve
stm
ent E
arn
ings
M
isce
llane
ous
Spe
cial
Ite
ms
Ext
raor
dina
ry h
ems
Tra
nsfe
rs
Tot
11I G
ener
al R
even
ues
, Sp
ecia
l It
ems,
Ext
rao
rdin
ary
Ite
ms,
and
Tra
nsf
ers
Cha
nge
in N
et A
sset
s
Net
Ass
ets
-Ju
ly I
, 200
9 N
et A
sset
s· J
une
30, 2
0 JO
0.0
0
0.0
0
0.00
0.
00
0.00
-·
••o.o
o o.o
o _
_ oo
i..
1ia•
D
I f
t .oo
I
I r.
•L •
ft
l.
ll'.0
0
I,
....
I
-0
.00
._ ... •
0.
00
-U
.00
0
.00
0
.00
0.
00
0.0
0
0.0
0
0.00
0.
00
0
.00
0.0
0 0
.00
0.00
0
.00
0.00
0
.00
0.0
0 0
.00
0.0
0 0
.00
0.00
0
.00
0.00
~I
»!!
~
0.0
0
0.0
0
•Thi
s am
ount
exc
lude
s th
e de
pr~'
Ciat
ion/
arno
rtiz
atio
n th
at i
s in
clud
ed in
the
dire
ct e
xpen
ses
of t
he v
ario
us f
unct
ions
.
The
: acc
ompa
nyin
g no
tes
to f
inan
cial
sla
tcm
ents
arc
an
inte
gral
par
t of t
his
sta
tem
ent.
ES
E 1
45
Exh
ibit
C-1
Ill
Pai
:c 1
4
Net
(E
xpen
se)
Rev
enue
and
Ch
ange
s in
Net
Ass
ets
Com
pone
nt U
nit
Act
ivit
ies
0.0
0 0.
00
0.00
0
. 00
0.
00
0.00
0.
00
0.00
0.
00
0.0
0 0
.00
0.0
0
0.00
0.
00
0.0
0
0.0
0
0.00
0.
00
0.00
0.
00
0.0
0
0.0
0
0.00
0.
00
0
.00
0.
00
0.00
0.
00
0.00
0.
00
0.00
0
.00
0.
00
0.00
0.
00

DIS
TR
ICT
SC
HO
OL
BO
AIU
> O
F D
UV
AL
CO
UN
TY
C
OM
BIN
ING
ST
AT
EM
EN
T O
F A
CT
IVIT
IES
(CO
NT
INU
ED
) M
AJO
R A
ND
NO
NM
AJO
R C
OM
PO
NE
NT
UN
ITS
l\
llll
jor C
omp
on
cnl
Uni
t N>
1mc
Fo
r th
e F
isca
l Y
eu
En
ded
Ju
ne
30, 2
010
FU
NC
TIO
NS
Co
111p
o11e
111 U
ni/ A
c1iv
i1ie
s:
Inst
ruct
ion
Pup
il P
erso
nnel
Ser
vice
s
Acc
ount
C
harg
es f
or
Nu
mb
er
Exp
ense
s S
ervi
ces
5000
0.
00
610
0 0.
00
Pro
e:ra
m R
even
ues
Ope
rati
ng
Cap
ital
G
rant
s an
d
Gra
nts
1m
d C
ontr
ibut
ions
C
ont
ribu
tion
s
0.00
0
. 00
..
0.00
0.
00
0.00
••
• 0.
00
Inst
ruct
iona
l Med
ia S
ervi
ces
6200
0.
00
0.00
~ -
u.1
0.00
In
stru
ctio
n an
d C
urric
ulum
Dev
elop
men
t S
ervi
ces
Inst
ruct
iona
l S
tafT
Tra
inin
g S
ervi
ces
Inst
ruct
ion
Rel
ated
Tec
hnol
ogy
Sch
ool
Boa
rd
Gen
eral
Adm
inis
trat
ion
Sch
ool
Adm
inis
trat
ion
Fac
ilit
ies
Acq
uisi
tion
and
Con
stru
ctio
n Fi
scal
Ser
vice
s Fo
od S
ervi
ces
Cen
tral
Ser
vice
s P
upil
Tra
nsoo
rtat
ion
Ser
vice
s O
pera
tion
of
Pla
nt
Mai
nten
ance
of P
lant
A
dmin
istr
ativ
e T
echn
olog
y S
ervi
ces
Com
mun
ity S
ervi
ces
Inte
rest
on
Long
-ter
rn D
ebt
Una
lloc
ated
Dep
reci
atio
n/A
mor
tiza
tion
Exo
cnse
• T
ota
l Com
pone
nt U
nit A
ctiv
itie
s
6300
0.
00
0.00
_ ..
6400
0
.00
0.
00 .a
11
1
6500
0.
00
:\~
7100
0.
00
;: ii
74
00
--
•••
7500
,,
.,..
Ill
: I
,...
0.00
7600
..
• 1
...
l 77
00
I 1
11
11
"'
0.00
78
00
· ·-0.
00
7900
0
.00
810
0 0
.00
82
00
0.0
0
910
0 0.
00
9200
0.
00
0.0
0 ~
0.00
Gen
eral
Rev
enue
s:
Taxe
s:
Pro
pert
y T
axes
, Lev
ied
for O
pera
tion
al P
urpo
ses
Prop
erty
Tax
es,
Lev
ied
for
Deb
t Ser
vice
P
rope
rty
Tax
es, L
evie
d fo
r Cap
ital
Pro
ject
s L
ocal
Sal
es T
axes
0.00
0.
00
0.00
0.
00
0.0
0 0.
00
0.0
0 0.
00
~~
0.00
Gra
nts
and
Con
trib
utio
ns N
ot R
estr
icte
d to
Spe
cifi
c P
rogr
ams
Inve
stm
ent E
arni
ngs
Mis
cell
aneo
us
Spec
ial
Item
s E
xtra
ordi
nary
Ite
ms
Tnm
sfcr
s T
ola
l Gen
eral
Rev
enue
s, S
pedl
ll I
tem
s, E
xlra
ord
inar
y I
tem
s, a
nd T
rans
fers
C
han
ge in
Net
Ass
els
Net
Ass
ets
-Ju
ly I
, 200
9 N
et A
sset
s -
June
30,
20
I 0
•Thi
s am
ounl
exc
lude
s th
e de
prec
iati
on/a
mor
tiza
tion
that
is i
nclu
ded
in t
he d
irec
t exp
ense
s o
f the
var
ious
fun
ctio
ns.
The
acc
ompa
nyin
g no
tes
to f
inan
cial
sta
tem
ents
arc
an
inte
gral
par
t o
f thi
s st
atem
ent.
E
SE
145
'u; I
ll l
..
.. 0.
00
I .-c
. ~ I..
,,-
0.00
-· Ill
0.0
0
-0.
00
0.0
0
... 0.
00
0.0
0
0.0
0 0
.00
0.
00
0.00
0.
00
0.0
0
0.0
0
0.0
0 0.
00
0.00
0
.00
0.00
0.
00
0.00
0.
00
0.00
0.
00
0.00
0.
00
0.00
0.
00
0.00
~ ~
0.00
0.
00
Exh
ibit
C-1
1 b
P>1e
:e 15
Net
(E
xpe
nse)
R
even
ue a
ud
Cha
nges
in
Net
Ass
ets
Co
mp
one
nt U
nit
Act
ivit
ies
0.0
0 0
.00
0.00
0.
00
0.00
0.
00
0.
00
0.0
0
0.0
0 0.
00
0.00
0.
00
0.00
0.
00
0. 0
0
0.0
0
0.00
0.
00
0.0
0 0.
00
0.0
0
0.0
0 0.
00
0.0
0
0.00
0.
00
0.00
0.
00
0.0
0
0.00
0.
00
0.0
0
0.00
0.00
0
.00

DIS
TR
ICT
SC
HO
OL
BO
AR
D O
F D
UV
AL
CO
UN
TY
C
OM
BIN
ING
ST
AT
EM
EN
T O
F A
CT
IVIT
IES
(C
ON
TIN
UE
D)
MA
JOR
AN
D N
ON
MA
JOR
CO
MP
ON
EN
T U
NIT
S
FU
NC
TIO
NS
C
ompo
nent
Uni
t Act
ivit
ies:
In
stru
ctio
n P
upil
Per
sonn
el S
ervi
ces
Inst
ruct
iona
l M
edia
S.:r
vice
s In
stru
ctio
n an
d C
urri
culu
m D
evel
opm
ent S
ervi
ces
Inst
ruct
iona
l Sta
ITT
rain
ing
Ser
vice
s In
stru
ctio
n R
elat
ed T
echn
olog
y S
choo
l B
oard
G
ener
al A
dmin
istr
atio
n S
choo
l Adm
inis
trat
ion
Fac
ilit
ies
Acq
uisi
tion
and
Con
stru
ctio
n Fi
scal
Ser
vice
s F
ood
Ser
vice
s C
entr
al S
ervi
ces
Puoi
l Tra
nspo
rtat
ion
Ser
vice
s O
pera
tion
of P
lant
M
aint
enan
ce o
f Pla
nt
Adm
inis
trat
ive
Tec
hnol
Ob'
Y S
ervi
ces
Com
mun
ity S
ervi
ces
lntc
n.'S
t on
Lon
i::-te
rm D
ebt
Una
lloc
ated
Dep
reci
atio
n/A
mor
tiza
tion
Exp
ense
• To
t11l
Co
mp
on
ent U
nit
Acl
ivil
ics
Acc
ount
C
harg
es f
or
Nu
mb
er
Exp
ense
s S
ervi
ces
5000
4.
727,
062
.37
610
0 14
9.13
6.68
62
00
66.2
27.6
8 63
00
295.
169.
43
6400
17
5,64
2.0
6
6500
0
.00
7100
65
,084
.24
7200
60
.782
.84
7300
2,
041
,264
.14
7400
62
0,13
1.88
75
00
240,
452
.90
7600
56
7.95
7.98
77
00
39.7
18.6
4 78
00
667.
843.
60
7900
98
7,68
6.58
8
100
268.
223.
40
8200
0.
00
9100
16
2,99
6.95
92
00
20.5
57.8
3 22
9.08
2.7
0 t*~~
11,3
85,0
21.9
0
Gen
erit
l R
even
ues:
Ta
xes:
P
rope
rty
Tax
es, L
evie
d fo
r O
pera
tion
al P
urpo
ses
Pro
pert
y T
axes
, Lev
ied
for
Deb
t Ser
vice
Pr
oper
ty T
axes
, Lev
ied
for
Cap
ital
Pro
ject
s Lo
cal
Sal
es T
axes
0.00
0.
00
0.00
0.
00
0.00
0.
00
0.00
0.
00
0.00
0.
00
0.0
0 3.
880.
00
0. 0
0
0.00
0
.00
0.
00
0.0
0 7.
777.
00
0.00
11.6
57.0
0
Gra
nts
and
Con
trib
utio
ns N
ot R
estr
icte
d to
Sp.
.--ci
fic P
rogr
ams
Inve
stm
ent E
arni
ngs
Mis
cell
aneo
us
Spe
cial
Ite
ms
Ext
raor
dina
ry I
tem
s T
rans
fers
Pro
era
m R
even
ues
Op
erat
ing
G
ran
ts a
nd
C
ontr
ibut
ions
198,
364.
90
7,74
9.40
24
,790
.00
106,
062.
00
34,2
70.1
0 0.
00
0.0
0
0.0
0
2,5
45.0
0 0.
00
0.00
13
2.49
5.59
6,
560.
00
0.00
.
35,1
46.0
0
0.0
0
0.0
0
39,3
85.7
8 0.
00
~""
'"""'
"~ 58
7,36
8.77
Tot1
1I G
ener
al R
even
ues,
Spe
cial
llem
s, E
xlr
aord
inar
y ll
ems,
and
Tra
nsf
ers
Cha
nge
in N
et A
sset
s
Net
Ass
ets
· Ju
ly I
, 200
9 N
et A
sset
s -
June
30,
201
0
"Thi
s am
ount
exc
lude
s th
e de
prec
iati
on/a
mor
tiza
tion
tha
i is
inc
lude
d in
the
dir
ect e
xpen
ses
of t
he v
ario
us f
unct
ions
.
The
acc
ompa
nyin
g no
tes
to f
inan
cial
sta
tem
ents
arc
an
inte
gral
par
t of t
his
stat
emen
t. E
SE
145
Cap
ital
G
ran
ts a
nd
C
ontr
ibu
tion
s
0.00
0.
00
0.0
0 0
.00
0.0
0
0.0
0
0.00
0.
00
0.
00
143,
382.
00
0.0
0 0
.00
0.0
0 0.
00
63,6
15. 0
0
83.4
20.0
0
0.0
0
0.0
0 0
.00
~
290,
417
.00
Exh
ibit
C-1
lc
Pag
e 16
Net
(E
xpen
se)
Rev
enue
an
d C
han
ges
in N
et A
sset
s
Com
pone
nt U
nits
A
ctiv
itie
s
( 4,5
28,6
97.4
7)
(141
.387
28)
(41,
437.
68)
( 189
.107
.43)
(1
41,3
71.9
6)
0.00
(6
5,08
4.2
4)
(60,
782
.84)
(2
.038
,719
.14)
(4
76.7
49.8
8)
(240
,452
.90)
(4
31.5
82.3
9)
(33
, 158
.64)
(6
67,8
43.6
0)
(888
.925
.58)
( 1
84.8
03.4
0)
0.00
(1
15,8
34.1
7 (2
0.55
7 .83
) (2
29,0
82.7
0)
(I 0
.495
,579
.13)
0.00
0
.00
0.00
0.
00
10,9
72.5
79.9
8 0.
00
102,
442.
03
0.00
0.
00
0.00
11
,075
.022
.01
579,
442.
88
2,47
4,54
5.7
4 3,
053,
988.
62

DIS
TR
ICT
SC
HO
OL
BO
AR
D O
F D
UV
AL
CO
UN
TY
C
OM
BIN
ING
ST
AT
EM
EN
T O
F A
Cfl
VIT
IES
M
AJO
R A
ND
NO
NM
AJO
R C
OM
PO
NE
NT
UN
ITS
FUN
CI"
ION
S C
o111p
o11e
111 U
11i1
Act
i\•iti
es:
Inst
ruct
ion
Pupi
l Per
sonn
el S
ervi
ces
Inst
ruct
iona
l Med
ia S
ervi
ces
Inst
ruct
ion
and
Cur
ricu
lum
Dev
elop
men
t Ser
vice
s In
stru
ctio
nal S
taff
Tra
inin
g Se
rvic
es
Inst
ruct
ion
Rel
ated
Tec
hnol
ogy
Scho
ol B
oard
G
ener
al A
dmin
istr
atio
n Sc
hool
Adm
inis
trat
ion
Faci
litie
s A
coui
sitio
n an
d C
onst
ruct
ion
Fisc
al S
ervi
ces
Food
Ser
vic
es
Cen
tral
Serv
ices
Pu
pil T
rans
port
atio
n Se
rvic
es
Ope
ratio
n o
f Pla
nt
Mai
nten
ance
of P
lant
A
dmin
istr
ativ
e T
cchn
olol
!Y S
ervi
ces
Com
mun
itv S
erv
ices
In
tere
st o
n L
ong-
tenn
Deb
t U
nallo
cate
d D
epre
ciat
ion/
Am
ortiz
atio
n E
xpen
se•
Tot
al C
om
pone
nt U
nit A
ctiv
itie
s
Acc
oun
t C
harg
es f
or
Num
ber
Exp
ense
s Se
rvic
es
5000
4,
727,
062.
37
610
0 14
9,13
6.68
62
00
66,2
27.6
8 63
00
295,
169.
43
6400
17
5,64
2.06
65
00
0.00
71
00
65,0
84.2
4 72
00
60,7
82.8
4 73
00
2,04
1,26
4.14
74
00
620,
131.
88
7500
24
0,45
2.9
0 76
00
567,
957.
98
7700
39
,718
.64
7800
66
7,84
3.6
0 79
00
987,
686.
58
8100
26
8,2
23.4
0 82
00
0.00
91
00
162,
996.
95
9200
20
,557
.83
229,
082.
70 ~
11,3
85,0
21.9
0
Gen
eral
Rev
enu
es:
Taxe
s:
Prop
erty
Tax
es, L
evie
d fo
r O
pera
tiona
l Pur
pose
s Pr
oper
ty T
axes
, Lev
ied
for
Deb
t Ser
vic
e Pr
oper
ty T
axes
, Lev
ied
for
Cap
ital
Proj
ects
L
ocal
Sal
es T
axes
0.00
0.
00
0.00
0.
00
0.00
0.
00
0.00
0.
00
0.00
0.
00
0.00
3,
880.
00
0.00
0.
00
0.00
0.
00
0.00
7,
777.
00
0.00
11,6
57.0
0
Gra
nts
and
Con
trib
utio
ns N
ot R
estri
cted
to S
peci
fic
Prog
ram
s In
vest
men
t Ear
ning
s M
isce
llane
ous
Spe
cial
Item
s E
xtra
ordi
nary
Ite
ms
Tra
nsfe
rs
Pro
2ram
Rev
enue
s O
pera
ting
Gra
nts
and
Co
ntri
buti
ons
198,
364.
90
7,74
9.40
24
,790
.00
106,
062.
00
34,2
70. 1
0 0.
00
0.00
0.
00
2,54
5.00
0.
00
0.00
13
2,49
5.59
6,
560.
00
0.00
35
,146
.00
0.00
0.
00
39,3
85.7
8 0.
00
• 58
7,36
8.77
To
tal G
ener
al R
even
ues,
Spe
cial
Ite
ms,
Ext
rao
rdin
ary
Item
s, a
nd T
rans
fers
C
hang
e in
Net
Ass
ets
Net
Ass
ets
-Ju
ly I
, 200
9 N
et A
sset
s -J
une
30, 2
0 I 0
•Thi
s an
1oun
t exc
lude
s th
e de
prec
iati
on/a
mor
tiwtio
n th
at is
inc
lude
d in
the
dire
ct e
xpen
ses
of t
he v
ario
us f
unct
ions
.
The
acc
ompa
nyin
g no
tes
to l
inan
cial
stat
emen
ts a
rc a
n in
tegr
al p
art o
f thi
s st
atem
ent.
ESE
145
Cap
ital
G
rant
s an
d C
ontr
ibut
ions
0.00
0.
00
0.00
0.
00
0.00
0.
00
0.00
0.
00
0.00
14
3,38
2.00
0.
00
0.00
0.
00
0.00
63
,615
.00
83,4
20.0
0 0.
00
0.00
0.
00
~
290,
417
.00
Exh
ibit
C-1
Id
Page
17
Net
(E
xpen
se)
Rev
enue
an
d C
hang
es
in N
et A
sset
s T
otal
C
om
pone
nt U
nits
A
ctiv
ities
( 4,5
28,6
97.4
7)
(14
1,38
7.28
) (4
1,43
7.68
) (1
89,1
07.4
3)
(14
1,37
1.96
) 0.
00
( 65,
084
.24)
(6
0,78
2.84
) (2
,038
,719
.14)
(4
76,7
49.8
8)
(240
,452
.90)
( 4
31,
582.
39)
(33,
158
.64)
(6
67,8
43.6
0)
(888
,925
.58)
( 1
84,8
03.4
0)
0.00
(1
15,8
34.1
7)
(20,
557
.83)
(2
29 ,0
82. 7
0)
(10
,495
,579
.13)
0.00
0.
00
0.00
0.
00
10,9
72,5
79.9
8 0.
00
102,
442.
03
0.00
0.
00
0.00
11
, 075
,022
.01
579,
442.
88
2,47
4,54
5.74
3,
053,
988.
62

D U V A L C O U N T Y P U B L I C S C H O O L S N O T E S T O T H E B A S I C F I N A N C I A L S T A T E M E N T S
F O R T H E F I S C A L Y E A R E N D E D J U N E 3 0 , 2 0 1 0
1. SUMMARY OF SIGNIFICANT ACCOUNTING POLICIES
The Duval County School Board (the Board) has direct responsibility for operation,
control, and supervision of District schools and is considered a primary government for
financial reporting. The Duval County School District (the District) is considered part of
the Florida system of public education. The governing body of the District is the School
Board which is comprised of seven elected members. The appointed Superintendent of
Schools is the executive officer of the Board. Geographic boundaries of the District
correspond with those of Duval County.
Reporting Entity
Criteria for determining if other entities are potential component units which should be
reported within the District's basic financial statements are identified and described in the
Governmental Accounting Standards Board's (GASB) Codification of Governmental
Accounting and Financial Reporting Standards, Sections 2100 and 2600. The
application of these criteria provides for identification of any entities for which the
District is financially accountable and other organizations for which the nature and
significance of their relationship with the Board are such that exclusion would cause the
District's basic financial statements to be misleading or incomplete.
Based on the application of these criteria, the following component units are included
within the District's reporting entity:
• Blended Component Unit
•
– The Duval School Board Leasing Corporation was
formed to facilitate financing for the acquisition of facilities and equipment as further
discussed in Note 6. Due to the substantive economic relationship between the
District and the Leasing Corporation, the financial activities of the Leasing
Corporation are included in the accompanying basic financial statements. Separate
financial statements for the Leasing Corporation are not published.
Discretely Presented Component Unit – The component units columns in the basic
financial statements, include the financial data of the District's other component units.
These component units consist of five of the seven District charter schools: Global
Community Outreach Academy; Florida School for Integrated Academics and

DUVAL COUNTY PUBLIC SCHOOLS NOTES TO THE BASIC FINANCIAL STATEMENTS FOR THE FISCAL YEAR ENDED JUNE 30, 2010
Technologies Jacksonville, Inc.; River City Science Academy; S.O.C.K. Outstanding
Students (S.O.S) Academy, Inc.; and Wayman Academy of the Arts, Inc.
The District considered Pathways Academy charter school operated by Florida
State College at Jacksonville for inclusion in its reporting entity; however, because
Pathways Academy is an operating component of the College and is not a separate
legal entity, it does not meet the criteria for inclusion as a component unit of the
District. The second charter school, Tiger Academy has been determined to be a
component unit of the Young Men’s Christian Association (YMCA) as the YMCA
provides a majority of the school’s funding and support.
The Charter Schools are separate not-for-profit corporations organized pursuant to
Chapter 617, Florida Statutes, the Florida Not For Profit Corporation Act, and
Section 1002.33, Florida Statutes, Charter Schools. The Charter Schools operate
under charters approved by their sponsor, the District. The financial information
disclosed in the Other Supplemental Information section is taken from the year-end
financial statements of the five qualified component unit charter schools.
Basis of Presentation
Government-wide Financial Statements
Government-wide financial statements are prepared using the economic resources
measurement focus. The statement of activities presents a comparison between direct
expenses and program revenues for each function or program of the District’s
governmental activities. Direct expenses are those that are specifically associated with a
service, program, or department and are thereby clearly identifiable to a particular
function. Depreciation expenses are allocated to the various expense functions based on
actual and estimated usage of the assets in those functions.
- Government-wide financial statements,
including the statement of net assets and the statement of activities, present information
about the District as a whole. These statements include the nonfiduciary financial
activity of the primary government and its component units.
Program revenues include charges paid by the recipient of the goods or services offered
by the program, and grants and contributions that are restricted to meeting the operational
EXHIBIT D PAGE 18-B

DUVAL COUNTY PUBLIC SCHOOLS NOTES TO THE BASIC FINANCIAL STATEMENTS FOR THE FISCAL YEAR ENDED JUNE 30, 2010
or capital requirements of a particular program. Revenues that are not classified as
program revenues are presented as general revenues. The comparison of direct expenses
with program revenues identifies the extent to which each governmental function is self-
financing or draws from the general revenues of the District.
The effects of interfund activity have been eliminated from the government-wide
financial statements.
Fund Financial Statements
The District reports the following major governmental funds:
- Fund financial statements report detailed information
about the District in the governmental, proprietary, and fiduciary funds. The focus of
governmental fund financial statements is on major funds rather than reporting funds by
type. Each major fund is reported in a separate column. Nonmajor funds are aggregated
and reported in a single column. Because the focus of governmental fund financial
statements differs from the focus of government-wide financial statements, a
reconciliation is presented with each of the governmental fund financial statements.
• General Fund
•
– to account for all financial resources not required to be accounted for
in another fund, and for certain revenues from the State that are legally restricted to
be expended for specific current operating purposes.
Federal Funds – American Recovery and Reinvestment Act (ARRA)
•
– to account for
financial resources related to the Federal Stimulus Funding, for the purpose of
providing accountability for all stimulus dollars spent.
Special Revenue Fund – Food Service
•
– to account for the financial resources related
to the preparation, distribution and sale of breakfast, lunch, and snacks to District
students and personnel as well as accounting for the National School Lunch Program.
Debt Service – Other Debt Service – to account for the accumulation of resources for,
and the payment of, debt principal, interest, and related costs for the District’s
Certificates of Participation (COPs), and Qualified Zone Academy Bonds (QZABs).
EXHIBIT D PAGE 18-C

DUVAL COUNTY PUBLIC SCHOOLS NOTES TO THE BASIC FINANCIAL STATEMENTS FOR THE FISCAL YEAR ENDED JUNE 30, 2010
• ARRA Economic Stimulus Debt Service
•
– to account for the accumulation of
resources for, and the payment of, debt principal, interest, and related costs of
Qualified School Construction Bonds (QSCBs).
Capital Project – Other Capital Projects Fund
•
– to account for the financial resources
received from the lottery capital outlay program, Certificates of Participation proceeds,
and other miscellaneous sources, to be used for educational capital outlay needs,
including new construction, renovation, remodeling, repairs and maintenance
projects.
Capital Projects – Local Capital Improvement Fund
•
– to account for the financial
resources generated by the local capital improvement tax levy to be used for
educational capital outlay needs, including new construction, renovations, and
remodeling projects.
ARRA Economic Stimulus Capital Projects
Additionally, the District reports separately the following proprietary and fiduciary fund
types:
– to account for capital construction and
improvement projects that are related to the specialized capital projects program that
has been allowed through the federal stimulus programs.
• Internal Service Funds
•
– to account for the District's individual workers compensation
and health insurance self-insurance programs and its printing department operations.
Agency Funds
•
– to account for resources of the school internal funds which are used
to administer moneys collected at schools in connection with school, student athletic,
class, and club activities.
Private-Purpose Trust Fund – The District is the trustee, or fiduciary, for assets that belong
to others, for the Robert E. Lee High School Gear Up Scholarships Irrevocable Trust. The
District is responsible for ensuring that the assets reported in these funds are used only for
their intended purposes and by those to whom the assets belong. The District excludes these
activities from the government-wide financial statements because the District cannot use
these assets to finance its operations.
EXHIBIT D PAGE 18-D

DUVAL COUNTY PUBLIC SCHOOLS NOTES TO THE BASIC FINANCIAL STATEMENTS FOR THE FISCAL YEAR ENDED JUNE 30, 2010
Basis of accounting refers to when revenues and expenditures, or expenses, are
recognized in the accounts and reported in the financial statements. Basis of accounting
relates to the timing of the measurements made, regardless of the measurement focus
applied.
Basis of Accounting
The government-wide financial statements are prepared using the accrual basis of
accounting, as are the proprietary funds and fiduciary funds financial statements.
Revenues are recognized when earned and expenses are recognized when a liability is
incurred, regardless of the timing of the related cash flows. Property taxes are recognized
in the year for which they are levied. Revenues from grants, entitlements, and donations
are recognized in the fiscal year in which all eligibility requirements imposed by the
provider have been satisfied.
Governmental fund financial statements are prepared using the modified accrual basis
of accounting. Revenues, except for certain grant revenues, are recognized when they
become measurable and available. Revenues are considered to be available when they
are collectible within the current period or soon enough thereafter to pay liabilities of the
current period. The District considers revenues to be available if they are collected or
collectable within 60 days past of the end of the current fiscal year. When grant terms
provide that the expenditure of resources is the prime factor for determining eligibility for
Federal, State, and other grant resources, revenue is recognized at the time the
expenditure is made. Under the modified accrual basis of accounting, expenditures are
generally recognized when the related fund liability is incurred, except for principal and
interest on long-term debt, claims and judgments, and compensated absences, which are
recognized when due. Allocations of cost, such as depreciation, are not recognized in
governmental funds.
When both restricted and unrestricted resources are available for use, it is the District’s
policy to use restricted resources first, then unrestricted resources as they are needed.
The Internal Service Funds are accounted for as proprietary activities under standards
issued by the Financial Accounting Standards Board through November 1989 and
applicable standards issued by the Governmental Accounting Standards Board.
EXHIBIT D PAGE 18-E

DUVAL COUNTY PUBLIC SCHOOLS NOTES TO THE BASIC FINANCIAL STATEMENTS FOR THE FISCAL YEAR ENDED JUNE 30, 2010
Proprietary funds distinguish operating revenues and expenses from non-operating items.
Operating revenues and expenses generally result from providing services and producing
and delivering goods in connection with the proprietary funds’ principal ongoing
operations. The principal operating revenues of the District’s Internal Service Fund for
self-insurance are charges to the District for health insurance, workers’ compensation,
general liability, and automobile liability insurance premiums. The principal operating
expenses include insurance claims and administrative expenses and fees. The principal
operating revenues and expenses of the District’s Internal Service Fund for printing
department operations are charges to District departments to recover the costs of printing
operations on a cost-reimbursement basis. All revenues and expenses not meeting this
definition are reported as non-operating revenues and expenses.
The charter schools are accounted for as governmental organizations and follow the
same accounting model as the District’s governmental activities.
All district cash bank deposits and Certificates of Deposit are held in qualified public
depositories pursuant to chapter 280, Florida Statutes, the "Florida Security for Public
Deposits Act." Under this Act, the District’s deposits are protected from loss by
applicable deposit insurance, securities pledged as collateral held by the State of Florida,
and the potential assessment against other qualified public depositories for the shared
loss.
Cash and Cash Equivalents
For purposes of the statement of cash flows, cash equivalents consist of amounts
invested in the Goldman Sachs Financial Square Government Institution 465 Money
Market Fund, the State Board of Administration (SBA) Local Government Investment
Pool (the “LGIP”), and the State of Florida’s Special Purpose Investment Account
(“SPIA”).
EXHIBIT D PAGE 18-F

DUVAL COUNTY PUBLIC SCHOOLS NOTES TO THE BASIC FINANCIAL STATEMENTS FOR THE FISCAL YEAR ENDED JUNE 30, 2010
Investments
The District’s investment policy limits investments to the Florida Prime Investment
Pool (PRIME) or similar intergovernmental investment pools, United States Treasury
securities, Obligations of United States Government Agencies and Instrumentalities, SEC
registered money market funds, commercial paper, and interest-bearing time deposits and
bankers’ acceptances.
Investments consist of amounts placed with the State Board of Administration for
participation in the PRIME investment pool created by Section 218.405, Florida Statutes,
State of Florida’s Special Purpose Investment Account (SPIA) authorized in Section
17.61(1), Florida Statutes, and those made locally. The investment pool operates under
investment guidelines established by Section 215.47, Florida Statutes. The District’s
investments in the PRIME are subject to the Securities and Exchange Commission Rule
2a7-like external investment pool, which requires reporting at fair value, which is
amortized cost.
The District’s investment in SPIA is part of an investment pool managed by the
Florida Department of Treasury, where the District owns a share of the pool, not the
underlying shares. The District’s share of the pool is reported at fair value. The District
relies on policies developed by the State Treasury for managing interest and credit risk
for this external investment pool.
The District allocates a pool of cash equivalents, other investment balances, and
related interest income, by Fund, based on the ratio of each Fund’s equity to the District
wide total.
Types and amounts of investments held at fiscal year-end are described in Note 3.
Inventories consist of expendable supplies held for consumption in the course of
District operations. Inventories are stated at cost on the moving weighted-average basis,
except that United States Department of Agriculture surplus commodities are stated at
their fair value as determined at the time of donation to the District's food service
Inventories
EXHIBIT D PAGE 18-G

DUVAL COUNTY PUBLIC SCHOOLS NOTES TO THE BASIC FINANCIAL STATEMENTS FOR THE FISCAL YEAR ENDED JUNE 30, 2010
program by the Florida Department of Agriculture and Consumer Services, Bureau of
Food Distribution. The costs of inventories are recorded as expenditures when used
rather than when purchased.
Certain assets held in escrow or by trustee, in the name of the District, in connection
with debt financing arrangements are classified as restricted assets on the statement of net
assets because they are set aside for repayment of maturing debt as required by applicable
debt covenants. Additionally, certain District assets held with a third-party administrator
in an Internal Revenue Code Section 125 Flexible Benefits Plan are classified as
restricted because, pursuant to Plan provisions, they may only be used in connection with
current and future employee benefit programs.
Restricted Assets
Expenditures for capital assets acquired or constructed for general District purposes are
reported in the governmental fund that financed the acquisition or construction. The
capital assets so acquired are reported at cost in the government-wide statement of net
assets but are not reported in the governmental fund financial statements. Capital assets
are defined by the District as those costing $750 or more. Such assets are recorded at
historical cost or estimated historical cost if purchased or constructed. Donated assets are
recorded at fair value at the date of donation. Land and buildings acquired or constructed
prior to July 1, 1969, were valued at appraised value when historical costs could not be
determined.
Capital Assets
Costs of construction-related capital assets and improvements are accounted for as
construction in progress until accepted as substantially complete by the District. Interest
costs incurred during construction of capital assets are not capitalized as part of the cost
of construction.
Depreciable capital assets are depreciated using the straight-line method over the
following estimated useful lives:
EXHIBIT D PAGE 18-H

DUVAL COUNTY PUBLIC SCHOOLS NOTES TO THE BASIC FINANCIAL STATEMENTS FOR THE FISCAL YEAR ENDED JUNE 30, 2010
Description Estimated Lives
Improvements Other than Buildings 10 - 40 years
Buildings and Fixed Equipment 10 - 50 years
Furniture, Fixtures, and Equipment 5 - 15 years
Motor Vehicles 7 years
Audio Visual Equipment 5 years
Computer Software 5 years
Long-term obligations that will be financed from resources to be received in the future
by governmental funds are reported as liabilities in the government-wide statement of net
assets. Bond premiums and discounts, as well as issuance costs, are deferred and
amortized over the life of the bonds. Bonds payable are reported net of the applicable
bond premium or discount. Bond issuance costs are reported as deferred charges and
amortized over the term of the related debt.
Long-Term Liabilities
In the governmental fund financial statements, bonds and other long-term obligations
are not recognized as liabilities until due. Governmental fund types recognize bond
premiums and discounts, as well as bond issuance costs, during the period originally
incurred. The face amount of debt issued is reported as other financing sources, while
discounts on debt issuances are reported as other financing uses. Issuance costs, whether
or not withheld from the actual debt proceeds received, are reported as debt service
expenditures.
In the government-wide financial statements, compensated absences (i.e., paid
absences for employee vacation leave and sick leave) are accrued as liabilities to the
extent that it is probable that the benefits will result in termination payments. A liability
is reported in the governmental fund financial statements only for the current portion of
compensated absences expected to be paid using expendable available resources.
Changes in long-term liabilities for the current year are reported in Note 8.
EXHIBIT D PAGE 18-I

DUVAL COUNTY PUBLIC SCHOOLS NOTES TO THE BASIC FINANCIAL STATEMENTS FOR THE FISCAL YEAR ENDED JUNE 30, 2010
Revenues from State sources for current operations are primarily from the Florida
Education Finance Program administered by the Florida Department of Education
(Department) under the provisions of Section 1011.62, Florida Statutes. In accordance
with this law, the District determines and reports the number of full-time equivalent
(FTE) students and related data to the Department. The Department performs certain edit
checks on the reported number of FTE and related data, and calculates the allocation of
funds to the District. The District is permitted to amend its original reporting for a period
of five months following the October and February surveys, and two months following
the June and July surveys. Such amendments may impact funding allocations for
subsequent years. The Department may also adjust subsequent fiscal period allocations
based upon an audit of the District's compliance in determining and reporting FTE and
related data. Normally, such adjustments are treated as reductions or additions of
revenue in the year when the adjustments are made.
State Revenue Sources
The State provides financial assistance to administer certain categorical educational
programs. State Board of Education rules require that revenue earmarked for certain
programs be expended only for the program for which the money is provided, and require
that the money not expended as of the close of the fiscal year be carried forward into the
following year to be expended for the same categorical educational programs. The
Department generally requires that categorical educational program revenues be
accounted for in the General Fund. A portion of the fund balance of the General Fund is
reserved in the governmental fund financial statements for the unencumbered balance of
categorical educational program resources.
The State allocates gross receipts taxes, generally known as Public Education Capital
Outlay money, to the District on an annual basis. The District periodically receives an
allocation under the Class Size Reduction Construction Program. The District is
authorized to expend these funds only upon applying for and receiving an encumbrance
authorization from the Department. Accordingly, the District recognizes the allocation of
EXHIBIT D PAGE 18-J

DUVAL COUNTY PUBLIC SCHOOLS NOTES TO THE BASIC FINANCIAL STATEMENTS FOR THE FISCAL YEAR ENDED JUNE 30, 2010
Public Education Capital Outlay and Class Size Reduction Construction Program funds
as deferred revenue until such time as an encumbrance authorization is received.
A schedule of revenue from State sources for the current year is presented Note 12.
The Board is authorized by State law to levy property taxes for district school
operations, capital improvements, and debt service.
District Property Taxes
Property taxes consist of ad valorem taxes on real and tangible personal property within
the District. Property values are determined by the Duval County Property Appraiser,
and property taxes are collected by the Duval County Tax Collector.
The Board adopted the 2009 tax levy on September 15, 2009. Truth in Millage (TRIM)
notices are prepared by August 15, based on the value of the property as of January 1 of
that year. Tax bills are mailed in October and taxes are payable between November 1 of
the year assessed and March 31 of the following year at discounts of up to 4 percent for
early payment.
Taxes become delinquent on April 1 of the year following the year of assessment.
After May 1, tax lien processing begins for delinquent taxes. State law provides for
enforcement of collection of tangible personal property taxes by seizure of the property to
satisfy unpaid taxes, and for enforcement of collection of real property taxes by the sale
of interest-bearing tax certificates to satisfy unpaid taxes. The procedures result in the
collection of essentially all taxes prior to June 30 of the year following the year of
assessment.
Property tax revenues are recognized in the government-wide financial statements
when the Board adopts the tax levy. Property tax revenues are recognized in the
governmental fund financial statements when taxes are received by the District, except
that revenue is accrued for taxes collected by the Duval County Tax Collector at fiscal
year-end but not yet remitted to the District.
Millages and taxes levied for the current year are presented in Note 13.
EXHIBIT D PAGE 18-K

DUVAL COUNTY PUBLIC SCHOOLS NOTES TO THE BASIC FINANCIAL STATEMENTS FOR THE FISCAL YEAR ENDED JUNE 30, 2010
Federal Revenue Sources
The District receives Federal awards, grants, entitlements, and stimulus funds, for the
enhancement of various educational programs. Federal awards are generally received
based on applications submitted to, and approved by, various granting agencies. For
Federal awards in which a claim to these grant proceeds is based on incurring eligible
expenditures, revenue is recognized to the extent that eligible expenditures have been
incurred. Expenditures are reimbursed to the District on a monthly basis.
The GASB issued Statement No. 49, Accounting and Financial Reporting for Pollution
Remediation Obligations (GASB 49) in November, 2006. The statement has no material
consequential financial impact to the District in fiscal year 2010.
Pollution Remediation
2. BUDGETARY COMPLIANCE AND ACCOUNTABILITY
The Board follows procedures established by State statutes and State Board of Education rules
in establishing budget balances for governmental funds, as described below:
Budgets are prepared, public hearings are held, and original budgets are adopted annually
for all governmental fund types in accordance with procedures and time intervals
prescribed by law and State Board of Education rules.
Appropriations are controlled at the object level (e.g., salaries, purchased services, and
capital outlay) within each activity (e.g., instruction, pupil personnel services, and school
administration) and may be amended by resolution at any School Board meeting prior to
the due date for the annual financial report.
Budgets are prepared using the same modified accrual basis as is used to account for
governmental funds.
Budgetary information is integrated into the accounting system and, to facilitate budget
control, budget balances are encumbered when purchase orders are issued.
EXHIBIT D PAGE 18-L

DUVAL COUNTY PUBLIC SCHOOLS NOTES TO THE BASIC FINANCIAL STATEMENTS FOR THE FISCAL YEAR ENDED JUNE 30, 2010
Appropriations lapse at fiscal year-end and encumbrances outstanding are honored from
the subsequent year's appropriations.
3. INVESTMENTS
As of June 30, 2010, the District has the following investments and maturities:
Maturities Fair Value
Unrestricted Investments State Board of Administration Local Government
Surplus Funds Trust Fund Investment Pool 46 days 996$ State Board of Administration Debt Service Accounts Within six months 643,415 State Special Purpose Investment Account (1) 1.81 year average 344,000,000 State Special Purpose Investment Account-COPs (1) 1.81 year average 47,659,805 Money Market Funds 32-44 days 30,348,298 Other Investments (Donated Common Stock at FMV) 53,562
Total Unrestricted Investments 422,706,075$
Restricted Investments Obligations of the United States Government Agencies and Instrumentalities (2) October 20, 2010 216,008$ Money Market Fund 32 days 6,835,320 Commercial Paper - HSBC Fin Corp (2) December 23, 2010 1,952,634 State Special Purpose Investment Account-COPS (1) 1.81 year average 1,360,866 Total Restricted Investments 10,364,828$
Total Investments, Primary Government 433,070,903$
Fiduciary Funds:Certificates of Deposit Various through 6/30/2013 649,537$ Money Market Accounts 120,691
Total Investments - Fiduciary Funds 770,228$
Restricted Assets:Cash Held by Fiscal Agent 5,472,445$ Restricted Investments 10,364,829 Total Restricted Assets 15,837,274$
Notes: (1) The pro-rata share of the State of Florida Treasury Investment Pool was 1.0116 as of June 30, 2010
(2)
Investment
Restricted investments are held by a trustee for Certificates of Participation, Qualified Zone AcademyBonds and Qualified School Construction Bonds. Restricted investments are reported at cost becausethey are held in a fiduciary capacity to provide a fixed amount at a future date certain rather than primarilyto generate income or profit.
Interest Rate Risk
Section 218.415(17), Florida Statutes, limits investment maturities to provide sufficient
liquidity to pay obligations as they come due. The District’s investment policy does not
specifically limit investment maturities as a means of managing its exposure to fair value
EXHIBIT D PAGE 18-M

DUVAL COUNTY PUBLIC SCHOOLS NOTES TO THE BASIC FINANCIAL STATEMENTS FOR THE FISCAL YEAR ENDED JUNE 30, 2010
losses from increasing interest rates, but generally requires shorter-term investment
maturities that are matched with cash flow needs to avoid selling securities prior to
maturity. As of June 30, 2010, the District’s weighted average maturity was 32-44 days
and 1.81 years for its Money Market Account and Special Purpose Investment Accounts,
respectively.
Credit Risk
Section 218.415(17), Florida Statutes, provides the authority to invest in the State Board
of Administration PRIME Investment Pool and limits investments in money market funds
to Securities and Exchange Commission (SEC) registered money market funds with the
highest credit quality rating from a nationally recognized rating agency, and investments
in interest-bearing time deposits to qualified public depositories, as defined in Section
280.02, Florida Statutes.
The District’s investments in the State Board of Administration Debt Service Accounts
are to provide for debt service payments on bond debt issued by the State Board of
Education for the benefit of the District. The District relies on policies developed by the
State Board of Administration for managing credit risk for this account.
Restricted investments of $216,008 in Federal Home Loan Mortgage Discount Notes and
$1,952,634 in HSBC Financial Corp commercial paper are authorized under forward
delivery agreements related to the Districts’ Qualified Zone Academy Bonds sinking
fund obligations. The forward delivery agreements authorize the investment of the
available sinking fund amounts in certain eligible securities, including United States
Treasury securities, obligations issued by agencies of the United States Government, and
short-term obligations issued by banks, corporations, or other borrowers having a rating
at the time of delivery of at least P-1 by Moody’s Investors Service or A-1 by Standard
and Poor’s Ratings Service.
As of June 30, 2010, the District’s investment in the SBA Local Government Surplus
Funds Trust Fund A was rated AAAm by Standard & Poors. Fund B is not rated. As of
June 30, 2010, the District’s investment in the State of Florida’s Special Purpose
Investment Account was rated A+f by Standard & Poors. As of June 30, 2010, the
EXHIBIT D PAGE 18-N

DUVAL COUNTY PUBLIC SCHOOLS NOTES TO THE BASIC FINANCIAL STATEMENTS FOR THE FISCAL YEAR ENDED JUNE 30, 2010
Goldman Sachs Financial Square Government Institution 465 Money Market Fund was
rated Aaa by Moody’s Investor Service, and AAAm by Standard and Poors.
Custodial Credit Risk
The District’s investment policy requires that all securities purchased and collateral
obtained be held by a third-party custodial institution and be properly designated as an
asset of the District. As of June 30, 2010, all investments are held with an appropriate
custodian / trustee or are held in accounts in the name of and belonging to the Board.
4. DUE FROM OTHER AGENCIES
The following is a schedule of amounts due from other agencies at June 30, 2010:
Funds/Source Amount
Major Governmental Funds:General:
Florida Department of Revenue:Fuel Tax Rebate 212,477$
Special Revenue - Food Service:City of Jacksonville Childrens' Commission:
Meal Reimbursements 297,809 Florida Department of Education:
National School Summer Lunch Program 1,376,814 American Recovery and Reinvestment Act: Special Revenue - Other (Miscellaneous Projects) 131,914
Nonmajor Governmental Funds:
Capital Projects - Public Education Capital Outlay:Florida Department of Education:
State Public Education Capital Outlay Appropriations 1,254,874 Special Revenue - Other (Miscellaneous Projects) 2,873,056
Total Governmental Funds 6,146,944$
Proprietary Funds:Internal Service Funds:
Special Disability Trust Fund 721,911
Total Governmental Activities 6,868,855$
EXHIBIT D PAGE 18-O

DUVAL COUNTY PUBLIC SCHOOLS NOTES TO THE BASIC FINANCIAL STATEMENTS FOR THE FISCAL YEAR ENDED JUNE 30, 2010
The amounts due from other agencies in the nonmajor governmental funds for State Public
Education Capital Outlay Appropriations and Class Size Reduction Construction are for long-
term capital projects and may not be entirely collected within one year. The amount due from
other agencies for the major ARRA funds and the nonmajor Federal Funds are requested cash
from the State for qualifying expenditures. The amount due from other agencies in the Internal
Service Funds from the Special Disability Trust Fund is paid on a first-in, first-out basis in the
order the reimbursement requests were received, based on available funding. Therefore, the
entire balance is not expected to be collected within one year.
5. CHANGES IN CAPITAL ASSETS
Changes in capital assets are presented in the table below.
Balance Additions Deletions Balance7-1-09 6-30-10
GOVERNMENTAL ACTIVITIES
Capital Assets Not Being Depreciated:Land 107,488,063$ 1,888,692$ 159,554$ 109,217,202$ Land Improvements - Nondepreciable 2,494,495 138,606 2,355,889 Construction in Progress 149,609,572 44,438,656 89,734,777 104,313,451
Total Capital Assets Not Being Depreciated 259,592,130 46,327,348 90,032,937 215,886,542
Capital Assets Being Depreciated:Improvements Other Than Buildings 119,427,456 11,676,716 - 131,104,172 Buildings and Fixed Equipment 1,185,910,368 78,543,361 1,594,965 1,262,858,764 Furniture, Fixtures, and Equipment 154,139,531 32,555,731 18,409,629 168,285,632 Motor Vehicles 9,223,518 1,340,930 1,392,004 9,172,444 Audio Visual Equipment 458,862 - 49,997 408,865 Computer Software 72,943,580 1,897,473 19,437 74,821,616
Total Capital Assets Being Depreciated 1,542,103,315 126,014,210 21,466,032 1,646,651,493
Less Accumulated Depreciation for:Improvements Other Than Buildings 73,414,488 2,044,475 - 75,458,963 Buildings and Fixed Equipment 623,309,648 22,709,743 743 646,018,648 Furniture, Fixtures, and Equipment 103,812,171 19,934,587 17,926,767 105,819,991 Motor Vehicles 7,718,402 763,329 1,387,242 7,094,489 Audio Visual Equipment 457,761 1,101 49,997 408,865 Computer Software 55,377,809 6,038,161 19,437 61,396,533
Total Accumulated Depreciation 864,090,279 51,491,396 19,384,186 896,197,489
Total Capital Assets Being Depreciated, Net 678,013,036 74,522,814 2,081,846 750,454,004
Governmental Activities Capital Assets, Net 937,605,166$ 120,850,163$ 92,114,783$ 966,340,546$
EXHIBIT D PAGE 18-P

DUVAL COUNTY PUBLIC SCHOOLS NOTES TO THE BASIC FINANCIAL STATEMENTS FOR THE FISCAL YEAR ENDED JUNE 30, 2010
On the reconciliation of the Statement of Revenues, Expenditures, and Changes in Fund
Balances of Governmental Funds to the Statement of Activities, the reconciling item relating to
capital outlays in excess of depreciation can be calculated as follows: Net capital asset additions
(less donations and losses on disposal) of $60,842,589, less net depreciation of $32,107,210.
Depreciation expense was charged to functions as follows for the year ended June 30, 2010:
Function Amount
GOVERNMENTAL ACTIVITIESInstruction 35,978,788$ Pupil Personnel Services 3,425,322Instructional Media Services 878,759Instruction and Curriculum Development Services 1,112,635Instructional Staff Training 1,764,707Instruction Related Technology 336,274Board of Education 41,930General Administration 237,168School Administration 3,667,045Facilities Acquisition and Construction 48,829Fiscal Services 361,224Food Services 285,516Central Services 751,944Pupil Transportation Services 94,667Operation of Plant 943,283Maintenance of Plant 1,282,091Administrative Technology Services 234,910Community Services 46,304
Total Depreciation Expense - Governmental Activities 51,491,396$
EXHIBIT D PAGE 18-Q

DUVAL COUNTY PUBLIC SCHOOLS NOTES TO THE BASIC FINANCIAL STATEMENTS FOR THE FISCAL YEAR ENDED JUNE 30, 2010
6. OBLIGATION UNDER LEASE PURCHASE AGREEMENTS – CERTIFICATES OF
PARTICIPATION PROGRAM (COPs)
Certificates of Participation outstanding at June 30, 2010 are as follows:
Series Amount Interest Lease OriginalOutstanding Rates Term Amount
(a) (Percent) Maturity
Series 2005 Refunding 32,765,000$ 3.000 - 5.000 2020 35,355,000$ Series 2005A 36,605,000 2.750 - 5.000 2025 38,290,000$ Series 2007A 141,820,000 3.500 - 5.000 2033 145,575,000$ Series 2009A 42,430,000 5.200 - 5.350 2035 42,430,000$
Series 2009B QSCB (b) 27,220,000 2.100 - 2.105 2025 27,220,000$
Series 2003-QZAB 5,667,000 (c) 2018 5,667,000$ Series 2005-QZAB 1,015,000 (c) 2021 1,015,000$
Subtotal 287,522,000
Unamortized Premium/Discount 3,358,101
Total Certificates of Participation 290,880,101$
Note (a): Annual Principal payments due 7/1 are reflected in the “Due to Fiscal Agent” account in the Liabilities section of the Statement of Net Assets as of June 30, 2010. The District is permitted to recognize an expenditure/fund liability in the current fiscal period for debt service principal and interest payments due early in the subsequent fiscal period if: • The government uses a debt service fund to account for debt service payments. • The advance provision of resources to the debt service fund is mandatory rather than discretionary. • Payment is due within a “short time period—usually one to several days and not more than one month."As of June 30, 2010, the District meets all the above stated criteria to utilize this permitted accounting methodology.
(b): Series 2009-A QSCBs (Qualified School Construction Bonds) are primarily principal only bonds, repaid by the District, with the investors receiving a tax credit in lieu of interest payments. The interest rates shown were an incentive to market the bonds and the District is paying this amounton the Certificates.
(c): Interest on this debt is "paid" by the United States Government through the issuance of Federal income tax credits to the holder of the QZABs. The rate of return to the holders was established by the United States Government at the time of the sale.
EXHIBIT D PAGE 18-R

D U V A L C O U N T Y P U B L I C S C H O O L S N O T E S T O T H E B A S I C F I N A N C I A L S T A T E M E N T S F O R T H E F I S C A L Y E A R E N D E D J U N E 3 0 , 2 0 1 0
The District entered into a master financing arrangement on October 1, 2000, characterized
as a lease-purchase agreement, with the Duval School Board Leasing Corporation whereby the
District secured financing of various educational facilities and equipment. The financing was
accomplished through the issuance of Certificates of Participation by the Corporation to third-
party investors, to be repaid from the proceeds of rents paid by the District. Primarily the
District uses local Capital Outlay millage levies to pay the rents as allowed by Statute.
As a condition of the financing arrangement, the District has given a ground lease on District
property to the Duval School Board Leasing Corporation, with a rental fee of $10 per year.
The properties covered by the ground leases are, together with the improvements constructed
thereon from the financing proceeds, leased back to the District. If the District fails to renew
the lease and to provide for the rent payments through to term, the District may be required to
surrender the sites included under the Ground Lease Agreements to the Trustee for the benefit
of the securers of the Certificates for the remaining term of the ground leases.
The District properties included in the ground leases under these arrangements include:
Certificates Lease Term Description of Properties
Series 2000 Earlier of date paid in full or (Related Series June 30, 2020 2005R)
Series 2003-QZAB Earlier of date paid in full or John Love Elementary SchoolDecember 23, 2018 Highlands Middle School
Southside Middle SchoolJ.E.B. Stuart Middle SchoolMandarin Middle SchoolLandmark Middle Schol (Designated for Technology related equipment and improvements)
Series 2005A Earlier of date paid in full or
June 30, 2025
Series 2005-QZAB Earlier of date paid in full or Ceder Hills Elementary SchoolOctober 20, 2021 Brookview Elementary School
(Designated for Technology related equipment and improvements)
Series 2007A Earlier of date paid in full or Atlantic Coast High SchoolJune 30, 2033 Westview K-8 School
North Shore K-8 School Completion
Series 2009A Earlier of date paid in full orJune 30, 2035
Series 2009B QSCB Earlier of date paid in full or Dinsmore Elementary School Classroom Additions December 16, 2025 Ed White High School Classroom Additions
Gregory Drive Elementary School Classroom Additions Robert E. Lee High School Classroom Additions New Berlin Elementary School Classroom Additions
Nutrition Service Center (New Districtwide Facility)
Alfred I. DuPont Middle School - Addition of New 6th Grade Wing
Bartram Springs ReimbursementDarnell Cookman Medical School of the Arts renovationsComprehensive Needs at Various Schools - technology and information upgrades
Don Brewer Elementary (New Elementary School "X")
Sandalwood High School - Ten Portable Replacements to Permanent Classrooms
Oceanway Elementary (New Elementary School "V")Kernan Trail Elementary (New Elementary School "W")
Kernan Middle (New Middle School "CC")
Paxon School for Advanced Studies - Additional Science Labs
Arlington Middle School (Replacement)
EXHIBIT D PAGE 18-S

D U V A L C O U N T Y P U B L I C S C H O O L S N O T E S T O T H E B A S I C F I N A N C I A L S T A T E M E N T S F O R T H E F I S C A L Y E A R E N D E D J U N E 3 0 , 2 0 1 0
Series 2009A Certificates
In November, 2009, the District issued a 2009A-Tax Exempt (TE)
Certificates with a reimbursement feature in the total amount of $42.43 million. Part of the 2009A
Series ($15.8 million) was issued to finance the cost of renovating an existing school and
providing for the update of technology related equipment at various other schools. The
reimbursement part of the series, ($24.6 million) is to reimburse the District for certain capital
costs incurred building a new elementary school, Bartram Springs Elementary. The Series 2009A-
TE is a conventional fixed rate issue with interest ranging from 5.2 percent to 5.35 percent.
Series 2009B – QSCB Certificates
In December, 2009, the District issued a 2009B-QSCB
(Qualified School Construction Bond) in the amount of $27.22 million. The Series 2009B-QSCB
was issued to finance the cost of construction, installation and equipping new additions to five
schools. The Series 2009B-QSCB Certificates are noninterest obligations, and are issued as
“principal only”, i.e. the principal is repaid by the District. Investors receive tax credits in lieu of
interest on the bonds. An interest amount is being paid by the District as was used to market the
bonds.
Series 2007A Certificates In January, 2008, the District issued Certificate Series 2007 in the
amount of $145.5 million. The Series 2007 was issued to finance the cost of acquisition,
construction, installation and equipping educational facilities. The Series 2007 is a conventional
Fixed Rate issue with interest ranging from 3.5 percent to 5.0 percent.
Series 2005A Certificates In March, 2005, the School Board issued District issued Certificate
Series 2005A in the amount of $38.3 million. The Series 2005A was issued to finance the cost of
acquisition, construction, installation and equipping educational facilities. The Series 2005A is a
conventional Fixed Rate issue with interest ranging from 2.75 percent to 5.0 percent.
Series 2005 Refunding Certificates (Crossover Refunding) for Series 2000 Certificates The
District entered into a crossover refunding arrangement on January 11, 2005, to advance refund the
Certificates of Participation, Series 2000. In a crossover refunding, an escrow account is
established with the proceeds of the refunding certificates that does not secure repayment of the
refunded certificates until a future designated crossover date. Upon the crossover date, July 1,
EXHIBIT D PAGE 18-T

DUVAL COUNTY PUBLIC SCHOOLS NOTES TO THE BASIC FINANCIAL STATEMENTS FOR THE FISCAL YEAR ENDED JUNE 30, 2010
2009, the crossover transaction met the definition of a defeasance and the liability for the
Refunded Series 2000 Certificates, along with the related escrow account assets has been removed
from the District’s government-wide financial statements. As a condition of the financing
arrangement, the District will maintain, subsequent to the refunding date of July 1, 2009, the
ground lease on District property given at the issuance of the Series 2000 Certificates to the
Leasing Corporation, with a rental fee of $10 per year. The final maturity date for the Series 2005
Refunding Certificates is July 1, 2020.
Series 2003 and 2005 QZAB Certificates The Qualified Zone Academy Bonds (QZABs) were
issued under a special program whereby the certificates will mature in full for the original issue
amounts. There is no interest cost for borrowing monies under this program. The financing
proceeds were used to acquire technology-related equipment and improvements at various
designated schools, which are leased by the District from the Leasing Corporation. The District
entered into forward delivery agreements under which mandatory deposits (rent payments) are
accumulated. The forward delivery agreements provide a guaranteed investment return whereby
the required deposits, along with accrued interest, will be sufficient to redeem the certificates at
maturity. The invested assets accumulated pursuant to the forward delivery agreements are held
under trust agreements until the certificates mature. The QZABs issues are secured by the assets
held under the trust agreements in the event of cancelation or default.
Minimum Lease Payments Lease payments for Series 2005R, 2005A, 2007A and 2009A
Certificates are payable, semiannually, on July 1 and January 1. The Lease payment for the
District’s Series 2009 QSCBs is payable, annually on December 16th. The District’s Series 2003
and 2005 QZABs are payable at maturity. The District uses revenues from local Capital Outlay
millage levies to pay the lease payments. The following is a schedule by years of future minimum
lease payments under the lease agreement together with the present value of minimum lease
payments as of June 30, 2010:
EXHIBIT D PAGE 18-U

DUVAL COUNTY PUBLIC SCHOOLS NOTES TO THE BASIC FINANCIAL STATEMENTS FOR THE FISCAL YEAR ENDED JUNE 30, 2010
Fiscal Year Ending June 30 Total Principal Interest
2011 19,749,227$ 6,925,000$ 12,824,227$ 2012 19,121,493 7,195,000 11,926,493 2013 19,846,479 7,435,000 12,411,479 2014 19,814,481 7,685,000 12,129,481 2015 19,774,096 7,945,000 11,829,096 2016-2020 98,594,798 44,435,000 54,159,798 2021-2025 98,743,388 54,930,000 43,813,388 2026-2030 92,762,281 62,285,000 30,477,281 2031-2035 95,054,875 82,005,000 13,049,875 Total Minimum Lease Principal Payments 483,461,118 280,840,000 202,621,118
Unamortized Premium 3,358,101 3,358,101 -
Total Net Certificates ofParticipation Payable 486,819,219$ 284,198,101$ 202,621,118$
QZAB Maturities:Series 2003-QZAB:
December 23, 2018 5,667,000$ 5,667,000$ -$
Series 2005-QZAB:October 20, 2021 1,015,000 1,015,000 -
Total QZAB Payable 6,682,000$ 6,682,000$ -$
Annual requirements to amortize the the net premium and discount related to the issuance of all
the District’s Certificates of Participation as of June 30, 2010, are as follows:
Fiscal Year Ending June 30 Total
2011 247,147$ 2012 247,147 2013 247,147 2014 247,147 2015 247,147 2016-2020 1,116,503 2021-2025 576,233 2026-2030 322,925 2031-2035 106,705 Total 3,358,101$
EXHIBIT D PAGE 18-V

DUVAL COUNTY PUBLIC SCHOOLS NOTES TO THE BASIC FINANCIAL STATEMENTS FOR THE FISCAL YEAR ENDED JUNE 30, 2010
Fiscal Year Ending June 30 Total Principal Interest
State School Bonds:2011 3,784,050$ 2,695,000$ 1,089,050$ 2012 3,766,100 2,810,000 956,100 2013 3,761,400 2,945,000 816,400 2014 3,760,000 3,090,000 670,000 2015 3,760,500 3,245,000 515,500 2016-2019 7,622,750 7,065,000 557,750
Total State School Bonds 26,454,800$ 21,850,000$ 4,604,800$
7. BONDS PAYABLE
Bonds payable at June 30, 2010 are as follows:
T
h
T
The various state refunding bonds were issued by the State to refinance capital outlay projects
on behalf of the District. The following is a description of the bonded debt issues:
State School Bonds
These bonds are issued by the State Board of Education on behalf of the District. The
bonds mature serially, and are secured by a pledge of the District's portion of the
State-assessed motor vehicle license tax. The State's full faith and credit is also pledged
as security for these bonds. Principal and interest payments, investment of Debt Service
Fund resources, and compliance with reserve requirements are administered by the State
Board of Education and the State Board of Administration.
Annual requirements to amortize the State School Bonds debt outstanding as of June 30,
2010 are as follows:
Interest AnnualAmount Rates Maturity
Bond Type Outstanding (Percent) To
State School Bonds:Series 2005A, Refunding 19,525,000$ 5.00 2017Series 2005B, Refunding 1,550,000 3.50 - 5.00 2018Series 2010A, Refunding 775,000 2.00 - 5.00 2019
Total Bonds Payable 21,850,000$
EXHIBIT D PAGE 18-W

DUVAL COUNTY PUBLIC SCHOOLS NOTES TO THE BASIC FINANCIAL STATEMENTS FOR THE FISCAL YEAR ENDED JUNE 30, 2010
8. CHANGES IN LONG-TERM LIABILITIES
The following is a summary of changes in long-term liabilities:
Description Balance Additions Deductions Balance Due in7/1/2009 6/30/2010 One Year
Governmental Activities
Estimated Insurance Claims Payable 21,584,860$ 16,862,894$ 19,083,443$ 19,364,311$ 10,482,958$ Bonds Payable 24,485,000 - 2,635,000 21,850,000 2,695,000 Certificates of Participation Payable 227,671,003 68,550,577 5,341,479 290,880,101 7,190,686 Other Post Employment Benefits Payable 22,500,000 9,108,000 - 31,608,000 - Compensated Absences Payable 61,117,477 3,550,859 8,440,475 56,227,861 7,051,001
Total Governmental Activities 357,358,340$ 98,072,330$ 35,500,397$ 419,930,273$ 27,419,645$
For the governmental activities, compensated absences and other post employment benefits
are generally liquidated with resources of the General Fund. Certificates of Participation are
paid from Capital Outlay millage levies. The estimated insurance claims are generally
liquidated with resources of the Proprietary Funds as discussed in Note 15.
9. RESERVE FOR ENCUMBRANCES
Appropriations in governmental funds are encumbered upon issuance of purchase orders for
goods and services. Even though appropriations lapse at the end of the fiscal year, unfilled
purchase orders of the current year are carried forward and the next year's appropriations are
likewise encumbered.
The Florida Department of Education requires that fund balances be reserved at fiscal
year-end to report an amount likely to be expended from the 2010-11 fiscal year budget as a
result of purchase orders outstanding at June 30, 2010.
Pursuant to provisions of Section 1006.40(6), Florida Statutes, the District is authorized to
issue purchase orders for instructional materials in anticipation of the subsequent year’s
legislative appropriations. Because revenues for these appropriations are not available at fiscal
year-end, a reserve for encumbrances is not shown for these outstanding purchase orders.
However, purchase orders outstanding in the General Fund for these instructional materials total
$10,936,782 at June 30, 2010.
EXHIBIT D PAGE 18-X

DUVAL COUNTY PUBLIC SCHOOLS NOTES TO THE BASIC FINANCIAL STATEMENTS FOR THE FISCAL YEAR ENDED JUNE 30, 2010
10. CONSTRUCTION CONTRACT COMMITMENTS
The following is a summary of major construction contract commitments remaining at fiscal
year-end:
Project Contract Completed Balance Amount to Date Committed
New Medical Academy 6-12 9,355,702$ 1,653,785$ 7,701,917$ New High School "AAA" 62,721,447 62,174,486 546,961 New School 103rd/Westside 26,916,132 26,892,424 23,709 New Waterleaf Elem. K-5 11,755,993 312,671 11,443,322
Total 110,749,274$ 91,033,366$ 19,715,909$
11. INTERFUND TRANSFERS
The following is a summary of interfund transfers reported in the fund financial statements for
the year ended June 30, 2010:
FundsTransfers In Transfers Out
Major: General 36,700,137$ 5,852,122$ Debt Service: Other Debt Service (290) 20,080,088.29 0.57 Capital Projects: Capital Improvement (370) 52,158,479.66 Other Capital Projects (390) 1,671,401.25 Food Service Program 4,057,092.00
Nonmajor: Federal Programs 51,195.01 2,950,344.00
Others: Internal Services 1,743,834.82 0.00
TOTAL 62,632,347$ 62,632,347$
Interfund
EXHIBIT D PAGE 18-Y

DUVAL COUNTY PUBLIC SCHOOLS NOTES TO THE BASIC FINANCIAL STATEMENTS FOR THE FISCAL YEAR ENDED JUNE 30, 2010
Interfund transfers represent permanent transfers of moneys between funds. The transfers
out of the Capital Projects – Local Capital Improvement Fund were to provide for debt service
payments in the Debt Service – Other Debt Service Fund and to fund transportation, property
insurance, minor maintenance, SAP technical upgrade and the active directory upgrade. The
transfers out of the Other Capital Projects fund was to close out the 2000 COPS and to fund the
Charter School Capital Outlay. The transfer into the Food Service Fund consisted mainly from
the District’s beverage contract three year recalculation of proportional revenue earned by the
Food Service Program. The transfers out of the nonmajor Federal Programs Funds were mainly
to reimburse the general fund for qualifying Medicaid administrative claim expenditures. The
transfers into the Internal Service Fund mainly relates to Medicare Part D payments that were
received into the general fund to reimburse qualifying prescription expenditures paid out of the
Internal Service Fund for eligible recipients. The remaining transfers between funds were
operational in nature, and used to cover anticipated appropriated expenditures so that funds do
not operate with a deficit fund balance.
12. SCHEDULE OF STATE REVENUE SOURCES
The following is a schedule of the District’s State revenue for the 2009-10 fiscal year:
Source Amount
Florida Education Finance Program 299,726,302$ Categorical Educational Programs: Class Size Reduction 137,967,195 School Recognition 5,858,110 Voluntary Pre-K Program 183,886 Excellent Teaching Program 14,247 Gross Receipts Tax (Public Education Capital Outlay) 4,169,609 Discretionary Lottery Funds 354,457 Motor Vehicle License Tax (Capital Outlay and Debt Service) 4,445,089 Food Service Supplement 824,476 Charter School Capital Outlay 761,889 Miscellaneous 1,625,798
Total 455,931,058$
Accounting policies relating to certain State revenue sources are described in Note 1.
EXHIBIT D PAGE 18-Z

DUVAL COUNTY PUBLIC SCHOOLS NOTES TO THE BASIC FINANCIAL STATEMENTS FOR THE FISCAL YEAR ENDED JUNE 30, 2010
13. PROPERTY TAXES
The following is a summary of millages and taxes levied on the 2009 tax roll for the 2009-10
fiscal year:
Millages Taxes Levied
GENERAL FUND
Nonvoted School Tax:Required Local Effort 5.0840 316,399,818$ Basic Discretionary Local Effort 0.7480 46,551,351 Discretionary Critical Operating needs Local Effort 0.2500 15,558,606
DEBT SERVICE FUNDS
Voted Tax: - -Special Tax School District No.1
CAPITAL PROJECTS FUNDS
Nonvoted Tax:Local Capital Improvements 1.5000 93,351,638
TOTAL 7.5820 471,861,413$
Actual property taxes collected totaled 96.6% of taxes levied. The Duval County Tax Collector is
not required by law to make an accounting to the School Board of the difference between taxes levied
and taxes collected. However, because discounts are allowed for early payments of taxes and
because of other reasons for non-collection, the School Board budget estimates an anticipated 5%
shortfall between taxes levied and taxes collected.
14. STATE RETIREMENT PROGRAM
Defined Benefit Plan The District’s obligations for defined benefit plans relate to the
Florida Retirement System (FRS). The FRS is primarily a State-administered, cost-sharing,
multiple-employer, defined retirement plan (Plan). Plan provisions are established by Chapters
121 and 122, Florida Statutes; Chapter 112, Part IV, Florida Statutes; Chapter 238, Florida
Statutes; and Florida Retirement System Rules, Chapter 60S, Florida Administrative Code,
wherein eligibility, contributions, and benefits are defined and described in detail. Essentially
EXHIBIT D PAGE 18-AA

DUVAL COUNTY PUBLIC SCHOOLS NOTES TO THE BASIC FINANCIAL STATEMENTS FOR THE FISCAL YEAR ENDED JUNE 30, 2010
all regular employees of participating employers are eligible and must enroll as members of the
FRS.
Benefits in the Plan become fully vested at six years of service. All members are eligible for
normal retirement benefits at age 62 or at any age after 30 years of service, which may include
up to 4 years of credit for military service. The Plan also includes an early retirement provision,
but imposes a penalty for each year a member retires before his or her normal retirement date.
The Plan provides retirement, disability, death benefits, and annual cost-of-living adjustments.
A Deferred Retirement Option Program (DROP) subject to provisions of Section 121.091,
Florida Statutes, permits employees eligible for normal retirement under the Plan to defer
receipt of monthly benefit payments while continuing employment with an FRS employer. An
employee may participate in the DROP program for a period not to exceed 60 months after
electing to participate, except that certain instructional personnel may participate for up to 96
months. During the period of DROP participation, deferred monthly benefits are held in the
FRS Trust Fund and accrue interest.
Funding Policy The contribution rates for members are established, and may be amended,
by the State of Florida. During the 2009-10 fiscal year, contribution rates were as follows:
Class or Plan Percent of Gross SalaryEmployee Employer
(A)
Florida Retirement System, Regular 0.00 9.85Florida Retirement System, Elected County Officers 0.00 16.53Florida Retirement System, Senior Management Service 0.00 13.12Florida Retirement System, Special Risk 0.00 20.92Teacher's Retirement System, Plan E 6.25 11.35Deferred Retirement Option Program - Applicable to Members from All of the Above Classes or Plan 0.00 10.91Florida Retirement System, Reemployed Retiree (B) (B)
Notes: (A)
(B)
Employer rates include 1.11 percent for the post-employment healthinsurance subsidy. Also, employer rates, other than for DROP participants,include 0.05 percent for administrative costs of the Public Employee OptionalRetirement Program.Contribution rates are dependent upon retirement class or plan in whichreemployed.
The District's liability for participation is limited to the payment of the required contribution
at the rates and frequencies established by law on future payrolls of the District. The District's
contributions (including employee contributions) for the fiscal years ended June 30, 2008, June
EXHIBIT D PAGE 18-BB

DUVAL COUNTY PUBLIC SCHOOLS NOTES TO THE BASIC FINANCIAL STATEMENTS FOR THE FISCAL YEAR ENDED JUNE 30, 2010
30, 2009, and June 30, 2010, totaled $58,844,870, $57,964,740, and $54,277,865 respectively,
which were equal to the required contributions for each fiscal year.
Defined Contribution Plan Effective July 1, 2002, the Public Employee Optional
Retirement Program (PEORP) was implemented as a defined contribution plan alternative
available to all FRS members in lieu of the FRS defined benefit plan. Employer contributions
are defined by law, but the ultimate benefit depends in part on the performance of investment
funds. The PEORP is funded by employer contributions that are based on salary and
membership class (Regular Class, Special Risk Class, etc.). Contributions are directed to
individual member accounts, and the individual members allocate contributions and account
balances among various approved investment choices. There were 2,115 District participants
during the 2009-10 fiscal year. Required contributions made to the PEORP totaled $7,578,797
for the 2009-10 fiscal year.
Pension Reporting The financial statements and other supplementary information of the
FRS are included in the comprehensive annual financial report of the State of Florida, which
may be obtained from the Florida Department of Financial Services. Also, an annual report on
the FRS, which includes its financial statements, required supplementary information, actuarial
report, and other relevant information, is available from the Florida Department of Management
Services, Division of Retirement.
15. POSTEMPLOYMENT BENEFITS OTHER THAN PENSIONS
The District has implemented Governmental Accounting Standard Board Statement No. 45,
Accounting and Reporting by Employers for Postemployment Benefits Other than Pensions
(OPEB), for certain postemployment health care plans provided by the District. The
requirements of this Statement were implemented prospectively, with the actuarially determined
liability of $139,083,000 as of October 1, 2007. Accordingly, for governmental financial
reporting purposes, no liability is reported for the postemployment health care benefits liability
at the date of transition, but the liability is reported on the entity-wide statements.
Plan Description Pursuant to the provision of the Section 112.0801, Florida Statutes, former
employees who retire from the District, and eligible dependents, may continue to participate in
the District’s health and hospitalization plans for medical and prescriptions. The District
EXHIBIT D PAGE 18-CC

DUVAL COUNTY PUBLIC SCHOOLS NOTES TO THE BASIC FINANCIAL STATEMENTS FOR THE FISCAL YEAR ENDED JUNE 30, 2010
subsidizes the premium rates paid by the retirees by allowing them to participate in the plan at
the blended group (implicitly subsidized) premium rates for both active and retired employees.
These rates provide an implicit subsidy for retirees because, on an actuarial basis, their current
and future claims are expected to result in higher costs to the plan on average than those of
active employees.
Funding Policy The District plans to fund this postemployment benefit on a pay-as-you go
basis. For fiscal year 2009-10, 2,117 retirees received health care benefits under these plans.
The District has provided required contributions of $118,000 towards the annual OPEB cost,
comprised of benefit payments made on behalf of retirees, net of retiree contributions, totaling
$9,226,000.
Annual OPEB Cost and Net OPEB Obligations for the year ended June 30, 2010 The
following table shows the District’s annual OPEB cost for the year, the amount actually
contributed to the plan, and changes in the District’s net OPEB obligation:
Description Amount
Normal cost (service cost for one year) 3,978,000$ Interest on Normal Cost 179,000 30 Year Amortization 4,703,000 Interest on Amortization 212,000
Annual Required Contribution 9,072,000 Interest on Net OPEB Obligation 1,013,000 Adjustment to Annual Required Contribution (859,000)
Annual OPEB Cost (Expense) 9,226,000 Contribution Toward OPEB Cost (118,000)
Increase in Net OPEB Obligation 9,108,000 Net OPEB Obligation, Beginning of Year 22,500,000
Net OPEB Obligation, End of Year 31,608,000$
EXHIBIT D PAGE 18-DD

DUVAL COUNTY PUBLIC SCHOOLS NOTES TO THE BASIC FINANCIAL STATEMENTS FOR THE FISCAL YEAR ENDED JUNE 30, 2010
The District’s annual OPEB cost, the percentage of annual OPEB cost contributed to the
plan, and the net OPEB obligation as of June 30, 2010 were as follows:
Percentage of Fiscal Annual Year Annual OPEB Cost New OPEB
Ended OPEB Cost Contributed Obligation
June 30, 2008 June 30, 2009
$12,538,000 $13,512,000
12.1% 15.0%
$11,019,000 $22,500,000
June 30, 2010 $9,226,000 1.28% $31,608,000
Funded Status and Funding Progress The funded status of the plan as of June 30, 2010,
was as follows:
Actuarial valuations of an ongoing plan involve estimates of the value of reported amounts
and assumptions about the probability of occurrence of events far into the future. Examples
include assumptions about rates of return, future employment and termination, mortality, and the
healthcare cost trends. Amounts determined regarding the funded status of the plan and the annual
required contributions of the employer are subject to continual revision as actual results are
compared with past expectations and new estimates are made about the future.
Actuarial Methods and Assumptions
Projection of benefits for financial reporting purposes are based on the substantive plan
provisions, as understood by the employer and participating members, and include the type of
benefits provided at the time of each valuation and the historical pattern of sharing benefit costs
between the employer and participating members. The actuarial methods and assumptions used
Actuarial Accrued Liability (a) 123,152,000$ Actuarial Value of Plan Assets (b) - Unfunded Actuarial Accrued Liability (UAAL) (c) = (a-b) 123,152,000$
Funded Ratio (b /a ) 0.00Covered Payroll (Active Plan Members [d]) 557,580,552$ UAAL as a Percentage of Covered Payroll (c / d) 22.09%
EXHIBIT D PAGE 18-EE

DUVAL COUNTY PUBLIC SCHOOLS NOTES TO THE BASIC FINANCIAL STATEMENTS FOR THE FISCAL YEAR ENDED JUNE 30, 2010
include techniques that are designed to reduce the effect of short-term volatility in actuarial accrued
liabilities and the actuarial value of assets, consistent with the long-term perspective of the
calculations.
The valuation requires assumptions on certain key items that the District has not historically
tracked. In the absence of credible, long–term data, the District has made conservative assumptions
based on the limited information available. The key assumptions are that 75% for pre-65 retirees
and 50% for post-64 retirees will participate in the District’s health plan, and that 50% of Medicare
eligible retirees in the District plan will participate in the Medicare Part B program. The District has
taken steps to more accurately track the data relating to these assumptions.
In the July 1, 2007 OPEB actuarial valuation, the Unit Credit method with amortization on a
level percentage basis was used. Because the OPEB liability is currently unfunded, the actuarial
assumptions included a 4.5 percent discount rate. The actuarial assumptions also included an
annual healthcare cost trend rate of 11.0 percent initially for fiscal year 2007-08, reduced by .5
percent per year, to an ultimate rate of 5 percent after reaching the ultimate trend. The unfunded
actuarial accrued liability is being amortized as a level percentage of projected payrolls on a closed
basis. The remaining amortization period at June 30, 2010 is 27 years.
16. RISK MANAGEMENT PROGRAMS
The District is exposed to various risks of loss related to torts; theft of, damage to, and
destruction of assets; errors and omissions; injuries to employees; and natural disasters.
Workers’ compensation, health and hospitalization coverage, general liability, and automobile
liability coverages are being provided on a self-insured basis.
The District’s liability for workers’ compensation is limited from $150,000 to $425,000 per
occurrence, depending on the year of occurrence, through January 31, 2003. Additionally,
during the period February 1, 1997, through January 31, 2002, the District’s liability is limited
by aggregate excess coverage when total claims minus specific excess coverage exceeds the loss
fund established annually by the District. For claims occurring on or after February 1, 2003, the
District retains the entire liability for workers’ compensation claims.
EXHIBIT D PAGE 18-FF

DUVAL COUNTY PUBLIC SCHOOLS NOTES TO THE BASIC FINANCIAL STATEMENTS FOR THE FISCAL YEAR ENDED JUNE 30, 2010
The District’s liability for tort claims under the general and automobile liability coverages is
limited by Florida statute to $100,000 per claim and $200,000 per incident. The District has
contracted with an insurance administrator to administer the self-insurance program, including
the processing, investigation, and payment of claims. The insurance administrator has been
approved by the Florida Department of Financial Services, Office of Insurance Regulation.
The following schedule represents the changes in claims liability for the past two fiscal years
for the District's self-insured health and workers compensation programs as well as the liabilities
that have been incurred but not reported (IBNR):
Fiscal Year Ended Fiscal Year EndedJune 30, 2009 June 30, 2010
Beginning Balance $19,234,525 $21,584,860
Additions:Current year claims and changes in estimates
Worker Compensation and GL/AL liabilityHealth Plans (IBNR) 8,271,000
Reductions:Claim payments Worker Compensation (78,000) (977,549)Health Plans (5,842,665) (1,243,000)Ending Balance $21,584,860 $19,364,311
Claims Liability by Fund:Worker Compensation and GL/AL liability $13,313,860 $12,336,311
Health Plans:Plan Year 10/1/07-09/30/2008 382,000 121Plan Year 10/1/08-09/30/2009 7,889,000 18,737Plan Year 10/1/09-09/30/2010 7,009,142Total Claims Liability $21,584,860 $19,364,311
Liability coverage for property protection, errors and omissions, employee blanket bond, and
other coverage deemed necessary by the Board are provided through purchased commercial
insurance, with minimum deductibles for each line of coverage.
The District is self-insured for employee health benefits. Management of the health plan
claims for the Duval County Public Schools Group Health Plan is provided by a contracted
health insurance administrator. The IBNR is for incidents that have been incurred, but not
EXHIBIT D PAGE 18-GG

DUVAL COUNTY PUBLIC SCHOOLS NOTES TO THE BASIC FINANCIAL STATEMENTS FOR THE FISCAL YEAR ENDED JUNE 30, 2010
reported. This is actuarially determined to record the current year’s liability, even though it has
not been reported and paid by the District.
The District has purchased individual excess loss insurance for catastrophic cases. The
individual stop loss level is $500,000 each plan year. A liability in the amount of $7,028,000
was actuarially determined to cover estimated incurred but not reported health insurance claims
payable at June 30, 2010.
The health and hospitalization coverage provided by the District contains high employee and
dependent deductibles. To satisfy the annual deductible associated with the coverage, the
District contributes $500 per eligible employee, and an additional $300 for dependent and
family coverage, to an Internal Revenue Code 125 Flexible Benefits Plan (Plan). These and
other Plan contributions are subject to a use-it-or-lose-it rule whereby unspent balances
remaining in the Plan after the reimbursement eligibility period are forfeited. The District’s
Plan Document generally requires that the forfeited balances be used to provide increased
benefits or compensation to employees in future years. At June 30, 2010, the District held
forfeited balances and interest earnings totaling $1,464,342 that are restricted to providing
employee benefits in future years.
Settled claims resulting from these risks have not exceeded commercial coverage in any of
the past three fiscal years.
The following is a summary of financial information as reported in the Internal Service
Funds for the District’s self-insured risk management program (workers’ compensation, health
insurance, unemployment insurance, general liability, and automobile liability) and printing
department operations for the 2009-10 fiscal year:
EXHIBIT D PAGE 18-HH

DUVAL COUNTY PUBLIC SCHOOLS NOTES TO THE BASIC FINANCIAL STATEMENTS FOR THE FISCAL YEAR ENDED JUNE 30, 2010
Self- Self- DistrictInsurance Insurance Printing
W/C Program Health Ins.Program Department Total
Total Assets 37,866,939$ 48,602,299$ 154,347$ 86,623,585$
Liabilities:Accounts Payable 36,019$ 13,598,776$ 154,347$ 13,789,142$ Deposits Payable - 4,837,483 - - Estimated Insurance Claims Payable 12,336,311 7,028,000 - 19,364,311 Net Assets: Restricted Net Assets - - - Unrestricted Net Assets 25,494,609 23,138,040 - 48,632,649
Total Net Assets 25,494,609 23,138,040 - 48,632,649
Total Liabilities and Net Assets 37,866,939$ 48,602,299$ 154,347$ 81,786,102$
Revenues:Premium Revenues 2,267,625$ 109,851,022$ -$ 112,118,647$ Charges for Services 683,143 683,143 Interest Income 859,739 856,387 (1,365) 1,714,761 Transfer In - 6,910,307 541,312 7,451,620
Total Revenues 3,127,365 117,617,716 1,223,090 121,968,170 Expenses (3,869,315) (108,913,838) (1,427,350) (114,210,503) Transfer Out (5,707,785) (5,707,785) Total Expenses (3,869,315) (114,621,622) (1,427,350) (119,918,288)
Change in Net Assets (741,951)$ 2,996,093$ (204,261)$ 2,049,882$
17. TRUST FUND
The District established a private purpose trust fund in 2009 that accounts for the activities of
the Gear -Up Scholarship program which grants four-year scholarships for Robert E. Lee High
School Gear Up students from the graduating cohort class of 2007-2008 and finances the
administrative management fees for the trust fund.
18. CONTINGENT LIABILITIES
The District is involved in several pending and threatened legal actions. In the opinion of
District management, the range of potential loss from all such claims and actions should not
materially affect the financial condition of the District. For governmental activities, claims and
judgments are generally liquidated with resources of the self-insurance Internal Service Fund
reported in the Proprietary Funds.
EXHIBIT D PAGE 18-II

DUVAL COUNTY PUBLIC SCHOOLS NOTES TO THE BASIC FINANCIAL STATEMENTS FOR THE FISCAL YEAR ENDED JUNE 30, 2010
In addition, the District receives grants from various Federal agencies. Amounts received or
receivable under the grant programs are subject to audit and adjustment by the various Federal
grantor and pass-through agencies. The amount, if any, of disallowed claims, including
amounts already collected, cannot be determined at this time, although the District expects such
amounts, if any, to be immaterial.
19. SUBSEQUENT EVENTS
In July, 2010, the District issued a 2010A Tax Exempt - YE Certificates in the amount of
$33.1 million, at 5.4%, maturing in July, 2027. The Series was issued to finance the
construction of a new Elementary School, classroom additions at an existing Middle School,
and additions and renovations at an existing K-8 School.
In August, 2010, the District issued a 2010B Certificates of Participation in amount of $25.0
million, with an interest rate ranging from 4.250% to 5.00%, maturing in July, 2035. The
Series 2010B was issued to finance the cost of acquisition, construction, installation and
equipping educational facilities.
EXHIBIT D PAGE 18-JJ

DISTRICT SCHOOL BOARD OF DUVAL COUNTY REQUIRED SUPPLEMENTARY INFORMATION· SCHEDULE OF FUNDING PROGRESS OTHER POSTEMPLOYMENT BENEFITS PLAN JuncJO, 2010
Actuarial Accrued Liability (AAL)
Actuarial Actuarial Value Projected Unit
Valuation of Assets Credit
Date (a) (b)
July I, 2009 123, 152.000
ESE 145
Unfunded AAL (UAAL) Funded Ratio
(b-a) (alb)
123.1 52,000 O.OOo/o
Covered Payroll
(c)
557,580,552
Exhibit D-2 Page 19
UAALasa Percent
of Covered Payroll
[(b-a)/c) 22.09%

DISTRICT SCHOOL BOARD OF DUVAL COUNTY SCHEDULE OF REVENUES, EXPENDITURES, AND CHANGES IN FUND BALANCES- BUDGET AND ACTUAL
GENERAL FUND For lhe Fis<al Year Endttl June 30, 2010
Acco uni Budoeted Amounts Number Orfainal Final
REVENUES Federal Dirccl 3 100 1,250,000.00 I , 193,057.62 Federal Throu11h Stare 3200 0.00 843.57 State Sources 3300 468,869,620.00 445,512,724.89 local Sources:
Proocnv Taxes Levied for Oocrntional Pumoscs 341 1 359.584,286.00 362.498.145.47 Propeny Taxes Levied for Debt Service 3412
Propeny Ta.•cs Levied for Capital Projects 3413 Local Sales Taxes 3418 Chllfl!eS for Service - Food Service 345X lmoact Fees 3496 Other Local Revenue 19,983,309.84 34,515,590. 15 Total Local Sources 3400 379.567.595.84 397,013,735.62
TolAI Revenues 849,687,2 IS.84 843,720,361. 70
EXPENDITURES Current:
Instruction 5000 589,886.149.20 589,866,014.80 Puoil Personnel Services 6100 43, 704.055. IS 46,5 I 0,024.45 Instructional Media Services 6200 13,533.915.01 14,283, I 58.49 lnsuucrion and Cuniculum Development Services 6300 26,615,463.91 17,155,069.26 Instructional Staff Training Services 6400 13.081.108.76 24.061.866.38 Instruction Related TcchnolollV 6500 I I .297A88. 77 I l,972.118.80 School Board 7100 1.786.635.57 2,451,609. 17 General Administration 7200 4.113,622.10 4,420,11 8.94 School Administration 7300 60,024,630.27 56,981,094.47 Facilities Acquis it ion and Construction 74 10 2,181,687.31 2,575,773.99
Fiscal Services 7500 5,938,626.52 6,080,378. 17
Food Services 7600
Central Services 7700 16,24 1.508.28 18,533,807.69 Pupil Transoortation 7800 48,946,809.32 49, 715,352.25 Operation of Pl:int 7900 70.329,383.33 68,897,244. 12
Mnintcnnncc of Pl:int 8 100 31.265,859.10 32.108.388.46 Adminisrrotive Technology Services 8200 6,512.424.03 7,565.665.52 Community Services 9100 577,112.30 901,395.48
Debt Service: (Function 9100) Retirement of Principal 7 10
Interest 720 26,246.00
Dues. Fees and Issuance Costs 730 Miscell:ineous Exocnditures 790
Capital 0111/ay: Facilities Acquisition :ind Consrruction 7420 Other Capital Outlay 9300 1.848,848.42 1.848,848.42
To!Jll Exotndihlres 947,911,573.35 955.927,928.86 Excess (Deficiency) of Revenues Over (Under) Expendihlres (98,224,357.5 l) (112.207,567. 16)
OTHER FINANCING SOURCES (USES)
Lon11-Term Bonds Issued 3710
Premium on Sale of Bonds 3791
Discount on Sale of Bonds 891
Refundin11 Bonds Issued 3715 Premium on Refundina Bonds 3792
Discount on Refundina Bonds 892 Certificates of Participation Issued 3750
Premium on Certificates of Participation 3793
Discount on Certificates of Participation 893
Loans Incurred 3720 Proceeds from the Sale of Caoital Assets 3730
Loss Recoveries 3740 37,658.71
Proceeds of Forward Supply Contract 3760 Soccial Facilities Construction 1\dvnnccs 3770 Pavments to Refunded Bond Escrow Aacnt (Function 9299) 760
Transfers In 3600 32.482,604.59 36,819,292.24
Transfers Out 9700 (58.581.581 (5,912.413.ISJ
Total Other Financine Sources (Us .. ) 32,424,023.0 I 30,944,537.80
SPECIAL ITEMS
EXTRAORDINARY ITEMS
Net Ch•nee in Fund Balances (65,800,334.50) (81,263,029.361
Fund Balances. July I. 2009 2800 124,002,259.44 122.849,832.69
Atliustment to Fund Balances 2891 Fund Bol:inces, June 30, 2010 2700 58.20 1,924.94 41,586,803.33
ESE l·IS
Actual Amounts
1,193,057.62 843.57
445,486,097.09
362,503,412.20 0.00 0.00 0.00 0.00 0.00
35.258,588.54 397,762.000.74 844,441,999.02
530,085,567.89 42,359.710.56 13.395,818.34 8.211.455.48
18,355,830.58 10,953,423.82 2,194,037.85 3.737,244.SJ
56,092,676.64 1.267,456.99 5,809,313.51
0.00 17.253,511.12 47,752,867.74 66,098,490.21 29.823,251.32
6,181,358. 13 751,166.8 1
0.00 0.00 0.00 0.00
0.00 1.848,848.42
862,172,029.94
(17,730,030.92)
0.00 0.00 0.00 0.00 0.00 0.00 0.00 0.00 0.00 0.00 0.00
37,658.71 0.00 0.00 0.00
36.700,137.19 (5.852.121.83) 30,885,674.07
0.00
0.00
13,155.643. 15 122,849,832.69
0.00 136,005.475.84
Exhibit E-1 Page 20
Vari:incc with Final Budget -
Positive (Nc11arive)
0.00 0.00
(26,627.80)
5,266.73 0.00 0.00 0.00 0.00 0.00
742,998.39 748,265. 12 721,637.32
59. 780,4-16. 91 4.150.313.89
887,340.15 8,943,613. 78 5.706,035.80
1.018.694.98 257.571.32 682,874.41 888,417.83
1.308,317.00 271,064.66
0.00 1,280,296.57 1,962,484.5 I 2,798,753.91 2.285.137.14 1.384.307.39
150.228.67
0.00 0.00 0.00 0.00
0.00 0.00
93,755,898.92
94,477.536.24
0.00 0.00 0.00 0.00 0.00 0.00 0.00 0.00 0.00 0.00 0.00 0.00 0.00 0.00 0.00
( 119. ISS.05) 60,291.32
(58,863.73)
0.00
0.00
94,4 18,672.5 I 0.00 0.00
94,418,672.5 1

DISTRICT SCHOOL BOARD OF DUVAL COUNTY SCHEDULE OF REVENUES, EXPENDITURES, ANO C HANGES IN FUND BALANCES - BUDGET ANO ACTUAL MAJOR SPECIA L REVENUE - FOOD SERVICE FUND For the Fisc:d Year Ended June JO, 2010
Acco uni Bud•cled Amounts Number OriRinal Finni
REVENUES Federal Direct 3 100 Federal Through S1a1e 3200 27.173.278.00 32,442.646.97 S1a1e Sources 3300 855,300.00 824.476.00
loro/ Sources: Proocrtv T3l<es Levied for Operalionol PUll>oses 341 1 Proocrtv Taxes Levied for Debt Service 3412 Property Ta.xes Levied for Copilll l Proiecls 3413 Local Sales T3l<es 3418 Cl1111ues for Service· Food Service 345X 17. 783,523.00 12.828.59 1. 91 Impact Fees 3496 01her Locol Re\•enue 199.000.00 1,075,011.36
Total Local Sources 3400 17 ,982.523.00 13.903.603.27
Total Revenues 46,011.101.00 47,170,726.24
EXPENDITURES Clirn!nt:
Instruction 5000
Pupil Personnel Services 6100
lnstruclionol Media Services 6200 Instruction 31\d Cwriculwn Development Services 6300
Instructional StaffTraininll Services 6400 Instruction Rcloted TcchnolollV 6500
School Board 7100 General Administration 7200 School Administration 7300 Facilities Acquisilion and Construction 7410 Fiscal Services 7500 Food Services 7600 45.931.957.60 SI ,290,S4 l.S2 Centra l Services 7700 Pupil Transpon otion 7800 Operation of Pl311t 7900
Main1en311ce of Plant 8100
Administr.1tivc Technology Services 8200 Community Services 9100
Debt Serdce: (Fu11ct1on 9100)
Retirement of Principal 710
Interest 720 Dues, Fees and Issuance Costs 730 Miscellaneous Expenditures 790
Capita/ 0 111/ay: Fnciliries Acquisition and Cons1n 1c1ion 7420
Other Capital Outlay 9300 Total Exoenditur., 45,931.957.60 51.290.541.52
Exe.,. (Deficiency) of Revenues Over (Under) Expenditures 79,143.40 (4, 11 9,815.28)
OTHER FINANCING SOURCES (USES) Lona-Term Bonds Issued 3710
Premium on Sale of Bonds 3791 Discount on Sale of Bonds 891
Refondina Bonds Issued 3715 Premium on Refimdina Bonds 3792
Discount on Refimdinl! Bonds 892 Cenifieates of Partic ipotion Issued 3750
Premiwn on Cenifica1cs of Participolion 3793 Discount on Cenificoles of Partieipation 893
Loons lncum:d 3720 Proceeds from the Sale of Caci1al Assets 3730
Loss Recoveries 3740
Proceeds of Forward Suoolv Con1rae1 3760
$peciol Facilities ConSlruction Advances 3770 Pnvmcnls 10 Rcfimdcd Bond Escrow A11cnr (Function 9299) 760
Tmnsfcrs In 3600 0.00 4,057.092.00
Transfers Our 9700 0.00 0.00
Toi.al O ther Financin2 Sources (Uses) 0.00 4,057,092.00
SPECIAL ITEMS
EXTR; \ ORDINARY ITEMS
Net Chane• io f und Balances 79.143.40 162,723.281
Fund Balances, July I. 2009 2800 1,071 ,079.63 1,071,003. 75
Adjustment 10 Fund Bolances 2891
Fund llalnnccs, June 30, 20 10 2700 1,150.223.03 1,008.280.47
ESE 145
i\erual Amounls
0.00 32,665.186.12
824.476.00
0.00 0.00 0.00 0.00
12.814.977.26 0.00
1.088.247.82 13.903.225.08 47,392,887.20
0.00 0.00 0.00 0.00 0.00 0.00 0.00 0.00 0.00 0.00 0.00
46.033,620.78 0.00 0.00 0.00 0.00 0.00 0.00
0.00 0.00 0.00 0.00
0.00 153.493.29
~6. 1 87. 114.07
1.205,773. 13
0.00 0.00 0.00 0.00 0.00 0.00 0.00 0.00 0.00 0.00 0.00
13.298.20 0.00 0.00 0.00
4.051 .092.00 0.00
4.070.390.20
0.00
0.00
5,276.1 63.33 1,071.003. 75
0.00 6.347,167.08
Exhibit E-28 Page 21
Vruia.ncc with Finni Budget •
Positive (NeRalivel
0.00 222.539.15
0.00
0.00 0.00 0.00 0.00
(13,614.65) 0.00
13.236.46 (378. 19)
222.160.96
0.00 0.00 0.00 0.00 0.00 0.00 0.00 0.00 0.00 0.00 0.00
S,256,920. 74 0.00 0.00 0.00 0.00 0.00 0.00
0.00 0.00 0.00 0.00
0.00 ( 153.493.29)
S, 103,427.45 5,325,588.4 1
0.00 0.00 0.00 0.00 0.00 0.00 0.00 0.00 0.00 0.00 0.00
13,298.20 0.00 0.00 0.00 0.00 0.00
13.298.20
0.00
0.00
5,338.886.61 0.00 0.00
5,338.886.6 1
DISTRICT SCllOOL BOARD OF DUVAL COUNTY SCllEDULE OF REVENUES, EXPENDITURES. AND CHANGES IN FUND BALANCES - BUDGET AND ACTUAL RESERVED FOR SPECIAL REVENUE FUND -OTHER IF MAJOR For che Fiscal Ytar Endrd June JO, 2010
Account Bud11e1ed Amounls Ac1ual Nwnbcr Orillinal Final Amounls
REVENUES Federal Direc1 3100 Federal Through S1a1e 3200 S1a1e Sources 3300 local So11rces:
Procenv TaJ<es Levied for 01>CraCional Purposes 3411 Procenv Taxes Levied for Debi Service 34 12 Procenv Tn.•cs Levied for Cnci1al Proiccts 34 13 Local Sales TaJ<es 34 18 Charges for Service - Food Service 345X lmpacc Fees 3496 01her Local Revenue To1ol Local Sources 3400 0.00 0.00
Toca! Rtvtnues 0.00 0.00
EXPENDITURES Current:
lns1ruc1ion 5000 I
Pucil Personnel Services 6100 ... lnsuuctional Media Services 6200 . ... u lns1ruc1ion and Curriculum Dcvclocment Services 6300 .......... lnstruc1ional StaffTrainin11 Services 6400
_ .. -lnstruc1ion Related Technoloav 6500
............ , __ School Board 7100 --~
...... General Administration 7200 ... ~y' School Adminismi1ion 7300 ..... '"'-• Facililies Acquisition and Cons1ruction 74 10 ... '' •• Fiscal Services 7500 ..... , ""~ Food Services 7600 --·-- -· Ceniral Services 7700 ..... ,.,,'9-Pupil Tronsconation 7800 _-..w,,_ ... 01)Crnlion of Plant 79 ,. Maintenance of Plnnl • ...... , ... Administralive Technolol!V Sc"•ices ... a .... Communicy Services
-__ , - 1111.•cr Debt Sen •ice: (1-imction 9100) ...... , .. i11'
Retirement of Principal .. A~~-- 710 ln1ereS1 _ ... ,, ..... '. 720 Dues, Fees and Issuance Costs .... ~~- 730 Miscellaneous Ex1>Cnditures ,,. 790
Capital Owlay: ... Facililies Acquisi1ion and Construction 7420 0 1her Caci1al Ou1lav 9300
Total Expenditures 0.00 0.00 Excess (Deficiency) or Revenues Over (Under) Exptnditures 0.00 0.00
OTHER FINANCING SOURCES (USES) Lon11-Tcnn Bonds Issued 3710
Premium on Sole of Bonds 3791 Discount on Sole of Bonds 891
Refundin11 Bonds Issued 3715 Premium on Refundin11 Bonds 3792 Discount on Rcfundina Bonds 892
Cenificotcs of Ponicication Issued 3750 Premium on Ccnificotes of Panicinalion 3793 Discount on Cenificnlcs of Panicination 893
Loons Incurred 3720 Proceeds from 1he Sale ofCaci1al Assets 3730 Loss Recoveries 3740 Proceeds of Forward Succlv Contract 3760 Sneciol Facili1ies Cons1ruction Advances 3770 Pavments 10 Refunded Bond Escrow Aaenl (function 92991 760 Transfers In 3600 Transfers Our 9700 Total Othtr Finandng Sources (Uses) 0.00 0.00
SPECIAL ITEMS
EXTRAORDINARY ITEMS
Net Chan2e in Fund Balancts 0.00 0.00 Fund Balances. Julv I. 2009 2800 Adius1mcn1 10 Fund Balances 2891 Fund Bnlanccs, June 30, 2010 2700 0.00 0.00
ESE145
0.00 0.00 0.00
0.00 0.00 0.00 0.00 0.00 0.00 0.00 0.00 0.00
0.00 0.00 0.00 0.00 0.00 0.00 0.00 0.00 0.00 0.00 0.00 0.00 0.00 0.00 0.00 0.00 0.00 0.00
0.00 0.00 0.00 0.00
0.00 0.00 0.00 0.00
0.00 0.00 0.00 0.00 0.00 0.00 0.00 0.00 0.00 0.00 0.00 0.00 0.00 0.00 0.00 0.00 0.00 0.00
0.00
0.00 0.00 0.00 0.00 0.00
Exhibic E-2b rai:e 22
Variance with Final Budg<I -
Posi1i"e (Neuoli\'e)
0.00 0.00 0.00
0.00 0.00 0.00 0.00 0.00 0.00 0.00 0.00 0.00
0.00 0.00 0.00 0.00 0.00 0.00 0.00 0.00 0.00 0.00 0.00 0.00 0.00 0.00 0.00 0.00 0.00 0.00
0.00 0.00 0.00 0.00
0.00 0.00 0.00 0.00
0.00 0.00 0.00 0.00 0.00 0.00 0.00 0.00 0.00 0.00 0.00 0.00 0.00 0.00 0.00 0.00 0.00 0.00
0.00
0.00 0.00 0.00 0.00 0.00

DISTRICT SCHOOL BOARD OF DUVAL COUNTY SCHEDULE OF REVENUES, EXPENDITURES, AND C HANGES IN FUND BALANCES - BUDGET AND ACTUAL
MAJO R SPECIA L REVENUE - ARRA ECONOMIC STIMULUS FUNDS For the Fisca l Year Ended June 30, 2010
Account Budaeted Amounts
Number Oriainal Final R EVENUES Federal Direct 3 100 Federal Throu11h St:lle 3200 74,634,098.91 67,638,204.68 S tare Sources 3300 local Sources:
ProoertV Ta.xes Levied for Ooerational Pumoses 34 11 Property Taxes Levied for Debt Service 3412 Property Taxes Lc1•ied for Caoital Proiecrs 3413 Local Sales Tnxes 3418 ChW'lZes for Service - Food Service 345X Impact Fees 3496 Other Local Revenue Total Local Sources 3400 0.00 0.00
T otal Revenues 74,634,098.91 67,638,204.68
EXPENDITURES Curre111:
Instruction ' 5000 49,353, I 40.87 45, I 51 ,325.37 Pupil Personnel Services 6 100 4,647.71 3.11 4,509,870.08 Instructional Media Services 6200 1.771.921.62 1,543,389.37 Instruction and Curriculum Development Services 6300 1,996.341.07 l .477,203.47 Instructional Staff Training Services 6400 14,139,779. 15 9,237,259.36 Instruction Related Technology 6500 56,! 19.94 276,568.60 School Board 7 100 0.00 0.00 General Administration 7200 628.493.67 2,621,099.38 School Administration 7300 1.2 18,877.00 988,659. 19 Facilities Acauisition and Construction 7410 0.00 0.00 Fiscal Services 7500 0.00 0.00 Food Services 7600 4!,853.80 0.00 Central Services 7700 0.00 0.00 Pupil Transportation 7800 400,310.00 92,949.33 Operation of Plant 7900 0.00 0.00 Maintenance of Plant 8100 0.00 0.00 Administrative Tcchnolo!IY Services 8200 25,000.00 338,624.90 Community Scn•ices 9100 0.00 5,286.95
Dehl Serwce: (F1mc/lon 9200)
Retirement of Principal 710 lntcrcsl 720 Dues, Fees and Issuance Costs 730 Miscellaneous Expenditures 790
Copl1al 0 111/ay: Facilities Acauisition and Construction 7420
Other Caoital Outlav 9300 354,548.68 1,395,968.68
T ota l E•penditures 74.634,098.91 67,638,204.68
ExcCSJ (Deficiency) or Revenues Over (Under) Expenditures 0.00 0.00
OTHER FINANCING SO URC ES (USES)
Loni:-Tcrm Bonds Issued 37 10
Premium on Sale of Bonds 3791
Discount on Sale or Bonds 891
Refundin11 Bonds Issued 371 5 Premium on Refundinl! Bonds 3792 Discount on Rcfundin11 Bonds 892
Cenificates of Particioation Issued 3750
Prcmiwn on Certificates of Particioation 3793 Discount on Ccnifi cntes of Participation 893
Loans Incurred 3720 Proceeds from the Sale of Capital Assets 3730
Loss Recoveries 3740 Proceeds of Forward Supolv Contract 3760
Specia l Facilities Constniction Advances 3770 Payments to Refunded Bond Escrow A1tent (Function 9299) 760
Transfers In 3600
Transfers Out 9700 Total O ther fin ancing Sources (Uses) 0.00 0.00
SPECIAL ITEMS
EXTRAORDINARY ITEMS
Net Chanee in Fund Balances 0.00 0.00 Fund Balances. July I. 2009 2800 0.00 0.00 Adjustment to Fund Balances 2891 Fund Balances, June 30, 20 10 2700 0.00 0.00
ESE 145
Acrual Amounts
0.00 68.485.024.96
0.00
0.00 0.00 0.00 0.00 0.00 0.00 0.00 0.00
68,485,024.96
45,527,558.44 4,H8,716.77
1,543.342.1 5 1,507.142.47 9,53 1,037.82
279,968.60 0.00
2.621,099.38 988,659. 19
0.00 0.00
! ,917.94 0.00
93,264.33 0.00 0.00
338,624.90 14,022.74
0.00 0.00 0.00 0.00
0.00 1.5 19.670.23
68,485,024.96
0.00
0.00 0.00 0.00 0.00 0.00 0.00
0.00 0.00 0.00 0.00 0.00 0.00 0.00 0.00 0.00 0.00 0.00 0.00
0.00
0.00
0.00 0.00 0.00 0.00
Exhibit E-2c Pogo 23
Variance with Final Budget -
Positive (Ne1rntive)
0.00 846.820.28
0.00
0.00 0.00 0.00 0.00 0.00 0.00 0.00 0.00
846,820.28
(376,233.07) (8.846.69)
47.22 (29,939.00
(293, 778.46 (3.400.00)
0.00 0.00 0.00 0.00 0.00
( 1,9 17.94) 0.00
(315.00) 0.00 0.00 0.00
(8,735.79'
0.00 0.00 0.00 0.00
0.00 ( 123.701.55) (846,820.28)
(0.00)
0.00 0.00 0.00 0.00 0.00 0.00 0.00 0.00 0.00 0.00 0.00 0.00 0.00 0.00 0.00 0.00 0.00 0.00
0.00
0.00
(0.00) 0.00
0.00 0.00

DISTRICT SCHOOL BOARD O F DUVAL COUNTY SCHEDULE OF REVENUES, EXPENDITURES, AND CHANGES IN FUND BALANCES · BUDGET AND ACTUAL RESERVED FOR SPECIAL REVENUE FUND · MISCELLANEOUS IF i\IAJOR For the Fiscal Ycur Ended J une 30, 2010
Accounl BudRctcd Amounts Numlx:r Oril!innl Final
REVENUES Federal Direct 3 100
Federal Throullh State 3200 State Sources 3300 local So1Jrce.r:
Propeny Tru<cs Levied for Opcrntionnl Purposes 34 11 Propeny T:ixes Le\'ied for Debt Service 3412 Propeny Tnxes Levied for Cnpita l Projec ts 3413
Local Sales Tru<cs 3418 Chortles for Service • Food Service 34SX lmpnct Fees 3496 Other Local Re\'enue Total Locnl Sources 3400 0.00 0.00
Total Revenues 0.00 0.00
EXPENDITURES Current:
Instruction sooo Puoil Personnel Services 6100 Instructional Media Services 6200 lnSlruction and Curriculum Dcvelooment Services 6300 ... Instructional StaffTrainina Service• 6400 ----Instruction Related TcchnolollV 6SOO ..... _~, School Board 7100 ~ti ' ...-.: -• Gcnernl Administrntion 7200 - ~.,. ........ School Administration 7300 - t '' ·' -Facilities Acquisition nnd Construction 7410
_ .. , ----Fiscal Scrvi~cs 7SOO
....... ___ -Food Services 7600 -Ylfi'-U• Central Services 7700 ,.-Puoil Transponation 780Q,., ~ ........ Ooeration of Plant ... 1.,.._' ...... Maintenance of Plant ... , .. Administrative TcchnoloJIY Scn•iccs _.... 0 ..
Communitv Services - - 100 Debt Service: (Ftmctwn 9200)
-~'~' ,.-Retirement of Principal 7 10 Interest ,,~. 720 Dues, Fees and Issuance Costs .F 730 Miscellaneous Expenditures 790
Capital Outlay: Facilities Acquisition and Construction 7420 Other Capital Outlay 9300
Total Expend itures 0.00 0.00 Excess (D<ficiency) of Revenues Over (Under) Expenditures 0.00 0.00
OTHER FINANCING SO URCES (USES) Long-Term Bonds Issued 3710
Premium on Snle of Bonds 3791 Discount on Sale of Bonds 891
Rcfundina Bonds Issued 371 S Premium on Rcfundina Bonds 3792 Discount on Rcfundina Bonds 892
Ccnificntcs of Panicioation Issued 37SO
Premium on Cenificntes of Panicioation 3793 Discount on Cenifieates of Pan icioation 893
Loans Incurred 3720 Proceeds !Tom the Snle of Capital Assets 3730
Loss Rcco\'cries 3740 Proceeds of Forward Supply Contract 3760 Soccial Facilities Construction Ad1•anccs 3770 Pavmcnts to Refunded Bond Escrow Auent (Function 9299) 760
Transfers In 3600
Trnnsfers Out 9700 Totul O ther Finoncing Sources (Uses) 0.00 0.00
SPECIAL ITEMS
EXTRAORDINARY ITEMS
Net Chun~• in Fund Oulances 0.00 0.00 Fund Balances, Julv I, 2009 2800 Adjus1men110 Fund Balances 289 1 Fund Balances, June 30, 2010 2700 0.00 0.00
ESE 14S
Actual Amounts
0.00 0.00 0.00
0.00 0.00 0.00 0.00 0.00 0.00 0.00 0.00 0.00
_ ... 0.00
~0.00 .. .. .-wo.oo 1~1t. 0.00
w::Jl ..... 0.00 .... 0.00 0.00 0.00 0.00 0.00 0.00 0.00 0.00 0.00 0.00 0.00 0.00 0.00
0.00 0.00 0.00 0.00
0.00 0.00 0.00 0.00
0.00 0.00 0.00 0.00 0.00 0.00 0.00 0.00 0.00 0.00 0.00 0.00 0.00 0.00 0.00 0.00 0.00 0.00
0.00
0.00
0.00 0.00 0.00 0.00
E>hibit E-2d Page 2~
Variance with Final Budget •
Positi\'c (NcRati\'c)
0.00 0.00 0.00
0.00 0.00 0.00 0.00 0.00 0.00 0.00 0.00 0.00
0.00 0.00 0.00 0.00 0.00 0.00 0.00 0.00 0.00 0.00 0.00 0.00 0.00 0.00 0.00 0.00 0.00 0.00
0.00 0.00 0.00 0.00
0.00 0.00 0.00 0.00
0.00 0.00 0.00 0.00 0.00 0.00 0.00 0.00 0.00 0.00 0.00 0.00 0.00 0.00 0.00 0.00 0.00 0.00
0.00
0.00
0.00 0.00 0.00 0.00

DIS
TR
ICT
SC
HO
OL
BO
AR
D O
F D
UV
AL
CO
UN
n'
CO
MB
ININ
G B
AL
AN
CE
Sll
EE
T
NO
NM
AJO
K G
OV
ER
NM
EN
TA
i. F
UN
DS
Ju
ne
JO, 2
010
AS
SE
TS
C
ash
and
Cas
h E
quiv
alen
ts
Inve
stm
ents
TA
JCcs
Rec
eiva
ble.
Net
A
ccou
nts
Rec
eiva
ble.
Net
In
tere
st R
ecei
vabl
e D
ue fr
om R
cins
urcr
D
coos
iu R
«:ei
vabl
c Du~ f"
ront
OtJN
.•r P
1111
J..(:
Bud~cwv F
unds
ln
tem
"1 F
unds
D
ue fr
om O
ther
A~c
ncic
s ln
vcnt
orv
Prc
oaid
Ite
ms
Tot
AI A
uet
s L
IAB
ILIT
IES
AN
D F
UN
D B
AL
AN
CE
S L
IAB
ILIT
IES
S
•h.r
ies.
Ben
efit
s an
d P
ayro
ll T
axe>
Pav
;abl
e Pa
yrol
l D
educ
tion
s an
d W
ithh
oldi
nus
Acc
ount
s P
ayab
le
Judu
men
ts P
•yab
le
Con
stru
ctio
n C
ontr
aclS
Pav
ablc
C
onst
ruct
ion
Co
ntn
as P
av.t>
le-K
euii
ned Pc
rcen
i.~e
M
arur
ed B
onds
Pav
able
M
atur
ed I
nter
est
Pava
ble
Due
10
Fis
cnl
Ai.tc
:nl
Sal
es T
u P
ayab
le
Acc
rued
lni
cres
t Pay
;abl
c D
cnos
its
Pav
•ble
D
ue 10
Oth
er A~c
ncie
s D
ur
to 0
1M
r F
unds
: Dud~c
i.ry
Fu
nds
ln1e
maJ
Fun
ds
~ft"
t!d R~~-
enuc:
Une
arne
d R(
:'Vcn
uc
Um
!vai
labl
c R
even
ue
Tol
Jll
Lla
bili
tin
f'
UN
D B
AL
AN
CE
S
Rts
.:rw
J P
or:
End
owm
ents
St
ate
Rco
uirc
d C
UT\
·ovc
r Pr
tw:•n
.1 ns
Encu
mbr
ance
s In
vent
ory
Deb
i S
ervi
ce
Oth
er P
uroo
ses
llun•
.rr:n
<ed:
fk
SIJ,
.'fkJ
ltcJ jo
r, rC
(X>r
t.:J
Ill.
ISoe
cifv
l IS
1x:c
ifvl
( l
11Je
.sig
na1r
:J, f
(/NJr
tc:d
m:
Gcn
cnl F
und
Soec
ial R
even
ue F
unds
D
ebt S
ervi
ce F
unds
C
aoit
al P
roje
cts
Fun
ds
Pcm
1anc
n1 F
unds
T
ocal
fu
nd
Uah
mct
-s
Tot
al L
i•b
ilil
in a
nd f
un
d B
alim
cts
Acc
oun1
N
umbe
r
1110
11
60
1120
11
30
1170
11
80
1210
114
1 11
42
1220
11
50
1230
211
0 2
170
21 2
0 21
30
2140
21
50
2180
21
90
2240
22
60
2210
22
20
2230
216
1 2
162
2410
24
10
2705
27
10
2720
27
30
2760
27
60
2760
27
60
2760
27
60
2760
27
00
The
acc
ompa
nyin
g no
tC'S
10 fi
nanc
ial
SLllc
mcn
15 a.
re a
n in
ttgt
al p
an
or t
his
stat
crnt
nl
ES
E
145
Food
S
ervi
ce
410
Spec
ial
Rev
enue
Fun
ds
Oth
er F
eder
al
Mis
cella
neou
s Pr
ogra
ms
Spe
cial
Rev
enue
42
0 49
0
0.0
0
0.0
0 0.
00
0.0
0
531.
17
40
8
0.00
0
.00
00
0
0.00
0
.00
177.
408
47
0.00
0.
00
0.00
0.
00
0.00
0.
00
0.0
0
0.00
0.
00
0
.00
0.0
0
0.0
0
0.0
0 0.
00
0
.00
0.0
0 0.
00
2,
873,
055
.59
0.00
0
.00
0.00
0.
00
0.0
0 0.
00
0.00
0
. 00
3.58
1,63
8.14
0.
00
0.00
0.
00
0
.00
0.00
0
.00
0
.00
0.00
3,
581.
638.
14
0.0
0 0.
00
0
.00
0.0
0 0.
00
0
.00
0.00
0
.00
0
.00
0.00
0.
00
0.0
0 0.
00
0.0
0 0.
00
0.00
0
. 00
0.00
0.
00
0. 0
0 0.
00
0.0
0
0.0
0 0.
00
0.00
0.
00
0.00
0.
00
0.
00
00
0
0.00
00
0
0.0
0
0.0
0 0.
00
0.0
0
0.00
0.0
0
0.0
0
0.00
0.
00
0
.00
0.00
0.
00
3,58
1,63
8.14
0.
00
0.00
0
.00
0.0
0
0.0
0 0.
00
0.00
0.
00
0.00
0.
00
0.00
0.
00
0.0
0
0.00
0.
00
0.0
0
0.0
0 0.
00
0.00
0.00
0.
00
0
00
0.
00
0.0
0
0.0
0
0.00
0
00
0
00
0.
00
0
.00
0.
00
0.00
0
.00
00
0
0.00
0
.00
0.00
0.
00
0
.00
0.00
0
.00
0.0
0 0.
00
0.0
0 3,
581.
638
.14
0.00
Tot
al N
onm
ajor
Sp
ecia
l Rev
enue
Fu
nds
0.00
53
1,17
4.0
8 0.
00
17
7,40
8 47
0,
00
0.00
0.
00
0.00
0.
00
2.87
3.05
5.59
0.
00
0.0
0 3,
581.
638.
14
0.00
0.
00
3,58
1.63
8.14
0.
00
0.00
0
00
0.
00
0.00
0
.00
0.0
0
0.0
0
00
0
00
0
0.00
0.
00
00
0
0.00
3,
581,
638.
14
0.0
0
0.0
0
0.0
0 0
.00
0.0
0 0
.00
0.00
0.
00
0.00
0
00
0
00
0.
00
0.00
0.
00
3,58
1,63
8.14
Eih
ibit
F·I
• P
•g<
25

DIS
TR
ICT
SC
HO
OL
BO
AR
D a
.· D
UV
AL
CO
UN
TV
C
Ol\
IBIN
ING
OA
UN
CE
SH
EE
T (C
ON
TIN
UE
D)
NO
N M
AJO
R G
OV
ER
Nl\
IEN
TA
L F
UN
DS
Jun
• JO
, 201
0
AS
SE
TS
C
ash
and
Cas
h E
nuiv
alcn
ts
lnve
stm
cnls
T
axes
Rcc
civa
blo.
Net
A
ccou
nts
Rec
eiva
ble,
Net
In
tere
st R
cc:c
ivnb
lc
Due
from
Rci
nsur
cr
Dep
osit
s R
ecei
vabl
e D
ue F
rom
Olli
t.•r
Fun
d,,·:
Bud
ceto
rv f
un
ds
Inte
rnal
Fun
ds
Due
from
Oth
er A
J:.cn
clcs
ln
vcnt
orv
Prep
aid
hem
s T
otaJ
Ass
ets
LIA
BIL
ITIE
S A
ND
t'U
ND
BA
LA
NC
ES
L
IAB
ILIT
IES
So
lari
cs, B
enef
its
and
Pay
roll
T.x
es P
avob
lc
Pay
roll
Ded
ucti
ons
ond W
ithhol
din~
s
Acc
ount
s Pa
vabl
c Jud~cnts P
ovab
le
Con
stru
aion
Con
tr.1
cts P
ayab
le
Con
stru
ctio
n C
on1t
11ct
s P
oyab
lc-R
ctai
ncd Pc
tcen
ta~c
Maw
rcd
Bon
ds P
ayab
le
~laturcd I
nter
est
Pova
blc
Due
to F
isca
l A
L!cn
l S
ales
T.x
l'a
vabl
c A
ccru
ed l
ntcr
csl
P11v
ablc
O
cr><
Kits
Pay
able
D
ue to
Oth
er A
i:.:c
ncic
s D
ur to
Otlk
:r F
unds
: Bud
~eta
rv F
unds
In
tern
al F
unds
Defa"~d R
rwu
ue:
Unc
.am
ed R
even
ue:
Una
vaila
ble
Rev
enu
e T
ota
l L
iab
ilil
in
FU
ND
BA
l..A
NC
ES
ll
cstr
ml F
or:
End
owm
ents
S
tate
Rco
uirc
d C
arrv
over
Pm
m·•
ms
Encu
mbr
ance
s In
vent
ory
Ocb
t Ser
vice
01
hcr Pu~scs
(ln
use
rwJ:
1k
S1g1
1atc
d for
, r~pvrtr:J
m:
(Sn«
"ify
l (S
pcci
fvl
l/11J
esig
110t
t•d. r
~1xmed in
: G
ener
al f
un
d
S~a
l Re
venu
e Fu
nds
Ocb
t Ser
vice
Fun
ds
C•P
ital
Pro
icct
s F
unds
Pc
nna.
ncnl
Fun
ds
Tot
al F
untJ
81d
Anc
c1
Tot
al U
al.li
lilic
s in
d Fu
nd D
alan
crs
Acc
ount
N
umbe
r
1110
11
60
1120
1 I
JO
1170
11
80
1210
1141
11
42
1220
11
50
123
0
2110
21
70
2120
21
30
21 4
0
215
0 21
80
2190
22
40
2260
22
10
2.,.,
0
2230
216
1 21
62
2410
24
10
2705
27
10
2720
27
30
276
0
2760
2760
27
60
2760
27
60
27
60
2700
The
acc
ompa
nyin
g no
tes
to fi
n3nc
ial s
1a1c
mcn
ts a
rc iU
l in
tegr
al p
art
of th
is s
u1cm
cn1
ES
E 1
45
SO
E/C
OD
I S
peci
al A
CI
Bon
ds
Bon
ds
210
220
0.0
0
0.0
0
643
,414
.74
0.
00
0
.00
0.
00
0
.00
0
00
0
00
0.
00
0.
00
00
0
0.00
0.
00
00
0
0.00
0.
00
0.
00
0.
00
0.
00
0.
00
0.
00
0
.00
0
.00
64
3,4
14 7
4 0
.00
0.0
0
0.00
0.
00
0.
00
0.
00
0.00
0.
00
0.00
0.
00
0
00
0.0
0
0.0
0
0.0
0
00
0
0.0
0
0.0
0
0.0
0
0.0
0
0.0
0
0.0
0
0.0
0
00
0
0.0
0
0.0
0
0.0
0
0.0
0
0.00
0.
00
0.00
0.
00
0.0
0
00
0
0.0
0
0.0
0
0.0
0
0.0
0
0.0
0
0.0
0
0.0
0
0.0
0
0.0
0
0.0
0
0.0
0
0.0
0
643,
414
.74
0.0
0
0.0
0
0.0
0
0.0
0 0
. 00
0.
00
0.
00
0.00
0.
00
0.0
0
0.0
0
0.0
0
0.0
0
0.0
0
0.0
0
0.0
0
0.0
0
<>13
.414
.74
0.0
0
643,
414
.74
0.0
0
Deb
t Ser
vice
Fun
ds
Sec
tion
101
1.1
4/15
M
otor
Veh
icle
D
i1tr
ict
F.S
B
onds
B
onds
23
0 24
0 2
50
0.0
0
0.0
0 0,
00
0.
00
0.0
0 0.
00
0
.00
0
.00
0.0
0
0.0
0
0.0
0
0.0
0
0.0
0
0.0
0
0.0
0
0.00
0.
00
0.
00
0.
00
0.
00
0
.00
0.0
0
0.0
0
0.0
0 0.
00
0
.00
0.
00
0.0
0
0.0
0
0.0
0
0.00
0
00
0.
00
0
.00
0
.00
0.0
0
0.0
0
0.00
0.
00
0.0
0
0.0
0
0.0
0
0.00
0.
00
0
.00
0.
00
0. 0
0
0.0
0
0.0
0
0.0
0
0.0
0 0
00
0
.00
0
.00
0.0
0
0.0
0
00
0
0.0
0
0.0
0
0.0
0
0.0
0
0.0
0
0.0
0
0.0
0
0.0
0
0.0
0
0.0
0
0.00
0.
00
0
.00
0.
00
0.
00
0.
00
0.0
0
00
0
0.00
0.
00
0.
00
0.00
0.
00
0.
00
0.0
0
0.0
0
0.0
0
0.00
0.
00
0
.00
0.0
0
0.0
0
0.0
0
0.0
0
0.0
0
0.00
0.0
0
0.0
0
0.0
0
0.0
0
0.0
0 0.
00
0
.00
0.
00
0.00
0
.00
0.
00
0.0
0
0.0
0 0.
00
0.0
0
0.0
0
0.00
0.
00
0.0
0
0.0
0
0.0
0
0.0
0
00
0
0.0
0
0.0
0
0.0
0
00
0
0.0
0
0.0
0
0.0
0 0.
00
0.0
0
0.0
0
0.0
0
00
0
0.0
0
0.00
0
.00
0.
00
0.
00
0.0
0 0.
00
0
.00
0
.00
0.0
0
Oth
erO
cbt
Serv
ice
290
0.0
0
0.0
0
0.0
0
0.0
0
0.0
0
0.0
0
0.0
0
00
0
0.0
0
0.0
0
0.0
0
0.0
0
0.0
0
0.0
0
0.0
0
0.00
0.
00
0.0
0
0.0
0
0.0
0
0.0
0
0.0
0
0.0
0
0.0
0
00
0
0.0
0
0.0
0 0.
00
00
0
0.0
0
0.0
0
0.0
0
0.0
0
0.0
0
0.0
0
0.0
0
0.0
0
0.0
0 0
.00
0.0
0
0.0
0
0.0
0
0.0
0
0.0
0
0.0
0
0.0
0
Tot
al N
onm
ajor
O
cbt S
ervi
ce
Fun
ds
0.0
0 E
1hib
il f
-lb
P
agt
26
643,
414
.74
0.0
0
00
0
00
0
0.0
0
0.0
0
00
0
0.0
0
0.0
0
00
0
0.0
0
643,
414
74
00
0
0.0
0
0.0
0
00
0
00
0
0.0
0
00
0
0.0
0
0.0
0
0.0
0 0
00
0
.00
0.
00
00
0
0.0
0
00
0
00
0
0.0
0
0.0
0
0.0
0 0
00
0.
00
643,
414
.74
0.00
0.0
0
0.0
0
00
0
0.0
0
0.0
0
0.0
0
0.0
0
643,
414
.74
643,
414
.74

~~~~~~!
5
8l:i88 88 8 0~00 0 00
~
~~~~~~ ;;.; ::;
88888 8 0000 00
8888888 888 8 88 O OOOO:iO 00000 0
~ -§i = ~~5~~ ~ ~~ ~~~ <Z
~~~
888 o o o
~~ ~ ~~~ "" §
8888 8 00 00 0
8888 8 OoO Q 0
88 8888888 o o oo o o ::i ·O O

DIS
TR
ICT
SC
HO
OL
BO
AK
D O
F D
UV
AL
CO
UN
'IY
CO
MB
INl!
'\C
BA
LA
NC
E S
HE
ET
(C
ON
TIN
UE
D)
NO
N M
AJO
R G
OV
ER
NM
EN
TA
L F
UN
DS
Juo
• 3
0.1
01
0
AS
SE
TS
C
ash
•nd
Cos
h E
<lu
ivol
cnts
ln
vesu
ncnt
s T
axes
Rec
civo
blc.
Net
Acc
ount
s R
ecei
vabl
e, N
et
lnlc
rat R
ecei
vabl
e D
ue fr
om R
cins
urcr
O
cNK
its
Rccc
ivoi
blc
Du~ F
rom
OtM
r F11
nd~·
:
Bud
StCW
V fu
nd
s In
tern
al f
un
ds
Due
fro
m O
ther
A~cncics
Inve
ntor
y p
...,
.;d
lre
ms
Tot
al A
ud
s
LIA
BIL
ITIE
S A
ND
FU
ND
BA
LA
NC
ES
L
IAB
ILIT
IES
S
al:u
ics.
Ben
efits
and
P•v
roll
Tax
es r
ovab
lc
Pav
roll
Ded
ucti
ons •
nd
Wit
hhol
din.
:s
Acc
ount
s P
avab
lc
lud1
ZJ11
cnts
P•v
•blc
C
onst
ruct
ion
Con
trac
ts P
avab
lc
Con
stru
ctio
n C
ontr.
tcts
P1v
ablc
-Rct
ain\
..-d
Pc:rccnua~c
~1ar
ured B
onds
P•v
ablc
~l
>tur
cd l
ntcr
e>t P
avab
lc
Du
e to
fisc
al A~cnt
Sal
es T
ax P
ayab
le
Acc
rued
lnt
crc>
t P
ayob
lc
Dep
osit
s P
ayob
lc
Due
10
Oth
er A
Rcn
Cic
s D
ue 1
0 01
/H.•r
Fun
ds:
Bud
geta
rv F
und
s In
tern
al F
un
ds
Def
e"ed
Re,o
r11u
e:
Une
arne
d R
even
ue
Un1
vaili
1blc
Rev
enue
T
ota
l L
iabi
liri
cs
FU
ND
BA
LA
NC
ES
IU~n..:JFor
.
EndO
Y.11
1cnt
s
Stot
c Re
<1ui
rcd
Car
rvov
cr P
row
ams
Encu
mbr
ance
s Jn
vcnt
orv
Deb
t S
ervi
ce
Olh
cr P
umos
cs
l/nr
esrm
•J:
~s1g
111a
1eJj
ar, r~
p<Nt
eJ m
: (S
peci
fy(
(Spe
cifv
l l /
11Jt
:lJg1
1a1t
J, rtp
t.JT
t~d
m:
Gen
eral
Fun
d Sp
ecia
l R
even
ue
fun
ds
Deb
t S
ervi
ce F
unds
Cap
ital
Pro
icct
s F
unds
Per
man
ent
Fun
ds
Tot
al F
und
Uah
mcr
s T
otal
Lia
bili
lits
in
d t~umJ U
al11
1cc-s
Acc
ount
N
umb<
r
1110
1160
11
20
113
0
1170
1180
12
10
1141
1142
12
20
1150
12
30
2110
2
17
0
21
20
2
13
0
2140
21
50
2
180
2190
2
24
0
2260
22
10
2220
22
30
216
1 21
62
24
10
24
10
2105
27
10
2720
2730
2760
2760
2760
2
76
0
27
60
27
60
2760
2700
The
acc
ompa
nyin
g no
tes
lo fi
nanc
iill
su1te
:mcn
ts a
re a
n in
tc-g
ral p
an o
f thi
s St
atem
ent
ES
E 1
45
Pcm
umcn
l F
und
00
0
0.0
0
00
0
00
0
00
0
0.0
0
0.0
0
0.0
0
0.0
0 0
.00
0.0
0
0.0
0
0.0
0
0.0
0
0.0
0
0.0
0
0.0
0
0.0
0
0.00
0.0
0 0
.00
00
0
0.0
0
0.0
0
0.0
0
0.0
0
0.0
0
0.0
0
0.0
0
0.0
0
0.0
0 0
.00
0.0
0
0.0
0
0.0
0
0.0
0
00
0
0.0
0
0.0
0
0.0
0
0.0
0
00
0
0.0
0 0
00
0.0
0
0.0
0
0.0
0
To
ut
Non
maj
or
Gov
ernm
ent.a
l F
und
s
0.0
0
4.85
7,35
7.42
0
.00
177.
408.
47
0
.00
0.0
0 0
. 00
0.0
0
0.0
0
4.12
7,92
9 59
0
.00
0
00
9.
162,
695.
48
0.0
0 0
.00
3,79
0.04
2 3
l 0
.00
0
00
52
,927
.49
0.0
0
0.0
0
0.0
0
0.0
0
0.0
0
0.0
0
0.0
0
0.0
0 0
.00
0.0
0
0.0
0
3,84
2,96
9.80
0.0
0
0.0
0
1,6
71,
421.
05
0. 0
0
643,
414.
74
0.0
0
0.0
0
0.0
0
0.0
0 0
.00
0.0
0
3,00
4,88
9.8
9
0.0
0
5,3
19, 7
25.6
8
9,16
2.69
5.48
Eih
ibir
•·-1
d
Pag
< ll

DIS
TR
ICT
SC
HO
OL
BO
AR
D O
F D
UV
AL
CO
UN
TY
C
OM
BIN
ING
STA
TE
ME
NT
OF
RE
VE
NU
ES
. EX
PEN
DIT
UR
ES
.AN
D C
llA
NG
ES
IN l
'UN
D ll
AL
AN
C£S
N
ON
MA
JOM
GO
VE
MN
ME
NT
AL
FU
ND
S t'o
r t•
c •U
a.I
Yc.
r [•
dcd
Ju
H J
O, l
OIO
S0
«,.
J R
c.·c
ouc
FIU
lds
Food
O
ther
Fod
er.II
M
i.soc
:lL1n
cous
A
ccou
lll
Num
ber
ME
VE
NU
ES
Fede
ral D
irec
t )1
00
fc:d
cr.a
l Thrau~h S
utc
:am l.o
c31
Jlll
O
Stile
Sow
-ca
))0
0
1.o
cal S
u11rc~~:
Pmn.
""rt,
·Ta.
tt1
Lcn
cd fo
rOpc
t11t
0na.
I JJ
\ltD
Dt.C
l 1.
-11
p..
....
_..,.
Ta.
v:t
Lc\
'ICd
for
DdK
Scm
cc
J.l
ll
Pl"IV'
!oM'n.'
Tu
es
lc\·i
cd fo
r Ca0
tu.1
Pn>
icca
s m
1
Loc:al~Ta.\CS
m•
ch .. -
.., r
or S
cn·ic
c •
Food
Scn
•1cc
l•
SX
lm~F
ccs
l•?6
O
lhc-
rl..o
Q:I
Ra
cwc
Tot.11
11 Lo
c:i.I
Sou
tccs
l•
OO
T
otal
llC'\c
HO
£
XP
EN
DIT
IJR
ES
Cu~nt
.
luW
Uct
lOO
SO
OD
nu
W P
cnon
ncl S
en 1~
610
0
hQ
ruct
iog
Mcd
b Sc
nic.
cs
621J
O
l1U11
UC11
D11 u
d C
wnc
ulua
1 O
cnio
NIM
"t,.
Scn'
lCC.
S 63
00
lnsu
u .•. "'l
iona
l SW
TTr:
uni1
12 S
c.n•
iccs
6
'00
ln
sttu
ctio
n R
eblc
d T
oc.h
nolo
L"'
6500
Sc
hool
Boo
n!
710
0 Ci
c'n::r
.al Adannul~n
7200
Sch>ol~tion
7300
F
acil
itie
s A
mui
J.iu
onan
d C
onst
ruct
ion
7~10
Fis
al S
cn•ic
c:1
1500
F
ood
Scn·
lcc:s
7600
Cc
.nlr.
il S<
MC
:CS
7100
w
1n
.i1
Tnr
1UV1
1UJJ
On
7llO
O
una:
uion
orf'
tMll
79
00
M~n1cmncc o
r P
bnl
1100
A
dnU
nist
rJll\
·c T
cchn
olot
?.\ S
cn-.c
:a
•lo
o
Con
umm
il\' S
cn·ic
:c:s
YIOO
D
<bl
&l'
Vfc~
: (F
wtd
on
9W
OJ
Rct
in:m
au o
( Pn
nc10
:>l
710
l~cr
a:t
720
Due
s. F
ees Q
.nd
luu;
1ncc
Cos
u 7
)0
Mis
c.cl
bnco
ta E
.\oc:
nd.it
wcs
79
0 CO
fHla
l 01d
la)':
f:
.ah1
a A
cow
siuo
n <&n
d C
onw
uc:u
on
1.iw
O
ther
w
ua O
u.lb
\' 9
)00
Tu
lal [1
on
dil
•ra
[1
ca1
(Dd
idn
C')
)of R
C'\c
:Ha
o,·c
r (U
ackr
) E
tpt•
dh•
ru
O
TH
ER
FIN
AN
CIN
G S
OU
HC
ES
(US
ES
) Lo
nJ.:·
Tcnn
Bon
ds I
ssue
d l7
1U
Prc.m
ham
on
S&lc
or
Bond
s )7
91
Dtim
l.Ull
on ~ o
f Bon
ds
391
Rcf
undu
u: B
onds
lsw
cd
l71S
Pr
tm1u
m on
RA:
fund
i.nl!
Bon
ds
1792
D
lscou
na o
n Rdundi~ ll
ondJ
. KY
2 CcnU~cs o
r Pan
.Kio
ot10
11 ls
.sued
l7
SO
Prt:m
iwu
on C
cn1r
ole$
ofhl
u.:t
o;:i1
.on
)79
)
Diu:owitonCc:rt.ir~of~ ....
......
n
"" l.o
ans
locu
md
)7
20
Pr
o:cc:'
Cis f
rvm
thc
Sale
orC
:iD1U
I A~lS
l1l0
L
oss R
«o
' c:n
cs
)7-1
-0
Pf'O
C«'d.
s off
otw
ard
Supp
l\· C
ontr
a:t
3760
s-
.. ...
Faci
liuc:
s Con
wuc
hon
Ad\
ilnc:
-cs
)77
0
P.11
nncn
u 10
Rcf
undc
d Bo
n:I E
.5cn>
" A
rcm
<Fu
nctt0
n 'l
?"
l 7G
O
Tr:
uWcn
ln
l60
0
Tr.
uWet
SOul
97
00
Tu
b I O
t•c
r }'i
u•c
l•t
Sour
ce
. (U
ICI)
SP
EC
IAL
IT
EM
S
EX
TR
AO
RD
INA
RY
ITE
MS
Nee
Chi~ l
• h
•d Ual.
u~
Fund
&bn
c.cs
.. Ju
tv l
. 200
'J
lllO
O
Adru
CJnM
"nt 1
0 F
wd
&b
tu.s
llS
91
fwid
&b
nca
. Jun
e JO
. 201
0 !1
00
Til
C l)C
COU1pa
11y1
1~ n
occs
10
rtrw
..:m
l sL.1
1em
cnu
an:
1111
1ruc
gral
p;a
n of
1h11
sblc
mcn
r.
ESE
I'S
Sen
.cc
f'rog
r:uru
Sp
ecia
l Rn·
enuc
<1
0 •w
•9
0
o.uo
3.l'
l9.7
0U
6
o.uo
00
0
11.0
SJ .
.. l.
42
0.
00
o.u
o 0.
00
0.
00
0.0
0
0.00
0.
00
0.
00
0.
00
0.0
0
00
0
00
0
00
0
0.00
0
00
0.
00
0.
00
0.00
0.
00
0,0
0 o.o
o 0.
00
0.00
o.o
o 0.
00
0.0
0
00
0
0.0
0
00
0
n.3,2.7~
.u
0.0
0
0.0
0
+.l.
02l..
&9,,
l I
0.0
0
00
0
IUS
l.6
11.9
2 0
00
0.
00
61
UlS
.IO
0.
00
0
00
9.
l2U
6JS
O
0.0
0
0.00
I U
26
.6l9
.72
0.00
0.
00
70.6
06-'0
0.
00
0.00
0.
00
0.
00
0.0
0
2.SO
O ..
l6.6
9 0.
00
0.0
0
117.
171
.7)
0.0
0
0.0
0
l.lj
J.61
JUtl
0.
00
0.
00
n.m
.ii
0.0
0
0.0
0
0.00
0.
00
0.
00
Jl
l<.7
S6.S
J 0
00
0
00
66
7.7l
90
S
0.0
0
0.0
0
Hl1
17
0
.00
0
00
0.
00
0.
00
0.
00
0.
00
0.00
0.
00
llJ.l .
. Ul.
KK
0.00
00
0
0.0
0
0.00
0.
00
0
00
0.
00
0.00
0.
00
0.
00
0.00
0.
00
0
.00
0.00
0.
00
0
00
0
00
l.
ll9
.'199
.H
00
0
00
0
116.
~SJJ
97.1
9 0.
00
0.
00
U9
9.l
<l.'
l'J
0.00
o.oo
0
00
u
oo
0.
00
0
00
0.
00
0
.00
0.
00
0
00
0
00
00
11
00
0
0.00
0
.00
0.0
0
00
0
00
0
0.00
0
00
0.
00
0.00
0
00
0
00
0.
00
00
0
0.0
0
00
0
0.00
0.
00
0.
IJO
00
0
0.0
0
0.00
0
00
0.
00
0.
00
00
0
0.0
0
0.00
0.
00
0.
00
0
00
0.
00
0.
00
0.
00
0.
00
S
l.l9
S.O
I 0.
00
0.
00
fl
.9SO
.JU
.001
0.
00
0.0
0
12.l
'l9.l
'K.9
91
0.00
0.0
0
o.w
0.
00
0.0
0
U.tlO
o.
oo
00
0
0.00
0.
00
0.
00
00
0
00
0
00
0
0.00
0
00
0.
00
0.0
0
0.00
Tow
Non
m:1
jor
Spec
ial R
C\'el
\UC
Fund
s
1.2
9\1.
70).
46
11.0
SJ.o
.&3.
H
0.0
0
0.0
0
0.0
0
00
0
00
0
00
0
0.00
0.
00
00
0
X9.
l!l.
7-'6
.U
H.0
23
. .&!J
~U I
IUS
J.6
1192
6
1UU
.IO
9
.l2
6.•
6U
O
11.5
26.6
39.7
2 70
.606
.<0
0.00
2.
SOO
.H66
9 11
7.17
1.7
) l.
Ul.6
91.U
n
.32
2.ll
0.00
l3
'.7S
6.S
l 66
7.71
905
2A
l7.l
7
00
0
0.0
0
IY-'
.~ll.n
o.oo
0.
00
0
.00
0.00
u.oo
1.
))9.
999.
U
116-
'SlJ
91.l
l9
!.89
9.14
1.9
9
0.0
0
0.0
0
0.0
0
0.00
0.
00
0.00
0
00
0.
00
00
0
OIJ
O
0.00
0.
00
0.0
0
00
0
o.oo
Sl.
l9SO
I f2
.9S
O.l
U. O
OI
U.ll
lJIJ
.1.-1
.99
)
0.0
0
0.0
0
0.00
0.
00
0.00
0.
00
tsta
lbil
t"-2
• P
aJ:<
l9

DIS
TR
ICT
SCH
OO
L B
OA
RD
OF
DU
VA
L C
OU
l>T
Y
CO
MB
ININ
G S
TA
TE
ME
NT
OF
JlE
VE
NU
ES
, EX
PE
ND
ITU
R£S
, AN
D C
llA
NC
ES
IN F
UN
D B
AL
AN
CE
S (C
Ol>
TIN
UE
O)
NO
NM
AJO
N. G
OV
ER
NM
EN
TA
L •
. UN
DS
•·ur
tlK f
lK.a
l V
ur [•
"'1
IJ•w
JO
, 201
0
1\C
CO
Wll
Nw
nl,.,
,. R
EV
EN
UE
S
FoJc
nl O
.rm
l
lOO
fal<
nl T
hmu<
J> S
ul<
..,.
J Lo
c.>I
3:?0
0 S
ul<
S.W
...
]JO
O
Loca
l Stwrt:~
J.
1"ro
n1.•rw
Ta.
'\i:s
Ln·
M:J
for
01'c
111t
ion1
l l~
s 3
'11
......
....
.n,,
T IL
'CS
Lcn
cJ r~ D
ebt S
an
ce
)-Ill
rn
mn"
ll. T
a.w.:s
ln'k
'J fo
t Cam
Llll
PtUI
Cl!ls
3
'13
L
ua
l Sal
es T
L'\O
J.1
18
Cru
ft'd
for
Scn
icc
· Fu
oJ
Scn
·1a:
H
SX
Jm
NC
I fa:
t 3
'96
Olh
ct L
oaJ
RC
\'cnl
k'
Tuu
l l.cK
:.U S
ourc
es
l.tO
O
Tot
alR
c-u
:•ll
ft
EX
PE
ND
ITU
RE
S
C&1r
rr11
1. lr
uUU
c111
m
sooo
l'\
lod
Pcno
nnd
Scni
OCl
i 61
00
lmtN
CtK
!IW M
cJia
Scn
ica
62
00
ln3'
Net
JOa
W
Cur
ricu
lum
°'-"'
_ _
... ..
.. , S
a\'
li;c
s
6300
tru
.1n1
c1.K
>cul
St.
a!f'
Tnan
m~ S
cnic
c.11
(M
OO
lrui
ln.le
lioo
Rd
alaJ
Ta:
h.no
Joav
~soo
Sc:h
ool l
Jo.ln
J 7
100
(;
(n..n
.I A
J.in
uu.M
ntlo
n no
o Sc
hool
Adm
inbu
alio
n 7J
OO
Fa
c1bu
a A
coui
.NU
UA
and
C<.1
CU&N
Clao
n W
O
f11
QJ
Sc
mc
a
7l0
0
fcx.
JSc
nicc
s 1(
.00
Ca1
1nl S
crvM
x:I
7700
Pu
r'!'I T~-
.nthon
71Jl
0 ''
"--
Mn
o( p
t;n
7'
l00
M&
mlC
NDCC
of l
"lan
l 81
00
A
Jmin
u1.u1
1J\'C
T o:
hnol
ol!\
Scr
\"lc
c:i.
8200
C
omm
wul
\' Sc
r.•ic
ci
9100
l>
rbl S
irm
u
/F1
1M
-IU
>fl 9
'100
) R
cum
ncnt
o< l'l
'w:•n
.I
11U
I.
....
,.
llO
D
ua..
Fee
s an
d I~ C
o:i;u
. 1
](1
MbC
Clla
ncuu
s lli.
.ncn
J1tu
n::s
190
c up
11oJ o
.. '1
oy:
t-'.:1
l1Llc
s A
l:Ww
hon
and
l*cr
ul.r\
.ll,!I
KN'I
7.SW
°'1\
a'C~
piul
CN
tl•\
9J
OO
~obi C
a.-.
dll
lilt
u
Ca
nD
('Dd
ick
M"Y
) <
I Ln:
•11r
a C
htr
CU•d
u) E
un
dll
uu
O
Tll
ER
FIN
AN
CIN
G S
OU
RC
ES
(US
ES
I 1.o
o ·T
enn
llooJ
s 1~
'1
!11
0 P
n::m
1wn
on S
ale
or
Bon
ds
319
1 D
i.:au
.n&
on
Sale
of I~
891
K
cf..
W"'
llo
oJi
1.-.
.J
ms
l'rcm
1um
oa
Rdu
ndm
i:: ~
17
9!
OiJC
iOUN
on
Rcf
unJ.i
n IJ
RMh
892
Ccr
uf'.c
alc:s
of r
11tic
io1b
on ls
.wcJ
m
o l"
rant
u.m
on
Ccn
1f t1
:1tc
1 o
f P:u
uc1r
uucn
11
93
IAtC
OUn
l oo
Ccr
hftc
.m:s
or
P .ut
w.:1
n.ar
.aon
89}
1.u.
ans l
ncw
ta:.I
31
20
Pruc
ecJ.
s fr
om lh
-: Sa
lcor
<.:a
i>1t
al A
k\id
.J
3130
Lu~ .. R
CCO\
"Glc:
s 31
40
I~ u
(fc
KW
MJ
Su
no
h C{•l
llllll~t
31(,(
1 s ..
..... ,.I
fx
1h11
...:s C
on.."
"-nK
tJOO AJ\·~
1770
l'.1
1' m
aw 1
u R
dunJ
cJ n
onJ Bo.~ A
.... -n
i tf
unch
on 9
29'))
'"'
Tra
aJ
cn
In
](,(
10
rnn
Jcn
;0u
1 91
00
Tue.
Ill 0
1k
r t1
u•d
D&
Sol
l ma
(UM
•)
SJ1 C
CIA
L IT
EM
S
ID.T
RA
Oll
OIN
AR
Y IT
F.MS
Ncl
C ..
aatc
ia t'
uad
Bat
.. ~n
Fund
lh
l2lla
:.. J
ul,.
1. l<
m
2!1W
A
J1u.
sunc
nt w
Fun
J. R.abn~
28'1
1 t-'
W).)
IU
bno.
-,.. J
in: 3
0. 2
U10
17
00
lll<
.MX'
Oln
pan,
1ng
notC
J lo
f~1al ""l
c~U.
S ;a
f'I:
on Ulk
p~I
p.ar1
o( U
lb S
UlCm
C'nl
liS
li l
4S
SllfJ
C01
11
Spa:
tal A
ct.
"'"""'
llu
nt.h
21
0 !2
0
00
0
00
0
0.00
0.
00
3.
7!1
.:!<1
9.7S
0
00
0.0
0
00
0
uoo
OJX
'J 0.
00
0
00
0
00
01
10
00
0
0110
(l
{Xt
0.00
0
00
0
00
0
00
0
00
J.
7l1~497S
00
0
U.00
0
00
0
00
UCI
O 0
00
0
00
0
00
0
00
0
00
0
00
0
00
0
00
0
00
0.
00
0
00
0
00
0
00
0
00
0
00
0
00
0
00
0
00
0
00
0
00
0
00
0
00
0
00
0
00
0
00
0
00
0
00
0
00
0.
00
00
0
000
0
00
1.s1
0.oo
oo
o
00
0
UI0
.66)
26
00
0
IO.S
l86?
0
00
94
4JU
2 91
0
00
00
0
00
0
00
0
00
0
.S.7
)6.f
l).t
19
00
0
fl.0
1~.7
SSO.O
00
0
00
0
0.0
0
00
0
00
0
0.0
0
00
0
870.
00
00
0
00
0
82.7
126S
0
00
0
00
0
00
0
00
0.
00
0
00
0
00
0
00
0
00
0
00
0
00
0
00
0
00
0
00
(1
00
00
0
00
0
00
0
00
0
00
0
00
0
00
0
00
0
00
0
00
0
9Sl.1
1l6
S
0.00
00
0
00
0
00
0
00
0
C62.C
M2.
39l
00
0
lOS.
4511
3 0
00
0
00
11.
00
60
.41
-17-
1 0
00
0..-b
t S<
nic<
F..
W
Soc"
°"
Mnt
atV
chid
c D
u;tr
ict
IUI 1
.14/
ISF
S
l1"o
J>
llon
J.
!lO
!.
tO
!lO
00
0
00
0
0.0
0
O<IO
0.
00
0
00
0
00
0
00
0
00
00
0
00
0
00
0
O.<I
O 0
00
0
00
0.
00
0
00
0
00
0
00
0
00
0
00
0.
00
0
00
0
00
0.
00
0.00
0
00
0.
00
00
0
0.0
0
00
0
00
0
00
0
00
0
00
0
00
0
t).(X
> U
.00
0
00
OC
XI
00
0
00
0
00
0
00
0
00
0
00
0
00
0
00
0
00
0
00
0
00
0
00
0
00
0
00
0
00
0
0.0
0
00
0
00
0
uoo
00
0
0.0
0
00
0
00
0
0.0
0
00
0
00
0
00
0
0.00
0
00
0
00
0
00
0
.00
0
00
00
0
OCXI
0
00
0
00
0
00
0
00
0
00
0
00
0
00
0
00
0.
00
0
00
0
00
0.
00
00
0
0.0
0
0.00
00
0
00
0
0.0
0
00
0
uoo
00
0
00
0
00
0
0.0
0
00
0
0.0
0
0.0
0
uoo
00
0
00
0
00
0
0.00
0.
0'.)
00
0
00
0
00
0
00
0
00
0
0.0
0
0.00
()
_00
00
0
00
0
00
0
00
0
0.00
0
00
0
00
0
00
0
00
0.
00
0
00
0.
00
0.0
0
00
0
00
0
00
0
0.00
0.
00
0.00
0
00
00
0
00
0
00
0
00
0
00
0
00
0
00
0
00
0
0.0
0
00
0
00
0
00
0
0.00
0.
00
uo
o 0
00
0.
00
0
00
0
00
0
00
0
00
0.
00
0.0
0
00
0
00
0
00
0
00
0
00
0
00
0
00
0
0.00
0.
00
0.0
0
00
0
00
0
00
0
00
0
00
0
00
0
00
0
0.0
0
00
0
UC.
I O
<XI
U.00
0
00
0
00
0
00
0
00
0
00
O!h
al><
bo
Sa
\'tcn
: 29
0
00
0
00
0
00
0
0.0
0
00
0
00
0
00
0
00
0
0.00
on
o 0
00
0
00
00
0
00
0
00
0
00
0
00
0
0.0
0
00
0
00
0
00
0
00
0
00
0
00
0
0.00
0
00
0
00
0
00
0
00
0.
00
00
0
00
0
00
0
00
0
00
0
00
0
00
0
00
0
00
0
00
0
00
0
00
0
00
0
uoo
00
0 0
00
0
00
0
00
0
00
0
00
0
00
0
00
0
00
0
00
0
00
0
00
00
0
00
0
0.0
0
00
0
00
0
00
0
Tot
alN
onm
1JlW
D.
:bt~
·)CC
~·unr.1~
00
0
00
0
3.7:
?1.2
4975
00
0
00
0
00
0
00
0
0.00
0
00
0
00
uo
o l.
7:?1
..249
75
00
0
00
0
00
0
00
0
00
0
00
0
00
0
00
0
00
0
1100
uo
o 0
00
0
.00
0.
00
0
00
0
00
0
00
0.
00
l.S7
0.00
0 0
0
1.21
0.66
1 ?6
10
.S28
6l
94-1
,812
.91
0.0
0
00
0
-1.7
36.0
04.7
9 (l.0
14.7
SS.~J
00
0
00
0
00
0
810,
0000
0 8
l.712
.6S
00
0
00
0
00
0
00
0
00
0
00
0
00
0
00
0
0.0
0
00
0
00
0
00
0
95!.
11l
6S
00
0
00
0
(62 ..
o.&2
)9)
10S.
4S7.
13
00
0
6'3.
414
74
Et~
IWt F
-lb
Paa
cJU

DIS
TR
ICT
SC
HO
OL
UO
AR
D 0
.' D
UV
AL
CO
UN
T\'
C
OM
BIN
ING
ST
AT
EM
EN
T O
F R
EV
EN
UE
S, U
P£
ND
ITU
RE
S.
AN
D C
HA
NG
ES
IN F
UN
D B
AL
AN
CE
S (
CO
NT
INU
ED
) N
ON
MA
JOR
GO
VE
RN
ME
NT
AL
FU
ND
S
Fo
r Hiie
F"u
.c&l
Yc
u E
•dN
JH
C JU
. 201
0
RE
VE
NU
ES
Fede
r.ii
Dir
ta
FC:d
cral
Thr
ough
Sta
te ;1
11d
LfX3
1 St
:a1c
Sou
n:cs
Lu
co/ S
ot"-
ccs:
Pr
ot>C
nv T
au
s L
cYic
d fo
r Opc
raoo
n.;il
Pur
pose
s Pr
opcr
h·T
.. ~ L
c\•lc
d ror
Deb
t Scr
v.cc
Pr
oocm
· Tu
es
Lc\·
icd
ror C
apit1
I Pro
icct
s L
«a
l Sal
es T
axes
Ch
:u~c
s ro
r Scn
·kc:
·Foo
d Sc
n·tc
c ln~Fccs
Oth
er L
ocal
RC\
-.:nu
c To
ul l«
al S
ource~
Tot
itl R
a·c:
a•c:
s E
XP
EN
DIT
UR
ES
C
'wnY
nr·
lnsu
u:uo
n
Pupi
J Pc
rsor
u.:I
Scn•
tecs
ln
sU\K
tJO
IW M
cd&
;1 Sc
:n'K
oCS
iftstr
ui:1
ion
:md
Cur
ricu
Jwu
Den
:loon
.cm
Scn
·i:C
s ln
suuc
:tion
:al S
bff
Tr.1
iiung
Scn
·iccs
ln
uruc
tion
Rcb
tod
Tc:c
hnol
o1:v
S
choo
l B
o.ud
G
cnc:t
:al A
dm.i1~uuuou
Scho
ol A
dutin
is:tr
.uio
u F
xilh
ic:1
Ac.a
uJsu
ion
itnd
Con
suuc
:Uon
Fl
SCll
Sc.
nic
cs
Food
Scr
nccs
Cc
l1r.a
J Sc
n·ic
cs
Pupi
l Tr.
iruw
nauo
n ()p
cr.U
IOn
of P
bM
M
ainl
mm
.:c o
r P
im
Adt
tuni
stru
.i\'C
Tcx
hnok
n, ....
· Scn
·ices
C
omm
wU
l\' S
cn•J
CCs
txb
r &
n·1
a::
(Fu
ncl
fon
920
0)
Rct
m:-m
cnl o
r Pri
oeip
.al
l11l
cra1
D
ues.
Fee
s aD
d lu
u:an
c:c C
ow
Mis
ccll:
tnco
us E
xocn
d11u
rcs
C.:a
pUaJ
U11
tlay.
fa
dliu
es A
cQu1
ssuo
11 im
d C
on.su
ucbo
n O
ther
C!lp
it.:L
I Ou
lb\·
To1a
l fa
on
diu
ua
E
sta1
1 (D
did
clK
)') o
( R
ae.u
s O
nr (U
ai.J
cr)
£.lp
cadi
c .. u
O
TH
ER
FIN
AN
CIN
G S
OU
RC
ES
(U
SE
S)
Lon.
it-T
enn
Bol
ds U
wcd
Pn
:miw
n oo
&al
e o
f Bon
ds
Oi.M
:oun
l on
Sale
of B
onds
R
cfl.l
ndin
.t B
onds
bsu
cd
Pn:m
ium
on
Rcfu
nd.11
1)! U
ond.
s D
isco
lltlt
on R
cfun
dinc
Bon
ds
'Cc..
nific
3l.cs
orP
anki
P3tio
n bs
ucd
Prem
ium
on
Ccru
f1t.a
lcs o
r P¥\
lt:ip
;iuon
D~unl on
CcnifiC3t~
of P
;mici
p;1L
ion
Loon
s ln
."'1
'Cd
Proc
Ccch
Crom
tbc ~
le of
Citp
iial A
sscl
s Lo
ss R
cco\
·c:ric
.s:
Pnx:
:ccd
s of
Fo"
''3rd
SuP
Oh'
Con
trxt
Sp
ccW
Fx
1lili
cs C
on:st
rue1
.io11
Ad,
·311c
cs
Pa:\"
OJcn
a 10
Ref
unde
d B
ond
EK
row
Agc
1d (F
uuru
on 9
299>
Tr
ansfe
rs In
Tt
:an.s
:tcrs
Ou1
To
tal O
U1n
-fia
Hci
ae, S
.O.r
cu (
Uta
) S
P£C
JAL
nE
.IS
EX
TR
AO
RD
INA
RY
IT
EM
S
Ncl
Cll
ni:
t la
t"a
ad U
.ahl
oca
Fund
831
ancc
s.. J
ul\'
I. 20
09
Ad1u
stmc:
n1 l
o Fu
nd 6
.:d:u
a:s
Fun
d&L:
uas.
Juuc
: Ju
. 2U
IO
Acc
oun
t N
umbe
r
JIU
O
)200
3300
JUI
3412
3'
13
3418
3'
SX
3•
'16
HO
O
sooo
6
10
0
62
00
6
30
0
6'0
0
G.SO
O 71
00
12
00
13
00
7-41
0 1.S
OO
7600
17
00
1800
79
00
SlO
O
•20
0
9100
710
720
130
190
7420
93
00
3110
)7
'JI
tllJI
l7
U
1792
89
2 31
SO
379)
S9J
3720
3730
J7
'0
)760
31
70
160
3600
97
00
2800
28
91
210
0
C.p
il.l
lOut
loy
Bon
d ls.
sues
(C
08
1)
JIO
Tl"C
acc
omp.'
Ul,\
'oV
; nc
Mcs
10
finan
c1a.
l su
&cm
cnu
i\rc
: an
inle
gr.tl
p11
1 o
f th.
is sb
lc1t'I
C'Jll
. ES
E l
H
U,0
0
0,0
0
0.0
0
O.U
O
0,0
0
0,0
0
0.0
0
00
0
0,0
0
00
0
0,0
0
0,0
0
0,0
0
0.0
0
0.0
0
0.0
0
00
0
00
0
0,0
0
0.0
0
0,0
0
0,00
0
. 00
0.0
0
0.0
0
00
0
00
0
0,0
0
0,0
0
0.0
0
o.uo
U,0
0
0,0
0
0.0
0
0.0
0
0.0
0
0.0
0
0,00
U.U
O
0.0
0
00
0
0.0
0
0,00
00
0
U.0
0 0,
00
U.0
0
0,0
0
0,00
0,00
0
.00
0
,00
0.0
0
0,0
0
00
0
0,0
0
o.0
0
0,0
0
0.0
0
0.0
0
00
0
0.0
0
Sp
x..
i A
ct
Bon
ds
320
0,0
0
0,0
0
0,0
0
0.0
0
00
0
U,0
0
0.0
0
0.0
0
0,0
0
0,0
0
0,0
0
0,0
0
0,0
0
0.0
0
0,0
0
0,0
0
U,0
0
0,0
0
0,0
0
0,0
0
0,0
0
0.00
0.
00
0.0
0
0.0
0
0.0
0
0.0
0
0,0
0
0.0
0
0,0
0
0,0
0
0,0
0
0,0
0
0,0
0
0.0
0
0.0
0
0,0
0
0.0
0
0,0
0
0.0
0
0.0
0
0.0
0
00
0
0.0
0
0.0
0
0,0
0
0.0
0
0,0
0
0.0
0
0,0
0
0.00
0,
00
0.00
0.
00
0,0
0
O.ll
O
0.0
0
0,0
0
0.0
0
0.0
0
0.0
0
0.00
Sect
ion
1011
.1.U
10
11.I
S
f.S.
~ns
330
0.0
0
0.0
0
0,1
)0
0.0
0
0,0
0
U,0
0
0,UO
0.0
0
0.0
0
0,0
0
0.00
0
,00
0,0
0
0.0
0
0.0
0
0.0
0
0.0
0
0,0
0
0,00
0
.00
0
,00
0.0
0
0.0
0
0,0
0
0,0
0
0.U
O
0.00
0.
00
0
.00
0
,00
o.oo
0,0
0
0.00
0
,00
0,0
0
0,00
0
,00
0,0
0
0.0
0
0,0
0
0.0
0
0.0
0
0.00
0.
00
0,0
0
0,0
0
0.0
0
0.0
0
0.0
0
0,0
0
0.0
0
0.0
0
0,0
0
0.00
0
,00
0.0
0
0,0
0
0.0
0
00
0
0,0
0
000
0
,00
Publ
ic E
duau
ion
Cap
iu1 Ou
l.b~
· (P
EC
O)
3'0
0.00
0.
00
-l,16
9.60
tJ,O
O
0.0
0
0.0
0
0,0
0
0,0
0
0,0
0
0.0
0
30.3~.86
JO.J
SU
6
4,1
99.9
63.8
6
0.00
0.
00
0,0
0
0,0
0
0,0
0
00
0
0.0
0
0.0
0
0.00
6.
113.
203
. 6!
0,0
0
0,0
0
0.0
0
0,0
0
0.0
0
0,0
0
0,0
0
0.0
0
0,0
0
0,0
0
0.0
0
0.0
0
2.43
2.92
8.7
9 0
,00
MO
G.1
32.'-
I (4
,406
,168
.58)
0.0
0
0.0
0
0.0
0 0
.00
0
.00
0
,00
0.0
0
0,0
0
0.0
0
0.0
0
00
0
0.0
0
o.uo
0,0
0
0,0
0
0,0
0
0,0
0
0,0
0
0,0
0
0.0
0
<• ... 1
6,16
•.SB
I 6,
l21
,•ll
,1S
0
,00
1.92
1,61
).17
Cap
ital P
r0icc
ts fu
nds
OIW
lCI
Bo
nd
s
3SO
0,00
0
,00
0
,00
0.0
0
0.0
0
0.0
0
0.0
0
0.0
0
0.0
0
0.0
0
0.0
0
0.0
0
0,0
0
0.0
0
0.0
0
0,0
0
U.0
0
0,0
0
0.0
0
0,0
0
0.0
0
0.0
0
0.0
0
0,00
0. 0
0
0,0
0
0.0
0
0,0
0
0,0
0
0,0
0
0.0
0
0.0
0
0,0
0
0.0
0
0.0
0
0.0
0
0,00
0,0
0
0,0
0
0.00
0.00
0
,00
0.0
0
0,0
0
0,0
0
0.0
0
0.0
0
0.0
0
0,0
0
0.0
0
0,0
0
0,00
0
,00
0.00
0
,00
0.0
0
0,0
0
0.0
0
0.0
0
0.0
0
0,0
0
00
0
Cap
i13l
Out
lay
and
D
ebt S
en· ic
e Fun
ds
(CO
kD
Sl
360
0.0
0
0,0
0
6!1.
1192
.U
0,0
0
0.0
0
0,0
0
0.0
0
0.0
0
0.0
0
•HS
9.%
'~-~S9
,96
102A
S2.l!
O
0,00
0
,00
U
.00
O
JJO
0
.00
0
.00
0.
00
0.00
0
,00
2.J
11
JO
0.0
0
0,0
0
0.00
0
.00
0
,00
0
.00
0
,00
0
,00
0.0
0
0,0
0
0,0
0
0.0
0
0,0
0
0,0
0
2.37
1.30
70
0,08
1.SO
0.00
0
.00
0
,00
0
,00
0
,00
0.0
0
0.0
0
0.0
0
0.0
0
"""'
0,0
0
0.0
0·
0,0
0
0.0
0
0,0
0
0.00
0
,00
0
,00
0.0
0
0,0
0
700,
081.
50
2,0S
4.S
•6 2
1 0
,00
1.15
4.66
1.17
C:1
pibl
lmpn
;n·cn
1el(
Scct
ioo
1011
.711
21
f.S
. J7
0
0,0
0
0.0
0
0,0
0
0.0
0
0.0
0
0.0
0
0,00
0
,00
0
,00
0.0
0
0,0
0
0,0
0
0,0
0
0.0
0
0,0
0
0.0
0
0,0
0
0.0
0
0,0
0
0.0
0
0.0
0
0.0
0
0.0
0
0.0
0
0.0
0
0,0
0
0,0
0
0,0
0
0,0
0
0,0
0
0.0
0
0.0
0
0,0
0
0,0
0
0,0
0
0.0
0
0,0
0
0.0
0
0.00
0
,00
0.0
0
0.0
0
0,0
0
0.00
0
.00
0
.00
0,
00
0,0
0
0,0
0
0,0
0
0,0
0
0,0
0
0.0
0
0.0
0
0,0
0
0.0
0
U.0
0
0.0
0
0.0
0 0
,00
0,0
0
0,0
0
Vo
l<d
Capi~
lmp
ro\'C
n'IC
lf.
380
0,0
0
0,0
0
0.0
0
0.0
0
0,0
0
0,0
0
0,0
0
0.0
0
0.0
0
0.0
0
0,0
0
0.00
0,0
0
0,0
0
0,00
0
,00
0.0
0
0.0
0
0.0
0
0,0
0
0,0
0
0.0
0
0.0
0
0.0
0
0.0
0
0,0
0
0,0
0
0,0
0
0.0
0
0.0
0
0.0
0
0,0
0
0,0
0
0.0
0
0.0
0
0,0
0
0,0
0
0,0
0
0,0
0
0,0
0
0,0
0
0.0
0
0.0
0
0.0
0
0,0
0
0,0
0
0.0
0
0,0
0
00
0
0.0
0
00
0
0.0
0
0.0
0
0.0
0
0,0
0
0.0
0
0,0
0
0,00
0.0
0 0
,00
0,0
0
0.0
0
Oll
er
C.p
i .. l
Pr
oJcc
u 39
0
0.0
0
o.oo
0,0
0
0,0
0
0,0
0
0.0
0
0,0
0
0,0
0
0.0
0
0,0
0
0,0
0
0,0
0
0,0
0
0.0
0
0.0
0
0,0
0
0.0
0
0.0
0
0,0
0
0.0
0
0.0
0
0.0
0
0,0
0
0,0
0
0,0
0
0,0
0
0.0
0
0.0
0
0,0
0
0,0
0
0.0
0
0,0
0
0.0
0
0.0
0
U,0
0
0,0
0
0.0
0
0,UO
0,0
0
0,0
0
0,0
0
0,0
0
0.0
0
0,0
0
0,0
0
0.0
0
0.0
0
0.0
0
00
0
0.0
0
0.0
0
0.0
0
0.0
0
0.0
0
0,0
0
0.0
0
0,0
0
0,0
0
0.0
0
0.0
0
0.0
0
0,0
0
Ed
1ib
hF
-k
'•i:
cJt
To
ul
NoW
NJO
r C
:ipiu
l Pn
>JW
fu
nds
0.0
0
0.0
0
4,8
27
,60
1.U
0.0
0
0.0
0
00
0
0,00
0.0
0
0.0
0
74.lf
.14.
82
7.J.
Kl·U
2
4.'J
02.4
16.ti
6
o.uu
0.0
0
0.0
0
0,00
0.0
0
0,0
0 0
.00
0
.00
0
00
6.
17'.
574.
Y5
0.0
0
0,0
0
0,0
0
0,0
0
o.oo
0
,00
0
,00
0,
00
0.0
0
00
0
0.0
0
0,0
0
l,4
)2.9
2K 7
'J
0,0
0
a.60
8.50
1.7-
4 (3
,106
.087
,.,.)
'
0.0
0
0,0
0
0,0
0
0,0
0
0.0
0
00
0
0.0
0
0,0
0
0.0
0
00
0
U,0
0
0,0
0
0.0
0
0.0
0
0,0
0
0.0
0
00
0
00
0
U.0
0
0,0
0
o. 70
6.oin
.mo
K31
Sl.J
9K.O
l 0
.00
,,
676,
l I0,
9'

DIS
TR
ICT
SC
HO
OL
llO
All
D O
F D
U\'
AL
CO
UN
TY
C
OM
BIN
INC
~•ATEMENTo•·
R£
\'E
NU
£S
. E
XP
EN
DIT
IJR
ES
, MD
CU
AN
CE
S I
N F
UN
D B
AL
AN
CE
S(C
ON
TIN
UE
D)
NO
NM
AJO
R C
OV
ER
NM
EN
TA
L F
UN
DS
F
or 1
'-c F
"uca
l Yar
EM
kil J
ue JO
. 201
0
Aa;ou~
Pmn:
uic.
nl F
und
Nw
ub
cr
RE
VE
NU
ES
Fc
dc.o
lOir
cct
310
0
Fcr:k
:m T
hruu
1:.b
SI.a
te a
ud L
.oc::a
.l )2
00
Sl.:l
tc S
oun;
Cl.
llOO
I.
Dal
l So
wtt
t.l'
P-"\'
T:1M
:s L
e' te
d ro
r ()p
cr.u
toru
l Pul
W'lu
-_c:
34
11
Pro
nat'
T:a.~ l.
.C'\t
cd r
or D
dn
Scn
-.cc
Hll
p
....
-\' T
a.\c
s Lcn
c:d
for C
aoit
il P
rotc
eas
JU)
l.o
cl S
:iik-s
Tt..
\CJ.
)41
8
c~ fo
r S
cn·1
cc •
Foo
d S
cnic
c J<
!)(
Im ...
.... F
ees
) ... ?
6
Oth
er L
oca.
I R
e\ cn
uc
Tou
.I L
oa
l Sow
tcs
)40
0
Tou
lll.
nc..
rs
EX
PE
ND
ITU
RE
S
C:11
rn.n
l
lnsu
uctio
n lO
OO
P
uDll
Pcr
ioru
ic:I
Scn
·1ccs
6
100
lnnr
uctio
n:&
I Mcd
i.:a
Scn
·iccs
62
00
lnw
u..."
1Mln
and
CU
mcu
lum
Dc\
· .. ~mau S
en io
:d
63
00
ln
s:tru
cu::u
W S
bfT
Tri
man
r. S
cn1c
cs
1>10
0 IQ
)tN
CUOU
Rcb
&cd
Tcx
::bno
lOJ:\
' 6
l00
Sc
bool
lloa
<d
71
00
G
cnc:
ral
Adm
1nul
nt10
n 72
00
Sch
ool A
drui
nist
r:m
on
7300
Fa
c1llt
in A
cuui
sitio
n a.
ad C
o1w
ruct
ion
7..tl
O
Fisa
J S
cn·ic
cs
7l0
0
Food
Sc:
n·1e
cs
7600
C
ct11
.al S
cnic
n
noo
... .
..ir
Tr:m
s:DO
l13l
.IOll
7SO
O
.~r.
::i1
.:>1
1orP
ta.1
c 79
00
M2i
nt.c
nJ.n
CC
of P
laut
81
00
Adm
inia
r.u.h
'c T
ccho
oloi
!'\' S
c.rv
icu
KlO
O
Com
mun
it'!
Scn
·K."C
.S 91
00
/Nb
t Sc-
ni<
t" (
Ftm
c.liO
lf 9i
OO
J kc
urcm
cnl o
f Pru
.:1N
I 7
10
ID
lcrQ
I 12
0 D
ues.
Fee
s an
d W
l.&3n
c:c
Cos
u no
M
tSCC
.ll:u
:w:o
us E
.\DC1
Mht
urtS
79
0 C
ap11
al O
u1lc
w.
Fai.:
d.ita
c:s ~ws1110n a
nd C
onsu
ucoo
n '"2
0 O
ther
Cam
ut O
ulb
'' 9
l00
T
ub.I
£nJ
Cad
h.,.
DI
£'-
«a
CD
f:f".0
C-ltC
1') u
l Re'
cH
c:s O
nr(
U•l
ltt)
E1
.pra
dit
•rn
O
Tll
tll
f!N
AN
CIN
C S
OU
RC
ES
(US
ES
) l..
onR
·Tc.
nn B
onds
Iss
ued
mo
Pr
c111
ium
on
5'1k:
of B
onds
37
91
Ois
coun
1 o
n S:
aJc o
r Oon
d.s
891
R
cfun
dirn
: Bon
ds W
uc:d
m
s P
rmu
wn
ou R
dund
um B
onJs
37
92
Duc
ou• o
n R.
crun
dJn
• Oon
ds
892
Ccr
uf.a
1.c.
s of
Pan
1t10
.:n.o
n ls
su:d
3
7so
P
rani
um o
n C
cniO
ca1c
s o
r ~titiP31ion
37
9)
Ois
coun
l on
Ccr
tific
ntc:
J of P
<ani
cipa
tion
•93
l..oonsh~d
)72
0
Pioc
c:cd
s fr
om 1h
c ~k o
f C.a
niCl
.I A
uct.
s 37
30
Lo
u RccO\~ncs
374
0
Proc
ccds
: off
orw
:ird
Suo
ol'
Co
nu
xt
3760
S
oa:&
al F
x.h
tu:J
Com
uuct
km Ad\
·~
ino
P
;i\m
coo
to R
efun
ded
Bon
.1 E
scro
w A
"CI•
(Fu
ur;:o
on 9
299J
7
60
T
r:uW
cnln
)6
00
Tr.
uWcr
lOul
9
70
0
Tu1:
1I 01~cr t1
aud
as: S
oll
n:a
(U1a
) S
PE
CIA
L IT
EM
S
EX
TR
AO
RD
INA
RY
IT
EM
S
Net
Cb
ai:.c
I• fu
d l
blH
cn
Fu
nd Ba~ J
uh·
I. 2
009
2800
A
djus
tmcn
& 1
0 f~ &
btu
s 21
?1
fund
llo
bJu
s. lw
x J0
. !0
10
2700
11'c
acco
mp:
myu
\I n
otes
to fi~ s
u1cn
K:n
u an
: ilD
rnltg
r.11
p.lr1
oft
h!J
saic
nlC
Q..
ES
E I•!
000
Tota
J N
o1um
jor
Go'l
'Cm
mcn
l.JJ
fund
s
o.ou
&
.29
9.7
Ul"
' 0.
00
Kl.
O.S
l.0 ... 3
..t?
0.0
0 K
.$4
US
LS
9
00
0
00
0
0.0
0
0.0
0
0.0
0
0.0
0
0.0
0
0.0
0
0.0
0
0.0
0
0.0
0
00
0
OJl
O
74.3
14.M
l 0
00
74
.KIU
2 0
. 00
97
,976
.4 I
J.2
9
00
0
·U.O
B.-
'98.
11
0.0
0
l .... 3
H.6
111J
l 0
.00
6
14.1
2!.
IO
0.0
0
9.12
6..&
62.5
0 0.
00
l l
.S26
.6l9
.1?
00
0
70.6
06...
lO
0.0
0
0.0
0
0.0
0
2.l
00
.4!6
.69
0
.00
11
7.K
71.7
3 0
.00
I .
2SJ.
691U
3
0.0
0
77.l
ll ll
0.0
0
0.0
0
00
0
3S
US
6.$
3
o.oo
667.
719.
0S
0.0
0
.t•ll
7.17
0
.00
0
00
0
.00
0
.00
0.
00
l'M
All
.H
00
0
?.~ 7
0.0U
O 0
0
0.0
0
1.2
I0.6
6J.
l6
0.0
0
12.8
99.9
2
0.0
0
9"..
t,ll
ll.9
1
0.0
0
8.60
6.ll
l...t.
.t 0
00
l.
ll9.9
99
U
0.0
0
99.79".106
.~2
0.0
0
(1.1
21.
69
).13
1
0.0
0
0.0
0
00
0
0.0
0
0.0
0
0.0
0
00
0
87
0.0
00.
00
0
00
"2
.712
6S
0
00
0
00
0.
00
0
.00
0.
00
0
00
0.
00
0
.00
o.o
o 0
.00
0.0
0
0.0
0
0.0
0
00
0
0.0
0
uoo
0.0
0
00
0
0.0
0
0.0
0
0.0
0
51.1
9!.
UI
0.0
0
(2.9
SOJ-
'UX
.1)
0.0
0
(l.9
'6.4
36.
341
0.0
0
0.0
0
0.0
0
U.0
0
0.0
0
ll.1C
.S.1
29.-
'7)
0.0
0
9,08
7.K
SS.IS
0.
00
0.0
0
0.0
0
$,)
19.7
2!.
61
[, .
. ibl
l l-'·2
d
Pa~J?

DISTRICT SCHOOL BOARD OF DUVAL COUNTY SCHEDULE OF REVENUES, EXPENDITURES, ANO CHANGES IN FUND BALANCES· BUDGET ANO ACTUAL NONMAJOR SPECIAL REVENUE FUN() FEDERAL PROJECTS For lhe Fiscal Year Ended June 30, 2010
Account Budoc1ed AmounlS Number Orioinal Final
REVENUES Federal Direct 3100 7,749,427.29 8,75 1.1 97.69
Federal Through Stale and Local 3200 I 0 I. 7n.466.05 82.256.016.00 Stare Sources 3300
lcx.YJ/ Sources: Proocrtv Taxes Levied for Oocrational Pumnses 3411 Proocrtv Taxes Levied for Debt Service 34 12 Proocnv Ta~cs Levied for Caoilal Proiects 34 13
Local Sales Ta~cs 34 18
ChaJ'ReS for Service· Food Service 345X
Impact Fees 3496
Other Local Revenue Total Local Sources 3400 0.00 0.00
Total Revenues I 09,521,893.34 9 1,007.213.69
EXPENDITURES Current:
lnsttucrion 5000 35.2S3.742.69 44,788.377. 13 Pupil Personnel Services 6 100 27.128,798.60 14,527.114.36 Instructional Media Services 6200 273,039.76 630,451.26 lnstruclion and Curriculum Development Services 6300 18,542,751.59 9,514,845. 13 lnstruclionnl Slaff Training Services 6400 18,505.222. 96 11,908,649.96 Instruction Related TechnoloJIY 6500 67,809.49 70,606.40
School Boan! 7100
General Administration 7200 2.911,413. 17 2,542,811.78
School Administration 7300 41 ,081.36 118,871.73
Facilities Acquisition and Construction 7410 511.223.80 1.260.469.17 Fiscal Services 7500 2.276,168.47 77,322.33 Food Services 7600
Central Services 7700 552,439.75 438,944.62 Pupil Trnnsponarion 7800 1.656,660.81 692.374. 15 Operation of Plant 7900 149,353.18 2.417. 17 Maintenance of Plant 8100 0.00 0.00 Administrative Technology Services 8200 0.00 0.00 Community Services 9100 370,769.4 1 202,196.20
Dehl Service: (F1111c1/011 9100)
Rcliremenr of Principal 710
Interest 720
Dues. Fees and Issuance Cos1s 730 Miscellaneous Expenditures 790
Capital 0 111/oy: Facilities Acquisition and Construction 7420 Other Capital Oullav 9300 1.339.999.88 1,339,999.88
Total E•penditures 109,580,474.92 88,115,451.27
Excess (Deficiency) of Revenues Ovrr (Under) Expenditures (58,581.58) 2,891,762.42
OTHER FJNANCING SOURCES (USES) Lon1t-Tcnn Bonds Issued 3710
Premium on Sale of Bonds 3791
Discount on Sale of Bonds 891
RcfundinR Bonds Issued 3715
Premium on Refundinst Bonds 3792
Discount on Rcfundin• Bonds 892 Cenificates of Panicioation Issued 3750
Premium on Cenificales of Panicioarion 3793 Discount on Ccnilicatcs of Panicioation 893
Loans Incurred 3720
Proceeds from 1he Sale ofCooirol Assets 3730
Loss Recoveries 3740
Proceeds of Forward Suoolv Contract 3760 S0ccial Facilities Construction Advances 3770
Pavmcnrs ro Refunded Bond Escrow Aacnr IFunction 9299) 760
Tr:insfers In 3600 S8,S8 l.S8 58,581.58
Transfers Out 9700 (2,950,344.00)
Total Other Financin2 Sources (Uses) 58,581.58 (2.891. 762.42)
SPECIAL ITEMS
EXTRAORDINARY ITEMS
Net Chane• in Fund Balances 0.00 (0.00)
Fund Balances. July I, 2009 2800 0.00 0.00
Adiustment to Fund Balances 289 1
Fund Balances, June 30. 2010 2700 0.00 (0.00'
ESEl45
Ac1ual Amounts
8,299,703A6 81.053,043.42
0.00 89.352,746.88
44,023.498.11 14,353,611.92
614,125. 10 9,326,462.50
11,526,639. 72 70,606.40
2.500,436.69 117,871.73
1,253,698.88 77.322.33
384,756.53 667,739.05
2.417.17 0.00 0.00
194.4 11.88
1,339,999.88 86,453,597.89
2,899, 148.99
51. 195.01 (2.950,344.001 (2,899, 148.99)
0.00 0.00
0.00
E>hibit G-1 PageJJ
Vnri:ince wi th
Final Budget • Positive (NeRalive)
(451,494.231 (1,202,972.58
0.00
0.00 0.00 0.00 0.00 0.00 0.00 0.00 0.00
( 1,654,466.81)
764,879.02 173,502.44
16,326.16 188,382.63 382.010.24
0.00 0.00
42,375.09 1,000.00 6,770.29
0.00 0.00
54,188.09 24.635. 10
0.00 0.00 0.00
7,784.32
0.00 0.00 0.00 0.00
0.00 0.00
1,66 1,853.38
7,386.57
0.00 0.00 0.00 0.00 0.00 0.00 0.00 0.00 0.00 0.00 0.00 0.00 0.00 0.00 0,00
(7.386.57) 0.00
(7,386.57)
0.00
0.00
0.00 0.00 0.00 0.00

DISTR ICT SCHOOL BOARD OF DUVAL COUNT Y SCHEDULE OF REVENUES, EXPENDITU RES, AND CllANGES IN FUND BAL\NCES - BUDG ET AND ACTUAL
OF.BT SERVICE FUND------For Che Fiscal Year Ended J une J O, 2010
Account Budaeted Amounts Number Oriainal Final
REVENUES Federal Direct 3 100 Federal ThrouRh State and Local 3200
State Sources 3300 3,707,139.33 3.72 1.249.75 l.ocal Sources:
Prooenv Taxes Levied for Operational Purooses 3411
Proocnv Taxes Levied for Debt Service 34 12 Propcny Taxes Levied for Capita l Proiects 34 13 Local Soles Taxes 34 18 Charges for Service · Food Se" •ice 345X Impact Fees 3496
Other Local Revenue 67,767.50 Total Local Sources 3400 0.00 67,767.50
To1al Reven ues 3, 707, 139.33 3,789,01 7.25
EXPENDITURES Current:
lnstnJction 5000 Pupil Personnel Services 6100 Instructional Media Services 6200 Instruction and Curriculum Developmen1 Services 6300 Instructional StaffTrainin11 Services 6400 Instruction Related Technology 6500 School Board 7 100 General Administration 7200 School Administration 7300 Facilities AcQuisition and Construction 7410
Fiscal Services 7500
Food Services 7600
Central Services 7700 Pupil Trnnspon ation 7800 Operation of Plant 7900 Maintenance of Plant 8100 Administrative Technology Services 8200 Community Services 9 100
Deht Service: (F1111ct1011 9200) Retirement of Principal 710 7.6 15,000.00 7.620.000.00 Interest 720 11.429.230.10 12.8 18,687.05 Dues, Fees and Issuance Costs 730 36.356.58 1,308,376.02 Miscellaneous Expenditures 790
Capua/ 0111/ay: Facilities Acauisition and Construction 7420 Other Capital Outlay 9300
Tota l E•pendirures 19,080,586.68 21, 74 7 ,063.07
E•ccss (Deficiency) of Revenues Over (Under) Expenditures (15,373.447.35) ( 17,958,045.82)
OTHER FINANCING SOURC ES (USES) Long-Term Bonds Issued 37 10
Premium on Sale of Bonds 379 1 Discount on Sale of Bonds 891
RcfundinR Bonds Issued 3715 952.7 12.65 Premium on Refundinu Bonds 3792 Discount on Refunding Bonds 892
Ceni ticates of Participation Issued 3750 1.240,070.09 Prcrniwn on Certificates of Panicipation 3793 Discount on Ccn ifi cates of Panicipation 893
Loans Incurred 3720 Proceeds from the Sale of Cao ital Assets 3730 Loss Rccovc1ics 3740 Proceeds ofF01ward Suoolv Contract 3760 Special Facilities Construction Advances 3770 Payments to Refunded Bond Escrow Agent (Fw1ction 9299) 760 (944,8 12.9 1) Transfers In 3600 15,401,891.97 20,080,088.29 Transfers Out 9700 (0.57) Tota l Other f inancing Sources (Uses) 15,401,891.97 21,328,057.55
SPECIAL ITEMS
EXTRAORDINARY ITEMS
Nel Chan•e in Fu nd Balances 28.444.62 3,370,0 11.73 Fund Balances. July I . 2009 2800 10.566,264.33 10,566.264.33 Adiustment to Fund Balances 2891 Fund Balances. June 30, 2010 2700 10.594,708.95 13,936,276.06
ESE l45
Actual Amounts
3,72 1,249.75
67,767.50 67.767.50
3.789,017.25
7.620,000.00 12,818,687,05 1,295.085. 73
944,812.91
22,678.585.69 ( 18,889.568.44)
870,000,00 82,712.65
1.240,070.09
20.080,088.29 (0.57)
22.272.870.46
3.383.302.02 10,566.264.33
13,949,566.35
EJ11ibit G-2 Page 34
Variance with Final Budget •
Positive (Ne11ative)
0.00 0.00 0.00
0.00 0.00 0.00 0.00 0.00 0.00 0.00 0.00 0.00
0.00 0.00 0.00 0.00 0.00 0.00 0.00 0.00 0.00 0.00 0.00 0.00 0.00 0.00 0.00 0.00 0.00 0.00
0.00 0.00
13,290.29 (944.812.91)
0.00 0.00
(93 1,522.62)
(93 1,522.62)
0.00 0.00 0.00
(82. 7 12.65) 82.7 12.65
0.00 0.00 0.00 0.00 0.00 0.00 0.00 0.00 0.00
944.8 12.91 0.00
0.00 944,8 12.9 1
0.00
0.00
13.290.29 0.00 0.00
13,290.29

DISTRICT SCHOOL BOARD O F DUVAL COUNTY
SCllEDULE OF REVENUES, EXPENDITURES, AND CHANGES IN FUND BALANCES - BUDGET AND ACTUAL CAPITAL PROJECTS FUND------For the Fiscal Yeu Ended J une J O, 2010
Accowit Budl!eted Amounts Number Oriuinal Fino I
REVENUES Federal Direct 3100 Federal 'Throullh State and Loc:il 3200 State Sources 3300 4,308,629.45 5.899.235.08 local Sources:
Property Ta.<es Levied for Oocratiomll Purposes 34 11 Property Taxes Levied for Debt Service 34 12 Property Ta.xes Levied fo r Capi1al Proiec1s 34 13 88,684,056.00 89.479.146.33 Local Sales Taxes 34 18 Chnr11es for Service - Food Ser"ice 345X Impact Fees 3496 Other Locnl Re\'enue 286,356.51 4,32 1,350.13 Total Local Sources 3400 88,970.412.5 1 93,800.496.46
Total Revenues 93,279,04 1.96 99,699.731.54
EXPENDITURES Current:
Instruction sooo Pupil Per.;onnel Services 6100 lns1ruc1ionnl Media Se rvices 6200 lnstruc1ion and Curriculum Development Services 6300 lns1ructional S1afTTmining Services 6400 lns1ruction Rela1ed Technology 6500 School Boord 7100 General Administralion 7200 School Admirustration 7300 Focili1ies Acquisi1ion and Construction 7410 38.489.050.18 38,489,050.18 Fiscal Services 1500
Food Services 7600
Ccnlral Services 7700 Puoil Transoortation 7800 Operation of Plant 7900 Moinlcnance of Plant 8100 Administralivc Technology Services 8200 Commwiity Services 9 100
Debt Service: (F1111c1/011 9200)
Re1ircment of Principal 710
ln1ercst 720 Dues. Fees and Issuance Costs 730 2.371.30 Miscellaneous Expenditures 790
Capital Outlay: Facilities Acquisition and Construction 7420 176,748,753. 11 214.429,047.25 Other Capital Outlay 9300
Total Expenditures 21 S,237,803.29 252,920,468.73
Excess (Deficiency) of Revtnues Over (Under) Expenditures ( 121.958.761.33) (153.220,737.19)
OTHER FINANCING SOURCES (USES) Lon11-Term Bonds Issued 3710
Premium on Sale of Bonds 3791
Discowi1 on Sole of Bonds 891
Refundin11 Bonds Issued 3715 Premium on Refundinu Bonds 3792
Discowil on Refundinl! Bonds 892 Certificoles of Participotion Issued 3750 27.220,000.00 67,284.713.69
Premium on Certificotes of Particiootion 3793
Discount on Certificates of Participation 893 Loans Incurred 3720 Proceeds from 1he Sale of Capital Assets 3730 370.000.00
Loss Recoveries 3740
Proceeds of Forward Suoolv Conlract 3760
Special Facil ities Construction Advances 3770
Payments 10 Refunded Bond Escrow Aj\en1 (Function 92991 760
Transfers In 3600
Transfer.; Out 9700 (47,884,496.56) (59.632,859. 14)
Total Other Financin2 Sources (Uses) (20,664,496.56) 8,02 1,854.55
SPECIAL ITEMS
EXTRAORDINARY ITEMS
Net Chane:• in Fund Balances ( 1·12,623,257.89) ( 145.198,882.64)
Fund Bolanccs, Julv I. 2009 2800 167,917,993.79 165,973.407.63
Adius1men1 10 Fund Balances 2891
Fund Balances. June JO, 2010 2700 25,294.735.90 20.774,524.99
ESE 145
Actual Amounts
5.899,235.08
89.479. 146.33
4.321.350.13 93,800.496.46 99,699,731.54
38.489,050. 18
113.409.709.98
IS 1.898,760.16 (52, 199,028.62)
67.284.713.69
370,000.00
(53,829,880.91) 13.824,832. 78
138,374. 195.84) 165,973,407.63
127.599,211.79
Exhibit G-3 Page.JS
Variance with Final Budget -
Positive (NeJ.l3li\'e)
0.00 0.00
0.00
0.00 0.00 0.00 0.00 0.00 0.00 0.00 0.00 0.00
0.00 0.00 0.00 0.00 0.00 0.00 0.00 0.00 0.00 0.00 0.00 0.00 0.00 0.00 0.00 0.00 0.00 0.00
0.00 0.00
2.371.30 0.00
IOl.019,337.27 0.00
101 ,021,708.57 101.02 1.708.57
0.00 0.00 0.00 0.00 0.00 0.00 0.00 0.00 0.00 0.00 0.00 0.00 0.00 0.00 0.00 0.00
5,802,978.23 5,802,978.23
0.00
0.00
106.8H.686.80 0.00 0.00
106.824,686.80

DISTRICT SCHOOL BOARD OF DUVAL C O UNTY SCHEDULE OF REVENUES, EXPENDITUR ES, AND CHANGES IN FUND BALANCES - BUDGET AND ACTUAL
P ERMANENT FUNDS For the Fisca l Year Ended June J O, 2010
Account Bud2c1ed Amounts Number Original Final
REVENUES Federal Direct 3 100
Federal TllfOUAA State and Local 3200
Stale Sources 3300
local SotJrces: Proocrtv Tnxe• Levied for Operationa l Purposes 34 11
Proocrtv Tnxes Levied for Debt Service 34 12 Property Tnxes Levied for Caoital Proiects 34 13
Local Sales Ta.xes 3418
Charges for Service - Food Service 345X
Impact Fees 3496
Other Local Revenue Total Local Sources 3400 0.00 0.00
Total Revenu05 0.00 0.00
EXPENDITURES Current:
Instruction 5000 ' Pupil Personnel Se rvices 6 100
Instructional Media Services 6200 Instruction and Curriculum Development Services 6300 Instructional StaffTrainin11 Services 6400 Instruction Related Technolo!!Y 6500
School Board 7100
General Administration 7200
School Administration 7300 ..... Facilities Acauisition and Construction 7410 --Fiscal Services 7500 .. , .. , Food Services 7600 .... ""6•' C entral Services 7700 .. ,, ' ... Pupil Transportation 7800 ... ~-T Operation of Plant 7900 Maintenance of Plant 8100 a.r'-U' Administrntive Technology Services 8200 ~,-Community Services 9100 _ l-- ..
Debt SenJicc: (fimc11011 9200)
.~l"'~ Retirement of Principal
Interest _ .... '6W~ •
Dues. Fees and Issuance Costs - - .. ~u Miscellaneous Expenditures .............. ~ 790
Capital Outlay: ............ , ........ "' Facilities Acquisition and Construction ~n,- 7420
Other Capital Outlay , .. 9300
Total E•pcnditure5 0.00 0.00 E•cC55 (Deficiency) of Revenues Over (Under) E•penditures 0.00 0.00
OTHER F INANCING SO URC ES (USES) Long-Term Bonds Issued 3710
Premium on Sale of Bonds 379 1
Discount on Sale of Bonds 891
Refundinu Bonds Issued 3715
Prcmiwn on Refundinu Bonds 3792 Discount on Rcfundin11 Bonds 892
Certificates of Participation Issued 3750
Premium on Certificates of Participation 3793
Discount on Cert ificates of Participation 893
Loans Incurred 3720 Proceeds from the Sale of Capital Assets 3730
Loss Recoveries 3740
Proceeds of Forward Supplv Contrnct 3760
Special Facilities Construction Advances 3770
Pavmenls to Refunded Bond Escrow Aitent (Function 9299) 760
Transfers In 3600
Transfers Out 9700
Toto! Other Financing Sources (Use5) 0.00 0.00
SPECIAL ITEMS
EXTRAORDINARY ITEMS
Net Chan~e in Fund Balances 0.00 0.00
Fund Balances. July I, 2009 2800
Adiustmcnl to Fund Balances 2891 Fund Balances. June 30. 20 I 0 2700 0.00 0.00
ESE 145
Actual
Amounts
0.00 0 .00
.... .... , ... ... .... ~,.
..... •
0.00
0.00
0.00
0.00
0 .00
fahib it G-4 Pa gc J 6
Varioncc with Final Budget -
Positive (NcJtalivel
0.00
0.00 0.00
0.00 0.00 0.00 0.00 0.00
0.00 0.00
0.00 0.00
0 .00 0.00 0.00 0.00 0.00 0.00 0.00 0.00
0.00 0.00
0.00 0.00 0.00 0.00 0.00 0.00
0.00 0.00
0.00 0.00 0.00 0.00
0.00
0.00 0.00
0.00
0.00 0.00
0.00 0.00
0.00 0.00 000 0.00 0.00
0.00 0.00
0.00 0.00
0.00 0.00
0.00 0.00 0.00
0.00
0.00
0.00 0.00
0.00 0.00

"'"~ ~ ,,,,, •••••••• ~~ ~ •••••••••••••••••• !!
f
f

DIS
TR
ICT
SC
HO
Oi.
DO
AR
D O
F D
UV
Ai.
CO
UN
TY
C
OM
BIN
ING
ST
AT
EM
EN
T O
t' R
EV
EN
UE
S. E
XP
EN
SE
S, A
ND
CH
AN
GE
S I
N F
UN
D N
ET
AS
SE
TS
NO
N M
AJO
R E
NT
ER
PR
ISE
FU
ND
S
For
th•
Fis<
lll Y
ur E
nd
rd J
ua•
JO. 2
010
Acc
:oun
1 S
dr-
lnsu
ranc
c C
onso
rtiu
m
ScJf.
Jnsu
ranc
c Con
son
ium
Sel
f-In
sura
nce
Con
soni
um S
elf-I
nsur
ance
Con
sort
ium
S
dr-
lnsu
ranc
c C
onso
rtiu
m
01hc
r E
nter
pris
e Pr
ogra
ms
Num
ber
OP
ER
AT
ING
RE
VE
NU
ES
C
har..
:cs
for
Scrv
icC5
34
81
Cha
r~cs
for S
oles
34
82
Prem
ium
Rev
erw
c 34
84
01he
r O.
..,.
tin~
Rev
enue
s 34
89
Tot
1I O
ptn
oti
ng
Rtv
.nut
s
OP
ER
AT
ING
EX
PE
NS
ES
Sola
ries
10
0
Emal
ovcc
Ben
efit
s 20
0 P
urch
ased
Sm
.ice
s 30
0 E
nerc
v S
ervi
ces
400
Mat
cri.i
ls a
nd S
uool
ics
soo
Cao
ilOIO
utla
v 60
0 O
th•r
Ex..
...,,..,
70
0 D
corc
ci1u
ion/
Arn
oniu
uio
n 78
0
To11
J O
ptra
lin,::
£1.
ptn.
so
Op
erat
ing
Inco
me
(Lo
n)
NO
NO
PE
RA
TIN
G R
EV
EN
UE
S (E
..'l:P
EN
SE
S)
lnt41
:.rcs
t R
even
ue
343
0
Gif
ts.
Gro
nu an
d ""'u
csts
3~
Mis
cella
noou
s L
ocal
Sou
rces
34
9S
Los
s R
.cco
vcri
cs
3740
G
ain
on D
i<nl
'lsiti
on o
f A.5.
54.:ls
37
80
Inte
rest
ExD
ensc
72
0 M
isce
llane
ous
Exo
cnsc
79
0 L
oss
on
Dis
oosi
tion
of A
sset
s 81
0 T
otal
Noaopcratin~ R
t•tn
uts
(E
xp
tnst
s)
lnco
m•
(Lo
ss) ll
do
tt O
po
ntl
ng
Tn
nsf
•n
Tra
nsfe
rs In
3
60
0
T~sfcrsOu
1 97
00
SP
EC
IAL
IT
EM
S
EX
TR
AO
RD
INA
RY
IT
EM
S
Cbaa~• l
a N
•t A
nds
N
et A
sset
s -
July
I.
2009
28
80
Adi
usun
cnl
to N
et A
sset
s 28
96
Net
Ass
ds
·Ju
no 3
0. 2
010
278
0
The
11c
com
pany
ing
nol
cS 10
fim
mcio
l sut
tcm
cnts
arc
an
inte
gral
pan
of t
his
stat
emen
t E
SE 1
4S
911
91
2
0.0
0
0.0
0
0.0
0
0.0
0
0.0
0
0.0
0
0.00
0.
00
0.0
0
0.0
0
0.0
0
00
0
0.0
0
0.0
0
0.0
0
0.0
0
0.0
0 -
0.0
0
....
Ol'H
l. ....
. _ ...
. ___ ......
-·-··-
.....
II
-.
1 •--
.n-
' -0
00
0.
00
0.0
0
0.0
0
0.0
0
00
0
0.0
0
0.0
0
0.0
0
0.0
0
913
914
91
S
92
1
0.0
0 0.
00
0.00
0.
00
0.0
0
0.0
0 0.
00
0.00
0.
00
0.0
0
0.0
0
0.0
0
0.0
0
0.0
0
0.0
0
0.0
0
00
0
0.0
0
0.0
0
0.0
0
0.0
0
0.00
0.
00
0.
00
0
00
0.00
-
.. \Vi
i 0
.00
0.
00
0.
00
0.0
0
0.0
0
0.00
0
.00
• -
--
0 0
. 00
0
.00
0
.00
~~ -.~-91
.Wll
0.0
0
0.00
0
.00
.oo-•
-o.o
o 0
.00
0
.00
0.0
0
• II
...
. 00
-
0.00
0.
00
0.00
.II
.um
•
-l
mix
0
.00
0.
00
0.
00
•
oo -
0.0
0
0.0
0
0.0
0
0.00.:-j~ ~ -
o.oo
0.0
0
0.0
0
0.00
0
.00
0.
00
0.
00
0.
00
.. , .. id~
··
0.0
0
O.Q
i 0
.00
0.
00
m
n_n
m,_
. -•'9
'0.0
0 0
.00
0
.00
0.
00
•.IX
ll ••
l --
0.0
0
0.0
0
0.0
0
0.0
0
!l..0
0' ,.-
0.0
0
0.00
0.
00
0.0
0
~
0.00
0.
00
0.00
0
.00
0
.00
0
.00
0.
00
0.0
0
0.0
0
0.0
0 0,
00
00
0
0.0
0
0.00
0
,00
00
0
0.00
0.
00
0
.00
0.
00
00
0
0.0
0
0.0
0
0.0
0
00
0
0.0
0
0.0
0
0.0
0
0.0
0
0.0
0
00
0
0.0
0
0.0
0
0.00
0.
00
0.
00
0.
00
0
.00
0.
00
0.0
0
0.0
0
0.0
0
0.0
0
0.0
0
0.0
0
0.0
0
0.0
0
0.0
0 0.
00
0.
00
0.
00
0
.00
0
.00
0.0
0
0.0
0
0.0
0
0.0
0 0
.00
0.
00
0
.00
0
.00
0.
00
0.00
0
.00
0
.00
0
.00
0.
00
0.
00
0
.00
Oth
er E
nter
pris
e P
rogr
ams
922
0.0
0
0.0
0
o.oo
0.0
0
00
0
0.00
0
.00
00
0
0.0
0 0
.00
0.0
0
0.0
0
0.0
0
0.0
0
0.0
0
0.0
0
0.0
0
0.0
0
0.0
0
0.00
0.
00
0.0
0
0.0
0
0.0
0
0.0
0
00
0
0.0
0
0.0
0
00
0
0.0
0
0.0
0 0.
00
0.
00
Esh
ibit
H-2
Pi
g•
38
T 01
&1 N
onm
ojor
E
ntcm
rise
Fun
ds 0
00
0
.00
0
.00
0
.00
0
.00
0.0
0
0.0
0
0.0
0
00
0
0.0
0
0.0
0
0.0
0
0.0
0 0
.00
0. 0
0
0.0
0
0.0
0
0.0
0
00
0
0.0
0
0.0
0
0.00
0
.00
0.0
0 0
. 00
0
00
0.
00
0.0
0
0.0
0
0.0
0
00
0
0.0
0
0.0
0

~~,. 888888 8888888888888888888888 88 ~~ 8888888 8888888 ~~+=F--+=F-=i.I
•••••••••••••••••••••••••••• 8! ,-::jt~ •••• !!!!!!! H-H-++-+-++-f-H-l--+-++-f-H-l-++-+-f-H-1--+-+-~~.~==
p~popp
888888
..... 88 8 881=;,8 8888888
0
g
PPPPPPP 8888888

I
;; s ~88888888888888888
pp PPP pp 00 pp c a
pp .op pp 88
00
88 8H cc oc
88 "" 88 88 88 88 88 oc pp po pp po ppc
88 888 88 88 88 8 88 88 88 88 88 88 88 88 88 88 88 88 888
!r " H ~
88 PPP
a 88 88 p
a pp pp pp
88 88 op
H8 88 88 88 a 88 a a a 88 a 88 a pp PP ppo
888 8 88 88 88 88 88 88 888
IC' ;;
;;r ~
88 888 H a a 8 a pp pp
88 88 a a 888 0 0
88 88 00 00
88 88 a 00 pp
a po
8~ pp PPP
88 88 88 88 88 88 88 88 88 888
ceeocc c 888888 8
J l ~ g Q
.. i: ~
88 a PP PPP p ="" p
a pp
88 pp
88 pp 00
88 a a a 88 pp
88 888 pp pp pp cc op
8 88 888 8 ~8 88 88 88 88 88 88 88 88 88 88
~1 !!' ~·
~
~ I"
!a t ls p
88 ooc c .. 0
a 88 00 00
888 H 88 Oc cc oc
88 PP ppc cc oc ??
~ 8 888 8 ~8 88 88 g 88 88 88 88 888 88 88 88
H ~;:
H
·i !;

DIS
TR
ICT
SC
HO
OL
BO
AR
D O
•' D
UV
AL
CO
UN
TY
C
OM
BIN
I NC
ST
AT
EM
EN
T O
F R
EV
EN
UE
S, E
XP
EN
SE
S, A
ND
Cll
AN
GE
S I
N F
UN
D N
ET
AS
SE
TS
INT
ER
NA
L S
ER
VIC
E F
UN
DS
Fo
r tb
t F
isca
l Y
ur
En
dtd
Ju
ne JO
, 201
0
Acc
ount
N
umbc
:r
OP
ER
AT
INC
RE
VE
NU
ES
Ch.
rues
for
Ser
vice
s 34
81
Cha
mcs
for S
ales
34
82
Pre
miu
m R
even
ue
3484
O
ther
Ooc
ratin
u. R
evc.n
ui:s
14
89
Tot
al 0
1>er
atiu
1e I
Uvc
nua
O
PE
RA
TIN
C E
XP
EN
SE
S
Sal
arie
s 10
0 E
mpl
ovcc
Ben
efit
s 20
0 P
urch
ased
Ser
vice
s JO
O
Encn
.'V S
cr\'i
ccs
400
Mat
eria
ls a
nd S
uppl
ies
500
Cap
ital
Out
lay
600
Oth
er E
xrvo
nscs
10
0 D
corc
ciat
iooJ
Am
oniz
atio
n 78
0 T
olJl
l Op
<nti
ng E
1pt
n><S
Ot>t
"ral
ittg
lncom~ (
Lou
) N
ON
OP
ER
A T
lNC
RE
VE
NU
ES
(E
XP
EN
SE
S)
lnte
rcsc
Rev
enue
34
30
Gif
\s. G
rant
s an
d B
caue
s1s
3440
M
isce
llan
eous
Loc
al S
ourc
es
349S
L
oss
Rec
over
ies
1740
G
ain
on D
isoo
sitio
n of
Ass
ets
1780
In
tere
st Exocn~
720
Mis
cell
aneo
us E
xocn
sc
790
Los
s on
Dis
oosi
tion
of A
sset
s 8
10
To l
Jll N
on
op
tnti
ni R
rvcn
uu
(E
1p<n
•u)
ln<
omt (
Los
s) O
.fo
rt O
pcn
uin
R T
ran
•frn
Tra
nsfe
rs In
16
00
Tra
nsfe
rs O
ut
9700
S
PE
CIA
L I
TE
MS
EX
TR
AO
RD
INA
RY
ITE
MS
Cb1
n2c
lo N
tl A
sscl
s N
et A
sstt
s -
Julv
I.
2009
28
80
Adi
ustm
ents
to
Ntt
Ass
ets
2896
N
et A
sscU
-Ju
ne
30, 2
010
27
00
The
acc
ompa
nyin
g n0
tcs
10 f
in:in
ci3.
l suu
crnc
:nts
arc
an
inte
gral
pan
o(t
hi1
s1at
cmen
t
ES
E 1
45
Scl
r-ln
wro
ncc
711
0.0
0
0.0
0 1,
768,
831.
28
498.
793
.78
2,26
7,62
5.0
6
0.00
0.
00
5,
269.
44
0. 0
0 0
.00
0.0
0 J.
864,
045.
99
00
0
J,86
9,3
15.4
3 (1
,601
,690
.37)
859.
739.
46
0.00
0.
00
0
00
0
.00
0
.00
0.00
0
. 00
859,
719.
46
(741
,950
.91)
0.00
0.
00
0.00
0.00
1741
.950
.91
26,2
36,5
59.4
3 0.
00
2S
.494
,608
.52
Sel
f-In
sura
nce
ScJr
.. Jns
uran
cc
712
713
0.00
0.
00
106,
191,
846.
9-1
3,65
9.17
4. 75
10
9,85
1,02
1.69
13S.
021.
SO
44,2
59.0
9 6,
951,
906
10
0.00
0.
00
0.00
I 0
1. 78
0,65
0.86
0
00
10
8,91
3,81
7.SS
91
7,18
4.1
4
856,
3866
4 0
.00
0.00
0.
00
0.00
0.
00
00
0
0.0
0
856,
386.
64
1.79
3,57
0 78
6.
910,
307.
42
(5.7
07,7
84.9
21
0.0
0
0.00
2. 9
96,0
93.2
8 20
,141
,946
74
0.00
2)
.138
,040
.02
Sel
f-In
sura
nce
Sd
f-ln
sura
ncc
Con
soni
um P
rogr
ams
714
71S
73
1
0.00
0
00
0
00
0
.00
0.00
0.
00
0
.00
0.
00
0.00
0
.00
0.0
0 0.
00
0.0
0
0.0
0 0
.00
0.00
0.
00
0
.00
0.0
0 0.
00
0.0
0
0.00
0.
00
00
0
0.00
0.
00
0.00
0.
00
0.00
0.
00
0.00
0
.00
0.00
0.
00
0.
00
0,0
0 0.
00
0.0
0
0.0
0
0.0
0 0.
00
0.0
0
0.0
0
0.0
0 0.
00
0.0
0
0.0
0
0.00
0
00
0
.00
0.0
0 0.
00
0.0
0
00
0
0.00
0.
00
0.0
0
0.00
0.
00
0.00
0.0
0
0.00
0.
00
0.0
0
0.0
0 0.
00
0.00
0.
00
0.
00
0.00
0.
00
0.0
0 0.
00
0.00
0.
00
0.0
0 0.
00
0.0
0
0.00
0
.00
0.00
0
.00
0
00
0.
00
0.00
0
.00
0
.00
0.
00
0.00
0
.00
0.
00
0.
00
0.00
0
.00
0,0
0 0.
00
0.00
0
.00
0.0
0 0.
00
0.0
0
0.00
0.
00
0.00
0.
00
0.
00
0.00
0.
00
0. 0
0
0.00
0
00
0.
00
0.00
0
00
0.
00
0.0
0
0.00
0.
00
0.00
0
.00
0.00
0.
00
0.
00
0.00
0.
00
00
0
0.0
0
0.0
0 0.
00
00
0
0.0
0
0.0
0
Oth
er ln
tcm
al S
ervi
ce
791 68
3,14
2.72
0.
00
0
.00
0
.00
683,
142.
72
249,
891.
71
90,1
19.7
5 87
9,3S
6.S7
0.
00
207,
782
.37
0.0
0
0.0
0
0.0
0 1,
427,
350.
42
(744
,207
.70)
(1.1
65.4
8)
0.0
0 0.
00
0.00
0.
00
0.0
0
00
0
00
0
(1,3
65.4
8)
(745
,571
.18)
54
1,)1
2.1
2 0
. 00
0.0
0
00
0
(204
,260
.86
204,
260.
86
0.
00
0.0
0
Eah
ibit
11-
5 l'
agt 4
1
To1a
l Int
erna
l Se
rvic
e F
unds
6&3,
142.
72
0.00
10
7.96
0,67
8.22
4,
I S7.
968.
SJ
112,
801,
789.
47
184.
913
23
ll4.
S78
&4
7,83
8,53
2.11
0
00
20
7,78
2.37
0.
00
105,
644,
696.
85
00
0
I 14,
210
,503
AO
(1
,408
,713
.93
)
1.7
14,7
60.6
2 0
00
0.
00
0.00
0
00
0.
00
00
0
00
0
1,71
4,7
60 6
2 )0
6,04
6.69
7,45
1,6
19.7
4 (5
.707
,784
,92)
00
0
00
0
2,04
9,88
1.S
I 46
,582
,767
. 03
0.00
48
,632
.648
. S4

DIS
TR
ICT
SC
HO
OL
llO
AR
D O
F D
UV
AL
CO
UN
TY
C
OM
BIN
ING
ST
AT
EM
El'
ff 0
~ C
AS
H •
'LO
WS
IN
TE
RN
AL
SE
RV
ICE
.-U
ND
S Fo
r ll
lc F
ix•I
Va
r E
atk
d J
Hc
lU. ?
UIO
Ct.
Sii
FL
OW
S t-
ilO
M O
rtll
AT
INC
AC
TIV
ITIE
S
Rcc
c:1o
ts fr
om c
:uuo
mc:
n an
d us
c:n
Rccc
iDt.S
fro
m t
nlaf
und
scrv
icci
DfO
\Wk
d
r:l\
lnC:
nlS
10
suoo
licn
P
l'·m
cnlS
to
c:zn
olo\
"CC:
S Pl
l\-m
cnls
for
int
crfu
nd K
nil
;C'I
use
d O
ther
rccc
1Dts
fonm
cnts
} Ni
.:1 u
sll
,,ro
,·idc
d (
Htd
) b
y on
tt•t
i•se
. 1cc
hiti
cs
CA
Sll
FL
OW
S F
RO
M N
ON
CA
PIT
AL
FIN
AN
CIN
G A
CT
IVIT
IES
S
ubsi
dia
froo
1 nn
l"'l""
'luni:
. un
ni.
I
Tra
nsfe
rs fr
om o
lhcr
fun
ds
Tra
nsfe
rs 1
0 O
lbcr
fun
ds
Net
c.u
l pt'O
\idn
t (H
al)
b)· m
u•u
pil
al fi
1a1c
i1c
1-ct
M1i
cs
CA
Sll
FL
OW
S F
RO
M C
AP
ITA
L A
ND
RE
LA
TE
D
FIN
AN
ON
G A
CT
IVIT
IES
Pr
ocee
ds fr
om c
.ao1
ul d
ebt
C3D
1lal
coo
uibu
tion.
s P
toco
:ds
from
dll-
ocui
tion
of C
IM'lit
aJ ll
UC
lS
Ac:
aui1
i1ioo
and
coa
.str
ucli
on o
f c:m
itAI t
llSC
tJ
Prin
crnJ
..1 o
:Ud
on c
.;ioil4
1 de
bt
lnle~I o
:iid
on c
aoila
.I de
.bl
Net
ca~ 1
1ro\
·idcd
( .. au
b)· c
avi1
al H
d rt
.l11c
d fi
1Hci
a1: a
c1i,·
hin
C
AS
H F
LO
WS
FR
OM
IN
VE
ST
ING
AC
TIV
ITIE
S
Pro
co:d
s fr
om s
.aks
and
m11
1mlie
1 o
r in\
UU
nc:n
lS
ln1c
rcs1
Ind
d.i,·
tdcn
d.J R
:Cc.
ind
Purc
:h:a
s.c o
f in\
cst.m
cnls
N
et u~ll p
nn
idal
(•ti
ed)
b)' i
1\·a
1i1
iacth
i1iu
N
CI i1
creu
c (d
«rc
a.K
l i1
c..,1
1 H
d t:
bll
H•i
nk
eu
C
.h a
nd
ca
ih O
lui\
·alc
nts
• Ju
lv l
, 200
9 C
uh
and
ca.
ti c
qu
h·ak
.nts
·Ju
no
30.
201
0
Rtt
0ac
ilia
tio•
of 0
1~nt
i1i;
: iuon~ (
Ion
) to
1ct
c.u
tl p
rO\i
dcd
(•R
d)
by 0
11
tnti•
tt 1
cth
itio
: O
ocnt
ing
inco
me
(So
u)
.Alfj
w1m
i:n1,
; 10
ucv
nd
l1: o
puol
ing
1ncC
J.nw
(Io
n)
10 n
d c
ash
prow
d<d
(u.r
cd)
by op
a1
1Jin
g O
C1/\'
lltts
• O
..:-n
rccl
atio
n/A
m01
11Ll
lKM
I C:\
DC
nSC
Com
mod
ities
use
d fr
ona
USD
A ..
......
.......
.. C
hang
e tn
an
cu
on
d liu
b1/1
11u:
(l
ElU
CUC
) dcc
rc.a
sc i
n ac
coun
ts r
ci;c
1nbl
c
<ln
au
Kl ~ '"
iA&
aQ
C n
:ICC
:t\ab
lc
Cln
ausc
)dcc
:n:.
uc
in d
ue fr
om rr
in11&
1U"
(lnc
rcue
) dc:
ctc.
asc
ia d
cnm
il.s
n:cc
1nb)
c (lo
crc:
a.s.c:
) dcc
:rcas
c ln
d~ fr
om
oth
er fu
ads
((n
acu
c) d
ccn
:uc
i.n d
ue fr
om o
ther
age
ncie
s ct
ncrc
AK
:)dc
cn:-
ucin
in
\a)l
on·
<
ln'"
.ucl
dec
reas
e: i
n ...
..... a
id il
cms
lncr
cllle
(dcc
rcllS
C) i
n nl
llli
cs A
r\d b
cndi
l.$ P
ilvab
lc
ln.;n
:uc:
Cdc:
('.rc
.uc)
in P
•l\TI>
ll ta
x tia
bili1
M.-i
Incr
ease
(dec
reas
e) 1
n ..:
coun
ts p
a,ab
lc
Incr
ease
(dc
:tse:
uc) i
n iu
ditm
cnlJ
IJ.J\
"1bl
c In
crea
se (d
caca
,;c)
in ~cs t.
:a..~
p2'·1
1bk
Incr
ease
(dcc.rc~) ia
aca
ual
1n1a
nt
oa,
·ab
k
Incr
ease
: (do
c::rQ
SC) i
n ~i
ls P
oJ\·a
bk
In
crea
se (d
c:cn
:;uc)
an
du
e'°
othe
r fu
nds
Incr
ease
(dc:
ctt.a
sc)
1n d~ t
o O
l.hcr
.a1?
coci
cs
lncr
cuc
(dcc
rc»
e) in
dcf
aTC
d f'C
\cnu
c In
crea
se (c
b:n
;a.s.
c:) in
atim
:aac
d un
oaid
d:1
uns
Incr
ease
(dec
reas
e) in
cst
inH
lcd
liabi
liw ro
r cla
ims
mliu
11m
cn1
c:xo
cruc
T
ul•
l •dj
us;u
ncl
ls
Net
cu
ll p
ru\i
dcd
Cu.
al)
b) upcrali
•~ a
cthi
lics
No1
taJl
a il'c
-iti
11..
n11i
t1d,
11
d lia
uci
ai a
cli,
itk.."
"S:
llon
vw
1n1t
unde
r c:
1p
1u
l lc
:IUC
Coa
lrib
ulio
n.s
of c
.JDita
l :u;
scts
Pu
rc-b
:uc
of Q
.lUJD
UICf
tl on
ICC
O\l.n
l C
ap11
al t
iSC
:I t
radc
-iru
N
cl ln
cra.
sdt'D
ccru
i.c)
1n
the
fair
\~uc o
f tn\
Olm
cnU
C
omm
od.a
ucs n
x:ch
cd d
uout
i.h U
SD
A""
"'""
'
The:
acc
omp.
an)io
C n
olcs
to fi
nain
c1al
sw
cmcn
u ar
c u
inLq;.
1"1.J
~of lh
i.s s
llkm
cnL
ES
E 14
S
Sd
f-ln
sur.m
cc
Scl
f·hu
ur.>
nc<
Sclf
·Wur
anc:
c 71
1 71
2 71
3
0.0
0
00
0
I.I 1
6.ll
6.2
1 I I
OJ9
7.8
76
.2?
(171
.01)
(1
0.62
7.12
9.39
) 0.
00
(I 7
9.21
0.l9
) (4
.841.l~
.99)
(98,
I 86.
I 67.
6l)
0.0
0
0.00
(3
,72l
.20
'J.1
6)
I AO
l.29
1.l9
0.00
0.
00
0.00
1.
202.
122.
lO
0.0
0
0.0
0
00
0
1.2
02
.m.s
o
0.0
0
0.0
0
0.0
0
0.0
0
0.0
0
0.00
0.
00
0.
00
0.
00
0.
00
0.0
0
0.00
0.
00
0.
00
2.16
l.H
0.4
U
43
J2
U94
.93
U9
.739
.46
U6
Jl6
.64
0.0
0
141.
9ll
.ll9
4ll
3.I
D.2
09.
16
2.
229.
662.
12
(0.0
0
03
7.4
13
.21
290.
000.
00
0.
00
29
0.00
0.0
0
U3
HS
J.2
1
(1.6
01.6
90.3
7)
93
7.I
H.1
4
0.0
0
0.00
0.
00
0.
00
00
0
62
l.0
9l.
91
0.0
0
171,
241.
JI)
(799
.066
. ll
0.0
0
0.0
0
0.0
0
0.0
0
0.0
0
fJl2
.00
2.7
0
0.0
0
0.0
0
0.0
0
o.o
o
0.0
0
0.0
0
0.0
0
0.00
0.
00
S.
091.
36
(3
.673
.223
.291
0.
00
0.
00
0.
00
0.
00
0.0
0
0.00
0.
00
0.
00
0
00
0.
00
0.0
0
0.0
0
0.0
0
0.0
0
(977-'~9
.00)
3.S
9HIJ.
21
0.0
0
0.00
(2
.123
.'19
.49
) 46
!.llH
S C
3.72
U0
9 8
6)
1.40
S.29
8.l
9
0.00
0.
00
0.00
0.
00
0
00
0.
00
0.
00
0.
00
00
0
0.0
0
0.0
0
0.0
0
Sclf·
lnsW
>llC
C
Scl
f·lo
swu
cc
Coa
.sor
uum
Pfo
cram
s 71
4 7
1l
731
0.0
0
0.0
0
0.0
0
0.0
0
0.0
0
0.0
0
0.0
0
00
0
00
0
0.00
0.
00
0.
00
0,0
0
0.00
0.
00
0.
00
0.
00
0.00
0.
00
0.
00
00
0
0.00
0.
00
0.0
0
0.00
0.
00
0.00
0.
00
0.00
0.
00
0.
00
0.
00
0.
00
0.
00
0
.00
0.
00
0
00
0.
00
0.
00
0.
00
0.
00
0.
00
0.
00
0.
00
0.0
0
0.0
0
0.0
0
0.00
0
00
0.
00
0.
00
0.
00
0.00
0.
00
0.
00
0.
00
0.00
0.
00
0.
00
0.
00
0.
00
0.00
0.
00
0.0
0
0.00
0.
00
0.
00
0.0
0
0.00
0.
00
0.0
0
0.0
0
0.0
0
0.0
0
0.0
0
0.0
0
0.0
0
0.0
0
0.0
0
0.0
0
00
0
00
0
0.0
0
00
0
00
0
0.0
0
0.0
0
0.0
0
0.0
0
0.0
0
0.0
0
0.0
0
0.0
0
0.0
0
0.0
0
0.00
0.
00
0.
00
0.
00
0.
00
0.00
0.
00
0.00
0.
00
0.00
0.
00
0.00
0.
00
0.
00
0.0
0
0.00
0.
00
0.00
0.
00
0.
00
0.
00
0.
00
0.
00
0.
00
0
00
0.
00
0.
00
0.
00
0.
00
0.
00
0.
00
0.
00
0.
00
0.0
0
0.0
0
0.0
0
0.0
0
0.0
0
0.0
0
0.0
0
0.0
0
0.0
0
0.00
0
00
0.
00
0.
00
0.
00
0.
00
0
00
0.
00
0.
00
0.
00
0.00
0.
00
0.
00
0.
00
0.
00
0.00
0.
00
0.
00
0.
00
0.
00
0.
00
0.0
0
0.0
0
0 00
0.
00
0.00
0.
00
0.
00
0.
00
0.00
0
00
0
00
0.
00
0.
00
0.
00
0
00
0.0
0
0.0
0
0.0
0
00
0
0.0
0
··o.
oo
0.
00
0.
00
0.
00
0.
00
0
00
0.
00
0.
00
0
.00
0.
00
0.
00
0
.00
0.
00
0
,00
0
.00
0
.00
0
.00
0.
00
0
.00
0.
00
0
,00
0.
00
0.0
0
0.0
0
0.00
0.
00
0.0
0
0.00
0.
00
0.
00
0.0
0
0.0
0
0.0
0
0.00
0.
00
0.
00
0.
00
0
00
0.
00
0.
00
0.
00
0.
00
0.0
0
0.0
0
0.0
0
0.0
0
Oth
er ln
Jcrn
ll S
cn-io
c 79
1
613.
142 n
0.0
0
(993
.136
.73
(34
0.2
11
.0
0.0
0
0.0
0
(6l0
.90
H9
)
0,0
0
Hl.
00
6.12
0.
00
l41
.00
6.12
0.0
0
0.0
0
0.0
0
0.0
0
0.00
0.
00
0.
00
111.
2<>1
.ll
11.3
61.4
1 0.
00
10
9.19
1.6
7
(0.0
0
00
0
(0.0
0)
(744
.20
7.70
)
0.0
0
0.0
0
0.00
0.
00
0.
00
0
00
0.0
0
0.0
0
0.0
0
0.0
0
0.0
0
o.o
o
93
J02.
21
0.0
0
0.00
00
0
00
0
0.0
0
00
0
00
0
0.00
0.
00
93.3
02.2
1 (6
l0.9
0H
9l
0.0
0
00
0
0.0
0
0.0
0
0.0
0
0.0
0
Es:
bibi
t H
-6
hr;
c4
l
To
ul I
nter
nal
Scn
ice
Fund
•
613,
142.
n 11
1.l
14.
432.
43
111.
621.
137 .
20)
ll19
,492
.07)
C
IOl,0
27
762
.64
) 0.
00
(2
.970
,11
6.76
)
0.0
0
l.7
43
.}2
9J2
0.
00
l.
743.
l29.
32
0.00
0.
00
0.0
0
0.0
0
0.0
0
0.0
0
0.0
0
46JO
l.l2
9A
I 1.
71
06
0.6
2
141.
9ll
.11
9.4
ll
6.0
1H
.no
.u
03
7.4
83.2
1 29
0.00
0.0
0
l.12
7.41
3.21
(1.4
08.7
13.9
3)
0.0
0
00
0
62
l.0
9l.9
1 17
1.24
1.JI
) (7
99
06
6.ll
l 0.
00
0.
00
(J
l2.0
02
. 70
) 0.
00
0.
00
0.
00
0
00
!3.l7
H22
. n1
0.0
0
0.0
0
0.0
0
0.0
0
0.0
0
0.0
0
0.0
0
2.61
6.93
4.21
0.
00
(l
.l62
.102
.S3)
(2
.970
. 11
6 7
6)
0.00
0.
00
00
0
00
0
0.00
0.0
0

DIS
TR
ICT
SC
HO
OL
BO
AR
D O
F D
UY
AL
CO
UN
TY
C
Ol\I
BIN
ING
ST
AT
EM
EN
T O
F F
IDU
CIA
RY
NE
T A
SS
ET
S
INV
ES
TM
EN
T T
RU
ST
FU
ND
S J
une
30,
20
10
AS
SE
TS
C
ash
and
Cas
h E
auiv
alcn
ts
Inve
stm
ents
A
ccou
nts
Rec
eiva
ble.
Net
In
tere
st R
ecei
vabl
e D
ue f
rom
Oth
er F
unds
-Bud
i:et
ruv
Inve
nto
ry
Due
fro
m O
ther
Ai:
enci
cs
To
tal A
sset
s L
IAB
ILIT
IES
Acc
oun
t N
umbe
r
1110
11
60
11
30
1170
11
41
1150
12
20
Sal
arie
s, B
enef
its
and
Payr
oll T
ruce
s P
ayab
le
2110
.•
Payr
oll
Ded
ucti
ons
and
Wit
hhol
ding
s ....
.. •
Acc
ount
s P
avab
lc
,.. .. •
a D
ue t
o O
ther
Ai.;
enci
cs
• -
• •• •
2!
'30
Due
to O
ther
Fun
ds-B
udl!
etar
v -• 1
l1l-
. ~-
2161
In
tern
al A
ccou
nts
Pav
ablc
·--
--22
90
To
tal
Lill
bili
tits
· ·-N
ET
AS
SE
TS
Ass
ets
Hel
d in
Tru
st f
or P
ensi
on B
cncl
its
Ass
ets
Hel
d in
Tru
st f
or S
chol
arsh
ips
and
Oth
er P
urpo
ses
To t
al N
et A
sset
s
Inve
stm
ent T
rust
F
und
Nam
e 8
4X
0.0
0
0.00
0.
00
0.
00
0.
00
~
~
L~
-0.
00
__ ...
~\lift
-~
I I...
00
0
• ~
0.00
0.
00
0.
00
0. 0
0
0.0
0
0.00
0
. 00
0.0
0
The
acc
ompa
nyi
ng n
otes
to f
inan
cial
sta
tem
ents
are
an
inte
gral
pan
of t
his
stat
emen
t. E
SE
145
Inve
stm
ent T
rust
In
vest
men
t T
rust
F
und
Nam
e Fu
nd N
ame
84
X
84
X
0.0
0 0
.00
0.0
0 ... ~
0.0
0
•••
0.0
0 -..
. -
-0.
00
-·•
1l -r .. _ ~
-.
·.-
~· 1
l ..
....
. ~
0.00
.. ...
.. -0.
00
0.0
0
r--
.. 0.
00
0
.00
0.
00
0.0
0
0.00
0.
00
0.00
0.
00
0. 0
0
0.0
0
0.0
0
0.0
0
0.00
0.
00
0.00
0
.00
0.0
0
0.0
0 0.
00
0. 0
0
Tot
al
Inve
stm
ent
Tru
st F
unds
"·
-
0.00
0.
00
0.
00
0.00
0.
00
~
0.0
0 0.
00
0.00
0.
00
0.00
0.
00
0.
00
0.0
0
0.0
0
0.0
0 0.
00
0. 0
0
Exh
ibit
1-1
P
age
43

DIS
TR
ICT
SC
HO
OL
BO
AR
D O
F O
UV
AL
CO
UN
TY
C
OM
BIN
ING
ST
AT
EM
EN
T O
F C
HA
NG
ES
IN
NE
T A
SS
ETS
IN
VE
ST
ME
NT
TR
US
T F
UN
DS
F
or l
bc
Fis
cal Y
ear
En
ded
Jun
e 30
, 201
0
AD
DIT
ION
S
Co11
1rib
ut1u
11s:
E
mo l
over
P
lan
Mem
bers
G
ifts
, Gra
nts
and
Beq
uest
s Jn
vc:s
tmc:1
11 Ear11i11g.~·
:
Inte
rest
on
Inve
stm
ents
G
ain
on S
ale
ofln
vesu
nent
s N
et I
ncre
ase
(Dec
reas
e) in
the
Fai
r V
alue
of I
nves
tmen
ts
Acc
ount
N
umbe
r
3440
3431
34
32
3433
Inve
stm
ent T
rust
Fu
nd N
ame
84X
0.0
0
0.0
0
0.0
0
0.0
0
0.0
0
lnve
sune
nt T
rust
Fu
nd N
ame
84X
0.00
0.
00
0.00
0.0
01
-..
~
Tou
il In
vest
men
t E
amin
i:s
I I
0.0
0 l
a U
I
P-l
l.ntl
Les
s In
vest
men
t E
x ns
e ~-
0.00
Net
lnv
esnn
ent
Eam
ini:
s .-
a
0.0
0 T
olll
l A
ddit
ions
1
0.00
DE
DU
CT
ION
S
Sal
arie
s 0.
00
Em
lo
cc B
enef
its
0.00
P
urch
ased
Ser
vice
s _
11 a
0.00
Oth
er E
xven
scs
•U:l
:'I
I •
• I
700
I 0.
00
Ref
unds
of C
ontr
ibut
ions
I
IO I•-
I I
0.0
0
Adm
inis
trat
ive
Exo
ensc
s •
-I
I 0.
00
Tol
al O
educ
lion
s C
han
ge
lo N
et A
sset
s N
et A
sset
s -
July
I, 2
009
2885
N
et A
sset
s -
June
30,
20
I 0
2785
The
acc
ompa
nyin
g no
tes
to f
inan
cial
sta
tem
ents
are
an
inte
gral
par
1 o
f thi
s st
atem
ent.
ES
E 1
45
0.0
0
0.0
0
0.0
0
0.00
0.00
0.
00
0.00
0
.00
0.00
0.
00
0.00
Inve
stm
ent T
rust
F
und
Nam
e 84
X
--· 0
.00
0.0
0 J>
.00
,\lV.:o
o ,~•[oo
0.00
0.
00
0.
00
0
.00
0.0
0
0. 0
0
0.0
0
0.0
0
0.00
0.
00
0.0
0
0.0
0
0.00
0.
00
0.00
Tot
al
Inve
stm
ent
Tru
st F
unds
0.0
0
0.0
0 0
.00
0.0
0
0.0
0
0.00
0.
00
0.
00
0.
00
0
.00
0.0
0 0
.00
0
.00
0
.00
0.
00
0.0
0
0.00
0.
00
0.
00
0.
00
Exh
ibil
1-2
Pa
ge 4
4

DIS
TR
ICT
SC
HO
OL
BO
AR
D O
F D
UV
AL
CO
UN
TY
C
OJ\
IDJN
ING
ST
AT
EM
EN
T O
F F
IDU
CIA
RY
NE
T A
SS
ET
S
PR
IVA
TE
-PU
RP
OS
E T
RU
ST
FU
ND
S Ju
ne
JO, 2
010
Priv
a1c-
Purp
osc
Acc
owll
G
EA
R U
P T
rust
Fun
d N
umbe
r A
SS
ET
S
Cus
h an
d C
ash
Equi
valc
n1s
111
0 In
vest
men
ts
1160
A
ccou
nts
Rec
eiva
ble.
Nel
11
30
In
tere
st R
ecei
vabl
e 1
170
D
ue f
rom
Oth
er F
unds
-Bud
i:cla
rY
1141
ln
vcnt
orv
1150
D
ue f
rom
01h
cr A
i:cn
cics
12
20
To
tal A
sset
s
LIA
BIL
ITIE
S
Sal
arie
s. B
cnef
i1s
and
Pay
roll
Tax
es P
ayab
le
211
0 P
ayro
ll D
educ
tion
s an
d W
ithh
oldi
ni:s
2
170
A
ccou
nts
Pnv
able
2
120
Due
to
01h
er A
i:en
cies
22
30
Due
10 0
1her
Funds-Bud~e
tarv
2
161
Inte
rnal
Acc
ount
s P
ayab
le
2290
T
ota
l L
iabi
liti
es
NE
T A
SS
ET
S A
sset
s H
eld
in T
rust
for
Pen
sion
Ben
efil
s A
sset
s H
eld
in T
rust
for
Sch
ohus
hips
and
Oth
er P
urpo
ses
To
tul
Net
Ass
ets
The
acc
ompa
nyin
g no
tes
to f
inan
cial
sta
tem
cnls
arc
an
inte
gral
par
t of
this
s1a
1cm
cn1.
ES
E 1
45
8500
1 344,
962.
12
0.0
0
0.0
0
0.00
0.
00
0.00
34
4,96
2.12
0.00
0.
00
0.00
0.
00
0.00
0.
00
0.
00
0.00
34
4,96
2.12
34
4,96
2.12
Pri
valc
-Pur
posc
P
riva
te-P
urpo
se
Tru
st F
und
Nam
e T
rust
Fun
d N
ame
85X
85
X
0.00
0.
00
0.00
0.
00
0.00
0
.00
0. 0
0
0.00
0.
00
0
.00
~
0.00
0.
00
0.00
0.
00
0.0
0 0.
00
0.
00
0.00
0
.00
0.
00
0.0
0
0.00
0.
00
0.00
0.
00
0.0
0 0.
00
0.00
0.00
0
.00
0.
00
0.00
0.
00
0.00
Tot
al
Pri
vate
-Pur
pose
T
rust
Fun
ds
344,
962.
12
0.00
0.
00
0.0
0
0.00
~
0.00
34
4,96
2.1
2
0.0
0
0.00
0.
00
0.00
0
.00
0.0
0
0.00
0.00
34
4,9
62.1
2 34
4,96
2.1
2
Exh
ibit
1-3
P
age
45

DIS
TR
ICT
SC
HO
OL
BO
AR
D O
F D
UV
AL
CO
UN
TY
C
OM
BIN
ING
ST
AT
EM
EN
T O
F C
HA
NG
ES
IN
NE
T A
SS
ET
S
PIU
VA
TE
-PU
RP
OS
E T
RU
ST
FU
ND
S
Fo
r th
e F
isca
l Y
ear
En
ded
Ju
ne
30
, 201
0
Pri
vate
-Pur
pose
Acc
ount
G
EA
R U
P T
rust
Fun
d
Num
ber
AD
DIT
ION
S
Cm
11rlb
utio
11s:
Em
o lo
ver
Pla
n M
embe
rs
Gif
ts. G
rant
s an
d B
eque
sts
3440
/1
1v~.
m11e
111
Ea
mm
gs:
Inte
rest
on
Inv
estm
ents
34
31
Gai
n o
n S
ale
ofl
nvcs
tmcn
ts
34
32
N
et I
ncre
ase
(Dec
reas
e) in
the
Fai
r V
alue
of I
nves
tmen
ts
3433
To
tal
Inve
stm
ent E
amin
cs
Les
s In
vest
men
t E
xpen
se
Net
Inv
estm
ent
Eam
inits
To
tal A
dd
itio
ns
DE
DU
CT
ION
S
Sal
arie
s 10
0 E
nmlo
vee
Ben
efit
s 20
0
Pur
chas
ed S
ervi
ces
300
Oth
er E
xoen
ses
700
Ref
unds
of C
ontr
ibut
ions
A
dmin
istr
ativ
e E
xpen
ses
To
tal
Ded
ucti
ons
Ch
ange
In
Net
Ass
ets
Net
Ass
ets
-Ju
lv I
. 200
9 28
85
Net
Ass
ets
-Ju
ne 3
0. 2
0 I 0
27
85
Th
e ac
com
pany
ing
not
es to
fin
anci
al s
tate
men
ts a
re a
n in
tegr
al p
an o
f thi
s st
atem
ent.
ES
E 1
45
8500
1
0.0
0
0.0
0
0.00
9.4
18.2
5 0.
00
0.0
0
9,4
18.2
5 0.
00
9,4
18.
25
9,
418.
25
0.0
0
0.0
0 0
.00
123.
560.
00
0.0
0
0.00
12
3,5
60.0
0
( 114
,14
1.75
)
459.
103
. 87
34
4.9
62.1
2
Pri
vate
-Pur
pose
Pr
ivat
e-P
urpo
se
Tru
st F
und
Nam
e T
rust
Fun
d N
ame
85
X
85X
0.0
0 0
.00
0. 0
0
0.00
0.0
0
0.0
0
0.0
0
0.00
0
.00
0.00
0
.00
0.0
0
0.0
0 0.
00
0.0
0 0.
00
0
.00
0.0
0 0
.00
0.00
0.0
0
0.0
0 0.
00
0.
00
0.0
0
0.00
0.
00
0.00
0
.00
0.00
0
.00
0.0
0
0.0
0 ··-
0.0
0
0.00
0.
00
0.
00
0.0
0 0
.00
0
.00
Tot
al
Pri
vate
-Pur
pose
Tru
st F
unds
0.0
0
0.0
0
0.00
9.41
8.25
0.
00
0.00
9.
418
.25
0.00
9.41
8.25
9.
41
8.25
0.0
0 0
.00
0.00
12
3,5
60.0
0
0.0
0
0.0
0
123,
560.
00
(114
,141
.75
)
459.
103.
87
34
4.96
2.12
Exh
ibit
14
P
age
-46
DIS
TR
ICT
SC
HO
OL
BO
AR
D O
F D
UV
AL
CO
UN
TY
C
Ol\
IUIN
ING
ST
A T
El\
IEN
T O
F F
IDU
CIA
RY
NE
T A
SS
ET
S
PE
NS
ION
TR
US
T F
UN
DS
Ju
ne
30, 2
010
AS
SE
TS
C
ash
and
Cas
h E
quiv
alen
ts
Inve
stm
ents
A
ccou
nts
Rcc
ci\'a
ble,
Net
In
tere
st R
ecei
vabl
e D
ue f
rom
Oth
er F
unds
-Bud
l!ct
arv
Inve
ntor
y D
ue fr
om
Oth
er A
l!enc
ies
To
tul A
sset
s
LIA
BIL
ITL
ES
Sal
arie
s. B
enef
its a
nd P
ayro
ll T
axes
Pay
able
Pa
yrol
l D
educ
tions
and
With
hold
inl!
S A
ccou
nts
Pay
able
-
A
tr:
Due
to O
ther
Al!
enci
cs
-•
& •1
1 D
ue to
Oth
er Fun
ds-B
ud~e
tnry
~• 1
l •.,
.. ~-
• In
tern
al A
ccou
nts
Pay
able
..
--....
-T
ota
l L
iabi
liti
es
. ··-N
ET
AS
SE
TS
A
sset
s H
eld
in T
rust
for
Pen
sion
Ben
efit
s A
sset
s H
eld
in T
rust
for
Sch
olar
ship
s an
d O
ther
Pur
pose
s
To
tal
Net
Ass
ets
Pen
sion
Tru
st
Acc
ount
F
und
Nam
e N
umbe
r 8
7X
11.1
0 0.
00
1160
0.
00
11
30
0.0
0 11
70
0.0
0 11
41
0.00
11
50
~
1220
0.
00
--~
.~·l
'f\l
•n1
• a r_
., • •
o.o
o l ~-
0.0
0
• 11wi~
0.00
21
61
0.0
0
2290
0.
00
0. 0
0
0.0
0
0.0
0
0.00
The
acc
ompa
nyin
g no
tes
to f
inan
cial
sta
tem
ents
are
an
inte
gral
pan
of
this
sta
tem
ent
ES
E 1
45
Pen
sion
Tru
st
Pens
ion
Tru
st
Fund
Nam
e Fu
nd N
ame
87
X
87
X
0.00
0.
00
0.0
0
M~O
0.00
...
0
.00
-
..... -
r -0
.00
~~ ... ~
~
••
.. 0.
00
l .• ·-.
-0.
00
0.0
0
r---
0.00
0.
00
0.0
0
0.00
0.
00
0
.00
0
.00
0
.00
0
.00
0
.00
0.
00
0.0
0
0.0
0 0.
00
0.00
0.
00
0.0
0
0.0
0
0.0
0
0.00
Tot
al
Pen
sion
Tru
st
Fun
ds
~
0.00
0
.00
0.00
0
. 00
0
.00
®i·
0.
00
0.00
0.00
0.
00
0
.00
0.
00
0. 0
0
0.00
0.
00
0.00
0.
00
0.00
Exh
ibit
1-5
P a
ge 4
7

DIS
TR
ICT
SC
HO
OL
BO
AR
D O
F D
UV
AL
CO
UN
TY
C
OM
BIN
ING
ST
AT
EM
EN
T O
F C
HA
NG
ES
IN
NE
T A
SS
ET
S
PE
NS
ION
TR
US
T F
UN
DS
Fo
r th
e F
isca
l Yea
r E
nde
d J
un
e 3
0, 2
010
AD
DIT
ION
S
Co1
11r1
hu11
011s
:
Em
olov
er
Pla
n M
embe
rs
Gif
ts. G
rant
s an
d B
eoue
sts
/111·cs1m~11/
Eom
i11g
s:
Inte
rest
on
Inv
estm
ents
Gai
n o
n S
ale
ofl
nvcs
tmen
ts
Net
Inc
reas
e (D
ecre
ase)
in th
e F
uir
Val
ue o
f Inv
estm
ents
Tot
al I
nves
tmen
t Eam
in11
.s L
ess
Inve
stm
ent
Exp
ense
N
et I
nves
tmen
t E
arni
ngs
To
tal A
dd
itio
ns
DE
DU
CT
ION
S
-... ~
,
Sal
arie
s
Em
olov
ce B
enef
its
----·
··-P
urch
ased
Ser
vice
s "" ...
........ --
Oth
er E
.xoe
nscs
...
1•.
...:11.
-R
efun
ds o
f Con
trib
utio
ns
....
Adm
inis
trat
ive
Exp
ense
s -
To
tal
Ded
ucti
ons
Ch
ani:
c In
Net
Ass
ets
Net
Ass
ets
-Ju
lv I
. 20
09
Net
Ass
ets
-Jun
e 3
0. 2
010
Acc
ount
Num
ber
34
40
3431
3432
34
33
'1 l
~ ,.
_oo 300
700
2885
2785
Pen
sion
Tru
st
Pen
sion
Tru
st
Fun
d N
ame
Fun
d N
ame
87
X
87X
0.0
0 0.
00
0
.00
0.
00
0.0
0
0.00
0.00
0
.(
0.0
0
--0.
00
... c
....
i.
0 O
Q,
a w
r •
11-•
o.
••• --
0.00
·-· --
0.0
0
·-··
·~
0.0
0
.,, ... -
0.00
0
.00
0
.00
0.
00
0.00
0.
00
0.00
0
.00
0.00
0.
00
0.0
0
0.00
0.
00
0.0
0
0.0
0
0.0
0
0.0
0
0.0
0
0.0
0 0.
00
The
acc
ompa
nyin
g no
tes
to f
inan
cial
sta
tem
ents
are
an
inte
gral
par
t o
f thi
s st
atem
ent.
E
SE
145
Pen
sion
Tru
st
Fun
d N
ame
87X
0.0
0
0.0
0
-.l
:\\C
.00
.00
.....
. ... -0.
00
..
0.0
0
0.0
0 0
.00
0.0
0
0.0
0
0.00
0.
00
0.00
0.
00
0.0
0
0. 0
0
0.0
0
0.0
0
0.0
0
0.0
0
Tot
al
Pen
sion
Tru
st
Fun
ds
0.00
0.
00
0.00
0.0
0
0.0
0
0.00
0.0
0 0.
00
0.0
0
0.0
0
0.0
0 0.
00
0.0
0
0.0
0
0.0
0
0.00
0.
00
0.0
0
0.0
0
0.0
0
Exh
ibit
1-6
Pag
e 48

DIS
TR
ICT
SC
HO
OL
BO
AR
D O
F D
UV
AL
CO
UN
TY
C
OM
BIN
ING
ST
AT
EM
EN
T O
F F
IDU
CIA
RY
AS
SE
TS
AN
D L
IAB
ILIT
IES
AG
EN
CY
FU
ND
S
Jun
e 30
, 201
0
Acc
ount
N
umbe
r
ASS
ET
S
Cas
h an
d C
ash
Eau
ival
cnts
11
IO
lnvc
s1m
cn1s
11
60
Acc
oun
ts R
ecei
vabl
e, N
et
1130
Inte
rest
Rec
eiva
ble
1170
D
ue f
rom
Oth
er F
unds
-Bud
l!el
arv
114
1
lnvc
mor
v 11
50
Due
fro
m O
ther
Ai:
cnci
cs
1220
To
tul A
sset
s
LlA
BIL
ITlE
S
Sal
arie
s. B
enef
its
and
Pay
roll T
a.~c
s Pa
yabl
e 2
110
Pav
roll
Ded
ucti
ons
and
Wit
hhol
dinJ
?S
217
0
Acc
owlls
Pav
ablc
2
120
D
ue to
01h
cr A
genc
ies
2230
D
ue to
Olh
er F
unds
-Bud
l!ct
arv
216
1 I n
tcm
al A
ccou
nts
Paya
ble
2290
T
otal
Lia
bili
ties
llte
acc
ompa
nyin
g no
lcs
to fi
nanc
ial
sta1
emcn
1s a
re a
n in
tei,'T
al p
art o
f thi
s s1
a1em
ent.
ES
E 1
45
Sch
ool
Inte
rnal
Fun
ds
891
6.64
2. 7
18. 9
6 33
3,09
8.05
0.0
0
0.0
0
0.0
0
0.00
0
.00
6,97
5,8
17.0
1
0.0
0
0.0
0
16.6
64.8
4
0.00
6,
959.
152.
17
6.97
5,81
7 .0
I
Age
ncy
Age
ncy
Fun
d N
ame
Fun
d N
ame
89X
89
X
0.0
0
0.0
0 0.
00
0.0
0
0.0
0
0.0
0
0.0
0
0.0
0
0.00
0
.00
0
.00
0.
00
0.0
0 0.
00
0.0
0 0.
00
0.0
0
0.0
0
0.0
0
0.0
0
0.00
0.
00
0.0
0
0.0
0
0.0
0
0.0
0
0.00
0.
00
Tot
al
Age
ncy
Fund
s
6,64
2,7
18.9
6
333.
098.
05
0.0
0
0.00
0.0
0
0.0
0
0.00
6
,975
,817
. 01
0.0
0
0.0
0 16
,664
.84
~
!$>
0.0
0
6,95
9,1
52.1
7
6,97
5,8
17.0
1
Ex
hib
it 1-
7
Pag
e 49

DIS
TR
ICT
SC
HO
OL
BO
AR
D O
F D
UV
AL
CO
UN
lY
CO
Mll
lNIN
G S
TA
TE
ME
NT
OF
CH
AN
GE
S I
N A
SS
ET
S A
NO
LIA
BIL
ITIE
S
SC
HO
OL
IN
TE
RN
AL
FU
ND
S 8
91
Jun
e 30
, 201
0
Acc
oWlt
Num
ber
AS
SE
TS
C
ash
and
Cas
h E
auiv
alen
ts
1110
In
vest
men
ts
116
0
Acc
oWlt
s R
ecei
vabl
e. N
et
1130
In
tere
st R
ecei
vabl
e 11
70
D11
~ F
rom
Oth~r F
unds
: B
udgc
truy
Fun
ds
1141
ln
vcni
orv
115
0 D
ue
from
Oth
er A
l!en
cics
12
20
To
tal
Ass
ets
LIA
BIL
ITIE
S
Sala
ries
. B
enef
its
and
Pay
roll
Tax
es P
ayab
le
211
0 P
ayro
ll D
educ
tion
s an
d W
ithh
oldi
nl!S
21
70
Acc
oWlts
Pav
able
21
20
Du
e to
Oth
er F
und
s B
udl!
etar
v 2
161
Inte
rnal
Acc
oum
s P
avab
le
2290
T
ota
l L
iabi
liti
es
Th
e ac
com
pany
ing
note
s to
fin
anci
al s
tate
men
ts a
re a
n in
tegr
al p
an o
f thi
s st
atem
ent.
ES
E
145
Bal
ance
Ju
ly I
. 20
09
6.62
5,64
2.73
68
0.3
11.9
9
0.0
0
0.0
0
0.0
0 0
.00
0.0
0 7.
305.
954
.72
0.0
0
0.0
0
0.00
0.0
0 7
.305
.954
.72
7,
305.
954.
72
Add
ition
s D
educ
tion
s
33,4
70.0
16.3
5
33,4
52.9
40.1
2 5
1.81
3.7
1 39
9,0
27.6
5
0.0
0
0.0
0 0.
00
...
0
.00
0.0
0 0
.00
0
.00
0.0
0 0.
00
0.0
0 33
,521
.830
.06
33
.851
.967
.77
0.0
0 0.
00
0.00
0.
00
16
.664
.84
0.0
0
0.0
0
0.0
0
33.5
05, I
65.
22
33,8
51.9
67. 7
7 33
.52
1,83
0.06
33
,851
,967
. 77
Bal
ance
June
30.
201
0
6,64
2.71
8.9
6
333
,098
.05
0.0
0
0.0
0
0.0
0 0
.00
0.0
0
6,97
5.8
17.0
1
0 .00
0.00
16
.664
.84
0.0
0
6.95
9.15
2.17
6.
975.
817 .
0 I
t:x
hib
it 1
-lla
P
age
50

DIS
TR
ICT
SC
HO
OL
BO
AR
D O
F D
UV
AL
CO
UN
TY
C
OM
BIN
ING
ST
AT
EM
EN
T O
F C
HA
NG
ES
IN
AS
SE
TS
AN
O L
IAB
ILIT
IES
(C
ON
TIN
UE
D)
Age
ncy
Fu
nd
Nam
e Ju
ne
JO, 2
010
Acc
ount
B
alan
ce
Num
ber
July
I, 2
009
AS
SE
TS
C
ash
and
Cas
h E
quiv
alen
ts
1110
In
vest
men
ts
1160
A
ccou
nts
Rec
eiva
ble,
Net
11
30
l111
cres
1 R
ecei
vabl
e 11
70
Due
Fro
m 01h
~r F
u11d
s:
0.00
0.
00
0.00
0.
00
Bud
gcla
rv F
unds
11
41
JJ.IA
J
Add
itio
ns --
'" \.~
In
vent
ory
1150
_ ..
....... -.
-.• -
Due
fro
m O
ther
Age
ncie
s 12
20 .
_ ....
.... T
ota
l Ass
ets
-·~' r
::.-
••..
.,•1
too
LIA
BIL
ITIE
S
~c ~&\
ill''
.. S
alar
ies.
Ben
efit
s an
d Pa
vrol
l Tax
es P
ayab
le
" Pa
vrol
l D
educ
tion
s an
d Wi
thho
ldin~s
_•
.a
~':.
....
..-
•21
10
Acc
ount
sPav
able
-1
•Jl•
'-..
-.-
212
0 D
ue t
o O
ther
Fun
ds B
udgc
tarv
1 ···-
2161
In
tern
al A
ccou
ms
Pav
ablc
J. -
2290
T
ota
l Lia
bili
ties
1l1c
acc
ompa
nyin
g no
les
to f
inan
cial
s1a
1cm
ents
arc
an
imes
ral
part
of t
his
stat
emen
t. E
SE
145
0.00
0.
00
0.00
0.
00
0.00
0.
00
• D
educ
tion
s
0.00
•
0.00
-
a )..
.llal
cm
-1
).00
0.
00
0.00
0.
00
0.00
0.
00
0.00
0.
00
0.00
0.
00
Bal
ance
Ju
ne 3
0. 2
0 I 0
.00
. 00 ~
0.00
0.00
0.
00
0.00
0.
00
0.00
0.
00
0.00
0
.00
0.00
0.
00
0.00
0.
00
0.00
0.
00
0.00
0.
00
0.00
0.
00
0.00
0
.00
0.0
0 0
. 00
0.0
0 0.
00
Exh
ill i
t I-8
11
Pag
e S
I

DIS
TR
ICT
SC
HO
OL
BO
AR
D O
F D
UV
AL
CO
UN
TY
C
Oi\
IBIN
ING
ST
AT
EM
EN
T O
F C
HA
NG
ES
IN
AS
SE
TS
AN
D L
IAB
ILIT
IES
(CO
NT
INU
ED
) A
genc
y F
und
Nam
e Ju
ne
JO, 2
010
AS
SE
TS
C
ash
and
Cas
h E1
1uiv
al~n
ts
Inve
stm
ents
A
ccou
nts
Rec
eiva
ble.
Net
In
tere
st R
ecei
vabl
e D
1w F
rom
Oth
er F
unds
: B
udi.:
ctar
y Fu
nds
lnvc
nto
Due
fro
m O
ther
Age
ncie
s T
otul
Ass
ets
LIA
BIL
ITIE
S
Tot1
1I L
iabi
litie
s
Acc
ount
N
wnl
lcr
1110
11
60
1130
11
70
212
0 21
61
2290
TI1c
acc
ompa
nyin
g no
tes
to fi
nanc
ial s
tate
men
ts a
rc a
n in
tegr
al p
art o
f thi
s st
atem
ent.
ESE
14
5
Bal
ance
Ju
lv 1
. 200
9 A
dditi
ons
0.00
0.0
0
0.00
0.
00
0.00
0.
00
0.00
0.
00
0.00
0.
00
0.00
0.
00
0.00
0.
00
0.00
0.
00
0.00
0
.00
0.
00
0.00
0.
00
0.00
0.
00
0.00
0.
00
0.00
Bal
ance
Ju
ne 3
0, 2
010
0.00
0.
00
0.
00
0.00
0.0
0 0.
00
0.00
0.
00
0.00
0.
00
0.
00
0.00
0.
00
0.00
Exh
illit
1-8~
Pag
e 52

DIS
TR
ICT
SC
HO
OL
BO
AR
D O
F D
UV
AL
CO
UN
TY
C
OM
BIN
ING
ST
AT
El\
lEN
T O
F C
llA
NG
ES
IN
AS
SE
TS
AN
D L
IAB
ILIT
IES
(CO
NT
INU
ED
) T
OT
AL
AG
EN
CY
FU
ND
S
Jun
e JO
, 201
0
Tot
al A
genc
y F
und
Acc
ount
N
umbe
r A
SS
ET
S
Cas
h an
d C
ash
Eau
ival
ents
11
10
Inve
stm
ents
11
60
Acc
ount
s R
ecei
vabl
e, N
et
1130
In
tere
st R
ecei
vabl
e 11
70
D11e
Fro
m O
t/Jer
Fun
ds:
Bud
geta
rv F
unds
11
41
Inve
ntor
y 11
50
Due
fro
m O
ther
A11
cnci
cs
1220
T
ota
l A
sset
s
LIA
BIL
ITIE
S
Sal
arie
s. B
enef
its a
nd P
ayro
ll T
axes
Pay
able
2
110
Pav
roll
Ded
ucti
ons
and
Wit
hhol
ding
s 2
170
Acc
ount
s P
ayab
le
212
0 D
ue to
Oth
er F
w1d
s B
udl!
etar
v 2
161
lntc
mnl
Acc
oun
ts P
ayab
le
2290
T
otll
l L
iabi
liti
es
Tit
c ac
com
pany
ing
note
s to
fin
anci
al s
tate
men
ts a
re a
n in
tegr
al p
art o
f thi
s st
atem
ent.
ES
E
145
Bal
ance
s Ju
lv I
. 200
9
6,62
5,64
2.73
68
0,31
1.99
0.
00
0.00
0.00
0.
00
0.0
0
7,30
5,95
4.7
2
0.00
0
. 00
0.
00
0. 0
0
7.30
5,95
4.72
7,
305,
954
.72
To
tal
Age
ncy
Fun
d T
otal
Age
ncy
Fund
A
ddit
ions
D
educ
tion
s
33,4
70,0
16.3
5 33
,452
,940
.12
51,8
13. 7
1 39
9,02
7.65
0.
00
0.00
0
.00
0.00
0.0
0 0.
00
0.00
0
.00
0.0
0
0.0
0 J3
,52
I ,83
0.06
33
,851
,967
. 77
0.0
0
0.0
0 0.
00
0.0
0
16,6
64.8
4 0.
00
0.0
0 0.
00
33.5
05,1
65. 2
2 33
,851
,967
.77
33,5
21.
830.
06
33.8
51.9
67.7
7
To
tal
Age
ncy
Fun
d B
alan
ces
June
30,
201
0
6,64
2,7
18.9
6
333,
098.
05
·o.oo
0.
00
0.00
0.
00
0.0
0 6,
975,
817.
01
0.0
0
0.0
0
16,6
64.8
4 0.
00
6,
959.
152
.17
6,97
5,81
7.0
I
Exh
ibit
l-8
d P
age
SJ

DISTRICT SCllOO L BOARD OF DUY AL COUNT Y COMBINING STATEMENT Of NET ASSETS NONM,\ J OR CO MPONENT UNITS June JO. 2010
ASSETS C;ish and C:ish Eoul\':iknts ln\·cstm.:nts T3.11:cs Rcc:ch·ablc. net Accounu Rcccil·ab lc. m:I lntcn:st Rccciv:lble Due from Reinsun:r DC"DOsits Rccci\'.lblc. Due from Other Aacncies Jntcrn31 &l:1t1U S lm·cntor\' Pn:Pol.id lccms Resrrlctecl Asstts:
Cash with Filc:tJ Ai:ttnt
Dtft"'d Chargts · lssu:incc Costs
Nom:u" tnt Asuw Other Post-cmDlo\mcnl Benefits Oblia;iuon (;issct) Capital huts:
l=d L:ind Improvements · Nondcrin:ci:lblc Construction in Proarcu lmoro\'Cf1J ents Other Th3l1 Buildinii:s
Le" Accumula1cd 11Htircci:ation Ouild ings :ind Fixed Eauiomcnt
Less Accumufatcd LJenrcci.uion Fumitun:. Fixlurcs :md EQuipmcnt
Less Accumulated flt.nrcci:ilion Molar Vehicles
Less Accumulated Ocon:c13lion P~m· Under Dpibl 1.c:Lscs
Less Accumulated lkpn:ci:ltion Audiovistail !\fo.1cri:ils
Less Accumulated IXon:ci:llion Computc:r Software
Le" Accumul.ucd Amortiution Toul Caoittl Asscu net of Accum. Dco'n
To1al asscts LIABILITIES AND NET ASSETS LIABILITIES SJ.l:irics :ind W:ti!ts P:l.\;\blc P:i\Toll Deductions :ind Withholdina:s Accounts P3\·01blc Judir.mcnu Pon"Olblc: Construction Conu:icts P.1,Wlc Conslruction Con11::icts Rct.:Un:uzc Pa\"Olblc: Due to Fiscal ARcnt Accrued lnt..:n:st P;i,•:ible Ocoosits P.l\'3bJc Om: ro Other A2cncics Saks Ta:\: P.in'3hlc Dcf.:m:d Revenue Estimated UnD.lid Cl:Ums EstimoaJcd Li i1bilir.· for Claims Adiustmcnt Eslim.ucd Li:ibilih· for Arbltr:l2C Rc001c NonctlfUnl l.Jobflltlts:
Portion Du' Within 011ot y,ar: Section 1011.13 No1es P:l\':lblc Notes Po.\Olblc Oblig:llions Under C.lri il.11 lc:iscs Bonds P.l\':lb le lio.bilitv for Comocn50Llcd Abscn~ CcrtJfiC.lld of Particio;11ion P:l\-:ih lc Estim;u:cd Li:ibilit\" for Lon11·Tcnn CJ:Ums Other Posl-cmpJo\mcnt Benefits Ob1io:uion Es:1ima.11:d PECO Adv3.ncc J>3,'lblc EMim3.led li3.b1litv for Arbi1~c Rcb.iti::
P"rf/011 Due Afltr Om Ytar' Notes Pl\'ablc Obli~~ions Under C:u: ibl l..c.ucs Bonds Pa\':lble Lioibilitv for ComocnS3.led Absences CcrtifiQtcs of P:ir1ici1Dtion P:n-ablc Es1imatcd l iab11lt\' for Lon ii:·T~nn CIJ.ims Other Post"<molo,mcnt Btncfit.s Obli2:ll1on F.srimoJcd PECO AdV311cc 1':1111hlc Es1imattd Liabiliw for Arbiu:utc Rcb~uc
Total Liabili1in NET ASSETS Jn,·csh:d in C;u:iil.ll .Assc:ts. Net of Rcl:i1cd Debt Rutricttd For:
Catt:Jf.orical Cam"O\'Cr Pro~r.uns Food Service Debi Scrl'ic.c C;ioil31 Projects OtherPu~s
Unn:strietcd Total Nd Asscl.s Total Liabilities and Net Audt
Account Number
1110 1160 1120 1130 1170 1180 1210 1220
I ISO 1230
11 14
14 10
13 10 ms 1360 1320 1329 1330 1339 1340 1349 13SO 13S9 1370 1379 1381 1388 1382 1389
2 1 lO 2170 2120 2130 21 40 21SO 2240 2210 2220 2230 2260 2410 2271 2272 2280
22SO 23 10 ms 2320 2330 2340 23SO 2360 2370 2280
1310 rns 2320 2330 2340 2350 2360 2370 2280
2770
2780 2780 2780 2780 2780 2190
The 2ccomp3.n~ing nolcl 10 fin3.nci:tl st:llcments ;m :i.n intcgDI p:u:t ofth1s .SU.ltmcnl ESE 145
Glob.t Outrtacb River City Charier Academy Scicoce Academy
69.425.S4 IS l.043.22 0.00 0.00 0.00 0.00 0.00 86.4SUO 0.00 0.00 0.00 0.00 0.00 0.00 0.00 0,00 0.00 0.00 0 .00 0.00 0.00 0.00
0.00 0.00
0.00 0.00
0.00 0.00
0.00 0.00 0.00 0.00 0.00 0.00
2,000.00 2,000.00 (S00.00) 0.00
0.00 0.00 0.00 0.00
44, 189.00 13S.2S8.90 IS,000.00) 112.087.971
0.00 0.00 0.00 0.00 0.00 0.00 0.00 0.00 0.00 0.00 0.00 0.00 0.00 0,00 0.00 0.00
40.689.00 12S.170.93 I IO, l 14.S4 362.668.9S
20.000.00 0.00 0.00 0.00
23,719.23 S,603.39 0.00 0 .00 0.00 0 .00 0.00 0.00 0.00 0.00 0.00 0.00 0.00 0.00 0.00 0.00 0.00 0.00
48.260.31 0.00 0.00 0.00 0.00 0.00 0.00 0.00
0.00 0.00 0.00 0.00 0 .00 0.00 0.00 0.00 0.00 0.00 0.00 0.00 0.00 0.00 0.00 0.00 0.00 0.00 0.00 0.00
13.200.00 0 00 0.00 0.00 0.00 0.00 0.00 0.00 0.00 0.00 0.00 0.00 0.00 0.00 0.00 0.00 0.00 0.00
IOS, 179.l4 S,603.39
40.689.00 0.00
0.00 0.00 0.00 0.00 OJIO 0.00 0.00 0.00 0.00 S31,S79.96
(3S,7S4.00) 1174,Sl4 40) 4,93S.OO 357,06S.S6
110,114.54 362,668.9S
Sthool or ln1eira1«1 S.O.C.K. School or Arademics 1nd SlilC cess Ac.ademy Ttchn~.,.,, Middle School
844.708.74 2Y.Oll.86 0.00 0.00 0.00 0.00 0.00 0.00 0.00 0.00 0.00 0.00 0.00 0.00
7.6S9.00 0.00 0.00 0.00 0.00 0.00
7, 199.63 0.00
000 0 .00
0.00 0.00
0.00 0.00
0.00 0.00 0.00 0.00 0.00 0.00
19.741.00 2S8,872.00 114.201.iS (24.886.001
0.00 l . 170.63S.OO 0.00 ln.838.ooJ
373.9Sl.19 7S.22S.93 (239,790.47) 137,4 14.00)
0.00 0.00 0.00 0.00 0,00 8,S39.00 0.00 (S. 124.00) 0.00 0.00 0.00 0.00
77,094.28 6.297.00 (69,12S.00) (S.892.00) l47.669.8S l.373.4 14.93
1.007.237.22 1.402,448. 79
0.00 0.00 S,090.22 0.00
167,608.39 14,098.64 0.00 0.00 000 0.00 0.00 0.00 0.00 0.00 0.00 0,00 0.00 0.00 0.00 000 0.00 0.00 0.00 0.00 0.00 0.00 0.00 0.00 0.00 0 .00
0.00 0.00 0.00 0.00 0.00 0.00 0.00 0.00 0.00 0.00 000 0.00 0.00 0.00 0.00 0 00 0.00 0.00 0.00 0.00
0.00 JS,000.00 0.00 2.S64.00 0.00 0.00 0.00 0.00 0.00 0.00 000 0.00 0.00 0.00 0.00 0.00 0.00 0.00
175,698.61 Sl,662 64
147.669.SS US0.786. IS
CJ.OD 0 .00 000 0 .00 000 0.00
S22,093 93 0.00 0.00 0.00
161.774 83 0.00 S31,SJ8.6 1 l ,3S0,786. IS
1.007.237.22 1,402,448. 79
Waymaa Audemy or the Arts
133.391.6 1 0.00 0.00 0.00 0.00 0.00 0.00
17.714.45 0.00 0.00 0.00
0.00
0.00
0.00
0.00 0.00 0.00 0.00 0.00
474,98833 1194.842.771 280.IS l.l I
(1 90.4~.461
12S,171.27 !98.619.32)
0.00 0.00 0.00 0.00 0.00 0.00
396.444.16 S47.SS0.22
0.00 11.~0.58
16.1146.34 0.00 II.OU 0.00 0.00 0.00 0.00 0.00 0.00 0 .00 0.00 0.00 0.00
0.00 0.00 0.00 0.00 0.00 0.00 0.00 000 0.00 0.00
0.00 0.00 0.00 0.00 0.00 0.00 0.00 0.00 0 .00
37,886.92
3"6.444.16
0.00 0.00 0.00 0.00 0.00
113.219.14 S09.663.30 S47.SS0.22
E1hibitJ· I Pace5"
Total Nonmajor Compooe.nt
Units
1.227.602.97 0.00 0.00
86.4S4.80 0.00 0.00 0.00
2S.373.4S 0.00 0.00
7.199.63
0.00
0.00
0.00
0.00 0.00 0.00
282,613.00 (39.l87. ISi
I ,64S,623.33 (267.680.77) 908.776.13
(4 84,696.90) 12S.1 71.27 198,619.32
8,S39.00 (S,124.00)
0.00 0.00
83,391.28 (7.1,017.00)
2.083.388.87 3,430.019.72
20,000.00 19.130.80
237,87S.99 0.00 0.00 000 0 .00 11.00 0.00 0.00 0.00
48.260.3 1 0.00 0.00 0.00
0.00 0 .00 U.00 000 000 000 0.00 0.00 0.00 0.00
48,200.00 2.564.00
0.00 0.00 0.00 0 .0<1 0.00 0 .00 0.00
376,031.10
1.93S.l89. l6
0.00 0.00 0.00
S22.093.93 Sl l.579.96 64.72S S7
3,0S3.988 62 3,430.0IY 72

DIS
TR
ICr
SC
HO
OL
BO
AR
D O
F D
UV
AL
CO
UN
TY
C
OM
BIN
ING
ST
AT
EM
EN
T O
F A
CT
IVIT
IES
NO
NM
AJO
R C
OM
PO
NE
NT
UN
ITS
Glo
bal O
utr
each
Ch
arte
r A
cade
my
For
the
Fis
cal
Yea
r E
nded
Ju
ne
30,
201
0
FU
NC
l'IO
NS
C
ompo
nent
Unt
t A,·t
ivilw
s:
Inst
ruct
ion
Pup
il P
erso
nnel
Ser
vice
s In
stru
ctio
nal
Med
ia S
ervi
ces
Inst
ruct
ion
and
Cur
ricu
lum
Dev
elop
men
t Ser
vice
s In
stru
ctio
nal S
tafT
Tra
inin
g S
ervi
ces
Inst
ruct
ion
Rel
ated
Tec
hnol
ogy
Sch
ool
Boa
rd
Gen
eral
Adm
inis
trat
ion
Sch
ool
Adm
inis
trat
ion
Faci
liti
es A
cqui
siti
on a
nd
Con
stru
ctio
n F
isca
l Se
rvic
es
Foo
d S
ervi
ces
Cen
tral
Ser
vice
s Pu
pil T
rans
pona
tion
Ser
vice
s O
pera
tion
of
Pla
nt
Mai
nten
ance
of
Pla
nt
Ad
min
istr
ativ
e T
echn
oloi
.'Y S
ervi
ces
Com
mun
ity S
ervi
ces
Inte
rest
on
Lon
g-te
mi
Deb
t
Acc
oun
t N
um
ber
5000
6
100
6200
63
00
6400
65
00
710
0 72
00
7300
74
00
7500
76
00
7700
78
00
7900
8
100
82
00
910
0 92
00
Pro
e.ra
m R
even
ues
Op
erat
ing
Ca
pita
l C
har
ges
for
Gra
nts
and
G
ran
ts a
nd
Exp
ense
s S
ervi
ces
Co
ntr
ibut
ions
C
on
trib
uti
ons
536,
619.
92
0.0
0
17,3
89.0
0 0
.00
0.00
0.
00
37.7
56.1
9 0.
00
24,0
36.0
0 11
1,89
2.26
0.
00
10
6,06
2.00
I0
,200
.00
0.0
0
10,0
00.0
0 0.
00
0.0
0 0
.00
5,99
3.59
0
.00
0.0
0 0.
00
0.00
0
.00
294,
674.
42
0.00
2,
545
.00
500.
00
0.00
0.
00
35,2
15.4
6 0.
00
0.00
72
,574
.82
3,88
0.00
0.
00
8,18
0.08
0.
00
6,56
0.00
12
4,09
1.07
0.
00
0
.00
291,
495.
06
0.0
0 35
, 146
.00
49
2.5
8 0
.00
0.0
0 0.
00
0.0
0 0.
00
16,6
74.5
5 7,
777.
00
0.0
0 80
.00
0.0
0 0
.00
U
nall
ocat
ed D
eore
ci:n
ion/
Am
orti
zati
on
Exp
ense
• 0.
00 ~~~~~
~
~~~
" "
To
tal C
om
pone
nt U
nit
Act
ivit
ies
1,54
6,44
0.00
Gen
eral
Rev
enue
s:
Taxe
s:
Pro
pert
y T
axes
, Lev
ied
for O
pera
tion
al P
urpo
ses
Pro
pert
y T
axes
. Lev
ied
for
Deb
t Ser
vice
P
rope
ny T
axes
, Lev
ied
for
Cap
ital
Pro
ject
s L
ocal
Sal
es T
axes
11.6
57.0
0
Gra
nts
and
Con
trib
utio
ns N
ot R
estr
icte
d to
Spe
cific
Pro
gram
s In
vest
men
t Ear
ning
s M
isce
llane
ous
Spe
cial
Ite
ms
Ext
raor
dina
ry I
tem
s T
rans
fers
T
ota
l Gen
eral
Rev
enue
s, S
peci
al I
tem
s, E
xtra
ord
inar
y I
tem
s a
nd T
rans
fers
Cha
nge
in N
et A
sset
s
Net
Ass
ets
-Ju
ly I
, 200
9 N
et A
sset
s -
June
30,
20
10
*Thi
s am
ount
exc
lude
s th
e de
prec
iatio
n/am
orti
zati
on t
hat
is in
clud
ed i
n th
e di
rect
exp
ense
s o
f the
var
ious
fun
ctio
ns.
The
acc
ompa
nyin
g no
tes
to f
inan
cial
sta
tem
ents
are
an
inte
gral
pa
rt o
f th
is s
tate
men
t. E
SE
145
20
1,73
8.00
0.0
0
0.0
0
0.00
0.00
0.
00
0.0
0 0
.00
0.0
0 0.
00
0.00
0.
00
0.0
0
0.0
0
0.00
0.
00
0.00
0.
00
0.0
0 0
.00 -0.
00
Exh
ibit
J-2
a P
age
SS
Net
(E
xpen
se)
Rev
enue
an
d C
hang
es
in N
et A
sset
s
Com
pon
ent
Un
it
Act
ivit
ies
(519
,230
.92)
0.
00
( 13.
720.
19)
(5,8
30.2
6)
(200
.00)
0.0
0 (5
,993
.59)
0.00
(2
92.1
29.4
2)
(500
.00)
(3
5,2
15.4
6)
(68,
694
.82)
(1
,620
.08)
(1
24,0
91.
07)
(2
56,3
49.0
6)
(492
.58)
0
.00
(8,8
97.5
5)
(80.
00)
0.00
( 1
,333
,045
.00)
0.00
0
.00
0.0
0 0.
00
1.33
3,76
5.00
0
.00
4,2
15.0
0
0.00
0.
00
0.0
0
1,33
7,98
0.00
4,93
5.0
0
0.00
4,
935.
00

DIS
TR
ICI'
SC
HO
OL
BO
AR
D O
F D
UV
AL
CO
UN
TY
C
OM
BIN
ING
ST
AT
EM
EN
T O
F A
CT
IVIT
IES
(C
ON
TIN
UE
D)
NO
NM
AJO
R C
OM
PO
NE
NT
UN
ITS
FU
NC
rtO
NS
C
ompo
ncnr
Uni
/ Acr
iviu
cs:
Inst
ruct
ion
Puo
il P
erso
nnel
Ser
vice
s In
stru
ctio
nal M
edia
Ser
vice
s In
stru
ctio
n an
d C
urri
culu
m D
evel
oom
ent S
ervi
ces
Inst
ruct
iona
l St
afT
Tru
inin
l! S
ervi
ces
Inst
ruct
ion
Rel
ated
Tec
hnol
ogy
Sch
ool
Boa
rd
Gen
eral
Adm
inis
trat
ion
Sch
ool
Adm
inis
trat
ion
Fac
ilit
ies
Acn
uisi
tio
n an
d C
onst
ruct
ion
Fis
cal
Ser
vic
es
Food
Ser
vice
s C
entr
al S
ervi
ces
Pup
il T
rans
pona
tion
Ser
vice
s Op
cr~t
ion
of
Pla
nt
Mai
nten
ance
of P
lant
A
dmin
istr
ativ
e T
echn
olog
y S
ervi
ces
Com
mun
ity
Ser
vice
s In
tere
st o
n L
onl!
-tcn
n D
ebt
Una
lloca
ted
Deo
reci
utio
n/A
mon
izat
ion
Exo
ense
• T
ota
l Co
mpo
nent
Uni
t A
ctiv
itie
s
Acc
ount
C
har
ges
for
Nu
mb
er
Exo
ense
s S
ervi
ces
5000
1,
515
,269
.17
610
0 0
.00
6200
0.
00
6300
6
1,78
4.76
64
00
4,15
5.6
9
6500
0.
00
7100
31
,359
.19
7200
0.
00
7300
42
3,75
7.37
74
00
230,
861.
40
7500
6
1,75
9.49
76
00
95,9
28.2
2 77
00
12,7
41.8
1 78
00
216
.050
.00
7900
18
7,58
8.0
1 81
00
26.4
69.0
3 82
00
0.0
0 9
100
103,
688.
48
9200
18
.133
.83
0.0
0 2,
989
,546
.45
Gen
eral
Rev
enue
s:
Twcc
s:
Pro
peny
Tax
es,
Lev
ied
for O
pera
tion
al P
urpo
ses
Pro
peny
Tax
es, L
evie
d fo
r D
ebt
Ser
vice
P
rope
ny T
axes
, L
evie
d fo
r Cap
ital
Pro
ject
s L
ocal
Sal
es T
axes
0 .00
0.
00
0.0
0 0.
00
0.0
0 0.
00
0.00
0.
00
0.
00
0.00
0.
00
0.00
0.
00
0.00
0.
00
0.00
0.
00
0.00
0.
00
0.0
0
Gra
nts
and
Co
ntri
butio
ns N
ot R
estr
icte
d to
Spe
cifi
c P
rogr
ams
Inve
stm
ent
Ear
ning
s M
isce
llan
eous
S
peci
al I
tem
s E
xtr
aord
inar
y It
ems
Tra
nsfe
rs
Pro1
1ram
Rev
enue
s O
per
atin
g G
ran
ts a
nd
Co
ntr
ibu
tio
ns
To
tal
Gen
eral
Rev
enue
s, S
peci
al I
tem
s, E
xtra
ord
inar
y I
tem
s an
d T
ran
sfer
s
Ch
ang
e in
Net
Ass
ets
Net
Ass
ets
-Ju
ly I
, 200
9 N
et A
sset
s -
June
30.
201
0
•Thi
s am
ount
exc
lude
s th
e de
prec
iati
on/a
mon
izau
on th
at i
s in
clud
ed i
n th
e di
rect
exp
ense
s o
f the
var
ious
fun
ctio
ns.
The
a~companying n
otes
to
fina
ncia
l st
atem
ents
are
an
inte
gral
pan
of t
his
stat
emen
t. E
SE
145
Cap
ital
G
ran
ts a
nd
Co
ntr
ibu
tio
ns
0.0
0 0.
00
0.00
0.
00
0.00
0.
00
0.00
0.
00
0.00
0
.00
0.00
0
.00
0.00
0
.00
0.0
0 0
.00
0.00
0.
00
0.00
0.
00
0.00
0.
00
0.00
0.
00
0.00
0.
00
0.00
0.
00
0.00
0
.00
0.00
0.
00
0.0
0 0
.00
0.0
0 0.
00
0.00
0.
00
~
~
0.00
0.
00
Exh
ibit
J-2
b
Pag
e 56
Net
(E
xpen
se)
Rev
e nu
e an
d C
hang
es
in N
et A
sset
s
Co
mp
on
ent
Uni
t
Act
ivit
ies
(1,5
15,2
69.1
7)
0.00
0.
00
(61,
784.
76)
(4.1
55.6
9)
0.00
(3
1,35
9.19
) 0.
00
(423
,757
.37)
(2
30,8
61.4
0)
(61,
759.
49)
(95
,928
.22)
( 1
2,74
1.81
) (2
16,0
50.0
0)
(187
,588
.01)
(2
6,46
9.03
) 0.
00
( 103
,688
.48)
(1
8,1
33.8
3)
0.00
(2
,989
,546
.45)
0.00
0.
00
0.00
0.
00
3.4
16.5
43.8
5 0.
00
97,7
33. 1
6 0.
00
0.0
0 0
.00
3,51
4,27
7.01
524,
730.
56
(167
,665
.00)
35
7,06
5.56

l>IS
TIU
CI'
SC
HO
OL
BO
AR
D O
F D
UV
AL
CO
UN
TY
C
OM
BIN
ING
ST
AT
EM
EN
T O
F A
CT
IVIT
IES
(C
ON
TIN
UE
I>)
NO
NM
AJO
R C
OM
P ON
EN
T U
NIT
S
FUN
CT
ION
S C
ompo
nent
I /11
11 A
ctiv
itu:
s:
lns1
ruct
ion
Pupi
l Per
sonn
el S
ervi
ces
Inst
ruct
iona
l Med
ia S
ervi
ces
Inst
ruct
ion
and
Cur
ricu
lum
Dev
eloo
men
l Ser
vice
s In
stru
ctio
nal
Stnl
TTra
inin
l.! S
ervi
ces
Inst
ruct
ion
Rel
ated
Tcc
hnol
ol!v
Sc
hool
Boa
rd
Gen
eral
Adm
inis
tratio
n Sc
hool
Adm
inis
tratio
n Fa
cilit
ies
AC
Qui
sitio
n an
d C
onst
ruct
ion
Fisc
al S
ervi
ces
Food
Ser
vice
s C
entra
l Se
rvic
es
Pupi
l Tra
nspa
natio
n Se
rvic
es
Ope
ratio
n of
Pla
nt
Mai
nten
ance
of P
lant
A
dmin
istr
ativ
e Tc
chno
loi::
v Se
rvic
es
Com
mun
itv S
ervi
ces
ln1e
rest
on
Lonl
.!-te
rrn D
ebt
Una
lloca
ted
Deo
reci
atio
n/A
mon
izat
ion
Exoe
nse•
T
otal
Com
pone
nt U
nit A
ctiv
ities
Acc
oun
t C
harg
es f
or
Num
ber
Exn
ense
s Se
rvic
es
5000
79
2.6
05.2
5 61
00
0.00
62
00
0.0
0
6300
17
.690
.00
6400
0.
00
6500
0.
00
7100
26
.337
.33
7200
60
.782
.84
7300
24
1.5
15.9
6 74
00
26,8
21.
94
7500
17
,690
.00
7600
0.
00
7700
18
,796
.75
7800
0.
00
79
00
15.7
09.7
6 81
00
0.0
0 82
00
0.0
0
910
0 0
.00
9200
0
.00
64,
900
.67
1,28
2,85
0.50
Gen
eral
Rev
enue
s:
Tax
es:
Prop
eny
Tax
es, L
evie
d fo
r Ope
ratio
nal
Purp
oses
Pr
open
y T
axes
, Lev
ied
for
Deb
t Ser
vice
Pr
open
y T
axes
. Lev
ied
for C
apita
l Pr
ojec
ts
Loc
al S
ales
Tax
es
0.00
0.
00
0.00
0.
00
0.
00
0.
00
0.00
0.
00
0.
00
0.00
0
.00
0.0
0
0.00
0.
00
0.
00
0.0
0
0.0
0
0.0
0
0.00
0.0
0
Gra
nts
and
Con
tribu
tion
s N
ot R
estri
cted
to S
peci
fic P
rogr
ams
Inve
stm
ent E
arni
ngs
Mis
cella
neou
s Sp
ecia
l Ite
ms
Ext
rao
rdin
ary
Item
s T
rans
fers
Pro1
1.ra
m R
even
ues
Ope
rati
ng
Gra
nts
and
C
ont
ribu
tion
s . 0
.00
.• 0
.00
0.00
0.
00
0.
00
0.00
0.00
0
.00
0.0
0 0
.00
0.0
0 0.
00
0.0
0
0.00
0.
00
0.
00
0.0
0
0.00
0
.00
0.0
0
Tot
al G
ener
al R
even
ues,
Spe
cial
Ite
ms,
Ext
raor
dina
ry I
tem
s an
d T
rans
fers
C
hang
e in
Net
Ass
ets
Net
Ass
ets
-Ju
ly I
. 200
9 N
et A
sset
s -
June
30,
20
10
"Thi
s am
ount
exc
lude
s th
e de
prec
iatio
n/ar
noni
zatio
n th
at is
incl
uded
in
the
dire
cl e
xpen
ses
of t
he v
ario
us f
unct
ions
.
The
acc
ompa
nyin
g no
tes
10 fi
nanc
ial
sta1
emen
ts a
re a
n in1
egra
l pa
rt o
f thi
s st
atem
ent.
ESE
145
Cap
ital
G
rant
s and
C
ontr
ibut
ions
0.0
0 0
.00
0.0
0 0.
00
0.00
0.
00
0.
00
0.
00
0
.00
143
,382
.00
0.0
0 0
.00
0.00
0.0
0
0.00
0.
00
0.
00
0.
00
0. 0
0
~
143,
382.
00
Exh
ibit
J-lc
P
age
57
Net
(E
xpen
se)
Rev
enue
and
Cha
nges
in
Net
Ass
ets
Com
pone
nt U
nit
Acl
iviti
es
(792
.605
.25)
0.
00
0.00
( 1
7.69
0.00
)
0.0
0 0
.00
(26.
337.
33)
(60.
782.
84)
(24
1,5
15.9
6)
116,
560.
06
(17,
690.
00)
0.00
(1
8,79
6.75
) 0.
00
(1
5,70
9.76
) 0
.00
0.0
0 0.
00
0.00
(6
4,90
0.67
) {I
, 139
,468
.50)
0.00
0
.00
0.0
0
0.0
0 1,
216
,533
.95
0.00
49
3.8
7
0.0
0 0.
00
0.
00
1,2
17.0
27.8
2 77
,559
.32
753
,979
.29
831,
538.
61

DIS
TR
ICT
SC
HO
OL
BO
AR
D O
F D
UV
AL
CO
UN
TY
C
Ol\
IBIN
lNG
ST
AT
EM
EN
T O
F A
Cl'
IVIT
IES
(CO
NT
INU
ED
)
NO
N M
AJO
R C
OM
PO
NE
NT
UN
ITS
S
.O.C
.K. S
choo
l or S
ucce
ss A
cade
my
Mid
dle
Scho
ol
Fo
r th
e F
isca
l Y
ear
End
ed J
un
e 30
. 201
0
FU
NC
TIO
NS
Com
pone
nt U
m/ A
ctiv
i111
1s:
Inst
ruct
ion
Pup
il P
erso
nnel
Ser
vice
s In
stru
ctio
nal
Med
ia S
ervi
ces
Inst
ruct
ion
and
Cur
ricu
lum
Dev
elop
men
t Ser
vice
s
Inst
ruct
iona
l Sta
fTT
rain
ini.:
Ser
vice
s In
stru
ctio
n R
elat
ed T
echn
oloi
.:y
Sch
ool
Boa
rd
Gen
eml A
dmin
istr
atio
n S
choo
l Adm
inis
trat
ion
faci
liti
es A
caui
siti
on a
nd C
onst
ruct
ion
fisc
al S
ervi
ces
foo
d S
ervi
ces
Cen
tral
Ser
vice
s P
upil
Tra
nspo
rtat
ion
Ser
vice
s O
pera
tion
of P
lant
M
aint
enan
ce o
f Pl
ant
Ad
min
istr
ativ
e T
echn
olog
y Se
rvic
es
Com
mun
ity
Serv
ices
In
tere
st o
n L
oni.:
-ter
rn D
ebt
Una
lloc
ated
Dep
rcci
atio
n!A
mon
izat
ion
Exp
ense
• T
ota
l C
om
po
nen
t U
nit
Act
ivit
ies
Acc
ount
C
harg
es f
or
Nu
mb
er
Exp
ense
s S
ervi
ces
5000
79
5.51
0.45
61
00
141.
820.
28
6200
28
.47
1.49
63
00
103.
802.
41
6400
14
3,78
6.37
65
00
0.00
71
00
1,39
4.13
72
00
0.00
73
00
395,
262.
47
7400
0.
00
7500
88
.287
.95
7600
14
4.2
41.7
6 77
00
0.00
78
00
194.
472.
50
7900
21
3.26
9.5
1 81
00
241.
261.
79
8200
0
.00
910
0 42
.633
.92
9200
2,
344
.00
112.
425.
75
~
2,64
8.98
4. 7
8
Gen
eral
Rev
enue
s:
Taxe
s:
Prop
eny
Tax
es, L
evie
d fo
r O
pera
tiona
l P
urpo
ses
Pro
pcny
Tax
es, L
evie
d fo
r D
ebt S
ervi
ce
Pro
pcny
Tax
es,
Lev
ied
for C
apit
al P
roje
cts
Loc
al S
ales
Tax
es
0.00
0.00
0.
00
0.00
0.
00
0.0
0 0.
00
0.00
0.
00
0.0
0
0.00
0.
00
0.00
0.
00
0.00
0.
00
0.00
0
.00
0.00
0.00
Gra
nts
and
Con
trib
utio
ns N
ot R
estr
icte
d to
Spe
cifi
c P
rogr
ams
Inve
stm
ent
Ear
ning
s M
isce
llan
eous
S
peci
al h
ems
Ext
raor
dina
ry h
ems
Tra
nsfe
rs
Pro
eram
Rev
enu
es
Op
erat
ing
Gra
nts
an
d
Co
ntr
ibu
tio
ns
180.
975
.90
7,74
9.40
75
4. 0
0
0.00
24
,270
.10
0.00
0.
00
0.00
0.
00
0.00
0.
00
132.
495.
59
0.00
0.
00
0.00
0.
00
0.00
39
.385
.78
0.0
0
~~
~
385,
630.
77
To
tal
Gen
eral
Rev
enue
s, S
peci
al I
tem
s, E
xtra
ord
inar
y I
tem
s a
nd T
ran
sfer
s
Ch
ang
e in
Net
Ass
ets
Net
Ass
ets
· Ju
ly l
, 200
9 N
et A
sset
s -
June
30.
20
I 0
•Thi
s am
ount
exc
lude
s th
e de
prec
iati
onla
rnon
izat
ion
that
is
incl
uded
in t
he d
irec
t exp
ense
s o
f the
var
ious
fun
ctio
ns.
The
acc
ompa
nyin
g no
tes
10 f
inan
cial
sta
tem
ents
arc
an
inte
gral
pan
of
this
slll
tem
cnt.
ES
E 1
45
Cap
iUI
Gra
nts
an
d
Co
ntr
ibu
tio
ns
0.0
0
0.00
0.
00
0.0
0 0
.00
0.0
0 0.
00
0.00
0.
00
0.00
0.
00
0.0
0
0.00
0.
00
63
.615
.00
83.4
20.0
0 0.
00
0.00
0.
00
"' ~
147,
035.
00
Exh
ibit
J-2
c
Page
58
Net
(E
xpen
se)
Rev
enue
an
d C
han
ges
in N
et A
sset
s
Co
mp
on
ent
Uni
t A
ctiv
itie
s
(614
.534
.55)
( 1
34,0
70.8
8)
(27.
717
.49)
( 1
03.8
02.4
1)
(11
9.5
16.2
7)
0.00
( 1
,394
.13)
0.0
0
(395
,262
.47)
0
.00
(88,
287.
95)
( 11.
746.
17)
0.0
0 ( 1
94.4
72.5
0)
( 149
.654
.51)
(1
57.8
41.7
9)
0.00
(3
.248
.14)
(2
,344
.00)
( 1
12,4
25.7
5)
(2,1
16,3
19.0
1)
0.0
0 0
.00
0.00
0.
00
2,02
6,27
2.16
0.00
0.
00
0.00
0.
00
0.00
2,
026,
272.
16
(90.
046.
85)
1,44
0,83
3.00
1,
350,
786.
15

DIS
TR
ICr
SC
HO
OL
BO
AR
D O
F D
UV
AL
CO
UN
TY
C
Ol\
IBIN
ING
ST
AT
El\
IEN
T O
F A
CT
IVIT
IES
(C
ON
TIN
UE
D)
NO
Nl\
L\J
Olt
CO
MPO
NE
NT
UN
ITS
--
Way
man
Aca
dem
y of
the
Art
s F
or
the
Fis
cal Y
ear
End
ed J
un
e JO
, 201
0
FU
NC
TIO
NS
Com
pom
:m U
mt A
cti\l
//te.
<:
Inst
ruct
ion
Pupi
l Per
sonn
el S
ervi
ces
Inst
ruct
iona
l M
edia
Ser
vice
s In
stru
ctio
n an
d C
urri
culu
m D
evel
oom
cnt S
ervi
ces
Inst
ruct
iona
l S
taff
Tra
inin
l! Se
rvic
es
Inst
ruct
ion
Rel
ated
Tec
hnol
oi:v
Sc
hool
Boa
rd
Gen
eral
Adm
inis
trat
ion
Scho
ol A
dmin
istr
atio
n Fa
cilit
ies
AcQ
uisi
tion
and
Con
stru
ctio
n Fi
scal
Ser
vice
s Fo
od S
ervi
ces
Cen
tral
Ser
vice
s Pu
pil T
rans
port
atio
n Se
rvic
es
Ope
ratio
n o
f Pla
nt
Mai
nten
ance
of P
lant
A
dmin
istr
ativ
e T
echn
olog
y Se
rvic
es
Com
mun
itv S
ervi
ces
Inte
rest
on
Lon
g-te
rm D
ebt
Una
lloca
ted
Dep
reci
atio
n/A
mor
tizat
ion
Exp
ense
• T
otal
Com
pone
nt U
nit
Act
ivit
ies
Acc
ount
C
harg
es f
or
Num
ber
Exu
cnsc
s S
ervi
ces
5000
1,
087,
057.
58
6100
7,
316.
40
6200
0.
00
6300
0.
00
6400
17
,500
.00
6500
0.
00
7100
0.
00
7200
0
.00
7300
68
6,05
3.92
74
00
361,
948.
54
7500
37
,500
.00
7600
25
5,2
13.1
8 77
00
0.00
78
00
133,
230.
03
7900
27
9.62
4.24
81
00
0.00
82
00
0.00
91
00
0.00
92
00
0.00
5
1,75
6.28
~
2,91
7,20
0.17
Gen
eral
Rev
enu
es:
Taxe
s:
Prop
erty
Tax
es, L
evie
d fo
r Ope
ratio
nal
Purp
oses
Pr
oper
ty T
axes
, L
evie
d fo
r D
ebt S
ervi
ce
Prop
erty
Tax
es,
Lev
ied
for C
apita
l Pr
ojec
ts
Loc
al S
ales
Tax
es
0.00
0.
00
0.00
0.
00
0.00
0.
00
0.00
0.
00
0.00
0.
00
0.0
0 0
.00
0.0
0 0.
00
0.00
0.
00
0.00
0.
00
0.00
0.0
0
Gra
nts
and
Co
ntrib
utio
ns N
ot R
estr
icte
d to
Spe
cific
Pro
gram
s ln
vest
mem
Ear
ning
s M
isce
llane
ous
Spec
ial
Item
s E
xtra
ordi
nary
Ite
ms
Tra
nsfe
rs
Pro
gram
Rev
enue
s O
pera
ting
G
rant
s an
d C
ontr
ibu
tion
s
m
• ~
Tot
al G
ener
al R
even
ues,
Spe
cial
Ite
ms,
Ext
raor
dina
ry I
tem
s an
d T
rans
fers
C
hang
e in
Net
Ass
ets
Net
Ass
ets
-Jul
y I.
200
9 N
et A
sset
s -J
une
30. 2
010
•Thi
s am
ount
exc
lude
s th
e de
prec
iatio
n/am
ortiz
atio
n th
at is
inc
lude
d in
the
dir
ect e
xpen
ses
of th
e va
riou
s fu
nctio
ns.
The
acc
ompa
ny m
g no
tes
to f
inan
cial
sta
tem
ents
are
an
inte
gral
par
t o
f thi
s st
atem
ent.
ESE
145
Cap
ital
G
rant
s an
d C
ontr
ibut
ions
0.00
0
.00
0.00
0.
00
0.00
0.
00
0.00
0.
00
0.00
0.
00
0.00
0.
00
0.00
0.
00
0.00
0.
00
0.00
0.
00
0.0
0 0
.00
0.0
0 0
.00
0.00
0.
00
0.00
0.
00
0.00
0.
00
0.00
0.
00
0.00
0.
00
0.00
0.
00
0.00
0.
00
0.00
0.
00
~ ~'~~"(!
0.00
0.
00
Exh
ibit
J-2
c Pa
ge 5
9
Net
(Exp
ense
) R
even
ue
and
Cha
nges
in
Net
Ass
ets
Com
pone
nt U
nit
Act
ivit
ies
(1,0
87 .0
57 .5
8)
(7.3
16.4
0)
0.00
0.
00
( 17,
500.
00)
0.0
0 0.
00
0.00
(6
86,0
53.9
2)
( 361
,948
.54)
(3
7,50
0.00
) (2
55,2
13.1
8)
0.00
( 1
33.2
30.0
3)
(279
,624
.24)
0
.00
0.0
0 0.
00
0.00
(5
1,75
6.28
) (2
,917
,200
.17)
0.00
0.
00
0.00
0
.00
2,97
9,46
5.02
0.
00
0.00
0.
00
0.00
0.
00
2,97
9,46
5.02
62.2
64.8
5 44
7.39
8.45
50
9.66
3.30

DIS
TR
ICT
SC
llO
OL
BO
AR
D O
F D
UV
AL
CO
UN
TY
C
OM
BIN
ING
ST
AT
EM
EN
T O
F A
CT
IVIT
IES
(C
ON
TIN
UE
D)
NO
NM
AJO
R C
OM
PO
NE
NT
UN
ITS
FU
NC
TIO
NS
C
ompo
nent
Un/
/ Ac1
1vi11
cs:
Inst
ruct
ion
Pup
il P
erso
nnel
Ser
vice
s In
stru
ctio
nal M
edia
Ser
vice
s In
stru
ctio
n an
d C
urri
culu
m D
evel
opm
ent
Ser
vice
s In
stru
ctio
nal S
tafT
Tra
inin
l! S
ervi
ces
Inst
ruct
ion
Rel
ated
Tec
lmol
ouv
Sch
ool
Boa
rd
Gen
eral
Adm
inis
1.ra1
ion
Scho
ol A
dmin
istr
atio
n Fa
cili
ties
AcQ
uisi
tion
and
Con
stru
ctio
n F
isca
l S
erv
ices
Food
Ser
vice
s C
entr
al S
ervi
ces
Pup
il T
rans
oon
atio
n S
ervi
ces
Ope
rati
on o
f P
lant
Mai
nten
ance
of P
lant
A
dmin
istr
ativ
e T
cchn
olo
uv S
ervi
ces
Com
mun
ity
Ser
vice
s I n
terc
st o
n L
on)!
-tcr
m D
ebt
Una
lloc
ated
Dep
rcci
atio
n/A
mon
iza t
ion
Exp
ense
• T
ota
l Com
pone
nt
Uni
t Act
iviti
es
Acc
ou
nt
Cha
rges
fo
r
Num
ber
E
xpen
ses
Ser
vice
s
5000
4,
727,
062.
37
610
0 14
9,13
6.68
62
00
66.2
27.6
8 63
00
295.
169
.43
6400
17
5,64
2.06
65
00
0.00
7
100
65,0
84.2
4 72
00
60,7
82.8
4 73
00
2,04
1,26
4.14
74
00
620,
131.
88
7500
24
0,45
2.90
76
00
567,
957.
98
7700
39
,718
.64
7800
66
7,84
3.6
0 79
00
987,
686.
58
810
0 26
8,2
23.4
0 82
00
0.0
0
910
0 16
2,99
6.95
92
00
20,5
57.8
3 22
9,08
2.70
11
,385
,021
.90
Gen
eral
Rev
enue
s:
Taxe
s:
Pro
pcny
Tax
es.
Levi
ed f
or O
pera
tion
al P
urpo
ses
Pro
pcny
Tax
es,
Levi
ed fo
r D
ebt S
ervi
ce
Pro
pcny
Tax
es,
Lev
ied
for C
apit
al P
roje
cts
Loc
al S
ales
Tax
es
0.00
0.
00
0.00
0.
00
0.00
0.00
0.
00
0.0
0 0.
00
0.00
0.
00
3,88
0.00
0.
00
0.00
0.
00
0.00
0.
00
7,77
7.00
0.00
11,6
57.0
0
Gra
nts
and
Con
trib
utio
ns N
ot R
estr
icte
d to
Spe
cific
Pro
gram
s In
vest
men
t E
arn
ings
M
isce
llane
ous
Spe
cial
Ite
ms
Ext
raor
dina
ry I
tem
s T
rans
fers
Pro
eram
Rev
enue
s O
per
atin
g G
rant
s an
d
Con
trib
utio
ns
198,
364.
90
7,74
9.40
24.7
90.0
0 10
6,06
2.00
34
,270
.10
0.00
0.
00
0.0
0
2,54
5.00
.
0.00
0
.00
132 ..
495.
59
6,56
0.0
0 0.
00
35,1
46.0
0
0.00
0.
00
39
.385
.78
0.00
587,
368.
77
Tot
al G
ener
al R
even
ues,
Spe
cial
Ite
ms,
Ext
rao
rdin
ary
Ite
ms
and
Tra
nsfe
rs
Cha
nge
in N
et A
sset
s
Net
Ass
ets
-Ju
ly I
, 200
9
Net
Ass
ets
-Ju
ne 3
0, 2
0 I 0
•Thi
s am
ount
exc
lude
s th
e dc
prec
iati
on/:
unon
izat
ion
that
is
incl
uded
in t
he d
irect
exp
ense
s of
the
var
ious
fun
ctio
ns.
The
acc
ompa
nyin
g no
tes
10 f
inan
cial
sta
tem
ents
are
an
inte
gral
par
t o
f thi
s st
atem
ent.
ESE
145
Ca
pita
l G
ran
ts a
nd
C
ontr
ibu
tio
ns 0.
00
0.00
0
.00
0.0
0 0.
00
0.00
0.
00
0.
00
0.
00
143,
382.
00
0.00
0
.00
0.0
0 0
.00
63,
615
.00
83,4
20.0
0 0.
00
0.
00
0.00
290,
417
.00
Exh
ibit
J-2
d P
age
60
Net
(E
xpe
nse)
R
even
ue
and
Cha
nges
in N
et A
sset
s T
otal
C
om
pone
nt
Uni
ts
Act
ivit
ies
(4.5
28,
697.
47)
(14
1,38
7.28
) (4
1,43
7.6
8)
(189
.107
.43)
(1
41,
371.
96)
0.00
(6
5,08
4.24
) (6
0,7
82.8
4)
(2,0
38,7
19.1
4)
(476
.749
.88)
(2
40,4
52.9
0)
(43
1,58
2.3
9)
(33.
158.
64)
(667
,843
.60)
(8
88.9
25.5
8)
( 184
,803
.40)
0
.00
(115
,834
.17)
(2
0,55
7.83
) (2
29,0
82. 7
0)
(10,
495,
579.
13)
0.00
0.
00
0.00
0
.00
10,9
72,5
79.9
8 0
.00
102,
442.
03
0.0
0 0.
00
0.0
0
11,0
75,0
22.0
I
579,
442
.88
2,4
74,5
45.7
4
3.0
53.9
88.6
2

CONTENTS:
Exhibit K-1
Exhibit K-2
Exhibit K-3
Exhibit K-4
Exhibit K-5
Exhibit K-6
Exhibit K-7
Exhibit K-8
Exhibit K-9
Exhibit K-10
Exhibit K-11
Exhibit K-12
Exhibit K-13
Exhibit K-14
Exhibit K-15
Exhibit K-16
Exhibit K-17
Return completed fonn to: Department of Education FLORIDA DEPARTMENT OF EDUCATION
REPORT OF FLNANCIAL DATA TO THE COMMISSIONER OF EDUCATION (ESE 348)
DISTRICT SCHOOL BOARD OF DUVAL COUNTY For the Fiscal Year Ended June 30, 2010
Office of Funding and Financial Reporting 325 W. Gaines St., Room 824 Tallahassee, FL 32399-0400
PAGE NUMBER
DOE
Statement of Revenues, Expenditures, and Changes in Fund Balance - General Fund -------------------------· 1-3
Statement of Revenues, Expenditures, and Changes in Fund Balance - Special Revenue Fund - Food Services --------------------------------------------------------------------------------------------------------------------· 4-5 Statement of Revenues, Expenditures, and Changes in Fund Balance - Special Revenue Fund - Other Federal Programs --------------------------------------------------------------------------------------------------------- 6-7 Combining Statement of Revenues, Expenditures, and Changes in Fund Balances - Special Revenue Funds - ARRA Economic Stimulus Funds ----------------------------------------------------------------------------· 8-1 I Statement of Revenues, Expenditures, and Changes in Fund Balance - Special Revenue Fund - 12 M isce 11 aneo us -----------------"----------------------------------------------------------------------------------------------· Combining Statement of Revenues, Expenditures, and Changes in Fund Balances - Debt Service Funds----· 13
Combining Statement of Revenues, Expenditures, and Changes in Fund Balances - Capital Projects 14-17 Funds -----------------------------------------------------------------------------------------------------------------------· Statement of Revenues, Expenditures, and Changes in Fund Balance - Permanent Fund -----------------------· 18
Combining Statement of Revenues, Expenses, and Changes in Fund Net Assets - Enterprise Funds--------· 19
Combining Statement of Revenues, Expenses, and Changes in Fund Net Assets - Internal Service Funds---· 20
Combining Statement of Changes in Assets and Liabilities - School Internal Funds-----------------------------· 21
Schedule of Long-term Liabilities -----------------------------------------------------------------------------------------· 22
Schedule of Categorical Programs - Report ofFunds Available and Expenditures-------------------------------· 23
Schedules of Selected Subobject Expenditures and Other Data Collection-----------------------------------------· 24-26
Schedule 3, School Program Cost Report, General Fund/Special Revenue Funds--------------------------------· 27
Schedule 4, District Aggregate Program Cost Report, General Fund/Special Revenue Funds------------------· 28
Schedule 5, Supplementary Schedule of Federal Financial Assistance Program Expenditures--------------· 29
The Report of Financial Data to the Commissioner of Education (ESE 348) for the fiscal year ended June 30, 2010, was submitted in accordance with Rule 6A-l.0071, F.A.C. (Section 1001.51(12)(b), F.S.). This report was approved by the school board on
-----------' 2010.
District Superintendent's Signature Date
ESE 348

DISTRICT SCHOOL BOARD OF DUVAL COUNTY STATEMENT OF REVENUES, EXPENDITURES, ANO CHANGES IN FUND BALANCE - GENERAL FUND For 1he Fiscal Year Ended June 30. 2010 - - - ---- - -- -- -- --- --- - -.
REVENUES Federal Direct:
Federal !mnacl, Current Operation Reserve Officers Trainin2 Corns (ROTC) Miscellaneous Federal Direct Total Federal Direct
Federal 711ro11gh State and local: Medicaid National Forest Funds Federal Throuah Local Miscellaneous Federal Throu"h State Total Federal Through State and Local
State: Florida Education Finance Pro2ram Workforce Development Workforce Develonment Caoi1alization Incentive Grant Workforce Education Performance Incentive Adults with Disabilities CO & OS Withheld for Adm"inistrative Expense Categoricals:
District Discretionarv Lotterv Funds Class Size Reduclion/Ooeratino Funds School Reco.,nition Funds Excellent Teachin2 Pro2ram Voluntarv Prekinder.,arten Prooram Preschool Proiects Reading Programs Full Service Schools
Other State: Diagnostic and Leamin" Resources Centers Racinl! Commission Funds State Forest Funds State License Tax Other Miscellaneous State Revenue
Total State
local: District School Taxes Tax Redemotions Pavment in Lieu of Taxes Excess Fees Tuition Rent lnlcresl on lnvestmenls Gain on Sale of lnveslments Net Increase (Decrease) in Fair Value of lnveslments Gifts. Gran1s and Beauests Adull General Education Course Fees Postsecondarv Vocational Course Fees Continuin2 Workforce Educalion Course Fees Caoital lmorovemenl Fees Postsecondary Lab Fees Lifelong Leamin" Fees General Education Oevelooment rGED) Testing Fees Financial Aid Fees Other Sludent Fees Preschool Prooram Fees Pre-K Early Intervention Fees School A2e Child Care Fees Other School. Course and Class Fees 1\!liscellaneo1is Local:
Bus Fees Transportation Services-School Activities Sale of Junk Receipt ofFederal Indirect Cost Rate Other Miscellaneous Local Sources Impact Fees Refunds of Prior Year's Exoenditurcs Collections for Lost, Dama2ed and Sold Textbooks Receiot of Food Service Indirect Costs
Total Local Total Revenues
ESE 348
Account Number
3121 3191 3199 3100
3202 3255 3280 3299 3200
3310 3315 3316 3317 3318 3323
3344 3355 3361 3363 3371 3372 3373 3378
3335 3341 3342 3343 3399 3300
3411 3421 3422 3423 3424 3425 3431 3432 3433 3440 3461 3462 3463 3464 3465 3466 3467 3468 3469 3471 3472 3473 3479
3491 3492 3493 3494 3495 3496 3497 3498 3499 3400 3000
Exhibit K-1 DOE Page I
Fund 100 - -·· -- -
332.356.20 658.656.18 202.045.24
I, 193,057.62
843.57
843.57
299. 726.302. 00
65.846.76
354.457.00 I 37,967, I 95.00
5.858. 110.00 14.246.66
I 83,885.80
114.080.92
43,808.43 446.500.00
7,934.05 311.889.28 391,841.19
445,486,097.09
362,503,412.20 3. I 83,791.06
52,762. 77 4.408.83 7.49
C22,618.00) 130.756.69
420.623 25
8, 720,206.08 2.421 ,309. 83
356.612.66 5. I 77.823.22 5.561.591.56
2,662,397.22 124,427.53
2,060,067.18 397, 762,000. 74 844,441,999.02

DIS
TR
ICT
SC
llO
OL
BO
AR
D O
F D
UV
AL
CO
UN
TY
S
TA
TE
ME
NT
o~· R
EV
EN
UE
S, E
XP
EN
DIT
UR
ES
. AN
D C
IL\N
GE
S I
N F
UN
D B
AL
AN
CE
-G
EN
ER
AL
FU
ND
(C
onti
nu<
d)
for
the
Fisc
:il Y
= E
nded
Jun
e JO
, 20
10
---
... _
----
·· --
--·
·---
--··
--
-· --
. -
100
20
0 JO
O
Acc
ount
E
mpl
oyee
P
urch
as..-
d N
umbc
:r Sa
lari
es
Dcn
cfil>
Se
rvi u
s E
XP
EN
DIT
UR
ES
Cur~nt:
lnsu
ucuo
n 50
00
352.
?79.
9t8
.92
12
0, 7
56,5
39. I
J
34.2
03.5
71.4
6
Pupi
l Per
sonn
el S
C1V
1ccs
61
00
27.4
96.6
38.8
8
I 0,0
72.1
06.8
0
4.42
5,92
5.93
lmtr
u<:u
onal
Med
ia S
ervi
ces
6200
8,
554.
668.
18
J,13
2,08
5.7
6
835.
160.
14
lmtr
u\.·U
on ii
llld
Cum
culu
m D
cvcl
oom
cnl S
uv1
ces
6300
5.
198.
091
97
1,
700.
608.
67
609,
797.
97
lnst
rutt.
ION
l S13
.ffT
r.un
ine
Serv
ices
64
00
9,36
3.22
.J.3
8 3.
069.
078.
89
5.69
7.3
18.9
9
lnstr
ue11
on R
clah
.. -d T
cchn
oloi
.:v
6500
3,
709
347.
85
1.25
7.20
3.55
5,
744.
878
.99
Sch
ool B
oard
7
100
471.
086.
45
181
.134
.75
1.38
0.30
9.21
Gcn
c.ra
l Adm
inis
trat
ion
7200
2,
664,
698.
74
73
7.24
5.9
0
142.
868.
25
Scho
ol A
dm1n
1str
auon
73
00
40.3
81.0
51.
85
14
.111
.846
.74
912
.084
.46
Fac
ihuc
s A
cqui
siti
on :a
nd C
on.tt
rucu
on
7410
4
98,4
49.7
6
I 55.
346.
42
79
,842
.&9
Fisc
ol S
cnri
ocs
7500
4,
005,
031.
32
1,S
82,5
47.0
0 14
3,56
2.29
Food
Ser
vice
s 76
00
Ccn
trol
S..r
vicc
s 77
00
8.16
8.18
0.42
2.
845.
538
.30
S,
967,
772.
73
l'up
il T
r.uu
poru
uion
Ser
vice
s 78
00
t ,06
3,58
2.82
35
9.26
3.2
3 4
2.90
6 S6
4.6
6
Ooc
rauo
n o
f Pla
nt
790
0 I 0
.b09
. 788
. I 0
4.63
9, I
70.8
8 2
8,79
3.00
7.8
0
Maa
nh:n
ancc
of P
lant
81
00
14.4
07.1
82.6
9
4.69
6,74
4.27
3.
917
,123
.64
Adm
1n1.s
lril1
1v.:
Tcc
hnol
o}!y
Ser
vice
s 82
00
2,63
9 . .,.
,.,_
18
833.
851.
50
2.64
0,09
5.86
Com
mun
ity S
ervi
ces
910
0 4
66.
720
.26
II
S,1
09.
07
140.
431.
09
C
opu
al O
utla
y:
~·~:
l'J
;;_,.
Faci
11uc
s A
cqu1
51u
on a
nd C
onst
n1cu
on
7420
i'
... ,~~
,, ~'
~
'fl
Oth
er C
aoua
l O
utla
y
9300
--·
-·· -
lHb
t &n1c~
: (F
unct
ion
9100
) ~;Fi.~'~:-·
r~~
:..;
•(
•••
r:i
;~~f,~
. ~--L
~ ,.:
-.. "
Red
empt
ion
of P
rinc
ipal
71
0 "'
.... -.;-
; !!~ .
•·r'
l-..-
ti..
~
. ln
tc.rc
s1
720
l"ou
S l::
1.pw
di1u
re.
49
1,97
6,88
3.7
7
170,
24S
.420
.86
I 3
8.54
0,J 1
6.3
6
£.s
ctu
(l>
cfic
icnc
y) o
r R
enn
uts
Ov
u U
ucn
dil
urc
s
ES
E3
48
400
500
Ene
rgy
Mat
eria
ls Se
rvic
es
ond
Supp
lies
28,3
86.t
I 19
.679
,938
.55
3.40
4.57
3
15,8
32.0
7
220,
142.
15
576.
643.
87
110.
940
.16
4 I ,
234.
9S
134,
666.
65
5.43
3.44
t4,9
10.2
8 4
7 9
91.3
1
414,
0S6.
l 1
2.48
2.03
47.4
10.1
7
103.
176.
54
I S0,
002.
4S
3.4
10,
395.
62
12.0
5S.4
1
20,9
70.2
16.6
4 98
3 4
09.
JS
580.
SJ4
.JJ
6,15
8,63
5.39
J 40
6.6
7
16,7
02 3
8 ir
·i.;;.
..
. -··
· ,.
' "t,
t' ·--
r ~
·rs
~
w .:-.. ~~
;
-..L
.of\.u
'. ~-'
_. .. \ ..
.. .'.
.~-~
-c;(
•,
le
l.'""t
[~~
.t.!"
!?.,.
-~~ ~ ~
:~,~~:~J
:-'_~ -
r'
,,
25,1
52,2
59.0
4 28
,879
. 748
.21
600
Cap
ital
O
ulla
v
1,67
7.43
6.8
9
38,6
17.2
3
65
20
08.
36
117,
927.
57
20.6
58.6
8
65,9
26.5
5
2.84
0 74
172,
344.
07
530,
525.
84
4.3
58 5
1
t 1.2
04.6
6
882
.00
85.9
6H.7
6
25.2
84. 0
0
63 2
81.9
2
56.
00
1.84
8,84
8.4
2
r• •
• ~
--
5.31
8.17
0.2
0
700
Oth
er
Ex
n.n
<C
$
1.4
59,
776
83
7.18
5.0
8
1.7S
J.7S
8.38
5.43
94.6
10.4
8
t65.
28
156,
074.
00
126.
689.
31
IOl.
293.
4t
81
00
0
26.4
04 2
2
7,63
6.0
2
124
00
16,9
28 6
8
37,7
47.0
0
1.50
0.0
0
12.t
48
01
~ ... --;~
~~~:J'
_
2.0S
9,23
I SO
Exh
1b11
K-l
D
OE
Pag
c2
Fun
d 10
0 --
---
---
To~ls
530,
085,
567
89
42.3
59.7
10.5
6
13,3
95,8
18 3
4
8.2
1 t.
45S
.48
I 8.J
SS
,830
.58
I 0.9
53.4
23.
82
2, t
94,0
37.8
5
3 73
7.24
4 53
S6.
092.
676.
64
1.26
7.45
6.9
9
S 8
09.3
I J.
S I
0.00
17.2
53.5
11.1
2
47,7
52.8
67,7
4
66.0
98,4
90.2
1
29 8
23.2
51.3
2
6,18
1,35
8.13
7S
l.l6
6 S
I
0. 0
0
1.84
8,84
8 4
2
0.0
0
00
0
862,
172
,029
.94
(17,
730.
030.
921

DISTRICT SCHOOL BOARD OF DUVAL COUNTY STATEMENT OF REVENUES, EXPENDITURES, AND CHANGES IN FUND BALANCE - GENERAL FUND (Continued) For the Fiscal Year Ended June 30. 2010 - - - -- -- - -- - ~- - -- - --- - - - --- - - - -,, ~ - - -
OTHER FINANCING SOURCES (USES)
Loans
Sales of Capital Assets
Loss Recoveries
Transfers In:
From Debt Service Funds
From Capital Projects Funds
From Special Revenue Funds
From Pennanent Funds
From Internal Service Funds
From Enterprise Funds
Total Transfers In
Transfers Out: (Function 9700)
To Debt Service Funds
To Capital Projects Funds
To Special Revenue Funds
To Pennanent Funds
To Internal Service Funds
To Enterprise Funds
Total Transfers Out
Total Other Financing Sources (Uses)
Net Change In Fund Balance
Fund Balance, July I, 2009
Adjustments to Fund Balance
Fund Balance, June 30, 2010
ESE 348
Account
Number
3720
3730
3740
3620
3630
3640
3660
3670
3690
3600
920
930
940
960
970
990
9700
2800
2891
2700
Exhibit K-1 DOE Page 3
Fund 100
37,658.71
0.57
33 ,749,792.62
2,950,344.00
36,700, 137.19
(4,108,287.01)
( 1,743,834.82)
(5,852,1 2 1.83)
30,885 ,674.07
13, 155,643.15
122,849,832.69
0.00
136,005,475.84

DISTRICT SCHOOL BOARD OF DUVAL COUNTY STATEMENT OF REVENUES, EXPENDITURES, AND CHANGES IN FUND BALANCE - SPECIAL REVENUE FUND - FOOD SERVICES For the Fiscal Year Ended June 30, 2010
REVENUES
Federal Through State and Local:
School Lunch Reimbursement
School Breakfast Reimbursement
After School Snack Reimbursement
Child Care Food Program
· USDA Donated Foods
Cash in Lieu of Donated Foods
Summer Food Service Program
Fresh Fruit and Vegetable Program
Other Food Service Revenues
Federal Throu!!h Local
Miscellaneous Federal Through State
Total Federal Through State and Local
State:
School Breakfast Suoolement
School Lunch Supplement
Other Miscellaneous State Revenues
Total State
Local:
Interest on Investments
Gain on Sale Of Investments
Net Increase (Decrease) in Fair Value of Investments
Gifts, Grants and Bequests
Student Lunches
Student Breakfasts
Adult Breakfasts/Lunches
Student and Adult a la Carte
Student Snacks
Other Food Sales
Other Miscellaneous Local Sources
Refunds of Prior Year's Expenditures
Total Local
Total Revenues
ESE 348
Account
Number
3261
3262
3263
3264
3265
3266
3267
3268
3269
3280
3299
3200
3337
3338
3399
3300
3431
3432
3433
3440
3451
3452
3453
3454
3455
3456
3495
3497
3400
3000
Exhibit K-2 DOE Page 4
Fund 410 - ---- ~ - - -
20, 744,223 .45
6,952,319.88
541,749.56
1,558,535.45
2, 190,226. 15
678, 131.63
32,665, 186.12
444,864.00
379,612.00
824,476.00
154,085.25
5,823,430.17
402,867.60
209,872.00
6,341 ,948.49
36,859.00
899,93 1.07
34,231 .50
13,903,225.08
47,392,887.20

DISTRICT SCHOOL BOARD OF DUVAL COUNTY STATEMENT OF REVENUES, EXPENDITURES, AND CHANGES IN FUND BALANCE - SPECIAL REVENUE FUND - FOOD SERVICES (Continued) For the Fiscal Year Ended June 30. 2010 - - - ---- - -- --- - - - - ----- - - --- - - ~ - - - -
EXPENDITURES (Function 7600/9300)
Salaries
Employee Benefits
Purchased Services
Energy Services
Materials and Suoolies
Capital Outlay
Other Expenses
Other Caoital Outlay (Function 9300)
Total Expenditures
Excess (Deficiency) of Revenues Over Expenditures
OTHER FINANCING SOURCES (USES)
Proceeds of Loans
Proceeds from Sale of Capital Assets
Loss Recoveries
Transfers In:
From General Fund
From Debt Service Funds
From Caoital Proiects Funds
Interfund
From Permanent Funds
From Internal Service Funds
From Enterprise Funds
Total Transfers In
Transfers Out: (Function 9700)
To General Fund
To Debt Service Funds
To Capital Projects Funds
Interfund
To Permanent Funds
To Internal Service Funds
To Enterprise Funds
Total Transfers Out
Total Other Financing Sources (Uses)
Net Change in Fund Balance
Fund Balance, July 1, 2009
Adjustments to Fund Ba lance
Fund Balance, June 30, 2010
ESE 348
Account
Number
100
200
300
400
500
600
700
600
3720
3730
3740
3610
3620
3630
3650
3660
3670
3690
3600
910
920
930
950
960
970
990
9700
2800
2891
2700
Exhibit K-2 DOE Page 5
Fund 4IO - ---- - - -
3,208,008.35
1,634.335.83
35,989,251.29
955,387. 13
1,837,290. 10
328,569.45
2,080, 778.63
153,493.29
46,187,114.07
1,205,773.13
13,298.20
4,057,092.00
4,057,092.00
0.00
4,070,390.20
5,276, 163.33
1,071 ,003.75
0.00
6,347,167.08

DISTRICT SCHOOL BOARD OF DUVAL COUNTY STATEMENT OF REVENUES, EXPENDITURES, AND CHANGES IN FUND BALANCE - SPECIAL REVENUE FUND - OTHER FEDERAL PROGRAMS For the Fiscal Year Ended June 30. 2010
REVENUES
Federal Direct:
Workforce Investment Act
Communitv Action Programs
Reserve Officers Training Corps (ROTC)
Miscellaneous Federal Direct
Total Federal Direct
Federal Through State and local:
Vocational Education Acts
Medicaid
Workforce Investment Act
Eisenhower Math and Science
Drug Free Schools
Individuals with Disabilities Education Act
Elementarv and Secondary Education Act, Title I
Adult General Education
Vocational Rehabilitation
Elementarv and Secondary Education Act, Title V
Federal Through Local
Cuban and Haitian Refugee Program
Emergency Immigrant Education Program
Miscellaneous Federal Through State
Total Federal Through State and Local
State:
Other Miscellaneous State Revenue
Total State
local:
Interest on Investments
Gain on Sale of Investments
Net Increase <Decrease) in Fair Value of Investments
Gifts, Grants and Bequests
Sale of Junk
Other Miscellaneous Local Sources
Refund of Prior Year's Expenditures
Total Local
Total Revenues
ESE 348
Account
Number
3170
3180
3 191
3199
3100
3201
3202
3220
3226
3227
3230
3240
3251
3253
3270
3280
3291
3293
3299
3200
3399
3300
343 1
3432
3433
3440
3493
3495
3497
3400
3000
Exhibit K-3 DOE Page 6
Fund 420
8,299,703.46
8,299,703.46
1,756,572.51
2,950,344.00
6,080,456.54
543,360.81
26,342,350.44
36,379,229.56
1,677,989.08
1,725,386.44
3,597,354.04
81,053,043.42
0.00
0.00
89,352, 746.88

DIS
TR
ICT
SC
HO
OL
BO
AR
D O
F D
UV
AL
CO
UIT
TY
S
TA
TE
ME
NT
Of'
RE
VE
NU
ES
, E
XP
EN
DIT
UR
ES
. AN
D C
llA
NG
ES
IN
FU
ND
BA
LA
NC
E -
SP
EC
IAL
RE
VE
NU
E F
UN
D -
OT
HE
R F
ED
ER
AL
PR
OG
RA
MS
(Con
tin
u<d)
F
ort
hc
Fis
cal Y
C3l
End
ed J
une
30. 2
010
···-
-·-
--·
-~ -
----
---
··-
--·
--
100
2
00
3
00
40
0 A
cco
un
t E
mpl
oyee
Pu
rcha
sed
Ener
i.'Y
N
umbe
r Sa
lllri
os
Ben
efits
Se
rvic
es
Ser
vice
s E
XP
EN
DIT
UR
ES
C
urn
:nt:
Jn
stru
cuon
50
00
20.9
86.7
07.9
5 7
. 796
.008
92
10
.644
.76
0.52
Pu
oil
Pers
onne
l 5C
fV1C
CS
610
0 8.
972.
282.
61
2.77
5.16
3 9
9
2.09
9.88
1.79
ln
stru
e11o
nal f
\·fcd
i3. S
ervi
ces
62
00
14
6.70
2.65
45
.63
4.4
5
26.
347.
39
In
stru
ctio
n an
d C
urric
ulum
Dc\
'clo
omcn
t Ser
vice
s 6
30
0
6.44
9. 70
4.3
8
1.87
4.73
9 63
77
5.19
2.9
5
Inst
ruct
iona
l SWTTminin~ S
c:M
ces
6400
4.
919
.44
1.73
1.
345.
104.
83
4.44
6.08
4.6
3 In
stru
ctio
n R
chuc
d T
cchn
olor
:v
6500
53
.05
70.5
53.3
5
llo>
rd
71 0
0
Gen
eral
Adm
in1s
trah
on
72
00
Scho
ol A
dmin
i.str
ntio
n 7
30
0
76.1
55.3
6
6.59
3.43
34
.842
.46
Faci
litie
s A
caui
sitio
n an
d C
on.s
uuct
ion
74
10
50
.145
.50
10 0
93.1
0 16
.876
.05
Fis
al S
ervi
ces
75
00
59
.070
.82
17.5
34.3
5
Foo
d Se
rvic
es
76
00
Cen
tral
Ser
vice
s 77
00
286.
445.
72
81
.399
.00
2.
737.
64
Puo
1l T
rans
nnn2
1tio
n Se
rvic
es
78
00
63
1.77
0.0S
35
.969
.00
0~
1ion o
f Pla
nt
79
00
2.
049.
17
36
8.0
0
Mam
lcru
nce
of P
lant
81
00
Adm
1n1.
s1ra
uve
Tcc
hnol
ol!V
Ser
vice
s 82
00
Com
mun
ity S
ervi
ces
910
0
54.1
26.6
7 16
.380
.80
120.
890.
08
C
nf)l
tul V
urla
y:
,. . ..
, ::r.
:f.."'1
1-.... '
l; ••
Fac
ilit
ies
Aca
uisi
tion
an
d C
onst
rucu
on
'·· -
;"
~
742
0
."''
-1".
:.:...
.. ·;:
Oth
i:r
C.11
1niu
l Out
lav
93
00
I'
" i'
-..
_..I ~~.....:... ~I
~ 5i
-I
MiM
----
;i,1
' ...
¥
""-I
I'.
lkb
t S<
nic.
:: (
J-im
,·rw
n 91
00)
-1
;::~
~·
'-ofi.
"'
. -~~·1~
~
•• ~.(II~
::.;.
Rcd
cmot
ion
or r
rinc
mal
71
0 !1
~
tn1c
rcs1
7
20
----.-
...;
:i;JI
Jll•
Toa
al Exp~dirurcs
42.0
02.8
32.5
6 13
.969
.07
3.55
18
.869
.936
.91
lS.9
69.
00
E
scas
(De.
ricie
ncy)
of R
even
ues
over
Es
pcad
itut
tS
OT
HE
R F
'IN
AN
CIN
G S
OU
RC
ES
(US
ES
>
~
l...o>
ns
3720
~)
·.:
··1..:..:
: . ..:
~L--?;-
,.1~
:-"
Sal
es o
rCop
1141
A5
seu
37
30
-L
oss
Ri:c
ovcr
ics
3740
1'
rons
fen
In:
Fro
m O
cncr
al F
un
d
3610
. :t
~::
::--J
:<
. Fr
om D
ebi S
ervi
ce F
unds
36
20
·r··
·:~ ,.
·•
-: •.
:.~·
ii"J
: ,_
!,,
""r,
'',:,
..,,..
.;r
.. i:.
..•~
,., ..
, l t
Fro
m C
anit
al P
roic
c;ts
Fu
nds
363
0
J,;.
~·
· ·-
... ~
,. -
r ·:J
-,..· r
f ... ~I.'
··;"
!!,·
•:.,
:;:
h ...
.. '
Jntc
rfun
d 36
50
. .,,,.
:;'
-1""
'1·~
':
--
.w
, ..
~'.C
''..
.nl-
"IN
~ .. ;.
~·:-~··.:.,..
Fro
m P
ctm
1ncr
t1 F
und
s 3
66
0
.. ..
-r
,. . ~
:--
''"..:'-
.:;'i:..
....;..
-F
rom
Int
erna
l S
ervi
ce F
W'ld
s 3
67
0
c ..,..
.., .. ,,.
:. ~·
:;':;.
. ... _
From
Enh
:mri
sc F
unds
3
69
0
. -~.::o .•
... _
-c.·
.v
""":
i-'~
· •-
,;.'
_,_J
Toc
al T
rans
fers
In
36
00
-..
·~ -
...i •
. .:
->
,...;
:;.
... .:r
!< ... --
.. ~
i?.r
Tra
1u/t
rs O
ut:
(/-:U
nc11
on 9
700)
.-::
} ,
To
the
Gen
eral
fun
d 9
10
..
To
Deb
t Ser
vice
Fun
ds
92
0
' . -
':'
.... T
o C
auiu
l Pro
iec:
lS F
unds
9
30
""
. ln
1crf
und
95
0
"' \
u.__
,"f.
:.
.:'.
-...
,.,.
~.:~
a ""
'A.·
~~-•,~~•
To
Pen
mm
cn1
Fun
ds
96
0
., -
• ...--!-.-~?.
:;:;
,_·~
·,;_
'fi(
.~l.
I )'_
'-.;
,.:
..;~-
-;i:
...
.
To
ln1c
mal
Scr
vlec
Fu
nds
97
0
--i·
~ "t,
.·-.. ..
-r
.,_
'
\~ '"'
.,~·
.. 'Em
...
~:~.J::'~~-.,.~.l:i..
To
Ent
cmri
sc F
unds
9
90
-
:....;
.·-i.-
< •.
·J.t.
-:.,.
·.!ts
.'
;.. .. }
t-.
. ;i;
r, ~~"1.!. -
· T
otal
Tra
nsrc
n O
ut
9700
.._
.' ·
-:..
; -~
\ ._
(.J .
• r
_"-q
l::
,.;:_
·; .:.-~
"'.:'. J''~
.... ';':
'"
Toe
al O
lhu
Fin
anci
nt:
So
urc
es (U
•u)
lU· .
.. ~-
_;-,
:.irw
.:.;:-
~
-t. ..
· . ..:~
-· .
~-:.
. f_':-
"L..
""'l
Ntl
Cha
ntl'
in 1
-"un
d U
alan
n
--
L ~-
': ~
Ji
... ,.
:,-_
~ ..
....
..
r"~
'· ,:-
~:.. ...
"':_.-".
':....... .
t. F
und
Bo
bn
cc. J
ulv
I.
2009
2
80
0
'!:•.
"'·
.J'
~
-.
~
~ ...
f',--,_
. l
1..
: ·~-:-.-~.h1<7'~
Ad1
ustm
cnts
to F
und
lla
lanc
c 28
91
-·-.. ..
;; ,,.
-~
'---~~.,~
-~"'--...
,.:.
;;~.
..;.
~ .,,
..,.,~
Fun
d ll
alan
cc. J
une
30.
20
10
2700
•
.I
....
. ,
-·
:1 .
..
~: .. :·-
-··-'-·
-'?'
-.:.
~-::::
l-,
-';
ESE
348
500
60
0
MA
tcri
als
Cap
iul
and
Suo
olic
:s
Out
lav
l.7
26
,22
8.7
2
801.
158
34
3
89.
562.
58
110.
069
87
4.08
8.12
38
9.52
7.4
9
206.
012.
24
20.2
32.3
0
363.
497.
20
121.
412
. 60
I 17
6 58
4 23
7
17.1
6
12.1
86.
52
1.98
7.6
5
3.01
4.3
3
:'"'
.. ....
...__
1.33
9.99
9.88
·;i:
. ..
<
_.
. ;f
;A
4.7
05.3
06.
87
3.96
0.97
2 3
6
~:.i.:
xL :C:;U
i:,~ ---
-•
I -
--·
••• 'i
t: .•
• ,.
""-:--
.:...~
,.; ·~
~t'c
..:r
. -·
·~~if''
i::. •
• ~ ,-~·
'.!., .
.. "'1-
" -·.
,;..
f :~ ~
:~1l
_,,_
~k,
~..,_,
,_ ":·.
' '.r.
:.Lr.'f
.1 °::"
-~
. -·
.:.;.
.. .,,.. ;
~:·
.,.
:.:;J
.. .. t..
..-~
-=
, . ,
~.
,, ""
1''•
"~
..,"
' .•.
'I
'
~:'!!t
~ .
. ,.
· •
• i
, .. .,...r,.:.;;.,._~~"J."'""
,. 1.
!,.~
.rrl
a.
,:_
_·:,
'·· -'·
-..
~·
-',~'11
. -
~;C.
r· .. - 1-
··;.
It.~~:.
_Jr .
....
700
Oth
er
Exo
cnse
s 68,6
33.6
6
6.65
1.08
1.
825
00
58
1.0
0
331.
098.
73
2.50
0.43
6.6
9
28
0 4
8
;:v
"l.:t
. 2.90
9.50
6 6
4
t~. ~
.. ""
"-'·
··~
-r
.,
".~.
\,
-· l
·-·:·
" ..
......
. ':
.1: i
i'.?.·...--~, . .
:.::
~-'-
1"""
'-~.
:i·
='·
J ~~:'I~~ •
. "
--~
,
''·-
~
-· -.
~ .
.:r.:r·
..r~v.·
-~ - ··-
.~1·
::·-..ii.
· _.-
:, ..
~.
~ .,
1.:.:
. ....
"JI
'•~
~.
-..
Exh
ibit
K-3
D
OE
Pag
e7
Fun
d 4
20
-·
Tot
als
44
.02
3.4
98.
11
14.3
53.6
11.
92
614.
125
10
9.32
6.46
2.5
0
11.
526.
639.
n 70
.606
40
0.0
0
2.50
0.43
6.6
9
117,
871.
73
1.25
3,69
8 8
8
77.
322
33
0.0
0
384.
756.
53
66
7.7
39
05
2.4
17.1
7 0
. 00
0
.00
19
4.41
1.88
0. 0
0 1.
339.
999.
88
0.0
0
00
0
86.4
53.5
97 8
9
2.89
9.14
8 9
9
51.1
95.0
1
Sl.
19
50
1
(2.9
50.3
44.0
0
(2.9
50.3
44.0
01
(2.8
99.1
48 9
9)
00
0
00
0
0.0
0
0.0
0
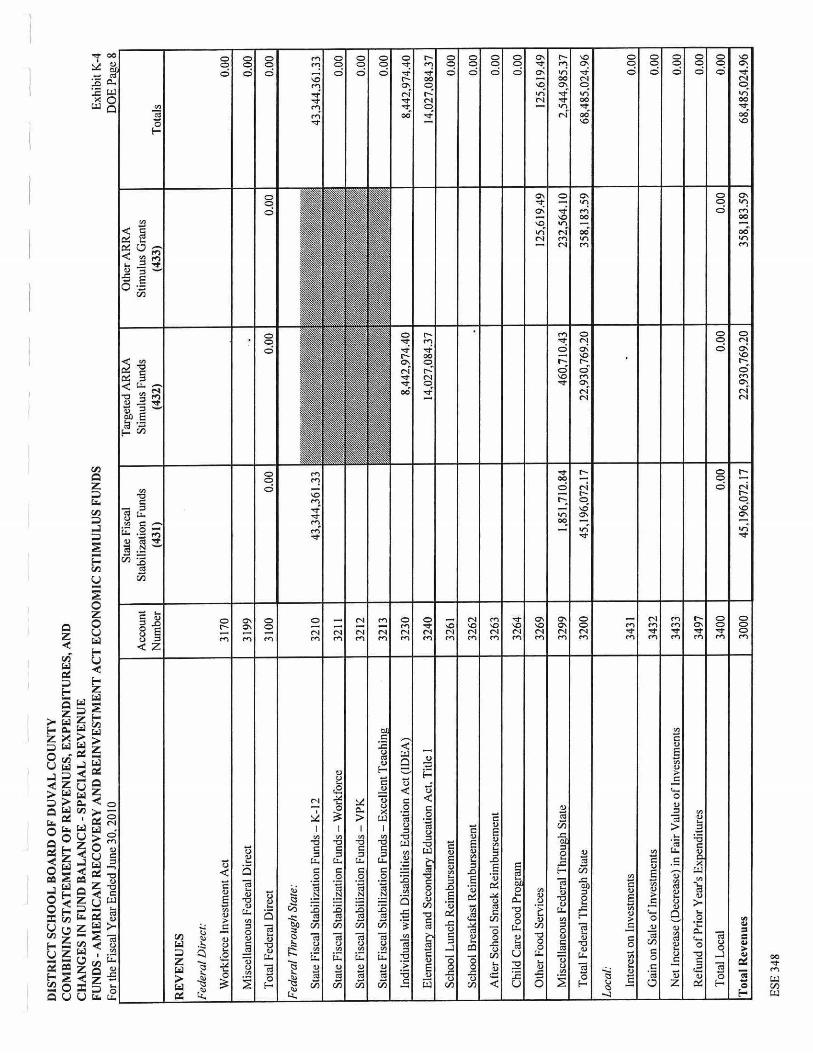
DIS
TR
ICT
SC
HO
OL
BO
AR
D O
F D
lJV
AL
CO
UN
TY
C
OM
BIN
ING
ST
AT
EM
EN
T O
F R
EV
EN
UE
S, E
XP
EN
DIT
UR
ES,
AN
D
CH
AN
GE
S IN
FU
ND
BA
LA
NC
E -
SPE
CIA
L R
EV
EN
UE
FU
ND
S -A
ME
RIC
AN
RE
CO
VE
RY
AN
D R
EIN
VE
STM
EN
T A
CT
EC
ON
OM
IC S
TIM
UL
US
FUN
DS
For
the
Fis
cal
Yea
r E
nded
Jun
e 30
, 201
0
RE
VE
NU
ES
Fed
eral
Dir
ect:
Wor
kfor
ce I
nves
tmen
t A
ct
Mis
cell
aneo
us F
eder
al D
irec
t
Tot
al F
eder
al D
irec
t
Fed
eral
Thr
ough
Sta
te:
Sta
te F
isca
l S
tabi
liza
tion
Fun
ds -
K-1
2
Sta
te F
isca
l S
tabi
liza
tion
Fun
ds -
Wor
kfor
ce
Sta
te F
isca
l S
tabi
liza
tion
Fun
ds -
VP
K
Sta
te F
isca
l S
tabi
liza
tion
Fun
ds -
Exc
elle
nt T
each
in
Indi
vidu
als
wit
h D
isab
ilit
ies
Edu
cati
on A
ct (I
DE
A
Ele
men
t E
duca
tion
Act
, Tit
le I
Sch
ool
Lun
ch R
eim
burs
emen
t
Sch
ool
Bre
akfa
st R
eim
burs
emen
t
Aft
er S
choo
l S
nack
Rei
mbu
rsem
ent
Chi
ld C
are
Foo
d P
rogr
am
Oth
er F
ood
Ser
vice
s
Mis
cell
aneo
us F
eder
al T
hrou
gh S
tate
Tot
al F
eder
al T
hrou
gh S
tate
Loc
al:
Inte
rest
on
Inve
stm
ents
Gai
n on
Sal
e o
f Inv
estm
ents
Net
Inc
reas
e (D
ecre
ase)
in
Fai
r V
alue
of
Inve
stm
ents
Ref
und
of P
rior
Yea
r's E
xoen
dilu
res
Tot
al L
ocal
Tot
al R
even
ues
ES
E 3
48
Acc
ount
N
umbe
r
3170
3199
3100
3210
3211
3212
3213
3230
3240
3261
3262
3263
3264
3269
3299
3200
3431
3432
3433
3497
3400
3000
Sta
te F
isca
l S
tabi
liza
tion
Fun
ds
(431
)
0.00
43,3
44.3
61.3
3
1,85
1,7
10.8
4
45, 1
96,0
72.1
7
0.00
45, 1
96,0
72.1
7
Tar
gete
d A
RR
A
Sti
mul
us F
unds
(4
32)
0.00
8.44
2,97
4.40
14,0
27,0
84.3
7
460,
7I0.
43
22,9
30,
769.
20
0.0
0
22,9
30,7
69.2
0
Oth
er A
RR
A
Sti
mul
us G
rant
s (4
33)
0.00
125,
619.
49
232,
564.
10
358,
183.
59
0.00
358,
183.
59
Exh
ibit
K-4
D
OE
Pag
e 8
Tot
als
0.00
0.00
0.00
43 ,3
44,3
61.
33
0.00
0.00
0.0
0
8,44
2,97
4.40
14,0
27 ,0
84.3
7
0.00
0.00
0.00
0.00
125,
619.
49
2,54
4,98
5.37
68,4
85.0
24.9
6
0.00
0.00
0.00
0.00
0.00
68,4
85,0
24.9
6

DIS
TR
ICT
SC
HO
OL
BO
AR
D O
t" D
UV
AL
CO
UN
TY
C
OM
BIN
ING
ST
AT
EM
EN
T o•
· RE
VE
NU
ES
. EX
PE
ND
ITU
RE
S, A
ND
CH
AN
GE
S IN
f'U
ND
BA
LA
NC
E-S
PE
CIA
L R
EV
EN
UE
FU
ND
-ST
AT
E F
ISC
AL
ST
AB
ILIZ
AT
ION
nJN
DS
(Con
1inu
td)
Fo
rih
e F
isca
l V
a.r
End
.:d J
une
30.
2010
I 0
0 20
0 30
0 40
0 50
0 60
0 70
0 A
ccou
n1
Em
ploy
ee
Pur
chas
ed
Ene
rgy
Ma1
erio
ls
Cap
it>I
Oth
er
Exh1
b11
K-4
D
OE
Pag
e9
l'u
nd
431
Num
ber
Sal3
1tcs
ll
enef
iu
Ser
vice
s S
ervi
ces
and
Suo
olic
s O
utla
v E
xocn
scs
Tot
als
EX
PE
ND
ITU
RE
S
('11~111:
lnS
INC
1o
On
50
00
23.7
47.6
59.8
2 7.
405.
753.
74
430.
768.
10
31.5
84.I
Sl.
66
Puo1
I l'c
rson
nel S
ervi
ces
610
0 1,
063,
318
.70
318.
249.
43
1.)8
1.56
8.13
ln
suuc
1ion
al M
edia
Ser
vice
s 62
00
1.17
3.38
7 2
0
353.
266.
37
16.6
88.5
8 1.
543.
342.
15
lnsu
ucti
on a
nd C
unic
ulum
Dcv
cloo
mcn
t Ser
vice
s 63
00
0.00
ln
s1ru
cuon
sl S
taff
Tr:
iino
nc S
ervi
ces
6400
4,
736.
646.
35
1.50
2.57
0.41
48
4.8
6
6.23
9.70
1 62
ln
suuc
tion
Rcl
a1cd
Tcc
hnol
o.v
65
00
184.
000.
00
184.
000.
00
Do
ud
71
00
0.00
G
encr
.U A
dmin
istn
111o
n 72
00
I 89
4.57
4.52
1.
894
.574
.52
Sch
ool
Adm
inis
ir:i
uon
7300
75
0.79
0.41
23
7.86
8.78
98
8.65
9.19
fa
cilit
ies
At<
1uis
ition
;m
d C
onst
ruct
ion
7410
0.
00
fi
scal
Ser
vice
s 75
00
0.0
0
Foo
d S
ervi
ces
7600
0.
00
Ccn
ll:l
l Ser
vice
s 77
00
O 0
0
Puoi
l Tna
nsoo
rutio
n Se
rvic
es
7800
0
.00
O
no
nti
on
of P
lan1
79
00
O 0
0 M
oin1
enan
c.: o
f Pla
nt
8100
0
.00
Adm
inis
trat
ive
Tcc
hnol
ol!v
Ser
vice
s 82
00
J)B
,624
.90
338.
624
.90
Com
mun
ity
Serv
icl!S
91
00
0.00
C
npil
a/O
utla
y:
r ~
:-rl-:
1,,..
. .....
~-
, ..
. ~
• ..,,,.
,
'"'"
.J
Fac
ilit
ies
Aca
u1si
tion
;ind
Con
stru
ctio
n 74
20
~:.
·· ':
O
00
01hc
rCan
it4l
Out
lov
9300
,.
. '"
~-!"
t -
•• ,
_, ••
w
mt
,;u
·--·
J.
041.
420.
00
1.
041,
420.
00
Dc!
b1 &
n·l
u:
(f'"'u
nc:li
un 9
100)
...
_ '1\
,~
.~
Red
cmo,
ion
of P
rinc1
o:al
71
0 · ·
~
o 00
Jn
1crc
st
720
........
..,,_
• ·
0.00
T
ora
l E
111<
ndit
urn
31.4
71.8
02 4
8 9.
817.
708.
73
970.
566.
44
0.00
0.
00
1.04
1.42
0.00
1.
894.
574.
52
45.1
96.0
72.1
7 E
s.ce
u (D
tfic
it:nC
')') o
f Rcv
tnu
n o
ver
Es:
pc.o
ditu
ra
.~ 0.
00
OT
HE
R F
INA
NC
IJ'iG
SO
UR
CE
S (U
SE
S)
. ·
Sale
s of
C10
1W A
sscu
37
30
}'_"'
..
"I'!
r
~ ~-~
•. :~
" L
oss
Rcc
oven
cs
3740
-·-
p-~
-u
L
.,....
;...
·.t-t.-
_ T
mn
sfen
ln:
~'
~ I'.
·~'.
. ·("
-
··
••
1 fr
om C
aoita
1 Pr
o ee
ls F
unds
36
30
.·1
• .c
,..
'" ~
·"'
""_
·~,
., .,,
, _,-
.r.-1
rt.....
!t
~ ~ ~·
T
otal
Tra
nsfc
n In
36
00
"".',
;;:: _
_ '.::
:o 1.
--.!
"-~(
..;.
.._~
1'----~
•
4.-..-.
--A
: _-
, ~.-__. ... _
_
.-• .
:.....
...:i_
~ ...
. :
0.00
Tro
ns/
en
Ou
1:
(1'im
c110
11V
700)
,_
Jf-
.:,-
""'~
-~
.1.·i-i
r L•
,. ~
r.-.. ~~ . .
--~
,·~t':
i ;:~
~,.
·o,-
To
C.ao
1t:1
I P
roit
cU F
unds
93
0 • ~
..
..:¥
~ ~
-r.. ...
.... _
: ...
. .-r
-1
• r-
" . .
, r:::
J. -
~·
Tot
al T
rans
fers
Out
97
00
..,.-
_ ..
_'\';
.....
..!~
,:-.
,.;.-
• :=
i ~
or:
! or4
0
00
To
talO
dtt
:rF
'io
.an
cin
t:S
ou
rccs
(Utn
) _
:· -
<_
.y
.~'!
""!"
·
_ ":~_~r
"---,;.
!'--'
' ..
~-
'___
.,.;
"-~
---····-
..
...
0.0
0
Nt:
1C
han
ct:i
nF
un
d8
alan
u
.'~:;.
t/.
.. :
,,.,
. o
.oo
Fun
dBal
ance
.Jul
vl.
20
09
2
80
0
••
--::.f
. -
~
-.,.'r
.. ~-
·~'..,,
,..
... 0
.00
A
d.u
slm
enc.
s to
Fu
nd
O:a
lanc
c 28
91
0.0
0
Fun
d B
alan
ce J
une
30
201
0 27
00
' -.•~
• 0.
00
ESE
148

DIS
TR
ICT
SC
HO
OL
llO
AR
D O
F D
UV
AL
CO
Ul'
ffY
C
OM
BIN
ING
ST
AT
EM
Ef'
IT O
F R
EV
EN
UE
S,
EX
PE
ND
ITU
RE
S, A
ND
Cll
AN
GE
S I
N F
UN
D I
JAL
AN
CE
·SP
EC
IAL
RE
VE
NU
E F
UN
D· T
AR
GE
TE
D A
RR
A S
TIM
UL
US
FU
ND
S (C
onti
nued
)
For
the
fls0
3I Y
ear
End
ed J
une
30, 2
01
0
-10
0
200
30
0
400
500
Acc
oun1
E
mpl
oyee
Pu
rcha
sed
Ene
rgy
Mat
eria
ls
Nu
mb
er
Sala
ries
Ben
efits
: S
ervi
ces
Serv
ices
an
dS
uo
oli
cs
EX
PE
ND
ITU
RE
S
Cur~lll
.
Inst
ruct
ion
50
00
8.63
3,81
3.7
9
2.7
78.S
41.7
9 1.
341,
97
5.12
93
1.1
80 5
9 P
uoil
Per
sonn
el S
ervi
ces
61
00
1.
028.
911
46
27
8.40
8.0
0
1.15
3,32
5.49
11
5.05
0.49
ln
suuc
tior
ul M
edia
Ser
vice
s 6
20
0
Inst
ruct
ion
and
Cum
culu
m D
evel
opm
ent S
ervi
ces
63
00
1.
090.
337.
65
340.
436.
09
76
,368
.73
lnsl
tuct
iona
l S
ufT
Tra
inin
e S
ervi
ces
64
00
96
4,07
6.84
2
94
745
.46
1.53
7.28
9.6
1 10
7,92
6.12
lnsu
ucti
on R
elat
ed T
cchn
olo
•v
65
00
68
.769
.98
23 7
98.6
2
3,40
0.0
0
0041
d 7
100
G
cncm
l A
dmin
istr
atio
n 72
00
Sch
ool A
dmin
istr
.alio
n 73
00
Faci
litie
s A
caui
sitio
n an
d C
ol\S
truct
ion
74
10
Fi
scal
Scr
vic:
es
15
00
F
ood
Ser
vice
s 7
60
0
Ccn
1r:1
I Serv
i=
7700
P
upil
Tr.u
upor
t.a.li
on S
4."fV
ICC:
S 78
00
86,4
83.8
4 6.
465.
49
Q
.-....
. 1io
n o
f Pla
na
7900
1'
.bin
tc.n
ance
of P
lan1
8
100
A
dmin
is1r
.uiv
c T
cchn
olo\
.,'Y S
ervi
ces
8200
C
om
mu
nh
v S
ervi
ces
9100
1.
000.
00
4.
286.
9S
Cap
irol
Ou
tlay
: .
~
.)(
·-·"
":'-
Fac
ilu
ics
Acq
u1
s1u
on
and
Con
s1ru
c1io
n 74
20
-:0.
.''
•,
0th~ C
onit
al O
u11a
v 9
30
0
·-~' .....
.... """
--'--
...i
-a1-
..t.
~Jll-
·,_,
.___
. -'
j...
,; I
·1-••'lj ..
;~
Dd
" S
ervi
c.::
(F
unct
ion
910
0)
' I·
-.~~
Red
empt
ion
of P
rmci
pal
710
~
' ~
-~.:..-·
Inte
rest
7
20
-
--·-
i&
::b .
lill
ll .~
-1
1:
... 4
To
1al [
1p
en
dit
uru
11
,785
,909
.72
J,7
1 S
,929
.96
4,
199,
842.
79
6,46
S.4
9 1.
158,
444.
15
Esc
eu (D
c.rt
e.if
'Dt'y
) o
r Rn
t:D
UC
I 0
\'f'
r U
pta
dit
ure
1
OT
HE
R F
INA
NC
ING
SO
UR
CE
S (U
SE
S)
.. ,.
~..
!i
Sol
es o
rCop
1tal
Ass
ets
3730
L
oss
Rec
over
ies
3740
;i
.-......
"'>;'""
·' -~ "
":".
--=-
~-
1t!
;.. .::J
,·•
.rr
~:-~,
___.
.
Tmns/~nln
: -
1\1
.-.,•
~· ....
" :~-.
~~ Fr
om C
aon.
:al P
ro1c
cts
fund
s 36
30
....
., T
otal
Tra
nsfe
rs I
n 36
00
·<.,
( ,~
:,.~;.~
't_lf:
1'm
n.1/
i:n
Ou
l: (
Fum
.·110
11 9
700)
~1
6.:
~
• . 1
.•1
-.~,
_..,
To
Cao
u.al
Pro
it..-c
ts Fu
nds
93
0
~
---·
,,
~'
' -;{i
:.
Toc
:il T
r:in
.rcr
s O
ut
97
00
~
-~":
....
' ·--~ ._
~,.
,~~·s
· is
,.i:
-~~~ ....
~
--·-:_
;;
Tot
al O
tbrr
Fin
•nci
ne S
ourc
es (U
1c.s
) .....
. _ ...
. 1'1
1.._
_ "
-,_
c"l-
' •
~-
.. -·-
·•l
·.-~
Nc:
t Ch
ante
ia F
w1d
Bal
an<'
.t ··'
.:;
. -··-
, .....
.... ,..:
.. ;;
.)
,o
' fu
nd B
alan
ce. J
ulv
I. 2
00
9
28
00
.~
A
Adi
w-t
mcn
u to
Fun
d B
alan
ce
2891
~
Fun
d D
>lan
cc. J
une
30.
201
0 27
00
.. i:l
.·1•
....
, ~~
...
i;IW
;l::
jl
r ,l
;ll;
E'
ES
E 3
43
600
C•p
i141
Out
lov 23
6.81
8.28
5
61.4
53.2
0
S3,
078.
17
342,
282.
58 .
1,19
3,63
2.23
,. .. ~·
·--
-~-£
_.,:'-
"-~ •
I
-:.J'
--
.... ,_
...
-
_r1
. ""'
;-;,.
4',.
i•
..
70
0
Oth
er
Ex~•es
144,
020.
00
72
6.52
4.8
6
• '!
!"'~
~M-.
~
870,
544.
86
··,, ... r
~L ·1:
1.:-!
.'"":
.! 0
f~~~~r
J..~' ~.
~ -
.... -
i:i
Exh
ibit
K-4
DO
E P
age
10
Fu
nd
4J2
--
··-
·--
To
uls
13.9
22.3
29.5
7 3.
137.
148
64
00
0
1,50
7,1
42
47
3.10
1.13
6.2
0
95.9
68.6
0
0.0
0
72
6 5
24.8
6 0
.00
0
.00
0
.00
0
.00
0
.00
92.9
49.3
3
0.0
0
0.0
0
0.0
0
S.2
86.9
5
0.0
0
342,
282
.58
0. 0
0
0.0
0
22,9
30,7
69.2
0
00
0
0.0
0
00
0
0.0
0
0.0
0
00
0
0.0
0
00
0

Ul~IRIC
I' S
Cll
OO
L U
OA
RD
OF
DU
VA
L C
OU
NT
Y
CO
MB
ININ
G S
TA
TE
ME
NT
OF
RE
VE
NU
ES
, EX
PE
ND
ITU
RE
S, A
NU
CH
AN
GE
S I
N t
'lJN
U B
AL
AN
CE
-S
PE
CIA
L R
EV
EN
UE
F\J
ND
-OT
llE
R A
RR
A S
TIM
UL
US
GR
AN
TS
(Co
ncia
utd
)
Fo
r ch
c F
isco
l Y
cor
En
ded
June
JO
. 201
0 10
0
200
300
400
soo
Acc
ou
nt
Em
ploy
ce
Pur
chas
ed
Enc
ri;y
Mat
eria
ls
Num
ber
Sahm
cs
Dcn
efot
s Se
rvic
es
Serv
ices
an
d S
uool
ics
EX
PE
ND
ITU
RE
S c·
um
:nt.'
ln
slN
ct1o
n so
oo
18 2
97.
21
2.7S
O.O
O Pu
:n1I
Per
sonn
el S
ervi
ces
610
0
lnsu
uctio
nal M
edia
Ser
vice
s 6
20
0
Inst
ruct
ion
illld
Cur
ricu
lum
Ocv
cloo
mcn
1 S
ervi
ces
63
00
In
stru
ctio
nal S
ta.ff'
Tm
inin
f! S
ervi
ces
64
00
19
0.20
0.0
0
lnst
rucl
ion
Rcl
:ucd
Tcc
hnol
OL.'V
6
50
0
Boa
rd
710
0
Gen
eral
Adm
inis
trai
ion
72
00
Scho
ol A
dmin
islr.
ltion
7
30
0
FacH
i1ic
s A
coui
sitio
n an
d C
onst
ruct
ion
741
0
Fisc
al S
ervi
ces
7SO
O
Foo
d S
ervi
ces
7600
Cen
ll3.l
Serv
ices
7
70
0
Pun
il T
r&ns
nArl"
tion
Ser
vice
s 7
80
0
315.
00
O
n.rr.
i.tio
n o
f Pla
nt
7900
Mai
ntt:
Nll
lCC
of
Pb
nt
8100
A
dmin
istr
ativ
e T
echn
oloL
"V S
c:f\•
1ccs
8
20
0
Com
mun
ilv
Ser
vice
s 9
100
8.
735.
79
C
npir
al 0
111/n
y:
.. Fa
ciht
ics
AcQ
u1si
tion
and
Con
stru
ctio
n 74
20
O
ther
Cop
i\31
Ou
tlo1•
93
00
•-·~am;
,,-w
.·.
'""'
"-' ~·
. ~·
·Jlt
iiill'
".iw.....t.J~
O..•
bt S
.:rv1
ce:
(Fun
ctio
n 9
100
) "'
' ,
.~
~
Rcd
cmp1
1on
of
Pri
ncip
al
71
0
. ~'
~
lntc
rcs1
n
o
-T
ota
l Ex
pm
dilu
res
0.0
0
0.0
0
217
.S48
.00
0.0
0
2.7S
O.O
O Eu
a1
(D
cfic
imcy
) or R
cv
mu
u o
ver
£sp
cnd
i1u
ra
OT
HE
R F
INA
NC
ING
SO
UR
CE
S (U
SE
S)
,.4· !
I S
ales
ofC
aD1t
al A
sset
s 37
30
; -.
--L
oss
Rcc
ovc:
tics
3740
:'
. •<
.:. ..
,..,.1 .
1"
rons
f•:t
7ltt
: ~
~
.. F
rom
Cao
1tal
Pro
1cct
s F
unds
3
63
0
-M~~
• ~
.'
Tot
aJ T
nmsf
\..-rS
In
36
00
.,
!'-,
,.-·
··'·
':&~-"'
-'i
'"l
:•
~ ,.,,,_..,,~
.. l~
-:.11;_r~
,,-:. ....
~~
Trru
ufi·n
Out
: (I
-Unc
tion
97
00)
~;{::"·.··1
•' '
To
Com
1l3I
Pro
iect
s Fu
nds
93
0
·r
;ll"j
Tot
al T
rans
fers
Ou1
9
700
' -
~~
Tot
al 0
1h
u F
inan
cin1
: Sou
rces
(U
1es)
•
Nd
Cla
ancr
ia F
u.nd
Bat
.nee
..
~-;:.
-• _
,
.:::;i
Fun
d &
lanc
e. J
ulv
I. 2
00
9
28
00
-~
••rr._
;..·
.... ~
&
.i;:..
..
Ad1
us1m
ents
10
fun
d B
alan
ce
28
91
Fun
d &
!onc
e. J
une
30.
20
10
27
00
ES
E 3
48
600
Cap
i13l
O
utlo
v
1.9
17.9
4
1JS
.967
.6S
... 13
7.88
S.S
9 . I.
;.
--·
i~
!.:·~~~·-i1
""
-·'•
~I~~
~_ .
;1~~~1
y .. ~·
' ......
' ..
...
f.
:I ~·+;:! .
•.•
&
T..
.· -
...
:.-t-1
r:·.
700
O
ther
Ex
ocno
es
lf-'
.!.:
.
00
0
. "L·'
..... ~
!.-
0
.~ ~ ... -
.J(
-:.-
-'i'T
: 1
i'.-
f .....
) ·
··:·~·i-:·~f~
),. :'i
\.'",
..t_
•-.,
'
.\L
· . ..a._
-,_;ll
--r·
~
J-; -~ ••
-4•
-·
-.t
·.r ,\
,_.,
.. .
Exh1
b11K
-4
DO
E P
ogo
I I
Fu
nd
43
l
To
ials
21.o
.17
21
0.0
0
0.0
0
0.0
0
19
0.1
00
00
0
00
0.
00
0
00
0.0
0
0.0
0
00
0
1.91
7.9
4 0
00
J
ISO
O
0.0
0
0.0
0 0
00
8.
735.
79
0.00
lJ
S.9
67.6
5
00
0
0.0
0
3S8.
183
S9
00
0
0.0
0
00
0
00
0
0.0
0
DISTRICT SCHOOL BOARD OF DUVAL COUNTY STATEMENT OF REVENUES, EXPENDITURES, AND CHANGES IN FUND BALANCE - SPECIAL REVENUE FUND -MISCELLANEOUS For the Fiscal Year Ended June 30. 2010 --- - - ·- - --- -·---- - ---- - - - ~ - - - -
REVENUES Federal Through Local Interest on Investments Gain on Sale of Investments Net Increase (Decrease) in Fair Value oflnvestments Gifts, Grants and Beouests Other Miscellaneous Local Sources Total Revenues EXPENDITURES Current:
Instruction Pupil Personnel Services Instructional Media Services Instruction and Curriculum Development Services Instructional Staff Training Services Instruction Related Technology ... , Board -.. "" General Administration
...... ~' ·' ~ School Administration .... , .. ¥,..... Facilities Acouisition and Construction .......... ,. ...... Fiscal Services ..... ~~ ,_ Central Services ~~ .. Pupil Transportation Sewi&... .... Operation of Plant ~'6 ,~~ Maintenance~ ~ ology Services
efvices
Ca~~~ay: Fac1 ities Acouisition and Construction Other Capital Outlay
Total Expenditures Excess (Deficiency) of Revenues Over Expenditures OTHER FINANCING SOURCES (USES) Loss Recoveries Transfers In:
From General Fund From Debt Service Funds From Caoital Projects Funds Interfund From Permanent Funds From Internal Service Funds From Enterprise Funds Total Transfers In
Transfers Out: (Function 9700) To General Fund To Debt Service Funds To Capital Projects Funds lnterfund To Permanent Funds To Internal Service Funds To Enterprise Funds Total Transfers Out
Total Other Financing Sources (Uses) Net Change in Fund Balance Fund Balance, July I, 2009 Adjustments to Fund Balance Fund Balance, June 30, 2010
ESE 348
Account Number
3280 3431 3432 3433 3440 3495 3000
5000
Exhibit K-5 DOE Page 12
Fund 490 ------- -
0.00
6100 -6200 ... ·-630J)4 ~' ~., ...... ~'50. ,...,JOO
7200 7300 7410 7500 7700 7800 7900 8100 8200 9100
7420 9300
0.00 0.00
3740
3610 3620 3630 3650 3660 3670 3690 3600 0.00
910 920 930 950 960 970 990
9700 0.00 0.00 0.00
2800 2891 2700

... ~ 0
~ g
8 g ,. g
88 .. g
0
8 8 "' g
8 0 0
8 g
... ; !
I"
,.. ~ c c ::! ;I :; ~
.. g g
" g
8
~
8
,. g
p g
~
~ ie
s ~
'° :::
.. <! § g
~
88888 8 88888~ 8 ~88
-~ 0:.... :;: 15:
~~ ~ ~
8 g
8 .. 8
8 8
0 c 8 g
·~ l!: ~
:g w ;; §' C!!
~ ;:: ~ 5~8
~ s:
i 8 ~ ~
:.: ~
:0 ~
~rt -> " g g .. 8
~ ~· , ., _ _ .,, .. !!i' ;:: -~:;: a:::: =
~ g ,. g <;:
5' ;:: ",, Ng~
g~& H
8 ~ p 8
'N ~ ~ ~~ii
8 g ,. g
-Ir~ ~
! , ~ l!;
~ "'
-ii'~
i ~ 8 .. -> ~
_u !id -, ::= ~ ~
.. 0 ~ ii ii 8 [
.~
OCl~OO C: CC
88:088 8 SS

DIS
TR
ICI'
SC
HO
OL
BO
AR
D O
F D
UV
AL
CO
UN
TY
C
OM
BIN
ING
ST
AT
EM
EN
T O
F R
EV
EN
UE
S.
EX
PE
ND
ITU
RE
S,
AN
D C
HA
NG
ES
IN
FU
ND
BA
LA
NC
ES
-C
AP
ITA
L P
RO
JEC
TS
FU
ND
S
Exh
ibit
K-7
1·u
1 lll\;1
·1~c.u
1'-
UI
L..
UU
'-U
"'"
'""
"J
v,
..o.v
1v
--
-
Sect
ion
1011
. 14/
101
1.15
Cap
ital
Out
lay
Bon
d Is
sues
S
peci
al A
ct B
onds
F.
S.
Pub
lic
Edu
cati
on C
apit
al
Dis
tric
t C
apit
al O
utla
y an
d D
ebt
Acc
ount
(C
OB
I)
(Rac
etra
ck)
Loan
s O
utla
y (P
EC
O)
Bon
ds
Ser
vice
Fun
ds
Num
ber
1310
) (3
20)
1330
\ (3
40)
(350
) (3
60)
RE
VE
NU
ES
F
eder
al:
Mis
cell
aneo
us F
eder
al D
irec
t 3
199
Mis
cell
aneo
us F
eder
al T
hrou
gh S
tate
32
99
Sta
te:
CO
& D
S D
istr
ibut
ed
3321
60
4,85
5.68
Inte
rest
on
Und
istr
ibut
ed C
O &
DS
33
25
53.1
37.1
6
SB
E/C
OB
I B
ond
Inte
rest
33
26
Rac
ing
Com
mis
sion
Fun
ds
3341
P
ubli
c Ed
ucat
ion
Cao
ital
Out
lay
!PE
CO
) 33
91
4.16
9,60
9.00
C
lass
room
s Fi
rst
Pro
gram
33
92
Sch
ool
Inf
rast
ruct
ure
Thr
ift
Pro!
!ram
33
93
Eff
on
Inde
x G
rant
33
94
Sm
an S
choo
ls S
mal
l Cou
ntv
Ass
ista
nce
Pro
gram
33
95
Cla
ss S
ize
Red
ucti
on/C
aoit
al F
unds
33
96
Cha
ner
Scho
ol C
apit
al O
utla
y Fu
ndin
g 33
97
Oth
er M
isce
llan
eous
Sta
te R
even
ue
3399
T
otal
Sta
te S
ourc
es
3300
0.
00
0.00
0.
00
4, 1
69,6
09.0
0
0.0
0
657,
992.
84
loca
l:
Dis
trict
Loc
al C
apit
al l
mor
ovem
cnt
Tax
34
13
Loc
al S
ales
Tax
34
18
Tax
Red
empt
ions
34
21
Inte
rest
on
Inve
stm
ents
34
31
30.3
54.8
6 44
,459
.96
Gai
n o
n S
ale
of I
nves
tmen
ts
3432
N
et In
crea
se (
Dec
reas
e) i
n F
air
Val
ue o
f In
vest
men
ts
3433
G
ifts
. Gra
nts.
and
Beq
uest
s 34
40
Mis
cell
aneo
us L
ocal
Sou
rces
34
95
Impa
ct F
ees
3496
T
otal
Loc
al S
ourc
es
3400
0.
00
0.00
0.
00
...
30,3
54.8
6 0.
00
44.4
59.9
6
To
tal
Rev
enue
s 30
00
0.00
0.
00
0.00
4,
199.
963
.86
0.00
70
2.45
2.80
E
XP
EN
DIT
UR
ES
(F
un
ctio
n 7
400)
L
ibra
rv B
ooks
61
0 A
udio
-Vis
ual
Mat
eria
ls (
Non
-con
sum
able
) 62
0 B
uild
ings
and
Fix
ed E
Qui
pmen
t 63
0 66
2,72
8.3
7 F
urni
ture
. F
ixtu
res
and
Equ
ipm
ent
64
0
Mot
or
Veh
icle
s Cl
nclu
ding
Bus
es)
65
0
Lan
d 66
0 Im
prov
emen
ts O
ther
than
Bui
ldin
gs
670
232,
976.
44
Rem
odel
ing
and
Ren
ovat
ions
68
0 7,
710.
427.
63
Com
pute
r Sof
twar
e 69
0 D
ebt
Ser
vice
(F
unct
ion
9200
) R
edem
ptio
n o
f P
rinc
ipal
71
0 In
tere
st
720
Due
s an
d Fe
es
730
2.37
1.30
M
isce
llan
eous
Exp
ense
s 79
0 T
ota
l E
xpen
ditu
res
0.00
0.
00
0.0
0 8,
606,
I 32.
44
0.00
2.
371.
30
Exc
ess
(Def
icie
ncy)
of
Rev
cnuL
'S O
ver
E11
1cnd
itur
cs
0.0
0 0.
00
0.00
(4
.406
.168
.58)
0
.00
700
.081
.50
ESE
34
8
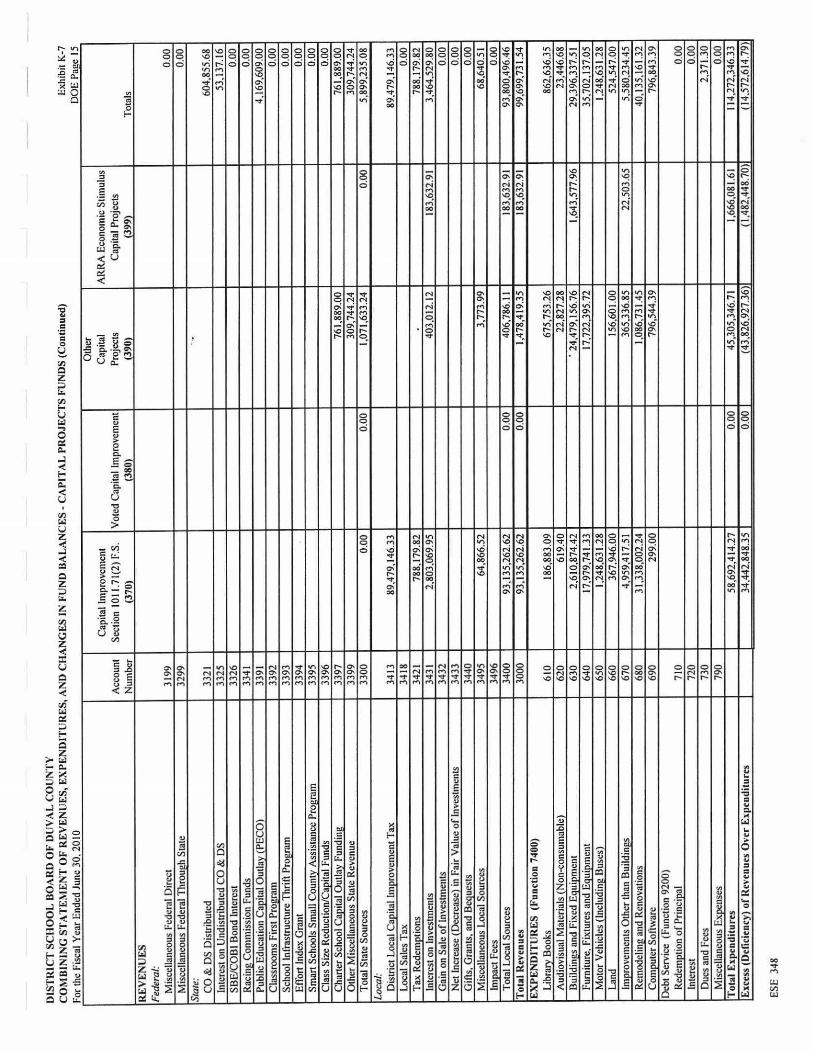
DIS
TR
ICT
SC
HO
OL
BO
AR
D O
F D
UV
AL
CO
UN
TY
C
OM
BIN
ING
ST
AT
EM
EN
T O
F R
EV
EN
UE
S, E
XPE
ND
ITU
RE
S, A
ND
CH
AN
GE
S IN
FU
ND
BA
LA
NC
ES
-C
AP
ITA
L P
RO
JEC
TS
FU
ND
S (C
onti
nued
) Fo
r th
e F
isca
l Y
ear
End
ed J
une
30. 2
010
Oth
er
Cap
ital I
mpr
ovem
ent
Cap
ital
Acc
ount
Se
ctio
n 10
11.7
1(2)
F.S
. V
oted
Cap
ital
Impr
ovem
ent
Proj
ects
N
umbe
r (3
70)
(380
) (3
90)
RE
VE
NU
ES
Fed
eral
: M
isce
llane
ous
F.:d
cral
Dir
ect
3199
M
isce
llane
ous
Fede
ral T
I1ro
u11.h
Sta
te
3299
Stat
e:
·~
CO
& O
S D
istr
ibut
ed
3321
ln
ter.:
st o
n U
ndis
trib
uted
CO
& O
S 33
25
SBE
/CO
BI B
ond
Inte
rest
33
26
Rac
ing
Com
mis
sion
Fun
ds
3341
Pu
blic
Edu
cati
on C
apita
l Out
lay
(PE
CO
) 33
91
Cla
ssro
oms
Firs
t Pr
oAra
m
3392
Sc
hool
Inf
rast
ruct
ure
Thr
ift
ProA
ram
33
93
Eff
ort
Inde
x G
rant
33
94
Smar
t Sch
ools
Sm
all C
ount
v A
ssis
lanc
c Pr
ogra
m
3395
C
lass
Siz
e R
educ
1ion
/Cap
ital
Fund
s 33
96
Cha
ner
Scho
ol C
a1ii1
al O
u1la
y Fu
ndin
v.
3397
76
1,88
9.00
O
ther
Mis
cella
neou
s St
ate
Rev
enue
33
99
309,
744.
24
Tot
al S
tate
Sou
rces
33
00
0.00
0.
00
1,07
1,6
33.2
4
loca
l:
Dis
tric
t Loc
al C
apita
l Im
prov
emen
t Tax
34
13
89,
479,
146
.33
Loca
l Sal
es T
ax
3418
T
ax R
edem
otio
ns
3421
78
8,17
9.8
2 In
tere
st o
n In
vest
men
ts
3431
2,
803
,069
.95
403,
012
.12
Gai
n on
Sal
e of
Inve
stm
ents
34
32
Net
Inc
reas
e (D
ecre
ase)
in F
air
Val
ue o
f Inv
estm
ents
34
33
Gift
s, G
rant
s, a
nd B
eque
sts
3440
M
isce
llane
ous
Loc
al S
ourc
es
3495
64
,866
.52
3,77
3.99
Im
pact
Fee
s 34
96
Tot
al L
ocal
Sou
rces
34
00
93, 1
35,2
62.6
2 0.
00
406,
786.
11
Tot
al R
even
ues
3000
93
, 135
,262
.62
0.00
1,
478,
419.
35
EX
PE
ND
ITU
RE
S (
Fun
ctio
n 74
00)
Lib
rary
Boo
ks
610
186,
883.
09
675,
753.
26
Aud
iovi
sual
Mat
eria
ls (
Non
-con
sum
able
) 62
0 61
9.40
22
,827
.28
Build
inJ.?
.S a
nd F
ixed
Equ
ipm
ent
630
2,61
0,87
4.42
.
24,4
79,1
56.7
6 Fu
rnitu
re, F
ixtu
res
and
Equ
ipm
ent
640
17,9
79,7
41.3
3 17
,722
,395
.72
Mot
or V
ehic
les
(Inc
ludi
ng B
uses
) 65
0 1.
248,
631.
28
Land
6
60
36
7,94
6.00
15
6,60
1.00
Im
prov
emen
ts O
ther
than
Bui
ldin
J.?.S
67
0 4,
959,
417.
51
365,
336.
85
Rem
odel
ing
and
Ren
ovat
ions
6
80
31
,338
,002
.24
1,08
6, 73
1.45
C
ompu
ter S
othv
arc
690
299.
00
796,
544.
39
Deb
t Ser
vice
(Fu
nctio
n 92
00)
Red
empt
ion
of P
rinc
ipal
71
0 In
tere
st
720
Due
s an
d Fe
es
730
M
isce
llane
ous
Exp
ense
s 79
0 T
otal
Exp
endi
ture
s 58
,692
,414
.27
0.00
4
5,30
5,34
6. 7
1
Exc
ess
(Def
icie
ncy)
of R
cvcu
ucs
Ove
r E
xpcu
ditu
res
34.4
42,8
48.3
5 0.
00
(43.
826.
927.
36)
ESE
348
AR
RA
Eco
nom
ic S
timul
us
Cap
ital
Proj
ects
(3
99)
0.00
183.
632.
91
183,
632.
91
183,
632
.91
1,64
3,57
7.96
22.5
03.6
5
1,66
6,08
1.6
1 ( 1
.482
.448
. 70)
Exh
ibit
K-7
D
OE
Pav
.e 15
Tot
als
0.00
0.
00
604,
855.
68
53.1
37.1
6 0.
00
0.00
4.
169,
609
. 00
0.00
0.
00
0.00
0.
00
0.00
76
1.88
9.00
30
9,74
4.24
5,
899,
235.
08
89,4
79.1
46.3
3 0.
00
788,
179
.82
3,
464.
529
.80
0.00
0.
00
0.00
68
,640
.51
0.00
93
,800
,496
.46
99,6
99,7
31.5
4
862,
636.
35
23,4
46.6
8 29
,396
,337
.51
35,7
02,1
37.0
5 1,
248,
631.
28
524.
547.
00
5.58
0,23
4.45
40
,135
.161
.32
796
,843
.39
0.00
0.
00
2.37
1.30
0.
00
114,
272,
346.
33
(14.
572,
614
.79)

DIS
TR
ICT
SC
HO
OL
BO
AR
D O
F D
UV
AL
CO
UN
TY
C
OM
BIN
ING
ST
AT
EM
EN
T O
F R
EV
EN
UE
S,
EX
PE
ND
ITU
RE
S,
AN
D C
HA
NG
ES
IN
FU
ND
BA
LA
NC
ES
-CA
PIT
AL
PR
OJE
CT
S F
UN
DS
(C
on
tin
ued
) E
xhib
it K
-7
.....
. u
.....
...
.................
....
. , _
__
~-··-
--·
--
• .,
--
--
Sec
tion
IO
I l.1
4/IO
l l.
l5
Cap
ital
Out
lay
Bon
d Is
sues
Sp
ecia
l A
ct B
onds
F
.S.
Pub
lic
Edu
cati
on C
apita
l D
istr
ict
Cap
ital
Out
lay
and
Deb
i
Acc
ount
(C
OB
I)
(Rac
etra
ck)
Loa
ns
Out
lay
(PE
CO
) B
onds
S
ervi
ce F
unds
Num
ber
(310
) 13
20)
(330
) (3
40)
(350
) (3
60)
OT
HE
R F
INA
NC
ING
SO
UR
CE
S (
US
ES
) S
ale
of
Bon
ds
3710
P
rem
ium
on
Sal
e o
f Bon
ds
3791
P
roce
eds
of
Ref
undi
n11.
Bon
ds
3715
P
rem
ium
on
Ref
undi
ng
Bon
ds
3792
L
oans
37
20
Sal
es o
f Cao
ital
Ass
ets
3730
L
oss
Rec
over
ies
3740
P
roce
eds
of C
erti
fica
tes
of
Par
ticio
atio
n 37
50
Pre
miu
m o
n C
erti
fica
tes
of
Par
tici
oati
on
3793
P
roce
eds
of F
orw
ard
Sup
ply
Con
trac
t 37
60
Pro
ceed
s fr
om S
oeci
al F
acil
itie
s C
onst
ruct
ion
Adv
ance
37
70
Pay
men
ts to
Ref
unde
d B
ond
Esc
row
A11
.ent (
Fun
ctio
n 92
99)
760
Dis
coun
ts o
n S
ale
of B
onds
(Fu
ncti
on 9
299)
89
1 D
isco
unts
on
Ref
undi
n!!.
Bon
ds (
Func
tion
929
9)
892
Dis
coun
ts o
n C
erti
fica
tes
of
Par
tici
oati
on C
Func
tion
929
9)
893
Tra1
1Sfe
rs I
n:
From
Gen
eral
Fun
d 36
10
Fro
m D
ebt
Ser
vice
Fun
ds
3620
F
rom
Soe
cial
Rev
enue
Fun
ds
3640
ln
terf
und
3650
F
rom
Per
man
ent
Fund
s 36
60
Fro
m I
nter
nal
Ser
vice
Fun
ds
3670
F
rom
Ent
emri
se F
unds
36
90
Tot
al T
rans
fers
In
3600
0.
00
0.
00
0.00
0.
00
0.
00
0.00
Tr
a11s
fers
Out
: (F
u11c
tio11
970
0)
To
Gen
eral
Fun
d 91
0 T
o D
ebt
Ser
vice
Fun
ds
920
To
Soe
cial
Rev
enue
Fun
ds
940
lnte
rfun
d 9
50
T
o P
erm
anen
t F
unds
96
0 T
o In
tern
al S
ervi
ce F
unds
97
0 T
o E
nter
pris
e Fu
nds
990
Tot
al T
rans
fers
Out
97
00
0.00
0
.00
0.00
0.
00
0.
00
0.
00
To
tal O
ther
Fin
anci
ng
Sou
rces
(Use
s)
0.00
0.
00
0.00
0.
00
0.0
0
0.00
N
et C
han
ge
in F
un
d B
ala
nce
s 0.
00
0.00
0.
00
( 4.4
06.1
68. 5
8)
0.0
0
700.
081.
50
Fun
d B
alan
ces.
Jul
y I,
200
9 28
00
6,32
7,8
11.7
5 2,
054,
586
.27
Adi
ust
mem
s 10
Fun
d B
alan
ces
2891
F
und
Bal
ance
s. J
une
30, 2
0 I 0
27
00
1.92
1.64
3. 17
2.
754,
667.
77
ES
E 3
48

DIS
TR
ICT
SC
HO
OL
BO
AR
D O
F D
UV
AL
CO
UN
TY
C
OM
BIN
ING
ST
AT
EM
EN
T O
F R
EV
EN
UE
S,
EX
PE
ND
ITU
RE
S, A
ND
CH
AN
GE
S I
N F
UN
D B
AL
AN
CE
S-
CA
PIT
AL
PR
OJE
CT
S F
UN
DS
(Co
ntin
ued)
-.....
···--
-----
----
-··-
----~
·---
, --.
-O
ther
C
apit
al I
mpr
ovem
ent
Vot
ed C
apita
l C
apit
al
Acc
ount
S
ecti
on 1
011.
71(2
) F.
S.
Impr
ovem
ent
Pro
ject
s N
umbe
r {3
70)
(380
) (3
90)
OT
HE
R F
INA
NC
ING
SO
UR
CE
S (
US
ES
) S
ale
ofB
on
ds
3710
P
rem
ium
on
Sal
t: o
f Bon
ds
3791
P
roce
eds
of R
efun
ding
Bon
ds
3715
P
rem
ium
on
Ref
undi
ng B
onds
37
92
Loa
ns
3720
S
ales
of C
apit
al A
sset
s 37
30
370,
000.
00
Los
s R
ecov
erie
s 37
40
Pro
ceed
s o
f Cer
tifi
cate
s o
f P
anic
ipat
ion
3750
40
,480
,534
.37
Prem
iun1
on
Cer
tifi
cate
s o
f Par
tici
pati
on
3793
P
roce
eds
of F
orw
ard
Sup
ply
Con
trac
t 37
60
Pro
ceed
s fr
om S
peci
al F
acil
itie
s C
onst
ruct
ion
Adv
ance
37
70
Pav
mcn
ts t
o R
efun
ded
Bon
d E
scro
w A
gent
(F
unct
ion
9299
) 76
0 D
isco
unts
on
Sal
e o
f Bon
ds (
Fun
ctio
n 92
99)
891
Dis
coun
ts o
n R
efun
ding
Bon
ds (
Fun
ctio
n 92
99)
892
Dis
coun
ts o
n C
erti
fica
tes
of P
arti
cipa
tion
(F
unct
ion
9299
) 89
3 T
rans
fers
/11:
Fr
om G
ener
al F
und
3610
F
rom
Deb
t Ser
vice
Fun
ds
3620
Fr
om S
peci
al R
even
ue F
unds
36
40
lnte
rfun
d 36
50
Fro
m P
erm
anen
t Fun
ds
3660
F
rom
Int
erna
l S
ervi
ce F
und
s 36
70
Fro
m E
nter
pris
e F
unds
36
90
Tot
al T
rans
fers
In
3600
0.
00
0.
00
0.0
0
Tra
nsfe
rs O
ut:
(Fun
ctio
n 97
00)
To
Gen
eral
Fun
d 9
10
(32,
078.
391.
37)
(1,6
71,
401.
25'
To
Deb
t Ser
vice
Fun
ds
920
(20,
080,
088.
29)
To
Soe
cial
Rev
enue
Fun
ds
94
0
Inte
r fun
d 95
0 T
o P
erm
am:n
t Fun
ds
960
To
Int
erna
l S
ervi
ce F
unds
97
0 T
o E
nter
pris
e F
unds
99
0 T
otal
Tra
nsfe
rs O
ut
9700
(5
2,15
8,47
9.66
) 0.
00
(1,6
71,4
01.
25)
To
tal
Oth
er F
inan
cin
g S
ou
rces
(U
ses)
(5
2,15
8,47
9.66
) 0.
00
39,
179,
133.
12
Net
Ch
ang
e in
Fu
nd
Bal
ance
s (1
7.71
5,63
1.31
) 0.
00
(4,6
47,7
94.2
4)
Fun
d B
alan
ces,
Jul
y I.
200
9 28
00
110,
865,
228.
79
46, 7
25, 7
80.8
2 A
djus
m1c
nts
to F
und
Bal
ance
s 28
91
0.00
F
und
Bal
ance
s. J
une
30, 2
010
27
00
93, 1
49,5
97.4
8 42
,077
,986
.58
ES
E 3
48
AR
RA
Eco
nom
ic S
tim
ulus
C
apit
al P
roje
cts
(399
)
26.8
04.1
79.3
2
0.00
0.00
26
,804
, 179
.32
25,3
21,7
30.6
2
0.00
0
.00
25,3
21,
730.
62
Exh
ibit
K-7
D
OE
Pag
e 17
Tot
als
0.00
0.
00
0.00
0.
00
0.0
0
370,
000.
00
0.00
67
,284
,713
.69
0.0
0 0.
00
0.00
0.
00
0.0
0
0.00
0.
00
0.00
0.
00
0.00
0.
00
0.00
0.
00
0.
00
0.0
0
(33
,749
,792
.62
) (2
0,08
0.08
8.2
9)
0.00
0.
00
0.00
0.
00
0.00
(5
3,82
9,88
0.91
)
13,8
24,8
32.7
8 (7
4 7, 7
82.0
I)
165
,973
,407
.63
0. 0
0
165,
225,
625.
62

DISTRICT SCHOOL BOARD OF DUVAL CO UNT Y STATEMENT O F REVENUES, EXPENDITURES, AND CHANGES IN FUND BALANCE - PERMANENT FUND For the Fiscal Year Ended June 30, 2010
REVENUES Federal Direct Federal Through State and Local State Sources Local Sources Tota l Revenues EXPENDITURES Current:
Instruction Pupil Personnel Services Instructional Media Services Instruction and Curriculum Development Services Instructional StafTTraining Services Instruction Related Technology Board ' General Administration School Administration .. ~ Facilities Acquisition and Construction ..... , Fiscal Services ...... ,~-Central Services Pupil Transoortation Services -~~~~ -
Ooeration of Plant ~' • Maintenance of Plant _ .... ~ Administrative Techn - -· -Community Serv.:...--- •
capital o"~C~ -Facill~ .IiC and Construction I ~ Outlay
Debt ~!Vice: (Function 9200) Retirement of Principal Interest
Total Expenditures Excess (Deficiency) of Revenues Over Expenditures
OTHER FINANCING SOURCES (USES) Sales ofCaoital Assets Loss Recoveries Transfers In:
From General Fund From Debt Service Funds From Capi tal Projects Funds From Special Revenue Funds From Internal Service Funds From Enterorise Funds Total Transfers In
Transfers 0111: (Function 9700) To General Fund To Debt Service Funds To Capital Projects Funds To Special Revenue Funds To Internal Service Funds To Enterorise Funds Total Transfers Out
Total Other Financing Sources (Uses) Net Change in Fund Balance
Fund Balance, July I, 2009 Adjustments to Fund Balance Fund Balance June 30, 20 10
ESE 348
Account Number
3100 3200 3300 3400
5000 6100 6200
Exhibit K-8 DOE Page 18
Fund 000
0.00
6300 ~ 6400 6500 ... -
-~~-PAOI~
~- 1410
7500 7700 7800 7900 8100 8200 9100
7420 9300
710 720
0.00 0.00
3730 3740
3610 3620 3630 3640 3670 3690 3600 0.00
910 920 930 940 970 990
9700 0.00 0.00 0.00
2800 2891 2700

DIS
TR
ICT
SC
HO
OL
BO
AR
D O
F D
UV
AL
co
urr
rv
CO
MB
ININ
G S
TA
TE
ME
l'IT
OF
RE
VE
NU
ES
, EX
PE
NS
ES
. AN
D C
llA
NG
ES
IN
FU
ND
NE
T A
SS
ETS
-E
l'IT
ER
PR
ISE
FU
ND
S F
or lh
c F
isco
l Y
ear
End
ed J
un
e JO
. 201
0
Self-
Insu
ranc
e Se
lf-In
sura
nce
Acc
ount
C
onso
rtiu
m
Con
sort
ium
N
umbe
r 19
111
1912
1 O
PE
RA
TIN
G R
EV
EN
UE
S
Ctw
vcs
for
Ser
vice
s 34
81
Clw~cs f
or S
ales
34
82
Pre
miu
m R
even
ue
3484
O
ther
Ooc
.ra1i
nt.? R
l!\•cn
ues
3489
T
otal
Qpc
raii.
oa: R
cn
.nu
a
0.0
0
0.0
0
OP
ER
A T
ING
E.X
PE
NS
ES
(Fun
c1io
11 9
900)
Sa
lari
es
100
Emolo~e B
enef
its
200
Pur
ctw
cd S
ervi
ces
300
Enc
rnv
Serv
ices
4
00
~
·Uccri
als
and
Suno
lics
so
o C
onil
al O
udov
60
0 O
ther
Exo
.:ns
cs
700
Dco
rcci.
3.11o
n
780
To
lal O
pu
a1in
2 E
s.pen
ses
0.0
0
0.0
0
01>
t'n
lin
e: In
com
e (L
ou)
0.0
0
0.0
0
NO
NO
PE
RA
TlN
G R
EV
EN
UE
S (E
.XP
EN
SE
S)
ln1c
rcst
on
Inve
stm
ents
34
31
Gai
n on
S:a
.lc o
f Inv
estm
ents
34
32
Nc:t
lncr
casc
(D~rc
::a.
sc)
in F
air
Val
ue o
f lnv
cstm
cnts
34
31
Gif
ts. G
ranl
S D
nd B
C<Ju
.:su
34
40
Misc
:clla
.nc<
>us L
ocal
Sou
rces
34
9S
Los
s R
ecov
erie
s 37
40
Gai
n on
D1s
oosi1
ion
of A
sset
s 37
80
lntc
cest
Exo
cnse
(fu
na
ion
99
00
) 72
0 M
isce
llan
eous
Exn
<nSe
IF
unci
ion
9900
1 79
0 --
Los
s o
n D
isoo
s1tio
n o
f Ass
ets
ffu
ncu
on
99
00
\ 81
0 _
... _.
.. T
otal
No
ao
pen
lina
: Rcv
t:n
ua
('E
spen
sn)
0.0
0
---~
Inco
me-
(Lon
) B
d'or
c O
per
atia
c. T
nuu
rcn
00
0 ~-
·--C
J'.'Vl 1i
nn
sfer
s /11
: ~~~ .....
..........
.. Fr
om G
.'flcr
.a-1
Fun
d 3
610
:::.....
-Fr
om D
ebt S
ervi
ce F
unds
36
20
_ .. ..,
._..
From
C:a
nit:a
l Pro
iect
s Fu
nds
363~
.. ··-,..
... Fr
on1
Soec
ial
Reve
nue
Fund
s 3
·-ln
terf
und
36S,. ••
Fr
om P
trm
.tn\!f
lt Fu
nds
3660
1 Fr
om ln
tem
:il S
ervi
ce F
unds
36
70
To
ti.I
Tt>
tlS
fcn
In
3600
0.
00
0.0
0
TroM/~n O
ur:
(1-lm
cuon
970
0)
To
Gcn
e12l
Fun
d 91
0 T
o D
ebi S
CIV
ice
Fun
ds
920
To
Cao
i1al
Pro
1ccu
fu
nd
s 93
0 T
o S
pec
ial
Rev
enu
e F
unds
9
40
ln
lcrf
und
9SO
T
o P
cmui
ncnt
FW
1ds
960
To
Inte
rnal
Ser
vice
Fun
ds
970
To
tAI
Tra
nsfe
rs O
ut
9700
0.
00
0.
00
C
hao
&c
in N
et A
sscu
0
00
0
.00
N
(t A
sset
s. J
uly
I, 2
00
9
2880
A
dius
tmcn
ts t
o N
et A
sset
s 28
96
Net
Ass
ets,
Jun
e 30
. 20
I 0
2780
ESE
148
Self-
Insu
ranc
e Se
lf-In
sura
nce
Sclf
·lns
ur.i
ncc
Con
sort
ium
C
onso
rtiu
m
Con
sort
ium
19
131
1914
\ (9
15)
0.0
0
0.0
0
0.00
0. 0
0
0.0
0
-•oo
0.0
0
0.0
0
-....
llJ~
~ "' ...
. .,.
, r•
• ---
--·
-.. ,.
. .,.
. • ~-·
__ ..
..... -·-
n-.
.....
-·-·
·--.·
~-~·
-0.
00
0.0
0
0.0
0
0.00
0.
00
0.
00
0.0
0
0.00
0
.00
0.0
0
0.0
0
0.0
0
0.0
0
0.0
0
0.00
01hc
r O
ther
Ente
rpris
e Pr
otr:
ims
Ent
erpr
ise
Pro
gram
s (9
11)
(91
2)
0.0
0
00
0
• .... .._
.-.,,
.._
...... ,.
.-0
.00
0.
00
0.0
0
00
0
0.0
0
00
0
0.00
0.
00
0.0
0
0.0
0
0.00
0
00
0.
00
0
00
Exh
1bi
lK·9
DO
E l'
o•o
19
-_
_,.., _
_
To!
als
0.00
0
. 00
0.
00
0.
00
0.
00
0.0
0
0.0
0
0.0
0
0.0
0
0.00
0.
00
0.0
0
0.0
0
0.0
0
0.0
0
0.0
0
0.00
0
. 00
0.
00
0
.00
0
.00
0.
00
0.0
0
0.0
0
0.0
0
0.0
0
0.0
0
0.0
0
0.0
0
0.00
0.
00
0.
00
0.00
0.
00
00
0
0.0
0
0.0
0
00
0
0.0
0
0.0
0
0.0
0
0.0
0
0.0
0
00
0
0.0
0 0.
00
0.0
0
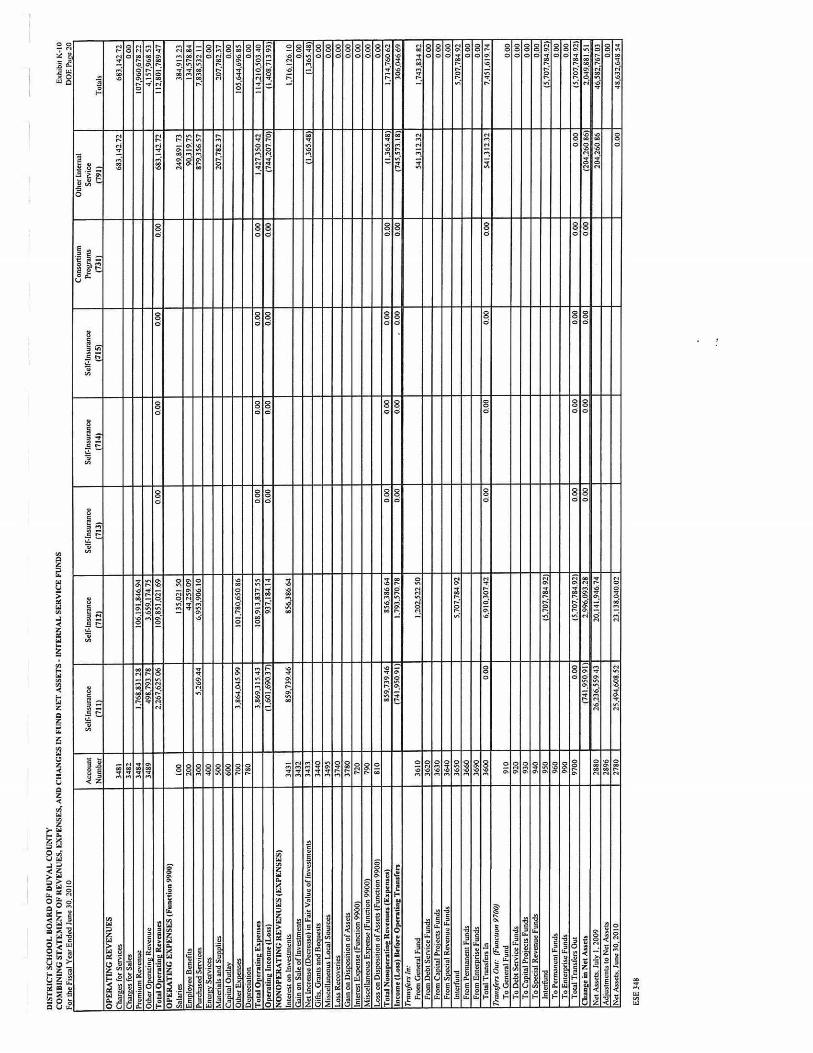
DIS
TR
ICT
SC
HO
OL
BO
AR
D Q
t' D
UV
AL
CO
UN
TY
C
OM
BIN
ING
ST
AT
EM
EN
T o
t· K
EV
t::N
UE
S, t
::Xl'E
NS
ES
, AN
D C
HA
NG
ES
IN F
UN
D N
ET
AS
SE
TS
-IN
TE
RN
AL
SE
RV
ICE
FU
ND
S fi
scal
Yea
r E
nded
Jun
e 30
. 20
l0
---
----
-·--
. --
---
-
Ac
co
un
t Se
lf-I
nsur
ance
S
elf·
lnsu
ranc
c Se
lf· I
nsur
ance
N
umbe
r 17
111
1712
1 17
131
OP
ER
AT
ING
RE
VE
NU
ES
C
han!
CS
for
Serv
ices
34
81
Chu
r.:c:
s fo
r Sa
les
3482
P
rem
ium
Rev
enu
e 34
84
I , 76
8.83
1.28
10
6.19
1,84
6.9
4 O
ther
Qn.
-mrin
L!. R
even
ue
3489
4
98,7
93.7
8 3.
659.
174
.75
Tot
al O~ral
ing R
cvcn
uc1
2.26
7.62
5.06
10
9.85
1.02
1.69
O
PE
RA
TIN
G E
XP
EN
SE
S (
func
tion
990
0)
Sala
ries
10
0
135.
021.
SO
Em
olov
cc B
ene.
fits
20
0
44.2
59.0
9
Purc
h:as
ed S
C1'V
iccs
3
00
5.
269.
44
6.95
3.90
6.10
En
cr1!
v Se
rvic
es
40
0
Mat
eria
ls ll
nd S
uool
ics
500
C01o
ita.J
Out
lay
60
0
Olh
crE
><oc
nseo
70
0 3,
864,
045.
99
101.
780,
650.
86
Dco
rcci
otio
n 78
0 T
o1•1
Op
crat
ine E~1
tcnscs
3,86
9.3
15.4
3 10
8.9
13,8
37.5
5 O
pu11
tin
e In
com
e (L
oq
) (l
.601
.690
.37)
93
7.18
414
N
ON
OP
ER
AT
ING
RE
VE
NU
ES
(E
XP
EN
SE
S)
lntcr~t o
n ln
vcst
rn..:
nts
343
1 85
9 73
9.46
85
6.38
6.6
4
Gai
n on
Sa.
le o
f In
vest
men
ts
3432
N
et ln
cre:
ase
(Dec
reas
e) in
Fai
r V
alu
e o
f Inv
estm
ents
34
33
Gil
ls. G
rant
s ;in
d 8C
Que
sts
34
40
M
iscd
!J.n
eous
Loc
al S
ourc
es
3495
L
oss
R1.."
Cov
cric
s 3
74
0
Gai
n on
DisP
OSi
tion
of A
sset
s 37
80
lntc
rcsl
Exo
cnsc
If un
ctio
n 99
00\
720
Mis
cell
.1nc
ous
FT
'nl"
ns
c f
f unc
tion
990
0)
790
Los
s on
Dis
oosi
1ion
of A
sset
s (f
unct
ion
9900
l 8
10
Tot
al N
unop
erat
int
Rev
enue
s (E
t.p<
nscs
) 85
9,73
9,4
6
856.
386.
64
Inco
me
(Lo
is)
Btf
ore
Opc
rati
n2 T
raru
fen
17
41.9
50.9
1 1.
793
.570
.78
Tmus
fon
/n:
From
Gen
eral
Fun
d 36
10
1.20
2.52
2.5
0 Fr
om D
ebt S
ervi
ce F
unds
36
20
From
C:a
nita
l Pro
icct
s Fu
nds
3630
Fr
om s~ia
l R
even
ue F
unds
3
64
0
lnte
tfun
d 3
65
0
5.70
7.78
4.9
2
From
Pcm
tane
nt F
unds
3
66
0
From
Ent
cmri
sc f
un
ds
36
90
T
ola!
Tra
nsfe
rs In
36
00
0.
00
6.
910.
307.
42
Tmn
sfen
Ou
t:
(Fun
c:ll
c>n
9700
) T
o G
ener
al F
und
91
0
To
Deb
t ScJ
Vic
c Fu
nds
92
0
To
Cao
ital P
roic
cu F
unds
93
0 T
o So
ccin
l Rev
enue
Fu
nds
940
lntc
rfun
d 95
0 15
.707
.784
921
T
o Pe
rman
ent
Fun
ds
960
To
En1c
:ror
is.e
Fund
s 99
0 T
otal
Tra
nsfm
Out
97
00
0.0
0
(5.7
07.7
84.9
21
Oaa
uec
in
Net
Au
eb
(7
41.9
50.9
1 2.
996.
093.
28
Net
Ass
ets,
Jul
v I.
200
9 28
80
26,2
36.5
59 4
3 20
.141
.946
. 74
Ad
iust
mcn
ts t
o N
et A
sset
s 28
96
N
et A
s.se
ts. J
une
30.
20
I 0
2780
25
.494
.608
.52
23.1
38.0
40.0
2
ESE
348
Con
sort
ium
Se
lf-I
nsur
ance
S
elf-
Insu
ranc
e P
rogr
ams
1714
1 (:1
151
(73
1)
0.0
0
0.0
0
0.0
0
0.00
0.0
0
0.00
0
.00
0
.00
0.
00
0,
00
0.0
0
0.0
0
0.0
0
0.0
0
0.0
0
0.00
0.
00
0. 0
0
0.0
0
0.0
0
0.0
0
0.00
0.
00
0.0
0
0.00
0
.00
0.
00
0.0
0
0.00
0
.00
0.
00
0.0
0
Olh
cr ln
tcm
ol
Serv
ice
(791
1 683.
142
.72
683,
142.
72
249,
891
73
90.3
19.7
5 87
9.3S
6.S7
20
7.78
2.37
1,4
27.
350.
42
(7
44,2
07.7
0)
11.3
65.4
81
11.3
65.4
8)
114
5.5
13. 1
8
541
312
.32
541.
312.
32
0. 0
0
(204
,260
.86)
204
,260
.86
0.0
0
Ex
h1b
i1 K
-10
DOEP
-.~c:
.20
·----
To
uls
683.
142.
12
0
.00
10
7.%
0.67
8.2
2 4,
l 57
,968
.Sl
112.
801,
789.
47
384.
913
23
134.
578
.84
7,83
8.53
2 11
0
.00
20
7.78
2.37
0
.00
10
5.64
4.69
6.85
0.
00
1
14,2
10,5
03.4
0 (1
,408
,71
3.9
3)
1.71
6.1
26.1
0 0
.00
fl.3
65 4
81
0.00
0.
00
0.0
0
0.00
0.
00
0.
00
0.
00
1.
714.
760.
62
306.
046.
69
1.74
3.8
34.8
2
0.0
0
0.0
0
0.0
0
5.70
7.78
4.9
2
0.0
0
0.0
0
7,45
1.6
19.7
4
0,0
0
0.0
0
00
0
0.0
0
(5,7
07.7
84.9
2\
0.0
0 0
. 00
(5
.707
.784
.921
2.
049,
881.
SI
46,5
82.7
67.0
3 0
. 00
48
,632
.648
54

DIS
TR
ICT
SC
HO
OL
BO
AR
D O
F D
UV
AL
CO
UN
T\'
S
CH
OO
L I
NT
ER
NA
L F
UN
DS
C
OM
BIN
ING
ST
AT
EM
EN
T O
F C
HA
NG
ES
IN
AS
SE
TS
AN
D L
IAB
ILIT
IES
Ju
ne 3
0, 2
010
Acc
ount
Num
ber
AS
SE
TS
Cas
h 11
10
Inve
stm
ents
11
60
Acc
ount
s R
ecei
vabl
e, N
et
1130
Inte
rest
Rec
eiva
ble
1170
Due
Fro
m O
ther
Fun
ds:
Bud
geta
ry F
unds
11
41
Inve
ntor
y 11
50
Due
fro
m O
ther
Age
ncie
s 12
20
To
tal
Ass
ets
LIA
BIL
ITIE
S
Sal
arie
s, B
enef
its
and
Pay
roll
Tax
es P
ayab
le
2110
Pay
roll
Ded
ucti
ons
and
Wit
hhol
ding
s 21
70
Acc
ount
s P
ayab
le
2120
Due
to B
udge
tary
Fun
ds
2161
Inte
rnal
Acc
ount
s P
ayab
le
2290
To
tal
Lia
bili
ties
ES
E
348
Bal
ance
A
ddit
ions
July
l, 2
009
6,62
5,64
2.73
33
,470
,016
.35
680,
311.
99
51,8
13.7
1
7,30
5,95
4.72
33
,52
J ,83
il:o6
16,6
64.8
4
7,30
5,95
4.72
33
,505
, 165
.22
7,30
5,9
54.7
2 33
,521
,830
.06
Ded
ucti
ons
33,4
52,9
40.1
2
399,
027.
65
33,8
51,9
67.7
7
33,8
51,9
67.7
7
33,8
51,9
67.7
7
Exh
ibit
K-1
1 D
OE
Pag
e 21
Fu
nd
891
Bal
ance
June
30,
20
I 0
6,64
2,71
8.96
333,
098.
05
0.00
0.00
0.00
0.00
0.00
6,97
5,81
7.0
I
0.00
0.00
16,6
64.8
4
0.0
0
6,95
9, 1
52.1
7
6,97
5,81
7.0
I

DIS
TR
ICT
SC
HO
OL
BO
AR
D O
F D
UV
AL
CO
UN
TY
S
CH
ED
UL
E O
F L
ON
G-T
ER
M L
IAB
ILIT
IE:S
Ju
ne 3
0, 2
010
Not
es P
ayab
le
Obl
ie.a
tions
Und
er C
aoit
al L
ease
s
Bon
ds P
ayab
le
Cer
tifi
cate
s o
f Par
tici
oati
on P
avab
le
Oth
er P
ost-
emol
oym
ent B
enef
its
Obl
ie.a
tion
Est
imat
ed P
EC
O A
dvan
ce P
avab
le
Oth
er L
one.-
tenn
Lia
bili
ties
Tot
al L
ong-
term
Lia
bilit
ies
Acc
ount
Num
ber
2310
2315
2320
2330
2340
2350
2360
2370
2380
[I]
Incl
ude
tota
l cu
rren
t and
non
curr
ent
liab
ilit
y ba
lanc
es a
t Jun
e 30
, 201
0.
ES
E 3
48
I I
Gov
ernm
enta
l
Act
ivit
ies
Tot
al B
alan
ce
June
30,
201
0 1
21,8
50,0
00.0
0
56,2
27 ,8
61.2
9
290,
880,
100
.56
19,3
64,3
11.0
0
31,6
08,0
00.0
0
419,
930,
272.
85
~usi
ness
-typ
e
· .. A
ctiv
itie
s
Tot
al B
alan
ce
Jun
e30
,20
10
1
0.00
Exh
ibit
K-1
2 D
OE
Pag
e 22
F
un
d 6
01
Tot
al
0.00
0.00
21,8
50,0
00.0
0
56,2
27 ,8
61.
29
290,
880,
l 00.
56
19,3
64,3
11.0
0
31,6
08,0
00.0
0
0.00
0.00
419,
930,
272.
85

DIS
TR
ICf S
CH
OO
L. B
OA
RD
OF
DU
VA
L. C
OU
NT
Y
SC
llED
Ul..
E O
F C
AT
EG
OR
ICA
L. P
RO
GR
AM
S
RE
PO
RT
OF
EX
PE
ND
ITU
RE
S A
ND
A V
AIL
AB
l..E
FU
ND
S
For
the
Fis
cal
Y ca
r E
nded
Jun
e 3
0, 2
0 I 0
CA
TE
GO
RIC
AL
. PR
OG
RA
MS
(Rev
enu
e Nwn
l~r)
[Foo
tnot
e
Cla
ss S
ize
Rcd
ucri
on/Q
pcra
tini
: Fun
ds (
3355
)
Cla
ss S
ize
Red
ucti
on/C
apit
al F
wtd
s (3
39
6
:Com
preh
ensi
ve K
-12
Rca
dini
: P
latt
(F
EF
P E
anna
rk)
Exc
elle
nt T
cnch
inu
(336
3
Flo
rida
Tea
cher
Lea
d Pr
ol!T
atn
(FE
l'P E
anna
rkcd
)
Inst
ruct
iona
l M
ater
ials
I F
EF
P E
anna
rkcd
)
Lib
M
edia
CFE
FP E
arm
arke
d)
Pre
scho
ol P
roje
cts
(337
2)
Pub
lic
Sch
ool T
echn
oloi
:y
Saf
e S
choo
ls (F
EF
P E
anna
rk)
12
Sal
orv
Bon
us O
utstan
din~ T
coch
crs
in D
and
F S
choo
ls
Sch
ool
Rec
ogni
tion
Fun
ds (
3361
)
SuPJ
>lem
cnta
l Aca
dem
ic I
nstr
ucti
on
(FE
FP
Ean
nark
)
Tc.ac
hc:r
Rc:
crui
tntc
nt a
nd R
clcn
lion
Teac
her
Tra
inin
l•
Pup
il T
ran
sJJO
rtat
ion
(FE
FP
Ean
nnrk
cdJ
Vol
unta
ry P
reki
nder
gart
en-S
choo
l Y
ear P
roi:r
run
(337
1)
Vol
unt
Gra
nt
Une
xpen
ded
Nw
nbcr
Ju
ne 3
0. 2
009
9474
0 34
.115
.421
.73
9105
0 2,
157,
795.
39
9080
0 5.
612.
277.
11
9057
0 o.
oo I
9758
0 85
5,04
5.12
9088
0 18
3,46
0.61
9088
1 65
1.11
2.52
9795
0
9032
0
908
03
1.11
2.87
1.83
I
9403
0
9204
0 86
4.47
1.66
9128
0 8,
881.
082.
54
9346
0
912
90
9083
0
9644
0
9644
1 42
.909
.52
I
J 1]
Rep
ort t
he L
ibra
ry M
edia
por
tion
or t
he I
nstr
ucti
onal
Mat
eria
ls a
lloc
atio
n on
the
lin
e "L
ibra
ry M
edia
."
(2)
Com
bine
all
prog
ram
s fu
nded
fro
m t
he S
are
Sch
ools
all
ocat
ion
on o
ne li
ne "
Saf
e S
choo
ls."
(3
) In
clud
e bo
ut s
tate
and
loca
l re
venu
e so
urce
s. R
even
ue s
houl
d ag
ree
to t
he F
EF
P 4
U1 C
alcu
lati
on a
lloc
atio
n.
Rct
umcd
To
DO
E
[4)
Rep
ort
the
amou
nt o
r fun
ds t
rans
ferr
ed f
rom
eac
h p
rogr
am t
o m
aint
ain
boar
d-sp
ecif
ied
acad
emic
cla
ssro
om i
nstr
ucti
on.
ES
E 3
48
I I I
Rev
enue
s (3
) E
xpen
ditu
res
Fle
xibi
lity
(4)
2009
-10
2009
-10
2009
-10
r:::~:
~:ci< ,.
..,.
~)".
?.
...
' ~~
137.
967.
195
.00
13
7.65
1,0
04.1
0 ?'{
;.8; ;Et~
1;?;
,,
.,
tfl'"
·~
886.
401.
37 l~
i:df
~; f1
'1Jf
r4.;
~~-
4,64
2,26
3.0
0
6, 1
93,5
13.3
6
14,2
46.6
6
14,2
46.6
6
1.58
6,56
1 .0
0 1,
385.
010.
00 ;.
:t.~
¥{"1
~f~Y
)l>~
, >:»
9,21
0.76
5.00
9,
029.
772.
00
556,
578.
00
93
4,3
13.0
1
·;:r
i!iM
JJ!l
~~~t
; ~,'
3.80
2.22
5.o
o I
4.53
8, 1
26.6
d
J
5.85
8. I
10.0
0 5,
848,
170.
10
29.4
24.4
66.0
0 28
,666
, 735
. 72
18.4
46.8
87.0
0 18
.446
,887
.00
183,
885.
80
266.
401.
10
\)v
"
\>-.6~
V
-.)
0:J~
\~l'i&/$~if!' ·o
'~
·~,{
;i'a
d ·$
2
.J ··~
,f!:
#~'<
·1~
"·'<
',t'
.. ;P
':'f
g·· f.
.Y,•11
• ,.
ffi:i''
>i,fJ
/'/,
J-k}y
-.-~
,,
.,)\
~7,,
:;.o
<,-
~jf/
•-
,
,:il1 ~t
91lt
f~~~
;
Exh
ibit
K-1
3 D
OE
Pai
:e 2
3
Bal
once
Ju
ne
30,
2010
Enc
umbe
red
Unc
ncw
nbcr
cd
34,4
31,6
I 2.6
3
1.27
1,39
4.0
2
1.88
1,9
89.9
1 2.
179.
036.
84
0.00
I ,05
6,59
6. I
2
226.
324.
45
138
,129
.16
160.
782.
23
I 12.
595
. 28
~
00
0
899.
355.
02
77,6
15.1
9
0.00
7.71
7.6
0
866.
693.
96
946.
157.
34
8.69
2.65
5.48
0.0
0
0.00
0.00
0.0
0
9,99
1.08
(4
9.59
6.8
6'
mcfarlint
Pencil

DIS
TR
ICT
SC
HO
OL
BO
AR
D O
F D
UV
AL
CO
UN
TY
S
CH
ED
UL
E O
F S
EL
EC
TE
D S
UB
OB
JEC
T E
XP
EN
DIT
UR
ES
For
lhe
Fis
cal
Yea
r E
nded
Jun
e 30
. 20
10
EN
ER
GY
EX
PE
ND
ITU
RE
S:
Nat
ura
l G
as
Bo11
lcd
Gas
Ele
c1nc
i1y
Hea
1inf
.! O
il
To
tal
EN
ER
GY
EX
PE
ND
ITU
RE
S F
OR
PU
PIL
TR
AN
SP
OR
TA
TIO
N:
Gas
olin
e
Die
sel
Oil
& G
reas
e
Tot
.al
EX
PE
ND
ITU
RE
S F
OR
SC
HO
OL
BU
SE
S
AN
D S
CH
OO
L B
US
RE
PL
AC
EM
EN
TS
:
Bus
es
EX
PE
ND
ITU
RE
S F
OR
CA
PIT
AL
IZE
D
AU
DIO
VIS
UA
L M
AT
ER
IAL
S:
Aud
iovi
sual
Mat
eria
ls
SU
BA
WA
RD
S F
OR
IN
DIR
EC
T C
OS
T R
A T
E:
Sub
reci
oic1
11 aw
ards
uo
to S
25.0
00
Sub
rcci
oiem
aw
ards
gre
ater
1han
S25
.000
Sub
rcci
picn
t aw
ards
uo
10 $
25,0
00
Sub
n:.-c
ip1c
n1 aw
ards
gre
ater
than
$25
.000
FO
OD
SE
RV
ICE
SU
PP
LIE
S S
UB
OB
JEC
T
Suo
ohcs
Pur
chas
ed fo
od 1
0 in
clud
e co
mm
odil
ics
ES
E
348
Sub
Obi
ect
410
420
430
440
450
460
540
Sub
Obi
ecl
651
621
Sub
-
Obj
ect
311
312
391
392
Sub
-
Obi
ecl
510
570
Gen
eral
Fund
628.
685.
04
20.1
73.8
44.4
9
20.8
02.5
29.5
3
Spe
cial
Rev
enue
Fun
d
Foo
d S
ervi
ce (
410)
194.
661.
28
749
,632
.98
944
,294
.26
VJ"'
,f!;
TU't
q'f~
f-t"
~~,£
@~~f~I
8.
217
.32 ff&i'.¥f'itf/~~~Afqi'j;
,, i<
ta !
$/ ~"'
'i&;:"
'I 3.
402
.11
8.3
0 L
:.f71
.:t:9
f?i.d
....
,,; fi!i
. ,1
3,41
0.39
5.62
11
?'1
--A
Gen
eral
Fund
Gen
eral
Fun
d 150.
000.
00
4,94
3,64
8.69
1,36
1.87
9.69
1.9
15.5
84. 7
6
Spe
cial
Rev
enue
Fun
d
Foo
d Se
rvic
es(4
10)
t'56.
337.
60
Spe
cial
Rev
enue
Fun
d
Oth
er (
420)
Spe
cial
Rev
enue
Fun
d
Foo
d S
ervi
ce (
410)
Spe
cial
Rev
enue
Fun
d
01he
r(42
0)
0.00
35,9
69.0
0
35.9
69.0
0
Spe
cial
Rev
enue
Fun
d
AR
RA
(43
0)
Spe
cial
Rev
enue
Fun
d
Oth
er (4
20)
50,0
00.0
0
2,70
9,34
0.14
229.
597.
60
2,24
9.22
9.44
Spe
cial
Rev
enue
Fun
d
AR
RA
(430
)
0.0
0
6,46
5.4
9
6,4
65.4
9
Cap
ital P
roje
cts
Fun
ds
Spe
cial
Rev
enue
Fun
d
AR
RA
(43
0)
25,0
00.0
0
306,
886.
55
112.
672.
85
762,
423
.40
Exh
ibit
K-1
4
DO
E P
age2
4
Tot
al 82
3.34
6.32
0.0
0
20,
923.
477.
47
0.0
0
21.7
46,8
23.7
9
8,2
17.3
2
3,44
4.6
12.7
9
0.00
3.45
2,83
0.11
Tot
al
0.00
0.00
Tot
al 22
5.00
0.00
7 .95
9.87
5.38
1.70
4.1
50.1
4
4,92
7.23
7.60

DIS
TR
ICT
SC
HO
OL
BO
AR
D O
F D
UV
AL
CO
UN
TY
S
CH
ED
UL
E O
F S
EL
EC
TE
D S
UB
OB
JEC
T E
XP
EN
DIT
UR
ES
--
--
--
---
-
Tea
cher
Sal
arie
s
Bas
ic P
rogr
ams
I 0 I
, I 0
2, a
nd I
03
(Fun
ctio
n 51
00)
Bas
ic P
rogr
ams
IOI,
102
, and
103
(F
unct
ion
5100
)
Bas
ic P
rogr
ams
I 0 I,
l 0
2, a
nd I
03
(Fun
ctio
n 51
00)
To
tal
Bas
ic P
rog
ram
Sal
arie
s
Oth
er P
rogr
ams
130
(ES
OL
) (F
unct
ion
5100
)
Oth
er P
rogr
ams
130
(ES
OL
) (F
unct
ion
5100
)
Oth
er P
rogr
ams
130
(ES
OL
) (F
unct
ion
5100
)
To
tal O
ther
Pro
gra
m S
alar
ies
ES
E P
rogr
ams
111,
112
, 11
3, 2
54, a
nd 2
55 (
Fun
ctio
n 52
00)
ES
E P
rogr
ams
111,
112
, 11
3, 2
54, a
nd 2
55 (
Fun
ctio
n 52
00)
ES
E P
rogr
ams
111
, 11
2, I
13,
254
, and
255
(F
unct
ion
5200
)
To
tal
ES
E P
rog
ram
Sal
arie
s
Car
eer
Pro
gram
300
(F
unct
ion
5300
)
Car
eer
Pro
gram
300
(F
unct
ion
5300
)
Car
eer P
rogr
am 3
00 (
Fun
ctio
n 53
00)
To
tal
Car
eer
Pro
gra
m S
alar
ies
Tex
tboo
ks (
used
for
cla
ssro
om i
nstr
ucti
on)
Tex
tboo
ks (
Fun
ctio
n 50
00)
ES
E 3
48
Sub-
Obj
ect
120
140
750
120
140
750
120
140
750
120
140
750
Sub-
Obj
ect
520
Exh
ibit
K-1
4
Gen
eral
S
peci
al R
even
ue F
und
Spe
cial
Rev
enue
Fun
d
Fun
d O
ther
(42
0)
AR
RA
(43
0)
Tot
al
0.00
0.00
0.0
0
0.00
U
.00
0.00
0
.00
0.00
0.00
0.00
0.00
0.
00
0.00
0.
00
0.00
0.00
0.00
0.00
0.
00
0.00
0.
00
0.0
0
0.00
0.00
0.00
0.
00
0.0
0 0.
00
Gen
eral
Sp
ecia
l R
even
ue F
und
Spe
cial
Rev
enue
Fun
d
Fun
d O
ther
(42
0)
AR
RA
(43
0)
Tot
al
9,30
6,01
3.54
1,
640,
227.
35
126,
694.
88
11,0
72,9
35.7
7
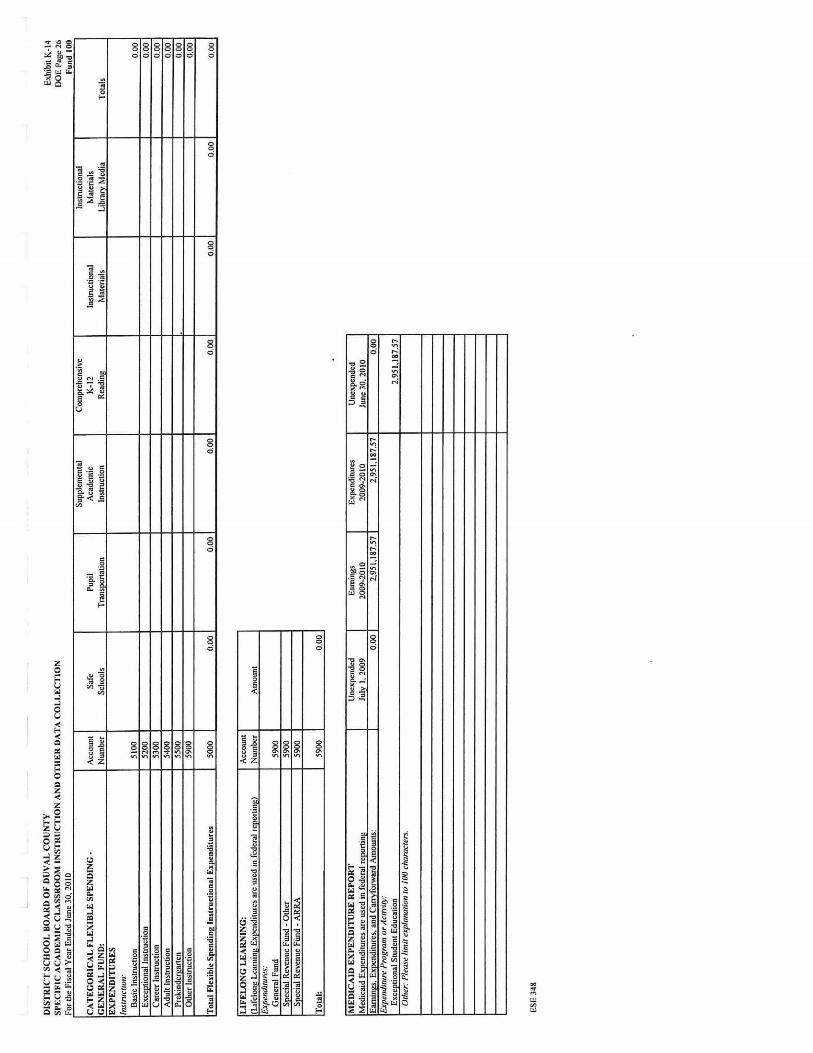
DIS
TR
ICT
SC
HO
OL
BO
AR
D O
F D
UV
AL
CO
UN
TY
S
PE
CIF
IC A
CA
DE
MIC
CL
AS
SR
OO
M I
NS
TR
UC
l"IO
N A
ND
OT
HE
R D
AT
A C
OL
LE
Cl"
ION
F
or th
e F
isca
l Y
ear
End
ed J
une
JO.
2010
CA
TE
GO
RIC
AL
FL
EX
IBL
E S
PE
ND
ING
· A
ccou
nt
Saf
e G
EN
ER
AL
.-U
ND
: N
wnb
cr
Scho
ols
EX
PE
ND
ITU
RE
S
/t1S
fn"'
liu
":
Bas
ic I
nstr
uctio
n 5
100
E
xcep
tion
al l
nstr
uc1i
on
5200
C
aree
r In
stru
ctio
n 53
00
Adu
lt l
nslr
ucti
on
54
00
P
rck
ind
eru
nen
55
00
Oth
er l
ns1r
uctio
n 59
00
To
llll
Fle
xibl
e S
pen
din
g In
stru
ctio
nal
E111
e11d
itu
ros
5000
LIF
EL
ON
G L
EA
RN
ING
: A
cco u
ni
Lifc
lon~
Lcamiu~
Exp
endi
ture
s ar
c us
ed in
fed
eral
rcP
orti
n~)
Num
ber
Am
ount
Ex
p1.m
ditu
rc:s
: G
ener
al F
und
5900
S
occi
al R
even
ue f
un
d -
Oth
er
5900
S
peci
al R
even
ue f
un
d -
AR
RA
59
00
To
tal:
59
00
ME
DIC
AID
EX
PE
ND
ITU
RE
RE
PO
RT
I U
nexp
ende
d M
edic
aid
Exp
endi
ture
s ar
c us
ed i
n fe
dera
l rc
Ponin
~ Ju
ly I
. 200
9 Ea
rnin
~. E
xt>C
ndit
ures
. an
d C
arrv
forw
ard
Am
ow1t
s:
I E
xpen
ditu
l"I!
J>ro
gra
m u
r A
ctiv
ity:
E
xceo
tion
al S
tude
nt E
duca
tio
n
Oth
er:
Plea
se li
mit
c.rp
/ano
lion
10 /
00 c
hara
c1er
s.
ES
E 3
48
Sup
plem
enta
l Pu
pil
Aca
dem
ic
Tra
nsoo
nati
on
Inst
ruct
ion
0.00
0
.00
0.
00
0. 0
0 I
Ear
ning
s I
Exp
cndi
lurc
s 20
09-2
010
2009
-201
0 0.
00
I
2.95
1.18
7.5
7 I
2.95
I.18
7.57
Com
preh
ensi
ve
K-1
2 ln
slru
ctio
nal
Readin~
Ma1
eria
ls
0.00
Une
xpen
ded
June
30.
20
10
0.0
0
2.95
1.18
7.57
lnsl
ruct
iona
l M
ater
ials
L
ibra
ry M
edia
0.00
0
.00
Exh
ibit
K-1
4 D
OE
Pas
e 26
F
und
100
---
----
-
Tot
als
0.00
0
.00
0
.00
0
.00
0
.00
0
.00
0.00

DIS
TR
ICT
SC
HO
OL
BO
AR
D O
F C
OU
NT
Y
NO
TE:
U
SE
WH
OL
E D
OL
LA
RS
ON
LY
. R
EPO
RT
NO
T A
CC
EP
T A
BL
E W
ITH
CE
NT
S O
R .0
0
SC
HE
DU
LE
3 S
CH
OO
L P
RO
GR
AM
CO
ST
RE
PO
RT
G
EN
ER
AL
FU
ND
_
SP
EC
IAL
RE
VE
NU
E F
UN
DS_
RE
PO
RT
ING
PE
RI O
D:
For
the
Fis
cal Y
ear
End
ed J
une
30, 2
010
DIR
EC
T C
OS
TS
IN
DIR
EC
T C
OS
TS
PR
OG
RA
M
SA
LA
RIE
S E
MP
LO
YE
E
PU
RC
HA
SE
D
MA
TE
RIA
LS
OT
HE
R
CA
PIT
AL
SC
HO
OL
D
IST
RIC
T
TO
TA
L
BE
NE
FIT
S
SE
RV
ICE
S*
&
SU
PPL
IES
E
XPE
NS
ES
OU
TI.
AY
IN
DIR
EC
T
IND
IRE
CT
P
RO
GR
AM
CO
ST
S
-"t• ·--
---
---
----
-.....,.
--
-....
--..
--I
••l.
.:1
1 . -~
--·-1
-----••ll I
I._
_
-I
..,.
..,,
•~• -
•
:
Trn.n
~ft
nrt
"t.ti
l"l.n
.... .:;
:. -
~~ ...
'.
·: ,_
,_
;;i
""l
-.~:-~~·
....
.. --
-~·;i
.
""""
c:.
~;r•
··
-·
,,.J
;. . .-
...::
.-.-
. .:
.-· ~--~._,,,.
.ru~·J..
. .n
:,
-.,
-~·J:.~
-·
r ...
~
. ..,'i>' _
_ -;lo.."
:-lr
.. ,
•. .
r!_
... -..
....
~ •.
:...
...
·-
.·-.
:"
. ~
·S."
:°~:
'';_
J~.
· . .;,
; .. .;
,-· -.·:
-·· -.
.
SC
HO
OL
IN
DIR
EC
T C
OS
T I
S C
OM
PO
SE
D O
F T
HE
FO
LL
OW
ING
FU
NC
TIO
NS
· 6
100-
Pup
il P
erso
nnel
s
6200
-Mcd
ia
$ 63
00-l
nst.
& C
urri
culu
m D
cvcl
oom
cnt
$ 64
00-S
tafT
Tra
inin
l! s
6500
-lns
truc
tion
Rel
ated
Tcc
hno
lol!
v s
7300
-Sch
ool
Adm
inis
trat
ion
$
7400
-Fac
iliti
cs A
caui
siti
on
$ 77
00-C
cntr
al S
ervi
ces
s 79
00-0
ocra
tion
of P
lant
s
810
0-M
aint
cnan
cc o
f Pl
ant
s 82
00-A
dmin
istr
ativ
c T
cchn
olol
!Y S
ervi
ces
$
•In
clud
e E
ncrb
'Y S
ervi
ces
For
m P
C-3
E
xhib
it K
-15
DO
E P
age
27
GE
NE
RA
L F
UN
D
ON
LY
S
TA
FF
UN
ITS
(
X.X
X)
<.:J
."
·-·-·
.........

DIS
TR
ICT
SC
HO
OL
BO
AR
D O
F
CO
UN
TY
NO
TE
: U
SE
WH
OL
E D
OL
LA
RS
ON
LY
. R
EPO
RT
NO
T A
CC
EP
TA
BL
E W
ITH
CE
NT
S O
R .0
0 --
---
---
--
--
-----
--
--
---
--
--
---
SC
HE
DU
LE
4
DIS
TR
ICT
AG
GR
EG
AT
E P
RO
GR
AM
CO
ST
RE
PO
RT
G
EN
ER
AL
FU
ND
_
SP
EC
IAL
RE
VE
NU
E F
UN
DS
_
RE
POR
TIN
G P
ER
IOD
: F
or th
e Fi
scal
Yea
r E
nded
Jun
e 30
, 201
0
DIR
EC
T C
OS
TS
IN
DIR
EC
T C
OS
TS
PR
OG
RA
M
SA
LA
RIE
S
EM
PL
OY
EE
P
UR
CH
AS
ED
M
AT
ER
IAL
S O
TH
ER
C
AP
ITA
L
SC
HO
OL
D
IST
RIC
T
BE
NE
FIT
S
SE
RV
ICE
S•
& S
UP
PL
IES
E
XPE
NSE
S O
UT
LA
Y
IND
IRE
CT
IN
DIR
EC
T
!
-···-
----
·--· -
----
· _.....
_ __ -
..........
. -.. .
I•••
-.--
--
·--'••
••I
I-• ---
-· .. ·-
·"'· _:_
•
-
Tr.
tns_
,.., ...
.. : ..
.....
,._ ...
. ·-
·-·-.. ..L:,~~·c
,-·a
.t·-
-.~
-......
_ .,....~..,......_"'
-. .,.
._.~ ,.-
-..,;,
,,..
.. i!''lllfl::-~EU-
... '"
J:,
"""" "
·-"·-
-.
. '
.. .
-'
..........
·.'
i#'c
-.
~--
.........
~· -
11
."ll'
r.
-,,_
DIS
TR
ICT
IN
DIR
EC
T C
OS
T I
S C
OM
PO
SE
D O
F T
HE
FO
LL
OW
ING
FU
NC
TIO
NS
: 61
00-P
upil
Per
sonn
el
$ 62
00-M
cdia
$
I 630
0-ln
st.
& C
urri
culu
m D
ev.
$ I
Rec
reat
iona
l & E
nric
hmen
t 64
00-S
taff
Tra
inin
g $
6500
-lns
t. T
ech.
Ser
vice
s $
I 710
0-B
oard
$
I O
ther
s, S
peci
fy
7200
-Gcn
cral
Adm
in.
$ 74
00-F
acil
itic
s. A
coui
siti
on
$ I 7
500-
Fisc
al
$ I
Non
-Pro
l!ra
rn C
aoit
al E
xoeo
se
7700
-Cen
tral
Ser
vice
s $
Com
mun
itv S
ervi
ces
7900
-0pc
rati
on o
f Pla
nt
$ T
rans
fers
8
100-
Mai
nt.
Of P
lant
$
Adi
ustm
cnt f
or R
ound
inl!
82
00-A
dmin
. Tec
h. S
ervi
ces
$ T
OT
AL
•I
nclu
de E
nerg
y S
ervi
ces
TO
TA
L
PR
OG
RA
M
CO
ST
S
. ..,.,
,;.. _ _, __
~G.:.r
. ··'l"'
-;r_"·f-&~4
•.
Form
PC
-4
Exh
ibit
K-1
6 D
OE
Pag
e 28
GE
NE
RA
L
FU
ND
ON
LY
ST
AF
F U
NIT
S
(X.X
X)
...,,.,,~
-. .• .
,_.J
,;.c
.... ·.
1

r(Oli::~ ~ DISTRICT SCHOOL BOARD OF DUVAL COUNTY
_}73(TB) SCHEDULES
SUPPLEMENTARY SCHEDULE OF FEDERAL FINANCIAL ASSISTANCE PROGRAM EXPENDITURES
For the Fiscal Year Ended June JO, 2010
Catalog of Federal Domestic Ass~tancc Pass-Through
Federal GrantorlPau-Tbrough GrantorlProgram Tille Number Grantor Number
United States Department of Agriculture: Indirect:
Child Nutrition Cluster: Florida Depanment of Agriculture and Consumer Services:
Non-Cash Assistance (Commodities): National School Lunch Program 10.555 (2) 300
Non-Cash Assistance Subtotal
Florida Depanment of Educ'!tion Cash Assistance:
National School Lunch Program 10.555 300
School Breakfast Program 10.553 321
Summer Food Service Program for Children 10.559 323
Child Nutrition Discretionary Grants Limited Availability 10.579 371,592
Child Nutrition Cluster Total
City of Jacksonville Child and Adult Care Food 10.558 NIA
Total United States Department of Agriculture
United States Department of Defense:
Direct: Reserve Officers Training Corps 12.000 NIA
Total United States Department of Defense
United States Department of Labor Indirect:
Employment and Training Administration
WlA Youth Activities 17.259 NIA
Total United States Department of Labor
Environmenta l Protection Agency
Indirect: Environmental Protection Agency; Office of Air and Radiation
Surveys. Studies, Research. Investigation, Demonstration. and Special Purpose Activities Relating to Clean Air Act 66.034 XA-96444406
Total Environmental Protection Agency
United States Department of Education:
Direct: Impact Aid 84.041 NIA
Magnet Schools Assistance 84. 165 NIA
Fund for the Improvement of Education 84.215 NIA
Advanced Placement Program 84.330 NIA
Gaining Early Awareness and Readiness for Undergraduate Programs 84.334 NIA
Transition to Teaching 84.350 NIA
Ans in Education 84.351 NIA
Total Direct
Indirect: Florida Department of Education:
Special Education Cluster: Special Education - Grants to States 84.027 262.263
Special Education - Preschool Grants 84. 173 266.267
Special Education - Grants to States. Recovery Act 84.391 ARRA 263
Special Education - Preschool Grants. Recovery Act 84.392ARRA 267
Total Special Education Cluster
(1) Amount of
Expenditures
s 2.190,226 2.190,226
21,285.973 6,952,320
678,132
125,619
29.042,044
31.232,270
1,558,535
32,790,806
658,656
658,656
7,907
7.907
s 332,356 3.508,985 3,531 ,937
208 ,137
524.829 482.741 323.026
8.912.012
25,514.490 843,771
6.067.502 2,375,472
34,801.236
Exhibit K-16 DOE Page 29
Amount Provided to Subrecipients
mcfarlint
Pencil
mcfarlint
Pencil

DISTRICT SCHOOL BOARD OF DUVAL COUNTY
SCHEDULES SUPPLEMENTARY SCHEDULE OF FEDERAL FINANCIAL
ASSISTANCE PROGRAM EXPENDITURES For the Fiscal Year Ended June JO, 2010
Federal Grantor/Pass-Through Grantor/Program Title Title I, Part A Cluster:
Title I Grants to Local Educational Agencies Title I Grants to Local Educational Agencies. Recovery Act
Career and Technical Education - Basic Grants to States Safe and Drug-Free Schools and Communities - State Grants Education for Homeless Children and Youth Charter Schools 21st Century Community !:earning Centers Education Technology State Grants Reading First State Grants English Language Acquisition Grants Improving Teacher Quality State Grants School Improvement Grants Education Technology State Grants. Recovery Act Education for Homeless Children and Youth, Recovery Act State Fiscal Stabilization Fund (SFSF) - Education State Grants, Reco· State Fiscal Stabilization Fund (SFSF) - Government Services, Recovt
Total Florida Department of Education
University of South Florida National Center for Education Research Mathematics and Science Partnerships
Total Indirect
Total United States Department of Education
United States Department of Health and Human Services: Indirect:
Agency for Health Care Administration: Florida Division of Emergency Management Center for Disease Control and Prevention Refugee and Entrant Assistance Discretionary Grant
Total United States Department of Health and Human Services
Corporation for Nntional and Community Service: Indirect:
Florida Department of Education Learn and Serve America - School and Community Based Programs
Total Corporntion for National nnd Community Service
uepartment ot ttomeiano ::.ecunt) Direct:
Hazard Mitigation Grant
Total Corporation for National and Community Servic1
Total Expenditures of Federal Awards
Catalog of Federal Domestic A5'istance
Number
84.010 84.389 ARRA
84.048 84.186 84.196 84.282 84.287 84.318 84.357 84.365 84.367 84.377
84.386ARRA 84.387 ARRA 84.394 ARRA 84.397 ARRA
84.305 84.366
93.039 93.293 93.576
94.004
97.039
Pass-Through Grantor Number
212,238,226,223 212.223
ISi 103 127 298 244 121 211 102
224,225.262 126 121 127 591 592
NIA 235
NA NA NA
NA
NA
s
(I) Amount of
Expenditures
36,714.887 13.536,115 50.25 1,002
1,756,596 543,361 112.732 694.615
1,281,477 .273,005 S6S ,9S4
2,029, 150 6,057,756
148.857 460,710
33,628 41.780.316 3,614,692
144,405,086
9,397 277.045
144,691,528
153,603,540
115,500 30,408
172,947 318,855
29,736 29,736
1,234,222 1,234,222
188,643,722
Exhibit K-16 DOE Page 29
Amount Provided to Subrecipients
694,6 15 1,281,477
1,435,149
3,411,241
3,411,241
3,411,241
s 3,411,241
(I) Basis of Presentation - The Schedule or Expenditures of Federal Awards represents amounts expended from Federal Programs during the 2009-2010 fiscal year as determined based on the modified accrual basis of accounting. The amounts reported on the Schedule have been reconciled to and are In material agreement wtth amounts
121 Noncash Assistance ol Food Distribution - Represents the amount or donated fOOd used during the 2009-2010 fiscal year. Commoodttles are valued at fair value as determined at the time of donation.
(JI Noncash Assistance to The Hazard Mttlgatlon Grant- Represents the amount provided for generator cost and Installation cost during the 2009-2010 fiscal year. This noncash amount is in addttion to any Federal reimbursement tor Installation cost.