WATER RESOURCES - usace-iwr
241
DECEMBER, 1971 DEPARTM CORP HE ARMY NEERS Volume III of III FOREIGN DEEP WATER PORT DEVELOPMENTS A Selective Overview of Economics, ,Engineering, and Environmental Factors APPENDIX D: UNITED KINGDOM APPENDIX E: CANADA (PORT CARTER) APPENDIX F: AUSTRALIA APPENDIX G: JAPAN APPENDIX H: THE PERSIAN GULF APPENDIX I: BANTRY BAY, IRELAND FE WATER RESOURCES IWR REPORT 71-11
-
Upload
khangminh22 -
Category
Documents
-
view
1 -
download
0
Transcript of WATER RESOURCES - usace-iwr

DECEMBER, 1971 DEPARTM CORP
HE ARMY NEERS
Volume III of III
FOREIGN DEEP WATER PORT DEVELOPMENTS
A Selective Overview of Economics, ,Engineering, and Environmental Factors
APPENDIX D: UNITED KINGDOM APPENDIX E: CANADA (PORT CARTER)
APPENDIX F: AUSTRALIA APPENDIX G: JAPAN
APPENDIX H: THE PERSIAN GULF
APPENDIX I: BANTRY BAY, IRELAND
FE
WATER RESOURCES
IWR REPORT 71-11

INSTITUTE FOR WATER RESOURCES
The Institute for Water Resources is the focal point of efforts to improve U. S. Army Corps of Engineers' planning for the development and management of the nation's water and related land resources, particularly as national objectives are affected by changing public values. Through in-house and contract stud-ies, the Institute identifies emerging planning issues and re-quirements; evaluates planning efficiency and effectiveness; develops applications to Corps' planning of analytical and pro-jectional techniques and planning management systems; and formulates the bases for improved Corps' planning policies and procedures. In concert with the Office, Chief of Engineers, it advises and as.sists Corps' agencies in utilizing such tech-niques and carrying out suchprocedures. Finally, it evaluates and recommends improvements in the professional develop-ment program for Corps' planners; develops training programs; and conducts training.
The Institute welcomes your comments and suggestions on its program and publications.
K. B. COOUER Brigadier General, USA Director
_3

FOREIGN DEEP WATER PORT DEVELOPMENTS

Volume III of III
FOREIGN DEEP WATER PORT DEVELOPMENTS
A Selective Overview of Economics, Engineering, and Environmental Factors
APPENDIX D: UNITED KINGDOM
APPENDIX E: CANADA (PORT CARTER)
APPENDIX F: AUSTRALIA
APPENDIX G: JAPAN
APPENDIX H: THE PERSIAN GULF
APPENDIX I: BANTRY BAY, IRELAND
.r
DECEMBER, 1971 IWR REPORT 71-11

APPENDIX D
UNITED KINGDOM

APPENDIX D
UNITED KINGDOM
D.1 Background & Summary D-1
D.2 Port Management and Funding D-4
D.2.1 Port Management D-4 D.2.2 Sources of Finance D-4
D.3 Economic Aspects D-5
D.3.1 Commodity Traffic and Patterns D-5 D.3.2 Inland Transport D-11 D.3.3 Industrialization D-11 D.3.4 Port Planning Methods D-11
D.4 Environmental Planning and Problems D-16
D.4.1 Planning Methodology D-16 D.4.2 Examples of Environmental Planning D-17
D.5 Engineering Considerations D-19
D.5.1 General D-19 D.5.2 General Cargo Quays D-19 D.5.3 Special Berths D-21 D.5.4 Technical Trends D-21
D.6 The Clyde Estuary D-23
D.6.1 Introduction D-23 D.6.2 Brief History of the Clyde Port Authority D-23 D.6.3 The Clyde Area: What it has to Offer D-25 D.6.4 The Clyde Estuary Development Group D-27 D.6.5 The Public Inquiry D-29 D.6.6 Future Plans D-31
D.7 Environmental Planning in the Medway Estuary D-32
D.7.1 Summary D-32 D.7.2 The MIDA Scheme D-33 D.7.3 Employment Considerations D-34 D.7.4 Preservation of Places of Touristic Interest D-35 D.7.5 Effect of the Proposed MIDA Scheme on the Environment D-36 D.7.6 Organization of Kent C.C.'s Planning Department D-37
D.8 Pollution Control on a Major Urban Industrial Estuary: The Thames
D.8.1 Summary D-37 D.8.2 The Thames River Personality D-38 D.8.3 Authorities controlling Pollution in the Thames D-40 D.8.4 History, Functions and Legal Powers of the Authorities -41 D.8.5 Sewage Disposal D-45 D.8.6 Pollution Measurement D-45 D.8.7 Policy for the Next 10 Years D-47
Page

LIST OF FIGURES
Figure Page
D-1 British Mainland Ports D-8
D-2 Clyde Port Authority D-24
D-3 Statutory River Authority Areas and Catchment D-39 Areas Controlling the Thames
LIST OF TABLES
Table page
D-1 Traffic at the Major Ports of Great Britain, 1968 D-5
D-2 Imports and Exports for Great Britain, 1965, 1968, D-6 and 1973

D.1 BACKGROUND AND SUMMARY
British ports are diverse in size, function, organization and ownership.
It is interesting that all important towns are not much further than 60
miles from the sea. Numerous ports (1600 ports reduced to 100 ports or
groups of ports for National Ports Council statistics) have grown in
general to serve a limited hinterland ,except for London , which handles
most foreign trade and a substantial part of the "inland" transport
flow.
The 19th century saw a rapid development of canal and railway systems,
followed by road transport, which expanded considerably each hinterland
and widened the scope for competition among the major ports. The advent
of deep draught vessels is calling for further traffic concentration,
which has resulted in 11 major ports now handling 90% of the cargo
volume.
Furthermore, there is little evidence of a coordinated general port
development plan in the U.K., although the National Port Council (NPC)
has the responsibility for advising the Ministry of Transport, now a
part of the Ministry for the Environment, as to a national port plan.
This lack of concerted action, and the widespread ecological and
environmental concern which has forestalled industry development as well
as reversed pollution in the Thames estuary, tend to make the U.K.
experience more relevant to the United States than its geographical and
trade pattern differences would initially indicate. Some of the high-
lights, noted along on investigations of the literature and our inter-
views with London and Edinburgh officials, follow hereafter:
• As in the U.S., major U.K. ports have an industrial-urban
basis and are managed by a local public body, but some
recent deep water terminals are owned by companies (Port
Talbot, Finnart).
• Since 1966, 20% of the cost of new infrastructure and
superstructures that are deemed of national benefit to
Britain's foreign trade has been granted by the government,
but dredging is carried out by contractors at the port's expense.
D-1

• Interport competition is particularly keen for container
terminals, including deep-sea-to-feeder service. The
recently forecast jump in draft beyond 40', should,
however,result in only 3 or 4 major ports (London, Southampton,
Liverpool, Greenock), assuming that they improve their image
and quality or service.
• Two major terminals for large tankers -- Milford Haven
(200,000 dwt) and Finnart (250,000 dwt) -- are linked
with pipelines to inland refineries. They are being further
developed to accommodate 300,000 dwt and 500,000 dwt vessels.
Milford Haven itself houses three major refineries and
requires substantial dredging while Finnart is a pure trans-
shipment terminal with more than 120 feet of natural depth.
• Waterfront steel plants are being created around ports
capable of handling 100,000-150,000 dwt ships. In the future
Hunterston will accommodate 300,000 dwt ships for cargo trans-
shipment, and will be zoned for a planned major steel plant,
along with Immingham, Teesport and Medway.
• Two major grain terminals were recently developed for
60,000-75,000 dwt vessels. However, much grain is still
trans-shipped from Rotterdam in smaller ships.
• In the U.K. inland waterways play a minor role in inland
transportation.
• The concept of Maritime Industrial Development Areas (MIDA
concept) has raised both concern and hopes in the U.K. but so
far has failed to foster industrial development schemes similar
to those in Fos or Dunkirk, France. The basic reason is the
lack of a national policy in the face of strong environmental
concern and interport competition.
• The procedure for gaining a planning and development permit
is complex but flexible. Therefore, many controls over land
development and any investment greater than $1.2 million
require an act of Parliament.
• In the U.K., environmental concern has begun to be reflected
D-2

to some degree in development planning, as illustrated by
several case descriptions in this report (Clyde, Medway, Thames).
A combination of the "least social cost" (Pr. Weddle) approach
and a "cost/benefit" method (Pr. Preston) is being worked on in
the Universities of Sheffield and London and in Eastern Canada.
• Investment into "amenities" includes the preservation of
old historic towns (Dover), landscaping and effluent control in
refineries and power-plants (Fawley-Southampton), and airport
location in deserted areas (Foulness) rather than close to
cities. Pollution is actually reversing in the tidal Thames
waters as a result of sewage and industrial waste treatment
facilities.
• On the negative side, besides the MIDA controversy, new
coastal refineries are being turned down systematically. A
large-scale expansion of existing refineries will have to fill
the increasing petroleum product deficit. The grounds for
rejection are land, water, air pollution, and road congestion
in urban areas (Glasgow, Southampton) or lack of comprehensive
local-regional planning (Hunters ton).
• In Finnart, Wemyss Bay (Clyde), and Bantry Bay, however,
terminals for the sole purpose of transshipping oil have been
allowed to proceed despite the trauma caused by the "Torrey Canyon"
catastrophic spill. Similarly, a general port and ore trans-
shipment harbor at Hunterston has been accepted, while the
proposed refinery and steel mill have been refused.
• Existing ports should be deepened only under extreme necessity,
and a good "prospective" (to at least 100-110 feet for 500,000
dwt) natural site is ideal. Lack of natural depth is forcing
Milford Haven to deepen at a high cost, in order to keep four
refineries competitive.
• Apart from "diaphragm walling" for quays, U.K. engineers see
little prospect for new techniques to counterbalance their
rising labor and equipment leasing costs. However, improved
collaboration and timing at the design stage, more rugged
D-3

equipment, and an integrated national plan allowing better
equipment depreciation would help.
• Jetties and single point morrin2 buoys seem to be taking the lead
for super tanker berths and slurry piping appears economically.
attractive. Half of the vessels under construction throughout
the world are still less than 20 feet draft and 4000 dwt, and
must be accommodated in some way, with roll-on, roll-off
developing for voyages of less than 3000 miles.
D.2 PORT MANAGEMENT AND FUNDING
D.2.1 Port Management
British ports may be managed by any of the following groups: a local
public utility body (trusts), a state agency (the result of post-war
nationalization of railways), a municipal agency, or a private company.
Private-company ports, with a few exceptions such as Port Talbot,
generally are small. The plan to reorganize the 11 main ports,
representing 90% of Britain's traffic, under the ownership of a National
Port Authority (outlined in a January 1969 Government White Paper) has
been shelved by the present Tory government. As a result of the 1962
Rochdale Committee report, however, the 1964 Harbours Act created an
advisory National Ports Council to formulate and keep under review a
national plan for the development of harbors in Great Britain (exclusive
of Northern Ireland and the Channel Islands), as well as to provide
research, training, statistics, finance and organization assistance.
D.2.2 Sources of Finance
As is mostly the case worldwide, port revenues are not a major source of
finance for large-scale improvements. Government loans and grants, and
open market borrowing (at close to government borrowing rate) are the
main sources. In 1966, a system of government grants (Port Modernization
Grants) was provided for 20% of the cost of any new harbor works and
cargo handling plant and equipment that benefit Britain's national
foreign trade. This amount is much less than has been the case in
most other maritime countries where infrastructure and channel
D-4

maintenance grants are typically greater than 50%. However, recent
decisions (Japan, LeHavre) indicate that in other countries, subsidies
for deep bulk terminals may be reduced to 15-20% on the ground that these
terminals usually directly benefit only a few private companies.
D.3 ECONOMIC ASPECTS
D.3.1 Commodity Traffic and Patterns
Table D-1 summarizes 1968 traffic data (the latest available) at 17
important ports. According to this data one-third of these ports'
trade was coastal and two-thirds foreign.
TABLE D.1
TRAFFIC AT THE MAJOR PORTS OF GREAT BRITAIN, 1968 (Million metric tons) Coastwise Foreign
.Inwards Outwards Imports Exports
Non- Non- Non- Non- Fuels fuels Fuels fuels Fuels fuels Fuels fuels
Total
Total 45.4 5.8 50.8 6.0 104.6 71.0 18.5 23.2 325.2
London 14.5 1.5 3.4 0.5 19.1 13.1 1.0 4.1 57.3
Medway 0.6 0.1 4.3 -- 13.6 1.2 6.7 0.1 26.8
Southampton 1.7 0.1 8.2 0.1 15.8 1.0 0.9 0.5 28.2
Bristol 2.8 -- 0.2 0.2 0.8 3.4 -- 0.2 7.7
Newport 0.3 -- -- -- -- 3.7 -- 0.8 4.8
Cardiff 0.4 -- -- -- 0.5 1.4 -- 0.2 2.5
Port Talbot -- -- -- 0.1 -- 3.3 -- 0.2 3.6
Swansea 0.3 -- 3.4 -- 0.4 0.4 1.7 0.4 6.6
Milford Haven 0.4 -- 6.8 -- 19.0 -- 3.5 -- 29.8
Liverpool 2.7 0.5 1.1 0.4 11.6 8.8 0.2 4.4 29.7
Manchester 2.6 0.3 2.1 0.1 5.5 3.7 0.5 1.2 16.0
Clyde 1.6 0.3 0.4 0.1 5.1 4.5 -- 0.8 12.7
Forth 0.9 0.3 2.2 0.3 0.7 2.3 0.5 0.6 7.9
Tyne 1.2 -- 4.2 -- 0.2 2.0 0.4 0.1 8.2
Tees & 0.4 0.2 2.8 0.6 7.6 4.7 0.8 1.6 18.7 Hartlepools
Hull 1.6 0.1 0.7 -- 0.4 3.6 0.1 1.1 7.6
Immingham 0.6 0.1 2.0 0.1 3.0 2.7 1.6 0.6 10.6
Source: National Ports Council Annual Digest of Port Statistics, Or' - D-5

According to Table D-2, crude petroleum, ores and cereals are the major
bulk commodities imported; two neo-bulk commodities, wood & cork, and
pulp & paper each equal about 6-8 million tons, and coal exports are
expected to pick up from stagnation. Fertilizers, sugar and clay are
in a lower category (2 to 5 million tons per year).
TABLE D-2
IMPORTS AND EXPORTS FOR GREAT BRITAIN, 1965, 1968 and 1973 (Million metric tons)
S.I.T.C. (Rev.)
Imports 1965 1968 1973
Dry cargo
04 Cereals 7.9 7.4 6.3
06 Sugar 2.7 2.5 2.2
28 Ores and scrap 21.3 20.2 26.3
27 Crude fertilizers and crude 4.3 4.4 4.7 minerals
24, 63 Wood, cork and manufactures 7.6 7.4 9.8
25, 64 Pulp, paper and board 5.5 6.1 8.2
Other dry cargo 20.3 23.0 25.3
Total dry cargo 69.6 71.0 82.7
33, 34 Petroleum 83.8 104.6 149.2
Total 153.4 175.6 231.9
Exports
32 Coal, coke and manufactured fuel 4.9 3.7 5.2
276.2 Clay 1.9 2.3 3.6
Other dry cargo 18.1 20.8 24.1
33, 34 Petroleum 10.9 14.9 18.0
Total 35.7 41.7 50.8
Source: J. Morris Gifford, "Port Planning in Britain."
Deep-Sea General Cargo (Figure D-1)
It has been something of a political battle to attempt to rationalize
deep-sea container port facilities. Two major economic forces have been
d-6

in evidence. First, the Minister has allowed the ports of London,
Liverpool, Southampton and Greenock (Glasgow) to develop major deep
sea container facilities, which implies that ship operators will call
there. Second, many smaller ports -- e.g., Felixstowe, Harwich, and
Falmouth -- have set up or propose to set up to service container feeder
services to the Continent so these particular deep-sea vessels will not,
in fact, call at any of the major U.K. container ports. These two
opposing forces prevent the realization of the full economics of
centralized container services. However, the pressures to support the
feeder ports are based on delays, congestion with transport and equip-
ment and labor troubles in the major ports. Hence, this backlash from
centralizing deep-sea container services at four major ports, which is
really a criticism of the planning for infrastructure, transport and
management of U.K. major new docks. Eventually, however, the four major
ports should provide satisfactory service, although there is some doubt
as to Liverpool's future (at the new Seaforth Docks).
Obviously, major container ports are selected in conjunction with the
ship operators who analyze their optimum port calling pattern as part
of their least cost through transport system.
Oil and Petroleum Products (Figure D-1)
Crude oil and petroleum products are the largest category of bulk
commodities arriving in the U.K. Vessels discharge their cargoes at
several major areas.
• The Thames Estuary, which has received half loaded 210,000 dwt
Shell tankers, services Shell and BP refineries.
• Southampton serves Esso's Fawley refinery and can handle
medium-sized vessels fully loaded (120,000 dwt, 49 ft
draft available).
• Milford Haven (S. Wales) can accommodate the large vessels
fully laden up to 200,000 dwt. BP and Texaco have refineries
there; Gulf Oil refinery is higher up in the estuary, capable
of only 120,000 dwt. Development for 300,000 dwt is being
considered for the future. D-7

Tankers<240,000 Dwt
Bulk Carriers <40,000 Dwt In Construction
© Deep Sea Container
0 Small Container Port
A RO/RO Port
ED Bulk Handling
(Small Tankers 22') Tankers Dundee
100' 326,000 Dwt e
Plan for 500,000 Dwt
Greenock
(Hunterston)
NORTH SEA
Hull A R 0/RO, Short Sea Containers
Immiiigham
Liverpool (Deep Sea)
°Manchester (Deep Sea)
Eastham Tankers <28'
(Shell)
Preston
RO/RO RO/RO ankers <200,000 Dwt
50' Depth
IRISH SEA
Tankers <250,000 Dwt
66'
Milford Haven
rt Talbot
Iron Ore CardiffRQ/R
Carriers 150,000 Dwt 59'
R0/130 and Deep Sea Containers
Thameshaven 200,000 Dwt Tankers
over RO/RO
Felixstowe
Harwic
RWRO
Southampton (Deep Sea)
Tilbury (Deep Sea
Newport RO/RO
Bristol RO/RO
Fawley
250,000 Dwt 49' Depth
ENGLISH CHANNEL
Graiigetnouth
Teeside r).\ Depth 33' Draft for Tankers
Tyneside 7\ RO/RO Services on N. Sea
FIGURE D - 1 BRITISH MAINLAND PORTS

• Shell's Stanlow refinery (near Liverpool) can accommodate
only medium vessels, or partly loaded larger vessels.
• Tees is being deepened by 10-12 feet to the new Red car ore
terminal for large ore carriers.
o Tyneside can handle only medium-size vessels (33 ft maximum
draft).
• Finnart (Clyde) which handles 250,000 dwt and is linked by
pipeline to a BP refinery at the smaller port of Grangemouth.
Crude arrives in the U.K. in three ways:
1. Supertankers are lightened of perhaps half their load out to
sea so that the lightened vessel can enter, say, the Thames
Estuary. Shell uses this method.
2. Supertankers arrive at Bantry Bay for transshipment to
Milford Haven via 80,000-100,000 dwt tankers.
3. Large tankers discharge at Milford Haven and Finnart
directly, or medium vessels at Fawley, Grangemouth, Stanlow,
etc.
Really deep water exists off the West Coast of Scotland (e.g., the Clyde
Estuary) and new refineries will undoubtedly be developed in this area.
It is also an area of outstanding amenity value and will be discussed
in Section D later.
Refined product is shipped in and out of the U.K. Supertankers are not
usually engaged in this trade as most shipments are to Europe or purely
U.K. coastal. This trade is not expected to grow more than 3% per
annum and will still center on 'handy size' vessels (10,000 to 60,000
dwt but, mostly 17,000 to 35,000 dwt).
The growth of crude oil imports is liable to change for various reasons,
not the least of which is the development of the oil strikes in the North
Sea. Scottish refinery development may well be affected by this factor.
Further influence on crude oil movement will come from the development
of pipelines. It has already been suggested that it is cheaper to
D-9

discharge supertankers in Milford Haven and pump the crude to the
London Thameside area than to dredge and develop the Thames Estuary.
Thus, future U.K. refineries may not be deep water based.
Dry Bulk
The British Steel Corporation (BSC) has several new sites for steel
making under review. Port Talbot (in S. Wales) can now receive 120,000
dwt bulk carriers and a few other main ports are likely to be developed
to supply nearby steel plants around the coast of the U.K. -- Teesport,
Immingham (on the East Coast) and perhaps the Medway Estuary (in Kent).
Only Hunterston (Clyde) has been considered so far for 300,000 dwt.
Grain and sugar are less significant bulk cargoes; both have been expe-
riencing a declining trend. They will probably be centered on Liverpool
and London, both of which have new grain terminals to enable 50,000-
60,000 dwt carriers into Tilbury-London and 75,000 dwt into Liverpool.
Much of the London grain may continue to be transshipped from Rotterdam.
Bauxite is handled through the private facilities of the aluminum
companies directly associated with the smelters; at Invergordon, Scotland,
for example, bulkers up to 40,000 dwt will soon be handled. (A refinery
there may soon be able to handle 250,000 dwt tankers.)
Short-Sea Services
There is a proliferation of ports all round the U.K. offering passenger
car and RO-RO cargo services to Europe. Unitization and RO-RO services
have proved successful if the past growth rate is any indication.
The largest single operator is British Rail. RO-RO is proving very
popular with exporters since delays are really minimized. In fact some
of the routes enable such rapid transport to be made that air cargo
between, for example, London-Paris, London-Frankfurt, etc. has been
affected. Highway networks linking ports with their inland areas allow
fast transit times in express trucks.
D-10

Some of the main ports in this short-sea trade are: Leith, Tynemouth,
Hull, Immingham, Felixstowe, Harwich, Dover, Folkestone, Newhaven,
Southampton, Bristol, Newport, Cardiff, Swansea, Holyhead, Preston,
and Stranraer.
D.3.2 Inland Transport
There are no comprehensive data on the means of transport used by port
cargo to and from points inland. However, 80-90% of non-bulk traffic
probably moves by road. The introduction of freightliner trains is
expected to stop or even reverse the decline of the railroad share.
Inland waterways will continue to play a very minor transport role,
contrary to what occurs in Northwest Europe.
Iron ore and bauxite are generally used by waterfront plants. A third
(28 million tons) of the imported crude moved inland by pipeline was from
Milford Haven and Finnart in 1968.
D.3.3 Industrialization
Ports have played a major role in U.K. industrialization. Although
there has been a lack of national coordination in port development,
their importance has been recognized in the recent Maritime Industrial
Development Areas (MIDA) concept. (See Section D.7.) However, MIDA has
not yet resulted in any major undertakings.
D.3.4 Port Planning Methods
Each main port in Britain has come into being through an act of
Parliament, primarily because the coastline below high water is owned
or controlled by the "Crown Estate Commissioners." In each port, major
developments (those costing over $1.2 million) require a further act
of Parliament to enable the development to proceed. Thus, each major
port in the U.K. has several Parliamentary acts associated with its
past and present development.
The planning procedures for a particular development are quite complex
D-11

and will vary with the nature of the development. Let us look at two
alternative possibilities:
Development within a port boundary
Each port authority owns a certain quantity of land that is associated
with its port and possibly within a large area under port control, but
directly outside existing dock facilities. The Clyde Port Authorities,
for example, control the shoreline development of scores of miles of the
Clyde Estuary. If a development is to take place entirely on land or
water owned within the dock perimeter, the local planning authority (town
or county authority) has no direct control over that development. If
the development is large enough to require an act of Parliament,
objectors can petition against the bill and a public inquiry will be
held. Such objections might come from local authorities or residents,
on amenity or environmental grounds. The conditions of other authorities
such as:
- Crown Estate Commissioners
- Board of Trade
- The relevant estuary authority
- The relevant river authority
- The Water Resources Board,
must all be satisfied with regard to standards of effluent, air pollution,
navigational hazards, etc.
An example of the outcome of such an inquiry was the direction from the
Government inspector to the British Steel Corporation to prevent iron
ore dust being blown from a new unloading facility at Bristol Deeps,
across the Bristol Channel to the resort town of Weston-Super-Mare.
New types of hoppers and handling equipment had to be designed.
Development of a port facility which overlaps with other authorities
Proposed development of a new docks facility outside of an existing port
boundary will necessitate permission from the local city and county
authorities and Parliament and the Minister (for the Department of the
Environment). This is a more complex process than the former example.
D -12

Briefly, the procedures would be as follows:
a. A general outline of the proposed development is submitted to
the local county council planning authority, which has powers
under the Town and Country Planning Act of 1947 to authorize the
development. If it is a small scheme the local authority may
handle the whole matter. If it is a large scheme -- e.g., a
greenfield site development for a berthing facility, a steel
works, or a petrochemical complex to be associated with the berth --
regional development department probably will be involved; also
the Minister, as well as the port authority. Such a scheme, if
over $1.2 million, will also require the blessing of the NPC.
There will be mutual agreement between the authorities and the
Minister that a public enquiry should be held to consider the
generalized scheme. Recent examples of such enquiries are:
- The Roskill Commission on the siting of London's third airport,
- The Hunterston development, and
- New power station sites, which, whether coastal or not,
almost invariably result in a major enquiry.
If local authorities try to reject such an enquiry (e.g., because
it takes a long time), the Minister has powers to order such a
procedure. His representative at the enquiry is a Government
inspector.
b. A Court of Enquiry will be held, with the developers presenting
their case to the authorities. Both sides produce expert witnesses
on economic, industrial, technical and environmental factors.
At this stage, the inspector may drop the whole development (if
objectors, for example, can show that a better alternative site
exists), the scheme may be modified, or permission to go to
the next planning stage may be granted. Let us assume the last.
c. The scheme is now drawn up in more detail and planning permission
may well be sought from the Minister to accept the scheme in
principle. For example, by presenting the Port Authorities Bill
in Parliament. If he gives this acceptance, conditions from all
the local interests must now be met by the developers.
D-13

d. A further public enquiry to consider all the details must now be held.
At this enquiry all the authorities, with overlapping interests,
will ensure that their various conditions are met. Members of the
public -- e.g., those whose property may be affected -- can also have
their say.
e. When all the details are worked out, the Minister will finally
approve or disapprove the plans. He has the powers to reverse the
Court's decision, "in the national interest," if he so desires.
The final decision is thus basically a political one.
There are many variations on these basic planning procedural steps. But,
the public generally have two enquiries at which to be heard -- the
general one and the detailed one -- and the Minister makes the final
decision.
Professor Weddle (see Section D.4.1) describes the British procedures
as flexible, overlapping and highly effective compared to other
countries. He believes the U.K. has probably the best controls on land
development and utilization of any country (not necessarily the strictest).
He believes that being flexible is the key to success, because it allows
all interested authorities to work out the best solution for any particular
scheme and to amend legislation on planning control in a continuous,
dynamic way. Planning for the environmental factors in a formal way is
relatively new, but is rapidly becoming an accepted and necessary part
of port and industrial planning. (See Section D.4.)
Planning For Works Above High Water Mark
Most planning permission above high water and outside the port authority
boundary is now granted or amended by county council planning authori-
ties who have such powers under the Town and Country Planning Acts of
1947. This process involves the correct advertisement of the scheme,
the making of objections, and, perhaps a public enquiry. By tradition,
adjacent planning authorities have no voice at these enquiries. If a
port development requires planning permission by the county authority
D-14

for access roads, pipelines and services, these elements will be subject
to the usual procedure once they cross the port perimeter. This is, of
course, usually the case.
Planning For Works Below High Water
The Coastal Protection Act of 1937, Section 34, is concerned with any
works round the coast of the British Isles which could obstruct the
rights to navigation. A department of the Board of Trade (B.O.T.) is
responsible for administering the Act. The department acts as the
planning authority and even though, for example, a port scheme Bill has
passed through Parliament successfully, work cannot commence below High
Water Mark without B.O.T. approval.
Land reclamation, below high water mark needs B.O.T. approval and control,
until the retaining wall is built. Dredging operations, and also the
disposal plans of the liftings, need B.O.T. approval. The construction
of cables and/or bridges over channels and estuaries needs approval. The
construction of underwater outflows or intakes for power stations,
industry ports, etc., needs B.O.T. approval. The B.O.T. will take
advice, where necessary, from the Crown Estate Commissioners on any
ownership problems. Its jurisdiction now extends to the U.K.-controlled
part of the Continental Shelf in the North Sea where oil and gas explora-
tion is undertaken. The U.K. Chamber of Shipping will inform U.K.
shipping interests of any schemes to obtain objections, if any. All
schemes must be advertised in Lloyds List and the local newspapers.
Effluent, pollution or environmental problems associated with any such
projects come under the control of the appropriate Estuary authority,
Ministry of Agriculture, Fisheries and Food (M.A.F.F.) and the particular
port authorities themselves. They will lay down the limits on various
kinds of effluent discharge.
Control of discharges or effluent into the sea (as opposed to rivers or
estuaries) is more by voluntary cooperation with industry, etc. than
D-15

by statute, although the MAFF does monitor water for radioactivity
on a regular basis. There is, at present, discussion about whether
discharge into the sea should be controlled by statute. The whole state
of environmental pollution and control in the U.K. is detailed in the
Royal Commission report, published in February 1971.
D.4 ENVIRONMENTAL PLANNING AND PROBLEMS
D.4.1 Planning Methodology
Professor Weddle, an architect, and head of the department
of landscape architecture at the University of Sheffield and a
recognized authority on environment and land use, has used systematic
(rather than truly analytical) approaches to environmental planning
(EP). He has attempted to list all the main factors relating to the
environment of a project, e.g.:
- scenic effect of project
- effect on the surrounding land
- noise effects
- air pollution
- employment changes
- effluent generation
- climate
Then attempts are made to rank these factors for the project alternatives
that exist, e.g., differing locations, and differing chimney heights.
The alternative which gives the lowest social disruption is deemed to
be the best. This alternative he calls "Least Social Cost Analysis."
This approach is well documented in the Metra/Weddle Report for the
Hunterston scheme. Such an approach is perhaps the most simple one.
Another approach is the cost/benefit method (as illustrated by the
Roskill Commission). The methodology of this approach is given in the
NPC report on the MIDA concept by Peston and Rees. The problems of the
method relate to the difficulties of attaching realistic and meaningful
costs to all factors. Professor Weddle believes there is much merit in
attaching monetary values whenever reasonable, but that frequently this
D-16

is impossible. Consequently, a mixed approach between 'Least Social
Cost' and 'Cost/Benefit' is perhaps the most realistic.
A further step called "continuum listing," is to develop 'linked' lists
of all the environmental factors. This means that the linkages show
logical dependencies between the factors.
The next step, now under development, is to be able to mathematically
express these linkages and factors in two and even three dimensions,
i.e., to develop analytical modelling techniques to be able to evaluate
the wide range of alternatives associated with any project.
In the U.K., Sheffield and London Universities provide formal courses
on these topics. Such courses are increasing the awareness of the
relationships between human and habitat factors.
D.4.2 Examples of Environmental Planning
a) Professor Weddle has written part of the Metra/Weddle report on
Hunterston. This report provides a good case example of the method
used and the part played by environmentalists in decision making,
and is discussed in section D.5.
b) Some county planning authorities now have an environmental planning
department. Indeed, considerable efforts in environmental planning
have gone into the Medway MIDA Scheme in Kent; for example, landscape
and agricultural experts were employed to help identify the areas
of the countryside which should be preserved or developments which
should be controlled to a very high amenity standard. Areas of
the land and coast are to be set aside for leisure pursuits only.
(See section D.6.)
c) Over the past 10 years, the Thames estuary pollution has been reversed.
(See section D.7).
d) Development plans for Dover (a very busy cross-Channel port) are
costing much extra money to by-pass the historic town with a
complex road system. The benefit to tourism is seen as one method
of justifying the cost of preserving the town.
D-17

e) Southampton docks and Hampshire County Council planners have been
concerned with the Fawley refinery developments. Southampton is
essentially zoned on each side of the water; the east side is
residential and recreational, while the west side is industrial.
It contains the Fawley refinery, still expanding onto 500 acres of
reclaimed land, and two large power stations. Elaborate precautions
have been taken to design smokestacks that will eliminate local
fallout from the smoke. Noise and vibration levels are also
being monitored and equipment is to be designed to within a noise
standard. Esso must pay $2.4 million extra to landscape refinery
extensions before planning permission will be granted, and the
proposed Chevron/Caltex refinery has been turned down, mainly
because:
- Congestion on Southampton water would result;
- Too high a concentration of air pollution would result;
- Not enough industrially zoned land available;
- Local road congestion could occur.
0 London's third airport, after two extensive public enquiries and a
Royal Commission under Roskill, which suggested an inland site near
London, is now likely to be placed in a near deserted area of the
coast, by decision of the Minister. Such a change is likely to
cost an extra $300 million, but such is the cost of preserving
amenity and the inhabited environment!
g) Almost every power station is now designed (external appearance and
siting) by eminent landscape architects. The Central Electricity
Generating Board (CEBG) has had an environmental planning unit
since 1960. The CEGB is deeply involved, from the preliminary
design studies onwards, with all new power stations and transmission
lines. The previous head of this organization has just joined the
B.S.C. to start up a similar unit for steel mill design.
h) The brick, sand and gravel industries have studied land economy and
amenity rather well. They leased the excavated holes in the ground
to the CEGB who filled the holes with ash and now some of the areas
are being turned into golf courses and recreational areas: three
incomes from one area of land.
D-18

i) Finally, the Ministry of Transport uses an advisory committee to
study the routing and plan the landscaping of all major new roads.
Again, such a committee is an integral part of the design and
planning process.
It is evident that more and more developers and planners are seriously
considering amenity planning as part of the design process and are, in
fact saving time in the overall planning process by correctly planning
for environmental factors at an early stage. This is saving much re-
planning as a result of public enquiries and pressures from the local
communities.
D.5 ENGINEERING CONSIDERATIONS
D.5.1 General
A fundamental difference to some London consulting engineers between
European ports and American ports is in the use of quayside cranes. The
European ports believe in their extensive use, while U.S. ports do not
to the same extent.
A fundamental question is why deepen ports. The only valid reason is to
accommodate very large bulk carriers. They believe it is then generally
economically sound to send these large vessels to available new deep
water, rather than deepen a lot of existing ports.
General cargo vessels can navigate into existing ports without extensive
deepening programs. Many bulk carriers will not need extensive port
facilities. With new jetty techniques and single-buoy moorings (SBM),
large carriers need only very rudimentary berths, so port should not be
deepened except under extreme necessity.
In the U.K., Hunterston is a good example of this philosophy.
D.5.2 General Cargo Quays
The construction system known as diaphragm walling is not new to civil
D-19

engineering, but relatively new to port construction. Such a system
allows concrete reinforced panels to be constructed in the ground
without having to put in temporary works to keep the ground open, i.e.,
no strutting, no sharing, etc. The whole of the structure is built
from the surface and made stable before the excavation is carried out.
The sides of the trench are held open by a thixotropic material, bentonite
mud. The advantage (and cost saving) of this system is the great reduction
in temporary works that would otherwise be required. Such a method of
construction has been applied to build the new Seaforth docks at
Liverpool, with a saving of some 40% on the civil construction. It is
also the proposed construction method for the Bristol West Dock 2
scheme. Apart from this technique, no major economies of construction
are in view for the U.K. and a period of rising costs is expected from
now on. However, NPC just received a report by Bertlin & Partn.
recommending a closer look at some Continental practices. NPC has
another study to evaluate by computer the relative merits of the
various known methods of port construction, but the Contractor -- Rendel,
Palmer and Tritton -- expects few differences to show up.
In port work, for example, precast concrete structures never achieve the
theoretical savings potential, basically because the throughput of
units is never large or fast enough to recover the double overheads
involved. The concrete plant has overheads, so does the site construction
company. To obtain a return on precast concrete structures requires a
doubling or tripling of the construction rate.
The same contractor sees a trend for the U.K.'s berths to be tidal rather
than locked, but these berths will still depend on tides and weather
elements. The contractor recommends that
the civil engineering constructors should work more closely
with the design engineers and the consultants, because the
constructors can contribute a fund of knowledge about the
practice of construction and thus help to make more economic
designs. Moreover, he believes that in the U.K., too much
emphasis is placed on sophisticated design of port
D-20

structures, whereas, for example, the U.S. takes a more rugged
approach, which may be the trend in the '70s for the U.K. This
change will mean that labor -- a critical cost element -- can be
used more effectively on-site.
Most important of all, as the contractor sees it, is to develop a
cohesive plan for port development so contractors will see a work
program ahead of them for years to come, and hence will be prepared to
invest in the large machines needed to obtain the productivity benefits
of a more mechanized approach. The U.K. approach at the present is to
tackle each project separately. An integrated plan will have a much
greater effect on port construction economics than the development of
fancy designs.
D.5.3 Special Berths
There is much need in the U.K. to develop deep water berths for vessels
of 250,000 dwt and up. The U.K., in particular, has to cope with large
tides and rough weather conditions; thus their quay and jetty construction
necessarily have to withstand higher stresses, etc., than, say, the
equivalent structure in Scandinavia. Complex port facilities are not
likely to be required for large bulk carriers of the future. Rather,
jetties and single buoy moorings (SBM) will set the pattern for the
future.
One comment was that much more attention should be paid to overall
project economics, especially the timing of the job. It is now generally
the cheapest or, at times, the quickest that wins a tender. For example,
the special berth situation at Hunterston should be phased as a project
into the BSC plans, the run-down at Glasgow City Docks, the local
housing and employment program, etc., so that it is not necessarily the
shortest construction time that is the most economic.
D.5.4 Technical Trends
According to a leading port engineering contractor, three types of vessels
D-21

will require different technical solutions:
(1) Vessels with a draft of 20 feet or less. A recent survey suggests
that 50% of all vessels under construction are still less than 4,000
dwt and less than 20 feet draft.
(2) Container ships. Although some recently built have a draft of
35-42 feet, many people feel these ships will continue to have a
draft not substantially greater than 32 feet.
(3) The large (greater than 100,000 dwt) bulk cargo vessel.
The technical developments, which are already under way, are really as
follows:
For the small vessels, the prime development still going on is for roll-
on roll-off berths for short and medium sea routes, a prime choice for
voyages of less than 2,000-3,000 miles.
The celular ship comes into its own economically on voyages greater
than 3,000 miles and we have already seen the kinds of container berths
being built for these vessels. This area is probably the most fully
advanced of the new port techniques to be developed and has been
discussed in Section D.3.2.
For the bulk vessels, a considerable expansion of the SBM techniques
is expected to fields other than oil, e.g., slurries for iron ore.
Such a system, of course, requires considerably less capital layout than
do conventional docks.
It was noted that ports, if they are to be deepened, should not make
the great blunder that Southampton did in incurring dredging costs of
$432,000 a year just to receive one vessel (the old Queen Elizabeth)
to go in and out of the docks. Thus, if American ports are to be
deepened by dredging, the economics should be carefully weighed against
the number of vessels calling at the port.
D-22

D.6 THE CLYDE ESTUARY
D.6.1 Introduction
This section presents a brief case study of the history, development and
present activity of the River Clyde. This river is a particularly
interesting area to look at from the point of view of environmental
planning because industrial development -- in terms of oil refineries --
has recently been turned down on the grounds of amenity value. The
significance of this decision, the way in which it was reached, and
its implications are described within the general context of the
history and geographical location of the Clyde.
D.6.2 Brief History of the Clyde Port Authority
The 106-mile long Clyde, with the greatest commercial estuaries in
Scotland, is both the principal river of Scotland and one of the most
important industrial rivers in the world. Formed by the junction of
Daer and Portrail Water, the Clyde flows through the city and port of
Glasgow to the Firth of Clyde (Figure D-2). During its course, it
passes through some particularly picturesque areas.
Some 250 years ago, to take advantage of trade with the colonies, the
Clyde River was first dredged and bigger ships started coming up to the
city of Glasgow. In 1858, the Clyde Navigation Trust took over manage-
ment of the city ports from the city administration, and operated for
more than 100 years as the major port authority. It was a successful
body, attracting much support, but with a 42-member board it was
somewhat unmanageable.
At the other end of the river Clyde, a smaller administrative body,
the Greenock Harbour Trust, operated in a similar way for roughly the
same length of time. There also existed in the earlier days the Clyde
Lighthouse Trust, a lighting/conservancy authority. Several attempts
were made to merge the three trusts, but all were unsuccessful.
During the war, the river's excellent strategic position brought a boom
D-23

Inveraray
Torbert Glasgow
•
Paisley WEMYSS BAY
Skipnesst Fairlie
"HERN lIT Hunterston
Brodick
Corrygills Point SOUTHERN LIMIT
Adrochar
Rowardennan
Balmana
Lochgilphead
Balloch
Ardmadam
Eastern Limit Dumbarton
owling
Dalmuir Longhaugh Point
—Clydebank
AkScotstoun
Greenock
Inverkip
Renfre
Largs
Ardrossan
IS. OF ARRAN
Irvine
FIGURE D-2 CLYDE PORT AUTHORITY
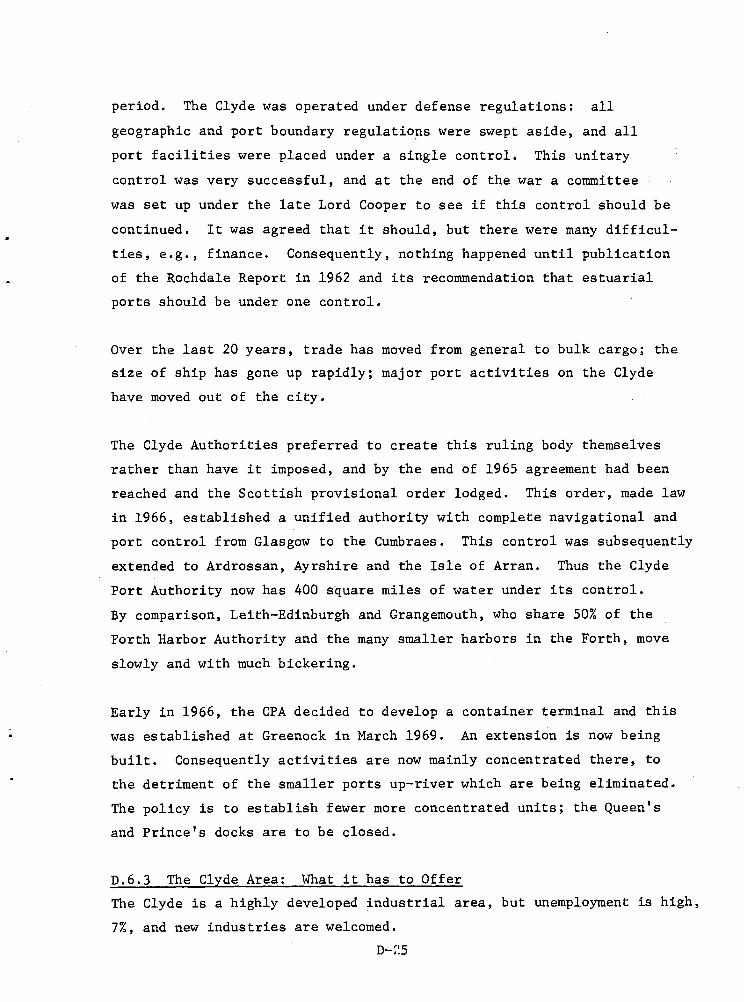
period. The Clyde was operated under defense regulations: all
geographic and port boundary regulations were swept aside, and all
port facilities were placed under a single control. This unitary
control was very successful, and at the end of the war a committee
was set up under the late Lord Cooper to see if this control should be
continued. It was agreed that it should, but there were many difficul-
ties, e.g., finance. Consequently, nothing happened until publication
of the Rochdale Report in 1962 and its recommendation that estuarial
ports should be under one control.
Over the last 20 years, trade has moved from general to bulk cargo; the
size of ship has gone up rapidly; major port activities on the Clyde
have moved out of the city.
The Clyde Authorities preferred to create this ruling body themselves
rather than have it imposed, and by the end of 1965 agreement had been
reached and the Scottish provisional order lodged. This order, made law
in 1966, established a unified authority with complete navigational and
port control from Glasgow to the Cumbraes. This control was subsequently
extended to Ardrossan, Ayrshire and the Isle of Arran. Thus the Clyde
Port Authority now has 400 square miles of water under its control.
By comparison, Leith-Edinburgh and Grangemouth, who share 50% of the
Forth Harbor Authority and the many smaller harbors in the Forth, move
slowly and with much bickering.
Early in 1966, the CPA decided to develop a container terminal and this
was established at Greenock in March 1969. An extension is now being
built. Consequently activities are now mainly concentrated there, to
the detriment of the smaller ports up-river which are being eliminated.
The policy is to establish fewer more concentrated units; the Queen's
and Prince's docks are to be closed.
D.6.3 The Clyde Area: What it has to Offer
The Clyde is a highly developed industrial area, but unemployment is high,
7%, and new industries are welcomed.
D-25

The Clyde estuary's natural deep water -- 80/90 ft -- makes it suited
for those industries which depend on commodities imported in bulk, where
large ships are being utilized increasingly. Among the possible
industries, as reported in the study by Metra Industrial Consultants,
are those that import petroleum, iron ore, grain, bauxite and alumina,
phosphate rock, sugar and forest products.
In view of the trend to inland oil refineries, the Clyde would seem
ideal because of its deep water. British Petroleum (BP) has already
recognized the possibilities of this area. Its oil terminal at Finnart
takes 250,000 dwt tankers with no dredging and could take bigger ones
very quickly. In 1970, 20 tankers of over 200,000 dwt came into the
Clyde fully laden, drawing about 68 feet, with 49 ft of water below.
Ten completely discharged at Finnart into the pipeline leading to the
oil refinery at Grangemouth; the others were lightened so they could
go on.
However, there are three basic drawbacks to developing industry in the
Clyde:
(1) There is little flat land near the deep water.
(2) The Clyde is badly located geographically, relative to industrial markets.
(3) It is scenically a very beautiful area.
The Clyde is not a very likely potential MIDA area, because the specifica-
tions for such an area are 5,000 acres of flat land with 60 ft of high
water. The best possibility, Hunterston (Figure D-1), has only 1,500
acres of flat land and another 1,000 acres that are directly reclaimable.
Furthermore, although the beach suddenly shelves down to give very deep
water, the beach is covered for quite a distance at high tide.
Though the CPA sees great possibilities for developing the Clyde as a
transshipment port, this idea is probably realistic at the moment only
for the iron ore terminal for which the British Steel Corporation has
been granted planning permission at Hunterston. Metra looked at the
D-26

Clyde as a transshipment port for grain, petroleum, and iron ore, but
considered only the latter to be a serious possibility.
The CPA is sold on the Oceanspan concept: the Atlantic and general bulk
trade could come into the Clyde for transshipment or onward passage
across to the Furth. An ideal situation for industrial belt development,
the CPA is investigating this further. It believes the concept has
great possibilities if the U.K. joins the EEC; and in any event conges-
tion in the Channel dictates that new ways of distributing traffic be
evolved. However, planning permission has been turned down recently at
Hunterston because of the environmental quality of the area, which the
Secretary of State for Scotland describes as "itself a valuable economic
resource," and Professor Weddle considers the area of outstanding landscape
value. Last year, the Murco oil group's proposal for a refinery on
Clydeside was rejected, the risk of pollution to the city being considered
too great. In May this year the Chevron oil group was refused permission
to build a $120 million 100,000-barrel-per-day refinery at Hunterston
even though this refinery would have benefited Britain's balance of
payments by $24 million a year.
It is interesting that conservationist interests in this area have
outweighed the Government's support for increasing the U.K.'s refining
capacity. The Government's strategy may then be to allow the limited
land at Hunterston to be developed as a fully integrated steel works,
alongside the ore terminal.
D.6.4 The Clyde Estuary Development Group
In 1967, the CPA saw tremendous potential as regards the deep-water, but
had no direct contact with the land authorities. To overcome this
problem, the CPA initiated formation of the Clyde Estuary Development
Group with membership as follows:
D-27

- Clyde Port Authority
- County Councils
Argyll Ayr Bute Dunbarton Renfrew
- Town Councils
Dunbarton Greenock Port Glasgow
- Scottish Development Department
The group soon commissioned a study report by METRA on economic and
technical aspects and by Professor Weddle on environmental aspects of
the development.
The projects to be considered were:
a. A marine terminal for iron ore with an associated iron ore stocking
area and rail terminal at Hunterston.
b. An integrated steel works for the British Steel Corporation capable
of producing 10 million tons/year.
c. A marine oil terminal and an associated oil refinery and railway
link for Chevron (U.K.) Ltd. with a throughput starting at 100,000
bbl/day of crude oil rising eventually to 200,000 bbl/day.
d. An oil terminal at Wemyss Bay with a pipeline to Longaugh Point
inside the Clyde for MURCO.
e. A general use deep-water port with bulk discharging and trans-
shipment facilities.
In some instances, the conclusions drawn on the basis of environmental
considerations were at odds with those based on technology and
economics.
• Both METRA and Weddle agree on the siting of terminals in Wemyss
Bay and Hunterston Point (150').
• METRA proposes Inverkip for the power station implantation,
which is opposed by Weddle because of the scenic coast.
D-28

Professor Weddle recommends instead the Irvine area or the
Dundonald area which are both deemed too costly by METRA.
The power station is now under construction at Inverkip by the
National Electric Authority.
• MURCO had proposed a refinery in Longhaugh, somewhat higher
on the Clyde, linked by pipeline to the Wemyss Bay terminal.
It was approved by both experts, although they opposed the
site of Longhaugh for a power station. However, the MURCO
refinery has been opposed on other grounds by the local
population and will not be built.
• Another refinery proposed by Chevron at Hunterston Point (the
deep water terminal) was supported by METRA but opposed strongly
by Weddle, who preferred an inland site for the refinery,
mostly on visual intrusion reasons. The project has been
postponed.
• Finally, steel works have been proposed by British Steel
Corporation at Hunterston. METRA is supporting the site.
Professor Weddle agrees that the site is acceptable, especially
if the steel works are limited to blast furnaces rather than
an integrated steel plant, and certainly better than the
alternative site considered at Ardmore.
D.6.5 The Public Inquiry
The County Councils (33 in Scotland) are usually the planning authorities.
(In the Clyde's case, the CPA was the link through the counties.) A
developer applies to the appropriate County Council for planning permission.
The Town and County Planning Act of 1947 has enabled the authorities to
zone areas for development. Where Councils are not the planning authority,
an application has to be made to the Secretary of State for an alteration
to the planning authority if it is in the public interest to do so.
The proposals are then announced and there are, by statute, 42 days to
state an intention to object. In this case the main objectors were
from West Kilbride, a high amenity area, and a public inquiry was held.
The following objections were presented:
D-29

• absence of regional planning;
• damage to amenity;
• loss to agriculture;
• impairment of recreational facilities;
• damage to the tourist industry in N. Ayrshire;
• pollution to atmosphere, sea, beach, soil; and
• safety hazards from a nuclear power station.
Testimonies were written by:
• British Steel Corporation, Chevron, and Murco;
• Consultants and officials; and
• Private citizens.
Finally, there is the statement of findings of facts and a final statement
by Commissioner Keith. The Secretary of State's "intentions" for
Hunterston port are: a go-ahead for all terminal and general users of
the port, approval of the zoning for an all-terminal and stocking yard,
general user port and future industrial use. The postponement (pending
consideration of further evidence) on the zoning of land for an oil
refinery, and the leaving open of a way for steel works. Note that this
action was taken in December 1970 on a development plan amendment
submitted by Ayre County Council in June, 1969 with public hearings held
between December 1969 and February 1970.
One of the CPA's main complaints is that the Secretary of State allows
only 42 days in which to state the intention to object, while the next
step may be delayed as much as two years. A government inspector
represented the Secretary of State to get the facts and draw the conclu-
sions. However, the Secretary is under no obligation to accept them.
In this case, the Inspector recommended that the land be zoned for the
proposed iron ore terminal, associated stocking yards and rail terminal,
but not the integrated steelworks. A general user port will be provided
for in the Development Plan amendment, and the land zoned for steel in
the amendment will be so zoned, but without commitment as to the type of
industry for which it may be used. He subsequently refused permission
for the Murco oil terminal and the Chevron oil refinery. D-30

The result is that the whole of the Hunterston area has been rezoned
for industry, but the Secretary can reserve the right to decide what
industry can go there. Most importantly, the area is available if the
BSC chose to apply for planning permission for a steelworks.
The CPA feels badly about turning down the oil refineries; it has tried
to pursue a rational development, and has succeeded in obtaining potential
developers, but Government policy has frustrated these efforts. The CPA
feels it is radically wrong to take 2-3 years to come to a negative
decision, because so much time and money are involved. Murco, for
example, spent $1.2 million presenting its case. Public Authorities
should define basic environmental criteria as soon as possible so that
both the public and the promoter would have a common ground for prior,
non-emotional discussions.
D.6.6 Future Plans
The CPA is preparing a 10-year plan to safeguard the investment in the
large granary at Meadowside. This granary has 176,000 tons of storage
space but it is too far up-river (limited to 27,000 dwt) for bulk
carriers. The grain comes mostly in ships of 15,000-20,000 dwt at the
moment, usually direct from Canada or America. There is a depth limita-
tion of 31 feet coming up the river.
Another consideration is iron ore, of which 3 million tons p.a. comes
into Glasgow's general terminal quay, 15 miles from the steelworks. This
arrangement is good, but it is limited to 28,000 dwt ships, and Australian
iron ore requires large vessels, as anticipated by the report of the
Benson Committee in 1965. Large carriers of either 250,000 dwt or
350,000 dwt are anticipated eventually at Hunterston for transshipment.
The Chevron project would have seriously inhibited a coastal steelworks
development. The CPA feels steel could orientate industry around the
Clyde; 350,000 tonners would be possible. Transshipment could be
developed to distribute the steel to other U.K. steel plants, or even
for distribution of ore to the Common Market countries.
D-31

To coordinate planning in the West of Scotland and to identify in
advance areas which should be developed for industry, the West Central
Planning Group has been formed. Its members comprise the Chamber of
Commerce in Glasgow, the CPA and the local authorities, all of whom
will make an annual contribution for the next 5 years. The Scottish
Development Department has allocated staff to work for this group, and
is advertising for a director to lead the team.
It is ironic that the port with practically the deepest available water
in Europe, should also be one of the most beautiful areas of the country,
and hence inhibits industrial developments.
D.7 ENVIRONMENTAL PLANNING IN THE MEDWAY ESTUARY
D.7.1 Summary
In the Medway estuary, the situation is somewhat different than that of
the Clyde, though in both areas, environmental planning has been an
important consideration in plans for future development. The Medway
is a proposed MIDA and the Kent County Council (Kent C.C.) is extremely
anxious that it be selected. To this end, the Council commissioned a
report in 1970 by the Economist Intelligence Unit to assess "The Poten-
tial of the Medway Estuary as a Maritime Industrial Development Area."
They are now getting a cross-section of opinion from all parties
concerned, and if the Medway site is selected by the Government, a local
public enquiry would probably ensue.
It will probably be at least another year before the Government makes any
decision on a MIDA. The Kent C.C., however, is well prepared and using
the EIU's Discussion Document as a basis, is consulting with interested
authorities, the public and other bodies. All the factors to be considered
have been well laid out in this document, the amenity, conservation and
recreation factors having been well covered. If the MIDA goes ahead
in this area, these elements are likely to suffer; however, the Kent C.C.
is making all efforts to lessen the impact of industrial development on
them. At this stage, one cannot assess the weight which the conserva-
tionists will carry, or whether the "national interest" will win the day.
D-32

D.7.2 The MIDA Scheme
The EIU's discussion document defines a MIDA, gives its characteristics
and presents the case for one in the U.K.
The idea of a MIDA was put forward by the National Ports Council in
1966. Essentially, the "principle was to establish a site or sites with
really competitive physical features -- space, deep water, flat land,
and adequate labor, electricity, water and other supplies -- all at as
low a cost as possible for the investing industry and for the nation."
Pooling of needs and resources was seen as a means to achieving this
end, and with Government support and impetus, the U.K. could gain on
export and save on import production which would otherwise be lost to
the Continent.
The Halcrow Report, identifying potential sites in Great Britain, was
completed in 1968; eleven sites were considered technically suitable,
the Medway being one of the foremost.
Professor M. H. Peston of London University completed a pilot feasibility
study in December, 1969, and in May, 1970 he started a detailed economic
cost/benefit study of the MIDA concept; the study will take 2-2 1/2
years to complete.
In the particular case of a Medway MIDA, the main considerations are:
• fairly deep water;
• general cargo increasing significantly to Medway waters;
• B.P. Kent Refinery well established on Isle of Grain: processes
more than 11 million tons of crude oil annually, taking tankers
up to 80,000 dwt;
• 2,000 MW power station just opened; a 3,300 MW one being
constructed;
• important recreational area, e.g., sailing;
• high amenity and scientific interest.
D-33

The report comments also on competition, notably from the Humber, the•
Severn Estuary coast between Cardiff and Newport, and the Clyde:
Humber: less manageable river, possibly more costly transport and
urban infrastructure, bad location for Channel Tunnel and EEC trade.
Cardiff/Newport: excessive tidal range and rough weather, far from
U.K.'s growing market areas -- S.E. England, Channel Tunnel and EEC.
Clyde: deep water but little adjacent flat land, remote location.
Should have good transshipment possibilities.
Foulness now having been chosen for London's third airport, it is
unlikely to be chosen for a seaport, too; the noise and congestion
would be excessive.
The main disadvantages of a Medway site are as follows!
o Road and rail systems and transport facilities will have
to be drastically improved;
• The Medway is on the wrong side of London for distribution
to the rest of the country; and
• Extra fresh water will have to be pumped into the area.
D.7.3 Employment Considerations
The level of unemployment in S.E. England has remained consistently
below the national average; it has deteriorated over the past few
months, but is still favorable compared to that in other regions
of the U.K. However, the unemployment rates for Kent (especially East
Kent) have been higher than those for the S.E. region: 3.7% compared
with 2.4% for the Southeast (based on relating the numbers unemployed
to the total number of workers living in the area). This relatively
high level of unemployment will continue to be influenced by the general
level of activity at national and regional levels. The Kent County
Planning Officer believes that the most likely way to ease the East Kent
situation is to attract a few large employers to the area, preferably
located where they would be accessible to a number of towns.
The Medway MIDA would alleviate the problem to a large extent, even
D-34

though the idea of a MIDA is to accommodate a large parcel of basic
industry with minimum demands for employment, i.e., to be as capital
intensive as possible. Consequently, the EIU has estimated the number
of workers needed as follows: 15,000 in 1986 - 25,000 in 1991. In
addition, these 24,000 service workers would be required in 1986 and
50,000 in 1991. The EIU does not believe that the creation of a fairly
large number of jobs in Lower Medway will obviously help to overcome
regional employment problems as it would, say, in South Wales, but the
time may be coming when development policies will have to look more to
building up new communities to fit the shape of an international grouping
of industries, and less to maintaining the employment patterns of the
nineteenth century.
D.7.4 Preservation of Places of Tourist Interest
New development is very much a matter of compromise and much thought is
given to modernization programs by Kent C.C. For instance, Dover -- a
flourishing and significant port, and an old town in itself -- needs a
new traffic system to cope with increased traffic flows, larger
vehicles and hovercraft traffic. There are two sides to the problem:
(a)without a new traffic system, traffic congestion will be unbearable;
(b) a new system will require some historical old buildings, tourist
attractions in themselves, to be pulled dawn. To satisfy both aspects
of the problem, the Kent C.C. has evolved a complicated by-pass to get
traffic down to the docks and to connect with a proposed lorry park.
Old towns and villages in Kent are well protected under the Civic
Amenities Act of 1967. Old buildings -- there are about 15,000 in Kent --
are put on a scheduled list. Of Kent's 300 villages, at least 150 are
of real interest architecturally. Furthermore, 30 towns in the County
have pockets of old buildings which add to their character. Villages
such as Faversham and Sandwich haven't changed much over the years;
however, Faversham would in fact be affected by the MIDA. By and large,
the Kent C.C. tries to keep pressures well away from these places,
because they have a cash value as tourist attractions.
D-35

D.7.5 The Effect of the Proposed MIDA Scheme on the Environment
The Environmental Planner at Kent C.C. is very realistic when he says
that jobs are more important than environment, if the national interest
is to be served.
A good deal of forward thinking has nevertheless gone into the proposed
Medway MIDA on the environmental and recreational questions. However,
the amenity value of this area, as will be reviewed later, will be
seriously affected. The proposed site, while it immediately avoids
areas of great landscape value and of outstanding natural beauty,
seriously infringes on sites of special scientific interest and nature
reserves. It also affects existing and potential areas for general water
based recreation, notably sailing.
The short summary from the EIU's chapter on amenity and conservation is
included here:
"A considerable part of the countryside is in the study area, particularly the North Downs, is noted for its beauty, much of which is protected in the Development Plan as being of Great Landscape Value and/or of Outstanding Natural Beauty. Planning policy is to protect rigorously the areas of lands-cape quality from development. As regards the coast, the Development Plan contains policies to protect the remaining undeveloped coastline from unnecessary building, recognising its scientific, landscape or recreational significance. The countryside contains a large number of attractive villages and hamlets, many with substantial numbers of buildings of architectural or historic interest. The accommodation of large increases in population in such settlements would be contrary to current planning policies."
The Kent C.C.'s recent survey of recreational boating facilities on the
Kent Coast indicated an existing demand for more and better facilities
plus a growing demand for more marinas, boat yards, etc. There is,
however, quite a problem in finding suitable locations because of
waterwide development of all types. In the EIU report, it was
recommended that the Medway Ports Authority and the Medway Yachting
Association discuss bringing into use the reserve of moorings in the
river in order to rationalize commercial boating developments on this
D-36

river, the estuary of which is extensively used for sailing and small
boat activities. The MIDA will in fact eliminate the main sailing base.
The Kent area also receives a large number of vacationers and day-trippers.
There is a demand for more holiday camps and facilities, especially on
the coast. The Kent C.C. is examining the possibility of establishing
regional country parks in appropriate locations. The countryside in
various parts of Kent is quiet and very attractive, and used for many
activities.
All these factors have to be taken into account if the MIDA is approved.
D.7.6 Organization of Kent C.C.'s Planning Department
The County Planning Department has 200 staff, under the County Planning
Officer and his deputy, of which two-thirds are technical. The depart-
ment has two sections:
• Strategic Planning, which deals with population changes, employment
issues, etc. This research section does social, industrial and
demographic surveys leading to policy plans which generally
relate the local population to employment available in the area.
• Environmental Planning which is further divided into:
(1) Coast, Countryside and Recreational Issues;
(2) Local Plans and Conservation; and
(3) Development Control
The Council gets 15,000-16,000 applications a year asking
permission to carry out development, and deals with these.
Applications may be ruled out because they are in basic
conflict with the Council's published plans.
D.8 POLLUTION CONTROL ON A MAJOR URBAN INDUSTRIAL ESTUARY: THE THAMES
D.8.1 Summary
The Thames is the most important river of England. Its tidal estuary is
much polluted although the trend has been reversed in the past decades by
energic action, under the sponsorship of the Thames Conservancy -- the
oldest known body concerned with pollution control (1857), the Port of
D-37

London Authority, and the Greater London Council. The Thames Conservancy
is well endowed with pollution knowledge and comprehensive control
legislation. Sewage disposal is the greatest polluting source because
overloaded treatment plants remove only half of the pollutants. Full
treatment is expected by 1974 thanks to a $50-60 million investment.
A 1915 Royal Commission set Up a limit of 5 milligrams per liter for
5 days BOD; beyond this limit the quality is doubtful. (Three milligrams
per liter is called fairly clean.) Such a standard is not applicable in
tidal waters, which may keep a given pollution load for three months
and result in an "effective oxygen load" (carbonaceous and nitrogenous
water) being measured in the sewage. Weekly surveys and discharge sampling
since 1909 and occasional major surveys lasting 10 years or more have
shown a continuing improvement of the tidal water quality, especially
over the past 10 years.
A reserve of oxygen of 10% saturation at all times everywhere is sought
for 1980, to accommodate accidents (shipping collisions, storm discharge,
strikes at sewage-treatment plants, etc.).
Reductions in the number of river authorities, drainage authorities and
concentration of water supply sources have been recommended throughout
the country. The new Ministry of the Environment is preparing a detailed,
computerized survey of English rivers, while the Royal Commission on
Environment will address itself next year to the subjects of coastal and
water management.
D.8.2 The Thames River Personality (Figure D-3)
The Thames is England's longest and most important river, with a total
length of 210 miles from its source in the Cotswold Hills to its outflow
into the North Sea. It is navigable by ocean-going steamers to the new
London Bridge. The Thames is tidal to Teddington (69 miles from its
mouth) and forms County boundaries almost throughout its course.
D-38

2 cm = 10 miles
FIGURE D-3 STATUTORY RIVER AUTHORITY AREAS AND CATCHMENT AREAS CONTROLLING THE THAMES

is much to see. Houseboats and
The Thames is London's premier amenity, yet it is also an industrial
river which London has to live on: pollution control is very much a
matter of balancing up interests. The uses to which the Thames is put
of water supply for
the main receptacle for
discharge). The waters
in power stations and
are many. Not only is the Thames a major source
London (300 million gallons per day), it also is
sewage (virtually all of which is treated before
of the Thames are also used for cooling purposes
industrial plants along the river side.
On the fresh water stretch of the river, 10,000 launches are registered,
and more than 250,000 anglers use it. Boat trips up
Thames are a big tourist attraction; London life has
and down the tidal
centered on this
river from the very beginning and there
restaurants are moored along the banks.
The fresh water part of the river is comparatively clean: 60% oxygen
saturated as compared with less than 10% in the tidal portion. However,
a measure of how much cleaner the Thames has become over the last 10
years is indicated in surveys conducted by Alwyn Wheeler, a Zoologist
at the British Museum: in 1958 the river was in such a bad state that
from Fulham to Gravesend only eels existed. In the last two years 57
species of fish, both sea fish and euryhaline (sea and fresh-water) fish
have been recorded. Recently two sea trout have been caught up-river
beyond the polluted areas -- weighing 3 3/4 pounds and 2 1/4 pounds.
Thus, the situation is a far cry from that of the mid-19th century when
the smell was so bad that Parliament could not meet, and when 20,000
Londoners died in the third cholera epidemic of that century.
D.8.3 Authorities Controlling Pollution in the Thames
The two main bodies concerned with control are the Thames Conservancy
and the Port of London Authority (PTA). The Greater London Council
(GLC) acts as "agents" for the PTA in certain respects.
The Thames Conservancy, set up in 1857, is the oldest body in the world
D-40

concerned with the pollution control function. The Conservators now
have jurisdiction over the River Thames from Cricklade in Wiltshire (the
source) to Teddington Lock: 141 miles, the area of the watershed being
3,656 square miles. In 1909, the PLA took over all rights, powers and
duties of the Conservators with respect to the river below Teddington,
namely, that part of the Thames which flows through Greater London,
the City, the counties of Essex and Kent, and to the limit of Territorial
Waters in the North Sea: 92 miles in all.
The GLC, through its Department of Public Health Engineering, is the
enforcement authority for the prevention of pollution in the non-tidal
rivers and canals in the London excluded area. (This area is excluded
from the jurisdiction of any other river authority or conservancy catch-
ment board. It includes some 410 square miles of Greater London.)
D.8.4 History, Functions and Legal Powers of the Authorities
Thames Conservancy
There has been legislation for the prevention of pollution of the River
Thames since very early days, but very little practical results until
the Conservators commenced their operations in 1857.
Originally there were 12 Conservators; there are now 39. Their scientific
staff comprises 2 chemists, 2 biologists and 4 assistants. They are
moving into a new building in Reading in two years time when they will
have advanced laboratory services with 20 staff.
The Thames Conservancy Acts and Orders 1932-1966, which are private acts,
give the Conservators most of their powers. The Conservancy is also
constituted the Drainage Board of the Thames Catchment Area for the
purposes of the Land Drainage Acts 1932 and 1966. The Conservators are
the Navigation Authority for the river, and under the Water Resources Act
1963, also exercise the new water resources functions of River Authorities
(Figure D-3) with respect to both surface and underground water in the
Thames Catchment Area and underground water in London (the London "excluded"
area), including the prevention of pollution.
D-41

As regards pollution control, they exercise jurisdiction over the Thames
Catchment Area (both surface and underground water), and over the
fisheries in the River Thames from Cricklade to Teddington.
The main water pollution control functions of river authorities are laid
down in the River (Prevention of Pollution) Acts of 1951 and 1961.
These powers of the Thames Conservancy are supplemented by their private
powers. The 1951 Act makes it an offense for anyone to cause or knowingly
permit poisonous, noxious or polluting matter to enter a non-tidal stream.
It also makes it illegal for anyone to make a new or altered discharge of
sewage or industrial effluent to a stream without the consent of the
river authority. In granting its consent, a river authority may lay down
conditions as to the volume and quality of the effluent.
The Clean Rivers (Estuaries and Tidal Waters) Act 1960 extended the
provisions of the 1951 Act to tidal estuaries and creeks. The 1961 Act
extended the "consent" procedure to discharges of sewage and industrial
effluent which were already being made to non-tidal waters when the 1951
Act came into force. Any discharger may appeal to the Department of the
Environment against a river authority's decision, but this is an
extremely rare occurrence.
The Water Resources Act, 1963, gives river authorities powers to take
emergency action to reduce or eliminate the consequences of any river
pollution which has occurred, and to control, by a "consent" procedure,
any discharges of sewage and trade effluent passed into the ground.
The river authority can summon to court any discharger who fails to
comply with its requirements. Action is free from control by Central
Government, unless of course, the river authority fails in its duty,
whereupon the Minister for the Environment can step in.
The Conservator's income is obtainable by dues from the Councils of the
various counties, county boroughs and London boroughs within the Thames
D-42

Catchment Area, from the Greater London Council, from license fees,
and from charges for water abstracted. In addition, the Conservators
derive income from various navigation tolls, fees, licenses and rents.
For 1971 the Thames Conservancy has budgeted 11255,860 ($613,000) for
river purification.
Port of London Authority
The PLA is the only port authority to hold full pollution control powers,
granted in 1909.
The Pollution Control Committee of the PM is composed of 9 members
nominated by the PLA plus representatives of:
- Essex River Authority;
- Kent River Authority;
- Lee Conservancy Catchment Board;
- GLC (2);
- City of London Corporation; and
- Confederation of British Industry.
There are also two advisory bodies:
- The Thames Estuary Study Group, to deal with technical and
scientific problems connected with the sea bed and movement
of water; and
- The Clean Thames Consultation Panel, to discuss reports on
the condition of the river.
The PLA's pollution department is headed by the River Conservator, and
two pollution control officers: one for the day-to-day running of the
inspectorate and the other for policy, planning, liaison, etc. All
three are science graduates. There are also four inspectors with
appropriate qualifications; all are members of the Institute of Water
Pollution Control. The department also has a consultant analyst, a
small laboratory, and consultant chemical engineers to advise on future
problems. Until 1964, the PLA derived its powers from a 1920 Act which
consolidated the various 19th century acts prohibiting discharges of all
D-43

sorts. This act was superseded by the Port of London Acts of 1964 and
1968.
In 1961, River Authorities took over from the Boards, in order to improve
the country's water resources; the London Excluded Area remained though
the PLA got the same powers of pollution control as the new Authorities.
In 1962, the Thames Conservancy was given control of ground water
abstractions in the London Excluded Area, the PLA was given control of
pollution and abstractions from the tideway, and the GLC was authorized
to administer flood prevention and control abstractions from streams.
The PLA was also to have the powers which all river authorities had
under the Rivers (Prevention of Pollution) Acts 1951 and 1961. These
arrangements were all included in the PLA's Private Bill in 1964.
Under the Oil in Navigable Waters Act of 1959, the PLA's jurisdiction
was extended over the whole of the river and estuary under its control,
but its powers under the Rivers (Prevention of Pollution) Acts do not
extend beyond the seaward limit of the port. The PLA owns most of the
river bed and foreshore down from Teddington and thus can impose condi-
tions on the use to which this land is put. The income it derives from
granting licenses goes to the work of pollution control without subsidy
from public funds or local rates.
Greater London Council
The Trade Effluent and Pollution Division of the GLC's Department of
Public Health Engineering has a staff of 11 pollution officers and
Inspectors. The GLC works with the PLA and controls the non-tidal
waters that flow into the PLA's section of the Thames. Its powers are
contained in the Rivers (Prevention of Pollution) Acts. The GLC works
with the local boroughs in tracing the source of any pollution, because
all public discharges are its responsibility. In the case of private
discharge direct into the river, the GLC deals directly with the person(s)
concerned. The GLC also exercises land drainage and flood prevention
functions.
D-44

D.8.5 Sewage Disposal
The greatest source of pollution in the River Thames is sewage, and there
is a marked difference, as indicated previously, between the state of
the river above and below Teddington.
Most of London's sewers were constructed in the late 19th century. There
was large-scale rationalization of sewage works through the country
around 1940, the first regional sewage works being opened at Mogdon for
West Middlesex. Beckton and Crossness works treat the majority of
London's sewage and between them remove 50-60% of the pollution matter
that would otherwise go into the river. Crossness is getting overloaded;
it was designed for 70 million gallons per day but frequently deals with
far more. About one-third of the sewage going to Beckton gets full
treatment, but by 1974 all sewage (220 - 250 m.g.d.) will be getting
full treatment at a cost of $50-60 million for an extra plant. Mogdon
deals with 90 million gallons per day.
As far as the non-tidal Thames is concerned -- a much cleaner part of
the river -- all of municipal sewage and 80% of trade/industrial effluents,
are disposed of by the local authority sewage works.
D.8.6 Pollution Measurement
When London's sewers were built in the 19th century, the idea was to
wash the sewage out to sea from the Beckton and Crossness outfalls.
The theory at that time was that it took five days for an inland river
to "process" all sewage, by using oxygen to purify itself. This did not
work; because the Thames is a tidal estuary, the sewage could take up to
three months to get out to sea, and in this length of time it used up
all the oxygen in the river.
In 1915, a Royal Commission set up certain standards:
D-45

5 days BOD* Classification (milligrams per liter)
1 Very clean
2 Clean
3 Fairly clean
5 Doubtful
10 Bad
*BOD = Biochemical Oxygen Demand
However, because the pollution load remains in the Thames estuary for up
to three months, the BOD test is virtually inapplicable. Consequently,
the PLA uses a parameter called the "effective oxygen load," which
measures the carbonaceous and nitrogenous matter.
No single standard is required and the river authorities consider each
discharge on its merits. Obviously, there is more tolerance in Canvey
than there is in Chelsea, and therefore people in Chelsea have to pay
more for sewage treatment.
Of the 220 m.g.d. of sewage and effluents discharged into the non-tidal
Thames, about 50% is required to conform with the Royal Commission
Standards, while the rest has to conform to a higher standard which
deals with everything other than suspended solids and B.O.D.
Various surveys are always going on about the subject of pollution in
the Thames. A recent Thames Conservancy Survey indicated that of all
the sewage works in the area, only 40% did not reach the standard
required 80% of the time: this is considered an improvement.
Other Thames surveys include:
1949 - Thames Survey Committee of the Water Pollution Research Board
to study the causes and effects of pollution.
1951 - Departmental committee of the Minister of Local Government and
Housing was set up to consider the effects of heated and
other effluents and discharges on the tidal reaches of the
D-46

River Thames" under Professor A. J. Sutton Pippard. This
turned out to be a very complicated subject and the committee
did not report until 1961. The outcome was that the pollution
control function should be arranged and organized to prevent
offensive conditions.
Both surveys took over 10 years to complete.
Subsequently, there has been continuing improvement in the quality of
the tidal Thames waters. The GLC (and the earlier LCC) has carried out
weekly surveys for more than 50 years. The PLA has been sampling major
polluting discharges since 1909. Many of its powers under the Oil in
Navigable Waters Act of 1955 are closely related to pollution control
(e.g., navigation, conservancy, hydrographic surveying, river regime
functions).
D.8.7 Policy for the Next 10 Years
The PLA is aiming to obtain by 1980 a reserve of oxygen in the river of
10% saturation at all times and in all places. The worst time of the
year is the third quarter when the upland flow is at its lowest and the
extractions above Teddington (for drinking water) are at their highest.
The PLA is trying to obtain this reserve (in fact, 10% saturation is
only about one part per million of dissolved oxygen to accommodate
accidents -- e.g., sugar boats or sludge boats sinkings, storm discharges,
strikes in sewage-treatment plants, etc.
Other factors which will affect the control of pollution:
• The report of the Central Advisory Water Committee, which has
been considering water and water disposal throughout the
country. The Committee recommended that:
a) the 29 river authorities plus PLA be reduced to 7-13
• river authorities
b) the 250 sources of water supply be reduced to 50
undertakings
D-47

c) the 1400 drainage authorities be reduced to 50. (There
were a variety of suggestions as to how this could be
organized and the Minister for the Environment will
decide.)
• The Royal Commission of Environmental Pollution, which will
look at coastal and esturial pollution next year. (The
Commission's work should have far-ranging effects.)
• The Ministry of the Environment, which is bringing out a
very detailed and computerized survey of rivers in England.
Thus, pollution control in the Thames has been a matter of concern for
many years, is improving radically, and may be an example to other
river authorities.
D-48

APPENDIX E
PORT CARTIER, CANADA

APPENDIX E PORT CARTIER, CANADA
Page
E.J.SUMMARY E-1
E.2 CANADIAN PORT STRUCTURE E-3
E.3 GENERAL DESCRIPTION E-6
E.3.1 Geography E-6
E.3.2 History E-12
E.4 ECONOMY E-14
E.4.1 Municipal Government and Town Budget E-14
E.4.2 Trade and Commerce E-19
E.5 SOCIAL-ECONOMIC-ENVIRONMENTAL CHARACTERISTICS E-19
E.5.1 Background E-19
E.5.2 Demography E-22
E.6 ENGINEERING APPRAISAL E-29
E.6.1 General Description E-30
E.6.2 Design Concepts E-30
E.6.3 Final Design E-33
E.6.4 Construction E-34
E.6.5 Ore-Handling System E-34
E.6.6 Harbor Pollution E-37
E.7 SHIPPING ECONOMICS VIA PORT CARTIER E-38
E.7.1 Iron Ore E-38
E.7.2 Grain E-43

LIST OF FIGURES
Figure Page
E-1 Port Cartier Harbor, Canada E-7
E-2 Growth of Port Cartier Town E- 11
E-3 Demography of Port Cartier Town E-23
E-4 Port Cartier Design Concepts E-32
LIST OF TABLES
Table Page
E-1 Bulk Carrier Daily Cost E-41
E-2 Ore Transportation Costs E-42
E-3 Grain Transportation Costs E-45

APPENDIX E
PORT CARTIER, CANADA
E.1 SUMMARY
Alcan Shipping Services, a consulting arm of Alcan and Saguenay Shipping
in Montreal, appraised a port handling bulk grain and ore in Canada and
conducted the research for this report. Data gathering, field interviews
and inspections took place in March, 1971.
Most of the 500 Canadian ports are public, and the 11 major ones are adminis-
tered by a National Harbor Board under the aegis of Ministry of Trans-
port, with advice from the Department of Public Works. Streamlining
of this ministerial tutelage with a special agency, and a decentraliza-
tion of the administration and financing of infrastructures, have been
recommended, with private enterprises becoming responsible for all cargo-
handling equipment.
The grain and iron ore terminal at Port Cartier was selected for this study
because in 1961 it was the largest excavated harbor in the world, and
because its rapid growth is now tapering and its future is threatened by com-
peting neighboring ports. The following report raises the following issues:
• Port Cartier was built in 1960 by Quebec Cartier Mining Co. close to
a declining lumbering and fishing settlement, located between two
existing ports: Baie Comeau and Seven Islands. The extra distance to
Baie Comeau, competition with the existing iron ore shipper at Seven
Islands, and probably some government pressure to help a depressed
area explain the decision. However, local weather and seastate dictated
an excavated harbor, which is expensive to extend and deepen, while the
natural deep bay at Seven Islands offers much more flexibility for
expansion. Port Cartier's iron ore loader, on the other hand, has pro-
vision for five-fold capacity increase (40 million tons per year from
the current 8 million tons).
E -1

• Despite the construction of a grain transshipment terminal with a 10
million bushel silo, the port activity remains essentially centered
on iron ore exports. No secondary industry has settled in the area
since completion of the iron ore terminal and population remain static.
A reactivation of the traditional lumbering activity for a projected
dissolving-pulp-mill operation would be a welcome diversification.
• Provincial subsidies have been limited to winter-road clearance, fire
prevention and aqueduct operation, for a total varying between $10,000
and $60,000 per year. The $600,000 revenue of 1968 represents a 30%
increase over 1962, mainly borne by the residents and is typically
spent : 1/3 on technical services, 1/6 on administration, 1/6 on secur-
ity and welfare, and increasingly (1/6) for servicing the debt ($770,000
in 1970), while capital equipment (1/6) is a variable low item. .
The debt servicing burden is continuously increasing, from 6% of bud-
getary expenditures in 1962, to 14% in 1968, and a projected 26.5%
in 1972. Investment in capital equipment, already irregular, could
suffer from this situation, although temporary structures erected during
the 1960 boom need replacement by permanent facilities.
• Local commerce and retail trade is sluggish, and suffers from compe-
tition by more aggressive enterprises in the two neighbor ports.
There is also a lack of integration between the new company settle-
ment and the original village close to Shelter Bay.
• The high unemployment rate (8% plus 6% on pension) is concentrated on
original, unskilled residents, who in 1960 preferred high-pay construc-
tion jobs to the training school established by Quebec Cartier Mining.
The old settlement of Shelter Bay still has an 85% untrained popula-
tion, and its housing is characterized as medium-to-poor, with crowded
conditions, all the more resented since the development of the well-
planned QCM Company sector across the creek. There is a need for more
E -2

park and recreation facilities, particularly children's playgrounds
at the neighborhood level. Sewage disposal close to the beach and
traffic congestion are other causes of dissatisfaction.
• As the port is about three miles east of the new, eastern part of
town, little inconvenience seems to have resulted from excavation
blasting or ore dust, although dust is mentioned by some residents.
Reduced ship traffic, and good ore-spillage control have prevented
any visible pollution inside and outside the harbor.
E.2 CANADIAN PORT STRUCTURE
Port administration and policy in Canada depend on whether a harbor is
privately owned or considered a public or government wharf.
Matters relating to a port when privately owned are the responsibility
of the owner, who generally nominates a port manager, to be responsible
for day-to-day operations. In Eastern Canada, the major private ports
are:
Port Alfred - owned by Alcan Port Cartier - owned by Quebec Cartier Mining Sept -Iles - owned by Iron Ore Co. of Canada
The privately owned wharves primarily handle the traffic of one major
industry. They have been built by private capital, and government control
is limited to navigation.
Since the Canadian Confederation in 1867, 315 harbors have been proclaimed
public and come under the Canadian Shipping Act and the Public Harbor
Regulation.
Actually, the responsibility for port administration is assumed by the
Department of Transport, who appoints the Harbor Master, through the various
Harbor Commissions, or the National Harbor Board and St. Lawrence Seaway
Authority.
E -3

The governing legislation is:
• The Canadian Shipping Act, Part X
• The Government Harbors & Piers Acts
• The Harbor Commission Act 1964
• The Individual Harbors' Commissioners Act
• The National Harbor Board Act 1936
• The St. Lawrence Seaway Authority Act
• The Navigable Water Protection Act
The Department of Transport is directly responsible for ten harbor
Commissions, over 300 public harbors and several thousand Government wharves.
Eleven ports and two grain elevators are administered by the National Har-
bor Board since the 1936 disbandment of Harbor Commissions at Montreal,
Quebec; Three-Rivers, Halifax; Chicoutimi, St. John; and Vancouver, Bri-
tish Colombia. The N.H.B. is composed of full-time members appointed by
the Governor in Council for a ten year period and has power to employ
and remunerate staff, to expropriate, to collect tolls, etc. The St.
Lawrence Seaway Authority is also responsible for certain public wharves.
The Canadian port administration and policy regarding the management of
public and government wharves is currently subject to criticism and revi-
sion. The existence of a centralized administration composed of four,
different federal bodies; Department of Transport, National Harbor Board,
St. Lawrence Seaway Authority, and Department of Public Works, compli-
cates management. It has been recommended (by the Glassco Commission
Report) to the Federal Government to decentralize to eliminate duplication
of work and give more authority to each port in matters relating to its
own administration and policy. This will create semi-autonomous Port
Authorities which will be responsible to the government but functioning
with specific duties and powers that allow the local administrators a
considerable degree of freedom. Specific recommendations include:
• A single Government Agency reporting to the Department of Transport
should be responsible for Federal action in Harbor administration.
An outline of the_organization of this administration follows:
E -4

ST. LAWRENCE SEAWAY
AUTHORITY
ADVISORY FUNCTION
NATIONAL PORTS COUNCIL
PLANNING FUNCTION
PORTS AND HARBORS
PLANNING COMMITTEE
I CANADIAN MARINE
TRANSPORTATION ADMINISTRATION 4
PORTS AND HARBORS
NATIONAL HARBORS BOARD (National Harbors)
HARBORS AND PROPERTY DIVISION (Commission And Public Harbors)
MARINE SERVICES
PORTS AND HARBORS
ADMINISTRATION
10 NATIONAL HARBOR BOARD PORTS
10 COMMISSION HARBORS
480 PUBLIC HARBORS

• A Local Harbor Commission under this single agency should be used
wherever possible, and harbors meeting the required criteria should
be administered locally. The main quality of the agency should be
flexibility in matters of operation of various ports. Direct nomin-
ation should be made when a local Harbor Commission is not possible.
• The capital expenditures, public borrowing, and user charges should
be subject to agency approval, but the local commission should be
autonomous in day-to-day operation.
• Responsibility for design and construction of marine work and dredging
should be consolidated rather than divided among several agencies.
• Cargo handling equipment, when possible, should be the responsibility
of private industries.
• The new agency should be responsible for overall harbor planning
and advice on harbor policy.
E.3 GENERAL DESCRIPTION
E.3.1 Geography
a. Local
Port Cartier is situated on the North Shore of the St. Lawrence River, be-
tween the deepwater ports of Sept-Iles, 38 miles to the east, and Baie
Comeau, 110 miles to the west. The town is connected to Gagnon, 191 miles
inland, by a railway which is owned and operated by Quebec Cartier Mining.
Highway 15, the major North Shore all-weather highway, runs about one-
half mile north of the town with exit and entry roads connecting to the
town. There are bus and air connections with Sept-Iles, Bale Comeau and
with Quebec and Montreal, through Sept-Iles.
Geographically, the village is situated at latitude 50 001' N and longitude
66 ° 55' W and the altitude varies gradually from sea level to 140 feet at
the northern boundary shown in Figure E-1. The land slopes towards the
E -6

FIGURE E-1 PORT CARTIER HARBOR, CANADA
FG14111 , (Private)
\tA
V.,
_
0. Slorap PORT. CARTIER
HARBOUR
Cr)
\\
Water To.ow 62?: V"'
\
C*87OT a.
8 3 Goncratt o.er
8 3 it e. s z 5. es
.---8",/a, ,
) • 0 Tank
13
, ■ Er, ;IA
"
51 12
C •
A.;
03 on
s; Os Jr ', 8.
5.. Be
30111 4 3 el/.6 / 7 1Pri ateb,
.—(Privete) Ce..6sen ,* 5 43.■
4 2 3 , 72
Zs
4 3,
4, 3, 4, 4 3 4,, 46
57.. 53
S 51
[ :44 5,....r.1
".' 53 ..: 24'
.--,
63
45 S.
66 66 .69
:4 4,
5't.: . e‘
sz •
..., ..-,.. ,
..
61 6 6, • .
,
• s . '6, \6 . 1°3'..'
6.
6.
G. 7 7,
6, 7, 73
' • A • -.. --'4.'.: 76
8 t. 7% 71 8 76 2.
12.
73
66 6s 6s
es
83 e. 7.
93 8,
8, 83
S. 96 8.
83 9 8, lo t
9' 92 9, IS,
•
8$ 8
83
es a,
10i 10,
9. 103 g, 9
I . 10.
S. 9 92
: 96
Sz
e, • /
/ 96 .
PO j •
• ••• •
E— 7
4

sea, insuring some protection against the prevailing northwest winds and
giving some measure of natural drainage for surface water.
The town is divided by Riviere aux Rochers, a small river originating
some fifty miles inland, the two sides being linked by Chemin des Iles,
an all-weather paved surface road. The river also acts as a natural drainage
basin for both east and west sections. In the east section, the slopes
range between 0 and 8% and in certain places there are sandy surfaces
which serve as beaches.
The geological formation of the area is essentially Pre Cambrian. The
basic sub-surface rocks are crystalline phase with some gabbro and granite.
Much of the surface rock is post-glacial deposits from the Champlain plain.
The central islands, river basins, and a large portion of the west sector
near the boundary shown outside the built-up area are composed of porous
rock and are favorable for heavy construction. The remaining surface areas
are either marine clay and silt, or sand and gravel favorable for light
construction.
b. Inland
The whole area is rocky terrain - with sedimentation, including ores,
minerals, sands, and gravel, in the escarpments - and is dissected by rivers
flowing into the St. Lawrence Gulf, which not only carry huge amounts of
water during the spring thaw, but also serve for floating logs downriver.
The surface of the terrain is heavily wooded - a typical Laurentian North-
Shore backwoods scenery - with about 65% spruce, 27% fir, and 8% birch
and aspen.
The faults and escarpments contain considerable iron ore, at a distance
of about 200 miles from the city. The mine at Lac Jeannine covers an area
of 330 acres. The stratum of this open-cut mine is specular hematite and
quartz, and the cut is 800 feet long, 2,300 feet wide and 1,000 feet deep.
Reserves presently being worked are estimated at one billion tons, and
given the current rate of production it can be roughly assumed that the
E -8

Sept-Iles
Baie Comeau
the deposits will be worked out within thirty years. Production is contin-
uous at around 60,000 tons of mineral and 40,000 tons of sterile rock per
day. The concentrator produces about 24,000 tons of iron ore concentrate
per day and some eight million tons per year. The ore is railed to Port
Cartier harbor where it is stockpiled and loaded on bulk carriers by a
sophisticated, highly automated system. Plans have been made to integrate
ore from another mine, some 30 miles from Gagnon, into the system.
c. Climate
Temperatures range from a mean maximum of 42.6 ° F to a mean minimum of 25.4 ° .
Monthly averages are:
January 7 ° (ay. min.)
April 30°
July 60 °
September 50°
December 10 °
Snow and rain precipitation data are not available for Port Cartier, but
Sept-Iles and Baie Comeau give a rough regional indication.
Rain (Inches)
31.26
24.16
Snow (Inches)
155.8
127.4
Wind direction is predominantly from the northwest and a year-long ob-
servation gives the following percentages:
Northwest 44%
East 20%
North 18%
NE and SE 10%
The northwest wind direction would suffice to disperse seaward any air-
borne pollution such as dust, odors, or toxic elements which could come
from the port located several miles to the East. The village then, seems
reasonably well protected from pollutants.
E-9

d. Land Use
Within the built-up area, shown on Figure E-2, there are as yet 126 acres
of vacant lots; 108 acres residential, and 102 acres taken up by commerce,
industry (practically concentrated around the marshalling yard north of
the new town), roads, and public services. There are 31 acres of "green
belt", a 20-acre trailer park and 14 acres for schools, with 7 acres for
churches. This seems to indicate a shortage of school space when the
large number of school children is considered (45% of the population is
19 years old or less). The area used for residential purposes represents
26.2% of the area containing buildings and construction, and according
to the 1970 Bemer, Inc. Survey (Dossier Urbain Concept) contains 497
buildings that are:
Single family 466 buildings Duplex 24 buildings Multi-family 7 buildings
This gives a population density of 27.5 persons per acre, which is con-
sidered fairly light. Of the 9.75 acres ascribed to industrial use, 8.5
acres are occupied by the Quebec Cartier Mining offices. The other 1.25
acres are occupied by a fishing cooperative (20 members) and a small wood-
working concern in West Port Cartier. The trees in the built-up area
of the west sector were cleared during construction works, thus removing
some of the natural protection from the bitter winter winds. Two islands
located in the river mouth are wooded, as is the north section of the
town, and a good measure of the surrounding area.
The green belt (31.25 acres) includes L'Ile de la Cite (29.25 acres).
There are several plans by public and private organizations to increase
the green space and recreation areas of the town. This year, the Lions
Club began development of a children's playground and picnic area in the
angle of Rue des Pins and Rue des Peupliers. Another long term project is
the planning stages is the development of L'Ile de la Cite into a multi-
faceted, open-air sports ground. The plans include a running track, tennis
courts, baseball field, arena, and restaurant. It is possible that this
centralization of community, sport, and activity centers would be detri-
mental if done at the expense of small neighborhood playgrounds.
E-10

> • ' •
.A -, .//(-.. L\ • ,.;
c-. • ;
•••■,../ •
-: .,,... - - --,,,,,,; f -----. • - • ; ( ' _741./i\I • / 7/ `):., ../: :.•, 1 :!' -7'":")••, .. i_ . .,,...,_,- ,---e•-•:,,, 4 1,....._
', 1 ... . ' 77 1f.."--.‘'. '"'-'--. . - ,,z . ;,-;.- ,, ,..,•--J•ti''
/ W .,": ....,,
.,- r-\ 0/ -. : • ,. -',-Jc_i'., i',.''
--MP • • \\‘ , 1
\
• • NIMININI • • • •• • • 1 • •
• 7
(;)
6.1°
. . _. .. .- : . \ '/,)
2." ,. - / /-\,/ - r ''.'1 < ,, . './\ ' / . • . '‘ .. .: '
I ,\--__. i ‘ ,.: ,:;---') ' • - t if'. .. \-
/ ., •‘ 4
)
• 1. , • • • t : ( . •
'
(pi
„,••
- (1 )\
I I 1918 — 1935
1935 — 1958
1958 — 1968
Port Cartier Harbor is about 4 miles ENE
0°
• I
■77,77/
FIGURE E-2 PHYSICAL EVOLUTION GROWTH OF PORT CARTIER TOWN

There is one 15-bed hospital serving the district, that is owned by
Quebec Cartier Mining. The mining company is anxious to dispose of
its interest in the hospital to the jurisdiction of the Provincial
Government.
e. Sewage and Sanitation
Port Cartier draws its drinking water from Riviere aux Rochers. The
water is slightly acid, with seasonal traces of yellowish, organic matter
and fits the general composition of this type of hydrological basin. The
water is treated with chlorine at the pumping station before distribution.
Sewage is disposed of via pumping stations, through an undersea outlet
pipe, some 50-100 feet offshore.
E.3.2 History
a. The Town
Apart from isolated Indian communities, there was no settlement as such
until 1916, when the Quebec North Shore Paper Company (an affiliate of
Ontario Paper) obtained a lease to exploit the timber in the Riviere aux
Rochers
Shelter Bay village was founded to house the people working in the forests
and to provide the shipment facilities to move felled timber to market.
A wharf was built at the mouth of Riviere aux Rochers and timber was floated
down river to the town, stripped by a work team, and loaded on board
inland coastal vessels. The timber exploitation radiated inland from
the town, and the Quebec North Shore Paper Company's activities supported
the entire economy of the village until 1950.
Although it was known that large deposits of iron ore existed in the Quebec
Labrador peninsula, mining on a large scale did not begin until 1950.
A growing world demand for this commodity spurred the rapid development
of the Quebec North Shore deposits and in 1954 the harbor of Sept-Iles
(Seven Islands), built to accommodate 75,000 dwt bulk ships, was es-
E-12

tablished as the first loading port for the ore. Finally, in 1957, Quebec
Cartier Mining was incorporated to mine the Lake Jeannine deposits.
This company founded two new towns: Port Cartier (with a 100,000 dwt
loading terminal) and Gagnon, 191 rail miles away at the minehead.
The name "Port Cartier" was granted with the city charter, incorporated
March 5, 1959, by which the former "Shelter Bay" area on the west bank,
and the urban cell built by Quebec Cartier Mining on the east side of the
aux Rochers river, were merged. The town planning and landscaping of
the new east side was done by the C. D. Howe company, the port engineers;
and Quebec Cartier Mining carried out the actual construction using local
and some imported labor for the project.
The city area extends over 19,200 acres; the boundary runs along the river
for 15 miles, with a depth of 4-5 miles towards the northwest. The inhabited
and industrial area comprises about 7% of the territory.
The physical evolution of the town is shown in Figure E-2. Its economic
and socio-environmental problems are described in the next two sections.
The old harbor facilities of Shelter Bay are still in existence at the
mouth of Riviere aux Rochers, but since the construction of the new port,
these wharves have fallen into disuse.
b. The Harbor
Two sites, some 3 1/2 miles east of the town, were considered for the
deepwater harbor. The basic requirements were year-round safe loading,
adequate berths, and docks capable of handling vessels from 3,500 to 100,
000 dwt capacity with maximum 48 foot draft. The shore area also had to
be large enough for the railway terminus and provide facilities for
freight handling, receiving of petroleum products, and bunkering of ves-
sels.
C.D. Howe were contracted to choose the location of the port and design
the facilities. They carried out extensive hydrological and topographical
tests on the two sites and instituted testing on a scale model.
E -13

The contract for the harbor was awarded in January 1959 and, despite the
vastness of the project, less than 2 1/2 years later in June 1961 the
first ore carrier was loading at Port Cartier.
Although not provided for in the original concept of the port, a grain
storage and transfer station was the next significant addition to the
harbor, when the Louis Dreyfus Company established these facilities
because of attractive transportation cost benefits.
Currently plans for diversification into yet another field exist with
the proposed establishment of a pulp-mill at the port. More details on the
port are given in Section E.6.
E.4 ECONOMY
In 20 years, Port Cartier went from a sleepy lumbering and fishing village
to a maturing one-company town, located between two dynamic port cities,
in a generally underdeveloped area. The two centers of economic activity
in Port Cartier are the port and the railroad, both associated with the
operations of Quebec Cartier Mining. Including the repair shops and ancillary
operations these are the two major employers. The building of a grain silo by
the Louis Dreyfus Company, with a capacity of more than 10 million bushels,
only marginally assists in providing increased continuous employment.
The town needs to attract more industries if it is to flourish. However,
the proximity of the far-better-developed centers at Sept-Iles and Baie-
Comeau-Hauterive, is a disadvantage. A prospective dissolving-pulp-mill
operation, studied by Rayonnier, is an example of the exploitation of a
natural resource (forest), given the convenience of transportation, which
could help the town.
E.4.1 Municipal Government and Town Budget
The functions and responsibilities of municipal government in a time of
rapid economic expansion due to a major one-shot investment inflow, is
certainly a matter requiring thorough economic analysis. The influx
of capital, the inflow of a working force, the setting up of infrastructures,
E -14

the liaison between this major new industry and the administration of the
town, the demand for housing, all provide for long-term secondary and ter-
tiary effects.
Unfortunately, in this particular case, no information is available about
the set-up of the municipal government of Port Cartier (the number of
departments, the number of employees in each, areas of responsibility and
decision-making, the growth of individual departments), which would assist
in comparing the growth of the town with the growth of the administra-
tive apparatus of the municipal government.
The budget, as one aspect of the financial structure, permits us to inves-
tigate the past income flows and expenditure patterns, and to predict these
flows in the future, within the context of the evolution of municipal
government planning and policies.
Our main observations about the municipal budget of Port Cartier are as
follows:
a. Budgetary revenue
The two main revenue groups analyzed were endogenous and exogenous. The
endogenous group contains a general section (property tax, drainage tax,
commercial licenses and permits) and an aqueduct section (water tax,
special taxes); while the exogenous group also contains a General Sec-
tion (sales tax, amusement tax, rentals and services, fines, earned
interest, and subsidies) and an Aqueduct Section (subsidies).
Property taxes in the General Section of the endogenous group have
increased from $151,009 .41 1962 to #388,100 in 1968, a growth of 157%.
To be sure, this very rapid six-year growth was due to an increased
assessment rate, rather than to dynamic building activity and an increase
in the real value of assets. It also reflects increased income of the
population and the increasing needs of the town over the same period.
The major share of property-tax payments derives from industry and com-
mercial establishments.
E -15

The drainage tax fluctuated quite significantly during this period, and
decreased 8% between 1962 and 1968, from $14,573 to #13,500.
Commercial license and permit collections decreased 26% from $13,336
to $10,000. As we may assume that the rates have not decreased, this
might be due to the decrease in the number of commercial establishments
which followed the period of commercial activity linked with the construction
of the port, and of the current stagnation in that activity.
The Aqueduct Section revenues (water tax collection) increased 18% from
$29,503 in 1962 to $35,000 in 1968, reflecting an increase in both the rate
and the number of dwellings.
Sales tax revenues in the General Section of the exogenous group increased
from $60,904 in 1962 to $111,180 in 1968, an increase of 82%. (This tax
is a specific problem because it relates to the financial policy of the
Provincial Government). Part of this increase reflects a general rise
in prices during the time period.
Interest gained, amusement tax, fines, etc., are rather irregular revenue
items, and only contribute about 3% of total revenue.
Subsidies contain provincial subsidies to municipalities for special pur-
poses, sometimes on a cost-sharing basis. (Again, its amount is likely
to vary from one year to another, but winter-road clearance subsidies are
quite normally granted, as is fire prevention.) The value of subsidies
received in 1962 amounted to $13,757, but the subsequent amounts fluctuated
from a high of $55,845 in 1963 to a low of $5,769.
Subsidies on aqueduct account also varied, but have been decreasing, from
$8,307 in 1966, to $5,500 in 1968.
The total of budgetary revenues, including all endogenous and exogenous
items, increased 28%, from $465,226 in 1962 to $602,715 in 1968. Since
E -16

the population increased hardly at all, the increase in the revenue burden,
mainly from the taxable revenue of the population, seems quite significant.
This point will be elaborated upon somewhat more fully later, when the
specific services provided by the city administration are discussed.
b. Budgetary expenditures
Six expenditure groups were analyzed, on the presumption that in a develop-
ing municipality, new construction, including sewers, roads, utilities, and
service extensions represent a heavier burden and occupy a much more sig-
nificant share in municipal expenditures than is the case with old settled
communities. Port Cartier, with its development phase in 1958-1968,
shows an increasing debt structure and nn increasing burden due to social
welfare and administrative expenses. The major expenditure items are:
1. Administration
2. Technical Services
3. Security
4. Welfare and Recreation
5. Debt payments
6. Capital Outlays
Administration. Total expenses rose slightly from $99,980 in 1962
to $103,700 in 1968, but they varied from a low of $92,705 in 1964
to a high of $125,091 in 1965. This variation derives from
increases or decreases in spare-time or professional services;
salaries have been going up steadily, showing a total increase of
65.7% from 1962 to 1967. This may be an indirect welfare subsidy to
local residents, but it is felt that the administration could try
to improve the efficiency of its services and should concern itself
much more with forward planning.
Technical services. The largest expenditure item, this pertains to
services which the city provides in road clearance and maintenance,
refuse collection, etc. The total outlay varied from a high of
E-17

$264,048 in 1966, to a low of $139,700 (estimated) in 1968. While
salaries were rising, road repairs, winter snow removal, and machinery
maintenance were the most unstable items.
Security. The largest expenditure item in this area is made up
of salaries, which increased from $42,657 in 1962 to $55,363 in
1967; the maintenance of vehicles, the second-largest item, showed a
doubling of cost in the same time period.
Social Welfare and recreation. This is a relatively minor item
($5,106 in 1967), but recreation now occupies a pre-eminent position
in budgetary expenditures. Whereas the total outlay on both of these
amounted to $2,720 in 1962, this sum increased to a total of $91,791
in 1967. For 1968, the budgetary allocation for both items decreased
to $51,300, and is said to be planned to remain at that level. We
might mention here that unemployment is a federal matter and that
social welfare payments pertain to provincial jurisdiction.
Debt payments. These payments comprise interest payments and bond
redemptions, and reflect some of the development problems of the
city. The total value of interest paid increased from $19,179 in
1962 to $41,606 in 1967; the redemption of bonds increased from $1,500
in 1962 to $19,600 in 1967. We must also emphasize that the total
indebtedness of the city increased significantly during the period
in question, the total amount outstanding in 1970 amounting to $769,500.
The share of the debt-servicing burden in the total budgetary expen-
ditures increased from 6% in 1962, to 14.2% in 1968. This burden
will continue increasing until it reaches 26.5% in 1972 (projected).
Capital equipment. Outlays on capital equipment varied significantly,
from a low of $25,068 to a high of $90,589 in 1964. It seems that
this variance shows a lack of forward planning, which would permit
the administration to budget its resources more efficiently, by way
of a continuous but slow rate of growth for the acquisition of cap-
ital equipment.
E -18

Having, in a sense, become a "mature" town (after the completion
of the Q.C.M. investment project), at least from the viewpoint of
that phase of its development, the town now faces the task of replacing
temporary structures (wooden bridges, sidewalks, etc.) by permanent
structures (concrete bridges, etc.)
E.4.2 Trade and Commerce
The infrastructure reflects the changeover from a traditional village to a
modern point of loading of staples and unloading of merchandise and goods,
which are required to sustain this operation and to provide the population
with the requirements of daily life.
The development of commerce in Port Cartier has been subject to the com-
petition of the establishments in Sept-Iles. Data, gathered from ques-
tionnaires, indicate that Port Cartier retailers lose substantial trade
to competitors in Sept-Iles or by way of catalogue selling. It seems that
the major problem lies in the fact of a relatively young population with
sufficient income, being faced with old-fashioned merchandising by indi-
geneous tradesmen, which results in spending the incomes earned in
Port Cartier in outside centers.
Census data indicate that the total value of retail sales in Port Cartier
amounted to $2,091,000 in 1961, in 23 stores, for a population of 3,458.
Baie Comeau, with a population of 7,956, accounted for retail sales values
of as much as $11,050,000. Sept-Iles, with a population four times that
at Port Cartier, had retail sales value of $21,916,000 in 1961. These
comparative figures indicate the relatively ineffective and uncompetitive
nature of Port Cartier commercial enterprises (given that the income
levels in the three areas are comparable.)
E.5 SOCIAL-ECONOMIC-ENVIRONMENTAL CHARACTERISTICS
E.5.1 Background
The North Shore of the Gulf of St. Lawrence is an underdeveloped area,
consistently dogged by high unemployment and (until the 1960's) limited
E -19

investment capital. The employable inhabitants were engaged in small
foresting operations, hariresting the wealth of natural forest in the area
or existing at a subsistence level on hunting and trapping in the interior
and fishing in the salt water of the Lower St. Lawrence River. By 1930,
however, most of the young men were working in the new pulp mills dotted
along the coastline. Interest in fishing for a livelihood began to decline
and today the attractions of higher wages,. an easier life in industry,
and the prohibitive costs of shipping small parcels of fish to distant
markets has relegated the fishing industry in Port Cartier to little more
than a local operation.
In Shelter Bay, wood-cutting and ship-loading operations of Quebec North
Shore Paper provided reasonably steady employment for a good percentage
of the village, but the waning interest in world markets for this commo-
dity and the growing inaccessibility of new stands of timber were making
the Port Cartier location more and more unattractive to Quebec North Shore
Paper. In 1957, the Company decided to abandon their operations in
Shelter Bay and moved to the Manicouagan and Outardes basin.
In the meantime, American capital has been flowing, in increasing volume,
into the development of the huge Eastern Quebec and Labrador iron-ore
deposits. Sept-Iles, Wabush, and Shefferville were opened up, and when
Quebec Cartier Mining decided to locate their mining headquarters and
shipping facilities in Shelter Bay, there was no doubt that the decision
was welcomed by the majority of residents.
Unfortunately, human frailty was to play a major part in frustrating
some of the high expectations of the villagers. One of the problems
which emerged from interviews with Quebec Cartier Mining officials was
that of integrating the then-existing work force into the new jobs which
had become available on the railway and in the port and offices. Quebec
Cartier Mining instigated a program of industrial re-training to enable
the residents to take up their new positions. At the same time, labor
was urgently needed to carry out the many building projects associated with
the new developments. ' ,The training program was, therefore, not as successful
E-20

as anticipated, because the local people elected to abandon the training
school in favor of the fast money to be obtained on the construction
sites. When construction began to taper off towards completion, these labor-
ers demanded jobs within Quebec Cartier Mining's ol -,erations. However,
they were unskilled and the company refused to employ them, suggesting they
resume their training. Unfortunately, skilled immigrants had replaced
them in the training schedule and the local inhabitants were relegated
to their original unemployment state.
The limited ability of the industry to absorb unskilled labor - because
of the high degree of automation employed in both the rail and port operation
- did nothing to alleviate the situation. Even the expansion of the port,
by the incorporation of the grain transfer installation, required only an
additional fifteen men.
In 1970, the Municipality of Port Cartier initiated a socio-economic study
to be prepared by Bemer, Inc. The purpose of the study was to gain an
understanding of the physical and socio-economic structure of Port Cartier,
preparatory to the yet-to-be-published companion volume "Concept d'Amen- ,
agements" which will present a master plan for future development.
The impact on the population of the Quebec Cartier Mining operation and
the new port comes through in the social inventory of this study and it
can be seen that the transition from sriall village to town was not a smooth
one for the local inhabitants. 'Furthermore, Port Cartier seems to have
reached a stagnation point, because no major industrial enterprise, was
attracted; the port is not becoming a major harbor for grain transship-
ments; and no major subsidy programs were forthcoming. However, the port
capacity is only half utilized; opening of the planned new mine means an
expansion of the port activities is imminent; and a dissolving-pulp-mill
operation by Rayonnier (a branch of I.T.T.) involving a total investment
of $500 million by 1986 was recently announced.
E -21

E.5.2 Demography
The town was divided into four areas, numbered 1 to 4 on Figure E-2,
roughly parallel to the evolution of the village. This division is a
fortunate one, as it emphasizes the differences of environment, social
background, wealth, and development, as well as the geographical dif-
ferences within this small town. A sample crossection of residents repre-
senting the population density in each area were issued simple questionnaires.
The results were processed by computer and in March 1971, the final report
was submitted to the Municipal Government.
For easy reference, Sector 4 comprises the entire Q.C.M. development on
the eastern side of the river, and of the three remaining sectors on the
western side, Sector 3 represents Q.C.M.-influenced expansion.
a. Population
Port Cartier's population has been quite stagnant since 1961; from 3,458
in 1961, to 3,547 in 1966 (and a projected increase to 3,618 in 1971)
-- about 6% during a ten-year period -- is not the sign of a flourishing,
dynamically growing industrial community. Compared with the rate of growth
of Sept-Iles, of over 250% during the same period, Port Cartier seems
regressive.
1956 1961 1966
Sept-Iles 5,592 14,196 18,950 Port Cartier N/A 3,458 3,537 Bale Comeau 4,332 7,956 12,236
However, since the major boost in its development was due to the Q.C.M.
project, including the port facilities, any additional rapid rate of increase
in the population, would have to depend on the inflow of additional (pos-
sibly manufacturing) industries. The analysis of Port Cartier's popula-
tion is available in some detail. Some 70% of the families now residing
in the town came from outside the "North Shore" area:
E -22

5 Years or Less
510 9 sr ears
10 Years and Over
rovil -4■-■
NIIIL ON r eve
.15 r 24
3 2 6 4 re, 4 ■ •••••4 I • 4 Irlr•••'4 •••• • ■ •••4
IF41-•-• • • 4 • 4 t .4
.41. • Ili I ' •••4 • • 7 4 • 4 q 8 4 • • 4 ; 1 •
0 • •.41„ il • 4 • .•744 • 4 •
■ 4 6 4 ■ 4 4
4 4
:::.: te.• /
1 ..... • 4 •.. a
1151 re
100
t 50
0
10 Years and Over
6 to 9 Years
5 Years or Less
I 1
37
7 8
94
• is •
....... . 2 5 . • .: .• . . . . .
: . X 6 )4.
100
4, 2 50
M;62Si
Over $6,000
$3 — $6,000
Under $3,000
10
24 34 29
73
76
2 7
FIGURE E-3 DEMOGRAPHY OF PORT CARTIER TOWN
1
SECTORS
2 3 4
a) Years of Residence in Port Cartier
b) Education of Head of Fami y
c) Incomes
d) Home Ownership
Rented
1771 Owned
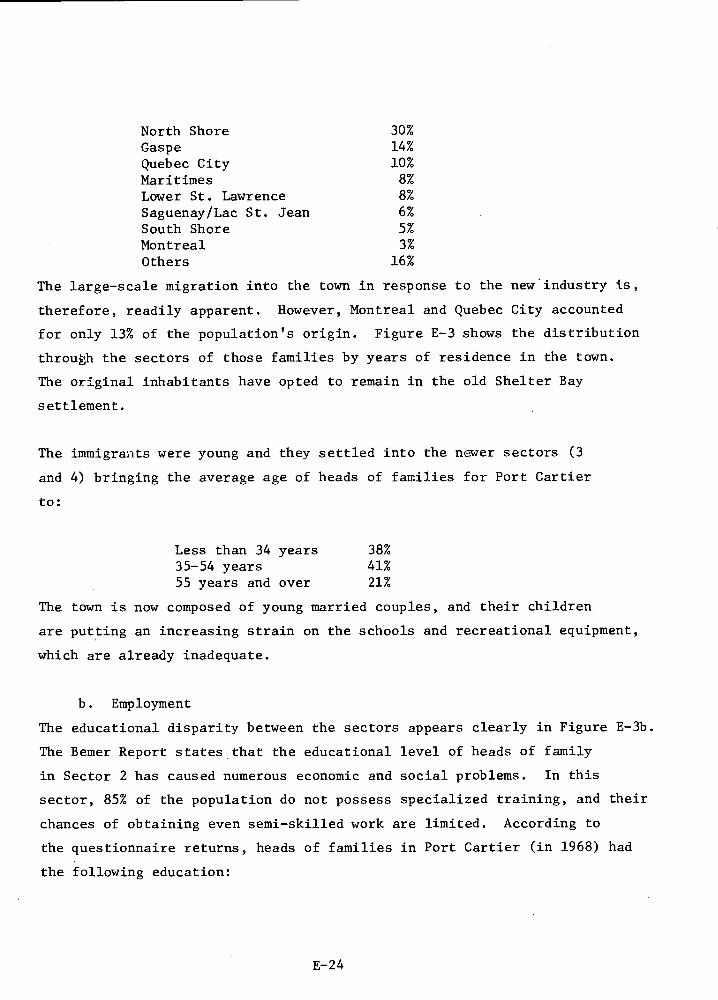
North Shore 30% Gaspe 14% Quebec City 10% Maritimes 8% Lower St. Lawrence 8% Saguenay/Lac St. Jean 6% South Shore 5% Montreal 3% Others 16%
The large-scale migration into the town in response to the new . industry is,
therefore, readily apparent. However, Montreal and Quebec City accounted
for only 13% of the population's origin. Figure E-3 shows the distribution
through the sectors of those families by years of residence in the town.
The original inhabitants have opted to remain in the old Shelter Bay
settlement.
The immigrants were young and they settled into the newer sectors (3
and 4) bringing the average age of heads of families for Port Cartier
to:
Less than 34 years 38% 35-54 years 41% 55 years and over 21%
The town is now composed of young married couples, and their children
are putting an increasing strain on the schools and recreational equipment,
which are already inadequate.
b. Employment
The educational disparity between the sectors appears clearly in Figure E-3b.
The Bemer Report states that the educational level of heads of family
in Sector 2 has caused numerous economic and social problems. In this
sector, 85% of the population do not possess specialized training, and their
chances of obtaining even semi-skilled work are limited. According to
the questionnaire returns, heads of families in Port Cartier (in 1968) had
the following education:
E -24

junior matriculation or more 24% 10th grade and 11th grade 14% 6th to 9th grade 42% 5th grade or less 20%
Those below 34 years of age have a higher level of education than those
above 34. The level of education descends with the age of the population.
Women have mostly between 6th and 9th grade, but the younger women also
have higher levels of education. It is interesting to observe that the
labor force with the highest level of education prefers living in Sector
4 of the town.
As to professional training and qualifications, the largest number of the
labor force comprises blue-collar workers (50%); the second largest
are white-collar (23%); then the group of professionals and technicians
(22%); and, lastly, sundry and unaffiliated (5%).
Of the population 82% were reported to be employed; 8% were reported unem-
ployed; 6% were reported on pension; and 4% were reported incapacitated.
Of the labor force, 39% worked in Port Cartier itself, and 44% in the
port or for the railways, while about 9% of the labor force reported having
second jobs.
The distribution of earnings for heads of families (Figure E-3c) is as
follows:
Less than $3,000 17% $3,000-$6,000 18% $6,000 or more 64% Not declared 11%
Sector 4 of Port Cartier is inhabited by the highest income group;
Sector 2 by the people of the lowest income group. The older age group
also belongs to the lowest income group, probably because it has the lowest
education level. Unemployment in 1968 amounted to 14% mostly in the older
age group, and again predominantly in Sector 2.
E -25

c. Housing
The dwellings in Sectors 1 and 2 of Figure E-2 are the oldest in Port
Cartier. Principal construction material is timber and shingles. The
outside appearance and general quality of buildings is distributed almost
uniformly by sectors. In Sector 2, 40% of the housing is more than 35
years old and their state can be called medium-to-bad. In Sector 1, the
proportion is 23% and the state is medium-to-good, as it is in the older
southernmost half of Sector 3. The other half of Sector 3 and the whole
of Sector 4 are in good condition. 58% of the population min their min
home. The balance rent their housing principally from Q.C.M. which is
responsible for most of the new housing construction in the town.
The proportion of privately-owned dwellings is increasing as a result of
purchase agreements between the residents and Quebec Cartier Mining.
Figure E-3d shows the ownership by area. In Sector 4 -- the highest rental
area--the cost of rent is relatively low for the type of housing available.
Housing quality then, tends to accent the socio-economic gaps between the
east and west sides. The careful planning encompassing shopping amenities,
green spaces, and recreational centers in Sector 4 differ sharply from
the unplanned and crowded conditions existing in Sectors 1 and 2. Sec-
tor 4, which is very much a Company sector, is segregated into top,
middle, and lower management by street, housing quality, and location
in relation to seafront.
d. Integration
The majority of families in Port Cartier immigrating into the area settled
into Sectors 3 and 4. These immigrants retained a degree of flexibility
in their choice of location and when questioned, 76% (Sector 3) and
57%(Sector 4) expressed the intention of remaining in the town. Those
intending to leave gave as reasons:
1) the need of higher education for the children; and
2) desire to live in a larger city.
E -26

The people in Sectors 1 and 2 were more content to remain in Port Cartier
and the percentage increased sharply with age.
There seems to be little social integration between the east and west
side of town, the original residents maintaining a closed circle of friends,
while the immigrants, separated by background and language, tended to form
their own friendships through the working milieu of the heads of the
house.
An interesting statement on environmental conditions arose when the
residents were questioned on re-location within the town. The foremost
reason for re-location was dissatisfaction with the environment, followed
by dust pollution, and size of housing, with Sector 2 expressing the great-
est discontent.
This feeling has arisen with the advent of new and better houses in the
east side giving some basis for comparison.
e. Leisure
Family entertainment in Port Cartier is centered around the home and
family. The following list gives the leisure occupations most enjoyed by
the population:
Regularly Occasionally
1. Television 83% 16% 2. Lectures 52% 39% 3. Leisure Driving 45% 39% 4. Evening with Friends 22% 71% 5. Hunting & Fishing 42% 26% 6. Evening with Relatives 22% 46% 7. Spectator sports 28% 33% 8. Sports Activity 30% 26%
Although lectures rank high on the chart, this may be a distorted response
as it is hard to reconcile the high lecture attendance with the population
composition. Visiting with family and friends seems to form a very impor-
tant function in the integration of the townspeople.
E-27

f. Recreation
When Q.C.M. planned the new east side of Port Cartier, provision was made
for recreation centers. The existing equipment in the east is located
in such a center containing a gymnasium, bowling alley with four lanes,
billiard room, and library. Exterior facilities consist of tennis
courts, children's playground, and a baseball field which in winter
converts to a skating rink. During the summer the center is monitored
by eight supervisors. This center is owned and operated by Q.C.M., but
there are no restrictions or membership requirements and the center is
open to the entire town.
Compared to those in the east, the west side facilities, which are owned
by the Municipality are sparse indeed. Outdoors they consist of a school-
yard with conventional children's playground equipment and a baseball field,
while a gymnasium borrowed from the school commission serves as the indoor
recreation center. This is monitored by one supervisor. A vacant lot
on Quebec North Shore property provides the only winter skating facilities.
Surveys reflected tl,e lack of equipment: green space was the primary
requirement of areas 3,2,1, and 4, in that order. About 57% of the
population would like to see more parks in the municipality, 42% would like
more group entertainment facilities, and 36% want more children's play-
grounds. On the neighborhood level, children's playgrounds seem to be the
most urgently required facility, particularly in areas 1,2, and 4.
g. Municipal Services
At the village level the services causing the most dissatisfaction were
the beach, traffic control, and parking. Some 49% of the population ex-
pressed unhappiness with the beach, but no reason is given in the Bemer
Report. A study of the sanitary water disposal map, however, shows that
most of the village's waste is pumped directly into the sea 50 to 100
feet offshore. When we visited the village, the prevailing weather condi-
tions (heavy snow) did not enable us to evaluate the beach condition.
It seems there is still some littering of the beach by pulpwood bark, des-
E -28

pite the long interval since Quebec North Shore suspended operations.
E.6 ENGINEERING APPRAISAL
When Quebec Cartier Mining was faced with mining and shipping Lac Jeannine
iron ore deposits, the first stage was to bring the ore down from the
remote interior to tie in with the transportation network operating
around the St. Lawrence River.
Basically, only two alternatives existed, linking with the established
railway system, or shipping through a point on the North Shore of the St.
Lawrence. Existing rail services on the North Shore came no further east than
the Saguenay River, and tying in on the Gaspe side would have involved a
ferrying operation across the St. Lawrence. Quoted costs for building
ra7lroads in the terrain involved, run as high as $1 million/mile. Ad-
ditional overseas shipment would have required either deepening and ex-
panding an existing port, or creating a new harbor.
A railroad had to be established between the minehead and the shipping
point. The additional distance to reach Bale Comeau made it economical-
ly unattractive. To make use of Sept-Iles would have necessitated building
a completely new wharf in the bay, or going in as a second (and possibly
junior) partner in an expansion of the existing iron ore shipment facil-
ities.
The Schefferville Railroad and the port were already running at a high
percentage of capacity. From Lac Jeannine, the natural routing of the
railroad came out in the vicinity of Shelter Bay close to both a shoal
area and a section with deep water to the shore line. Both of these were
suitable sites for establishing a new deepwater port.
Despite disclaimers from company officials to the contrary, it is unlike-
ly that there was no government influence either directly or indirectly
in Quebec Cartier Mining's decision to locate in the Shelter Bay area,
thus effectively replacing the departing Q.N.S. paper company.
E-29

E.6.1 General Description
The port is situated 3 1/2 miles east of the old Shelter Bay settlement
at Riviere aux Rochers. It consists of an A-shaped man-made excavation,
with one arm parallel to the shore line providing the berthing area,
the turning basin forming the apex, and the other arm providing the access
channel protected by a breakwater in the woutheast.
The two iron-ore berths (loading and stand-by) form the north wharf, while
grain vessels and tankers use the two southern berths. Anti-freezing
bubbler systems have been installed over the floor of the harbor basin. The
rail terminus is situated at the port site, and there is a general cargo
operation to serve the isolated population.
E.6.2 Design Concepts
The most significant single factor which determined the final design
of the port layout was the prevailing weather in the area. The harbor
had to provide year-round accommodation for vessels up to 100,000 dwt
that require a minimum of 50 feet depth at low water, with a 1,000-foot
berthing length.
Although the initial annual tonnage was 8 million, provision had to be made
for expansion to 40 million tons per year. Freight handling, receipt
of petroleum products, and the ability to bunker vessels also had to be
incorporated.
a. Weather
Analysis of the weather conditions was based on the preceding 50 years'
records, with special emphasis on the last ten years.
These studies revealed that for 78% of the year, the weather was not likely
to cause delay, but that of the remaining 22% any combination of following
winds over 35 m.p.h. from any direction; or crosswinds exceeding 20 mph,
on the approach channel; less than one mile visibility; and waves of eight
feet or more, outside the harbor, would close the port. This was considered
E -30

acceptable.
In winter, the prevailing NW wind would tend to minimize ice conditions at
the harbor entrance. Also, during the summer months, SE winds were suf-
ficient to build up waves which could have seriously affected the harbor
operation.
b. Choice of Site
The hydrographic charts of the area showed that deep water approached the
shore a few miles east of the old village of Shelter Bay and that a few
thousand feet east of this, there was shoal water offshore. These two
circumstances were of interest as they both offered the possibility of a
harbor site. The land space required for the railway terminal and the
port equipment was sufficient in both cases and the area was reason-
ably level. Intensive study was undertaken on both sites, consisting of
both echo and seismic sounding to establish depths and study the geological
composition of the bottom. Information collected by these studies led
to design of a possible terminal layout.
c. Evolution of the Harbor Concept
The study produced 15 different layouts of the harbor, of which eight were
of interest, as shown in Figure E-4. The proposal for the first site
was to build a harbor consisting of a dock protected by a breakwater
shown on sketch 1. The port installation was to advance into the river,
turn west and run parallel to the shore for 2,000 feet. It was decided
that the bottom could not support such a heavy structure, and both the
site and proposal had to be abandoned.
It became evident that the most practical concept would be the excavation
of an artificial harbor on the second site. Two different proposals for
the harbor on this site were considered:
1) A slip dock with an arrangement of breakwater at each side of the harbor entrance offered certain economic attraction (sketches 2,3,4,5); and
E -31

FIGURE E-4 PORT CARTIER DESIGN CONCEPTS
1.
8.
2.
3.
5.
4.
6.
E-32

2) The "A" dock, which was chosen because it would provide better protection (sketches 5,6,7,8).
It was then necessary to check the various hypotheses against a scale model
to determine wave action in the harbor area and also to study Modifications
to the harbor configuration. The hydraulic laboratory of the National
Research Council, Ottawa built a 1:120 model which consisted of movable
concrete sections. The test results were measured, recorded, and analysed;
then the outline of the harbor was modified and a new series of tests
run. With this material in hand, it was possible to product the final
design.
E.6.3 Final Design (Figure E-1)
In the final design, certain modifications had to be made on the beach
shape, particularly at the eastern side of the harbor. It was also found
necessary to extend the south dock further east (to protect against wave
action), and to enlarge the turning basin to facilitate ship maneuvering
in the harbor. The final design of the harbor also provided a possibility
for future expansion of the facility on the eastern side.
Arriving vessels are maneuvered into berth using two tugs. The bow
is positioned into the northeast corner of the turning basin, the stern
is swung, and the vessel berths stern first. The south dock knuckle was
rounded to act as a pivot for departing vessels maneuvering to line up with
the channel. Corrections were also made to the breakwater to direct waves
more toward the west beach.
There is very little room for error in either operation, and tugs are
essential, especially as the bubbler system discourages the use of anchors,
and their effectiveness would be limited by the very nature of the bottom.
The final dimensions of the port, including a wave-absorbent beach, gave
a frontage length of 5,500 feet, out of which 4,000 feet were usable as
a loading and mooring dock, integrated with 2,600 feet of graded beaches.
E -33

The 2,500-foot-long by 450-foot-wide inner harbor consists of two 1,000
feet ore-loading berths at the west end. At present, the south berth
has been rented from Q.C.M. for a grain transshipment point and--' with the
adjacent 450-foot-dock-- used for unloading freight and petroleum products.
The ore loader is located on the north side.
E.6.4 Construction
The berth is built with"Z"-type sheet-steel piling, bolted to three layers 3
of channel waling, dowelled into the rock. The piling was erected close
to the excavation and the lower part was filled with lean concrete. The 1
remaining area was filled with rock. The south dock was built with verti-
cal "strong backs" dowelled into rock at the bottom and connected to con-
crete anchor walls at the top.
A 1,500-foot mooring berth, which is on the northern side, consists of a a
wave-absorbent beach with concrete piers 130 feet apart. .c
A 1,000-foot-long breakwater was built of circular sections, 70 feet in
diameter, with height varying from 55 to 80 feet at the east side of the
harbor. The sections are rock-filled with concrete capping. The exca-
vation necessitated the blasting and removal of 925 million tons of rock.
This was approximately the volume required to construct the breakwater in
the wharf/breakwater concept, found economically unfeasible. The construc-
tion was conducted over a 2 1/2-year period and. at the time it was built,
Port Cartier Cartier was believed to be the largest artificial harbor in the world
to be built completely inshore.
E.6.5 Ore-Handling System ):
Port Cartier handling facilities for concentrated ore can be described
by the three major functions:
1) train unloading • 2) direction and storage of ore at the harbor; and 3) vessel loading.
E -34

A train of cars coming into the system is directed through the dumping
house. The flow of mineral is then carried by conveyor either to the
storage shed or directly to the oreloader. The ship-loading tower can
be fed from both sources or a combination of the two. However, the usual
practice is to reclaim the ore from the storage area.
The system permits some saving in operating costs, because shipment of ore
does not require utilization of the storage shed, conveyor, and re-
claimer system. Its utilization and rational would certainly be proven
with an increase in annual tonnage loaded.
Another feature of the system is its high degree of mechanization, requiring
only three men to run it. The first operator is located in the dumper
house, and retains control over the rate of feed of the train into the
rotary dumper and all subsidiary operations. The second operator at the
conveyor drive house determines the routing of the ore into the storage
or the shiploader, and controls both the feeding to and the reclaiming
from the storage building. He also controls the flow of ore from the
shed or dumping house to the surge bin. The third operator controls
both the loading tower, and the conveyor belts from the surge bin.
a. The Dumper House
The basic idea behind the design of the Port Cartier dumper was to pro-
duce a single automatic system to handle the two separate functions of
pushing and dumping cars.
The main advantage of this train pusher/dumper is that a train is
moved through this operation as a unit without uncoupling of cars and
without the use of locomotives. Thus, a train approximately 4,300 feet
long, carrying about 11,250 tons of ore can be discharged in about three
hours.
When a train arrives, the locomotive is disengaged and passes through to
go for servicing. The train is then automatically advanced car by car
through the rotary dumper. At this point the ore is screened, and any
E -35

rejected ore receives further crushing, before re-entering the system.
b. Transportation and Storage
An overhead conveyor carries ore from the dumper house to the shed.
This shed has a capacity of 400,000 tons and is so located that it may
be expanded by at least 100 percent. Provision to store ore outside the
building has also been made for emergency stockpiling, in case of unfore-
seen delays in shipping. -
_ -
From the overhead conveyor -- which covers the full length of the building--
ore is distributed by a tripper which automatically fills the building
to a predetermined height.
The ore is reclaimed through 50 vibrating,feeders, located in tunnels
under the storage building. They withdraw ore from any part of the building
and at any rate desired. This operation brings ore to the shiploader
gallery conveyor and tipper, which delivers the ore directly to the
shiploader. An interesting feature of the shiploader gallery is a radio-
active sensing device which moves the tripper in unison with the ship-
loader, eliminating any mechanical connection between the two.
c. The Shiploader
The shiploader, consisting of a vertical swing boom, retractable shuttle,
and stationary hoist tower unit, was chosen because of its ability to
move, and its flexibility to suit a great range of vessel dimensions. It
is designed for a loading speed of 6,370 tons/hour of concentrated ore.
The structure, which moves horizontally on rails, is 118 feet long by
48 feet wide and weighs some 650 tons. It can move at a speed of 76
feet/minute parallel to the face of the loading dock.
To give sufficient reach for the larger vessels, the boom is retractable,
has an extension range of 50 feet and a maximum reach of 80 feet from
dock face. It extends laterally at a speed of 23 feet/minute and can
be raised or lowered within a 30° arc. This shiploader has proven suc-
E -36

cessful in operation, offering good accuracy for positioning over the hatches
and flexibility for trimming the ship.
Port Cartier is a good example of dynamic engineering applied to a ship
terminal operation. The modern handling equipment was designed for an
initial annual capacity of 8 million tons a year, but provides for an
increase in annual shipment up to 40 million tons. This can be done through
a stage readaption program, such as the addition of another shiploader
and upgrading of the mechanical plant.
All conveyors are covered, to facilitate ore handling during winter.
The maneuverability of the loading tower, and the ship size currently
calling in Port Cartier eliminates both ore spillage during loading
and any dredging to recover it.
E.6.6 Harbor Pollution
Our efforts to obtain information on remembered or documented pollution
of Port Cartier Harbor turned up only negative evidence. There does not
appear to be a "resident ecologist", and the corporate nature of the town
would tend to make the obvious sources of information on the village level,
such as Town Council, city fathers, and harbor personnel, reluctant to
divulge what they may know. Again, the private ownership of the port
means it is outside the jurisdiction of any National or Provincial Har-
bors Board. Actual water pollution within the Seaway and St. Lawrence
River comes under Federal Government control but to our knowledge, there
have not been any studies conducted in or around Port Cartier.
When we brought up the topic of pollution with Quebec Cartier Mining
officials, they were quick to reassure us that there had been no pollu-
tion from any of their operations and that they were quite ecology-
minded. The newness of the facilities, the semi-automatic loading
gear, and the 50% utilization of the port would seem to bear out this
claim. When we visited the port, the "Chelsea Bridge" was loading iron
ore for shipment overseas. Visual observation detected no obvious pollu-
tants such as oil slicks or floating debris, which sometimes accompany
E -37

ships.
Indeed, it is difficult to see in what manner the harbor could be pol-
luted at this stage of the development. The number of vessels calling at
the port during a year is such that any human effluent discharged within
the harbor would tend to be dispersed with little or no damage to the
marine ecology.
In summation then, we must reach the tentative conclusion that no serious
pollution occurs within the harbor.
We did notice non-toxic grain dust around the grain elevators, but the
location of the port relative to the tnwn (3-1/2 miles distant) should
allow the dust to dissipate before it reaches the town. However, there
were complaints concerning dust from some residents.
E.7 SHIPPING ECONOMICS VIA PORT CARTIER
E.7.1 Iron Ore
The relative stability which had prevailed for a long time in iron ore
trade, with traditional partners trading in logical geographical pat-
terns , has recently been upset. The remoteness of Japan (a major con-
sumer) and Australia(a new major supplier) was the basis for a snowballing
sequence of events which has propelled the shipping of iron ore into the
super-carrier range. Australia could have supplied Japan at competitive rates
in moderate sized vessels, say 30,000 tonners. However, new, large scale
deposits permitted Australian producers to create super ports at the start allowing
them to sell economically to the more distant markets. The side efect of this
was to give Japan very favorably priced ore, and consequently steel, as
transportation is a relatively large portion of the ore's delivered
cost. Economies of scale had to be introduced by the other consumers to
remain internationally competitive. Super ports are now being created
in the major steel producing areas in Japan and Europe, a lesson not to be
lost on the U.S., and the source countries are being obliged to match
E-38

this to remain competitive. Basically, then this means that Canada
has the opportunity to sell to previously non-traditional markets if it
can keep abreast of the super-carrier revolution.
Besides some scattered deposits in British Columbia, where iron ore
is mainly a by-product, Canada possesses two major workable reserves
of iron ore. One is in northern Ontario and the other on the Quebec-
Labrador border. Low transportation costs make the Labrador Trough the
major and largest Canadian source of ore exports.
This ore is loaded at the Northern St. Lawrence ports of Sept-Iles
and Port Cartier, the greater part being destined to the U.S. Great
Lakes, in vessels suitable to the St. Lawrence Seaway. The balance
has moved principally to Western Europe and to the East Coast of U.S.A.
When created, Port Cartier was, for that period, a super port. Although
tanker sizes were growing rapidly, the concensus then was that dry bulk
vessels would not keep pace, especially with the slowly increasing capa-
city of European countries which had limited facilities capable of
handling vessels of 60-100,000 dwt.
These limitations were not serious at the time since the U.S. East Coast
ports were also restricted to about 60,000 dwt bulk carriers.
Establishing a super port on the U.S. east coast with reasonable access
to the major steel producing area, could tip the relatively delicate
balance which presently favors shipment via the St. Lawrence Seaway.
In this respect Port Cartier could find itself in a relative backwater.
The port was developed with the capability of handling 100,000 dwt carriers
compared with 75,000 dwt at Sept-Iles. Two major contracts with Japan
and Europe, for Canadian ore, have recently been negotiated. These
involve a total of 150 million tons ex Sept-Iles over 15 years, and
six million tons ex Port Cartier over five years. Thus was prompted
E-39

the large expansion project of Sept-Iles, at a cost of $290 million,
to handle up to 250,000 ton vessels.
The shipments from Sept-Iles to Japan will be tied in with crude oil
backhaul, feeding the new Golden Eagle Refinery at Quebec, and provide
Sept-Iles with an opportunity to install a "lightening" or transshipment
facility for the inbound tankers which have draft limitations to Quebec.
Compared to Sept-Iles, it appears that the cost of the planned expansion
to bring Port Cartier into the super-carrier age will be high. The cost of
the necessary excavation to the east could be offset by leasing the
existing ore-dock to the I.T.T. for the pulp mill. Of the original har-
bor, only the approach channel and turning basin area would be used
by Q.C.M. which casts a doubt on the decision to locate at the site rather
than extending the railroad approximately 15 miles to the deep water in
Sept-Iles Bay. Furthermore, as pointed out in Section E-5, in the
long run little was done to alleviate unemployment at Shelter Bay. Finally,
excavated harbors appear somewhat inflexible, thus vulnerable to un-
foreseen technological change.
In order to test the economies of scale we have calculated the savings
for a range of bulk carriers on various routes with Canadian iron ore
and grain shipments ex Port Cartier. This has not been confined to
ports that could handle specific classes and size but makes hypothetical
assumptions to determine the size of carriers that could generate
transportation savings.
For transport to New Orleans, Philadelphia, Rotterdam Range and Yoko-
hama Range, we have tested bulk carriers ranging from 30,000 tons dead-
weight to 250,000 tons deadweight, at a speed of 15 knots. Our approach
has been to analyze these vessels on each of the routes for the round
voyage. We have not introduced any backhaul cargoes in our calculations
such as oil from Persian Gulf to U.S. or Europe for vessels trading to
Japan. We have assumed new vessels, operated under British Flag rather
E-40

than vessels under flag of convenience which would have had lower
daily operating costs. The following daily cost have been estimated
(Table E-1).
TABLE E-1 : Bulk Carriers Daily Cost , U.S.$
D.W.T. SIZE TYPE SPEED DAILY COST (Excl. Fuel)
30,000 dwt bulk carrier 15 $ 3,850
50,000 dwt MI 15 4,380
70,000 " tir 15 5,490
100,000 " ,, 15 6,135
150,000 " Ore/Oil 15 8,515
200,000 " it ,, 15 10,175
250,000 " It ,, 15 12,020
24,750 " Lake Bulk Carrier 15 5,420 (Canadian flag)
For vessels up to 50,000 dwt trading to Japan, we have assumed routing via
the Panama Canal both ways whereas 70,000 dwt would go via Panama in
ballast only. In the loaded condition vessels of 70,000 dwt and over
are routed via Cape of Good Hope and Malaca Strait. The 250,000 dwt ship
would be routed via Lombok Strait when fully loaded but could ballast
via Malaca Strait.
The following costs cannot be compared to present day freight rates as
they do not introduce market fluctuations nor do they include the oper-
ator's profit margin.
E -41

TABLE E-2 : Ore Transportation Costs
(U.S.$ Per Long Ton of Iron Ore)
Port Cartier to: N.Orleans Phildelphia Rotterdam Yokohama
Distances 2,700 miles 1,400 miles 3,000 mi. 10,500 - Panama 15,200 - Cape
Size of Carriers
30,000 dwt $ 3.11 $ 2.21 $ 3.22 $ 11.82 *
50,000 " 2.24 1.63 2.34 8.29 *
70,000 " 2.07 1.52 2.15 8.55 **
100,000 " 1.72 1.29 1.78 7.71
150,000 " 1.71 1.33 1.77 7.16
200,000 " 1.68 1.34 1.75 6.68
250,000 " 1.74 1.40 1.80 6.54
* Panama Canal
** Loaded Via Cape
It is obvious from the above figures that the relationship between dis-
tance and port time on the various routes is a very important factor
which sets the different optimum sizes for each. For instance the above
table indicates that vessels of over 100,000 dwt from Port Cartier to New
Orleans and Philadelphia are not attractive, even without including
inventory and storage costs. On the Rotterdam movement, marginal savings
are possible up to 200,000 dwt, but the 100,000 dwt here again could hold
its own. Definitely, 250,000 dwt vessels reduce substantially the trans-
portation costs on the Port Cartier/Japan route. With an ore/oil carrier
of this size, backhaul cargo such as oil from Persian Gulf would fur-
ther reduce the ore costs by about $1.00 - $1.50 per ton.
E -42

Rates from Sept-Iles to Japan should be identical to those produced for
Port Cartier.
E.7.2 Grain
Both U.S. and Canadian grain exported via the Seaway and the St. Law-
rence are potential business for the Port Cartier facilities. The
Canadian Wheat Board has options on a large percentage of the Port Car-
tier storage but as these are not always taken up, considerable U.S.
corn passes through the port. Competing alternatives exist but the case
is more clear cut with U.S. origin grains. The destination is of course
a prime factor, but potential alternatives are by rail to Atlantic ports
or by barge via the Mississippi to Gulf ports. U.S. grains tend to
follow the least cost route whereas the fate of Canadian grain is, until
loaded on the ocean vessel, in the hands of the Canadian Wheat Board,
whose selling policy can offset geographical differences in delivery cost:
it is not unusual for European-bound grain to be shipped via B.C. ports.
This can mean the loss of what could have been potential traffic for the
St. Lawrence system and consequently Port Cartier. In our calculations
we have only compared Port Cartier to other St. Lawrence route alternatives.
Basically the entire St. Lawrence River area is considered as one origin
for grain fixtures. The normal freight differential on St. Lawrence
grain runs between $3.50 and $4.30 compared with shipments ex Great
Lakes. Port Cartier grain is offered at a further l5c to 35C freight
reduction to the ship, and this has been maintained even when fixtures
have included Baie Comeau in the options.
This is no inducement for vessels to fix ex Port Cartier especially
as the majority of the vessels, loading grain out of the St. Lawrence
River are "open" from their previous trade in the area. In addition,
the average grain cargo size runs around 20,000 tons and therefore suffers
no draft restriction. Finally, Port Cartier may be considered in prac-
tice as a one stevedore port, which further discourages some shipowners
from taking a fixture there on a "gross basis."
E -43

Port Cartier's potential at the moment is in vessels fixed from outside
the U.S. Gulf area, and in the future will be realized to an even greater
extent when larger carriers come into the trade. Unfortunately, the lack
of a rail connection to the west limits grain to a seasonal operation,
as barge and laker operations are stopped in winter.
To illustrate the economics of Port Cartier for large bulk carriers, we
have calculated the transportation savings on Canadian Grain from the
Lakehead (Fort William, Thunder Bay area) when shipped via Port Cartier.
Using the same type of vessels as on the iron ore trade, we have assumed
that the 30,000 dwt vessels, with the Seaway limitations could load
port cargo in the Lakes, i.e., up to maximum draft of about 25 feet
and then would top-off in Port Cartier to full draft.
Normally, bulk carriers (specially designed) for the Seaway and Great
Lakes, carrying the grain down to the lower St. Lawrence deep ports, are
restricted to 34-35 feet channel depth as far as Quebec. These same
vessels backhaul iron ore for Canadian and U.S. Lakes ports.
Our calculations indicate that a typical Lake bulk carrier of 24,750
dwt at $5,420/day can carry grain from Lakehead to Port Cartier and
return in ballast for $5.60 including discharging in Port Cartier, seaway
tolls, insurance, etc. Present freight rate from Lakehead to Port
Cartier is quoted at about $5.50/ton discharged in Port Cartier. Re-
loading charges into Ocean vessels in Port Cartier is about $0.40 per
long ton.
It must be understood that freight rates for grain are quoted basis
Port Cartier only, and smaller vessels could quote for a differential
if loading at Lakehead. Physically, Port Cartier can handle the 50-60,000
ton grain cargoes required to compete with the topping off system and it
is possible albeit bold to visualize many larger cargoes to one specific
area at a time.
E-44

Port Cartier to:
Size of Carriers
30,000 dwt *
50,000 dwt
70,000 dwt
100,000 dwt
Rotterdam
$ 9.44
8.60
8.47
8.13
Yokohama Range
$ 18.40
15.01
15.41 **
14.66
TABLE E-3 : Grain Transport Costs
(U.S. $ Per Long Ton)
I. 30,000 dwt Loading in the Lakes, topping off at Port Cartier
Port Cartier to: Rotterdam Yokohama Range
Bottom cargo 17,200 T 17,200 T
Top-off 12,000 T 11,375 T
Basic haulage cost $6.19 $15.32
Top-off cost @ $6.00 over whole cargo 2.47 2.39
$8.66 $17.71
II. Full Grain Cargo ex Port Cartier in larger ocean carriers
with $6.00 Surcharge
* For smaller sizes it is more economical to load bottom cargo in the Lakes than to load full cargo in Port Cartier
** Via Cape of Good Hope.
E -45

APPENDIX F
AUSTRALIA

F.1 SUMMARY F-1
APPENDIX F AUSTRALIA 22Et
F.2 AUSTRALIAN PORT DEVELOPMENT AND STRUCTURE F-4
F.2.1 General F-4
F.2.2 Bulk Ports F-6.
F.2.3 Port Management F-7 ,
F.3 PORT OF GLADSTONE, QUEENSLAND F-9
F.3.1 Background F-9
F.3.2 Queensland Alumina, Ltd. F-16
F.3.3 Geography and Surf icial Character F-20
F.3.4 Demography F-21
F.3.5 Land Use F-22
F.3.6 Environment F-24
F.3.7 Costs and Benefits F-25
F.3.8 Port Developments and Operations F-26
F.3.9 Pollution F-34

LIST OF FIGURES
Figure Page
F-1 Australian Ports of Call and Cargoes Handled F-5
F-2 Total Cargo Passing through Gladstone, 1954 to 1970 F-11
F-3 Gladstone Zoning for Industrial Expansion F-23
F-4 Auckland Point/Barney Point Development F-28
LIST OF TABLES
Table Page
F-1 Cargo Statistics, Port of Gladstone, 1959 to 1970 F-12
F-2 Capital Investment in Gladstone, 1960 to 1970 F-13
F-3 Queensland Alumina, Ltd., Plant Site Criteria and Ranking F-16
F-4 Plant Capital Costs for the Port of Gladstone F-17
F-5 Revenue Account for the Port of Gladstone F-31
F-6 1964 Balance Sheet for the Gladstone Harbors Board F-32
F-7 1970 Balance Sheet for the Gladstone Harbors Board F-33
ii

APPENDIX F
AUSTRALIA
F.1 SUMMARY
A literature survey and a brief exchange of correspondance has yielded a
limited picture of the fast-changing situation at Australian bulk ports.
Over the past decade, Australian ports have been confronted with two
major changes: the unitized general cargo (to which they responded most
effectively), and a huge increase in long-haul ore and coal exports,
first to Japan and now to Europe. Contrary to the experience of other
countries, port deepening and new deepwater terminals were not supported
by long-haul crude oil (which is imported in limited quantities), compared
to the movement of coal, iron ore, bauxite, and their concentrates or
derivatives.
The increase in size of bulk carriers has been generally ten years behind
that of tankers, but the advent of combination carriers (ore/oil, coal/
oil, and ore/bulk/oil) has accelerated this evolution over the past few
years. Australia expects 250,000 to 300,000 dwt vessels, but the 100,000
dwt class will provide the bulk of the fleet, particularly for domestic
traffic, unless the Great Barrier Reef Pass is deepened considerably.
Most ports are public, and administered by the seven individual States,
or the Federal Government for the Northern Territory. Local authorities
belong to three types: autonomous Harbor Trusts, a Maritime Board super-
vising several major ports (New South Wales), and Harbor Boards elected
by local interests. National coordination appears limited to liaison
through the Australian Port Authorities Association. Government (mostly
State) subsidy plays a substantial role which has not been quantified,
essentially in the financing of infrastructure.
F-1

Dampier and Port Headland are the deepest of the new ports, but their
most recent experience could not have been appraised without a field
trip. Of the three ports contacted--Newcastle, Port Kembla and Gladstone--
each handling coal and ores at more than 10 million tons per year, only
Gladstone sent data in time.
Although Gladstone is not a very deep port (two berths have 40-foot
depth, with 9 feet to 11 feet more at high tide), the authorities are
considering dredging it for 100,000 dwt. The port is interesting because
of its rapid growth from a sleepy 12th place (in 1968-1969) to a current
4th in cargo traffic, and the variety of commodities handled (coal,
bauxite, alumina, and grain). Queensland Alumina, Ltd (Q.A.L.) invested
$240 million in an alumina plant between 1964 (600,000 T/y) and 1970
(1,275,000 T/y), and plans to again double plant size by 1972 (at $150
million additional cost). This, and the reopening of two coal mines
(in 1961 and 1965) for the Japanese export market have been the mainstay
of this growth. An additional $20 million growth in fertilizer and chemical
(H2SO
4) plants, clay brick works, and mineral sand extraction, during the
past two years have added to port expansion, along with two power stations
(in 1968 and 1974).
Q.A.L. choose Gladstone because of a protected natural harbor, good plant
sites (including open-air red-mud disposal areas), low capital costs, and
low fuel and power costs. There is an attractive climate and good living
conditions for the 7,500 population (1963), with daily rail and road
connections to Brisbane. Brisbane (600,000 inhabitants), a strong
contender in the site selection, was discarded because of dredging
problems (beyond 25,000 dwt) and long-term, red-mud-disposal problems.
The Queensland Harbor Board subsidized about one quarter of the required wharf
and navigation-aids infrastructure.
Gladstone was an agricultural town and port in 1963, and is now a dynamic
town of 13,000 that is still growing by leaps and bounds. There is a tight
housing situation, which could grow worse, as additional industrial acreage
F-2

(1,850 acres) is being offered by the government, while the Harbor Board
has reclaimed additional mangrove land between the existing coal terminals.
Raw landfill, huge coal stockpiles, petroleum tanks, and an absence of
vegetation (destroyed during development) leave the port with a desolate
appearance, in full view of a new residential development. The rest of
the town is somewhat recessed towards an inlet, developed as a recreational
area and marina. An anti-pollution committee has recently been formed to
review new projects and combat incipient pollution. The alumina plant is
reducing its dust emission, but coal dust and Q.A.L. caustic effluents
are yet untouched. University of Queensland students are trying to find
which vegetation will grow on the red mud "burgs". There is a shipwaste
incinerator, and the new power plant site was changed to isolate thermal
pollution.
There have been upward real estate reassessments, and the tax rate has
gone sky-high to support developments in municipal services and infra-
structure. Many of the original residents have been hard hit and would
like industry to foot part of the bill. Reversal of stagnation, employ-
ment, and growth potential are the counterparts of these environmental
and economic hardships. New employment and decentralization, and
exploitation of coal and bauxite resources are of benefit to the State.
On the technical side, coal handling berths have traveling gantry loaders:
370 feet long and 800 tons per hour at Auckland Point; 1,520 feet long and
2000 tons per hour at Barney Point. Two similar loaders 550 feet long
and 1200 tons per hour handle alumina at Southtrees Q.A.L. berths, with a
bauxite unloader. A 10,000-ton silo was equipped with modern loading
facilities in 1970.
A survey is being conducted to determine the most economic way of
accommodating 100,000 dwt bulk carriers. Contrary to the town, which is
chronically short of cash, the financial position of the Harbor Board
remains healthy--the ratio of liabilities to assets has actually decreased
from 0.91 to 0.83 in the past five years.
F-3

The Port of Gladstone appears to fulfill its new role of industrial
center for northern Queensland, but now has to consider harbor deepening
again to remain competitive. Its booming growth since 1963 has created
some hardship for those real estate owners who did not cash in on the
industrial development. A tight housing situation, and incipient air,
land, and water pollution are other complaints. Pollution is now
officially considered by an ad hoc committee. There has also been a
recent ban on oil drilling within the Barrier Reef, a major decision
for Queensland, still struggling to escape its rural state.
F.2 AUSTRALIAN PORT DEVELOPMENT AND STRUCTURE
F.2.1 General
An island continent, Australia has an economy which depends heavily on
coastal and overseas trade: ports, therefore, are vital to its life,
and exports make up 12% of GNP. As shown in Figure F-1, there are 66
ports serving the coastal and overseas trade--a large number, considering
the 1969 population of 12,250,000 and the unique problems created by a
continent.
In most of these ports, trade is good, because of expansion in primary
and secondary industry, and development of mineral resources. Cargo-
handling statistics show a booming economy. So also do the ports them-
selves, which are being transformed (and, in some cases, created) to serve
a fast-developing nation.
There is very little competition between Australian ports for cargo,
because great distances separate the general cargo ports. Where ports
are closely situated it is because they are catering for specialized
trade. Every year more than 100,000,000 tons of cargo, about two-thirds
of which is for overseas trade, moves through the ports.
The first ten major ports of Australia, in terms of tonnage of cargo
handled for the year 1967-1968, are: Sydney (14,800,000 tons), Melbourne
(11,923,787 tons), Newcastle (11,792,575 tons), Fremantle (11,304,895 tons),
F-4

Bundaberg Port Hedland
Rockhampton
Gladston MANGANESE ORE—.-__.
GENERAL CARGO
BAUXITE, ALUMINA,COAL
SUGAR
IRON ORE
GENERAL CARGO
mpier
Darwin
Groote Eylandt
BAUXITE
IRON ORE arm,
Cairns
Mourilyan
Lucinda
Townsville
MANGANESE ORE
GENERAL CARGO
UGAR
COPPER, SUGAR GENERAL CARGO
SUGAR, STEEL Mackay GENERAL CARGO
COKE, IRON ORE PIG IRON, STEEL
Brisbane
Colts Harbour
STEEL, BARLEY
GENERAL CARGO
HARDWOODS
SALT
WHEAT OIL ORES
SALT
COAL
IRON ORE, COKE ALUMINA, STEEL
ILMENITE SAN
Cape Couvier
eless Loop
eraldfon
Fremantle
Kwinana
Bunbury
PHOSPHATE,GRAIN
Esperance.
BULK WHEAT
GYPSUM
IL, WHEAT, ORE
Theyenard PortPi ` le WHEAT
WHEAT, COAL
BARLEY, BULK -- Port Lincol delaide
BULK WHEAT / DOLOMITE LIMESAND croi'anr:°
Proper Ba
Stenhouse B apid Bay-LIMESTONE Bal st Head
COAL,SALT
BULK GYPSUM
WHEAT Isin_
ALUMINA, COAL OIL PRODUCTS
WHEAT, STEEL Port Latta
IRON ORE--STelr-oe, Burnie
ILMENITE SAND, PAPER--------fieyonport
GENERAL & SEAROAD TERMINAL
BULK GYPSUM Melbourne
Portland
COAL, COKE
ZINC CONCENTRATES
WHEAT, GENERAL CARGO
ZINC CONCENTRATES SEAROAD TERMINAL
Newcastle
Sydney
Botany Bay
Kembla
Eden
ernport
GENERAL CARGO PRODUCE & TIMBER
atInI cBelton _.... Bay GENERAL CARGO, BULK BARLEY, BULK WHEAT, SEAROAD TERMINAL
MANGANESE ORE, BAUXITE
ALUMINA, SEAROAD TERMINAL
BULK WHEAT
STEEL PRODUCTS, COKE, COAL, BULK WHEAT, IRON ORE, LIMESTONE
GENERAL CARGO
COAL & OTHER BULK CARGOES SEAROAD TERMINAL
PETROLEUM PRODUCTS
STEEL PRODUCTS, COKE, DOLOMITE IRON ORE, LIMESTONE, COPPER
OIL TIMBER
GENERAL CARGO
COPPER, STEEL, COAL, SEAROAD TERMINAL
FIGURE F-1 AUSTRALIAN AND TASMANIAN PORTS OF CALL AND CARGOES HANDLED

Port Kembla (10,098,657 tons), Adelaide (6,678,465 tons), Whyalla (5,954,380
tons), and Brisbane (5,229,506 tons). Since then, Gladstone has jumped from
4.8 million tons in 1967-1968 to fourth place; with 7.7 million tons in 1969,
and 10.1 million tons in 1970.
Throughout the ports, a revolution in cargo-handling methods has been going
on for more than 12 years. Virtually all the general cargo in the coastal
trade now moves in container, unit-load, or roll-on/roll-off systems. In
the ports of the island State of Tasmania, for instance, roll-on/roll-off
handling has reduced shipping costs by about 40% and tripled traffic in 19
years. The stevedore work force on the Australian waterfront now totals
about 22,000 men, most of whom are now employed on a permanent basis--recently
introduced to replace a system of casual hiring. By 1978, due to changes in
cargo-handling methods, this work force is expected to be reduced to between
11,000 and 12,000.
F.2.2 Bulk Ports
Parallel to changes in general cargo-handling, another transformation in
the Australian maritime scene has been the result of mineral development--
the most dramatic aspect of the nation's economy in the past ten years.
Vast deposits of iron ore, bauxite, and coal are being exploited for
shipment to Australian mills and overseas--mostly to Japan, and soon to
Europe. The result has been the creation of new ports in isolated corners
around the Australian coastline, and dramatic expansion of existing ports.
Weipa (see Figure 1) sprang into existence--almost overnight it seemed--to
handle bauxite shipments at the rate of 3,500,000 tons a year from Oueensland's
Cape York peninsula, to serve both the export trade and an alumina plant in
Gladstone. A similar development occurred on the northwest coast of Australia
at Dampier(7.5 million tons per year), Port Headland (4 million tons/year)
to serve iron ore discoveries, and at Port Latta in Tasmania for iron ore
pellets. Port Headland was a pastoral town of 1,000 inhabitants--jumped
to 6,000 in five years as development for 100,000 dwt ore carriers took
place, and it could reach 12,000 inhabitants in the next five years if
F-6

development for 300,000 dwt takes place. (A site is being sought on
the Pilbara coast).
Coal shipments to Japan have made Newcastle the third port of Australia,
and the small city of Gladstone on the Queensland coast jumped from 12th
place to 4th in 1969, because of the volume of coal, bauxite, and alumina
handled.
We expect that the number and size of bulk carriers in the Australian
overseas trade can be expected to increase in conjunction with the
capacity of ports to accept them. Certainly bulk carriers of 250,000 dwt
will not be uncommon, and ships of 100,000 dwt will provide a large pro-
portion of the total. Already bulk carriers of 100,000 dwt are calling
at Port Headland and Port Dampier where the trade to European and Asian
Ports (particularly Japan) is not limited by the depth in the Torres Strait.
A similar increase in the coastal trade can be forecast, with a balance
being struck between an optimum stockpile and regular replenishment.
Unless voyages from east-coast ports of Australia to the west coast,
and vice versa, are unrestricted by depth of water (the Great Barrier
Reef pass is limited to 35-39 feet draught), we estimate that the
economical bulk carrier for most routes will be 100,000 dwt.
Dampier and Port Headlandbeing too recent to document without a field trip,
a selection of more established bulk handling ports--e.g., Newcastle,
Port Kembla, and Gladstone--were questioned by mail, but only Gladstone
responded in time for this study.
F.2.3 Port Management
a. Administration
In Australia, port administration is the responsibility of the six states,
with the exception of the Northern Territory where ports are administered
by the Federal Government. The administrative arrangements vary from state
to state. Some ports, like Melbourne, are controlled by Harbor Trusts;
government instrumentalities with a high degree of autonomy. Other ports
F-7

are administered jointly by one authority--as in the case of Sydney,
Newcastle, and Port Kembla under the Maritime Services Board of the
State of New South Wales. In other states, both systems operate side
by side, and the Harbor Board is elected by interested communities
(such as at Gladstone). A few ports are under private control. Yampi
Sound is an iron-ore port controlled by the Broken Hill Co. Pty., Ltd.,
to supply its steel mills at Newcastle and Port Kembla.
There is no overall coordinating authority for the ports, but liaison
is maintained through the Australian Port Authorities Association.
Although it is a purely consultative body which can only make recommenda-
tions, the Association has achieved uniformity of practice in many
aspects of port operations.
b. Financing
Government subsidy plays a role in port development, but generally only
for infrastructure. Dredging (estimated at $1.30 per cubic yard removed
beyond the 35-foot depth in Port Stevens channel) is proceeding at Port
Kembla, funded within a $17.5 million grant of the New South Wales
Government, as part of a $200 million expansion program of Australian
Iron and Steel Property, Ltd., and some roll-on/roll-off berth improve-
ment. New South Wales says it will spend $200 million on developing its
ports in the next ten years; mostly at Port Kembla, Botany Bay, Newcastle,
and Port Stevens. Queensland has spent $130 million in the past ten years.
Dredging is expected soon in Gladstone and Brisbane which handles 25% of
this state traffic.
British shipping companies have invested about $20,000,000 in container
terminal facilities at the ports of Fremantle, Sydney, and Melbourne.
Another $3,200,000 in private capital has been spent on container
facilities in Brisbane. Port authorities, meanwhile, have begun large-
scale complementary projects on dredging, docks, cranes, sheds, and
depots. They are committed to spending at least $21,500,000 under
contracts existing in 1969 and further heavy investment was then planned.
F-8

F.3 PORT OF GLADSTONE, QUEENSLAND
F.3.1 Background
Until the 1960's, Queensland drifted slowly along on an agricultural
economy of beef and sugar, a slight tourist industry (to Barrier Reef
islands), and marginal fruit and grain production. The young gravitated
to the cities in search of work, and the Australian-wide pattern of
centralization of population in the capital cities seemed to be repeating
itself in Queensland.
In the late 1950's and early 1960's Japan's escalating role in Australia's
trade patterns--as a result of proposed British entry into the Common
Market--prodded mineral prospecting to meet the huge Japanese demand for
raw materials. In 1949, the Queensland Coal Board instigated programs
of drilling to determine coal reserves throughout the state. The Moura
fields, which were to be one of the principal reasons for Gladstone's
development and prosperity during the 1960's, were mapped out during
this time.
Mining companies were also active in other areas. Bauxite was found on
the inaccessible Cape York Peninsula; ilmenite, tin, and phosphate bodies
were located; and oil was discovered at Poma. International corporations,
long bedevilled by unstable political climates in the countries supplying
raw materials, were encouraged to spend large sums developing mines and
building processing complexes in the area. In this atmosphere of economic
rejuvenation, Gladstone was born as a major port.
Gladstone, in the late 1950's and early 1960's appeared to be stagnating.
The sugar belt was too far north to be of much benefit to the town, and
any production south of Gladstone was drawn to the rum distillery in
Bundaberg. The important rail connection with the interior terminated at
Rockhampton 69 miles north, and a meat-processing factory was the only
industry (along with small local farming operations) to provide employment.
Queensland itself was too far from the important industrial centers of •
Melbourne and Sydney to attract any major manufacturing concerns, and
F-9

although Gladstone had a fine, natural, deepwater harbor, tonnage moving
over the wharves actually decreased slightly during the years 1954-1961.
Coal had been discovered at Blackwater as early as 1928. A labor strike
in the Victorian coal mines promoted temporary development of the field
in the thirties. A crane was installed on Auckland Point Jetty to handle
the coal loading. When the strike broke, the coal demand tapered off
except for intermittent shipments over the years to interstate users.
By 1960, several small coal mines, a local meat-packing industry, a
co-operative dairying association, and the port provided the only
secondary industry. Figure F-2 shows the 1954 to 1970 cargo flows from
the port, reflecting the town's development. More detailed data appear
in Table F-1.
In 1961, occurred the first of the two major events destined to change
the face of Gladstone. As a direct result of Japan's increasing demand
for coal, the company of Thiess Peabody and Mitsui was formed to develop
the Moura coal fields. The plans called for port facilities to handle
the proposed output and the Gladstone Harbors Board (GHB) began plans
for a huge expansion of the port area. T.P.M. later built their own
wharf under the aegis of the GHB, but early shipments went over the
Auckland Point Jetty.
The second major event was the decision of Queensland Alumina, Ltd., to
establish the world's largest bauxite treatment plant at Parson's Point,
Gladstone to process the Weipa bauxite deposits. The decision process
involved in the selection of Gladstone is described later in this section.
The last decade has been one of extraordinary development as industry,
population influx and attracted industry have escalated. The rapid
series of events must, at times, have outstripped the townspeople's
ability to comprehend or cope with the transformation which propelled
their sleepy little town into being both Queensland's major port (by
tonnage) and a booming industrial center in little more than six years.
F-10

*1954 1956 1958 1960 1962 1964 1966 1968 1970
*Year ended June 30th
FIGURE F-2 TOTAL CARGO PASSING THROUGH GLADSTONE 1954 to 1970
7
0
6
o 5
10
11
4
3
8
9
2

CARGO STATISTICS, PORT OF GLADSTONE 1959 to 1970
(thousand tons)
EXPORTS 1959 1960 1961 1962 1963 1964 1965 1966 1967 1968 1969 1970
Beef Products 18 10 4 12 11 9 not 4 4 4 4 3 Grain 44 28 - 27 77 39 A 33 83 89 173 46 Pyrites 14 19 20 16 26 31 V 4 0 0 0 21 Coal 20 39 47 292 240 828 a 1714 1701 2312 4050 5654 Butter, Wool 3 4 3 4 4 4 i 2 3 1 0 0 Alumina - _ - - - - L - 35 569 934 1117 Bunker Fuel - - - - - a - - 19 25 40 Nickel Ore - - - - - - b - - - - 7 Ilmenite - - - - - - 1 - - - - 23 General Cargo 5 1 2 - - - e -- 1 2 - Coke - - - - - - - - - - 10
N.) TOTAL 104 101 76 351 358 911 - 1757 1826 2995 5188 6921
IMPORTS
Petroleum Prods. 79 95 87 86 77 71 not 106 129 133 138 143 Caustic & Fuel Oil '4 5 6 5 7 6 avail- - 162 202 332 391 General 3 1 - 1 3 - able 26 12 3 3 6 Bauxite - - - - - - - 415 1520 2118 2628 Min. Concentrate - - - - - - - - - 5 45
TOTAL 86 101 93 92 87 77 - 132 718 1858 2596 3213
Fiscal years' end June 30th.

& Mitsui
Queensland Alumina, Ltd.
1963
Queensland Alumina, Ltd.
1964
1967 Queensland Alumina, Ltd.
1968 Utah Development Co.
Callide Power Station
1968
Queensland Alumina, Ltd.
1968
We do not have the exact dates on which the various industries presently
located in Gladstone decided to site their operations, but the following
chart gives a rough chronological history of capital investment in the
area during the 1960's.
Table F-2
Capital Investment In Gladstone, 1960 to 1970
DATE COMPANY INTEREST AND INVESTMENT
Early 1960's Thiess Peabody & Mitsui
Coal mining in Moura deposits, est. reserves 1.75 billion tons
April 1963 Thiess Peabody Operations with heavy machinery begun
Bauxite reduction to alumina announed intention to establish refinery at Gladstone
Primary plant costs $130 million ground first broken Sept. capacity 600,000 tons per year
First shipment of alumina
Coal mining in Blackwater deposits, est. reserves 1.85 billion tons
Sited on inland open cut coal field, completed 1968/1969 Supplies Rockhampton, Gladstone, Q.A.L., Moura, & Blackwater mines Cost $37.5 million
Expansion of plant to lift production capacity by 50% Cost $59 million, 900,000 tons per year capacity
F-13

DATE COMPANY INTEREST AND INVESTMENT
Murpheyores Holdings, Ltd.
1969
A.C.F. Shirley Fertilizers, Ltd.
Super phosphate plant, cost $4 million
1969
Central Queensland Acid Pty., Ltd.
1970
Capricornia Industries, Ltd.
Clay brick works at Calliope, 12 miles SW of Gladstone, cost $430,000
1970
Table F-2 (Continued)
Capital Investment In Gladstone, 1960 to 1970
Mineral sand mining and processing to produce 93,000 tons per year in initial stage, cost $2.2 million
Built on reclaimed land at Barney Pt., sulphuric acid plant will use 250,000 tons of pyrites per year from Mt. Morgan, capacity 1,000 tons per day, cost $13 million, commencing production 1970
1970
1970
1970
State Government
Grain Board
Queensland Alumina, Ltd.
Confirmed construction of 1,100-megawatt powerhouse to be completed by 1974
$2 million bulk grain storage and terminal, construction begun
Production increased to 1,275,000 tons per year, cost $69 million
1972
PROJECTED
Queensland Alumina, Ltd.
Production increase to 2 million tons per year approximate cost $150 million.
F-14

This chart would indicate that a chain reaction took place, beginning
with Thiess Peabody & Mitsui, Ltd.'s mining and need for a deeper harbor.
With development plans for the harbor underway, Queensland Alumina, Ltd.,
for reasons detailed further in this study (but principally dealing with
port and labor supply), began their plant construction. These two
industries attracted small supportive industries such as trucking and
real estate development, and interacted in some measure with each other
(e.g., a coal supply for the alumina plant operations).
The Callide Power Station, and a now-established port and labor supply
set the stage for a burst of development in the late 1960's, which has
not yet reached full fruition.
While we have little information on the reasons leading to the siting
of Thiess Peabody & Mitsui's operations at Gladstone, we do have precise
data on the site selection for Queensland Alumina, Ltd.'s giant bauxite-
processing plant.
With this information and the qualitative criteria laid down by the
consortium in selecting an optimum site, we may draw fairly accurate
assumptions regarding the movements of other groups into the area.
Thiess Peabody & Mitsui, Ltd. could have been attracted to the town by
five important factors:
1) Japanese demand for coal for the steel making process,
2) Large deposits of coal adaptive to strip mining,
3) The presence of a natural harbor in reasonable
proximity to the mine,
4) Willingness of the Gladstone Harbors Board to develop
the port sufficiently to handle the coal,
5) State government's policy of decentralization and
development of rural areas which would ensure a
comfortable political climate in which to operate.
F-15

F.3.2 Queensland Alumina, Ltd.
In 1959, large deposits of commercial bauxite were discovered at Weipa
on the lonely Cape York Peninsula. A consortium of four companies--
Kaiser Aluminum (U.S.A.), Aluminum Company of Canada, Pechiney (France),
and Comalco (Australia)--was formed to mine the deposits and process the
raw bauxite to alumina. This consortium was to be known as Queensland
Alumina, Ltd. It became imperative to find a suitable site to locate
the plant. A total of seven plant locations were examined, and comparative
data was assembled. By 1963, the decision which was to be so vital to
both Gladstone and the future of Central Queensland had been made. Table
F-3 is a comparative listing which delineates the criteria established by
the consortium and the rating of each site.
Table F-3
Queensland Alumina, Ltd., Plant Site Criteria
Flock Towns- Pigeon Port Glad-
Weipa ville Mackay Island Alma stone Brisbane
Established Community & Labor Supply P G G P P G VG
Deep draught harbor F P G G G VG G
Red mud disposal VG F F F F G P
Fuel Costs (Fuel Oil & Coal) P P F P G VG G
Electric Power P F F P F VG G
Plant Sites G F G F P G G
Water Supply F F P P P G VG
Transport & Communications P G G P F G VG
Plant Costs P F G P P G VG
F-16

VG Bauxite Supply
Costs
Shelter from Cyclone
F F
Table F-3 (Continued)
Queensland Alumina, Ltd., Plant Site Criteria
Flock Towns- Pigeon Port Glad-
Weipa ville Mackay Island Alma stone Brisbane
VG - Very Good G - Good F - Fair P - Poor
Following is a site description for each area investigated and an appraisal
of its locative advantages and disadvantages.
a. Gladstone
The town, with .a 1963 population of 7,500, has a pleasant climate and
attractive living conditions suitable for retaining a stable labor supply.
The protected natural harbor can be expanded to accommodate the number of
vessels and draught requirements which would be used to transport bauxite
and alumina. Two good plant sites are available in proximity to a red-mud
disposal area. Plant capital costs would be lower than any other site,
excluding Brisbane, and fuel costs from coal and electric power would be
the lowest of all sites considered. Bauxite supply costs would be
practically equal to any east coast location.
b. Weipa
High plant capital costs, remoteness, and inaccessibility for the mainten-
ance and.stability of a. labor force make this site unattractive.'
c. Townsville
Townsville is the second largest city in Queensland with a 1963 population
of 52,000. High plant costs, lack of red-mud disposal area, and lack of a
F-17

suitable harbor would offset the labor supply, pleasant living conditions,
and road and rail transport availability. The harbor is artificial, with
a channel 26'6" deep, and would require extensive dredging to accommodate
vessels over 10,000 dwt capacity.
d. Mackay
The artificial harbor at Mackay would need extensive dredging, and major
extensions to the water supply would be necessary for the plant. On all
other points, Mackay would rate close to Gladstone or Brisbane with a
1963 population of some 17,000 and good plant site and red-mud disposal
area. Plant capital cost would be only slightly higher than Gladstone.
e. Flock Pigeon Island
This virgin site offered a deepwater port and the possibility of a coal
shipment terminal in the event of Blair Athol deposits being developed.
Labor and utility supply and shelter were poor.
f. Port Alma
Port Alma is the deepwater port for the city of Rockhampton, 35 miles
from the town. The port offered a possible terminal for Moura-Callide
coal, but as the port is surrounded by mangrove and mud flats with no
reasonably close community, it would be unsuitable.
g. Brisbane
Brisbane, with 600,000 population offered the best potential labor supply,
plant capital costs, transportation, and water supply. The port can
handle vessels up to 25,000 dwt, but extensive dredging of the Brisbane
River would be necessary to bring in larger ships. The problem of red-mud
disposal areas was, however, seen as a prohibitive long-term problem which
could probably require barging the mud to sea for dumping. This factor
then tended to offset the advantages of a Brisbane location, which ranked
--along with Gladstone--far above all the others. Queensland Alumina, Ltd.
gave the following estimated capital costs for the initial Gladstone plant
development beginning in 1963. These costs, taken from an inhouse study,
F-18

are given in percentages of the total as it was not possible to obtain
actual detailed costs.
Table F-4
Plant Capital Costs PERCENT
DIRECT COSTS
Alumina plant proper, including site preparation 59%
Engineering, Administrative, Personnel, and Productive Services 3%
Wharf Approach 1%
Bauxite Stockpile 2%
INDIRECT COSTS
Construction Management & Services, Design Engineering and Procurement 9%
Escalation and Contingency , 13%
ADDITIONAL OWNER CAPITAL COST
Permanent Staff Housing 1%
Site Purchase 1%
Hospital Subsidy --
Other Costs, including Administration, Start-up, Capital Spares, Interest on Funds, etc. 11%
TOTAL 100% •
F=19

Costs to others were estimated to be approximately $7 million, broken
down roughly as follows:
PERCENT
Wharf and navigation aids 25
Public build-up, School extensions
Access Road & Railroad 3
Employee housing 34
Water Supply 37
Power supply & communications 1
100%
We are unable to ascertain at this time whether these costs were borne
by Municipal, State, or private enterprise. However, it is our under-
standing that the Queensland Harbor Board did begin work on the wharf
partly or wholly supported by government funds. When the costs ran
over the $2 million budget, funds were cut off and Q.A.L. took over and
completed the work. The wharf is now owned and operated by Q.A.L.
F.3.3 Geography and Surf icial Character
Gladstone is located on the central Queensland coast, approximately 330
rail miles north of Brisbane, 86 road miles south of Rockhampton (a city
of some 45,000 population), and 146 miles northwest of Bundaberg (popula-
tion 23,000). Queensland's state railway provides transport north and
south on six days a week. Bruce Highway, the major State highway,
connects Gladstone to all the major coastal towns. Chi Transport Services
operate daily runs from Brisbane except Sunday.
Gladstone has a mild semi-tropical climate making living conditions
exceedingly pleasant. Farenheit temperatures range between a maximum
of 85 ° and minimum of 52 ° .
F-20

The coal deposits at Moura and Blackwater, and ilmenite deposits near
Gladstone comprise the mineral source for the town. Small farms are
dotted through the fertile Callide and Dawson Valleys, and some small
timber concerns operate a little further inland. Coal reserves are
estimated to be 1.85 billion tons at Blackwater and 1.75 billion tons
at Moura. A power station at Callide provides a high voltage power to
Rockhampton, Gladstone, Q.A.L., and the Moura and Blackwater mines.
The bauxite source is some 1,200 miles from Gladstone at Weipa on Cape
York Peninsula. Bauxite is shipped to Gladstone where it is refined to
alumina at the Q.A.L. plant.
F.3.4 Demography
Central and Northern Queensland is, as previously stated, a largely
agricultural area. Until the discovery of minerals, employment was
patterned after the growing and processing of beef, sugar cane, fruit
and grain, with tourism taking a small but growing part in the economy.
There was a drift of population to the cities as the land reached its
optimum growth capabilities and itinerant labor was forced from the cane
fields by automation. Unemployment could not be considered a problem,
as the population was relatively mobile and could relocate in other areas.
In the early 1960's, Swift's meatworks, the only large secondary industry
in Gladstone, decided to close its plant and relocate elsewhere, leaving
the town with no appreciable source of secondary employment. Development
of the Moura coal fields and Q.A.L.'s plant opened up a new source of
employment for the residents of the town, and the prospects of an
increased prosperity for local small businesses.
At the present time, the population of Gladstone stands at approximately
13,000. New industries and the expansion plans of present plants are
expected to contribute to the growth of Gladstone's population for some
time yet.
F-21

Construction of Queensland Alumina, Ltd.'s plant employed some 650 men
and the completed plant absorbed all labor available at the time. The
Gladstone Harbors Board is operated by 47 men, approximately 20 of whom
are engaged in the handling of the Blackwater coal. Other industries
account for the remainder of the working population. Rapid growth of
industry continues to attract new labor and there appears to be no
backlash of unemployment as occurred in Port Cartier, Canada, on
completion of construction work. In fact, there appears to be a mild
labor shortage.
F.3.5 Land Use
The rapid growth of Gladstone and a pressing need for industrial land
brought about two interesting schemes to cater to both existing industry
and potential industries.
The Gladstone Harbor Board engaged in a series of land reclamation
operations as early as 1965 near the harbor and other potential deep-
water sites. This land is now, for the most part, available for rental
or purchase to any industrial concerns attracted to the area by the
proposed $200 million power plant.
The second scheme was that of the Queensland State Government. Aware
of the potential of Gladstone, and anxious to establish an industrial
center in Northern Queensland, the State reserved 2,000 acres of prime
industrial land as a basis for three Industrial Estates near the town
(see Figure F-3). The Toolooa estate covers 150 acres on the main
highway south of Gladstone near Q.A.L.'s plant. The estate is already
partly serviced, with roads, water, power, and drainage, and houses,
several light engineering, building materials, and food-processing plants.
The 600 acre South Trees site is being reserved for a large plant
capable of utilizing the whole area.
Clinton Industrial Estate, which is being retained for heavy industries
is northwest of Gladstone and consists of roughly 1,250 acres. Roads
F-22
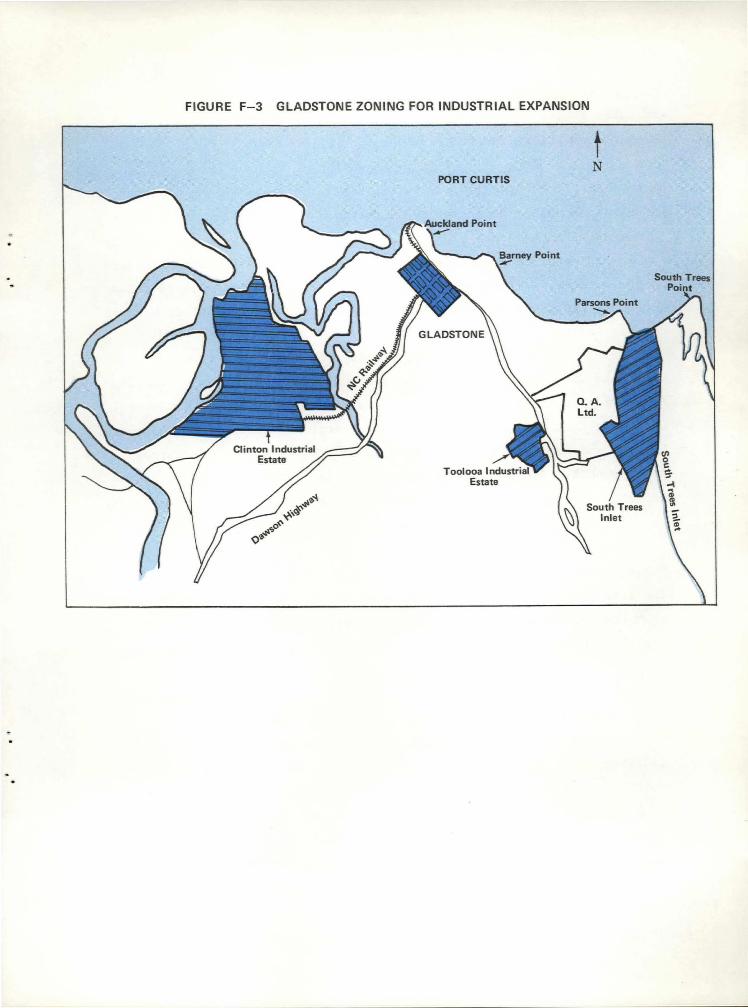
FIGURE F-3 GLADSTONE ZONING FOR INDUSTRIAL EXPANSION
PORT CURTIS
Auckland Point Ate--
Barney Point
South Trees Point
Parsons Point
GLADSTONE
Toolooa Industrial Estate
0
02'
South Trees Inlet

and other facilities were due to be constructed following construction
of an access bridge in early 1970.
We have little information on the residential development of Gladstone.
We have been unable to determine if there is any direction to the con-
struction of much-needed housing. A study was recently commissioned by
the Co-ordinator General of Public Works, to examine the infrastructure
of the rapidly developing town and to make recommendations in relation
to future provision of services. We have been unable to obtain a copy
of this study.
The rapid influx of labor to Gladstone outstripped the town's capacity
to provide suitable housing. Few properties were available for rental
and those that were commanded very high rentals. Provision of adequate
housing and facilities has become a major problem for the Gladstone
Town Council. The greatly increased demands for basic service, and
inadequate funds to meet these demands, is a source of discontent among
the original residents of the town.
F.3.6 Environment
The residential and business section of Gladstone is set back, somewhat,
from the port area. Auckland Point, a large bluff, and the coal rail-
way line, form the present limits of the town.
Much of the Auckland Point terrain has been or is in the process of
being reclaimed by landfill. The area between Auckland Point and
Barney Point previously had been low-lying mud and mangrove swanps--
familiar along these coasts. A large area behind the Auckland Point
Wharf is used for the stockpiling of Blackwater coal. The only other
structures, other than terminal sheds close to the wharves are huge
petroleum storage tanks. Aesthetically, Auckland Point looks barren
and ugly, because all natural vegetation was destroyed during the
development process, and has not been replaced.
F-24

The Barney Point development, originally separated from Auckland Point
Wharf by shallow sea water and swamp, has been linked by a causeway
(Macfarlan Road) to Auckland Point. Landfill already in progress will
eventually reclaim this area for industrial development, but the huge
coal stockpiles and raw landfill still give the port a desolate
appearance. The Barney Point coal stockpile is in rather close proximity
to a new residential housing development.
South Trees Point is approximately two miles from the town, linked to
Q.A.L. by a conveyor-belt bulk-handling system. Some natural foliage
has been left on the foreshore, but there seems to be no intentional
beautification of the area.
While these three points certainly had little to recommend them as local
beauty spots in the past, their appearance has not been improved by
recent activities.
However, attempts have been made to beautify the foreshores of Auckland
Inlet, the town's principal recreational area, and a small-crafts harbor
has been built by the G.H.B. In 1969, the Central Wharf in Auckland
Inlet was repaired and reconstructed at a cost of $7,240.
F.3.7 Costs and Benefits
Funds for municipal works programs were raised from rates and taxes
levied against the local population's real estate. These properties
were re-assessed every eight years, the last time in 1960. From the
time of the 1960 assessment to the next reappraisal of property values,
the little township had become a boomtown. Real estate values rose
astronomically without a corresponding increase in rates. Concurrent
with the rise in real estate values, the demand for municipal services,
principally sewage facilities, roads, and related services, had also
increased drastically. The Town Council became chronically short of
funds long before the new assessment date and the new rates imposed to
cover costs to some degree hit not only those who had been able to
F-25

capitalize on the boom--such as owners of rental properties and vacant
real estate, or owners of profitable commercial businesses--but also
those who were retired, or were small wage earners long established in
the town. Some rates were reassessed as high as 1,200% and the original
inhabitants, hard hit by the new rates, feel justifiably unhappy with
these circumstances.
The Council is still short of funds and there is some feeling that the
large industries should help out with at least $2 million to enable the
town to provide essential services.
The social benefits to the State seem to have been:
a) decentralization of population, and
b) employment;
and to the town:
a) reversal of stagnation,
b) employment, and
c) growth potential for small businesses.
The social cost would be some measure of financial hardship to established
small wage earners brought about by increased rates and taxes; the natural
disruptions brought about by a greatly increased demand placed on
recreational and municipal facilities; the unsettling effects of a large
influx of people into a quiet rural community; and environmental pollution.
F.3.8 Port Developments and Operations
a. The 1960's
The signing of long-term contracts by Thiess Peabody & Mitsui to export
45 million tons of hard coking coal to Japan over'a ten-year period
provided the necessary boost required for development. Immediately
after the contracts were signed, the Gladstone Harbors Board began
improving the bulk-loading facilities at Auckland Point (Figure F-2).
The fixed-head loader was converted to a travelling-gantry loader, a
new wharf was constructed, and stockpiling and unloading facilities
were improved.
F-26

Queensland Alumina, Ltd., provided their own facilities for the loading
and unloading of alumina and bauxite at South Trees Island.
In the early 1960's, the port could accommodate vessels of 23,000 dwt.
The increased demand for coal and the economies to be gained from larger
vessels induced the G.H.B. to carry out deepening work. By 1966, the
port was able to accommodate vessels of 35,000 dwt, and by 1968 vessels
of 55,000 dwt capacity were able to use the port daily.
In 1967, Thiess Peabody & Mitsui shifted to a new facility at Barney
Point. A new, shorter railway line (built at a cost of $28 million)
linking Gladstone and Moura reduced the haulage distance from 170 to
112 miles. The railway terminated at Barney Point, where two 40-foot-
low-water-depth berths are used to ship coal and mineral sands (Figure
F-3).
In 1968, the Utah Development Co. began exporting coking coal to Japan
through a further-improved Auckland Point bulk loader.
Grain-handling facilities, erected in 1962, were expanded in 1965. The
storage shed has a capacity of 15,000 tons and is equipped with inloading
and outloading conveyors.
Concurrent with the expansion of wharves and facilities, the Gladstone
Harbors Board embarked on a land-reclamation scheme. In 1965, a scheme
was begun to reclaim 300 acres of land between Auckland Point and Barney
Point, as illustrated in Figure F-4. Another project on the western
side of the town brought a further 50 acres of land into use by 1970.
b. Work in Progress and Future Plans
A geophysical survey and test-boring program is being carried out to
determine the most economical approach to the Port for vessels of 100,000
dwt capacity. Q.A.L.'s South Trees wharf is being expanded, and bulk
facilities enlarged. Two land-reclamation schemes are proposed, one in
F-27
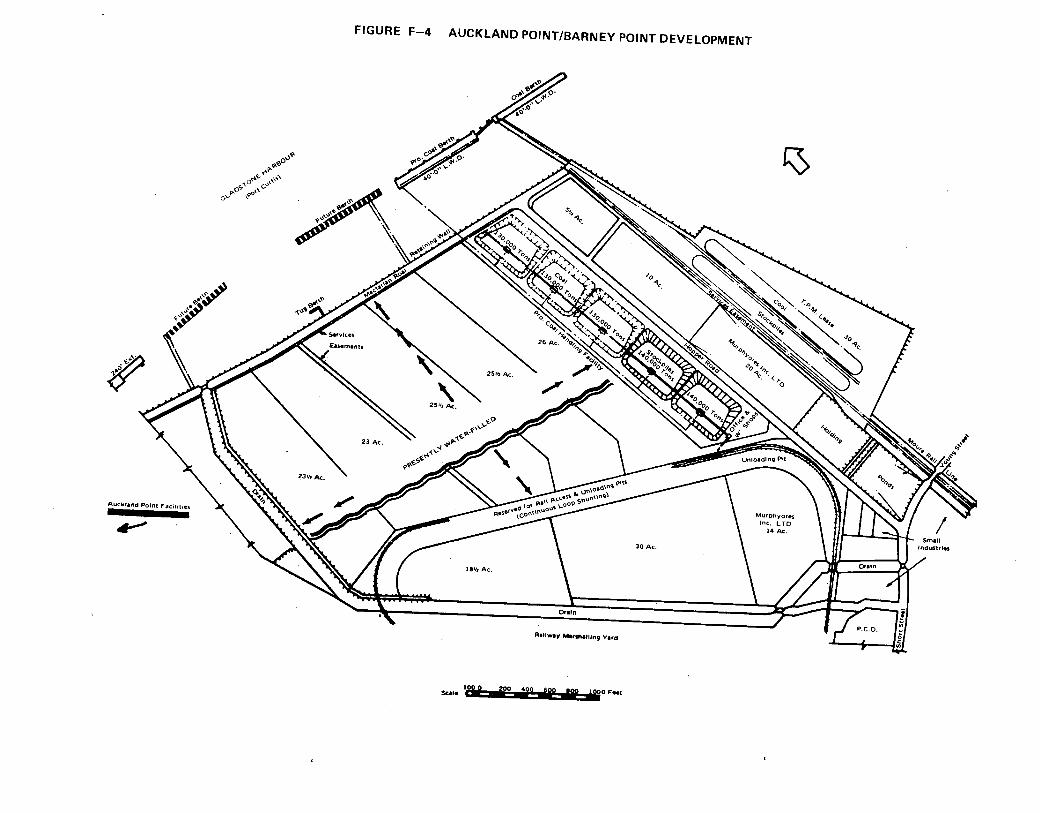
Auckland Point Facilities
Rahway Marshalling Yard
100 0 200 400 600 100 1000 Fmt
FIGURE F-4 AUCKLAND POINT/BARNEY POINT DEVELOPMENT

the port area to provide a further 250 acres, and another eastward into
the Auckland Inlet/Calliope River area, adjacent to the new power site,
to reclaim a further 1,600 acres.
Tenders have been let for a bulk ship loader linked to the grain storage
sheds and for a new silo complex (10,000 tons capacity). Tenders have
also been let for major reconstruction and extension of the Auckland
Point Wharf.
c. Port Facilities
The port facilities in Gladstone comprise three berths with an approach
channel. This channel is some six miles long, with a bottom width of
600 feet dredged to 34 feet at low water. The tide fluctuation between
high water neaps and springs is from 9 to 16 feet.
1. Auckland Point, owned by Gladstone Harbors Board has three berths.
The bulk-handling plant is equipped with a travelling-gantry loader
which traverses No. 1 berth for a length of 370 feet. A telescopic
chute fixed to the boom on the loader can be moved out 50 feet from
the wharf face, and a trimmer mounted on the telescopic chute is
capable of throwing 50 feet in any direction. The loader is connected
to the stockpile area by a 36-inch conveyor, and loading capacity is
800 tons per hour.
2. Barney Point, which has a single berth, is the property of Thiess
Peabody & Mitsui, Ltd., and has a travelling-gantry ship loader that
traverses the wharf for a length of 520 feet and is designed to load
60,000 dwt vessels at a rate of 2,000 tons per hour.
3. South Trees, for alumina handling, consists of two berths owned by
Queensland Alumina, Ltd. The eastern section of the wharf is
equipped with a loader which has an outreach of 75 feet and a load-
ing rate of 1,200 tons per hour. A similar one was to be installed
in 1970. Both the loader and bauxite unloader traverse the wharf for
a length of 550 feet.
F-29

d. Management
Most Australian harbors are managed by trusts or boards whose members
are elected by interested persons, or are appointed by the state govern-
ment. Gladstone harbor is administered by a board consisting of:
• Five members representing the shires of Miriamvale,
Calliope, Banana and Monto;
• Two members representing the Town of Gladstone; and
• Two members representing the Queensland government;
• An Engineer/Manager is responsible for the actual
operation of the Gladstone Harbors Board's Auckland
Point Wharf.
The Board has full jurisdiction over the two private wharves, Barney
Point, and South Trees, but seldom interferes with the management of
these wharves; preferring to work co-operatively with the owners, Q.A.L.,
and Thiess Peabody Mitsui.
The financing of port operations is carried out with funds earned through
harbor dues and various wharf charges and by government approved low
interest bank and treasury department loans. All surplus funds are re-
channelled back into harbor improvements and foreshore development.
e. Port Finances
A comparison of 1964 and 1970 fiscal year balance sheets shows the rapid
development of the port and the financing of this development. Loans
increased from $2 million in 1964 to $5 million in 1970. Inscribed
stock showed a very sharp rise from $0.9 million to $5 million. The
Board's policy of developing foreshore land by reclamation greatly
increased the value of such land, from $1.2 million to $4.7 million.
The reclaimed land will be used principally for ancillary light, medium,
and heavy industry. The sale or rental of this land will put the Board
in a strong revenue-earning position allowing continued expansion of the
port and facilities.
F-30

606,591 932
669,960
A.$1,956,063
1,956,063
Revenue emanating directly from the port services (harbor dues, tonnage
rates, fees, and licenses, etc.) has more than tripled during this period.
The large investment in improving the wharf and storage and handling
facilities resulted in a value increase from $2 million to $7.3 million.
The position of the Gladstone Harbors Board is a healthy one. Liabilities
in the form of loans, stock, and debentures have risen somewhat from
$3 million to $10 million (i.e., 241%) from 1964 to 1970, along with the
value of the fixed assets, land and wharves, from $3.3 million to $18
million (i.e., 267%).
Table F-5
Revenue Account For The Port Of Gladstone (Australian Dollars)
INCOME
Sale of land & property, reclamation refunds
Harbor dues, tonnage rates, rents, conveyor handling charges, plant hire, mooring fees, licenses, interest on investments, etc.
Sundries
EXPENDITURES2
A.$ 62,437
Administration 19,786 71,275 Repairs & maintenance, gen.
expenses 252,845 76,188 Interest, Redemptions 145,745 408,634
418,376 556,097
Excess of Income over Expenditure
1Year ended June 30th.
A.$251,584 A.$1,399,966
2Does not include purchase of land, equipment, development expenditures, or depreciation.
F-31

Debtors Harbors Fund Loan & Trust Funds Interest Bearing Deposits and Loans
Plant & Stores, Office furniture & equipment
Land Buildings Petty Cash
42,099 75,428 56,154
284,000
208,193 894,564
1,637,668 20
ASSETS LIABILITIES
Creditors Contractors Deposits Treasury Dept. Loans Inscribed Stock Debenture Loans Capital A/C
12,760 4,690
507,000 724,680
1,034,646 914,350
A.$3,198,126 A.$3,198,126
Table F-6
1964 Balance Sheet for the Gladstone Harbors Board
F-32

Unexpend. Loan Funds
Debtors Harbor Fund Interest Bearing Deposits
ASSETS
Bank A/C 97,516 Interest Bearing Deposits 475,500
Plant, Stores, Office Furniture 312,172
LAND less advances 3,602,642 Wharves, buildings,
harbor installations 5,648,022 Investments, State Electricity Comm. 40,000
Petty Cash 20 Sinking Fund Balance 14,856 Roads & Developmental
Dredging 1,146,836
LIABILITIES
Creditors Rent P/A Treasury Dept. & Loans Commonwealth Gov't. Loans Inscribed Stock Debenture Loans
25,609 38,552
1,632,035 125,500
3,832,243 2,137,412
163,987 127,256
1,024,000
Capital A/C 4,861,456
Table F-7
1970 Balance Sheet for the Gladstone Harbors Board
$12,652,807 $12,652,807
F-33

F.3.9 Pollution
Information so far received on pollution is sketchy and inconclusive.
There appears to be some measure of air, sea, and land pollution in
Gladstone from the various operations in and around the town. An anti-
pollution committee has been formed, but we know little of its operations
except that any new project must be reviewed by the committee.
Emissions from the Q.A.L. plant, and coal dust from stockpiles, are the
major source of air pollution. Q.A.L. has taken steps to reduce the
emissions.
Q.A.L. disposes of red mud from the alumina reduction process in huge
earth-enclosed burgs near the plant. As the burgs fill up they could
eventually become an aesthetic eyesore. University of Queensland
students are carrying out experiments with the mud in an attempt to find
some form of vegetation which will grow successfully on the burgs.
There is a ship's-waste incinerator on the wharf to treat ship's garbage.
No major oil spills have occurred along the shore line from ships calling
at the port.
Caustic is discharged from the Q.A.L. plant directly into the sea, but
no scientific experiments have been carried out to determine the effects
of the caustic on marine life.
There is little or no commercial fishing in the waters off Gladstone,
and "Sunday fishermen" are divided as to the effects of the caustic;
some claiming it improves the fishing, others claiming that the fish
"taste", and are not as prolific as in previous years.
The anti-pollution committee was effective in changing the selected
location of the proposed Gladstone power plant. The dangers of thermal
pollution at the original site were such that a new location had to be
found.
F-34

Any discussion of sea pollution must take into account the Reef. This
natural and beautiful barrier of coral islands and submarine reefs stretches
from New Guinea to south of Gladstone, forming a natural blockade to both
ships and violent wave action. Once inside the reef there are few exits
to the open sea, except through Torres Strait between Cape York Peninsula
and New Guinea, which has a limiting draught of 30 to 35 feet.
Ships transporting bauxite from Weipa must come down inside the reef, and
ships delivering or taking alumina and coal oil must pass through the
Capricorn Channel near Gladstone. The reef-strewn waters make navigation
tricky and the increase in vessels using these waters as a result of the
Gladstone development multiply the chances of spills. No special efforts
have been made by the Gladstone Harbors Board or industries associated
with the port to reduce the chance of an accidental spill, but should such
an event occur there would be a wide-spread public outcry. Furthermore,
industrial development on the coast could increase effluent discharge,
such as Q.A.L. caustic, to a dangerous level.
An attempt to drill for oil in the waters between reef and mainland was
finally defeated through the intervention of the Queensland government.
The decision was a major one for this development-conscious state, so
reliant on new industries to escape from its agricultural bondage.
Should pollution occur, therefore, State and public pressure would
probably combine to enforce changes to ship design, optimum ship size,
and navigational aids, as well as industrial waste disposal methods,
sufficient to directly affect the port and town of Gladstone and other
northern Queensland ports.
F-35

APPENDIX G
DEEPWATER PORTS OF JAPAN

APPENDIX G DEEPWATER PORTS OF JAPAN
G.1 SUMMARY G-1
G.2 BACKGROUND G-3
G.3 PORT MANAGEMENT AND FINANCING G-6
G.3.1 Administration G-6
G.3.2 Funding Structure G-7
G.4 ECONOMIC FUNCTIONS G-9
G.4.1 Traffic G-9
G.4.2 Port Congestion G-14
G.4.3 Coastal Industrialization G-15
G.4.4 Land Shortage and Reclamation G-16
G.4.5 Economic Plan and Improvement of Port Facilities G_17
G.4.6 The Mechanics of Development Planning G-18
G.5 ENGINEERING PROBLEMS AND SOLUTIONS G-22
G.5.1 Port Construction Problems G-22
G.5.2 Alternatives for Port Infrastructure G-24
G.5.3 Small Excavated Harbors G-25
G.5.4 Storm-tide and Tsunami Protection G-26
G.5.5 Superstructures G-26
G.5.6 Port Engineering Research G-27
G.6 ENVIRONMENTAL PROBLEMS G-30
G.6.1 Coastline G-30
G.6.2 Marine Pollution G-31
G.6.3 Other Pollution G-34
G.7 THE RESPONSE: PORT PLANNING AND DEVELOPMENT OUTLOOK G-35
G.8 SOME JAPANESE DEEPWATER PORTS, 1970 G-39

LIST OF FIGURES
Figure Page
G-1 The Main Ports of Japan G-4
G-2 Port Cargo Volume Versus GNP and the Index of
Mining and Manufacturing G-10
G-3 Future Port Projects of Japan G-20
LIST OF TABLES
Table
G-1 Distribution of Dredging Costs G-8
G-2 Cargo Volume Handled in the Ports of Japan and
18 Major Cities G-9
G-3 Overseas Dependence for Major Raw Materials G-11
G-4 Selected Growth Statistics for 1960 through 1968 G-13
G-5 Large Tankers Average Port Time G-15
G-6 Annual Land Reclamation G-17
G-7 Tanker Berths in Japan G-43

APPENDIX G
DEEPWATER PORTS OF JAPAN
G.1 SUMMARY
Based on a literature survey and a few short interviews with top repre-
sentatives of the Bureau of Port and Harbors, Ministry of Transport,
and Tokyo Tanker Co., Japan ports appear to be a mainstay of remarkably
dynamic economy and of an active regional development policy. Given the
high population and activity concentration, and the constricted land and
coastal environment, plagued every other year by some major disaster, it
is not surprising that the local environment has often been severely
affected, to a degree unknown elsewhere.
From this brief survey, we have extracted the following highlights
of Japan deepwater port experience.
• Although foreign trade accounts only for 10% of Japan's GNP, the
shipping industry and ports are closely knit together, mostly
because the country is 95-100% dependent on overseas sources for
major raw materials (crude oil, iron ore, coking coal) and the
limited flat land is available only at seaside.
• Population and activity are concentrated in a 450-mile-long cluster
of "Progressive Zones" (18% of Japan's area, containing two-thirds of
the national production and 60% of the population) around three bays
(Tokyo, Ise, Osaka) and the Inland Sea.
• Municipal ports, with public and private terminals (handling 70% of
all cargo), are subsidized by the Japanese government in variable
ratios:
- depending on importance to the economic, social and
regional policy (40-100%); and
- decreasing with depth for bulk terminals (from 50%
for less than 40 feet to 10% beyond 53 feet).
G-1

• Congestion is chronic in both ship and cargo handling. Traffic has
outstripped for 10 years the forecast growth and budgeted improvements,
and in urban-industrial development Tokyo, Bay is "choked".
• Land shortage is acute (now reclaimed at $35,000/acre versus $5,000
in 1955).
• Ships under construction draw up to 95' for oil (500,000 dwt), 80'
for ore (300,000 dwt), and 40-45' for containers.
• Lack of deepwater natural sites has led to the use of excavation
techniques on flat unprotected coastline, and offshore islands or
sea berths, which have helped reduce channel congestion.
• Strong engineering experience has been acquired on deep dredging,
deepwater and soft-ground construction, and storm-tide protection.
Extensive research has been carried out on tugs and superships,
lateral resistance of piles, underwater concrete and soil packing,
model tests, and site testing of dikes.
o As earthquakes, stormtide or tsunami cause extensive damage almost
every other year, Japan has only recently become sensitive to man-
made aggressions to the environment:
- excessive ground water pumping by industry causes ground sub-
sidence in the "Progressive Zones";
- marine pollution, stemming from industrial plant effluents, dry
bulk storage run-off or fertilizer leaching by rain, has
caused a variety of diseases in people and seafood;
- Oil spills, bilge pumping, raw sewage and solid waste dis-
charge, and dredging-polluted silt have all affected the quality
(odor, taste) and/or the volume of seafood catches.
G-2

• Current planning calls for increased attention on environmental
matters and foresees:
- new industrial ports for a) decongestion of progressive zones,
b) transport efficiency; and
c) balanced regional development
- energetic action on industrial bays to:
a) specialize piers, ports and zoning (confine heavy
industry and hazardous cargo handling);
b) rationalize communications to hinterland;
c) improve water quality and living amenities; and
d) build outside congested bays; offshore islands to keep tankers
out, and distribution ports to serve the hinterland from behind,
with products manufactured in the new industrial ports.
Tokyo Bay, the worst area in which air pollution and urban congestion are
added to extreme marine pollution, is expected to be closed to all tankers
as soon as the Futtsu terminal is completed outside the bay and the canal
to New Kashima port on the Pacific coast, east of the bay, is put into operatinn.
G.2 BACKGROUND
The economy of Japan is the most dynamic economy in the world (over 10%
annual growth for the past 10 years) and is tightly linked to coastal
industry and port development under a wide array of constraints.
In an area barely larger than Norway or Montana (140,000 square miles),
slightly more than 100 million inhabitants and 27,000 square miles of
cropland coexist on only 29,700 square miles of flat land, leaving just
2,700 square miles for dwellings and industrial uses.
The high average population density of 690 people per square mile (the
U.S. average is 57 overall, 370 in Middle Atlantic States) is further
concentrated by geography and industrialization in four major areas within
450 miles of the southern ocean front, as shown in Figure G-1.
G-3

17(61-(.,K•AID10
• Muroran
r,
HONDO
TOKAI D° dijoya • 4:41
g ShIM Ybkkaidfir
Ise Bay
Tokyo s • Chiba - • Kavvasaki
Yokohama
izu
Tokyo Bay
• Specially Designated Major Port
o Major Port
Himeji
Tokuv,m— _ Shimonoseki KitakyushM
Kobe • 0 • _•0saka w Sakai
• Wakayama
I KOK
Osaka Bay 0
0
FIGURE G-1 MAIN PORTS OF JAPAN
G-4

The climate in Japan is generally temperate and rainfall is abundant.
Agriculture has concentrated on cultivation of rice as a prime crop
since ancient times, and fishing is a major industry and source of food.
Mineral resources are scarce, and 95% or more of the iron ore, coking
coal, and petroleum must be imported.
In the early 1900's, Japan commenced industrialization and advanced
from light industry to the more recent heavy and chemical industries.
Even though the export trade is less than 10% of the GNP, the biggest
reason for Japan's success in industrialization is attributed to the
effective utilization of her coastline and coastal areas. Notwith-
standing the frequent attack by natural calamities, such as typhoon,
earthquake, tsunami, etc., on her land, shore, and sea, the
geographical characteristics and topography of Japan allowed the construc-
tion of large, deep ports, and ideal seaside industrial zones. This
facilitated regular shipping service to bring in raw materials, and
export finished products. Consequently, the provision of more new
ports and the improvement of existing ports and harbors are of
paramount importance. In fact, a linear relationship between cargo
handling and GNP is a major factor in national economic and port
planning.
Japan has a total coastline extending 16,700 miles and containing 1,058
ports,including 17 specially designated ports (for foreign trade), 80
major ports, and 951 local ones, a ratio of one port per 16 miles of
coastline. About 40% of all the cities in Japan have ports, and their
population accounts for 60% of the total Japanese population. For
example, big thriving cities like Tokyo, Yokohama, Nagoya, Osaka, and
Kobe invariably have their own ports.
Harbor facilities were more than 60% destroyed during the latter stages
of World War II, and it was not until 1955 that they reached pre-war
levels in terms of asset value. Facilities are now four times the
1955 level.
G-5

Here, as in Western Eurpoe, crude oil imports have played a major role
in fostering the development of deepwater ports and is expected to con-
tinue: Japan's oil consumption--about 150 million tons per year in
1970 and growing at 13% per year-- is more than 99% imported.
G.3 PORT MANAGEMENT AND FINANCING
G.3.1 Administration
The 1950 Port and Harbor Law marked an important iilestone in port
administration, by replacing centralized, national ownership of ports
with port authorities--set up separately by local public entities--to
develop or manage the ports in the capacity of "Port Management Bodies."
According to the law, there are three forms of port facilities
construction: 1) direct government works undertaken by the central
government through the Ministry of Transport (MOT), with the cost
shared between the state and the Port Management Body; 2) subsidized
works undertaken by the Port Management Body, with only part of the
cost supported by the state; and 3) independent works undertaken by
the Port Management Body on its own budget. Completed port facilities
are placed under control of the Port Management Body (PMB).
The law stipulates that port facilities under control of the Port
Management Bodies shall be offered for public use and operated to be
available to any person under the same conditions. The Management Body
may be provincial in scope (Niigata), or more often municipal (Tokyo,
Osaka). State duties are shared by various Ministries; e.g., Ministry
of Transport (supervision of PMB for development, financing, cargo
handling, safety of navigation, signals, and lights), Ministry of Forestry
and Agriculture (fisheries, animal, and plant inspection), Ministry of
International Trade and Industry (import and export licensing), etc.
G-6
G.3.2. Funding Structure
The MOT Planning Department estimates the typical share of port
construction costs as follows:
Breakwaters and structural work 30%
Channel dredging and improvements 30%
Quaywalls and superstructure 30%
Roads and communications 10%
Private investment in cargo handling and warehousing is generally
similar to road investment by the government. Practically all of the
actual construction work is implemented by private firms.
For basic port infrastructure, including breakwaters and channels, the
government (MOT) provides theoretically a variable share of the capital
funds, depending on port type:
- Specially designated foreign trade ports (18), 75%;
- Major harbors (80, including 19 beyond 100,000 dwt), 50%;
- Local harbors (951), 40%; and
- Refuge harbors (10), 100%
The actual share is somewhate different depending on location and
negotiation. For example, the August, 1967 law for special port project
expansion provides for 40% MOT, 40% prospective operator, 10% PMB,
and 10% local government shares in loans to ad hoc Development Authorities
in Osaka Bay and Tokyo Bay. These reduced 50% subsidy applies to
important but congested areas.
Yokohama, an artifical island with 40 foot depth for general cargo and
containers, has been subsidized over 75% MOT, "because of the leading
position of the port for Japan economy". On the Sea of Japan side, the
infra-structure of the East Niigata integrated harbor is 79% subsidized
by the state as a depressed area. Reciprocally, the government has
lately become concerned over the benefits enjoyed by a particular group
of enterprises from the high cost development of deepwater bulk terminals.
The share of port infrastructure expenses to be borne by private enterprise
has thus climbed substantially, as shown in the fiscal 1970 budget
G-7

(Table G-1).
TABLE G-1
1970 DISTRIBUTION OF DREDGING COSTS IN PETROLEUM AND IRON ORE PORTS
Depth Government Port Mgt. Bodies Private Companies
down to -40' 25% 25% 50%
-40' to -46' 20 20 60
-46' to -53' 15 15 70
-58'and deeper 10 10 80
Quaywalls, basins, and reclaimed land related to all four port categories
are subsidized in the same amount by the government. But only those
facilities administered by the Port Management Bodies receive such a
subsidy. Some 70% of the trade volume is still handled in unsubsidized
private berths, but this percentage is-expected to decline somewhat.
As another illustration, the new port of Kashima (Sumitomo steel plant;
200,000 dwt ore carriers) is being created east of Tokyo to relieve
the Tokyo Bay congestion and help a depressed area. About 200 billion
yen ($550 million) will have been invested between 1960-75, including
70 billion yen of public investment and 130 billion yen of private invest-
ment--a relatively low public share. An additional 800 billion yen
($2.2 billion) in land preparation and utilities will be spent by private
interests.
The financial situation of Japanese ports remains precarious. Mooring
facilities and storage facilities are deemed a source of revenue by
law, but--within the context of public service--the corresponding fees
assume the character of commissions and are quite small by world
standards. When the initial government subsidy is taken away, consolida-
ted accounts of public ports show 1/3 supported by the sponsoring local
public entities and 1/3 stemming from bond floating. This situation is
being modified, as in most world ports, in the direction of higher port
charges. Between 1955 and 1965, the growth of public harbor assets
G-8

averaged 7% annually; and was 9% between 1960 and 1965, lagging much
behind the increase in cargo volume handled.
G.4 ECONOMIC FUNCTIONS
G.4.1 Traffic
Japan's ports and harbors are closely associated with economic activities
in production and distribution industries. Figure G-2 shows excellent
linear correlation between the gross national product (GNP), the index
of mining and manufacturing production (IMM), and the cargo volume
handled at ports. Namely, there is an increase of about 13 million tons
in cargo handling volume for every $1 million increase in GNP, or for
every increase of 1 in the IMM index. Table G-2 shows the evolution of
cargo volume, with an annual average increase of nearly 15 percent
over the 19-year period, 195071969. Of the total cargo volume handled
by Japanese ports in 1969, 467 million tons (29%) represented foreign
trade, while the remaining 1,148 tons were domestic (down from 75% in
1960).
TABLE G-2
CARGO VOLUME HANDLED IN THE PORTS OF JAPAN
(million tons)
Year Volume
1910 41
1920 78
1930 126
1940 223
1950 108
1955 245
1960 440
1965 808
1969 1,615
G-9

1966 \
'§Dv 1965 -1
1968 •, • 1968
\ tx•
bin) 1967 o.cb
7
1967
#-'
1963 — 1962
• N 1961 • 1962 _.... 1961
• 1963
^
I I I I I I I
11■•■•
-
1966
-
I-- 1965 •
c, 1964 • 1964
Larg
o v
olu
me (
Ivili
no
ns 0
1 I o
ns)
1000
1200
1500
300
800
500
60 80 120 100 160 180 140
IMM (Index)
FIGURE G-2 PORT CARGO VOLUME VERSUS GNP AND THE INDEX OF MINING AND MANUFACTURING
200
G- 10

Japan relies on imports from overseas for the supply of a wide variety
of materials, from staple foods to industrial raw materials including
petroleum, iron ore and coal. Table G-3 illustrates Japan's dependence
upon foreign sources of supply for major substances. In turn, Japan
exports manufactured products to practically every part of the world.
Table G-4 shows the 1960 through 1968 statistics for growth in the
economy, in port cargos, and in the two major bulk cargos. Crude oil
and iron ore imports both increased 4.5 times between 1960 and 1968,
to 121.5 and 68 million tons, respectively. In the meantime, the
average freight was reduced despite inflation and increase in average dis-
tance. The advent of large ships (the average size of bulk carriers
ordered in Japan quadrupled between 1960 and 1968, for both oil and ore)
about halved the cost of transport per ton-mile. The maximum size of
ships cleared by the MOT for construction in Japanese yards in 477,000
dwt for oil and 277,000 dwt for ore.
G-11

TABLE G-3
JAPAN
OVERSEAS DEPENDENCE FOR MAJOR RAW MATERIALS
Items Dependency Rate
Wheat 74%
Salt 80
Coal 51
Petroleum 99
Iron ore 96
Phosphates 100
(1964 data cited from the Foreign Trade White Book)
G-12

3.7 '68/'60 Ratio 2.3 3.0
TABLE G-4
SELECTED GROWTH STATISTICS FOR 1960 through 1968
Economic Growth of Japan ,
GNP EXPORT Production Index of (millions) (millions) Mine & Mfr. Industry ,
1960 $ 43,100 $ 4,060 58
1965 88,300 8,450 100
1969 166,400 15,990 186
'65/'60 Ratio
'69/'65 Ratio
2.1 2.1 1.7
1.9 1.9 1.9
Volume of Port Cargoes Handled (millions of metric tons)
Overseas Trade Domestic Trade Total
1960 ' 107 338 445
1965 242 585 827
1968 397 983 1,380
- Imported Iron-Ore, Crude Oil
Volume of Average Distance Average $/Ton 1000 Import of Transport Freight Nautical
(1,000 M.T.)• (Sea Miles) ($/Ton). Miles.
Iron Ore
1960 15,036 4,404 5.50 1.25
1965 39,018 5,982 5.00 .84
1968 68,143 6,340 3.80 .60
'681'60 Ratio 4.53 1.44 0.69 .48
Crude Oil
1960 27,056 6,077 5.82 .96
1965 73,095 6,490 3.81 .59
1968 121,469 6,438 3.45 .54
'68/'60 Ratio 4.49 1.06 0.59 .56
G-13

The volume of domestic cargo movement has grown at a slower pace, about
10% per year between 1956 and 1965 (1965 was a recession year). Shipping
has maintained a 10% share of national cargo transportation for the first
five years, but declining to 7% between 1960 and 1965; while road
transport was growing from 68% to 82%, mostly at the exnense of rail transport. Shipping remains the cheapest transportation beyond 1000
miles, and its share in ton-miles increased from 36% to 42% during the
same period.
G.4.2 Port Congestion
The tremendous increase in traffic has not been without ill effects.
When the 7% growth in harbor assets is matched against twice as large
a growth in cargo volume, it is not surprising that congestion has
become a chronic illness in Japanese ports. MOT plans, for example
that public berths of 25 to 35 foot depth should handle 1000 tons per
linear meter of quay. The average for all public ports has been rather
constant around 1200 tons per meter in the past decade, but major ports
are handling up to twice that much (Tokyo: 1,950; Osaka: 2,410).
Conversion factors of 1/3 and 2/3 are applied to berths of less than
13 feet, and 13 to 25 feet, respectively, in the calculating of these
ratios.
The average waiting time for ships is over a day at the major city
ports, despite the fact that offshore barge unloading still accounted
for 70-85% in 1965 in Yokohama and Kobe, 45% in Moji and Osaka, and
20% in Tokyo.
Table G-5 shows the average turn-around time of large (60,000 dwt and
over) tankers in some Japanese harbors, compared to other world
unloading ports. Although some improvement shows in the last year,
the average is still higher than Europe and the United States.
G-14

1.55
1.5 1.7 1.9 1.8
1.6 1.5 1.3 1.3
• Milford Haven
Fawley
1.95
2.1 1.7 1.8 2.1
1.8 1.9 1.9 1.8
•:4
•
Portland, Maine Cl
• Philadelphia
TABLE G-5
LARGE TANKERS' AVERAGE PORT TIME
1966 1967 1968 1969 Average 1969
- 0.9 1.0 0.9
1.6 1.8 1.6 1.8 1.53
2.0 1.7 1.8 1.9
1.4 1.7 1.5 1.5
Gothenburg (Sweden)
w Rotterdam a 2 Antwerp
Le Havre
Yokohama 3.0 3.0 2.9 1.8
Chiba 3.1 3.1 2.6 2.6
Yokkaichi 2.8 2.6 3.0 2.5
Mizushima 2.3 2.5 2.2 1.9
Tokuyama 2.5 2.6 2.2 3.0
2.25
Source:: Fearnley 4 Egers, Large Tankers, 1970.
G.4.3 Coastal Industrialization
European migration of industry to the coast is a post-war development
fostered by impoverishment of national resources and reduction in
shipping costs. In contrast, Japanese industrial establishments
industry originally located close to ports to be on flat land and near
the overseas sources of raw materials. There is also an historical reason
since industrialization proceeded essentially when Japan was opened to
foreign (overseas) influence by the Meiji restoration. Development
centered in large consumption areas, in the vicinity of what are now called
"Progressive Industrial Zones": Kehin (Yokohama, Tokyo, and Chiba), Chukyo
(Nagoya and Ise Bay), and Hanshin (Osaka and Kobe) which,with Kitakyushu on
the west Inland Sea, presently account for 2/3 of the total industrial
production. In these areas, the 1965 ratio of coastal industrial pro-
duction to Japan production was 46% for the whole industry sector, and
was 86% for petroleum and coal products, 75% for iron and steel, and 57%
for chemicals. G-15'

These industrial zones--which constitute the overpopulated urban
centers in Japan--are beginning to feel various restrictions to further
growth as industrial districts, owing to the deteriorating situation on
the fundamental facilities for industrial activities, as typified by
the shortage of industrial water, and the public hazards threatening
the living environments of the inhabitants.
Meanwhile, overemphasis on industrial activities in selected areas has
brought about a wide economic disparity by regions, particularly in
personal income: from one prefecture to another, manufacturing
production varies from $100 million to $9 billion while personal
income varies from $2 billion to $100 billion.
Consequently, since 1960, a program of regional dispersal of industrial
activities has been under way to achieve further growth in national
economy through industrial development while at the same time seeking
to correct economic disparities without downgrading the living en-
vironment of inhabitants in the Progressive Zones.
G.4.4 Land Shortage and Reclamation
The scarcity of flat land and the concentration of population have
forced Japan to an intensive land exploitation. Land reclamation is
an ancient practice, and the use of dredging spoil began in the
early 1900's, as natural deep water sites grew scarce in populated
areas; industrial ports like Kobe, Chiba, and Kawasaki have grown
that way. Table G-6 shows the growth to the land reclamation pro-
gram in Japan, in acreage and cost. The increase in unit cost between
1955 and 1965 from $5,000 to almost $30,000 per acre of industrial or
city land reflects--more than inflation--the increased depth of fill.
Current costs average $35,000 per acre.
G-16

TABLE G-6
ANNUAL LAND RECLAMATION
Industrial City Construction TOTAL
Year Acres Cost Acres Cost Acres Cost (millions) (millions) (millions)
1954 200 $ 1.0 200 $ 1.0
1955 320 1.5 320 1.5
1960 2,375 63.5 2,375 63.5
1961 4,710 139. 550 $ 4.7 5,260 144.
1965 6,760 188. 900 26.5 7,660 214.
1964-68* 42,000 1,181. 10,000 486. 52,000 1,607.
1967-71* 52,500 1,528. 17,500 861. 70,000 2,389.
* 5-year plans
G.4.5 Economic Plan and Improvement of Port Facilities
Since 1955, when Japan finally recovered from the war, and harbor assets
came back to prewar levels, six National Economic Plans have been
launched consecutively. These plans are: the Five-Year Self-Supporting
Economic Plan, 1955 the New Long-term Economic Plan, 1957; the Doubling
National Income Plan, 1960; the Intermediate Economic Plan, 1964; the
Socio-Economic Development Plan, 1966; and the New Socio-Economic
Development Plan, 1970. Except for the latest and current one,
projected growth rates were outstripped by the actual growth rates,
and modifications were required after only two or three years of
implementation.
As in France, the national economic plan seeks to direct the nation's
general economic policies--serving as a guideline to private enterprise
and business activities, without controlling or restricting them. The
goal of a five-year plan is adjustable, and the plan itself is flexible
and subject to modification in line with changes in international
economic situations, trends in equipment investments, and fluctuation
of prices.
G-17

The New Socio-Economic Development Plan, formulated in 1970 for
completion by 1975, has set the actual economic growth rate at 10.6%
and the GNP at US$267 billion in terms of the 1957 price level.
This plan defines four major tasks: 1) internationalization and
streamlining of the economy; 2) price stabilization; 3) promotion of
social planning; and 4) maintenance of reasonable economic growth and
promotion of economic development. Since these tasks are not
independent, but correlated with each other, it is necessary to deal with
them comprehensively and systematically for attaining a higher rate of
growth and overall efficiency.
In particular, it is recognized that the capacities of ports and
harbors are a controlling factor for the distribution of cargoes. The
development of industrial ports is a powerful tool for economic growth
as well as regional development. Social development, safety and
elimination of public nuisance are essential to qualitative improvement
of living conditions, not only in city life but in port and transporta-
tion activities. Consideration will be given to the reclamation of
land that is free from public nuisance, consolidation of port
facilities to secure safety, improvement of narrow channels, and
provision of facilities to prevent public nuisance in harbors and sea.
G.4.6 Development Planning
The actual planning process may be summarized as follows.
a) First, a macro-economic model, with some 60 equations, will project
the GNP and given various assumptions, the optimum amount of government
investment.
b) The Ministry of Transport will establish 15-20 year forecasts from
the correlation between cargo volume and GNP shown in Figure G-2.
From these will be developed a five-year forecast for the port construc-
tion program, separated into domestic and foreign trade, and general
cargo and bulk. These cargo volumes are then allocated between private
company berths and public PMB' berths.
c) MOT will then evaluate technical and budgetary requirements,
G-18

starting from specific ratios such as : general cargo to be handled at
the rate of 1000 tons per meter of quay length per year for 10 meters
or more draft. Bulk cargo will be much larger, and containers may be
handled at the rate of 600,000 - 800,000 tons per berth per year. Average
budget requirements are approximately 10 billion yen ($28 million) per
1000 meters of quay wall for both infrastructure and superstructure.
In steps b) and c), MOT works with the local port authorities and com-
pany ports. There are no formal attempts to regionalize planning pro-
grams or to coordinate between competitive ports. In the major trading
bays, Tokyo and Osaka Bays, port authorities and government are quite
concerned about the need for more coordination. Both bays may even end
up by having an area-wide port authority, already created on paper to handle
overall government subsidy. But even MOT does not expect it to really
work for 10 years, as those proud individual ports are quite jealous of each
other. New consciousness about problems such as those encountered in Tokyo
Bay -- water pollution, lack of land, sea traffic construction, road con-
gestion, air pollution by industry--may force the issue.
In the meantime, the government, besides giving its subsidies to the Bay
Development Authorities (1967 law) rather than to the ports, is considering
a new distribution port outside Tokyo Bay, near Kashima, to decongest the
Bay. The main function of the port will be to receive and distribute oil
products refined in the new refining and petrochemical industrial port
planned in the north, in New Tomakomai near Muroran. Pipelines will carry
these products inland, into the "backyard" of Tokyo-Yokohama-Chiba. If
accepted, the Chiba canal project will provide an additional linkage.
Planning is present on the cabinet level as an attempt to save the major
urban areas from choking while promoting the economy of less advanced
zones, under the "Master Plan for Developing New Industrial Cities and
Special Areas for Leading Industries." Illustrated on Figure G-3, this
plan shows almost exclusively the coastal locations.
G-19

Suo
klbrel•
Akita _ft
Wakasa Bay
• Owase
tsu
• fl New
hiba Kashima ...Effp A wFuttsu
rs hibushi 4,5e
FIGURE G-3 PORT PROJECTS OF JAPAN
G-20

As a result of this planning process, total public investment during
the six years from 1970 through 1975 was fixed at $153 billion (at the
1965 price level), aiming for $267 billion of GNP in 1975, and a 10.6%
annual average economic growth rate.
This investment should cover traffic facilities, land preservation, living
environment, education, agriculture, and others and includes $5.3 billion
for ports. Although this allocation is not sufficient to meet all the
requirements, it was judged as the maximum possible investment consider-
ing financial resources and current price levels, despite the recognized
important role of ports and harbors in implementing the economic plan.
During the past decade, public investment in ports amounted to $8.4
billion with an additional $1.7 billion for 67,000 acres of seaside
industrial land reclamation. We have seen that this amount has not been
sufficient to prevent congestion in the major city ports, so that the
current plan was revised and a New Five-Year Plan for Ports and Harbors
from 1971 through 1975 was drafted. In this plan, the total quantity
of cargo handled in all Japanese ports is estimated at 3,380 million
tons in proportion to GNP, and the amount of investment is assumed to
be U.S. $6.9 billion, based on the policy of the New Socio-Economic
Development Plan. The goals of the plan are the development and
improvement of: 1) Ports for physical distribution, 2) Ports for
regional development, 3) Facilities to ensure safety, 4) Facilities for
the prevention of public nuisance, and 5) Facilities for promoting port
function (transfer).
By comparison, the third five-year port and harbor improvement plan'
(April 1965 to March 1970) budgeted $1.5 billion (including $850 million
government subsidy) for infrastructure, and 280 million dollars for
superstructure--about 1/4 the new 1971-75 plan.
Similarly, following the government's New Plan for Economic and Social
G-21

Development (April 1970), the Energy Research Council to the Ministry
of International Trade and Industry (MITI) was called upon to revise
their last forecast, made in February of 1967. The latest total energy
requirement forecast envisions a need for 2.75 billion barrels in
oil equivalents for 1975, or 1.42 times the previous forecast, and 5.9
to 6.6 billion barrels of oil equivalents in 1985 or 1.7 to 1.9 times
the previous forecast (depending on whether 7.8% or 8.9% is taken as
the annual growth rates for 1976 to 1985).
The dependence on imported energy is forecast at 72.8% for petroleum
and petroleum products in 1975 and 67.2 to 68.5% in 1985. It is of
interest to note that over 10 million tons of LNG imports have been
forecast for 1985. Crude oil and fuel oil imports will increase from
1.4 billion barrels in 1970 to 2.1 billion barrels in 1974.
The 1970 forecast indicates that the total requirement for energy in
1975 will be over double, and that for 1985 will be 4 to 8 times the
energy required for 1968. The Council in 1970 had reservations as to
where all of this energy would come from, and decided to recommend
positive measures to develop sources of supply, consider relocation of
industries related to energy, and to deal with pollution control.
- G.5 ENGINEERING PROBLEMS AND SOLUTIONS
G.5.1 Port Construction Problems
In the course of the past 10 years, Japan has been required to deepen
some of the existing ports, to open new industrial ports, to create
additional industrial and even residential coastal land, and finally
to protect these structures and assets from the assault of the sea, in
the constricted and crowded Japanese environment. The Ministry singled
out the following problem areas in its 1966-67 Port Annual:
New Industrial harbors
These require proper site selection and a three to five year survey and
construction period, in sten with nlant (refinery or steel mill) erection.
Tomakomai, Kashima, East Niigata, New Toyama, Mizushima, and Akita are
such examples.
G-22

Erection of Structures on Soft Ground
Sites having proper load-bearing characteristics for new ports or old
port expansion are becoming hard to find. Displacement of poor material
by good sand (100 feet of clay and silt had to be dredged out for the new
Kobe breakwater) and the sand drain process (320' wide, 120' deep for Kinio
wharf, Nagoya) are popular, but entail long lead time and high costs.
Sometimes, a pier-type quay is adopted (Hiroshima). Research is conducted
on solidifying the clay under water and on chemical treatments.
Dredging Channels
Because of the decreasing availability of near shore deep water, dredging
is being more frequently used to prepare harbor areas. Material handling
is often a problem, particularly if spoil cannot be dumped nearby. For
long hauls of spoil, a stationary suction dredge may be served by two or
three remodeled T-2 tankers (19,200 cubic yard capacity each) moored fore
and aft on buoys. For shorter distances, a pusher-tug operates a 960-cubic
yard barge (with opening bottom) in up to three-foot swells. Rock cutting
has also required various solutions and developments.
Construction in Deep Water
Construction of sea islands and breakwaters in more than 80-100' depth, with
200-foot piles or 3,000 tons caissons as standards, in relatively un-
protected waters is a challenge. As in Bantry Bay, much delay may be caused
by insufficient floating equipment. These needs are answered in Japan
by specialized installations, such as a 138' x 79' x 12' jack-up platforms
with 174-foot long legs, to work in 108' of water with a 17-foot clearance.
Construction Materials
Stones, traditionally used for construction are difficult to obtain
weighing more than one ton. Reinforced concrete blocks of 1 to 25 tons,
are used for wave breaking as well as slope face armour. Among the
some 25 types available, the tetrapods, hollow triangles, and six-
legged blocks are most popular.
G-23

Steel pipes, plates and sheet piles are often replacing concrete in struc-
tures, making construction easier and quicker. PVC boards have been used
with success to prevent sand and mud seepage through structures. A 3"-
thick asphalt mat can prevent the settlement of foundation blocks by
increasing frictional resistance to sliding and rotation.
Fishing Rights
Reclamation and channel dredging damage or destroy valuable fishing grounds
which must be "bought" from former users. This traditional environmental
problem is now only one of many others, borne surprisingly well in such
a crowded country (see section G.6).
G.5.2 Alternatives for Port Infrastructure
Since the early 1960's, a considerable number of additional industrial
ports have been constructed. Historically, industrial ports developed first
in the areas around the ideal harbors with great water depth, such as
Dokai Bay and Muroran Port; subsequently, sites were chosen along Tokyo
Bay and Osaka Bay. Recently, areas which were previously considered unsuit-
able have been utilized, first for "reclamation-type" ports and then
for "excavation-type" ports. The former is built by reclaiming the shoal
with soil and sand obtained from the dredging of fairways and basins
(e.g., Kashima and East Niigate). The physical problems involved in such
projects are immense, not the last of which is the handling and dispo-
sal of vast amounts of excavated material. For example, the MOT must handle
100 million cubic yards of spoil at Kashima and half as much in East Niigata;
the material will be disposed of by several means, including beach nourish-.
ment, dumping at sea on land reclamation or breakwater sites; raising the
land inshore for industrial use, housing, or developments; building road
or river banks; etc. The methods chosen are based primarily on conven-
ience, efficiency and cost, rather than the question of environmental
suitability.
In the case of petroleum, the traditional practice of mooring 100,000 dwt
tankers along the front quay of a plant is giving way to use of jetties
or sea berths to avoid ever increasing expenditures for dredging as
G-24

200,000 dwt and larger vessels become more common.
Thus, in the ports of Yokohama, Kawasaki, and Chiba along the coast of
Tokyo Bay, sea-berths were constructed one after another at 68 to 93
foot depths. The offshore berths contributed in great measure not only
to solving the cargo handling of the 200,000 dwt class tankers, but also
to maintaining safety in already over-congested channels. Jetties are more
expensive, but allow higher unloading rates and may be more economical
for high utilization ratios.
G.5.3 Excavated Harbors
Although basin excavation is an age-old technique, it has been recently
refined and used in Japan as a systematic technique for new port construction,
when natural deep sites with flat industrial land became scarce. Its
merits and demerits have been characterized by an MOT technical advisor;
"On the plus side is the possibility of developing virgin
land into a highly productive area contributing to regional
economic and social development; obtaining a shorter open
water line, with reduced breakwaters and better protection
against the sea and wind (an advantage found in major river
ports of other countries); gaining reduced maintenance and
dredging, except in outer harbors; and providing good land for
industry and communications.
"On the other hand, initial (breakwater) construction
is expensive and difficult, because the coast line is
generally straight and open to rough seas, which means a
substantial initial investment that will not be recoverable
for some time. Nearby coastal stretches may be disturbed
by alteration currents which produces erosion and sand drifting.
There is an inherent lack of flexibility for expansion
of port configuration, as it is hard to deepen and enlarge basins,
or create new ones, if technological change requires it
during continued operation. The overall plan must be
drawn up with excellent perspective, and one may expect
there will probably be changes during construction (Kashima).
G-25
Finally, as there is little flushing, some means to keep the basins'
water clean must be devised."
G.5.4 Storm-Tide And Tsunami Protection
One cannot leave the subject of port infrastructure in Japan without
mentioning the huge storm and tsunami protection works, rendered
complex by soil subsidence which is occurring in most of the major
industrial cities. In 1966 alone, Japan spent $60 million in levees,
breakwaters and gates (compared to $350 million on the U.S. Gulf since 1955).
Extensive theoretical and model test work is conducted prior to con-
struction. Recent works of importance include embankments at Nagoya
and a tsunami barrier at Ofunato.
G.5.5 Superstructures
Cargo handling methods are generally similar to those used elsewhere.
Although Japan has experience in coal slurry pipelining, and closely follows
the Marcona ore slurry system performance, we are not aware of firm projects
of this type for coal or iron ore.
As early as 1966, a 3300-ton-per-hour unloader with a 27-foot diameter
reclaiming-bucket wheel was used at Mitsukojima, outside Kure Harbor,
for 140,000 dwt salt carriers. Coal and iron ore may be discharged at
2,400 tons per hour. A 1000-ton-per-hour unloader is accommodating
coasters and barges for secondary transport, and a 15-ton bulldozer may
be lifted into the ship to help handle cargo. Higher unloading speeds
are now available for iron ore at various terminals (e.g., about 4,000
tons per hour at Nippon Steel, Fukuyama).
For quays on soft ground, construction of inclined steel piles with steel
plates have often been used. During the 1960s concrete-packed steel
cylinders were first used; typically they are 27 feet in both diameter and
height, with 0.12-inch-thick walls, but have been made up to twice the diameter
and three times the wall thickness. Injected mortar may be made with a mix
of 640 parts of cement; 251 fly-ash; 867 sand; 7.68 injection additives.
G-26

SOIL MECHANICS LABORATORY
SOIL STABILIZATION LABORATORY
FOUNDATION LABORATORY
RUNWAYS LABORATORY
SOIL TEST AND INVESTIGATION SECTION
EARTHQUAKE RESISTANT STRUCTURE LABORATORY
VIBRATION LABORATORY
MATERIALS LABORATORY
DESIGN STANDARD SECTION
COMPUTATION CENTER
TRAINING AND LIBRARY SECTION
HYDRAULIC TRANSPORTATION LABORATORY
G.5.6 Port Engineering Research
The Port and Harbor Research Institute, attached to the MOT, is organized
as follows:
ORGANIZATION
HYDRAULICS DIVISION
WAVE LABORATORY
SAND DRIFT LABORATORY
BREAKWATER LABORATORY
HYDRAULICS LABORATORY .
STORM SURGE AND TSUNAMI LABORATORY
OBSERVATION AND INQUIRY SECTION
MODEL TEST SECTION
DIRECTOR
SOILS DIVISION
STRUCTURE DIVISION
DESIGN STANDARD DIVISION
DREDGER AND CONSTRUCTION EQUIPMENT MACHINERY DIVISION LABORATORY
ADMINISTRATION DIVISION
MACHINERY SECTION
GENERAL AFFAIRS SECTION
FINANCIAL SECTION
PLANNING SECTION
G-27

In addition to ports, the Institute carries out research on airport
civil engineering. In 1966, about 70 of the 200 research staff members
held B.S. degrees of higher, and the staff was supported by 71 clerical
personnel. Some typical subjects in the late 1960's were:
• Soils Division --model tests and new calculation methods for
pile resistance to lateral forces;
• Structure Division --improvement of precast concrete process
for better control and execution of underwater concrete
structures;
• Machinery Division --improvement of water-jet design for
underwater excavation, deep dredging techniques;
• Hydraulics Division --(10 model basins and 6 channel models) tug and
supership interactions, with 100,000 - 150,000 dwt field
tests in Yokohama, Mizushima, and Tokuyama Ports during 1965
and 1966, followed by model experiments during 1967 and 1968.
In addition, there are five regional port construction bureaus with their
own research and design departments, generally with one hydraulic basin
per bureau.
In a new port concept, models will be used for the design of protective
works, for the study of waves inside the basins, for preliminary estimates
of silt and sand transportation, and channel maintenance problems.
Because sediment transport cannot be predicted accurately by such methods
or by calculation, the next step, when difficulties can be forecast,
will be to build a "site-testing dike" before constructing the final
breakwater. This amounts to building the most critical part of the
breakwater on a preliminary basis and observing phenomena for some time (a
year or two) before completing the job or modifying the design. Siltation,
sand transportation, and beach conservation are examined. When results are
not satisfactory, prevention works are introduced, such as beach stabilizers.
In extreme cases, the port development should be cancelled or moved else-
where.
G-28

G.6 ENVIRONMENTAL PROBLEMS
Saddled with unusually severe natural conditions, heavy growth and ex-
treme concentration of industry and population in a few coastal areas,
Japan epitomizes most of the environmental features which aroused world-
wide concern in the western world in the late 1960's. In fact, one cannot
but wonder at the philosophical and traditional traits of character which
enable Japanese people to remain most urbane, active and even-tempered
under conditions which would severely tax western tempers.
G.6.1 Coastline
Aside from the impact of industrial development, natural forces such as
storm-tides, tsunami, earthquakes, and ground subsidence are taking a
heavy toll on the Japanese coast.
• The 1969 typhoon storm-tide caused 4,689 deaths and left 298 missing
in Ise Bay, damaged 535,000 houses (37,000 totally destroyed), affected
nearly two million people and scoured 700,000 acres of farmland. In-
dustrial and agricultural losses were estimated in excess of $175 million.
• The 1960 tsunami caused by the Chilean earthquake inflicted similar
havoc in small northeast ports, destroyed 39,000 homes, scoured
23,000 acres of farmland, and affected 156,000 people.
• The Niigata (Richter 7) earthquake killed 446 persons, destroyed 27,000
homes, and inflicted over $170 million in damages. Port operations
were completely disrupted for some time.
• Excessive withdrawals of underground water for industrial and other pur-
poses, combined with unstable ground conditions, has resulted in large-
scale ground subsidence in some major port cities: a ten-foot subsidence
in Tokyo close to the Sumida River over a forty-year period (1918-1958)
brought 35 square miles below flood-tide level, and nine square miles
below ebb-tide levels; nine feet of subsidence between 1935 and 1965
brought 29% of Osaka city acreage below flood-tide level.
G-29

• West Japan is hit by typhoons in the fall, and the Japan sea coast
has strong winter winds and swells, causing severe coastal erosion
and sand displacement.
To fight these relentless natural conditions, anti-disaster plans have
been implemented, and coast preservation work is proceeding. By 1967,
some 22% of the coastline was protected, or about half of the length which
requires protection. Huge breakwaters (an anti-storm-tide embankment at
Nagoya, and a tsunami barrier at Ofunato) have been built, and bigger ones
are being considered (across Tokyo Bay and the Kanmon Straits). About $310 mil-
lion were spent on coast protection in the nine-year period from 1958 to 1966
($60 million in 1966, alone), including waterline levees, jetties, offslore
breakwaters, revetments, gates, and sluices.
In addition to prevention work, local restoration is proceeding at an
average of $23 million per year for port facilities alone; i.e., 10% of
port construction expenses. This constant preoccupation with hostile
natural forces may in part explain the past relative insensitivity of
Japanese people to man-made ecological damage.
G.6.2 Marine Pollution
Although confined to limited coastal areas, marine pollution is, however,
on the increase. Environmental water-quality criteria are being applied
to specified regions, and mapping of the polluted areas is in progress
under a five-year plan started in 1968 by the Fishery Agency, which is a
major factor in pollution fighting. The following list of problems
speaks for itself:
• A decrease in sea transparancy is prominent between Tokyo Bay and
the Seto Inland Sea; these two bodies of water are at either end of
a 400-mile long narrow plain which produces almost 2/3 of the country's
GNP.
• Dark-green coloration in oysters (green oyster) is caused by high
copper or zinc content in the sea (0.01 ppm and 0.1 ppm, respectively).
This has occurred offshore near copper refineries (Hitachi, Takehara),
G-30

Bemberg plants (Nobeoka Bay), and open ore storage (Nagoya).
• The minamata disease, in the early 1960's affected 89 persons with
mercury poisoning caused by eating fish and shell fish from
Minamata Bay: 36 died. The chemical plant responsible has since treated
its methyl mercury effluents with apparent success. The disease broke
out again later in the Agano River (Niigata), killing 5 out of 29 patients.
While methyle mercury effluents, as well as the use of mercury in agri-
cultural chemicals are now strictly forbidden, fish in the polluted areas
have not entirely lost their mercury content after 5 to 10 years,
despite removal of the cause.
• Offensive Odors in sea food come from polluted sea water (effluents of
oil refineries and petrochemicals, ship bilges) or the sea bed (precip-
itation, dumping). Fish is often eaten raw in "Sashimi" or lightly
fried in "Tempura", which make these odors particularly objectionable
in Japan. Oil odor is offensive in Osaka harbor, which does not have
a refinery, but the bottom mud contains oil from ship bilges and 0.2%
content in mud has been shown to give fish a foreign odor. Off the
petrochemical port of Yokkaichi. all the fish caught within 1.3 miles,
half of the fish caught between 1.4 and 2.5 miles and several species
including sea-eel and flatfish between 2.5 and 9 miles had offensive
odors. Studies of this latter example indicated a critical concentration
of 0.01 ppm of oil in seawater, which is now the accepted limit for
water quality in fisheries. Activated sludge treatment is believed
to reduce adverse effects, so that the oil concentration of 1 ppm is
accepted in effluents so treated. Oil effluent discharges into the harbor
are further restricted during the winter, as fish crowd to warmer port
waters, and a reinforcement of odors was noted at that time around
Yokkaichi and Mizushima.
• Agricultural chemicals have polluted the Ariake Sea off the Chikugo
River Estuary: in 1953, many mysid shrimp died from pesticides, and
tide-land soft clams sustained heavy damage in 1962 from PCP herbicide,
which is now regulated.
G-31

• Matsushima Bay oyster culture grounds have been devastated since
1961 by fish processing plant effluents in Shiogama harbor. In the
bottom mud, organic materials have tripled (13% to 41%), and sulfides
have increased 27% in 10 years.
• Laver(Porphyra Tenera), a much-priased, edible seaweed, besides ac-
quiring offensive oil odors, has suffered at Nagoya, Tokyo Bay, and
off the Ohmuta River can cause a carcinomatous disease linked experimen-
tally to cyanide, phenol, and other chemicals.
• Soft clams in the Ohmuta River estuary have a bitter taste, attributed
now to aromatic nitro-compounds in the bottom mud, originating from
coal and chemical plants. A 1963 survey showed that 10% of the clams
taken within three miles of the estuary are thus affected.
• Twenty-four oil spills in the past 10 years, including six by collision,
twelve by stranding, and three deliberate disposals, resulted in heavy
casualties, particularly to laver seaweed. Spill volumes ranged from
10 to 26,900 tons and were treated with chemicals. Aircraft monitoring
of floating oil now takes place in Tokyo Bay during the laver season.
• Pearl oysters were heavily damaged by dredging operations in the Bisan
channel in 1965.
In these cases and others, the Tokai Regional Fisheries Research Laboratory
in Tokyo has done considerable research, particularly in severely polluted
bays (Tokyo, Ise, and Osaka). Some of the effluents it singles out besides
those mentioned above are: lignin from papermills; products from fermen-
tation and fish-processing plants; effluents from chemical fibers plants; wastes
from steel, aluminum and titanium mills; and thermal pollution from power
plants.
Tokyo Bay is the worst off, and in 1970 all fishing stopped. The metro-
polis spent $3.7 million and the government $4.7 million that year and formed
a Pollution Council. Dredging-spoil disposal was halted inside the bay,
and a monitoring system is being set up.
G-32

G.6.3 Citizen Reaction
Despite the apparent earlier reluctance of Japanese citizens to complain
about their worsening environment, public awareness and resentment is
becoming a major force for change. During several days in the early summer
of 1971, the following events were reported in local newspapers:
• A Tokyo opinion poll showed of those questioned, 81% resentful of pollu-
tion, 29% afraid of induced disease, 55% doubtful about the possibility
of future correction. Deficiency was particularly felt in greenery,
clear air, and sunlight.
• On June 28, a record 8500 Tokyoites, including 1000 school children,
were sent home, suffering from eye irritation, sore throats, and head-
aches due to photochemical smog. The government had issued its
12th smog warning of the year. Record densities of 0.29 and 0.27
ppm of oxidant were recorded at two locations. Chiba, Saitama, Kana-
gawa, Yokohama and Kawasaki, all in the Bay, were also affected to
a lesser degree. It is not infrequent to see people walking in the
streets with gauze masks on their mouth and nose on such days.
• There is concern that the water of Tokyo's Tama River is to blame for
Kashin-Beck's disease, a bone ailment (deformed joints, pains) common
among local residents. The Tamagawa filtering plant has been
closed, and will remain so pending further research.
• MITSUI suffered a loss through court action in Toyama. Although
not occurring in Tokyo Bay, the event will have long range effects:
Mitsui is to pay a total of $200,000 to a first contingent of 31
victims (8 ill, 6 dead and their families) of the "Itai-Itai" disease
which has affected 514 people and dependents along the Jinzu River.
This is the first ruling to attribute any environmental hazards to indus-
try and should have far-reaching effects on public attitudes and juris-
prudence. Other legal cases pending involve the Minimata disease linked
to mercury (see above), and mass outbreaks of asthma in the petrochem-
ical port of Yokkaichi.
G-33

Mitsui is appealing the verdict, as it claims that the link to cadmium
discharge from its Kamioka zinc-smelting plant is more than doubtful.
After some days of hesitation, however, the company agreed to pay the
indemnities under protest.
It is remarkable that not all the town residents were happy with the
judgement rendered. Some 21,000 work at the plant and many are afraid
of reduction in production output, as the city really depends on the plant
for a living.
• Finally, an Environment Agency went into operation on 1 July 1971,
to unify the fight against environmental disruption.
G.7 THE RESPONSE: PORT PLANNING & DEVELOPMENT OUTLOOK
From the above discussions, one may infer that port development planning
is vital to the Japanese economy and that natural and man-made problems
put a tremendous strain on planners. The 1960's have witnessed some
new approaches in planning for the following reasons:
• Most of the 1940's and 1950's were spent recovering from World War II
damage;
• Technological change in transportation is bringing containers and
superships; the mid-1970's ports will receive 500,000 dwt tankers
(95-foot-draft), 300,000 dwt ore-carriers (80-foot-draft) and 40-45 foot
draft containerships, all now under construction;
• Consistent underrating of the rate of economic growth and of cargo
handling requirements is resulting in unacceptable crowding and
port congestion;
• The MOT has had to consider more and more the efficiency of the total
transport and distribution system in planning, along with the indus-
trialization of depressed areas. Over the past year, the latter
proposition has been helped by an even stronger requirement: how to
G-34

effectively decongest the Tokaido (Tokyo, Ise and Osaka Bays) area;
• Awakening of environmental consciousness in the late sixties, beyond
the traditional fishing rights problem, has currently focused atten-
tion on water-pollution and land-use efficiency; and
• The transportation system includes not only primary and secondary
marine transport, but interactions with airports, road, pipelines, and
railroads.
Ports for regional development are designed on a large scale as "Bases
for Seaside Industry" and are provided with large-sized, high -efficiency
facilities through adequate investment at the outset. Plants will be
built for annual steel production of 20 million tons and daily refining
capacity of one million barrels of oil -. The port-related industrial area
should be more than 25,000 acres to receive large-scale industry and foster
the advantages of the "Kombinat". Comparatively remote sites from central
regions have to be selected for the new ports, because of the strong concern
of current large communities regarding air pollution, public nuisance
and environmental hazards, as well as for securing safe passages for the
300,000 to 500,000 dwt vessels. Such selection will contribute to regional
development.
In the next five years, six new industrial ports, each about three times
the size of Kashima, will be started to divert industrial expansion from the
now-congested urban areas, along with several distribution satellite ports
nearby. Four or five years ago, the justification for these new ports was
to help depressed areas: Kashima or Oita, Tomakomai, and East Niigata.
Now, however, the primary requisite is location away from large cities,
followed by a favorable natural site, and general efficiency in transportation
systems.
The new ports are shown in Figure G-3. From SW to NE, they are Shibushi
(South Kyushu, 7,500 acres), Suonada (North Kyushu, 75,000 acres, 1 million
dwt mooring), Akita and Mutus Bay (North Hondo), New Tomakomai (south
Hokkaido, 75,000 acres) and Tsu-Matsusaka (Ise). Each will have a major
G-35

refinery (1 million b/d), and probably a steel mill (20 million t/y) or
an aluminum smelter. Products from the northern three ports will be exported
or shipped to major consumption areas through 'backyard" distribution ports:
New Kashima for Tokyo Bay, Wakasa Bay for Kobe-Osaka and Ise Bays.
To further help decongestion, major Central Terminal Stations (CTS) for
tankers are considered, analogous to the Kiire-Kagoshima terminal. As
soon as one such terminal is built at Futtsu (with 25 million tons
of crude storage on 25,000 reclaimed acres) at the outer entrance of Tokyo
Bay, the bay may be closed to tankers altbgether, as its pollution is
the worst in the country. Other CTS's will be built for Osaka Bay and the
Seto Inland Sea, all with 500,000 dwt to 1,000,000 dwt sea berths.
Inside the bays themselves, each with six or seven major ports, plans are
drawn for cooperative specialization with the following aims (Tokyo Bay
1975, 400 million t/y):
a) use of coastline and water to create pleasant amenities, free of
public nuisance;
b) specialization of each port by character, eliminating useless over-
lapping; and
c) rational circulation of goods inland.
In particular, heavy industry will be confined to the southeast, around
Kisarazu Port and towards Chiba.
Each pier will be specialized by cargoes, and more efficient systems
than "first-come-first-served" are being tried. The handling of
hazardous cargoes will be well separated from ordinary goods. Seaside
trunklines for road-rail transport, and a mid-bay east-west embankment are
planned to improve communications.
The May 1969, "Comprehensive Land Development Program for All Japan"
strongly calls for harmony between man and nature. Along with future
development of transportation systems and information networks, it
aims at expanding land development throughout the country and basically
G-36
reorganizing the overall land-use program. Environmental planning should
be improved by the creation on 1 July 1971 of an Environmental Agency to
group all the environmental activities of the various ministries such
as the Ministry of Transport, Ministry of International Trade, Ministry
of Welfare, and Ministry of Agriculture and Forestry. For example, MOT
wants to preserve the natural coastline areas up to 13,000 miles out of the
total 16,000 miles, but many of the currently concerned Ministries disagree
with this policy. Inside MOT itself, practically the only work done on
sea pollution inside ports is in the Machinery Division and the Shipping
Division. An example of precautions taken recently include the quay sur-
face slopes inshore at Oita to avoid run-off (from ore storage and handling
spills) into the sea. The Ministry of Public Works is concerned with land
use, the Ministry of Welfare and MITI are concerned with air pollution.
In the early sixties, when regional development was a prime consideration,
along with efficient land use, reclamation and excavation habors were
the preferred alternatives for new port construction. But natural sites
became scarce, deeper channels were required and decongestion of the major
bays became the prime concern. Offshore sea berths and central terminal
stations outside industrial bays, and large industrial harbors in virgin
sites coupled with"backyard" distribution ports, are now favored.
When possible, MOT's Planning Division prefers reclamation harbors in a
natural site to excavation harbors, because they are cheaper and provide
additional land. If one looks at the experience in ports of more than 45
foot depth, the past five-years' experience is in favor of excavated harbors:
four of them (Tomakomai, Kashima, Niigata, and Kamasawa) between 1965-70
versus practically no reclaimed and natural-site deep water harbors; and
four inland sea types (private companies at Kiire, Oita, Tokuyama, and Keiyo),
as well as sea berths and monobuoys in major bays. But when one looks at
the next five year plans, only one excavated harbor appears, New Tomakomai,
which has been planned to protect good beaches, by opening basins behind
them (like at Dunkirk, France). The five other new industrial harbors,
although in a less-advanced state of planning, will probably be reclaimed
at natural sites.
G-37

New artificial islands are planned at Wakayama and Sakaide, with possibly
some large islands in Tokyo and Osaka Bay to "get things away from people."
The Kiire CTS terminal operating results are satisfactory, but indicate
an advantage to jetty mooring over offshore berth for discharge speed, as
well as a dire need for faultless handling equipment and efficient
oil booms to contain oil spills created by the former.
G.8 SOME JAPANESE DEEP WATER PORTS,
BAY OF ISE
A basic plan has been adapted for the development of 23 ports within
the Bay of Ise, with 1980 as the target year. Among the ports are those
of Nagoya, Yokkaichi, Mikawa, and Kinuura. Reclamation is underway at
these three ports, as well as Atsumi Bay and Matsuzaka Port. The sea land
at the mouth of the Bay will be given a sufficient depth for vessels up to
200,000 dwt, with future plans for vessels up to 300,000 dwt.
KASHIMA
This port is claimed to be the world's largest man-made harbor and was
officially opened in 1970. When all facilities are completed, in about
three years' time, ships of 200,000 dwt can be berthed there. Along these
waterways, 7500 acres of industrial land are to be developed. Present depth
is 76 feet.
KAWASAKI
This port is included in the development plan for Tokyo Bay. Two sea
berths of 20 and 17 meters (65 and 55 feet), as well as a 44-foot LPG
sea berth. Plans are to accommodate large-sized vessels with utilization
of the land reclaimed from the sea for harbor facilities and redevelopment
of the urban area. Total area is about 10,000 acres.
KIIRE (Kagoshima Bay)
A Central Terminal Station was constructed by CALTEX in 1969, on reclaimed
land (240 acres) for 500,000 dwt transshipment.
G-38

KISASARU (Tokyo Bay)
Nippon Steel Corporation has a 56-foot deep terminal for ore, which
it plans to deepen to 83 feet for 250,000 dwt OBO combination carriers.
NIIGATA
The Niigata port faces the sea of Japan. A new industrial zone and new
basins are being developed. The depth will be 53 feet in the outer harbor.
The area of the adjoining industrial land is about 5,000 acres.
OITA (Kyushu)
Nippon Steel is building a 90-foot offshore terminal for 300,000 dwt OBO.
SASEBO
A fine natural harbor, affording safe anchorage for large vessels with
a depth of 168 feet at the entrance, and 76 feet at anchorage, Sasebo
Ship Industry is the major activity. Some anchorage areas are controlled
by the U.S. Navy (10).
SENDAI
The industrial harbor facilities at Sendai comprise over 1825 acres with
holdings of adjacent land for future use. Some two million cubic meters
of mud have been dredged out and the plan is for a harbor depth of 57 feet.
An oil refinery is to be built in near future. The port is scheduled for
completion in 1980.
SURUGA BAY
Tagonura Harbor in Suruga Bay is in the development stage. It is an
"excavated harbor," and uses pneumatic caissons for the breakwater.
TOKUYAMA
A sea berth for 200,000 dwt vessels has been installed.
TOKYO BAY
Three sea berths have been provided for large tankers to unload oil through
pipes laid on the sea bottom, and construction of four more sea berths is
G-39

underway for tankers of 250,000 dwt (68 feet to 93 feet depth). The idea
of an oil terminal outside the bay is being considered, from which the
oil can be conveyed by pipelines or small tankers.
CHIBA CANAL
There is a plan for a 20-mile canal to join Tokyo Bay to the Pacific
Coast near Kashima, through a lake. The depth of the canal is to be
50 feet at low tide. The excavated soil, about 300 to 400 hundred
million cubic meters, could be used for reclaiming low areas, and providing
space for industrial complexes.
TSURUGA
This port is the center of trade with Asia and the USSR. Maximum depth of
the outer harbor is more than 73 feet.
YOKKAICHI (Ise Bay)
In addition to a 200,000 dwt sea berth, the port channel was recently
deepened from 40 feet to 60 feet along with land reclamation of
3,100 acres and a new 3000-foot breakwater.
YOKOHAMA
In addition to the 68 to 93-foot berths of Tokyo Bay, two Negishi Refinery
piers are 55 feet (crude oil) and 45 feet (fuel oil). The Kokusai Futo
Pier has a 58-foot pier for bulk cork carriers. There are extensive
shiprepair drydock facilities.
Existing deep water tanker terminals are listed on Table G-7.
G-40

Kyokuto Sekiyu Idemitsu Kosan Fuji Sekiyu Maruzen Oil
Showa Oil
Keiyo Sea Berth
Keihin Kawasaki Sea Berth
Depth of Berth (MLWS) Draft
Tanker Size
DWT
20.50M 19.50M 200,000
28.00 20.00 200,000
Yokkaichi
Owase
Shimotsu
Mizushima
Iwakuni
Tokuyama
Oita
Ube
Kiire
Mitsubishi Oil Ogishima Sekiyu Kichi Nippon Petroleum Refining Co.
Showa Yokkaichi Sekiyu K.K. Daikyo Oil
Toho Oil
17.00
16.50 18.00
19.00
16.50
16.50
19.00
21.00
20.00
16.50
27.00
150,000
150,000 200,000
190,000
180,000
160,000
210,000
210,000
210,000
150,000
500,000
Outer Berth
Umaokoshi
Toho Oil Pier Sea Berth
Ogake No. 1 Pier 187,000
Crude Oil No. 2 Pier 165,200
Crude Oil Berth
Sea Berth
Kyuseki No. 2
Sea Berth
No. 2 Berth
No. 3 Berth
148,300
140,000
- 100,000
50,000
CTS
Keihin
Port
Chiba
Name of Oil Company
TABLE G-7
TANKER BERTHS IN JAPAN (OVER 150,000 DWT)
Refining Berthing Name or No. of Berth Capacity Method
(BPCD)
60,000 Alongside 180,000 70,000
155,000
99,000 S.B.M.
Toa Nenryo Kogyo
Nippon Mining Co.
Koa Oil Co.
Idemitsu Kosan
Kyushu Oil
Seibu Sekiyu
Nippon Oil Staging Terminal Co.
74,440 CTS S.B.M. 21.00-25.00 20.00
220,000 Alongside 17.00 16.50 Ogishima Sea Berth Berth A
180,000 S.B.M.
105,000 S.B.M. 17.00
40,000 Alongside 18.00 21.00
Alongside 20.00
Alongside 17.00
Alongside 17.00
Multi-Buoy 20.00
Alongside 21.00-30.00
S.B.M. 21.00
Alongside 18.00
Alongside 28.00
21.00
210,000 160,000
22.00 250,000
Source: The Japanese Energy Problem and Its Shipping Solution," J. S. Kagami, IAPH, London, October 1970.

SOURCES
Port & Harbours Annual, 1966-1967
Proceedings of the IAPH Special Committee on Large Ships, London, October
1970.
- "The Japanese Energy Problem," Dr. J. S. Kagami, Tokyo Tanker Co.
- "The Advent of Large-sized Vessels and Ports in Japan," Dr. H. Sato, Dr. Gnl, Japan P&H Association
Proceedings of the IAPH Conference, Montreal, June 1971.
- "The Role of Ports and Harbors in National Economic Planning," Dr. Y. Kurisu, Dr. Gnl, Bureau of P&H Minister of Transport
Ports of the World, 1970-1971
"Development of Artificially Excavated Harbors," Civil Engineering in Japan, 1969, 1966, T. Okabe, Bureau of P&H, MOT.
Proceedings of the FAO Technical Conference on Marine Pollution, Rome, December 1970.
- "Marine Pollution in Japan," T. Nitta, Tokyo Fisheries Research Laboratory
G-42

APPENDIX H
THE MIDDLE EAST

APPENDIX H
THE MIDDLE EAST Page
11.1 SUMMARY H-1
H.2 PERSIAN GULF LOADING TERMINALS 11-2
11.3 KHARG ISLAND, IRAN H-8
H.3.1 Terminal Development History 11-8
11.3.2 Site Selection 11-9
H.3.3 Kharg Operations H-11
11.3.4 Environmental Impact H-12
11.3.5 Engineering on the Sea Island H-12
11.4 MINA-AL-AHMADI, KUWAIT H-14
11.4.1 Terminal Development History 11-14
11.4.2 Decision Rationale H-16
11.4.3 Operations at Mina-Al-Ahmadi 11-17
H.4.4 Socio-Economic Impact H-18
11.4.5 Environmental Impact 11-19
H.4.6 Engineering Aspects 11-19

LIST OF FIGURES
Figure
H-1 Persian Gulf Oil Terminals
H-2 Technical Layout of Mina-Al-Ahmadi, Kuwait
LIST OF TABLES
Table
H-1 Persian Gulf Tanker Terminals H-5
H-2 Pros & Cons of Supertanker Berths H-7
Page
H-4
H-15

APPENDIX H
THE MIDDLE EAST
H.1 SUMMARY
Long-haul transportation from the Persian-Arabian Gulf to Europe and
Japan was the rationale for the supertanker developments in the 1960's.
Crude reserves of 2/3 of the world supply (and production 1/3) make the
Middle East a major source of world supply. The initial concentra-
tion of production in a few countries, and in the hands of one consor-
tium in each of these countries, helped create major terminals and foster
technological developments. Through a literature survey, and brief
field trips and interviews in Iran and Kuwait, the following highlights
became apparent:
• 250,000 dwt tankers are received by practically all major
producers, except for Iraq which pipes much of its current
production to the Mediterranean Sea, and has a program to
develop a deepwater terminal in the mid-1970's. Two of the
three largest producers are preparing for 500,000 DWT in the
early 1970's; the third already receives 350,000 DWT tankers.
Sizes in the range of 750,000 DWT to 1,000,000 DWT are
expected in the late 1970's.
• The producing consortium generally owns and operates the
terminal, but the facility may revert ultimately to the host
country (as in Iran after ten years), although the oil
companies remain as terminal operators.
• The oil throughput is generally the major source of national
income by far, in the producing states. Some projects to
diversify (Aluminum Smelter plant in Bahrain) have recently
picked up strength.
• Site selection depends on port location versus the feeder
oil fields, deepwater access, reduced dredging maintenance,
gravity-loading capability, and political safety. Computer
models are used in the planning and design process, hydraulic
models for the actual depth requirements in channels and at
berths.
H-1

• Extensive experience has been acquired with underwater pipe-
lines up to 48 and 56 inches in diameter, and with various
berth structures: single buoy or multi-buoy offshore berth,
sea island, jetty and T-piers, and underwater storage.
• Environmental problems still appear around deepwater terminals,
possibly due to warm water conditions. Faulty valves, equip-
ment, and human error are the cause of spills, but in much
less volume than released by offshore oil-well leaks and
operations. Strong action is taken by some governments about
spills and bilge disposal in port, while an oil company coopera-
tive is planned for larger spills. Dispersants and burning
are common corrective actions.
11.2 PERSIAN GULF LOADING TERMINALS
The Persian-Arabian Gulf is a natural geafront for almost 2/3 of the
world's crude oil reserves and about 1/3 of current production, most of
which is exported to Europe and Japan. This long-distance haul has
fostered the development of Mammoth tankers, and there is a concentration
of deepwater terminals analogous to those being developed in Europe and
Japan.
Nine countries are producing 17 million barrels per day (May 1971),
showing a 20% increase during the five first months of 1971, compared
to 1970. Saudi Arabia (4.83 million, 94% ARAMCO), Iran (4.25 million,
91% Consortium), and Kuwait (3.4 million, 93% Kuwait Oil Co.) are the
major producers, followed by Iraq (1.85 million), Abu Dhabi (1 million),
Qatar (0.47 million), Oman Dubai, and Bahrain. Production in each
country is generally held almost entirely by one particular group of
companies, except in Abu Dhabi where an offshore group and an onshore
group take almost equal shares. It is not surprising then that these
groups have developed important terminals to improve the off take of a
vital production. Figure H-1 and Table H-1 show these terminals, and
their controlling depth of access channels or berths.
H-2

Kharg Island, Iran (67 feet); Mina-Al-Ahmadi, Kuwait (93 feet); Ras
Tanura, Saudi Arabia (85 feet) and Das Island, Abu Dhabi (64 feet)
serve the major producers; with the conspicuous exception of Iraq, whose
ports of Fao and Khor-al-Amaja are limited to 35 feet and 50 feet, but
have an outlet through pipelines to the Eastern Mediterranean Sea.
Some special techniques have been tried to respond to the challenge of
offshore production and terminals. The sea islands at Mina-al-Ahmadi,
Ras Tanura and soon at Kharg are record breakers, and the first under-
sea terminal storage was erected at Fateh, off Dubai. Oil terminal
improvements are welcome by host governments, who draw a major part of
their revenues from oil royalties and taxes. Kuwait and Abu Dhabi
have the two highest per capita incomes in the world -- even higher
than United States. These revenues trigger much import trade as they
are increasingly shared by more of the population, and much general-
cargo port development is underway. Diversification is still small,
except in Iran and Bahrain (where an aluminum smelter is planned).
The above-listed ports run the gamut of techniques which can be used to
berth and load (or unload) a supertanker (exclusive of quay-walls);
jetties and T-piers, or sea-berths (single or multi-buoy moorings, and
sea islands) connected by underwater pipeline to the shore. Ras Tanura
has two T-piers and three sea islands, with an additional sea island
projected for 1972, and a new offshore terminal, 80 miles north, by
1975 (500,000 to 1,000,000 dwt). Mina-al-Ahmadi has two T-piers and
one sea island. Kharg has one jetty with ten berths (250,000 dwt) and
plans for a 500,000 dwt sea island for 1972, with two to four berths.
Das Island and Djebel Dhana, Abu Dhabi, each have several offshore
mooring buoys.
The choice between the various techniques is complex and Table 11-2 lists
some of the arguments heard in the field (Kuwait, Iran, Abu Dhabi, and
Saudi Arabia). The cost of these facilities may run from $10 to $40
million, but their high rate of use reduces the transfer fee to below
$0.02 per barrel.
H-3

• Lavan Island
1/4 Flalul Island
cs Bahrain: /, •
• Sea Island 85'0" Ras Tanura 490"
• .8.itra 44'0"
• Das Island 640" Fateh ujairah
Ras AI-Khaimah
• t. . . Umm Al-Qaiwainc
."-?
yharjah ubau \\\.
i""
j Muscat and Oman
SAUDI ARABIA
• • • • • • • • • • •
Umm Said 400"
Abu Dhabi
Jebel Dhanna 43'0"
FIGURE H-1 PERSIAN GULF OIL TERMINALS
IRAQ
.......
__Bandar Mar Shahr iV.3ad2,a6n ,
IltBandar Deylam
Fao 35'0" IPKhor-al-Amaja 500"
.....
I /
> ..... ...' ....... .1...- KUWAIT Mina-al-Ahmadi 93'0" Kharg Island
Neutral Zone
Mina Abdullah 510" 670"
• v
■••"--s.. I
....... .. ...., ...
' 'Mina Saud 52'0" 1: Neutral
i
I .1. Zone \
•LRas Kbafji 56'0"
SAUDI ARABIA
IRAN

1 680' 1 949'
36'0" 51'0"
(Berth No. 1) (Berth No. 2)
Table H-1
PERSIAN GULF TANKER TERMINALS
Port Terminal No. of Maximum Size or Berths Length 0.A. Draught
Abadan 11 600' 32'6"
Bandar Deylam
Bandar Mar Shahr
Das Island
(Berth No. 1) 1 850' 52'0" (Berth No. 2) 1 1,150' 64'0"
Fao (Berths No. 1,2,3,4) 4 675' 35'0"
Halul Island
Jebel Dhanna 2 1,100' 43'0"
Kharg Island
(No. 1) 1 NL 67'0" (No. 2) 1 700' 62'0" (No. 3) 1 NL 67'0" (No. 4) 1 800' 63'6" (No. 5) 1 NL 67'0" (No. 6) 1 900' 64'0" (No. 7) 1 NL 58'0" (No. 8) 1 780' 58'0" (No. 9) 1 NL 55'0" (No. 10) 1 850' 55'0"
Khor-al-Amaja 2 1,000' 50'0"
Lavan Island
Mina Abdullah
Mina-al-Ahmadi
(Sea Island) 2 NL 93'0" (North Pier) 4 NL 63'0" (South Pier) 8 NL 51'0" (Sea Berths) 6 NL 50'0"
Mena Saud 2 950' 52'0"
Ras-al-Khafji
(Terminal) 3 NL 56'0" (207,000 DWT)
H-5

40'0" 40'0";
Table H-1
PERSIAN GULF TANKER TERMINALS (CONTINUED)
Port Terminal No. of Maximum Size or Berths Length 0.A. Draught
Ras Tanura 10 940' 49'0"*
(Sea Island) 6 1,200' 85'0"
Sitra (listed under Bahrain)
(No. 1 [Island] Wharf) 2 900' 44'0" (No. 2 Wharf) 2 820' 43'0" (No. 2 Wharf) 2 560' 32'0" Coastal Tanker Wharf 1 240' 16'0"
Umm Said
(North Berth) 1 875' (South Berth) 1 1,000'
*or up to 51' draught on rising tide. . .
H-6

SPM GRADE SINGLE-POINT MOORING SEA ISLAND JETTY AND PIERS
Less costly for one berth Less costly than SPM for several berths
Less costly for high loading rates and short offshore distances
Access is difficult to crews and supplies
Access somewhat easier than SPM
No access problems
TABLE H-2
PROS & CONS OF SUPERTANKER BERTHS
Suited to higher sea state 10-12 Feet to berth 25 Feet once moored
Can be designed for waves 10 Feet longitudinal 5 Foot beam, while moored
Flexible on siting, orientation (ship swings with wind, current)
Less damage prone in poor approach (can be ducked easily and tried again)
Orientation condition by wind and wave directions
Damage to dolphins and plat-form are costly in time and dollars
Same as sea island
Damage at T-pier connections endangers pipelines
Flexible and floating hose, risers are liable to damage (mechanical, fatigue, corrosion) and pollution (drainage difficult)
Loading rate generally lower
Steel chicksan arm better than aluminum or flexibles
Higher loading rates than SPM
Same as sea island
No limits on loading rate

Other developments include testing of various types of tug arrangements
and propulsion systems: Kort nozzles versus twin-screw/rudder versus
Voith-Schneider vertical propeller. No clear superiority of one parti-
cular system has yet emerged, as there are trade-offs in maneuverability,
bollard pull forward and backward, maintenance, etc., which complicate
matters.
Oil spills have been a problem in the Gulf, but the largest volume by
far comes from offshore wells. Some parts of the southern coast of the
Gulf, between Djebel Dhana and Abu Dhabi town, are uniformly coated
with a thin mixture of oil and sand, resembling dark volcanic or mineral
sands. However, only scattered damage is visible and clear blue waters,
white sands, and good fish and shrimp catches can be enjoyed almost
everywhere -- including around large terminals.
Faulty equipment or human error are responsible for the minor spills which
do occur in these terminals. Hydraulic cargo valves (overflow) and
underwater pipeline control valves (leaks) are somewhat troublesome in
this respect. Flexible hoses and aluminum chicksan arms have been
known to fail, and drainage of connections and manifolds must be effi-
cient. Strong enforcement action is being taken by several countries
in this respect, but there is no deballasting equipment available, as
tankers have much time on long voyages to clean their ballast.
H.3 KHARG ISLAND, IRAN
H.3.1 Terminal Development History
After a short field visit and interviews with representatives of the
Iranian Consortium operating companies in Tehran, we conclude that Kharg
Island (a record-setting loading terminal) will becapable of exporting
a substantial share of the world's production.
At the completion of Phase II (1966), crude oil storage capacity was
7,680,000 barrels, and there were four 48" and one 36" loading lines
(capable of a 45,000-tons-per-hour total loading rate -- or 10,250 tons
H-8

per hour per single ship). It had ten berths on the East Side jetty
and was the largest oil terminal in the world (70 feet on outside
berths, for 250,000 dwt tankers).
Phase III, completed in 1969/70, brought tankage to 11,180,000 barrels,
including the first one-million-barrel tanks ever built (there are now
three such tanks and another one under construction), and the total
loading capacity to 60,000 tons per hour, or 15,000 tons per hour each
for two ships, on both light and heavy crudes.
Phase IV, now proceeding, involves an investment of some $40 million,
with a two-berth sea island at 105 foot depth. Two 5,000 foot-long, 56"
diameter, underwater pipelines to the west shore, link to two 5,200 foot-
long, 78" diameter, onshore feeders from the tank farm. By late 1972,
the sea island will handle 500,000 dwt -ships on the outside, and up to
300,000 dwt on the inside berth; with 30,000 tons per hour loading
capacity on each berth. Future expansion may add two more berths to
the 1,800 foot-long sea island.
Average tanker size received was 65,000 dwt in 1969 and 77,000 dwt in
1970 (80,000 dwt in December). Maximum size is currently 250,000 dwt,
so that the "Universe" tankers (326,000 dwt) cannot load. Looking
beyond the 500,000 dwt berth for 1972/73, the Consortium expects
1,000,000 dwt tankers, although 750,000 dwt may load more frequently.
H.3.2 Site Selection
The decision to develop Kharg Island rested with the Iranian Consortium*,
which decided to develop Kharg as its main crude-oil terminal towards
1960. Up to that time, the port facilities at Abadan on the Shatt-al-
Arab were used to handle refined products from the local refinery. The
facilities at Bandar Mahshahr (to the East of Abadan) were used to handle
crude oil from the light crude fields located to the north and to the
east. It became evident, at this time, that:
*British Petroleum 40%, Shell 14%, Gulf/Mobil/Socal/Esso/Texas 7% each, CFP 6%, and Iricon (Aminoil, Arco, Conoco, Getty, Signal, Sohio) 5%; formed in 1955
11-9

• Politically, the Shatt-al-Arab presented a problem in that by virtue of a 1935 (or so) agreement between British-dominated Iraq and Iran the river was practically given to Iraq instead of using the thalweg principle. Thus, Iraq has claimed the river, has done all the dredging, and collects all the pilotage and dredging dues. At any time, therefore, the Iraq Government could shut the river down and thus inter-
. fere with the movement of oil, the life blood of Iran.
• Although the Bandar Mahshahr oil terminal functioned well,. the Khor Musa inlet-river complex was costly to dredge to depths greater than the existing 30-35 feet draft, (vessels up to 45,000 dwt). With crude-oil tanker sizes going up, dredging would become prohibitive in the future.
Thus, a new location was necessary to load refined products and crude oil,
as well as to expand the capacity of the loading facilities.
In searching for new locations it was decided that Bandar Mahrshahr could
be used to handle refined products from the Abadan refinery, if a pipe-
line were built from Abadan to Mahshahr. The land was flat and offered
no problem in laying the line, and Bandar Mahshahr could offer a loading
terminal within the safety of Iran itself and not on an alien, border
river. The only terminal needed became that for handling crude oil.
While selecting a crude terminal area the following points were also
considered:
• The need for relatively deep water, and expansion possibilities;
• Preference for areas where dredging on a continuous basis would present few difficulties and, most likely not be required; and
• The market swing to heavy crude oil.
The coastline of the Iranian shore on the Gulf is quite inhospitable.
It is quite shallow at a considerable distance from shore. Kharg
Island was finally chosen because it offered deeper water, relatively
easy dredging, and was located within Iranian waters relatively near the
heavy crude area. Actually, there were a few locations from which to
choose and Kharg stood out like a beacon. Beside being a crude terminal,
Kharg also is a bunkering terminal. The fuel is shipped from Bandar
H-10

Mahshahr to Kharg and stored in tanks (800,000 barrels of Bunker C;
180,000 barrels of Marine Diesel) awaiting use.
H.3.3 Kharg Operations
The Iranian Consortium invests in and operates (through its Iranian Oil
Exploration and Producing Co.) the crude facilities on Kharg. The
initial funds for construction of facilities come from the member
companies. The Iranian Government, through the National Iranian Oil
Company (NIOC), pays the consortium back on a ten-year basis. Therefore,
NIOC completely owns all facilities over ten years old, but the consortium
operates the terminal with no interference from NIOC.
The cost of handling crude oil through the terminal has been estimated
at 1.5 cents per barrel, similar to the marginal cost of transshipment
in Bantry Bay. Heavy crude exports went from nothing in 1960 to over
1.1 million barrels per day in 1969, while Iranian Light went from 0.6
to 1.6 million barrels per day over the same period, and crude
processing in local refineries was stagnating at 380,000 to 480,000
barrels per day. These benefits which accrue to the Iranian Consortium
as well as Iran itself, which has received an average of $0.85 per
barrel (before 1970) to $1.30 (1971) and expects $1.50 (1975) for crude
production.
The number of jobs created (presently) are estimated to be 326 basic
and 189 non-basic, or a total of 515 personnel on Kharg.
On the island, IPAC (NIOC and Standard Oil of Indiana) has LPG and
sulphur facilities (100,000 barrels per day) which may or may not have
resulted from the decision of the consortium to develop the area.
Sociologically, the old village (250-300 people) on the island now
thrives. None has left the island because of the terminal, although the
young people still continue to leave because few job opportunities
exist and the big cities lure them. Trading has naturally increased
in the village: there is now a bazaar and a good school.
H-11

The only port in the vicinity of Kharg Island is the general cargo
port of Bushehr which has not been affected.
H.3.4 Environmental Impact
There are occasional small oil spills, but the operation appears quite
clean. The small, uninhabited island located about two miles to the
Northeast of Kharg continues to retain its absolutely clean sand, in
spite of the fact that it is on the leeward side of Kharg and subject
to the prevailing winds which blow across the oil terminal towards
the island. No provision, at present, exists for disposing of dirty
ballast. Oil vessels are supposed to be deballasted when they tie up
at the jetty.
In contrasting the Kharg terminal, the impact on the marine environment
was minimal. Although it was necessary to do considerable blasting
while laying the pipelines to the island, apparently fish and other
marine life continue to thrive and coral continues to grow. The marine
balance has remained.
H.3.5 Engineering on the Sea Island
a. Underwater Pipelines
Iranian Oil Exploration & Producing Company already has experience in
laying and operating "large" diameter pipelines. This year it added
a 72" loading line to the four 48" and one 26" lines taking oil from
the Kharg tank farm to the ten-berth jetty at the island's eastern
shoreline.
Submarine lines have been designed for installation by the bottom-pull
method. When plans were made for the project, a lay barge had never
successfully installed 56" line with a designed negative buoyancy of
110 lb/ft. The contractor is expected to weld the pipe on the beach
and use either a specially designed pull barge or a winch installed on
a jackup platform for the pulling operation.
11-12

Since the concrete-coated 56" submarine lines will weigh about 2,500
lb/ft, and have a relative specific gravity of 1.64 when filled with oil,
line stability will be of concern only during construction. Some 500
feet of coral reef will require blasting. The pipelines will be recessed
into the seabed by jetting, fluidization, or any other method proposed
by the contractor and accepted by the engineers. Pipe cover will be
minimal. After the pipes have been laid, coral spoil will be dumped
back into the trench to protect the piping through the surf zone. A
36"-thick, 75 foot-wide blanket of coral and indigenous gravel,
extending 500 feet from the sea island towards the shore, will counteract
propeller scouring at the tanker berths.
Positive protection of underwater lines against galvanic corrosion will
be provided by an impressed-current system. The offshore structures
will also be protected by a combination of anodes and impressed current.
Transition from horizontal sea lines to vertical risers will be by
installing 90° bends of three-diameter radii. With the high fluid
velocities involved (10 ft/sec at 225,000 barrels/hr) a long-radius
bend will substantially reduce vibration and avoid accumulation of wax
and sludge at the bottom of the riser.
Provisions will be made in the piping arrangements for launching and
receiving spheres and swabs for line cleaning and test purposes only.
These will be removed for normal operations.
b. Offshore Berths
The 1,800-foot-long island consists of a central loading platform, with
berthing structures on either side for each tanker berth, and six mooring
dolphins. Walkways connect all parts of the offshore structure. The
central platform contains prefabricated deck trusses, supported by piles,
combined in a twin-template structure. A continuous deck supports all
piping and equipment on the platform.
H-13

Monobuoys (SPM) were also considered, but the consortium decided on a
sea island because they believed that:
• There might be prototype problems with buoys and hoses, rather than dolphins and chicksan arms;
• Rough weather (November-March is the storm season in the area) would undoubtedly cause, at the time in SPM development, pollution at the hose connections, and drainage problems would occur;
• Rough (stormy) weather would cause much stress on the SPM, with a resultant increase in corrosion fatigue, and corresponding problems. (The weather has already had considerable affect on the loading operations. A yearly average of 138 hours delay per month prevails, with December having weather delays of up to 434 hours.)
Actually, the engineers of the consortium were divided about what to
build. However, the tested sea-island idea prevailed. The consortium
believed that its advantages would compensate for the $10 to 12 million
increased cost (part of it unforeseen in engineering estimates) over
the SPM. The additional two berths now planned on the sea island seek
to improve the economics.
H.4 MINA-AL-AHMADI, KUWAIT
H.4.1 Terminal Development History
The Kuwait Oil Company (KOC), headquartered in London, is owned 50% by
British Petroleum and 50% by Gulf Oil (Pittsburgh). In 1934, it was
granted concessions (until the year 2020) for prospecting in Kuwait and
in 1930 found the Burgan field, world's largest. The export of oil
started in 1946 from a one-mile-long, 12" submarine pipeline connected
to a hose buoy. KOC crude oil production was 2,575,000 barrels per day
in 1969 (3 million per day in December19691, covering about 93% of the total
oil produced in the nation (including the Kuwait/Saudi Arabia Neutral
Zone).
There were up to four offshore loading lines at Mina-al-Ahmadi, which
have been replaced by the following three permanent installations
(Figure H-2):
H-14

North Pier
111.."--41:"72:181111111111.0bdalarlisnlaenl_
dine
North Tank Farm
Gravity Lines
Filling Manifold
• / 4-0. 4,...1 ' 4-11HI 1._____ . :2 1 .7;
•Tr • '"_ •_:_•,,.,.,
,itt:,!-
4 .1 _. ikiki it t South Tank Farm
Nlanifold • N
ct
South Pier
FIGURE H-2 TERMINAL LAY-OUT OF MINA AL AHMADI, KUWAIT
H-15

• South Pier, completed in 1949, to a depth of about
40-49 feet, with three crude berths, two LPG and
refined-products berths, and one general-cargo berth.
Tankers up to 100,000 dwt are handled;
• North Pier, completed in 1959, to a depth of 50-60
feet, with four berths served by three major loading
lines 38"-44" in diameter. Tankers of 200,000 dwt
can be received under limited conditions;
• Sea Island, completed in 1968, is located about nine
miles offshore with a depth of about 95 feet at the
berths, and 93 feet in the 28-mile channel to be used
by ships of 70' draught or more. There are two berths,
but one main loading 48" line from the shore loads only
one ship at a time. Bunker C is available from a 20"
pipeline. The island can handle the "Universe" class
of tankers at 326,000dwt for which it was designed.
Storage capacity is 12,500,000 barrels, with 600,000 barrels being the
largest capacity tanks in use, although one-million-barrel tanks are
considered in the expansion scheduled for 1973, with a second underwater pipeline to the sea island. Crude production is now about 2.7 to 3
million barrels per day, though the loading capacity is greater: over
5.5 million barrels were delivered in one specific day, an average of
about 30,000 tons per hour on all berths.
H.4.2 Decision Rationale
Gulf Oil was the most instrumental partner in the creation of the new
sea island (for reasons developed in Appendix I: Bantry Bay). The sea
island is part of a system incorporating the six giant "Universe" tankers
of 326,000 dwt chartered by Gulf from National Bulk Carriers, Ltd. In
1965, Gulf was faced with the prospect of tanker size increasing far
beyond the capacity of its European refineries terminals. To keep these
refineries competitive, and continue its market expansion, Gulf devised
a trans-shipment operations at Bantry Bay, with the largest ships coh-
ceived at the time. The system has been branching into two new
ref inery-deepwater terminal complex: one in Okinawa, to penetrate the
H-16

Japanese market; and one in Point Tupper, Nova Scotia, to make fuel oil
for the U.S. east coast. Kuwait is the common crude oil origin.
The site of Mina-al-Ahmadi was selected initially because of its focal
position versus the oil fields, and the possibility of loading ships by
gravity from a 400-foot ridge close to shore. It was just coincidence
that some of the deepest water on the Kuwait coast was in the area.
H.4.3 Operations at Mina-Al-Ahmadi
Kuwait Oil Co., Ltd., carries out the operations of exploration,
production refining, storage, and loading of crude oil and products,
including LPG on behalf of BP (Kuwait), Ltd., and Gulf Kuwait Co.
Kuwait Oil Tankers Co. (KOTC) is the general agent.
Since 1946, KOC's crude-oil production has increased at an average 8.6%
per year, to 2.575 million barrels per day in 1969. Some degree of
stagnation occurred in 1956-1957, 1959, 1961-1963, and 1965-1968, due to
the general crude supply/demand situation, to the Suez Canal closures,
and to the specific characteristics of KOC oil, a relatively heavy
crude with high 3.6% sulfur. A strong rally is taking place in 1970-71.
The local refinery processed about 20,000-40,000 barrels per day in
1950-1957, then expanded regularly between 1958 and 1965 from 130,000
to 215-235,000 barrels per day, where it now stands. Another refinery,
built by Kuwait National Petroleum Co. (KNPC) took 65,000 barrels per
day in 1969, and about 2.3 million barrels per day were exported
in 1969; the first full year of operation for the sea island. The
U.K. took more than 15%, followed by Italy and the Netherlands and Japan
(each about 10%), France (7.3%), and Ireland (6.3%). The United States
received 2.8 million tons (or 2.2% of exports).
In 1969, the new sea island loaded 208 tankers, including the six
326,000 dwt "Universe" tankers; and one of them loaded a full cargo of
312,482 tons at a record average rate of 14,204 tons per hour in
December, 1970.
H-17

H.4.4 Socio-Economic Impact
Gulf Oil's 50% share of KOC's crude production was almost half of its
world production, so that the harmonious development of this crude
source (as allowed by terminal developments) was crucial to the
company. Gulf's share in the sea island investment is about 20% of Gulf's
1969 depreciation and some 2% of its yearly capital exnenditures. This is
a high percentage -- when added to the rest of the 'Universe Tankers"
system -- for a captive function like transportation, traditionally
not very high on the priority list of oil companies. Benefits to Gulf
are discussed later (Appendix I: Bantry Bay). Success was particularly
felt by the European markeiing organization (as witnessed by refinery
expansions) and by Gulf Oil Transportation, whose present performance
and future flexibility are enhanced.
As far as the nation of Kuwait is concerned, when oil started to flow,
Kuwait economy started to move, and has yielded the highest per capita
income in the world for many years. Kuwait's take was around $0.80 bbl
in royalty and taxes before the recent Tehran agreement, is now $1.29/bbl,
and will escalate to $1.50/bbl by 1975. In 1968-69, transactions in the
oil sector made 95% of exports and 40% of the GNP. In addition, Kuwait
received an investment tax on terminal construction. Gross investment
makes about 25% of the GNP, but savings are still 40% of the GNP,
and only 60% of these savings were domestically used.
In 1969, Kuwaitis numbered about 259,000 -- 37% of the total population --
and this percentage is decreasing further as new immigrants arrive. About
70% of the Kuwaiti labor force are on the government payroll, with 87.5%
of the officials at the elementary or no-education level. However,
an extensive program of education and training, as well as "Kuwaiti-
zation of government, commerce, and industry is under way to palliate these
deficiencies. Health care is free as well as education, for all Kuwaitis.
Kuwait Oil Co. itself has a permanent staff of 2,000 (72% Arab, 28.6%
Kuwaitis), out of a permanent and occasional work force of 5,000 at the
H-18

end of 1969. The Arab and local share of staff has increased regularly
from 30% since 1963 at the expense of Indian and Pakistani nationals.
The supportive work force has decreased from about 5,000 in 1961 to
some 3,000 in 1969, mostly at the expense of non-Arabs.
H.4.5 Environmental Impact
Little pollution is evident. Ships can deballast at berths, but must
retain dirty ballast, as the Kuwait government heavily fines ships
discharging dirty ballast into Kuwaiti waters. An average 5,000 KD
($14,000) per charge is generally levied against the faulty vessel,
under a 1968 ordinance which specifies $4,200 to 15,800 for first offense;
$7,900 to 15,800 for second offense (within one year from date of first
sentence); and $15,800 minimum for third offense -- with a $15,800
"stay of execution guarantee" in all cases.
Minor spills do occur, but apparently are readily dispersed, due to
warm-water conditions and the fresh-water inflow from the Shatt-al Arab.
The usual "detergents" are used to clean spills.
There were no baseline studies, but no adverse effect on the local marine
life has yet been noted in the vicinity of the piers or the sea island
on the dredged channel. Kuwait has an active program of shrimp and fish
trawling, and no complaints have been heard about odor or taste.
H.4.6 Engineering Aspects
a. Design Selection
The design of the South and North Piers was chosen (based on proven
design), because they were more effective than the offshore berths of
the 1940's. The sea island was selected over monobuoys because KOC
felt that the SPM's couldn't handle more than 500,000 barrels per day
and that hose-handling problems would develop.
b. Model Tests
To optimize the depth at the berth and in the departure channel, the
H-19

design engineers (Frederic R. Harris) had tests run in the ships model
basin at Wageningen, The Netherlands. The results may be summarized
as follows:
• Conditions -- 90-foot water depth, 79.1-foot vessel draft,
1:88 scale -- zero speed in head, following, and beam waves
(regular) -- 6 to 10 knots in head & following waves (regular);
• Results -- a) at wave height 3.5 meters (11.5 ft) and period
up to 14 second, the largest immersion of a loaded ship at
8 knots is 1.8 meters (6 foot) at bow, 1.7 meters (5.6 feet)
at stern -- b) largest vertical motions occurred for wave
periods of 18 seconds and the model on the bottom (10.9-foot
immersion) for zero speed in following waves of 3.5 meters
(11.8 feet) high, and at zero speed in beam waves 1.7 meters
(5.6 feet) high, with a 16 second period.
c. Construction
No unusual problem was encountered in the construction or operation of
the sea island terminal itself. A special jack-up platform, which had
been especially designed to facilitate pile driving and concrete injection,
was built in Scaramanga, Greece, to be towed through the Suez Canal.
The canal closed before it was ready, so the towing had to proceed
around the Cape of Good Hope. The platform itself, 160 feet long,
138 feet wide and 12 feet deep, is supported by 6-foot-diameter legs.
On each side, six loading arms (four 16" crude, two 12" bunker Chicksan,
and their control tower reaching 90 feet above water level) give a
maximum loading rate of 15,000 tons per hour (8,000 tons per hour with
gravity-loading alone). The Bunker C rate of 800 tons per hour is now
considered too small. Fresh water and diesel storage tanks, a slop
tank and surge tanks (part of a system which can stop the flow completely
in 15 seconds without undue overpressure), are also on the platform.
There are four breasting dolphins (two on each berth) and six moving
dolphins (three at each end). Each breasting dolphin is made of three
6-foot-diameter, high-tensile-steel piles, driven vertically 75 feet
H-20

into the sea bottom and held together by a top platform holding a large
square fender. Each moving dolphin consists of an eight-leg-template
structure, secured by 30-inch-diameter piles driven through the legs
100 feet into the sea bed.
Water, air, diesel, fire-fighting foam, and power are supplied on the
platform and some dolphins. Connection to land includes a 48" crude
line (to be doubled by 1972) and a 20" Bunker C line. The crude pumping
unit is driven by a 11,500 BHP gas turbine through a 5000/1430 spin-
reduction gear. The two 500-HP pumps for Bunker C are deemed too small.
d. Traffic Control
KOC receives about 8-days notice that a given tanker has been "nominated" for
a cargo of Kuwait oil of a particular grade and quantity, and the estimated
time of arrival (ETA) of the ship, as well as its ultimate destination.
The master of the tankers confirms this nomination 72 hours from ETA,
along with the loading rate required for cargo and bunker. He also
radios the information to Kuwait Oil Terminal Company, his agents at Mina,
along with its conventional requirements (stores, medical, etc.). Upon
sighting, the tanker is contacted by Mina's signal section on VHF radio
or signal lamp, and given her estimated time of berthing. A pilot then
boards the vessel and brings her alongside the allotted berth with tug
assistance. After clearance, the loading operator takes over, and is
also responsible for inspection of ballast discharges, water, safety,
and anti-pollution prescriptions.
Cargo loading rate is adjusted automatically from the shore, and is
reduced gradually when nearing completion, or at the request of the duty
officer, to minimize the possibility of an overflow during the final
"topping off," which is conducted on gravity-flow alone.
The port nautical surveyor then inspects the loaded draft of the vessel,
to make sure she is not overloaded. Before the loading hoses are
H-21

disconnected, they are emptied to avoid spillage. Cargo documents have
been prepared during the loading and receive the final meter readings.
H-22

APPENDIX I
BANTRY BAY

APPENDIX I: BANTRY BAY Page
1.1 SUMMARY I-1
1.2 HISTORY AND RATIONALE OF DECISION 1-3
1.3 GENERAL DESCRIPTION 1-4
1.3.1 Geography 1-4
1.3.2 Surficial Character 1-4
1.3.3 Weather 1-4
1.3.4 Channel 1-6
1.3.5 Land and Sea Use 1-6
1.3.6 Population 1-6
1.4 INSTITUTIONS AND FINANCING 1-6
1.5 ECONOMIC APPRAISAL 1-7
1.6 ENGINEERING ASPECTS I-10
1.6.1 Site Description 1-10
1.6.2 Configurations 1-11
1.6.3 Channel and Basin 1-12
1.6.4 Design Vessel 1-12
1.6.5 Docking 1-12
1.6.6 Materials 1-14
1.6.7 Cargo Handling 1=14
1.6.8 Cost Data 1-16
1.6.9 Crucial Problems and Lessons 1-17
1.7 ENVIRONMENTAL IMPACT 1-18
1.7.1 Planning and Results 1-18
1.7.2 Water 1-18
1.7.3 Traffic Control 1-19
1.7.4 Air Pollution 1-20
1.7.5 Solid Waste 1-21)
1.7.6 Noise, Visual Intrusion 1- 2n
1.7.7 Safety 1-20
1.7.8 Land and Water Use 1-20
1.7.9 Socio-Economic Aspects 1-20

Page 1.8 ENVIRONMENTAL PROTECTION 1-21
1.8.1 Storage Area 1-21
1.8.2 Vessels 1-22
1.8.3 Oil Spills 1-22

LIST OF FIGURES
Figure Page
I-1 Map of Bantry Bay, Ireland 1-5
1-2 Gulf Oil Dolphin Loading Diagram, Bantry Bay 1-15
LIST OF TABLES
Table Page
I-1 Cost of Tanker Alternatives 1-9

APPENDIX I
BANTRY BAY
1.1 SUMMARY
Bantry Bay was the first transshipment terminal built as part of a sys-
tem involving supertankers that for several years were the largest afloat
(325,000 dwt). Gulf Oil has since built similar terminals at Okinawa
and Point Tupper (Nova Scotia); each, however, has a refinery rather than
mere transshipment storage to serve several refineries saddled with shallow
water terminals. Another oil company, CALTEX, has since built a "Cen-
tral Terminal Station" at Kiire in Japan, and several more are being
considered in Japan and in Western Europe. All these terminals are de-
signed essentially to receive 300,000-500,000 dwt tankers out of Kuwait
Kharg Island (Iran) in the Persian Gulf. Some ports are plan-
ning for an ultimate capacity of one million dwt.
In the particular case of Bantry Bay, the objective was to maintain, with
minimum investment, the competitiveness of the company's European refin-
eries, whose shallow terminals were ill-equipped to receive the supertan-
kers being studied by rival oil companies. After 2 1/2 years of experience,
one may draw some conclusions about the strengths and weaknesses of
the project.
• Economics: Transshipment by 325,000 dwt was determined to be 30-40%
cheaper than the use of 80,000 dwt vessels, the maximum size possible in the
early 1960's until Rotterdam deepened its port. Direct shipment in carriers
of 200,000 - 250,000 dwt is a slightly better economic solution using ports
which have since been deepened independently. Another advantage of the ,
Bantry Bay approach was the opportunity to select a virgin site, away from
congested routes.
• Environment : The company has employed good environment planning:
- Ship design includes ballast, bilge and sewage retention, with
I- 1

cargo tanks smaller than what may soon be required by IMCO, and con-
servative scantling. Ballast water treatment equipment, capable of
reducing water pollutants to less than 4 ppm is a good alternative
to the ballast tank system.
- Traffic control is tight, although it does not include a land-based
radar system for the very limited traffic involved. The success
of the Doppler Sonar Docking System mounted on one ship should
determine the installation of a similar system on the sea island, as
in Okinawa, Verdon and other ports.
- An effort has been made, at least partially successful, to limit
the visual intrusion of the tank farm. Tanks are semi-buried and the
spoils used to build a dorsal ridge which further reduces their pro-
trusion. No other social or environmental impact has been noted.
Besides the possible opening of the earthen dike in case of catas-
trophic rupture of a full tank, the only "black spot" is the occur-
rence of a couple of minor oil spills during cargo handling. Al-
though equipment modification should help in the future, this risk
cannot be discarded entirely. A program of water quality and biologi-
cal monitoring has been initiated by a local college. In the mean-
time, no water pollution has appeared and the stream trout fishing
and resort activities have been proceeding. In fact, the "big ships"
have even provided an added tourist attraction.
- No refinery or other basic industry is e;cpected to be allowed in
the area, even though a company recently looked at ship repair acti-
vities. Dry bulk storage does not seem to have been contemplated.
• Engineering : The sea-island formula has proven viable in 3-foot
swells, and 40-knot winds (25-knot beam winds for sailing on ballast), with
little current present.
Insufficient floating equipment for survey and construction caused costly
delays during pile driving.
1-2

1.2 HISTORY AND RATIONAL OF DECISION
In 1965, Gulf Oil had four refineries in Europe, operating or under dev-
elopment all with shallow water terminals : Milford Haven, U.K. (up-
stream from the recent deep-water, 250,000 dwt developments); Stigsnaes-
Gulfhaven, D.K.; Europoort- Rotterdam (there was no talk at that time of the
later deepening to 65 and 72 feet); and Huelva, Spain. Gulf had to im-
prove the competitiveness of its crude supply and there were prospects
for expansion or additional refineries (now: Emden, West Germany) in
the area..
At the time Shell and Esso were talking of 155,000 dwt tankers that could
ballast through Suez, but the Gulf Transportation London Group also
investigated 255,000 dwt, the maximum conceivable at the time, to avoid
the technical limitations (999 ft. length and a cross-section ratio of
1:4), the extra costs (towage, waiting time, ballast free requirements)
and the political and war risks. A presentation to Gulf's chairman was
well received and a committee was formed -- with P. Binsted (London),
R. Cooke (N.Y.),and other transportation experts -- to study the economics
of direct movement to each European refinery and the possible alternatives.
The objective was to remain competitive at the least capital cost while,
in Okinawa, it was to enter a new venture (retailing, third-party crude
sales), requiring a refinery adjacent to the terminal.
As work progressed, it became clear that direct shipment by 255,000 dwt
brought the maximum savings but at the cost of a huge investment in 59-
ft. draft terminals. Initially, the concept was to lighten these ships
on their way to Rotterdam, and this solution may still be used now that
65-ft. depth (and soon 72-ft) is available there, unless tanker size
again escalates. Such lightening is already involved when one of the
"Universe" tankers retains some cargo which she unloads at Huelva on the
way back to Kuwait.
1-3

Transshipment was also investigated because of favorable experience in
Aruba (for exports of Maracaibo crude) and in Rotterdam (to Finland which
was icebound in 1962). A system analysis based on loading in Kuwait,
and unloading at a deepwater location in NW Europe with 85,000-100,000
dwt shuttle tankers serving the refineries, showed reasonable flexibility,
reduced capital requirements and improved competitiveness.
Having thus settled on transshipment, the Commission looked for deepwater
sites, away from congested channels and reasonably close to the satel-
lite terminals. In addition to SW Ireland, the commission evaluated the
Jersey Islands, the Coast of Wales, Loch Ewe, and Scapa Flow in Scotland
were considered, but fog frequency counterbalanced the advantages of a
Scottish location (50% investment grant, lower short-to-long-haul ratio,
better shelter and land availability).
Then, Gulf Oil quietly acquired land on Whiddy Island after having es-
tablished preliminary contacts with Irish authorities (Bantry municipal-
ity and the central government), none of whom offered or were requested
to give incentives. Ground was broken in March 1967. The first unloading
took place on October 29, 1968,and formal inauguration on May 6, 1969.
Operations have been continuous since October 1969.
1.3 GENERAL DESCRIPTION
1.3.1 Geography
Bantry Bay is one of several deep bays on the hilly, picturesque Irish
coast. The area economy is based mostly on low-density fishing (sea and
streams), and rural and resort activities. The hinterland does not offer
a strong market for basic industries.
Several islands in the bay offered the necessary location requirements,
and Whiddy Island was selected to house a storage farm, linked to a
"sea island" by an 1100-ft. underwater pipeline at 100-ft. depth.
1-4

FIGURE 1-1 MAP OF BANTRY BAY

1.3.4 Channel
A 20-mile natural channel, 180 to 120 feet deep, mostly 2-3 miles wide,
is oriented WSW to ENE. Current is limited, but waves do come up to 6
feet in Southwest weather. This caused some trouble during construction
because the floating equipment was too small. Tides have a maximum
amplitude of 5.5 feet (neap) to 10.3 feet (spring).
1.3.5 Land and Sea Use
One-third of the island has been taken from traditional farmland and
moors. The bay is a resort area, and local residents requested that
an embankment be built to hide the tanks from the mainland. Gulf used
the spoils from excavation to bury part of the tank walls.
Fishing is active but only outside the bay. Local fishermen showed
little concern about the effect on marine life in the bay itself. Stream
fishing (trout, salmon) did require some attention, but opposition re-
mained limited.
1.3.6 Population
Of the some 150 people who had been living on Whiddy Island's 1500 acres,
only about 50 stayed. Some continue to fish or farm. Some are employed
in the terminal's 60-man work force.
1.4 INSTITUTIONS AND FINANCING
Gulf Terminals (Ireland) Ltd. was appointed port authority by the Irish Fed-
eral Port and Waterways Department, and Gulf made the Port Authority by-laws
on the basis of Milford Haven and other terminal experience. These by-
laws were approved by the Irish Federal Port and Waterway Dept. and the Irish
Tourism Department. Terminal performance is assessed by the Refinery
Division (London), now in charge of Marine Terminals, with the Marine
Operations Groups or Gulf Transportation,Inc., helping on request. The
terminal is leased to Gulf Europe. As mentioned before, Gulf Oil did not
receive any government financing, and paid all of the capital costs.
1-6

The local management consists of a terminal manager, and an operations
manager. Originally the payroll consisted of 48 persons. This has since
increased to 60,due to the union pressure for increased operating personnel.
(This latter figure does not include the crews on four tug boats.) A
typical operating shift, exclusive of office and general maintenance
personnel, consists of seven people: dispatcher (1); pumpman (1);
assistant pumpman (1); dockman (1); utility people (3). Four shifts
permit a 24-hour loading/unloading operation. Of the entire staff, all
are Irish and only three were Gulf Oil Corporation employees prior to
1968.
1.5 ECONOMIC APPRAISAL
1.5.1 Direct Benefits and Costs
Because of intra-company transfer prices, it is quite difficult, in an
integrated oil company, to ascertain the real values of product and
services exchanged. Shipping, in particular, is a captive operation
which has little effect on supply and demand balance and, even though
Gulf expresses satisfaction with Bantry Bay's economic success, one
cannot say that its existence has had a substantial impact on off take
patterns of Kuwait crude, the major crude used by Gulf-Europe (with AgaJari
crude a distant second ). Similarly, a judgment of what European
refinery runs would have been without the trans-shipment system is
difficult, and further obscured by the intense turmoil of events which
have taken place since 1967 (Suez War, Nigerian War, Tapline closure,
Libyan cutdown, Teheran agreement, etc.). Refinery expansions from
40,000 bbl/day to 80,000 bbl/day at Europort and Stigsnaes, and the
acquisition at Emden, have probably not been triggered by Bantry Bay,
but may have been made easier by its success. Gulf Europe's product
marketing activities have been aided considerably, while Gulf Trans-
portation's performance has improved in the past two years. An
indication of this success can be seen in the following considerations:
• Gulf Europe refineries appear to have benefitted and
expansion has proceeded. We understand that actual
economics were quite close to original estimates. In
1-7

addition, Gulf Transportation is now well positioned
should tanker size increase to 500,000 dwt (but not
for a million dwt).
• System output must be about 200,000 bbl/day or slightly
more for breakeven, since this is the approximate
transport capacity of the six "Universe" tankers. The terminal
now handles 250,000 to 300,000 bbl/day and, through use
of 100,000 dwt shuttle ships, could go to 400,000 to
500,000 bbl/day without strain. The marginal storage
cost of a barrel of oil beyond 200,000 bbl/day should
not exceed 1.5 to 2/bbl (11-1501ong ton).
• The Kuwait-Bantry Bay 325,000 dwt could be more expensive
than direct shipment to Rotterdam in 200,000 to 250,000
dwt tankers but, at the time, Rotterdam did not talk in
terms of these sizes and such tankers acquired now
would cost more than twice their 1965-68 price. Even
now, however, the "system" is still ahead of direct
shipments or lightering at Milford Haven, Huelva and
Gulfhaven. Compared to costs incurred with the 80,000
dwt used at the time, transport savings are an estimated
33% or more (Table 1.1) with the Bantry Bay system.
Direct shipment in 250,000 dwt tankers could bring
slightly greater savings, but these would be shaved
down by unloading port delays. Given the low cost of
the "Universe" tankers, actual savings of at least
40-45% have probably been realized over direct shipment
in 80,000 dwt.
1-8

Tanker Size, dwt 80,000 225,000 326,000+ 80,000
6.79 8.52 5.13 6.05
4.28+.78 5.41+.97 = 5.06 =6.38
High Low High Low High Low
To Rotterdam: Direct
Through Bantry Bay
9.17
8.74+1.23
Freight Rate Estimate
Table I-1 COST OF TANKER ALTERNATIVES-$/ton
Kuwait to Milford Haven and Rotterdam " Direct Direct Transshipment
Worldscale, % 100 74 93 56 66 48 + 74 62 + 93
To Milford Haven:direct 8.90 6.59 8.28 4.98 5.88
Through Bantry Bay 8.74+ .78 4.28+.58 5.41+.72 . 4.86 = 6.13
Savings per ton are $1.73 in the low-rate hypothesis, $2.15 in the'higher
case. At a throughput of 200,000 bbl/day or 10 million tons/year, $17-22
million appear available for terminal, storage and profit. Current
increased output (by 50%) and favorable timing in ship buying enable Gulf
to do much better.
1.5.2 Side Benefits and Costs
Having solved engineering problems for the largest ship afloat for several
years, Gulf Oil was in a good position when it came time to acquire super-
tankers. Because of the pioneering character, conservative practice was
used (twin screws, tank size less than 12,000 cubic meters) and is paying
off now with excellent insurance rates and conformity to pending IMCO's
regulations. The ballast water treatment at Whiddy Island and retention
of all ship waste during bay transit are becoming standards all over the
world.
Construction work benefitted contractors: F. R. Harris (design engineers), an
Irish engineering firm, Brown & Root (offshore construction), and the
Dutch contractor who built the storage tanks have all improved their images
by this pioneering project. Given the low cost of the ships and low
1-9

charter rate, neither the two Japanese shipyards nor National Bulk
Carriers, the owner, should make much profit beyond the intangible
image build-up. Terminal operations give about 30 jobs to local
islanders ashore and 30 more on service boats, and Gulf Terminals
(Ireland) Ltd. pays taxes to the local and central government.
No complaints have surfaced from former residents (adequately compensated),
remaining fishermen (who do not fish much inside the bay anyway), or
summer visitors (bayshore real estate prices apparently have not declined
and the trout fishing is still good). No Irish tax money has been lost
on subsidy. The latter decision seems wise since an Arthur D. Little,
Inc., study for the Irish government in the late 1960's showed that trans-
shipment (dry and/or liquid bulk) would not bring much public benefits
until the local market could justify a refinery or other basic industry,
which would be quite objectionable in Bantry Bay. Gulf is prevented by
law from storing petroleum products, much less manufacturing them.
Other companies have looked at supership repair activities (without results)
but have not yet evaluated dry bulk storage and trans-shipment.
1.6 ENGINEERING ASPECTS
1.6.1 Site Description
Whiddy Island, the site of the terminal, is the innermost of four islands
in Bantry Bay. Important elements in its selection were the relatively
protected and isolated location (away from main traffic routes such as
Dover Straits); the low fog record; the natural deepwater, maintenance-
free, channel that reaches a depth of 100 feet about 1,200 feet offshore;
land availability; and the full cooperation of the Irish Government during
selection and location. Bantry Bay is also conveniently sited for access
to Gulf's European refineries. Gulf owns one-third of the Island, which
measures three miles by one mile at its widest points, and has a total
area of 1,500 acres. The terminal occupies one-fourth of the portion
owned by Gulf. Although Whiddy Island has accessibility problems from
the mainland, its remoteness does provide easier handling for safety.
I-10

1.6.2 Configurations
During its construction, the actual pier was "T"-shaped with a Bailey
Bridge available to gain easy access to the loading/unloading facility.
Once the loading platform was fully constructed, the bridge was removed
to permit the dockage of 80,000-100,000 dwt coastal tankers at the inshore
side of the platform. Currently, access to the platform can be gained
only by small boat, which entails a trip of approximately 1,100 feet.
Submarine pipelines (submerged for a distance of some 1,300 feet) are
provided to transport the crude oil to and from the bulk storage area.
-The loading/unloading "sea island" is of concrete and steel construction.
It has an overall length of 1,600 feet and maximum width of about 160
feet. The dolphins and the 140 feet x 14 feet central platform are
supported by clusters of 36-inch diameter steel pilings, concrete
filled. Over 9,000 cubic yards of reinforced concrete were used in the
casing shells. The pilings varied in length from 130 feet to 220 feet,
because of fissions and cracks in the grey-green slatestone rock that
underlies a 5-40 feet layer of (primarily) soft silt.
The product handled is crude oil, from Kuwait and Iran. The terminal
has 12 bulk storage tanks, each 262 feet in diameter, 64 feet high, and
each having a capacity of 600,000 bbls. Bunker C and diesel fuel oils
are also received and stored in a 200,000 and 50,000-bbl tank, respectively.
The fuels are used to bunker visiting vessels, tugs and small craft used
by the terminal.
1.6.3 Channel and Basin
A preliminary survey was done by Bechtel Corporation but the conception
design and engineering was handled by Frederic R. Harris. A naturally
maintenance-free channel 100-102 feet deep (mean low water depth)
provides safe access for mammoth tankers (90 feet draught) up to the
docking area.
1-11

Tidal ranges above zero mean level are as follows:
High Water:
Low Water:
Mean Spring
12.1 (feet)
1.9
Mean Neap
9.6 (feet)
4.1
1.6.4 Design Vessel
The initial 255,000 dwt (59 feet draught) ship was worked up in stages
to 276,000 dwt in the shipyard contract with an option to go to 312,000
by use of a 79-foot scantling draught. It was finally carried to 326,700
dwt (81.7 feet draught) by new loadline rules. The 100-feet depth
capability was precious through all these changes. There is some regret
about not having built the 59-foot draught tanker because they could now
go straight into every Gulf terminal except Milford and North Kuwait.
However, the present advantage is flexibility for the future, including
500,000 dwt tankers.
The vessel can turn on a 2,150-foot diameter (a T-2 tanker requires
2,250 feet). Stopping distance is 9,000 feet but reaction to astern
power is unpredictable, because it depends importantly on wind strength
and direction.
Shipboard navigation equipment is normal (10-cm and 3-cm radars, Loran,
Decca, etc.), but one of the ships is being equipped with a doppler
docking-speed monitor.
1.6.5 Docking
There is no noticeable current in Bantry Bay that would affect safe
entry or maneuvering in the channel.
The terminal is equipped with a 4-channel VHF radio, one of them kept
under continuous watch. The radio system links the shore (harbor
master), ship (bridge, cargo room), tugs and mooring master (aboard tanker)
and its capacity is almost doubled through the use of walkie-talkies
(explosion proof).
1-12

A total of 11 channel market buoys, including a mid-channel line with
in-and-out separation, comprise the main navigational aids for channel entry
and exit. Gulf also put markers onshore. When visiting vessels reach
Buoy 2, twelve miles down the Bay, four tugs and a pilot rae dispatched
to the approaching tankers. At Buoy 5 (halfway) two tugs go on the port
side of the vessel and two secure to the bow and stern. The vessel enters
at a speed of 3-4 knots, although the exact speed is left to the pilot's
discretion based on the ship's stopping limit. Once the tanker is broadside,
to the pier at about 1,000 feet, two tugs take a push position at the
starboard side of the vessel while the other two tugs take a pull position
on the port side. The pier approach is then made at a maximum speed of
0.6 feet per second (0.8 design). With the same criteria, a 500,000
dwt tanker would have design and effective docking speeds of 0.33 and 0.25
feet per second, respectively. The mooring master has walkie-talkie
communication with each tugboat, and at a given time the pull tugs ease
off and move into the push position so that four tugs are pushing the tanker
into the pier at the final approach. Before the mooring lines are secured,
ship and shore manifolds are lined up by using ship engines. Mooring lines
are handled by the tanker's 50-ton capacity tension automatic winches. The
lines generally consist of four bow lines, four stern lines,
two breast lines and two spring lines. During adverse weather conditions,
additional spring and breast lines are used for a total of up to 9 ahead,
10 astern.
The Raykin Fenders (Accordeon rubber 2-3 feet square, mooring in horizontal/
vertical directions, with 20 foot square wooden shield) had a little
problem with a steel fitting. They deflect 10 inches (with dolphin
movement 0.6 inch) at 2 inches/second docking speed. Tugs must push on
tug marks (over frames), and the hull has recess with bits to pull from.
There are four tugs (2800 HP, 35-ton pull ahead, 22-ton astern) including
one stand-by. Fully loaded tankers are not very sensitive to wind: limits
are 40 knots, but with 3-foot swells, the tugs cannot push safely. Minimum
1-13

draught is 40 feet and sailing limit is 25 knots of beam wind. A berth
loading diagram is given in Figure 1-2. A twin-screw tug is more
maneuverable than a one-screw-kort nozzle tug but has less astern pull.
During a tug strike, a double-ruddered tanker left the pier without tug
assistance. Two of the four tugs have booms to service buoys--Gulf also
operates two or three boats for line handling and ferrying crews to the
mainland.
1.6.6 Materials
Dolphins (4 mooring, 4 breasting on each side of this island) are made
of a cluster of 36-inch steel piles filled with concrete. Of the 9,000
cubic yards of reinforced concrete used for casing shells, 6,500 cubic
yards were used in dolphin and platform structures. Induced current
cathodic protection is used on the steel piles. Steel beams and concrete
slab make the top of the island platform 140 feet x 140 feet in the center.
1.6.7 Cargo Handling
No flexible hose lines are used at the loading/unloading facility. The
berths are equipped with hydraulically operated Chicksan Articulated
Loading Arms as follows:
North Berth Four 16" crude/ballast arms Two 16" ballast Arms Two 12" Bunker C Arms
South Berth Four 12" Crude/Ballast Arms Two 12" Bunker C Arms
One of the six supertankers has a $50,000 doppler sonar speed-measurement
system, designed and manufactured by EDO. After eight months' debugging,
it is reliable and has proven useful enough to warrant installing a
similar system at both ends of Gulf's Okinawa terminal.
Two-inch diameter submarine pipelines are used to transfer the products
and one-inch diameter line is used for ballast. Ships have four pumps
of 3,500 m3/R at 175 psi, with Worthington Vacstrip to prevent cavitation
(Mitsubishi stripping pumps are a good alternative); all are remote
1-14

Wind Force 600T
1 160T160T
Wind , 4 :rust uu •
1901951
j 95T
19'0T
100.000 DWT I 1 1_ Wind Thrust
Wind Force 3401
•
30.000 DWT (Min.)
100.000 DWT (Max)
30,000 DWT (Min.)
0 100' 300' 500'
Graphic Scale
312.000 DWT
(Max.)
30.000 DWT
(Min.)
312.000 DWT
110TM 265TM
220TM 13 5307N1 Zfr
1---Ig
- 100.000 DWT
/ 130
65TTMj
310TM Ultimate
155TM Normal
(
Normal
Ultimate
Berthing Alternatives
Friction Component
50% of Reaction
Spring Lines 1401 1401
3001
,OOT 50 No,
'45° 20°7 15
-A. ==.-?--7-::7180----".\ 180T 1807
85T 85T Spring Lines
18o° 180°,
100
180T
Spring -Cittes 140T 140T.
ff •
/45° \ Y
1001
20° --
50° /
450A -2
20 . 451,
180°-711------/180° 180 85T 857 Spring Line
100.000 DWT (Max.)
300T
2-60 243
180T
Max. Ship Light
Min. Ship Loaded
30.000 DWT •
(Min.)
312.000 DWT
(Max.)
FIGURE 1-2 GULF OIL DOLPHIN LOADING DIAGRAM, BANTRY BAY
Berthing Alternatives
Source: Frederic R. Harris (Holland) N. Y., Consulting Engineers.

controlled hydraulically (282-tube bundle).
A central control tower on the dock hydraulically operates all fill lines,
while bolted connections are made manually. Plans are under way to convert
to camlock flange connections in the near future. The ship's pumps are
used primarily to transfer products into the bulk storage tanks and the
ship's figures on tonnage transfer are accepted. The Terminal has four
15,000-ton/hour transfer pumps. Maximum loading/off-loading at the mammouth
tanker berth is about 100,000 bbls/hour (50,000 bbl/hour ballast). Tankers
can also be gravity loaded at a rate of 40,000 bbls/hour.
Tankage consists of twelve 600,000-bbl tanks with floating roof (262-foot
diameter, 64 feet high) of strength steel (1.55 to 3/8 inch thick); two
500,000-bbl ballast tanks and two 100,000-bbl bunker tanks with cone roof;
and one 500-bbl slop tank.
1.6.8 Cost Data
The entire facility was built at a cost of some $45 million excluding tugs.
The original design has proven to be quite satisfactory; only $300,000 has
been spent on plant improvements. Some typical improvements are as follows:
1) The ballasting/deballasting system has been improved
by an oil reclamation system in which oil is skimmed
off the top of the ballast tanks and transfered into
a heated 10,000-bbl settling tank. In the latter tank,
heat and chemical treatment are used for oil separation
prior to pumping the recovered oil into any of the main
storage tanks. The 4-ppm design limit still gives a
visible film, however;
The Terminal's electrical generators were originally
cooled by salt water, but this system has been converted'
to a closed-cycle fresh water cooling system to eliminate
salt and seaweed accumulation in the cooling systems.
The initial estimate for the facility was about $32 million ($22-23 million
onshore, and $8-9 million for the sea island, depending on alternatives).
1-16

Some of the overrun is due to insufficient equipment for pile driving
in a sea state and bad labor relations of the Irish contractor. The
plant handles an average of one mammoth tanker every ten days, and
crude oil handled in and out averages 250,000-300,000 bbl per day.
Trans-shipments are normally made to England, Holland, Denmark, France,
Belgium and occasionally Spain, and some supplies go to Esso in Ireland.
Some trade-offs are also made with other countries.
The cost of maintaining a mammoth tanker while in port has averaged
$50 per minute or $72,000 per day. The inflation in transport costs is
limited to 5-6% per year of running costs because insurance so far has
remained constant. New building costs went from $60/dwt in 1966 (Japan)
to $90 in 1968 (Spain, small escalation included) to $125-140 today be-
cause of selling margin. This evolution cost is in agreement with the
recent Japanese 477,000 dwt tanker: $26 million initially, now $42 million
and $52 million if the tank size limitation goes to 15,000 cubic feet.
1.6.9 Crucial Problems and Lessons
Some problems were encountered during construction. Broken subsoil led
to the use of floating barges instead of jack-up equipment for pile
driving. The barges were too small for swell conditions. Piling which
could not be braced underwent fatigue stress of up to 11,000 psi and butt
welds failed between 1 and 2 million cycles (35 to 70 days). Heavier
equipment was finally brought in.
Surface templates were used economically as pile guides for dolphins.
They were set by outriggers from the barge and supported on soldier
piles.
The ballasting/deballasting and bilge pumping facilities are worthy of
reproduction at any marine terminals in the U.S. More generally, Gulf's
1-17

conservative approach in vessel and terminal design is technically and
environmentally sounder than many taken since.
1.7 ENVTRONMENTAL IMPACT
1.7.1 Planning and Results
Environmental planning, whether on Gulf's own volition, or spurred by the
Irish Tourism Board (Dublin) and Department of Fisheries, seems to have
been serious in Bantry Bay's terminal and in ship design. An Air and
Water Conservation Advisor is now Informante in Residence in Gulf
Headquarters in Pittsburgh. Gulf Energy Environment Services (San Diego)
and Gulf Degremont (Liberty Corner, New Jersey) also deal directly with
environmental matters. Regulations were submitted by Gulf Oil on the
basis of Milford Haven and other experiences and approved by the govern-
ment. There were no baseline studies, only bbrings for pile driving,
but neither dredging nor fill was needed and there are no traces of
irreversible damage by operations such as pipelaying, and island dock
construction. Semi-buried tanks and an embankment make a reasonable
attempt to reduce the tank farm profile, which has nevertheless raised
a few protests.
Not much concern for water pollution was experienced, and local residents
were easily reassured by the strict control measures adopted. There was
very little complaint from fishermen who fish outside the bay, but some
local politicians and the terminal manager called to Town Hall once in
awhile. The biggest spill (January 1970) went as far as the Federal
Government, which took Gulf to court for a small fine.
More details are given later in a special chapter on environmental
protection but the following considerations are of particular interest.
1.7.2 Water
Shuttle ships ballasting from close-by refineries do not have time to
clean ballast, so two 500,000-bbl tanks receive their dirty ballast.
A separating capacity, built as an afterthought, yields less than 4 ppm
oil, but is not often used because it still gives a visible film. Dirty
1-18

ballast is routinely loaded into the cargo tanks of superships while
they are unloading, to maintain at least a 40-foot draught for windage.
It is allowed to settle for 24 hours, then 90% decanted; the remaining
10% goes to a high-capacity, on-deck oil separator (Butterworth), believed
to be a first. The separated oil goes to a load-on-top tank. All ballast
(normally 30-foot draught) is clean by the time the ship reaches Capetown.
Ballast lines, as well as two permanent clean tanks, are coated in and
out. Half of the cargo tanks are coated on horizontal surfaces with
Demetkote 2 and vinyl. A garbage-sewage tank on-board retains ship waste
during bay transit. Each tug also has a garbage and sewage processing
facility.
A student, under the supervision of Dr. Crapp, professor at the University
College, Swansea, has been hired by the Irish Department of Fisheries to
observe the biological aspects of terminal operations. No report is yet
available, but no oil pollution seems to have been detected.
Inflatable oil booms have been used for 3 or 4 small spills and a small
skimming barge (with steel roller) is kept at hand. The four specially
designed and built 2,800- BHP tugs have 1,000-gallon dispersant (BP 1011)
tanks and spraying booms. One tug is always kept on standby. This
equipment has been found efficient in the few spills which have occurred,
without, however, bringing evidence to contradict the generally recognized
inefficiency in swells and current.
1.7.3 Traffic Control
The port manager is in charge of traffic which remains small, and VHF
radio communications are deemed essential between mooring master, ship,
tug, shore, and doppler operators. This communication capability is
doubled by walkie-talkies. The ship receives radiotelephone orders to
come in; it then enters on its own radar, helped by 'a center line of
buoys, each with light and reflector installed by Gulf. Tankers have
sufficient crew members to secure two tugs at a time, one fore and one
aft.
1-19

1.7.4 Air Pollution
There are neither fumes nor odors, because of floating roof construction
on storage tanks. Some escaping odors could occur during loading and
unloading through vapor vent valves.
1.7.5 Solid Waste
None.
1.7.6 Visual Intrusion
The tanks are hidden from the mainland by an embankment. Ships' passages
are infrequent but draw the attention of visitors and tourists, who have
requested observation points. No noise intrusion can be noticed.
1.7.7 Safety
No accidents have occurred. The four tugs have fire fighting equipment
including a remote control hydrant on a soft tower, to be higher than
the ship's deck. Foam and water systems are distributed on the sea island
and terminal.
1.7.8 Land and Water Use
Bantry Bay was constructed on one-third of the 1,500 acres of agricultural
land. The land was purchased by Gulf and a quarter of the acreage is
being taken by the present terminal. Gulf is forbidden to build petroleum
product tankage, and cannot sell Bunker C outside its own operations.
There are no prospects for a dry bulk terminal, basic industry or ship
repair activities in the Bay. Fresh water requirements are small.
1.7.9 Socio-Economic Aspects
Sixty people, all Irish, are employed at the terminal and on service boats.
Crews on leave seem to have brought little disturbance; they enplane to
other destinations as soon as possible.
Bantry is a fishing town, but little fishing is done in the Bay, mostly
outside in the ocean. Little is known of what happened to the 100
Islanders who moved away, or to the real estate of the area, or to the
1-20

standard of living of people who stayed on the island in 'the Bantry area.
However, no complaints have been lodged with the local and central
government or with Gulf itself.
Recreation has been practically untouched: some protests about the some-
what hidden tanks are balanced by requests from residents and visitors
to have better observation points to view the "big ships."
1.8 ENVIRONMENTAL PROTECTION
1.8.1 Storage Area
All storage tanks are diked with natural earthen dikes which would
contain a gradual tank leak. It is doubtful, however, whether the dikes
could withstand the impact of a crude oil tidal wave in the event of a
sudden accidental release of the entire contents of a tank (of similar
experience in Antwerp or Holland).
The water drains from the diked area are kept closed when not in use to
drain rainwater from within the dike.
The tanks are equipped with a remotely controlled "VAREC" liquid level
reading system, whereby the tank's liquid content can be determined
from a computerized control panel within the central control center in
the land-based administration office.
All of the tanks are equipped with integral steam heating coils.
The accumulated condensate water from within the bulk storage tanks is
drained into a closed drainage system which empties into the terminal's two
ballast tanks.
The ballasting/deballasting, bilge pumping system is quite unique. A
dock-located pumping facility provides the terminal and visiting vessels
with a means of discharging contaminated water into any of two 500,000-
bbl onshore ballast tanks. This same contaminated water (see statement
1-21

of plant's improvements p.1-i6) is then used to ballast ships prior to
their departure. Generally, after 7 to 9 hours of crude oil cargo
discharge, the tankers are ready to take on ballast. The ballast tanks
are filled with bay water prior to a tanker's arrival, and once the
computerized filling system displays the need for taking on ballast,
80,000-100,000 tons of ballast water are transferred into the unloading
vessel.
1.8.2 Vessels
Vessel design has 24 tanks in 8 compartments, of maximum size 12,000 m 3
versus 15,000 m3 asked by conservationists. Excellent insurance rates
were obtained on account of twin screw-rudders, route and performance.
Cargo handling is remote controlled, but without datalogger on cargo
volume, trim and stress, as Gulf could not get a level gauge reliable
enough for inputs. Coating and scantling, which were then conservative,
now look better and better.
Gulf had the option to add 15,000 tons of steel over shipyard design,
and exercised it entirely. Stiffening under focs'le deck, skipped by
the shipyard, is now done under guarantee. Ship services include ballast
transfer from shuttle ship to shore tanks and then mammoth tankers. Ship
waste and sewage are contained entirely as soon as the tanker enters the
Bay.
1.8.3 Oil Spills
Past spill experience has not been severe. There was one 3-bbl Bunker C
overfill spill when a visiting ship was transfering fuel oil within the
vessel. The resulting slick was cleaned up within 1 1/2 hours.•
Another spill occurred while disconnecting two unloading arms. Due to
a misunderstanding, oil standing in the lines was drained onto the ship's
deck. The ship's scuppers were plugged, but the vessel was down at the
1-22

stern and due to a recent rain, accumulated water was evident at the
stern section. The oil slid over the standing water into the Bay. This
spill occurred on 1/29/70 and Gulf was fined $300 on 3/26/71. Modifica-
tions initiated because of these accidents are: bigger vent valves on
the chicksan arms, and bleeding lines on the manifolds. A small, tank
overflow spill seeped through fractured rock under the dike and reached the
walls to everybody's surprise.
The only other spill occurred when some hydraulic oil was spilled into
the Bay. This happened from the loading platform and was quickly "killed"
from the platform.
No fishing is conducted in the area of the Terminal, although some fishing
is conducted in the Bay itself (but mostly outside). The fish consist
mainly of scallops, herring, codfish, and salmon. No fishing complaints
have been experienced for the entire period of operation. Currently,
Gulf is funding an Irish University student to conduct regular water
quality tests in the Bay, and a small laboratory (an old construction
shack) is made available within the Terminal for this purpose. The
student has not published any analytical reports on his study.
All four of the Terminal's tugs can provide fire and spill clean-up
protection. Each tug has three lances capable of discharging and
directing 3,400 bbls of dispersal chemicals (BP 1011) onto an oil slick.
Two tugs are kept on constant standby for oil spill clean-up and fire
prevention service. Chemical detergent sprayers are also evident on the
loading/unloading pier. The sprayers use a high water pressure to agitate
and emulsify the spill. During an actual spill, one tug dispersed the
chemical while its companion tug provided an agitation water jet. A
3,000 to 4,000 square foot area was cleaned up in one hour by this method.
In addition, each ship has two drums of Gulf Agent 100G to fight small
spills.
The Terminal maintains its own fire engine and a fire fighting team
comprised of trained plant workers. The tugs can also provide hose
1-23

service when required. The storage tanks can be foam blanketed in the
event of fire and two pumps are used to maintain pressure on the foam
system. Water and foam distribution systems cover terminal and berth.
The Terminal also maintains 1,000 meters of inflatable oil containment
boom in 50-meter lengths. The boom has a 20-inch freeboard and a 20-inch
submerged skirt. A 30-cubic-meter capacity oil recovery barge is avail-
able. This operates on a paddle wheel principle by which the slick is
raised from the water surface and deposited into the oil and water
separation section of the recovery barge. The "TT" oil boom and skimmer
are manufactured by Trygve Thune, Oslo 1, Munchsgate 5, Norway. A bubble
curtain around the island was considered but found very expensive and
inefficient in the sometimes strong swells.
Originally, only one side of the Terminal was fenced. This fence is
being extended to fully enclose the property. As an additional security
measure, the services of a private guard company are retained on a 24-hour,
7-day week basis.
Viewed from a mountain side elevation near Glengarriff directly north -
of Whiddy Island, the entire Terminal blends well with the natural background
and lessons can be learned from the aesthetic design of the property.
1-24

UNCLASSIFIED
DOCUMENT CONTROL DATA - R & D (security classification of title, body of abstract and indexing annotation must be entered when the overall report is classified)
I. ORIGINATING ACTIVITY (Corporate author) 2a. REPORT SECURITY CLASSIFICATION
Arthur D. Little, Inc. Unclassified Cambridge, Massachusetts 2b. GROUP
N/A 3. REPORT TITLE
Foreign Deep Water Port Developments
4. DESCRIPTIVE NOTES (Type of report and inclusive dates)
Final Report 5. AUTHOR(S) (First name, middle initial, last name)
Bertrand de Frondeville, et al
6 REPORT DATE 7a. TOTAL NO. OF PAGES 7b. NO. OF REFS
December 1971 800 N/A Se. CONTRACT OR GRANT NO. oe. ORIGINATORS REPORT NUMBER(S)
N/A b. PROJECT NO. IWR Report 71-11
C. N/A 9b. OTHER REPORT NO(S) (Any other numbers that may be assigned this report)
d. None
14. DISTRIBUTION STATEMENT
This document has been approved for public release and sale; its distribution is unlimited.
C 11. SUPPLEMENTARY NOTES 12. SPONSORING MILITARY ACTIVITY
None U.S. Army Engineer Institute for Water Resources, 2461 Eisenhower Ave., Alexandria, Virginia 22314
13. ABSTRACT
The economic advantages of large scale ocean carriers of oil and ores have developed considerable pressure for the development of a number of deep ports in the United States providing drafts in excess of 60 feet. This report is a study of selected foreign harbors (and off-shore loading and unloading facilities) where the experience was judged to be relevant to the U.S. situation. Specifically, the decision process leading to deep port develop- ment is examined, difficulties met and solved in construction and operation, and the relation between anticipations and experience are documented. Impacts on national economic policy, regional development objectives and environmental factors are discussed.
DD !NT...1473 REPLACES DO FORM I471. 1 JAN 64. WHICH II O•SOLETIL FOR ARMY UNCLASSIFIED
Sirity Classification

UNCLASSIFIED Security Classification
14. LINK A LINK II LINK C KEY WORDS
ROLE WT ROLE WY ROLE NT
Water Resources Planning Engineering Works Techniques of Planning Evaluation Process Ecologic Impact of Water Development Cost Sharing Port Development
0 .
UNCLASSIFIED Security Classification