Part 3. Hydrology and Water Resources
270
·" I I t-L Le1f /f , ... f... . ·15· f/8 l D0-22034-USGS - (T 3 GEOGBAPRY, GEOLOGY AE'D WA!rER EESOURO!lS OF ~Bl :NATIONAL D.A.OTOR TESTIEG S'.J!.A,!ION, IIlABO PART 3. XID.BOLOGY · Am> WATER llSOtra.O!lS - l3y R. L. liaee, J. w. Stwart. W. c. Walton and others Report not renewed for 00:nformanee with Geological Survey editorial sta.ndard.s aud. usage of geologic names. Prepared tor the U. s. Atomic J:nergy Commission :Boise, Idaho 1959 .Administrative lieport Not !or Public Release
-
Upload
khangminh22 -
Category
Documents
-
view
2 -
download
0
Transcript of Part 3. Hydrology and Water Resources

·"
I I t-L Le1f /f , ... f... .
~ ·15· f/8 l D0-22034-USGS - (T 3
GEOGBAPRY, GEOLOGY AE'D WA!rER EESOURO!lS OF ~Bl :NATIONAL D.A.OTOR TESTIEG S'.J!.A,!ION, IIlABO
PART 3. XID.BOLOGY · Am> WATER llSOtra.O!lS -
l3y R. L. liaee, J. w. Stwart. W. c. Walton and others
Report not renewed for 00:nformanee with Geological Survey editorial sta.ndard.s
aud. usage of geologic names.
Prepared tor the U. s. Atomic J:nergy Commission
:Boise, Idaho 1959
.Administrative lieport Not !or Public Release


UNITED STA.TES DEPARTMEMT OF THE INTERIOB GEOLOGICAL SUB.VEY
WATER :RESOURCES DIVISION
GEOGRAPHY, GEOLOGY A..'lffi WA.TEE. RESOURCES OF THE NATION.AL BEA.CTOR TESTING STATION, IDAHO
PART 3. HYDROLOGY AND WATER :RESOURCES
:By R. L. Nace, J. W. Stewart~ W. C. Walton and others
Report not reviewed for con:fonna.noe with Geological Survey editorial standards
and usage of geologic names.
Prepared for the U. S. Atomic Energy Oommi ssion
:Boise, Idaho 1959
AdlninistTative Report Not for Public Release

II

PREFACE
This report embodies results o! the work of many people in addi t-ion ,,
to the authors~~ They contributed mu.ch field and laboratory works
preliminary notes, suggestions and., most important of all, ideaso Also,
they helped. with. the vri ting of earlier special reports which have been
used as reference material. Special recognition is due to the i'ollow
iDg members of the Geological Survey: J. T. l3arra.cloughp Morris
Deu.tseh, F. E. Fennerty, X. R. Fowle::, J. :a. Jones, I. So Mc~een,
Alan E. Peckham, Rex O. Smith, R. E. Skibitzk:e, O. V. Theis, W. !o
Travis, and P .. T. Voegeli. The authors are grateful to these geologists
a.?ld. engineers for their help. Some of them are co-authors of :parts of'
this report, as indicated in the table of contents. All sections not
otherwise c:red.i ted., were vri tt-en by the senior author o

\ !

CONTENTS
Introduction . w.
Purpose and scope of report.
Field and labo~atory work
Well-ntmtberirig system •.
The bydrologic cycle in the Snake Bi ver Plain
Natu;-e of the ~ycle ....•.•.•
Precipitation and evaporation.
Runoff and in:filtration .••••
Surface-water, by J. T. Barraclough and :a. L. :Nace.
:Big Lost River
Regimen of the river
Discharge at station below Arco
Discharge in 1951
Discharge in 1952.
Percolation from the river . • ••.
Channel losses • • • •
Summary . • ••
Percolation in playa basins
Little Lost Bi ver and .Birch Creek . .
Lo cal runoff • . . . . . . • • • .
Flood and erosion baza...-d
i
Page
l
l
5
6
7
7
8
9
11
11
11
13
17
21
21
22
29
30
35
35
36
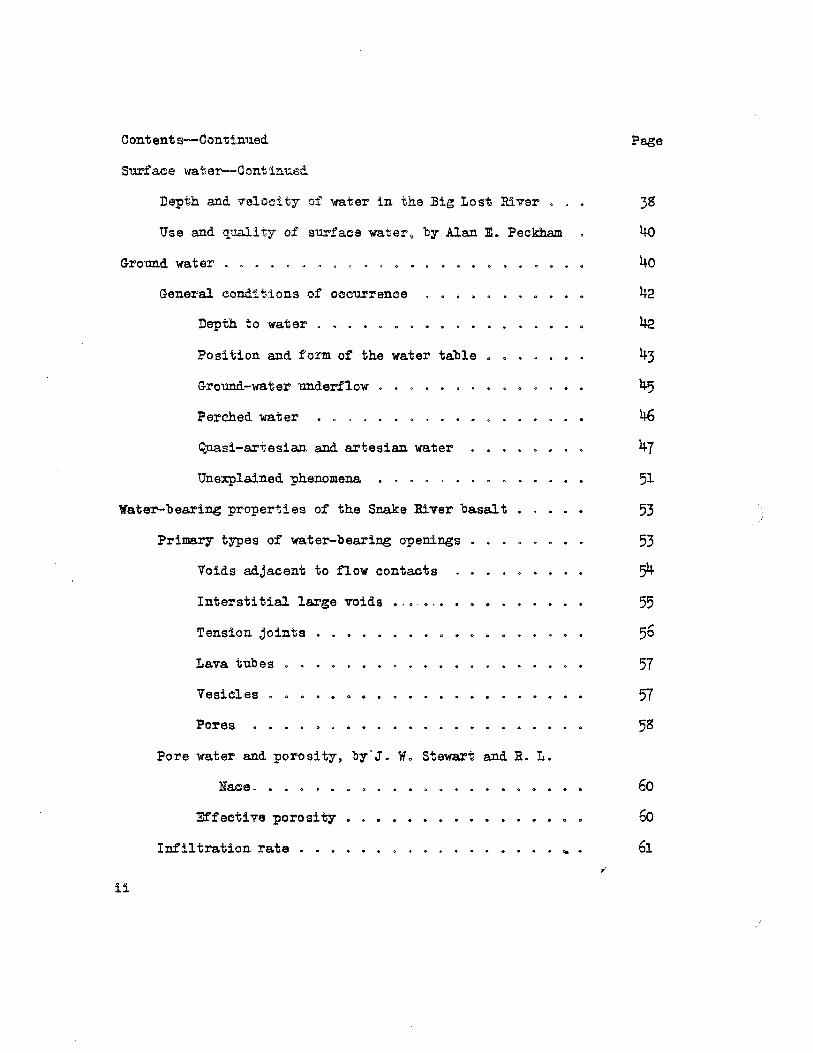
Contents-Continued
Surface water--Continued
Depth and velocity of water in the ~ig Lost River ..
Use and quality of su...-.face water, by Alan E. Peckham
Ground water
General conditions of occurrence
Depth to water . • •
Position and foHJ. of the water table.
Ground-water underflow
Perched water . . , .
~si-artesian and artesian water
Unexplained phenomena • . . . , .
Yater-bearing properties of the Snake ru. ver basalt •
ii
Primary types of water-bearing openings.
Voids adjacent to now contacts
Interstitial large voids
Tension joints .
Lava tubes .
Vesicles .
Pores
Pora water and porosity, by·J. W. Stewart and R. L.
N°a(;e. • • • • ••
Effective porosit7.
Infiltration rate •.• ... .
Page
3g
lt-o
40
42
42
43
~
46
47
51
53
53
54
55
56
57
57
5g
60
60
61

Contents-Continued
Water-bearing properties o:f the Snake River basalt-Continued
Percoiation rate, by J. W. Stewart and R. L. Nace
Speci:f'i~ (lapadties of wells, by W. C. Walton and
J. W. Stewart
H:yd.ra.ulk p:rope:rtier,., by J. W. Stewart and W. E. Wal ton
Del''i"Jation and signifi~anc:e of coefficients
Aqu.:t:fe:r tests
O?P area
Derivation from spe~ific-~apa.city data.
Well spa.a-:tng . •
Permissible spacing •
E~onomic-optimum spacing 9 by C. v. Theis
Water--beari:ng properties of the sediments
Coar~e-gra.._in.ed sed.iment:s
Hydraulic properties
Infiltration thl"o'tlgb. infiltromaters.
Infiltration rate in channel of Big Lost
River
Permeability, by A. I. Johnson
La.be:rat<:i:ry method of ~ysis
ments.
:l.H
Page
61
75
77
84
87
95
97
98
100
100
101
101
109
109
112
115

Contents--Continued
Water-bearing properties of the sediments--Continued
Fine-grained sediments
Hydraulic properties
Infiltrometer tests
Permeability, by A.. I. Johnson and I. S.
McQ;a.een .
Gro'OJld..:.water hydrology
iv
Recharge . .... .
Recharge from precipitation.
Recharge from surface drai!l.88~S
Big Lost River • . • • • • • • • •
Ephemeral drai!l.88~S and pla.yas
Recharge by underflow • • • • . • .
Under.flow from nearby vallqs
Underflow from the Mad Lake basin
Amount of ground water in storage.
Ground-water movement
Nature of movement
Rate of movement
Direction of movement
Movement beneath the Station
Regional movement
Volt1J11e of 'tlnd.erf'low through the N'B.!!!S, by W. C. Walton. •
Potential g:roillld-water development and its effects ••• ,-
Page
116
117
117
121
132
132
133
135
135
137
137
13s
139
141
143
144
146
ll+S
151
152
153
155
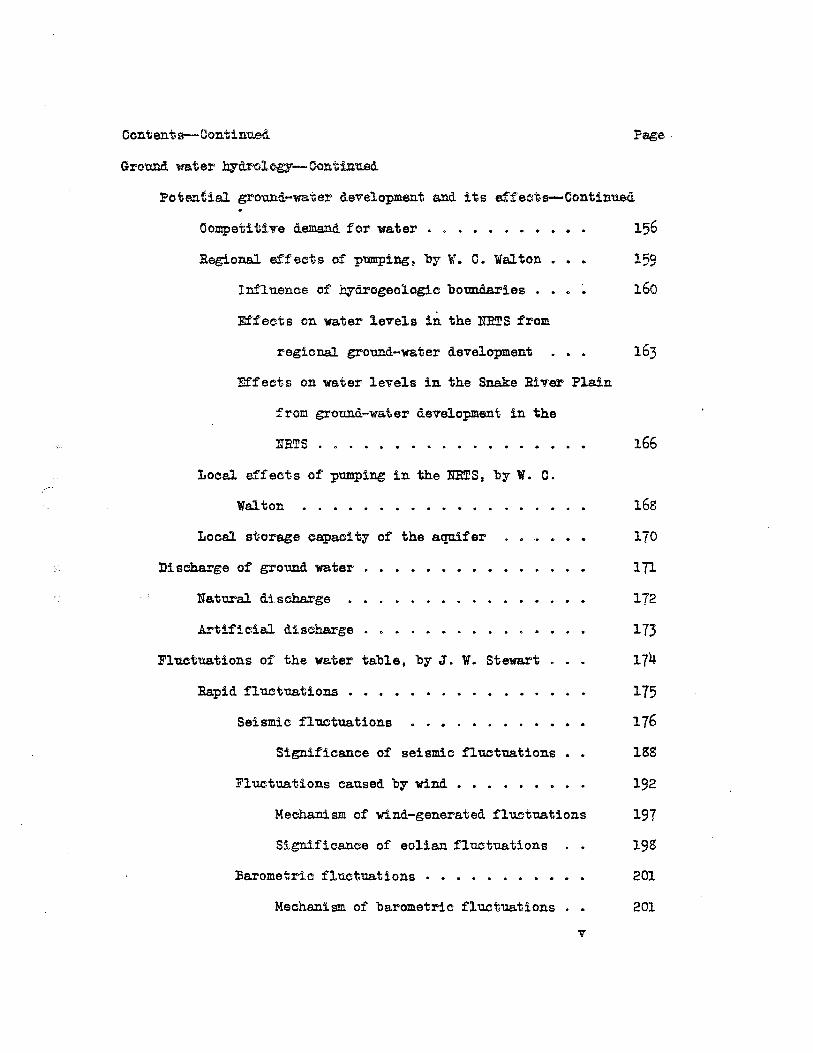
Oontents--Continued
Ground water hydrology-Continued
Potential ground-water development and its effects-Continued
Oompetitive demand for water. . • • • • • • • • • 156
Regional ef'fecri.s of p"Cmpi:ng, by W. C. Wal.ton • 159
Influence of hydrogeologic bound.a.Ties. 160
Effects on water levels in the NRTS from
regional gro'Olld.-wa.ter development
Effects on water levels in the Snake River Pl.a.in
from groUil.Cl-water development in the
NRTS . o • • • • • • • • • • • • • •
Local effects of pumping in the NRTS, by W. C.
Wal.ton
Local storage capacity of the aquifer
Discharge of gro'Olld. water
Natural di.scharge
Artificial. dis~ha.rge •••
Fluctuations of the water table, by J. W. Stewart
Rapid fluctuations. • ••••••
Seismic fluctuations
166
168
170
171
172
173
174
175
176
Significance of seismic fluctuations. • l8S
Fluctuations caused by wind. . • . • . • 192
Mechanism of wind-generated fluctnations 197
Significance of eolian fluctuations 198
Barometric fluctuations • • • • . • • • • 201
Mechanism of barometric fluctuations 201
V

Contents--Continued Page
Ground water hydrclogy-Conti:0.1:J.ed
vi
Fluctuations of the water table, by J. W. Stewart--Continued
Rapid flu.otuations--Continued
Barometric fluctuations-Continued
Significance of barometric fluctuations 210
Fluct'tlations caused by changes in storage 215
Yearly fluctuations in small ra:cge. . 215
Fluctuations caused by loc~ recharge . . • • • 216
Recharge from :Big Lost River • • • • • 216
Recharge from local sources • • 219
Seasonal water-level fluctuations 222
Regional water-level ·fluctuations in the~
River Plain9 by R. L. Nace and
J. W. Stewart . • • • • •
Arco area.
Howe area..
Mud Lake basin
Roberts-Taber area
Minidoka area .
Long-term trenns ••
Effects of precipitation • • • •
Chemical quality of the ground water, by R. L. Nace and
Alan E. Peckham
Analytical results
. .. .
223
223
225
225
227
22S
230
233
237
238

Contents-Continued
Ground water bydrolog:y--Continued
Chemical qu.a.li ty of the ground water. by R. L. Nace and
ilan E. Pecl!::b.sm--Continued
Geologic significance of the chemical quality.
Loca.l va.'t'ia.tions in quality
Temperature of the ground water
llad.ioac;tivi ty in the ws.ter, by Alan E. Peckham •
References
ILLUSTRATIONS
PLATES (in pocket)
lo Map showing location of wells in the Natiolla.l Reactor TestiD.8 Station and vicinity.
2 ..
3.
4.
Contour map showiD.8 the water table, National Reactor Testing Station, April 1953.
Contour map showiD.8 the water table, National Reactor Testing Station, October 1956.
Map showing depth to water, NatioDal. Reactor Test:iDg Station, April l, 1953°
5. Map showillg chemical qua.li ty of ground water in the National Reactor TestiD.8 Station, 1955.
vii
Page
248
249
251

FIGudS
Page
1. Ind.ex map of sauthe'.f:'n 'Idaho shewing 1::i~a.ti,:n oi Na.t;icnal Reaot<':lr Tesii:og S¾a.tlon on -the S:na.ke B.i"fer Plain • • 3
2. .Annual and monthly mean dis,:;harge ;:;if Big Lest ru."!]'er below Ar~o 1 water years 1947-55 . , . . . . . . . . 15
3. Mean daily dis~harge of Big Lost River near Al:'co 0 April 1951 to September 1952 . . . . . ;. • . . . • 19
4. Relation of dis~ha.rge to average rate of i:c:filtration between stations land 9, Big Lost River. . • • 27
5. Grad.a of channel of Big Lo st River through the NRTS • 31
6. Comparison of b:yd:rcgraphs of Big Lo3t, River and two wells, one near ri"J'er ob.annal a.nd one 12 miles distant~ 1951-52 . . . . . . . . 0 • • • • • • • ' • • • • • 63
7. Comparison of generalized hyd.:t'ographs of Big Lost River and wells 2N-31E-35dcl and 3N-29E-l4adlo 1950-54 67
g. Time-d.rawdown curvs for well 6N-31E-13a~l (ANP-1) . • • • 81
9. Dista:ncs-dra.wdown c~e for well 6N-31E-l3ac2 (ANP-2) 85
10. Genera.Hzad composite d:rawdown graph for well 3N-30E-19cbl ( OPP-3) • • 0 • • • • • , • • • • 93
11. In:fil tration rate through imdi st1::r":Jed ~a.".Tel core in concrete ring infiltTometar~ May 19-31, 1950 103
12. Gravel exposed in pit where infiltration test was made near MTR plant . . . . . . . . • • . • . • • • 107
13. Permeabili i;y apparatus :for ~onsta.nt-h.ead method . 113
14. Pe:rmeabili ty apparatus for va:::'iable-h.ea.d method • 127
15. Variations in permeability with d.spth in two series of samples . . . . . . . . . .· . . . . 129
16. Hyd.rograph of well 2N-31E-35dcl (USGS no. l) 177
viii

17. :Re~c:rods c-f sei~ic sr,,:,'.:ck,, :in Lyd.'.'.'t:gra.ph c,f well 4N. 30:E- 7a.d.l f9r ¥.,""'ts oi 195;:, and ~9::4: s.b.c,,~rl tg wa.t er--le'7e1 fl't.'10-
Page
1Sl
18. Hydrc.g.r·a.ph o:f well 3n-23:rr1\.ad1 0 sn.;:;·,r'..r"g ws. 1: e!"-level fl 'tl.."
'!?u.a.tions c;a'j_sed. b~· a sei8l!lic: 2h,,,ok . . , . . . . . . • 183
19.
20.
Plot cf· a.1!rp1.i.t1.~dJ2 ,::-f sei~:!!:"i·:, fl-ct:'t':Ja~·~o:.:.~ Ir.t vrell 7 adl aga'i '!: s't C.1 '.~t ar:v::~ f ~.'tjrr,_ ea~~~.bq-t~'1E!.1t:e f CJ~tz.s
Wind-ge:r:.~:r·a f· e,j :fl;,,~ ,.;~a-:. ~er.;; ll+a.il (:-e;·;.;···6.-:.'_·_~.-y.t CL r,f
4N-30E-
21. W:tncl--ge:.:r;e-1r2.•+i :fl U' ['.~~;;," .;,:r,;::; cf wai e:r 1EW'E',1 :'..!J 1953 in well 31~·.,..,.?3r:..-..... ~½s.iL!' '.!.l."~;. .-iv_-! O'Y--:-rc:'!'"'i·'·"tlr,~ "'"'•e"'·,,,';·r;f,e r:f T~elative call'! \-r: :. · e :-- ·"· - ;·,,. -: ;_ ,::; ~ ,;;:/ c~' ( ;;T;\'",d;,':tion c-:f
193
t!"aC: e : ::-, :: r,·: . ~·c 1, ·:· :.s.:: i • • • • . • " • 195
22. Effec:t of r,ni:i sr,'cE:6. c::. '::a;;:., ... :ucr':<l fl~!!:·1,·,,,a;1ons ln well 3H-23:ID- -14a.iL Se;,- . 23 t D 0:: L 2 a:r.d. Nr)~r. 22-23, 1953 199
24. Correlatior. cf ,m4re:r-le..,.el :fiu.:;1.t:/?_tjcus in well 3N-29E-14ad1 with baro:m€:t'l'.'3 <: p:r0 e1a•s11:re • • • • • . • 207
25. Correlation cf \<i:.rc111er-r ~ - p.re2sur e ,.._,.:: f·:.: water le'Tfels at t:w::-ho,1?' :, r. •. rt::'" al r ~ . .:: 1,,: ';, 1 }N'-2~!:F>-J)-ia.d.l 211
26. Hydrog~a.pl':: C/£ v;e1 l 31:r 29:E :la-4( . ~;;:.7 .. ?.JC.
a.dju.stee. f;::, ::,a;::cne~ -:-·;;,.;: pt '= r. :,:.,,u e "'i i!;; ( B"O"'e) and .. ~_, . ··"""- ~ ' .
t tH::::. o·w) ~ " •
27. Three types of water-le·\n,il fluct~d.ons in wells on the
213
Snake ru. ""e'!' ?lai !l • • • • • 217
2S. Types cf wat;er-le?el fl~t,t>a.tions in wells in and near the NRTS . • • . . • • . , . . , . • • • . • • 217
29. Hyd.Tograph of wells nero- 1.he rrnTs. :i3irJghain Couni;y (above), and wells in Minidc-k&. Nort:.t, s~d12 P,:mrp{ng Div:i sion, Jer::in.e and M:\n5.d.oka Cou.r.:.,..i€-'s (t,e'lc,w) . • • . • . 231
30. Cu.m1llatl1.re; d.,rpartu:re fni:c:J nc,.,...1rt2..: year1y p::e·~:ip:i+.at:J.cn at thl"ee •:~_a1, or:s ,:,n 'he S,:c=,zs R: ":"<:;·r ?; a; n 235
31. Sodiu:o content r.·f g:,r· :: :i. v,·2.· 'cc'.!' as; . 1,'.'a:! 1 ~·:Er:. on the Snake Ri v5y Pl a.': n
ix

T.A.BLES
Page
1. Maximum and minimum instantaneous and yearly mean dis-charge of Big Lost River below Arco, 1947-55 • . • • 14
2. Departure from normal precipitation a.t stations in southeastern Idaho, July and A'Dgtl.st 1951 and 1952 1S
3. Dimensions and areas of measured reaches of the :Sig Lost River . . . . . . . . . . . . . . . . . . . . 23
l+. Average infiltration rates in :Sig Lost River below station l, 1951-52 . • • • • ~ • • • • • • • • . . .
5. Average infiltration rates in measured reaches of the Big Lost River, 1951-53 • • • • • • • • . • • . • . 25
6. Infiltration rates in the Big Lost River playas, 1952 and 1953 . . . . . . . . . . . . . . . . . . . 33
7. Representative velocities, depths, and rates of discharge of water in the Big Lost River, 1951-53 • • • 39
S. Chemical analyses of water from the Big Lost Ei ver
9. Loss of pore water from samples of basalt at 105°0
10. Specific capacities of wells in the NETS
41
59
69
11. Specific capacities of wells in the Snake River Plain. 74
12. Hydra'Olic coefficients of the aquifer in the .A.NP area
13. Specific drawdown and weighted logarithmic mean for well OPP-3 • • • • • • • • • • • . • . . • • • • gg
14. Coefficients of transmissibility and storage of the aquifer at the 1f.RTS·and vicinity ... 92
15. Laboratory- permeability of repacked samples of coarse-grained sediments . • • • • . . • . . . . • • • 111
16. !n:f'il tration rates through double-rillg in:f'il trometer 120
17. Laboratory permeability of core samples of fine-grained -sediments • • • . . • • . . . . • • • . • : • 122
X

Tables-Continued . Page
1$. Estimated pumpage cf ground water fo:r- irrigation on Snake 'River Plain, 1955 . . • • . . . . . . . . . . . . . 158
19. Estimated gro'Ulld-wate:r- pumpage and its effects on water levels in the NRTS • • • • . • • • • • • 164
20. Computed effects of pumping on water levels in the NRTS, at differing values of T and S . . . • . 166
21. Estimated effects of potential grotmd.-wa.t:er development in NRTS on water levels in Snake River Plain 168
22. Seismic water-level fluctuations in well 4N-3or,..;7aa.1, National Reactor Testing Station, Idaho • . • • 1S5
23. Barometric efficiency of wells on and near the Im.TS 203
24. Summary of chemical properties of representative ground waters from the Snake River Plain . . • . • • . • • 239
:ti


GEOGRAPHY, GEOLOGY J> .. Jf.D WATEE RESOtmCES OF TEE
l!ATIOlT.AL REACTOR TESTnm S~Tl01T, IDA.RO
PA.RT 3.. HYDROLOGY AND W.A.TER EESOURCES
:By B.. Lo Nac;:e, J. W. Stewart, Wo 0~ Walton and others
Il:rTRODUCT!ON
?l1RP0SE AUD SCOPE OF REPORT
The ground-water yiel1 of th6 Snake: ru. "Ye:r Plain :f:r,cm the area.
east cf the Rage:r"Olrul Valley execeeods 5r,OOO dso This water is discllarged.
through large spri:ngs in the valley of foe Snake R:i'l?'et"p of which the
Hagerman Valley is a pa:t'to Wa:ter wslls on the NRTS tap the same body
of ground water that :f eeis the sp:i:J:n_gs ~ Pumpage from the wells is a
beneath the NRTS are capa.'ble of yielding ma.cy t.~~m~s the amount of water
now pumped. Nevertheless» the water demand of the NRTS is bound. to
in~rease and. the inGreass mey be large. Therefore: !tis desirable to
know the potential perenn!al }~:teld. of a.quifel'f;i ·ormeath the NRTSo An
estimate is derived in this repo:rt"
l

2
is diverted directly from springs to genera~e hydroelectric power. Use
of ground-water on the Snake River Plain has increased markedly since
1946, and by 1965 developments on the plain will :require pumpa.ge of about
25 pct of the pereDD.ial ground-water yield of the area. Consumptive
depletion, chiefly by irrigated crops, may be on the order of 15 pct of
the total supply. If the water requirement of the NB.TS increases greatly,
the station will compete directly with other water users within 20 years,
if not sooner. In some parts of the plain, water developments alrea.d:3'
have created local conflicts of interest.
These few facts about the water outlook are su:fficient reason for
the interest of the Commission in the quantity, occurrence, source,
movement, and. chemical quality of the ground water .. The regional cydro
logie relations <:1£ the water beneath the NRTS, the mutual effects of'
water use by the Commission a.nd by others, and the ul tima.te or stabi
lized water regimen that ma;r be expected on the Snake River Plain are
among the more important :!actors in the Wa'~er si tua.tion. The publio
health hazard that may be created or threatened by routine waste, dis
posal or by an accident with radioactive materials is a problem of
related importance. The hazard would apply to a large segment of the
Snake River Plain because the ground-water body is essentially pla.ins
wide. The problem, therefore, is regional, and certain sections of this
report deal with the large plains area bounded approximately by the Snake
River on the south and west :from Blacld'oot to Bliss, by the Mud Lake
basin on the east, and by the mountain complex of central Idaho on the
" north (fig. l; see also pl. 2 of pt. 2). The land area so circumscribed
comprises about S,000 sq mi.

~-------------------------------------- ··-----------.-----.-----,------.----------.---r---------r----r----------------------------·~----
1170 11 ° I
/---"\ ID AH 0
.__ ______ _ II o
\ Approximate boundary of the Snoke River Plain. / \_-f
~45~0 --l- __ ( (
' ADAMS ,, 50 60 MILES J-, ( 0 Mc Coll
- I Coonc,11 V A L L E y
I ~ 0 } ;
f l 1 0 cascode \
f w "'" m >t1 j r~1
LV Weiser I I J J •_r ---- ~
'Fbyette--J r1 ~ I ~ .) PAYETTE B O I S E / \
r TGOEM . ~_; '-v -~c~~ ;_____ ·, "-,__,.L.fr'-l 1'1,oho c,;J_ - \_, 'Z,
NYDN 'Boi "' 1 , c~' f1i'f.' ' ,
\ OIOwe~~l lloise r l "'\ / 'f',1' F t ompo '\ 0 Hoiley \. /~ ~ "' ~ I CA M A S } ('ff'~;ers '"'' ' '
\J A D A E L M O R E Ll ~ .,, Cor'e;:"''\_i,=h~~~n ~ 1, -, ioirf,e~d~ ~ L 'A' 1'~H L _, y,-"f.; B I N G
Murpsy l ~ I ''"'""' <=::,"'._ '"'::)o.,,,c 0 Mountoin Home ---- ;: --- -.----1 'i_ 1GOODING~,lNCOLN I ,--
'""''': ~;,;";~~:·~;-1-J rr-_-__,__.._:,"1eri'l:~.J :JPocotello
L--1· l-... I 1 I w ., foils \ \l JEROME MIN IOOK!'J--_.: op, ,
'1 -,;;:-Fo~~~_,.mner LRuperto ;· ·=""'\, ";·: w E R -r B A N N ~o C K
,;.~,,,. ' --"t\'\_, :\ ' ,...,\ \\ 11111 1 ~~!1~,Y,111111u,.%. J -J J
iTWIN FALLS''' :"'""""'"",~;' . Morta _ __r- ,_,,...._, J-- BEAR LAKE\
4 0
OWYHEE
--'---'
CUSTER
-- --------- IQ~JiQ__ __ NEVADA
II I CA S SI A o Molodo J";RANKLIN \ r'\ I
I ON ~~:H~ __ _J_ -~j_1__1 _ _l ---------'-- ---------- UTAH
42°
II o 113°
Figure I. - Index map af southern Idaho showing locolion of Notional Reactor Testing Station on the Snake River Plain. (Circle, radius
50 miles, centers on CF area.)
II 10
\

,·

5
Fr.ELD .AND LABORATORY WORK
The gr-ound-water geology and hydrclogy of the Nm:S was studied
mapping and study of ba.sa.lt outc:rops helped. to delineate the vater
bea....-in,; :proper·Ues of the basalt. Test drilling aided the delinea.tion8
yielded information a!:lou.t the occurrenc~ cf ground water and the posi-
observation wells.
Stud..v and descripti.on of the general g:?:",:und.--111c!.ter geec•logy of the
1IBTS was assisted by Morris Deuts:::h, J. R. Jones, R. O. Smitht P. T.
Voegeli~ and Sc W. West. R. C. Ga;rson, Eugene Shuter, and H. G. Sis~o
made most, of the water-level measurements. J. T. :Barraclough. studied
the discharge of the Big Lost ru:.·er and made most of the direct: measu:r·e
ments of diso:harge. A recording gage near old Pioneer station is
operated by the Geological S·..:..r7e;:;r, and. anr.'.1.al report,s on the stream
gaging have been prepared by Wa~me I. Tra":"i.s. Latir.,ratory work in !d.a.ho
was chiefly by I. S. Mc:Q.u,een and J. W. Stewa.~, a.ssist,ed by other members
of the Geological Survey. Work at the Den:rer Bydrologic Laboratory was
supervised by Ao I. Johnsen, engineer in eo.ha.1'ge. Geochemical and geo
physical field experiments on ground-water beha:vior were by H. E.
Sk:l.bitzke, assisted by A. E. P.obinson 9 both from Phoenix, Arizona.
Chemical analyses of water were made in Ge,:,l~,gical SUI'Y·ey laboratories
at Salt Lake City. Uta...½.i and Portland, Oreg. Radiomet::ric ana.lyses of
water samples were ma.de in the Washingtcn, D. C, la.borator,ies of the
Geological Sur;rcy.

6
The well-numbering system used in Idaho indicates the locations of
wells within the official rectangolar subdivisions of the public lands,
with reference to the :Boise baseline and meridian. The :f'irat two seg
ments of a number designate the township and range. The third segment
gives the section number and is followed b7 two let~ers and a numeral,
which indicate the quarter-section, the 4o-a.cre tract, and the serial
m:imber of the well Yi thin the tract. Quarter sections are lettered a,
b, e and din 00,mterclookwise order, from the northeast quarter of
each section ( see diagram). Within the quarter-sections 4o-aore- tract a
are lettered in the same manner. Well 2.5-3lll-35dcl is in the SW¼s:m¼
sec. 35, T. 2 N., R. 3 E., and is the well first visited in that tract •
. . 6 5 4 3 2 1 . . . . . . . . 7 g 9 10 ll l2 •..... b· •... ..... c· ..•• t
'? . . . .
lS 17 16 15 14 13 2 . . . .
N . 3: . .
19 20 21 22 23 24
~ . . . b . a . . .
30 29 28 27 26 25 • ••••• C• •• • .•••. d- •... It
~,53, ~ . a:
31 32 33 34 C • . . . . :a. 31 !:. 2li-31E-35dcl

E'ydrology, the science dealing with water, is concerned chiefly
with water in its course from the place where it falls on the land. to
where it reaches the sea or is returned to the atmosphere. The hydro
logic cycle consists of a general eire'lll.ation of water from the sea
into the atmosphere, onto the land, a.nd _back to the sea. The major
cycle contains maIJY subcyoles. Geologic and physiographie factors are
two of the principal natural environmental factors that affect local
and regional subeycles.
NATURE OF TEE CYCLE
7
Some precipitation is intercepted. by vegetation aud. other obstacles
and is re-evaporated directly; some evs;pora.tes from the land surface and
:f'rom lakes snd ponds; some rans off at the stir:t'ace; and some· become soil
moisture and ie transpired b;y plants. Ground.-va.ter recll.a.rge occurs only
where and. when the supply of water exceeds the amount disposed. of by
these processes, which have, in effect, a prior call. Water in the zone
o:f' saturation does not remain there :forever but migrates inexorably
through various enviromnents back to the sea. -
'?he water ~ly on the Snake lli ver Plain is perennially dependable
o:cly because it is replenished, directly and indirectly, by perennial
precipitation. Precipitation on the plain and its tributa.:ey- areas is
derived largely from moist air masses that move in from the Pacific and
Arctic regions. Mountain barriers between the plain and those regions
wring most of the water from the air masses before they reach the plain,
which is in their rain shad.ow. Water th.at is not consumed on the plain
leaves the area through the Snake River and by ground-water underflow.

g
The Snake River is one of the most thoroughly regulated streams in
North America.1 but ad.di tional regulating works are under construction,
are authorized, or are planned. The surface-water supply upstream :f'rom
:Bliss probably will be in full use within 20 years or less.
The Snake River Plain is the gathering ground for surface water and
gro'Ulld water that originate within an area mu.oh larger than the plain.
The grotilld. water, most of which is in the Snake River basalt aquifer, is
the only abUDdant and thorough.J.7 dependable water so:p:ply that is directly
available to the NB.TS. Some surlace water runs into the Station and con
tributes soil moisture and gro'O.Ild-water recharge by seeping into the
ground, but there is no "through-goi:cg11 surface drainage. Relatively
little ground-water recharge occurs from precipitation directly on the
plain, and underflow from more distant sources is the chief means of
replenishment.
PBECIP!TATION AND EV.APOBATION
Precipitation ra.Ilges between 6 and Sin. on the central part of the
Snake m.ver Plain and between 10 and 12 in. in some border areas ( see
part 2, p. 26). Precipitation is greater in the east than in the west,
being ~bout 16.2 in. at Ashton and S.S in. at :Slisso Precipitation in
mu.ch of the area barely suffices to supply the soil moisture needed for
sUl'V'ival by the sparse growth of 1 desert 11 shrubs and grasses. Most of
the water precipitated on the plain is more or less continuously evapo
rated and transpired from the land where it falls.
9
pr·ecipi tatic:n tha.c-i doe:e the plain, ·c-:.:t:~ s,::im.'9 va:lleys a.re nea:r.ly as d:ry a~
the plain.' Fo!'" e,;ample 9 p:recipi tat.:ion. :ts 15.,3 in. at Hailey and 14ol in.
at Hill City 9 but it is ~n.ly atc,ut 7c3 in. at Challis and. 9.,3 in. a.t
Mackay Ranger Station. On the t;igher m,-:unt.a.ins in areas tributary to the
Sr.Lake Rivel" Plain, pI'ec:dpi.ta.tion :fa.Us la.!"gely as snow du-;ing September
through April and t,he ws.ter eq:""i?alent p~obabl:y :t"snges up to 35 in. or
more. !fhe seasonal pattern of precipit:.ation en the plain differs from
that in the mountains t mid.s'Ummer being the time of heaviest pre:si:pi tation.
wr...ich cause relatively :r-ar,,td B"tapo:r.ati o:n and. t:r:,anspi:ration.
RUIWFF Al:."'D INFILTBATI ON
Certain regional pecuJ.iari.ties a.bout ri..mc,ff are decisive fac:tors in
the hydrology of the Snake Bi ver Pla:tn, espe~ially the ground-water
hydl"olog,. Precipitation d.ir ectly on the pla't:n yield.s practically no
ground. Precipi ta.tion generates c:onsid.e,rable rim.off in mountains north
of the plain and some of the water later sinks into the ground and
reaches the plain by under.flow. Water that reaches the plain at the
surfac:e sinks into the ground a..'1'>0und. the edges of the plain. !l!hus,
unconsumed. sur.f"Me water from much cf the t:t'ibutary area is a sourcie of
replenishment for ground water· bene,a.th t.he plain.
The Snake RiYer, the m.a:in~'te:m sur-fae:ei drainagews.y cf the plain,
derives some millions of ac;:r<e-feet cf ML'lOf':f yeal'."ly fr'om the mountains
of eastern Idaho and northwestern Wyoming. !n ?'ee:ent yea.rs, however,

10
owing to :regulation and ~1.se of the ri·;re!" wa:i:ie:r, the average discllarge
the yea.rs no water spilled :pas~ Milner Dam" The water diverted for
irrigation is used and reused one to se'J'e:ral times on the plain. The
net consumptive use 'by e"l!"apotranspiration on c::rop lands was not ca.leu:
lated, but a large unconsumed residual volr:m:ie of the diverted sur.f'a.ee
water enters the ground and recll.arges the ~und watero
The water-bearing, permeable Snake Biver basalt rests on non:perme
able older rocks which crop out along the east wall ·Of the valley of the
Snake River betw~en Milner and Bliss at many pla.Ges above the level of
the river., Ground water is disc.barged. at the surface in springs along
the top of the basement rock9 'Which fems a. natural dam over which the
water spillso The yield of the springs is an ap:p:roxima.te measure of the
unused ground-water yield of the 'basin to the east--currantly about
4 9 000 9 000 ac-ft a year 9 whiC'h is about 30 pct, greater than the estillla.ted
o:f' the water now discilarged by the springs probably is ,mconsumed irri
gation wa.te:ro In the natural w.ter regimen 9 all sur:f'ace water yielded
by valleys tributary to the north side of the plain formerly reached the
plain and became grou.nd watero Now 9 however 9 much of the tributary
surface water is consumptively used by irrigated crops. Ground-water
recharge from those sources decreased concurrently with the increase from
Snake River water., The regimen is complicated also by iarge withdrawals T'
of ground water :from wells east of the springs. For these reasons the
aggregate discharge of the springs does not represent the perennial gross

ll
supply.
BIG LOST F..lV"E.R
4 mi R. 27 l!l. The
the gaging station and dovms".::r·eam at ten temporary measuring stations
on the geologic map (pl. 1 2 pt. 2,)

12
water for irrigation have drasticall.7 curtailed ?"O.IlOff to the plain.
Mac~ Reservoir regulates the river above Ar~o 9 and irrigation diversions
above and below the :reservoir deplete the flow.
"Old-timerae inha.bi tan.ts of the area. report that during seasons of
high r,mof:f' in former times the river ~ommonl7 reached the :first and
second :Sig Lost liver plqas east of Rowe. Jew people have seen ponded
water in the third and fourth plqaso !he late George Walker,!/ a
resident of the area from lS82 to 1951 9 saw •the waters of :Birch Creek
and the :Big Lost R1 ver mingle" several times in the fourth plqa.9 but the
:Sig Lost River probably has not reached the fourth plqa since the turn
of the centuey. Water has reach.ad the f':irst playa in substantial amount
in~ years-1921, 19229 19239 1927g 1938, 19439 19449 1947, and per
haps otherriJ. In 1943 Mr. Crandall observed water extending along the
outlet channel from pla.ya. l toward the secsond plqa., but he believed that
no water had reached the second pl~ since 1918. The first and second
playas contained ponded water during pa.rt of 1952. Water reached the
first plqa again in 1953.
The four playas in the northern part of the NRTS are connected b7
s.ballow channels. Playas l a.Ild 2 are in the northeastern part of T. 5 i.,
:a. 30 11.; plqa 3 1 s in the south-can tral part of T. 6 :N. 11 :a. 31 E., and
plqa 4 is in the northeastern. ~a.rt of To 6 N., Ro 31 Ee (pl. 1). The
Oral commmnoation, 1951. .Accorditlg to Iqnn Cram.all,. Snake River Watermaster at Idaho Falls, Idaho (written com.mw::tlcation. ~ l, 1952) it is said. that :Sirocb. Creek and the :Sig Lost River mincled in the Mlover sinJcaM in 1s9~.
z./ L,-mi Crandall, vri tten communication, ~ l, 1952. ,,

13
playa.s were flooded re:peat;ed.l;y- during recent geologi~ time, a.Ild they
contained ponded water during perlods sufficiently long that distinctive
shoreline" s."ld. offshore physiographic fea.tut"es developed... Clim.a.tic cb.a.ngei
probably incl u.d.ing reduced precipitation, rns;v have reduced ranoff d~
relatively recent geologi~ times.
Nowadqs, the small amount of water discharged pa.st the gaging
station near Arco du.ring most of the year is dissipated by evaporation
and. seepage within a few miles below the station. The cma.nnel ordinarily
is d.7 below the old diversion dam in the Im.TS in sec. 5, T. 2 N.,
R. 29 E. During periods cf raised runoff, water sometimes rea.ches the
crossing of ID.ghway 20 in sec. 33, T. 3 N •• n. 29 :m. .A.t still higher
:runoff stages, the river extends several miles farther downstream, as it
did late in 1951, 1952& and 1953.
Discharge !;1 Station ~elow ~
The records of daily discharge pa.st the ga.giI1g station are published.
e:rm:uall.;J. High windr channel moss, a.Ild ice were miner disturbing
!actors a.t times during the period of record. In general. however, the
daily records probably eonfo:m to us'tlal standards of a.ccuraey - that is.
within 3 to 5 pet. Table 1 shows the ma.ti.mum, minimum and mean yearly
discharge at the station d'tll"ing 9 water yea:r,;?} of record. The mean
U. s. Geol. Survey Water-Sc.pply Papers 1093 (1947), 1123 (194S), 1153 (1949), llS3 (1950), 1217 (1951), 1247 (1952), l2S7 (1953). 1347 (1954), and. 1397 (1.955).
~Y convention, any water year begins on October l of the preoed.1%18 year. The 1947 water year began on Oct. l, 1946.

14
records of miscellaneous m~a.s1.u-eme.nt:i$ of dis~hargce at the temporary
tables l and. 2 of Appendix 2o Th.e mean a.nm:tal and monwy discharge of
the river during the period ~f record is represented graphically in
figure 2.
Table l .. -M.axilll".:un and minimwn instantaneous a.nd yearly mean
discharge of Eig L~st River below Arco9 1947-55
Ma:d.mlm M:l..niwm Year Date Ofs Dats C:fs
1947 6- 6 285
194S 6-15 l 71 5'-20i 21 3o0
1949 6- 3 237 5- 7 9o9
1950 lJ- 3 102 5-22 5ol
1951 g... 6 272 ~
1952 6-11 698 S=25 36
1953 6-17 251 S--,14~ 169 18 16
1954 1-23 }./ S5 5- 9s 10 6 .. o
1955 10-31 E/52 6- 2 :d{ o5
1947-55 6-11-52 698 6- ~55 2o7
Mean yearly ct s Acr&-f eet
83o3
37 .. 0
3206
25o0
3906
171
so.s
39.4
1609
6011260
26 7 870
239620
18,127
289649
12411310
589470
28,530
611173'
4111669
Not determinedo Estimated minimum da.il;," :flow of 10 ds Jan. 28 to Feb. 2. Maximum mean d.ai~ di seha:rge. Mimmum mean daily di soha:r'ge.

" "1l 0
"' "'
400t-------l------t------+-----t------t---¥-,'l--+----- 1--------1-------1793
3501----------------
300t-------,------<f---------- --- - -----------
(/) .... ~ 250
Cl> 0, .... 0 .c u 200 -----------!--(/)
0
1947 1948
+--------+-------
1949 1950
Monthly mean~-
a: 2 I-' <t :::, a_
~ -:, ~
1951 1952
------------ 694
---------- -- --- ·-------- -------t595
>, 0 ---1--------1------1496 ~
.... 'I-
1953
a, --- ,------ 397 t,
<{
--- 99
1954 1955
Figure 2. - Annual and monthly mean discharge of Big Lost River below Arco, woter years 1947-1955. (J1


17
Di scllarge in 1951
Preoip1 ta.tion in July a.ud. Augusto 1951 and 1952 exceeded the not-lrial s
amount in ma.cll.·of southea.stem Id.ah~ (table 2) .. During those months in
1951, precipitation oc.ctll.l"'!'ed. cl:rl.e.fly d.url.llg a two-wsekperlod. A.bout
two inches cf rain fell on .A.u.:,t!'Ust 3 in less than an h.our during a
cloud.bU't"trt on hills neaz' !,rr:J,t; o The ma.i~ irT:tga.tion-di version oanal
below Ma.G~ Dam was ove:dca.ded. and br>ea.chei after the cl.oudb'tll"st;
several lateral oanals and. ditches failed, and. the M?lal headga.te had
to be closed. Water frcm the b~eached ~a.nals$ und.iverted water in the
:Big Lost River, and flash runoff flooded thou.sa.nd.s cf cWres, including
the town of Arco. .A.t the gaging station below Arco, the river rose
sharply on August 3 (fig. 3), reaclled a peak on August 6, and returned
to normal on August 19. The storage level in Ma.clal.y B.esen"Oir, about
20 mi. above Arco, was high, owing to unusually high ruuof:f' late in
July and early in August. :Because of disrupted diversion works upstream,
an unusually large amount of water was :t'elea.sed. f:rom Ma~ Da.m.9 and tb.e
d.isclla.l"ge below Arco reached a se~onda.ey peak about August 280 A:t'ter
September the discll.a.rge rate fluctuated. in a gra.d:ual.l.y rising trend
until early November, after which 1 t leveled. off imtil early in the
s-pring of' 1952. During se"Veral months thereafter the discllarge rates
and fluctuations were high.

Table 2.-Departure from normal precipitation at stations in south- ... eastern Idaho, July and August 1951 and 1952 Oil
Linches of water. From published records of the U. S. Weather Bureai/
(T, total; D» departure from normal; N, normal)
1951 .llJ.g_ __ ··· Jul;[ Augt1g1'1; July --~ At1.@if~-·-·-·-
N D T N D T N D T N D ·-·-----·-.... IOc.>
Aberdeen Experiment Oo42 o .. 6f5 ~Oo42 0,42 Station Oo53 0 .. 50 0 .. 03 1.10 0,08 Oe50 1.23 0.,81
A.'!."iJ.1) -. 1 .. 24 055 069 ~28 .60 ~c32
Blackfoot 025 .,66 ~o41 1.11 064 c4] 028 .66 ~e}8 e29 .64 ~¢35
Chi'.11y«<Barton Flat 2c27 .. 60 1.67 3.17 .,95 2.22 1.30 .60 .10 )i5 o'3) -. ¢ sn
G:ro'llse L24 • TT ~4{ .s6 c82 004 079 0 77 .. 02 1~6? 0 3~? 085
Hame'.C' LS4 .47 1.,37 4.22 080 3.42 1.17 .47 ,,70 5"' 0 •. .11., .,BG -c;:!9
Idaho Falls .. 22 .. 62 -040 2.43 0 59 lo84 007 .62 =o55 "53 • ~>9 -.,06
Mackay RS 2.31 .85 L46 2.71 ,.78 1.93 1.s3 .85 .98 1o69 .1s .,91
Reactor Testing Statj,on .. 38 .29

" 'O 0
"' "' (D
'" "
eoo~---~---~---~---~--------~----~------7------.--------f-----1------+------l-------1-----1----.!------1----- ----- ------- ---- -------•----<----l----~-----1----------- ----
100,1-------1----4-----l--------i-----f----.i------ -----1------1--··-- ----l------1-------l-----+----->------l----·-l----
.. f------'1-------- ----------!-------1-------l------- ----- ---------- -----l----l·------1-----•----,..I- ___ _,___,~11--.. --1---------l------·-·- ------
2 v 60q1-------l-------------~--·--------<-------1-----'1------+-·----<-----__...;1---------<-------+------ -----1----!----1--!-----r- 1-,.:..... -- ---~-------l--------1 ..,
C 0 ... 1------>------1----------· ----__...;f----+-----+-------- ~-·-----!-----+-----+--- ------ ----·-+-1·-->1---·f-ll-1----l----1-------1--·---
!:: 5001------1-----1--·-·-·-··---l-------l--------11----.!----.. ., 0.
I
7 h-1-----1------1------1
I ] 4001-----1- --------1----+-----l-----+-----1-------1-+I--H- - --- L...-..
... ,--1--~. 1 300l-----1------+------l----------l-----11-----.!----l------l------·1-----4------l-----+---~---H--11'H---I--H--+---l----ll------l u
.!: >"----~-------lll>-----l------l-1--l----1-------+--- __ ,~_·:::~:-:~:~~~~~~=:::::::::::::::~+---------~~-----'~-=~~~~_-'._"_._-_-_-___ ..,_:_--_-_,,-_-_-_-_---_,·l---_, _ _,-:::_.-A.._-_-_-~:-_-~---_-_-_-_~-l-,_-_-_-_-_-_-__,---1
; 200 \
0 1------l-------1--------l----+..J-.--l--~,I------~--- !a
:;: 10~ - • __,.,, ~ ,-J I, \ I\ 1.-----..U ~ \) ~
r I\ \ \ I'
- J '-.I IV A
·.\v \ ,__.,._, V ~'- J
Apr. Moy June July Aug. ___ _J___. __ __1_ ___ _.J_ ___ ____cL.__S_e_p_t._.,___Oc_t_. __ , __ N_o_v __ _j___D_e_c __ -~--J-o-n.-_j___F_e_b_. ___JL__M_o,-. --'--A-p,-.--'--M-,o-y---'---Ju_n_t _ _,__ __ J_u_ly_....__A_ug-.---'--S-e_p_t_--'
1951 1952
Figure 3.-Meon doily discharge of Big Lost River near Arco, Idaho, April 1951 to September 1952.


2l
:By the time repair's were ma.de to b?"eac:hed cana1s in the :Big Lost
River ''fslle;r~ the main irrigation season was :pastp the stc;;irage level wa.a
still hig..~ in Mackay Rese:rroir~ and there was no need to divert or store
much water for irr·:tgation. The river below .t-i,r(J,c, continued to d.iscllarge
more thfm the normal amo,m.t of water during the :!:'est cf 1951 and. the
f'irst half of' 1952~ and. water' extended :far dovm the channel through the
NRTS ..
Dis~ge in 1952
The d.iscllarge of the r-i ver. below J!.:Fcc was at:f:".ve normal during most
of' 1952, the Yea:!'.° having the highes~ msan daily discb.a.rge rate in the
9 yea.rs of reco:r0d. :Before 1952 the ma:rl.mum discha.T'ge was 2S5 d's, on
June 6, 1947. That amount was excc;eed.ed. en 5S days :1.n 1952 and a new
ma:x:imwn of 681 d's C:'H'>CU!"red on June l1. The hi.gh runoff was derived :from
the melting of imusually hea.'cy' snow that M::l'.:tm'lllated on the entire water
shed from December 1951 fh.T'~u.g,.½ Februa.:ry 1952c
The relation of' the :Big Lost ru. ver to the water table in the
vicinity of Aroo and upstream from there changes from time to time and
place to place, but the rlve!" gains in aggregate flow from effluent
ground. water. Do\'mst:r.,eam from kr:M the water ~able drops some hundreds
of' feet and the rlveT :is perd-ied far abo~re it o Prae:tic..ally nothing is
known about percolat:l.or. losses between A'r:,o and the gaging stati.on
below Arco. :Below the gage~ losses were measU1"'ed while the discharge
was high in 1951-520 The losses meas':.:.!"ed in~icate the magnitude of

22
infiltration rates in materials 1:lke those in the channel of the Big
Lost River, and infcrmation abou.t ths ra:tes may be useful in planning
the disposition of liq,:Jid waste in the g:,ound..
From 1951 to 1953 nine sets of dis~harge measurements were ma.de
along the ma.in channel of the :Big Lost River, and inflow and outflow in
the plays. areas were measuredo Water was ponded in three o:f' the four
playas ill 1952, and the seepage losses in the pla.:ya.s were computed..
Throughout the gravelly part o:f' the flood plain 9 the river bed is
permeable and the loss of water by infiltration is proportionately large.
The flowing reach of the river extends far into the NRTS only when the
discharge exceeds the seepage rate through the channel deposits. Also,
the river is able to extend its flowing reach., when runoff persists
long enough. for seepage water to saturate the sediments beneath the
channel. On .A.ugu.st 2, 1951 water extended al.ong the channel to a point
a.bout midway between the abandoned di version dam on the NETS and the
bridge on Highwey 20. Following the cloud.burst and canal failures o:f'
August 3, water extended a short distance "below the h:i'ghwa.y- bridge on
August 4; beyond the Lincoln Boule'Vard bridge in the NE¼ sec. 24,
T. 3 N., R. 29 E. on August 6; and to a ford on the West Monument :Road
in the SW¼ sec. 3, T. 4 N., Ro 30 Eo on August 9. A trickle of water
flowed into playa noo l on August 31.
Channel Losses
The surface areas of measured reaches in the river cha.Dnel
(table 3) were computed from stadia measurements of stream-eha.rmel cross
sections at half-mile intervals. Linear channel distances were sealed

23
wa$ made because the loss was appre:~ia.ble -:.ne,:,e.
-----·----------·----------·-------------· P..ive:r r.iile:c
Station __ _,L=· cr,£.\·.r, ----~ Miles .t 1,~< fr~:m
refe:'enc,e poic1:,".:2../ ---------~-------l 008
2 1403 13o5 719280 48 0 0 3,42opooo
3 19.7 5.4 28,510 ..,, ,-. ~., )j .- l,112~000
4 22.0 2.3 "''? ,4,; ~-i;- - 36(,4 442s000
5 2607 41#7 24;;. ~2:: '.<?; .o ,,_; 820,000
,. 3009 402 22 r. l3Ci 23"1 5129000 b
7 34~5 306 13s. 1Y~Q -~ ,.. 676,000 )?oO
g 4o.,2 5°7 30rl00 38.0 1,14o~ooo
9 42 .. 6 2 \, .~ 12!670 29.9 3749000
1-9 4·lo8 220i700 8;496,000

Table 4o-Averags ini'iltra~lon rates in Big Lost River below
:;;t,as:icn 19 1951~52
§_~~?B.g·B r·a·~t}~ Date 0.t~ st i of d./ :ft2 gpd./:ftF ' . . ) ~::i:5.a.ndS
'-"' ------· A."llgo 16-17 9 1951 6309 5,521 0.677 5ol
Aug. 30-319 1951 70.3 69070 0746 506
Sept. 13--14g 1951 9603 3v320 0930 7o4
Nov. 2-39 1951 65.s 50690 .697 5.2
Apr. 30-Ma.y 19 1952 111 90600 1.18 808
May 22-249 1952 130 11~200 L3S l0o3
June 30, 1952 90 79780 &955 7o2
Sept. 15-179 1952 50o4 49350 ,,534 4.o
Apr. 3-109 1953 22.s l,,970 .242 1.8
Average 0.820 602
,

Table 5.--Average infiltration rates in measured. reaches of Big Lost R:he:t', 1951..,.,53
Sta. 1=2
Sta. 3-4
Sta. ::,-6
St.a. 6-9
13.5
5.4
2.3
4.7
4.2
2.4
16,,6
11.7
39.5
41.B
71,280
28,510
12,140
24;820
22,180
19,000
30,100
12,670
.87 i 650
619no
208,500
220,700
3,420
1,112
442
820
512
676
l ,l4o
374
2,886
2,190
8;147
B,504
1.20
1.11
1.15
2.2
1,2
6 .1
5P920
3,960
7,600
99630
1,460
3.095
2~9800
15,600
,/ The a~~c:·;nnulat:lv~ tol;;als of :u.ne8 1 to 8 d.:, nol, v.gree wHh the c,:,mp0und totals in lirHHJ 9 t,) 12 beca1.1se no roeasit:rements were slmultar1er,:c,0 and rhe com.pound totals art1 from averages on days when thie stage of the :r·:l..'.rer c1 Hf ert1d. from that, on days when tJil'.gle segments ·vreire measured. Nevertheless the totals correc,tly show th,e general magn:l:bude of seepage losses.
N \JI

The rates of infiltration along the river ch.a.mlel were quite uniform
until the time of the measurements on April &-10, 1953, when the discharge
rate was moderate., At that time the iilf'iitration rate was much smaller
than it was during earlier periods of moderate discharge. The change in
the infiltration rates occurred after the river had maintained a rather
steady :flow at medium stage throughout the winter of 1952-53, following
the high.er stages in the summer of' 1952. Siltil:l& of' the channel ~ have
reduced its permea.bili ty, and prolo11ged seepage mq have saturated a
considerable volume of' gravel beneath the river bed and decreased the
sub surf ace hydraulic gradient awa::, from the river. The most permeable
reach :for which the infiltration rate was determined was that between
stations 5 and 6, where the rate averaged 2.52 cfd./ft.2 (lS.9 gpd/f't.2 )
( see table 5). A general direct relationship between river stage and
rate of' infiltration is shown by a plot of the data in table 4 (fig. 4).
The maximum observed aggregate rate in the entire reach between stations
land 9 was 10 .. 3 gpo./:f't2 on~ 22-24, 1952, when the discharge at the
gaging station was 130 cf's. The minimum was 1.8 gpd/ft2 on April S-10,
1953, when the discharge was 22.S cf's.

GPO 991857
J 9
8
N
- 7
' v c.. 0,
C:
"' II)
..2 6
QI
g
I I Moy 22-24, 1952
Apr. 30-Moy I, 1952
o Sept. 13-14, 1951
~ Aug. 30-31, 1951 QI II)
4 Sept. 15-17, 1952
3
2
20 30 40 50 60 70 80 90 100 110 120
Discharge in cfs
130
Figure 4,- Relation of discharge to overage rote of infiltration between stations I and 9, Big Lost River.
27
J
140


about 1 .. 3 -lfte Upstr>eam i:t"om staHcn 2 the channel of the river :ts cm.t
chiefly in basalt; between statd,on.s 2 and 6 it is chiefly in gravei;
downstream from st,a.tio:n. 6 the bed is l1'.and and. s:i.lt.. A eiorrelat:i:"tre
cihange is a.ppaz,en t in the grade; of tr~e ohami.el (:fig. 5) • The. average
segment, stati.ons l t;c 9 ( table 5) o
The average rat.es of infilt:r:-a.tion in single :r·eac.b.es ranged from
o .. 2s9 to 2.52 cfd/f t 2 (2 ... 2 tc, 18.9 gpd./ft2 ). Du.ring the diffe:r-ent
1'" f ii ~ • ,~. 2 '1 8 10 3 "t\r"mile gaged. segment va!":l.ed rom 00242 t;o .r,03B c:ld1~t ~ ·• lie "
gpd/ft2 ) o The average of the averages for the nine se:r·ies o:f meas'!Jre
ments was 0.82 cfd/f't2 (602 gpd./ft2 ), which is more representative of
the a~erage rate of infiltration d'l.l!'lng the pe~iod.
In~reasing dis~harge ~aused a proportional inerease in the total
volume cf seepage and :l.n the a.ve:n,.ge rate cf 5.-r .. f il t:r-aHon pe::-· unit,
29

30
saturation which were continuous with the river at places in the ground,
which tended to redu~e the losseso Entrapped air in the ground also
impeded infiltration. The water was comparatively shallow in most
sections of the channel; higher rates of infiltration would o~c'\l.?' with
greater depth of watero
Percolation in ~ :Ba.sins
The rates of water loss in the Big Lost River plqas were measured.
when they contained ponded water in 1952 and 19530 The discharge through
inflow and outflow channels of three playas was measured, the total water
loss in ea.ch playa was computed9 and the wetted areas were mapped on
aerial photographs.. The loss by evapot:ranspiration was estimated. by
computations based on :records of the mean monthly evaporation at three
weather stations on the Snake ~v.er Plain at Aberdeen 9 Jerome 0 and Milner
Dam. The in:f'iltration rates ranged from Oo7l9 cfd/ft2 (5 .. 4 gpd/ft2) to
0.05s cfd/ft2 (Oo4 gpd/ft2 ) ij and the average loss: in the three p~s was
0.30s cfd/tt2 (2.3 gpd/ft2) (table 6)0
The ratio of the infiltration rate to the depth of ponded water in
the plEcy"S,s varied considerably between playas and between the different
times of measurement. The depth of water direct~ affects the l'a.te of
in:f'iltration, but other :f'ootors also are importanto Some of these
factors were the length of time the pla.yas were wett-ed11 the nature of
the underl.7iIJ.g sediments 1 the time of year~ the tempera.ture 9 and the
relative h'lll!lidi ty".,
,

Gl 1l 0
"' "'
5200-----~-----,.------~----~-----,.-----------·-.------.--·----s
grade ----------i--------+ --------+-
6 50001---------1------+-------1---------=-------1-------1--- ---,------t-----------QI
E
QI
~ .Q C
Chiefly basalt; small of alluvium
~ 4900---- -+-------;--------+-------t-t--·------+-----t-'"<::-li---------------- -----~ Alluvium +-<{
4800
0
-----t-·-----+-------,
5 10 15
and basalt
I I I
Sta.7 /1.1% grade
----r~----1-------t--~------i--------~ I
20 25 Distance, in river miles
30
I Fine-grained I I I I 1
35
alluvium
40
ILoke 1ond :ploya I beds I
45
Figure 5.- Grade of channel of Big Lost River through the NRTS, Idaho. (>I

,-

1'9'j2 1 f' 1 !l ., 1
" ··l l'.' ?l.! M i}
:1? :? ' t1t'-" l ' Ji,, .")
!9).3 1 r ~ L !. .,l .. LS
l ,, '' 1 ;· r_
.,'lt
(, f•, ' ... .::6 .-, [~
; 1:1 c:
I~1)3 ,., Ar·~, , -~ (.~ '.l·\1' lJ. .'I,,
~~ .J\..p'! l ' )
1952 3 Mn;1 ~:J.1 ·7. M::,y 26 ., 3 Junl?> 2'{'
Table 6 .--Inf:ll t:ration rates in the B:lg Loat Rt>rer playas 5 1952-1953
(AdJust:ed :for evapo:ra.t:lon loss)
Dlsc:::ha:r.gt:!I Wet;ted.Jilaya a:rft:a. • ,_"_J~~fs}, ___ Squa:rre, Sq11,3,1:e1
nf bw Out.flow mllP.i:i'I A:;::,ic: fef'll; ·.~,h.,mnel channel
_,T9tal_l,,. Cf1:4
( tho
20.5 0.08'4 .,., , .. ~n (.," '.; J t , .. '.7'1 -(.,.~· 0) 0, ·y~ J ... {) -~ J
g4o2 )12 11 f• /00 f;{ 02 -:-; c. ~:;~~1 vOf 3 ' 9
6e~2 )l2 ?":) 1 l tl rno G~.2 r· ,i;/J •·, ~· p
s 3 l' f__l }/oJ 04r~.g 12g":,00 lif o2 3/0JO -0 c .. ~·? ,, ;
l .. ot16 0 ti }R280 J C, l 615 r, ~u .OJlt e .E. ·,,;
c:.:::1 o4 ::~ ~~ ,, t~ f)2S8 { sl~O " 'i:ZG - ',; •s· .016 . c., L ~
]i ",T oOj4 ,, ., lt O 7 t~ QJ')
...,. 0 : t'.1. 0 31-t5 r", ' •• ( ..
lt"1J·~1rtl.,g~
(, ' olOO fJiJ c:" 7'30 bel ~ ~33 oOl'j C C
1 C s .oq 2L ! 919 : .1 " )~ .on o.l (4
; ~
_,;«1(" 0 13.r 11,.c,~:o ;;,') o1 2~:~:0') JF'. o 1)! J ,,
' ) rT ' .14),4 ;j s c;:.o i0o8 ~) 53 . . ., > I ,), >, ),'} ... , C (., )c: " "' t·,)r.? Jlcll, oll,)~ 9;: ~.:.' :i ~ O~\) 310$ tJ '7C..r'\ 0b,3'ii o·,' c... 9 ' • ./'-' 0 c..:~
1 ·: )-le 0.1 .144 •. j_ 4,020 17.3 1~ 1,130 oJ'fl o- 1'' n' J ;)
iJ.9 0~7 ,.11+1+ 92~ r ;J 4;020 10.2 e,''31 c?l9 oOTS .A.11 en3g~
4.6 4.6 .068 I.J-3,.5 1,890 397 .210 .019 4.6 .068 43.5 1,s90 l~.6 397 .210 .019
24.o .430 595 259900 24.o 2,070 .080 .022 Average
Average of 3 pleyas
-------~--------- ·-----
0.119 :; ,ti
"602 4 0 5. ~l.J,gl;. Jr,·~~ o29T '/,
C <
046:} 5 ., ~)
;wi ~-: o) 0 ·-
.408 l Jc )169 3c5
o:qo L} 0081-~ C ,::;
C -.,•
.479 7tob ·,Tt\ -; 6
:6E2 ,!, C
)r!O
0 355 2~7' .203 L5 .309 2.3
.191 1 olf
.191 lo4
.0~8 ,.li
.1 7 1.1 \.s-8 \.,,I
.308 2.:J --·------

Pla:ya.s 1 to 3 a.re underlain by a.ltel"nate lay.:1rs 9 a. !w inches to
gravel occur'cs in the ~en-t.!'al pa.rt o:f playa 1 "beneath a. thin e;oYer of fine
sedimento The uppermost layer of sediment beneath the playas at many
places is a c:"USt\:ed layer ,of silt and clayey silto The o;regetal cover is
spa.rse 9 consisting of s~:ri.iliby desert shrubs and gra.sseso It was not
practical to measure the depth of ponded water in the playas during the
periods for which water losses were computed, but the depth in parts of
plqa. l was 5 to 6 f'to In other pla,yas the water at most places was
only a few illl"'..hes deep.,
Most of pla:;ra l is in se~so 2 and 3 9 To 5 No~ Ro 30 Ea 9 but a small
pa.rt is in sec a 34 9 T o 6 No 9 Ra 3 0 E.. The ma:x:1:mrun area of ponded water
in the plqa. was about 287 ac (about 129500 0 000 sq ft), at which stage
some of the water spilled eastward into playa 2 o The gross rate of water
loss varied from 00317 cfd/ft2 (2o3 gpd/ft2) to 00738 dd/tt'2 (5.4
gpd/ft2 ), and the average was o.469 ddi£t2 (3.5 gpd/ft2 ),,
Pla,ya 2 is in se~o 29 To 5 No~ Ra 30 E. 9 and a small pa.rt of se~.
35 9 T. 6 N' o 9 It, 30 E. The ma."d.mum area of ponded wa·te:r in the plays. was
about 92 a.c (about 4 9 020 9 000 sq ft), at whi:M stage water spilled east
ward in an over.flow channel toward playa 3. The gr't)SS rate of water
loss varied from Ool03 cfd/ft,2 (Oo.6 gpd/ft2 ) to Oo6B4 dd/ft2 (5o0
gpa/ft2 ) 9 and the average was 00309 dd/tt2 (2o3 gpd/ft2 ).
Plays. 3 is very ineguJ.ar in form and lies in se~ 8 s 4 and 5,
To 5 N.9 R. 31 Ea and sec 8s 26 9 279 289 329 339 and 349 T. 'No, R. 31 E. tr
The total pl~ a.:rea. is about 800 ac 9 but the maximum area under water

in 1952 was about 595 ac-:. A:n cutlet ch.ar...n.el extend.s n~rtheastward to
no;r,th.. Water d!d. not spr68.d into playa 4. The inf il tra:tion rate in
p~ 3 was less t-h.a.n. in the ether two be~.ause the materials in i t,s
floor ere less pe:rmeable.. The gross rate of loss ranged. from 0.,080
dd/ft2 (o.4 gpi/it2) te, 00210 cld/ft2 (1 .. 4 gpd./tt2}, a.."'1.d the averaga
0 147 _;o /.cc,..2 (l f ft'n" !,,i:";,2.\ was .. ~a.,.,."" o- =o./ .,l , i o
LITTLE LOST RIVEE AND BIB.OH CREEK
The LH':';,le Lest B.:1."~sr spills int.:, i is playa. basin adjacent to the
35
the Station. Practically al.l the wat,e:r i:n Birch Creek is diverted. for
1.ITigation in u;pst?"ealll a..T'eas and very little runoff reaclles the Station ..
LOCAL RUNOFF
Ephemeral ru.ru:;ff fTcm the :focthilla bords:d.ng the NRTS on the
northwest reaches the Station. at times but;. :t"a'.!"e.ly extends beyond the
edges of the allt!:!ia.l fans at the foot of the mountain slopes. :Numerous
short, epheme..'!<'Sl d.raiIJageways are sC;S.tt-ered. over the rest of the Station,
where they drain from low slopes ont,c flats and small pla:ya.s.
Ma.ny small pla.va.s are s~tterei thTough the NETS (pl. l, part 2)$
ranging in a.T'ea from less than an a.c:t"e to a few tens of' a~es. These
Many of them c:onta:i ned po!cied water- d.u:ring thawlng c:f an unusually hea.y
of the ju.neat.ion of U. Se F..i.g.~way 20 and 26, was c~Ve!"ed by a.bout 5 ft o:f'

water, and a pl~a 2 mi north of the high.wa_r junction was covered ~
about 2 ft of water ..
FLOOD A.ND ERO SI OE' RAZ.A.RD
The flood hazard on the NmS is relatively smallo :Birch Creek
reported.17 has not discharged water onto the Station since about lS94;
it is not likeJ.7 that much flood or freshet water originating in the
upstream area grrer will reach the NB.TS. A local cloudburst might pro
duce heav,r flash discharge and that possibility should be considered in
construction plans. Clo'W!burst drainage across the alluvial fan of
:Birch Creek, which extends into the northeastern part of the lmTS, would
spread out in distributary channels and might form a sheet flood. A
struct'llre, such as an air strip with its lo:Dg arls transverse to the
direction of flow of the water, might be im:mdated a.nd litvered with
debris at places ..
The Litvle Lost River terminates in a smaJ.l pla.ya. near Howe, out
side the lm.TS. That area is topogrspbicalq low 7 and the :possibilit7,· of ·
flood water spreading beyond the pla.ya. is remote. In the !Went of a
catastrophic flood, spill from the filled playa would be toward :Big Lost
River pl~a. l.
The :Sig Lost River is a more imminent flood and erosion hazard.
Although the river seldom discharges much water as far as the bridge on
Rigb.,my 20, it has reached there and beyond to the first plS1'B, in at
least ll of the y-ears since 1920, and perhaps in more.. The" combination ,
of circomstances that increased the discharge greatly- in 1951-1953 '!1J8'3'

,, unleash a serlc/l'u.a fl'.?:::,do
the Gapa.c:i ty c:f the c:ha.n:o.el. The :possibility and pl"cba.ble ext;ent- of
l/ After the :field. wo:r-k ·.fi:n" t-his :r·eip-:·:r·'i:' was ::::t>!p:l.eted, me,dl:fica.tians were made ,:,f ~bf:, -r:.'("""f., ::har.,ne.1 a:d. <id. r:a.:·.,,:Js. :J:.r..1::$8 ,:ha::.ges materially alt.er tne '!:"Uu::ff s!ih:.ai .. t,:::,t.i,
37

DEPTH .AHD VELOCITY OF WATER IN THE :BIG LOST RIVER
No speciaJ. study was ma.de of channel erosion or of potential
threats to ove:r-cllannel structu:res 9 such as bridgeso Inasmuch as the
depth and velocity of water are functions of er~sion 7 however 7 some data
on the depth and velocity of water in the :Big Lost River channel are
su:mmarized in Table 7e
The ma.::d.mum depths of water listed in Table 7 are the maxima in
cross-sectio:nal areas where discharge rates were mea.su:rede They are Il0t
necessarily actual maximum depths in the stream reaches. Criteria for
the selection of measuring stations commonly operate to avoid the deep
est channel areas.
The •average' velocity of the water in a stream section where a
discharge measurement is ma.de is computed. by dividing the rate of dis
charge by the cross-sectional area of the water in the measured section.
The marlmnm measured veloeit7 is a •representative velocity•; rather
than a true maximum, because the true ma."rlmum is Il0t determined for dis
charge computationso
The velocities along the bottom and sides of a channel largely
determine the erosive power 11 while the variation of velocity in the
vertical column generally determin~s the ch.ara.cteristics and a.mount of
suspended load that can be cmrried. ..

39
Table 7 o-:B.epresentat:i.ve velo~i ties, dspths an.d ~ates ~f dis~harge o:f water in the Bi.g lt>st PJ. "S"er' s 1951-53
Lstat:ton numbers :r·e!er t,o stations shown an plo lo Part if ..
Velocity tr.t setl.. Maximtm Disciharge Station Date .A.ve!'age Mrur:immn. depth (ft) (ds)
{ eo~u.ted.} ( measu.'f'ed.}
l 9-14-51 lc99 3o28 lo75 119 5-22-52 3.,16 4"29 3 .. 20 483 6-24.-53 1.,52 2Q2'2 "' 5/'\ 120 C:::o. "'
2 5-23-952 4.12 6)+6 2o~O 449 6-25-53 lo92 2o46 L.5 79o5
3 9-14=51 ,,.., =-fr. 4 °'·t:::' 1o24 64o5 C::...,c, iV o.J-,)
5-2~52 4c22 6 -:,:4 Zo50 43S o~,
6-25-53 2036 2088 loSO 7lo2
4 9-13-'.51 L75 2.,15 1e36 5601 6-2g.,.;52 4.06 5o8S 2 .. 35 399
5 9-13-51 2.,98 4.,o6 1o36 49.4 5-23-52 3.99 5°99 2o30 415
6 s-17-51 1 .. 60 2.45 l.,20 19.4 4-30-52 2.,72 3o00 236
T g.,17-51 1.oJ4 2o25 .. so l4e3 5-23-52 2o92 4o40 2~85 376 9-17-52 1.,62 1os9 1ol8 63.,6
g s-16-51 092 1 .. ;e .. 61 6.86 6-30-52 2o94 4o29 3 .. 14 30s
9 S-17-51 062 .,76 062 4.77 5- ~52 3o20 3 .. 20 209

USE AND Q.UALITY OF sum'ACE WATEli
Surface water is used on the NETS only sporadically 9 as for road
construction. The chemical quality of water in the :Big Lost River is of
interest chiefly because the river contributes to gro,md-water recharge.
Table g shows the results of analyses of three samples from the :Big
Lost Rivero No analyses were made of water from the Little Lost River
or :Birch Oreek:o The principal dissolved ions in the "Water :f'rom the Big
Lost River are silica, calcium, magnesium, sodium 11 potassium 11 bicarbonate,
sulfate, and chlorideo The water contains small amounts of iron and
fluoride. It is moderately hard but is suitable in qual.i ty for all
ordiD.a:7 uses. No determinations were ma.de of the suspended load of
sediment in the water.
; !he groimd water beneath the NRfS is part of the great regional
body of water that underlies the entire Snake River Plain east of :Bliss.
The water occupies pores and other voids in the basalt a.Dd in sedimen
ta.I7 inter.flow beds associated with the basalt. It is :replenished by
several processes :f'rom numerous sources, but under.flow from adjacent·
areas to the north, northeast, and.northwest is the chief source of
replenishment beneath the NRTSo A small amount of recharge occurs
directly from precipitation on the station and from infi1tration along
the channel of the Big Lost River.

j

253
Theis 9 C. Vo, 1957~ The spacing of pumped wells~ U.S. Geol. Su:rvey Openfile report (du;pliClated)~ 4 p.
U. s. Coast and Geodetic Su:rveyg Annual Reports of United States earthquakes'.
Wenzel, L. K., 1942 9 Methods for determining permeability of va.te~bearing ma. terlal s s with special reference to di scharging-vell methods g U. S. Geol. Survey Wa.ter-St1p. Paper 887.

Jae•, :a. :r.., 1956, Groud. water in the watu econo117 o'! Idaho: U'. s. Gtiol. Sm-Yq report (m.:m.eographed.), 23 p., J&rmarT.
P&l'br, G. G. and StriDg!ielcl., T. ! • , 1950, Mfects o'! earthqv.kea, trains, Udea, wind.a, a:ad. auaoapheric pressure cha:ages on water ill ihe geologic tormations of ao11.thera nond.a: Econ. Geoloa, TOl. 45, u. 5, P• ~5~452, ~t.
Slt.11.ter, ~eu, 1953. llecord.1 ot vella and. w.ter-lffel tlunaiioaa in veaien. :Bi:nghaa CotmtJ"t I4ahoi U •. s. Geol. Sm-Yq d.12:pl. report, ,96· P• .
SJ:m.ter, .... , and. !rand.TOld., .G. 1. • 1952, Water lffela in vellt iJI. !illghaa, !omle"l'1lle, !11.tte, and J~erson CounUea, Idaho a V. s. (hol. Sm"rq cmpl • .l"'l)Ol°t I 99 P •
Sl1chter, c. a., 1905, l'ield. aean.reaa.h o'l '11• rate ot uTeae:a.t o'l u.d.ergro,md w.terai V. s. Geol •. ~ Yater-SUp. l'aper llk>, 125 P•
Slichter, o. s., and. Wolfi", B. 0.,.1906, !he u4arfl.ow of the 8011.th Pla\\e · Tallqi lJ'. s. Geol. hffq 'later-Sap. ~•r l.84, lt,2. P•
St..na, B. !., 1921!, lleocrd. ot earthqua]ce m&4e b7 au.tomaUo reoo~ OIL well• in Oalifonia: Seiaol •. Soo • .blerioa ltall., nl .. is·, p. ,-;.15 •.
Sta.ma, :a. '! .. , !1711,11, L. ;ta., u4 Orand&Jl, LJml, 1939, Geoloa and. w.io reeovcea of the K"lld. Lake Region, Id.a.ho, incl"adi:DC 1he Ia1-, Parle areaz U. s. Geol •. S<arYq Yaier-hp. Paper Sl8, 125 p.
St-.nt.a, :a:. ! . ., .Oru.dall, :t.:m,., and. ~eva:rd., w. G .• , 1936, Record.a of vella in '12.e Snalce Rift%' Plain, an.theaaten Ida.hot tr. s. Geol. SuTq Yater-811:p. Ja:per 775, 139 P•
Stearn.a, :a:. ·!., Crandall, tqm,., au4 s,lnf&1'd., W. G • ., l93S, Geologr and. grou:nd.-nier reeoU'Cea of the ~ River Plain in aoutheaatern Jclahot U. s. Geol. Yater-Sap. Paper 77~, p •. 16;.
St-.n.a, :a:. !., Bobinaon, !. Y., and. !¢or, G. JI., 1930, Geoloa ad. waler reaovcea ot 1h.e Xokelum.e area, Oal.Uornia: u. s. Geol • . ~Yater-hp.Paper 619, ·P• 1~51.
!ll,J'ler1 <J.. !!., u4 Iaegetie, ll. M., 1gl4,g, Gro,md Yater in the Jorclu Tallq, \1'8.b.: U. S. Chol. h:n'q Yater-hp •. Paper 1029, P• 76-ll..
!hei1, o. T ., 1935, !he relation 'bemen the loweZ"ine of the piaaoanrio · a1Uitaae an4 the rate and. dvaUon d ilacharge of a well uiDC
31"oud-w&ter atorace: .Aa. hopbT,a, l1J:tion !ran.a., pt. :"2, .p •. 519-52~. ,
!l:leia, O. T ., .ed. 0th.era, 19;4, Jatuatuc. ,n:a.ai11illilit1' from speo!f'io ca;pacit,'i u. S. Geel. h:1"ft1', !h'ou:nd. Yater :Branch (,m.p,,.bliahod.) :aote 24, J'al.T• . . .
,)

:Ba.rraclotigh., J. T. ~ 1952~ Records of wells in western Jef:f'eraon Oount,rf Idaho:' U. S. Geological Survq mimeographed report, June.
Cal.ifornia State Water Pollution Control :Board~ 1952 9 Water qua.lit,' criteria: Publication no. 3, 512 p., 4 figs, with Addend.um no. l., 164 p.
Cooper, R. :a: •• and Jacob, 0. E., 1946, A general.ized graphical method for evaluating formation constants and stmmiarizing well-field history: Am. Gec:,pbys. Union Trans., vol. 27, no. 4, p. 526-534.
Crosthwaite, E.G., and Scott, R. 0., 1955, Ground water in the Horth Side Pumping Division of the Minidoka Project, Minidoka. Oo., Idaho: U. s. Geol. Survey Circ. 371, 20 p.
Fancher, G. H., Lewis9 J. A •• and :Ba.mes, X.. B., 1933, Some plcy"sical characteristics of oil sands: Proc. Third Pennsylvania. Mineral. Industries Conference, sec. 6: Pennsylvania. State College Mineral Industries Exp. Station Bull. 12, p. 159.
Ferris, J. G., 1949, •Ground water,• chap. VII, in Wisler, C. O. and :Bra.ter, E. :F., Hydrology: John Wiley and Sons, Inc., New York, p. 19s-272.
Humphrey, P. A., and Wilkins, X. M., 1953, Engineering climatology of the .ANP site, Nationa.l Reactor Testing Station: U.S. Weather :B'lll". report no. ID0-10021 (mimeographed).
Jacob, C. l!l., 1947, Dra.wdown test to determine effective radius of artesian well: .A:m.. Soc. Civil Engineers Trans., vol. 112, p. 1047-1070.
__ ....,... __ , 1950, "Flow of gro'TI!l.d water", chap. V, in Rouse, Hunter (ed.) Engineering hydraulics: John Wiley and Sons, Inc., New York:r-;-," p. 321-3s6.
Knowles, D. :B., 1955, Ground-water hydraulics: U. S. Geol. Survey openfile report, Ground-Water note 28, 105 p.
Leggette, R. M., and Taylor, G. H., 1937, Geology and ground-water resources of Ogden Valley, Utah: U.S. Geol. Survey Water-Sup. Paper 796-D, p. 128.
Meinzer, O. E., 1928, Compressibility and elasticity of artesian aquifers: Econ. Geol., vol. 23P no. 3, p. 263-291, May.
Mower, R. W., 1953, Records of wells and gro,md-wa.ter levels in eastern Jerome County, Idaho: (mimeograpb.ed), June.

250
The bulk of the determinations of beta-gamma activity were made in
the laboratory- of the Atomic Energy Commission 9 and this laboratory-,
taking into account its procedu:res and the sensitivity of its co,mting
apparatus, considers that the backgro'l.llld (natural activity) for beta
gamma activity is 200:xl0-12 c/L (curies per liter.).
ApplyiDg these criteria, ve f'ind that about ten pct of the sampled.
sources have had. at one time or another, somewhat more than the bacm
ground level of beta-gamma activity. Less than 5 pct of the sources
have had values of 4oo:ti0-12 curies per liter, which is only twice the
background. value. The values above background are not only few, but
no1tpersistent, for they occur only occasionally' in a series of determina
tions from a given source.
From the foregoing it appears that the radioactivity of ground waters
in the S:z:iake River Plain is generally low, and commonly it is less than or
barely- exceeds the limit of detectability against the backgroulld radio
activity. A. few samples have appreciable activity but it does not a;ppear
to be significantly higher than that of other natUl."al waters from ~
other parts of the west; however, valid comparisons with waters elsewhere
cannot be made at present because of the differences in sampliDg and
counting methods used by the several organizations and laboratories that
are now making measurements of radioactivity- of waters.
lio pattern of levels of activity has y-et been detected., though it
would be normal for one to e:dst. If so, it will be detected. eventually-.
/

to the west and southwest. Temperature readings are not available for all
sea.sons of the year~ but those record.eel pro·0a.bly are representa.tive 9
be01a.use sea"Bonal. variations are sma.11.
Some pumped samples of water contained. mixtures of water from
several prodUGtive zones in which the tempera.tu.res probably differ some
what. ~he temperatures o:f those samples would not reli.a.bl,- show the geo
thermal gradient, but :from the standpoint· of plant operation they a.re the
ef:fecti"IJ'e temperatures. In genera.lo higher temperattJres occur at greater
depth, but the trend is not very sy-stema.tio. As was mentioned. earlier~
waters :from certain wells near the mountain f?'Ont - for e:x:amplef wells
JN-27E-9a.bl and 3N-27E-9ab2 - have tmu.sually high temperatures. This may
be caused by hot waters rising along faults. Also, the Snake .River Plain
was the scene of comparatively recent volcanic a.ctiVity, and the geothermal
gradient probably is steep. Local temperature anomalies ~ arise from
residual. heat of volcanism.
RADIOACTIVITY IN !HE WATER
Since the establishment of the Imrs. the Atomic Energy Commission has
made periodic determinations of the radioactivity of the waters o:f' the
Snake :River Plain. The Geological Survey has made a small number of check
determinations on samples from the same sources. The purpose of this
sampling was to determine the normal values of radioactivity in these
waters and to detect whatever changes occur in time. The surf ace and
ground waters have been sampled at many points and repeatedly at a number
of chosen points. A compilation of the results is given in Table 12,
append.ix 2.

The chemical characteristics of these two waters probably- vary
seasonally', especially' in the sha1lover aquifer ta;pped b7 well -7a.d.l,
owing to seasonal variations in the relative proportions of recharge b;r
underflow from distant sources and recharge from nearer sources. Much
more st~ is needed of the chemical characteristics of the waters.
Diurnal changes in soil temperature extend to depths of onl7 a few
inches or feet, and seasonal changes extend but little deeper. In
ordinar;r rock and soil, the temperature a few feet below the land sur.face
is about the same as the mean annual air temperature in that area. The
temperature of ground water in veey shallow aqoifers also is near the
mean annual air temperature, but some fluctuation is caused bY" variations
in the temperature of recharge water.
Beneath the 1Ipper few feet of earth or soil, the earth temperature
increases downward, so that ground water from successively' deeper zones
is apt to be increasingly warm. Moreover, deep water is apt to be more
nearly' constant in temperature throughout the year than is shallow ground
water. The temperature in wells mq be increased very sligb.tl7 durillg
prolonged heavy pumping, because of the heat of friction in a pumped
aquifer.
Water from wells and test holes on the 1m?S ranges in temperature
from 50 to 66°F, and the arithmetic mean of the temperatures is 56. !he
temperature in wells nearby on the plain ra:nges from l!,s to ·g9o, but most ,
of the high.er temperatures are in wells near the flanks of the mountains
\
j

Chemical analyses show certain anomalies in the chemical character of
waters from different ~arts of the N:aTS. For example, water from test
hole 3N-29».l9cdl differs in chemica1 properties from the water from other
wells in that genera.l area. Jiotewortby is the presence of chlorides. 47
ppm; nitrate 4al ppm; noncarbona.te hardness, 46 ppm; and dissolved solids
22S ppm. The water from wells in that general vicinity is somewhat
warmer than at most locations on the NETS. Some privately owned deep
wells to the northwest, near the flank of the ~ig Lost River Range, dis
close occurrences of high chloride and warm temperature in that area. The
water may be associated with a fault a1ong the flarJc of the mountains.
Similar conditions may prevail a1ong the mountain flank northeastward from
Arco to Howe. Warm mineralized water thus could be moving from the border
of the plain southward and southwestward under the NB.TS. If flow of the
water in the aquifer is streamlined, marked differences in the chemical
quality of water~ occur in relatively short distances.
A. marked difference in the chemical quality of the water samples
collected from two wells in the central part of the NRTS is related
directly to their origin from different depths (table 10, Appendix 2).
Well 4N-30E-6abl derives water from basalt at a depth of l,407 to l,480
ft, and well -7adl taps water in basalt from a depth of 387 to 51S f't.
The water from well -7ad.l does not differ greatly from that in other
wells which tap the basalt aquifers, but the sample from well -6abl
differs markedly from all others collected on the Station. The water is
very soft, low in silicae calciumt magnesiu.m, and sulfatei and high in
sodium, fluoride, and boron(?). The temperature of 66°F is the highest
recorded on the Station.
partly because the basaltic aquifer is a li:fast-circulating" system which
does not retain water in storage as long as is common in more slowly
Local Variations in ~ity
With a few exceptions, the ground-water samples tested are generally
similar in cllemica.l composition. Waters from wells near the irrigated
areas to the northeast~ north 9 and northwest of the NmS tend to contain
somewhat more dissolved solids than water elsewhere" Uncons'CJ!led irriga
tion water from the Mud Lake basin lea.shes mineral matter and agrlcul.
t'llral chemicals :from the soil as it :percolates downward, and increments
from that source change the chemical composition of the water as it moves
down-gradient. The greatest increase in concentration in the wells adja
cent to the irrigated areas commonly is in Ca and Cl.
In some wells scattered through the central part of the NB.TS the
:percent sodium is slightly higher than that in most other wells on the
Station but much lower than in most wells in the south.em and western
parts o:f the plain. The ca.use of the difference was not determined, but
it existed before the beginning of large operations on the Station.
Three wells in the northeast quarter of section 9g T. 3 N., R. 27 E.,
yield waters having appreciably higher temperatures than in those of water
from other wells in th.at general area. The amount of <lissolved solids in
the wells also is comparatively high and is :probably related to the tem
:perature9 because of the higher solubility of some minerals in waters of
high.er temperature. The temperature and quality may make the water less
desirable for some purposes or necessitate more treatment.

area :tn the Mud Lake 'basin. Therefore, one might expect to find some
chemical differences between the water coming from the north and west and
that from the northeast.
The information now available d.iseloses no obvious correlation of the
chemical qua.li ty of the water vi th the stratigrapl:cy, depth, or mineralogy
of the aquifer. The proportionately- ls.rge amount of bicarbonate (doubt
less chiefly of Oa a.ud Mg) is eh.a.racteristie of waters from the basalt
generally ( see table 11, .Appendix 2). Oa.leitmt and. magnesium are essential
constituents of the principal minerals in the Snake River basalt. Much of
the water is derived by und.er:f'low from the adjacent mo'lllltainous area., where
limestone (Oaco3) a.ud dolomitic limestone (Oa,Hg003) are common rocks.
'fhe soil and gravel throtigb. vb.ich the water passes in intermonta.ue valle;rs
also contains abtm.d.ant calcium carbonate. Undoubted:t.7, gromd water that
is recharged. directly from preeipi tation on the plain also must be charged
'With oaoo3, 'because the plains soils are rich in that mineral. !he total.
dissolved solids and the ca.rbona.te-bicarbonate content increase westward
in the plain, probably from two ca.uses: (l) longer contact vi th the
aquifer rock, and (2) increased. contributions of recharge from irrigated
areas where percolating water is more mineralized.. !f!he basalt minerals
are not readily soluble in water, but some leaching occurs of silica., iron,
mmiga.nese, calcium, magnesium, sodi'tlll1 6J1d potassium, all of vhieh are
present in mineral.sin the basalt.
The generaJ.ly low amount of d.issolved solids in most of the samples
is indicative partly of the low solubility of minerals in relatively
fresh and unaltered basalt; partly of a la.ck of opportunity for solution
to occur, orlng to the nearness of some reeh.a.rge areas to the NRTS; and

,

GPO 991857
• z 0
:J ~
(/)
lo:: < Q.
z
.. 1-z w 1-z 0 (.)
:E ::>
C 0
{I)
243
l5rr-..,.........,..,....,....,-..-........ .,........ ........ ...,....,,.....,...,-,-"T""T"-r-r-r-.--r-..,........ ......... ...,....,,.....,...,---r-.--,--r-,--,-.....,....,.....,....,...... ..........
10
5
3N-30E-19scl
0 ................ -'-' ........ -"-" ........ ""--""~....,_,_ ........ ~..u:.,....:,,_"--"~i......:,.. ........ .:....i...::.....a...,c_l'....l..<:.J...a--'-~..:J...<I...L.....:.J..Li-,<l....,L~
25r-r-.-,-...,...,~..,...........,....,.-,-,.......,...,....,....,--,-T""T"'T""'l"-r-T"""T".,....,.........,-,-,.....,.....,....,.-r-T""T""..,.......""T'"'"I-,-,....,....,........,.....,
20
15
10
5
7S-23E- 5ccl
0 ............... _,_..r.....1.""-'~~A-"'-l.....l."-....a....L-1.::....U:J...d....&-.L::.J..a.....d:......::.....1..c..1..u.....:1...L......:......a..A-1::.....::..~..L..J"-'-':.....:::,...A...J
25rr-.,......,.........,-..-'l"""T'".,....,....,...,r-r-..,...,........,-r-,-,--r-r...,.....,r-,-..-..--r-r......-,-,-.,....,.-,-,.-.-..,...,..-r-r-r-................ ...,.....,
20
15
10
5
6$- 17E- 2AB I
o ............................ '-"' ......... ...._~.1..a.-'-"-'-";.,..a....:;_"-'-':.....:1....c;......:......"'-<(-L."'-..L.w.....d-L..~~~...::......"'-..d:.....::......:...i...u...A
30 r.-.,.......""T'""1C""T""-r-r-.-......--,--,--,-,,T"""T""T-.-r-r.,....,.-r-T""T"...-.-,-.,........-.--,......-.,....,...-,-,......-..--,--,-,---
25
20
15
10
5 •
1952 1953 1954
THOUSAND SPRINGS
1955
FIGURE 31.--SOOIUM CONTENT OF GROUND WATER AT LOCALITIES ON THE SNAKE RIVER PLAIN.

The graphs 1n figm>e 31 also disclose certain changea in sodi"Om con
tent with time. All four graphs indicate a slight decrease in sodi"Om
content during the period cf samplillg 9 :f'rtlm early- in 1952 to the end of
1955. !his decirease JDa1' be correlated. w1 th greater recharge during this
period, when precipitation was above average. The graph of sodim content
of the water from the '?hou.saud Springs shows some eTidence of a seasonal
CJ'C].e in which the sodium content is greatest in vinter, least in summer.
Geologic Significance of the Ohemioal Qpal.itz
Water is a geochemical agent and its chemical character is a result
of the geologic enviromnent thro'llgh 'Which it has passed and the length of
time spent in tl:lat enviromient. !he dissolved constituents in the water
are derived from minerals with which it has come in contact (ignoring. tor
the moment 0 artificial contaminants introduced in the vater). !he co:nca
tration o:f' minerals in the vater depends on their solubility, the temper
ature of the water, the chemical composition o:f' the vater at the time of
contaet 0 and geochemical changes, such as ion-excllal'lge, that OCC'lll" as the
vater moves thri,tigh the aquifer.
The gro'\llld water on the '.li.Ei'fS is deriTed 'ey' recharge :from seTeral
distinct sources ( see p. 7-S). Water from the north and northwest is
derived from a terraue o:f' Paleozoic aedimenta.17 rocks, Mesozoic intl"l:18ive
rocks, and ~erbiar,y volcanic and. wroclastie rocks. DolOlllitic limestone
is a.b'IDldant 1n parts of that terrane. Water enterlllg the area from the
northeast has had a long and complicated. histof7, including passage ,
thro'Tlgb. a wide range of tn,ea o! host rocks. In a late stage before
enteri:ng the lra!S, llrtl.Ch of the water is eycled through the irrigated

The disclla.rge of organic and. industrial wastes by plants on the NETS
has had no observed. effect on the quality of' water pumped from wells out
side the Station. Except for a few cases, the quality of water in the
NBTS is suitable for domesticr agricultural, and ordinary industrial use.
Descriptions of the' relationship of various chemical ions to the
utility of water a.re available in stand.a.rd works on that subject. A.
rather exhaustive summary of the relationship of the utility of water to
its chemical consti tuenta was published. by the State of California {1952).
Special information en water quality has been collected by the
Commission since 1952. Samples from wells and. springs scatte?'ed. through
out the Snake River Plain have been analyzed. for sodium and. radioactivity.
Waste water disclla.rged to the ground. at the NRTS contains considerable
amoim.ts of ord.ina.ry' sodium chloride, and slight amounts of radioisotopes.
Pres'CI!18.bly, continual plainmdde monitoring of sodium and radioactivity
in the ground. water wow.d give a check on whether contamination occurs.
The graphs in figure 31 show the sodium content of water from three
representative wells on the Snake River Plain and from the Thousand
Springs, a. principal outlet for the ground water of the plain. The,y
indicate that, in general, t.he waters acquire sodium in tra.nsi t through
the aquifer from northeast to southwest, or that the water from the
northeast mingles, in transit with water from other sources of recharge.
The water that drains from irrigated. trae;ts and. enters the ground is a
principal source of dissolved sodium. Certain wells in sediments along
the southern edge of the plain, especially the Rupert city well and to a.
lesser extent the Eden and. Aberdeen city wells, contain much greater
amounts of sodium than d.o wells in the basalto Graphs for these and
other wells are included in appendix 2.

Table 24.--Summa.cy of chemical properties of representative ground waters from the Snake River Plain--Continued
Oonstituent or property
:Boron (13)
Dissolved Solids: ppm tons per a.c-f t
Hardness as OaC03: total noncarbonate
Percent sodium.
Speoific6conduotanoe (Kxl.O at 25°0 . )
pH
Reactor Testing Station
Minimum Maximum
o.oo
144 .20
44 0
3
182
0.11
540
9.5
Arithmetic mean
0.037
218.l .300
155.3 22.0
12.0
Central Snake River Plain
Minimum Maximum
o.oo 0.25
143 821 .19 1.12
85 516 O 380
o 79
257 1260
7.1 9.4
Arithmetic mean
0.065_
293.8 .4o
1} Analyses of samples of spring water are not included in this table. Some reports of analyses of water combined Na and K values; those values were not used to develop this table.

Table 24.-Summary of chemical properties of representative ground waters from the Snake River Plain!/ LChemical constituents in ppm; analyses by Geological Surve'i]
Reactor Testing Station Central Snake River Plain Constituent or property Arithmetic Arithmetic
Minimum Maximum mean Minimum Maximum mean
Temperature (0 :r) 50 66 56 45 g9 55.9
Silica (Si02) 15 39 25 s.1 50 32.1
Iron (Fe) dissolved .oo .34 .052 .oo .38 .05g
Manganese (Mn) .oo .5g .035 .oo .93 .043
Calcium (Oa) 7.7 70 39.3 16 141 43.4
M~esltun (Mg) 2.s 22 14.05 9.3 4o 16.4
Sodium (Na)!/ 2.6 20 9.62 3.3 155 28.2
Potassium (K)!/ 1.0 15 3.18 1.6 20 4.35
Bicarbonate (HC°J) 58 226 165.9 99 422 188.8
Carbonate (003) 0 lS .60 0 58 l.lt4
Su1fate (S04) 12 42 23.8 9.1 210 36.5
Chloride (Cl) 6.o 58 15.4 4.2 265 29.3
Fluoride (F) .o .7 .24 .o 2.0 .53
Nitrate (no3) .02 5.5 2.15 o.o 72 4.41
1/ See footnote at end of table. N v1 '-0

Differences of several degrees in temperattrre 111a.7 be of interest in con
nection with plant designs.
A.nal;yti cal Results
The results of chemical analyses of waters from the Nll:TS and other
parts of the Snake !liver Plain are s'tl1Dlt18rized in table 249 and the
detailed results a.re given in Appendix 2, tables 10 and ll.. The chemical
cha.rs.ct er of some of the samples was a!f ected by conditions during their
collection. ~ samples, for example, necessarily were obtained by
bailing from test holes that were not equipped with pumps. In some cases
the water had been in con ta.ct with clqq ·mud in the holes and mq have
increased its sodium concentration b7 ion-exchange :f'or calcium in the
water. In a :f'ew instances, cement grout had been used during drilling,
and the cement produced an increase in the hardness of the water. In
order to clarify possible discrepancies in the analy'ses, a complete list
of the samples and descriptions of the ciretm1stauces of their collection
a.re given in Appendix 2.
The quality of the sampled waters was generally excellent for ord.1-
nar;r uses. In all but tvo samples the amo'mlt of dissolved solids was
a;pprecia.bly less than 500 ppm, the u:pper limit speci:!ied by the U. S.
Public Health Service for desirable dri:nld.Ilg water. Softening treatment
probably would be required for most industrial uses (aside from deminer
alizillg for special use), 'but the water is not excessivel7 ha.rd. Water
from well JN-27E-9aal had 265 ppm of chloride, which is slightly high.er ,
than the ma:rl.mu:m of 250 ppm recommended by the u. s. Public Health
Service for drinking water.

237
is large, the volume o:f' und.er:f'lov from tributary areas is considerable,
the seasonal variations in underflow probably are small, a.ud the movement
of grotllld water is slow. :Because of the considerable time between periods
of reduced precipitation a.ud decline o:f' the water table, lol'lg-term. records
of watel"-level :f'luetua.tions are essential for satisfactory interpretation
of the complex interrelationships between precipitation an.d watel"-level
fluctuations. The overall effect of defi'cient precipitation on the water
table probably would be a general trend in watel"-level :fluctuations similar
to that in USGS wells l a.ud 4 (figs. 16 and. .2S). The l:qdrographs of these
wells show several yea:rs of declining water levels, :followed by a st~
rise, al.though precipitation during the period of record averaged below
normal.
Watel"-lt,Vel fluctuations in the area do not correlate closely 'With
/
local precipitation because local replenishment by precipitation is com-
paratively small. Most replenishment is from sources outside the 1raTS.
Very little is kn.own about the relative importance of the various sources
as contributing factors in water-table fluctuations, but the relationships
between them probabl.7 vary from time to time.
CHEMICAL ~.ALifi OP' !rBE GlIDUND YA.!ER
!he grotm.d waters tapped by wells and test holes 1,200 ft or less in
depth on the :rmf!S are basically similar i:n chemical tn,e. Some variations
in chemical quality occur, both 'With location and 'With depth, and the
qua.li ty at some places might influence the locations of facilities having
very specialized water requirements. There is a slight regional variation
in water temperature, a.ud more noticeable variations with depth.

,

" 1l 0
"' "' .. U1 ..,
II) a, .c 0 C
C:
0 E ,._ 0 C
E 0 .i:: a, ,._ :::, +-,._ 0 0. a,
"O
a, >
-+-0 :::, E :::, u
+40
+30
+20
+10
0
-10
Pocotel lo
-Aberdeen
Figure 30.-Cumulotive departure from normal yearly precipitation at three stations on the Snoke River Plain.
' ' '---
I\)
OJ (.JI
234
The plotting of ctll!Illlative departures tends to Mliron out" the fluetu.ar
tions in years of short,-term departures 9 such as si:agle years when precip
i tation is deficient or excessive. A recent iewet" ey~le began about 1935
and reached a climax in 1942, 'When the cumalative depa.rture of precipita
tion was plus 3 in. at Aberdeen and 37 in. at Pocatello. .A. subsequent
drier period continued thro'Ugh 1955, and the accumulated excess at
Pocatello was reduced to about 12 in., and an accumnlated deficiency of
10 in. developed at Aberdeen. At Howe a dl'ier period began in 1946 and
continued in 1954. At the end of 1954 the accumulated deficiency at Hove
was a.bout 13 in. Precipitation was sligb.tl.7 above normal a.t Howe in 1955
and the accumala.ted deficiency was slightly less than 13 in. Acc'tllD.'tlla.ted
deficiencies prevailed in 1955 at Idaho :ra.l.ls, Arco 9 and Spencer.
The water level in wells in the central and northern parts of the
plain began to decline in 1954 and by the end of 1955 were at record low
levels. Decline began in the southern part in 1953 and also reached
record lows in 1955. In the l'..inidoka area., water levels in most wells
began a general decline in 1954 9 and by the end of 1955 the net decline
amounted to about 2 to 4 ft (see fig. 29).
Precipitation at most stations on the Snake River Plain averaged
below normal during 1943-55, but water-level records are not long eno'Ugh
to show the effects of reduced recharge as a consequence of declining
precipitation. The Snake River Plain contains a very- large grotmd-water
reservoir on which several years of subnormal precipitation probabl7
wuld have little noticeable effect. Several to ma.Icy' yearff might elapse ,
before the water table in most parts of the plain wuld show appreciable
ef':fects of reduced recharge, because the amotlD.t o:f ground-va.ter storage

233
cu.rrent.ly a.bout a foot belov the 1950 levels. In wells where there are
:markedly regola.r annual !luetuations, as in !l!ps. 5-6 N., :Rs. 33-34 E.,
water levels declined a.bout a :foot during 1950-52, but recovered during
1952-~. In 1955 the,- declined about a foot. On the other hand, water
levels in wells in !ps. 2 E'., to l S., :Rs. 28-31 E. remained fair]¥ con
stant duri:ag 1950-52 but declined about l to 2 f't from 1952 to 1955. As
Yas noted earlier (p. 229), a decline in.the southern part of the Jral!S
began about a yea:r sooner tha.n in the Minidoka. area ( see fig. 29). Da.ta
a.re not su:f'fieient to show a relationship between the declines in water
levels in the two areas. In general., water levels in most wells in the
eastern Snake River plain have declined gradually since about 1953-~ and
are now at record low levels in :many parts 0'f the plain.
Effects of precipitation.-In general, the water-level trends during
the period of record seem inconsequential despite a steady cumulative
decline in precipitation after 1943 at weather stations on the Snake River
Plain. Figure 30 shows the amnulative departure from normal precipitation.
!fhe curves were obtained by algebraic addition of annual departures from
normal plus the cmnul.ative total obtained for the previous years, at three
stations on the Snake R1 ver Plain. An 'a:p'W8,rd slope to the right indicates
a etmmlative increase in precipitation and a downward slope to the right
indicates a decrease. The longest continuous period of' record •is from the
Pocatello station, beginning in 1900. Except for a few records whicb.
began about 1934, records from other stations on the plain cover periods
beginniDg between 1905 and 1920.

,

710
0., (.)
0 - 711 ... :::, Cl)
"O C:
.!:! 712
3 .2
CL> .,Q
-0., 0., -C: 141
... CL> 142 -0 3:
0 143 -.s::. 144 -Q. 0.,
0
342
344
346
348
350
GPO gg,ae7
1950
Figure 29. -
231
BS-24E-31 dcl
9S-20E-ldol
1951 1952 1953 1954 1955
Hydrogrophs of wells 2N-31E-35dcl and 1S-30E-15bcl near NRTS, Bingham County '=ibove), and wells 8S-24E-31dcl and 9S-20E-ldol in Minidoka North Side Pumping Division, Jerome and Minidoka Counties (below).

230
and 1 to 2 f't ad.di tional. in 1955. The decline began in the Minidoka area
about a year later than in Bingham and Butte counties. Figa.re 29 shows
the water-level fluctuations in several wells near the NRTS and in the
Minidoka. North Side Ptlmpi:ng Division in Jerome and Minidoka Counties. No
direct relation between the declines in the two areas is known.
Long-Term '?rends
Long-term trends (net changes of' water levels at corresponding times
in su.ccessi ve years) are an ef'f ect of changes in gro'tllld.-vater storage.
Factors that influence the trends are weather variations, irrigation,
pomping, and changes in the surface-water regimen. Records of' water
level fluctuations in the NR.rS and vicinity span only a 7-7ear period and
good area coverage is available only f'or a 5-:rear period; these records
define only short-term trends.
!he trend in water levels in wells near the .AEP and I:!? sites
(T. 6 N., Rs. 31-33 E.), where the ;rearly range of fluct'Uations is small,
has been slightly upward since about 1950, vi th a net rise of about o.l!.
f't near the AEP area.. .About S mi northeast of the .AEP area. 9 in a pri
vately owned vell (7N-33E-35bbl) near the southwestern edge of the :Mild
Lake area., the range greatly exceeds that in wells at the A.NP and Im
sites; the net rise of the water table has been a.bout 2 ft since 1950.
Yater levels in these wells declined slightly after Jul.y 1955. In wells
affected by imder!lov from the valleys of the Big Lost and Little Lost
Rivers and :Birch Creek, the net rise from December 1951 to -Ma;y 1953 was ,
about 7 to 9 ft in the northern wells and about 4 to 6 ft in the souther.a.
wells. Water levels declined steadily after 1953 and in 1955 were

229
Project included. 32 wells from vhich 54,000 ao-ft of water was pumped. to
irrigate about 14,200 a.c; about l4o private wells withdrew about 108,000
ae-f't for 29,800 a.c of land. The gross water requirement for the completed .
Government project will be 235,000 ac-ft yearly and that for private devel-
opment :llla1" be about 325,000 ac-:f't (Crosthwaite and Scott, 1955). !he heavy
pumping may lower the water table a few feet and bring in water by underflow
from adjacent areas. Thus far there has ·been no appreciable interf'erence
among wells and no regional decline of water levels in the Snake River
basalt attributable to pumping in the Minidoka. area.
Immediately west of the Minidoka. area, in eastern Jerome County, about
28,000 ac-ft of ground water was pumped from 36 irrigation wells to serve
a.bout 9,700 ac of land in 1955 . .A. report by Mower (1953) contains records
of wells and grotmd-water levels in the area.
In general, water levels in the Minidoka. area rise and fall in an
annual eycle similar to that in wells south of the NllTS in Tps. 2 N. to
l S., R. 28 E. ~he downward trend usually starts in October or November
and the rise usually begins in April or May. '.rhe annual range of :fluctua
tions in the Minidoka. area. is about 1 to 5 :f't (Crosthwaite and Scott,
1955). In wells south o:f' the N'RfS the annual range in fluctuations is
l to 1.5 ft.
During 1950 to 1952 va.ter levels remained rather constant in wells
in Tps. 2 N., to 1 S., Rs. 28-32 E., :Bingham and :Butte Coimties, but in
1953 the levels declined about 0.5 ft; by the end of December 1955 an
additional foot of decline occurred. During 1948-53 water levels in the
Minidoka. area showed a. net rise of 0.5 to 3 ft (Crosthwaite and Scott,
1955). ~hereafter, the water levels declined about l to 2 ft in 1954,

22S
rallged f'l'Om about 300 to 29500 gpmo :By- 1955 the estimated number of wells
increased to 160 9 which produced a.bout 60 9 000 ao,,oft of water and sen-ed
about 18 9 000 a.c of land.
Water levels in wells that reach the regional water table in the
lloberts-Taber area. ranged between about 164 and 720 ft below the land
surface ( see Appendix 2) • The depths of the wells range from 219 to 786
ft. High water levels occur from October to N'ovem.ber and low levels from
April to June. The wells were measured. bimonth17 and the actual highest
and lowest levels probably were not detected 9 but the meas'll?'ementa probabl.1'
correctly indicate the months in vhieh maxillram and minimam levels occur.
The yearly range of water-level fluct'llations averaged between 2 and 4 ft,
but in a few wells south of' Roberts the 7ea.rly range was about 15 f't.
Water levels in a few wells south and southeast of Mud Lake declined about
2 to 3 ft from 1950 to 1955.
Minidoka. ~.-In the Minidoka. area 9 ground water is being developed.
extensively f'or irrigation by the U. S. Bu:reau of' Reclamation in the North
Side Pumping Division of' the Minidoka Project 9 and by private enterprise
for large adjacent tracts of land. The new developments center in southern
Minidoka. County- and parts of' Lincoln and :Blaine Counties, about 55 mi
southwest 0£ the N"RrS. Within a few years this area probably will be the
most heavil7 pumped of those currently tmder development. !he present
total withdrawals are second in amount only to those in the Mud Lake basin.
In 1955 about 162,000 ac-ft of ground water was pumped in the Minidoka.
area to irrigate 44,000 ac of la:nd. The gro,md-water deve?opment began in
1947 vi th the drilling of three :private irrigation wells. :By 1955 the
n'lllD.ber increased to more than 170. In 1955 the U. s. Bureau of Reclamation
227
the shallow wells remained fairly steady, without mu.ch change duri.l'lg the
period of record. Water levels in the Mud Lake area rose appreciably only
to the west- of Mud Lake in Tps. 6 a.?ld 7 E'., R. 33 11. Well 7N-33E-35bbl is
70 ft deep and the water level is very responsive to recharge by in.fil tra
tion of irrigation water. A seasonal rise in the water level begins late
in ea.eh spring, shortly after the start of irrigation. The higher levels
are reached in July and. August and lower "in Ma,y. The yearly range is
between 7 and S ft, and. the net rise since 1950 is about 3 ft (see fig.
27). Well 6N-33E-2bal is 245 ft deep and. its water level also is
affected by irrigation, but the effect occurs later in the year and is
less pronounced than in the shallow well. The water lev.el in the well
has trended steadily u;pwa.rd since 1950 and the net rise at corresponding
times of the yes:r was about 2 ft ( see fig. 27).
The water levels in wells that reach the regional water table about
6 to 10 mi south of Mud Lake, are not :noticeably affected by deep seepage
from irrigation. Daily water-level records for well 5N-34E-9bdl, 1950-55,
show no unusual fluctuations that could be attributed to irrigation in the
Mud Lake area. T.he loDg distance of the wells from Mu.d Lake and the large
ratio of storage in the S:oake River basalt to unclerflow from the basin
probably are the reasons :for the lack of noticeable effects.
Roberts-Taber ~.-The Roberts-Taber area, ea.st and south of tb.e
NRTS, extends from the Vicinity of Roberts to Taber in a broad arc aloDg
the north side of the Snake lliver. The estimated number of irrigation
wells in the area south of Taber and. north of .Aberdeen and Springfield was
55 in 1953 (Shuter, 1953), and. the estimated pumpage was about 23,000 ae
ft of water for 7,000 ac of land. The rate of discharge from single wells

226
disc.barge being by ground-water underflow to the Snake River Plain. The
principal pumpage is done where the depth to water ranges from a few feet
to about 50 :f't below the land surface. Numerous flowing artesian wells
furnish much of the irrigation water. About 99 pct of all the ground
water ptmtpage is :f'or irrigation.
The estimated pumpage of ground water from 61 irrigation wells and
86 stock and domestic wells in 1952 was 83,300 ao-ft (Earraclougb.9 1952),
and the water supplied about 58,000 acres of land. The yields of single
irrigation wells ranged from 36o to 9,900 gpm and averaged about 3,000
gpm. Pumpage in 1955 was about 266,000 a.c-:f't, derived from 165 irrigation
wells for use on about 90,000 acres (Nace, 1956). Therefore, ground-water
pumpage increased by about 300 pct in a 3-year period, and the total irri
gated acreage more than tripled.
Records of water levels in the Mud Lake basin have been published.
(Stearns and others, 1936; Shuter and Brandvold, 1952; Barraclough, 1952).
Water-level records are available since 1949 for wells tapping shallow
ground water northeast of Mud Lake in Tpso 7-8 N. 9 Rs. 36.-37 E. The
depths of the wells range from 45 to 93 ft and the average depths to water
in single wells ra.I1ge from 13 to 50 ft. The yearly range of :f'lt10tt1ation
is about a footo High levels occur in April and Mq and low ones in
.A.ugw3t and September. The net trend in levels after 1953 was slightly
downward, amounting to about a foot at the end of 1955. Wells south of
Mud Lake in Tps. 5-6 N., Rs. 34-35 E. range from 280 to 930 f't in depth
and from 50 to 160 ft in depth to water ( see Append.ix 2). "The deeper ,
wells reportedly tap several water-bearing zones. Water levels in the
deep wells declined as much as 20 ft after 1951, whereas water levels in

.. 225·
tion of irrigation va.te~.
the D!'S. The principal uses cf gro,un.d lit-ate:> a.rotllld Howe aria for domestic,
the area are contained in a:n earlier rep.:>rl ( Sh.u:i,er and :Brand:roldp 1952) •
!b,e estimated gr>o"lmd-va.tel' pumpage in 1949 was 1~300 ac-:f't from 10 vells.
About 3, 500 ad.di tional a.c-:ft was p~mped in the valley about 5 to 10 :mi :north
of Bove. ~e in the rtoi:b:1 ty c,f :ID:lwe in 1955 vas about l P 500 ao-ft am4.
that :north of Rowe a.bout 4~ 000 a.f-ft.
!he average depth ta wat,el" in the Htwe area. f'a!!ges between about 65 to
available for the pe~iod De~~ber 1949 thr~'Cgh O~tcber 1953 0 and mon'bhl.7
am. qtaarterly' records thereafter. The highest re~orded water leTel in the
area occurred in .Lugo.st 19520 about 7 tc 9 months earlier than the peak
lffel cf that ;rear in velle in the NRTS. The annual range in fluctuation
aTeraged l to 3 ft. Water levels were fairly ~onstant through Deceaber
1952 but declined. theI"eaf ter abr.iu.t l tc 2 :t' i; •
north and east o:r the NRTS 9 are the largest: in ldab.o and totaled about
270,000 a.o-ft in 1955 o There :1s no sutf a.~e; ranr.ff from the basin, all

224
7 mi west of the western edge of the NR?S. .A.bout 33 9 000 acres of land. in
the :Big Lost m.ver Valley0 :from Ma~ to about 3 mi ~outheast of .A.rco 0 is
irrigated vith sur.face water from :1$.acka;r Resenoi:r <llln the :Big Lost !.iver.
About 9, 000 ad.di tiona.1 acres is irrigated above the rese~oir o Ground
water in the Dig Lost River Valley- is used chiefly- for domestic, stock,
and mimicipal S'llpplies. A. few irrigation wells have been drilled since
1954, principally- along Antelope Creek, but litt-le is known about the
depths and yields of the wells. The largest single vi thdrawal of ground
water is for the municipal supply of Arco, which averages about 250,000
gpd. The municipal sy-stem includes three wells ra.Dg3..ng in depth from
about 2S to 6o ft. The depth to water ranges from 12 to 30 ft and the
y-ields of the wells average about 4oo gpm. The Village o:f' Butte City,
about 2.5 mi southeast of Arco, has one deep well vhich taps the regional
water table. The depth of the well is about 414-3 ft and the depth to water
is about 4oo ft. The ;yield during a test in 1952 was about 60 gpm. Except
for a few wells tapping the deep aquifer, most wells in the Arco area ra.Dge
in depth from S to 14o ft 9 and the depth to water ranges :f'rom 3 to 55 ft
(see Appendix 2).
In the shallow water table in the vicinity- of Arco, ranging from
about 2 to 6 feet below the land surface, the highest water level of
record occi:irred in J'Oly- and August 1951, shortly- a!ter umisually- heaV7
rains during those months. The high levels where the water table is
deeper (lS to 55 ft belov the land surface) were not reached until J'til.7
and September 19520 In the regional water table (205 to 40'0 f'eet below ,
the land sur.face) water levels remained fairly steaq- and shoved little
or no effect of the heavy rtm.off in 1951 and 1952.

223
In T. 3 N •• Rs. 31-33 E. the ye.ll'iy range :ts about. L5 to 2 ft; with the
higher levels about :mid-Jan'll&!'y a:nd ths lower between mid-July and early
. ft. The high lavelg are reaclled between ea:r>ly November and mid-December,
and the lows in M!cy" and July.
The greatest yearly range in f'l UGtua.tions oeicurred in wells in T. 5 Jr.,
lls. 33-34 :S:o, where the ~lope of the wate:r: tS:ole was about 5 to 7 ft per mi.
South of T. 5 lL ~ in :as e 27= 34 E. , net wa:teI'-level Ghallges avera..ged l to 2
:f't and the slope of t,b.e water table was only 2 to 3 ft per mi. The sea-
eneed largely by uud.e!'flow :ft>~m Mud Lake, the apparent direction of vhich
is southwestward toward the wells. Roweve:r:·p no definite time pattern is
tanoes :from Mud Lake. Probably fa.crtcirs othu than underflow from Mud Lake
strongly affecit water levels in that area.
The area here treated is the par't of the Snake B.iver Plain outside the
ERTS and includes several large ground-water irrigation troots. Regional
water-level fluctuations have twofold interest: their records assist inter
pretation of fluctuations in the NRTS, and they register changes in ground
water stora..ge. so they a.I"e significant in problems o:r ground-water deple
tion now and in the future. Figure 27 illu.stmted the principal types of
water-level f'lu~tua.tions in wells on the Snak6 River Plain •
.A:rco ~o-The Arco a.'!'.'ea. 9 at the mouth of the :Big Lost River Valley
in Tps., 4-6 N. • Rse 25=2? E09 is a.bout 20 mi oorthwest of the CF area. and

222
Underflow from the Mud La.ke 'basin is an important som'ce cf ground-
of under.flow ha.ire not been identifiad in wa.te:r-,,lte7el fl~tuations south
and southwest of Mud Lake. The apparent la.cl: of ~rrelation in water
levels ~ be partly due to inadequate records, but the la.ck of strong
fluctuations probably is normal.o Owing to the relatively lo13g d.istanee of
the wells from the main irrigated area ~und. Mud Lake, the recllarge wave
moving southward is damped before :reaching the wellso Also 0 the Mud Lake
basin itself is such a large reservoir that seasonal variations in i:mderflov
probably a.re relatively small.
Wells in which the seasonal rise a.nd fall of water levels is most
marked are in the path of the apparent mo"Vement of va.ter from Mud Lake.
A few deep wells tap water under local artesian or quasi-artesian
presS'll%'e; which ms:, cause some of the differences in the behavior of the
water levels in some of the wellso
The greater :range in water-level fluctuations occurs in areas having
the greater slopes on the water table.
Seasonal. Wate:r-Level niwtu.ations
A yearly eycile of water-level fluct,.1ations 9 represented by a gra:ph
having appro::dma.tel;r sinusoid.al form, occurs in wells in Bingham and
Jefferson Coim.ties, in Tps. 2-6 E'., Rso 31-34 Eo, and in Butte County
south of U. So lli.ghwa.y- 20p in Tps. 2 R., to 2 So, Rs. 27-31 Eo (see fig.
28, well 5N'-34E-9bdl). The yearly :range of flu.citua.tion in .lfps o 5-6 llo, ,
Rso 32-34 Eo averages about 3 ft. ~he high. Yater levels occ'lll." between
m.id-Januar., and mid-March., the lows between mid-Augnst and mid-September.
/

rise of the water level in noo 18 in 1953 was less than bali' that in no.
12. !fhe total rise of the we.t:el" level in the MTB test well (3N-29r14adl)
was a.bout 14. ft in 1952 and 6 :ft in 1953. In 1950-51P howeV'er, before the
effects o:f recharge from the :Big Lost ~ver were registered., the annual
water-level flootua.tion in the well was about a f' oot. In well 3ll-30Jl-5laal
(field. no. 20, a.bout 3 mi southeast of the MTR site) the high.est water
level also was reaclled in mid.,,,Maroh. 9 and· the ?"ange in :f'luotu.ations was
about the same as in the MTR test velle Water levels at the OF area in
1953-54 also were at theil" peak le",;"els in the :first ha.1:f of March.
In general, rises of watel" level c;a.used by under.flow from the valle,"B
of the Little Lost and :Big Lost Rivers and. Eil"Olh. Oreek began ear~ in 'the
spring of' 1952, about 6 to 10 months a:t't.er the tuta.sUal~ high :rnno:t'f and
recharge that 'began late in July and early in J:ugust 1951. Except for
slight seasonal decline in several wells in 1952» water levels in all the
wells rose steadily, rea.cli.ing a peak in the spring of 1953 c Water levels
declined steadily a:fter rea.cll.ing the rie~ord hi.gh levels, and by the end of
1955 were a.bout 2 ft lower than at the 6:o.d of 1950.
Water levels in the western cent:t'al pa:r't o! the area0 near the Little
Lost E.iver p~ in To 5 E'., Ro 29 lllo 9 :rea©h.ed. peak levels early in .April
1953; those in the intermediate area. 11 near the :Big Lost River plqas in
!p. 14-5 :I., Rs .. 29-31 E., 9 wers at peaks in early and mid-~; those in the
southern part, near the CF area and MTR si te 9 were at peak levels in early
and mid-March.
The greatest range in w:te:r..-,level fl'!.Wt~t:ions~ and the most rapid
seasonal rise and de~line of water l~els 9 o~~urs in wells near the Little
Lost River pl~ south of the Village af &we.
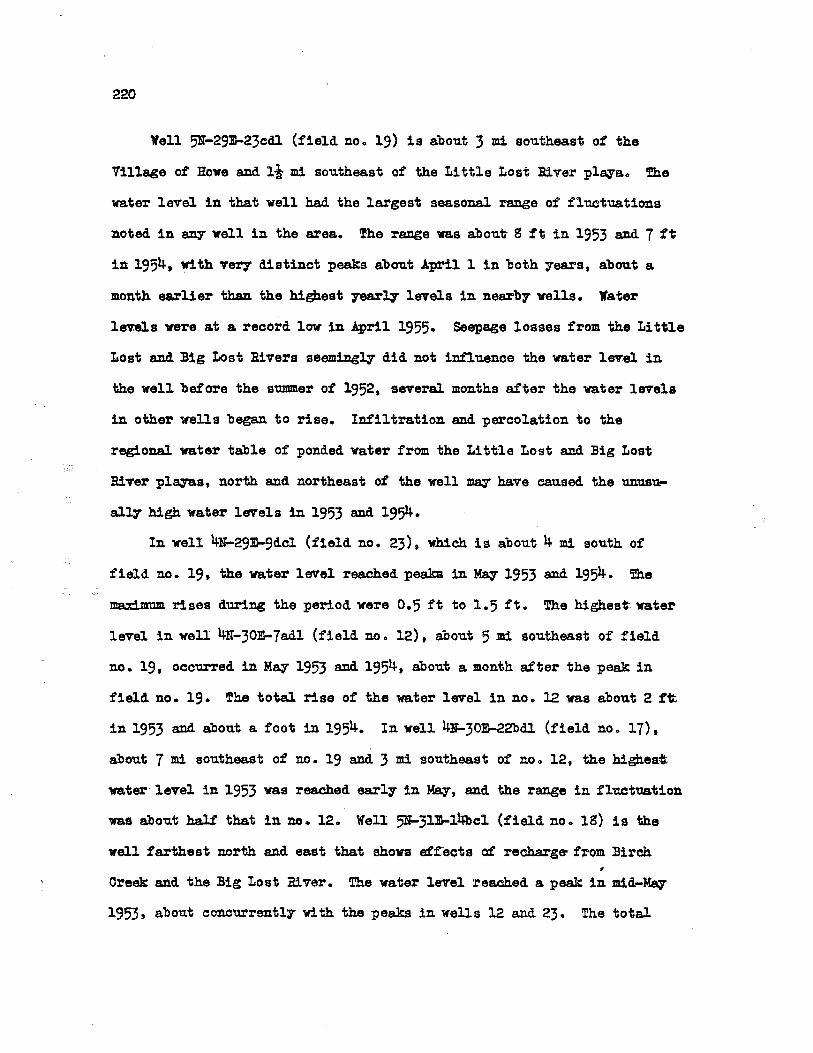
220
Yell 5N-29E-23cd1 (field noo 19) is about 3 mi southeast of the
Villa8e of Hove and l½ mi southeast of the Little Lost Bi ver pla;ra.o !he
water level in that well had the largest seasonal range of fluctuations
noted in a.ll.1' well in the area. '?he range was about- g ft in 1953 and 7 ft
in 1954, with Ter'1' distinct peaks about April l in both years, about a
month earlier than the highest yearl7 levels in nearby wells. Water
lEmtls were at a record low in April 1955. Seepage losses from the Li tUe
Lost and :Big Lost Rivers seemingly did not in:f'lu.ence the water level in
the well before the s1lllD!ler of 1952, several months a.f'ter the water levels
in other wells began. to rise. Infiltration and percolation to the
regional water table of ponded water from the Little Lost and :Big Lost
River plqas, north and northeast of the well mq have caused the unusu
ally high water levels in 1953 and 1954.
In well 4N-29E-9dcl (field no. 23), which is about 4 mi south of
field no. 19, the water level reached peaks in May 1953 and 19514-. !he
ma:id.mull1 rises during the period were 0.5 ft to 1.5 :ft. !rhe highest· water
level in well 14-N-30E-7adl (field no. 12), about 5 mi southeast of field
no. 19, oecu:rred in Mq 1953 and 1954, about a month after the peak in
field no. 19. !he total rise of the water level in no. 12 was about 2 ft;
in 1953 and about a f'oot in 1954. In well 411-30E-22bd1 (field no. 17),
about 7 mi southeast o:f' no. 19 and 3 mi southeast of noo 12, the higheat:
water level in 1953 was reached early in Ma.7, and the range in fluctuation
was about half that in no. 12. Well 5N'-31JD-l4bcl. (field no. 18) is the
well farthest north and east that shows effects of recharge' from :Birch. ,
Oreek and the :Big Lost River. !rhe water level reached a peak in mid-Ma:y
1953, about concurrently" with the peaks in wells 12 and 23. The total

219
production wells near the rlvsro For well 2N-3lE-35dcl, near Atomic Cit7
and about ll mi from the :river 9 the bydrograph in 1952 repeated veey
elosely th& seasonal pattern of 1951 • .
Wells in T. 2 N., Rs. 27-213 :m. 9 l to 4 mi south of the river, reacb.ed
peaks in November and December 1953 and perhaps were affected strongq b,
recha.rge from the river. Records are not available for those vells
earlier than 1952 and there is no basis for comparison. Noticeable affects
of seepage from the river seemingly did not extend to wells about 10 mi to
the southeast, in Tps. 2-3 N. , R. 31 Jl. , where d.a.ily records for several
wells show that peak levels were rea!Shed at about the same time ea.ch year
during 1950-55.
The effect of recharge from the ~ig Lost River was registered
earliest in wells at the MTB. and CFA sites. The highest water level, in
the MTB. test well and in we11 3N--30E-3laal (field no. 20) occurred duri1:1g
earfy and mid-March, about 2 to 4 weeks earlier than in other wells
affected by the river.
~e larger rises in water levels (7 to 10 ft) occurred in we1ls north
of the STR site in Tps. 4-5 N., · Rs. 29-31 :m. The general slope of the
water table in that area was about 10 to 12 ft per mi. liear the M!l1 and
OPP sites the water levels rose about 6 ft; the slope of the water table
ranged from about 5 to 7 f't per mi •
Becbarge from local so'Ul"~es.--In wells in the western-central part at"
the Station, in Tpso 3-5 Nq Jis. 29-31 Jl., water-level fluctuations follow
a fairly well-defined seasonal patt,ern that is influenced both by local
and by regional reclla.rge (see fig. 28 9 well :;:N--29E-14adl).

,,

GPO 991 B57
I I
217
i I I I
.s I 7N-33E-35bbl Jefferson Co.
I I
(J) C 0
:.;:: 0 ::i .... (..)
~,-........ :·\ I A • •. I :\ ·· ..
. ' . I f \ .
/ ......... .; \
J ·\. .2 .... i /! \,"\
I f I j
l I I o I
I I
1950 1951 1952 1953 1954 1955
Figure 27.-Three types of water-level fluctuations in wel Is on the Snake River Plain:
I
(I) relatively large annual range, with superimposed short-term fluctuations and longer-term trends in wel I 7N-33E-35 bbl, Jefferson Co.; (2) somewhat irregular short-term fluctuations and longer term trends in wel I 6N-33E-
2 bal, Jefferson Co.; (3) smal I short-term fluctuations, relatively large annual range, and pronounced longer-term trend in wel I l0S-20E-5bal, Minidoka Co.
w 5N-34E-9bdl 6N-31E-27bal Butte ·Co. ~ Jefferson Co. ,.,
.£ (J) C 0 -0 ::i -(..) .2
..... 0
<V c,, C 0
a::: I I
\ \1 \ (
\ I I I
' I \ I
\ / \ I v
... /········ ......... .
1950
\ \ I \ (
\ I \ I \ I
\ / \
\./ .... ··
195!
" \ \ I . r·····.. I.: / \ ···· . .[ .... . I /
\ I \ I \ I
I v Wei I deepened from
775 to 1,000 feet
1952 1953 1954 1955
Figure 2a-Types of water-level fluctuations in wells in and near the NRTS: (I) small seasonal and annual range in wel I 6N-31E-27bal, Butte Co.; (2) small
normal seasonal and annual range in wel I 3N-29E-14adl, Butte Co., modified by effects of unusual recharge from Big Lost River from late
1951 to early 1954; (3) relatively large annual range and cyclic trends in wel I 5N-34E-9bdl, Jefferson Co.

216
rose about 3 f'to Therea.fter 9 the water level in the deepened well
remained about 3 ft above the old genaral level, but the annual ra.z:ige of
fluctuation after 1952 was only a.bout Oo5 fto The yearly ra.Dge in well
6N'-33E-2bal, about 8 mi northeast of the JmTS 9 also was a.bout Oo5 f'to
In the northern part of the NRTS the water table seems to be nearly
flat, and at plaees the slope is less than a foot per mileo Pumping from
the AllP wells has had no noticeable regional e:ffecit on water levels o
Fluctuations Caused b7 Lo~al liecllarge
percolation from the Big Lost lliver during the high runoff' period 1951-53
were considered briefl7 on po 61-65 9 in co:rmection with the rate of perco
lation through the basalt o Hyd.rographs show that 9 beginning in September
1952 9 a change occurred in the seasonal pattern of water-level fluctuations
near the river O probably' as a result of exceptional recllarge o Some of the
recharge mey have been from deep percolation out of the rivero In well
3N-29».14adl ( see fig o 28'9 a mile from the rl ver O the seascnal trends in
1950 and 1951 wera entirel;y different from those in 1952-550 About
September 15 9 1951 the water level in well -l4acu began a general rise
that continued thro'llgh April 1952 9 when the water table reached its
highest level during the :,ear. Except for a slight decline from Jtll18
thro'llgh October 1952, the water table rose stead.il;r and reached its
highest· level of record in March 1953 o The begim:dng of the general rise
lagged. about five weeks behind the arrival of surface water in the :Big ,
Lost lliver channel and the beginning of seepage losses in the channel
reach nearest to the wello Similar rising trends occurred in senral

215
Fluctuations Ca.used El: Changes in storage
Ground.-water fluctuations ca.used by changes in storage :f'ollov several
patterns in the BTS and 'Vicinity. ll'i thin a single pa.ttern-gro"Up the
magc.itude of f'luctilations and the time of oocu:rrenoe of the high and low
water levels vary. The grollps differ from each other in the magnitude and
trend o:f' :f'luctua.tions. The following grottping is made for convenience in
discussion: (l) :f'luctua.tions in which the yearly range is small; (2)
fluctuations which are a:ff'eC";ted markedly by loC';SJ. recharge; (3) :fluctua
tions which follow a. well-defined. seasonal pattern. The types overlap to
some extent and various combinations can be found.. Figures 27 and 2S
illustrate several types of va.ter-level fluctuations.
Yearly Fluctuations in Small Rallge
The water table in the northern NRTS, in T. 6 N. , Rs 31-33 JC.
orcliilari~ fluctuates only through a small range, with little or no cyclic
yearly pattern ( see :f'ig. 2S, well 6N-3ll-27bal). A continuous water-level
record for the period 1950-55 is available for well 6N-31E-27ba.l. .A
record nearly as long, represented by weekly and monthly measurements, is
available for a well in T., 6 N., :a. 33 E., showill8 similar .bydrogl:'8.phic
characteristics. Water-level records for other wells in that general area
average only about three years in length and are too short to be classi:f'ied.
readily. D'urillg the period ~ 1950 to Jun.e 1952 the range in yearly wate~
level fluct'll!l.tions in well 6N-:,U-,27ba.l was about a foot. The depth of the
well was 775 ft and the depth to water was a.bout 214 ft below the land
surface. In 1952 the well was deepened to 1 9 000 ft and the water level

,

1oPO 991657
-a.,
~ ~ C J:: ·- ~ ,_ :::, a., IJ) -0 ,:, :t C
0 0 -- 3: .c 0 - -0.. a., ~ .Cl
a., ,_ :::, ,_ :g ~ a., 0 ~ 3
213
.!2 o 28.2 r------.,.......-----------------------------+-l ,._ -~ &: E-e .!: Cl
Barometric pressure at ---' Central Facilities area
CD 28.4 t------------------------+-+---------l
Adjusted for a barometric efficiency of 60 %
2 3 4 5 6 7 8 March 1951
Figure 26.-Hydrograph of wel I 3N-29E-14adl, unadjusted (above) and adjusted for barometric pressure (below),
9

,

" 1l 0 <O <O
., "' "
+-C
0 a.
0, C ,._ ::, (/)
0 QJ
E
3 ..2 QJ .0
+-QJ QJ .,_
.!::
~ QJ
,._ QJ +-0 ~
flP 454 .. 51-------"'k------+------l·---
454.7
454.8
455.1
455.2
Solid circles ore plot of daily high ond low water levels in the wel I ond doily high ond low barometric pressures, which sho_w about the some correlation.
0 0
0 March 24-29, 1951
0 0
0
00.
455_3..__ _ _._ __ ..__ _ __._ __ ..._ _ ___._ __ ...._ _ ___. __ __._ __ .__ _ _._ __ ....__ _ _._ __ ..._ _ __,
28.0 28.1 28.2 28.3 28.4 28.5 28.6 28.7 Barometric pressure, in feet of water
Figure 25.- Corre lotion of barometric pressure with water levels at two - hour Intervals In well 3N-29E-14odl.
I\)

210
figure 26 is 'based on a computed barometric efficiency of' 60 pct. Tho~
the adjustment is quite small, it is an appreciable percentage of' the
total ra.Dge of' short-term fluctuations and would noticeably affect ca.lcu
lations based on those fluctuations. Nonbarometric factors obviously
affected the vatel'"-level, because the adjustments leave considerable
irregularity in the ~drograph. A correlation of water-level f'luct'OB.tions
in the well with increasing and decrea.si?lg barometric pressure shows a
slight change in the efficiell01' of the well during these periods. So part
er! the irregnlari ty is due to di:t'ferences in the barometric efficiency of
the well during periods of' rising and falling pressure.
Significance of barometric nuctuations.-Ba.rometric fluctuations of
water levels in wells are caused by fluctuations of atmospheric pressure
on the water s'tlrf'aee in the well. In ordina.:ey porous geologic material
which is permeable thro'llghout and is in free comm'Cllication with the atmo&
phere, a.ir moves in and out of the grotmd freely through the land-sur.f'aee
area. Where the zone of aeration contains non-permeable lqers, these
restrict the free exchange of air between the atmosphere and the ground,
and pressures ~ be equalized only by :movement of air through local pe~
able zones or thro,:igh openings such as wells which are not cased to the
water table. Wells in such materials characteristically 11blow and suck. 11
In the ease of the Snake River basalt, barometric fluctuations of water
levels show that tight material occurs between the land surface a.nd the
water table and impedes the movement of air, which oa.n escape from or
enter the gro,md only- through. local fractures, caverns, and' wells. A. verr ,
large voli:rme of a.iris moved, and circulation of air through. wells and.
caverns often persists in one direction for some hours.

!he time scale of the FM 32-day :recording ga.ge is so condensed. that
it is di:t'fie'tll.t to correlate the trace of water-level fluetua.tions nth
hourly barometric-pressure readings. The barometric efficiencies of wells
equipped with that tn,e of record.er were computed b,- correlating da.il.7
high and low water levels vi th daily minimmn and m&l:imam barometric
pressures. In general, the resuJ. ts were fairly consistent !or different:
seasons of the year. Figure 25 is a scatter diagram of 'barometric pres
sure and water levels at two-hour intervals in well 3N-29:&-l4ad.l during
March 24-29, 1951 and July 13-1S, 1951. Far comparison. the daily high
and low wa.ter levels in the well and the daily high and low barometric
pressures are shown b;y solid circles. These are the only plottings that
could be made from a 32-cucy- chart, but a straight line through those
points would not differ appreciably :f'rom tha.t drawn thro'tlgb. all the points
in the figures.
Plottings for longer periods up to one month confirm the short-term
correlations. Tha.t is, the width of the scatter band for summer periods
is narrow and that for winter is somewhat broader, but the slopes of the
lines are about the same.
!he barometric efficiency of a well is a function of the rate of
ehal:!ge of the barometric pressure. Though the water level in a well mq
follow the di'tlrnal. :f'luctua.tions rather closely, the lo:nger, slower baro
metric changes are not recorded with the same clarity and some are not
identifiable.
Using a microbarogram oi' atmospheric pressure, and applying the
barometrif>.eff'iciency factor to the water-level fluctuations in a well,
the bydrograph for the well can be adjusted. The adjusted hydrograph in

,

Gl "]
()
"' 'D
(D
"' "
0, C ~ ::, (/)
454.2r---,---.---.::----r---.----,-----.----,----...---~---.---~--~~-~-~
~ 454.6r------+----~~~-----P*----~~+------1-__::::,...,Jan. 15-17, 1951~ __ ____, E
3: .2 <I> .0
+!" <I> OJ
..... 454.81--------1------+----'"'=,~--+----"-l'k--JC.-,:,...1-X-X--'l{:>.Jl..,,-.---I--___:::"-.-
.s
Dec. 4-9, 1950 Oct. 4 -6, 1950 I
July 27 -31, 1950
une 17-20, 1951 455. 2'-----'----'----L---'--_...J'----'---.L.----'----'----L---'--·___J'----'----'
27.8 28.0 28.2 28.4 28.6 28.8 29.0 Barometric-pressure equivalent, in feet of water
Figure 24.-Correlation of water-level fluctuations in well 3N-29E-14adl with barometric pressure.


205
454.7!------+---f----:::...i-::----'.._..---+----'t--'r-+------+--f---:;,4
I .... C: ·o C.
0, C:
Barometric pressure (inverted graph)
'§ 454.91-------l-----1----1-------4--------+-.+-------+--'----~~ IJ)
0 QI
E ;: 0 QI .0
j .!:
Gi >
..!!,!
GP09918S7
24 25
:,-Barometric pressure (inverted graph)
13 14
26 27 28 29 Morch 1951
15 16 17 18 July 1951
Figure 23:-Borometric water-level fluctuations in wel I 3N-29E-14odl. Compares typical winter (above) and summer (below) with contemporary barometric -pressure changes. (M icrobarographic record from U.S.
Weather Bureau l
.E QI ... ::, Ill Ill
~ C.
-'
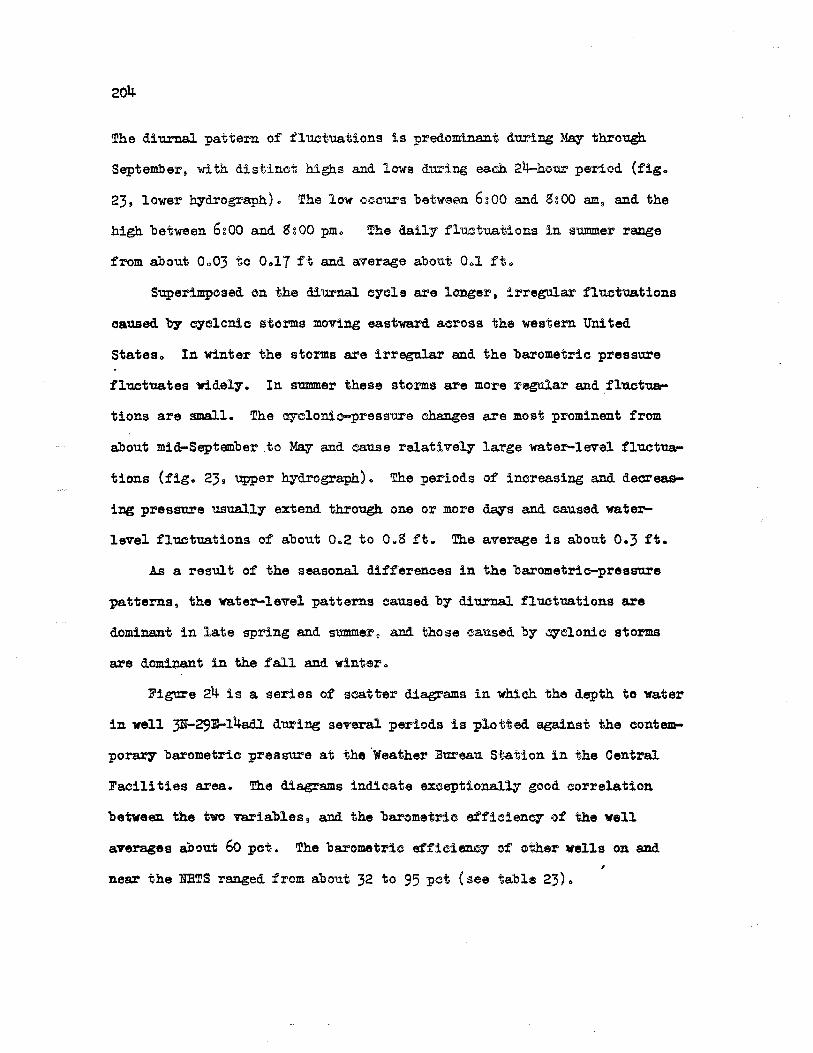
204
The diurnal pattern of fluctuations is predominant duriDg May through
September, with distinct highs and lows during each 2l.J.=hour petiod (figo
23, lower hyd.rogra;ph). The low O<ClC11I'S betwae.n. 6~00 and SiOO am 9 a.nd the
high between 6g00 and SiOO pmo The daily flootuations in summer ral'.lge
from about Oo03 to Ool 7 ft a.nd average about Ool :ft Q
Superimposed on the diiXl:'na.1 cycle are longer, irregular :f'luct'tlations
oaused by cyclonic storms moving eastward across the western United
Stateso In winter the storms are irregular and the barometric pressure
fluctuates Yidel7. In summer these storms are more regular a.nd fluctua
tions are small. The cyclonio-pressure changes a.re most prominent :from
about mid-September .to May and ca.use relatively large water-level fluct't'IB.
tions (figo 23, upper hyd.rogra:ph.). The periods of increasing and decreas
ing pressure usuall7 extend through one or more dqs and caused water
level fluctuations of about 0~2 to Oe8 ftu The average is about 0.3 ft.
A.s a result o:f the seasonal differences in the barometric-pressure
patterns, the water-level patterns caused by diurnal fluct'llations are
dominant in late sprlng and summer 9 and those caused by cyclonic storms
are domillant in the fall and wintero
Figure 24 is a series of s~tt-er diagrams in whicll the depth to water
in well 3N-29E-l4adl during several periods is plotted against the contem
porar;v barometric presstll"e at the ·weather Bureau St..a.tion in the Central
Facilities area .. The diagrams indieate e:weptionally good correlation
between the two variables, and the barcmetrl~ efficiency of the well
averages about 60 pct. The barometric e:ff'icieney of ether wells on and ,
near the N:RTS ranged from about 32 to 95 pct ( see table 23) o

203
Ta.ble 23-llarometric af'fieieney of wells on and near the DTS
l3a.rometric :Barometric Well number ef f i ci eney Well number ef'!ieienClj"
., {"Percent) (:esrcnt)
7li-3ll-34bal 5:;: 4:N-30:;.. 7adl 45
6N-3lli-l3dbl S6 3N-29!-l4adl JI fl:)
6N-3lE-27bal 65 3N--30E-3laal E,/95
6N-32X-llalil 52 3:1i-32E-29ddl 45
6N-32E-36adl g7 3N-33E- 3a.bl gg
6N-33E-26ddl g9 3N-29lll-25bdl 77
5N-29:m-23cdl !/41 2N-27E- 2ddl 52
5N-31:;..14bel ~95 2N-28li-35adl 65
5li--32»-36adl 91 2N-3l:E-35del 51
5N-34E- 9bd.l 64 1s-30J-.l5bel 32
4N-29E- 9del 2S Average 6o
'!/ Large nonbs.rometric challges in water levels make determination of barometric effects difficult.
g/ Apparent e:f':f'ieieney un:u.sually high.. Other factors ~ be involved.
3} Apparent ef:f'icienClj" :ra::c.ges between 56 and 67 percent at different· times.
In general, barometric fluctuations in wells on the :trarS follow two
distinct seasonal patt11rns. One is a typical diurnal eycle induced by
solar heating a£ the atmosphere; the other is a less qstematic fluctua
tion caused 'b7 c;yclonic storms (fig. 23). The pressure changes caused bf
solar heating d'1.1%'in8 the dq and by- cooling during the night cause regul.ar
diurnal low and high pressures throughout the S'tll!Xlller. Water levels in
wells respond by rising during the dar and declining during the night.

202
In a truly tmconf insd aquifer the water table communicates freel;y" Yi th
the atmosphere through ground air in the zone of aeration. Inasmuch as the
barometric pressure a.f:f'e~ts all parts of the water table about equall;y" and
about the same as the;;" affect the water level in the well, the water level
does not change 'Id th cili.a.ngi:cg pressure o
:Barometric fluctuations of water levels commonl;;" ocenr in wells on
the Snake River Plain be~use the water is partly confined, especially'
at depth. Impermeable layers in the basalt, both in the zone of satura
tion and in the zone of aeration, locally con:fine the ground. water to some
extent and they impede communication between the atmosphere and ground air
( see discussion of ground air, part 2 9 p. 4:,-46).. In most wells in the
S?lake River basalt that have been observed qstematically', water levels
respond to ohal:lges in barometric pressureo
The confining bed in an artesian system resists the eff'ect of rising
atmospheric pressureo The decline of the water level in the well: is a
fUllCtion of the proportion of barometric pressure that does not overcome
the resistance of the confining bedo That is, the well is not 100-pct
efficient as a water barometero The barometric efficienc;;" is expressed as
a percentage ratio of water-level cb.al:lge in the well to the barometric
change, in equivalent ,mi tso A barometric ef:f'i~ienoy of 60 pct means that
the water level in a well rises 0~6 ft in response to a barometric pressure
drop equivalent to a. head of one foot of watero The computed barometric
efficieney- of representative wells on the ::traTS is shown in table 23.
,

201
Barometric Fluctuations
Prominent and regular sb.ort-term water-level fluctuations in wells
on the ml.TS ar& caused by changes in atmospheric pressure. These are
called barometric fluctuations because the wells aet as water barometers.
:Barometric fluctuations do not indicate changes in grOUlld-water storage,
but they disclose certain characteristic~ of the aquifer. At times thq
mask other water-level fluctuations. Therefore, microbarogra.ms of atmos
pheric pressa.re are used in conjunction vi th records of barometric water
level fluctuations to interpret the hyd.rographs of wells whenever accurate
reading of sma:n fluctuations is necessary. The barometric fluctuations
are especially important during pum.pil'lg tests when small drawd.011n in a
well mq be masked. completely' by barometric fluctuations. Observed
water-.level fluctuations can be ad.justed. for barometric effects and this
is necessar,- before making computations based on effects caused by pumping.
Mechanism of barometric fluctuations.-:Barometric fluctuations, like
seismic ones, ordinarily are more prominent in artesian wells than in
wells that tap tm.con:fined water. The water level in an artesian well
expresses a balance between the internal pressure in the aquifer and
atmospheric preasure on the water surface in the well. The waiter level
chal:lges when the two pressures become unbalanced. Artesian aquifers are-
elastic (Meinzer, 192s, p. 263-291). When pressure in the aquifer
increases, the aquifer may expand. and compress the overlying con:fining
bed ( the rise and expansion, of course, are extremely small per unit
volume). Pressure increases when barometric pressure rises and water is
forced from the well into the aquifer. The reverse occurs when atmos
pheric pressure falls.


G)
"II 0
" " ., .. "
C
.06r---.-----.----------------,....--------,...----,...----,.------,.------,.------,.-----,.-----,,----.---------,
0
00
Cf) 04 1--------1---~--~1-------1---- ---+---------+---------+---------+-------• C .2 +-0 ::,
B ....
.... 0
C 0
Southwest winds
All winds except--~
southwest winds
i .02-------lH3'--'l--<--ft--li--------li--------l~------l-------li------l---'l--9-l-9-----l--- ----1 ::, +-
Q.
E <t 0 0 0 0
oo oo
0 ~-.__...._ __ .__ __ .__ __ .___ __ .___ __ .__ _____ .__ _____ .__ __ .__ __ .__ ___ .___~.__ __ .____~.___ ____ _
10 20 30 40 0 10 20 30 Wind speed, in miles per hour
Fioure 22,-Effect of wind speed on water-level fluctuations in well 3N-29E-14adl,Sept. 28 to Oct. 2,ond Nov. 22-23,1953.

Jigure 22 shows 9 in addition to the high. incidence of southwest
winds, the greater range in wate:r-,,level fl~tuations induced by those
winds compared to winds from othar qu.ad.rantso In general, a southwest
wind of 12 mph noticeably affe~ts the water level in a well, whereas a
wind speed of only about 10 mph from other quadrants is sufficient to
cause noticeable fluctuations. The difference probably is due largely
to the fact that the southwest winds usually are less gusty than other
winds and tend to produce more gradual pres sure changes in wells. .A.n·
increase in speed of 10 mph in a southwest wind causes a water-level
fluctuation of about 0.024 f'to whereas a similar increase in wind speed
from any other quadrants causes a water-level fluctuation of about 0.017
ft.
Significance of eolian fluctn.a.tions.-ilthougb. wind-generated watel'-·
level f'lu.ct'llB.tions in wells are small to negligible, the fluctuations
often interfere with the interpretation of recorder charts because thq
mask other fluctuations. This is especially true during pumping tests,
when small water-level changes caused by pumping must be identified. in
order to compute the hydraulic coefficients of the aquifer. Wind
generated fluctuations are less apt to occur in water table wells than
in artesian wells. Their occurrence in wells on the NmS shows that
there is poor communication between ground air and the atmosphere, so '
that air pressure is not applied unif'armly to all parts of the water
table.
,

197
in response to a. aha.rp increase in atmospheric pressure. Figure 2l shows
typical periods o£ wind-generated nuetua.tions, and. intervening periods of
rela.ti ve calm.
Mecb.a.nism g,! wind-generated fluetua.tions.-Wind-generated. fluctuations
a.re ea.used by cb.mlges in air pressure w1 thin the reeorder shelters and in
the well ca.si11gs. Ai~pressu:re changes inside the shelter, caused by
fluctuations in wind speed, are transmitted directly down the well to the
water surface. J. gu.st of wind blowing past a recorder shelter increases
the velocity and decreases the pressure of the moving air at the ends of
the shelter. The net effect is lowered air pressure inside the shelter
and the well casing and a rise of the water level in the well. As the
gust of wind dies,. the pressure in the shelter and well casing returns to
normal and the water level declines. :Because wind speed alld direction
never a.re constant, pressure in the well casing fluctuates continually.
Peak gusts, which produce relatively large and very rapid pressure changes
within the shelter and well easing, cause the irregular and jagged traces
on the charts.
A wind blOWing normal to the axis of the ventilator openings in a
recorder shelter causes the greatest water-level fluctuations in the wells.
For example, the vents in the shelter on well 3Ji-291C-l4adl open to the
northwest and southeast, and the water level in the well responds more
strongly to winds from the northeast and southwest quadrants than to those
from other quadrants. On the left side of figo.re 22 is a plot of ho'al'ly
southwest wind speeds against the amplitude of the induced water-level
fluct'lla.tions. On the Tight side of the figure the fluctuations in
response to all winds except those from the southwest are shown.

,

+-C
0 a. O>
.!: ,._ ::i (/)
0 (l)
E ~ 0 (l)
.0
.... (l) (l) ....
.!: ..: (l) -0 :: 0 -
.r::. .... a. (l)
0
GPO 991857
195
450.7r-------"'T""""-----~-------r---------.-------,
450.8
450.9
451.0
451.1.__ _______ __. ______ __._ ______ ....__ _____ ____......_ _____ _,
17 18 19 20 21 June
Figure 21. - Wind -generated fluctuations of water level in 1953 in wel I 3N-29E-14adl, and intervening periods of relative calm with very little fluctuation ( reproduction of actual trace on recorder chart).


+-C:
0 0.
O> C: ... ::J Cl)
0 Ill
E
3 ~ Ill .0
+-Ill Ill ..... C:
..:-Ill +-0 3
0 +-
.c +-a. Ill 0
GPO 991857
193
451.6 .----.......... ---.-----.----,-----,------,-----,-----,.----,-----,
'\
45!.7
451.8
451.9
452.0,...__ __ ....__ __ __._ __ __._ ___ ..__ __ ...._ __ ...,__ __ __,_ __ ___. ___ .,__ _ ___, 3P 6P 9P 12M 3A 6A 9A 12N 3P
November 22 November 23
Figure 20:- Wind-generated fluctuations of water level in 1953 in wel I 3N- 29E-14ad I (reproduction of actual trace on recorder chart),

192
the well, aDd the water-level rises.. The rise of water level is strictl.7
a well phenomena; nothing but compression and :rise of pressure occurs in
the aquifer.
Wells in the NE.TS respond readily to seismic waves because the aqui
fer is a complex interlayering of permeable and nonpermea.ble basalt and
inter.flow sediments. The nonpermeable beds locally restrict conmmnication
between successive vertical. levels in the aq'l]j.fer .. Water between such
layers is subjected to collfined compressive force when the seismic waves
strike, and responds like artesian watero It is statistical.l7 probable
that any deep well in the basalt penetrates one or more nonpermeable
la;yers at or beneath the water table and is able to register seismic waves.
Fluctuations Caused by Wind
Wind-generated :fluctuations, which are recognizable on most recorder
charts from wells on the NE.TS, are momenta.r,y and do not indicate changes
in ground-water stora.geo lfind effects obscure the record of other watel"
level c.ha.nges and lessen the accuracy o:f water-level readings from a
recorder chart. The rapid eolian oscillations also reduce the accuracy of
direct water-level measurements. The small :fluct'Ua.tions caused by wind are
a minor concern, however, and readings of water level are suf'ficientl7
accurate :for most purposes.
!he amplitude of the observed wa.te:r-level fluctuations caused by wind:
averages between OoOl and 0.02 ft; few exceeded 0.06 ft. Figure 20 is a
direct reproduction of the record.er trace of the water lev$l in a well ,
while the wind speed ra.Dged from 6 to 37 mph and averaged a.bout 25 mph.
The rapid decline of the water level at about 9: 00 am on November 23 was

191
550 mi northwest of the E:'m!!boldt County epicenter, caused a fluctuation of
0.29 ft in the same well. Even successive quakes from the same foc'llS a.nd
comparable magai tude do not have 'mdf orm effects. The Fa1lon, lievada . quake of J'ul.7 6, 1954, magnitude 7, caused a water-level fluctuation of
o.4 foot in well 4:N-30E-7adl, vb.erea.s the Fallon quake of August 24, 1954,
magnitude 6.S, caused a. water-level :f'luctua.tion double th.at of the earlier
quake. On the other hand, in some instances there is a direct apparent
correlation between the magnitude o:f' the quake, its distance f'rom the Yell
and the amplitude of the water-level fluctuations. For SD:mple. an earth
quake on Jan. 11, 1953, magnitude 6-1/2, in Yukon, Canada, with an epi
center a.bout 1,650 mi distant, caused a wa.tei-level fluctuation of 0.09 ft
in the well. ~e average of the fluctuations caused by the two Oalifornia
quakes is 2.5 times that caused b7 the Yukon quake, the distance to whose
epicenter was 2.5 times that of the California quake.
The surface and transverse waves of earthquakes do not noticeably
affect water level in wells. The observed seismic fluctuations are
solely in response to the compressional waves, which are analogous to
sound waves. Local geologic conditions 1n the aquifer deter.mine its
response to a seismic shook and the ef'ficieney with which the response is
transmitted thro,:zgb. the aquifer. Water in unconfined aquifers ord.inaril.1'
does not respond perceptibly to seismic vaTes because the waves travel
very fast, affecting all parts of the water table about simnltaneousl7 and
about eq:na.lly, and the compression does not cause water levels to rise in
wells. Many artesian aquifers on the other hand, are quite sensitive to
seismic shocks because the aquifers are elastic. The compressional wave
increases the pressure on the aquifer and £orces some water out of it into

,

.... Cl> ~
.!:: C: .Q -0 ::, -(.)
2 ...... Q) > ~
I ... Cl> -0 3: .... 0
Cl> ,:, ::, -Q. E <t
GPO 9918e7
0.1
Cape Mendocino, Calif.~ Nov. 25, 1954
Magnitude 6 1/2 --~·
Kamchatka
Magnitude
Hokkaido, Japan-Mar. 3-4, 1952
Vancouver Island- __ Canada Dec. 4, 1953
189
.01.__ ____ ..__ __ .___..____.__.___.__...._ ........ ____ __., __ __._ _ __. _ _.___.___.__.__.__.
I 00 1,000 10,000 .
Epicenter of earthquake, in miles from NRTS, Idaho
Figure 19.-Plot of amplitude of seismic fluctuations in wel I 4N-30E-7adl against distance from earthquake focus.

lSS
available. The measured depth was 292 :feet in 1949, but in 1950 it was
deepened to 310 fto The chief' aquifer probably is sand.
Significance of seismic fluctuationso-The seismic :fluctuations of
water levels at the NB.TS show only minor local disturbances. Most of the
shocks registered originated. at foci hundreds to thousands o:f miles from
the lmTS.
Study' discloses a general relation between earthquake magnitude,
distance o:f the epicenter from the wells, and amplitude of induced. vatel'
level fluctuations. Figare 19 shows the slopes of the lines obtained b7
plotting, for earthquakes of eqi:ial ma.gni tud.e, the ampli tu.de of the vatel'
level fluctuations in well 4N-30E-7adl against the arc distance o:f the
quake loci, in miles from the NRrS. Similar plots for other wells in the·
Station and in the Minidoka. North Side Reclamation Project show about the
same general degree of divergence between the lines. The steeper slope is
obtained b,- the plot for the Ja:panese and Siberian earthqa.altes.
'rhe amplitude of seismic water-level :fluctuations in wells probabl.7
is not a. simple function of the magni ta.de of a quake and the distance of
its epicenter from the wellso The depth of the earthquake focus, the
type of earth movement that caused. the quake, local and regional geologic
conditions, the paths o:f the seismic waves, and other factors Illllst ex.en
appreciable in!l.uenceo For example, the earthq:aa.ke on July 29, 1952,
magnitude 6-1/2, bad its epicenter in Humboldt County, California about
675 mi southwest of the ~s.. This quake caused. a vatel'-level fluctuation
in well 4E'-30E-7adl haviDg an amplitude of 0.15 ft. An earthquake of ,
similar magni tud.e on Deco 25, 1954, whose epicenter w.s of:f the coast of
Cape Mendocino, California about 675 mi southwest o:f the l!IIiTS but about

187
!he epicenter of the Tulare Valley, California. earthqua.ke 9 magnitude
7-1/2, was about 600 mi southwest of the IraTS and was recorded by 7 of 10
gages in operation on the Station a.t the time of the quake. The amplitude
of water-level fluctuations in the wells ranged from 0.16 ft to l ft. !he
quake of November 4, 1952 on Kamchatka.» Siberia., magD.itude S-l/4" whose
epicenter was about 4,100 mi northwest of the JraTS, was recorded by 5 of
the 10 gages.. The water-level fluctuations in the wells ranged from about
o.o4 to 0.09 ft. The greatest observed effects of seismic shocks vere
those caused by the Fallon, Nevada quakes, amplitude 6.S to 7a of J'Cl.;y 6
and A.ugu.st 24, 1954, whose epicenter was about 400 mi southwest of the
NRTS. The first quake was recorded on 9 of 16 gages then in operation and
the second on 12 gages. lfhe amplitude of the fluctuations ranged from
o .. o6 to 0.78 ft in July and. 0 .. 02 ft to l ft in August.
The quake of A.ugu.st 12, 1953 in Greece, 'Whose epicenter was about
6,700 mi distant, va.s the most remote quake recorded at the l'lmS. !!!he
effect of the quake was registered on only one gage, and the ampli tu.de of
the water-level fluctuation was 0 .. 03 ft.. The gage was equipped. with a 10
in. float in a l2-1n. ca.siDg. The shock probably was dampened out in
wells of smaller diameter by the frictional resistance between the floats
and well ca.siDgs.
Seismic-shock traces on several record.er charts do not correlate Yi th
allY earthquakes reported by seismological stations. The traces probably
represent minor seismic disturbances at local foci.
Well 6N-32E-36adl (Second Owsley) is the only well on the NB.TS on
which a recording-gage was operated longer than a year without registering
an earthquake shock. The well was drilled many years ago and no log is

Table 22.-Seismic water-level fluctuations in well 4n-30:m-7ad.1 1 National Reactor Testing
Station, Idaho--Oontinued
Dee. 21, 1954 Febo 27, 1955 Har. 1, 1955 Mar. 17, 1955 Apr. 4, 1955 June 14, 1955 Aug. 23, 1955 Sept. s. 1955
IJ:/ Aftershock
Water-level fluctuation in well
Amplitude (feet)
.55
.19
.14
.09
.1.7
.OS
.05
.05
Time (GOT)
14-19 21-22 03-o4 21-23 17-19 o4-05 09-11 12-14
'W Pen trace on recorder chart indistinct •
...
lfime (OOT)
19:56 19:21 OS:03 03:22 11:11 03:43 09:53 10:59
Epicenter of quake Location
41 °ll., 124°w., Humboldt County, Off coast of Honshu, Japan Off coast of Me:x::lco Hear coast of Kamchatka
California
22°ll. 1 121°E., near south coast of Formosa 6<>:N., 78½0w., off coast of Colombia Mindanoa, Philippine Islands 53½0N., 160°E., near coast of Kamchatka
Magnitude {Pasadena
scale)
6A-6 3/4
6

Table 22.--Seismic water-level fluctuations in well 4N-30E-7adl, National Reactor Testing Station, Idaho.
(Quake epicenters and magnitudes from published records of the u. s. Coast and Geodetic Survey)
Watel'-level fluctuation !12icenter of guake
Date in well Time Location Magnitude .Amplitude Time (GCT) (Pasadena.
(feet) (GCT) ~cale)
Nov. 18, 1951 0.10 Otll 09:35 ~1°N., 9~0 E., eastern Tibet ij Mar. 3-4, 1952 .29 2 02 01:23 !l;OJf ., l j 0 E., Hoklcddo, Je;pan Mar. 5, 1952 .06 15-17 15:46 2 °R. , 10 oW. , Gulf of Cal if ornia 5 3/"q.;.6 July 29, 1952 .15 05-06 07:03 ~5 ., 119°lr., Southern California 6! Aug. 20, 1952 .35 15-17 15:25 3°N., 127°w., off coast of Oregon 7-n Nov. 4, 1952 .89 16-18 16:58 52~-, 159°1., east coast of Kamchatka Jan. 11, 1953 .09 22-24 22:~ 65 • , 133oW. , Yukon, Canada Aug. 8, 1953 .07 18-21 1!3: 5,0JJ., 159t•J1., east coast r,! Jramchatb Aug. 12, 1953 A':~ 08-10 09:24 3 °N., 21 °11., west coast of Greece 7¼ Aug. 17, 1953 02-08 02:12 3 ON., 21°1., west coast of Greece Aug. 18, 1953 .06 03-05 04:37 , Aleutian Islands Sept. 30, 1953 .18 20-23 23,04 220:U., 107½0w., off coast of Sinaloa,
Mexico 6 3/lt-7 Nov. 4, 1953 .04 01-04 03:49 12i0 S., 1661°:m., New Hebrides Islands 7.3 Nov. 17, 1953 .16 12-14 l~:30 140B., 92°w., near coast of Guatemala 7¼-7t Dec. 4, 1953 .09 14-15 1 :55 49½°1'., 129°w., off coast of Vancouver
Island 7 37! Dec. 12, 19~ .os 16-18 17:31 3½0 s. , 81 °w. • off coast of Peru
Jan. 7, 19 .04 04-07 o4 & 07 - , south of Fiji Islands Mar. 19, 1954 .07 09-12 09:54 33.3°»., 116.1°w., Santa Rosa Mountains,
Calif. 6-6¼ Apr. 29, 1954 -~ 10-12 11:34 112i0w., Gulf of California 7½-7 3/4 July 6, 1954 09-11 11:13 3 "II., 11!"11., near Fallon, HeTada 7 July- 6, 1954 w:18 19-22 22:0S 39 0:N., 118 °w., near Fallon, Nevada 6 3/4-7 Aug. 24, 1954 "9./ .86 05-07 05:51 3 0N., 11 °w., near Fallon, Nevada 6.s Oct. 17, 1954 .10 22-24 22:57 31 N., 11 W., Lower Oalif orn1a 5.s Nov. 12, 1954 .06 09-12 12:26 116°w., Lower Oalifornia 6.1 NoT. 25, 1954 .29 10-12 11:17 1260w., off Cape Mendocino, Oalif.
7-~ ...,
· Dec. 16, 1954 >l.O 09-11 11:07 119oW., near Fallon, Nevada 01 \J1


G 91857
-C:
0 Cl.
183
45041-------1--------------------------I Earthquake .epicenter: Tulare Valley,
Shock record--..,
450.51--------+--------
California. Time (MST) and date at epicenter: 4:52am,July 21,1952. Apparent time (MST) of water-level fluct
uation in wel I: between 5 :oo and 7:00 am. Amplitude of water-level fluctuation: > I foot (drum revolved more than once and caused pen to retrace its previous mark).
o 450.6 C: ,._ ::i fJ}
0 Q)
E it .2 Q)
.0 -Cl) Cl) -C:
,.,:-Q) -0 ~
0 -..c: -C. Cl)
0
450.7
450.8
45 '· 0 17 18 19 20 21 22 23 24 25 26 27 28 29 30 31 July 1952
2 3 4 5 August
Figure 18.- Hydrograph of well 3N-29E-14adl showing water-level fluctuation caused by a seismic shock.


325.4 ..... . 5: 0 a.
O> C: .... ::, (f)
0 Cl> E 325.5 3: .2
Cl> .0
..... Cl> Cl> ..... C:
~ 325.6 Cl> ..... 0 3:
0 -.c -Cl. Cl> Cl
325.7
GPO 991857
s
28 29 Feb.
Shock record
2 3 4 5 6 7 Morch
1952
A. Earthquake epicenter: Hokkaido,
Japan. Total water-level fluctuation: 0. 29 foot.
322.4
322.5
322.6
322.7
181
-shock record
25 26 27 28 29 30 April
1954
2 Moy
8. Earthquake epicenter: Gulf of
Col ifornio. Total water-level fluctuation: 0.39 foot.
Figure 17.-Records of seismic shocks .in hydrogroph of wel I 4N-30E-7odl
for ports of 1952 and 1954, showing water-level fluctuations.

1SO
apparent arrival time was one to two hours earlier than the shock at the
epicenter. Generall7, the tremors registered. b7 wells on the plain can
be correlated. readil7 Yi th shocks origillati:cg beneath kn.own epicenters.
'!he alllplitude of most seismic wate?-level fluctuations in the Snake
River Plain ranged between 0.02 and 0.2 f't. The ampli t'Cde o:f' the fluctua
tions caused b7 earthquakes originating near l'allon, Nevada, and Tulare
Valle7 and H'Olllboldt Count,-, California e:cceeded l ft i'n seven wells on
the ?ifMS. '?he. Fallon quake of December 10, 1954 caused a fluctuation
exceedi:cg 2 f't in well 3]f-29E-14adl. The cha.rt dram on the gages was so
geared that one revolution of the drum (full width of cha.rt) represents
either l or 2 ft. Fluctuations exceedi:cg l ft or 2 ft cause the dram to
revolve more than once and the pen retraces its mark ( see f'ig. lS) • ?or
that reason, the full amount of the water-level fluctuation could not be
read from the charts. The magnitude of the quakes causi:cg the fluctua
tions ranged from 5-3/'4 to g-J.j4 (Pasadena scale). !able 22 lists all
seismic shocks recorded b7 the gage in well 4N-30E-7adl from November 1951
to December 1955 and correlates them Yi th earthquakes reported by the
U.S. Coast and Geodetic SUrvq. Records of all identifiable seismic
fluctuations in wells in the !OlTS are in the files o:f' the Geological
SurTe7.
,

tivity o:f' the gages, so that more shocks have bean reco:rded sin.ca~ the
~t was repeatil3d. (:fig. 18). The sh,i:ik :f~om the Tula.re Valley~
more than onae.
iDg a perlod of 8 hrs. At times some gages were equipped. with gea.:rs
giving time sciales of lo2 and 2.4 in. per ~v, and the smallest divi-
on charts from mc;st gages the time o.ould n?t bs l"e:ad. clcse!' than wi th:i.n

,,

a., <.)
C -,_ :::, 1/)
"C C:
..!:
3:: ..!2 a.,
..0
-a., a., -.!:
,_ a., -C 3:
0 -..c -0. a., 0
GPO 99 I 8S7
177
583.2.-------,------,------,------.-------r------,
583.3
Wind effects\
583.4
583.5
583.6 5 6 7 8 9 10
July 1951
582
583
584
fol I
585'-----........o--------------------------1950 1951 1952 1953 1954 1955
Figure 16.-Hydrograph of well 2N-31E-35dcl (USGS no. I). Illustrates various types of concurrent fluctuations (above) and seasonal and long - term fluctuations and trends (below).
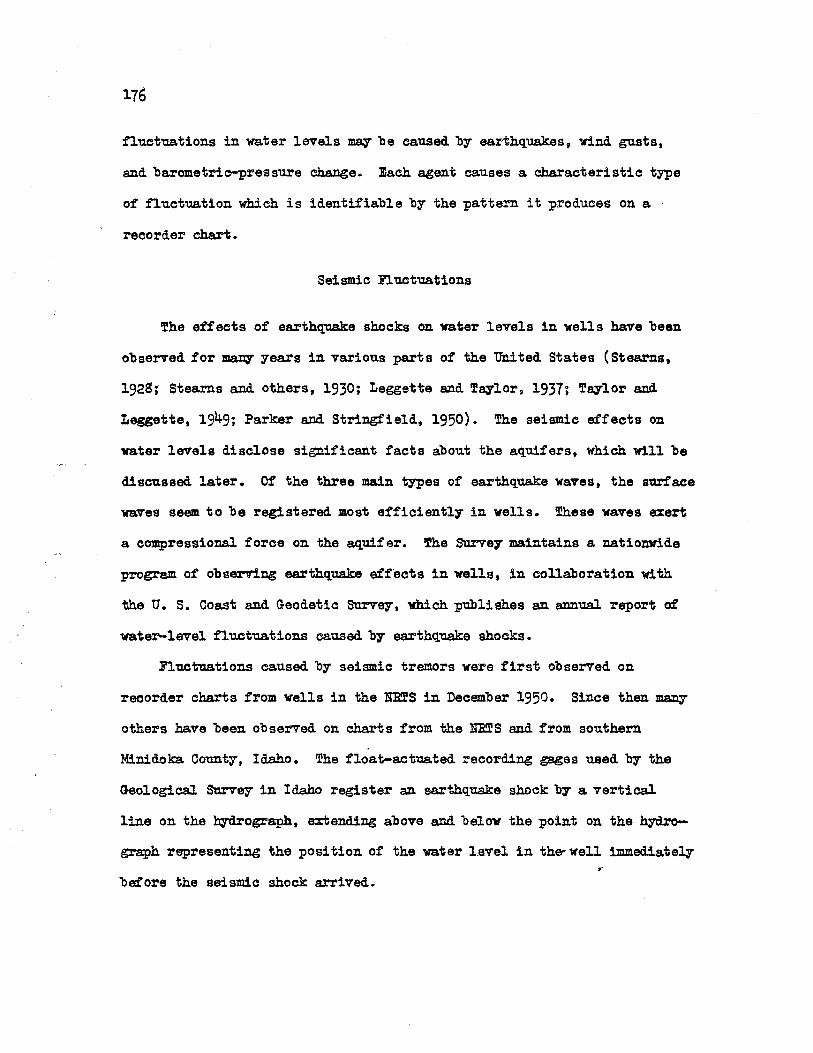
176
fluctuations in water levels ms:, be ea.used by earthquakes, wind gusts,
and barometric-pressure change. Each agent causes a characteristic type
of fluctuation which is identifiable by the pattern it produces on a ·
recorder chart.
Seismic Fluctuations
lfhe effects of earthquake shocks on water levels in wells have been
observed for ma:ey- years in various parts of the United States (Stearns,
192S; Stearns and others, 1930; Leggette and 'fqlor, 1937; 'fqlor a.mt
Leggette, 1949; Parker and StriDgfield, 1950). The seismic effects on
water levels disclose sigc.ificant facts about the aquifers, which will be
discussed later. Of the three main types of earthquake waves, the surface
waves seem to be registered. :aost efficiently in wells. These waves exert
a compressional force on the aquifer. !he Survey maintains a nationwide
program of observing earthquake effects in wells, in collaboration with
the U. s. Coast and Geodetic Survey, vhich publishes an aimual report of
water-level fluctuations ca.used by earthquake shocks.
Fluctuations ca.used by seismic tremors were first observed on
recorder charts from wells in the N:B:!S in December 1950. Since then mat:IY
others have been observed on charts from the NB.TS and from southern
Minidoka. County, Idaho. The f'loat-act'lla.ted recording gages used 'b7 the
Geological Sarvey in Ida.ho register an earthquake shock b7 a vertical
line on the eydrograph, extending above and below the point on the hydro
graph representing the :position of the water 1.evel in the- well immediately ,.
before the seismic shock arrived.

ordinarily a.t"e identi:fia'bls in ths flu~tua.hons, In deep wells on the
at most pla.C1es"
Fluatuatfons of the \l."ater table are ana.lcg;~us to tlwse of the water
are clues to c:ha.racrte:r.i.stie>s of the aq1.:ti:fe:rs wb.i.eh oth.e:rwise might be
di:f'fi cult to determine o
Most wate:r--level :fl,,.ct:uatiots :in wells on the Snake Rive:r Plain ~
be readily identifi,;;d. with their catLsesc. The fluctuat::i.ons a,•e g:?"ouped
tuations and trend.so The hydrc.graph cf W!tll 2N=31E= 35dd (USGS no o l) ia
typicml. for wells on the Snake :ru:vel" Plain, and shows some prino.ipal
tn,es of fluctuations (figo 16).

1'74
discharge of ground-water to the Snake River meas'W:'ably. On a prol)or
tional scale, the reduction caused by depletion at the current rate on
the NRTS is negligible.
FLUCTUATIONS OF THE WATER T.AJ3LE
The static water level in a well having free communication with an
,mco:n:f'ined zone of saturation is essentially- continuous with the water
table. For the purposes of this report, the two are assumed to coincide
exactly. The water levels in artesian and quasi-artesian wells reflect
the pressure head in the aquifer. Fl:actuations of water levels in wells
represent changes in the position of the water table or in the artesian
pressure head. The water-level fluctuations discussed. here are those of
unconfined water and the water table, incltUling q'llasi-artesian water.
Periodic mea.sa.rements of water levels in the NmS and adjoining area
began with a few wells in Ju:t;r 1949. :B.ecording gages have operated con
tinuously in some wells, but most of the gages were rotated among wells
in order to obtain recording-gage records for representative periods from
as ~ wells as possible. In ad.di tion, records of water levels in
various parts of the Snake liver Plain have been obtained in connection
with other projects of the Survey. Some of those records are used in
this report.
A shallow water table commonly nuct,:ia,tes markedly d-aring short
periods, responding to local im'luences such as rech.a:rge from precipita:
tion and irrigation, the diurnal qcle of evapot:ra.nspira.t:ton, withdrawal ,
of water by P":lll1Ping 9 and fluctuations in the stages of streams and lakes
which comnnmicate with the aquifer. A deep water table is less responsive

173
and. indu.stnal ·wells in the Sna..'ke River Plain. Oilly e part cf the pumped.
(1953> p. 8), estimated that the yea.rly withdrawal in 1952 i:r::m m:ire thar,
1,150 ac-ft.
D1.l.I'ing 1955 the a.ve:ra.ge daily pumpage of water c:i: the :tIBTS was about
2.6 million gallons (see part l, p .. 62) Mu-::h c,f the wat.ez returned. to
ground--wa:i;:,e:r' sto:rage th:rough se~pa.ge, pi ts and di s:pc.sal wells bt:tt ,:e~or·ds
of the amount c,f' wate:r :returned. are in1:omple• r.. Tr1e a•.re1·2.gcc :ratl':: of
withdrawal o:n the l?RTS in 1955 (s-:.:n:i,·v:hf:.'. r.::: r, ·:,,:"'· ,.;

172
Natural Disch.a:rge
The vallq of the Snake River between Milner and King Hill is the
principal natural discharge area for the ground water. The aggregate,
discharge rate averaged. about 3,SOO cfs in 1902 (Stearns and others,
193s, p. 163), but the rate iner.eased markedly after the advent of irri
gation on the S?lake River Plain with S'Dl"!ace water diverted fr0111 the
Snake River. The rate now exceeds 5,500 cfs. A general check of the
volu:me of water discharged. from the ground. water reservoir to the Snake
River was obtained by st,ucy- of the discharge rates at gag:h:ig stations on
the river at Milner and King Hill. The increment to the Snake River
between these stations in 1910 was about 5,250 cfs. :B;r 1917 it had
increased to about 7,250 cfs. It was relativel;r constant from 1917 to
1936 but increased. to about S,ooo· cfs between 1936 and 1942. In 1953 it
was S,526 cfs. lfb.e increment includes some groimd.-water and surface
discharge from the south side of the river, bo.t is largely from springs:
on the north side. The rate of discharge from these springs was esti
mated from records of a series of direct measurements of all the princi
pal. springs during 1950-55. !he increase in the ground-water discharge
largel.7 reflects new recharge from irrigation on the Snake :River Plain.
Substantial volumes of grouud water are discharged in other areas,
as b;r effluent seepage around the borders of .American Falls Reservoir,
the upstream northern edge of Lake Walcott, and alo:ng certain 'llpstream
reaches of the Snake River.
Eva:potranspiration direct~ from the water table is propol'tionatel7·
small except in the Mud Lake :Basin, in an area in the vicini t7 of Carq,
and in a f fnf other border areas of the plain.

a.bout 0 .. 2 ft pe:- yearp ave:r.aged. :f~r the whcle station.
On the ot1;er bandp if the sffetitive poros:l ty of the aquif s:i:o is 5
pct. the e:f'fe~tive voltim8 of stc:>ed wate%' is 21~700 0 000 a.o,-:f't and t.b.e
crurrent rate of pumpa.ge would lower the water table only about O ol3 :f't ·
per :rea.r9 averaged.for the whcla stationo
Still assumi:cg a. sta.t:tc @'.'Ou.nd--wa'!.te?' brsd.y\ :pumping on the Station
at a greatly' enlarged ~ontin"t.:Wus rate of' 250 cfs would rem.eve about
lS2,000 a.Clre-,feet of water yearly 9 lwe:rlng ths wate~ table a.bout So3 to
12 ft, and the resen-o:tr would cicntain a 120,,,, t,::: 80,,,,y~ s:upply of vat-er.
Going farther afield., csonsider the a.'t"ea cf the S!.iake Ri ve:r Plain
used in the image-will study - 7p000 sq mi (4.,5xJ.06 at:;) - and assume
the sam.e airerage depth of sa.tUTated thi(;;kness; -- 11\000 :f'to At 3.5 and
5 pct effective porosity, the vclume of ste:r"ed. water is l .. 6::c108 or
2.2::c10S ao-ft 0 respeetivel.yo If the total cf effe~tive net consumption
of pumped. ground water on the Snake E.tver Plain were at a rate of 1 9 200
ds eontinuouslyr annual pmnpage wo"tU.d 'be 874;000 a.c:,.,,ft. lf th.era ware
no recharge or a.rtif:tcial discllarge; the annual lowe~i:cg of the water
table, averaged for the whole area.p would be a.bout 5 ft at 3 • .5 p~t
effective porosit,' or a.bout 3o4 ft at 5 pet.,
DISCH.Ami OF GROUND WATE.R
Ground water from the Sllake :Rive:r Plain is clis~ha.'r.'ged natt.rally from
springs end seeps and artific:ia.lly f?'::m we.llso Na:tuz,al clisGharge is by
fa:r the larger 9 but withdrawal from wells is p!'oceed.in.g at a.n accelerat
ing rate.. Some gioound water is eonS"~ed d.i:r-e:itly by e-vapotra.nspiration.

170
The Stationwide aggregate effects from mutual interference amollg
wells, if all were pumped continually' for lO?lg periods, cou1d be computed.
The lowerillg of water levels throughout the Station a.t the present rate
of consumptive withdrawals,. however, is inconsequential. Likewise, the,
increase of pumpiD.8 lifts, ,caused by- mutual interf erenee, is economi
cally- inconsequential. So it does not seem worthwhile to compute Station-. wide aggregate ef:f'ects at this time. Moreover, further observations and
tests will lead to refinements in calculations so thatt by- the time local
and regional ef:reets become significant, useful computations of long-term
effects can be made.
Local Storage Capacit:y; o:! ~ Aquifer
For comparison with the computed effects of pumpillg, it is interest
ing to estimate the ef:!ects of pumping that wou1d occur in the :NmS• if
all water were withdrawn from storage vi thin the Station botmdaries.
That is, s"O;ppose that there were no recharge or replenishment by- und.81'
now and that no water were drawn into the Station. Some simple calcu
lations give a hint of the vast amount o:! water siiored in the basalt,
am. thq help to explain~ prol013ged pumpiDg at current rates on the
ltE!rS have so little observable effect.
The conservatively' estimated average ef:rective porosity o:f' the
Snake River basalt is 3.5 pct. Assumillg that the average thickness of
the zone of sat'U3:'a.tion is 1,000 feet, the total ef:!ective volume of
stored ground water beneath the 435,000-acre Station is 15;200,000 ac-,,
f't. Nearly' a billion gallons of water was pumped in 1955, or about

:Notieea.ble drawd.011m from :pimpirig was ot•Hrved. at a. diatan~e of more than &
mile from the pi:mtped w~ll. Theoretio:a.lly·i the cicne of influence of well
.&:NP-2 had~ spre~ to a di etanoe of ab out 4 mi at the!> end cf 72 hrs.
fhe cione a! influenc.e wo'llld deepen and. spread ~..h farther than 4 mi
it pumping in well AWP-2 were continued indef'irdti!tly. For e:ample 9 using
the theoretic hydraulic systems mentioned. 88.!'lier in tbil:i repo1°t and the
average lcy-draulio properties of the Snake RiY'er basalt in the ~S area.
and throughout the plain, Gomputations show that pumping of well ABP-2
csontinuall:y at a rate of 1220 gpm eventually would lowsr water lev..els in
the S:l:li area (a.bout lS mi south.we~ of th8 »IP area) about Oo3 ft. The
lowering of pumping lenle in wells in the STR area would be negligible.
The amount a! interf'ereMe between welts is propor'tionsl to the rate of
pumping. !husp pumping well .A.EP-2 at a rate o! 610 gpm would lower water
levels 1n the sn area onl.y about 0.15 ft.
The drawd.ovn in well ilP-2 at a pumping rate of 1220 gpm and a pump
ing period of 72 hrs was 21.4 ft. If the well were pumped continuously
the drawd.own would inerea.se 'Wltil th.e ~one of influ.eni5e stabilized and
equilibrium eionditions preT.a.iled. Consid.ertng hydrogeologici boundaries
and the average h1drauli~ properties of the Snake Biver basalt in the
?lmS area and throughout the pla.in9 the Clomputed drawdown under equili
bria conditions would be 21 .. 9 ft. Thus 9 if well A:NP-2 were pumped
csontin'a.OU.Sl,- at a rate o:f lp220 gpmll the dra.wd.own would be o:cl.y a.bout 0.5
:f't greater than that measured. a.t the end of 72 hr5e The int:trease in
drawdow. is propor>tiona.1 to the p'Umping :r.<e.tec lf the :rate of pump:uig
were 2,440 gpmp the increase in dra.wdown would be about l ft. The total
drawdown from long-term ~ontinual p'Ompii;g at 2 9 44o gpm would 'be a.bout 44
feet.

l6S
Table 2lo=Esi.:imated aff~ts of pctsnt:ia.l g:rot1nd=water development in NETS
Point cf observation
Midwq between Taber and Blaclt:f'o~t
Southern Minidoka. County
Drawdon of water levels (:feet)
o .. 6
0.1
W'i th.drawals of ground water from prodU.©tion wells in one part of the
N'mS eventually will lower water levels in other partso The data from an
a.rea.9 illustrate loeial interferencis am~ng wells a.t the end of a. relative~
short period of pumpingo The d.rawdo..m of water let'.els in obsenation
wells 9 ca.used b7 pumping of well .A.NP=2 at a ?'ate o! 1220 gpm for 72 hrs,
were as followsg
Distance :f'rcm Drawdown Well pimped well (:f'eet) · (feet.)
ANP-1 595 . OoSO ..
Al.llP-Disposal 19960 o .. 45·
I:E-Di sposal 5o4;o O .. l

steepenso The:t"e£ore, underl'low frc,:m ths NETS to the pla.'ln dMrea.ses, and
inflow to the N.B.TS increases. Water level~ in the Snake River Plain u,e
a:ff eGted. by cllmlges in 'lmder:f'lmr from the: NRTS tev the plain and 'by ~ha.nges
in inflow to the NRTS from the pla:b:.o The magnitude of these effe©t9 f'%'Cm
pumping a.t the ciurrent low ratesp of e;oitl!"se, is vanishi:agly small ..
Ground-water pumpage f~cm prod~ticn wells on the NRTS w.s about
4 ef s or 2,900 a.c.-ft in 1955 ( see pt e 2!· table 10). Much of the pumped
water was returned to ground storage th?'o'llgh disposal wells and infiltra
tion pits, so the net depletion of ~ound. water was lowi probably ranging
from 15 to 50 pGt of the amount p"..Unped at different facilitiesc The esti
mated consumptive use of water on the NRTS in 1955 is 1.3 cfs. Theoreti
cally-. Yi thdrawal of this small amount of water will lower water levels in
irrigation-well fields on the Snake Ri-v~ Plain only a few hundredths of a
foot or lesso That isp the lowering from th.is cause will be indistinguish
able from the lowering from other ca.uses.
Suppose tha.t the consumptive use of ground water en the N'RTS
inoreases by 1975 to 15 cfs (11,000 a.c-ft per year). Computations similar
to those desaibed in preceding se~tions cf this report were made to
determine the effects of withdrawing 15 ds on water levels in irrigated
areas on the Snake River Plain. The results of the c:o?Z?F.ttations (table
21) show that withdrawal at the assumed rate would not lower water levels
noticeably in the Mud Lake, Taber or Minidoka areas. No allowance was
made in the computations for the partial hydraulic bound.a..7 between the
?raTS and Mud Lake. The boundary probably redu.-,es greatly the sffe~t a!
pumping at ?raTS on water levels in the Mud. Lake a;r,ea..

166
computations were made to illustrate the i:c!l~e on the total drawdown
in the NRTS a:rea. 0£ :possible variances in the average hydraulic :properties
of the aqui:f er ( table 20). The table shows that the order 0£ magnitude of
computed d.rawd.owns is not changed. by varying the a.qui.fer :properties within
reasonable limits. The computed values of drawdown that are based on T and
S values of SxJ.06 gpd/ft and Oo05 are believed to be realistic 0 so the
d.rawdown in the NRTS will be on the order of 5 to 10 ft after a loDg term
of ;rearso
Table 20 .. -Com:puted. effects of :pumping on water levels in
the Nll.TS9 at different values of T and S.
Assumed values of T and S
T = 4x10⁶ gpd/ft, S:. 00025
T: Sx106 gpd/ft, S: 0.05
T: lo2xl07 gpd/fti S: OolO
Computed. drawdown of water levels in Nll.TS area
(feet) ~ased on consumptive Based on cons'tllllptive
use in 1955 · use in 1975
2
16
ll
6
Effects on Water Levels in the Snake River Plain
from Ground-Water Development in the 1IllTS
The amount of underflow beneath the NII.TS is adequate to supply all
existing :t'acilities and all additional ones that a:re definitely foreseen.
However, the area is not an isolated cell. Pumping from wells in the
lm.TS catlSes a reg!.o:cal lowering of water levels within the N:a!?S. .A.a a ,,
result, the qdraulic gradient out of the southern part of the :rm.rs is
reduced, and the gradient :f'rom surrounding areas on the northeast

some b asai t drains
test data. probably is mu.ch sn.aller th.a:: ".'.;he. tn,e c~:e:ff:ki.en+ of th~ aq_u.i..:fer-.
,_.,....,...., - .. ·~..:rt.-.::,-_,.J_ -- - ' _, ,.!. , __ ,,,_.
tude of 5 pct (0.05). real and image
nonequilibrium fcrnr.u.a.
Computed d:rawdo'W!ls 1.n the 1IB:.:$ as the :res;;j_ i. of pT"esent and futur·e
developments on the Sna}:e P..:.ver Plai.:;:i. ;,re:-e shown ta'b'le J c _, 0 Geologic
and. bydrclogic studi.es made in t.he <ffea 1:w:visen the lffiTS a...~d Mud Lake
boundaries can net be appraisea. -vrl th ~he :.:cic:r::.'.a.t.ion now available. The
a.nticipa.ted total drawdowns at t:te liTR'I'S a.f,.e:r 108 year:.;, which would be
caused by the estirnat-ed pumpage in 1955 a..Tld 1975, are 4 and 10 ft,
respectively. This estimate nakes soTie allr:-,.,;2-!:.c2 fc,:: the pa;t:iaJ. bourni-
a.ries near Mud Lake.
tions of dr a\'ro..oK:r::.s ,-;cr·e ....... , ........ ,- ,r. ~-<~ .•. .': ..
minimum and

Table 19.-Estimated. ground-water pumpage and its effects on water levels in the NRTS at the end.
of 100 years
Withdrawal rate Consumptive use Computed lowering of wahr
Area of heavy (Acre-fee·h per year) (Acr&=-feet per year) levels in NRTS area
withdrawal (feill ·---1955 1975 1955 1975 Based on 1955 Based. on 1975
consumnti ve use ~!H!!l!J:2 t:tve Y.§..! ·-Mud Lake Basin 27oiooo 4oos 000 160,000 24o,ooo 2.3 3°9
Mini do kn. Coo 160,000 500~000 10011000 300,000 lo2 3~7
Taber--W o Bonneville 80,000 24011000 60,000 160,000 1..1 205
Aberdeen-Springfield 60 8 000 901)000 33,000 50,000 Ou6 Oo9
E. Je:r·ome Oo. 2Sll000 40 8 000 14iooo 20,000 Oo2 Oo3
Gooding & W. Jerome Oo. 9,500 1Sp000 5,000 911000 - 0.1 - -- --~~
Total 607,500 lp2S8i000 3"l2,000 7999000 5.4 11.4

remote pla~ee to rea~h the NRTS.
that the ave:r,age Cloef'f:ic.ient.s o:f transmissibility and stor-gge of the
Snake River basalt are 4no6 gpd/ft a.nd. Oc025 9 res-p~~tl\"e,ly. These

Thusi the basalt a.qu:1:fer is not infinite in a.:real extent, it is :f':1nite 9
and the Snake River is a finite boundary. This condit!on 9 and the fa.ct
that the river is not a straight-line d.emar~a.tion9 we:r>e provided for in
our hypothetical h:ydra.ullc system by in~reasing the distan~es from
heavily ptllllped areas to the line of recharge and by assuming an aqui:f' er
with rectangular boundaries.
The in:fluence of the by'drogeologic boundaries on the regional
effects of pumping were determined by means of the image-well theory
(see Ferriss 1949). The image-,well theory as applied to ground-water
hydrology- ma;v be stated as follows~ The drawdown in a pumped well is
increased by pumping from another well.. .A. barrier boundary also increases
the dra.wdown, and the effect on the pumped well is the same as though the
aquifer were infinite and another well 9 discharging at the same rate, were
located across the real boundary on a perpendicular thereto and at the
same distance from the boundary as the real pumped well. For a recharging
boundary the principle is the same except that the ima.ge well is assumed
to be recharging the aquifer instead of pumping from it. The hydraulic
system discussed earlier consists of parallel boundaries. Analysis of
parallel boundaries by the image-well theory recp.ires a multiple image
well system (:Knowles, 1955). The image-well theory was applied in deriv
ing the estimates in the following seGtion of this report.

system ~onl\'Jistil'lg cf a, ;;I'E;e~ta..ng,.:.'ia.!' a.qoifer 0 190 and 65 mil~~ in lang1"..,h
and width. 9 and eooleised. by twc :t:o:r.e:t"se~:'.cit.g ·!:iar:r'i~s and twi;,, inte:rs,S©t!:ng
recl:larging b~isso Th.6 ba.nie:r bcitmda:r'i15ia al?e' fsihe 'b~rd.srs a£ the
Snake llive:r, ba.sslt 9 about 10 m.ilsis ne.n°thwsa;t and. SC miles ncrthea.st cf the
OPP area in th& N'R?S~ These boW'.lda..l"ies 11:lOiMicl,s appr-onma.tely \d th th.61
bases o:f mountains and hilb that ·::,c:r-de:t" t:h~ enMr>e Sna.k.6 !liver Plain on
the northwest 9 :north a.tid. e.ast. The :r,ec;liax·g!ng bc~""i.es are two seg:menta
of the Snake River~
Along the Snake :ru.:"'er· a.be:i-we Milne~ Da.mr influ~n:t :!"ea.ohas altema:te
with ef:f'l uent e,:nss.. Spr··1 "'lgs and se.e.ps di ialzbsrgs gro~ "1'8 t>e:c tc1 the
rive?' in some reacllei:1 9 and, water pe~~ola:t'.es fr;:,m the. ?'iwe:::, into the aqui
fer in others wh5re the wa~er table 16 below str6Slll level. hem Milner
Dam to lllissr the wate:r table is higt.er than. the :r-'i:1rer and ground wate;:,
is di scllarged ~ontinua.lly.
Lowering of water levels along rlver reaches where infl.i:umt or
effluent ~onditicns e:tlet wi.11 l6ssen the d.iscl.Large c:f ground va:te::r to
the rt vs?' «ill" inc:rease psrc>.cla.tfor. c;f wa.·re:I" f ~cm the :r:1:'irer into the a.qui=
fero Thus~ the ef:flusnt l'ea~nes of ths :r:i.vE.:r whe:re the water table h
above the bed of the river a.re re~ge 'bo'tmd.aries, whicl. limit the spread
of the ~ene of influen~eo Pu:!npage on the plain ultimat,ely will reduc:e the
amount ~ va:t«f' diseiharged. from springE< in the valley of the Snake River
and i:c.i:i?'ease streBJn losseis along lnf'lu.ent !"eac:.hes of the rivero
!n certain rea.c:h6.,. cf ths :rt:~re:r\ as fT,:,:m R~'bsr'%s to Fir:'~h and. f;r,cm
Lake Walcott tc the "''i.:d.:1-.i ty c,f M1 lne~ the :r,e,g:1 encl water r.at•le 1.a belcw
the bed. of the rivero Furth.er, lowe:r-·:\..ng of water le~els wo~d net inoreas.e
river losses 9 so these :rea!:ah.es of the river' a:r,e; ni:;i rectl.a.T'gs boUDcia.rl.elii·o

160
a.Ild. to an observation point were 20 mi 9 a.bout 50 yea.rs would elapse
be.fore the cone stabilized at the obse:MJation point. ~y then the cone
would have spread mora. than 200 miles from the pumped well1 if the aqui
fer were that extensive 9 so the boundaries of the a.qui:f'er would have been
reached loDg since.. Thus, ground-water withdrawals remote· from Nm!S
ultimately will lower water levels in the Stat1on9 and pumpillg at the
Station will lover water levels elsewhere on the Sna.ka River Plain.
In:f'luence of H1'drogeologic :Boundaries
The l:qdrogeologic boundaries of the Snake River basalt a.re irregular
in shape and extent, and the l:qdraulic properties of the aqu.li'er vary
from place to place on the plain. The regional loweri:cg of' water levels
by pcmpi:cg, however 9 is not affected mu.ch by irregala.rlties in l:qdro
geologic bo'lllldartes nor by variabili t:, of ~aulic properties. '!he
regional lowering is controlled. largely by the average .hydraulic proper
ties of the Snake River basalt within the large areas of in:f'luence of'
pumping and by the general shape and extent of the boundaries.
The order of magnitude of the regional af:f'e~ts of pumping can be
determined by treating the h7drogeolog:Lc boundaries as straight-line
demarcations and mald.Dg studies of a hypothetical h7draulic system that
satisfies the hydrogeologic condi tiona of the aquifer. The results of
a.quif er tests and specif'io-capaci t7 data can be used to estimate the
average l:qdraulic properties of the aquifer.
Studies in the Snake River Plain show that the effecits of hydro-
geologic botmdaries on the response of the aquifer to pumpi:og from wells
ean be simalated. by mathematical analysis of' a. hypot.b.eti~ hydraulic

159
in the aquifer and water le"vels are lo,re:red in the a:t'ea of influence.
to the well the a.mc'tmt of water pumped.. The d.imenaions of the o:one of
influence depend u.pon the h.,.vd.raulio prope:rt1es cf ths aq_uife!', the location

7ear by 1975; in the Mud Lake basin, about 400,000 acre-feet per yea:r b7
1975; and in. the Tabe~West :Bonneville County area, about 240,000 acre
feet per year by 1975.
Table lS.-Estimated p'1lmpage of ground water for irrigation. on
Snake Bi Ter Plain, 1955
Mud Lake :Basin
Southern Minidoka. Coimt7
Taber-W. :Bonneville County- area
Aberdeen-SpriDg!ield tract
Eastern Jer0118 County-
Gooding and Western Jerome Counties
:Big Lost River Valley
Lit~le Lost River Valley
National Reactor !esting Station
Total
Water pumped (acre-feet per zear)
270,000
160,000
S0,000
60,000
28,000
9,500
14,000
ll,000
2,900
In the Mud Lake :Basin ground-water withdrawals are- chief17 from a
perched wa.tel'-beariDg zone at sllallow depth and from artesian wells. In
the :Big Lost mid Little Lost River vallqs, p'WD.ping is from an 'tmcon:t'inect
water bod.7 'Where the depth to the water table rallges from 3 to 100 ft
below the land surface. Pimpi:ng in these areas is f~om pound-water ~
bodies that are tributar., to the plain, and increased p'tlmpSCe of the
tributa.1"7 water will reduce under:f'low to the plain..

157
of the increase occu.rred after 1950. Mc.st pulllptng i:if ground water has
increases will be l:ilDB.ll i.n th~ L:1 ttle Lost ru~sr Valley a.:o.d in ea1rtern
Jerome County, 'but large it oih~r a.l"SaSo The ~e:n:ters -:i:f at<eas of hea,ry

SO'lll"~es o The Statio:n 9 theraf'o:re, is Eli t.:iated. :fa.v~:rably :for a. large and
pemanent water supplyo The available suppl7p htrve~er 9 is not l.imitlessi
owing to geologic :f'a~tors that (Sontrol the movement and acscessibili ty of
the water, and to physi~a.1. 9 e~onomic 9 and competi ti ire !acstors that deter
mine the :feasibil'ity' of water reccveryo !he e~onomic :fa.citors are DOt
discussed in this report.
The perennial ground-water yield of the Snake River Plain 9 computed
from water records for the natural-discharge area between Milner and
l!liss 9 is at least 4 million acre-feet a "3'ear.. The average continuous
discharge of the springs is more than 5,000 cr!s and may be as much as
50 500 e:fso '?his represents all or meat o:f the grotmd..:water yield from
the plain to the east o All ground-water d~~ments on the plain will
tap the stlpply' 9 and ea.ch development will have lcw and regional effects
on water levelso Th.ere.f10re 0 the followi:ng fa©to:rs will now be considered.:
local and regional e:f':fetits of ground-water development on the NBTS.
Competitive Demand for~
Several large developments of gro'!llld water for irrigation are in
progress on the Snake River Plain 9 and other large develcpments are
expectedo !he water d.isClharged from sprlDgs in the Snake River v~q is
derived from the same :regio:cal body of grOUlld water th.at supplies these .. developments. 'fhe ground-water withdrawals ultimately will lower water
levels at the NII.TS 9 and withdrawals on the Station will a.f'f'e~t water

s
Underflow from Little Lest RiveT Va.1.lcy Underf'le:.;w· :from Bi.rC!h 0:t"eek Valley Una.er.flow from Mu.cl Lake Ba.id.rt Seepage los:s f:reim Big Lost Bi ve:r
85 1~4-0 100
25
61 5 000 100~000
71;000 18sOOO
155
Their estimates we:re based largely on et:.t>eamflow lr.,sses and they did not
southwestwa.t"d and westward to the valley ot the Snake i.U~er between

1!54
compensate for the deitla."eased h,yd...""aul:i~ gt'adient in that seetion. :Based
on aqui:f'e:r-test and spe:'1i!'i~©SpMi ty data, and allowing for the fa.ct
tha.t the wells tested penetrate only p~ of the Snake Jiiver basalti the
estimated average coeff'ieient of transmissibili't;y is 2no6 gpd./ft in the
pa.rt of the section east of the STR area and 4uo6 gpd/ft in the western
part. Values of I and L for the two parts of the se~tion were sea.led from.
plate 2. The ,isomputed under.flow through. the eastern and western sections
is 6.1x.1.07 and 1.6:x:108 gpd respectively-. The estimated total underflow
beneath the ~Sat the latitude of the STR areag therefore, is 202%1.0g
gpd. or about 350 d s .
The sources of the water moving through the se«:Jtion of the aquifer
imder discussion are (1) underflow from the Little Lost Ei ver Valley, (2)
Ullder!low from the :Bircll Creek Valley O (3) under.flow :from the Mud Lake
:Basin, (4) and seepage loss :from the Big Lost River. The average rate of
seepage loss from the :Big Lost River north of the 4480 water-table conr
tour9 estimated :from the stream:flow data in appendix 2 9 is about 25 cfs
(18,000 ao-ft/-:rr)e Underl'lov ~ontributions from the Little Lost River
Valley, ::Bircll Creek Vallq 9 and the Mad. Lake :Basin were ccmpa.ted b1" the
modified Darey equation, using estimated values of T and flow lines drawn
to delimit the secit:ions of the aquifer through vhicll the in~rements of
,mder:f'low a.re mort12g. Follorl:cg are the reSlllts of the ciomputations:

153
VOLUME OF u1IDEPJ'LOW THROUGH THE NE.TS
following modified form of the Darey equation { see Knowles~ 1955):
in whicm ~ is the discl:iarge in gallons per ~, T is the ~ioef'f'icd.ent o!'
transmissibili ty in gal.1®6 :per day per f'oote I is the b1'dra:aliei gradient
in feet per mile, and L is the width in miles of the cross section thJ:>ougb.
'.Whicll. disclla.rge occurs.
Ths ra.te o:f 'Wld.er.f'low through the Snake River 'basalt within the NRI!S
at the latitude of the ST:R area 0 between the 44go.,;. and 4490-f oot wate~
table contours (see plate 2), has been e1.omputed. The transmissibilit;y o.f
the aquifer is variable within this se~tion. The wa.te;r..table C"JOll.tour msp
{see plate 2) indicates that the average transmissibil:lty in the se~tion
of' the aquifer east of the STB area is mucll less than that to the west.
:Based on a study of limiting :now lines, the wa.t·er moving through the
section o:f the aquif'el° west of the ST:R area is for the most part und.er:f'low
from the Little Lost Ri irer Valley. A part of the imder:flov from the
Little Lost River Valley, under.fl.OW' from :Bircli Creek Valley, and under.flow
from the Mud~ basin 1s mo'rl:Dg through the se~tion of the aquifer east
of the STB areao Underl'low :f'rom l3ircll Creek Valley and the Mud Lake basin
is :ma.oh gea.ter than that :f'rom the Little Lost lli 'IJ'er Valley. !!heraf ore,
the vol'tlllle of 'l.mdmlcw ea.st of the STl!. area is mucll. greater than that
west o:t the STB. area.. Howeirer 9 the bydra:ulic gradient of the we.tel" table
west of the STB. area. is mucll greater than that east of the 5TB. area.. The
greater width of the eross se~tion ea.st o:f the STB. area does not fully

152
however~ that the low~ water ta.'ble in the west: isi caused by some other
factor\ such as an area 'Of high pe:rmeabili ty in the southwest~ which
would tend to 'bleed water off and. c.i:reat~ a. gi:oadiant in th.at direeltion.
Ground water that flows southeastward into the NRI!S :from the Li ttlle
Lost River Valley- seems ttl have only local effeieits on the direction of
movement th:rough the Station.
In B'lllllilla.?7, wat-er enters the NmS from the north, northeast and
northwest and moves south.Yard to southwestward thrnugh the Station. The
direction of movement beneath a given point or specified. area, however,
probably d.1:f':f'ers appreciably from the directions indicated by' the map.
Most planning maps for constrtWtion areas on the WTS include a
directional •rose00 showing true and magnetic north9 prevailing wind
direction9 direction of sm'.f'ace drainage, and d.ireetion of ground-water
'llllderf~o The direction of underflow sho'Cl.d be prominentl.7 labelled as
a rough approximatione
Regional Movement
Ground-water in the Snake m.ve:r Plain moves generally southwestward
toward the famous springs alo:og the valley- a! the Snake River between
Milner and :Bliss. The hy'drauJ.ic gradients are varia.bl:.e but general~
they' are on the order of 5 to 10 ft/mi~ PrMticially nothing is known
about the ~log 0£ the vast, un:1:nhabited ~ent:ral lava plain between
the mi.TS and the belt of irrigated land on the west, adjacent to the
spri~soharge area. Most of the water from the northeast moves through ,.
the iminbabited plain on its wq to the dis~ge area.

1£e the :f'crm and posi ticn o:! the water table.
West of' Oirc-.uar :Buttes, undsrl'low from the Mud Lake basin is south
ward. into the plain wfilst- of the. ll'm!S. lfhiii water also •us aouthws~
north. .A. bean.er in:f'l-a from Mad Lake would tend to build up the water
table in the east and create a gradient tcvard the Station. !hie GaUBe
is at least partly responsible fer the observed. phenomena.. (2) .A. non
permeable b&H'ier sc:uth of the Mud Lake basin would te:>.d to impound

150
Cooling C?'a.()ks tand. to be normal to the @ooling su.rl'~es of a. lava.
quite random in ortant.a.tion. The longi tud!naJ. ©rawa.sses :in border rolls
are parallel to the front of the :flow11 and the ~ra.ns7srse :frMtures en
the border :roll are a.bout normal to the :front o
consist of su.ccessi ve layers ha.Ting d.1:f':f erlng d.ira~tional permeabilities-..
In proj edion onto a plane these dire~tions would f o:rm a random pattern
of interwoven lineso
Ma.ny' of the late la?"a. !lows e?'1ipted :£'rem a line of vcl:e;anic vents
along the a.xis o! the Snake River Plain~ and some flows spread northvard
a.:nd southward (see pa.rt 2, po 77 ... 78) o If' this wa.s t%"lle also of the deeper
lava flows in the ~one of saturation, and if the dire~tion of greates~
permeabilit7 has some qstematic general relation to the direction of
flow 9 then the average d.ire©tion of greatest permeability beneath the
for some pecularl ties of the :eonf'igura.tion of the water table beneath
the E'RTS.
In S'llJllI!lar7~ for mathematical treatment and des~ptions of condi-
desaiption of the beha:vi~r of water or an aqui!er l'.:lould be derived at
all. The results mu.st 'be weighed against observ.ed :f'~ts and modified. on
the basis of experiencie and judgment. Si:milarl~ • observed data must be tr
interpreted and used with understanding of their nature and limitations,
and the distinction between precision and a.ticu.ra~y must be recognized.

map, therefore, is a b'at,her c?"Ude gene'l:'al'.!$r;.rion. It c:o:rreotly represents
For these reasons, the Wl"'.'.te:r· :prefe:rs ~:.e t:::.::nk c,f u:nder.f'low as being
along the pa.th of lea.st l·esi stancE, a path ,:hich seldom ca.n be deter-
the dire~tion of ma....,..J.mUD1 perm~ici:::i:.:
meabili ty and deviates from the a.ppa,:,ent di:rect'.i. on i::f maximum grad.tent
shown on a map.
For example, lava tubes, \111€1:her large c:r- 7ery :arma1.1, i·,end to extend
roughly pa.l'."allel to the d.'trec:tion of flew of the lar-a. Highly fluid thin
!lows of lava. develop a lineation of sma.11 t~~0~ ar..1 p~res in the direc-

148
of movement cannot be calculated accurately for a:n;y specific locality
because of the heterogeneity of the aquifer and other quantitative
unknowns. A general or average velocity might be determined by identifi
cation and dire~t meas'lll"ement through test holes of a thread of water at
successive pointso The water follows tortuous paths through the basalt,
however 9 and its speed along those paths can not be measured. The
apparent speed would be net velocity of cilal:lge o:f' position in a straight
line direction between the pointa.
Direction of Movement
Ordinarily it is assumed that the movement (under.fl@w) of ground
water is in the dire~tion of the ma.::d.mum grade of the water table, at;
rigb.t angles to the water-table contours. This assumption is correct- for
the idealized conditions which mu.st be assumed in mathematical treatments
- a frictionless fluid in an isotropic aquifer.. l3ut natural aqa.ifers
are not perfectl.7 homogeneous, and the S?lake River 'basalt is conspieoi
ously heterogeneous in its physical properties o For ~le 9 great
directional differences in permeability and porosity are obvious from
1nspecition. For practical purposes,, a compromise must be reached between
idealized and act'Oal conditions.
Where ground-water moves through successive rock zones which differ
in their permeabili t79 the now lines are refracted in a W&7 analogous to
the refraction of light ~s as they pass through media having diff'e:ri:ng
optical densi tieL Precise wate~ta.bla contours, would bend wherever the ..
:f'lov lines bend. 9 but the real pattern is so complex and localized that it-.
eludes detection in a coarse grid of obsenation points. The details,

The velo~ity of movement thre,ugh massive 'basalt obviously- is small to
form distribution of porosityt the fellowing ~e ef' velocities is :tna.1-
oated:
Transmiss:ibility Porosity Velocity (,md.lft} {:E~t) (ft{'.da.YJ
2,000,000 l 26
do 2 13
do 3~5 7.4
do 5 5
5pooo,ooo 2 32
do 3.5 lS
do 5 13
On the other hand, ve know that the porosity af the aquifer is not
Ullif'orm, some zcnes being ext:>em.6ly permeable and others having 11 ttle or
no permeabi?it)r. Most of the movement is through the highly permeable
son.esp where the velocities greatly exoeed these in other zones. Bo
trial computations have been mad.e, using average transmissibili ty 'fal.ues,
and estimates o:f' the thiaknes& and porosity of higbly permeable son.es.
!hese computations indieate velocities ranging up to 300 ft/d.s:1°•
J'rom place to pl~e and. from lcye:r to l~er, the velo0ities evi
dent~ vary from almost nil to several hundred. feet per~. The speed
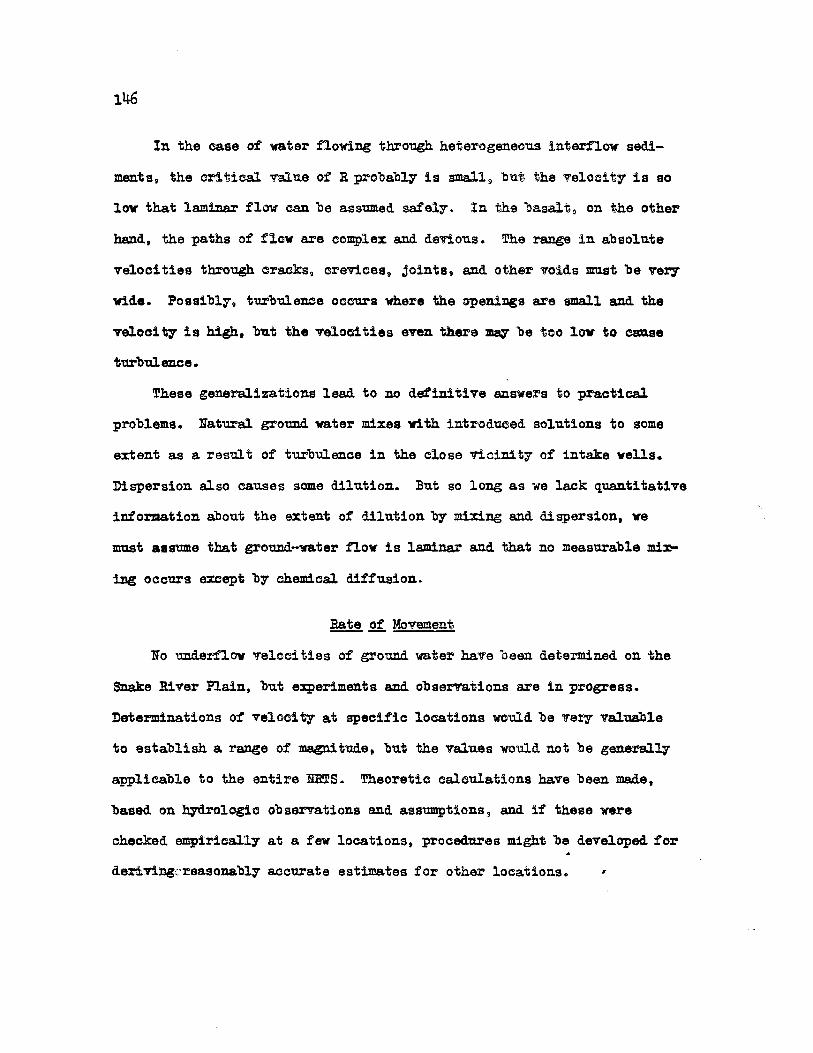
146
In the case of water flowing through heterogeneous interflow sedi
ments, the crltieal value of R probablj" is small 9 bu.t the velocitY' is so
low that laminar flow can be assllllled safely-. In the "oasa.lt 0 on the other
hand, the paths of flow are complex and devious. The range in absolute
velocities through cracks, crevices 9 joints, and other voids mllst be ver:,
wide. Possibly, turbulence occurs vb.ere the openiDgs are small and the
veloci t7 is high, but the velocities even th.ere '1IJlq' be too low to ca:a.se
turbulence.
These generalizations lead to no definitive answers to practical
problem.so Natural ground water mixes vi.th introduced solutions to some
extent as a result of turbulence in the close vicinity- of intake wells.
Dispersion also causes some dilution. But so long as we lack quantitative
information about the extent of dilution b;r mixing and dispersion, we
must aasume that ground-water now is laminar and that no measurable~
iDg occurs except b;r chemical diffusion.
:Rate ~ Movement
No under.flow velocities of ground water have been determined on the
Snake River Plain, but experiments and. observations are in progress.
Determinations o'l veloc:1 tj" at specific looations would be ver::, valuable
to establish a range of :magnitude, but the values would not be general~
applicable to the entire N:RTS. Theoretic calculations have been made,
based on ~logic observations and assumptions, and if these were
checked empirically a.t a few locations, procedures might be developed for
deri.TiDgcreasonably accurate estimates for other locations. ,

wastes will fJ~Cl'tU' •
.A.n index cf the ten.de'!ley o:f f1tiw to ');le t,::r"r:1.1.leot :ts the B.eynold.s
number, which is defin.ed. by the equa:i.J,cr;,e R : t'[, in w..'1.r::h R is the "e'
Rey.nolds number, L is e. typical dimension (a. tube cU.ameter, a depth cf'
i ty of' the fluid..
between 1 and. 10 (Fa.nezhel"' and. ether's~ 1933). Th~ crlti~ value of R
diameters of 11pipesll>i and using wa.t-e:r 'f'el©d tiss i:n T'a.nges up tc seve:t'.'al
hundred fee;t per da.Y ~ the ~~mp· ... tsd Reyn;j,ld1S w:.1n"ris:rs a:re is: bel~w the
threshold of turbulen~e.

144
:from gravel aqa.i:f'ers, and the nature and rate of movement also mq differ
ra.dicallyo There are bOU'tl.d to be wid6 lroeal variations in the speed o:t
movemento Therefore, knowledge of the velo~!ty past a point 0 if' it could
be determined, might have little practical value.. No empirical. data are
available about water movement in the basalt and 0 for the present 1 s~
of the problem mu.st be based largely on theoretie principles.
Nature Qi Movement
We have no direct information about the nature o:f' g:ro'Ul'ld.-water :move
ment because it cannot be observed directlyo The movement usually is
ass'lll!18d to be laminar (streamlined). Darey 8s lawi the Thiem formula, the
!heis nonequilibrium. for.nmla and others assume laminar flow. Under
lam1:na:r-flov conditions velocit7 varies directly as the loss in head.
The applicabili t7 o:f Darey8 s law and its linear relationship af
veloci t7 to head under ccndi tions o:f' laminar flow has been disputed from
time to time. Absolute proof o:f its applicability is lacJdng9 but circum
stantial evidencie su;pports it. The ob served responses o! aqa.1.f ers and
hydraulic qstems to pumping and recllarge are quite close to the responses
calculated :f:rOlll the classic formul.as. Therefore, the ass,:mptions on
which the :formulas are based must be substantially correct for ordinar7
aqui:f" ers under ordillal7 conditions. Al though the Snake River basalt is
not an ord.i:nar7 aqui:f'er, its observed areal. responses to recharge and dis
charge also co?l:f'orm reas0Dabl7 close~ to calculated responses. ~
weight o:t evidence now available :favors belief that turbulent motion is ,
rare, if it occurs at all 9 except in the close vicinity of discllarging
and. recharging vellslt heavily :flowing springs, and. perhaps in ground
water casoa.deso
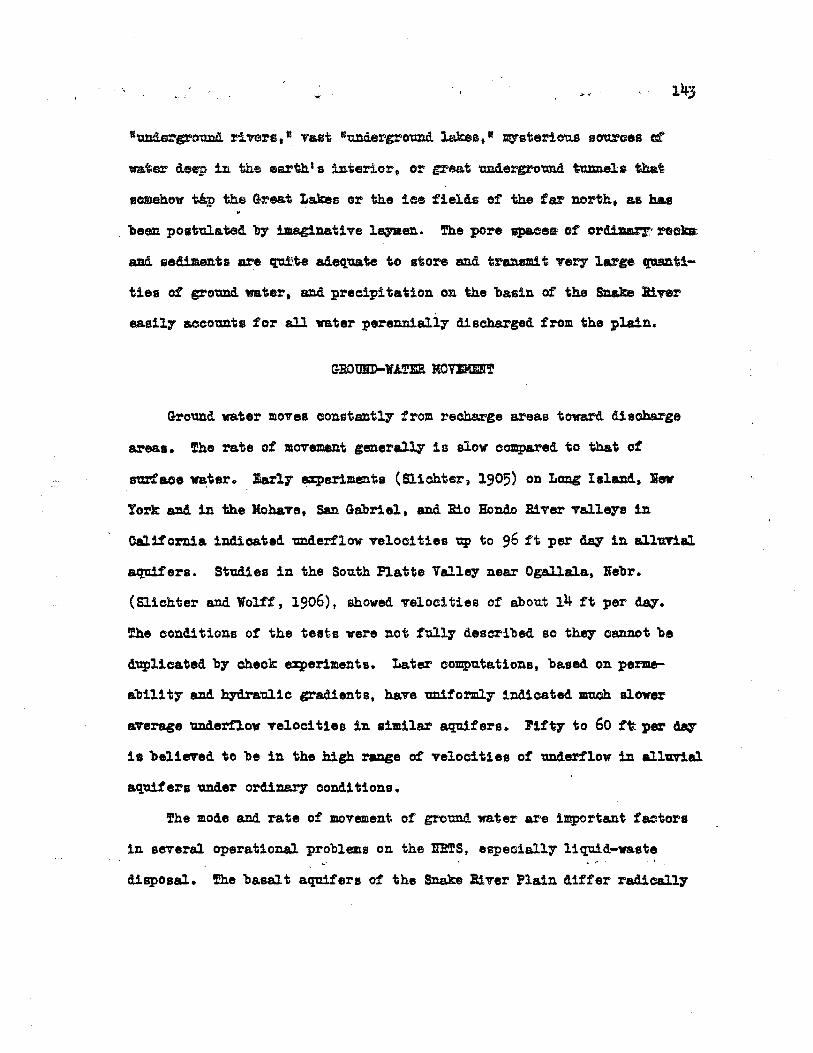
•underground. rt vers, • vast •una.e:z.oground lakes•"' :a,ysterious sources at
water deep in the earth's intertor 0 or great und.ergroi:md tmmela that
somehow ta.p the Great Lakes er the ice fields of the far north. as has
. 'been postulated b7 imaginative lqaen.. !he pore apaeea: of ord.i.Jla.1T' rocm
8lld sediments are q:a.f.te adequate to store and transmit Tecy large craanti
ties of ground water, and precipitation on tb.e basin of the Su.lee lliver
e.asil7 aecotm.ts for all water perenniall;r discharged from the plain.
Gro'1111d water moves eonstantl,' from recl:la.t>ge areas toward disoharge
areas. !he rate of movement gener&ll.7 is slow compared to that of
Bm'faoe WB:ter. larl7 e.z:perim.ents (Sliehter11 1905) on Long Island, Jin
York and. in the Mohave, San Gabriel, and llio Hondo River valleys in
Oalifor.c.ia indicatecl underflow veloei ties ttp to 96 ft per da;r in alluTiaJ.
aquifers. Studies in the South Platte Valle;r near Ogallala, J'ebr.
(Slichter and Wolff, 1906), showed velocities of about l~ ft per da;r.
The oonditions of the teats were not fully described so the;r cannot be
dttplieated by eh.eek experiments. Later computations, based on perme
abili t1' and hydraulic gradients, have 'lttliforml.7 indicated llUCh slower
average 'lmd.erf'lov Telocities in Bimilar aquifers. ?if'ty to 60 f't: per dq
1a believed to be in the high range of Telocities of 'ml.derf'lov in alluvial
aquifers under ordinar;r conditions.
lfhe mode and. rate of movement of ground water are important factors
in several operational problems on the lmTS, espeeiall7 liquid-waste
disposal. !he basalt aquifers of the Snake River Plain differ radieall7

142
3o5 pct in the basalt and 25 pct in the lesser volume of water-bearing
sediments -- probably is at least 5 pct. If so 9 the effective volume of
stored water is about 5xl0g ac-ft 9 or about 135 t!mas the storage capacity
of the surface reser,~irs.
All the water stored in effective pore space is ~holdover~ storage
and is between 200 and 300 times the average amount of holdover storage
in the surface reservoirs. If the plainswide average of precipitation is
10 in., its average yearly volume on the plain is about S .. 3x10⁶ ac-ft.
The water stored in effective pore space is equivalent to all the precip
i tation on the plain in 60 years. These estimates accent the size of the
ground-water resourGe.
Although the volume of stored water is enormous, the effective volume
which it would be practical to use is mu.eh smallero Most of the water is
in dead storage 9 and to pump a large percentage of it would entail heavy
d.rawd.own, high pumping lift 9 and excessive cost. That is, the lo:og-time
average rate of withdrawal cannot exceed the long-term average rate of
replenishment vi thout lffmining11 holdover storage that would not be renewed.
The unconsumed perennial yield of this aquifer is about 402x1.06 ac-ft.
Spread out in the zone of saturation east of King Hill 9 this would occupy
a thickness of only 804 ft of the aquifer.
These very crude estimates surely are substantially in error 9 but
they are use:ful 9 as will be shown latero .AJ.so 9 they belie certain popu
lar notions. For example, they illustrate that the tremendous ground.
water 7ield of the Snake .Biver Plain does not require the pt>esence of ,.

141
AMOUNT OF GBOWD WJ..TER IN STOR/1.Gll\
The ~ouud..,water ~ese:rvo.i:r of t,he Snake ~ 't'e:r Plain east of Xing ~
Rill tmderlies•nearly ll ~llion ~es @:f land. Drilling re!flcrds sh.0w
that wate~bearix!g rocks ue present to depths of at least 1 5 500 ft ~
the :rm.TS Slld. lp600 ft at Idaho Fallso The ma.ximum and a.werage depths o:f
the sa.tura.ted zone are not mo.m be~ue~ neither the full depth nor the
whole area has been e:x:plored.o Neir.-ertheless 9 we e1an estimate the amount
properties.
material is 1 9 000 ±"to The median small-p~re porosity of' the basalt is
a.bout 13 pcit (see p., 56) o The estima.ted e:f'f"e~tive forma.tiona.l porosity
of the basalt f:rom open f'~tures and other> megase::epk voids is about
3o5 pct (see Po 61). !nterflow sediments and sediments intertonga.ed with
the basalt a.ro'Ulld the plain probably average abci:.t 25 pct in porosity.
Their volume is less than that cf the basalt 9 but t,hey raise the overall
average porosity some'What. ?here!cr6, it seems likely that th~ plains
wide average porosity of vate:r-bearing material is about 20 pcto
On that basiss the 10.-million ~e area. ea.et of Xing Hill contains
ic,10 ao-,ft of saturated. material in whicll the total water content is.
2x1o9 ao-fto This is roughly a thou.sand times the combined storage
capa.cii ty of all the surfooe reservoirs on ".,he Snake ru.:,;er above King Rillo
Only a. pa.rt of the total volume of water is in effective pore spMeo
Most of it is in capilla.xy pores and closed voids frcm whicll it would not
drain by gra.vi ty. The pla.inswid.s ave:rage eff ee;t:t 7e pore spa~e - assuming

140
The estimate a.~tually is conserratively low d!lsp:i te inci:reased. con
sumptive use o! water in the .Mild Lake basin sin~e 19270 The estimates
for contributions :from the Cen~~al .and. l3ea"lfe?>h.aad. d."'ainage wl91'e based
on surf a.(Je d:is©baJ:>ge ot st:;:>eams and loas ~f wa.ta:r tc ~e g:t>tmnd in the
streamso Ground-water mlde:n'low from the mo'lmtains and valleys that
never appears at the su:r"!a©e was not ineluded.o The ~<0tal 'lllWcnsumed
'IItlderflow through the Mud Lake basin TD:aY be two or me:t>e times the
amo'llllt estima:ted'o lions of the water is direetl7 available to the lra?S.
lleverthelessj the basin is a major :f~tlOl:r in the reglol:lal eyd..rolog
because through it moves a. large in.c1rement o:f water to the plain in and
near the NRTSo This :f'a.iclt would bear materially- on the water-supply'
problem at the Station if a very large S1lpply were developed in the
future. The area of influence of large fields of heavily pumped wells
might extend far beyond the boundaries of the Sta.tion9 and the wells then
would draw in water from the adjacent areao
Mud Lake and associated small lakes, ponds, and slcughs are fed by
effluent gro'Ulld water~ The hydrclcgr 0£ the basin is ex"t:remely comple~
for it contains extensive btidies -of per~ed ground wa.ter 1 copiously pr~
ductive artesian aquifers in some area.s 9 and a. main zone of i.m.confined
ground. water. All or most o£ the g?'O'll::ld water that is not cionsumed in
the basin :1 s di scllarged southward and southwestwa.T'd.9 becoming a part of
the main body of water in ~e basalt 'beneath the Snake River Plain.

valley and 57 s300 a0=:ft :fr·om. 3ir~'>s. C':t''~E<~ ·tall,;;yo Ls.'te:t e~rima:1.es a:'.'~
given in i>he se©'ti!O!l ~:f tt:i~ :i::'~~:rt %~ ":'.i.e:i ('1Y::'l ume 'C'f 'tltld.@~1.ow t:it:'ougb,
The Mud Lake ba&:tn~ ·wnicli lie.§ i?a~t an.d. !l.~::theas~, c,f the ?10:rth~
part of thei lffiTS, l'.'i,<(;)6~ ",; e~ la:r"ge C!O:t1 t:f'ibuf,j .:'~ c:f g:"O'clnd -.-af;;e,7: by UlJ.i£l..."'
flow from the va11~y~ and mo't:il1ts:ins 'b¢ th.~ r..,,T.''t'tc 9 ch:i. 1:.fly the, Oentmu:dal
and l3eave:t:h~ Mc:u:::t;s;Jns" St:.ti a.~6 6-"':'at"riagi:, :',.:w.4 ·~ ".::h~ Mud. Lake bas.in is
very small 0 and :o.,v, wate:r lea.;;'etB :;:1,1;:, :::a.s1.:r:. as Et.l.!"!·aQ:1:1 ?"..::n,,ri':f o Stearn~ and.
Oth6:r>s (193Sr Po 2Jt) esH.lta:;;ei tha't the 0.:uid<!!!:ti'law eeollt:r·ibu.ticna tc the
plain :from :Beave:r' and Ca.mas 0:reeks abij·v~ Ditbois d.\:..'t"i,:ng 1921-24 ave:r,,aged
a.bout 109 0 000 a~re,-,i'e;et anm:ially 9 a.ni '\:,hat !:rom Med.ic:'.'..ne Lodge Cr-eek vat
about 49 ~ 500 a.ci-f t. Mu~h of the gx 011.!id wat:el" is ussd. f o:r irrlga tion in
the Mud Lake ba.E:in. 9 bu.t. t,he unc::n..;t,ln&i r-iE<sicilla1 gr-::i1:::i..-i~wa.te:r recllarge
p:r'Obably 1 e. on. the o:::od.e.:r o:f 75 9 :oj a.c-f .;;, ~ l.7-! a.ic:. :ic:r.r a la:g1:, :i.nc;r-l!Illsn.t
to the basin is beli.e~sd to bs cc:o:t-:rlbu:~~5. 'by 'UilG.$:t:'!'low !:r>~m Egin :Be:llcilj
an irrigated area ea.st ct the basino SteaI"nS and. ci;hers eatima:ted that
that contribution in 1920,,.27 a'l'fersged not less than l4o~ooo ac.-ft yea:-ly.
ill the estimates W6re crud~ and a:>e ou.~d.at,ei be~se of ~®S$q~t
deirelopmen tal us~ c:f ad.di tlonal ~a-..nd water O b'l::t theay Ehow t,ha:;, the Mud
Lake basin is rui. imp·:C~':."Bllt; hydrdcgl~ c::o:mpe,r~e.!'.!".: cf the SnaJts B.ive:r Plaino

13s
:f'rom adjacent inte:rmontane valleys and highlands and from adjacent :parts
of the pla:lno Area.a that cc:.mt:11nlte tributary underflow include the
ea.stern slope of the ]ig Lost River Ba.nge, the Lemhi Ra.!lge 9 the ]eaver
head Mountains 9 the Centennial Range south of the Salmon River and
OontinentaJ. DiVide 9 intervening valleysi and the Mud Lake basino
Under.flow :from Nearby Valleys
The :Big Lost River VaJ.ley above Arco is one source o:f' recharge to
the Snake River Plaino Water discharged by- underflow along the channel
o:f' the riveri as well as deep percolation losses from irrigation, joins
a local body of ground water in the valley and moves by u:cder.f'low into
the plain. The water passes south o:f' the NRTS without contributing
directly to wells on the Station 0 but it helps to maintain storage in
the regional ground-water ra-servciro Stea.ms and others (193S 0 p. 245)
estimated that the average contribution of ground-water underflow :from
the :Big Lost River Valle,' to the plain dU?'ing the period 1920-27 was.
226iooo a.c-ft yearly. The estimate was based largely on stream!low
depletion and estimates of evapotranspiratione Very likely' the actual
contribution is nearer 300,000 ac-:f't.
Underflow :from the valleys of the Little Lost River and Bir~ Creek
directly replenishes the ground water "beneath the NRI!So Ground water
:from the valley of Little Lost Ri var enters the Station beneath the
cent:ral pa.rt o£ its northwest bound.ary 9 and under.flow from Birch Creek
enters from the north. Stea...~ and others (19389 po 232, ~3) estimated. ,
that the average annual contributions of ground water to the Snake River

137
The above estimates were d.eri. vecl by over-simplified. methods and. th.er
are indicative only. !hey mq be revised. when longer records of stream-,,
flow are avaq.able and when other pertinent data a.re obtained. Most of
the river water reaches the zone of saturation in parts of the E'R!S where
it cannot be recovered directly by existing wells. Nevertheless, the
water helps to maintain regional groim.d-water storage and is, in effect,
a contribution to the ~S s'tlppl.y.
Ephemeral Draina.gevqs and Pl~
Small pl~s and undrained. depressions a.re sea.ttered widely over the
D!S and. most of these contain ponded water after occasional periods of
flash ranoff. Records of measurements in three playas along the ::Sig Lost
Jliver channel show the general magnit'tlde of rates of infiltration in the
plqas (see P• 30-35). The data are important mainly because they show
that in:f'il tration does occur in the plEqaS despite the low permeabili t7
of the sediments. .The observed. infiltration occurred during transient
conditions that Will recur o:cly ra.rel7, so no special computation was
ma.de of recharge in plqa areas. !he small average amount of 7ear11"
recharge from the playas vas included automatically in the previous
estimates of average direct infiltration of precipitation.
Recharge 'Ez. Underfi ow
Recharge by underflow is by far the larger source o:.f ground-water
replenishment in the vicinity of the NRTS and perhaps in the whole Snake
River Plain. Ground 1'18.ter beneath the Nm'S is replenished by underflow

or was dissipated by avapotranspiration between station land Big Lost
River pl~a. 3o Some transpiration occurred in the pl~a a.t'ea.s and in a
few places a.long the rl"J'e?' channel whia?'a sioil and gra:wel retain suffi
cient soil moisture to support sparse growths of willow9 wildrose 0 and
cottonwoodo But most of' the evapotranspiration loss was by evaporation.
Evaporation from ~he river and transpiration a.long its borders in the ~
mile rea.cll in the NI!.TS is ass-amed. to have averaged O.,l ft/da:y'. !rhe 8.1:'ea
o:f the evapot:ra.nspiration belt is about 200 ae.. !rhe estimated evapotrans
piration loss was about 20 a.c-ft/day 9 or slightly more than 8~500 ~ft
during the 426-da.y penodo The residual dis~ge of the river during
that period - about 128,000 ao-.ft (39 billion gallons) - presumably
became ground-water rechargeo
The mean discharge o:f the river past station l during the 9-year
period of record (see table l) was a.bout 58 ds (seep. 14). None of the
water escaped from the NRTS by surface :runoff. !rhe e:halmel at station l
is in basalt and u.:ngaged i.mderflow past the Station probably is negli
gible. Ordinarily 9 the river does not extend mucll beyond the old div~
sion dam in se~o 60 T. 2 N. 9 R. 9 E. Evapotranspiration loss in the
reach of a ff!M miles below the Station is probably about 311500 a.o-ft/yr.
The estimated average yearly contribution of the Eig Lost River to
ground-water recllarge below stati~n l during the period 1947-55 was about
42 9 000 ac-ft, and the average daily- contribution was about 115 ao-ft -
substantially more than the total amount of water for which the Commission
had filed application :for water rigb.tso "

lf.n.e:re basalt is expossd {nei soil @ower} 0 water from heavy t:>ain and.
snowmel t enters the ~UD.d ra.pid.1~ 0 and. the. proporticn r'ea.ching the ioone
of sa.tu-m~ion is higher than in s@il=©@Te:r.ad. areaiit,., D5Pe:t:i.ding ~ the
season.al distribution and storm-intensity of p~ecipitation 9 and on the
snow ~over and its melting rate 9 g!"ound-vater re~ge on the Station ma.v
range from nil in some years to an i~h. or more in ~th.er years o A.ssum:b:ig
an average of Oo25 :lno yearly 9 the vol:uma of di?"e~t rei~ge on the
entire station (about 44nOOO oo) ia a.bout 900 a~ :ft 0 equivalent to a con
tinuous flow e,f lo25 ~s.. This is about equa.l to the estima:ted CJonsumptive
use by NRTS fa.c:ili ties in 1955 and aboU,t 30 p©t of eietima:tscl g:!:"oss pu.mpage
in that yearo
Re~ge: :trom. Surf a~e Drainag!!@lsi
:Big Lost ru."f'er
Upstream runoff in the Big Lost River :ls stored. in Mac~ Reservoir
and. is dive:r>ted. a.bove kr'Go for inoigat:ton. E:x:~ess runoff which epills
over the dam is sag:mentF.ld by return flC;"W :t:t?~m il:"!"iga:ti.ed a:r·eas below the
reservoir and is discll.arged. onto the plain. Some of this water evaporates 9
but a large pereentage sinks into the river 'bed. and becomes ground-wa.t-el'c
The river loses water in its entir>e ciou.T'se a.aoss the plain below the
irrigated area and eventuallf di&appea.T'So
The gage record at station l ( table lf appen.di:x: 2) shows that fr'Olm
August 1 9 1951 to Ssptem.be:" 300 19529 a period ot e~eptioilally high
runoff (see figt:L!"e 2) 0 the rl~er- disci1a·r:cged a'i:iout 136 0 960 aCl=ft (4402
billion gallons) of wateT pa.st the Station. The river channel is perme
able throughout the NRTS 9 and. all the water, ei.the!' sank into the gr~'tmd
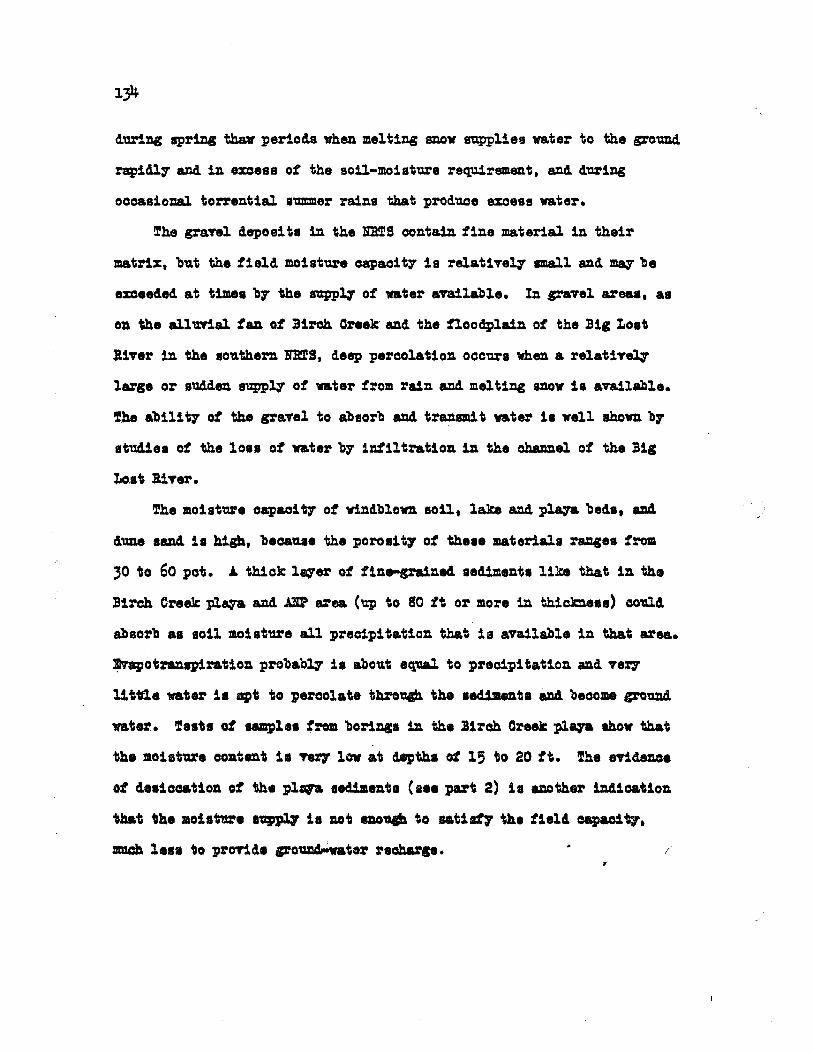
1yi.
dun.Jig spring thaY periods when melting snov supplies water to the ground
:rapidl7 and in excess of the soil-moisture requirement, and during
occaaioJl&l. torrential a"m!m1er rains that produce excess water.
!he granl deposits 1n the ~S contain fine material 1n their
matrix, but the :tield moisture capaoit7 is :relat1vel7 small and ~ 'be
exceeded at times b7 the suppl.7 of water available. In gravel areas, aa
on "11• allUTial tan ot :Birch ONek· and the floodplain ot the :Big I.oat
liver in the 1outhern !li'l!S, deep percolation occurs when a relativ~
large or sudden auppl7 ot water :trom rain and melting snow is available.
!he abili t7 ot the g:"avel to absorb and transmit w.ter 1a well ahown b7
attldiea of the loaa o:t water b7 im'il tration in the ohamiel o:t the :Big
l.io.8" 31 ver.
!he moisture oapacitjr ot windblown soil, lake and. plqa beda, and.
dune sand ia high, becauae the poro1it7 of theae 21ateriala raz:icea :trom
30 to 60 pct. .A. thick: lqer ot :f'ine,-grained. sediments like that in the
:Birch Creek plqa and .m area (up to 80 ft or more in thicmesa) could
absorb as soil 110iature all precipitation that is available in that area.
~otranapiratiozi probabl7 ia about eq-aal to precipitation and ver7
Ut'iile w.ter 1a a:pt to percolate tbroq:11 the aed.iJaenta &Zl4 become gl'Ound
water. !eat, of aamp1H :f'rom borings in the Jirch Creek pl.qa lhov that
the 11oiature contct ia ft%7 low at depth.a at 15 -to 20 :tt. The mdm:l.ae
ot desiccation of the plqa 1ed.imenta (ae• part 2) 11 cother ind.1caUon
'bhat \he 11oi1t'ar• n:ppl7 ia noi coqh to u.tia:t7 the field. oapaci'71

The first oall on water applied to the land, vh~the:r> by pr>ee:i:pi ta-
transpired by pla.utso Water pereclatee d.ownward. to the zone of sat'tlr&
tion o~ where or when thare is an ex~ese over the soil-moisture dema.nd.o
Precipitation on the plain is lov and. is rather well distributed tl:l.f'ougb.
the ;rear o Where the:t"e is soil Clover on the ba.ss.1 t g most preeipi tation
be~mes soil moisture, and Te?7 little is left over for reoharge.
The normal precipitation. &"lera,g~d fetir the Snake River Plain as a
whole. is about 10 ino a yea.ro Potential eva.potranspira.tion is a.bout
25 in., but the ao:tua.l amount never equals the potential be~use not
enough water is a.va.Usbleo On the ~the!' handp not all pree.ipi ta.ti.on is
consumed1 bees.use tempora.r;y excesses o:f' moistu?'e c0csur. From studies
made elsevhere 9 the writer bel:ievee that a.bout Oo 75 in. cf the precip1 ta
tion on the plain 'be0omes ground.-wa.te:c recharge ;yearly'. If so~ in the
l 7 t 000 sq mi (lOi 900,000 ac) of the Snake lis;rer P':0 3.in the total volume cf
recharge directly from precipi ta.ti.on woul.d be a.bout 6Sl~ 000 aerft annually.
lfhe assumed average amount of :t"e~harge cwmot, of' course, be applied
to specific areas on a unit basis. On the NRTS, :for examplep precipita
tion is 7 o5 in. per year - barely enough to keep the natiTe vegetation
alive. During warm months potential eva.potra.uspira.tion far ex~eed..s precip
i ta.tionv and min in warm months probably d.oee not oa.use recllarge in areas
vb.ere there is soil ecvero Du..""ing winter months the ground. iB frozen.
Moisture transfer in and through frozen ground probably is a.lm:,st entirely
in the vapor phase P so the p:rlzwipal recllarging of ground water oceurs

132
!he Snake lliver Plain is the gatheriDg ground for water contributed.
by a drainage area more than four times the size of the :plain. The con
tributiDg area includes most of the 35,soo sq mi in the drai?1age basin
o:t the Snake Ri.ver and its tributaries east of Xillg :S:111. '?he plain is
about hal:t that area, the rest being mountains and tributa.17 vallqs.
Precipitation is the ultimate source of all water in the basin
(iporing the small amount o! jUTenile water that m&7' rise trom depth • .)
Low rates o! precipitation preT&il throughout the basalt :plain, but the
rates in the surrounding area, especially the mountains• are much higher
( see p. S). Considerably :more than half the water that ul tilll&tel7
reaches the plain originates aa precipitation on adjoining hichlu4s.
Some ground water beneath the plain is· derived. from direct intil
tration and deep percolation.of' precipitation. Some is from infiltration
of s"Urface water aloDg the channels and in flooded areas of suri'ace
streams. Some is contributed. by und.er.f'low from vallqs adjoining the
plain. J.n4 some is acquired b;r mass percolation i'rom mountain areaa
adjacent to the plain. On the ~S, recharge occurs directly from
precipitation; by in:f'iltration from the :Big Lost Ri.ver and :from ephemeral
and intermittent drainagewa;rs and plqa basins; b;y underflow from the
vaJ.lqs of' the :Big Lost and Little Lost R1 vers and :Birch. Oreek; b;r ,m,4~
flow from the north and northeast; and. b;r percolati01, from adj()inil'lC
toothilla. The contributions :!rom each aovce differ videl.7 in amoim.'b,
but only a general q,uantitative eTaluation oan be made at this time. )

131
sequence markedly affect their permea.bili i--y B espee:iially in a direction
perpendio;.i.lar to the bed.ding planes (verti~al permeability). This :ts .
illustrated by the two samples from To 2 N. 9 Ro 29 E. 9 S$:Bl¼p S. ,l
(see table 17 0 p., 122). The: pemea.'bility in a d.ireeition parallel to
the 'bedding (horizontal permeability) usually exceeds the verti~
permeability. Unfortunately 0 these samples were disturbed and the
illustration is not spe~ta.oula.ro At infiltration test site n'IJil!.ber 4
(T. 5 N. 9 R. 31 E.; 5W¼ 0 S. 9) a thin silt leM was observed at the d~~h
of sampling c A sample ( sample; 55!D.A.20) of the upper sand had a pe:rme
a.bili ty thl"ee times as great as a sample of the same sand with contained
silt lens ( sample 55ID.A20a).. !he variations in ve:r>tir.}al permeability
are illustrated. by tests of samples f':rom suc4Se~is;ive depths at several
locations (figure 15). These variations in the permeability of various
~rs in stratified sediments a.re a prino:ipal obstacle to accro.ra.te
calcrulation of in:f'ilt:r'ation rates in the zone cf ae:r>a:tiono

,,

" 1J 0
" ~ a, /p "' "
.,,, R. 31 E., SEt. 27
2 /
< w <.) ' <( ' 1.1.. ' ~ ' Cl) 3 0 z 5 T.6N.,R. 31 E., ~ SE¼NW¼ SEC. '2:T ...J w co I- 4 w ~ z
-i: I-a. ~ 5
CONNECTING LINES IDENTIFY THE SERIES; THEY DO NOT SHOW PERMEABILITY AT INTERVENING DEPTHS.
6
7--:--__ __._ _ __,_ _ _.___-1,_..L-L...L...L-l-----1----L___JL_J__L...l_l_.L..L ___ ..L_ _ __J__..t_L_JL_L.....L,~---L-___J
o. I 10 PERI-EABILllY IN GALLONS PER DAY PER SQUARE FOOT
FIGURE 15.-VARIATIONS tN PE~MEABll ITV WITH DEPTN IN TWO SERIEJ, OF SAMPLES.


127
time, t
Figure 14. - Variable - head permeometer.
GPO 9918~7

126
The greatest permeability recorded exceeded 4oo gpd per sq ft and
the least was 0.005 gpd per sq ft. In general, the playa sediments have
very low permeabilities - 10 gpd per sq ft or less, and the loess is
only slightly more permeable. The Terreton lake bed sediments have
medium-range permeabilities. Dune sands probably are the most permeable
of all the :fine-grained sediments.
The apparent permeability of fine-grained samples that were dis
ttirbed sampli?l& are abnormally high because water moved mainly through.
fractures rather than through. the natural pores. Some of the clq
samples that were moist when collected dried and shrank before they were
tested. The ann'Dl.ar space between the shrlmken sample and the enclosing
cylinders was an unna.ttiral avenue for ready movement of water.

125
. level in a manom~'ter ~onne©ted ii>-:: a sample- tbrough w.hiro wa:~er is per--
the sample in c.'lent:t:m~i,e:r0 i:s ~ o~ is 'the d!memi£;o!!.less :ratio cf the vis,,-.,,
in w:b.id:l k is in gallons pe:r day pe;r "'\'l':la.t<~ ;t\',:'.:t- tmd.e:r a h.,vd.'t"au.li©
gradient of rule foot per :foot at. 60~ s A ana. a ar~ in ~quare Gentimete~s 9
~ is dimensionles~o

Table 17 .-Laboratory permeability of core samples of fine-grained sediments--Continued
Location of source
(township, range, and section)
T. 3 N. I :a. 32 I.
s:m¼SE¼, s. 29
1!. 2 :H., :a. 29 :a:.
sl!l¼NE¼, s. 1
~. ~- l
T. 2 N., R. 30 JD.
NW¼NW¼, S. 15
T. 2 N., R. 31 E.
s:m¼:a, s. 16 SWt , S. 35 SW¼ , S. 35
Depth (ft below
land surface)
o.4
13.0
. 13.Q
1.Q
o.4
o.4 o.6 0.5
Field sample number
7V
lH
2V
14V
13v llV 12V
Laboratoey sample number
1/
531D.A.4
53IDA1
53IDJ.2
Description of
material
Soil mantle
SU t, clayey
55IDA22 Loess
531DA.S
5JIDA.7
531DA6
Coefficient of
permeability (meinzers)
120
o.6
o.4
.,. 17
30
Remarks
Slightly disturbed
Horizontal sample; greatly disturbed
Vertical sample; greatly disturbed
Slightly disturbed
l/ Laboratory numbers were assigned to samples tested in the Hydrologic Laboratory, LiJ1.coln, Nebraska. No laboratory numbers were assigned to samples tested at the temporary field laboratory.

Table 17 .-Laboratory permeability of core samples of fine-grained sediments--Continued
Location of Depth Field Laboratory
Description Coefficient source (ft below· sample sample of of Remarks
(township, range, land surface) number number
material permeability and section} 11 (meinzers) '
T. 6 N., R. 3i E.
Sil s. 27 o.s 22V 531DA11 1a S NW , s. 27 2.3 2av 53IDA15 s ' s. 27 ~-2 2 V 53IDA12 10 SJ!liNWt, s. 27 .1 25V 52IDA13 12
Sa!IW¼, S, 27 5.4 26v 531DA13 4 SW, S. 34 2.0 55IDAl9 Clay, silty 1
s swt· s. 9 6.o 55IDA20 Silt, clayey 13g SE SW , S. 9 6.o 55IDA20a Sand, silty ~
NW¼, S. 20 Surface 55IDA23 Dune sand 190
T. 5 N., R. 30,J.
$Jilt=, s. 2 o.4 35v 52ID~~ 0.03 =· s. 2 0.3 36v 52IDA! 0.005
, s. 2 1.0 37V 52IDA5 Sand, med. 420 , s. 3 1.0 3v 52IDAl Silty, cl~ey 22
=a: s. 3 1.6 4v Sand, fine 17 s. 3 2.5 5V 531DA.3 Silt 41
:tnt: s. 3 t~ 6v Sand 120 s. 3 20V l Disturbed
'.' \,-t I t ,/ ... . ,. ' ~~.: J,,J ~. .... r .... ., ., ,. ;·
NEiNE¼, s. 3 ·li-i.5 '21V· ·'Sima; ~/silt ., .. 9 Disturbed
~er t =: s. 3 o.4 av 0.3 \.,-I
s. 3 o.~ 9v 53IDA.5 52 Slightly disturbed

Table 17.-Laboratory permeability of core samples of fine-grained sediments .... N N
Location of Depth Field Laboratory
Description Coefficient·· source (ft below sample sample of of Remarks
(township, range, number permeability and section) land surface) number 11 material (meinzers)
T. 6 N. • R. 31 E.
li' s. 13 o.6 3SV 52IDA6 Ola;r, silty, 80 Greatly disturbed
SW. • s. 13 1.~ ,9v 52ID.A.7 Oley, silty 22 Greatly disturbed
:1 : s. 13 1.8 ov 52ID.A.8 Oley, silty 4 Greatly disturbed s. 13 3.0 55IDAl8 Olay, silty 10
{~ ~a· s. 24 o.6 34v 53IDAl6 38 :r· s. 24 o.~ 19v 53IDA10 3 Slightly disturbed
• s. 27 1.0 55IDA21 Oley I silty 12 NW I s. 27 o.6 1SV 220
it s. 27 o.6 15V 52IDAl2 Sand, silty 160 s. 27 1.0 16v Dune sand 180 s. 27 1.4 27V 52ID.A.3 Sand, silty 38 s. 27 2.2 28V 5JIDA14 0.5 Slightly disturbed
it s. 27 ~-1 29V 2 s. 27 .o 30v 52IDAlO Olq, silty 12 s. 27 4.6 31v 52IDA2 Olay, silty 10 s. 27 5.6 32v 52ID.A.11 o.t+
N~~I' s. 27 6.7 33v 32 s NW I s. 27 o.s 17v 53IDA9 30
~
1/ See footnote at end of table
\ ..

121
seepage l~sses from the :Big Ltii,rt Rt 'lfe;:r :tn ~imi1ar sediments o .A.uget'
salI;Pling showed. that the water £rem the in.:fil :;:r·ometer sp?"ead. laterally
through a 'Wide zone. The volume o!· the o:rudsly heml sphsri~a.l body of
sediment wb.ie;h was wetted. beneath infiltromei>s:r.> dte 40 for e,:ample9 was
a:ppro:.d.mately 1 9 000 ~tibie'J f.eeto At the wi:rul.a:ted. pcrosity 9 it would.
requir>e most of the water that entered.. the gl"ound. just tc moisten the
earth 9 leaving little or none to per~clate downward 'by g.r>avity. Much cf
the water was pulled by ~pillatl ty away from the t]Ol'OOllll. cf earth imme=
diately 'imd.e:r> the ~ylind.ero Not u:r:.til the sedimen:ts we1."e saturated.
would the obsen"ed. i:n.f'i1 t:<>ation ?"ate approacll the pe:rmeabili ty o Most of
the tests were operated for- about a week~ wher-ea.s a test of moderatel;y
fine material probably would have to be r,..m for several weeks to get a.
true infiltration ra.teo In very fine-,,grained material an infiltrometer
test might require months~
Relatively undistttt"bed. samples ~f a wld.s range of the fine-graine.i
sediments from the NB.TS we?'a tes~ed.. in ths laboratory. The samples were
taken with spe~ially const~ted coririg equipment, in 2-inc:h diameter
cylinders. The cylinders we:os ~pped 0 sealed and transported. to the
laboratory where the samples we:roe tested intact in the ~ylind.ers. The
res'Ul ts of the laboratory tests are summarbed in table 17 o Some of the
samples were unavoidably disturbed du.~ing oo~ing and tra.nsportings a.ncl
these a.re sui ta.bly noted i.n. the table"

Table 16 .-lnfil tration rates through double-ring infil trometer
Test Nature of material Infiltration rate Remat'ks Location number £t/{w;' gpd/fttt.
. --
T. 6 N., R. 31 E., NW¼ Sec. 13 l Silty clay, calcareous; LO 7.5 Inside ring
in l3i:rch Creek pll3¥a 3.2 24 Outs:ld.a :r:lng near .ANP site 2.8 21 Both rings
SW¼ Secs 34 3 Silty cley, calcaraousp in Big Lost River l.,8 13 Both 1··:lngs playa 3 ( 1;1hort t:1.me)
9.5 Tl Both rings (long t:hne)
T. 5 N., R. 31 lll. 5 Fine sandp s1lty 11 and SWt S~c. .9 4 silta clayey~ Terreton
Lake beds 5.7 43 Both rings
T., 4 N. • R. 30 E.~ Fine to coarse gravel, sw¼ Sec. 29 5 sandy, with some cal-
careous cement; Big Lost R:lver alluvium in . borrow pit E. of STR 41 306 Both rings

119
~elow the cylinde~a the bulb of w~t~ eal"th during ea.cll teat was
mwili wider th.an the dia.metel" of the i:nfiltromste:rcc Test ~o 4 was ma.de
in the b~ttom cf a b~r.row pit 4 feiet d.eiep in the SZ¼SW¼ See;., 9s T. 5 No»
Ro 31 lll., The a~th materials prtrbably are Ten.oaton lake 'bed.s 9 consisting
of very f'ine;-grained. silty sand which is dense;~ oomp~ted and d.eyo !hese
bed.s overlie basalt at a clepth of about 7 .6 feet belc,w the nat'Ul:'&l land
surfa.~e. The natural moisture oontent cf the soil at infil t:ration test
site 4 was about 12 percente d.epend.1:ng on deptho The moisture C'lontent
at the outside of the lower end of tb.e ~ylini~r r~ee to lS percentr and
the lS-percent belt extended downward tc a pc!nt 3o5 !&et below the
cylinder and laterally 4 feet from the oen~er line of the eylindero
The results of seve~al infiltration tests are summarized in table
16. !est- number 5 is included. to ~ompare in.filtntion :rates in gravel
with those in finer sedi:m.sntso The data. indie.a:te that the infiltration
rates would be e::::Clleedingl,- low in the fine-~a.ined :ma.terlsle that ~c,re:o
l1'tlCh cf the n.o:r-theI'Il one-thi;r,d er! the Station, but the;y would be reler
tive~ high in the :Big Lost Rive:r a.lluns.l gravels iil the i:entr>al and
southern part cf the Stat1eno The dune sands that mantle much of the
northern o:ne-third of the Station would have moderate infiltration
rates. No in!iltf'Ometer tests were ms.de in the medium--grained sediments
of the central pa.rt of the Stationp but labomteey pe:omeability teats
indiC'la.te that the in:fil tration rates would be on the order of 25 to 50
ft per dayo
These resw.ts are not poEitive in.d!ca.tions of infilt:r'ation rates
that ~ be expeoited in seepage :pends for waste disposal. In all ca.see
the rates are h.igher than those compuo;ed frcm mea.swcement a! natural

llS
float valves maintained. ::he wai:e?' in 'i;:>:;,bb. C!'Jlind.e?'s a.t constant levels ..
The flow of water was calculatoo. frcm the re~©rd ~ts of watsr-level
recorders in each tank. The hiead. of wa:2a'.1:' in the cylinders was slightly
less than 5 ft. Covers over the tank trailer and th~ cylinders reduced
evaporation ..
Vertical :f'low th.rough inhomoganroous sediments is divergent 9 but ·the
basic theory applicable to in:f'iltrometer teats requires that downward
flow into and thrio1J8h the sediments be nond.ivergent. Where a subsurl'a.ce
horizon is less permeable th.an the horizon in or di:recitly beneath the
infiltration cyli:nd.ers 1 £'low will be divergent. Many investigators have
believed that divergent-now effects can be minimized if the inf'il tration
cylinder is surrounded by a larger guard cylinder, thus the term double- ·
ring inf'ilt:rometero The i:o:f'ilt:iation rate :from the inner cylinder sup
posedly is a. truer rate than that from the outer cylinder~ Other inves
tigators have found no significant difference "between in:f'il tration rates
obtained with the si?lgl~I"!ng infil trometer and do'\ible,,.:rlng infil trometers.
However, these investigators usually carried on their tests in uniform
soils where there was small cha.Il.ce !or diYargent :flowo As the question is
controversial 9 the double-rl:cg in:f'ilt:rometer was used in the belief' that
the guard ring at least does not d.is'lmrb a. testo The results show th.at
the guard ri:cg does have an e!fe~t 9 b-a.t which in:f'iltra.tion rate to accept
(inner or outer) remains contr,oversialo
We tested a moderate range of sediment types at wid& intervals on a ,,.
north-south line th.rough the norlhern NliTS. Determinations of the
moisture content were made of soil samples fMm each infiltrometer site
to show the soil-moisture distribution be:f'ore and a.t the end of the test.

117
ill. the fi:ue=gra.:i.n.ed. sea.:tmen t :1:1 s.:re p~ t;~n.t,ia.lly U,seful 9 in 'll"a'ryi:ng
degrees~ as med.la :for the d.ispc,sa.l cf :fqu:td waste an,d for the burial o:f
solid was'te. Theil" chief nattn.:·al hYd.!""lc;g;J.Ct :fun.ctfon~ however 9 is to
store soi.1 moist'tll"e 9 most of 'Which is t;r,anspi.rea. and evaporated"
Whereas the Goa.rse-grained sediments we:r-e favorable :fo?' ready infil
tration a.nd perel{,la:ticn of wa:\:.erD the :fine,,=g:,,a:ined s1=,d.imen:t;~ are mum less
favorable.. \fne:re !:m.ly fi-:n.e-g:rained materials ar-e p:ress:t,, 9 spe~ial p:r>ob·
leme arise in liquld-wasie disp·:isal 8 drainage cf :??!;;ad sabgrades 9 mud
contrclv stability o:f materials und~;r, st'.t"'l::1cf:-ural 1oads 9 and ot,her i'M'i:iors.
The rates of inf:ilt:ra~:::on in the pleyas wer·e i:.mmma!':hed en page~ 30-=
350 They ind.i:::,at0e cnly the general !.1:rd.e:r c:f ma.grd ~ude ct :rates that
might be expe;;Jted :i.n a.rtUicdal infil t,:,a.tion pends in those areas i! the
disposed liquid did not cllemic:ally al:ter th€' :fine-=grained clayey sed.i=
ments and redwe thei.r pe:rmea.bili ty.
field by means cf' infil t,:r"(J,m~t.i:ir-s. The ps:no.ea.ti.1:1.t'Y cf ~hl!lst. sediments
was tested in a tempo:r'a..""Y field labc:rato:ry a:o.d in the h.yd.rclogic labor
atory. The tests will be dea~ribed briefly wlth a tabulation of the
resuJ. ts.
Several field lr.f:tl +:ration tEscs we're mad.1:: in 1955 'W':! tb double-rill€
infil trometers. The ap:paTa:h,:ts was a 6.,.-,,:;,r.,i. sf:,e.el cyl :inde?' c,~nte!"ed in a.n
lS-in~,h e;ylind.er 0 beth 5-ft long. !t was installed with its br.,,ttom 4 ft

116
The ma:x:::1mum permeability observed during a test (saturation perme
ability) probably is nea.?' the field permeabilities of material in the
zone of saturation, so we report that value as the permeability of a
sample. However 9 the permeability of the repacked sample may differ
appreciably from that of the Wld.isturbed material in nature.
The sur!icial sediments in the NRI!S seldom are saturated except in
the upper few inches or for short times. Therefore 0 the saturated perme
ability of a sample in the laboratory represents no colllI!lon natural field
condition in the zone of aeration9 and the laboratory value can not be
used directly to compute the rate at which infiltration by unsaturated
:flow would occur. The permeability varies directly with the degree of .
saturation 9 and values decrease at saturations of less than 100 percent.
Nevertheless 9 it is desirable to have a uniform basis for comparing the
permeability of various materials. As it is dif'f'icul t to determine
permeability at a predetermined degree of' saturation, the saturated
permeability of' each sample is a value that can be defined and reproduced.
FINE-GRAINED SEDIMENTS
The pla-va deposits and Terreton lake beds that overlie the Snake
River basalt in the northern part of the ml.TS are fine grained and their
permeability is lowo Nevertheless 9 the material. is porous and the sedi
ments can slowly absorb substantial amounts of water o The loess that
mantles the basalt and alluvium in mu.ch of the N:RTS is slightly more
permeable than the plqa and lake bedso The 'Windblown f:i:ne sand, which
is prevalent in the northern part of the Station is moderately permeable.

115
Faotcrs th.a~ affe~t permeabili t;r meastu"ements.,-I:! readings are
taken a.t least every hour during permeability ci.6termi:na.tiona~ the follow
ing even1s usually oeetnro During a. short period. 9 the apparent psrM&'bil
it7 increases to a. mi.rl:nrom va.l:a.5. Thereatte:t\ the permea.bili:t7 decreases,
finall7 ~levelill€-Cff~ at a minimun valW5o This general trend persists
during several to many dqs. Alsop the permea."bility usually f'l~tuates
dving e&Clh dey.,
!he permeability inc:rea.see while air is being abao,.-bed from th.e
sa.mplep reaclling a. maximum when all gas is absorbed and saturation of the
samplG poree is oomplei~e .. The a.1%" or other gases trapped in a sample
plugs pore spaces and red~es the apparent permea.bili ty. A vacuum qatem
is used to de-air the tap water used. a.s the percolation fluid. !he de
aired water absorbs air and. earn es it out of the sample. !he pore
spaces in coarse-grained sed.imentfi are generally large eno,:igh that mu.ch.
of the air is flushed out of the sample. mecma.nieall.y ratb.er than 'beizig
absc1"bed in the f'lt:ido TherefcND the maxi.main pf;?'!!lea.bili ty for eoa.rae
grained sediments usually is reacl:.ed very early in t.he test.
Max1ma.m permeability is reached when all gases have been removed and
the sample is completelj" saturated. However, by that time other factor&
tend to red~e tb.e permeabilit,-. For examplep the water may contain.
enough solid matter o! microsecpi~ size to plug some pores in the sample
or in the filter disks at ea.ch end of the sample. Some of the :f'iner
particles o:f the sample migra.tg and plug poreso Small amounts of dis
solved substances in the water may reao:t cllemio:a.l~ nth the samplep
especially- i! it contains an appreciable amount of collcidal clq part
icles. The development and growth of miGroorganisme also would decrease
the penieability.

./

GPO 9918S7
113
upper head tank
.... - ----,
lower head tank
Temperature C
Figure 13. - Constant -head permeometer.
The disturbed samples were pocked into the permeameter cylinders with o jolting- type
pocking machine. ( Denver Hydro logic Laboratory.}
!

112
Laboratory method of anaj.zsis.-Permeability is determined in the
laboratory by observing the rate 0£ percolation of water through a sample
o:r known length and cross-sectional area. The coef'ficients for samples
o:r the coarse-grained sediments were determined by means of constant-head.
permeameters in which the flow of water was vertically upward through the
material (fig. 13).
The constant-head. method requires that the rate of discharge tb.rouch
a sample be measured while the d.if:f'erence in head of water at the top and.
bottom of the sample is held constant. From Darey' s Law, the basic formtlla
for the constant-head permeameter is
k = At~h) C~ (6)
where k is the coefficient of permeability, Q, is the volume of percolation,
L is the length of the sample, A is the cross-sectional area of the
sample eylinder, t is the length of the period of flow, .6h is the dif
ference in head. at the top and bottom of the sample and CT is a temper
ature correction to convert the :permeability at a:1J:Y given temperature to
that at 60 degrees Fahrenheit. E:xpressi:cg permeability in meinzers, the
previous formula becomes
k _ 21,200 r= °'? - At(~h (7)
in which k is in gallons per dair per square foot under a qd.ratllic
gradient of one foot per :f' oot at 60 degrees Fahrenheit, Q, is in cubic
centimeters, L and .6h are in centimeters, A is in square centimeters, .
tis in seconds, and Ci.r is the ratio of the viscosity of water~at the
observed temperature to the viscosity at 60 degrees Fahrenheit.

Table 15.--Laboratory permea'b:llil;y of repacked samplss of coa't'se-grained aed.iments
Location of sourC2te Desc,rlptlon of
( tovmsh:1.p, range location ·-·-~n~L§§l.~ti.9.!!l.., _______ _
Depth Laboratory Coefffoi.ent (().f; (ft below samplie permeab:Ui ty,
land nmriber (gal/dB¥/ $q f't) , __ s_·u:_:rf'aee L.---------·--------····---- ___ ..
T. 3 N., R. 29 E., FoundaUon ex~avaUon. 23 55lDA25 ¼60 SE¼, 9 Sec. 14 MTR
SW¼SW¼ 9 Se~~ 34 Gra,rel pH, north of EBR 6 551DA2'; 560
T. 4 N. 9 R. 30 E., Gravel pl!;, Blg Lo?.'!t g 551DA26 700 SW¼, Seis. 15 R:lve:i!:'
SW¼i See. 23 Gravel p:i.ts east o:f STR 8 55IDA2'-l '780 --------------------· -·--- -----------

110
gradient of one foot per foot at a temperature of 6o degrees Fahre:nheit
(the unit is sometimes called a meinzer)o Bee1ause water is specified,
Viscosity and density effects are neglected.
Coefficients of permeability0 ranging from OoOOOOl to 309 000
gallons per ~ per square foot 0 have been measured in the laborato?'7.
The value of the coefficient depends in general upon the degree of sort
ing and ttpon the arl'allgement and sizes of particlaso Usually it is low
for clay and other fine-grained or tightl~cemented materials 9 and high
for coarse 9 clean gravelo Few productive Il&t"ll.ral water-bearing materials
have coeff'lcients less than 10, and for most it is above 100 ..
7our disturbed channel samples o:f' coarse-grained sediments were
shoveled. from exposed vertical surfaces in several gravel pi ts and in a
fo,mdation excavation in the Big Lost River alluviumo The results of
laborato?'7 tests of repacked samples are reported in table 150 The data
show that the permeability is good but not exceptional, ra:agiDg from 460
to 780 gallons per dq per square foot. The permeability and other
properties of these sediments favor ready' infiltration and percolation
of water or other fluids.
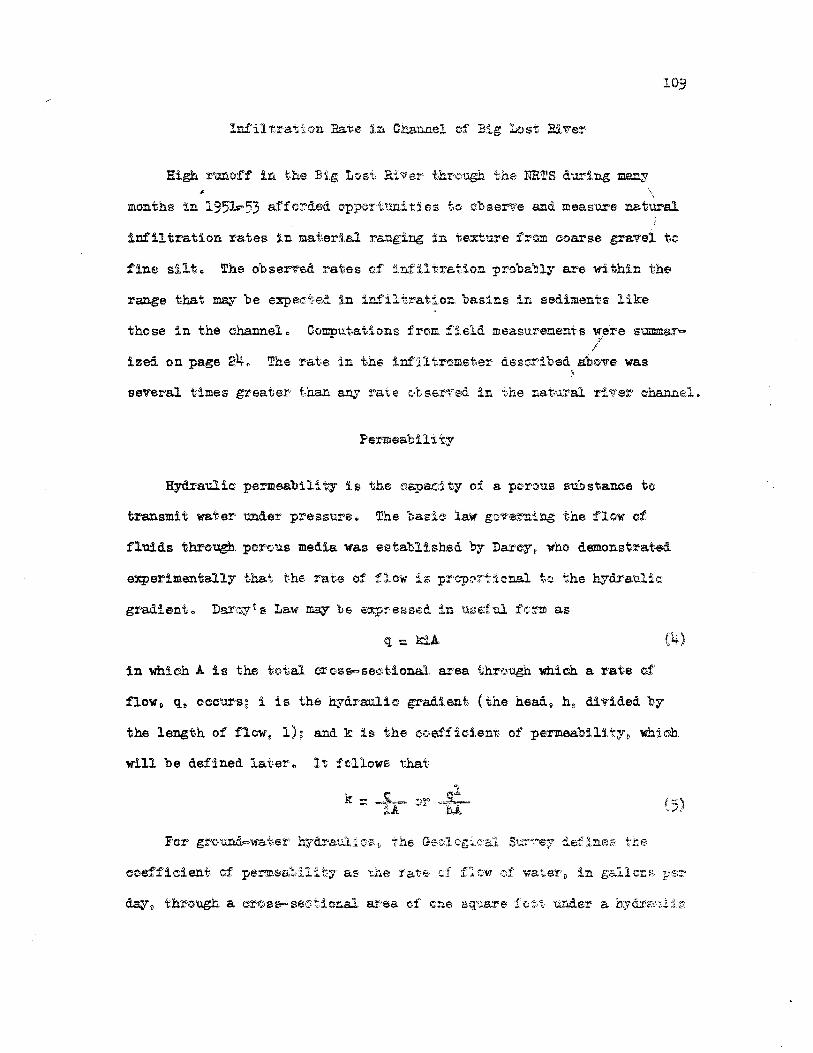
109
months in 1951P53 afford.ea. oppc:rtnni ties to cbse:Mre and measure natural
inf'il traticn rates in mai',erisl ranging in texture f'rcim coarse gravel to
fine silte The obse:t""fSd rates cf :nfiltration :proba1::ly are within the
range that ~ be expe,i:,ted. in in.filtrat.ion basins ir, sediments like
those in the channel e Oompu:_tations from :fi.eld measurements wel"e s:wr:m.sr/:v
ized. on page 240 The rate in th~ infil tr~mete:r- descr:U,ed. above was
fluids t.hl':'ough por,i:;,u.s media. was established by DarC(y ~ who demonstrated.
(4)
in which A is the total C1ross-,,se~tiona.l area thr,,ugh \rlhich a rate oo:·
will be defined latere lt !~llow& that

,

107
.# ,, ·-~
-C: -. .!2 ~ ~ Cl.
11 a: I-:E
... 0 . I (I> C:
H~ (I> -· "O 0 E II)
0 il -II) (I> -C: .E .... 0 ... -;;: C:
(I> ... (I> .c:
~ ,.! ·, 3: I -·a
C:
··""''" "O
! .~~-- ~ (I>
l II)
i · j 0 Cl. X (I>
f' '. ii (I>
1~ L~ > 0 ...
(.!) I •·:·,,.
I I . I : 1
C\J
(I>
n ... :, .2' LL.
I ' . l .. l "' !,
I
GPO 991857

106
saturation to develop in the gravel, and when that occurred the rate of
im'il tration might be reducedo The rate in the infiltrometer was nm.ch
higher than an-:, noted during st'lld.y' of infiltration in the channel of the
:Big Lost Rivero
The infiltrometer test was improvised because information vas
needed immediatel7 at the MTli site. It also helped to define conditions
and factors that mu.st be contended with in further tests. Infiltration
rates depend on the physical nature and condition of the earth material
and the character of the water, and these may cha.Dge as iD!iltration and
percolation proceed. Among the more important factors are the internal
pqsical structure and composition of the sediment and the condition of
its surface; the chemical and mineralogic composition of the sediment,
includi12g the organic contents; the' aaount of entrapped air retained
during infiltration; the chemical qualit7 and turbidit7 of the water;
the temperature of the water and the sediments; the distribution and
amoimt of soil moisture 9 or moisture tension; the barometric pressure;
the kind of equipment used; the hydraulic head applied; and the duration
of the test.
Waste water discharged to infiltration pi ts on the NmS is a chem
ical solution which is marked.11' different from the natural water, and
the sediments on the NRTS, espec:iall-:, the fine-grained ones, are su..
ceptible to mineralogio and chemical chan8e from reaction. with waste
vater. Some infiltration taata should be made with water that is
ohemicall-:, comparable to the wastes that are discharged to the gro'lll'ld. ,.
Some tests should be made also in sma;l.l pi ts or ponds that simulate
operati:ag conditionso )

105
reached its bighee.t levelf 0.,25 ft lowe:r than the bcittom of the eylinde:c>o
Thereafter II t,he water level in the hcl6 dec;H.ned and aftesr- 66 hours the
hole was dry.
The total amciu.n~, of wa.t-eZ" that, pasic'F.,d thr~ugb. t<he ;:-sc::re was 115 11 ~370
gallons" !oc~luding the ea.rl,y pa.r·t- c:f t.he test 0 be.fcT~ midnight on Mq
21, the a.mount; o:f wat-er Wl:iS' 67 r 020 gal in 8,5 aa.v1;'.s and the a.ve::oage rate
of percclation in that p~~tcd was 5o5 gpm {7 p900 gpdr o:r 630 gpri./ft.2).
lll:FalU:og headw (lbseffa":icn~ cf the wa.~0e:r le,'f.'·e1 in the cylinde:t"
a.f'ter the test was shut down con.fil"Jlled. the CJcmpu:tation. of t,h.g averagev
giving a.n in.filt:ratio:o. :r>a-:e of 506 gpm at the end. of the test.
A plot of the small flwtuatlons <Of hydratiJ.io head cve:r> the gravel
core dis~losed no obvious dire~t ~c:r.Tela.tion nth !lootua.tion~ in the
rate of :f'lowe Temperah1re a.ppree>iably af:fed-s wa,ter 't"is~osHy, and the
prt~i,pal v~at:ions in the '.i.nfil t;:r·s.Hon TatE:t a.f t;.sr May 21 ~eey likely
we:t>e c;aused by tempera:i;;n;re, :fl't:l.Ct"U3.ticns in the ·1ra:l::ero The high.er rates
occrorred during the mid.pa.rt o:f ea.ch fucy' 9 whsn the tempera.tur>e of the
exposed storage tank was highest.
The average flow rats of 630 gpd/ft2 would be a poor guide :for
designing an inf'iltra.Hon :pend. ~.n g:ra.s:r&l l:ike that at the MTB site.
The saturated pe:rniea.bil:i ty of f:he ma.ter,a.1 wl-th all g:r::11nd air sx~luded
might be scimewhat hJgher' iban bar ~,._na.'i :o.&"'?d, On the othe~· hand. 0 layers

,

w 1-<X 0::
Gl 11 0
"' "' .. "' "
,o -------,-------~~l---rr~ ---
DATE 19-31 1950. in fi I trometer, May ' . concrete ring d gravel core in
h undisturbe temperature changes.) . rate throug f
. 11 -Infiltration (Not adjusted or Figure ·

102
to lubricate the cyli?ld.er and to seal it to the coreo When the cylinder
reached the desired depth, a seal of asphalt emulsion was placed a.round
the outer side of its bottom edge to prevent pipillg by water~ and the
space a.round the cylinder was back:f'illed with tamped soil and gravelo
The cross-seetio:cal area o'! the core was 1206 sq fto
A l~er of graded, clean pebble gravel was spread over the core in
the ey!inder and covered. with a perforated metal plate to reduce tur1rni
lence in the incomi11g water o Water was provided :from a l u 000-gall~
storage tank and provision was made for maintaim.Dg a reasonabl7 con
stant head of water over the coreo A canvas cover over the cylinder
reduced evaporation, which was estimated to be only 38o5 gallons durillg
the test, and was disregarded. Meter readiDgs and head measurements
from a staff gage in the eylinder were made about f!IVery- hour durillg -;he
test, which lasted 2S9 hours. .llo vatel'-tempera.tu:re data were obtained.
The bottom of a dug hole in the ground about eight feet south of
the ey-linder, was below the lf!IVel of the cylinder bottom. The develop
ment of a zone of saturation a.round the infiltrometer was show. b;y the
a;ppeara.nee of ponded water in this hole duruig the testo
The rate of flow through the core vas relativel;r rapid during the
first 4S hours (:f'ig. ll), but thereafter 1 t fluctuated about a norm of
somewhat more than 6 gpm. The average rate of infiltration declined.
slightly duriDg the last 5 d.a.78 of the test.. The first 25 minutes of
the test produced. enough saturation in the oore to cause ponding of
water a%ld. development o:£ head in the free part of the cylinder. After
about 35 ho'lll"s the head was 13 in. Thereafter, the head fluctuated
between 13 a:cd 14.5 inches. At the end o:£ 7 .. 5 hours water appeared in

lOl
redwe the permeability JrlUcll. A disflo:ntinuous thin bed of nonpermeable
cla;v and silt rests bet,w~en the gravel and 'llilderlying basalt at some
places. Perched. zones of saturation may develop en the bed wherever
excess water percolates through. the graveL Sma.ll permanent or ephem
eral natural bodies of perched water may ?'est on the silt a.t some :pla.Cles,.
Water is perched. on the sil't and perhaps on tight basalt beneath part of
the MTR-:mTR site. The distribution cf 'bhe silt bed beneath the :Big Lost
Ili ver flood. plain bas been d.elinea ted ouly l oc.a..lly, as at the MTR site,
where it is 3 to 3.5 feet thiclc.
Prelimi:D.a.?7 experiments have been made on illfil tra.tion rates in the
eoa.rse-gra.ined sediments. The permeability of coarse,-gra..ined. sediments
was not determined by well-perfo!"maD.ce tests (Mpumping tests~) but
several samples of these sediments we~e tested. for permeability in the
Hydrologic Laboratory at Denver-~ Colorado~
In:f'il tra.tion Thr0ugh lnfil trom.eters
In May 1950 a crude infiltration test was made in gravel near the
present site of the MTR digposal pond.? using an improvised ring i:n:f'il
trometer in the bottom of a dug pit. A con~rete eylinderi 48 in. in
diameter and 4 ft long, was lowered a.round a core of undisturbed material
by setting the cylinder on the ground. and digging around it, allowing
the cylinder to settle and snclose the core. Cobbles that projected. cut
of the core beneath the e:ige of the c:ylind.er were removed. and replaced.
with clay grout. Al so r the sur.fa01e of the e;cre was plast,ered with cl.ay

100
~-:BE.ARING PROPERTIES OF m SEDIMENTS
The surl'icdal sediments that overlie the Snake River basalt in the
NRTS lie :far above the main water ta.bleo They contain ground water only
in local perched zones of satura.tion 0 as was des~ribed on page 460 The
yields o! the perched aquifers to wells were not tested be~use these
aquifers a.re not a prospective souroe of water S'Opply for the NRrSo
The sedimentary inter.f'low beds in the main zone o! saturation 7ield
water 9 but it was not practical to test their capacities separatel;r from
that of the basal.to Most of the sediments are poor water-bearers 9 are
troublesome in well const:ruction, a.nd are best excluded :from !inished
well So
The surf'icial sediments can absorb a considerable a.mount of water,
and coarse material transmits water readily. Thus 9 the sediments are an
important factor in local ground-water recharge and in the disposal of
liquid w.stea Some of their l:cy"draulic properties were tested and
:further study' is planned.
The alluvial sand and gravel in the flood plain of the Big Lost
:aiver9 in the alluvial :fan of Bir.ch Creek9 and in :foothills alluvial
:f'ans absorb and transmit water readily. These properties are important
:factors in the regional regimen of ground-water recharge and in locial
:provisions for the disposal of liquid wa.steo Much of the gravel con-. tains second.a.ey' deposits a! cald.tllll carbonate at shallow depth{ but at
most places the amount of secolld.a.r7 minerals is small and does not

,#
r _ 24.,2 QE:, = Tk
well (wells a.spumed to be pumping at equal rates) 0 in gpm 9 Tis the
oioeffic:lent of transmissibilityp in gpm/ftt and k is the ~italized
c:ost of pip6line and transmission lines 'between wellsp in dollars p8%"
7ear per foot of inteNerdng distan~e.
99
The optimum spa.cd.ng of wells in the A.NP area was computed. using
this formula.. The coefficient of t?'Wlsmi.sdbili ty determined from the
results of aquifer tests on wells in the A.NP area. is a.bout sx105 gpd./ft.
Assume that k is $12.00 and is capitalized at 10 p~t per year, or $1.20
per ft per year for C'Japi tal ciha.:r'ges.p overhead.p d.epre~iation and mainte- -
nance. Assume further that the pumping :rate of ~h of two wells is
l,000 gpmo Substituting these and other values g!.ven above in the
formula., the economici-optimum spa:sing would be about 25 feet. The prob
lem here has been over-simplified to illustrate the pr:tncd.ples involved..
In const:rue;tion planning, ether !aestors would have to be considered and
The chief signi:fi~oe of this computation is its demonstration that,
tmder ordinary oondi tions on the DTS, wells mq be spac;ed a.s closel.1' as
is desired without creating emessive pumping cost. The result thus
directly contradicts our earlier recommendations that wells be spaced at
wide inte:rva.la of' about 500 :feeto When those reoomme!ld.a.tions were made
they seemed prudent be~use 11 ttle was k!Wwn a'bout the aquifer, and. the
· optimum spa.c;i:ng CJould not be computed.o

ft/ft, and a T value of 3.3:x:J.06 gpd/ft computed from aquifer-test data
for well OPP-3 (see table 14), the permissible spacing is 580 feeto
.Uthough this indicates an apparent safety factor of about 3 in the
existiDg spacing, it must be emphasized that this would be true only of
a homogeneous aquifer. The real margin of sa:f' ety, if S:tr3', in the e:xist
illg setup is indeterminate.
The mini:mwn permissible spacing varies directly as the rate of dis
c.barge. Further increases in the pumpillg and disposal rates should not
be made unless a recalculation, based on the latest available hydraulic
data, shows that the erlsti:ng spacing would be adequate. The fillal test
of "adequate spacing," of course, is whether or not any water is recircu
lated.
Econo:mic-Optimma Spacin&
OwiDg to the cost of constra.cti:ng and maintainiDg power lines, pipe
,lines, service roads, and to other factors, wells at a given site should
be spaced as close together as is possible without excessive pumping
costs)/ The less the distance between yells, the greater their intez...
ference and the greater the drawdow and pumping lift. The greater the
distance between wells, the leSl!I their interference but the greater the
cost of connecting pipelines and electrical installation.
The cost of installing two wells, insofar as it is affected by
their spacing, is computed by a formal.a derived. by Theis (1957)
r'
'JJ 1or operational reasons, of course, it ~ be desirable to space wells more videl7 than. the economio-optim,m.

97
Penni ssJ.ble Spacing
Ja.co·o (1950, p. 34S; eq. 34) derived a:! equation for computing the ,#
permissible d:1-"sta.nce between produC".tion a.r.d. disposal wells, Assuming
that the disposal well is di:r·ectly dovm the ma:ri,mum water-table gradient
from the pumped well, the per.miscible spacing may be computed from the
}. -· -~?9, __ 'i'r' T ! 0
(2)
dispcsal \~ells, Q, is tbe p,:.11:p::.r,£ -:··a.te or· disposal rate (assumed. to be
equal), in gpd, T is the cM:.ificient ,;:,f transmiss.ibil:ity, in gpd/ft,
and I0
is the na.t:-ural hydraulic gradient- of the water table~ in ft/ft.
Like other gr-ound.-wate:r e.q;.:.at:i.or:.e .. the one above ne.:,ei:;sa.rily assumes
idealized aquifer ccndi t'.!.OD$ wfnch cliff er w:..de1y from :real conditions.
be:fore the wells were d.:i:il.led., at (i. t •. me ·wr..en ?alues of T were not
available. The results cf a.q·:t.1.:fer· tests, pump:i:n.g-rate data, and the
equation given above wer-s used. to det-ermine the a.dsqua~y of the spacing.
The hydraulic g:ra.d.ient cf the water tab.i.e 1.n the OPP area. before
pumping started was abc.ut 5 !set pe:r mile ..:,:r- 0.001 ft/!t, The installed
capacity cf we:,lls CPP--1 a.r~d. ~2 rn. 1.955 was 2,500 gpm (3.600,000 gpd).
Ordinarily, only one Wi.·ll 1 s p.,..:;rrr;,sd. at a tnne and pum:p.;r-.g :s net con-
tinu.cus; the pr,:,bai:,le a"-''2:rage \·Gta.l pu.mp1ng rate of the wells is
3~000,000 gpi. Using i'.ha~ ·,a:Cue for Q, a hydraulic grad1ent of 0.001

well-ccnstru.ction data9 and. values of specific capacity were substituted.
in the nonequilibrium. formula to obtain rough estimates of the coefi'i
cient of tra.nsmissibility of the SDake River basalto Judging from the
common range and average of the specific capacities given in table 11,
the coefficient of transmissibility of the Snake River basalt ranges
between 1x1.o5 and 7xJ.06 and averages about 4:x106 gpd. per foot for the
Sllake River Plain as a whole.. :Based on data given in table 10 the
average eoe:f:f'icient of transmissibility of the Snake liver basalt for
the NRTS area is about 2x10⁶ gpd. per foot.
The desirable distance between wells ftl!'ies with the physical con
ditions and the uses of wells and, like well construction, is an indi
vidual problem at each site. The problem of detenii:ning the desirable
spacing of wells is chiefly- economico Wide~ spaced wells inter.Care
with each other very little, but the cost of interconnecting pipelinea,
and electrical transmission lines is greater than for closely spaced
wellso Where one well is pumped and the other is an intake (disposal)
vell 9 the desirable spacing (here called "permissible spacing') is that;
which assures no recircuJ.a.tion of waste liquid through the pumped well.
Where all wells are pumped, th~ desirable spacing (here called Ueconomio
optimum spacing11 ) is that which asstll"es maximum water production at the
least cost for construction and for lo~term operation and maintenance.

95
The well~ :fo:t< whioh aquifer-teat d.ata. are available penetrate only
part of the sa.t'l.'!l"ated. :zonE< i:!l rbe Snake River basalt. Layer~ of rela-
t:t vely impermeable basalt and :fine--grained.. inter:tlow sediments separa:te
pe:rmea.ble zone~ at many place8p and they aJ.so impede hyd1"a.ulii:i commimi.ea
tion between the zones penetrated. ·Cly wells and d.eeper parts of the basalt.
Therefcrep the ec:m:pu.ted values of T probably appl,- Clhiefly to the part cf
the basalt penet:,:,a.ted by wells o:r in :fr~e ~cmmuni~tion with them. The
coefficient of t~ansmissibil!ty of the entire thi~k:c.eas of the Snake
River basalt pro·oa.bly g:t>eatly ex~esd.s the values ccmputed. from data on
partially penst:r>ating wslls . .,
The computed c:oe:f':fid.ents o:f stoo:t"age vary from 0&01 tc Oo06 and are
in the range cl:t.aracteristic of water-table conditions. These coeffi
eiients. apply largely to the part of the aq'tlifer thftlugh whl.~ the water
table :f'luoituated during t,he tests 9 and they mq oot represent the whole
basalt a.qui:f er & Furthermore v beciause water drains from some of the
basalt very slowly 0 longer pumping tests might give considerably larger
coef:f'icients of stc,:,age;. The C;tlef :fidem.ts cf S computed from the data
for several. aquifer tests in the A.NP area and. given in table 14 ra.rige
from O,.Ol to Oo02. Oonsidertng the complex clla.racitertsties of the
basalt the agreement between the values of Sis as close as ean be
expected.
Derivatio~ from Spe~ific-Capa~ity Data
Specific-oa.pa.,:;i ty data ::an "De used. to estimate the coefficient of
transmissibility (Theis and others,. 1954). The average C;oeff:icdent of
storage comput5d from the results of aq'Uife~ tests (sae table 14) 9


•
" 'U 0
" "
0 r------,.....----,--,,---y----,,--,.---,,--y--,-------y----r---.-----..----.---r--.---r-1r----n:,-------,.---,---r--i
0.00002
0.00004
• t:f ~ -~O'
0.00006
o.ooooa
0.0001 100 1,000
;r• FT2 (;:-) M i'ii'i:i-r'E S
0 •
fs/tt)lo.ooooa
10,000
FIOURE 10.--GENERALIZED COMPOSITE DRAWDOWN ~RAPH FOR WELL 3N-3Cl::-19cal (CPP-3).
50,000

Table 140--0oefficients of transmissibility and storage of the aquifer at the NRTS and vicinity
Date Observation of Ooef'ficient- Penetration of \.0
Observation pumped well N Pumped of tranemissibility of well test well (gpd/ft,) storage below water table (feet)
6N-Jlll-l3acl (A.NP-1) 4/16.-17/53 None 7009000 157
do 4/30/53 6»-, Jllll-l~dbl 950.000 OoQl 157 (USGS 2 )
do 7/20.:.23/53 6N-3lll-1Joal (.!NP-Disposal)
640,000 OoOl 157
6N-Jllll-l3acl, 6w-311-13ac2 -13cal, -12aol
(ANP-2) 11/11.;.16/ 53 (ANP-1. soo.ooo 0.()2 133 AN:P-Di sposal IE'f.oDi spo sal ~
55-31!1--lOcdl 7/1o;.11/53 None 570,QOO 177
4:N-_30:m- 7adl S/29-30/50 do 1,700.000 367
4N-30!l--30ad.l {NRF-2) S/y-5/51 do 3.100.000 163
JN-3Plll-19bcl 9
Ooo6 153 & 136 and -24adl. 11/11-13/51 3N= JOE-lr:bl 3.300.000 (OPP 1 and 2) (CPP-3
~
ZN-291- ldbl 2/27/51 160,000 (OF-2) None - 209

a==-=· =-·----------------
3.,223 965 39110 3.,24S t;<J;;:;, 19 740 "'"'~ ./ 3~346 10 94'.; C: SO"' , .... s ... .J
3.,s26 - 4oo -~3,20~ :f t-.J~ 9o!s30 3.230 l,B 670' 022 .,0000724 !) "'
3ol46 965 30040 3ol64 5;35 lo70':J 3 .,243 l,, 94-0 6 9 30-, 30571 ~
).J.f\J'"'. _.,t_;l=420 . ' • .,(\,!
3c01-0 - ;}9620 3ol,60 10450 0245 00000806
3~079 ~!"-· 'jO'J 2o97G
3.,097 :,'35 l~64o 3el61 1~940 6~15C 3.,412 - 400 ::L~= 3~ 9 ~:+00 311090 lp230 .,25 .,0000822
30076 965 29960 3c090 5~5 l.s650 3.155 1/Ji.i.0 6~130 3.,403 - ~()0 ::bJ~{L
7, 0'-+0 .,,.,.r, . 9r.330 30080 1D200 025 .,0000322
3o04~ ,so,.""-- 2o94c ~C'J 3 0"4 535 1-g 64o " 0' 3ol24 lo94o 6;060 ~0348 - 4oo -19330
.,2Sl -1~4o -8~0 lglOO loll:O l.,010 10 .,21 000019

90
Table 13 o~Speci:fic d.rawdown and weighted
Date a.nd time k n Discllarge ~k <\½k (~~) well "
{:f'aet) {minutes) (ft2 /min)
November 13
6:30 A. l OPP-2 l 9 S3o 29 000 19670 2 CPP-2 l 0 S3o 19890 19770·
l CPP...l l 9 S30 l 9 5lO 29220 CPP...2 19830 500 69 700
4
lgJ,.Q A. r CPP=2 l 0S30 294oo lo4oo 2 CPP-2 ls830 2\}290 19460
~ OPP..l l9S30 ls910 19750 CPP-2 19g30 900 30720
4
7;50 A. l CPP-2 1,830 20800 1 0200 2 CPP-2 1,830 20690 1.250
~ CPP-1 1 0 830 29310 1,450 CPP-2 1,830 10300 2t5SO
4
8:15 A. l OPP-2 1 9 830 29825 l,190 2 CPP-2 1,830 20715 1,230
~ CPP-l 1 0 830 29335 10430 CPP-,2 19830 lo325 29530
4
11:10 A. 1 CPP-2 1,s30 3 9 000 1 9 110 2 CPP...2 1 0 830 2,890 1 0 160
rt CPP-l 1,830 2,510 11330 CPP-2 liS30 1,500 2,230
5 CllP-l 1,830 175 l9gll0
r

Log1~ ~Qk:
..6.Qk X Lc.1glO Log lO (s/Q.)n ( ? /4,k) #r:2 B - ) {~/t)'A ,~rr"-~ i°' rk ~, ~ l·k.11rk ~, ' t
{f~[min) { ' !:tt2Lm:n) ~feet.} (ftl~m} _£12ui.i
4.483 965 4.483 .,025
3 .. s~5 965 39700 3.,9 5 5:32 2.illO
1,500 59Sl0 3 .. s70 .05
3°747 06~ ., .., 3v62'0 ~
0 835 \:i'2:5 29050 .,483 l~~ 8 7'(},I'\
3r · · 14:310 4.,180 15,14o oo4 .0000116
3.621 965 7 490 .,It,
ao6S7 5~ lg970 .Q33 l:; - 111S30
3g - 0 13g290 3.,s60 7,24o .07 .. 0000203
3 .. 525 965 3;400 3.575 525 19910 3 .. sis -~:~ cLltOO
l2s'Jl0 3.700 5,000 .,ll 00000320
30446 9"i::: 39320 O;,,
3c4S7 5;35 19860 3 .. 674 l.~ Z»l_gQ_
3f . 12,300 3 .. 5so 3,soo .14 .oooo4o6
3.34S 965 3t230 3o3S2 1)~E l,SlO 3.521 6~$30
3,$to ll, 870 3 .. 4,o 2,S20 .,lS .. 0000523
30270 965 3,160 30297 535 1 9 760 a.,4os 1~940 6v620
.. 047 _::. 4.90 -1~600 3,Qi...O 9~-9~0 3.,270 10860 .21 .0000691

gg
Table 13 o-Spe<Clli'il'.3 dra.'Wdown and. weighted.
Date and time k :n Dis!C'harge ::rk .. k (r2,dtk) "' (1951) well
(ft2/min) (:feet) (minutes)
November ll
ll:00 A. l 1 CPP-2 l 0 S30 110 309420
5:20 P l OPP-2 19830 490 69S4o 2 CPP-2 l 9 S30 :;so S,820
2:
7:10 P l CPP-2 l,S30 600 5,580 2 CPP-2 l,S30 490 6,s4o 3 CPP-1 l7S30 l!O 30,420
3
10:30 P l CPPc-2 19830 800 4,180 2 CPP-2 17 830 690 11-, 860 )' CPP...l l 0 S30 310 10,SOO
3
liovember 12
1:50 A l CPP-2 19830 19000 3,350 2 OPP-2 1,830 890 3,760 3 CPP-l 19830 510 6,570
5:10 A l CPP...2 10830 1 0200 2,790 2 CPP=2 1 0 $30 1 0 090 ~v070 3 CPP-1 lvS30 710 ,720
3
10:10 A l OPP-2 1,830 1,500 29230 2 CPP-2 l,830 10390 2,410 3 epp..;i 19830 1 9 010 3,329
3 •
lla50 A l CPP-2 l9S3o 1,800 l,S6o 2 OPP-2 l,830 111690 l,980
l OPP-l lo830 1,310 2,560 CPP-2 l,S30 300 11,150
4 ~

table l4o Values of the: C?eiefficie:nt o:f i:ra:nsmi ssibili ty of the $:nabs
River basa.lt !'ange bet,waen 2.,6,-.105 gpd./!t a:nd 3~ 7:r.:106 gpd/fte The
high!'Jr rc:a.lues cf T (mo:r,e t:t,ar., 3x1.06 gpi/ft) a:r1c, those computed f::,om,
data :fat' the CPP and NRF aT'eais c '.the ~~s::._:r' ic c.apa.oity cf wsll MTB-l
ind.ioa:-bes th.st the c,oe:fii,:.isn":- c,f t:t'ans:m.issibility e:x:~eeds 3x1.06
NRTSo

"

G)
1l 0
"' "' "" "' "
.... Cl) QJ -.!:
"Cl QJ .... Cl)
::J
"O <{
Figure 9.-Distance drawdown curve for well 6N-31E-13ac2 (ANP-2) 00 Ul

Interpretive studies of the time-dra.wdown data for well ANP-1 show
that the hydra.ul.ic properties of the basalt vary within the area of ill:!lti:
ence around well ANP-2. None of the cha.Ilges, however, is su:f'ficientl.7
great 8"Ten to approximate the e!f ect of an impermeable bo'Ulld.a.17. Such a
bo'll?l.Cia%7 voul.d distort the cone of i?lfluence, and the vaJ.ues of 'f and S
comput~d from distance-drawd.own data would disagree with those computed'
from unaffected ti~wdown data. The agreement between the two sets
of T values silpl)Orta belie! that no important impermeable boundaries
e:.d.st within the area of influence.
PPP Area
Wells OPP-1 and-2 were pumped simultaneously for 39 hours on
E'ovember 1i,.;13, 1951. !he pwnpillg rates for wells CPP-1 and -2 were
1,500 and l,94o gpm, respectivel~. The drawdown from concurrent p1!Ullping
of the two wells was measured in well CPP-3. The conditions of the test
are described and water-,;l8"Tel data are tabulated in appendix 2.
The test data were analyzed by the generalized composite-drawdown
graph method (Cooper and Jacob 1946). ~omputations to determine values
of the weighted logarithmic mean (r2/t)11 and the corresponding valuss of
the specific drawdown (s/Q)n are shown in table 130
The calculated values in table 13 were plotted on semilogarithmic
paper to obtain the generalised composi te-drawdown graph in figure 10.
A straight line was drawn through the plotted points. The slope of the
line and the intercept of the line vi th. the line of zero specific draw-,.
down were s'libsti tuted in the equations shown in figure 10 to compute the
l:cy'draulic coefficients of the aquifer. The computed values of T and S
are 3.3x1.06 gpd/rt and o.o6, respectivel:7.

6N-31E-13a.Cl2 T:ime;-drawd~wn (ANP-2)
6N,,'31.E-l 3~-al (.A.Np-D 1 sposal)
61r-. 31:m-13:a.ru,,
ci.o
=l}cal? (A1'P-l Dl~t:anc~d.rawd..,-:J'lffl an.i
-~~Di spMal J
820,000
7009000
9oojooo
800r000
Coe!fic:iento! storagii!
e02
the 72-hoiur test, sampled an srea. cf' basalt hating a diameter o:f about g
several values of T and S that wer>e ~omputed :from data obtained from the
spe~ifici loe'ation in this area ~ct be pred.:kted E:.C;~a.tely by using
the ~omputed values of T Wld. S. :Be~se of lo~al irregularities in the


" 1l 0
"' "'
"C C1I +U)
:::, .-, "'O <(
10 100 ,poo 1opoo Time In minutes ofter pumping started
Figure 8.-Time-drowdown curve for well 6N-31E-13ocl (ANP-1). 0:,

so
Adjusted d.rawdowns in observation wells .A.NP-l and ilP-Disposal at
the end of the test were plotted on logarithmic paper against the squares
of the distances from the respeeti ve ob serration wells to the pumped
well, to obtain a distan~drawdown curve. This Clll'Ve is pa.rt o:f the
profile of the cone of influence around the pumped well. The tn,e ClU'Ve
was matched to the distauc&-drawdown curve. match-point coordinates were
substituted in the formula, and the coefficients of tra.nsmissibiliq and
storage were computed as shown in figure 9.
The d.rawdown in well IET-Disposal, which is 5,450 ft from the pmnped
well, cannot be determined accurately- because barometric water-level
fluctuations almost completely- masked the fluctuations caused by- pumpi13g.
RoweTer, watei-level data sh.ow that the drawdown in this well was in the
magnitude o:f O .. l ft at the end of the test.,
The values of! and S, computed from time-drawdovn and d.istance
dravd.own data, are listed in table l2o
.... ,'

79
Dra."trdo;wn in th.a pimpe.d. ~::.i ritse:r">J·a""ion w~11s was di!termined by ~m
paring e:x:trapc:la:i';.ei gf'aphs cf 'i.'iT'd'tes:r: le:~els. mea.st:;.·r,ed. bef or>e pumping started.
with the g!:'a;phs e1f water levels :m.ea$~ed during pumping. The dt'awdow.n
d.a:ta we:re the=. stljuz ted fer a. 1;mo sphent.....presStll"e c,b.a.nges during the test.
Ad.justed. d.rawd..o·wi::..l:l were plof:ted &.gain.st tim.e (m logari thmit! or semilog
axi thmi ~ pa.per' o
As an exampl6~ figure 8 sho<n the H:me-d.r-awd.own d.a~a for well A:NP-l,
adjusted. fer a baromct?'i~ efH.~i.sney of 88 pC:it. The test data were ana
l;yzed by the gr,apb.i©a.l method of ~ttp~:i"J?C8i.t.:.on (Wen.2:als 1942, p. gg...g9)
to solve the non.equilibrium ! c:rmcla. T:.:.s ~ype c,'l,ll"v',s was matciled to the
latter part cf ths tims,,,,d::·a.wd.;'w:o, d.ata~ and. 1r.1a:'0~h-pt,:i.:ct C?c,erdin.a.tes were
substituted :tn the form:u1a. t;-, compute the ~oefficd.ents of transmiui
bility and 1:1t~rage. Oo:mp:ita.tions foT well ANP-1 are shovn in the figure.
The drawd.eiiw:n during the :first 90 mi.Imt,es r,f pumping depa:r,ted from
the type ~e be~au,se. the basalt- a.qulier d.ciE(s not resp~nd instantS21e
ously tic pumping 9 as wct..ld a. hcmcgenEt')::.~. !1?:<t~:,pi~, and. perle.:::tly
ela.sties ar'f;esian aquif e:r. The:t<e is a t!me-lag in the discllarge of water
released :from stc:r'age in the aquif e:r and the dif:f erent hydraulic proper
tien 0£ two ~eiel:ls1 ve pet'meable zones can not be integrated instantane
ously by the Gone of inf.lu..encie. As pumping c:cntim.ed., however, the now
between zones having d.iffe:ring permeability adjusted 1 tsslf, the ef:f'e~ts
of grarl ty d..Tai.n2.ge be~& small 9 and. the e...."f e~t e cf d.i:ff' erenoes between
the; wa ter--,,bea't":ing cl-.ia:ra~te:r·:1. ,d_-:ie;s -~;f i:'he basal'!: and a~strr.ri:ed ideal
cllarac'b-er.istios 'r,e:::sms nsgl:.gt"tleo

7g
outlined by Ferris (1949) and Cooper and Jacob (1946) were used to cal
culate coefficients of tra.nsmissibility and storageo
Water levels in wells at the NRTS :f'luetuate in response to fluctua
tions in atmospheric pressureo These ef'feets are d.isc:u.ssed fully in the
section of this report entitled 111barometric fluctua.tionsM o The fluctua
tions are sufficiently large to mark the illf'luence of pumping 0 so the
d.ravdown data collected during the aqo.ifer tests were adjusted for changes
in atmospheric pressure before they were used to compute the .hydraulic
coefficientso Adjustments for each well were based on its barometric
efficiency, which is the ratio o£ the change in the water level in the
well to the associated chailge in atmospheric pressureo The barometric
efficiency of a well is determined by comparing prominent changes ill
atmospheric pressure with corresponding fiuct'Oations in water level
during a time interval when water levels were not affected. by pumping ..
The data. for two aq'Oifer tests will now be presented in detail to
illustrate methods of analysis. The results of these and S other tests
are summarized on later pages.
During pumping of well ANP-2 on November 12-15, 1953, the drawd.ow:n
was measured in wells A:NP-l, .AEP-Disposa.1 0 and !ET-Disposal. Pumping was
started at 12:30 pm 011 November 12 and continued for 72 hours at a con
stant rate of 1,220 gpm. The water-leTel data are tabulated and the eon
di tions of the test are described in Appendix 2.

77
Mu.,::b erf th~· V,?,-t ei:r p,Jcnpe::l ltu:ring :a:t1 a.qrdfer +,$Sf, i::s \cl thcra.wn ff'Om
sto:r-'age by g!'a'rtt:y d:ra:iri.ago; :f:t','.llt pa.-'{ i):f a ps:r.me.s.1:ils :z;eme. That is, some
cf the a.qtifeI" materi.a.1 ::...~ dl\l'war.et~eiL ~be flow m. va.ter· toward. a well is
three-d.imensi.oncl beGJa:use ~av:: ty drro~. cf ~tCl:red. wa.ter involves
ve:rtie:al :f'lciv e;c,:rr:ponents du.ring elow d~tering crf' the aquifer. However,
the nonequili1:>:rtum :foI'l!!'.fla d@s·::f·lbe~ cnly ";we-dimensional radial flow with
definee d.ra.w'd.ovn in the Sna.ke. R'l ve::- basal 1. 01ily a:f tsr the :flow of water
between psrmeabl~ inf:E::.rf'J ow zclices h.ss:r;r,.g f~ffe:rein+; hyd..t:a.ulic properties
reaches appronma:te sta'!:'1.L ty < A,+. t l:'...a~ ;;:,{.a:.g2., f:he ve!'ti.ca.1-:flow o:ompo
nents of gmvlty d.:r·ain9ge a.t'e. sma11 r d.e---v.ra'·e:r-1.:o.g :is ~s;,entiaJ.ly complete,
and the flow is largely radial a.n.d. essant:ia.lly two-dimensional. Befo:t"e
that stage the acrtual d.!'awdown d.S\'."ia.te~ :f:r,om +-he thetretical. The initial
transitional period may be several m.inu:f..es o:r h~urs i.n duratiori. 9 depend.iDg
on aquifer condJ t,: ons. Du:"ing prol o:n.ged pump:l:ng t.'.he ~o?le of infl u~e
adjusts to the a..,..e:rage, and 0'1!e:::all h;rd.ras.:1:5e prcpezf'Heis of the aquifer,
and. the far:im:.la then dt:·sel~! d1:s.:.'rn,e" :_,:r;'? d,:r·awd.':,wn in wells. Thus~
meaningful values fer.' hyd.i0 acl:':..c p:r·c,pe;:;t-:ies c.rf the Snake Ri'l"er basalt oan
be derived if aqirlier i,ests a.'t"e'mad@ic p!"cp~:t·ly and if jua.gmentp based on
knowle:,dge of geeil@gic:? c:ond:ltfons£ is u~Ed in :tn:~erpretiDg data.
The data fc,r, J.O aqniferc foes..,~ at ·.be NR1'S dtt'!'.''lng 1949--1954 were
analyzec tc de~e'f~.cr:rie. the hvd.'t'-9")1:i ':' :p'!":'p"',,.,., <:$ -:,,i the Snake R:1~"er basalt.

aquifer is in:f'ini te in areal extent and uniform in thickness; that it is
homogeneous and iaot::>op:icg that i 4; is c"n:fined between impermeable beds;
that the coefficient of sto~a.ge is the same for all parts of the aquifer;
that water is released from sto?'age instantaneously with a decline in
head; a.nd that the well has an infinitesimal diameter and penetrates the
entire thickness of the :f'omation. The nonequilibr:1:mn formula is a puti
O'tllar solution of a partial differential equation describing two-dimensional
radial now. Theoretically the :formula is not valid for watel"-table
conditions, be~use the flow towards a well in water-table aquifer ia thre ..
dimensional and release of wa.te?' :from storage is not instantaneous with
the decline in head.
The ideal eondi tions assumed. in the derivation o:t the formula do not,
of course, prevail in a:rr, aquifer. In :pahoehoe nows al the Snake !iver
basalt, for example, permeallle zones oecu:r largely along the oontactm
between separate flow. Maseive luyers of relativel7 impermeable basalt
and fine-grained inte:rbeds separate mazcy- o:f' the permeable zones, and the
hydraulic connection between these zones is pooro The hydraulic permea,
bili t7 ot the basalt, like the ef'teotive porosity, is a characteristic· ot
the !ormation and not of the roek i tsel:f', because the rook is eaaentiall}'
impermeable. The vertical :f'ormational permeability of the basalt ia much
smaller than the horizontal.
Most wells in the Snake River basalt extend through two or more
permeable inter!low 1«:1neao The pemeabili t;r h not lilasl.7 -t.o be the same
..

75
BYDRA.ULIC PROPERTIES
ity is the :rate o:f' now of water 9 in gallons per ~D through a. vertical
strip of the aqw.fe!" 1 :feet wide and extending th.e full saturated th.iek
ness under a hyd.re.uliC' gr.,a.diant, of 100 ~ereant (l fcot per foot) at the
prevailing tampemture of the watel"o The coefficient of storage is the
,rolume of water :r>elea.sed from or taken into storage per unit surface area
of the aquifer per u.rdt chang6 in the component of head normal to that
field. d.ata.o
The hydrauli~ properties of the Snake River basalt were determined
by means of aquifer tests in which the e:f'fe:ets of pwnpi?lg w&re observed.
The drawd.own esa.u.sed. by pumping a well at a Clonsta.nt known rate is meas
ured in the pumped wsll and a.t cbsena:tion wells which tap the same
aquifer. Graphs of drawd.own versus time after p'Wlq)i:cg started, and. of
d.rawd.own versus distan~e :from the pumped well 9 are used to solve equa
tions whicm express the relation between the coefficients of tranamissi
bility and storage of' an aquifer and the lowering of water levels in the
vicinity of a pumped well.
The formula most widely used to analyze aqu.Uer-test data is the
ncnequili.brtum formula (Theise 1935). The fcm.ula 8 like other similar
onesp was developed on the basie of' the fellowing assumptions: t.b.a.t the

Table 11.-Specific capacities of wells in the Snake River Plain -a +="
Average Average Average Average Range of Average Average
Looatio~ Number depth penetration diameter length specific speoific pumping of wells (feet) below water of casing of test capacity- capacity rate
~i!-bl~ 'ffi!fi!t) ( incllfi! a) (h0~1) (gpmlft) (~mLn) (&12m)
Jefferson County 5 200 72 16 16 33-14,ooo 311200 211400
Group 1 15 266 ;~ 21 110- 9,000 29300 2~900 2 21 264 24 2½ 110-20,000 411500 29500
Minidoka 9 Jerome~ 29 282 91 21 3 20()... 69000 1 0700 2p200 and Linl}n 31 276 88 21
il 59-1411000 19800 111800
Oountie 1 5 22 ~: S3 21 2}=170000 1 0800 19700 6 lS 112 21 63- 39000 800 111500 7 30 271 71 21 15(),--229000 311900 111800
:Singh.am Count:, 15 252 71 18 s l&=. 711700 111800 111900
NRTS 11 Butte County 14 590 200 16 24 12- 2,900 900 900
Gooding County 9 120 60 12 2 300- 211700 900 19000
Jerome County 6 362 77 16 3 6- 10600 900 19700
Bonnevilla County 6 207 88 18 4 33- 1,000 500 19800
Blaine Oounty 2 226 179 16 2 37- 110 70 111400
Oamas Oo,mty 3 210 77 16 6 30- 110 60 1.200
1/ U. s. :Bureau of Reclamation Minidoka Project, North Side Pumping DiVision.

73
smalls vell losses at pump:lng rate~ at seve!'s.l ~ubic feet peI' ea~ond are
appre~ia.ble parts of the "tot,a.1 d..t:awd.o·wns in the wslls., For examples the
well loss e:f 3.1 :ft in Woll CPP...l at a pumping re.ts of 20475 gpm is nearly
53 pC!t ci' ths tctal. dl"a.wd..~, 5.,9 Hr a.t: tJ:i.a.t rate. Large head losses
o~crtu• as water enters the wells a.t high velo!;:i ties through the grav&l
en-vslope and. perlc:oa.ted casing. Ses;rsntY'""f'ive fest o:f the 16-inch casing
in well CPP-l are perfora-:-,ed. with 3/8 by· 3-in. lorigitud.inal slotsc provid
iug a. total d ll sq ft, of en~:i:=an~~ area. Gravel is pa.c;ked a.round. in the
slotted. pipe in the w&lo Ass.mi::..ng that the effe~tive open area. is 5.5
sq ft 9 the entl'an,,e ~ele:::s:i ty wo,.ud be 60 .f.'t. per min at a p'Wl'lpi:cg rate of
2,475 gpm.
Table ll B'tllm!la.l"izes the data now a.vaila.ble on the speci:1:f'ic ~ities
of prod.iwtion wells in the ~ River basal 't throughout the Snake River
Plain. The ave:t'age yield o:f a. J.t,-in~ well during a:n 8-hr test was about
2POOO gpm per foct of dra.wa.<:,'W'll, The a.ve:t'age depth cf the wells is 290 :f'i; 9
and the average penet!'alfon. beJ .. ow "7he ~egfona.l water table b 100 ft.
Although the spe~ific C'-a~·itie,; rar,.ge. f:rc:m 6 t,r., 22,000 gpm per foot, the
Ciommon range is f:,cm 60 to 3,200 gp:m per :fcoto
Specifiei-c:apacd ty clata o:an be used. to estimate the coefficient cf
transmissibili t;y of aqui:fe:r>sp and this will be done later in this report.

72
The specific ©apa(:li ty of well NRF=2 during the test on June ll-12,
1951 was im:usually low, either beciau.se the well was not properly devel
oped before the test 9 or becau~a entrained air bl~cked pa.rt of the
aqui:f'er 9 or both. The test on .A:og. 3-50 1951 showed that subsequent
development by ptimpillg greatly increased the spe~i:f'ie capacity.
The specific capacity of' well CPP-3 is abnormally low because at
the time of the test only the lower part of the ~sillg was perforated.
'?he casing w.s not perforated opposite permeable zones in the upper pa.rt
of the basalt.
The yields of some wells in the basalt have been increased greatly
by relatively small increase in their depth. For e:x:ample 9 when well
lraB'-l was 485 feet deep, its specific ~pacity was 16 gpm/ft.. After the
well was deepened to 535 feet 9 its speci.fic (;lapacity was 25 860 gpm/£t.
This and many si:mila.r cases illustrate that in ll1ailY wells the yield is
obtained principally from a few extremely permeable zoneso Water is not
contributed uniformly by the entire penetrated thickness cf the zone of
saturation.
During the period 1949-1955 9 two or more tests a.t different pumping
rates were made on several wellso The specific capacities of wells M!l!B-1,
CPP-l and -2 9 and ANP-1 daorease as the pumping rate in~reases (table 10),
which indicates that well loss is appreciable.
Accurate well-loss constants can not be computed from the available
data. Their order of ma.gnitude 9 however 9 was determined. by a method out
lined by Jacob (194-7).. The value of O is less than Oo05· for well MTR-l; .,
it seems to be about Ool for wells CPP-1 and -2, but the data for these
wells is not oonsistento .Although the well-loss constants a.re relative:cy,

USGS 30
TJSGS 31
Table 10.-Spei,ific ciapad ti.es of wells in the NRTS--·~Oontinued
1/ Plus \ll.'Jlnes r,ep.n,::1,snt bulldup o:f' yater lev(!l du:d.ng recllarg0 test..
g/ Well CPP-2 0 500 f't distant;, was pumped intermittently d·uring the test at 2~300 gpm, wh1,4'h ma:y aecount for t;he anomalous apparent specilfi~ yield.

Table 10.-Specific capacitie13 of wells in the NmS--Oontinu.ed '
Dura,,. Diameter Depth Well ~umber Date tion Pumping Drawdown or Specific of of
of of rate buildup fr> capacitr casing well test test (gpm) (feet) (gpm./ft (inches) (feet)
Field Location hours)
4/21-22/"1 24 .
1. 07i0 ·f.1 l.07i0 16 6oi:;
11/~7/r:)+ l l.4J:iJ:i 1.~ l.120 16 6oi:; CPP-2 3N-29E:-24adl 11/ll-17i/Ju 24 1.i:;00 2.4 62J:i 16 6oi:;
6/2q-,o/i:;1 24 1.S'iO 2.7 6si:; 16 6oi;
11/22-24/i:;4 24 2.'iOO ~o2 781 16 6015
OPP-3 Dis- JN-3011l-19cbl 9/11-12/51 24 800 +38.l 21 16 598 posal
NRF-1 8/3-4/50 24 1,010 62 16 18 485 (STR-1)
11/17-18/ 50 12 1.400 0.5 2,800 18-16 535
. 8/3-5/51 48 1.430 0.5 2,860 16 528 NBF-2 4N-30E-30adl (STB--2) 6/11-12/51 24 1,245 +4.f! 259 do 528 "
USGS 4N-30E- 7ad1 12
8/29-30/50 24 420 5 84 12-10 692
Depth to static water level (feet)
41=i2
4'11
41=i2 4i:;1
41u
451
363
do
365
364
325
Well construction
Casing perfor-ated, 458-483
· and 551-600 ft •
Casing perfor-ated. 490-593 ft. Casing per-forated, 412-452 ft 10/151.
Casing perfor-ated. ,q4-47g ft
18-ino casing ?erforated, 394-
78 f·t • 16-in. casing perfor-ated 4si:;-i:;-:so ft.
Casing pe:r:for-ated11 37'4397 ft, 422- 8 ft, 4<H-l=i27i ft.
12-in. open hole i:;s1-6q2 rt.
...... 0
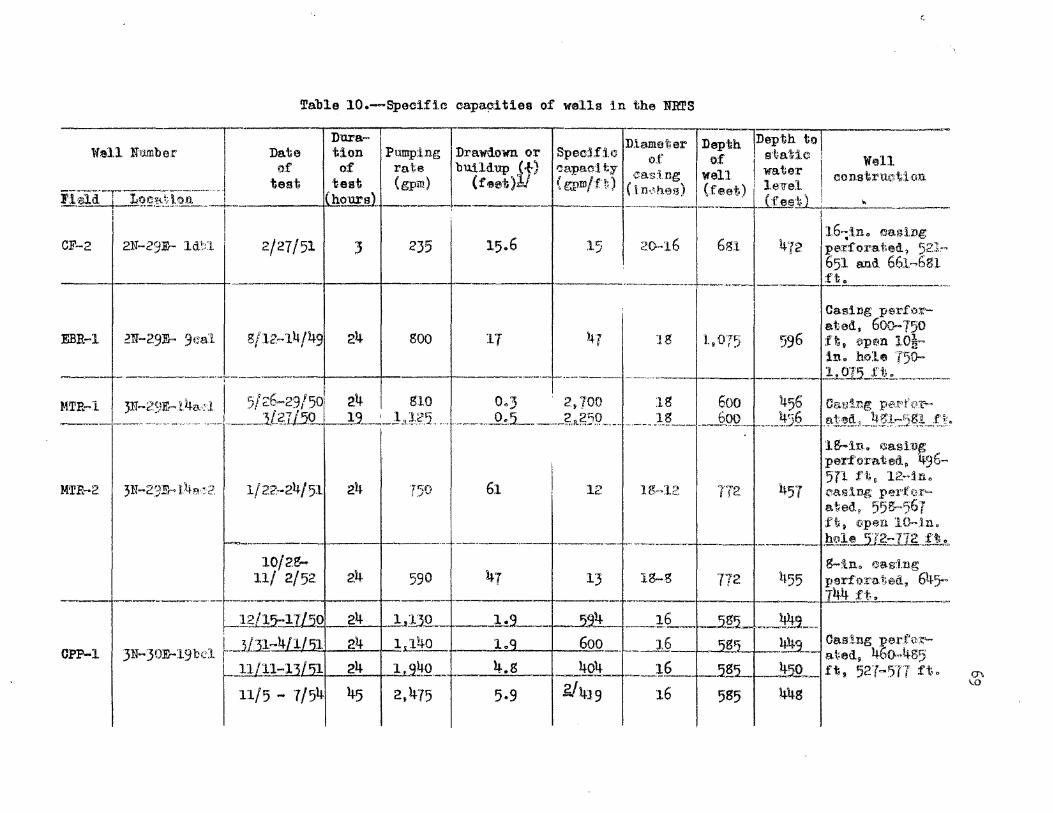
Table 10.-Specif:i,c cap~itiea of walls in the NRTS
-- Dura= Diameter Well llumbe.r Date tion Pumping Draw.own or Sped:fi." of.'
of of rate bUildup l_+) ~a.pa.clty '"'"·-~·;nu, I ( .) (f' )1J < /· . ") """"·"·(· t, ---·--·-r--------·----- 1 test test gpm !Bet ,gpm. L (tn.,~he 2 )
Fl®l.L.f- Lor.i1:1.i;l'O.o, -----1-----·-----+>=hours) -·----------· ... ___________ _ i I
CF-2 2N-29E--- ld~/l 1 2/27/51 3 235
Depth Depth to of' s~au~
well water
(
Well eonst:r,u~tlon
(feeI,) / le1rel _ _____ · _lf e_~""'·lc.,_' -'----"-------_
I
681 I 16-~:in o r.iaslng
472 pe:i:forai;ed? 521"' 651 and 661-6in
---·----1----1----+-·------+-----·-------- ___ ··--· ______ f-j;, o, __ , ______ .,,. ..
800 17 4-. I 18 1,075
- ---------.-----------............-------------·-·-r·-~---- ---------MTR-1. JN-2{)Ji'rl4a.d I 5/'26~23/50 24 I $1Q 0°3 2,700 113 ~QO -------· _-· _____ ·- ,_,_1 ___ ___3[2I}5_0 ~9- ,_1,12_5_ .. ·----- 0.5_ ____ 2,l\.250 .... ----· 18 ---- 600_
·3N-20.m~ 14.,..•:;; ·..1- .... "~- 750 61 12 lT2
--------+----------- --·------- ·-----· -----·---·-10/2t-
11/ 2/52 24 13 772 --- ----~-----!--~ - ·-+----- ------+---~
LJgl!5::..:::..l~Oc.i-,:...;_-1-1
24 .bI}O _ _ _b~--- 4 16 .®. --------I z/'31-4 1 1
CPP-1 3N-30E-19bd I~--..: __ 11/11~13l5!.__.;;;;._ _ _=.,..e<,
24 ll.J4.Q__ lo 609. __ _ _],§ ~ --24 1 ~---- -~g ·---~Q!± - --·- 16 -· 58
11/5 - 7/54 45 2,475 5.9 Y419 16 585
Ca.sing perfo'.f'ated, 600-750
596 ftf i)p~n le½, in. holie 150-
______ .h0l5 .t: t . ·-------
18-:i.n. i;'iaslll~ per.forated, 1+96-571 ft& 12~-ln.
457 eiadne: P"'rf.-,:r ..... ~ted.r '"55$.-.567 ft,; !())pen 10-lno
-----·--- h~l!..5fl::1I!LfJl · 8-:t.n. "aslng
lt55 IH3rfDrated, 6l-1-s,.. '"'lt4 ft • --""
--~----· _4\i,~ - Casing ped'\1r-
ated9 460~485 4~0 . ,.._ ft 9 52'{-577 ft.
448 {J'\ w

.,

443
444
445
446
447 f-w I.I.! u.
448 z -a:: w f- 447 < ;;::
0 f-
:r: 449 f-Q. w Cl 451
453
455
500
40tl
300
(I) u. 200 t)
z
O' 100
0 1950
FIGURE
WELL 2N-3 IE-35oc I, 12 Ml SE OF RIVE
~ELL 3N-29E-14AD , I MI N'.'/ OF RI VER
1951 1952
1EAN MONTHLY DIS HARGE OF BIG
LOST RIVER
1953
67
1954
7.-COMPARISON OF QENERALIZED HYDROGRAPHS OF BIG LOST RIVER ANO WELLS 2N-31E-35ocl AND 3N-29E-l4AD1, 1950-54.
GPO 991857

66
:friction of turbulent :flow 1n the aquifer in the immediate vicinity of
the well 9 through the well SClreen and in the well ciasillg. Yell loss, in
feet, ~ be represented a.ppro::d.matel;y b;y the following relationship
(Jacobi o. E.9 1947):
well loss. er/ (l)
where C is the •vell-loss1 constant, its dimension being in se~2/:rt5,
and Q, is the rate of pampil:Jg in cubic feet per second .. A decrease in
the specific capacity of a well Y1 th an increase in the ptm1pi:ng rate :mq
indicate that well loss is appreciable, but other factors ~ cause the
same res'lll.t. :l:r.amples are devateri:ng of some of the saturated zone, pump
intake pipe breaking suction, and perhaps others.
Speci:f'ic-ca:pacit7 data for wells in the JraTS and vicinity are
summarized in table lOo The specific eapaci ties ratlge from 12 to 2,860
gpm./ft. !he tabulation indicates that, in the :Nli!rS area, the average
specific capaci t7 of a well 16 inches in diameter during a 24-hour test
is about 900 gpm./ft. The average depth of the wells is 586 ft, and
average depth of penetration below the regional va.ter table is 206 ft.
Wells NRF-1 and -2 and MTB-l have the largest specific capacities on
the lm!S, averaging a.bout 2,800 gpm/ft. Yells AEP-1 and -2 in the
northern part of the Nli!S, and wells CJl-2 and D:B:-1 in the southern part,
have moderatel;y low specific capacitieso !he spec:i:f'ic capaeit7 of well
CF-2 might be about of the same magnitude as that :for well :m:Bl¼-1 (47 gpm./
ft) if the depth of penetration were as great (480 feet) o

On the other hand, the rec~rd fo~ 1950-54 shows that the water level
1n well -l4adl normally rises shortly after Auga.s:-r; in some 7ears (fig. 7).
The rise was c:mmuls.tive during the three high-runoff years of 1951-539
culminating in the re~ord.-high water le~el in 1953. If the correlations
shown in figure 7 are va.lid 9 the lag between i:c:filtra.tion a.nd a.."Tival of
the va.ter a.t the wa.ter table may be on the order cf 6 to 8 months.
S't!;ppose that :perCJcla.ting water from· the river spread to a belt 500
to l,000 feet ride 'beneath a 10 to 20 mile reach cf the river. The area.
in which percolation recharge oGcu..rred wuld be about 600 to 2 9 400 acres.
At 3.5 pot average formational porosity9 it would require 21 to 84 ao-ft
of va.ter to raise the water table l ft. A rise of about 4 ft occurred in
230 ~s from September 10 to the end of April, representing about S4 to
330 acre-feet. This inm-ement would be eqaival.ent to a. esontinuous recliarge
new of about 0.18 to 0., 72 ds. These figures have no standiDg whatever
as f~t. They merely- show that it is :tieasona'ble to expe~t tbat recharge
:f'?'Om the river voul.d ~use a. det.e~t,a.ble ritae in the water table. !he
ma.tter requi~es furthc~ study an.d no concl.uaion6 a.re drawn now.
SPECIFIC CAPACITIES OF WELLS
!he perl'orJIIS.IWe of a wll may be expl'essed in terms of its specific
oapac:1 t1', Yhicm is d.e.fined. as the ,-:teld in gal.lens per minute per foot of
dravdovn. The spe~ifiG ~a.pa~i ty- of a. well varies both w1 th the d'Dration
of p'l.1l!lping and with the pumpi:cg rate.
The dra.wd.offll in a. pumped well has 't:"tl'C- components. One is the head
loss from the friction of lamina: flow cf water in the aquifer towar!s
the well.. The other is the head loe~, (well loss) resulting from the

was unusuall;y great ( see p. 17-21) 9 and. much water entered the ground 'b7
infiltration along the river channel on the NRTS. If a rise of water
levels occurred, it wouJ.d appear first in wells near the river and later
or not at all in distant wells. Therefore, we studied well byd.rographs
and compared them with the hy'd.rograph of the Big Lost lliver in 1951-52
On September 10 9 1951 the water level in several wells near the
river on the :N:RTS rose sharpl7 about 0 .. 35 ft - a large rise in this
aqui:fer and locali t7. The residual rise a!ter adjustment for a correla
tive drop in barometric pressure was Ool5 ft. Perhaps this rise was not
related to infiltration from the Big Lost River, because a similar rise
was recorded on the same day in other wells ~ miles from the river.
Recharge from the river ~ have reached the water table about concur
rently with a temporary- rise caused b7 some other factoro Revertheless,
the water levels in some wells near the river continued to rise a.f'ter
September 10.
Infiltration from the river was along a narrow belt 9 the vetted
c.bannel, but the percolatillg water spread to a wider belt before reaching
the water table. Owing to that spread, the rise of the water table
caused by increased infiltration was too small to be detected at its
begi:iming or in daily increments, but infil t:ration may .nave caused :part
of the cima.lati ve ,:q,ward trend of the water-table in well -14a.dl ( see
fig. 6) .. I:f so, the :percolation time through nearly' 500 :ft o'£ basalt and.
sediments to the water table was on the order of four to seven weeks. ,,·

61
distinguim1 10 ro~k. porosi tytt f :r'om OCformaticna.1 porosi t,-., 00 Ws hav& no
practicial method f~t' m'Sasuring c;:r eg'i:ima ting a.©cura:tal.;y the :f offlatio:rial.
po3'.'0s1 tyo .,, It seems "ertain., frttm stt!dy ~.f 4)U'tCl:!:"0lpS &Ud. from. drilli:r:ig
reco?'d.s 9 that the average effective po:t>os:i ty is a.t least 2 pe:t and
probably is a.bcut 5 pcito Fo:r the neoeiHary purposes cf this :t<>eport, we
assume e;onse:M'at:tvsl:, tha~ the a:ve:,age effse,ti,re fo,%'ll'la.tional porosity o:!
the Snake Ri var 'be.sa.1 t 1 s 3., 5 pet.
INFILTRATION RA.TE
No means have be.en d.~.sed. fo.!' d...i:t"ee'=t mea.suremsnts cf infilt?>a.tion
rates in the basal.to The :rate ra:nges from high to nil~ d.epen.d.ing on
physical variations in tb.e :rock. Wherever there a.re i:n:g,emeable la;ye:n
in the basal t 0 the per<.!!clating water tends to form a perched saturated.
zone on ea.ch impermeable l~er. Water in these pe~ched zones moves
laterally till it finds openings through whie:h :Ui can move dovmrard.
Water dispaseid at a point or small a:r-ea on the s'i.'.iiia.~er there:foreo tends
to spread through a wldsr area by the tims it l"eaclles the vater table.
Perclhing of per~~lating wa.tsr is well illust~ated by the artificial.
zone of saturation at the MT1t si te 0 which was built 1Ip with water r-eleased
to the enviromnent (see po 47).
PERCOLATION BA.TE
In Gonne~ticn with waste dispoeal and. nume~~us other problemsD it
would be helpful tc knew how long water t;a.'.te~ 00 peroola.t:.e frfJm the land.
surlac:e to the water, ta,'t:ilec Dtrring '.!.951=53 :runcff in the Big Lost River

60
FOBE WATEB. ARD POROSITY
The presence of pore water in the basalt is easily verified by
direct inspection a.nd by simple laboratory tests. Pieces of basalt were
collected from under water and from the zone of saturation at springs in
the valley of the Snake River. Freshly broken pieces were damp along 'fihe
:f'resh breaks. When the specimens were collected, sttper:f'icial water was
dried of:f' and they- were weighed immediatel7 on a chemical balance. In the
laboratory they were heated in an oven at 105°0 and were weighed periodi
cally until they ceased to lose weight. '.rhe larger samples required about
100 hours for dr;ying. The twenty-five samples of Snake River basalt
listed in table 9 ranged in porosit7 from about 4 to 25 pct and average~
10 pct. The water content ranged :f'rom 1.4 to 11.6 pct by- weight and
aver98ed 4.2 pct. The porosity- o:f' two samples of Banbury basalt aveI'98ed
1S.6 pct and the wat·er content was S pct.
The basalt is permeable to air and 11breathesrl free1y-. Dried samples
exposed to the atmosphere change weight in response to cha.Ilges in rela
ti ve humidity.
Jll:f':f'ective Porosity
Though the total porosity- :f'rom pores and vesicles is relativel.7
high, most of the pores a.re too small to transmit water under the pres
sures that normally prevail in the aquifer, and most of the vesicles are
isolated. The effective porosity- of the rock r8Jl8es from about nil to a
small percentage. Nevertheless, the considerable void space of other
kinds in a mass of lava is hydraulically effective. Therefore, we

Table 9.-Loss of pore water from samples of basalt at 105°0
Weight of Weight o! Volume of' Volume of Porosity Water Location of source of sample wet sample d.ey sample material water (pcit) content Re.w,,,Tk8
{gr) (gr) {~) (cm3) (~!)__-~
:Blue Lake Sprlng 99.,s51 97oi44 34.206 2.707 7.3 208 Vesi~·ruar Seco 28, T. 9 S.p Ro 17 E .. 1080889 103.,503 36.,445 5.,336 l2o9 5,2 Spariu:,l;r ~·efd. «,'alar, Jer(f.)me Ci:mnty 50.508 49.so7 17.,538 .701 JnS L4 Very veid~ulM'
De'l'll I s Washbowl Sp-rJ.ng 4~; 787 45e202 15.916 3.585 18.4 7o9 S~llrlMeous Seo. 4, To 10 s.~ R. 1S I. 6 .oos 60.61'7 21.344 3 .. 391 13~7 5.,6 Ves;i(<Ul~T' J e:rQme Coun1;y 200.173 188~391 66.335 1L782 15.1 6.3 s~orta~tg(i,lfl:!8
Malad Sp:r.lngs 42.243 1~t;~l 14.432 1.256 8.0 3.1 SH.gb.tly 'Wed~nlat> See. 36, Tn 6 Sq R. 13 E., 108.350 37.,527 ln774 1i .• 5 1.7 Denf!!!!l (klod:tng Cm:m i;y 690379 68<0Jf3 23.957 1.341 i:; 3 2.0 V el>llffllla'i." ..I.
151o329 145.42t 510205 5.903 10.3 4.1 Vea:1,©ula,:, 162.s51 145.SJS 51.~5 16.973 2.4.8 11.6 Vesl~ula.:1:'
s2.57s 80.T75 28. 2 2.sri0 9.0 3.5 Vea:l©'illa.i• 1os .. 957 102. 71'5 36.17s 6.212 14.7 6.o Very T~B1~ltli9X t@
se~rla~~'tltl.111 122.121 1160224 4o.924 5.897 12.6 5.1 'V'e d~ula'f' 106.053 98°336 34.625 7. Tl7 18.2 7.8 Den~,r.i
89o26o 84e523 29.762 4.7J7 13.7 5.6 D'l!lr.tst,; fru1',11r<!d
Thousand Sp:d.:ogs 177.,168 114.5113 61)i72 2.650 4.1 1.5 Dens~ Sec. S, T. S S.p R. 14 E. so. TT9 7!L328 27.5so 2Jt51. 8.2 3.1 Ve s:l 4"lila.:i:> Gooding Coun-t:y 121.,502 119.899 42.21g 1.703 3.9 0.8 DerO.ll.tii!
107.'733 105.302 37.07g 2.431 6.2 2.3 Slightly TtiSi(>''llla.T
64.srr 63.618 22.4ol 1.259 5.3 2.0 Very veeielllar 101.947 100.526 35.396 1.421 3.9 1.4 Dense 174.081 16~.941 ~:~~ 4.140 6.~ 2.lf. Very vesiia!ll.ar 123.951 11 -~52 9.099 18 •. 'T •9 l3anbU'f7 basalt 93.754 S6.6g7 30.524 7.Q67 1s.~ So2 l3anb11:Q' basalt
tB

Much of the Snake ru.ver basalt - even that which seems dense and
tight - is permeated by small pores between its mineral grains. .Pores
of that type occupy as much as 25 pet of some rock. Laboratory measure
ments of the :porosity of g random samples of drill cores from fo,mdation
borings on the NRTS were as follows:
Sample Porosity Sample Porosity-~ ~
l 13.4 5 16.0
2 14.3 6 10.l
3 22.3 T 13.7
4 16.7 g 25.2
Tests were made of 25 additional samples in a stud:y of pore water
( table 9). The median value for the 33 samples is about 13 pct and the
average is 10 pct.
Most of the pores are capilla.17 or subca.pillary in size and store
water but do not transmit it. In the zone of saturation they are filled
with water, but the hydraulic head on the water is not sufficient to
overcome the capilla17 force that holds it in the pores. The water
stored in capillary pores cannot be withdrawn thro'll8h wells because it
will not drain from the rock b7 gravity.

57
Tension .ioirl,ts that were prod.u~e:i b;r d.:u'ferenHa.1 :movement o:f the
hardened. ~ust of a lava. flew are, mc:r-,e ·wia.sly c:pen than shn.nk:age joints,
a.nd. the voids ?bserwed range up to 10 0~ 12 ft wideo a few !e~t tc
hundreds of feet lcng, and. at least 20 ft deep. These 01)emings 9 com
mol'.ll.y repo:r":.ed in well logs as c:r'svicies 9 a..t'e e;cpicu.s water bearer's.
13:reacli.ed la'lm tubes we!'e. ft,und at th..'r'ee pla.c.es on the Station.
Other tubes, br-eoohed. and un'b:r,ea.c:hed., u:o.do'U!J-::-eclly ccc'Ul" beeia.use they are
not rare on the plain.. No S'u.t>S""...r-ta"e, t'tir:,,es h.a."7's been identified in the
zone of. saturation 'bensath ths Statton.. Unde:r.-g:rcund ~vities were
reported in the logs of some; test, h.~les: but ncna was identified a.s a.
lava. tu.be. Lava ttibes store and t:r>a.nsm:lt, vezy large amounts of gro'Ulld
water. Their pemea.bili ty is prMti.~ly in.finite.
Most vesic;les in basalt con::rib·-1t1;; ·y.:t'fa little to Hs permeability
and their p~ti((!laJ. hyd.ralogic impc.rta.n~e h minor compared to that. of
joints 8 ~evices, flow-conta.c:t ~ones~ a.n.d interstice~ in scoria and in
cinders. Vesi~les are so abundant in scm6 layers that the rock is
spo?lQ" in appeara.n~s" Some well d:t"illers believe that spongy basalt is
a copious so'Ul"o:e cf water. DespH,e their a.bcm~s. however~ the vesi
cles usually are net wldely int,srccnnectsd ar,1,d de net tra.nsmi t much
ground water~ The m.,:,st spcngy maf,erie.l g:e:,era11.y ,,~cars at the tops of
flows, where the main so,.:;r,ce of wa.te:r, a.::tually :i,1, the v.oi,ds adjacent to
the flow contact.

vesicular or scorlaceous basalt which has been pulverized by the drill.
These kinds of materials are ciommon at the tops of some flowso Some
reported thick beds of cinders ma.y be sc:oria.cseous parts of aa flows.
Fresh aa - broken, blocey basalt - is among the most permeable of
all types of rock. Some aa. weathers readily when exposed to the atmos
phere9 and decomposes when acted on by subterranean water and gases.
Therefore, it becomes less permeable as it ageso The aa in the Snake
River basalt is geologically very yo'llllg and but little al teredo The
physical characteristics of aa were described briefly on page 113 of
part 2o
Tension Joints
Open tension joints a.re very common in the Snake River basalt.
Shrinkage during cooling is a principal cause of tension joints in
basalt (see pa.rt 2 9 p. 108-111) 9 but these joints a.re less widel.7 open
than those produced by other ca.useso The vertical and lateral extent of
single shrinkage joints ra;nges up to a few tens of feeto Shrinkage
joints undoubtedly are developed. in nearly all the Snake River basalt
because they are typical of pahoehoe. The systems of shrinkage joints
in a. flow a.re interconnected and thus provide irregular channels for the
storage and movement of ground water. The average shrinkage Joint is
quite narrow - on the order of a few millimeters to practically nil-
and shrinkage joints alone would not transmit the large yields eommonl.y'
obtained from wells in the basalt unless they extended far into the zone ,. of .saturation.

55
forward part of the !low moves f10J:rwa.:ru with the now a.nd i.s rolled under
overran 1t":foms a. higbl.y per:msa.ble layer. The combination of facitors ' .
produces a porousF permeable zone a.dja~ent to the c:ont~ts betweien flows.
nows. The average contact zone is thin and may transmit relative~
little water, but the ~egate ea.paisity af all the zones is large.
lnt,ersti tia.l Large Voids
Some Snake River basalt flows moved into pla.oe and cooled on marshy
gro'llnd or under water in streams, ponds and. lakes. The cooling lava
formed rounded, pillow-like masses among whicll there are interstices
beca'U.Se the pillows, though plastic, did not mold complete~ a.gs.inst
each other be.tore they ha.Td.ened~ Pillow lava. was obsel"V'ed at a few
exposures in the Gazcy-on of t-he Snake lli'1rer between Milner and :Bliss.
Geologic and physiGal ccnclitions obrtously favored its development there.
In most of the Snake Jilver Plain, however, only a few surficia.l layers
of basalt are exposed and pillows have not beell observed in them. We have
no direct evidence that pillow lava. is an important component of the main
mass of the Snake River basalti though some geologists believe that
pillow lava is widespread.
Volcanic cinders generally a.re a.bout equal in perm.eabili ty to
poorly sorted sand and gra~el. Cinders were found in maJJY test holes
and wells in and. near the NRTS (.A.ppendix l, pa.rt 3). Material reported
a.s cinders in some drillerst logs, however, actually is reddish

3o Open tension joints formed b;y shrinkage of the
basalt during cooling, or by differentiaJ. movements
0£ the crust of a hardening basaJ.t flow.
4. T'llllllels and cavities produced by liquid lava
draining out from under a hardened crust (lava
tu.bes) o
5. Vesicles and cavities formed by expanding gas
bubbles during cooling of the basalt.
6. Pores, chiefl.7 interstitial (between mineral
grains).
7. Tree molds .. These are largel.7 of academic inter
est and have little h;rdrologic importance. They will
not be discussed. further.
~ Ad.jacent 12. :now Contacts
Voids along or near the contacts between nows are among the most
important of the water-bearing openings in basaJ.to Most larger voids of
this sort are interconnected and they are distributed a.bout as widel,- as
the nows in which the;r occur •. The upper surface of a now eommonl:7 is
somewhat brecciated, extensive~ fractured, or highly irregul.ar in con
figuration. A later :f'low that spreads over an earlier one tends to
chill and solidify rapidly a.t its base, without completely filling the
su:rficial voids in the und.er~ing flow. .:Ma.:cy flows also a.re somewhat
brecciated along their bases. .It is cha.ra.cteristio of slowl=y moving ,;
:pahoehoe flows that the stiffened and fractured 'Opper crust along the

53
Evidently 9 ~omple~i ty of gx'ound=wa.":el'" conill ticri..s is no:rmal ~n the
NRTS. The c~mpleA'.i ties at the OPP site s~~.m unusual bei©a.use we have mo::,e
test holes ""there and know more local details than a.re available for other
areas., The na.tt.ral c;omplexity is C!Omptrund.ed by heavy· p'l.lm,Ping of the OPP
wells 9 vhicll causes d.rawd.own of the water table there 9 and 'by the di~
posal of liquid waste a.t a. well a :few h'Ul'ld.?>ed. :feeit distant 0 ~using some
build-u;>o The wa.te::r level in the disposal well ~ct be mea.sureds but
the build-up around it and the d.rawd.ovm nearby p:r-·c,ba.bly ~use the wate:l'.'
table contcl'urs to 11 wa.nd.er1' 1n that vic.:i.nity.
~-EE.A.RING PROPERTIES OF 1.fil1 SllAXE lUVE.R BASALT
Denset massive basalt is nearly impermeable to waterc Most flows
of the Snake River basalts howeve?" 9 contain primary voids which store
and transmit ground wa.'ber. Certain. secondary voids i as in talus brecClia
buried beneath younger sso.:lm.ent~ or basalt P are copious water bearers.
We have no eT'id6ll~e cf c,~e;urt'en~es of wa:i:-er-bea.r:.r,g ta.::i,u£ bre~cia in or
neal" the NRTS 9 so this ma,¾e:t"ial will zwt. be d.esc;r!.bed.o
PRIMARY TYPES OF WATER-BEA.RING OPENINGS
The principal kinds of voidsi listed in the approximate order of
their relative i:mportance 9 are as :follong
l. Voi.ds adjacent to the ccntac,'ts between flows or
between a :flcrw and an u.nder1yi:og format.ion..
2. Int-erst:1 tial openirigs fcrmed duri!lg empla.e:ement
O:f pillOWS 9 cincie:rs and a.ao

52
than that in the northern well. These water levels impl7 a. reverse
gradient of the water table (northeastward more than 10 ft/mi) o '?he
regional gradient is southwestward a.bout 3 ft/mi. Il.eleveling to measur
ing points and repeated remeasurement of the water levels failed to
remove the apparent discrepancy, which must be accepted as a fa.ct.
Theories to explain this phenomenon have been enterta.ined. 9 but there- is
litt'le evidence directly st2pporting them, so discussion seems pointless
at this timee The ano~ probably arises partly from quasi-artesian
conditions a.Dd partly from differences in the construction of the two
wellso
The detailed. co:c:t'igcration of the water table and the direction of
gro'llild-wa.ter underflow are important considerations in the Vicinity of
the OPP area and southwestward from there. Regional contours on the
water table indicate a generaJ. southwestward gradient of the water table.
We tried to trace the course of saline liquid-waste materials in the
zone of saturation by drilling test holes where interception of the
waste seemed likely. Lacking direct evidence of the true direction of
mo-v:ement, now directly down the apparent maxim'lllll gradient had to be
a.sS'llllled. Six test holes were drilled at 500-!oot intel"V'aJ.s along a
2,500-!oot line normal to the direction of the apparent ma.x:1mml. gradient
of the water ta.bleo The saline waste was not found)J This problem is
discussed more !uJ.17 in part 4 (waste disposal) o
l/ After thia report waa writt·en the waate liquid was !o'lmd by f''m'ther exploration. It was n.ot following the apparent maximulD, gl"adient.
;·

Owing to the prevalen~e ef quas~,-a.rtesia.n c:io:o.di tions, predictions
of the depth at w.ich water will be st:rliclt'. in w~lls at soma plae.ss on
the Snake I(1ver Plain are apt to 'be iti. e:i::rcr by a. few feetc Prediction
is more a.ecurate when ph.._":'a.sed. as a progn!.ls:ii:; of static wate:r le-vel in
the finished. well, rather th.an of the depth at wb.i.ceh water will be
encountered.
In some wells in the Sna.ks lU srer Plain the water-level fluotuations
resemble those in a.?'te~ia.n aquifers be~ause the wa.teI' levels respond to
fluctuations in baromstric press'l.ll"e. Ncticea.·ble barcm6tr:k fluctuations
do not occur in water-table aqui:fe!"s 1r;-b.1::,re therE' is free c:onmrunication
between gro"tmd air and the ai::.,mosphei:rec The ba..t"ometric fluctuations in
basalt wells confirm that th~re are tigh:~ zones in the basalt above the
zone of' saturation, and. these imped.e equa.liza.t:!on of p:ressure between
ground air and the atmospb.ere. Other kinds of wa:te:r-level :fluotua.tions
in basalt wells 9 sucll a.s those oaused by earthquakes and by heavy pump
i:og, also simula:te phenomsna. ordinarily seen only in artesian wells.
Water-level flU©tua.tioti.s, will be ctlsC!U.ssed. :fw.ly in later pages.
Unexplained Phenomena
Certain anomalies in the oecurren{2e a.nd beha:vior of ground water in
the Im.TS cause eri tioial problems. A case in point is the behavior of
water levels in the two wells at the CF area (wells 2N-29E-la.al and
-ld.bl). At times tne water levels in the wells a:re at about the aams
altitude; but on mes~ oe:ca.sions when th.e wslls we:r,e, meaSUTea. the water
in well -lcfol, the southe...""nT!lcs~ of the twc, was 0.,1 to 4c0 :ft higher

50
immersed in the zone of saturation in a water-bearing gravel. A drill,
striking the boulder above the level of the water ta.ble 0 would not
strike water imtil it broke through the bottom o:f' the bouldero Water
then would rise in the boulder, but it would not be (la'.J.led artesian. In
an extreme case, sucll as th.at of the basalt well, it is di:f':f'icult to
determine whether the aquifer is artesian or qoasi-artesiano
Test well 4N-30E-7a.dl, illustrates a more common situation on the
Snake River Plain. Water was first recognized in the hole at the depth
o:£ 366 f'to The water rose to 332 ft within about four minutes after it
was struck. Twenty-four hours later the depth to water was 326 :f't. '?he
water occu:rs in broken basalt overlain by solid, nonpemeable basalt.
!he latter seemil:lgly con:f'ined the water under quasi-artesian pressure in
the perm.eabl.e bed, the pressure surface of which coincides with the
regional water tableo Other better-~verage water-bearing zones in
this well were struck in basalt at depths of 4oo to 405 ft, in sand.stone
at 500-504 ft~ and in creviced basalt at 655 ft. 'fable 7 of Append.ix 2
shows the depth-tc-water :measurements made in th.is well during drilling.
Another ex.ample is test well 4N-3cm,;6abl :for which water level
measurements are shown in Append.ix 2 table 6. Water was :first reco~
nized: at the depth of 331 ft and rose promptly to 315 ft. The water
occurred in broken basalt overlain by a local confining bed of solid,
nonpermeable basalt. Additional water was struck in basalt at 605 ft;
a.nd. in sand at l,4oo :fto Water rlth a :foul odor was found at a depth of
l, 010 :f't. In th.is and the previously noted test hole, the ,mter level
was quite stable during d.rilli?lg except when the holes were bailed
rspidl;v or when water-bearing zones were cased off ..

cond1.tion.s:. Test hi:.le ~34'E='9°t1d.lr 322 f-:; deep 9 ene:otu.";.:i6l"ed water at a
depth of 256 f: 9 ka:t ~·t.esiar1 wa.t,e:- seszm.ngly was not st.!"'J.clt:. The hole
was d.eepened to 553 ft wi.t:.1.0:1.'b finding artesian wa.te:t·~ A private weu.l
(5N-35E4bd.2) 6 miles to the ea.st, hm\i't\Ve!' 9 repor.tedly str:~k a.rtesia.n
water at a depth cf abo"l.t 750 :fto Ths wa.i;,er rnne te:i a.bout 50 ft below
the land surfs.ca.
Flowing a.r~~sia.n wells oec:'UI' in ·bhe Abe:-d.e-e:a,=Spri!lgf'ield irrigation.
distriett noz-th of Amerioen Falls Rese:n-ci:::. Other a:teisia.n areas prob
ably will be frnmd. il'.I. the plain.
Exploratory d.aep drilling o~ the NETS did no'!: d:lsclttse uuqu.estion.ed
occurrences of a..:-tesia.n wa.tero If artesian water is present, it is at
depths from which recoT~ry probably woi.tl.d not 'be eco:nomicaL Also, the
deep water is apt to be inferior in chemical quality 8 as was the case
with unco:ofi:n.oo. wat,er :f:-om the l!Mer pa.rt of the deepest test hole
(4N-30E-6aril). ,-rm.ch tapped gro'.lni wai,er- at !tu:mero~J.£ dept.b.B down tCJ
nearly l, 500 ft. The wa:t,e:.- fr,:im permes."cile zones rose n., highs:r than the
regional water ta.'ble.
Test hole 2N-27E-33a.e2 reached. a depth of l,065 !t be.fore water was
struck a.n.d. the water rose to a. static level 981 ft below the surface.
By literal definition, the water is artei;;ia.n. In this hole extremely
tight basa1t extend.ti to a considerable c.epth below the level of the
regional wa.ter ta.·,;,le,. and the hole a.c~.ua.J..:Ly wa.s ·c,one d..ey until water was
struck. After a. depth cf 1,, 000 ft ·was reached faro hole was ·undisturbed
for 13 months, but it contained no water when d.rilling was resumedn The
situ.a.ti on may be analogous to that c:'eatE'la. 'by e large boulder partly

voids and extremely low hydraulic permea.bili ty o The zone of saturation
often is not rec,;ognized in a drill hole in such material~ because the
influx of water to the well is small and. d.ces net n1oticsably deaease
the amount of water that mu.st be added f•o?' dtilli:cgo When a. permeable
zone finally is st~k the h~le fills to the level 0£ the water tableo
This rise of the water level simulates that Cl8.USed by artesian presirnre,
thotlgh the cond.i tions are not tl"Ul.y artesiano Nonpermeable sediments in
the zone of saturation sometimes ca.use e:f'fe~ts similar to those of tight
basalt.
The conditions that produce simulated artesian effects are here
called quasi-artesiano Q.uasi-artesian pressure is very comm.on in the
Sllake River Plain. In many instances the rise of water in a well is less
than 5 ft 9 but 25 :ft is not u.nu.sual (Appendix 211 table 5) 9 and rises as
great as 50 ft are reported by drillers ..
Water occurs in some parts of the Snake ru.ver Plain under trnl;r
artesian condi tions 9 most co:rnmonly in areas where widespread sheets o£
impermeable sediments overlie permeable basalt., At Rupert 9 for example,
a thick blanket of nonpermeable lacustrine sediments oYerlies basalt, in
which water is confined under pressure. Water was struck in basalt at a
depth of 500 ft in one well and rose to a static level about 90 ft below
the land sur.faceo In a few localities on the plain 9 water rises more
than l,000 ft above the level at which the aqu:li'er is tapped.. .A.t some
of these places the ecm:f'ining material. is tight basal.to
Water is confined under pressure beneath impermeable ba.sal t in
parts o! the Mud. Lake basin also, and flowing and no:ru'lowing artesian
wells a.re n'lllllerous there.. In that "oasin 9 which is hydrologically

water in st.orag~ 9 the pe,:,ched. -water' is nz."t a likdy sour~ei of Sl'Jp:ply- for . fa.clil1ties on the mrrs.
to the grotmd. through an infil tl':'e.tion pond. The waste water built -o;p a
the holep he ~o'Uld. not bail the hc,le d....7. The water endently is percilied
on impermaable basalt"
The perched zcne of sat,:.::a:M.cI!. beneath the waste-disposal pond at
the MTR site spread. outward. teJ an imkn.own dist.a.n<'Je beyond the borders cf
the pond and appeared in shallow tes,:; h!ll~s 25 and 50 feet distant. Tha
perched: zone cf' aatura.ti® would devglcy a.t the MTR site if ~ waste
water were disposed cf in the g:mvelo Simila?' d.~elopm.ents ~ be
expe~ted. a.t other pla.o:ss where the geolog 1s eimilar.
The ground. water in the Snake Rivero basalt- and i!i. seilman~s associ-

46
the wate:r--table maps)J On that basis, under.flow in the northern :NRTS
is generally southward. The southward bulgiDg of the contour that
passes through the :Birch Creek pl~a probably is ca.used by under.flow
increments from the :Sircll Creek valley. A similar southwa%'d bulge south
of the mouth of the Little Lost River vallq is CltO.Sed by underflow from
that basin.
South of If. 4 N. the regional trend of imderflow is west of south,
the western component being most pronounced in the southwestern pa.rt of'
the Station. A.loDg the eastern part of the Station 9 south of Circular
:Butt:e, the contours show that water from the Mud Lake basin enters the
Nm!S, moving southwestward across the Station boundary o Along the
entire southern. bo'Ulld.a:t7 o! the Station9 Ullderflow is southwestward..
Perched Water
Perched groimd water was struck in well 6N-31E-2Toal, in the
northern NB.TS, where it occurs in al.lu:n:om or lake bed.so The depth to
the water table was about 60 ft and the saturated thickness was a.bout
30 ft. No perched water was found in other test holes or wells. Well
5lT-30J!l-2lbel, which was drilled~ years ago and for 'Which drilling
records are not available, probably taps perched water.
Perched water was not given a;q special study. It is apt to be
present near the northwestern edge of the !ra.TS from T. 5 N'., R. 29 :s:.
The nature o:f' ground-water under.flow and of factors that control its speed and direction are di seussed in detail on pates 143-151. 'fhe principles discussed. there sho'lll.d be born in mind when'usil'lg water-table :maps or basi:cg plans on them.
' •, .. ' ..
_ .. :,

successive times 11 and. sc:me o:f these ~ represent actclB.l clla.r..ges in the
be ma.d.e 9 would represen.t o:cily a transi tor.r? instanta...'1.eou.s Mnd.i tion
wh.ic.h never would be repeatedo

44
The config,..lt'ation of the water table at the NRTS is quite irregular.
The contours on the maps are smo~th and gently c~ng be©ausa the depth
to water o:an be mea.sursd only at widely s:eiattared points ·mich do not
reveal the i:rregi.tlaritieso The irregularities a.re not great enough a.t
most pla.(;es to ca.use mucll error in an estimate r,f tohe depth to water at-.
a new siteo Where the cionfigara:tion ef the water table is fairly regular
and where water-level control points are spa.C'Jed at intervals of 5 to 10
mii> the error in estimates ra.Dges between a few inches and 5' fto Yh.ere
the configuration of the water table is less regalar or where control
data are poor 0 errors o:f' estimate may be larger.. Additional factors
that affect the 8.Clet!.1"~ and use o:f' watel"-2table maps are discussed in the
section on lilGrotmd-water Under:f'lovo 00
Little is known about ground water in the area :immediately north of
the Im site in the .A:NP areao The water table seemingly is veey flat
there and at plari:ses ~ slope less· than a foot per mileo The general
slope is southwa.'t'd~ but locally the maximum slope departs by at least
90 degrees from that clirectiono
From Pole,..Line Road southward through To 5 N., the general slope of
the vater table is southward 9 ranging between about 7 and 10 :f't per mi
in most of the :row of townships 9 and the contours trend. a.bout eastwardo
To the west O in TO 5 NO 9 Ro 29 Eo the grad:i en t 1 s steeper V ranging up:. to
about 12 :f't per mi ..
In To 4 N. the wate:r-table gradient becomes natter toward the south.,
ranging between a.bout 2 and 10 ft per mi., The co:ntigura.t:io?r of the vater
table is less simple in this township than 1 t is to the nortb. 9 as is
shown by the b:roadly sweeping curves of the contours.,

can. be determined readily by :i,I;,spec,:t:ic:r.t. Maps a,e-,c,ompa.nying this report
(pl. l ~ part 2, • and. pl.o 2s pa.:ri; 3 J repr·le'S6I1.'t tb.e general oonf'igu.ra.tio:n
and al ti tu.de cf the piezc-met;t'ic: smfa.c,e in the area stud.iedo They show
that the depth to tha wa.t,er tacle rar.ges :from accut 200 ft in the northern
NRTS to more than 800 ft i:r:.. iJ1e ~cn.1thsast,e:.r:n pa.rt near Twin Buttes
(plo 2) o
The a.ltittui!;! cf the wa<:e!' ta.'t:1e 1ange:-s f:rc.:m abcu:: 4,580 :ft abo'lJ"e
msl in ths oorthe.rn pa7't' of tche Stat.ion. tc a.bout 4,405 ft·. near the
southwest corner (pl e 2) 6 The water-table oont-01r:a o:n plate 2 represent:
the generalized. al ti tudie and con:figt?ration cf th.e wa.t,er table throughout
the NB.TS in April 1953. Maps for other times! 6oms m.onths spart 9 are
included in appendix 2 (pls. l a.ri.d 3). The maps are broadly generalized,
'being based en ncns:tmul t·ar~e::::t:.'<I measu:r,smen.t~ i.n vdde,ly f:pa.,:ied. wells and
test holes o Eac.n rep:resen.': s an ac;:c·erage 1.:c': i: .. d.:t tier:. whi :::h ~ s !"ea.eonably
corre~t for the Nm:S as a wh~le but is not ~~~~e~t in pinpoint detail.
The maps are iJ.Setul and satisfa.c;tc:ey so long as their limitations are
recognized.
Most of the meas'tll"ements en wh:icb. the Clontour maps are based were
made on the days or in t:he mc,nths sper.:ified on the maps, but a few were

GENEBAL CONDITIONS OF OCOURBENCE
The Snake River basalt, which underlies all but a few square miles
of the northwestern part of the Station, is the only reliable aquifer
from which large amounts of water can be obtained. peremially on the
?ra?S. The thickness of the basalt is believed to be at least 2,000 feet.
but it 1IJS:/' be eonsiderabl7 more.
The ground water beneath the NliTS is largely unconfined. in a
regional zone of saturation. Locally, the water is q'lla.Si-artesian, and
true artesian eon.di tions may prevail at some places or at great depth.
Perched ground water occurs at some places in the northwestern pa.rt of
the Station. An artificially created. perched zone of saturation is
present in the Vicinity of the MTB. plant.
The depth to the water table (normal pressure surface) in an aqui
fer can be measured readily where the aquifer is tapped by wells, test
borings, or other openingso The general form of the water table co~
moniy is represented on a map by isopiestic lines. These are lines
drawn on the pressure surface, connecti:cg points of equal altitude, and
control is obtained biJ' direct mea~urements of water levels in wells.
The accuracy of the map depends upon the number a:cd spacing of the wells
a:cd the time and accuracy of the measurementso
The depth to the water or pressm-e surface at a:n.y-point is the
d.i!f erence between the la.nd~surface altitude and the altitude of the
isopiestic line at that point. If land-surface and watei-table contours

(Ar,alyses l1y Uo So G-ec;lC·glJ>a.1 S1W?!a":f" an.d.. loah(l Agr:i,c:ult'llt'al E..-q>c:::'imsnt Stats: ~:in.. Pa.rc""'s 'D6:!'." m:;.J .. l5J.3lis ei~,epi; where· notei
~ (. t.tJ.e:rvri se O)
Loca:i;;io~.
Date of colle~tlcfi T ' I'"""'' empera.'ti't:.'l."e 1,,~i'.)
Silica (S!02;) Iron (Fe)~
Di 1:; sol vsd. Cald um ( Ca 'i Magnesium (Mg) Sod.i um (Ha) Pot;a.ss:i.um CK) Bicarbona:t;e, (Roo3) Sw.f'a.te ( S'4) Cblorl.dei ( Cl) Fl:u.o:r'ide (F) Nitrate (NO")) Total dissolved solidsg
Ppm Ton!:! per at=f t
Rardnest as CaCO~: ,I
:BtJTTE COUNTY 1 mile nc:rtb
of A:t:;:r:;,,
252 4"-< .J ·~
I
Ho:rthwest of OPP a.::0 ea
9/8/51 68 14
~ot;: 'u.:::. «I--;:, ,l, t,
ll
24 6.6
o) eOO
216
361 8(\1
CUSTER COUNTY AtM~
3g 10 5.7
10.9 139 19 9.6
125 11
290


![[5253] - 501 T.E. (Civil) (End Sem.) HYDROLOGY & WATER ...](https://static.fdokumen.com/doc/165x107/6334fa163108fad7760fc1ec/5253-501-te-civil-end-sem-hydrology-water-.jpg)


![International Symposium on Hydrology Water Resources and Environment Development and Management [Pengelolaan Sumberdaya Air dan Lingkungan]](https://static.fdokumen.com/doc/165x107/631afe74bb40f9952b02412c/international-symposium-on-hydrology-water-resources-and-environment-development.jpg)