Hydrology and stream sediments in a mountain catchment
464
Hgdrolog _g & Stream Sediment from Torle88e Stream Cat. ehment .. ' . I • • by J. A. Hayward Published by Tussock Grasslands & Mountain Lands Institute, Lincoln College. Special Publication No. 17
-
Upload
khangminh22 -
Category
Documents
-
view
1 -
download
0
Transcript of Hydrology and stream sediments in a mountain catchment

Hgdrolog_g & Stream Sediment from Torle88e Stream Cat.ehment ..
' .
I • • ~
by J. A. Hayward
Published by Tussock Grasslands & Mountain Lands Institute, Lincoln College.
Special Publication No. 17

( i)
HYDROLOGY AND STREAM SEDIMENTS
IN A MOUNTAIN CATCHMENT
JOHN ~ HAYWARD
1980
This volume prepared for publication by P. Ackroyd (TGMLI), from the Ph.D, thesis submitted to the University of Canterbury.
Tussock Grasslands and Mountain Lands Institute Special Publication No. 17

(ii)
Requests to reproduce material from this publication should :nade
to The Director of the Institute, P.O. Box 56, Lincoln College. Canterbury, New Zealand,

List of tab 1 es
List of figures
Acknowledgments
(iii)
HYDROLOGY AND STREAM SEDIMENTS
.N A MOUNTAIN CATCHMENT
CONTENTS
PART A - A SUMMARY
Page
(v)
(vi )
CHAPTER 1: The status of knowledge about hydrology, erosion and 7 sediments in New Zealand mountain lands.
CHAPTER 2: A summary account of studies in the Torlesse Stream 17
CHAPTER 3:
Catchment 1972-1977.
The floods of April 1978: An example to illustrate the 30 findings of this study.
CHAPTER 4: The implications for future management. 47
PART B - THE STUDIES
CHAPTER 5: The rainfall study. 61
CHAPTER 6: The stream flow study. 75
CHAPTER 7: The infiltration rates study. 81
CHAPTER 8: The study of subsurface discontinuities. 87
CHAPTER 9: The partial contributing study. 91
CHAPTER 10: The water yield study. 99
CHAPTER 11 : The vortex tube sediment trap. 109
CHAPTER 12: The sediment studies. 121
CHAPTER 13: Channel morphology. 137
REFERENCES: 151

0v)
PART C - THE DATA AND APPENDICES Page
APPENDIX 1: Climatic information recorded in the Torlesse Stream 175 Catchment, 1972 - J977.
APPENDIX I 1: A summary of rainfall observations, Mt. Torlesse Station, 184 1909 - 1975. (Derived from records held by N.Z. Meteorological Service.)
APPENDIX I II: Mean daily stream f1ows 1 Torlesse Stream Catchment, 1973 - 1977.
190
APPENDIX IV: Double ring infiltration rates, Torlesse Stream 196 Catchment.
APPENDIX V: The seismic refraction method used In the determination 206 of subsurface discontinuities.
by R.W. Lewandowsky
APPENDIX VI: Hydrographs, hyetographs, sediment yields and sediment 214 transport rates, Torlesse Stream Catchment, 1972 - 1977.
APPENDIX VII: Bed load sediment sizes from some storms, Torlesse 217 Stream Catchment.
APPENDIX VII I :Movement of sheep within the Torlesse Stream Catchment, 219 1973. R.P. Stratford, J.A. Hayward, E.J. Stevens.
APPENDIX IX: An attempt to determine the source areas of stream sediments by X-ray fluorescence.
APPENDIX X: Survey information of Torlesse and Kowal Rivers.
APPENDIX XI: A laboratory study of stream energy in a simulated pool-riffle channel.
225
230
231

(v)
OF ES, PART A
Slope classes, Torlesse Stream Catchment.
Soil sets, Torlesse Stream Catchment. ~1
Lt
3. Degree of depletion, Torlesse Stream Catchment. 25
Soil loss and erosion, Torlesse Stream Catchment. 25
LIST OF TABLES, PART B
5. Precipitation, Mt. Torlesse Station, 1909 - 1975. 66
6. Storm frequency and direction, Mt. Torlesse Station, 67 1909 - 1973.
7. Precipitation, Torlesse Stream Catchment, 1973 - 1977. 69
B. Rainfall depths and duratloh. Torlesse Stream Catchment, 70 1973 - 1976.
9. Rainfall depths and duration, Lake Coleridge, 1951 - 1975. 71
10. Precipitation at three sites in Torlesse Stream Catchment, 71 1975.
11. Comparison of Torlesse Station and Torlesse Stream 72 Catchment rainfalls.
12. Monthly stream flow (mm), Torlesse Stream Catchment, 79 1973 - 1977.
13. Infiltration rates (at 30 minutes) from plant communities 85 in the Torlesse Stream Catchment.
14. Storm characteristics for 29 floods, Torlesse Stream 95 Catchment. 1972 = 1975.
15. Precipitation water yield and estimated evapotranspiration, 102 Torlesse Stream Catchment.
16. Potential evapotranspiration at Nursery Hill, Craigieburn. 104
17. Precipitation and stream flow for some United States 105 experimental water-sheds.
18. Vortex tube design criteria. 115
19. Laboratory tests with semi-circular vortex tube. 115
20. Sediment yields from some New Zealand mountal:-i rivers. 123
21. Suspended sediment yields for seven storms, Torlesse 126 Stream Catchment.
2.2, Bed load yields for floods classified by peak flows. 129
23. A summary of morpholoqic features of Torlesse Stream Channel. 144

(vi) '
LIST OF FIGURES, PART A
1. Extracts from the Christchurch Press and Christchurch Star, 1940 - 1943,
2. Extracts from Campbe 11 (undated).
3. Extract from 11The Weekly News••, 29 May 1963.
4. The Torlesse Stream Catchment.
5. Location of Torlesse Stream Catchment.
6. Plan of study area showing places mentioned in text.
7. Area altitude relations, Torlesse Stream Catchment.
8. Soil sets, Torlesse Stream Catchment.
9. Degree of depletion, Torlesse Stream Catchment.
10. Distribution of major plant communities, Torlesse Stream Catchment.
11. Land capability assessment.
12. The Torlesse Stream Catchment.
13. The Kowai River Catchment.
14. Rainbow Gully.
15. The Irishman Stream.
16. Sediment accumulation in Rainbow Gu 11 y.
17. Alluvial sediments stored in the Torlesse Stream channe 1 •
18. Synoptic conditions, 14' 18' 20, 22 April 1978.
19. Hyetograph and hydrograph, 16- 18 April 1978.
20. Ground water emerging to the catchment surface.
21. Stable channel below a point of qround water emergence.
22. Unstable channel below a point of ground water emergence.
23. Movement of debris deposit in Slug Gut.
24. Face above Helen Stream.
5. Failure of unconsolld~Led stream banks
Fo II ows Page
10
14
14
20
20
20
20
22
22
22
22
32
32
32
32
32
32
38
38
38
38

(vii)
LIST OF FIGURES CONTD.
26. The Kowal River.
27. Sediment accumulation upstream of the Torless~ Stream control section.
28. Remnants of a gravel wave.
29. Hyetograph and hydrograph, Torlesse Stream Catchment, 19 - 23 Apri 1 1978.
30. The Kowai River flowing alongside the Kowai scree slopes.
31. Rock outcrop provides stabiiity to the upper slope.
32. Degradation of the Foggy Fan.
33. Degradation of the Foggy Fan.
34.
3c ::;>.
36.
37.
38.
39.
40.
41.
42.
43.
44.
45.
46.
47.
48.
49.
LIST OF FIGURES, PART B
Meteorological station, Torlesse Stream Catchment.
Location of rain qauges, Torlesse Stream Catchment.
Average annual rainfall, Mt. Torlesse Station.
Annual rainfalls, Mt. Torlesse Station.
Storm frequency, Mt. Torlesse Station.
The outlet of the Torlesse Stream Catchment.
Stage height and discharge relationship, Torlesse Stream control section.
Torlesse Stream control section and water level recorder.
Monthly stream flow, Torlesse Stream Catchment, 1973 - 1977.
Annual hydrographs, Torlesse Stream Catchment.
Relations between flow and flow one day later for 11 selected low flow periods, Torlesse Stream Catchment 1973 - 1977.
Flow duration curves, Torlesse Stream Catchment 1973 - 1976.
Diurnal variation in flow for a seven day summer period.
Flood flow through the control section.
Location of infiltration trial sites.
Seismic wave paths.
Fo 11 OlrtS
Page
42
42
42
46
46
46
46
64
61!
64
64
76
76
76
78
78
78
78
78
78
88

(viii)
LIST OF FIGURES CONTD, Follows
Page
50. Equipment used in th~ seismic survey. 88
51. Relation between surface and sub~surface bedrock, Gingerbread 88 Spur.
52. Relation between surface and sub-surface bedrock, Helen Stream 88 face.
53. Relation between surface and sub-surface bedrock, Kowai site. 88
54. Erosion downslope of a point of ground water emergence. 88
55. Possible stages In the evolution of an eroded landscape. 88
56. A diagrammatic time lapse view of source areas of stream flow. 92
57. Estimated contributing zone for storms of less than 25mm, Torlesse Stream Catchment.
58. Estimated contributing zone for storms of more than 100mm.
59. Non Darcian flow through terrace qravels.
60. A vortex tube sediment trap.
6'1. Relations between stage height and discharge for control section and upstream channel.
63.
64.
65.
66.
67.
68.
Laboratory model of the vortex tube.
The Torlesse Stream vortex tube sediment trap and control section.
Vortex tube discharging Into work pit.
Sediment trap construction, February 1972.
Sediment weighing.
Sluice across work pit.
Night work on the sediment trap.
A chronological sequence of sediment yields.
70. Changes In cross-sectional area, Torlesse Stream channel.
71. Changes in cross-sectional areas, Torlesse Stream catchment 30 April - 1 May 1975.
72. Range of sediment yields, Torlesse Stream Catchment.
ed me t ., 1 ? .
Var!ab li in distribution of particle size during one storm.
96
96
114
114
116
116
116
11 6
116
116
118
128
132
132

(ix)
LIST OF FIGURES CONTD. Follov:s
Page
75. Sediment transport rates at the vortex tube sediment trap. 134
76. Bed load sediments recorded at sediment trap vs those estimated 134 by some conventional estimating equations.
77. Bed load transport rates estimated by some conventional equations. 134
78. Measured bed load transport rates and calculated stream power. 134
79. Relation between
80. Boulder steps.
81. Riffle steps.
82. Rock steps.
83. Schematic diagram morphology.
sediment load and flume slope (Schumm & Khan). 142
142
142
142
of the Torlesse Stream channel pool riffle 142
84. Pool riffle morphology of Torlesse Stream channel. 144
85. Relations between step height and distance between steps, 144 Torlesse Stream channel.
86. Relations between step length and slope of channel, Torlesse 144 Stream channel.
87. Point velocities through riffle and pool C/S 8. 148
88. Velocity change in a laboratory pool riffle model with qravel 148 accumulation in the pool.
89. Kinetic energy of stream flow with gravel accumulation in the 148 pools of a laboratory model.

(x)

ACKNOWLEDGEMENTS
This study has almost become a way of life and I should like to grateful!
acknowledge the many people who are a part of it.
Between 1967 and 1969 I carried out an erosion study using small run-off
plots at Porter 1 s Pass on the Southern end of the Torlesse Range. During
that study I realised that while soil erosion was active on that catch
ment1s surface, 1 ittle if any of this debris appeared to reach the stream
channel. This observation caused me to doubt the complete validity of
a presumed direct relationship between land erosion and presumed sediment
accumulations in downstream channels.
During that period those concerned for soil conservation and rivers con
trol throughout the high country were encouraging and promoting the
retirement and rehabilitation of high altitude lands with the objectives,
inter alia> of reducing both the rates at which sediment accumulated in
streams and rivers, and the frequency and magnitude of flooding. . .
It was my view that these were untested propositions.
In 1970 I was fortunate to be able to visit the Western United States.
Almost by chance i met Dr. Peter Klingerman at Oregon State University and
saw his vortex tube sediment trap at Oak Cre2k.
central element of our Torlesse experience.
This device has been the
It was my view that high country erosion and sediment research should be
based on whole catchments and that such studies should be of a multl-dis-
cipl inary nature. In 1971 a group came together and submitted a success-
ful proposal to the Nuffield Foundation.
This group included Dr. D.J. Painter (New Zealand Agricultural Engineering
Institute, Lincoln College), Dr. J.H. Soons (Geography Department,
Canterbury University), Dr. l\.J. Sutherland (Civil Engineering Department,

2
Canterbury University) and myself. We were given support from Mr. R.D.
Dick (rJorth Canterbury Catchment Board), rlr. D.'>li. lves (then of D.S.I.R.
Soi 1 Bureau), Dr. W. McCave (D.S. f .R. Institute of i~uclear Sciences),
Mr. A. Ryan (Ministry of Transport Meteorological Services) and Dr. G.T.
Daly (Plant Science Department, Lincoln College).
Although the work reported here represents my contribution to this group's
endeavours it could not have been accomplished without a great deal of
assistance from many people. I wish.to place on record my most sincere
appreciation to all those who have contributed to this physically demanding
and intellectually stimulating experience.
In !~ovember 1971 vJe began construction of the base hut and sediment trap.
I should 1 ike to pay a particular tribute to the enthusiasm and competence
of Messrs !an Fryer and John Stevens of the Tussock Grasslands and Moun
tain Lands Institute. Without their building skills and without the
help of Messrs Terry Crowhen, Hugh Orr, and Dick Martin this project
would have remained an idea. I am grateful to Mr. T.D. Heiler for his
assistance v1ith hydraulic design; to r1r. I Calvert for his assurances
that'my elementary structural design was ''unlikely to fail"; and to
Mr. J.T. Johnson (Ministry of Works and Development Testing Laboratory)
for his advice on how best to make concrete from river bed gravels. To
the many friends who helped us pour the concrete and build the base faci-
1 ities; thank you.
I am grateful to Mr. Alan Ryan and his staff in the Meteorological Office
at HarevJOod for their storm vvarnings.
The task of weighing sediments during storms has been exhausting, demanding
and occasionally fun. To Messrs ian Fryer, Ross Stratford, Chris Ward,
Errol Costello, Clyde Shumway, Rob Blakely, Peter Ackroyd, Doug 1'\ilne,
Gerry McSweeney, Phil McGuigan, Dave Adam, Lindsay Main, Mike Mardin and
Drs. Bob and Emily Oaks, thank you for the cheerful way in which you helped
v1e gravel !n \riht=Jt vias usually appalling weather. ,,
I expre~:::,s n:y grateful thanks for their assistance with ti"'!C: stu of in I l ~·

3
tration rates.
In 1974/75 I was invited to Colorado State University as a visiting
Professor in Watershed Management. During that time I met, and was
profoundly impressed by, Dr. S.A. Schumm and his postgraduate group of
students •vho were doing research into the morphology of fluvial systems.
By 1974 we had recorded, marked varlabil ity in, and periodicity of,
sediment-movement, but there was little apparent pattern in this movement.
It was exciting to find that from a physically very different, small,
experimental sand bed catchment, some of Dr. Schumm 1 s group were recording
comparable behaviour. My association with Dr. Schumm was a major in-
fluence in understanding the behaviour of the Torlesse Stream catchment.
I should also like to express particular thanks to f1r. Rob Blakely.
During my absence Mr. Blakely had been employed by the Institute to help
maintain the project, to carry out sediment size analyses, and to make
detailed surveys of the pool-riffle morphology of the stream systems. In
correspondence with Hr. Blakely I advanced the proposjtions that the
variability in sediment yields was in part due to a pulsing or wave-1 ike
movement of sedir.1ents and asked that his surveys attempt to establish the
presence or absence of gravel 11waves 11 in the stream channel. lr/hile the
results show that such 11waves 11 do exist they are not as I had originally
conceived. It was Mr. Blakely 1 s competence as an observer, rather than
his survey skills, which established t:1eir presence. Follmving his
observations Mr. Blakely took a number of initiatives aimed at better
understanding the storage and release of sediments within the channel
system. The descriptions of gravel wave movement (Chapter 12/Part B)
are derived from his measurements.
I am also indebted to Mr. Blakely for the surveys of the Kowal and Torlesse
Stream channels and to the invaluable help of Mr. Derry Gordon and students
from the Civil Engineering Department, Canterbury University.
In 1976, Dr. Robert Oaks, (Department of Geology, Utah State University)
spent a sabbatical leave mapping the geology of the Torlesse Stream catch-

4
ment. In addition to these studies he made some most important observations
about t~e significance of the fine fractions to the stabfl ity of colluvial
deposits. These observations have been of the utmost importance in under-
standing the stability of the Torlesse stream catchment.
By focussing my attentions on one catchment I have been better able to note
short term and longer term changes which have provided me with insights
into the process~s operating in the catchment. A notable example was the
study of subsurface discontinuities and I am particularly grateful to tlr.
Richard Lewandowsky (Geology Department, Canterbury University) for the
seismic refraction surveys reported in Chapter~ Part B.
A second example is in the concept that stream energy relations play an
important role in control] ing catchment stabfl ity. I am most grateful
to Dr. Tim Davies (Department of Agricultural Engineering, Lincoln College)
for his enthusiastic sharing of my intuitions, and for his help with the
laboratory study reported in Chapter 13,Part B. also express my
graditude to Messrs Geoff Thompson and Col in Tinker for their part in
that study.
In presenting these results and in interpreting their sfgnificance I
recognise that I have received the benefit of comment and criticism from
many people. Information contained in Chapter 12,Part B has been presented
at a symposium of the New Zealand Hydrological Society and some of that
presented in Chapters 7,9, 10, Part B, vJas delivered to a D.S.I.R.
Symposium on Soil Plant Water relations.
In the last five years ! have accompanied many New Zealand and overseas
visitors to the Torlesse catchment. ! doubt that there has been one
occasion in which I have not developed my understandings and insights as
a direct result of these visits.
l owe much to my friend and col league Mr. Terry Heiler who tolerated my
enthusiasms and critiqued my ideas. i should also like to express my
unreserved appreciation for Dr. Kevin 0 1 Connor, Director ot l
Grasslands and Mountain Lands Institute, who has given the Torlesse

5
project his unfailing support and been a constant source of stimulus, and
~upport to my endeavours of the last five years. I am grateful to t1r.
Ken Lefever, Dick Martin and LeBa Hong for their competent assistance
wit!1 data processing; to Pat Prendergast and Val Davies for their draught
ing and illustrative work; and to Mrs. Beryl Bond and Mrs. Nan Thomson
for their typing of this manuscript.
To Maurice and Helen Milliken (Brooksdale Station) on whose land this
project fs centred I should like to say a sincere thank you for your
hospitality, generosity and friendship. There have been times when you
must surely have questioned our sanity and the value of this wi1ole
project.
Finally I should I ike to express my appreciation for the support and
encouragement given to me by my wife and family. It was their tolerance
of the disruptions that storm events have brought to our family life that
really made this study possible.

6
PART A
A SUMMARY

7
CHAPTER 1
1970
THE STATUS OF KNOWLEDGE AND CONSERVATION PRACTICES IN MOUNTAIN LANDS
SUMMARY
New Zealand attitudes to soil and water conservation have their origins
in Europe and North America where legislation for the conservation of
soil and water resources preceded research by 20- 30 years.
In the 1930's and 40's much New Zealand land was in a depleted and eroded
condition. Those who first advocated soil conservation saw a clear need
for remedial action in preference to research. North American attitudes
pol i ci es and research fIndings became the bases for New Zea 1 and po 1 i ci es
and programmes.
Most surveys and investigations made in New Zealand mountain land were
predicted on North American concern for soil surface conditions and
Horton's concept of overland flow.

8
1970: THE STATUS OF KNOWLEDGE AND CONSERVATION PRACTICES
IN MOUNTAIN LANDS.
It is possible to search the writings of ancient philosophers and fi
occasional evidence of a concern for relations between land use, so 1
erosion and river behaviour (for example Glaken, 1958).
However contemporary soil and water conservation is generally believed
have it 1 s origins in 19th century Central Europe.
In the 18th and 19th Centuries the population of the Swiss Alps increased
as entrepreneurs clear-cut forests for the rapidly developing down country
iron and glass industries. The subsequent erosion and flooding went
largely unheeded until the Vienna Congress of 1848 gave political stabili
to the region. Disasters in the 1870's and 1880's convinced the Swiss
Government that remedial action was necessary. In 1876 and again in
1902 the Swiss Constitution and forest legislations gave authority to the
Government to undertake remedial work with Federal money.
In 1902 Arnold Engler began the Emmenthal project to study the effects of
forests on stream flow. There are at least two features of the early
Swiss experience which are of interest. First, the political decision to
rehabilitate the n~untain lands preceded research into forest influences
by about 25 years. Second, Engler and later Hans Burger were experienced
and practical foresters who not only believed in the Swiss Government 1 s
policies of rehabilitation but felt responsible for them. we
apparently strong willed and determined men who engaged In science in
search of support for their opinions. From their writings a reader can
apparently learn much of the political 1imate of the time, ( !\e l e r

9
Meanwhile settlers in the Western United States were recognising the
importance of water for irrigation. Their concern for the limited avail-
ability of water, and the prevailing European view that forests had a
favourable influence on streams, led Congress to enact legislation in
1897 to create forest reserves for the prime purpose of ''securing
favourable condit.ons of water flows". In 1911 the Week's Forest Purchase
Act extended the ''acquisition of lands for the purpose of conserving the
navigability of navigable waters" (USDA Forest Service 1933).
In the same year (1911) the United States Forest Service and Weather
Bureau set up a co-operative paired catchment study into the effects of
forests on stream flow at Wagon Wheel Gap in Colorado, the results of
which would not be reported for another 17 years (Bates and Henry 1928).
However in the following year (1912) Raphael Zon attempted to enlighten the
U.S. Congress and public with his report "Forests and Water in the Light
of Scientific Investigation". Forests, he reported, were not only
beneficial to stream flows, but they actually caused increases in preci-
pitation (Zon, 1912). Although this latter view is now discredited it
was at the time an important contribution to the developing concern about
forest influences.
But the concern was not limited to forest lands. In 1917 F.L. Duley and
M.F. Miller began a series of runoff and erosion experiments on agricultural
land and showed that greatest runoff and erosion took place on bare un-
cultivated soils. In contrast permanent pasture allowed 1 ittle runoff or
soil loss. (Duley, 1952)
In 1928 Bennet and Chap] ine produced an assessment of the erosion problem
in the United States and warned that 11corrective action mu.st be taken .soon -z~f far grea·ter' damage and more difficult control are to be obviated. OWners of range land should consider the use of their land not only for immediate gain~ but stiU more in the light of the futu.re productivity of the range, the protection of water supply 3 and stream-flow regulation'1 •
(Bennet and Chap! ine, 1928).

10
Three years later~ (1S3J), Forsling reported results of 15 years of measure
ments on two experimental watersheds in Utah.
11The resuUs show the importance of herbaceous vegeta-tion in reduc-ing rainfall runoff and floods and in controUing erosion. They also show the need for regulating grazing to prevent depletion of the her•baceous cover ... u (Forsl ing 1931).
The dust storms of the l930 1 s had a profound influence on American and
international attitudes to water and soil conservatfon. The 1 'Black
Dusters 11 of Oklahoma, l<.ansas and Colorado not only confirmed the fears of
early conservationists but occurred in combination with a major economic
depressLon and led to a widespread migration from the ::lust Bowl.
"Approximately 100 miUion acres stiU largely in cuUivation has lost all or the greater part of its topsoil. In short~ half of the better cropland of the Nation has been affected by erosion in degrees varying from the state of incipiency to complete destruction. Tens of thousands of farmers have become subsoil farmers., which means something very close to bankrupt farming on bankrupt land" (Bennett 1937; quoted by United States Department of Agriculture 1940).
Sennett's magnum opus 11 Soil Conservation 11 and Jacks and Whytes 1 11The Rape
of the Earth 11 published in 1938 were widely read and acclaimed for the
clarity of the simple messages they contained.
By 1940 there was an established and recognised need for conservation of
the soil and water resources of the United States.
l n i~ew Zea 1 and, lkCask i 11 ( 1 973) records that between 1870 and ] 930
J. Bucnanan, Captain Campbell Walker, the Rev. P. Walsh, H. Hill, J.P.
Grossman, J. Henderson and t'LH. Ongley, Dr. E. Kidson, and 11t1alabar11 all
expressed concern for erosion and it's consequences.
public support for their views.
There was 1 ittle
It is generally accepted that it was the Poverty Bay and Hawkes' Bay floods
in February and April 1~38 that triggered public interest in river and
eros ion control . Newspaper articles of the day reflect a concern for
urgent remedial action, (Figure J). They also record that the early New
Zealand advocates for soil and water conservation were very familiar with

\SoiLERoSION 1
PROBLEM:NEED I \FOR ACTION ~!3. \
AGAIN URC.ED. ·.(~:~~ The executive o t night decided to
Progress Lea!!:~ ~~: in the campaign cont~nue ~~ t e ~overnment actiOn in
SOIL EROSION
Investigation . and Control
·A tESSON FOR NEW ZEALAND f the ca.nteJ bnrY \'
fOr tmme a e . M mbers were combating soil ~~0~10~~sp~e the diffi· in agreement a the war situation. (sPr' r' LLY WTUTIP.ll roa T!!ll Pn8s.)
culties arising from b f ced at once \ I By L. W. McCASKILL.) the llroblem should r epa R CHmiel ' . The secretarY (M th t the Minister 'I he mOJ c one travels H America cullected in the 77,000-!lcre watersht-d reminded m~~~e~~he :ron R SPmple l \ st~d;:ing l rr 'Jl~rns . of on I] erosion, I and the 3501J-acre lake thro h which of Puhlle \V he intended to Introduce l .. fme~tey,. a 1d w!ld life cor.tl ol g:=ncr- it di~harge< to arrive at p~ctlces on statt>d that d n•hi~h an orl'(anlsa- ·1ally, the r 101 c one feels ho v dmilar the farms which will reduce ail tat ion ·- -'~1otl{)n un t>r n ' th th b to II tniO!ffil rrt. . ..n.1nrtHke e 1 e pro lr rm are to those in New
Abeehoe ef Data
HOW. PROBLEM IS SOLVED IN
Figure I: Extracts from the Christchurch Press and Christchurch Star 1940 _ 1943.
in~y that rnething ;rrepated . experiwe our~
.normous
It was found quite early in the scheme that there Wl8 insufficient data ' an:ywhcre 1 '1 the world as tci the relJtwn bet\\een soil eros14Jn and the nature of r:dnstorms. It was realised that o~d rpcords from the few exiot• 1n1.: ramfall station,. gave little fundamental knowledlle. Accordingly there was set up at New Phlladelph!a tlle headquarters of the tnost elaborate climatic research !n existence. Because of the vast number of observers neces· ... ~ .... -· H ... - ~--1" .............. ~ ll'Al11r1 ha\71:\ bP~n dif ...
Ql_:;'
Steps Taken In The United States
1\EED SEEN FOR SIMlLAH
ACTIO~ IN DOMiNION

ll
the preceding 30 years of experience in the United States.
Three years later (J94J] the Soil Conservation and Riversl Control Act
became law. This Act inter alia establ [shed the Soil Conservation and
Rivers 1 Control Council which had the objects of:
1. the promotion of soil conservation 2. the prevention and mitigation of soil erosion 3. the prevention of damage by floods 4. the utilisation of lands -in such a manner a.c: will tend
toward the attainment of the objects afore said.
To attain these objectives in eroded mountain lands the Council would
evolve policies and programmes which would include:
1. the retirement of eroded high altitude land from grazing by domestic and feral animals. (wnere this required fenc-ing_, government grants would cover the total cost.)
2. the provision of alternative grazing for displaced stock. 3. the prohibition or strict control of burning. 4. the provision of firebreak access tracks. 5. -the rehabilitation of eroded retired lands. (Poole 1972)
Although the reasons for these policies have been stated in various forms
they may be summarised as a desire to create
"a more protective and stabilising cover of vegetation_, so as to mitigate soil erosion_, and the choking of river channels with detritus_, and to minimise flooding". (Anon 1961)
By 1970,530,000 ha (1.3 million acres) had been, or was in the process of
being retired from the 1.25 million ha (3.1 mill ion acres) of South
Island high country reckoned to be in need of retirement. (Anon 1973).
As it was generally recognised that retirement per se would not reverse
erosion processes in many areas, catchment authorities were being urged
to address the issue of rehabilitation for eroded and depleted lands.
(Poole 1973).
What evidence was there to support these attitudes, policies and programmes?
Those who read the writings of the New Zealanders who first promoted a

12
concern for soil conservation must come to the conclusion that New Zealand
attitudes were profoundly influenced by North American experience. Being
biologists and agriculturalists the early writers were quick to accept
such propositions as:
"Any modificat-ion of the plant cover and sv_rface soil_, by cultivation, burning, or overgrazing_, induces conditions unfavorable to the optimum development of these soil fauna and flora, which affect the ability of the soil to take up water." (U.S. Department of Agricul·· ture 1940)
11When a drop of rain strikes the gr•ound covered with a dense covering of vegetation, it breaks into a spray of clear water which j~nds it way into the numberless 1:nterstices and channels of the soil; but when it strikes bare soil formerly developed under a mantle of vegetation, the force of the drop causes it to take up fine particles into suspension; it becomes a drop of muddy water. As it sinks into the soil the fine particles filter out at the surface to form a thick film which chokes up the surface pores of the soil. Then only a part of the drop filters into the soil, another part is left unabsorbed and flows over the surface; the accumulation of infinite unabsorbed drops on sloping land gives rise to supel~ficial storm flows." (Lowdermilk, quoted by U.S. Department of Agriculture 1940)
From writings such as these, and from the condition of much New Zealand
hill and high country it was obvious to the early conservationists that
exploitive land use led. to a deterioration of the plant cover with con-
sqeuent increases in erosion and flooding. This proposition was regarded
as a fundamental truth. But also, Implicit in this proposition was the
view that the restoration of plant cover meant a reduction in the rates of
erosion and flooding. If such 'self evident' propositions needed the
support of research then this could be found in the writings of:
Horton (1933, 1938) Baver (1937) Bennett (1933) Lowdermilk (1935) Duley &
Ackerman (1934) Musgrave (1947) Kittredge (1954) an~ others.
Both before and after 1940, a nu~ber of New Zealand surveys gave emphasis
to plant, soil, erosion relations. (See for example Zotov (1938) Commit
tee of Inquiry (1939) Gibbs et al. (1945) Barker (1953) Tussock Grasslands
Research Committee (1954) Wraight (1960, 1963, 1967)}. These studies
gave implicit (and sometimes explicit) support to the view that because
good plant cover was a desirahle watershed feature, it should become an

13
objective for 1 and management. This view was further supported by much
general writing and a number of reports commissioned or presented by
visitors from overseas (see for example Ellison (1957) Heady (1967) Costin
(1962) Love (1957).
The earliest bulletins of the Soil Conservation and Rivers Control Counci I
and other agencies left a reader in no doubt as to their authors 1 views of
the problem and its solution. Their sometimes extravagent titles, (for
example 11 Fire- Public Enemy No. 111 (Campbell undated), 11At War with a
River" (Scott undated), their dramatic photographs and presentation (Fis;.
2), were clearly intended to arouse public awareness of the need for
positive soil and water conservation. In the 1950's and 60 1 s editorial
and feature writers in daily newspapers and magazines gave support for
erosion control measures. including the retirement and rehabilitation of
eroded mountain lands (for example see Fig. 3).
That such views came to have general acceptance is illustrated by the out
come of submissions to a Parl iarnentary Select Committee considering
noxious animal legislation in 1964. Service (1964) stated
In evidence the New Zealand Forest
11the key to control of floodi-ng and el'Os1.:on and to saUsfactory water supplies 'lies in the weU being of the skin of vegei:ation ... wh-ich cove:r>s the mountains".
Similar views were expressed by the New Zealand Catchment Authorities
Association (1964)
11There wiU in future be an incr•easing importance plaeed on a continuous yieLd of good water from mountain catchments for domestic~ agricultural~ hydro electr-ic and industrial use 11 •
"Vegetation depletion and soil compaction lead directly to increased rates of r•unof'j' and accelerated erosion".
Although such views were accepted, we, with the benefit of hindsight might
well ask 11Where was the New Zealand evidence upon which such views were
based? 11
The mountain lands of New Zealand have been host to much research but
comparatively 1 ittle of this has been directed toward understanding plant,
soil, sediment and hydrologic relations. The vegetation studies noted
earlier, established that much mountain land was in a severely eroded or

14
depleted condition. In response, O'Connor (1962, 1967) Dunbar (1970, 1971)
Nordmeyer (1976) and others found species that would be suited to revege
tation and established the fertility needs for a range of sites. The
benefits from the widespread application of these findingswerenot clear.
Viork by Gradwell (1955~ 1957, 1962) Soens (1968, 1971), and Butterfield
(1970) confirmed that frost andwindwere active agents of erosion. Not
withstanding these studies, soil surveys and soil process studies, Cutler
(1961) reported that although erosion in South Island high country had
long been a controversial and frequently acrimonious subject of debate,
there were no valid data on the stability of soils on steep slopes.
Subsequent work by Molloy (1962) showed that instability hud been a
periodic feature of at least one New Zealand mountain range (Torlesse).
Geologic mapping (for example Grindley et aZ. 1961) has provided much in-
formation about New Zealand's complex geologic history. However the
emphasis on mapping time - stratigraphic units has not been particularly
useful in understanding rates and mechanisms of erosion. 0 1 Loughlin 1 s
(1969) study of the geology and geomorphology of a mountain catchment was
an important contribution towards such understanding. From his investi
gations he concluded that a modern phase of accelerated erosion (associated
with the depletion of plant cover) had substantially modified stream bed-
forms. He suggested that the morphology of the stream bed and channel
was controlled by infrequent catastrophic events, and called for longer
term studies to verify his findings and provide more information on sources
of bed load.
Prior to 1970 there was information about sediment loads in lowland rivers
(see for example Jones (1968)) but Johnson's (1970) preliminary study in
the Craigieburn Range was the only contribution to an understanding of
mountain stream sediments.
In the decade before 1970 rapid advances were made in understanding the
character of mountain climate, and the temporal and spatial variability of
temperature and precipitation. (See for example Coulter (1964,1967)

6. Figure 2a: T
his cartoon was first published in the U
nited States and w
as reprinted in the Soil C
onservation and Rivers
Control C
ouncil Bulletin N
o. 4. It was clearly intended to arouse public aw
areness of the need for soil and
water conservation.
\1 Figure 2b: T
he cover o
f this bulletin indicates that in the 1940's the priorities for soil conservation w
ere public awareness
and action R
esearch is the lOth in a list o
f 10 "first steps in soil conservation".
0::
~\ :::>
""" 0
IS!
.... ""'
:z
..... ,.,_
w
:::;: 0
-w
<.:I
..... -:J:
-l
~ z~
a!
..... !-
"' 0~
,_ <:::1
U,
0 ·1
..... "'
0:: ~
"-
LL.Il a=: <
3
: <
,;
:l ""
f
fi
I' l iiJ I J;,
~·{ ,j t .t ,,, ~--·-.
"
c ... " ... 0 :;,:: ..... 0
" 0
" ·;:; 0
§ .. ... :;: <: 0 u
w
z E
• 0
o""!
~ ..::~ i
,.,. ... 0
0 "'
·-u
.~ <II
...
"' " OJ
0 w
,_ "'
~
Q.Q
J
EO:
C)
c: z
rn
0 u
·;:: C
) OJ
E
<(
c: <(
...: 00 i.i:

l1.,orestry the
am~nver
to erosion JJroblems
T E WEEKLY
Hl 1lw -t
Jt i~ th{·
Figure 3: Extract from The Weekly News 29th May, 1963.
NEWS
HaH>~' • \Vhvre !ll'W t'Ortt . ..,H•r {n f.V;;-Htr-l· h
Ln,:h J',
h!Fiilp~,

15
Grant (1966, 1969a, 1969b) Greenland (1969) Hutchinson (1969) Mark (1965)
Morris (1965) Rowe (1968, 1970)). Investigations by Archer (1969, 1970)
Chinn (1969) Chinn & Bellamy (1970) Gillies (1964) Morris (1965) 0 1 Loughi in
(1969a~ 1969b) established that snow made a significant contribution to
total precipitation above about J ,500 m.
Toebes (1970) reviewed hydrological research relating to land management,
and noted that because experimental basins (Anon (1965, 1969)), begun in
the mid 1960 1 s, required three to four years for both calibration and
evaluation, few results were available. Although results on the hydro
logic Impact of land use were available for Moutere (Scarf 1970a, 1970b)
and Makara (Yates (1964, 1965, 1966, 1971) Toebes et aZ.. (1968)) there
was no comparable information for high country catchments.
Some information was available about some hydrologic processes. For
example studies of interception had been made by Aldridge & Jackson (1968),
Blake (1965) Fahey (1964) and Kel Jer (1964). Work by Rowley (1970) led
Mark & Rowley (1969) to conclude that a natural undisturbed cover of tall
tussocks provided for the maximum yield and control of water from low
alpine snow tussock grasslands.
Infiltration studies by Nordbye & Campbell (1951) Gillingham (1964) Sel
& Hosking (1971) confirmed earlier findings from the United States that
infiltration rates decreased with an increasing intensity of land use.
However, results from Gill Ingham & Selby were less clear-cut than those
of Nordbye & Campbell.
The fate of infiltrated water and the significance of soil water to a
mountain catchmenes hydrologic response were largely matters of speculation.
Gradwell & Jackson (1970) had noted the broad differences in hydrologic
behaviour that could be expected as a consequence of variations in soi 1
pore space. Jackson (1966) and Grant (1966, 1969) had provided some
information about soil mass stabll ity under saturated conditions associated
with heavy rainfalls.

16
Those who read the pre 1970 literature relating to the conservation of
soil and water resources in mountain lands must come to the conclusion that
valuable as they were, the studies referred to here were largely incidental
to our attitudes, policies and programmes in mountain lands. Holloway
(1954) in his major work on forests and climate in the South Island
cautioned
11 hypotheses themselves are not facts., though they may sometime be proven to be sUbstantiaUy founded on fact."
By 1970 high country land management in New Zealand was based on a large
number of hypotheses.

17
CHAPTER 2
A SUMMARY ACCOUNT OF THIS STUDY
2.1 Introduction
2.2 The Torlesse Stream Catchment
2.3 A summary of work done 1972 - 1977
SUMMARY
This chapter describes the Torlesse Stream Catchment and outlines investigations
carried out between 1972 and 1977.
This is an inteqrated study of the hydrologic and hydraulic processes which
determine the output of water and sediment from an eroded mountain catchment.
It began with the design and construction of a sediment trap and the measurement
of bed load and suspended load sediments. It evolved to include studies of
other processes which appeared to be significant to an understanding of catch
ment behaviour.
The studies reported in Part B may appear discrete but were carried out as
interrelated components of a whole system, in which findings from one study
led to the formulation of hypotheses for the next.
The concept of the Torlesse Catchment as a system is an important characteristic
of this study.

18
2.1. INTRODUCTION
In the late 1960 1 s the National Development Conference focussed attention
on New Zealand 1 s future needs. lt became clear that if the country's
population doubled by the turn of the century there would be as much
agricultural and industrial development in the following 30 years as in
the preceeding century. There would be greater competition for, and
more intensive use of, the country's soil and water resources.
The mountain lands were an acknowledged source of much of the country 1 s
water, but the suitability of some of this water for some purposes (such
as hydro electric power generation, irrigation) was limited by the
sediments it carried.
The preamble to this study 1 s successful 1970 application for a research
grant from the Nuffield Foundation noted:
"Despite the widely acclaimed, but rarely studied severity of erosion '[n high country and the sediment laden condition of most streams derived there~ curiously little is known about the .relationships between land erosion and stream sediment. Despite the publicity of erosion in the South Island high country, reliable data are lacking on the stability of soils on steep slopes. :rhe uJorld literature on river sedimentation is almost without exception based on the behaviour of sand bed rivers. As such it has limited appl-icability for New Zealand's predominantly gravel bed streams.
Tradit-ionally it has been thought that a simple and dir'ect r•elationship exis+ed between land erosion and stream sediment. However~ the causes and sources of stl'eam sediment may be considerably more camp lex than fm'TnerZy thought_, and reduc'i.ng sediment yields may involve more or less than the rehabilitation of whole eroded catchments. The practices of soil conservation and river control have developed fm' many years without commensurate resemoch in these fields. There is an urgent need for a nationally sponsored programme of erosion research. As a contribution to such a programme this study aims at understanding the natur•e of eros-i.on and stream sed1:ment in one catchment. 11
!t is important to note that the aim of this study was to develop an under
standing of the character of, and relations between, catchment hydrology
19
and stream sediments in an eroded mountain CFJtchment.
To achieve this aim the study took four primary objectives:
1. To determine stream flow responses to precipitation.
2. To determine the character and origins of stream sediments.
3. To determine the character of relations which were presumed to exist
between land erosion and stream sediments.
4. To infer downstream responses to charges in the condition of upper
catchments.
This aim and these objectives constrained the choice of study method.
Earlier experience with runoff plots (Hayward 1969) had shown that although
they had been used widely in the United Stat~s they would be, in this
context, entirely unsatisfactory. Because the aims and objectives
required information about integrated catchment responses the basic unit
of study had to be a catchment. However the experimental catchment
method (Hewlett et aZ. 1969) was best suited to comparative studies
of the affects of land management. It was not intended that this study
would involve the application of land management treatments.
The most appropriate study method would be an 11observationa1 11 study
(Boughton 1968) of a whole catchment. This method would be supplemented
by individual process studies if there was reason for believing that the
understanding of a process was important to an understanding of whole
catchment behaviour.

20
2. 2.. THE TORLESSE STREAM CATCHJ'1PH
Several catchments were considered as possible study areas and judged
against the following crfteria:
1. The area had to be a moderately to severely eroded mountain catchment;
2. The area had to be close enough to Christchurch to allow gauging
parties to reach the catchment in time to make observations during
storms and to record sediment dtscharge during floods;
3. Access had to be certain in times of flood;
4. The catchment had to be small enough to-
(a) allow the hydrologic effects of a variety of surface conditions
to be studied and
(b) produce manageable peak discharges;
5. The catchment had to be large enough to allow s~udies of channel
behaviour;
6. The catchment outfall had to be stable and suitable for a gauging and
sediment measuring station (i.e. the construction of a control section
would not alter the hydraulic behaviour of the channel).
A catchment on Brooksdale Statton of south-east aspect on the Torlesse
Range was chosen as the one most closely meeting all criteria, (see Figures
4 & 5). This basin, named after Mt. Torlesse its highest point, drains
into the Kowai river and thence into the Waimakariri system. It has an
area of 385 ha and is 80 km from Christchurch. Figure 6 is a plan of the
basin and shows the location of features mentioned in this study. Access
is gained via State Highway 73 to the foot of Porter 1 s Pass and then by
4 km of track suitable for only four wheel drive vehicles.
The basin is steep. Within about 4 km, altitude rises from 760 mat the
outlet to about 2.,000 m at the highest point, Figure 7 shows a mean
altitude of about 1,300 m. Table 1 shows that most land surfaces slope
between 26° and 35°.


Figure 5: Location of Torlesse Stream Catchment.
Torlesse Stream Catchment
HRISTCHURCH
0 10 20 km

'Sa '<too '.Joo '<n.. r-.... o -- ' -u /~,.. /. ......_ ' .,.,..-·-· ' \- ' Gl ,. ..,.., ·---·-""- - ...... _ . ....-· . , en ,-·-·-
1 ' ' v_?' \ \ -.. C I • ·-·-686 •. / \ / \ 1 i Pa\la~ui ""j-·-·-·....114.._ 0
/ ·-·-·-·-/{ ______ _.,. 1 1 / . I
1 Road ·-·--- ) ,- I l I I f \._ I \. 1_,>- ,.
1700 ,. / I _ / f \ \ /;'~,--... •
I I
I ,--" --' 1 \ I ,.------/ ! ~ \..""" .· ,.
I
r f ' I • . • · I I / \ I . l f I \ii5 --.... _ . . \
. r I -/ • J · I I f''- 1100
I I
t J / ,--·-,: r"'-' I 11 { l _............ ,.-. ':'f.._ __ ,....L--\-"'/
• r r · -~ · l · I o .._ · ! I I I -· l -c..i '. -""' \ \ 1 I .//'· I , I j Rainbow \
0 1'--fi __ i_ \ /\UV...,
1 1 , I ).. .. (><.... J t\ I 11 Gully / -r __ _.. .......
1soO/'\ I . I / 1
- • '-_/-'-----' \)~ I 1 - , / d-~~ · \ , 900 . , I I. 1 1 ...--_ .. . 1 ,, I I -- f . •-/ 1 , 1 ( . 1
1 r··. .. · . 1 • ~ 1 e. /' _..._-----1
I. II\ I ··..... t' \ /1 .. '-- --/ I I •c•,/ \ ! a"" \ I ... .. I .,_:.-. . i. - I I '' \ /.,vv i \ l\) . .. t :b.:cx -~<, ' ... \> -,J \ r-;-r<, •• ,
I. I \ \ ./ '- '" ., )
\ \ \ ', ./ ' '-, / ' / . I \ I ,. . \ >', -..._ -
/1\ : \ .... , ' - ....... \ -------1900 I I \ \ '> -, ' \ ~;:::=~ ' \ ' I ' ..._......,
i \ \ ~< \ \ -, 1963~0orles~··· \ ',, _, .... ;7·---)--·-·-... ~~ l
r ·-·-. , -... ,¥·__, , J ' Jasp~r SHea. '-• • ' ,... ~ -" '< < ' ' t ..->· \ /' I .& .,- ._, ' '- \ -·-·-·-d" / -·---+·-' 1 ,.,.. -1- al -·-·' \ .><"· Stretcne<
{! d" r .+> {'> .,- '-"".--.:"./ I
,'ll ,sf .,_It' r;{ ' I " ~ ri d" ' ,,o ,o
0 100 200 300 400 500
metres
Figure 6: Plan of Torles•n S -~. tn•am C· atchmenl showin • wned in the text. g places mer.t'

E
c 0
2000
1800
1600
...... 1400 0 > (1)
L!.l
1200
0 20 40 60 80 100 /o of area below indicated altitude
Figure 7: Area altitude relations Torlesse Stream Catchment.

SLOPE
' 1 ess than 25°
j I 26° - 35°
! I Steeper than 35°
I I I
2!
I AREA % Of CATCHt1ENT
47 ha 12 %
300 ha 78 %
38 ha )0 %
385 ha 100 ~~
TABLE 1
Slope classes, Torlesse Stream Catchment.
Source: D.H. Saunders pers comm.
SOIL SET AREA Ha % OF CATCHt1ENT
Cass 10 1 2.6
I Tekoa 46 I 12 .J
l I
Pukete rak i 14 ! 3.7 I I ' '
Ka i koura 163 I 42.J
Alpine 148 I 33.5
I River Bed 4 l 1.0
!
385 I
JOO.O
TABLE 2
Soi 1 sets, Torlesse Stream Catchment (provisional)
Source: D.H. Saunders pers comm.

22
The basement rocks are sandstones, silt~stones 1 mud stones and cherts
si.mi.lar to those reported from other parts of the Torlesse supergroup
(Andrews U9741 1 Bradshaw (1972), Blair (1972)). The sandstones usually
form massive beds which can be very thick or quite thin, while the silt
stones are interbedded with each other, coarse and fine varieties
alternating. There is a thick chert unit of various colours in the
north west of the area and two basaltic dykes have been found, one of
which feeds a small dolerite intrusion into the Irishman Stream (Main
1975).
The catchment occupies part of a major fault zone and the base rocks have
been intensely faulted. Adjacent blocks of rock frequently bear no
relation to each other. 0espite a history of active faulting the stream
channels do not appear to be closely related to fault movements (Main
1975). One important consequence of faulting, is the micro-fractures or
jointing that are common features of the bed rocks. Exposed surfaces
disintegrate rapidly into 1 em to 30 em particles. These particles form
the scree deposits and rock debris slides of the basin. (Baldwin 1972).
The geomorphic features of the basin are a product of its geology, and
its tectonic and glacial histories, Although the Kowal valley displays
abundant evidence of late Pleistocene glaciation (Marden 1976) glacial
effects are not well developed in the Torlesse basin. (Main 1975).
Saunders (pers comm.) has provided a provisional map of the distribution
of soil sets of the basin. (Figure 8, Table 2). All soils are upland
and High Country Yellow Brown Earths and have some ~eneral features common
to this group. They are weakly weathered but strongly leached and contain
poor supplies of nutrients essential for plant growth. Topsoils are
marginally more fertile than subsoils. Textures are silty to sandy loams
and all profiles contain rock fragments. The soils drain freely but soil
moisture rarely falls below wilting point (Leamy J971). While soil
profiles do not have illuvial pans, some show gradational texture differ
ences down the profile which may in part be due to illuviation (Harvey

1963
Figure 8: Soil sets Torlesse Stream Catchment. Source: D. H. Saunders pers comm.
+
/
soo /

I
--j-
I
--r

I I
r
+ 'so '<~oo 'Joo ':?o
r-... o ~~ 1 o '6o 1
· . ...._ ' ----·-·-' L. ' .·.· r o ·- __ ..,.._ ...... ...,.....-·v· 1 --··-'-· 1686 •• / \ .>;>' . ) ... \ .i <1 ~·:4--....... ·-~-.·.·~~. 144 . . . . ... /.· ·.···. ;......;.-.,... • .._,_ . .;.-.· .. --.·
/.-----'-._../ \ I / ; I .. I . . . ~--·./' . / (-/I \ I / ( \ \ \ .. . _l(:Z.. i i
1700 . I I r ·. 1 · .. · / .,. . r • ' • .
I I
I I r-' I \ . \\; ?~~..c~ ·?/ ' f • f • 1 r F" I \ ' .' .f ( · .. · - · · · ·· C,-.c i ; . I / / /
1
\, / \~ \ ( .1. ., .. ..., / \ ,,oo
(
f ) I
1
--'( 1 \'/ 1 I .· .... _r.., .... \--'/ I f' I ·. -" ·. 1 ·. . .\·· I · ' ' ., 1 I I . /- \ j i ! / ., ,ooO
I I (
. /1 I I I .- . . I
• ··· ... _./ .1 \ .·1 (·. --+-- : i_ j _.j I I ' " . (i. , _,.--- .,.-
1800 ,.-, : ... : r ···r, .. _/"' ____ ) \J : : , •. - \ /900 ' I -1 I ·. /·. · .J':. I I ' /'
I
. \ I r. I I < \ ·, .. . ( '~""' I - \ ..--~~-------\ 1 I ·. I 1'. · · i ' -'C .
. \ I I . I \ I . • / \ I . I I \ I I +· \ I ,". ,r---1 • /gOO
I. \ ) + I I \ / (.; \ ; )
1
/ j : \ I 1 ICC:~ 1
', \ . . \ f/-f' r.ri'e'
1 I I .· \ \ , ~---~ \ .· . ' - -~/.I
I
\ I \ ' .. / \ '- ' '- r?"'_...
. \ \ \ ,. \ .. \ / · I I I ' /' ' ' /-l. 1 \ '- / , ' ' .. , / I
I !\ I ', ;/ ........... '- \ \ ' I 1900 I \ \ \ .... ', ' ', '--.. \.. .· / I
I \ ' . >< ' I, ' \ ' . rf- I 1963...
1\ \' \ '-, / ..... 7·---)--·-· I i. -:J ... · .... <. I .....-·-1-· , ,_ . ....-- , ; ...... , --~v::· · o I ~·-. \ '-, /K ' l'· :<:c•\·;''-,' 00 <;,0
r __ ...,..__ ' / I ~oo cf' r ---····'·' ,,,. • q
0
o / ·-·--+·-'· 1 "' ,~ 0o . ....;,,., .. , .. , X \q cf' 1 00 {? .,-. -.._,~.;_.;;;/' I ~ d ~ ~ . ' I ~ ~ I cf'
' ' cf'~ D . .
~ D ~
Figure 10: Distribution of main plant communities Torlesse Stream Catchment. Source: D. H. Saunders pers comm.
"'"'
~ L___j
---+~-

+
Figure II· L . and capabilit Source: D H y assessment T · · Saunde orlesse St rs pers comm ream Catch . ment.
~-

23
J974)' Other localised di.sconttnui.ties in the profile are found where
topsoil has been overwhelmed and buried by material of upslope origin.
These buried soils give support to Molloyts (1962) view that instability
has long been a feature of New Zealand steeplands. The modern phase of
erosion has been described by Saunders (pers comm.) using the methods
outlined in the Land Use Capability Survey Handbook (SC & RCC. 1969).
Tables 3 and 4 and Figure 9 show that about 80% of the catchment is in a
severely eroded and depleted condition.
In pre-Polynesian times Nothofagus forests covered the catchment up to
about 1,400 m with Chionocloa grasslands, rock and scree above this alti-
tude. During the period of Polynesian occupation the forests were
destroyed by fire and replaced by DracophyUum scrub and .Chionocloa grass
lands. (Molloy 1964}. The burning and grazing of the early European
period of occupation brought about further dramatic changes in the dis
tribution of the main species resulting the pattern of vegetation shown
in Figure 10.
With the exception of the rainfall record from nearby Mt. Torlesse StatJ..9_12.,
there were no long term climatic records which could give a reliable indi-
cation of the catchment 1 s climate. [twas thought that the climate would
be comparable with the drier eastern Canterbury high country. Information
gathered during the study period is presented in Appendix 1, Part C •
The catchment is part of a block that was traditionally used for summer
sheep grazing. In recent years half bred ewes grazed the catchment from
mid summer until early autumn. Appendix VIII, Part C, presents an
account of the manner in which animals distributed themselves throughout
the basin, Based on a land capability assessment (Figure JJ), and under
a soi 1 and water conservation plan adroini.stered by the North Canterbury
Catchment Board, the.basin, as part of a larger area was retired from
sheep grazing between J97J and 19]5. The reasons for this retirement

24
included;
uTo decrease soil erosion on the property where it occurs, and to encourage where possible, a denser vegeta-tive cover on the ground surface. This wiU in turn assist a reduction in the rate of surface runoff and the quantity of s'i-U and debris travelling down the gullies and streams. u (Dick et al., pers comm.)
The area behind the retirement fence is still used for limited winter
cattle grazing.
Figure 6 shows the location of the base hut~ vortex tube sediment trap
and meterological equipment. The hut is well appointed for wet weather
work, and a portable generator provides electric light for night work at
the sediment trap.

25
l DEGREE OF DEPLETlON I (% OF BARE GROUND} AREA . % Of CATCHMENT I
I
10% 17 4.5
11 - 20% 17 4.3
21 - 40% 32 8 .. 4
41 - 60% J4 3.7
60% + 300 7}.8
Bush 5 1.3
100.0
TABLE 3
Degree of depletion, Torlesse Stream Catchment.
Source: D.H. Saunders per's corrm.
SOIL LOSS AREA Ha % Of CATCH~1ENT
i
Up to 75% topsoil I
I 22 5.7
75% top so i 1 - 25% subso; II 22 5.7
I 25% to 75% s ubso i l 30 7.8
fvlore than 75% subsoil 306 79.5
Bush 5 I 1..3
I 385 100.0 I
I
TABLE 4 Soil loss and erosion, Torlesse Stream Catchment.
Source: D.H. Saunders pers comm.
\ I i
I I j
I I
I
l I I
I I I ! I
26
2.3. A SUMMARY OF .FINDINGS AND WORK DONE BETWEEN 1972 AND J977.
The Torlesse stream catchment was chosen as the study area in the spring
of 1970. The following summer a channel survey was made of the Torlesse.
The problems of selecting representative sites through which to establish
cross sections, drew attention to the pool~riffle morphology of the
channel. Subsequent investigations., (reported in Chapter 13,Part B)
showed that:
the Torlesse stream channels are generally well ordered sequences of pools and riffles.
two patterns are discernable. A 'major' pattern of riffle steps (or boulder steps) separates regions of lower velocity stream flow. A 'mino:r' pattern of boulder steps is found within the major riffle steps. These boulder steps are separated by pools.
relations between step height and length are found to be consistent and vary with grade.
it is thought that the major pattern is determined by low frequency events with return periods in the order of 50 - lOO years.
it is thought that the minor pattern is determined by more frequent events in the order of <l - 5 years.
although channels are well ordered, they include some disordered segments. It is thought that these are in the process of adjustment toward a more ordered state.
it is thought that the concept of dynamic equilibrium may be more appropriate to the Torlesse stream channel than the appearance of the channel might at first indicate.
During the first recorded floods in 1972 it appeared that the stability
of some riparian lands was strongly influenced by flows in the stream
channels. Subseq...:ent field and laboratory investigations showed that:
the pool riffle morphology is a most significant mechanism for dissipating stream energy.
when pools are s1ilimerged by high flow rates or inundated by sediments, stream energy is increased sharply.
although streams such as the Torlesse have been loosely described as mountain torrents, this description is accurate only when a channel's pool riffle morphology is subme;r;ged.
The sediment trap and base hut were built during the summer of 1971/72
but it was not untfl August 1972 that the sediment trap became fully oper-


28
pools within the stream channel also periodically store and release gravel. (Chapter 12 ,Part B)
suspended sediments were also observed to move as 'waves'· or 'clouds' but less frequently than bed load.
Observations made during a storm in J9]2 led to studies whi.ch have altered
our understanding of the hydrologic responses of this catchment to rainfall.
In that storm 135 mm of rain fell in 36 hours .. However water which was
poured by hand onto an eroded subsoil was observed to soak directly into
it. This experience confirmed the experience of many hydrologists that
overland flow was a rare phenomenon in mountain soils such as these. An
infiltration study (Chapter ?,Part B)showed that;
infiltration rates varied with the degree of surface cover depletion but that the lowest recorded values were in excess of most rainfall intensities.
This finding raised the question, that if overland flow did not exist,
by what mechanism was the 1 overland flow' component of the hydrograph
generated? The partfal cuntributrng area study (Chapter 9,Part B) is
an attempt to apply that concept to the Torlesse stream catchment. That
study over-simp] ifies the conversion of rainfall to runoff but indicates
that for this catchment at least:
stream channels and adjacent riparian lands are more important source areas of flood flow than has been generally recognised.
In the course of several storms water was observed to flow from some eroded
areas. It was reasoned that a subsurface discontinuity such as bedrock
was forcing ground water to the surface and transforming it into surface
flow. A siesmic refraction study (Chapter B,Part B) confirmed that:
some erosion features are associated with bedrock which is close to the catchments surface.
return flow (Dunne & Black ~970) is one process by which rainfall is converted to runoff.
From rainfall and stream flow records obtained over the study period it has
been possible to estimate the proportion of catchment precipitation vvhich
is yielded as stream flow. It has also been possible to consider the

29
producHon of summer low flows from the basin.
Part B } i.nd icates that;
That study (Chapter .10,
between 80% and 90% of catchment precipitation is returned as water yield.
from published North American data, land management influences on water yield have been recorded when lO% ..- 60% of precipitation is yielded as stream flow.
preliminary results from three other South Island catchments suggest that land management for water yield may be more realistic in areas other than the Torlesse stream catchment.
The studies reported in Part B should not be viewed as isolated pieces
of work. While the rnanrter of presentation may suggest that each was a
separate and self contained unit, they are part of a whole system. They
evolved in response to observations, questio~s and under~tandings about
the inter-relationships which determine the behaviour of the Torlesse
stream catchment.

30
CHAPTER 3
THE FLOODS OF APRIL 1978
AN EXAMPLE TO ILLUSTRATE THE FINDINGS OF THIS STUDY
SUMMARY
The floods of April 1978 are not Included in the study period but an account
is presented here to illustr-ate some findings of this study.
A low pressure system of tropical origin produced four flood events in nlne
days. The response of the catchment to each event was quite different.
Throughout most of the storm sequence sediment transport rates exceeded the
capacity of the sediment trap. The estimates of sediment yield are based on
extrapolations of former experience, with the occasional confirmation of a
recorded transport rate.
The first event was small and insignificant from the point of view of this
study. The second was a major storm of 175 mm. In the 12 month flood-free
antecedent period, sediments had accumulated in the channel and riparian lands
and the catchment was in an 'oversupplied' condition. Sediment yield from
this event was estimated at 600 tonnes. This may be compared with the total
yield of 564 tonnes ~or the five year period 1972-77 to indicate the Importance
of low frequency events to long term sediment yields.
At the time of the third event sediment supply conditions were assumed to be
'average' and the yield was estimated at 200 tonnes. Thus within five days
the Torlesse Stream Is estimated to have delivered nearly twice as much sediment
as in the preceding flve years.
the fourth event the supply of sediment was virtually exhausted. The
response of the rlesse and Kowai Rivers was to degrade their channels. !n
31
the Kowat River this also involved undercutting the toe of a scree which
subtends the stream channel.
slope above the channel.
This action caused rejuvenated erosion of the
As in other storms rain-~"all intensities were much lower than recorded infil
tration rates and overland flow was observed only on limited areas of rock and
saturated riparian lands. Overland flow did not occur on other sites regardless
of vegetation type or degree of erosion.
Sediments were derived from limited areas of riparian land. The extensive
scree fields which dominate the upper catchment remained stable and did not
contribute sediment. The most important source areas were limited areas of
intensively faulted argillite and greywacke, and volcanic intrusives. As
these fine textured sediments flowed into the main stream channels they
inundated the channel 1s pool riffle morphology, and the water surface slope
steepened to approximate valley slope. This 3-5 fold increase in slope
conferred additional stream power and allowed sediments to pass rapidly down
channel in a series of 'waves'.
At the end of the second storm evidence of remnant waves. could be found
throughout the Irishman and lower Torlesse Stream channels. These remnants
were remobilised in the third event and by the end of the fourth flood almost
all evidence for their existence had been removed.
As in other storm events less than 30% of Incoming precipitation appeared as
flood discharge (quick flow). The remainder was detained in the catchment
to be released subsequently as low flow.
The implications of these and other findings are discussed in Chapter 4.

32
THE FLOODS OF APRIL 1978
The studies reported in Part B derive from data collected between 1972
and 1977. Although the floods of April 1978 are outside the study period
they are referred to here as they illustrate some of this study's findings.
The reconstruction of these storms is based on hydrograph and hyetograph
records and field observations at the time. It is also supplemented by
experience gained during the study period, and reported in Part B,
Places mentioned in this chapter are shown in Figures 12 and 13.
Antecedent Conditions
The 12 months preceding April 1978 were notable for the lack of significant
storm events. In this respect the antecedent period was similar to a 10
month flood free period in 1972-73 (Figure 39, Chapter 12, Part B ) , This
periodicity of drought and storms has been suggested by Grant (1969) and
reported by Tomlinson (1976). (Because climatic conditions fluctuate about
long term means, there must always be an element of uncertainty about the
long term significance of results from short term periods of study.)
During the 1 drought 1 of 1977 there was continual disintegration of surficial
material of the intensely faulted exposed volcanic intrusives in the
Irishman stream, and the crushed sandstones and siltstone in Rainbow Gully
(Figures 14, 15). In summer this disintegration was due mainly to diurnal
temperature changes causing unequal expansion and contraction within the
joints assisted the disintegration process. Because these rocks have been
intensely faulted and crushed, they disintegrated into particles ranging
from coarse sand to medium gravels. Elsewhere on the catchment, exposed
rock which was less jointed and fractured, disintegrated at a slower rate,
and into larger particles.

/
Figure 12: I h~ m catchment . . 'Torlesse stn•a
./

t Torlesse
Figure 13: Th K e owa· · t nver catchment

Fil'!ure i4: Rainbow Gully
H~:ure 15: The Irishman stream

Figure 16: Rainbo,.· gully. Prior to April 1978, I m depth of sediment had accumulated at this site.

Figure 17: Collu~i;l) sediments stored in the riparian zone of the Torlesse stream channel.

..
' .S

33
By April 1978 up to 1 m depth of fine gravels had accu~ulated in the
channel of Rainbow gully (Figure 16). Elsewhere, alluvial and colluvial
deposits were perched along the riparian zone (Figure 17). By April 1978
the Torlesse stream channel had been provided with a larger quantity of
gravel than normal. This condition is described as 'oversupply'
(Figure 43, Chapter 12, Part 8 ).
During the 'drought', stream flows had beeh low. Stage heights at the
control section varied between 0.05 m - 0.08 m. These depths correspond
to flow rates of between 0.06 and 0.12 m3sec-l.
The bed of the Torlesse stream had become armoured and showed no indications
of movement during the few minor freshets of the preceding 12 months. This
experience is in line with Ke11erha11's (1967) laboratory study which showed
that channel pavements form only at low bed load transport rates.
Meteorological .Conditions
On the 6th April 1978 the Australian Meteorological Service reported that a
tropical depression had formed in the Gulf of Carpenteria. This depression
(named HAL) was drawing moist air down from the tropics. It filled and was
lost as it passed over the Cape York peninsuia, but an air fiow on its
eastern side persisted to draw very moist equatorial maritime air southward
into the north Tasman Sea. Between the 18th and 10th April, a shallow
depression formed off the Queensland coast and moved in a S.E. direction.
By the 13th April, an upper atmospheric depression formed over S.E.
Australia. This began to supply colder polar air into the western side of
the tropical depression. The colder air was mixed with the warmer moist
equatorial air mass, and condensation occurred. It was the la~ent heat
released by this condensation which allowed the depression to deepen
rapidly in the next two days.

34
On the 14th, New Zealand's weather was dominated by a westerly air flow and
a front embedded in this flow passed over the country. This produced the
29 mm rainfall recorded at the study area.
On the 16th, the now deep depression was centred on the North Tasman Sea
and air was flowing into it across the isobars. That Is~ the moist air of
tropical origin which was drawn southward on the depression's eastern side
was now being drawn into the depression from the south east. The
South Island's east coast st!11 further deflected these winds to the south
west. Thus although the surface winds were from the south west the air mass
originated in the tropics. There were relatively high temperatures of 13°-
140C at Christchurch and 18°-20°C at Hokitlka. Onthe 16th and 17th most
parts of Canterbury experienced heavy rainfall and widespread flooding. In
42 hours from 1600 hours on the 16th. 175 mm of rain were recorded at the
study area.
On. the 19th, the depression was centred off Cook Straight and pressures were
low off the Kaikoura coast. By 0900 hours on the 20th, the depression had
reformed east of Kaikoura. The 85 mm of rainfall recorded on the 19th and 20th
derived from the depression reforming off the Kaikoura coast. Although the
air mass was still of tropical origin it was beginning to cool as the
depression moved further south.
Onthe 21st and 22n~ remnants of the depression which had been left in the
Tasman sea linked with the now stationary reformed depression, and central
New Zealand was covered by a convergent air flow. In this time a further
89 mm was recorded at the study area. This came in two periods, each
associated with a remnant low pressure cell reforming with the main
depression.
There were therefore four phases of activity in this single synoptic
condition:-
Phase 1 April 14- a cold front crossed the study area and
produced 29 mm rainfall.

Phase 2
Phase 3
Phase lf
35
April 16-18- a warm moist airflow moved on to the
Torlesse range from the south west-south east and
produced 175 mm rainfall.
April 19-20- the depression reformed off the Kaikoura
coast 2nd a cooler S.W. airstream flowed on to the
Torlesse range. This produced a further 85 mm rainfall.
April 21-22- central New Zealand was covered by a
zone of convergence as remnants of the depression
moved eastward to join with the reformed depression.
Rainfall was continuous but two heavier showers were
recorded. The total rainfall for this phase was 89 mm.
At the study area a total of 378 mm of rainfall was recorded in nine days.
At Mount Torlesse Station the total rainfall was 230 mm.
The concept of a return period has little significance to an event such as
this. Each autumn, low pressure systems of tropical origin can be
expected to produce significant rainfall. The unusual feature of this
system was that it deepened rapidly about the 15th (Kingan, pers comm).
The return period for a synoptic condition that yields a total storm
rainfall of 230 mm at Mount Torlesse Station is about once ln 40 years
(Chapter 5, Part B ). The return period for the second phase might be
1 : 2 years. Phases 3 and 4 would be annual events.
From the 16th there was a strong likelihood that this synoptic condition
would produce a significant flood. Experience during the study period had
shown that although storms froman easterly quarter are less common than
those from the south there is a greater probability that they will produce
a major flood (Chapter 5, Part B ).

36
Catchment Responses
Phase 1 14th Apri 1 1978
From 1400 hours, April 14, to 0800 hours, April 15, a total of 29 mm of
rain falls on the study area.
0.06 m3sec-l to 0.08 m3sec-l.
In response, stream flow rates increase from
This is the largest 'event 1 recorded since
December 1977 but has no significance to either sediment movement, channel or
catchment stability.
Phase 2 16-18th Apri 1 1978
Total rainfall:
Peak flow:
Estimated sediment yield:
175 mm
2.1 m3sec- 1 (approx.)
600 tonnes
Rain begins to fall at 1600 hours (Apri 1 16, 1978) and wi 11 continue at a
steady rate of about 4 mm h- 1 for the next 14 hours. These rates are in
keeping with the generally low rainfall intensities common to most of
New Zealand and are substantially less than infiltration rates for all sites
within the basin (Chapter 7, Part 8 ).
At about 1900 hours (the 16thl stage height at the control section begins
to rise in response to 10 mm of rain falling directly on the stream channel.
At 0400 hours on the 17th, 0.10- 0.12 m depth of water flows through the
control section, and bed load begins to move at rates in the order of
10 - 20 kg min- 1 • These transport rates are higher than normal due to a
more than adequate supply of sediment.
At 0600 hours stage height has Increased rapidly to 0.15 m in response to
55 mm of rainfall. Rainfall intensity increases to 7 mm h- 1 and will be
maintained at this rate for the next 10 hours. This will be the maximum
rainfall intensity for this storm. As the lowest recorded Infiltration
rates in this catchment are in the order of 10-80 mm h- 1 all rainfall will

37
infiltrate into the catchment surface regardless of ground cover or
condition. The only exceptions are limited areas of impervious bed rock,
and the saturated channel zone.
Rain which falls on the stream channel and the now saturated riparian zone
may travel between 4,000 and 8,000 metres in the next 24 hours. In
comparison, rain which infiltrates may travel only 1 to 10 metres in the
same period. Because Infiltrated water moves so slowly, most of it will
be delivered to the stream channel after this flood,
At 0900 hours stage height is 0.20 m and a gravel wave passes through the
control section. This is the first of six such waves which will move
through the trap in the next 15 hours. These waves cause violent
fluctuations in water level and make it difficult to establish 'true'
water depths. It is probable that this first wave has come from the release
of gravels stored in pools immediately upstream of the sediment trap.
1200 hours. 17th April 1978. Rising stage.
Since this phase began, 100 mm of rain have fa 11 en in 20 hours.
Infiltration rates are - _.__ ~ , 'I
Sl: I I I in excess of rainfaii intensity. There is no
over 1 and flow. At sites such as those depicted in Figure 20, ground water
is emerging to the surface where bedrock or other subsurface discontinuities
intersect with the surface. The significance of the conversion of ground
water into surface water (return flow, Dunne & Black (1970)), depends on the
nature of the land downstream from the point of emergence. Where this is
stable (Figure 21), the water will move to the main stream channel without
. entraining sediment. However, if the downslope land is unstable (Figure 22),
erosion occurs as soil particles are entrained by the surface flow. The
mass of soil removed from these sites will not be great but it will give
spectacular colour to the Torlesse stream.

38
The response of the alluvial and colluvial debris deposits to this rainfall
Is variable. Water drains rapidly into and through the coarse block fields
and scree deposits which dominate the upper catchment. These show no
indication of movement. The fine gravel deposits respond quite differently.
Because transmission rates for water are lower than in coarse deposits, pore-~
water pressures increase and the deposit becomes more fluid. The deposit in
'Slug gut 1 will move three metres down stream !n the next 10 hours. Debris
on its leading face will move in a series of amoeba-like advances
(Figure 23). As sections of leading face collapse a small flow of water
entrains debris from the new channel and from the body of the deposit and
transports it rapidly down the oversteepened face. The stream continues to
cut through the unconsolidated debris until Its oversteepened sides collapse
inward and divert its flow back Into the body of the deposit. A quiesent
period will follow until a new section of leading face attains a fluidity
that will cause it to slump and repeat the process.
Fine gravel deposits which have accumulated on mid slopes above steep
channels will move rapidly as debris flows. The stability of such deposits
appears to depend on their proportion of fine gravels and sands, and the
rainfall amount and duration. Experience in earlier storms would suggest that
these deposits remain stable until a threshold value is exceeded. Because
we know little about these threshold conditions it is difficult to predict
their behaviour in this storm. We do know however that following failure,,
their movement can be rapid. For example in a previous storm, debris
moved 200 m from a point of accumulation, to Helen stream In 5 to 10
minutes (Figure 24). About 20 minutes later a 'c1oud 1 of suspended and
colloidal sediments moved through the sediment trap.
The fine gravels which had accumulated during the antecedent period in
Rainbow gully have become a semi-fluid mass and have moved as a gravel and
water slurry into the Irishman stream. The pools in the Irishman stream have
been filled and additional inputs of gravel submerge the riffles. In this
storm the influx of gravel will cause the stream bed to be raised by up to
1.0 m above its mean bed level. The most Important consequence this is
that the slope of the water i1e Is Increased from about 0.03 through the

0·9 0
G84
078
0·72
0·66
060
0·54
Vl
~D-48 -+-' Ql
..50·42 -+-' ..c. C)
~0-36
0-30
0·2 4
0·18
0·12
0·0 6
i(} . 0·0
12·4·78 12' 12 am pm
13·4·78
I jl' 2·0 'Ill II 'W' 4·0
- 6·0 E E 8·0 ;;10·0 .E 12·0 c ·o14·0 0::: 1&Q-
18·0 2(}n.
Actual troce -------- Reconstructed
~ r2 m a 1i m p
14·4·78 r2m~
I
Figure 19: Hyetograph and hydrograph Torlesse stream catchment 16-l8th April 1978.
II
trace
'd ~ p 15·478
' I I I I
12am
I
''liiiiiiiiiiiiii!IIIIIIIIIIIIIIIIIIIJIIIIIIIII II'
-············
' I • 12 m p
16·4·78
I I
~ w
A~ ,~\I~,~~ ! I
!I 1
i I i I
if .'/ il
.fl /1
... ~ .-'/
.. ~/
I : 12am
I 'd ~ p '17-4-78
.... .......
I 1 1ta~
.......
I
....... ~'I ......,.
'd ~ p 18·4·78
I I -

Figure 20: Ground water emerging to the surface of the Torlesse stream catchment.

Figure 21 : Stable hmd below a point of ground water emergence.
Figure 22: Unst11ble surface conditions below a point of ground water emergence.

Figure 23: Mon•ment of the debris deposil in Slug gut. The right-hand photograph shows that sediment has been transported from the body of lhe deposit and deposited on the leading face. Note that the snow iJIIIch has ~~~ almost totally overwhelmed. The time inten ·al between the two photographs wa.~ about 3 mlnutes.

Figure 24: Face above Helen stream.

Figure 2S: Failure of unconsolidated ~trcam banks following entrainment of toe deposit~ by ~lream llow. The lo10·er photololnph shows lh11t ~iments inundated the channel and raised the ~tream above its former lev~l. In thi~ mannl'f\ the stream gainro acce<>s tn its unconsolidated side ~lope~.

39
forMer pools, to the channel slope of between 0.10- 0.15. Because of this
increase in slope, there is an increase in stream power and a consequent
Increase in sediment transport. (Chapter 13, Part B ). In addition, the
now elevated stream has access to unprotected and unconsolidated side
slopes. Within the next few hours several sections of stream bank will be
eroded {Figure 25). Because such erosion reduces the sheer strength of
the side slope the probability of additional side slope failure is
increased.
1300 hours. 17th April 1978. Rising stage.
A second gravel wave passes through the sediment trap. Bed load transport
rates are in the order of 200 - 400 kg min- 1 and the water depth is about
0.30 m. The chaotic nature of the water surface and the violent fluctuations
in bed load transport rate make it difficult to estimate either with any
pretence of accuracy. The capacity of the vortex tubes has now been
exceeded. Estimates of sediment yield can only be made by extrapolation
former experience and records (Chapter 12, Part B ) and compared with the
few transport rates recorded at this time.
A gravel wave is moving through the lower Irishman stream, The pools and
riffles are totally inundated. Stream flow is shallow and fast with the
slope of the water surface close to channel slope. The channel appears to
be adopting a sinuous form. This is possible since it ls now not confined
to its former channel.
The ~ading edge of this gravel wave arrives at the Forks control section.
In the next hour the bed will rise 0.7 metres and force the stream to flow
around the control section.
1400 hours. 17th April 1978. Rising stage/Peak.
At the Forks, the Torlesse stream is now flowing bank to bank. !t is wide,
shallow and fast as it flows over gravels which have inundated its former

40
bed. Within the next hour the stream will begin to down cut through these
gravels suggesting that the supply rate Is being reduced and that the bulk
of this wave has moved through this section of stream channel. It is
probable that this wave represents the bulk of sediment which was stored in
Rainbow gully. It is also probable that lt began to move between 0900 and
1000 hours and has moved through to 0.7 km of stream channel In the preceding
4-5 hours.
Although the catchment of the true right branch of the Torlesse stream is
three times larger than the catchment of the adjacent Irishman stream, it
contributes the same volume of water to the flood. This illustrates the
important detention effect of the coarse scree deposits which dominate its
catchment. In addition the true right stream is clear carrying neither
bed nor suspended load. This reflects the stability of the coarse screes.
1500 hours. 17th April 1978. Peak flow.
Storm rainfall is now 121 mm. A further 54 mm will fall in the next 19
hours but intensities will be less than 3 mm hour- 1 , Although the evidence
(Chapter 9, Part B ) for a partial contributing area (Hewlett 1961)
suggests that this is an appropriate concept for runoff generation in this
basi~ it Is not possible to define the extent of the contributing zone.
Water can be observed making its way to the stream channel as saturated
overland flow (Hewlett 1961) and saturated through-flow (Hewlett and
Hibbert 1967) in the riparian zone. Return flow (Dunne and Black 1970)
is evident from many mid and lower altitude sites. In addition, water can
be heard moving under scree slopes In what must be subsurface stream flow
(Weyman 1973).
In the lower channels, bed levels have been raised by up to 0.5 m. In
many reaches the pool riffle morphology is completely inundated by the
influx of gravel from upstream. Other pools not inundated by sediment
have been 1 drowned 1 by the increase ln stage height. Low flow velocities
through these pool sect ons are usually less n 0.5 m sec Velocities

41
recorded at this time are In the order of 1.5- 2.5 m sec-1. Froude
numbers are within the range 0.8- 1.4 suggesting that shooting flow,which
is normally found only through riffles, now occurs through some pools.
Under these conditions it fs appropriate to describe this channel as a
mountain torrent.
Below the sediment trap the Kowai River is in full flood and very turbid,
Sediment brought down from the upper catchment is contributing to the rise
In water level. Because of aggradation and increased stage height the
river has been raised out of its usual channel and now has access to the
full width of its bed. It is migrating toward the Kowai screes which form
its true left bank (Figure 26).
Rainbow gully has been swept clean of all but the largest sediments.
1800 hours- 2400 hours. 17th April 1978. Recession flow.
The gravel wave which moved through the Forks at 1400 hours moves through
the sediment trap with peaks at 2000 hours and 2200 hours. When the wave
arrives at the control section aggradation occurs upstream to the height of
the true left ~all. (This was designed as a side spill way.) Water
overflows, for although the control section can discharge stream flow, it
cannot cope with the gravel wave (Figure 27).
Day1 ight observations wi 11 subsequently show that the channel 150 m upstream
of the control section was inundate~ by up to 0.5 m gravel.
0000- 0600 hours. 18th April 1978. Recession flow.
By 0600 hours bed load transport rates through the sediment trap are
reduced to 10 kg min-1. 'This material derives from the down cutting ,of the
stream as it returns to its former bed level. Field observations during
other storms have shown that pools continue to fill or receive sediment
until the upstream supply is exhausted. When an upstream pool ceases to

42
scour, the next pool downstream wi 11 scour until it reaches an equilibrium
with the flow. In this manner bed movement ceases, beginning first in the
upper catchment and extending downstream.
0600 hours- 1200 hours. 18th April 1978. Recession flow.
Bed load transport rates are in the order of 5-10 kg min- 1 • Unlike the
pulsing movement earlier in the storm, bed transport rates are steady as
the stream reforms its bed.
During the storm many riffles were destroyed when their boulders were
dislodged. localised movement is taking place throughout the stream as the
pool riffle morphology reforms. This process will not be completed in this
recession flow but will continue in future freshets.
Remnants of gravel waves can be found throughout the channel systems of the
Irishman and lower Torlesse streams (Figure 28). There is no evidence of
disturbance or instability in the channel of the true right branch.
Phase 3 19-20 April 1978
Total storm rainfall:
Peak discharge:
Estimated sediment yield:
85 mm
2.0 m3sec- 1 (Approx.)
180 tonnes
For the first time in the study period it ls not possible to galn access to
the Torlesse catchment. The Kawai River !s in full flood and impossible to
cross. This account is inferred from rainfall and stream flow records, from
observations made across the Kowal River and from subsequent inspections of
the upper catchment.
1200 hours. 19-20th April 1978. Rising stage.
Rain begins to fall again 1400 hours (19th). The still saturated riparian
zone responds quickly and stream discharge increases \'I thin an hour"

Hgure 26: Looking upslream in the Kowai River below its confluence with the Torlesse stream.

• Figure 27: Upper: The Torlesse stream in flood How. Lower: A!wut 0.5 m depth of sediment accumulated above the control section causing water to spill over the true right
hand wall.

Figure 28: Remnants of gravel waves, Torlesse stream channel.

078
0·72
0·66
Q-60
Vi 0·54 (I) 1-- 0·48 (I)
E
1:: 0·42 CJ)
(I)
:r: 0·36
OJO
0-24
Q-18
0·12
0·6
0·00
IL----------------------~----
12pm 18·478
------ Actual trace -------- Reconstructed trace
----------------------------------------
-------- --~-- ····--·· --~-----·-· ... -------------·-------------------------------
·------ --·-·
I I I I I I I
12om 12pm 21478
1 I I
12om I I I
12pm 224·78
I I I I I ; 12om 12pm
23-4·78
I I I
12om I I I
12pm 24·4·78
I I I I I 12om 12pm
25·4·78
Figure 29: Hyetograph and hydrograph Torlesse stream catchment 19-2 3 April 1978.

43
Rainfall will be continuous for the next 12 hours but 5 more intensive
periods of rainfall will produce 5 observable stream flow responses
(Fl gure 29).
1200 hours. 20th April 1978.
A small gravel wave passes through the control section. This is the first
of eight such waves that will be recorded in the next 18 hours.
1900 hours. 20th Apri 1 1978.
Peak discharge occurs about now but it is difficult to separate the
influence of rainfall from sediment on stage height. Subsequent observations
will indicate that few if any new sediments are introduced to the stream
channel. Sediments delivered in this storm are derived from a reworking of
channel deposits which are almost entirely remnants of gravel waves left by
the Phase 2 flood. The Torlesse stream is clear, in marked contrast to the
turbld Kowai River.
1300 hours. 21st April 1978. Recession flow.
Sediment transport rates are measured at between 10 kg min-1 and 20 kg min-1.
This supports the opinion that there .were only average supplies of sediment
available for transport during this storm (see Chapter 12, Part 8 ) .
Although peak discharge was comparable with the Phase 2 flood, sediment
yield is estimated at 30% of the yield from that storm. This is because of
the limited amount of sediment available to be transported by this flood
flow.
Because the stream is clear, bed load transport can be easily observed.
Sediments are not moving over the whole width of the control section but are
confined to a 0.5 m- 1.0 m mid section. The location of this ribbon of
sediment varies in response to changes in upstream approach conditions.

44
1800 hours. 21st April J978. Recession flow.
An Inspection of the upper catchment shows that most of the sediment left
in the channel by the flood on 17/18 April has been removed. Although
there have been many changes to individual channel features the general
character and morphology is comparable with pre-flood conditions except that
the supply of sediment available for transport has been almost totally
exhausted. Pools have been scoured and the most accessible riparian
deposits have been removed. The Torlesse stream !snow in an undersupplied
condition (Chapter 12, Part B ).
Phase 4 22nd-23rd AEr.iJ 1978
Total storm rainfall
Peak discharges (2 peaks):
Estimated sediment yield:
89 mm
1.5 m 3 sec-~ 1.9 m3sec
10 tonnes
Throughout the April 21, light rain continued to fall at an average rate of
about 1 mm h- 1 • (Figure 29).
2200 hours, April 21. 0500 hours, Apri 1 22 1978.
Rainfall intensities increase to maximum rates of 9-10 mm h- 1 • Stream stage
height shows an immediate response to a peak 0.26 m (1.5 m3sec-l) at 0600
hours. Three small pulses of sediment move rough the control section.
(These are dlscernable from the stage height record as abrupt changes in
stage height.) This sediment Is derived from the release of gravels held In
upstream pools. Sediment availability is very lo~rJ and the yield for this
first peak is estimated at 4 tonnes. is estimate may be compared with an
estimated 100 tonnes which could be delivered a flood discharge of is
magnitude (see Chapter 12, Part B ).

45
1200 hours- 2400 hours. 22nd April 1978.
Between 0500 hours and 1200 hours (22 April), rainfall rates ease to less
than 1 mm h- 1 . Beginning at 1100 hours rainfall intensity increases to an
average 3 mm h- 1 for the next 13 hours. In response, stage height rises to
a peak of 0.29 m (1.9 m3sec- 1 ) and two small waves pass through the control
section. The estimated sediment yield associated with this peak flow rate
is 6 tonnes.
When these two events are compared with the floods recorded between 1972
and 1977 they are major events. Although they transport little sediment,
their recession flows aid in the reformation of the pool riffle morphology
of the Torlesse stream channel. The last remnants of sediment stored in
pools has been scoured. A portion of this sediment is redeposited in the
riffle zones of reforming pools and the remainder is transported through
the control section.
The Torlesse stream channel includes many large boulders and bed rock
channel sections. Together these elements prevent channel degradation by
flow which is undersupplied with sediment. The response of the Kawai River
is, however, altogether different.
In the first and second phases, sediments from the confined channels of the
upper Kawai catchment were transported into the less confined channel below
the confluence with the Torlesse stream. Channel sedimentation caused an
increase in Kawai River stage height and gave the river access to the whole
width of Its bed. During the second phase the river migrated to the true
left bank.
In the third phase, sediment supplies to the Kowal were reduced and the river
began to entrain debris from within its channel. This process of downcutting
in response to a reduced sediment supply becomes most active in this fourth
phase. Channels down cut 0.5- 1.0 metres.

46
Figure 30 shows that a 50 m length of the Kawai River is flowing alongside
the scree deposits which form its true left bank. As well as degrading its
channel the river entrains about 200 m3 of sediment from the toe of Kowai
screes. The most significant consequence of thls removal is that a
20,000 m3 wedge of up slope gravels has now lost its toe support. Potential
slope instability has been increased because of the erosion of these
riparian sediments. Slope failure above the undercut toe can already be
observed. In the next 12 months or so there will be significant down slope
movement of surface deposits. Re-activation will extend upslope, perhaps to
the ridge 500 m above the channel.
As the river erodes toe slope deposits and degrade~ It exposes a bed rock
outcrop (Figure 31) which prevents further bank erosion at that site. It Is
interesting to note that there is a remnant tongue of vegetation upslope of
this protective feature.
The inescapable conclusion of the river's behaviour at this reach is that
the depleted condition of the Kowal screes is in large part maintained by
periodic undercutting of the slopes. Stability of both vegetation and
soil is very dependent on protection against stream bank erosion of lower
slopes.
Further downstream at the Foggy stream confluence, degradation of the
channel by an undersupplied river is illustrated by dramatic entrainment
of Foggy fan sediments (Figures 32 and 33). By 1200 hours on the 24th, the
river will have eroded 1000 m3 of sediment from thls fan.
Downstream at State Highway 73 there has been 11tt1e evidence of variation
in sediment supply.· Throughout all phases of the storm the river is thought
to have transported sediment at rates which would vary only in response to
changes in discharge. Thus while there have been obvious and sometimes
spectacular changes in channel morphology in response to flow rate and sediment
supply in the upper catchment, these effects have not been observed In the
lower catchment, at least in this storrn.

iWii!: a.!;mg~uEe the Ko,,:>ai scrrH· >lll!l<S. AiYGws murk tile region from which 200m3 or sediment t>f_:a~Ja~-"
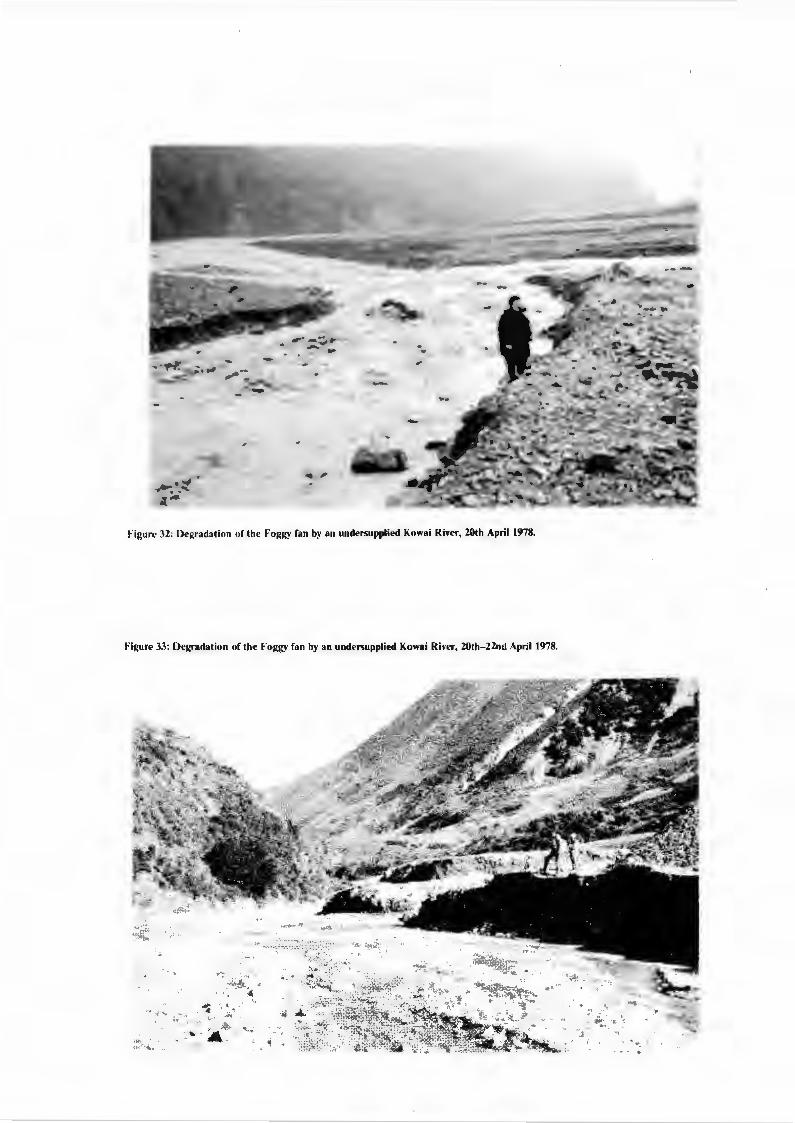
.. -....... ,. . _., ....
-
H~:urc 32: Degradation of !he Foggy fan by an undersupplied Kowai River, 20th April 1978.
Figure 33: Degradation of the Fogg)' fan by an undermpplied Kowai Ri¥cr, 20th-22nd April 1978 .
.. .
-· ::'f;.. _,. . .& .· 'it . ~,· _..

47
CHAPTER 4
IMPLICATIONS FOR FUTURE LAND MANAGEMENT,
RESOURCE USE PLANNING AND RESEARCH
SUMMARY
Some of the findings of this study have important implications for the future
management of the Torlesse Stream Catchment. The application of these findings
to other areas of New Zealand high country is untested.
Flood control, water yields, low flows and sediment yields are found to be un
realistic objectives of land management. If it was necessary, most sediments
could be prevented from entering stream channels by the e.ffective treatment of
less than one per cent of the total catchment. However, in consequen.ce, the
channel would degrade its channel and riparian lands.
more serious problems than were. 11 solved 11 •
This may give rise to
Stream channels are found to be more important to land stability than has been
generally recognised. Strategic mGnagement of riparian lands may be the most
cost effective method of inducing upper slope stability.
Findings from this study support the view tha:t land management proposals should
avoid slopes which might fail as a consequence of land use. Such failure may
lnJtiate a cycle of erosion which could be impossible to arrest.
This study makes a major contribution to our understanding about the revegetation
of eroded lands, It establishes that because the area of land in need of treat
ment is much less than is generally believed, (from the point of view of stream
sediment supplies) the cost per unit area is less important than was formerly
thought.
Two Issues relevant to resource use planning in mountain lands are discussed and
some directions for future research are outlined.

48
FUTURE LAND MANAGEMENT
In chapter J it was suggested that some of our approaches to the management
of high altitude land have been conditioned more by tJorth American and
European views than by New Zealand evfdence. However results of this
study call in to question some conventional attitudes and practices to
high country land management and the directions of some contemporary
research and investigation.
Land managef!lent f_or water yield. (Ref. Chapter 10, Part B)
The estimates of evapotranspiration and the proportions of precipitation
returned as stream flow cast serious doubt on the val idfty of improvement
of water yield as an objective of management for this and comparable
catchments. The results suggest that in very dry seasons 80% of precipi-
tation \vi 11 be returned as stream flow while in •vet seasons the recovery
is about 90%. Such values are fn sharp contrast to the 10% to 60%
recovery rates recorded in North Amerlca from where most of our attitudes
to land management for water yield have been derived,
It is difficult to conceive of any high country management practice which
could significantly alter yields in the order of 90% of precipitation and
it is problematic if any management could be practiced with an assurance
of altering yield in any chosen direction. r example afforestation of
grasslands will lead to increased water consumption only if water is
available. In view of the free-draining nature of the soils of the
Torlesse catchment 1 increased consumption may occur only on damper riparian
sites. But it can be postulated that, because a forest canopy can alter
the energy balance of a site, the conversion of riparian grasslands to
forests wil lead to cooler surface temperatures and reduced evaporation.
Evaporation from the Torlesse stream and adjacent riparian lands may make
a significant contribution to evapotranspiration. Therefore it can be
speculated that a dramatic change in plant type mi t produce higher rates
of transpiratfon, but lower rates of evapo tion, wfth, no net change
in water yield.

49
Even if such speculation cannot be substantiated it must be remembered
that water yield was found to be heavily dependent on precipitation.
Therefore minor variations in yield due to vegetation management will be
masked by the more dominant variations in precipitation.
Land management for low flow regulation. (Ref. Chapter 6f Part B)
A case, comparable to that proposed by advocates of land management for
water yield, has sometimes been advanced for land management to enhance
summer low flows. Results from the study suggests this to be an unreal-
listie objective for management.
Low flows have long been recognised as a function of precipitation,
catchment size, geology and geomorphology. This study bas found that
summer months average 10 raindays per month and that the longest average
period without rain is only eight days. The study area receives regular
summer rainfall and also has the ability to store water and release it
only slowly. For example, it was estimated that in the driest periods,
low flows would halve in about ]0 days.
The impact of land management on low flows will be greatest in catchments
which have thin soils overlying bedrock of low hydraulic conductivity.
Although the soils of the Torlesse c3tchment are frequently shallow, the
scree deposits are believed to be deep and primarily responsible for
sustaining low flow.
Land management for flood control. (Ref. Chapter 9, Part B)
The impact of land management on floods was once a 1 ively topic of debate
(see for example Leopold & Maddock 1954) but it is now generally recognised
to be greatest In small catchments and i.n small storms (see for example
Burton J969). In addition to these constraints, an understanding of the
partial contributing area concept allows probable responses to be more
clearly stated.
50
The concept postulates that a catchment can be divided into hydrologically
active and passive zones, and that runoff is generated from a relatively
small active zone. For flood generation 1 the active zone will be deter-
mined by storm duration and by flow velocities through the soil. For
short duration storms the actfve zone will be the stream channel. As
storm duration increases, the active zone will be extended headwards into
ephemeral channels and laterally into riparian land. The impact of land
management on floods will therefore depend on the changes invoked in the
active zone. Practfces such as reading or urban development which increase
a basints drainage density are ]fable to produce significant increases in
f 1 ood flows.
This opinion is in agreement with a large body of North American experi
ence which has repeatedly found i.ncreases in flood flovJS where forest
clearfell ing has involved track construction or skidder logging (for
example see Harr et at. 1975}. However~ experiments tn which timber has
been felled but left in place have shown only very minor fncreases in
flood flows (see for example Hewlett & Helvey 1970).
On the other hand practices such as the rehabilitation of eroded land in
the passive zone wi 11 have no effect on f 1 ood f1 ows.
Although the concept of a partial contributing zone is simple and may be
readily supported by field ev[dence,the task of defining the contributing
zone is more difficult. The contributing zone is known to vary both within
and between storms and seasons (Dunne et aZ. 1975). Before the concept
can be useful for flood prediction, water quality management, land planning
etc. it will be necessary to develop methods for recognising and predicting
runoff producing zones. This study has not attempted that task.
Although the concept of a partial contributing area has been developed with
respect to flood flows there is no logical reason why it should not be
applied to characteristics such as ]ow flows, water quality or water yield.

51
Land management for sediment control. (Ref. C~apter 12, Part B)
It has been implicitly assumed, and sometimes explicitly stated (see for
example Hayward 1967 p. 170) that a reduction in stream sediment yields
should be an objective of high country land management, However four
findings call to question the validity of this objective in at least this
catchment.
First, sediment yields were found to be less than historic or long term
rates and were amongst the lowest recorded values for mountain catchments.
Second, major (low frequency) events were found to dominate long term
sediment yields. 11anagement practices, such as the rehabilitation of
eroded land, will be less effective under these condit1bhs than in smaller
or more moderate storms.
There is a popular view which assumes that spectacular and visually domi
nant scree fields contribute sediment directly to stream channels.
However in the Torlesse catchment the scree fields were found to be coarse-
textured and stable. Of this 385 ha basin, only 0.5 ha contributed bed
load sediments to the stream over the 5 year study period. These sites
were found to be finely shattered exposures of bed rock which would be
difficult if not impossible to rehabilitate. Nevertheless this study has
shown that a majority of stream sediments could be denied access tb the
stream system if treatment of less than 0.1% of the total catchment could
be effective.
Such treatment may not however reduce stream sediments. It was found that
in the absence of adequate sediment loads the streams tend to down cut
and derive sediments from their own beds. Where such down cutting produces
oversteepened banks, there is an increased risk of riparian slope failure
and a new supply of sedi,ment to the stream channel.
Management for sediment control should be put into effect only when the

52
impl icati.ons of such management are understood. Sediment transport is a
natura 1 ri. ver function. Management schemes which a 1 ter this function may
induce down stream instability and create a more serious 11 problem11 than
they attempted to control.
The management of mountain lands for the maintenance of vegetation.
Whereas the findings from this study question the validity of some con
ventional attitudes toward the rehabilitation of this mountain catchment
they should not be interpreted as support for more exploitive practices.
The reverse in fact is true.
Findings from this study suggest that there are a complex series of inter
related dovm stream responses to a sudden influx of sediment. If practices
such as logging or roading result in slope failure and an influx of sediment
to a stream channel, the sediment will move down channel in a wave-1 ike
form. As it moves, it wi 11 submerge poo 1 s and riffles and make them 1 ess
efficient dissipaters of potential and kinetic energy. With an increase
in velocity (and stream power) there will be an increase in the capac[ty
to transport sediment, While most sediments wil 1 be derived from the
sediment 'wave' some may be entrained from unstable banks subtending the
stream. This leads directly to an increased risk of further slope failure.
Although downstream responses to failure at one site are at present poorly
understood, the implications for mountain land management are clear.
Avoid slopes which may fail as a consequence of land use for such fai Jure
may induce instability further down stream and initiate a cycle of erosion
which may be impossible to arrest.
Land management for erosion control. (Ref. Chapters 7, 8 and 12, Part B)
Findings from this study suggest a more discriminating approach to revege•
tation than has been generally advocated. The fnfiltration study showed
that regardless of plant coverordegree depletion, infiltration was

53
possible on all soil~vegetation associ.ati.ons within the expected range of
rai.nfa11 i.ntensi.ties. However the study of subsurface discontinuities
showed tl1at the conditi.on of vegetation below a point of ground water
emergence had an important influence on down~slope stabi J ity.
it is evident that the control of soil eros[on by water needs a different
emphasis. The revegetation of eroded soils at points of water entry is
relatively unimportant, as this will have no impact on catchment hydrology,
or the rate of soil erosion by water, However the rehabilitation of
depleted land below points of water emergence has significance to both
on~s[te erosion and down stream se~iments. In the Torlesse stream catch
ment such sites represent less than J% of all depleted lands. The signi
ficance of this new emphasis is, therefore, that effective treatment of
less than 1% of a catchment could yield results which might not be inferior
to treatment of the whole catchment. Dunbar (1971) and Nordmeyer (J976)
have developed methods and found suitable species for the rehabilitation
of eroded mountain lands. Ho] loway (1970) reported that the main problem
~,o;as one of reducing the cost of treatment. This study is a major contri-
bution to that objective for it establishes that cost per unit area treated
is relatively unimportant if a majority of total benefits can be obtained
from the. effective treat.m_ent of very 1 imited areas ..
This study also establishes that rivers have a greater influence on slope
stability than is generally recognised. Early advocates of soil conser
vation drew attention to slope instability following forest clearance,
and recommended afforestation of steep slopes (see for example Campbell
1945). However it has been shown that some slopes in the Torlesse and
Kawai river catchments are maintained in a depleted condition by periodic
river erosion of toe slopes (Chapter 3, Part A). Even if afforestation of
upper slopes were feasible, it is doubtful that, under contemporary channel
conditions, it would be successful. The findings of this study establish
that in this catchment at least, stable hill slopes are associated with
stable river channels. Land management programmes which give greatest
priority to the stability of limited areas of riparian land might be more
cost effective than those which give priority to upper slope man~gement.

54
IMPLICATlONS fOR RESOURCE USE PLANNlNG.
Relations between erosionz depletion'and stream sediments.
Land inventory and capability mapping have long been a basis on which to
develop management plans for the conservation of soil and water resources
(see for example Greenall & Hamilton J954). Although such surveys may be
appropriate for some purposes, thts study found erosion, depletion and
capability mapping to be unreal[able indicators of source areas of stream
sediments. The surveys by Saunders et al. (pers comm) followed conven-
tional procedures and showed that nearly 80% of the catchment had lost
all topsoi 1 and 25% ~· 75% of its subsoi 1. Tney also showed that nearly
80% of the catchment supported more than 60% bare ground. Based on this
and other physical and biological features, 85% of the catchment was
classified as class V! II land (land not suitable for crops, grazing or
commercial forestry- recommended for watershed protection, (Anon 1964)).
This study found that from 1972 to 1977 most stream sediments were derived
from less than 0.1% of the whole catchment. it therefore becomes ciear
that if stream sediment management is to be an objective of land management
a more discriminating method of source area assessment is required.
The findings of this study give support to the more recent approaches of
Cuff (1974, 1977) Brougham (1978) and others.
Sediment yields for resource use plannin[. (Ref. Chapter 12, Pi3rt B)
Management plans for river gravels need information about sediment yields
in order that extraction rates not exceed supply rates. Proposals for
dam construction need information about sediment yields as the rate of
sediment accumulation can have an important influence on the economic 1 ife
of a resevoi.r. This study has a number of implications for these and
other resource use plans which involve estimates of stream sediment yields.
In the last few decades much information has been presented about sediment

55
transport in flumes and lowland rivers. r1owever th.i s study has demonstrated
that because mountain streams have differences in stream energy and sedi
ment supply, the application of lowland findings to mountain systems is
inappropriate.
This study has shown that the visual appearance of a mountain catchment may
be a poor indicator of 1 ikely sediment yields. The Torlesse stream has
been described as severely erod~d but measured rates were found to be amongst
the lowest reported values.
Conventional bed load estimatin~ equations were found to over estimate sedi
ment yields by several order~ of magnitude. Bagnoldts (1966) stream power
approach to sed i.ment estimation was found to produce re 1 i ab 1 e estimates for
maximum sediment yields. Howev~r this method needs further testing before
it can be recommended with confidence.
Suspended sediments were found to contribute less than 10% to Torlesse stream
annual sediment yields. This is a reversal of conditions which usually
apply in lowland rivers. Therefore, the technique which estimates bed
load on the assumption that it represents up to 20% of suspended load is
not valid.
The most reliable method of estimating sediment yields is to resurvey mater
ial trapped in resevoirs and to compare annual specific yields with estimates
from 11similar11 environments. If an investigation resorts to field sampling
its information will only be reliable if the investigation takes adequate
account of the spatial and temporal variability of sediment transport.
Field studies therefore need to be both comprehensive and systematic.
There can be 1 ittle confidence in 11one-off 11 estimates.
Not withstanding the contributions that this study has made to an under
standing of mountain stream sediments, reliable Information for planning can
only be derived from taking several different approaches to sediment yield
estimation and comparing results. With the present state of our knowledge,
order of magnitude estimates are acceptable.

56
IMPLICAHONS FOR FUTURE RESEARCH .AND INYESTIGAT!ON,
Research into the hy~rologic implicatlons of land use,
This study has shown that it is inappropriate to apply the Hortonian
concept of runoff generation by overland flow to this catchment. Instead,
the concept of a partial contributing area is presented as a more realistic
alternative. Thts impl [es that future research should place less emphasis
on understanding hydrologic relations on a catchment's surface in favour of
those which attempt to understand the subsurface processes by which rain-
fall is converted to runoff. Particular attention should be paid to
water movement through unsaturated soils. Studies of non-Darcian flow,
translatory flow & return flow warrant further attention. The partial
area concept may have relevance for other catchment characteristics such
as water quality or water yield and the manner in which these are affected
by land management. Emphasis should therefore be given to studies which
attempt to better define the extent, character and variability of, the
partial contributing area.
The question of where such work should be carried out should in itself be
the topic of study. Critical analyses and careful interpretation of
rainfal 1 and stream flow information already held by many New Zealand
agencies would incicate where future studies of hydrologic processes might
be most cost effective. Studies of existing data could also indicate
the relative importance of individual hydrologic processes to particular
management objectives.
Erosion research
Some aspects of erosion as it is related to stream sediments warrant
further study. This study has shown erosion to be an episodic phenomenon.
It has been suggested that slopes and debris deposits may remain stable
until a critical or threshold condition is exceeded, Future studies might
well give emphasis to the concept of threshold conditions for instabi 1 ity.
lnstabi 1 ity involves I ithologic, geomo ic, mechanical and hydraulic

57
parameters and processes. Those studies which are co-ordinated and
multidisciplinary will be most likely to make significant advances in
our understandings.
Stream sediment research
This study has demonstrated the importance of low frequency events to
long term sediment yields. It has been shown that although the vortex
tube trap performed effectively in smaller events it became less effective
with increasing storm magnitude. Therefore studies of sediment yield
should concentrate on the direct measurement of sediments deposited in
resevoi rs or on fans. Such surveys should be complimented by studies
of trapping efficiency.
The problem with instal lations such as the Torlesse stream sediment trap
is that they are confined to one river. Future studies might well give
emphasis to bed and suspended load samplers. These devices have the
advantage of being able to provide lnformation about relations between
solid and fluid flows in a range of rivers. By using information pre-
sented in this study it should be possible to design sampling programmes
which could adequately account for spatial and temporal variability of
sedimeot transport and there by provide reliable information.
The responses of downstream channels and riparian lands to a sudden
influx of sediment are poorly understood. Future studies might well
give emphasis to a better understanding of the movement of sediment within
stream channels and its implications to the stability of riparian lands.
In this respect, the complex response model of Schumm and Parker (1973)
should be critically assessed for its application to mountain channels.
Hydraulic Research
This study has suggested that changes in channel morphology can have a
significant influence on stream energy (stream power), sediment transport
and hill slope stability. At present relations between channel morphology

58
and stream energy are poorly understood. The signfficance of channel
morphology in channel management is therefore largely a matter of specu
lation. Further studres should be made on the dissipation of energy in
steep channels so that channel management can become a realistic objective
for land management.

59
PART B
THE STUDIES

60

61
CHAPTER 5
THE RAiNFALL STUDY
SUMMARY
Problems of precipitation measurement are briefly reviewed.
nfonilation from one recording rain gauge is presented and compared with
limited information from other sites. It Is concluded that Information from
th s one site can be used as a reliable Index of catchment precipitation.
Information from a 66 year record at nearby Mt. Torlesse station provides an
surance that precipitation values recorded during the study period are
representative of the population of possible values. It also shows that
while easterly storms are less common than southerly storms, they are more
likely to produce floods.

62
INTRODUCTION
Errors In precipitation measurement account for many of the inaccuracies n
rainfall runoff relations and In consequence there Is a large literature on
the subject of ralnfa11 estimation (fo example see Rodda, 1 1).
There are two principle objectives ln measuring precipitation, The fi s
is to obtain an unbiased estimate of the rain which would have fa!ien t
site had a gauge not been present. The second Is to ensure that a site s
representative of the area to which the estimate will be applied,
Many studies have investigated bias caused by the gauge itself and there is
a wide range of "improved 11 designs. For example Kurtyka's (1953) st of
rainfall measurement and gauge design lists 1079 references. Two princ p e
sources of bias are wind and topography,
In 1861 Jervons (Hamilton, 1954) attributed discrepancies In measured ran-
fal 1 to turbulance in the airflow around the gauge. Studies at Rotherarn
(England) led to the accepted British practice of Jnstalling a gauge one
above ground level and surrounding It by a turf wall on a radius 5 feet.
While this is satisfactory in low vegetation and in land of low relief, lt
is unsuitable for mountain lands supporting tall vegetation.
Attempts to el imlnate bias caused by turbu ent air flow around tall gau~jes
have produced shields of the rigid Nl or the flexible Alter pe.
A number of studies have shown that such shields increase gauge catch
reducing eddies around the orifice, and that these Increases are more marked
with snow than rainfa 1 (see for example Allis ei; aZ, 1963). Hovvever, only
a few studies hav~ attempted to evaiuate shield effectiveness
"true." precipitation (for example see Dreaver and Hutchinson,
rneasu ;·l ng
) . The
main problem appears to be an inability to measure 11 true 11 precipitation.
The problems of bias caused by mountain topography have been discussed a
number of authors (for example see Hamilton and Reiman, 1958). The es ~' ence,
of concern is that rainfall estimates conventiona vertical gauges will
be !n error in s lands when wind d ves ra n onto slopes at nat

63
the vertical. Hamilton (1954) found that when gauges were tilted and
oriented normal to slope and aspect, they could accurately sample rainfall
actually reaching the ground. Several studies have been made of the char-
acter and significa~ce of inclined rainfall in New Zealand (Aldridge (1975),
Jackson and Aldridg~ (1972~ 1975) and Finklesteln (1972}). The tilted
versus horizontal issue can best be resolved by considering the purpose of
rainfall ~easurement. Tilted gauges can be justified in research studies
that need "hydrologic" estimates of rainfall. Horizontal gauges should be
used for national networks, precipitation maps and comparative purposes
(Peck, 1972).
The problem of extending point rainfall data to larger areas is illustrated
by Linsley et aZ (1949), who note that a standard 8 inch gauge provides
data from a 8.0x10⁻⁷ml1e2 point. Rain gauge networks are therefore intend-
ed to record the spatial variability in rainfall and to provide greater
confidence in data obtained from such small areas. Although there are
guide lines to help establish the density of gauge networks in mountain
lands (W.M.O. (1970), Ferguson (1972)), these are modified by a number of
considerations.
Three of the mere important are:
1. The purpose for which data are needed.
2. The resources available for network establ lshment, maintenance and
data processing.
3. The accuracy which fs required of the data.
There is, therefore, no general solution to the problem of network density.
If absolute values are needed, then an intensive network should be estab-
ll shed (McKay, 1864). Fewer gauges can be used if their data are used as
Indices of area rainfall. In such cases gauges should be located in areas
which contribute most to rainfall (McKay, 1964).
PROCEDURES A 10.2 em (411 ) storage gauge and a 16.0 em seven day recording syphon gauge
were established at 780m on an open terrace above the catchment's outlet. A
solar panel was fitted to the recording gauge to prevent freezing in the

64
syphon chamber (Stra ford and Costello, 1 (Figure Sever· a 1
influenced the decision to record prec pitatlon at only one site.
(a) There were insufficient resources to establish a net-work of
gauges.
(b) Although precipitation could be to increase vJi
altitude, It was thought that such increases would be l on a 11
more important for II train and snow events. For rain storms it
was thought that a reliable Index
obtained from the chosen site.
catchment rainfall could be
c) Rainfall data was needed to better understand stream fl
responses. In turn, flow responses were needed to understand
stream sediment behaviour. At the time the study was set up, sedi
movement was a principle objective of study, As order of magnitude
estimates would have been acceptable, there was little to justi
unwarranted accuracy in the estimation of rainfall.
(d) Data from a level orifice gauge would be comparable with that
from other gauges in the New Zealand Meteorological Senrlce network.
However~ to test the variability in rai II w thin the basin, as e
gauge was temporarily located at 1100m (see Figure 35) the per od
January - 1975. In 1976 a network of gauges was set up to provide
data r a s of the basin 1 s stream flow contributing areas.
Daily precipitation records from 1909 were available for Mt. Torlesse
s 0 km east of the study area. These records cover the
period from about 0900 hours but dally rainfalls the Torlesse stream
catchment are r t hour period ml dn g
The storm frequency analysis of Mt. Torlesse data was based on a ~.,.;,.~.;.;;.;..;.
partial duration series.
To supplement the Mt. Torlesse record, the Christchurch 11 Press 11 was _ _;.,.,_., __ _ searched for i formation about on of the three lar~est storms n
each year Because ear ' y a.ccoun s we i only three categories of
rec v'rt::re us a

Figure 34: Meteorological station Torlesse stream catchment (780m). A solar panel has been fitted to the recording gauge · to prevent freezing in the syphon chamber.

_.,..--.. -·-· I ·---·---·---· . ,,-·- I
h I • j '.Joo <tJo . ...... ! . oO ' ' \ ...Jl • ..___ c·-, ; / \ ~" "Oo ->.---........ ·-· /, '~ . . ' \.J ,(J)O
"lH' -·-· \ I - , ' , --, -·- ' ·- /! , .... :... / -~--. / l·•~ -·-· 1 I / , , "--- · ' J v, /' I I \ ---- .l, ! i f ! i..- ...n
..;-- I ' ' t ' · • • • ---T """ r
' . \ ,/ \ I \ i ' ____ , __ "' 1'--"'?' ., /T
. ...._.___ I "' i I I ' .I - ·. ./
' I · I ( ) , ,..
/
1
I \ I I I 1t ~ ...-\ ldoo />' I I \ I I I \ \ --- 'I &00 -.r' / I . I I .1 I / _,-.- , / ,., / \ ' I ""''. I l . .-·~ I ~ -- -.. \ / r • I -' I ·. · · --- ·.. 1 ..-, ' / .- '· / · ' I I • '/ e< 1686·-~---~· / r- --""' I "· i I ~ . ,. ,___ . / ) ----rHut r\'11 . ..r- I / / ' (' I I '- / . . -
. I I ' .. ' • I \ ' '' . • Rain I I (,--/ / / / >.-.- ) '0~ ! J ~-. t , / \~gouge . ) ·.. ~-x tutbte·~ap I 1
• 1 -- ~"•\~ : • - ·\ 1 .,....,.._ «.··-/,- ·- S d·1men ' I I ,- -·- ' · 1 .1r-:;. · >Y"!' e • 1100 . 1 , 1 ..... -' -~ , ·, \ 1 r;r i. 7 .,..,_____ J. • /
111
aogical .I r I l (">. ;..-' ./ • ' I ...JJ ~ /~.,.--· ·' } Meteoro,
I. I I f.. .. ".,. ,- . / ~-=. =-y- .~ / I S. te I 1 , ·.,- .• -·- , . ·· • 1 I I • I ,.. . 'i ' # / ' I I • .. ·· · f ~ p. io ' • I ' I I 1. I l ··,·-·"····. ~·• ... \.·,a... . "' .. J I ! I : I ·· ' 1
· · Rom •, r' -ro I I ···f.. I \ 1 '(' gauge _/ I IJ I 1 -1•. l ' . \ I I ...n I • \ I I . ' '< ' /, <T 1800 ! \ I I l· . ~ :::L ::: . , ', '·,-, / _,;;.., ' q;
l \ I I . t··-··· . ,_ . "' ', --. .I_,. # 1 I I J .. .' \ ,, ' -~ • • 1 \ 1 I o '-, ', 1 ,/
f \ I \ 1\ ./ ,, \. ,\ '--... ·-·-. I I ) ' -~- ' -I ', .· ' l I ____,_... k'
J I X ', -""' ' • ' \ I I ,, '-----, ' I , ' ./ I I \ I \ . . J .f.--·-...... , ' \- - I . I \ '-, . . / ' ·--/ l'._·-·-.\..-·-·"""", _., I
\ \ ..,, ,. . ..,. • ' J .,.. , . " . , ; ..n 1 -n,a . l I, ' ..-1-" <r 1:> ,-d, I '~\ .. ' '\ _,_...· ,4\ {i' ,"J ~ ,~ 190o ! , \ .. , ,.., , ,
I ' I ' " ' ·' W ' \ I ( \ '-, / I \ '\ \ . ~ ,;,. ''"+-·-·-·-·-·--+·-' It' 1963...-; __...- I "'.:
( / I'
oo ci=>/ ~<P ~ ~ '
catchment. . ·n Torlesse stream . f rain gauges I "". I ocatoon o Figure ·'"· >

1300
E
5 1100 c 0 ...... 0 -c. 900 (.) Q) ..... a.
0 700 :J c c
<t: 500
1910 1915 1920 1925 1930 1935 1940 1945 1950 1955 1960 1965 1970 1975
Figure 36: Average annual rainfall Mt. Torlesse Station: 3 yr. moving means.

1200 E E c 1100 0
...... co ...... 0. (.) Q) ,_ 0.
co 900 :::l c c 4:
0/0 /C probability that annual rainfall will be exceerled
99
• • •
•-1969
..
90 80 70 60 50 40 30 20 10
• ••• •
lfl!_1974 • J ..
..,-i 1972 . ... .,. -· . ./ .---1973
10 20 30 40 50 60 70 80 90
• • •-1951
•-1975
99
0/o probability that annual rainfall will not be exc.eeded
Figure 37: Annual rainfalls Mt. Torlesse Station 1909- 19'75.
0·1
99·9

320
E 280 E
c 0 -0 240 -a. u Q) ..... a. E 20 ..... 0 -rJ)
0 ;:, c c 0
E ;:, 120 E >< 0 ~
80 ..... 1·01
... ..,.., • •• _.,. .....
1·2 1·3 1·5
• ... ..... •
••• •
4
••• ••
• • • •
10
Return period years
Figure 38: Stonn frequency Mt. Torlesse Station 1909- 1975
• •
• •
•
•
15 io 40

65
west) and east (north east to south east).
The 67 years of record from Mt. Torlesse Station introduced the possibility
of generating a synthetic rainfall record for the Torlesse stream catchment
based on regression analyses of the 1973-76 records from stream and station.
To reduce variability, the data was stratified by storm direction. Only
two classes of storm origin were used for these analyses, viz those from the
south west (south through west) and those from the north (north through east).
Unless otherwise stated, a storm was arbitrarily taken as any event in which
rainfalls exceeded 10 mm in 24 hours.
RESULTS
PRECIPITATION - MT. TORLESSE STATION
The record of annual precipitation for Mt. Torlesse station from 1909 to
1975 is presented in Appendix 2. Figure 36has been derived from that data
and shows a cyclic pattern of annual precipitation about the mean valve.
Although the period from 1973 was generally wetter than normal, Figure 37
shows that 1973 was a dry year (probability about 10%}, and 1975 was a wet
year (probabiiity about 3%).
Table 5 has been derived from data held by the New Zealand Meteorological
Service and shows that rainfalls, rain days, storms and consecutive days
without rain are well distributed throughout the year.
A partial duration series for storms in excess of 20 mm was used to establish
return periods for maximum storm precipitation (Figure 38)
STORM DIRECTION- MT. TORLESSE STATION
Table 6 shows that nearly two-thirds of the major storms came from the south
or south west and only about one quarter came from the east. However,
easterlies produce an equal number of major events. The probability of a
southerly storm being in excess of a five year return period is about 0.1.
The probability of an easterly storm exceeding the same return period is
~bout 0.3. Major storms from east and south are both characteristically

r1ean monthly rainfall
standard deviation
No. of storms
Rain days
Jan
98.4
(51. 2)
2.6
10.7
ecutive days 8.7 without r·a 1 n
Feb Mar Apr May June July Aug Sept Oct Nov
79.7 76.3 89.0 85.5 71.1 78.9 76.6 80.7 96.9 92.9
( 4 3. 2) (41.0) (60.3) (55.2) (38.8) (54.8) (51.0) (!15.1) (53.4) (43.7)
2.2 2. 1 2. 1 2. 1 1.9 1.9 2. 1 2.2 2.4 2.7
9.0 9.0 9.2 9.8 8. 1 8.4 8.3 9. 1 10.4 10.3
8. 1 9. 1 9.8 9.6 10.8 10.2 11.1 9.6 8.2 8.4
TABLE 5
Mt. Torlesse Station 1909 - 1975
Mean monthly rainfall (mm); mean number of storms per month; (precipitation in
excess of 10 mm); mean number of rain days for month; (rainfall in excess of
mm); mean number of consecutive days without rain.
Dec Total
102.0 1025
(54.9) ( 173)
2.9
10.9 0', a,
8.2

Storm Size
mm
< 100
100 - 150
> 150
TOTALS
67
Numbe~ of storms from each quarter
NW
20
0
21
TABLE 6
s
106
12
2
120
Mt. Torlesse Station precipitation 1909 - 1973
Frequency and direction of the 3 largest storms in each year.
E
33
11
5
49

68
of two day duratlon,
PRECIPITATION -STUDY AREA
The monthly and annual totals shown in
daily rainfalls presented in Appendix 1,
le 7 have been summaris from t
rt C. Tabl 8
mum and mean rainfall amounts for eight durat ons In the peri r 1
to October 1976.
The mean values were derived from an analysis of 180 ral
comparison, maximum values from 24 years
shown In Table 9.
RAINFALL VARIATION WITHIN THE STUDY AREA
record at La
11 events,
Coleridge are
TablelO shows accumulated rainfall totals for 3 gauges within the study area
for a period of 5 months. The meteorological station storage gauge m)
recorded 4% more rainfall than the adjacent recording gauge. The s
gauge at 1100 metres recorded 6% more than the storage gauge {780 m)
more than the recording gauge (780 m).
RAINFALL RELATIONSHIPS BETWEEN MT. TORLESSE STATION AND THE
CATCHMENT ESSE STREAM
Table 11 shows the results of regression analyses ln which Torlesse s ation
rainfall was the independent variable
the dependent variable (y).
While there Is little ln the 1
Torlesse stream ral 11 vJas
,. T
and storm totals southerly events (analyses 3 & t is consi e
improvement betwe~n weekly totals
(analyses 4 &
storm totals even s from the north
if necessa , storm totals To lesse ream could est mated from
Torlesse station data using the prediction equations:
y = 42.3 + 1.3(x ~ 26, for storms south to westerly origin
r or na
easter

69
--·----~----·-·h~~--.-- .. --- ~--···"-"'""'-"-···-~·-·--~---~· .... ,._, •... -- ·------~--.~----·-~----------~-..... - . ----~- ~- '"~'" .... " ......... -. .. -.. --.. ---~-~-- -~----.----~- ---------·-··-·····--------·-- -·--·
1973 1974 1975 1976 1977
.Jan 64.9 284.8 147.2 177.0 Feb 145.6 116.6 208.3 77.9 Mar 145.9 205.7 68.0 37.9 Apr ll 82.4 294. 1 160.4 77.1 120.2 May ·1 28.7 79.5 111.1 129.3 116.3 June 64.2 89.7 159.8 93.4 July 1+4. 0 163.3 103.0 105.2 Aug 284. 1 72.8 184.9 133.8 Sept 42.5 180.2 126.2 260.5 Oct 60.6 141.5 139.6 217.7 Nov 147. 1 33.6 119.7 137.7 Dec 48. 1 42.2 73.3 223.3
An. total 1453 1785 1801
TABLE 7
Monthly and annual precipitation (mm) Torlesse Stream
catchment 1973 - 1977

1 h r 2 hr 6 hr 12 hr 24 hr 48 hr 72 hr
MearP'' 2.9 4.7 7.3 13.2 17.5 21.1 24.5 26.4
15.8 20.9 25.9 47. 1 7'6. 0 113.4 167.7 177.9
-derived from an analysis of rainfall events between April 1973 and October 1976.
TABLE 8
Mean* and Maximum rainfall depths (mm)
Torlesse Stream Catchment 1973 - 1976

1 hr 2 hr 6 hr 12 hr 48 hr 72 hr
11 15 132 192 193
*- incomplete record- there is a possibility that a greater value
could have occurred.
TABLE 9
Maximum rainfall depths (mm) Lake Coleridge
1951 - 1975
Source: N.Z. Meteorological Service
Lambrecht recording gauge
Storage gauge
Storage gauge at Diorite downs
780 m.
780 m.
11 00 m.
catch. mm. 646.5
673.7
714.0
TABLE 10
% variation from recording gauge
+ 4%
+ 10%
Rainfalls recorded at 3 sites in the Torlesse Stream Catchment
January - May 1975

c i pt ion of
analysis
~·leek 1 y totals, a 1 1 data
2. \1eek 1 y totals greater than 1 5 mm
3. Weeklf totals of storms greater than 5mm from South, S.W., or West
4. Weekly totals of storms rea er than 5mm from .hi., N. ~ N.E. E.
torm totals greater than from South 1 S.W., or
\Vest
Storm totals greater than from N. W. , N . , N. E. ,
c b
4.47 1.09
-0.85 1. 19
6.82 1. 36
-O.Lf1 0.62
6.57 1. 34
-7.65 1. 21
Equation Variation - b(x x) r y = y + - explained
0.78 y = 29.4 + 1 . 1 (x - 22.8) 61%
0.71 y 44.3 + 1. i 9 (x - 37.8) 50%
0.85 y = 48.2 + 1.36(x- 30.5) 71%
0' 71 y = 17.3 + 0.62(x- • 8) 50%
0.83 y = 42.3 + 1.34(x- 26.7) 69%
0.84 y = 36.5 + 1.21(x- 36.4)
TABLE 11
\-ession analyses of storm and weekly rainfall between Torlesse Stream (y) and Torlesse ~~~a_t!~~
1973 - 1976
y == bx + c

73
DISCUSSION
The 68 year rainfall record from Mt. Torlesse s+-ation allows data from the
Torlesse stream catchment to be used with some confidence. First, annual
rainfalls in the period 1972- 1977 have been shown to be representative of
the population of possible values. Second, the station record provides
valuable information about the relatively uniform distribution of rainfall
and storm events throughout the year. Third, the record confirms the
locally held view that easterly storms are less common than southerly storms
but are more likely to be major flood produ~ing events.
It had been hoped that from this record, it would be possible to derive a
synthetic record of flows for the Torlesse stream catchment. However, it
is evident from the unexplained variability of the regression analyses, that
such a record would have limited value. The regression analyses can, however,
be used to estimate the probability (or return period) of particular events.
It is possible that better relationships might be derived as the length of
record is increased. However, it is probable that the 10 km and the mountain
ridge which separate the two stations will always 1 imit the rel lability of
such relations.
Although there is only four years of rainfall Intensity and duration record
for Torlesse stream catchment, results from a 24 year record at lake
Coleridge suggest that the Torles~e Information is reliable.
in the studies reported here, catchment rainfall is accepted as that recorded
by the one recording gauge at the meteorological site. limited comparisons
with other gauges suggest discrepances of up to 10%. In the nearby Craigie
burn Ranges Rowe (pers aomm.) found considerable variability in precipitation
but failed to show the clear trends of increasing precipitation with altitude
shown by Mark (1965) and others. Although It is probable that precipitation
does increase with elevation in the Torlesse stream catchment, observation
during the study period suggests that these increases are greatest for fogs
and mists which have 1 ittle influence on the basin's rainfall runoff relations.
Catchment precipitation is dominated by frontal systems from the south and
east. It is little influenced by north westerly snow storms. Because of

74
the basin's aspect, information from the one recording gauge can us
as a reliable index of catchment precipitation.

75
CHAPTER 6
THE STREAM FLOW STUDY
SUMMARY
The methods of stream flow measurement and hydrograph analysis are described.
Results including variation in flow are presented.
results is presented in Chapters 9 and 10, part B.
Discussion of these

76
l NTRODUCT l ON
Stream flow represents the integration of hydrological, meteorological a
catchment factors that operate in a drainage basin, Because It can be
measured at one location it is easier to obtain reliable estimates a
catchment's stream flow than of its precipitation.
Methods of flow measurement have been reviewed by many authors ( r examp e
see Church & Ke11erhals (1970), Boyer (1964). In most conventional tech-
niques. discharge is estimated as the stream veloci and cross
sectional area. The measurement of velocity presents more problems than
area measurements, current meters, floats velocity head loss rods and
pltot tubes are used. For most stable channels there is a unique relation-
ship between water level and discharge. Once this relations lp
established, discharge can be estimated from records of water level. If
there Is no suitable site for a water level recorder, a weir may provi
artificial control.
cannot be met.
A flume may be us where the constraints to weir use
The hydrograph is perhaps the single most valuable piece rologic
information, for, by analysis one can i much about the contributing
catchment and its responses to precipita ion.
PROCEDURES
Streamflow t
The Torlesse stream leaves Its catchment through a well d ined opening . ' \rJ ~ oe large rock outcrops (F gure ) • The site prov ded an
exce ent tlon on which to anchor a control section channe 1. This
control section included the vortex tube s lment trap (see Chapter
deta l s ;::· Oo ) \t>JC!S [nt ncorporate ,.. hall f1ume
this section, but at design stage it became evident that the costs of a
Parshall flume would the costs the lment trap. !n v!ew of the
uncer lnties about the efficiency rmance of the sediment trap there
s itt e . .... . J L:S <..I the
ement,. an

Figure 39: The outlet of the Torlesse stream catchment before the control section was built. Arrows show the rock outcrops to which the control section was later anchored.

0·30
E
.....
.c Ol Q)
0·15 .c
Q) Ol 0 ...... (f)
0·10
0·05
0·5 1·0
Figure 40: Stage height and discharge relationship. Torlesse stream control section.
1·5 Flow m 3j sec.
\rGauged 16/4/74
lstage fluctuating± ·05m
2·0 2·5

Figure 41: Torlesse stream control section and water level recorder.

77
current meter gaugings (Figure 40 ). An eight day 0ater level recorder has
provided a continuous record of stage height from May 1973 (Figure 41).
Elsewhere in the Torlesse stream and Kc~1ai river discharge was estimated
using current meters (Boyer, 1964) and a velocity head loss rod (Wilm &
Storey (1944), HeedL (1974)). Current meter gaugings are generally reliable
but slow. A ve·!ocity head loss rod was used on those occasions when time
was more important than accuracy. Low flow gaugings in the pool-riffle
system of the Torlesse stream were difficult and unsatisfactory, even with
pygmy meters. Chemical dilution gauging (British Standards institute, 1964)
was attempted but abandoned because of unacceptable errors in rates of
injection and in the analyses of diluted samples (errors were in the order
of 40% to 100%).
Hydrograph Analysis
Each hydrograph was separated into quick flow ("surface runoff 11 ) and delayed
flow (base-flo~tJ). At first this was done by plotting the hydrograph on
semi-logarithmic paper (Barnes, 1939). This procedure was later discarded
when it was found that separation using a master recession curve (Linsley
et al~ 1949) was faster, and gave the same results.
Recession Flow
Base flow recession was derived graphically using stream flow periods which
were free of rains, snow or snow melt (Bruce & Clarke, 1966). A straight
line drawn to envelop points on the right hand side (Figure 44) represents
the slowest prevailing base flow recession rate.
Although base flow rates are, commonly characterised by a single base flow
recession constant (k) it is unusual for all base flow recessions to have
the same value. Martin (1973) noted that k values tend to 1 ie between 0.5 and 1.0 with a distinct 'bunching' as k approaches unity. Because of this
bunching and because they lack physical meaning, Martin suggested that k
values are an unsatisfactory method of characterising recession rates of
streams. He advocated a concept of a half flow period as a more meaningful
and sensitive flow characteristic. The half flow period can be estimated

78
from the equation:
log 1
t0.5 "" 2
-log K
where t0.5 = half flow
and k = base flow
RESULTS
SJ;.~~a,e,, Di_s~harfi!_e_)~e;).~tion.?. (Rating Cu
Figure 40 shows the rating curve for the
period
recession constant rt in, 1
rlesse control section. This
rating curve has been used to convert stage height records into flow rates
and yields.
Annual Stream Flow
Mean daily stream flows from the Torlesse basins for the peri 1973-1977
are presented in Appendix i! i. Figures a Table 12 summarise
Flood Flows
Figure 143 shows that flood flows were well distributed throughout the year. ·~ 1
Hydrographs of floods In excess 0.200 ec are presented n ix !V.
The largest reco low l n the per l -1
ec
Figures 43 show that al h st lmv is reasonably well distributed
throughout the year the periods i ov1es t low to be summer and winter.
Low Flows
The lowest recorded flow in the period 9 3 -1 1977 was 0.075 m sec ·, Figure
indicates t an average value he. 1 s recession constant is in
the order of k- 0.87 but that the s se f -~ow recess on rate s l n
ch cor oond ith
ss J

T""
I (.) <D (/)
(I')
E <D Ol ,_ (lj ..c (.) (/) ·-0
300
260
220
180
140
100
60
Monthly minimum
Jan. Feb. Mar. Apr. May Jun. Jul. Aug. Sep. Oct. Nov. Dec.
Figure 42: Monthly stream flow (mm) Torlesse stream catchment 1973- 1977.

1975 B
·5
mysec.
2 3 L. 5 5 7 B 9 10 11 12 13 11. 15 16 17 1B 19 20 21 22 23 21. 25 25 27 2B 29 30 31 32 33 34 35 35 37 3B 39 40 41 42 43 41. 45 45 1.7 I.B 1.9 50 51 52 January February March April May June July August September October November December
Figure 43: Annual Hydrographs Torlesse Stream Catchment 1973- 1977. Time (weeks)

r'
I (.) Q) (/)
M E Q) Ol ,_ 0 ..c () (/)
0
·16
·10
·08 ·10 ·12 ·14 ·16 ·18 ·20
Discharge one day later (m3jsec -1)
Figure 44: Relations between discharge and discharge one day later for 11 selected low flow periods Torlesse stream catchment 1973- 1977.

...-I 0 Q) en
"' M
E
3: 0
LL
2·0~
1·0 ~
0·40
0·36
0·32
0·28
0·24
0·20
\ \ ,, ~ ',
' ' ' \ \ ' ' \ ' \ \
' ' ' ' ' ......_, ~ \~ ' ....... ' ....... ', ....... ..... ......_
' -....... ....... .......... ', .......
......... ....... ....... '
.... ' ....... ....... _ --
Daily --------- Weekly ------ Monthly
--....... ....... _ ...............
....... .......
.......
' " " '
0·04 ~-..... --~-....... --.,....-..... --.,...---,r---..... --,.--...., 0 20 40 60 80 100
Percentage of time indicated flow was equalled or exceeded
Figure 45: Flow duration curves Torlesse stream catchment 1973- 1976.

·20
...... I () Q) (/)
·15
(/) Q) .... +--
Q) ·10 Ol .... aj
..s::: () (/)
0 ·50
Wind-
12 24 12 24 12 24 12 4/1 6/1 6;1 7j1
Time
1cm2 - 6·09 megajoules m-2
4;1 Time
Figure 46: Diurnal fluctuation in How for a 7 day summer period TorlesS«~ stream catchment.
24 12 8j1
HYDROGRAPH RECORD
24
ACTINOGRAPH RECORD
12 24 9j1
24

Figure 47: F
lood flows
through the Torlesse stream
control section. Fluctuatoins o
f stage heights in excess of 0.30 m
(2.08 m
'sec-1) m
akes it difficult to obtain accurate estimates of discharge.

79
--~·--•"''.-."'·""~~-,--,--,w•....._.--.-~·~·>-•""--·-·----~-..-.-.""~'•"~-,-· ----···~~-«-~------····---·-·~- ~-,
1973 1974 1975 1976 1977 1:
Jan 55.3 134.3 96.0 144.0
Feb 70. 4~'< 83.6 115.8 71.6
Mar 119.7 189.9 68.2 63.3
Apr 195. 97< 113. 1 59. 8>'< 66.0
87.3 96.7 137.7 85.6 105' 7
June 85.5 133.3 103.7 81.5
July 61.9 141.9 92.4 75.8
Aug 132.9 85.6 1 00. 3 ;'< 106.4
Sept 75.4 146.8 129.3 156.2
Oct 94. 6,~ 176.0 125.9 295.7
Nov 92.9 154. 2''' 128.6 212. 1
Dec 50. g,•, 77.2 68. 9'"' 169. p
TABLE 12
Month"iy streamflow (mm) Tor:essc Stream Catchment 1973 - 1977
______________ l

80
V a r i at i on i n O'vl
Figure 45shovJs f'lavv duration curves
mean monthly flow.
r mean 11 y ~ mean ly
During summer months the water level reco er showed a diurnal variation n
flow. From about 9 a.m. to 9 p.m. there was frequently a uction n
flow up to 0.01 m3sec-1 (Figure46). A reduction such as this s equ va 3 -1
to about 400 m day '.
DISCUSSION
While the significance of these data will be discussed in subsequent
chapters, comment Is made here about their reliability.
These data refer only to surface flow. Although the control section cut
off wall extends 0.7m Into river bed gravels, it does not adjoin the
rock believed to under! ie the structure. Although water discharge through
the stream bed is thought to be a very small proportion of total discharge.
its rates are unknown. While this uncertainty Is not significant to the
stream sediment st ies, it may contribute to the errnr~ In wate
balance study.
The choice control section design was limi the t to
Incorporate the vortex tube sediment trap. in consequence it is not an
ideal structure r measuring stream ischarge. The rating curve (Figure
40) shows the section to be relatively insens t ve, icular y at higher
fl 0\rJS. In it ion, measurements are made more ifflcult su
waves ~vh i ch lop at flows greater than .sbout 0, rn de h i'\lhen f 1 ow s
near c r i t l ca l 9
use (Figure 47).
standing waves created the vortex tubes a e in

81
CHAPTER 7
THE iNFilTRATION STUDY
SUMMARY
Horton's (1933) concept of surface water runoff requires rainfall rates to
exceed infiltration rates. Many studies have compared the Influences which
factors such as vegetation and land man~gement have on reducing infiltration
rates. Such studies have stated or Inferred that overland flow rates are
increased by more intensive or exploitive land use practices. This is
valid only when infiltration rates become less than rainfall rates.
A study of infiltration rates throughout the Torlesse Stream Catchment
confirmed that there are major differences between, for example, eroded and
we11 vegetated sites. However, these differences were found to have 1ttt1e
significance to the generation of overland flow,for even the lowest infil-
trat!on values were found to be in excess of recorded rainfall rates.
This finding is supported by field observations which have failed to confirm
the presence of overland flow ln this basin, in regions other than saturated
riparian lands.

82
l NTRODUCT I 01~
The role of infiltration in the hydrologic cycle was probably first recog-
nised by Horton (1
the soil surface.
) who described it as the movement of water th
The rate at whlch v.Jater can enter the soil is dependent em many tors
among which may be, 1 itter and plant cover, surface crusting, rain
energy, slope, soil texture, bulk density, season of the year, soil moisture
status and soil structure. Horton recognised maximum and minimum rates
of infiltration. Maximum rates occur at the beginning of a storm and
decrease rapidly because of changes In the control! ing factors.
lnfi ltration has been widely studied and it has been a common conclusion that
the quantity of living plant material and litter is more significantly
correlated with infiltration rates than any other variables. (for example
see Meeuwig 1970, Branson et aZ. 1972). Other studies have shown signifi
cant differences between plant communities (Dee et at. 1966), surface
conditions (Haupt 196 ,season (Gifford 19 ~grazing intensities (Rauzl &
Hanson 1966),and land improvement ill iams et aZ. 1972). A general con
clusion is that infiltration rates are reduced by more intensive or exploi
tive forms of land use.
Several New Zealand workers have confi d his general conclusion. For
example, Nordbye & Campbell (1951) rna reductions in infiltration
rates l !owing the conversion Nort land forest lands to pasture.
In North Island pumice soils Se by (19 and Selby & Hosking ( 971) und
reductions in Infiltration rates llowing conversion from manuka scrub to
pasture .. ( 1 ) sud ed I filtrati r¢tes on three a cent
areas of mounta n land at Porters Pass id-Canterbury). A 1 though a 11
sites were formerly tall tussock grass ,. Q! rent grazing treatments
had in uced contrasting vegetation His results suggested that
on ltJere inverse y the tens and use:~
ren cou ~ te

83
Water which is unable to infiltrate moves over the surface as overland flow.
This has long been regarded objectionable for t'•'O principle reasons. First,
overland flow rapidly concentrates in defined channels and causes higher
peak discharges in shorter time than water which moves through the soil.
Second, high velocity overland flow causes erosion. Because of this,
watershed managers have been concerned about the maintenance (or improvement)
of catchment cover.
However, while more intensive forms of land use may reduce infiltration
rates there will not necessarily be an increase in surface water runoff
rates. Horton 1 s overland flow model requires rainfall rates to exceed
infiltration rates. In New Zealand, rainfall intensity rates are generally
low, and while Horton's excess rainfall concept might apply to the mid
Western United States, It has not been validated in New Zealand mountain
lands. It has, however, been accepted as a basic premise of watershed
management in this country.
The proposition to be tested in this study was that, regardless of ground
cover or degree of depletion, infiltration rates are in excess of all but
the most extreme rates of rainfall.
PROCEDURES:
Infiltration measurement
Methods for measuring infiltration rates have been reviewed by Branson et al.
("1972), Musgrave & Holtan (1964), Selby (1970), Gillingham (1964), Fitzgerald
et aZ. (1971), many of whom report the concentric ring type of flooding
infiltrometer to be a comparatively crude and somewhat unsatisfactory
technique. Despite these reservations this method was adopted because it
was simple and did not require large amounts of water. Further, this study
was more concerned with establishing the lowest rates of infiltration than
with evaluating absolute differences within or between plant communities.
Under these conditions the technique could be expected to give reasonably

reliable indications of infiltration rates.
the infiltrometer was similar to tha desc ibed The operation
G i 11 i ngham i\ 10 em internal ing vJas s rrounded Cl 15 Cnl
buf r ring and inserted 5-10 em into the soil. A 2.5 em was main ..
tained in both the internal ~nd b r rlngs. filt ton tes re
assessed as the rates at which water was re eased into the internal ring
from a graduated Marriote tube. Reco ing continued un a constant
infiltration rate was attained. gene lly between
minutes. On completion of the f rst tr al, r ngs VJe re 1 e in place
and a second trial VJaS ed out .8 to hours ater.
Study sites were selected in the following manner. .L. Hoi
comm) selected representative sites detailed botanical s within
each of the plant co~nunities mapped G.D.
Working from the centre each botanical site ur infiltration areas were
chosen using grid co-ordinates and a table ran numbers. The ly
constraints to se1ecti were that each area had to be within 10m of
Hol s te and that t to be possible to insert the double rings
wit only minimal disruption to the soi If the constraints not
apply the ected and another was chosen; four sites \'1/ere
ected for this reason. The coarse scree fiel were excluded from
st
Resu 1 ts
;::· 1 1 gure shows the location he test ' tes n d ! X I v
' r the mean ~F 1 t rat on rete i n the f' rs t " '! ct results are presented
the t i
tration rate r both dry and wet runs.
:ni u te 1lt tion tate, • 1,

Figure 48: Location of infiltration trials in the Torlesse stream catchment.
Legend: Short tussock grassland plots I, 2, 3, 4, S, 6, 9, 10, 13, 16 Tall tussock grassland plot 8 Manuka scrub plots 7, 14 Dracophyllum scrub plots II, 12 Snow totara scrub plot 15

85
Table 13
Ring Infiltration Rates after 30 minutes from
Plant Communities in the Torlesse Stream Catchment.
Community
Short
Tall tussock
Dracophyllum scrub
Manuka and matagouri scrub
Snov~ totara
Bare ground
Beech rest and herb field
ree
Bare ground;~
% of Catchment
8
9
3
6
9
4
41
00
9
Number of \ Sites
Number of Plots
in Parentheses
5 ( 1)
4 ( 1)
4 ( 1)
4 ( 1)
8 (2)
12 (3)
Maximum mm.h- 1
5' 120
2,700
820
3, 120
5,000
950
420
~1 in i mum -1
mm.h
120
30
2'10
750
80
10
I Mean an Standard Deviation
in Parentheses
-1 mm.h
930 (1,050)
930 ( 1 ,050)
610 (150)
1 ,080 (1,390)
2,360 ( 1 , 890)
275 {280)
120 ('115)
;',Wet run results, i.e;, 15 to 2L1 hours after 11 dry run 11 •
!
i :

86
Discussion
Although experience in this study was somewhat more satisfactory than that
reported by Gillingham the results show the same marked variabili ln
infiltration rates.
rences between sites but Part of this variation may be due to real di
part is without doubt due to instrument error. Lateral flow, soil distur-
bance during emplacement, boundary fects and the smallness of the sampling
area, all contribute to instrument error. While sprinkling plots may have
overcome some of these problems they would have needed large quantities of
water to be carried up to 1,000 metres up steep mountain slopes.
These results are indicative rather than absolute, for flooding rings are
known to give higher values than rainfall simulators (t<1usgrave & Holton
Nevertheless Gillingham 1 s rainfall simulator study on depleted
tall tussock at Porters Pass gave values for ultimate infiltration rates n -, -1
of between ~5 mm.h - and 105 mm.h . His results indicate that the
values reported here are reasonable.
Tables 8 and 9 (ChapterS) showed that t.he maximum ra[n 11 depths recorded
for a minute period were 15.8 mm in he rlesse catchment and 1 .0 mm
at Lake Coleridge. These depths are equ valent to intensities of hveen
20 and l rnm. h · • Further west at Cass, it has been estima that the
maximum 30 minute intensity for a twen year return period would be in the
l '"l(·i .-l t~ 1 d orcer or ~. mm,n .~breen an & 7).
Therefore despite the variability and possible inaccuracy of the results
t support the contention that rafnf l intensity will rarely exceed
nfi ration capacity. The results suggest that even in a wet condition,
1 \ rat ates extreme ra 'J I intensities on :iiore thi'in of . ' tee" This f nd l ~J s rted fiel observations ch
ed to resence of overland flow in t s

87
CHAPTER 8
THE STUDY OF SUB-SURFACE DISCONTINUITIES
SUMMARY
Although there has been a tendency to regard catchments as two dimensional
surfaces, this study demonstrates that some soil erosion and some catchment
to rainfall are determined by sub-surface conditions.
A seismic refraction study is described. This study confirmed that
return flow (Dunne & Black, 1979) and some erosion forms are associated
wl bed rock which Is close to the catchment's surface.

S8
INTRODUCTION
There has been a tendency to regard catchments as two dimensional su
This view has been encouraged by that watershed research wh ch has
focussed on vegetation influences and given 11 t1e attention to sub-su
conditions. Although geologists have much ta on the hydrologic role
bedrock this has been most often interpreted for its significance to
ground water. Only a few studies have attempted to define the ro1e of
bedrock in the rainfall runoff process (for example, see Yamamoto (1976). Stephenson (1967), Shields & Sapper (1967, 1969), Burroughs et aZ (1965),
Megahan (1973)).
Water which infiltrates flows downward until lt reaches a zone of reduced I ~· .... .. -
hydrau1 ic conductivity. This could be either bedrock or an e11uviated
soil horizon. Continuing inflow produces saturation above this zone and
downslope subsurface flow along the discontinuity.
There are throughout the hlgh country many eroded 11 scalds 11 similar to that
shown in Figures 51- 53. Their evolution and existence appear to have
been accepted as simply another erosion form. Hov1ever, ring and
l !n the Tm·
observed to flow from these sites.
sub-surface conditions caused 11g
se catchment~ water been
twas possible that at such sites
' to intersect with the catch-
ment surface. Further it was poss b l e that this 11 ground water 11 \vas sub-
surface f1o~v moving over bedrock. F e1d observations suggested that when
sub-surface flow was transformed into su flov1~ there was an actual or
potential threat to land stabil i Observations also suggested that
this transformation was Important to
response to rainfall,
cr~bes a pilots
lng the basin 1 s hydrologic
, the aim of which 't.las to determine This chapter
relationships between bedrock, the presence of erosion scalds, and the
transformat on of so 1 vJater iP"to sur-face ow.
p
! c raction su used In oil explorat on, but w t
deve por .flb s tec.hn beer more wi l•l < f

~-- -~
/ '
~i} · c=•~ hammer-.~ " "_;;j l_ (geophone -~
counter
low velocity
surfi cia 1 deposits
v,
high velocity
refractor 1 ayer
Vz
Figure 49: Seismic wave paths.
refracted wave-
I direct wave
reflected wave

Figure 50: Equipment used in the ~ismic survey. The geopbone has been set at the far end of the transect. The travel time of shock waves set up by the hammer are recorded by the electronic clock.

rock -Gingerbread Spur. Urface and sub-surface bed ...-. between s ; . 51· Relation .--F~re . ...-

Figure 52: Relation between surface and sub-surface bedrock - Helen Stream face.

figure 53· R · elatio be n tween · rf su ace and sub-surface bedr ock- Ko . wa1 site.
----

Figure 54: Erosion down slope of a point of ground water emergence.

? ',;:;J /

89
used. This summary statement of procedu. e:s results is based on the
more detailed account presented in Appendix V by R.W. Lewandowski.
Seismic refraction evaluates differences in energy wave velocities that are
racted by bedrock as opposed to those which move more slowly through soil
and other surficial deposits.
A knowledge of wavL velocities and the distance from their point of origin
is used to calculate depth to a refracting surface. There are three basic
Items equipment:
(a) a source of seismic energy (in this case a hand operated hammer);
(b) a geophone (or receiving device);
(c) an electronic clock (in this case the Instrument had a mill 1-
second digital readout).
Three areas were selected for study. They were selected because water had
been erved to flow from them during floods.
to 50m transects were laid out across each of the 3 study areas. At one
end of each transect the geophone was set, and connected to the clock and
hammer as shown in Figures 49 and 50. At regular intervals along the tran-·
sect the ground was struck with the hammer. At the Instant of Impact a
signal was sent to the clock to begin measuring time. The seismic wave
then travelled through the ground and the Instant the geophone recorded the
. arrival of a first wave» the clock stopped.
The information obtained in this manner was used to construct time distance
graphs which were then interpreted to estimate profiles of refractor depth
and seismic velocities.
Results
Velocity contrasts between surficial deposits and bedrock were generally -1
good. For the surficial deposits velocities were between 200m sec and -1 -1 6 500 ~sec Bedrock velocities were between 1000 m sec and 3 00 m
sec- 1 (A few values of between 500 m sec- 1 and 1000 m sec- 1 were
recorded and alternative interpretations of these results are presented in

90'
Appendix IV. Velocities recorded at three sites are presented In Appendix
V and interpreted in Figures 51 to 53 to Indicate the relationship between
land surface and bedrock at the three trial areas.
Discussion
The accuracy of seismic refraction surveys is in part dependent on the
control available against which r~~sul_ts can be tested. In this study,
control was 1 imited to a few surface exposures. The problems of a lack
of control are Illustrated by the two sets of overlapping traverses on the
Gingerbread Spur site which did not give coincident refractor profiles
(Appendix V). !t is probable that such errors can be attributed to
variable velocities in the surficial deposits, and to the irregular
refractor or,bedrock surfaces. However, in this study the magnitude of
depth to bedrock along each traverse was more important than the absolute
depths below each point on the traver"se.
Despite the pilot nature of the study and uncertainties in velocity
interpretations, the results confirm t t erosion scalds were associated
with bedrock close to the ?Urfac§.
This finding makes it possible to consider the evolution of some erosion
features. Figure 55 shows surface and sub-surface conditions similar to
those described in F l gures 51 - 5>3. Results from the infiltration study
indicate that, regardless of plant cover, almost all rainfall will infiltrate
into the upper slope. Howevert where bedrock intersects with the surface,
soil water is transformed into surface flow. Adequate ground cover downslope
of the exit po! nt will allow th flow to be safely discharged, However,
l f the downslope plant cover cannot provtde for the safe discharge of
emergent ground water. eros ion wi 11 occur ( F i g u r e 54 ) • Figure 55 l s
presented to Illustrate possible stages in the evolution of an eroded
landscape.
the
Those concerned with soil conservation in mountain lands have considered
that vegetation affects the entry of rai 11 into the soil. This study
ts that vegetation might a rMJ.ch more significant role in
nfluenclng so11 st Ill at sltes water emerges as su

9!
CHAPTER 9
THE PARTIAL CONTRIBUTING AREA STUDY
SUMMARY
infiltration model has dominated approaches to
generation tal premise watershed manag~ment.
r~ in last It been Increasingly recognised over-
land flow is an unsatls ry model for runoff generation In many humid
areas.
study re Is the first attempt to apply the concept of partial
contrl ting area (or variable source area) to a New Zealand ca t.
over s i 1 'If I the rain 11 generation process but es lis
partial contributing area concept provides for a more satisfactory
explanation qui f1 rog than does
!an overland f ow 1.

Since the 1930s the Horton (1 3, 19 1 1 lnfiitration to
runoff generation has domtna se ro ogy the conversion
rain 11 to runoff. It has ncorporated In most s ard texts
forms the basis for many
example see Crawford
rary wate
Linsley, 1
simulation l <" ( "' \
However. n recent years it has been ncreas ng y recognised that Horton 1
concepts are valid in only spec al ci tances~ For example, the
results presented in Cha r 7 indicate In the Torlesse basin,
Infiltration rates are In excess the most extreme ra!n 11
Hortonian overland flo\JIJ should thus be conf to lanai events or
very 1 imited impervious areas,
in other humid regions
found to be in excess
t
ral
Such
worl
1 ra
cone usion is In line with exper ence
re most l lltration rates have
!n such areas It been sugges t t sto can originate
small but rather consistent part is alterna lve view of
a partial contributing area was flrs by Hewlett p--
explain ~ -~;? to
the "sur rog from ts n
vJhich surface d1d not occur, he last 15 years t· "'
received a great deal of overseas s t attention.
Overland flo\!11 as it s gene
the order 0. sec to 0, 1m sec
water which inf:1trates ' 1 l ' . 1 ' -1 crave on y a0out ~m aay
The concep
ranks the stream channel responses to direct ral
has genera
by fl 0\fJ
v to
.:1
moves at velocities n
f
contrast,
\AJ ll
11 as more important
1 is from
Figure

Shallow , Soils ,'
',_ / ____ , \ --~
Figure 56: A diagrammatic time lapse view of a basin showing expansion of the source area and channel system during a storm (after Hewlett and Nutter, 1970).

93
slower unsaturated flow. Weyman (1973) fou that unsaturated flow was
ca 1e of maintaining river flow for months without rainfal I. Moreover,
it was the decreasing gradient of upslope soil moisture that controlled the
area of saturation in subsequent storms.
Although there is now general agreement that storm runoff is generated from
relatively small areas of a catchment, there are divergent views as to how
water makes its way to a stream channel. For example~ In contrast to the
satura through-flow concept developed by Hewlett and Hibbert (1967), Dunne
and Black (1970) proposed a concept of return flow, saturated overland flow
and direct channel precipitation. Return flo\-'J could occur when the ground
surface intersects the water table and ground water is forced to emerge as
overland flow. Saturated overland flow occurs when water is forced to flow
over the surface of the relatively small saturated zone. As a third alter-
native, Hewlett and Hibbert (1967) have proposed translatory flow in which a
pulse soil water Is displaced from the soil by the impact of Incoming
precipitation. Weyman (1973) proposes yet another process of non-Darcian
flow in which water moves rapidly through larger pore spaces, animal burrows
and hi 1y permeable subsurface strata (see also Jones 9 1971). Freeze (1972) has devel a simulation study that theoretically explains partial area
in terms of saturated overland flow and direct channel precipitation.
!t ls probable ~hat all processes contribute to runoff generation, but the
relative Importance of each depends on rainfall intensity and duration. and
such characteristics as catchment morphology and sells.
Despite divergent vieii'JS on the processes of flow, th.::re ls ~videspread
agreement that In humid regions storm flow can be generated from only pa t
of a catchment. There is also general agreement that this partial contrib-
uting area is dynamic In the sense that It may vary throughout a storm and
between seasons.
The study reported here is a first attempt to apply the concept to a New
Zealand catchment. The proposition to be tested was that the quick flow
component of storm hydrographs could be explained In terms of the partial
contributing area concept.

. 94
Procedures
Twenty nine floods or freshes were selected from the flow records presen
in Appendix VI. Floods which had been derived from snow melt were excluded,
as were those which originated from long duration st6rms that produced no
quick flow.
Each flood hydrograph was separated into quick flow and delayed flow (Hewlet
and Hibbert, 1967) as outlined in Chapter 6. Floods were then grouped into
four rainfall classes (Table 14). The hydrologic response of each flood
was then calculated by expressing the volume of quick flow as a percentage
of the volume of the catchment 1 s flood producing rainfall (Hewlett & Nutter,
1969) .
This study adopted the saturated throughflow and direct channel precipitation
model of Hewlett and Hibbert (1967) and Freeze (1972). This required some
information about water movement rates through soil and scree.
The rates at which water wi 11 rr.ove through the so i is of the catchment are not
known. However, as Harvey (1974) had reported values of saturated hydraulic
conductivity (k) of 10-2cm sec- 1 to 10-5cm sec- 1 for four variants wlthln the
Puketarakl
k = 10-3cm
va 1 ue of k
soil set at Dog Range in Central Canterbury, a value of -1
sec was adopted. For screes and gravel river beds an arbitrary -1
- O.lcm sec was adopted.
The contributing area for storms of less than 25mm and more than 100mm ~\las
then estimated, using these assumed k values and the average storm duration.
Storm duration was defined as the period from the onset of rain until the
of quick flow. For storms of less than 25mm the average storm duration was
11 hours. During this period rain which soaked Into the riverbed and scree
deposits was assumed to have moved about 40 metres. Raln which soaked into
the soil was assumed to move about 0.5m. For these storms the contributing
area was estimated as the perennial stream channel extended 40 metres into
scree and gravel deposits and laterally
about 0.5 metres.
For IOOmm storm on ave
into the riparian soils by
hours. Us ng t

TABLE 14
Storm characteristics for 29 floods
Torlesse Stream Catchment 1972-1975
Date Precipitation Peak Quick flow Storm Hydrologic m.m. Discharge m.m. Duration Response
m3/sec hrs %
29.5.73 14.0 0.24 0.22 12 1.6
4.6.73 21.5 0.24 0.14 10 0.7
26.6.73 20.3 0.15 0.20 17t 1.0
21.11. 73 12.0 o. 19 0.11 13 1.0
16. 1. 74 24.0 0. 18 0.10 16 0.4
6.8.74 17.0 0.19 0.10 10 0.6
18.9.74 12.0 0.18 0.05 13 0.4
19.9.74 18.0 0.22 0.10 17 0.6 24.2.75 26.0 0.25 0.30 10 1.0
7.4.75 26.5 0.35 0.30 11 1.1
19.5.75 15.5 0.39 0.23 11 1.5 2.11.75 22.5 0.48 0.36 7 1.6
26. 11.75 2i.O 0.24 0.10 l1 0.5 23. 1. 76 16.0 0.20 0.06 10 0.4
23. 1. 76 13.0 0.26 0.17 8 1.3
Mean 18.6 0.25 0.17 1l 0.9 Standard deviation 4.9 0.09 0.10 3 0.4
<J.-"----·-·-~'-•-•--c---~
23.10.73 34.8 0.32 0.9 22 2.5 3.11.73 34.4 0.25 0.3 12 0.8 15.2.74 34.0 0.28 o.s 16 1.5 15.3.74 35.0 0.32 0.9 17 2.5
. 2. 7. 74 35.0 0.32 0.7 12 1.9 1.4.75 43.0 .... t.n " ., 12 1.7 U.,'tO Vol
Mean 36.0 0.33 0.7 12.7 1.8 Standard deviation 3.4 0.08 0.2 3.6 0.7
----·--------·--· 28.1. 75 78 0.38 2.5 45 9.8 29.4.75 72 1.90 16.4 56 22.0
6.6.75 91 0.69 4.6 53 26.5 18.8.?5 56 0.46 4.8 57 8.6
Mean 74.3 1.02 7.1 52.8 16.7 Standard deviation 14.5 0.!.) 6.3 5.4 8.9
-~----
15.4.75 123 2.65 36.0 47 29.0 20. 1. 75 10) 1. 55 7.8 99 7.5 11.3. 75 183 2.85 49.0 78 27 .o
Mean 137 2.35 Standard
30.9 72 21.2
deviation 41.0 0.70 21.1 25.7 11.9

same contributing area was assessed as the tream 5
metres Into scree gravel d~posits and 2.5 metres into
r l par l an so i 1 s.
Resu1
le 14 shows the mean hydrologic: response for storms of less than 25mm to
about 1%. Flgut·e 57 s the assessed contributing area for these
storms. This area represents about 2% of the catchm~~t. For storms
between 25mm and 50mm the mean hydrologic response and estimated contributing
area were both about
For storms in excess of iOOmrn the mean hydrologic response was 21% (Table 19),
The estimated contributing area (Figure 58) represents 14% of the catchment.
Discussion
The estimates of hydrologic response show fair agreement with the assumed
contributing area and give support to the concept of a partial contributing
area. They do not, however, constitute a proof of its existence.
The saturated throughflow and channel precipitation model is known to be
an oversimplified approach. Resu 1 ts presented in Chapter 8 demonstrate the
ex.lstence of return flow and Figure 59 shows non-Darcian flow through scree
and terrace deposits. Furt terat Lons_ to tiJe assumed _va 1 ue of k make
or ln the size of the contributing area. For example, if the -1 assumed value of k = O.lcm sec for scree deposits was replaced by a value
-1 of LOcm sec ,the channel extension would be increased from 250m to 2500m
for a 72 hour storm.
A rther complication Is that hydraulic conductivity values apply to a
porous !urn ln a satura condition. Velocities are known to be reduced
in unsaturated conditions.
The agreement between hydroelogic response and assumed contributing area is
best
poor.
storms of less than 50mm.
mean values ls only
For storms i~ excess of 100mm the agree
ir and for some storms It is extremely

N
0
Figure 57: Stonn flow hydrograph, hyetograph and estimated contributing area for stonns of less than 25 mm precipitation, Torlesse Stream Catchment.

N
0
2500
2000
0
Time hours
Figure 58: Storm How hydrograph, hyetograph and estimated contributing area for storms of more than 100 mm precipitation, Torlesse Stream Catchment.
10


97
In a recent study Pearce and McKerchar(1978) re-ana1ysed the data presented
here and compared the hydrologic responses with those derived from rainfall
runoff reco from nine other New Zeal and 1 ~:c<:n. ions. They have suggested
that the methods of analysis used In this study underestimate the volume of
qu l ck flow because:
(a) No allowa"'ce has been made in this study for interception. (Pearce
and McKerchar suggest that, because of interception, only 90% of
gross precipitation is potentially available for stream flow),
(b) The hydrograph separation method extrapolated a master recession
curve back to a point beneath the hydrograph peak, rather than the
point of inflection on the recession 11mb.
The combination of these two factors means that the hydrologic response
storms in excess of 50mm might be 50 - 70% of those calculated by Pearce and
l~cKe r, They suggest that for storms in excess of 100mm precipitation
the contributing area should be in the order of 40% rather than the 20% - 30%
estimated here.
Despite these dl icultles, results presented here show generally good
similarity to those of Pearce and McKerchar, particularly for the larger
events"
varlabl11 In hydrologic respons of large storms needs further st
it Is probable that antecedent conditions are a dominant tor. Fiel
observations rther suggest that the antecedent condition of stream bed
gravels may have a significant influence on hydrologic response. Ground-
water wells installed in the active stream bed in March 1 have shovm thElt
streams can flow over unsaturated gravels. The recharge of this unsaturated
zone may be a first demand on water which would otherwise generate quick
flow. For example, the low hydrologic response from the storm of 20.1.
(Table 14) may be due to the first requirement of quick flow to recharge
stream bed gravel storage.
Despite the many uncertainties inherent in this study, It does lend support
to the concept of a partial contributing area. This concept is a reasonabl

98
explanation of the or~gin of the 11 sur
hydrograph In the absence of surface ru
study also demonstrates the importance of t
storm runoff.
' component
from the ca
the
This
near in the uc on

99
CHAPTER 10
THE WATER YIELD STUDY
SUMMARY
In the United States water yield has been one of the most frequently
researched topics of land use hydrology. Notwithstanding confusing and
conflicting results, water yield has been proposed as an objective for
mountain land management in New Zealand.
A catchment water balance model Is applied to five periods of Torlesse
catchment rainfall and stream flow, to show that 80%- 90% of precipitation
Is returned as water yield. It is difficult to conceive of any management
practice which could significantly affect such yields.
Some North America, studies are reviewed and it is found that management
1uences on water yield have been recorded when 10% - 60% of precipitation
s yielded as stream flow.
A pilot study of water yields from three other South lsl catchments
inns view that management for water yield might be more realistic
in some drier hill country catchments than in areas similar to the Torlesse
Stream Catchment.

lOO
INTRODUCTION
Despite the caution expressed by Holloway (1 ) and others, water yield
has been advocated as an objective for management of mountain lands
for example Mark & Rowley 1969, Cuff 19 \ ) . proposition has been
that an alteration in the type and/or extent of plant cover will have an
affect on the volume of water yielded by the catchment. This proposition
derives from much experience In the United States and a few New Zealand
studies which have shown that larger native tussocks intercept and supply
more water to the soil than does either shorter vegetation or deple
surfaces (Rowiey 1970, Mark & Rowley 1969).
Water yield refers to the long term volume of runoff, frequently expressed
as annual yield. Low flovv refers to low flow rate during a specific
period of ti-me. 1"hese terms are f y used synonymously but
refer to hydrologically distinct characteristics. Techniques which s
to manipulate low flow rates may also involve management for water yield
but a clear distinction must be made between two phenomena,
This discussion refers to water yield.
It is probable that water yield has been the single most frequently re
searched topic in the last 50 years of srnall watershed resea From
his review of thirty-nine predominantly North American
studies, Hibbert (1965) concluded that:
1. Reduction of forest cover uJate.r yield.
rest treatment
2. E'stablishznent of fo:Pest cove.r on sparsely vegetated land water• y1:eld.
,3. Response to treatment is unpr•ed1.:ctab le.
var·iab Le and., most part_,
In contrast to rs have repor
in water yield ith increases n rest \ J •
these conf1 ct ng can

lOl
when individual studies are considered in the context of their geographic
setting and precipitation form, they serve to illustrate the I imitations
of generalisations.
This study consider. the hydrology of the Torlesse catchment from a water
yield point of view. The proposition to be tested was that an a priori
case could be established for including water yield as an objective of
catchment management.
Procedures
This study is based on a solution to the water balance equation
P=Q+E2:_LS
where P = precipitation
Q = stream f l ov~
E =evapotranspiration
S =soil moisture
There are many methods of estimating evapotranspiration (Veihmeyer 1964),
but a solution based on rewriting the water balance equation (E = P - Q 2:. 6 S), has the advantage of integrating al 1 the spatial variations :n
evaporation over a catchment without the need to know details of these
variations. However, while the consept is simple the need for accurate
observations makes it a difficult method to use in most situations. Short
term estimates are impossible. Longer term estimates can be made if the
term L Scan be eliminated by considering periods between conditions of
total soil saturation. In this manner evapotranspiration is treated as a
residual in the equation E = P - Q.
The data used in this study are derived from that presented in Appendices
i and Ill ( Part C ) •
Results
Table 15 shows the values for precipitation streamflow and the residual

102
Stream Estimated % of
Precipi- flov1 11 Evapotrans- annual Precipitation Period tat ion yield pi rat! 11 Evapot rans- appearing as
mm mm plrationll \'llater yield,
11. 8. 73 to 802 661 141
20. 3. ]b,
20. 3. ]b, to 1747 1612 135
14. 3.75
1L 8. 73 to 5332 4730 602 165 89
30. 11 • 76
24. 4. ]Lf to 4057 3573 484 193 88
24. 10.76
26. 6.74 to 4058 3602 456 188 89 30. 11 . 76
Table 15
Precipitation, w&~er yield and estimated evapotranspiration for five peri
from Torlesse Stream Catchment.

103
term 11 E11 for five periods between 1973 and 1';76. It shows that between
82% and 92% of precipitation was delivered to the stream as water yield.
Table 16 shows that annual potential evapotranspiration rates at Nursery
Hi 11 (Craigieburn R-nge) are in the order of 250 mm - 350 mm.
Discussion
The estimates of 11evapotranspiration 11 include all errors of measurement
and calculation. For example, the stream flow terms refers only to surface
flow (Chapter6) and the precipitation data are derived from only one site
(Chapter 5) . Therefore it is possible that these results may be conser-
vative. Further, results for shorter periods may be less reliable than
those for longer periods.
One fundamental assumption in solving the water balance equation is that
by taking the period between times of total saturation the soil moisture
term can be neglected. However, it is doubtful that the Torlesse basin
with its steep slopes, free draining soils and deep scree deposits can
ever be 11 saturated 11 • Errors due to variations in soil moisture are pro-
portiona11y more important to shorter periods than to longer ones.
of these uncertainties the derived values of evapotranspiration and water
yield should be considered as indices rather than as absolute values.
Nevertheless, the five periods show close agreement and the estimated
values of evapotranspiration are realistic when compared against estimated
potential evapotranspiration from a similar environment (Table16). This
implies that the estimates that 80% to 90% of precipitation was returned
as water yield are also realistic.
This finding raises a first important point. The impact of vegetation
management on water yield has been most actively studied In the United
States. The environments in which those studies have been made are
markedly different from the Torlesse basin. Table 17 has been compiled

Jan. Feb. Nar. Oct. Nov. Dec. Total
F frozen
T f.l.B L.E 16
1mum, minimum and mean values for tlal ransplrat!on at Nursery Hill, Craigleburn
Source: N.Z. Forest Service, 1967 - 19

TABLE 17
hean annual precipitation, mean annual stream flow and percenta<)e of
precipitation returned as water yield for
Watersheds.
(Source: A.R, Hibbert, 1965).
CATCHMENT Mean Annual Precipitation
mm
~nited States Experimental
Mean Annual Stream Flow
IT! in % ------·-··------------.. ----------------------------.. ·--·---------------------
Cov-1eeta, North Carolina
13 17 22 19
1 3
10 41 40 6
37 28
Fernow, West Virginia
1 2 5 3 7
H.J. Andrews, Oregon
3
San Dimas, California i''oon roe Canyon
Sierra Ancha Arizona North ;·"rk \~orkman Creek South Fork Workman Creek
Frazer Colorado Fool Creek
Wagon Wheel Gap, Colorado B
Coshocton, Ohio 172
Western Tennessee Pine Tree Branch
Eastern Tennessee White Ho 11 ow
Central New York Sage Brook Cold Spring Brook Shackham Brook
Adirondacks, New York Sacandaga River
South Western Washington Naselle River
1829 1895 2068 2001 1725 1814 1854 202~
1946 1821 2244 2270
1524 1500 1473 1500 1469
2388 2388
648
813 813
536
970
1230
1184
974 1030 1030
1143
3300
792 775
1275 1222 739 607
1072 1285 1052
831 1583 1532
584 660 762 635 788
1372 1346
86 87
283
300
255
460
.535 616 627
770
2690
43 41 62 61 43 33 58 63 54 46 Tl 67
38 44 52 42 54
57 56
10
11 11
37
29
31
21
39
n: :J.;
60 61
67
82

106
from Information presented by Hibbert (1 ) and l i cates r
United States experimental catchments water yield was only 10%- o
catchment precipitation. The notable ion was the Naselle Rive
(Washington) where 80% of precipitation was returned as s ream f!
also significant that in that basin no in nmo
response to Jogging. In a multiple regression analysis of data f
Californian catchments, Anderson (19 ) conc1 that regions w th amlU(:11
precipitation in the order of 1640mm were those In whi water sav
management could be most effectively practl
catchments (including Torlesse) are wlthln such a zone it ls Important to
note that Anderson's analyses estimate annual stream flows to be o
60% of annual precipitation. One essential di renee between the
North American experience and that repo here is that some 90%
precipitation Into the Torlesse stream catchment Is retu
flow.
as stream
The opportunities for water yield management were rther considered
pilot study which estimated a water ba ance three catchments for whi
rain l1 and runoff records were available (Ministry of Works Deve opment
Filed Data List). Because of the ing influence of snow the storage
term, only summer rainfall and was considered. Jo11 ie catchment
In the Southern Alps was originally lnc1 rejected e
uncertainties associated with snow 1 I • The following yields were
obtained:-
Ahuri ri (566 km2) 1964 - 1976
Reynolds ( Marlborough ) 3.2 ituna ( Peninsula) 17.6
summer yield
- 'I %summer yield
"" .. 1976 summer yield
From this pilot study, from the analyses of Torlesse records and from an
interpretation United States experl t Is sugges t management
r water yield Is Jess reeallstlc n some mcuntai ca ts
country ts.

l07
A comparison of the two periods li August 1973 i·o 30 March 1974 and
20 March 1974 to 14 March 1975 shows that although evapotranspiration
estimates show close agreement, precipitation in the first period was
only about one half of that for the second perfod. Assuming that these
estimates are reliab1e,they suggest that this catchment 1 s losses from
evapotranspiration may be more dependent on evaporation and less dependent
on transpiration than in other areas. It is also possible that these
losses may be generated from a small portion of the catchment. It is well
known that in semi -arl d regions major ~vapotransp i rat ion losses occur from
riparian zones where water Is freely available (Campbell, 1970; Horton,
1974). It is conceivable that ln the free draining soils and gravels of
the Torlesse basin the major evapotranspiration losses occur only from
damper riparian sites.
The results from this study make it difficult to conceive of any
management which could significantly effect water yield from this catchment.
This conclusion is at odds with that of Mark and Rowley (1969). it should
be noted however that Mark and Rowley based their conclusion on evidence
obtained at a point on their catchment 1 s surface. They then assumed that
it was valid to infer responses from behaviour at that point~
in view of the known complexity of hydrologic processes which operate
between a point on a catchment an~ its stream outlet (Sharp et aZ, 1959),
validity Mark and Rowley's conclusion cen be called to question.
That tall plants can intercept fog and light rain and thereby provide
additional water to the soil is not in question. It is the fate of that
water about which there is uncertainty. For example, it is possible that
surplus water at a point may be transpired by downslope plants as the water
makes Its way to the stream channel.
These results also illustrate the fundamental but often neglected proposition
that water yield is largely dependent on precipitation 'The changing volume
of water which (r•i-vers) carry is accountabl-e first of aU by variations in
precipi tat,: on • .• 1 (Mo 1 chanov, 1960) . Even if i t were pos sib 1 e to mod l fy

108
water yield by vegetation management, variations In rain
would mask these affects.
(Ch.:ipte 5
This study has failed to confirm the proposition that water yield 1s a
realistic objective for land management In this basin.

109
CHAPTER 11
THE VORTEX TUBE SEDIMENT TRAP
SUMMARY
Methods of bed load measurement are reviewed. The Torlesse vortex tube
sediment trap is described and its performance is reviewed.
The device Is more successful In small and moderate sized storms, In
which It gave reliable information about sediment yields and transport
rates.

uo
ION
Each year the world's rivers deliver 1 x ? " 1 .. 09 -'~' X ' nes
to the oceans and In so doing play an Important part in I scape evo1u
(Holeman ( 1968) 1 Sundberg ( 1973)}. But societies, 1 ike 1 scapes ~ r
also dynamic and in response to changing s build structures on r
to rivers for power generation, communications, fl control, water
abstraction~ etc. Sediment tends to be recognised only when it becomes ~
problem, for example by Impairing the lveness of a structure.
natively demand for river sediments for construction lopment
their supply. in both cases rrnation 5S ctbout yie·~c
supply rates river sediments.
Prior to 1925 there were only a few isola s iment measurements
l n the wo r 1 d • It is only within the last few es that p res for
sediment measurement have been seriously consi !n and rivets
total sediment yields have been assess by direct measurement,
sampllng 1 estimating equations, or correlation with sus sedlmen
measurements. (Total sediment yield usually regarded as bed y eld
plus sus load yield .. )
Oi
The simplest estimating s lment yields and mean transport tes
is to trap material In a dam and peri cal y resurvey he 1 n vo lwne
of sto rltus, making allowances var e p
this manner Thomson comrn) t the te o
latlon In Lake Roxbrough (Centra 0 at tonnes per square k lometer
catchment. Howeve , because surveys are ! lm ted to dam sltes 9
provi In rmation about relations between solid
of <:1lternat ve s have the d mea sur Exne.n t
sediments.
Instruments which provid a cont nuous ecord
en
tion ()

Ill
basket, pan or pressure difference sampling device. Bed load sampling is
fraught with problems and much effort has been directed to improving sampler
design and performance (see for example lnter-~gency Committee, 1964).
in the United States suspended sediments form the bulk of sediment yield.
With sponsorship from several federal agencies a variety of suspended
sediment samplers have been developed. The USDH48 depth integrating
sampler is one such device (Federal Inter-agency Committee, 1948). In
Europe, greater attention has been paid to bed load measurement and a
variety of pans, baskets, trays and boxes hJve been developed. The Swiss
Federal Authority Sampler (1939) is an example of one such device.
The ideal bed load sampler makes secure contact with the bed and recovers
an unbiased sample of bed sediment discharge. A first major problem is
that the instrument can alter flow conditions in the sample zone and so
bias the estimate of discharge. A second problem can be that as the
sampler is lowered into the stream it passes first through a surface zone
of higher velocity and moves into a zone of lower velocity near the stream
bed. As the down stream force is reduced, the sampler may tend to move
up stream and dive into the bed. The sediment it scoops up may not be in
motion. A third problem is that alluvial stream beds are dynamic and
irregular with consequent temporal and spatial variations 1n the rates of
bed load movement. Short period sampling introduces uncertainty as to
the representativeness of the sample. Long period sampling produces large
quantities of sediment and the possibii lty that flow conditions alter during
the sample period.
An Inter-agency subcommittee on sedimentation (1964) concluded that basket
or box samplers are best suited for coarse gravel measurements in mountain
streams. However, as these may have hydraulic efficiencies of 30% - 50%
(Nanson, 1974) the information they provide should be used with care. Pan
type samplers, for example the Pol iakov sampler, are best suited to relative
ly smooth sand bed rivers with relatively low rates of bed load discharge
(Da Chuna, 1968).
Although there are a variety of pressure-difference samplers, the Helley
Smith (1971) bed load sampler appears to offer promise as~ versatile

112
instrument sui to range f ow
i n sma 11 ts, sediment yields have been sampl
atlons using multislot
the Coshocton
visors ( ' 1933) itters (Brown et
slot samplers (Ba rsons ~ 19 or s
Fraevet, 195!4). 1d & Emmett (1
programme to assess s lments
m ll es ,
river
square kilometres), using a
is s ot was flt
to a sump on the river bank.
In itlon to the ures
' a arno
a large catchment
1 ess l t
here there have
at to develop devices us ng acoust~c nuclear tr~:;,c ng pr r
(Gregory & Walling, ) . A 1 t a met s have to
or less sat!s ry r a particular place and set of flow it! ens , ther·e
is still:
11no s·ing le which has determination
The general approach estimating equa ions has been to as ume hat
stream transports a capacl s lment h<'lt h s •s re
shear stress. If the size of the
the crltlca shear stress requ to te movernent are
rate of b load transport can be eel 1 ts frrom
various rm:.J 1 re ten drast
should guides r
use estlmat
r to a number examp t:!
Civi l neers ( 1 , \ G ( 1 1 l ' " i ' • I ~
'~~h t 07 1l a,. I'
Zealand lowland grave rivers ls that a or! have
5 and silt b systems. no
to descr be a recoursE-~
derived

1!3
Correlation with SL!_spended Sediment,s
Estimates of suspended sediments are in general more reliable than estimates
of bed load, and easier to obtain. If a sed ~ent rating curve can be
estab 1 i (f 1 ow rate vs sediment concentratl ons) 1 nformat ion about tota 1
suspended sediment yields can be derived from information about stream flows.
To estimate total sediments It Is often assumed that bed load Is a fixed
percentage of susper~ed load. Although this may vary from 2% to 20%
(Gregory & Walling, 1973), a figure of 10% is frequently adopted (Maddock &
Borland, 1).
Vortex Tub~ S~diment Traps
Vortex tubes have been used for many years to eject unwanted sand and silt
from Irrigation canals and ditches in several parts of the world. In the
United States their use ~J\fas pioneered by Parshall (1933) and Rowher et al
(1933) and their hydraulic behaviour has been tested by Robinson (1962).
Their use for measuring bed load transport rates In a cobble-bottomed stream
in Oregon has been described by K1 ingerman and Milhous (1970).
Figure 60 shows a vortex tube trap which is simply a tube open along the top
and placed In the bed of a controlled section of stream channel at an angle
to the direction of flow. Movement of water across the opening sets up a
vortex pattern within the tube. The vortex has a component along the tube
towards the downstream end, which can be opened to allow discharge into a
work-pit area adjacent to the stream. Sediment moving on the stream bed
drops or ls drawn into the tube and is trapped. It is carried to the dovvn-
stream outlet and discharged into the work-pit whenever the gate is opened.
Although vortex tube traps are confined to one site they have a number of
advantages. They provide continuous records and avoid problems of samp1 ing;
they are simple of design and construction and have no moving parts; and
provide Information about relations between solid and fluid flows.
By emptying the trap at regular intervals during a storm, a rate measurement
can be obtained. This represents a significant advance on methods, which
either sample (In 1 leu of a total measurement) or simply measure total yield
for a storm.

114
Construction of t
The Torlesse Stream leaves Its catchmen th a well defined open
approximately 7m ~ide between a large rock outcrop and a s
39 Chapter 6) , The outcrop provided an excellent foundation on wh ch to
anchor the control structure. At t time the trap was desi
little hydraulic, rological or sediment I rmation available t
Torlesse Stream catchment. The control structure was the re des i
to relate as closely as possible to the upstream and downstream channeL
A longitudinal slope approximately 1: 5 persls r a distance of
upstream and for low to medium flows the str·earn had a wldth less the'!
To determine a suitable flume width. lscharge curves fer r st
cross sect ons near the flume site were estlma assuming a Manning 1s
of 0.055. These curves are plot in Flgure61 which shows that r a
wide section there should be little di
relationship of the control section
flows up to 6m3sec- 1 •
renee between the s lsc:harge
that the a cent
Velocities through the section would ·:argely control! upstream
flow conditions~ 1Yiz a steep channel. To compe!'lsate the.
la drop in roughness, the control section was deslg to have a slope
1:220, the value obtained by use of the Manning equation. A sect on l
8m was
As a sa ture, the true right-ha 1l
high~ wlth its top
flows (approximately
0.2m lower than the -1
sec ) thls wou d act.
flooding of work area behind the wa
as , ' .
the section was t
-hand w;:, 11 , A.t ve
a s l f! spi '! hvay and
A slope of 1 : was I
po across the section to improve t measurement of low flmvs
confin ng them to the left-hand wall. (Subs exper ence showed t
. ' n1
e ups ream sediment agg tion the s.ide spillway could ove low a 3 -1 about 2.5m sec )
Resu ts from Kl ngerman and Ml hous 1 s exper l ence \4ere t
he ig t !''·0 the VO tubes
These set
h

fi2ure 60: A vortex tube sediment tr11p.

1.t>
--E
I- 1.0 I (.9
UJ I UJ
(.9 0.5 <( 1-:J)
0 _____ ._l_ . -···-
5
X
" 3 m control section . J - - -- _____ L __ _ _____ l ___ _ 10 15 20 DISCHARGE (m 3/s)
Figure 61: Relations between stage height and discharge for control section and upstream channel.
25

ll5
Robinson's criteria
('!) ~Ji dth of tube opening - between 15 and 30 em 27 em
(2) Tube angle - 45° to flow 45° (3) Tube length less than 4.5 m 4.24 m
( Tube lengthf.ddth of opening should not exceed 20 1 5. 7
S !ment
size
(mm)
<9.5 <9.5
9.5 - 19.0
9.5 - 19.0
9.5 - 19.0
19.0 - 38.0
19.0 - 38.0
Vortex
Water
velocity -1
m sec
0.9!
1. 04
1.13 1. 07
1. 19
1. 16
1. 22
TABLE 18
tube design
Water
depth
(m)
0" i 0
0.18
o. 0. 18
0.25
0.32
0.24
0.31
criteria
Froude
No.
0.92
0.78
0.72
o. 0.72
0.67
0.76
o. 71
Prototype Percentage
discharge retained 3 -1
m sec
0.278. 98.5
0.555 23.4
0.834 3.7
0.555 98.5
0.834
1 • 1 i 0
0.834
1.110
96.9
25.6
100.0
89.0 ,, ______________________________ _
I I
TABLE 19 I I
Laboratory tests with semi-circular vortex tube. I --~-----· ___ j

116
Robinson suggested (i) that the shape the tube was not t 1
important provided that material entering the tube is not a1 <Y~Je<l
back Into the channel, (II) that constant-section channels are as
as tapered ones, and (i li) that the elevation
1 ips can be the same.
the upstream and dovvnst
To ease cons ruction, a length of 0. iameter stee pipe with t
removed to give an 0.27m opening was selected to rm the tube.
ing was thought large to trap the larger sizes bed oed~
tube shape would lnh bit any tendency
the flow.
r t material to be retu
To test the performance of the proposed vortex tube~ a 0.6m wide sect on
was built and tested in the Fluid Mechanics Laboratory at the University
Canterbury. A floor 8m long and 0. wide was placed In a 1.1m wide
The vortex tube was set into this floor at
from the upstream end (Figure
to the flow dlrect;on
;I
Two tube shapes were tested. first was t 0.3m diameter semi-c rcular
shape described above. The second a square cross-section with 0.2 • rl Sl-eS. The upstream and downstream 1 1ps were at the same leve flush
with the floor. The tubes ex t rough the side wall of the structure
and could be either blocked off or al owed to discharge nto the flume"
Discharges were measured using one he laboratory 1 s calibrated pits, a~d
flow depths were determl with po nt gauges.
Sediment was ntrod approximate y upstn~am the vor t rd
pouring from a wei ing tray, Th s a small bar across t f l
was subsequently e over per l od up to 15 mim.Jtes. ring t is
lour the tubes could be obs when al ' the 5 irnen had , !
moved through the flume~ their trapping clency determined,
t\ va sediment s zes was test ra
't ka1 resul s, a

I
Figure (12: LabQratory model of vortex tube. Sediment introduced by haml can be seen moving along the floor of the model towards the vortex tube at the bottom of the photograph. , '


I I I I I I I I I I I
Fi2ure 64: Vortex tube discharging into work. pit.
I I I I I I I I I I I I I I I I I I I I I I I I I I I I I I I I I I I I I I I I I I I I I I I I I I I I I I I I I I I I I I I I I
1-: I I I I I I I I I I I I I I I I I I I I I I I I I I I

Figure 65: Construction of the Torlesse Stream vortex tube sediment trap, February 1972.

Fi~ture 66: Sediment weighing.

Figure 67: A sluice is filled under the vortex tube to by-pass the work~pit when sediment transport rates exceed 2000kg h-'. This is periodically removed and sediment transport rates for short periods is recorded.

1!7
Table 19 the tube outlet was closed and a 9.1kg sample was Introduced
upstream.
results indicate that trapping efficiencies of 90 per cent and above
can be obtained. The efficiency is reduced markedly r the finer sizes,
particularly at the higher discharges. Part of the loss can be attributed
to material passing -lght over the tube. However, the larger portion is
caused the strong Induced vortex in the tube, which was observed to throw
trapped ma rial into the main flow do11'/nstream of the trap. T.ests
wit the square-section tube showed greater trapping efficiencies, with
material being able to remain in the corners where the vortex flow is not so
effective.
Wi tube outlets open, very mu higher efficiencies were obtained for
the finer materials. in this case the sediment was sluiced from the tube
as rapidly as it was deposited, giving little time for any to be ejected by
the vortex flovv$ Sluicing through the outlet was not as effective with the
square tube.
Three main points eme ed from the 1 ratory tests:
(1) the trap is functioning, tube outlets should be open and the
iment removed continuously.
(2) The trap should consist of two parallel tubes so that sediment
wh ch escapes from the first tube of semi-circular section may
become trapped in the seconJ. which should be of square section.
(3) A design based on Roblnson 1 s criteria would be satls ry, at - • ? -1
least r the tested range ot flovJs, v-~z up to 1.10mJsec ,
Accordingly, two tubes 0.5m apart were incorporated into the control s ct-
ure. They protruded through the left-hand wall and discharged Into a
concrete-floored work pit. A vertically sliding plate (miner's gate) was
provided at the end of each tube. This gate has the advantage, essential
in determining sediment rates, of being easily and quickly opened or shut
regardless of the water and sediment flow.
Facilities designed adjacent to the structure included the work pit, a

118
monorail and hoist~ extensive wingwa11s upstream to ensure that t uc
would notbe bypassed, and a protective apron downstream to preven
undermining. structure is shown n Figure 63. vortex tubes
be seen discharging Into the work pit in igure
The structure was built by staff of the Tussock Grasslands and Mountai
institute from January to May 19 The tonnes concrete us in t
reinforced control section was mixed on site using sc gravels frorn
river bed (Figure 65).
-!
At streamflows up to approximately 0.1 ec ' the entire flm1 is divert
through the first vortex tube. With increasing flows the intensity th
vortex is increased and the proportion diverted st low ls
The vortex always been strong enough to ca the bed associ
with the particular flov\1 from the stream t
section and into the work plt.
h the wa 11 the control
The vortex tubes discharge into a steel-mesh basket li with an
time the basket is filled it is removed, using the monorai a and
weighed (Figure 66). Material not retai for size analysis s hen
moved down the monorail and returned to the stream below the control
structure.
r transport rates up to 2000kg/hour all the sediment can be tra
~ve i and returned to the stream. The gate is open while t bas t
is being filled (5-20 minutes), and iS cios while the basket Is
weighing (2-3 minutes). During this latter time some material may ost
from the t being thrown back lnto the flow? but at l.m'J flovJs thi
certainly a minimal amount.
Rates in excess 2000kg/hour can only be hand1 by a programme of samp
n t For hese hi r ·low rates i e to
ube (F


!9
gravel across the work p t and discharges it into the stream channel. To
make a measurement the outlet Is closed, at time zero, sluice Is removed
and laced the bas t ~ t gate l s opereec nd the sediment collected ; "" rrH::asured time. l ca 11 y the gate wou'ld be closed for 20-30 seconds
and t basket 'vlfOUl d fill in 1-3 minutes.
e the bed loP transport appears to be an unsteady phenomenon, the
per ods between amp1es must be kept to a mi"imum. With two or three men
wo ng s possible to sample every 10 to 20 minutes for periods up to , "F • c.. a) hours\ tgure w •
Sus
and sta
iments were estimated using a DH48 suspended sediment sampler
rd methods of sediment determination (Inter-agency Committee,
DISCUSSION
vortex trap has to be a most satls • if lcally
ing. method of estfmating bed load movement from this catchment.
Ho•,,Jever, tvvo observations are relevant to others contemplating this method,
first con~erns the operating range of the trap. From his investigations
the pe
number
vortex tubes~ Robinson (1
f OVJ over the tubes :•c:,u l d be In the
also noted that the F number 1 it i e
suggested that t Froude
0,8, However 1 he
on trapping
he ghts less than 1.5 times the width o tube opening.
iciency
This
sugges that the Torlesse trap might be i ve up to s e he i ts of
Dur ng floods ri ·1 1974 and Apri 1 , (recurrence interval
between 1:5- 1: rs) trap iclencies were observed to mar ly
mpaired at stage heights greate~ than 0.30m. it is evident therefore.
that the vortex tube trap can provide valuable information about sediment
movement in more frequent events but is less useful ln the larger lower-
The observation concerns the rate at wh ch sediment can be discha
through the vortex tubes. From experience during the study period, lmen

!20
rates in excess 2
pit or dis !thin t
nmge s rat on
ho~ren ate t
stream is control ed supp 1
~rom Figure (Cha erl can.
to tlon
about , 12m This \~OU l 5 if s
.:~va 11 ab he To es e stream, have
rom only event3,
~i 1 th n ope rat ng ange~ rc1pp l ng l c ency i s be ' eved to be
excess t\s the seml -c ! rct1i2 tube was f~ to d i
most sediments, the square tream tube was seldom us t dj
r ~ provi a val e guide to t cture 1 s trapping ic

!21
CHAPTER 12
THE SEDIMENT STUDIES
SUMMARY
In the last few decades much Information has been presented about sediment
transport in flumes and lowland rivers but comparatively little Is known
about lments in mountain streams. Because there are obvious differences
In stream energy and sediment supply, mountain streams can be expected to
behave differently to lowland streams.
Results and experience from mountain streams are reviewed and found to be
sometimes confusing and in conflict. Results from five years of study in
the Torlesse Stream Catchment are presented as a contribution to a better
understanding of mountain stream sediment behaviour.
Although the Torlesse Stream Catchment Is commonly described as 'severely
eroded 1 , sediment yields have been found to be amongst the lowest reported
values. Suspended sediments are estimated to contribute less than 10% to
annual sediment yield. Bed load sediment yields are found to vary greatly
storms and are also found to be more dependent on a supply of sedi
ment than on the transport capacity of stream flow. A down stream 1wave-
1!ke1 movement of sediments is described.
Conventional bed load prediction equations are found to overestimate sedi
ment yields by up to several orders of magnitude. Bagnold's (1966) concept
of stream power and the proportion of stream power utilised in bed load
transport is found to show close agreement with measured values.

122
INTRODUCTION
!n the last few decades much information has been provided about stream
sediments in lowland rivers. Most of this work has been carried out in
silt and sand bed flumes and lowland rivers. In the same period little
attention has been paid to mounta'n streams, where, because of obvious
differences in stream energy and sediment supply the pattern of behaviour
can be expected to be different.
Mountain Rivers
Results from the comparatively few studies of sediment in mountain streams
are sometimes confusing and in conflict. Table20 presents mean annual
sediment rates as estimated from reservoir surveys in a range of New
Zealand catchments. These results suggest that the models of Langbein
& Schumm (1958) and Fournier (1960) in which sediment yield Is regarded
as a function of climate are Inadequate r New Zeal 1 s steep and mountain
lands. Likewise the models of Strakov (1967) (sediment as a function of
relief) and Corbell (1964) (sediment as a function of climate and reli
are equally inadequate. Although much n rmation is concealed In the
results presented in Table 16 they do provide a valuable first s toward
the regional isation of sediment yields.
From the studies reported by Leaf (1 ) , it can be assumed that annual
sediments yields will vary perhaps an order of magnitude or more about
mean values. Var!ation in sediment production within any one season can
also be expected as a reflection of variations in bo stream flow and seal-
ment supply. For example Nanson (1974) and Sundberg (1956) working
Canada and Sweden bo found that sedl concentrat ons Increased drama-
tically with seasonal peak discharge but that concentrations per unit dis-
charge declined after the of seasona snow melt. This decline was
attr buted to a reduction in iment uppl St 1 es Ta i et aL ( 1 and rd & Sutherland ( have also shmvn r a bed
upply rate and mo

Location
Frazer, Central Otago
puho
i hi
Tangawa i .
Otaki
Mangahao
Tuki Tukl river, Folgers Lake
Lake Tutira
Waipoa
South Eastern Ruahines
North Westland
Nelson
123
Yield
m3 km- 2 yr- 1
30
70
so 220
1000
1600
1500
1700
6500
1000 - 5000
55
5
1, presenteu by Mosley 1977 (Table 8)
2. Mosley 1977
3. 0 1 Loughl in et aZ. personal communication
TABLE 20
Source
2
3
3
Annual sediment yields for some New Zealand mountain catchments

124
dependent on sediment supply than on stream flow. Mi lhous E; Kl1ngeman
(1971) found that bed load transport per unit water discharge increased
after peak flow. They attributed this increase to a break down in bed
armour which allowed sediments to be supplied from the stream bed.
11any studies of suspended sediments on lov~land rivers have shown a te
sis loop of concentration associated with rising and falling stage. How-
ever Nanson 1s (1974) results suggest that a series of sub-parallel rating
curves may more accurately describe this relationship for mountain streams.
He concluded that variations in this relationship were due to varJations
in sediment supply.
Although sediment estimating equations have been used to assess annual
yields and transport rates, a major[ of these have been developed from
laboratory flume data. Field verification has generally been limited to
sand and silt bed rivers. Kellerhalls (1972) repor that in steep
gravel-bed rivers in Canada, published rmulae give inconsistent and
widely divergent results. Hayward & Sutherland (1974) showed that even
the "most appropriatejj formuiae overestimated ~ediment yield by up to two
orders of magnitude.
The relative proportions of bed load and suspended load in total stream
sediments are much more variable than for lowland rivers. For example
Jarecki (1957 quoted by Gregory & \'<'ailing ) estimates that bed load
the total sediment from alpine streams. Kellerhalls accounts for 70%
(1972) and Leaf (1 ) both confirm that bed load makes a significant con-
tribution to total sediments in the mountain levels Alberta and Colorado.
On the other hand the studies of i1acPherson (19Fi) and :,Janson (1374) si:ovJ
contrary results. f..\t Bragg Creek 1 berta) ~1acPherson found that bed load
accounted for less than 1% of total annual sediment yield. An analysis of
Nanson's data for Bridge Creek Alberta, confirms this finding. Klingeman
& Mi lhous U970) showed that r Oak Creek (Ol·egon) the proportion of bed
load in total stream sediments va flood magnitude. At fl dis-
lng to the ann , about sedimenL y ld

125
was transported as bed load, for d[scharges with a return period of about
once~fn..,.zo ... years 40+% of sediment was transported as bed load.. While it
may be possible to explain such widely divergent results in terms of catch
ment size, glacial hfstory, 1 ithology flood magnitude etc. they serve for
the moment to illustrate the variabil fty which is assocfated with mountain
stream sediments.
PROCEDURES
Procedures for measuring suspended and bed load sediments have been out-
1 i ned in Chapter 11.
RESULTS. A. SUSPENDED SEDlMENTS.
Suspended sediments were found to be transported for only brief periods
during some storm events. This response in the Torlesse stream was in
marked contrast to the adjacent Kowal River which drains a 10 km 2 catchment
(above the Torlesse confluence} and in which suspended sediments were
transported continuously throughout each storm event.
Table 21 summarises suspended sediment yields from five storm events for
which reliable information is available. Suspended sediment sampling was
discontinued in 1975 when it was found that suspended sediments were only
a minor fraction of total annual sediment yield but their determination
required a disproportionate amount of time and effort.
Discussion
Suspended sediments were observed to move through the sediment trap in
'clouds' or 'waves'.
three hour duration.
These 1 clouds 1 were characteri.stically of one to
In most storm events there were prolonged periods
during which suspended sediment was not transported and the watet was clear
enough to observe bed load movement.,
Field observations showed that the passage of each cloud of suspended sedi-

f-·
I
126
TABLE 21
Suspended sediment yields for seven storms, Torlesse stream catchment.
<I) +-' !ll
C\
12.
20. 8. 73.
29. 8. 73.
30. 8. 73.
7.10.74.
29. 1. 75.
Totals
<I) E ·-
1-
0700 1000
1800 2000
2330 0130
1···-·· .. -·--~ 1500 1600
0430 0530
05]5 ()71~ ..... ..1 - ,.#
1400 1500
1800 1900
1400 1500
1800 1900
1900 2100
0900 1200
[
!3
c 0
(l) u c 0
u
E 0. 0.
225
114
276
61
92
365
'1688
13 j
:
40
24
620
r 5 storms
3 0
rl
I u (l) (/)
~~
u... E
0,270
0 .. 350
0.3]0
0.240
0.400
0.450
0.700
0.540
0.570
0.500
0.470
0.600
'lJ ~
<I) ·->-
655
287
735
53
132
L147
919
1337
268
72
Lf]
LfOJ]
E !.. 0 4-J Ol (/) .::L.
--· J6]7
1-. 0
4-
'lJ 1... !ll (l) 0 a. ~
<I) 'lJ E (l) !ll
ro Vl
8lf
6]
.10]
>-E
'U !.. (IJ 0 0 4-J ~(f)
v 1... <I) 0
ro 4-
15000 ... ,, .. '
53 10 75
74
478
3800
5]]5
i 2770 ! i 74000 -,
20 -123 i 150
i --- 936
! 1-10]7 i 23000
,- i i ~~~ i
12225 I
I
4-J c (l) E
~-a ro~
4-J <I)
0 ·-1- >-
739
354
842
16]00
128
206
1625
4719
7052
493
'7)770
122
6J ') (,
4953 27000
1 r:: I .;
!ll 4-J
(/) 0 4-J .j.J +-' c c
4- (l) 4- (l) 0 E 0 r::::
o-R 'lJ 0'\' 'lJ <I) Q)
Vl Ill Vl IJl !ll !ll ~ E • ro !..
(/) J,.J !Jl 0 • 0 • -!-'
IJl -!-' IJl Vl
89
8J
87
! 10
81-! : 41
T
64 '
70
20 !
19
54
4 :
59
67
45
81
15
7 i
(l) Ol 11) <l-J tl"l
Rising
Risin9
Peak
f ... ,. ...
Rising .......
Rising
1 Rising
Peak
Falling
. Fa 11 i ng
Peak
Falling
Peak

127
ment was related to a sudden tnflux of sediment into the stream channel;
for example In the case of a bank collapse.
Table 21 shows that when suspended sediments are being transported they
may account for up to 90% of sediment yield. However, because suspended
sediments are transported for only a small proportion of total storm time
they account for much less of total storm sediment yield. Table 21 also
shows that the percentage of total sedtments, that is suspended sediment,
is greatest in small events. It will be shown later that these small
events contribute little to total annual sediment yield. These results
support the findings of Leaf (1966} and Kellerhalls (1972) that suspended
sediment is a relatively mfnor component of total sediments in some moun
tain streams.
The time distribution of suspended sediment was similar to those reported
by O'Loughlin et al .. (pers eomm) in that the highest concentrations occurred
on the rising 1 imb. Field observations suggest that fine material perched
on stream banks was entra[ned on the rising stage. On a falling stage
such sediments were generally unavailable to the stream.
RESULTS: B, BED LOAD SEDIMENT YIELDS.
Results
Bed load sediment yields and transport rates from 81 storm events between
1972 and 1977 are shown in Appendix VI. Results for sediment yield are
summarised in Figure 69 and Table 22. The total yield of sediment amounts
to 564 tonnes. The average annual sediment yield was 115 tonnes or 30
tonnes per square kilometer of catchment.
Figure 73 shows that a majority of thi.s sediment was delivered in only a
few events, for example it can be shown that 10 storms produced 90% of the
5 year total. As these storms took place over a total of 17 days it is
evident that 90% of the sediments were delivered in 1% of total time.

128
Table 22 shows sedtment yields from the
between J2 storm classes.
DISCUSSiON
Sediment Yields
recorded storms distributed
Reliable bed load data are sparse and it fs there re possible hat these
results, 1 ike those presented by Leopold & Emmett (1976), have greater
value than analyses or interpretations which may be possible at the time
of writing.
30 tonnes per square kilometer of The estimated spectfrc sediment yteld
catchment is approximately 12m 3 km- 2 y .,.1 -q
· (density 2.5 g em "). This
indicates that erosion rates in the Torlesse catchment are amongst the
lowest-reported values (see Table 20). !f this result is taken for its
face value it is indeed surprising. F l gure 9, rt A and detailed surveys
by Saunders et al. (pePs comm) suggest that over 50% of this catchment is
ln a 1 severely eroded' condition. However, a re-examination of
areas shows that the coarse scree and block fields are much more stable than
their depleted condition mi tat first suggest.
This contemporary rate of erosion can be compared with a long-term or
natural erosion rate. A paleo-range was reconst simple but
subjective method of extrapolating the present day contours along the pro-
bable trends of tr.e range. The volume of material removed from the paleo-
catchment to create the present catchment was distributed over an assumed
2.5 mill ion year period of landscape evolution. Although ~ this
method indicates a Jon -term erosion rate cubic metres
per square kilometer of catchment per year. This suggests that erosion
rates measured between 1972 and 1977 m be at least an order of magnitude
less than long-term or natural rates of erosion.
t the st per l od vvas reason<l both wea her and
t inc 1 ude

c ' 0 E u :Jl
? I I I I I -I-I I I I
? . I I I I I
_I_ I I I
Figure 69: A chronological sequence of sediment yields and associated peak flows. Torlesse stream catchment 1972- 1977.
I I I II I I I
-'

129
TABLE ff
Bed load yields for floods classified by peaK llow rate, Torlesse stream catchment
1972 - 1977 ~~-------:-----.;.;;..;..-.....;..;;..:..:....._--t-----------·---- .. -·------1
peak ! flow class.l
3/-m . sec. 1
(depth m} I I
sediment yield tonnes
Nc. of storms mtn
max tonnes.
mean
,._ ------+---------------11!-----------------------···-·i I I
0 0 . 150 ~ . 200 1 (0. 10m) I
0 0 0
0 0. 10] 0.04
14 0 . 155 0.03 0.058 0.025 0.155 0.02 0,005 0.03 I
rl ----------~~--------------------------+----------------------------------! l i . 20] - . 250
(0.115m),
I 0 0 0.015 0 0.014 0.032
0,042 0,136
0 0 0.002
0
0.075 0.44 0.034
0.050
12 0 .44 0.05
4 0 . 136 0.06 . 251 - . 300 1 (0.13m) I
;·-------+--------------t-----------------. 301 - . 400 1
(0. 15m) I
l I
0.01 0.84 0 0.015 ]. 20
I
o. 4o 1 - o. 5oo 1 29. 6 (0.165m) 1 1.26
' 0 1 4.o,
0. 50 1 - 0. 600 ll 6. 0 ( 0 . 1 Sm) 10 • 6
.-- I 0 •. 60 1 - 0 . 800 ,1.. . 0 5
(0. 20m) . 3. 5 '--- ' I 1. oo - 1. 1 o !2 7. o L. (0 .23m) l 1 I ! 1 . 21 - 1 . 30 j50. 0
(0.245m) 1
0.0]8 0.20 2. 15 0.,40 1.00
0.080 0.20 0,40
4.7 0.50
1.0
0.9
0.002 0.54 0.58 0
l7 .6
1.0 0.085 0.405 l.O
0.06 2.5 2.5 0.15 3.0 35.0
0.095 27.8
0.05 73.6
91.2 .065
J9
6
5
4
0 17.6
0 29.6
0.095 2].8
0.05 73.6
.065 91.2
1. 43
4.52
8.28
15.64
" ~ ----i 35.5
-~------+--------------+----------------~- ... -·-·-! I I
I 1 . 4 1 - 1 . 50 5 . 0 I (0.26m) i 1--·-------!-------------t-------------1 1.75 ~,1.57 I (0.28m) I I 8 I I 2. !72.0 1 co. 35m) 1
. i . .i.." -------!.---------------''---------------··-··--··--

130
return period in excess of 20 years delive about 800 tonnes sediment
in 70 hours. Alt this event is not included tn the data presen
here, it is mentioned to indicate the significance of low frequency events.
Wolman & Miller (1960) have suggested that most of the work of moving
sediment from a drainage basin is done f flows of moderate
magnitude. However as they caution, this proposition is valid only when
applied stress exceeds a critical or threshold value. refore wh i 1 e
their proposition may be valid for sediment movement in silt and sand bed
rivers several authors have pointed out that it cannot be applied to moun-
tain land erosion (Se 1976, Rapp & StrBmquist 1976, Renwick 1977) or
mountain stream sediment yields (0 1 Loughlin pers comm). The findings of
this study supports these views.
!f the study period 1972-1977 is exten to include the e~ent of April
1978, specific sediment yields increase from 30 tonnes km-2 yr- 1 to about
60 tonnes km- 2 yr~ 1 • Although it is a matter of some speculation, it is
possible that if the study could be extended for a much longer period to
include several low frequency events, contemporary erosion rates might be
found to be of the same order as long.,...term or natural rates of erosion.
Be that as it may, these results question the validity of the generally
accepted view that contemporary erosion has increased stream sediment yields
in this mountain catchment.
While Figure69 shows that the largest sediment yields are associated v·lith
highest peak flows, it also shows a number notable exceptions. For
example, storms on 8 September 1976 and ll October 1976 both produced peak
flows of 1.3 m3 -1
sec-. However, sediment yields were 9J,OOO kg for the
first storm and only 65 r t second .. Results such as these give a
new perspec ive to the movement ment from this ca
f gu ves of (- ; -' of sedi vvh 1 ch

131
is only partially dependent on flood magnitude. Table 22 shows that there
is great variabilfty tn sediment yield from floods of comparable peak
discharge. While part of this var[at[on can be explained in terms of
hydrograph shape and duration of flood flows, a more important explanation
invo 1 ves the avail ab f 1 i ty of sediment.
During the study tt became clear that sediment yields were strongly in
fluenced by the amount of sediment held in storage in the stream channel.
(In turn, thfs was influenced by the stability of a restricted area of
upper catchment riparian land). [n 1974 the programme was extended to
monitor changes in the storage of channel sediments.
Although streams such as the Torlesse have been generally described as
mountain torrents, this description is inappropriate (see Chapter 13,Part B). The Torlesse stream channel is a sequence of pools and ripples. Sediment
has been found to be stored within the pools and subsequently released by
flood flows. A series of cross sections was established throughout the
channel to monitor changes in the volume of detritus held in storage.
Figure 70 indicates the changes which took place in a pool 75 m upstream
from the sediment trap. Three features should be noted about Figure 70.
Changes in storage are expressed as changes in the cross sectional area
with respect to a mean bed level. Values below the mean bed line represent
scouring and levels above represent aggradation. An alternative view would
be to consider everything above the lowest recorded levels as sediment held
in storage.
Changes in cross sectional area can be rapid. The general pattern was that
pools would scour on a rising stage and refill on a falling stage. Hov~eve r,
many changes went unrecorded during a storm because of the difficulties of
monitoring sediment yields and channel conditions at the same time. While
Figure 70 underestimates the frequency of channel change it does indicate
periodic increases in the volumes of stored sediments. These were found to
be coincident with variability in recorded yields at the trap.

132
A clearer pattern emerges when changes at all cross sections
on th.e long file of the Torlesse stream. Figure 71
measured and in rred nges which took place over a 30 hour period in
Apr i 1 1975. This figure gtves support to field observations ~ed i me
moving wave~lfke down the stream channel. n thrs storm the bulk he
1wave 1 did not reach the sediment ttap and the reco eld of J500
was low for a peak discharge
A gravel wave ~vas observed 1 to move 1 th the Torlesse stream channel
in two events between December and Jvlarch J9]7. This wave travelled
3.5 km tn hours, say 0.15 km h ~1
In the five year study period there was a tot~l of about 650 hours of
sediment transport time. This is an average about 10 hours per month. ~.1
Based on a trave 1 rate of 0.] 5 km h the average residence time r
gravel once deposited in the Torlesse stream channel would appear to be
1 - 3 months.
Experience during the st period suggests that it is both the presence
(or absence) and location of these sediment twaves~ which is the main
determinant of storm sediment yteld.
In presenting results from the Hirudani experimental catchment, Japan,
Ashida et aZ. (1 ) show var ations s ream bed levels s milar to those
described here. Although those authors do not present results to show
variability in s2diment yiel , it wou d be easonab to conclude thA
such variablll exis ,
ran rnent y e1 from
floods of comparable peak discharge the mean values show an orderly pro-
gression with peak flow rate. The l ne which can be fitted by eye through
these mean values represents the average our t:he Torlesse stream
channel (Fi ) . u~:) i ng t:e I no·! ogv en
r f

, 0
<ll
+020
Figure 70: Changes in cross-sectional area, pool 2A Torlesse stream channel 1974- 1976.

0 '() 0 0 ::r -.. (/)
I'.)
0 0 ..!. w I'.)
0 ::r -.. (/)
w 0 ~
~
I'.)
w 0 .!.. VI 0 0 ::r -.. (/)
1·0
JO April- I .\fa) 1975.
Torlesse
1·5 3·8 4·0
Sediment transport rate = 2-4 kgjmin.
Vortex tube Sediment trap
1
Sec:iment transport rate = 1 kg/min.
Vortex tube Sediment trap
1
Sediment transport rate= Okgjmin
4 ·1
Vortex tube Sediment trap
+0·2m2
4·4
Distance from furthest sediment source (km)

100
10
(/) Q) c c .8 "0 Q)
>- 1·0 "0 0
..Q
"0 Q)
ID
0·1
100
0 ~ield d \00
'tle v({'
:f..' ({I ~0
,ood I/· eO '0
e ~ol0
.:.e 10·0 'i" •
I •
I (/) undersupply Q)
c c .8 "0 • .9! >-
1·0 "0 0 ..Q
"0 Q)
ID
load yield 0·1
•
~~--~~~~--~~--~--~~--~--~-.--~ 0·2 0·4 0·6 0·8 lO 1·2 1·4
Peak flow rote m3/sec ·20 ·40 ·60 ·80 ·10
Figure 72: Torlesse stream catchment range of sediment yields (minimum, mean, maximum) and peak flows 1972- 1977 Peak flow rote m 3/sec (logarithmic scales).
r •
·12 ·14

133
stream catchment. If further study can con"'i.rrr1 this relationship and
extend it to higher flow rates and sediment yields then future long~term
sediment yields could be predicted fro~ information about flood frequency.
For a particular str;m, sediment yield will be determined by the amount of
sediment held in storage. When stream bed levels exceed mean bed level,
yields wfll be high and the stream will be in a condition of oversupply.
Conversely, the stream will be undersupplieJ when bed levels are below
mean bed 1 eve 1.
Sediment size
The smallest bed load particles retained in the trap were coarse sands.
These were observed inall flows capable of transporting bed load. The
largest particles to be ejected by the vortex tubes were in the order of
0.4m(long axts) and of 20 kg mass. At flow depths in excess of 0.30 m 3 -"
(2.0 m sec ~} boulders in excess of 0.5 m and 40 kg mass were observed to
roll or slide over the vortex tubes.
Figure 74 has been selected from data presented in Appendix VI I to i llus
trate the variability in particle stze distribution throughout a storm.
Because only a I lmited number of samples were retained for size analysis,
Figure 74 and the data presented in Appendix VII probably under-state the
variation in the proportions of bed load sediments during storm events.
Observations of bed load movement through the sediment trap confirm these·
significant changes in the size distribution of sediments. Wh i 1 e the
reasons for these changes need further study it is probable that they
reflect changes in the upper catchment and channel. Fol- example the
col lapse of a stream bank may cause an influx of sediment to the stream
channe 1 • The preferential movement of the finer fraction results in a
shift in si.ze dtstrtbutions of sediment retained at the trap. Coarser
sediments may be stored or detained rn pools and subjected to a degree of
sorting, The subsequent release of these coarse gravels from a pool (or

!34
pools) may result in substantially coarser material be[ng d[scha
through the trap.
Some trends in sediment size distributions which are common to the flgtnes
in Appendix VI I are shown in figure 74. The highest proport ens of coa
material are found about or immediately following peak flow. This is
also the period when bed load transport rates show their most rapid rates
of increase. (see Appendix VI). As the flow rate decreases, stream
power and sedfment transport rates decrease, and the stream loses compe-
tence to transport coarser material. F gure shows that the proportion
of fine sediments increases. A storm storm comparison data pre-
sented in Appendices VI and VI I shows that this increase in the proportion
of finer sediments is associated wfth a rapid decrease in the rate of
sediment transport.
Measured Yields vs Those Dedved from Esttn:~_!:Jn~ Equations.
( ~, ) Figure 75 shows the distribution of bed load transport rates .kg min -
through the 3m wide sediment trap for a range of flow depths.
lower envelope curves and a line of best fit are also shown.
and lower curves are fitted by eye.
The upper
Figure compares bed load transport rates estimated by five prediction
equations with measured rates. Figure shov1s the range possible
transport rates ing on the value r slope in the estimating
equation. In each case the lower est mates are based on the slope of the
water prof i 1 e through the pool (0, ) ' The upper estimates represent
transport rate when the pool-riffle features are 'drowned' by water and
sed rnent and the water surface slope approximates va ley s ope (0.
For both measured and computed transport rates particle sizes were,
d50 : 0.015 m, d90 : 0,050 m.
authors have u caution in the use of bed oad red ct on equations. T re.::.u1 t confi nn l<e erha I s ) v ha conven Olli::l es t l n 1
on~, ! te es v i c: 1 t0 ~ n

100------------~~=============================================~ ., .... .-·· •• fl
" " 80 0.. ~
I
fl
' I • ~ ' ; 60 ! E I i 40 i 120 i
• 4 6 9
10 14 17 20 43
20 30 40 50 60
Percentage of storms
Figure 73: Sediment yields Torlesse stream catchment 1972- 1977. ·
Number of storms
86
70 80 90 100

0 <.0
m N
0 N
0 0 0 00 tO -.....t" N
C!ZIS pa{D:JlpUI UDLIJ, JaUit %

~ -"0
~ 200 E
(")
..... 0 100 .....
T"""
I c E Ol ~
Q) ...... ~ ..... -..... 0 0.. (/) c cu ..... -"0 cu 0
"0 Q)
co
0
.. • . • • • • • . . • • • •
0
• • 0 • . .. • .. • .. • • \ • • • • . •• . • . I . : • •• 1: • .. .. ••• • . • . . ): .. • • • . . . . . • .. • 4~. :: . 0 • . . .. <· • .. .. . • • /o • • • ·r •
\ . . •• • ., .... !\ f f •• •
I • :::. ... 00 •o• ... •• • • •
'· I • • . • • " . • • 0 • • • I • .. . ••• •• \ • • • • I ..
•• • I • • •• \
• • • • •• . • . 0
•• • ••
' • • 0
0
0·12 0·15 0·18 0·21 0·24
Depth of flow m.
Figure 75: Sediment transport rates at the vortex tube sediment trap. Upper and lower envelope curves filled by eye. The line of best fit for depths between 0.12 m and 0.28 my D 48190 3 ·5 where D = depth of flow (m) and y = sediment transport rate (kg min 11 ).
--___ ...,..., <"
. •
• . • •
. • \
• . • •
•
0·28

I= 1-1- -1- -t- -1- -r- -
~ : 1- -r- -1- -1- -
..c 1- --"0
~
E M 104 .._ Q) a.
1-/Shields
-
/ , :
1- -r- -r-
Q) r- -+-' ::J r- -c E r- -...... I Q)
a. 103 O'l ~
, Meyer- Peter-M ller r- v -1- : 1-r- -t- -1- -..._.
"- I- -0 a. (/)
t- -c ~ .._
102 .....
"0 ~ 0
t-
~ 7 -f: I = -t- Torlesse :>tream -t-
""0 1- -
Q) t- -co
t- -
/ 1-
1 -
1- -t- -t- -1- -1- --- -
I
1·2 2 2"8 3 4 5 6 7 8 9
Average flow depth (1o- 1m)
Figure 76: Bed load sediments recorded at the Torlesse stream sediment trap vs those estimated by some conventional estimating equations. -

..c -"0
~ E
C"') ,_ Q.) Q.
Q.) -:::J c E
-,_ 0 Q. (/')
c co I... -
"0 co 0 "0 Q.)
CD
1 2 2 3
Average flow depth (10-1m)
Figure 77: Bed load tran,p<>rt rate' e'timated tn 'orne comentinnal I.'QU&tinn,. i·.,timai<><. for ead1 I.'QUation are within the slop<' range, 0.02~ and (I.(Jt,"/

E Cll (j) "-
en Cll (/) (/)
Cll "-
~ Cll
"0 ·~
E C')
(j) 02 .cl
"-0 -.... I c
E OJ
.X. +-' ,_ 0 Q. (/)
c Cll "--
"0 Cll 0
1 "0 10 Cll co
0·15 0·19
LEGEND
stream efficiency
= proportion of power utilised in sediment transport
Stream power = n
0·23
Depth of flow
= 10 g Q S Newton's sec-1
d.= ,.cOS kg sec-1
= 10 60QS kg min - 1
-3 ) where,.o= density of fluid (1kg 10cc
Q = dischargern3sec-1
S = slope = 0·046
Figure 78: Measurt..'<l bed load transport rates and calculated stream power.

135
catchments.
Shield's formula has been found to over-estimate yields in a wide range of
flume and field conditions (White 1973). In this study the estimates from
Shield's formula were consistently three orders of magnitude higher than
the measured values_ The best agreement came from Engelund & Hansen 1 s
formula (quoted by White et aZ., 1973), which gave estimates in the same
order of mc:gnltude as the measured values. However, as this formula was
developed in a laboratory flume using sand sized particles. this agreement
should be regarded as fortuitous.
lt was noted earlier that most estimating equations assume that a capacity
load is transported and that this is related to bed shear stress. These
assumptions are not valid for the Torlesse stream and therefore the use of
such estimating equations is inappropriate for this or similar mountain
catchments.
Measured Yields vs Stream Power
Bagnold (1966) is the only author to describe theoretically bed load
transport without recourse to experimentally derived coefficients. In
Bagnoid 1 s approach the rate of bed 1oad transport should be a function of
stream power. Stream power ls the product of mean flow velocity and bed
shear stress. That is, stream power ls the product of water density, vel-
oclty. depth and slope. When sediment Is freely available, Bagnold has
suggested that at low values of stream power transport rate increases rapidly
with increases in stream power. However, at higher values of stream power
further increases ln bed load transport are a direct and linear function of
stream power. This hypothesis was tentatively confirmed by Leopold &
Emmett (1976) using measured bed load data for the East Fork River, Wyoming.
ln a further study, Emmett (1976) reported that at lower values of stream
power a river loses competence to transport the coarser bed particles and
the channel bed becomes armoured. This limits the availability of smaller
materia 1.

136
The highest recorded r~tes for sedfment transport in the Torlesse stream
are shown in Figure 75. lt ts assumed that these rates represent pe1-i
when sediment was freely available. These upper values tend to confirm
Bagnold 1 s view that, in this case, transport rates increase rapidly with
increases in flow depth up to about 0.15 m. Thereafter, increases
appear to be directly proportional to increases in depth. The upper
limit values shown in Figure 78 have been derived from a li.ne fitted by
eye through the upper values shown in Figur~
In Figure 78 comparisons are made between stream power calculated for a
range of flow depths for the Torlesse stream through the 3m wide cant
section, the upper values of recorded bed load transport rates, and the
mean values of transport rates within the depth range 0.15 m - 0.28 m.
The median of gravel stzes ranged from 0.015m - 0.030m. The proportion
of stream power utilised in sediment transport (E =efficiency) when sedi
ment was assumed to be freely available was found to be within the range
of 5% - 7%. This finding is in remarkable agreement with the estimates
of Leopold & Emmett (1976) who suggested efficiency values of 8% for
0. OlOmand 5% for d50 , 0.050 m.
The proportion of stream power expended in bed load transport in 11average 11
conditions (i.e. on the 1 ine of best fit) was found to be less than 1%
(0.6% - 0.8%).
These estimates of stream efficiency have been made from data obtained over
a I imited range of flow depths and n consequence they should not be gener-
alised. They do indicate however that stream power and stream efficiency
can provide more reliable estimates of bed load In at least this mountain
stream than can conventional estimating equations.

137
CHAPTER 'i 3
THE CHARACTER AND SIGNIFICANCE OF THE MORPHOLOGY OF
THE TORLESSE STREAM CHANNEl
SUMMARY
Although river channels exhibit widely differing form, It has been suggested
that there Is a continuum or uninterrupted range of patterns, (Leopold &
Wolman 1957). A review of channel literature shows that shallows and deeps
(pools and riffles) are a feature of a11 channels but that they may become
a dominant feature in mountain stream channels.
Longitudinal and cross section profile surveys were made of the Torlesse
stream channels. During these surveys, channel forms were classified on
largely subjective criteria. The survey and classification showed a 1major: pattern of riffle steps or boulder steps which separated regions of
lower velocity stream flow. The riffle steps usually included a 1minor 1
pattern of boulder steps which separate~ pools. It is suggested that the
or 1 pattern ls determined by low frequency events wlth return periods in
order of 50 - 100 years. The 1mlnor 1 pattern is determined by more
frequent events with return periods of <1 - 5 years. Although the channels
are generally well ordered 1 they include some disordered segments. These
are believed to be in the process of adjustment towards a more ordered state.
The concept of dynamic equilibrium may be more appropriate to the Torlesse
Stream channel than the appearance of the catchment might at first Indicate.
Relations between step height and length are found to be consistent and vary
with grade.
A comparison fs made of stream energy through one pool to Illustrate the
significance of the pool riffle morphology in dissipating 95% of the stream 1 s
capacity to do work. It is suggested that this energy dissipating role is
relatively unimpaired as long as flow through the pool remains subcritical.

138
Results from a laboratory study are to support the field
that when gravels fl11 pools there Is a sharp Increase in the stream's
capacity to do work.
ticn
The significance of these findings to channel management is briefly discus

139
INTRODUCTION
Over the last century there has been a rapid growth in the number and value
of structures built on, over,or adjacent to rivers. From a river engin
eer's point of view ~he problem is that rivers generally refuse to remain
in one position. It has therefore become necessary to know something
about a river patterns, and their likely responses to change.
The literature on the reasons for river patterns shows a diversity of
hypotheses which are comparable only to the diversity of channel pattern
itself (Schumm & Khan l9]2}. Some authors (for example Simons & Richardson
1962, 1971 Callender 1969} give emphasis to an understanding of channel
hydraulics. Others give emphasis to geologic and geomorphic understanding
(see for example Schumm 1971, J977). Schumm l972 has campi led a selection
of some of the more significant contributions to our understanding of
channel morphology and behaviour.
There are a number of systems for channel classification but Leopold &
Wolman 1957 noted that although braided and meandering patterns are
strikingly differ~nt, they actually represent extremes of an uninterrupted
range of channel patterns. They presented the concept of a continuum of
channel patterns and suggested that the h~draulic processes operating within
channels may be more comparable tha~~ c..ifferences in their patterns would at
first suggest.
Schumm & Khan (1972) developed this concept of a continuum and showed that
when a channel is at or close to a threshold of change, a relatively small
increase in sediment load could cause the river to adopt a different form
(Fig. 79 ) .
A majority of the 1 iterature on channel form refers to the straight, mean-
dering and braided channels shown in fig.79 These channels characteris-
tically have gradients of up to about 0.02.
there is less information.
For channels steeper than this

140
Leopold & \dolman (195/ noted that shallows
characteristic of almost all natural rivers.
deeps are a amen
Because the shallows have a
riffle surface, Leopold et aZ. (1964) proposed the term pool-riffle.
In some mountain areas, the pool-riffle pattern becomes the dominant chan
form. (See,for example,the descri ions ( 1972), Harr ( 1976)
Ke 1 1 e r h a 1 l s ( 1 9 6 6) , In other investigations this nel rm has no
mentioned. (See, for example, the studies of 0 1 Lough1in (1969).
et aZ. ( 1964) sugges that a poo l-rl ff1 e logy depends to some de~i''e'''
on the ity of bed material size. Pools tend to form behind
coarser bed materials or boulders. In some instances poo s may a 1 so
behind logs •..vhich have become embedded in a channel (Heede~ 1972).
Mountain channels are characteris by s gradients, but the pool-riffle
morphology modifies is grade_ Wate moves more slowly through the r
pool segments and rapidly through t shallower ri le s. A sequence
of pools is thus a sequence hydraul lc jumps and is one mechan l sm
for dissipating the tial energy
It is known that a submerged hydraulic jump is a iess energy
dissipater than a free jump (Govinda & aratnam, 196 it can
be ass that in a pool riffle channel s
example .t::• I ! flows) wi 11 Increase ve1oc1
of the pools
stream energy,
r
Thfs
crec:1se n capacity the stream do work wl l have a en i a l
ton stream channel stabili
To a casual erver t Torlesse s ream appears to contain section
pools les that have been ld s
larger s iments across the stream charnel. appear to
s rnents s revm rent random fash on.
The this s was to ribe the morphology of the Torlesse
st to consider f!cance to stream ene

!41
PROCEDURES
Channel Description
The channel descr[p~ion was based on stadia theodolite surveys and descrip
tions of channel morphology at each survey point.
Long[tudinal and cross section profile surveys were made of the channels of
the Kowai river and Torlesse stream tn March/Apri 1 1974 (see appendix 10).
These were stadia theodolite surveys in which bearings were related to grid
north. A geodometer and second theodolite were used to establish ground
control and tie this to the nearest bench mark some 30 km distant. The
Tor 1 esse stream channe 1 was surveyed for a distance of 1 . 450 km upstream of
the sediment trap. The [rishman stream was also surveyed 0.645km upstream
from its confluence with the matn channel. The survey was closed in a
loop joining the two branches, The accuracy of this survey is estimated at
+ 0.05 m for reduced levels and 0.5 m for distances.
A first survey was made in March/April 1974. A resurvey was made in May
1975 to check the reliability of the 1974 survey and to determine if two
majoi storms in the intervening 12 months had modified the channels9
The description of the morphology of tile channel at each survey point is
based on a classification of riffle zones. Three types of riffle zone
were defined and used as a basis for the channel description.
boulder steps, riffle steps and rock steps.
They were,
1. Boulder steps consist of a group of boulders arranged in a
straight or curved line across the channel (Fig. 80).
2. Riffle steps are a collection of larger than average sized
sediments which steepen the channel profile (Fig. 81 ) .
3. Rock steps are found where the channel is confined between bed
rock outcrops. In these regtons channel morphology is controlled
by geologic rather than hydraulic conditions (Fig. 82).

142
Although clear cut examples of theses types are frequently
are many variations In their form. Figs. 81 sho~il the subdivisions
the s types which were used as an ald to field identification.
classification was itself the subject
trials and 'practlce'surveysJ
'
s evolved from sever
actual field classification was rnaae sta during the ch<~
survey. (In less obvious conditions there was consulta ion between
man and surveyor). Survey points we e made every 1 m - 5 m along t
stream channe 1, factor that t surface water p
reco at these sites (e.g. s ~ :> s) and
diagrams and notes bed features were made. The boundaries
channel features were frequently indistinct and different observers cou d
identl different features.
and discernable to several observers.
vJere less clear.
it was found
During the trials to
although di rent
reaches boundaries were c
in less ordered
ve the system of class fica
rs en . ' l! to record
s
coincident bounderies, the overall patterns described ent a ses -
ments were comparable, when ave over several 1 hs of channel ,
Results
The long profile survey showed that the Torlesse stream channel consisted
of a series s and flatter The overall
centro 11 ed steps (masslve s s i 1 tsto1~e wh i out rop
and confine In some rger s up to 2 m d
appear to asimllarg control
Betvveen thes<:: c.ontro patterns were den I i wh
tentatively described as 1major 1 and 'minor'. The 'minor' patterns were
within the 'major' and were most commonly boulder s The 1
terns were n1c)st comrnonly ri le s $ or s
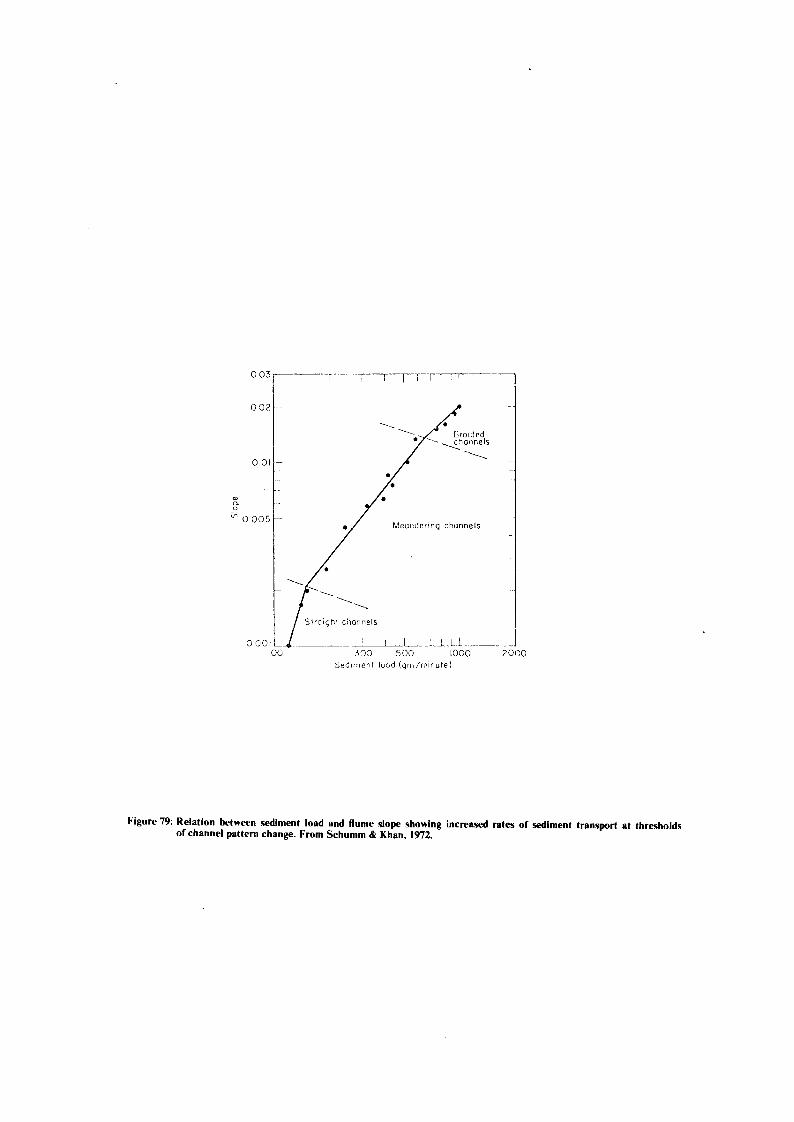
"' 0. 0
0.02 ..
0.01
iji 0 005-
1--
•
Meondenng channels
SirOighl channels
OOOIL.._ __ ·----~~-~~-L~I ----100 300 500 1000 20CO
Sed1menl lood (gm/mmule)
Figure 79: Relation between sediment load and flume slope showing increased rates of sediment transport at thresholds of channel pattern change. From Schumm & Khan, 1972.

Figure 80: Boulder steps. This channel rorm also includes broken boulder steps and boulder/ rock steps.
.. ..... ..

FiJ!I.Ire 81: Riffle sleps.

Figure 82: Rock ~lep~.
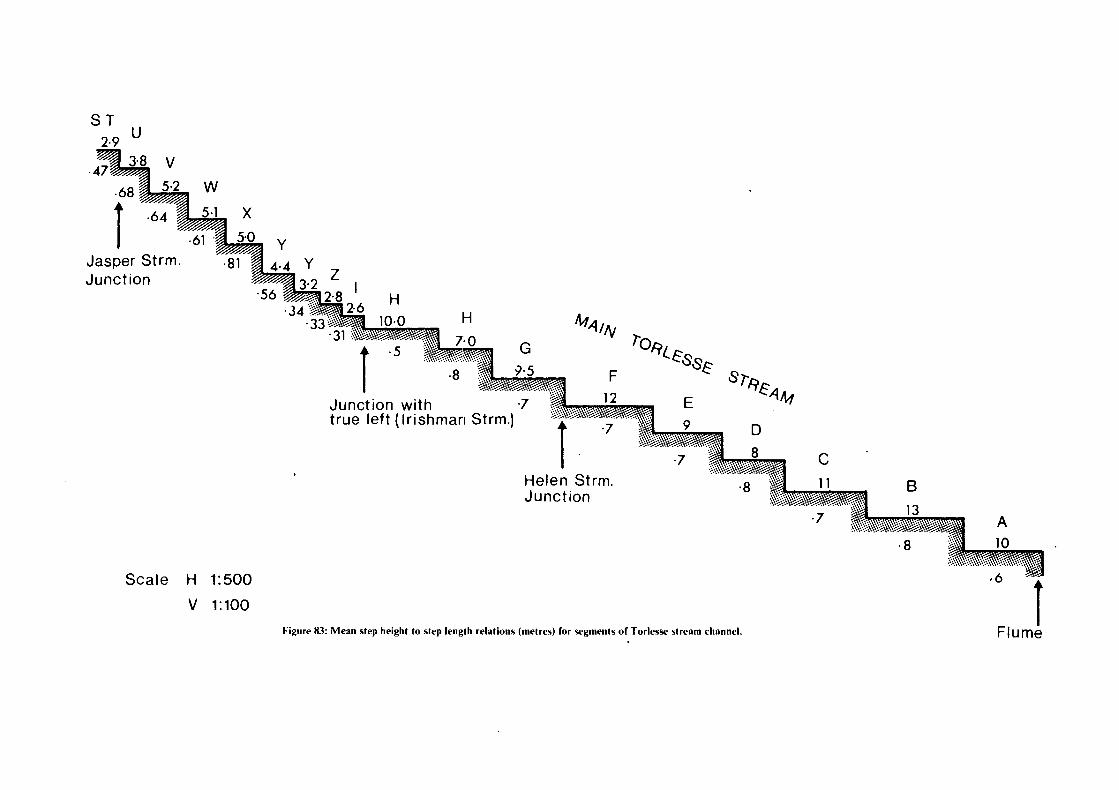
ST 2·9 u
-47~~
-68
l Jasper Strm. Junction
·81
Scale H 1:500
v 1:100
·56
y
·34 ·33
H H
·31 ·. G
Junction with ·7 12
true left {Irishman Strm.)
l Helen Strm. Junction
Figure 83: Mean step height to step length relations (metres) for segments of Torlesse stream channel. l
Flume

143
schematic presentation to show the manner in which the 'major' pattern
modifies channel grade, and the 'minor' pattern modifies the grade of the
'major' pattern. This 1major 1 and 'minor' pattern was found in the lower
channel below the Forks. The upper channels were characterised by a series
of minor patterns (boulder steps). Table23 summarises step height to step
length relations for the surveyed reaches of the Torlesse stream channel.
Figure 84 shows distance, height relations for the 1minor 1 pattern throughout
the Torlesse stream channel. The consistency of relations between step
helght and distance between steps is shown in Figures85 and 86.
The upper Torlesse channel above the Forks includes large boulders of up to
2m diameter and two segments of rock step. The channel gradient is very
steep (0.12- 0.16), but the well ordered boulder and rock steps have created
a stable channel. Throughout the study period there was no major source of
sediment to this reach. Channel morphology is assumed to be determined by
major floods of return period in excess of 50 years. Channel side slopes are
stable since flow rarely escapes from the ordered channel.
The Irishman stream from Rainbow gully down to Beech Falls shows a wide
variation in slope and channel form. There are no rock steps or large boulder
steps. The ch::mnel is composed of angular rock fragments (from Rainbow gul"iy)
and exhibits little order. The gradient is very steep (0.15) and is modified
only by unstable small rock steps. These break down in freshets and minor
floods and the channel adopts a debris-flow form.
The channel of the Irishman stream from Beech Falls to the Forks ls on or near
bed rock. The channel is ordered and consists of a 1major 1 pattern of boulder
steps (up to 1 m diameter) and rock steps. A minor pattern Is superimposed on
the major pattern. In storms in 1974 and 1975 at least four 'minor' boulder
steps were observed to break down and reform within a few metres.
The lower Torlesse channel between the Forks and the control section shows

TABLE 23
A summary of morphologic features of Torlesse stream channel.
Tributary Reach Code ~1ean step Mean step Mean BED ~~I DTHS Length Height Slope (m)
(v"ave 1 en 9th} (amp J i tude) ACTIVE Total Avai 1. (m) (m) Channel Bed
"""~"'·-~--=-·,_,_,.~,_...."-"'= __ ~"=--"'~· ~,._._,.,.,.,..,~. _,,,._,..,--=o""""""'"'~--=~=~"'"'''"''~--~. ~~~""""'""-~~. ~-~=-~'"'"''""~'~""'""~·'oo''"~"-""""'""""~·-·---~_.,....,.._. ___
minor tA,AJOR minor MAJOR (low flow)
r1a in True Right s ..... v 3.5 0.56 0. 160 0.8 ..... 3.5 5 - 16
Branch - Torlesse ~ .;:..
Stream X ..... 3.0 0.38 0. 123 0.6 ..... 2.5 10 ·- 30
True left Ql ~ Nl 1.8 0.27 0.] 51 0.5 _, 1.5 15 ~ 35
irishman's Creek N - 4.0 0.44 0. l 08 0.5 ..... 3.0 8 15
( Hl - F 10.2 15.9 0.69 1.06 0.067 1.2 ..... 2.5 20 -· 50 Main Torlesse ( Stream ( (be loh' Forks) ( D -+A 10.3 14.8 0.59 0.84 0.057 1.5 ..... 3.5 15 - 30

riffle step ~~ ~ iri'corporating boulder steps
figure 84: Pool riffle morphology of Torlesse stream channel.
boulder step
I

2 0 y = a + bx = 0 26 + 0·05x
r2 = 0·65 • • 1 5
• •
1 0 • •
0 • • • E
\ ~
0 ..c: 8 0> • Q)
..c: y = 0·26 + 0·05 2-os • •• r2 = 0·65 ~
Vl
c .& ~04 • :::<:
0 3
LEGEND
0 Upper Torlesse Strm.
0 2 0 Slug Creek
.& Irishman Strm
• Lower Torlesse Strm. (minor pattern)
• Lower Torlesse Strm. (major pattern)
0 2 4 6 8 10 12 14 15 18 Mean step length ( m)
Figure 85: Relations between step height and distance between steps. Torlesse stream catchment (semi-logarithmic plot).

10
9
8
7
g-s -U1
c 0 C1> ~
4
3
2
•
•
0 02 04 0 6
~OTE: Tht.• following sections ha,-e been deleted from these linear regressions:-Lower Torlesse CB (wide divide of channel, disordered reach)
DC (wide divide channel) llpper Torlesse YY' )
YZ )bed with 2 X --3 X greater than remainder of Upper Torlesse Zl ) stream channel
,._ .. '0 ... \yy1 ',,
\ ....
Upper Torlesse ' 0',
Channel 0 yz, "' ' • I
0 8 10 Slope
', Z I,/ _ ...
12 14
•
•
16 18 20
Figun• 86: Rdatinn"> bt•hH_"en lifcp hdght and ~ilopt>. Torlt>s.~· stream (:atchmcnt.

145
a full range of structures in both 'major' an~ 'minor' patterns. The
1major 1 pattern is determined by rock ste~ and riffle steps of boulders
of up to 2 m diameter. The 'minor' pattern of boulder steps is contained
within the 1major 1 pattern. Between 1974 and 1977 several minor steps
were observed to break down and release sediment to flood flows. The
largest boulders In these steps moved only a metre or so downstream to
become the basic elements about which new boulder steps formed.
Discussion
It is Important to appreciate that this classification of channel features
was chosen to describe a pattern which was observable in the stream
channel. If the river had been regarded as only a physical system, and
if sites for wholly objective measurement were selected in random fashion,
it is doubtful that the results presented here could be substantiated.
Schumm 1972 pointed out that to regard the river as a contemporary physi
cal system is to ignore its history. The character of any channel or
section of channel is a product of both its physical properties, and its
history. This method of description requires the observer to have an a
priori understanding of channel behaviour in order that sites mi t be
classified as outlined here.
Boulder steps were generally four1d on slopes greater than 0.05, vJhere a
straight or curved 1 ine of boulders extended across the stream channel.
The lip of this line forms a small waterfall which discharges Into a
downstream pool.
Riffle steps were found on slopes of less than O.Oi Whereas the boulder
ste~separate distinct pools, the riffle steps separate reaches of lower
velocity water and may contain boulder steps.
Between the first survey in 1974 and the resurvey in 1975 there were two
floods with return periods in the order of 2 - 5 years. The resurvey
showed that whereas the main channel structures were unaltered, the over-

I
146
all pattern was more clearly defined.
more ordered.
That is the channel had become
From this finding and from other observations made during the study pe i\i
it is suggested that the 'major' pattern is determined by large magnitude
low frequency floods with return periods in the order of 50- 100 years.
The 1minor 1 pattern (boulder steps) is gradually superimposed on the ~ajo
pattern by more frequent events (return periods of perhaps < 1 - 5 years
The 11 disordered 11 sections of stream channel are thought to be part
minor' pattern which is in a process of readjustment. It is suggested
that the Torlesse channel will always include segments of channel whi
are adjusting to changes in flow and sediment conditions. However,
overall the stability of the channel was found to be determined by
11 permanent 11 features such as rock steps and large boulders.
The channel is therefore regarded as a sluice for eroded debris ltJhich
moves dovms t ream to the Kowa i R l ve r.
Mackin (1948) described a graded stream as one:
11r~n which_, over a period of years" slope is delicately to pr'ovide, with available discharge and with px'evaiZing characteY'istics, just the veloc1: :eequ-irecl f01~ of load from the drainage basin ...
Its diagnostic char-acteristic is i;hat any change -in any of the controlling factm's w1:U cause a d-isplacement of equiliby•ivoill in a directlon that !Jill tend to absorb the
In v;hat he believed to be a more va id approach to 11 5 state 11 Hack
(1960) p the concept of "dynamic equilibrium11 in which:
11 w1: thin an tem l elements of aYe l y are down a t rate. The forms and processes are in a steady state of balance ... (thus) ... an al-luvial fan would be in dynamic equilibrium if the debY·is shed fr'om the behind it were depos1:ted on the at exactly the same rate as it was removed erosion
the surface of the fan itse
ckts amlc eq il ibr r a 1andsca e l ve
o to

147
The application of the graded river and dyn~mlc equilibrium concepts to
a high energy environment 1 ike the Torlesse system is open to geomorphic
debate. However it is clear from the description of the Torlesse stream
channel and its behaviour over the study period that they are more
appropriate to thic system than may be at first assumed from casual
observations of the depleted appearance of the catchment, and the 'boulder
strewn' stream channel.
During floods there were observable differences in flow conditions between
well ordered and poorly ordered segments of channel. In an attempt to
better describe these, a pygmy current meter vJas used to determine point
velocities through pool riffle segments of stream channel. These measure--
ments were found to be reliable at low flows in well ordered pools. At
low flows in poorly ordered reaches, and at higher flows when sediment
was being transported through well ordered reaches, the results were unre-
1 iable and sometimes confusing. Velocities at higher flows were estimated
using a velocity head rod. Fig. 87a shows velocities and Froude numbers
through a riffle and pool at a low flow of 0.350 m3 sec- 1 (Four to six
velocity estimates were made by pygmy meter at each section within the
riffle and pool). These estimates were made 0.04 m above the bed.
Fig. 87b shows velocities and Froude numbers through the same pool riffle
when the flow rate was 0.800 m3 sec- 1
Fig. 87 illustrates some interesting features of the energy status of
water flowing through this riffle and pool. At point A (the lip of the
upstream boulder step) stream energy is the sum of both potential and
kinetic energy. At point B (outlet of the pool) stream energy is kinetic
energy. Between these two points energy is dissipated by the friction of
turbulent mixing in the pool. That which is not dissipated in heat is
available to do work.
Fig. 87 shows that at the lower flow rate the energy available at point
A was 1,500 joules but the energy available at point B was only 100 joules.
That is, there was a 95% loss of energy due to turbulent mixing in the

148
pool. At a higher flow, energy available at point A was 10, joules
but the energy available at po[nt B was 800 joules. The loss due to
turbulent mixing was again 95%. Although the relative effectiveness o
the pool in dissipating energy was unimpaired lt is important to note
there was a 7 fold increase In the absolute amount of energy available
sediment transport and other work at point B.
The Froude number estimates indicate that at 0.300 m3sec- 1 , stream flow
through the upstream riffle is shooting, or supercritical. However a
the pool outlet flow is streaming or subcrltical. Altho this patte
is maintained at 0.800 m3sec- 1 the Froude number estimate of 0.9 at the
downstream end of the pool suggests that flow through the pool ls apo
ing supercritical. !t is thought that a relatively small increase
discharge under these conditions would result in shooting turbu ent fl
through both riffle and pool.
The data in Figs. 87 are presented as a tentative illustration t
significance of the pool riffle morphology in dissipating stream energy.
A number of factors I imit their reliability.
Although several low flow and higher flow estimates were made these are
the only two which can be compared. There are many difficulties assoc
ated with field measurements at higher flows. During storms it was not
possible to service the sediment trap survey the pool riffle mo
and monitor stream flows at the same time. Although a number of veloc
and depth estimates \Here made at higher flows, all but those presented in
Fig. 87 could not be compared with prestorm conditions because of signi i-
cant alterations to the pool and riffle zone. Further, it Is dlfficu t
to obt in reliable estimates of veloc using a veloci he a . . roo ~
flows. The flood flow estimates therefore include errors which are un-
known but presumed to be large.
Despite these and other 1 imitations th s example indicates he importance
logv as one sm

8
8
Stream energy kinetic energy mv 2
Low f 1 ov.1 When Q
v D F
Then E
0.350 0.78 m 0. 18 m 0.6
2
106 joules
A
A
Stream energy Kinetic Energy + Potential Energy mv 2 + m.g.z.
Low flood When Q
v D z F
Then E
E
0.350 1. 6 m 0. 12 m 0.30 m 1 • 5
2
3 - 1 m sec sec- 1
1,480 joules
Energy dissipation in pool = 93%
Minor flood flm< Minor flood flow When Q 0.800 m3 sec- 1 When Q 0.800 m3sec- 1
V 1.40 m sec- 1 V 4.40 m sec- 1
D 0.25 0 0.20 F 0.9 z 0. 35
F 3. 1
Then E 784 joules Then E 10,490 joules
Energy dissipation in pool = 93%
Legend: Q v D z m g E
· f 1 Ov< velocity depth height above pool surface mass gravitational constant total stream energy
Fi2ure 87: Ener2._v estimates in a pool and riffle in both low How and minor Hood How.
F Froude number v

50
L.O N
I
0
X
"' 30 u <I! Ill
E
>---'() 20 0
<I! >
5 10 15 25 Discharge m3 sec -1 x 10 -4
Proportion of pool filled with gravel
Figure 88: Mean velocities through a laboratory model of a pool riffle channel. (Ref. Appendix II Part C)

3000
M
~1000 X
1/l Ol '-
LLJ
500
100
Pools full with gravel
Pools 1tL. full of gravel
0 ·5 1· 0 1· 5 2. 5 Discharge cc sec-1 x10³
(non -linear)
Figure 89: Kinetic energy of stream How in a laboratory model of a pool riffle channel. (Ref. Appendix II Part C)

149
The 0.30 m boulder step Illustrated in Fig, 87 a and b is a
substantial channel feature. Most other steps are Jess substantial and
their pools 1 are submerged' by either higher stream flow rates or
sediment waves.
Observations during sto.rms indicated that although minor pools would
become submerged by higher flow rates their effectiveness in dissipating
stream energy was more seriously impaired when they were filled with
gravel. Because of the difficulties of field measurement, this
observation was tested In a laboratory flume (see Appendix i 1). Fig. 88
has been extracted from data presented In Appendix I I and shows that in
a laboratory pool-riffle model, mean velocity through the test reach
increased with increasing discharge. However when the pools were filled
with gravel to simulate a gravel wave which would prevent turbulent mixing
in the pools, there was up to a four fold increase in mean velocity.
As kinetic energy Increases with the square of the velocity, the
significance of these velocity increases is more apparent ln Fig. 89 in
which the kinetic energy of stream flow is plotted for flows of the
same discharge with and without gravel filling the pools. Fig. 89 shows
up to a 20 fold increase In the capacity of the stream to do work because
gravel has filled the pools.
This laboratory study gives support to the field observations which sug
gest that the effectiveness of a pool riffle morphology to dissipate
stream energy is markedly impaired when gravels fill pools and prevent
energy dissipation by turbulent mixing. It further aids In our under
standing of why it Is that this normally stable channel can, in major
storms events, transport large quantities of sediment through it, in
comparatively short periods of time.
These findings have considerable significance to stream channel management
but this wi 11 only be briefly noted here.
Figures85 and 86 show that in the absence of artificial structures stream

150
flows and channel debris interact to form a discernable and repeatabl
channel pattern. Any modification to the channel (such as darn
construction, log jams etc.) can be d to set up new hydraulic
conditions which may induce a new channel pattern. For e;<amp l e
debris dam is a major channel structure and if not sited with respect
the existing channel pattern it may set up downstream adjustments
negate the benefits of the structure.
I • v1n!
A comparison of the upper Irishman stream and the upper Torlesse stream
(true right) suggests that afforestation of the Irishman channel would
be more significant in terms of inducing channel and riparian land sta
I ity than would comparable treatment the upper Torlesse channel.
Because the upper Torlesse channel contains a diversity of s iment sizes
it has formed an ordered and stable channel. In contrast the Irishman
stream channel includes few large roughness elements, is poor y ordered
and unstable. Perhaps the greatest influence of a restation in such
a catchment would be the formation of steps by logs which fell across
the channe 1 . Where these were effective in ucing flow energy, the
would be greater stability of both channel and adjacent riparian and
It has been found that stream energies increase sharply when graves
pools and thereby eliminate the opportunity for energy dissipation
turbulent mixing in pools. This finding has significance for those
management practices which aim to prevent, or may cause. slooe it
to col lapse into a stream channel. ! n Chapter ] 2 l t lrJas s a
sudden i lux of sediment moves do"':nstreamas a 1wave'. .1\s this 'vva
moves through each segment of stream channel, flow energies may in
sharply~ When the stream is raised out of its normal channel an
access to unconso dated riparian lands or ripa 1a posits <.1
of this increased energy is expended in the entrainment and transport of
additional rip21rlan sed rnents. Land rna r soil conservation
gives emphasis to the retention of so slope depos ts on site. One
important reason in some moun ain cat r th l p
tenance of stream c
tabi

151
REFERENCES

152
REFERENCES
Aldridge, R., 1975: The resultant direction and inclination Taita experimental station. New land. Journal of (N.Z.) 14(1): 42-54. -
Aldridge, R.; Jackson, R.J.; 1968. Interception of rain II manuka (Leptospermum scoparicwn) at Taita, New Zealand. N.Z. J"ourna l of Science 11: 30] -- J 7.
Allis, J.A., Harris, B., Sharp, A.L, 1963: /\comparison '1" five ra!n gauge installations . • Journal of as: 3-4730.
American Soci of Civil Engineers, 1969: S !mentation engineering C V. Economic aspects of sedimentation. Jourrwl D1:v-is-ion~ P:r_,oaeedings Ame:r_•ican Civi Z 191-207.
American Society of Civil Engineers (Committee on Sedlmentatl , 197 Sediment transportation mechanics .) s lment discharge formulas. Journal of HydrauUcs Society of Civ·H Eng-ineers HY1:
Anderson, H.W., 1975: The hydrologic managing water resources. International Water Resources 61-
World De h ,
Andrews, P.B.; 1974. Deltaic Sediments, Upper Triassic Torlesse Super-·
Anon.
Anon.
Anon.
{-\non.
Anon.
group, Brokem Rfver, North Canterbury. N,Z. Geology and Geophysics 17 ): 881
1961. Objectives of the Tussock Grasslands and Mountain Lands institute. Tussock Mounta'in Review. No. 1. p.S.
1964. Land capability cl~ssifications explained. Gr•ass lands and tute
New Zealandts programme for the decade. logy ( N. ZJ 4 ) :
1969. New Zealand experimental basins. (N.Z.) 8(2): 98-106.
Tusr:wek 6': l1-
1973. Table I (p.18) Summary of retirement of grazing lands in the South Island High Country "Proceedings of a meeting on future use lands retired from grazing November, 19 Pub1lshed Soi Conse vat on and Ri rs uncl

!53
Archer, A.C.; 1969. The influence of aspect upon the alpine and subalpfne ecosystems in the Twin Stream catchment of the eastern Ben Ohau Range. Watershed Management : Part 1 of the Proceedings of a Symposium on Watershed Management in Water Resources Development. Lincoln Papers in Water Resources 8: 82-96.
Archer, A.C. Studies of snow characteristics 1n the N.E. Ben Ohau Mou: cains, New Zealand. Journal ofHydrology (N.Z.) ,9(1): 4-21.
Ash ida, K., Takahashi, T., Sawada, T., 1974: Runoff process sediment yield and transport in a mountain watershed. Kyoto University Disaster Prevention Research Institute, Annual report No.17B. (in Japanese)
Bagnold, R.A., 1966: An approach to sediment transport problems from general physics. U.S. Geologlcal Survey Professional Paper_, 422 I: 37 RJ·
Baldwin, R.D.; 1972. Rock debris slopes, Canterbury University,
Unpublished M .. A .. Thesis
Barker, A.P.; 1953. An ecological study of tussock grassland, Hunter Hi 11 s, South Canterbury. N. Z. Department of Scientific and Industrial Research, Bull. 107,
Barnes, B.S., 1939: Structure of discharge recession curves. Transactions American Geophysical Union 20: 721-725.
Barnes, K.K., Frevert, R.K., 1954: A runoff sampler for large watersheds. Agricultural Engineering 35: 84-90.
Bates, C.J.; Henry, A,J.; J928. Forest and Streamflow experiment at Wagon Wheel Gap, Colorado. Final report on completion of the second phase of the experiment. U.S. Monthly Tleather Review. Supplement 30. 79 pp.
Baver, L.D.; 1937. Rainfall characteristics of Missouri in relation to runoff and erosion. Proceedings of Soil Science ,CJociety of America. 11: 533-536.
Bennett, H.H.; 1933. The quantitative study of erosion technique and some preliminary results. Geographical Review. 23: 423-432.
Bennett, H.H.; Chapline, W.R.; 1928. Soil Erosion a national menace. United States Department of Agriculture Circular No. 33. 36 pp.
Blair, J.R.; 1972. The influence of variations in lithology and structure in the Torlesse Supergroup upon erosion processes in Blackley Stream catchment Torlesse Range, Canterbury, New Zealand. Unpublished IL Sc. Thesis, Canterbury University Library.

154
Blake, G- J. ; 1 t'1eas.urernent of
B 1 en , T. , 1 9 57 : ime behaviour
nterc.eption . z ) 4
ca l s
1 oss i i 87 .
rive P
Boughton, ;vLC.; 1968. Hydrological studies of changes in nd Water·4(3): J9-23.
Boyer, M.C., 1964: Stream flow measurement , V.T. Ch01r1. 15-1-15-
book
Bradshaw, J.D.; 1972. Stratigraphy and str ure of the rlesse group riassic- Jurassic) in the foot il so he Alps near Harwarden, Canterbury. N.Z. ,Journcd Ceo Geophysics 15(1): 71
Branson, F.A. G!f rd, Amer i Soc
pp.
and Range
British Standa Institute, 1964: measurement quid fl In open channels. Part 2. 0
ectlon. British Standard Methods. 2a Constant
Part 2a.
Brougham, G.G.; 1978. 2000 11 •
North.
"The South Eastern RtJahine pub l shed by lianawatu
Brmvnt H.E., en, E.A., Champagne, .E., 1 total sediment yield from small waters s. Research 6
Bruce, J.P.~ Clark, R.H. 1966: 11 1nt to Pergammon Press. 319 pp.
Bur s, E~Re, H fp S~P .. , Hicks ~t.,},
explorat on in waters stud Cons ervat·ion 2 0: 7 ,
Burton, J.R.; The sensitiv changes in land use.
of stream flow cha
Butterfield,
the Proceedings Water Resources Resources 8:
\late- rs of a lum Development~
on \~ate rs
Thc:c s.usceptibi of h 1
wIn ~. Pr'oc. N. Z, Assoe, on Catch;nent Massey Um:vers1~ty; 329-3115.
Ca1 e:1t''er, r Channels. of

!55
Campbell, D.A.; 1945, 11fra.m Forest to Farmland" Rivers Control Council, Wellington.
Soil Cotiservation and Bulletin No. 3.
Campbell, D.A.; (undated). "Fire! Public Enemy l~o. 1''. Soil Conser-vatfon and Rivers Control Council. Bulletin No. 7.
Chinn, T.J.H.; 1969. Snow survey techniques in the Waitaki Catchment, South Canterbury., Journal of Hydrology (N,Z.) 8(2): 68~]?. .
Chinn, T,J.; Bellamy, R.J.; J970. Annual Hydrological Research Report No, l. for Ivory Glacier.. For the period ended 31st December, 1969. Ministry of Works and Development, Wellington.
Church, M., Kellerhals, R., 1970: Stream gauging techniques for remote areas using portable equipment. Canadian Department of Energy, Mines and Resources, Inland Waters Branch, Technical Bulletin No. 25. 90 pp.
Committee of Inquiry.; 1939. Maintenance of Vegetative Cover in New Zealand, with special reference to land erosia.n. Department of Scientific & Industrial Research Bulletin 7?: 53 pp.
Corbell, J., 1964: L'erosion terrestre etude quantitative (Metha.des -techniques- resultats). Annals de Geographic 73: 385-412. (Quoted by Gregory & Walling, 1973)
Costin, A.B. ; 1962. Some impressions of a visit to parts of the South Island. Tussock Grasslands & Mountain Lands Inst . Special publication No. 2: 14 pp.
Coulter, J.D.; 1964. The climate of New Zealand in relation to agriculture. New Zealand Meteorological service Technical Note No. 158. (Ministry of Transport, New Zealand).
Coulter, J.D.; 1967. i·1ountain c~ imat0. Proceedings N.Z. EcoZogicaZ Soc-iety 14: 40-57.
Crawford, N.H., Linsley, R.K., 1966: Digital simulation in hydrology, Stamford Watershed Model IV. Technical report No. 39, Department a.f Civil Engineering, Stanfa.rd University.
Cuff, J.R.I.; 1974. "Erosia.n i.n the upper Opihi catchment". South Canterbury Catchment Board publ icatia.n, No. 6.
Cuff, J. R. I . ; 1977. "A description of the upper Ashbu rton catchment with emphasis on land use capability and sources of detritus:. South Canterbury Catchment Board publication No. 15. 154 p. plus maps.
Cuff, J.R. I., 1977: The possible influence a.f vegetatia.n on water yields. Soil and Water 13(4): 12-13, 30.

156
Cutler, E.J.B.; 1962. Stability of s Zeal and. International l ,!<
Joint Meeting of Commissioners IV & V. 1.962.·
Da Chuna, L.V., 1968: The calculation s iment discharge directional channel flovJs, Formento 6 ) Portugese)
Dee, R.F., Box, T.W., Robertson, E., 1966: influence water intake of Pullman silty clay loam. 19: 79.
Dick, R.D. and Staff (Personal communication). 11 Conserva ion r p No. 9l+ Brooksda fe s"tat i on 11 ~--- North Canterbury Catchrnen Board unpublished report.
Dreaver, K.R., Hutchinson, P., 1974: Random and systematic errors precipitation at an exposed site. ,Jour~nal of 13(1): 54-
Duley, F.L.; 1952. Relationship between surface cover and water runoff, and soil losses. Proceedings of the Grasslands Congress 6: 9lJ2-946.
Duley, F.L.; Ackerman, F.G.; 1931~. different lengths. 48: 505·-SJO.
Run and erosion from Jo&~nal Agricultural
Dunbar, G.A,; 1970, Fertilisers Grasses and clover for hi revegetation. Tussock Gr•ass & Mountain Rev,iew 18; i 6.,-2J,
Dunbar, G.A.; J97l. The effectiveness of some herbaceous species
,.7 ~
$ 'l; ;'I ./
montane and subalpine Ecological Society 18: I1
ati.on. z.
Dunne, T,; Black, R.D.; 1970. An experimental production in permeable soils~ 6(2): 48]~490.
i.nvest gation Water Resoupces
Dunne, T.; Moore, T.R.; Taylor, C.H.; 1975. Recognition and of runoff-producing zones in humid regions, Sciences BuUeh:n XX (3); -327.
Ellison, L.; 1957. Observations on erosion in relation to grazing i high country of the South sland of New Zea and. n uo-1 ished report,
Emmett, W.W., 1976: Bed load transport in two large gravel-bed rive Idaho Washington. P ngs the Third Federal Inter-Agency Sedimentation
1jq.'
Fahey, B.D .. ; 1 Th 11 and of Radiata pine. ,JOUi'iial
~ Der1ver ~ Co 1
nf Z~) ~1(.l):
I' d

!57
Fainestock, R.K., 1963: Morphology and hydrology of a glacial stream -White River, Mount Rainier, \.Jashington. Geological Bur•vey Professional Paper 422A=70 pp.
Federal Inter-agency River Basin Committee, Sub-committee on Sedimentation, 1948: Measurement of sediment discharge of streams, Report No. 8. Measurement and analysis of sediment loads of streams. U.S. Corps of Engineers, St. Paul, Hydraulic laboratory, University of Iowa, Armes, , owa.
Ferguson, H.L. 1 1972: Precipitation network design for large maintenance areas. In Distribution of precipitation in mountainous areas. WMO/OMH No. 326, Vol. 1. 85~103. World Meteorological Organisation.
Finkelstein, J., 1972: Driving rain indices in New Zealand. N.Z. Meteorological service, Technical Note 210.
Fitzgerald, P.D., Cassens, G.G., Rickard, D.S., 1971: Infiltration and soil physical properties. Journal of Hydrology (N,Z.): 120-126.
Forlsing, C,L.; 1931. A study of the influence of herbaceous plant cover on surface run-off and soil erosion in relation to grazing on the Wasatch Plateau in Utah. United Btates Department of Agriculture Technical BuUetin No. 220. 71 pp.
Fournier, F., 1960: 11 Climat et ~rosion: 1a relation entre l'erosion du sol par 1 1 eau les precipitations atmospheriques 11 • Paris. 210 pp. (Quoted by Gregory & Walling, 1973)
Freeze, R.A., 1972: Role of subsurface flow in generating surface runoff, 2. Upstream source areas. Water Resources Research 8(5): 1272-1285.
Geib, H.V., 1933: A new type of installation for measuring soil and water losses from control plots. Journal American Bociety of Agronomy 24: 429-440.
Gibbs, M.S.; Raeside, J.D.; Dixon, J.K.; Metson, A,J.; 1945. erosion in the high country of South tsland. Department of Bcientific & Industrial Research 92: ]2 pp.
Soi 1 N. Z. Bulletin
Gifford, G.F., 1972: infiltration rate and sediment production trends on a plowed big sage brush site. Journal of Range Management 25: 53-55.
Gi 11 ies, A.J.; 3964. Review of snow survey methods, and snow surveys in the Fraser Catchment, Central Otago. Journal of Hydrology (N.Z.) 3(1): 3-16.
Gillingham, A.G. 11A study of infiltration properties of a steepland and yellow-brown earth under diverse conditions of vegetation at Porters Pass 11 • M.Agr.Sci. Thesis, University of Canterbury, Lincoln College.

158
Glacken, C.J.; 1958. Origins of the conservation ii College Rural Education Bulletin 13 (5):
Govinda, N.S .• Rajaratnam, N., 1963: submerged of Hydraulics DivisionJ Proceedings American Eng-Z:neers HY.1: 139-162.
Gradwell, tvl.W.; 1955. Soil frost studies at a high country Part 2: New Zealand Journal of Science & 267-275.
J
Gradwell, .M.W,; 1957. Patterned ground at a high country station.. JVe1,J Zealand JoUPnal of' Science & 'l'echnoZogy B 88;
Gradwell, .M.W.; 1960., Soil frost action in tussock grasslands. New Zealand Journal of Science 3: 580~590.
Gradwell, M.W.; J~ckson, R.J.; 19]0. Proceedings Jllew Zea Lincoln College Press,
Soil moisture fn New Water Conference: 6. 1
Graf, \.J.H., 1971: "Hydraulics of sediment transport 11 • Nev·J Yo k.
Grant, P.J,; 1966. Variations of rainfall frequency in re erosion in eastern ~1awke's Bay. Journal of
Z.) 5(2); 73~86.
Grant, P,J.; l969a .. Rainfall patterns on the Kaweka Range, oj'Hydrology (N,Z.) 8(1): 17-34.
Grant, P.J,; 1969b. Some influences of rainfall on stream flow a management. Watershed Management ; Part J ings of a Symposium on Watershed Hanagement i Resources Deve 1 opmen t. Linea ln Paper's 8; J28~15l.
Greenall, A. F.; Ham[] ton, D.; 1954. Soi I conservation survey5 Zealand. lV.Z. Journal & 505-517.
Greenland, D.E.; 1969. Solar radiation studies at Cass i Alps. Section 21, 41st ress /\. Z. Australia: 18-22. (cyclostyled).
Greenland, D.E., Owens, I .F., 1967: An analysis of moisture characteristics in t Va Hydrology (N.Z.) 6(2): 80-88.
Gregory, K.J., Walling, D.E., 1973: Ora nage basin form Wiley. 456 pp.
Grindley, G.W.; Harrington, 1-l.J.; v!ood, ILL.; l96L New Zealand l : 2,000, N.Z. Geo 66: ]]] p.
oces s. John

!59
Hack, J.T., 1960: Interpretation of erosional topography on humid regions. American Journal. of Sa1:enae (Bradl-ey Vo Z.wne) 258A: 80-97.
Hamilton, E.L., 1954: Rainfall sampling on rugged terrain. U.S. Department of Agricul-ture~ Technical Bul-letin 1096: 41 pp.
Hamilton, E.L., Reiman, L.F., 1958: Simplified method of sampling rainfall on the San Deinas Experimental Forest. Technical paper No. 26, Californ'a Forest and Range Experiment Station, Forest Service, U.S. Department of Agriculture. 8 pp.
Harr, R.D.; Harper, W,C.; Krygier, J.T.; Msieh, F.S.; 1975. Changes in storm hydrographs after road building and clear cutting in the Oregon Coast Range, Water Resources Research .11(3): 436~444 ..
Harr, D.R., 1976: Hydrology of small forest streams in Western Oregon. U.S. Department of Agriculture Forest Service, general technical report, PNW 55. 15 pp.
Harvey, M.D., 1974: Soil studies in a high country catchment, Paddle Creek, South Canterbury. Unpublished M.Agr.Sci. Thesis, Lincoln College Library. 126-134.
Haupt, H.F., 1967: Infiltration, overland flow and soil movement on frozen and snow covered plots. Water Resources Research 3: 145-161.
Hayward, J.A.; 1967. The Waimakariri Catchment. Tussock Grasslands & Mountain Lands Inst. Special. publication No. 5: Lincoln College Press. 288 p.
Hayward, J.A.; 1969. The use of fractional acre plots to predict soil loss from a mountain catchment. Lincoln Paper's in Water' Resources ?: 9) pp. Lincoln Col lege Press.
Hayward, J.A.~ Sutherland, A.J., 1974: The Torlesse stream vortex tube sediment trap. Journal~ of Hydrology (N.Z.) 13(1): 41-53.
Heady, H. F.; 1967. Comments on the condition and management of Mountain lands in the South Island of New Zealand. A report sub-mitted to the Director, Forest & Range Experimental Station, N.Z. Forest Service, Rangiora; New Zealand.
Heede, B. H., 1972: Influences of a forest on the hydrau1 ic geometry of two mountain streams. Water Resources Bulletin 8: 523-530.
Heede, B.H., 1974: Velocity head rod and current meter use in boulder-strewn mountain streams. U.S. Department of Agriculture Forest Service Research note RM 271. 4 pp.
Helley, E.J., Smith, W., 1971: Development and calibration of a PressureDifference bed load sampler. U.S. Department interior Geologic Survey Water Resource Division. Open file report, M~nlo Park, California. 18 pp.

160
Herbertson, J.G., !\critical review convent! al bed : Journal of Hydx'oZogy 8: 1
Hewlett, J.D., 1961: Soil moisture as a source of base flow mountain watersheds. South eastern t
Forest Service Station Paper 1 11 pp.
Hewlett, J.D.; Helvey, J,D.; J9]0, the storm hydrograph.
Effects of t Water Resources
Hewlett, J.D.; Hibbert, A.R.; 1967. tors affecting the response small watersheds to precipitation in humid areas, 11 P'orest Hydroiogy'', Eds .. \J.K. rand ~U·L H L 290. Pergamon Press .•
Hewlett, J.D. i lull, H.W.; Reinhart, I(.G.; !n defence of mental vJatersheds. W~ter Resources Research .5:
expe
Hewlett, J.D., Nutter& W,L., 1969: outline of forest ro 1 Clgy"' University of Georgia Press. p.
Hibbert, A.R., 1965: Forest treatment effects on water yield. In 1
Hydrology" (Eds. VI.E. Soppe.r, H.W. lull). Pres p. 527-5!13.
Holeman, J.N., 1968: The iment yle d or r vers of the war Water Resouraes Resear•ch 4: 73
Holgate, G.L. (pe1"BonaZ (JOm:rrrunicati.onJ: Plant atlve sites n the Torlesse Stream ca
Holloway, J.T.; 1954. Forests and climate i the South Is an of Zealand. Transactions of the Royal 82(2); 329-410.
Holloway, J.T., 1969: The role of Protection Forestry Branch, Research Institute, In the Hi Country. Mounta1:n Lands Institute 16: 3
Holloway, J.T.; 19]0. Control of erosion on class VII I ev"lluation of a research po cy. Tussock Moun tm:n Lands Ins Review 18:
Ne1iJ
Horton, R. E. ; 1938. An interpretation and appl [cation of runoff plot experiments with reference to soil erosion problems.
d . • S' ' ' f C" 'J C • '7. ?L!n~-J/ 1 0 Proceec.?.-ngs Amer?.-can I OC1.e·ty 0 u01/ v uC?.-ence. t). .) '.. · . .:;.
Horton, R,E., 1939: Analysis ot experiments with tration capaci
7

Horton, R.E .• 1 An a tration capacity. America 5: 399-417.
ic.:d in retat!on of infi 1-of the Soil Science Society of
Horton, J.S.$ Campbell, C.J.; 1974: Management of phreatophyte and riparian ion maximum multiple use values. U.S. Department
Agriculture t Service Research Paper RM '1'17. 23pp.
Hubbell, D.\1-1,~ 1 Geolog-~eal
techniques measuring bed load. U.S. Z-y Papev 1748.
Hutchinson, P.; 1 Estimation of rainfail in sparsely gauged areas. Hydvo logy XIJ/3 Internat'[onal of
Annee.. No. 1 : J o 1 - l 1 9 .
Inter-agency Committee on \;,later Resources, 1 Measurement and analysis of s lment 1 s In streams. rt No. 14. Determination of fluvial discharge. Publ s by St. Anthony Falls Hydraulic Laboratory, M i s. 151 PI'·
Jackson, R. J. ; 1966. S istics.
Jackson~ R.J., A1d ge, R, 9 1 tal sta ion, New Zea
reiation to rainfall and soil characterof Hydrology (N.Z.) 5(2): 45~53.
Rainfall measurements at Taita experimen-1 - Vertical ra i ngauges. Jowmal
Hydrol-ogy ) 11 (1): llf.
Jackson R.J. 1 A rl tal station; Net.v pluviometers.
Jackson~ R.J., Aldrl (~!e-i'YI.Jnannia Science 16:
Jarecki, W., 19 A Morskl e j Pol
Rainfall measurements at Taita experimen-2- Tilted ralngauges and vecto
Hydrology (N.Z.) 11(1): 15-39.
Interception of rainfall by Kamahi a Talta, New Zealand. N.Z. Jozn?nal of
Rumowski). Wyda wriictwo Waling, 1973)
Johnson, F.A.; 970. iment movement 1n a smai 1 mountain stream. N.Z. rest Service Research Institute, Protection Forestry
Branch, Report No, 86.· (unpublished).
Jones, A,, '1971: Soil pl Researeh ?(3);
stream channel initiation. Water Resourc:es
Jones, !,E.; 1968. radation of the \Jaipoua River. 5(5); 16.
Soil Water
Ke 1 I e r , H . t1 • Personal Communication.
i<.e 1 e r , H . M . ; 964. Interception loss in a mountain beech stand. (type-script). N.Z. Forest Service, Forest Research Institute, Protection Forestry Branch.

162
Ke11erha11s, R., 1966: Stable channels with gravel-paved beds. American Society Civil Engineers, Water Resources Conference, Denver, Colorado: Conference reprint No. 330.
Kellerhalls, R.; 1967. Stable channels with gravel-paved beds. American Society of Civil Engineers. Journal of the vlaterways and Harbours Division 43: (W.WI.) 63~84,
Kel1erha1s, R., 1972: Hydraulic performance of steep natural channels in Slaymaker, H.O., Macpherson, H.J. (Ed) ''Mountain Geomorphology, geomorphological processes in the Canadian Cordiilera' 1 • British Columbia Geographical series No. 14, Vancouver, Canada. p. 229-233.
Kingan, H. Personal Communication.
Kittredge, J.; 1954. lnfluences of pine and grass on surface runoff and erosion, Journal S01:z & Water Conservation 9: 179.,.185, 193.
Klingerman, P.C. t Milhous, R.T., 1970: Oak creek vortex bed-load sampler. Paper delivered to American Geophysical Union, Puget Sound, Tacoma, Washington, October, 1970.
Kurtyka, J.C., 1953: Precipitation measurements study, Illinois State Water Survey, report of Investigation 20 Urbana, Illinois (quoted by Bruce, J.P., Clark, R.H., 1966). p. 68.
Langbein, W.B., Schumm, S.A., 1958: Yield of sediment in relation to mean annual precipitation. Transactions Amer-[can GeophysicaL Union 39: 1076-1084.
Leaf, C. F., 1966: Sediment yields from high mountain watersheds in Colorado. U.S. Forest Service Research Paper RM 23. 15 pp.
Leamy, H.L.; 1971.· Some characteristics of the upland and High Country yellow brown earths. N.Z. JournaL of Science 14(4): 1057-1081.
Leopold, L.B., Emmett, W.W., 1976: Bed load measurements, East Fork River, Wyoming. Proceedings National Academy of Sciences {U.S.) 73(4). 1000-1004.
Leopold, L.B.; Maddock, T.; 1954. 11The flood control controversy". Ronald Press.
Leopold, L.B., Wolman, M.G., 1957: River channel patterns: Braided Meandering and Straight. Geological Survey Professional paper, 282·-B. 283-300.
Leopold, L.B., Wolman, M.G., Miller, J.P., 1964: 11 Fluvial processes in geomorphology11 • Freeman. 522 pp.
Linsley, R.K., Kohler, ~~.A., Paulhus, J.L., 1949: 11App1ied Hydrology". McGraw-Hill. 400 pp.
Love, M.R.; 1957. Some thoughts on plant ecological research and its relation to the solution of tussock problems. N.Z. Science J'uly/Aug.; 51-::;4.

163
Lowdermilk, W.C,; 1935. Certain aspects of the role of vegetation in
Mackin,
erosion cont ro 1 • the Modern Era in Botanical 1: 12.~-1)2_,
J.H., 1948: Concept of the graded Society of Amer~ca 59: 463-512.
eommemor>ating Si.r. Decades of Seicmce. Uowa State CoUegeJ
river. Bullet-in of the Geolo:r:cal
Maddock, T., Borland, W.M., 1951: Sedimentation studies for the planning of reservoirs by the Bureau of Reclamation Transactions 4th Congress on large dams, New Delhi Lf, 103-118.
Main, L.; 1975. The geology of the Torlesse Stream Catchment, Canterbury. Unpublished B.Sc. Hons. Thesis, Geology Department, Canterbury University.
Marden, ,''L; 1976. Late Pleistocence geology of the Kowal river valley, Mfd Canterbury. Unpublished M.Sc. Thesis, Canterbury University Library.
Mark, A. F.; 1965. Central Otago : vegetation and mountain climate. Central Otago; special publication of the N.Z. Geographieal Society:> Special PublicaHon., MiscelLaneous Serie.c;_, No. 5: 69-9 J ,
Mark, A.F.; Rowley, A,J.; l969. Hydrological effects in the first two years following modification of snow tussock grassland. Watershed Management : Part 1 of the Proceedings of a Symposium on Watershed Management in Water Resources Development. Lincoln Papers in Water Res'ources 8: 188-202.
Martin, G.N., 1973: Characterisation of simple exponential base flow recessions. Jou~nal of Hydrology (N.Z.) 12: 57-62.
McCaskill, L.W., 1973. 274 pp. Reed, Wellington.
McKay, G.A., 1964: Meteorological measurements watershed research in Proceedings of rology Symposium No. 4 National Research Council of Canada, Subcommittee on Hydrology. 185-205.
McPherson, H.J., 1971: Disso1ved 9 suspended and bed load movement patterns in Two o 1 clock Creek, Rocky Mountains~ Canada, Summer 1969. Journal of Hydrology 12: 84-96.
McSweeney, G.D., pel"SonaZ corr,rmmication: Plant communities of the Torlesse Stream catchment.
Meeuwig, R.O., 1970: Infiltration and soil erosion as influenced by vegetation and so i1 in Northern Utah. Journal o.f Range Management
Megahan,
23: 185-188.
W.F.; 1973: Role of bedrock in watersheJ management. Proceedings the Irrigation and Drainage Division, American Society of Civil
Engineers Speciality Conference, Fort Collins Colorado 1973. 449-470.

164
Milhouse, R.T., Kl ingeman, P.C., 1971: Bed load transport in mountain streams. American Society Civil Engineers Hydraulics Division Speciality Conference, University of Iowa, Iowa, August 1971. 16pp.
Molchanov, A.A., 1960: ''The hydrological role of forests". Academy of Sciences of the U.S.S.R. Institute of Forestry. Translated from Russian by the Israel Program for Scientific Translations, Jerusalem 1963. 320-323.
Molloy, B.P.J.; 1962. Recent changes in mountain vegetation and effects on prof i 1 e stab i 1 i ty. Proceedings N. Z. Society So-il Science 5: 22~26.
Molloy, B.P.J.; 1964. Soil genesis and plant succession in the subalpine and alpine zones of Torless Range, Canterbury, ilew Zealand. Part 2. Distribution characteristics and genesis of soils. N.Z. Journal of Botany 2: 143-176.
Morris, J.Y.; 1965. Climate investigations in the Crai9eburn Range, New Zealand. N.Z. Journal of Science 8(4): 556-582. ·
Morris, J.Y.; O'Loughlin, C.L,; 1965. Snow investigations in the Craige-burn Range. Journal of Hydrology (N.Z.) 4(1): 2-16.
Mosley, M.P., 1977: South Eastern Ruahine Investigation Report on Erosion and Sedimentation, Manawatu Catchment Board, Palmerston North. 105 pp. plus appendices.
Musgrav~, G,W.; 1947. The quantitative evaluation of factors in water erosion- a first Clpproximation. Journal Soil & Water Conservation 2; JJJ-138,
M G W H lt n H N 1~964· lnfil.tration in 11Handbook of App~l ied usgrave, .• , o a, .•. , . Hydrology". Ed. Ven Te Chow. McGraw-Hi 11.
Nanson, G.C., 1974: Bed load and suspended load transport in a small steep mountain stream. American Journal of Science~ 2?4: 471-486.
Nordbye, D,J., Campbell, D.A., 1951: Preliminary infiltration investigations ln New Zealand. International Association of Scientific Hydrology~ Brussels 1951: 98- JOl.
Nordmeyer, A.H.; Davis, M.R.; J976 .. Legumes in high-country development. P:Mceedings N, Z. G1•ass lands Associat~· on Conference 38 ( 1) ; 119 .. 125.
N.Z. Catchment Authorities Assoctatfon. 1964. Eradication of Deer, Submission to Lands & Agriculture Commfttee df the House of Representatives, July, 1964. (p.2.).
New Zealand Forest Service, J964. Evidence for Parliamentary Select Committee considering noxrous animals legislation. p.4. N.Z. Forest Service, Wellington.
N.Z. Forest Service: Annu81 rlimate summary Craigleburn Forest, 1967 et seq unpublished inter~Jl report.
\65
0 1 Connor K.F; 1962. Success and ilure in the culture of mountain so i 1 s. Proceedings N. Z. Society of Soil Science B: 31-38.
0 1 Connor, K.F.; Lambrechtsen, N.C.; 1967. Some ecological aspects of revegetation of erode& Karkowan soil A & Black Birch Range, 1'1ar1 Pr•oceedings N.Z. Ecolog1:cal Society 14: 1-7.
O'Loughlin, C.L.; 1969. rther snow fnvestigations in the Craigeburn Range. N.Z. Forest Service, Forest Research Institute, Protection Forestry Branch, Report No 52 (unpublished); 48 pp.
D1 Lough1 [n, C.L.; 1969. The influence snow on stream flow. Watershed fv!,anagement : Part 1 of the Proceedings of a Symposium on Watershed Management in Water Resources Development. Lincoln Papers Water Resources 8: 112-127;
0 1 Lough 1 in, C. L. ; 1969. catchment. 684-706.
Stream bed investigations in a smal 1 mountain N. Z. ,Journal of Geology (li Geophysics 12(4):
011 Lough·l in, C.L., Rowe, L.K., Pearce, A.J., personal corrrmun-icat·ion: Sediment yields from small forested catchments, North Westland -Nelson, New Zealand. Paper presented to the N.Z. Hydrological Society Symposium, Christchurch, 1977.
Pars 11 1 R.l, 1 1 3: Control of Land and Sediment in irrigation, Power and Municipal Water Supplies. Paper presented to the Annual Meeting of the American \4/ater Works Association, Denver, Co lorado, October 1933. 18 pp.
Parsons, D.A., 1955: CoshoctonService Publication ARS.
runoff sampler. 41-2.
U.S. Agricultural
Pearce. A.J. 1 McKerchar, A. I. 1 1978: Upstream generation of storm runoff. Toebes l'lemorial Volume, N.Z. Hydrological Society. In press.
Peck, E.L. 1 1 Discussion problems In measuring precipitation in mountainous areas in Distribution precipitation in mountainous areas, WMO/OMH No. 1-16. World Meteorological Organisation.
Poole, A.L.; 1972. Management of retired lands, statements of problems with existing Government Policy. ·Z:n 11 Proceedings of Meeting on Future Use of Lands Retired from Grazing, i~ovember, 1972". Published by t1inistry of Works and Development, It/ellington. p. 39.
Poole, A.L.; 1973. The future of retired high country. Tussock Gx•asslands & Mountain Lands Institute Review 26: 8-12.
, A., Stramqulst. L., 1976: Slope erosion due to extreme rainfall in Scandinavian mountains. Geografiska Annaler 58A: 193-200.

166
Rauz i, F., Hanson, C .L., 1966: intensity of grazing.
Water intake and runoff as affected by the Journal of Range Management 19: 351-356.
Renwick, W.H., 1977: Erosion caused by intense rainfall in a small catchment in New York State. Journal of Geology 5: 361-364.
Robinson, A.R., 1962: Vortex tube sand trap. Journal of the Irrigation and Drainage Division. Proaeedings of the American Soaiety of CiviZ Engineers IR 4: 1-34.
Robinson, A.R., 1962: Vortex tube sand trap. Transactions of the American 391-425. Society of CiviZ Engineers 12?(3):
Rodda, J.C., 1971: The precipitation measurement paradox- the instrument-accuracy problem. Rep0rt No. 16 WM0/1HD World Meteorological Organisation.
Rowe, L.K.; 1968. Summary of surface wind data, Craigeburn Range, 1961-1967. N.Z. Forest Service, Forest Research Institute, Protection Forestry Branch, Report No. 45 (unpublished).
Rowe, L.l<..; 1970. Precipitation in the Craigeburn Range, 1960-1969. N.Z. Forest Service, forest Research Institute, Protection Forestry Branch, Report No, 82 (unpubl ish~d),
Rowher, C., Code, W.E., Brooks, L.R., 1933: 1933. Fort Collins, Colorado.
Vortex Tube Sand Trap Tests for 21 pp.
Rowley, J., 1970: Lysimeter and interception studies in tussock grassland. N.Z. Journal of Botany 8:
narrow-leaved snow 478-93.
Saunders, D.H. Personal col7].l7!Unication, Inventory Survey of the Kowai Catchment (Mt. Torlesse Range) Erosion and Sediment Study area North Canterbury Catchment Board.,
Scarf, F.; 1970. llydrological effects of cultural changes at Moutere experimental basin. Journal of Hydrology (N.Z.) 9(2): 142~,162.
Scarf, F.; 1970. Some runoff results from Moutere Soil Conservation Station. Hydrological Research Progress Report No. 1. 11inistry of Works and Development, Wellington.
Schumm, S.A., 1971: Channel adjustment and river metamorphosis in River Mechanics, Vol. I. Ed. H.W. Shen. Fort Collins, Colorado.
Schumm, S.A., 1972: 11 River Morphology'' (Benchmark papers in Geology). Dowden Hutchinson & Ross Inc. Pennsylvania. 429 pp.
Schumm, S.A., 1977: 11 Tite Fluvial System''. Wiley. 338 pp.
Schumm, S.A., Khan, H.R., 1972: Experimental study of channel patterns. Bulletin of Geological Society of America 83: 1755-1770.

t67
Schumm, S.A,; Parker, R.S,; J973. implications of Complex Response of drainage systems for Quaternary alluvial stratigraphy. Natural Physical Science 243: 99-100.
Scott 1 R.F.; (undated). 11At War wtth a River''. Rangitikei Catchment Board Publication No. J. 12 pp.
Selby, M.J., 1970: Design of a hand-portable rainfall simulating infiltrometer with trial results from the Otutira catchment. Jow•nal of Hydrology (N.Z.) 9(2): 117-132.
Selby, H.J., 1976: Slope erosion due to extreme rainfall -a case study from New Zealand. Geografiska Annaler 58(A) 3: 131-138.
Selby, H.J. ~Hosking, P.J., 1971: Causes of infiltration into yellow-brown puml ce sol1 s. .Tournal of HydJ'ology (N. Z.) 10{,2}: 113-119.
Sharpe, A.L., Owen, W.J. 1 Gibbs~ A. E., 1959: Co-operative water yield procedures study- a two year report on progress. U.S. Depart-ment of Agriculture, per•sonal communicaUon.
Sheppard~ J.R., 1963: Methods and their suitability for determining total sediment quantities. Proceedings of the Inter-agency Sedimentation Conference, 1963. U.S. Agricultural Research Service Miscellaneous Pub}icatlons 970: 272-287.
Shields, R.R., Sapper, W.E. ~ 1967: A shallow seismic refraction study of the soil mantle and bed crock configuration of an experimental watershed. International Union Forest Research Organisation Congress Proceedings 1: 362-386.
Shields, R.R., Sopper, W.E., 1969: An application of surface geophysical techniques to the study of watershed hydrology. Water Resources BuZZetin 5(3): 37-49.
Simons, D.B., Richardson, E.V., 1962: Resistance to flow in al luvlal channels. Transactions American Society of Civil Engineers 128: 284-302.
Simons, D.B., Richardson, E.V., 1971: Flow in alluvial sand channels in ~River Mechanics~ Ed. H.W. Shen. Fort Call ins~ Colorado.
Soil Conservation and Rivers Control Counci 1 1969. Land use capability survey handbook published by Water and Sotl Division, Hlnistry of Works and Development, Wellington, 139 pp.
Soens, J.M.; 1971. Factors involved in soil erosion in the Southern Alps, New Zealand. Zeitzchrift fii:P Geomorphologie 15(4): 460~4]0, (Germany).
Soons, Jane M.; Rayner, J.N.; 1968. in the Southern Alps.
Micro-climate and erosion processes Geografis k._;_ Anna ler 5 OA: 1 - 1 5 .

. 168
Stephenson, G.R,, Zuzel, J.F., 1967: Seismic refraction studies in watershed hydrology. A paper presented to the 5th Annual Symposium on Engineering Geology and Soils Engineering, Idaho 1967.
Strakov, N.M., 1967: Principles of Lithogenesis 1. trans. J.P. Fitzsimmons, S. I. Tomkieff & J.W. Hemmingway, New York. 245 pp. (Quoted by Gregory & Walling, 1973)
Stratford, R.P., Costello, E.J., 1974: Solar heating to prevent freezing in recording raingauges. N.Z. Journal of Hydrology 13(2): 139-141.
Sundberg, A~, 1956: The river K1ara1ven, a study of fluvial processes. Geografiska Annaler 38: 12?-316.
Sundberg, A., 1973: Significance of fluvial processes and sedimentation. Hydrology Symposium No. 9, published by Inland Waters Directorate, Department of Environment, Canada. 1-10.
Swiss Federal Authority, 1939: Untersuchungen in der natur Uber Bettbildung Geschlebe-und Schwebest-offUhrung mitterlung des Antes fur wasser wirtschaft 33 Berne. (Quoted by Da Chuna, 1968)
Takei, A., Kobashi, S., Fukushima, Y., 1975: The analysis of runoff from two small catchments in granitic mountains. The hydrological characteristics of river basins. Proceedings of the Tokyo Symposium, December 1975, I.A.H.S. - A.I.S.H. publication No. 117, 29-34.
Thompson, S.M., personal aorrmuniaation: Siltation of Clutha hydro-electric lakes. Paper delivered to N.Z. Hydrological Society symposium, Rotorua~ November 1976.
Toebes, C.; 1970. The use of Representative and experimental basins. N. Z. Wa-ter Conference Part II 30: 1-30. 7. Lincoln Co 11 ege Press.
Toebes, C.; Scarf, F.; Yates, M.E,; 1968. Effects of cultural changes on Makara Experimental Basin. Hydrological and Agricultural production effects of improving intensely grazed small catchments. International Association of Scientific Hydrology Bulletin 13(2): 95-122.
Tomlinson, A. I.; 1976. Short period fluctuations· f New Zealand rainfall. N.Z. Jow"nal of Science 19: 149..-J61 ..
Tussock Grasslands Research Commi.ttee; J954. The high altitude snow tussock grassland in South Island, New Zealand. N,Z. Journal of Science and Technology A 36; 335~364.
United States Department of Agriculture Forest Service; 1933. Watershed and other related influences and a watershed protective programme. From 11A national Plan for American Forestryl 1
Senate Document No. 12, separate No. 5.

169
United States Department of Agriculture; 1940. 11 1nfluences of vegetation and watershed treatments on run-off silting, and stream flow. Mise~ PtJ.blication .39c 80 pp. U.S. Government printer.
Veihmeyer, F.J., 1964: Evapotranspiration in Handbook of applied hydrology. Ed. V.T. Chow. McGraw Hll'l, Section 11.
Weyman, D.R., 1973: Measurements of downslope flow of water in a soil. Journal of Hydrology 20: 267-288.
White, W.R., Mill I, H., Crabbe, A.D., 1973: Sediment transport: an appraisal of available methods. Hydraulic Research Station Wallingford. Report No. INT 119.
Williams~ G., Gifford, G.F., Coltharp, G.B., 1972: Factors influencing infiltration and erosion on chained pinyon-juniper sites in Utah. Journal of Range Management 25: 201-205.
Wilm, H.G., Storey, H.C., 1944: Velocity head rod calibrated for measuring stream flow. Civil Engineering 14: 475-476.
Wolman, M.G., Miller, J.P., 1960: geomorphic processes.
Magnitude and frequency of forces in Journal of Geology 68(1): 54-74.
World Meteorological Organisation 1970: Guide to hydrometeoro1ogica1 practices, WMQ No. 168 TP 82.
Wraight, M.J.; 1960. The alpine grasslands of the Hokitika river catchment? Westland, N,Z. Journal of Science 3: 306""332.
Wraight, M.J,; 1963. The alpine and upper montane grasslands of the Wairau River Catchment, Marlborough. N.Z. Journal of Bo-tany 1: 351-376.
Wraight, M.J.; 1967. The alpinR an~ upper montane grasslands of the Waimakariri. River catchment in 11The Wai.makariri Catchmene 1 •
Tussock Grasslands and Mountairt Lands Institute special publication No. 5: 73-76.
Yamamoto Tervo, 1976: Geophysical measurements of a mountain watershed. Jouraal of Soil and Water Conservation 31(3): 105-109.
Yates, M.E.; 1964. Makara experimental station -preliminary results. Soil and Water 1(2): 19-21.
Yates, M.E.; 1965. Effect of some land management practices on the hydrology of smal 1 catchments. H.Z. Science Congre,c;s II, Conservat-ion Subsection: 30-32. \.Jellington, N.Z. Government Printer .
Y t S I' E · 1966. Some. effects of and management practices at Hakara. a e . , '1. • , Soil and Water 3(2): 18-19.

170
Yates, t1.E.; 1971. Effects of cultural changes on Makara experimental
Zon, R. ; 192 7.
basin : Hydrological and agricultural production effects of two levels of grazing on unimproved and improved small catchments. Journat of Hydrotogy (N.Z.) 10(1): 59-84.
Forests and Water in the 1 ight of Reprinted with revised bibliography of the final report of the National 1912. (Senate Document 469 62a. 106 pp.
scientific investigation. 1927 from appendix V Waterways Commission, Congress 2nd Session).
Zotov, V.D.; 1938. Survey of tussock grasslands of South Island, New Zealand. Preliminary report. N,Z. Journat of Science and Technotogy A 20: 212~241-L

J7J
PART C
THE DATA AND APPENDICES

172

1.1.
1. 2.
1 L 1.
11.2.
11. 3.
11 . 4.
11. 5.
v. 1.
I X. 1.
173
LIST OF TABLES, PART C
Page.
Dally rainfalls, Torlesse stream catchment, 1973- 1977. 177-181
Monthly wind run and direction, Torlesse stream catchment, 182 1974 - 1976.
Monthly minimum and maximum recorded air temperatures, 183 Torlesse stream catchment, 1973 - 1977.
Annual precipitation, Mt. Torlesse Station, 1909 - 1975. 185
Mean monthly precipitation, Mt. Tdrlesse Station, 1909 - 1975. 186
Storm events per month, Mt. Torlesse Station, 1909 - 1975. 187
Longest periods without rain, Mt. Torlesse Station, 1909 - 1975. 188
Raindays per month, Mt. Torlesse Station, 1909 - 1975. 189
A worked example of the determination of surface depths from 209-211 seismic velocities (3 pages).
X-ray spectra for Torlesse stre~m sediments and rocks. 228

174
LIST OF FIGURES, PART C
1.1. Monthly precipitation, Torlesse stream catchment 1973- 1977.
1.2. A summary of wind direction, Torlesse stream catchment.
V.l. Seismic wave paths.
V.2. The time distance graph.
V.3. Possible interpretation of profiles.
V.4. Composite profile, Gingerbread spur.
Composite profile, true right face, Helen stream. v.s.
V.6. Composite profile of a site opposite the Kawai river, Torlesse stream confluence.
Hydrographs, hyetographs, sediment yields and transport rates: 86 figures presented in chronological order.
Variation in bed load size within and between storms: 22 figures presented in chronological order.
Vlll.1. Sheep presence, lower Torlesse stream catchment, 22 Feb. - 4 Mar.'
VI I I . 2. Sheep presence, lower Torlesse stream catchment, 6 - 9 Mar. '73.
VI I I . 3. Sheep presence, lower Torlesse stream catchment, 17 - 18 Mar. '73.
VI I I • 4. Sheep presence, lower Torlesse stream catchment, 22 - 25 Mar. 1]3,
VII 1.5. Sheep prese.nce, lower Torlesse stream catchment~ 26 - 29 Mar. '73.
Vl1!.6. Sheep presence, lower Torlesse stream catchment, 30 Mar. - 1 Apr. 1
VIII.]. Sheep presence, lower Torlesse stream catchment" 2 - 19 Mar. '73.
VI I I. 8. Summary of sheep presence, Torlesse stream catchment.
X I • 1 • laboratory model to simulate a mountain stream channel.
X I • 2, Velocity discharge relatiors in a simulated mountain stream channel.,
212
2H)
2 g
222.
222
222
22.2
222
22.2.
XI. 3. Velocity discharge relations in a simulated mountain stream channel, 234 with gravel in pools.
X l • 4. Flow and kinetic energy relations in a simulated mountain stream channel with and without gravel s in pools.

175
APPENDIX I
CLIMATIC INFORMATION RECORDED IN THE TORLESSE STREAM CATCHMENT
1972 - 1977

176
The following cl imatil... data have been recorded in the Torlesse stream
catchment and are held at the Tussock Grasslands and Mountain Lands
Institute, lincoln College.
( i ) Da i 1 y rainfall 8. 9. 72 31.5.77
( i i) Solar radiation 18.3.73 31.5. 77
( i i i ) Wind run 1 • 5. 73 31.5. 77
Wind run and wind direction 17.10.74- 10.12.74 19.12.74- 5.5.75 9.5.75 8.7.75
16.7.75 19.8.75 30.8.75 22.12.75
25.12.75- 24. 1 . 76
9.2.76 19.3.76 5.5.76 31.5.76
( i v) Temperature:
Monthly minimum and maximum
temperatures October 73 May 77
with selected means for those months with more than 10 days ta.

350
E E
250 0 -c: 0 a: 150
50
75 74
., 75
77 .. :~ ., 74
75
·: .. ::~
74 :·
l~ ::
73
75 74
~ 7576 .. :: ~ . P4 ~
76
74
7475
76
73 7i
75
Jan Feb I March I Apri I I Moy I June I July I August I Sept I Oct I Nov
Figure 1.1: Monthly precipitation, Torlesse Stream Catchment, li973 -1977.
76
~ 75 ·.
Dec

N
1%
w---- 0% 1% ----E
2%
s
Figure 1.2: A summary of wind direction for Torlesse stream catchment, 1974- 1976.
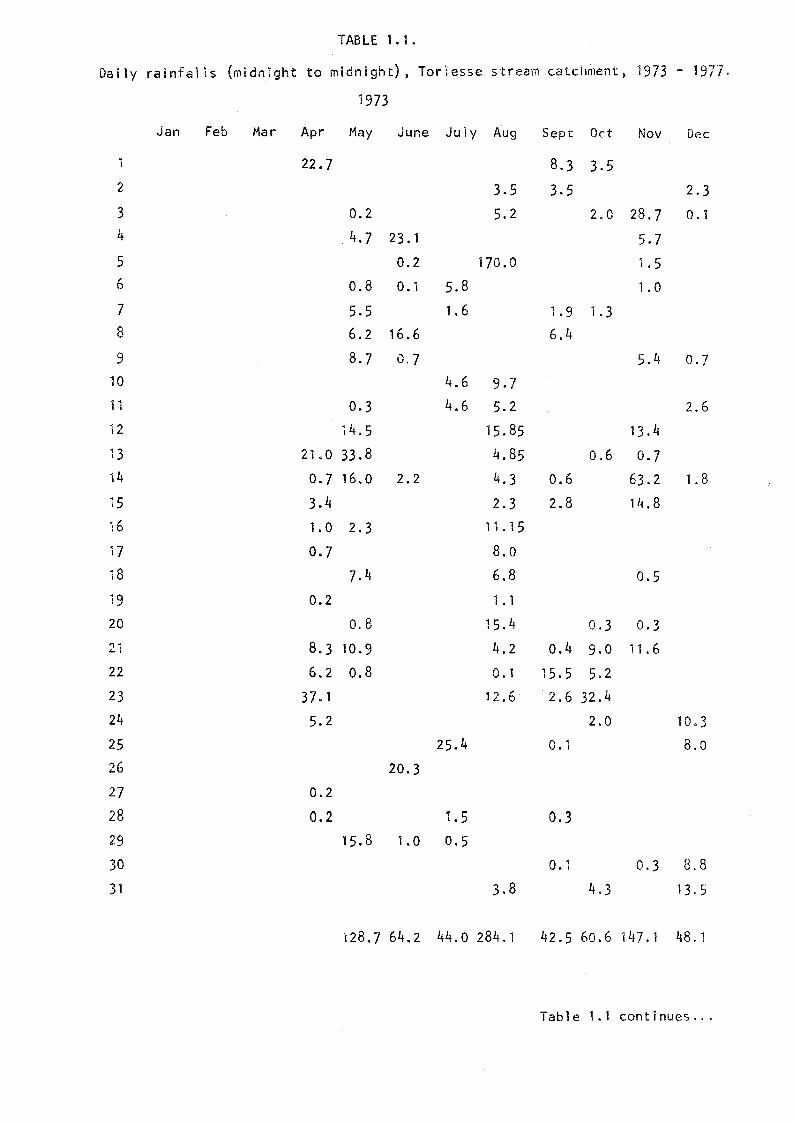
TABLE 1.1.
Da i 1 y ra I nf a 11 s (midnight to midnight), Torlesse stream catchment, 1973 - 197'7.
1973
Jan Feb Mar Apr May June July Aug Sept Oct Nov Dec
22.7 8.3 3.5 2 3.5 3.5 2.3 3 0.2 5.2 2.0 28.7 0. 1 4 4.7 23. 1 5.7 5 0.2 170.0 1.5 6 0.8 0. 1 5.8 1.0 7 5.5 1.6 1.9 1.3 8 6.2 16.6 6.4
9 8.7 0,7 5.4 0.7 10 4.6 9.7 11 0.3 4.6 5.2 2.6 12 14.5 15.85 13.4 13 21.0 33.8 4.85 0.6 0.7 14 0. 7 16.0 2.2 4.3 0.6 63.2 1.8
15 3.4 2.3 2.8 14.8
16 1.0 2.3 11. 15
17 0.7 8.0 18 7.4 6.8 0.5 19 0.2 1.1
20 0.8 15.4 0.3 0.3 21 8.3 10.9 4.2 0.4 9.0 11.6 22 6.2 0.8 0. 1 15.5 5.2 23 37.1 12.6 2.6 32.4 24 5.2 2.0 10 .. 3
25 25.4 0. 1 8.0 26 20.3
27 0.2
28 0.2 1.5 0.3 29 15.8 1.0 0.5
30 0. 1 0.3 8.8
31 3.8 4.3 13.5
128.7 64.2 44.0 284.1 42.5 60.6 147.1 48. 1
Table 1.1 continues ...

178
Table 1.1 contd. 1974
Jan Feb Mar Apr May June July Aug Sept Oct Nov
0.6 0.8 1.5 2 0. 1 3.3 24.7 3 2.4 1.2 24.6 1.2 13.2 10.2 24.3 4 15.0 2.0 3.0 65.0 5 4.5 29.3 2.3 2. 1 20.3 6 48.8 7.3 16.7
7 0. 1 0.3 4.3 4.4 1.3 1 c . .., 8 1.2 2.7 0.3 0.2 26.5 2,8 20.0
9 0.5 10.2 2.5 9.5 15.4 15.2 0,3
10 15.2 3.0 0.6 1' 0.4 25~7 ].2 I
i 11 2.8 0.1 10.7 I 0.6
I 12 0. 1 9.7 9.0 0. 1 0.7 13 0.9 0. 1 6.5 I 7.4
! 1lf 0.8 9.3 1.0 13.2 7.5 15 64.0 30.5 15. 1 1.8 I O.] 0.2 l 16 23.7 9.6 5.2 107. 1 1.8 '>¥ o.s 0.4 17 0.2 43.6 1.2 0. 1
18 0. 1 28.2 0.5 0.3 2.8 13.5 2.5 1Q 1 1 ') 0 (\ (\ 1 ..,,.. ., ., " ... o • " 1 '.I ~ ~ • L. ;;; .. v v •• , • ..; 8 &- ,;) ~ 'v' LV• i u. ~
20 15.5 0.4 41.9 0.4 3.3 1.9 21 19.7 5.2 0.3 16.7 5.4 22 0.6 12.8 25.8 30.3 17.7 8.8 23 1.0 0 .I~ 3.8 8.4 12.9 0.7 24 16.5 0.6 lf-5 0. 1 1.2 25 1.7 0. 1 7.8 0.6 26 0.7 0.3 5-7 7. 1 3. 1 5.0 11.8
27 6.3 5.2 1.0 15.5 28 10.8 21.4 2.2 18.0 10.0 2.0 29 21.0 2.2 8.2 30 0.2 3.6 6.4 31 7. 1
64.9 145.6 145.9 • 1 79.5 89.7 163.3 72.8 180.2 1lr1~5 33.6 IJL20
to-t a 1 -· 1 3 j
T e ~ 1 cor1

!79
Tab 1 e 1 • 1 contd. 1975
Jan Feb Mar Apr May June J u 1\1 Aug Sept Oct Nov Dec
7.4 46.8
2 7.2 2. 1 22.4 0.3
3 0.3 0.3 12.. 4 1.9 3.8 8.2 it 1./ 3. 1 0. l 3.7 25.5 34.7 3.8 0.7
5 14.6 0.5 ? 16.8 6.3 6 0.2 5.8 8.3 79.2 1.5 0.2
7 1.1 26.5 0. 1 10.3 5.3 0.7 2.0
8 9.4 0.7 3.6 7.0 2. 1 20. 1
9 0. L1 1.8
10 2.3 12.7 0.5 0.2 11 40.4 0.1 8.4 8. 1 ') h '"- ,..._,,
12 102.8 9.5 1.8 0.2
13 40.6 7.4 11.7 1.1 0.5 14 2.7 9. 1 0.2 0.7 5.2 30.8 0.2 13.5 9.8
15 0.2 0.2 10.3 8.7 9.9 24.6 0.1 16 49.4 2.0 10.8 7. 1 0.3 2.2 0.3 17 13.8 0.4 9. Lt 4.7 5.5 5.3 14.0 18 21.6 8.3 1.2 0.6 11.7 5-5 19 15.8 50.2 1.0 10.7 11.9
20 105.5 0. 1 1.7 0.2 5.3 25.7 2.8 21 1.5 1.9 6.7 3.7 1.2 0.3 8.4 1.1
22 2.2 24.6 1.5 0,4 1.4 5.9 2.9 0.9 23 0. 1 0. 1 7.0 24 24.4 0.2 7.9 22.l) 13~2
25 0.4 1.6 24.8 3.2 o.G 13.7 26 8.2 6.8 4.3 4.5 0.2 15.9 0.4 9.0 8.8 0.5
27 5.3 7. 1 0.2 32.5 12.2
28 17.3 31.9 0. 1 5.7 1.7 30.3
29 60.5 25.5 lt. 6 17.3 0. 1
30 7.5 46.7 18.2 15.8
31 5.1 4.2
281!. 8 116.6 205.7 ] 60 .If 111 • 1 159.8 103.0 184.9 126.2 139.6 119.7 73.3
An. total "' 1785.1
Table 1.1 continues ...

180
Table 1.1 contd. 1976
Jan Feb Mar /~p r Nay June July Aug Sept Oct Nov Dec
5.5 6.9 0.5 0.6 0. 1 1.9 a ;:; -'·-
2 3. 1 0.3 4.5 0.4 7.9 0.2 6.2
3 0. 1 25,4 4.0 0.9 3.8 4 9 •. 1 1.3 0.5 6.9 1.0 0.
5 5.8 1.0 4.9 12' 1 8. 1
6 1.1 0' 1 0.2 2.9 33. j 8.5
7 49. 1 9.3 93.9 8 1.8 66. 1 28,1 0.2 31.6 0.4
9 0, 1 11.3 ] 4. Lf 29.4 8.9 15.5 0.0 8 .. 1 2.4 22.0 3~8 40.8
10 L7 7.5 28.4 2.9 45.6 6.6 0.3 2.6 1.2 ]] 3.0 0. 1 2.4 1 3. 1 0.3 41-t. 5 10.2
12 1.4 9.2 6.9 3.0 1.8 13.9 6. 1
13 11.4 16.7 9.8 9.2 0. 1 3.0 1.6
14 20.6 31.6 0. 1 13.6 9.8 0.2 13.9
15 2.4 1.3 51.9 11.4 10.9 0.2 0. 1
16 0.2. 0. 1 6.9 5.0 17 0.9 8.9 0. 1 1.4 2.3 18 0.7 0.5 0. 1 L12. 8
19 0. 1 54.5 5.8 0.8 5.9 31.1
20 3.8 5.6 4.6 3 Q;'; ._, 3.8 0.2 9.3 21 0.3 0.2 0. 8:'; 8.8 4.4 22 1.1 3.7 3. 8•'' 6. 1 22.7
23 29.8 2.7 0.9 0.5 19.2 27.0
24 0. 1 0.6 27JI 0.7
25 0.7 1.9 2.4 22 ,lf 23.8 15.4 27.6 26 10.9 20.7 1.2 0.3 3.9 14.7 15.7 lt. 6
27 IL8 1.0 1.8 0. 1 1.3 ~.6 2.0 0. 1 0.2
28 29.5 1.1 1 1 1 1 0.7 2.5 0.3 1 r Q l • ' 1 • ' I;.)'!\.;'
29 3.6 2.0 3.4 LO 30 2.0 8 .. 8 31.1 5.8 0.6 0.9 3.2 32.3 0.9 ''1 ), l9.8 20.7 2.3 0 ,l 1-t • 1 15.8
11+?.2 ? 68.0 77. 1 129.3 93 .lf 1 ,,
133.8 260.5 217.7 137.7 223. z . ..) ,L
f\n. totn1 = 1 "l+
b1e • 1 coc~t f nues ·t "',.

181
Table 1.1 contd. 1977
Jan Feb t1a r Apr May June July Aug Sept Oct Nov Dec
1.9 0.3 1.4
2 1.5 9.6 2.0 1.7 19.9
3 26. 1 35.9 4 15.3 Ll. 4
5 6.0 0.3 6 5.7 1.5
7 16.4 0.5
8 3.5
9 23.6 10 0. 1 10.7 6.3 1 1 1.7 6.3 22.2 12
13 3.4 14
15
16 3.0 3.2
17 2.5 6.2 0. 1 0. 1
18 62.8 5.5 2. 1
19 14.4 3.6 4.0 0.5
20 0.9 0.6 13.0
21 1.6 32.3 1.4 22 2.0 0. 1
2"" )
24 0.6 21.7 4.7 2. 1
25 10.8 31 .ll
26 12.8 2.8
27 1.8 2.6 28
29 29.6 0.2
30 5.5 10.4
31 4.2
177.0 77.9 37.9 120.2 116. 3

182
TABLE 1. 2.
Monthly wind run (hrs) and direction, Torlesse stream catchment, 1971-1 - 1976.
Month Days N t:" s w NE SE sw NW Var. of record t...
10/74 15 3 6 3 0 123 88 81 32 24
11/74 30 10 5 17 0 249 169 164 65 41
12/74 23 2 9 0 261 71 128 53 27
1/75 31 2 4 6 0 245 201 191 46 51
2/75 28 ] 7 5 0 230 158 195 65 12
3/75 31 14 0 ] 7 0 318 119 189 75 13
4/75 30 3 4 17 0 392 83 125 85 12
5/75 28 7 0 38 0 360 52 109 72 37 6/75 30 8 2 4 0 488 53 108 41 16
7/75 24 7 2 8 0 353 63 77 60 6
8/75 21 5 2 10 3 230 42 135 51 22
9/75 30 12 11 23 358 79 143 83 8
10/75 31 2 16 17 0 337 105 177 62 28
11/75 30 9 15 25 0 271 126 158 90 26
12/75 29 4 15 31 0 237 131 198 60 14
1/76 24 2 8 26 0 161 149 183 39 8
2/76 20 2 12 0 216 70 106 50 11
3/76 19 0 15 16 0 225 50 114 29 7 Ll/76
5/76 27 2 13 0 418 56 85 70 3 6176 15 0 2 0 0 225 32 62 37 7/76 3 0 0 0 0 38 15 10 9 8/76 20 7 10 0 279 61 66 53 9/76 21 0 8 0 292 58 106 33 7
10/76 26 3 4 12 0 316 88 152 50 3 11/76 20 0 0 181 ]ll2 132 22
12/76 7 0 3 0 63 29 46 26
613
Totals 97 133 331 4 6866 2290 3240 1358 379 == J4,698 hrs
% of total 1% 1% 2% lf]% 16% 22% 9% 3% ----·
87.6

TABLE 1. 3.
Monthly minimum and maximum recorded temperatures, Torlesse stream catchment.
1973 1974 1975 ] 976 1977
January max. 33.5 34.5 30.0 28.0 min .. 6,0 4.0 2.0 0.5 mean (14.5) (14.5)
February max. 26.0 32.0 27.0 31.0 min. 8.0 1.0 -1.0 0.5 mean (15.5) (13.0)
March max. 25.51 29.0 27.5 26.0 min. ,.., .5 ,., 12 days 5.0 1.0 1.5
data mean U3 .o) (14.5)
Apr i 1 max. 24.0) 21.0 23.0 26.0 min. -2. oJ ,., 16 days -3.5 -3.0 -4.0
data mean (11.0) (10.5)
May max. 17.51 16.0 19.0 15.0 min. -3.oL·, 9 days -3.0 -5.5 -7.5
data mean
June max. J2.5 13.5 22.0 13.0 min. -8.0 -7.0 -9.0 -6.0 mean
July max. J3. 5 11.0 12.5 min. -6.0 -1.0 -8.0 mean
August max. 15.0 14.0 15.0 min. .., " -7.0 -5.5 -;,u mean
September max. 17.0 2.5.0 '15 .0 min. ...6.0 -5.0 -6.0 mean
October max. 26.5 25.0 23.0 21.0 min. -3.0 -2.0 -5.0 -6.0 mean
November max. 23.5 26.0 27.0 22.0 min. 0.0 o.o -2.0 -8.0 mean
December max. 31.0 30.01 32.0 25.5 min. 3.5 2 ,Qh'< 9 days -3.0 0.0
data mean (13.6)

184
APPENDIX I l
A SUMMARY OF RAINFALL OBSERVATiONS
MT. TORLESSE STATION 1909 - 1975
(Derived from records held by N.Z. Meteorological Service)

185
TABLE I I. 1.
Annual precipitation Mt. Torlesse Station 1909 - 1975.
Year Precipitation Year Precipitation
1909 1030 1942 1141
1910 1065 1943 956 19 'j 1 1255 1944 12111
1912 1118 1945 1341
1913 947 1946 1038
1914 919 1947 8£6
1915 668 1948 865
1916 1033 1949 834
1917 1081 1950 1038
1918 1022 1951 1400
1919 1040 1952 1019
1920 967 1953 114 3
1921 893 1954 951
1922 798 1955 8811
1923 1038 1956 1105
1924 1090 1957 1288
1925 1346 1958 1006
1926 1055 1959 1237
1927 11 18 1960 926
1928 1159 1961 1179
1929 1239 1962 1077
1930 1024 1963 1235
1931 948 1964 789
1932 8]6 1965 1043
1933 828 1966 912
1934 925 1967 957
1935 1002 1968. 980
1936 1194 1969 561
1937 986 1970 870
1938 1215 1971 684
1939 674 1972 1057
1940 1015 1973 838
1941 1083 1974 1200
1975 1383

Jan. Feb. Mar. April May June July Aug. Sept. Oct. Nov. Dec. Total
t·1ean 98.4 79-7 76.3 89.0 85.5 71.1 78.9 76.6 80.7 96.9 92.9 102.0 1025. 1 ..... co ~.
Standard
deviation 51.2 43.2 41.0 60.3 55.2 38.8 54.8 51.0 45.] 53.4 43.7 54.9 173.2
TABLE 11.2.
Mean monthly precipitation i'1t. Torlesse~ 1909 - 1975.

Jan. Feb. I'\ a r. Apri 1 May June July Aug. Sept. Oct. Nov. Dec.
Hean 2.6 2.2 2. 1 Z. 1 2.1 1.9 1.9 2. 1 2.2 2.4 2.7 2.9 oc -...J
Standard
de vi at ion 1.2 1.3 1.2 0.9 1.1 1.2 1.2 1.4 1.3 1.3 1.3 1.7
TABLE I I .3.
Storm events* per month (mean( Mt. Torlesse Station 1909 - 1975.
* precipitation in excess of 10 mm.

Jan. Feb. ~1a r. Apr i 1 May June July Aug. Sept. Oct. Nov. Dec. :;;; 00
l"lean 8.7 8. 1 9. 1 9.8 9.6 "10.8 10.2 l ]. 1 9.6 8.2 8.4 8.2
Standard
deviation 4.6 3.5 4. 1 4.5 4.2 4.5 3.7 5. J 4.5 3.3 3.7 3.8
TABLE 11.4.
Longest period w1thout rain (mean) Mt. Torlesse Station 1909 - 1975.

Jan. Feb. t·1a r. April May June J u 1 y Aug. Sept. Oct. Nov. Dec. 00 '<0
Mean 10.7 9.0 9.0 9.2 9.8 8. 1 8.4 8.3 9.] 10.4 10.3 10.9
Standard
de vi at ion 4.0 2.? 3.3 3.7 4. 1 3. ] 3.6 3.4 3.6 3.5 3.5 4.5
TABLE II. 5.
Number of raindays}'< per month (mean) Mt. Torlesse Station 1909- 1975.
}'< precipitation in excess of 0.0 mm.

190
APPENDIX ll I
MEAN DAILY STREAM FLOWS (MIDNIGHT TO MIDNIGHT)
TORLESSE STREAM CATCHMENT 1973- 1977. (m 3sec- 1 )
Note ( ) = flow estimated

191
1973.
Jan. Feb. Mar. Ap 1. May June July Aug. Sept Oct. Nov. Dec.
1 ' • 130 . 150 . 115 .075 . . 217 . 1 35 .098 ,085
2 . 123 • ] 4 7 . 113 .080 . 195 • 125 .095 .085
3 • 115 .138 . 105 .077 . 178 . ] 08 • 1 31 ,083
4 . 115 . 155 • 100 .077 . 156 . 115 . 151 .082
5 . 112 .1]0 .097 .080 . 144 . 108 . 138 .083 / . ] 03 • ] 57 .093 • 115 . 130 .110 . 128 .085 b
7 . 100 . ] 48 .0~0 • 115 . 123 . 125 . 123 .085
8 .'103 • ] 48 .090 .080 . 113 • 129 . 120 .085
9 • 110 . 153 .089 .090 • 103 . 134 . 120 .085 10 . 120 . ] 55 .086 .110 .099 . 150 . 115 .083 I 1 D~ .135 .085 . 140 .099 • 165 . 105 .080 12 A . 130 .085 .265 .098 • 180 • 113 .080
1 3 M .085 .398 .094 . 190 . 113 .083 IS . 127 14 DA
s .084 .352 • 111 . 185 .238 .085 IN .127 15 TA G.124 .083 .253 . 120 . 168 . 335 .085 16 Ml • 12.3 .083 .230 . 103 • 153 .270 .083
17 ss
. 122 .083 .200 .098 . 140 .250 .080 IN 18 G .117 .082 .1]0 .098 .130 . 185 • 100
19 .280 .098 .081 ·155 .090 . 130 . 140 . 105
20 .098 .270 .090 .081 . 1 71 .090 • 128 • 128 .090
21 .108 .255 .097 .087 . 160 .089 . 133 . 128 .090
22 • 118 .25 3 .097 .088 . 14 5 .OB8 . 135 • 128 .090
23 .180 .257 . 100 .083 . 137 .087 • 1 ]li . 125 .090 24 • 177 .235 . 103 .080 • 11-tO .083 . 156 .123 .095
25 . ] 55 .205 . 103 .095 . 14 7 .082 . 133 . 105 . 100
26 . 148 . 185 . 115 . 100 . 150 .083 • 12ll .090 oo·-. ~) 27 . 133 . 175 . 125 .090 .140 .087 . 122 .090 DA
TA 28 .130 .160 . 120 .087 .175 .092 . 120 .089 Ml
29 . 130 .153 . 120 .084 .536 .095 • 11 5 . 088 S< • .) I
30 .130 . 153 • ] 19 .076 .596 • 108 . 105 .087 :-~" ,, 31 . i50 .070 .369 .100
t1onth1y . 137 . 168 . ] 27 .089 • 191 . 112 .136 .138 .087 Mean
Appendix Ill continues .. ,
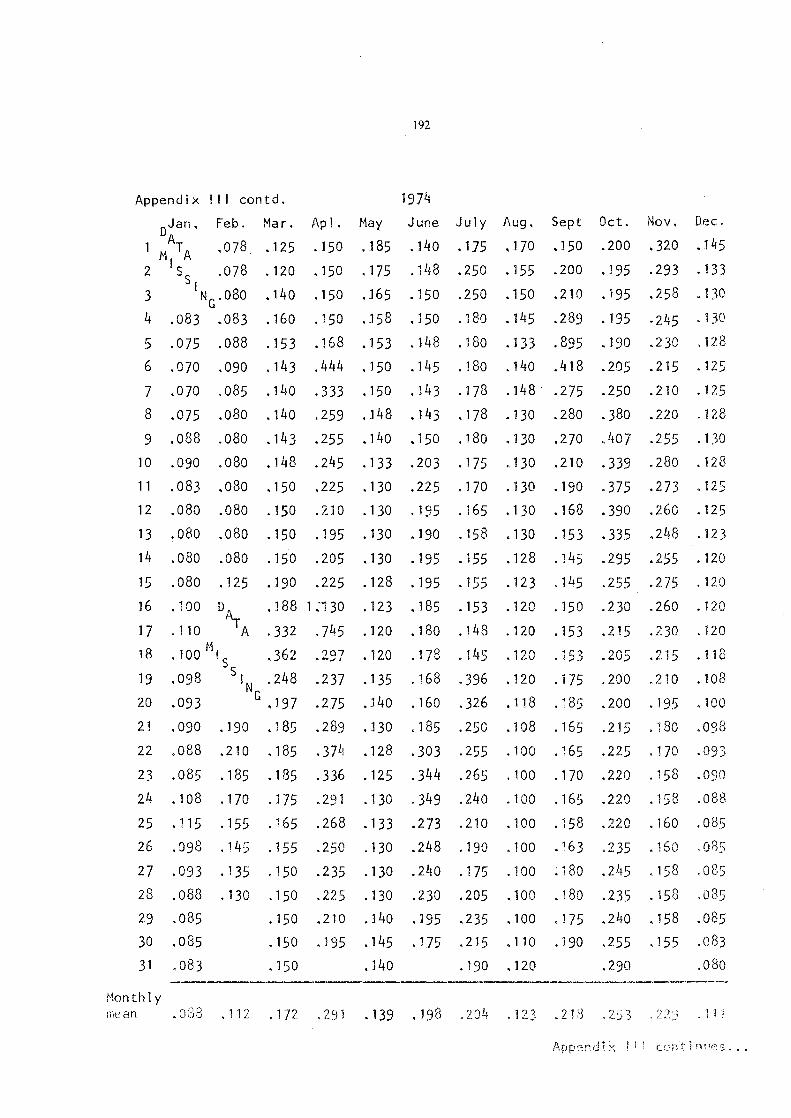
192
Appendix ! I I contd. 1974
0Jan. Feb. Mar. Apl. May June July Aug. Sept Oct. Nov. Dec.
l MATA .078 .125 .150 .185 ,140 .175 ,]]0 .150 .200 • .320 .1h.5
2 1s .078 .120 .15o .175 ,148 .250 .155 .200 .195 .293 .133 s!
3 NG.080 .1110 .150 .165 .150 .250 .150 .210 .195 .258 .130
4 .083 .083 . 160 .150 .158 .150 . 180 .145 .289 .195 ·245 . 130
5 .075 .088 .153 .168 .153 . 148 .180 .133 .895 .190 .230 .128 6 .070 .090 .143 .444 .150 .145 .180 .140 .418 .205 .215 .1
7 .070 .085 .140 .333 .150 .143 .178 .148 .275 .250 .210 .125
8 ,075 .080 .140 .259 .148 .143 .178 .130 .280 .380 .220 .128
9 .088 .080 .143 .255 .140 .150 .180 .130 .270 .407 .255 .130
10 .090 .080 .148 .245 .133 .203 . 175 .130 .210 .339 .280 . 128
11 .083 .080 .150 .225 .130 .225 .170 .130 .190 .375 .273 . 125
12 .080 .080 .150 .210 .130 . 195 . 165 .130 .168 .390 .260 .125
13 .080 .080 .150 .195 .130 .190 .158 .130 .153 .335 .248 .123
14 .080 .080 .150 .205 .130 .195 .155 .128 .145 .295 .255 .120
15 .080 '125
16 . 100 D A
17 .110 TA M
18 • !00 ! s
.190 .225 .128 .195 .155
• 1 8 8 1 ;·1 30 • 1 2 3 • 18 5 • 1 53
.332 . 745 .120 .180 .148
.362 ?07 •'-,..!/ • 120 • 145
.123 . 145 .255 .275
.120 . 150 .230 .260
. 120 . 153 .215 .230 1'lf\
, IL..V . 153 .215 s 19 .098 IN .248 .237 .135 .168 .396 .120 .175 .200 .210
20 .093 G.197 .275 .140 .160 .326 .118 .185 .200 .195
21 . 090 • 190 • 185 . 289 . 130 . 185 . 250 . 108 . 165 . 215 . 180
22 .088 .210 . 185 .374 .128 .303 .255 .100 . 165 .225 . 170
23 .085 .185 .185 .336 .125 .344 .265 .100 .170 .220 .158
24 .108 .170 .175 .291 .130 .349 .21.10 .100 .165 .220 .158
25 . 115 .155 .165 .268 .133 .273 .210 .100 .158 .220 . 160
26 .098 .145 .155 .250 .130 .248 .190 .100 .163 .235 .160
27 .093 .135 .150 .235 .130 .240 .175 .100 :180 ,216 .158
. 120
• 120
• 120 .. /)
• I !0
.108
.100
.098
.093
.090
.088
.085
28 .088 .1]0 .150 .225 .130 .230 .205 .100 .180 .235 .158 .0
29 .085 .150 .210 .140 .195 .235 .100 .175 .240 .158 .085
30 .085 .150 .195 .145 .175 .215 .110 .190 .255 .155 .083
31 .083 .150 ,140 .190 ,120 .290 ,080
t1onthly mean .112 .172 .291 .139 .198 .204 .123 .218 3 . 22 1 i
I" (j ~ )(

Appendix I I! contd.
Jan. Feb. t-1ar.
.080 .240 .260
2 .075 .205 .210
Apl.
.175
. 195
!93
1975
May June
• 467 • ] 50
• 306 .150
July Aug. Sept Data
.135M' . . .160 1 ss1. ng
.125 .240 .160
3 .070 .170 .185 .145 .268 .140 .125 .150 .150
4 .080 .148 .165 .138 .220 .130 .130 .130 .209
5 .078 .148 .150 .133 .190 .120 .125 .120 .240
6 .073 .145 .135 .125 . 180 .300 .125 .110 .250
Oct,
• 140
. 125
Nov.
.. 220
.349
Dec.
• 160
. 180
.130 .280 .160
.228 .280 • 155
.220 .260 .150
. 220 . 250 ; 150
7 .070 .133 .125 .155 .160 .280 .125 .110 .200 .200 .220 .140
8 .080 .125 .120 .175 .170 . 184 .125 .125 .180 . 180 .257 . 130
9 .088 .122 .120 .150 .160 .160 .125 .110 .160 .170 .230 .125
10 .085 .117 .123 .135 .160 .150 .130 .100 .160 .170 .220 .125
11 .085 .110 .186 .128 .160 .150 .130 .098 .190 .165 .220 .120
12 .085 . 105 1.385 .128 .160 .150 . 130 .095 . 190 . 165 .200 . 110
13 .085 .105 2.078 .135 .160 .150 .130 .090 .160 .175 .180 .100
14 .088 .113 .468 .130 .158 .160 .211 .095 .155 .190 .155 .090
15 .093 .115 .300 .120 .180 .160 .320 .110 .150 .200 .155 .085
16 .1'64 .110 .240 .120 .160 .150 .240 .125 .155 .180 .155 .090
. 155
.155
.145
17 .202 .110 .210 .120 .160 .145 .180 .120 .150 .165
18 .173 .108 .195 .120 .237 .140 .160 .120 .155 .160
19 .153 .103 .180 .120 .289 .130 .150 .281 .190 .170
20 .]80 .09) .165 .120 .260 .125 .140 .377 .265 .180
21 .645 .093 .158 .120 .230 .155 .130 .209 .200 .160
22 .323 .113 .153 .120 .220 .140 .125 .160 .170 .160
M . 1 60 I c;
-s . 140 iN
. 140 G
23 .233 .118 .150 .120 .190 .135 .110 .155 .170 .160 .1L10
24
25 2,. _o
27
. 190
• 160
. 155
. 150
28 . 150
29 . 5 33
30 . 44 3
31 .302
.119
• 161
. 14 3
• 140
.220
. 150
.138
. 125
. 123
. 120
. 115
• 110
. 110
• 120
• 140
• 155
. 153
• 153
.207
.992
.180 . 140 . 100 . 155
.160 . 140 .095 . 155
. 160 . 140 .145 . 155
. 170 . 140 . 130 . 150
. 160 . 140 . 120 . 140
. 158 .135 .110 . 150
• 155 .135M" Da.ta . 160 lSStng
.150 .170
.280
.260
.240
.230
.210
.190
• 170
.150 .140
. 160 . 140
. 180 . 140
.209 .163
. 190 . 150
.:10 .155
.250 .160
.240
.085
.085
.090
. 100
. 159
. 160
. 160
• 160
~~:~hly .193 .133 .273 .168 .198 .154 .142 .149 .192 .181 .191 .128
Appendix I I I continues .•.

Appendix I I I contd.
Jan. Feb. Mar. Apl.
.160 .140 .120 ,]]]
2 .160 .130 .115 .085
3 .155 .125 .115 .08
194
1976
May June July Aug. Sept
.111 .110 .100 .115 .170
.09 .JJO .095 .110 ,160
.09 .160 .090 .100 .155
Oct. Nov. Dec.
.220 .370 . 340
.235 .31-10 .300
.240 .345 .270
4 .150 .125 .115 ,]1 .09 .150 .090 .100 .150 .240 .390 .240
5 . 150 . 130 • 130 . 1 • 09 . 140 . 085 • 1 00 • 150 • 240 . 420 . 210
6 .130 .130 .130 .1 .09 .140 .080 .095 .223 .250 .440 (.210)
7 .135 .189 .130 .1 .09 .135 .070 .090 .650 .325 .380 (.200)
8 .130 .212 .130 .1 .08 .130 .070 .085 .670 .!tOO .360 Cl )
9 .125 .250 .150 .135 (.10) .131 .070 .088 .288 .460 .340 .265
10 .120 .320 .140 .105 (.095) .240 .070 .210 .260 .550 .330 .310
11 .120 .430 .120 .105 .09 .210 .080 .298 .270 .663 .340 .285
12 . 110 .270 .115 . 110 .09 .160 .085 .280 .250 .980 .330 .245
13 .110 .210 .110 . 120 .085 .130 .080 .215 .220 .590 .335 .200
14 .145 .275 .100 . 120 .09 .130 .080 .200 .210 .495 .330 .200
15 .150 .270 .09 .125 .10 (.125} .35 .170 .220 .425 .320 .180
16 .150 .235 ,085 ,125 .09 (.120) .1/3 .155 .230 .380 .320 .190
17 .145 . 170 ,085 .120 .100 (.115) . 130 . 155 .205 .350 .310 . 180
18 . 140 .120 111'\ ( 11rl\ -~-~V \•A~VJ . 125 . 150 . 180 4..,,..
• ::o 1""1r • l I "J
19 .150 .130 .08 .120 .40 (.100) .120 .140 .170 .590 .265 .219
20 . 150 . 125 .07
.150 .125 .07 21
22 • j 40
23 .153
21-t .150
.120
• 120
.. 07
• ] 07
.120 .107
.120 .30 (.095) . 115 .125 . 155
.125 .18 (.090) .1'15 .125 .155
.130 .155 (.085) .115 .125 .160
DAT .155 .085 .110 .125 .160
A .14 .080 .100 .125 .155
25 • 12.0 • 120 • 07 M I I
.125 .080 .095 .176 .183
. 120 .075 .090 .190 .225
. 090 . 1 00 . 180 . 225
26 . 110 . 140 .07 ss I
NG • 120 27 . 130 . 130 .07
.51-~:0 .250 .265
.480 .245 .265
.405 .240 .280
.410 .235 .371
.370 .21-!0 .360
.420 .308 .290
• l.f60 • 380
.410 .300 .230
28 .160 .125 .07 .115 .100 . 120 . 180 • 225 • 4 10 .245 (.220)
.210 (.210)
.284 (.205)
29 .130 .120 .07 .08 .110 .095
30 .120 .089 . 116 .J 10 .JOO
31 .120 .097 ,1]0
1'1onthly
.125 .180 .255 .410
.120 .180 .235 .405
. 120 . i80 .390 (.200)
mean .138 .178 .098 .111 .123 ,12] .109 .153 .232 • .315 .243 Appendix I I! co~tinues ...

195
/\ppend i x Ill contd. 1977
Jan. Feb, Mar. Apl. May June July Aug. Sept Oct. Nov. Dec.
.195 (. 130) . 100 .080 • 180
2 . 190 ( . ] 40) .100 .080 (. 175)
3 .235 . 140 .095 .080 (. 224)
4 .285 .135 ,095 .085 (. 440)
5 .270 .130 .095 .080 .280
6 ·255 . '125 .090 .080 .210
7 .235 • 131 .090 .080 .170
8 .205 . 130 .085 .075 . 160
9 .270 . 120 .095 .075 . 145
10 .285 .109 .085 .085 • lltO
11 .260 . 134 .085 (. 100) .135 12 .230 . 115 .080 (. 090) . 120
13 .200 . 100 .080 (.085) . 120
14 . 175 .095 .080 .090 . 120
'15 . 170 . 100 .080 .090 .130 16 . 165 . 100 .085 .090 .135
17 • 160 .095 .095 .090 . 130
18 .266 .090 (. 090) .100 . 125
19 .330 .090 (.095) . 105 . 120
20 .270 .090 (.095) .110 .115 21 .220 .132 (. 090) .119 . 105
22 . 190 . 150 (. 090) . 100 • 1 0(;
23 .no .125 .090 .090 .100
24 . 160 • j 10 .103 .085 . 100
25 . 160 • 100 . 113 .095 (.116)
26 • 155 .095 .095 .120 . 140
27 . 150 .095 .090 . 125 . 110
28 • 145 .095 .085 . 110 . 100
29 . 140 .085 .1 04 . 135
30 .135 .085 .233 . 176
31 (. 130) .085 .165
.207 . 114 .091 .098 . 152 Monthly mean

196
APPENDIX IV
DOUBLE RING INFILTRATION RATES, TORLESSE STREAM CATCHMENT.

197
DOUBLE RING INFILTRATION RATES, TORLESSE STREAM CATCHMENT.
f 0-lO =
f =
DRY
WET
X
SD =
LEGEND
Average infiltration rate for the first 10 minutes
(mm h- 1 )
Average infiltration rate (mm h-1 )
Infiltration rate after 30 minutes
infiltration trial terminated before 30 minutes because
a steady rate of infiltration had been attained
Dry run tria 1 s
Wet run trials 18 - 25 hours after dry run
Mean va 1 ue
Standard deviation

PLOT J
PLOT 2
198
INFILTRATION PLOTS "'SITE DESCRIPTIONS
Vegetation
Aspect
Slope
Soils
Site
Site 2
Site 3
Site 4
X
SD
Vegetation
Aspect
Slope
Soi 1 s
Site , Site 2
Site 3
Site 4
X
so
f 0-10
J '182
1 '218
:1,080
] '] 60
72
f 0-10
213
8J6
1,920
390
835
]67
short tussock grassland, including Celmisia sp.
south J32~
Jo
Cass hi 11 so i 1 , s 1 i ght l y stony s i 1 t l oams,
stony stlt loams, bouldery silt learns.
DRY
f f 30
986 900
] '] 48 J ,020
998 960
1 ,044 960
90 60
f 0--] 0
240
6]8
459
330
WET
f
228
628
428
283
180
510
345
233
short tussock grassland including clovers and
sweet verna 1 grass
north-east 55°
26°
Tekoa steep land so i 1 s, very stony silt loam.
DRY WET
f f30 f 0-10 f f30
J54 J20 40.5 32.4 15
752 ]80 798 ]36 ]20
1 '754 J,380 309 283 240
322 300 25.5 10.2 10
745 645 293 265 244
718 564 361 337 336

199
PLOT 3 Vegetation Short tussock grassland including Celmisia spp.
and sweet vernal grass.
Aspect s.s.w. 205°
Slope 90
So i 1 s Cass silt loam, slightly stony s i 1 t loams,
DRY WET
f 0-10 f f30 fO~JO f f30
Site 8JO 696 660 582 498 420
Site 2 402 334 300 159 130 60
Site 3 396 348 360 270 216 120
Site 4 516 464 420 258 195 200
X 53J 461 435 317 260 200
so 194 168 159 183 163 158
PLOT 4 Vegetation short tussock grassland including sweet vernal
grass.
Aspect S.S.E, 150°
Slope 12°
Soi 1 s moderately gravelly silt Joams.
DRY WET
f 0-10 f f30 f 0-10 f f30
Site 378 276 210 192 155 150
Site 2 224 134 90 125 76 30
Site 3 515 318 210 258 170 120
Site Ll 332 22] J95 201 154 105
X 362 239 1]6 194 139 1 OJ
SD j 2J ]9 58 55 43 51

200
PLOT 5 Vegetation short tussock grassland including significant
sweet vernal,
Aspect south-east 135°
Slope J80
Soils Cass hi 11 soils, slightly gravelly to slightly
stony si:lt loams.
DRY WET
f0-:10 f fZ f 0-JO f f30 '30
Site 462 3l3 240 266 J 91-! 180
Site 2 537 407 330 378 308 240
Site 3 656 558 450 624 527 465
Site 4 ] ,404 1 ,294 J ,080 1 '158 1 '1 08 1 ' 11 0
X 765 643 525 566 534 lf99
SD 434 446 380 362 407 426
PLOT 6 Vegetation Short tussock grassland including significant
sweet verna 1 grass
Aspect south 195°
Slope 29°
Soi.l s Stony s i 1 t loams
DRY WET
f 0-10 f f30 fo~1o f f30
Site 5,400 5,400 5' 120 4,800 4,800 4,000
S i.te 2 1 > 5JO ] '504 J '320 2,000 2,000 ] '980
Site 3 220 205 J95 225 J73 200
Site 4 3,396· 3,205 2,600 3,396 3,205 2,600
X 2,632 2,579 2,309 2,605 2,545 2'] 95
SD 2,260 2,247 2 '116 1 ,956 1 3 1 ,576 ''

201
PLOT 7 Vegetation Manuka and Discaria scrub, with tussock (Bare
p 1 ot).
Aspect north-·wes t 295°
Slope 25°
Soi 1 s Tekoa steep land eroded phase, very gravelly
s i 1 t loams.
DRY WET
f Q..-]Q f f30 f 0-10 f f30
Site 333 319 300 J40 J41 150
Site 2 J ,425 J ,132 950 426 426 420
Site 3 14J ] J J 80 82 64 45
Site 4 192 J73 ] 35 198 172 120
X 523 434 366 212 201 184
SD 607 474 400 J51 157 164
PLOT 8 Vegetation Hatt shrub (Hymenanthra sp.) and Chinochloa.
otherwise bare ground.
Aspect south-·east ] 50°
Slope 31°
Soils stony 5 i l t loam.
DRY WET
f0-10 f f30 f0-10 f f30
Site 1 ,230 1 '192 l ,000
Stte 2 576 529 400 738 712 660
Site 3 70 64 30
Site 4 2,820 2,820 2,]00
Si.te 5 684 625 5JO
x 1 ,0]6 J ,046 928
so l ,058 1 ,070 1 ,049

202
PLOT 9 Vegetation short tussock grassland
Aspect south.,...west 235°
Slope 24°
Soils Cass hi 11 so r 1. Slightly stony to stony silt
loam
DRY WET
fO-JO f f30 f a-Jo f f30
Site 744 692 540·1< 720 649 5401<
Site 2 3,864 3,727 3 ,48o·~
Site 3 5JO 432 270 498 420 300:'<
Site 4 2,466 2,316 ] '980:'<
X J ,896 ] ,791 .]51 ,567.5 609 534.5 420
SD 1 ,575 l '183 ] ,480 157 162 170
PLOT 10 Vegetation short tussock grassland with Discaria.
(Bare Plot)
Aspect north-west 3l00
Slope 20°
Soils Cass hill soi 1, eroded phase. Very gravelly
s i 1 t loam.
DRY WET
f0-10 f f30 f 0-10 f f30
Site 708 260 160 179 160 135
Site 2 215 168 120 138 127 110
Site 3 359 30J ] 75 257 251 240
Site 4 348 3J5 2]0 113 ]QQ 90
x 408 261 ] 8] 172 160 J44
SD 2JJ 66 61-1 63 66 67
,., denotes run stopped before full tlme.

203
PLOT 11 Vegetation mi.xed DracophyUwn and ChinochZoa (Bare plot)
Aspect south 170°
Slope 10°
Soi 1 s Tekoa hi 11 soil, eroded phase. Slightly stony
to very stony silt loam.
DRY WET
f Q..-JQ f f30 f 0-10 f f 30
Site ] 90 43.4 45>': 61.5 38.4 30>':
Site 2 NO DATA
Site 3 71 25 52.5 30;': 70.5 58 30•':
Site 4 ]OJ 20.7 30 84 67 30~'
x 77.3 38.9 35 72 54.5 30
SD l ] J6 9 11 15 0
PLOT 12 Vegetation DracophyZZum scrub
Aspect south 195°
Slope 35°
Soi 1 s No information.
DRY WET
f0-10 f f30 fO-iO f + I 30
Site 492 507 525 342 333 330
Site 2 627 564 500 540 472 390
Site 3 980 896 820 744 660 600
Site 4 675 613 600 ] ,026 974 980
x 694 645 6J J 663 610 575
so 206 173 J 46 292 2}] 294
,., denotes run stopped before full time.

204
PLOT l3 Vegetation short tussock grassland 1 some matagour i,
Aspect west 250°
Slope 22°
Soils cass hill so i 1 ' very gravelly to stony silt
loam.
DRY WET
fO-JO f f30 f 0-10 f f30
Site 2,268 2,0]0 1 ,800•':
Site 2 432 400.5 360•'• 8]0 828 720'''
Site 3 2,532 2,270.6 1 ,680•'•
Site 4 2,0]0 J ,859.5 1 '860•'•
X l ,825.5 1 ,650. 2 ] ,425
so 949 850 71 /-!
PLOT 14 Vegetation manuka scrub
Aspect west 240°
Slope 26°
Soi 1 s no t n format ion .
DRY WET
f 0-10 f f30 f 0-10 f f30
Site 1 '917 1 ,6] 5 750 1 ,998 l ,877 1 ,840
Site 2 359 269 225 222 182 130
Site 3 396 264 210 434 299 22.5
Site l.j. 3,936 3,576 3 ~] 2.0
X J ,652 1 ,43J 1 ,076 885 786 748
SD 1 ,687 J 1565 1 '385 970 91.+ 7 946
,., denotes run stopped before full time.

205
PLOT 15 Vegetation snow totara
Aspect no information
Slope no in format ron
Soi 1 s very stony, s i 1 t loam.
DRY WET
f O~·J 0 f f30 f o-w f f 30
Site
Site 2 J ,086 994 750
Site 3 ] ,320 J ,320 1 ,300
Site 4 2,625 2,625 2,400
X 1 ,677 1 ,646 2,363
so 829 863 1 '887
PLOT 16 Vegetation short tussock grassland
Aspect west 240°
Slope 25°
Soi 1 s Tekoa hi 11 soi 1, slightly stony to very stony
5 i 1 t loam.
DRY WET
f o~lQ f f30 f 0-J 0 f f30
Site 1 ,200 1 '] 1 0 840 1''
Site 2 372 324 240 1'' 270 233.3 21 0'''
Site 3 447 352 J35''' 279 198 120'''
Site 4 ] ,500 ] ,472.7 1 ,200'''
v 879J5 814.} 603 .}5 2]1+. 5 215.7 165 A
so 558 570 504 6 25 64
·}: denotes run stopped before full time.

206
J1,PPENDIX V
THE SEISMIC REFRACTION METHOD USED IN THE
DETERJvliNATION OF SUBSURFACE DISCONTINUITIES (Chapter 8, Part B)
by R.W. Lewandowsky

207
INTRODUCTION
Seismic refraction surveys have long been used in petroleum exploration.
With the advent of relatively cheap, portable seismographs the method became
applicable to site investigation for other purposes such as engineering
works. Using the same equipment, the techniques can be applied to a
number of problems other than engineering site investigations. In this
study the depth to bedrock was determined in several areas of eroded land
in the Torlesse stream catchment.
Seismic Refraction Theory.
A refraction seismograph consists of three basic components:
i) A source of seismic energy, in this case a hand operated
hammer.
ii) A geophone.
iii) An electronic counter to measure time.
The mode of operation is as follows: at the instant the hammer hits the
ground a signal is sent to the counter to start measuring time;
waves travel through the ground and are picked up by the geophone and the
counter is stopped by the first wave arrival.
Three different paths can be followed by the seismic wave: as a direct
wave, as a reflected wave or as a refracted wave (Figure V.l). Seismic
waves obey the laws of optical physics.
In a seismic refraction survey only the direct and refracted waves are
used. If the seismic wave is initiated close to the geophone the direct
wave will reach the geophone first, followed by the refracted wave. If
the seismic wave is initiated at some distance from the geophone, the
refracted wave will reach the geophone first followed by the direct wave.

208
Lf seismic waves are initiated at a number of points of known distance
from the geophone, a graph of time of travel against distance can be
drawn (Fig. V.2.) - this is the field information obtained during a
survey.
FIELD METHOD
A 11 Bison 1501 11 engineering seismograph was used. This instrument has
a digital readout in mi 11 iseconds (1 second= 1,000 mi 11 iseconds). A
tape was laid out along the direction of traverse and the geophone was
set at one end. Travel-time readings were taken at 1 m intervals for
the first 5-10 m of the traverse and at 3m intervals thereafter to a
total length of 40-50 m. At the conclusion of this forward traverse
the geophone was moved to the other end of the traverse and the proce
dure repeated in the opposite direction.
INTERPRETATION
The reciprocal method of Hawkins (1961) was used to interpret the time-
distance graphs. This method gives a profile of refractor depth as
well as seismic velocities within the refractor. The seismic velocities
of the surface layer were determined directly from the time-distance
graphs. A worked example for one traverse can be seen in Table V.l.
RESULTS
In general, velocity contrasts between the colluvium and the Torlesse
Group rocks were good; the colluvium having velocities between 200-
500 m sec- 1
' and the Torlesse Group rocks between 1 ,000-3,600 m sec- 1
A few velocities between 500-1,000 m sec- 1 were found. These could be
ascribed to highly crushed shear-zones in the Torlesse Group, water
logged and compacted surficial deposits, or to a layer of Intermediate
velocity between the Torlesse Group and the colluvium. Flg. V.3 shows
the three possible interpretations: more sophisticated instruments or
test pits and bores would be required to define the alternative.

counter----~/ -·--· l oqo 1
C) 0 -~ ~
~ ··-----------------'.~======~==:;=======J~ I direct wave
low velocity
surficial deposits
vl
high ve 1 oc i ty
refractor iayer
Figure V.l: Seismic wave paths.
reflected wave
refracted wave--
v

geophone I ________ .. ,
direct waves
/ time
I /:
shot points
slope equivalent to Vz
I / I
~ope e:uiv: lent-to-~1- -- -- -. ·---- ---
distance
Figure V.2: The time distance graph.
v

colluvium -1 200-500 m sec
shear greywacke 1000-3500 m sec- 1
colluvium; waterlogged or compacted 500-750 m sec- 1
greywacked/argillite 1000-3500 m sec- 1
----------
co II uvi urn -1 200-500 m sec
intermediate l~yer 750-1000 m sec
greywacke 1000-3500 m sec- 1
Figure V .3: Possible interpretation of profiles.
v

209
TABLE V. 1.
A worked example of the determination of surface depths
from seismic velocities.
Page 1 (of 3 pages) Calculation ~heet
, r rDist! Forward I Reverse 1 m
1 t i me ms I t i me ms
t ! ;Time depth Corrected 1 td fwd. time
Corrected rev. time
v2 m/s I F Ftd
i '
I I 0 I I 43.5
~ I ! I s I
46
47 ! 48
i 49
50
1.6
4.5
7.8
11.4
20.5 24.7
24.7
30.6
34.2
33.4 34.6
37.0 39.0
37.6
39.5
39.0 40.4
42.5
44.5
I I I
I I
I l
I I !
I
II
40.5
40. 1
33.5
39.3
39.7 32.0
27.8
26.4
29.4
26.6
24.3
20.2
19.3
15.5
14.4
10.3
10.7
6.5 2.5 2.0
10.2
1 9.3 9.0
7.9
9.8
9.7
6.9
7.4 5.3
14.5
21.3
25.2
25.5
27.2
29.3
30.7 32. 1
33.7
I
29.5 22.7
1 18.8
I
I
18.5
19.5 11' 0 10.0
14.6
13.3
1L9
10.2
I
II 769
I 769 ! '3529
~~~~: 12045
izo45 ' '2045
2045
..,,, m
0.53 5.4
0.53 4.9
0.53 4.7
0.44 3.5 0. 44 4 .It
I A J,), /, :I
~::; 1::~ I
0. 45 ! 3. 1
lo.4s 3.3
0.45 2.4
Explanation and legend for Table V. 1. continues ...

Table V. 1. contd.
(page 2 of 3 pages)
Legend.
forward geophone G1
Time depth td.
210
shot point S reverse geophone G11
where T is the time between the indicated sections.
The distance from S to the refractor normal to the refractor (Zs)
is given by the equation:
the term V1/Cos 1 may be regarded as a depth conversion factor F,
and by using Snell 1 s law may be written as:
Therefore
Zs f,td
Table V.I. continues ...

Gorrected time·iistance graph.
time ms
20
10-
Uncorrected time- 40 distance graph ..
time ms
30
20
10
V 2 = 769m/s
10
-----·-.
-·~·-
30
sta.:nce m
-·------. ---· w ()
0 0 ;:\ -h rt
0... w . -u
----·- !:.1 f.Q (i) U1
-1
3: fT1
0
(/)
-1 )> z ::::! (}
rn G)
:::0 :> -o :I: (/)
:\
v ~-\ 1-= 416m/s

212
As a tentative classification the velocity variations could be ascribed
to the following conditions:
The
DISCUSSION
Debris from debris avalanches, deep humus
layers 1 screes.
350-500 m sec- 1 Typical colluvium of angular particles In
a fine matrix with a thin humus layer on the surface.
500-750 m sec-1 • Short grazed ground, waterlogged ground,
or surfaces with the humus layer completely removed. -1
750-1000 m sec Highly fractured shear-zones, or a
canso! !dated weathering layer.
1000-2000 m sec- 1
with many joints.
2000-3000
with few joints.
Above 3500 m sec- 1 •
Interbedded greywacke and argill lte
Interbedded greywacke and argillite
Thick greywacke beds with little
argillite and few joints.
from the traverses are shown in Figs. V.4, V.S, V.6.
The accuracy of seismic refraction surveys to a large degree depends on
the control available to test the results. In this study the control
was 1 imlted to a few surface exposures. The problem of lack of control
is exemplified in the two sets of overlapping traverses on Gingerbread
spur (Fig. V.4.) that do not give coinciding refractor profiles.
Variable velocities in the colluvium layer probably account for much of
this error. A very irregular refractor surface or a bedrock surface
that is intensely jointed can affect the accuracy of the derived profile;
these conditions are probably common in the area of study. For this
study however, the magnitude of the variation of depth between individual
traverses is probably more important than the absolute depth un reach
point on the traverses.

1 0 20m.
Torlesse Seismic Survey
Composite profile- 'Gingerbread Spur'
P, 900 m
~~~==--==~==~~------0 ~----~===========-----~~========--------------- ~ 260m/s
200 m/s 1456 m/s
2738 m/s
P,
2727 m/s 2962 m/s
3333 m/s
P,
850 m
416 m/s
2205m/s
759 m/s J529 mis

>.
Cll >
'--::J
(f)
u E
Vl
Cll (f)
Cll V
l V
l Cll
'--0 ~
"CII u I'll
LL
"' L.. ~
L..
.LL
~
0 L-
0.
~
"' 0 0.
E
0 u
E
0 0 "'
Fi11ure V.S: C
omposite profile true right face o
f Helen stream
.
"' "E ~.;
"' 'E
"' E
"' "'
E
0
"' .., I 0
·
I :;::t

"P. ~~ < ~ ,... ::~·
3 1 :5. ;;
l 2, • ~;;
t ;; ~ "' ~ = ! :L ... ~ ..; ! !J ~ ~ ;; • 3 g ,. = ~ ~
10
Torlesse Seismic Survey
Composite profile -'The Elephant'
A,
62~
AJ
~ 1000m/s SOv "'" ~ 1680 m/
~ Ao ~ 426m/s
~ 150 7 m/s 750 m Is 1 4 2 8 _m=/~•----~
AL A,
6~ l84mts
A,
357 m/s
1554 m/s
1538 m, s "-- ---
"
x----.---~!_2 __ ~--~~~
A a
·----·--~ 42 8 m/s
'' 5 S m s
20m
•
830 m
6 2 S m/s
780 m

213
Again because of the lack of control the in~erpretation given to the
velocities found in the colluvium and refractor materials must, at best,
be regarded as tentative.
Despite these unce~tainties the results confirm that the three erosion
features were associated with areas where the refractor came close to
the surface.
REFERENCES
Anon, 1969: lnstruction Manual - Bison Instruments Engineering Seismograph Model 1501: Bison Instruments inc. 25 p
Hawkins, L.V. 1961: The reciprocal method of routine shallow seismic refraction investigations. Geophysics Vol. 26: 806-19.

214
APPENDIX VI
HYDROGRAPHS, HYETOGRAPHS, SEDIMENT YIELDS AND SEDIMENT
TRANSPORT RATES, TORLESSE STREAM CATCHMENT 1972 - 1977

vi 215
EVENTS
1972 1974 1975 1976
14 July 16 Jan 16 Jan 14 Jan 8 Sept 15 Feb 20 - 21 Jan 23 Jan 9 Sept 3 Mar 25 Jan 28 Jan
13 Sept 15 Mar 24 Feb 7 Feb 8 Oct 17 - 18 Mar 28 Feb 9 - 10 Feb
5 - 7 Apr 12 - 13 Mar 11 Feb 16 - 18 Apr 1 Apr 14 - 15 Feb 22 June 7 Apr 19 May
1973 24 June 30 Apr 10 June 2 July 19 May 15 July
23 Apr 19 July 6 June 10 Aug 9 May 28 July 14 July 7 - 8 Sept
29 May 6 Aug 26 July 11 - 12 Oct 4 June 4 - 6 Sept 1 Aug 18 - 19 Oct 6 Aug 7 - 8 Sept 19 Aug 24 Nov
10 Aug 19 - 20 Sept 30 Aug 25 - 26 Nov 12 - 15 Aug 8 Oct 4 Sept 30 Nov 20 Aug 11 Oct 20 Sept 9 Dec 29 - 31 Aug 24 Sept 19 Dec 23 Oct l1 Oct
3 Nov 2 Nov 14 - 15 Nov 8 Nov 21 Nov 27 Nov 1977
24 Dec 28 Dec 3 Jan
18 - 19 Jan 7 Feb
10 Feb 21 - 22 Feb 24 - 25 Mar

216
I I I I I I I I I I I I I I I I I I I I I I I I I I I I I I I I I I I I I I
I I I I I I I I I I I I I I I I I I I I
I I I I I I I I I I
I I I I I
I I
I
I I I I

0 z w
{!)
w
_J i Q
l
E
I-
'Ol
0
- Q)
>.
I
u Ql
>.
u 0 0
u Ql
..0
u Ql
- 0 ::)
E
::) u u 4
:
Ul
'::)
0 ..c. Q
l
E
;..=

Torlesse Stream Catchment 14 July 1972
Precipitation ____ ? ____ _
Peak flow rate
Bed load yield 0 ·145 tonnes

Torlesse Stream Catchment 8 Sept 1972
Precipitation 0 · (snow melt)
Peak flow rate 0 ·380m3/sec
Bed load yield 0·405 tonnes

Torlesse Stream Catchment 9 Sept 1972
Precipitation -~2=-=5_· ~S___!_m~m.._ __
Peak flow rate 0 · 200 m3/sec
Bed load yield __ ~O~----

Torlesse Stream Catchment 13 Sept 1972
Precipitation ?
Peak flow rate 0·270 m3/sec
Bed load yield 0·042 tonnes

Torlesse Stream Catchment 8 Oct 1972
Precipitation 190 mm (approx)
Peak flow rate 1· 3QQ m3J sec
Bed load yield large - 50 tonnes?

Torlesse Stream Catchment 23 April 1973
Prec1pi ta tion --=3=6_· 6.:::___:cm~m_,__ __
Peak flow mte 0 ·180 m3/sec
Bed load yield ___ ~O~---

.-I
t.) Cl1 Vl
M E
. Cl1 01 L..
0 L t.) Vl
0
0&00 0
E 2 E
0 3 -c 0
a: 4
0·20
0·15
0·10
0·05
0900
T1 me hrs.
1000 1100 1200
I
Torlesse Stream Catchment 9 May 1973
Precipitation 7·5 mm
Peak flow rate 0·180 m3/sec
Bed load y1eld 0
- .
1000 12{)0 1600

0600
..-I
u (1) V1
M E
. QJ
en
250
225
200
175
150
125
100
75
a so L u V1
0 25
,/
r
6
0700 0800 0900 1000
7 8 9 10
1100
1
2
3
l.
5
6
7
8
11
E E
0 -c 0
a:
12 T1me hrs
13 11.
Torlesse Stream Catchment 29 Ma:t 1973
Precipitation 14 mm
Peak flow rate 0 ·240 m~sec
Bed load y1eld 0
-
15 16 17 18

..-1
·250
·200
·150
~ ·100 Vl
("")
E
<lJ
2.o5o 0
£ u Vl
0
9
Time hrs
1
2
3
I 4
5
6
7
10 11 12 13 14 15
Torlesse Stream Catchment
4 June 1973
Precipitation 18 mm
E Peak flow rate 0 ·250m3/sec E - 0 - Bed load yield 0 ._ c 0 a:
~ -.,
16 17 1 8 19 20 21

·150
.,.-I
u ·'KXJ (])
Vl
M E
-(])
0>
0 ·050 _c u Vl
0
18
T; me hrs
6/8
19 20 21 22 23 24
718
2
Torlesse Stream Catchment
6 Aug 1973
Precipitation Snow 0·80 -1-0m water equivalent 170mm- 210mm Peak flow rate 0·150 m3/sec
Bed load y1eld 0 · 033 tonnes
3 4

E E
0 -c 0
0:::
I u
16
2
3
4
5
6
7
·20
·15
~ ·10 ("")
E
(j)
O'l a ·OS r_ u VI
0
16
.... /
T1 me hrs
17 1 8
17 18
19 ~" ::w:azc.:t_lli!!'!lj,~~~~""'"
Torlesse Stream Catchment
10 Aug 1973
Precipitation 10mm on 0·50m -0·60m snow pack
Peak flow rate 0·175 m3Jsec
Bed load yield 0
10 /8 11 I 8 . 19 20 21 22 23 2

2-E E
450 ' '·- -0
'>--c:
6- 0 a:
400
350
300
'I u <lJ (/)
('")
E 250 ~ 0
LL
200
·150
0 8 12 16 20 24 4 8 12 Hi 20 21. 4 12 8 73
_,.__ 13.8 73 --~-
Time hrs.
8 12 16 14 8 73
Torlesse Stream Catchment
12-15 Aug.1973
Prec1pilot1on 20m_m_(on 50-60cm snow poe
Bed toad yleld_29·60 tonnes
105
10 4
3~ 10 -o
ClJ
22 2>,
10 0 10 -g '-- 0 '-0 n. u
10 (/)
10~ c 0 '-
u 0 0
-o Q)
co
20 24 I. 8 12 15 20 24 __ ,.__ 15·8·73 ~,

~
I
u <l> I})
M E
(!;
2
3
E 4 E
"c35 c 0 0::6
·25
-20
-15
·10
O'l L
i! ·05 u I})
0
10 .
Time
•
11 12 13 14 15 16 17
hrs
18
Torlesse Stream Catchment
20 Aug 1973
Precipitation 14mm On 40-50 Cm snow pack
Peak tlow rote 0·250 m3Jsec
Bed load yield 0· 075 tonnes
19 20 21 22

0 8
07
06
0-5 ~
I ? ? u (I) Vl
M
E 0·4 ~ 0
LL
03 rWl ? 0·2 ?
0 1
0 50 ~~O'!~ii!fi?l=t'11l'&'J.:illt'l5
12 16 20 24 4 8 12 16 20 24 4 8 12 16 20 24 28 8 73 -+I+- 29 8 73 -+I+- 30 8 73 -+i+-
Time hrs
i i 4 8
I 12
Torlesse Stream Catchment
29-31 Aug. 1973
Precipitation 0 (m~lt of 30-L.Ocm snowpack)
Peak flow rate 0730 m3/sec
Bed load y1eld _?]_"'-6--'t_.,._o._.,nn'-'-'e,_,s,___ __ _
105 105 I c
104 E 104 Ol
.:;{_
(I)
1 o3 .....
103 . a L
Ol .:;{_
102 ~
10 u u
a a 0 0
u u (I) (I)
Cl) Cl)
I i 16 20 24
31 8 73 -+I

·300
·250
·200
·150
-r-1
u ~ ·100
. (!)
01
0 ·050 £ u V1
0
10 11 12 . 13 1L. 15 16
T1me hrs
Torlesse Stream Catchment 23 Oct 1973
Pr ec 1 pit at ion ---------=3....,2'--'· 4"'----'--'m_,_,_m,__,_____
Peak f I ow rate _ ____:0_·_3_2.-::0_m_3_/ S:.._e_C_
Bed I o ad y 1 e I d __ 0,___,· 0"--'1,__,_t-=o~nc:....:n:...::e-==S'------
2
3
4
6
7
8
E E
a -c -----"1a 0::
Estimated flows from 1700 hours incorrect hydrograph trace.
17 18 19 20 21 22 23

2
3
4
E 5 E
0 6 ·300 --c 0
0:: 7
·250
·200
·150
I u ~ ·100 L-------
("')
E
<l> 0\
a ·o5o L u V1
0
10 11 12 13 14 15 16 17 1B
Torlesse Stream Catchment
3 Nov 1973
Pr ec i pit at ion ------=2:=2~m'-'-'-'-'m'-'--
Pea k flow ra te _ __,0~·__,2=-=4=0<..___!_m_,_,__3-'-'/s=e"-'C"'------
Bed load yield 0 · 015 tonnes
19 20 21 22 23

~_,_,~
·900
2
·800 3
4
·700 Gravel "waves"? 5
6
·600 7
s
·500 9 E E
= 10 0 ......
c 0 a: ·400 11
Torlesse Stream Catchment 12
·300 14-15 Nov 1973 13 .-I
u a;
Precipitation 75 mm 14 Vl ("')
E
0 ·450 m3/sec ·200 Peak flow rate -a; O'l L..
3·0·5·0 tonnes 0 Bed load y1eld .c. 14 /11 15 /11 u
'!2 0 ·100
10 11 12 13 14 15 16 17 18 19 20 21 22 23 24 2 3 4 5 6 7 8 9 10 11 T1me hrs

0
E 2 E
a 3 -c
~ 4
·150
..-I
v ~ ·100
"' E
. (1)
0'>
0 ·050 L u 1/1
0
I-'""
24 T1me hrs
I
2 3 4 5
Torlesse Stream Catchment J 21 Nov 1973
Precipitation 12 mm
Peak flow rate 0 ·170 m3/sec
Bed load yield 0·058 tonnes
-
6 7 8 9 10 11 12 13


·300
·250
·200
·150
.-I
u ~ 400
M E
-ClJ 0'>
0 ·05 L u Vl
0
j
I
-4 5 6 7 8 9 10
I 1 E E -
2 -0
Torlesse Stream Catchment -c
15 Feb 1974 0
3 £r
Precipitation 37 mm 4
Peak flow rate 0·280 m3/sec 5
Bed load yield 0·136 tonnes 6
7
8
9
10
11
-.
11 12 13 14 15 16

2
E 3
E
= 4 a --c a 5 0::
·200
·150
..-I
<..)
~ ·100 M
E
(!) (J\
o ·OS L
<..) IJl
0
2
Time hrs
Torlesse Stream Catchment
3 ~orcb:l97lt
Precipitation 25mm
Peak flow rate 0·200 m3/sec
Bed load
3 4 5 6 7 8 9 10 11 12 13

...-I
u (I) lll
M E
-(I)
O'l I-
a _c u lll
0
E 2 E
0 4 c
!]_ 6
·500
·400
·300
·200
·100
·050 8 12
17/3 18/3
16 20 24 4 8 12
Time hrs.
16
Torlesse Stream Catchment 17/18 March 1974
Precipitation 61 m m. rain and snow
Peak flow rate --=0_· =5_,_1 0=---cm'-'-'---3_,_/-=s-=e=c __
Bed load yield estimated 6·0tonnes
19/3
20 24 4 8

.-I
u Q) Vl
M E
. Q)
0\ L..
2
::::: 0
'C 4 0
a: 5
·350
·300
·25 0
~ ·'100 u Vl
0
14 16 18 20 22 24 7
T1me hrs 6
Torlesse Stream Catchment
15 March 1974
Pr ec1 pit at ion ---'3"--5"'----'m'-'-'-'-m~--
Pea k flow rate -----'0~·....::3'-"2,_,5~m:..:.3-'/-=s=e=C'---
Bed load y1eld 0·078 tonnes
8 10 12 14

.-I
L)
E E
0 I. '+-
c 0
0:: 6
·600
·500
·400
·300
~ ·200 M
E
. Q)
0'\
0 ·100 L
~ 5/1. 611.
Torlesse Stream Catchment
5-7 Apr 1974
Prec ipi ta tion ---=6-=-0-'-m:...:..m:..:....:._ __ _
Peak flow rate ---=0'-· =5....:....7-=-5--=-m:...:..3-'-"t S,__,e,_,C<--
Bed load yield 4. 700 to nnes
7/4 0 050~ __ ._ __________________________________ ._ ______________________ ~--~--~--~--~--~--~--~--~------~
21 5 9 13 17 21 5 9 13 17 21
Time hrs

E Torlesse Stream Catchment ~0 E
16·18 Apr 1974
2·60 Pr ec 1 pit at ion ___ 8c::...4--'--'-m::..:...:..:.m-'------
2·40 Pea k f 1 ow rate __ 2_· 6-=--5-=---m'-'-3---'-/s=-e=-c=-----
2·20 Bed l 0 ad y I e l d -----">-----'1-'-0-'-0___;;_to_:_n:..c.:....:n.=e=.s?
2·00
1-80
1-60
11.0
1·20
roo I
u 060 «.>
VI
M
E 0·60 -«.>
0\
0 040 ..c. u VI
0 0·20 15/4 17/4 18/4
0 18 22 2 6 10 14 18 22 2 6 10 14 18 2 2 2 6 10 14 18 22
T1me hrs

550P-~--~--~--~~----.e----~~--~--~--~~~------------------------------------------~
·500 2 Torlesse Stream Catchment
3 22 June 19Z4 E
·450 4 E Precipitation 22 mm. rain and snow 0
0·550 m3tsec ._
Peak flow rate c 0
0:::
·400 Bed load yield 0 · 095 tonnes
·250
...--I
u ill Vl ·200
M E
. <1J Ol ..... 0 ·150 .c 22/5 23/5 u Vl
0
16 18 20 22 24 2 4 6 8 10 12 T1me hrs

·600
·500
·400
·300
·250
·200
....... I
u ~ -150
M
E
(J)
en
0 ·100 23/6
E E 1 0 ..... c 2 0
cr
5
Torlesse Stream Catchment 24 June 1974
Prectpitation 18mm
Peak flow rate 0·430 m3/sec
Bed load yIeld _ _.:=_.0_· o:::_a::::_o::::__:t..::.o.:_:n~n-=-e-=-s-
.c u lll 0 ·050._--~~;---~~;---~~~--~~~--~~~--~~~--~--~--~--:---~--~----------~----------._ __ ._ __ j
19 20 21 22 23 24 2 3 4
24/5
5 6 7
Tt me hrs

~
I
u <11 lll
M E
L..
2
3
4
5
E 6 E
0 7 -c 0 a: 8
·300
·250
·200
·150 2/7
Torlesse Stream Catchment
2 July 1974
P r ec i pit at ion -------'3~6...._. --'-'mL!.!ml..ll'-. ___ _
Peak flOW rate _ _:_0_· 3.::..._1_c_,O:::.__c_m __ 3_t--s=-e--c=----~
Bed load y1eld 0 · 002 tonnes
4 5 7
0 ..c. u lll 3/7
0 ·100~----~~-----;~_.--~------;;------·~------~--._--~--~~~~------------------_. ______________ _j 19 20 21 22 23 24 2 3 6
Time hrs

...--' u ClJ
E 2 E
~ 4 --c a
cr: 6
·600
·500
·400
1/l ·300 M
E
-ClJ 0'> .__
_g ·200 u 1/l
19/7
Torlesse Stream Catchment
19 July 1974
Precipitation 20mm. rain and snow
Peak flow rote 0·610 m3/sec
Bed load y1eld 0 ·050 tonnes
20/7
0 150~--M---------~------~--~--~--~---~------~--._ __ ._ __ ._ __ ~--~--------~------_.--~ __ _. ______ -J 0 4 8 12 16 :20 24 4 8 12 16 20 24
T1 me hrs

u <IJ Vl
·300
·250
·200
·150
M ·100 E
. <IJ O'l L..
a -5 ·050 Vl
0
No accurate rainfall data.
Overall ppt. probably about 20 mm.
15 16 17 18 19 20
T1me hrs
21 22
Torlesse Stream Catchment
28 July 1974
Prec i pita ti on --=a=b-=o_,u_,_t _,2=0~m_,_,_m~. ?_
Peak f I ow rate ___::0:_·-=2=9-=0--'m'-'-'-3-'--'1 S=-e=-=C=-:.. _
Bed load y1eld ----=0~---
23 24

~
I
L)
<1J Vl
2
E 3 E
2 4 c a
0:: 5
·250
·200
·150
M •100 E
. <1J 0\ '-a -5 ·050 U1
0
~
c ~
14
-
15 16 17
r
Torlesse Stream Catchment I 6 Aug 1974
I Precipitation 17mm
Peak flow rate 0·190 m3/sec.
Bed load yield 0
-
6/8 7/B
18 19 20 21 22 23 24 2

2
4 E Torlesse Stream Catchment E 6 4-6 Sept 1974 0 .....
89 mm c 8 Precipitation 0
a:
10 Peak flow rate 1· 30 m3/sec
Bed load yield 0 · 900 toooes
1•40
1·20
1{)0
I ·80 u (!) Vl
·60 M E
. ·40 (!)
0"\ L..
0 ·20 _c
u Vl
0 4/9 5/9 6/9
0 n 3 6 9 12 15 18 21 24 3 6 9 12 15 18 21 24 3 6 9 12 15 1'0 21 24
T1 me hrs.

·40
·35
·30
-20
Torlesse Stream Catchment
15 7-8 Sept 1974
Precipitation Q (SnOW melt) ..--
I
u OJ Peak flow rate ___,Oo_·__,3~8'-'0"-'-"-m"'-3-'-t=s=e=c __ Vl .10
M E Bed load y1eld 0 ·405 tonnes OJ CJ) .... a ·05 .r:. u Vl
0
1.1 23 3 5 7 9 11 13 15 17 19 21

...... I
u Ql
2
E 3 E
0 4 -c 0 5 0::
·250
·200
·150
r: ·100 E
-Ql 0\ I...
_g ·050 u ~
0
8 10 12 14 16
Torlesse Stream Catchment
19-20 .SeQt.1974
Precipitation 19mm.
Peak flow rate 0·240 m3/sec.
Bed load yield 0
19/9 20/9
18 20 22 24 2 4 6
T 1me hrs

..I
E E
a ._ c a
0:
u
0
2
3
·50
·45
·40
·35
·30
~ ·25 M
E
. (I)
0">
0 ·20 .c. u (/)
0
?/10 8/10
18 20 22 24 2 4 6 8 10 12 14 16 18 2 0 22 24 2
Torlesse Stream Catchment
8 Oct 1974
Pr ec 1 pit at ion _ ____::3:....:0=--:m:...:..:.:...:mc.:..+~. _,(c=S_:__:n:...:=O...:._W::_:),_
Peak t 1 ow rate--=0'-·-=5'-"0,__,0~m_,_3_,/'---'s=e~ce.__
Bed load y1eld 0 ·150 tonnes
9/10
4 6 e 10 12 14

...---I
v 41 V1
M E
41 Ol .... 0
L u V1
0
-soar-~~~--~--~--~--~--~--~--~--~--~--~--~-------------------------------------------------.
-450
-250
-200
-150
·100 11 /10
-¥.W''::.rt~,..,.;.,
~2 14 16 18 20 22 24 4
Time hrs.
Torlesse Stream Catchment
11 Oct 1974
Precipitation SnOW melt
Peak flow rate 0 ·480 m3/seC
Bed load y1eld ___ 0=------
12/10
6 8

·45
·40
·35
·30
·25
·20
I u ~ ·15
M E
-CIJ Ol
0 ·10
Torlesse Stream Catchment 16 Jan 1975
Pr ec i pit at ion __ _::_6_7~m_:_m:._:_:_ ___ _
Peak flow rate-----.:0~· 4~3~0~m~3~/~s~e..:::C:__
Bed load y1eld 0 · 060 tonnes
~ ~------------~--~ <1'1
0
5 7 8 9 10 11 12 13 14
Jl
11:' -• Ti rne
16/1
16 hrs
17 18 19 20 21 22 23
17/1
24 2 3
2
3
4
5
6
7 E E
s-o -c a
go:::
10

1·2
1{)
oe I
u
~ ~ M
E 0'4
'-
~ 02 u Vl
20/1 21/1 22/1
Torlesse Stream Catchment 20-21 Jan 1975
Precipitation 100m m
Peak flow rate 1·50 m3/sec
Bed load yield approx 5· 0 tonnes
0 0~--~~~~~~~~~~~~--~--~--~--~--~--~--~--~--~--~~~--~--~---------------------' 6 9 12 15 18 21 21.. 3 6 9 12 15 18 21 21. 3 6 Q 12 15 18 Time hrs

I u
90
80
·70
60
*50
M E ~ .9 lL 1.0
·30
2
I.
6
B
0
-? .... ? ., , .. ~',
E E
0 '+-c 0
0::
Torlesse Stream Catchment 28 Jan.1975
Precipitation 70mm
Peak flow rote 0701]3 Sec-1
Bed load yield 27_. Q_tonnes
102
10
I
c E 0) ~ -'-&_ Ill c: 0 '--"0 0 0
"0 4>
£l)
osoL---~~~~--~~~~--~--~~--~--~--~~--~--~--~~--~--~--~~--~--~--~~--~--~~ 19 21 22 3 5
28·'1 75 -+1 7 9 11 13 15 17 19
29 1 75 21 23 1 3
-....I~ 5 7 9 11 13 15 17 19 21 23 3
30 1 75
"0
103 ~ >.
"0 0 0
"0 QJ
£l)
1rf
101

2
E 3 E
== 4 0 -c 0
a: 5
·250
·200
·150
..-I
u <1.1 Vl
("") ·100 E
-<1.1 01 '-0
·050 s::. u '~ 0
17
24/2
18 19 20 21 22 23
Time hrs
24
Torlesse Stream Catchme·nt 24 Feb .1975
Pr ec i pi tot ion ---'--'2~6"--·-=m_,_,_m-"-'-----
Peak flow rate_· --=0~:=2.-:.4-=-0---". m:..:...· :.._3-"-l=se-=--=-C _
Bed load yield ___ _:_0,__ ___ _
25/2
2 3 4

.f.O
·35
·30
·25
·20
I u Cll Vl
M
E ·15
' Cll 0\ L...
0 s::. u Vl ·10
0 27/2
20 21 22
Torlesse Stream Catchment
28 Feb 1975
Preci pita tion __ __,3~6"---'-'m'-'-'m~---
Peak flow rate_0_·_3_8_0_m_3_/_s_e_c __
Bed load yield 0 ·015 tonnes
28/2
23 2J. 2 3 5 6 7 8 9 10 11 12 13 14 15 1 6 17 18 19 2 0 21 Time hrs
3
4
5
6
7
E E
0 -
22
c 0
0:::

3·0
2·6
2·2
~ 1 ·8 <II Vl
("')
E
~ ~ 1-L. LL
1·0
·60
20
15 18 21 24 3 6 9 12 15 18 21 24 3 6 11 . 3 75 ---+1+-- 12·3·75 ---+1+--
T1 me hrs
Torlesse Stream Catchment 12-13 Mar 1975
Pr ec1 pi to tlon _,1_,S'-='4:...Jmu..u..mu.._ ___ _
Peak flow rate __...2.__· 8.::.___:_m~3_.cs::..:e=.:C=·---
Bed load y1eld 72·0 tonnes
2
4 ;:u 0
::J
6 0
8 3 3
10
104 OJ ID 0;
30 10 g_
'<
!.. 0;
2,.-10'9
10
0
9 12 15 18 21 24 3 6 9 12 15 18 21 24 13·3·75 ~1+-- 14·3 75 --+

..-I
l) 4> VI
M E
. 4> Ol '-a .I: l)
.!!! 0
-soar-~~--~~--~~--~~----~-.--~~--~~----------------------------~
·450
f27 mm in this interval------*"-~~ I
-400
·350
-300
·250
·200
·150
·100 1/4
12 14 16 18 20 2-~ ,_ 24
Time hrs
1
2 E E
3 a -c a 4 a::
5
2/4
2 4
Torlesse Stream Catchment
1 April 1975
Precipitation 33-0mm. (approx.l
Peak flow rate 0· 480 m3/sec
Bed load yield 0 · 400 to ones

·400
·350
·300
·250
·200 ..-
I
u C1l VI
("")
E ·150
-C1l 0'\ '-a
J::. u Ill ·100
0
12 13 14 15 16 17 18 19 Time hrs.
E E 2 = a -c 3 a
0::
20
Torlesse Stream Catchment 7 April 1975
Pr ec 'pit a ti on __ __:3:_:0:._:_m~m~. ___ _
Peak t 1 ow ra te~O::._::· 3~6~0=---:._m~3/:.c::se=-=-=c'----_
Bed load yield -~Oc_·::!_4~0~0_t~o~n!..!.n~e~s~
21 22 23 24

~
I
22
2·0
1-80
1-60
~1-40 (")
E ~ 120 0
I.J.. 1·0
08
0·6
0 16 18 20
29 I. 75
2
I. E E
6 0 ..... c
8 0 0:::
10
12
22 21. 2 I. 6 8 10 12 11. 16 18 20 30 I. 75 ---+1+-- Time hrs.
Torlesse Stream Catchment
30 Apci! 1975
Precipitation
Peak flow rate 1-75 m3 /sec
Bed load y1eld 1· 57 tonnes
10 10
~
I
10 c
10 E c:n
.::£
«> 0 '-
..... c:n '- .::£ 0
10 Cl. 10~ VI c «> 0 '-
>-.... u
u 0 0 ~ 0
"U u «> «>
en en
22 24 2 I. 6 8 10 12 11. 15 18 20
--+1+-- 1· 5 75 ---+

.-I
u <L> Vl
·400
·350
·300
·250
·200
M ·150 E
. <L> 0> '-0
-D ·1 00 Vl
0
2 3 4 5 6 I' 8 Time hrs.
9 10
2
E 3 E
0
4 -c: 0
0::
5
Torlesse Stream Catchment 19 May 1975
Precipitation 16 mm
Peak flow rate 0· 380 m3/sec
Bed load yreld _____ O ___ _
11 12 13 14 15

-OJ en L.
0 .I:
·700
•600
·500
·400
·300
~ ·100 0
2 6 8
2
4 E E
6 0 -c
8 0 a:
10
6/6
10 12 14 16 18 20 22 24 2 Time hrs
Torlesse Stream Catchment 6 June 1975
Precipitation 81 mm.
Peak flow rate 0·680 m3/sec
Bed load yield 1· 0 tonnes
I
7/6
4 6 8 10 12 14 16 18 20 22 24

·450
·400
·350
·300
·250
~ ·200 I
u «< VI
M E
. ·150 «< 01 '-a
..c. u VI
0 ·100
12
L
-~
13 14 15 16 17 18 19 20
Time hrs
1
2
3
4
5
,. 6
7
8
9
1 0
Torlesse Stream Catchment 11
14 July l9Z5
Precipitation 32 mm.
Peak flow rate 0·410 m37sec
Bed load yield 2·5 tonnes
21 22 23 24

.I
u GJ Vl
M E
-GJ 01 L..
0 .I::. u Vl
1
2
E3 E
.E 4 c 0
a:: 5
6
7
·200
·150
·100
0 ·050
9 10
I
11 12 13
Torlesse Stream Catchment
26 July 1975
Pr ec i pita t ion ----=8'-·-"'5---'m--'-'-'--m:...:..:. __ _
Peak flow rate __ 0.:_·_1-'-8-'0_m_3_/_s_e_c_
Bed load yield 0 ·1 0 7 ton nes
~
~------------------------------------------------------J
'14 15 16 17 18 1 9 20 21 22 Time hrs.

Torlesse Stream Catchment 1 Aug 1975
Precipitation 41 mm (rain and snow melt)
Peak flow rate 0·500m3/sec (approx)
Bed load y1eld 3·0 tonnes (estimated)

'I u QJ Vl
(")
500
450
400
350
300
E 250 3: 0
l.L
·200
·150
wo
050
22 24
I~ 4 6 B 10 12 14
19 8 75
(
Torlesse Stream Catchment
19 Aug.1975
Prec1 pi to t1on __ 5_5~m~m~-----
Peak flow rate 0·475 m3 /sec-
Bed load y1eld 15 · 0 tonnes
16 18 20 22 24 2 6 B 10 12 14 ___.I.__ 20 8 75
2 E E
4 = a -6 c a
a::
8
16 18 20 22 24
--+I
...... I
c. E
10 0)
.::s:. QJ
0 L.. -L.. 0 a. Vl c a .... -u a 0
u QJ
(l)
2
105
10
4
u Ql
(l)

·250
·200
·150
.... I
u dl VI
M ·100 E
. Q)
01 '-a
..c u ·050 .~
0
12 13 14 15 16 17 18 19
Time hrs
20
Torlesse Stream Catchment
30 Aug 1975
Precipitation 0 (snow melt)
Peak flow rate 0 ·185 m3/sec
Bed load yield 0·15 5 to ones
21 22 23 24

~
I
u Q) Vl
M
·30 0
·250
·20 0
·150
E ·100 .
Q)
0'1 L..
0 _c u Vl ·050
0
I
24
l l
r I
1 2 3 4 5 6 7 Time hrs.
l I 1
2 E E
3 = 0 -c c;·
4 0::
5
--...........
Torlesse Stream Catchment 4 Sept 1975
Precipitation 18mm
Peak flow rate 0 · 230 m3tsec
Bed load y1eld 0 ·440 tonnes
8 9 10 11

·400
·350
·300
·250
·2oo L-------.
I
u Q) VI
M
E ·150 .
Q) 01 '--0 .c u V1
0 ·100 19/9
22 23 24 21 2
2
3
4
5
8
3 5 6 7
Torlesse Stream Catchment E 20 Sept 1975 E
C) Precipitation 25 mm. .... c: C)
0·345 m3/sec a: Peak flow rate
Bed load yield 1·00 tonnes
20/9
8 9 10 11 12 13 14 15 16 17 18 19 20 21 22 23 24 Time hrs

..--' u QJ VI
M E
. OJ Ol L-
a ..c: u 1/l
·1.00
·350
·300
·250
·200
·150
0 ·100
20 21
23/9
22 23 24 2 3 4 5
2 c '-
E Torlesse Stream Catchment 3 a 24 SeRt 1975 -c
a 4 cc Precipitation
Peak flow rate 0·375 m3/sec
6 Bed load yield 1· 0 tonnes
24/9
7 8 9 10 11 12 13 14 15 16 17 18 19 20 Time hrs.

-CIJ 0\ ..... 0 .c:
·400
•350
·300
·250
·200
-~ ·100 0
20 21 22 23 24 1 2 3 4 5
4/10
6 7 8 9 10 11
Time hrs.
Torlesse Stream Catchment 4 Oct 1~Z5
Prec i pita tion __ __,_4-=0___,_,m=m........_ __ _
Peak flow rate 0 · 34 Q m3/sec
Bed load yield 0 ·840 tonnes
E E
0 -c 0
a::
3
4
5
6
12 13 14 15 16 17 18 19 20 21 22

·45o.._ __ _
·400
·350
·300
·250
~ ·200 V1
M E
. Cll
~·150 a .r. u V1
0
·100
11 12 13 14 15 16 17
Time hrs.
E E
2
3
18 19
Torlesse Stream Catchment 2 Nov 1975
Pr ec 1 pit at ion __ ___,2=-1_!__· -=m_,_,·'-'-m,_,__ __ _
Peak flow rate_--=.0_·_:_4_:_0_:_0__c_m_3_/s_e_c_
Bed toad yield _1:_· -=2c.=O_t.:_:o_;_n_;_n_c_e_s __
20 21 22 23 24

.I
u <11 Vl
(Yl
E
. <11 0> '-0 ..c: u Vl
·350
·300
·250
·200
·150
0 ·100
4
I
~
5 6 7 8 9 10 11 12
Time hrs
I 1
2
3
4 E E
::::: 5 0 .....
c. 0
6 0::
7
8
Torlesse Stream Catchment 8 Nov 1975
Precipitation 20mm
Peak flow rate 0 ·320 m3tsec
Bed load y1eld 0 ·200 tonnes
13 14 15 16 17

250
·200
1 ·150 u Ql Vl
("")
E
~ ·100 0\ L...
0 s::. u .~ 0
22
.....
23 24 2
1
_j • 2
3
4
5 . E E
• 6 ~ '+-
c
7fi
8
-
4
Torlesse Stream Catchment
2Z t:io~ 19 Z5
Precipitation 21 mm
Peak flow rate 0·240 m3tsec
Bed load yield 0· 014 tonnes
-I
5 6 7 8 9 10

..--I
l) (!) 1/l
M E
(!)
0"> L...
0
2
3
4
E E 5 ::::: 0 -~6 0 a:
7
·150
·100
~ ·050 1/l
0
~
-17 18 19 20 21 22
Time hrs 23
Torlesse Stream Catchment
24 Dec 1975
Precipitation 13 mm
Peak flow rate 0 ·110 m3/sec
Bed load y1eld 0·020 tonnes

.I
u Q) VI
·200
·150
M ·100 E
-(])
Ol 1...
0 -5 ·05') VI
0
r--___.J
8 10 12 14 16 20
2
3
4 E
5 E
= 0 ..... c:
6 0 0::
7
8
9
22 24
Torlesse Stream Catchment 28 Dec 1975
Pr ec i pit at ion ---=3=0--'-'-m~m_,_,__ __ _
p eo k f l 0 w rate ____;:o::.___c: 2=1~0=--.:....:_m.:_3~' =se=-c=---
Bed load yreld 0 ·032 tonnes

.-I L) Q; Vl
2
3
E 4 E
::::: .2s c a
a: 6
·200
·150
M -100 E
(!) C]l L...
a -5 {)50 Vl
0
I
:----__
2 3
Torlesse Stream Catchment 14 Jan 1976
Precipitation 15 mm
Peak flow rate 0·190 m3/sec
Bed load y1eld 0 · 030 tonnes
-
4 5 6 7 8 9 10 11 12
T1 rne hrs

2
3
4 E E
5 a c a 6 0:::
7
8
·250.
·200
..-1
u «J Vl
M ·150 E
-«J 0> ..... a -5 ·1 00 Vl
0
6 8 10
Torlesse Stream Catchment 23 Jan 1976
Precipitation 31 mm
Peak flow rate 0·240 m3/sec
Bed load yield 0·002 tonnes
23 /1 24/1
12 14 16 18 20 22 24 2 T1 me hrs

2
3
4
5 E E
6 a ..... c a 7 0::
8
g
·2'5 0
·200
Q.J
0\ 1-
a -5 ·1 0 0 <ll
0
0 2 4 6 8 10 12 16 Time hrs
Torlesse Stream Catchment 28 Jan 1976
Pr ec 1 pit at ion ___ _,2'-"2"---'-'mC.:..:m~---
Peak flow rate 0 · 22 0 m3/sec
Bed load yield 0·034 tonnes
18 20 22 24

·350
·300
·2~0
·200 ~
I
u Q]
Vl
M
E
. Q]
O'l '-0
L u Vl
·150
0 ·100
11
71 2
13 15 17 19 21
Time hrs
1
2
Torlesse Stream Catchment 3 7 Feb 1976
4 Precipitation 51 mm (inc. snow)
E 5 Peak flow rate 0 · 3!t5 m3Lsec E
0 6 Bed load y1eld 0 · 540 tonnes
7
i/2
23 3

·450
400
·300
250
·200
I ·150 v Q) Vl
M
E
-~ ·100 '-0
L v Vl
0
12 14 15
10/2
18 20 22 2 Time hrs
Torlesse Stream Catchment 9 ·10 Feb 1976
Precipitation 0 SnOW me( t
Peak flow rate 0·440 m3/sec
Bed load yield 1 · 2 6 0 to nnes
11/2
5 8 10 12

0·8
07
0·6
0·5 I u 41 Vl
("')
E 0·4 ~ 0
LL
0·3
0·2
0·1
t 0 0. Cll c a '.......
10 4
103
-a -a a a 0 0
-a 41
en
Torlesse Stream Catchment
11 Feb.1976
Precipitation 60mm(rain on snowmelt)
Peak flow rate 0·520 m 3 I sec
Bed load yield 27· 8 tonnes
0·50 ~~---.---.--~--~--.---~~~~--~--~--~--~--4---¥---~~~~--~--~--~--~--¥-~ 12 13 14 15
11·2·76 23 24
--+1+-Time hrs
12·2 76 7 8 9 10 11 12

·450
·400
350
·300
·250
·200
..-1
u <lJ Vl
M E ·150
-<lJ Ol 1-
0 L
~ ·100 0 13/2
8 12 16 20 24 4
2 E
4 E :::: 0
'+-
Torlesse Stream Catchment 14-15 Feb 1976
Precipitation ___ 5-=--:...1_;m:...:.:..:..m.:...:..._ __ _
Peak flow rate 0·400 m3/sec
Bed load y1eld 1·00 tonnes
14/2 15/2
8 12 16 20 8 12
Time hrs

2
Torlesse Stream Catchment 19 May 1976 3
E E
·BOO Precipitation 55mm 4
.E c
Peak flow rate 0·590 m3 /sec 5 0 0::
700 Bed load yield 10· 6 tonnes
600 8
I Note: bed load transport I continued until
I 1600 hrs. 20·5 ·76 I u·500 I Cli
I <.f)
M I E I 102 102 3 I ~·400 LL
~
I
E E
·300 10 Ol ~ 10 41 -0 '-- Ol '- ~ 0 0.. "0 <.f) c 41 0 :>, '-.....
"0 "0 0 0 0 0
·100 "0 "0 41 41
m co
·050 22 23 24 1 2 3 4 6 7 B 9 10 11 12 13 14 15 16 17 18 19 20 21 22 23 24 2 -+I+- 19 5 76 -+I Time hrs.

..-' u 41 Vl
("')
E
L-
-350
·300
-250
·200
·150
a L u .~ o~oo
17
9/6
19 21 23 1
10/6
3 5 Ttme hrs
2
3
4 E E
5 .2 c
. a 6 cr:
7
8
Torlesse Stream Catchment 10 June 1976
Prec i pita tion __ ___::3:...::8::.__:_cm:...:.m:..:....:..... __ _
Peak flow rate ___::0:....·_::3:....4.:...:5::__:m:..:..:._3-=-/ S=e=C-
Bed load yield 0 · 085 tonnes
7 9 11

or-r u 4.> Vl
("'")
·800
·700
·600
·500
·400
·300
E ·200 .
4.> 0\ '-0
..c u
6 ·1001-------
0 2 4 6 8 10 12 14 16 Ti m<e hrs
2
3
4
5
6
7
8 E E ::::
9 0 ..... c 0
10 a:
18
Torlesse Stream Catchment
15 July 1976
Prec 1 pi to ti on __ ___,5:..::0o...__:.:m'-'....:...:.m.:__ __ _
Peak flow rate 0·790 m3/sec
Bed load yield 3·5 tonnes (2·6tornes recoraea;
20 22

350
300
250
I u (]) rJ)
M
E 200
3: 0
LL
150
100
·050
16 18 20 22 24 2 4 6 8 9·8 76 ~1+---
2 ~
-Torlesse Stream Catchment 3 0
10 AUG 1976 3 4 3
Pre c 1 p 1 t a t1 on 51 (,_,6'-'7__!_C) m'-'--'-'-m,_,___ __ _
~
I
c E
Sf 10 (]) ..... 0 '---L 0 0.. Ul c 0 L -
Peak flow rate 0J60 m3 SeC - 1
Bed load y1eld 17·6 tonnes
\
10 12 14 16 18 20 22 24 2 4 6 B 10·8·76 ____., +--
Time hrs
5
10 12 14 16 18 20 22 2J.. 118·75 --+I

3·0
2·8
2·6
2·1.
22
2·0
....... I 1·B a; Vl
1: , 6
~ 0
u_ 1 I.
12
·lO
80
60
1.0
20
0 2 6 8 10 12 11. 16 18 20 22 24 2 6
7. 9 ·76 --+1+--
E E
Cl ..... c fi_------
Torlesse Stream Catchment 7-8 Sept 1976
Pr ect pi tot ion _1:_::5::_::3=--:m,_,_.__.m_._._ ____ ~
Peak flow rate 1·30 m I sec-
Bed load yteld 91·2 tonnes
10 12 14 16 18 20 22 24 8·9·76
10 10
..... .... Cll 0 .::£ a. Vl "0 c Cl <II .... .... >-
"0 "0 Cl Cl 0 0
"0 "0 <II <II
(]) (])

I
------------ _J E 2 E Torlesse Stream Catchment
:::: 3 a -- 25 Aug 1976 c a
4 a: 23 mm (approx) Precipitation
5 P eo k f l ow rate ---'0=----=· 2=-8=-0..=.._:m..:_:_3...:.../-=-s=e-=-c-
6 Bed load y1eld 0· 050 to noes
7
·300
·200
..... I
u <1.> Vl
M E
. <1.> 0\ L...
a _c u -100 Vl 25/8 0 26/8
12 14 16 18 20 22 24 2 4 6 Time hrs

.2 E E = 4 a -c
r!i. 6
1·400
1·200 ..
I
u C1l VI
("")
E
. C1l O'l L..
a s::. u VI
·800
11/10 12/10
Torlesse Stream Catchment 11·12 Oct 1976
Prec 1pi ta tion ----'5=--6::........:...:m:...:..:m...:....:._ __ _
Peak flow rate 1 · 20 m3/sec
Bed load yield 0· 065 tonnes
0 ·400._--~~--_. ________________ _. __ ~----------~~---*--~----------~~------------------------~ 10 14 18 22 2 6 10 14 18 22
Time hrs.

2
E E 3
a 'C 4 a
0:::
,..... I
u Cll
5
·700
·600
·500
·400
Vl ·300 M
E
. Cll O'l .._
1? ·200 u Vl
0
10
18/10
12 14 16 18 20 22 2
T1me hrs
Torlesse Stream Catchment 18·19 Oct 1976
Precipitation 49 m m (and SnOW melt)
Peak flow rate 0 '680 m3fsec
Bed load y1eld 0 · 0 50 tonnes
19/10
4 6 8 10 12

·350
·300
·250
~ ·200 I
u Q.l Vl
M E
. ·150 (!)
0> L..
0 .c. u Vl
0 -100
13
I
/
14 15 16 17 18 19 20 21
Time hrs
r
Torlesse Stream Catchment
24 Nov 1976
Precipitation 26 mm.
Peak flow rate 0·350 m3/sec
Bed load yield 0
-
'
22 23 24
1
2
3
It
5
6
17
8
9
1 0
E E
0 ..... c 0
0:::

.,.... I
u q, Ill
M
·500
'450
·400
·350
·300
·250
E ·200 .
C1J 0"> L..
2 E E
3 0 -c 0
4 0::::
2 5/11
Torlesse Stream Catchment 25·26 Nov 1976
Prec1pi ta tion ____ 2_2_m'-'-'-'-m~---
Peak flow rate 0 · 450 m3/sec
Bed load y1eld 0 · 20 tonnes
26/11 0 L u Ill
0 ·150~------------~--~------------~------~_.------------------~------------._--~------------~
12 14 16 18 20 22 24 2 4 6 8 10
Time hrs.

·700
·600
·500
·400
..-I
u ~ ·300
M E
. (!)
(]I
a -2oo .c u 1/l
0
J 15 1cb. 1 7 18 19 20 2
T1me hrs
2
Torlesse Stream Catchment 4 30 No~ 1976
4 Precipitation 32mm
Peak flow rate 0·600 m3/sec
6 Bed load yield 0·50 tonnes
E
e E --0 -c:: 0
0:::
10
12
14
16
22 23 24 18

·550 r---"1----.
·500
·450
·400
·350
·300
·250 ...... I
u GJ V'l
M E
·200 . GJ Ol L..
a _c u V'l
0 ·150
12 13 14 15 16 17 Time hrs
18 19 20
Torlesse Stream Catchment
9 Dec 1976
Precipitation --~3"--'7~m~m:.!._ __ _
Peak flow rate 0 · 500 m3tsec
Bed load yield 4 · 00 tonnes
21 22 24
2
3 E E
I. a -c
5 0 0::
6
7
8
9
10

. (I)
Ol ..... 0
•400
·350
·300
·250
·200
-5 ·100 Vl
0 19 /12
10 12 14 16 18 20 22 Time hrs
2
Torlesse Stream Catchment 3 19 Dec 1976
4 Precipitation 31 mm
5 E E Peak flow rate 0 · 350 m3/sec
0
6 ~ Bed load yield 2 ·15 tonnes 0
0::
7
8
20/12
2

.-I
u Q)
·350
·300
·250
·200
Vl ·150 ("")
E
Q)
0> '-
_g ·100 u Vl
0
. I
"""' -
I
9 10 11 12 13 15
T1me hrs
1
2
3
E E 4
J :::: 0 .._ c 5 0
a:
6
7
....,
Torlesse Stream Catchment 3 Jan 1977
Precipitation 26 mm
Peak flow rate 0·330 m3/sec
Bed load y1eld 0 ·580 tonnes
16 17 18 19 20 21 22

·450
·400
·350
·300
·250
4 5 10 12 14 16 18 20 22 24 2 6
T1 me hrs.
8
2
4
Torlesse Stream Catchment
18·19 Jan 1977
Prec i pita tion ___ 7_8_m-'-m-'--'----
Peak flow rate O ·450 m3/sec
Bed load y1eld 2 ·50 tonnes
19/1
10 12 14 16 18 20 22 24

·200
I ·150 u dJ Vl
M E
~ ·100 0'> '-0
_c u Vl
0
·050
12 13 14
L 1
...--•
2 E E
3 = 0 -c
4 0 a:
5
-
-
7/2
15 16 1 7 1 8 19 2 0 21 22 2 3 24
Tt me hrs
Torlesse Stream Catchment 7 Feb 1977
Precipitation 16mm
Peak flow rate 0·170 m3/sec
Bed load yield 0 · 0 20 tonnes
8/2
2 3

·200
a: ·150 Vl
("')
E
. QJ 0\ a -1oo L u Vl
0
·050
...._
~
10/-2
18 19 20 21 22 23 24
1
2
3
~ E E
5 =s -c
6 ~
7
2 3 4 T1 me hrs.
Torlesse Stream Catchment 10 Feb 1977
Prec1pi ta tion 18 mm.
Peak flow rate 0·170 m3/sec
Bed load yield 0
11/2
5 6 7 8 9

2
E 3 E
Torlesse Stream Catchment 0
21-22 Feb 1977 4 c 0 a:
Precipitation 34 mm 5
Peak flow rate 0 ·200m3/sec 6
Bed load y1eld 0 · 0 40 tonnes
·200.
·150
.--I
u QJ Vl
·100 M
E
QJ Ol '--0
·050 L. u Vl 21/2 22/2
0
10 11 12 13 14 15 16 17 18 19 20 21 22 23 2J. 2 3 4 5 6 7 8 9 10 11 12
T1 me hrs.

.I
u Q)
1
2
3
4
5
6
7
·200
·150
r: ·100 E
-Q) Ol .... 2 ·050 u Vl
0 24/3
10 11 12 13 11. 15 16 17 18 19 20 21 22 23 '}}. 2
Ttme hrs
Torlesse Stream Catchment
24·25 March 1977
Prec tpi ta tion ------'2,__.,_2---'m'--'..!.!..:m'-'-----
Peak flow rate
Bed load yield
25/3
3 I. 5
0 ·180 m3 /sec
0·005 tonnes
6 7 8 9 10 11

217
APPENDIX VII
BED LOAD SEDIMENT SIZES FROM SOME STORMS,
TORLESSE STREAM CATCHMENT.

218
EVENTS
12 - 13 August 1973
29 August 1973 2] November 1973
16 - 17 January 1974
15 - 16 March 1974
21 - 23 June 1974
19 - 20 July 1974
8 - 9 October 1974
8 - 9 October 197lf
20 - 23 January 1975
29 - 31 January 1975
11 - 13 March 1975
11 - 13 March 1975
- 2 Apr i 1 1975
6 - 7 June 1975
14 - 15 July 1975
19 - 20 August 1975 8 - 9 February 1976
11 - 12 February 1976
16 - 17 February 1976
17 February 1976
30 April 1976
10 - 12 August 1976

~
Ul
:::J O
l :::J <
(
"" I N
0 0
L/')
L/')
-..t ~
0 0
0 0
L/')
l.(l
":'! --:-
0 0
L-::>as E
w
• a5
JoL
.pst0
0 co
E
E
<? C
Jl
c3Z!S
0 <D
palD:l!P
U!
0 --s
UDLH JBU!~
%
I E
E
0 N
0 ("i

'"" r--. 0"\
..... Ill :::J O
l :::J
<(
0 '"" I ·c
o
N
0 0 r---0
0 0 L()
0
0 0 M
0
N
..-CIO
CIO
- 0 ("')
-..t
-..t N
vi '--..c Q
)
E
1-
E
E
0
•" E
E
c;> 0 N
E
E
0
0 0
ClC
) <D
E
E
0
0 0
-..t N
UD
4l
JaU!J
%
E
E
C? N

,_ Q)
..a E
Q
)
>
~
N
co --...--N
0 N
1.0
N
co
vi '-.c. Q
l
E
·-t-
0 1.0
E
E
0 N

I \.0
0 Ill ~
0
0 Ill <)I 0
~-::Jas £
w
Ill ..-;-0
'a5
JD
l,PS
IO
vi 'L
Q)
E
1-
0 0
0 0
co 1
0
~
N
.3Z!S P-3lD:> !PU
! U
D4l
J8U!J
%

.-1
l.)
«> Vl
M
0·350
E 0 ·250
«> 0'\ L..
0 .c. l.)
.~ 0 ·150 .,.__, 0
80 <II N Ill
"0 <II -0 l.) 60 "0 c
c 0 .c -..... 40 <II c
~ 0
20
15-i6 March 1974
15/3 16/3 16 20 8 12 16 20 24
Time hrs.

I u di Vl
M
E
. (])
0'\ L..
0 .c. u -~
0 ·600
0·400
0 0·2 OOL-----------
12 16
80 Ql N Ill
"'0 .! 0 60
.!:::! "'0 c
c 0
.J::.
~ 40
Ql c -~ 0
2
21-23 June 1974
21 /6 22/6 20 24 4 12 16 20 24
23/6 4 8 8
Time hrs.
Average for storm

I u «< t/)
M
0·
E 0·400 -
«< Ol L.
a .J::. u t/)
0 0·200
80
Ql N .iii
"0 60 Ql 0 .!::!
~ c 0 .c. 40 ..... ... Ql c
.....
~ 0
20
4
19-20 July 1974
19/7 12 16
20/7 8 12 24 4 8 20 16 20 24
Time hrs 35 ·Omm
20 ·Omm
9·0mm
Average for 19th Average for 20th
2·0mm

-:t"
" (T\ ~
N
I-. Q
) ..c 0 ....... u
0 0
(T\
N
I 0
0
N
0 N
E
E
E
E
E
E
0 0
0
0 O
'l N
<D
N
ui L
..c.
N
Q.l
E
f-
0 0
0 0
0 0
0 0
co <D
~
N
IJ? .....,
<'I 0
0 0
o3Z!S pa~D::l!PU!
UD4~
JSU
!t '%
~-::>as £
w
'<lD
JDL
i::JSIQ

>I.. Ill :J
c: Ill
...., N
N
I .o
N
0 ~ 0 0 ap 0
L-::>as £
w
0 LO
(V)
N
0 0
0 co
~
0
'a6
JD4
::lSIQ
E
E
0 0
0 O
'l N
0 0
tD
~
.lZ!S
P
CllD
:>!P
U!
UD
I.fl JC
lU!J
%
0 N
E
E
0 N

Lt\
,..._
>I.. Ill ::J c: Ill .., 0 I"'"\ I
0'\
.N 0
~
~
0 0
'a5
JD
lpS
IO
%
UD
4l

....- 0 ·350 I
u QJ V1
M
E
. 0 ·250 <II 0\ L..
a .r. u V1
0
Ql N Ill
1J
2
80
0 60 .!.! "0 .k
c: a .r. ..... ..... 40 Ql c:
20
16-17 February 1975

1.1'\ r-... 0"\
L.
a. <
(
CV'\
'
0 1/)
~
0
0 0
1/)
1/)
<":"~ "":""
0 0
~-"J.as £w
'.a
5JD
l,PS
I 0
~
-- M ::::! N
N
co
0 N
ID
.,.....
N
co
0 N
1/)
M vi
'--L Q
J
E
f-
E
E
0 0 N
0 co
E
E
9 01
N
0 0
0 ID
~
N
<3Z!S pa~D:>!PU! UD4~ J8U!~
%

C>
"' 0
0 0
0
\0
<!JZ IS
P<> ~0::1! PU
! %
0 IN

0 0
~
0 0 ~
0 0
UP
4l--t
JaU
!j %
N

I u (1) Vl
M
0·600
E 0·4
-(1) Ol L.
0 .c u .~ 0 ·200 0
Qj N 1/)
"0
~
80
.~ 60 "0 c
c 0
;;;::. .... ... 40 Qj c
~ 0
20
4
6-7 June 1975
6/6 716 8 12 16 20 4 8 12 16 20 24
Time hrs
Average for storm
9·0mm
2·0mm

~1 ~.
>-i
-:J ., Lt\
-I '
...:r -
I
N
N
i
= ~
I lli
I '-
..c -.3
~
OJ
' E
f-
! I
r I
j L
n
0
! ~
'
I,U?'iftt , o_': "o
0 0
0 I• •• "o-•
• lo o 0 0
0 ° 0 0 -~
l·>:'• 0 -::_o.,·: 1: ~· ...
E
E
~ E
E
c
'
0 c~
?
I U
1
~~ CTI
M
N
' '"
j I _
<n
I .-
'
~ j
.-
I ' I
0 .-
I
c _.
"' ---- ~
\ ~·
~
~a5JDLpS1Q~
0 0
0 0
co ~
N

~
<11 :::1 r:n :::1 <
!
0 N I
en
N
%
0 N

0·350
..--1
u ~ 0 ·250
('")
E
. (])
O'l
a 0·15o ~ ~----------~ .~ 0
.... Ql c
10
20
14 8/2
8-10 February 1976
18 22 2 6 10 912 14 18 22 2 6
Time hrs
9·0mm
Average for storm
2·0mm

.... I <.) «.> Vl
M
0·600
E 0·400 .
«.> CT> 1...
0 .c <.) Vl
0 0 ·200
Ql N Cl)
a1
80
c 60 C)
-o c
c 0 ..c +- 40 'QI c
.....
20
4 8
11-12 February 1976
11/2 12/2 12 16 20 24 4 8 12 16 20 24
20·0mm Time hrs.
2·0rnm

I 0 u Q.> Ul
("")
E
~ 0·2 (]\ L..
a ..c. u .~ 0
Q.> N
Ill
al -a u '6 c:
c: 0
.&:. ..... ... Cll c
..... ~ 0
8
6
4
20
12
10-12 August 1976
16 1018 20 11/8
12 16 8 12/8
8 4 20 24 4 24
Time hrs. mm
9·0mm
Average for 12th
2·0mm

2!9
APPENDIX VI II
MOVEMENT OF SHEEP WITHIN THE TORLESSE STREAM CATCHMENT, 1973.
R.P. Stratford, J.A. Hayward & E.J. Stevens.

220
INTRODUCTION
The Torlesse stream catchment is part of the upper Kawai catchment and is
occupied under a pastoral lease by Brookside Station. This valley was
used annually for grazing by a flock of half bred ewes from mid February
to April.
The affect of domestic stock on the condition of South Island mountain
lands has been the subject of much discussion and debate but curiously
1 ittle study.
This study was carried out during the summer grazing periods of 1973 -
1975 in an attempt to better understand the distribution of animals within
the Torlesse stream catchment.
Methods.
Following weaning (in February 1973) a ewe flock was released Into the
upper Kowai catchment. A number of these sheep were marked with 11 Ritchie 11
ear tags and canvas collars in order that they (or an associated mob)
might be easily spotted, Although these sheep were released within the
Torlesse stream catchment, they left within the first 24 hours in favour
of the larger Kowai catchment and were not seen again during the period of
observation. (That was a waste of effort!)
To plot sheep positions a grid was set over an aerial photograph which
divided the area into 0.75 ha units. At three times each day (daybreak,
mid-day and dusk) the number of sheep observed in each unit was recorded.
It was found that all observations could be made from one point within
the catchment (on Gingerbread spur). Observations were made every day
and interrupted only by fog (or very wet weather) and the unavailability
of staff during some weekends. Stock disturbance was kept to a minimum
by careful movement to and from the observation point and by limiting
other field vvork during the 1973 observation period.

221
Sheep were recorded for their presence or absence. No attempt was made
to distinguish between activities such as grazing, sleeping or travelling.
No observations were made between dusk and dawn.
The sheep were allowed a week after their release to settle down before
observations began.
Because the observation times varied in length, the results for each unit
of catchment area are expres~ed as the degree of utilization.
defined as N X h H
Where N = number of animals present in a unit
h = time of presence in hours
H = total daylight hours for the period.
This is
The summer grazing period was subdivided into seven periods and the degree
of utili2ation data was converted to an approximate stocking rate for each
period.
The most intensive observations were made during 1973. Early in 1974 it
became evident that the distribution of animals was similar to the pre-
ceeding year. In consequence the observations for 1974 and 1975 were
less intensive. The results presented here are for 1973.
Res u1 ts
Period 1. 22. 2. 73 - 4. 3.73 (10 days) (Fig. VIII .1).
Although the sheep had been in the catchment for one week there was much
apparantly aimless movement as they adjusted to their weaned condition and
their shift from farm land to hill country. Presence was even and lightly
distributed over the more accessible parts of the catchment. t~ost of the
sheep within the basin appeared to use the accessible sites above the
stream as camp sites but left the catchment to graze. There was a lot of
traffic in and adjacent to the stream channel.

222
Period 2. 6. 3.73 - 9. 3.73 (_4 days) (Fig. Vl11.2)
By the 9th Harch there had been a general migration from the basin,
Those sheep that remained had begun to show preference for particular
areas within the basin.
Period 3. 17- 18. 3.73 (2 days) (Fig. Vlll.3)
Observations made between periods 2 and 3 indicate that sheep presence
became increasingly localised with a few areas receiving quite high use.
Movement in and out of the catchment was much reduced by the end of this
period.
Period 4. 22- 25. 3.73. (4 days) (Fig. VI I 1.4)
As heavier localised grazing reduced the feed suppl~ movement within and
out of the catchment increased. This was a trave11 ing and grazing
activity unlike the mass migrations preceeding and during period 1.
presence over the whole catchment was less than periods 1 - 3.
Period 5. 26 - 29. 3.73 (4 days) (Fig. VIII. 5).
:Ytock
Hovement in and out of the basin increased. This period was comparable
to period 1. with a return to ' 1mass 11 mi9rations but low total presence
throughout the basin.
Period 6. 30. 3.73 to 1. 4.73 (3 days) (Fig. VII!. 6).
By the end of this period there was a return to localised presence by a
11 resident 11 flock. Although the pattern of presence was similar to that
of periods 2 and 3 different areas were selected for higher levels of
localised presence.
Period 7. 2 · 19. 3.73 (18 days) (F g, VI! I. 7).
Migration from the basin contin thro this period. l\nimczi

Sheep Sheep/ ha. densities (approx)
D 1-5 Up to 7
5-10 7-13
~ 10-15 13-20
' 6 15-20 20-27
20-25 27-34
Figure VIII. I: Sheep presence, lower Torlesse stream catchment, 22 February- 4 March, 1973.

D
~ ~ ~
-
Sheep Sheepj ha. densities (approx)
Up to 7
5-10 7-13
10-15 13-20
15-20 20-27
20-25 27-34
Figure VJII.2: Sheep presence. lower Torlesse stream catchment 6-9 March 1973.

OJ
~ ~ .
.
Sheep Sheepj ha. densities (approx)
1-5 Up to 7
5-10 7-13
10-15 13-20
15-20 20-27
20-25 27-34
Figure VIII.3: Sheep presence, lower Torlesse stream catchment 17- 18 March 1973.

Sheep Sheep/ ha. densities (approx)
CJ. 1-5 Up to 7
5-10 7-13
~ 10-15 13 -2o
~ 15-20 20-27 '
20-25 27-34
Figure VHI.4: Sheep presence, lower Torlesse stream catchment 22-25 March 1973.

Sheep SheeP/ ha. densities (approx)
CJ l-5 Up to 7
5-10 7-13
~ lQ-15 13-20
' ~ 15-20 20-27
20-25 27-34
' / '
Figure VUI.5: Sheep presence. lower Torlesse stream catchment 26-29 March 1973.

EJ
~
-.
Sheep Sheepj ha. densities (approx)
l-5 Up to 7
5-10 7-13
10-15 13-20
15-20 20-27
20-25 27-34
.·
Figure Vlll.6: Sheep presence, lower Torlesse stream catchment 30 March- I April 1973.

~ L________j
Sheep Sheepj ha. densities (approx)
. 1-s Up to 7
s-w 7-13
10-15 13-20
20-25 27-34
I
I I
I


22.3
dec] ined in a manner similar to period 2. It was quite viden by the
end of this period that the favoured feeding areas had been g out
and that stock showed a greater tendancy to travel and feed at the same
time. This was also observed in the adjacent upper Kowa catchment.
Figure Vi 11.8 summarises the presence of anin;als throughout the summer
period. Figure VI l 1.8 cannot show the authors 1 cle3r impression that
throughout the study period, stock adjusted their behavLour to the feed
supply.
DISCUSSION
The results presented here are for a 57 day grazing peri6d in 1973. In
1974 other field work fncreased stock disturbance and although the patterns
of presence were comparable with 1973 the absolute numbers of animals
within the catchment we:re less.
In 1975 there was an abundance of sumrner feed and fewer stock moved in to
the catchment. Those that did favoured the lower slopes adjacent to the
stream channel. The spring and summer of 1972/73 vvere drier than normal
(Chapter 5,Part B) and it is thought that in consequence the Kowal catch
ment (including the Torlesse stream catchment) provided less summer feed
than normal. This was therefore likely to be the season for most exten-
sive movement through the catchment.
Despite this it was found that there was little stock presence above 1,100 m
and at no time were stock observed above 1 , 300 m. That is, a majority of
stock presence was on the 20% of the catchment that was the lowest altitude
land. No animals were observed on the upper half of the catchment which
is the most depleted of vegetation.
More than half of the area on which presence was recorded had a presence of
less than l,S sheep per hectare for the 57 day grazing period. Almost al 1
of the stock presence in excess of 1.5 sheep per hectare was on land with
a ground cover of more than 80% (see Fig. VII I .8 and Fig. 9,Part A).

The ut i
posslb: t
in d r-ent
Be tha
$
d
224
ng th!s catchment were half bred evJes. It is entirely
erent breeds, ages and classes of livestock would behave
h o~ than that desc ibed here.
, the findings of this study call into question the
validi 1 of attr buting contemporary high altitude deterioration to the
pre:,e
futute _,
s ep I at least this catchment. The opportunities for
nagement in at leas catchment are still open for study
and d :; cuss on.

225
APPENDIX IX
AN ATTEMPT TO DETERMINE SOURCE AREAS OF
STREAM SEDIMENTS BY X-RAY FLUORESCENCE.

226
INTRODUCTION
Channel surveys and field observations during floods showed that a majority
of the sediments recovered at the sediment trap derived from Rainbow gully
and a 1 imited section of the Irishman stream. A method was sought which
might confirm these observations and give quantitative estimates of their
importance as source areas. The tdea of labelling sediments at a variety
of potential source areas and recovering a proportion of them at a down
stream point is not new but was rejected because of the practical diffi
culties involved.
In an earlier study in the Torlesse stream catchment Martin ("1972) had
attempted to estimate sediment yields and source areas using natural
characteristics of the bed material. Although his study was inconclusive
it was a valuable contribution to an understanding of the opportunities
and constraints of techniques tnvolving natural tracers. Lithological
composition was the most promising of the characteristics investigated.
This study was an attempt to develop Martin 1 s work, by comparing the
1 ithology of four rock types from the upper catchment with the lithologies
of particles of sand sized material recovered from the sediment trap.
Martin 1 s (1972) method of microscope sorting was time consuming, and the
use of artificially labelled material was rejected because of anticipated
problems of recovery and in the case of isotopes, safety. X-ray fluor-
escence had a number of potential advantages and was a technique judged
worthy of further study.
METHODS
With the facilities and assistance of the Institute of Nuclear Sciences
(see acknowledgements) the surfaces of rock samples were irradiated with
X-rays in the hope that the elemental composition of each rock type might
have a characteristic X-ray 'signature'. Four rock types were tested.

227
They were chert, dolerite, ~andstone and argill ;te.
Under X~ray irradiation surface elements fluoresce in proportion to their
presence. The energy levels of fluorescence can be monitored on an
oscilliscope or storc;d tn digital form. As changes in surface geometry
alter the magnitude of fluorescence, the energy levels of fluorescence
for each element are best expressed as a proportion of the largest and
most common peak, Iron.
RESULTS
Table lX.1 shows the fluorescent energy levels relative to iron, for ele
ments within the four rock samples and the sand sample taken from the
sediment trap. The large standard deviations of each estimate ~re due to
wide variations in fluorescence levels when a different face of the same,
apparantly homogeneous, rock was irradiated.
DISCUSSION
N.E. Whitehead pers comm wrote a computer programme to ''juggle'' the
relatfve proportions of the rock types to obtain a minimum difference from
the sand composition. This indicated that the best fit for the relative
contributions of the four rock types to the sand sample was: chert 10%,
argillite 60%, sandstone 20%, gabbro 10%.
An analysis of the overall precision of the original data suggested that
the standard deviation of each percentage value was about 30% that is for
example the argillite contribution might range from 40%- 80%. In view
of the variability of fluorescence levels of each rock sample, Whitehead
expressed surprise at this 'hight level of precision.
Further analyses suggested that the composition of the sand sample was
chert 51%- 63%, argillite 20% ~ 25%, sandstone and gabbro 9%- 16%.
The levels of zinc and titanium in the sand sample are higher than those of

Tf.\BLE lX.1.
X-ray spectra of four rock samples and one sand sample, Toriesse stream catchment.
Source: N.E. Whitehead pers comm.
(Note: values are expressed as a ratio to iron peak value.)
K Ca Ti Cu Zn Pb Rb Sr
Chert 0.007 J2.6 l . J 8 0. 17 J.OO 0.54 0. 17 56
:!_0. 017 JS 0.72 0.25 1. 30 :1.06 0.25 99
Argillite 0.68 0.09 L 10 0. 19 0.63 0.51 5.2 5.2
+0.58 0,15 0.06 0.04 0.09 0. 18 0.9 6. 1 N N 00
Sandstone 0.43 0.84 l. J 2 0.59 0.79 1.05 7.9 60
:!_0.09 0.80 0.] 5 0.26 0. J 6 1.05 4.2 10
Gabbro 0.66 2.02 2.40 0.42 0.3] 0.21 1.08 61
:::_0.97 0.31 .0.40 0.23 0.] 3 0. 34 0.38 52
Sand composition 0.37 0.95 0.80 0. 187 0.43 0.38 3. 19 1 7 (estimated) :::_0.25 1. ] l 0 . ] 1 0.077 0.] 4 0.29 0.95 13
Sand composition 0.301 0.992 1. 97 0. 146 3.24 0.47 3.99 20 (actual) :::_o .032 0.024 0. 14 0.048 0.89 0.33 0.08 2
All figures given for errors represent one standard deviation.

229
the rock samples and the calculated sand composition, This would suggest
that the sand sample was composed of material of higher than normal zinc
and titanium status. This example illustrates the sampling problems
associated with the method of X-ray fluorescence of these rock and sediment
types.
Because of large within sample variability it is not possible for this
method to add significantly to a quantitative understanding of sediment
source areas. A visual estimate of sediment retained in the trap is able
to provide information of comparable reliability.
Th~s while the X-ray fluorescence method may have promise as a technique
for tracing fine sediments in some catchments, it is not suited to the
needs of a quantitative assessment of sediment sources in the Torlesse
stream catchment.
Acknowledgement
I am particularly grateful to Dr. N.E. Whitehead (Department of Scientific
and Industrial Research Institute of Nuclear Sciences) for his willing and
painstaking assistance with this study.
References
Martin, R.S. 1972: Natural tracers: of mountain streams. University Library.
a method of determining bed discharge Unpublished M.A. thesis Canterbury
Whitehead N.E. personal communication X-ray spectra of sediment samples Torlesse stream catchment,

230
APPENDIX X
SURVEY INFORMATION OF TORLESSE AND KOWAl RIVERS.

/
/ \
/' \ LIST OF REACH LOCATION POINTS -strea dist.
loco- from tion rt~ point
rce A 4451 B' 4380 B 4342 c 4266 D 4146 E 4095 F 4022 G 3961 H' 3847 H 3820 I 3780 z 3709 Y' 3628 y 3573 X 3513 w 3363 v 3271 u 3209 T 3095 s 3000
J 1540 K 1467 L 1398 M 1324 N 1293 0 1242 p 1167 a 1018
level \ ~~1 /
m) /\ 993·17
/\ 996·7 99S7 \ 1004·5
/'\. 1011-0 1016·0 / 1021'3
/\ 1025·1 1033·1 " '()36·4 / 10383 \ 1046·6 /
10564 /'\ 1062·1
/'\ 1071·0 1095-6 ::g '\ 1"00·5 0/ 1114·2 i'i '\ 1134·5 / 1149-9 \
a::/ UJ
' 101.2·4 Q/ 1050-4 I- '\ 1059·1 ~ / "0019 I-
' 1070!7 1/)
/ 10803 1090·0 1115 ·0
GP METEOROLOGICAL
[!)
STATION
I
\ r, I ..... , II'
'" o:;,\ ~/\
\ o/'\ ~/\ fa/\ 0:/ \
~/\ ~ ..... ' (!)/ '\.
- '/'· -:'1: v .--1 '• ~ ..-1 I, o:l.u
I I, ~~1 I~ !j
;;:5/$ ,!!~-.:.
Y.
::E ~ Ul a:: I-1/)
For plan and profi .. of Upper Irishman and Rainbow Gully refer to Drawing No.46
LEGEND
•Y Chamel Survey Location Point • Geodimeter Survey Location Point
...._. Sediment Storage Channel Cross-Section
~ Detailed Topographic Survey · Available
For plan and profile of the "Slug" refer to s Drawing NO- 52
TORLESSE STREAM CATCHMENT
INDEX TO SURVEY POINTSCHANNEL CROSS SECTIONS AND TOPOGRAPIC SURVEYS

TORLESSE STREAM
TORLESSE AND KOWAl RIVER CATCI-tllENTS LOCATI()'.l OF CHAI\IIIEL CROSS SECTIONS HELD BY TUSSOCK GRASSLANDS AND MOUNTAIN LANDS INSTITUTE LINCOLN CCllEGE
SERIES 1 96 TORLESSE STREAM CROSS SECTIONS Su-yeyed 'fJ71172. 11E!Sl.W"Veyed 1974175
SERIES 100 150 KOWAl RIVER CROSS SECTIONS Surveyed 1974
SERIES 300 FOGGY RIVER CROSS SECTIONS Surveyed 1973
SERIES CS 1 CS 16 SEDIMENT STORAGE CROSS SECTIONS Rec}Jiar surveys since establishment in 1974
/---, / \ ------ \. ./ ..._
' / ~ .... - - -. - - /UPPER KOWAl CATCHtwENT BOUNDARY "- ...._ __ _

/
-- ____ ,...--__....
TORLESSE At-1> KOWAl RIVER CATCHMENTS.
INDEX TO CHANNEL SURVEYS 1-ELD BY TUSSOCK GRASSLANJS AIIV MOUNTAIN LAt-DS INSTITUTE
UNCOLN COLLEGE
LEGEIIV 52 DRAWING Nl.)o4BER
/. /(
I . . )
( .
. ( I . l \ I //
( . I I

231
APPENDIX XI
A LABORATORY STUDY OF STREAM ENERGY IN A
SIMULATED POOL-RIFFLE CHANNEL.

232
INTRODUCTION
Field observations and experience indicated that the Torlesse stream
channel was a series of steps and hydraulic jumps and that in a free state
these played an impdrtant role in the dissipation of stream energy.
However, when a pool was submerged by water and/or gravel ,stream velocities
increased, and its efficiency for energy dissipation was presumed to be
markedly reduced (see Chapter 13,Part B).
As it was difficult to obtain reliable field information a pilot study was
carried out to consider the interaction of sediment and flow rate,on stream
velocity through a pool riffle channel.
In 1962 leopold & Langbein (1962) first introduced the concept of entropy
to explain the evolution of stream patterns, Since that time there has
been considerable interest in the application of thermodynamic principals
of energy dissipation rate relationships to fluvial systems (see for
example Yang 1971 a, b, & c, 1976).
In a recent review, Davy & Davies (in press) established that it was not
valid to transfer certain thermodynamic laws governing the behaviour of
entropy in a system to streams. While the observed behaviour of streams
is not in qualitative conflict with entropy principles they caution
against fu1·ther quanHtative application of these principles.
This study attempted to better understand the significance of pool riffle
morphology to the dissipation of a stream 1 s kinetic energy. Although it
concerns son1e of the same principles as Yang (1971, 1976) and others have
reported, its aim was to consider, in controlled conditions, some possible
features of mountain stream behaviour. This study was not concerned with
attempting to understand the evoluti.on of mountai.n channel forms.
METHODS
Fig.XI.1 shows the model that was built to simulate the pool riffle channel

233
of the Torlesse stream. The test reach was cu~tained within a flume 2m
x 0.15 m. The channel slope was set at 0.03 and the step length to hei
ratio was arbitrarily set at 14:1. \<later was supplied from a calibrated
head tank.
Velocity measurements were made by injecting a salt solution (sodium
carbonate) into the upstream pool and recording its passage through the
test reach. Electrodes were set on upstream and down stream riffles and
connected through conductivity meters to chart recorders.
The time between the peak values for upstream and down stream salt concen-
trations was used to estimate mean velocities. Test trials showed that
the trace of downstream salt concentration was unreliable when gravel
covered the down stream electrode. The last pool was therefore excluded
from tests of the effectsof gravel storage on stream velocity. Test
trials also established that more reliable results were obtained when the
upstream electrode was located on the third riffle (from the top).
(Variability in entry conditions for water and salt into the upstream pool
lead to variations in the storage and release of salt from that pool.
' L
This frequently produced a multiple peak of salt concentration of the upper
By recording concentration at the third pool, the multipeak
problem was eliminated.)
A series of trials was carried out in which n1c<:H1 velocities were determined
for a range of flow conditions.
A second series of trials was then carrie~ out for the same flow rates but
with gravels occupying 1/4, 1/2, 3/4 and total pool storage capacity. At
the beginning of each trial, gravel v.Jas placed parallel to the slope.
Water flow repositioned the gravel, and at the highest flow rates scoured
some of it to the lowest pool.
RESULTS
Figs. X1.2, XI .3 show velocity depth relations through the test: channel,
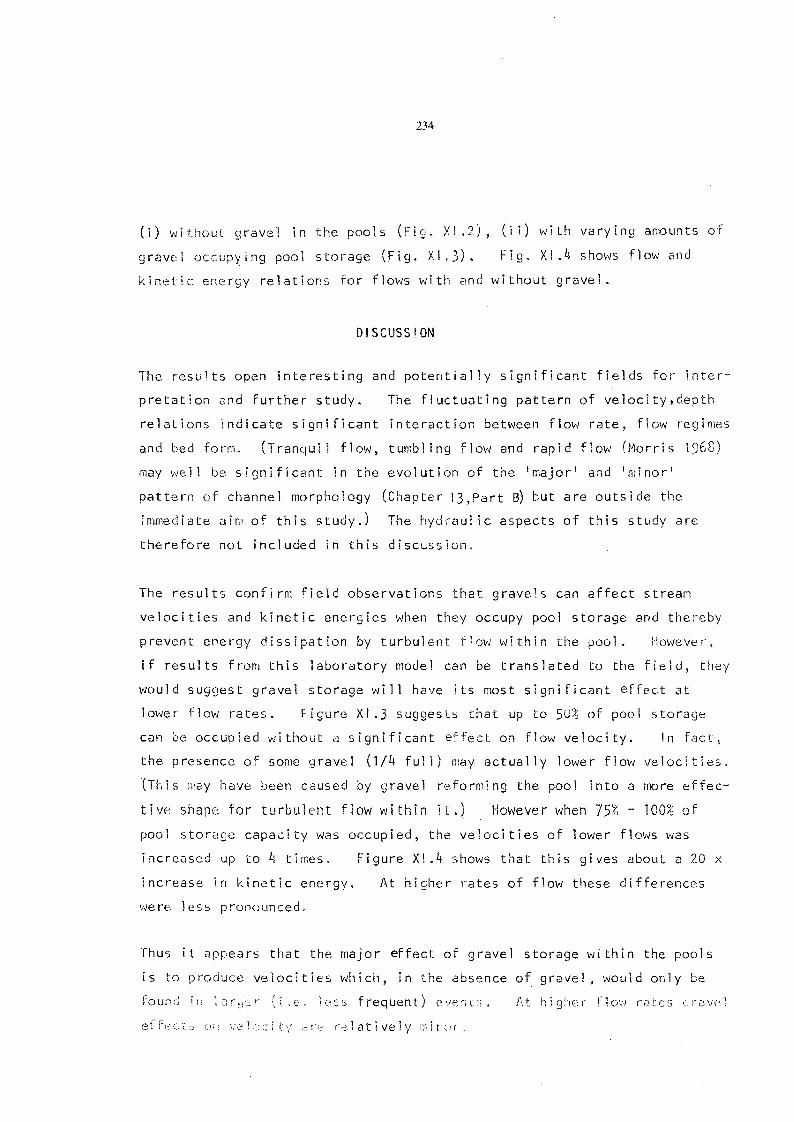
234
(l) without 9rave1 in the pools (Fig, Xl.2) 1 (i i) with varying amounts of
gravel occupying pool storage (Fig. Xl.3). Fig. Xl.4 shows flow and
kinetic energy relations for flows with and without gravel.
DISCUSSION
The results open interesting and potentially significant fields for inter-
pretation and further study. The fluctuating pattern of velocity,depth
relations indicate significant interaction between flov-1 rate, flow regimes
and bed form. (Tranquil flow, tumbling flow and rapid flow (Morris 1968)
may well be significant in the evolution of the 'major' and 'minor'
pattern of channel morphology (Chapter 13,Part ~ but are outside the
immediate aim of this study.) The hydraulic aspects of this study are
therefore not included in this discussion.
The results confirm field observations that gravels can affect stream
velocities and kinetic energies when they occupy pool storage and thereby
prevent energy dissipation by turbulent f1ov; within the pool. However,
if results from this laboratory model can be translated to the field, they
would suggest gravel storage will have its most significant effect at
lower flow rates. Figure XI .3 suggests that up to 50% of pool storage
can be occupied without a significant effect on flow velocity. In fact,
the presence of some gravel (1/4 full) may actually lower flow velocities.
(This may have been caused by gravel reforming the pool into a more effec
tive shape for turbulent flow within it.) However when 75% - 100% of
pool storage capacity was occupied, the velocities of lower flows was
increased up to 4 times. Figure Xi .4 shows that this gives about a 20 x
increase in kinetic energy.
were less pronounced.
At higher rates of flow these differences
Thus it appears that the major effect of gravel storage within the pools
is to produce velocities which, in the absence of gravel, would only be
faun n 1 c~Jc (i.e. ic:ss frequent) eve s. /\ t h j r fl ovr r a t e s r ,;1
relatively min-;r·.

Head tank
205·5cm ---------+
I
Figure XI. I: The laboratory model to simulate a mountain stream catchment.

70
60
50
I u 40 (I) Ill
E u
>-u 30 0 (I)
>
20
10
Stage height of head tank em, 3 1 1 6 1 ~ 9 1,0
I I
i 0·1 0·25 040 0·60 0·90
Flow rate m3 sec -1 X 10- 4
Figure Xl.l: Mean velocities through laboratory model with increasing discharge.

l) 0
<II
80
70
60
50
> 30
20
10
0
Flow m3 sec -1 x 10 -4
10 0·25 O·L.O 0·60 0·90
J_ ~ .............. ..... / /,· ...... , /
.,-.--...._ /~ '-..... I . /// ........ -...._ / I
,.··············7'········ / . ,--------,, I /'
.)'-, / / ........ ~/ I , ..... .__.,-· , _ _,
/ / ······· ···:::;::.... ·--·---.---/ .-;,:;:.·-/ / .... -·-; / " ... . / _,_" --·l_..,
/ ~-- .· .J'/ ,.<? .... ., .,._...-_;, .·
.,., .JO~.;..;"" •• •
............... ~<!f- ·•·•··•• ...- ~~···-············ ,..--
2 3 5 6 7 Stage height ot head tank (em)
Figure Xl.3: Mean velocities through laboratory model with increasing discharge and an increasing proportion of pool storage occupied b~· gravel.
8 9
Empty
11. Full
l'2 Full
:n. Full Full
10 11

(')
0
X
til 0\ ,_ a;
E cJ QJ '-
0
>. Ol '(])
c (]}
1 o4..
..1
10
Pools full with gravel
2
17
3
Flow rate 21
I. Depth head
Pools empty of gravel
m3 sec-1 x 10 -1.. 29 1..1
5 6 tank m x 10 _2
56
7
Figurf.' Xl.4: Flow and kinetic energy relations in a simulated mountain stream channel with and without gra\-·eJ "itorage in pools.
55
8

235
It must be emphasised that this was a laboratory study and it serves only
to confirm field observations that gravel presence can significantly effect
flow velocities and energy status. Because of the well known difficulties
in translating results from hydraulic models to the real world, the results
presented here should be regarded as tentative and qualitative. Further
there is an obvious interaction of flow, flow regime and channel form at
depths greater than 3.5 em. Velocity results at the higher flow rates
may well be unique to this model. Therefore the finding that gravels have
their greatest influence on stream velocities and kinetic energy at lower
flow rates should be considered as tentative.
further investigation.
This topic clearly requires
ACKNOWLEDGEMENTS
i am grateful to Messrs. Geoff. Thomson and Col in Tinker for their assist
ance with this study and to Dr. T.H.R. Davies for his advice and help.
This study was carried out as part of a project on site selection for the
rehabilitation of eroded land with financial support from the Department
of Lands and Survey.
REFERENCES
Davy, B.W.; Davies T.R.H. in press. Entropy concepts in river develop-ment: a re-eva 1 uat ion. Water Resou.rce.s ResearcJI
Leopold L.B.; Langbein, W.B. 1962: The concept of entropy in landscape evolution. v.s. Geological Survey Professional paper 500 A.
r1o r r is , H. M. 1968: Hydraulics of energy dissipation in steep, rough channels. Research Division Virginia Polytechnic Institute, Blacksburg, Virginia. Bulletin 19, 108 pp ..
Yang, C.T. 1971a: Potential energy and stream morphology. Water Resources Research?: 311-322.
Yang, C.T. 1971b: Formation of riffles and pools. Wate.r Resources Research 7: 1567-1574.

Yang, C.T. 1971c:
Yang~ C.T. 1976:
236
On river meanders. Journal of Hym'oZogy 13: 231-253.
Minimum unit stream power and fluvial hydraulics. American Society of Civil Engineers. Journal Hydraut-z:cs Divis1:on 102: H x 7.