Tidal stream device reliability comparison models Tidal stream device reliability comparison models
13
http://pio.sagepub.com/ Reliability Engineers, Part O: Journal of Risk and Proceedings of the Institution of Mechanical http://pio.sagepub.com/content/early/2011/10/29/1748006X11422620 The online version of this article can be found at: DOI: 10.1177/1748006X11422620 October 2011 published online 31 Proceedings of the Institution of Mechanical Engineers, Part O: Journal of Risk and Reliability T M Delorm, D Zappalà and P J Tavner Tidal stream device reliability comparison models - Feb 9, 2012 version of this article was published on more recent A Published by: http://www.sagepublications.com On behalf of: Institution of Mechanical Engineers be found at: can Proceedings of the Institution of Mechanical Engineers, Part O: Journal of Risk and Reliability Additional services and information for http://pio.sagepub.com/cgi/alerts Email Alerts: http://pio.sagepub.com/subscriptions Subscriptions: http://www.sagepub.com/journalsReprints.nav Reprints: http://www.sagepub.com/journalsPermissions.nav Permissions: What is This? - Oct 31, 2011 OnlineFirst Version of Record >> - Feb 9, 2012 Version of Record at Durham University on May 28, 2013 pio.sagepub.com Downloaded from
Transcript of Tidal stream device reliability comparison models Tidal stream device reliability comparison models
http://pio.sagepub.com/Reliability
Engineers, Part O: Journal of Risk and Proceedings of the Institution of Mechanical
http://pio.sagepub.com/content/early/2011/10/29/1748006X11422620The online version of this article can be found at:
DOI: 10.1177/1748006X11422620
October 2011 published online 31Proceedings of the Institution of Mechanical Engineers, Part O: Journal of Risk and Reliability
T M Delorm, D Zappalà and P J TavnerTidal stream device reliability comparison models
- Feb 9, 2012version of this article was published on more recent A
Published by:
http://www.sagepublications.com
On behalf of:
Institution of Mechanical Engineers
be found at: canProceedings of the Institution of Mechanical Engineers, Part O: Journal of Risk and ReliabilityAdditional services and information for
http://pio.sagepub.com/cgi/alertsEmail Alerts:
http://pio.sagepub.com/subscriptionsSubscriptions:
http://www.sagepub.com/journalsReprints.navReprints:
http://www.sagepub.com/journalsPermissions.navPermissions:
What is This?
- Oct 31, 2011 OnlineFirst Version of Record>>
- Feb 9, 2012Version of Record
at Durham University on May 28, 2013pio.sagepub.comDownloaded from
Tidal stream device reliability comparison modelsT M Delorm*, D Zappala, and P J Tavner
School of Engineering and Computing Sciences, Durham University, Durham, UK
The manuscript was received on 6 February 2011 and was accepted after revision for publication on 16 August 2011.
DOI: 10.1177/1748006X11422620
Abstract: Tidal stream devices are a new technology for extracting renewable energy from thesea. Various tidal stream device models have been proposed and, if they are installed at cho-sen high tidal stream velocity sites, they may face extreme climatic, current, and wave loadconditions. As they contain complex mechanical, electrical, control, and structural systems,reliability and survivability will be a challenge. Data on their reliability have been scarce, asonly a few prototypes have been built and operated. However, reliability prediction of newdevices could minimize risk in prototype work. A practicable tidal stream device reliabilityprediction method could assist the development of cost-effective and viable future options.The present study proposes such a method and derives system reliability models for four gen-eric-design, horizontal-axis, tidal stream devices, all rated 1–2 MW. Historical reliability datafrom similarly rated wind turbines and other relevant marine databases were used to populatethe devised reliability models. The work shows that tidal stream devices can expect to have alower reliability than wind turbines of comparable size and that failure rates increase withcomplexity. The work also shows that with these predictions, few devices can expect to survivemore than a year in the water. This suggests that either predicted failure rates must bereduced dramatically or that methods for raising reliability – by the use of twin axes orimproving maintenance access by unmooring or the use of a seabed pile and turbine raising –will be needed to achieve better survivor rates. The purpose of this work is not to predict defi-nitive individual device failure rates but to provide a comparison between the reliabilities of anumber of different device concepts.
Keywords: tidal stream device, reliability prediction model, reliability block diagram,
environmental adjustment factor, surrogate data sources, wind turbine failure rate, failure
rate, comparison
1 INTRODUCTION
Tidal stream devices (TSDs) are an emerging tech-
nology. Permanently installed at selected tidal sites,
they may endure extreme climatic, current, and
wave load conditions, and their mechanical and
electrical control systems are complex. Therefore
their reliability and survivability will be an engineer-
ing challenge, although this could be mitigated by
selecting benign tidal sites.
Probabilistic reliability modelling is a proven
methodology for assessing probability of system
success or failure [1, 2] at the conceptual design
stage. The present paper reports the conceptual
development of generic reliability prediction models
to quantify reliability and make life-cycle predic-
tions for specific TSD types. Surrogate reliability
data from the wind turbine (WT), marine, and con-
ventional electric power generation industries are
used to predict device failure rates and survivor
functions. The purpose of this work is to provide a
means of comparing relative concept reliabilities,
rather than to derive definitive device failure rates.
The paper is organized as follows: Section 2 is an
overview of current TSD technology and problems
*Corresponding author: School of Engineering and Computing
Sciences, Durham University, South Road, Durham DH1 3LE,
UK.
email: [email protected]
SPECIAL ISSUE PAPER 1
Proc. IMechE Vol. 000 Part O: J. Risk and Reliability
at Durham University on May 28, 2013pio.sagepub.comDownloaded from
with reliability predictions. Section 3 presents a
methodology for deriving non-repairable prediction
models for single- and twin-axis turbine devices
with a ‘mission time’ of 1 year and an overview of
acceptable surrogate source data sources for use in
those models. Section 4 presents results and a dis-
cussion of applications for comparison of reliability
model results. Section 5 presents conclusions and
recommendations for the future on the basis of this
methodology and its results.
2 BACKGROUND STATE OF THE ART
2.1 Tidal stream technology specifics and
uncertainties
TSDs can be constructed as modules, installed
incrementally in arrays, with minimal environmen-
tal intrusion, unlike barrages, which require large-
scale civil engineering [3]. They can be horizontal or
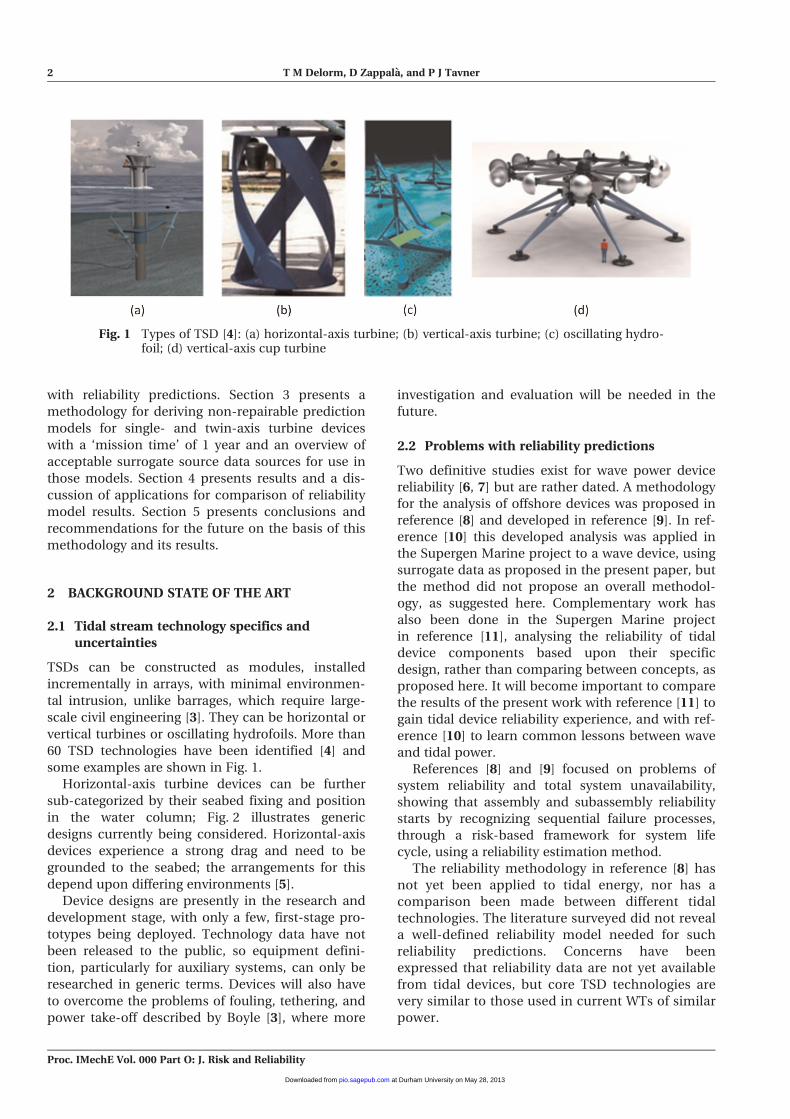
vertical turbines or oscillating hydrofoils. More than
60 TSD technologies have been identified [4] and
some examples are shown in Fig. 1.
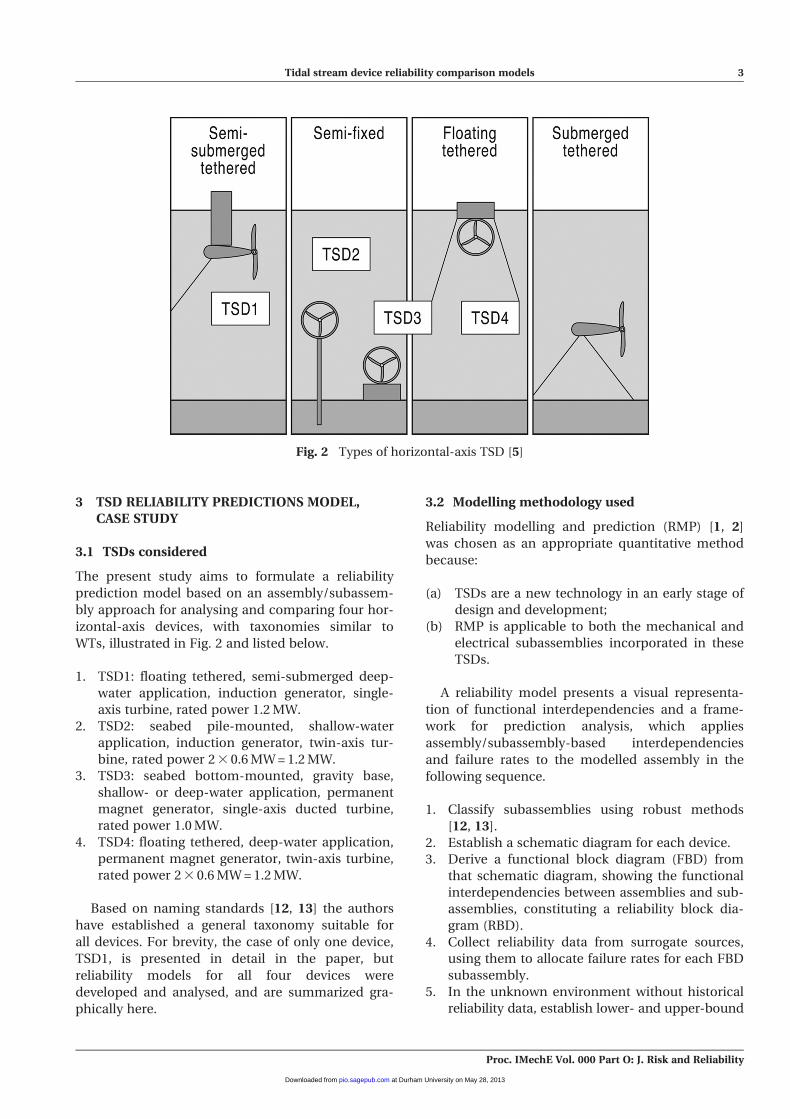
Horizontal-axis turbine devices can be further
sub-categorized by their seabed fixing and position
in the water column; Fig. 2 illustrates generic
designs currently being considered. Horizontal-axis
devices experience a strong drag and need to be
grounded to the seabed; the arrangements for this
depend upon differing environments [5].
Device designs are presently in the research and
development stage, with only a few, first-stage pro-
totypes being deployed. Technology data have not
been released to the public, so equipment defini-
tion, particularly for auxiliary systems, can only be
researched in generic terms. Devices will also have
to overcome the problems of fouling, tethering, and
power take-off described by Boyle [3], where more
investigation and evaluation will be needed in the
future.
2.2 Problems with reliability predictions
Two definitive studies exist for wave power device
reliability [6, 7] but are rather dated. A methodology
for the analysis of offshore devices was proposed in
reference [8] and developed in reference [9]. In ref-
erence [10] this developed analysis was applied in
the Supergen Marine project to a wave device, using
surrogate data as proposed in the present paper, but
the method did not propose an overall methodol-
ogy, as suggested here. Complementary work has
also been done in the Supergen Marine project
in reference [11], analysing the reliability of tidal
device components based upon their specific
design, rather than comparing between concepts, as
proposed here. It will become important to compare
the results of the present work with reference [11] to
gain tidal device reliability experience, and with ref-
erence [10] to learn common lessons between wave
and tidal power.
References [8] and [9] focused on problems of
system reliability and total system unavailability,
showing that assembly and subassembly reliability
starts by recognizing sequential failure processes,
through a risk-based framework for system life
cycle, using a reliability estimation method.
The reliability methodology in reference [8] has
not yet been applied to tidal energy, nor has a
comparison been made between different tidal
technologies. The literature surveyed did not reveal
a well-defined reliability model needed for such
reliability predictions. Concerns have been
expressed that reliability data are not yet available
from tidal devices, but core TSD technologies are
very similar to those used in current WTs of similar
power.
Fig. 1 Types of TSD [4]: (a) horizontal-axis turbine; (b) vertical-axis turbine; (c) oscillating hydro-foil; (d) vertical-axis cup turbine
2 T M Delorm, D Zappala, and P J Tavner
Proc. IMechE Vol. 000 Part O: J. Risk and Reliability
at Durham University on May 28, 2013pio.sagepub.comDownloaded from
3 TSD RELIABILITY PREDICTIONS MODEL,CASE STUDY
3.1 TSDs considered
The present study aims to formulate a reliability
prediction model based on an assembly/subassem-
bly approach for analysing and comparing four hor-
izontal-axis devices, with taxonomies similar to
WTs, illustrated in Fig. 2 and listed below.
1. TSD1: floating tethered, semi-submerged deep-
water application, induction generator, single-
axis turbine, rated power 1.2 MW.
2. TSD2: seabed pile-mounted, shallow-water
application, induction generator, twin-axis tur-
bine, rated power 2 3 0.6 MW = 1.2 MW.
3. TSD3: seabed bottom-mounted, gravity base,
shallow- or deep-water application, permanent
magnet generator, single-axis ducted turbine,
rated power 1.0 MW.
4. TSD4: floating tethered, deep-water application,
permanent magnet generator, twin-axis turbine,
rated power 2 3 0.6 MW = 1.2 MW.
Based on naming standards [12, 13] the authors
have established a general taxonomy suitable for
all devices. For brevity, the case of only one device,
TSD1, is presented in detail in the paper, but
reliability models for all four devices were
developed and analysed, and are summarized gra-
phically here.
3.2 Modelling methodology used
Reliability modelling and prediction (RMP) [1, 2]
was chosen as an appropriate quantitative method
because:
(a) TSDs are a new technology in an early stage of
design and development;
(b) RMP is applicable to both the mechanical and
electrical subassemblies incorporated in these
TSDs.
A reliability model presents a visual representa-
tion of functional interdependencies and a frame-
work for prediction analysis, which applies
assembly/subassembly-based interdependencies
and failure rates to the modelled assembly in the
following sequence.
1. Classify subassemblies using robust methods
[12, 13].
2. Establish a schematic diagram for each device.
3. Derive a functional block diagram (FBD) from
that schematic diagram, showing the functional
interdependencies between assemblies and sub-
assemblies, constituting a reliability block dia-
gram (RBD).
4. Collect reliability data from surrogate sources,
using them to allocate failure rates for each FBD
subassembly.
5. In the unknown environment without historical
reliability data, establish lower- and upper-bound
Fig. 2 Types of horizontal-axis TSD [5]
Tidal stream device reliability comparison models 3
Proc. IMechE Vol. 000 Part O: J. Risk and Reliability
at Durham University on May 28, 2013pio.sagepub.comDownloaded from
failure rates, kGi_min and kGi_max, for each sub-
assembly from surrogate data and use the upper
bound as the more conservative value.
6. Adjust surrogate failure rate data to the tidal
environment using two failure rate estimate
approaches.
7. Calculate predicted tidal environment failure
rates.
8. Evaluate the total device reliability, using the
parts count reliability prediction technique [14,
15], assuming that subassembly times-to-failure
are exponential, i.e. hazard rates are the result of
random failures.
3.3 Reliability data collected from surrogate
sources
Data are vital to new technology reliability predic-
tion. However, when no historical information is
available, surrogate data can be used [1] and in the
present case were available from the following pub-
lic databases.
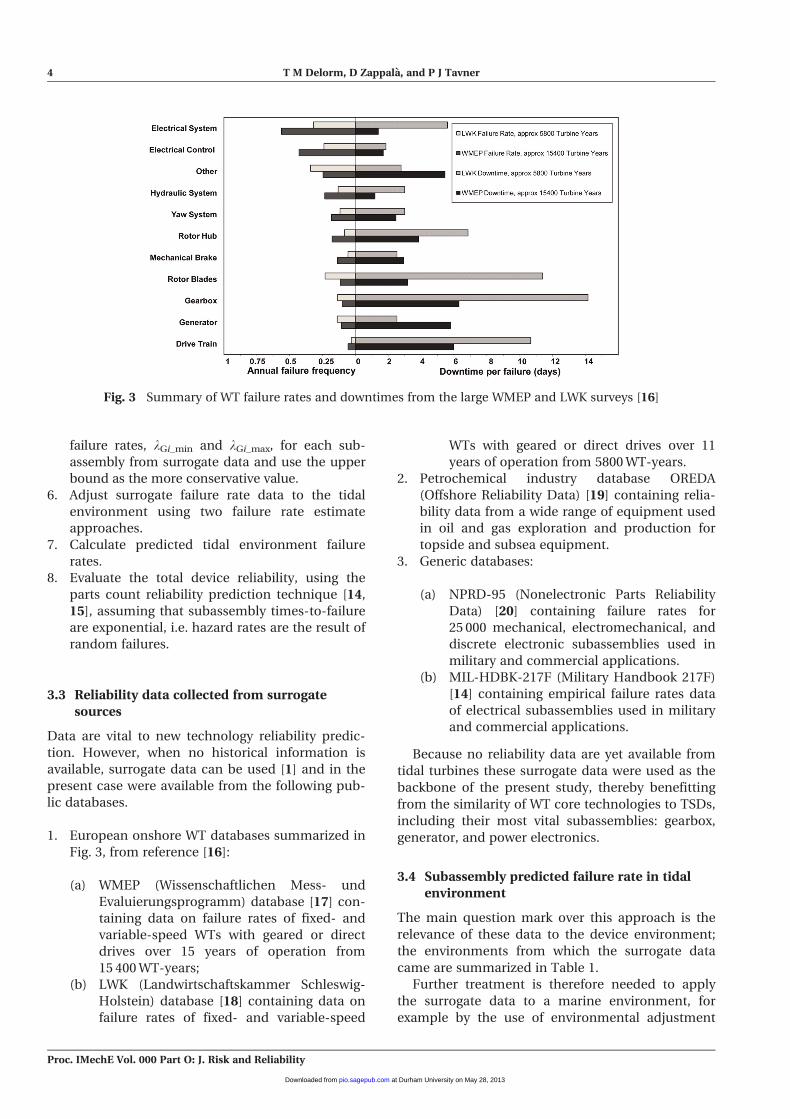
1. European onshore WT databases summarized in
Fig. 3, from reference [16]:
(a) WMEP (Wissenschaftlichen Mess- und
Evaluierungsprogramm) database [17] con-
taining data on failure rates of fixed- and
variable-speed WTs with geared or direct
drives over 15 years of operation from
15 400 WT-years;
(b) LWK (Landwirtschaftskammer Schleswig-
Holstein) database [18] containing data on
failure rates of fixed- and variable-speed
WTs with geared or direct drives over 11
years of operation from 5800 WT-years.
2. Petrochemical industry database OREDA
(Offshore Reliability Data) [19] containing relia-
bility data from a wide range of equipment used
in oil and gas exploration and production for
topside and subsea equipment.
3. Generic databases:
(a) NPRD-95 (Nonelectronic Parts Reliability
Data) [20] containing failure rates for
25 000 mechanical, electromechanical, and
discrete electronic subassemblies used in
military and commercial applications.
(b) MIL-HDBK-217F (Military Handbook 217F)
[14] containing empirical failure rates data
of electrical subassemblies used in military
and commercial applications.
Because no reliability data are yet available from
tidal turbines these surrogate data were used as the
backbone of the present study, thereby benefitting
from the similarity of WT core technologies to TSDs,
including their most vital subassemblies: gearbox,
generator, and power electronics.
3.4 Subassembly predicted failure rate in tidalenvironment
The main question mark over this approach is the
relevance of these data to the device environment;
the environments from which the surrogate data
came are summarized in Table 1.
Further treatment is therefore needed to apply
the surrogate data to a marine environment, for
example by the use of environmental adjustment
Fig. 3 Summary of WT failure rates and downtimes from the large WMEP and LWK surveys [16]
4 T M Delorm, D Zappala, and P J Tavner
Proc. IMechE Vol. 000 Part O: J. Risk and Reliability
at Durham University on May 28, 2013pio.sagepub.comDownloaded from
factors. Three different operational environments
found in tidal devices were to be applied as pre-
sented in Table 2.
1. GF – ground, fixed: severe environment.
2. NS – naval, sheltered: normal environment.
3. NU – naval, unsheltered: severe environment.
In general, WTs and electrical equipment are in the
GF environment, whereas TSDs are in the NS or
NU environment. Tidal environment subassembly
failure rates could be predicted using surrogate
data by applying a GF to NU or NS adjustment
factor.
Environmental conversion factors for electrical
and electronic components from MIL-HDBK-217F
[14] are tabulated in Table 6.4.1-2 of reference [2].
These data must be modified for the present study,
which considers component failure rates, ki,
because MIL-HDBK-217F multipliers were intended
for mean time between failures (MTBF). The modi-
fied data are presented in Table 2 and environmen-
tal definitions are described in references [14]
and [21].
Applying appropriate environmental adjustment
factors will reduce errors in the subsequent predic-
tions. The authors were unable to find a previously
defined rationale for this approach, so they propose
the use of two failure rate estimates set out in
Table 3:
(a) a conservative failure rate estimate without
adjustment, FREcon;
(b) an environmentally adjusted conservative fail-
ure rate estimate, FREenv.
In the particular case of OREDA data, where the
tidal environment differs from the oil and gas
environment, the authors have used OREDA failure
rates at the upper limit of the 90 per cent confi-
dence interval, to ensure the most conservative
estimate.
3.5 Reliability prediction model calculations
Individual subassembly failure rates were combined
into a total failure rate for two alternative operating
constraints, as follows:
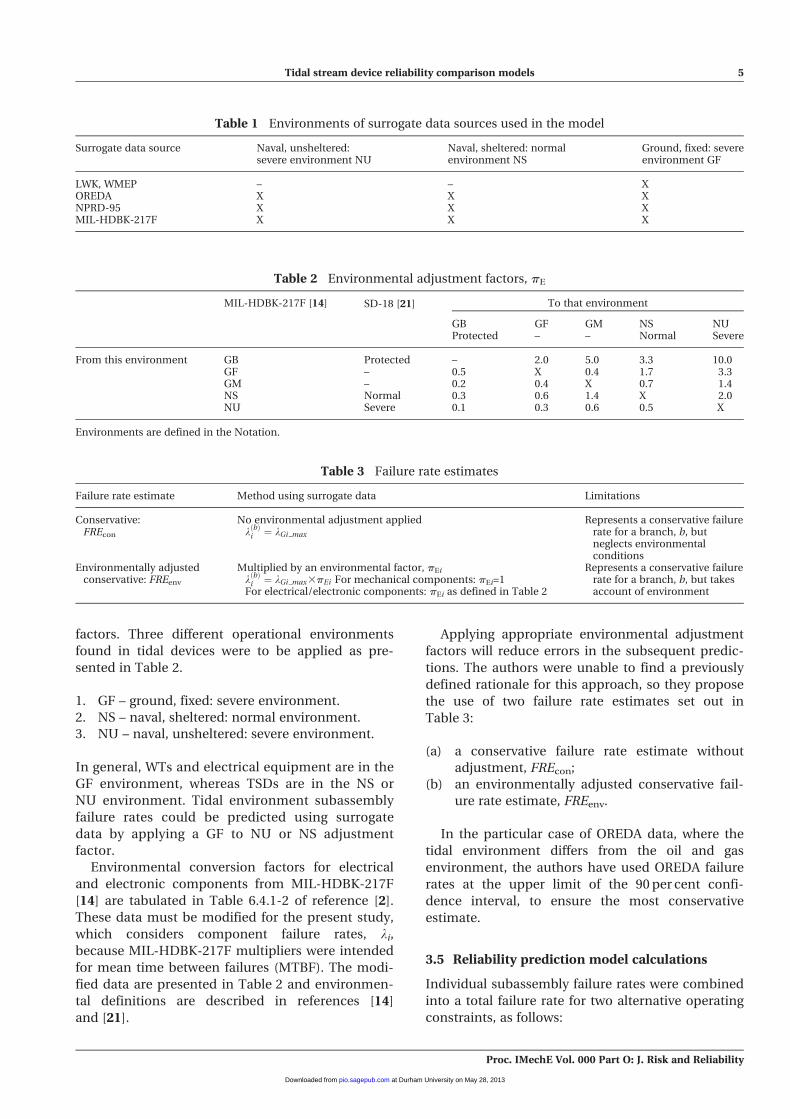
Table 1 Environments of surrogate data sources used in the model
Surrogate data source Naval, unsheltered:severe environment NU
Naval, sheltered: normalenvironment NS
Ground, fixed: severeenvironment GF
LWK, WMEP – – XOREDA X X XNPRD-95 X X XMIL-HDBK-217F X X X
Table 2 Environmental adjustment factors, pE
To that environmentMIL-HDBK-217F [14]
GB GF GM NS NU
SD-18 [21]
Protected – – Normal Severe
From this environment GB Protected – 2.0 5.0 3.3 10.0GF – 0.5 X 0.4 1.7 3.3GM – 0.2 0.4 X 0.7 1.4NS Normal 0.3 0.6 1.4 X 2.0NU Severe 0.1 0.3 0.6 0.5 X
Environments are defined in the Notation.
Table 3 Failure rate estimates
Failure rate estimate Method using surrogate data Limitations
Conservative:FREcon
No environmental adjustment appliedkðbÞi ¼ kGi max
Represents a conservative failurerate for a branch, b, butneglects environmentalconditions
Environmentally adjustedconservative: FREenv
Multiplied by an environmental factor, pEi
kðbÞi ¼ kGi max3pEi For mechanical components: pEi=1For electrical/electronic components: pEi as defined in Table 2
Represents a conservative failurerate for a branch, b, but takesaccount of environment
Tidal stream device reliability comparison models 5
Proc. IMechE Vol. 000 Part O: J. Risk and Reliability
at Durham University on May 28, 2013pio.sagepub.comDownloaded from
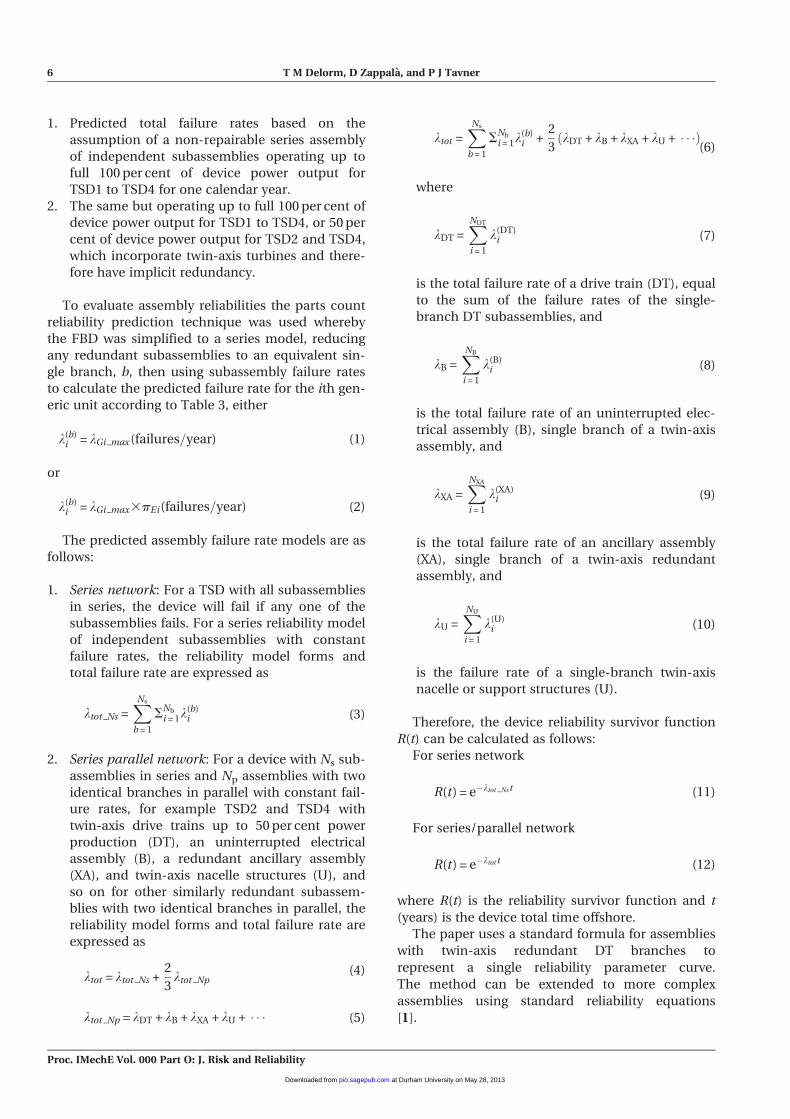
1. Predicted total failure rates based on the
assumption of a non-repairable series assembly
of independent subassemblies operating up to
full 100 per cent of device power output for
TSD1 to TSD4 for one calendar year.
2. The same but operating up to full 100 per cent of
device power output for TSD1 to TSD4, or 50 per
cent of device power output for TSD2 and TSD4,
which incorporate twin-axis turbines and there-
fore have implicit redundancy.
To evaluate assembly reliabilities the parts count
reliability prediction technique was used whereby
the FBD was simplified to a series model, reducing
any redundant subassemblies to an equivalent sin-
gle branch, b, then using subassembly failure rates
to calculate the predicted failure rate for the ith gen-
eric unit according to Table 3, either
k(b)i = kGi max(failures=year) (1)
or
k(b)i = kGi max3pEi(failures=year) (2)
The predicted assembly failure rate models are as
follows:
1. Series network: For a TSD with all subassemblies
in series, the device will fail if any one of the
subassemblies fails. For a series reliability model
of independent subassemblies with constant
failure rates, the reliability model forms and
total failure rate are expressed as
ktot Ns =XNs
b = 1
SNb
i = 1k(b)i (3)
2. Series parallel network: For a device with Ns sub-
assemblies in series and Np assemblies with two
identical branches in parallel with constant fail-
ure rates, for example TSD2 and TSD4 with
twin-axis drive trains up to 50 per cent power
production (DT), an uninterrupted electrical
assembly (B), a redundant ancillary assembly
(XA), and twin-axis nacelle structures (U), and
so on for other similarly redundant subassem-
blies with two identical branches in parallel, the
reliability model forms and total failure rate are
expressed as
ktot = ktot Ns +2
3ktot Np
(4)
ktot Np = kDT + kB + kXA + kU + � � � (5)
ktot =XNs
b = 1
SNb
i = 1k(b)i +
2
3kDT + kB + kXA + kU + � � �ð Þ
(6)
where
kDT =XNDT
i = 1
k(DT)i (7)
is the total failure rate of a drive train (DT), equal
to the sum of the failure rates of the single-
branch DT subassemblies, and
kB =XNB
i = 1
k(B)i (8)
is the total failure rate of an uninterrupted elec-
trical assembly (B), single branch of a twin-axis
assembly, and
kXA =XNXA
i = 1
k(XA)i (9)
is the total failure rate of an ancillary assembly
(XA), single branch of a twin-axis redundant
assembly, and
kU =XNU
i = 1
k(U)i (10)
is the failure rate of a single-branch twin-axis
nacelle or support structures (U).
Therefore, the device reliability survivor function
R(t) can be calculated as follows:
For series network
R(t) = e�ktot Nst (11)
For series/parallel network
R(t) = e�ktot t (12)
where R(t) is the reliability survivor function and t
(years) is the device total time offshore.
The paper uses a standard formula for assemblies
with twin-axis redundant DT branches to
represent a single reliability parameter curve.
The method can be extended to more complex
assemblies using standard reliability equations
[1].
6 T M Delorm, D Zappala, and P J Tavner
Proc. IMechE Vol. 000 Part O: J. Risk and Reliability
at Durham University on May 28, 2013pio.sagepub.comDownloaded from
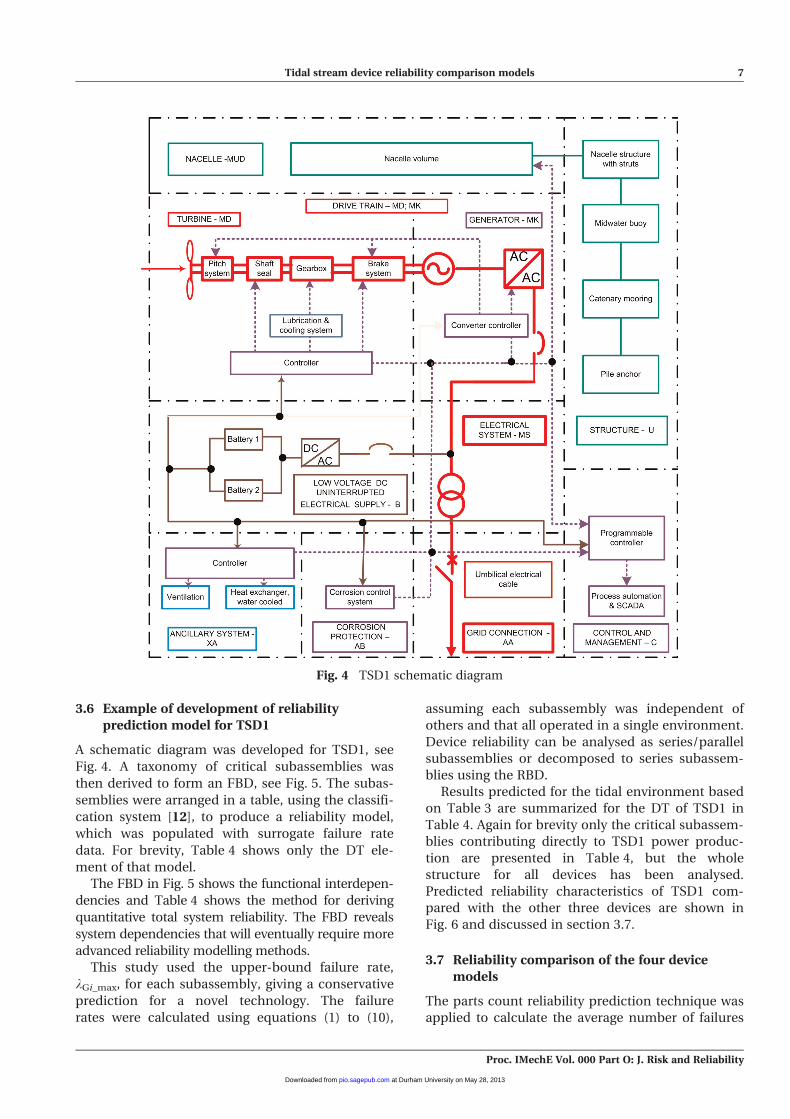
3.6 Example of development of reliability
prediction model for TSD1
A schematic diagram was developed for TSD1, see
Fig. 4. A taxonomy of critical subassemblies was
then derived to form an FBD, see Fig. 5. The subas-
semblies were arranged in a table, using the classifi-
cation system [12], to produce a reliability model,
which was populated with surrogate failure rate
data. For brevity, Table 4 shows only the DT ele-
ment of that model.
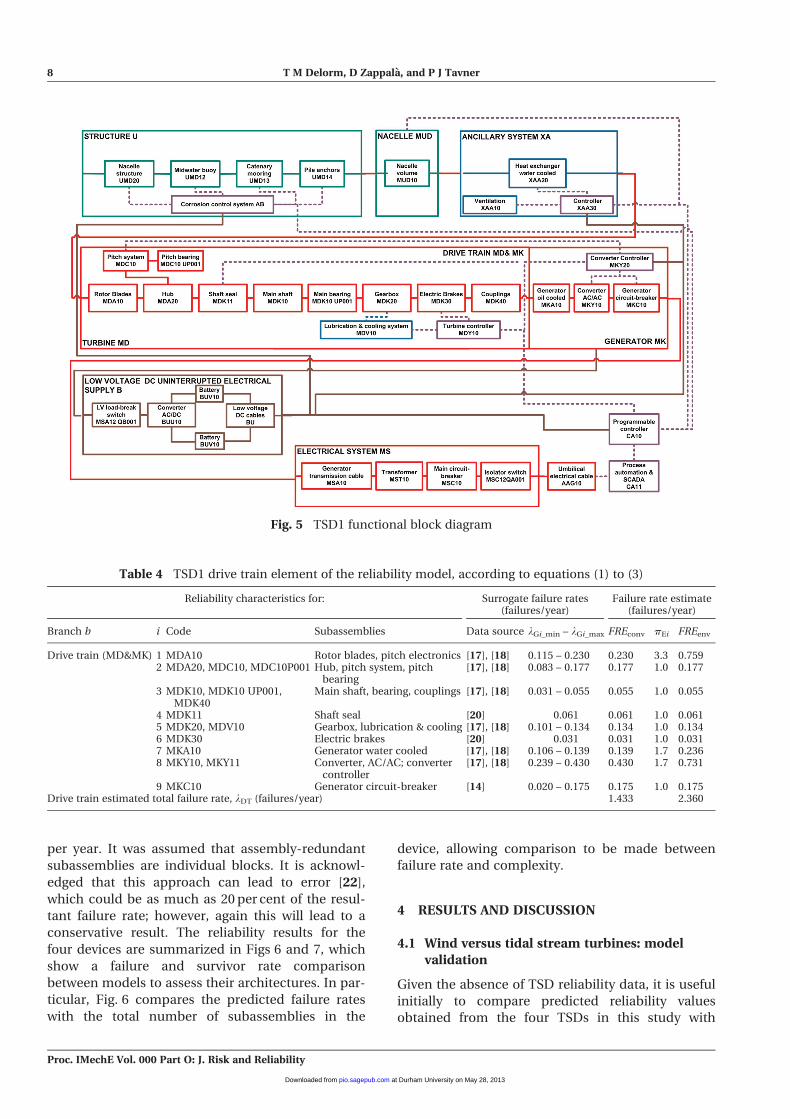
The FBD in Fig. 5 shows the functional interdepen-
dencies and Table 4 shows the method for deriving
quantitative total system reliability. The FBD reveals
system dependencies that will eventually require more
advanced reliability modelling methods.
This study used the upper-bound failure rate,
kGi_max, for each subassembly, giving a conservative
prediction for a novel technology. The failure
rates were calculated using equations (1) to (10),
assuming each subassembly was independent of
others and that all operated in a single environment.
Device reliability can be analysed as series/parallel
subassemblies or decomposed to series subassem-
blies using the RBD.
Results predicted for the tidal environment based
on Table 3 are summarized for the DT of TSD1 in
Table 4. Again for brevity only the critical subassem-
blies contributing directly to TSD1 power produc-
tion are presented in Table 4, but the whole
structure for all devices has been analysed.
Predicted reliability characteristics of TSD1 com-
pared with the other three devices are shown in
Fig. 6 and discussed in section 3.7.
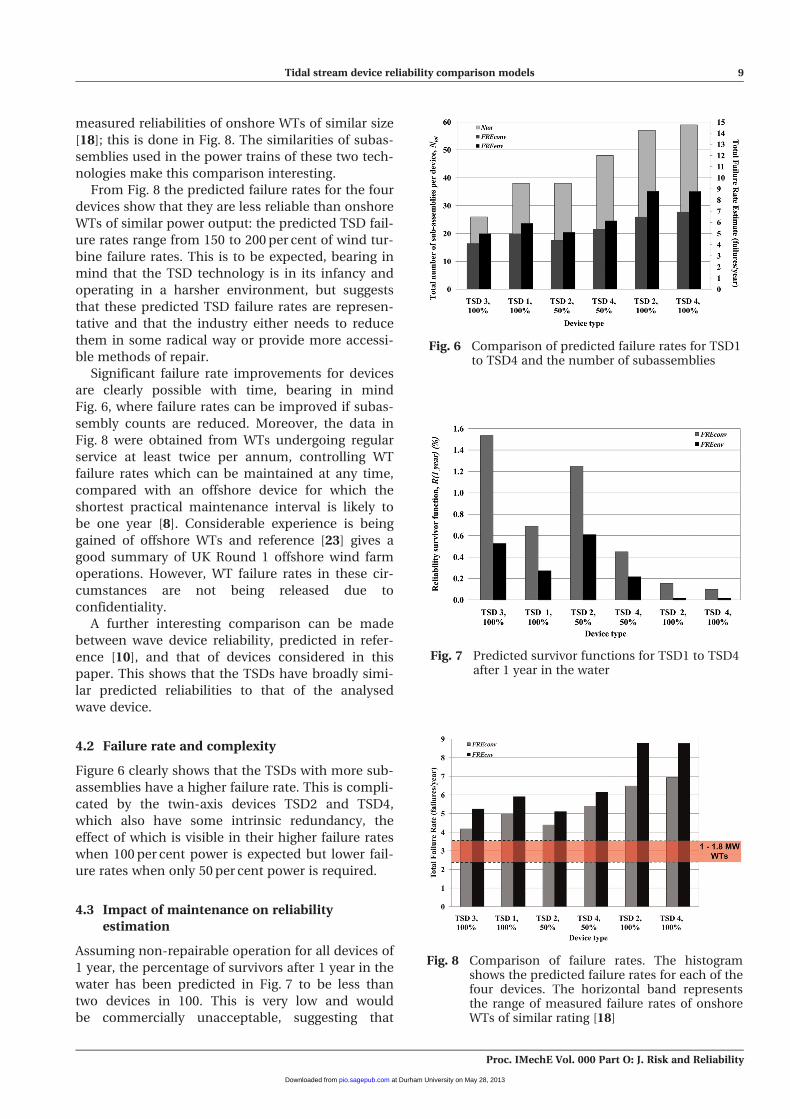
3.7 Reliability comparison of the four device
models
The parts count reliability prediction technique was
applied to calculate the average number of failures
Fig. 4 TSD1 schematic diagram
Tidal stream device reliability comparison models 7
Proc. IMechE Vol. 000 Part O: J. Risk and Reliability
at Durham University on May 28, 2013pio.sagepub.comDownloaded from
per year. It was assumed that assembly-redundant
subassemblies are individual blocks. It is acknowl-
edged that this approach can lead to error [22],
which could be as much as 20 per cent of the resul-
tant failure rate; however, again this will lead to a
conservative result. The reliability results for the
four devices are summarized in Figs 6 and 7, which
show a failure and survivor rate comparison
between models to assess their architectures. In par-
ticular, Fig. 6 compares the predicted failure rates
with the total number of subassemblies in the
device, allowing comparison to be made between
failure rate and complexity.
4 RESULTS AND DISCUSSION
4.1 Wind versus tidal stream turbines: model
validation
Given the absence of TSD reliability data, it is useful
initially to compare predicted reliability values
obtained from the four TSDs in this study with
Fig. 5 TSD1 functional block diagram
Table 4 TSD1 drive train element of the reliability model, according to equations (1) to (3)
Reliability characteristics for: Surrogate failure rates(failures/year)
Failure rate estimate(failures/year)
Branch b i Code Subassemblies Data source kGi_min – kGi_max FREconv pEi FREenv
Drive train (MD&MK) 1 MDA10 Rotor blades, pitch electronics [17], [18] 0.115 – 0.230 0.230 3.3 0.7592 MDA20, MDC10, MDC10P001 Hub, pitch system, pitch
bearing[17], [18] 0.083 – 0.177 0.177 1.0 0.177
3 MDK10, MDK10 UP001,MDK40
Main shaft, bearing, couplings [17], [18] 0.031 – 0.055 0.055 1.0 0.055
4 MDK11 Shaft seal [20] 0.061 0.061 1.0 0.0615 MDK20, MDV10 Gearbox, lubrication & cooling [17], [18] 0.101 – 0.134 0.134 1.0 0.1346 MDK30 Electric brakes [20] 0.031 0.031 1.0 0.0317 MKA10 Generator water cooled [17], [18] 0.106 – 0.139 0.139 1.7 0.2368 MKY10, MKY11 Converter, AC/AC; converter
controller[17], [18] 0.239 – 0.430 0.430 1.7 0.731
9 MKC10 Generator circuit-breaker [14] 0.020 – 0.175 0.175 1.0 0.175Drive train estimated total failure rate, kDT (failures/year) 1.433 2.360
8 T M Delorm, D Zappala, and P J Tavner
Proc. IMechE Vol. 000 Part O: J. Risk and Reliability
at Durham University on May 28, 2013pio.sagepub.comDownloaded from
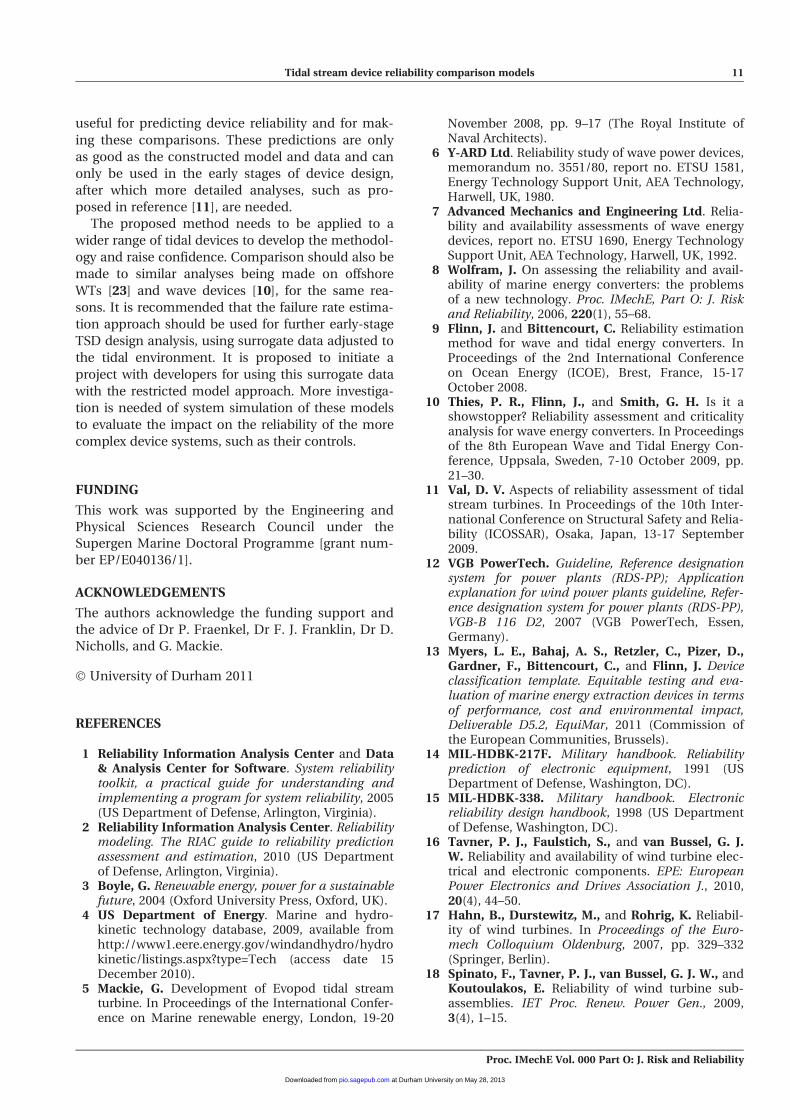
measured reliabilities of onshore WTs of similar size
[18]; this is done in Fig. 8. The similarities of subas-
semblies used in the power trains of these two tech-
nologies make this comparison interesting.
From Fig. 8 the predicted failure rates for the four
devices show that they are less reliable than onshore
WTs of similar power output: the predicted TSD fail-
ure rates range from 150 to 200 per cent of wind tur-
bine failure rates. This is to be expected, bearing in
mind that the TSD technology is in its infancy and
operating in a harsher environment, but suggests
that these predicted TSD failure rates are represen-
tative and that the industry either needs to reduce
them in some radical way or provide more accessi-
ble methods of repair.
Significant failure rate improvements for devices
are clearly possible with time, bearing in mind
Fig. 6, where failure rates can be improved if subas-
sembly counts are reduced. Moreover, the data in
Fig. 8 were obtained from WTs undergoing regular
service at least twice per annum, controlling WT
failure rates which can be maintained at any time,
compared with an offshore device for which the
shortest practical maintenance interval is likely to
be one year [8]. Considerable experience is being
gained of offshore WTs and reference [23] gives a
good summary of UK Round 1 offshore wind farm
operations. However, WT failure rates in these cir-
cumstances are not being released due to
confidentiality.
A further interesting comparison can be made
between wave device reliability, predicted in refer-
ence [10], and that of devices considered in this
paper. This shows that the TSDs have broadly simi-
lar predicted reliabilities to that of the analysed
wave device.
4.2 Failure rate and complexity
Figure 6 clearly shows that the TSDs with more sub-
assemblies have a higher failure rate. This is compli-
cated by the twin-axis devices TSD2 and TSD4,
which also have some intrinsic redundancy, the
effect of which is visible in their higher failure rates
when 100 per cent power is expected but lower fail-
ure rates when only 50 per cent power is required.
4.3 Impact of maintenance on reliabilityestimation
Assuming non-repairable operation for all devices of
1 year, the percentage of survivors after 1 year in the
water has been predicted in Fig. 7 to be less than
two devices in 100. This is very low and would
be commercially unacceptable, suggesting that
Fig. 6 Comparison of predicted failure rates for TSD1to TSD4 and the number of subassemblies
Fig. 7 Predicted survivor functions for TSD1 to TSD4after 1 year in the water
Fig. 8 Comparison of failure rates. The histogramshows the predicted failure rates for each of thefour devices. The horizontal band representsthe range of measured failure rates of onshoreWTs of similar rating [18]
Tidal stream device reliability comparison models 9
Proc. IMechE Vol. 000 Part O: J. Risk and Reliability
at Durham University on May 28, 2013pio.sagepub.comDownloaded from
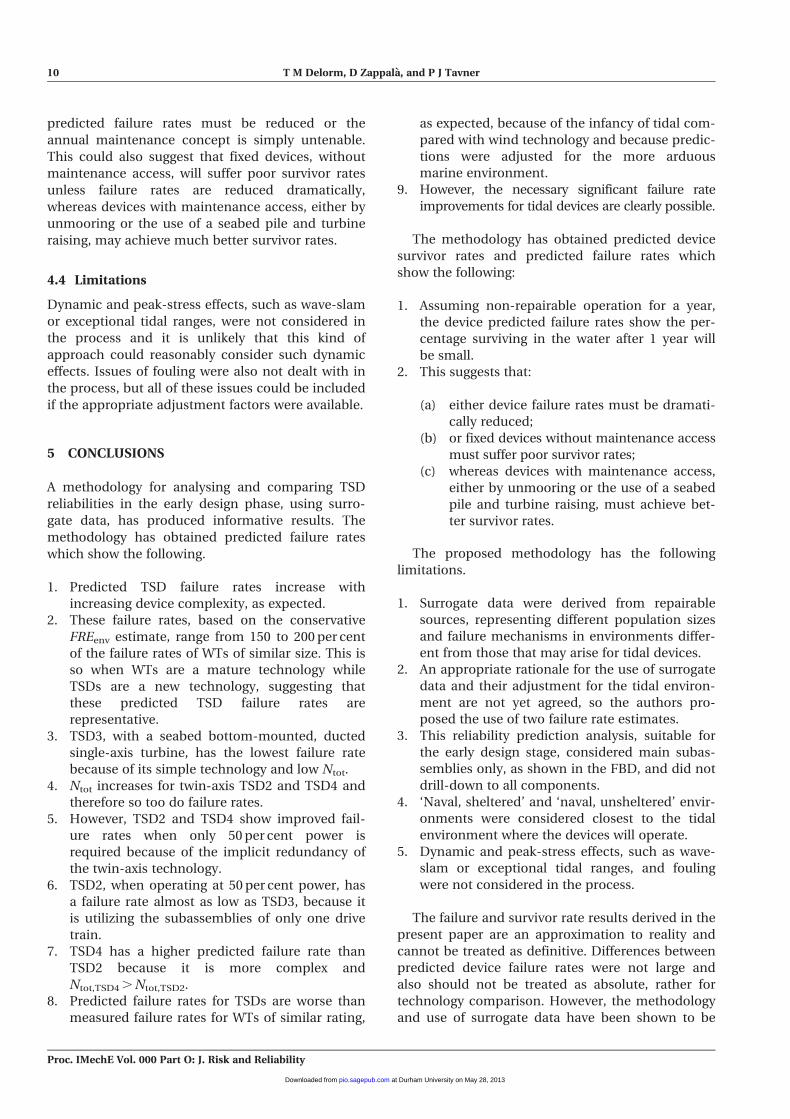
predicted failure rates must be reduced or the
annual maintenance concept is simply untenable.
This could also suggest that fixed devices, without
maintenance access, will suffer poor survivor rates
unless failure rates are reduced dramatically,
whereas devices with maintenance access, either by
unmooring or the use of a seabed pile and turbine
raising, may achieve much better survivor rates.
4.4 Limitations
Dynamic and peak-stress effects, such as wave-slam
or exceptional tidal ranges, were not considered in
the process and it is unlikely that this kind of
approach could reasonably consider such dynamic
effects. Issues of fouling were also not dealt with in
the process, but all of these issues could be included
if the appropriate adjustment factors were available.
5 CONCLUSIONS
A methodology for analysing and comparing TSD
reliabilities in the early design phase, using surro-
gate data, has produced informative results. The
methodology has obtained predicted failure rates
which show the following.
1. Predicted TSD failure rates increase with
increasing device complexity, as expected.
2. These failure rates, based on the conservative
FREenv estimate, range from 150 to 200 per cent
of the failure rates of WTs of similar size. This is
so when WTs are a mature technology while
TSDs are a new technology, suggesting that
these predicted TSD failure rates are
representative.
3. TSD3, with a seabed bottom-mounted, ducted
single-axis turbine, has the lowest failure rate
because of its simple technology and low Ntot.
4. Ntot increases for twin-axis TSD2 and TSD4 and
therefore so too do failure rates.
5. However, TSD2 and TSD4 show improved fail-
ure rates when only 50 per cent power is
required because of the implicit redundancy of
the twin-axis technology.
6. TSD2, when operating at 50 per cent power, has
a failure rate almost as low as TSD3, because it
is utilizing the subassemblies of only one drive
train.
7. TSD4 has a higher predicted failure rate than
TSD2 because it is more complex and
Ntot,TSD4 . Ntot,TSD2.
8. Predicted failure rates for TSDs are worse than
measured failure rates for WTs of similar rating,
as expected, because of the infancy of tidal com-
pared with wind technology and because predic-
tions were adjusted for the more arduous
marine environment.
9. However, the necessary significant failure rate
improvements for tidal devices are clearly possible.
The methodology has obtained predicted device
survivor rates and predicted failure rates which
show the following:
1. Assuming non-repairable operation for a year,
the device predicted failure rates show the per-
centage surviving in the water after 1 year will
be small.
2. This suggests that:
(a) either device failure rates must be dramati-
cally reduced;
(b) or fixed devices without maintenance access
must suffer poor survivor rates;
(c) whereas devices with maintenance access,
either by unmooring or the use of a seabed
pile and turbine raising, must achieve bet-
ter survivor rates.
The proposed methodology has the following
limitations.
1. Surrogate data were derived from repairable
sources, representing different population sizes
and failure mechanisms in environments differ-
ent from those that may arise for tidal devices.
2. An appropriate rationale for the use of surrogate
data and their adjustment for the tidal environ-
ment are not yet agreed, so the authors pro-
posed the use of two failure rate estimates.
3. This reliability prediction analysis, suitable for
the early design stage, considered main subas-
semblies only, as shown in the FBD, and did not
drill-down to all components.
4. ‘Naval, sheltered’ and ‘naval, unsheltered’ envir-
onments were considered closest to the tidal
environment where the devices will operate.
5. Dynamic and peak-stress effects, such as wave-
slam or exceptional tidal ranges, and fouling
were not considered in the process.
The failure and survivor rate results derived in the
present paper are an approximation to reality and
cannot be treated as definitive. Differences between
predicted device failure rates were not large and
also should not be treated as absolute, rather for
technology comparison. However, the methodology
and use of surrogate data have been shown to be
10 T M Delorm, D Zappala, and P J Tavner
Proc. IMechE Vol. 000 Part O: J. Risk and Reliability
at Durham University on May 28, 2013pio.sagepub.comDownloaded from
useful for predicting device reliability and for mak-
ing these comparisons. These predictions are only
as good as the constructed model and data and can
only be used in the early stages of device design,
after which more detailed analyses, such as pro-
posed in reference [11], are needed.
The proposed method needs to be applied to a
wider range of tidal devices to develop the methodol-
ogy and raise confidence. Comparison should also be
made to similar analyses being made on offshore
WTs [23] and wave devices [10], for the same rea-
sons. It is recommended that the failure rate estima-
tion approach should be used for further early-stage
TSD design analysis, using surrogate data adjusted to
the tidal environment. It is proposed to initiate a
project with developers for using this surrogate data
with the restricted model approach. More investiga-
tion is needed of system simulation of these models
to evaluate the impact on the reliability of the more
complex device systems, such as their controls.
FUNDING
This work was supported by the Engineering and
Physical Sciences Research Council under the
Supergen Marine Doctoral Programme [grant num-
ber EP/E040136/1].
ACKNOWLEDGEMENTS
The authors acknowledge the funding support and
the advice of Dr P. Fraenkel, Dr F. J. Franklin, Dr D.
Nicholls, and G. Mackie.
� University of Durham 2011
REFERENCES
1 Reliability Information Analysis Center and Data& Analysis Center for Software. System reliabilitytoolkit, a practical guide for understanding andimplementing a program for system reliability, 2005(US Department of Defense, Arlington, Virginia).
2 Reliability Information Analysis Center. Reliabilitymodeling. The RIAC guide to reliability predictionassessment and estimation, 2010 (US Departmentof Defense, Arlington, Virginia).
3 Boyle, G. Renewable energy, power for a sustainablefuture, 2004 (Oxford University Press, Oxford, UK).
4 US Department of Energy. Marine and hydro-kinetic technology database, 2009, available fromhttp://www1.eere.energy.gov/windandhydro/hydrokinetic/listings.aspx?type=Tech (access date 15December 2010).
5 Mackie, G. Development of Evopod tidal streamturbine. In Proceedings of the International Confer-ence on Marine renewable energy, London, 19-20
November 2008, pp. 9–17 (The Royal Institute ofNaval Architects).
6 Y-ARD Ltd. Reliability study of wave power devices,memorandum no. 3551/80, report no. ETSU 1581,Energy Technology Support Unit, AEA Technology,Harwell, UK, 1980.
7 Advanced Mechanics and Engineering Ltd. Relia-bility and availability assessments of wave energydevices, report no. ETSU 1690, Energy TechnologySupport Unit, AEA Technology, Harwell, UK, 1992.
8 Wolfram, J. On assessing the reliability and avail-ability of marine energy converters: the problemsof a new technology. Proc. IMechE, Part O: J. Riskand Reliability, 2006, 220(1), 55–68.
9 Flinn, J. and Bittencourt, C. Reliability estimationmethod for wave and tidal energy converters. InProceedings of the 2nd International Conferenceon Ocean Energy (ICOE), Brest, France, 15-17October 2008.
10 Thies, P. R., Flinn, J., and Smith, G. H. Is it ashowstopper? Reliability assessment and criticalityanalysis for wave energy converters. In Proceedingsof the 8th European Wave and Tidal Energy Con-ference, Uppsala, Sweden, 7-10 October 2009, pp.21–30.
11 Val, D. V. Aspects of reliability assessment of tidalstream turbines. In Proceedings of the 10th Inter-national Conference on Structural Safety and Relia-bility (ICOSSAR), Osaka, Japan, 13-17 September2009.
12 VGB PowerTech. Guideline, Reference designationsystem for power plants (RDS-PP); Applicationexplanation for wind power plants guideline, Refer-ence designation system for power plants (RDS-PP),VGB-B 116 D2, 2007 (VGB PowerTech, Essen,Germany).
13 Myers, L. E., Bahaj, A. S., Retzler, C., Pizer, D.,Gardner, F., Bittencourt, C., and Flinn, J. Deviceclassification template. Equitable testing and eva-luation of marine energy extraction devices in termsof performance, cost and environmental impact,Deliverable D5.2, EquiMar, 2011 (Commission ofthe European Communities, Brussels).
14 MIL-HDBK-217F. Military handbook. Reliabilityprediction of electronic equipment, 1991 (USDepartment of Defense, Washington, DC).
15 MIL-HDBK-338. Military handbook. Electronicreliability design handbook, 1998 (US Departmentof Defense, Washington, DC).
16 Tavner, P. J., Faulstich, S., and van Bussel, G. J.W. Reliability and availability of wind turbine elec-trical and electronic components. EPE: EuropeanPower Electronics and Drives Association J., 2010,20(4), 44–50.
17 Hahn, B., Durstewitz, M., and Rohrig, K. Reliabil-ity of wind turbines. In Proceedings of the Euro-mech Colloquium Oldenburg, 2007, pp. 329–332(Springer, Berlin).
18 Spinato, F., Tavner, P. J., van Bussel, G. J. W., andKoutoulakos, E. Reliability of wind turbine sub-assemblies. IET Proc. Renew. Power Gen., 2009,3(4), 1–15.
Tidal stream device reliability comparison models 11
Proc. IMechE Vol. 000 Part O: J. Risk and Reliability
at Durham University on May 28, 2013pio.sagepub.comDownloaded from
19 OREDA. Offshore reliability data handbook, 1984–2002. Edition 1: VERITEC – Marine TechnologyConsultants/PennWellBooks; editions 3 and 4: SIN-TEF Industrial Management/Det Norske Veritas.
20 Reliability Information Analysis Center. NPRD-95,Nonelectronic parts reliability data, 1995 (RAIC,Utica, New York).
21 Naval Surface Weapons Center. SD-18, Programguide for parts requirements and application,Defense Standardization Program, 2006 (Naval Sur-face Weapons Center, Crain, Indiana).
22 Faraci, V. Calculating failure rates of series/parallelnetworks. Journal of the System Reliability Center,First Quarter – 2006, 1–7.
23 Feng, Y., Tavner, P. J., and Long, H. Early experi-ences with UK round 1 offshore wind farms. Proc.Instn Civil Engrs, Energy, 2010, 163(EN4), 167–181.
APPENDIX
Notation
B uninterrupted electrical assembly
DT drive train
FBD functional block diagram
FRE failure rate estimate
FREcon conservative failure rate estimate
without adjustment
FREenv environmentally adjusted conserva-
tive failure rate estimate
GB ground benign: protected
environment
GF ground fixed: severe environment
GM ground mobile environment
LWK Landwirtschaftskammer Schleswig-
Holstein
MIL-HDBK Military Handbook
MTBF mean time between failure
Nb number of sub-assemblies in series
in one branch b of an assembly
Np number of subassemblies in series
within an identical parallel branch
Ns number of subassemblies in series
with none in parallel
Ntot total number of device
subassemblies
NPRD Nonelectronic Parts Reliability Data
NS naval sheltered: normal environment
NU naval unsheltered: severe
environment
OREDA Offshore Reliability Data
R(t) reliability survivor function
RBD reliability block diagram
RMP reliability modelling and prediction
t device total time offshore
TSD tidal stream device
U support structure
WMEP Wissenschaftlichen Mess- und
Evaluierungsprogramm
WT wind turbine
XA ancillary assembly
k(t) failure intensity function
kB uninterrupted electrical assembly
single-branch total failure rate
kDT drive train single-branch total failure
rate
kGi_max maximum generic failure rate for ith
subassembly
kGi_min minimum generic failure rate for ith
subassembly
kðbÞipredicted failure rate of ith sub-
assembly in branch b
ktot series/parallel network total pre-
dicted failure rate
ktot_Np parallel network single-branch total
predicted failure rate
ktot_Ns series network total predicted failure
rate
kU support structure single-branch total
failure rate
kXA ancillary assembly single-branch
total failure rate
pE environmental adjustment factor
12 T M Delorm, D Zappala, and P J Tavner
Proc. IMechE Vol. 000 Part O: J. Risk and Reliability
at Durham University on May 28, 2013pio.sagepub.comDownloaded from