135 imagine a place® 2022 Pricing carolina.ofs.com 800.763.0212 ...
Upload
independentCategory
view
0download
0
Evaluating the Imagine Stream Architecture
Jung Ho Ahn, William J. Dally, Brucek Khailany, Ujval J. Kapasi, and Abhishek DasComputer Systems Laboratory
Stanford University, Stanford, CA 94305, USA{gajh,billd,khailany,ujk,abhishek}@cva.stanford.edu
Abstract
This paper describes an experimental evaluation of theprototype Imagine stream processor. Imagine [8] is a streamprocessor that employs a two-level register hierarchy with9.7 Kbytes of local register file capacity and 128 Kbytesof stream register file (SRF) capacity to capture producer-consumer locality in stream applications. Parallelism is ex-ploited using an array of 48 floating-point arithmetic unitsorganized as eight SIMD clusters with a 6-wide VLIW percluster. We evaluate the performance of each aspect ofthe Imagine architecture using a set of synthetic micro-benchmarks, key media processing kernels, and full appli-cations. These micro-benchmarks show that the prototypehardware can attain 7.96 GFLOPS or 25.4 GOPS of arith-metic performance, 12.7 Gbytes/s of SRF bandwidth, 1.58Gbytes/s of memory system bandwidth, and accept up to2 million stream processor instructions per second from ahost processor.
On a set of media processing kernels, Imagine sustainedan average of 43% of peak arithmetic performance. Anevaluation of full applications provides a breakdown ofwhere execution time is spent. Over full applications, Imag-ine achieves 39.4% of peak performance, of the remain-der on average 36.4% of time is lost due to load imbal-ance between arithmetic units in the VLIW clusters and lim-ited instruction-level parallelism within kernel inner loops,10.6% is due to kernel startup and shutdown overhead be-cause of short stream lengths, 7.6% is due to memory stalls,and the rest is due to insufficient host processor bandwidth.Further analysis included in the paper presents the impactof host instruction bandwidth on application performance,particularly on smaller datasets. In summary, the experi-mental measurements described in this paper demonstratethe high performance and efficiency of stream processing:operating at 200 MHz, Imagine sustains 4.81 GFLOPS onQR decomposition while dissipating 7.42 Watts.
1. Introduction
Media applications such as video processing, wire-less communication, and 3-D graphics are pervasive and
computationally demanding. To decompress, deinter-leave, and scale an HDTV video stream in real time, forexample, requires billions of operations per second. For-tunately these applications are characterized by ampleparallelism. Most of these applications are served to-day by special-purpose ASIC processors containing hun-dreds to thousands of ALUs. While such ASIC solutions areefficient, they lack flexibility and are not feasible for cer-tain low-volume applications.
Imagine [8] is a programmable stream processor aimedat media applications. Expressing an application as a streamprogram, sequences of records flowing through computa-tion kernels, exposes both parallelism and locality. Imag-ine exploits the parallelism of a stream program with an ar-ray of 48 32-bit floating-point units. Two levels of registerfiles, 9.7 KBytes of local register files and 128 KBytes ofstream register file, capture the locality of stream programs,enabling a high ratio of arithmetic to off-chip bandwidth.By keeping most data transfers local (over 95% of all trans-fers are from local registers) Imagine offers efficiency ap-proaching that of an ASIC while retaining the flexibility ofa programmable processor.
This paper describes the experimental evaluation of aprototype Imagine processor fabricated in an 1.5 Volts, 0.18µm CMOS process1 and packaged in a 768-pin BGA pack-age. A set of micro-benchmarks are used to measure the per-formance of each feature of Imagine independently. Mediakernels and applications are then used to measure the over-all performance of Imagine on actual workloads.
Imagine achieves 7.96 GFLOPS / 25.4 GOPS ALU per-formance on synthetic benchmarks and sustains between16% and 60% of this peak performance on four media ap-plications. On all of these applications, a single Imaginechip is able to sustain greater than real-time performance.On MPEG encoding, for example, Imagine sustains a com-pression rate of 138 frames per second while consuming 6.8Watts. At the kernel level, the difference between peak andsustained performance is primarily due to idle ALUs causedby limited ILP and load imbalance across ALUs. On three
1 The process used to fabricate Imagine has 0.18µm metal rules with0.15µm devices.
Kernel
Stream
Input Data
Output Data
Left CameraImage
Right CameraImage
DepthMap
7x7convolve
7x7convolve
3x3convolve
3x3convolve
SAD
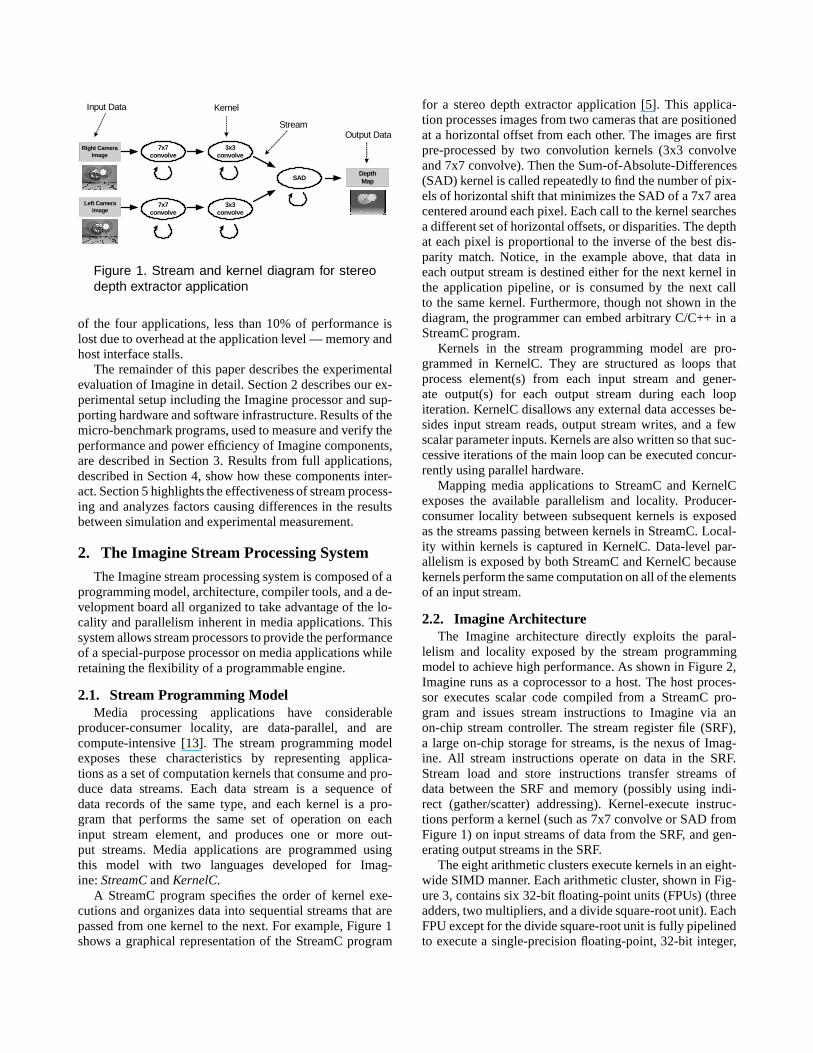
Figure 1. Stream and kernel diagram for stereodepth extractor application
of the four applications, less than 10% of performance islost due to overhead at the application level — memory andhost interface stalls.
The remainder of this paper describes the experimentalevaluation of Imagine in detail. Section 2 describes our ex-perimental setup including the Imagine processor and sup-porting hardware and software infrastructure. Results of themicro-benchmark programs, used to measure and verify theperformance and power efficiency of Imagine components,are described in Section 3. Results from full applications,described in Section 4, show how these components inter-act. Section 5 highlights the effectiveness of stream process-ing and analyzes factors causing differences in the resultsbetween simulation and experimental measurement.
2. The Imagine Stream Processing System
The Imagine stream processing system is composed of aprogramming model, architecture, compiler tools, and a de-velopment board all organized to take advantage of the lo-cality and parallelism inherent in media applications. Thissystem allows stream processors to provide the performanceof a special-purpose processor on media applications whileretaining the flexibility of a programmable engine.
2.1. Stream Programming ModelMedia processing applications have considerable
producer-consumer locality, are data-parallel, and arecompute-intensive [13]. The stream programming modelexposes these characteristics by representing applica-tions as a set of computation kernels that consume and pro-duce data streams. Each data stream is a sequence ofdata records of the same type, and each kernel is a pro-gram that performs the same set of operation on eachinput stream element, and produces one or more out-put streams. Media applications are programmed usingthis model with two languages developed for Imag-ine:StreamCandKernelC.
A StreamC program specifies the order of kernel exe-cutions and organizes data into sequential streams that arepassed from one kernel to the next. For example, Figure 1shows a graphical representation of the StreamC program
for a stereo depth extractor application [5]. This applica-tion processes images from two cameras that are positionedat a horizontal offset from each other. The images are firstpre-processed by two convolution kernels (3x3 convolveand 7x7 convolve). Then the Sum-of-Absolute-Differences(SAD) kernel is called repeatedly to find the number of pix-els of horizontal shift that minimizes the SAD of a 7x7 areacentered around each pixel. Each call to the kernel searchesa different set of horizontal offsets, or disparities. The depthat each pixel is proportional to the inverse of the best dis-parity match. Notice, in the example above, that data ineach output stream is destined either for the next kernel inthe application pipeline, or is consumed by the next callto the same kernel. Furthermore, though not shown in thediagram, the programmer can embed arbitrary C/C++ in aStreamC program.
Kernels in the stream programming model are pro-grammed in KernelC. They are structured as loops thatprocess element(s) from each input stream and gener-ate output(s) for each output stream during each loopiteration. KernelC disallows any external data accesses be-sides input stream reads, output stream writes, and a fewscalar parameter inputs. Kernels are also written so that suc-cessive iterations of the main loop can be executed concur-rently using parallel hardware.
Mapping media applications to StreamC and KernelCexposes the available parallelism and locality. Producer-consumer locality between subsequent kernels is exposedas the streams passing between kernels in StreamC. Local-ity within kernels is captured in KernelC. Data-level par-allelism is exposed by both StreamC and KernelC becausekernels perform the same computation on all of the elementsof an input stream.
2.2. Imagine ArchitectureThe Imagine architecture directly exploits the paral-
lelism and locality exposed by the stream programmingmodel to achieve high performance. As shown in Figure 2,Imagine runs as a coprocessor to a host. The host proces-sor executes scalar code compiled from a StreamC pro-gram and issues stream instructions to Imagine via anon-chip stream controller. The stream register file (SRF),a large on-chip storage for streams, is the nexus of Imag-ine. All stream instructions operate on data in the SRF.Stream load and store instructions transfer streams ofdata between the SRF and memory (possibly using indi-rect (gather/scatter) addressing). Kernel-execute instruc-tions perform a kernel (such as 7x7 convolve or SAD fromFigure 1) on input streams of data from the SRF, and gen-erating output streams in the SRF.
The eight arithmetic clusters execute kernels in an eight-wide SIMD manner. Each arithmetic cluster, shown in Fig-ure 3, contains six 32-bit floating-point units (FPUs) (threeadders, two multipliers, and a divide square-root unit). EachFPU except for the divide square-root unit is fully pipelinedto execute a single-precision floating-point, 32-bit integer,

KEU
Imagine Processor
Stream
Controller
Network
Devices
(other Imagines
or I/O)
D R
A M
I n t e
r f a
c e
Host Processor
Network
Interface
SRF
12.8 GB/s
16 W/Cycle
217.6 GB/s
272 W/Cycle
1.6 GB/s
2 W/Cycle
Micro-controller
(& Instruction Store)
ALU Cluster
ALU Cluster
ALU Cluster
LRF
SDRAM
SDRAM
SDRAM
SDRAM
Figure 2. Diagram of Imagine architecture with bandwidth hierarchy numbers
Intra-cluster Switch To/From
SRF
To/From
Other Clusters COMM SP DSQ MUL MUL ADD ADD ADD
Figure 3. Imagine arithmetic cluster
or multiple lower-precision integer operations per cycle.These six FPUs execute kernel VLIW instructions issuedfrom a single micro-controller each clock cycle. Two-portlocal register files (LRFs) feed the inputs of each FPU andan intra-cluster switch connects the outputs of the ALUsand external ports from the SRF to the inputs of the LRFs.In addition, a scratchpad (SP) unit is used for small indexedaddressing operations within a cluster, and an interclustercommunication (COMM) unit is used to exchange data be-tween clusters.
When a kernel-execute instruction is received from thehost processor, the micro-controller starts fetching and is-suing VLIW instructions from the microcode instructionstore. For each iteration of a typical kernel’s inner loop,the eight clusters read eight subsequent elements in paral-lel from one or more input streams residing in the SRF,each cluster executes an identical series of VLIW instruc-tions on stream elements, and the eight clusters then writeeight output elements in parallel back to one or more outputstreams in the SRF. Kernels repeat this process for severalloop iterations until all elements of the input stream havebeen read and operated on. In this manner, data-level paral-lelism is exploited across the eight clusters through SIMDexecution and instruction-level parallelism is exploitedwithVLIW instructions per cluster. Locality within kernels is ex-ploited during each loop iteration when intermediate results
are passed through the intra-cluster switch and stored in theLRFs. Producer-consumer locality between kernels is cap-tured by storing kernel output streams in the SRF and read-ing input streams from the SRF during subsequent kernelswithout going back to external memory. While kernel exe-cution is ongoing, the host processor can concurrently issuestream load and store instructions so that when the next ker-nel is ready to start, its input data is already available in theSRF.
In our example application, the stereo depth extractor,each stream in the SRF is a row from an input image, andeach stream element is a pair of 16-bit pixels from thatrow. For each iteration of a 7x7 convolution kernel, 16 in-put pixels (two per cluster) are operated on, convolved withneighboring pixels, and 16 output pixels are produced. Out-put streams from the 7x7 convolution kernel are stored inthe SRF and passed directly to the 3x3 convolution ker-nel. The other kernels proceed similarly. By exploiting par-allelism and locality in this manner, stream processors areable to achieve high performance on a range of media ap-plications with only modest off-chip memory bandwidth re-quirements.
2.3. Software SystemThe Imagine software system provides the compile-time
and run-time support necessary for running stream pro-grams. As shown in Figure 4, the software system includescompilers for converting StreamC and KernelC programsinto host CPU assembly code and kernel microcode, respec-tively, and provides run-time support for issuing stream in-structions to Imagine via the host CPU’s external memoryinterface.

Imagine Memory Space
Imagine
Host
CPU
StreamC
Micro-
controller
KernelC
Kernel
Compiler
Kernel
Microcode
Host Memory Space
Stream
Application
Stream
Compiler
Generic C++
w/ coprocessor
extensions
C++ Compiler
Compile Time
Run Time
Microcode
Store
Stream
Instruction
Record
Stream
Dispatcher
Playback
Dispatcher
Figure 4. Imagine software system
The KernelC compiler uses communication schedulingto produce VLIW microcode from KernelC [9]. It per-forms high-level optimizations such as copy-propagation,loop unrolling and automatic software pipelining, schedulesarithmetic operations on functional units, specifies the datamovement between ALUs and LRFs, and performs regis-ter allocation. All of the kernel microcode for an applica-tion is loaded from the host CPU into the Imagine memoryspace during startup. At the start of application execution,the kernel microcode is transferred from Imagine memoryto the microcode store (2K VLIW instructions total). If allthe kernel microcode for an application does not fit in themicrocode store, the host ensures that kernels are loadeddynamically from Imagine memory to the microcode storebefore kernel execution occurs. If new kernels are beingloaded while another kernel is being executed, a perfor-mance degradation of less than 6% occurs.
The StreamC compilation process is split into two stages.In the first stage, a stream compiler performs a number ofhigh-level tasks such as dependency analysis between ker-nels and stream load/stores, software pipelining betweenstream loads or stores and kernel operations, optimal siz-ing of stripmined streams, and allocating and managingthe SRF [6]. After these optimizations and analyses arecompleted, the stream compiler generates stream instruc-tions (stream loads or stores, kernel invocations, and Imag-ine register reads and writes). These stream instructions areembedded in intermediate C++ code, which preserves thecontrol flow of the StreamC. During the second stage, astandard C++ compiler compiles and links the intermedi-ate code with a stream dispatcher, generating a host proces-sor executable (assembly code).
At run time, a command line interface is used to run aStreamC application of user’s choice, which inturn invokesthe stream dispatcher with relevant stream instructions. Thestream dispatcher manages a 32-slot scoreboard on Imag-ine. When a slot is free, it issues a new stream instruc-
Figure 5. Dual-Imagine development board
tion to be written into the scoreboard. The dependencies be-tween the new stream instruction and other scoreboard en-tries are encoded with the instruction itself by the streamcompiler. The stream controller on Imagine uses these de-pendencies to determine the next stream instruction to is-sue from the scoreboard when necessary resources becomeavailable. The dispatcher performs all reads/writes from/toImagine registers, which are mapped to addresses in thehost memory space. For data transfers between the hostCPU and Imagine, the stream dispatcher performs memory-mapped reads/writes to a on-chip fifo.
For many media applications such as stereo depth ex-traction, the control-flow for the entire application is data-independent. In these cases, the StreamC compiler takes ad-vantage of the static control-flow by using a playback mode,in which the intermediate C++ code is replaced by a recordof the encoded stream instructions, in order. The playbackdispatcher reads from this recorded sequence of stream in-structions and dispatches them as scoreboard slots becomefree. Although less general than running application codeon the host processor, this playback method allows for amore lightweight efficient dispatcher implementation whencontrol-flow is data independent.
2.4. Development BoardThe Imagine development board, shown in Figure 5, pro-
vides a platform for testing the Imagine stream processinghardware and software tools. The board contains two Imag-ine processors running at 200 MHz, fed by a single 150MHz PowerPC 8240 host processor. Each Imagine proces-sor has four SDRAM channels and is connected to eight256Mbit SDRAMs running at 100 MHz for a total capac-ity of 256 Mbytes per Imagine. An FPGA serves as a bridgebetween the PowerPC and Imagine chips, providing a 66MHz interface for issuing stream instructions and readingImagine control registers. The board is connected to a hostPC with a PCI interface, providing a command-line user in-terface and file storage system for the PowerPC host pro-

cessor on the development board. Additional board compo-nents are used for I/O and a multi-processor network, butare beyond the scope of this paper.
This development board provides a platform for evalu-ating the effectiveness of stream processing in exploitingthe parallelism and locality to achieve high performance onmedia applications. The remainder of this paper presentsthis detailed evaluation using experimental measurementsfrom this development board, except where otherwise men-tioned.
3. Micro-Benchmark performance
In order to explore the range of achievable performanceand power efficiency2 on Imagine, a number of tests werewritten in KernelC and StreamC to exercise specific com-ponents of the Imagine stream processor. First, a set ofsynthetic micro-benchmarks validate the peak performanceof Imagine subsystems. Second, key media processing ker-nels show how actual kernel characteristics affect sustainedperformance. Finally, another set of micro-benchmarks areused to explore how Imagine performance is affected bystream length.
3.1. Micro-benchmarksThe six micro-benchmark programs used to exercise the
peak performance of Imagine components are shown in Ta-ble 1. The first four micro-benchmarks affect kernels andthe last two affect application performance. Peak achievedfloating-point performance while running kernels in thearithmetic clusters occurs with a mixture of floating-pointadds and multiplies while peak achieved integer perfor-mance occurs with four 8-bit operations on each adder andtwo 16-bit operations on each multiplier. Inter-cluster com-munication bandwidth is stressed with a kernel that sorts32 elements of a stream, which requires a large number ofinter-cluster data exchanges, per loop iteration. Peak SRFbandwidth is achieved with a kernel that reads multiple in-put stream elements per loop iteration and writes the datadirectly back to the SRF via output streams. Memory sys-tem bandwidth and host interface bandwidth are stressedwith the last two micro-benchmarks. Peak memory band-width is measured by running two memory stream loads thathit a small range of random memory addresses simultane-ously. Host interface bandwidth is stressed by writing a se-ries of stream instructions which continually update controlregisters.
Table 1 shows that all tested components except the hostinterface achieve over 98% of the theoretical peak. Thebandwidth of the host interface is 10x lower than the the-oretical peak because it is limited by the development boardimplementation, not the host interface on Imagine. The ef-fect of host interface bandwidth on application performance
2 These are measured at 200 MHz and 1.8 Volts throughout the paper.3 When the chip is idle, it dissipates 4.72 W.
Component (achieved / theoretical) PowerCluster (OPS) (25.4 / 25.7) GOPS 5.79 W
Cluster (FLOPS) (7.96 / 8.13) GFLOPS 6.88 WInter-cluster comm. (7.84 / 8.00) ops/cycle 8.53 W
SRF (12.7 / 12.8) GB/s 5.79 WMEM (1.58 / 1.60) GB/s 5.42 W
Host Interface (2.03 / 20.0) MIPS 4.72 W
Table 1. Performance of Imagine components3
is discussed in detail in Section 5. The peak cluster perfor-mance benchmarks also demonstrate Imagine’s power effi-ciency, sustaining 4.39 GOPS/W for integer operations and1.16 GFLOPS/W for floating point operations. All powermeasurements use input data patterns that incur high tog-gle rates on internal nets, so during applications with highlycorrelated data, the average power dissipation in the stressedcomponents will be lower.
3.2. KernelsAlthough Imagine sustains close to peak performance on
synthetic micro-benchmarks, when actual media process-ing kernels are mapped to Imagine, limited parallelism, in-struction mix, and stream lengths can affect sustained per-formance substantially. Table 2 summarizes performance,power, register bandwidth, and instructions per cycle (IPC)for a set of kernels from the media processing and scien-tific computing domains. All of the kernels except for RLEand GROMACS achieve an IPC of over 35, indicating thatthere is ample arithmetic intensity and parallelism in thesekernels to be exploited by the kernel compiler. The registerbandwidth data shows that more than 95% of data accesssesare to the cluster LRFs, demonstrating the large amount oflocality within kernel computations. On average, most ker-nels require significantly less than the peak SRF bandwidthof 12.71 GB/s, meaning that some headroom remains formemory streams and for portions of kernels requiring burstsof higher SRF bandwidth.
Further analysis provides insight into the differences be-tween peak and sustained performance on kernels. Run-time during kernel execution can be classified into the fourcategories shown in Figure 6: minimum inner-loop run-timerequired to execute arithmetic operations, extra run-timewithin kernel inner loops incurred from ILP limitations andload imbalance, non-main loop execution time, and clusterstalls.
The first two categories combined from Figure 6 is thepercentage of execution time spent in kernel main loops.‘Operations’ are what execution time would be if peak per-formance were achieved within the main loop (operations)and the remaining execution time is due to limited ILPwithin cluster main loops and load imbalance between thetypes of arithmetic units in a cluster. For example, the innerloop of theupdate2kernel executes inner products requir-ing one multiplication and one addition per element. Sincethe Imagine clusters have 3 adders and 2 multipliers, per-

LRF BW SRF BW PowerKernel ALU (GB/s) (GB/s) IPC (Watt)
2D DCT 6.92 GOPS 95.13 2.09 35.9 6.99 two-dimensional direct cosine transformof 16-bit 8-by-8 pixel macroblocks
blocksearch 9.62 GOPS 98.18 0.07 35.9 7.07 search similar macroblocks for motion estimationRLE 1.21 GOPS 54.00 0.39 19.8 6.15 apply run length encoding to macroblocks (16 bit)
conv7x7 9.76 GOPS 99.44 2.75 36.7 7.76 convolve images with a 7x7 filter (16 bit)blockSAD 4.05 GOPS 108.7 8.87 35.2 7.79 compute SAD of two images (16 bit)
house 3.67 GFLOPS 101.4 2.26 35.3 7.05 compute the Householder matrix (float)update2 5.82 GFLOPS 119.6 2.20 47.5 7.42 matrix-matrix multiplication (float)
GROMACS 2.24 GFLOPS 44.18 0.51 15.3 6.65 force computation between water molecules (float)
Table 2. Performance of representative kernels of media applications on Imagine
0%
20%
40%
60%
80%
100%
2D DCT update2 conv7x7 blocksearch blockSAD house RLE GROMACS Average
R u
n - t
i m e
p e
r c e
n t a
g e
operations kernel main loop overhead kernel non-main loop overhead cluster stall
Figure 6. Breakdown of kernel performance
formance in this case is limited by the multiplication units.GROMACS and RLE on the other hand are two kernelswhich have even worse main-loop performance relativelybecause they are limited by divide/square-root and scratch-pad bandwidth, respectively. Dependencies between arith-metic operations limit ILP in other kernels, another causeof degradation in main-loop performance.
The third and fourth categories in the kernel run-timepercentage are due to non-main loop cycles and clusterstalls. Non-main loop cycles are cycles during kernel execu-tion spent in loop prologues, epilogues, outer loop blocks,and in additional main loop iterations used to prime soft-ware pipelined loops. Note that when kernels are invoked tooperate on longer streams, more main loop iterations are ex-ecuted and the percentage of run time in non-main loop cy-cles goes down. In Figure 6, average stream lengths mea-sured during application execution were used to measurethe run-time percentages. The effect stream length has onkernel performance is analyzed in detail in the next section.The last category of run-time percentage accounts for clus-ter stalls during kernel execution when the SRF is not readyto accept new stream read or write requests from the clus-ters. Since the average SRF bandwidth used by these ker-nels is significantly lower than the peak SRF bandwidth,these cluster stalls occur during kernel startup periods whenSRF streams have not been initialized and during kernelswhich have bursty SRF bandwidth requirements. However,even in these kernels, less than 5% of kernel run-time cy-cles are spent in stalls waiting for the SRF.
3.3. Stream Length EffectsAs shown in the previous section by the percentage
of kernel runtime spent in non-main loop cycles, streamlengths affect the average performance of kernels. Streamlengths also affect average memory bandwidth since loadsand stores of long streams can more easily hide the la-tency of accessing individual stream elements from exter-nal memory. In this section, we present a set of syntheticmicro-benchmarks to analyze the effect of stream length onboth kernel performance and memory performance.
The first two sets of micro-benchmarks demonstrate theeffect of stream length on kernel performance. Both micro-benchmarks make use of a kernel where the main loop sus-tains 4.8 GOPS and the non-main loop portion sustains 1.6GOPS. Furthermore, the main loop is software pipelinedin order to achieve higher arithmetic intensity and to simu-late typical kernel conditions. Average performance is mea-sured over a time period when this kernel is repeatedly is-sued from the host in order to make sure host interface band-width effects are taken into account.
The first micro-benchmark, shown in Figure 7, keeps theprologue length fixed at 64 cycles and varies the streamlength for different sized main loops. Since this kernel readsone stream element per cluster per loop iteration, in thismicro-benchmark the number of main loop iterations exe-cuted per kernel invocation is 1/8 the stream length. Theideal BW number corresponds to an infinite stream length,when all execution time would be spent in the main loop.As shown in the figure, shorter streams degrade the perfor-

0.1
1
10
8 16 32 64 128 256 512 1024 2048 4096
Length of streams (word)
K e
r n e
l p
e r f
o r m
a n
c e
( G
O P
S )
main loop 8 cycles
main loop 16 cycles
main loop 32 cycles
main loop 64 cycles
main loop 128 cycles
main loop 256 cycles
ideal BW
Figure 7. Kernel performance with varied streamlength - prologue fixed at 64 cycles
0.1
1
10
8 16 32 64 128 256 512 1024 2048 4096
Length of streams (word)
K e
r n e
l p
e r f
o r m
a n
c e
( G
O P
S )
prolog 8 cycles
prolog 16 cycles
prolog 32 cycles
prolog 64 cycles
prolog 128 cycles
prolog 256 cycles
ideal BW
Figure 8. Kernel performance with varied streamlength - main loop fixed at 32 cycles
mance of the shorter main loop kernels more severely be-cause a larger percentage of kernel run-time is spent in non-main-loop cycles. Also, note that there are cases when thearithmetic performance of the kernel is less than 1.6 GOPS,the performance of the non-main-loop portion of the ker-nel. This is because it takes more time to send stream in-structions from the host to run a kernel than to run a kernelin some cases, meaning the clusters are idle waiting for thenext kernel to be issued. On the development board, it takesabout 500 ns to send a stream instruction over the host inter-face and this kernel requires 5 stream instructions before itcan start running, so that if the kernel execution time is lessthan 2.5µs, kernel performance is limited by the host inter-face bandwidth.
In the second micro-benchmark, shown in Figure 8, themain loop cycles are fixed and the effect of stream lengthis measured for different prologue lengths. In this case, forstream lengths of 64 elements or less, kernel performance isdominated by limited host bandwidth. As a result, kernelswith shorter prologues have worse performance because theclusters spend a larger percentage of time idle waiting forthe next kernel to be issued. For stream lengths greater than64, performance is dominated by the percentage of run timein main-loop vs. non-main-loop cycles, so shorter prologueshave higher performance.
0
0.2
0.4
0.6
0.8
1
8 16 32 64 128 256 512 1024 2048 4096
Length of streams (word)
Mem
ory
ban
dw
idth
(G
B/s
)
record 1, stride 1
record 1, stride 2
record 4, stride 12
idx range 16
idx range 2K
idx range 4M
HI limit
ideal BW
Figure 9. Memory system performance from asingle AG with varied stream lengths
0
0.4
0.8
1.2
1.6
2
8 16 32 64 128 256 512 1024 2048 4096
Length of streams (word)
M e
m o
r y b
a n
d w
i d t h
( G
B / s
) record 1, stride 1
record 1, stride 2
record 4, stride 12
idx range 16
idx range 2K
idx range 4M
HI limit
ideal BW
Figure 10. Memory system performance fromtwo AGs with varied stream lengths
The next two micro-benchmarks demonstrate the ef-fect of stream length on the memory system perfor-mance. On Imagine, there are two address generators(AGs) in the memory system, allowing two concur-rent stream load or store instructions to be executed. Thefirst micro-benchmark, shown in Figure 9, plots the mem-ory system performance as stream length is varied whenonly one of these AGs is used at a time. In this ex-periment, six different memory access patterns - unitstride with record size one, stride 2 with record sizeone, stride 12 with record size 4, indexing random ad-dresses over the range of 16 words to 2K words and 4Mwords - are used since external DRAM bandwidth is heav-ily influenced by the sequences of addresses received.
For stream lengths of less than 64, on most access pat-terns the memory system bandwidth is still limited by thehost interface bandwidth, even though each memory ac-cess has 30 to 40 cycles of latency. As streams get longer,the achieved memory bandwidth approaches the limits ofthe external DRAM. The indexed random with range of16 words pattern is a special case where all memory ac-cesses are captured in a small on-chip cache in the Imag-ine memory controller, thus stressing the on-chip maximumAG bandwidth rather than the maximum external DRAMbandwidth. The second memory system micro-benchmark

Appli- Performance Powercation ALU IPC Summary (Watts)
DEPTH 4.91 GOPS 33.3 90 frames/s 7.49MPEG 7.36 GOPS 31.7 138 frames/s 6.80QRD 4.81 GFLOPS 40.1 326 QRD/s 7.42RTSL 1.30 GOPS 17.7 44 frames/s 5.91
Table 3. Application Performance
is shown in Figure 10. It is similar to the above micro-benchmark, but with two simultaneously active AGs. As aresult, higher bandwidth is achieved in some patterns whenthere are no DRAM bank conflicts between the two mem-ory streams.
Note that although indexed memory addresses over asmall range approach the theoretical peak of 1.6 GB/sasymptotically, the unit stride case is approximately 20%lower than was expected from simulation. This discrepancyis due to a performance bug in the on-chip memory con-troller which causes unnecessary DRAM precharges be-tween some accesses to the same DRAM row.
In summary, the micro-benchmarkspresented in this sec-tion show how Imagine is able to achieve near peak per-formance with synthetic micro-benchmarks. However, boththe characteristics of typical media processing kernels andstream length effects lead to a difference between sustainedperformance and peak performance during the execution ofreal applications.
4. Application Performance
The previous section studied the performance of specificcomponents of Imagine in isolation. In this section we willstudy the performance of entire applications, which dependson all of these components working together.
4.1. OverviewTable 3 lists the overall performance for four applica-
tions: DEPTH is the stereo depth extractor first presentedin Section 2; MPEG encodes three frames of 360x288 24-bit video images according to the MPEG-2 standard; QRDconverts a 192x96 complex matrix into an upper triangu-lar and an orthogonal matrix, and is a core component ofspace-time adaptive processing [1]; and RTSL renders thefirst frame of the SPECviewperf 6.1.1 advanced visual-izer benchmark using the Stanford Real-Time Shading Lan-guage [10].
The first column in the table, which lists the numberof arithmetic operations executed per second, shows thatImagine sustains up 7.36 GOPS and 4.81 GFLOPS. If weconsider all operations, not just arithmetic ones, then Imag-ine is able to sustain over 40 instructions per cycle on QRD.In fact, for all three video applications, Imagine can easilymeet real-time processing demands of 24 or 30 fps. Thesehigh absolute performance numbers are a result of carefullymanaging bandwidth, both in the programming model and
host bandwidth stalls
stream controller overhead
memory stalls
microcode load stalls
cluster stalls
kernel non main
loop
kernel main loop overhead
operations 0%
10%
20%
30%
40%
50%
60%
70%
80%
90%
100%
DEPTH MPEG QRD RTSL Average
E x
e c u
t i o n
t i m
e
Figure 11. Execution time breakdown of applica-tions obtained from cycle-accurate simulation.
in the architecture, as discussed in Section 2. Imagine dis-sipates between 5.9W and 7.5W while executing these ap-plications at their highest performance levels. Furthermore,as shown in [7], voltage and frequency scaling allow thesame Imagine chip to execute the MPEG and QRD applica-tions at about half the performance but only one-fourth thepower (< 2W).
4.2. Analysis of OverheadsWhen compared to the peak capabilities of Imagine, the
applications achieve between 16% to 60% of the maximumarithmetic performance, and between 21% to 50% of themaximum IPC. The difference between the peak perfor-mance of Imagine and the achieved performance is due toseveral factors, shown graphically in Figure 11. The firstfour categories account for kernel run-time in the clus-ters, comprising 90% of the execution time for all appli-cations except RTSL. The kernel run-time, as discussed inSection 3.2, is affected by operation mix, limited ILP, av-erage stream lengths, and required SRF bandwidth in thekernels. During the remaining execution cycles, the clus-ters idle waiting for a new kernel invocation due to one offour overheads: stalls waiting for a microcode load opera-tion to complete, memory stalls (waiting for a stream loador store to complete), stream controller issue overhead in-curred once per stream instruction, and stalls due to inade-quate host interface bandwidth. If more than one of these isresponsible for delaying a kernel at any given time, the ex-tra cycles are attributed to the overhead earliest in the list.
While these four non-kernel overheads occupy less than10% of the total execution time for the first three applica-tions, they occupy over 30% of the time for RTSL. The twobiggest culprits are memory stalls and host interface stalls.The large overhead caused by memory stalls may come asa surprise since RTSL actually requires the least DRAMbandwidth of any of the presented applications (see Sec-tion 5.1). It turns out that the problem is not pure band-width. Instead, there are periods in the application wherekernels are required to wait until a memory load or store fin-ishes, either because the kernel needs to use the data still be-

DEPTH
1.00%
10.00%
100.00% GOPS
LRF BW
SRF BW MEM BW
HI BW
QRD
1.00%
10.00%
100.00% GFLOPS
LRF BW
SRF BW MEM BW
HI BW
RTSL
1.00%
10.00%
100.00% GOPS
LRF BW
SRF BW MEM BW
HI BW
MPEG
1.00%
10.00%
100.00% GOPS
LRF BW
SRF BW MEM BW
HI BW
Figure 12. Average sustained performance of Imagine components on applications
ing loaded or because it needs to use the SRF space that isoccupied by a stream being stored to memory. The streamcompiler does not do as good a job on scheduling memoryoperations and kernel operations concurrently for RTSL asit does with the other applications, mainly because streamlengths in RTSL are less predictable from batch to batch.The other major non-kernel overhead for RTSL, host inter-face stalls, arises when control-flow decisions on the hostprocessor are serialized on kernel results, causing Imag-ine to idle during a Imagine-host processor round-trip de-lay. While certain portions of these non-kernel overheadsare probably inherent to the RTSL application, future re-search can produce superior compilation strategies to over-lap Imagine operations and improve kernel occupancy tohigher than 70%.
Further insight into application performance is providedby measuring the average performance of Imagine com-ponents during application execution. Figure 12 shows thepercentage of peak GOPS, host interface (HI) bandwidth,memory bandwidth, SRF bandwidth, and LRF bandwidthsustained on the four applications plotted on a logarithmicscale. This data demonstrates a range of application char-acteristics typical to media applications and shows that dif-ferent applications stress different components of Imagine.The effect that these four components - the host interface,the memory system, SRF, and LRFs - have on arithmeticperformance are explored in more detail in the next section.
5. Discussion
5.1. Arithmetic to Memory Bandwidth RatioImagine’s arithmetic to memory bandwidth ratio
for floating point computation is over 20:1. It can per-form over 20 floating point operations for each 32-bitword transferred over the memory interface. This is5×higher than the 4:1 ratio typical of conventional micro-processors and DSPs [14, 16]. Yet Imagine is still able tosustain half of peak performance on a variety of applica-tions. Many conventional processors do not do as well evenwith their greater memory bandwidth.
Imagine is able to achieve good performance with rela-tively low memory bandwidth for two reasons. First, expos-ing a large register set with two levels of hierarchy to thecompiler enables considerable locality (kernel locality andproducer-consumer locality) to be captured that is not cap-
0.1
1
10
100
1000
Peak DEPTH MPEG QRD RTSL B
a n
d w
i d t h
( G
B / s
)
LRF
SRF
DRAM
Figure 13. Bandwidth hierarchy of applications
tured by a conventional cache. This locality is evidenced bythe LRF to memory bandwidth ratio of over 350:1 acrossfour applications shown in Figure 13.
Second, by scheduling stream loads and stores to hide la-tency, the Imagine memory system can be designed to pro-vide theaveragebandwidth required by applications with-out loss of performance. In contrast, conventional proces-sors are highly sensitive to memory latency and hence pro-viding memory bandwidth well in excess of the average isrequired to avoidserialization latencyon each memory ac-cess. Although the memory system of a conventional pro-cessor is idle much of the time, reducing its bandwidthwould increase memory latency (by the additional cycles re-quired to transfer a cache line across the lower bandwidthinterface) and hence increase execution time.
5.2. Kernel versus Application EvaluationSome previous studies of stream processors [15, 2]
showed relatively low performance. These results weredue to evaluating the performance of a single kernel ac-cessing its input and output streams from memory. Thebandwidth demands of many kernels exceed the sustain-able memory bandwidth of Imagine (see the SRF BWcolumn of Table 2). Thus, if run from memory, these ker-nels would be memory bound. However, in actual applica-tions, most kernels run from the SRF, not from memory,and the scheduler uses software pipelining to hide the la-tency of the few required memory operations under the ex-ecution time of many kernels. The results in Figure 13show conclusively that for real applications, a stream pro-cessor is not memory bound.

Stream Ops Register OpsKernel SDR MAR UCR SDR References BW
Application + Restart Memory Write Write Write Move Misc. (Reuse) Total (MIPS)DEPTH 5344 3629 45 3608 4635 0 11 32263 (717×) 17272 1.6MPEG 489 407 182 412 528 108 428 2744 (15.1×) 2554 0.12QRD 252 103 215 93 36 0 6 664 (3.09×) 705 0.23RTSL 2835 1535 6477 1536 1733 927 1643 15166 (2.34×) 16685 0.75
Table 4. Histogram of stream operation lists of media applications
Avg kernel Avg kernel Avg memoryduration stream length stream length
DEPTH 374.5 cycles 606.3 words 188.6 wordsMPEG 8244 cycles 1191 words 2543 wordsQRD 2234 cycles 2087 words 1261 wordsRTSL 1022 cycles 585.8 words 520.0 words
Table 5. Cluster characteristics of applications
There is a serious pitfall involved in evaluating proces-sors, and in particular stream processors, using just kernels.As described in Section 5.1, much of the efficiency of astream processor derives from its ability to (a) forward re-sults from kernel to kernel via the SRF, and (b) to hide mem-ory latency by overlapping memory references with the ex-ecution ofseveralkernels, not just one. Both of these ad-vantages are lost in a kernel-only evaluation.
5.3. Stream Instruction AnalysisThe different stream instruction types supported by
Imagine are shown in Table 4 in the form of an his-togram per application. “Stream Ops” either transfer orprocess entire data streams. This includes kernel op-erations, memory loads and stores, as well as cluster“Restart” operations that are used to sequence multiple fi-nite streams between the SRF and clusters while presentingthe abstraction of a single longer stream to the kernel. “Reg-ister Ops” read or write control registers. These can beused to pass parameters to kernels (“UCR Write”) and ac-cess descriptor registers that hold length and location in-formation for streams in the SRF (“SDR Write”) and inDRAM (“MAR Write”). Since the data held in the descrip-tors consists of a large number of bits, these registers helpto reduce the required amount of host instruction band-width. Instead of encoding the length and location infor-mation for streams into all stream instructions, we can in-stead send the information once via a descriptor writeand then use it multiple times by having other opera-tions simply refer to the descriptor index. Imagine contains32 SDRs and 8 MARs. Data can also be transferred be-tween register files (“Move”). Finally, there are otherstream instruction types for tasks such as loading mi-crocode and synchronization between different Imaginecomponents. These have been lumped into a single cate-gory on the chart (“Misc.”).
The stream instruction bandwidth used by each applica-
tion is shown in the last column in Table 4. DEPTH requiredthe most bandwidth, 1.6 MIPS, because it operates on rel-atively short streams (see Table 5). Other applications re-quire less than half the 2 MIPS maximum bandwidth pos-sible in our current setup. It is interesting to note the num-ber of times each SDR is reused. If it were not for the717×reuse of SDRs, it is likely that DEPTH would exceed themaximum possible host bandwidth. For example, if onlythe minimum amount of SDR reuse was achieved, i.e.,2×,then the total number of stream instructions would increaseby 1.9x. DEPTH does so well at reusing SDRs because allpossible SDR values fit within the 32 entries in the SDRfile, reducing the necessary host interface bandwidth. How-ever, a change in the implementation of DEPTH might re-quire more SDR values than can fit in the SDR file, resultingin performance losses due to insufficient host bandwidth.To alleviate this host bandwidth bottleneck, a new evalua-tion board is being built that is expected to achieve closer tothe peak theoretical host bandwidth of 20 MIPS. This im-pact of host bandwidth is quantified in the following sub-section.
5.4. Host Processor BandwidthEach kernel execution, memory operation, or scalar reg-
ister update on Imagine requires that the host proces-sor transfer a stream instruction to the stream controller.The 32-entry scoreboard in the stream controller acts as abuffer, allowing the host processor to run ahead of Imag-ine, buffering up instructions for future use. Limitedhost interface bandwidth can affect Imagine perfor-mance in two ways. First, if the average demand for streaminstructions is greater than the host bandwidth, the score-board will ultimately empty, causing Imagine to idle wait-ing for new instructions. Second, some applications requirethat the host read the results of a previous stream instruc-tion before issuing the next instruction. These host depen-dencies can stall execution until a host read-compute-writecycle is completed.
We use the most demanding application, DEPTH, toevaluate the effect of varying host interface bandwidth. Fig-ure 14 shows how execution time is affected as host in-terface bandwidth is varied from 0.5 MIPS to 50 MIPS.The figure shows that with a host bandwidth of 2 MIPSor greater, Imagine never idles waiting on the host. Withbandwidth less than 2 MIPS, execution time increases withthe inverse of bandwidth. Most of the increased execution

0.0
5.0
10.0
15.0
20.0
25.0
30.0
20 2 1 0.5
Stream instruction bandwidth (MIPS)
E x
e c
u t i o
n t
i m e
( m
s )
host bandwidth
stalls
stream controller
overhead
memory stalls
microcode load
stalls
cluster stalls
cluster busy
Figure 14. Execution time breakdown on DEPTHover different host interface bandwidth
App Lab running cycles ISIM running cyclesDEPTH 2.22 M 2.11 MMPEG 4.33 M 4.24 MQRD 0.615 M 0.603 MRTSL 4.47 M 4.24 M
Table 6. Lab vs. ISIM running cycles
time is spent waiting on the host interface (“host bandwidthstalls”). Also, with reduced host bandwidth, it is not possi-ble to fully overlap memory operations with kernel execu-tion, which results in the clusters idling waiting on a mem-ory operation to complete (“memory stalls”).
5.5. Simulation versus ExperimentAs shown in Table 6, execution times measured in the
laboratory are within 6% of the results measured from theImagine cycle accurate simulator, ISIM. In all cases, the ac-tual hardware is slower than simulation. These differencesare due to small inaccuracies in the simulation model. Inthe hardware, pipeline latencies not modeled in ISIM areincurred when kernels and stream loads or stores are issuedfrom the stream controller. Furthermore, a performance bugin the hardware implementation of the memory controllerresults in lower sustained memory bandwidth under certainmemory access patterns. Finally, ISIM’s model of host pro-cessor execution is optimistic, resulting in lower simulatedexecution times for host processor dependencies. The effectof these seemingly innocuous differences on overall execu-tion time highlights the need to validate all simulation re-sults against actual hardware.
5.6. Power Efficiency ComparisonImagine compares very favorably on power efficiency
to other programmable floating-point processors when nor-malized to the same technology generation. As explainedin Section 3.1, Imagine achieves a performance efficiencyof 1.16 GFLOPS/W (862 pJ per floating-point operation)at 1.8 Volts on the peak cluster performance benchmark.When normalized to a modern 0.13µm 1.2 Volt processtechnology, Imagine would achieve 277 pJ/FLOP on this
benchmark, between 3x and 13x better than modern com-mercial programmable DSPs and microprocessors targetedfor power efficiency in similar process technologies. For ex-ample, based on its published peak performance and powerdissipation in a 0.13µm 1.2 Volt technology, the 225 MHzTI C67x DSP dissipates 889 pJ/FLOP [16] while the 1.2GHz Pentium M dissipates 3.6 nJ/FLOP [4]. Furthermore,the improved design methodologies and circuit designs typ-ically used in these commercial processors would provideadditional improvement in the achieved power efficiencyand performance of Imagine, demonstrating the potential ofstream processors to provide over an order of magnitudeimproved power efficiency when compared to commercialprogrammable processors.
6. Conclusion and Future Direction
This paper has presented an experimental evaluation ofthe Imagine stream processor. A set of microbenchmarkswas used to characterize the performance of each compo-nent of Imagine. These tests show that except for host inter-face bandwidth, the Imagine components individually areable to achieve 98% of their theoretical peak.
A set of kernelswas run to determine how these com-ponents work together on small blocks of code. These testsshow that Imagine achieves an average of 43% of peak per-formance across a number of kernels. The difference be-tween peak and achieved performance at the kernel levelis due to time spent in loop prologues/epilogues and un-used instruction slots due to limited ILP or load imbalanceacross types of arithmetic units.
Four full Imagine applications were evaluated to mea-sure the effects of memory operations, host bandwidth, andinter-kernel communication on performance. Imagine sus-tains between 16% and 60% of the peak arithmetic per-formance and between 21% and 50% of the peak IPC onthese applications. Much of the difference between peakand achieved application level performance is due to thekernel issues discussed above. At the application-level asmall amount of time is lost due to kernels waiting on thememory system or the host interface. For all of our applica-tions except RTSL, this application-level overhead was lessthan 10% of execution time. RTSL has an application-leveloverhead of 30% due to dependences with the host proces-sor that serialize execution.
Overall, our evaluation has shown that the Imag-ine stream processor can efficiently support a widevariety of applications (ranging from molecular dynam-ics to video compression). Programming entirely in ahigh-level language, with no assembly performance tun-ing, stream and kernel compilers are able to keep an ar-ray of 48 floating-point-units busy using a combination ofdata-level parallelism (8-way SIMD) and instruction-levelparalellism (6-way VLIW) - achieving over 50% utiliza-tion at the kernel level (and over 80% on many inner loops).The same compilation tools are able to efficiently ex-

ploit the two-level register hierarchy of Imagine keepingthe register to memory ratio over 350:1 across all four ap-plications.
ASICs are becoming more difficult and costly to design.At the same time, many media applications demand the flex-ibility of a programmable processor — for example to sup-port multiple video codecs or multiple wireless air inter-faces. Stream processors address these issues by providingperformance competitive with an ASIC while retaining theflexibility of a programmable processor.
Stream processors pose many opportunities and chal-lenges for compilers. Our current software system addressessome of these — using communication scheduling [9] toschedule kernels on clusters with partitioned LRFs and us-ing stream scheduling [6] to schedule stream operations andallocate the SRF. Much more can be done, however, to op-timize the mapping of programs onto a stream architecturewith an exposed register hierarchy. We expect future streamcompilers to restructure applications by splitting and join-ing kernels to better use the available LRF and SRF band-width. Better stream scheduling algorithms will optimizere-use in the SRF and minimize kernel stalls on memoryoperations. Also, we expect techniques to be developed thatautomate the extraction of kernels and streams from conven-tional “C” code, effectively converting “C” into StreamCand KernelC.
Recent work has shown that stream processing is appli-cable to scientific computing [3]. Good performance hasbeen demonstrated on codes with both irregular and regulargrids. Streams have also been applied to network process-ing [11] and software defined radios [12]. Efficient stream-ing demands only large amounts of data paralellism and ahigh arithmetic to memory ratio, not regularity. We expectmany other applications of stream processing to emerge.
7. Acknowledgements
We would like to thank Scott Rixner, John Owens, PeterMattson, and Ben Serebrin, as well as all past members ofthe Imagine team. We also thank Jinwoo Suh, Chen Chen,Li Wang and Steve Crago of USC-ISI East for their collab-oration on the Imagine development board.
This research was supported by a Sony Stanford Grad-uate Fellowship, an Intel Foundation Fellowship, the De-fense Advanced Research Projects Agency under ARPA or-der E254 and monitored by the Army Intelligence Cen-ter under contract DABT63-96-C0037 and by ARPA orderL172 monitored by the Department of the Air Force undercontract F29601-00-2-0085.
References[1] K. C. Cain, J. A. Torres, and R. T. Williams. RTSTAP: Real-
time space-time adaptive processing benchmark. TechnicalReport MTR 96B0000021, MITRE, February 1997.
[2] S. Chatterji, M. Narayanan, J. Duell, and L. Oliker. Perfor-mance evaluation of two emerging media processors: Viram
and imagine. InInternational Parallel and Distributed Pro-cessing Symposium, pages 229–235, April 2003.
[3] W. J. Dally, P. Hanrahan, M. Erez, T. J. Knight, F. Labont´e,J. H. Ahn, N. Jayasena, U. J. Kapasi, A. Das, J. Gummaraju,and I. Buck. Merrimac: Supercomputing with streams. InSC2003, November 2003.
[4] Intel R©. Intel R© pentiumR© m processor. http://www.intel.com/design/mobile/datashts/25261202.pdf.
[5] T. Kanade, A. Yoshida, K. Oda, H. Kano, and M. Tanaka. Astereo machine for video-rate dense depth mapping and itsnew applications. InProceedings of the 15th Computer Vi-sion and Pattern Recognition Conference, pages 196–202,San Francisco, CA, June 18–20, 1996.
[6] U. J. Kapasi, P. Mattson, W. J. Dally, J. D. Owens, andB. Towles. Stream scheduling. Concurrent VLSI Architec-ture Tech Report 122, Stanford University, Computer Sys-tems Laboratory, March 2002.
[7] U. J. Kapasi, S. Rixner, W. J. Dally, B. Khailany, J. H. Ahn,P. Mattson, and J. D. Owens. Programmable stream proces-sors.IEEE Computer, pages 54–62, August 2003.
[8] B. Khailany, W. J. Dally, S. Rixner, U. J. Kapasi, P. Matt-son, J. Namkoong, J. D. Owens, B. Towles, and A. Chang.Imagine: Media processing with streams.IEEE Micro, pages35–46, Mar/Apr 2001.
[9] P. Mattson, W. J. Dally, S. Rixner, U. J. Kapasi, and J. D.Owens. Communication scheduling. InProceedings of theninth international conference on Architectural support forprogramming languages and operating systems, pages 82–92, November 2000.
[10] K. Proudfoot, W. R. Mark, S. Tzvetkov, and P. Hanrahan.A real-time procedural shading system for programmablegraphics hardware. InProceedings of ACM SIGGRAPH,pages 159–170, August 2001.
[11] J. S. Rai. A feasibility study on the application of stream ar-chitectures for packet processing applications. Master’sthe-sis, North Carolina State University, Raleigh, NC, 2003.
[12] S. Rajagopal, S. Rixner, and J. R. Cavallaro. A pro-grammable baseband processor design for software definedradios. In 45th IEEE International Midwest Symposiumon Circuits and Systems, volume 3, pages 413–416, August2002.
[13] S. Rixner.Stream Processor Architecture. Kluwer AcademicPublishers, Boston, MA, 2001.
[14] D. Sager, G. Hinton, M. Upton, T. Chappell, T. D. Fletcher,S. Samaan, and R. Murray. A 0.18µm CMOS IA32 micro-processor with a 4GHz integer execution unit. In2001 IEEEInternational Solid-State Circuits Conference Digest of Tech-nical Papers, pages 324–325, February 2001.
[15] J. Suh, E.-G. Kim, S. P. Crago, L. Srinivasan, and M. C.French. A performance analysis of pim, stream processing,and tiled processing on memory-intensive signal processingkernels. In30th Annual International Symposium on Com-puter Architecture, pages 410–421, June 2003.
[16] Texas Instruments.TMS320C6713 Floating-Point DigitalSignal Processors, 2003.03 edition.
Copyright © 2022 FDOKUMEN