
Flow Analysis and Optimization of Supersonic Rocket Engine ...
Upload
khangminh22Category
view
0download
0
����������
������������� �����������������������������
�!��"#$�����%���!�����&��'("�������
�����"#$�������������$���������


SuperSonic Imagine 510, rue René Descartes Bat F 13857 Aix en Provence Cedex
0459SuperSonic Imagine Ultrasound products may be manufactured underor operate in accordance with one or more of the following United Statespatents and corresponding patents in other countries:
U.S. Patent Numbers:
• (US) 5606971• (US) 5810731• (US) 9117439• (US) 7252004
Other patent applications are pending in various countries.
�)!�����*�����������
The software used for this system includes software owned bySuperSonic Imagine and licensed to SuperSonic Imagine by a licensor.
Availability of this software and related documents is restricted.
The software and related documents must be used only for this system.
The intellectual property of this software and related documents is notassigned to you.
You must not copy the software or documents, nor modify the softwarein whole or in part.
You must not recompile or reassemble the software.
You must not assign, disclose, transfer, or sublicense the software ordocuments to a third party.
The ultrasound system software is subjected to the US and French Exportand Administration Laws and Regulations and you must not export or re-export the software in whole or in part unless properly authorized by theUS or French government.
The information in the documents, or programs in the software are subjectto change without notice.
� �����
No modification of this equipment is allowed.
� �)!�����*�����������

The following names are trademarked or registered by SuperSonicImagine, Inc:
• Aixplorer®• The Theragnostic Company™• ShearWave™ Elastography• SWE™ Mode• Q-Box™• UltraFast™ Imaging• SuperCompound™• UltimateFocus™• SuperRes™• TissueTuner™• SonicTouch™• SonicSoftware™• ManualTouchTGC™• SuperLinear™ 15-4 transducer• SuperLinear™ 18-5 transducer• SuperCurved™ 6-1 transducer• SuperEndocavity™ 12-3 transducer• SuperEndocavity™ Volumetric 12-3 transducer• SuperLinear™ Volumetric 16-5 transducer• SuperLinear™ 10-2 transducer• SuperMicroConvex™ 12-3 transducer• SuperLinear™ HockeyStick 20-6 transducer• TouchRing™• SonicResearch™• MultiWave™• Thy-RADS™• ReportBuilder™• UltraFast™ Doppler• PLanewave UltraSensitive™
�)!�����*����������� �

� �)!�����*�����������
���������������������������������������������������������������������������� ���������������������������������������������������7 ����� �������������������������������������������8+�(��"� ����������������������������������������������������������������� ��
����� ��!�"���������������������������������������� �:�����(��-��&�!$�������������������������������������������������������$���������� ��������������������������������������������������������� �����&($���� �������������������������������������������������������� �C ��$�(��&($������������������������������������������������������� �C����&�!$���-��&�������������������������������������������������� �C �� ��'(�&���$(��(��������������������������������������������� �� ��$ &($���� ��������������������������������������������������������� �D
�����������������������������������������������������������A.�(�&�� ��������������������������������������������������������������������E/��$#��'��&(� ������������������������������������������������������� �E��$���0�"��'��������������������������������������������������������E���'(��� �������������������������������������������������������������� ��� #�(� ��������������������������������������������������������������������������&�� ���������������������������������������������������������������� ���
#��"��� �������������������������������������������������������$%�����������$���������������������������������� ��&&��' (������"��"�)������������������������ ��7!����������������������������������������������������� ��:*����������$�����%�+�,������������������� ��<��$�-��$�������������������������������������� ��>��1����$�� ��������������������������������������������������������������-2�����$� �������������������������������������������������������������� ��E -3-2-�-���� ������������������������������������������������������ ��E
'������� ������������������������������������������������� �&���$�"�($������$����4�!$��(�5��������������������������������� ������$��(�����$���������������������������������������������������� ���
��������.����!�"�������������������������������&7/�������#�������0�$�����1����������������������� �&:�-�1(�&�����&(������������������������������������������������� ��C �'!($%���1(�&����+�!��������������������������������������� �A��(�('�$���-� (�$�������������������������������������������������AA
�)!�����*����������� �

���$������2�'�����������3���(4���� ������������������������������������������������������7:+���"�%�����#����%� 5$�����6�������������� �7:�$��("��� �$#��-��&�������������������������������������������� �A��( ��-�!��(��� �$#��-��&������������������������������������ �AC
7��#����(� ���������������������������������������� �7>!����������'��������4�"����������������������7A#(������ ���������������������������������������������������8C��������*,$�����#����(��������������������������8&*���������#����(�������������������������������������� �88*��������%��������������������������������������8:��&�''��������!(�($���-�$(�&���1�$6������$(%���(���,�%����.� �''�&($����78!'��$(����)!�����*������������������������������������������������������ ���-�&�(�($���� �7��&$��'("��$&�7'�������������������� ���-�&�(�($���� ��''�$������������������������������������������ ���
� ������#����(���������������������������������������� �:8��� ������#����(�������������������������������������::#����(�'�������%�����������*5��������)� �� ��#$��#�������%��� 5$�����6#(����� ��������������������������������������������������� �:>1�� �&$��(���1�!#��&��� ���$�(������$��(&$���� ��������������������������������������������������������� ���+#��'(��,�&#(��'���������������������������������������������� �CC/���$#��'(��,�&#(��'��������������������������������������� ��A1��� $��� ���$�(�����2�������9���������������������������+#���:�������&!������������������������������������������������ �D�+#��;$!$�-�!�(���$(��(����������������������������������� �D���(&$&�"�$#���:�������&!�������������������������������� �E�
�����#(�������������������������������������������� ���C8��#(������"��"�)���������������������������:!����$�������� ��#(�������������������������� ���>����������� ��������� �������������������� ���@��������'������������������������������������������������A<�6�$��,����$#�� ��$�����(�����!�(���-�6��������� ���E<�6�$���6����$#�� ��$�����(���������������������������������E�!�(9����(���������=�$'��$��������������������������� ����
�������������������������������������������������������&�
� �)!�����*�����������
����&$�"�(�+�(���&��������������������������������������� �����$���"�(�+�(���&�������������������������������������������� �������"�$#�� (%���<��������������������������������������������� ���A
��������#����%������������������������������������� ��&8����<������� �������������������������������������������������������������$��("�����(����������������������������������������������������������
�����(� ��������������������������������������������������&<<(������ ������������������������������������������������������������� ���C>#����:�&9�������������������������������������������������������� ����.��$����$�� �������������������������������������������������������� ����
��"�%�� ��#(������������������������������������ ��&@���!(��"�$��,����$#�����$�'��������������������������������D,���"�$#�����$�'��������������������������������������������� ���D
��������%�� ��'�)�������������'������"�*��� � ��������������������������������������������������� ��7C�� ��'($���&��&����"�$#��$��'�(��$��6#&#�$#�!�$��$(���8(�?($���&���&$�����$��%��&����&$��
4 5�� ������������������������������������������������������������������ ��A����$������ ��������������9��������������� ��7������ ������������������������������������������������������������������ ��A�����>(�'���������������������������������������������������������� ��AA+�(���&����#�($#��������������������������������������������� ��A� ��(��"����$�������������������������������������������������� ���A���$����(!���(���+������������������������������������������ ���A1�!������������������������������������������������������������ ����
:�����%�� ��#(��������������������������� ��8:���"������������������������������������������������� ��8> �����$�����������$#������������������������������ ���� �����$�����������$#�����$�'�������������������������� ���D0��%���"�� ���������������������������������������������������������� ���E
�����%�#������������������������������������������� ��:�+���"�$#�����$�'�;��(���; ���������������������������� ������$$�"�$#��$'��(����($������������������������������������ ������$$�"�$#��:(�"("�������������������������������������������������$$�"� ����&$���$��(�/�$6��9�������������������������� ��������&$�"�(�+�(���&������������������������������������������ ����1�"���"�(��7)('���������������������������������������������� ���C7���"�(��7)('�������������������������������������������������� ��CA
���%�%�����������������������������������������������<8
�)!�����*����������� )
�����(���� ��'($�������'("�"�,���������������������� ��C� �''����'("�"� ��$��������������������������������������������1�,�����'("�"�������������������������������������������������� ���E�#�(�>(��@�7�(�$�"�(!#������������������������������������ ���� �����,�����'("�"��������������������������������������������� ���E������>(���-�!!����,������������������������������������� ���DA-� �'("�"� �������������������������������������������������������� ���� ��$�(�$�7�#(�&�����$�(������'("�"�4 7��5����������,�,�����'("�"����������������������������������������������������C�.���3/(�"($���4�!$��(�5���������������������������������� ��CE
���(;�%�������%�����������������������������������&>C���"�1����,(�9����������������������������������������������� ��������$($�"�$#���&���������������������������������������������������� ��'�"�,�(���'��$������������������������������������ ����1����-�*���(���������������������������������������������������A��+#����-�@���(������������������������������������������������ �A��
<��+�$����������������������������������������� �77�!����$�������� ��+�$����=���������������� �777+�$����/������������������������������������������� �777-��&�!$���� �$#����!��$�1����������������������������� �AAA�($��$��� ��'($����������������������������������������������� �AA��'("��� �������������������������������������������������������������� �AA�,�(���'��$����������������������������������������������������� �AA�>��9�#��$� ��������������������������������������������������������� �AAD ��&����� ��������������������������������������������������������� �A��
��������%�+�$������������������������������������ �78<'����%�+�$���������������������������������������� �78<*5$����%�+�$���������������������������������������78<>�����%������!��������%������������ �78>#�"�%�!�����������������������������������������������78A (!$��"��'("���(��� �!����������������������������������� �A�E����6�"�(��7)('���������������������������������������������� �A�����$�"� �'("������������������������������������������������������A�C�����"�(��$�����������������������������������������������������A�E
!�����%��5����������%����������������������� �7<>+������$���������'����'("�������������������������������� �AC�+������$���)('����������������������������������������������������AC�
���%��?��(�����+����"�������������������������7<@�����(���� ��'($���(%�$�B������$����������������� �ACD
) �)!�����*�����������
��� ��'�"�(�B������������������������������������������������ �A����� ��'�"�(���$�����������������������������������������������A�A;!���"�!�#���-� ;,��($(�������������������������������� �A��-�!�(��"�(���/(�"($�"���$�������'("������������� �A��7)$�"�B����(�����$����������������������������������������A�C
*���%����*5��������������������������������������� �7><������%����*5�����������������������������������7><@�������;�%�� ��#(�������������������7>>!����$�������� ��#(��������%���������������������������������������������� �7>A#(����-!�$��(����������������������������������������7@C-��&�!$���� �$#�����$�'3-�!�(��+(%������������������ �AD����$�'� ���������������������������������������������������������������AD���"��(��!(�('�$���������������������������������������������� �AD�7)('� ����������������������������������������������������������������� �ADA
!�"���#����%�������������������������������������� �7@:-��&�!$���� �$#��-��&����$$�"��+(%����������������� �AD�,��(���$$�"���������������������������������������������������� �AD�,��(�����&($������������������������������������������������� �AD����$�'�-� ;,��!$������������������������������������������ �ADE
������������������������������������������������� �7A�-��&�!$���� �$#����'��$�($���+(%������������������� �AE�-��&��� ���������������������������������������������������������������AE�7$#����$� �� "�($������������������������������������������ �AE�>�.�� �� "�($������������������������������������������������� �AE�/�$6��9�+�������������������������������������������������������������-�9�,(�$��(�&������������������������������������������������� ����,��&(���$( � ����������������������������������������������������� ����
'������� ������������������������������������������������ �8C<-��&�!$���� �$#�������$��+(%���������������������������� ���C����$($��� ��������������������������������������������������������� ����1���'(�9��� �����������������������������������������������������������E�'("�"������$�������������������������������������������������������
�������������������������������������������������� �8�>-��&�!$���� �$#��,�(���'��$��+(%������������������ ����,�(����� ���������������������������������������������������������� ����:(%����(��� (�&�($������������������������������������������ ���D�(&9("��� ����������������������������������������������������������� ����;%�$�$�&�� ��������������������������������������������������������� ����
#(�����!�%���������������������������������������8&>
�)!�����*����������� )
A��#(����������B��������������������8&A� ��%�%�'������'�$����������������������� �87�������%�� ��#(���������������������������������� �87� ��(��"�.��8��&�������������������������������������������������A� ��(��"�$#��7)$������ �$#��,(&#���������������������� ��AA ��(��"�$#��,��$��������������������������������������������� ��AA ��(��"�$#��+�&#��&�����-�!�(���������������������������AA ��(��"����.�$���������������������������������������������������A�
������%�����!�������%�� ��/������#������� �������������������������������������������������87<,(�$��(�&�������������������������������������������������������� ��AC
������%�����!�������%���������������� �87@+�(���&��� ��(��"��( �$�������������������������������������AD+�(���&��� ��(��"�(���-�� �&$�����(�&�����������������(�� ��(��"�(���-�� �&$������&������ ���$#��)!�����*�+�(���&������������������������������������������ ���� ��(��"�(���-�� �&$�������&$������������������������ ���A��(9�"�:'$����������������������������������������������������� �������$��(���� ��'($�����"(���"� ��(��"�(��-�� �&$���� ���$�(�����+�(���&�������������������� ���E
�C��������� ����%�������������������������8:����� ��������$��!������+�$����%��������������������������������������� �8::��5�������$�������!�������������������������8:>���������#(������������ ��������$�+�$����%���������������������������������������������� �8:>!������� ��������$��������������������� �8:A�&��$&�;$!$�+�(���&��3,�����''(��+(%��� ����������������������������������������������������������������� ���E,�(���'��$���&��$(�$�������������������������������������C��&��$&�;$!$�-�$(����+(%����������������������������� ��C�
�&��+�����������������������������������������::7��������+����������������������������������������� �:::�����������+������������������������������������ �:<C.�$(�����6$#�78($����(���+(%�������������������������� ��C����$($��(���"��78($����(���+(%���������������������� ��CA7�$'($���.�$(��>�"#$�78($����(���+(%�������������CC
����5� ������������������������������������������������������������������ �:>�
) �)!�����*�����������

�7�����*#������������������������������������ �:>A
�)!�����*����������� )

)� �)!�����*�����������

������������
�)!�����*����������� �

� �)!�����*�����������
��������Welcome and congratulations on your purchase of the Aixplorer®Ultrasound System.
The following documents are available for the Aixplorer® UltrasoundSystem:
• Quick GuideThe Quick Guide contains basic information regarding the use of theproduct.It does not replace the User's Guide.
• User's GuideThis User's Guide contains important information regarding the useand safety of the product. Please read this guide carefully and store itin a location where it can be easily accessed.
• Fusion/Navigation Guide (optional)The Fusion/Navigation Guide contains important informationregarding the use of the fusion/navigation feature.
• Obstetrical ReferencesThe Obstetrical References Guide contains the detailed obstetricaltables and equations that are used on Aixplorer®.
The Aixplorer® system has been designed with the safety of the operatorand patient in mind.
Please read the following chapters thoroughly before you start workingwith the system.
SuperSonic Imagine guarantees the system will perform as intended onlywhen all cautions and warnings specified in this user's guide are observed.
�)!�����*����������� A
����� ������������This user's guide contains important information about the use of yourultrasound system.
The features described in this user's guide may be optional. Please contactyour local SuperSonic Imagine sales or service representative for furtherinformation.
Pictures are not contractual and are only displayed for generalinformation purposes.
It also contains information about contacting SuperSonic Imagine forsupport.
This guide is intended for use by, or by the order of, and under directsupervision of a licensed physician qualified to direct the use of theultrasound device.
This guide is intended for users who have been trained or are otherwisefamiliar with the use of medical ultrasound devices.
Clinical guidance on how to perform an ultrasound examination is notprovided in this manual.
This user's guide complies with the following:
• 93/42/EEC European Directive modified by 2007/47/EEC EuropeanDirective
• FDA regulation, 21 CFR § 801
�����%In case further information is needed, trainings are advised andavailable upon request at SuperSonic Imagine. Please contact your localrepresentative for more information.
� �)!�����*�����������
����� ��!�"��
��������!����$���The SuperSonic Imagine Aixplorer® system is a cart based ultrasoundimaging system used to perform diagnostic general purpose ultrasoundimaging studies.
The system contains a scan converter and can be coupled to a variety oflinear, curved, micro-convex, and motorized linear array transducers toproduce images, which are displayed on a LCD monitor.
An adjustable control panel with integrated touch screen allows the userto perform an ultrasound exam quickly and efficiently in accordance withALARA principles.
The system also allows the user to perform measurements and associatedcalculations, capture images to digital memory or to an external device(such as a printer), and review diagnostic studies in the form of a report.
The system functions in a manner similar to existing devices andtransducers for the imaging modes: B-Mode, M-mode, Color Dopplerimaging, Pulsed Wave Doppler, Harmonic Imaging, Amplitude PowerDoppler imaging, Directional Amplitude Power imaging, ContrastImaging, Elasticity Imaging, and 3D imaging.
������������The SuperSonic Imagine Aixplorer® ultrasound system is intended forgeneral purpose pulse echo ultrasound imaging, Doppler fluid flowanalysis of the human body, and tissue elasticity imaging of soft tissues.
�)!�����*����������� �
�����������������The SuperSonic Imagine Aixplorer® ultrasound system is indicatedfor use in the following applications: Abdominal, Small Organs,Musculoskeletal, Superficial Musculoskeletal, Vascular, PeripheralVascular, Non-invasive Cardiac, OB-GYN, Pelvic, Pediatric, Urology,Trans-rectal, Trans-vaginal and Neonatal/Adult Cephalic.
The system also provides the ability to measure anatomicalstructures (Abdominal, Small Organs, Musculoskeletal, SuperficialMusculoskeletal, Peripheral Vascular, GYN, Pelvic, Pediatric, Urology,Trans-rectal, Trans-vaginal, Neonatal/Adult Cephalic, Fetal/Obstetrics).
This device is intended for use by, or by the order of, and under thesupervision of a licensed physician qualified to use or direct the use ofthe device1.
This system should only be used by trained sonographers who areknowledgeable about the risk of excessive acoustic energy in the body,particularly in the case where a great amount of fluid is present in thescanning area.
��������������The Aixplorer® system is not designed for ophthalmic use or any usecausing the acoustic beam to pass through the eye.
The use of the Aixplorer® system with a defibrillator is prohibited.
The Aixplorer® system is not intended for use with flammableanaesthetics or in conjunction with flammable agents.
'�����$����!�"��Caution: United States federal law restricts the sale of diagnosticultrasound devices to sale by or on the order of a physician 1.
1Information delivered by the device must be used by a licensed physician qualified toestablish a diagnosis.
C �)!�����*�����������
������������#��������According to 93/42/EEC European Directive modified by 2007/47/EECEuropean Directive, Aixplorer® is a Class IIa Medical Device.
According to :
• IEC/EN 60601-1, Equipment is Class I, type BF.• IEC 60601-1-2, Equipment is Class A.
The product is compliant to the following standards:
• UL 60601-1 Medical Electrical Equipment, Part 1: GeneralRequirements for Safety
• CAN/CSA-C22.2 No. 601.1Medical Electrical Equipment - Part 1:General Requirements for Safety
• IEC/EN 60601-1-1 Medical electrical equipment – Part 1-1: Generalrequirements for safety – Collateral standard: Safety requirements formedical electrical systems.
• IEC/EN 60601-1-2 Medical electrical equipment – Part 1-2: Generalrequirements for safety – Collateral standard: Electromagneticcompatibility – Requirements and tests.
• IEC 60601-2-37 Medical electrical equipment – Part 2-37: Particularrequirements for the safety of ultrasonic medical diagnostic andmonitoring equipment.
• IEC 62304 Medical device software – Software life cycle processes• NEMA UD 2 Acoustic Output Measurement Standard for Diagnostic
Ultrasound Equipment• NEMA UD 3 Standard for Real-Time Display of Thermal and
Mechanical Acoustic Output Indices on Diagnostic UltrasoundEquipment
• EN ISO 10993-1 Biological evaluation of medical devices – Part 1:Evaluation and testing
• EN ISO 14971: Medical devices – Application of risk management tomedical devices
• IEC/EN 60601-1 Medical electrical equipment – Part 1: Generalrequirements for safety
• IEC 61340-5-1: Electrostatics – Part 5-1: Protection of electronicsdevices from electrostatic phenomena – General Requirements
�)!�����*����������� �

• IEC 61340-5-2: Electrostatics – Part 5-2: Protection of electronicsdevices from electrostatic phenomena – User guide
• EN 50419: 2006 Marking of electrical and electronical equipment inaccordance with Article 11(2) of Directive 2002/96/EC (WEEE)
• Digital Imaging and Communications in Medicine (DICOM) standard:PS 3 -2011
�����������SuperSonic Imagine is ISO 13485 certified.
SuperSonic Imagine is ISO 14001:2015 certified.
D �)!�����*�����������
����������Customer service representatives are available regionally to help answeryour questions.Please contact your local SuperSonic Imagine sales or servicerepresentative for assistance.
=�����
SuperSonic ImagineLes Jardins de la Duranne - Bât E & F510, rue René Descartes13857 Aix en Provence Cedex - FranceTelephone: +33 (0)442 99 24 32Telephone: +33 (0)426 70 02 70Fax: +33 (0)442 52 59 21E-mail: [email protected]
���� � �����
SuperSonic Imagine, Inc.2625 Weston RoadWeston, FL 33331- North AmericaTelephone: +1(954) 660 3528E-mail: [email protected]
������9�%���
SuperSonic Imagine Ltd.,18 Upper WalkVirginia Water
�)!�����*����������� E
Surrey GU25 4SN - United KingdomTelephone: +44 (0)845 643-4516E-mail: [email protected]
������(
SuperSonic Imagine GmbHZeppelinstr. 71 – 7381669 München - GermanyPhone: +49 89 36036 - 844Fax: + 49 89 36036 - 700E-mail: [email protected]
� ��
SuperSonic ImagineSuite 2304, Block D, Ocean International, DongSiHuan ZhongLu,Chaoyang District, Beijing (100025), ChinaPhone : +86-10- 85861023/ 2951/ 2917Fax: + 86-10-8586 2389E-mail: [email protected]
#��"��Call your SuperSonic Imagine local representative.
�� �)!�����*�����������
#��"��The SuperSonic Imagine Aixplorer® ultrasound system is intended toprovide many years of service.
The lifetime of the product is directly impacted by the followingvariables:
• Hours of clinical operational use of the product• Hours of clinical non-operation use while the product is energized and
in the “on” state• Environmental exposure of the product with regard to temperature,
humidity and pressure• Appropriate electrical power conditions• Proper handling and moving of the product• Proper storage of the product when not in use• Proper maintenance and cleaning of the product• Quality of repairs• Quality of accessories used with the device
The SuperSonic Imagine Aixplorer® ultrasound system has to beinstalled by an authorized SuperSonic Imagine sales or servicerepresentative.
To optimize operation and maximize the life of the product, werecommend having an annual maintenance performed by a SuperSonicImagine authorized representative.
Maintenance and service contracts are available.
All repairs must be conducted by a SuperSonic Imagine authorizedrepresentative.
Maintenance operations as described in Chapter 9, System Care &Maintenance [429] can be performed by the user.
Improper installation, repair or maintenance will void any warrantiesassociated with the product.
Please contact a SuperSonic Imagine sales or service representative forfurther information.
�)!�����*����������� ��
�$%�����������$�����Upgrades may be announced that consist of hardware or softwareimprovements.
Updated user information will accompany those system upgrades.
Always verify that you are using the revision of this documentappropriate for your product version.
To verify the correct version of the document for your system or to obtainthe latest revision, contact your SuperSonic Imagine representative orlocal distributor.
�� �)!�����*�����������

&�' (������"��"�)
�)!�����*����������� �A

�� �)!�����*�����������
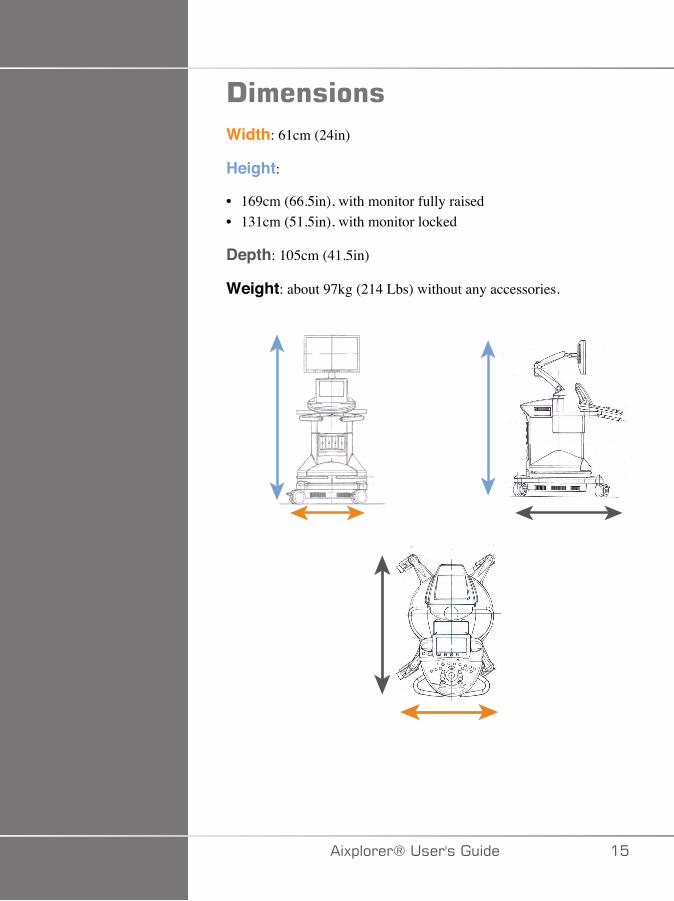
!�������Width: 61cm (24in)
Height:
• 169cm (66.5in), with monitor fully raised• 131cm (51.5in), with monitor locked
Depth: 105cm (41.5in)
Weight: about 97kg (214 Lbs) without any accessories.
�)!�����*����������� ��
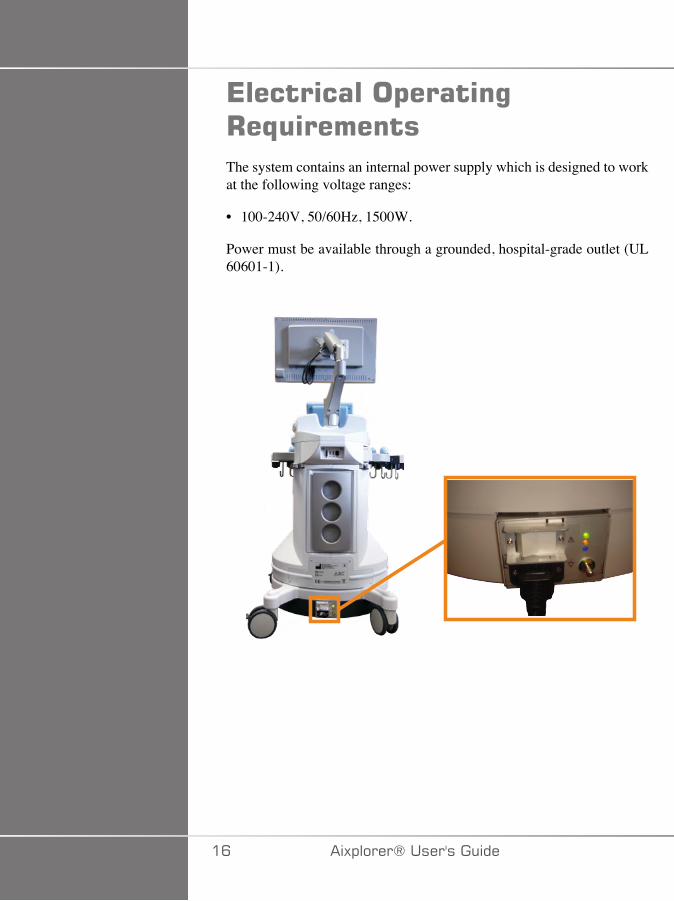
*����������$�����%+�,�������The system contains an internal power supply which is designed to workat the following voltage ranges:
• 100-240V, 50/60Hz, 1500W.
Power must be available through a grounded, hospital-grade outlet (UL60601-1).
�C �)!�����*�����������
��$�-��$������������
�#/�'����
� �����
Externally powered USB devices powered are not permitted to beconnected to the USB ports of the Aixplorer® ultrasound system.
Ethernet connectors must only be connected to IEC certified equipment.
Any USB device may be connected to the system as long as it is SELF-powered through the USB port (two USB ports can be used) or poweredfrom an external supply IEC60601 compliant.
� +����
When using a USB port, ensure that both the user and the patient do notplace hands or any other body parts on or in the USB port.
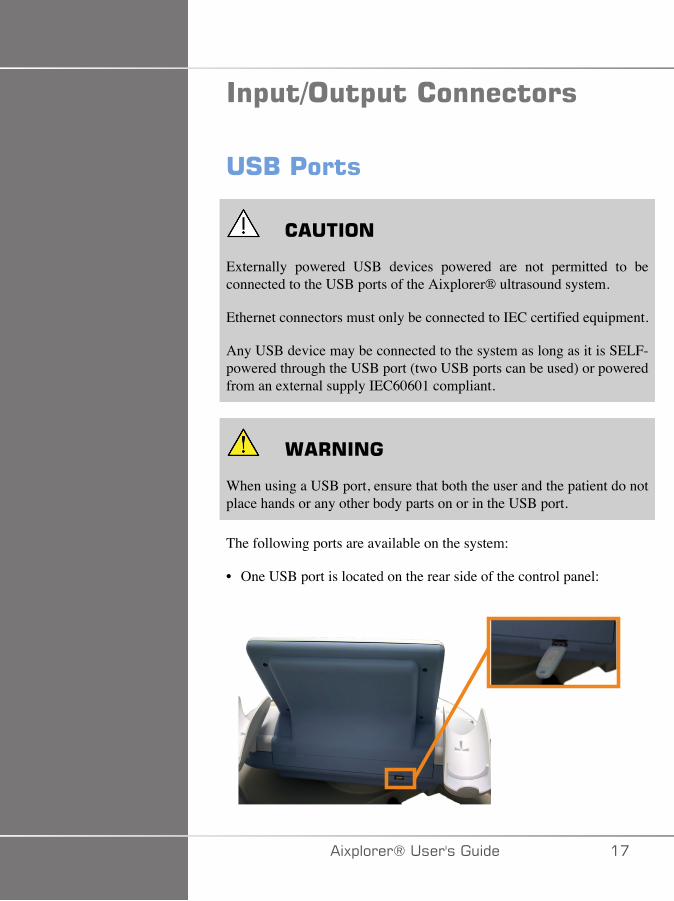
The following ports are available on the system:
• One USB port is located on the rear side of the control panel:
�)!�����*����������� ��
In this USB port, you can plug a memory stick.
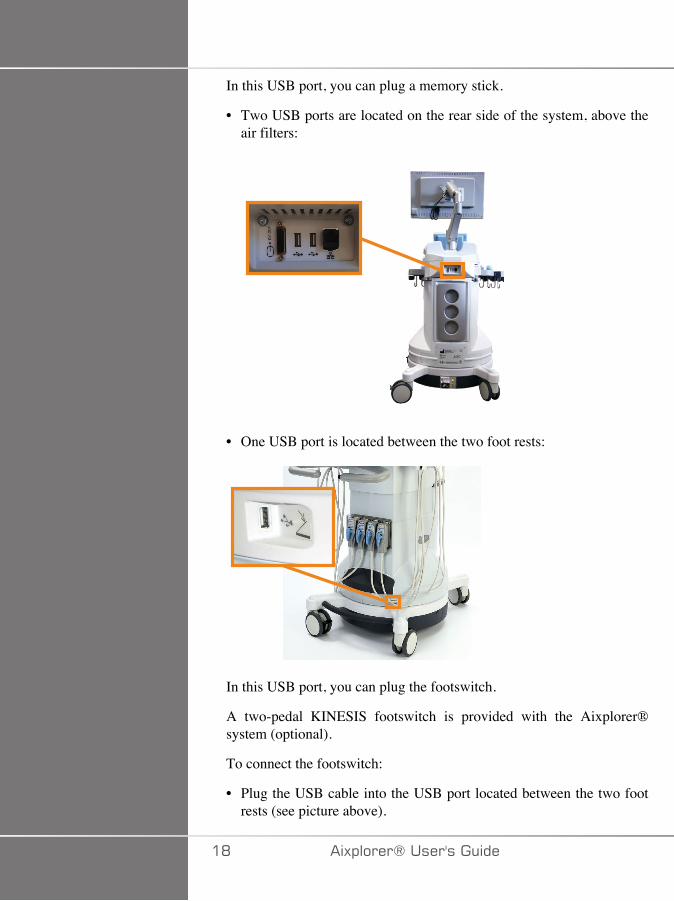
• Two USB ports are located on the rear side of the system, above theair filters:
• One USB port is located between the two foot rests:
In this USB port, you can plug the footswitch.
A two-pedal KINESIS footswitch is provided with the Aixplorer®system (optional).
To connect the footswitch:
• Plug the USB cable into the USB port located between the two footrests (see picture above).
�D �)!�����*�����������
• When the system is on, you can configure the function of the two pedalsin the Setups (see Chapter 8, Customizing the System [377]).
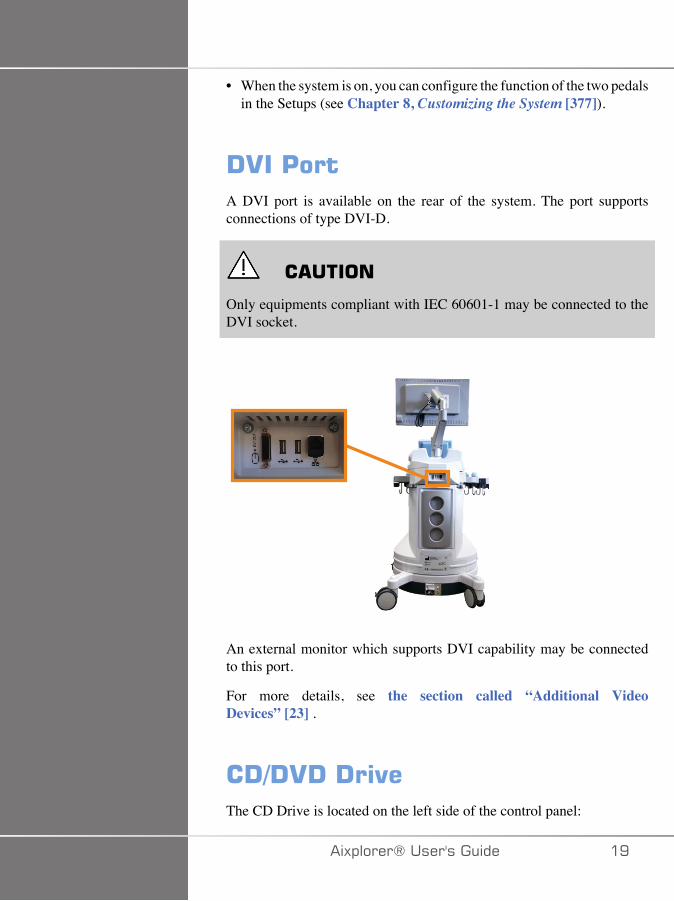
!.��'���A DVI port is available on the rear of the system. The port supportsconnections of type DVI-D.
� �����
Only equipments compliant with IEC 60601-1 may be connected to theDVI socket.
An external monitor which supports DVI capability may be connectedto this port.
For more details, see the section called “Additional VideoDevices” [23] .
�!-!.!�!�"�The CD Drive is located on the left side of the control panel:
�)!�����*����������� �E
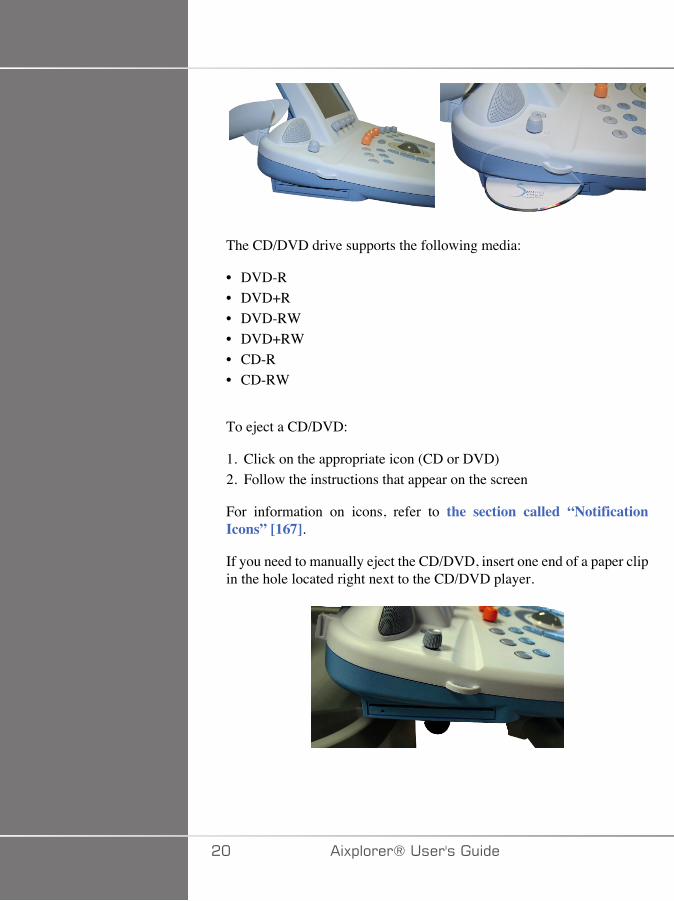
The CD/DVD drive supports the following media:
• DVD-R• DVD+R• DVD-RW• DVD+RW• CD-R• CD-RW
To eject a CD/DVD:
1. Click on the appropriate icon (CD or DVD)2. Follow the instructions that appear on the screen
For information on icons, refer to the section called “NotificationIcons” [167].
If you need to manually eject the CD/DVD, insert one end of a paper clipin the hole located right next to the CD/DVD player.
�� �)!�����*�����������
'������
����%������'�������0�$�����1
A SONY black and white thermal printer is integrated on the system. Itis located at the rear of the cart.
The SONY black and white thermal printer provided with the systemshould remain on.
It will stay in an energy-saving mode. Turning Off and restarting theprinter stresses the Aixplorer® system and could cause other electricalproblems.
��������'�����
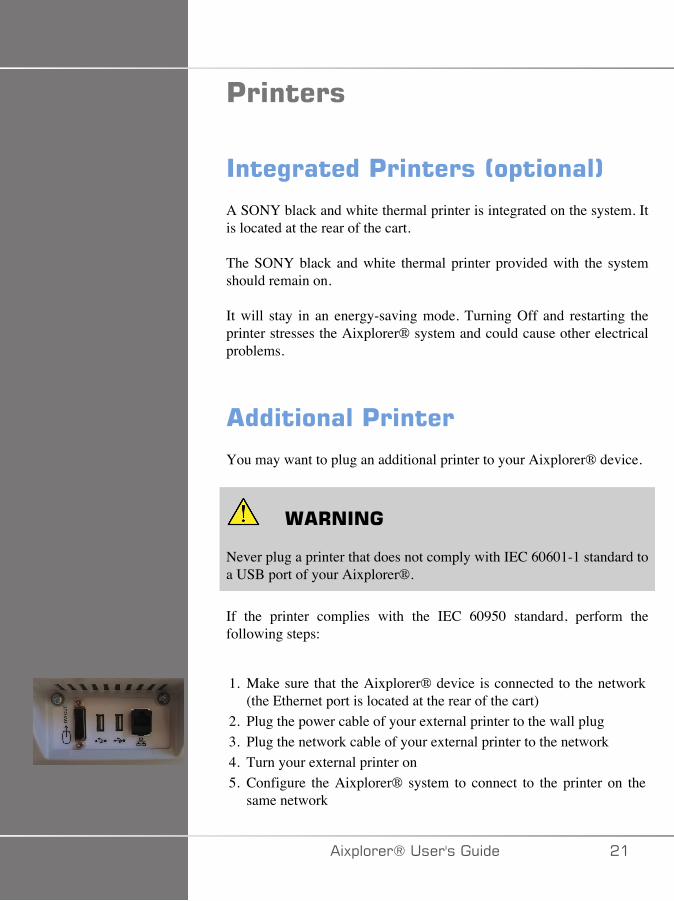
You may want to plug an additional printer to your Aixplorer® device.
� +����
Never plug a printer that does not comply with IEC 60601-1 standard toa USB port of your Aixplorer®.
If the printer complies with the IEC 60950 standard, perform thefollowing steps:
1. Make sure that the Aixplorer® device is connected to the network(the Ethernet port is located at the rear of the cart)
2. Plug the power cable of your external printer to the wall plug3. Plug the network cable of your external printer to the network4. Turn your external printer on5. Configure the Aixplorer® system to connect to the printer on the
same network
�)!�����*����������� ��
���*
The Aixplorer® and the external printer may be plugged into the samenetwork at your facility.
If the printer complies with the IEC 60601-1 standard, perform thefollowing steps:
1. Plug the power cable of your external printer to the wall plug2. Do one of the following, depending on the printer model:
• connect the printer to Aixplorer® with the USB cable• connect the printer to Aixplorer® with the network cable
For the list of the recommended printers, please contact your LocalSuperSonic Imagine representative.
�� �)!�����*�����������
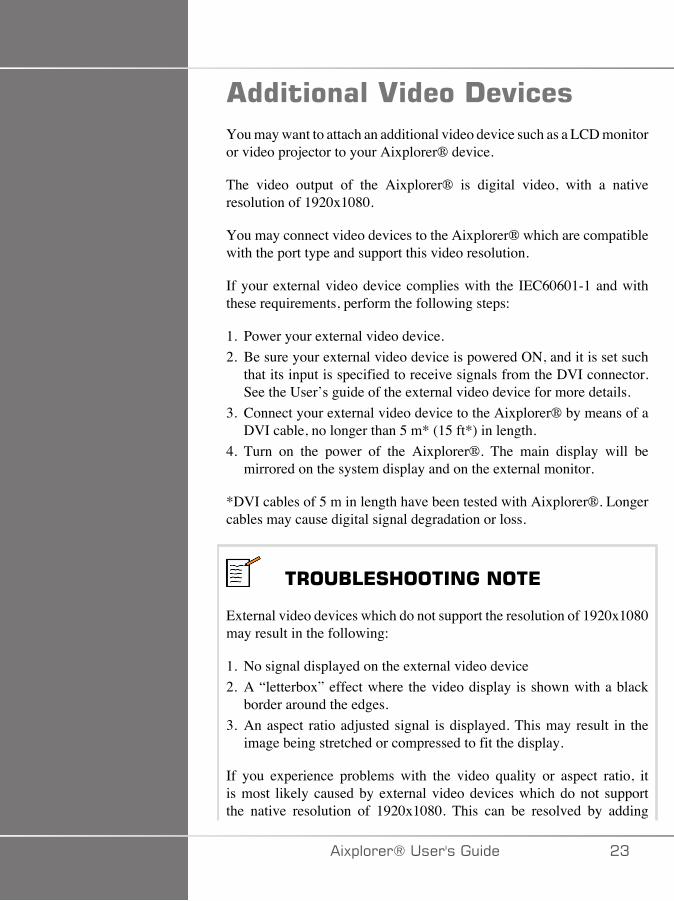
��������.����!�"���You may want to attach an additional video device such as a LCD monitoror video projector to your Aixplorer® device.
The video output of the Aixplorer® is digital video, with a nativeresolution of 1920x1080.
You may connect video devices to the Aixplorer® which are compatiblewith the port type and support this video resolution.
If your external video device complies with the IEC60601-1 and withthese requirements, perform the following steps:
1. Power your external video device.2. Be sure your external video device is powered ON, and it is set such
that its input is specified to receive signals from the DVI connector.See the User’s guide of the external video device for more details.
3. Connect your external video device to the Aixplorer® by means of aDVI cable, no longer than 5 m* (15 ft*) in length.
4. Turn on the power of the Aixplorer®. The main display will bemirrored on the system display and on the external monitor.
*DVI cables of 5 m in length have been tested with Aixplorer®. Longercables may cause digital signal degradation or loss.
�+��/4*#3����������*
External video devices which do not support the resolution of 1920x1080may result in the following:
1. No signal displayed on the external video device2. A “letterbox” effect where the video display is shown with a black
border around the edges.3. An aspect ratio adjusted signal is displayed. This may result in the
image being stretched or compressed to fit the display.
If you experience problems with the video quality or aspect ratio, itis most likely caused by external video devices which do not supportthe native resolution of 1920x1080. This can be resolved by adding
�)!�����*����������� �A
a “digital scaler” between the external monitor and the Aixplorer®.For more information, please contact your local SuperSonic Imaginerepresentative.
� �����
Additional equipment connected to medical electrical equipment mustcomply with the respective IEC or ISO standards (e.g. IEC 60950 for dataprocessing equipment).
Furthermore all configurations shall comply with the requirements formedical electrical systems (see IEC 60601-1).
Any person connecting accessory equipment to medical electricalequipment is configuring a medical system and is therefore responsiblethat the system(s) complies with the requirements for medical electricalsystems.
Attention is drawn to the fact that local laws take priority over the abovementioned requirements.
If in doubt, consult your local representative or the technical servicedepartment.
�� �)!�����*�����������
/�������#�������0�$�����1The Aixplorer® supports a model of hand-held barcode scannerespecially designed for healthcare applications and environements, forlogging data as patient ID: barcode scanner (JADAK Flexpoint HS-1M).
If only Patient ID is acquired from barcode scanner, the Patient ID canbe acquired reading in Patient, Worklist or Q&R Aixplorer screens.
When delivered by SuperSonic Imagine, the HS-1M barcode scanner isfactory programmed and therefore doesn't need any customizations by theuser. If you need to change these settings, programming is accomplishedby scanning the bar codes in this guide or by sending the commandsbelow them.
See the section called “Cleaning and Disinfecting the BarcodeScanner” [436] for details regarding disinfection and cleaning of theHS-1M barcode scanner.
� �����
The HS-1M contains a laser based aiming system that is fully compliantwith eye safety certifications.
This device emits CDRH/IEC Class 2 laser and IEC Class 1M light.
Do not stare into beam.
���*
When not in use you can store HS-1M in an available probe holder.
�)!�����*����������� ��
�!�/�������#������
�"��"�)
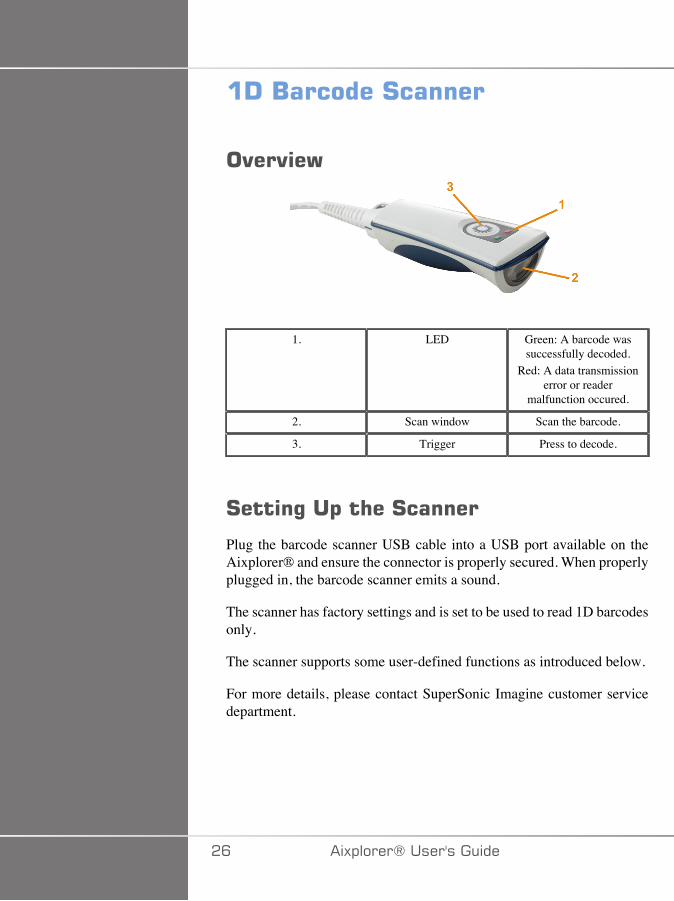
1. LED Green: A barcode wassuccessfully decoded.
Red: A data transmissionerror or reader
malfunction occured.
2. Scan window Scan the barcode.
3. Trigger Press to decode.
#����%��$�� ��#������
Plug the barcode scanner USB cable into a USB port available on theAixplorer® and ensure the connector is properly secured. When properlyplugged in, the barcode scanner emits a sound.
The scanner has factory settings and is set to be used to read 1D barcodesonly.
The scanner supports some user-defined functions as introduced below.
For more details, please contact SuperSonic Imagine customer servicedepartment.
�C �)!�����*�����������
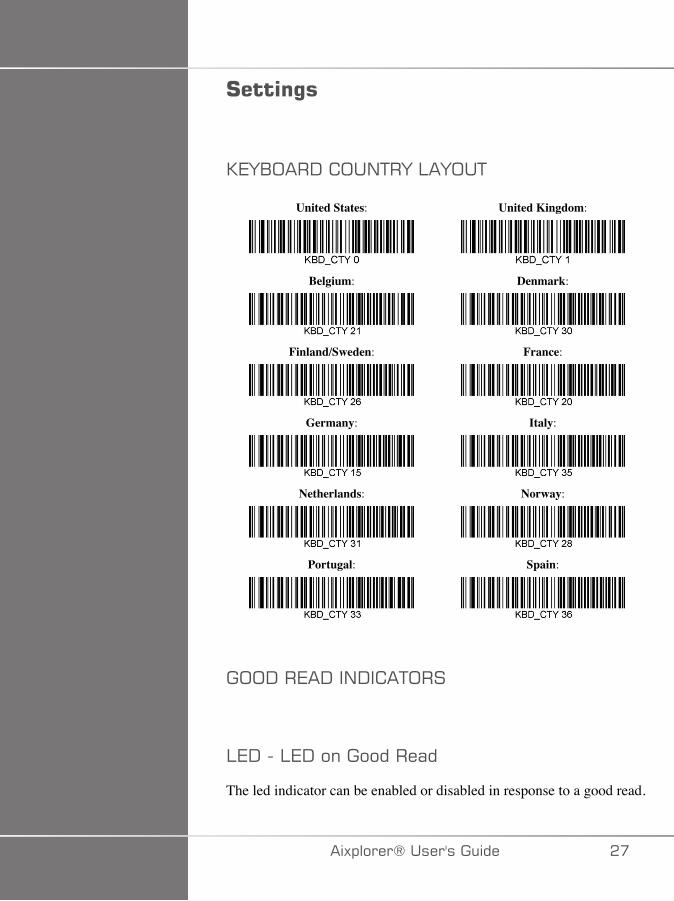
#����%�
07F1;��-� ;�/+�F�:�F;�+
United States:
Belgium:
Finland/Sweden:
Germany:
Netherlands:
Portugal:
United Kingdom:
Denmark:
France:
Italy:
Norway:
Spain:
�;;-��7�-��/-� �+;��
:7-���:7-�����������(�
The led indicator can be enabled or disabled in response to a good read.
�)!�����*����������� ��
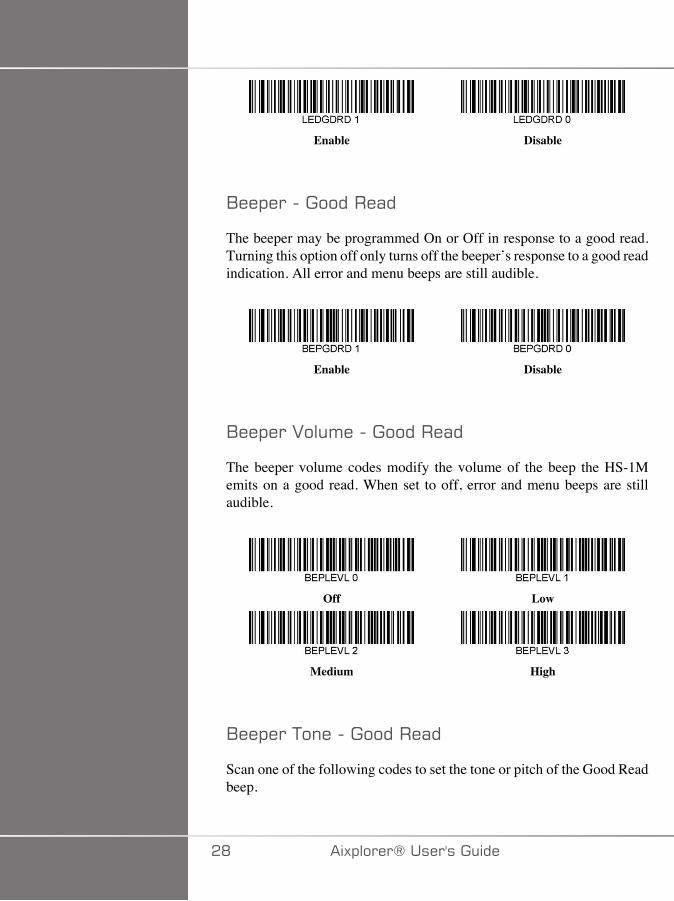
Enable Disable
1��!������������(�
The beeper may be programmed On or Off in response to a good read.Turning this option off only turns off the beeper’s response to a good readindication. All error and menu beeps are still audible.
Enable Disable
1��!���2��'�����������(�
The beeper volume codes modify the volume of the beep the HS-1Memits on a good read. When set to off, error and menu beeps are stillaudible.
Off
Medium
Low
High
1��!���+�������������(�
Scan one of the following codes to set the tone or pitch of the Good Readbeep.
�D �)!�����*�����������
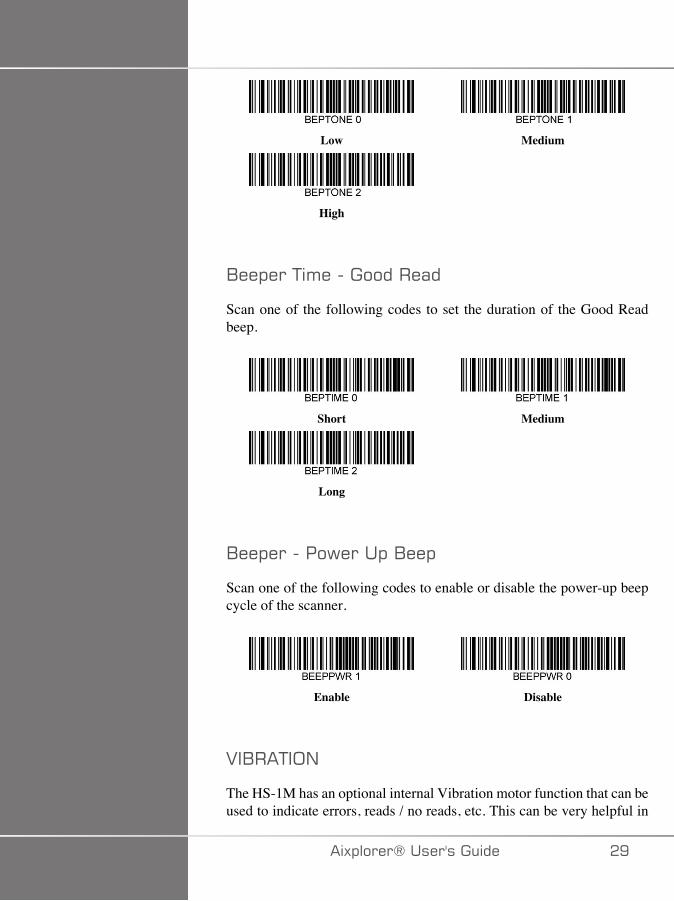
Low
High
Medium
1��!���+'�����������(�
Scan one of the following codes to set the duration of the Good Readbeep.
Short
Long
Medium
1��!�������6����!�1��!
Scan one of the following codes to enable or disable the power-up beepcycle of the scanner.
Enable Disable
2�1��+�;/
The HS-1M has an optional internal Vibration motor function that can beused to indicate errors, reads / no reads, etc. This can be very helpful in
�)!�����*����������� �E

an environment where an audible beep would be unwanted; for instancein a patient ward at night in a hospital, where patients are sleeping.
2%�($���,����
The HS-1M can use its vibration engine to vibrate in different situations.Use one of the codes below to set the vibration mode of the HS-1M.
Don't Vibrate
Vibrate on error
Vibrate on good read
Vibrate on BEL (from host)
Vibrate on No Read
2%�($�������� ��$
Set the Vibration Pulse count (i.e. number of vibrations) between 1 and5 pulses. Each pulse’s duration will be determined by the vibration timesetting (see next page).
1 Vibration Pulse
3 Vibration Pulses
2 Vibration Pulses
4 Vibrations Pulses
A� �)!�����*�����������
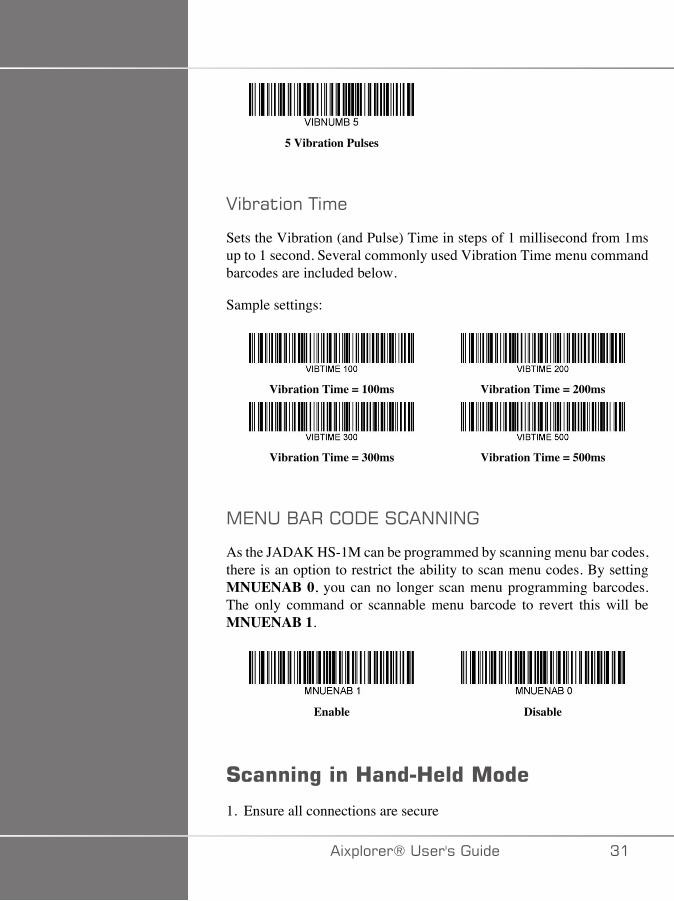
5 Vibration Pulses
2%�($���+'�
Sets the Vibration (and Pulse) Time in steps of 1 millisecond from 1msup to 1 second. Several commonly used Vibration Time menu commandbarcodes are included below.
Sample settings:
Vibration Time = 100ms
Vibration Time = 300ms
Vibration Time = 200ms
Vibration Time = 500ms
,7/��1��� ;-7�� �//�/�
As the JADAK HS-1M can be programmed by scanning menu bar codes,there is an option to restrict the ability to scan menu codes. By settingMNUENAB 0, you can no longer scan menu programming barcodes.The only command or scannable menu barcode to revert this will beMNUENAB 1.
Enable Disable
#�����%���3����3��������
1. Ensure all connections are secure
�)!�����*����������� A�

2. Put the pointer over the field to fill in3. Aim the scanner at the barcode. Press the trigger.
���*
Ensure the scan line cross every bar and space of the symbol, see thefigure below.
4. Upon successful decode, the reader beeps and the LED turns green.
���$������/��������($��• GS-1 Databar Limited (RSS Limited)• GS-1 Databar Expanded (RSS Expanded)• Codabar• Code 11• Interleaved 2 of 5• Code 128• Matrix 2 of 5• Code 39• Code 93• NW7• MSI• EAN/JAN-13• EAN/JAN-8• UPC-A• GS1-128• UPC-E• GS-1 Databar (RSS-14)• UPC-E1
A� �)!�����*�����������

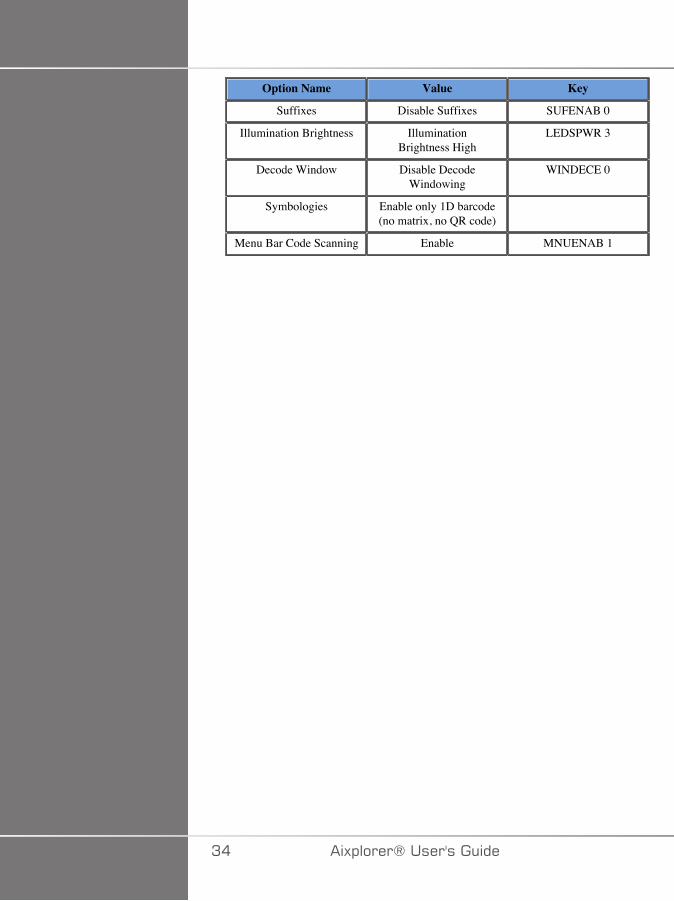
'���������!������Refer to the following table for parameter defaults of the Jadak HS-1MBarcode Scanner
Option Name Value Key
Interface USB HID Keyboard HOSTCFG1
Keyboard Country Layout United States KBD_CTY 0
Keyboard ControlCharacter Output
Disable KBD_NPE 0
Numeric Keypad Mode Disable KBD_NMPS 0
LED - LED on Good Read Enable LEDGDRD 1
Beeper - Good Read Enable BEPGDRD 1
Beeper Volume- Good Read
High BEPLEVL 3
Beeper Tone - Good Read High BEPTONE 2
Beeper Time - Good Read Long BEPTIME 2
No Reads Disable No Read NO_READ 0
No Read Message No Read Message NORDMSG
Beeper - Beep on [BEL] Disable BEEPBEL 0
Beeper - Power Up Beep Enable BEEPPWR 1
Error LED Duration Error LEDduration = 100 ms
ELEDDUR 100
Aimer Mode Enable AIMMODE 1
Aimer Delay Aimer Delay Off AIM_DLY 0
Vibration Modes Don't vibrate VIBMODE 0
Vibration Pulse Count 1 Vibration pulse VIBNUMB 1
Vibration Time Vibration time = 100 ms VIBTIME 100
Trigger Modes Manual (lever) Trigger TRGMODE 0
Multiple Symbols Mode Multiple Symbol Mode Off MULTSYM 0
Good Read Delay No Good Read Delay DLYGDRD 0
Re-read Delay Re-read delay 0.6 seconds DLYRERD 600
Transmit AIMID Character
Don't Transmit AIM ID XMITCID 0
Prefixes Disable PREENAB 0
�)!�����*����������� AA
Option Name Value Key
Suffixes Disable Suffixes SUFENAB 0
Illumination Brightness IlluminationBrightness High
LEDSPWR 3
Decode Window Disable DecodeWindowing
WINDECE 0
Symbologies Enable only 1D barcode(no matrix, no QR code)
Menu Bar Code Scanning Enable MNUENAB 1
A� �)!�����*�����������
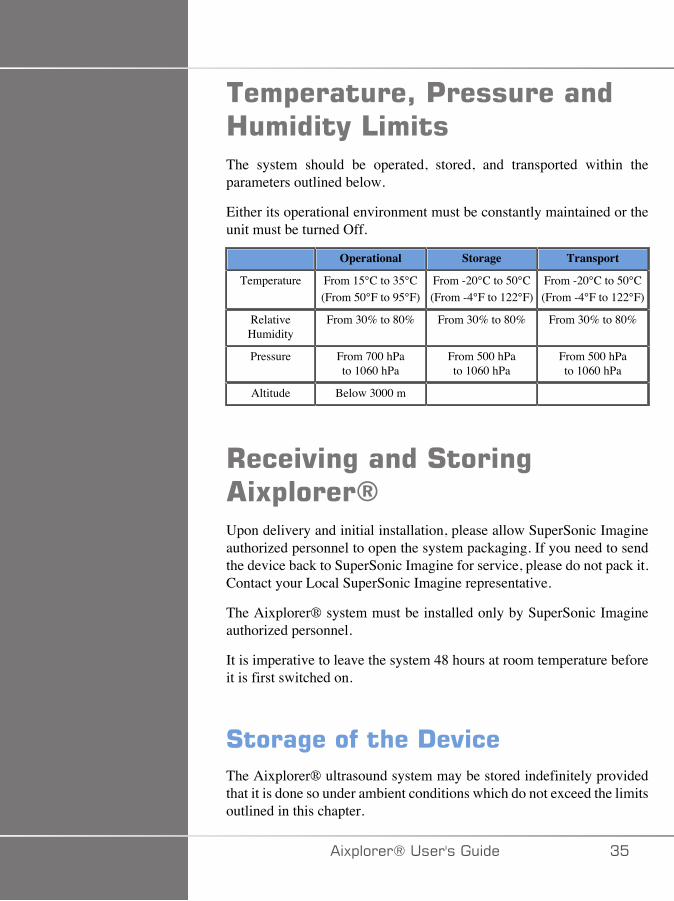
���$������2�'����������3���(�4���The system should be operated, stored, and transported within theparameters outlined below.
Either its operational environment must be constantly maintained or theunit must be turned Off.
Operational Storage Transport
Temperature From 15°C to 35°C(From 50°F to 95°F)
From -20°C to 50°C(From -4°F to 122°F)
From -20°C to 50°C(From -4°F to 122°F)
RelativeHumidity
From 30% to 80% From 30% to 80% From 30% to 80%
Pressure From 700 hPato 1060 hPa
From 500 hPato 1060 hPa
From 500 hPato 1060 hPa
Altitude Below 3000 m
+���"�%�����#����% 5$�����6Upon delivery and initial installation, please allow SuperSonic Imagineauthorized personnel to open the system packaging. If you need to sendthe device back to SuperSonic Imagine for service, please do not pack it.Contact your Local SuperSonic Imagine representative.
The Aixplorer® system must be installed only by SuperSonic Imagineauthorized personnel.
It is imperative to leave the system 48 hours at room temperature beforeit is first switched on.
#����%������ ��!�"��The Aixplorer® ultrasound system may be stored indefinitely providedthat it is done so under ambient conditions which do not exceed the limitsoutlined in this chapter.
�)!�����*����������� A�
In the case of extremely long periods of storage (greater than 1 year), itis possible that on-board batteries may become discharged.
If you plan to store the system for extended periods of time, please consultyour authorized SuperSonic Imagine service representative regardingbattery removal prior to storage.
It is also prudent to have a service representative on-site when re-startingthe system for the first time after prolonged storage.
#����!�$��������� ��!�"��The Aixplorer® ultrasound system contains components that are similarto those found in a typical personal computer.
As such, the electronic parts contained within the housing may containsmall amounts of lead (electrical components), mercury (electricalcomponents and batteries) and lithium ions (batteries).
The housing is also composed of plastic material, which can be recycled.Please verify with your local regulations regarding recycling of electricalcomponents, plastics and overall safe disposal of this device.
Please contact your SuperSonic Imagine representative for furtherinformation.
AC �)!�����*�����������

7�#����(
�)!�����*����������� A�

AD �)!�����*�����������

!����������'�������4�"���The following symbols are used in this document:
A WARNING symbol describes precautions necessary to prevent injuryor loss of life.
WARNING
A CAUTION symbol describes precautions necessary to protect theequipment.
CAUTION
�)!�����*����������� AE
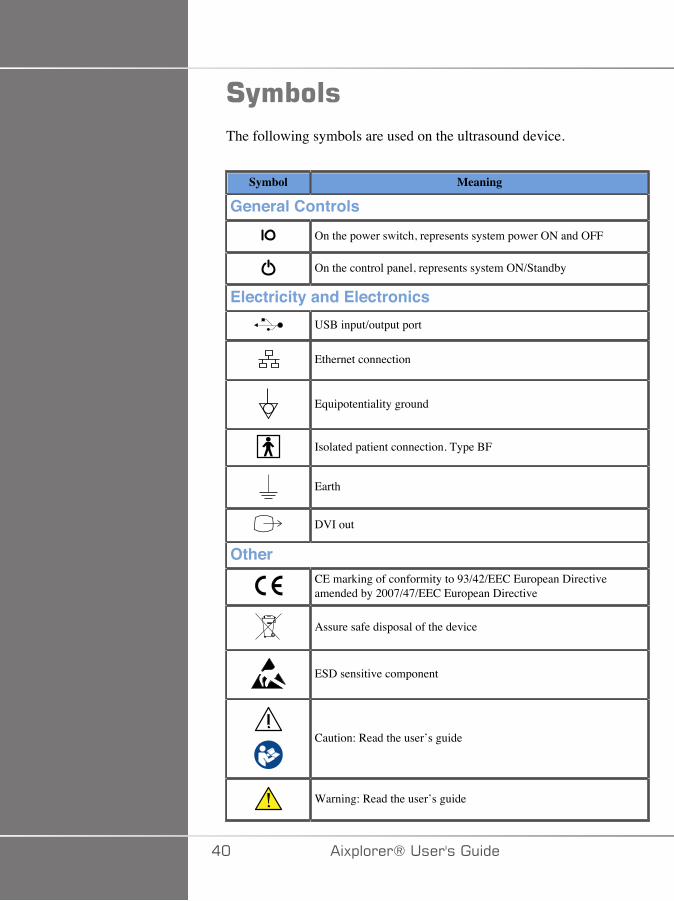
#(�����The following symbols are used on the ultrasound device.
Symbol Meaning
General ControlsOn the power switch, represents system power ON and OFF
On the control panel, represents system ON/Standby
Electricity and ElectronicsUSB input/output port
Ethernet connection
Equipotentiality ground
Isolated patient connection. Type BF
Earth
DVI out
OtherCE marking of conformity to 93/42/EEC European Directiveamended by 2007/47/EEC European Directive
Assure safe disposal of the device
ESD sensitive component
Caution: Read the user’s guide
Warning: Read the user’s guide
�� �)!�����*�����������
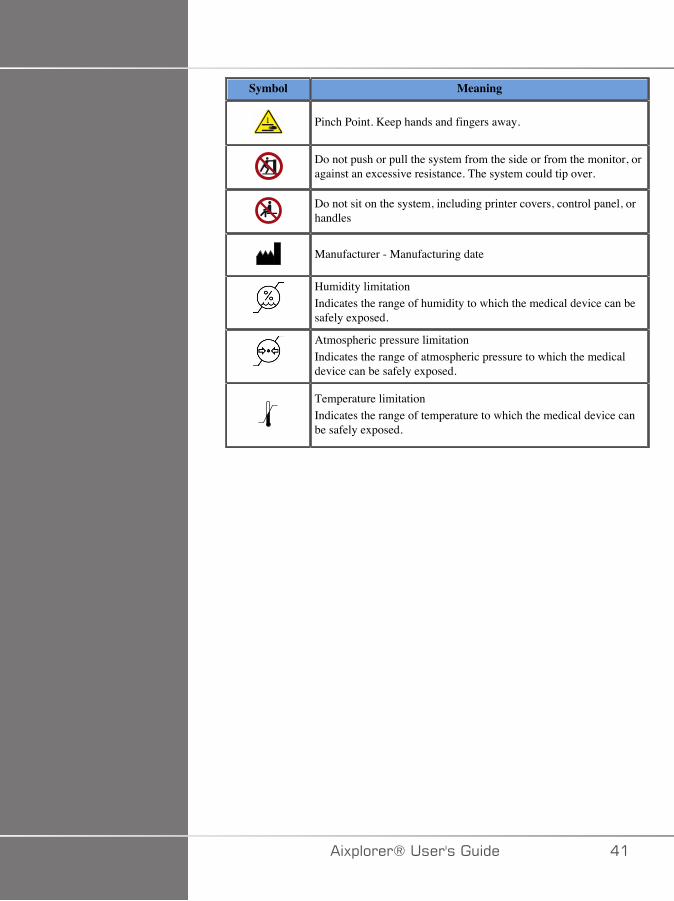
Symbol Meaning
Pinch Point. Keep hands and fingers away.
Do not push or pull the system from the side or from the monitor, oragainst an excessive resistance. The system could tip over.
Do not sit on the system, including printer covers, control panel, orhandles
Manufacturer - Manufacturing date
Humidity limitationIndicates the range of humidity to which the medical device can besafely exposed.
Atmospheric pressure limitationIndicates the range of atmospheric pressure to which the medicaldevice can be safely exposed.
Temperature limitationIndicates the range of temperature to which the medical device canbe safely exposed.
�)!�����*����������� ��

��������*,$�����#����(Read the User’s Guide carefully and get acquainted with the transducersand the ultrasound system before using them.
� +����
Do not remove system covers. Hazardous voltages are present inside thesystem.
To avoid electrical shock, use only the supplied power cords and connectto properly grounded wall receptacles.
Do not operate the system in the presence of flammable anesthetics.Explosion can result.
Never operate the system if a significant quantity (2 mL or greater, wet tothe touch) of liquid (gel, water, saline, alcohol, blood, etc.) has penetratedthe outer casing, including control panel. Discontinue use of the deviceuntil the liquid is removed or completely dried.
Exercise caution when negotiating ramps and narrow hallways.
Keep hands and feet away from system wheels when moving ortransporting the system.
Before performing maintenance or cleaning, always press the On/Standby switch to put the system into standby mode, set the power switchto Off, and then disconnect the system from the wall outlet.
Do not push the system from the side, or against an excessive resistance.The system could tip over.
� �����
Repairs must be performed by authorized personnel only.
Repairs and maintenance performed by unauthorized parties are at theuser’s risk, and shall void all warranties, explicit or implied.
�� �)!�����*�����������
For optimal performance, the Aixplorer® system should be connected toan electrical circuit that is able to sustain at least 1500W.
To avoid interference, avoid operating the system in an environmentwhere portable and mobile radio-frequency (RF) communications are inuse.
Avoid handling fluids near the system. Fluids leaking through the airvents of the system may cause electrical failure.
Warm air will be exhausted from the rear, the sides and the bottom of thesystem. This is normal behavior when the system is in operation. Do notblock or obstruct air vents at the rear of the system.
Use the handle to move the system.
To prevent damage to system cables or transducer cables, be careful notto run over them with the machine.
Never attempt to open system covers, transducers or transducerconnectors.
Do not submerge the system cables or the transducer cables in liquid.
Ultrasound transducers are easily damaged when handled improperly.Avoid dropping the transducer or bringing it into contact with any sharpor abrasive surfaces or objects.
Improper cleaning or sterilization of the transducers maycause permanent damage. See Chapter 9, System Care &Maintenance [429].
The automatic Freeze feature will turn Off the acoustic output to thetransducer when the system is not in use. This will help prevent heatbuild-up and damage to the transducer.
If an error message appears on the monitor indicating a hazardouscondition, note the error code and turn Off the power to the system.Contact the SuperSonic Imagine Customer Service Department to relateand troubleshoot the problem.
Do not load the system with any peripheral devices or equipmentweighing more than 10 kg (20 lbs). Doing so may cause the system tobecome unstable and tip over.
�)!�����*����������� �A
If an excessive internal temperature is reached, the system displays awarning message and will eventually automatically shut down for 30minutes to prevent over-heating damage.
*���������#����(This device has been tested by a third-party testing agency and isdescribed as a Class 1 electrical device with Type BF isolated patientapplied parts.
This device has demonstrated conformance to the following standards:
• IEC 60601-1, UL 60601-1, CAN/CSA-C22.2 No. 601.1
� +����
Shock hazards may exist if this system is not properly grounded. Thesystem must be plugged into a fixed power socket that is grounded.The grounding wire must not be defective. Never use an adaptor orconverter to connect with a power source plug (three- prong to two- prongconverter).
Use only the cables provided by SuperSonic Imagine and connect thesecables according to the installation process.
To avoid electrical shock and fire hazard, check power cables and plugsfor damage on a regular basis.
Hazardous voltages exist inside the system; therefore, the protectivecovers on the system should not be removed. Any internal adjustment orreplacement must be made by an authorized SuperSonic Imagine servicerepresentative.
Servicing the power supply : the system must be unplugged for aminimum of two minutes before accessing the live parts of the powersupply.
To avoid risk of electrical shock hazards, always inspect the transducerbefore use. Make sure the face is not cracked, torn or chipped and thatthe housing of the transducer or the cord is not damaged before use.
�� �)!�����*�����������

Electrostatic discharge (ESD) or static shock is a natural phenomenon.Static shock is a discharge of electrical energy that can be transferredto file cabinets, computer equipment, metal door knobs and otherindividuals. Static shock occurs most often during low humidityconditions that can be brought on by heating or air conditioning.
To avoid damage to the system or transducers resulting from an electricalenergy discharge from a system user or patient, the use of anti-static mats,anti-static sprays or a ground wire connection between the system andthe patient table are recommended.
� �����
Ethernet connectors must only be connected to IEC certified equipment.Any USB device may be connected to the system as long as it is self-powered.
Use caution when plugging in or unplugging the system.
Do not touch transducer connector pins when plugging in or unplugginga transducer.
Do not insert any objects through openings in the system covers.
If a foreign object should fall into an opening in the system cover,immediately power down the system and discontinue use until the systemcan be inspected by an authorized service representative.
*��������%�����������������Medical electrical equipments need special precautions regarding EMCand need to be installed and put into service according to theEMC information. The Aixplorer® system must be installed only bySuperSonic Imagine authorized personnel. This equipment has beentested and found to comply within the limits for medical devices inIEC 60601-1-2 Class A. These limits are designed to provide reasonableprotection against harmful interference in a typical medical institution.This equipment can radiate radio frequency energy, and if not installedand used in accordance with the instructions, may interfere with other
�)!�����*����������� ��
devices in the vicinity. Powering the system Off and On can determineif the problem is caused by this unit. In addition, electromagnetic fieldsfrom fixed transmitters such as base stations for radio (cellular/cordless)telephones and land mobile radios, amateur radio, AM and FM radiobroadcast, and TV broadcast may interfere with the use of this device.Portable and mobile RF communications equipment can affect the device.These fields may cause degradation of the image quality of the device.Sources of electromagnetic interference cannot be predicted theoreticallywith accuracy.
If this system causes harmful interference to other devices, or the systemdemonstrates an interference pattern on the image, the user is encouragedto try to correct the interference by:
• Increasing the distance separating the pieces of equipment• Ensuring the system is not connected to the same outlet as the other
device(s)• Using only shielded cabling when connecting the device to networks
and peripherals• Reorienting the device• Consulting the manufacturer or field service representative for help
If abnormal performance persists, additional measures may be necessary,such as relocating the system.
�C �)!�����*�����������
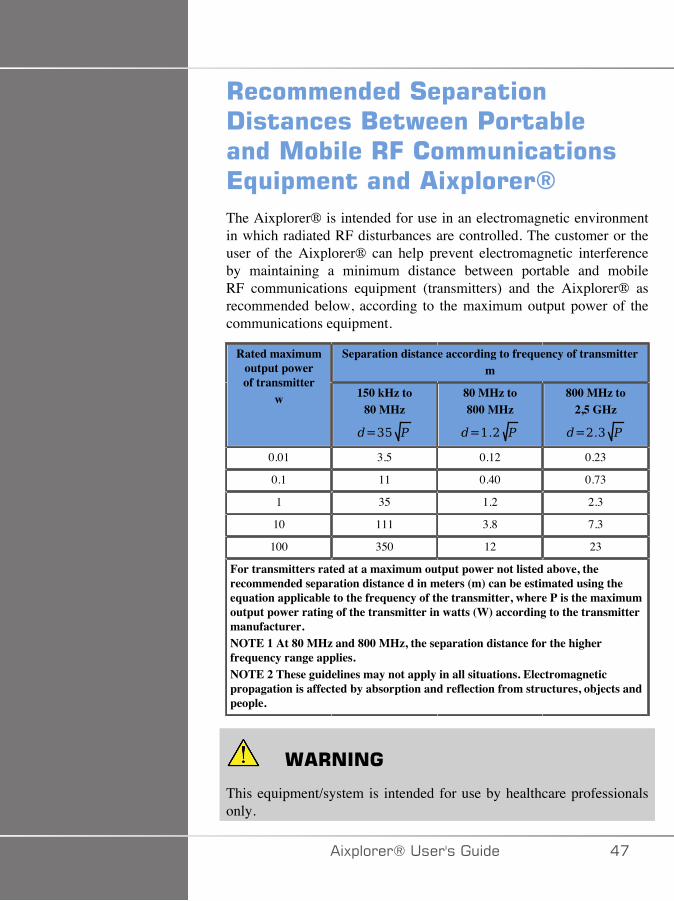
+�����������#�$������!��������/��)����'�����������������+=������������*,$��������� 5$�����6The Aixplorer® is intended for use in an electromagnetic environmentin which radiated RF disturbances are controlled. The customer or theuser of the Aixplorer® can help prevent electromagnetic interferenceby maintaining a minimum distance between portable and mobileRF communications equipment (transmitters) and the Aixplorer® asrecommended below, according to the maximum output power of thecommunications equipment.
Separation distance according to frequency of transmitterm
Rated maximumoutput powerof transmitter
w 150 kHz to80 MHz
80 MHz to800 MHz
800 MHz to2,5 GHz
0.01 3.5 0.12 0.23
0.1 11 0.40 0.73
1 35 1.2 2.3
10 111 3.8 7.3
100 350 12 23
For transmitters rated at a maximum output power not listed above, therecommended separation distance d in meters (m) can be estimated using theequation applicable to the frequency of the transmitter, where P is the maximumoutput power rating of the transmitter in watts (W) according to the transmittermanufacturer.NOTE 1 At 80 MHz and 800 MHz, the separation distance for the higherfrequency range applies.NOTE 2 These guidelines may not apply in all situations. Electromagneticpropagation is affected by absorption and reflection from structures, objects andpeople.
� +����
This equipment/system is intended for use by healthcare professionalsonly.
�)!�����*����������� ��
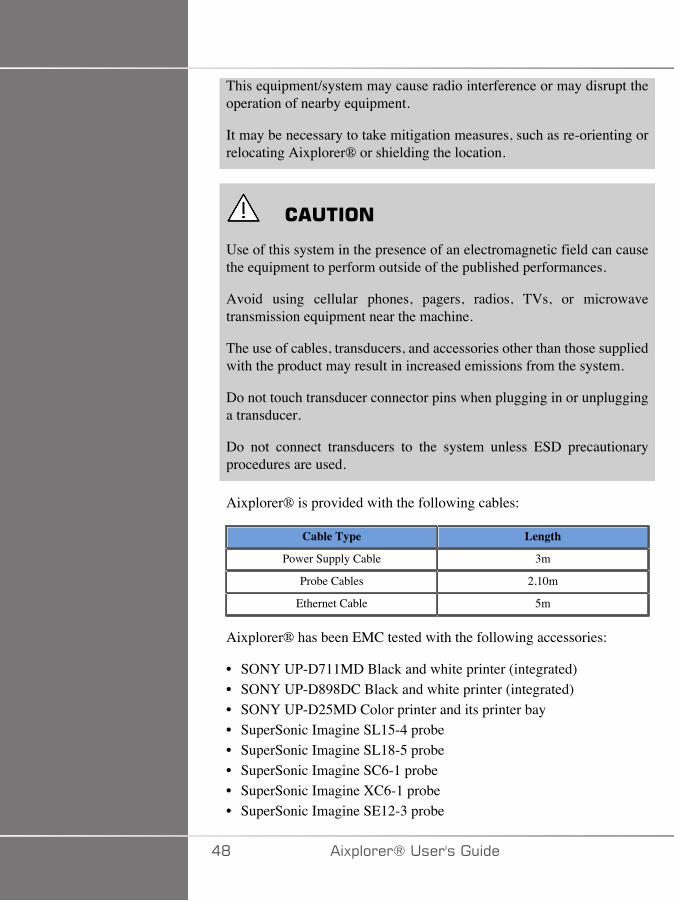
This equipment/system may cause radio interference or may disrupt theoperation of nearby equipment.
It may be necessary to take mitigation measures, such as re-orienting orrelocating Aixplorer® or shielding the location.
� �����
Use of this system in the presence of an electromagnetic field can causethe equipment to perform outside of the published performances.
Avoid using cellular phones, pagers, radios, TVs, or microwavetransmission equipment near the machine.
The use of cables, transducers, and accessories other than those suppliedwith the product may result in increased emissions from the system.
Do not touch transducer connector pins when plugging in or unplugginga transducer.
Do not connect transducers to the system unless ESD precautionaryprocedures are used.
Aixplorer® is provided with the following cables:
Cable Type Length
Power Supply Cable 3m
Probe Cables 2.10m
Ethernet Cable 5m
Aixplorer® has been EMC tested with the following accessories:
• SONY UP-D711MD Black and white printer (integrated)• SONY UP-D898DC Black and white printer (integrated)• SONY UP-D25MD Color printer and its printer bay• SuperSonic Imagine SL15-4 probe• SuperSonic Imagine SL18-5 probe• SuperSonic Imagine SC6-1 probe• SuperSonic Imagine XC6-1 probe• SuperSonic Imagine SE12-3 probe
�D �)!�����*�����������
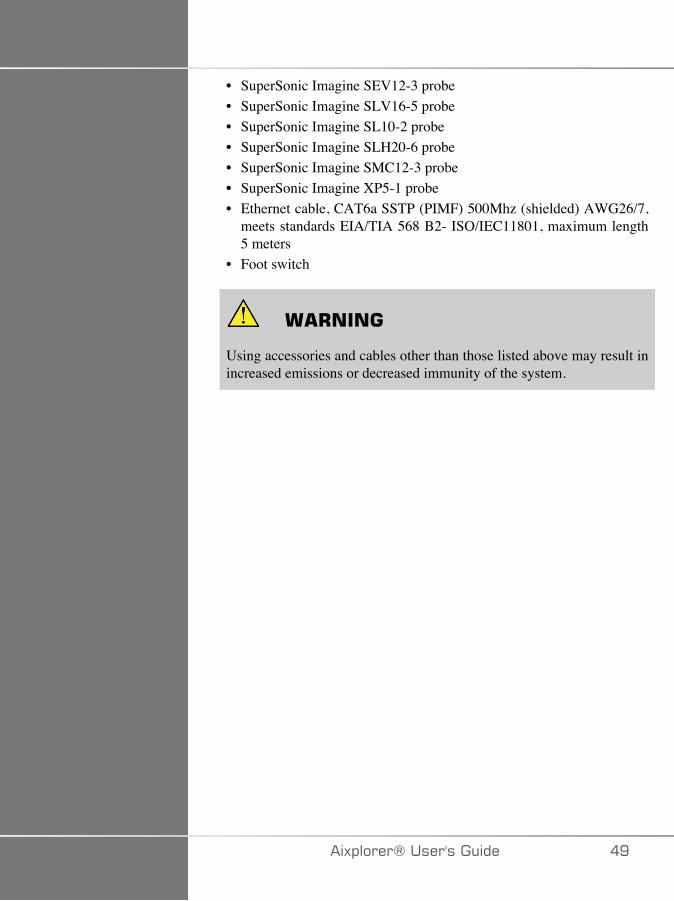
• SuperSonic Imagine SEV12-3 probe• SuperSonic Imagine SLV16-5 probe• SuperSonic Imagine SL10-2 probe• SuperSonic Imagine SLH20-6 probe• SuperSonic Imagine SMC12-3 probe• SuperSonic Imagine XP5-1 probe• Ethernet cable, CAT6a SSTP (PIMF) 500Mhz (shielded) AWG26/7,
meets standards EIA/TIA 568 B2- ISO/IEC11801, maximum length5 meters
• Foot switch
� +����
Using accessories and cables other than those listed above may result inincreased emissions or decreased immunity of the system.
�)!�����*����������� �E
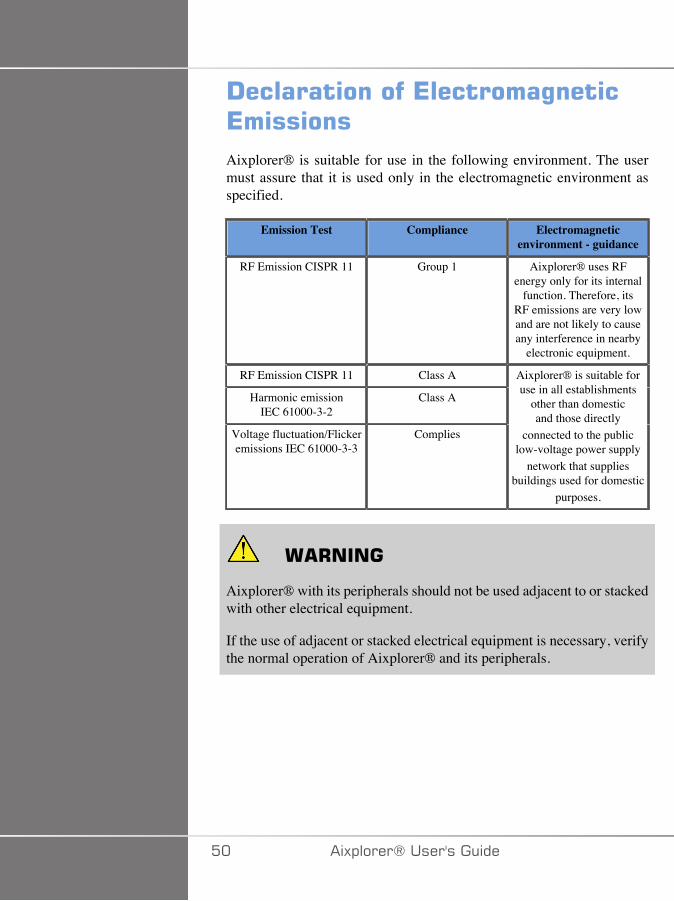
!�������������*��������%����*������Aixplorer® is suitable for use in the following environment. The usermust assure that it is used only in the electromagnetic environment asspecified.
Emission Test Compliance Electromagneticenvironment - guidance
RF Emission CISPR 11 Group 1 Aixplorer® uses RFenergy only for its internal
function. Therefore, itsRF emissions are very lowand are not likely to causeany interference in nearby
electronic equipment.
RF Emission CISPR 11 Class A
Harmonic emissionIEC 61000-3-2
Class A
Voltage fluctuation/Flickeremissions IEC 61000-3-3
Complies
Aixplorer® is suitable foruse in all establishments
other than domesticand those directly
connected to the publiclow-voltage power supply
network that suppliesbuildings used for domestic
purposes.
� +����
Aixplorer® with its peripherals should not be used adjacent to or stackedwith other electrical equipment.
If the use of adjacent or stacked electrical equipment is necessary, verifythe normal operation of Aixplorer® and its peripherals.
�� �)!�����*�����������

!������������������(
Guidance and manufacturer’s declaration - electromagnetic immunity
Aixplorer® is suitable for use in the following environment.The user must assure that the system is used according to the
specified guidance and only in the electromagnetic environmentlisted in the electromagnetic environment as specified.
ImmunityTest
IEC 60601Test
ComplianceLevel
ElectromagneticEnvironment Guidance
ConductedRFIEC
61000-4-6Radiated RF
IEC61000-4-3
3 Vrms150 kHz
to 80 MHz3 V/m
80 MHz to2,5 GHz
0.10 Vrms3.0 V/m
Portable and mobile RF communicationsequipment should be used no closerto any part of Aixplorer®, including
cables, than the recommendedseparation distance calculated
from the equation applicable tothe frequency of the transmitter.
Recommended separation distance
80 MHz to 800 MHz
800 MHz to 2,5 GHzwhere P is the maximum outputpower rating of the transmitter in
watts (W) according to the transmittermanufacturer and d is the recommended
separation distance in meters (m).Interference may occur in thevicinity of equipment markedwith the following symbol:
NOTE 1 At 80 MHz and 800 MHz, the higher frequency range applies
NOTE 2 These guidelines may not apply in all situations.Electromagnetic propagation is affected by absorption and reflectionfrom structures, objects and people.
a) Field strengths from fixed transmitters, such as base stations for radio(cellular/cordless) telephones and land mobile radios, amateur radio,AM and FM radio broadcast and TV broadcast cannot be predictedtheoretically with accuracy. To assess the electromagnetic environmentdue to fixed RF transmitters, an electromagnetic site survey should
�)!�����*����������� ��
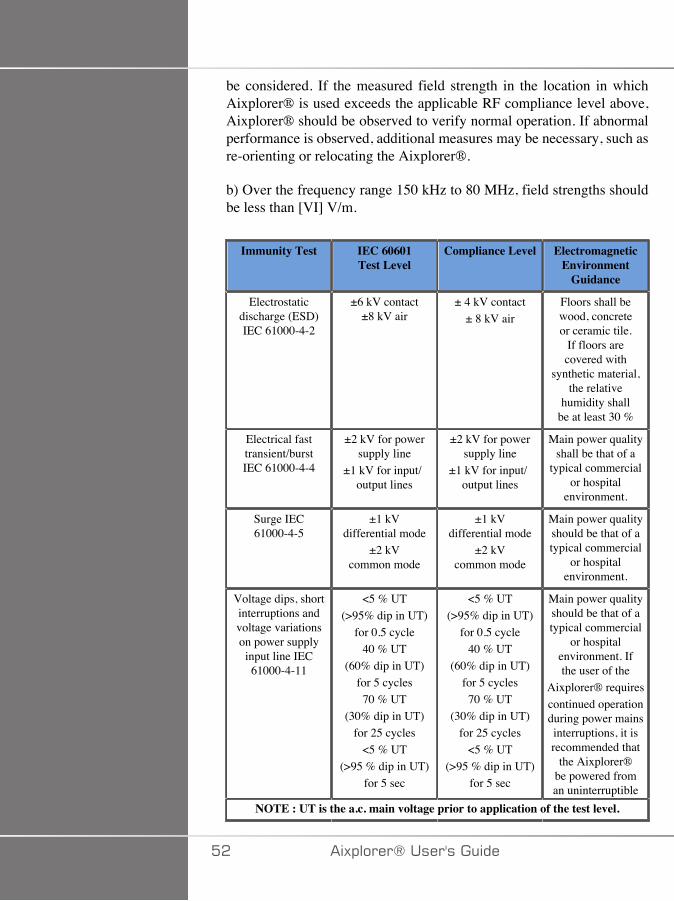
be considered. If the measured field strength in the location in whichAixplorer® is used exceeds the applicable RF compliance level above,Aixplorer® should be observed to verify normal operation. If abnormalperformance is observed, additional measures may be necessary, such asre-orienting or relocating the Aixplorer®.
b) Over the frequency range 150 kHz to 80 MHz, field strengths shouldbe less than [VI] V/m.
Immunity Test IEC 60601Test Level
Compliance Level ElectromagneticEnvironment
Guidance
Electrostaticdischarge (ESD)IEC 61000-4-2
±6 kV contact±8 kV air
± 4 kV contact± 8 kV air
Floors shall bewood, concreteor ceramic tile.
If floors arecovered with
synthetic material,the relative
humidity shallbe at least 30 %
Electrical fasttransient/burstIEC 61000-4-4
±2 kV for powersupply line
±1 kV for input/output lines
±2 kV for powersupply line
±1 kV for input/output lines
Main power qualityshall be that of a
typical commercialor hospital
environment.
Surge IEC61000-4-5
±1 kVdifferential mode
±2 kVcommon mode
±1 kVdifferential mode
±2 kVcommon mode
Main power qualityshould be that of atypical commercial
or hospitalenvironment.
Voltage dips, shortinterruptions andvoltage variationson power supplyinput line IEC
61000-4-11
<5 % UT(>95% dip in UT)
for 0.5 cycle40 % UT
(60% dip in UT)for 5 cycles70 % UT
(30% dip in UT)for 25 cycles
<5 % UT(>95 % dip in UT)
for 5 sec
<5 % UT(>95% dip in UT)
for 0.5 cycle40 % UT
(60% dip in UT)for 5 cycles70 % UT
(30% dip in UT)for 25 cycles
<5 % UT(>95 % dip in UT)
for 5 sec
Main power qualityshould be that of atypical commercial
or hospitalenvironment. Ifthe user of the
Aixplorer® requirescontinued operationduring power mainsinterruptions, it isrecommended that
the Aixplorer®be powered froman uninterruptible
NOTE : UT is the a.c. main voltage prior to application of the test level.
�� �)!�����*�����������
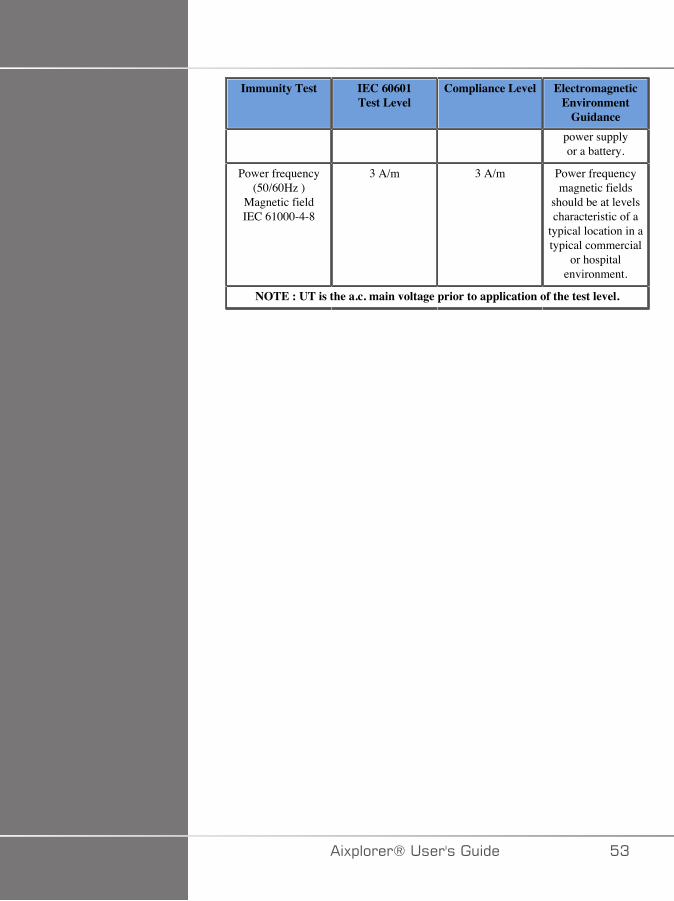
Immunity Test IEC 60601Test Level
Compliance Level ElectromagneticEnvironment
Guidancepower supplyor a battery.
Power frequency(50/60Hz )
Magnetic fieldIEC 61000-4-8
3 A/m 3 A/m Power frequencymagnetic fields
should be at levelscharacteristic of a
typical location in atypical commercial
or hospitalenvironment.
NOTE : UT is the a.c. main voltage prior to application of the test level.
�)!�����*����������� �A
� ������#����(Our device has been designed to have a surface temperature notexceeding 50°C in air and 43°C when in contact with the patient or userwhen measured under the requirements of the IEC 60601-2-37 standard.Some heat is generated by the ultrasound system, and by the transducer.Heat generated by the electrical components of the ultrasound system isdissipated through specific outlets.
Heat may also be generated at the surface of the ultrasound transducer.In some cases the heat of the transducer may be detected at the surfaceof the skin. This would occur if the transducer remains in contact with apart of the body for a prolonged period of time.
The ultrasound system has been equipped with internal sensors whichmonitor the temperature rise within the chassis. Alarms and WARNINGmessages may be displayed on the system in the event of an overheatingcondition. In the case of extreme or prolonged heat build-up, the systemmay automatically shut-down.
If heating of either the transducer or system is determined to be a problem,please call your SuperSonic Imagine service representative immediately.
� +����
Ultrasound system overheating may occur if the environment exceeds therecommended ambient operating conditions. To avoid overheating, besure the system is operated under normal “room temperature” conditions,and adequate ventilation is provided.
Ultrasound can produce harmful effects in tissue and potentially resultin patient injury. Always minimize exposure time and keep ultrasoundlevels low when there is no medical benefit (ALARA principle).
A system which is overheating due to external conditions or an internalfault may issue a warning followed by a spontaneous shut-down toprevent heat damage or fire. If this occurs, discontinue use of the systemand call your SuperSonic Imagine service representative.
Transducer surfaces may experience heat-build up. This is especially trueif the transducer is in prolonged use and/or the point of contact with the
�� �)!�����*�����������

body is stationary. Please use ALARA principles to prevent unnecessaryheating of the patient or the transducer.
Using the “Freeze” control is recommended to suspend acoustic energyto the transducer when not in use.
Do not maintain the transducer in one position on the body for prolongedperiods of time. Prolonged exposure can produce minor burns.
� �����
Do not operate the system if ambient temperature is above therecommended limit.
Use caution when operating the system in small spaces. Ambient roomtemperature increases may occur.
Change or clean air filters regularly to prevent system overheating.
The ultrasound system is designed to auto-Freeze if the imaging controlsare not changed for a duration defined by the user. This is designed toreduce heat build-up of the transducer. Use the Freeze button to resumescanning.
If a system persistently issues an operating temperature-related warning,discontinue use of the system and call your SuperSonic Imagine servicerepresentative.
If the system reaches a certain temperature, follow the instructions thatappear on the screen.
��� ������#����(The ultrasound system has been ergonomically and mechanicallyoptimized to be pleasant, efficient and safe, provided that it is used asintended and all instructions, warnings and cautions specified in thisGuide are followed.
If the system suffers mechanical damage, discontinue use and call anauthorized SuperSonic Imagine representative for assistance.
�)!�����*����������� ��
� +����
Never use the system if any of the exterior covers are cracked, damaged,missing or improperly installed.
Touching internal electrical or mechanical parts may cause injury ordeath.
If a foreign object should fall into an opening in the system cover,immediately power down the system and discontinue use until the systemcan be inspected by an authorized service representative.
Do not push or pull the system from the side or from the monitor, oragainst an excessive resistance. The system could tip over.
� �����
Use caution when accessing the peripheral bays.
Use caution when accessing cables on the back of the system. Somemechanical exterior parts may cause abrasion.
If the system does not roll smoothly on its wheels, do not force the systemto move.
Do not load the system with any peripheral devices or equipmentweighing more than 20 lbs (10kg). Doing so may cause the system tobecome unstable and tip over.
To prevent damage to system cables or transducer cables, be careful notto run over them with the machine.
Never attempt to open a transducer or a transducer connector.
Do not submerge the system cables or the transducer cables in liquid.
�C �)!�����*�����������

#����(�'�������%����������*5���������)� �� �#$��#�������%�� 5$�����6�#(����
/�������������/�$ (���������������������������
=��,����������*���%(�4�"������������������"��
Ultrasound is sound at a very high frequency above human hearing, i.e.above 20 kiloHertz (kHz). For medical diagnostic purposes, ultrasoundsystems generate ultrasound waves typically ranging from 1 to 20MegaHertz (MHz). A probe, or transducer, is applied on the patient’sbody. It emits ultrasound waves that pass into the body, then reflectoff the different tissue boundaries. The transducer then receives thesereflections, which are assembled and processed by a computer systemto generate a picture displayed on a video monitor. Key parametersof the ultrasound waves can vary, such as their frequency, density,focusing and aperture. For example, beams at higher frequencies producehigher resolution images but cannot penetrate as deeply into the bodyas lower frequencies, which penetrate more deeply but show lowerresolution. Therefore, the choice of frequency is a trade-off betweenspatial resolution of the image and imaging depth. Energy levels ofultrasound waves are measured in W/cm². The two typical values that arecalculated and taken into account are the spatial-peak temporal averageintensity ( ), measured in mW/cm² and of the spatial-peak pulseaverage intensity ( ), measured in W/cm². Diagnostic ultrasoundsystems usually use energy levels corresponding to an rangingbetween 0 and 720 mW/cm².
�)!�����*����������� ��

� ��%����'���(������$������*������The first guidelines and recommendations ever published for ultrasoundmanufacturers was proposed by the American Institute of Ultrasound inMedicine (AIUM) in 1983. These guidelines were revised in 1988 wherethe energy maximum limit was fixed to 100 mW/cm². Below this limit, noadverse bioeffects had ever been reported on animals or patients, althoughcontradictory observations have been reported later, in 1993. Since 1993,the Food and Drug Administration (FDA) imposed a maximum limit onthe acoustic output of ultrasound devices. However, due to the continuousdevelopment of sophisticated systems with improved image quality anddiagnostic sensitivity, it was realized that safely increasing the limitunder specific circumstances could bring diagnostic advantages (i.e.,patients with fatty tissues). In 1997, the FDA increased the maximumlimit of energy output level up to a much higher value (see sectionPresent state of output levels) and recognized an increased role of theoperator in limiting the potential for ultrasound bioeffects. In conclusionthe operator has the responsibility of making an informed decisionconcerning the desired diagnostic information in comparison to possibleadverse bioeffects. Achieving this goal requires an adapted education thatneeds to be provided to every operator in order to make an informedand balanced decision. In this context, the AIUM document publishedin 1994, "Medical Ultrasound Safety", is highly recommended, as is thisparticular educational content.
�������������D�3����(�����#����(+�����Ultrasound really started to be used in clinical medicine in the 1950’s.It has always been considered as a potential medical imaging techniquedespite continuing concerns of potential related risks: from the beginning,some studies demonstrated that sufficient ultrasound levels could harmbiological material, even with lower doses than used today. Due to theabsence of adverse effects reported on patients, the diagnostic ultrasoundtechnology kept on being developed and improved, culminating in themid-1980’s with grayscale and real-time imaging modes. In parallel,the ability to quantify ultrasonic fields also improved considerably, thusgiving a tool to measure accurately ultrasound energy levels. Diagnosticultrasound imaging has accumulated an excellent safety record over the
�D �)!�����*�����������

past 50 years. The recent development of new applications and newmodes and the increase in ultrasound use have not impacted on thissafety record. However, ultrasound safety continues to be discussedand regulatory authorities are continuously revising the guidelines andstandards in order to minimize potential risks and maintain a safeframework for patients, manufacturers and users.
'��������3�;��������3% ���$�4�"���
The first deleterious effects of ultrasound were observed by PaulLangevin in 1917: “fishes placed in the beam in the neighborhood ofthe source operation in a small tank were killed immediately, and certainobservers experienced a painful sensation on plunging the hand in thisregion”. In 1930, Harvey released the first review paper on biologicaleffects of ultrasound: he reported on the physical, chemical, andbiological effects in which alterations were produced in macromolecules,micro-organisms, cells, isolated cells, bacteria, tissues, and organs witha view towards the identification of the interaction mechanisms. In themid 1990’s, an animal study observed lung and intestine hemorrhagewith a pulsed, 2 MHz ultrasound exposure for 3 minutes, although thisobservation was not confirmed intraoperatively with transesophagealechocardiography.
Here are some examples of possible deleterious bioeffects of ultrasound:
• Cells of the sensory organs (eye, ear, nervous tissue) are particularlysensitive to ultrasound and can be destroyed by thermal effect.
• Cavitation mechanisms can create tearing lesions of the inner layer ofblood vessels, thus leading to thrombogenic processes.
• Cell lysis has been observed in vitro with 1 MHz continuous ultrasoundexposure, due to cavitation.
• Cardiac premature contractions have been observed in frogs with 1.2MHz exposure to a single 5-millisecond pulse with normal recovery.
• The development of blood cells has been reported to be altered inmonkeys after multiple exposures to ultrasound at diagnostic levels.
Moreover, potential bioeffects of ultrasound at the subcellular levelmay lead to structural and functional changes in cell membranes, thusaffecting signal transduction, for example.
�)!�����*����������� �E

��� ����������� ��������������� ������/��������
Ultrasound can cause heating of the tissues (thermal effect) and can createnon-thermal effects (mechanical effects).
+<7�,�:�7..7 +�
An ultrasonic wave propagating into a biological tissue is attenuated withdistance from its emission source, due to scattering (redirection of theultrasound beam) and/or absorption (conversion into heat). Dependingon the tissue characteristics, a temperature increase will occur if the rateof heating is greater than the rate of cooling the tissue. Operators must beaware of that risk, which may counterbalance the benefits of ultrasoundexamination.
/;/�+<7�,�:�;��,7 <�/� �:�7..7 +�
Non-thermal effects include cavitation, production of audible sounds,movement of cells in liquid, electrical changes in cell membranes,shrinking and expansion of bubbles in liquid, and pressure changes.Cavitation has been extensively studied: it happens when bubbleslocated in an ultrasound field start to resonate. This effect has not beendemonstrated in human tissue; some observations of haemorrhagia haveonly been made in lung or intestine of laboratory animals. Other non-thermal effects caused by ultrasound include changes in pressure, force,torque (causing tissues to rotate) and streaming. Audible sounds andelectrical changes of cell membranes can derive from such changes,potentially causing cell damage. Consequences of non-thermal bioeffectscan cause damage to the tissue, eventually cell death, cell membranedisruption or ruptures of small blood vessels. Although these bioeffectshave not been observed in humans, they could potentially occur withfuture technology.
7G�;���7�7..7 +��+�-�7�
The bioeffects of ultrasound on fetuses have always been of concern,due to the presence of developing tissues. This has become even more
C� �)!�����*�����������
present due to new ultrasound modalities arising in the late 1980’s(harmonic imaging, color Doppler and 3D imaging) that have allowednew diagnostic capabilities. Since these methods potentially requiredmore ultrasound energy, the FDA revised its diagnostic ultrasoundregulatory guidelines in the early 1990’s. As a result, the upper limitof output intensity allowed in fetal examinations has been raised morethan 7 times its original value. Some concerns have arisen aboutthe new regulations and researchers conducted epidemiological studieslooking for associations between ultrasound exposure and newborndefects linked to fetal development. As reviewed by the NationalCouncil on Radiation Protection and Measurements (NCRP), one ofthe largest studies followed 15,000 women in Australia, but was notdesigned to study birth defects. Therefore, the lack of increase in birthdefects was reassuring but not conclusive. Another large Canadianstudy focused on the correlation between ultrasound screening andprematurity. It concluded that the group receiving more ultrasound scansduring pregnancy had slightly lower birth weights. The interpretationof epidemiological studies, however, can be biased by the prescriptionof ultrasound due to a suspected fetal problem. Additionally, the NCRPhas stated that there is insufficient evidence to conclude that diagnosticultrasound is the cause of adverse effects such as low birth weight, or anyadverse effect whatsoever. However, this conclusion does not precludethe possibility of any effect. Research is limited because physicianscannot perform more stringent experiments on their patients. As apreliminary mandatory step, more animal studies are recommended bythe NCRP.
+�E�.�����/�����
Diagnostic ultrasound systems provide diagnostic information thatcreates a clear benefit to the patient, to the physician, and to healthcaresystems. Currently available systems give very good quality imagesand highly relevant information that allow physicians to make optimaldecisions.
Ultrasound imaging is a favorite imaging technique because:
• It appears to be safe,• It is known to provide diagnostic information with great sensitivity and
specificity,• It is widely accepted by patients,
�)!�����*����������� C�
• It has low costs when compared to other radiological modalities.
However, there are risks in doing or not doing an ultrasound exam:
On the one hand, performing an ultrasound examination may expose thepatient to potential adverse bioeffects by heating or cavitation, althoughno such incidents have ever been reported on humans at diagnosticultrasound levels. Physicians must also weigh the expected benefitagainst the potential risks of the ultrasound exam. They must balancethe intensity and energy that is used to perform the exam against thebeneficial information it brings. Increasing the intensity, the exposuretime, focal properties, and the pressure are associated with an increasedrisk of bioeffects. However, using a low intensity may lead to poordiagnostic information.
On the other hand, not doing an ultrasound examination may preventphysicians and patients from getting relevant diagnostic information,or may lead to the acquisition of the same information through othermodalities, which may be more invasive or require exposure to ionizingradiation. There currently should be no hesitation when choosingto perform an ultrasound examination when a significant clinicalbenefit is expected. For example, cardiac ultrasound examinations withtransesophageal echocardiography give the ability to image the structureand function of the heart and great vessels, and allow the operatorto follow the course of blood flow within the heart. In obstetrics, theNational Institute of Health consensus development conference heldin the early 1980's recommended not to perform routine ultrasoundexamination, but identified a number of appropriate clinical indicationsfor the use of ultrasound imaging during pregnancy.
"Diagnostic ultrasound has been in use since the late 1950s. Given itsknown benefits and recognized efficacy for medical diagnosis, includinguse during human pregnancy, the American Institute of Ultrasound inMedicine herein addresses the clinical safety of such use: No confirmedbiological effects on patients or instrument operators caused by exposureat intensities typical of present diagnostic ultrasound instruments haveever been reported. Although the possibility exists that such biologicaleffects may be identified in the future, current data indicate that thebenefits to patients of the prudent use of diagnostic ultrasound outweighthe risks, if any, that may be present."
C� �)!�����*�����������
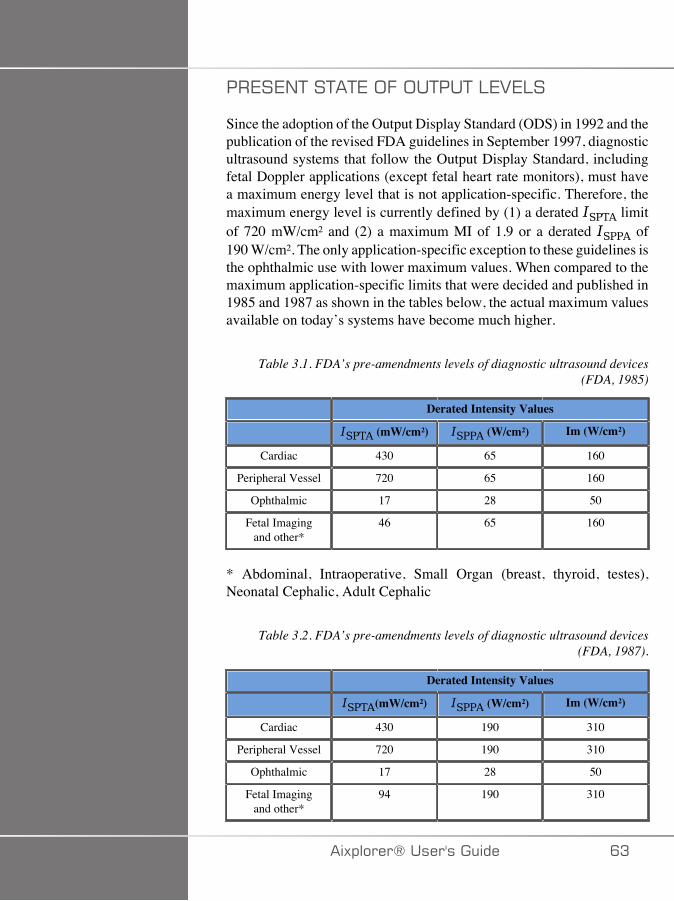
��7�7/+��+�+7�;.�;�+��+�:727:�
Since the adoption of the Output Display Standard (ODS) in 1992 and thepublication of the revised FDA guidelines in September 1997, diagnosticultrasound systems that follow the Output Display Standard, includingfetal Doppler applications (except fetal heart rate monitors), must havea maximum energy level that is not application-specific. Therefore, themaximum energy level is currently defined by (1) a derated limitof 720 mW/cm² and (2) a maximum MI of 1.9 or a derated of190 W/cm². The only application-specific exception to these guidelines isthe ophthalmic use with lower maximum values. When compared to themaximum application-specific limits that were decided and published in1985 and 1987 as shown in the tables below, the actual maximum valuesavailable on today’s systems have become much higher.
Table 3.1. FDA’s pre-amendments levels of diagnostic ultrasound devices(FDA, 1985)
Derated Intensity Values
(mW/cm²) (W/cm²) Im (W/cm²)
Cardiac 430 65 160
Peripheral Vessel 720 65 160
Ophthalmic 17 28 50
Fetal Imagingand other*
46 65 160
* Abdominal, Intraoperative, Small Organ (breast, thyroid, testes),Neonatal Cephalic, Adult Cephalic
Table 3.2. FDA’s pre-amendments levels of diagnostic ultrasound devices(FDA, 1987).
Derated Intensity Values
(mW/cm²) (W/cm²) Im (W/cm²)
Cardiac 430 190 310
Peripheral Vessel 720 190 310
Ophthalmic 17 28 50
Fetal Imagingand other*
94 190 310
�)!�����*����������� CA
* Abdominal, Intraoperative, Small Organ (breast, thyroid, testes),Neonatal Cephalic, Adult Cephalic
However, with the publication of the ODS in 1992, the ultrasoundusers have been given the ability to operate their systems with real-time information on the potential risk of biological effects within thetissue. The real-time information consists of two biophysical indicesknown as the Thermal Index (potential risk for temperature increase)and the Mechanical Index (potential risk for mechanical tissue damage).This has allowed operators to make appropriate and informed clinicaldecisions, to weigh risks versus benefits, and to implement the “As LowAs Reasonably Achievable” (a.k.a. ALARA) principle.
'��$���������������������������� ������������� ������*������
+<7�,�:��/-7G
The Thermal Index (TI) estimates the temperature increase within theinsonified tissue; its value derives from the ratio of the total acousticpower to the acoustic power required to raise the tissue temperature by1°C. Every type of tissue has different absorption characteristics, andtherefore a different absorption coefficient, which is directly proportionalto the ultrasound wave frequency: the higher the frequency, the greaterthe absorption and the lower the depth penetration. Thus, optimizingthe image penetration should take into account the increased riskof a temperature rise in the tissue. Because various tissues (blood,amniotic fluid, cerebrospinal fluid, urine, soft tissue, and bone) havedifferent absorption capabilities and coefficients, some devices furthersubcategorize the TI according to the nature of the insonified tissue: softtissue thermal index (TIS) for soft homogeneous tissues, cranial bonethermal index (TIC) for bone at or near the surface, and bone thermalindex (TIB) for bone after the beam has passed through soft tissue. Bonehas a very high absorption coefficient. Biological liquids such as amnioticfluid, blood, cerebrospinal fluid, and urine have an absorption coefficientof zero and therefore show minimal temperature rise. Soft tissue has anabsorption coefficient that falls somewhere between fluid and bone.
C� �)!�����*�����������
,7 <�/� �:��/-7G
The mechanical or non-thermal effects of ultrasound absorption areestimated by a relative measure: the Mechanical Index (MI). It iscalculated by dividing the spatial-peak value of the peak rarefractionalpressure (rated by 0.3 dB/cm-MHz at each point along the beam axis)by the square root of the center frequency. As described above, themechanical effects are the result of compression and decompressionin the tissue and the formation of microbubbles (cavitation). Thisphenomenon is related to the peak negative pressure during a pulse,which is related to the pulse-average intensity. Therefore, the spatial-peakpulse-average intensity ( ) is related to cavitation. Many ultrasoundproducts use for specifications and therefore, operator awarenessis a necessity. Current standards recommend that if an ultrasound deviceis capable of achieving a TI or MI of greater than 1.0, then the outputdisplay screen must show the appropriate index value for the operator topredict the potential for adverse bioeffects.
�)!�����*����������� C�

� ��������� �����
� ������/��������
As introduced in the previous section, the absorption of ultrasoundenergy by biological tissues can produce heating. The self-heating ofthe probe may also contribute to heating in tissue. The mechanism ofthermal bioeffects is well understood and can be estimated for differentexposure conditions. However, even if some studies in mammaliantissue demonstrate that some aspects of the theory are reasonably wellunderstood, many unanswered concerns still remain in terms of beingable to assess in vivo temperature increase.
The rate of heat generation per unit volume is directly proportional to:
• the ultrasonic temporal-average intensity, which is itself proportionalto the pressure amplitude and inversely proportional to the density ofthe medium
• the ultrasonic amplitude absorption, which increases with theincreasing frequency
If damage occurs during exposure of tissue to elevated temperature, theextent of damage will be dependent upon the duration of the exposureas well as on the temperature increase achieved. Detrimental effects invitro are generally noted at temperatures of 39–43°C, if maintained fora sufficient time period. At higher temperatures (>44°C) coagulation ofproteins can occur. These effects have been documented in experimentalstudies of heat-induced cell death in cell cultures. Ultrasound machineoperators must be particularly aware that risks may offset the benefitsof ultrasound exposures when the temperature rise at the focal point ofthe ultrasound beam is calculated to be, for example in fetus echographicstudies, more than 3°C for ten minutes or more. In Aixplorer®, thetemperature is calculated according to the Standard for real-Time Displayof Thermal and Mechanical Acoustic Output Indices on DiagnosticUltrasound Equipment, NEMA UD3-2004 (refer to the section "Meaningof the TI and MI and Relation with Bioeffects"). However, threshold-based data suggest that for non-fetal soft tissue, and for scanningconditions consistent with conventional B-mode ultrasound exams forwhich the exposure durations at the same in situ location would be lessthan a few seconds, the allowable maximum temperature increase couldbe relaxed relative to longer exposures.
CC �)!�����*�����������

Table 3.3. Temperature thresholds for biological risks on embryonic and adulttissues
Thermal threshold Temperature (°C) Biological risk
Physiological level 37.0 safe region
Embryonic tissues 39.5 risks for obstetricsand pediatrics
Adult tissues 41.0 general risks
�����=���������������%����������� ������*������
Ultrasonic waves propagating into biological tissues are attenuateddue to the properties of the tissue. This attenuation is due to eitherabsorption (portion of the wave energy that is converted into heat) orscattering (portion of the wave energy which changes direction). Thehigher the absorption, the higher the potential risk of rise of temperaturewithin the tissue. Furthermore, as explained above, tissues with poorvascularization, (eye, tendon, fat) and tissues that conduct the heat (bone),are subject to higher temperature rises.
��� ���������*5$�����=��������������%������������ �����/��������
Several technical factors also affect the temperature rise in the insonifiedtissue:
• Frequency of the ultrasound wave
Tissue heating depends on the absorption of ultrasound; absorptiondepends on the frequency of the ultrasound wave received. Therefore,heating in tissues will increase as the frequency of the ultrasound waveincreases.
• Beam focusing
�)!�����*����������� C�

It improves the image resolution but it also increases the intensity andthe potential of a temperature rise.
• Type of ultrasound wave form (pulsed or continuous waveforms)
Pulsed waves usually produce less heat than continuously emittedwaves. The spatial-peak temporal-average intensity (ISPTA) is definedas the intensity at the maximum temporal-average intensity.
Other factors include pulse duration, pulse repetition frequency andbeam/scanning configuration. The duty cycle is the product of thepulse duration and pulse repetition frequency. The heating in tissue isproportional to the duty cycle.
• Exposed tissue volume
Scanned modes (B-mode and color flow Doppler) allow a greatervolume of tissue exposed to the ultrasound energy; this decreases therisk of heating. Unscanned modes (M-mode and spectral Doppler)use a stationary beam over a narrower volume of tissue; these modesshow a higher risk of heating in tissues. The greatest temperature riseoccurs between the focal point and the surface, the exact location ofthe “hottest point” depending on tissue attenuation, absorption, and thefocal depth.
• Duration of ultrasound exposure
Temperature is affected by energy absorption during ultrasoundexposure. The longer the tissue is exposed, the greater the absorption,thus the greater the risk for potential heating.
+<7�,�:�-;�7� ;/ 7�+
An immediate consequence of a temperature increase is an increase inbiochemical reaction rates. Most enzymes have their biological activityincreased by a factor 3 for each 10°C temperature increase. However,they become denatured over 39°C, and deleterious effects are seenin vitro at temperatures ranging from 39 to 43°C, if exposure lasts asufficient time. The concept of thermal dose describes the dependencebetween the duration of exposure and the increase of temperature. Inbiological tissues, the temperature of 43°C has been found to be a
CD �)!�����*�����������

transition threshold temperature, which serves as a reference, units ofthermal dose being “equivalent minutes at 43°C”. Practically everyincrease of 1°C above 43°C halves the equivalent time, while everydecrease of 1°C below 43°C results in a 4-fold equivalent time.
1�;:;�� �::F��7/��+�27���+7�
All biological tissues are sensitive to temperature, which can havedeleterious irreversible effects. The fetus and the lens of the eye are twoexamples of some tissues that are more sensitive. During pregnancy,the fetus can absorb higher temperature elevation than its mother'ssurrounding tissue. Also, the ongoing ossification that occurs during thefirst trimester can lead to alteration of brain tissue by heat conductionwithin the neonatal skull. The 1998 recommendations from the WorldFederation of Ultrasound in Medicine and Biology (WFUMB) withregard to ultrasound-induced temperature elevation are as follows:
1. A diagnostic ultrasound exposure that produces a maximum in situtemperature rise of no more than 1.5°C above normal physiologicallevels (37°C) may be used clinically without reservation on thermalgrounds.
2. A diagnostic ultrasound exposure that elevates embryonic and fetal insitu temperature above 41°C (4°C above normal temperature) for 5min or more should be considered potentially hazardous.
3. The risk of adverse effects is increased with the duration of exposure.
�1�;��+�;/
The volume rate of heat generation due to absorption is proportionalto the acoustic intensity and absorption at a single frequency. After theinitial propagation, the heat diffuses slowly into the tissue, expands,smoothes out, and diminishes from the original pattern. Tissue propertiesinfluence the temperature rise induced by ultrasound energy in the waythe absorption of heat is directly affected by the protein proportiontissue contains (collagen has particularly high absorption capabilities). Inmost of the clinical situations, bone tissues have the greatest absorptioncoefficient, skin and tendon have intermediate absorption capabilities,brain, liver and kidney have a low absorption and finally, fluids showabsorption coefficients close to zero. Absorption properties are knownto be dependent on the wave frequency, but it is important to know
�)!�����*����������� CE

that amplitude and shape of waveforms also change as they propagateand energy is absorbed into the medium. Absorption in the body is ahighly significant effect, especially because it limits the penetration ofultrasound waves in the body, i.e. the maximum depth at which tissuescan be imaged. Usually imaging systems have a way of increasingacoustic amplitude as a function of depth to compensate for theabsorption phenomenon.
����;�/-�/��+����7�
The actual temperature rise in tissue depends on several factors includingthe local specific heat capacity, the time of exposure, the rate oftemperature rise and the rate of distribution of heat in neighboring tissue.The measurable parameter for this distribution of heat, known as theperfusion length, depends directly on the thermal conductivity of thetissue and inversely on the blood perfusion flow rate and the specificheat capacity of blood. Perfusion lengths are measured in millimetersand range for different tissues from 1 (for highly vascularized organs)to 20 (for poorly perfused tissue). Blood perfusion plays a significantrole in cooling the tissue and must be considered when estimating thetissue temperature and its variations. Tissue with poor vascularization,such as tendon, fat and cornea, and tissue that conduct the heat, such asbone, are subject to higher temperature rises. Where the perfusion lengthis smaller than any dimension of the insonated volume, heat transferfrom surrounding tissue is small. On the contrary, where it is larger thanany of the dimensions of the insonated volume, heat transfer within theinsonated volume becomes important. Therefore, tissues adjacent to boneare particularly susceptible to heat increase via conduction.
<7�+� ;/-� +�;/�7..7 +
Temperature rise by heat conduction refers to the increase of the localtemperature of a tissue that is located close to another heating object.When the temperature gets elevated in a bone structure within the body,due to absorption, the surrounding tissue may then be subject to heatingby conduction. This phenomenon is of particular concern for brainheating due to the proximity of the skull. It can also happen when atransducer is selected but left unused. Acoustic power may flow to theouter absorbing lens where it causes self-heating. The transducer itselfcan then heat the body by conduction due to direct contact when the
�� �)!�����*�����������
operator starts the exam. However, temperature of the probe surface iscontrolled not to exceed a few degrees when in air and air-gel mixture.When the transducer is in use, the temperature contribution throughconduction is often neglected because it is limited to the surface of thebody and it is smaller than the absorption contribution.
� �++7��/�
The scattering effect depends on the shape and roughness of the objectinsonified (scatterer). Three categories can be distinguished, dependingon the size of the scatterer.
�!�&�(���&($$���"
Specular scattering relates to reflections from objects whose shapes aremuch bigger than a wavelength. If the object’s dimensions are larger thanthe wavelength, the approximation of the reflection on the object formsa wavefront that mimics the shape of the object.
- ����&($$���"
Diffusive scattering happens for objects that are much smaller than awavelength. Irregularities on the surface of the object create individualreflections that do not cause any significant interference effects. It hasimportant implications in medical imaging because biological tissue isoften considered as aggregates of small sub-wavelength point scatterers.Doppler methods measure blood flow depending on scattering effectby numerous small spatially unresolved blood cells. Most ultrasoundcontrast agents also act as tracers to enhance the scattering of ultrasoundon gas-filled resonant spheres.
- �(&$����&($$���"
Diffractive scattering occurs on objects slightly less than a wavelength tohundreds of wavelengths. This group of scattering objects is the largest.Scattered waves in this situation can be considered to be originating fromthe surfaces of the scatterers, which act as secondary ultrasound sources.
�)!�����*����������� ��

#$�����.���������������������
For a given duration of ultrasound exposure and a given level of acousticenergy delivered, larger volumes of insonated tissue will be submitted toa more diffuse heating, avoiding too high temperatures. At the preciselocation of ultrasound beam focusing, the temperature will be higher thanbefore or after the focus zone. The aperture of the ultrasound beam alsoimpacts the heating capabilities of the ultrasound beam in the way itgenerates a more or less focused ultrasound beam, bringing more or lessenergy into the tissue. As described above, the scanning mode used canalso impact the spatial volume of insonified tissue.
3���%����(�������������������.����
The homogeneity of tissue being insonified is a key characteristic in heattransfer. The ultrasound waves must typically pass through the severallayers of tissue that form organs. These layers influence the absorptionof the ultrasound energy since increased absorption in any given layerdecreases the ultrasound energy available at the point of interest. Theeffect of tissue layering on the biological effects of ultrasound has beenextensively studied in obstetrics. They demonstrated that the attenuationmodel that applies best to real observations is the overlying tissuemodel, in which attenuation depends upon both frequency and non-fluiddistance. Furthermore, they demonstrated that the attenuation coefficientasked by the international standards was 2 to 3 times lower than themeasured mean values to estimate ultrasonic intensity quantities in tissue.
�� �)!�����*�����������

����� ��������� �����In addition to heat, ultrasound waves also have various types ofmechanical effects on biological tissue and media, also called non-thermal effects.
��"����������+�����������/�����
�2�+�+�;/
Acoustic cavitation may occur when the ultrasound beam crosses a cavityarea, such as a gas pocket. Some adult tissue contains gas bubbles (lungand intestine), and therefore are more vulnerable to cavitation. Withacoustic cavitation, pre-existing bubbles are modified or new bubblesare formed, due to both expansion and contraction of the gas body.The ultrasound waves can lead the bubbles to expand and contractrhythmically, i.e. to pulsate or resonate. The hypothesis of bubbles thatwould form in tissues and organs that do not contain gases is currentlyunder investigation.
�7 +�.�7-�-�..���;/
Under ultrasound insonification and certain conditions, a gas bubblecan resonate and grow instead of dissolving in the medium liquid. Theultrasound wave makes the bubble expand and outer dissolved gases getpumped in, which increases its size rapidly.
=���������������%���"�����
The generation of cavitation depends on numerous factors including theultrasonic pressure, the type of ultrasound wave emitted (focused or not,pulsed or continuous), the presence of standing waves and the natureand state of the material. Cavitation can be prevented by first beingaware of whether or not gas bubbles stay in the tissue being imaged. Inliquid media, another significant biological factor over cavitation is thedensity of the liquid: higher density liquids create intense cavitation with
�)!�����*����������� �A

a greater implosive force. Some technical factors can also be of great help,including limitation of the pressure amplitude of the ultrasound pulseand length of the pulse. When gas bubbles are present in the tissue, theirnumber, size and location are also significant contributors to the effect.
�($��������"�����
�+�1:7� �2�+�+�;/�H�,� �;�+�7�,�/�
Stable cavitation refers to the periodic expansion or contraction ofa gas bubble. The gaseous body pulsates due to the ultrasoundfield, and remains stable. Part of the liquid medium surrounding thegaseous bubbles can begin to stream with the oscillations, leading tomicrostreaming. Theoretically, microstreaming could also be caused by“acoustic streaming” in fluid media, due to the stirring action of theultrasound wave. As happens in microstreaming, the acoustic streamingresults in a flow of liquid speeding up as the acoustic pressure of theultrasound increases. This phenomenon could damage cell membranes,which could undergo disruption. However, the real effect of cellmembrane damage has only been observed in animal experiments andwhether it occurs in humans remains unclear.
/&��($����$��
When the insonified tissue contains bubbles, gas or vapor, the ultrasound-induced strain may induce cavitation originating from the location ofthe gas, termed as a “nucleation site”. The exact nature and source ofnucleation sites are not well understood in a complex medium such astissue. Theoretical analyses and predictions have not yet been verifiedexperimentally.
�/7�+��:� �2�+�+�;/
The inertial cavitation, called unstable or ‘‘transient cavitation’’ whenfirst observed, refers to the rapid growth and violent collapse of abubble, seen as a threshold event that tends to increase with frequency.This phenomenon is closely linked to very high temperatures (about
�� �)!�����*�����������

5000°K) and its consequences include the generation of biological toxiccompounds, the generation of shock waves, and ‘‘sonoluminescence.’’
;+<7��,7 <�/� �:�7..7 +�
Ultrasound waves can also generate other mechanical effects that are notrelated to bubbles. They include changes in pressure, force, torque andstreaming; they can produce audible sounds and cause electrical changesin cell membranes, thus increasing their patency to large molecules; theycan lead to the movement and redistribution of cells in liquid, and theycan also damage cells.
�(�($���.��&�
Recently, static or dynamic acoustic radiation force techniques have beenapplied to ultrasound diagnosis. Amongst the different techniques thatuse radiation force to locally move or vibrate tissue, the technique usedby the Aixplorer® system is Supersonic Shear Imaging. This techniqueutilizes the ultrasound-induced temporal-average force on the medium tocreate the tissue motion. The magnitude of the effect is proportional tothe local temporal-average intensity and is in the range of microns.
� ��� ����' �������
The cavitation effect is a far more rapid response than temperature riseand is also a threshold phenomenon. In inertial cavitation, the thresholdis defined by the amplitude of the ultrasound wave, its frequency, and thesize of the pre-existing nucleation sites. The threshold is such that thereis a critical size range over which bubbles will undergo inertial cavitationif insonified by an appropriate sound field. In other words, for a givenfrequency and sound pressure amplitude, bubbles within a certain radiusrange will undergo inertial cavitation, and those outside of it will not.
4�%�3����� �%���� �����
Under experimental circumstances, ultrasound has to be used outside ofthe diagnostic range in order to be able to detect any adverse bioeffect.
�)!�����*����������� ��
Among them, lung hemorrhage is probably the most extensively studied,although its mechanism still remains unclear. Thermal bioeffects andinertial cavitation have both been excluded as being responsible forlung lesions. However, general observations can be made from thelarge amount of ultrasound-induced lung damage threshold studies. First,the degree of damage observed in animals does not appear to be aconcern since the extent of lung damage is limited and the organ canrecover from the effect. Second, the mechanisms of lung injury seemto be similar in all species and the features of the lesions induced areindependent from the frequency, pulse repetition frequency, and thebeamwidth. Therefore similar biological mechanisms may be of concernin patients undergoing ultrasound lung exposure, and especially patientswith pulmonary disorders or “at risk” neonates.
�C �)!�����*�����������
/��������������������.����+�E�
/�������������
Without question, ultrasound imaging has had a significant impact onthe field of medical diagnostic imaging. Examples of the benefits ofultrasound diagnostic imaging can be easily found in cardiology andobstetrics. In cardiology, ultrasound allows for the detailed visualizationof the anatomical structure and function of the heart and its great vessels.The radiologist can see the blood flow within the heart ventricles andatria as well as the function of the valves under normal and pathologicalconditions. In obstetrics, there is a particular concern for potentialbioeffects on the embryo-fetus during pregnancy. However, becauseof its excellent safety record, this imaging modality is routinely usedworldwide. During the past few years, the technology of ultrasoundimaging has greatly improved and refers to an expanding array of clinicalapplications. A variety of ultrasound systems are currently availablefor specific medical and clinical situations such as elasticity imaging,vascular medicine, cardiac studies and musculoskeletal applications.Recent technological developments have allowed for images of farbetter quality and also better diagnostic information. However, thesetechnological advances and applications also require more responsibilityto be assumed by the operators. From both healthcare systemsand patients’ perspectives, the cost effectiveness and non invasivenature of ultrasound examinations make them very well tolerated.Ultrasound examinations are universally accepted by patients and theirreimbursement agencies.
+�E��������
Despite the excellent safety record, the potential risk of adverse biologicaleffects at the tissue and cellular levels exist. As mentioned above,biological mechanisms of lung injury similar to the ones observed in non-human mammals may be of concern in patients undergoing sonographicprocedures with lung exposure. There is also the theoretical potentialfor bioeffects to occur at the subcellular level, although these effects arepoorly understood. Adverse bioeffects that were observed in mammals
�)!�����*����������� ��
have never been reported to occur in human patients. Therefore, theregulation now reinforces the operator’s responsibility in limiting thepotential risk of ultrasound adverse bioeffects to their patients. To achievethis, the operator should be given all the necessary information to makean informed balanced decision, weighing possible bioeffects againstthe expected diagnostic information. However, newer applications(transesophageal echocardiography, intravascular ultrasound) may causebioeffects that have never been anticipated. Further specific research isneeded in these fields before all risks can be defined.
+�E�����������%����������
In the meantime, ultrasound operators should permanently weighpotential biological effects against the real risks of not doing theexamination and thus missing key diagnostic information. In obstetricsand cardiology, the clinical diagnostic value of ultrasound information isso well accepted by the medical community, that it is acknowledged thatthere is a higher risk to the patient if an ultrasound exam is not performed.Ultrasound imaging provides a large amount of highly valuable clinicalinformation that is pertinent to a variety of diagnostic applications. Thisinformation can be used instead of a higher risk procedure, or can beused in conjunction with other diagnostic procedures, in order to improvediagnostic confidence or to obtain crucial diagnostic information. Inmost cases, obtaining the same information with other tests or imagingmethods would be at a higher cost or with increased risk.
�����������+�E���� ��������$����������
At the tissue site where the ultrasound temporal-average intensity is ,the rate of heat generation per unit volume is given by the expression
, where stands for the ultrasonic amplitude absorptioncoefficient. This means that the increase in temperature is proportional toan average value of the ultrasound intensity over a time period, also calledthe acoustic output. Therefore, the risk of generating thermal bioeffectswithin insonified tissues depends directly on the acoustic output.
�D �)!�����*�����������
�����������!�%������������������� ��������$�����������
Since 1991, the technical evolution of ultrasound systems has allowed forsignificant increases in acoustic output and therefore has lead to betterspatial resolution, enhanced contrasts, increased image definition andimproved diagnostic sensitivity. Real 3D and 4D imaging modes, colorDoppler, and recently strain imaging illustrate the new and enhancedimaging capabilities of current ultrasound systems. Other potentialbenefits of increasing the acoustic output include the ability to imageat greater depths due to improved echo and Doppler signal acquisitionand penetration, and improvements in resolution due to the transmissionof higher frequencies. Simultaneously, the scientific knowledge ofbiological adverse effects of ultrasound has largely expanded and hasraised the concept of weighing the risks against the benefits of getting abetter ultrasound image.
�����������+��$������(������������3% �����$��4�"���
In relaxing the limits of the acoustic output power on currentultrasound systems, the regulatory authorities of course have allowedthe development of increased diagnostic capabilities and image quality,but they have also placed increased responsibility on operators. Theoperator has to evaluate the risks and benefits of diagnostic ultrasoundin general, but also of increasing the acoustic output power to getbetter images. To fulfil this responsibility, ultrasound operators needto have full knowledge of ultrasound systems and tools. This requiresspecific education and training, which has now been included as part ofthe accreditation process for ultrasound clinical use in most developedcountries.
The operator should:
1. be familiar with the possible risk factors,2. be aware of the need to adjust the acoustic output to obtain a good
image,3. evaluate and consider the patient’s clinical state and4. know all the system controls that affect the acoustic output.
�)!�����*����������� �E
Current ultrasound systems allow the operator to balance risks versusbenefits and make an informed decision. Systems display real-timeinformation on the potential risks of adverse bioeffects via indices thatrefer to the output intensity and the possible thermal and mechanical risks(Thermal Index: TI, and Mechanical Index: MI). According to the NCRP,the risks of diagnostic ultrasound have to be weighed against the benefitswhen the MI is above 0.5 or the TI is above 1.0. Practically speaking,generating a better image may lead to greater risks, especially dependingon the patient’s anatomy and presentation: thin and obese patients do notpresent the same risks, full and empty bladder at the time of examinationdo not have the same risks, and the presence of gas bubbles in the scannedarea of the body may increase risk.
D� �)!�����*�����������
� �� 4 + �'���$��According to the International Commission of Radiological Protection“Medical exposure is the only category in which large reductions inaverage dose are possible, and it is therefore highly desirable to reduceapplications of medical radiation which are of no benefit to the patientsand to minimize useless radiation in the course of medical examinations”.To reduce the risks related to ultrasound exposure, the ALARA principlecan be applied to ultrasound examinations. ALARA stands for “As LowAs Reasonably Achievable”. It means that the total ultrasound exposurehas to be kept as low as reasonably achievable, in order to guarantee thepatient’s safety while optimizing diagnostic information.
���������%�����%(
The ALARA principle applied to ultrasound diagnostic imagingrecommends that the total ultrasound energy should be maintained belowa level at which bioeffects are generated while diagnostic informationis preserved. The implementation of ALARA enables obtaining theinformation needed while keeping the potential for bioeffects as low asreasonably achievable. The operator should start the exam by selectingthe correct transducer frequency and application and then use a lowoutput level. Then all image quality controls should be used to optimizethe image (focus, receiver gain…). Only if the image is not diagnosticallyuseful at this point, then acoustic output can be increased. The outputpower control allows the operator to select intensity levels less than theestablished maximum. Prudent use dictates that the operator select thelowest output intensity that is consistent with good image quality.
���������%��5$��������
The indices that are displayed do not take into account the lengthof exposure. As the total amount of energy received at a location isproportional to length of exposure of this particular site, the operatorsshould also keep the total exposure time in one location as short aspossible. Therefore, a more complete definition of the ALARA principleis to use the lowest output setting that will yield the best possiblediagnostic information, while keeping the exposure time as short aspossible.
�)!�����*����������� D�
���������%�������%���� �,�
The operating guidelines that derive from the ALARA principle shouldremain very clear and have the only goal of quality of the diagnosticinformation.
In addition, the operator should ensure that:
• only medically required scanning is performed,• an exam is not rushed,• the quality is never compromised.
A poor exam will most probably require a secondary exam or a follow-up, thus increasing exposure time.
���������%��(��������$
Selecting the most appropriate system setup (transducer, application) isthe first step to take before starting an ultrasound scan. Then the operatorshould select the correct range of acoustic intensity for the application,if not done automatically by the system. Ultimately, the operator has theresponsibility for proper clinical use. The Aixplorer® ultrasound systemprovides both automatic (default) settings and manual (user-selectable)settings.
*�����������(�������$������
The system offers the possibility to control the acoustic output thanks to3 different types of controls.
Direct controls affect directly the acoustic intensity. They include theApplication Selection (see above) and the control of the Output Power.The Application Selection affects the allowable output intensity range.Selecting the correct range of acoustic intensity for the application isone of the first things that occur in any exam. For example, peripheralvascular intensity levels are not recommended for fetal exams. Somesystems automatically select the proper range for a particular application,while others require manual selection. Ultimately, the user has theresponsibility for proper clinical use. The Aixplorer® ultrasound system
D� �)!�����*�����������
provides both automatic (default) settings and manual (user-selectable)settings. The Output Power directly affects the acoustic intensity, byincreasing or decreasing it. Once the application has been established,the Output Power control allows the operator to select intensity levelsless than the established maximum. Prudent use dictates that the operatorselect the lowest output intensity that is consistent with good imagequality.
Indirect Controls are those that have an indirect effect on acousticintensity. They refer to the transducer selection (see “Effects oftransducer capabilities” below), the imaging mode (see “Effects ofoperating mode” below), the pulse repetition frequency, the focal depthand the pulse length. All of them indirectly impact the output intensityfor specific reasons: for example, the transducer operating frequencyhas to be adapted to the expected depth of scanning; also, a scannedand a stationary mode will not deliver the same amount of energy in aparticular location. For complete details on other indirect controls theoperator should refer to sub-section “Indirect Controls” in the section“Applying ALARA with the Aixplorer® Ultrasound Imaging System”.Pulse repetition frequency or rate refers to the number of ultrasoundbursts of energy over a specific period of time. The higher the pulserepetition frequency, the more pulses of energy in a period of time.Several controls affect pulse repetition frequency: focal depth, displaydepth, sample volume depth, flow optimization, scale, number of focalzones, and sector width controls. Focus of the ultrasound beam affectsthe image resolution. To maintain or increase resolution at a differentfocus requires a variation in output over the focal zone. This variationof output is a function of system optimization. Different exams requiredifferent focal depths. Setting the focus at the proper depth improvesthe resolution of the structure of interest. Pulse length is the time duringwhich the ultrasonic burst is turned on. The longer the pulse, the greaterthe time-average intensity value. The greater the time-average intensity,the greater the likelihood of temperature increase and cavitation. Pulselength or burst length or pulse duration is the output pulse durationin pulsed Wave Doppler. Increasing the Doppler sample volume sizeincreases the pulse length.
Receiver controls have no effect on acoustic output and can be used bythe operator to improve image quality. They only change the way theultrasound echo is received and should always be used before the outputpower is increased. They include gain, TGC, dynamic range, and imageprocessing features. The important thing to remember, relative to output,
�)!�����*����������� DA
is that receiver controls should be optimized before output is increased.For example: before increasing output, optimize gain to improve imagequality.
*�����������$�����%�����
The choice of imaging mode determines the nature of the ultrasoundbeam. For example, the B-Mode is a scanning mode, while Doppler is astationary or unscanned mode. A stationary ultrasound beam concentratesenergy in a single location. A moving or scanned ultrasound beamdisperses the energy over an area such that the beam is concentrated onthe same area for only a fraction of the time as that of an unscanned mode.
*����������������������$������
Transducer selection indirectly affects acoustic output intensity. Tissueattenuation changes with frequency. The higher the transducer operatingfrequency, the greater the attenuation of the ultrasonic energy. A highertransducer operating frequency requires more output intensity to scanat a deeper depth. To scan deeper at the same output intensity, a lowertransducer frequency should be required. Using more gain and outputbeyond a point, without corresponding increases in image quality, canmean that a lower frequency transducer is needed.
� +����
Ultrasound exposure time should always be limited; however, do not rushthe exam.
Ensure that the indices are kept to a minimum and that exposure time islimited without compromising diagnostic sensitivity.
D� �)!�����*�����������

� ����$��!�$��(�#�������
'�$�������� ����$��!�$��(#�������
The system Output Display Standard (ODS) comprises two basic indices:a mechanical index and a thermal index. The thermal index furtherconsists of the following indices: a thermal index for soft tissue (TIS), athermal index for bone or tissue located near bone (TIB), and a thermalindex for cranial bone (TIC). The Aixplorer® user is able to choosethe TI and MI display format in the System Configuration, i.e TIS and/or TIB and/or TIC, or the maximum value of the three TI, which inreturn depends upon the application at hand. Either the TIS or TIB or themaximum value of those indices will be displayed at all times. Whichone is displayed depends upon the system preset or user’s choice, whichin return depends upon the application at hand. The application-specificnature of the default index setting is also an important factor in indexbehavior. A default setting is a system control state which is preset bythe manufacturer or the operator. The system has default index settingscorresponding to each transducer application. The default settings areinvoked automatically by the ultrasound system when power is turnedon, new patient data is entered into the system data base, or a change inapplication takes place.
The decision as to which of the 3 thermal indices, or the maximum valueof the three, to display should be based on the following criteria:
• Appropriate index for the clinical application: TIS is used for imagingsoft tissue TIB for a focus at or near bone, and TIC when imagingthrough the cranial bone or near the skull.
• Factors that might create artificially high or low thermal indexreadings: location of fluid or bone, or blood flow. For example, if thereis a highly attenuating tissue path so that the actual potential for localzone heating is less than the thermal index displays.
Scanned modes versus unscanned modes of operation affect the thermalindex. For scanned modes, heating tends to be near the surface; forunscanned modes, the potential for heating tends to be deeper in the focalzone.
�)!�����*����������� D�

��� ����������5
Mechanical bioeffects are threshold phenomena that occur when a certainlevel of output is exceeded. The threshold level varies, however, withthe type of tissue. The potential for mechanical bioeffects varies withpeak rarefactional pressure and ultrasound frequency. The MI accountsfor these two factors. The higher the MI value, the greater the likelihoodof mechanical bioeffects occurring. There is no specific MI value thatindicates that a mechanical effect is actually occurring. The MI shouldbe used as a guide for implementing the ALARA principle.
� ����������5
The TI informs the user about conditions that might lead to an increasein temperature at the surface of the body, within the body tissue, or at thepoint of focus of the ultrasound beam on bone. That is, the TI informs theuser of the potential for temperature rise in body tissue. It is an estimateof temperature increase in body tissue with specific properties. The actualamount of any temperature rise is influenced by factors such as tissuetype, vascularity, mode of operation and others. The TI should be used asa guide for implementing the ALARA principle. The bone thermal index(TIB) informs the user about potential heating at or near the focus afterthe ultrasound beam has passed through soft tissue or fluid, for example,at or near second or third trimester fetal bone. The cranial bone thermalindex (TIC) informs the user about the potential heating of bone at or nearthe surface, for example, cranial bone. The TI informs the user about thegeneral potential for heating within tissue. Depending on the Aixplorer®user's choice, the TIS or TIB or TIC or the maximum value of the threeis continuously displayed over the range of 0.0 to maximum output. Themechanical index is continuously displayed over the range of 0.0 to 1.9.
#(�����!�$��(�4�"�������� �����(�������������
As mentioned above, and depending on the Aixplorer® user's choice, theTIS or TIB or TIC, or the maximum value of the three is continuouslydisplayed from 0.0 to maximum output, based on the transducer andapplication, in increments of 0.1. The mechanical index is continuously
DC �)!�����*�����������
displayed from 0.0 to 1.9, in increments of 0.1. Therefore, the MI and TIprecision is 0.1 unit on the Aixplorer® system. The MI and TI displayaccuracy estimates for the Aixplorer® system are given in AcousticOutput Tables in this user manual. These accuracy estimates are basedon the variability range of transducers and systems, inherent acousticoutput modelling errors and measurement variability, as discussed below.The displayed values should be interpreted as relative information tohelp the operator achieve the ALARA principle through prudent useof the system. The values should not be interpreted as actual physicalvalues in interrogated tissues or organs. The initial data that is usedto support the output display is derived from laboratory measurementsbased on the AIUM measurement standard. The measurements arethen put into algorithms for calculating the displayed output values.Many of the assumptions used in the process of measurement andcalculation are conservative in nature. Over-estimation of actual in situintensity exposure, for the vast majority of tissue paths, is built into themeasurement and calculation process.
For example:
• The measured water tank values are derated using a conservative,industry standard, and attenuation coefficient of 0.3 dB / cm-MHz.
• Conservative values for tissue characteristics were selected for usein the TI models. Conservative values for tissue or bone absorptionrates, blood perfusion rates, blood heat capacity, and tissue thermalconductivity were selected.
• Steady-state temperature rise is assumed in the industry standard TImodels, and the assumption is made that the ultrasound transducer isheld steady in one position long enough for steady state to be achieved.
A number of factors are considered when estimating the accuracy of thedisplayed values: hardware variations, estimation algorithm accuracy,and measurement variability. Variability among transducers and systemsis a significant factor. Transducer variability results from piezoelectriccrystal efficiencies, process-related impedance differences, and sensitivelens focusing parameter variations. Differences in system pulser voltagecontrol and efficiency may also contribute to variability. There areinherent uncertainties in the algorithms used to estimate acoustic outputvalues over the range of possible system operating conditions andpulser voltages. Inaccuracies in laboratory measurements are related to,among others, differences in hydrophone calibration and performance,positioning, alignment, and digitization tolerances, and variability among
�)!�����*����������� D�

test operators. The conservative assumptions of the output estimationalgorithms of linear propagation, at all depths, through a 0.3 dB/cm-MHzattenuative medium is not considered in the accuracy estimate for thedisplay. Neither linear propagation, nor uniform attenuation at the 0.3dB/cm-MHz rate, occurs in water tank measurements or in most tissuepaths in the body. In the body, different tissues and organs have dissimilarattenuation characteristics. In water, there is almost no attenuation. Inthe body, and in particular, in water tank measurements, non-linearpropagation and saturation losses occur as pulser voltages increase.Therefore, the display accuracy estimates are based on the variabilityrange of transducers and systems, inherent acoustic output modellingerrors, and measurement variability. Display accuracy estimates are notbased on errors in, or caused by measuring according to, the AIUMmeasurement standards, or the effects of non-linear loss on the measuredvalues.
�����%����� ����������������+������)� �/��������
+<7�,�:��/-7G
The TI gives a relative indication of the potential for temperature increaseat a specific point along the ultrasound beam. The reason for the term‘relative’ is that the assumed conditions for heating in tissue are socomplex that this index cannot be assumed to give the actual increase intemperature for all possible conditions. Thus, a TI of 2 represents a highertemperature rise than a TI of 1, but does not necessarily represent a rise of2° C. This temperature rise is a theoretical estimate based on experimentalconditions that may not apply to clinical conditions. The important pointto remember about the TI is that it is designed to make users aware of thepossible temperature rise at a particular point in tissue. The concern overtemperature rise induced by ultrasound in the body is based on observedchanges in cellular activity as a function of temperature. In general, forhealthy activity of enzymes, the enzymatic activity doubles for every 10°C rise. The human body is able to tolerate hot drinks and fevers for acertain period of time. A fever of +2° C is not a problem, where 37° C istaken as an average core body temperature. The following table identifiesstages of temperature effects.
DD �)!�����*�����������
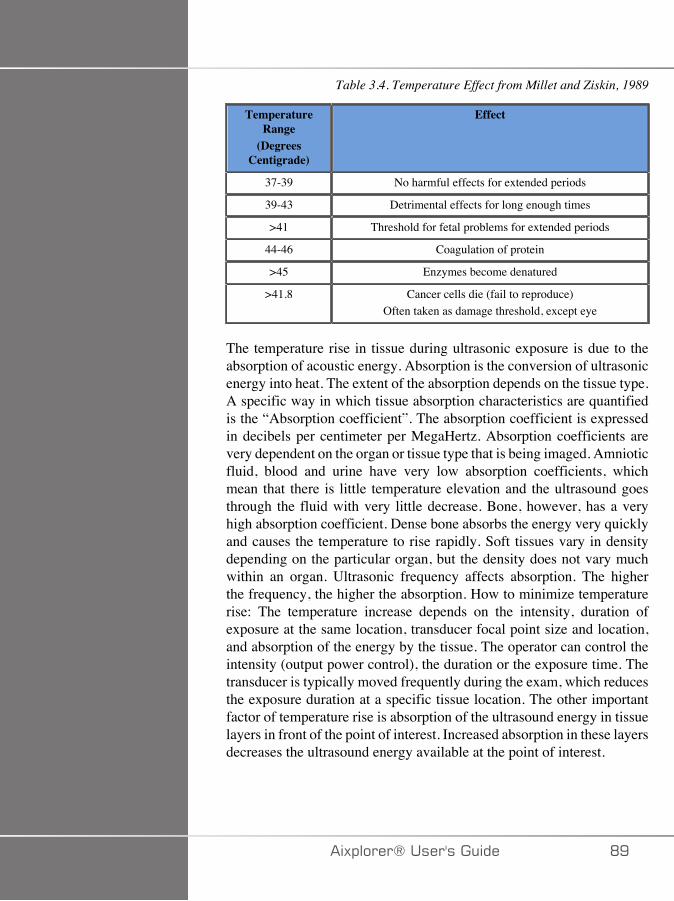
Table 3.4. Temperature Effect from Millet and Ziskin, 1989
TemperatureRange
(DegreesCentigrade)
Effect
37-39 No harmful effects for extended periods
39-43 Detrimental effects for long enough times
>41 Threshold for fetal problems for extended periods
44-46 Coagulation of protein
>45 Enzymes become denatured
>41.8 Cancer cells die (fail to reproduce)Often taken as damage threshold, except eye
The temperature rise in tissue during ultrasonic exposure is due to theabsorption of acoustic energy. Absorption is the conversion of ultrasonicenergy into heat. The extent of the absorption depends on the tissue type.A specific way in which tissue absorption characteristics are quantifiedis the “Absorption coefficient”. The absorption coefficient is expressedin decibels per centimeter per MegaHertz. Absorption coefficients arevery dependent on the organ or tissue type that is being imaged. Amnioticfluid, blood and urine have very low absorption coefficients, whichmean that there is little temperature elevation and the ultrasound goesthrough the fluid with very little decrease. Bone, however, has a veryhigh absorption coefficient. Dense bone absorbs the energy very quicklyand causes the temperature to rise rapidly. Soft tissues vary in densitydepending on the particular organ, but the density does not vary muchwithin an organ. Ultrasonic frequency affects absorption. The higherthe frequency, the higher the absorption. How to minimize temperaturerise: The temperature increase depends on the intensity, duration ofexposure at the same location, transducer focal point size and location,and absorption of the energy by the tissue. The operator can control theintensity (output power control), the duration or the exposure time. Thetransducer is typically moved frequently during the exam, which reducesthe exposure duration at a specific tissue location. The other importantfactor of temperature rise is absorption of the ultrasound energy in tissuelayers in front of the point of interest. Increased absorption in these layersdecreases the ultrasound energy available at the point of interest.
�)!�����*����������� DE

,7 <�/� �:��/-7G
In addition to heat effect, various types of mechanical effects on the bodyare generated by ultrasonic exposure. These effects can be divided intotwo categories. The first category is called acoustic cavitation. Cavitationcan occur when sound passes through an area that contains a cavity, suchas a gas bubble or other air pocket. Some tissues, most notably adult lungand intestine, do contain air bubbles, and are therefore more vulnerableto these cavitation effects. The fetal lung and intestine do not containobvious air bubbles, because the fetus does not breathe air yet—it getsoxygen from the mother’s blood stream. However, tiny bubbles couldpotentially form in parts of the body other than the lung and intestine.More research is needed in this area. In cavitation, the sound waves cancause the bubbles or air pockets to expand and contract rhythmically:in other words, to pulsate, or resonate. When they pulsate, the bubblessend secondary sound waves off in all directions. If the bubbles contracttowards the point of collapsing, they can build up very high temperaturesand pressures for a few tens of nanoseconds. These high temperatures andhigh pressures can produce highly reactive chemicals called free radicals,and other potentially toxic compounds which, although consideredunlikely, could theoretically cause genetic damage. The rapid contractionof bubbles in cavitation can also cause micro-jets of liquid whichcan damage cells. When diagnostic ultrasound is focused on the lungor intestine of laboratory animals, which contain gas bubbles, thesecavitation effects can cause ruptures in very small blood vessels. Thesafety guidelines for diagnostic ultrasound are designed to try to preventcavitation effects, because these effects can be damaging. Restrictionson the pressure amplitude of the ultrasound pulse, in combination withawareness of whether or not there are gas bubbles in the tissue beingimaged, can help prevent cavitation. Other factors such as the lengthof the pulse, and the density of the liquid, also influence whether ornot cavitation occurs. And if there are gas bubbles, the number, sizeand location of the bubbles also contribute to the effect. The occurrenceof cavitation and its behavior depend on many factors, including theultrasonic pressure and frequency, the focused or unfocused and pulse orcontinuous ultrasonic field, the degree of standing waves, and the natureand state of the material and its boundaries. Currently there is no evidenceof cavitation occurring in human tissue or fluids resulting from diagnosticultrasonic exposure. In addition, the control parameters on our ultrasoundimaging system limit the peak output. Ultrasound can also create othermechanical effects that do not require the presence of bubbles in order tooccur. These effects include changes in pressure, force, torque (causing
E� �)!�����*�����������
things to rotate) and streaming (stirring of the liquid). These changes,in turn, can cause audible sounds, electrical changes in cell membranesthat make them more permeable to large molecules, movement andredistribution of cells in liquid, and cell damage. When ultrasound passesthrough liquid, it causes a sort of stirring action called acoustic streaming.As the acoustic pressure of the ultrasound increases, the flow of liquidspeeds up. This stirring action, in theory, could occur in fluid-filled partsof a patient’s body, such as blood vessels, the bladder or amniotic sac.In experiments with animals, when streaming of the liquid comes near asolid object, shearing can occur, and this can damage platelets and leadto abnormal blood clotting (thrombosis). It is not clear to what extentthis effect occurs in humans exposed to diagnostic ultrasound. Althoughpossible adverse effects of ultrasound exist, the overall risk of undergoingan ultrasound diagnostic examination has been found to be minimal, evenunder moderate to prolonged exposure. Under normal circumstances ofdiagnostic examination, ultrasound applied prudently using the ALARAprinciple has been shown to be a safe, effective and reliable diagnostictool.
�)!�����*����������� E�
'������%�� �� 4 + �'���$��
3�)������$������� 4 +
�:�������/ ��:7
The guiding principle for the use of diagnostic ultrasound is definedby the “As Low As Reasonably Achievable” (ALARA) principle. Thedecision as to what is reasonable has been left to the judgment andinsight of qualified personnel. No set of rules can be formulated thatwould be sufficiently complete to dictate the correct response to everycircumstance. By keeping ultrasound exposure as low as possible, whileobtaining diagnostic images, users can minimize potential ultrasonicbioeffects.
��7����<;�:-�.;::;>�+<7��:������/ ��:7��/��::��+�-�7�
Since the threshold for diagnostic ultrasound bioeffects is undetermined,it is the operator’s responsibility to control total energy transmitted intothe patient. The operator must reconcile exposure time with diagnosticimage quality. To ensure diagnostic image quality and limit exposuretime, an ultrasound system provides controls that can be manipulatedduring the exam to optimize the results of the exam. The ability of the userto abide by the ALARA principle is important. Advances in diagnosticultrasound - not only in the technology but in the applications of thattechnology, have resulted in the need for more and better information toguide the user. The output display indices are designed to provide thatimportant information. There are a number of variables which affect theway the output display indices can be used to implement the ALARAprinciple. These variables include index values, body size, location of thebone relative to the focal point, attenuation in the body, and ultrasoundexposure time. Exposure time is an especially useful variable, because itis controlled by the user. The ability to limit the index values over timesupports the ALARA principle.
E� �)!�����*�����������
�,�:7,7/+�/���:�������/��+<7�+���/-�,��/-� 7�
The ALARA concept is achieved by using the information displayed onthe screen in the form of biologically relevant exposure indices: the TIand the MI. The display of biological index information is only a tool.Safe use of the ultrasound imaging device can be ensured by using thelowest indices that will yield the best possible diagnostic information.
�F�+7,� ;/+�;:��27������ ;��+� ;�+��+
An ultrasound scan of a patient begins with selecting the appropriatetransducer frequency. After selecting the transducer and the application,which are based on patient anatomy, adjustments to output power shouldbe made to ensure that the lowest possible setting is used to acquire animage. After the image is acquired, adjusting the focus of the transducer,and then increasing the receiver gain, dynamic range, and the TGC toproduce a uniform representation of the tissue follows. If an adequateimage can be obtained with the increase in gain and adjusting the TGC,then a decrease in output should be made. Only after making theseadjustments should the operator increase output to the next level. Havingacquired the B-mode display of the scanned organ, Color Flow Imagingcan be used to localize blood flow. As with the B-mode image display,gain, TGC, and image processing controls must be optimized beforeincreasing output. Having localized the blood flow, use the Dopplercontrols to position the sample volume over the vessel. Before increasingoutput, adjust velocity range or scale and Doppler gain to obtain anoptimal Doppler trace. Only if maximum Doppler gain does not createan acceptable image does the operator increase output. In summary:select the correct transducer frequency and application for the job; startwith a low output level; optimize the image using focus, receiver gain,and other imaging controls; if the image is not diagnostically useful atthis point, then increase output. Overall gain and TGC are the 2 mostimportant receiver controls that must be used by the operator to improveimage quality, before increasing the acoustic output. These controls haveno effect on acoustic output and only affect the way the ultrasoundecho is received. The important thing to remember, relative to output,is that receiver controls should be optimized before output is increased.For example: before increasing output, optimize gain to improve imagequality. Dynamic range and image post-processing are also receiver
�)!�����*����������� EA

controls that have no effect on acoustic output power. Again, it is offirst importance for the operator to remember that these two controls alsoshould be optimized before output is increased.
#(����� $$�������.����� �������$�
Application selection and the Output Power control directly affectacoustic intensity. There are different ranges of allowable intensity oroutput based on operator’s selection. Selecting the correct range ofacoustic intensity for the application is one of the first things that occursin any exam. For example, peripheral vascular intensity levels are notrecommended for fetal exams. Some systems automatically select theproper range for a particular application, while others require manualselection. Ultimately, the user has the responsibility for proper clinicaluse. The Aixplorer® ultrasound system provides both automatic (default)settings and manual (user-selectable) settings. Output Power has directimpact on acoustic intensity. Once the application has been established,the Output Power control can be used to increase or decrease the intensityoutput. The Output Power control allows the operator to select intensitylevels less than the established maximum. Prudent use dictates that theoperator selects the lowest output intensity that is consistent with goodimage quality.
����������*��������� ��������$�
The controls that affect the acoustic output are:
• pulse repetition frequency,• focus depth,• pulse length,• transducer selection.
Pulse repetition frequency or rate refers to the number of ultrasoundbursts of energy over a specific period of time. Dwell time is equal tothe inverse of the pulse repetition frequency minus the burst length. Thehigher the pulse repetition frequency, the more pulses of energy in aperiod of time and the shorter the dwell time. Several controls affectpulse repetition frequency: focal depth, display depth, sample volume
E� �)!�����*�����������
depth, flow optimization, scale, number of focal zones, and sector widthcontrols. Focus of the ultrasound beam affects the image resolution. Tomaintain or increase resolution at a different focus requires a variationin output over the focal zone. This variation of output is a functionof system optimization. Different exams require different focal depths.Setting the focus at the proper depth improves the resolution of thestructure of interest. Pulse length is the time during which the ultrasonicburst is turned on. The longer the pulse, the greater the time-averageintensity value. The greater the time-average intensity, the greater thelikelihood of temperature increase and cavitation. Pulse length, alsoknown as burst length or pulse duration, is the output pulse duration inpulsed Doppler. Increasing the Doppler sample volume size increasesthe pulse length. Transducer selection indirectly affects intensity. Tissueattenuation changes with frequency. The higher the transducer operatingfrequency, the greater the attenuation of the ultrasonic energy. A highertransducer operating frequency requires more output intensity to scanat a deeper depth. To scan deeper at the same output intensity, a lowerfrequency transducer is required. Using more gain and output beyond apoint, without corresponding increases in image quality, can mean that alower frequency transducer is needed.
#(������$�����%�������"���� ��������$�
The choice of imaging mode determines the nature of the ultrasoundbeam. B-mode is a scanning mode, Doppler and M-mode are stationaryor unscanned modes. A stationary ultrasound beam concentrates energyin a single location. A moving or scanned ultrasound beam disperses theenergy over an area such that the beam is concentrated on the same areafor only a fraction of the time as that of an unscanned mode.
ShearWave™ Elastography mixes the two types of scanned andunscanned modes:
• the generation of the acoustic radiation force is a scanned ultrasoundemission,
• the acquisition of the Shearwave propagation is achieved by unscannedflat insonification at a very high frequency (UltraFast™),
• the B mode imaging is performed in an interleaved manner with theelastography sequence and is a scanned mode.
�)!�����*����������� E�
�����������*5$��������
One important contributor to ALARA, not incorporated in the outputdisplay indices, is the element of time. As the total exposure is directlyproportional to the amount of time the ultrasound beam remains inone area, users should remember that, besides keeping the TI andMI as low as possible, the total exposure time in any one locationshould be kept as short as possible. The concept of ALARA is to usethe lowest output setting that will yield the best possible diagnosticinformation, while keeping the exposure time as short as possible. Witha clear understanding of the new responsibilities, users will have morecapabilities and potentially more diagnostic information available fromthese higher output devices, while minimizing risk to patients. Ensurethat scanning time is kept to a minimum, and ensure that only medicallyrequired scanning is performed. Never compromise quality by rushingthrough an exam. A poor exam may require a follow-up, which ultimatelyincreases exposure time. Diagnostic ultrasound is an important tool inmedicine, and, like any tool, it should be used efficiently and effectively.
$$�(�%� 4 + �)� �� �� 5$�����6�������������%�%�#(����
The system imaging mode used depends upon the information needed. B-mode imaging provides anatomical information. Pulsed Doppler, ColorPower Imaging (CPI), Directional Color Power Imaging (dCPI) andColor Flow Imaging (CFI) provide information about blood flow. TheM-mode is used for cardiac assessment and measurement of the fetalheart rate. ShearWave™ Elastography Imaging displays informationabout tissue stiffness via color-scale or grayscale. A scanned mode,like B-mode, SWE™, CPI, dCPI, or CFI, disperses or scatters theultrasonic energy over an area, while an unscanned mode, like PulsedWave Doppler, concentrates ultrasonic energy. The M-mode should beused instead of spectral Pulsed Wave Doppler imaging to documentembryonic/fetal heart rate. Understanding the nature of the imaging modebeing used allows the operator to apply the ALARA principle withinformed judgment. Additionally, knowing the transducer frequency,system setup values, and scanning techniques, and the operator’sexperience allow him or her to meet the ALARA principle. The decisionas to the amount of acoustic output is, in the final analysis, up to theoperator. This decision must be based on the following factors: type
EC �)!�����*�����������
of patient, type of exam, patient history, ease or difficulty of obtainingdiagnostically useful information, and the potential localized heatingof the patient due to transducer surface temperatures. Prudent use ofthe system occurs when patient exposure is limited to the lowest indexreading for the shortest amount of time necessary to achieve acceptablediagnostic results. Although a high index reading does not mean thata bioeffect is actually occurring, a high index reading should be takenseriously. Every effort should be made to reduce the possible effectsof a high index reading. Limiting exposure time is an effective way toaccomplish this goal. There are several system controls that the operatorcan use to adjust the image quality and limit the acoustic intensity.These controls are related to the techniques that an operator might use toimplement ALARA. These controls can be divided into three categories:direct, indirect, and receiver controls. As various system controls areadjusted, the TI and MI values may change. This will be most apparentas the Output Power control is adjusted; however, other system controlswill affect the on-screen output values.
-��7 +� ;/+�;:�
;$!$���6��
Output Power controls the system acoustic output. Two real-time outputvalues are on the screen: a TI and MI. They change as the system respondsto Output Power adjustments. In combined modes, such as simultaneousCFI, B-mode, the individual modes each add to the total TI. One modewill be the dominant contributor to this total. The displayed MI will befrom the mode with the largest peak pressure.
�)!�����*����������� E�
�/-��7 +� ;/+�;:�
1� ��$����
SECTOR WIDTH
Narrowing the sector angle may increase frame rate. This action willincrease the TI. Pulser voltage may be automatically adjusted down withsoftware controls to keep the TI below the system maximums. A decreasein pulser voltage will decrease MI.
ZOOM
Increasing the zoom magnification by pressing Zoom may increase framerate. This action will increase the TI. The number of focal zones may alsoincrease automatically to improve resolution. This action may change MIsince the peak intensity can occur at a different depth.
NUMBER OF FOCAL ZONES
More focal zones may change both the TI and MI by changing framerate or focal depth automatically. Lower frame rates decrease the TI. MIdisplayed will correspond to the zone with the largest peak intensity.
FOCUS
Changing the focal depth will change MI. Generally, higher MI valueswill occur when the focal depth is near the natural focus of the transducer.
,� ��$����
The M-mode is accessible from the B-mode controls. All 2D controlsmentioned above apply to the M-mode image. Similarly, the MI and/orTI are displayed on the Aixplorer® monitor when operated in M-mode.
ED �)!�����*�����������
Additional indirect controls dedicated to the M-mode also impact on theTI and MI.
SAMPLE VOLUME DEPTH
When M-mode sample volume depth is increased the PRF mayautomatically increase, leading to an increase of the TI.
.�I� ���(���� ��� ��$����
VELOCITY OPT
Increasing the Color sensitivity with the Velocity Opt control mayincrease the TI. More time is spent scanning the Color image. Colorpulses are the dominant pulse type in this mode.
COLOR BOX/SECTOR WIDTH
Narrower color sector width will increase color frame rate and the TI willincrease. The system may automatically decrease pulser voltage to staybelow the system maximum. A decrease in pulser voltage will decreasethe MI.
COLOR BOX/SECTOR DEPTH
Deeper color sector depth may automatically decrease color frame rate orselect a new color focal zone or color pulse length. The TI will change dueto the combination of these effects. Generally, the TI will decrease withincreased color sector depth. MI will correspond to the peak intensity ofthe dominant pulse type which is a color pulse.
SCALE
Using the scale control to increase the color velocity range may increasethe TI. The system may automatically adjust pulser voltage to stay below
�)!�����*����������� EE
the system maximums. A decrease in pulser voltage will also decreaseMI.
SECTOR WIDTH
A narrower 2D sector width in Color imaging will increase color framerate. The TI will increase. MI will not change.
������>(���-�!!���� ��$����
SAMPLE VOLUME DEPTH
When Doppler sample volume depth is increased the Doppler PRF mayautomatically decrease. An increase in PRF will increase the TI. Thesystem may also automatically decrease the pulser voltage to remainbelow the system maximum. A decrease in pulser voltage will decreaseMI.
7�(�$�"�(!#�� ��$����
ELASTOGRAPHY BOX/SECTOR WIDTH
Narrower Elastography sector width may increase elastography framerate and the TI will increase. The system may automatically decreasepulser voltage to stay below the system maximum. A decrease in pulservoltage will decrease the MI.
ELASTOGRAPHY BOX/SECTOR DEPTH
Deeper Elastography sector depth may automatically decreaseelastography frame rate. The TI will change. Generally, the TI willdecrease with increased Elastography sector depth. MI will correspondto the peak intensity of the dominant pulse type in the combined mode.
��� �)!�����*�����������
SECTOR WIDTH
A narrower 2D sector width in Elastography imaging will decrease theElastography frame rate. The TI will increase. MI will not change.
;$#��
B-MODE, CFI, CPI, DCPI, PULSED WAVE DOPPLER, ANDELASTOGRAPHY
When a new imaging mode is selected, both the TI and MI may changeto default settings. Each mode has a corresponding pulse repetitionfrequency and maximum intensity point. In combined or simultaneousmodes, the TI is the sum of the contribution from the modes enabledand MI is the MI for the focal zone and mode with the largest deratedintensity.
DEPTH
An increase in B-mode depth will automatically decrease the B-mode frame rate. This would decrease the TI. The system may alsoautomatically choose a deeper B-mode focal depth. A change of focaldepth may change the MI. The MI displayed is that of the zone with thelargest peak intensity.
APPLICATION
Acoustic output defaults are set when the operator selects an application.Factory defaults vary with transducer, application, and mode. Defaultshave been chosen below the FDA limits for intended use.
�)!�����*����������� ���

������� $$�������*5��$���
�,�::����+�
For any small parts, the clinician starts with selecting the appropriateapplication and Tissue Preset Setting (Breast/Breast, Superficial Breast,Deep Breast, Genitourinary/Scrotum, Thyroid/Thyroid, or General on theSL15-4 or or Breast or General on the SLV16-5 or Breast or Thyroidon the SL10-2, or Breast on the SL18-5), the clinician starts imagingthe tissue and starts adjustments of the output power to ensure that thelowest possible setting is used to obtain a B Mode image. The user shallthen adjust the spread and depth of the focal zone of the transducer, andthen using the AutoTGC key or increasing the receiver gain to produce auniform representation of the tissue follows. If an adequate image can beobtained with the adjustment/ increase in gain, then a decrease in outputshould be made. Only after making these adjustments should the operatorincrease output to the next level in the case of an unsatisfying image.
Having acquired the B Mode images of the small part/superficial tissue,CFI CPI and/or dCPI can be used to localize blood flow. As with theB Mode image display, gain and image processing controls must beoptimized before increasing output, if ever needed.
Having localized the blood flow, the clinicians shall use the PulsedWave Doppler controls to position the sample volume over the vessel.Before increasing output, the user shall adjust velocity range or scaleand Doppler gain to obtain an optimal Doppler trace. Only if maximumDoppler gain does not create an acceptable Doppler spectrum does theoperator increase output.
Having acquired 2D, Color Flow and Pulsed Wave Doppler,Elastography can be used to assess the tissue stiffness. SWE Opt. setting(Resolution, Standard or Penetration), size and location of the SWEBox and SWE gain shall be adjusted to obtain an optimal Elastographyimage before increasing output. Only if optimal settings and maximumElastography gain do not create an acceptable image does the operatorincrease output.
A Three-dimensional acquisition can be performed with the SLV16-5of B-Mode of ShearWave ™ Elastography once the conventional two-dimensional planes have been acquired.
��� �)!�����*�����������
,�� �:;�07:7+�:
For any MSK imaging, the clinician starts with selecting the appropriateapplication and Tissue Preset Setting (MSK/ Shoulder, Elbow, Wrist/Hand, Knee, Ankle/Foot or Muscle on the SL15-4, SL18-5, SL10-2,SLH20-6 probe) then the clinician starts imaging the tissue and startsadjustments of the output power to ensure that the lowest possible settingis used to obtain a B Mode image. The user shall then adjust the spreadand depth of the focal zone of the transducer, and then using the AutoTGCkey or increasing the receiver gain to produce a uniform representationof the tissue follows. If an adequate image can be obtained with theadjustment/increase in gain, then a decrease in output should be made.Only after making these adjustments should the operator increase outputto the next level in the case of an unsatisfying image.
Having acquired the B Mode images of the small part/superficial tissue,CFI, CPI and/or dCPI can be used to localize blood flow. As with theB Mode image display, gain and image processing controls must beoptimized before increasing output, if ever needed.
Having localized the blood flow, the clinicians shall use the PulsedWave Doppler controls to position the sample volume over the vessel.Before increasing output, the user shall adjust velocity range or scaleand Doppler gain to obtain an optimal Doppler trace. Only if maximumDoppler gain does not create an acceptable Doppler spectrum does theoperator increase output.
Having acquired 2D, Color Flow and Pulsed Wave Doppler,Elastography can be used to assess the tissue stiffness (not available onSLH20-6). SWE Opt. setting (Resolution, Standard or Penetration), sizeand location of the SWE Box and SWE gain shall be adjusted to obtainan optimal Elastography image before increasing output. Only if optimalsettings and maximum Elastography gain do not create an acceptableimage does the operator increase output.
�)!�����*����������� ��A
�1-;,�/�:3�7:2�
For abdominal imaging, the clinician starts with selecting the appropriatetransducer (SC6-1 and XP5-1 for deep abdominal Imaging and SL15-4,SL18-5 or SL10-2 intestine Preset for superficial) and the appropriateTissue Preset Setting (Renal, Abdomen, Prostate, Gyn for SC6-1 andXP5-1 and Intestine for the SL15-4 or SL10-2). The clinician then startsimaging the target organ and adjusts the output power to ensure that thelowest possible setting is used to obtain an adequate B Mode image. Afterthe first B Mode image is obtained, adjusting the depth and spread of thefocal zone, and then increasing the receiver gain should be used first toproduce a uniform representation of the tissue. If an adequate image canbe obtained with the increase in gain, then a decrease in output should bemade. Only after making these adjustments should the operator increaseoutput to the next level, if ever needed.
Having acquired the B Mode images of the target organ, CFI, CPI and/or dCPI can be used to localize blood flow. As with the B Mode imagedisplay, gain and image processing controls must be optimized beforeincreasing output. In case of artifacts due to the increase in gain, the usershall activate the Flash suppression key to be able to increase gain anddecrease output acoustic power.
Having localized the blood flow, the operator shall use the pulsed waveDoppler controls to position the sample volume over the vessel. Beforeincreasing output, the operator shall adjust velocity range or scale andDoppler gain to obtain an optimal Doppler trace. Only if maximumDoppler gain does not create an acceptable Doppler spectrum does theoperator increase output.
Having acquired 2D, Color Flow and Doppler, Elastography can beused to assess the organ tissue stiffness. Before increasing output, theuser should first adjust the appropriate SWE Opt. setting (Resolution,Standard or Penetration), adjust the size and location of the SWE boxand adjust SWE gain to obtain an optimal Elastography image. Only ifmaximum Elastography gain does not create an acceptable image doesthe operator increase output.
��� �)!�����*�����������
7/-; �2�+��F�4/;/�;1�+7+�� �:5
For genitourinary and gynecologic imaging, the clinician starts withselecting the appropriate transducer (SE12-3 for intracavitary scanning),the desired clinical application and the appropriate Tissue Preset Setting(Genitourinary/ Prostate or OB-GYN/Gyn/). The clinician then imagesthe target organ and adjusts the output power to ensure that the lowestpossible setting is used to obtain a B Mode image. After the first B Modeimage is obtained, adjusting the depth and spread of the focal zone, andthen increasing the receiver gain should be used first to produce a uniformrepresentation of the organ. If an adequate image can be obtained withthe increase in gain, then a decrease in output should be made. Only aftermaking these adjustments should the operator increase output to the nextlevel, in case of poor quality images.
Having acquired the B Mode images of the organ, CFI, CPI and/ordCPI can be used to localize blood flow. As with the B Mode imagedisplay, gain and image processing controls must be optimized beforeincreasing output. The user shall then turn one the Power Doppler Modeand adjust its controls to position the sample volume over the vessel.Before increasing output, the user shall adjust velocity range or scaleand Doppler gain to obtain an optimal Doppler trace. Only if maximumDoppler gain does not create an acceptable image does the operatorincrease output.
Having acquired B Mode, Color Flow and Pulsed Wave Doppler images,Elastography can be used to assess the target organ tissue stiffness(not available on any obstetrical presets). Before increasing output, theuser should first adjust the appropriate SWE Opt. setting (Resolution,Standard or Penetration), adjust the size and location of the SWE boxand adjust SWE gain to obtain an optimal Elastography image. Only ifmaximum Elastography gain does not create an acceptable image doesthe operator increase output.
�)!�����*����������� ���
2�� �:��
For vascular imaging, the clinician starts with selecting the appropriatetransducer (SL15-4, SL18-5 and SMC12-3 for superficial vascularimaging, SL10-2 for deep vascular imaging; SC6-1 for vascularabdominal imaging and XP5-1 for Transcranial imaging) and theappropriate Tissue Preset Setting (Carotid, Upper Extremity Arterial/Venous, Lower Extremity Arterial/Venous for SL15-4, SL18-5,SMC12-3 or SL10-2, Vascular Abdominal for SC6-1). The clinician thenstarts imaging the target vessel or organ and adjusts the output powerto ensure that the lowest possible setting is used to obtain an adequateB Mode image. After the first B Mode image is obtained, adjusting thedepth and spread of the focal zone, and then increasing the receiver gainshould be used first to produce a uniform representation of the vesselor the organ. If an adequate image can be obtained with the increase ingain, then a decrease in output should be made. Only after making theseadjustments should the operator increase output to the next level, if everneeded.
Having acquired the B Mode images of the target vessel or organ, CFI,CPI and/or dCPI can be used to localize blood flow. As with the B Modeimage display, gain and image processing controls must be optimizedbefore increasing output. In case of artifacts due to the increase in gain,the user shall activate the Flash suppression key to be able to increasegain and decrease output acoustic power.
Having localized the blood flow, the operator shall use the pulsed waveDoppler controls to position the sample volume over the vessel. Beforeincreasing output, the operator shall adjust velocity range or scale andDoppler gain to obtain an optimal Doppler trace. Only if maximumDoppler gain does not create an acceptable Doppler spectrum does theoperator increase output.
��C �)!�����*�����������

;1�+7+�� �
Diagnostic ultrasound studies of the fetus are generally consideredsafe during pregnancy. This diagnostic procedure should be performedonly when there is a valid medical indication, and the lowest possibleultrasonic exposure setting should be used to gain the necessarydiagnostic information under the ALARA (as low as reasonablyachievable) principle.
The thermal index for soft tissue (TIS) should be used at earlier than 10weeks’ gestation, and the thermal index for bone (TIB) should be used at10 weeks’ gestation or later when bone ossification is evident. In keepingwith the ALARA principle, M-mode imaging should be used instead ofspectral Doppler imaging to document embryonic/fetal heart rate.
For a use of the Early OB preset on the SC6-1 and SE12-3, thesystem is limiting the Mechanical Index to a maximum value of 1.0 (onboth probes) and the Thermal Index to a maximum value of 2.0 (onboth probes). These limits are following the recommendations and theguidelines for safe use of an ultrasound diagnostic system during a fetalexam:
• American institute of ultrasound of medicine (AIUM)• British medical ultrasound society (BMUS)• European committee for medical ultrasound safety (ECMUS)• Société des obstétriciens et gynécologues du Canada (SOCG) et Santé
Canada
And more particularly the information provided by the AIUM on theultrasound biological effects, its recommendations published in theJournal of Ultrasound in Medicine in April 2008, and the article publishedby DL Miller.
During the first trimester of pregnancy and especially during the first 10weeks, it is essential to follow these recommendations.
For obstetrics imaging, the clinician starts with selecting the appropriatetransducer (SE12-3 for Early OB scanning, SC6-1 for General OBscanning) and the desired clinical application (OB-GYN- application,GYN, Early OB or Gen OB). The clinician then images the targetorgans and adjusts the output power to ensure that the lowest possiblesetting is used to obtain a B Mode image. (Obstetrics presets havea limited Mechanical Index and Thermal Index [MI & TI] to follow
�)!�����*����������� ���
the recommendations and guidelines from AIUM, BMUS, ECMUS andSOCG). After the first B Mode image is obtained, adjusting the depth andspread of the focal zone, and then increasing the receiver gain should beused first to produce a uniform representation of the organ. If an adequateimage can be obtained with the increase in gain, then a decrease in outputshould be made. Only after making these adjustments should the operatorincrease output to the next level, in case of poor quality images.
Having acquired the B Mode images of the organs, CFI, CPI and/or dCPIcan be used to localize blood flow. As with the B Mode image display,gain and image processing controls must be optimized before increasingoutput.
Having acquired B Mode and Color Flow, the user can image the desiredorgan using M Mode imaging. M Mode can be used to assess the beatsper minute of fetal cardiac activity. Before increasing output, the usershould first adjust the appropriate B/M Modes parameters such as gain,maps, and dynamic range; adjust the size and location of the M zone toobtain an optimal M Mode trace. Only if maximum M-Mode gain doesnot create an acceptable trace does the operator increase output.
Having acquired B Mode, Color Flow and M Mode, the clinician alsohas the ability to use the Pulsed Wave (PW) Doppler Mode and adjust itscontrols to position the sample volume over the vessel. Before increasingoutput, the user shall adjust velocity range or scale and Doppler gain toobtain an optimal Doppler trace. Only if maximum Doppler gain doesnot create an acceptable image does the operator increase output. PWDoppler can be used to assess blood flow in the later stages of the fetaldevelopment.
��D �)!�����*�����������
�7-��+�� �
For any pediatric exam, the clinician starts with selecting the appropriatetransducer (superficial Pediatric on the SL15-4, SL18-5, SL10-2,SLH20-6 or SMC12-3 and deep Pediatric on the SC6-1, SMC12-3)and appropriate application and Tissue Preset Setting (Pediatrics/generaland neonatal head) the clinician starts imaging the tissue and startsadjustments of the output power to ensure that the lowest possible settingis used to obtain a B Mode image. The user shall then adjust the spreadand depth of the focal zone of the transducer, and then using the AutoTGCkey or increasing the receiver gain to produce a uniform representationof the tissue follows. If an adequate image can be obtained with theadjustment/ increase in gain, then a decrease in output should be made.Only after making these adjustments should the operator increase outputto the next level in the case of an unsatisfying image.
Having acquired the B Mode images of the Pediatric tissue, CFI CPI and/or dCPI can be used to localize blood flow. As with the B Mode imagedisplay, gain and image processing controls must be optimized beforeincreasing output, if ever needed.
Having localized the blood flow, the clinicians shall use the PulsedWave Doppler controls to position the sample volume over the vessel.Before increasing output, the user shall adjust velocity range or scaleand Doppler gain to obtain an optimal Doppler trace. Only if maximumDoppler gain does not create an acceptable Doppler spectrum does theoperator increase output.
Having acquired 2D, Color Flow and Pulsed Wave Doppler,Elastography can be used to assess the tissue stiffness (not available onSLH20-6). SWE Opt. setting (Resolution, Standard or Penetration), sizeand location of the SWE Box and SWE gain shall be adjusted to obtainan optimal Elastography image before increasing output. Only if optimalsettings and maximum Elastography gain do not create an acceptableimage does the operator increase output.
�)!�����*����������� ��E

�����#(����The usage of the Aixplorer® ultrasound system requires the physicalpresence of the operator. The operator and patient are co-located to thesystem. Thus the Aixplorer® alarm system is composed of visual alarmsonly. The Aixplorer® alarm system utilizes either a pop-up windowwith suggested actions or a message in the information area of the mainmonitor. The Aixplorer® alarm conditions are not configurable by anoperator. The Aixplorer® logs the occurrences of alarms for later reviewby a SuperSonic Imagine representative.
The medium priority alarms are used to intervene automatically byhalting the system upon detection of an alarm condition that may result inharm to the patient, operator, or the system. The operator is instructed viaa visual alarm. The course of operator’s actions is limited to contactingan SuperSonic Imagine representation and acknowledgement of therestarting the system.
The low priority alarms are used as informational. The user may be ableto take action to resume system usage or the alarm is strictly to informthe user of a condition that may impact workflow.
��� �)!�����*�����������
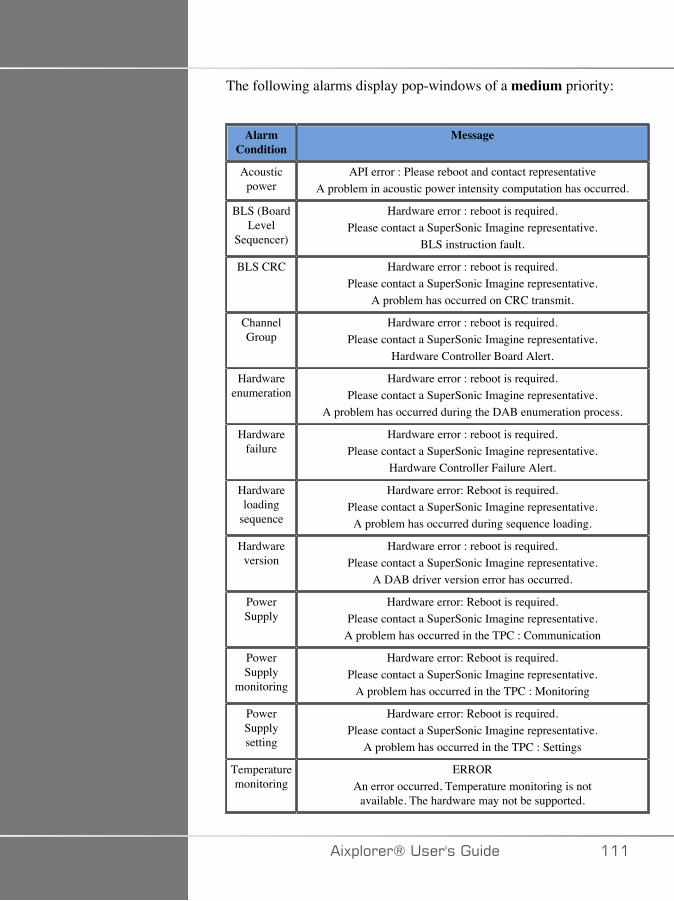
The following alarms display pop-windows of a medium priority:
AlarmCondition
Message
Acousticpower
API error : Please reboot and contact representativeA problem in acoustic power intensity computation has occurred.
BLS (BoardLevel
Sequencer)
Hardware error : reboot is required.Please contact a SuperSonic Imagine representative.
BLS instruction fault.
BLS CRC Hardware error : reboot is required.Please contact a SuperSonic Imagine representative.
A problem has occurred on CRC transmit.
ChannelGroup
Hardware error : reboot is required.Please contact a SuperSonic Imagine representative.
Hardware Controller Board Alert.
Hardwareenumeration
Hardware error : reboot is required.Please contact a SuperSonic Imagine representative.
A problem has occurred during the DAB enumeration process.
Hardwarefailure
Hardware error : reboot is required.Please contact a SuperSonic Imagine representative.
Hardware Controller Failure Alert.
Hardwareloading
sequence
Hardware error: Reboot is required.Please contact a SuperSonic Imagine representative.A problem has occurred during sequence loading.
Hardwareversion
Hardware error : reboot is required.Please contact a SuperSonic Imagine representative.
A DAB driver version error has occurred.
PowerSupply
Hardware error: Reboot is required.Please contact a SuperSonic Imagine representative.
A problem has occurred in the TPC : Communication
PowerSupply
monitoring
Hardware error: Reboot is required.Please contact a SuperSonic Imagine representative.
A problem has occurred in the TPC : Monitoring
PowerSupplysetting
Hardware error: Reboot is required.Please contact a SuperSonic Imagine representative.
A problem has occurred in the TPC : Settings
Temperaturemonitoring
ERRORAn error occurred, Temperature monitoring is not
available. The hardware may not be supported.
�)!�����*����������� ���
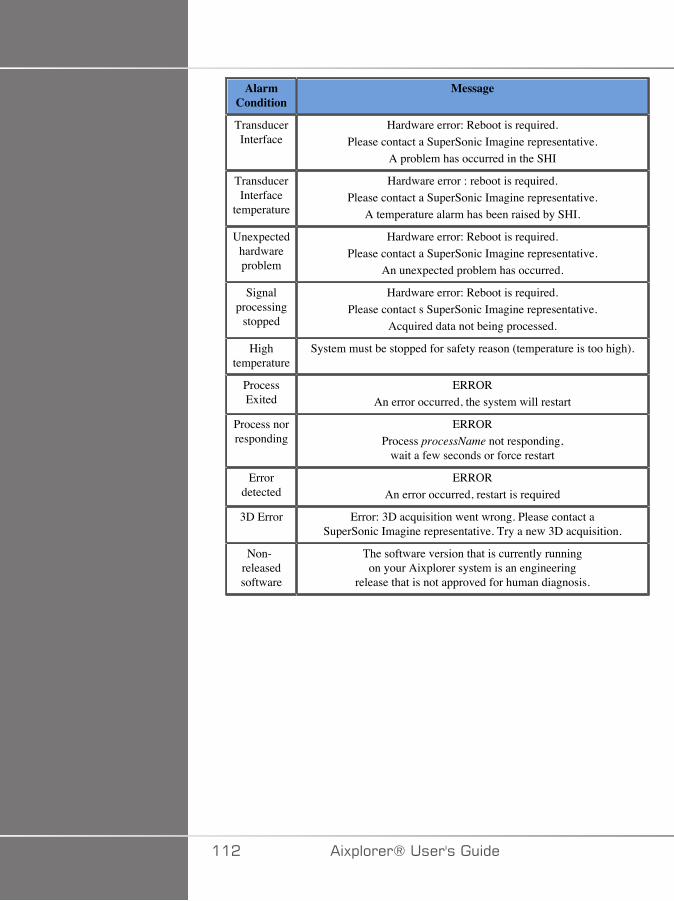
AlarmCondition
Message
TransducerInterface
Hardware error: Reboot is required.Please contact a SuperSonic Imagine representative.
A problem has occurred in the SHI
TransducerInterface
temperature
Hardware error : reboot is required.Please contact a SuperSonic Imagine representative.
A temperature alarm has been raised by SHI.
Unexpectedhardwareproblem
Hardware error: Reboot is required.Please contact a SuperSonic Imagine representative.
An unexpected problem has occurred.
Signalprocessing
stopped
Hardware error: Reboot is required.Please contact s SuperSonic Imagine representative.
Acquired data not being processed.
Hightemperature
System must be stopped for safety reason (temperature is too high).
ProcessExited
ERRORAn error occurred, the system will restart
Process norresponding
ERRORProcess processName not responding,
wait a few seconds or force restart
Errordetected
ERRORAn error occurred, restart is required
3D Error Error: 3D acquisition went wrong. Please contact aSuperSonic Imagine representative. Try a new 3D acquisition.
Non-releasedsoftware
The software version that is currently runningon your Aixplorer system is an engineering
release that is not approved for human diagnosis.
��� �)!�����*�����������
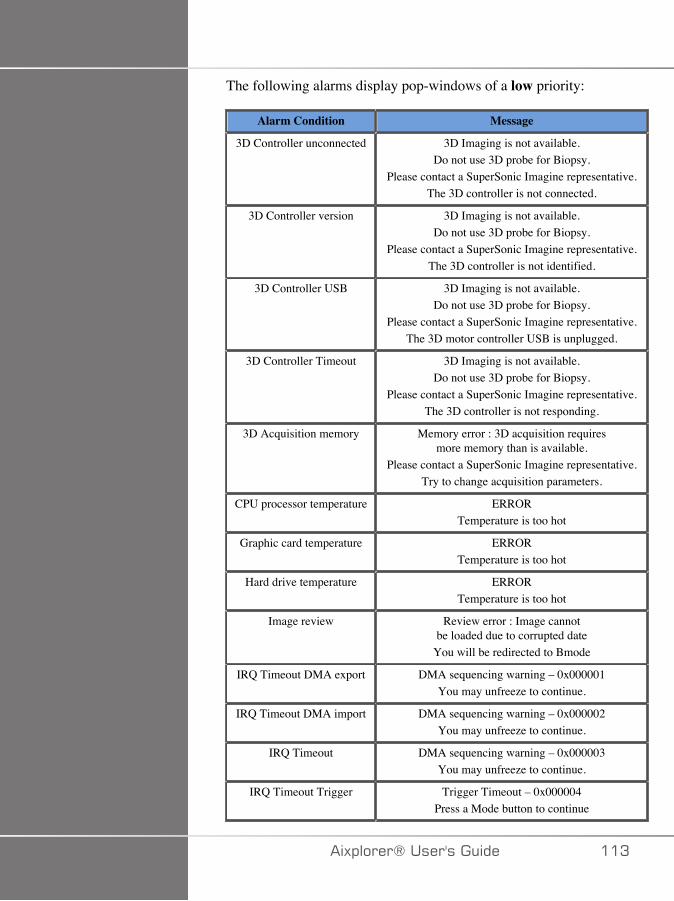
The following alarms display pop-windows of a low priority:
Alarm Condition Message
3D Controller unconnected 3D Imaging is not available.Do not use 3D probe for Biopsy.
Please contact a SuperSonic Imagine representative.The 3D controller is not connected.
3D Controller version 3D Imaging is not available.Do not use 3D probe for Biopsy.
Please contact a SuperSonic Imagine representative.The 3D controller is not identified.
3D Controller USB 3D Imaging is not available.Do not use 3D probe for Biopsy.
Please contact a SuperSonic Imagine representative.The 3D motor controller USB is unplugged.
3D Controller Timeout 3D Imaging is not available.Do not use 3D probe for Biopsy.
Please contact a SuperSonic Imagine representative.The 3D controller is not responding.
3D Acquisition memory Memory error : 3D acquisition requiresmore memory than is available.
Please contact a SuperSonic Imagine representative.Try to change acquisition parameters.
CPU processor temperature ERRORTemperature is too hot
Graphic card temperature ERRORTemperature is too hot
Hard drive temperature ERRORTemperature is too hot
Image review Review error : Image cannotbe loaded due to corrupted date
You will be redirected to Bmode
IRQ Timeout DMA export DMA sequencing warning – 0x000001You may unfreeze to continue.
IRQ Timeout DMA import DMA sequencing warning – 0x000002You may unfreeze to continue.
IRQ Timeout DMA sequencing warning – 0x000003You may unfreeze to continue.
IRQ Timeout Trigger Trigger Timeout – 0x000004Press a Mode button to continue
�)!�����*����������� ��A
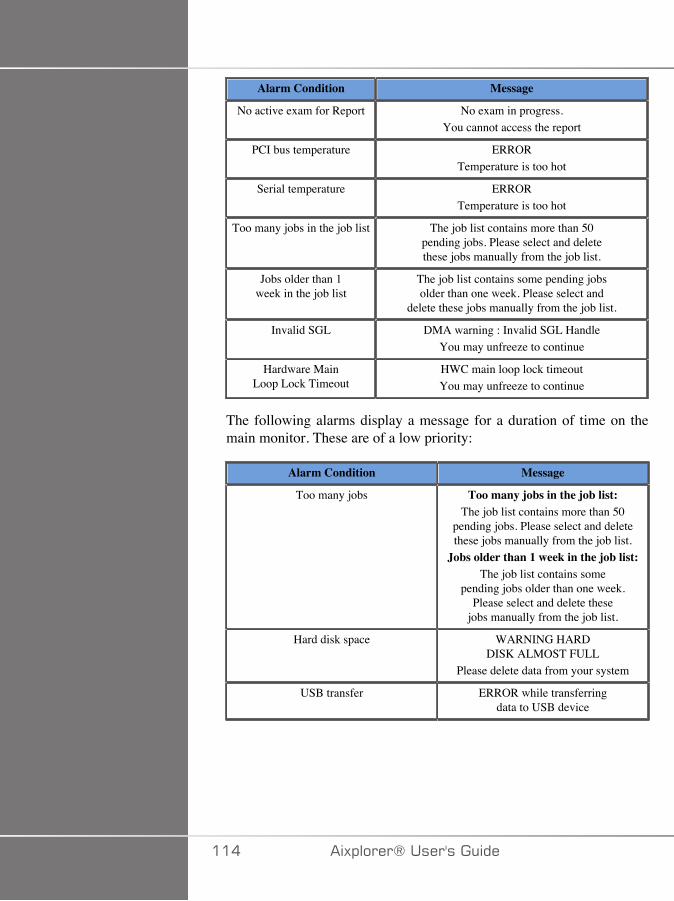
Alarm Condition Message
No active exam for Report No exam in progress.You cannot access the report
PCI bus temperature ERRORTemperature is too hot
Serial temperature ERRORTemperature is too hot
Too many jobs in the job list The job list contains more than 50pending jobs. Please select and deletethese jobs manually from the job list.
Jobs older than 1week in the job list
The job list contains some pending jobsolder than one week. Please select and
delete these jobs manually from the job list.
Invalid SGL DMA warning : Invalid SGL HandleYou may unfreeze to continue
Hardware MainLoop Lock Timeout
HWC main loop lock timeoutYou may unfreeze to continue
The following alarms display a message for a duration of time on themain monitor. These are of a low priority:
Alarm Condition Message
Too many jobs Too many jobs in the job list:The job list contains more than 50
pending jobs. Please select and deletethese jobs manually from the job list.
Jobs older than 1 week in the job list:The job list contains some
pending jobs older than one week.Please select and delete these
jobs manually from the job list.
Hard disk space WARNING HARDDISK ALMOST FULL
Please delete data from your system
USB transfer ERROR while transferringdata to USB device
��� �)!�����*�����������

8�#(������"��"�)
�)!�����*����������� ���

��C �)!�����*�����������
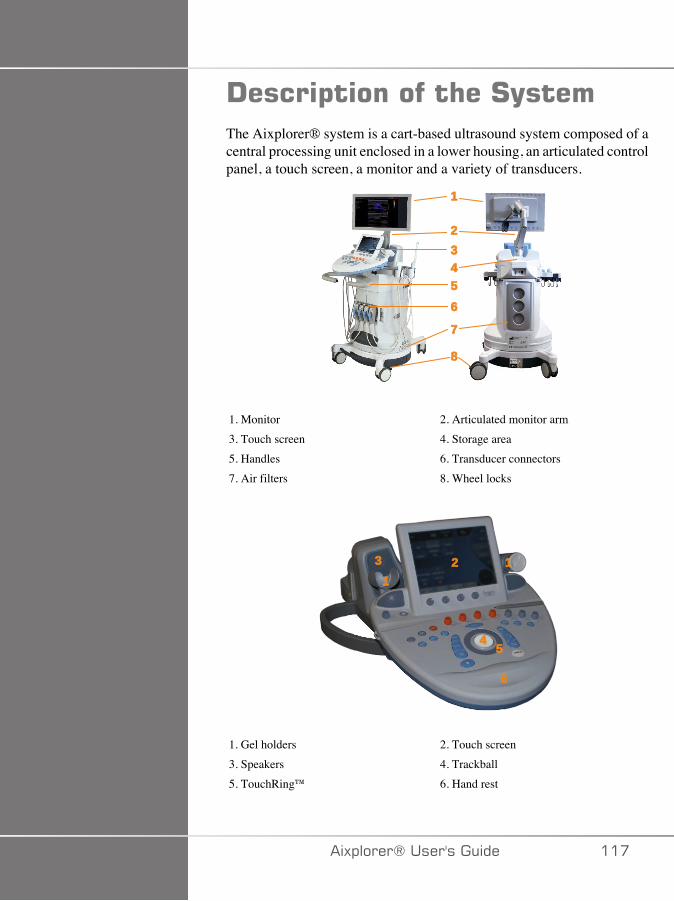
!����$�������� ��#(����The Aixplorer® system is a cart-based ultrasound system composed of acentral processing unit enclosed in a lower housing, an articulated controlpanel, a touch screen, a monitor and a variety of transducers.
�
�����
�
�
1. Monitor 2. Articulated monitor arm3. Touch screen 4. Storage area5. Handles 6. Transducer connectors7. Air filters 8. Wheel locks
����
��
�
1. Gel holders 2. Touch screen3. Speakers 4. Trackball5. TouchRing™ 6. Hand rest
�)!�����*����������� ���
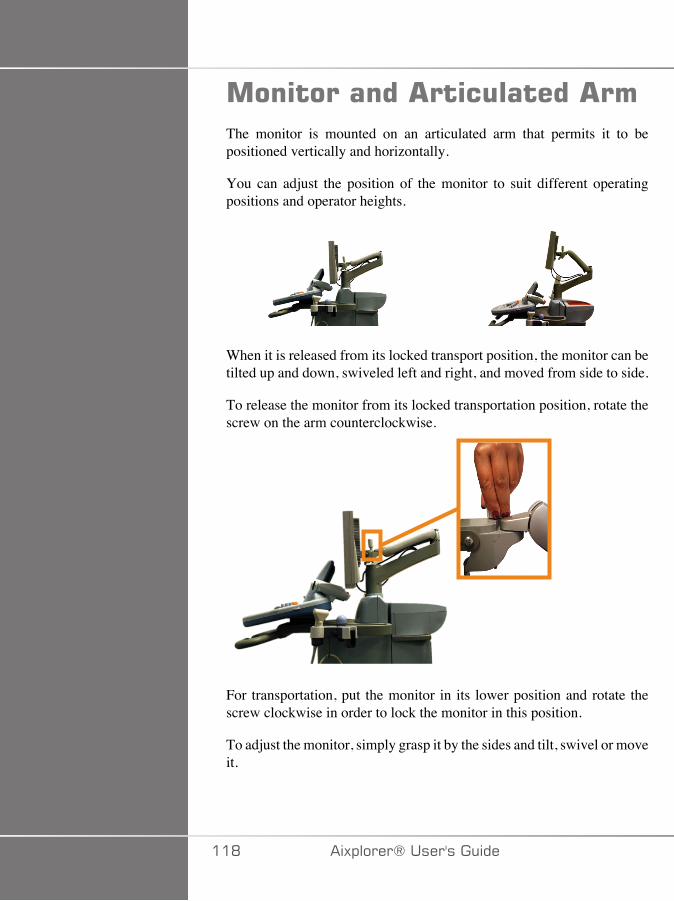
����������� ��������� ��The monitor is mounted on an articulated arm that permits it to bepositioned vertically and horizontally.
You can adjust the position of the monitor to suit different operatingpositions and operator heights.
When it is released from its locked transport position, the monitor can betilted up and down, swiveled left and right, and moved from side to side.
To release the monitor from its locked transportation position, rotate thescrew on the arm counterclockwise.
For transportation, put the monitor in its lower position and rotate thescrew clockwise in order to lock the monitor in this position.
To adjust the monitor, simply grasp it by the sides and tilt, swivel or moveit.
��D �)!�����*�����������

��������'����
3�)������"��� ����������'�����$�����!�)�1. Push the button located on the tip of the right handle, as shown below:
2. Do one of the following, while the button is still pressed:• To push the control panel down, push the handle down• To lift the control panel up, just let it go up without pulling it
3�)����#)"���� ����������'����
1. Pull the lever located under the control panel to unlock it2. Rotate the control panel to the left or to the right for your convenience
�)!�����*����������� ��E
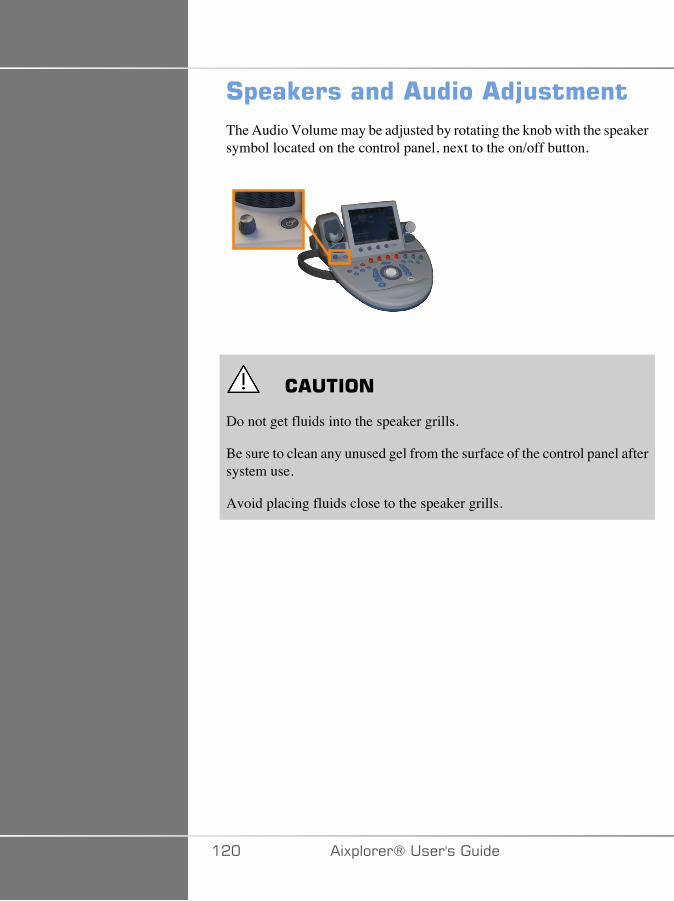
#$��E�������� ��� �F������The Audio Volume may be adjusted by rotating the knob with the speakersymbol located on the control panel, next to the on/off button.
� �����
Do not get fluids into the speaker grills.
Be sure to clean any unused gel from the surface of the control panel aftersystem use.
Avoid placing fluids close to the speaker grills.
��� �)!�����*�����������
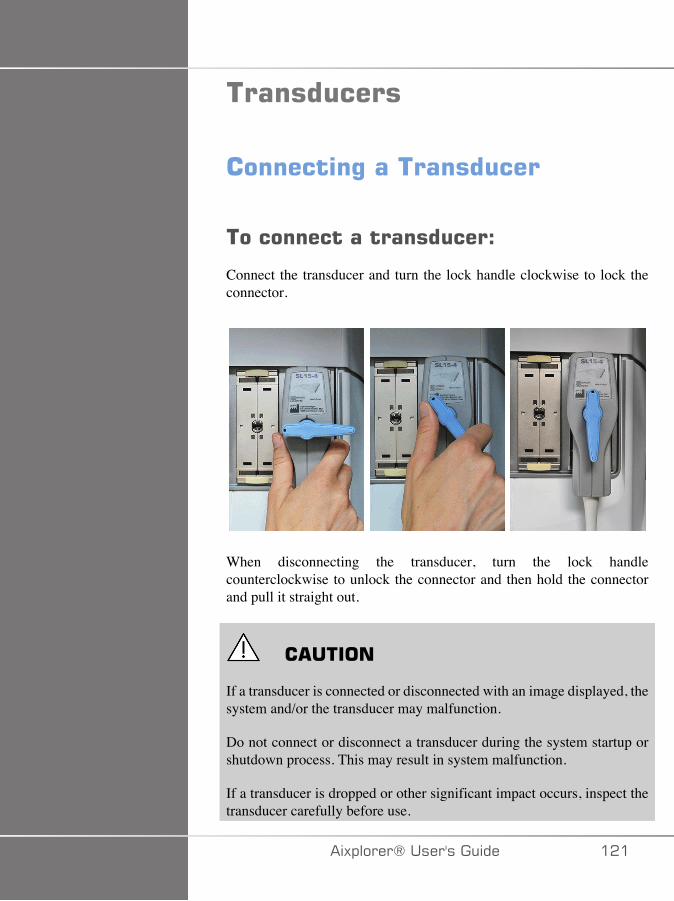
����������
��������%������������
����������������������D
Connect the transducer and turn the lock handle clockwise to lock theconnector.
When disconnecting the transducer, turn the lock handlecounterclockwise to unlock the connector and then hold the connectorand pull it straight out.
� �����
If a transducer is connected or disconnected with an image displayed, thesystem and/or the transducer may malfunction.
Do not connect or disconnect a transducer during the system startup orshutdown process. This may result in system malfunction.
If a transducer is dropped or other significant impact occurs, inspect thetransducer carefully before use.
�)!�����*����������� ���
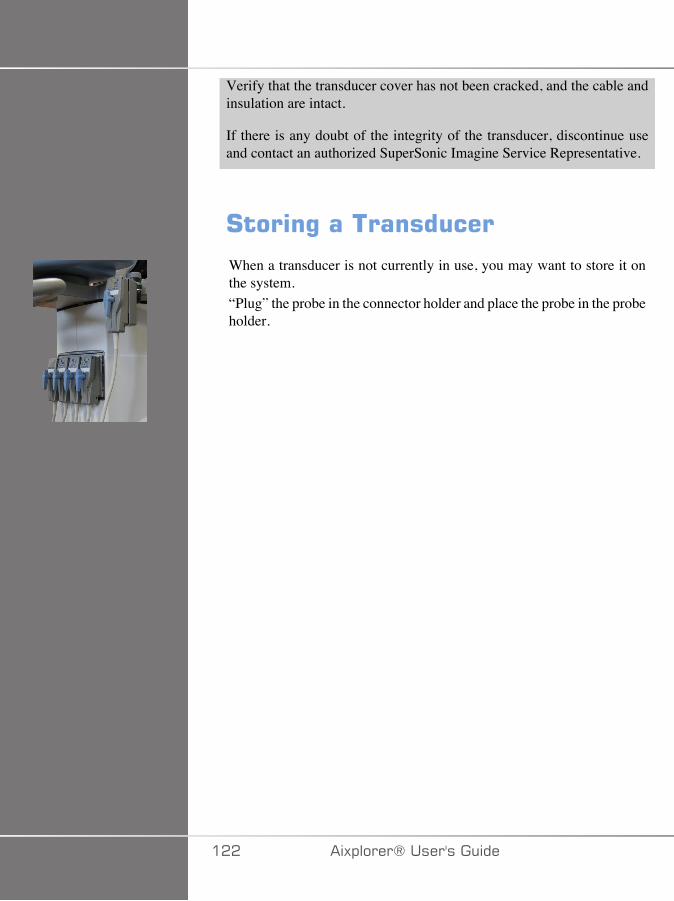
Verify that the transducer cover has not been cracked, and the cable andinsulation are intact.
If there is any doubt of the integrity of the transducer, discontinue useand contact an authorized SuperSonic Imagine Service Representative.
#����%������������
When a transducer is not currently in use, you may want to store it onthe system.“Plug” the probe in the connector holder and place the probe in the probeholder.
��� �)!�����*�����������
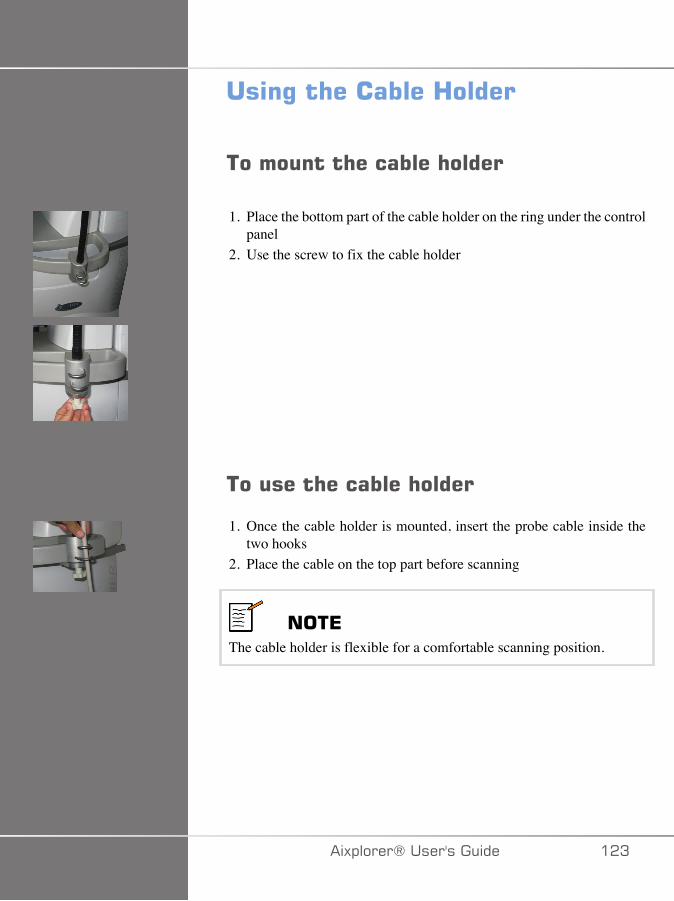
���%�� ��������3�����
��������� �������� �����
1. Place the bottom part of the cable holder on the ring under the controlpanel
2. Use the screw to fix the cable holder
������� �������� �����
1. Once the cable holder is mounted, insert the probe cable inside thetwo hooks
2. Place the cable on the top part before scanning
���*The cable holder is flexible for a comfortable scanning position.
�)!�����*����������� ��A
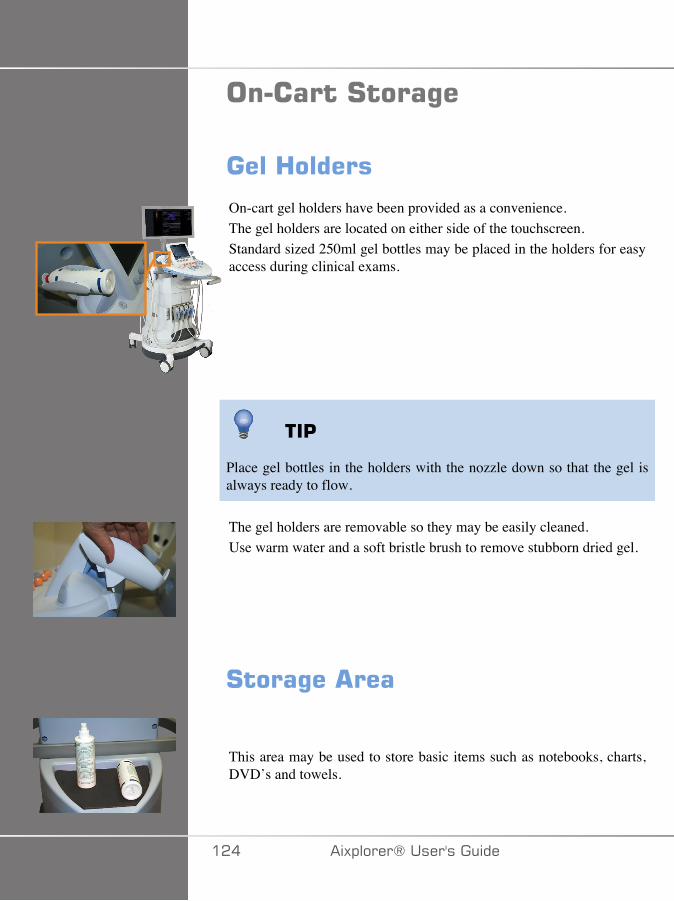
��������#����%�
����3������
On-cart gel holders have been provided as a convenience.The gel holders are located on either side of the touchscreen.Standard sized 250ml gel bottles may be placed in the holders for easyaccess during clinical exams.
��'
Place gel bottles in the holders with the nozzle down so that the gel isalways ready to flow.
The gel holders are removable so they may be easily cleaned.Use warm water and a soft bristle brush to remove stubborn dried gel.
#����%�� ���
This area may be used to store basic items such as notebooks, charts,DVD’s and towels.
��� �)!�����*�����������
� �����
Do not attempt to open the cart to attach devices.
Call your SuperSonic Imagine sales or service representative forassistance.
Incorrectly connecting electronic devices to the ultrasound system willvoid all warranties and may result in malfunction, electrical shock or fire.
Do not overload the system with peripheral devices or other equipmentweighing more than 9kg (20lbs).
Excessive loading of the system with peripherals, or stacking peripheralsoutside of the designated peripheral bay may cause system instability,resulting in the peripheral or system falling over.
�)!�����*����������� ���

�����(The SuperSonic Imagine Aixplorer® ultrasound system is a transportablecart based system.
The chassis is mounted on four swivel wheels (casters) which allow youto easily roll the system over flat surfaces.
Swivel wheels allow the user to steer the system around corners.
��'
Pushing the system is much easier and safer than pulling it. Grasp thehandles firmly and maintain an upright posture when pushing.
3������
Front mounted handles are provided to comfortably and safely grasp thesystem while moving.Large handles mounted beneath the control panel allow the user to firmlyand safely grasp the system when moving.To steer the system, move the handles in the opposite direction youwould like the cart to go (e.g. push handles to the right to steer the cartto the left).
� +����
The handles are not designed to be used to lift the system.
The handles are to be used only to push and pull the system.
To lift the system, it must be secured to a pallet, or be contained in itsoriginal shipping crate.
Do not use a hand-truck to move the system.
��C �)!�����*�����������
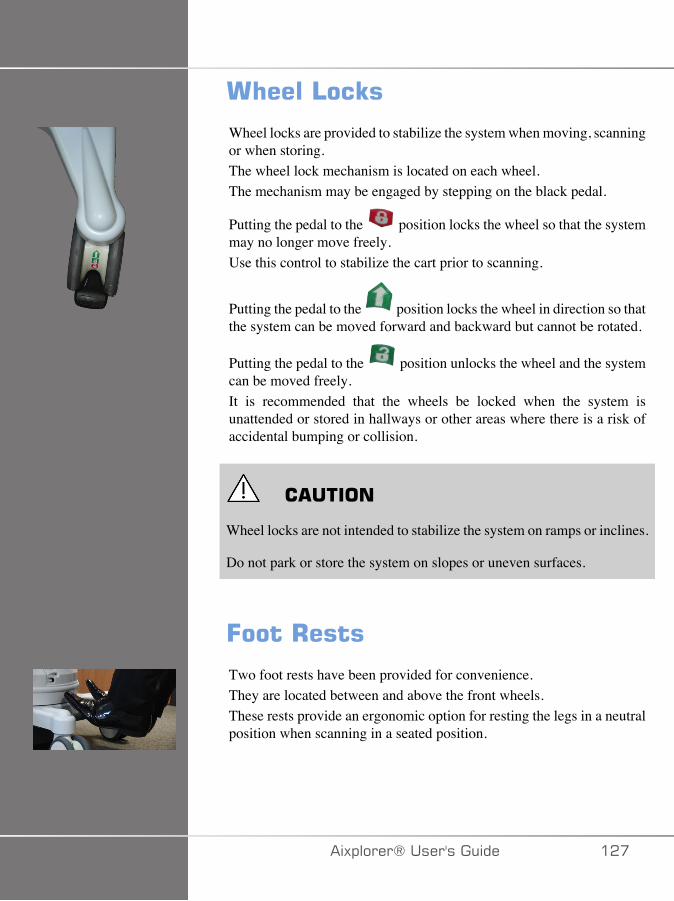
� ����4��E�
Wheel locks are provided to stabilize the system when moving, scanningor when storing.The wheel lock mechanism is located on each wheel.The mechanism may be engaged by stepping on the black pedal.
Putting the pedal to the position locks the wheel so that the systemmay no longer move freely.Use this control to stabilize the cart prior to scanning.
Putting the pedal to the position locks the wheel in direction so thatthe system can be moved forward and backward but cannot be rotated.
Putting the pedal to the position unlocks the wheel and the systemcan be moved freely.It is recommended that the wheels be locked when the system isunattended or stored in hallways or other areas where there is a risk ofaccidental bumping or collision.
� �����
Wheel locks are not intended to stabilize the system on ramps or inclines.
Do not park or store the system on slopes or uneven surfaces.
=����+����
Two foot rests have been provided for convenience.They are located between and above the front wheels.These rests provide an ergonomic option for resting the legs in a neutralposition when scanning in a seated position.
�)!�����*����������� ���

��"�%�� ��#(����
'��$���%������"��� ��#(����1. Turn the system power off.2. Unplug the main power cord, and disconnect any accessory cords
(network, etc.).3. Use the transducer cable management system to raise transducer
cables up from wheel level.4. Remove or ensure that all peripherals and items in the storage area are
secure.5. Lock the articulating monitor arm in its lowest position.6. Unlock the wheel locks.
��"�%�� ��#(����1. Grasp the handles at the front of the machine firmly.2. Keeping an upright posture, push the system forward.3. Steer by moving the handles in the opposite direction you would like
the cart to go (e.g. push handles to the right to steer the cart to the left).
� +����
Use caution when moving the system. It could cause injury to you orothers if it rolls over feet or into shins.
Use the monitor arm and control panel locking mechanisms when movingthe system.
Never attempt to lift the system manually.
In order to prevent injury, an aide such as a ramp or elevator must be used.
Exercise caution when going up or down ramps.
Do not push the system from either side with excessive force. The systemcould tip over.
��D �)!�����*�����������

Do not allow the wheels to roll over transducer or power cables.
If you encounter any failure of the wheels, handles or brakingmechanisms, park the system on a level surface in a safe area, setthe wheel locks and discontinue use until the mechanical parts can beinspected by an authorized SuperSonic Image Service representative.
�)!�����*����������� ��E
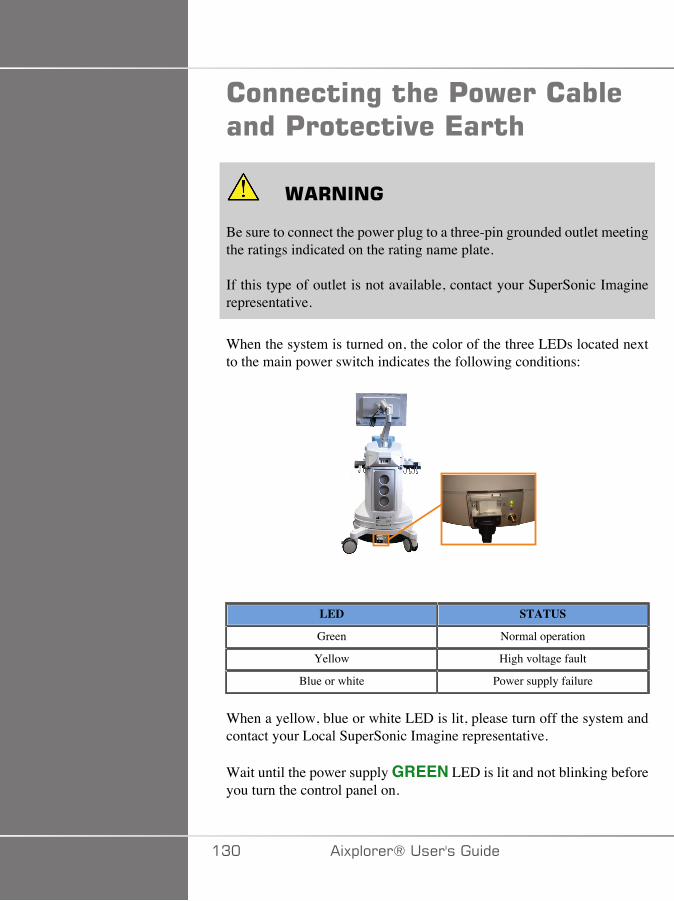
��������%�� ��'�)������������'������"��*���
� +����
Be sure to connect the power plug to a three-pin grounded outlet meetingthe ratings indicated on the rating name plate.
If this type of outlet is not available, contact your SuperSonic Imaginerepresentative.
When the system is turned on, the color of the three LEDs located nextto the main power switch indicates the following conditions:
LED STATUS
Green Normal operation
Yellow High voltage fault
Blue or white Power supply failure
When a yellow, blue or white LED is lit, please turn off the system andcontact your Local SuperSonic Imagine representative.
Wait until the power supply GREEN LED is lit and not blinking beforeyou turn the control panel on.
�A� �)!�����*�����������
�������������������%�� ������������) � �� ��$��������,��;���������������������
����������0 1DTo use another medical device in combination with this system, anequipotential wire for connecting to an equipotential bus must besupplied. For more information, contact your SuperSonic Imaginerepresentative. Be sure to connect the potential-equalization lead wirebefore inserting the equipment power plug into the receptacle. Also, besure to remove the equipment power plug from the receptacle beforedisconnecting the wire to avoid electrical shock.
���$������ �������������9��Under some use conditions, additional materials provided by third-partyvendors may be used by clinicians performing exams with the system.The decision to use the system and transducers with third-party productsis completely at the discretion of the clinician. The following tableslist products which are suitable for use with the Aixplorer® systemand transducers. The use of third-party products outside of those on thefollowing lists is to be done at the user’s and patient’s own risk.
�)!�����*����������� �A�
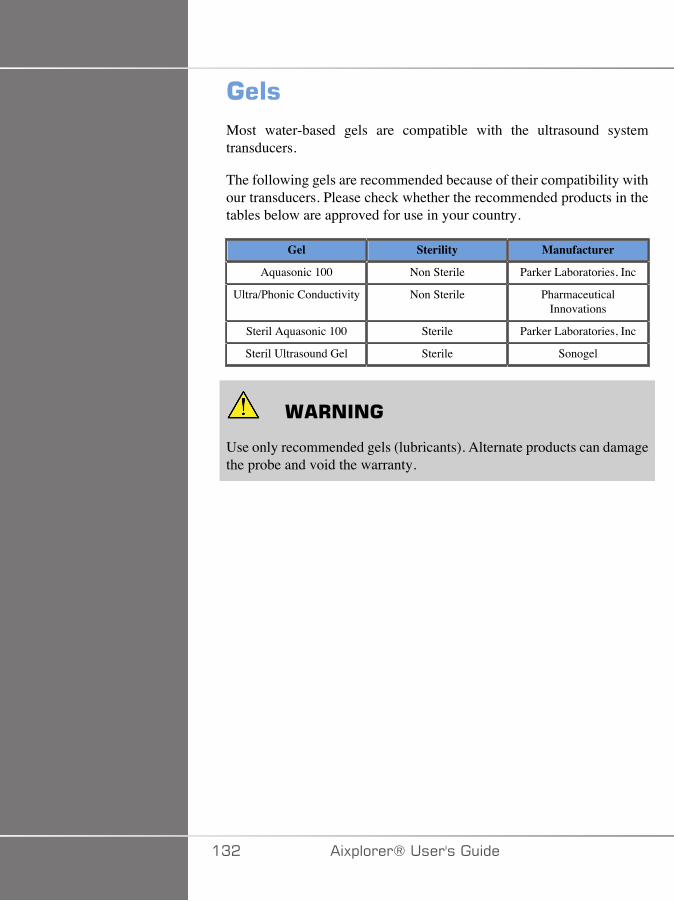
����Most water-based gels are compatible with the ultrasound systemtransducers.
The following gels are recommended because of their compatibility withour transducers. Please check whether the recommended products in thetables below are approved for use in your country.
Gel Sterility Manufacturer
Aquasonic 100 Non Sterile Parker Laboratories, Inc
Ultra/Phonic Conductivity Non Sterile PharmaceuticalInnovations
Steril Aquasonic 100 Sterile Parker Laboratories, Inc
Steril Ultrasound Gel Sterile Sonogel
� +����
Use only recommended gels (lubricants). Alternate products can damagethe probe and void the warranty.
�A� �)!�����*�����������
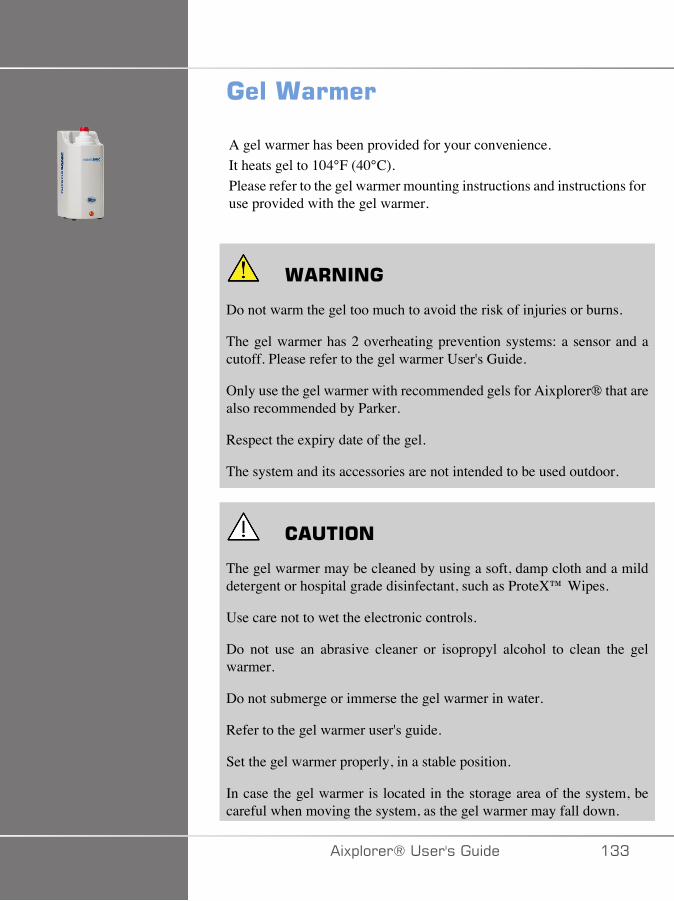
����������
A gel warmer has been provided for your convenience.It heats gel to 104°F (40°C).Please refer to the gel warmer mounting instructions and instructions foruse provided with the gel warmer.
� +����
Do not warm the gel too much to avoid the risk of injuries or burns.
The gel warmer has 2 overheating prevention systems: a sensor and acutoff. Please refer to the gel warmer User's Guide.
Only use the gel warmer with recommended gels for Aixplorer® that arealso recommended by Parker.
Respect the expiry date of the gel.
The system and its accessories are not intended to be used outdoor.
� �����
The gel warmer may be cleaned by using a soft, damp cloth and a milddetergent or hospital grade disinfectant, such as ProteX™ Wipes.
Use care not to wet the electronic controls.
Do not use an abrasive cleaner or isopropyl alcohol to clean the gelwarmer.
Do not submerge or immerse the gel warmer in water.
Refer to the gel warmer user's guide.
Set the gel warmer properly, in a stable position.
In case the gel warmer is located in the storage area of the system, becareful when moving the system, as the gel warmer may fall down.
�)!�����*����������� �AA
Only use ultrasound gels in the gel warmer. Do not use any otherproducts.
The gel warmer has a limited warranty. Please refer to the gel warmeruser's guide.
����������# ��� �Under certain conditions where the transducer may come in contact withmucous membranes, blood or other bodily fluids, the use of a transducersheath is recommended.
� +����
The use of a transducer cover is recommended.
After use, the single-use sheath should be removed and discarded.
Endocavity probe should be used with a sterile sheath.
If these probes are used to assist biopsy procedures, all of the biopsyaccessories should be sterile for the procedure and should be cleanedand resterilized according to manufacturer’s recommendations, after eachuse.
The SE12-3 and SEV12-3 probes should be cleaned and received highlevel disinfection after use, even if a sterile sheath was used.
Sheaths can fail during use and the level of resulting contamination maynot be easily visible.
The following tables list basic information regarding sterile transducersheaths which will physically fit our ultrasonic transducers. Please checkwhether the recommended products in the tables below are approved foruse in your country.
�A� �)!�����*�����������
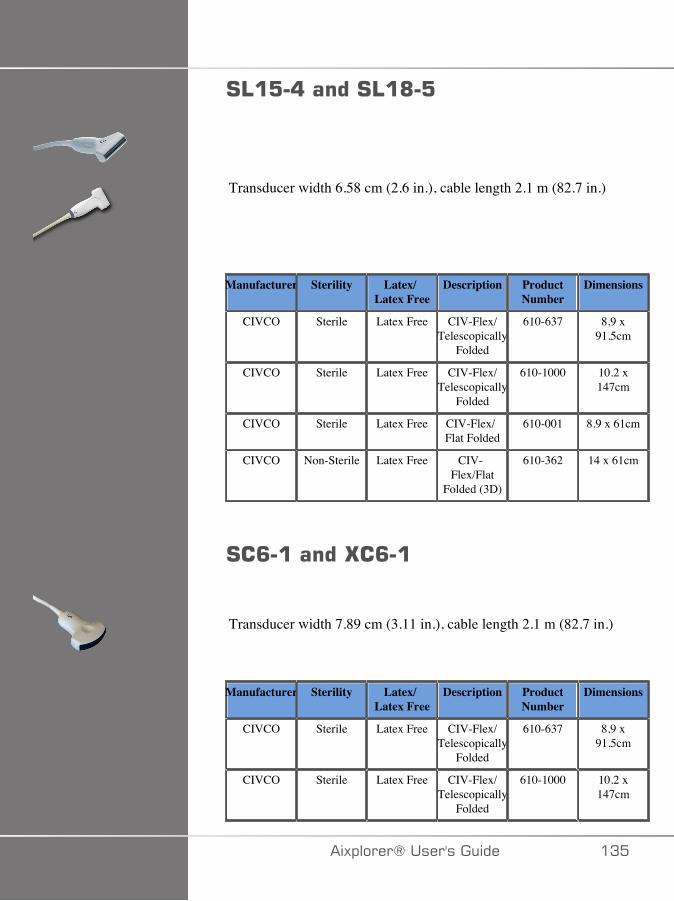
#4�:�8�����#4�@�:
Transducer width 6.58 cm (2.6 in.), cable length 2.1 m (82.7 in.)
Manufacturer Sterility Latex/Latex Free
Description ProductNumber
Dimensions
CIVCO Sterile Latex Free CIV-Flex/Telescopically
Folded
610-637 8,9 x91,5cm
CIVCO Sterile Latex Free CIV-Flex/Telescopically
Folded
610-1000 10.2 x147cm
CIVCO Sterile Latex Free CIV-Flex/Flat Folded
610-001 8.9 x 61cm
CIVCO Non-Sterile Latex Free CIV-Flex/Flat
Folded (3D)
610-362 14 x 61cm
#�<�������G�<���
Transducer width 7.89 cm (3.11 in.), cable length 2.1 m (82.7 in.)
Manufacturer Sterility Latex/Latex Free
Description ProductNumber
Dimensions
CIVCO Sterile Latex Free CIV-Flex/Telescopically
Folded
610-637 8,9 x91,5cm
CIVCO Sterile Latex Free CIV-Flex/Telescopically
Folded
610-1000 10.2 x147cm
�)!�����*����������� �A�
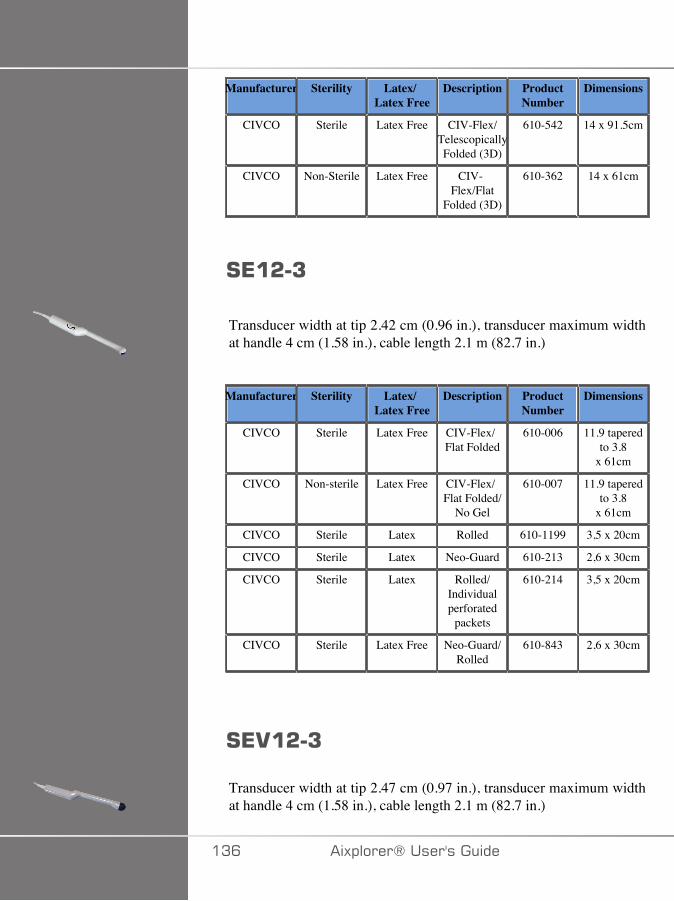
Manufacturer Sterility Latex/Latex Free
Description ProductNumber
Dimensions
CIVCO Sterile Latex Free CIV-Flex/TelescopicallyFolded (3D)
610-542 14 x 91.5cm
CIVCO Non-Sterile Latex Free CIV-Flex/Flat
Folded (3D)
610-362 14 x 61cm
#*�&�7
Transducer width at tip 2.42 cm (0.96 in.), transducer maximum widthat handle 4 cm (1.58 in.), cable length 2.1 m (82.7 in.)
Manufacturer Sterility Latex/Latex Free
Description ProductNumber
Dimensions
CIVCO Sterile Latex Free CIV-Flex/Flat Folded
610-006 11.9 taperedto 3.8
x 61cm
CIVCO Non-sterile Latex Free CIV-Flex/Flat Folded/
No Gel
610-007 11.9 taperedto 3.8
x 61cm
CIVCO Sterile Latex Rolled 610-1199 3,5 x 20cm
CIVCO Sterile Latex Neo-Guard 610-213 2,6 x 30cm
CIVCO Sterile Latex Rolled/Individualperforated
packets
610-214 3,5 x 20cm
CIVCO Sterile Latex Free Neo-Guard/Rolled
610-843 2,6 x 30cm
#*.�&�7
Transducer width at tip 2.47 cm (0.97 in.), transducer maximum widthat handle 4 cm (1.58 in.), cable length 2.1 m (82.7 in.)
�AC �)!�����*�����������
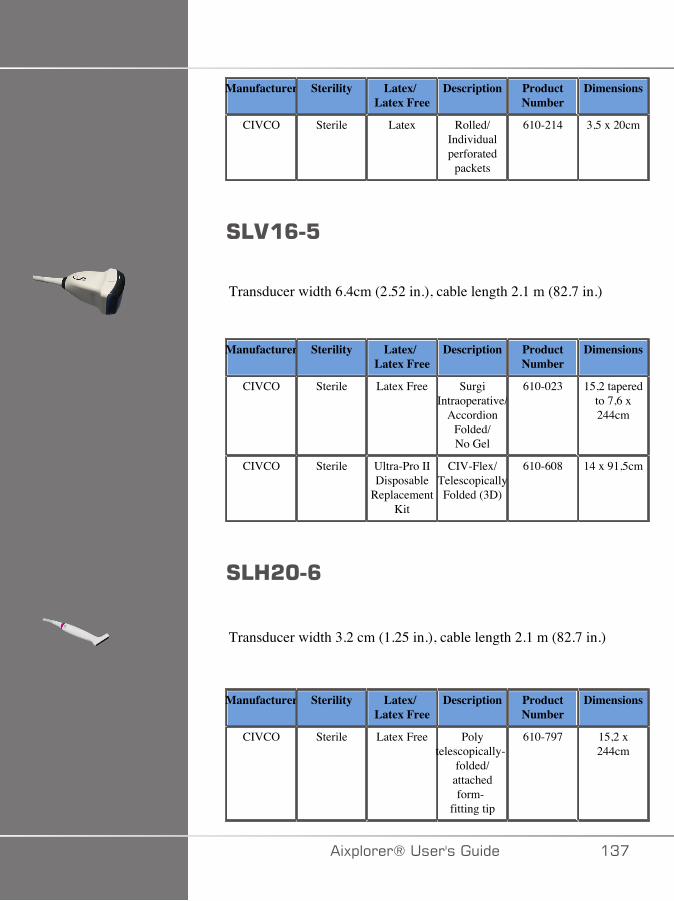
Manufacturer Sterility Latex/Latex Free
Description ProductNumber
Dimensions
CIVCO Sterile Latex Rolled/Individualperforated
packets
610-214 3,5 x 20cm
#4.�<�:
Transducer width 6.4cm (2.52 in.), cable length 2.1 m (82.7 in.)
Manufacturer Sterility Latex/Latex Free
Description ProductNumber
Dimensions
CIVCO Sterile Latex Free SurgiIntraoperative/
AccordionFolded/No Gel
610-023 15,2 taperedto 7,6 x244cm
CIVCO Sterile Ultra-Pro IIDisposable
ReplacementKit
CIV-Flex/TelescopicallyFolded (3D)
610-608 14 x 91,5cm
#43&C�<
Transducer width 3.2 cm (1.25 in.), cable length 2.1 m (82.7 in.)
Manufacturer Sterility Latex/Latex Free
Description ProductNumber
Dimensions
CIVCO Sterile Latex Free Polytelescopically-
folded/attachedform-
fitting tip
610-797 15,2 x244cm
�)!�����*����������� �A�
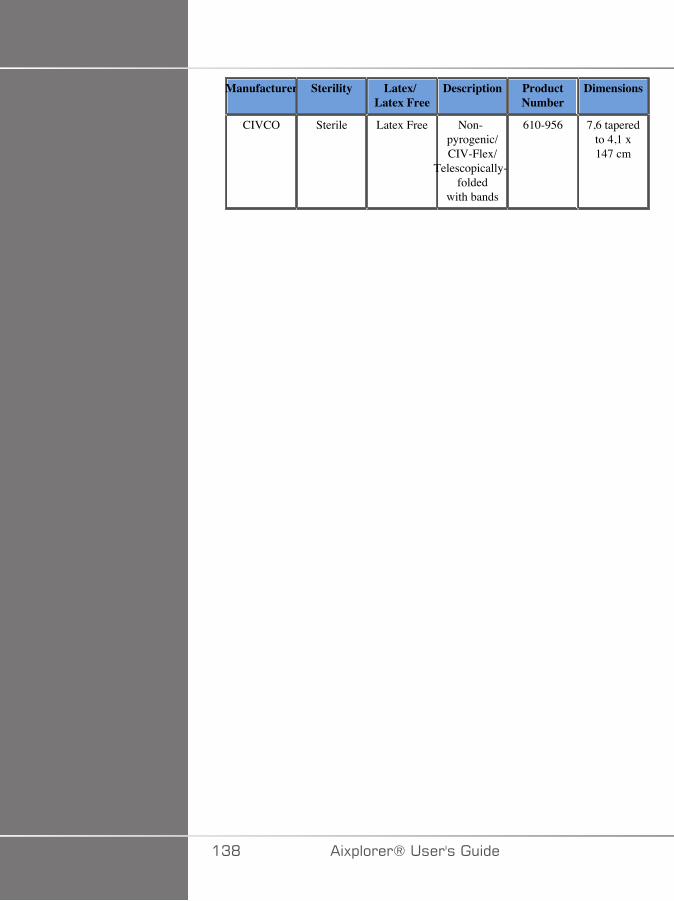
Manufacturer Sterility Latex/Latex Free
Description ProductNumber
Dimensions
CIVCO Sterile Latex Free Non-pyrogenic/CIV-Flex/
Telescopically-folded
with bands
610-956 7,6 taperedto 4,1 x147 cm
�AD �)!�����*�����������
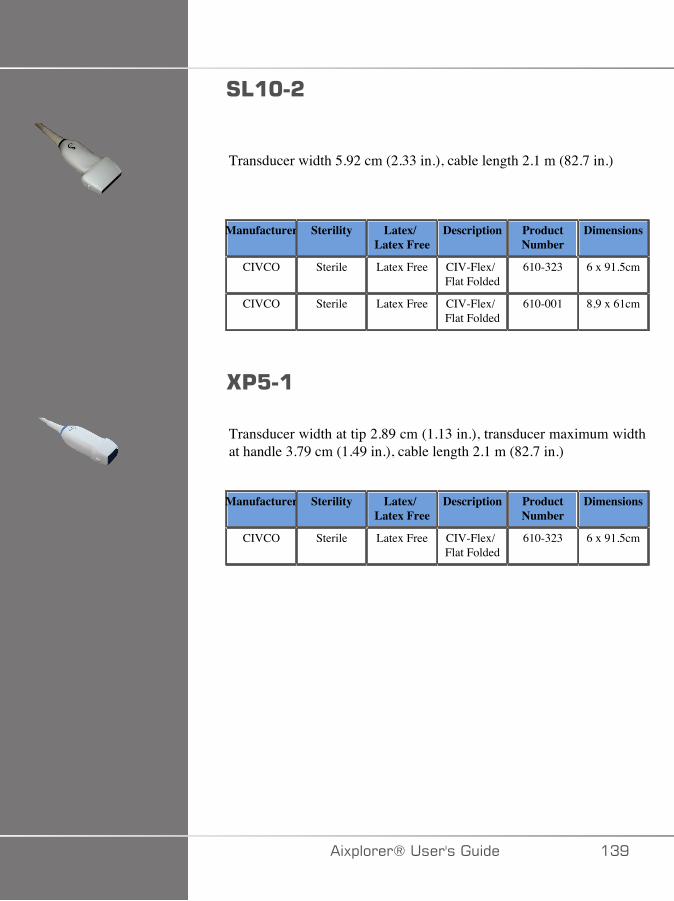
#4�C�&
Transducer width 5.92 cm (2.33 in.), cable length 2.1 m (82.7 in.)
Manufacturer Sterility Latex/Latex Free
Description ProductNumber
Dimensions
CIVCO Sterile Latex Free CIV-Flex/Flat Folded
610-323 6 x 91.5cm
CIVCO Sterile Latex Free CIV-Flex/Flat Folded
610-001 8,9 x 61cm
G':��
Transducer width at tip 2.89 cm (1.13 in.), transducer maximum widthat handle 3.79 cm (1.49 in.), cable length 2.1 m (82.7 in.)
Manufacturer Sterility Latex/Latex Free
Description ProductNumber
Dimensions
CIVCO Sterile Latex Free CIV-Flex/Flat Folded
610-323 6 x 91.5cm
�)!�����*����������� �AE
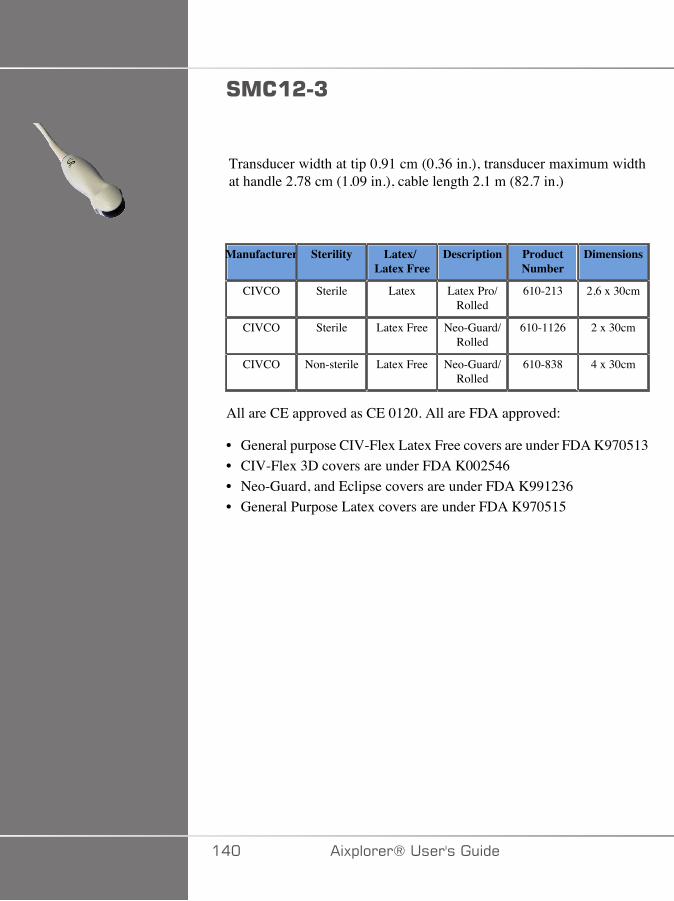
#���&�7
Transducer width at tip 0.91 cm (0.36 in.), transducer maximum widthat handle 2.78 cm (1.09 in.), cable length 2.1 m (82.7 in.)
Manufacturer Sterility Latex/Latex Free
Description ProductNumber
Dimensions
CIVCO Sterile Latex Latex Pro/Rolled
610-213 2,6 x 30cm
CIVCO Sterile Latex Free Neo-Guard/Rolled
610-1126 2 x 30cm
CIVCO Non-sterile Latex Free Neo-Guard/Rolled
610-838 4 x 30cm
All are CE approved as CE 0120. All are FDA approved:
• General purpose CIV-Flex Latex Free covers are under FDA K970513• CIV-Flex 3D covers are under FDA K002546• Neo-Guard, and Eclipse covers are under FDA K991236• General Purpose Latex covers are under FDA K970515
��� �)!�����*�����������

4 �*G��+ �#!��*+�#3* �3#
Transducers may be sheathed in latex or latex-free sheaths for semi-critical applications. However, the use of latex sheaths for any proceduremay involve the risk of an allergic reaction.
The following medical alert has been reprinted to inform the user of thepossible risk of using latex sheaths.
FDA Medical Alert, March 29, 1991, Allergic Reactions to Latex-Containing Medical Devices (FDA MDA91-1)
Because of reports of severe allergic reactions to medical devicescontaining latex (natural rubber), the FDA is advising health careprofessionals to identify their latex sensitive patients and be prepared totreat allergic reactions promptly.
Patient reactions to latex have ranged from contact urticaria to systemicanaphylaxis.
Latex is a component of many medical devices, including surgical andexamination gloves, catheters, intubation tubes, anesthesia masks, anddental dams.
Reports to the FDA of allergic reactions to latex-containing medicaldevices have increased lately.
One brand of latex cuffed enema tips was recently recalled after severalpatients died as a result of anaphylactoid reactions during barium enemaprocedures.
More reports of latex sensitivity have also been found in the medicalliterature.
Repeated exposure to latex both in medical devices and in other consumerproducts may be part of the reason that the prevalence of latex sensitivityappears to be increasing.
For example, it has been reported that 6% to 7% of surgical personneland 18% to 40% of spina bifida patients are latex sensitive.
Proteins in the latex itself appear to be the primary source of the allergicreactions.
�)!�����*����������� ���

Although it is not known how much protein is likely to cause severereactions, the FDA is working with manufacturers of latex- containingmedical devices to make protein levels in their products as low aspossible.
FDA’s recommendations to health professionals in regard to this problemare as follows:
When taking general histories of patients, include questions about latexsensitivity.
For surgical and radiology patients, spina bifida patients and health careworkers, this recommendation is especially important.
Questions about itching, rash or wheezing after wearing latex gloves orinflating a toy balloon may be useful.
Patients with positive histories should have their charts flagged.
If latex sensitivity is suspected, consider using devices made withalternative materials, such as plastic. For example, a health professionalcould wear a non-latex glove over the latex glove if the patient issensitive.
If both the health professional and the patient are sensitive, a latex middleglove could be used. (Latex gloves labeled “Hypoallergenic” may notalways prevent adverse reactions.)
Whenever latex-containing medical devices are used, especially when thelatex comes in contact with mucous membranes, be alert to the possibilityof an allergic reaction.
If an allergic reaction does occur and latex is suspected, advise the patientof a possible latex sensitivity and consider an immunologic evaluation.
Advise the patient to tell health professionals and emergency personnelabout any known latex sensitivity before undergoing medical procedures.
Consider advising patients with severe latex sensitivity to wear a medicalidentification bracelet.
The FDA is asking health professionals to report incidents of adversereactions to latex or other materials used in medical devices. (See theOctober 1990 FDA Drug Bulletin)
��� �)!�����*�����������
To report an incident, call the FDA Problem ReportingProgram, operating through the U.S. Pharmacopeia toll-free number:800-638-6725.
For questions about FDA activity related to latex sensitivity andanesthesiology, call the Office of Health Affairs, Center for Devices andRadiological Health, Rockville MD.
For a single copy of a reference list on latex sensitivity, write to: LATEX,FDA, HFZ-220, Rockville, MD 20857.
������%�#������See Chapter 9, System Care & Maintenance [429] for detailsregarding disinfection and cleaning and associated products.
'������'�$������������See Chapter 9, System Care & Maintenance [429] for detailsregarding changing printer paper and toner and associated products.
� �����
Additional equipment connected to medical electrical equipment mustcomply with the respective IEC or ISO standards (e.g. IEC 60950 for dataprocessing equipment).
Furthermore all configurations shall comply with the requirements formedical electrical systems (see IEC 60601-1).
Any person connecting accessory equipment to medical electricalequipment is configuring a medical system and is therefore responsiblethat the system(s) complies with the requirements for medical electricalsystems.
Attention is drawn to the fact that local laws take priority over the abovementioned requirements.
�)!�����*����������� ��A
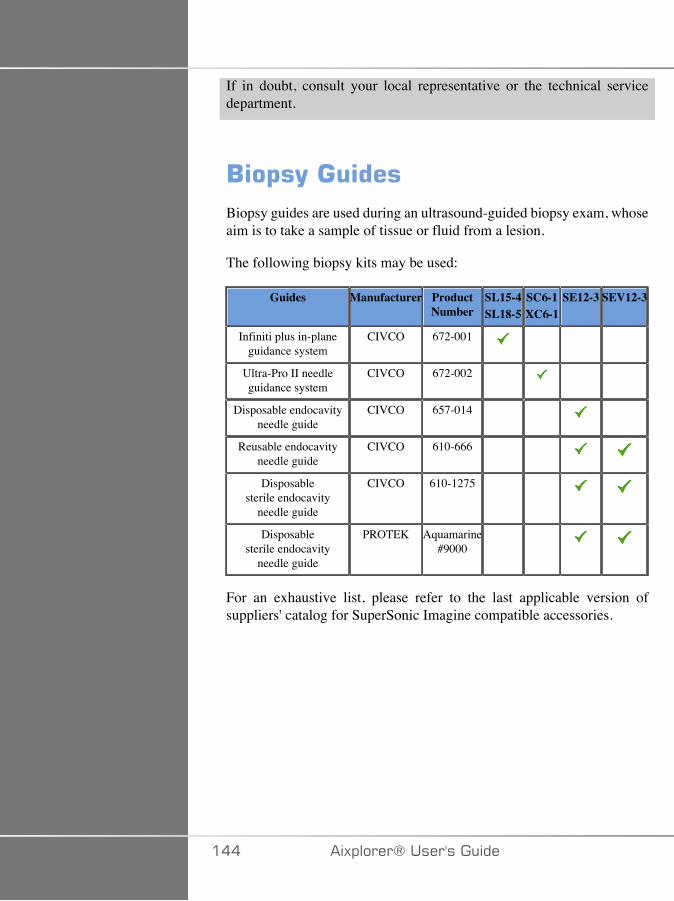
If in doubt, consult your local representative or the technical servicedepartment.
/�$�(�����Biopsy guides are used during an ultrasound-guided biopsy exam, whoseaim is to take a sample of tissue or fluid from a lesion.
The following biopsy kits may be used:
Guides Manufacturer ProductNumber
SL15-4SL18-5
SC6-1XC6-1
SE12-3 SEV12-3
Infiniti plus in-planeguidance system
CIVCO 672-001
Ultra-Pro II needleguidance system
CIVCO 672-002
Disposable endocavityneedle guide
CIVCO 657-014
Reusable endocavityneedle guide
CIVCO 610-666
Disposablesterile endocavity
needle guide
CIVCO 610-1275
Disposablesterile endocavity
needle guide
PROTEK Aquamarine#9000
For an exhaustive list, please refer to the last applicable version ofsuppliers' catalog for SuperSonic Imagine compatible accessories.
��� �)!�����*�����������

:����%�� ��#(����
�)!�����*����������� ���

��C �)!�����*�����������
���"������
���"��������������� �����������This user's guide uses the following conventions:
All procedures are numbered. You must complete steps in the sequencethey are presented to ensure a correct result.
Bulleted lists indicate general information about a particular function orprocedure. They do not imply a sequential procedure.
Control names, menu items and/or titles are spelled as they are on thesystem.
Symbols appear as they appear on the system.
The left side of the system is to your left as you stand in front of thesystem, facing the system.
Touch means to press a button on the touch screen.
�)!�����*����������� ���
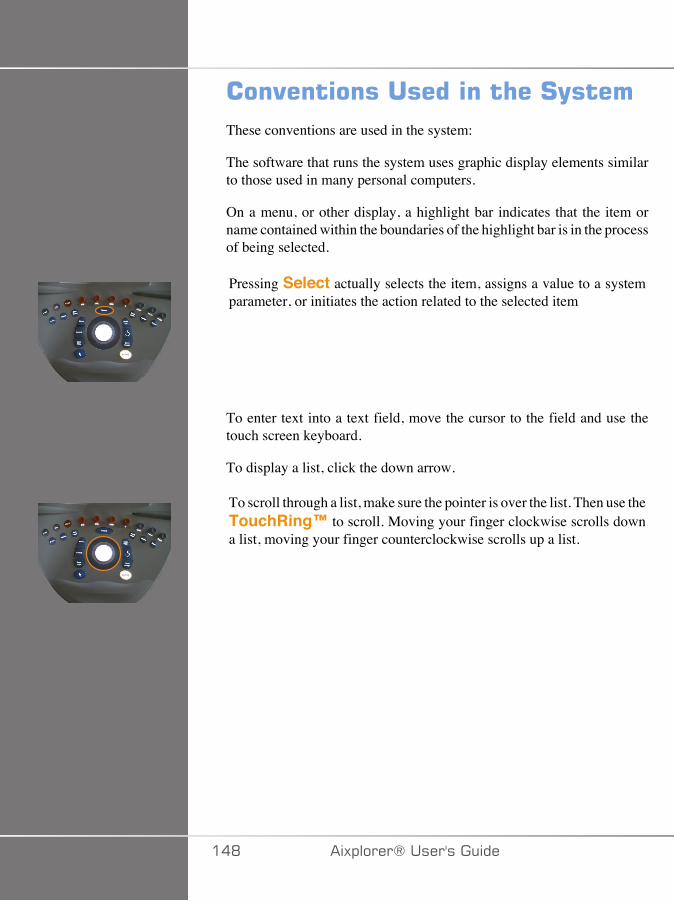
���"��������������� ��#(����These conventions are used in the system:
The software that runs the system uses graphic display elements similarto those used in many personal computers.
On a menu, or other display, a highlight bar indicates that the item orname contained within the boundaries of the highlight bar is in the processof being selected.
Pressing Select actually selects the item, assigns a value to a systemparameter, or initiates the action related to the selected item
To enter text into a text field, move the cursor to the field and use thetouch screen keyboard.
To display a list, click the down arrow.
To scroll through a list, make sure the pointer is over the list. Then use theTouchRing™ to scroll. Moving your finger clockwise scrolls downa list, moving your finger counterclockwise scrolls up a list.
��D �)!�����*�����������
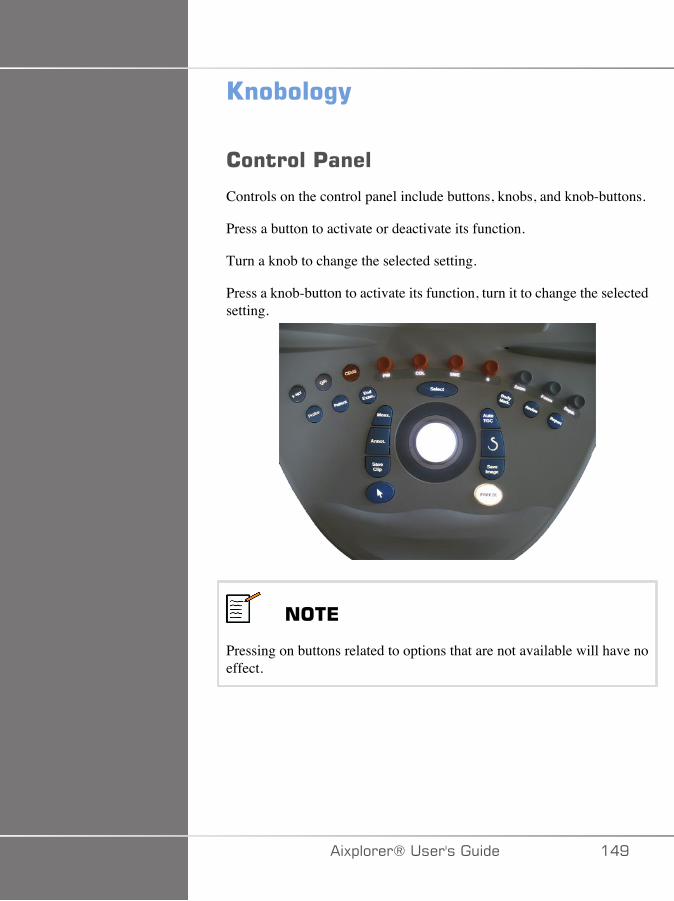
9������%(
��������'����
Controls on the control panel include buttons, knobs, and knob-buttons.
Press a button to activate or deactivate its function.
Turn a knob to change the selected setting.
Press a knob-button to activate its function, turn it to change the selectedsetting.
���*
Pressing on buttons related to options that are not available will have noeffect.
�)!�����*����������� ��E
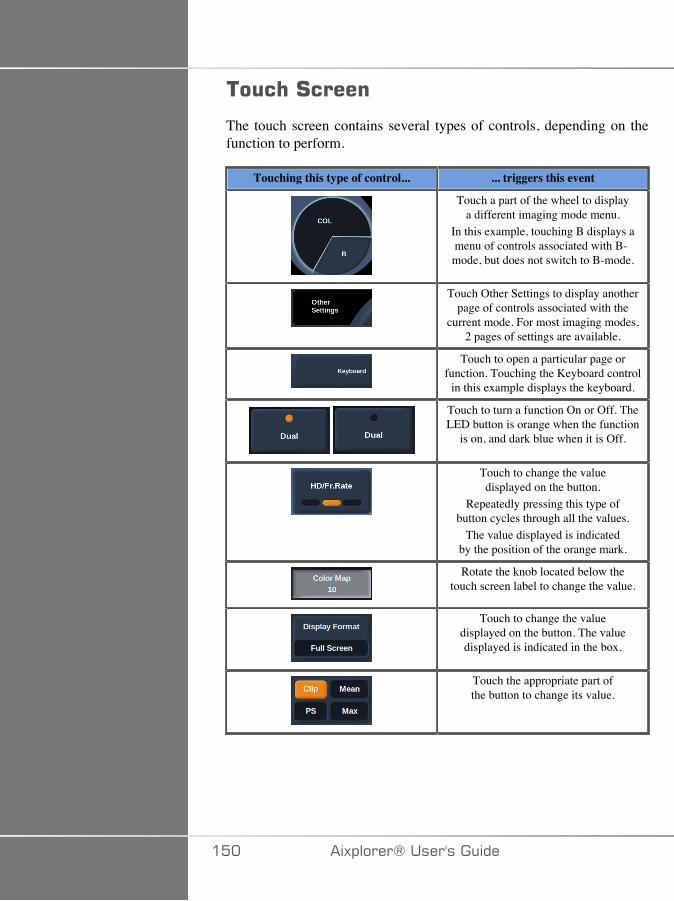
��� �#�����
The touch screen contains several types of controls, depending on thefunction to perform.
Touching this type of control... ... triggers this event
Touch a part of the wheel to displaya different imaging mode menu.
In this example, touching B displays amenu of controls associated with B-mode, but does not switch to B-mode.
Touch Other Settings to display anotherpage of controls associated with the
current mode. For most imaging modes,2 pages of settings are available.
Touch to open a particular page orfunction. Touching the Keyboard control
in this example displays the keyboard.
Touch to turn a function On or Off. TheLED button is orange when the function
is on, and dark blue when it is Off.
Touch to change the valuedisplayed on the button.
Repeatedly pressing this type ofbutton cycles through all the values.
The value displayed is indicatedby the position of the orange mark.
Rotate the knob located below thetouch screen label to change the value.
Touch to change the valuedisplayed on the button. The valuedisplayed is indicated in the box.
Touch the appropriate part ofthe button to change its value.
��� �)!�����*�����������
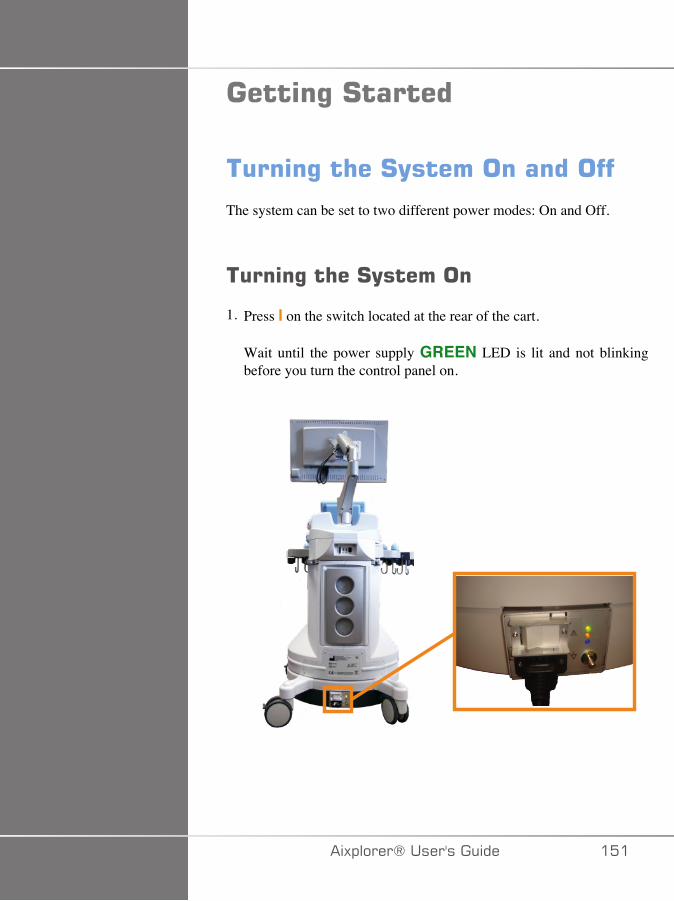
�����%�#������
����%�� ��#(���������������
The system can be set to two different power modes: On and Off.
����%�� ��#(�������
1. Press I on the switch located at the rear of the cart.
Wait until the power supply GREEN LED is lit and not blinkingbefore you turn the control panel on.
�)!�����*����������� ���
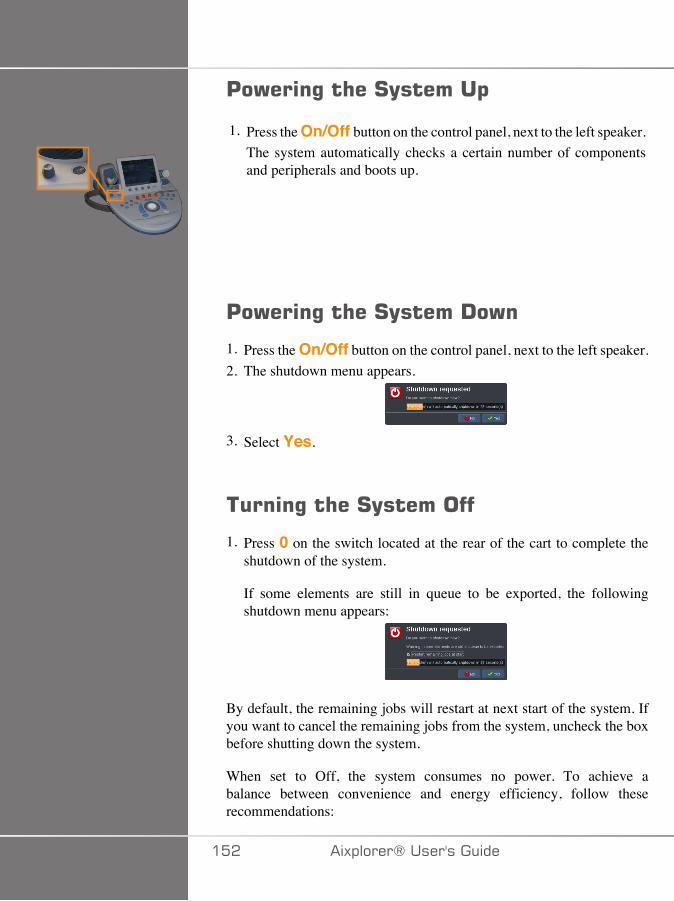
'�)���%�� ��#(������$
1. Press the On/Off button on the control panel, next to the left speaker.The system automatically checks a certain number of componentsand peripherals and boots up.
'�)���%�� ��#(�����!�)�
1. Press the On/Off button on the control panel, next to the left speaker.2. The shutdown menu appears.
3. Select Yes.
����%�� ��#(��������
1. Press 0 on the switch located at the rear of the cart to complete theshutdown of the system.
If some elements are still in queue to be exported, the followingshutdown menu appears:
By default, the remaining jobs will restart at next start of the system. Ifyou want to cancel the remaining jobs from the system, uncheck the boxbefore shutting down the system.
When set to Off, the system consumes no power. To achieve abalance between convenience and energy efficiency, follow theserecommendations:
��� �)!�����*�����������
• If the system will not be used overnight, switch the system to Off atthe end of the day. Press the On/Off switch above the control panel toturn the system off.
• If the system will not be used for longer than overnight, power thesystem down. Press the On/Off button on the control panel to powerthe system down.
Always use the procedures listed here for turning off the system, ifpossible.
Turning off the system in any other way will result in longer initializationtime when the system is turned on again, and may cause other problems.
� �����
Turn on the system only after the power has been off for more than 15seconds. If the system is turned on immediately after being turned off,the system may malfunction.
If power cannot be turned off by the normal procedure, press and holddown On/Off for at least 5 seconds. If the power is still not turned off,turn off the switch of the power supply panel at the rear of the system.
These methods should not be used under normal conditions. They maydamage the system.
If the power is not turned off by following the normal procedures, B-mode images may not be displayed when the system power is turned onagain. This does not indicate system failure. Turn off the switch on thepower supply panel on the rear of the system, wait at least 15 seconds,and then turn the system power on.
Never shut down the system while files are being transferred. Datacorruption or loss may result.
� +����
For emergency stop of the device, use the switch located at the bottomrear of Aixplorer®
�)!�����*����������� ��A
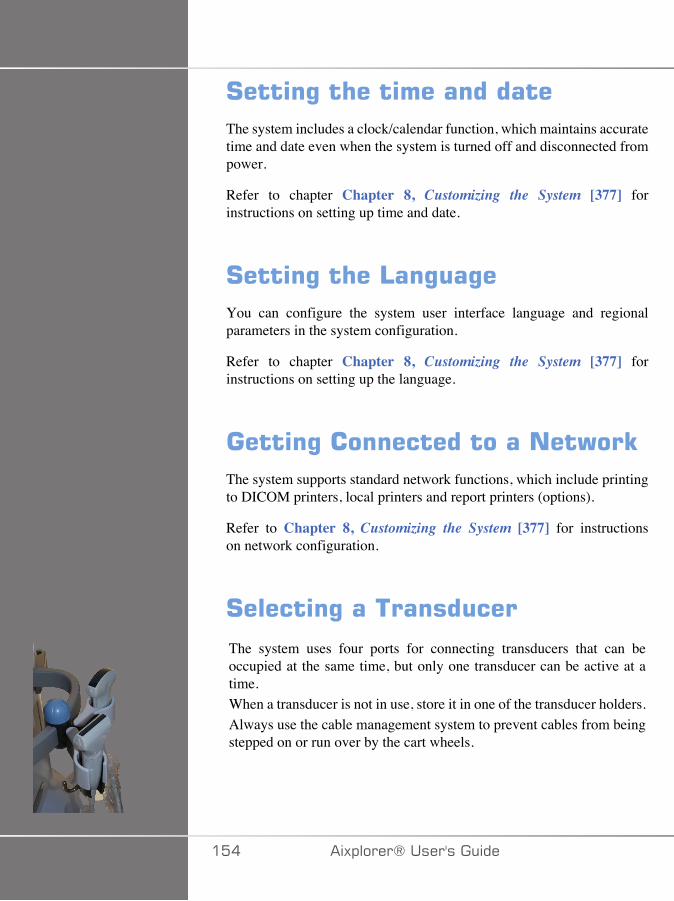
#����%�� ��������������The system includes a clock/calendar function, which maintains accuratetime and date even when the system is turned off and disconnected frompower.
Refer to chapter Chapter 8, Customizing the System [377] forinstructions on setting up time and date.
#����%�� ��4��%�%�You can configure the system user interface language and regionalparameters in the system configuration.
Refer to chapter Chapter 8, Customizing the System [377] forinstructions on setting up the language.
�����%�������������������)��EThe system supports standard network functions, which include printingto DICOM printers, local printers and report printers (options).
Refer to Chapter 8, Customizing the System [377] for instructionson network configuration.
#������%������������The system uses four ports for connecting transducers that can beoccupied at the same time, but only one transducer can be active at atime.When a transducer is not in use, store it in one of the transducer holders.Always use the cable management system to prevent cables from beingstepped on or run over by the cart wheels.
��� �)!�����*�����������
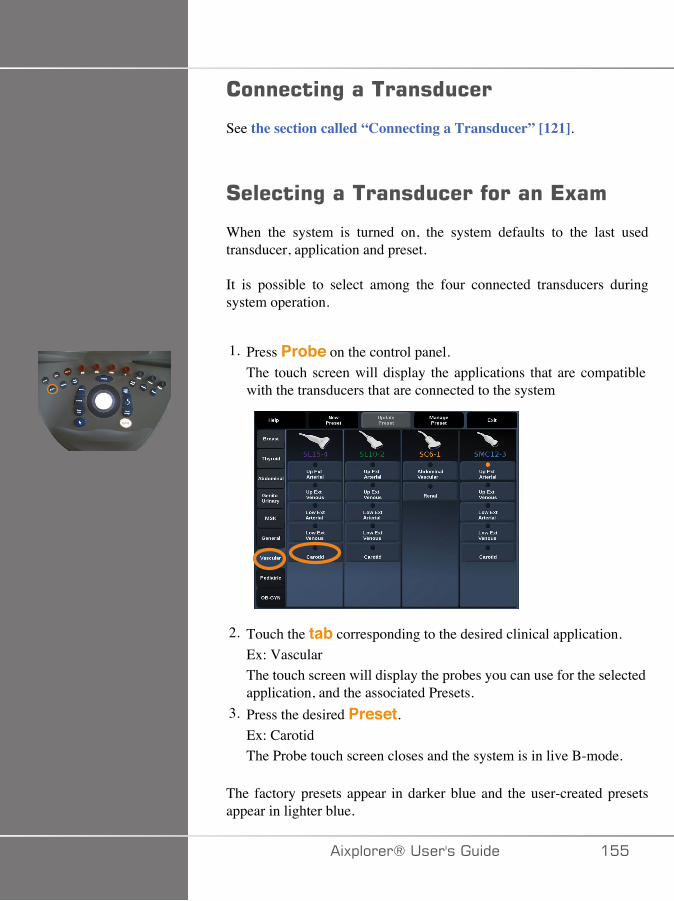
��������%������������
See the section called “Connecting a Transducer” [121].
#������%��������������������*5��
When the system is turned on, the system defaults to the last usedtransducer, application and preset.
It is possible to select among the four connected transducers duringsystem operation.
1. Press Probe on the control panel.The touch screen will display the applications that are compatiblewith the transducers that are connected to the system
2. Touch the tab corresponding to the desired clinical application.Ex: VascularThe touch screen will display the probes you can use for the selectedapplication, and the associated Presets.
3. Press the desired Preset.Ex: CarotidThe Probe touch screen closes and the system is in live B-mode.
The factory presets appear in darker blue and the user-created presetsappear in lighter blue.
�)!�����*����������� ���
���*
It is possible to customize the displayed list of presets in the systemconfiguration. Refer to Chapter 8, Customizing the System [377]
The selected transducer, application and preset appear on the header ofthe imaging main display.
� +����
Use only recommended gels (lubricants). Alternate products can damagethe probe and void the warranty.
/�%���%����*5��
�����%�+���(
Before acquiring images, you may want to create a patient exam orretrieve a patient you already created in the system.Before scanning a new patient, make sure the previous exam has beenended, by doing one of the following:
• Press End Exam on the control panel.• Press New Patient on the touch screen.
��C �)!�����*�����������
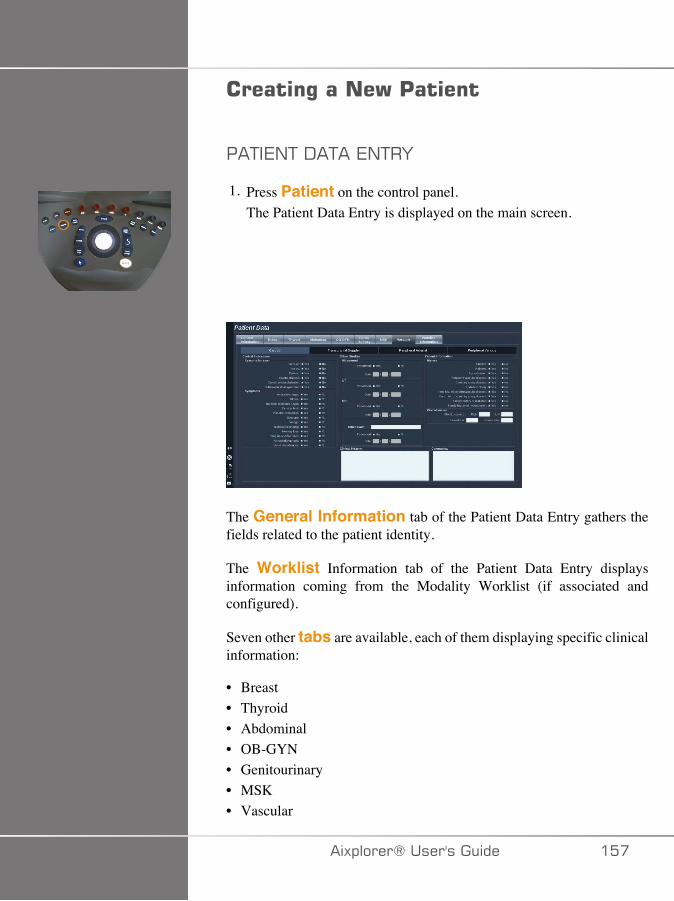
������%�����)�'�����
��+�7/+�-�+��7/+�F
1. Press Patient on the control panel.The Patient Data Entry is displayed on the main screen.
The General Information tab of the Patient Data Entry gathers thefields related to the patient identity.
The Worklist Information tab of the Patient Data Entry displaysinformation coming from the Modality Worklist (if associated andconfigured).
Seven other tabs are available, each of them displaying specific clinicalinformation:
• Breast• Thyroid• Abdominal• OB-GYN• Genitourinary• MSK• Vascular
�)!�����*����������� ���
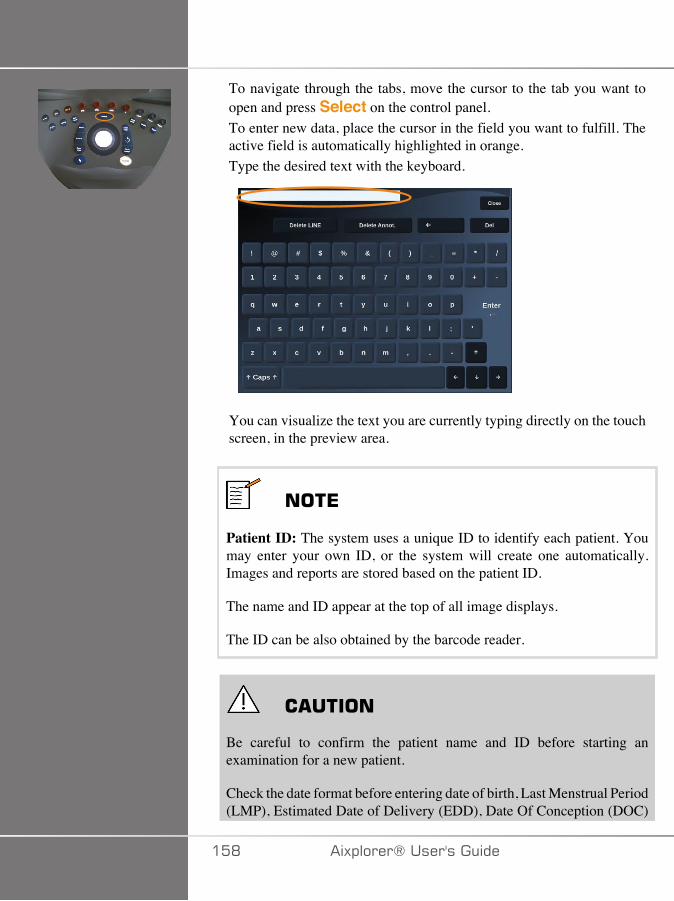
To navigate through the tabs, move the cursor to the tab you want toopen and press Select on the control panel.To enter new data, place the cursor in the field you want to fulfill. Theactive field is automatically highlighted in orange.Type the desired text with the keyboard.
You can visualize the text you are currently typing directly on the touchscreen, in the preview area.
���*
Patient ID: The system uses a unique ID to identify each patient. Youmay enter your own ID, or the system will create one automatically.Images and reports are stored based on the patient ID.
The name and ID appear at the top of all image displays.
The ID can be also obtained by the barcode reader.
� �����
Be careful to confirm the patient name and ID before starting anexamination for a new patient.
Check the date format before entering date of birth, Last Menstrual Period(LMP), Estimated Date of Delivery (EDD), Date Of Conception (DOC)
��D �)!�����*�����������
and Ovulation Date. Incorrect entry of these parameters will result in anincorrect Gestational Age (GA).
Enter the EDD and GA in the patient's medical record for backup.
Check the "Activate OB calcs" button on the Patient Data Entry page(PDE) in order to perform obstetric calculations.
It is necessary to specify which OB author is to be used for each particularmeasurement to calculate the GA and get an Estimated Fetal Weight(EFW).
A diagnosis can not be only based on one measurement or data. Be carefulto always consider the overall clinical evaluation of the patient, includingthe medical record.
Depending on fetal position, some measurements may be incorrect. Becareful to always consider the overall clinical evaluation of the patient,including the medical record.
The system provides fetal measurements for up to five fetuses. Be carefulnot to confuse the fetuses during measurements.
For each measurement performed, you can select either the first,last, average, minimum, maximum or specifically one of the fivemeasurements that are allowed to be displayed, using the selector featurein the Measurements tab of the Report.
Be careful when deleting measurements, as this will affect the selectorresult.
Deviations from the normal values of measurements must be judgedbased on the graphs and literature.
+;� <;;�7���2�:�7��/���:��+�
1. Move the cursor to the arrow on the right of the drop-down list.2. Press Select to display the list.3. Move the cursor down to the selected value and press Select again
to validate your choice.
�)!�����*����������� ��E
You can save the Patient Data Entry as an image of the exam.To do so, press Save Image while in the Patient Data Entry.This will save the active tab as a screenshot.
4����%���'���������������� �������(����E���
.�/-�/��7G�,���/�+<7�>;�0:��+
This feature is available if the system is connected to the network and theDICOM feature is enabled.
1. Press Patient on the control panel.
The Patient Data Entry is displayed on the main screen.
The Patient touch screen is now displayed.
���*
If a Modality Worklist is configured and associated, pressingEnd Exam will automatically display the Modality Worklist (ifconfigured).
2. Touch M.Worklist on the touch screen.
The modality worklist is displayed on the main screen.
�C� �)!�����*�����������
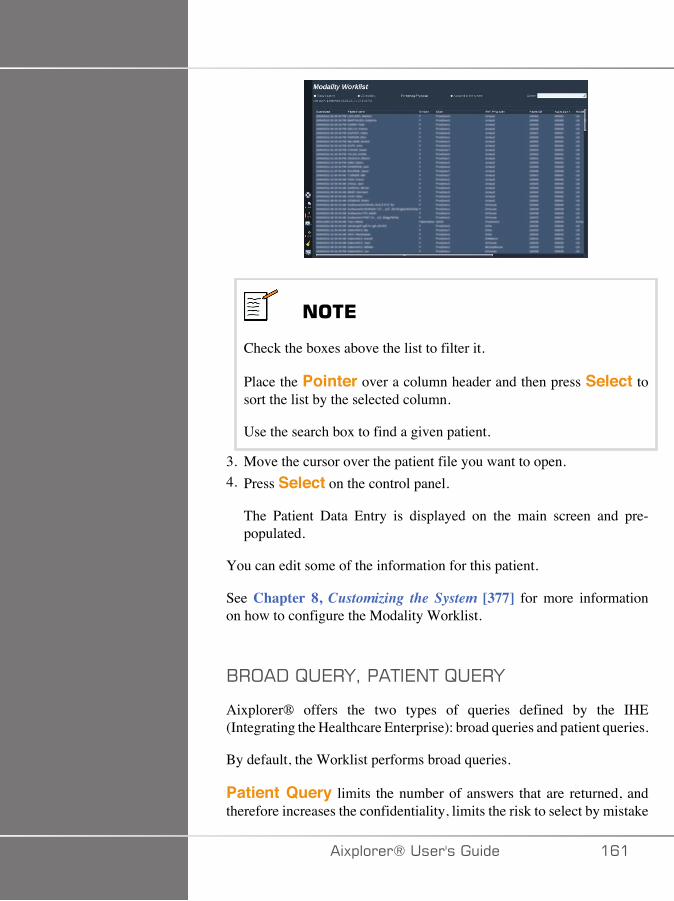
���*
Check the boxes above the list to filter it.
Place the Pointer over a column header and then press Select tosort the list by the selected column.
Use the search box to find a given patient.
3. Move the cursor over the patient file you want to open.4. Press Select on the control panel.
The Patient Data Entry is displayed on the main screen and pre-populated.
You can edit some of the information for this patient.
See Chapter 8, Customizing the System [377] for more informationon how to configure the Modality Worklist.
1�;�-�B�7�FI���+�7/+�B�7�F
Aixplorer® offers the two types of queries defined by the IHE(Integrating the Healthcare Enterprise): broad queries and patient queries.
By default, the Worklist performs broad queries.
Patient Query limits the number of answers that are returned, andtherefore increases the confidentiality, limits the risk to select by mistake
�)!�����*����������� �C�
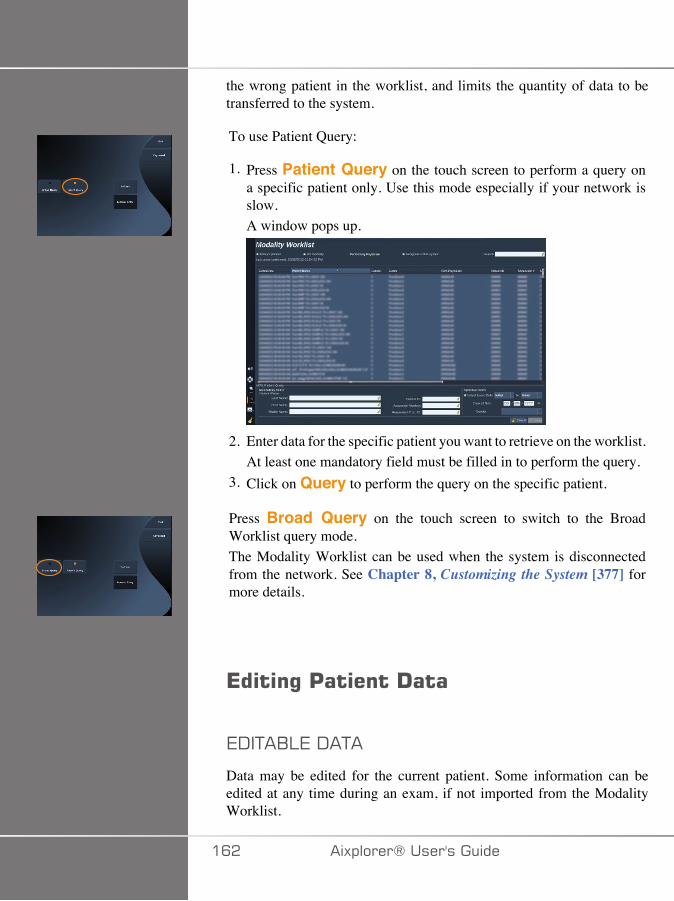
the wrong patient in the worklist, and limits the quantity of data to betransferred to the system.
To use Patient Query:
1. Press Patient Query on the touch screen to perform a query ona specific patient only. Use this mode especially if your network isslow.A window pops up.
2. Enter data for the specific patient you want to retrieve on the worklist.At least one mandatory field must be filled in to perform the query.
3. Click on Query to perform the query on the specific patient.
Press Broad Query on the touch screen to switch to the BroadWorklist query mode.The Modality Worklist can be used when the system is disconnectedfrom the network. See Chapter 8, Customizing the System [377] formore details.
*���%�'������!���
7-�+�1:7�-�+�
Data may be edited for the current patient. Some information can beedited at any time during an exam, if not imported from the ModalityWorklist.
�C� �)!�����*�����������
+;�7-�+���+�7/+�-�+�
1. Place the text cursor in the field you want to edit.
The active field is highlighted in orange.2. Type the new text with the keyboard.
If you edit one of the identifier fields, a pop up message is displayed.Press Yes to confirm or No to cancel.
The identifier fields are the following:
• Patient Last Name• Patient First Name• Patient Middle Name• Patient ID• Accession Number• All the fields in the DICOM tab of the Patient Data Entry
���*
If you edit one of the fields listed above AFTER the exam was sent toa server, the DICOM store may start a new exam with the new patientinformation.
Entering the patient's height and weight automatically calculates theBody Mass Index (BMI).
*���%����*5��
Make sure all the images you need are saved.After the exam is complete, end the exam as follows:Press End Exam on the control panel.
�)!�����*����������� �CA
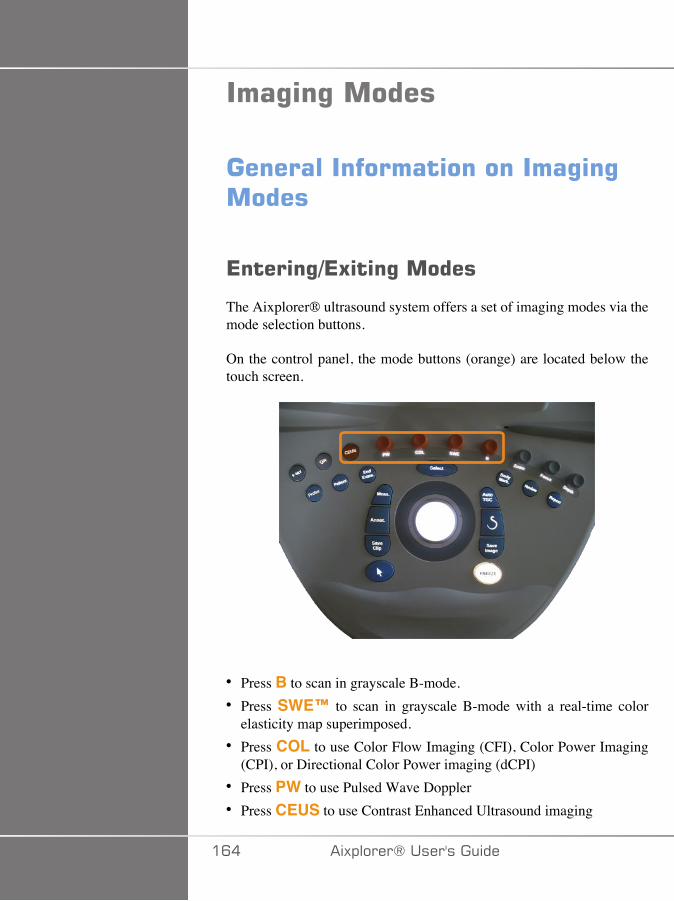
���%�%������
�������������������������%�%�����
*�����%-*5��%������
The Aixplorer® ultrasound system offers a set of imaging modes via themode selection buttons.
On the control panel, the mode buttons (orange) are located below thetouch screen.
• Press B to scan in grayscale B-mode.• Press SWE™ to scan in grayscale B-mode with a real-time color
elasticity map superimposed.• Press COL to use Color Flow Imaging (CFI), Color Power Imaging
(CPI), or Directional Color Power imaging (dCPI)• Press PW to use Pulsed Wave Doppler• Press CEUS to use Contrast Enhanced Ultrasound imaging
�C� �)!�����*�����������
���*
Access to 3D and M modes is given on the touch screen.
In any mode other than B-mode, whenever the B key is pressed, thecurrent mode is exited and B-mode is displayed.
The previous settings are restored.
�)!�����*����������� �C�
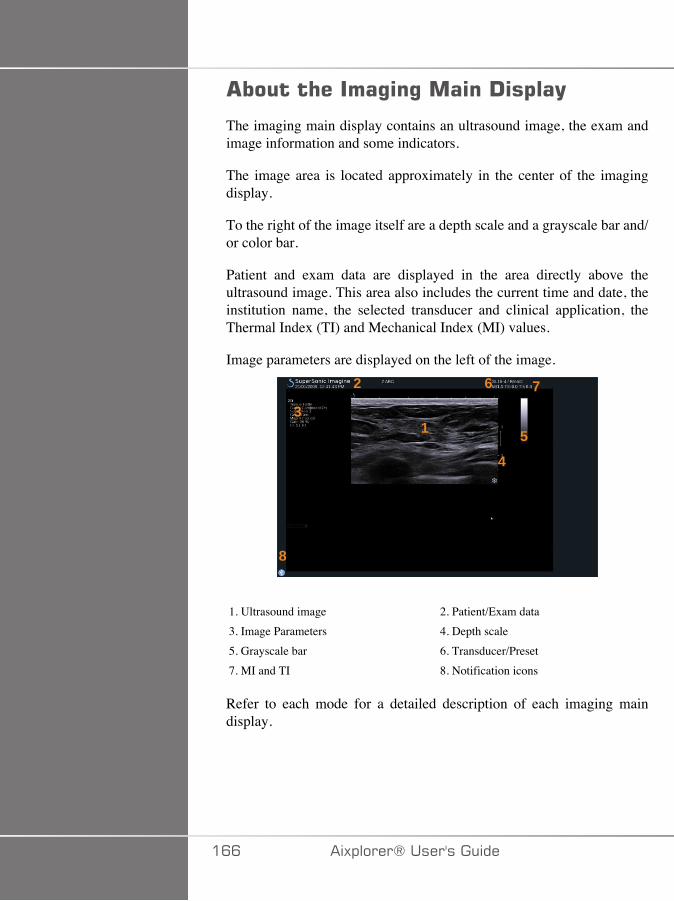
����� �����%�%�����!�$��(
The imaging main display contains an ultrasound image, the exam andimage information and some indicators.
The image area is located approximately in the center of the imagingdisplay.
To the right of the image itself are a depth scale and a grayscale bar and/or color bar.
Patient and exam data are displayed in the area directly above theultrasound image. This area also includes the current time and date, theinstitution name, the selected transducer and clinical application, theThermal Index (TI) and Mechanical Index (MI) values.
Image parameters are displayed on the left of the image.
�
�
�
�
�
�
� �
1. Ultrasound image 2. Patient/Exam data3. Image Parameters 4. Depth scale5. Grayscale bar 6. Transducer/Preset7. MI and TI 8. Notification icons
Refer to each mode for a detailed description of each imaging maindisplay.
�CC �)!�����*�����������

���������������
Some icons appear at the bottom left of the main display to inform youabout the state of the system.
Icon Meaning
There is a CD in the CD/DVD drive
The system is burning a CD
Error during CD burning
There is a DVD in the CD/DVD drive
The system is burning a DVD
Error during DVD burning
No CD or DVD in the CD/DVD drive
There is a USB device plugged in
The system is exporting data to a USB device
Error during USB export
The system is connected to a network
Network error
The system is exporting data to a DICOM store SCP
Error with the DICOM Modality Worklist SCP
�)!�����*����������� �C�
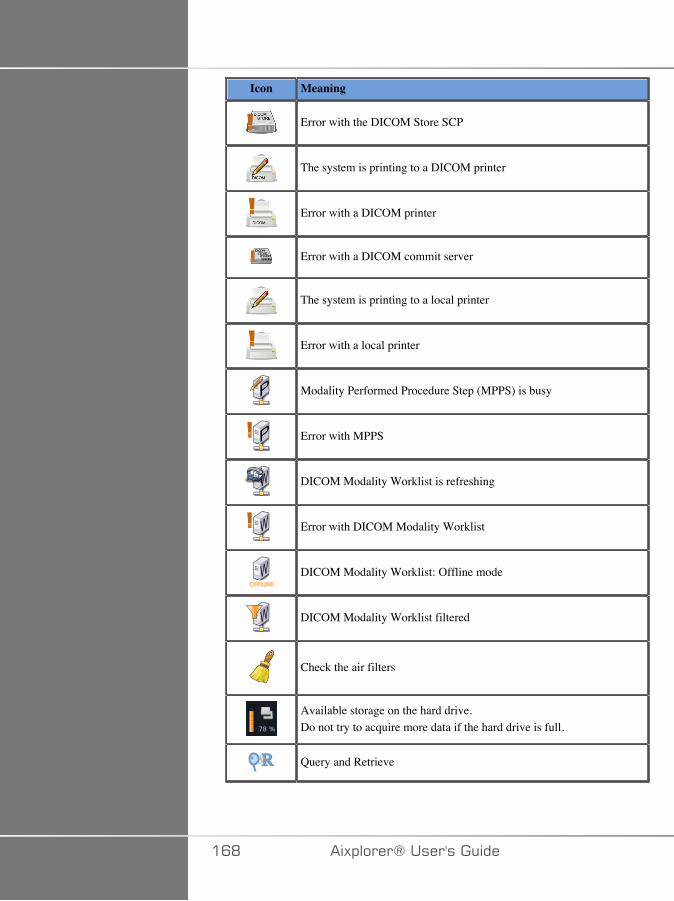
Icon Meaning
Error with the DICOM Store SCP
The system is printing to a DICOM printer
Error with a DICOM printer
Error with a DICOM commit server
The system is printing to a local printer
Error with a local printer
� Modality Performed Procedure Step (MPPS) is busy
� Error with MPPS
� DICOM Modality Worklist is refreshing
� Error with DICOM Modality Worklist
� DICOM Modality Worklist: Offline mode
� DICOM Modality Worklist filtered
Check the air filters
Available storage on the hard drive.Do not try to acquire more data if the hard drive is full.
R& Query and Retrieve
�CD �)!�����*�����������
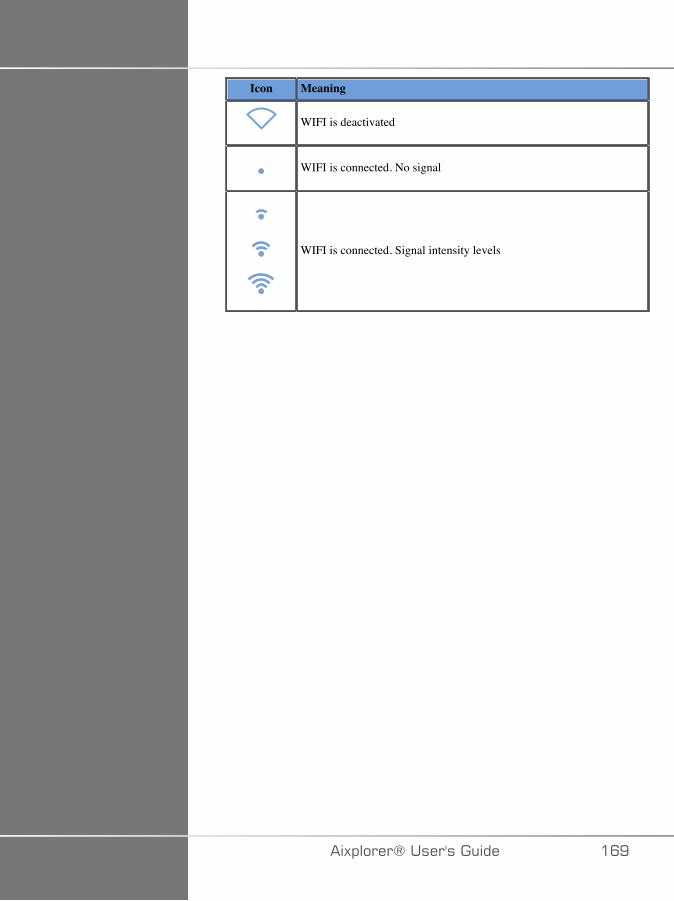
Icon Meaning
WIFI is deactivated
WIFI is connected. No signal
WIFI is connected. Signal intensity levels
�)!�����*����������� �CE
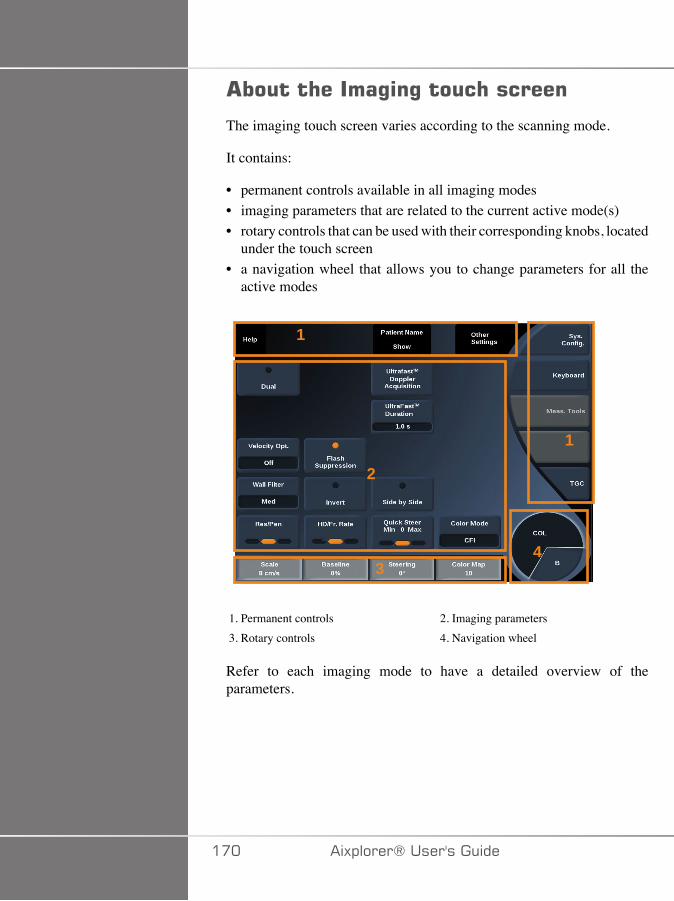
����� �����%�%���� �������
The imaging touch screen varies according to the scanning mode.
It contains:
• permanent controls available in all imaging modes• imaging parameters that are related to the current active mode(s)• rotary controls that can be used with their corresponding knobs, located
under the touch screen• a navigation wheel that allows you to change parameters for all the
active modes
�
�
�
�
�
1. Permanent controls 2. Imaging parameters3. Rotary controls 4. Navigation wheel
Refer to each imaging mode to have a detailed overview of theparameters.
��� �)!�����*�����������
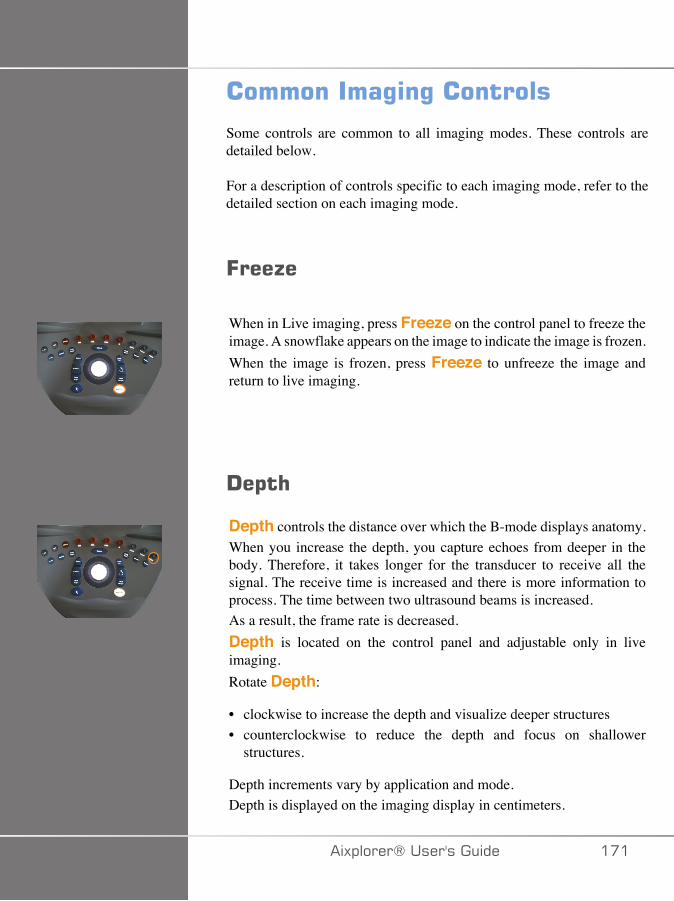
����������%�%���������
Some controls are common to all imaging modes. These controls aredetailed below.
For a description of controls specific to each imaging mode, refer to thedetailed section on each imaging mode.
=���;�
When in Live imaging, press Freeze on the control panel to freeze theimage. A snowflake appears on the image to indicate the image is frozen.When the image is frozen, press Freeze to unfreeze the image andreturn to live imaging.
!�$�
Depth controls the distance over which the B-mode displays anatomy.When you increase the depth, you capture echoes from deeper in thebody. Therefore, it takes longer for the transducer to receive all thesignal. The receive time is increased and there is more information toprocess. The time between two ultrasound beams is increased.As a result, the frame rate is decreased.Depth is located on the control panel and adjustable only in liveimaging.Rotate Depth:
• clockwise to increase the depth and visualize deeper structures• counterclockwise to reduce the depth and focus on shallower
structures.
Depth increments vary by application and mode.Depth is displayed on the imaging display in centimeters.
�)!�����*����������� ���
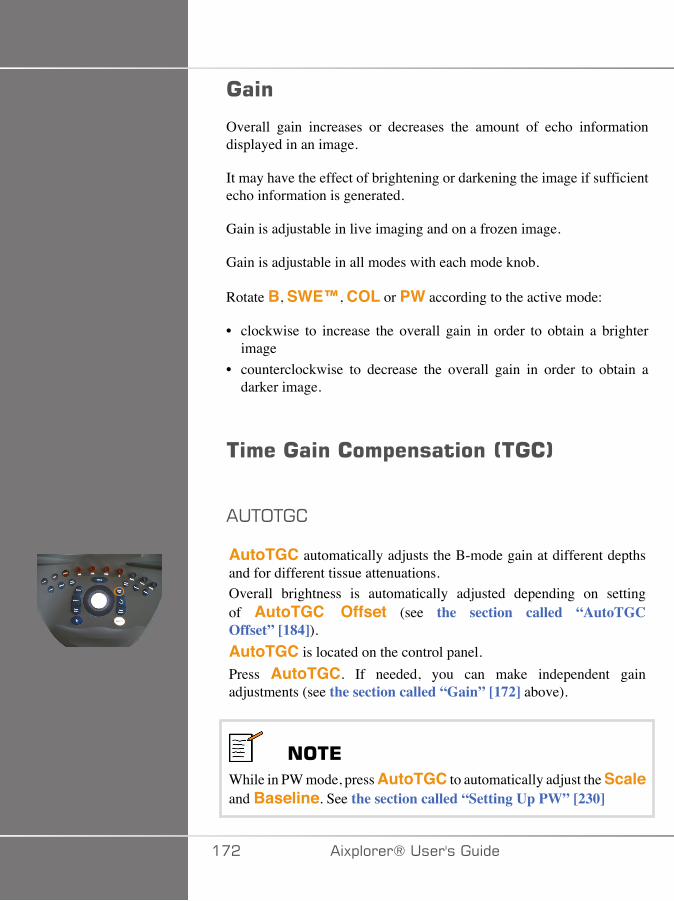
���
Overall gain increases or decreases the amount of echo informationdisplayed in an image.
It may have the effect of brightening or darkening the image if sufficientecho information is generated.
Gain is adjustable in live imaging and on a frozen image.
Gain is adjustable in all modes with each mode knob.
Rotate B, SWE™, COL or PW according to the active mode:
• clockwise to increase the overall gain in order to obtain a brighterimage
• counterclockwise to decrease the overall gain in order to obtain adarker image.
�����������$��������0���1
��+;+�
AutoTGC automatically adjusts the B-mode gain at different depthsand for different tissue attenuations.Overall brightness is automatically adjusted depending on settingof AutoTGC Offset (see the section called “AutoTGCOffset” [184]).AutoTGC is located on the control panel.Press AutoTGC. If needed, you can make independent gainadjustments (see the section called “Gain” [172] above).
���*While in PW mode, press AutoTGC to automatically adjust the Scaleand Baseline. See the section called “Setting Up PW” [230]
��� �)!�����*�����������
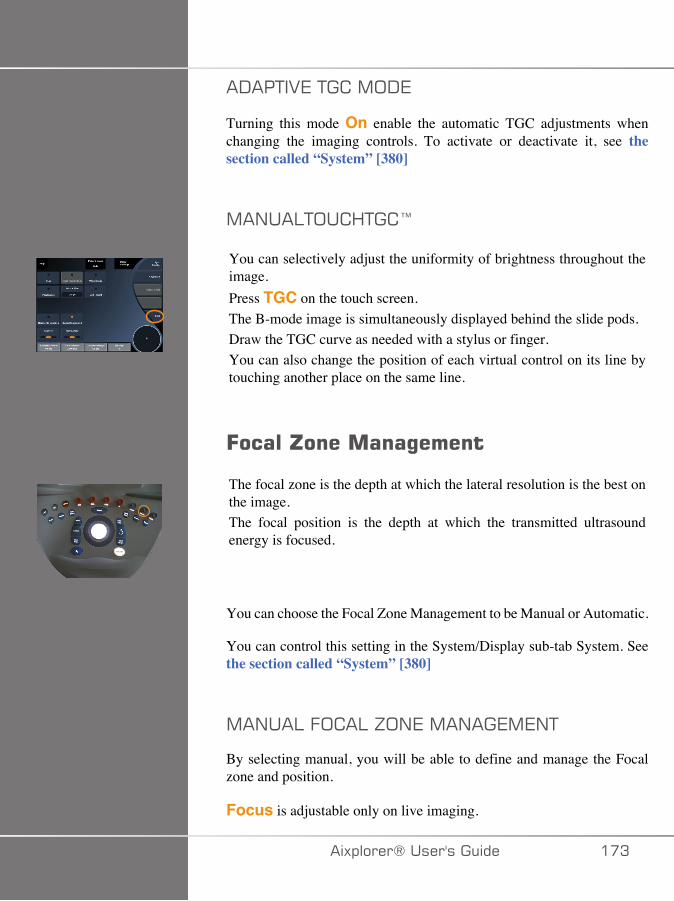
�-��+�27�+� �,;-7
Turning this mode On enable the automatic TGC adjustments whenchanging the imaging controls. To activate or deactivate it, see thesection called “System” [380]
,�/��:+;� <+� @
You can selectively adjust the uniformity of brightness throughout theimage.Press TGC on the touch screen.The B-mode image is simultaneously displayed behind the slide pods.Draw the TGC curve as needed with a stylus or finger.You can also change the position of each virtual control on its line bytouching another place on the same line.
=�����H��������%�����
The focal zone is the depth at which the lateral resolution is the best onthe image.The focal position is the depth at which the transmitted ultrasoundenergy is focused.
You can choose the Focal Zone Management to be Manual or Automatic.
You can control this setting in the System/Display sub-tab System. Seethe section called “System” [380]
,�/��:�.; �:�J;/7�,�/��7,7/+
By selecting manual, you will be able to define and manage the Focalzone and position.
Focus is adjustable only on live imaging.
�)!�����*����������� ��A

Focus is located on the control panel.
Rotate Focus:
• clockwise to place the focal zone deeper• counterclockwise to place the focal zone at a shallower depth
Press Focus and then rotate it:
• clockwise to increase the size of the focal zone• counterclockwise to decrease the size of the focal zone
Press Focus again to move the focal zone.
Changing the size of the Focal Zone affects the frame rate.
The larger the Focal Zone, the slower the frame rate.
��+;,�+� �.; �:�J;/7
By using the automatic option, the Focal Zone will be automaticallymanaged to provide the most appropriated focal zone size and position.The ratio between the Focal Zone size and depth will be maintained andthe Focal Zone position will be adjusted within any depth change.
H���
A region of interest in imaging modes can be magnified for closerexamination. Two types of zoom are available on Aixplorer®: HD Zoomand Digital Zoom.
<-�J;;,
HD Zoom concentrates the system acquisition and processing ability ona specific region of interest in the real-time image display.
��� �)!�����*�����������
The result is a reduced field of view overall, but greater detail and higherframe rate, which contribute to better image quality over the region ofinterest.
HD Zoom is adjustable only in live imaging.
To use the HD Zoom function:
1. Press Zoom on the control panel
A box appears on the image.2. Use the trackball to move the zoom box3. Press Select to arbitrate the trackball to Box size4. Use the trackball to resize the zoom box5. Press Zoom again to have an enlarged image6. Press Zoom again to exit zoom
-���+�:�J;;,
Digital Zoom is a magnifying post-processing function. As such, it hasno effect on the frame rate.
Digital Zoom is adjustable in live imaging and on a frozen image.
Rotate Zoom:
• clockwise to increase the zoom factor• counterclockwise to decrease the zoom factor
���*
In live imaging, both HD Zoom and Digital zoom may be used at thesame time.
Press Reset Zoom to set the zoom back to the preset default value.
�)!�����*����������� ���
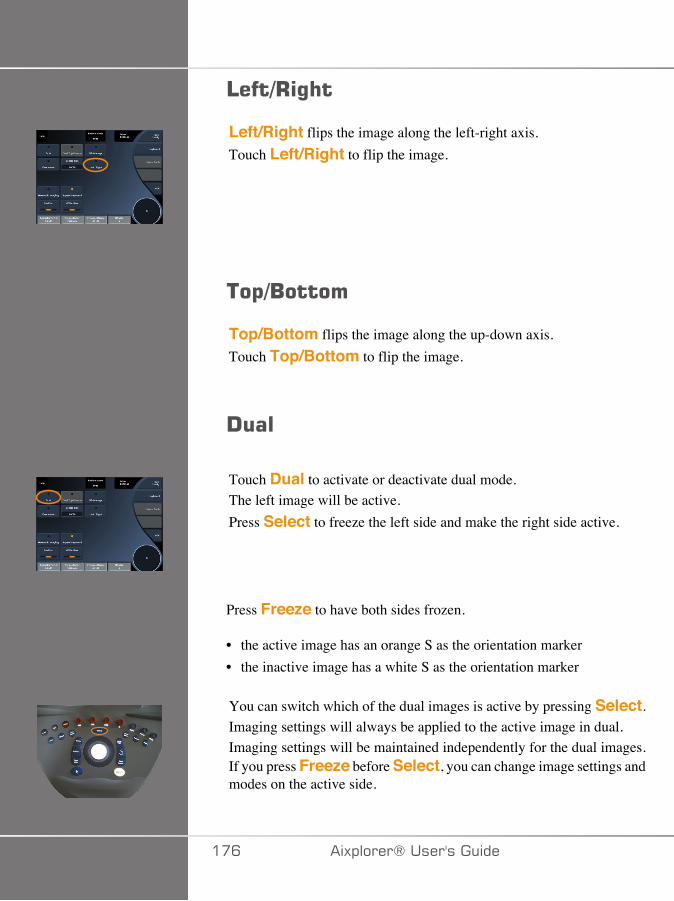
4���-+% �
Left/Right flips the image along the left-right axis.Touch Left/Right to flip the image.
��$-/�����
Top/Bottom flips the image along the up-down axis.Touch Top/Bottom to flip the image.
!��
Touch Dual to activate or deactivate dual mode.The left image will be active.Press Select to freeze the left side and make the right side active.
Press Freeze to have both sides frozen.
• the active image has an orange S as the orientation marker• the inactive image has a white S as the orientation marker
You can switch which of the dual images is active by pressing Select.Imaging settings will always be applied to the active image in dual.Imaging settings will be maintained independently for the dual images.If you press Freeze before Select, you can change image settings andmodes on the active side.
��C �)!�����*�����������
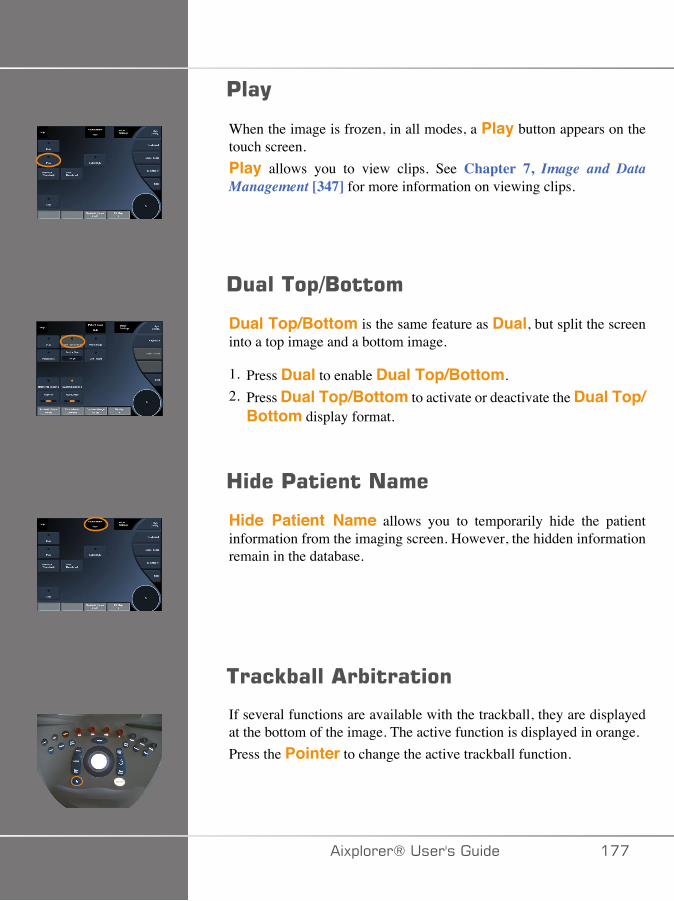
'��(
When the image is frozen, in all modes, a Play button appears on thetouch screen.Play allows you to view clips. See Chapter 7, Image and DataManagement [347] for more information on viewing clips.
!�����$-/�����
Dual Top/Bottom is the same feature as Dual, but split the screeninto a top image and a bottom image.
1. Press Dual to enable Dual Top/Bottom.2. Press Dual Top/Bottom to activate or deactivate the Dual Top/
Bottom display format.
3���'����������
Hide Patient Name allows you to temporarily hide the patientinformation from the imaging screen. However, the hidden informationremain in the database.
����E����� ��������
If several functions are available with the trackball, they are displayedat the bottom of the image. The active function is displayed in orange.Press the Pointer to change the active trackball function.
�)!�����*����������� ���

Press Select to change between Box move (position of the box) andBox size (resize the box).Press Select to switch between Img1 and Img2 in dual displays.
��D �)!�����*�����������
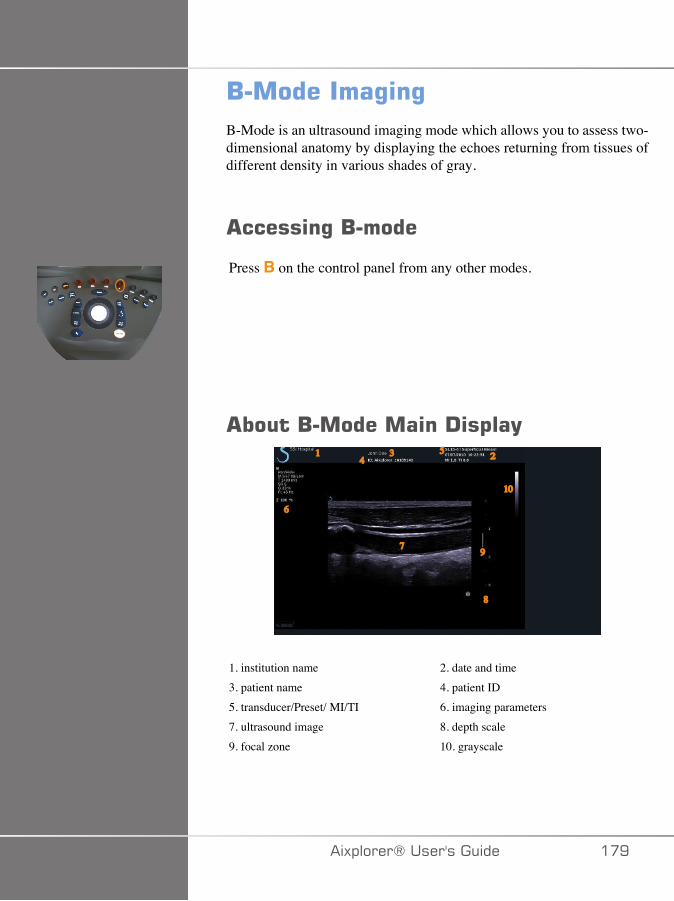
/���������%�%B-Mode is an ultrasound imaging mode which allows you to assess two-dimensional anatomy by displaying the echoes returning from tissues ofdifferent density in various shades of gray.
������%�/�����
Press B on the control panel from any other modes.
����/����������!�$��(1
4 23 5
6
7
8
10
9
1. institution name 2. date and time3. patient name 4. patient ID5. transducer/Preset/ MI/TI 6. imaging parameters7. ultrasound image 8. depth scale9. focal zone 10. grayscale
�)!�����*����������� ��E

����/��������� �������
When in B-mode, the touch screen displays various image controls whichhelp you to optimize your B-mode image.
There are two pages of B-mode parameters. These settings are controlledby touching the control on the touch screen, or by turning the rotary knobdirectly below the touch screen.
You can navigate through the pages by touching Other Settings.
�D� �)!�����*�����������
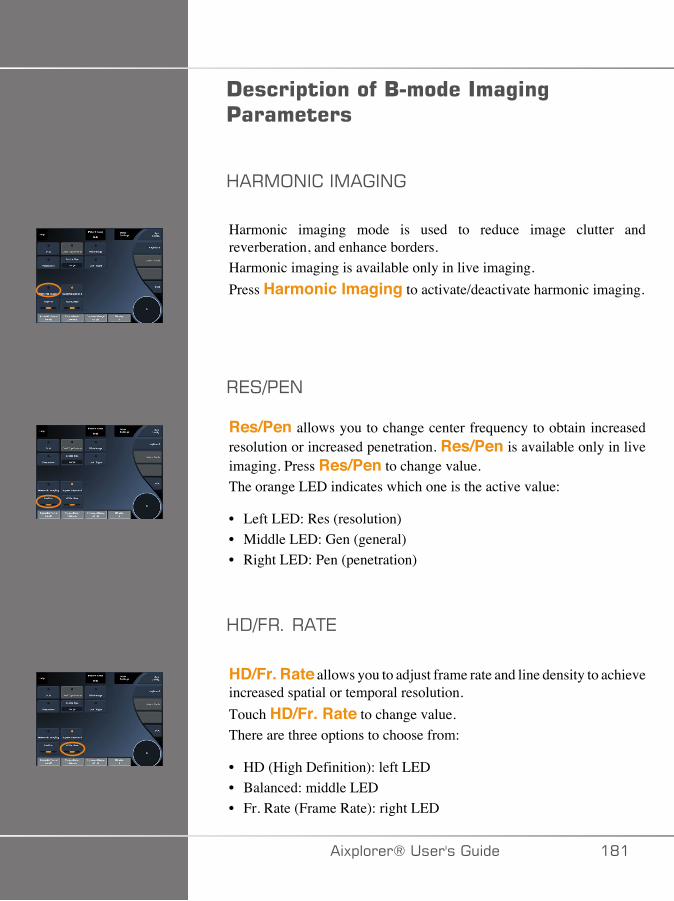
!����$�������/���������%�%'���������
<��,;/� ��,���/�
Harmonic imaging mode is used to reduce image clutter andreverberation, and enhance borders.Harmonic imaging is available only in live imaging.Press Harmonic Imaging to activate/deactivate harmonic imaging.
�7�3�7/
Res/Pen allows you to change center frequency to obtain increasedresolution or increased penetration. Res/Pen is available only in liveimaging. Press Res/Pen to change value.The orange LED indicates which one is the active value:
• Left LED: Res (resolution)• Middle LED: Gen (general)• Right LED: Pen (penetration)
<-3.�����+7
HD/Fr. Rate allows you to adjust frame rate and line density to achieveincreased spatial or temporal resolution.Touch HD/Fr. Rate to change value.There are three options to choose from:
• HD (High Definition): left LED• Balanced: middle LED• Fr. Rate (Frame Rate): right LED
�)!�����*����������� �D�
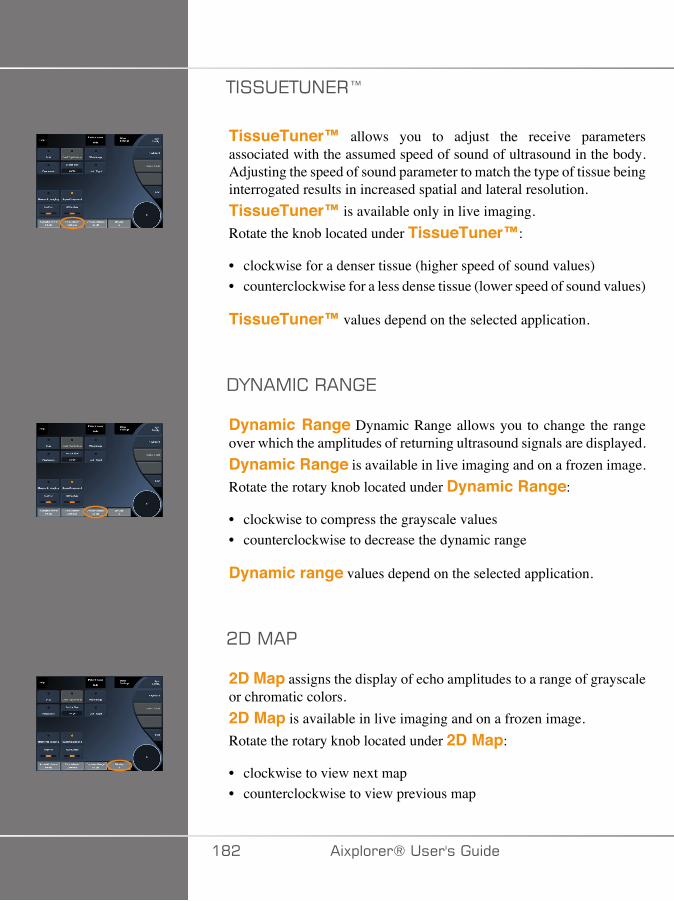
+����7+�/7�@
TissueTuner™ allows you to adjust the receive parametersassociated with the assumed speed of sound of ultrasound in the body.Adjusting the speed of sound parameter to match the type of tissue beinginterrogated results in increased spatial and lateral resolution.TissueTuner™ is available only in live imaging.Rotate the knob located under TissueTuner™:
• clockwise for a denser tissue (higher speed of sound values)• counterclockwise for a less dense tissue (lower speed of sound values)
TissueTuner™ values depend on the selected application.
-F/�,� ���/�7
Dynamic Range Dynamic Range allows you to change the rangeover which the amplitudes of returning ultrasound signals are displayed.Dynamic Range is available in live imaging and on a frozen image.Rotate the rotary knob located under Dynamic Range:
• clockwise to compress the grayscale values• counterclockwise to decrease the dynamic range
Dynamic range values depend on the selected application.
�-�,��
2D Map assigns the display of echo amplitudes to a range of grayscaleor chromatic colors.2D Map is available in live imaging and on a frozen image.Rotate the rotary knob located under 2D Map:
• clockwise to view next map• counterclockwise to view previous map
�D� �)!�����*�����������
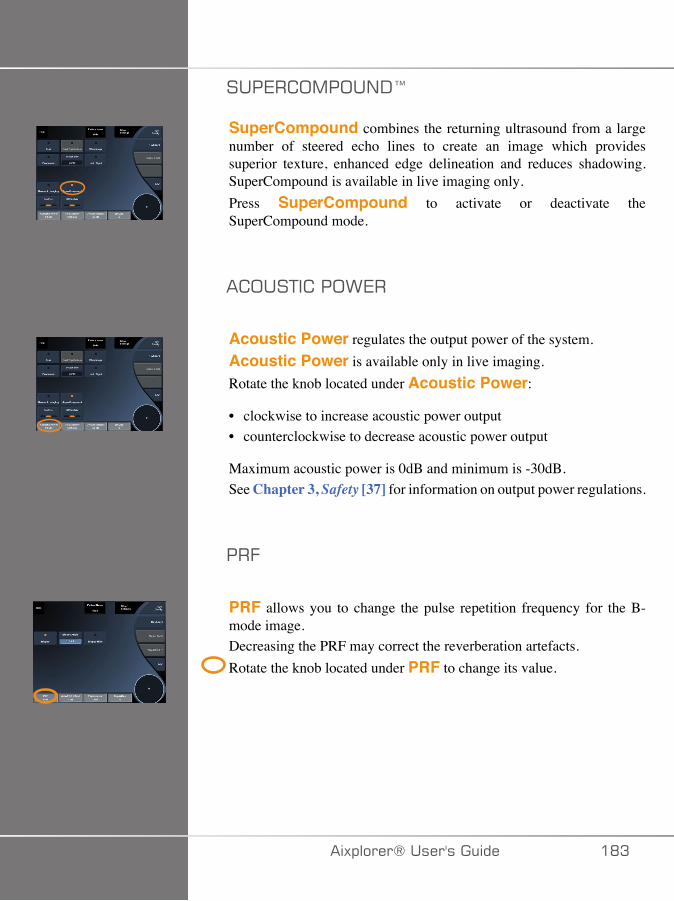
���7� ;,�;�/-@
SuperCompound combines the returning ultrasound from a largenumber of steered echo lines to create an image which providessuperior texture, enhanced edge delineation and reduces shadowing.SuperCompound is available in live imaging only.Press SuperCompound to activate or deactivate theSuperCompound mode.
� ;��+� ��;>7�
Acoustic Power regulates the output power of the system.Acoustic Power is available only in live imaging.Rotate the knob located under Acoustic Power:
• clockwise to increase acoustic power output• counterclockwise to decrease acoustic power output
Maximum acoustic power is 0dB and minimum is -30dB.See Chapter 3, Safety [37] for information on output power regulations.
��.
PRF allows you to change the pulse repetition frequency for the B-mode image.Decreasing the PRF may correct the reverberation artefacts.Rotate the knob located under PRF to change its value.
�)!�����*����������� �DA
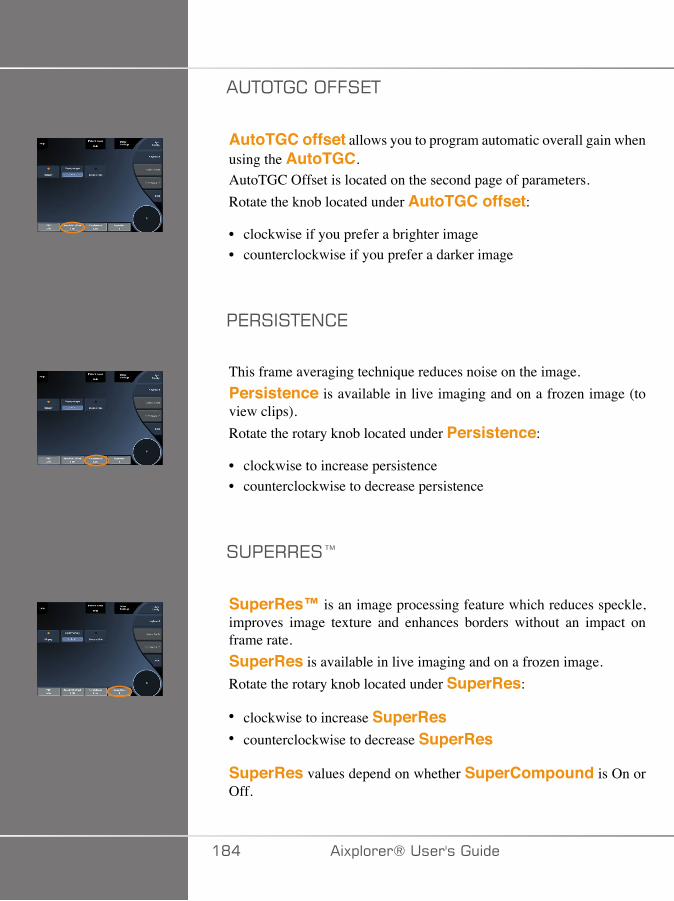
��+;+� �;..�7+
AutoTGC offset allows you to program automatic overall gain whenusing the AutoTGC.AutoTGC Offset is located on the second page of parameters.Rotate the knob located under AutoTGC offset:
• clockwise if you prefer a brighter image• counterclockwise if you prefer a darker image
�7����+7/ 7
This frame averaging technique reduces noise on the image.Persistence is available in live imaging and on a frozen image (toview clips).Rotate the rotary knob located under Persistence:
• clockwise to increase persistence• counterclockwise to decrease persistence
���7��7�@
SuperRes™ is an image processing feature which reduces speckle,improves image texture and enhances borders without an impact onframe rate.SuperRes is available in live imaging and on a frozen image.Rotate the rotary knob located under SuperRes:
• clockwise to increase SuperRes• counterclockwise to decrease SuperRes
SuperRes values depend on whether SuperCompound is On orOff.
�D� �)!�����*�����������
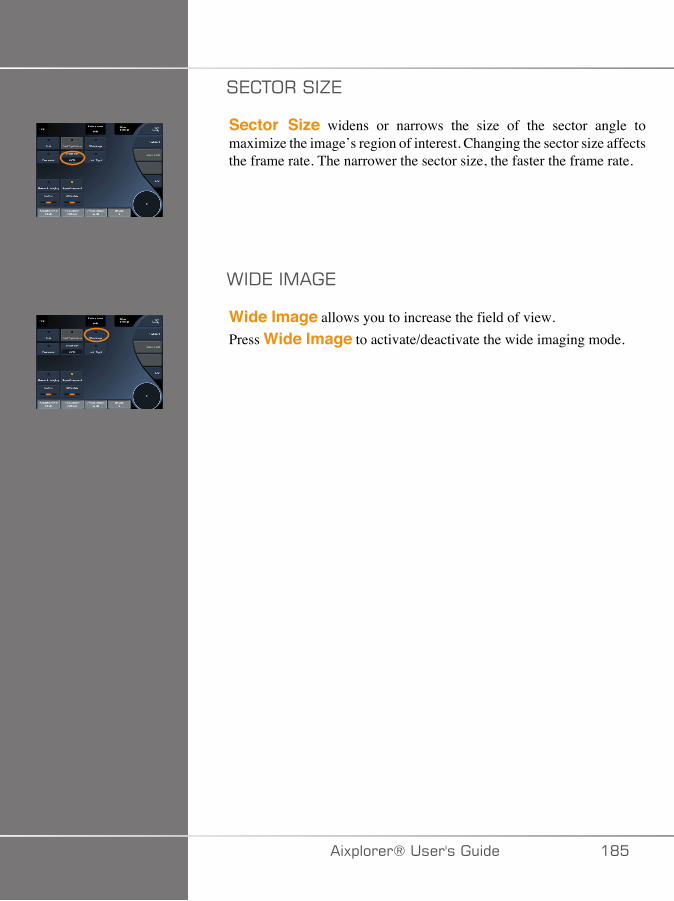
�7 +;����J7
Sector Size widens or narrows the size of the sector angle tomaximize the image’s region of interest. Changing the sector size affectsthe frame rate. The narrower the sector size, the faster the frame rate.
>�-7��,��7
Wide Image allows you to increase the field of view.Press Wide Image to activate/deactivate the wide imaging mode.
�)!�����*����������� �D�
/�$�(
Biopsy guides are used to assist in the guidance of a biopsy tool. Thesystem generates a guideline that represents the anticipated path of thebiopsy tool.
See the section called “Compatible Accessories and Kits” [131] forthe list of compatible biopsy kits.
�++� <�/���/-��7,;2�/����1�;��F����-7
� +����
Inspect all components and the transducer.
Ensure that the biopsy guide you are using is the correct one for thetransducer, the system, and system software.
Some biopsy guides must be installed over a sterile transducer cover.Refer to the instructions provided with the biopsy guide.
After each use, biopsy guides must be either sterilized or disposed of,depending upon the type. Refer to the instructions included with thebiopsy guide.
Refer to the biopsy kit instructions on how to attach the biopsy guide onthe probe.
�/�+�� +�;/��.;��+<7�����7�;.�+<7�1�;��F���-7:�/7
The Aixplorer® generates two biopsy guide lines which are the “lines”shown on the ultrasound image.
The displayed guide lines indicate the anticipated path of the needle, andshould not be used as a standard in which the needle must lie within thetwo guide lines.
�DC �)!�����*�����������
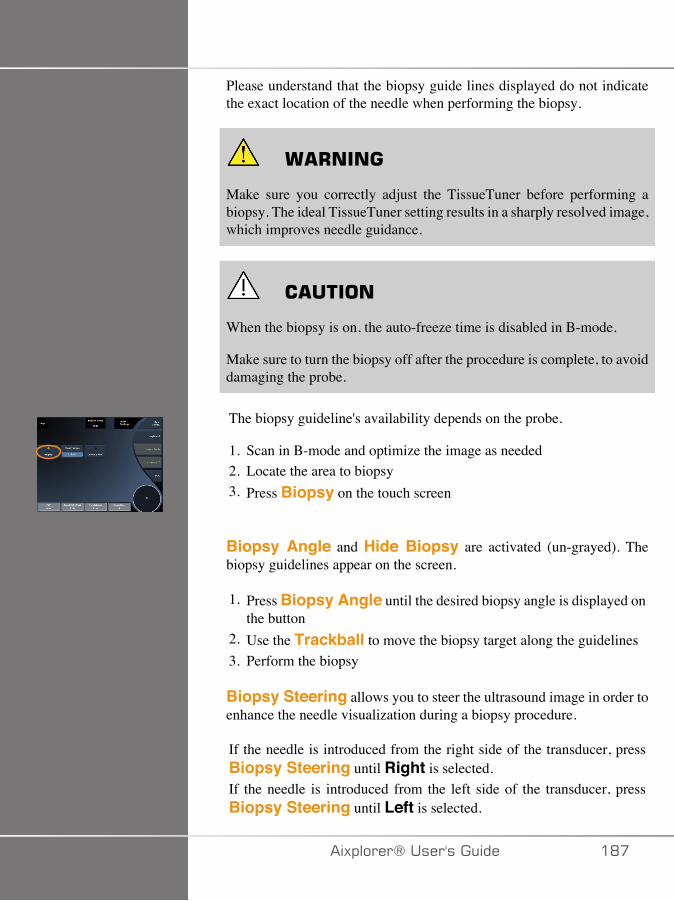
Please understand that the biopsy guide lines displayed do not indicatethe exact location of the needle when performing the biopsy.
� +����
Make sure you correctly adjust the TissueTuner before performing abiopsy. The ideal TissueTuner setting results in a sharply resolved image,which improves needle guidance.
� �����
When the biopsy is on, the auto-freeze time is disabled in B-mode.
Make sure to turn the biopsy off after the procedure is complete, to avoiddamaging the probe.
The biopsy guideline's availability depends on the probe.
1. Scan in B-mode and optimize the image as needed2. Locate the area to biopsy3. Press Biopsy on the touch screen
Biopsy Angle and Hide Biopsy are activated (un-grayed). Thebiopsy guidelines appear on the screen.
1. Press Biopsy Angle until the desired biopsy angle is displayed onthe button
2. Use the Trackball to move the biopsy target along the guidelines3. Perform the biopsy
Biopsy Steering allows you to steer the ultrasound image in order toenhance the needle visualization during a biopsy procedure.
If the needle is introduced from the right side of the transducer, pressBiopsy Steering until Right is selected.If the needle is introduced from the left side of the transducer, pressBiopsy Steering until Left is selected.
�)!�����*����������� �D�

�DD �)!�����*�����������

�������'4���#�
Needle PL.U.S. is a new feature from SuperSonic Imagine that facilitatesthe biopsy procedure by improving the needle visualization, improvingoverall confidence in the biopsy procedure, helping the physician to keepthe needle in the best elevation plane and providing a guidance tool toplan the needle trajectory and secure the procedure’s accuracy. It maybe used in all applications, all presets, except Neonatal Head preset onSL10-2, SL18-5 and SLH20-6.
See the section called “Compatible Accessories and Kits” [131] forthe list of compatible biopsy kits and sheaths.
� +����
Make sure you correctly adjust the TissueTuner before performing abiopsy. The ideal TissueTuner setting results in a sharply resolved image,which improves needle guidance.
� �����
1. When Needle PL.U.S. is on, the auto-freeze time is disabled in B-mode. Make sure to turn the Needle PL.U.S. off after the procedure iscomplete, to avoid damaging the probe.
2. This feature improves the visualization of the needle main body inthe enhancement area. It does not allow to have a larger view of theneedle tip.
In this feature the following conditions are recommended:• Insertion angle of the needle: 5° to 45° (-5° to -45°)• Needle Size: from 14 to 25 GA
3. According to the settings, especially the gain, other signals than needleinformation could be enhanced instead of the needle. Please, adjustthe insertion angle and the settings in order to avoid it.
4. During a biopsy procedure, adjust the probe position in order to havean insertion angle of the needle between 5° and 45° (-5° to -45°)from the target. Out of these values, the automatic calculation of theinsertion angle will not display any angle (« A --° » on the monitor).
�)!�����*����������� �DE
5. The enhancement area is defined by a white dotted line. Please do notlocate the area to biopsy beyond this limit line.
6. It is recommended to use this feature with only one needle.7. Needle PL.U.S. must not be combined with Biopsy Steering
functionnality, in which case the image can be degraded.8. The cineloop is lost when Needle PL.U.S. is activated or deactivated.9. Needle Path, Freeze, and Save Image functions can be set on the Foot
switch in Syst. Config./System/Display/System/User controls/Actionof the Foot Switch; and on the S key in Syst. Config./System/Display/System/User controls/Action of the S key, in order to avoid the use ofhands during the procedure.
The Needle PL.U.S. availability depends on the probe and on the preset.
1. Scan in B-mode and optimize the image as needed2. Locate the area to biopsy3. Press Needle PL.U.S. on the touch screen
Orientation, Needle Gauge and Show Needle Path can beactivated.
1. If the needle is introduced from the right side of the transducer, pressOrientation until Right is selected.
2. If the needle is introduced from the left side of the transducer, pressOrientation until Left is selected.
3. If needed, the insertion side could be modified during thebiopsy procedure. The insertion side is also displayed onthe image as a reminder by the following circular icon:
4. Press Needle Gauge until the desired needle gauge range isdisplayed on the button. If needed, this value could be adjusted duringthe procedure.
5. If needed, press Show Needle Path which generates a biopsyguide line which is the “line” shown on the ultrasound image. Thedisplayed guide line indicates the anticipated path of the superior edgeof the needle, and should not be used as a standard in which the needlemust lie within the guide line.
6. Perform the biopsy
�E� �)!�����*�����������

7. When the biopsy is performed, press Needle PL.U.S. on the touchscreen to deactivate the feature.
-7� ���+�;/�;.�/77-:7��:����������,7+7��
;�� �+F
Opacity allows you to change the transparency of the needleenhancement over the B-mode image.
Opacity is available in live imaging and on a frozen image. Rotate theknob located under Opacity:
• clockwise to increase the prominence of the needle enhancement overthe B-mode image
• counterclockwise to decrease the prominence of the needleenhancement over the B-mode image
Opacity ranges from 0 to 100%. The default setting is 80%.
/77-:7�,��
Needle Map assigns the display of echo amplitudes to a range ofgrayscale or chromatic colors.
Needle Map is available in live imaging and on a frozen image. Rotatethe rotary knob located under Needle Map:
• clockwise to view next map• counterclockwise to view previous map
The default setting is 0.
�7����+7/ 7
This frame averaging technique reduces noise on the image.
�)!�����*����������� �E�
Persistence is available in live imaging. Rotate the rotary knoblocated under Persistence:
• clockwise to increase persistence• counterclockwise to decrease persistence
The default setting is Medium (Med).
7-�7�7/<�/ 7,7/+
Edge enhancement is a mixture of different tools used forsharpening the enhanced needle in order to provide a more consistentappearance of the needle edges.
Edge enhancement is available in live imaging and on a frozenimage. Rotate the knob located under Edge enhancement:
• clockwise to increase the Edge Enhancement effect• counterclockwise to decrease the Edge Enhancement effect
The default setting is 2.
�E� �)!�����*�����������
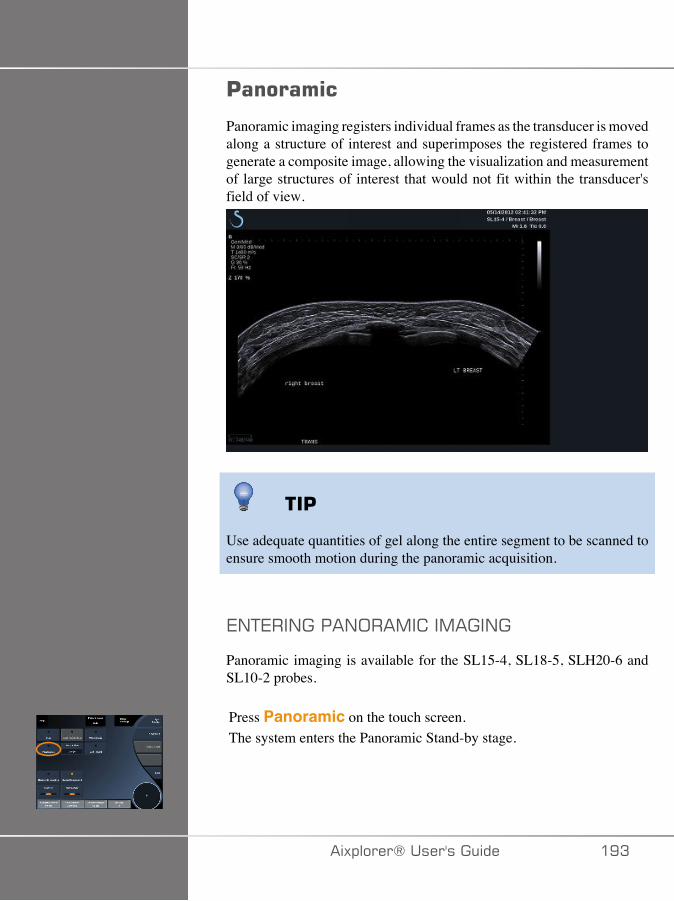
'�������
Panoramic imaging registers individual frames as the transducer is movedalong a structure of interest and superimposes the registered frames togenerate a composite image, allowing the visualization and measurementof large structures of interest that would not fit within the transducer'sfield of view.
��'
Use adequate quantities of gel along the entire segment to be scanned toensure smooth motion during the panoramic acquisition.
7/+7��/����/;��,� ��,���/�
Panoramic imaging is available for the SL15-4, SL18-5, SLH20-6 andSL10-2 probes.
Press Panoramic on the touch screen.The system enters the Panoramic Stand-by stage.
�)!�����*����������� �EA
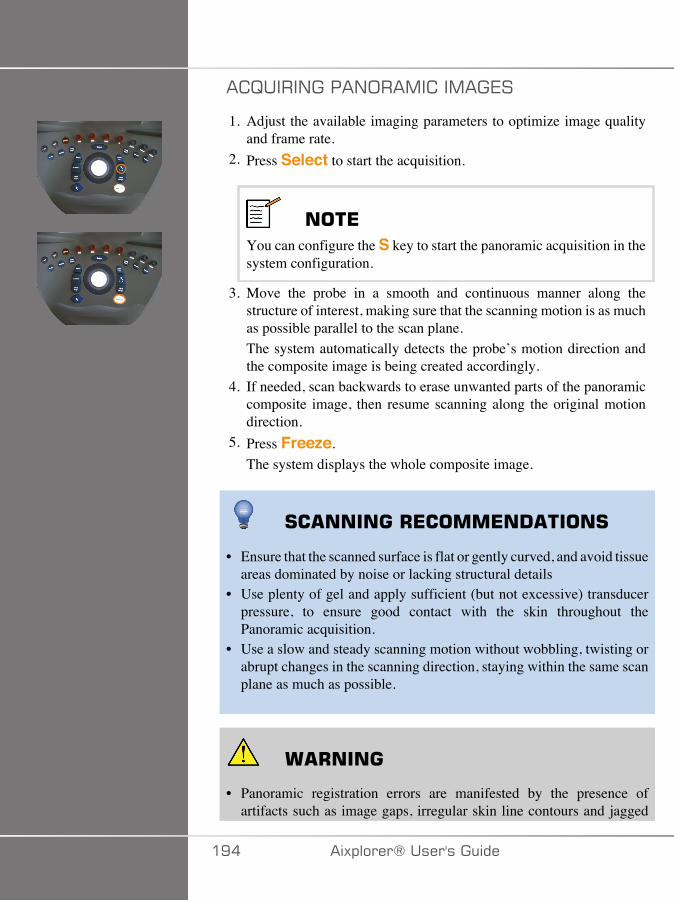
� B����/����/;��,� ��,��7�
1. Adjust the available imaging parameters to optimize image qualityand frame rate.
2. Press Select to start the acquisition.
���*You can configure the S key to start the panoramic acquisition in thesystem configuration.
3. Move the probe in a smooth and continuous manner along thestructure of interest, making sure that the scanning motion is as muchas possible parallel to the scan plane.The system automatically detects the probe’s motion direction andthe composite image is being created accordingly.
4. If needed, scan backwards to erase unwanted parts of the panoramiccomposite image, then resume scanning along the original motiondirection.
5. Press Freeze.The system displays the whole composite image.
#� ������+*����*�! ����#
• Ensure that the scanned surface is flat or gently curved, and avoid tissueareas dominated by noise or lacking structural details
• Use plenty of gel and apply sufficient (but not excessive) transducerpressure, to ensure good contact with the skin throughout thePanoramic acquisition.
• Use a slow and steady scanning motion without wobbling, twisting orabrupt changes in the scanning direction, staying within the same scanplane as much as possible.
� +����
• Panoramic registration errors are manifested by the presence ofartifacts such as image gaps, irregular skin line contours and jagged
�E� �)!�����*�����������
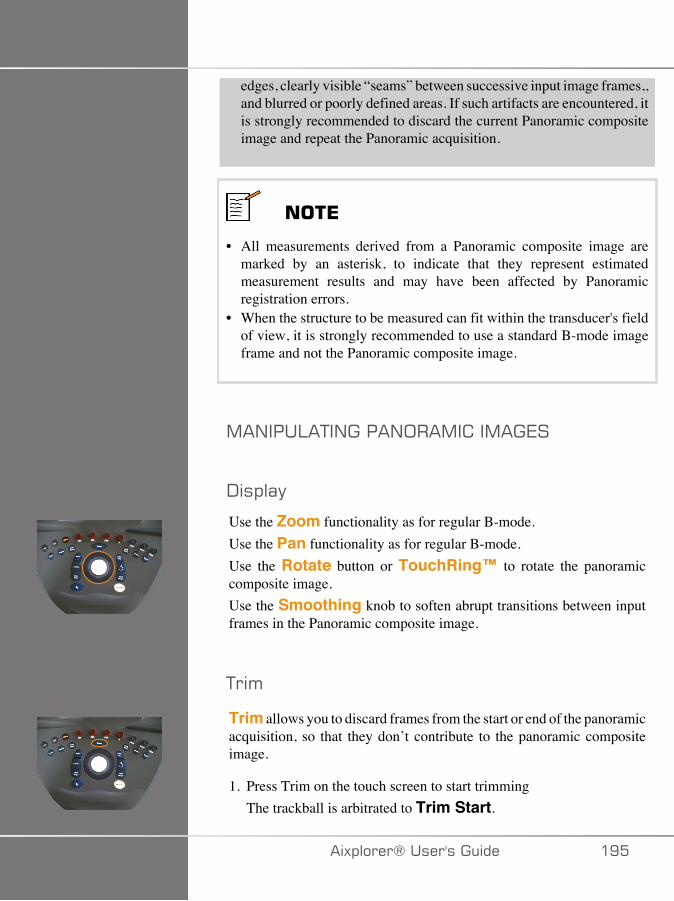
edges, clearly visible “seams” between successive input image frames,,and blurred or poorly defined areas. If such artifacts are encountered, itis strongly recommended to discard the current Panoramic compositeimage and repeat the Panoramic acquisition.
���*
• All measurements derived from a Panoramic composite image aremarked by an asterisk, to indicate that they represent estimatedmeasurement results and may have been affected by Panoramicregistration errors.
• When the structure to be measured can fit within the transducer's fieldof view, it is strongly recommended to use a standard B-mode imageframe and not the Panoramic composite image.
,�/���:�+�/����/;��,� ��,��7�
-�!�(�
Use the Zoom functionality as for regular B-mode.Use the Pan functionality as for regular B-mode.Use the Rotate button or TouchRing™ to rotate the panoramiccomposite image.Use the Smoothing knob to soften abrupt transitions between inputframes in the Panoramic composite image.
+�'
Trim allows you to discard frames from the start or end of the panoramicacquisition, so that they don’t contribute to the panoramic compositeimage.
1. Press Trim on the touch screen to start trimmingThe trackball is arbitrated to Trim Start.
�)!�����*����������� �E�
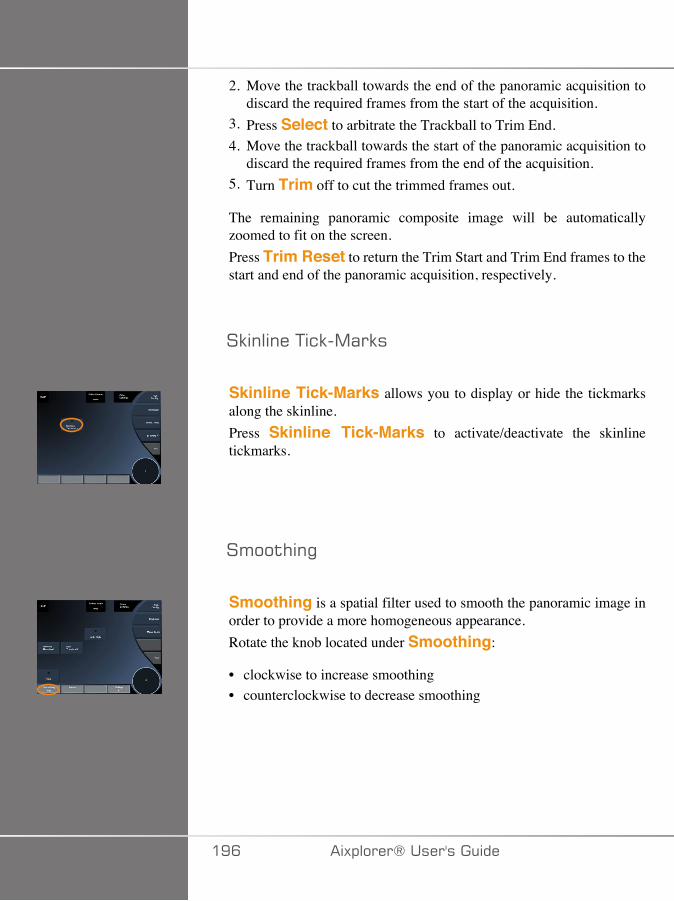
2. Move the trackball towards the end of the panoramic acquisition todiscard the required frames from the start of the acquisition.
3. Press Select to arbitrate the Trackball to Trim End.4. Move the trackball towards the start of the panoramic acquisition to
discard the required frames from the end of the acquisition.5. Turn Trim off to cut the trimmed frames out.
The remaining panoramic composite image will be automaticallyzoomed to fit on the screen.Press Trim Reset to return the Trim Start and Trim End frames to thestart and end of the panoramic acquisition, respectively.
�9�����+&9�,(�9�
Skinline Tick-Marks allows you to display or hide the tickmarksalong the skinline.Press Skinline Tick-Marks to activate/deactivate the skinlinetickmarks.
�'��$#�"
Smoothing is a spatial filter used to smooth the panoramic image inorder to provide a more homogeneous appearance.Rotate the knob located under Smoothing:
• clockwise to increase smoothing• counterclockwise to decrease smoothing
�EC �)!�����*�����������
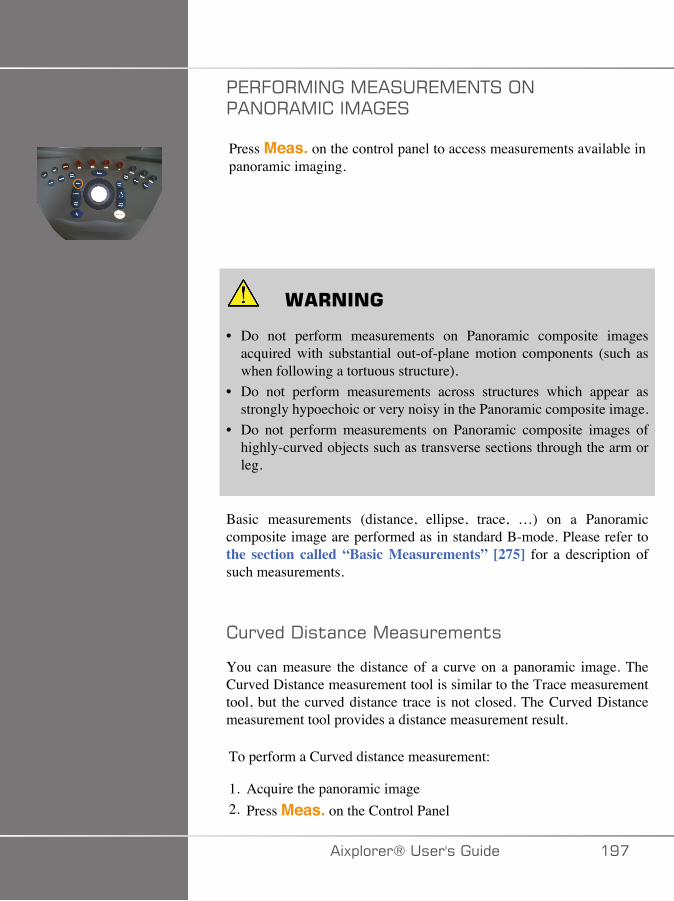
�7�.;�,�/��,7����7,7/+��;/��/;��,� ��,��7�
Press Meas. on the control panel to access measurements available inpanoramic imaging.
� +����
• Do not perform measurements on Panoramic composite imagesacquired with substantial out-of-plane motion components (such aswhen following a tortuous structure).
• Do not perform measurements across structures which appear asstrongly hypoechoic or very noisy in the Panoramic composite image.
• Do not perform measurements on Panoramic composite images ofhighly-curved objects such as transverse sections through the arm orleg.
Basic measurements (distance, ellipse, trace, …) on a Panoramiccomposite image are performed as in standard B-mode. Please refer tothe section called “Basic Measurements” [275] for a description ofsuch measurements.
�����-�$(�&��,�(���'��$�
You can measure the distance of a curve on a panoramic image. TheCurved Distance measurement tool is similar to the Trace measurementtool, but the curved distance trace is not closed. The Curved Distancemeasurement tool provides a distance measurement result.
To perform a Curved distance measurement:
1. Acquire the panoramic image2. Press Meas. on the Control Panel
�)!�����*����������� �E�
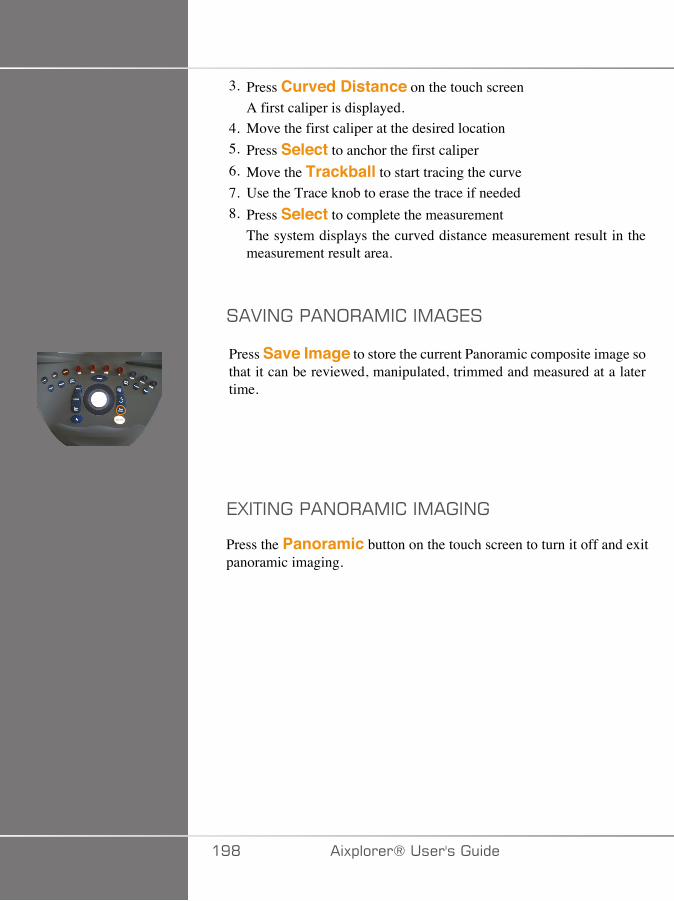
3. Press Curved Distance on the touch screenA first caliper is displayed.
4. Move the first caliper at the desired location5. Press Select to anchor the first caliper6. Move the Trackball to start tracing the curve7. Use the Trace knob to erase the trace if needed8. Press Select to complete the measurement
The system displays the curved distance measurement result in themeasurement result area.
��2�/����/;��,� ��,��7�
Press Save Image to store the current Panoramic composite image sothat it can be reviewed, manipulated, trimmed and measured at a latertime.
7G�+�/����/;��,� ��,���/�
Press the Panoramic button on the touch screen to turn it off and exitpanoramic imaging.
�ED �)!�����*�����������
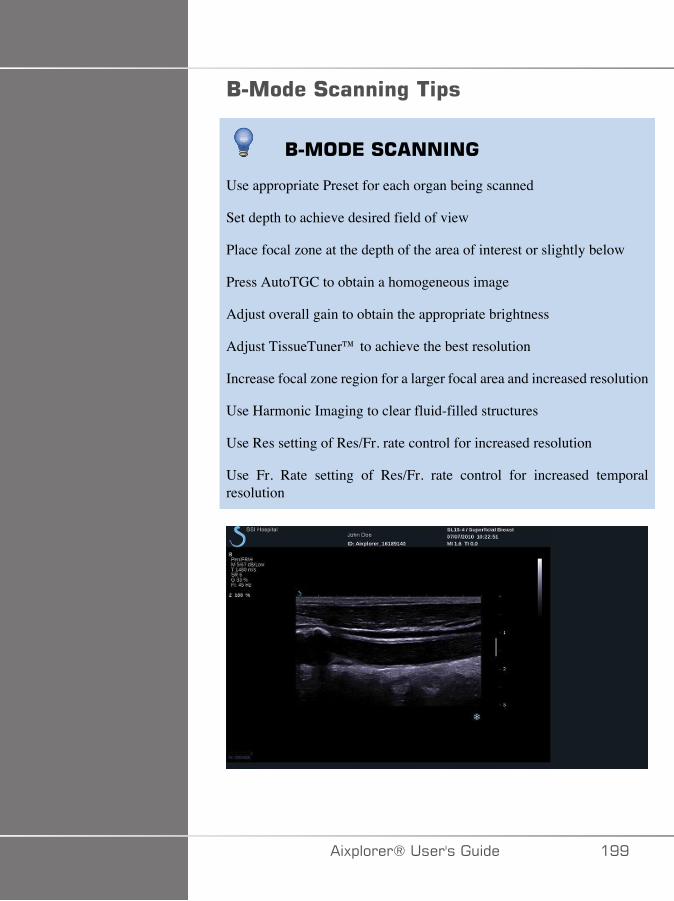
/������#�����%��$�
/���!*�#� �����
Use appropriate Preset for each organ being scanned
Set depth to achieve desired field of view
Place focal zone at the depth of the area of interest or slightly below
Press AutoTGC to obtain a homogeneous image
Adjust overall gain to obtain the appropriate brightness
Adjust TissueTuner™ to achieve the best resolution
Increase focal zone region for a larger focal area and increased resolution
Use Harmonic Imaging to clear fluid-filled structures
Use Res setting of Res/Fr. rate control for increased resolution
Use Fr. Rate setting of Res/Fr. rate control for increased temporalresolution
�)!�����*����������� �EE
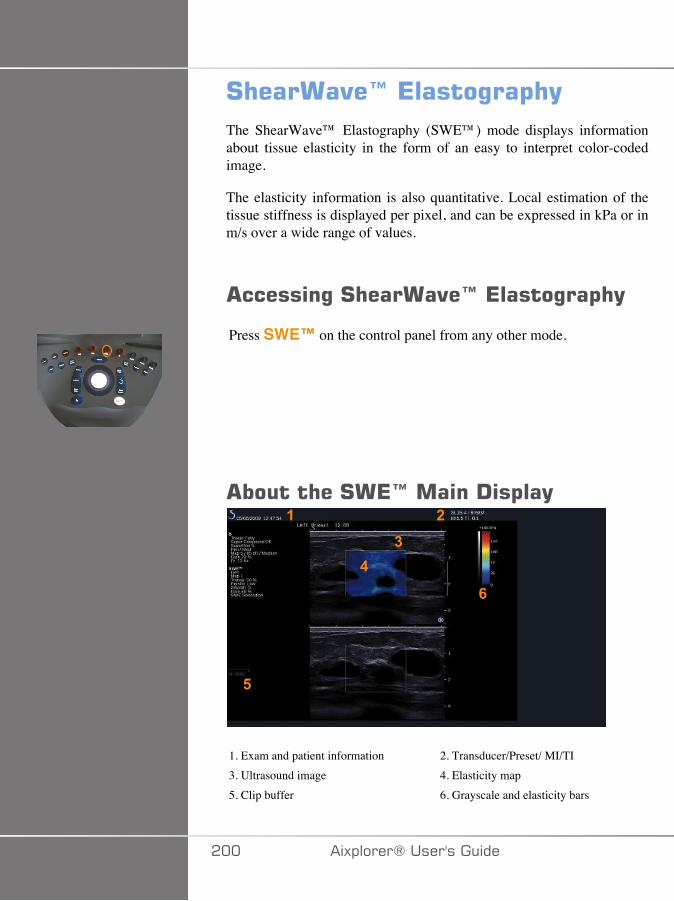
# �����"�I�*�����%��$ (The ShearWave™ Elastography (SWE™) mode displays informationabout tissue elasticity in the form of an easy to interpret color-codedimage.
The elasticity information is also quantitative. Local estimation of thetissue stiffness is displayed per pixel, and can be expressed in kPa or inm/s over a wide range of values.
������%�# �����"�I�*�����%��$ (
Press SWE™ on the control panel from any other mode.
����� ��#�*I�����!�$��(�
�
��
�
�
1. Exam and patient information 2. Transducer/Preset/ MI/TI3. Ultrasound image 4. Elasticity map5. Clip buffer 6. Grayscale and elasticity bars
��� �)!�����*�����������

����#�*I���� �������
When in SWE™, the touch screen displays various image settings whichhelp you to optimize your elasticity image.
There are two pages of SWE™ parameters. These settings are controlledby touching the control on the touch screen or turning the rotary knobdirectly below it.
You can navigate through the pages by touching Other Settings.
�)!�����*����������� ���
!����$�������#�*I�'���������
�>7@�;�+�,�J�+�;/
SWE Opt allows you to optimize the elastography resolution andpenetration according to the area you are scanning.SWE Opt is available in live imaging only.Rotate the knob located under SWE Opt:
• clockwise to go to next value• counterclockwise to go to previous value
There are 3 settings to choose from:
• Resolution
Use this setting when imaging small shallow areas of interest.This setting will also help to clear any erroneous elastography signal outof areas which are suspected to be comprised of fluid.
• Standard
This setting is balanced between resolution and penetration.Use this setting as the default starting point for evaluation the stiffnessof a object of interest
• Penetration
Use this setting when imaging deeper or larger areas (anechoic orhypoechoic) which may show posterior dropout in the echo image.These areas are suspected to be stiff and require a penetration modeoptimized for high velocity shear waves.
��� �)!�����*�����������
-���:�F��/�+
This control allows you to change the color bar scale for SWE™ fromkPa to m/s.Display Unit is available in live mode and on a frozen image.Touch Display Unit to change its value.
7:��+� �+F���/�7
The Elasticity Range in SWE™ mode is similar to the dynamicrange in B-mode. It changes the maximum elastic value displayed.It is used to compress the colored image for better visualization of tissueswhich have a variety of stiffnesses.It does not affect the actual values of elasticity, as long as they are withinthe elasticity range.Elasticity Range is available in live imaging or on a frozen image.Rotate the knob located under Elasticity Range:
• clockwise to increase the elasticity range• counterclockwise to decrease the elasticity range
Elasticity Range is displayed in kPa, the values depend on theselected application.Stiff tissue should appear yellow, orange or red.Increase the Elasticity Range if you see predominantly dark red inthe color box.
27:; �+F���/�7
The Velocity Range works in the same manner as the ElasticityRange.
Velocity Range appears and replaces Elasticity Range when theDisplay Unit is set to m/s.
�)!�����*����������� ��A
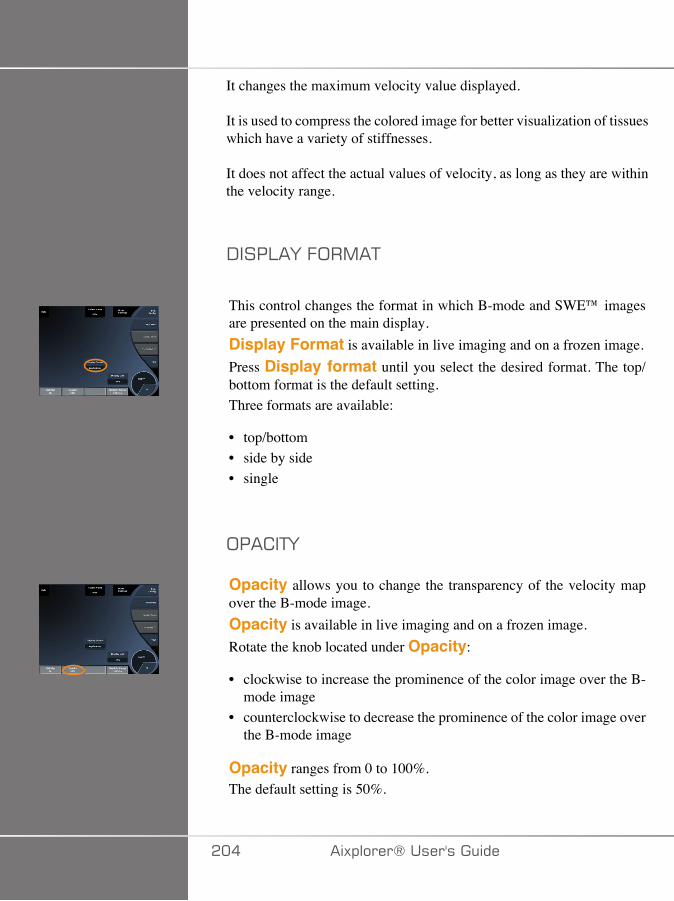
It changes the maximum velocity value displayed.
It is used to compress the colored image for better visualization of tissueswhich have a variety of stiffnesses.
It does not affect the actual values of velocity, as long as they are withinthe velocity range.
-���:�F�.;�,�+
This control changes the format in which B-mode and SWE™ imagesare presented on the main display.Display Format is available in live imaging and on a frozen image.Press Display format until you select the desired format. The top/bottom format is the default setting.Three formats are available:
• top/bottom• side by side• single
;�� �+F
Opacity allows you to change the transparency of the velocity mapover the B-mode image.Opacity is available in live imaging and on a frozen image.Rotate the knob located under Opacity:
• clockwise to increase the prominence of the color image over the B-mode image
• counterclockwise to decrease the prominence of the color image overthe B-mode image
Opacity ranges from 0 to 100%.The default setting is 50%.
��� �)!�����*�����������
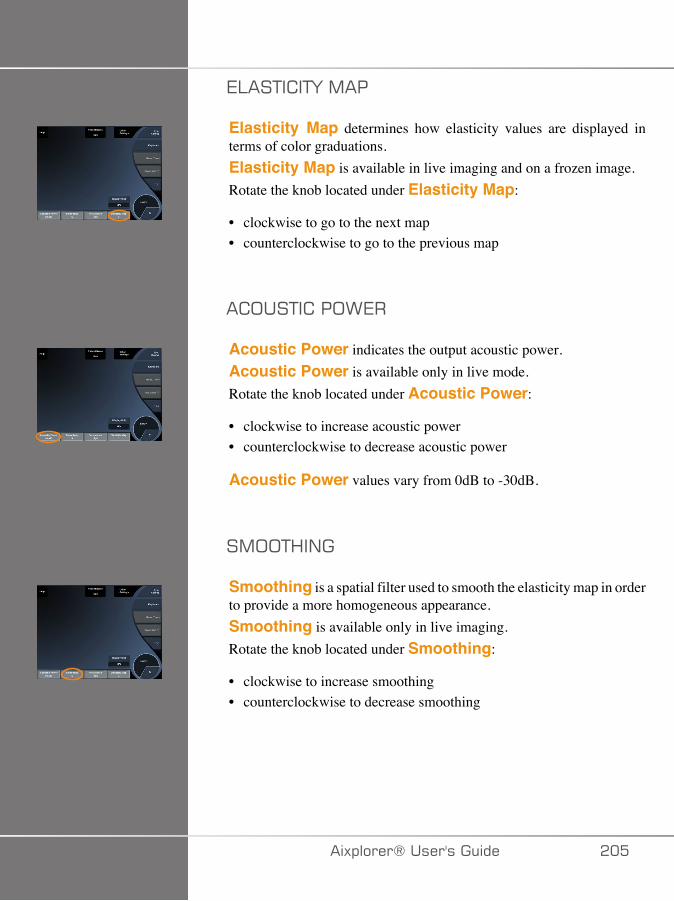
7:��+� �+F�,��
Elasticity Map determines how elasticity values are displayed interms of color graduations.Elasticity Map is available in live imaging and on a frozen image.Rotate the knob located under Elasticity Map:
• clockwise to go to the next map• counterclockwise to go to the previous map
� ;��+� ��;>7�
Acoustic Power indicates the output acoustic power.Acoustic Power is available only in live mode.Rotate the knob located under Acoustic Power:
• clockwise to increase acoustic power• counterclockwise to decrease acoustic power
Acoustic Power values vary from 0dB to -30dB.
�,;;+<�/�
Smoothing is a spatial filter used to smooth the elasticity map in orderto provide a more homogeneous appearance.Smoothing is available only in live imaging.Rotate the knob located under Smoothing:
• clockwise to increase smoothing• counterclockwise to decrease smoothing
�)!�����*����������� ���
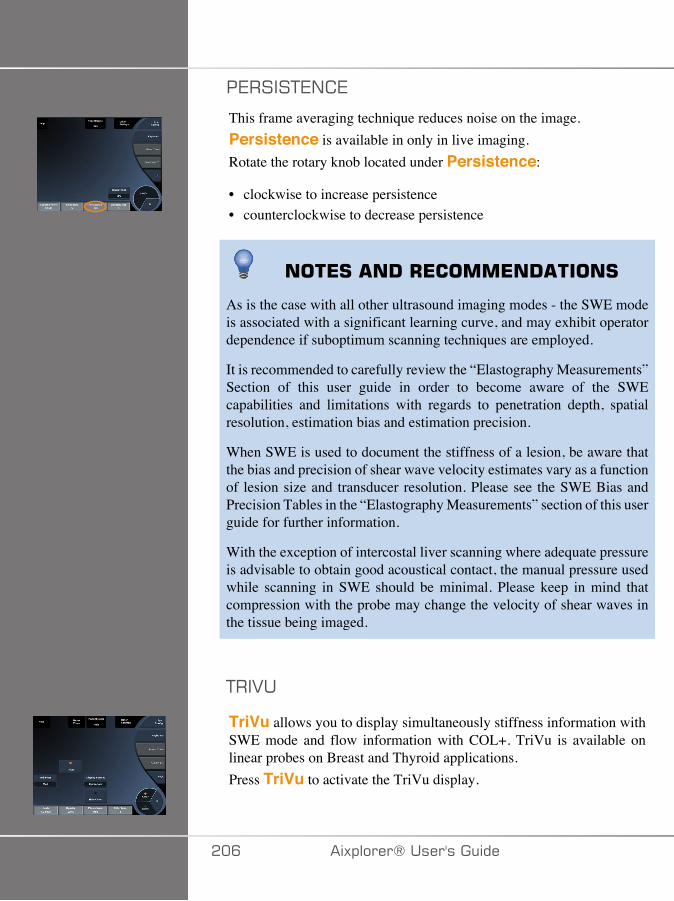
�7����+7/ 7
This frame averaging technique reduces noise on the image.Persistence is available in only in live imaging.Rotate the rotary knob located under Persistence:
• clockwise to increase persistence• counterclockwise to decrease persistence
���*#� �!�+*����*�! ����#
As is the case with all other ultrasound imaging modes - the SWE modeis associated with a significant learning curve, and may exhibit operatordependence if suboptimum scanning techniques are employed.
It is recommended to carefully review the “Elastography Measurements”Section of this user guide in order to become aware of the SWEcapabilities and limitations with regards to penetration depth, spatialresolution, estimation bias and estimation precision.
When SWE is used to document the stiffness of a lesion, be aware thatthe bias and precision of shear wave velocity estimates vary as a functionof lesion size and transducer resolution. Please see the SWE Bias andPrecision Tables in the “Elastography Measurements” section of this userguide for further information.
With the exception of intercostal liver scanning where adequate pressureis advisable to obtain good acoustical contact, the manual pressure usedwhile scanning in SWE should be minimal. Please keep in mind thatcompression with the probe may change the velocity of shear waves inthe tissue being imaged.
+��2�
TriVu allows you to display simultaneously stiffness information withSWE mode and flow information with COL+. TriVu is available onlinear probes on Breast and Thyroid applications.Press TriVu to activate the TriVu display.
��C �)!�����*�����������

� �����Avoid using the same color maps for SWE and CPI
B�1;G@
Refer to the section called “Q-Box™” [292].
B�1;G@���+�;
Refer to the section called “Q-Box™ Ratio” [292].
�)!�����*����������� ���
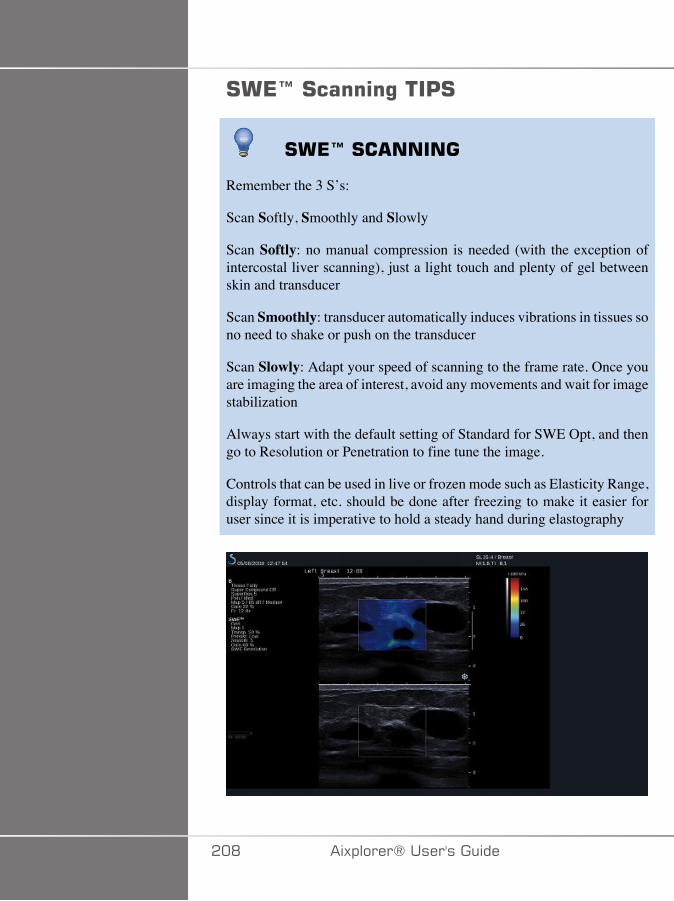
#�*I�#�����%���'#
#�*I�#� �����
Remember the 3 S’s:
Scan Softly, Smoothly and Slowly
Scan Softly: no manual compression is needed (with the exception ofintercostal liver scanning), just a light touch and plenty of gel betweenskin and transducer
Scan Smoothly: transducer automatically induces vibrations in tissues sono need to shake or push on the transducer
Scan Slowly: Adapt your speed of scanning to the frame rate. Once youare imaging the area of interest, avoid any movements and wait for imagestabilization
Always start with the default setting of Standard for SWE Opt, and thengo to Resolution or Penetration to fine tune the image.
Controls that can be used in live or frozen mode such as Elasticity Range,display format, etc. should be done after freezing to make it easier foruser since it is imperative to hold a steady hand during elastography
��D �)!�����*�����������
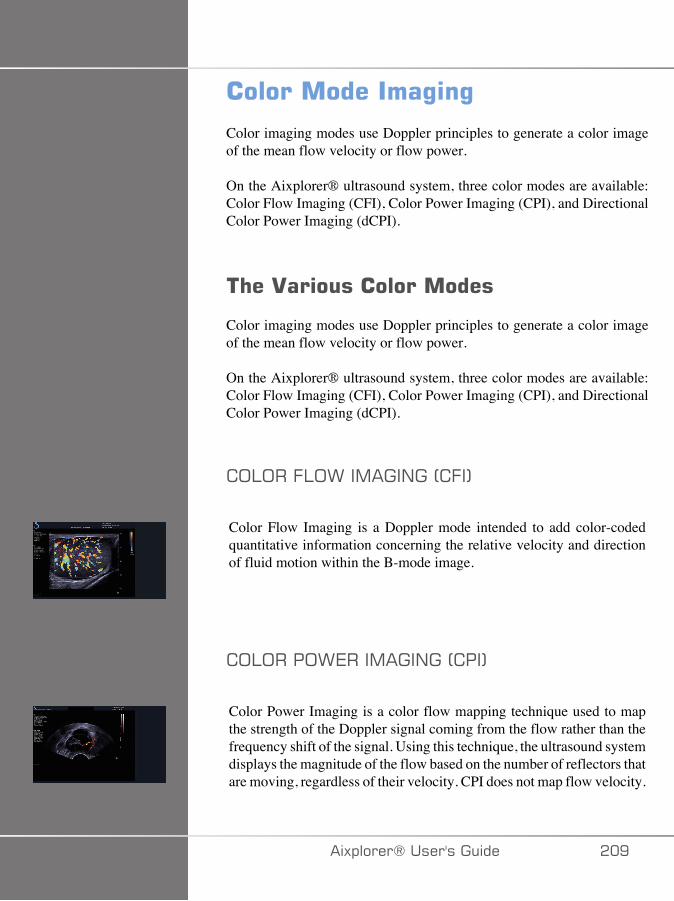
��������������%�%
Color imaging modes use Doppler principles to generate a color imageof the mean flow velocity or flow power.
On the Aixplorer® ultrasound system, three color modes are available:Color Flow Imaging (CFI), Color Power Imaging (CPI), and DirectionalColor Power Imaging (dCPI).
� ��.����������������
Color imaging modes use Doppler principles to generate a color imageof the mean flow velocity or flow power.
On the Aixplorer® ultrasound system, three color modes are available:Color Flow Imaging (CFI), Color Power Imaging (CPI), and DirectionalColor Power Imaging (dCPI).
;:;��.:;>��,���/��4 .�5
Color Flow Imaging is a Doppler mode intended to add color-codedquantitative information concerning the relative velocity and directionof fluid motion within the B-mode image.
;:;���;>7���,���/��4 ��5
Color Power Imaging is a color flow mapping technique used to mapthe strength of the Doppler signal coming from the flow rather than thefrequency shift of the signal. Using this technique, the ultrasound systemdisplays the magnitude of the flow based on the number of reflectors thatare moving, regardless of their velocity. CPI does not map flow velocity.
�)!�����*����������� ��E
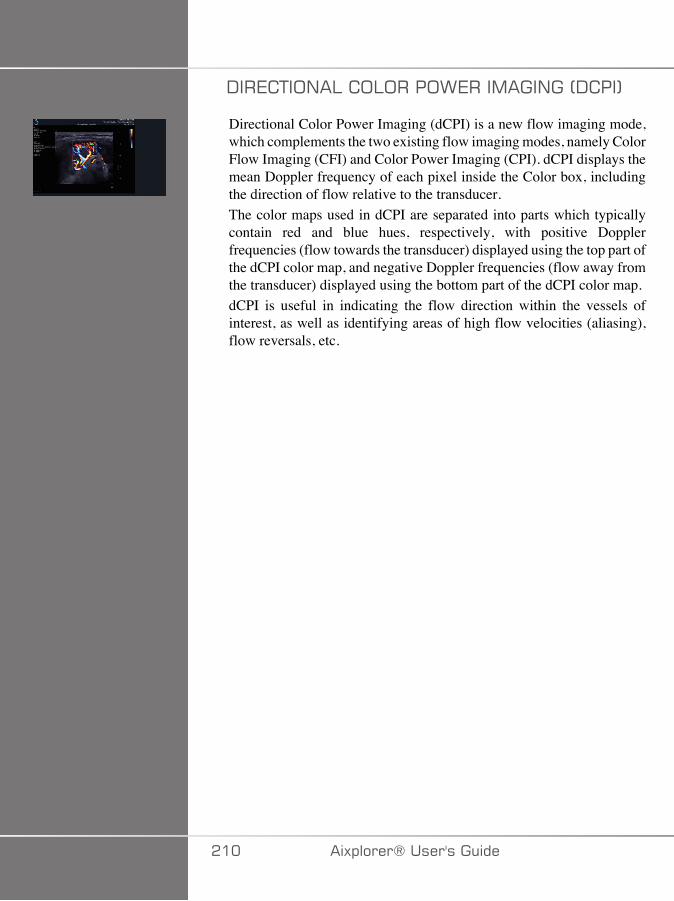
-��7 +�;/�:� ;:;���;>7���,���/��4- ��5
Directional Color Power Imaging (dCPI) is a new flow imaging mode,which complements the two existing flow imaging modes, namely ColorFlow Imaging (CFI) and Color Power Imaging (CPI). dCPI displays themean Doppler frequency of each pixel inside the Color box, includingthe direction of flow relative to the transducer.The color maps used in dCPI are separated into parts which typicallycontain red and blue hues, respectively, with positive Dopplerfrequencies (flow towards the transducer) displayed using the top part ofthe dCPI color map, and negative Doppler frequencies (flow away fromthe transducer) displayed using the bottom part of the dCPI color map.dCPI is useful in indicating the flow direction within the vessels ofinterest, as well as identifying areas of high flow velocities (aliasing),flow reversals, etc.
��� �)!�����*�����������
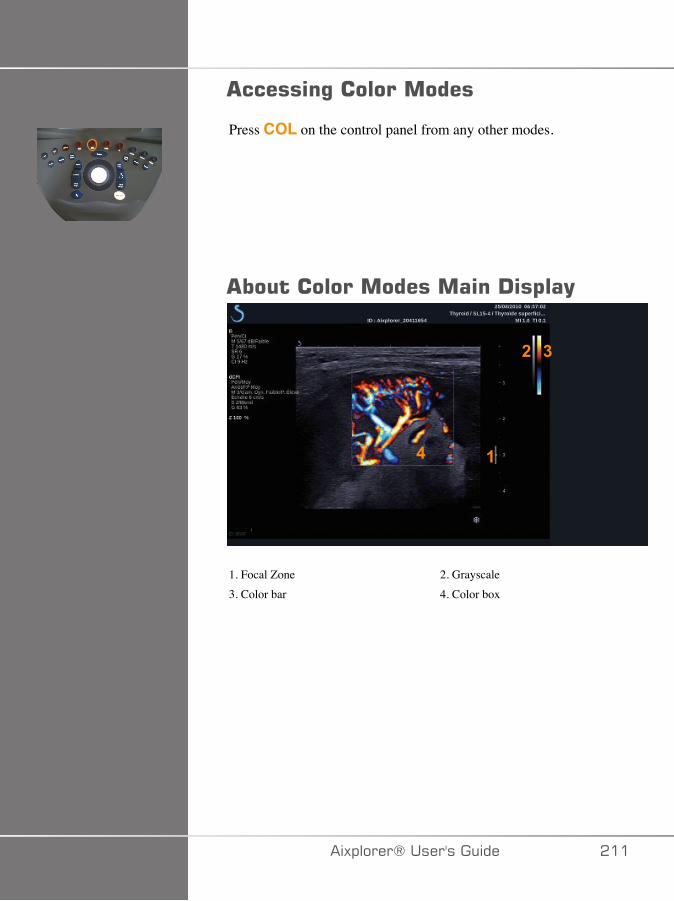
������%������������
Press COL on the control panel from any other modes.
��������������������!�$��(
�
�
�
�
1. Focal Zone 2. Grayscale3. Color bar 4. Color box
�)!�����*����������� ���
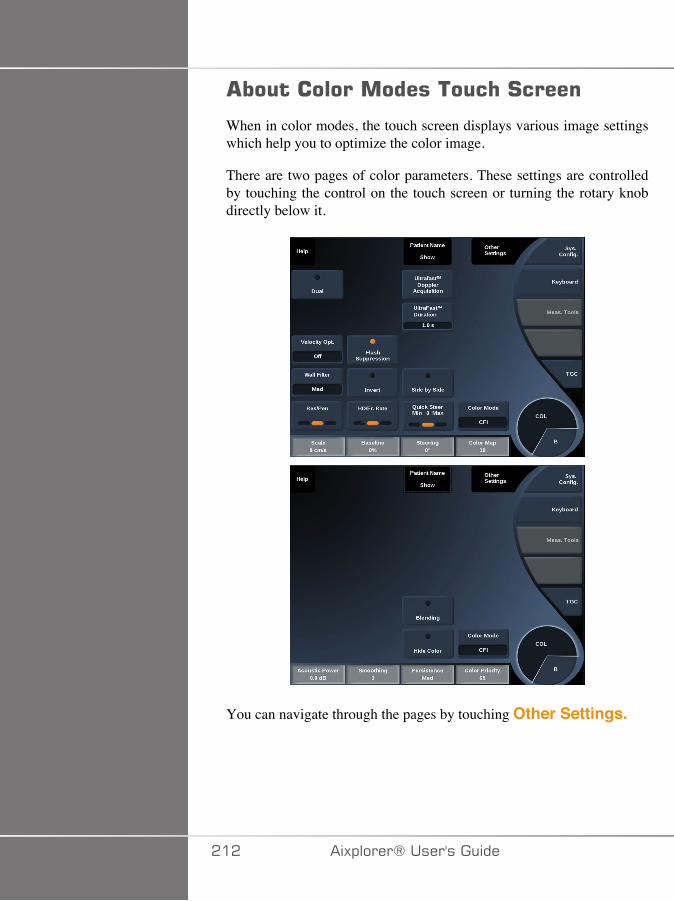
������������������� �#�����
When in color modes, the touch screen displays various image settingswhich help you to optimize the color image.
There are two pages of color parameters. These settings are controlledby touching the control on the touch screen or turning the rotary knobdirectly below it.
You can navigate through the pages by touching Other Settings.
��� �)!�����*�����������
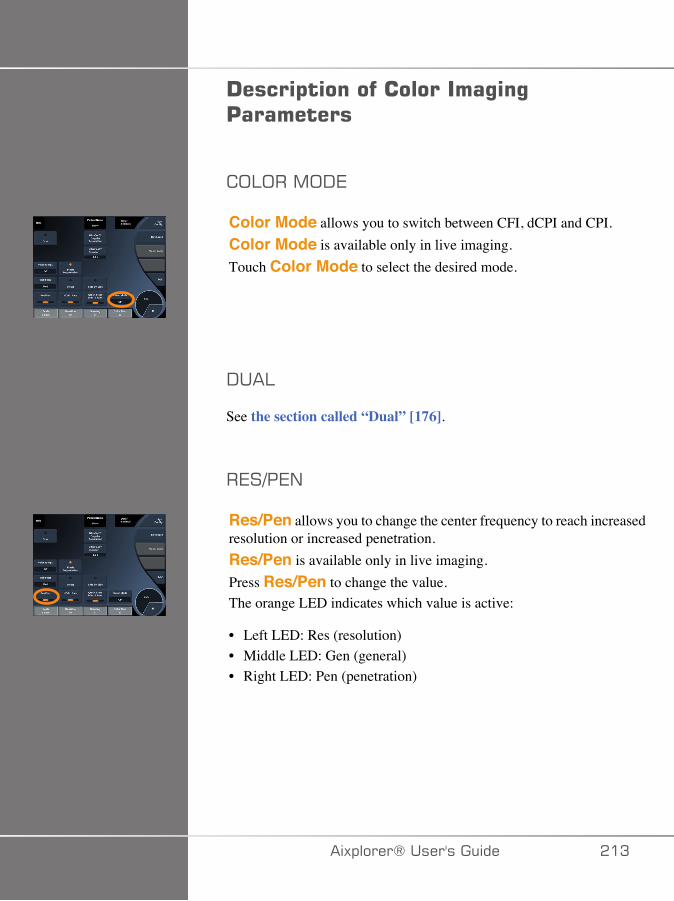
!����$����������������%�%'���������
;:;��,;-7
Color Mode allows you to switch between CFI, dCPI and CPI.Color Mode is available only in live imaging.Touch Color Mode to select the desired mode.
-��:
See the section called “Dual” [176].
�7�3�7/
Res/Pen allows you to change the center frequency to reach increasedresolution or increased penetration.Res/Pen is available only in live imaging.Press Res/Pen to change the value.The orange LED indicates which value is active:
• Left LED: Res (resolution)• Middle LED: Gen (general)• Right LED: Pen (penetration)
�)!�����*����������� ��A
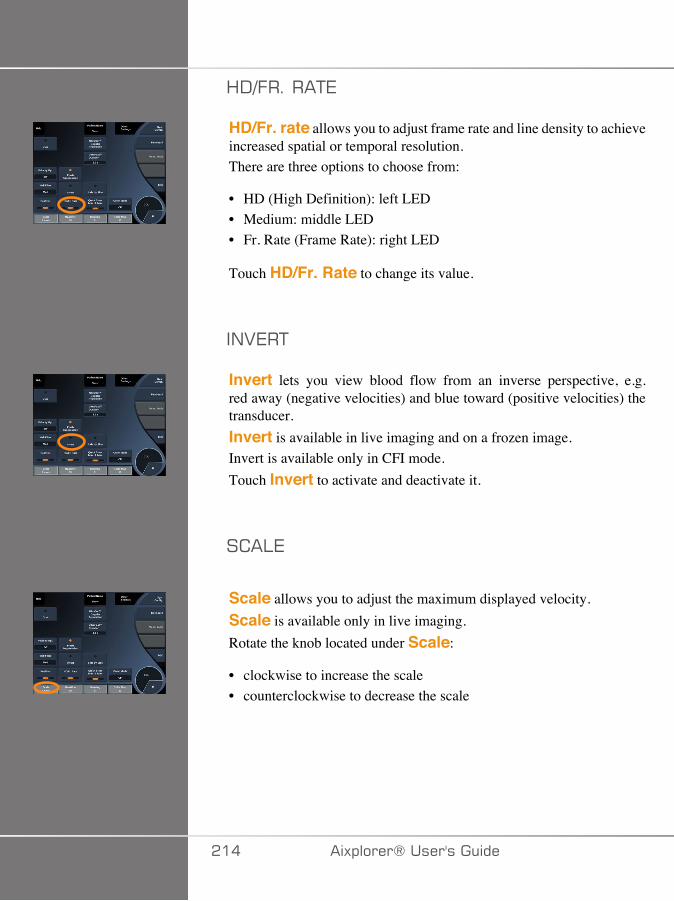
<-3.�����+7
HD/Fr. rate allows you to adjust frame rate and line density to achieveincreased spatial or temporal resolution.There are three options to choose from:
• HD (High Definition): left LED• Medium: middle LED• Fr. Rate (Frame Rate): right LED
Touch HD/Fr. Rate to change its value.
�/27�+
Invert lets you view blood flow from an inverse perspective, e.g.red away (negative velocities) and blue toward (positive velocities) thetransducer.Invert is available in live imaging and on a frozen image.Invert is available only in CFI mode.Touch Invert to activate and deactivate it.
� �:7
Scale allows you to adjust the maximum displayed velocity.Scale is available only in live imaging.Rotate the knob located under Scale:
• clockwise to increase the scale• counterclockwise to decrease the scale
��� �)!�����*�����������
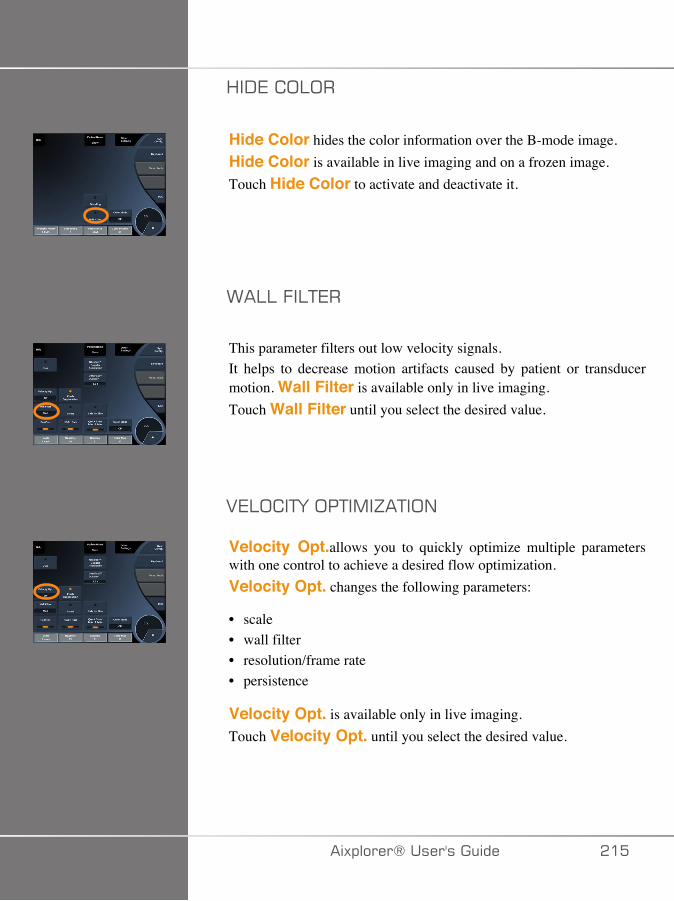
<�-7� ;:;�
Hide Color hides the color information over the B-mode image.Hide Color is available in live imaging and on a frozen image.Touch Hide Color to activate and deactivate it.
>�::�.�:+7�
This parameter filters out low velocity signals.It helps to decrease motion artifacts caused by patient or transducermotion. Wall Filter is available only in live imaging.Touch Wall Filter until you select the desired value.
27:; �+F�;�+�,�J�+�;/
Velocity Opt.allows you to quickly optimize multiple parameterswith one control to achieve a desired flow optimization.Velocity Opt. changes the following parameters:
• scale• wall filter• resolution/frame rate• persistence
Velocity Opt. is available only in live imaging.Touch Velocity Opt. until you select the desired value.
�)!�����*����������� ���
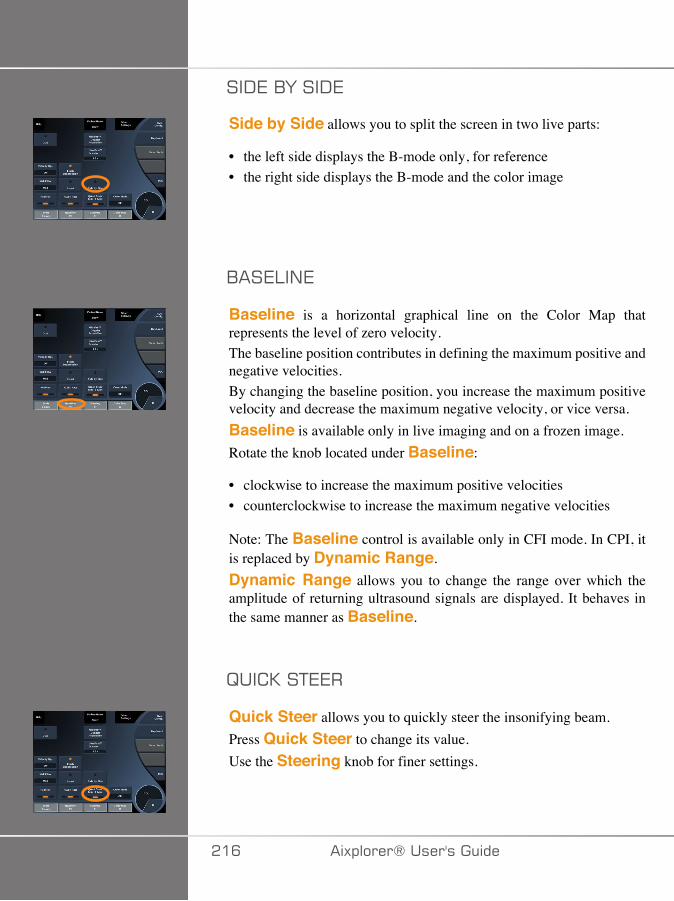
��-7�1F���-7
Side by Side allows you to split the screen in two live parts:
• the left side displays the B-mode only, for reference• the right side displays the B-mode and the color image
1��7:�/7
Baseline is a horizontal graphical line on the Color Map thatrepresents the level of zero velocity.The baseline position contributes in defining the maximum positive andnegative velocities.By changing the baseline position, you increase the maximum positivevelocity and decrease the maximum negative velocity, or vice versa.Baseline is available only in live imaging and on a frozen image.Rotate the knob located under Baseline:
• clockwise to increase the maximum positive velocities• counterclockwise to increase the maximum negative velocities
Note: The Baseline control is available only in CFI mode. In CPI, itis replaced by Dynamic Range.Dynamic Range allows you to change the range over which theamplitude of returning ultrasound signals are displayed. It behaves inthe same manner as Baseline.
B�� 0��+77�
Quick Steer allows you to quickly steer the insonifying beam.Press Quick Steer to change its value.Use the Steering knob for finer settings.
��C �)!�����*�����������
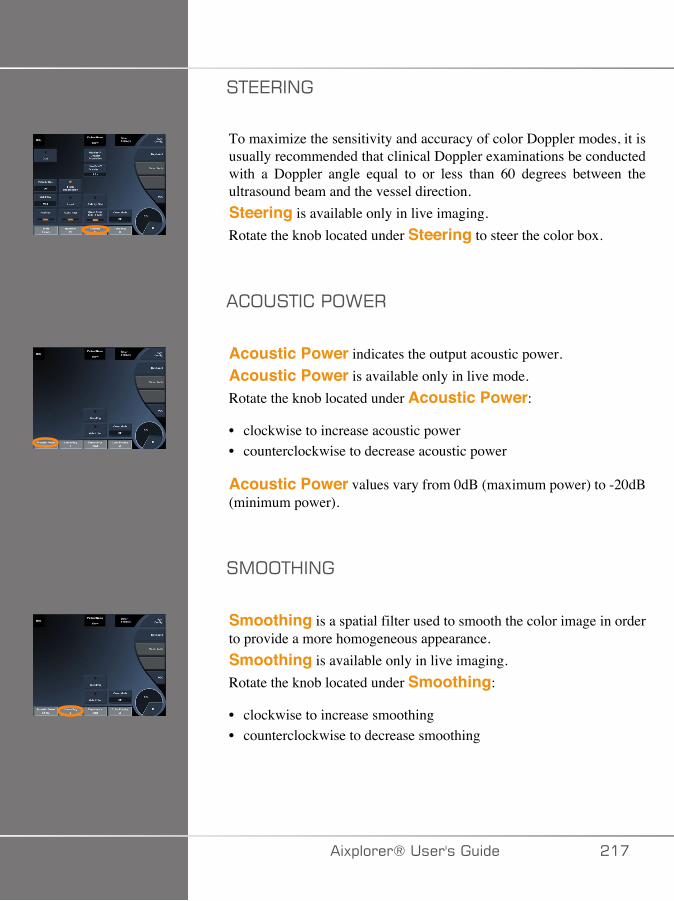
�+77��/�
To maximize the sensitivity and accuracy of color Doppler modes, it isusually recommended that clinical Doppler examinations be conductedwith a Doppler angle equal to or less than 60 degrees between theultrasound beam and the vessel direction.Steering is available only in live imaging.Rotate the knob located under Steering to steer the color box.
� ;��+� ��;>7�
Acoustic Power indicates the output acoustic power.Acoustic Power is available only in live mode.Rotate the knob located under Acoustic Power:
• clockwise to increase acoustic power• counterclockwise to decrease acoustic power
Acoustic Power values vary from 0dB (maximum power) to -20dB(minimum power).
�,;;+<�/�
Smoothing is a spatial filter used to smooth the color image in orderto provide a more homogeneous appearance.Smoothing is available only in live imaging.Rotate the knob located under Smoothing:
• clockwise to increase smoothing• counterclockwise to decrease smoothing
�)!�����*����������� ���
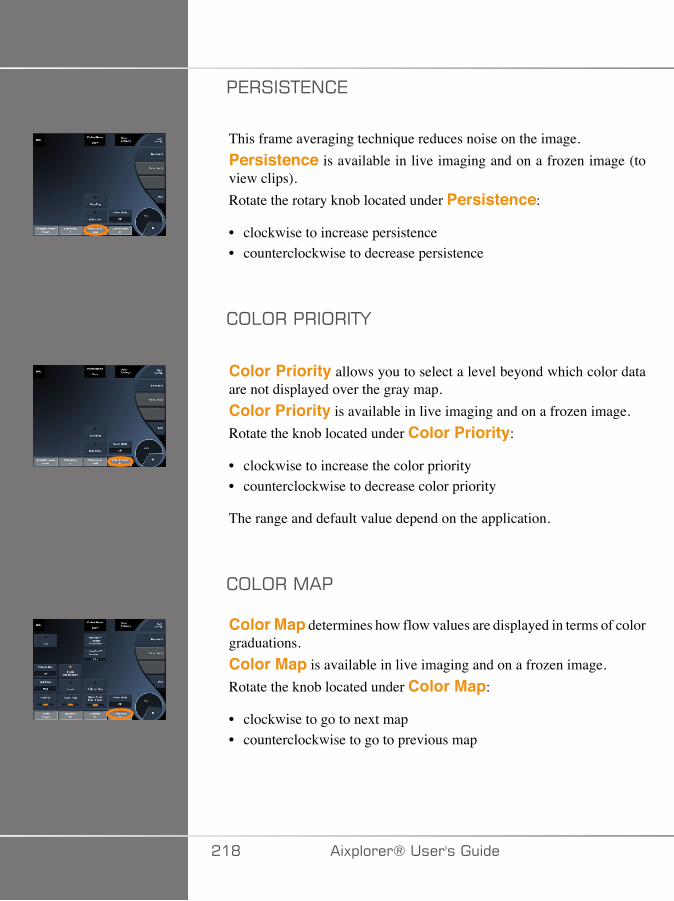
�7����+7/ 7
This frame averaging technique reduces noise on the image.Persistence is available in live imaging and on a frozen image (toview clips).Rotate the rotary knob located under Persistence:
• clockwise to increase persistence• counterclockwise to decrease persistence
;:;�����;��+F
Color Priority allows you to select a level beyond which color dataare not displayed over the gray map.Color Priority is available in live imaging and on a frozen image.Rotate the knob located under Color Priority:
• clockwise to increase the color priority• counterclockwise to decrease color priority
The range and default value depend on the application.
;:;��,��
Color Map determines how flow values are displayed in terms of colorgraduations.Color Map is available in live imaging and on a frozen image.Rotate the knob located under Color Map:
• clockwise to go to next map• counterclockwise to go to previous map
��D �)!�����*�����������
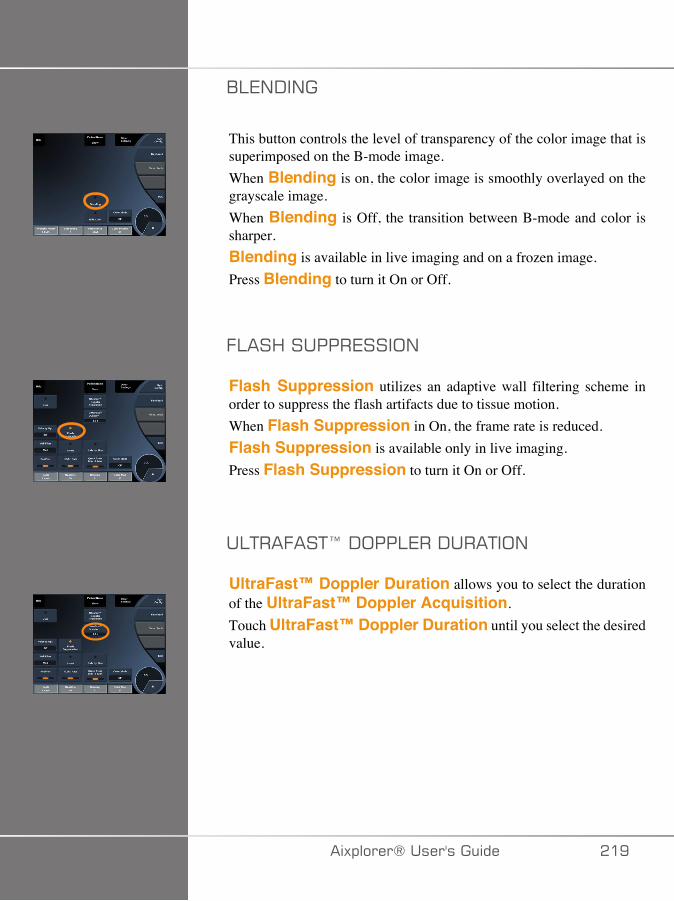
1:7/-�/�
This button controls the level of transparency of the color image that issuperimposed on the B-mode image.When Blending is on, the color image is smoothly overlayed on thegrayscale image.When Blending is Off, the transition between B-mode and color issharper.Blending is available in live imaging and on a frozen image.Press Blending to turn it On or Off.
.:��<������7���;/
Flash Suppression utilizes an adaptive wall filtering scheme inorder to suppress the flash artifacts due to tissue motion.When Flash Suppression in On, the frame rate is reduced.Flash Suppression is available only in live imaging.Press Flash Suppression to turn it On or Off.
�:+��.��+@�-;��:7��-���+�;/
UltraFast™ Doppler Duration allows you to select the durationof the UltraFast™ Doppler Acquisition.Touch UltraFast™ Doppler Duration until you select the desiredvalue.
�)!�����*����������� ��E
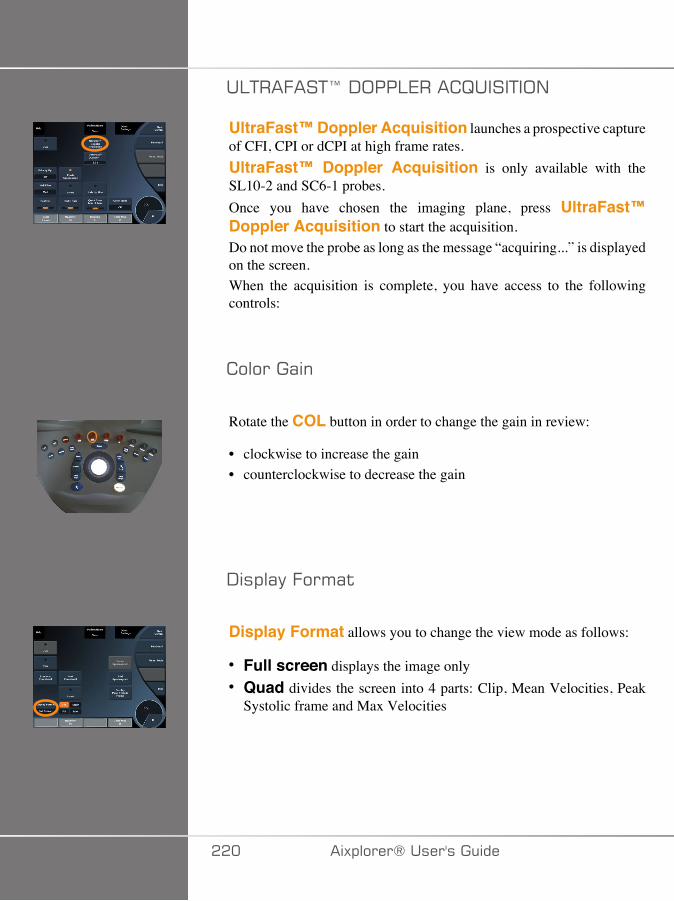
�:+��.��+@�-;��:7��� B����+�;/
UltraFast™ Doppler Acquisition launches a prospective captureof CFI, CPI or dCPI at high frame rates.UltraFast™ Doppler Acquisition is only available with theSL10-2 and SC6-1 probes.Once you have chosen the imaging plane, press UltraFast™Doppler Acquisition to start the acquisition.Do not move the probe as long as the message “acquiring...” is displayedon the screen.When the acquisition is complete, you have access to the followingcontrols:
������(�
Rotate the COL button in order to change the gain in review:
• clockwise to increase the gain• counterclockwise to decrease the gain
-�!�(��.��'($
Display Format allows you to change the view mode as follows:
• Full screen displays the image only• Quad divides the screen into 4 parts: Clip, Mean Velocities, Peak
Systolic frame and Max Velocities
��� �)!�����*�����������
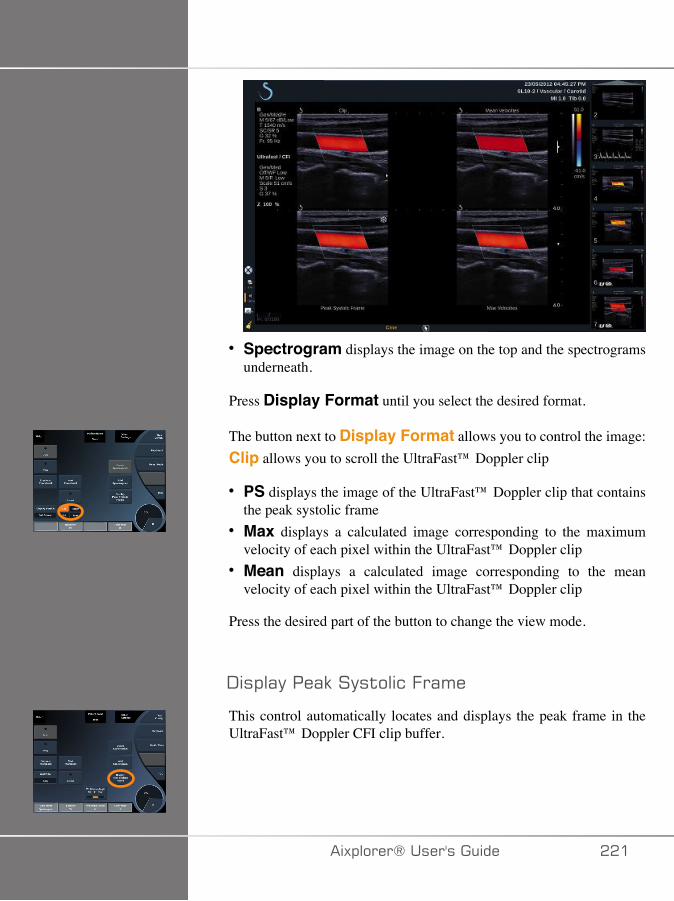
• Spectrogram displays the image on the top and the spectrogramsunderneath.
Press Display Format until you select the desired format.
The button next to Display Format allows you to control the image:Clip allows you to scroll the UltraFast™ Doppler clip
• PS displays the image of the UltraFast™ Doppler clip that containsthe peak systolic frame
• Max displays a calculated image corresponding to the maximumvelocity of each pixel within the UltraFast™ Doppler clip
• Mean displays a calculated image corresponding to the meanvelocity of each pixel within the UltraFast™ Doppler clip
Press the desired part of the button to change the view mode.
-�!�(����(9����$��&�.�('�
This control automatically locates and displays the peak frame in theUltraFast™ Doppler CFI clip buffer.
�)!�����*����������� ���
�����,(!
See the section called “Color Map” [218].
1�����"
See the section called “Blending” [219].
<��� ����
See the section called “Hide Color” [215].
�����$��&�
See the section called “Persistence” [218].
���������$�
See the section called “Color Priority” [218].
��� �)!�����*�����������
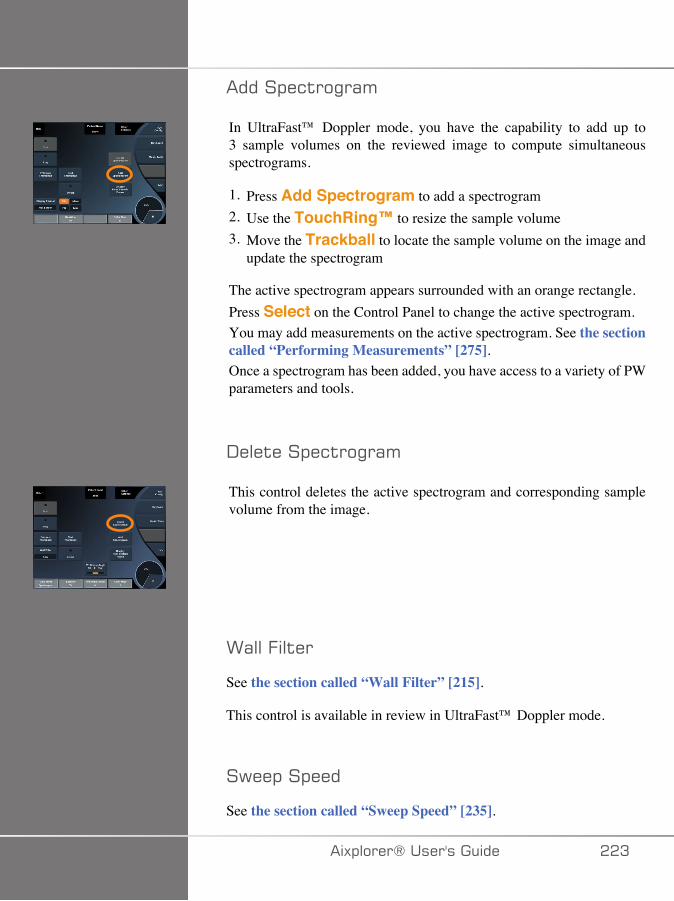
�����!�&$��"�('
In UltraFast™ Doppler mode, you have the capability to add up to3 sample volumes on the reviewed image to compute simultaneousspectrograms.
1. Press Add Spectrogram to add a spectrogram2. Use the TouchRing™ to resize the sample volume3. Move the Trackball to locate the sample volume on the image and
update the spectrogram
The active spectrogram appears surrounded with an orange rectangle.Press Select on the Control Panel to change the active spectrogram.You may add measurements on the active spectrogram. See the sectioncalled “Performing Measurements” [275].Once a spectrogram has been added, you have access to a variety of PWparameters and tools.
-���$���!�&$��"�('
This control deletes the active spectrogram and corresponding samplevolume from the image.
>(���.�$��
See the section called “Wall Filter” [215].
This control is available in review in UltraFast™ Doppler mode.
�6��!��!���
See the section called “Sweep Speed” [235].
�)!�����*����������� ��A
You may change the following parameters for the individual activespectrogram:
-��('&��(�"�
See the section called “Dynamic Range” [232].
�&(��
See the section called “Scale” [234].
�'��$#�"
See the section called “Smoothing” [217]
�(������"��
See the section called “PW Coarse Angle” [231].
.�����"��� ����&$
See the section called “Fine Angle Correct” [232].
�>�,(!
See the section called “PW Map” [233].
�����$
See the section called “Invert” [233].
��� �)!�����*�����������
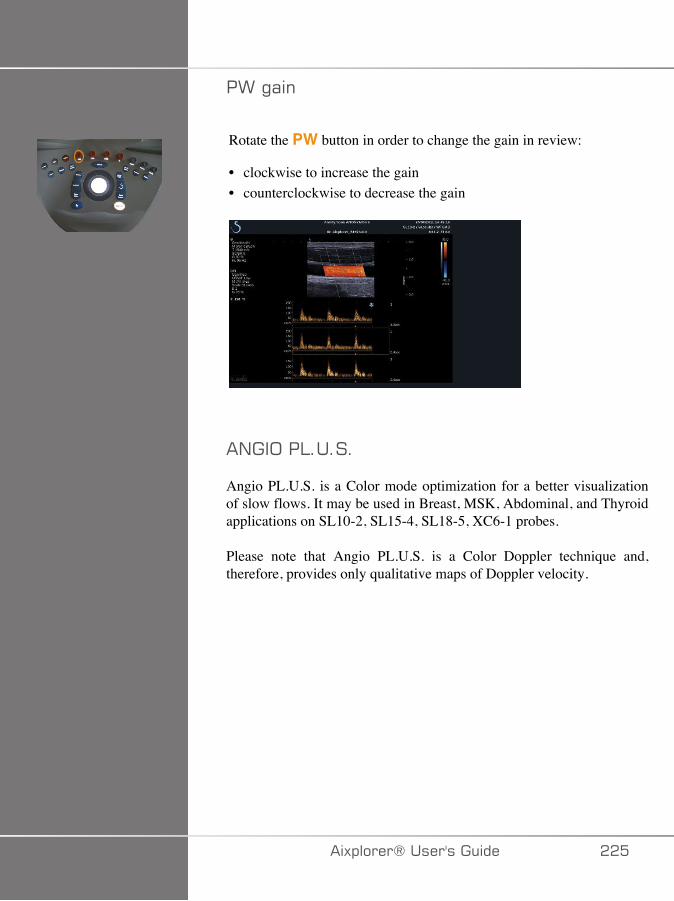
�>�"(�
Rotate the PW button in order to change the gain in review:
• clockwise to increase the gain• counterclockwise to decrease the gain
�/��;��:�����
Angio PL.U.S. is a Color mode optimization for a better visualizationof slow flows. It may be used in Breast, MSK, Abdominal, and Thyroidapplications on SL10-2, SL15-4, SL18-5, XC6-1 probes.
Please note that Angio PL.U.S. is a Color Doppler technique and,therefore, provides only qualitative maps of Doppler velocity.
�)!�����*����������� ���
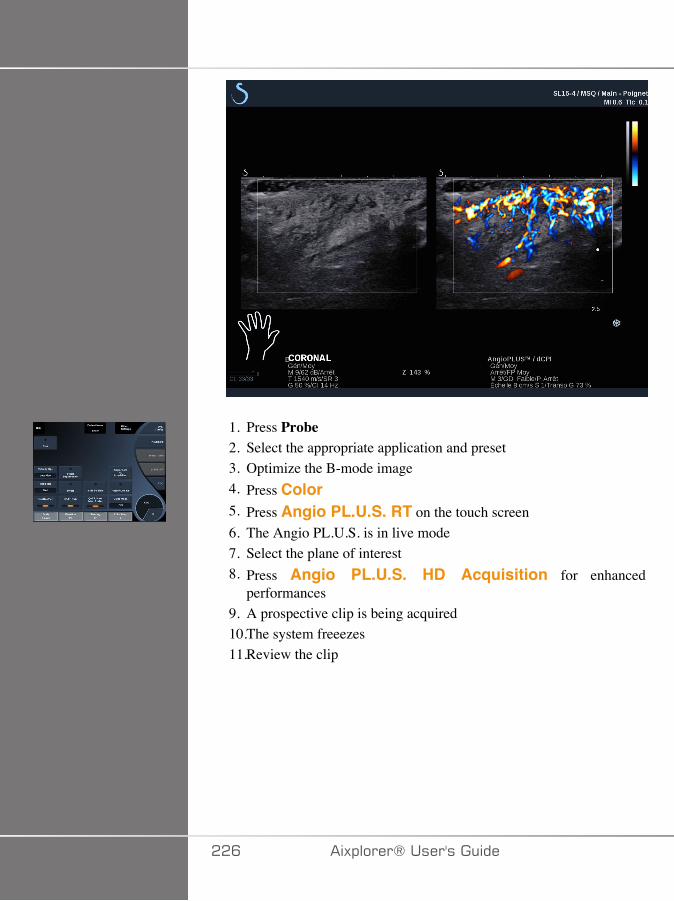
1. Press Probe2. Select the appropriate application and preset3. Optimize the B-mode image4. Press Color5. Press Angio PL.U.S. RT on the touch screen6. The Angio PL.U.S. is in live mode7. Select the plane of interest8. Press Angio PL.U.S. HD Acquisition for enhanced
performances9. A prospective clip is being acquired10.The system freeezes11.Review the clip
��C �)!�����*�����������
��4�+�#�����%���'#
��4�+�#� �����
Scan to obtain best angle to maximize flow sensitivity.
Use the TouchRing™ to change size of color box if needed. A larger boxwill cause a decrease in temporal resolution (frame rate).
Increase Color Gain until you see noise and then reduce the gain justto eliminate noise. This will ensure that you have the best color flowsensitivity possible.
If scanning smaller vessels (i.e. breast, thyroid), center steer is typicallythe best choice. In larger vessels (i.e. carotid artery, axillary artery) steercolor box to obtain the best (least) angle to flow. You will see a changein sensitivity when you choose the appropriate steering angle.
Select the appropriate Velocity Optimization level according to the typeof vessel you are interrogating.
Low is typically used for smaller vessels with lower velocities and venousflows.
High is used for larger vessels with higher velocities and for arteries.
To increase flow sensitivity, you can lower the Scale or lower the WallFilter.
To eliminate aliasing (CFI only), increase the Scale.
Do not move the probe while acquiring an UltraFast™ Doppler CFI clip
�)!�����*����������� ���
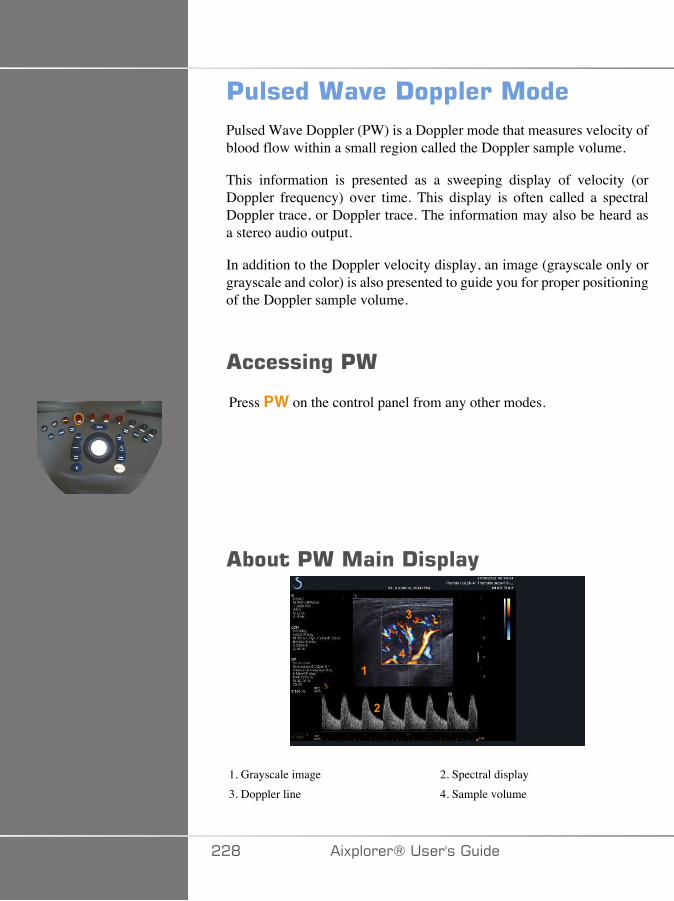
'�������"��!�$$��������Pulsed Wave Doppler (PW) is a Doppler mode that measures velocity ofblood flow within a small region called the Doppler sample volume.
This information is presented as a sweeping display of velocity (orDoppler frequency) over time. This display is often called a spectralDoppler trace, or Doppler trace. The information may also be heard asa stereo audio output.
In addition to the Doppler velocity display, an image (grayscale only orgrayscale and color) is also presented to guide you for proper positioningof the Doppler sample volume.
������%�'�
Press PW on the control panel from any other modes.
����'������!�$��(
�
�
�
�
1. Grayscale image 2. Spectral display3. Doppler line 4. Sample volume
��D �)!�����*�����������
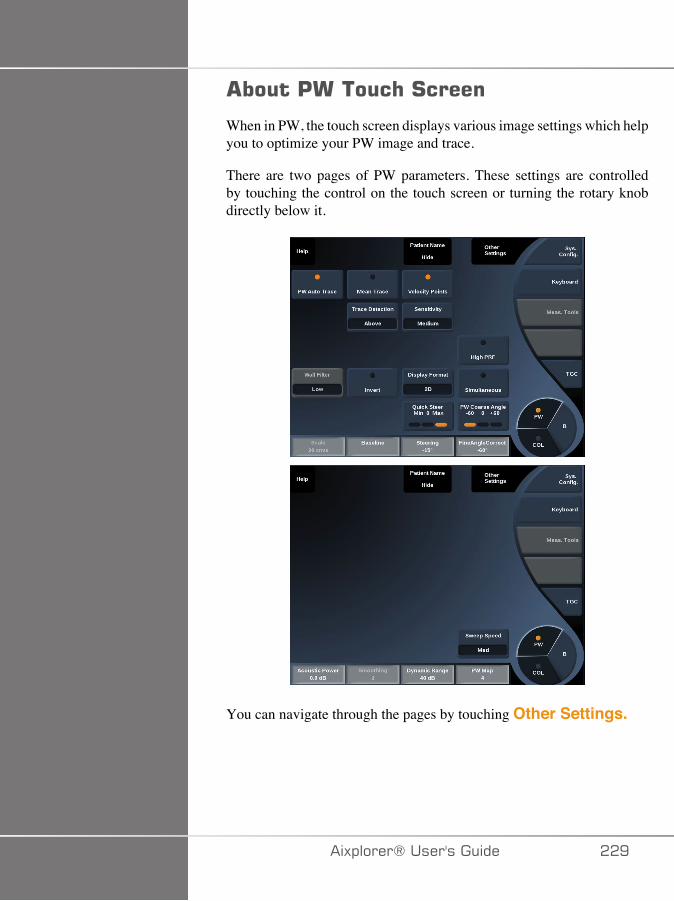
����'����� �#�����
When in PW, the touch screen displays various image settings which helpyou to optimize your PW image and trace.
There are two pages of PW parameters. These settings are controlledby touching the control on the touch screen or turning the rotary knobdirectly below it.
You can navigate through the pages by touching Other Settings.
�)!�����*����������� ��E
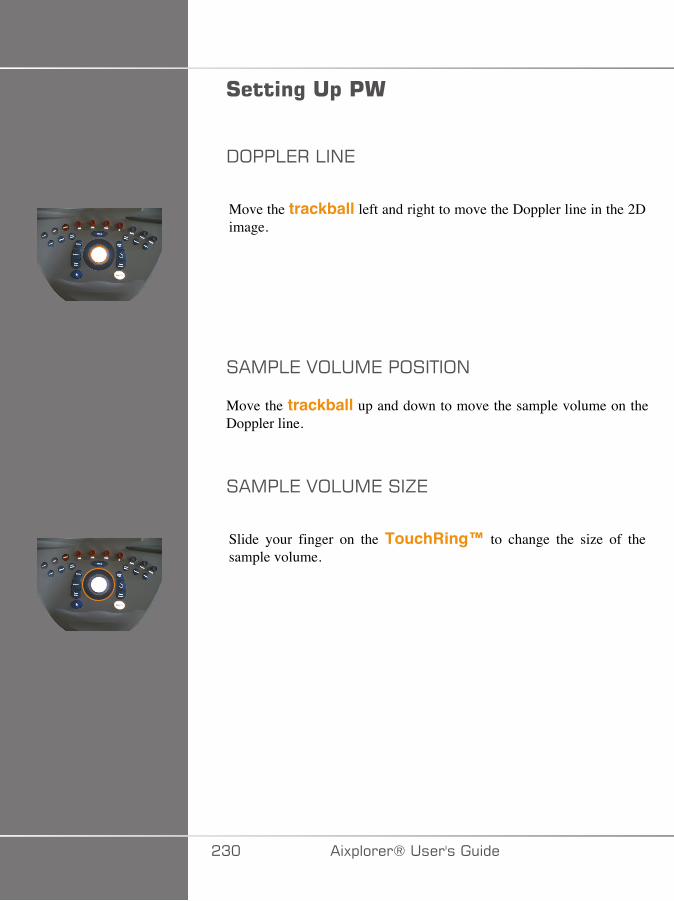
#����%��$�'�
-;��:7��:�/7
Move the trackball left and right to move the Doppler line in the 2Dimage.
��,�:7�2;:�,7��;��+�;/
Move the trackball up and down to move the sample volume on theDoppler line.
��,�:7�2;:�,7���J7
Slide your finger on the TouchRing™ to change the size of thesample volume.
�A� �)!�����*�����������

!����$�������'�����%�%�'���������
B�� 0��+77�
Quick Steer allows you to quickly steer the insonifying beam.Press Quick Steer to change its value.Use the Steering knob for finer settings.
�+77��/�
The insonifying beam can be steered in a direction as close as possibleto the expected direction of motion, within limitations imposed by thetransducer and the image plane geometry.Steering is available only in live imaging.Rotate the knob located under Steering to steer the Doppler line.
�>� ;���7��/�:7
PW Coarse Angle is available in live imaging and on a frozenimage.Touch PW Coarse Angle until you select the desired value.
�)!�����*����������� �A�
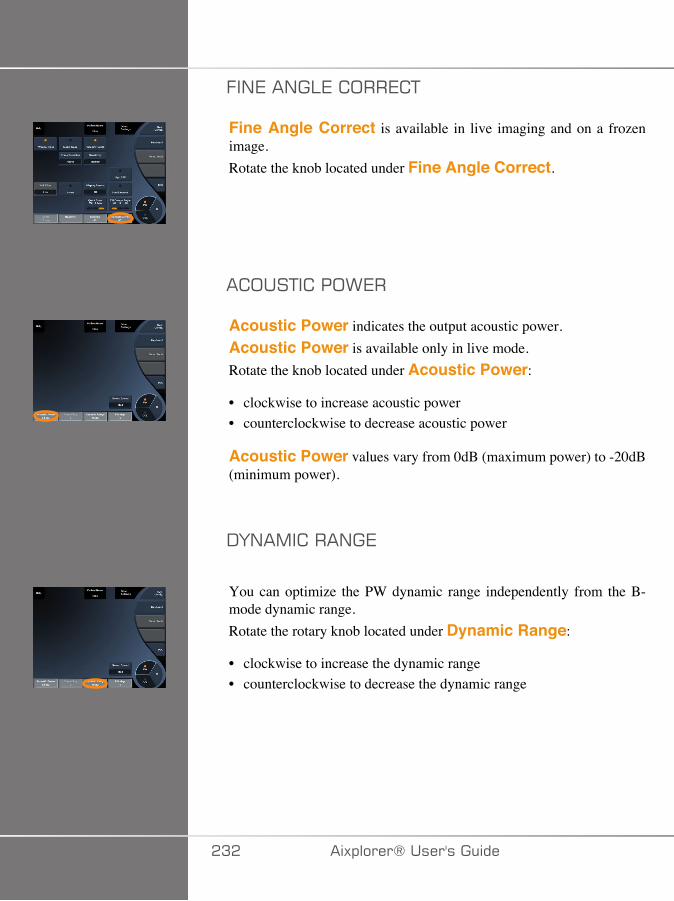
.�/7��/�:7� ;��7 +
Fine Angle Correct is available in live imaging and on a frozenimage.Rotate the knob located under Fine Angle Correct.
� ;��+� ��;>7�
Acoustic Power indicates the output acoustic power.Acoustic Power is available only in live mode.Rotate the knob located under Acoustic Power:
• clockwise to increase acoustic power• counterclockwise to decrease acoustic power
Acoustic Power values vary from 0dB (maximum power) to -20dB(minimum power).
-F/�,� ���/�7
You can optimize the PW dynamic range independently from the B-mode dynamic range.Rotate the rotary knob located under Dynamic Range:
• clockwise to increase the dynamic range• counterclockwise to decrease the dynamic range
�A� �)!�����*�����������
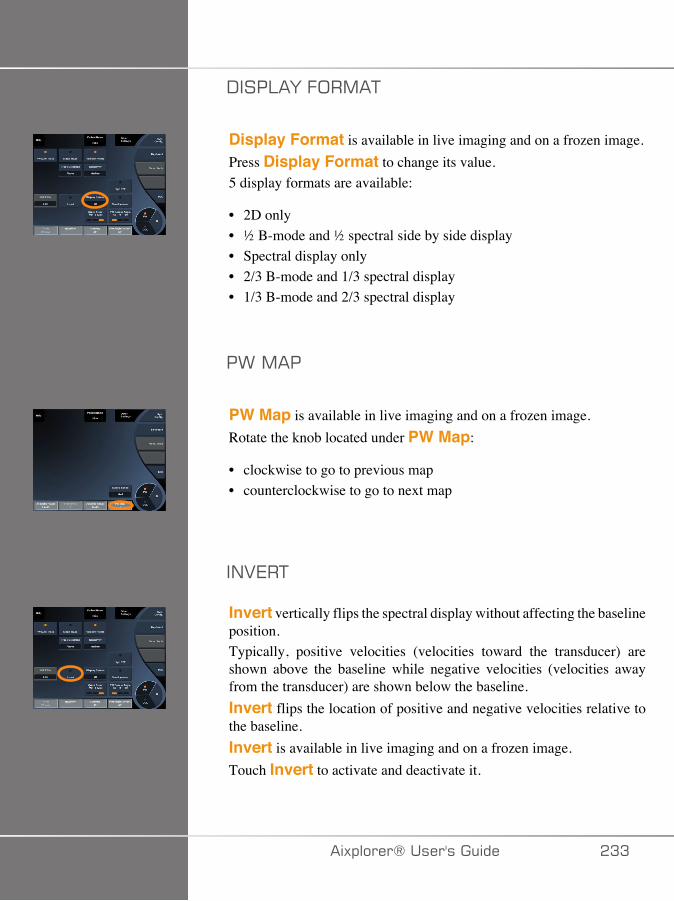
-���:�F�.;�,�+
Display Format is available in live imaging and on a frozen image.Press Display Format to change its value.5 display formats are available:
• 2D only• ½ B-mode and ½ spectral side by side display• Spectral display only• 2/3 B-mode and 1/3 spectral display• 1/3 B-mode and 2/3 spectral display
�>�,��
PW Map is available in live imaging and on a frozen image.Rotate the knob located under PW Map:
• clockwise to go to previous map• counterclockwise to go to next map
�/27�+
Invert vertically flips the spectral display without affecting the baselineposition.Typically, positive velocities (velocities toward the transducer) areshown above the baseline while negative velocities (velocities awayfrom the transducer) are shown below the baseline.Invert flips the location of positive and negative velocities relative tothe baseline.Invert is available in live imaging and on a frozen image.Touch Invert to activate and deactivate it.
�)!�����*����������� �AA

>�::�.�:+7�
This parameter filters out low velocity signals.It helps to decrease motion artifacts caused by patient or transducermotion.Wall Filter is available only in live imaging.Touch Wall Filter until you select the desired value.
� �:7
Scale allows you to modify the maximum velocities displayed on theDoppler spectrum.Scale is available only in live imaging.Rotate the knob located under Scale:
• clockwise to increase the scale• counterclockwise to decrease the scale
1��7:�/7
Baseline is a horizontal graphical line that represents the level of zerovelocity.The baseline position contributes in defining the maximum positive andnegative velocities.By changing the baseline position, you increase the maximum positivevelocity and decrease the maximum negative velocity, or vice versa.Baseline is available only in live imaging and on a frozen image.Rotate the knob located under Baseline:
• clockwise to increase the maximum positive velocities• counterclockwise to increase the maximum negative velocities
�A� �)!�����*�����������
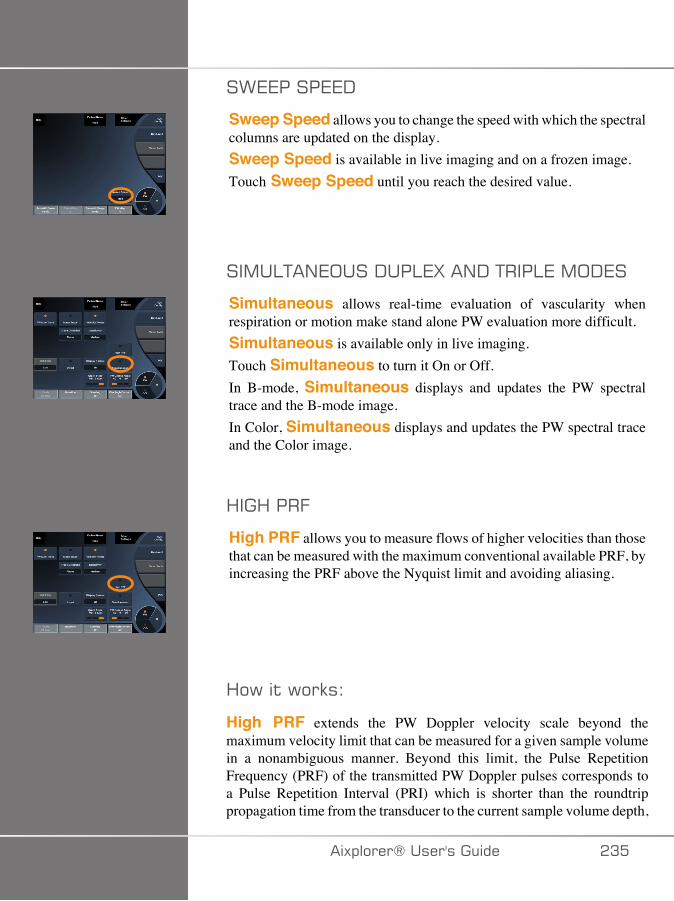
�>77����77-
Sweep Speed allows you to change the speed with which the spectralcolumns are updated on the display.Sweep Speed is available in live imaging and on a frozen image.Touch Sweep Speed until you reach the desired value.
��,�:+�/7;���-��:7G��/-�+���:7�,;-7�
Simultaneous allows real-time evaluation of vascularity whenrespiration or motion make stand alone PW evaluation more difficult.Simultaneous is available only in live imaging.Touch Simultaneous to turn it On or Off.In B-mode, Simultaneous displays and updates the PW spectraltrace and the B-mode image.In Color, Simultaneous displays and updates the PW spectral traceand the Color image.
<��<���.
High PRF allows you to measure flows of higher velocities than thosethat can be measured with the maximum conventional available PRF, byincreasing the PRF above the Nyquist limit and avoiding aliasing.
<�6�$�6��9��
High PRF extends the PW Doppler velocity scale beyond themaximum velocity limit that can be measured for a given sample volumein a nonambiguous manner. Beyond this limit, the Pulse RepetitionFrequency (PRF) of the transmitted PW Doppler pulses corresponds toa Pulse Repetition Interval (PRI) which is shorter than the roundtrippropagation time from the transducer to the current sample volume depth,
�)!�����*����������� �A�
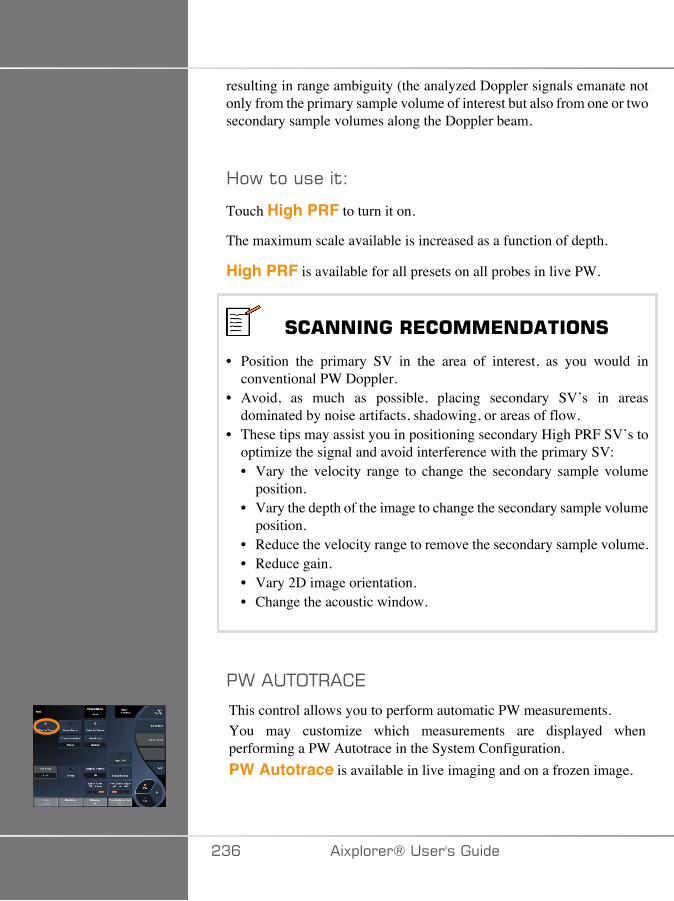
resulting in range ambiguity (the analyzed Doppler signals emanate notonly from the primary sample volume of interest but also from one or twosecondary sample volumes along the Doppler beam.
<�6�$�����$�
Touch High PRF to turn it on.
The maximum scale available is increased as a function of depth.
High PRF is available for all presets on all probes in live PW.
#� ������+*����*�! ����#
• Position the primary SV in the area of interest, as you would inconventional PW Doppler.
• Avoid, as much as possible, placing secondary SV’s in areasdominated by noise artifacts, shadowing, or areas of flow.
• These tips may assist you in positioning secondary High PRF SV’s tooptimize the signal and avoid interference with the primary SV:• Vary the velocity range to change the secondary sample volume
position.• Vary the depth of the image to change the secondary sample volume
position.• Reduce the velocity range to remove the secondary sample volume.• Reduce gain.• Vary 2D image orientation.• Change the acoustic window.
�>���+;+�� 7
This control allows you to perform automatic PW measurements.You may customize which measurements are displayed whenperforming a PW Autotrace in the System Configuration.PW Autotrace is available in live imaging and on a frozen image.
�AC �)!�����*�����������
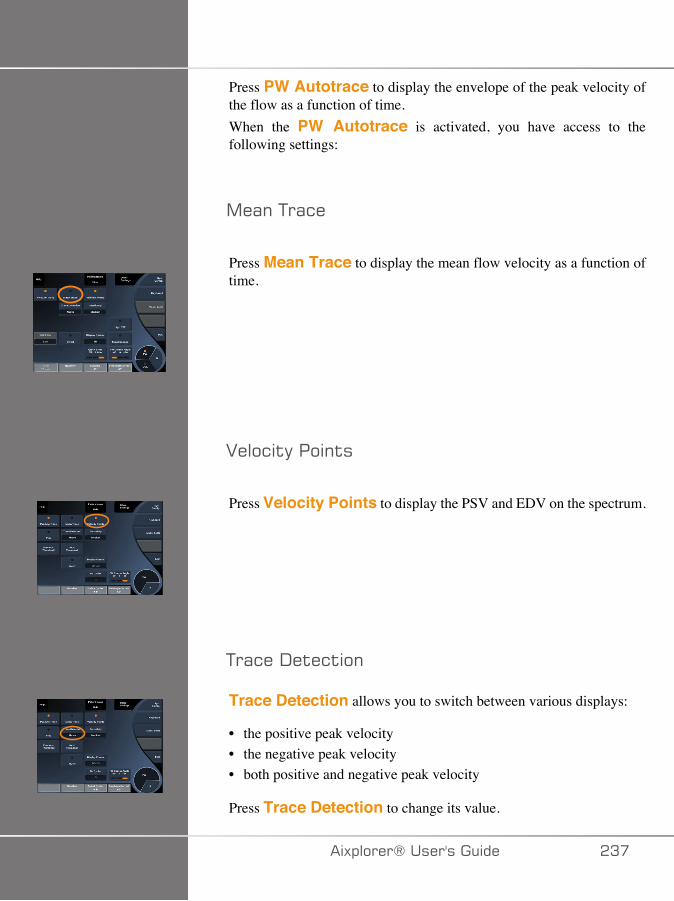
Press PW Autotrace to display the envelope of the peak velocity ofthe flow as a function of time.When the PW Autotrace is activated, you have access to thefollowing settings:
,�(��+�(&�
Press Mean Trace to display the mean flow velocity as a function oftime.
2���&$�����$�
Press Velocity Points to display the PSV and EDV on the spectrum.
+�(&��-�$�&$��
Trace Detection allows you to switch between various displays:
• the positive peak velocity• the negative peak velocity• both positive and negative peak velocity
Press Trace Detection to change its value.
�)!�����*����������� �A�
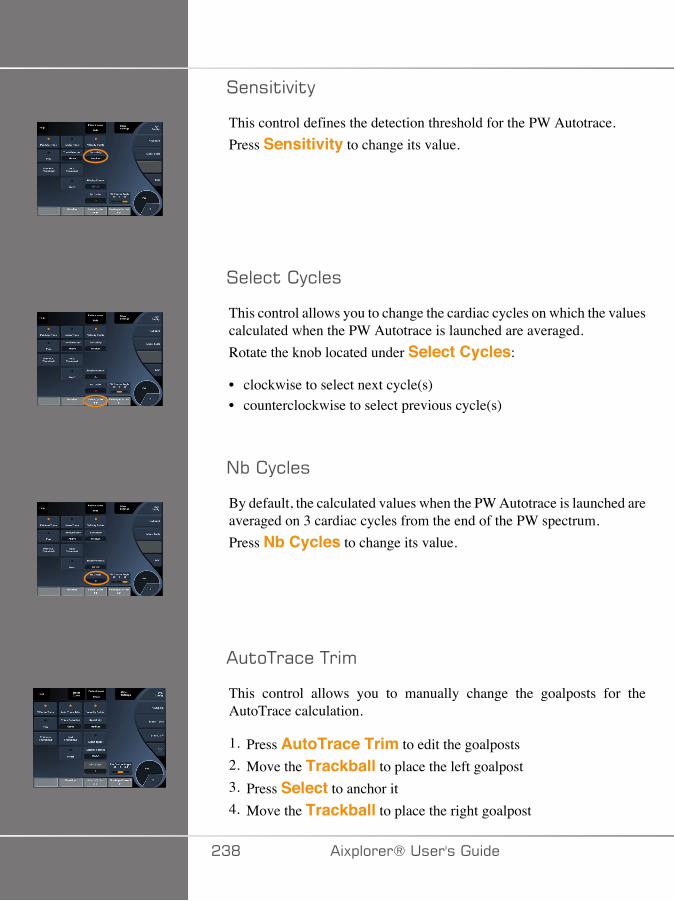
����$�$�
This control defines the detection threshold for the PW Autotrace.Press Sensitivity to change its value.
����&$� �&���
This control allows you to change the cardiac cycles on which the valuescalculated when the PW Autotrace is launched are averaged.Rotate the knob located under Select Cycles:
• clockwise to select next cycle(s)• counterclockwise to select previous cycle(s)
/%� �&���
By default, the calculated values when the PW Autotrace is launched areaveraged on 3 cardiac cycles from the end of the PW spectrum.Press Nb Cycles to change its value.
�$�+�(&��+�'
This control allows you to manually change the goalposts for theAutoTrace calculation.
1. Press AutoTrace Trim to edit the goalposts2. Move the Trackball to place the left goalpost3. Press Select to anchor it4. Move the Trackball to place the right goalpost
�AD �)!�����*�����������

5. Press Select to anchor it
�)!�����*����������� �AE
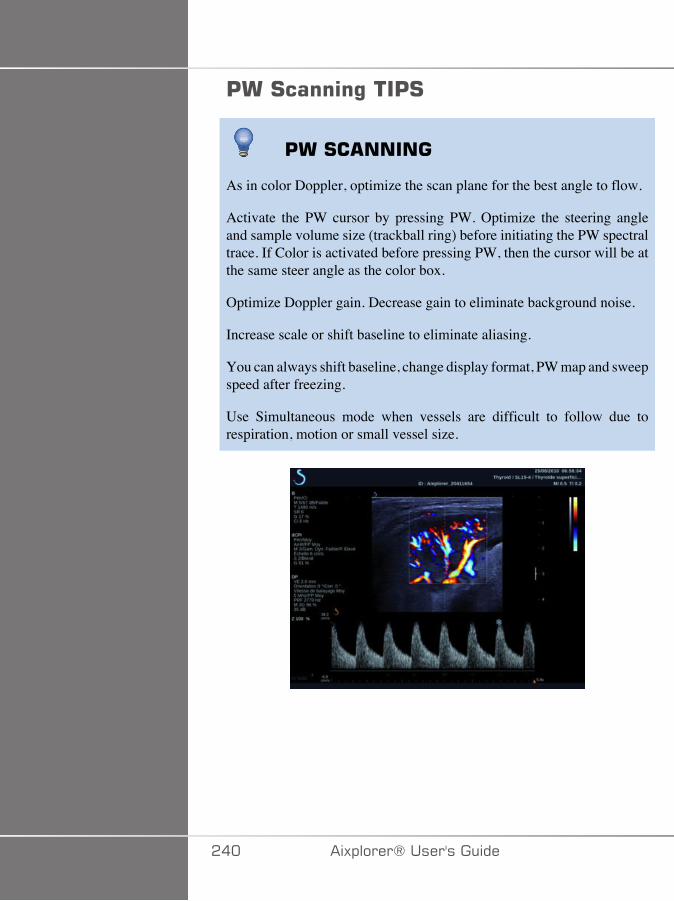
'��#�����%���'#
'��#� �����
As in color Doppler, optimize the scan plane for the best angle to flow.
Activate the PW cursor by pressing PW. Optimize the steering angleand sample volume size (trackball ring) before initiating the PW spectraltrace. If Color is activated before pressing PW, then the cursor will be atthe same steer angle as the color box.
Optimize Doppler gain. Decrease gain to eliminate background noise.
Increase scale or shift baseline to eliminate aliasing.
You can always shift baseline, change display format, PW map and sweepspeed after freezing.
Use Simultaneous mode when vessels are difficult to follow due torespiration, motion or small vessel size.
��� �)!�����*�����������
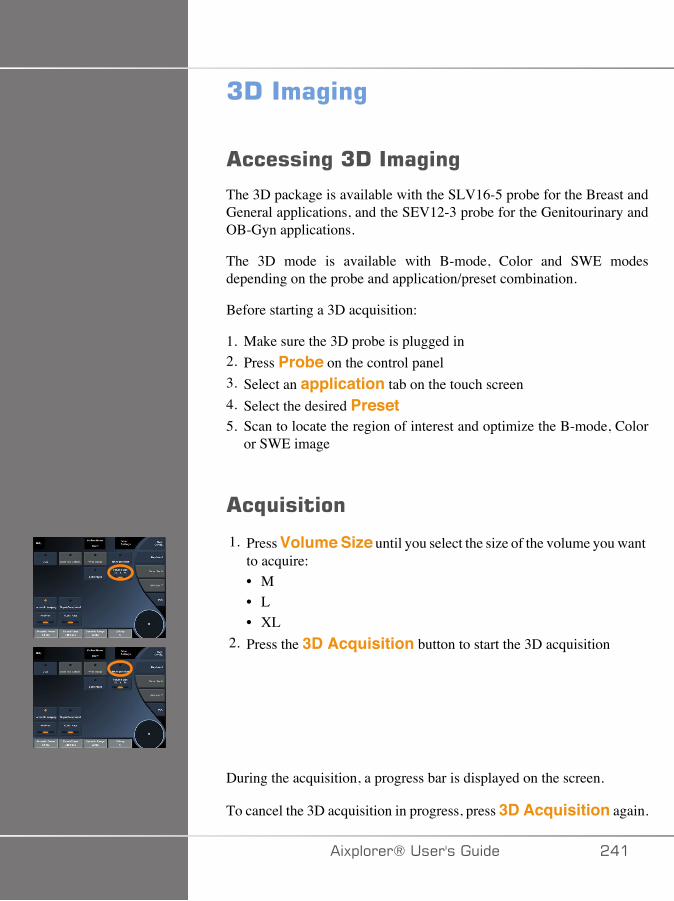
7!����%�%
������%�7!����%�%
The 3D package is available with the SLV16-5 probe for the Breast andGeneral applications, and the SEV12-3 probe for the Genitourinary andOB-Gyn applications.
The 3D mode is available with B-mode, Color and SWE modesdepending on the probe and application/preset combination.
Before starting a 3D acquisition:
1. Make sure the 3D probe is plugged in2. Press Probe on the control panel3. Select an application tab on the touch screen4. Select the desired Preset5. Scan to locate the region of interest and optimize the B-mode, Color
or SWE image
�,����
1. Press Volume Size until you select the size of the volume you wantto acquire:• M• L• XL
2. Press the 3D Acquisition button to start the 3D acquisition
During the acquisition, a progress bar is displayed on the screen.
To cancel the 3D acquisition in progress, press 3D Acquisition again.
�)!�����*����������� ���
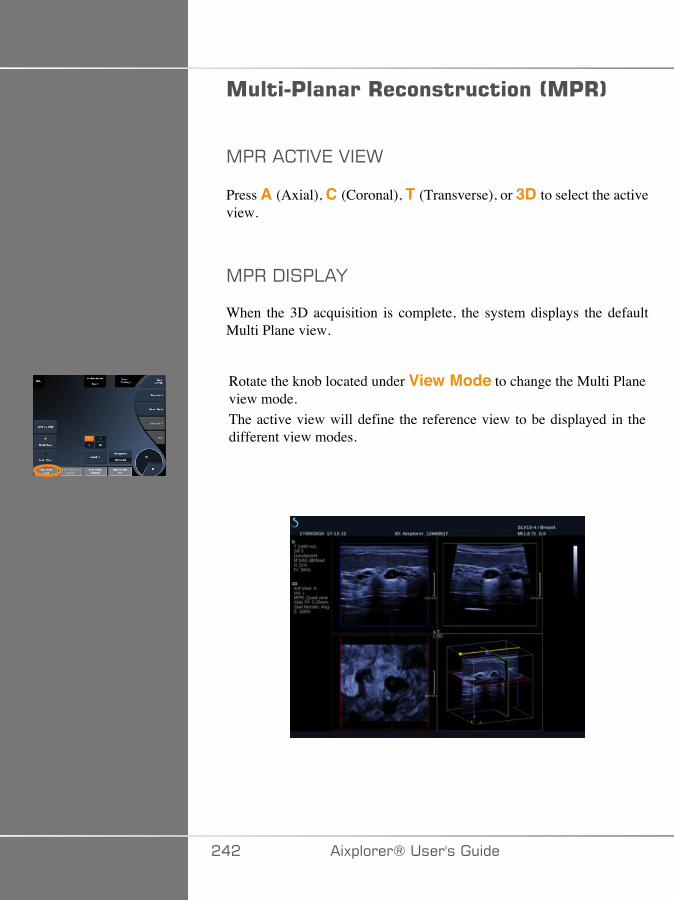
����'������+������������0�'+1
,���� +�27�2�7>
Press A (Axial), C (Coronal), T (Transverse), or 3D to select the activeview.
,���-���:�F
When the 3D acquisition is complete, the system displays the defaultMulti Plane view.
Rotate the knob located under View Mode to change the Multi Planeview mode.The active view will define the reference view to be displayed in thedifferent view modes.
��� �)!�����*�����������
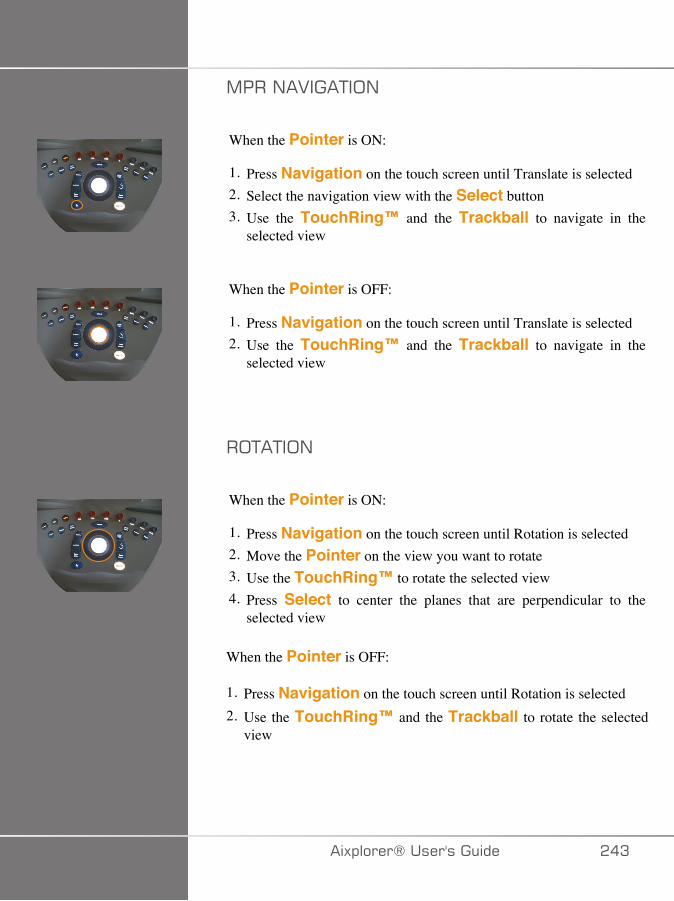
,���/�2���+�;/
When the Pointer is ON:
1. Press Navigation on the touch screen until Translate is selected2. Select the navigation view with the Select button3. Use the TouchRing™ and the Trackball to navigate in the
selected view
When the Pointer is OFF:
1. Press Navigation on the touch screen until Translate is selected2. Use the TouchRing™ and the Trackball to navigate in the
selected view
�;+�+�;/
When the Pointer is ON:
1. Press Navigation on the touch screen until Rotation is selected2. Move the Pointer on the view you want to rotate3. Use the TouchRing™ to rotate the selected view4. Press Select to center the planes that are perpendicular to the
selected view
When the Pointer is OFF:
1. Press Navigation on the touch screen until Rotation is selected2. Use the TouchRing™ and the Trackball to rotate the selected
view
�)!�����*����������� ��A
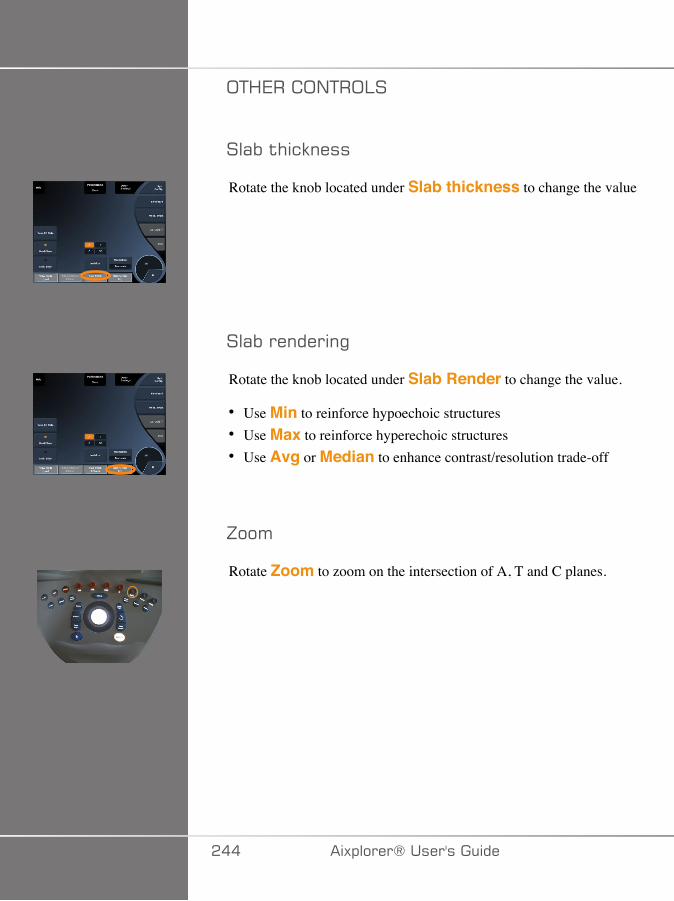
;+<7�� ;/+�;:�
��(%�$#&9����
Rotate the knob located under Slab thickness to change the value
��(%��������"
Rotate the knob located under Slab Render to change the value.
• Use Min to reinforce hypoechoic structures• Use Max to reinforce hyperechoic structures• Use Avg or Median to enhance contrast/resolution trade-off
J��'
Rotate Zoom to zoom on the intersection of A, T and C planes.
��� �)!�����*�����������
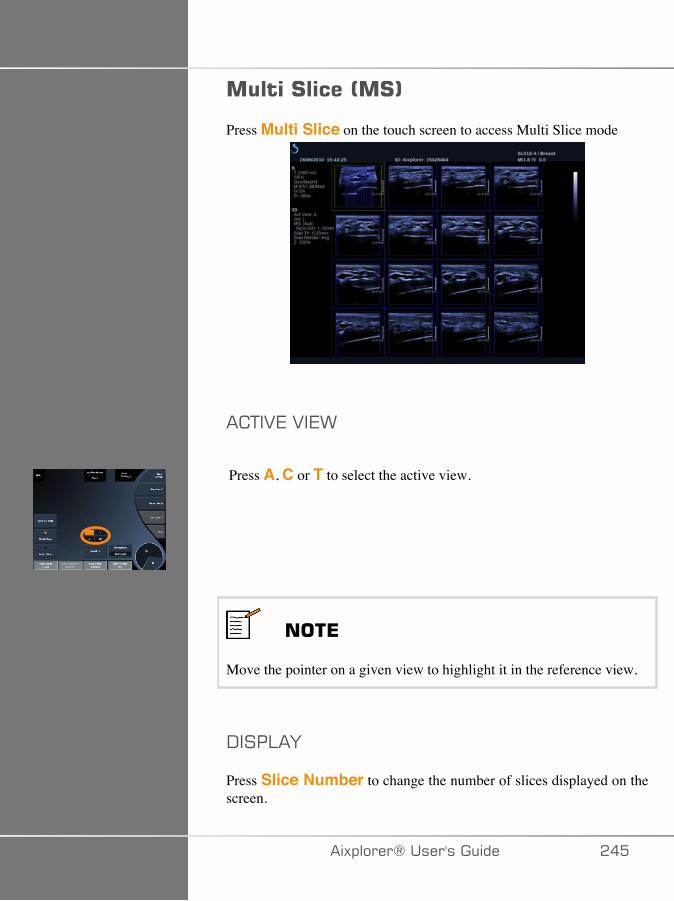
����#����0�#1
Press Multi Slice on the touch screen to access Multi Slice mode
� +�27�2�7>
Press A, C or T to select the active view.
���*
Move the pointer on a given view to highlight it in the reference view.
-���:�F
Press Slice Number to change the number of slices displayed on thescreen.
�)!�����*����������� ���
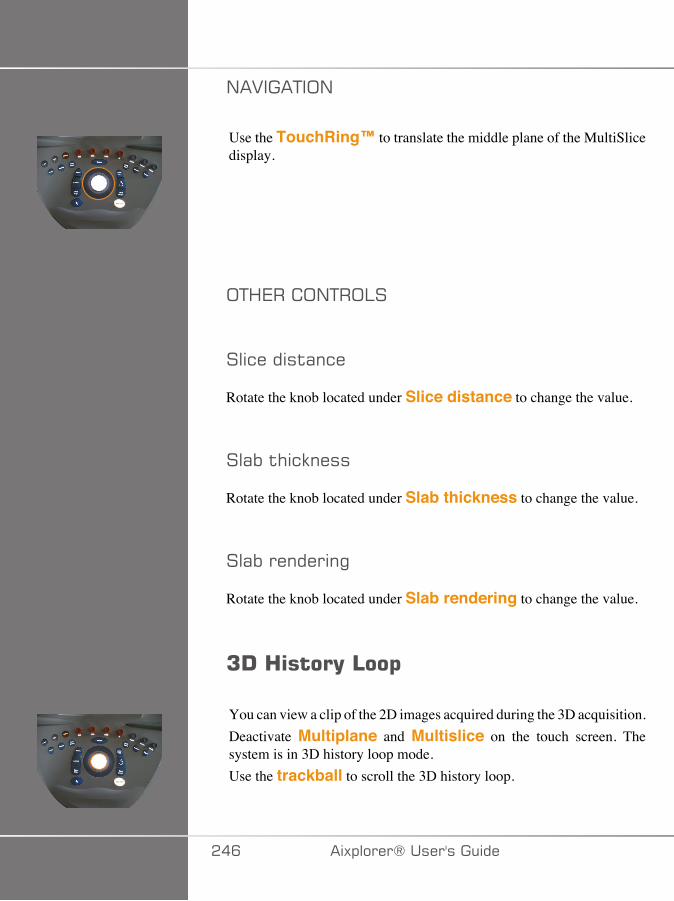
/�2���+�;/
Use the TouchRing™ to translate the middle plane of the MultiSlicedisplay.
;+<7�� ;/+�;:�
��&����$(�&�
Rotate the knob located under Slice distance to change the value.
��(%�$#&9����
Rotate the knob located under Slab thickness to change the value.
��(%��������"
Rotate the knob located under Slab rendering to change the value.
7!�3����(�4��$
You can view a clip of the 2D images acquired during the 3D acquisition.Deactivate Multiplane and Multislice on the touch screen. Thesystem is in 3D history loop mode.Use the trackball to scroll the 3D history loop.
��C �)!�����*�����������
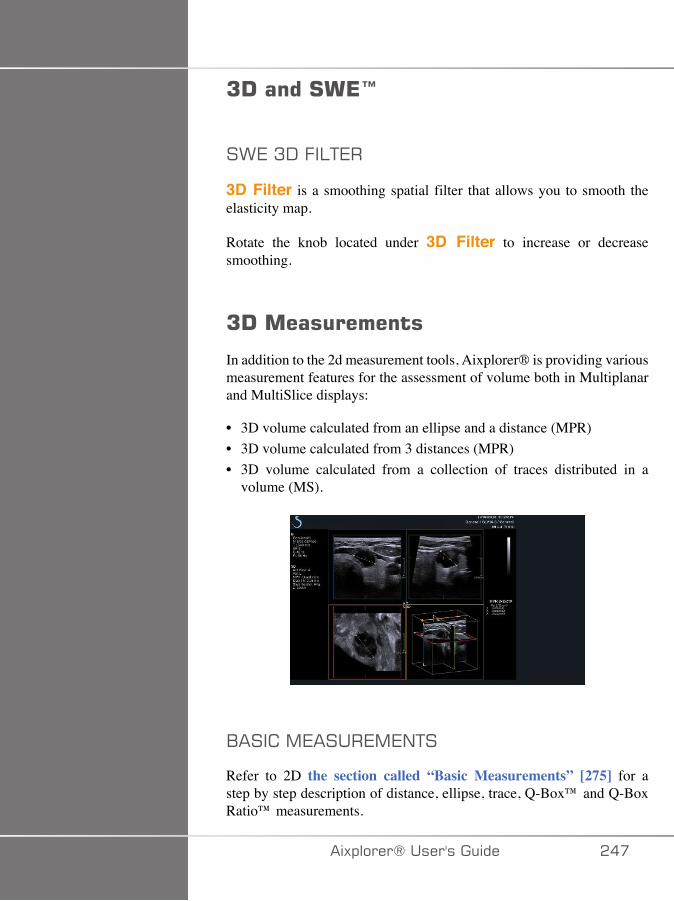
7!�����#�*I
�>7�A-�.�:+7�
3D Filter is a smoothing spatial filter that allows you to smooth theelasticity map.
Rotate the knob located under 3D Filter to increase or decreasesmoothing.
7!������������
In addition to the 2d measurement tools, Aixplorer® is providing variousmeasurement features for the assessment of volume both in Multiplanarand MultiSlice displays:
• 3D volume calculated from an ellipse and a distance (MPR)• 3D volume calculated from 3 distances (MPR)• 3D volume calculated from a collection of traces distributed in a
volume (MS).
1��� �,7����7,7/+�
Refer to 2D the section called “Basic Measurements” [275] for astep by step description of distance, ellipse, trace, Q-Box™ and Q-BoxRatio™ measurements.
�)!�����*����������� ���
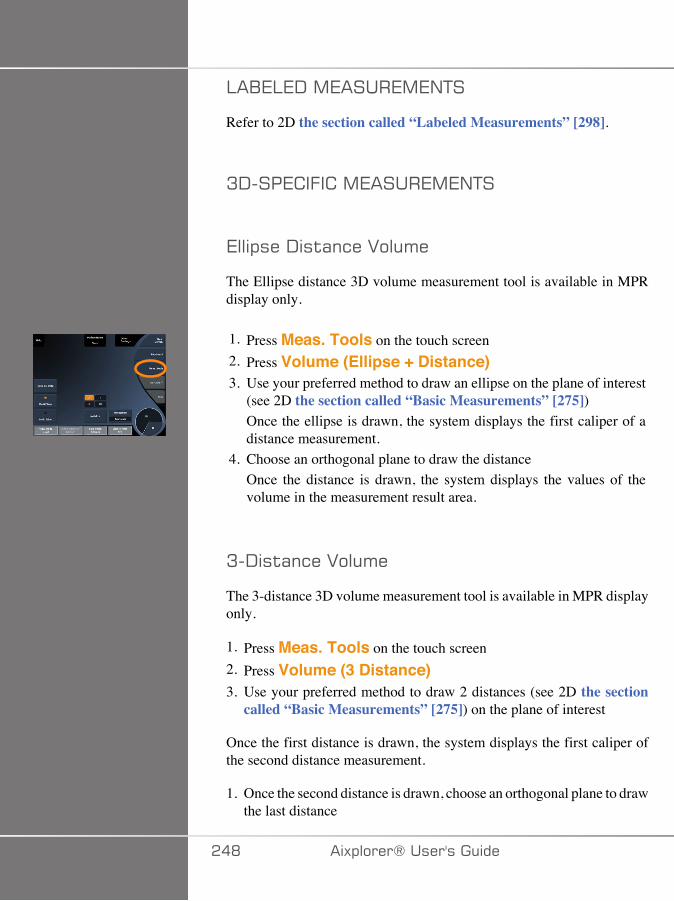
:�17:7-�,7����7,7/+�
Refer to 2D the section called “Labeled Measurements” [298].
A-���7 �.� �,7����7,7/+�
7��!���-�$(�&��2��'�
The Ellipse distance 3D volume measurement tool is available in MPRdisplay only.
1. Press Meas. Tools on the touch screen2. Press Volume (Ellipse + Distance)3. Use your preferred method to draw an ellipse on the plane of interest
(see 2D the section called “Basic Measurements” [275])Once the ellipse is drawn, the system displays the first caliper of adistance measurement.
4. Choose an orthogonal plane to draw the distanceOnce the distance is drawn, the system displays the values of thevolume in the measurement result area.
A�-�$(�&��2��'�
The 3-distance 3D volume measurement tool is available in MPR displayonly.
1. Press Meas. Tools on the touch screen2. Press Volume (3 Distance)3. Use your preferred method to draw 2 distances (see 2D the section
called “Basic Measurements” [275]) on the plane of interest
Once the first distance is drawn, the system displays the first caliper ofthe second distance measurement.
1. Once the second distance is drawn, choose an orthogonal plane to drawthe last distance
��D �)!�����*�����������
Once the last distance is drawn, the system displays the values of thevolume in the measurement result area.
+�(&�� ����&$���2��'�
The trace collection 3D volume measurement tool is available in MSdisplay only.
1. Press Meas. Tools on the touch screen2. Press Volume (Trace Method)3. Use your preferred method to draw a first trace on a given slice (see
2D the section called “Basic Measurements” [275])
Once the first trace is drawn, the system displays the first caliper of thenext adjacent slice.
1. Draw as many trace measurements as needed (a minimum of 2 isrequired to calculate a volume)
2. Press End to finalize the measurement
The system displays the values of the volume in the measurement resultarea.
����$($��2��'��,�(���'��$� ��'�A-�-($(��$
1. Press Probe2. Select the Genitourinary application and the Prostate preset of the
SEV12-33. Optimize the B-mode image of the prostate4. Press 3D Acquisition5. The system is in Multiplanar imaging (refer to 3D chapter of this
User's Guide)6. Press Volume measurement on the touch screen7. Perform 2 distance measurements on one plane8. Perform 1 distance measurement on another plane9. The system displays the 3 distance results together with a calculated
volume
�)!�����*����������� ��E
� �����
Make sure the image quality of the 3D acquisition is sufficient in orderto perform a 3D volume measurement.
7!���������+�"�)�'��E�%�
The 3D on-cart review package allows you to append a closed examand save a secondary capture with new information from acquired 3Dvolumes coming from the former exam.
��� �)!�����*�����������
���������*� ������������������%�%�0�*�#1Contrast Enhanced Ultrasound Imaging (CEUS) is a mode of imagingwhich allows you to assess micro and macro-vascular perfusioninformation in an ultrasound image.
CEUS requires that the ultrasound imaging be performed in conjunctionwith the injection of a microbubble based contrast agent.
The microbubbles appear as intravascular tracers in the ultrasound image,allowing the differentiation of structures based on their vascularity.
���*
SuperSonic Imagine does not sell contrast agent products.
� +����
CEUS is available only for the liver in the USA. Do not use CEUS inother organs.
Carefully follow manufacturer’s instructions for use, includingindications and contra indications, when administering ultrasoundcontrast agents.
�)!�����*����������� ���
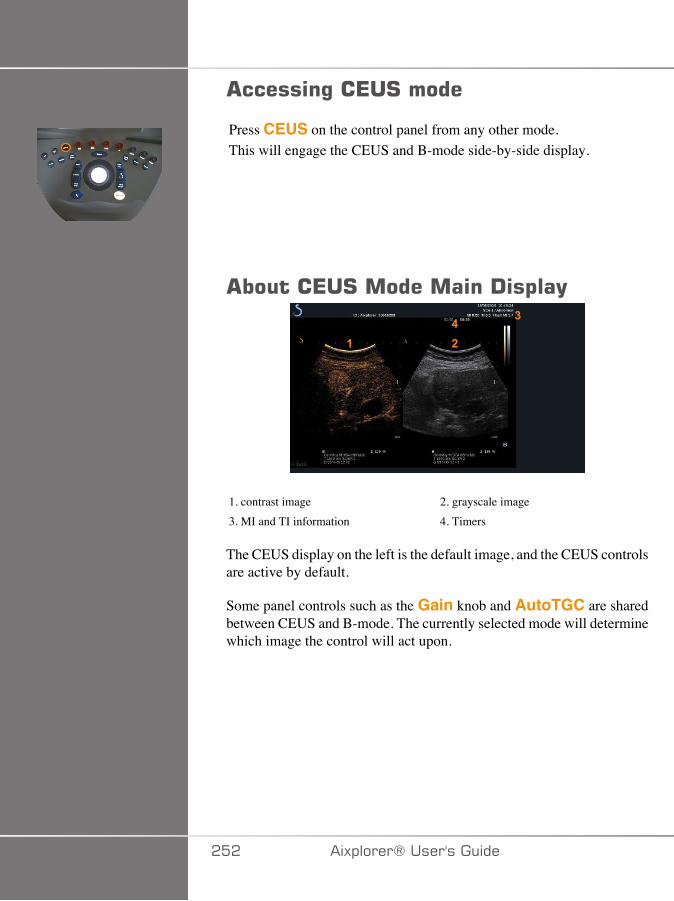
������%��*�#�����
Press CEUS on the control panel from any other mode.This will engage the CEUS and B-mode side-by-side display.
�����*�#����������!�$��(
��
��
1. contrast image 2. grayscale image3. MI and TI information 4. Timers
The CEUS display on the left is the default image, and the CEUS controlsare active by default.
Some panel controls such as the Gain knob and AutoTGC are sharedbetween CEUS and B-mode. The currently selected mode will determinewhich image the control will act upon.
��� �)!�����*�����������
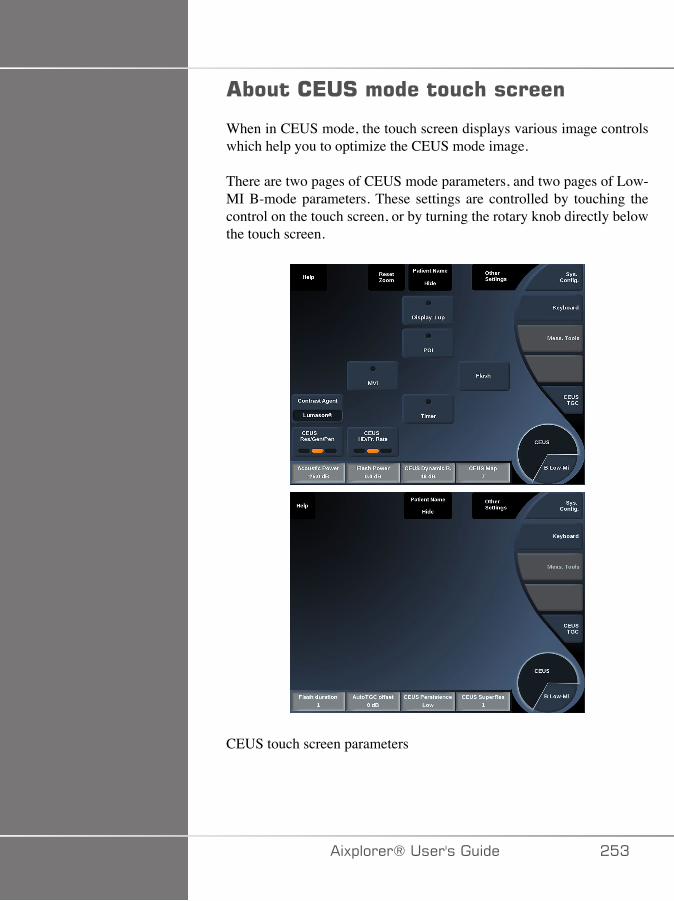
�����*�#��������� �������
When in CEUS mode, the touch screen displays various image controlswhich help you to optimize the CEUS mode image.
There are two pages of CEUS mode parameters, and two pages of Low-MI B-mode parameters. These settings are controlled by touching thecontrol on the touch screen, or by turning the rotary knob directly belowthe touch screen.
CEUS touch screen parameters
�)!�����*����������� ��A
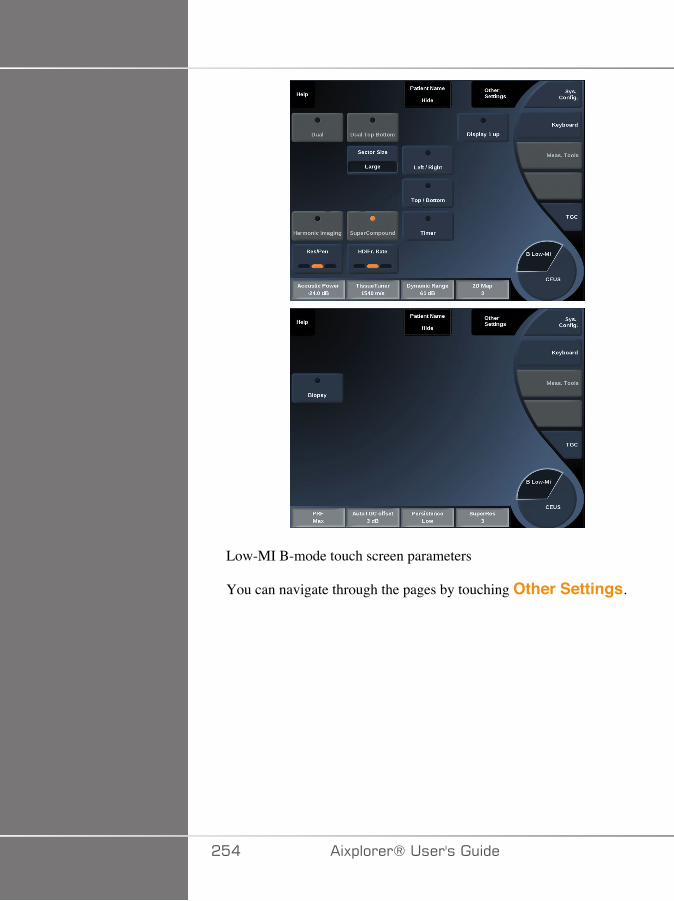
Low-MI B-mode touch screen parameters
You can navigate through the pages by touching Other Settings.
��� �)!�����*�����������
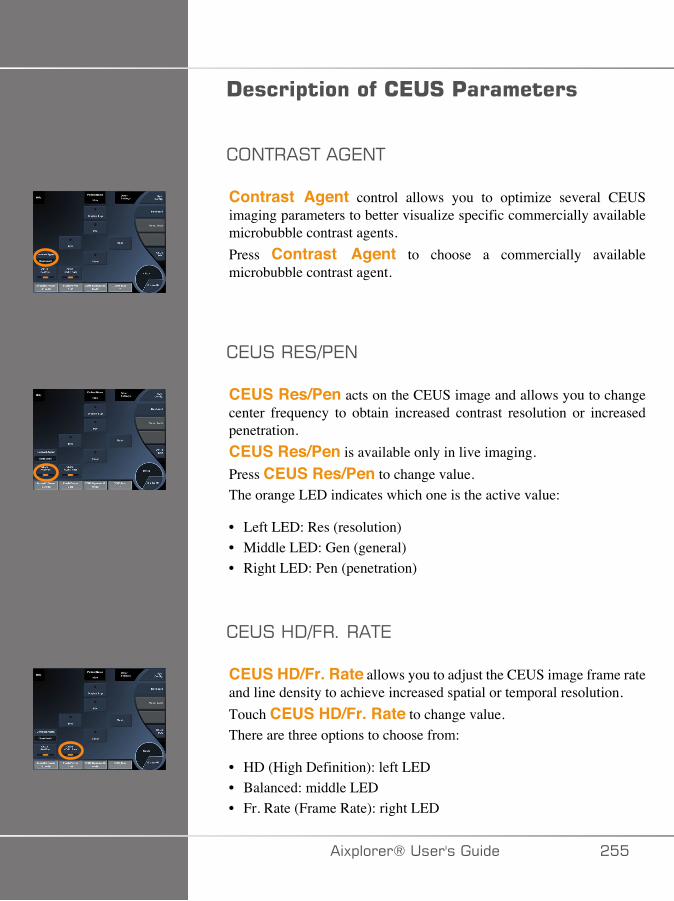
!����$��������*�#�'���������
;/+���+���7/+
Contrast Agent control allows you to optimize several CEUSimaging parameters to better visualize specific commercially availablemicrobubble contrast agents.Press Contrast Agent to choose a commercially availablemicrobubble contrast agent.
7����7�3�7/
CEUS Res/Pen acts on the CEUS image and allows you to changecenter frequency to obtain increased contrast resolution or increasedpenetration.CEUS Res/Pen is available only in live imaging.Press CEUS Res/Pen to change value.The orange LED indicates which one is the active value:
• Left LED: Res (resolution)• Middle LED: Gen (general)• Right LED: Pen (penetration)
7���<-3.�����+7
CEUS HD/Fr. Rate allows you to adjust the CEUS image frame rateand line density to achieve increased spatial or temporal resolution.Touch CEUS HD/Fr. Rate to change value.There are three options to choose from:
• HD (High Definition): left LED• Balanced: middle LED• Fr. Rate (Frame Rate): right LED
�)!�����*����������� ���
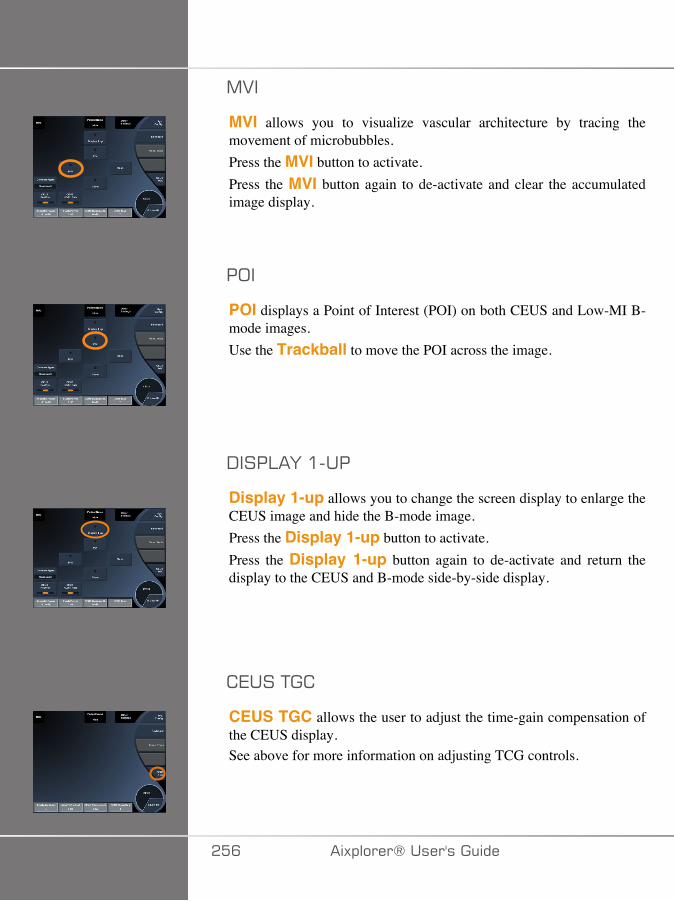
,2�
MVI allows you to visualize vascular architecture by tracing themovement of microbubbles.Press the MVI button to activate.Press the MVI button again to de-activate and clear the accumulatedimage display.
�;�
POI displays a Point of Interest (POI) on both CEUS and Low-MI B-mode images.Use the Trackball to move the POI across the image.
-���:�F�����
Display 1-up allows you to change the screen display to enlarge theCEUS image and hide the B-mode image.Press the Display 1-up button to activate.Press the Display 1-up button again to de-activate and return thedisplay to the CEUS and B-mode side-by-side display.
7���+�
CEUS TGC allows the user to adjust the time-gain compensation ofthe CEUS display.See above for more information on adjusting TCG controls.
��C �)!�����*�����������
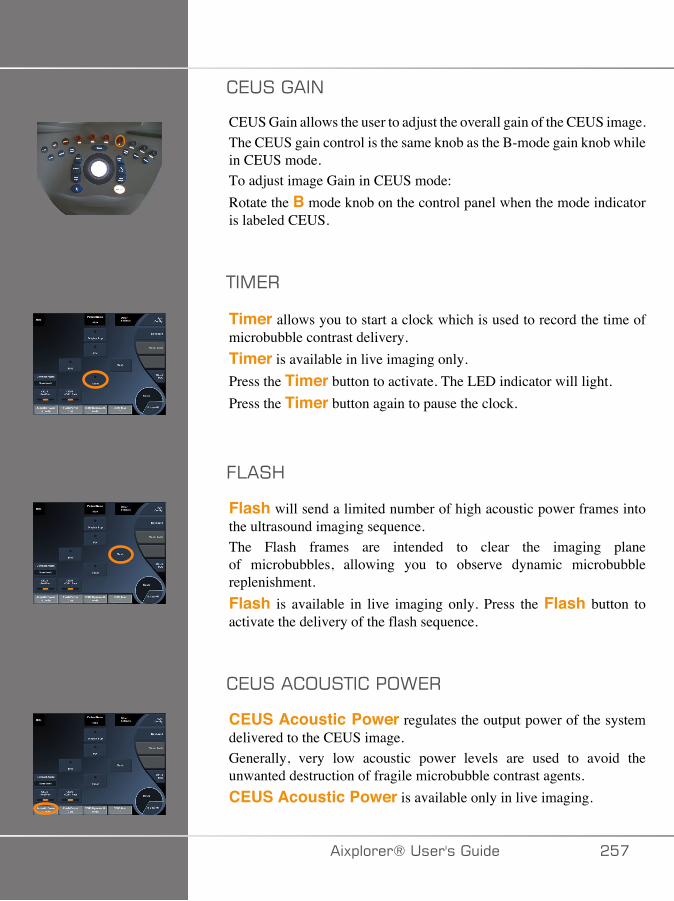
7������/
CEUS Gain allows the user to adjust the overall gain of the CEUS image.The CEUS gain control is the same knob as the B-mode gain knob whilein CEUS mode.To adjust image Gain in CEUS mode:Rotate the B mode knob on the control panel when the mode indicatoris labeled CEUS.
+�,7�
Timer allows you to start a clock which is used to record the time ofmicrobubble contrast delivery.Timer is available in live imaging only.Press the Timer button to activate. The LED indicator will light.Press the Timer button again to pause the clock.
.:��<
Flash will send a limited number of high acoustic power frames intothe ultrasound imaging sequence.The Flash frames are intended to clear the imaging planeof microbubbles, allowing you to observe dynamic microbubblereplenishment.Flash is available in live imaging only. Press the Flash button toactivate the delivery of the flash sequence.
7���� ;��+� ��;>7�
CEUS Acoustic Power regulates the output power of the systemdelivered to the CEUS image.Generally, very low acoustic power levels are used to avoid theunwanted destruction of fragile microbubble contrast agents.CEUS Acoustic Power is available only in live imaging.
�)!�����*����������� ���

Rotate the knob located under Acoustic Power:
• clockwise to increase acoustic power output• counterclockwise to decrease acoustic power output
Maximum acoustic power is 0dB and minimum is -30dB.See Chapter 3, Safety [37] for information on output power regulations.
.:��<��;>7�
Flash Power regulates the output power of the system delivered tothe CEUS image when the Flash control is pressed.Generally, the Flash power is set to a high acoustic power level andis delivered in a just a few frames. The high Flash acoustic powerwill destroy microbubbles in the CEUS image, allowing you to observedynamic microbubble replenishment.Flash Power is available only in live imaging.Rotate the knob located under Flash Power:
• clockwise to increase acoustic power output• counterclockwise to decrease acoustic power output
See Chapter 3, Safety [37] for information on output power regulations.
7���-F/�,� ���/�7
CEUS Dynamic R. allows you to change the range over which theamplitudes of returning ultrasound signals are displayed in the CEUSimage.CEUS Dynamic R. is available in live CEUS imaging and on afrozen CEUS image.Rotate the rotary knob located under CEUS Dynamic R.:
• clockwise to compress the grayscale values• counterclockwise to decrease the dynamic range
��D �)!�����*�����������
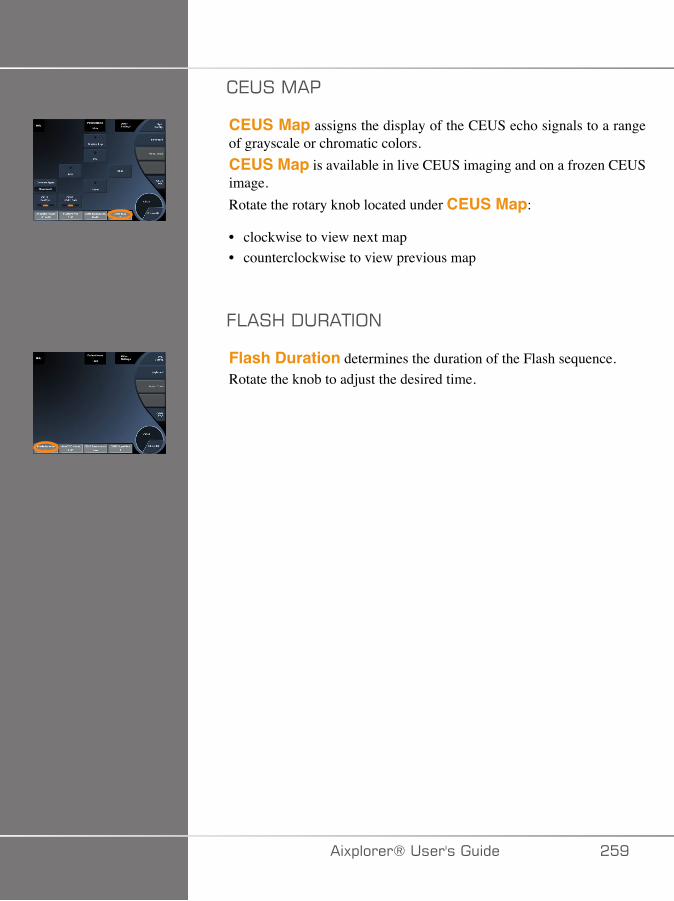
7���,��
CEUS Map assigns the display of the CEUS echo signals to a rangeof grayscale or chromatic colors.CEUS Map is available in live CEUS imaging and on a frozen CEUSimage.Rotate the rotary knob located under CEUS Map:
• clockwise to view next map• counterclockwise to view previous map
.:��<�-���+�;/
Flash Duration determines the duration of the Flash sequence.Rotate the knob to adjust the desired time.
�)!�����*����������� ��E
�*�#�#�����%���'#
�*�#�#� �����
Optimize the B-mode image as usual. Then press CEUS
Select the Contrast Agent setting most appropriate for the microbubblecontrast agent being used.
Administer an amount of contrast agent advised by the contrast agentmanufacturer for the targeted application.
Press Save Clip, when agent arrives to capture prospectively the contrastbolus.
Use a low CEUS Acoustic Power to minimize microbubble destruction.
Adjust the Res/Pen control to optimize the image.
Adjust the HD/Fr. Rate control to optimize the image.
Allow the contrast agent to completely clear before administering thedose appropriate for diagnostic imaging.
Remember to start the Timer when injecting contrast agent!
�C� �)!�����*�����������
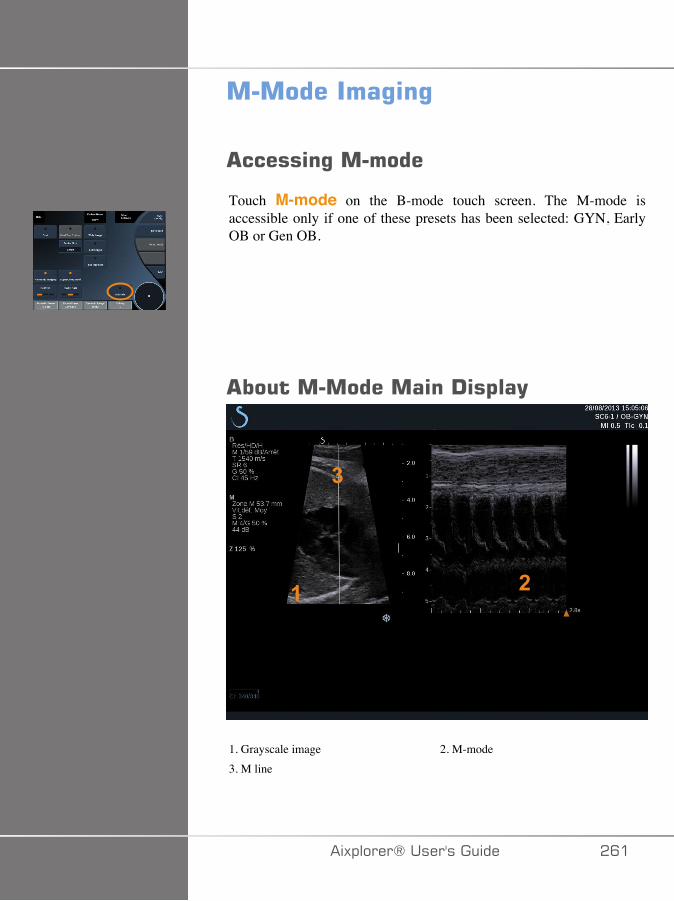
����������%�%
������%�������
Touch M-mode on the B-mode touch screen. The M-mode isaccessible only if one of these presets has been selected: GYN, EarlyOB or Gen OB.
���������������!�$��(
� �
�
1. Grayscale image 2. M-mode3. M line
�)!�����*����������� �C�
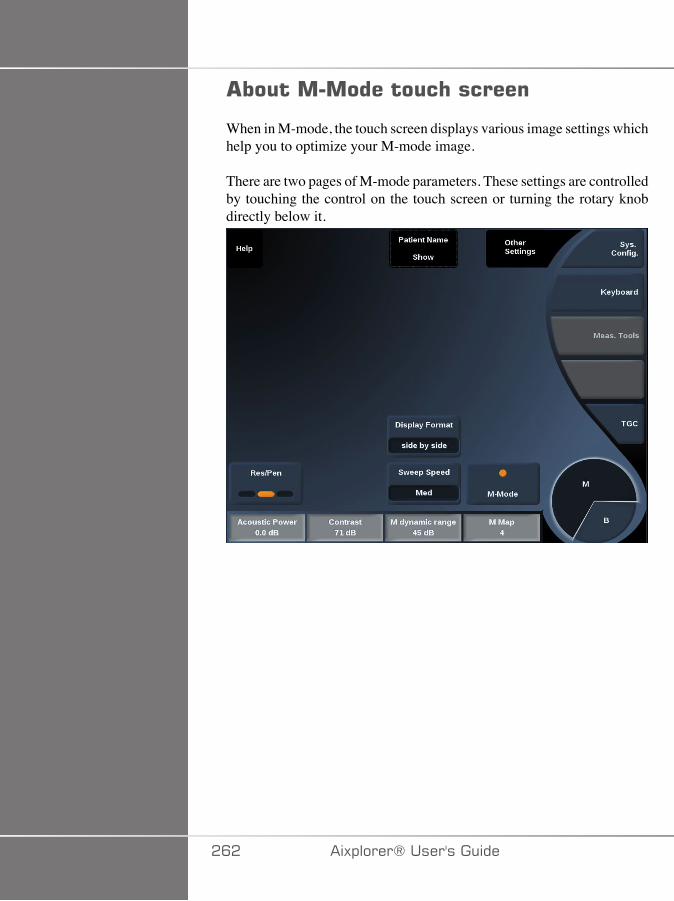
�������������� �������
When in M-mode, the touch screen displays various image settings whichhelp you to optimize your M-mode image.
There are two pages of M-mode parameters. These settings are controlledby touching the control on the touch screen or turning the rotary knobdirectly below it.
�C� �)!�����*�����������
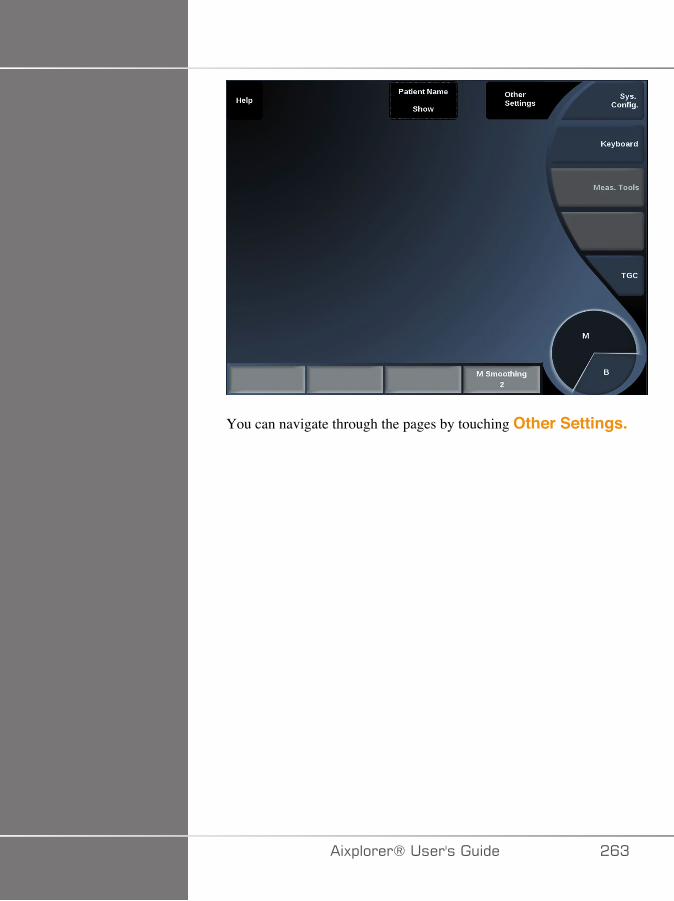
You can navigate through the pages by touching Other Settings.
�)!�����*����������� �CA
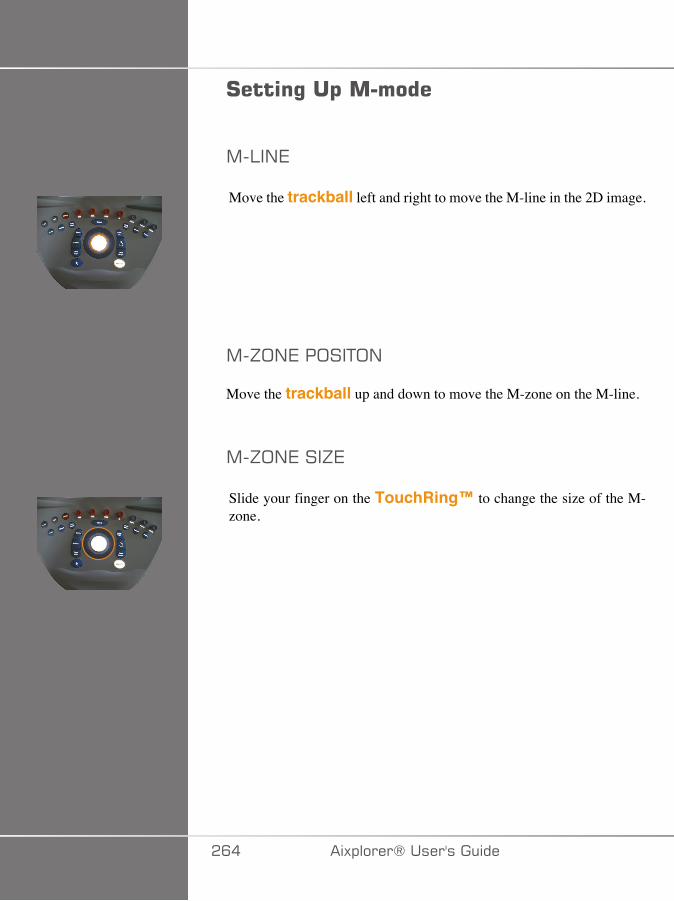
#����%��$�������
,�:�/7
Move the trackball left and right to move the M-line in the 2D image.
,�J;/7��;��+;/
Move the trackball up and down to move the M-zone on the M-line.
,�J;/7���J7
Slide your finger on the TouchRing™ to change the size of the M-zone.
�C� �)!�����*�����������
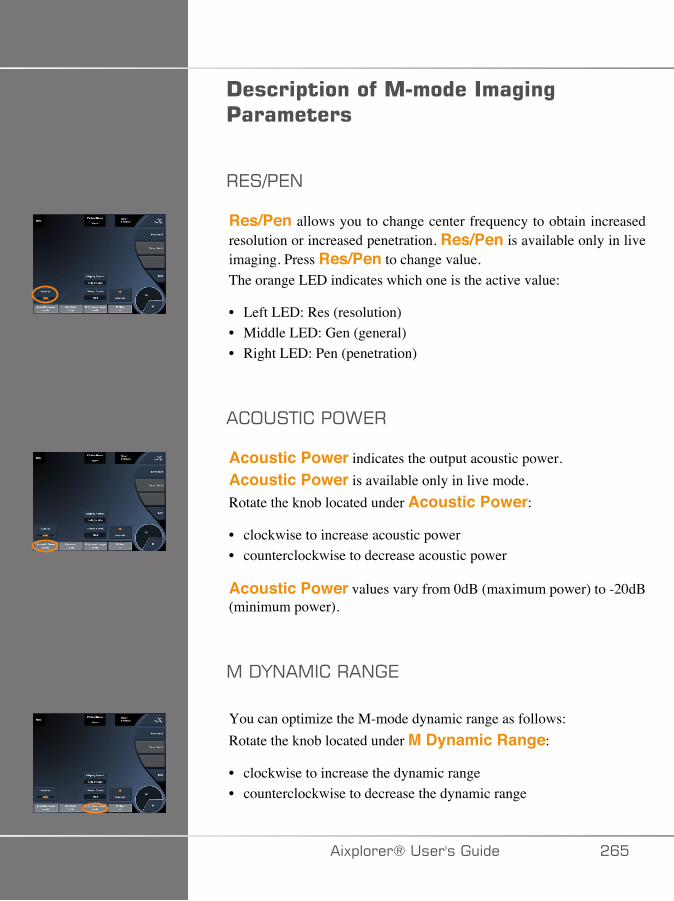
!����$�����������������%�%'���������
�7�3�7/
Res/Pen allows you to change center frequency to obtain increasedresolution or increased penetration. Res/Pen is available only in liveimaging. Press Res/Pen to change value.The orange LED indicates which one is the active value:
• Left LED: Res (resolution)• Middle LED: Gen (general)• Right LED: Pen (penetration)
� ;��+� ��;>7�
Acoustic Power indicates the output acoustic power.Acoustic Power is available only in live mode.Rotate the knob located under Acoustic Power:
• clockwise to increase acoustic power• counterclockwise to decrease acoustic power
Acoustic Power values vary from 0dB (maximum power) to -20dB(minimum power).
,�-F/�,� ���/�7
You can optimize the M-mode dynamic range as follows:Rotate the knob located under M Dynamic Range:
• clockwise to increase the dynamic range• counterclockwise to decrease the dynamic range
�)!�����*����������� �C�
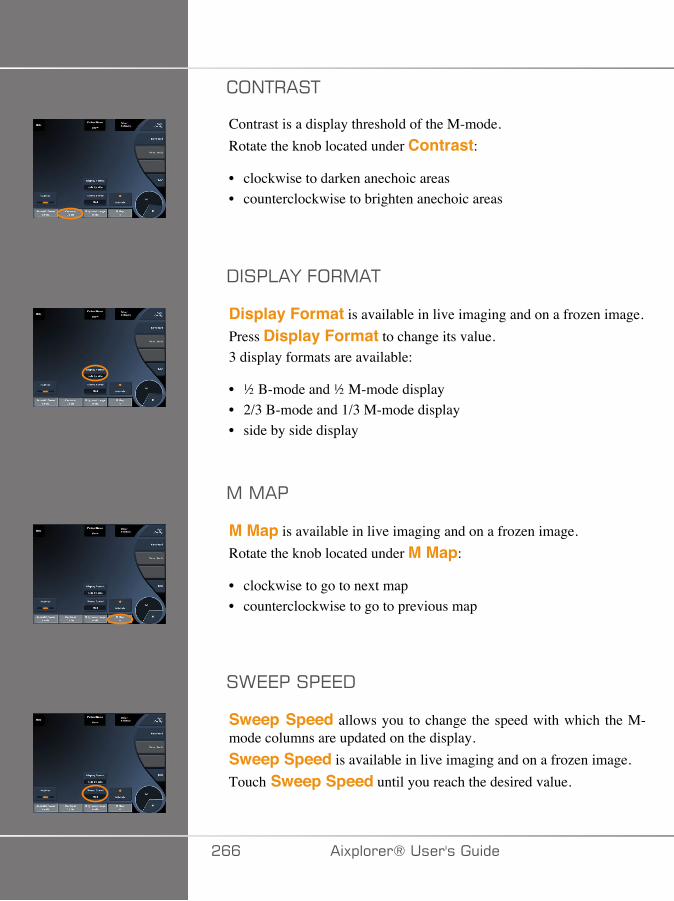
;/+���+
Contrast is a display threshold of the M-mode.Rotate the knob located under Contrast:
• clockwise to darken anechoic areas• counterclockwise to brighten anechoic areas
-���:�F�.;�,�+
Display Format is available in live imaging and on a frozen image.Press Display Format to change its value.3 display formats are available:
• ½ B-mode and ½ M-mode display• 2/3 B-mode and 1/3 M-mode display• side by side display
,�,��
M Map is available in live imaging and on a frozen image.Rotate the knob located under M Map:
• clockwise to go to next map• counterclockwise to go to previous map
�>77����77-
Sweep Speed allows you to change the speed with which the M-mode columns are updated on the display.Sweep Speed is available in live imaging and on a frozen image.Touch Sweep Speed until you reach the desired value.
�CC �)!�����*�����������
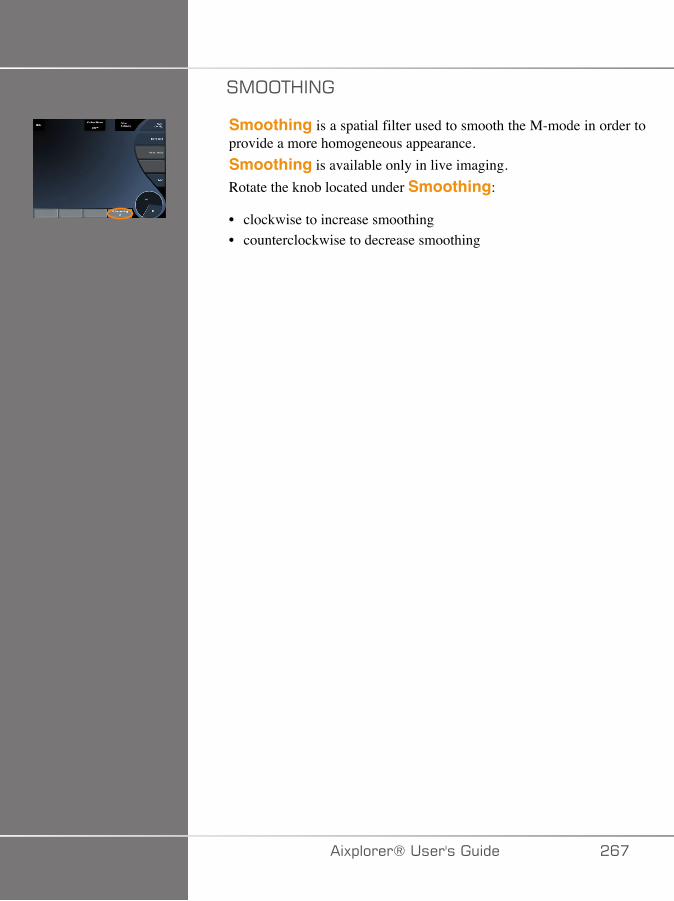
�,;;+<�/�
Smoothing is a spatial filter used to smooth the M-mode in order toprovide a more homogeneous appearance.Smoothing is available only in live imaging.Rotate the knob located under Smoothing:
• clockwise to increase smoothing• counterclockwise to decrease smoothing
�)!�����*����������� �C�
�������#�����%���'#
����!*�#� �����
The M-mode will represent movements of structures along one line overtime.
Initially a B-mode image is acquired.
Optimize the grayscale image by adjusting the image depth and zoomfactor, and by setting the appropriate focal zone (position and spread).
Other optimization controls shall be used as necessary such as theAutoTGC, the B-mode map, the overall gain and the dynamic range.
Activate the M-mode with the dedicated button on the touch screen.
Set the proper size and positioning of the M zone.
Decrease the gain to eliminate background noise.
The M-mode has a good temporal resolution, and the sweep speed may beadjusted if needed to match the speed of the movements that are observed.
The display format can be changed to match the user's workingconditions.
�CD �)!�����*�����������
=���-��"%�����0�$�����1The Aixplorer® offers you a fusion/navigation feature which providesyou with additional image information from a second modality duringa therapeutic or diagnostic ultrasound session. This is accomplished bymounting a tracking device on the transducer, which provides the positionand orientation in space while the standard ultrasound procedure takesplace.
The information from the tracking device and the 3D dataset of the 2ndmodality (typically a CT scan) is combined to compute a virtual sliceimage that is spatially comparable to the currently displayed ultrasoundscan.
Please refer to the Fusion/Navigation dedicated User's Guide.
�)!�����*����������� �CE
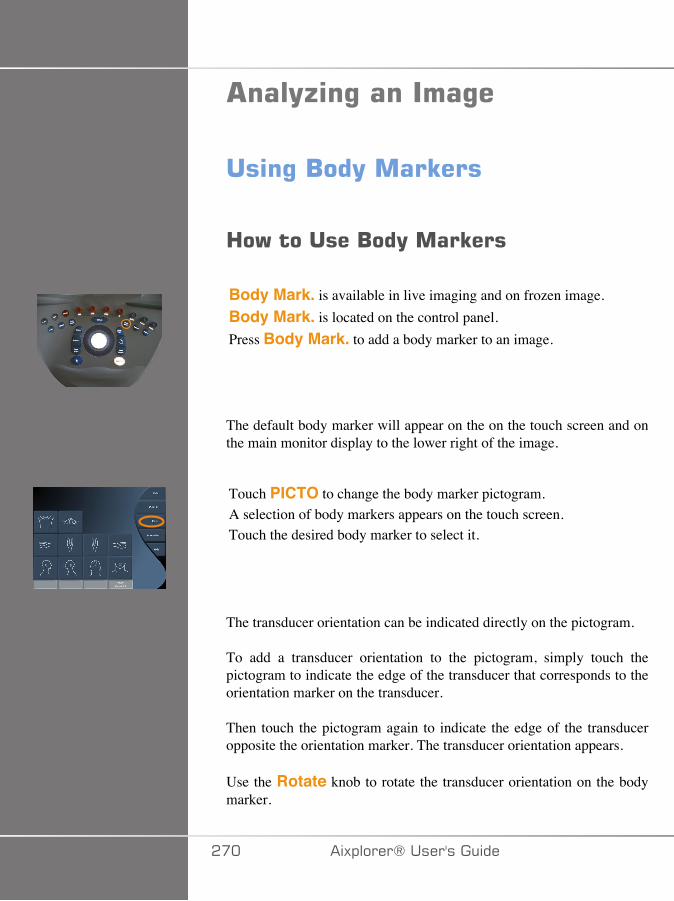
���(;�%�������%�
���%�/��(����E���
3�)��������/��(����E���
Body Mark. is available in live imaging and on frozen image.Body Mark. is located on the control panel.Press Body Mark. to add a body marker to an image.
The default body marker will appear on the on the touch screen and onthe main monitor display to the lower right of the image.
Touch PICTO to change the body marker pictogram.A selection of body markers appears on the touch screen.Touch the desired body marker to select it.
The transducer orientation can be indicated directly on the pictogram.
To add a transducer orientation to the pictogram, simply touch thepictogram to indicate the edge of the transducer that corresponds to theorientation marker on the transducer.
Then touch the pictogram again to indicate the edge of the transduceropposite the orientation marker. The transducer orientation appears.
Use the Rotate knob to rotate the transducer orientation on the bodymarker.
��� �)!�����*�����������
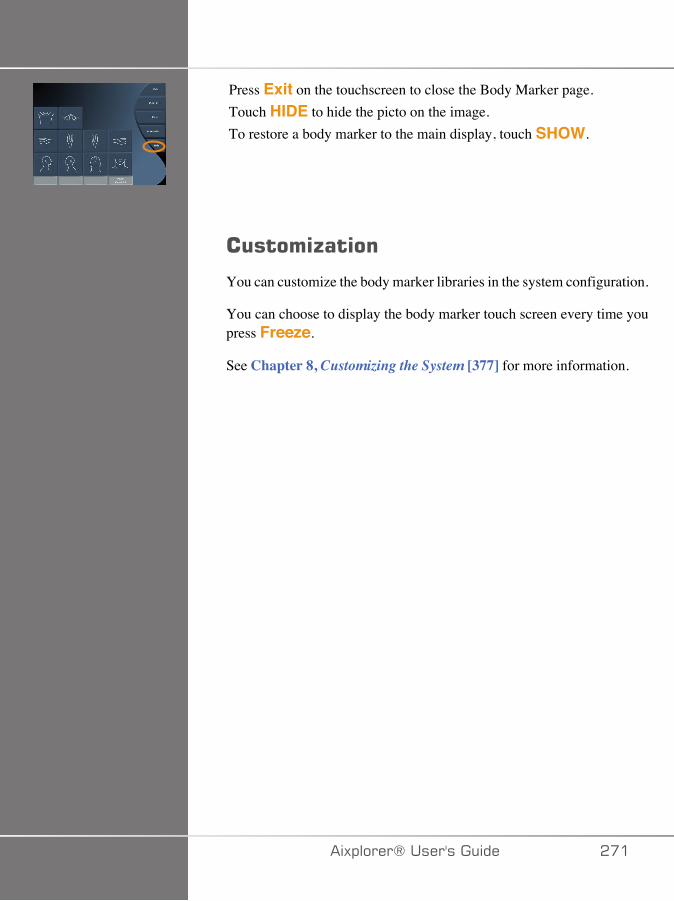
Press Exit on the touchscreen to close the Body Marker page.Touch HIDE to hide the picto on the image.To restore a body marker to the main display, touch SHOW.
�����;����
You can customize the body marker libraries in the system configuration.
You can choose to display the body marker touch screen every time youpress Freeze.
See Chapter 8, Customizing the System [377] for more information.
�)!�����*����������� ���
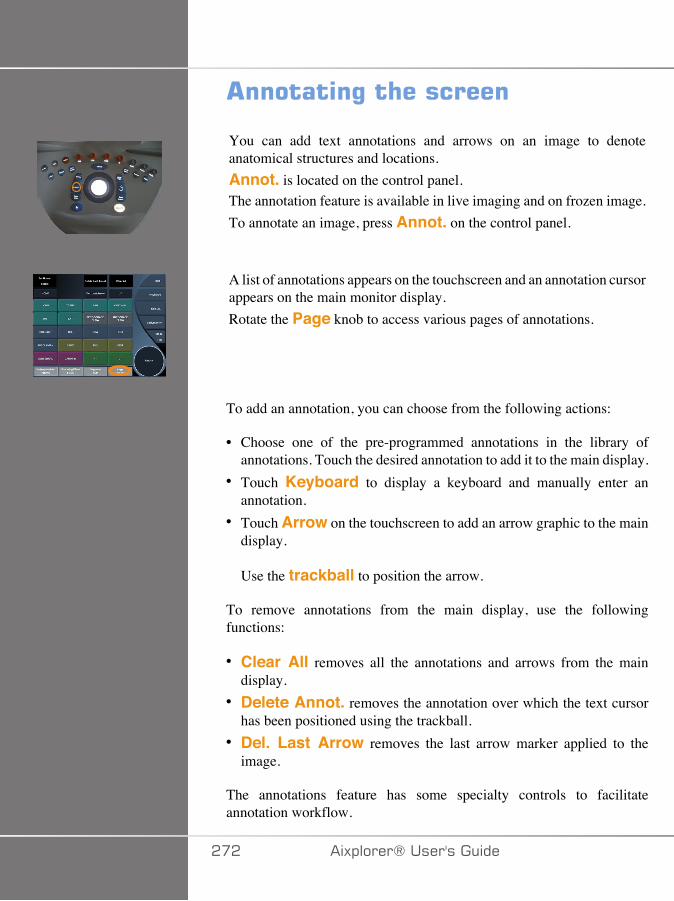
�������%�� ��������
You can add text annotations and arrows on an image to denoteanatomical structures and locations.Annot. is located on the control panel.The annotation feature is available in live imaging and on frozen image.To annotate an image, press Annot. on the control panel.
A list of annotations appears on the touchscreen and an annotation cursorappears on the main monitor display.Rotate the Page knob to access various pages of annotations.
To add an annotation, you can choose from the following actions:
• Choose one of the pre-programmed annotations in the library ofannotations. Touch the desired annotation to add it to the main display.
• Touch Keyboard to display a keyboard and manually enter anannotation.
• Touch Arrow on the touchscreen to add an arrow graphic to the maindisplay.
Use the trackball to position the arrow.
To remove annotations from the main display, use the followingfunctions:
• Clear All removes all the annotations and arrows from the maindisplay.
• Delete Annot. removes the annotation over which the text cursorhas been positioned using the trackball.
• Del. Last Arrow removes the last arrow marker applied to theimage.
The annotations feature has some specialty controls to facilitateannotation workflow.
��� �)!�����*�����������
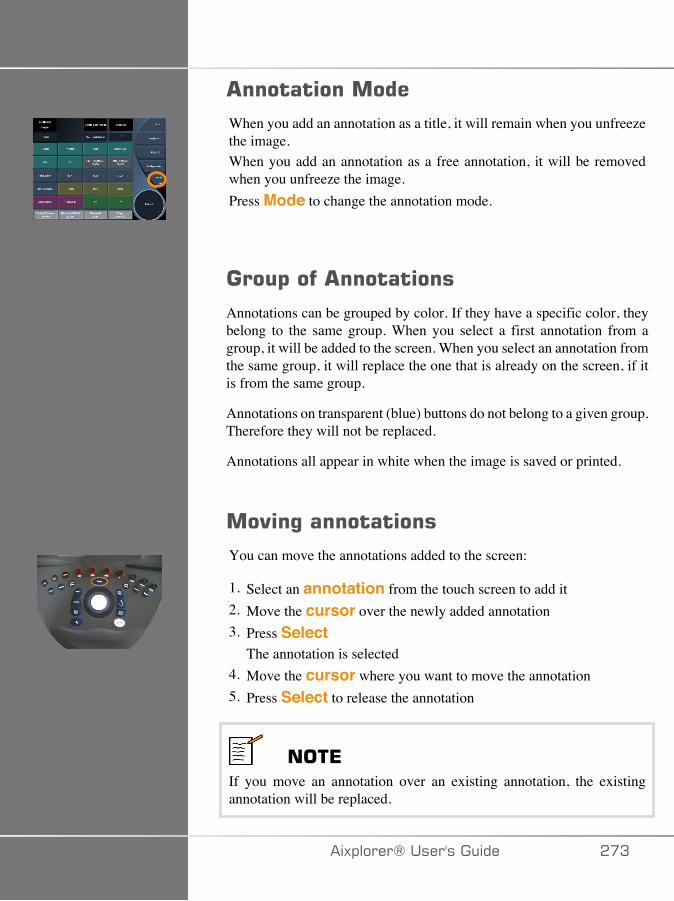
�������������When you add an annotation as a title, it will remain when you unfreezethe image.When you add an annotation as a free annotation, it will be removedwhen you unfreeze the image.Press Mode to change the annotation mode.
���$���� ���������
Annotations can be grouped by color. If they have a specific color, theybelong to the same group. When you select a first annotation from agroup, it will be added to the screen. When you select an annotation fromthe same group, it will replace the one that is already on the screen, if itis from the same group.
Annotations on transparent (blue) buttons do not belong to a given group.Therefore they will not be replaced.
Annotations all appear in white when the image is saved or printed.
��"�%�����������You can move the annotations added to the screen:
1. Select an annotation from the touch screen to add it2. Move the cursor over the newly added annotation3. Press Select
The annotation is selected4. Move the cursor where you want to move the annotation5. Press Select to release the annotation
���*If you move an annotation over an existing annotation, the existingannotation will be replaced.
�)!�����*����������� ��A
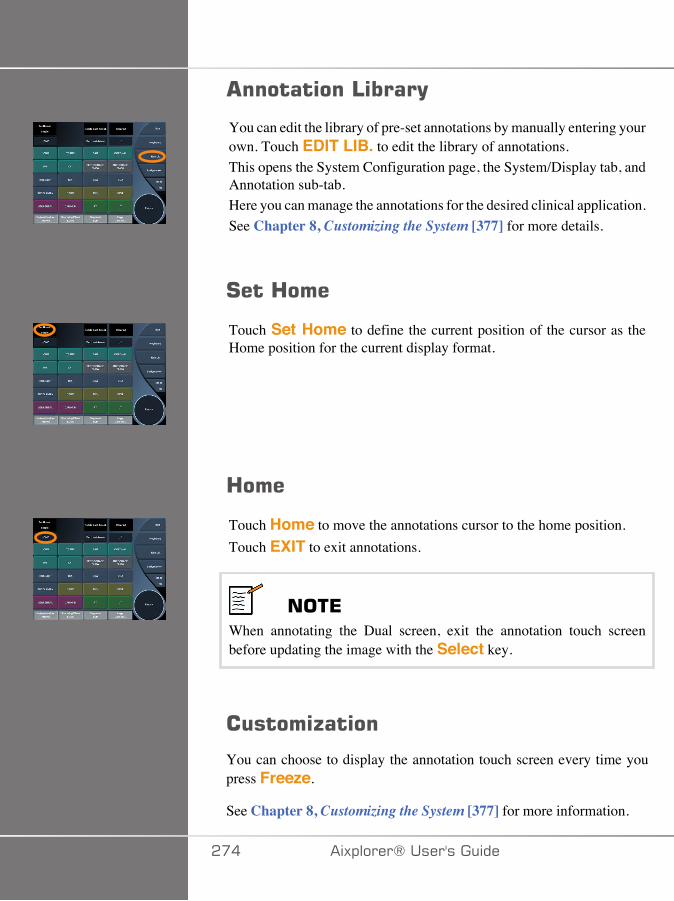
���������4����(
You can edit the library of pre-set annotations by manually entering yourown. Touch EDIT LIB. to edit the library of annotations.This opens the System Configuration page, the System/Display tab, andAnnotation sub-tab.Here you can manage the annotations for the desired clinical application.See Chapter 8, Customizing the System [377] for more details.
#���3���
Touch Set Home to define the current position of the cursor as theHome position for the current display format.
3���
Touch Home to move the annotations cursor to the home position.Touch EXIT to exit annotations.
���*When annotating the Dual screen, exit the annotation touch screenbefore updating the image with the Select key.
�����;����
You can choose to display the annotation touch screen every time youpress Freeze.
See Chapter 8, Customizing the System [377] for more information.
��� �)!�����*�����������
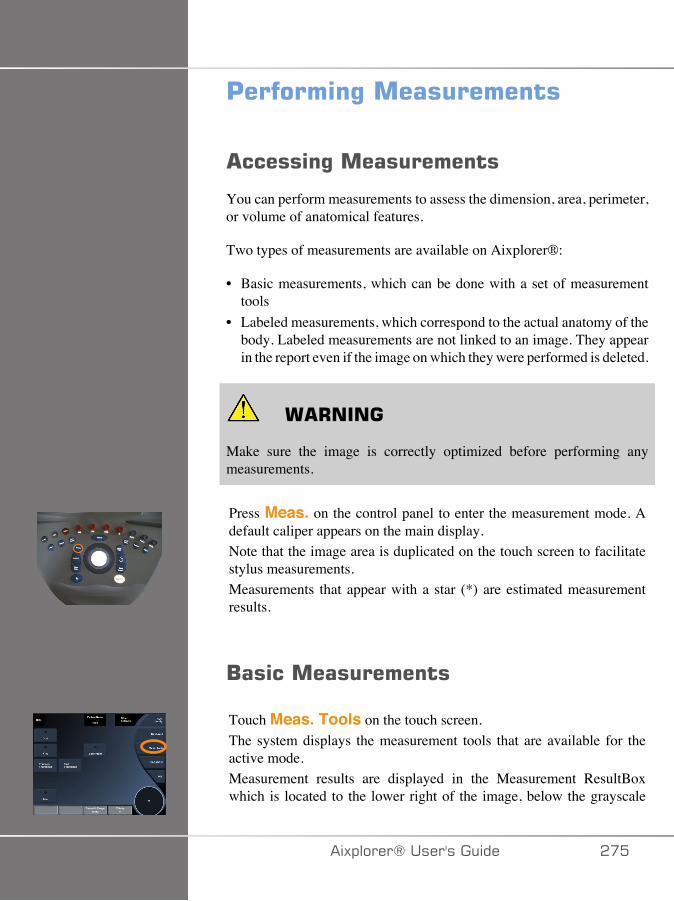
'�������%������������
������%������������
You can perform measurements to assess the dimension, area, perimeter,or volume of anatomical features.
Two types of measurements are available on Aixplorer®:
• Basic measurements, which can be done with a set of measurementtools
• Labeled measurements, which correspond to the actual anatomy of thebody. Labeled measurements are not linked to an image. They appearin the report even if the image on which they were performed is deleted.
� +����
Make sure the image is correctly optimized before performing anymeasurements.
Press Meas. on the control panel to enter the measurement mode. Adefault caliper appears on the main display.Note that the image area is duplicated on the touch screen to facilitatestylus measurements.Measurements that appear with a star (*) are estimated measurementresults.
/���������������
Touch Meas. Tools on the touch screen.The system displays the measurement tools that are available for theactive mode.Measurement results are displayed in the Measurement ResultBoxwhich is located to the lower right of the image, below the grayscale
�)!�����*����������� ���
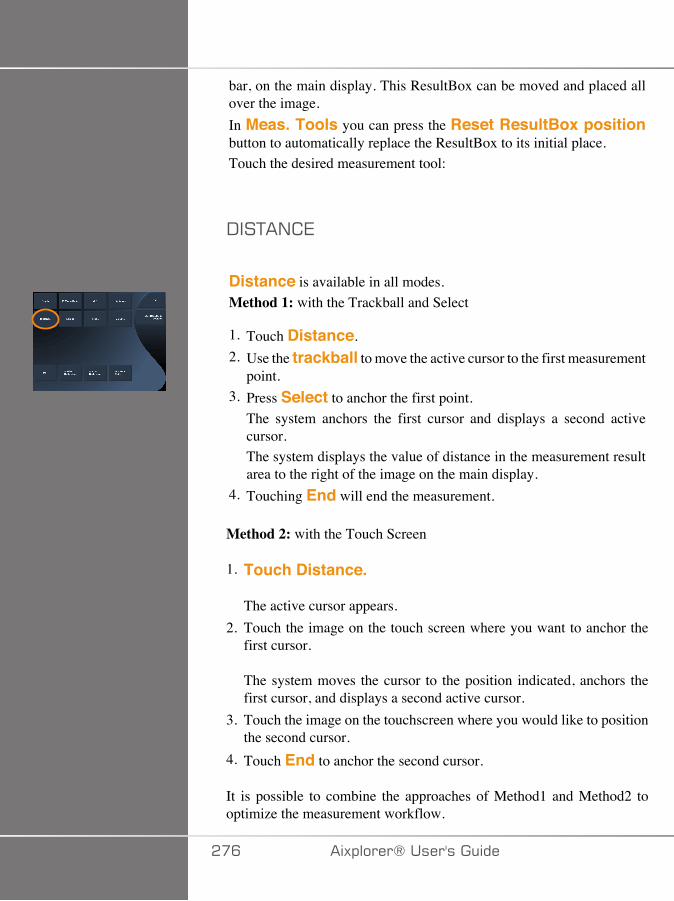
bar, on the main display. This ResultBox can be moved and placed allover the image.In Meas. Tools you can press the Reset ResultBox positionbutton to automatically replace the ResultBox to its initial place.Touch the desired measurement tool:
-��+�/ 7
Distance is available in all modes.Method 1: with the Trackball and Select
1. Touch Distance.2. Use the trackball to move the active cursor to the first measurement
point.3. Press Select to anchor the first point.
The system anchors the first cursor and displays a second activecursor.The system displays the value of distance in the measurement resultarea to the right of the image on the main display.
4. Touching End will end the measurement.
Method 2: with the Touch Screen
1. Touch Distance.
The active cursor appears.2. Touch the image on the touch screen where you want to anchor the
first cursor.
The system moves the cursor to the position indicated, anchors thefirst cursor, and displays a second active cursor.
3. Touch the image on the touchscreen where you would like to positionthe second cursor.
4. Touch End to anchor the second cursor.
It is possible to combine the approaches of Method1 and Method2 tooptimize the measurement workflow.
��C �)!�����*�����������
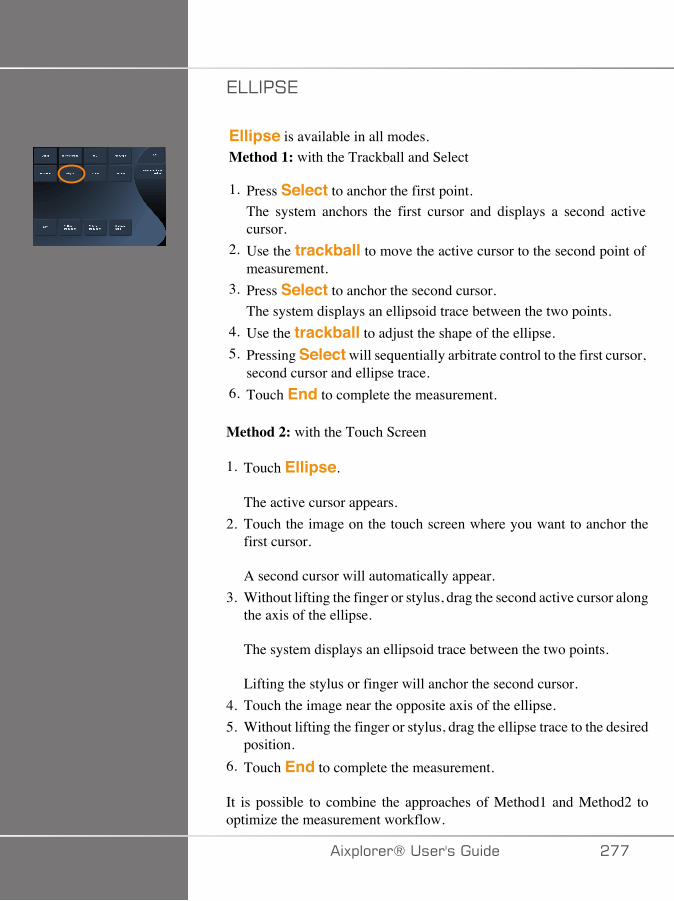
7::���7
Ellipse is available in all modes.Method 1: with the Trackball and Select
1. Press Select to anchor the first point.The system anchors the first cursor and displays a second activecursor.
2. Use the trackball to move the active cursor to the second point ofmeasurement.
3. Press Select to anchor the second cursor.The system displays an ellipsoid trace between the two points.
4. Use the trackball to adjust the shape of the ellipse.5. Pressing Select will sequentially arbitrate control to the first cursor,
second cursor and ellipse trace.6. Touch End to complete the measurement.
Method 2: with the Touch Screen
1. Touch Ellipse.
The active cursor appears.2. Touch the image on the touch screen where you want to anchor the
first cursor.
A second cursor will automatically appear.3. Without lifting the finger or stylus, drag the second active cursor along
the axis of the ellipse.
The system displays an ellipsoid trace between the two points.
Lifting the stylus or finger will anchor the second cursor.4. Touch the image near the opposite axis of the ellipse.5. Without lifting the finger or stylus, drag the ellipse trace to the desired
position.6. Touch End to complete the measurement.
It is possible to combine the approaches of Method1 and Method2 tooptimize the measurement workflow.
�)!�����*����������� ���
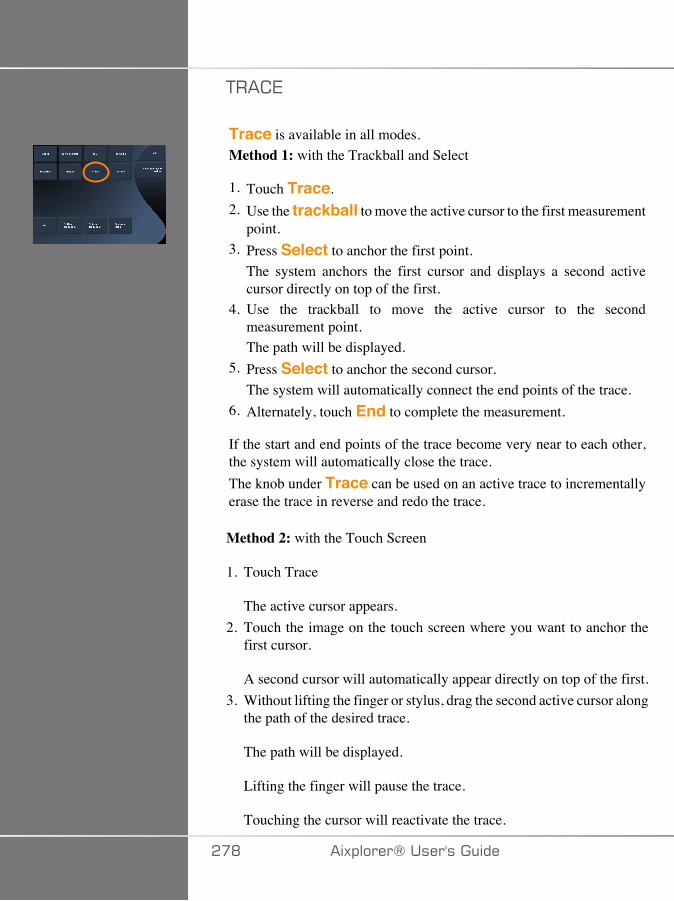
+�� 7
Trace is available in all modes.Method 1: with the Trackball and Select
1. Touch Trace.2. Use the trackball to move the active cursor to the first measurement
point.3. Press Select to anchor the first point.
The system anchors the first cursor and displays a second activecursor directly on top of the first.
4. Use the trackball to move the active cursor to the secondmeasurement point.The path will be displayed.
5. Press Select to anchor the second cursor.The system will automatically connect the end points of the trace.
6. Alternately, touch End to complete the measurement.
If the start and end points of the trace become very near to each other,the system will automatically close the trace.The knob under Trace can be used on an active trace to incrementallyerase the trace in reverse and redo the trace.
Method 2: with the Touch Screen
1. Touch Trace
The active cursor appears.2. Touch the image on the touch screen where you want to anchor the
first cursor.
A second cursor will automatically appear directly on top of the first.3. Without lifting the finger or stylus, drag the second active cursor along
the path of the desired trace.
The path will be displayed.
Lifting the finger will pause the trace.
Touching the cursor will reactivate the trace.
��D �)!�����*�����������
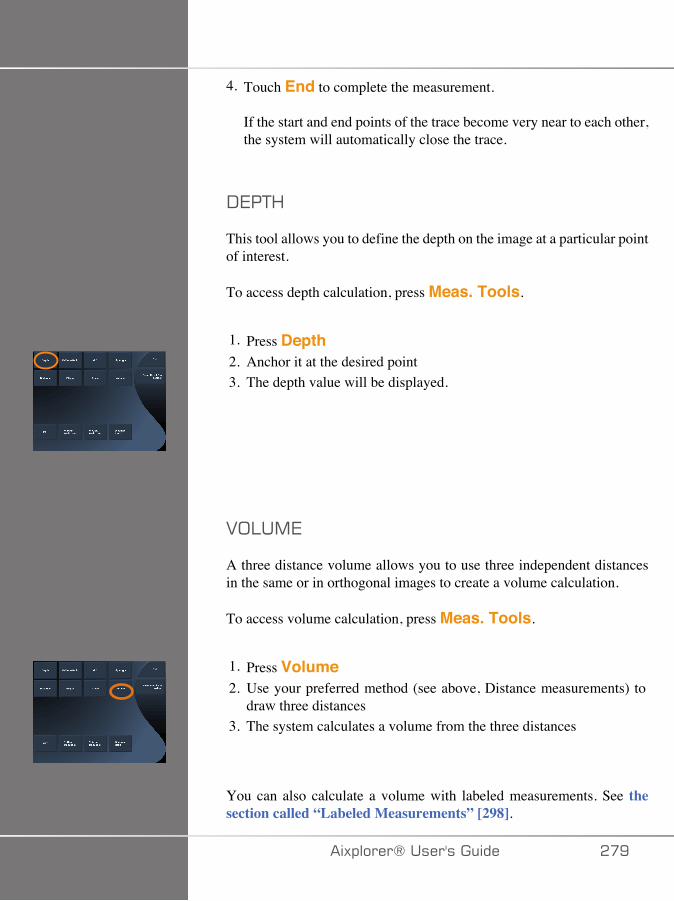
4. Touch End to complete the measurement.
If the start and end points of the trace become very near to each other,the system will automatically close the trace.
-7�+<
This tool allows you to define the depth on the image at a particular pointof interest.
To access depth calculation, press Meas. Tools.
1. Press Depth2. Anchor it at the desired point3. The depth value will be displayed.
2;:�,7
A three distance volume allows you to use three independent distancesin the same or in orthogonal images to create a volume calculation.
To access volume calculation, press Meas. Tools.
1. Press Volume2. Use your preferred method (see above, Distance measurements) to
draw three distances3. The system calculates a volume from the three distances
You can also calculate a volume with labeled measurements. See thesection called “Labeled Measurements” [298].
�)!�����*����������� ��E
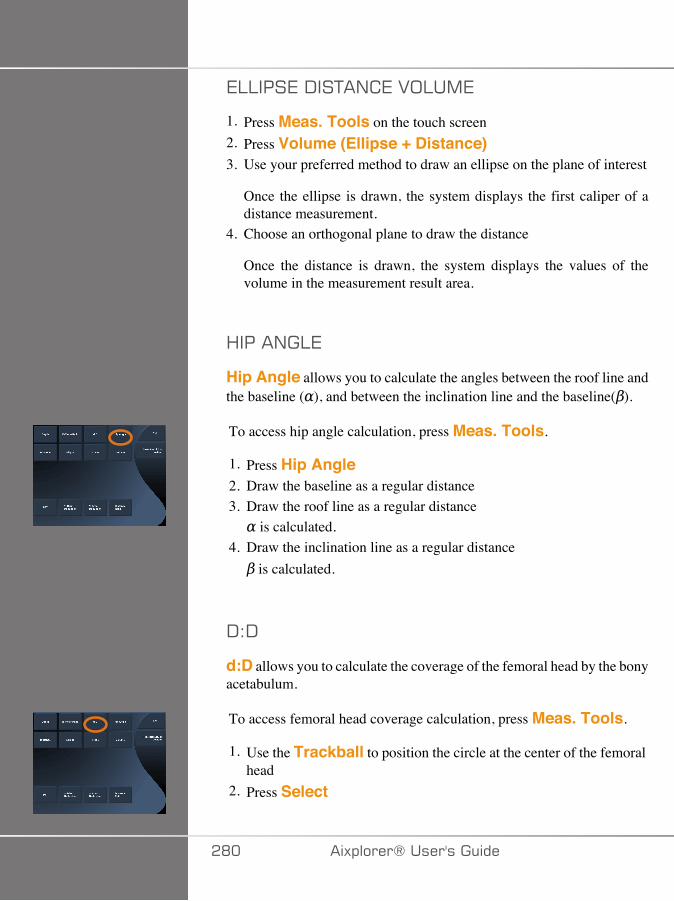
7::���7�-��+�/ 7�2;:�,7
1. Press Meas. Tools on the touch screen2. Press Volume (Ellipse + Distance)3. Use your preferred method to draw an ellipse on the plane of interest
Once the ellipse is drawn, the system displays the first caliper of adistance measurement.
4. Choose an orthogonal plane to draw the distance
Once the distance is drawn, the system displays the values of thevolume in the measurement result area.
<����/�:7
Hip Angle allows you to calculate the angles between the roof line andthe baseline ( ), and between the inclination line and the baseline( ).
To access hip angle calculation, press Meas. Tools.
1. Press Hip Angle2. Draw the baseline as a regular distance3. Draw the roof line as a regular distance
is calculated.4. Draw the inclination line as a regular distance
is calculated.
-�-
d:D allows you to calculate the coverage of the femoral head by the bonyacetabulum.
To access femoral head coverage calculation, press Meas. Tools.
1. Use the Trackball to position the circle at the center of the femoralhead
2. Press Select
�D� �)!�����*�����������
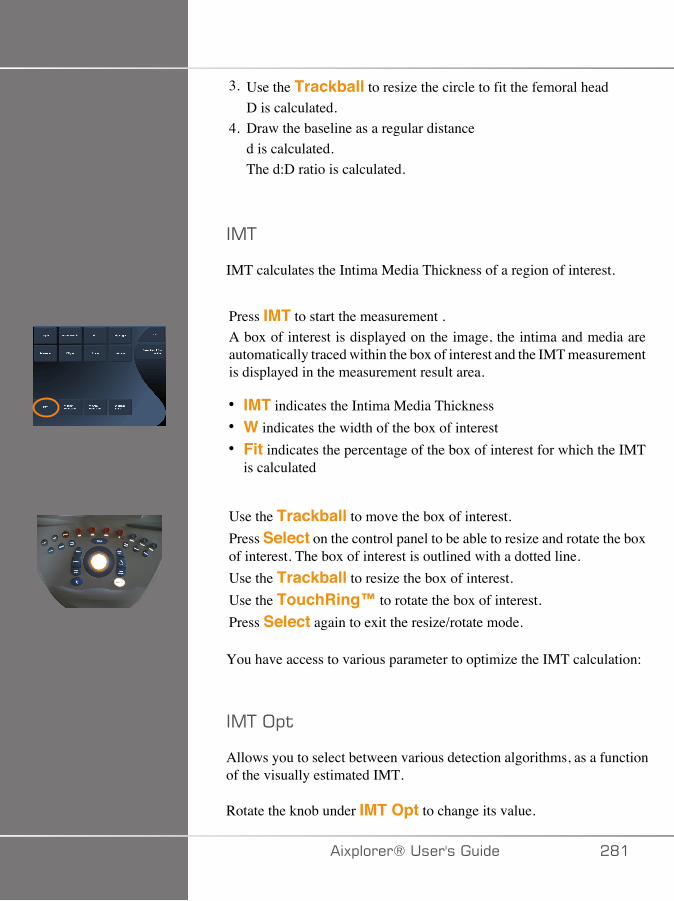
3. Use the Trackball to resize the circle to fit the femoral headD is calculated.
4. Draw the baseline as a regular distanced is calculated.The d:D ratio is calculated.
�,+
IMT calculates the Intima Media Thickness of a region of interest.
Press IMT to start the measurement .A box of interest is displayed on the image, the intima and media areautomatically traced within the box of interest and the IMT measurementis displayed in the measurement result area.
• IMT indicates the Intima Media Thickness• W indicates the width of the box of interest• Fit indicates the percentage of the box of interest for which the IMT
is calculated
Use the Trackball to move the box of interest.Press Select on the control panel to be able to resize and rotate the boxof interest. The box of interest is outlined with a dotted line.Use the Trackball to resize the box of interest.Use the TouchRing™ to rotate the box of interest.Press Select again to exit the resize/rotate mode.
You have access to various parameter to optimize the IMT calculation:
�,+�;!$
Allows you to select between various detection algorithms, as a functionof the visually estimated IMT.
Rotate the knob under IMT Opt to change its value.
�)!�����*����������� �D�

�,+�-�!�(�
Rotate the knob under IMT Display to hide or show the IMT trace onthe image.
J��'
Rotate the knob under zoom to zoom the image that is duplicated on thetouch screen.
7�$���� �$#���,+�$�(&�
You may want to slightly change the IMT trace.
1. Press Edit Intima or Edit Media as needed2. Move the cursor to modify the trace3. Turn off Edit Intima or Edit Media to exit the edition of the IMT
trace
,(�(������ ��
You may want to manually draw the IMT trace.
1. Press Manual Redefine2. Press Redefine Intima or Redefine Media as needed3. The Intima or Media trace is erased a cursor appears4. Move the cursor to manually draw the Intima or Media5. Press Exit Manual Redefine to exit the Manual Redefine mode
Draw backwards to erase the trace.
Press Exit IMT to exit.
1�,;-7���+�;
B-mode Ratio allows you to compare the brightness of two regions ofinterest (ROI) on the same image.
�D� �)!�����*�����������
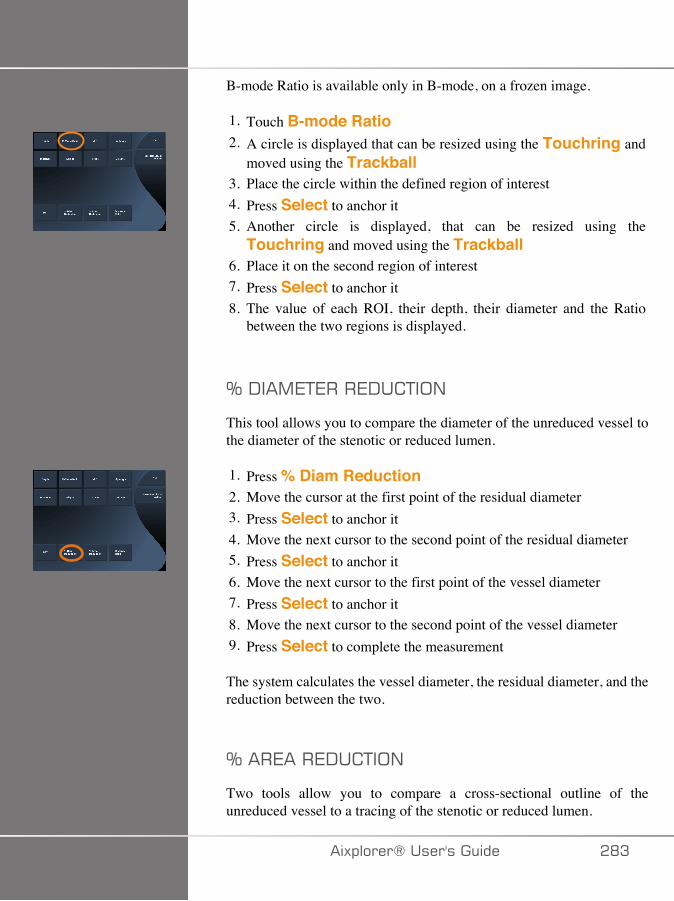
B-mode Ratio is available only in B-mode, on a frozen image.
1. Touch B-mode Ratio2. A circle is displayed that can be resized using the Touchring and
moved using the Trackball3. Place the circle within the defined region of interest4. Press Select to anchor it5. Another circle is displayed, that can be resized using the
Touchring and moved using the Trackball6. Place it on the second region of interest7. Press Select to anchor it8. The value of each ROI, their depth, their diameter and the Ratio
between the two regions is displayed.
K�-��,7+7���7-� +�;/
This tool allows you to compare the diameter of the unreduced vessel tothe diameter of the stenotic or reduced lumen.
1. Press % Diam Reduction2. Move the cursor at the first point of the residual diameter3. Press Select to anchor it4. Move the next cursor to the second point of the residual diameter5. Press Select to anchor it6. Move the next cursor to the first point of the vessel diameter7. Press Select to anchor it8. Move the next cursor to the second point of the vessel diameter9. Press Select to complete the measurement
The system calculates the vessel diameter, the residual diameter, and thereduction between the two.
K���7���7-� +�;/
Two tools allow you to compare a cross-sectional outline of theunreduced vessel to a tracing of the stenotic or reduced lumen.
�)!�����*����������� �DA
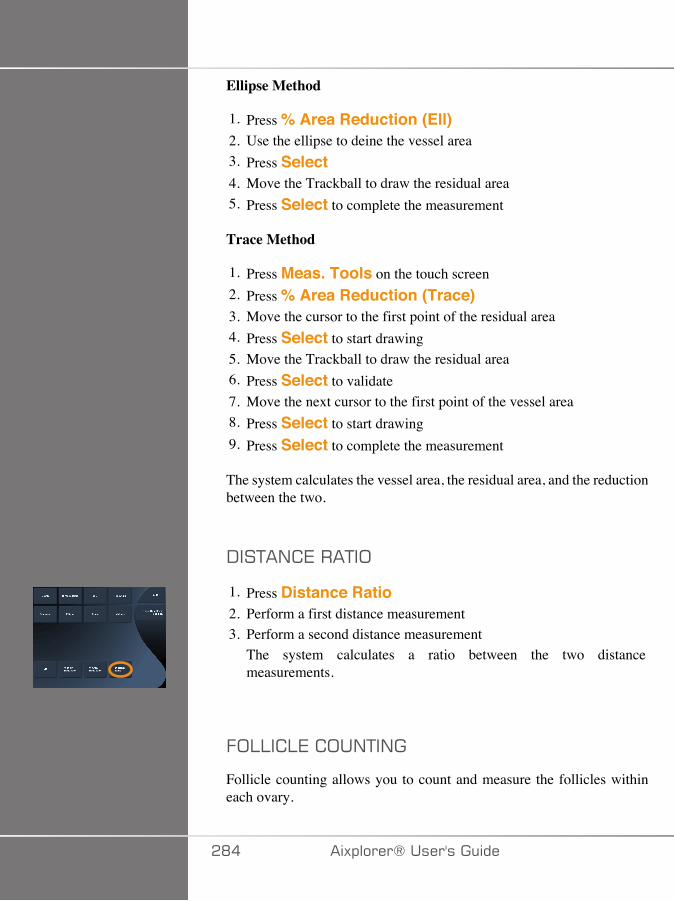
Ellipse Method
1. Press % Area Reduction (Ell)2. Use the ellipse to deine the vessel area3. Press Select4. Move the Trackball to draw the residual area5. Press Select to complete the measurement
Trace Method
1. Press Meas. Tools on the touch screen2. Press % Area Reduction (Trace)3. Move the cursor to the first point of the residual area4. Press Select to start drawing5. Move the Trackball to draw the residual area6. Press Select to validate7. Move the next cursor to the first point of the vessel area8. Press Select to start drawing9. Press Select to complete the measurement
The system calculates the vessel area, the residual area, and the reductionbetween the two.
-��+�/ 7���+�;
1. Press Distance Ratio2. Perform a first distance measurement3. Perform a second distance measurement
The system calculates a ratio between the two distancemeasurements.
.;::� :7� ;�/+�/�
Follicle counting allows you to count and measure the follicles withineach ovary.
�D� �)!�����*�����������
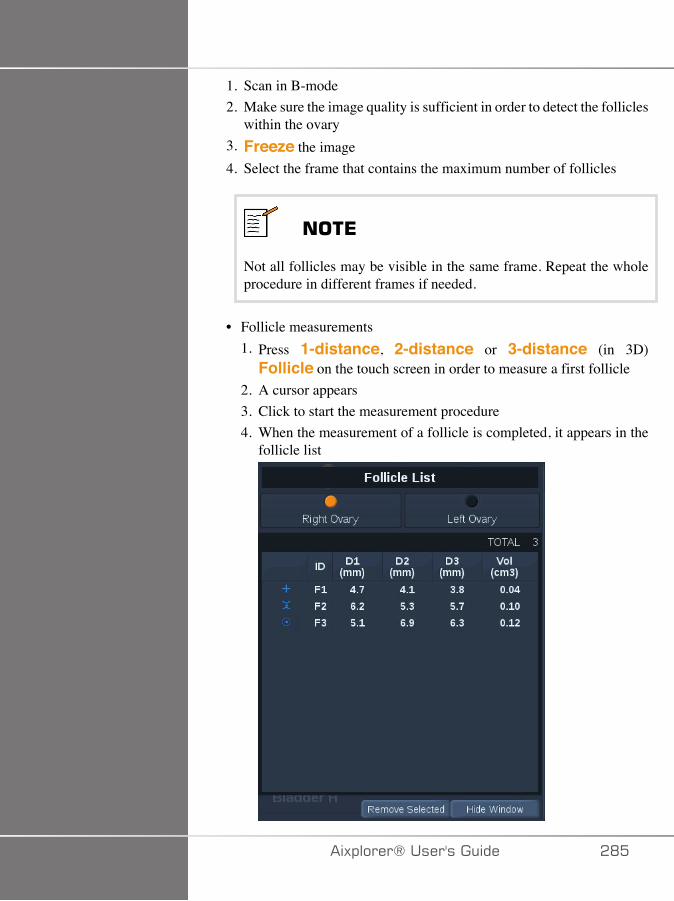
1. Scan in B-mode2. Make sure the image quality is sufficient in order to detect the follicles
within the ovary3. Freeze the image4. Select the frame that contains the maximum number of follicles
���*
Not all follicles may be visible in the same frame. Repeat the wholeprocedure in different frames if needed.
• Follicle measurements1. Press 1-distance, 2-distance or 3-distance (in 3D)
Follicle on the touch screen in order to measure a first follicle2. A cursor appears3. Click to start the measurement procedure4. When the measurement of a follicle is completed, it appears in the
follicle list
�)!�����*����������� �D�
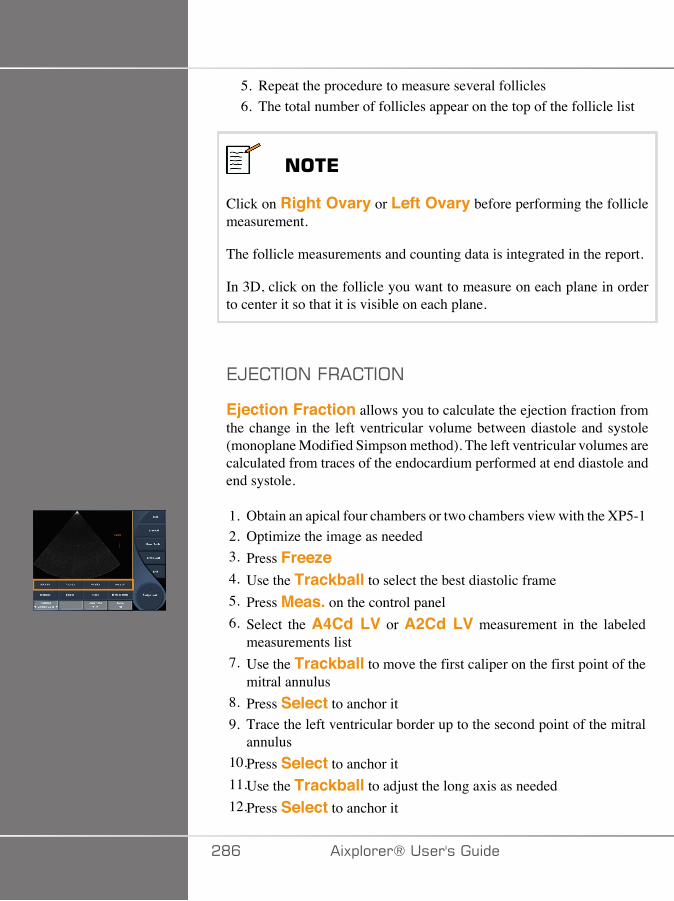
5. Repeat the procedure to measure several follicles6. The total number of follicles appear on the top of the follicle list
���*
Click on Right Ovary or Left Ovary before performing the folliclemeasurement.
The follicle measurements and counting data is integrated in the report.
In 3D, click on the follicle you want to measure on each plane in orderto center it so that it is visible on each plane.
7�7 +�;/�.�� +�;/
Ejection Fraction allows you to calculate the ejection fraction fromthe change in the left ventricular volume between diastole and systole(monoplane Modified Simpson method). The left ventricular volumes arecalculated from traces of the endocardium performed at end diastole andend systole.
1. Obtain an apical four chambers or two chambers view with the XP5-12. Optimize the image as needed3. Press Freeze4. Use the Trackball to select the best diastolic frame5. Press Meas. on the control panel6. Select the A4Cd LV or A2Cd LV measurement in the labeled
measurements list7. Use the Trackball to move the first caliper on the first point of the
mitral annulus8. Press Select to anchor it9. Trace the left ventricular border up to the second point of the mitral
annulus10.Press Select to anchor it11.Use the Trackball to adjust the long axis as needed12.Press Select to anchor it
�DC �)!�����*�����������
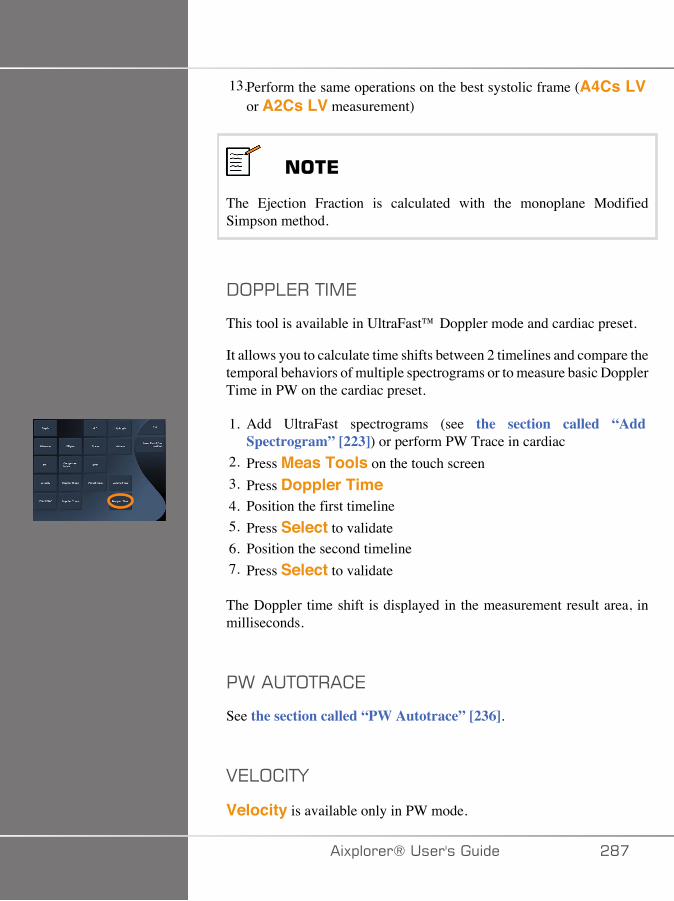
13.Perform the same operations on the best systolic frame (A4Cs LVor A2Cs LV measurement)
���*
The Ejection Fraction is calculated with the monoplane ModifiedSimpson method.
-;��:7��+�,7
This tool is available in UltraFast™ Doppler mode and cardiac preset.
It allows you to calculate time shifts between 2 timelines and compare thetemporal behaviors of multiple spectrograms or to measure basic DopplerTime in PW on the cardiac preset.
1. Add UltraFast spectrograms (see the section called “AddSpectrogram” [223]) or perform PW Trace in cardiac
2. Press Meas Tools on the touch screen3. Press Doppler Time4. Position the first timeline5. Press Select to validate6. Position the second timeline7. Press Select to validate
The Doppler time shift is displayed in the measurement result area, inmilliseconds.
�>���+;+�� 7
See the section called “PW Autotrace” [236].
27:; �+F
Velocity is available only in PW mode.
�)!�����*����������� �D�
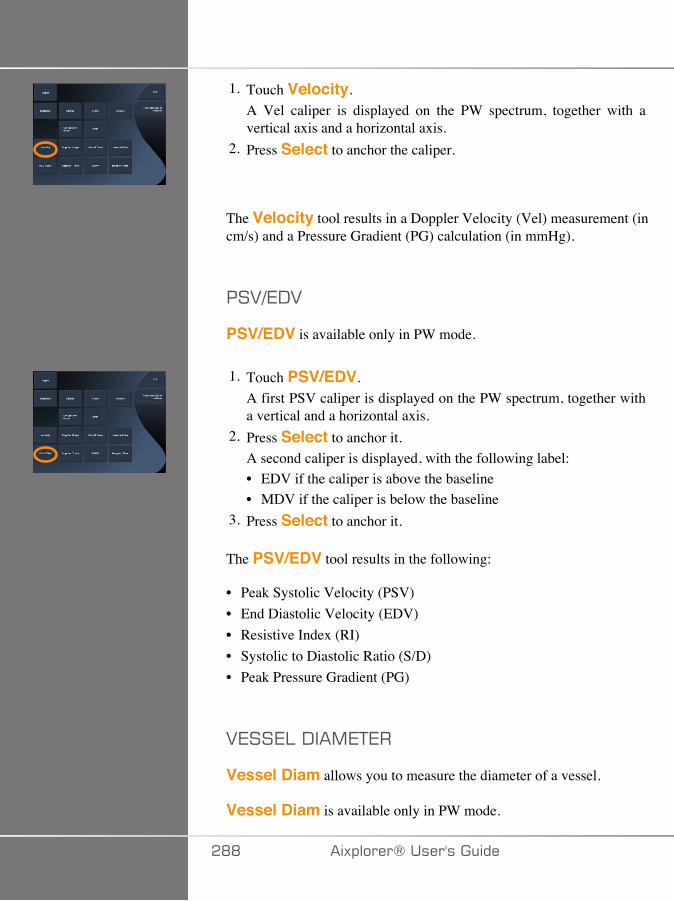
1. Touch Velocity.A Vel caliper is displayed on the PW spectrum, together with avertical axis and a horizontal axis.
2. Press Select to anchor the caliper.
The Velocity tool results in a Doppler Velocity (Vel) measurement (incm/s) and a Pressure Gradient (PG) calculation (in mmHg).
��237-2
PSV/EDV is available only in PW mode.
1. Touch PSV/EDV.A first PSV caliper is displayed on the PW spectrum, together witha vertical and a horizontal axis.
2. Press Select to anchor it.A second caliper is displayed, with the following label:• EDV if the caliper is above the baseline• MDV if the caliper is below the baseline
3. Press Select to anchor it.
The PSV/EDV tool results in the following:
• Peak Systolic Velocity (PSV)• End Diastolic Velocity (EDV)• Resistive Index (RI)• Systolic to Diastolic Ratio (S/D)• Peak Pressure Gradient (PG)
27��7:�-��,7+7�
Vessel Diam allows you to measure the diameter of a vessel.
Vessel Diam is available only in PW mode.
�DD �)!�����*�����������

1. Touch Vessel Diam.A first caliper is displayed within the sample volume
2. Use the Trackball to resize the first part of the caliper3. Press Select to anchor
A second caliper is displayed within the sample volume4. Use the Trackball to resize the second part of the caliper5. Press Select to anchor.
-;��:7���:;�7
Doppler Slope allows you to measure the acceleration or decelerationslope on the Doppler spectrum.
Doppler Slope is available only in PW mode.
1. Touch Doppler Slope.A first caliper is displayed
2. Press Select to anchor the first caliperThe system anchors the first caliper and displays a second activecaliper
3. Use the Trackball to move the active caliper4. Press Select to anchor the second caliper
-;��:7��+�� 7
Doppler Trace allows you to trace a single heart cycle on the Dopplerspectrum.
Doppler Trace is available only in PW mode.
1. Touch Doppler Trace.2. Use the trackball to move the active caliper to the first
measurement point.3. Press Select to anchor the first point.
The system anchors the first caliper and displays a second activecursor.
4. Use the trackball to move the active caliper along the desired path.
�)!�����*����������� �DE
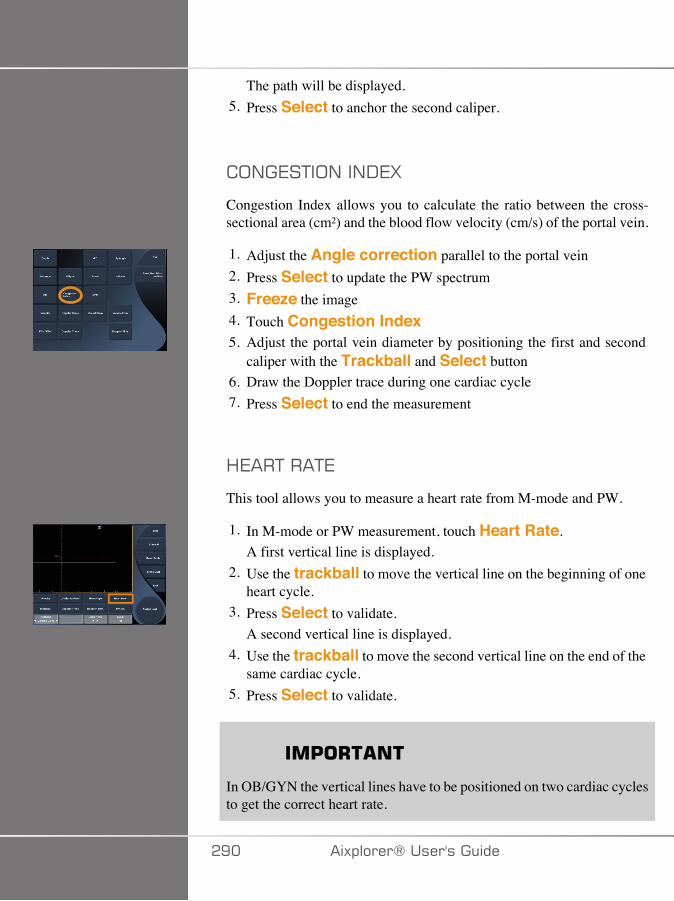
The path will be displayed.5. Press Select to anchor the second caliper.
;/�7�+�;/��/-7G
Congestion Index allows you to calculate the ratio between the cross-sectional area (cm²) and the blood flow velocity (cm/s) of the portal vein.
1. Adjust the Angle correction parallel to the portal vein2. Press Select to update the PW spectrum3. Freeze the image4. Touch Congestion Index5. Adjust the portal vein diameter by positioning the first and second
caliper with the Trackball and Select button6. Draw the Doppler trace during one cardiac cycle7. Press Select to end the measurement
<7��+���+7
This tool allows you to measure a heart rate from M-mode and PW.
1. In M-mode or PW measurement, touch Heart Rate.A first vertical line is displayed.
2. Use the trackball to move the vertical line on the beginning of oneheart cycle.
3. Press Select to validate.A second vertical line is displayed.
4. Use the trackball to move the second vertical line on the end of thesame cardiac cycle.
5. Press Select to validate.
��'�+� ��
In OB/GYN the vertical lines have to be positioned on two cardiac cyclesto get the correct heart rate.
�E� �)!�����*�����������
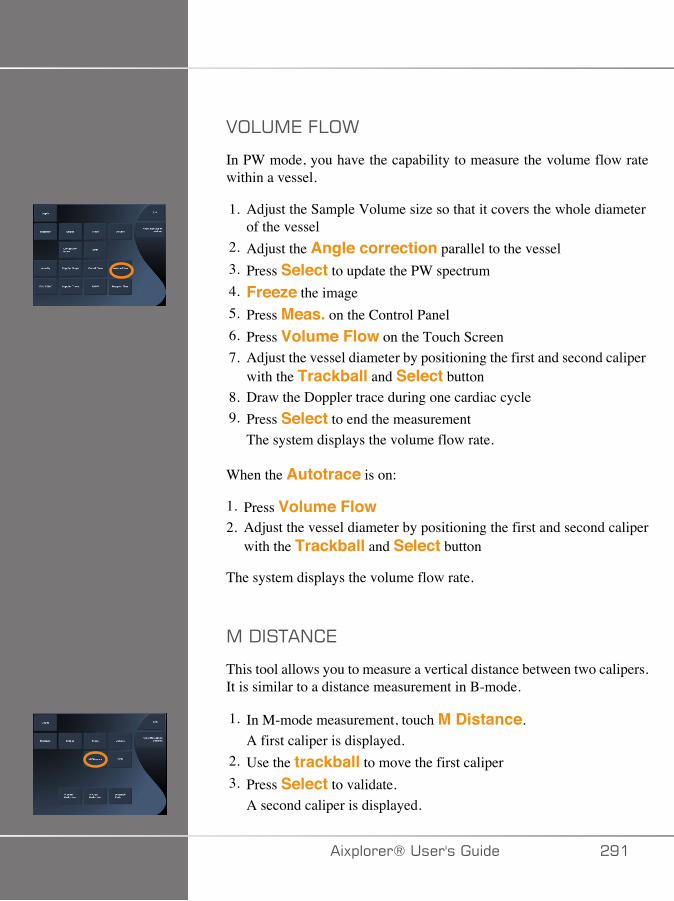
2;:�,7�.:;>
In PW mode, you have the capability to measure the volume flow ratewithin a vessel.
1. Adjust the Sample Volume size so that it covers the whole diameterof the vessel
2. Adjust the Angle correction parallel to the vessel3. Press Select to update the PW spectrum4. Freeze the image5. Press Meas. on the Control Panel6. Press Volume Flow on the Touch Screen7. Adjust the vessel diameter by positioning the first and second caliper
with the Trackball and Select button8. Draw the Doppler trace during one cardiac cycle9. Press Select to end the measurement
The system displays the volume flow rate.
When the Autotrace is on:
1. Press Volume Flow2. Adjust the vessel diameter by positioning the first and second caliper
with the Trackball and Select button
The system displays the volume flow rate.
,�-��+�/ 7
This tool allows you to measure a vertical distance between two calipers.It is similar to a distance measurement in B-mode.
1. In M-mode measurement, touch M Distance.A first caliper is displayed.
2. Use the trackball to move the first caliper3. Press Select to validate.
A second caliper is displayed.
�)!�����*����������� �E�
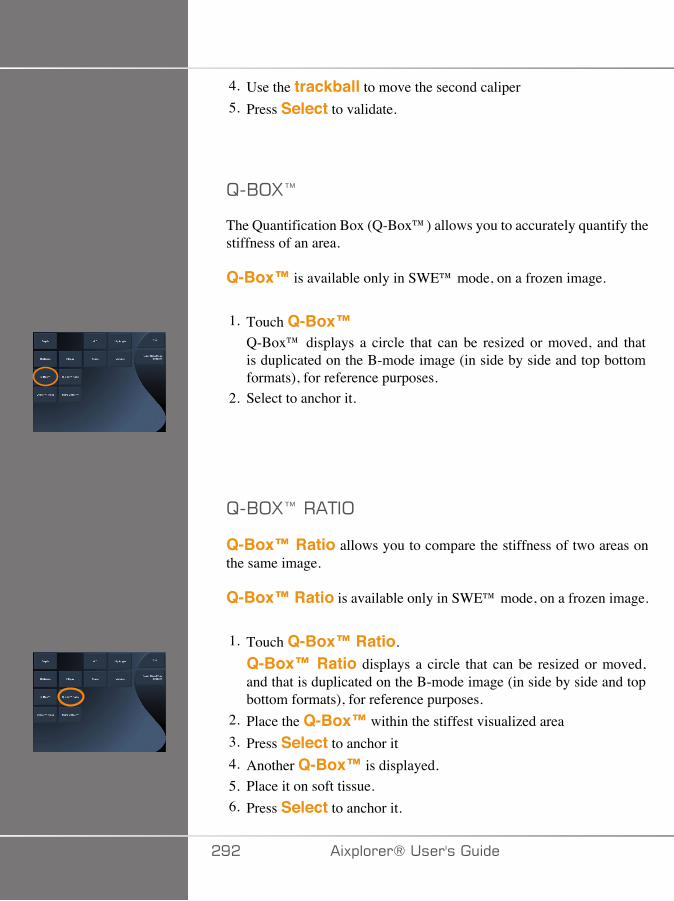
4. Use the trackball to move the second caliper5. Press Select to validate.
B�1;G@
The Quantification Box (Q-Box™) allows you to accurately quantify thestiffness of an area.
Q-Box™ is available only in SWE™ mode, on a frozen image.
1. Touch Q-Box™Q-Box™ displays a circle that can be resized or moved, and thatis duplicated on the B-mode image (in side by side and top bottomformats), for reference purposes.
2. Select to anchor it.
B�1;G@���+�;
Q-Box™ Ratio allows you to compare the stiffness of two areas onthe same image.
Q-Box™ Ratio is available only in SWE™ mode, on a frozen image.
1. Touch Q-Box™ Ratio.Q-Box™ Ratio displays a circle that can be resized or moved,and that is duplicated on the B-mode image (in side by side and topbottom formats), for reference purposes.
2. Place the Q-Box™ within the stiffest visualized area3. Press Select to anchor it4. Another Q-Box™ is displayed.5. Place it on soft tissue.6. Press Select to anchor it.
�E� �)!�����*�����������
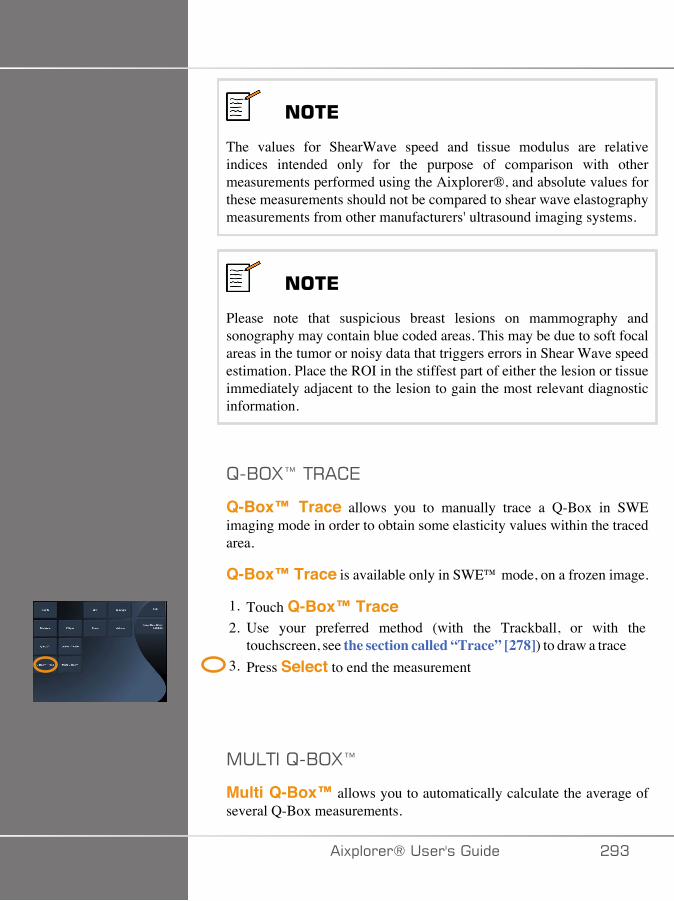
���*
The values for ShearWave speed and tissue modulus are relativeindices intended only for the purpose of comparison with othermeasurements performed using the Aixplorer®, and absolute values forthese measurements should not be compared to shear wave elastographymeasurements from other manufacturers' ultrasound imaging systems.
���*
Please note that suspicious breast lesions on mammography andsonography may contain blue coded areas. This may be due to soft focalareas in the tumor or noisy data that triggers errors in Shear Wave speedestimation. Place the ROI in the stiffest part of either the lesion or tissueimmediately adjacent to the lesion to gain the most relevant diagnosticinformation.
B�1;G@�+�� 7
Q-Box™ Trace allows you to manually trace a Q-Box in SWEimaging mode in order to obtain some elasticity values within the tracedarea.
Q-Box™ Trace is available only in SWE™ mode, on a frozen image.
1. Touch Q-Box™ Trace2. Use your preferred method (with the Trackball, or with the
touchscreen, see the section called “Trace” [278]) to draw a trace3. Press Select to end the measurement
,�:+��B�1;G@
Multi Q-Box™ allows you to automatically calculate the average ofseveral Q-Box measurements.
�)!�����*����������� �EA
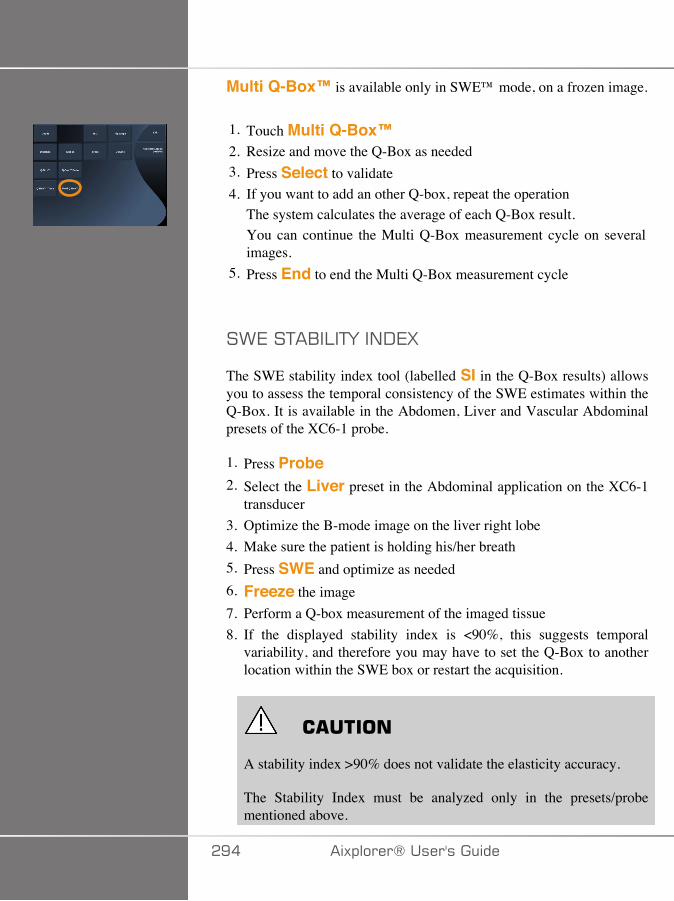
Multi Q-Box™ is available only in SWE™ mode, on a frozen image.
1. Touch Multi Q-Box™2. Resize and move the Q-Box as needed3. Press Select to validate4. If you want to add an other Q-box, repeat the operation
The system calculates the average of each Q-Box result.You can continue the Multi Q-Box measurement cycle on severalimages.
5. Press End to end the Multi Q-Box measurement cycle
�>7��+�1�:�+F��/-7G
The SWE stability index tool (labelled SI in the Q-Box results) allowsyou to assess the temporal consistency of the SWE estimates within theQ-Box. It is available in the Abdomen, Liver and Vascular Abdominalpresets of the XC6-1 probe.
1. Press Probe2. Select the Liver preset in the Abdominal application on the XC6-1
transducer3. Optimize the B-mode image on the liver right lobe4. Make sure the patient is holding his/her breath5. Press SWE and optimize as needed6. Freeze the image7. Perform a Q-box measurement of the imaged tissue8. If the displayed stability index is <90%, this suggests temporal
variability, and therefore you may have to set the Q-Box to anotherlocation within the SWE box or restart the acquisition.
� �����
A stability index >90% does not validate the elasticity accuracy.
The Stability Index must be analyzed only in the presets/probementioned above.
�E� �)!�����*�����������

If necessary, the Stability Index tool can be disabled in the systemconfiguration.
�)!�����*����������� �E�
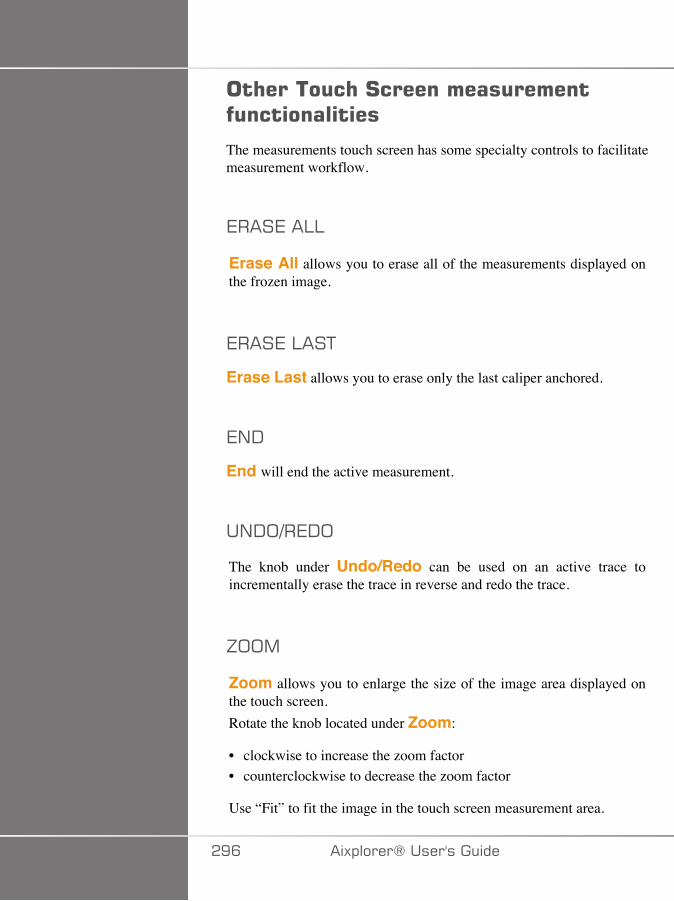
�� ������ �#���������������������������
The measurements touch screen has some specialty controls to facilitatemeasurement workflow.
7���7��::
Erase All allows you to erase all of the measurements displayed onthe frozen image.
7���7�:��+
Erase Last allows you to erase only the last caliper anchored.
7/-
End will end the active measurement.
�/-;3�7-;
The knob under Undo/Redo can be used on an active trace toincrementally erase the trace in reverse and redo the trace.
J;;,
Zoom allows you to enlarge the size of the image area displayed onthe touch screen.Rotate the knob located under Zoom:
• clockwise to increase the zoom factor• counterclockwise to decrease the zoom factor
Use “Fit” to fit the image in the touch screen measurement area.
�EC �)!�����*�����������
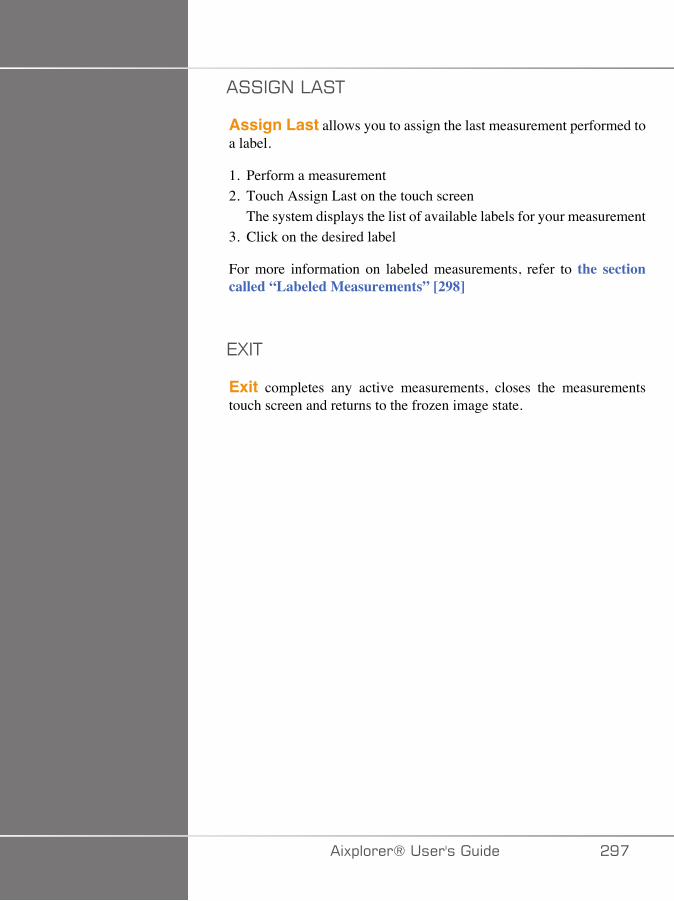
�����/�:��+
Assign Last allows you to assign the last measurement performed toa label.
1. Perform a measurement2. Touch Assign Last on the touch screen
The system displays the list of available labels for your measurement3. Click on the desired label
For more information on labeled measurements, refer to the sectioncalled “Labeled Measurements” [298]
7G�+
Exit completes any active measurements, closes the measurementstouch screen and returns to the frozen image state.
�)!�����*����������� �E�

4������������������
Press Meas. on the control panel.A list of labeled measurements is displayed on the right side of theimage.The available labels depend on the selected application and on thecurrent active mode.The label packages can be configured in the System Configuration. Seethe section called “Packages” [420].
Press Pointer.To scroll the list, place the Pointer over it, and use theTouchRing™.Pick the appropriate label from the list by pressing Select.The appropriate measurement tool is launched (distance...).Perform the measurement as for a basic measurement.You can make up to 5 measurements for the same label. They appearwith their corresponding caliper in the list.Note: Labeled measurements may be hidden, depending on the selectedoption from the system configuration.
����������������;����
You can customize the measurements in the system configuration.
You can choose to display the measurement touch screen every time youpress Freeze.
See Chapter 8, Customizing the System [377] for more information.
�ED �)!�����*�����������
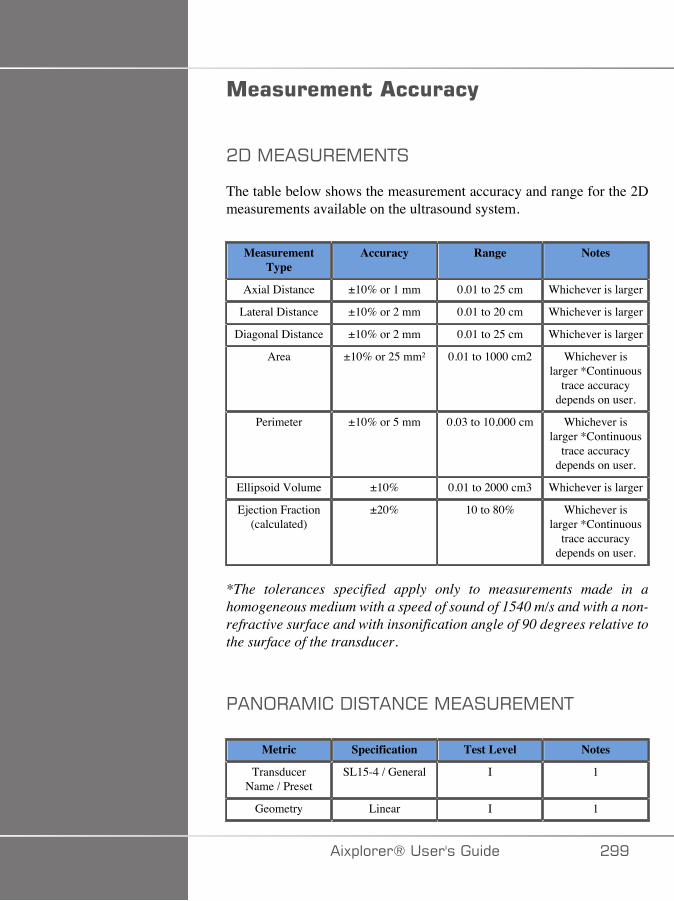
����������� �����(
�-�,7����7,7/+�
The table below shows the measurement accuracy and range for the 2Dmeasurements available on the ultrasound system.
MeasurementType
Accuracy Range Notes
Axial Distance ±10% or 1 mm 0.01 to 25 cm Whichever is larger
Lateral Distance ±10% or 2 mm 0.01 to 20 cm Whichever is larger
Diagonal Distance ±10% or 2 mm 0.01 to 25 cm Whichever is larger
Area ±10% or 25 mm² 0.01 to 1000 cm2 Whichever islarger *Continuous
trace accuracydepends on user.
Perimeter ±10% or 5 mm 0.03 to 10,000 cm Whichever islarger *Continuous
trace accuracydepends on user.
Ellipsoid Volume ±10% 0.01 to 2000 cm3 Whichever is larger
Ejection Fraction(calculated)
±20% 10 to 80% Whichever islarger *Continuous
trace accuracydepends on user.
*The tolerances specified apply only to measurements made in ahomogeneous medium with a speed of sound of 1540 m/s and with a non-refractive surface and with insonification angle of 90 degrees relative tothe surface of the transducer.
��/;��,� �-��+�/ 7�,7����7,7/+
Metric Specification Test Level Notes
TransducerName / Preset
SL15-4 / General I 1
Geometry Linear I 1
�)!�����*����������� �EE
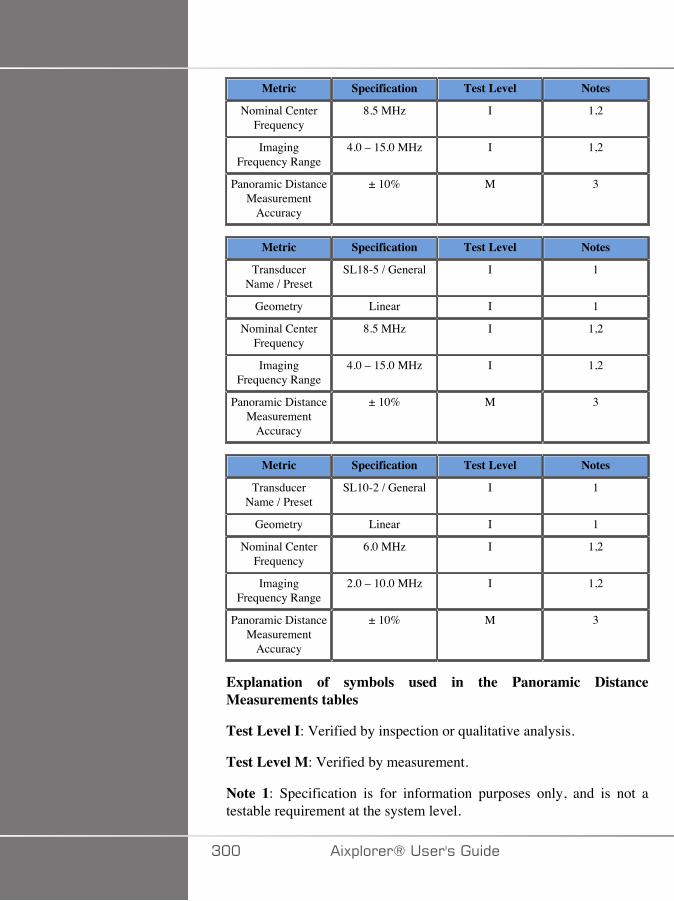
Metric Specification Test Level Notes
Nominal CenterFrequency
8.5 MHz I 1,2
ImagingFrequency Range
4.0 – 15.0 MHz I 1,2
Panoramic DistanceMeasurement
Accuracy
± 10% M 3
Metric Specification Test Level Notes
TransducerName / Preset
SL18-5 / General I 1
Geometry Linear I 1
Nominal CenterFrequency
8.5 MHz I 1,2
ImagingFrequency Range
4.0 – 15.0 MHz I 1,2
Panoramic DistanceMeasurement
Accuracy
± 10% M 3
Metric Specification Test Level Notes
TransducerName / Preset
SL10-2 / General I 1
Geometry Linear I 1
Nominal CenterFrequency
6.0 MHz I 1,2
ImagingFrequency Range
2.0 – 10.0 MHz I 1,2
Panoramic DistanceMeasurement
Accuracy
± 10% M 3
Explanation of symbols used in the Panoramic DistanceMeasurements tables
Test Level I: Verified by inspection or qualitative analysis.
Test Level M: Verified by measurement.
Note 1: Specification is for information purposes only, and is not atestable requirement at the system level.
A�� �)!�����*�����������
Note 2: Specification refers to the ultrasound pulses used in the imagingpart of the B-mode sequence.
Note 3: The Panoramic distance measurement accuracy test is performedusing the ATS 551 Small Parts phantom and covers a maximum distanceof approximately 20 cm.
�)!�����*����������� A��
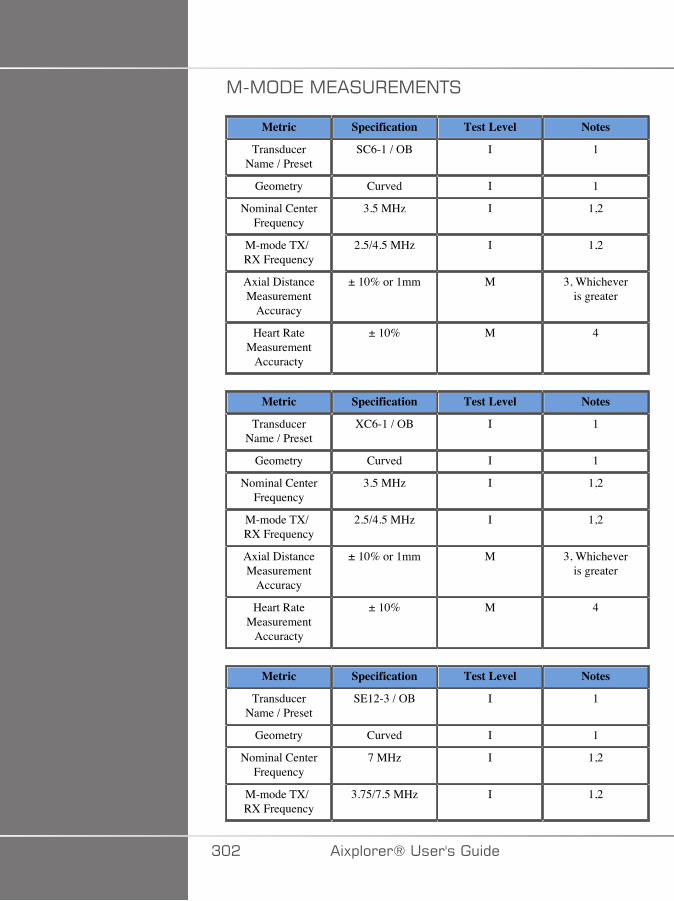
,�,;-7�,7����7,7/+�
Metric Specification Test Level Notes
TransducerName / Preset
SC6-1 / OB I 1
Geometry Curved I 1
Nominal CenterFrequency
3.5 MHz I 1,2
M-mode TX/RX Frequency
2.5/4.5 MHz I 1,2
Axial DistanceMeasurement
Accuracy
± 10% or 1mm M 3, Whicheveris greater
Heart RateMeasurement
Accuracty
± 10% M 4
Metric Specification Test Level Notes
TransducerName / Preset
XC6-1 / OB I 1
Geometry Curved I 1
Nominal CenterFrequency
3.5 MHz I 1,2
M-mode TX/RX Frequency
2.5/4.5 MHz I 1,2
Axial DistanceMeasurement
Accuracy
± 10% or 1mm M 3, Whicheveris greater
Heart RateMeasurement
Accuracty
± 10% M 4
Metric Specification Test Level Notes
TransducerName / Preset
SE12-3 / OB I 1
Geometry Curved I 1
Nominal CenterFrequency
7 MHz I 1,2
M-mode TX/RX Frequency
3.75/7.5 MHz I 1,2
A�� �)!�����*�����������
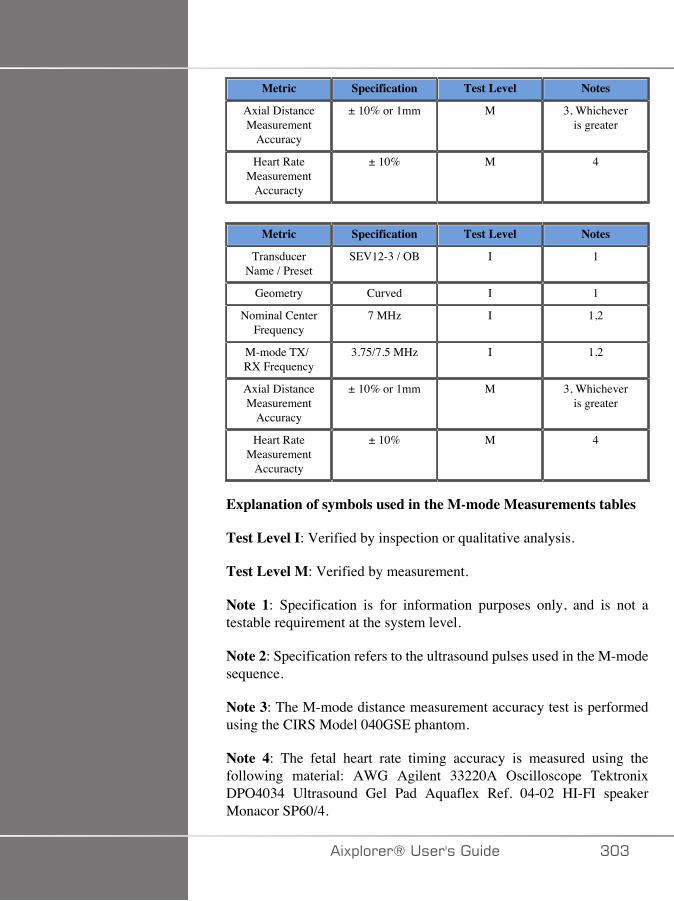
Metric Specification Test Level Notes
Axial DistanceMeasurement
Accuracy
± 10% or 1mm M 3, Whicheveris greater
Heart RateMeasurement
Accuracty
± 10% M 4
Metric Specification Test Level Notes
TransducerName / Preset
SEV12-3 / OB I 1
Geometry Curved I 1
Nominal CenterFrequency
7 MHz I 1,2
M-mode TX/RX Frequency
3.75/7.5 MHz I 1,2
Axial DistanceMeasurement
Accuracy
± 10% or 1mm M 3, Whicheveris greater
Heart RateMeasurement
Accuracty
± 10% M 4
Explanation of symbols used in the M-mode Measurements tables
Test Level I: Verified by inspection or qualitative analysis.
Test Level M: Verified by measurement.
Note 1: Specification is for information purposes only, and is not atestable requirement at the system level.
Note 2: Specification refers to the ultrasound pulses used in the M-modesequence.
Note 3: The M-mode distance measurement accuracy test is performedusing the CIRS Model 040GSE phantom.
Note 4: The fetal heart rate timing accuracy is measured using thefollowing material: AWG Agilent 33220A Oscilloscope TektronixDPO4034 Ultrasound Gel Pad Aquaflex Ref. 04-02 HI-FI speakerMonacor SP60/4.
�)!�����*����������� A�A
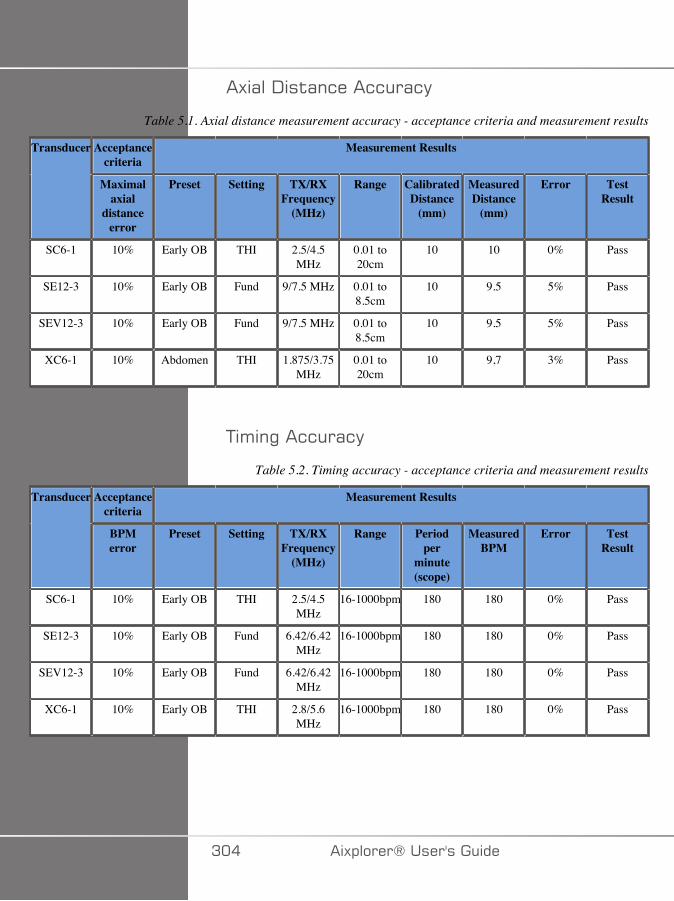
�)(��-�$(�&���&&�(&�
Table 5.1. Axial distance measurement accuracy - acceptance criteria and measurement results
Acceptancecriteria
Measurement ResultsTransducer
Maximalaxial
distanceerror
Preset Setting TX/RXFrequency
(MHz)
Range CalibratedDistance
(mm)
MeasuredDistance
(mm)
Error TestResult
SC6-1 10% Early OB THI 2.5/4.5MHz
0.01 to20cm
10 10 0% Pass
SE12-3 10% Early OB Fund 9/7.5 MHz 0.01 to8.5cm
10 9.5 5% Pass
SEV12-3 10% Early OB Fund 9/7.5 MHz 0.01 to8.5cm
10 9.5 5% Pass
XC6-1 10% Abdomen THI 1.875/3.75MHz
0.01 to20cm
10 9,7 3% Pass
+'�"��&&�(&�
Table 5.2. Timing accuracy - acceptance criteria and measurement results
Acceptancecriteria
Measurement ResultsTransducer
BPMerror
Preset Setting TX/RXFrequency
(MHz)
Range Periodper
minute(scope)
MeasuredBPM
Error TestResult
SC6-1 10% Early OB THI 2.5/4.5MHz
16-1000bpm 180 180 0% Pass
SE12-3 10% Early OB Fund 6.42/6.42MHz
16-1000bpm 180 180 0% Pass
SEV12-3 10% Early OB Fund 6.42/6.42MHz
16-1000bpm 180 180 0% Pass
XC6-1 10% Early OB THI 2.8/5.6MHz
16-1000bpm 180 180 0% Pass
A�� �)!�����*�����������
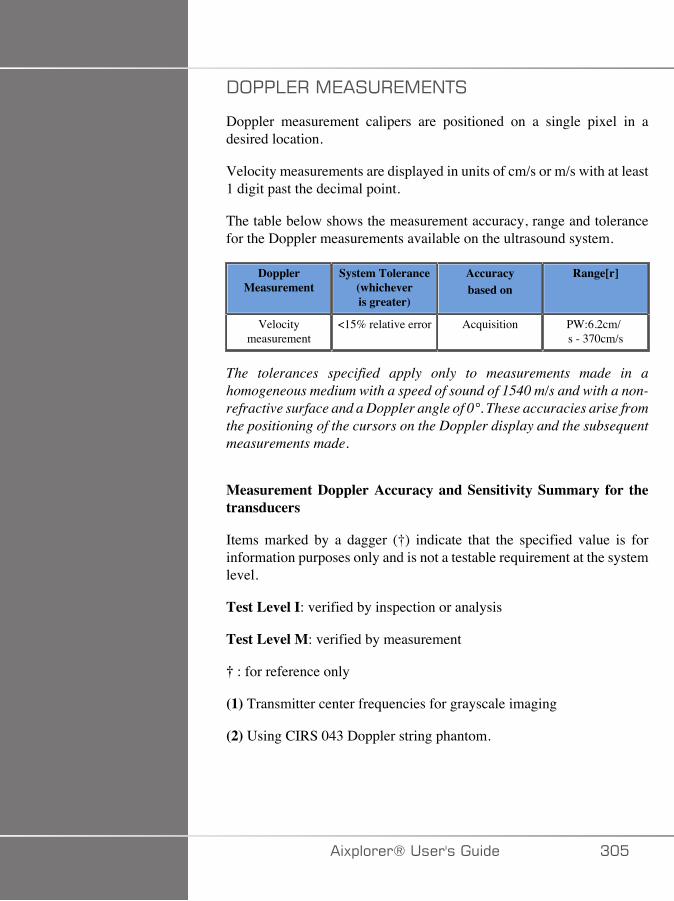
-;��:7��,7����7,7/+�
Doppler measurement calipers are positioned on a single pixel in adesired location.
Velocity measurements are displayed in units of cm/s or m/s with at least1 digit past the decimal point.
The table below shows the measurement accuracy, range and tolerancefor the Doppler measurements available on the ultrasound system.
DopplerMeasurement
System Tolerance(whicheveris greater)
Accuracybased on
Range[r]
Velocitymeasurement
<15% relative error Acquisition PW:6.2cm/s - 370cm/s
The tolerances specified apply only to measurements made in ahomogeneous medium with a speed of sound of 1540 m/s and with a non-refractive surface and a Doppler angle of 0°. These accuracies arise fromthe positioning of the cursors on the Doppler display and the subsequentmeasurements made.
Measurement Doppler Accuracy and Sensitivity Summary for thetransducers
Items marked by a dagger (†) indicate that the specified value is forinformation purposes only and is not a testable requirement at the systemlevel.
Test Level I: verified by inspection or analysis
Test Level M: verified by measurement
† : for reference only
(1) Transmitter center frequencies for grayscale imaging
(2) Using CIRS 043 Doppler string phantom.
�)!�����*����������� A��
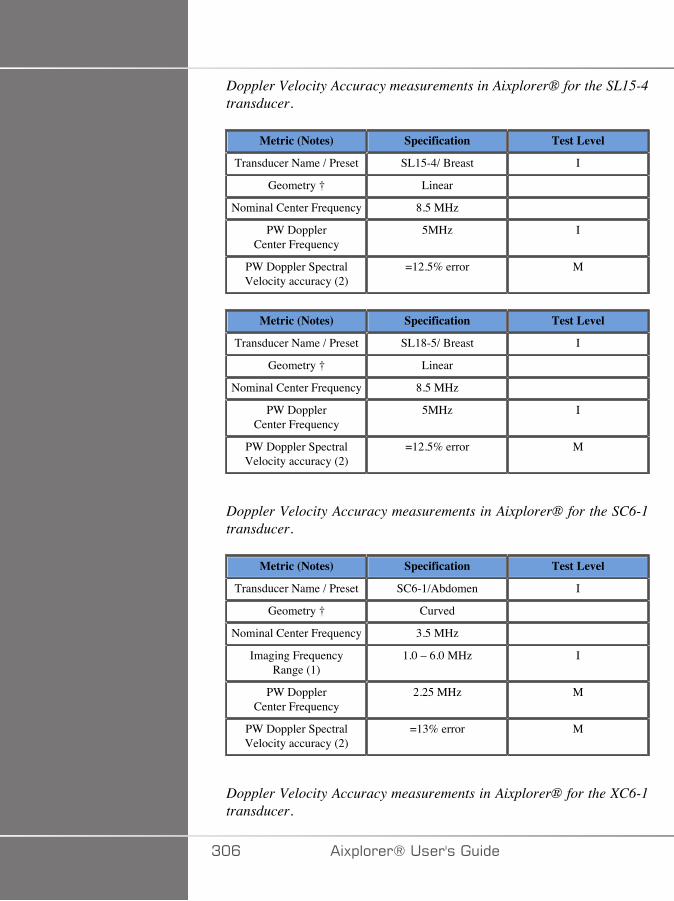
Doppler Velocity Accuracy measurements in Aixplorer® for the SL15-4transducer.
Metric (Notes) Specification Test Level
Transducer Name / Preset SL15-4/ Breast I
Geometry † Linear
Nominal Center Frequency 8.5 MHz
PW DopplerCenter Frequency
5MHz I
PW Doppler SpectralVelocity accuracy (2)
=12.5% error M
Metric (Notes) Specification Test Level
Transducer Name / Preset SL18-5/ Breast I
Geometry † Linear
Nominal Center Frequency 8.5 MHz
PW DopplerCenter Frequency
5MHz I
PW Doppler SpectralVelocity accuracy (2)
=12.5% error M
Doppler Velocity Accuracy measurements in Aixplorer® for the SC6-1transducer.
Metric (Notes) Specification Test Level
Transducer Name / Preset SC6-1/Abdomen I
Geometry † Curved
Nominal Center Frequency 3.5 MHz
Imaging FrequencyRange (1)
1.0 – 6.0 MHz I
PW DopplerCenter Frequency
2.25 MHz M
PW Doppler SpectralVelocity accuracy (2)
=13% error M
Doppler Velocity Accuracy measurements in Aixplorer® for the XC6-1transducer.
A�C �)!�����*�����������
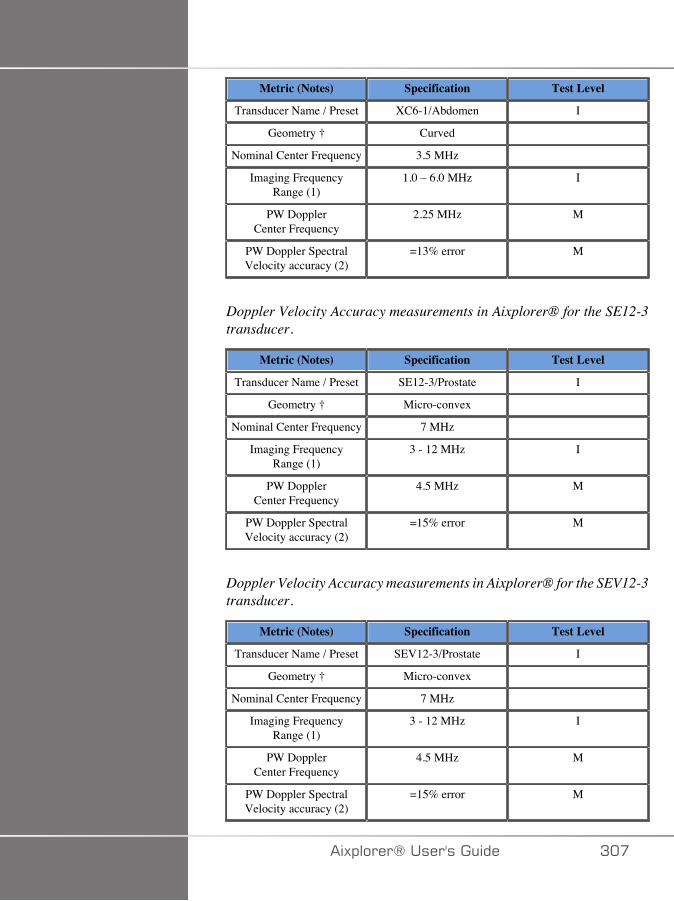
Metric (Notes) Specification Test Level
Transducer Name / Preset XC6-1/Abdomen I
Geometry † Curved
Nominal Center Frequency 3.5 MHz
Imaging FrequencyRange (1)
1.0 – 6.0 MHz I
PW DopplerCenter Frequency
2.25 MHz M
PW Doppler SpectralVelocity accuracy (2)
=13% error M
Doppler Velocity Accuracy measurements in Aixplorer® for the SE12-3transducer.
Metric (Notes) Specification Test Level
Transducer Name / Preset SE12-3/Prostate I
Geometry † Micro-convex
Nominal Center Frequency 7 MHz
Imaging FrequencyRange (1)
3 - 12 MHz I
PW DopplerCenter Frequency
4.5 MHz M
PW Doppler SpectralVelocity accuracy (2)
=15% error M
Doppler Velocity Accuracy measurements in Aixplorer® for the SEV12-3transducer.
Metric (Notes) Specification Test Level
Transducer Name / Preset SEV12-3/Prostate I
Geometry † Micro-convex
Nominal Center Frequency 7 MHz
Imaging FrequencyRange (1)
3 - 12 MHz I
PW DopplerCenter Frequency
4.5 MHz M
PW Doppler SpectralVelocity accuracy (2)
=15% error M
�)!�����*����������� A��
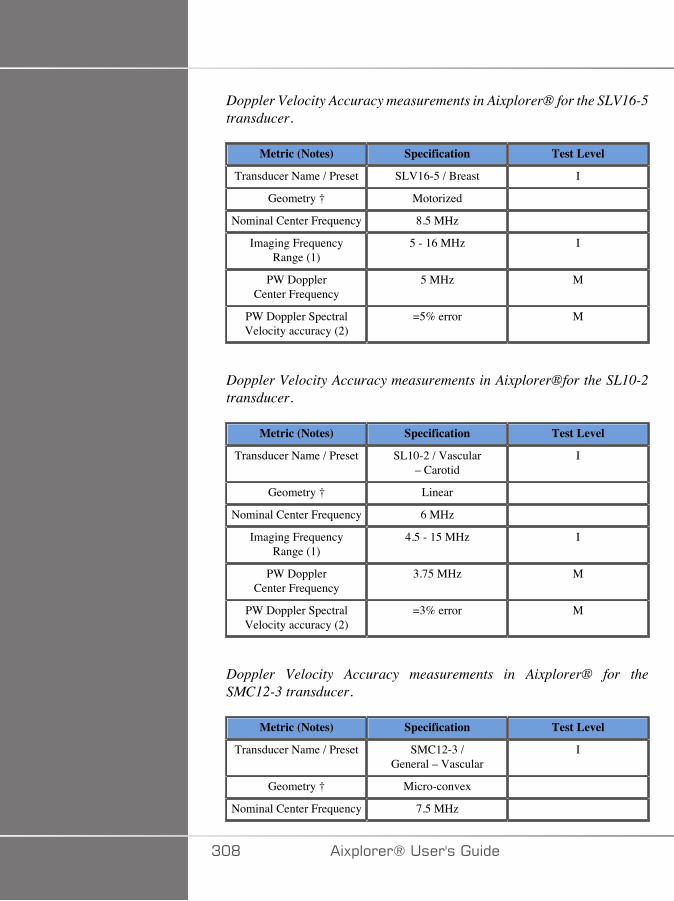
Doppler Velocity Accuracy measurements in Aixplorer® for the SLV16-5transducer.
Metric (Notes) Specification Test Level
Transducer Name / Preset SLV16-5 / Breast I
Geometry † Motorized
Nominal Center Frequency 8.5 MHz
Imaging FrequencyRange (1)
5 - 16 MHz I
PW DopplerCenter Frequency
5 MHz M
PW Doppler SpectralVelocity accuracy (2)
=5% error M
Doppler Velocity Accuracy measurements in Aixplorer®for the SL10-2transducer.
Metric (Notes) Specification Test Level
Transducer Name / Preset SL10-2 / Vascular– Carotid
I
Geometry † Linear
Nominal Center Frequency 6 MHz
Imaging FrequencyRange (1)
4.5 - 15 MHz I
PW DopplerCenter Frequency
3.75 MHz M
PW Doppler SpectralVelocity accuracy (2)
=3% error M
Doppler Velocity Accuracy measurements in Aixplorer® for theSMC12-3 transducer.
Metric (Notes) Specification Test Level
Transducer Name / Preset SMC12-3 /General – Vascular
I
Geometry † Micro-convex
Nominal Center Frequency 7.5 MHz
A�D �)!�����*�����������

Metric (Notes) Specification Test Level
Imaging FrequencyRange (1)
3-12 MHz I
PW DopplerCenter Frequency
4.5 MHz M
PW Doppler SpectralVelocity accuracy (2)
=14.5% error M
Doppler Velocity Accuracy measurements in Aixplorer® for the SLH20-6transducer.
Metric (Notes) Specification Test Level
Transducer Name / Preset SLH20-6 / MSK I
Geometry † Linear
Nominal Center Frequency 11 MHz
Imaging FrequencyRange (1)
6-20 MHz I
PW DopplerCenter Frequency
7.5 MHz M
PW Doppler SpectralVelocity accuracy
=15% error M
Doppler Velocity Accuracy measurements in Aixplorer® for the XP5-1transducer.
Metric (Notes) Specification Test Level
Transducer Name / Preset XP5-1 / Vascular – TCD I
Geometry † Phased
Nominal Center Frequency 2.9 MHz
Imaging FrequencyRange (1)
1-5 MHz I
PW DopplerCenter Frequency
1.875 MHz M
PW Doppler SpectralVelocity accuracy
=15% error M
�)!�����*����������� A�E
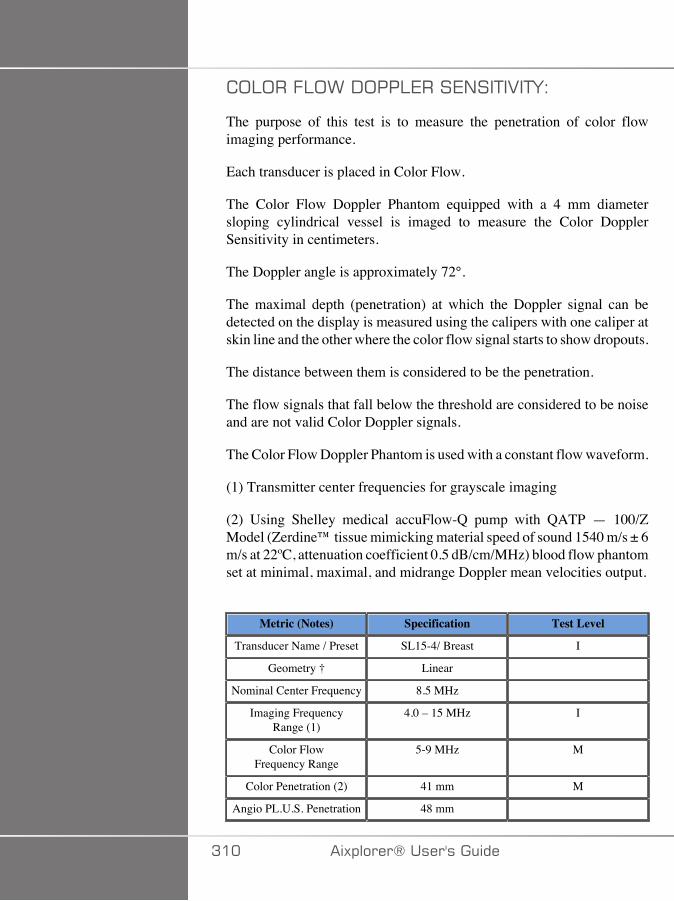
;:;��.:;>�-;��:7���7/��+�2�+F�
The purpose of this test is to measure the penetration of color flowimaging performance.
Each transducer is placed in Color Flow.
The Color Flow Doppler Phantom equipped with a 4 mm diametersloping cylindrical vessel is imaged to measure the Color DopplerSensitivity in centimeters.
The Doppler angle is approximately 72°.
The maximal depth (penetration) at which the Doppler signal can bedetected on the display is measured using the calipers with one caliper atskin line and the other where the color flow signal starts to show dropouts.
The distance between them is considered to be the penetration.
The flow signals that fall below the threshold are considered to be noiseand are not valid Color Doppler signals.
The Color Flow Doppler Phantom is used with a constant flow waveform.
(1) Transmitter center frequencies for grayscale imaging
(2) Using Shelley medical accuFlow-Q pump with QATP — 100/ZModel (Zerdine™ tissue mimicking material speed of sound 1540 m/s ± 6m/s at 22ºC, attenuation coefficient 0.5 dB/cm/MHz) blood flow phantomset at minimal, maximal, and midrange Doppler mean velocities output.
Metric (Notes) Specification Test Level
Transducer Name / Preset SL15-4/ Breast I
Geometry † Linear
Nominal Center Frequency 8.5 MHz
Imaging FrequencyRange (1)
4.0 – 15 MHz I
Color FlowFrequency Range
5-9 MHz M
Color Penetration (2) 41 mm M
Angio PL.U.S. Penetration 48 mm
A�� �)!�����*�����������
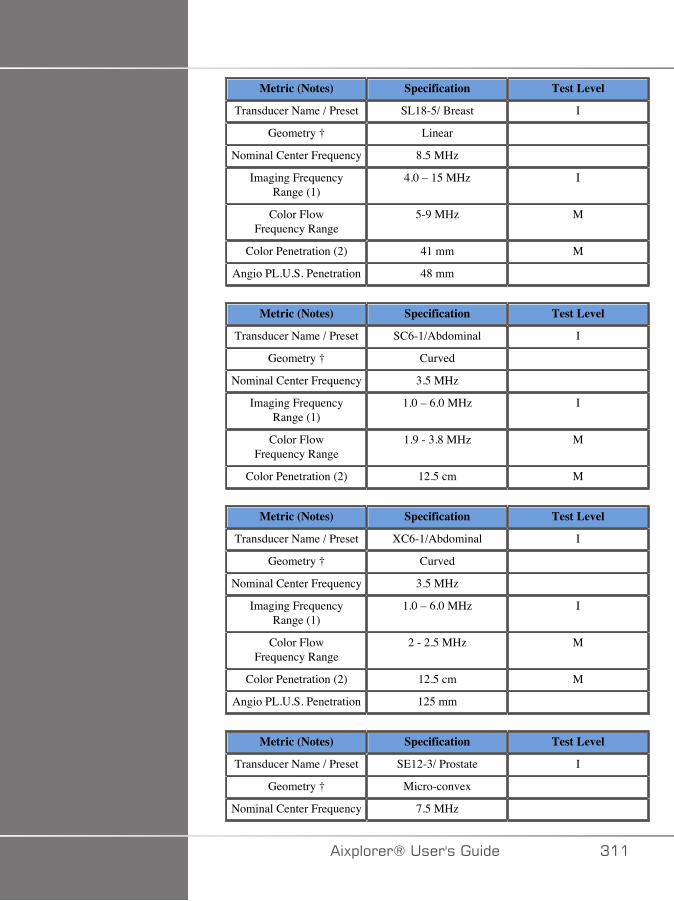
Metric (Notes) Specification Test Level
Transducer Name / Preset SL18-5/ Breast I
Geometry † Linear
Nominal Center Frequency 8.5 MHz
Imaging FrequencyRange (1)
4.0 – 15 MHz I
Color FlowFrequency Range
5-9 MHz M
Color Penetration (2) 41 mm M
Angio PL.U.S. Penetration 48 mm
Metric (Notes) Specification Test Level
Transducer Name / Preset SC6-1/Abdominal I
Geometry † Curved
Nominal Center Frequency 3.5 MHz
Imaging FrequencyRange (1)
1.0 – 6.0 MHz I
Color FlowFrequency Range
1.9 - 3.8 MHz M
Color Penetration (2) 12.5 cm M
Metric (Notes) Specification Test Level
Transducer Name / Preset XC6-1/Abdominal I
Geometry † Curved
Nominal Center Frequency 3.5 MHz
Imaging FrequencyRange (1)
1.0 – 6.0 MHz I
Color FlowFrequency Range
2 - 2.5 MHz M
Color Penetration (2) 12.5 cm M
Angio PL.U.S. Penetration 125 mm
Metric (Notes) Specification Test Level
Transducer Name / Preset SE12-3/ Prostate I
Geometry † Micro-convex
Nominal Center Frequency 7.5 MHz
�)!�����*����������� A��
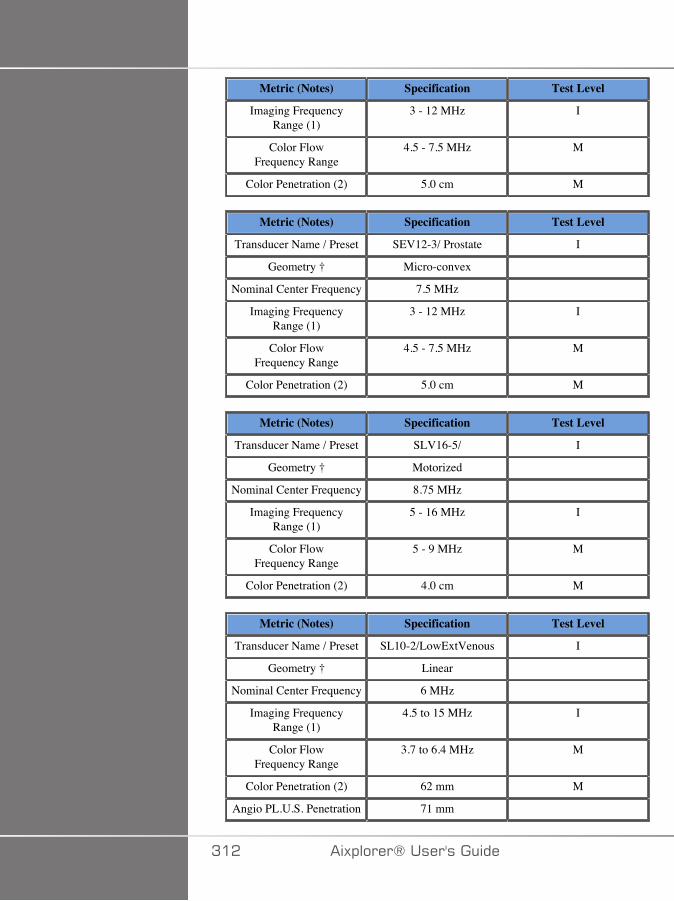
Metric (Notes) Specification Test Level
Imaging FrequencyRange (1)
3 - 12 MHz I
Color FlowFrequency Range
4.5 - 7.5 MHz M
Color Penetration (2) 5.0 cm M
Metric (Notes) Specification Test Level
Transducer Name / Preset SEV12-3/ Prostate I
Geometry † Micro-convex
Nominal Center Frequency 7.5 MHz
Imaging FrequencyRange (1)
3 - 12 MHz I
Color FlowFrequency Range
4.5 - 7.5 MHz M
Color Penetration (2) 5.0 cm M
Metric (Notes) Specification Test Level
Transducer Name / Preset SLV16-5/ I
Geometry † Motorized
Nominal Center Frequency 8.75 MHz
Imaging FrequencyRange (1)
5 - 16 MHz I
Color FlowFrequency Range
5 - 9 MHz M
Color Penetration (2) 4.0 cm M
Metric (Notes) Specification Test Level
Transducer Name / Preset SL10-2/LowExtVenous I
Geometry † Linear
Nominal Center Frequency 6 MHz
Imaging FrequencyRange (1)
4.5 to 15 MHz I
Color FlowFrequency Range
3.7 to 6.4 MHz M
Color Penetration (2) 62 mm M
Angio PL.U.S. Penetration 71 mm
A�� �)!�����*�����������
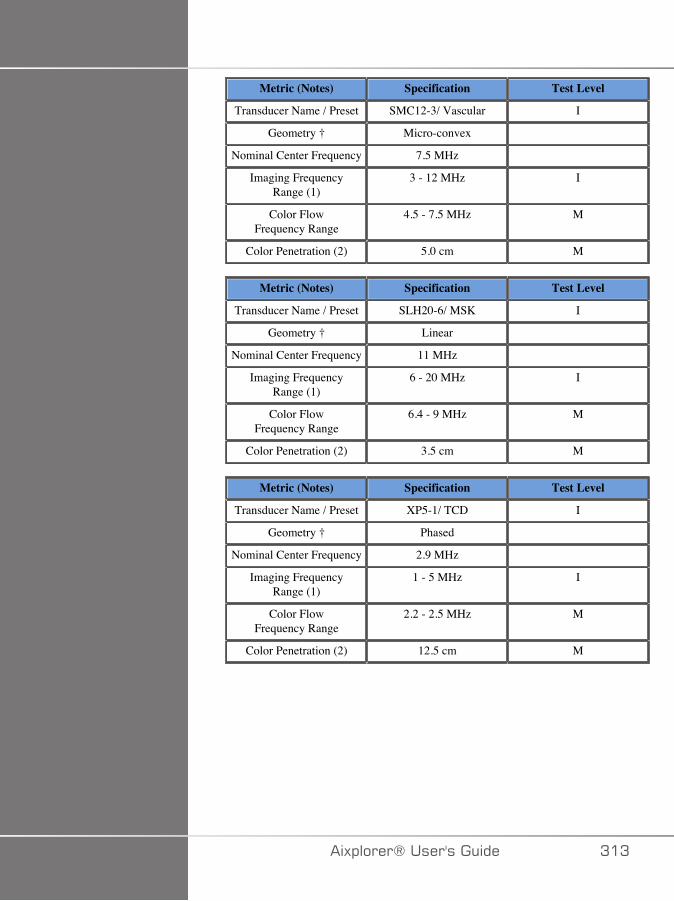
Metric (Notes) Specification Test Level
Transducer Name / Preset SMC12-3/ Vascular I
Geometry † Micro-convex
Nominal Center Frequency 7.5 MHz
Imaging FrequencyRange (1)
3 - 12 MHz I
Color FlowFrequency Range
4.5 - 7.5 MHz M
Color Penetration (2) 5.0 cm M
Metric (Notes) Specification Test Level
Transducer Name / Preset SLH20-6/ MSK I
Geometry † Linear
Nominal Center Frequency 11 MHz
Imaging FrequencyRange (1)
6 - 20 MHz I
Color FlowFrequency Range
6.4 - 9 MHz M
Color Penetration (2) 3.5 cm M
Metric (Notes) Specification Test Level
Transducer Name / Preset XP5-1/ TCD I
Geometry † Phased
Nominal Center Frequency 2.9 MHz
Imaging FrequencyRange (1)
1 - 5 MHz I
Color FlowFrequency Range
2.2 - 2.5 MHz M
Color Penetration (2) 12.5 cm M
�)!�����*����������� A�A
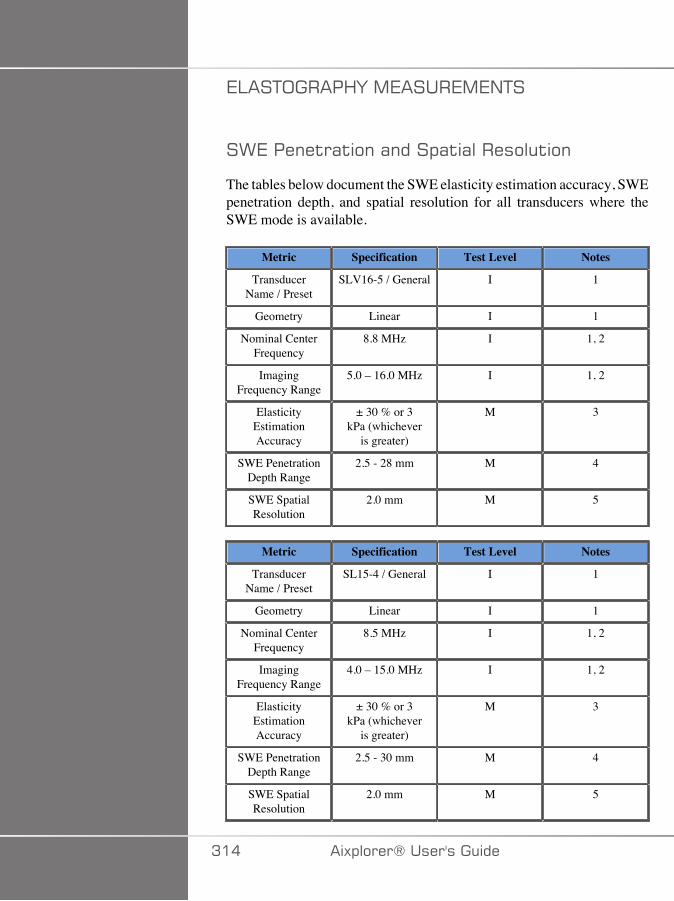
7:��+;����<F�,7����7,7/+�
�>7�����$�($���(����!($(�������$��
The tables below document the SWE elasticity estimation accuracy, SWEpenetration depth, and spatial resolution for all transducers where theSWE mode is available.
Metric Specification Test Level Notes
TransducerName / Preset
SLV16-5 / General I 1
Geometry Linear I 1
Nominal CenterFrequency
8.8 MHz I 1, 2
ImagingFrequency Range
5.0 – 16.0 MHz I 1, 2
ElasticityEstimationAccuracy
± 30 % or 3kPa (whichever
is greater)
M 3
SWE PenetrationDepth Range
2.5 - 28 mm M 4
SWE SpatialResolution
2.0 mm M 5
Metric Specification Test Level Notes
TransducerName / Preset
SL15-4 / General I 1
Geometry Linear I 1
Nominal CenterFrequency
8.5 MHz I 1, 2
ImagingFrequency Range
4.0 – 15.0 MHz I 1, 2
ElasticityEstimationAccuracy
± 30 % or 3kPa (whichever
is greater)
M 3
SWE PenetrationDepth Range
2.5 - 30 mm M 4
SWE SpatialResolution
2.0 mm M 5
A�� �)!�����*�����������
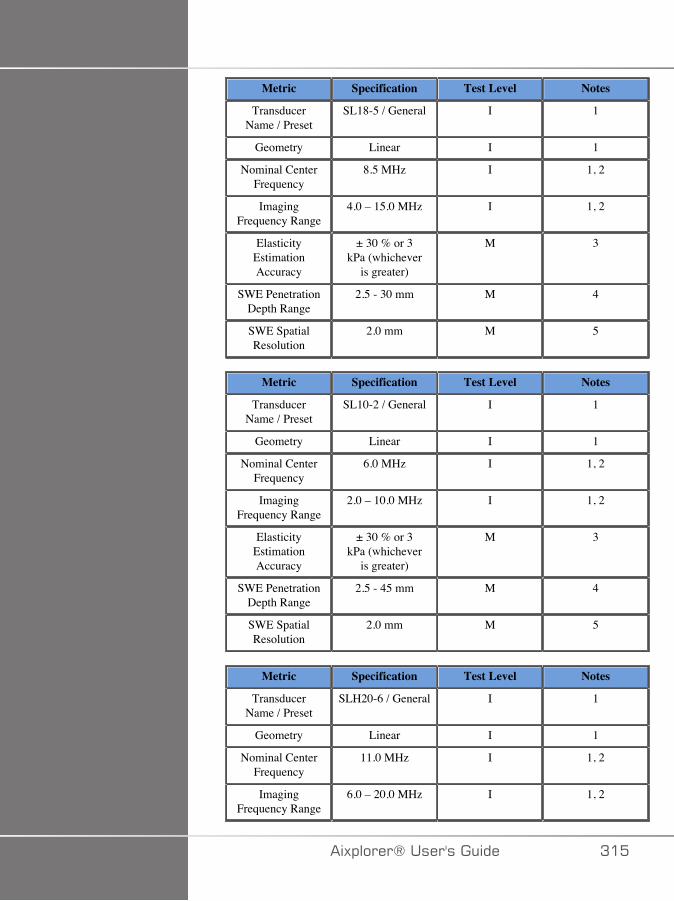
Metric Specification Test Level Notes
TransducerName / Preset
SL18-5 / General I 1
Geometry Linear I 1
Nominal CenterFrequency
8.5 MHz I 1, 2
ImagingFrequency Range
4.0 – 15.0 MHz I 1, 2
ElasticityEstimationAccuracy
± 30 % or 3kPa (whichever
is greater)
M 3
SWE PenetrationDepth Range
2.5 - 30 mm M 4
SWE SpatialResolution
2.0 mm M 5
Metric Specification Test Level Notes
TransducerName / Preset
SL10-2 / General I 1
Geometry Linear I 1
Nominal CenterFrequency
6.0 MHz I 1, 2
ImagingFrequency Range
2.0 – 10.0 MHz I 1, 2
ElasticityEstimationAccuracy
± 30 % or 3kPa (whichever
is greater)
M 3
SWE PenetrationDepth Range
2.5 - 45 mm M 4
SWE SpatialResolution
2.0 mm M 5
Metric Specification Test Level Notes
TransducerName / Preset
SLH20-6 / General I 1
Geometry Linear I 1
Nominal CenterFrequency
11.0 MHz I 1, 2
ImagingFrequency Range
6.0 – 20.0 MHz I 1, 2
�)!�����*����������� A��
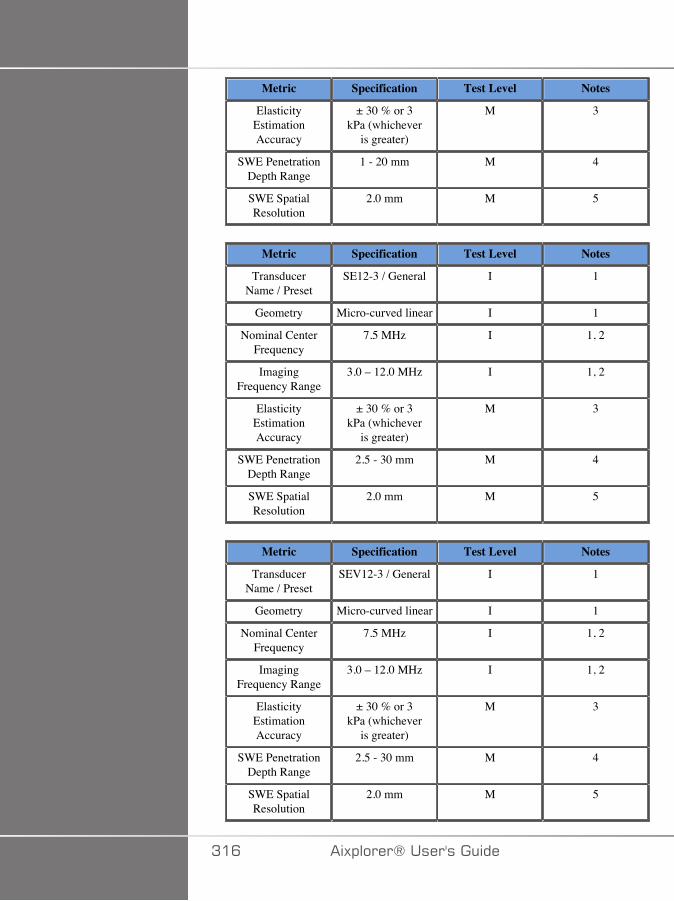
Metric Specification Test Level Notes
ElasticityEstimationAccuracy
± 30 % or 3kPa (whichever
is greater)
M 3
SWE PenetrationDepth Range
1 - 20 mm M 4
SWE SpatialResolution
2.0 mm M 5
Metric Specification Test Level Notes
TransducerName / Preset
SE12-3 / General I 1
Geometry Micro-curved linear I 1
Nominal CenterFrequency
7.5 MHz I 1, 2
ImagingFrequency Range
3.0 – 12.0 MHz I 1, 2
ElasticityEstimationAccuracy
± 30 % or 3kPa (whichever
is greater)
M 3
SWE PenetrationDepth Range
2.5 - 30 mm M 4
SWE SpatialResolution
2.0 mm M 5
Metric Specification Test Level Notes
TransducerName / Preset
SEV12-3 / General I 1
Geometry Micro-curved linear I 1
Nominal CenterFrequency
7.5 MHz I 1, 2
ImagingFrequency Range
3.0 – 12.0 MHz I 1, 2
ElasticityEstimationAccuracy
± 30 % or 3kPa (whichever
is greater)
M 3
SWE PenetrationDepth Range
2.5 - 30 mm M 4
SWE SpatialResolution
2.0 mm M 5
A�C �)!�����*�����������
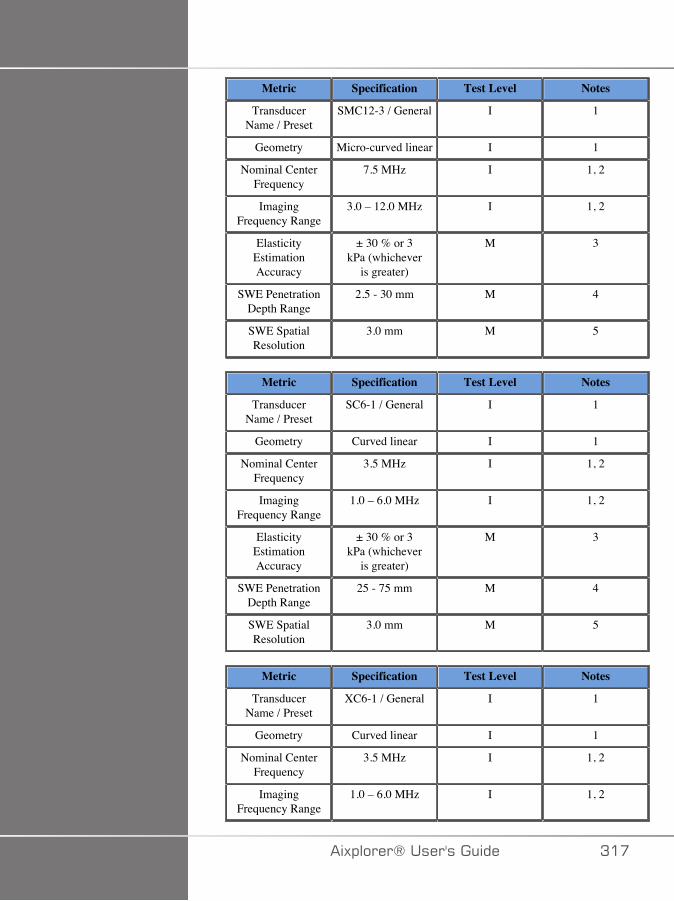
Metric Specification Test Level Notes
TransducerName / Preset
SMC12-3 / General I 1
Geometry Micro-curved linear I 1
Nominal CenterFrequency
7.5 MHz I 1, 2
ImagingFrequency Range
3.0 – 12.0 MHz I 1, 2
ElasticityEstimationAccuracy
± 30 % or 3kPa (whichever
is greater)
M 3
SWE PenetrationDepth Range
2.5 - 30 mm M 4
SWE SpatialResolution
3.0 mm M 5
Metric Specification Test Level Notes
TransducerName / Preset
SC6-1 / General I 1
Geometry Curved linear I 1
Nominal CenterFrequency
3.5 MHz I 1, 2
ImagingFrequency Range
1.0 – 6.0 MHz I 1, 2
ElasticityEstimationAccuracy
± 30 % or 3kPa (whichever
is greater)
M 3
SWE PenetrationDepth Range
25 - 75 mm M 4
SWE SpatialResolution
3.0 mm M 5
Metric Specification Test Level Notes
TransducerName / Preset
XC6-1 / General I 1
Geometry Curved linear I 1
Nominal CenterFrequency
3.5 MHz I 1, 2
ImagingFrequency Range
1.0 – 6.0 MHz I 1, 2
�)!�����*����������� A��
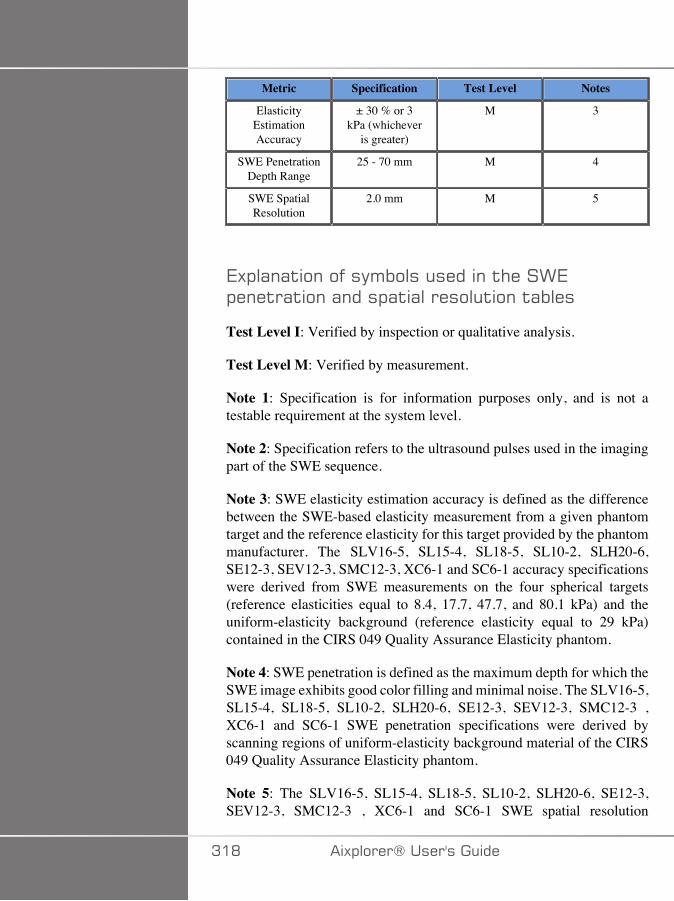
Metric Specification Test Level Notes
ElasticityEstimationAccuracy
± 30 % or 3kPa (whichever
is greater)
M 3
SWE PenetrationDepth Range
25 - 70 mm M 4
SWE SpatialResolution
2.0 mm M 5
7)!�(�($���� ���'%����������$#���>7!���$�($���(����!($(�������$���$(%���
Test Level I: Verified by inspection or qualitative analysis.
Test Level M: Verified by measurement.
Note 1: Specification is for information purposes only, and is not atestable requirement at the system level.
Note 2: Specification refers to the ultrasound pulses used in the imagingpart of the SWE sequence.
Note 3: SWE elasticity estimation accuracy is defined as the differencebetween the SWE-based elasticity measurement from a given phantomtarget and the reference elasticity for this target provided by the phantommanufacturer. The SLV16-5, SL15-4, SL18-5, SL10-2, SLH20-6,SE12-3, SEV12-3, SMC12-3, XC6-1 and SC6-1 accuracy specificationswere derived from SWE measurements on the four spherical targets(reference elasticities equal to 8.4, 17.7, 47.7, and 80.1 kPa) and theuniform-elasticity background (reference elasticity equal to 29 kPa)contained in the CIRS 049 Quality Assurance Elasticity phantom.
Note 4: SWE penetration is defined as the maximum depth for which theSWE image exhibits good color filling and minimal noise. The SLV16-5,SL15-4, SL18-5, SL10-2, SLH20-6, SE12-3, SEV12-3, SMC12-3 ,XC6-1 and SC6-1 SWE penetration specifications were derived byscanning regions of uniform-elasticity background material of the CIRS049 Quality Assurance Elasticity phantom.
Note 5: The SLV16-5, SL15-4, SL18-5, SL10-2, SLH20-6, SE12-3,SEV12-3, SMC12-3 , XC6-1 and SC6-1 SWE spatial resolution
A�D �)!�����*�����������

specifications were derived by using a custom-made phantom containingtwo rectangular tissue-mimicking blocks with an elasticity ratio equal to3, scanning the custom-made phantom twice so that the interface betweenthe two blocks is oriented first axially and then laterally, and measuringthe average width of the SWE elasticity vs. distance curves across theblock interfaces on the axially- and laterally-oriented SWE images.
�>7�1(��(������&���
The tables below document the estimation bias and estimation precisionas a function of target size and target stiffness for all transducers wherethe SWE mode is available.
The table results were obtained by performing experiments on a CIRS049A Quality Assurance elasticity phantom. This phantom containsstepped-cylinder targets of four stiffness types I – IV corresponding tonominal shear wave velocities of 1.6, 2.2, 3.9 and 5.2 m/s of differentdiameters, embedded in uniform-elasticity background (nominal shearwave velocity of 2.9 m/s). Note that the bias and precision specificationslisted below should not be extrapolated when scanning tissue types withshear wave velocities outside the shear wave velocity range of [1.6– 5.2]m/s considered in these experiments.
SWE estimation bias was derived as the difference between the meanof five independent SWE shear wave velocity measurements and thenominal shear wave velocity, normalized by the nominal shear wavevelocity and expressed as a percentage.
SWE estimation precision was derived as the standard deviation of fiveindependent SWE shear wave velocity measurements normalized by themean of the five independent SWE measurements, and expressed as apercentage.
SLV16-5
Target Type I Target Type II Target Type III Target Type IVTargetDiameter
(mm)Bias(%)
Precision(%)
Bias(%)
Precision(%)
Bias(%)
Precision(%)
Bias(%)
Precision(%)
4.1 21.9 3.9 -7.0 2.2 -19.2 2.3 -24.1 1.9
6.5 7.6 0.6 -7.8 2.2 -8.7 1.3 -12.5 2.2
�)!�����*����������� A�E
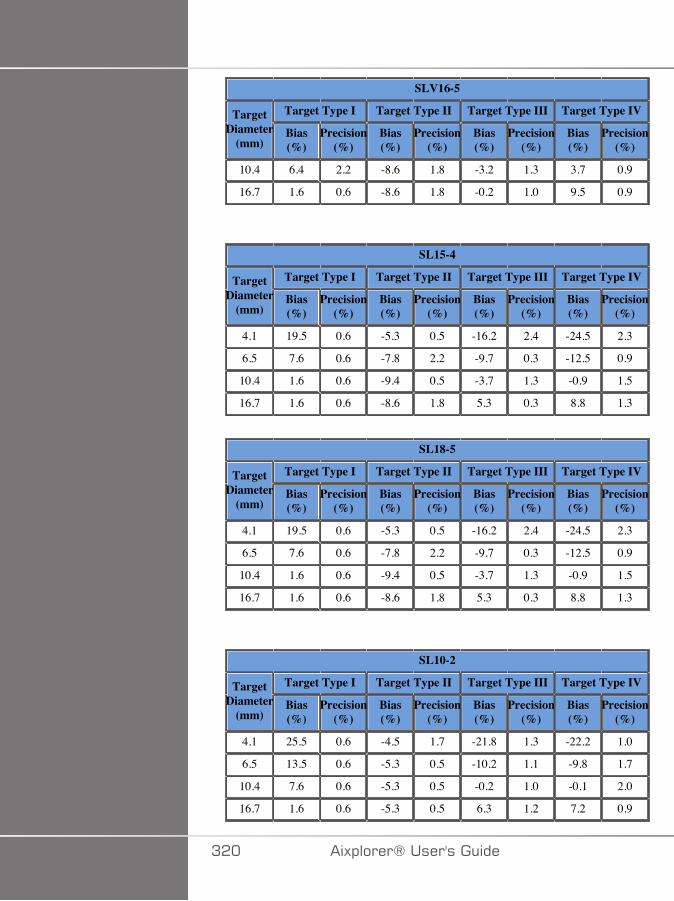
SLV16-5
Target Type I Target Type II Target Type III Target Type IVTargetDiameter
(mm)Bias(%)
Precision(%)
Bias(%)
Precision(%)
Bias(%)
Precision(%)
Bias(%)
Precision(%)
10.4 6.4 2.2 -8.6 1.8 -3.2 1.3 3.7 0.9
16.7 1.6 0.6 -8.6 1.8 -0.2 1.0 9.5 0.9
SL15-4
Target Type I Target Type II Target Type III Target Type IVTargetDiameter
(mm)Bias(%)
Precision(%)
Bias(%)
Precision(%)
Bias(%)
Precision(%)
Bias(%)
Precision(%)
4.1 19.5 0.6 -5.3 0.5 -16.2 2.4 -24.5 2.3
6.5 7.6 0.6 -7.8 2.2 -9.7 0.3 -12.5 0.9
10.4 1.6 0.6 -9.4 0.5 -3.7 1.3 -0.9 1.5
16.7 1.6 0.6 -8.6 1.8 5.3 0.3 8.8 1.3
SL18-5
Target Type I Target Type II Target Type III Target Type IVTargetDiameter
(mm)Bias(%)
Precision(%)
Bias(%)
Precision(%)
Bias(%)
Precision(%)
Bias(%)
Precision(%)
4.1 19.5 0.6 -5.3 0.5 -16.2 2.4 -24.5 2.3
6.5 7.6 0.6 -7.8 2.2 -9.7 0.3 -12.5 0.9
10.4 1.6 0.6 -9.4 0.5 -3.7 1.3 -0.9 1.5
16.7 1.6 0.6 -8.6 1.8 5.3 0.3 8.8 1.3
SL10-2
Target Type I Target Type II Target Type III Target Type IVTargetDiameter
(mm)Bias(%)
Precision(%)
Bias(%)
Precision(%)
Bias(%)
Precision(%)
Bias(%)
Precision(%)
4.1 25.5 0.6 -4.5 1.7 -21.8 1.3 -22.2 1.0
6.5 13.5 0.6 -5.3 0.5 -10.2 1.1 -9.8 1.7
10.4 7.6 0.6 -5.3 0.5 -0.2 1.0 -0.1 2.0
16.7 1.6 0.6 -5.3 0.5 6.3 1.2 7.2 0.9
A�� �)!�����*�����������
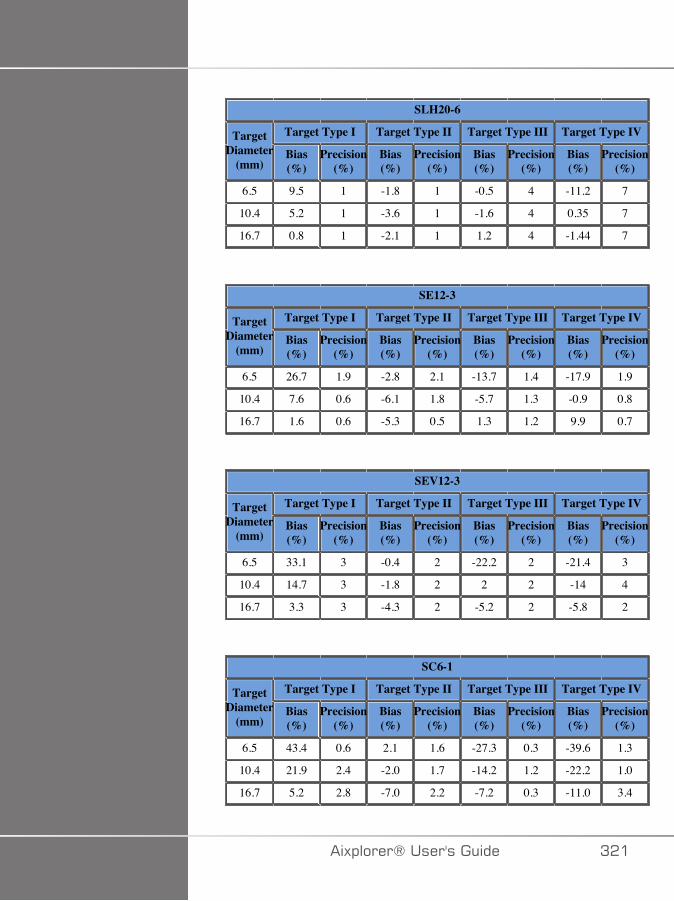
SLH20-6
Target Type I Target Type II Target Type III Target Type IVTargetDiameter
(mm)Bias(%)
Precision(%)
Bias(%)
Precision(%)
Bias(%)
Precision(%)
Bias(%)
Precision(%)
6.5 9.5 1 -1.8 1 -0.5 4 -11.2 7
10.4 5.2 1 -3.6 1 -1.6 4 0.35 7
16.7 0.8 1 -2.1 1 1.2 4 -1.44 7
SE12-3
Target Type I Target Type II Target Type III Target Type IVTargetDiameter
(mm)Bias(%)
Precision(%)
Bias(%)
Precision(%)
Bias(%)
Precision(%)
Bias(%)
Precision(%)
6.5 26.7 1.9 -2.8 2.1 -13.7 1.4 -17.9 1.9
10.4 7.6 0.6 -6.1 1.8 -5.7 1.3 -0.9 0.8
16.7 1.6 0.6 -5.3 0.5 1.3 1.2 9.9 0.7
SEV12-3
Target Type I Target Type II Target Type III Target Type IVTargetDiameter
(mm)Bias(%)
Precision(%)
Bias(%)
Precision(%)
Bias(%)
Precision(%)
Bias(%)
Precision(%)
6.5 33.1 3 -0.4 2 -22.2 2 -21.4 3
10.4 14.7 3 -1.8 2 2 2 -14 4
16.7 3.3 3 -4.3 2 -5.2 2 -5.8 2
SC6-1
Target Type I Target Type II Target Type III Target Type IVTargetDiameter
(mm)Bias(%)
Precision(%)
Bias(%)
Precision(%)
Bias(%)
Precision(%)
Bias(%)
Precision(%)
6.5 43.4 0.6 2.1 1.6 -27.3 0.3 -39.6 1.3
10.4 21.9 2.4 -2.0 1.7 -14.2 1.2 -22.2 1.0
16.7 5.2 2.8 -7.0 2.2 -7.2 0.3 -11.0 3.4
�)!�����*����������� A��

XC6-1
Target Type I Target Type II Target Type III Target Type IVTargetDiameter
(mm)Bias(%)
Precision(%)
Bias(%)
Precision(%)
Bias(%)
Precision(%)
Bias(%)
Precision(%)
6.5 44 1 21 1 -28 1 -42 2
10.4 25 1 11 1 -23 1 -26 1
16.7 1 1 1 1 -10 1 -12 1
SMC12-3
Target Type I Target Type II Target Type III Target Type IVTargetDiameter
(mm)Bias(%)
Precision(%)
Bias(%)
Precision(%)
Bias(%)
Precision(%)
Bias(%)
Precision(%)
6.5 26.7 1.9 -2.8 2.1 -13.7 1.4 -17.9 1.9
10.4 7.6 0.6 -6.1 1.8 -5.7 1.3 -0.9 0.8
16.7 1.6 0.6 -5.3 0.5 1.3 1.2 9.9 0.7
.��8��&��1(��6�$#
The SW generated using SWE mode is broadband. The frequencybandwidth displayed on the screen corresponds to the minimal andmaximal frequencies of the SW pulse.
Note that the SW speed map may vary as a function of frequency of theSW.
A-�,7����7,7/+�
Transducer Mode TX/RXFrequencies
Depth (mm) Transverseresolution (mm)
SLV16-5 THI 20 1.3
3D transverse spatial resolution measurements for B-mode imaging forthe SLV16-5
A�� �)!�����*�����������
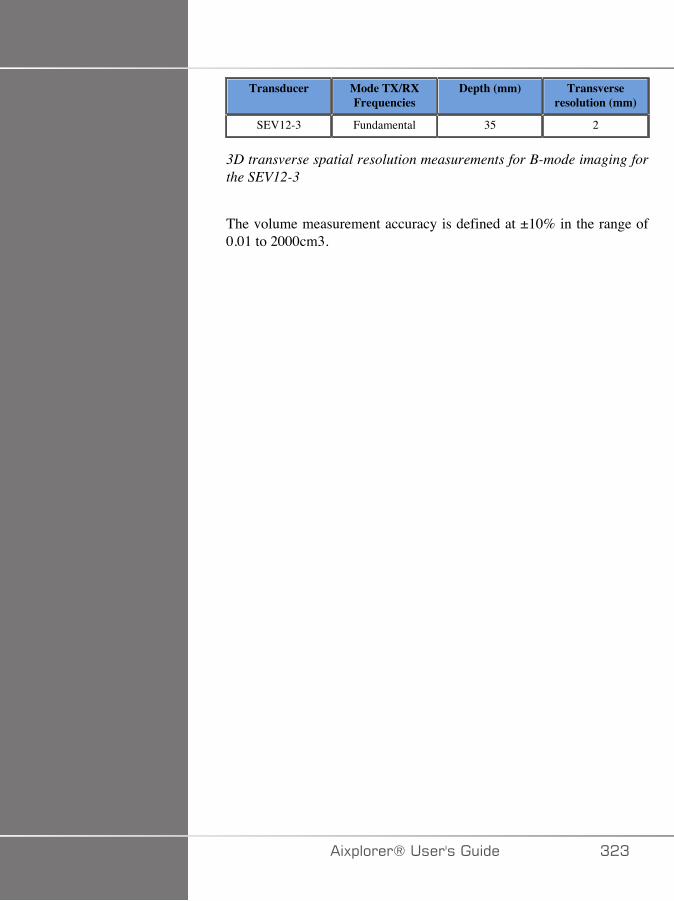
Transducer Mode TX/RXFrequencies
Depth (mm) Transverseresolution (mm)
SEV12-3 Fundamental 35 2
3D transverse spatial resolution measurements for B-mode imaging forthe SEV12-3
The volume measurement accuracy is defined at ±10% in the range of0.01 to 2000cm3.
�)!�����*����������� A�A

/��+ !#6� ���(��The Breast Imaging Reporting and Data System (BI-RADS®), developedby the American College of Radiology, provides a standardizedclassification for ultrasound studies of the breast.
It is composed of a series of descriptors, from which an assessment linkedto a category can be made by the physician.
/��+ !#6� ��������������%����
BI-RADS® score Assessment
0 Assessment incomplete: Need additional Imaging Evaluation
1 Negative
2 Benign finding
3 Probably benign finding
4 Suspicious Malignancy
4a Low suspicion for malignancy
4b Moderate suspicion for malignancy
4c High suspicion for malignancy
5 Highly suggestive of malignancy
6 Known biopsy-proven malignancy
The American College of Radiology BI-RADS® assessmentcategorization for ultrasound.
���*
All BI-RADS criteria are displayed in English on the system, regardlessof the selected language.
You can easily perform BI-RADS® classification using the integratedBI-RADS® Lexicon Classification form.
Up to twelve lesions may be classified in a single study.
A�� �)!�����*�����������

'�������%�/��+ !#6�4�5��������������
1. In any mode, freeze the image.2. Touch Add New Lesion.
A new lesion touch screen button will appear (e.g. Lesion A).3. Using the trackball, position the lesion arrow marker to indicate
the lesion of interest on the main display.4. Press Select to anchor the arrow marker.
The BI-RADS® menu will appear to the left of the image on the maindisplay.
5. Select the results in the BI-RADS® lexicon classification form usingthe pointer and Select button
6. Click on the NEXT button in the menu or the Lesion Pagecontrolon the touch screen to move to the next page of the BI-RADS® menu.
7. Press Save Image.8. Touch Exit to close the BI-RADS® menu.
�)!�����*����������� A��
��'�+� ������*
You must press Save Image after filling out the BI-RADS®classification form and exiting the menu or the data will not be saved.
The BI-RADS® menu can be accessed as many times as needed tocomplete the assessment for a particular lesion.
Measurements performed while in the BI-RADS® menu will be directlyassociated with the Lesion selected (e.g. Lesion A) in the final report.
Measurements performed in the BI-RADS® menu will appear on page 4.
!�������%�/��+ !#6�4�5���������������)� ����%��
A single image is not able to document all of the features contained inthe BI-RADS® lexicon classification form.
To assist in documentation of lesion features, the integrated BI-RADS®menu offer you the advantage of documenting one or more BI-RADS®features with an associated image.
1. Define a new lesion and activate the BI-RADS® menu.2. Using the pointer and Select button, results may be selected in the
BI-RADS® lexicon classification form.3. Press Save Image.
Note that the image number appears to the right of the selected answeron the BI-RADS® lexicon classification form.
4. You may exit BI-RADS® after each Save Image and return to thesame lesion to enter additional data associated with new images.
5. In the case that disparate results are entered for the same lesion,reconciliation of results can be done in the Report (see Chapter 6,Reports [331]).
A�C �)!�����*�����������
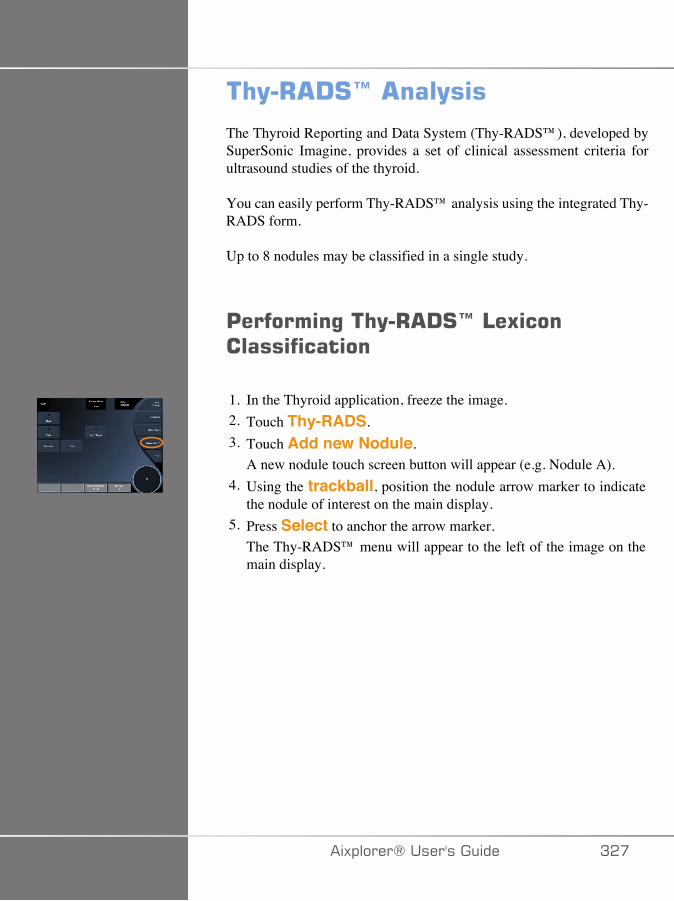
� (�+ !#I� ���(��
The Thyroid Reporting and Data System (Thy-RADS™), developed bySuperSonic Imagine, provides a set of clinical assessment criteria forultrasound studies of the thyroid.
You can easily perform Thy-RADS™ analysis using the integrated Thy-RADS form.
Up to 8 nodules may be classified in a single study.
'�������%�� (�+ !#I�4�5��������������
1. In the Thyroid application, freeze the image.2. Touch Thy-RADS.3. Touch Add new Nodule.
A new nodule touch screen button will appear (e.g. Nodule A).4. Using the trackball, position the nodule arrow marker to indicate
the nodule of interest on the main display.5. Press Select to anchor the arrow marker.
The Thy-RADS™ menu will appear to the left of the image on themain display.
�)!�����*����������� A��
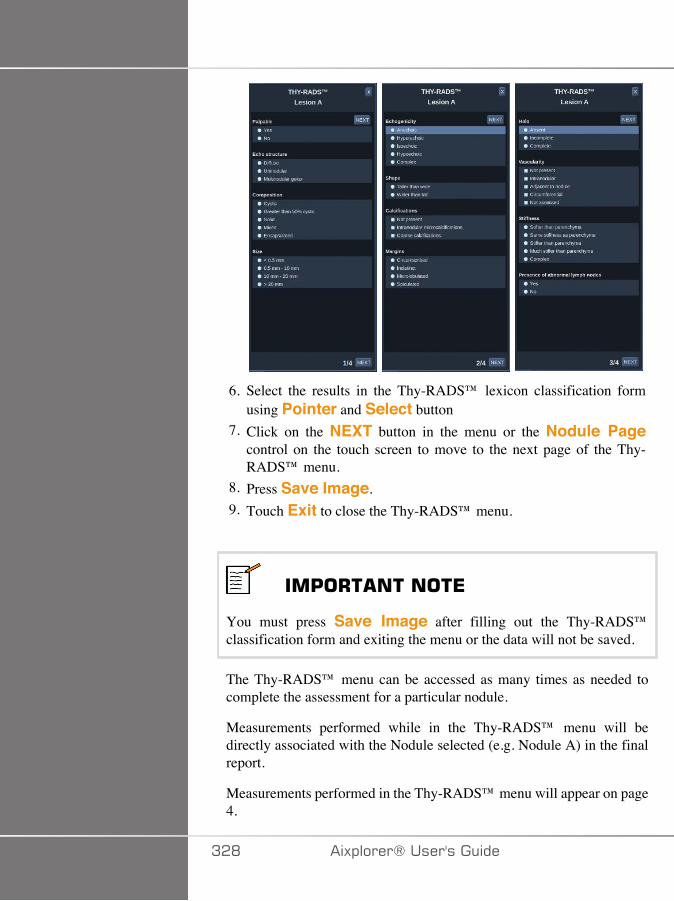
6. Select the results in the Thy-RADS™ lexicon classification formusing Pointer and Select button
7. Click on the NEXT button in the menu or the Nodule Pagecontrol on the touch screen to move to the next page of the Thy-RADS™ menu.
8. Press Save Image.9. Touch Exit to close the Thy-RADS™ menu.
��'�+� ������*
You must press Save Image after filling out the Thy-RADS™classification form and exiting the menu or the data will not be saved.
The Thy-RADS™ menu can be accessed as many times as needed tocomplete the assessment for a particular nodule.
Measurements performed while in the Thy-RADS™ menu will bedirectly associated with the Nodule selected (e.g. Nodule A) in the finalreport.
Measurements performed in the Thy-RADS™ menu will appear on page4.
A�D �)!�����*�����������
!�������%�� (�+ !#I�4�5���������������)� ����%��
A single image is not able to document all of the features contained inthe Thy-RADS™ lexicon classification form.
To assist in documentation of lesion features, the integrated Thy-RADS™ menu offer you the advantage of documenting one or more Thy-RADS™ features with an associated image.
1. Define a new nodule and activate the Thy-RADS™ menu.2. Using the Pointer and Select button, results may be selected in the
Thy-RADS™ lexicon classification form.3. Press Save Image.
Note that the image number appears to the right of the selected answeron the Thy-RADS™ lexicon classification form.
4. You may exit Thy-RADS™ after each Save Image and return tothe same nodule to enter additional data associated with new images.
5. In the case that disparate results are entered for the same lesion,reconciliation of results can be done in the Report (see Chapter 6,Reports [331]).
�)!�����*����������� A�E

AA� �)!�����*�����������

<�+�$����
�)!�����*����������� AA�

AA� �)!�����*�����������
!����$�������� ��+�$���=�����The Aixplorer® ultrasound system allows you to manage all theinformations collected during the study and generate a report.
The Report features is composed of two different views:
• the Report Builder, which allows you to create and customize the report• the Report Preview, which allows you to view the report as it will be
printed or generated as pdf file
Press Report to access the report feature.The Report Builder is displayed.
+�$����/����
!����$�������� ��+�$����/����The Report Builder allows you to choose which elements of theexamination are to be included in the final report.
The Report Builder is composed of five tabs:
• Patient Info, where you can retrieve/edit patient informations• Images, where the images acquired during the exam, associated
measurements, BI-RADS®/Thy-RADS™ and comments are stored• Measurements, where you can view all the labeled measurements
and calculations of the exam• Worksheet, where you can visualize the constitutive elements of
the final report, modify patient information and patient data entry, use
�)!�����*����������� AAA
diagram or anatomical data to locate or precise the performed labeledmeasurements
• Conclusion, where you can add your conclusion of the exam
'����������������The Patient Info tab displays the patient information, which is populatedwith the same information as the Patient Data screen.
As with the Patient Data screen, the Patient Information tab displaysgeneral information, as well as further information specific to eachclinical application.
You can edit all the information from the Patient Information tab.
You can enter information in more than one tab if multiple applicationshave been used.
If you press Patient to return to Patient Data entry, all your edits fromthe Report Builder will be saved and updated.
You can choose what information to show in the final report by using theShow/Hide Info icons:
•Selecting the Show Info icon will designate that informationto appear in the final report
•Selecting the Hide Info icon will designate that information tonot appear in the final report
Information which is hidden in the final report always remains part of thestudy as stored on the ultrasound system.
AA� �)!�����*�����������
���%��
The Images tab in the Report Builder displays all of the imagesacquired in the exam.
The images are organized into clinical application tabs.
Vertical tabs are dedicated to images associated with BI-RADS® andThy-RADS™ table.
You can choose which images to show in the final report by selectingthem.
Click on the icon above the image to have it included in or excluded fromthe report.
Images which are not shown in the final report always remain part of thestudy as stored on the ultrasound system.
Next to each image is a text box designated for comments.Select the white text box next to the image for which you want to addcomments.Enter comments using the Keyboard.
Measurements associated with each image are shown in the area to theright.
You can choose to show/hide the measurements in the final report byusing the Show/Hide Info icons:
• Selecting the Show Info icon will designate the measurements toappear in the final report
• Selecting the Hide Info icon will designate the measurements to notappear in the final report
If no measurements were performed on the set of selected images, theregion may appear empty.
�)!�����*����������� AA�

���*
For OB images on which labeled measurements were performed, clickon GRAPH to display the growth chart corresponding to the selectedreference table.
AAC �)!�����*�����������
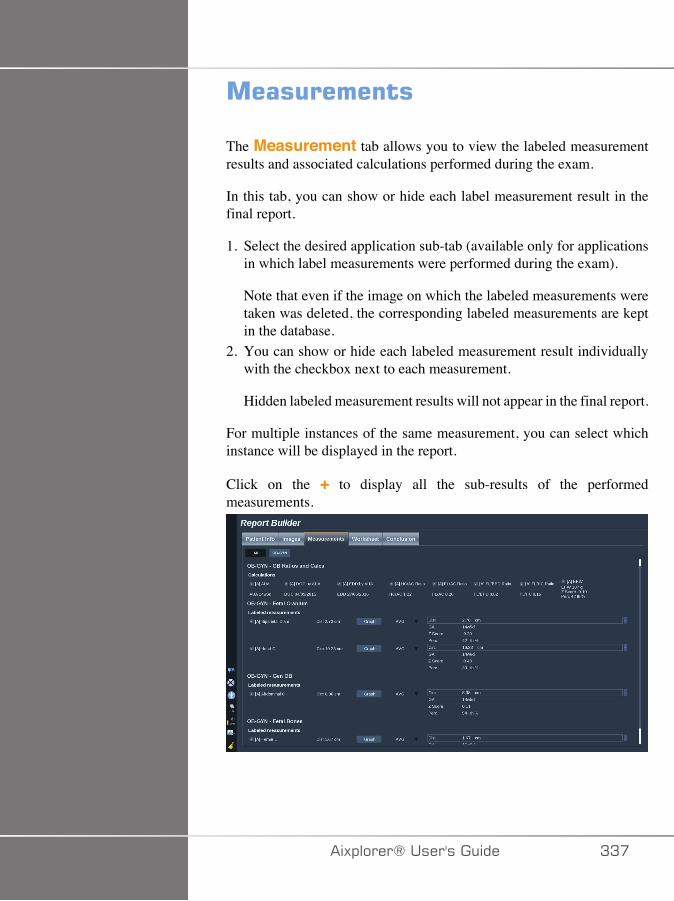
�����������
The Measurement tab allows you to view the labeled measurementresults and associated calculations performed during the exam.
In this tab, you can show or hide each label measurement result in thefinal report.
1. Select the desired application sub-tab (available only for applicationsin which label measurements were performed during the exam).
Note that even if the image on which the labeled measurements weretaken was deleted, the corresponding labeled measurements are keptin the database.
2. You can show or hide each labeled measurement result individuallywith the checkbox next to each measurement.
Hidden labeled measurement results will not appear in the final report.
For multiple instances of the same measurement, you can select whichinstance will be displayed in the report.
Click on the + to display all the sub-results of the performedmeasurements.
�)!�����*����������� AA�
���E� ���The Worksheet tab is divided in sub-tabs corresponding to theapplications and presets used to perform the exam.
For all applications, the Worksheet displays the informations containedin the Patient Data Entry and the Patient Information tab. It includesdiagrams and clinical informations for Breast, Genito Urinary andThyroid, and Area of pain for MSK. The measurements are also displayedand BI-RADS or THY-RADS if they have been performed.
For the Vascular and OB-GYN applications, the Worksheet tab displaysthe labeled measurements performed in an interactive report or onAnatomical Data.
�/��J�����E� ���
The OB-GYN Worksheet displays Exam information, Fetus conditioninformation and the labeled measurements performed in the OB-GYNapplication on an interactive report.
;1��7� 7/+�:7���/-�J�� ;�7�
OB Estimated Fetal Weight percentile and Growth Percentile dataare used to interpret and manage fetal growth. EFW percentile datais presented along with the calculated EFW as determined by usingdata from peer-reviewed publications and the gestational age. Growthpercentile data is presented along with fetal measurements as determinedby using data from peer-reviewed publications and the gestational age.The display of this data allows the clinician to assess fetal growth andmanage the pregnancy.
� �����
Be careful to confirm the patient name and ID before starting anexamination for a new patient.
AAD �)!�����*�����������
Check the date format before entering date of birth, Last Menstrual Period(LMP), Estimated Date of Delivery (EDD), Date Of Conception (DOC)and Ovulation Date. Incorrect entry of these parameters will result in anincorrect Gestational Age (GA).
Enter the EDD and GA in the patient's medical record for backup.
Check the "Activate OB calcs" button on the Patient Data Entry page(PDE) in order to perform obstetric calculations.
It is necessary to specify which OB author is to be used for each particularmeasurement to calculate the GA and get an Estimated Fetal Weight(EFW).
A diagnosis can not be only based on one measurement or data. Be carefulto always consider the overall clinical evaluation of the patient, includingthe medical record.
Depending on fetal position, some measurements may be incorrect. Becareful to always consider the overall clinical evaluation of the patient,including the medical record.
The system provides fetal measurements for up to five fetuses. Be carefulnot to confuse the fetuses during measurements.
For each measurement performed, you can select either the first,last, average, minimum, maximum or specifically one of the fivemeasurements that are allowed to be displayed, using the selector featurein the Measurements tab of the Report.
Be careful when deleting measurements, as this will affect the selectorresult.
Deviations from the normal values of measurements must be judgedbased on the graphs and literature.
1. Perform obstetrical labeled measurements2. The Measurements appear in the report together with the indication
of the percentile and Z-score (based on the selected reference table,author and date)
�)!�����*����������� AAE
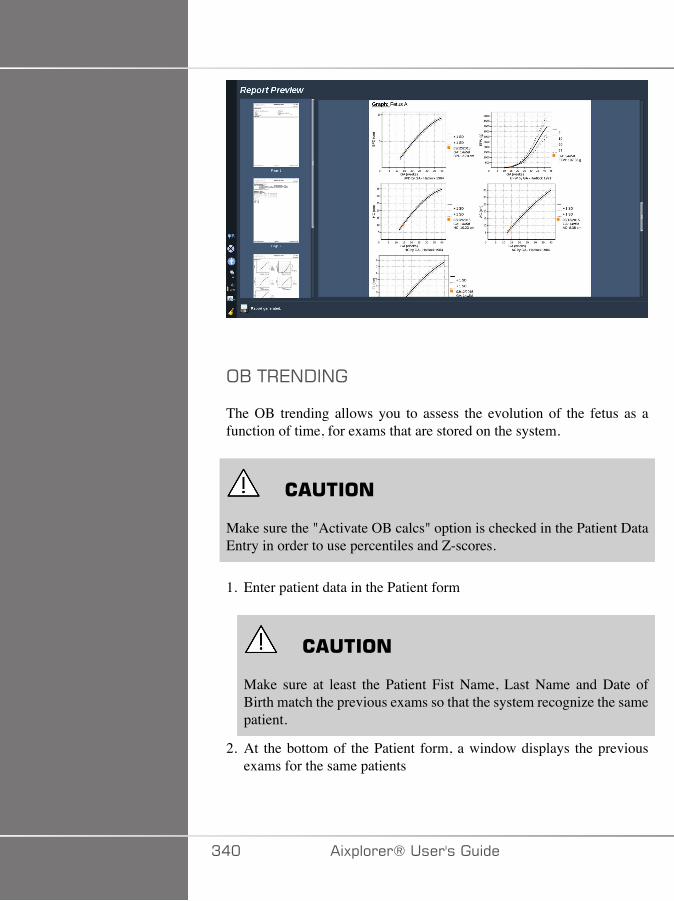
;1�+�7/-�/�
The OB trending allows you to assess the evolution of the fetus as afunction of time, for exams that are stored on the system.
� �����
Make sure the "Activate OB calcs" option is checked in the Patient DataEntry in order to use percentiles and Z-scores.
1. Enter patient data in the Patient form
� �����
Make sure at least the Patient Fist Name, Last Name and Date ofBirth match the previous exams so that the system recognize the samepatient.
2. At the bottom of the Patient form, a window displays the previousexams for the same patients
A�� �)!�����*�����������
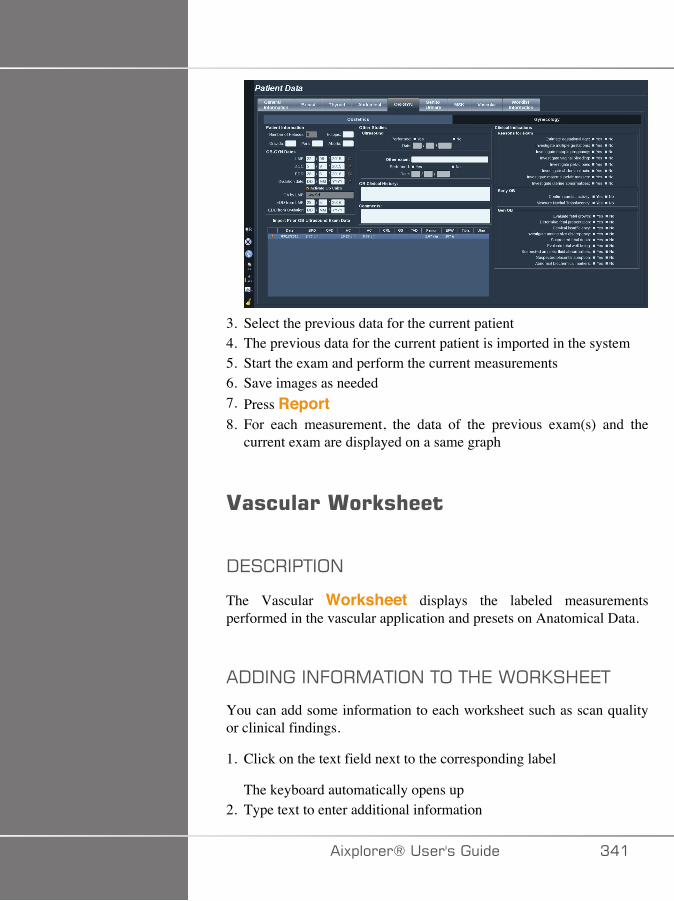
3. Select the previous data for the current patient4. The previous data for the current patient is imported in the system5. Start the exam and perform the current measurements6. Save images as needed7. Press Report8. For each measurement, the data of the previous exam(s) and the
current exam are displayed on a same graph
.����������E� ���
-7� ���+�;/
The Vascular Worksheet displays the labeled measurementsperformed in the vascular application and presets on Anatomical Data.
�--�/���/.;�,�+�;/�+;�+<7�>;�0�<77+
You can add some information to each worksheet such as scan qualityor clinical findings.
1. Click on the text field next to the corresponding label
The keyboard automatically opens up2. Type text to enter additional information
�)!�����*����������� A��
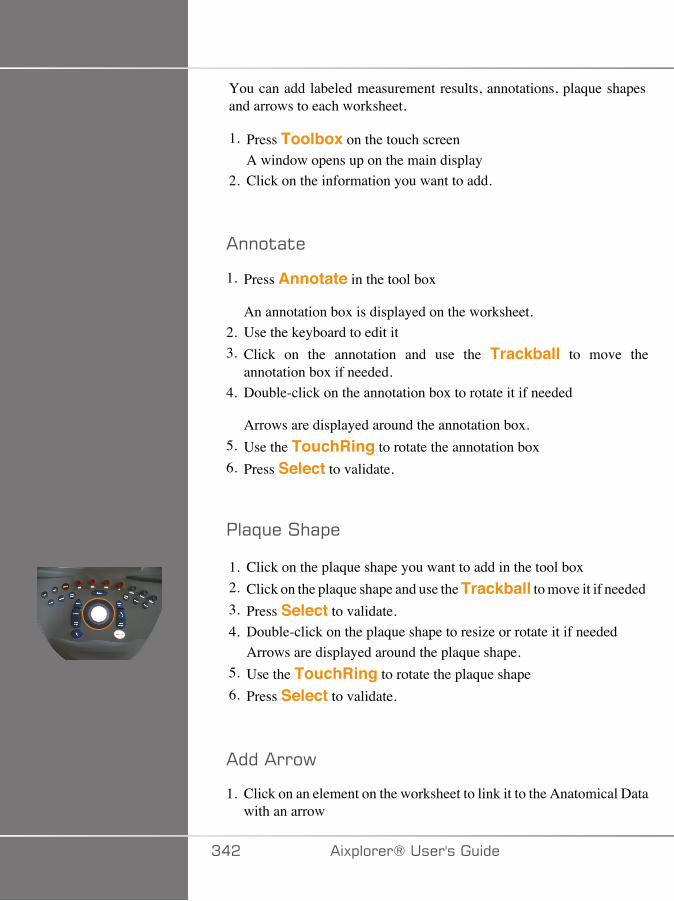
You can add labeled measurement results, annotations, plaque shapesand arrows to each worksheet.
1. Press Toolbox on the touch screenA window opens up on the main display
2. Click on the information you want to add.
����$($�
1. Press Annotate in the tool box
An annotation box is displayed on the worksheet.2. Use the keyboard to edit it3. Click on the annotation and use the Trackball to move the
annotation box if needed.4. Double-click on the annotation box to rotate it if needed
Arrows are displayed around the annotation box.5. Use the TouchRing to rotate the annotation box6. Press Select to validate.
��(8���#(!�
1. Click on the plaque shape you want to add in the tool box2. Click on the plaque shape and use the Trackball to move it if needed3. Press Select to validate.4. Double-click on the plaque shape to resize or rotate it if needed
Arrows are displayed around the plaque shape.5. Use the TouchRing to rotate the plaque shape6. Press Select to validate.
��������6
1. Click on an element on the worksheet to link it to the Anatomical Datawith an arrow
A�� �)!�����*�����������
2. Press Add arrow in the tool box3. Click on the added arrow4. Use the Trackball to move the tip of the arrow to the selected
location on the Anatomical Data5. Press Select to validate.
�7,;2�/���/.;�,�+�;/�.�;,�+<7>;�0�<77+
1. Click on the element you want to remove2. Press Toolbox on the touch screen3. Click on Remove on the tool box.
�--�+�;/�:��/.;�,�+�;/���7 �.� �+;�+<7 ��;+�-�>;�0�<77+
The Carotid worksheet provides the SRU1 and NASCET2 criteria at thebottom of the worksheet.
Click on the elements that apply to the findings to add them to theworksheet.
4"������E� ���
The Liver Worksheet provides you with a summary table of all Q-Box Liver labeled measurements performed on the liver, with detailedinformation for each Q-Box measurement.
1Society of Radiologists in Ultrasound2North American Symptomatic Carotid Endarterectomy Trial
�)!�����*����������� A�A
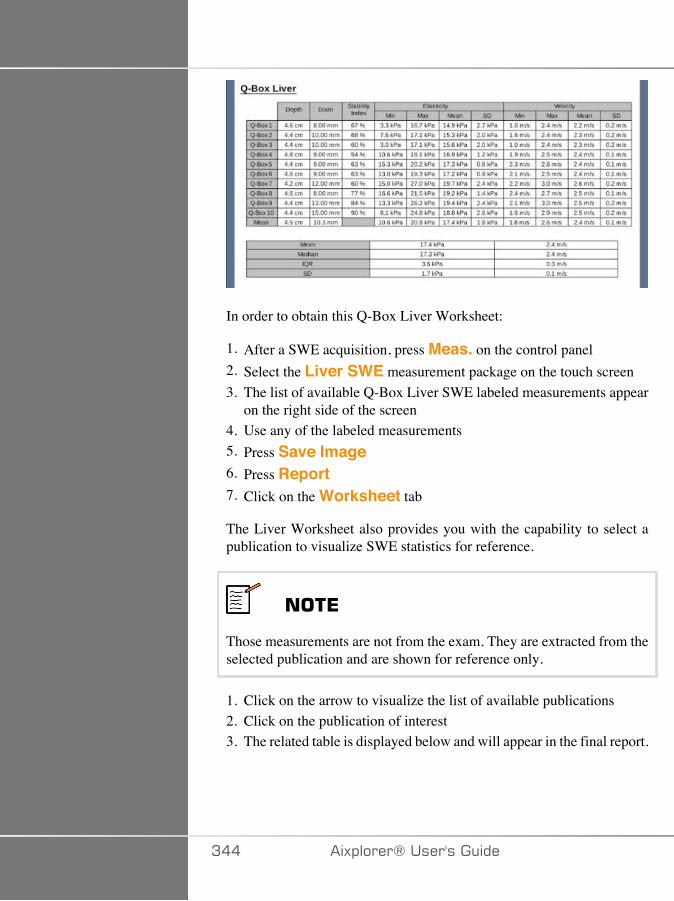
In order to obtain this Q-Box Liver Worksheet:
1. After a SWE acquisition, press Meas. on the control panel2. Select the Liver SWE measurement package on the touch screen3. The list of available Q-Box Liver SWE labeled measurements appear
on the right side of the screen4. Use any of the labeled measurements5. Press Save Image6. Press Report7. Click on the Worksheet tab
The Liver Worksheet also provides you with the capability to select apublication to visualize SWE statistics for reference.
���*
Those measurements are not from the exam. They are extracted from theselected publication and are shown for reference only.
1. Click on the arrow to visualize the list of available publications2. Click on the publication of interest3. The related table is displayed below and will appear in the final report.
A�� �)!�����*�����������
��������The Conclusion tab in the Report Builder is a free-form text entryscreen.
Enter any final information or conclusions about the exam here.
You can choose to show the conclusion in the final report by using theShow/Hide Info icons:
• Selecting the Show Info icon will designate that conclusion toappear in the final report
• Selecting the Hide Info icon will designate that conclusion to notappear in the final report
�)!�����*����������� A��
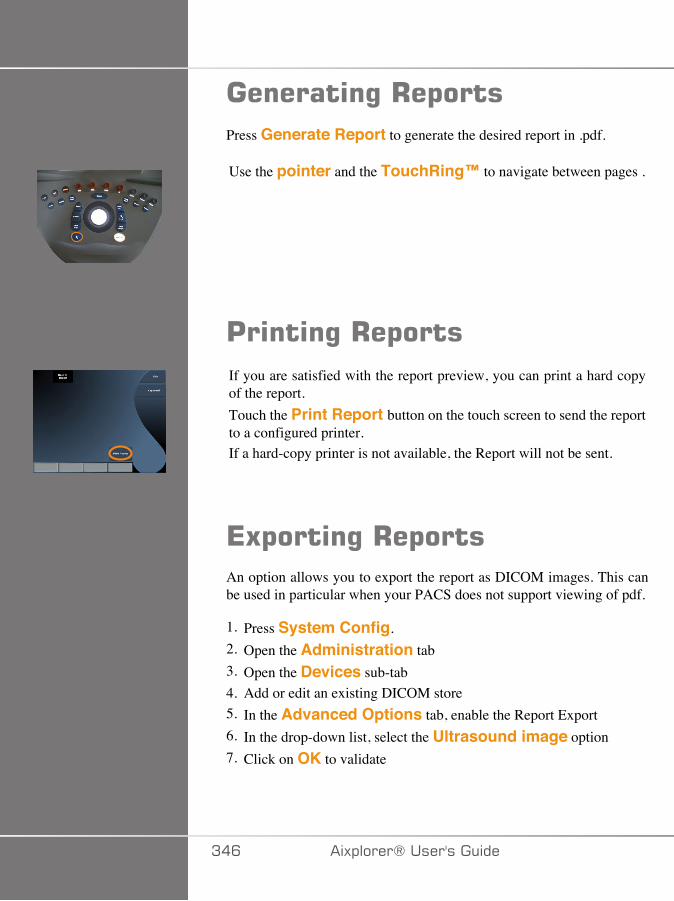
��������%�+�$����Press Generate Report to generate the desired report in .pdf.
Use the pointer and the TouchRing™ to navigate between pages .
'����%�+�$����If you are satisfied with the report preview, you can print a hard copyof the report.Touch the Print Report button on the touch screen to send the reportto a configured printer.If a hard-copy printer is not available, the Report will not be sent.
*5$����%�+�$����An option allows you to export the report as DICOM images. This canbe used in particular when your PACS does not support viewing of pdf.
1. Press System Config.2. Open the Administration tab3. Open the Devices sub-tab4. Add or edit an existing DICOM store5. In the Advanced Options tab, enable the Report Export6. In the drop-down list, select the Ultrasound image option7. Click on OK to validate
A�C �)!�����*�����������

>����%������!�������%�����
�)!�����*����������� A��

A�D �)!�����*�����������
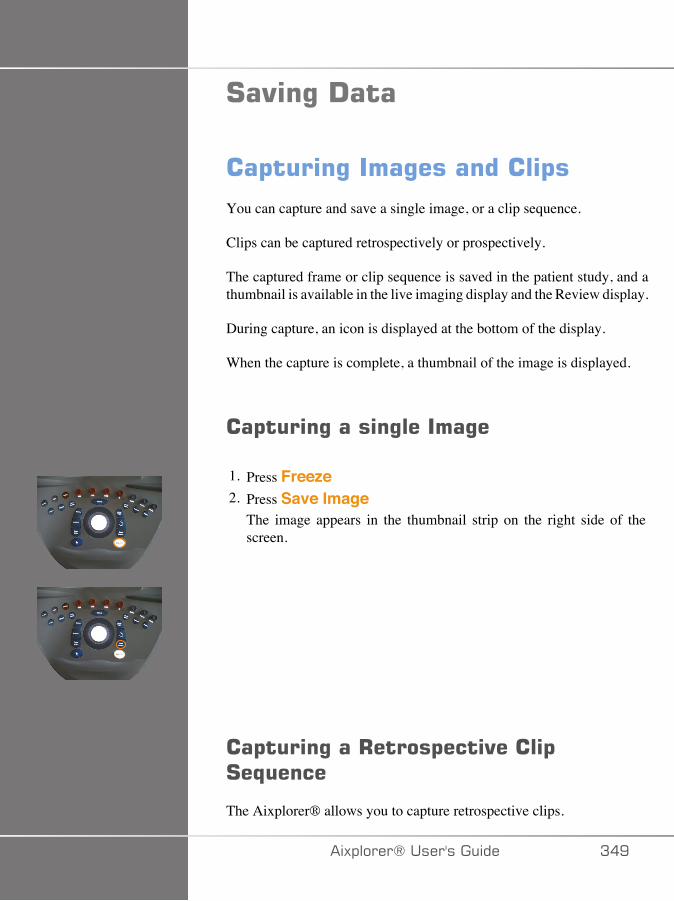
#�"�%�!���
��$���%����%���������$�You can capture and save a single image, or a clip sequence.
Clips can be captured retrospectively or prospectively.
The captured frame or clip sequence is saved in the patient study, and athumbnail is available in the live imaging display and the Review display.
During capture, an icon is displayed at the bottom of the display.
When the capture is complete, a thumbnail of the image is displayed.
��$���%�����%������%�
1. Press Freeze2. Press Save Image
The image appears in the thumbnail strip on the right side of thescreen.
��$���%���+�����$���"����$#�,����
The Aixplorer® allows you to capture retrospective clips.
�)!�����*����������� A�E
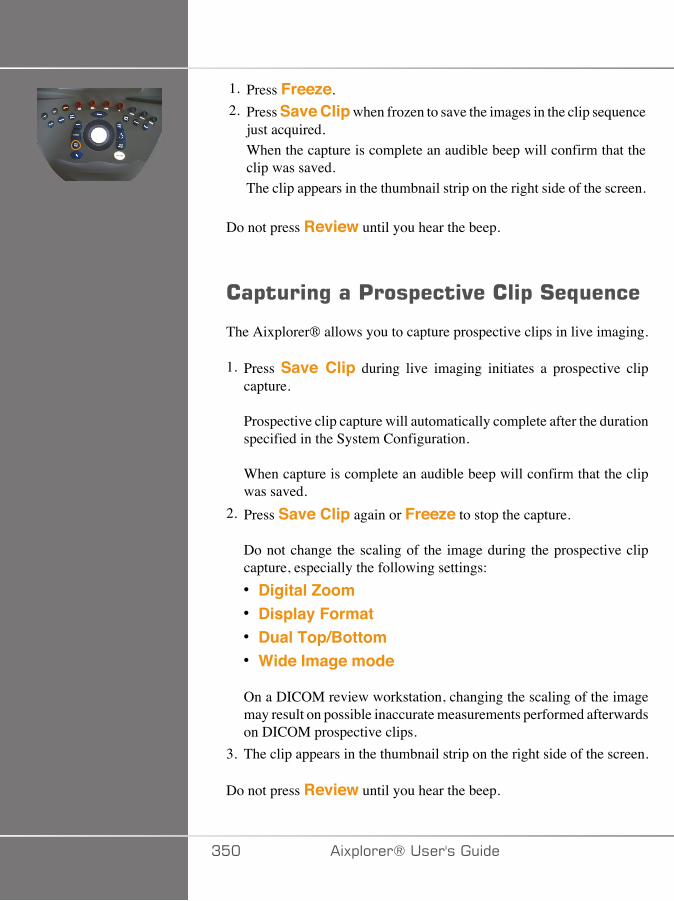
1. Press Freeze.2. Press Save Clip when frozen to save the images in the clip sequence
just acquired.When the capture is complete an audible beep will confirm that theclip was saved.The clip appears in the thumbnail strip on the right side of the screen.
Do not press Review until you hear the beep.
��$���%���'���$���"����$�#�,����
The Aixplorer® allows you to capture prospective clips in live imaging.
1. Press Save Clip during live imaging initiates a prospective clipcapture.
Prospective clip capture will automatically complete after the durationspecified in the System Configuration.
When capture is complete an audible beep will confirm that the clipwas saved.
2. Press Save Clip again or Freeze to stop the capture.
Do not change the scaling of the image during the prospective clipcapture, especially the following settings:• Digital Zoom• Display Format• Dual Top/Bottom• Wide Image mode
On a DICOM review workstation, changing the scaling of the imagemay result on possible inaccurate measurements performed afterwardson DICOM prospective clips.
3. The clip appears in the thumbnail strip on the right side of the screen.
Do not press Review until you hear the beep.
A�� �)!�����*�����������

���*
Pressing Save Image while acquiring a prospective clip does not stopthe prospective clip acquisition.
#����%�$�� �������������$���$���"����$���$���
See Chapter 8, Customizing the System [377].
To set up the duration of a prospective clip capture:
Choose the desired duration of prospective clip captures from theavailable options:
2 sec, 5 sec, 10 sec, 15 sec, 30 sec, 1, 2, 3, 4, 5 min
�����%���$�
Trim allows you to discard frames from the start or end of a prospectiveor retrospective clip.
1. Press Trim on the touch screen.
The trackball is arbitrated to Trim End.2. Move the Trackball towards the beginning of the clip to discard the
required frames from the end of the clip
The trackball is arbitrated to Trim Start3. Move the Trackball towards the end of the clip to discard the
required frames from the start of the clip4. Turn Trim off to cut the trimmed frames out.5. Press Save Clip to save a new clip without the trimmed out frames.
If needed, press Trim Reset to return the Trim Start and Trim Endframes to the start and end of the acquisition, respectively.
�)!�����*����������� A��
+�"�)�%����*5��
During or after an exam, use Review to examine and compare imagesacquired in the exam. Multiple exams for one patient may be reviewed.In Review, you can look at the images or clip sequences that have beenstored.
Stored images can be viewed, sent, printed, searched and backed up.
Image analysis can also be performed in Review.
Images that are stored on the ultrasound system hard-drive can be sent toa DVD, USB media, or on DICOM-compatible devices on a network.
����������������������+�"�)
In Review mode, a variety of tasks may be completed, includingperforming measurements and playing clip sequences.
,7����7,7/+���/��72�7>
In Review mode, measurements on images in the current exam can beperformed.
An image must first be displayed in full size.
Measurements made in Review on the current exam can be saved in thereport.
Measurements made in Review on prior exams cannot be saved.
To display the measurement controls on the Review Exam touch screen,press Meas. Clear all measurements from an image by touching Eraseall on the Review Exam touch screen.
A�� �)!�����*�����������
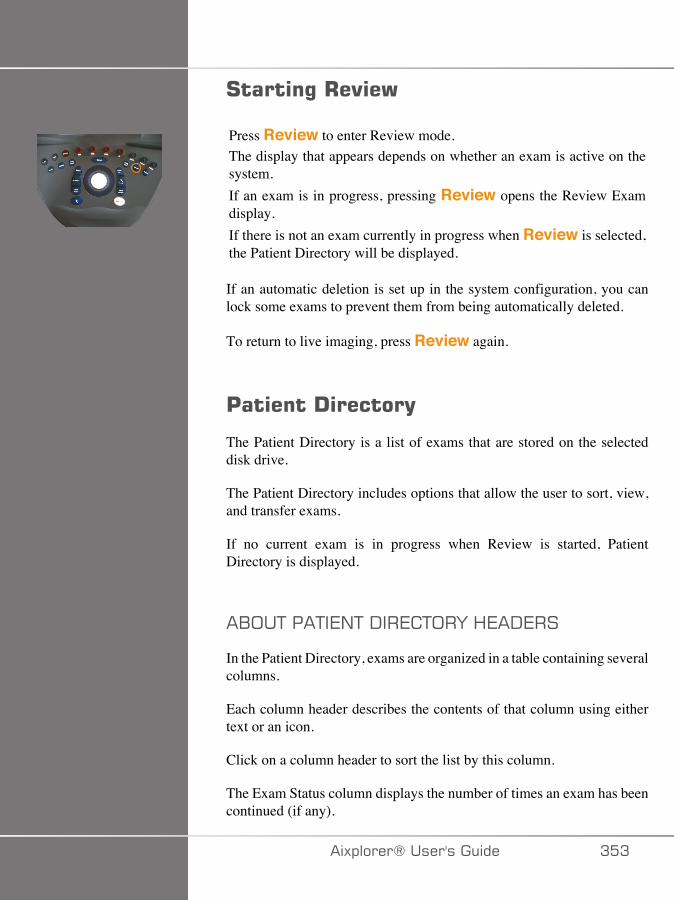
#�����%�+�"�)
Press Review to enter Review mode.The display that appears depends on whether an exam is active on thesystem.If an exam is in progress, pressing Review opens the Review Examdisplay.If there is not an exam currently in progress when Review is selected,the Patient Directory will be displayed.
If an automatic deletion is set up in the system configuration, you canlock some exams to prevent them from being automatically deleted.
To return to live imaging, press Review again.
'������!������(
The Patient Directory is a list of exams that are stored on the selecteddisk drive.
The Patient Directory includes options that allow the user to sort, view,and transfer exams.
If no current exam is in progress when Review is started, PatientDirectory is displayed.
�1;�+���+�7/+�-��7 +;�F�<7�-7��
In the Patient Directory, exams are organized in a table containing severalcolumns.
Each column header describes the contents of that column using eithertext or an icon.
Click on a column header to sort the list by this column.
The Exam Status column displays the number of times an exam has beencontinued (if any).
�)!�����*����������� A�A
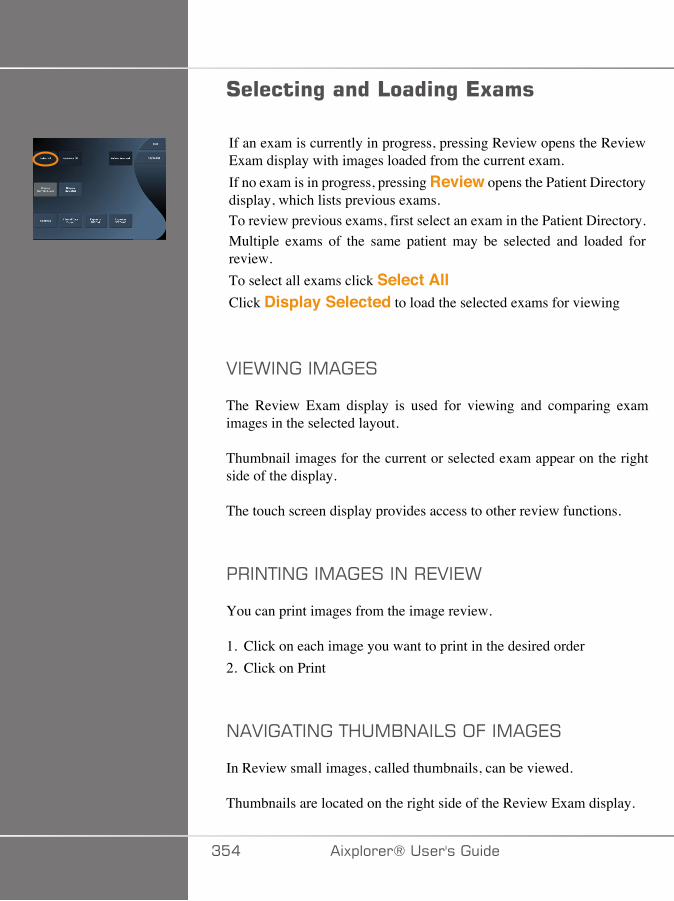
#������%�����4����%�*5���
If an exam is currently in progress, pressing Review opens the ReviewExam display with images loaded from the current exam.If no exam is in progress, pressing Review opens the Patient Directorydisplay, which lists previous exams.To review previous exams, first select an exam in the Patient Directory.Multiple exams of the same patient may be selected and loaded forreview.To select all exams click Select AllClick Display Selected to load the selected exams for viewing
2�7>�/���,��7�
The Review Exam display is used for viewing and comparing examimages in the selected layout.
Thumbnail images for the current or selected exam appear on the rightside of the display.
The touch screen display provides access to other review functions.
���/+�/���,��7���/��72�7>
You can print images from the image review.
1. Click on each image you want to print in the desired order2. Click on Print
/�2���+�/��+<�,1/��:��;.��,��7�
In Review small images, called thumbnails, can be viewed.
Thumbnails are located on the right side of the Review Exam display.
A�� �)!�����*�����������
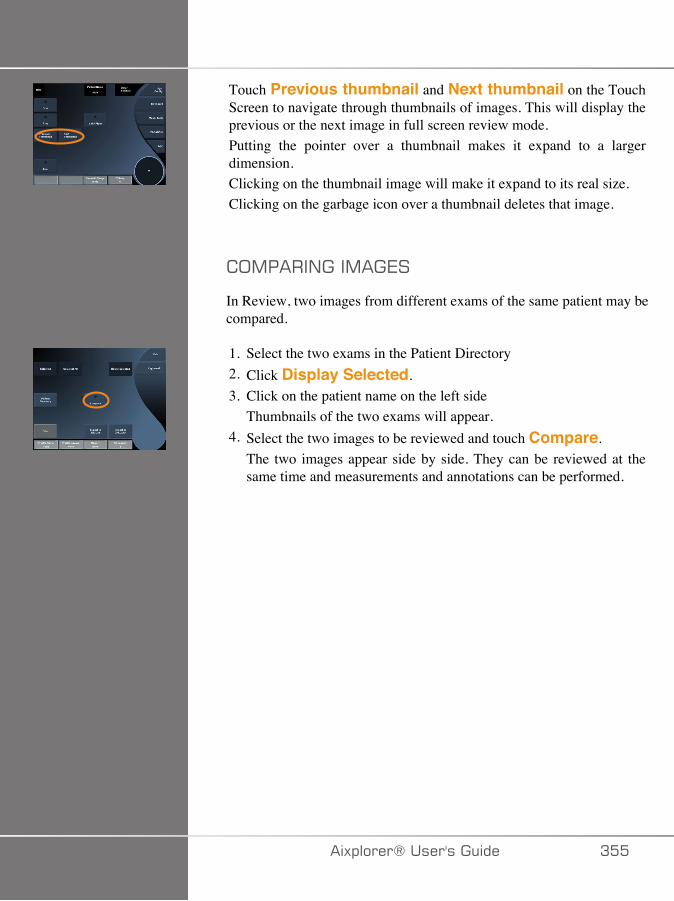
Touch Previous thumbnail and Next thumbnail on the TouchScreen to navigate through thumbnails of images. This will display theprevious or the next image in full screen review mode.Putting the pointer over a thumbnail makes it expand to a largerdimension.Clicking on the thumbnail image will make it expand to its real size.Clicking on the garbage icon over a thumbnail deletes that image.
;,����/���,��7�
In Review, two images from different exams of the same patient may becompared.
1. Select the two exams in the Patient Directory2. Click Display Selected.3. Click on the patient name on the left side
Thumbnails of the two exams will appear.4. Select the two images to be reviewed and touch Compare.
The two images appear side by side. They can be reviewed at thesame time and measurements and annotations can be performed.
�)!�����*����������� A��
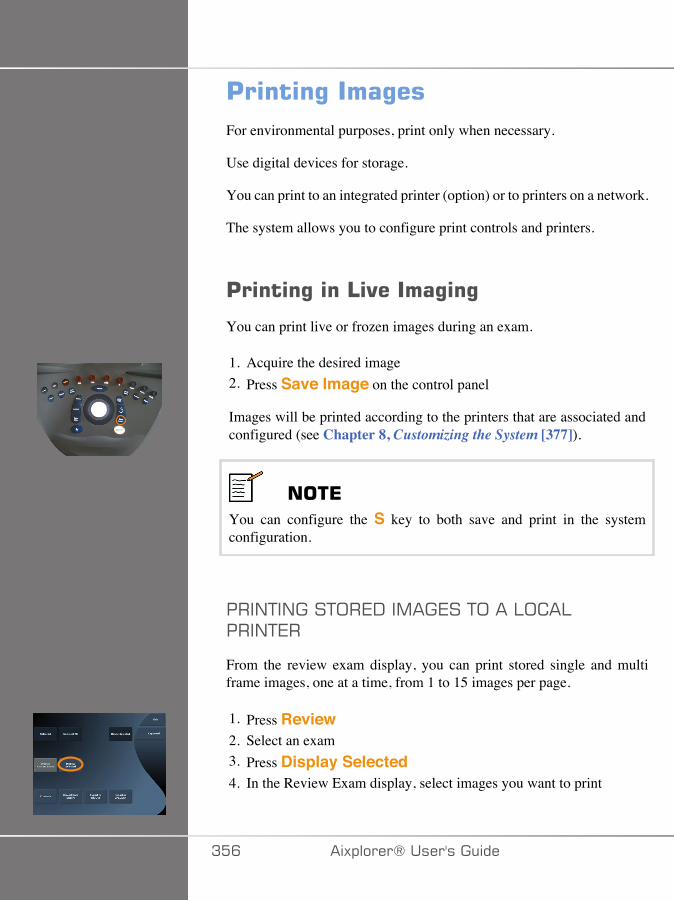
'����%����%��For environmental purposes, print only when necessary.
Use digital devices for storage.
You can print to an integrated printer (option) or to printers on a network.
The system allows you to configure print controls and printers.
'����%���4"�����%�%
You can print live or frozen images during an exam.
1. Acquire the desired image2. Press Save Image on the control panel
Images will be printed according to the printers that are associated andconfigured (see Chapter 8, Customizing the System [377]).
���*You can configure the S key to both save and print in the systemconfiguration.
���/+�/���+;�7-��,��7��+;���:; �:���/+7�
From the review exam display, you can print stored single and multiframe images, one at a time, from 1 to 15 images per page.
1. Press Review2. Select an exam3. Press Display Selected4. In the Review Exam display, select images you want to print
A�C �)!�����*�����������
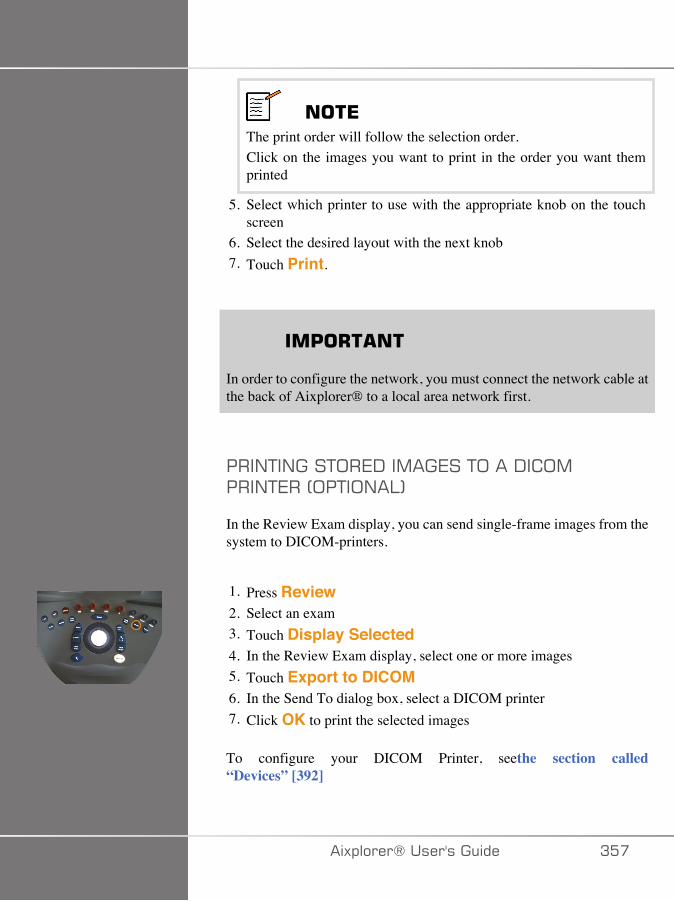
���*The print order will follow the selection order.Click on the images you want to print in the order you want themprinted
5. Select which printer to use with the appropriate knob on the touchscreen
6. Select the desired layout with the next knob7. Touch Print.
��'�+� ��
In order to configure the network, you must connect the network cable atthe back of Aixplorer® to a local area network first.
���/+�/���+;�7-��,��7��+;���-� ;,���/+7��4;�+�;/�:5
In the Review Exam display, you can send single-frame images from thesystem to DICOM-printers.
1. Press Review2. Select an exam3. Touch Display Selected4. In the Review Exam display, select one or more images5. Touch Export to DICOM6. In the Send To dialog box, select a DICOM printer7. Click OK to print the selected images
To configure your DICOM Printer, seethe section called“Devices” [392]
�)!�����*����������� A��

'����%���%�������"�)
You can print images from the image review.
1. Click on each image you want to print in the desired order2. Click on Print
A�D �)!�����*�����������
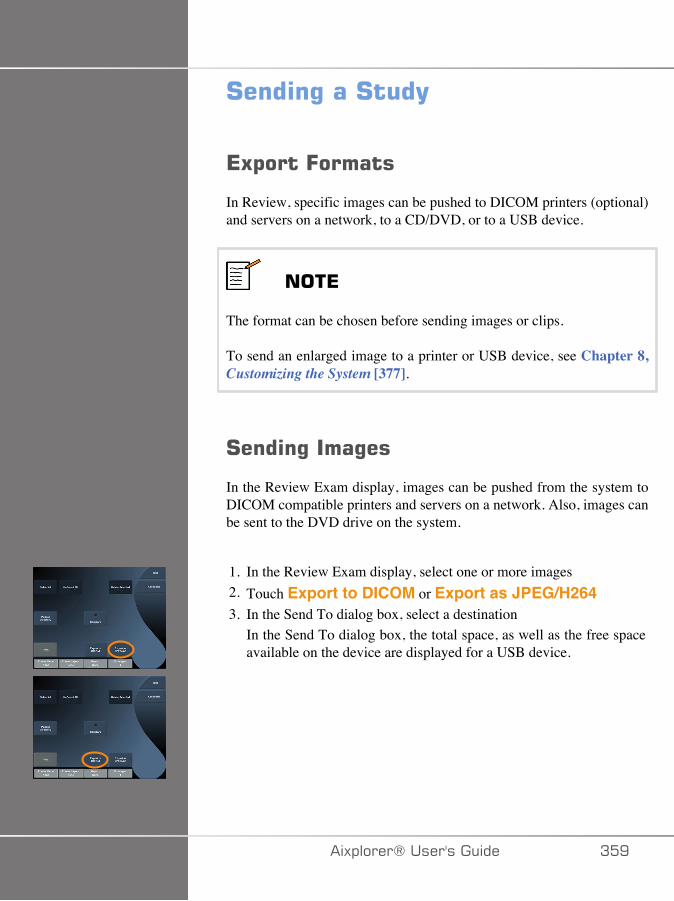
#����%���#��(
*5$����=������
In Review, specific images can be pushed to DICOM printers (optional)and servers on a network, to a CD/DVD, or to a USB device.
���*
The format can be chosen before sending images or clips.
To send an enlarged image to a printer or USB device, see Chapter 8,Customizing the System [377].
#����%����%��
In the Review Exam display, images can be pushed from the system toDICOM compatible printers and servers on a network. Also, images canbe sent to the DVD drive on the system.
1. In the Review Exam display, select one or more images2. Touch Export to DICOM or Export as JPEG/H2643. In the Send To dialog box, select a destination
In the Send To dialog box, the total space, as well as the free spaceavailable on the device are displayed for a USB device.
�)!�����*����������� A�E
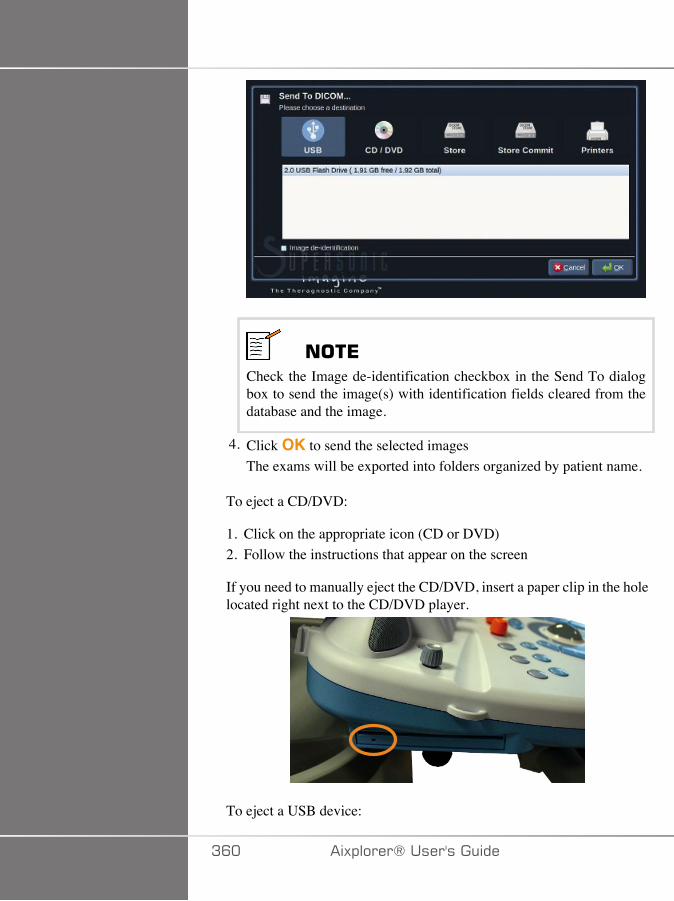
���*Check the Image de-identification checkbox in the Send To dialogbox to send the image(s) with identification fields cleared from thedatabase and the image.
4. Click OK to send the selected imagesThe exams will be exported into folders organized by patient name.
To eject a CD/DVD:
1. Click on the appropriate icon (CD or DVD)2. Follow the instructions that appear on the screen
If you need to manually eject the CD/DVD, insert a paper clip in the holelocated right next to the CD/DVD player.
To eject a USB device:
AC� �)!�����*�����������

1.Wait until the symbol (exporting data to USB) is replaced by in the notification icons area
2. Remove the USB device
� +����
Ensure that both the user and the patient do not place hands or any otherbody parts on or in the USB port
At anytime, you can check the export status, by clicking on theappropriate notification icon on the left side of the screen.
For information on icons, refer to the section called “NotificationIcons” [167].
�)!�����*����������� AC�
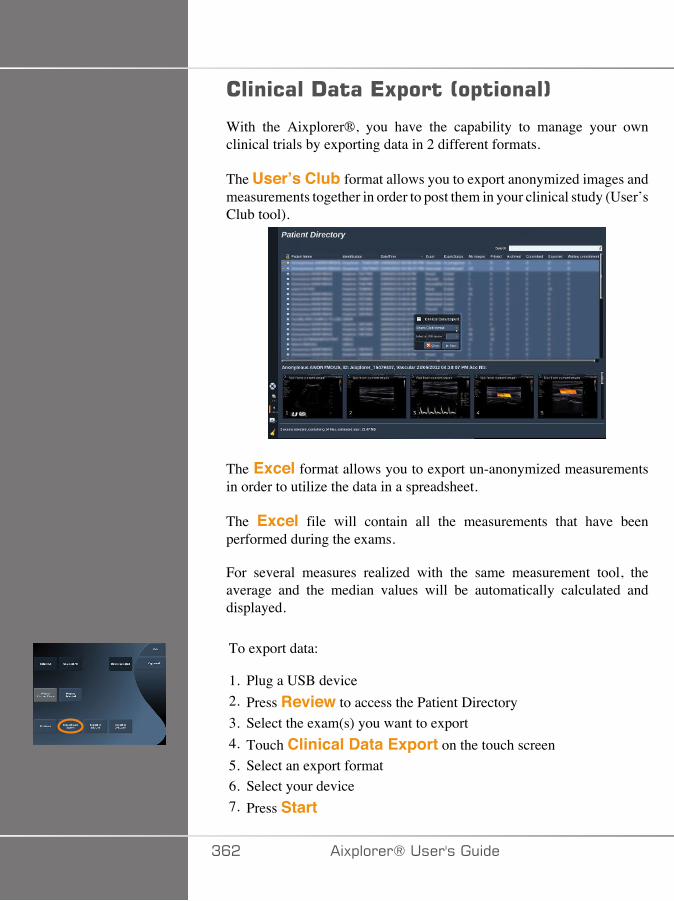
�������!����*5$����0�$�����1
With the Aixplorer®, you have the capability to manage your ownclinical trials by exporting data in 2 different formats.
The User’s Club format allows you to export anonymized images andmeasurements together in order to post them in your clinical study (User’sClub tool).
The Excel format allows you to export un-anonymized measurementsin order to utilize the data in a spreadsheet.
The Excel file will contain all the measurements that have beenperformed during the exams.
For several measures realized with the same measurement tool, theaverage and the median values will be automatically calculated anddisplayed.
To export data:
1. Plug a USB device2. Press Review to access the Patient Directory3. Select the exam(s) you want to export4. Touch Clinical Data Export on the touch screen5. Select an export format6. Select your device7. Press Start
AC� �)!�����*�����������

The systems exports your data in the selected format on your USB device.
For more information on the User’s Club: www.aixplorerclub.com[http://www.aixplorerclub.com]
�)!�����*����������� ACA
!�����#��������+�$����%�0!����#+1
The DICOM Structured Report is a document architecture designed forencoding and exchanging clinical information and findings in the contextof Radiology imaging.The DICOM SR is supported for OB-GYN andVascular clinical applications on the Aixplorer®.
For the OB-GYN application it uses the NEMA’s Template ID 5000 OB-GYN Ultrasound Procedure Report.
For the Vascular application it uses the NEMA's Template ID 5100Vascular Ultrasound Procedure Report.
One image/clip acquired within the OB-GYN or Vascular clinicalapplication will trigger the creation of a DICOM SR report.
By default, the Aixplorer® will not generate DICOM structured Reportsat the end of the exam.
;/.�����+�;/
-� ;,��$�&$������!��$�4��5��!$��
In order to activate the DICOM SR feature:
1. Press System Config.2. Open the Device Settings tab3. Open the System DICOM options sub-tab4. Check the Generate Structured Reports checkbox
-� ;,��$���
1. In the System Configuration, click on the Devices sub-tab of theAdministration tab
2. Click on Edit Selected3. Click on the Advanced options of your DICOM store device
AC� �)!�����*�����������

4. Select the Enable Export of SR checkbox of your choice
-� ;,���'���(%���'��(
1. In the System Configuration, click on the Devices sub-tab of theAdministration tab
2. Click on the DICOM Removeable media3. Click on Edit Selected4. Select the Enable Export of SR checkbox of your choice
�7/-�/��,7+<;-�
�$�'($&������� �-� ;,������!��$�
When the export of SR is enabled for one or several DICOM Storedevices, a DICOM SR file will be sent automatically at the end of theexam to this/these configured DICOM Store devices.
�����;��-�'(���� �-� ;,������!��$�
During a live examination, and if the export of SR is enabled for oneor several DICOM Store devices, you may send on demand updatedversions of the DICOM SR report to this/these configured DICOM Storedevices.
1. Press Review or Report on the control panel2. Press Send SR on the touch screen
,(�(�������� �-� ;,������!��$�
1. When an exam is ended, click on Review2. Select the exam for which you want to send the SR, and press
Display Selected3. In the Review Image List, click on the DICOM SR icon
�)!�����*����������� AC�
4. Press Export to DICOM on the touch screen5. Select the device and click on OK
���*
You can configure all your DICOM exportation settings. See the sectioncalled “Devices” [392]
ACC �)!�����*�����������
!�����%��5����������%��The Patient Directory allows you to delete exams from the system.
If an exam is accidentally deleted, and the exam has been archived to aDVD, the archived exam can be re-loaded.
In the Review Exam display, stored images from an exam can be deleted.
This is only possible, however, when Send Images/Clips in Print/Network setups is set to At End of Exam.
When an image is deleted, it remains temporarily in the Review Examdisplay with an X marked through it.
������������������������%��1. Select the images to be deleted2. Touch Delete Selected on the touch screen3. Click on Delete in the confirmation box
�����������5���1. In the Patient Directory, select one or more exams. To select all exams,
touch Select All2. Click Delete Selected3. Click on Delete in the confirmation box
�)!�����*����������� AC�
���%��?��(�����+����"�Prior to, or during an exam, a query may be performed to find patientexams located on a remote workstation, external USB media, or CD/DVD.
Qualified images can be extracted from these exams and retrieved by theAixplorer®.
Once retrieved, the images can be browsed, and an appropriate image canbe selected for Review.
A retrieved image may also be displayed in a side-by-side manner nextto a live image in the current exam.
Important: The Query and Retrieve feature requires the Aixplorer®system is connected to a network hosting a DICOM compliant imagearchive workstation.
������������������������?��(�+����"�If there is no current exam, a query may be performed for any number ofstudies from the workstation.
These studies can be retrieved by the Aixplorer® in preparation forupcoming new exams.
If there is a current exam in progress, the query will attempt to find priorexams of the current patient (if the automatic Q/R was configured).
Valid types to be retrieved are as follows:
• DICOM Ultrasound images• DICOM Ultrasound images extracted from ultrasound clips• DICOM images from a variety of modalities: Computed Radiography
(CR), Computed Tomography (CT), Magnetic Resonance (MR),Nuclear Medicine (NM), Secondary Capture (SC), X-RayAngiographic (XA), Radio Fluoroscopy (RF), Mammography (MG)
ACD �)!�����*�����������
Please consult your workstation user's manual, the workstation DICOMconformance statement or your workstation/PACS administrator forassistance with secondary captures.
Any retrieved exam can be displayed along with a live image in a currentexam.
However, if there are mismatches in patient identification characteristicsbetween the current exam and the retrieved exam, a warning will bedisplayed.
=�+���+*���=�+� ��������!����
For more information on DICOM, have a look at our DICOMConformance Statement and IHE Statement on our website:
http://www.supersonicimagine.com/dicom
http://www.supersonicimagine.com/ihe
Refer to the section called “Notification Icons” [167] for Query-Retrieve notification icon.
� +����
Displaying a patient with a different patient identification to that in thecurrent exam must be done with caution.
This feature is provided in the event of a patient name change, or hospitalID change.
The operator assumes all risk when performing query retrieve operationson Aixplorer®.
Retrieved images can be very helpful when used for referencecomparison to the same feature of interest in the live ultrasound image.
Use caution when reviewing retrieved images on Aixplorer®, as theymay be compressed or displayed at a lower level of image quality thanobserved on the PACS workstation.
�)!�����*����������� ACE
Images retrieved and displayed on the Aixplorer® are not intended to beused for sole diagnosis.
���*
You may also push studies from your PACS workstation to yourAixplorer® system.
A�� �)!�����*�����������
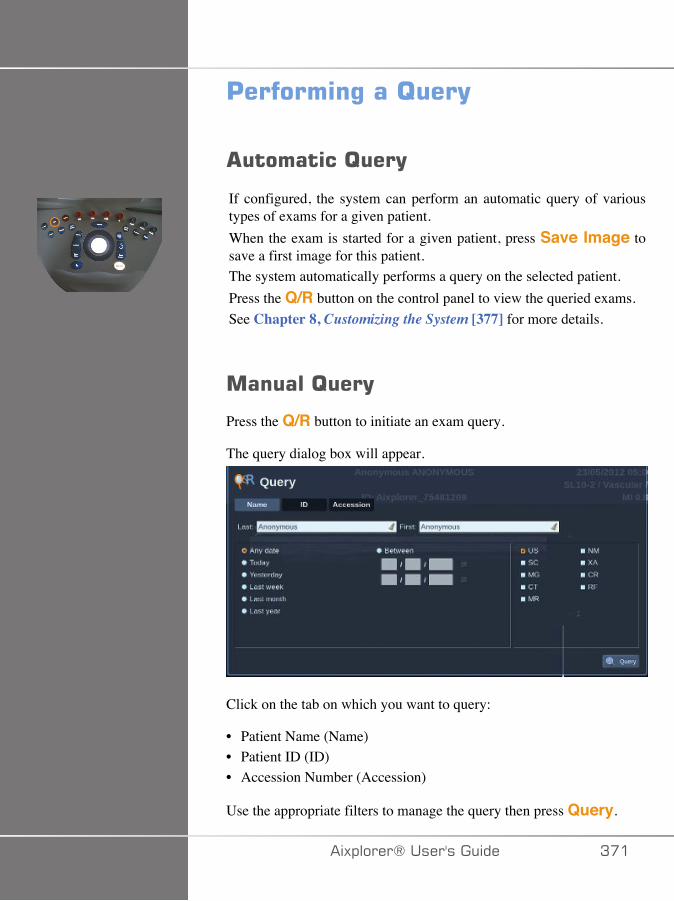
'�������%���?��(
�������?��(
If configured, the system can perform an automatic query of varioustypes of exams for a given patient.When the exam is started for a given patient, press Save Image tosave a first image for this patient.The system automatically performs a query on the selected patient.Press the Q/R button on the control panel to view the queried exams.See Chapter 8, Customizing the System [377] for more details.
������?��(
Press the Q/R button to initiate an exam query.
The query dialog box will appear.
Click on the tab on which you want to query:
• Patient Name (Name)• Patient ID (ID)• Accession Number (Accession)
Use the appropriate filters to manage the query then press Query.
�)!�����*����������� A��
A list of matching exams will be displayed.
��$����������#/����������!-!.!
1. Press the Q/R button to initiate an exam query.2. Click on the Import from Media button3. A browser window appears4. Select the location of data to be imported
���*
You may select a folder containing DICOM data, a specific DICOMfile or a DICOMDIR file to import.
5. Click on OK to confirm
A�� �)!�����*�����������
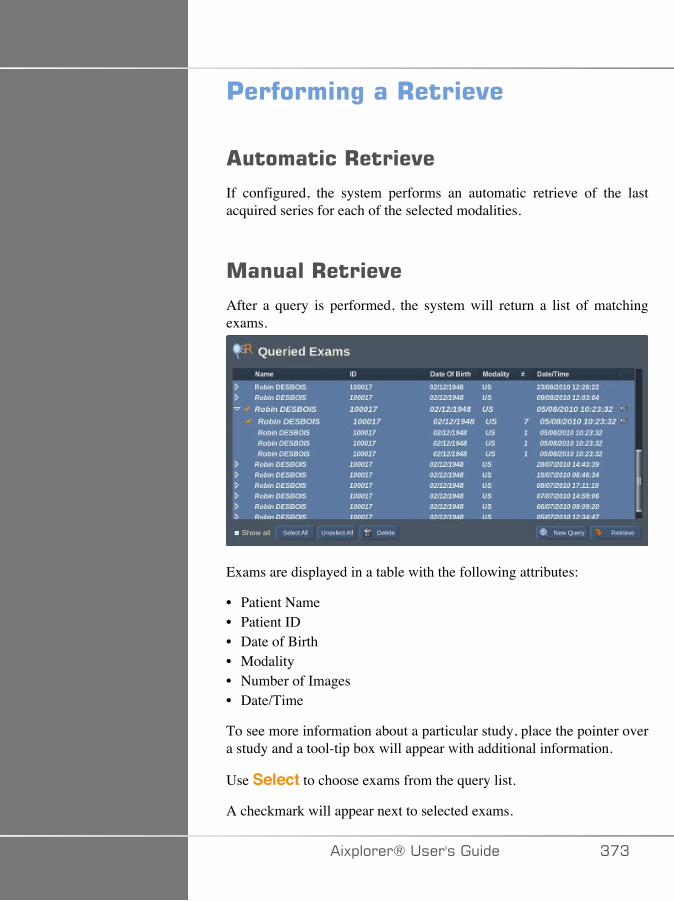
'�������%���+����"�
�������+����"�
If configured, the system performs an automatic retrieve of the lastacquired series for each of the selected modalities.
������+����"�
After a query is performed, the system will return a list of matchingexams.
Exams are displayed in a table with the following attributes:
• Patient Name• Patient ID• Date of Birth• Modality• Number of Images• Date/Time
To see more information about a particular study, place the pointer overa study and a tool-tip box will appear with additional information.
Use Select to choose exams from the query list.
A checkmark will appear next to selected exams.
�)!�����*����������� A�A
If you would like to query again, choose the New Query button at thebottom of the menu.
Press the Retrieve button to retrieve the selected exams.
These exams will be transferred to the Aixplorer® system.
���*
Exams containing large numbers of images or long ultrasound loops maytake a long time. It is best to perform a query and retrieve operation priorto the start of an exam.
When the selected exams have been retrieved, RETRIEVED appearsnext to each line.
�$���%�$� ���!���������You may send DICOM data from a PACS or a DICOM modality to theAixplorer®.
The Q/R notification icon will be displayed to indicate data have beenpushed on the Aixplorer®
Click on the notification icon or press the Q/R button on the control panelto see the received exams.
!�$��(�%�������"%���%+����"������%��
Double-press Select on an image to display it in full screen.
A�� �)!�����*�����������
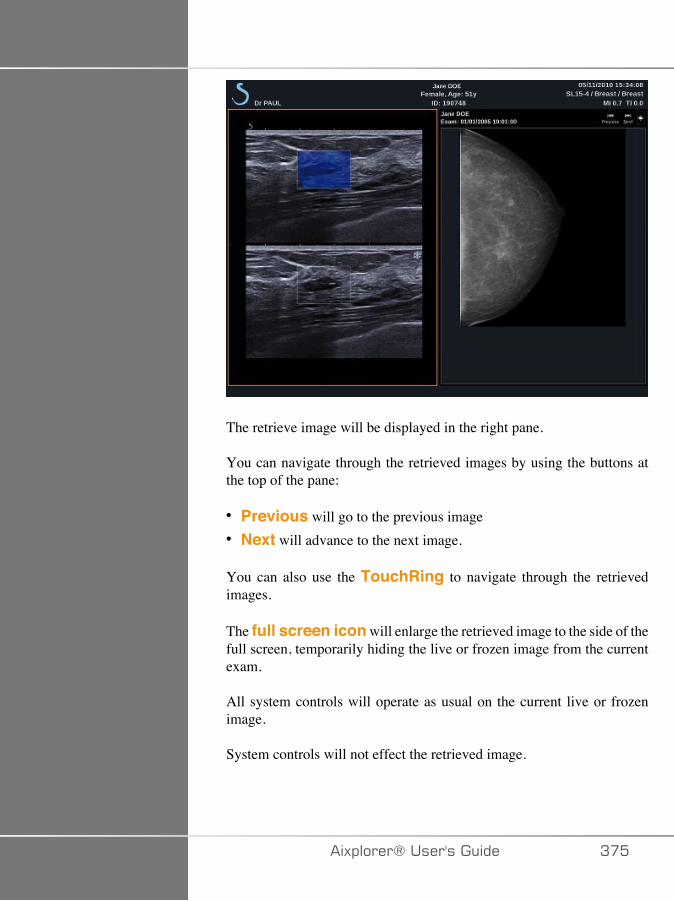
The retrieve image will be displayed in the right pane.
You can navigate through the retrieved images by using the buttons atthe top of the pane:
• Previous will go to the previous image• Next will advance to the next image.
You can also use the TouchRing to navigate through the retrievedimages.
The full screen icon will enlarge the retrieved image to the side of thefull screen, temporarily hiding the live or frozen image from the currentexam.
All system controls will operate as usual on the current live or frozenimage.
System controls will not effect the retrieved image.
�)!�����*����������� A��
*5��%�?��(�����+����"�
To quit viewing retrieved images, press the Q/R button on the controlpanel.
*���%����*5��Make sure all the images you need are saved.After the exam is complete, end the exam as follows:Press End Exam on the control panel.
������%����*5��You have the possibility to continue an exam that was ended.
1. Press End Exam to make sure there is no exam in progress2. Press Review3. From the Patient Directory, select the exam you want to continue4. Press Continue on the touch screen
The system has re-opened the closed exam and is in B-mode. Thethumbnails of the previous session(s) of the same exam are displayedon the right side.
The time limit to re-open an exam may be configured in the System/Display tab of the System Configuration.
Press End Exam to close the exam.
A�C �)!�����*�����������

@������;�%�� �#(����
�)!�����*����������� A��

A�D �)!�����*�����������
!����$�������� ��#(��������%�����Your system can be customized in several ways to make it more usefulfor your needs.Presets designed specifically for the exams you perform can be created,and system settings can be changed to optimize your workflow.System configuration allows you to configure the entire system, itsapplications, and additional options.
To access system configuration, touch Syst.Config. on the touchscreen while in any active imaging mode.Any changes made to the system configuration are automatically saved,unless otherwise specified.Touch Exit on the touch screen to exit system configuration.
The system configuration is divided in 7 tabs:
• System/Display• Device Settings• Administration• Presets• Measurements• Research (optional)• System Diagnostics
Refer to each section for detailed information.
�)!�����*����������� A�E
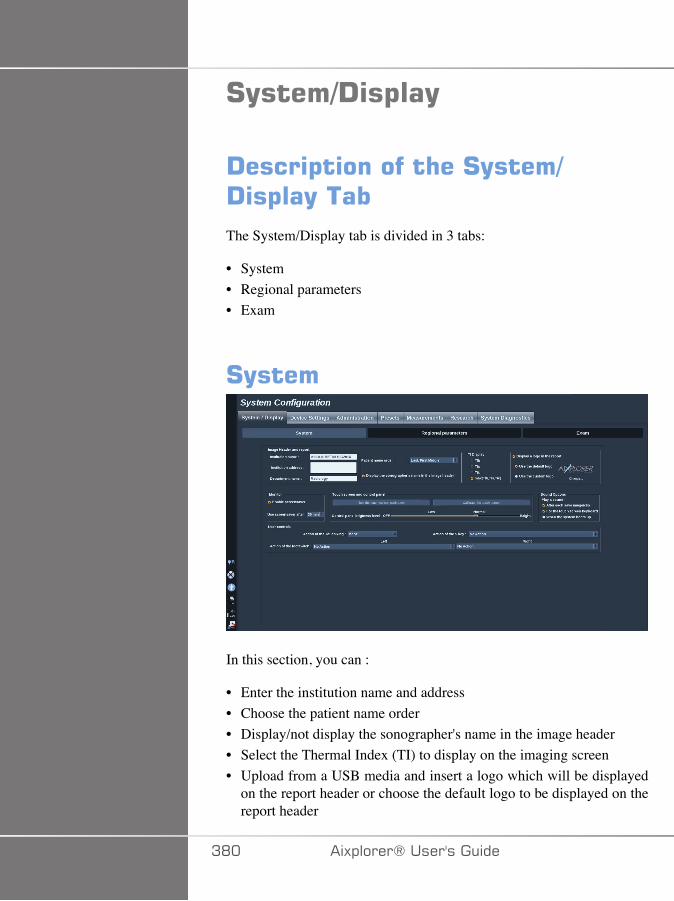
#(����-!�$��(
!����$�������� ��#(����-!�$��(����The System/Display tab is divided in 3 tabs:
• System• Regional parameters• Exam
#(����
In this section, you can :
• Enter the institution name and address• Choose the patient name order• Display/not display the sonographer's name in the image header• Select the Thermal Index (TI) to display on the imaging screen• Upload from a USB media and insert a logo which will be displayed
on the report header or choose the default logo to be displayed on thereport header
AD� �)!�����*�����������
���*
To change the logo to be displayed in the printed report:1. Make sure the «Display logo in report» checkbox is checked2. Do one of the following:• Select «Use the default logo» if you want to use the Aixplorer® logo• Select «Use the custom logo» if you want to use your own logo
• Then plug a USB device with the logo you want to use into thesystem
• Then click on the logo to browse for your own logo
• Enable/disable the screen saver, and configure it• Calibrate the touch screen
���*
To calibrate the touch screen:1. Press “touch screen calibration - calibrate now”2. Press each calibration point that appears on the touch screen until
it disappears
• Set the illumination intensity of the control panel• Activate a sound while for the following functions:
• After each Save Image/Clip• For the touch screen Keyboard• When the system boots up
• Set the function assigned to the TouchRing™ while in B mode• Assign a function to the programmable key (’S’ Button on the control
panel)• Assign a function to each side of the foot switch (available as an option)
�)!�����*����������� AD�
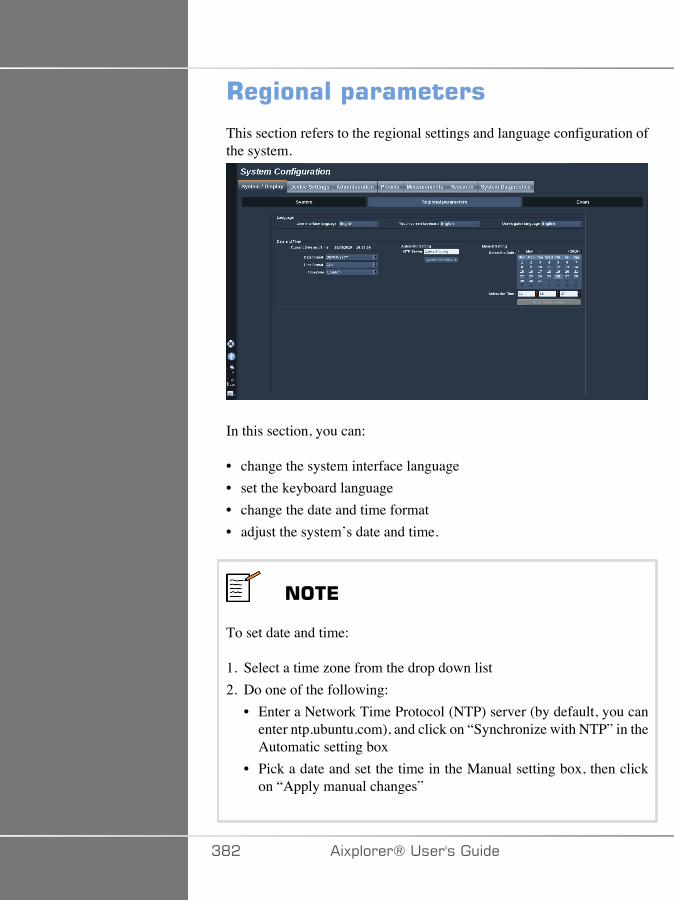
+�%�����$���������
This section refers to the regional settings and language configuration ofthe system.
In this section, you can:
• change the system interface language• set the keyboard language• change the date and time format• adjust the system’s date and time.
���*
To set date and time:
1. Select a time zone from the drop down list2. Do one of the following:
• Enter a Network Time Protocol (NTP) server (by default, you canenter ntp.ubuntu.com), and click on “Synchronize with NTP” in theAutomatic setting box
• Pick a date and set the time in the Manual setting box, then clickon “Apply manual changes”
AD� �)!�����*�����������
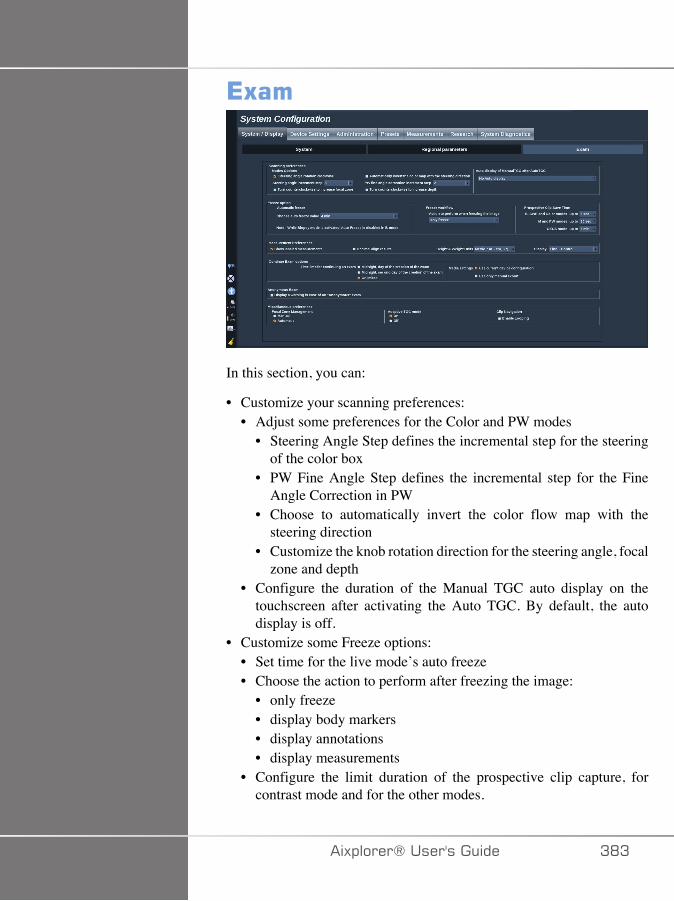
*5��
In this section, you can:
• Customize your scanning preferences:• Adjust some preferences for the Color and PW modes
• Steering Angle Step defines the incremental step for the steeringof the color box
• PW Fine Angle Step defines the incremental step for the FineAngle Correction in PW
• Choose to automatically invert the color flow map with thesteering direction
• Customize the knob rotation direction for the steering angle, focalzone and depth
• Configure the duration of the Manual TGC auto display on thetouchscreen after activating the Auto TGC. By default, the autodisplay is off.
• Customize some Freeze options:• Set time for the live mode’s auto freeze• Choose the action to perform after freezing the image:
• only freeze• display body markers• display annotations• display measurements
• Configure the limit duration of the prospective clip capture, forcontrast mode and for the other modes.
�)!�����*����������� ADA
• Customize the way the measurements are displayed• Customize the Continue exam mode (see the section called
“Continuing an Exam” [376])• Choose to have a warning popup when saving an image for an
anonymous patient• Choose if you want the Focal Zone Management to be manual or
automatic.• Choose to activate or deactivate the Adaptive TGC mode• Choose to enable looping in clips• Customize the rotation direction for the Depth and Focus knobs
AD� �)!�����*�����������
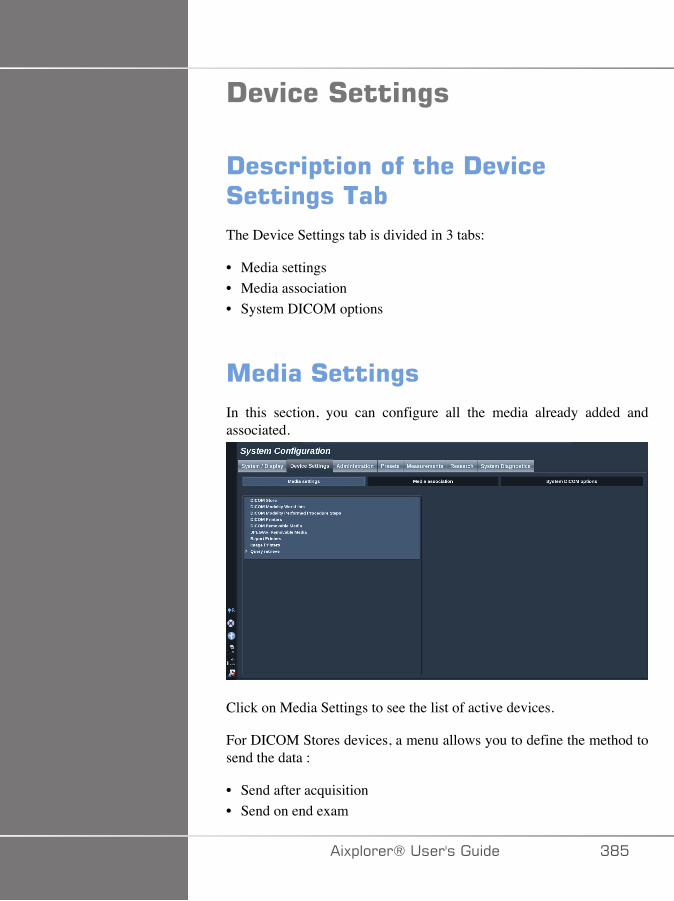
!�"���#����%�
!����$�������� ��!�"��#����%�����The Device Settings tab is divided in 3 tabs:
• Media settings• Media association• System DICOM options
�����#����%�In this section, you can configure all the media already added andassociated.
Click on Media Settings to see the list of active devices.
For DICOM Stores devices, a menu allows you to define the method tosend the data :
• Send after acquisition• Send on end exam
�)!�����*����������� AD�
• Send manually
You can also define printing parameters for DICOM printers, ReportsPrinters, and Image printers, as well as JPEG/AVI RemovableMedia Export parameters (Compression level, export LUTs (Look UpTables),...)
A dedicated "WorkList Settings" menu is available for the DICOMModality Worklist servers. You can set the way of querying the ModalityWorklist SCP:
• By Modality• By AE Title• By Date
and set the maximum reponses you want to receive from the ModalityWorklist server(s) when this device is available and configured in theAdministration part.
ADC �)!�����*�����������
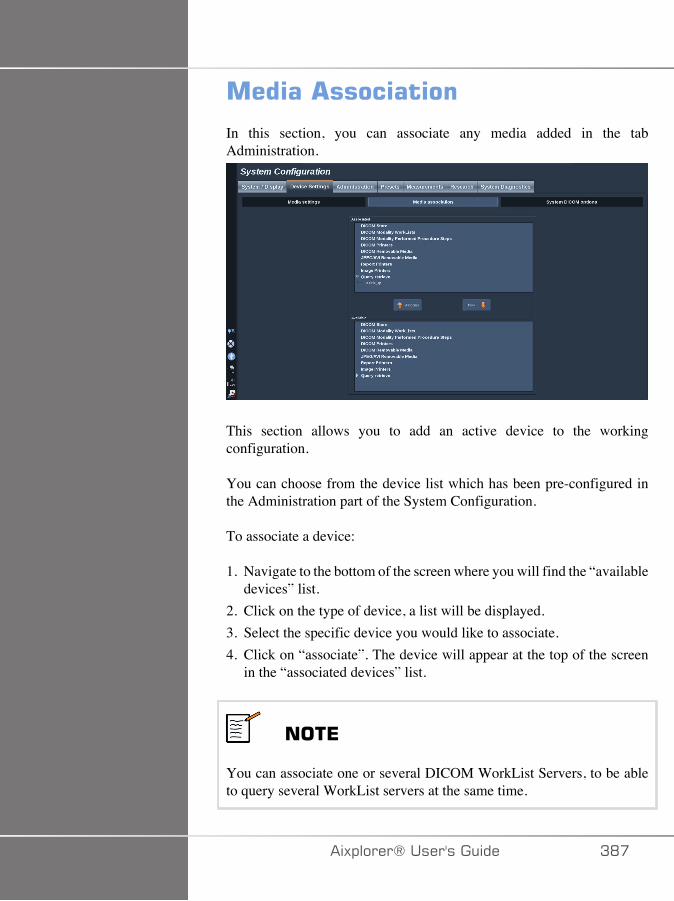
����� ��������
In this section, you can associate any media added in the tabAdministration.
This section allows you to add an active device to the workingconfiguration.
You can choose from the device list which has been pre-configured inthe Administration part of the System Configuration.
To associate a device:
1. Navigate to the bottom of the screen where you will find the “availabledevices” list.
2. Click on the type of device, a list will be displayed.3. Select the specific device you would like to associate.4. Click on “associate”. The device will appear at the top of the screen
in the “associated devices” list.
���*
You can associate one or several DICOM WorkList Servers, to be ableto query several WorkList servers at the same time.
�)!�����*����������� AD�

���*
You can remove a device from the associate list by selecting it and clickon the ‘unlink’ button.
ADD �)!�����*�����������
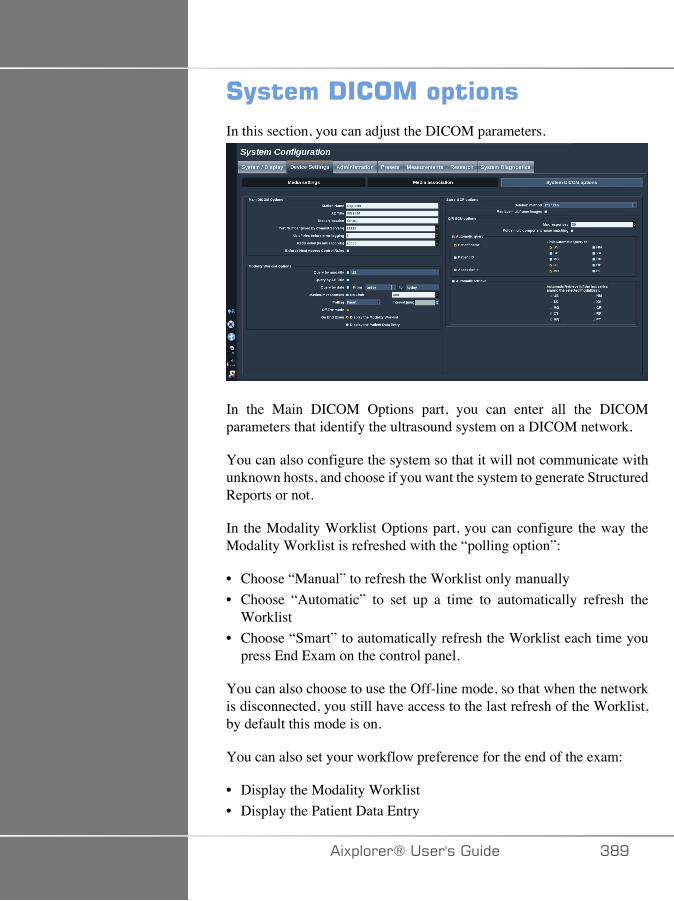
#(�����!������$����In this section, you can adjust the DICOM parameters.
In the Main DICOM Options part, you can enter all the DICOMparameters that identify the ultrasound system on a DICOM network.
You can also configure the system so that it will not communicate withunknown hosts, and choose if you want the system to generate StructuredReports or not.
In the Modality Worklist Options part, you can configure the way theModality Worklist is refreshed with the “polling option”:
• Choose “Manual” to refresh the Worklist only manually• Choose “Automatic” to set up a time to automatically refresh the
Worklist• Choose “Smart” to automatically refresh the Worklist each time you
press End Exam on the control panel.
You can also choose to use the Off-line mode, so that when the networkis disconnected, you still have access to the last refresh of the Worklist,by default this mode is on.
You can also set your workflow preference for the end of the exam:
• Display the Modality Worklist• Display the Patient Data Entry
�)!�����*����������� ADE

Finally, you can select the way of querying the Worklist when pressingEnd Exam in the "Query preference" drop-down list:
• Enable the Broad Query option• Enable the Patient Query option• Maintain the last selected option
In the Store SCP Options part, you can choose the deletion method andif you want to retrieve the multiframe images.
In the Q/R SCU options part, you can configure the Query/Retrieveparameters.
You can also configure the automatic query and automatic retrieve byselecting the queried fields and modalities.
AE� �)!�����*�����������
����������
!����$�������� � ��������������
The Administration tab is divided in 5 tabs:
• Devices• Network configuration• Network tools• Disk maintenance• Medical Staff
� �����
Image compression may result in the loss of image information.
While low levels of image compression are generally acceptable inmedical imaging, using high levels of lossy compression may result inimage degradation.
It is the responsibility of the user to set and maintain the degree of imagecompression which is diagnostically acceptable in exported images.
If you are uncertain as to what degree of compression is acceptable,consult the literature, or use the system default compression.
�)!�����*����������� AE�
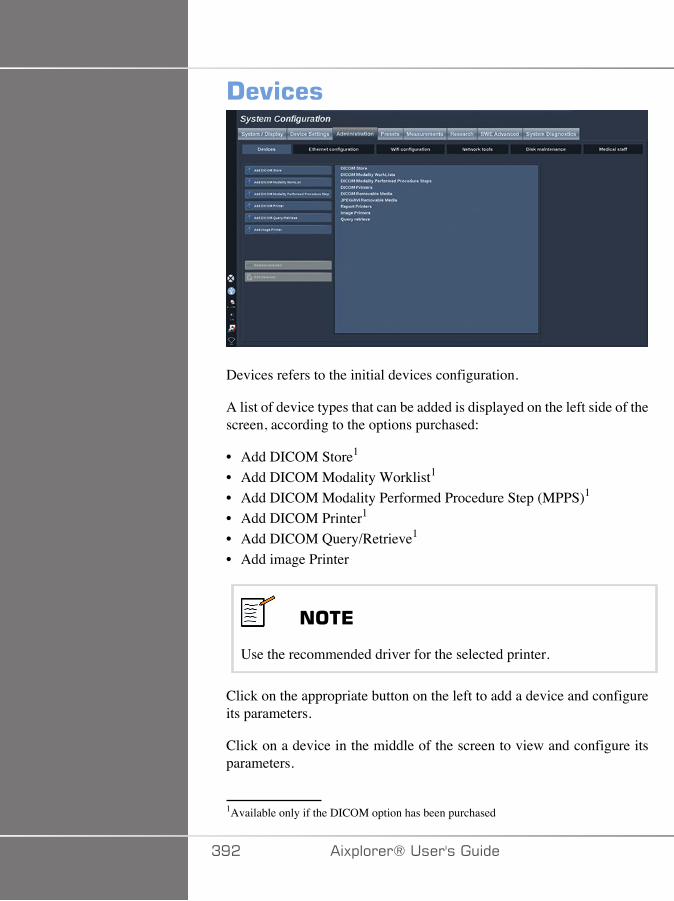
!�"���
Devices refers to the initial devices configuration.
A list of device types that can be added is displayed on the left side of thescreen, according to the options purchased:
• Add DICOM Store1
• Add DICOM Modality Worklist1
• Add DICOM Modality Performed Procedure Step (MPPS)1
• Add DICOM Printer1
• Add DICOM Query/Retrieve1
• Add image Printer
���*
Use the recommended driver for the selected printer.
Click on the appropriate button on the left to add a device and configureits parameters.
Click on a device in the middle of the screen to view and configure itsparameters.
1Available only if the DICOM option has been purchased
AE� �)!�����*�����������
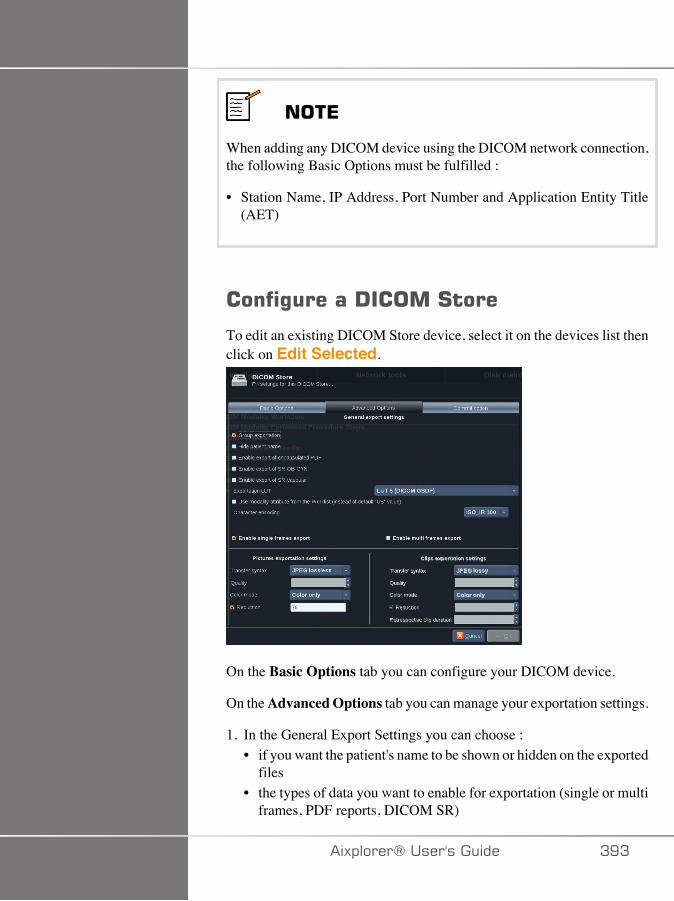
���*
When adding any DICOM device using the DICOM network connection,the following Basic Options must be fulfilled :
• Station Name, IP Address, Port Number and Application Entity Title(AET)
����%�����!�����#����
To edit an existing DICOM Store device, select it on the devices list thenclick on Edit Selected.
On the Basic Options tab you can configure your DICOM device.
On the Advanced Options tab you can manage your exportation settings.
1. In the General Export Settings you can choose :• if you want the patient's name to be shown or hidden on the exported
files• the types of data you want to enable for exportation (single or multi
frames, PDF reports, DICOM SR)
�)!�����*����������� AEA
• the Look Up Table (LUT) you want to apply on the exportedimages/video clips
• the type of character encoding2. In the Pictures and Clips Settings you can define :
• the transfer syntax with pre-set image compressions• the compression quality of the images• the support of Color or Monochrome modes at the exportation• the level of image size reduction• the duration of the retrospective clip
���*
You can configure all these options the same way for any DICOMRemovable Media.
In the Commit Option tab you can choose to ask for a commitment fromthe storage service.
When all the desired options have been set, press OK to save the changes.
���*
The nine available LUTs are pre-set filters acting on specific Brightnessand Contrast settings of the exported images and/or clips.
They are used to make the images appear on a DICOM Reviewworkstation Monitor as they appear on the Aixplorer® Monitor.
� �����
Applying a too bright or too contrasted LUT can have outcomes on thequality of the images informations.
It is the user's responsibility to carefully adjust all imaging parametersto avoid image saturation and obtain optimal quantitative time-intensitydata.
AE� �)!�����*�����������

�)!�����*����������� AE�
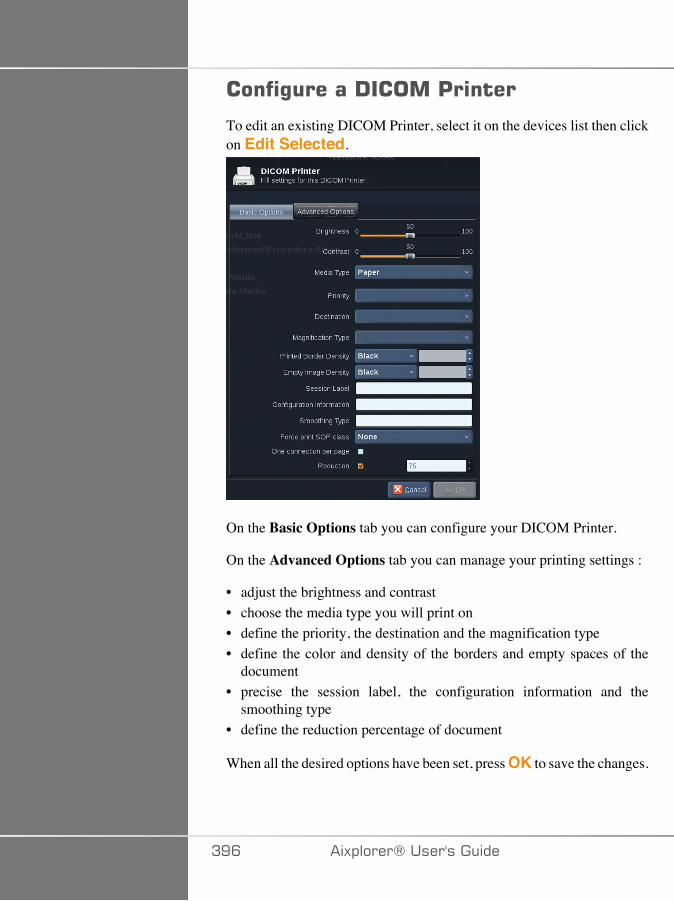
����%�����!�����'�����
To edit an existing DICOM Printer, select it on the devices list then clickon Edit Selected.
On the Basic Options tab you can configure your DICOM Printer.
On the Advanced Options tab you can manage your printing settings :
• adjust the brightness and contrast• choose the media type you will print on• define the priority, the destination and the magnification type• define the color and density of the borders and empty spaces of the
document• precise the session label, the configuration information and the
smoothing type• define the reduction percentage of document
When all the desired options have been set, press OK to save the changes.
AEC �)!�����*�����������
*� ����������%�����This section concerns the network configuration of Aixplorer®. Thesystem shall be connected to the network through an ethernet cable.
The system can be configured with a specific IP address and networksetting, with a cable connected or can be automatically configured inDHCP mode.
For any network configuration, the MAC address is displayed and onceconnected, the network status is also displayed (especially important forthe DHCP configuration).
���*
The Aixplorer® network connection is only opened for DICOM andnetwork printer service.
The system does not require a minimum data rate to perform on thenetwork.
In case of network connection failure, the data can be exported using aDICOM removable media or the embedded printer.
� �����
Integrating the Aixplorer® to a network with other connected devicesmay result in unpredictable risks. Nevertheless, the restricted access tothe system prevents the user from using an antivirus solution.
��=������%�����The Aixplorer® may be connected to the hospital WIFI network.
Check the section called “Notification Icons” [167] for a desciption ofWIFI icons.
�)!�����*����������� AE�
���*
The WIFI connection is not guaranteed in all geographies, and dependson the characteristics of the network.
The WIFI dongle is the Linksys AE3000, FCC/IC certified (FCC ID:Q87-AE3000).
Tests performed by external accredited lab are according to the followingstandards:
• RF measurements according to EN 300 328: WLAN 2.4GHz, IEEEStd. 802.11b/g/n
• MC measurements according to FCC part 15B• European directive RED
Operating frequency range: 2412 ~ 2462MHz 5745 ~ 5825MHz (notactive)
����%�����
The Aixplorer® may be connected to the hospital WIFI network.
1. Plug the WIFI dongle on the Aixplorer®
� �����
Select a device whose temperature range is compatible withAixplorer®'s use.
2. Open the WIFI Configuration sub-tab of the Administration tab
AED �)!�����*�����������
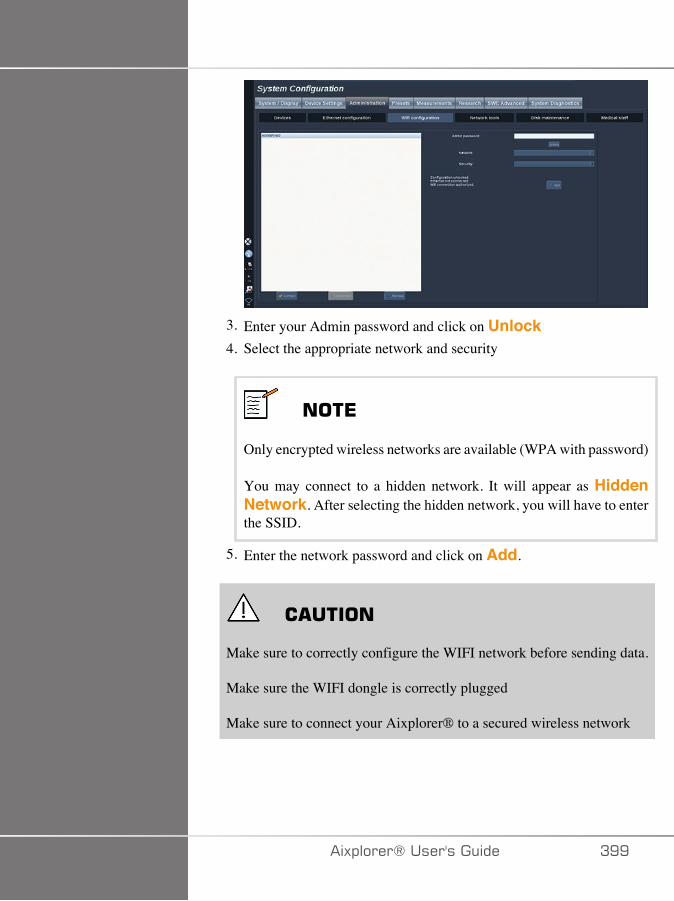
3. Enter your Admin password and click on Unlock4. Select the appropriate network and security
���*
Only encrypted wireless networks are available (WPA with password)
You may connect to a hidden network. It will appear as HiddenNetwork. After selecting the hidden network, you will have to enterthe SSID.
5. Enter the network password and click on Add.
� �����
Make sure to correctly configure the WIFI network before sending data.
Make sure the WIFI dongle is correctly plugged
Make sure to connect your Aixplorer® to a secured wireless network
�)!�����*����������� AEE
���*
The wired connection has the priority over the wireless connection. Itis therefore not possible to connect to a WIFI network if an Ethernetconnection is detected.
If a network cable is connected to the Aixplorer® and an Ethernetconnection is detected while the Aixplorer® is connected to a WIFInetwork, the WIFI connection will be automatically deactivated.
You may also modify WIFI connection parameters or delete a WIFInetwork with the Admin password.
Please contact a SuperSonicImagine representative.
���������
1. Select the appropriate WIFI network in the list2. Click on Connect
���*
The selected WIFI connection will remain active as long as it is notdeactivated (Disconnect button) or the system is not switched off.
Check the section called “Notification Icons” [167] for a desciption ofWIFI icons.
��� �)!�����*�����������
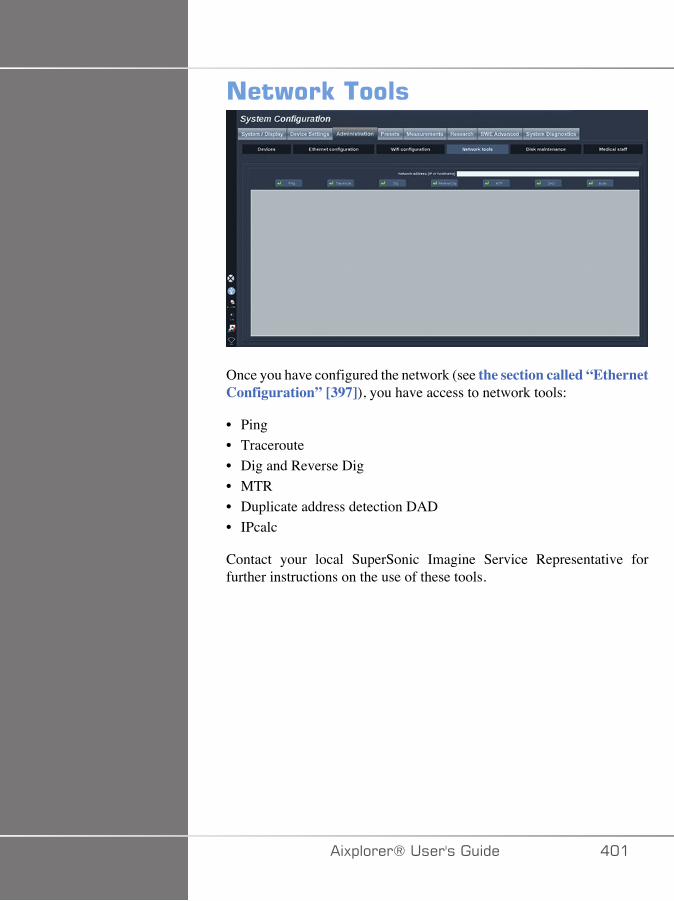
���)��E������
Once you have configured the network (see the section called “EthernetConfiguration” [397]), you have access to network tools:
• Ping• Traceroute• Dig and Reverse Dig• MTR• Duplicate address detection DAD• IPcalc
Contact your local SuperSonic Imagine Service Representative forfurther instructions on the use of these tools.
�)!�����*����������� ���
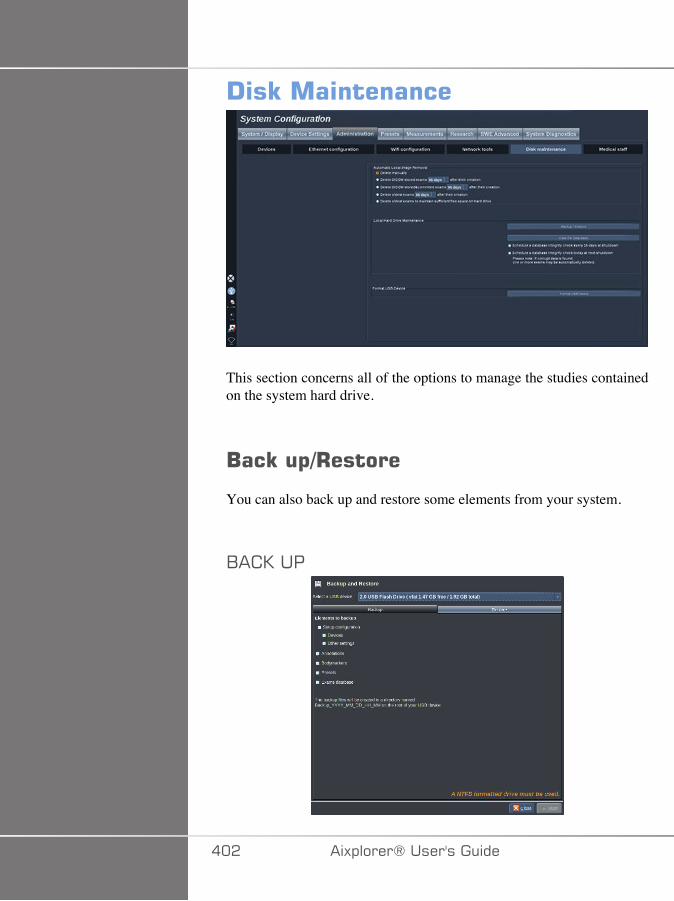
!�E�����������
This section concerns all of the options to manage the studies containedon the system hard drive.
/��E�$-+������
You can also back up and restore some elements from your system.
1� 0���
��� �)!�����*�����������
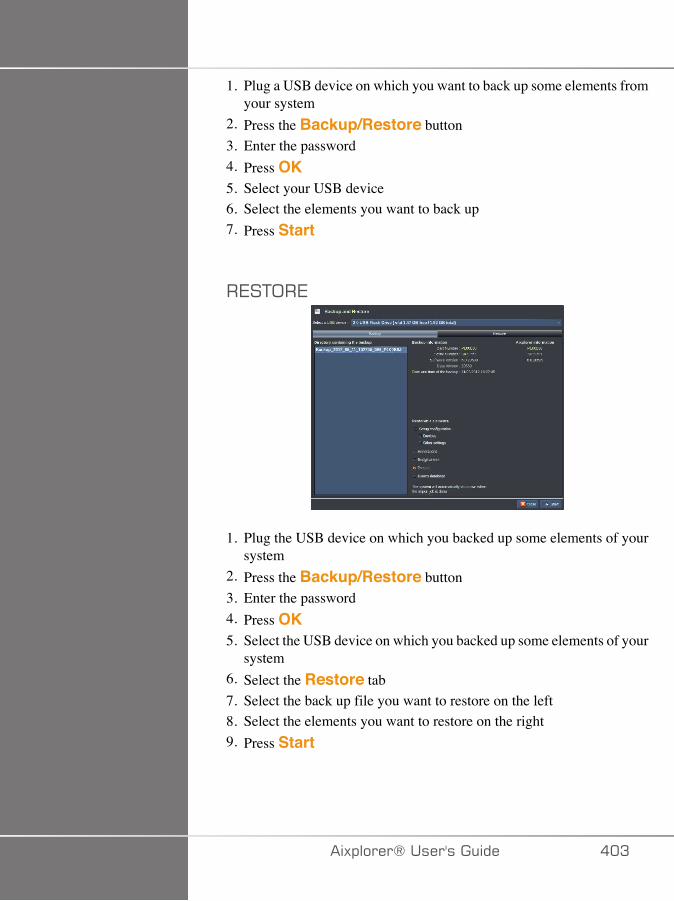
1. Plug a USB device on which you want to back up some elements fromyour system
2. Press the Backup/Restore button3. Enter the password4. Press OK5. Select your USB device6. Select the elements you want to back up7. Press Start
�7�+;�7
1. Plug the USB device on which you backed up some elements of yoursystem
2. Press the Backup/Restore button3. Enter the password4. Press OK5. Select the USB device on which you backed up some elements of your
system6. Select the Restore tab7. Select the back up file you want to restore on the left8. Select the elements you want to restore on the right9. Press Start
�)!�����*����������� ��A
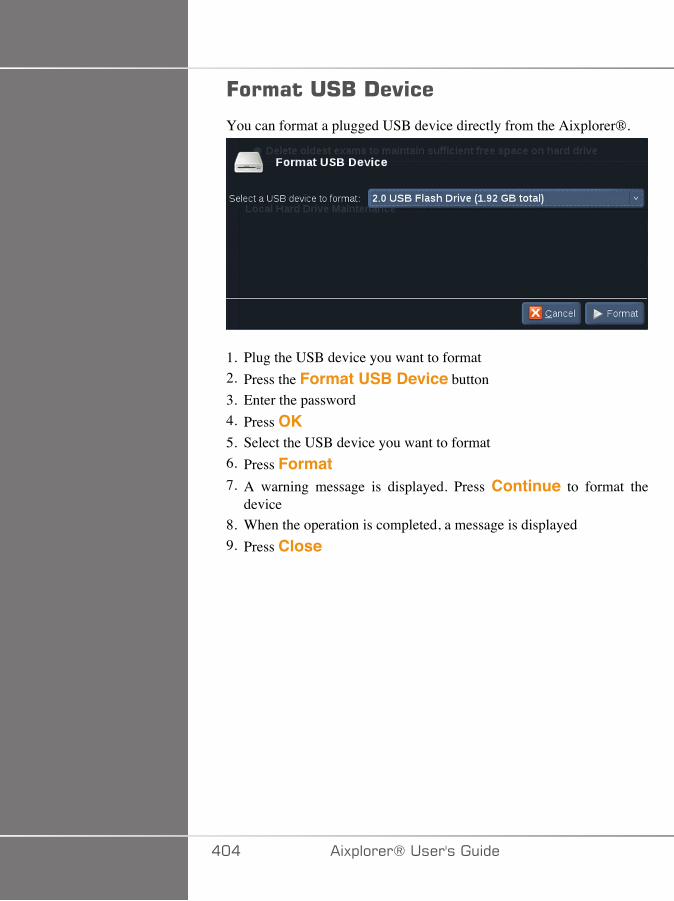
=�������#/�!�"��
You can format a plugged USB device directly from the Aixplorer®.
1. Plug the USB device you want to format2. Press the Format USB Device button3. Enter the password4. Press OK5. Select the USB device you want to format6. Press Format7. A warning message is displayed. Press Continue to format the
device8. When the operation is completed, a message is displayed9. Press Close
��� �)!�����*�����������
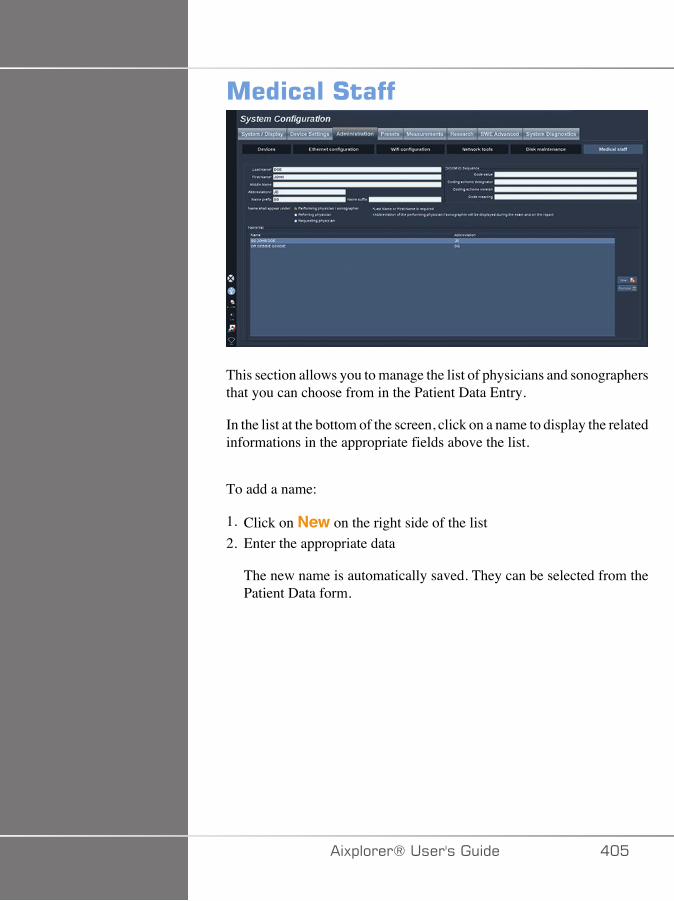
�������#����
This section allows you to manage the list of physicians and sonographersthat you can choose from in the Patient Data Entry.
In the list at the bottom of the screen, click on a name to display the relatedinformations in the appropriate fields above the list.
To add a name:
1. Click on New on the right side of the list2. Enter the appropriate data
The new name is automatically saved. They can be selected from thePatient Data form.
�)!�����*����������� ���
'������A Preset is a group of settings that optimizes the system for a specifictype of exam. Presets establish many initial settings, such as gain value,color map, filter, TissueTuner™, Flow Optimizations, etc… When thesystem is turned on, the default Preset is active. Before beginning anexam, be sure that the appropriate Preset is active. You can choosefrom several default Presets. These default Presets cannot be deleted.Several Presets per transducer/application combination can be createdand stored, depending on the number of buttons available on theindividual transducer touch screen.
!����$�������� ��'����������The Presets tab is divided in 3 tabs:
• Annotations• Bodymarkers• Presets
It allows you to customize annotations and bodymarker packages, as wellas imaging presets.
��C �)!�����*�����������
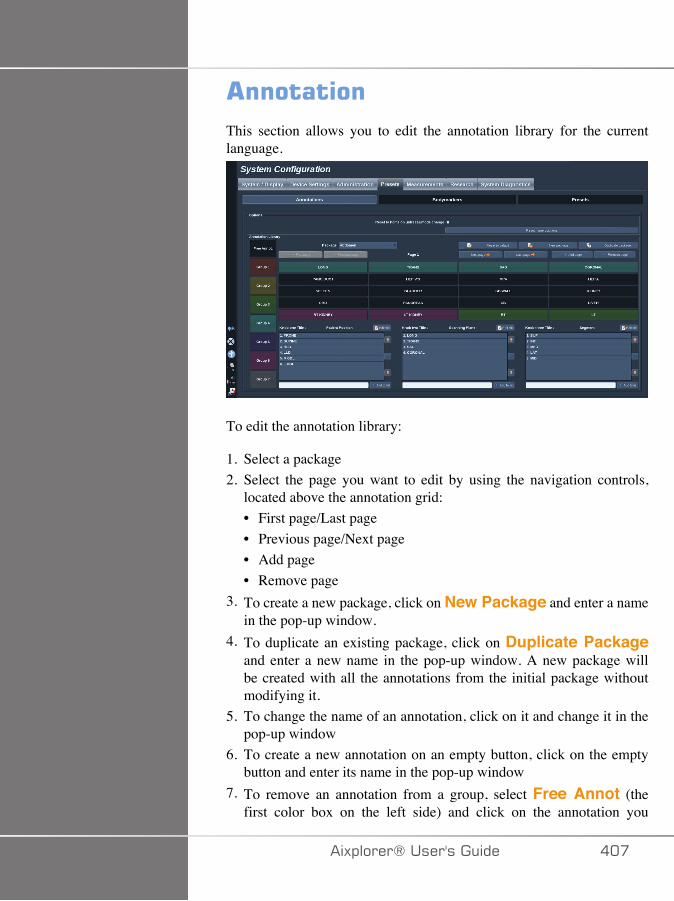
��������This section allows you to edit the annotation library for the currentlanguage.
To edit the annotation library:
1. Select a package2. Select the page you want to edit by using the navigation controls,
located above the annotation grid:• First page/Last page• Previous page/Next page• Add page• Remove page
3. To create a new package, click on New Package and enter a namein the pop-up window.
4. To duplicate an existing package, click on Duplicate Packageand enter a new name in the pop-up window. A new package willbe created with all the annotations from the initial package withoutmodifying it.
5. To change the name of an annotation, click on it and change it in thepop-up window
6. To create a new annotation on an empty button, click on the emptybutton and enter its name in the pop-up window
7. To remove an annotation from a group, select Free Annot (thefirst color box on the left side) and click on the annotation you
�)!�����*����������� ���

want to remove from its group. The annotation button becomes“transparent” (no color) and will not be replaced by another one
8. To move an annotation from one group to another, click on the newgroup color you want to apply, and click on the annotation. Theannotation will change color
9. To change a rotary knob label or create a new one, click on the EditTitle button located next to the knob you want to edit, and change itin the pop-up window
10.To delete a rotary knob value, click on the value and then click on the- button next to it
11.To add a rotary knob value, type the new value in the box and clickon the + Add to the list button next to it
12.To move a rotary knob value within the list, click on it and then clickon the arrows next to it
��D �)!�����*�����������
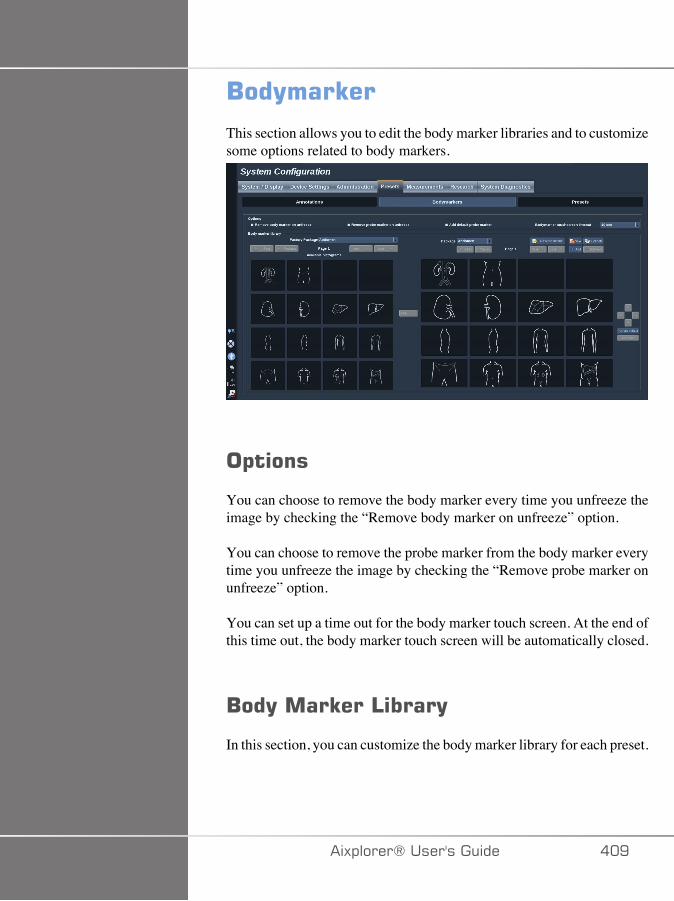
/��(���E��
This section allows you to edit the body marker libraries and to customizesome options related to body markers.
�$����
You can choose to remove the body marker every time you unfreeze theimage by checking the “Remove body marker on unfreeze” option.
You can choose to remove the probe marker from the body marker everytime you unfreeze the image by checking the “Remove probe marker onunfreeze” option.
You can set up a time out for the body marker touch screen. At the end ofthis time out, the body marker touch screen will be automatically closed.
/��(����E���4����(
In this section, you can customize the body marker library for each preset.
�)!�����*����������� ��E
+;�2�7>�+<7�1;-F�,��07��:�1���F�2��:�1:7�.;������27/���7�7+
1. Select the package you want to modify on the right part
You can navigate through the different pages of the library by using thefollowing buttons:
• First displays the first page of the library• Previous displays the previous page of the library• Next displays the next page of the library• Last displays the last page of the library
You can add and remove pages for the selected library by using the Addand Remove buttons.
+;��7,;27���1;-F�,��07��.�;,�+<7�� 0��7
1. Click on the body marker you want to remove2. Click on the Remove button below the arrow
+;�,;27���1;-F�,��07��;/�+<7��� 0��7���7
1. Click on the body marker you want to move2. Click on the appropriate arrow
+;��7+�����27/�1;-F�,��07�����-7.��:+.;��+<7��� 0��7
1. Click on the body marker you want to set as the default body markerfor the library
2. Click on Set as default below the arrows
The selected body marker will be displayed by default every time youpress Body Marker on the control panel for the selected preset.
��� �)!�����*�����������
+;��--���1;-F�,��07��+;����� 0��7
All the available libraries on the system are displayed on the left part.
1. Select the appropriate package
The available body markers are displayed below.2. Click on the body marker you want to add to your library3. Click on the Add button
The selected body marker will be added at the first available space inyour library.
Note: all changes are automatically saved.
You can reset a body marker library for a given preset as it was by defaultby clicking on Reset to default.
+;� �7�+7���/7>�1;-F�,��07���� 0��7
1. Click on New and enter the name of the package in the pop-upwindow.
2. Choose bodymarkers in the library and add them to your package.Refer to the section called “To add a body marker to apackage” [411]
+;�-��:� �+7����� 0��7
1. Click on Duplicate and enter a new name in the pop-up window.
A new package will be created with all the bodymarkers from theinitial package without modifying it.
To add a bodymarker from another package, select the appropriatepackage and proceed as for adding a bodymarker.
�)!�����*����������� ���
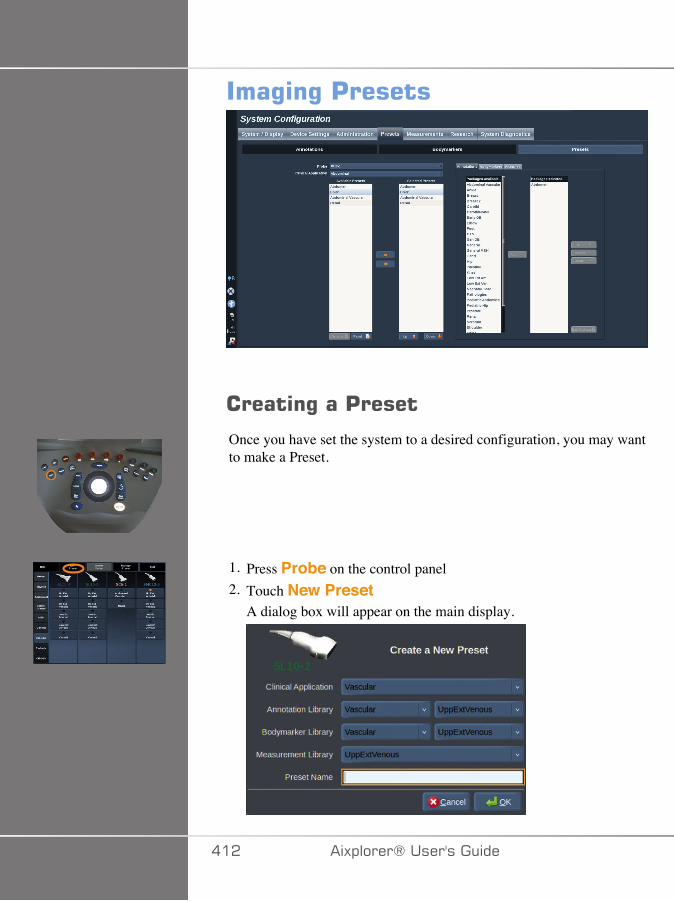
���%�%�'������
������%���'�����
Once you have set the system to a desired configuration, you may wantto make a Preset.
1. Press Probe on the control panel2. Touch New Preset
A dialog box will appear on the main display.
��� �)!�����*�����������
3. Select the application in which you want to save the preset4. Select an annotation library for your new preset5. Select a body marker library for your new preset6. Select a measurement library for your new preset7. Using the keyboard, enter a name for your new Preset.8. Select OK.9. Press Probe on the control panel to verify your Preset.
The user-created presets appear in light blue on the touch screen.The factory presets appear in dark blue on the touch screen.
����%�%�'������
In the Presets sub-tab, you can manage imaging presets.
1. Select the appropriate probe and application on the left side of thescreen.
The available presets for this probe and this application will appear.
�--�/����7�7+�
Selected Presets lists the presets as they will appear on the touch screen.
1. Click on the preset you want to add from the Available Presets list onthe left
2. Click on the right arrow to add it to the Selected Presets list
�7,;2�/����7�7+�
Selected Presets lists the presets as they will appear on the touch screen.
1. Click on the preset you want to remove from the Selected Presets list2. Click on the left arrow to add it to remove it
�)!�����*����������� ��A
<�/��/��+<7�-���:�F�;�-7��;.�+<7��7�7+��;/�+<7�+;� <�� �77/
1. Select the preset that you want to modify in the Selected Presets list.2. You can move a preset within the list with the Up and Down buttons.
They will be displayed in the same order on the touch screen presetpage.
���*
To reset a factory preset to the default configuration, click on Reset.
,;-�.F�/��+<7��//;+�+�;/��� 0��74�5�;.����7�7+
1. Select the small annotation tab on the right side of the screen.
You will see the available packages box on the left of the Add buttonand the selected packages box on the right.
The selected packages are those already available in the preset.2. To add an annotation package, select the appropriate package in the
available packages box and click on Add.
It will appear in the selected packages box.3. In the selected packages box you can remove a package by clicking
on Remove.4. You can also move a package within the list using the Up and Down
buttons.5. To edit the annotation package, select a package in the selected
packages box and click on Edit Package.
,;-�.F�/��+<7�1;-F�,��07���� 0��74�5�;.����7�7+
1. Select the small bodymarker tab on the right side of the screen.
��� �)!�����*�����������
You will see the available packages box on the left of the Add buttonand the selected packages box on the right.
The selected packages are those already available in the preset.2. To add a bodymarker package, select the appropriate package in the
available packages box and click on Add.
It will appear in the selected packages box.3. In the selected packages box you can remove a package by clicking
on Remove.4. You can also move a package within the list using the Up and Down
buttons.5. To edit the bodymarker package, select a package in the selected
packages box and click on Edit Package.
,;-�.F�/��+<7�,7����7,7/+��� 0��74�5;.�����7�7+
1. Select the small measurement tab on the right side of the screen.
You will see the available packages box on the left of the Add buttonand the selected packages box on the right.
The selected packages are those already available in the preset.2. To add a measurement package, select the appropriate package in the
available packages box and click on Add.
It will appear in the selected packages box.3. In the selected packages box you can remove a package by clicking
on Remove.4. You can also move a package within the list using the Up and Down
buttons.5. To edit the measurement package, select a package in the selected
packages box and click on Edit Package.
�)!�����*����������� ���
� ��%�%���'����������
1. Do one of the following:• Press Probe on the control panel, then touch Manage Presets
on the touch screen• Touch Syst. Config. on the touch screen, then click on
Presets and Presets2. Choose the probe and the application
The list of user-defined Presets appears.3. Click on the Preset you want to rename and click on Rename
A popup menu appears4. Enter a new name5. Click on OK to validate
!�����%���'�����
You can delete the Presets you created. The factory presets cannot bedeleted.
1. Do one of the following:• Press Probe on the control panel, then touch Manage Presets
on the touch screen• Touch Syst. Config. on the touch screen, then click on Presets
and Presets2. Choose the probe and the application
The list of user-defined Presets appears.3. Click on the Preset you want to delete and click on Remove.
A popup menu appears.4. Click on OK to validate
��C �)!�����*�����������
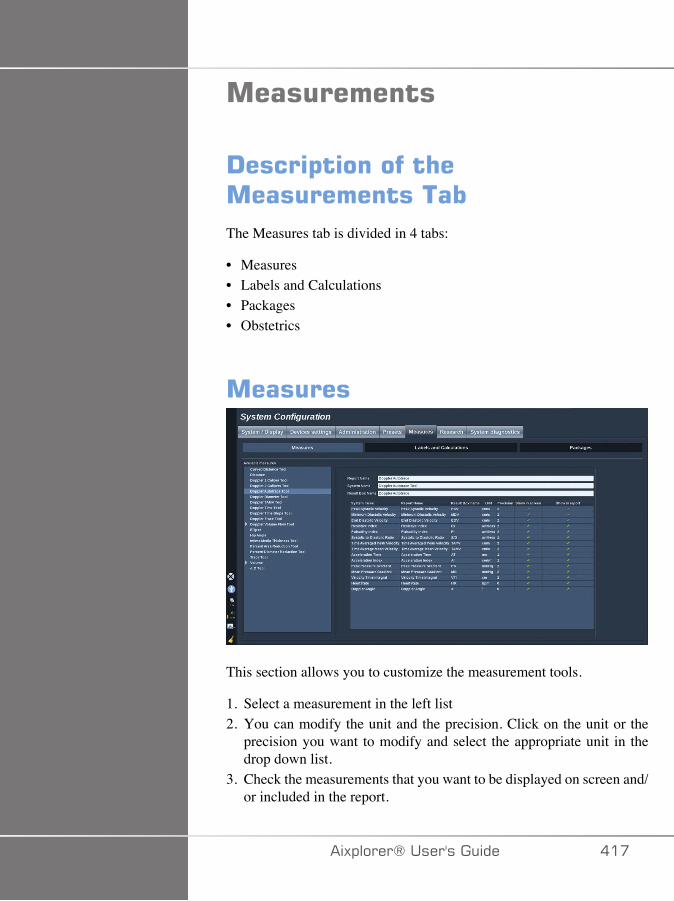
�����������
!����$�������� ����������������The Measures tab is divided in 4 tabs:
• Measures• Labels and Calculations• Packages• Obstetrics
�������
This section allows you to customize the measurement tools.
1. Select a measurement in the left list2. You can modify the unit and the precision. Click on the unit or the
precision you want to modify and select the appropriate unit in thedrop down list.
3. Check the measurements that you want to be displayed on screen and/or included in the report.
�)!�����*����������� ���
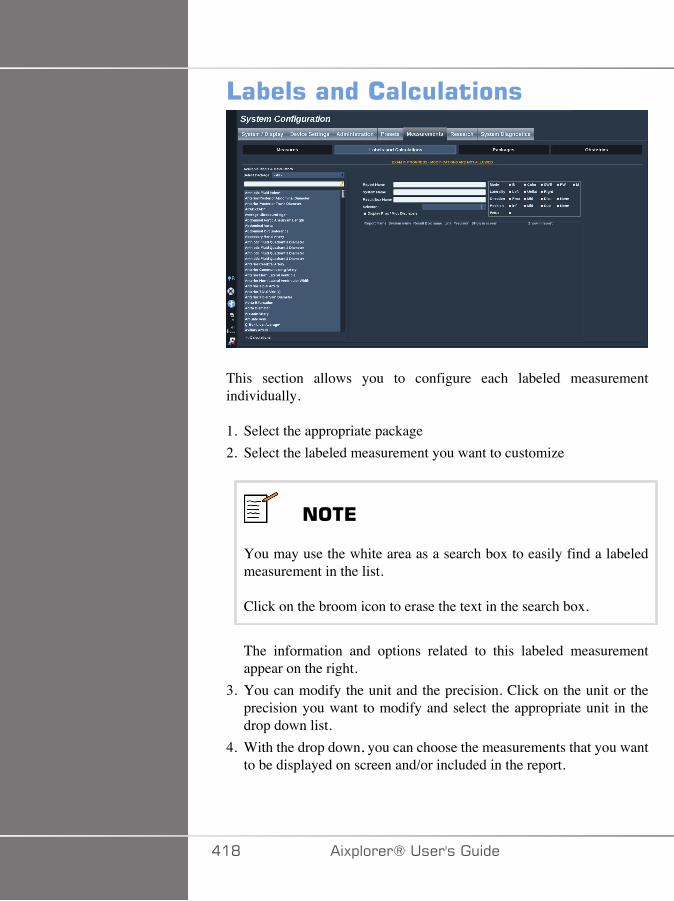
4��������������������
This section allows you to configure each labeled measurementindividually.
1. Select the appropriate package2. Select the labeled measurement you want to customize
���*
You may use the white area as a search box to easily find a labeledmeasurement in the list.
Click on the broom icon to erase the text in the search box.
The information and options related to this labeled measurementappear on the right.
3. You can modify the unit and the precision. Click on the unit or theprecision you want to modify and select the appropriate unit in thedrop down list.
4. With the drop down, you can choose the measurements that you wantto be displayed on screen and/or included in the report.
��D �)!�����*�����������
���*
For Internal Carotid Artery and Common Carotid Artery labeledmeasurements, you may uncheck the Display Prox/Mid/Distlabels checkbox to hide the segment labels. Only Internal CarotidArtery and Common Carotid Artery generic labels will appear in thelabeled measurement list.
�)!�����*����������� ��E
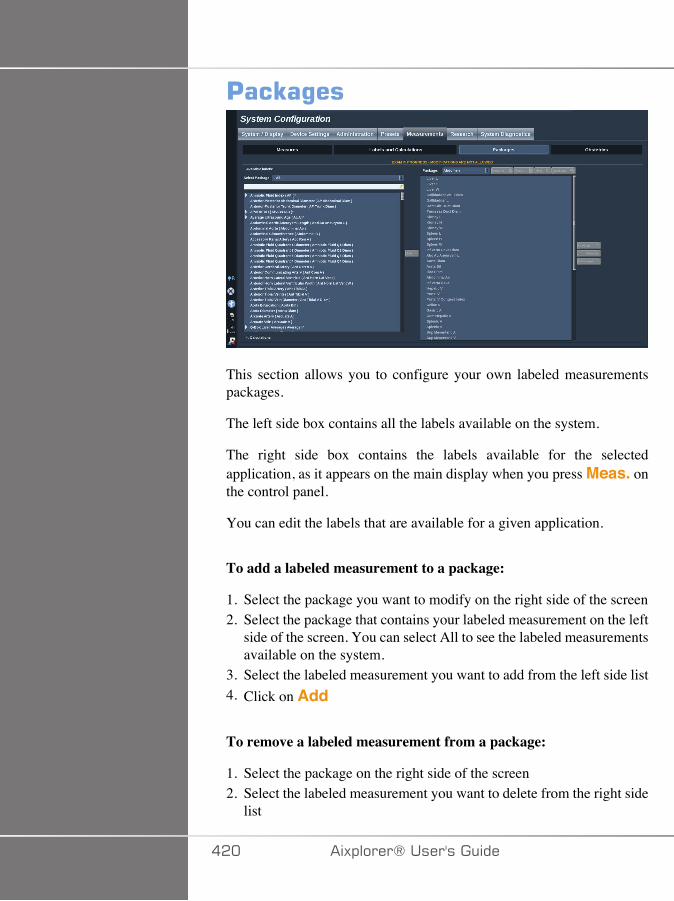
'��E�%��
This section allows you to configure your own labeled measurementspackages.
The left side box contains all the labels available on the system.
The right side box contains the labels available for the selectedapplication, as it appears on the main display when you press Meas. onthe control panel.
You can edit the labels that are available for a given application.
To add a labeled measurement to a package:
1. Select the package you want to modify on the right side of the screen2. Select the package that contains your labeled measurement on the left
side of the screen. You can select All to see the labeled measurementsavailable on the system.
3. Select the labeled measurement you want to add from the left side list4. Click on Add
To remove a labeled measurement from a package:
1. Select the package on the right side of the screen2. Select the labeled measurement you want to delete from the right side
list
��� �)!�����*�����������
3. Click on Remove
To move a labeled measurement within the list in a package:
1. Select the package2. Select the labeled measurement you want to move from the right side
list3. Click on Move up or Move down until it reaches the desired place
To rename a package:
1. Select the package on the right side of the screen2. Click on Rename3. Enter a new name in the pop-up window
To reset a package to its default configuration:
1. Select the package on the right side of the screen2. Click on Reset
To create a new package:
1. Click on New2. Enter a name in the pop-up window and click on OK3. You can then add labeled measurements to the new package. It will
be available in the presets.
To duplicate a package:
1. Click on Duplicate2. Enter a name in the pop-up window and click on OK
A new package will be created with all the labeled measurements.
�)!�����*����������� ���
���������The Obstetrics section is divided in 3 parts:
• GA - EFW (Gestational Age - Estimated Fetal Weight)• Fetal Growth and EFW Percentiles• Tables and Equations
� �����
Be careful to confirm the patient name and ID before starting anexamination for a new patient.
Check the date format before entering date of birth, Last Menstrual Period(LMP), Estimated Date of Delivery (EDD), Date Of Conception (DOC)and Ovulation Date. Incorrect entry of these parameters will result in anincorrect Gestational Age (GA).
Enter the EDD and GA in the patient's medical record for backup.
Check the "Activate OB calcs" button on the Patient Data Entry page(PDE) in order to perform obstetric calculations.
It is necessary to specify which OB author is to be used for each particularmeasurement to calculate the GA and get an Estimated Fetal Weight(EFW).
A diagnosis can not be only based on one measurement or data. Be carefulto always consider the overall clinical evaluation of the patient, includingthe medical record.
Depending on fetal position, some measurements may be incorrect. Becareful to always consider the overall clinical evaluation of the patient,including the medical record.
The system provides fetal measurements for up to five fetuses. Be carefulnot to confuse the fetuses during measurements.
For each measurement performed, you can select either the first,last, average, minimum, maximum or specifically one of the fivemeasurements that are allowed to be displayed, using the selector featurein the Measurements tab of the Report.
��� �)!�����*�����������
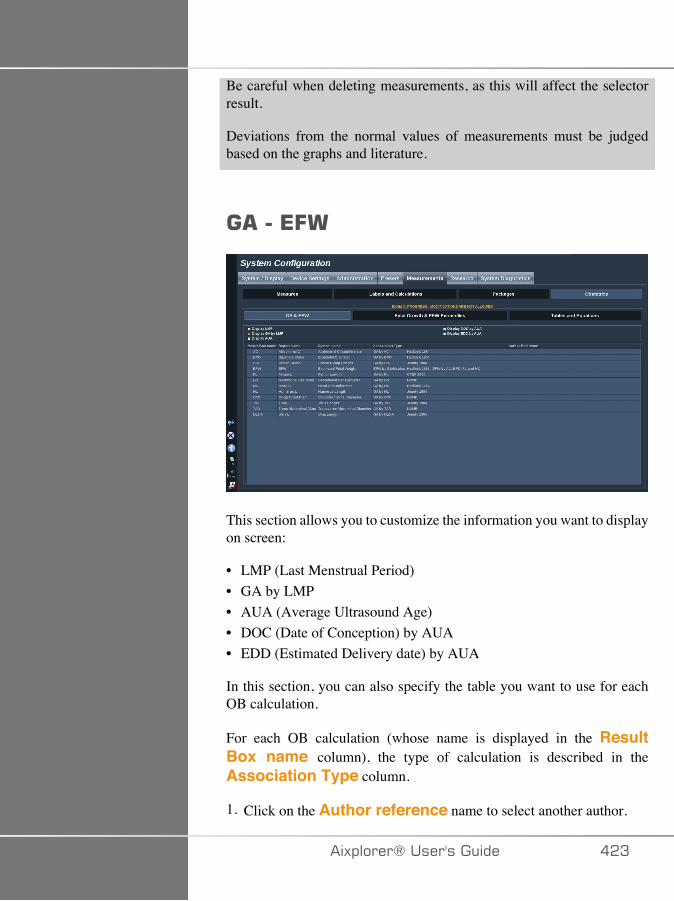
Be careful when deleting measurements, as this will affect the selectorresult.
Deviations from the normal values of measurements must be judgedbased on the graphs and literature.
� ���*=�
This section allows you to customize the information you want to displayon screen:
• LMP (Last Menstrual Period)• GA by LMP• AUA (Average Ultrasound Age)• DOC (Date of Conception) by AUA• EDD (Estimated Delivery date) by AUA
In this section, you can also specify the table you want to use for eachOB calculation.
For each OB calculation (whose name is displayed in the ResultBox name column), the type of calculation is described in theAssociation Type column.
1. Click on the Author reference name to select another author.
�)!�����*����������� ��A
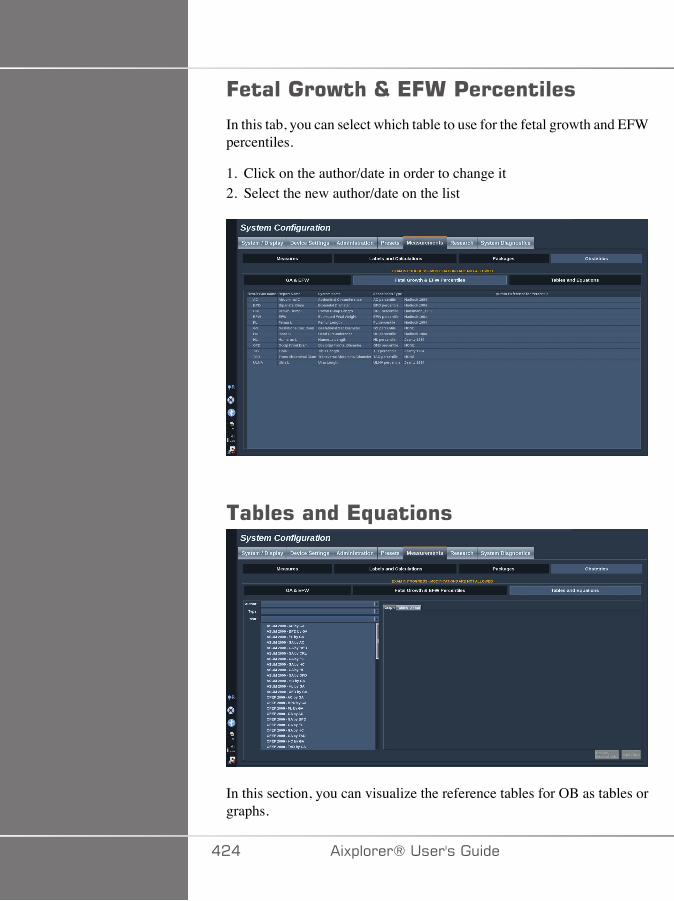
=��������)� �B�*=��'���������
In this tab, you can select which table to use for the fetal growth and EFWpercentiles.
1. Click on the author/date in order to change it2. Select the new author/date on the list
�����������*,�����
In this section, you can visualize the reference tables for OB as tables orgraphs.
��� �)!�����*�����������
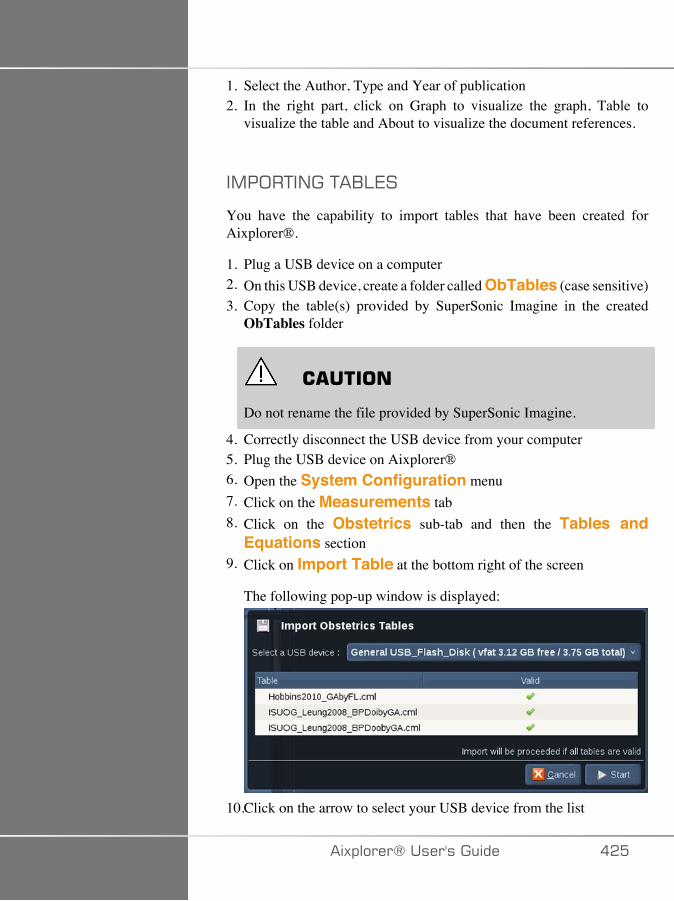
1. Select the Author, Type and Year of publication2. In the right part, click on Graph to visualize the graph, Table to
visualize the table and About to visualize the document references.
�,�;�+�/��+�1:7�
You have the capability to import tables that have been created forAixplorer®.
1. Plug a USB device on a computer2. On this USB device, create a folder called ObTables (case sensitive)3. Copy the table(s) provided by SuperSonic Imagine in the created
ObTables folder
� �����
Do not rename the file provided by SuperSonic Imagine.
4. Correctly disconnect the USB device from your computer5. Plug the USB device on Aixplorer®6. Open the System Configuration menu7. Click on the Measurements tab8. Click on the Obstetrics sub-tab and then the Tables and
Equations section9. Click on Import Table at the bottom right of the screen
The following pop-up window is displayed:
10.Click on the arrow to select your USB device from the list
�)!�����*����������� ���
11.If tables are correct on the USB device, a green checkmark will bedisplayed
���*
If one or several tables are displayed with a red dot, the system didnot recognize them.
The Import Tables button will be grayed out.a. Plug your USB device on your computerb. Delete all tables from your USB devicec. Copy correct tables on your USB device and restart the above
procedure.
12.Click on Import Table on the pop-up window13.Configure the imported tables as needed
���*
A re-installation of the same software version would remove all importedtables.
-7:7+�/���,�;�+7-�+�1:7�
It is possible to delete all imported tables from Aixplorer®.
1. Open the System Configuration menu2. Click on the Measurements tab3. Click on the Obstetrics sub-tab and then the Tables and
Equations section4. Click on the Delete all imported tables button at the bottom
right of the screen
��C �)!�����*�����������
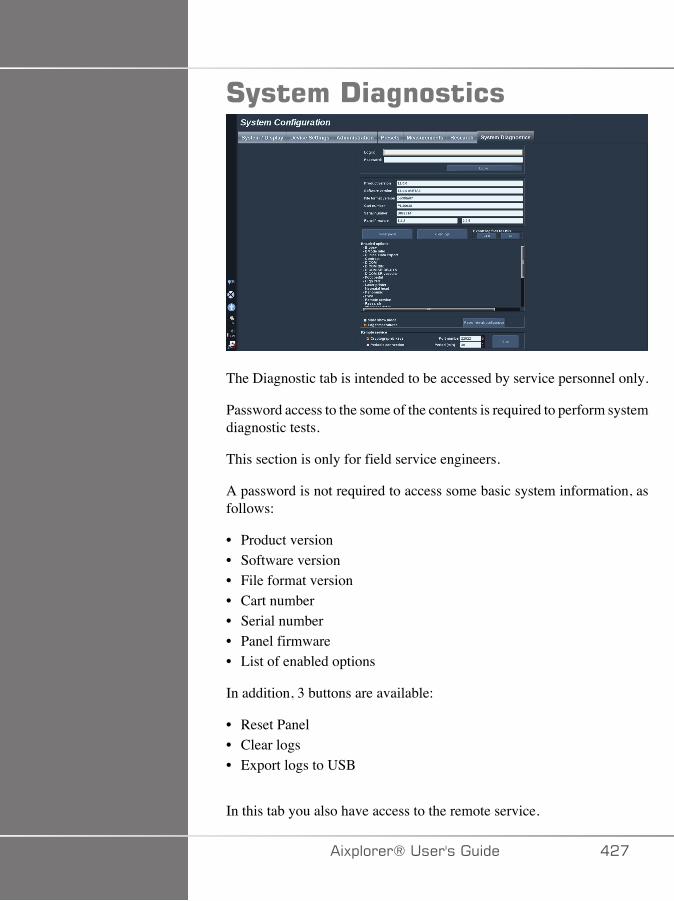
#(�����!�%������
The Diagnostic tab is intended to be accessed by service personnel only.
Password access to the some of the contents is required to perform systemdiagnostic tests.
This section is only for field service engineers.
A password is not required to access some basic system information, asfollows:
• Product version• Software version• File format version• Cart number• Serial number• Panel firmware• List of enabled options
In addition, 3 buttons are available:
• Reset Panel• Clear logs• Export logs to USB
In this tab you also have access to the remote service.
�)!�����*����������� ���
The Super Sonic Imagine Remote Service Solution enables themonitoring of the Aixplorer® Ultrasound System.
Two ways are defined to communicate with Aixplorer® :
• the user of the Remote Service web interface communicates in real-time with the system
• both tasks to perform and results are pushed on the remote server bythe User of the Remote Service web interface and Aixplorer® whenconnected.
A manual system logs upload on the Remote Service website allows athird way to recover data from the system.
���*
You can refer to the Remote Service Solution User's Guide for furtherinformations.
��D �)!�����*�����������

A�#(����������B����������
�)!�����*����������� ��E

�A� �)!�����*�����������
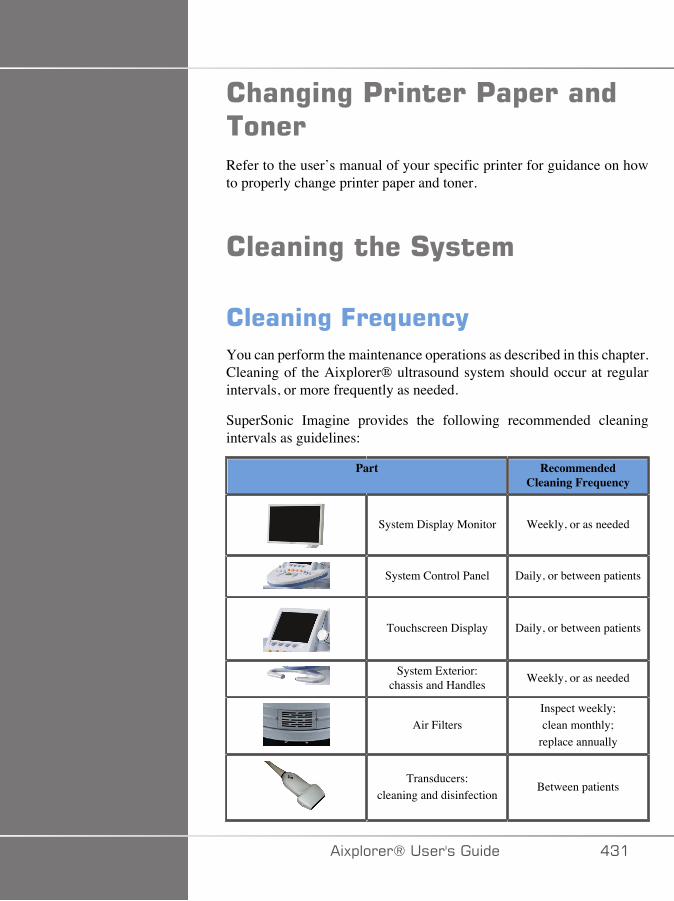
� ��%�%�'������'�$�����������Refer to the user’s manual of your specific printer for guidance on howto properly change printer paper and toner.
������%�� ��#(����
������%�=��,���(You can perform the maintenance operations as described in this chapter.Cleaning of the Aixplorer® ultrasound system should occur at regularintervals, or more frequently as needed.
SuperSonic Imagine provides the following recommended cleaningintervals as guidelines:
Part RecommendedCleaning Frequency
System Display Monitor Weekly, or as needed
System Control Panel Daily, or between patients
Touchscreen Display Daily, or between patients
System Exterior:chassis and Handles Weekly, or as needed
Air FiltersInspect weekly;clean monthly;
replace annually
Transducers:cleaning and disinfection
Between patients
�)!�����*����������� �A�
It is prudent to continually survey the system for maintenanceneeds. Contact your SuperSonic Imagine Sales or Service authorizedrepresentative for further details.
� �����
If you have any questions regarding basic maintenance, or prefer to havemaintenance service performed, contact your authorized SuperSonicImagine Service representative.
Always press the On/Off switch, turn off the power switch at the backof the machine, and disconnect the system from the wall outlet beforeperforming maintenance or cleaning the system.
It is recommended that gloves and protective eyewear are used whencleaning the system.
Do not spray any cleaning agents directly onto the system. They may leakinto the system, damaging the system and voiding the warranty.
Do not allow standing liquid to collect around the control panel keys.
Do not allow liquid to drip inside the system chassis.
�A� �)!�����*�����������
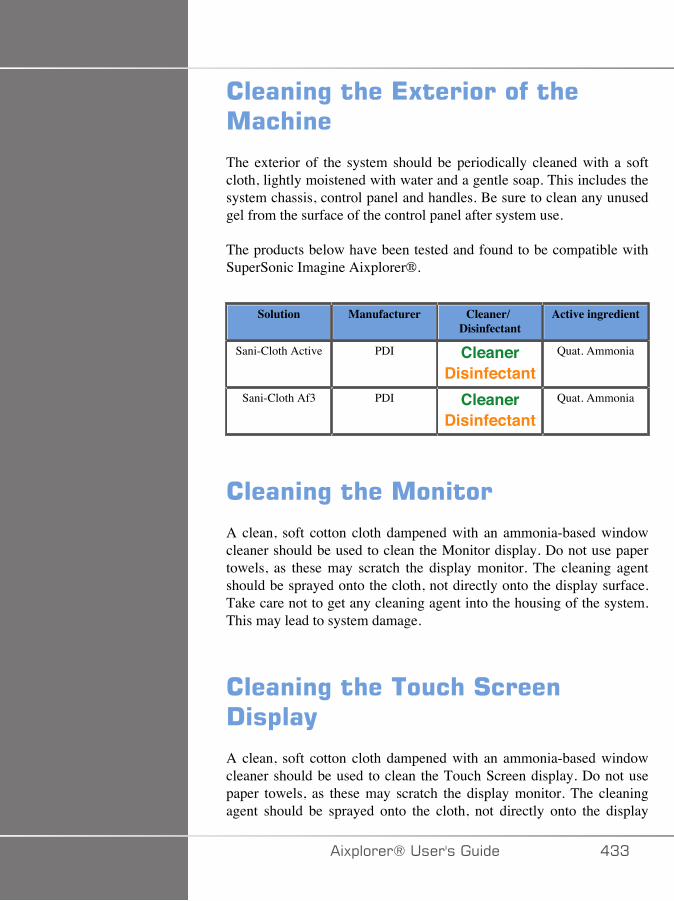
������%�� ��*5���������� ���� ��
The exterior of the system should be periodically cleaned with a softcloth, lightly moistened with water and a gentle soap. This includes thesystem chassis, control panel and handles. Be sure to clean any unusedgel from the surface of the control panel after system use.
The products below have been tested and found to be compatible withSuperSonic Imagine Aixplorer®.
Solution Manufacturer Cleaner/Disinfectant
Active ingredient
Sani-Cloth Active PDI CleanerDisinfectant
Quat. Ammonia
Sani-Cloth Af3 PDI CleanerDisinfectant
Quat. Ammonia
������%�� ��������
A clean, soft cotton cloth dampened with an ammonia-based windowcleaner should be used to clean the Monitor display. Do not use papertowels, as these may scratch the display monitor. The cleaning agentshould be sprayed onto the cloth, not directly onto the display surface.Take care not to get any cleaning agent into the housing of the system.This may lead to system damage.
������%�� ����� �#�����!�$��(
A clean, soft cotton cloth dampened with an ammonia-based windowcleaner should be used to clean the Touch Screen display. Do not usepaper towels, as these may scratch the display monitor. The cleaningagent should be sprayed onto the cloth, not directly onto the display
�)!�����*����������� �AA
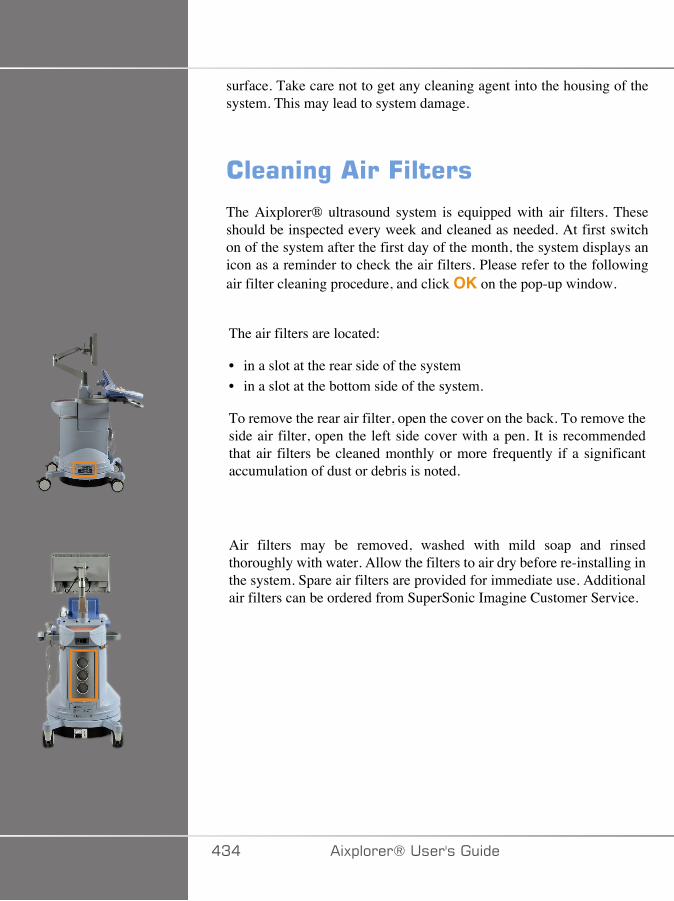
surface. Take care not to get any cleaning agent into the housing of thesystem. This may lead to system damage.
������%� ��=�����
The Aixplorer® ultrasound system is equipped with air filters. Theseshould be inspected every week and cleaned as needed. At first switchon of the system after the first day of the month, the system displays anicon as a reminder to check the air filters. Please refer to the followingair filter cleaning procedure, and click OK on the pop-up window.
The air filters are located:
• in a slot at the rear side of the system• in a slot at the bottom side of the system.
To remove the rear air filter, open the cover on the back. To remove theside air filter, open the left side cover with a pen. It is recommendedthat air filters be cleaned monthly or more frequently if a significantaccumulation of dust or debris is noted.
Air filters may be removed, washed with mild soap and rinsedthoroughly with water. Allow the filters to air dry before re-installing inthe system. Spare air filters are provided for immediate use. Additionalair filters can be ordered from SuperSonic Imagine Customer Service.
�A� �)!�����*�����������
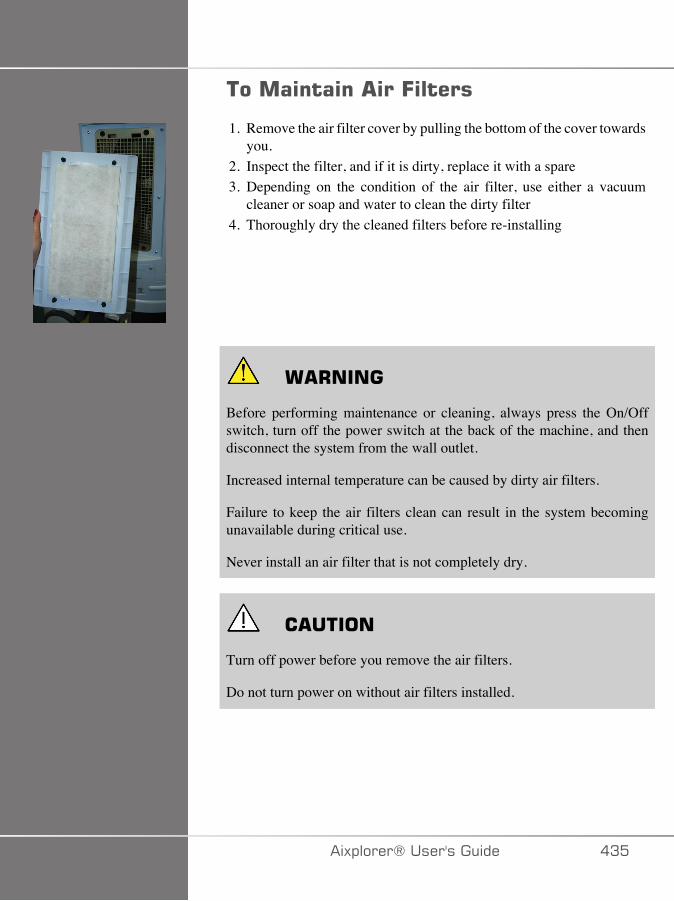
���������� ��=�����
1. Remove the air filter cover by pulling the bottom of the cover towardsyou.
2. Inspect the filter, and if it is dirty, replace it with a spare3. Depending on the condition of the air filter, use either a vacuum
cleaner or soap and water to clean the dirty filter4. Thoroughly dry the cleaned filters before re-installing
� +����
Before performing maintenance or cleaning, always press the On/Offswitch, turn off the power switch at the back of the machine, and thendisconnect the system from the wall outlet.
Increased internal temperature can be caused by dirty air filters.
Failure to keep the air filters clean can result in the system becomingunavailable during critical use.
Never install an air filter that is not completely dry.
� �����
Turn off power before you remove the air filters.
Do not turn power on without air filters installed.
�)!�����*����������� �A�

������%�����!�������%�� �/�������#������
����������Cleaning the Scanning Window
Reading performance may degrade if the scanner's window is not clean.If the window is visibly dirty, or if the scanner isn't operating well, cleanthe window with a soft cloth or lens tissue dampened with water (or amild detergent - water solution). If a detergent solution is used, rinse witha clean lens tissue dampened with water only.
Cleaning the Scanning Housing
The HS-1M is IP54 rated when the cable is attached. This means thatliquids and dusts will not penetrate into the housing. However, thescanner should not be submerged in water or other liquids. It is also goodpractice to dampen the cleansing cloth vs. spraying the scanner directly.
The HS-1M housing is compatible with the following medical gradecleaners:
• Sani-Cloth® HB• Sani-Cloth® Plus• Hydrogen Peroxide• CaviWipes™• 409® Glass and Surface Cleaner• Windex® Blue• Clorox® Bleach (100%)• Isopropyl Alcohol• Gentle dish soap and water
� �����
Do not submerge the HS-1M in water.
�AC �)!�����*�����������
Do not use abrasive wipes or tissues on the HS-1M's window - abrasivewipes may scratch the window.
Never use solvents (e.g., acetone, benzene, ether, or phenol-based agents)on the housing or window - solvents may damage the finish or thewindow.
�)!�����*����������� �A�
������%�����!�������%����������
����������������%�#����(
� +����
Use care when handling and cleaning ultrasound transducers.
Do not use a damaged or defective transducer.
Do not immerse or allow liquid to penetrate a transducer which has hadits face or cable sheath compromised.
Failure to follow these precautions can result in serious injury andequipment damage.
Follow these precautions to avoid injury and equipment damage.
Inspect the transducer prior to cleaning for damage or degeneration to thelens, housing, cable and connector.
Do not use or apply liquid cleaning agents to a damaged or defectivetransducer.
Do not immerse the transducer into any liquid beyond the level specifiedfor that transducer.
Never immerse the transducer connector or transducer adapters into anyliquid.
Transducer damage can result from contact with inappropriate couplingor cleaning agents.
Use only cleaning agents which have been approved for the specifiedtransducer.
Do not soak, immerse, or maintain prolonged contact with solutionscontaining alcohol, bleach, ammonium chloride compounds or hydrogenperoxide.
�AD �)!�����*�����������
The level of disinfection required for a device is dictated by the type oftissue it will contact during use. Ensure the solution strength and durationof contact are appropriate for the intended clinical use of the transducer.
Always use protective eyewear and gloves when cleaning, disinfectingor sterilizing any equipment.
Be sure to observe the expiration date of the solution.
Avoid disinfectant contact with the connector label.
� �����
Biological hazards may exist if ultrasound transducers are not properlycleaned, disinfected or sterilized.
This is especially true if the transducer comes in contact with mucousmembranes or bodily fluids.
Proper cleaning and disinfection are necessary to prevent diseasetransmission and infection control.
It is the responsibility of the equipment user to verify and maintain theeffectiveness of the infection control procedures in use.
For any procedures where the transducer may come in contact with bodilyfluids or mucous membranes, the use of a legally marketed, sterile, non-pyrogenic transducer sheath is recommended.
Only use disposable sheaths. Sheaths are never to be reused.
Use caution when using disinfectant products.
Wear rubber gloves and protective eyewear.
Always follow the manufacturer’s instructions.
In order for liquid chemical disinfectants to be effective, all visibleresidues must be removed during the cleaning process.
For effective cleaning, follow the instructions accompanying the cleaneror disinfectant product.
�)!�����*����������� �AE
Care should be taken to avoid applying disinfectant agents to the cable-housing junction.
Do not allow any fluids to enter the cable-housing junction.
Do not use any alcohol or alcohol-based products on the transducer cable.
If the transducer shows signs of damage such as cracks, splitting,delamination of the face or cable damage, discontinue use of thetransducer and contact your authorized SuperSonic Imagine Servicerepresentative for assistance.
����������������%����!���������������Cleaning and disinfection is a two step process: a cleaning step followedby a disinfection step.
������%
Cleaning is intended to remove all foreign matter (blood, tissue, protein,scanning gel, etc.) from the device.
!��������
The level of disinfection required for a device is dictated by the typeof tissue it will contact during use. There are three classifications: non-critical, semi-critical, and critical. These are based on the degree of riskof infection involved in the use of the device.
Non-critical applications are those where the device contacts only intactskin; semi-critical applications are those where the device contacts mucusmembranes or minor skin breach; critical applications are those where thedevice enters a normally sterile environment, sterile tissue or vasculature.
Ultrasound transducers used for non-critical applications generally needonly to be cleaned and low-level disinfected between patient uses.
��� �)!�����*�����������
Transducer used in semi-critical application should be cleaned and highlevel disinfected after use even if a sheath was used.
Transducers used in critical applications should be sterilized and the useof a sterile sheath is recommended. Transducer used in critical applicationshould be cleaned and sterilized after use even if a sheath was used.
��������������%����!���������'�������������� � 5$�����6�����������The SuperSonic Imagine Aixplorer® transducers are intended for usein non-critical and semi-critical imaging applications. The transducermust be thoroughly cleaned and disinfected after each use. In general,only low-level disinfection is required for non-critical applications of theSuperSonic Imagine Aixplorer® transducer.
For semi-critical applications, high-level disinfection is required and onlyone of the high-level disinfectants chosen from the list below should beused.
High-level disinfection for semi-critical is recommended, carefullyfollowing the manufacturer’s instructions with regard to application andcontact time as indicated on the product label.
'�����������'��$�����������������!��������
1. After every patient exam, carefully wipe the face and housing of theultrasound transducer to remove any traces of ultrasound coupling gel.
2. Inspect the transducer for any signs of damage such as cracks,splitting, delamination of the face or cable damage. If any damage isnoted, do not proceed with the cleaning or disinfecting procedures andcall your authorized SuperSonic Imagine Service representative forassistance.
3. Wipe the transducer face, housing and cable with a water-moistenedsoft cloth. The use of a mild soap, low-level cleaner or enzymaticcleaner (from the table below) is acceptable.
�)!�����*����������� ���
4. If stubborn material has dried on the face or housing of the transducer,carefully scrub the transducer using water moistened gauze, spongeor surgeon’s soft bristle brush. Wipe away any material with a water-moistened soft cloth.
5. Rinse the transducer thoroughly with water. Do not allow water toaccess the cable-housing junction.
6. Air dry or dry using a soft dry cloth.
!���������'�������
1. Always clean the transducer prior to disinfection. (See steps above.)2. When using an FDA or CE -cleared (as appropriate) disinfecting
agent, carefully follow the instructions provided by the manufacturerof the product.
3. For low-level disinfection, the lens and housing of the transducer maybe wiped with any of the cleaners/low level disinfectantslisted in the associated transducer table.
4. For high-level disinfection, the transducer may be wiped or soakedusing one of the disinfectants listed in the associated transducertable.
5. Air dry or dry using a soft dry cloth.6. Re-inspect the transducer for any signs of damage such as cracks,
splitting, delamination of the face or cable damage before putting thetransducer back into use.
��� �)!�����*�����������
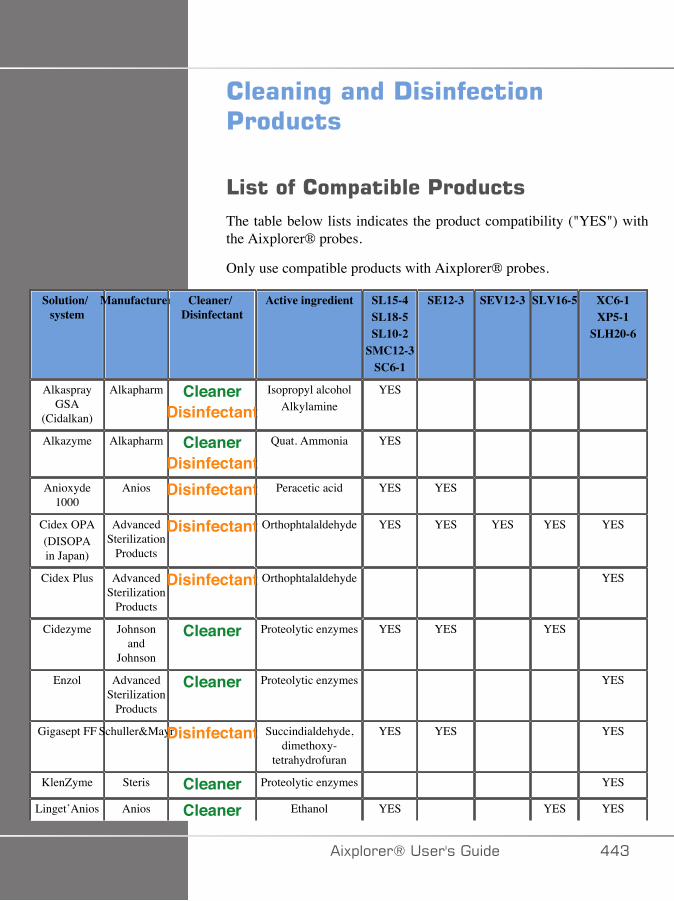
������%�����!��������'������
4���������$������'������The table below lists indicates the product compatibility ("YES") withthe Aixplorer® probes.
Only use compatible products with Aixplorer® probes.
Solution/system
Manufacturer Cleaner/Disinfectant
Active ingredient SL15-4SL18-5SL10-2
SMC12-3SC6-1
SE12-3 SEV12-3 SLV16-5 XC6-1XP5-1
SLH20-6
AlkasprayGSA
(Cidalkan)
Alkapharm CleanerDisinfectant
Isopropyl alcoholAlkylamine
YES
Alkazyme Alkapharm CleanerDisinfectant
Quat. Ammonia YES
Anioxyde1000
Anios Disinfectant Peracetic acid YES YES
Cidex OPA(DISOPAin Japan)
AdvancedSterilization
Products
Disinfectant Orthophtalaldehyde YES YES YES YES YES
Cidex Plus AdvancedSterilization
Products
Disinfectant Orthophtalaldehyde YES
Cidezyme Johnsonand
Johnson
Cleaner Proteolytic enzymes YES YES YES
Enzol AdvancedSterilization
Products
Cleaner Proteolytic enzymes YES
Gigasept FF Schuller&MayrDisinfectant Succindialdehyde,dimethoxy-
tetrahydrofuran
YES YES YES
KlenZyme Steris Cleaner Proteolytic enzymes YES
Linget’Anios Anios Cleaner Ethanol YES YES YES
�)!�����*����������� ��A
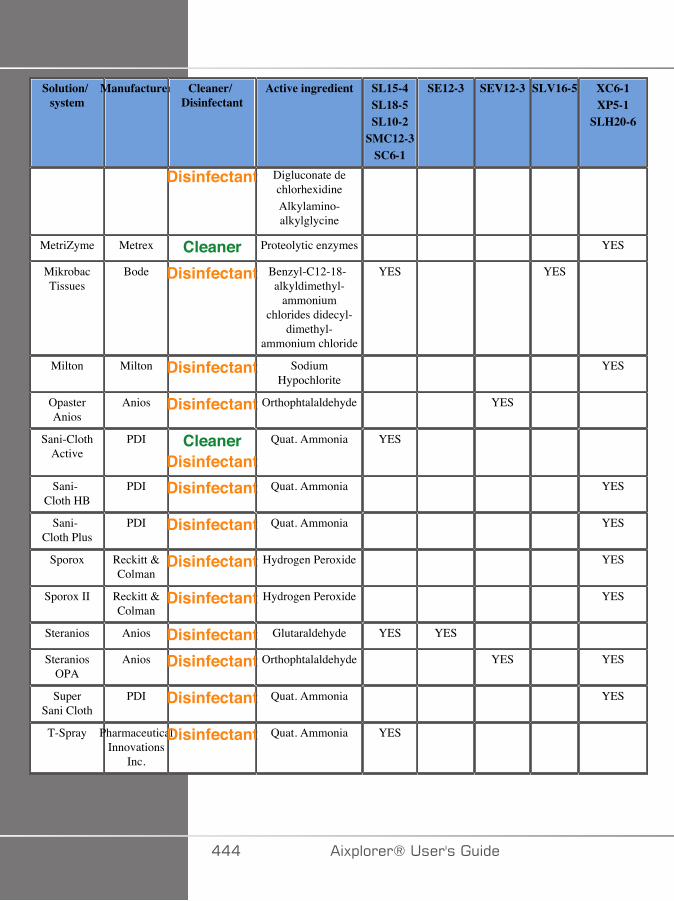
Solution/system
Manufacturer Cleaner/Disinfectant
Active ingredient SL15-4SL18-5SL10-2
SMC12-3SC6-1
SE12-3 SEV12-3 SLV16-5 XC6-1XP5-1
SLH20-6
Disinfectant Digluconate dechlorhexidineAlkylamino-alkylglycine
MetriZyme Metrex Cleaner Proteolytic enzymes YES
MikrobacTissues
Bode Disinfectant Benzyl-C12-18-alkyldimethyl-
ammoniumchlorides didecyl-
dimethyl-ammonium chloride
YES YES
Milton Milton Disinfectant SodiumHypochlorite
YES
OpasterAnios
Anios Disinfectant Orthophtalaldehyde YES
Sani-ClothActive
PDI CleanerDisinfectant
Quat. Ammonia YES
Sani-Cloth HB
PDI Disinfectant Quat. Ammonia YES
Sani-Cloth Plus
PDI Disinfectant Quat. Ammonia YES
Sporox Reckitt &Colman
Disinfectant Hydrogen Peroxide YES
Sporox II Reckitt &Colman
Disinfectant Hydrogen Peroxide YES
Steranios Anios Disinfectant Glutaraldehyde YES YES
SteraniosOPA
Anios Disinfectant Orthophtalaldehyde YES YES
SuperSani Cloth
PDI Disinfectant Quat. Ammonia YES
T-Spray PharmaceuticalInnovations
Inc.
Disinfectant Quat. Ammonia YES
��� �)!�����*�����������
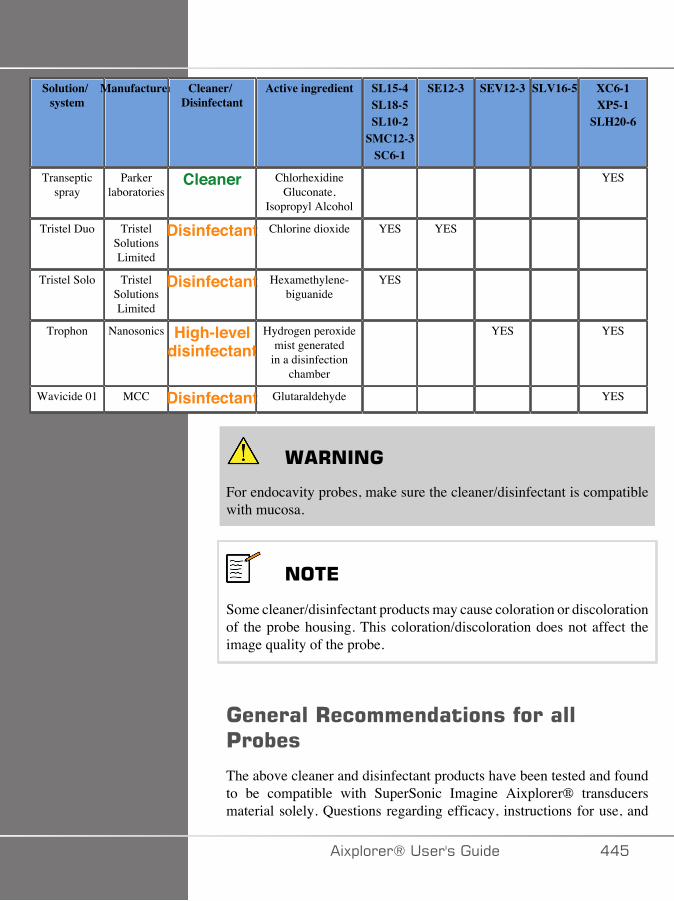
Solution/system
Manufacturer Cleaner/Disinfectant
Active ingredient SL15-4SL18-5SL10-2
SMC12-3SC6-1
SE12-3 SEV12-3 SLV16-5 XC6-1XP5-1
SLH20-6
Transepticspray
Parkerlaboratories
Cleaner ChlorhexidineGluconate,
Isopropyl Alcohol
YES
Tristel Duo TristelSolutionsLimited
Disinfectant Chlorine dioxide YES YES
Tristel Solo TristelSolutionsLimited
Disinfectant Hexamethylene-biguanide
YES
Trophon Nanosonics High-leveldisinfectant
Hydrogen peroxidemist generated
in a disinfectionchamber
YES YES
Wavicide 01 MCC Disinfectant Glutaraldehyde YES
� +����
For endocavity probes, make sure the cleaner/disinfectant is compatiblewith mucosa.
���*
Some cleaner/disinfectant products may cause coloration or discolorationof the probe housing. This coloration/discoloration does not affect theimage quality of the probe.
��������+���������������������'�����
The above cleaner and disinfectant products have been tested and foundto be compatible with SuperSonic Imagine Aixplorer® transducersmaterial solely. Questions regarding efficacy, instructions for use, and
�)!�����*����������� ���

proper handling should be directed to the manufacturer. Please checkwhether the recommended products are approved for use in your country.The use of a non-approved cleaner or disinfectant which results indamage to the probe will void the warranty. The use of products outsideof those on this list is to be done at the user’s and patient’s own risk.
��C �)!�����*�����������
#��E�%�4���
If soaking a transducer is required, the SL15-4, SL18-5, SL10-2, SC6-1,SMC12-3 transducers may only be immersed in liquid to a level of 3cm(1.18 in.) above the cable-strain relief junction. The SEV12-3, SLV16-5,XP5-1, XC6-1, SLH20-6 and SE12-3 transducers may be immersed inliquid to a level of 1m (39.37in.) above the cable-strain relief junction.See figure below.
According to the IEC 60529 standard, all Aixplorer probes are IPX7according to the figure below.
Never immerse the probe connector. Never immerse the cable-connectorjunction. Do not leave the transducer immersed longer than required fordisinfection. See figure below.
�)!�����*����������� ���
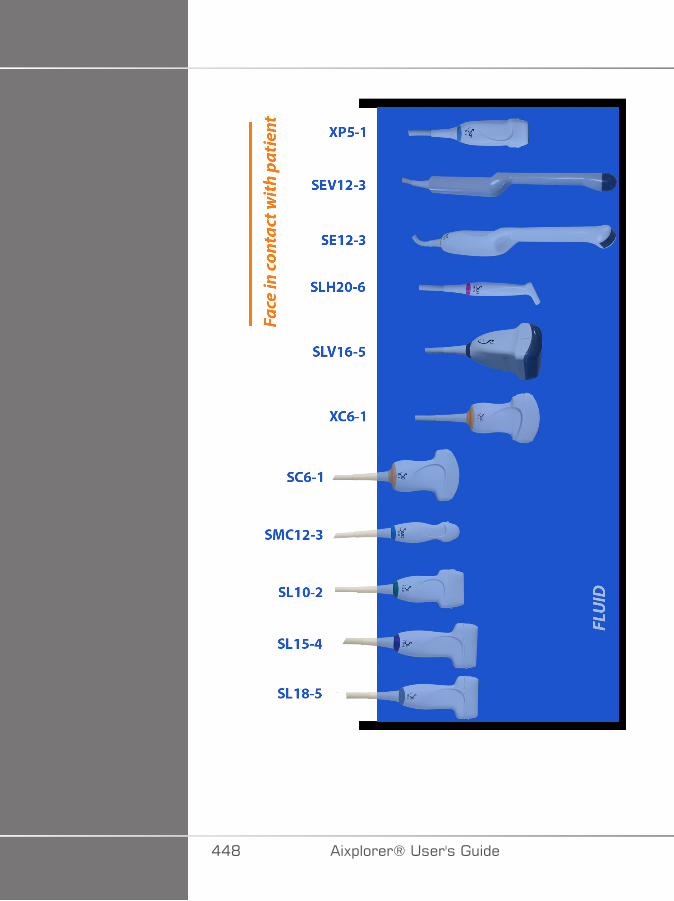
��D �)!�����*�����������

�������������������+�%����%������%�����!�������������������������������Additional information regarding cleaning and disinfection of ultrasoundtransducers can be found in the following references:
Chemical Sterilization and high-level disinfection in health care facilities.ANSI/AAMI ST58:2005 Sterilization and Disinfection of MedicalDevices: General Principles. Centers for Disease Control, Division ofHealthcare Quality Promotion.
http://www.cdc.gov/ncidod/hip/sterile/sterilgp.htm (5-2003) [http://www.cdc.gov/ncidod/hip/sterile/sterilgp.htm%20(5-2003)]
ODE Device Evaluation Information—FDA Cleared Sterilants andHigh Level Disinfectants with General Claims for Processing ReusableMedical and Dental Devices.
http://www.fda.gov
�)!�����*����������� ��E

��� �)!�����*�����������

�C�������� ����%
�)!�����*����������� ���

��� �)!�����*�����������
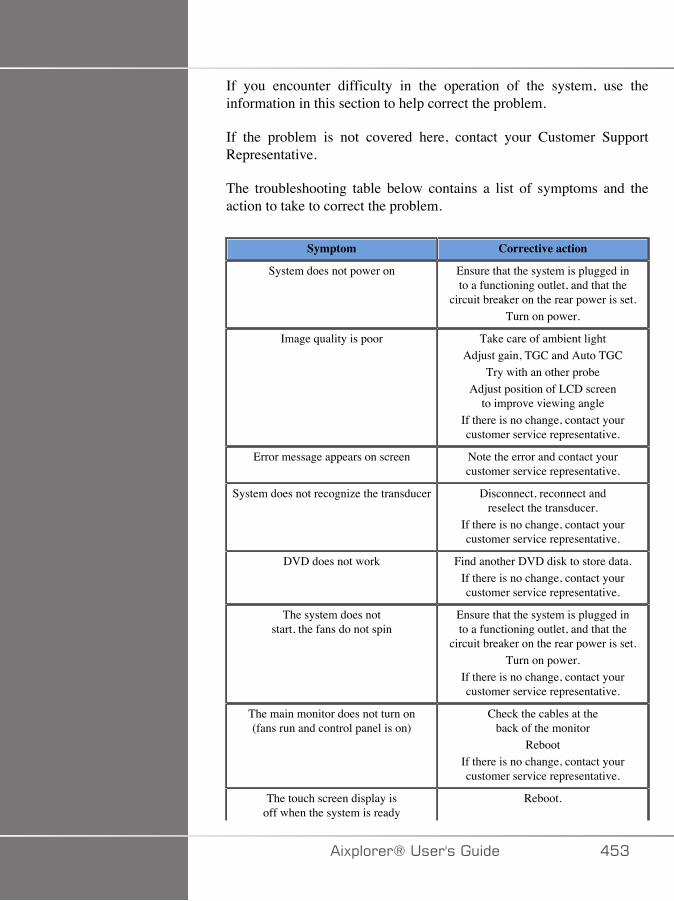
If you encounter difficulty in the operation of the system, use theinformation in this section to help correct the problem.
If the problem is not covered here, contact your Customer SupportRepresentative.
The troubleshooting table below contains a list of symptoms and theaction to take to correct the problem.
Symptom Corrective action
System does not power on Ensure that the system is plugged into a functioning outlet, and that the
circuit breaker on the rear power is set.Turn on power.
Image quality is poor Take care of ambient lightAdjust gain, TGC and Auto TGC
Try with an other probeAdjust position of LCD screen
to improve viewing angleIf there is no change, contact yourcustomer service representative.
Error message appears on screen Note the error and contact yourcustomer service representative.
System does not recognize the transducer Disconnect, reconnect andreselect the transducer.
If there is no change, contact yourcustomer service representative.
DVD does not work Find another DVD disk to store data.If there is no change, contact yourcustomer service representative.
The system does notstart, the fans do not spin
Ensure that the system is plugged into a functioning outlet, and that the
circuit breaker on the rear power is set.Turn on power.
If there is no change, contact yourcustomer service representative.
The main monitor does not turn on(fans run and control panel is on)
Check the cables at theback of the monitor
RebootIf there is no change, contact yourcustomer service representative.
The touch screen display isoff when the system is ready
Reboot.
�)!�����*����������� ��A
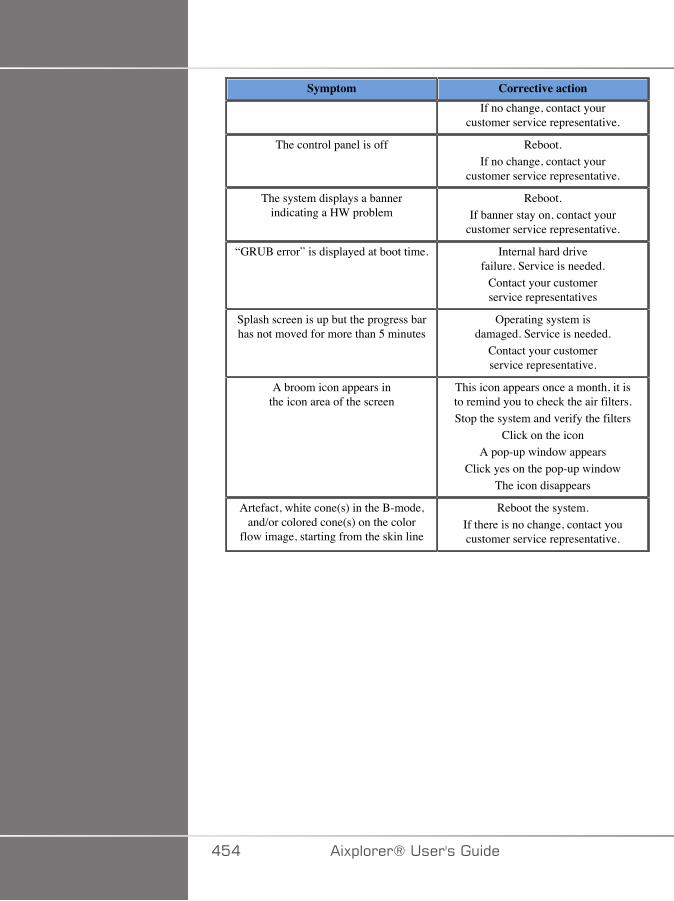
Symptom Corrective actionIf no change, contact your
customer service representative.
The control panel is off Reboot.If no change, contact your
customer service representative.
The system displays a bannerindicating a HW problem
Reboot.If banner stay on, contact your
customer service representative.
“GRUB error” is displayed at boot time. Internal hard drivefailure. Service is needed.
Contact your customerservice representatives
Splash screen is up but the progress barhas not moved for more than 5 minutes
Operating system isdamaged. Service is needed.
Contact your customerservice representative.
A broom icon appears inthe icon area of the screen
This icon appears once a month, it isto remind you to check the air filters.Stop the system and verify the filters
Click on the iconA pop-up window appears
Click yes on the pop-up windowThe icon disappears
Artefact, white cone(s) in the B-mode,and/or colored cone(s) on the color
flow image, starting from the skin line
Reboot the system.If there is no change, contact youcustomer service representative.
��� �)!�����*�����������
��� ��������$�!�������+�$����%
�)!�����*����������� ���

��C �)!�����*�����������
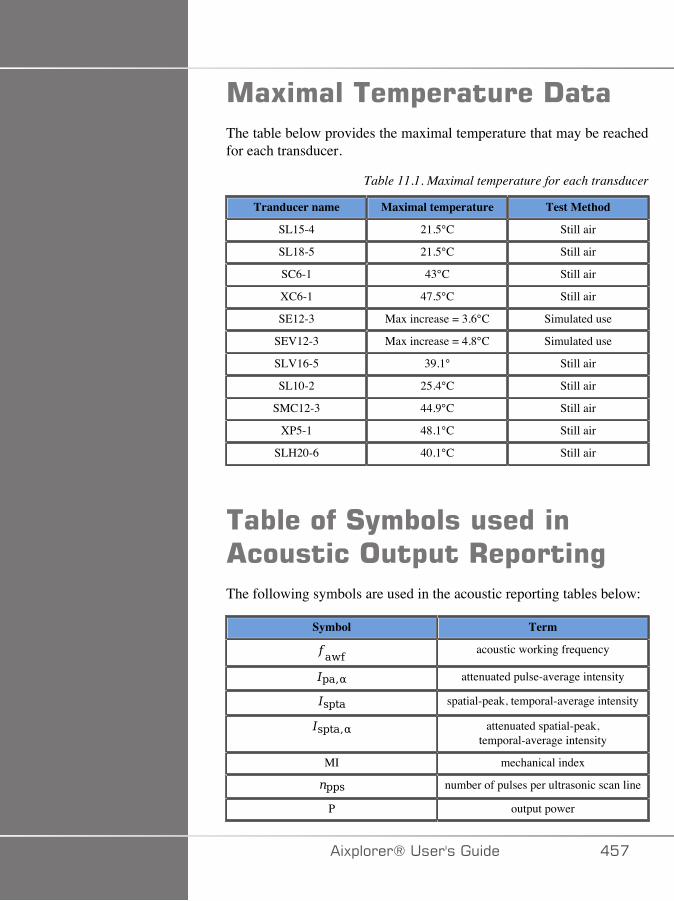
��5�������$�������!���The table below provides the maximal temperature that may be reachedfor each transducer.
Table 11.1. Maximal temperature for each transducer
Tranducer name Maximal temperature Test Method
SL15-4 21.5°C Still air
SL18-5 21.5°C Still air
SC6-1 43°C Still air
XC6-1 47.5°C Still air
SE12-3 Max increase = 3.6°C Simulated use
SEV12-3 Max increase = 4.8°C Simulated use
SLV16-5 39.1° Still air
SL10-2 25.4°C Still air
SMC12-3 44.9°C Still air
XP5-1 48.1°C Still air
SLH20-6 40.1°C Still air
���������#(����������� ��������$��+�$����%The following symbols are used in the acoustic reporting tables below:
Symbol Term
acoustic working frequency
attenuated pulse-average intensity
spatial-peak, temporal-average intensity
attenuated spatial-peak,temporal-average intensity
MI mechanical index
number of pulses per ultrasonic scan line
P output power
�)!�����*����������� ���
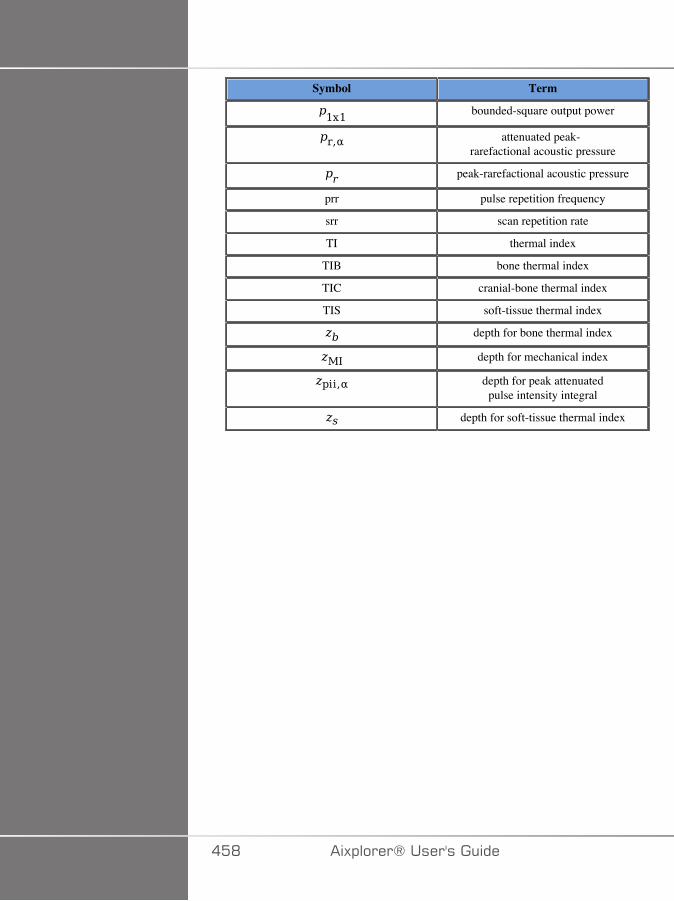
Symbol Term
bounded-square output power
attenuated peak-rarefactional acoustic pressure
peak-rarefactional acoustic pressure
prr pulse repetition frequency
srr scan repetition rate
TI thermal index
TIB bone thermal index
TIC cranial-bone thermal index
TIS soft-tissue thermal index
depth for bone thermal index
depth for mechanical index
depth for peak attenuatedpulse intensity integral
depth for soft-tissue thermal index
��D �)!�����*�����������
!������� ��������$�������
��������$�����������-�����#����(������
The SuperSonic Imagine Aixplorer® system complies with IEC60601-2-37 standard.
The following table summarizes the transducer/mode combinations forwhich the global maximum displayed MI or TI is greater than 1.0.
�)!�����*����������� ��E
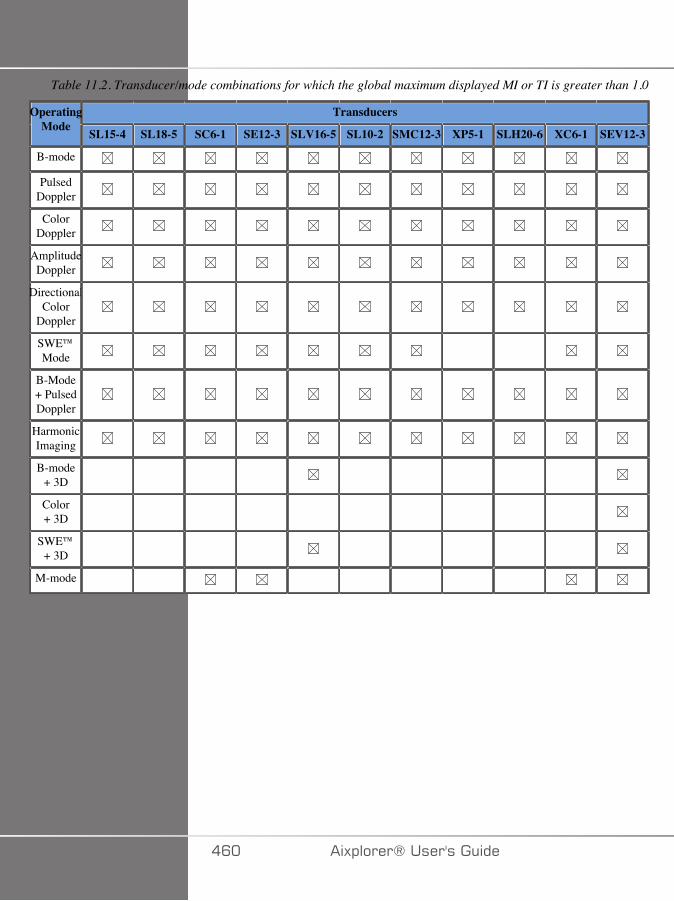
Table 11.2. Transducer/mode combinations for which the global maximum displayed MI or TI is greater than 1.0
TransducersOperatingMode SL15-4 SL18-5 SC6-1 SE12-3 SLV16-5 SL10-2 SMC12-3 XP5-1 SLH20-6 XC6-1 SEV12-3
B-mode
PulsedDoppler
ColorDoppler
AmplitudeDoppler
DirectionalColor
Doppler
SWE™Mode
B-Mode+ PulsedDoppler
HarmonicImaging
B-mode+ 3D
Color+ 3D
SWE™+ 3D
M-mode
�C� �)!�����*�����������
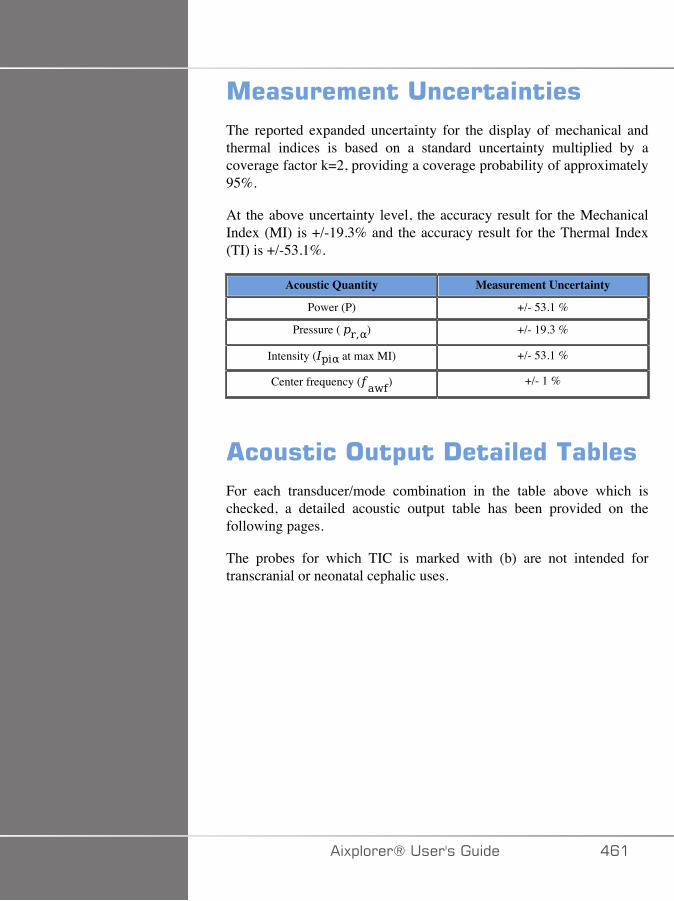
����������������������The reported expanded uncertainty for the display of mechanical andthermal indices is based on a standard uncertainty multiplied by acoverage factor k=2, providing a coverage probability of approximately95%.
At the above uncertainty level, the accuracy result for the MechanicalIndex (MI) is +/-19.3% and the accuracy result for the Thermal Index(TI) is +/-53.1%.
Acoustic Quantity Measurement Uncertainty
Power (P) +/- 53.1 %
Pressure ( ) +/- 19.3 %
Intensity ( at max MI) +/- 53.1 %
Center frequency ( ) +/- 1 %
��������$��!�������������For each transducer/mode combination in the table above which ischecked, a detailed acoustic output table has been provided on thefollowing pages.
The probes for which TIC is marked with (b) are not intended fortranscranial or neonatal cephalic uses.
�)!�����*����������� �C�

#4�:�8����������
Operating Mode: B + CD Doppler
TIS TIBIndex Label MI At
surfaceBelowsurface
Atsurface
Belowsurface
TIC
Maximum index value 1.7 (a) (a) (a)
Index components value # - # -
at (MPa) CD:3.55
B: 3.82
(mW) # # #
(mW) # #
(cm) -
(cm) -
(cm) CD:1.6
B: 1.41
(cm) -
Associatedacoustic parameters
(MHz) CD:7.38
B: 5.25
# # #
prr (Hz) CD:176
B: 16
srr (Hz) 14
CD: 11B: 1
at (W/cm²) CD: 26B: 310
at (mW/cm²) CD:123
B: 12
Other information
at (mW/cm²) CD:279
B: 21
�C� �)!�����*�����������
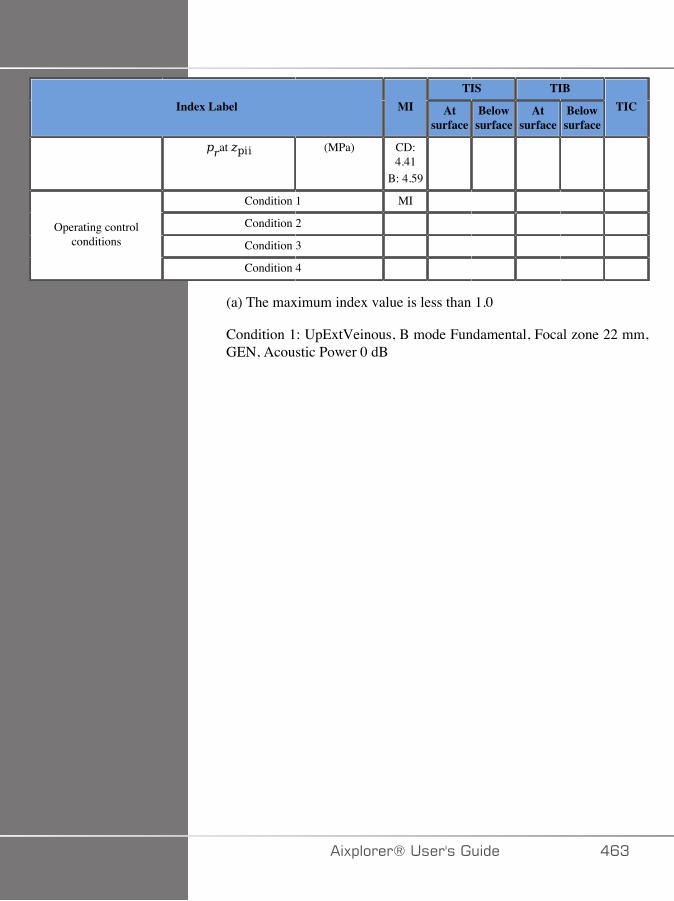
TIS TIBIndex Label MI At
surfaceBelowsurface
Atsurface
Belowsurface
TIC
at (MPa) CD:4.41
B: 4.59
Condition 1 MI
Condition 2
Condition 3 Operating control
conditions
Condition 4
(a) The maximum index value is less than 1.0
Condition 1: UpExtVeinous, B mode Fundamental, Focal zone 22 mm,GEN, Acoustic Power 0 dB
�)!�����*����������� �CA
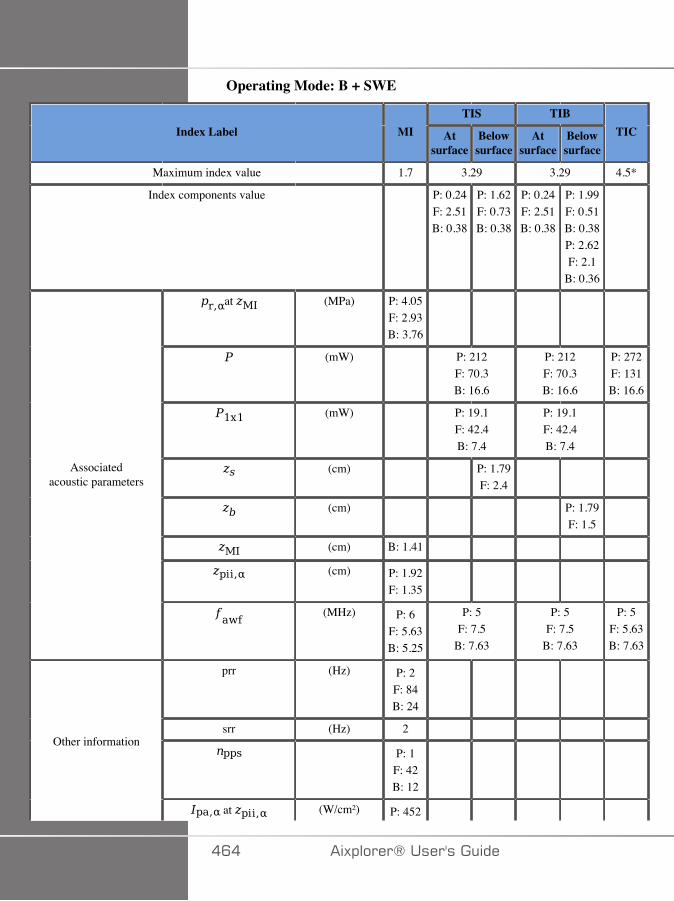
Operating Mode: B + SWE
TIS TIBIndex Label MI At
surfaceBelowsurface
Atsurface
Belowsurface
TIC
Maximum index value 1.7 3.29 3.29 4.5*
Index components value P: 0.24F: 2.51B: 0.38
P: 1.62F: 0.73B: 0.38
P: 0.24F: 2.51B: 0.38
P: 1.99F: 0.51B: 0.38P: 2.62F: 2.1
B: 0.36
at (MPa) P: 4.05F: 2.93B: 3.76
(mW) P: 212F: 70.3B: 16.6
P: 212F: 70.3B: 16.6
P: 272F: 131B: 16.6
(mW) P: 19.1F: 42.4B: 7.4
P: 19.1F: 42.4B: 7.4
(cm) P: 1.79F: 2.4
(cm) P: 1.79F: 1.5
(cm) B: 1.41
(cm) P: 1.92F: 1.35
Associatedacoustic parameters
(MHz) P: 6F: 5.63B: 5.25
P: 5F: 7.5
B: 7.63
P: 5F: 7.5
B: 7.63
P: 5F: 5.63B: 7.63
prr (Hz) P: 2F: 84B: 24
srr (Hz) 2
P: 1F: 42B: 12
Other information
at (W/cm²) P: 452
�C� �)!�����*�����������
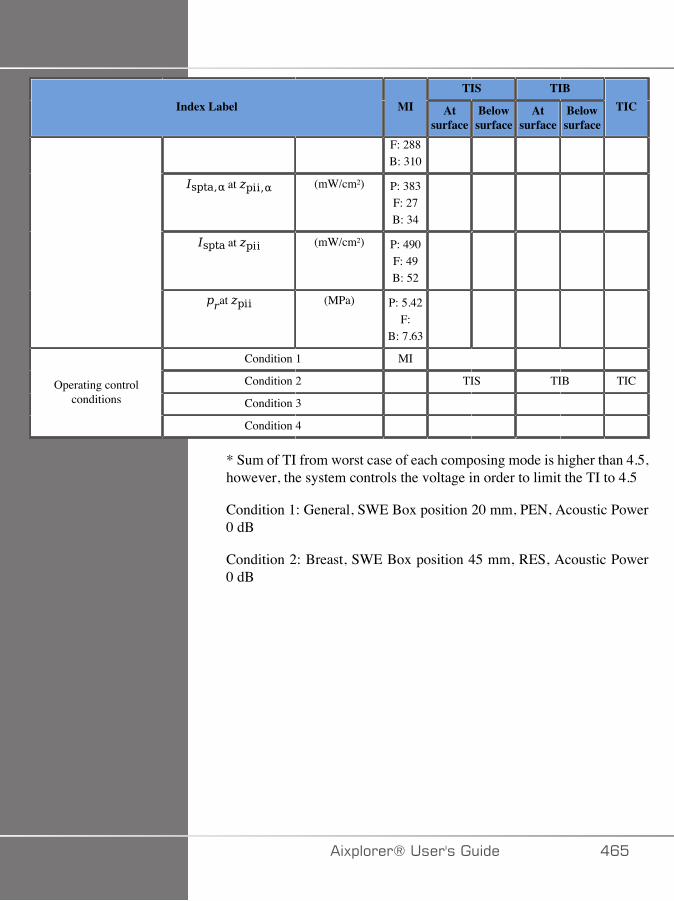
TIS TIBIndex Label MI At
surfaceBelowsurface
Atsurface
Belowsurface
TIC
F: 288B: 310
at (mW/cm²) P: 383F: 27B: 34
at (mW/cm²) P: 490F: 49B: 52
at (MPa) P: 5.42F:
B: 7.63
Condition 1 MI
Condition 2 TIS TIB TIC
Condition 3 Operating control
conditions
Condition 4
* Sum of TI from worst case of each composing mode is higher than 4.5,however, the system controls the voltage in order to limit the TI to 4.5
Condition 1: General, SWE Box position 20 mm, PEN, Acoustic Power0 dB
Condition 2: Breast, SWE Box position 45 mm, RES, Acoustic Power0 dB
�)!�����*����������� �C�

Operating Mode: B + Trivu
TIS TIBIndex Label MI At
surfaceBelowsurface
Atsurface
Belowsurface
TIC
Maximum index value 1.7 4.19 4.19 4.5*
Index components value P: 0.24F: 2.51CDF:0.9
B: 0.38
P: 1.62F: 0.73CDF:0.26
B: 0.38
P: 0.24F: 2.51CDF:0.89
B: 0.38
P: 1.99F: 0.51CDF:0.18
B: 0.38P: 2.62F: 2.1CDF:0.75
B: 0.36
at (MPa) P: 4.05F: 2.93CDF:2.93
B: 3.76
(mW) P: 212F: 70.3
CDF: 25.1B: 16.6
P: 212F: 70.3
CDF: 70.3B: 16.6
P: 272F: 131CDF:46.8
B: 16.6
(mW) P: 21F: 24
CDF: 8.57B: 11.1
P: 21F: 24
CDF: 8.57B: 11.1
(cm) P: 1.79F: 2.4CDF:2.4
(cm) P: 1.79F: 1.5CDF:1.52
(cm) B: 1.41
Associatedacoustic parameters
(cm) P: 1.92F: 1.35
�CC �)!�����*�����������
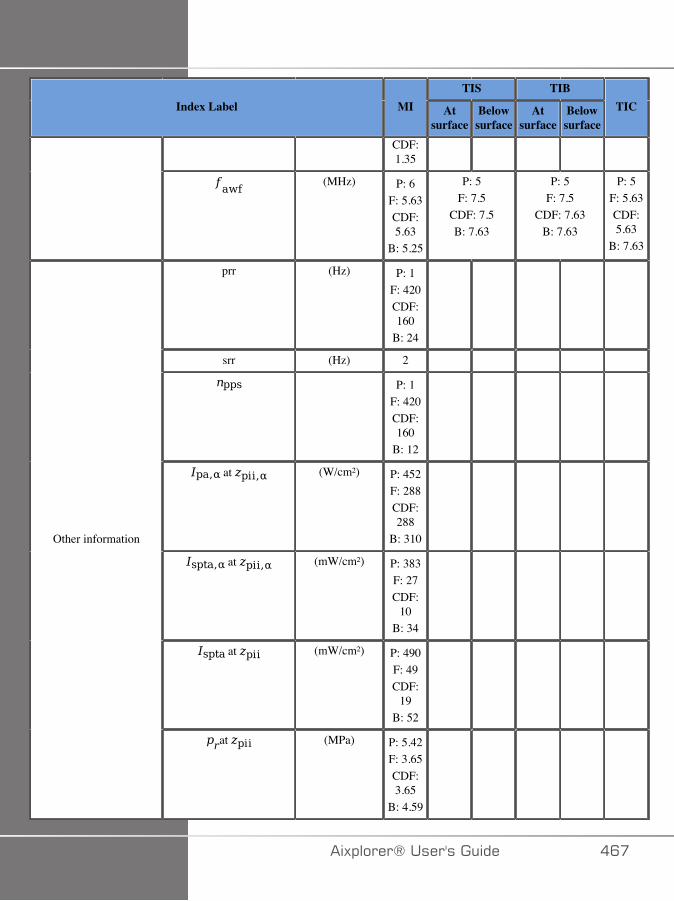
TIS TIBIndex Label MI At
surfaceBelowsurface
Atsurface
Belowsurface
TIC
CDF:1.35
(MHz) P: 6F: 5.63CDF:5.63
B: 5.25
P: 5F: 7.5
CDF: 7.5B: 7.63
P: 5F: 7.5
CDF: 7.63B: 7.63
P: 5F: 5.63CDF:5.63
B: 7.63
prr (Hz) P: 1F: 420CDF:160
B: 24
srr (Hz) 2
P: 1F: 420CDF:160
B: 12
at (W/cm²) P: 452F: 288CDF:288
B: 310
at (mW/cm²) P: 383F: 27CDF:
10B: 34
at (mW/cm²) P: 490F: 49CDF:
19B: 52
Other information
at (MPa) P: 5.42F: 3.65CDF:3.65
B: 4.59
�)!�����*����������� �C�
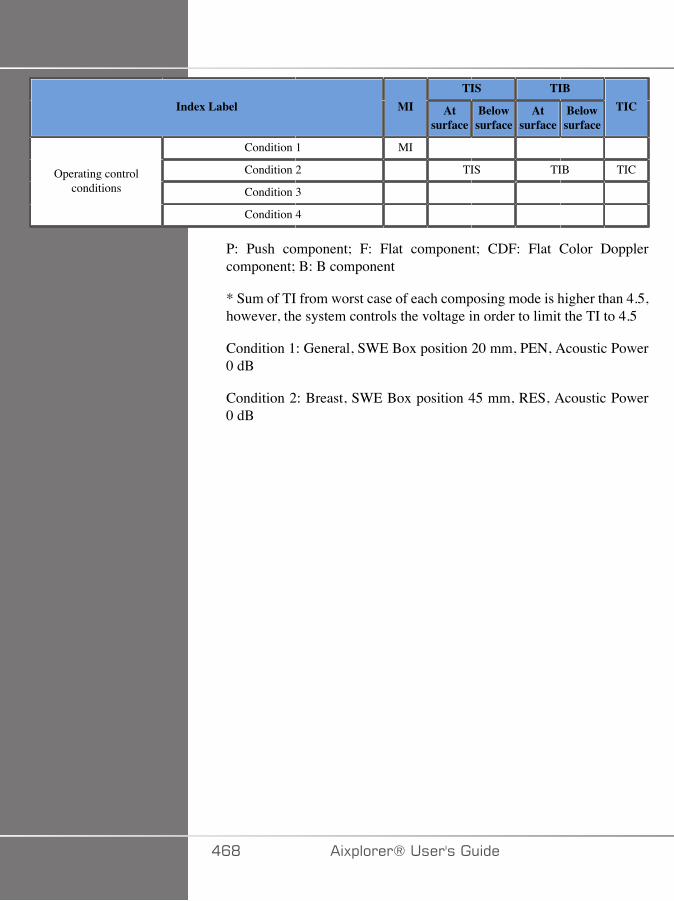
TIS TIBIndex Label MI At
surfaceBelowsurface
Atsurface
Belowsurface
TIC
Condition 1 MI
Condition 2 TIS TIB TIC
Condition 3 Operating control
conditions
Condition 4
P: Push component; F: Flat component; CDF: Flat Color Dopplercomponent; B: B component
* Sum of TI from worst case of each composing mode is higher than 4.5,however, the system controls the voltage in order to limit the TI to 4.5
Condition 1: General, SWE Box position 20 mm, PEN, Acoustic Power0 dB
Condition 2: Breast, SWE Box position 45 mm, RES, Acoustic Power0 dB
�CD �)!�����*�����������
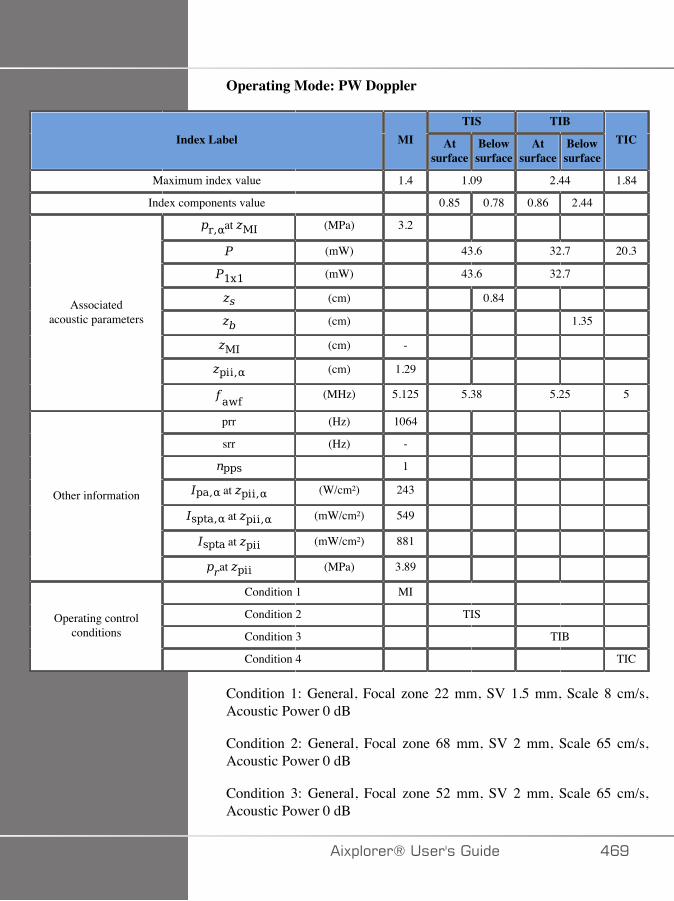
Operating Mode: PW Doppler
TIS TIBIndex Label MI At
surfaceBelowsurface
Atsurface
Belowsurface
TIC
Maximum index value 1.4 1.09 2.44 1.84
Index components value 0.85 0.78 0.86 2.44
at (MPa) 3.2
(mW) 43.6 32.7 20.3
(mW) 43.6 32.7
(cm) 0.84
(cm) 1.35
(cm) -
(cm) 1.29
Associatedacoustic parameters
(MHz) 5.125 5.38 5.25 5
prr (Hz) 1064
srr (Hz) -
1
at (W/cm²) 243
at (mW/cm²) 549
at (mW/cm²) 881
Other information
at (MPa) 3.89
Condition 1 MI
Condition 2 TIS
Condition 3 TIB Operating control
conditions
Condition 4 TIC
Condition 1: General, Focal zone 22 mm, SV 1.5 mm, Scale 8 cm/s,Acoustic Power 0 dB
Condition 2: General, Focal zone 68 mm, SV 2 mm, Scale 65 cm/s,Acoustic Power 0 dB
Condition 3: General, Focal zone 52 mm, SV 2 mm, Scale 65 cm/s,Acoustic Power 0 dB
�)!�����*����������� �CE

Condition 4: General, Focal zone 7 mm, SV 0.5 mm, Scale 65 cm/s,Acoustic Power 0 dB
��� �)!�����*�����������

#4�@�:����������
Operating Mode: B + CD Doppler
TIS TIBIndex Label MI At
surfaceBelowsurface
Atsurface
Belowsurface
TIC
Maximum index value 1.6 (a) (a) (a)
Index components value # - # -
at (MPa) CD:2.88
B: 3.34
(mW) # # #
(mW) # #
(cm) -
(cm) -
(cm) CD:1.4
B: 1.43
(cm) -
Associatedacoustic parameters
(MHz) CD:7.5
B: 5.25
# # #
prr (Hz) CD:288
B: 70
srr (Hz) 18
CD: 16B: 4
at (W/cm²) CD:311
B: 41
at (mW/cm²) CD: 94B: 15
at (mW/cm²) CD: 96B: 54
Other information
at (MPa) CD:4.41
�)!�����*����������� ���

TIS TIBIndex Label MI At
surfaceBelowsurface
Atsurface
Belowsurface
TIC
B: 4.59
Condition 1 MI
Condition 2
Condition 3 Operating control
conditions
Condition 4
(a) The maximum index value is less than 1.0
Condition 1: B: Thyroid, B mode Harmonic, Focal zone 14 mm, PEN,SuperCompound on, HD/FR med, Acoustic Power 0 dB
COL: Breast, Focal zone 14 mm, PEN, HD/FR med, Acoustic Power 0dB
��� �)!�����*�����������

Operating Mode: B + SWE
TIS TIBIndex Label MI At
surfaceBelowsurface
Atsurface
Belowsurface
TIC
Maximum index value 1.8 2.84 3.21 4.0
Index components value P: 0.24F: 1.64B: 0.31
P: 1.61F: 0.91B: 0.31
P: 0.24F: 1.64B: 0.31
P: 1.99F: 0.91B: 0.31P: 2.62F: 1.37B: 0.26
at (MPa) P: 3.99F: 2.54B: 3.34
(mW) P: 125F: 79B: 7.3
P: 125F: 79B: 7.3
P: 125F: 79
B: 11.6
(mW) P: 9.9F: 79B: 9.7
P: 9.9F: 79.9B: 7.3
(cm) P: 1.79F: 2.34
(cm) P: 1.79F: 1.34
(cm) B: 1.37
(cm) P: 1.42F: 1.55
Associatedacoustic parameters
(MHz) P: 5F: 7.5
B: 5.25
P: 5F: 7.5
B: 7.63
P: 5F: 7.5
B: 7.63
P: 5F: 5.63B: 7.63
prr (Hz) P: 2F: 624B: 70
srr (Hz) 1
P: 2F: 624B: 70
Other information
at (W/cm²) P: 21.9
�)!�����*����������� ��A

TIS TIBIndex Label MI At
surfaceBelowsurface
Atsurface
Belowsurface
TIC
F: 10.5B: 41
at (mW/cm²) P: 471F: 99B: 15
at (mW/cm²) P: 490F: 221B: 54
at (MPa) P: 5.2F: 3.8B: 4.6
Condition 1 MI
Condition 2 TIS TIB TIC
Condition 3 Operating control
conditions
Condition 4
P: Push component; F: Flat component; B: B component
Condition 1: PUSH and FLAT: Breast, SWE Box position 20 mm, Std,Acoustic Power 0 dB
B: Thyroid, B mode Harmonic, Focal zone 14 mm, PEN,SuperCompound on, HD/FR med, Acoustic Power 0 dB
Condition 2: PUSH and FLAT: Breast, SWE Box position 45 mm, Std,Acoustic Power 0 dB
B: Thyroid, B mode Harmonic, Focal zone 14 mm, PEN,SuperCompound on, HD/FR med, Acoustic Power 0 dB
��� �)!�����*�����������
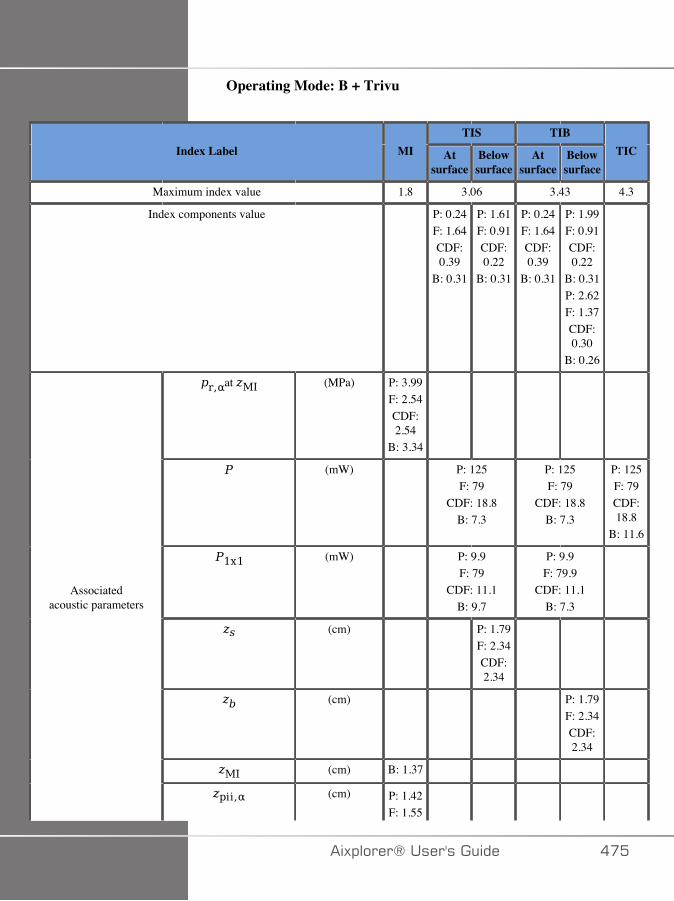
Operating Mode: B + Trivu
TIS TIBIndex Label MI At
surfaceBelowsurface
Atsurface
Belowsurface
TIC
Maximum index value 1.8 3.06 3.43 4.3
Index components value P: 0.24F: 1.64CDF:0.39
B: 0.31
P: 1.61F: 0.91CDF:0.22
B: 0.31
P: 0.24F: 1.64CDF:0.39
B: 0.31
P: 1.99F: 0.91CDF:0.22
B: 0.31P: 2.62F: 1.37CDF:0.30
B: 0.26
at (MPa) P: 3.99F: 2.54CDF:2.54
B: 3.34
(mW) P: 125F: 79
CDF: 18.8B: 7.3
P: 125F: 79
CDF: 18.8B: 7.3
P: 125F: 79CDF:18.8
B: 11.6
(mW) P: 9.9F: 79
CDF: 11.1B: 9.7
P: 9.9F: 79.9
CDF: 11.1B: 7.3
(cm) P: 1.79F: 2.34CDF:2.34
(cm) P: 1.79F: 2.34CDF:2.34
(cm) B: 1.37
Associatedacoustic parameters
(cm) P: 1.42F: 1.55
�)!�����*����������� ���
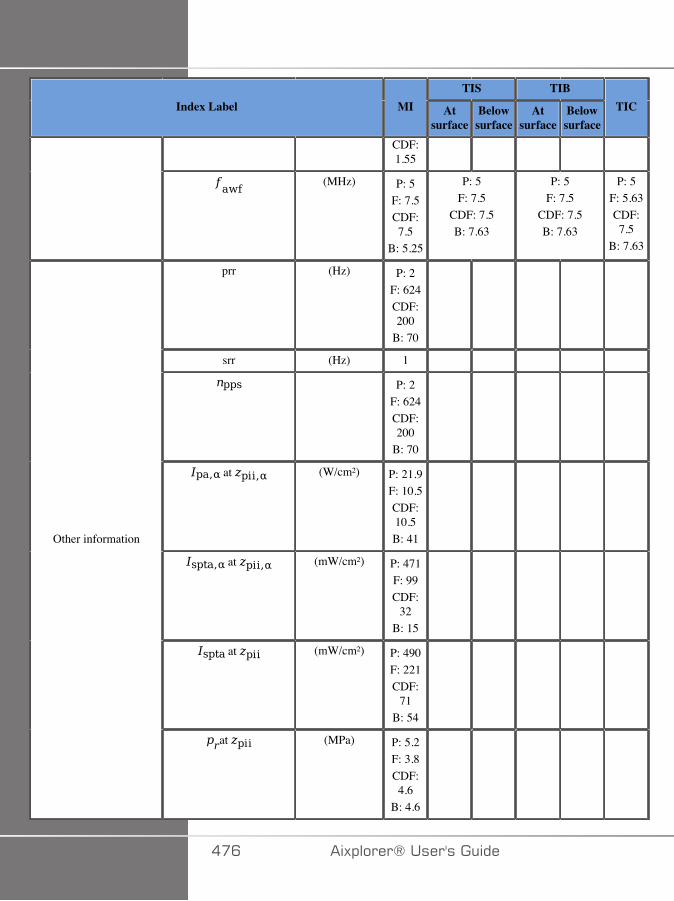
TIS TIBIndex Label MI At
surfaceBelowsurface
Atsurface
Belowsurface
TIC
CDF:1.55
(MHz) P: 5F: 7.5CDF:7.5
B: 5.25
P: 5F: 7.5
CDF: 7.5B: 7.63
P: 5F: 7.5
CDF: 7.5B: 7.63
P: 5F: 5.63CDF:7.5
B: 7.63
prr (Hz) P: 2F: 624CDF:200
B: 70
srr (Hz) 1
P: 2F: 624CDF:200
B: 70
at (W/cm²) P: 21.9F: 10.5CDF:10.5B: 41
at (mW/cm²) P: 471F: 99CDF:
32B: 15
at (mW/cm²) P: 490F: 221CDF:
71B: 54
Other information
at (MPa) P: 5.2F: 3.8CDF:4.6
B: 4.6
��C �)!�����*�����������
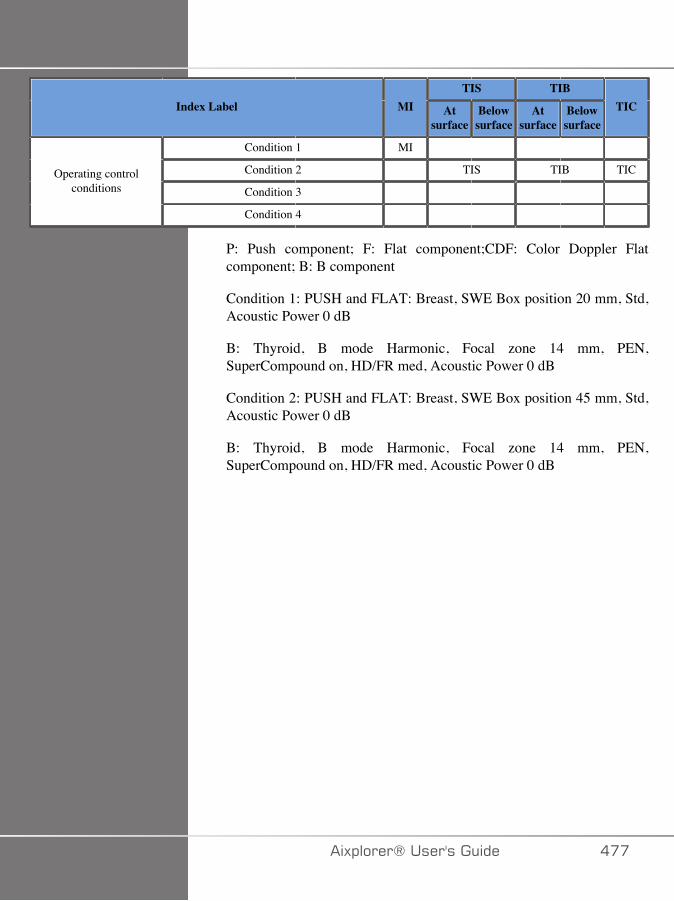
TIS TIBIndex Label MI At
surfaceBelowsurface
Atsurface
Belowsurface
TIC
Condition 1 MI
Condition 2 TIS TIB TIC
Condition 3 Operating control
conditions
Condition 4
P: Push component; F: Flat component;CDF: Color Doppler Flatcomponent; B: B component
Condition 1: PUSH and FLAT: Breast, SWE Box position 20 mm, Std,Acoustic Power 0 dB
B: Thyroid, B mode Harmonic, Focal zone 14 mm, PEN,SuperCompound on, HD/FR med, Acoustic Power 0 dB
Condition 2: PUSH and FLAT: Breast, SWE Box position 45 mm, Std,Acoustic Power 0 dB
B: Thyroid, B mode Harmonic, Focal zone 14 mm, PEN,SuperCompound on, HD/FR med, Acoustic Power 0 dB
�)!�����*����������� ���
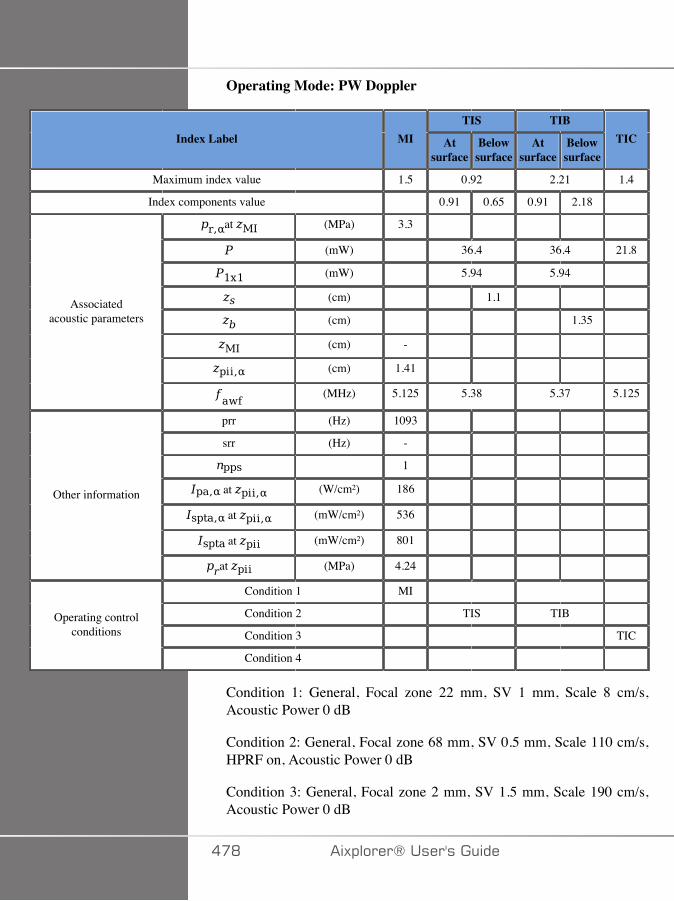
Operating Mode: PW Doppler
TIS TIBIndex Label MI At
surfaceBelowsurface
Atsurface
Belowsurface
TIC
Maximum index value 1.5 0.92 2.21 1.4
Index components value 0.91 0.65 0.91 2.18
at (MPa) 3.3
(mW) 36.4 36.4 21.8
(mW) 5.94 5.94
(cm) 1.1
(cm) 1.35
(cm) -
(cm) 1.41
Associatedacoustic parameters
(MHz) 5.125 5.38 5.37 5.125
prr (Hz) 1093
srr (Hz) -
1
at (W/cm²) 186
at (mW/cm²) 536
at (mW/cm²) 801
Other information
at (MPa) 4.24
Condition 1 MI
Condition 2 TIS TIB
Condition 3 TICOperating control
conditions
Condition 4
Condition 1: General, Focal zone 22 mm, SV 1 mm, Scale 8 cm/s,Acoustic Power 0 dB
Condition 2: General, Focal zone 68 mm, SV 0.5 mm, Scale 110 cm/s,HPRF on, Acoustic Power 0 dB
Condition 3: General, Focal zone 2 mm, SV 1.5 mm, Scale 190 cm/s,Acoustic Power 0 dB
��D �)!�����*�����������

#�<�����������������������������
Operating Mode: B + CD Doppler
TIS TIBIndex Label MI At
surfaceBelowsurface
Atsurface
Belowsurface
TIC
Maximum index value 1.6 2.38 2.38 (b)
Index components value CD:1.92
B: 0.46
- CD:1.92
B: 0.46
-
at (MPa) CD:2.35
B: 2.38
(mW) CD: 277B: 60
CD: 277B: 60
#
(mW) CD: 218B: 52.4
CD: 218B: 52.4
(cm) -
(cm) -
(cm) CD:1.23
B: 2.36
(cm) -
Associatedacoustic parameters
(MHz) CD:3.06
B: 2.19
CD: 2.44B: 1.88
CD: 2.44B: 1.88
#
prr (Hz) CD: 99B: 9
srr (Hz) 9
CD: 11B: 1
at (W/cm²) CD:164
B: 118
at (mW/cm²) CD: 35B: 5
Other information
at (mW/cm²) CD: 46
�)!�����*����������� ��E

TIS TIBIndex Label MI At
surfaceBelowsurface
Atsurface
Belowsurface
TIC
B: 8
at (MPa) CD:2.69
B: 3.17
Condition 1 MI TIS TIB #
Condition 2 #
Condition 3 #Operating control
conditions
Condition 4 #
CD: Color Doppler mode; B: B mode
(b) This probe is not intended for transcranial or neonatal cephalic uses
Condition1: General, B mode Fundamental, Focal zone 22 mm, GEN,Acoustic Power 0 dB
�D� �)!�����*�����������
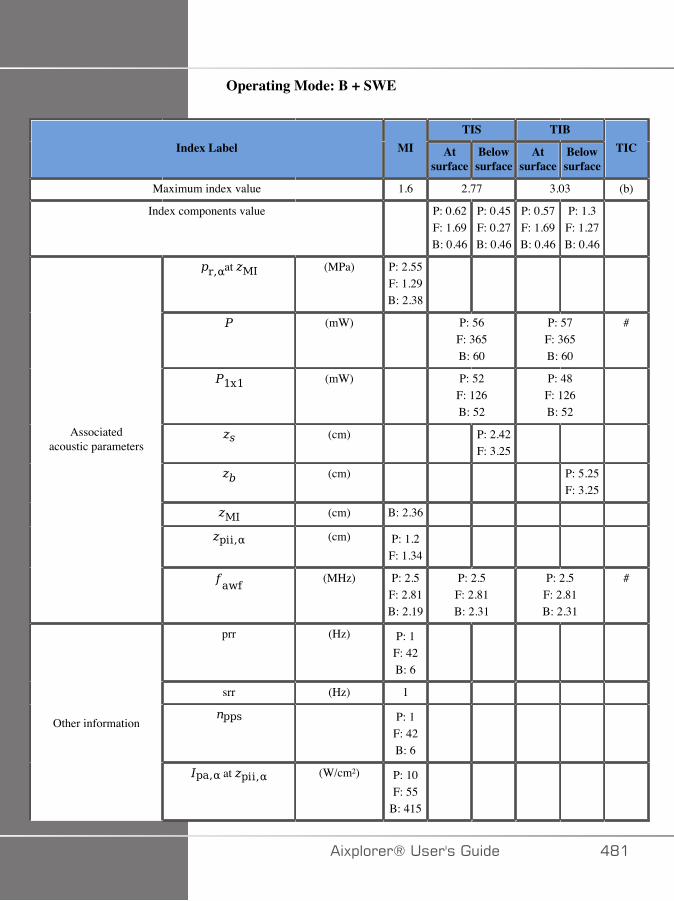
Operating Mode: B + SWE
TIS TIBIndex Label MI At
surfaceBelowsurface
Atsurface
Belowsurface
TIC
Maximum index value 1.6 2.77 3.03 (b)
Index components value P: 0.62F: 1.69B: 0.46
P: 0.45F: 0.27B: 0.46
P: 0.57F: 1.69B: 0.46
P: 1.3F: 1.27B: 0.46
at (MPa) P: 2.55F: 1.29B: 2.38
(mW) P: 56F: 365B: 60
P: 57F: 365B: 60
#
(mW) P: 52F: 126B: 52
P: 48F: 126B: 52
(cm) P: 2.42F: 3.25
(cm) P: 5.25F: 3.25
(cm) B: 2.36
(cm) P: 1.2F: 1.34
Associatedacoustic parameters
(MHz) P: 2.5F: 2.81B: 2.19
P: 2.5F: 2.81B: 2.31
P: 2.5F: 2.81B: 2.31
#
prr (Hz) P: 1F: 42B: 6
srr (Hz) 1
P: 1F: 42B: 6
Other information
at (W/cm²) P: 10F: 55
B: 415
�)!�����*����������� �D�
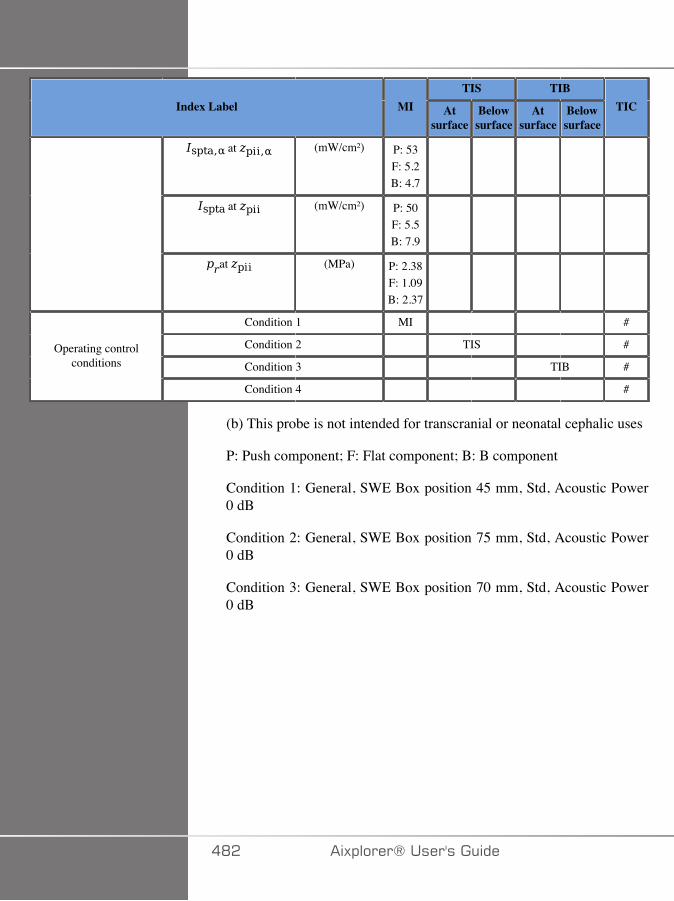
TIS TIBIndex Label MI At
surfaceBelowsurface
Atsurface
Belowsurface
TIC
at (mW/cm²) P: 53F: 5.2B: 4.7
at (mW/cm²) P: 50F: 5.5B: 7.9
at (MPa) P: 2.38F: 1.09B: 2.37
Condition 1 MI #
Condition 2 TIS #
Condition 3 TIB #Operating control
conditions
Condition 4 #
(b) This probe is not intended for transcranial or neonatal cephalic uses
P: Push component; F: Flat component; B: B component
Condition 1: General, SWE Box position 45 mm, Std, Acoustic Power0 dB
Condition 2: General, SWE Box position 75 mm, Std, Acoustic Power0 dB
Condition 3: General, SWE Box position 70 mm, Std, Acoustic Power0 dB
�D� �)!�����*�����������

Operating Mode: PW Doppler
TIS TIBIndex Label MI At
surfaceBelowsurface
Atsurface
Belowsurface
TIC
Maximum index value 1.0 3.74 4.5 (b)
Index components value 3.74 2.1 2.42 4.5
at (MPa) 1.52
(mW) 332 246 #
(mW) 349 226
(cm) 2.57
(cm) 5.8
(cm) -
(cm) 2.91
Associatedacoustic parameters
(MHz) 2.19 2.25 2.25 #
prr (Hz) 3787
srr (Hz) -
3787
at (W/cm²) 276
at (mW/cm²) 549
at (mW/cm²) 876
Other information
at (MPa) 1.51
Condition 1 MI
Condition 2 TIS
Condition 3 TIB Operating control
conditions
Condition 4
(b) This probe is not intended for transcranial or neonatal cephalic uses
Condition 1: General, Focal zone 48 mm, SV 1.5 mm, Scale 65 cm/s,Acoustic Power 0 dB
Condition 2: General, Focal zone 180 mm, SV 3.0 mm, Scale 65 cm/s,Acoustic Power 0 dB
�)!�����*����������� �DA

Condition 3: General, Focal zone 180 mm, SV 10.0 mm, Scale 65 cm/s, Acoustic Power 0 dB
�D� �)!�����*�����������
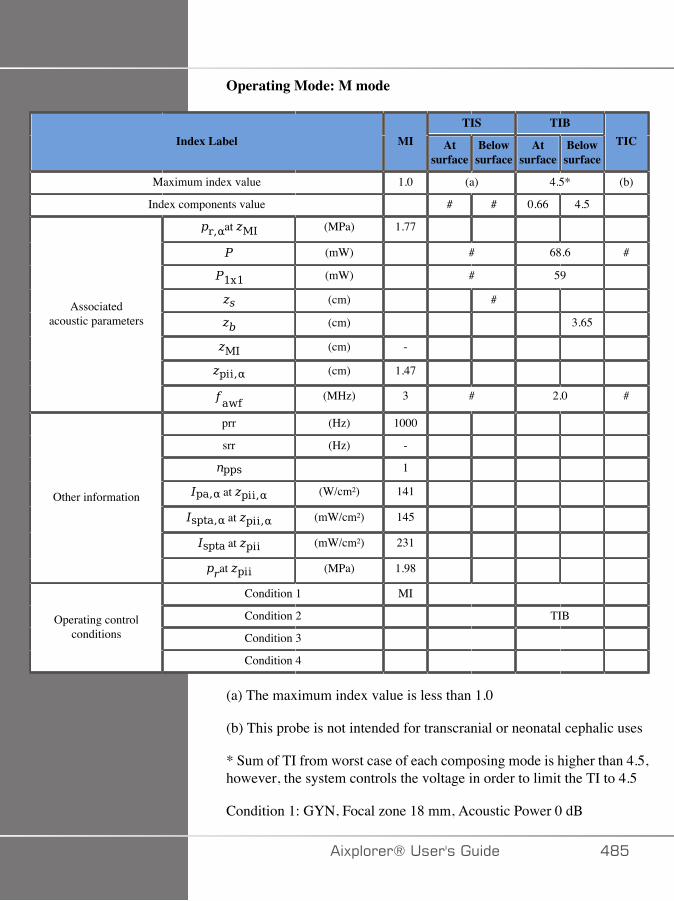
Operating Mode: M mode
TIS TIBIndex Label MI At
surfaceBelowsurface
Atsurface
Belowsurface
TIC
Maximum index value 1.0 (a) 4.5* (b)
Index components value # # 0.66 4.5
at (MPa) 1.77
(mW) # 68.6 #
(mW) # 59
(cm) #
(cm) 3.65
(cm) -
(cm) 1.47
Associatedacoustic parameters
(MHz) 3 # 2.0 #
prr (Hz) 1000
srr (Hz) -
1
at (W/cm²) 141
at (mW/cm²) 145
at (mW/cm²) 231
Other information
at (MPa) 1.98
Condition 1 MI
Condition 2 TIB
Condition 3 Operating control
conditions
Condition 4
(a) The maximum index value is less than 1.0
(b) This probe is not intended for transcranial or neonatal cephalic uses
* Sum of TI from worst case of each composing mode is higher than 4.5,however, the system controls the voltage in order to limit the TI to 4.5
Condition 1: GYN, Focal zone 18 mm, Acoustic Power 0 dB
�)!�����*����������� �D�

Condition 2: GYN, Focal zone 180 mm, Acoustic Power 0 dB
�DC �)!�����*�����������
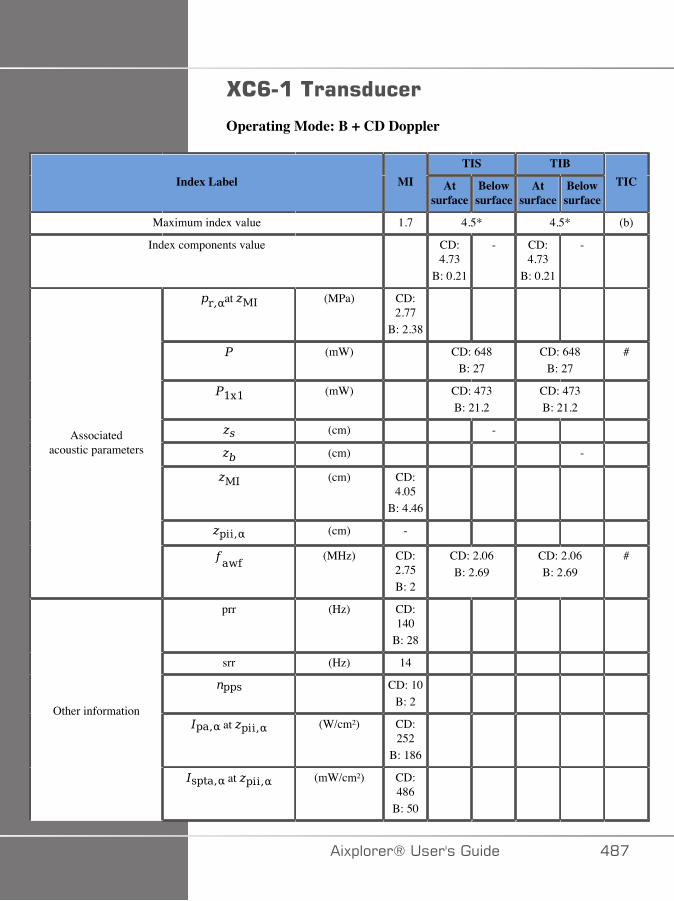
G�<������������
Operating Mode: B + CD Doppler
TIS TIBIndex Label MI At
surfaceBelowsurface
Atsurface
Belowsurface
TIC
Maximum index value 1.7 4.5* 4.5* (b)
Index components value CD:4.73
B: 0.21
- CD:4.73
B: 0.21
-
at (MPa) CD:2.77
B: 2.38
(mW) CD: 648B: 27
CD: 648B: 27
#
(mW) CD: 473B: 21.2
CD: 473B: 21.2
(cm) -
(cm) -
(cm) CD:4.05
B: 4.46
(cm) -
Associatedacoustic parameters
(MHz) CD:2.75B: 2
CD: 2.06B: 2.69
CD: 2.06B: 2.69
#
prr (Hz) CD:140
B: 28
srr (Hz) 14
CD: 10B: 2
at (W/cm²) CD:252
B: 186
Other information
at (mW/cm²) CD:486
B: 50
�)!�����*����������� �D�
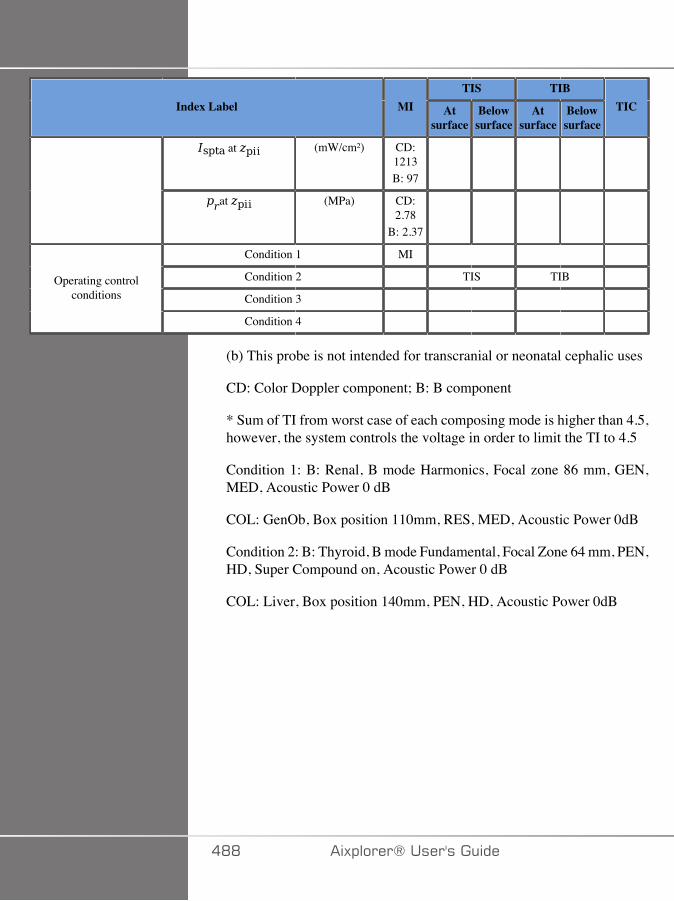
TIS TIBIndex Label MI At
surfaceBelowsurface
Atsurface
Belowsurface
TIC
at (mW/cm²) CD:1213B: 97
at (MPa) CD:2.78
B: 2.37
Condition 1 MI
Condition 2 TIS TIB
Condition 3 Operating control
conditions
Condition 4
(b) This probe is not intended for transcranial or neonatal cephalic uses
CD: Color Doppler component; B: B component
* Sum of TI from worst case of each composing mode is higher than 4.5,however, the system controls the voltage in order to limit the TI to 4.5
Condition 1: B: Renal, B mode Harmonics, Focal zone 86 mm, GEN,MED, Acoustic Power 0 dB
COL: GenOb, Box position 110mm, RES, MED, Acoustic Power 0dB
Condition 2: B: Thyroid, B mode Fundamental, Focal Zone 64 mm, PEN,HD, Super Compound on, Acoustic Power 0 dB
COL: Liver, Box position 140mm, PEN, HD, Acoustic Power 0dB
�DD �)!�����*�����������
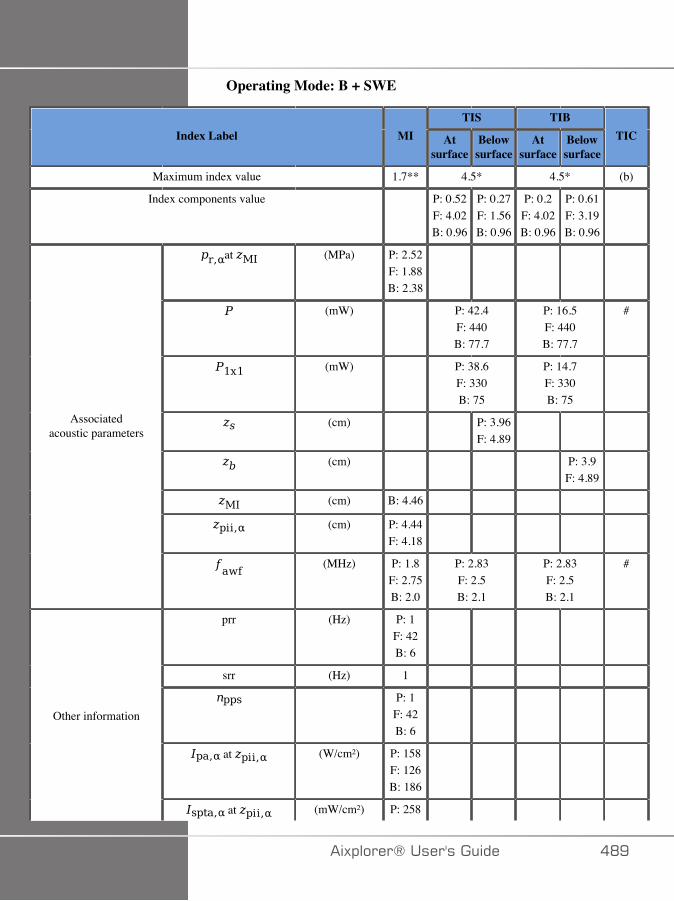
Operating Mode: B + SWE
TIS TIBIndex Label MI At
surfaceBelowsurface
Atsurface
Belowsurface
TIC
Maximum index value 1.7** 4.5* 4.5* (b)
Index components value P: 0.52F: 4.02B: 0.96
P: 0.27F: 1.56B: 0.96
P: 0.2F: 4.02B: 0.96
P: 0.61F: 3.19B: 0.96
at (MPa) P: 2.52F: 1.88B: 2.38
(mW) P: 42.4F: 440B: 77.7
P: 16.5F: 440B: 77.7
#
(mW) P: 38.6F: 330B: 75
P: 14.7F: 330B: 75
(cm) P: 3.96F: 4.89
(cm) P: 3.9F: 4.89
(cm) B: 4.46
(cm) P: 4.44F: 4.18
Associatedacoustic parameters
(MHz) P: 1.8F: 2.75B: 2.0
P: 2.83F: 2.5B: 2.1
P: 2.83F: 2.5B: 2.1
#
prr (Hz) P: 1F: 42B: 6
srr (Hz) 1
P: 1F: 42B: 6
at (W/cm²) P: 158F: 126B: 186
Other information
at (mW/cm²) P: 258
�)!�����*����������� �DE
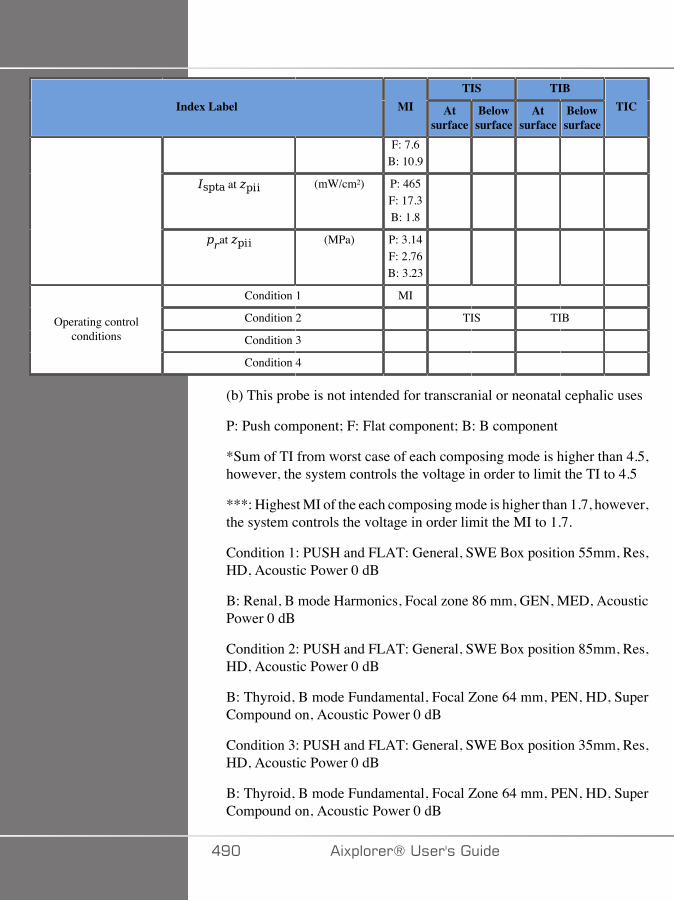
TIS TIBIndex Label MI At
surfaceBelowsurface
Atsurface
Belowsurface
TIC
F: 7.6B: 10.9
at (mW/cm²) P: 465F: 17.3B: 1.8
at (MPa) P: 3.14F: 2.76B: 3.23
Condition 1 MI
Condition 2 TIS TIB
Condition 3 Operating control
conditions
Condition 4
(b) This probe is not intended for transcranial or neonatal cephalic uses
P: Push component; F: Flat component; B: B component
*Sum of TI from worst case of each composing mode is higher than 4.5,however, the system controls the voltage in order to limit the TI to 4.5
***: Highest MI of the each composing mode is higher than 1.7, however,the system controls the voltage in order limit the MI to 1.7.
Condition 1: PUSH and FLAT: General, SWE Box position 55mm, Res,HD, Acoustic Power 0 dB
B: Renal, B mode Harmonics, Focal zone 86 mm, GEN, MED, AcousticPower 0 dB
Condition 2: PUSH and FLAT: General, SWE Box position 85mm, Res,HD, Acoustic Power 0 dB
B: Thyroid, B mode Fundamental, Focal Zone 64 mm, PEN, HD, SuperCompound on, Acoustic Power 0 dB
Condition 3: PUSH and FLAT: General, SWE Box position 35mm, Res,HD, Acoustic Power 0 dB
B: Thyroid, B mode Fundamental, Focal Zone 64 mm, PEN, HD, SuperCompound on, Acoustic Power 0 dB
�E� �)!�����*�����������
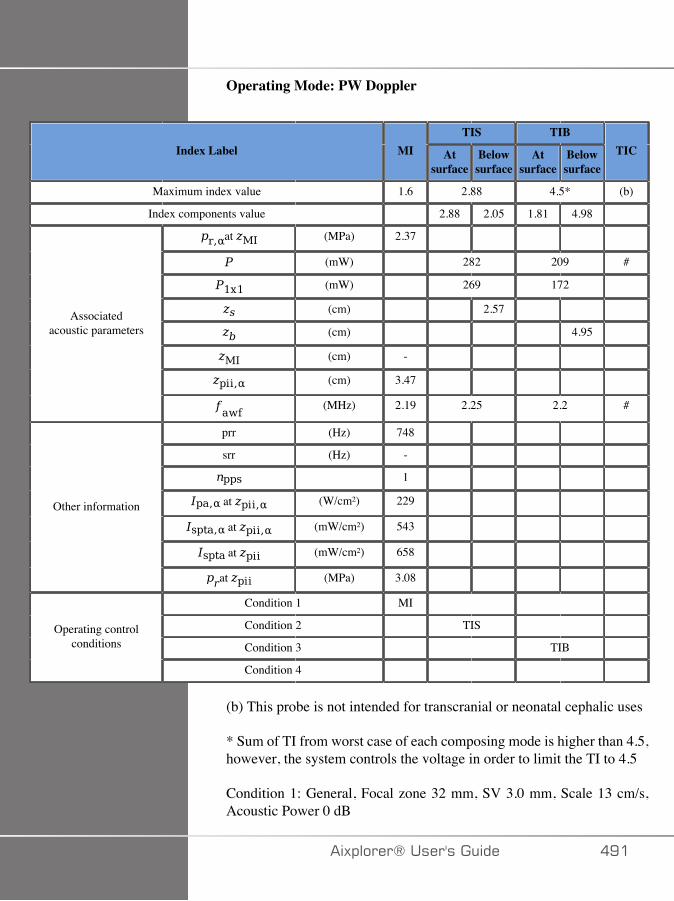
Operating Mode: PW Doppler
TIS TIBIndex Label MI At
surfaceBelowsurface
Atsurface
Belowsurface
TIC
Maximum index value 1.6 2.88 4.5* (b)
Index components value 2.88 2.05 1.81 4.98
at (MPa) 2.37
(mW) 282 209 #
(mW) 269 172
(cm) 2.57
(cm) 4.95
(cm) -
(cm) 3.47
Associatedacoustic parameters
(MHz) 2.19 2.25 2.2 #
prr (Hz) 748
srr (Hz) -
1
at (W/cm²) 229
at (mW/cm²) 543
at (mW/cm²) 658
Other information
at (MPa) 3.08
Condition 1 MI
Condition 2 TIS
Condition 3 TIB Operating control
conditions
Condition 4
(b) This probe is not intended for transcranial or neonatal cephalic uses
* Sum of TI from worst case of each composing mode is higher than 4.5,however, the system controls the voltage in order to limit the TI to 4.5
Condition 1: General, Focal zone 32 mm, SV 3.0 mm, Scale 13 cm/s,Acoustic Power 0 dB
�)!�����*����������� �E�

Condition 2: General, Focal zone 180 mm, SV 1 mm, Scale max,Acoustic Power 0 dB
Condition 3: General, Focal zone 86 mm, SV 7.5 mm, Scale max,Acoustic Power 0 dB
�E� �)!�����*�����������
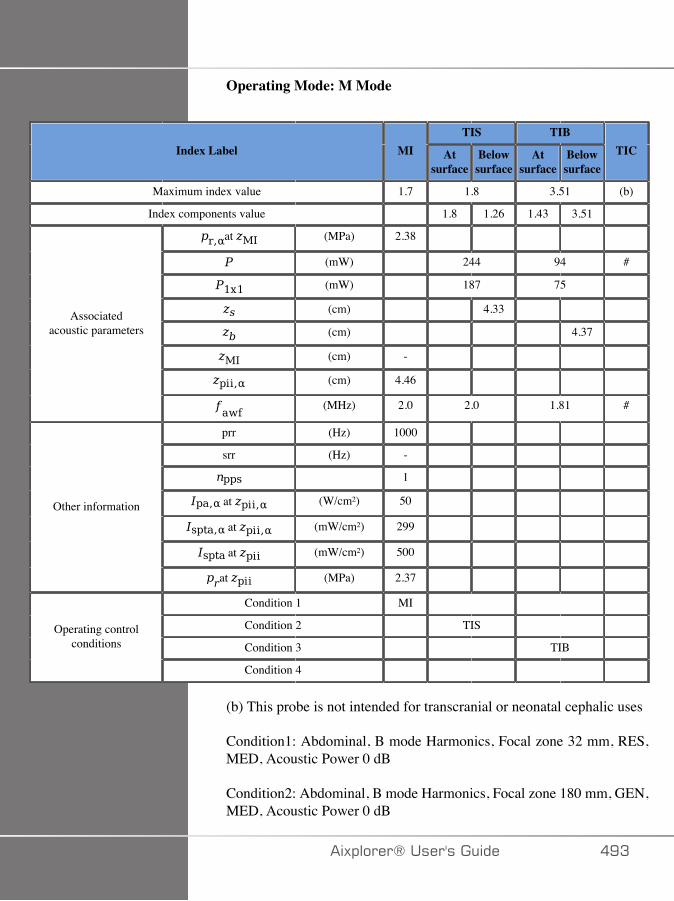
Operating Mode: M Mode
TIS TIBIndex Label MI At
surfaceBelowsurface
Atsurface
Belowsurface
TIC
Maximum index value 1.7 1.8 3.51 (b)
Index components value 1.8 1.26 1.43 3.51
at (MPa) 2.38
(mW) 244 94 #
(mW) 187 75
(cm) 4.33
(cm) 4.37
(cm) -
(cm) 4.46
Associatedacoustic parameters
(MHz) 2.0 2.0 1.81 #
prr (Hz) 1000
srr (Hz) -
1
at (W/cm²) 50
at (mW/cm²) 299
at (mW/cm²) 500
Other information
at (MPa) 2.37
Condition 1 MI
Condition 2 TIS
Condition 3 TIB Operating control
conditions
Condition 4
(b) This probe is not intended for transcranial or neonatal cephalic uses
Condition1: Abdominal, B mode Harmonics, Focal zone 32 mm, RES,MED, Acoustic Power 0 dB
Condition2: Abdominal, B mode Harmonics, Focal zone 180 mm, GEN,MED, Acoustic Power 0 dB
�)!�����*����������� �EA

Condition3: Abdominal, B mode Harmonics, Focal zone 66 mm, GEN,MED, Acoustic Power 0 dB
�E� �)!�����*�����������

#*�&�7���������������������������
Operating Mode: 2D + CD Doppler
TIS TIBIndex Label MI At
surfaceBelowsurface
Atsurface
Belowsurface
TIC
Maximum index value 1.7 (a) (a) (b)
Index components value # - # -
at (MPa) CD:3.27
B: 3.6
(mW) # # #
(mW) # #
(cm) -
(cm) -
(cm) CD:0.79
B: 0.74
(cm) -
Associatedacoustic parameters
(MHz) CD:6.63
B: 4.75
# # #
prr (Hz) CD:275
B: 25
srr (Hz) 25
CD: 11B: 1
at (W/cm²) CD:250
B: 310
at (mW/cm²) CD: 31B: 8
at (mW/cm²) CD: 67B: 8
Other information
at (MPa) CD:3.23
�)!�����*����������� �E�
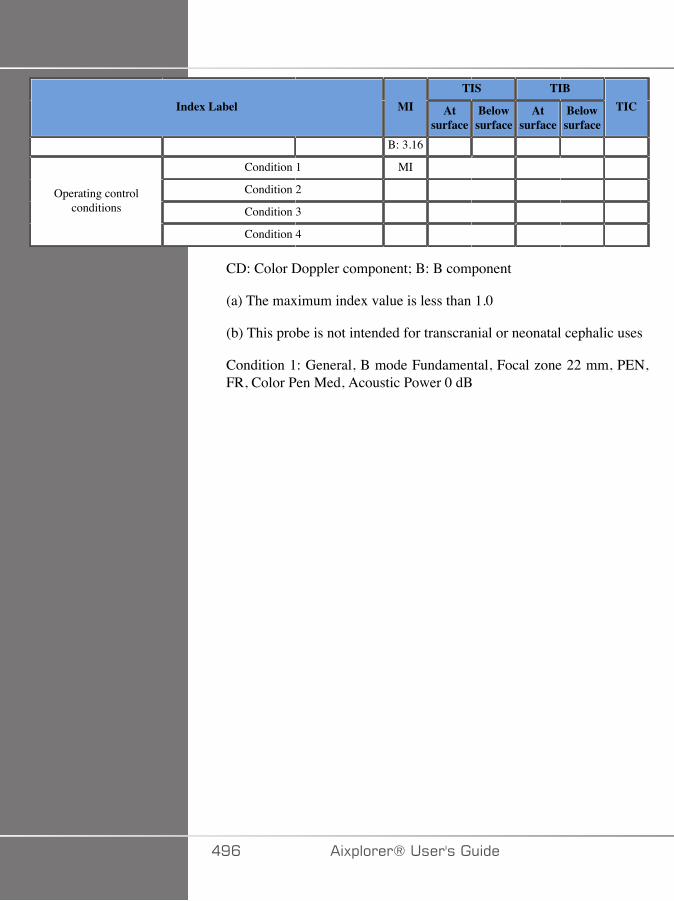
TIS TIBIndex Label MI At
surfaceBelowsurface
Atsurface
Belowsurface
TIC
B: 3.16
Condition 1 MI
Condition 2
Condition 3 Operating control
conditions
Condition 4
CD: Color Doppler component; B: B component
(a) The maximum index value is less than 1.0
(b) This probe is not intended for transcranial or neonatal cephalic uses
Condition 1: General, B mode Fundamental, Focal zone 22 mm, PEN,FR, Color Pen Med, Acoustic Power 0 dB
�EC �)!�����*�����������
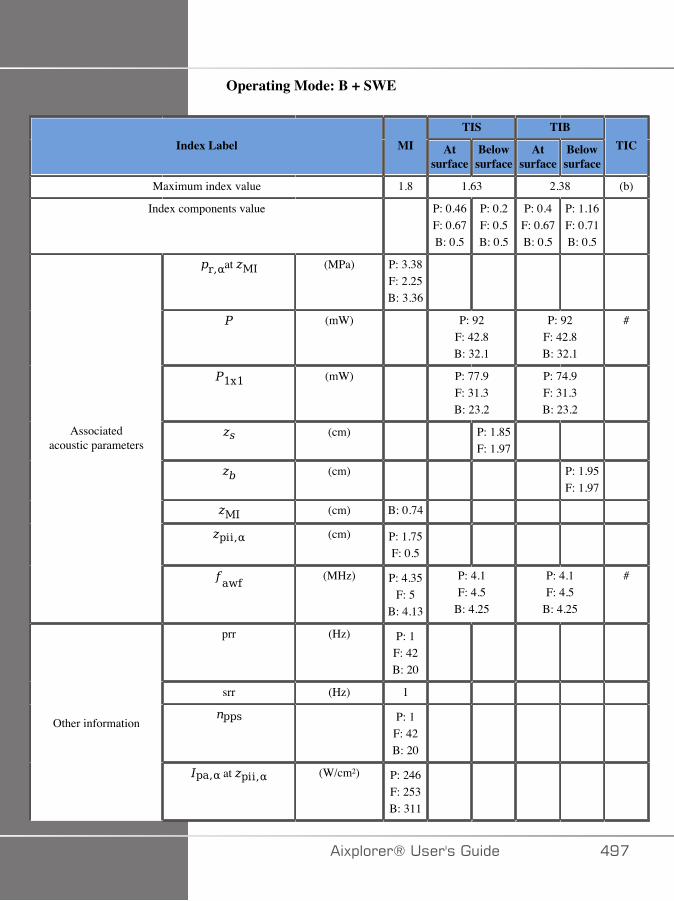
Operating Mode: B + SWE
TIS TIBIndex Label MI At
surfaceBelowsurface
Atsurface
Belowsurface
TIC
Maximum index value 1.8 1.63 2.38 (b)
Index components value P: 0.46F: 0.67B: 0.5
P: 0.2F: 0.5B: 0.5
P: 0.4F: 0.67B: 0.5
P: 1.16F: 0.71B: 0.5
at (MPa) P: 3.38F: 2.25B: 3.36
(mW) P: 92F: 42.8B: 32.1
P: 92F: 42.8B: 32.1
#
(mW) P: 77.9F: 31.3B: 23.2
P: 74.9F: 31.3B: 23.2
(cm) P: 1.85F: 1.97
(cm) P: 1.95F: 1.97
(cm) B: 0.74
(cm) P: 1.75F: 0.5
Associatedacoustic parameters
(MHz) P: 4.35F: 5
B: 4.13
P: 4.1F: 4.5
B: 4.25
P: 4.1F: 4.5
B: 4.25
#
prr (Hz) P: 1F: 42B: 20
srr (Hz) 1
P: 1F: 42B: 20
Other information
at (W/cm²) P: 246F: 253B: 311
�)!�����*����������� �E�

TIS TIBIndex Label MI At
surfaceBelowsurface
Atsurface
Belowsurface
TIC
at (mW/cm²) P: 142F: 8.3
B: 17.6
at (mW/cm²) P: 238F: 9.5
B: 27.5
at (MPa) P: 4.35F: 2.43B: 4.29
Condition 1 MI
Condition 2 TIS TIB
Condition 3 Operating control
conditions
Condition 4
(b) This probe is not intended for transcranial or neonatal cephalic uses
P: Push component; F: Flat component; B: B component
Condition 1: General, SWE Box position 20 mm, Std, Acoustic Power0 dB
Condition 2: General, SWE Box position 40 mm, Std, Acoustic Power0 dB
Condition 3: General, SWE Box position 35 mm, Std, Acoustic Power0 dB
�ED �)!�����*�����������

Operating Mode: PW Doppler
TIS TIBIndex Label MI At
surfaceBelowsurface
Atsurface
Belowsurface
TIC
Maximum index value 1.2 (a) 2.92 (b)
Index components value # # 1 2.92
at (MPa) 2.62
(mW) # 46.6 #
(mW) # 46.6
(cm) #
(cm) 0.9
(cm) -
(cm) 2.1
Associatedacoustic parameters
(MHz) 4.63 # 4.5 #
prr (Hz) 2396
srr (Hz) -
1
at (W/cm²) 272
at (mW/cm²) 296
at (mW/cm²) 611
Other information
at (MPa) 3.62
Condition 1 MI
Condition 2 TIB
Condition 3 Operating control
conditions
Condition 4
(a) The maximum index value is less than 1.0
(b) This probe is not intended for transcranial or neonatal cephalic uses
Condition 1: General, Focal zone 48 mm, SV 0.5 mm, Scale 31 cm/s,Acoustic Power 0 dB
Condition 2: General, Focal zone 22 mm, SV 3.0 mm, Scale 31 cm/s,Acoustic Power 0 dB
�)!�����*����������� �EE

Operating Mode: M mode
TIS TIBIndex Label MI At
surfaceBelowsurface
Atsurface
Belowsurface
TIC
Maximum index value 1.6 (a) (a) (b)
Index components value # # # #
at (MPa) 3.32
(mW) # # #
(mW) # #
(cm) #
(cm) #
(cm) -
(cm) 2.1
Associatedacoustic parameters
(MHz) 4.5 # # #
prr (Hz) 1000
srr (Hz) -
1
at (W/cm²) 0.37
at (mW/cm²) 222
at (mW/cm²) 425
Other information
at (MPa) 1.98
Condition 1 MI
Condition 2
Condition 3 Operating control
conditions
Condition 4
(a) The maximum index value is less than 1.0
(b) This probe is not intended for transcranial or neonatal cephalic uses
Condition 1: Early On, Focal zone 22 mm, GEN, Acoustic Power 0 dB
��� �)!�����*�����������

#*�&�7������������������
Operating Mode: 2D + CD Doppler
TIS TIBIndex Label MI At
surfaceBelowsurface
Atsurface
Belowsurface
TIC
Maximum index value 1.65 (a) (a) (b)
Index components value - - - -
at (MPa) CD:3.02
B: 4.2
(mW) - - -
(mW) - -
(cm) -
(cm) -
(cm) CD:0.76
B: 0.48
(cm) -
Associatedacoustic parameters
(MHz) CD:6.63
B: 6.75
- - -
prr (Hz) CD:185
B: 40
srr (Hz) 40
CD: 5B: 1
at (W/cm²) CD:232
B: 584
at (mW/cm²) CD: 67B: 42
Other information
at (mW/cm²) CD:671
B: 65
�)!�����*����������� ���
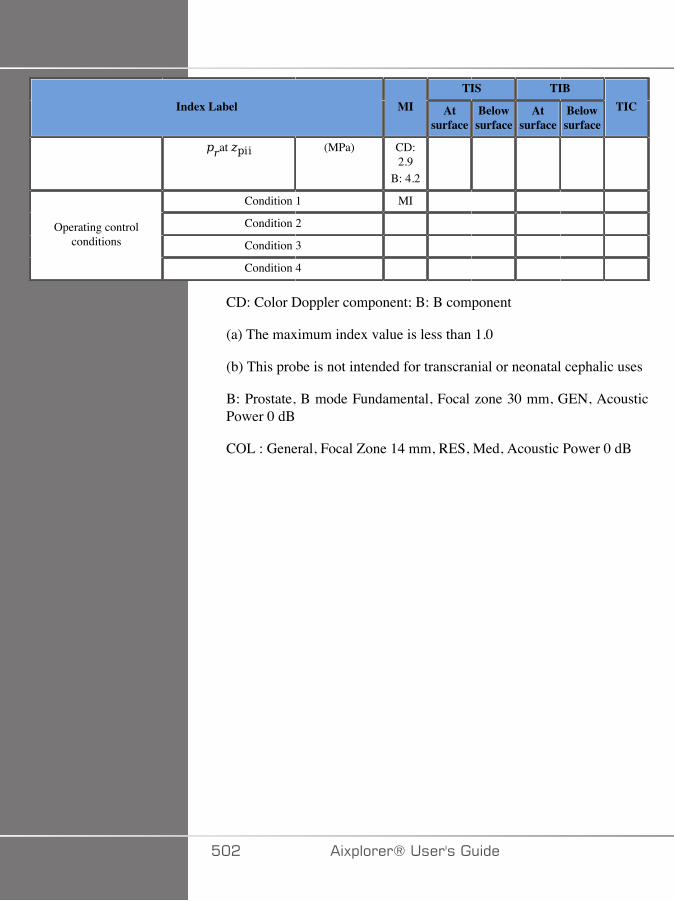
TIS TIBIndex Label MI At
surfaceBelowsurface
Atsurface
Belowsurface
TIC
at (MPa) CD:2.9
B: 4.2
Condition 1 MI
Condition 2
Condition 3 Operating control
conditions
Condition 4
CD: Color Doppler component; B: B component
(a) The maximum index value is less than 1.0
(b) This probe is not intended for transcranial or neonatal cephalic uses
B: Prostate, B mode Fundamental, Focal zone 30 mm, GEN, AcousticPower 0 dB
COL : General, Focal Zone 14 mm, RES, Med, Acoustic Power 0 dB
��� �)!�����*�����������

Operating Mode: B + SWE
TIS TIBIndex Label MI At
surfaceBelowsurface
Atsurface
Belowsurface
TIC
Maximum index value 1.7 1.2 2.23 (a)
Index components value P: 0.26F: 1.08B: 0.05
P: 0.16F: 1.0
B: 0.05
P: 0.3F: 1.1
B: 0.05
P: 1.0F: 1.2
B: 0.05
at (MPa) P: 3.47F: 1.25B: 1.65
(mW) P: 13.6F: 83.6B: 2.3
P: 15.5F: 83.6B: 2.3
-
(mW) P: 13.6F: 50.9B: 1.8
P: 13.6F: 50.9B: 1.8
(cm) P: 1.76F: 1.97
(cm) P: 2.16F: 1.97
(cm) B: 0.48
(cm) P: 2.16F: 0.5
Associatedacoustic parameters
(MHz) P: 4.1F: 4.38B: 6.75
P: 4.1F: 4.38B: 4.25
P: 4.1F: 4.38B: 4.25
-
prr (Hz) P: 1F: 786B: 40
srr (Hz) 1
P: 1F: 786B: 40
Other information
at (W/cm²) P: 157F: 240B: 584
�)!�����*����������� ��A
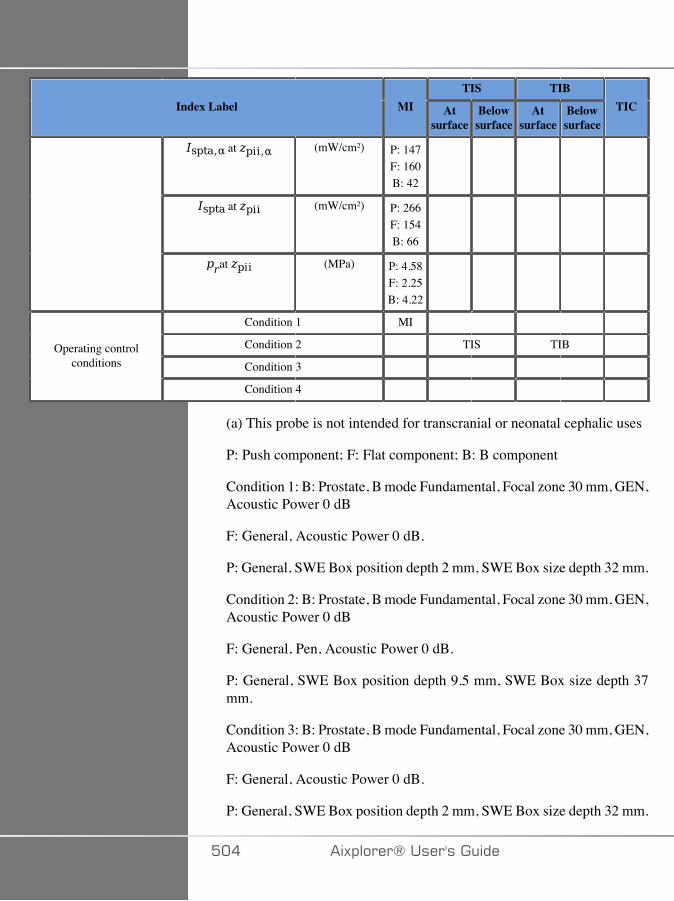
TIS TIBIndex Label MI At
surfaceBelowsurface
Atsurface
Belowsurface
TIC
at (mW/cm²) P: 147F: 160B: 42
at (mW/cm²) P: 266F: 154B: 66
at (MPa) P: 4.58F: 2.25B: 4.22
Condition 1 MI
Condition 2 TIS TIB
Condition 3 Operating control
conditions
Condition 4
(a) This probe is not intended for transcranial or neonatal cephalic uses
P: Push component; F: Flat component; B: B component
Condition 1: B: Prostate, B mode Fundamental, Focal zone 30 mm, GEN,Acoustic Power 0 dB
F: General, Acoustic Power 0 dB.
P: General, SWE Box position depth 2 mm, SWE Box size depth 32 mm.
Condition 2: B: Prostate, B mode Fundamental, Focal zone 30 mm, GEN,Acoustic Power 0 dB
F: General, Pen, Acoustic Power 0 dB.
P: General, SWE Box position depth 9.5 mm, SWE Box size depth 37mm.
Condition 3: B: Prostate, B mode Fundamental, Focal zone 30 mm, GEN,Acoustic Power 0 dB
F: General, Acoustic Power 0 dB.
P: General, SWE Box position depth 2 mm, SWE Box size depth 32 mm.
��� �)!�����*�����������

Operating Mode: PW Doppler
TIS TIBIndex Label MI At
surfaceBelowsurface
Atsurface
Belowsurface
TIC
Maximum index value 1.38 (a) 2.92 (b)
Index components value - - 0.84 2.51
at (MPa) 2.92
(mW) - 39.4 -
(mW) - 39.4
(cm) #
(cm) 0.9
(cm) -
(cm) 2.04
Associatedacoustic parameters
(MHz) 4.5 - 4.5 -
prr (Hz) 724
srr (Hz) 1
1
at (W/cm²) 435
at (mW/cm²) 447
at (mW/cm²) 883
Other information
at (MPa) 3.9
Condition 1 MI
Condition 2 TIB
Condition 3 Operating control
conditions
Condition 4
(a) The maximum index value is less than 1.0
(b) This probe is not intended for transcranial or neonatal cephalic uses
Condition 1: General, SV Position depth 40 mm, SV size 2 mm, Scale6.2 cm/s, Acoustic Power 0 dB
Condition 2: General, SV Position depth 50 mm, SV size 2 mm, Scale170 cm/s (HPRF), Acoustic Power 0 dB
�)!�����*����������� ���

Operating Mode: M mode
TIS TIBIndex Label MI At
surfaceBelowsurface
Atsurface
Belowsurface
TIC
Maximum index value 1.37 (a) (a) (b)
Index components value - - - -
at (MPa) 2.93
(mW) - - -
(mW) - -
(cm) -
(cm) -
(cm) -
(cm) 2.1
Associatedacoustic parameters
(MHz) 5 - - -
prr (Hz) 1000
srr (Hz) 1
1
at (W/cm²) 300.2
at (mW/cm²) 150
at (mW/cm²) 298
Other information
at (MPa) 3.66
Condition 1 MI
Condition 2
Condition 3 Operating control
conditions
Condition 4
(a) The maximum index value is less than 1.0
(b) This probe is not intended for transcranial or neonatal cephalic uses
Condition 1: GYN, Focal zone 40 mm, PEN, Acoustic Power 0 dB
��C �)!�����*�����������
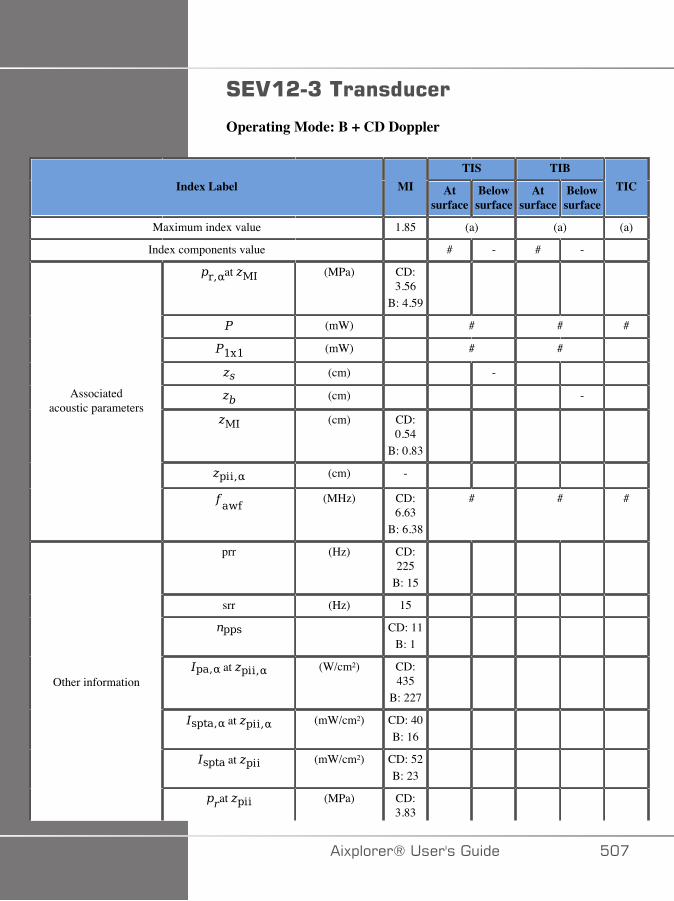
#*.�&�7����������
Operating Mode: B + CD Doppler
TIS TIBIndex Label MI At
surfaceBelowsurface
Atsurface
Belowsurface
TIC
Maximum index value 1.85 (a) (a) (a)
Index components value # - # -
at (MPa) CD:3.56
B: 4.59
(mW) # # #
(mW) # #
(cm) -
(cm) -
(cm) CD:0.54
B: 0.83
(cm) -
Associatedacoustic parameters
(MHz) CD:6.63
B: 6.38
# # #
prr (Hz) CD:225
B: 15
srr (Hz) 15
CD: 11B: 1
at (W/cm²) CD:435
B: 227
at (mW/cm²) CD: 40B: 16
at (mW/cm²) CD: 52B: 23
Other information
at (MPa) CD:3.83
�)!�����*����������� ���
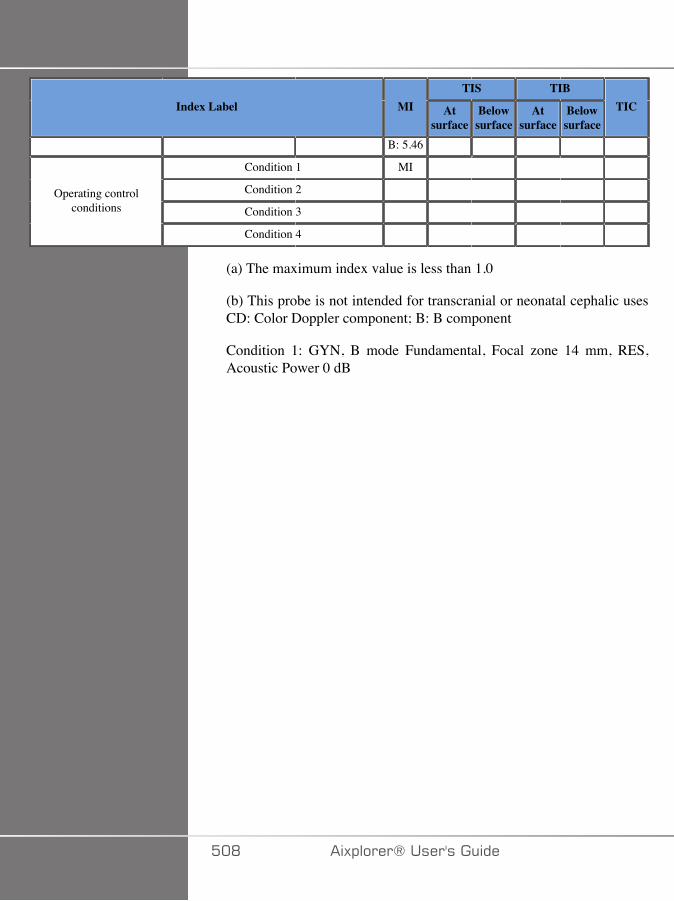
TIS TIBIndex Label MI At
surfaceBelowsurface
Atsurface
Belowsurface
TIC
B: 5.46
Condition 1 MI
Condition 2
Condition 3 Operating control
conditions
Condition 4
(a) The maximum index value is less than 1.0
(b) This probe is not intended for transcranial or neonatal cephalic usesCD: Color Doppler component; B: B component
Condition 1: GYN, B mode Fundamental, Focal zone 14 mm, RES,Acoustic Power 0 dB
��D �)!�����*�����������

Operating Mode: B + SWE
TIS TIBIndex Label MI At
surfaceBelowsurface
Atsurface
Belowsurface
TIC
Maximum index value 1.85 1.51 3.09 (b)
Index components value P: 0.3F: 1.36B: 0.25
P: 0.19F: 1.08B: 0.25
P: 0.3F: 1.36B: 0.25
P: 1.17F: 1.67B: 0.25
at (MPa) P: 3.3F: 3.4
B: 4.59
(mW) P: 15.5F: 86.3B: 7.67
P: 15.5F: 86.3B: 7.67
#
(mW) P: 15.5F: 65
B: 7.38
P: 15.5F: 65
B: 7.38
(cm) P: 1.72F: 1.87
(cm) P: 1.2F: 1.87
(cm) B: 0.85
(cm) P: 1.79F: 0.53
Associatedacoustic parameters
(MHz) P: 4.1F: 5.63B: 6.38
P: 4.1F: 4.5
B: 7.13
P: 4.1F: 4.5
B: 7.13
#
prr (Hz) P: 1.8F: 77B: 7
srr (Hz) 1.8
P: 1F: 43B: 4
at (W/cm²) P: 401F: 269B: 658
Other information
at (mW/cm²) P: 480
�)!�����*����������� ��E
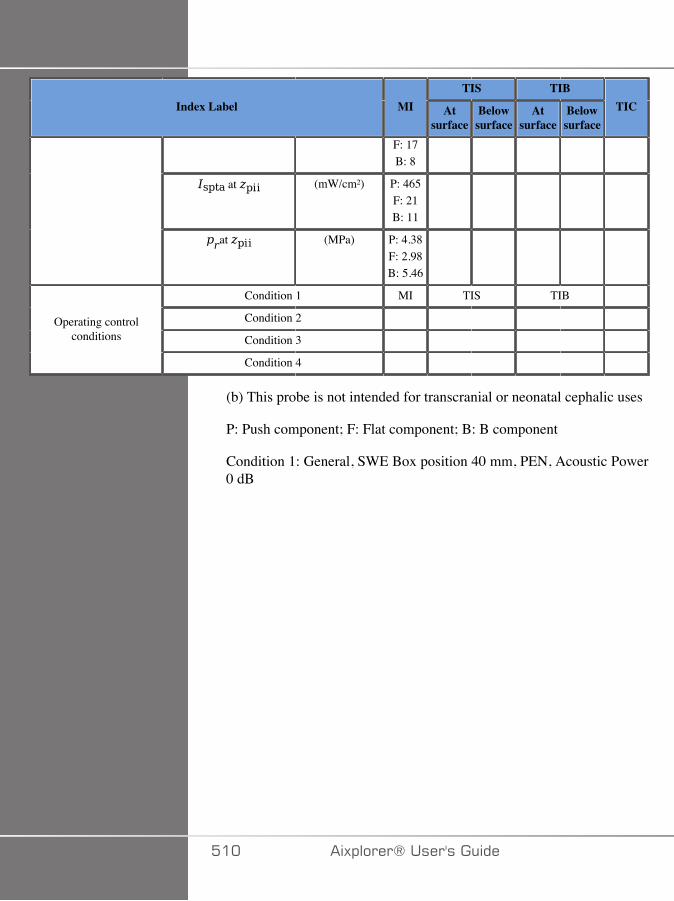
TIS TIBIndex Label MI At
surfaceBelowsurface
Atsurface
Belowsurface
TIC
F: 17B: 8
at (mW/cm²) P: 465F: 21B: 11
at (MPa) P: 4.38F: 2.98B: 5.46
Condition 1 MI TIS TIB
Condition 2
Condition 3 Operating control
conditions
Condition 4
(b) This probe is not intended for transcranial or neonatal cephalic uses
P: Push component; F: Flat component; B: B component
Condition 1: General, SWE Box position 40 mm, PEN, Acoustic Power0 dB
��� �)!�����*�����������

Operating Mode: PW Doppler
TIS TIBIndex Label MI At
surfaceBelowsurface
Atsurface
Belowsurface
TIC
Maximum index value 1.63 (a) 2.21 (b)
Index components value # # 0.86 2.21
at (MPa) 1.95
(mW) # 40.1 #
(mW) # 40.1
(cm) #
(cm) 2.1
(cm) -
(cm) 1.81
Associatedacoustic parameters
(MHz) 4.5 # 4.5 #
prr (Hz) 724
srr (Hz) -
1
at (W/cm²) 401
at (mW/cm²) 113
at (mW/cm²) 218
Other information
at (MPa) 4.47
Condition 1 MI
Condition 2 TIB
Condition 3 Operating control
conditions
Condition 4
(a) The maximum index value is less than 1.0
(b) This probe is not intended for transcranial or neonatal cephalic uses
Condition 1: General, Focal zone 30 mm, SV 1.5 mm, Scale 6 cm/s,Acoustic Power 0 dB
Condition 2: General, Focal zone 60 mm, SV 2.5 mm, Scale 10 cm/s,Acoustic Power 0 dB
�)!�����*����������� ���

Operating Mode: M mode
TIS TIBIndex Label MI At
surfaceBelowsurface
Atsurface
Belowsurface
TIC
Maximum index value 1.85 (a) (a) (b)
Index components value # # # #
at (MPa) 4.59
(mW) # # #
(mW) # #
(cm) #
(cm) #
(cm) -
(cm) 0.83
Associatedacoustic parameters
(MHz) 6.38 # # #
prr (Hz) 1000
srr (Hz) -
1
at (W/cm²) 658
at (mW/cm²) 255
at (mW/cm²) 360
Other information
at (MPa) 5.46
Condition 1 MI
Condition 2
Condition 3 Operating control
conditions
Condition 4
(a) The maximum index value is less than 1.0
(b) This probe is not intended for transcranial or neonatal cephalic uses
Condition 1: GYN, B mode Fundamental, Focal zone 14 mm, GEN,Acoustic Power 0 dB
��� �)!�����*�����������

#4.�<�:�����������������
Operating Mode: B + CD Doppler
TIS TIBIndex Label MI At
surfaceBelowsurface
Atsurface
Belowsurface
TIC
Maximum index value 1.7 (a) (a) (b)
Index components value # - # -
at (MPa) CD:4.12
B: 4.6
(mW) # # #
(mW) # #
(cm) -
(cm) -
(cm) CD:1.28
B: 0.63
(cm) -
Associatedacoustic parameters
(MHz) CD:7.5
B: 7.75
# # #
prr (Hz) CD:150
B: 15
srr (Hz) 15
CD: 10B: 15
at (W/cm²) CD:517
B: 896
at (mW/cm²) CD:123B: 2
Other information
at (mW/cm²) CD:279
B: 2.5
�)!�����*����������� ��A
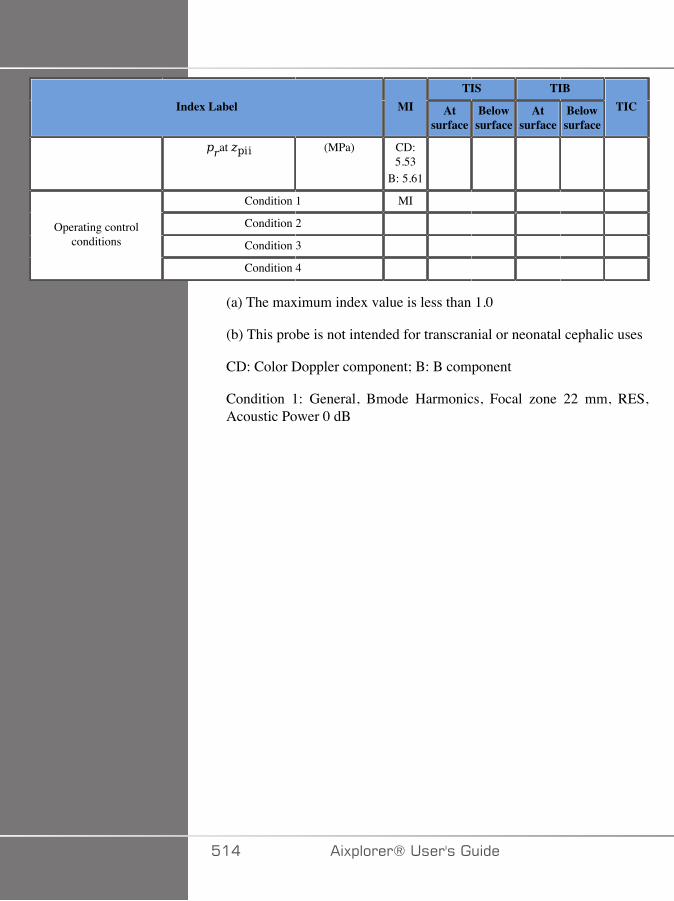
TIS TIBIndex Label MI At
surfaceBelowsurface
Atsurface
Belowsurface
TIC
at (MPa) CD:5.53
B: 5.61
Condition 1 MI
Condition 2
Condition 3 Operating control
conditions
Condition 4
(a) The maximum index value is less than 1.0
(b) This probe is not intended for transcranial or neonatal cephalic uses
CD: Color Doppler component; B: B component
Condition 1: General, Bmode Harmonics, Focal zone 22 mm, RES,Acoustic Power 0 dB
��� �)!�����*�����������

Operating Mode: B + SWE
TIS TIBIndex Label MI At
surfaceBelowsurface
Atsurface
Belowsurface
TIC
Maximum index value 1.7 3.13 3.13 (b)
Index components value P: 0.24F: 2.51B: 0.38
P: 1.62F: 0.73B: 0.38
P: 0.24F: 2.51B: 0.38
P: 1.99F: 0.51B: 0.38
at (MPa) P: 4.05F: 3.31B: 5.37
(mW) P: 212F: 70.3B: 16.6
P: 212F: 70.3B: 16.6
#
(mW) P: 19.1F: 42.4B: 7.4
P: 19.1F: 42.4B: 7.4
(cm) P: 1.79F: 2.4
(cm) P: 1.79F: 1.52
(cm) B: 0.66
(cm) P: 1.92F: 1.24
Associatedacoustic parameters
(MHz) P: 6F: 7.5
B: 7.75
P: 5F: 7.5
B: 7.63
P: 5F: 7.5
B: 7.63
#
prr (Hz) P: 2F: 84B: 24
srr (Hz) 2
P: 1F: 42B: 12
at (W/cm²) P: 452F: 312B: 896
Other information
at (mW/cm²) P: 392
�)!�����*����������� ���
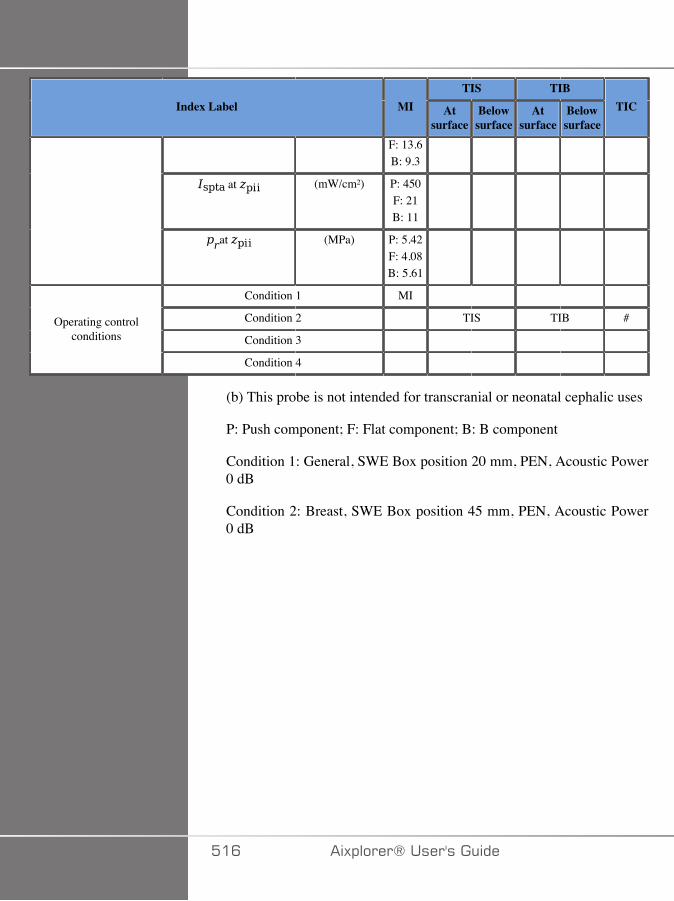
TIS TIBIndex Label MI At
surfaceBelowsurface
Atsurface
Belowsurface
TIC
F: 13.6B: 9.3
at (mW/cm²) P: 450F: 21B: 11
at (MPa) P: 5.42F: 4.08B: 5.61
Condition 1 MI
Condition 2 TIS TIB #
Condition 3 Operating control
conditions
Condition 4
(b) This probe is not intended for transcranial or neonatal cephalic uses
P: Push component; F: Flat component; B: B component
Condition 1: General, SWE Box position 20 mm, PEN, Acoustic Power0 dB
Condition 2: Breast, SWE Box position 45 mm, PEN, Acoustic Power0 dB
��C �)!�����*�����������

Operating Mode: PW Doppler
TIS TIBIndex Label MI At
surfaceBelowsurface
Atsurface
Belowsurface
TIC
Maximum index value 1.4 1.09 2.69 (b)
Index components value 1.09 0.77 0.9 2.69
at (MPa) 3.18
(mW) 45.9 35.9 #
(mW) 45.9 35.9
(cm) 1.1
(cm) 1.1
(cm) -
(cm) 0.5
Associatedacoustic parameters
(MHz) 5 5 5.25 #
prr (Hz) 837
srr (Hz) -
1
at (W/cm²) 378
at (mW/cm²) 487
at (mW/cm²) 574
Other information
at (MPa) 3.49
Condition 1 MI
Condition 2 TIS
Condition 3 TIB Operating control
conditions
Condition 4
(b) This probe is not intended for transcranial or neonatal cephalic uses
Condition 1: General, Focal zone 7 mm, SV 5.0 mm, Scale 6 cm/s,Acoustic Power 0 dB
Condition 2: General, Focal zone 68 mm, SV 2.5 mm, Scale 54 cm/s,Acoustic Power 0 dB
�)!�����*����������� ���

Condition 3: General, Focal zone 52 mm, SV 1 mm, Scale 54 cm/s,Acoustic Power 0 dB
��D �)!�����*�����������
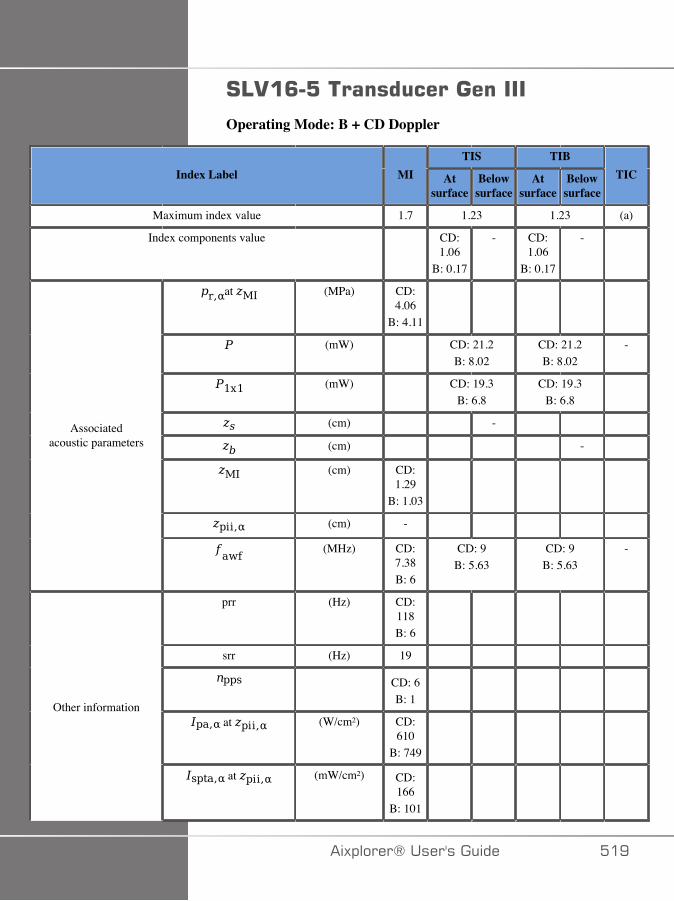
#4.�<�:������������������
Operating Mode: B + CD Doppler
TIS TIBIndex Label MI At
surfaceBelowsurface
Atsurface
Belowsurface
TIC
Maximum index value 1.7 1.23 1.23 (a)
Index components value CD:1.06
B: 0.17
- CD:1.06
B: 0.17
-
at (MPa) CD:4.06
B: 4.11
(mW) CD: 21.2B: 8.02
CD: 21.2B: 8.02
-
(mW) CD: 19.3B: 6.8
CD: 19.3B: 6.8
(cm) -
(cm) -
(cm) CD:1.29
B: 1.03
(cm) -
Associatedacoustic parameters
(MHz) CD:7.38B: 6
CD: 9B: 5.63
CD: 9B: 5.63
-
prr (Hz) CD:118B: 6
srr (Hz) 19
CD: 6B: 1
at (W/cm²) CD:610
B: 749
Other information
at (mW/cm²) CD:166
B: 101
�)!�����*����������� ��E
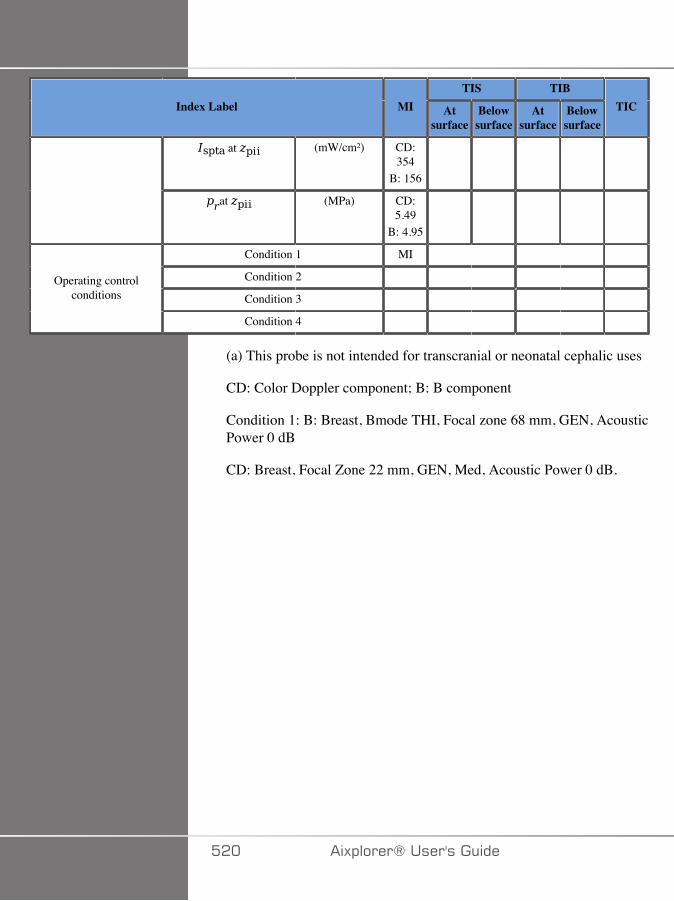
TIS TIBIndex Label MI At
surfaceBelowsurface
Atsurface
Belowsurface
TIC
at (mW/cm²) CD:354
B: 156
at (MPa) CD:5.49
B: 4.95
Condition 1 MI
Condition 2
Condition 3 Operating control
conditions
Condition 4
(a) This probe is not intended for transcranial or neonatal cephalic uses
CD: Color Doppler component; B: B component
Condition 1: B: Breast, Bmode THI, Focal zone 68 mm, GEN, AcousticPower 0 dB
CD: Breast, Focal Zone 22 mm, GEN, Med, Acoustic Power 0 dB.
��� �)!�����*�����������
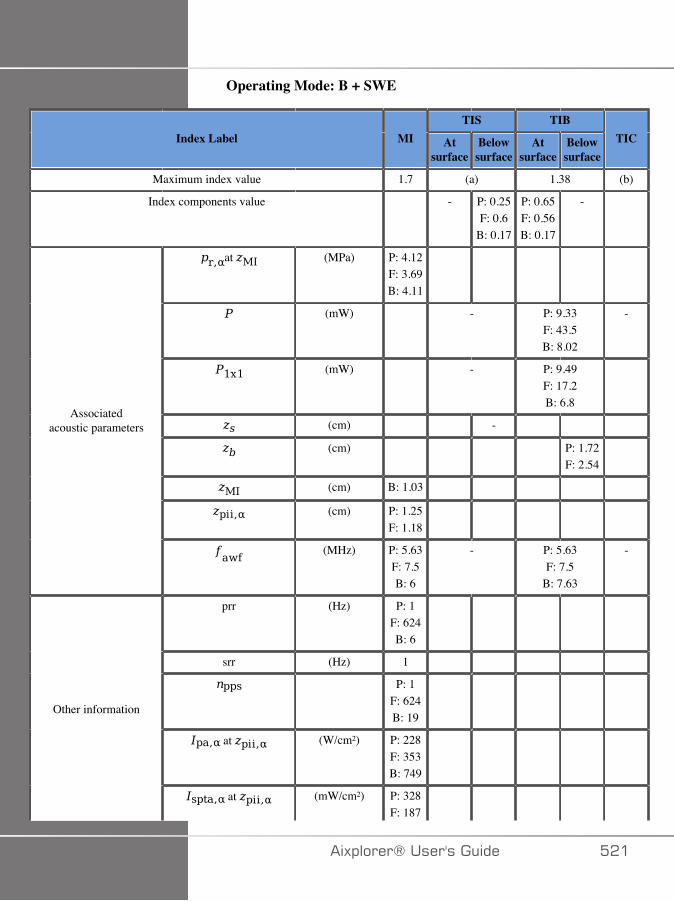
Operating Mode: B + SWE
TIS TIBIndex Label MI At
surfaceBelowsurface
Atsurface
Belowsurface
TIC
Maximum index value 1.7 (a) 1.38 (b)
Index components value - P: 0.25F: 0.6
B: 0.17
P: 0.65F: 0.56B: 0.17
-
at (MPa) P: 4.12F: 3.69B: 4.11
(mW) - P: 9.33F: 43.5B: 8.02
-
(mW) - P: 9.49F: 17.2B: 6.8
(cm) -
(cm) P: 1.72F: 2.54
(cm) B: 1.03
(cm) P: 1.25F: 1.18
Associatedacoustic parameters
(MHz) P: 5.63F: 7.5B: 6
- P: 5.63F: 7.5
B: 7.63
-
prr (Hz) P: 1F: 624B: 6
srr (Hz) 1
P: 1F: 624B: 19
at (W/cm²) P: 228F: 353B: 749
Other information
at (mW/cm²) P: 328F: 187
�)!�����*����������� ���
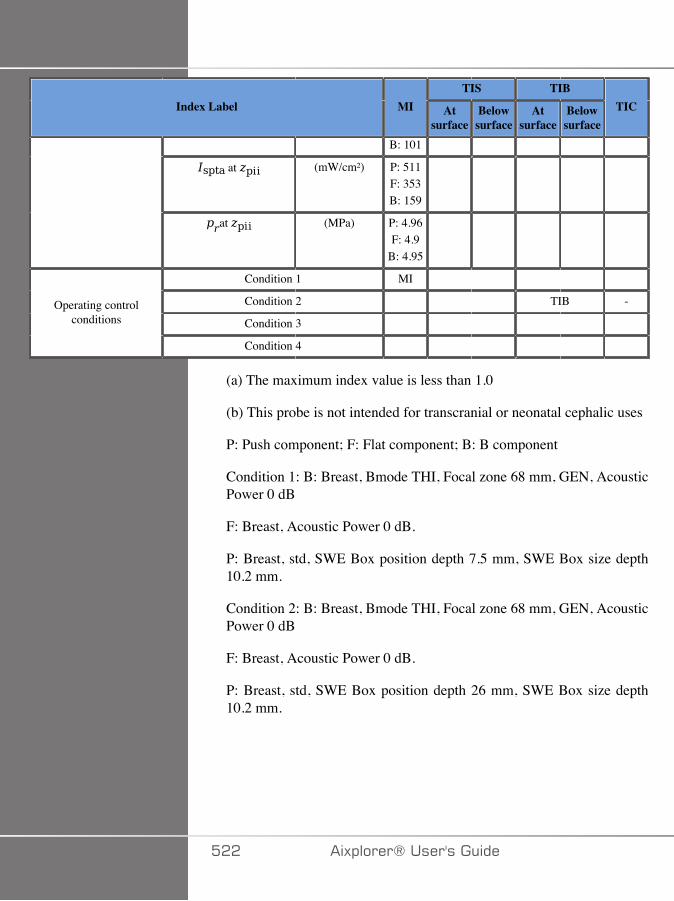
TIS TIBIndex Label MI At
surfaceBelowsurface
Atsurface
Belowsurface
TIC
B: 101
at (mW/cm²) P: 511F: 353B: 159
at (MPa) P: 4.96F: 4.9
B: 4.95
Condition 1 MI
Condition 2 TIB -
Condition 3 Operating control
conditions
Condition 4
(a) The maximum index value is less than 1.0
(b) This probe is not intended for transcranial or neonatal cephalic uses
P: Push component; F: Flat component; B: B component
Condition 1: B: Breast, Bmode THI, Focal zone 68 mm, GEN, AcousticPower 0 dB
F: Breast, Acoustic Power 0 dB.
P: Breast, std, SWE Box position depth 7.5 mm, SWE Box size depth10.2 mm.
Condition 2: B: Breast, Bmode THI, Focal zone 68 mm, GEN, AcousticPower 0 dB
F: Breast, Acoustic Power 0 dB.
P: Breast, std, SWE Box position depth 26 mm, SWE Box size depth10.2 mm.
��� �)!�����*�����������
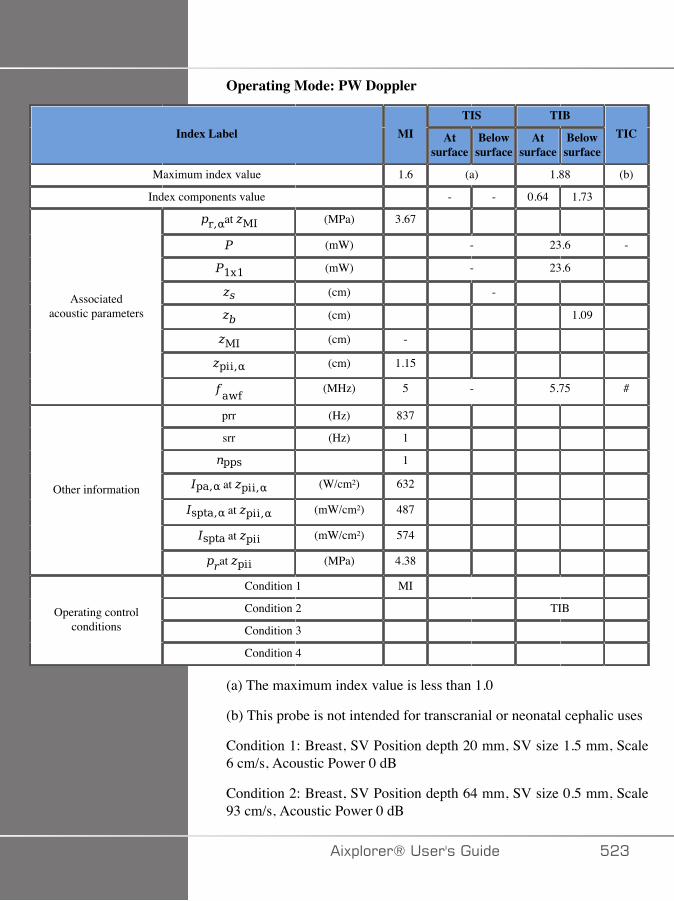
Operating Mode: PW Doppler
TIS TIBIndex Label MI At
surfaceBelowsurface
Atsurface
Belowsurface
TIC
Maximum index value 1.6 (a) 1.88 (b)
Index components value - - 0.64 1.73
at (MPa) 3.67
(mW) - 23.6 -
(mW) - 23.6
(cm) -
(cm) 1.09
(cm) -
(cm) 1.15
Associatedacoustic parameters
(MHz) 5 - 5.75 #
prr (Hz) 837
srr (Hz) 1
1
at (W/cm²) 632
at (mW/cm²) 487
at (mW/cm²) 574
Other information
at (MPa) 4.38
Condition 1 MI
Condition 2 TIB
Condition 3 Operating control
conditions
Condition 4
(a) The maximum index value is less than 1.0
(b) This probe is not intended for transcranial or neonatal cephalic uses
Condition 1: Breast, SV Position depth 20 mm, SV size 1.5 mm, Scale6 cm/s, Acoustic Power 0 dB
Condition 2: Breast, SV Position depth 64 mm, SV size 0.5 mm, Scale93 cm/s, Acoustic Power 0 dB
�)!�����*����������� ��A

#4�C�&���������������������������
Operating Mode: B + CD Doppler
TIS TIBIndex Label MI At
surfaceBelowsurface
Atsurface
Belowsurface
TIC
Maximum index value 1.7 1.02 1.02 1.2
Index components value CD:0.93
B: 0.1
- CD:0.93
B: 0.1
-
at (MPa) CD:3.28
B: 3.2
(mW) CD: 46.6B: 3.7
CD: 46.6B: 3.7
CD:46.6
B: 3.7
(mW) CD: 44.4B: 3.7
CD: 44.4B: 3.7
(cm) -
(cm) -
(cm) CD:2.08
B: 1.98
(cm) -
Associatedacoustic parameters
(MHz) CD:3.75
B: 3.75
CD: 4.5B: 5.25
CD: 4.5B: 5.25
CD:4.5
B: 5.25
prr (Hz) CD:330
B: 30
srr (Hz) 30
CD: 11B: 1
at (W/cm²) CD: 41B: 449
Other information
at (mW/cm²) CD:274
B: 4.3
��� �)!�����*�����������
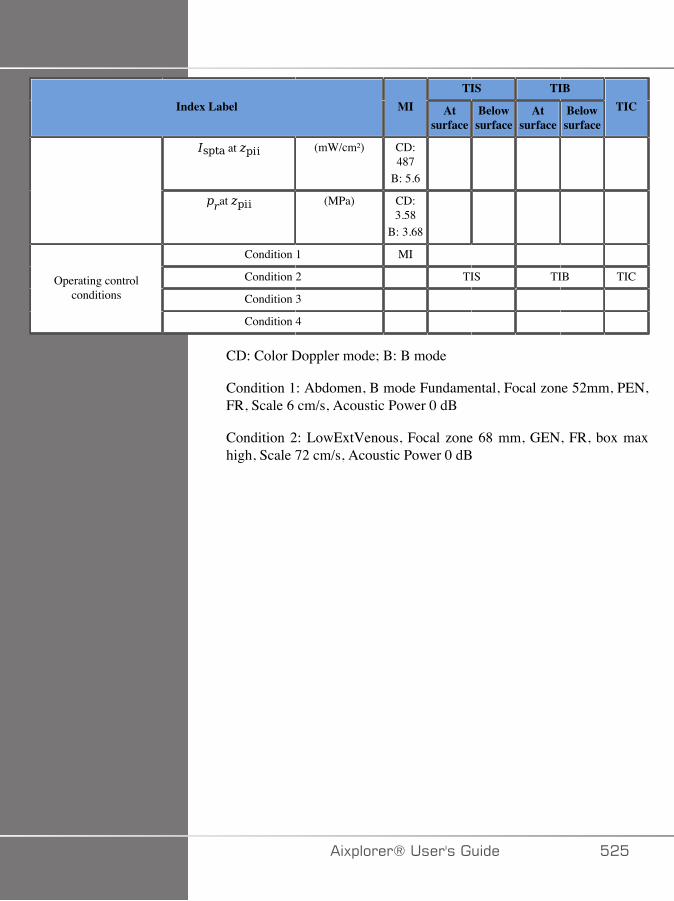
TIS TIBIndex Label MI At
surfaceBelowsurface
Atsurface
Belowsurface
TIC
at (mW/cm²) CD:487
B: 5.6
at (MPa) CD:3.58
B: 3.68
Condition 1 MI
Condition 2 TIS TIB TIC
Condition 3 Operating control
conditions
Condition 4
CD: Color Doppler mode; B: B mode
Condition 1: Abdomen, B mode Fundamental, Focal zone 52mm, PEN,FR, Scale 6 cm/s, Acoustic Power 0 dB
Condition 2: LowExtVenous, Focal zone 68 mm, GEN, FR, box maxhigh, Scale 72 cm/s, Acoustic Power 0 dB
�)!�����*����������� ���
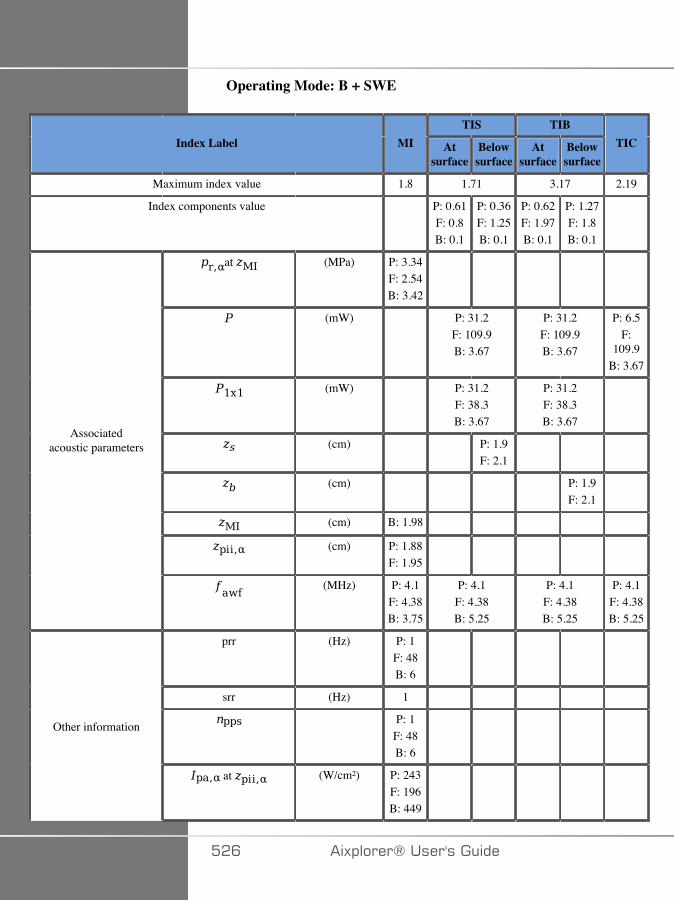
Operating Mode: B + SWE
TIS TIBIndex Label MI At
surfaceBelowsurface
Atsurface
Belowsurface
TIC
Maximum index value 1.8 1.71 3.17 2.19
Index components value P: 0.61F: 0.8B: 0.1
P: 0.36F: 1.25B: 0.1
P: 0.62F: 1.97B: 0.1
P: 1.27F: 1.8B: 0.1
at (MPa) P: 3.34F: 2.54B: 3.42
(mW) P: 31.2F: 109.9B: 3.67
P: 31.2F: 109.9B: 3.67
P: 6.5F:
109.9B: 3.67
(mW) P: 31.2F: 38.3B: 3.67
P: 31.2F: 38.3B: 3.67
(cm) P: 1.9F: 2.1
(cm) P: 1.9F: 2.1
(cm) B: 1.98
(cm) P: 1.88F: 1.95
Associatedacoustic parameters
(MHz) P: 4.1F: 4.38B: 3.75
P: 4.1F: 4.38B: 5.25
P: 4.1F: 4.38B: 5.25
P: 4.1F: 4.38B: 5.25
prr (Hz) P: 1F: 48B: 6
srr (Hz) 1
P: 1F: 48B: 6
Other information
at (W/cm²) P: 243F: 196B: 449
��C �)!�����*�����������
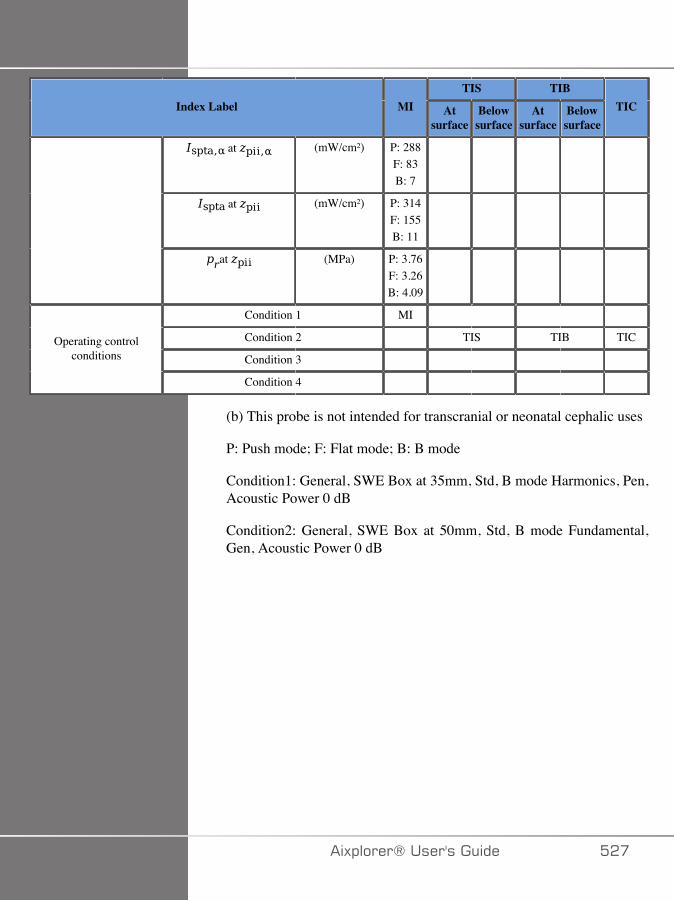
TIS TIBIndex Label MI At
surfaceBelowsurface
Atsurface
Belowsurface
TIC
at (mW/cm²) P: 288F: 83B: 7
at (mW/cm²) P: 314F: 155B: 11
at (MPa) P: 3.76F: 3.26B: 4.09
Condition 1 MI
Condition 2 TIS TIB TIC
Condition 3 Operating control
conditions
Condition 4
(b) This probe is not intended for transcranial or neonatal cephalic uses
P: Push mode; F: Flat mode; B: B mode
Condition1: General, SWE Box at 35mm, Std, B mode Harmonics, Pen,Acoustic Power 0 dB
Condition2: General, SWE Box at 50mm, Std, B mode Fundamental,Gen, Acoustic Power 0 dB
�)!�����*����������� ���
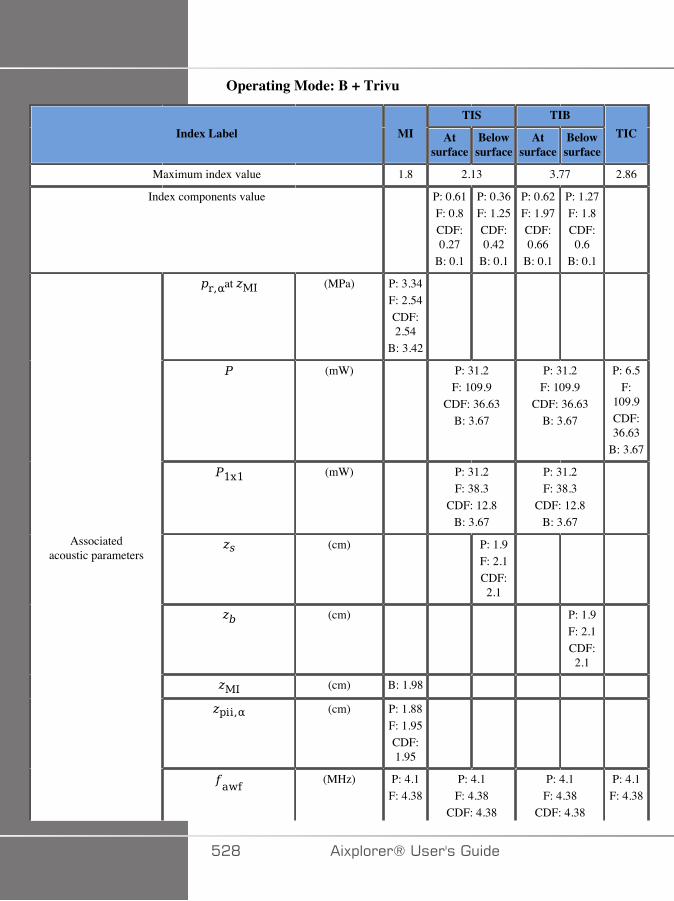
Operating Mode: B + Trivu
TIS TIBIndex Label MI At
surfaceBelowsurface
Atsurface
Belowsurface
TIC
Maximum index value 1.8 2.13 3.77 2.86
Index components value P: 0.61F: 0.8CDF:0.27
B: 0.1
P: 0.36F: 1.25CDF:0.42
B: 0.1
P: 0.62F: 1.97CDF:0.66
B: 0.1
P: 1.27F: 1.8CDF:0.6
B: 0.1
at (MPa) P: 3.34F: 2.54CDF:2.54
B: 3.42
(mW) P: 31.2F: 109.9
CDF: 36.63B: 3.67
P: 31.2F: 109.9
CDF: 36.63B: 3.67
P: 6.5F:
109.9CDF:36.63
B: 3.67
(mW) P: 31.2F: 38.3
CDF: 12.8B: 3.67
P: 31.2F: 38.3
CDF: 12.8B: 3.67
(cm) P: 1.9F: 2.1CDF:2.1
(cm) P: 1.9F: 2.1CDF:2.1
(cm) B: 1.98
(cm) P: 1.88F: 1.95CDF:1.95
Associatedacoustic parameters
(MHz) P: 4.1F: 4.38
P: 4.1F: 4.38
CDF: 4.38
P: 4.1F: 4.38
CDF: 4.38
P: 4.1F: 4.38
��D �)!�����*�����������
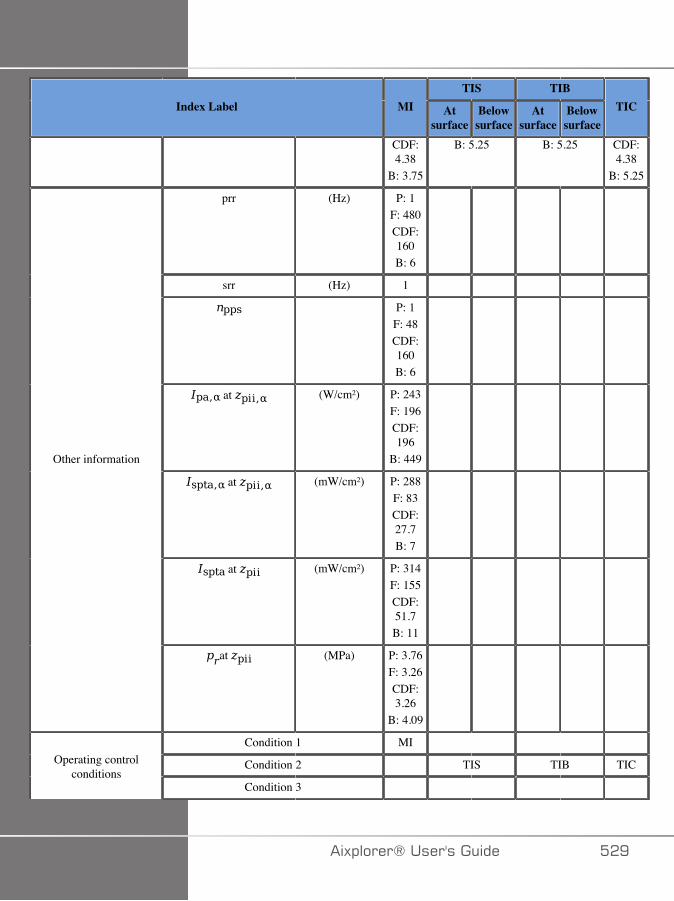
TIS TIBIndex Label MI At
surfaceBelowsurface
Atsurface
Belowsurface
TIC
CDF:4.38
B: 3.75
B: 5.25 B: 5.25 CDF:4.38
B: 5.25
prr (Hz) P: 1F: 480CDF:160B: 6
srr (Hz) 1
P: 1F: 48CDF:160B: 6
at (W/cm²) P: 243F: 196CDF:196
B: 449
at (mW/cm²) P: 288F: 83CDF:27.7B: 7
at (mW/cm²) P: 314F: 155CDF:51.7B: 11
Other information
at (MPa) P: 3.76F: 3.26CDF:3.26
B: 4.09
Condition 1 MI
Condition 2 TIS TIB TICOperating controlconditions
Condition 3
�)!�����*����������� ��E
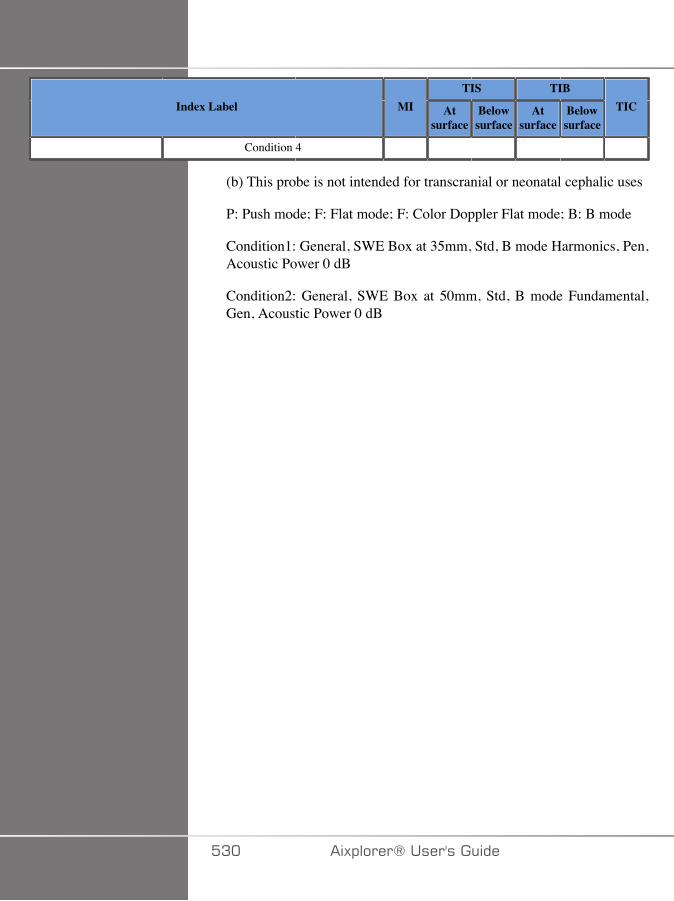
TIS TIBIndex Label MI At
surfaceBelowsurface
Atsurface
Belowsurface
TIC
Condition 4
(b) This probe is not intended for transcranial or neonatal cephalic uses
P: Push mode; F: Flat mode; F: Color Doppler Flat mode; B: B mode
Condition1: General, SWE Box at 35mm, Std, B mode Harmonics, Pen,Acoustic Power 0 dB
Condition2: General, SWE Box at 50mm, Std, B mode Fundamental,Gen, Acoustic Power 0 dB
�A� �)!�����*�����������

Operating Mode: PW Doppler
TIS TIBIndex Label MI At
surfaceBelowsurface
Atsurface
Belowsurface
TIC
Maximum index value 1.2 1.7 4.5 2.7
Index components value 1.7 1.22 0.58 4.5
at (MPa) 2.34
(mW) 93.3 33.1 29.9
(mW) 93.3 33.1
(cm) 1.31
(cm) 1.96
(cm) -
(cm) 2.28
Associatedacoustic parameters
(MHz) 3.75 3.75 4.125 3.75
prr (Hz) 628
srr (Hz) -
1
at (W/cm²) 275
at (mW/cm²) 381
at (mW/cm²) 697
Other information
at (MPa) 2.99
Condition 1 MI
Condition 2 TIS
Condition 3 TIB Operating control
conditions
Condition 4 TIC
Condition 1: General, Focal zone 52 mm, SV 2.5 mm, Scale 6 cm/s,Acoustic Power 0 dB
Condition 2: General, Focal zone 68 mm, SV 1.5 mm, Scale 80 cm/s,Acoustic Power 0 dB
Condition 3: General, Focal zone 68 mm, SV 4.0 mm, Scale 80 cm/s,Acoustic Power 0 dB
�)!�����*����������� �A�

Condition 4: General, Focal zone 7 mm, SV 0.5 mm, Scale 80 cm/s,Acoustic Power 0 dB
�A� �)!�����*�����������

#���&�7����������
Operating Mode: B + CD Doppler
TIS TIBIndex Label MI At
surfaceBelowsurface
Atsurface
Belowsurface
TIC
Maximum index value 1.8 (a) (a) (a)
Index components value # - # -
at (MPa) CD:3.67
B: 3.42
(mW) # # #
(mW) # #
(cm) -
(cm) -
(cm) CD:2.08
B: 1.98
(cm) -
Associatedacoustic parameters
(MHz) CD:5.38
B: 4.25
# # #
prr (Hz) CD:275
B: 25
srr (Hz) 25
CD: 11B: 2
at (W/cm²) CD:296
B: 3.9
at (mW/cm²) CD:152
B: 24
Other information
at (mW/cm²) CD:222
B: 46
�)!�����*����������� �AA
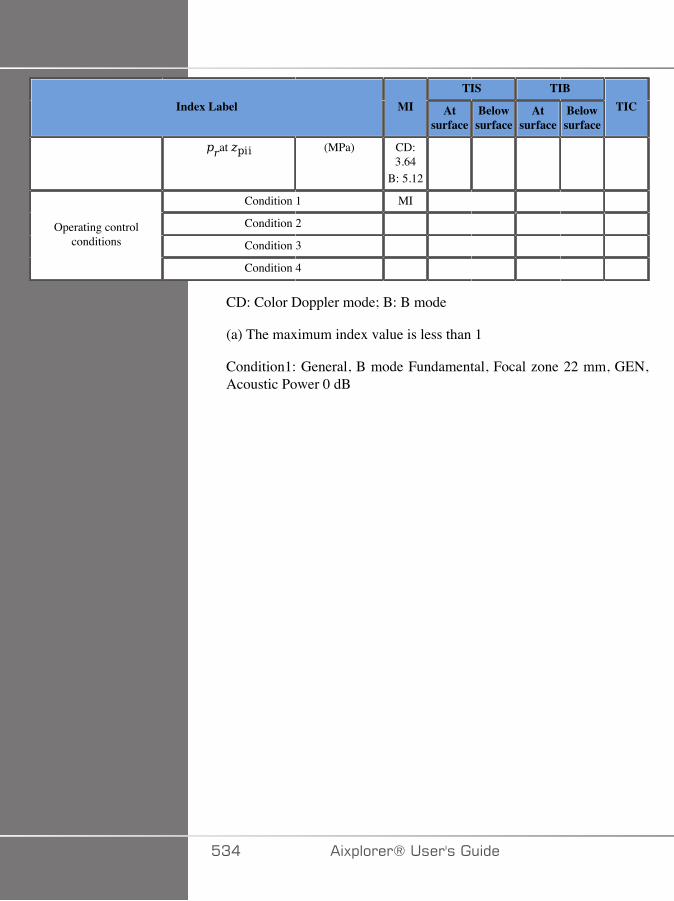
TIS TIBIndex Label MI At
surfaceBelowsurface
Atsurface
Belowsurface
TIC
at (MPa) CD:3.64
B: 5.12
Condition 1 MI
Condition 2
Condition 3 Operating control
conditions
Condition 4
CD: Color Doppler mode; B: B mode
(a) The maximum index value is less than 1
Condition1: General, B mode Fundamental, Focal zone 22 mm, GEN,Acoustic Power 0 dB
�A� �)!�����*�����������

Operating Mode: B + SWE
TIS TIBIndex Label MI At
surfaceBelowsurface
Atsurface
Belowsurface
TIC
Maximum index value 1.8 1.46 2.25 2.31
Index components value P: 0.12F: 1.93B: 0.2
P: 0.08F: 1.18B: 0.2
P: 0.12F: 1.93B: 0.2
P: 0.37F: 1.44B: 0.2
at (MPa) P: 3.34F: 2.85B: 3.74
(mW) P: 6.32F: 102.7B: 11.49
P: 6.32F: 102.7B: 11.49
P: 6.32F:
102.7B: 10.8
(mW) P: 6.32F: 80.93B: 10.17
P: 6.32F: 80.93B: 10.17
(cm) P: 1.72F: 2.18
(cm) P: 1.72F: 2.18
(cm) B: 2.19
(cm) P: 1.79F: 2.36
Associatedacoustic parameters
(MHz) P: 4.1F: 5
B: 4.25
P: 4.1F: 4.88B: 5.25
P: 4.1F: 4.88B: 5.25
P: 4.1F: 4.88B: 5.25
prr (Hz) P: 1F: 42B: 6
srr (Hz) 1
P: 1F: 42B: 6
Other information
at (W/cm²) P: 63F: 232B: 3.9
�)!�����*����������� �A�
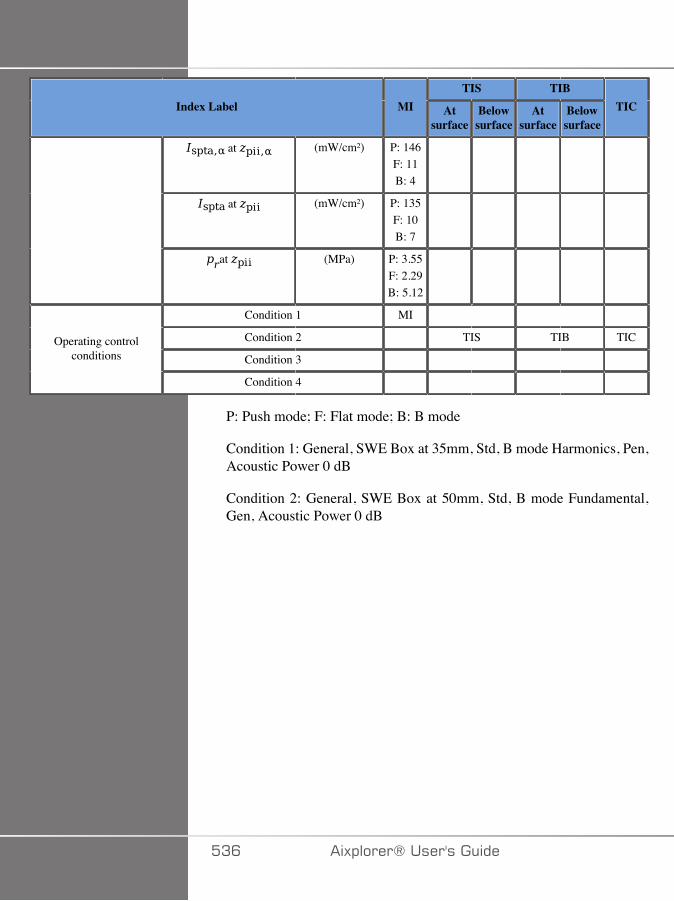
TIS TIBIndex Label MI At
surfaceBelowsurface
Atsurface
Belowsurface
TIC
at (mW/cm²) P: 146F: 11B: 4
at (mW/cm²) P: 135F: 10B: 7
at (MPa) P: 3.55F: 2.29B: 5.12
Condition 1 MI
Condition 2 TIS TIB TIC
Condition 3 Operating control
conditions
Condition 4
P: Push mode; F: Flat mode; B: B mode
Condition 1: General, SWE Box at 35mm, Std, B mode Harmonics, Pen,Acoustic Power 0 dB
Condition 2: General, SWE Box at 50mm, Std, B mode Fundamental,Gen, Acoustic Power 0 dB
�AC �)!�����*�����������
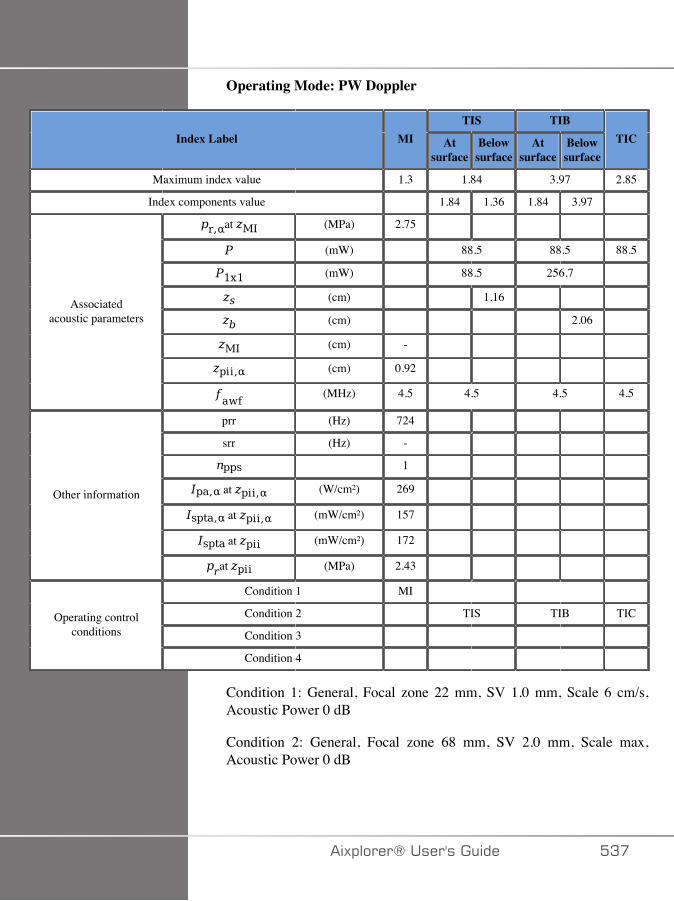
Operating Mode: PW Doppler
TIS TIBIndex Label MI At
surfaceBelowsurface
Atsurface
Belowsurface
TIC
Maximum index value 1.3 1.84 3.97 2.85
Index components value 1.84 1.36 1.84 3.97
at (MPa) 2.75
(mW) 88.5 88.5 88.5
(mW) 88.5 256.7
(cm) 1.16
(cm) 2.06
(cm) -
(cm) 0.92
Associatedacoustic parameters
(MHz) 4.5 4.5 4.5 4.5
prr (Hz) 724
srr (Hz) -
1
at (W/cm²) 269
at (mW/cm²) 157
at (mW/cm²) 172
Other information
at (MPa) 2.43
Condition 1 MI
Condition 2 TIS TIB TIC
Condition 3 Operating control
conditions
Condition 4
Condition 1: General, Focal zone 22 mm, SV 1.0 mm, Scale 6 cm/s,Acoustic Power 0 dB
Condition 2: General, Focal zone 68 mm, SV 2.0 mm, Scale max,Acoustic Power 0 dB
�)!�����*����������� �A�

G':������������
Operating Mode: B + CD Doppler
TIS TIBIndex Label MI At
surfaceBelowsurface
Atsurface
Belowsurface
TIC
Maximum index value 1.7 3.08 3.08 4.5*
Index components value CD:2.02
B: 1.06
- CD:2.02
B: 1.06
-
at (MPa) CD:1.85
B: 2.28
(mW) CD: 149B: 109
CD: 149B: 109
CD:149
B: 109
(mW) CD: 105B: 93
CD: 105B: 93
(cm) -
(cm) -
(cm) CD:4.84
B: 3.61
(cm) -
Associatedacoustic parameters
(MHz) CD:2.4
B: 1.9
CD: 2.42B: 2.4
CD: 2.42B: 2.4
CD:2.42
B: 2.4
prr (Hz) CD:248B: 8
srr (Hz) 8
CD: 8B: 4
at (W/cm²) CD:202
B: 168
Other information
at (mW/cm²) CD:185
�AD �)!�����*�����������
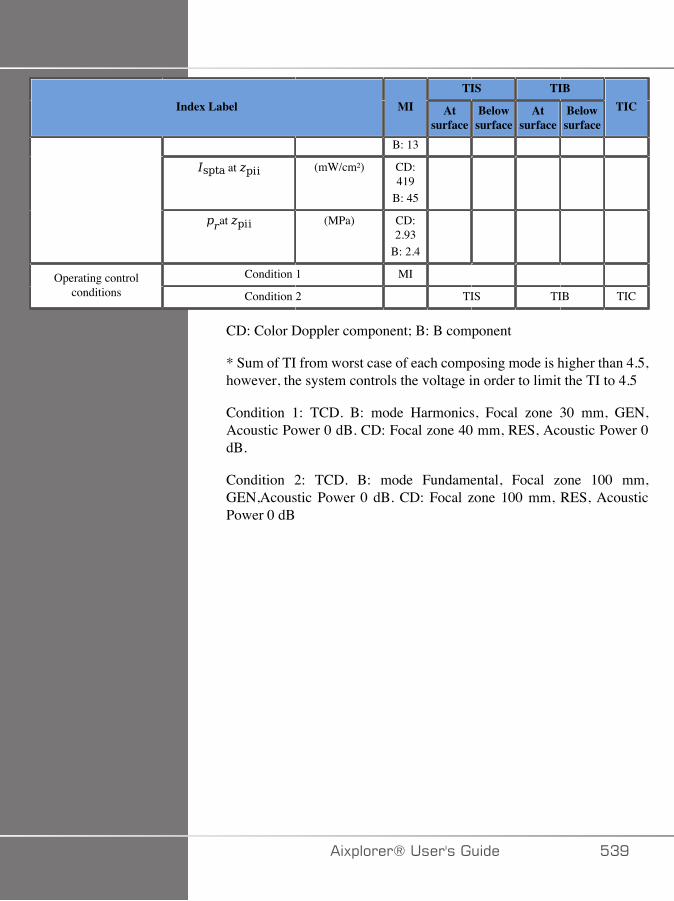
TIS TIBIndex Label MI At
surfaceBelowsurface
Atsurface
Belowsurface
TIC
B: 13
at (mW/cm²) CD:419
B: 45
at (MPa) CD:2.93
B: 2.4
Condition 1 MI Operating controlconditions Condition 2 TIS TIB TIC
CD: Color Doppler component; B: B component
* Sum of TI from worst case of each composing mode is higher than 4.5,however, the system controls the voltage in order to limit the TI to 4.5
Condition 1: TCD. B: mode Harmonics, Focal zone 30 mm, GEN,Acoustic Power 0 dB. CD: Focal zone 40 mm, RES, Acoustic Power 0dB.
Condition 2: TCD. B: mode Fundamental, Focal zone 100 mm,GEN,Acoustic Power 0 dB. CD: Focal zone 100 mm, RES, AcousticPower 0 dB
�)!�����*����������� �AE
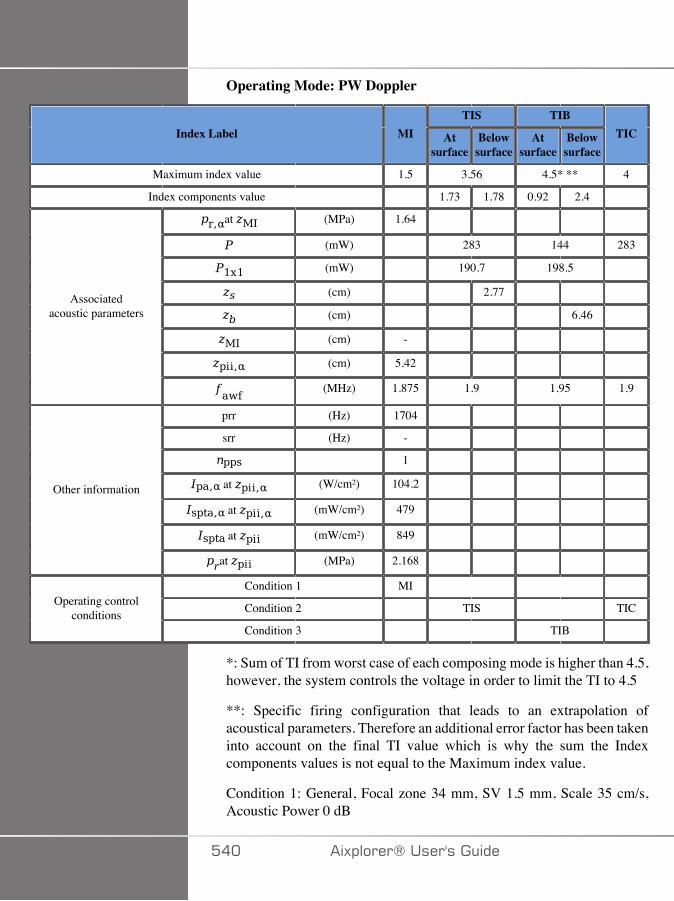
Operating Mode: PW Doppler
TIS TIBIndex Label MI At
surfaceBelowsurface
Atsurface
Belowsurface
TIC
Maximum index value 1.5 3.56 4.5* ** 4
Index components value 1.73 1.78 0.92 2.4
at (MPa) 1.64
(mW) 283 144 283
(mW) 190.7 198.5
(cm) 2.77
(cm) 6.46
(cm) -
(cm) 5.42
Associatedacoustic parameters
(MHz) 1.875 1.9 1.95 1.9
prr (Hz) 1704
srr (Hz) -
1
at (W/cm²) 104.2
at (mW/cm²) 479
at (mW/cm²) 849
Other information
at (MPa) 2.168
Condition 1 MI
Condition 2 TIS TICOperating controlconditions
Condition 3 TIB
*: Sum of TI from worst case of each composing mode is higher than 4.5,however, the system controls the voltage in order to limit the TI to 4.5
**: Specific firing configuration that leads to an extrapolation ofacoustical parameters. Therefore an additional error factor has been takeninto account on the final TI value which is why the sum the Indexcomponents values is not equal to the Maximum index value.
Condition 1: General, Focal zone 34 mm, SV 1.5 mm, Scale 35 cm/s,Acoustic Power 0 dB
��� �)!�����*�����������

Condition 2: General, Focal zone 140 mm, SV 1.5 mm, Scale 60 cm/s,Acoustic Power 0 dB
Condition 3: General, Focal zone 80 mm, SV 0.5 mm, Scale 90 cm/s,Acoustic Power 0 dB
�)!�����*����������� ���

#43&C�<�����������������
Operating Mode: B + CD Doppler
TIS TIBIndex Label MI At
surfaceBelowsurface
Atsurface
Belowsurface
TIC
Maximum index value 1.7 1.33 1.33 1.4
Index components value CD:0.87
B: 0.46
- CD:0.87
B: 0.46
-
at (MPa) CD:4.81
B: 4.59
(mW) CD: 11.3B: 17.4
CD: 11.3B: 17.4
CD: 20B: 12.8
(mW) CD: 11.3B: 17.4
CD: 11.3B: 17.4
(cm) -
(cm) -
(cm) CD:0.97
B: 1.02
(cm) -
Associatedacoustic parameters
(MHz) CD:8.38
B: 7.13
CD: 8.5B: 7.38
CD: 8.5B: 7.38
CD:7.38
B: 7.38
prr (Hz) CD:132
B: 24
srr (Hz) 12
CD: 11B: 2
at (W/cm²) CD: 41B: 449
Other information
at (mW/cm²) CD:509
B: 226
��� �)!�����*�����������
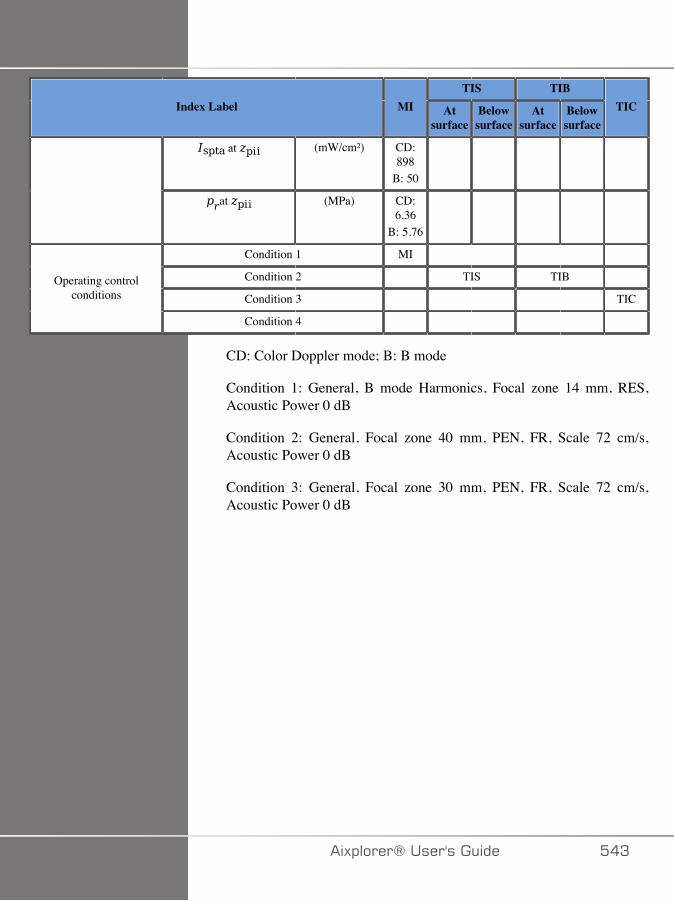
TIS TIBIndex Label MI At
surfaceBelowsurface
Atsurface
Belowsurface
TIC
at (mW/cm²) CD:898
B: 50
at (MPa) CD:6.36
B: 5.76
Condition 1 MI
Condition 2 TIS TIB
Condition 3 TICOperating control
conditions
Condition 4
CD: Color Doppler mode; B: B mode
Condition 1: General, B mode Harmonics, Focal zone 14 mm, RES,Acoustic Power 0 dB
Condition 2: General, Focal zone 40 mm, PEN, FR, Scale 72 cm/s,Acoustic Power 0 dB
Condition 3: General, Focal zone 30 mm, PEN, FR, Scale 72 cm/s,Acoustic Power 0 dB
�)!�����*����������� ��A

Operating Mode: B + SWE
TIS TIBIndex Label MI At
surfaceBelowsurface
Atsurface
Belowsurface
TIC
Maximum index value 1.7 1.61 2.01 2.51
Index components value P: 0.11F: 1.12B: 0.55
P: 0.06F: 1.01B: 0.55
P: 0.11F: 1.12B: 0.55
P: 0.3F: 1.23B: 0.55
at (MPa) P: 3.17F: 4.4
B: 4.59
(mW) P: 3.3F: 54.6B: 25
P: 3.3F: 54.6B: 25
P: 3.3F: 54.6B: 25
(mW) P: 3.3F: 31.9B: 25
P: 3.3F: 31.9B: 25
(cm) P: 1.59F: 1.35
(cm) P: 1.59F: 1.35
(cm) B: 1.02
(cm) P: 0.96F: 0.93
Associatedacoustic parameters
(MHz) P: 6.94F: 7.13B: 7.13
P: 6.94F: 7.38B: 7.38
P: 6.94F: 7.38B: 7.38
P: 6.94F: 7.38B: 7.38
prr (Hz) P: 1F: 42B: 20
srr (Hz) 1
P: 1F: 42B: 20
at (W/cm²) P: 234F: 358B: 611
Other information
at (mW/cm²) P: 94
��� �)!�����*�����������
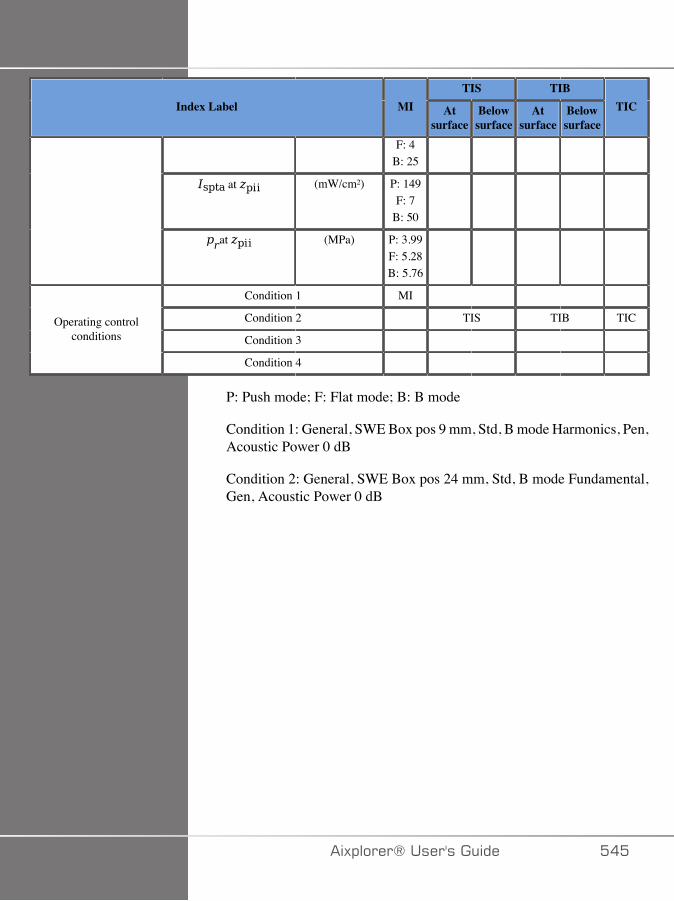
TIS TIBIndex Label MI At
surfaceBelowsurface
Atsurface
Belowsurface
TIC
F: 4B: 25
at (mW/cm²) P: 149F: 7
B: 50
at (MPa) P: 3.99F: 5.28B: 5.76
Condition 1 MI
Condition 2 TIS TIB TIC
Condition 3 Operating control
conditions
Condition 4
P: Push mode; F: Flat mode; B: B mode
Condition 1: General, SWE Box pos 9 mm, Std, B mode Harmonics, Pen,Acoustic Power 0 dB
Condition 2: General, SWE Box pos 24 mm, Std, B mode Fundamental,Gen, Acoustic Power 0 dB
�)!�����*����������� ���

Operating Mode: PW Doppler
TIS TIBIndex Label MI At
surfaceBelowsurface
Atsurface
Belowsurface
TIC
Maximum index value 1.7 (a) 1.75 1.2
Index components value # # 0.74 1.75
at (MPa) 1.75
(mW) # 20.6 12.5
(mW) # 20.6
(cm) #
(cm) 0.9
(cm) -
(cm) 0.86
Associatedacoustic parameters
(MHz) 7.38 # 7.38 7.5
prr (Hz) 1207
srr (Hz) -
1
at (W/cm²) 675
at (mW/cm²) 260
at (mW/cm²) 416
Other information
at (MPa) 4.84
Condition 1 MI
Condition 2 TIB
Condition 3 TICOperating control
conditions
Condition 4
Condition 1: General, Focal zone 14 mm, SV 0.5 mm, Scale 8 cm/s,Acoustic Power 0 dB
Condition 2: General, Focal zone 40 mm, SV 4.0 mm, Scale 80 cm/s,Acoustic Power 0 dB
Condition 3: General, Focal zone 7 mm, SV 4.0 mm, Scale 80 cm/s,Acoustic Power 0 dB
��C �)!�����*�����������
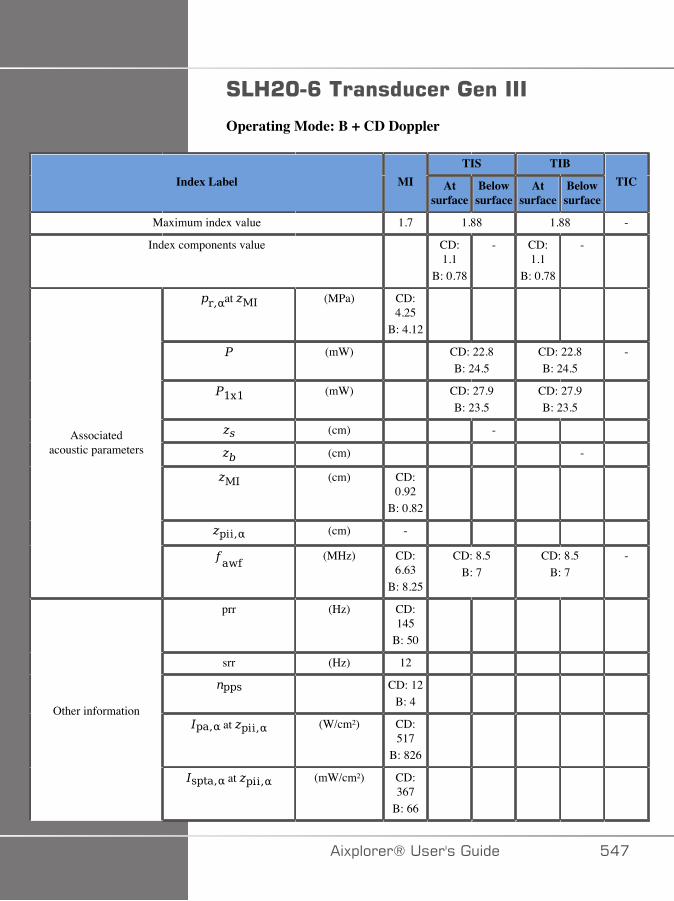
#43&C�<������������������
Operating Mode: B + CD Doppler
TIS TIBIndex Label MI At
surfaceBelowsurface
Atsurface
Belowsurface
TIC
Maximum index value 1.7 1.88 1.88 -
Index components value CD:1.1
B: 0.78
- CD:1.1
B: 0.78
-
at (MPa) CD:4.25
B: 4.12
(mW) CD: 22.8B: 24.5
CD: 22.8B: 24.5
-
(mW) CD: 27.9B: 23.5
CD: 27.9B: 23.5
(cm) -
(cm) -
(cm) CD:0.92
B: 0.82
(cm) -
Associatedacoustic parameters
(MHz) CD:6.63
B: 8.25
CD: 8.5B: 7
CD: 8.5B: 7
-
prr (Hz) CD:145
B: 50
srr (Hz) 12
CD: 12B: 4
at (W/cm²) CD:517
B: 826
Other information
at (mW/cm²) CD:367
B: 66
�)!�����*����������� ���
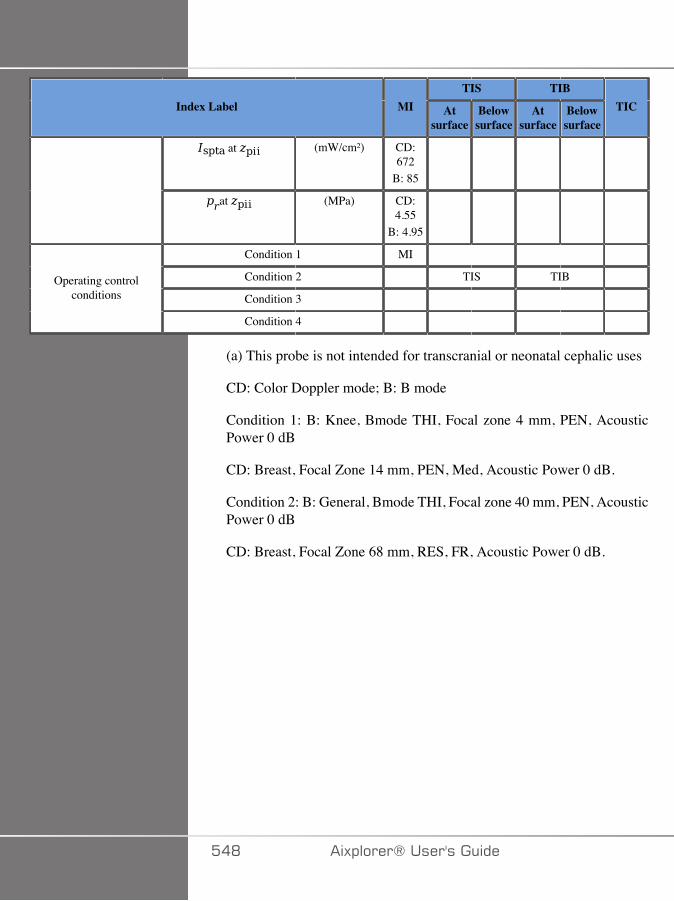
TIS TIBIndex Label MI At
surfaceBelowsurface
Atsurface
Belowsurface
TIC
at (mW/cm²) CD:672
B: 85
at (MPa) CD:4.55
B: 4.95
Condition 1 MI
Condition 2 TIS TIB
Condition 3 Operating control
conditions
Condition 4
(a) This probe is not intended for transcranial or neonatal cephalic uses
CD: Color Doppler mode; B: B mode
Condition 1: B: Knee, Bmode THI, Focal zone 4 mm, PEN, AcousticPower 0 dB
CD: Breast, Focal Zone 14 mm, PEN, Med, Acoustic Power 0 dB.
Condition 2: B: General, Bmode THI, Focal zone 40 mm, PEN, AcousticPower 0 dB
CD: Breast, Focal Zone 68 mm, RES, FR, Acoustic Power 0 dB.
��D �)!�����*�����������
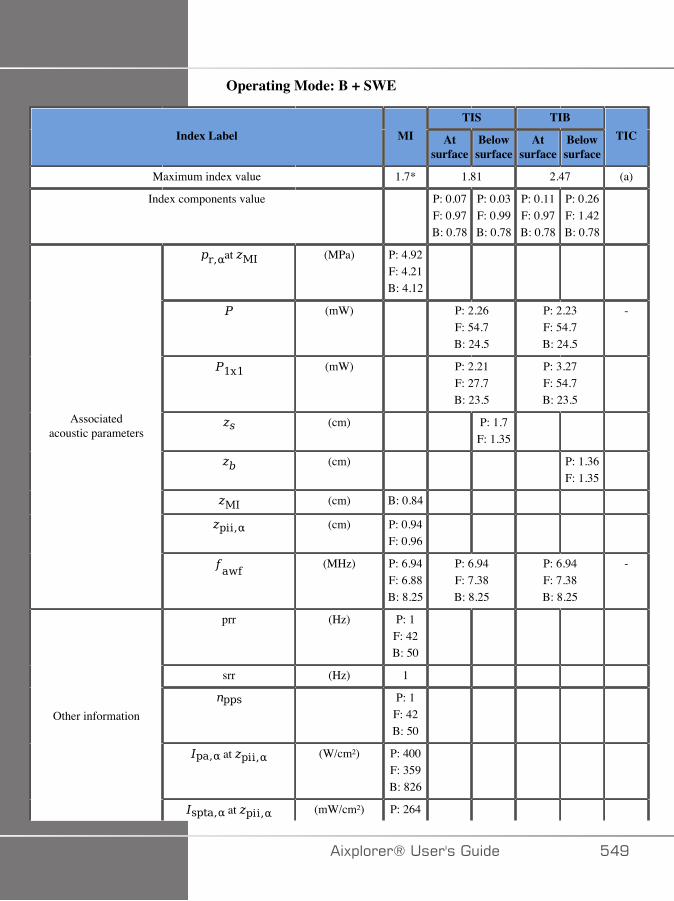
Operating Mode: B + SWE
TIS TIBIndex Label MI At
surfaceBelowsurface
Atsurface
Belowsurface
TIC
Maximum index value 1.7* 1.81 2.47 (a)
Index components value P: 0.07F: 0.97B: 0.78
P: 0.03F: 0.99B: 0.78
P: 0.11F: 0.97B: 0.78
P: 0.26F: 1.42B: 0.78
at (MPa) P: 4.92F: 4.21B: 4.12
(mW) P: 2.26F: 54.7B: 24.5
P: 2.23F: 54.7B: 24.5
-
(mW) P: 2.21F: 27.7B: 23.5
P: 3.27F: 54.7B: 23.5
(cm) P: 1.7F: 1.35
(cm) P: 1.36F: 1.35
(cm) B: 0.84
(cm) P: 0.94F: 0.96
Associatedacoustic parameters
(MHz) P: 6.94F: 6.88B: 8.25
P: 6.94F: 7.38B: 8.25
P: 6.94F: 7.38B: 8.25
-
prr (Hz) P: 1F: 42B: 50
srr (Hz) 1
P: 1F: 42B: 50
at (W/cm²) P: 400F: 359B: 826
Other information
at (mW/cm²) P: 264
�)!�����*����������� ��E

TIS TIBIndex Label MI At
surfaceBelowsurface
Atsurface
Belowsurface
TIC
F: 121B: 66
at (mW/cm²) P: 409F: 203B: 84
at (MPa) P: 6.68F: 5.22B: 4.95
Condition 1 MI
Condition 2 TIS TIB
Condition 3 Operating control
conditions
Condition 4
(a) This probe is not intended for transcranial or neonatal cephalic uses
*: The highest MI from the worst case of the composing mode is higherthan 1.9, however the system
P: Push mode; F: Flat mode; B: B mode
Condition 1: B: Knee, Bmode THI, Focal zone 4 mm, PEN, AcousticPower 0 dB
F: Breast, Acoustic Power 0 dB.
P: Knee, std, SWE Box position depth 5.3 mm, SWE Box size depth 10mm.
Condition 2: B: General, Bmode THI, Focal zone 40 mm, PEN, AcousticPower 0 dB
F: Breast, Acoustic Power 0 dB.
B: General, Bmode THI, Focal zone 40 mm, PEN, Acoustic Power 0 dB
��� �)!�����*�����������

Operating Mode: PW Doppler
TIS TIBIndex Label MI At
surfaceBelowsurface
Atsurface
Belowsurface
TIC
Maximum index value 1.65 (a) 1.4 (b)
Index components value - - 0.49 1.41
at (MPa) 3.45
(mW) - 13.7 -
(mW) - 13.7
(cm) -
(cm) 0.46
(cm) -
(cm) 0.9
Associatedacoustic parameters
(MHz) 7.25 - 7.5 -
prr (Hz) 2006
srr (Hz) 1
1
at (W/cm²) 297
at (mW/cm²) 459
at (mW/cm²) 647
Other information
at (MPa) 3.83
Condition 1 MI
Condition 2 TIB
Condition 3 Operating control
conditions
Condition 4
(a) The maximum index value is less than 1.0
(b) This probe is not intended for transcranial or neonatal cephalic uses
Condition 1: General, SV Position depth 40 mm, SV size 0.5 mm, Scale10.3 cm/s, Acoustic Power 0 dB
Condition 1: General, SV Position depth 4 mm, SV size 2 mm, Scale 150cm/s, Acoustic Power 0 dB
�)!�����*����������� ���

��� �)!�����*�����������

�&�+���������
�)!�����*����������� ��A

��� �)!�����*�����������
��������+���������Abbott, JG. Rationale and derivation of MI and TI - a review. Ultrasoundin Med. and Biol. 25:431-441; 1999.
American Institute of Ultrasound in Medicine (AIUM). Bioeffects andsafety of diagnostic ultrasound. Laurel, MD: AIUM Publications; 1993.
American Institute of Ultrasound in Medicine/National ElectricalManufacturers Association (AIUM/NEMA). Standard for real-timedisplay of thermal and mechanical acoustic output indices on diagnosticultrasound equipment, Revision 1. Laurel, MD: AIUM Publications;1998a.
American Institute of Ultrasound in Medicine/National ElectricalManufacturers Association (AIUM/NEMA). Acoustic outputmeasurement standard for diagnostic ultrasound equipment. Laurel, MD:AIUM Publications;1998b.
American Institute of Ultrasound in Medicine (AIUM). Medicalultrasound safety. Rockville, MD: AIUM Publications; 2002.
American Institute of Ultrasound in Medicine (AIUM). StandardMethods for Measuring Performance of Pulse Echo Ultrasound ImagingEquipment. Rockville, MD: AIUM Publications; 1991.
American Institute of Ultrasound in Medicine (AIUM). Methods forMeasuring Performance of Pulse-Echo Ultrasound Equipment, Part II:Digital Methods. Rockville, MD: AIUM Publications; 1995a.
American Institute of Ultrasound in Medicine (AIUM). AIUM QualityAssurance Manual for Gray-Scale Ultrasound Scanners. Rockville, MD:AIUM Publications; 1995b.
American Institute Of Ultrasound In Medicine. Standard For Real-Time Display Of Thermal And Mechanical Acoustic Output Indices OnDiagnostic Ultrasound Equipment. Laurel, Maryland: AIUM, 1992.
American Institute of Ultrasound in Medicine (AIUM). MechanicalBioeffects from Diagnostic Ultrasound: AIUM Consensus Statements. J.Ultrasound in Medicine 19: number 2; (February 2000). (Also availablefrom AIUM Publications.).
�)!�����*����������� ���
Apfel, R.E. and Holland, C.K. Gauging the likelihood of cavitation fromshort-pulse, low duty cycle diagnostic ultrasound. Ultrasound in Med.and Biol. 17:179-185;1991.
Baggs, R., Penney, D.P., Cox, C., Child, S.Z., Raeman, C.H., Dalecki,D. and Carstensen, E.L. Thresholds for ultrasonically induced lunghemorrhage in neonatal swine. Ultrasound in Med. and Biol. 22:119-128;1996.
Barnett, S.B., ter Haar, G.R., Ziskin, M.C., Rott, H.D., Duck, F.A. andMaeda, K. International recommendations and guidelines for the safeuse of diagnostic ultrasound in medicine. Ultrasound in Med. and Biol.26:355-366; 2000.
Bly, S.H.P., Vlahovich, S., Mabee, P.R. and Hussey, R.G. Computedestimates of maximum temperature elevations in fetal tissues duringtransabdominal pulsed Doppler examinations. Ultrasound in Med. andBiol. 18:389-397; 1992.
Bosward, K.L., Barnett, S.B., Wood, A.K.W., Edwards, M.J. andKossoff, G. Heating of guinea-pig fetal brain during exposure to pulsedultrasound. Ultrasound in Med. and Biol. 19:415-424; 1993.
Carstensen, E.L., Duck, F.A., Meltzer, R.S., Schwarz, K.Q., Keller, B.Bioeffects in echocardiography. Echocardiography 6:605-623; 1992.
Child, S.Z., Hartman, C.L., McHale, L.A and E.L. Carstensen. Lungdamage from exposure to pulsed ultrasound. Ultrasound in Med. andBiol. 16:817-825; 1990.
Dalecki, D., Raeman CH, Child SZ, et al, . The influence of contrastagents on hemorrhage produced by lithotripter fields. Ultrasound in Med.and Biol. 23:1435-1439; 1997.
Dalecki, D., Child, S.Z., Raeman, C.H., Cox, C. and Carstensen, E.L.Ultrasonically induced lung hemorrhage in young swine. Ultrasound inMed. and Biol. 23:777-781; 1997.
Dalecki, D., Child, S.Z., Raeman, C.H. and Cox, C. Hemorrhage inmurine fetuses exposed to pulsed ultrasound. Ultrasound in Med. andBiol. 25:1139-1144; 1999.
Doody, C. Porter, H., Duck, F.A. and Humphrey, V.F. In vitro heatingof human fetal vertebra by pulsed diagnostic ultrasound. Ultrasound inMed. and Biol. 25:1289-1294; 1999.
��C �)!�����*�����������
Duck, F.A., Starritt, H.C., ter Haar, G.R. and Lunt, M.J. Surface heatingof diagnostic ultrasound transducers. Br. J. Radiology 67:1005-1013;1989.
Duggan, P.M., Liggins, G.C. and Barnett, S.B. Ultrasonic heating of thebrain of the fetal sheep in utero. Ultrasound in Med. and Biol. 21:553-560;1995.
Duggan, P.M. and McCowan, L.M.E. Reference Ranges andUltrasonographic Exposure Conditions for Pulsed Doppler SonographicStudies of the Fetal Internal Carotid Artery. J Ultrasound in Medicine12:719 - 722; 1993.
European Federation of Societies for Ultrasound in Medicine andBiology (EFSUMB) Guidelines and Recommendations on the ClinicalUse of Ultrasound Elastography. Part 1 : Basic principles and technology;EFSUMB, Ultraschall Med. 2013 Apr; 34(2): 169-84.
European Federation of Societies for Ultrasound in Medicine andBiology (EFSUMB) Guidelines and Recommendations on the ClinicalUse of Ultrasound Elastography. Part 2 : Clinical Applications;EFSUMB, Ultraschall Med. 2013 Jun; 34(3): 238-53
Frizzell, L.A., Chen, E. and Lee, C. Effects of pulsed ultrasound on themouse neonate: hind limb paralysis and lung hemorrhage. Ultrasound inMed. and Biol. 20:53-63;1 994.
Henderson, J., Willson, K., Jago, J.R. and Whittingham, T. A surveyof the acoustic outputs of diagnostic ultrasound equipment in currentclinical use. Ultrasound in Med. and Biol. 21:699-705; 1995.
Holland, C.K., Deng, C.X., Apfel, R.E., Alderman, J.L., Fernandez, L.A.,and Taylor, K.J.W. Direct evidence of cavitation in vivo from diagnosticultrasound. Ultrasound in Med. and Biol. 22:917-925; 1996.
Lele, P.P. Local hyperthermia by ultrasound for cancer therapy. In:Nyborg, W.L.; Ziskin, M.C., eds. Biological effects of ultrasound.Clinics in diagnostic ultrasound, Vol.16. New York: ChurchillLivingstone:135-155; 1985.
Lopez, H. How to Interpret the Ultrasound Output Display Standard forHigher Acoustic Output Diagnostic Ultrasound Devices. J. Ultrasound inMedicine, Vol 17, pg 535 (1998).
�)!�����*����������� ���

Miller, D.L. and Gies, R.A. Gas-body-based contrast agent enhancesvascular bioeffects of 1.09 Mhz ultrasound on mouse intestine.Ultrasound in Med. and Biol. 24:1201-1208; 1998.
Meltzer, R.S., Adsumelli, R., Risher, W.H., et al., Lack oflung hemorrhage in humans after intraoperative transesophagealechocardiography with ultrasound exposure conditions similar tothose causing lung hemorrhage in laboratory animals. J. Am. Soc.Echocardiography 11:57-60; 1998.
National Council on Radiation Protection and Measurements (NCRP).Exposure criteria for medical diagnostic ultrasound: I.Criteria based onthermal mechanisms. Bethesda, MD: NCRP; June 1, 1992.
National Council on Radiation Protection and Measurements (NCRP).Exposure criteria for medical diagnostic ultrasound: II. Criteria based onmechanical mechanisms. Bethesda, MD: NCRP; in preparation
O’Brien, W.D. and Zachary, J.F. Lung damage assessment from exposureto pulsed-wave ultrasound in the rabbit, mouse and pig. IEEE TransUltras Ferro, Freq Cont 44: 473-485; 1997.
O’Neill, T.P., Winkler, A.J. and Wu, J. Ultrasound heating in a tissue-bone phantom. Ultrasound in Med. and Biol. 20:579-588; 1994.
Patton, C.A., Harris, G.R. and Phillips, R.A. Output Levels andBioeffects Indices from Diagnostic Ultrasound Exposure Data Reportedto the FDA. IEEE Trans Ultras Ferro, Freq Cont 41:353-359; 1994.
Ramnarine, K.V., Nassiri, D.K., Pearce, J.M., Joseph, A.E.A., Patel,R.H. and Varma, T.R. Estimation of in situ ultrasound exposure duringobstetric examinations. Ultrasound in Med. and Biol. 19:319-329; 1993.
Shaw, A., Preston, R.C. and Bond, A.D. Assessment of the likelythermal index values for pulsed Doppler ultrasonic equipment - Stage I:calculation based on manufacturers’ data. NPL Report CIRA(EXT) 018;1997.
Shaw, A., Pay, N.M. and Preston, R.C. Assessment of the likely thermalindex values for pulsed Doppler ultrasonic equipment - Stages II andIII: experimental assessment of scanner/transducer combinations. NPLReport CMAM 12; 1998.
Siddiqi, T.A., O’Brien, W.D., Meyer, R.A., Sullivan, J.M. andMiodovnik, M. In situ human obstetrical ultrasound exposimetry:
��D �)!�����*�����������

estimates of derating factors for each of three different tissue models.Ultrasound in Med. and Biol. 21:379-391; 1995.
Tarantal, A.F. and Canfield, D.R. Ultrasound-induced lung hemorrhagein the monkey. Ultrasound in Med. and Biol. 20:65-72; 1994.
U.S. Food and Drug Administration (FDA). Information formanufacturers seeking marketing clearance of diagnostic ultrasoundsystems and transducers. Rockville, MD: FDA; Sept 30, 1997.
World Federation for Ultrasound in Medicine and Biology (WFUMB)WFUMB Symposium on Safety and Standardisation in MedicalUltrasound, Chapter 1, ed., Barnett, S.B. and Kossoff, G. Ultrasound inMed. and Biol. 18:739-750; 1992.
World Federation for Ultrasound in Medicine and Biology (WFUMB)WFUMB Symposium on Safety of Ultrasound in Medicine. Conclusionsand recommendations on thermal and non-thermal mechanisms forbiological effects of ultrasound. ed., Barnett, S.B. Ultrasound in Med.and Biol. 24: Supplement 1, 1998.
Zachary, J.F. and O’Brien, W.D., Jr. Lung lesions induced by continuous-and pulsed-wave (diagnostic) ultrasound in mice, rabbits and pigs. VetPathol 32:43-54; 1995.
�)!�����*����������� ��E

�����������+���������The detailed tables and equations listed below are availablein the Obstetrical References Guide. You may download it atthe following link: http://www.supersonicimagine.com/Aixplorer-R/Women-s-Healthcare/Obstetrics.
=��������)� �*,���������������
��������������������0 ���(�� 1
ASUM: ASUM and Campbell Westerway S , Ultrasonic fetalMeasurement Standards for an Australian Population, ASUM, 2003
CFEF: Crequat J, Duyme M and Brodaty G, Fetal growth charts by theFrench College of fetal ultrasonography and the Inserm U 155 , Biometry2000, 28, pp 435-455, 2000
Hadlock: Hadlock F.P, Deter R.L, Harrist R.B. and Park S.K, Estimatingfetal age: computer-assisted analysis of multiple fetal growth parameters,Radiology, 152, pp 497-501, 1984
Merz: Merz E, Goldhofer W and Timor-Tritsch E , Ultrasound inGynecology and Obstetrics, Textbook and Atlas, Georg Thieme Verlag ,1991
/$�������!�������0/'!��(�� 1
ASUM: ASUM and Campbell Westerway S , Ultrasonic fetalMeasurement Standards for an Australian Population, ASUM, 2003
CFEF: L.J. Salomon, M. Duyme, J. Crequat, G. Brodaty, C. Talmant, N.Fries and M. Althuser - CFEF - Collège Français d'Echographie Foetale,Paris, France - Ultrasound Obstet Gynecol 2006; 28: 193-198, 2006
�C� �)!�����*�����������

Hadlock: Hadlock F.P, Deter R.L, Harrist R.B. and Park S.K, Estimatingfetal age: computer-assisted analysis of multiple fetal growth parameters,Radiology, 152, pp 497-501, 1984
Merz: Merz E, Goldhofer W and Timor-Tritsch E , Ultrasound inGynecology and Obstetrics, Textbook and Atlas, Georg Thieme Verlag ,1991
���)��+�$�4��%� �0�+4��(�� 1
Hansmann: Hansmann, Hackeloer, Staudach and Wittman, UltrasoundDiagnosis in Obstetrics and Gynecology, Springer-Verlag, New York,1986
ASUM: ASUM and Campbell Westerway S , Ultrasonic fetalMeasurement Standards for an Australian Population, ASUM, 2003
CFEF: Crequat J, Duyme M and Brodaty G, Fetal growth charts by theFrench College of fetal ultrasonography and the Inserm U 155 , Biometry2000, 28, pp 435-455, 2000
=����4��%� �0=4��(�� 1
Hadlock: Hadlock F.P, Deter R.L, Harrist R.B. and Park S.K, Estimatingfetal age: computer-assisted analysis of multiple fetal growth parameters,Radiology, 152, pp 497-501, 1984
Jeanty: Ultrasonic Evaluation of Fetal Limb Growth, Jeanty et al., June1982, Radiology 143: 751-754
Merz: Merz E, Goldhofer W and Timor-Tritsch E , Ultrasound inGynecology and Obstetrics, Textbook and Atlas, Georg Thieme Verlag ,1991
3����������������03���(�� 1
ASUM: ASUM and Campbell Westerway S , Ultrasonic fetalMeasurement Standards for an Australian Population, ASUM, 2003
�)!�����*����������� �C�

CFEF: Crequat J, Duyme M and Brodaty G, Fetal growth charts by theFrench College of fetal ultrasonography and the Inserm U 155 , Biometry2000, 28, pp 435-455, 2000
Hadlock: Hadlock F.P, Deter R.L, Harrist R.B. and Park S.K, Estimatingfetal age: computer-assisted analysis of multiple fetal growth parameters,Radiology, 152, pp 497-501, 1984
Jeanty: Jeanty P and Romero R, Obstetrical Ultrasound, McGraw-Hill,1984
Merz: Merz E, Goldhofer W and Timor-Tritsch E , Ultrasound inGynecology and Obstetrics, Textbook and Atlas, Georg Thieme Verlag ,1991
3�����4��%� �034��(�� 1
ASUM: ASUM and Campbell Westerway S , Ultrasonic fetalMeasurement Standards for an Australian Population, ASUM, 2003
Jeanty: Ultrasonic Evaluation of Fetal Limb Growth, Jeanty et al., June1982, Radiology 143: 751-754
���$���=�������!�������0�=!��(�� 1
ASUM: ASUM and Campbell Westerway S , Ultrasonic fetalMeasurement Standards for an Australian Population, ASUM, 2003
������ ��������!�������0� !��(�� 1
CFEF: Crequat J, Duyme M and Brodaty G, Fetal growth charts by theFrench College of fetal ultrasonography and the Inserm U 155 , Biometry2000, 28, pp 435-455, 2000
����0��/��(�� 1
Jeanty: Ultrasonic Evaluation of Fetal Limb Growth, Jeanty et al., June1982, Radiology 143: 751-754
�C� �)!�����*�����������

����������� %��*,���������������
��������������������0� ��(� �1
ASUM: ASUM and Campbell Westerway S , Ultrasonic fetalMeasurement Standards for an Australian Population, ASUM, 2003
CFEF: Crequat J, Duyme M and Brodaty G, Fetal growth charts by theFrench College of fetal ultrasonography and the Inserm U 155 , Biometry2000, 28, pp 435-455, 2000
Hadlock: Hadlock F.P, Deter R.L, Harrist R.B. and Park S.K, Estimatingfetal age: computer-assisted analysis of multiple fetal growth parameters,Radiology, 152, pp 497-501, 1984
Hansmann: Hansmann, Hackeloer, Staudach and Wittman, UltrasoundDiagnosis in Obstetrics and Gynecology, Springer-Verlag, New York,1986
Merz: Merz E, Goldhofer W and Timor-Tritsch E , Ultrasound inGynecology and Obstetrics, Textbook and Atlas, Georg Thieme Verlag ,1991
/$�������!�������0� ��(�/'!1
ASUM: ASUM and Campbell Westerway S , Ultrasonic fetalMeasurement Standards for an Australian Population, ASUM, 2003
CFEF: Crequat J, Duyme M and Brodaty G, Fetal growth charts by theFrench College of fetal ultrasonography and the Inserm U 155 , Biometry2000, 28, pp 435-455, 2000
Hadlock: Hadlock F.P, Deter R.L, Harrist R.B. and Park S.K, Estimatingfetal age: computer-assisted analysis of multiple fetal growth parameters,Radiology, 152, pp 497-501, 1984
Hansmann: Hansmann, Hackeloer, Staudach and Wittman, UltrasoundDiagnosis in Obstetrics and Gynecology, Springer-Verlag, New York,1986
�)!�����*����������� �CA

Merz: Merz E, Goldhofer W and Timor-Tritsch E , Ultrasound inGynecology and Obstetrics, Textbook and Atlas, Georg Thieme Verlag ,1991
���)��+�$�4��%� �0� ��(��+41
ASUM: ASUM and Campbell Westerway S , Ultrasonic fetalMeasurement Standards for an Australian Population, ASUM, 2003
Hansmann: Hansmann, Hackeloer, Staudach and Wittman, UltrasoundDiagnosis in Obstetrics and Gynecology, Springer-Verlag, New York,1986
=����4��%� �0� ��(�=41
ASUM: ASUM and Campbell Westerway S , Ultrasonic fetalMeasurement Standards for an Australian Population, ASUM, 2003
CFEF: Crequat J, Duyme M and Brodaty G, Fetal growth charts by theFrench College of fetal ultrasonography and the Inserm U 155 , Biometry2000, 28, pp 435-455, 2000
Chitty: Altman D.G and Chitty L.S, New charts for ultrasound dating ofpregnancy, Ultrasound Obstet. Gynecol, Vol 10, pp 174-191, 1997
Hadlock: Hadlock F.P, Deter R.L, Harrist R.B. and Park S.K, Estimatingfetal age: computer-assisted analysis of multiple fetal growth parameters,Radiology, 152, pp 497-501, 1984
Hansmann: Hansmann, Hackeloer, Staudach and Wittman, UltrasoundDiagnosis in Obstetrics and Gynecology, Springer-Verlag, New York,1986
Jeanty: Ultrasonic Evaluation of Fetal Limb Growth, Jeanty et al., June1982, Radiology 143: 751-754
Merz: Merz E, Goldhofer W and Timor-Tritsch E , Ultrasound inGynecology and Obstetrics, Textbook and Atlas, Georg Thieme Verlag ,1991
�C� �)!�����*�����������
�����������#���0� ��(��#1
Daya: Daya S, Woods S, Ward S, Lappalainen R and Caco R, Earlypregnancy assessment with transvaginal ultrasound scanning, CMAJ,Vol 144(4), pp 441-446, 1991
3����������������0� ��(�3�1
ASUM: ASUM and Campbell Westerway S , Ultrasonic fetalMeasurement Standards for an Australian Population, ASUM, 2003
CFEF: Crequat J, Duyme M and Brodaty G, Fetal growth charts by theFrench College of fetal ultrasonography and the Inserm U 155 , Biometry2000, 28, pp 435-455, 2000
Chitty: Altman D.G and Chitty L.S, New charts for ultrasound dating ofpregnancy, Ultrasound Obstet. Gynecol, Vol 10, pp 174-191, 1997
Hadlock: Hadlock F.P, Deter R.L, Harrist R.B. and Park S.K, Estimatingfetal age: computer-assisted analysis of multiple fetal growth parameters,Radiology, 152, pp 497-501, 1984
Hansmann: Hansmann, Hackeloer, Staudach and Wittman, UltrasoundDiagnosis in Obstetrics and Gynecology, Springer-Verlag, New York,1986
Jeanty: Jeanty P and Romero R, Obstetrical Ultrasound, McGraw-Hill,1984
Merz: Merz E, Goldhofer W and Timor-Tritsch E , Ultrasound inGynecology and Obstetrics, Textbook and Atlas, Georg Thieme Verlag ,1991
3�����4��%� �0� ��(�341
ASUM: ASUM and Campbell Westerway S , Ultrasonic fetalMeasurement Standards for an Australian Population, ASUM, 2003
Jeanty: Ultrasonic Evaluation of Fetal Limb Growth, Jeanty et al., June1982, Radiology 143: 751-754
�)!�����*����������� �C�

���$���=�������!�������0� ��(��=!1
ASUM: ASUM and Campbell Westerway S , Ultrasonic fetalMeasurement Standards for an Australian Population, ASUM, 2003
Hansmann: Hansmann, Hackeloer, Staudach and Wittman, UltrasoundDiagnosis in Obstetrics and Gynecology, Springer-Verlag, New York,1986
������ ��������!�������0� ��(�� !1
CFEF: Crequat J, Duyme M and Brodaty G, Fetal growth charts by theFrench College of fetal ultrasonography and the Inserm U 155 , Biometry2000, 28, pp 435-455, 2000
����0� ��(���/1
Jeanty: Ultrasonic Evaluation of Fetal Limb Growth, Jeanty et al., June1982, Radiology 143: 751-754
�����0� ��(��4� 1
Jeanty: Ultrasonic Evaluation of Fetal Limb Growth, Jeanty et al., June1982, Radiology 143: 751-754
*��������=�������% �*,����������������
����������� %��0*=���(�� 1
CFEF: Courbe d'estimation de poids foetal 2014 par le CFEF - Janvier2015 - Massoud M., Duyme M., Fontanges M., Collège Françaisd'Echographie Foetale (CFEF), Combourieu D. - Journal de GynécologieObstétrique et Biologie de la Reproduction - Accepté le 15 janvier 2015
�CC �)!�����*�����������

Doubilet: J Ultrasound Med. 1997 Apr
Hadlock: Hadlock FP1, Harrist RB, Martinez-Poyer J, In utero analysisof fetal growth: a sonographic weight standard, Radiology. 1991 Oct,181(1):129-33.
Oken (all): BMC Pediatr. 2003, 3:6. Published online 2003 Jul 8.doi:10.1186/1471-2431-3-3 A nearly continuous measure of birth weightfor gestational age using a United States national reference Emily Oken,Ken P Kleinman, Janet Rich-Edwards, and Matthew W Gillman
Oken (females): BMC Pediatr. 2003, 3:6. Published online 2003 Jul 8.doi:10.1186/1471-2431-3-6 A nearly continuous measure of birth weightfor gestational age using a United States national reference Emily Oken,Ken P Kleinman, Janet Rich-Edwards, and Matthew W Gillman
Oken (males): BMC Pediatr. 2003, 3:6. Published online 2003 Jul 8.doi:10.1186/1471-2431-3-6 A nearly continuous measure of birth weightfor gestational age using a United States national reference Emily Oken,Ken P Kleinman, Janet Rich-Edwards, and Matthew W Gillman
�����������������������/$�������!�������0*=���(� �2�/'!1
Hadlock: Hadlock F.P, Harrist R.B, Carpenter R.J, Deter R.L and ParkS.K, Sonographic estimation of fetal weight. The value of femur lengthin addition to head and abdomen measurements, Radiology, 150, pp535-540, 1984
Merz: Merz E, Goldhofer W and Timor-Tritsch E , Ultrasound inGynecology and Obstetrics, Textbook and Atlas, Georg Thieme Verlag ,1991
�������������������2�/$������!�����������=����4��%� �0*=���( �2�/'!2�=41
Hadlock: Hadlock F.P, Harrist R.B, Sharman R.S, Deter R.L, ParkS.K, Estimation of fetal weight with the use of head, body, and
�)!�����*����������� �C�

femur measurements--a prospective study, Am.J.Obstet.Gynecol., 151,pp 333-337, 1985
�������������������2�/$������!������2�=����4��%� �����3���������������0*=���(� �2�/'!2�=423�1
Hadlock: Hadlock F.P, Harrist R.B, Sharman R.S, Deter R.L, ParkS.K, Estimation of fetal weight with the use of head, body, andfemur measurements--a prospective study, Am.J.Obstet.Gynecol., 151,pp 333-337, 1985
������������������������=���4��%� �0*=���(� �2�=41
Hadlock: Hadlock F.P, Harrist R.B, Sharman R.S, Deter R.L, ParkS.K, Estimation of fetal weight with the use of head, body, andfemur measurements--a prospective study, Am.J.Obstet.Gynecol., 151,pp 333-337, 1985
�������������������2�=���4��%� �����3����������������0*=��(� �2�=42�3�1
Hadlock: Hadlock F.P, Harrist R.B, Sharman R.S, Deter R.L, ParkS.K, Estimation of fetal weight with the use of head, body, andfemur measurements--a prospective study, Am.J.Obstet.Gynecol., 151,pp 333-337, 1985
�CD �)!�����*�����������

������������������������3���������������0*=���(� �2�3�1
Hadlock: Hadlock F.P, Harrist R.B, Carpenter R.J, Deter R.L and ParkS.K, Sonographic estimation of fetal weight. The value of femur lengthin addition to head and abdomen measurements, Radiology, 150, pp535-540, 1984
/$�������!����������������"����� ������!�������0*=���(�/'!2���!1
Hansmann: Hansmann, Hackeloer, Staudach and Wittman, UltrasoundDiagnosis in Obstetrics and Gynecology, Springer-Verlag, New York,1986
�)!�����*����������� �CE

��� �)!�����*�����������
����5
#(�����3D Imaging, 241
3D and SWE, 2473D History Loop, 2463D Measurements, 247Acquisition, 241Multi Slice (MS), 245Multi-Planar Reconstruction(MPR), 242
Absorption, 69Accessories
Gels, 132Transducer Sheaths, 134
Accuracy (see MeasurementsAccuracy)Acoustic Output DetailedReporting, 455
Mode Summary Table, 459SC6-1 Transducer, 479SE12-3 Transducer, 495, 501SEV12-3 Transducer, 507SL10-2 Transducer, 524SL15-4 Transducer, 462SL18-5 Transducer, 471SLH20-6 Transducer, 547SLH22-6 Transducer, 542SLV16-5 G3 Transducer, 519SLV16-5 Transducer, 513SMC12-3 Transducer, 533Symbols, 457XC6-1 Transducer, 487XP5-1 Transducer, 538
Acoustic PowerB-mode, 183CEUS, 257Color Modes, 217M-mode, 265PW, 232SWE, 205
Additional Video Devices, 23Air Filters
Cleaning, 434Recommended CleaningFrequency, 431
ALARAApplying ALARA with theSystem, 96Controlling energy, 81Controlling exposure time, 81Controlling scanning technique,82Controlling system setup, 82Effects of operating mode, 84Effects of system capabilities,82Effects of transducercapabilities, 84Practicing the ALARAPrinciple, 92The ALARA Principle, 81
Alarm System, 110Annotations
Annotation Library, 274Home position, 274
Audio Adjustment, 120
�)!�����*����������� ���
AutoTGC (see Time GainCompensation (TGC))
/B-Mode, 179
Scanning Tips, 199Baseline
Color, 216PW, 234
Beginning an Exam, 156BI-RADS, 324Bioeffects and Biophysics ofUltrasound Interactions, 57Biopsy
Biopsy Guidelines, 186Compatible Biopsy Guides, 144
Blending, 219Body Markers, 270
�Cable Holder, 123Capturing Images and Clips, 349Cavitation
Cavitation and Role of GasBubbles, 73Factors Generating Cavitation,73Types of Cavitation, 74
CD/DVD Drive, 19Certifications, 8Cleaning and DisinfectionProducts, 443Cleaning the System, 431Clinical Application Examples
Abdominal/Pelvic, 104Endocavitary (Non obstetrical),105Musculoskeletal, 103Obstetrics, 107Pediatrics, 109Small Parts, 102Vascular, 106
Clinical Data Export, 362Clips
Play, 177Color Modes, 209
Color Flow imaging (CFI), 209Color Power imaging (CPI), 209Directional Color Powerimaging (dCPI), 210Scanning TIPS, 227
Color Priority, 218Comparing images, 355Conformance Standards, 7Contact Us
China, 10France, 9Germany, 10North America, 9Service, 10United Kingdom, 9
Continuing an Exam, 376Contraindications, 6Contrast Agent, 255Contrast Enhanced UltrasoundImaging (CEUS), 251
Scanning TIPS, 260Contrast Imaging (see ContrastEnhanced Ultrasound Imaging(CEUS))Control Panel
Cleaning, 433Cleaning Frequency, 431How to Move the Control Panel,119How to Swivel the ControlPanel, 119Knobology, 149
Customizing the System, 377Administration, 391Device Settings, 385Measurements, 417System Diagnostics, 427System/Display, 380
��� �)!�����*�����������

!Date and time, setting, 382Declaration of ElectromagneticEmissions, 50Declaration of Immunity, 51Depth, 171DICOM
Devices, 392DICOM ConformanceStatement, 369DICOM options, 389DICOM Printer, 357, 396DICOM Store, 393Icons, 167
Digital Zoom, 175Dimensions of the system, 15Disinfectants (see Cleaning andDisinfection Products)Disk Maintenance, 402Display Format
M-mode, 266PW, 233SWE, 204
Display unit, 203Doppler Line, 230Dual imaging, 176Duplex Mode (see SimultaneousDuplex and Triple Modes)DVD
Drive, location, 19How to eject, 360
DVI Port, 19Dynamic Range
B-mode, 182CEUS, 258
*Elasticity Range, 203Electrical OperatingRequirements, 16
Electromagnetic Emissions (seeDeclaration of ElectromagneticEmissions)Electromagnetic Interference, 45Ending an Exam, 163, 376Entering Patient Data, 157Ethernet
Configuration, 397
=Fine Angle Correct, 232Flash, 257Flash Power, 258Flash Suppression, 219Focal Zone (see Focal ZoneManagement)Focal Zone Management, 173Foot Rests, 127Footswitch, 18Freeze, 171
�Gain, 172Gel
Gel Holders, 124Recommended Gels, 132
Getting Started, 151
3Handles, 126Hard Drive Maintenance (see DiskMaintenance)Harmonic Imaging, 181Heat Conduction Effect, 70Hide Color, 215Hide Patient Name, 177High PRF, 235
�Icons (see Notification Icons)Image Orientation
Left/Right, 176
�)!�����*����������� ��A
Top/Bottom, 176Imaging Modes, 164Immunity (see Declaration ofImmunity)Indications for Use, 6Indices as Indicators of Thermaland Mechanical Effects, 64Intended Use, 5Invert
Color, 214PW, 233
9Keyboard, 158Knobology, 149
4Labeled Measurements (seeMeasurements)Languages, 382Latex
Allergic Reactions, 141Transducer Sheaths, 134
Left/Right (see Image OrientationLeft/Right)
�M-Mode, 261Measurements, 275
% Area Reduction, 283% Diameter Reduction, 2833D Measurements, 247Accuracy, 299B-mode Ratio, 282Curved Distance, 197d:D, 280Depth, 279Distance, 276Distance Ratio, 284Doppler Slope, 289Doppler Time, 287Doppler Trace, 289
Ejection Fraction, 286Ellipse, 277Follicle Counting, 284Functionalities, 296Hip Angle, 280IMT, 281Multi Q-Box, 293PSV/EDV, 288PW Autotrace, 287Q-Box, 292Q-Box Ratio, 292Q-Box Trace, 293Trace, 278Volume, 279
Mechanical Index (MI), 65, 86,166Mechanisms for Thermal and Non-Thermal Bioeffects, 60Modality Worklist, 160Monitor
Cleaning, 433Description, 118Display, 166Recommended CleaningFrequency, 431
Moving the System, 128MPR (see Multi-PlanarReconstruction)Multi Slice (MS), 245
Active view, 245Display, 245Navigation, 246
Multi-Planar Reconstruction, 242Active view, 242Display, 242Navigation, 243Rotation, 243
MVI, 256
�Network
Tools, 401
��� �)!�����*�����������
Notification Icons, 167
�On-Cart Storage, 124On/Off
Symbols, 40Turning the System On and Off,151
Opacity, 204Output Display Standard, 85
'Panoramic, 193Patents, iiiPatient Data
Creating a New Patient, 157Editing Patient Data, 162Loading a Patient file from theModality Worklist, 160
Patient Directory, 353Patient Reports (see Reports)Persistence
B-mode, 184Color, 218SWE, 206
Physical Overview, 13POI, 256Potential Hazards at High OutputLevels, 59Power
Cable, 130Switch, 151
Presets, 406Printers
Additional Printer, 21Configuration, 392Integrated Printers, 21
Printing Images, 356Prospective Clip, 350Pulse Repetition Frequency (PRF)
PRF, 183Pulsed Wave Doppler (PW), 228
?Query and Retrieve, 368
+Radiation Force, 75References, 553Reports, 331
Generating Reports, 346Report Builder, 333
Retrospective Clip, 349Reviewing an Exam, 352
#Safety
Electrical Safety, 44General Equipment Safety, 42Mechanical Safety, 55Safely Performing UltrasoundExaminations with theSuperSonic Imagine System, 57Thermal Safety, 54
Sample VolumePosition, 230Size, 230
ScaleColor, 214PW, 234
Scattering, 71Sector Size, 185Sending a Study, 359Service, 10, 11ShearWave Elastography, 200
Scanning TIPS, 208Sheaths
For the SC6-1, 135For the SE12-3, 136For the SEV12-3, 136For the SL10-2, 139For the SL15-4, 135For the SL18-5, 135For the SLH20-6, 137For the SLV16-5, 137
�)!�����*����������� ���
For the SMC12-3, 140For the XC6-1, 135For the XP5-1, 139
Simultaneous Duplex and TripleModes, 235Smoothing
Color, 217M-mode, 267SWE, 205
Speakers, 120Speed of Sound (see TissueTuner)Steering
Color, 217PW, 231
Storage Area, 124Storing The System, 35SuperCompound, 183SuperRes, 184SWE (see ShearWaveElastography)SWE Optimization, 202Sweep Speed, 235Sweep Speed; M-mode, 266Symbols, 40System Configuration (seeCustomizing the System)System Overview, 115
�Temperature, Pressure andHumidity Limits, 35TGC (see Time GainCompensation (TGC))Thermal Bioeffects, 66Thermal Index (TI), 86, 88, 166Thumbnails, 354Thy-RADS, 327Time and date, setting (see Dateand time, setting)Time Gain Compensation (TGC),172
Adaptive TGC Mode, 173
Auto TGC Offset, 184AutoTGC, 172ManualTouchTGC, 173
Timer, 257TissueTuner, 182Top/Bottom (see ImageOrientation Top/Bottom)Touch Screen
Cleaning, 433Description, 170Knobology, 150
TransducersCleaning and Disinfection, 440Connecting, 121Selecting, 155Sheaths, 134Storing, 122
Troubleshooting, 451
�UltraFast Doppler, 219, 220Ultrasound Use, 58Upgrades and Updates, 12USB Ports, 17
.Velocity Optimization, 215Velocity Range, 203Volume Measurements
2D, 2793D, 247
�Wall Filter
Color, 215PW, 234
Wheel Locks, 127Wide Image, 185Worklist (see Modality Worklist)Worksheet, 338
��C �)!�����*�����������

HZoom, 174
HD Zoom, 174
�)!�����*����������� ���

��D �)!�����*�����������

�7����*#
�)!�����*����������� ��E

�D� �)!�����*�����������

�)!�����*����������� �D�

�D� �)!�����*�����������

SuperSonic Imagine, S.A.Les Jardins de la Duranne - Bât. E et F
510 rue René DescartesF - 13857 Aix-en-Provence, Cedex - France
Telephone: +33 (0)442 99 24 32Fax: +33 (0)442 52 59 21
Email: [email protected]

Copyright © 2022 FDOKUMEN