High Tunnels - Sustainable Agriculture Research and Education
Upload
khangminh22Category
view
0download
0
, NASA CR 2920 C.1
, .
1 (
I 7 NASA Contractor Report 2920
LOAN C9-V: RETI..lF, AFWL TFr! '?'fCfi 1.. LIBRARf ._
Calibration of Transonic KIRTLAND AFB, N. M. - - *.? -
and Supersonic Wind Tunnels
T. D. Reed, T. C. Pope, and J. M. Cooksey
CONTRACT NAS2-8606 NOVEMBER 1977
NASA

~-
NASA Contractor Report 2920
Calibration of Transonic and Supersonic Wind Tunnels
T. D. Reed, T. C. Pope, and J. M. Cooksey Vought Corporation Dallas, Texas
Prepared for Ames Research Center under Contract NAS2-8606
National AeroMubics and Space Administration
Scientific and T e c h i d Information Office
TECH LIBRARY KAFB, NM
1977

- " . .

FOREWORD
I n A p r i l , 1970 a repor t was issued by an ad hoc NASA-USAF group on tran-
son ic sca le e f fec ts and test ing techniques. This report assessed t ransonic
test ing techniques and recommended, among other th ings, that a t ransonic wind-
tunne l ca l i b ra t i on manual be wr i t ten which rev iewed the s ta te-of - the-ar t . Th is
was viewed as a necessary step toward the development o f more accurate and
standardized tunnel cal ibrat ion procedures.
For t h i s purpose, the present manual was j o i n t l y funded by: (1) t he
U. S. Navy through the Off ice of Naval Research, (2) t he U. S. A i r Force through
the Air Force F l i g h t Dynamics Laboratory and Arnold Research Organizat ion, (3) NASA through the Washington Headquarters and the Lewis, Langley and Ames Research
Centers. The con t rac t was administered by NASA Ames. Mr. F. W. Steinle served
as technical monitor.
A rough d r a f t o f t h i s manual was reviewed by personnel o f NASA Ames
Research Center and Arnold Research Organization. The comments o f t he va r ious
reviewers were compiled by M r . F. W. S t e i n l e a t Ames and M r . F. M. Jackson a t ARO.
The manual was improved considerably by the constructive comments t h a t were
received, and we w ish t o t hank a l l t hose i nvo l ved f o r t he i r t ime and e f f o r t s .
Our thanks go t o M r . C. J. Stalmach o f t h e Vought Corpora t ion fo r the
discussion of hot wires and f i l m s w h i c h i s g i v e n i n Appendix 1 . F i n a l l y , we
w ish to acknowledge the superior typing and secretar ia l ass is tance prov ided
by Ms. F. H. Deason.
.. . I l l


TABLE OF CONTENTS
Sect ion
1 . INTRODUCTION . . . . . . . . . . . . . . . . . . . . . . A . Gackground . . . . . . . . . . . . . . . . . . . B . His to r ica l Sketch . . . . . . . . . . . . . . . c . Cal ibrat ion Procedures . . . . . . . . . . . . .
I t . TUNNEL VARIABLES . . . . . . . . . . . . . . . . . . . . References
1 1 1 .
A . Types o f Tunnels . . . . . . . . . . . . . . . . B . Operational Parameters . . . . . . . . . . . .
1 . Pressure Control . . . . . . . . . . . . . . 2 . C a l i b r a t i o n Accuracy. Flow U n i f o r m i t y and
Re la t ionsh ip to Model Test ing . . . . . . . C . Flow Parameters and Uncer ta in ty Relat ionships .
1 . Pressures . . . . . . . . . . . . . . . . . 2 . Temperature . . . . . . . . . . . . . . . . 3 . Mach Number . . . . . . . . . . . . . . . . 4 . Flow Angu lar i t y and Curvature . . . . . . . 5 . Reynolds Number . . . . . . . . . . . . . . 6 . Unsteadiness. Turbulence. and Noise . . . . 7 . Humidity . . . . . . . . . . . . . . . . . . 8 . Test Mediums . . . . . . . . . . . . . . .
References
References
CALIBRATION PROCEDURES AND INSTRUMENTATION . . . . . . . A . S e t t l i n g Chamber Pressure . . . . . . . . . . . B . Tota l Temperature . . . . . . . . . . . . . . . C . Pi to t Pressures . . . . . . . . . . . . . . . . D . Test Sect ion Stat ic Pressures . . . . . . . . .
1 . Transonic Survey Pipes . . . . . . . . . . . 2 . Transonic Stat ic Pressure Probes . . . . . . 3 . Supersonic Stat ic Pressure Probes . . . . . 4 . Ori f ice- Induced Stat ic Pressure Errors . . .
References
References
References
5 . General Purpose Static Pressure Probe . . . References
E . Measurement o f Flow Angu lar i t y . . . . . . . . . 1 . Di f fe ren t ia l Pressure Yaweters : 2-D . . . 2 . Di f fe ren t i a l P ressu re Yawmeters: 3-0 . . . 3 . Hot Wire/Fi lm Yawmeters . . . . . . . . . . 4 . Force Balance Yawmeters . . . . . . . . . .
References
1
1
2 4
7
7 8 8
12
22 22 34 36 40 42 47 52 56
59
59
63
68
78 79 86
105 110 116
124 124 128 134 137
V
Sect ion Page
"
. " ~ . ;r ....
I V .
. . . .
F . Measurement o f Unsteady Flow Disturbances . . . . 144 1 . DynamIc Pressure Measurements . . . . . . . . 147
References G . Transonic Tunnel Boundary Conditions and
Wal l In te r fe rence . . . . . . . . . . . . . . . . 162 1 . Convent ional Vent i la ted Wal ls . . . . . . . . 162 2 . Adaptive Wall Studies . . . . . . . . . . . . 165 3 . Boundary Layers and Wall Generated Noise . . 169
H . Standard Models . . . . . . . . . . . . . . . . . 174 1 . AGARD Force Models . . . . . . . . . . . . . 174 2 . Transonic Pressure Models: 2-0 . . . . . . . 175 3 . Transonic Pressure Models: 3-0 . . . . . . . 175
References 1 . Opt ica l Methods . . . . . . . . . . . . . . . . . 182
1 . Supersonic Tunnels . . . . . . . . . . . . . 182 2 . Transonic Tunnels . . . . . . . . . . . . . . 182 3 . Newer Methods . . . . . . . . . . . . . . . . 183
J . Humidity Measurements . . . . . . . . . . . . . . 185 References
References
ERROR AND UNCERTAINTY I N CALIBRATION MEASUREMENTS . . . . 189
A . Random Er ro r . . . . . . . . . . . . . . . . . . 189 B . Fixed Error . . . . . . . . . . . . . . . . . . . 190 C . Uncer ta in ty . . . . . . . . . . . . . . . . . . . 191 D . Error Propagat ion . . . . . . . . . . . . . . . . 192
References
v .... . CONCLUSIONS AND RECOMMENDATIONS . . . . . . . . . . . . . 195 . .
A . Summary o f S ta te -o f - the-Ar t of Transonic and Supersonic Wind Tunnel C a l i b r a t i o n . . . . . . . 195
B . Transonic Tunnel s . . . . . . . . . . . . . . . . 198 C . Supersonic Tunnels . . . . . . . . . . . . . . . 202
APPENDICES
. . . . . . . . . . . . . . . . . .. 1 . HOT WIRES AND HOT FILMS 203 Nomenclature . . . . . . . . . . . . . . . . . . . . 217 References
I1 . LASER DOPPLER VELOCIMETERS . . . . . . . . . . . . . . . . 222 Nomenclature . . . . . . . . . . . . . . . . . . . . 249 References
I l l . EFFECTS OF VIBRATION OF A CIRCULAR CYLINDER ON STATIC PRESSURE MEASUREMENTS . . . . . . . . . . . . . . . . . . 255
A . Table 1 : F a c i l i t i e s . . . . . . . . . . . . . . 260 B . Table I I : Test Sect ion Character is t Ics . . . . . 267
. .
I V . FACILITIES WHICH RESPONDED TO QUESTIONNAIRE
v i
"
LIST OF ILLUSTRATIONS -. T i t l e Page
Data and Error Flow Diagram, Ref. 1 . . . . . . . . . . 5
Jackson 's F low Qua l i t y Cr i te r ia fo r T ranson ic Tunnels, Ref. 1 . . . . . . . . . . . . . . . . . . . . 14
Fiqure .
1.c.1
2. B. 1
2. B. 2
2. B. 3
2. B. 4
2. c. 1
2.c.2
2.c.3 .
2.C.4
2.c.5
2.C.6
2.C.7
2.C.8
2.C.9
2.c. 10
Al lowable L inear Mach Number Gradient Over Model Length for Bouyancy Drag C o e f f i c i e n t C o n t r i b u t i o n o f 0.0001, . . . . . . . . . . . . . . . . . . 17
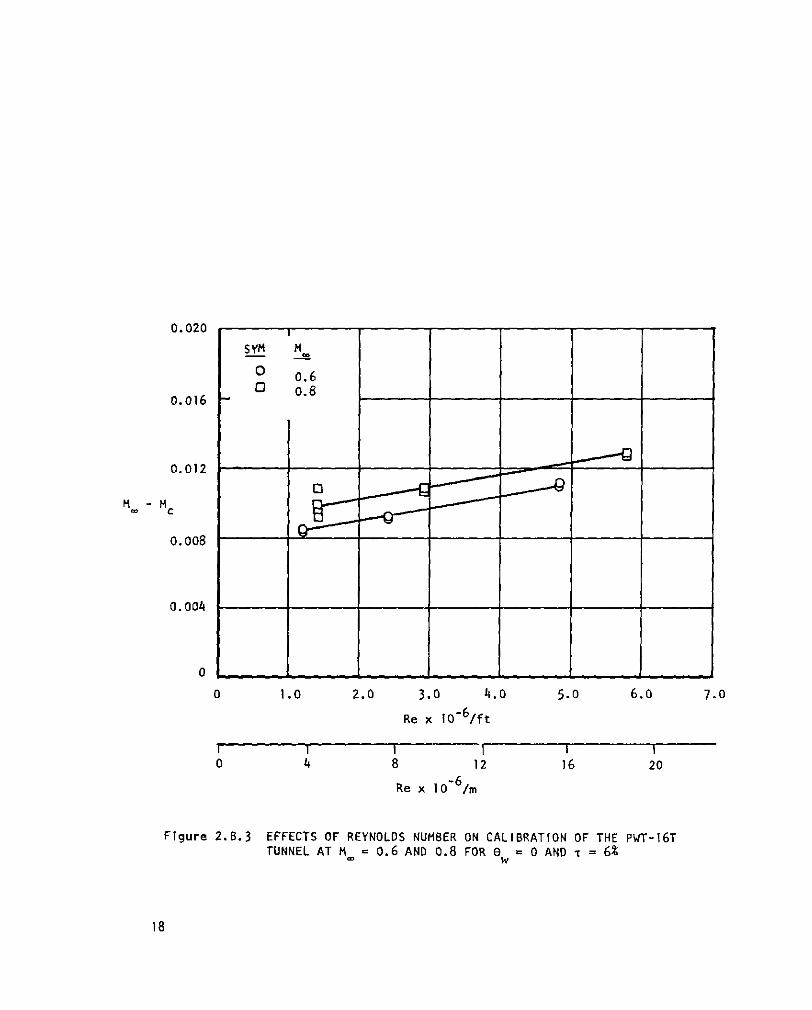
Effects of Reynolds Number o n C a l i b r a t i o n o f t h e PWT-16T Tunnel a t Mm = 0.6 and 0.8 f o r ew = 0 and ~ = 6 . . . . . . . . . . . . . . . . . . . . . . . . . 18
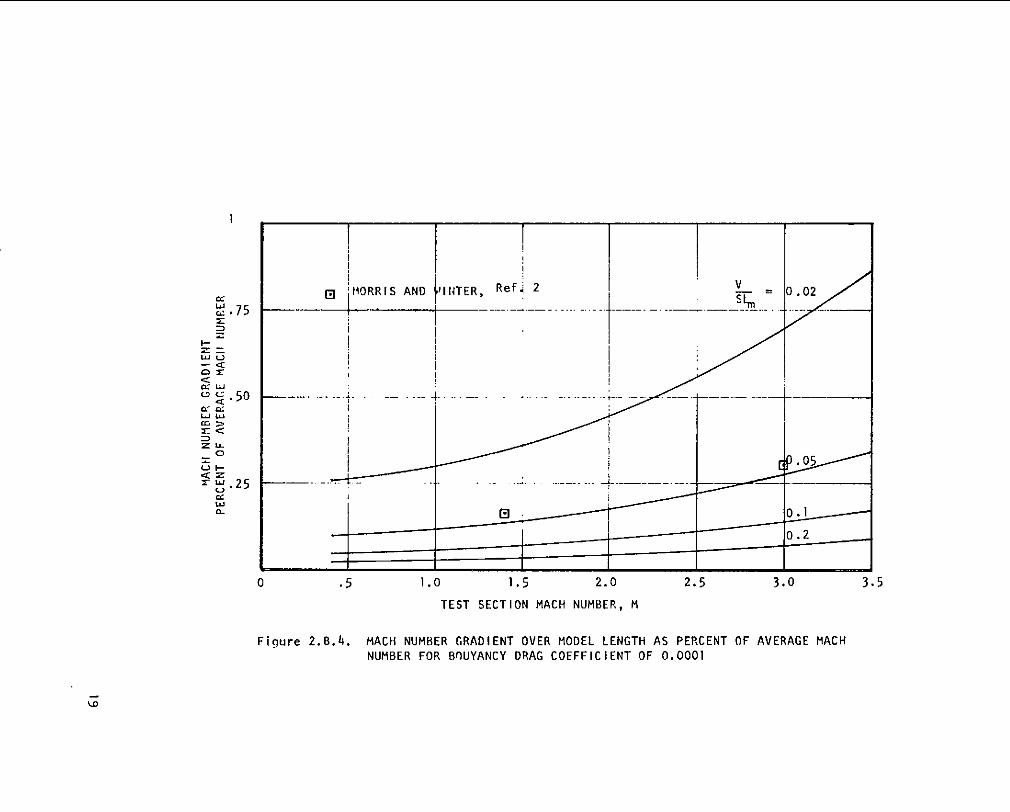
Mach Number Gradient Over Model Length as Percent o f Average Mach Number f o r Bouyancy Drag.Coef f fc Ien t o f 0.0001 . . . . . . . . . . . . . . . . . . . . . . . 19
Afterbody Drag Data a t an Average Mach Number of 0 . 9 5 . . . . . . . . . . . . . . . . . . . . . . . . . . 23
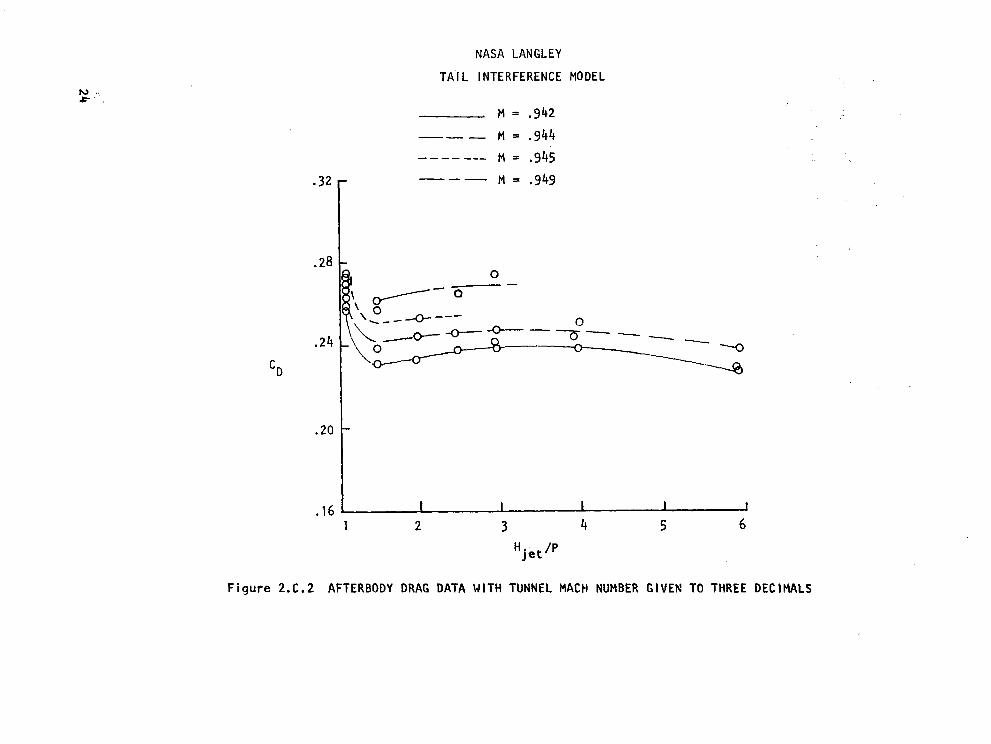
Afterbody Drag Data With Tunnel Mach Number Given t o Three Decimals . . . . . . . . . . . . . . . . . . . 24
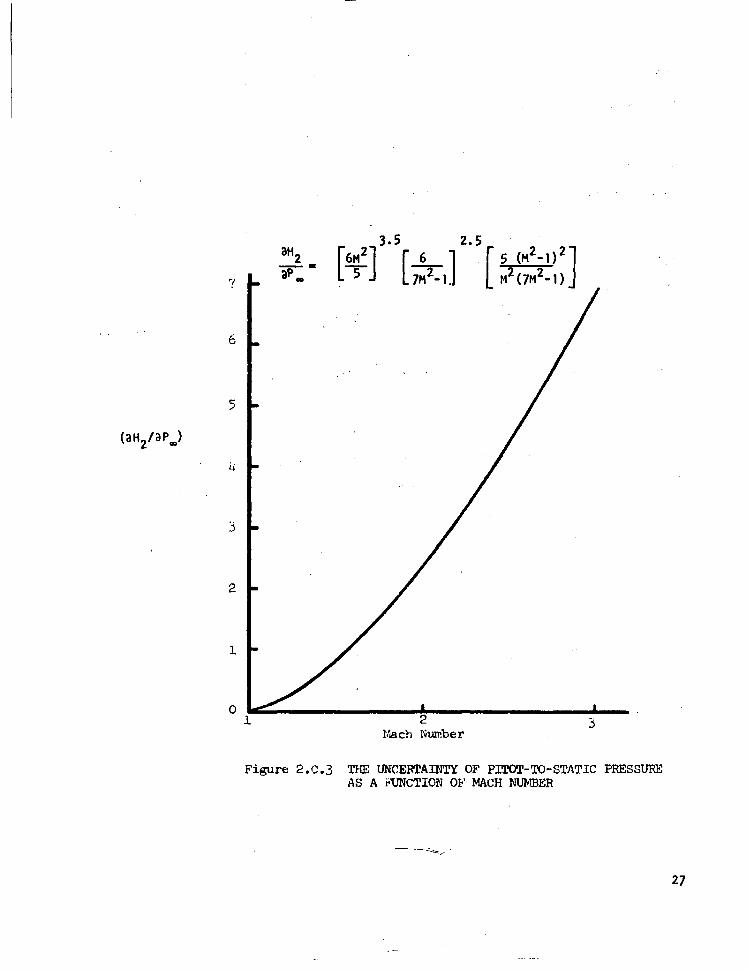
The Uncer ta in ty o f Pi tot - to-Stat ic Pressure as a Func t ion o f Mach Number . . . . . . . . . . . . The S e n s i t i v i t y o f Dynamic Pressure to Stagnat ion
27.
Pressure Error, Transonic Operation . . . . . . . . . . 29
The S e n s i t i v i t y o f Dynamic Pressure to Stat ic Pressure Error, Transonic Operation. . . . . . . . . . . . . . . The S e n s i t i v i t y o f Dynamic Pressure t o Mach Number
31
Error, Supersonic Operation . . . . . . . . . . . . . . 32
The Re la t ion o f S tagnat ion to S ta t i c Tempera ture as a Function o f Mach Number . . . . . . . . . . . . . . . The S e n s i t i v i t y o f Mach Number to S ta t i c P ressu re
35
and Stagnation Pressure Error . . . . . . . . . . . . . 38
The S e n s i t i v i t y o f Mach Number to S ta t i c P ressu re and Stagnation Pressures. . . . . . . . . . . . . . . . 39 Change i n F low Di rect ion Wi th Increment o f Mach Number, Ref. 3 . . . . . . . . . . . . . . . . . . . . . 41
v i i
' Flgure
2.c. 1 1
Title Page
The'Sensitlvity of Unit .Reynolds Number to Statfc Pressure Error. . . . . . . . . . . . . . . . . . . . . 43
The Sensitivity of Unit Reyno1,ds Number to Stagnation Pressure Error. . . . . . . . . . . . . . . . . . . . . 2.c.12
2.C. I3
44
The Sensitivity of Unit Reynolds Number to Stagnation Temperature Error . , . . . . . . . . . . . . . . . . . 45
2.C.14 The Sensltlvity of Unlt Reynolds Number to Mach Number E r r o r . . . . . . . . . . . . . . . . . . . . . . . . . 46
49
50
Flow Disturbances in Transonic Tunnels, Ref. 5 . . . . 2.C.15
2.C. 16 Flow Disturbances in Supersonic and Hypersonic Tunnels, Ref. 5 . . . . . . . . . . . . . . . . . . . The Ratio of Relative Humidity in the Stream to Reservoir as a Function of Mach Number. . . . . . . . . 2.C. 17
53
Reservoir Temperature Required to Avoid Condensation, Ref. 1 0 . . . . . . . . . . . . . . . . . 2.C. I8
54
64 3.8.1 Total Temperature Probes. . . . . . . . . . . . . . . . Isentropic Stagnation Pressure Probe, Ref. 8. . . . . . AEDC Supersonic Mach Number Probes. . . . . . . . . . . Mach Number Probe for Small Pilot LEHRT Facilities, Ref.9.... . . . . . . . . . . . . . . . . . . . . .
3.C. 1
3.C.2 70 72
3.c.3 73 83 3.0.1
3. D. 2
R.A.E. Subsonic Static-Pressure Probe . . . . . . . . . Typical Pressure Distributions Along Probe at Two Locations on Tu ne1 Center1 ine, M = 0.74 (choked), R/L = 19.7 x 10 per meter. . . . . . . . . . . . . . . Variation of Static-Pressure Reading With Position of Static Holes and Nose Shape at I4 = 1.6, Ref. 8 . . . Transonic Pressure Distributions on a 20 deg Cone- Cylinder Wtth 0.008% Blockage, Ref. 12 . . . . . . . .
z 84
3.0.3 87
3.D.4 90
3. D. 5 Transonic Pressure Distributions on a 20 deg Cone- Cy1 inder , Ref. 20 . . . . . . . . . . . . . . . . . . . 93
96
97
3.D.6
3-0.7
3.D.8
Dimensions of the R.A.E. Static Pressure Probes . . . . Transonic Characteristics of the Two R.A.E. Probes. . . Effect of Orifice Location Utilizing a Double Wedge Support Strut, Ref. 32. . . . . . . . . . . . . . . . . 103
viii
F I qure
3.D.9
3.D.10
3.0.11
3.E. 1
3. E. 2
3.E-3
3.E.4
3.E.5
3.E.6
3. F. 1
3. F. 2
A.l.l
A. 1.2
A. 1.3
A. 1.4
A. 1.5
A.1.6
T i t l e
General C r i t e r i a for Probe Survey Rakes, Ref. 33. . . . Ori f ice- Induced Stat ic Pressure Errors , Ref. 50 . . . '. Transonic/Supersonic Stat ic Pressure Probe. . . . . . . Two Dimensional Yameters . . . . . . . . . . . . . . . Pyramid Yameter. . . . . . . . . . . . . . . . . . . . S e n s i t i v i t y o f 60 deg Conical Yawmeter. . . . . . . . . S p l i t Hot Fi lm, 20° Wedge Probe Cal lbrat ion Br. idge Vol tage Dl f ference vs F low Angle, Ref. 23 . . . . . . . Geometry o f AEDC Force Balance Yawmeter . . . . . . . . S e n s i t i v i t y o f t h e AEDC Force Balance Yameter. . . . . Frequency Spectra o f Noise from a Turbulent Boundary Layer on a Sol id Wal l , Ref. 3 . . . . . . . . . . . . . Noise Frequency Spectra for Some Exist ing Cont inuous Windtunnels a t M- = 0 . 8 0 , Ref. 3. . . . . . . . . . . . Small P iezoe lec t r i c Dynamic Pressure Probe, Ref. 14 . .
APPENDIX I
Corre la t ion o f Convect ive Heat Transfer f rom Transverse Cy1 inders, Ref. 3. . . . . . . . . . . . . . F luc tua t i on Diagram f o r 1 Percent Mass Flow F luc tua t ions w i th Vary inq Degrees o f C o r r e l a t i o n , R e f . 7 . . . . . . . . . . . . . . . . . . . . . . . . . F luc tua t i on Diagrams f o r 1 Percent Turbulent V e l o c l t y F l u c t u a t i o n s ( V o r t i c i t y Made), Ref. 7.
Fluctuat ion Diagram for 1 Percent Temperature Spott iness (Entropy Mode), Ref. 7 . . . . . . . . . . . Mach Waves Having I % Pressure Fluctuat ions, Ref. 7. . . F luc tua t i on Diagram f o r Sound Waves that are A lmost
F luc tua t i on Diagram for Uncorre la ted Modes a t M11.75; Temperature Spottiness of 0.1 Per Cent: Turbulent Veloc i ty F luctuat ions o f 0.2 Percent; Sound Waves (Detectable) 0.1 Percent o f Mass Flow Fluctuat ions. (Dot ted L ines Show Separate Contr i - butions.) Ref. 7. . . . . . . . . . . . . . . . . . . . .
Paqa
1 04
113
117
126
129
131
136
138
139
145
145
1 54
206
206
209
209
21 0
21 0
f x

Fiqutc
A.1.7
A.II.l
A. 11.2
A. 11.3
A. 11.4
A. 11.5
A. 11.6
A . 1 1 . 7
A. 11.8
A. 11.9
A.lll.1
Title
Comparison of Pitot Probe and Hot-wire .Measurements of Free-Stream Pressure Fluctuations in a Conventional, Mach 5
1
Nozzle, Ref. 14 . . . 1 . . . . . . . . . . . . . .
APPENDIX I I
Dual Beam Laser Doppler Velocimeter, with Optional Forward and Backscatter Modes. . . . . . . Generation of Interference Fringes in Measur- ing Volume of Dual Beam Laser Doppler Velocimeter . . Light Scattered by a Small Particle . . . . . . . . . Laser Anemometer Signal From Photodetector. . . . . . Effect of Particle Diameter on Frequency Response . . . Time Constant As a Function of Particle Diameter For Various Mach Numbers, Particle Density = 1 gm/cc . . . . . . . . . . . . . . . . . . . . . . . Maximum Frequency For No More Than 5% Attenuation of Sinusoidal Velocity Variations, Particle Density- 1 gm/cc. . . . . . . . . . . . . . . . . . Effect of Velocity Biasing on Mean Velocity Measurements in Turbulent Flow . . . . . . . . . . . Sensitivity Coefficlentr For Determination of Mach Number From Velocity and Stagnation Temperature Measurements. . . . . . . . . . . . . . .
APPENDIX I l l
Pressure Distribution on a Circular Cylinder in Crossf low, Ref. 1 . . . . . . . . . . . . . . . .
Page
214
224
225
226
226
238
240
240
243
248
2 58
X
A
0
*M
BY
AC DG
D
DS
d
d l
F (n)
NOMENCLATURE* . . .. .
amp l i t ude o f s inuso ida l osc i l l a t i on , or probe in ter ference func t i on i n t roduced i n Eq. (3.0.1)
f unc t i on i n t roduced i n Eq. (3.D.l) as a measure o f probe- c ross f low in te r fe rence
f i x e d e r r o r 1 imit f o r Mach number, Eq. (4.0.2)
Chapman-Rubesin v i s c o s i t y parameter
drag coeff icient increment produced by a l inear pressure. g r a d i e n t i n t h e t e s t s e c t i o n
RMS v a l u e o f f l u c t u a t i n g s t a t i c p r e s s u r e c o e f f i c i e n t
RMS f l u c t u a t i n g s t a t i c p r e s s u r e c o e f f i c i e n t p e r u n i t band w id th a t f requency n.
d iameter o f a t ransverse, cy l indr ica l , probe suppor t
d is tance between cen te rs o f s l o t s i n t unne l wa l l
d iameter o f s ta t i c p ressure p robe
d iameter o f P i to t p robe
o r i f i c e d i a m e t e r
nondimensional spectral funct ion which is a measure o f t h e i n t e n s i t y o f s ta t i c p ressu re f l uc tua t i ons pe r un i t band width a t the f requency n,
ACp = 1; F(n)dn
f f requency o f osc i l l a t i on
fP f r e q u e n c y o f s t a t i c p r e s s u r e f l u c t u a t i o n s
f r f i neness ra t i o o f p robe nose (2Ln/d)
H t o t a l head or s tagna t ion p ressu re i n t es t sec t i on
* Separate l i s t s o f symbols appear i n Appendices I and I I .
x i

a
n
"d
P
<P' >
t o t a l head i n s e t t l i n g chamber
P i t o t p r e s s u r e a t a = 0 (e i ther subsonic or supersonic)
time-averaged, to ta l pressure behind a normal shock
RMS o f f l u c t u a t i n g t o t a l p r e s s u r e b e h i n d a normal shock
s l o t parameter, Eq. (3.6.7)
model l eng th
nose 1 eng t h
d is tance from cone-cy l i nde r j unc tu re t o nea res t s ta t i c p r e s s u r e o r i f i c e
distance f rom a s t a t i c p r e s s u r e o r i f i c e t o b e g i n n i n g o f a probe enlargement, e.g., f l a r e or support
Mach number based on s t a t i c p r e s s u r e i n plenum chamber
Mach number i n t e s t s e c t i o n
mass f l ow pe r un i t a rea t h rough ven t i l a ted wa l l
mass f low per un i t a rea in f rees t ream o f tes t sec t ion
reduced f requency o f s ta t ic pressure f luc tuat ions, fpwT/u,
genera l des ignat ion for d i rect ion normal to a w a l l
s t a t i c p r e s s u r e i n f r e e s t r e a m o f t e s t s e c t i o n
RMS o f f l u c t u a t i n g s t a t i c p r e s s u r e
measured, unsteady s ta t i c p ressu re
s t a t i c p r e s s u r e i n s e t t l i n g chamber
t rue, unsteady stat ic pressure of undisturbed f reestream
time-averaged, t r u e s t a t i c p r e s s u r e
s ta t i c Pressure measured on a probe or tunne l s idewal l
ind icated dynamic pressure, H I - P
i n c o m p r e s s i b l e d e f i n i t i o n o f dynamic pressure, H-P
dynamic p r e s s u r e i n s e t t l i n g chamber
dynamic p ressure o f f rees t ream in tes t sec t ion
porosity parameter, Eq. (3.G.5)
x i i
R S viscous parameter for flow through slots
Re Reynolds number
Rex
S wing reference area, or width of a strut support for a probe
Reynolds number based on wetted length
SY compressible yameter sensitivity. Eq. (3.E.2)
sy* incompressible yameter sensiflvity, Eq. (3.E.l)
T period of sinusoidal oscillation
t time
u(t1 total, unsteady velocity along a probe axis
ut4 toea1 uncertainty Interval for Mach number, Eq. ( 4 . 0 . 3 )
" m velocity of freestream in test section
us
U turbulent friction velocity, (T~IP)
veloclty of sound source
112 T
v mode 1 vo 1 ume
Vn(t) total, unsteady velocity normal t o a probe axis
vn average velocity normal to a ventilated wall
WS width of slots
WT square root of cross-sectional area of test section
X Cartesian coordinate measured along the tunnel axis
Y Cartesian coordinate measured normal to the tunnel sidewalls
2 Carteslan coordinaee measured normal to the top and bottom walls of tunnel
Greek Letters
a angle of attack
8 ( I " 1
Y ratio of specific heats
2 112
6 angle between orifice planes of a yameter
ll azmuthal angle or polar coordinate angle
xiii
e
9w
'e
'W
0
a m
T
TW
$
rlr
0
semi-vertex angle of a cone
tunnel wall angle (positive for divergent walls)
viscosity coefficient at edge of boundary layer
viscosity coefficient at wall temperature
density of gas
standard deviation in Mach number along tunnel centerline
wall porosity
shear stress at a solid wall
perturbation velocity potential, Eq. (3.6.1)
yaw angle
angular velocity, rad/sec
xiv

I-
1 . INTRODUCTION
1 .A. Background
The use of a wind tunnel for aerodynamic measurements requires a knowledge of the test environment. Furthermore, a definite relationship obviously exists between the accuracy with which the test conditions are known and the uncertainty in the final results. The demand for increased wind tunnel data accuracy fol- lows naturally from the demand for improved full scale vehicle performance and accuracy of performance prediction. A sustained effort has been directed toward improving the accuracy of test data from existing wind tunnel facilitfcs. In addition, requirements have been established for new wind tunnel facilities with more complete simulation capabilities.
The results of one of the first comprehensive test programs to study the correlation of wind tunnel data from several transonic facilities were reported by Treon et al. in Ref. ( I ) . Since the same model, instrumentation and support sting were used in each of the three tunnels, this unique series of tests allowed a comparative evaluation of the effects of facility flow environment and calibra- tion upon data agreement. The results of this series of tests, using state-of- the-art techniques and instrumentation, were considered good but deficient relative to current goals.
The purpose of this report is to review the current state-of-the-art of .
wind tunnel calibration techniques and instrumentation, evaluate the expected results and, where possible, recommend improvements. This program was carried out by ( 1 ) acquiring information from eighty-eight wind tunnel facilities by means of a c.omprehensive questionnaire, (2) a detailed literature search, (3) personal visits and telephone conversations, and (4) independent analyses.
This report documents the results of these investigations. In addition to the above background information, Section I also presents ( I ) a brief historical sketch of attempts to improve wind tunnel flow quality and calibra- tion procedures and (2) a sumnary of tunnel cal ibrat ion tasks. Section I I
discusses tunnel variables and how uncertainty in the measurements of various flow quantities affect test results. The details of measuring static and total pressures, temperature, flow angularity, flow unsteadiness, and humidity are all discussed in Section 1 1 1 . This section also includes a review of the
I
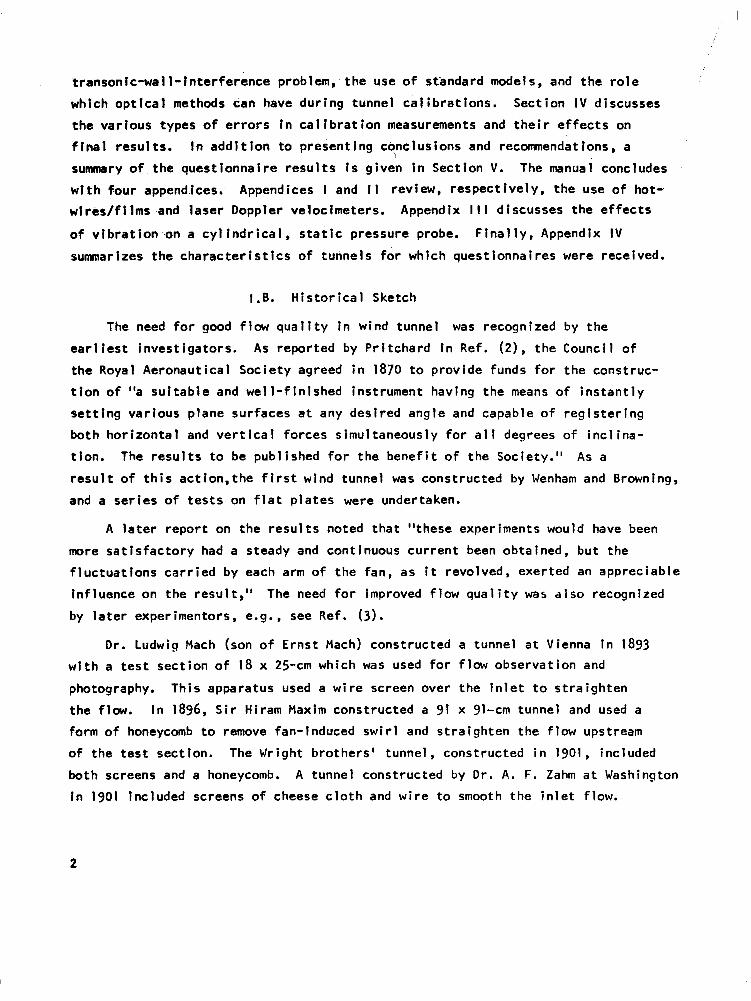
t ransonic-wal l - interference problem, the use of standard models, and t h e r o l e
wh ich op t i ca l methods can have dur ing tunne l ca l ib ra t ions . Sec t ion IV discusses
the var ious types of e r r o r s i n c a l i b r a t i o n measurements and t h e i r e f f e c t s on
f i n a l r e s u l t s . In add i t i on t o p resen t ing conc lus ions and r e c m e n d a t l o n s , a
summary of the ques t i onna i re resu l t s i s g i ven i n Sec t i on V. The manual concludes
with four appendfces. Appendices I and t i rev iew, respect ive ly , the use o f hot - ,
w i r t s / f i l m s and laser Doppler velocimeters. Appendix 1 1 1 d iscusses the e f fec ts
of v i b r a t i o n o n a c y l i n d r i c a l , s t a t i c p r e s s u r e probe. F i n a l l y , Appendix IV
sumnar izes the charac ter is t i cs o f tunne ls fo r wh ich ques t ionna i res were rece ived.
1 .B. His tor ica l Sketch
The need f o r good f l o w q u a l i t y i n w i n d t u n n e l was recognized by the
ea r l i es t i nves t i ga to rs . As repor ted by Pr i t chard in Ref. (21, t he Counci 1 o f
the Royal Aeronautical Society agreed i n 1870 to p rov ide funds fo r the cons t ruc-
t i o n o f 'la s u i t a b l e and wel l - f in ished inst rument hav ing the means o f i n s t a n t l y
se t t ing var ious p lane sur faces a t any desired angle and capable o f r e g i s t e r i n g
bo th ho r i zon ta l and v e r t i c a l f o r c e s s i m u l t a n e o u s l y f o r a l l degrees o f i n c l i n a -
t i on . The r e s u l t s t o be pub l i shed fo r the benef i t o f the Soc ie ty . ' ' As a
r e s u l t o f t h i s a c t i o n , t h e f i r s t w i n d t u n n e l was constructed by Wenharn and Browning,
and a s e r i e s o f t e s t s on f l a t p l a t e s were undertaken.
A l a t e r r e p o r t on the results noted that "these experiments would have been
more s a t i s f a c t o r y had a steady and cont inuous current been obtained, but the
f l uc tua t i ons ca r r i ed by each arm of the fan, as it revolved, exerted an appreciable
inf luence on the resul t , " The need f o r improved f l o w q u a l i t y was also recognized
by later exper imentors, e.g., see Ref. ( 3 ) .
D r . Ludwig Mach (son o f E r n s t Mach) constructed a tunnel a t V ienna in 1893 w i t h a t e s t s e c t i o n o f I 8 x 25-cm which was used f o r flow observat ion and
photography. This apparatus used a w i re sc reen ove r t he i n le t t o s t ra igh ten
the f law. In 1896, Sir Hiram Maxim constructed a 91 x 91-cm tunnel and used a
form o f honeycomb t o remove fan- induced swi r l and straighten the f low upstream
o f t he t es t sec t i on . The Wr ight brothers ' tunnel , const ructed in 1901, included
both screens and a honeycomb. A tunnel constructed by D r . A . F. Zahm a t Washington
i n 1901 inc luded screens o f cheese c lo th and w i r e t o smooth the i n le t f l ow .
2

Dr. Zahm also was concerned with flow uniformity and the accuracy of
calibration of the tunnel velocity. He developed an extremely sensitive manometer for measuring the pressures generated bv a.Pitot-statlc tube which was used for velocity measurements. In describing this instrument, he used the term "wind tunnel" for the first time in the literature. Zahm also used a toy balloon moving with the flow to obtain a time-of-flight measurement of
the velocity.
Another calibration procedure used by Zahm involved measurement of the force on a llpressure plate" or drag plate at the same time the flow velocity
This method allowed determination of the flow velocity during observing the force on the pressure plate, Ref. 4.
1 discussion of early wind tunnels and measurement techniques is
was measured. .later tests by
Add i t iona also given in an article by Goin -(Ref. 5).
From the beginning, the development of wind tunnel facilities has usually been a precursor of improved flight vehicles as outlined by Goethert in Ref. 6. The development of new and improved wind tunnels has, in turn, required new calibration procedures, techniques and instrumentation in the struggle to provide experimental data with the accuracy required by vehicle designers.
3
I .C. Cal ibrat ion Procedures
Bo th t he qua l i t y of, the wind tunnel f low environment and the accuracy with
wh ich th is env i ronment i s known cont r ibu te to the accuracy o f aerodynamic
measurements. The t o t a l u n c e r t a i n t y i n aerodynamic data i s t h e r e s u l t o f a
l a rge number of e r r o r sources, as i s discussed in Sec t i ons 11.8.2 and I V .
Figure I . C . 1 , from Ref. (71, i l l u s t r a t e s t h e many sources of e r r o r and
t h e manner i n which errors propagate to a t y p i c a l t e s t r e s u l t such as drag
coe f f i c i en t . Cons ide r ing t he t o ta l number o f e r r o r sources, the necess i ty to
minimize those due t o t u n n e l c a l i b r a t i o n i s o b v i o u s . T h i s f l o w d i a g r a m i s
he lp fu l s i nce i t i s o l a t e s t h e f a c i l i t y f l o w e n v i r o n m e n t and c a l i b r a t i o n elements
which are discussed herein.
Bo th t he qua l i t y o f t he f l ow and the accuracy wi th which the f low
cond i t ions a re known are considered as p a r t o f t h e c a l i b r a t i o n c o n t r i b u t i o n .
I t i s suggested tha t the ca l ib ra t ion e f fo r t inc lude the fo l low ing e lements :
1.
2.
3.
4.
5.
6 .
I n i t i a l e v a l u a t i o n of per formance character is t ics and f l o w q u a l i t y ,
and determinat ion as t o need f o r c o r r e c t i v e a c t i o n .
Determinat ion o f optimum tunnel operational parameters such as
wal l angle and po ros i t y , con t ro l system performance, etc.
Diagnost ic measurements t o i n v e s t i g a t e a spec i f i c f low p rob lem or
def ic iency.
Measurement o f mean, unsteady and s p a t i a l d i s t r i b u t i o n s o f t e s t
sec t ion f low cond i t ions fo r the se lec ted tunne l con f igura t ion and
var ious operat ing condi t ions.
Standard model t e s t s f o r i n t e r - f a c i l i t y comparisons.
Per iod ic re -eva lua t ion o f bas ic tunne l ca l ib ra t ion fo r con t ro l or
monitoring purposes. This may be accomplished in par t by tes ts on
a s tandard fac i 1 i t y model.
Considering the above task descr ip t ions, i t can be observed that f low
q u a l i t y improvements, v e r i f i c a t i o n t e s t s and bas ic tunne l ca l ib ra t ions a re
i n t ima te l y re la ted . The accuracy requirements may vary, depending upon the
t y p e o f c a l i b r a t i o n t a s k and the primary purpose o f t h e f a c i l i t y , b u t a r e
most s t r ingent fo r i tems 4 and 6 s ince e r ro rs i n t he measurements can c o n t r i b u t e
d i r e c t l y t o t h e random or f i x e d e r r o r i n t h e f i n a l d a t a .
4

0 F A C I L I T Y
1
I ' FORCE PRESSURE &
TEMPERATITRF: TRANSIENTS I
Figure l . C . 1 . DATA AND ERROR FLOW DIAGRAM, Ref. 7
R . J.: "Fu r the r Cor re la t i on o f Data From I n v e s t i g a t i o n s o f a Hig
Subsonic-Speed T r a n s p o r t A i r c r a f t Model i n Three Major Wind Tunne
A l A A Paper 71-291, Albuquerque, New Mexico, 1971-
h
1
2. Pr i t cha rd , J. L.: "The Dawn o f Aerodynamics,'' Journal of the Royal
Aeronaut ical Society,
3 . Randers-Pehrson, H. H.
Miscel laneous Col lect
V . 61, March 1957.
: "Pioneer blind Tunnels," V . 93, No. 4, Smithsonian
ions.
4. B i rd , K. D.: "Old Tyme Wind Tunnels," Perspective Sept.-OCt., 1957,
Cornel1 Aeronautical Laboratories, Inc.
5. Goin, K. L.: "The H is to ry , Evo lu t ion , and Use o f Wind TunneIs,"
A l A A Student Jour., Feb. 1971.
6 . Goethert, B. H . : Transonic Wind Tunnel Testing, pp 2-31, Perrnagon Press ,
New York, 1961.
7. Picklesimer, J. R . , Lowe, W. H., and Cumrning, D . P. : ''A Study o f
Expected Data P r e c i s i o n i n The Proposed AEDC H l R T F a c i l i t y , " AEDC-TR-
75-61, August, 1975.
6

I I . TUNNEL VARIABLES
I I .A.l Types of Tunnels
The mater ia l presented here in is d i rected toward wind tunnels operat ing
i n t h e Mach number range from 0.4 to 3.5. The modes of operat ion of the
va r ious f ac i l i t i es su rveyed i nc lude : (1) continuous f low, (2) blowdown, and
(3) i n t e r m i t t e n t .
In the case of in te rmi t ten t tunne ls , e.g., a Ludwieg tube, the very
shor t run t imes requ i re spec ia l p rov is ions fo r measurement and record ing
systems. Pressure measurements can be accomplished using ei ther h igh-response
pressure t ransducers or a capture system which permits measurements of
p ressure a f te r the run . However, the same basic procedures must be followed
i n o r d e r t o c a l i b r a t e t h e f a c i l i t y as f o r a l ong - run - t ime fac i l i t y . Thus, the
specia l problems assoc iated wi th the shor t run t imes o f in termi t tent tunnels
are not d iscussed, but the genera l d iscuss ions o f ca l ibrat ion procedures are
appl icable.
A l though t ranson ic tunne ls w i th h igh-aspec t - ra t io (2-D) t es t sec t i ons
are genera l l y opera ted a t h igher Reynolds numbers, t h i s t ype o f t unne l i s no t
d iscussed separately because they share the same c a l i b r a t i o n problems as sym-
metr ica l tunnels .
D iscuss ions o f the var ious top ics a re o f a general nature where possible.
Subd iv is ions in to t ranson ic and supersonic areas are made where d i c ta ted by
the pecu l ia r i t ies o f these reg ions . Fur ther subd iv is ions a re made, as
appropr ia te , in d iscuss ions o f d e t a i l s .
7
1I.B. OPERATIONAL PARAMETERS
I I . B . l Pressure Control
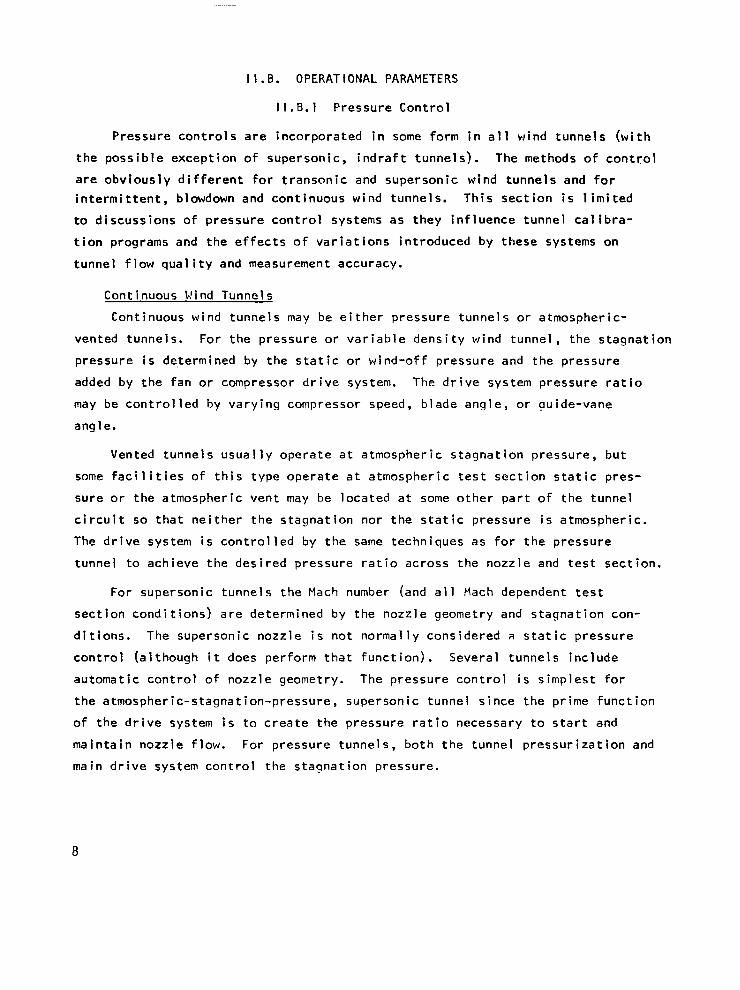
Pressure controls are incorporated in some form in all wind tunnels (with the possible exception of supersonic, indraft tunnels). The methods of control are obviously different for transonic and supersonic wind tunnels and for intermittent, blowdown and continuous wind tunnels. This section is limited to discussions of pressure control systems as they influence tunnel calibra- tion programs and the effects of variations introduced by these systems on
tunnel flow quality and measurement accuracy.
Continuous Wind Tunnels Continuous wind tunnels may be either pressure tunnels or atmospheric-
vented tunnels. For the pressure or variable density wind tunnel, the stagnation pressure is determined by the static or wind-off pressure and the pressure added by the fan or compressor drive system. The drive system pressure ratio may be controlled by varying compressor speed, blade angle, or auide-vane
ang 1 e.
Vented tunnels usually operate at atmospheric stagnation pressure, but some facilities of this type operate at atmospheric test section static pres- sure or the atmospheric vent may be located at some other part of the tunnel circuit so that neither the stagnation nor the static pressure is atmospheric. The drive system is controlled by the same techniques as for the pressure tunnel to achieve the desired pressure ratio across the nozzle and test section.
For supersonic tunnels the Mach number (and all Mach dependent test section conditions) are determined by the nozzle geometry and stagnation con- ditions. The supersonic nozzle is not normally considered a static pressure
control (although it does perform that function). Several tunnels include automatic control of nozzle geometry. The pressure control is simplest for the atmospheric-stagnation-pressure, supersonic tunnel since the prime function of the drive system is to create the pressure ratio necessary to start and maintain nozzle flow. For pressure tunnels, both the tunnel pressurization and main drive system control the stagnation pressure.
8
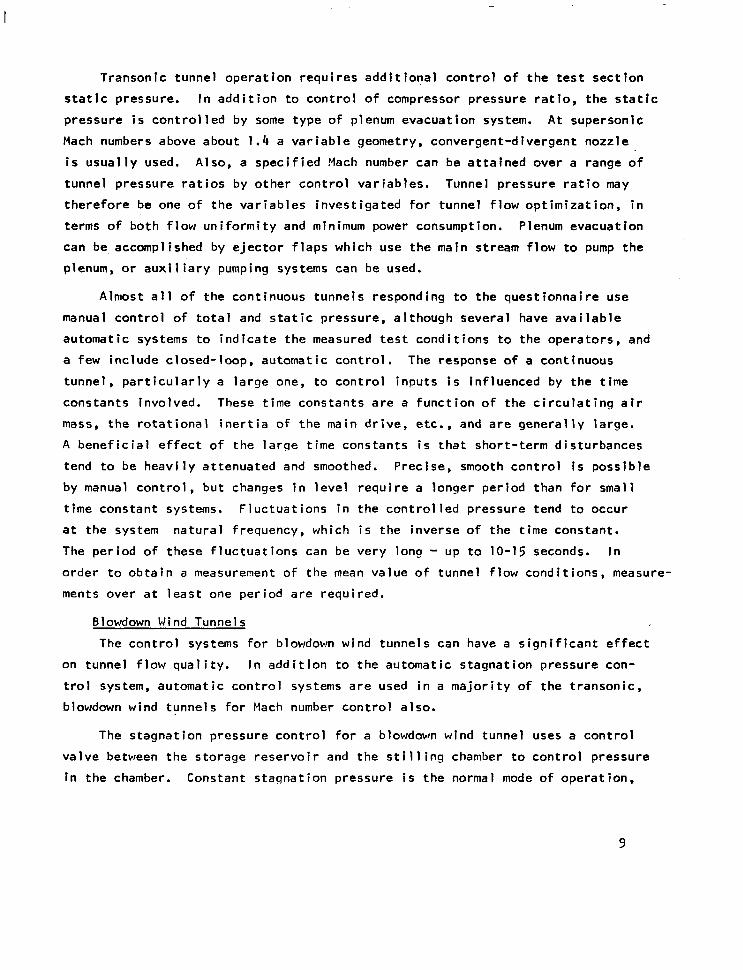
Transon ic tunne l opera t ion requ i res add i t iona l con t ro l o f the tes t sec t ion
s t a t i c p r e s s u r e . I n a d d i t i o n t o c o n t r o l o f compressor pressure r a t i o , t h e s t a t i c
p ressu re i s con t ro l l ed by some t ype o f plenum evacuation system. A t supersonic
Mach numbers above about 1.4 a v a r i a b l e geometry, convergent-divergent nozzle
i s u s u a l l y used. Also, a s p e c i f i e d Yach number can be a t ta ined over a range o f
tunne l p ressure ra t ios by other control var iables. Tunnel .pressure rat io may
the re fo re be one o f t he va r iab les i nves t i ga ted f o r t unne l f l ow op t im iza t i on , i n
terms o f b o t h f l o w u n i f o r m i t y and minimum power consumption. Plenum evacuation
can be accompli
plenum, o r a u x i
Almost a l l
ma nua 1 con t r o 1
shed by e jec to r f l aps wh ich use the main stream flow to
1 i a r y pumping systems can be used.
of the cont inuous tunnels responding to the quest ionna
o f t o t a l and s tat ic pressure, a l though severa l have ava
pump the
i r e use
i l a b l e
automatic systems t o i n d i c a t e t h e measured tes t cond i t ions to the opera tors , and
a few include c losed- loop, automat ic control . The response of a continuous
t u n n e l , p a r t i c u l a r l y a la rge one, t o con t ro l i npu ts i s i n f l uenced by the t ime
constants involved. These t ime constants are a f u n c t i o n o f t h e c i r c u l a t i n g a i r
mass, t h e r o t a t i o n a l i n e r t i a o f the main dr ive, etc. , and are genera l ly large.
A b e n e f i c i a l e f f e c t o f the large t ime constants is that shor t - term d is turbances
tend t o be heavi ly a t tenuated and smoothed. Precise, smooth c o n t r o l i s p o s s i b l e
by manual con t ro l , bu t changes i n l e v e l r e q u i r e a longer per iod than for smal l
t ime constant systems. F luctuat ions in the cont ro l led pressure tend to occur
a t t he system natural frequency, which i s the inverse o f the t ime constant.
The per iod o f these f luc tua t ions can be very long - up t o 10-15 seconds. I n
o r d e r t o o b t a i n a measurement o f t h e mean va lue o f tunne l f low cond i t ions , measure-
ments over a t l e a s t one per iod are requi red.
Blowdown Wind Tunnels
The c o n t r o l systems f o r blowdown wind tunnels can have a s i g n i f i c a n t e f f e c t
on tunnel f low qual i ty . In addi t ion to the automat ic s tagnat ion pressure con-
t r o l system, automat ic cont ro l systems a r e used i n a ma jo r i t y o f t he t ranson ic ,
blowdown wind tunnels for Mach number cont ro l a lso .
The s tagnat ion p ressure con t ro l fo r a blowdown wind tunnel uses a c o n t r o l
va lve between the s torage reservo i r and t h e s t i l l i n g chamber to con t ro l p ressu re
i n t h e chamber. Constant stagnation pressure is the normal mode o f opera t ion ,
9
but the system can also be computer or program con t ro l l ed t o ma in ta in cons tan t
Reynolds number as the stagnat ion temperature drops dur ing the run, or t h e
pressure may be i nc reased l i nea r l y w i th t ime to i nves t i ga te Reyno lds number
e f fec ts , exp lo re f l u t te r boundar ies , e t c . I n genera l , t he f unc t i ona l capab i l i t y
o f the s tagnat ion p ressure system has become more s o p h i s t i c a t e d w i t h t h e i n t r o - d u c t i o n o f d i g i t a l computer con t ro l .
From the f low qua l i t y s tandpo in t , the most important performance parameter
o f t h e system i s t h e a c c u r a c y o f p r e s s u r e c o n t r o l o r , i n more speci f ic terms,
the var iance of the stagnat ion pressure about the mean leve l . The p e r i o d o f
t h i s v a r i a t i o n i s t y p i c a l l y about 1 second and the cu r ren t s ta te -o f - the -a r t
appears t o be about a 0.1 percent standard deviat ion; much la rger per tu rba t ions ,
up t o 1/2%, can e a s i l y r e s u l t due t o e l e c t r i c a l n o i s e , m e c h a n i c a l f r i c t i o n or
misadjustment o f t h e c o n t r o l computer. The stagnat ion pressure control system
must operate cont inuously to overcome the disturbance created by the decreasir
reservoir pressure. Thus a cont ro l le r o f h igher o rder than tha t used for a
cont inuous tunnel pressure cont ro l is usual ly requi red to achieve the desired
accuracy. A simple regulator is normally inadequate.
The shock system generated downstream of the blowdown-wind-tunnel Control
‘9
va lve may introduce excessive f low unsteadiness. Test-sect ion f low angular i ty
may a l s o v a r y w i t h v a l v e p o s i t i o n (and therefore, t ime). Thus, t h e e n t i r e f l o w
channe l , f rom the s to rage reservo i r to the s t i l l i ng chamber, must be considered
when des ign ing the s tagnat ion pressure cont ro l system. Considerable work has
been accomplished i n r e c e n t y e a r s t o i d e n t i f y and c o r r e c t flow problems caused
by the stagnat ion pressure control system. Cor rec t i ve measures have included
choked-flow devices i n s e r i e s downstream of the valve, special ized valves,
acous t ic s i lencers and honeycombs i n t h e s t i l l i n g chamber.
A second pressure control system used in t ransonic tunnels , the Mach
number cont ro l , func t ions to ma in ta in a desired Mach number by c o n t r o l l i n g
s ta t i c p ressu re as a func t ion o f s tagnat ion p ressure . A lmost a l l blowdown,
t ransonic tunnels use a choked t h r o a t downstream o f t h e t e s t s e c t i o n t o c o n t r o l
subsonic Mach numbers. The primary advantage o f t h i s c o n t r o l mode i s t h a t t h e
Mach number i s determined by the test section geometry (at a f i x e d model angle
o f a t t a c k ) and i s t h e r e f o r e independent of f luc tua t ions in s tagnat ion p ressure .
10

Automat ic cont ro l of the downstream t h r o a t a r e a i s used i n a number o f f a c i l i -
t i e s . A u t o m a t i c c o n t r o l i s h i g h l y d e s i r a b l e i n o r d e r t o m a i n t a i n c o n s t a n t Mach
number dur ing model a t t i t u d e v a r i a t i o n s and simultaneously maintain optimum
plenum evacuation. More sophisticated operational modes a r e a v a i l a b l e under
computer c o n t r o l , such as Mach number sweeps, e tc . The performance of t h i s
system a l s o d i r e c t l y i n f l u e n c e s t h e v a r i a t i o n o f t h e t e s t s e c t i o n Mach number.
Current best performance appears to be 'about 0.001. bu t l a rge r va r ia t i ons a re
poss ib le a t subson ic speeds, pa r t i cu la r l y a t h igh mode l -p i t ch ra tes .
In the absence o f per tu rba t ions in t roduced by the Mach o r s ta t i c p ressu re
contro l loop, smal l var ia t ions in s tagnat ion pressure cannot necessar i ly be
taken into account by simultaneous measurement of the two pressures because o f
phase l a g and a t tenua t ion e r ro rs .
An impor tant procedura l d i f ference in making ca l ibrat ion measurements i n
a blowdown tunnel i s that runs should be made a t each c a l i b r a t e d Mach number
where a l l tunne l var iab les a re he ld cons tan t dur ing an e n t i r e blowdown, i n
o rde r t o de tec t t ime o r va l ve pos i t i on dependent e f fec ts . I f a t r a v e r s i n g
a n g u l a r i t y p r o b e i s moved a long the tunne l cen ter l ine dur ing the run , fo r example,
time-dependent e f f e c t s will be obscured by the spat ia l var ia t ions and vice versa.
In te rmi t ten t ( Impu lse) Wind Tunnels
In te rmi t ten t w ind tunne ls a re cons idered to be those that operate in a
bas ic blowdown mode, b u t w i t h a run t ime o f about 4 t o 5 seconds or less. The
Ludwieg t u n n e l i s a t y p i c a l f a c i l i t y o f t h i s c l a s s . The Ludwieg p r i n c i p l e
can be applied to e i t h e r a supersonic or a transonic wind tunnel. Pressure
con t ro l i s l im i ted t o t he i n i t i a l cha rge t ube p ressu re and i s t h e r e f o r e r e l a -
t i v e l y s t r a i g h t f o r w a r d . An advantage of the Ludwieg tunnel i s tha t the s tagna-
t i on p ressu re downstream o f t he i n i t i a l expans ion t ube i s cons tan t (neg lec t i ng
v iscous e f fec ts ) . The p r i m a r y c a l i b r a t i o n measurement problems associated
w i t h t h e Ludwieg tunnel obviously ar ise from the shor t tes t dura t ion .
11
l l .B.2 Cal ibrat ion Accuracy, Flow Un i fo rm i t y and Re la t ionsh ip to Model Test ing
The c a l i b r a t i o n o f a t ranson ic w ind t unne l i s s ign i f i can t l y more d i f f i c u l t
t h a n c a l i b r a t i o n o f a supersonic tunnel due p r i m a r i l y t o t h e v e n t i l a t e d t e s t
sec t ion wa l ls . The v e n t i l a t e d w a l l s and the bas ic na ture o f t ranson ic flow
prevent the de termina t ion o f tes t sec t ion cond i t ions from tunnel or nozz le geom-
e t ry a lone, as i s the case wi th a cal ibrated supersonic tunnel nozzle. A
measurement o f t e s t s e c t i o n s t a t i c p r e s s u r e , i n a d d i t i o n t o stagnat ion pressure,
i s r e q u i r e d d u r i n g c a l i b r a t i o n and rou t i ne t es t ope ra t i ons . Fu r the r , f o r f i xed
t e s t s e c t i o n geometry, the model o r o the r appara tus i n t he t es t sec t i on can i n f l u -
ence the Mach number. These fac to rs requ i re t ha t t he t unne l ca l i b ra t i on p rov ide
a r e l a t i o n between t h e s t a t i c p r e s s u r e d i s t r i b u t i o n i n t h e t e s t s e c t i o n and a
reference pressure measured i n t h e plenum chamber o r on the vent i la ted wal l .
T ranson ic tunne l ca l ib ra t ion i s fu r ther compl ica ted by the addi t ional degrees
of freedom provided by a v e n t i l a t e d w a l l , i.e., a t each Mach number, the optimum
wa l l ang le , wa l l po ros i t y ( f o r ad jus tab le po ros i t y wa l l s ) , plenum evacuat ion f low
ra te , tunne l p ressure ra t io , and choke c o n t r o l p o s i t i o n must a l l be determined.
C r i t e r i a f o r optimum ad jus tment inc lude un i fo rmi ty o f Mach number and, a t super-
sonic speeds, shock and expansion-wave c a n c e l l a t i o n c h a r a c t e r i s t i c s w h i c h a r e
usual ly eva luated based on tes ts o f cone-cy l inder models. A t subsonic speeds, i n
a d d i t i o n t o m i n i m i z i n g v a r i a t i o n s i n Mach number d i s t r i b u t i o n , o t h e r c r i t e r i a f o r
op t im iza t ion a re tunne l no ise leve l and forces on a standard model. A recent
repo r t by Jackson (Ref. I ) provides a comprehensive discussion of the procedures
employed in se lect ina t ransonic tunnel parameters to min imize Mach number v a r i a -
t ions.
Many of the t ransonic tunnels surveyed determine the wal l angle based on
shock and expansion wave cance l l a t i on a t superson ic speeds, and t h i s a n g l e i s
o f t e n m a i n t a i n e d c o n s t a n t a t a l l Mach numbers, wh i le o thers ad jus t the wa l l
angle according to a Mach number schedule. In genera l , ad jus tment o f wa l l ang le
w i t h Mach number will prov ide a more uni form f low.
A t yp ica l op t im iza t ion p rob lem a t subson ic Mach numbers i s b a l a n c i n g o f
plenum evacuation and choke area for a choke-control led blowdown tunnel. The
average test sect ion Mach number can be a t t a i n e d w i t h an i n f i n i t e number of
combinat ions of plenum pumping and choke area. For example, the c r i t e r i o n
u s u a l l y chosen i s t o m i n i m i z e downstream Mach number increases or decreases from
12

the upstream value. Downstream d is tu rbances i n Mach number a re undes i rab le
because they can create bouyancy effects further upstream. Since the disturb-
ance magnitude i s e x t r e m e l y s e n s i t i v e t o changes i n plenum pumping a t subsonic
Mach numbers below about 0 . 8 5 , the optimum pumping i s de termined dur ing ca l ib ra t ion
and main ta ined cons tan t fo r rou t ine tes t ing . The t e s t s e c t i o n Mach number i s
c o n t r o l l e d by vary ing the choke area which does not a l t e r t h e downstream d i s t u r b -
ance.
A s imi lar upst ream d is turbance occurs a t Mach numbers near 1.0. Therefore,
one o f the purposes o f a c a l i b r a t i o n program i s to de termine the reg ion o f f low
a long t he t es t sec t i on w i th in wh ich t he Mach number d e v i a t i o n does no t exceed
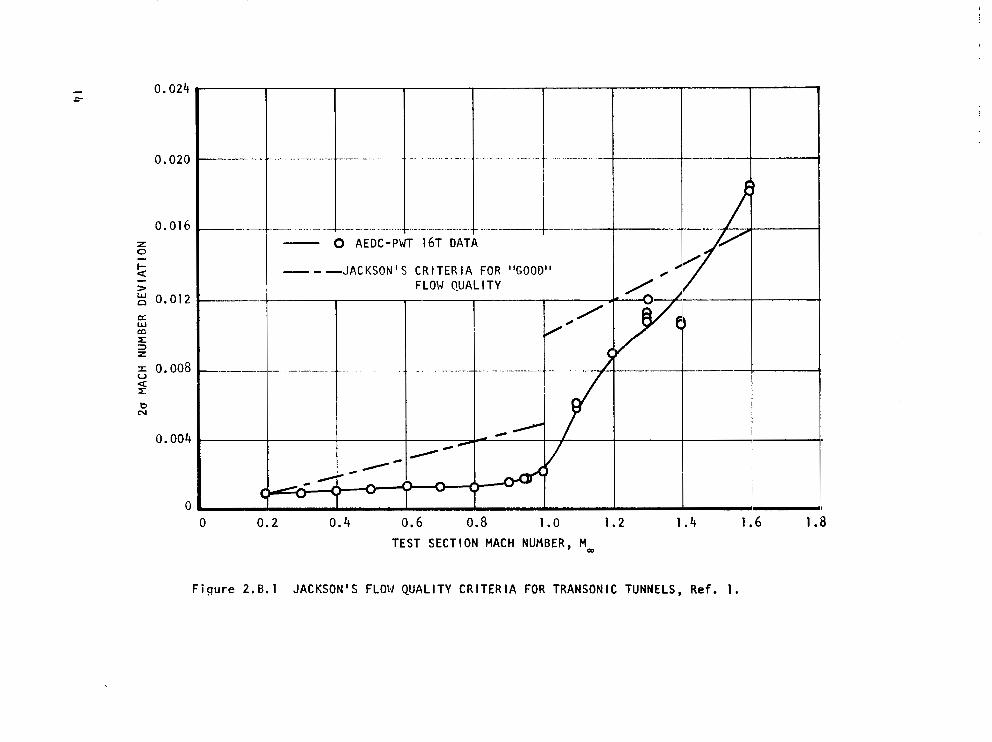
var ious l im i ts such as +O.OOl, 20.002, etc. Jackson (Ref. I ) has suggested t h e
f o l l o w i n g c r i t e r i a be adopted as an industry standard for "good f l o w q u a l i t y " i n
transonic tunnels. For subsonic f lows, 2a d e v i a t i o n s i n c e n t e r l i n e Mach number
should be less than 0.005 and less than 0.01 i n t h e case o f supersonic flows. O f
course, the minimum Mach number d e v i a t i o n i s i n d i c a t i v e o f t h e b e s t d i s t r i b u t i o n
and t h e r e f o r e f l o w q u a l i t y f o r a g iven tes t sec t ion leng th and s e t o f t u n n e l c o n d i t i o n s . J a c k s o n ' s f l o w q u a l i t y c r i t e r i a a r e shown i n F i g . 2.8.1 as a
f u n c t i o n o f Mach number. Recent c a l i b r a t i o n d a t a from t h e AEDC-PWT 16T
Transonic Tunnel i s a l s o i n c l u d e d f o r comparison.
Mor r is and Winter (Ref. 2) have suggested even more s t r ingent requi rements
for supersonic tunnels. These i n v e s t i g a t o r s have suggested the maximum al lowed
v a r i a t i o n s i n ( I ) f l o w a n g u l a r i t y be +0.1 - deg and (2) Mach number be 20.003 a t
M = 1.4, +0.005 a t M = 2, - +0.01 a t !I = 3 .
I t should be n o t i c e d t h a t c r i t e r i a based on the standard deviat ion do not
d i s t i n g u i s h between random o r p e r i o d i c v a r i a t i o n s and mean f low gradients . Thus,
i n a d d i t i o n to s tandard dev ia t i on c r i t e r i a , cons ide ra t i on must be g i v e n t o empty-
tunne l s ta t i c p ressure g rad ien ts . The s t a t i c p r e s s u r e d i s t r i b u t i o n a l o n g t h e
t e s t s e c t i o n must be e i t h e r c o n s t a n t ( w i t h i n a c c e p t a b l e l i m i t s ) o r any grad ien t
must be known and repeatable to a s u f f i c i e n t l y h i g h d e g r e e o f accuracy so t h a t
bouyancy correct ions can be made t o a t t a i n t h e r e q u i r e d a c c u r a c y i n measurements
o f model drag. I t i s t h e r e f o r e o f i n t e r e s t t o i n v e s t i g a t e , i n a systemat ic
manner, t h e e f f e c t s of tes t sec t ion p ressure g rad ien t on d rag measurement accuracy
and how t h i s r e l a t e s t o f l o w q u a l i t y r e q u i r e m e n t s .
0.024
0.020
0.01 6 z 0 - I- a - > : 0 .0 12
I 0.008 u I: a
0.004
0
- 0 AEDC-PWT 16T DATA
" " J A C K S O N S CR I T E R I A FOR "GOOD" FLON QUAL 1 T Y
t.' -
/
3 ,/
l-
-" "
0 0.2 0.4 0.6 0.8 1 .o 1.2 1.4 1.6 1.8 TEST SECTION MACH NUMBER, Mm
Figure 2.8.1 JACKSON'S FLOW Q U A L I T Y C R I T E R I A FOR TRANSONIC TUNNELS, Ref . 1 .
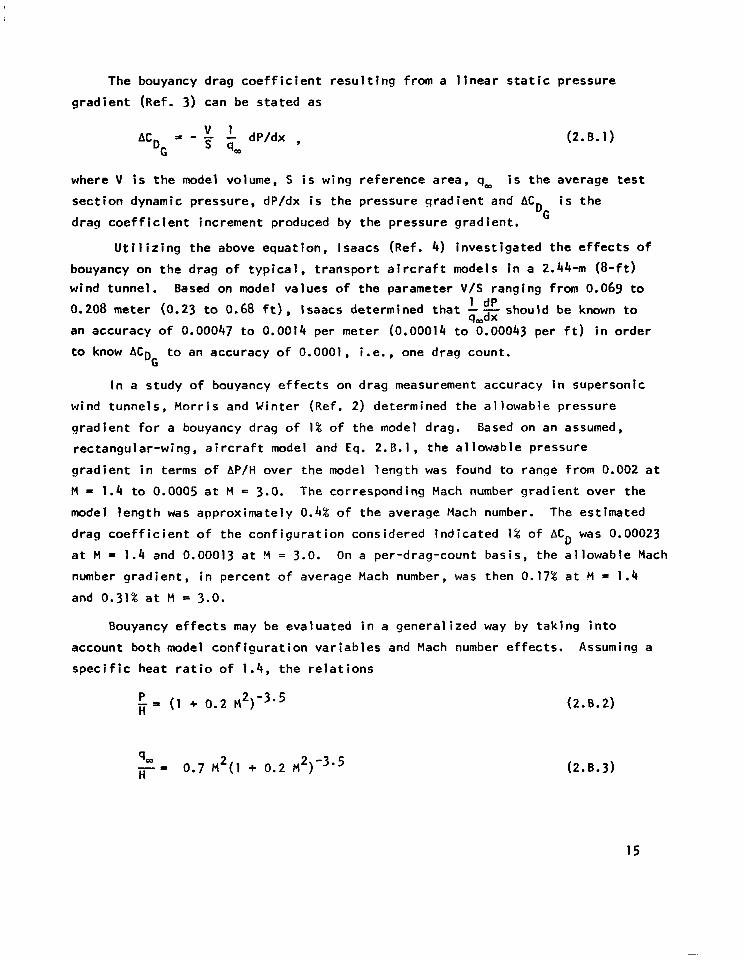
The bouyancy
g rad ien t (Ref. 3)
AC = - DG
d r a g c o e f f i c i e n t r e s u l t i n g from a l i n e a r s t a t i c p r e s s u r e
can be s ta ted as
” dP/dx , q w
(2.8.1)
where V i s t h e model volume, S i s wing reference area, qm i s t he ave rage tes t
sec t i on dynamic pressure, dP/dx i s t he p ressu re g rad ien t and AC i s t h e
drag coeff ic ient increment produced by the pressure gradient. DG
U t i l i z i n g t h e above equation, lsaacs (Ref. 4) inves t iga ted the e f fec ts of
bouyancy on t h e d r a g o f t y p i c a l , t r a n s p o r t a i r c r a f t models i n a 2.44-111 ( 8 - f t ) wind tunnel. Based on model values of the parameter V / S ranging from 0.069 t o
0.208 meter (0.23 t o 0.68 f t ) , lsaacs determined that -- dP should be known t o
an accuracy o f 0.00047 t o 0.0014 per meter (0.00014 t o 0.00043 per f t ) i n o r d e r
to know AC t o an accuracy o f 0.0001, i .e. , one drag count.
q,dx
DG
I n a study of bouyancy e f f e c t s on drag measurement accuracy i n supersonic
wind tunnels, Morr is and Winter (Ref. 2) determined the a l lowable pressure
g r a d i e n t f o r a bouyancy drag o f 1% o f t h e model drag. Based on an assumed,
rec tangu la r -w ing , a i r c ra f t model and Eq. 2.8.1, the a l lowable pressure
g rad ien t i n t e rms o f AP/H over the model l eng th was found to range from 0.002 a t
M - 1.4 t o 0.0005 a t M = 3.0. The corresponding Mach number gradient over the
model l eng th was approximately 0.4% o f the average Mach number. The estimated
d r a g c o e f f i c i e n t o f the conf igurat ion cons idered ind icated 1% o f ACD was 0.00023
a t M = 1.4 and 0.00013 a t ?l = 3.0. On a per-drag-count basis, the a l lowable Mach
number g rad ien t , i n pe rcen t of average Mach number, was then 0.17% a t M = 1.4
and 0.31% a t M -- 3.0.
Bouyancy e f f e c t s may be eva lua ted i n a general ized way by t a k i n g i n t o
account both model c o n f i g u r a t i o n v a r i a b l e s and Mach number e f fec ts . Assuming a
s p e c i f i c h e a t r a t i o o f 1.4, t h e r e l a t i o n s
P - x (1 + 0.2 M ) H
2 -3.5 (2.B.2)
q W - D H 0.7 M 2 ( 1 + 0.2 M 2 -3.5 (2.B.3)
15

may be used t o w r i t e Eq. (2.6.1) as #- -
2 (2. e.4) M (1+0.2 Hz)
Where H and qm are considered constant at their average values. If the Mach num-
be r g rad ien t i s assumed t o be 1 inear, =may be w r i t t e n as AM/Ax w i t h Ax taken as
the model length, L,. AM i s then the Mach number va r ia t i on pe r model length.
Eq. (2.6.4) becomes
dM
AC = "[ 2 ] AM . (2.6.5) DG SLm M(I+O.Z M')
The parameter V/SLm i s a nondimensional configuration parameter and i s there-
fore independent o f model scale. Figure 2.8.2 shows the a l lowable Mach number
gradient, over the model leng th , fo r a bouyancy- induced, drag coef f ic ient er ror
o f 0.0001 as a funct ion o f the conf iaurat ion parameter V/SL Owing t o t h i s
extreme s e n s i t i v i t y o f d r a g measurements a c c u r a t e t o w i t h i n one count, there
a re a number o f problems in ach iev ing th is goa l . For example, i f the random,
shor t wavelength var ia t ions in Mach number a re too la rge , the mean grad ien t
may be obscured and d i f f i c u l t t o def.ine. One approach i s to use empty-tunnel p ressure d is t r ibu t ions , measured d u r i n g c a l i b r a t i o n s , t o i n t e g r a t e Over the model
length. However, t h i s procedure can be i n e r r o r because o f l ack o f exac t
repea tab i l i t y o f t unne l f l ow cond i t i ons . lrt the case o f t ranson ic tunne ls , the
model may induce departures from empty-tunnel cal ibrations, e.g., Parker (Ref. 5) I n a d d i t i o n , Jackson (Ref. 1 ) has found that a chanqe i n u n i t Reynolds number
from 4.1 x 10 t o 15.8 x 10 (per meter) can cause an increase o f 0.003 in tunne l
Mach number, see F i g . 2.6.3. This i s an e f fec t t ha t i s f requen t l y i gno red
dur ing t ransonic tunnel ca l ibrat ions.
m'
6 6
The data o f F ig . 2.6.2 a re a l so shown i n F i g . 2.B.4 w i t h t h e Mach number
gradient expressed in percent of the averaae Mach number. Points der ived f rom
t h e c r i t e r i a suggested by Mor r is and Winter '(Ref. 2) for supersonic f l o w a r e
shown on Fig. 2.8.4 f o r comparison. This comparison indicates the model
con f igu ra t i on used by Mor r i s and W i n t e r t o e s t a b l i s h f l o w u n i f o r m i t y c r i t e r i a
had a value o f approximately 0.05 f o r V/SLm.
16

" V
sLm
L/ -
2 3
T E S T S E C T I O N MACH NUHEER
~ l ~ u r e 2 .8 .2 ALLOWABLE LINEAR MACH NUMBER GRADIENT OVER MODEL LENGTH FOR BOUYANCY DRAG C O E F F I C I E N T C Q N T R I B U T I O N OF 0.0001
17
0.020
0.016
0.012
Hm - Mc
0.008
0.004 -
0 0 1 .o 2.0 3.0 4.0 5.0 6.0 7.0
Re x 10-6/ft
I~ 0
1 4
I 8 12
1
Re x 10'6/m
16 1
20 1
Flgure 2.8.3 EFFECTS OF REYNOLDS NUMBER ON C A L I B R A T I O N OF THE PWf-16T TUNNEL AT M _ = 0.6 AND 0.8 FOR Ow = 0 AND T = 6%
18
I
0 . 5 1.0 1.5 2.0 2 . 5 3 . 0 3.5 TEST SECTION MACH NUMBER, M
F i g u r e 2.8.4. MACH NUHHER GRADIENT OVER NOOEL LENGTH AS PERCENT OF AVERAGE MACH NUMBER FOR RQUYANCY DRAG C O E F F I C I E N T O F 0.0001

The value of the parameter V/SLm f o r s e v e r a l a i r c r a f t t y p i c a l O F f i g h t e r , 2.
a t tack and t ranspor t con f i gu ra t i ons a re l i s ted below.”
A i r c r a f t -m W/SL
F - 1 5 F-16
YF-17
A-7
oc-8 DC-9
D C - I O
8-741
8-727-100
8-727-200
C-141A
C -5A
0.054
0.048 0.043
0.071
0.061
0. 088
0.083
0.065
0.076
0.056
0.055
0.078
The above data demonstrates the var iat ion i n V/SLm w i t h a i r c r a f t t y p e
i s no t l a rge , a t l eas t For convent ional conf igurat ions, and that the model
con f igura t ion se lec ted by H o r r i s and Winter (Ref. 2) i s representat ive o f
s u p e r s o n i c f i g h t e r a i r c r a f t . I t i s a n t i c i p a t e d t h a t V/STOL conf igura t ions
would have a l a rge r va lue o f V/SL, t h a n t h e a i r c r a f t l i s t e d above and would
therefore be more s e n s i t i v e t o Hach number q rad ien t e f fec ts .
* Due to the approximate values used f o r some o f t h e a i r c r a f t volumes, the values of W/SL, should be regarded as approximate.
20

I I .D. P.eferences
1 . Jackson, F. M.: " C a l i b r a t i o n o f t h e AEDC-PWT 16-F t Transonic Tunnel a t
Test Section \,la11 P o r o s i t i e s o f Two. Four, and Six Percent." AEDC-TR-76-13,
Jan. 1976.
2 . Mor r i s , 0. E. and & l i n t e r , K. G . : "Requirements f o r U n i f o r m i t y o f Flow
i n Supersonic \,!ind Tunnels," RAE Tech Note AERO 2340 ( l?54) .
3. G lauer t , H . : "Wind Tunnel In te r fe rence on Vinqs, Yodies and Ai lerons,"
A.R.C. R&M 1566 (1933).
4. Isaacs, 0 . : " C a l i b r a t i o n o f t h e R.A.E. Bedford 8 - f t . x 3 - f t . Wind Tunnel
a t Subsonic Speeds, Inc lud ino a Discussion of the Correct ions Appl ied to
the Measured P r e s s u r e D i s t r i b u t i o n t o Allow f o r t h e D i r e c t and Crlockaae
Ef fec ts due to the Ca l ib ra t ion Probe Shape,': A.R.C. R&M 3583 (1569).
5. Parker, P.. L.: "Flow Generat ion Propert ies o f Five Transonic Wind Tunnel
Test Section Wall Confiaurations," AEOC-TR-75-73, Aug. 1975.

1I.C. FLOW PARAMETERS AND UtKERTAlNTY RELATIONSHIPS
The proper measurement o f stream properties to allow the accurate
determination of the various flow parameters is necessary for the meaningful
interpretation o f wind tunnel test results. For example, the desirability o f
a Mach number accuracy of 0.001 has been suggested (i.e., Ref. I). The neces-
sity of such a requirement may be illustrated by the afterbody data of Fig. 2.C.I.
This data appears to have substantial scatter but may be correlated using Mach
number measurements with a precision of 0.001 as shown in Fig. 2.c.2.* I t
also may be noted that for a typical fighter aircraft configuration the tran-
sonic drag rise is such that a Mach numt.er uncertainty o f 0.001 is "equivalent"
to 0,0002 (2 counts) in drao coefficient. Similarly. other parameters must be
computed to high degrees of accuracy. The sensitivities o f the several flow
parameters to the various measurements are presented in this section to illus-
trate the consequences of measurement uncertainty on accuracy.
II.C.1. Pressures
The pressure o f a fluid is one of its most significant properties, The
knowledge o f static and stagnation pressures in a wind tunnel is necessary
to define characteristic flow conditions such as Mach number and Reynolds number
and to properly normalize the various data coefficients. The following discus-
sion concerns the measurement of these two pressures.
Static Pressure: During transonic operation static pressure is obtained from a
reference pressure (wall or plenum) and a predetermined relation (calibration)
of this pressure to the test section static pressure. During supersonic opera-
tion static pressure is usually obtained from stagnation pressure and the Mach
number previously obtained during calibration o f the facility w i t h the particular
nozzle setting. - Figures 2.C.l and 2 were obtained through private communication with Mr. Jack Runkel. NASA Langley Research Center. This requirement for a Mach number accuracy O f at least 0.001 i s also substantiated by the recent nozzle-afterbody tests reported by Spratley and Thompson (Ref. 17) .
22

cD
NASA LANGLEY
TAIL INTERFERENCE MODEL
M = .95
.28
.24
1 2 3 4 5 6
" jdP
Figure 2.C.l AFTERBODY DRAG DATA A T AN AVERAGE MACH NUMBER OF 0.95
W h)
.2a
.24
%
.20
.16
NASA LANGLEY
T A I L I N T E R F E R E N C E MODEL
Figure 2 . C . 2 AFTERBODY DRAG DATA WITH TUNNEL MACH NUMBER GIVEN TO THREE DECIMALS
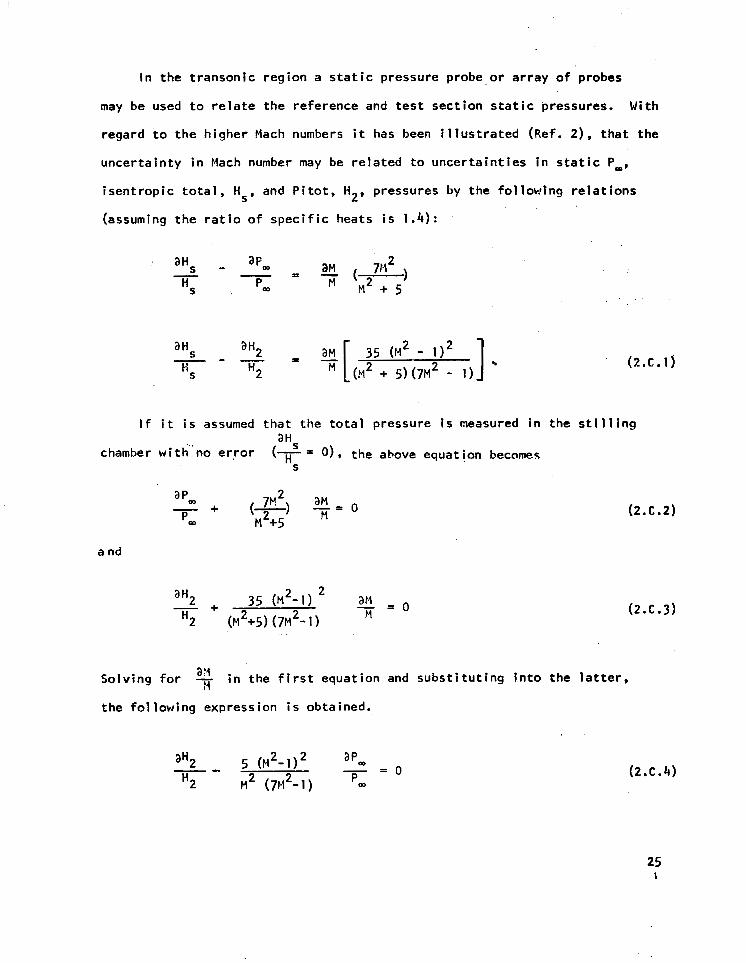
In the t ranson ic reg ion a s ta t i c p ressure p robe,or a r ray o f probes
may be used t o r e l a t e t h e r e f e r e n c e and tes t sec t ion s ta t i c p ressures . Wi th
regard t o the h igher Mach numbers it has been i l l u s t r a t e d (Ref. 2) , that the
u n c e r t a i n t y i n Mach number may be r e l a t e d t o u n c e r t a i n t i e s i n s t a t i c P-,
i s e n t r o p i c t o t a l , H s , and P i t o t , H 2 , pressures by the fo l lowing re la t ions
(assuming t h e r a t i o o f s p e c i f i c h e a t s i s 1.4):
"- aHS a H2 aM[ 35 (M2 - 112 3 HS H2 (M2 + 5) (7M2 - 1)
= (2.c.1)
I f it i s assumed t h a t t h e t o t a l p r e s s u r e i s measured i n t h e s t i l l i n g
a nd
Solv ing for - i n t h e f i r s t e q u a t i o n and s u b s t i t u t i n g i n t o t h e l a t t e r ,
the fo l lowing express ion is obta ined.
H
" aH2 5 (M2-1)2 'Pm - H2
= o M2 ( 7M2- 1 ) Po0
(2.c.2)
(2.C.4)

which y ie lds
aH2 H2 5 (M - 1 ) a pm M2(7M2-l) '
2. 2 - I -
2 3.5 2.5 Since - "2 = [ F] [4"] , then aH2 -
pm 7H - 1 a pm
can be s i m p l i f i e d to:
(2.C.5)
(2.C.6)
Hence t h e r a t i o of uncer ta in t y o f P i to t - to -s ta t i c p ressu re becomes a simple
f u n c t i o n o f Mach number and i s shown i n F i g . 2.C.3. It may be noted that the
r a t i o becomes 1 near M 1.6. Thus, fo r a s p e c i f i e d e r r o r i n Mach number a t an
M 1.6, t h e e r r o r i n s t a t i c p r e s s u r e may be greater than , . the er ror in
Pi tot pressure. For Mach numbers greater than 1.6 the reverse i s t rue . Th is
occurs because the s ta t i c p ressu re becomes very smal l a t h igh Mach numbers,
and smal l absolute er rors in the .measurement of Pm produce r e l a t i v e l y l a r g e
e r r o r s i n c a l c u l a t e d Mach number. For example, Fig. 2.C.3 shows t h a t a t
Mach 3 t he abso lu te e r ro r i n P i to t p ressu re can be approximately seven times
the s ta t i c p ressu re e r ro r f o r t he same e r r o r i n c a l c u l a t e d Mach number. Thus
*
the use of s ta t i c p ressure fo r the de termina t ion of Mach number i s genera l l y
r e s t r i c t e d to Mach numbers less than 1.6; wh i l e P i to t p ressu re i s employed
(w i th s tagnat ion p ressure) a t h igher Mach numbers.
* Also see Fig. 2.C.9, p.39.
26
5
2

Stagnation Pressure: The pressure of t h e t e s t medium i s measured w i t h t h e
f l u l d a t r e s t e i t h e r i n t h e s e t t l i n g chamber o r by means of a t o t a l head tube.
The s e t t l i n g chamber ( i sen t rop ic s tagnat ion) p ressure , Hs, i s g e n e r a l l y
used for both t ransonic and supersonic operat ion. Because o f t h e a f o r e -
mentioned s e n s i t i v i t y o f Mach number to s ta t i c p ressu re , a f te r - shock t o ta l
(p i to t ) p ressure , H2, i s employed above a nominal 1.6 Mach number.
Dynamic Pressure: Dynamic pressure, q, i s perhaps the most f requen t l y employed
flow parameter used to normalize wind tunnel data. Thus the accuracy o f q i s
d i r e c t l y r e f l e c t e d i n t h e a c c u r a c y o f c o e f f i c i e n t d a t a . I n most instances,
a f t e r s t a t i c p r e s s u r e has been obtained by measurement ( t ranson ic ) o r by
inference (supersonic) it i s used w i t h Mach number t o compute q from
q = M2Pm . (2.c.8)
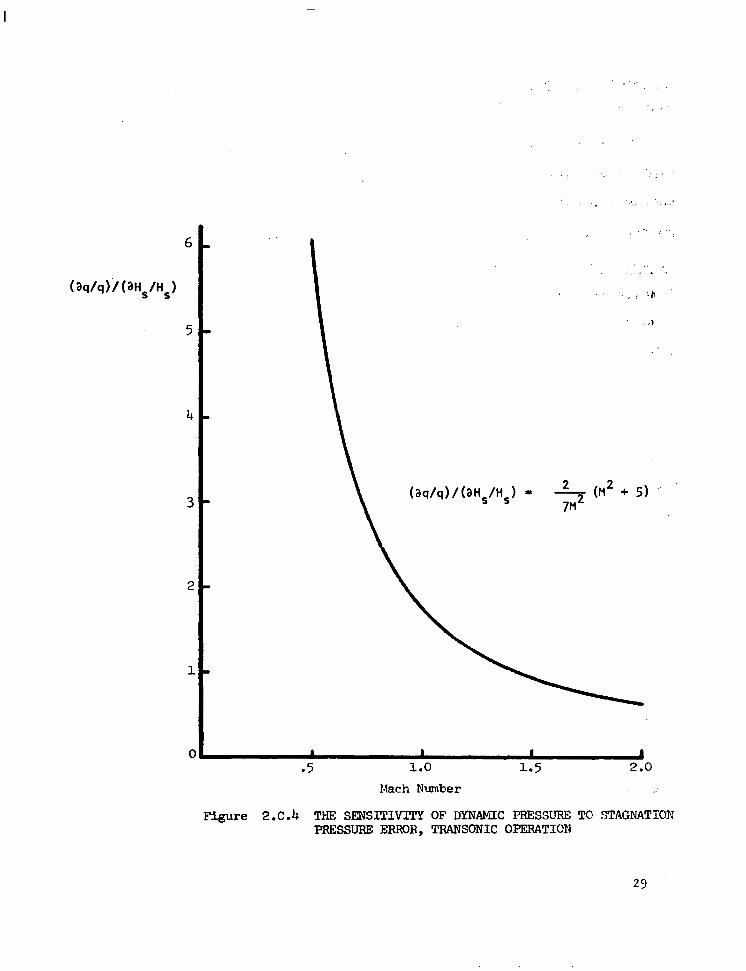
In the t ranson ic range, both Pm and !i are measured. E r r o r s i n e i t h e r a f f e c t
Mach number. Fig. 2.C.4 shows t h e s e n s i t i v i t y o f q t o HS wh ich resu l t s so le l y
from Mach number error as determined f rom the fo l lowing.
S
Since 2
q + p m ,
= YMP- - aM , aHS a HS
(2.C.9)
and ( aq/q )/(aHS/Hs) - 5 = - = 2 (aM/M)/(aHS/Hs) . q aHs
I t will subsequently be i l l u s t r a t e d (see Section Il.C.3) t h a t
aM/(aHS/Hs) 31 7~ (1 + .2M , 5 2
(2.C. IO)
28
I
6
4
3
2
1
C -5 1.0 1.5
Mach Number 2 .o
Figure 2.C.4 THE SENSITIVITY OF DYNAbEC PRESSURE To STAGNATION PRESSURE ERROR, TRANSONIC OPERATION
Equation 2.C.10 may be subs t i tu ted in to the p reced ing equat ion to o b t a i n
(2.c.11)
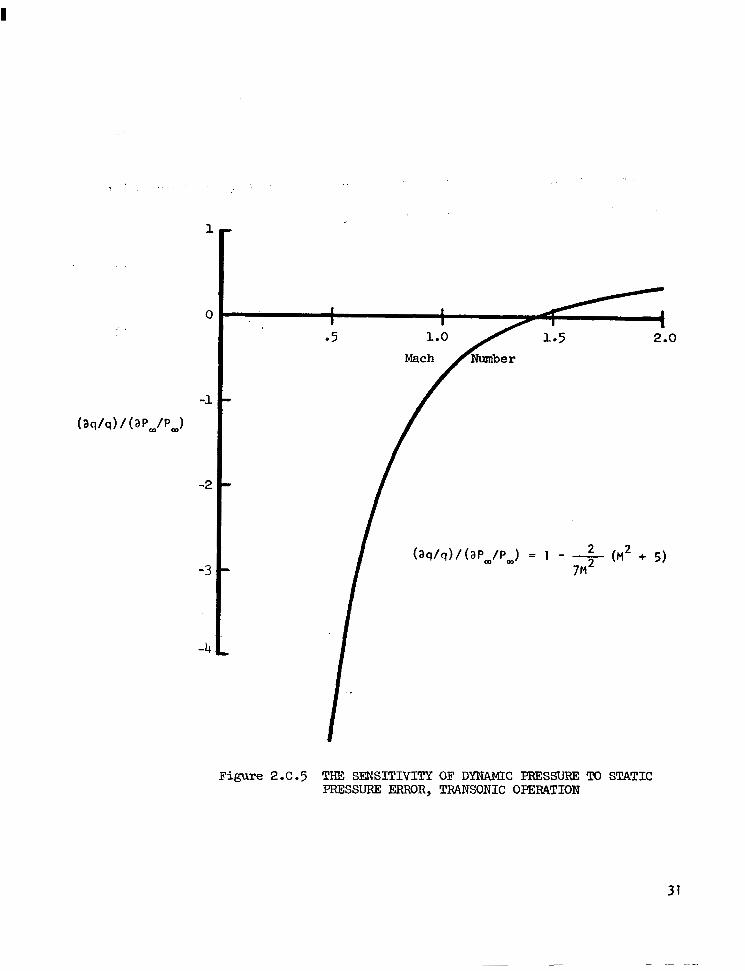
Errors i n Pm a f f e c t q by means of the Pm term and the erroneous Mach number
as i l l u s t r a t e d i n F i g . 2.C.5. From q = 7 Y 2 M Pm :
= yMPm - + -$ M aM 2
a a I
1
I -
M (aM/(aPm/Pm)) + I . It will be shown i n S e c t i o n Il.C.3 tha t
aM/ (aPJP,) = - - ( 1 +.2M ) , 2 7M
which upon s u b s t i t u t i o n y i e l d s
(aq/q)/(aPm/Pm) 1 - 7 ~ z (M2+5) . 2
(2.c.12)
(2.C.13)
(2.C. 14)
(2.C.15)
(2.C.16)
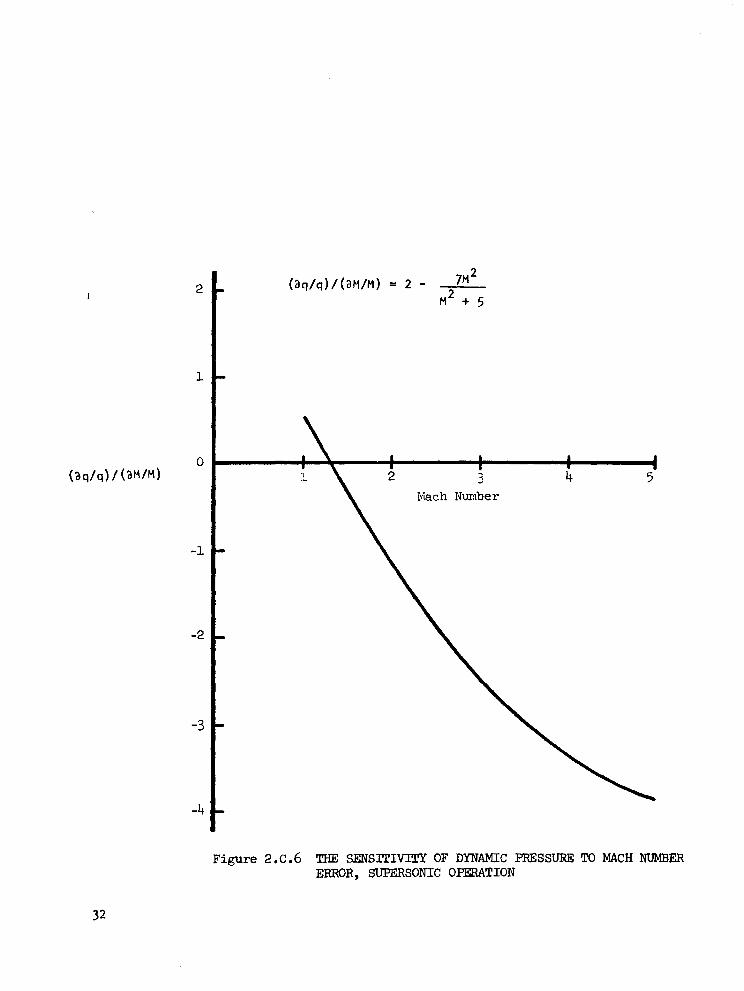
During Supersonic operat ion, cal ibrated Mach numbers a re known fo r the
f a c i l i t y geometry s e t t i n g and are employed w i t h H for q determinat ion. .
However, an e r r o r i n d e f i n i n g t h e c a l i b r a t e d Mach number will a f f e c t q as
shown i n F i g . 2.C.6. The f u n c t i o n i l l u s t r a t e d i n t h i s f i g u r e was obtained
as fo l lows:
S
30
1
0
-2
-3
-4
I I
I I
05 1.0 Mach
Figure 2.C.5
I er
THE Sli3KLTIVITY OF DYNAMIC PRESSURE 'K) STATIC PRESSURE ERROR, TRANSONIC OPERATION
31
2
1
-1
-2
-3
-4
\ Mach Number
Figure 2.c.6 THE SENSITIVITY OF DYNAMIC PRESSURE To MACH NUMBER ERROR, SUPERSONIC OPERATION

= 2 + (aP /P ) / , ( ~ M / M ) W O D
As shown in Sec t i on l l . C . 3 ,
aM/(aPw/Pw) = - - ( 1 + .2M ) , 5 2 7M
hence
(aM/M)/(aP /P 1 = - - ( I + .2M ) - 2
w w 7M2
Then
or
(2.C.'17)
(2.C. 18)
(2.C. 19)
(2.C.20)
(2.C.21)
(2.C.22)
(2.C.23)
I n a s i m i l a r manner, e r r o r s i n HS can be shown t o have a one-to-one relat ionship
w i t h errors i n q.
A t low subsonic Mach numbers, the p ressure ra t io Pw/HS approaches un i t y ,
s o tha t de termina t ion o f the Mach number and dynamic pressure from measure-
ments o f the ind iv idua l p ressures becomes increasingly Inaccurate. A t these
low Mach numbers (below about 0.4) a preferred procedure i s t o measure the
d i f f e r e n t i a l (Hs - P,) d i r e c t l y w i t h a low range transducer and to compute the
dynamic pressure from:
(2.C.24)
33
A t low Mach numbers, o n l y t h e f i r s t t e r m of the ' se r ies i s usua l l y requ i red .
For example, t h e e r r o r i s o n l y 0.14 percent a t M = 0.5 u s i n g o n l y t h e f i r s t
term. A t M = 1.0,the f i r s t t h r e e terms y i e l d r e s u l t s a c c u r a t e t o 0.1 per-
cent.
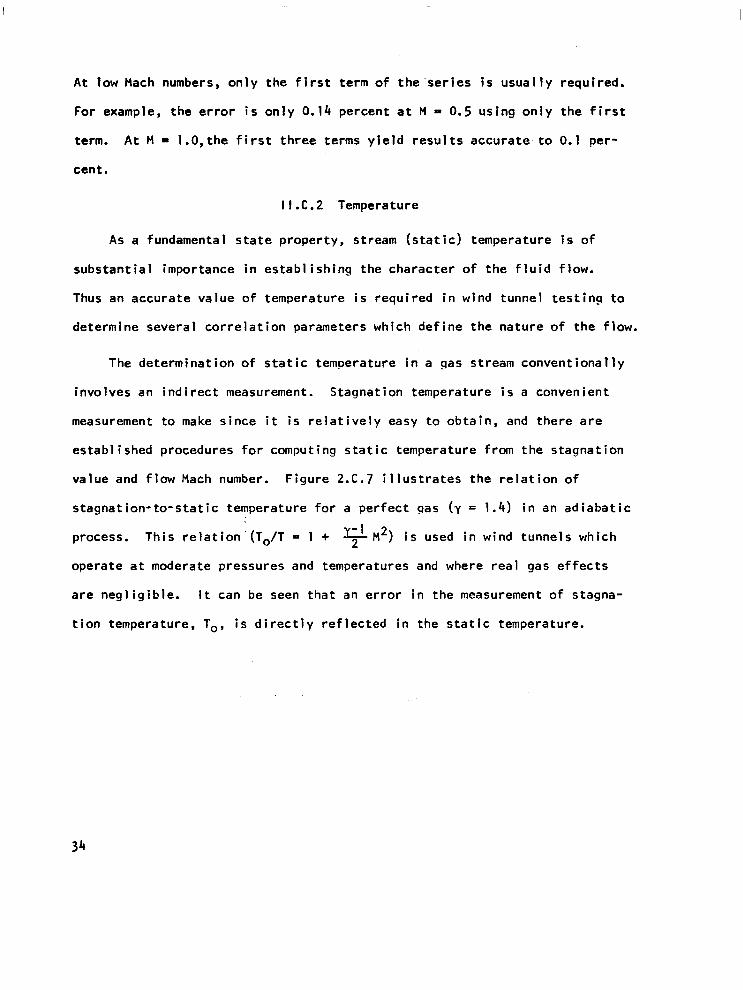
I I .C.2 Temperature
As a fundamental s ta te p roper ty , s t ream (s ta t i c ) tempera ture i s o f
subs tan t ia l impor tance in es tab l i sh ing the charac ter o f t h e f l u i d f l o w .
Thus an accurate va lue o f temperature is requi red in wind tunnel test ing to
determine several correlat ion parameters which def ine the nature of the f low.
The de te rm ina t ion o f s ta t i c t empera tu re i n a gas stream conventional ly
invo lves an ind i rect measurement. Stagnation temperature i s a convenient
measurement t o make s ince i t i s r e l a t i v e l y easy to ob ta in , and there a re
establ ished procedures for comput ing stat ic temperature from the s tagnat ion
value and f l o w Mach number. F igure 2.C.7 i l l u s t r a t e s t h e r e l a t i o n o f
s tagnat ion- to -s ta t i c tempera ture fo r a pe r fec t gas (y = 1.4) i n an ad iaba t i c
process. This re lat ion'(To/T = 1 + 2 M y-1 2 ) i s used i n wind tunnels which
operate at moderate pressures and temperatures and where r e a l gas e f f e c t s
a r e n e g l i g i b l e . I t can be seen t h a t an e r r o r i n t h e measurement o f stagna-
t i o n temperature, To, i s d i r e c t l y r e f l e c t e d i n t h e s t a t i c temperature.
34

Mach Number

I I . C. 3 t,iach Number
As prev ious ly d iscussed Mach number i s computed usi.ng s e t t l i n g chamber
pressure and e i t h e r s t a t i c p r e s s u r e o r a f t e r - s h o c k (Pitot) stagnat ion pres-
sure. In the t ranson ic reg ion , Mach number i s computed from
The sens it
be der ived
respec t t o
i v i t y o f Mach number t o s e t t
by ob ta in ing t he pa r t i a l de
HS, i.e.,
(2.C.25)
l i n g chamber pressure measurement can
r i v a t i v e of the above express ion wi th
This expression may be non-d imensional i ted to obta in
" 5
pW
2 aM/(aHS/Hs) = - 7M ( - 4 7
o r
(2. C .27)
(2.C.28)
Simi la r ly , the non-d imens iona l sens i t i v i t y of Mach number to Poo i s found t o
be
aH/(aPw/Pw)= - - 7M ( 1 + .2M ) , 2 (2.C.30)
which i 1 l u s t r a t e s t h a t
. . .. ":$,;.
aM/(aPw/Pw) = - aM/(aHS/Hs) . (2.C.31)
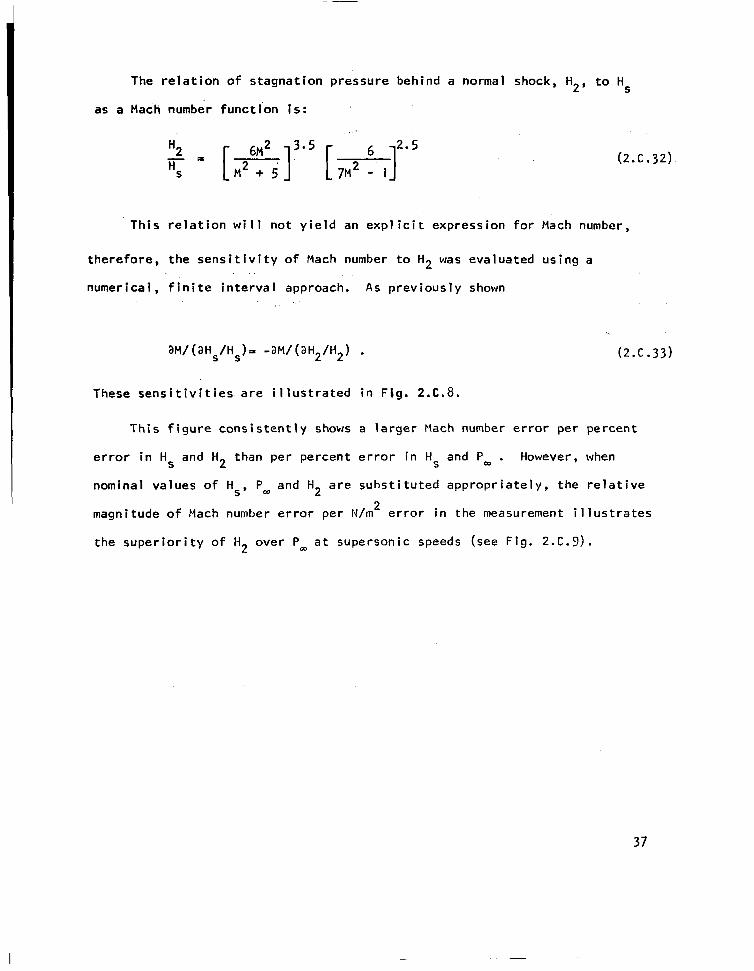
The re la t i on o f s tagna t ion p ressu re beh ind a normal shock, H2, t o HS
as a Mach number f u n c t i o n i s :
(2.C.32)
T h i s r e l a t i o n will n o t y i e l d an e x p l i c i t e x p r e s s i o n f o r Mach number,
t h e r e f o r e , t h e s e n s i t i v i t y o f Mach number t o H2 was evaluated using a
numer i c a l , f i n i t e i n t e r v a l approach. A s prev ious ly shown
(2.C.33)
These s e n s i t i v i t i e s a r e i l l u s t r a t e d i n F i g . 2.C.8.
T h i s f i g u r e c o n s i s t e n t l y shows a l a r g e r Mach number er ror per percent
e r r o r i n Hs and H2 than per percent error in H and Pa . However, when
nominal values of HS, PW and H a r e s u b s t i t u t e d a p p r o p r i a t e l y , t h e r e l a t i v e
magnitude o f Mach number e r r o r p e r N/m2 e r r o r i n t h e measurement i l l u s t r a t e s
t h e s u p e r i o r i t y o f H2 over PIP a t supersonic speeds (see Fig. 2.C.9).
S
2
37

2.4
2 .o
1.6
1.2
0.8
0.4
0
f o r M = f (HS, P,)
1 2 3 4 5 Mach Number
Figure 2.C .El THE SENSITIVIm OF h4ZH NUMBER TO STATIC PRESSURE ANI) STAGNATION PRESSURE ERROR

-1600
-1300
"200
-1OOO
-800
-600
-400
-2oc
C
L
Hs = 2.75 x 10⁵ N/m2
x lo6 N/m2
1 2 3 4 5 Mach Number
Figure 2 .c. 9 THE SENSITMTY OF MACH NUMBER "0 STATIC PRESSW AND STAGNATION PRESSURES
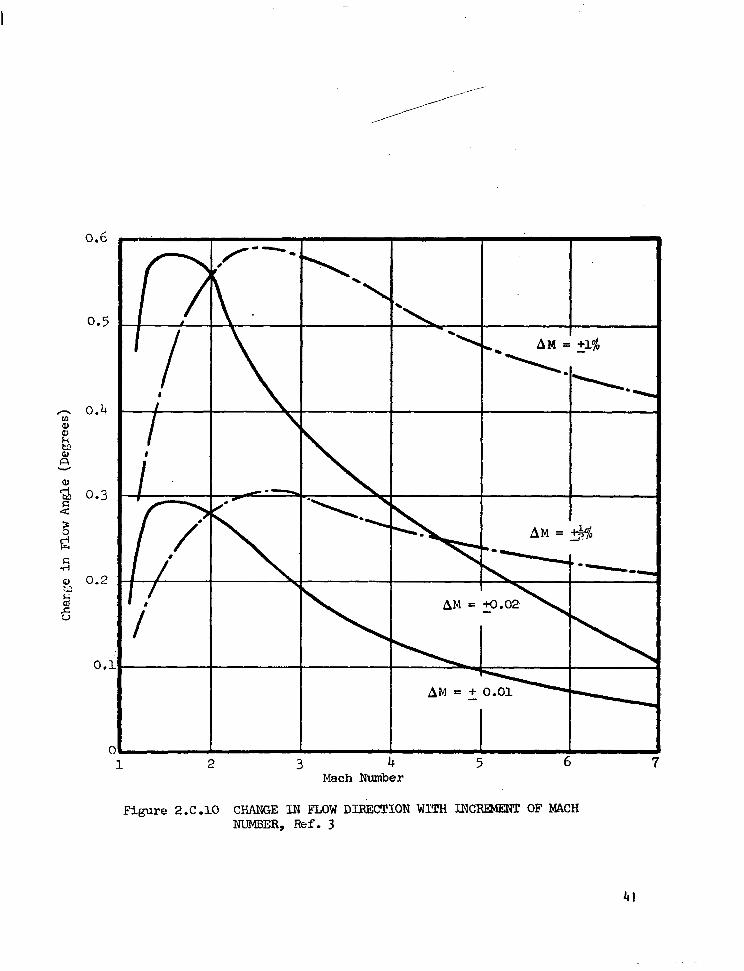
I 1 .C.4 Flow Angu lar i t y and Curvature
F
i r regu
low angu
l a r i t i e s
l a r i t y and curva ture can resu l t from nozz le contour er rors ,
o r d i s c o n t i n u i t i e s i n t h e i n t e r n a l s u r f a c e s o f a tunnel ,
i n - f l ow o r ou t - f l ow due t o leakage, and s w i r l or curvature propagated from
upstream of the nozz le o r con t rac t ion . The resu l t ing non-un i fo rmi ty p ro-
duces l oca l pe r tu rba t i ons i n t he f l ow wh ich resu l t
pressure
taken to
t i o n s i n f l o w p r o p e r t i e s i n c l u d i n g s t a t i c
number (see Fig. 2.C. 10). Thus s teps are
ances by means a p p r o p r i a t e t o t h e p a r t i c u
cor rec t ive ac t ions inc lude nozz le con tour
l a r t u n n e l
i n g r a d i e n t s o r v a r i a -
and therefore, Mach
d i ss ipa te t hese d i s tu rb -
conf igura t ion . These
c o r r e c t i o n s , i n s t a l l a t i o n o f
honeycombs i n r e g i o n s o f l o w Mach number f low, and more recent ly , per fo ra ted
p l a t e s i n r e g i o n s where an uncontro l led, h igh-pressure-rat io shockdown would
generate addi t ional undesirable perturbat ions (Ref. 4).
Because o f t h e a c u t e s e n s i t i v i t y o f c e r t a i n model con f igu ra t i ons t o
non-uni formity of f low such as l o c a l f l o w d i r e c t i o n and Mach number, i t
i s necessary t o d e f i n e v i a c a l i b r a t i o n any f low anomalies that may e x i s t
i n t h e t e s t s e c t i o n . Probes f o r measur ing f low angular i ty are d iscussed in
Sect ion I I 1 .E .
40
0.6
0.5
cu
0, 0.2 2 F Ed u
0.1
c
I
&
2 3 4 5 6 Mach Number
7
Figure 2.C .10 CHANGE IN F L O W D I I E C T I O N WIT)i INCRplENT OF MACH “ B E R , Ref. 3
41

I I .C.5 Reynolds Number
The r a t i o o f i n e r t i a l t o v i s c o u s f o r c e s i n t h e t e s t medium i s
obtained from wind-tunnel measurements as a dimensional unit Reynolds
number given by
R/E = - PU lJ (2.C.34)
This can be expressed i n u n i t s o f m-l i n terms o f To, M and Pm as f o l lows:
R/I1 = 2.29 x 10 6 P,,H - ( 1 + .2M ) To2 ’ 2, 2, ( 1 :.,,I (2.C.35)
6 HSM R/E = 2 .29 x 10 TZ ( 1 + .2H 2 ) 1.5
Since P,/Q i s a l i nea r f unc t i on o f Pa and HS, t h e s e n s i t i v i t y t o t h e s e
parameters i s one-to-one; that i s , a given error i n e i t h e r o f , t h e s e will
be r e f l e c t e d i n t h e same pe rcen t e r ro r i n R/R. However, i n t he t ranson ic
range poo and H are used t o o b t a i n Mach number which i s a l s o a v a r i a b l e i n
the above expressions. Thus e r r o r s i n P,, and Hs can be r e f l e c t e d i n R / %
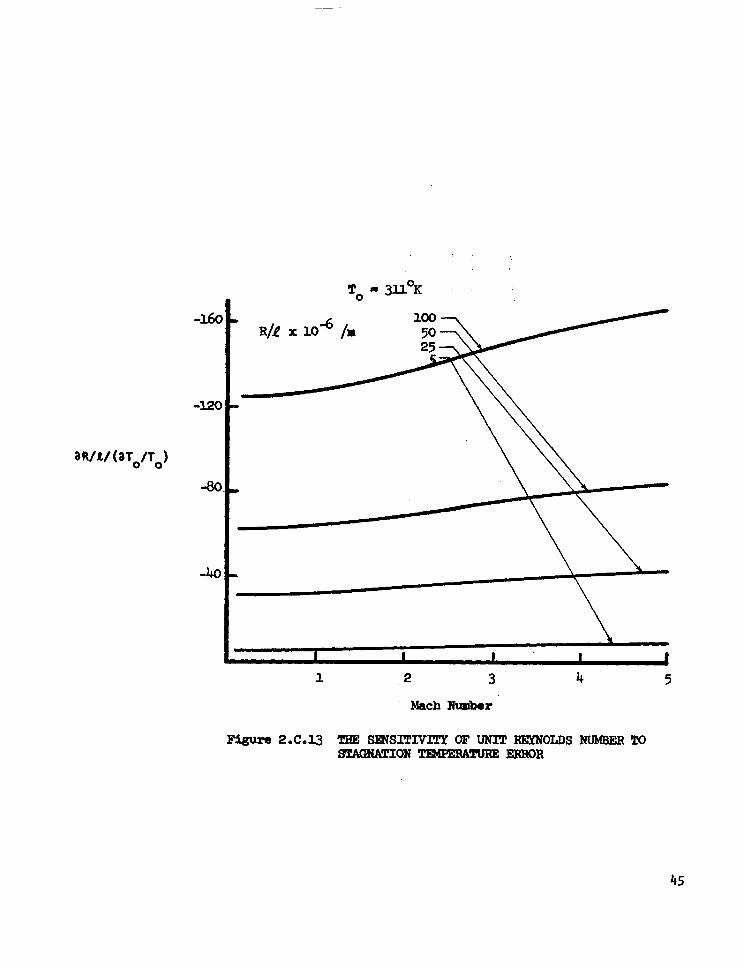
t h rough e r ro rs i n M. Figures 2.C.11 and 2.C.12 i l l u s t r a t e these s e n s i t i v i t i e s
f o r s e l e c t e d u n i t Reynolds numbers (5, 25, 50 C 100 x 10 /meter) a t a nominal
stagnation temperature of 311 OK (100 OF) . The s e n s i t i v i t y Df .?eynolds number
t o measurements o f stagnation temperature i s shown i n Fig. 2.C.13.
S
6
In tunnels where c a l i b r a t e d Mach numbers are obta ined and considered
cons tan t fo r subsequent operation with the same f a c i l i t y c o n f i g u r a t i o n s , any
e r r o r s i n Mach number due t o c a l i b r a t i o n or a d i ss im i la r con f i gu ra t i on will con-
t r i b u t e t o e r r o r s i n R/Q . T h i s e f f e c t i s shown in F ig . 2.C.14.
42
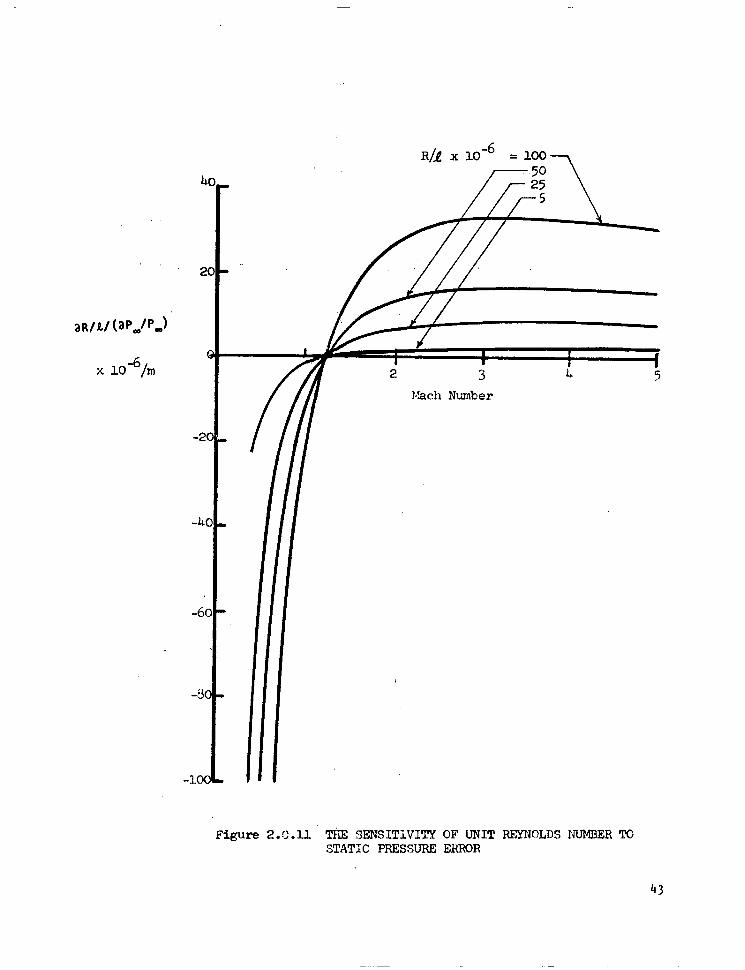
Figure 2. C .11 TI& SENSITiVI!iT OF UNIT REYNOLDS NUMBER TO STATIC PRESSURE EHROR
4 3

100
x 60
40
20
I I I 1 2 3 4 5
h c h €,Jwnber
Figure 2 .C .12 THE SENSITIVITY OF UNIT REYPIOLDS F W E R TO STAGNATiON PRESSURE ERRCR
4 4
-160
-40
To = 3UoK
2- \ \ ”
\
I I I I I 1 2 3 4 5
Mach Number
45

1 2 3 4 5 Mach Number
Figure 2 .C .14 THE SENSITIVITY OF UNIT REYNOLDS NUMBER To MACH NUMBER ERROR
46
l l . C . 6 . Unsteadiness, Turbulence and Noise
Large, continuous f low tunnels often have small-amplitude, low-frequency
o s c i l l a t i o n s i n t h e mean f low condi t ions. For example, the 11-Ft Transonic
Tunnel a t NASA Ames has a cha rac te r i s t i c pe r iod o f app rox ima te l y 10 seconds.
O f course, t h i s t y p e o f v a r i a t i o n s h o u l d be c a l i b r a t e d and used t o e s t a b l i s h
rout ine test ing procedures.
According to ‘Jestley (Ref. 5), measurements i n AEDC, Langley, and Modane
wind tunnels indicate the maximum a x i a l and t ransverse tu rbu lence in tens i t ies
are approximately 1.0% and 0.4% f o r Mach numbers near one. I n Pa r t 11.2 o f
Ref. 6 , i t i s noted that wind tunnel turbulence has been used a t MLR (Netherlands)
and ONERA (France) t o e x c i t e model f l u t t e r modes.” However, T i m e (Ref. 7 )
caut ions, that turbulence not only can mask t h e i n i t i a t i o n o f f l u t t e r , b u t may
also e x c i t e response modes wh ich a re no t t rue f l u t te r modes. A l s o , T i m e
po in ts ou t t ha t Mabey (RAE) found the t ransonic buf fet boundary to be very sen-
s i t i ve to f low uns tead iness , In add i t ion , f rees t ream tu rbu lence in t roduces
a f f e c t s bounda r y
edges, and shock-
e r r o r s i n s t a t i c p r e s s u r e measurements (see Section 1I I .D) and
laye r t rans i t i on , separa t i on phenomena a t lead ing and t r a i l i n g
boundary layer interact ions.
known t o be sources o f no i se i n t ranson
11s which can generate d is t inct f requenc
and/or organ tones,
The fo l l ow ing a re
1. porous wa
edgetones
ic wind tunnels:
i e s known as
2. slotted walls which generate broad-band disturbances due t o
shear ing i n t he s lo t s between the movino a i r i n t h e t e s t
sec t i on and t h e a i r i n t h e s u r r o u n d i n g plenum chamber,
* A preferred procedure would appear to be a c o n t r o l l e d e x c i t a t i o n o f the model v i a e i t h e r a mechanical exci tor , pressure pulse generator, or loudspeakers.
47
3.
4 .
5.
6.
7.
8.
9.
10.
1 1 .
reverbera t ion o f tunne l wa l ls ,
plenum chamber surges,
t u r b u l e n t boundary layers a long the tunne l wa l ls ,
d i f f u s e r f l o w i n s t a b i l i t y ,
compressors in cont inuous wind tunnels ,
c o n t r o l v a l v e s i n blowdown wind tunnels,
v i b r a t i o n o f t u n n e l s i d e w a l l s ,
working sect ion cutouts, and
model supports and s t r u t s .
,The noise sources, which usual ly dominate at var ious Mach numbers, a re ind ica ted
i n Figs. 2.C.15 and 16.
I t i s noted i n t h e r e v i e w paper by b!estiey (Ref. 5) t h a t CL bu f fe t max ’
onset,
f r i c t i
tunnel
t ranson ic d rag r i se , boundary layer t rans i t ion and separati.on, sk
on drag, shock shapes and locat.ions, etc.’,, m a y ’ a l i . . I be.affected by
-generated noise. Hence, wind tunnel data will n o t be representat
I .
n.
ve
of f r e e - f l i g h t c o n d i t i o n s i n cases where this, i s t r u e . Our p resent s ta te o f
knowledge does no t a l l ow a q u a n t i t a t i v e d e f i n i t i o n o f t h e complex i n t e r a c t i o n s
between turbulence, noise, and aerodynamic tes t i ng i n w ind t unne ls . The funda-
menta l ob ject ive o f cu r ren t research i n t h i s ‘ a rea i s t o ob ta in a bet ter under-
standing of t h i s phenomena v i a a sys temat ic tes t ing program which uses standardized
instrumentat ion. P. l i s t o f 25 recommendations concludes the paDer by Westley
. .
(Ref. 5). These recommendations m a i n l y c o n s i s t o f :
(1) decisions which need t o be made to s tandard
and test procedures, and
(2) new experimental programs.
ize inst rumentat i on

TRANSONIC
I I
M,< 0.3 TUR.BULENCE u (valves. compressor 1
C Dominant Souta
DIFFUSER
Y
H
p 4- " I
0.3 < M,< I WALL HOLE RESONANCE I+ "
I
1 JET No'SE IC II n
Figure 2.C.15 F I x l W DISTURBANCES IN TRANSONIC TUNNELS, R e f . 5

SUPERSONIC - HYPERSONIC I I
- M,. I -3 - Usually
Dominant
M, = 3 - IO RADIATED NOISE .( 20 (cold flow)
c Usuolly Dominant ""-
M, > IO ENTROPY
Arc tunnels Shock 9
MHD . Pigure 2.c.16 i!TQW DISTURBANCES IN SUPERSOKIC AND HYPERSO1:IC TUNNELS, Ref. 5
One of the pr imary recamnondations i s that standard Instrtnnentation be adopted
t o measure free-stream disturbances. This probim of noise measurements i n
transonic tunnels i s discussed In Section 1 I I . F .
51
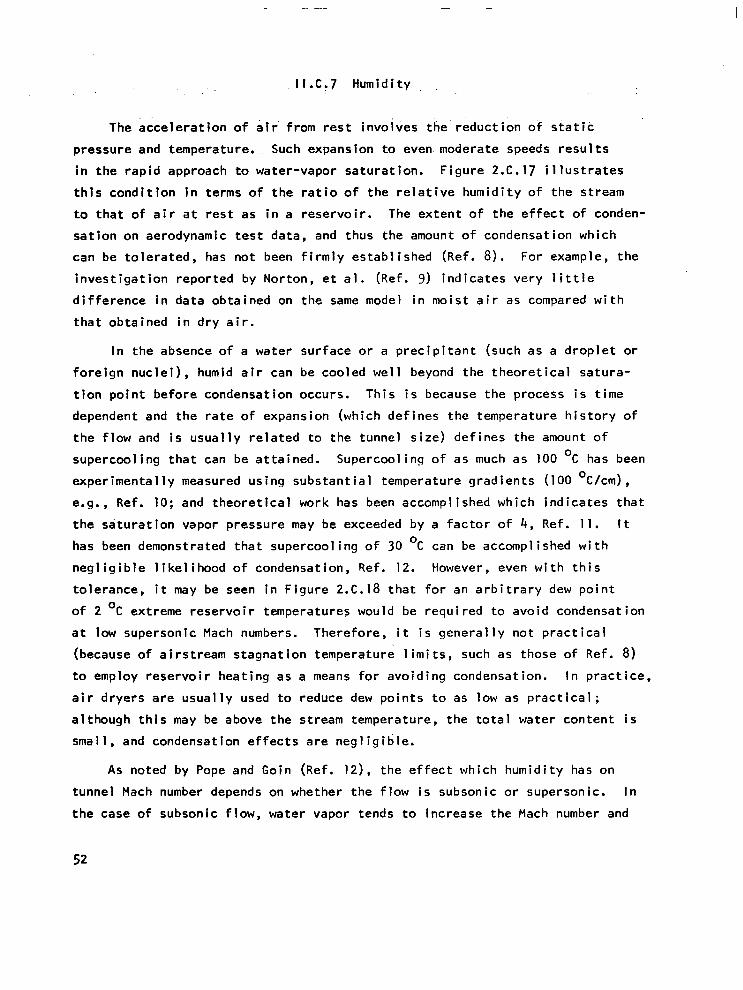
I I . C , 7 Humidity
The a c c e l e r a t i o n o f a i r f r o m r e s t i n v o l v e s t h e r e d u c t i o n o f s t a t i c
pressure and temperature. Such expanslon t o even moderate speeds r e s u l t s
in the rap id approach to water-vapor saturation. Figure 2.C.17 i l l u s t r a t e s
t h i s c o n d l t i o n i n terms o f t h e r a t i o o f t h e r e l a t i v e h u m i d i t y o f t h e s t r e a m
t o t h a t o f a i r a t r e s t as i n a reservo i r . The e x t e n t o f t h e e f f e c t o f conden-
sa t ion on aerodynamic test data, and thus the amount of condensation which
can be to le ra ted , has not been f i rmly establ ished (Ref. 8). For example, t he
inves t iga t ion repor ted by Nor ton , e t a l . (Ref. 9) indicates very l i t t l e
d i f f e rence i n da ta ob ta ined on the same model i n m o i s t a i r as compared w i t h
t h a t o b t a i n e d i n d r y a i r .
I n t he absence o f a water surface or a p rec ip i tan t (such as a d r o p l e t o r
f o r e i g n n u c l e i ) , humid a i r can be cooled wel l beyond the theore t ica l sa tu ra-
t ion po in t be fore condensat ion occurs . Th is i s because the process i s t i m e
dependent and the ra te o f expansion (which def ines the temperature h is tory o f
t he f l ow and i s usua l l y re la ted t o t he t unne l s i ze ) de f i nes t he amount o f
supercool ing that can be at ta ined. Supercool ing o f as much as 100 C has been
exper imental ly measured using substantial temperature gradients (100 C/cm),
e.g., Ref. 10; and t h e o r e t i c a l work has been accompl ished which indicates that
the sa tura t ion vapor pressure may be exceeded by a f a c t o r o f 4, Ref. 1 1 . It
has been demonstrated that supercooling o f 30 OC can be accompl ished w i t h
neg l i g ib le l i ke l i hood o f condensa t ion , Ref. 12. However, even w i t h t h i s
to lerance, i t may be seen i n F i g u r e 2.C.18 t h a t f o r an a r b i t r a r y dew p o i n t
o f 2 OC extreme reservoir temperatures would be requ i red to avo id condensat ion
a t low supersonlc Mach numbers. Therefore, i t i s g e n e r a l l y n o t p r a c t i c a l
(because of a i rs t ream s tagnat ion temperature 1 im i t s , such as those o f Ref. 8) t o employ reservo i r heat ing as a means for avo id ing condensat ion. In pract ice,
a i r d r y e r s a r e u s u a l l y used t o reduce dew p o i n t s t o as low as p r a c t i c a l ;
a l though th i s may be above the stream temperature, the total water content is
small , and condensat ion e f fects are negl ig ib le .
0
0
As noted by Pope and Goin (Ref. 12), the effect which humidity has on
tunnel Mach number depends on whether the f low is subsonic or supersonic. In
the case o f subsonic flow, water vapor tends to i nc rease t he Mach number and
52
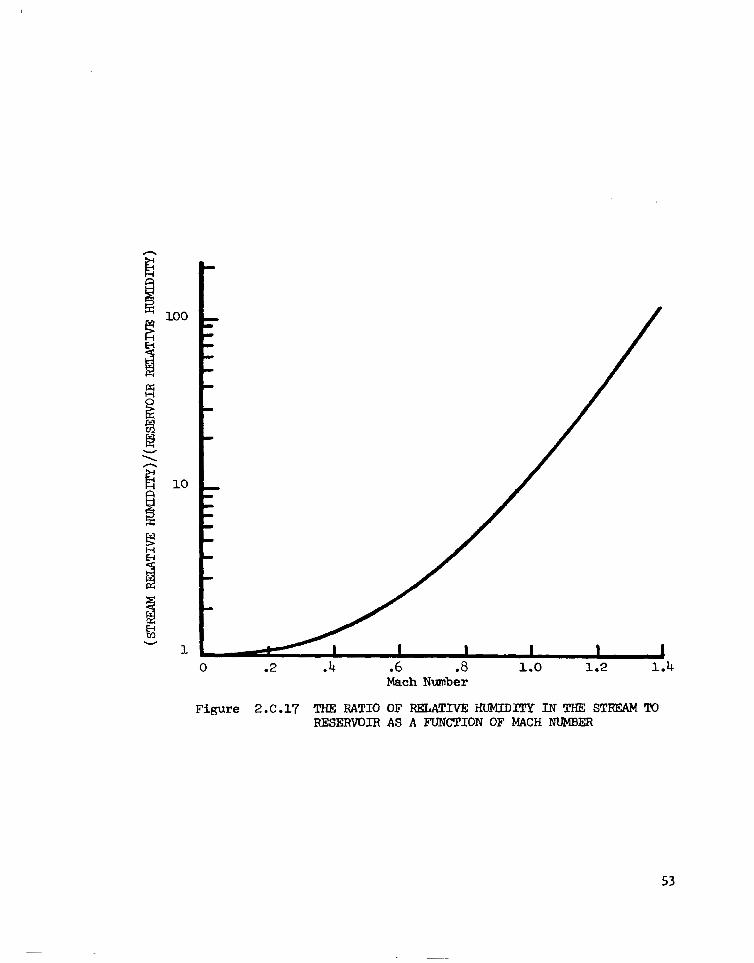
100
10
1
Mach Number
Figure 2 .C .17 THE RATIO OF RELATIVE HUMIDITY I N THE STREAM TO RESERVDIR AS A FUNCTION OF MACH NUMBER
53

Assumptions: Dew Point Temperature = 2 c Allowable Supercooling = 30 C
Allowable Stream Temperature = -29 c
1 2 3 4 Mach Number
Figure 2 .c .l8 RESERVOIR TEMPERATLTRE: REQUIRED TO AVOID CONDEXSATION, Ref. IO
54
reduce s ta t i c p ressu re ; whereas, the opposi te occurs in supersonic f low. Th is
e f f e c t has a l s o been substant ia ted by analyses a t AEDC.* These r e s u l t s i n d i c a t e
a negat ive Mach number gradient occurs when moisture condenses i n supersonic
f low.
The absence o f condensat ion dur ing tunnel ca l ibrat ion (i .e., empty tunnel)
-does no t p rec lude the poss ib i l i t y o f loca l condensat ion in p rox imi ty o f a model
dur ing p roduc t ion tes t ing . It has been observed i n t h e AEDC Aerodynamic Wind
Tunnel 4T (Transonic 4T) t ha t t ranson ic . fo rce da ta i s una f fec ted by moisture
content unt i l condensat ion can be seen (a nominal water-vapor content o f 0.002
gm/gm o f a i r ) . However, tes ts invo lv ing sur face p ressure measurements a r e more
sens i t i ve , and exper ience a t AEDC i n d i c a t e s t h i s t y p e o f t r a n s o n i c t e s t i n g
should be conducted w i th humid i t y < 0.0015 gm H20/gm a i r . An a d d i t i o n a l
procedure fo r reduc ing t he e f fec t o f humid i t y i n t ranson ic t unne ls i s t o ad jus t
wa l l ang le accord ing to the tes t medium dew p o i n t , e.g., Ref. 8. In the super-
sonic regime, experience a t NASA Ames has shown t h a t 0.0004 gm H20/gm o f a i r i s
a good ru le-of - thumb for model t e s t s w i t h M 3.5.' For example, mass f l o w
through an i n l e t model i s found to vary about 1% a t M = 3.0 when the moisture
content var ies f rom 0.0002 t o 0,001. Because o f t h e f a c i l i t y v a r i a b l e s w h i c h
a f fec t the a l lowab le mo is tu re con ten t , it i s d e s i r a b l e t o e s t a b l i s h t h e l e v e l
which can be t o l e r a t e d i n a p a r t i c u l a r f a c l l i t y by conduct ing tests on a repre-
s e n t a t i v e c o n f i g u r a t i o n and vary ing on ly humid i ty . Th is t ype o f tes t was included
i n t h e work reported by Corson, et al. (Ref. 8).
** -
* ff
Private communication, M r . J. D. Gray, AEDC.
Private communication, Mr. J. Gunn, AEDC. ' Private communication, M r . F. W. Ste in le , NASA Ames.
55
I I .C.8 Test Mediums
Air i s a lmost , un iversa l ly used as t h e t e s t medium i n t r a n s o n i c and
supersonic wind tunnels . A l though these fac i l i t ies have d i f ferent operat ing
c h a r a c t e r i s t i c s w i t h t h e a i r b e i n g s u b j e c t e d t o d i f f e r e n t p r e s s u r e and tempera-
tu re leve ls dur ing the var ious cyc les , i t i s g e n e r a l l y a l l o w a b l e t o c o n s i d e r
the gas t o be ideal. Real gas effects may become r e l e v a n t a t extreme condi t ions
such as i n a Ludwieg tube f a c i l i t y (Ref. 6). Departures from the i dea l gas
r e l a t i o n s may occur when o t h e r t e s t mediums a r e employed. However, i t has been
found tha t the idea l re la t ions a re su i tab le fo r the very low tempera ture
n i t rogen used in the Langley IO-Meter Transonic Cryogentc Tunnel (Ref. 14).
Recent t ranson ic w ind tunne l tes ts o f a i r fo i l s have indicated an ef fect of
vary ing y , Refs. 15 and 16. Al though no e f fect was detected for s u b c r i t i c a l
f lows, a sys temat i c reduc t i on i n l oca l peak Mach numbers was observed for
s u p e r c r i t i c a l f l o w s . T u t l a , e t a l . (Ref. 16) suggest t h i s t r e n d i s a s s o c l a t e d
w i t h t h e e f f e c t s o f y on transonic-shock/boundary-layer i n t e r a c t i o n s . T h i s i s
r e l e v a n t t o t h e c a l i b r a t i o n o f empty, t ransonic tunnels i f a convent ional ,
s ta t i c -p ressure p robe i s used t o measure freestream Mach number i n d i f f e r e n t
t e s t gases, As discussed i n S e c t i o n lll.D.2, a t ransonic shock always forms
on a conventional stat ic-pressure probe. If v a r i a t i o n s i n y can a f f e c t super-
. . c r , i t i c a l p r e s s u r e d i s t r i b u t i o n s , t h i s may a l s o change the loca t ion on a probe
at which f reest ream pressure ex is ts . Research on th is phenomena i s c o n t i n u i n g
a t NASA Ames.
56

1 I .C. References
1. H i 1 1, Jacques A. F. e t a l , "Mach Number Measurements i n High Speed Wind
Tunnels," MIT, Naval Supersonic Laboratory Technical Report 145, Februaty 1956.
2. Thompson, J.. S. and Holder, D. Y., "Notes on Wind Tunnel Pressure
Measurements from the Operator 's Point o f View," RAE TN Aero. 2547,
February 1958.
3. Raney, D. J., "Flow D i r e c t i o n Measurements i n Supersonic Wind Tunnels,"
Her Ma jes ty 's S ta t ionery Of f i ce , London 1956.
4. Cooksey, J. M. and Arnold, J. W., "Flow q u a l i t y Improvements i n a Blowdown
Wind Tunnel Using a M u l t i p l e Shock Entrance Diffuser,' ' A l A A Journal,
Vol. 10, No. 9, September 1973.
6. MiniLaWs Working Group, "A Fur ther Review o f Cur ren t Research Aimed a t t h e
Design and Function of Large Windtunnels," AGARD-AR-83, Sept. 1975.
7. T i m e , A., "Ef fects o f Turbulence and Noise on Wind-Tunnel Measurements
A t Transonic Speeds ,I' AGARD-R-602, Apr i 1 1973.
8. Corson, Blake, W., e t a l . "Cal ibrat ions of the Langley 16-foot Transonic
Tunnel wi th Test Sect ion Air Removal," NASA TR R-423, August 1974.
9. Norton, Harry T. Jr., Runckel, Jack F., and Pendergraft, Odis C. Jr., "Tran-
sonic Performance o f Two Convergent-Divergent Ejector Nozzles Designed
for Corrected Secondary Flows o f 3 and 9.4 Percent," NASA TM X-909, 1964.
IO. Lundquist, G. A., "Recent Experimental Work a t NOL on Condensation
i n Compressible Flows," Geophysical Research Paper No. 37, ARDL, Ju l y 1955.
57
14. Adcock, J e r r y B . , Kilgore, Robert A. an'd Ray, Edward J., "Cryogenic Nitrogen
as a Transonic Wind Tunnel Test Gas," AlAA Paper 75-143, January 1975.
IS. Gross, A. R. and Ste in le , F. W.: "Pressure Data from a 64010 A i r f o i l a t
Transonic Speeds i n Heavy Gas Media o f R a t i o o f S p e c i f i c Heats from 1.67 t o
1.12 , ' I NASA TH X-62468, Aug. 1975.
16. Tuzla, K.; Wai, J. C.; and Russell , 3. A.: "y-Effects on 2-Dimensional Transonic
Aerodynamics," Proc. A I M 9 t h Aerodynamic Testing Conference, June 1976.
17. Sprat ley, A. B., Thompson, E. R., and Kennedy, T. L . : l'Reynolds Number and
and Nozzle Af terbody Conf igurat ion Effects on Model Forebody and Afterbody Drag,"
A I A A Paper 77-103, January 1977.
58

1 1 1 . CALIBRATION PROCEDURES AND lNSTRUMENTATlON
A. S e t t l i n g Chamber Pressure
As discussed in Sec t i on 11 .A., the re'servoi r t o t a l p r e s s u r e i s a fundamental
va r iab le wh ich i s usua l l y measured d i r e c t l y i n t h e s e t t l i n $ c h a m b e r s o f b o t h
t ransonic and supersonic tunnels. The Mach number and dynamic pressure i n t h e
s e t t l i n g chamber are determined by the con t rac t i on ra t i o , Ao/A , where A. i s
the c ross sec t iona l a rea a t the se t t l ing chamber and A* i s t h e choked throat area
cor respond ing to the tes t sec t ion Mach number. The maximum s t i l l i n g chamber
Mach number normal ly occurs a t Mach 1.0 i n a transonic-supersonic tunnel. A t
a c o n t r a c t i o n r a t i o o f I O , . f o r example, t h e c o r r e s p o n d i n g s t i l l i n g chamber Mach
number i s 0.058. The f l o w may be considered incompressible and t h e r a t i o o f
dynamic to stagnat ion pressure determined frbm
*
- q S = " 5 - ps = 1 - (-+, pS
HS HS S
where (PS/Hs) i s d e f i n e d by t h e s e t t l i n g chamber Mach number. A t a con t rac t i on
r a t i o o f 10, t h e s t i l l i n g chamber dynamic p ressu re i s 0.235 percent o f the
stagnat ion pressure. Thus, t h e e r r o r i n measured t o t a l head, induced by using a
s t a t i c o r i f i c e i n p l a c e o f a P i t o t probe, would be 0.235 percent. This would
c o n t r i b u t e a Mach number e r r o r o f 0.002. Therefore, if a Mach number accuracy
o f 0.001 i s t o be achieved and s t a t i c o r i f i c e s a r e used to measure s e t t l i n g
chamber pressure, the er ror must be e l i m i n a t e d v i a c a l i b r a t i o n w i t h P i t o t probes.
When using a P i t o t probe t o c a l i b r a t e t o t a l p r e s s u r e i n a s e t t l i n g chamber,
the probe must be located downstream o f any screens, honeycombs, etc. , s ince
these items can cause s ign i f i can t p ressu re losses, Ref. 1. Also, the chamber
cross sectlon should be surveyed for v a r i a t i o n s i n t o t a l p r e s s u r e . I f a s i n g l e
v a l u e o f t o t a l p r e s s u r e i s t o be used (as i s comnonly done) and i t s c o n t r i b u t i o n
t o Mach number e r r o r i s t o be less than 0.001, then 2a o f s p a t i a l v a r i a t i o n s i n
to ta l p ressu re must be less than 0.05 percent (EAM = 0.0005 a t M = 0 . 8 0 ) . Un-
f o r t u n a t e l y , t h i s i s n o t o n l y n e a r t h e s t a t e - o f - t h e - a r t o f pressure measurement
accuracy, it i s a l s o v e r y d i f f i c u l t t o a c h i e v e t h i s u n i f o r m i t y i n p r a c t i c e .
Thus, the dec is ion as to what i s an acceptable amount o f nonun i fo rm i t y in
s e t t l i n g chamber pressure must be l e f t t o i n d i v i d u a l judgment. Th is dec is ion
* The terms "Set t l ing chamber" and " s t i l l i n g chamber" a r e used interchangeably.
59

should be based on t h e p a r t i c u l a r f a c i l i t y c h a r a c t e r i s t i c s * and t h e t y p e o f
tes ts wh ich a re conducted in tha t fac i l i , t y .
Once t h e s p a t i a l v a r i a t i o n s i n s e t t l i n g chamber p ressure a re judged to be
acceptable, i t i s suggested t h a t an appropr iate average be def ined based on
measurements i n t h e c e n t r a l p o r t i o n o f t h e f l o w . F o r example, i n t h e 16 ft. Transonic Tunnel at NASA Langley, four Pi tot probes have been mounted i n t h e
c e n t r a l p o r t i o n o f t h e f l o w t o d e f i n e an average (Ref. 2 ) . I n g e n e r a l , i n - i t i a l
c a l i b r a t i o n s r e q u i r e more measurements i n o r d e r t o e s t a b l i s h a s u i t a b l e average.
However, once the average to ta l pressure is determined for the range o f operat ing
condi t ions, a s imple wal l mounted tube (or a s t a t i c o r i f i c e ) can be c a l i b r a t e d
t o r e l a t e i t s measurements t o t h e average. By fo l l ow ing t h i s p rocedure , rou t i ne
test, ing can be accomplished without any unnecessary obstructions i n t h e c e n t r a l
po r t i on o f t he f l ow .
Although a w ide va r ie t y o f P i to t p robe nose geometries have been used i n
low speed f lows, s imp le s tee l tub ing w i th an in te rna l to ex te rna l d iameter
r a t i o - B 0 . 5 and a square-cut nose will measure t o t a l p r e s s u r e i n t h e s e t t l i n g
chamber w i t h n e g l i g i b l e e r r o r . A P i t o t probe w i t h t h i s d i a m e t e r r a t i o i s
unaffected by f low angles of 10 degrees or less, Ref. 3. Assumina t h a t
reasonab le ca re i s t aken t o a l i gn t he p robe w i th t he f l ow , t h i s t ype o f p robe
will provide adequate accuracy even i f cons iderab le tu rbu lence ex is ts in the
s e t t l i n g chamber. Th is conc lus ion i s subs tan t ia ted by the fo l lowing discussion.
**
The problem o f P i t o t probe measurements i n an incompress ib le , turbulent
f l ow has been examined by Becker and Brown (Ref. 4). These authors have
analyzed data for four d i f ferent probe geometr ies: ( 1 ) spherical-nosed
probe (a sphere on a tubular support) , (2) a hemispherical-nosed tube, ( 3 ) a
square-nosed tube, and (4) sharp-1 ipped probes made by con ica l l y t ape r ing t he
e x t e r i o r o f a tube. The resu l ts o f the i r semi -empi r i ca l ana lys is fo r square-
nosed probes ind icates the fo l lowing. In an i s o t r o p i c , t u r b u l e n t f l o w w i t h
a tu rbu lence i n tens i t y o f 5 percent, a square-nosed probe w i t h a d iamete r ra t i o
* A number of supersonic tunnels have f ixed-contour , s l id ing b lock nozz les which are rou t ine ly opera ted o f f des ign . These nozz les can have s ign i f icant to ta l pressure losses which can only be determined by P i t o t surveys w i t h i n t h e t e s t section. However, the average test sect ion to ta l pressure could be r e l a t e d t o s t i l l i n g chamber p ressu re v ia ca l i b ra t i on t es ts . Th i s assumes the nose i s f r e e o f b u r r s . F i n i s h i n g o f o r i f i c e s i s b r i e f l y discussed in Sec t i on I 11.0.4.
A*
60
of 0 . 5 will c a p t u r e t h e t o t a l p r e s s u r e w i t h a n e r r o r o f 0.56 x 10 q. For a
given amount o f turbulence, the er ror decreases wi th increas ing d iameter ra t io .
This accuracy i s more than ample f o r most tunnels s ince hot-wire measurements
a t AEDC i n t h e s e t t l i n g chamber o f t h e Aerodynamic Wind Tunnel (4T), Ref. 5, 3.
i nd i ca te t he l ong i tud ina l component o f t he t u rbu lence i n tens i t y i s o f t h e o r d e r ,
of one percent fo r 0.3 M 1.2. Assuming i so t rop i c t u rbu lence , t h i s means I .
t he t o ta l t u rbu lence i n tens i t y i s app rox ima te l y 1.73 percent. Thus, the
suggested square-nosed probe can be used i n most s e t t l i n g chambers w i t h c o n f i - ;
dence.
-4
The above descr ibed accuracy analysis ignores a number o f o t h e r p o s s i b l e '
sources o f e r r o r . It i s assumed the probe nose i s l o n g enough t o i s o l a t e
it from any e f f e c t s o f downstream geometry. Becker and Brown (Ref. 4) suggests
the nose length be grea ter than s ix p robe d iameters . A lso , the e f fec t o f
changes in the in te rna l d iameter i s ignored. In o rder to e l im ina te in te rna l
geometry as a va r iab le , Becker and Brown suggest the internal diameter be con-
s t a n t f o r a d is tance o f three probe d iameters. In addi t ion, the probe should
be located more than two diameters f rom the nearest wal l in order to avoid a
r e d u c t i o n i n measured pressure (e.g., Ref. 3 , p. 12).
;i.
Fina l ly , the probe should be designed and mounted to m in imize v ib ra t ion .
Winterni tz (Ref. 6) has presented a s imp l i f i ed p rocedure f o r des ign ing can t i -
l eve red , c i r cu la r cy l i nde rs t o avo id osc i l l a t i ons i nduced by vortex shedding.
Ower and Pankhurst (Ref. 7, p. 54) observe that for a c y l i n d e r w i t h a diameter
o f 0 . 8 cm ( 9 1 6 in.) the vortex shedding f requency in a i r i s 40 Hz a t 1.5 m/sec
and 160 Hz a t 6 m/sec. Hence, they conclude resonance between vortex frequency
and the natura l f requency of the probe i s u n l i k e l y i n most wind tunnel appl ica-
t ions. However, i n some cases t h i s c o u l d be a problem a t t h e low speeds character-
i s t i c o f s t i l l i n g chambers. Thus, probes f o r measurements i n t h e s t i l l i n g
chamber should be designed t o a v o i d t h i s phenomenon.
f: The problem o f i n t e r n a l geometry changes caus ing b ias ing o f measured mean p ressu res i n f l uc tua t i ng f l ows i s b r i e f l y d i scussed i n Re f . 3 , p. 105.
1 I I .A . References
1 . Loehrke, R. 1 . and Nagib, H. M.: "Experiments on Management o f
Free-Stream Turbulence," AGARD-R-598, Sept. 1972.
2. Corson, B. W . , Jr. ; Runckel, J. F. ; and Igoe, #. B. : "Cal ib ra t ion of
the Langley l6-Foot Transonic Tunnel with Test Section Air Removal ,'I
NASA TR-R-423, Aug. 1974.
3. Bryer, D. W. and Pankhurst, R. C . : Pressure-Probe Methods for Determining
Wind Speed and Flow Direct ion, Nat ional Physical Laboratory, Her Majesty 's
S ta t ionery Of f i ce , London, 1971.
4. Becker, H. A. and Brown, A. P. G.: "Response o f P i t o t Probes in Turbu len t
Strearns,l' Jour. F l u i d Mech., Vol. 62, Par t 1 , 8 Jan. 1974.
5. Credle, 0. P.: "An Evaluation of the Fluctuating Airborne Environment
i n t h e AEDC-PWT 16-Ft Transonic Tunnel , I1 AEDC-TR-69-236, NOV. 1969.
6. Win tern i tz , F. A. L.: "E f fec ts o f V ib ra t ion on P i to t Probe Readings,"
The Engineer, 1/01. 201, 30 Mar. 1956, pp. 273-275 and 6 A p r i l 1956, pp. 228-290, London.
7. Ower, E. and Pankhurst, R. C. : The Measurement o f Air Flow, Pergamon
Press, London, 1966.
62
I I I . B . TOTAL TEMPERATURE
The t o t a l t e m p e r a t u r e i s n o r m a l l y m o n i t o r e d . i n t h e s t i l l i n g chamber dur ing
rout ine tunnel operat ion. S ince the d i f ference between to ta l and s t a t i c tempera-
t u r e i s s m a l l a t low v e l o c i t i e s , a shielded, high-recovery thermocouple probe
is no t usua l l y necessary . In fac t , da ta ob ta ined by Stickney (Ref. 1 ) f o r t hese
two types o f probes show tha t the recovery fac to rs a re near ly iden t ica l ("0.999) f o r temperatures near ambient and M < 0.2. Thus, Pope and Goin (Ref. 2) note
t h a t i n many cases the to ta l tempera ture can be measured i n t h e s t i l l i n g chamber,
w i th sa t is fac to ry accuracy , by using a simple bare-wire thermocouple junction.
A schematic o f t h i s t ype o f t empera tu re p robe i s shown i n t h e upper p a r t o f
F igure 3.8.1. Measurements by Stickney (Ref. 1) indicate that such unshielded
temperature probes have a much shorter response t ime compared t o more elaborate,
shielded probes. In the case of blowdown tunnels where total temperature can
v a r y r a p i d l y , t h i s i s an essential advantage. For example, i f tes ts a re con-
ducted at constant Reynolds numbers, the to ta l temperature must be monitored
*
t ime cons tan t o f 0 .1 sec . in a i r a t
a v e l o c i t y o f 19.8 m/sec (65 f t / s e c ) .
0.53 mm (0.021") diameter wire has a
* >*:
I n response to t he ques t i onna i re
cont inuously s o t ha t t o ta l p ressu re can be con t ro l l ed au tomat i ca l l y . A l s o ,
smal l wire thermocouples wi th t ime constants of the order of 0.1 sec. a re
typ ica l l y requ i red . For example, a 0.13 mm (0.005 in . ) d iameter wi re has a
ambient temperature and pressure and
Whereas, f o r t h e same cond i t ions , a
1.0 sec time constant, e.g., Ref. 4.
, the major i ty o f tunnel operators ind i ca ted
they do i n f a c t use the bare-wire thermocouple fo r t o t a l temperature measurements.
Est imated accuracies var ied f rom +0.56"C t o 2 1 . 1 " C (21°F to 22°F) . Based on
the re la t ions p resented in Sec t ion l l . C . 2 , an unce r ta in t y i n t o ta l t empera tu re
o f 1 ° C will cause, a t M = 1 , a maximum uncer ta in t y o f 0.5 pe rcen t a t a Reynolds num-
ber per meter of 33 m i l l i o n . F o r most t e s t i n g purposes t h i s i s acceptable. However,
few tunnels ( t ransonic or supersonic) appear to have been ca l i b ra ted f o r tempera-
ture gradients which may ex is t ac ross and along the f low.
* A comprehensive d iscussion of thermocouple pr inciples, c i rcui ts, e lectromot ive f o r c e t a b l e s , s t a b i l i t y and compa t ib i l i t y da ta , i ns ta l l a t i on t echn iques , e t c . may be found i n Ref. 3. I A r . I.
The t ime constant i s here def ined as the t ime required to reach 63.2% of an instantaneous temperature change.
63

Typical Bare-Wire Probe
/Two-hole ceramic holder .229 O.D. x .033 W a l l t A l l Dimensions In Centimeters
AEDC-IWT 1 6 ~ Probe (Ref. 5
7 .635 O.D. x .089 W a l l
h
v“ v
1.12 R -.+” 1.27
30.48
.478 O.D. x .081 W a l l
L 4 Vent holes (0.17) equally spaced
Figure 3 .B. 1 TOTAL !E!&PEMTUFU3 PROBES
One o f t h e most complete and extens ive ca l ibrat i .on o f temperature gradients
i n a t ransonic tunnel has been done i n t h e AEDC Propuls ion Wind Tunnel (16T),
Ref. 5. The tempera tu re ca l i b ra t i on was done t o i n v e s t i g a t e t h e e f f e c t s o f a
special-purpose, cryogenic cool ing system which consists o f a l i q u i d n i t r o g e n sys-
tem t o c h i l l t h e c o o l a n t i n the tunne l coo le r and a l i q u i d a i r system for d i r e c t
i n jec t i on i n to t he t unne l a i r s t ream. A rectangular array of shielded tempera-
ture probes was loca ted in the nozz le con t rac t ion reg ion and i n t h e t e s t
sect ion. A schematic o f a t yp ica l p robe i s shown i n F i g u r e 3.8.1.* Since
the recovery factor of a l l thermocouple probes need t o be c a l i b r a t e d f o r Mach
and Reynolds number e f f e c t s (Ref. l ) , t he raw temperature data were f i r s t
co r rec ted f o r t hese e f fec ts by Robson (Ref. 5 ) . Subsequently, the temperature
o f the f low th rough the cen t ra l por t ion o f the nozz le en t rance sec t ion was de f ined
by an average o f th i r teen tempera tures measured over a 2 x 3.5 m (6 x 1 1 f t )
rectangular region. The tempera ture o f the tes t sec t ion f low was def ined by
an average o f 17 temperatures obtained over a 2 x 2 m (6 x 6 f t ) p o r t i o n o f
the core. The d i f f e rence between these two temperatures was used t o d e f i n e
a temperature cal ibrat ion parameter which re lates temperature at the nozzle
en t rance to tes t sec t ion tempera ture . In th is case, t h e t e s t s e c t i o n f l o w was
found t o be approximately 1 . 1 " C (2°F) lower than the nozzle f low. Deviations
of 28°F were obtained across both the nozzle and the t es t sec t i on ove r a Mach
number range 0.2 t o 0.8 and -22°C < To < 21°C. These deta i led temperature
measurements were made because of the ant ic ipated nonuni formi t ies produced by
the special cooling system. Although smaller temperature gradients usually
ex is t in tunne ls w i thout spec ia l coo l ing or heating systems, this example
i l l us t ra tes t he p rocedure requ i red t o accu ra te l y ca l i b ra te w ind t unne l tempera-
tures. For rou t i ne t es t i ng , a single temperature probe can be re la ted t o t he
average s t i l l i n g chamber t e m p e r a t u r e v i a c a l i b r a t i o n i n o r d e r t o e l i m i n a t e t h e
d i s t u r b i n g e f f e c t s o f an unnecessary thermocouple grid.
-1. .L I\ ,.
.L
"Robson (Ref. 5) states that the copper-constantan thermocouples used i n t h i s probe are genera l ly cons idered to have a sys temat ic e r ro r o f +2.2"C (24°F).
-8. I I. I.
Temperatures i n t h e 1/3-Meter Transonic Cryogenic Tunnel a t NASA Langley have also, been surveyed using a g r i d o f thermocouple probes, Ref. 6 .
65

Additional information on the design and ca l ib ra t ion o f to ta l tempera ture
probes can be found i n Refs. 7-10. Also, Bate (Ref. 1 1 ) has reviewed the
problem o f e r r o r s i n thermocouple measurements based on exper ience in the DFVLR
wind tunnels i n West Germany.
66
I
I I I . 6. References
1. St ickney, T. M.: "Recovery and Time-Response C h a r a c t e r i s t i c s o f S i x
Thermocouple Probes i n Subsonic and Supersonic Flow," NACA TN 3455, July 1955.
2. Pope, A. and Goin, K. L.: High-speed Wind Tunnel Testing, Wiley, New York,
1965.
3. American Society for Test ing and Ma te r ia l s (ASTM), Committee E20: Manual
on the Use o f Thermocouples i n Temperature Measurement, ASTM Special
Technica l Publ icat ion No. 470, Phi ladelphia, Pa., 1974.
4. The Omega Temperature Measurement Handbook, Omega Engineering, Inc., Stamford,
Conn., 1975.
5. Robson, G. D. : "Test Section Temperature Calibrat lon of the AEDC PWT 16-Ft
Transonic Tunnel a t S tagnat ion Temperatures from -30 t o 3OoF," AEDC-TR-69-2,
Feb. 1969.
6. Polhamus, E. C . ; K i lgore, R . A. ; Adcock, J. 6. ; and Ray, E. J. : "The Langley
High Reynolds Number Wind-Tunnel Program," Astro. 5 Aero., Oct. 1974.
7. Benedict, R. P . : Fundamentals of Temperature, Pressure, and Flow Measurements,
Wiley, New York, 1969.
8. Baker, H . D.; Ryder, E.A.; and Baker, FI. H.: Temperature Measurement i n
Engineering, Vol. I I , Wiley, New York, 1961.
9. Vol luz, R. J.: "Handbook o f Supersonic Aerodynamics, Section 20, Wind
Tunnel Instrumentation and Design," NAVORD Rept. 1488 (Vol . 6) , 1961.
10. Dean, R. C . , Jr.: Aerodynamic Measurements, MIT Gas Turbine Lab., Eagle
Enterpr ises, New York, 1953.
1 1 . Bate, J.: "Temperature Measurements i n Wind Tunnels," RAE Lib. Transl . No.
1736, AD 922 120, Farnborough, Hants, England, June 1974.
67

1II.C. PITOT PRESSURES
Use of P i t o t Pressures f o r C a l i b r a t i o n
As descr ibed in Sect ion II.C.l, when M > 1.6 t h e u n c e r t a i n t y i n c a l c u l a t e d
t e s t s e c t i o n Mach number i s l e s s i f t h e c a l c u l a t i o n i s based on P i to t p ressu re
ra ther than f rees t ream s ta t i c p ressure . Thus, most supersonic tunnels have been
ca l ib ra ted v ia P i to t p robe surveys and assuming an isentropic expansion f rom
t h e s t i l l i n g chamber. In the pas t , inves t iga tors such as Hill (Ref. 1 ) and Hill,
e t a l . (Ref. 2) have repor ted that measurements in smal l , supersonic tunnels
(<0.5 m) of t h e r a t i o o f t o t a l p r e s s u r e i n t h e t e s t s e c t i o n t o r e s e r v o i r p r e s -
su re exh ib i t a range of 0.998 - + 0.003. This t ype o f resu l t leads t o t h e con-
elusion tha t non isent rop ic expans ion e f fec ts a re neg l ig ib le a t normal operating
temperatures and pressures in a properly designed supersonic tunnel, i.e., one
i n which the empty t u n n e l i s f r e e o f shocks. However, large cont inuous tunnels
a re o f ten ope ra ted a t re la t i ve l y h igh humid i t y l eve l s i n o rde r t o i nc rease t he
opera t ing t ime p r io r to d ryer sa tura t ion . For example, Maxwell and Har t l ey
(Ref. 3) found i n t h e AEDC-PWT 165 Tunnel t h a t when the humid i ty was 0.002 gm
H20/gm o f d r y a i r , t h e average to ta l p ressu re o f t he t es t sec t i on was 2 t o 6%
lower than the reservoir pressure. This loss was reduced 50% by decreasing
tunnel humid i ty to 0.001. t
In addit ion to water vapor condensation, obl ique shocks and r e a l gas
e f f e c t s can cause a loss in to ta l pressure. A lso, large tunnels can have non-
u n i f o r m i t i e s i n t o t a l p r e s s u r e caused by incomplete mixing i n t h e s t i l l i n g
chamber, and small tunnels can have losses caused by a x i a l v e l o c i t y g r a d i e n t s
(e.g., Ref. 4) . W i t h t h i s number o f poss ib le causes o f t o t a l p r e s s u r e v a r i a t i o n ,
it i s recommended that operators o f both t ransonic and supersonic tunnels make
c a l i b r a t i o n measurements to va l i da te t he assumpt ion o f un i fo rm to ta l p ressu re .
This can be accomplished i n subsonic f low v ia a P i t o t probe, since it can be
used d i r e c t l y t o compare tes t sec t i on t o ta l p ressu re w i th rese rvo i r p ressu re .
In supersonic f low, another independent pressure must be measured such as free-
stream stat ic, surface pressure on,a cone o r wedge, or Pi tot pressure behind an
obl ique shock. Once a cho ice i s made, the two pressures and t h e r a t i o o f s p e c i f i c
**
?t These r e s u l t s were obtained wi th 2 55 OC < To < 78 OC.
Th i s can be determined dur ing set t A*
.o < M < 4.75, 3
l i n g chamber c a l
.1 Wcm < Hs < 9.1 N/cm ,
ibre t ion , Sec t ion 1II .A.
2 2
68
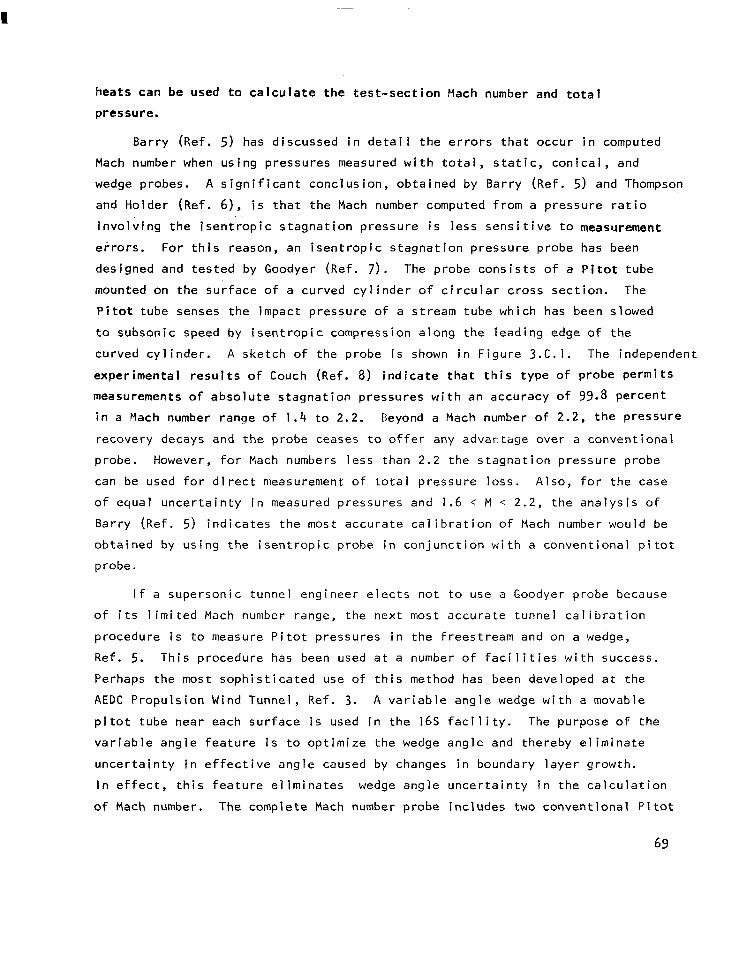
heats can be used t o c a l c u l a t e t h e t e s t - s e c t i o n Mach number and t o t a
pressure.
Barry (Ref. 5 ) has d i scussed i n de ta i l t he e r r o r s tha t occu r i n
Mach number when using pressures measured w i t h t o t a l , s t a t i c , c o n i c a
computed
, and
wedge probes. A s ign i f i can t conc lus ion , ob ta ined by Barry (Ref. 5) and Thompson
and Holder (Ref. 6 ) , i s t h a t t h e Mach number computed from a p r e s s u r e r a t i o
invo lv ing the i sen t rop ic s tagnat ion p ressure i s l e s s s e n s i t i v e t o measurement
e r ro rs . For t h i s reason, an isentropic stagnation pressure probe has been
designed and tes ted by Goodyer (Ref. 7 ) . The probe cons is ts o f a P i t o t t u b e
mounted on the sur face o f a curved cy l inder o f c i rcu la r c ross sec t ion . The
P i t o t tube senses the impact pressure of a stream tube which has been slowed
to subsonic speed by isentropic compression along the leading edge o f t h e
curved cy l inder . A sketch of the probe i s shown In F igure 3 . C . l . The independent
exper imenta l resu l ts o f Couch (Ref. 8) ind ica te tha t th is t ype o f p robe permi ts
measurements o f absolute s tagnat ion pressures wi th an accuracy o f 99.8 percent
i n a Mach number range of 1 .4 t o 2.2. Beyond a Mach number o f 2.2, the pressure
recovery decays and the probe ceases t o o f f e r any advar, tqe over a conventional
probe. However, f o r Mach numbers less than 2.2 the stagnation pressure probe
can be used f o r d i r e c t measurement of to ta l p ressure loss . A lso , fo r the case
o f equa l uncer ta in ty in measured pressures and 1.6 M < 2 .2 , t h e a n a l y s i s o f
Barry (Ref. 5) ind ica tes the most a c c u r a t e c a l i b r a t i o n o f Mach number would be
obtained by us ing the i sen t rop ic p robe in con junc t ion w i th a conven t iona l p i t o t
probe.
I f a supersonic tunnel engineer e lects not to use a Goodyer probe because
o f i t s l i m i t e d Mach number range, the next most accura te tunne l ca l ib ra t ion
procedure i s t o measure P i to t p ressures in the f rees t ream and on a wedge,
Ref. 5. This procedure has been used a t a number o f f a c i l i t i e s w i t h success.
Perhaps the most soph is t i ca ted use of t h i s method has been developed a t t h e
AEDC Propuls ion Wind Tunnel, Ref. 3. A var iab le ang le wedge w i t h a movable
p i t o t tube near each surface i s used i n t h e 16s f a c i l i t y . The purpose o f t h e
var iab le ang le fea ture i s t o op t im ize t he wedge angle and thereby e l iminate
u n c e r t a i n t y i n e f f e c t i v e a n g l e caused by changes i n boundary layer growth.
I n e f f e c t , t h i s f e a t u r e e l i m i n a t e s wedge ang le unce r ta in t y i n t he ca l cu la t i on
o f Mach number. The complete Mach number probe includes two conventional Pitot
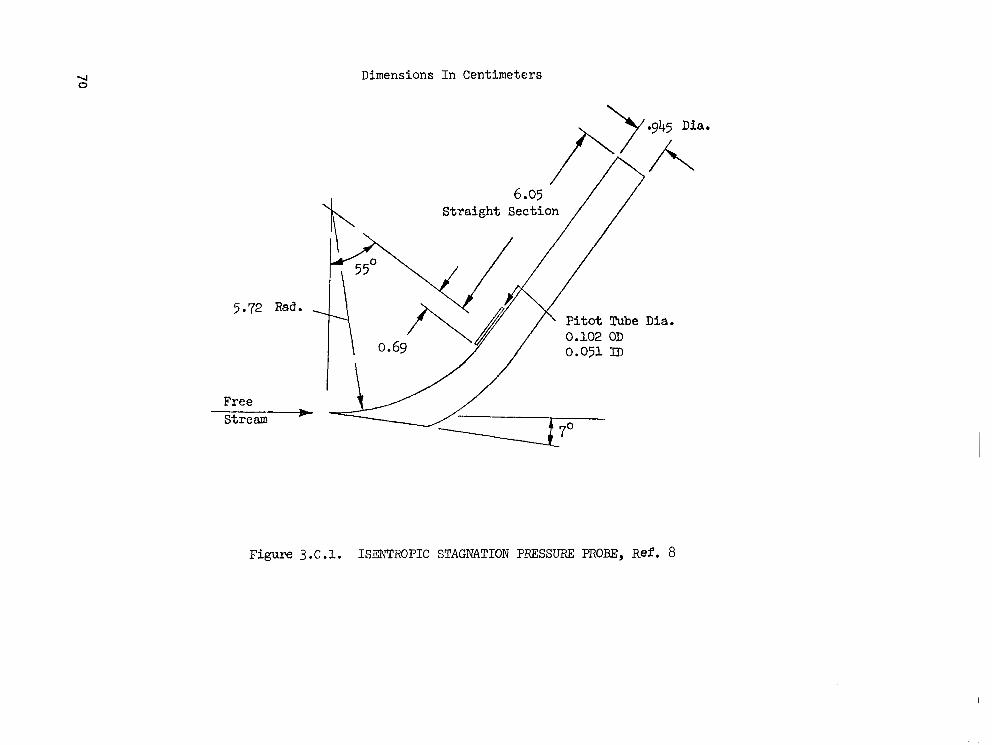
Dimensions In Centimeters
Straight Section
Dia .
Figure 3 .C .l. ISENTROPIC STAGNATION PRESSURE PROBE, Ref. 8
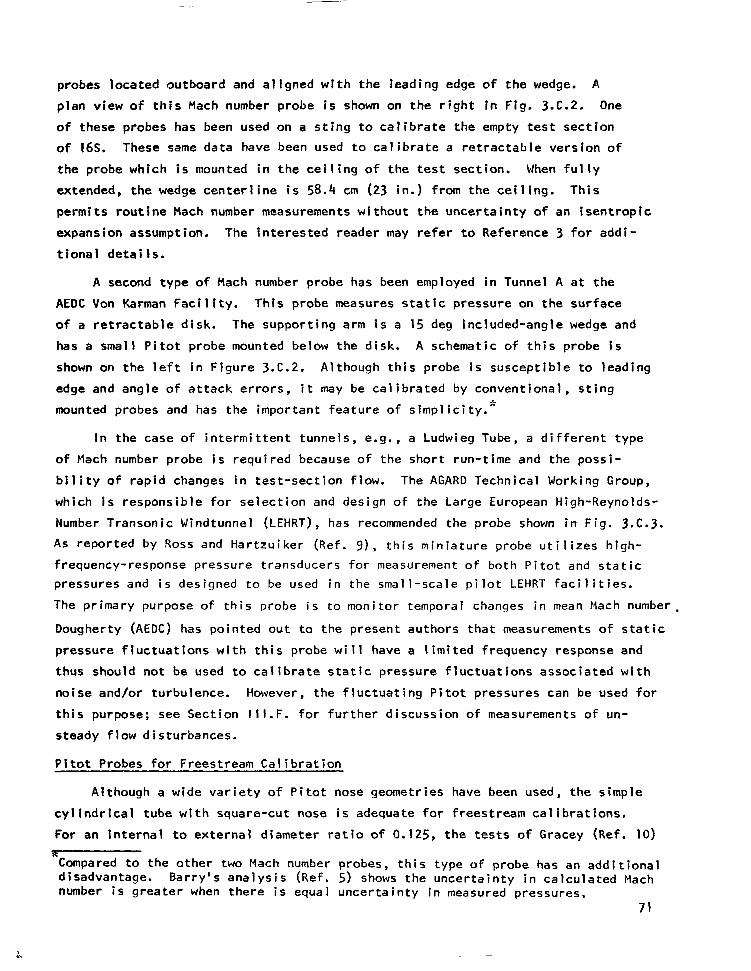
probes located outboard and a l igned w i th the lead ing edge o f t h e wedge. A
plan view o f t h i s Mach number probe i s shown on t h e r i g h t i n F i g . 3.C.2. One
of these probes has been used on a s t i n g t o c a l i b r a t e t h e empty t e s t s e c t i o n
of 165. These same data have been used t o c a l i b r a t e a re t rac tab le ve rs ion o f
the probe which i s mounted i n t h e c e i l i n g o f t h e t e s t s e c t i o n . When f u l l y
extended, the wedge cen te r1 i ne i s 58.4 cm (23 in.) from t h e c e i l i n g . T h i s
permi ts rou t ine Mach number measurements w i thou t t he unce r ta in t y o f an i s e n t r o p i c
expansion assumption. The in terested reader may r e f e r t o Reference 3 f o r a d d i -
t i o n a l d e t a i l s .
A second t y p e o f Mach number probe has been employed i n Tunnel A a t t h e
AEDC Von Karman Fac i l i t y . Th i s p robe measures s t a t i c p r e s s u r e on the surface
of a r e t r a c t a b l e d i s k . The support ing arm 1s a 15 deg included-angle wedge and
has a smal l P i to t p robe mounted below the disk. A schematic o f t h i s probe i s
shown on the l e f t i n F i g u r e 3.C.2. Al though th i s p robe i s suscep t ib le t o l ead ing
edge and ang le o f a t tack e r ro rs , i t may be c a l i b r a t e d by convent iona l , s t ing
mounted probes and has the impor tan t fea ture o f s imp l ic i t y . 3:
I n t h e case o f i n t e r m i t t e n t t u n n e l s , e.g., a Ludwieg Tube, a d i f f e r e n t t y p e
o f Mach number probe i s r e q u i r e d because of the short run-t ime and the possi-
b i l i t y o f r a p i d changes in t es t - sec t i on f l ow . The AGARD Technical Working Group,
which i s r e s p o n s i b l e f o r s e l e c t i o n and design o f the Large European High-Reynolds-
Number Transonic Windtunnel (LEHRT), has recommended the probe shown i n F i g . 3.C.3. As reported by ROSS and Hartzuiker (Ref. g ) , t h i s m i n i a t u r e p r o b e u t i l i z e s h i g h -
frequency-response pressure transducers for measurement o f b o t h P i t o t and s t a t i c pressures and i s designed to be used i n t h e s m a l l - s c a l e p i l o t LEHRT f a c i l i t i e s .
The primary purpose of this probe i s to monitor temporal changes i n mean Mach number.
Dougherty (AEDC) has pointed out to the present authors that measurements o f s t a t i c
p r e s s u r e f l u c t u a t i o n s w i t h t h i s p r o b e will have a l imited frequency response and
thus should not be used t o c a l i b r a t e s t a t i c p r e s s u r e f l u c t u a t i o n s a s s o c i a t e d w i t h
noise and/or turbulence. However, t he f l uc tua t i ng P i to t p ressu res can be used f o r
t h i s purpose; see Section 1 I I . F . f o r f u r t h e r d i s c u s s i o n o f measurements o f un-
steady f 1 ow d i s turbances.
P i t o t Probes for Freestream Calibrat ion
Although a w ide var ie ty of P i t o t nose geometries have been used, the s imple
cy l i nd r i ca l t ube w i th square -cu t nose i s adequate fo r f rees t ream ca l ib ra t ions .
For an i n t e r n a l to ex terna l d iameter ra t io of 0.125, t h e t e s t s o f Gracey (Ref. IO) R
Compared to t he o the r two Mach number disadvantage. Barry’s analysis (Ref. number i s g r e a t e r when t h e r e i s equal
probes, th is t ype o f p robe has an a d d i t i o n a l 5) shows the unce r ta in t y i n ca l cu la ted Mach u n c e r t a i n t y i n measured pressures.
71
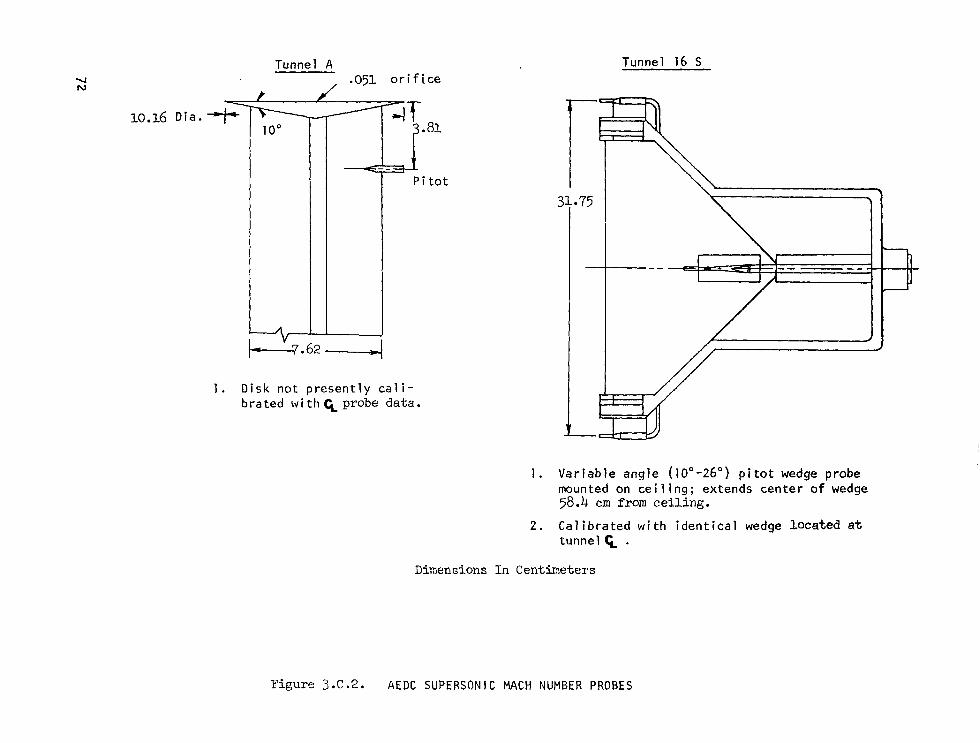
7-
Tunnel A .051
t A
1 0' II.' o r i f i c e
P i t o t
1 . D isk not present ly Cal i - bra ted w i t h C, probe data.
Tunnel 16 S
31 75 , 1 . Variable angle (10'-26') p i t o t wedge probe
mounted on cei l ing; extends center of wedge 58.4 cm from ceil ing.
2. Ca l i b ra ted w i th i den t i ca l wedge located a t tunnel G, .
Dimensions In Centimeters
Figure 3.C .2. A E D C SUPERSON I C MACH NUMBER PROBES
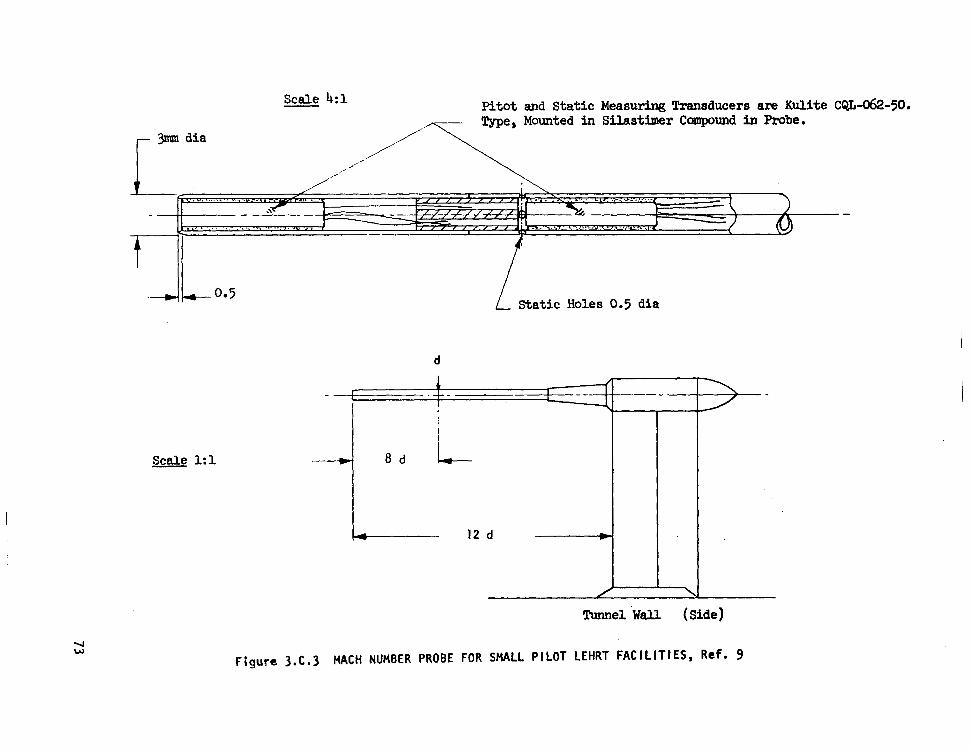
U W
Scale 4:l
d
Pitot and Static Measuring Transducers are K u l l t e CQL-062-50. Type, Mounted in Silastimer Compound i n Probe.
- Scale 1:l
,!. Static Holes 0.5 dia
1 r I
I . -
I t
-1 8 d
f-
? -" 3"
demonstrated that total pressure measurements w i t h t h i s p r o b e will be i n
e r r o r by 0.01q' a t an angle o f a t t a c k o f 1 1 degrees and M , = 0.26 and 1.62.
Th is same accuracy was a t t a i n e d a t a = 223 , M = 0.26 and a = +29O, M = 1.62
by i nc reas ing the d iameter ra t io to 0;96. The ang le o f a t tack range was
increased even more by us ing i n te rna l .beve l l i ng t o i nc rease t he d iamete r
r a t i o t o near one. However, s i n c e f l o w a n g u l a r i t y i n empty tes t sec t ions
seldom exceeds 1 or 2 degrees, a tube w i th a s t r a i g h t impact opening and a
d i a m e t e r r a t i o o f 0.5, o r more, will prov ide impact pressures wi th negl ig ib le
e r ro r . (Of course, t h i s assumes the probe i s f r e e o f b u r r s . )
0 -
Effects of Var ious Parameters on P i t o t Probes
Size: - Early exper iments wi th P i to t probes showed measured pressures t o be
independent o f probe size, e.g., Ref. 1 1 . Thus, s i z i n g i s u s u a l l y g u i d e d
b y t h e s i z e o f f a c i l i t y and Mach number a t wh ich t he p robe i s t o be used.
When to ta l pressure gradients are present , a P i t o t probe senses an impact
pressure corresponding t o a displacement towards the higher pressure, Ref. 12.
T h i s e f f e c t decreases w i t h probe s ize and wi th increas ina wal l th ickness.
However, Livesey (Ref. 13) found that a conica l nose P i t o t , w i t h a sharp edge
a t t h e opening, i s b e s t f o r use i n a t ransverse pressure gradient s ince i t
e x h i b i t s a neg l ig ib le d isp lacement e r ro r . But since cones cannot be used
v e r y c l o s e t o w a l l s , two dimensional boundary layer measurements a r e u s u a l l y
made w i t h P i t o t probes having very small, f lattened-oval openings and a
square-cut nose, e.g., Refs. 1 1 and 12.
Ana lys i s o f da ta f o r t he s imp le , c i r cu la r P i to t t ube i nd i ca tes t he
measured pressure i s independent o f Reynolds number (based on ins ide rad ius
of the opening) when i t i s greater than 100, Ref. 12.
Mach number:
I n d r y a i r , t h e
Mach number and w i l
subsonic speeds and
son i c speeds.
Tu rbu 1 ence :
P i t o t t u b e has
1 r e l i a b l y p r o v
the stagnat ion
aenera l l y been found t o be i n s e n s i t i v e t o
ide the f reestream stagnat ion pressure at
pressure behind a normal shock a t super-
The incompress ib le analys is o f Becker and Brown (Ref. 14) i nd i ca tes t ha t
a c i r c u l a r t u b e P i t o t w i t h s q u a r e - c u t nose i s r e l a t i v e l y i n s e n s i t i v e t o t u r b u -
lence. However, these authors suggest that the length of the constant diameter
74

opening be a t leas t th ree d iameters . The i n t e n t i s t o e l i m i n a t e s u r g i n g o f t h e
f l o w , i n response to turbulence, and thus assure the existence of stagnat ion
c o n d i t i o n s p r i o r t o changes i n i n t e r n a l geometry. When. t h e r e s u l t s o f Becker and
Brown a re viewed i n l i g h t o f t h e d a t a o b t a i n e d by Gracey (Ref. l o ) , which demon-
s t r a t e s d e c r e a s i n g f l o w a n g l e s e n s i t i v i t y o f P i t o t probes w i th inc reas ing Mach
number, one may conc lude tha t c i rcu la r tube Pi tot probes are unaffected by low
leve ls o f t u rbu lence . S ince t he t u rbu lence i n tens i t y i n most empty tunnels i s
less than two percent, the recommended P i t o t probes ( i .e . , c i rcu lar tubes wi th
i n te rna l j ex te rna l d iamete r ra t i os > 0.5) can be used w i th con f i dence t o ca l i b ra te
t ransonic and supersonic wind tunnels.
Rakes, Arrays and Supports,:
In subsonic f lows, impact pressure can be successfu l ly measured w i t h an
o r i f i c e i n a c i r c u l a r c y l i n d e r mounted normal t o t h e flow, e.g., Ref. 12. Thus,
P i t o t probes are genera l ly cons idered to be insensi t ive to support arrangements.
However, near Mach one the bow shock generated by a support could conceivably
i n t e r f e r e w i t h t h e p r o b e shock. The resu l t ing p ressure measured behind the shock
in teract ions would be expected t o d i f f e r from the normal shock pressure. Thus,
a t t ranson ic speeds the nose o f t h e P i t o t probe should extend far enough forward
t o a v o i d t h i s problem. A t ube l eng th a t l eas t 12 t imes the support th ickness is
recommended. A t subsonic speeds, Dudtini ski and Krause (Ref. 15) have observed
t h a t t h e e f f e c t o f p r o x i m i t y o f a t r a n s v e r s e c y l i n d r i c a l s u p p o r t i n g s t r u t i s
n e g l i g i b l e i f t h e s t r u t i s two o r more s t ru t d iameters downstream from t h e P i t o t
tube t ip . For supersonic appl icat ions, Pope and Goin (Ref. 16, p. 353) no te tha t
t h e P i t o t t u b e l e n g t h i s u s u a l l y I 5 t o 20 tube diameters.
When severa l P i to t probes are used i n a rake o r an ar ray , the measured
pressures may be a f f e c t e d by i n t e r a c t i o n s between the bow waves on adjacent tubes.
Bryer and Pankhurst (Ref. 12) note that experiments a t H = 1.6 ind ica te the gap
between P i t o t probes may be as small as one d iameter wi thout caus ing s ign i f icant
e r ro r . As Mach number decreases toward one, the separation distance must be
increased. I n subsonic f low, the spacing of Pi tot probes is general ly not con-
s idered to be c r i t i c a l , e.g., Ref. 17.
75
I I
1. Hill, J. A. F.: "On the Cal
Aero. Sci . , Vol . 22, No. 6,
2. Hill, J. A. F.; Baron, J. R.
.C. References
Schindel', L. H.: "Mach Number Measurements
i n High-speed Wind Tunnels," HIT Naval Supersonic Laboratory Tech. Rept.
145, Jan. 1956 (A lso ava i lab le as AGARDograph 22, Oct. 1956).
3. Maxwell, H. and Hart ley, M. S. : "Aerodynamic Ca l i b ra t i on Resu l t s f o r t he
AEDC-PWT 16-Ft. Supersonic Tunnel a t Mach Numbers from 1.50 t o 4.75 ,I'
AEDC-TR-69- 102, May 1969.
4. Murphy, J. S . : "Evidences o f an Inherent Er ro r in Measurement o f Total-Head
Pressure a t Supersonic Speeds," Aero. Engr. Rev., Nov. 1953.
5. Barry, F. W.: "Determination o f Mach Number From Pressure Measurements,''
Trans. ASME, A p r i l 1956.
6. Thompson, J. S. and Holder, D. W. : "Notes on Wind Tunnel Pressure Measure-
ments from the Operator 's Point of View," R.A.E. Tech. Note Aero. 2547,
Feb. 1958.
7. Goodyer, M. J.: "A New Probe f o r t h e D i r e c t Measurement of Stagnation
Pressure i n Supersonic Flow," R.A.E. Tech. Rept. 73122, March 1974.
8. Couch, L. H.: "Effects of Geometr ic Var iables on the Performance o f a
Probe f o r D i r e c t Measurement o f Free-Stream Stagnation Pressure i n Super-
sonic Flow," NASA TN 0-7887, May 1975.
9. Ross, R. and Hartzuiker, J. P.:
LEHRT P i l o t F a c i l i t i e s , " AGARD
Act ion 61, June 2, 1975.
10. Gracey, W.: "Wind-Tunnel Invest
a t High Angles of Attack," NACA
"Recommended Flow Q u a l i t y Measurements i n
Technical Working Group AC/243 (PG.7/WG. 1)
i g a t i o n o f a Number of Tota l -Pressure Tubes
Rept. 1303, Jan. 1956.
11. Folson, R. G.: "Review o f t h e P i t o t Tube," Trans ASME, Oct. 1956.
12. Bryer, D. W. and Pankhurst, R. C.: Pressure-Probe Methods for Determin ing
Wind Speed and Flow Direct ion, Nat ional Physical Laboratory, Her Majesty 's
Stat ionery Of f ice, London, 1971.
76
13. Livesey, J. L.: "The Behavior o f Transverse Cy1 i n d r i c a l and Forward Facing
Total Pressure Probes i n Transverse Total Pressure Gradients," Jour. Aero.
Sci., Vol. 23, p. 949, Oct. 1956.
14. Becker, H. A. and Brown, A. P. G . : "Response of Pitot Probes i n Turbulent
Streams,'' Jour. F l u i d Mech., Vol. 62, Par t 1, 8 Jan.. 1974.
15. Dudziniski , T. J. and Krause, L; N.: "E f fec t o f I n l e t Geometry.on Flow-Angle
Charac te r i s t i cs of Miniature Total-Pressure Tubes," NASA TN 0-6406, J u l y
1971.
16. Pope, A. and Goin, R . L . : High-speed Wind Tunnel Testing, Wiley, 1965.
17. Chew, W. L . , Jr.: "Ca l ib ra t ion of Five Total Pressure and Temperature
Survey Rakes a t Speeds from M = 0.2 t o 1.0," AEDC TN-59-37, May 1959.
77

I I I.D. TEST SECTION STATIC PRESSURES
As discussed in Sect ion I I . C . l , measurement o f s t a t i c p r e s s u r e i s
fundamental to t ranson ic w ind tunne l ca l ib ra t ion . I t i s c u r r e n t l y s t a n d a r d
p r a c t i c e t o measure s e t t l i n g chamber pressure and empty-tunnel s t a t i c to
ca l ib ra te subson ic and t ransonic tunnels when M < 1.6. T y p i c a l l y , an average
o f s ta t i c p ressu re da ta , measured a l o n g t h e c e n t e r l i n e , i s used t o c a l i b r a t e
a re ference pressure. in order to avoid in ter ference, it i s genera l l y
considered good p r a c t i c e n o t t o measure th i s re fe rence p ressu re w i th a probe
permanently mounted i n t h e t e s t s e c t i o n . Thus, the re fe rence p ressure i s
u s u a l l y measured e i t h e r i n t h e plenum chamber or a t s i d e w a l l o r i f i c e s l o c a t e d
i n t h e f o r w a r d p o r t i o n o f t h e t e s t s e c t i o n . Once ca l ib ra ted , the re fe rence
pressure i s used t o c o n t r o l Mach number dur ing rou t ine opera t ion .
The bes t l oca t i on t o measure the re fe rence s ta t i c p ressu re appears t o
be a matter of opinion. All of the larger tunnels (> 2.4 m ) , which responded
to the quest ionnaire, use plenum chamber measurements. The survey indicated
smal ler tunnels use e i ther upst ream or i f ices or plenum chamber measurements.
A t o t a l o f t h e responses indicated a ma jo r i t y o f app rox ima te l y 2:l p r e f e r r e d
t o use plenum chamber measurements.
Advantages o f us inq plenum chamber data are: ( I ) i t i s r e l a t i v e l y
i n s e n s i t i v e t o l o c a t i o n a t w h i c h t h e p r e s s u r e i s measured, and (2) i t avoids
hav ing to contend wi th eros ion and/or contaminat ion o f or i f ices. However,
exper ience wi th tunnel wal l p iezometer r ings in a number o f t unne ls has proven
o r i f i c e d e t e r i o r a t i o n i s n o t a s i g n i f i c a n t problem. A t supersonic Mach numbers,
the plenum chamber pressure i s general ly lower than f reestream stat ic pressure,
and the di f ference increases wi th increasing t lach number, becoming increas ing ly
more s i g n i f i c a n t a t Mach numbers exceeding 1.4. I n con t ras t , t es t - sec t i on -wa l l
78

pressures are genera l ly h igher than f reest ream s tat ic pressure a t supersonic Mach
numbers. I n t h e Vought High Speed Wind Tunnel (w i th wa l l s s l i gh t l y conve rged) ,
tunne l -wa l l p ressure Is c loser to f rees t ream s ta t i c than plenum pressure when
1 < M < 1.6. Thus, th is tunne l i s ca l ib ra ted us ing tunne l -wa l l p ressures because
smaller departures from f r e e s t r e a m s t a t i c o f f e r t h e p o s s i b i l i t y o f g r e a t e r
accuracy I n Mach number c a l i b r a t ion. In genera l , a more accurate tunnel ca l i bra-
t i o n may be expected when the re fe rence p ressure i s c loser to f rees t ream s ta t i c
pressure.
In the case o f subsonic Mach numbers, t es t - sec t i on -wa l l and plenum pres-
sures general ly agree very c losely. A possib le except ion to th is genera l con-
c l u s i o n i s t h a t models, wi th large b lockage ra t ios ( i .e . , > 2 % ) , may reduce
plenum chamber pressure below the cal ibrated, empty-tunnel values at h igh
subsonic Mach number, e.g., Parker (Ref. 57) . As i s w e l l known, i n c l i n e d
holes, such as used i n t h e AEDC t ranson ic tunne ls , a re des igned to inh ib i t
excessive inf low from the plenum to t he t es t sec t i on , bu t ven t i l a ted t unne ls
w i t h s l o t s o r normal holes are more vu lne rab le t o t h i s t ype o f depar tu re f rom
empty- tunne l ca l ib ra t ion . In add i t ion , the plenum chamber pressure may lag
f reest ream pressure dur ing rap id changes i n model o r i e n t a t i o n .
III.D.l. Transonic Survey Pipes
Responses to t he ques t i onna i re i nd i ca te t ha t 31 o u t o f 53 t ransonic tunnels
have used long pipes to su rvey cen te r l i ne s ta t i c p ressu re . The r e s u l t s o f t h e
center l ine s ta t ic pressure survey are usual ly averaged over one o r more lengths
o f t h e t e s t s e c t i o n and used t o c a l i b r a t e a re ference pressure. In rout ine
tes ts , a ca l ib ra ted leng th i s se lec ted wh ich most c l o s e l y matches the l oca t i on
and l e n g t h o f a p a r t i c u l a r model. An a l te rna te p rocedure i s to cons t ruc t a
number o f ca l i b ra t i on cu rves t o re la te t he re fe rence p ressu re t o seve ra l s ta -
t ions a long the cen ter l ine . By l o c a t i n g t h e aerodynamic center o f a model a t
79

I 1 I
a station which has been calibrated, the local Mach number at that station
can be used in data reduction. This method is used in transonic tests at
NASA Ames And is considered to be important for measurements o f Mach num-
ber at which a model encounters transonic drag rise. In low supersonic
tests (M < l . 6 ) , the nose of the model is usually located at one of the
calibrated stations for more accurate wave drag measurements. In either case
(i.e., calibrations of the reference static pressure with a n averaae along
the centerline or with pressures measured at particular locations), buoyancy
corrections are usually applied by using centerline pressure measurements
obtained in the empty tunnel.
A
f*
Guidelines for the installation of a long survey pipe are presented in
Reference 1. Some rules of thumb are:
1. The nose of the pipe should be a sma.11 angle cone or ogive and
should be located well upstream in t,he subsonic portion of the
tunnel nozzle, e.g., in the 11-ft. Transonic Tunnel at NASA Ames
the nose of the pipe extends into the settling chamber and is
supported under tension.
2. In order to minimize pipe sway, the pipe should be loaded with a
large tensile force, and if appropriate, an upward moment should
be applied a t the downstream support.
* In cases where a measured-average is used to calibrate a tunnel, a variation on this procedure would be to account for- local departures from the average.
Private communication, Mr. F. b!. Steinle, NASA Ames. .L J. .. n
80
3. In the case o f very long p ipes, three or four cables should be
a t t a c h e d t o f u r t h e r c o n t r o l p i p e sag and v i b r a t i o n .
4. A l l support cables should be f ree of obstruct ions, and a l l t u r n -
buckles and cable at tachment f ix tures should be located behind the
tunnel wal ls.
5. Cables near or w i t h i n t h e t e s t s e c t i o n s h o u l d be swept back a t
an angle of approximately 30 deg t o t h e c e n t e r l i n e .
Although a number o f t u n n e l c a l i b r a t i o n s have been conducted w i t h t h e nose
o f t he p ipe l oca ted , i n t he t es t sec t i on nea r t he beg inn ing o f un i fo rm ven t i l a -
t i o n (e.g., Refs. 1 and 2 ) , the p re fe r red arrangement i s w i t h t h e nose w e l l
upstream so t h a t i t i s always i n subsonic flow, Ref. 3. This arrangement
minimizes disturbances caused by the nose (e.g., no bow shock) and assures
tha t no t ransonic shock passes over t h e o r i f i c e s .
A properly-designed, stat ic-pressure survey pipe requires no t ransonic
c a l i b r a t i o n c u r v e and suppl ies s imultaneous data throughout the length of *
the test sect ion. In t ransonic tunnels, boundary layer growth on the p ipe
does not usual ly induce any l o n g i t u d i n a l Mach-number gradients because o f
the ven t i la ted wa l ls fea ture . In con t ras t , the d isadvantages o f the long
p ipe are:
**
1. sag can cause the p ipe to be i nc l i ned t o t he f l ow wh ich
i n t u r n can cause erroneous s ta t i c p ressure da ta ,
2. v i b r a t i o n can induce errors, see Appendix I l l ,
* Th is conc lus ion i s o f ten sus ta ined by demonstrat ion that a p l o t o f p i p e measured s ta t i c p ressure versus plenum chamber pressure i s smooth through t ransonic Mach numbers.
However, as a r u l e o f thumb, the b lockage ra t i o o f t he p ipe shou ld be kept less than 0.5%, Ref. 6.
**
81

3. disturbances generated by supports may in t roduce e r ro rs , and
4. i t s b u l k makes i t d i f f i c u l t t o use f o r surveys o f f c e n t e r l i n e
O r i f i c e s a r e a source o f e r ro r , wh ich i s o f ten ove r looked when us
*
ing a
long f ixed p ipe. An example o f s i g n i f i c a n t o r i f i c e - i n d u c e d e r r o r has been
discussed by lsaacs (Ref. 5). Th i s t unne l ca l i b ra t i on p robe i s shown i n
Fig. 3.D.l. The o r i f i c e s have a diameter of 0.076 cm (0.030 in . ) and were
ground and deburred w i t h p a r t i c u l a r c a r e t o prevent chamfer of the opening.
However, s ta t i c p ressure var ia t ions as la rge as 0.3% o f t h e dynamic pres-
sure were observed. The f a c t t h a t t h e e r r o r s were indeed o r i f i c e e r r o r s
was ascertained by moving the probe along the tunnel centerl ine. A repeatable
p a t t e r n i n t h e v a r i a t i o n o f measured s ta t i c p ressu re was observed. Figure
3.D.2 shows a comparison o f da ta ob ta ined a t two d i f f e r e n t t u n n e l l o c a t i o n s
w i t h M = 0.74.
This example i l l u s t r a t e s t h e need f o r c a u t i o n when using a f i x e d , s t a t i c
Pressure survey p ipe ; par t i cu la r ly when the p ressure a t a given tunnel
s t a t i o n i s o b t a i n e d w i t h on l y one o r i f i c e . It i s suggested that tunnel
operators, who use such p ipes, check the or i f ice problem by t rans lat ing the
p i p e f o r a t l e a s t one high subsonic and one supersonic Mach number. I f a
problem i s d e t e c t e d , t h i s s o u r c e o f e r r o r may be reduced by manifolding four
o r more o r i f i c e s t o g e t h e r a t a g iven s ta t ion. A second a l t e r n a t i v e i s
t o t r a n s l a t e t h e p i p e e i t h e r f o r w a r d or rearward and take several measure-
ments a t a g i ven s ta t i on w i th d i f f e ren t o r i f i ces . E i the r o f t hese p rocedures
would improve the accuracy o f s t a t i c p r e s s u r e c a l i b r a t i o n s . Also, it i s
* A second pipe, mounted on t h e f l o o r , has been used f o r subsonic Cal ibrat ion measurements i n t h e 11-Foot Transonic Wind Tunnel a t NASA Ames,
82

Dimensions In Centimeters
QUADRANT
25 STATIC PRESSURE HOLES AT :Oa.'076 'ID,
S T I N G F A I R I N G
5.1 CM SPACING
STATIC PRESSURE PROBE MOUNTED ON CALIBRATION GEAR S T I N G (FAC I L I T Y FOR TRANSLATI ON ALONG TUNNEL CENTER LINE OVER -229 CM)
W Q)
Figure 3.D.1. R.A.E. SUBSONIC STATIC-PRESSURE PROBE
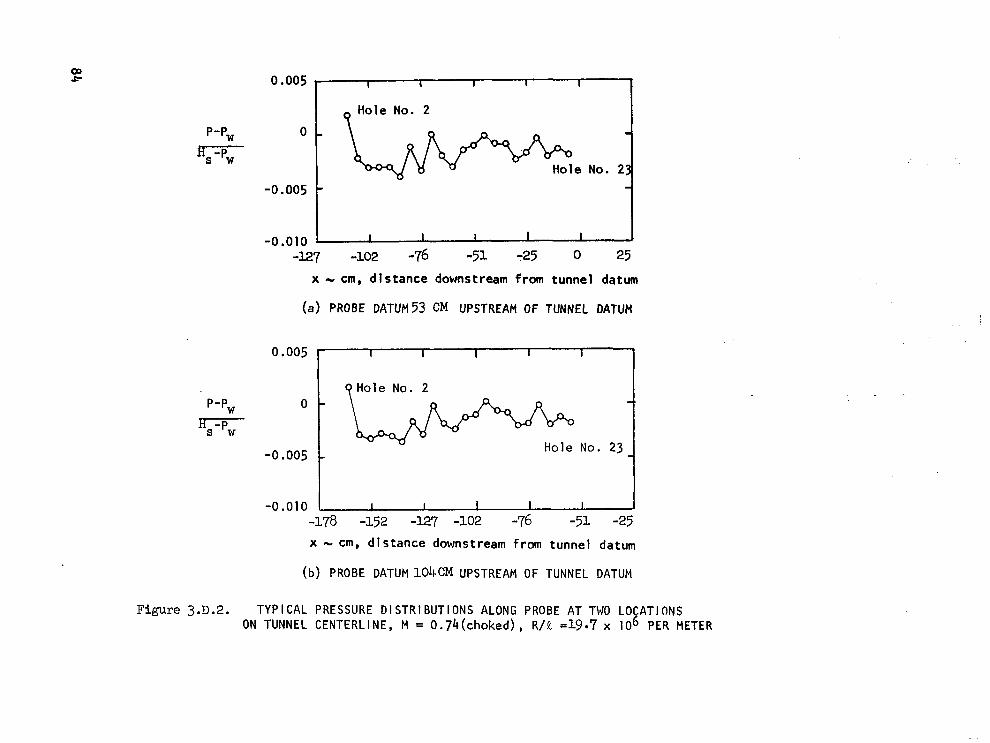
P-Pw
Hs-Pn
I Hole No. 2
Hole N o . 2
-0.005 t -0.010 L I I I I I I
-127 -102 -76 -51 -25 0 25
x - cm, distance downstream from tunnel datum
(a) PROBE DATUM53 CM UPSTREAM OF TUNNEL DATUM
P -Pw
Hs-Pw
-0.010 I 1 I i I I I -178 -152 -127 -102 -76 -51 -25
x - cm, distance downstream from tunnel datum (b) PROBE DATUM 104m UPSTREAM OF TUNNEL DATUM
Figure 3.D.2. T Y P I C A L P R E S S U R E D I S T R I B U T I O N S ALONG PROBE A T TWO LO ATIONS ON TUNNEL CENTERLINE, M = 0.74 (choked) , R/R =19-7 x los PER METER

general ly considered good p r a c t i c e n o t t o p l a c e o r i f i c e s d i r e c t l y i n l i n e
w i t h each other , s ince a d is tu rbance a t an ups t ream o r i f i ce can propagate
downstream and induce e r ro rs a t a downstream o r i f i c e .
As noted by Pope and Goin (Ref. 6 ) , t h e s t a t i c p i p e i s seldom
used to cal ibrate c losed-wal l supersonic tunnels. The p ipe no t on ly
a l t e r s t h e Mach number because o f t h e reduced area r a t i o b u t a l s o i n t e r -
feres wi th the expansion pat tern which is requi red for uni form f low. *
A However, a s t a t i c p i p e has been used qu i te success fu l l y f o r Mach numbers up t o two a t AEDC i n t h e Aerodynamic Wind Tunnel (4T), Ref. 7. For example, a t M = 1.6 the 2 (I v a r i a t i o n i n measured cen te r l i ne Mach numbers was o n l y .007 and a t M = 1.99 was 0.008. Th is app l i ca t i on o f a s t a t i c p i p e was made pos- s ib le by the un ique fea tures o f th is tunne l , v iz . , ad jus tab le poros i ty (0-10%), wal l angle, and plenum pumping.
85
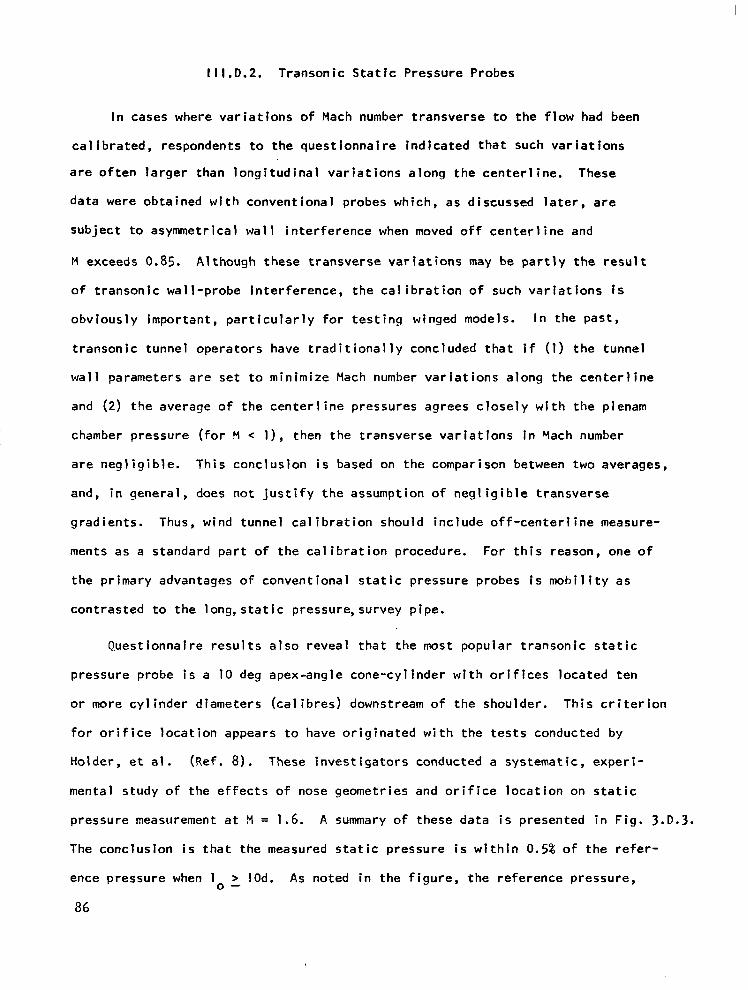
lll.D.2. Transonic Stat ic Pressure Probes
I n cases where v a r i a t i o n s o f Mach number t ransve rse t o t he f l ow had been
ca l ibrated, respondents to the quest ionnai re ind icated that such v a r i a t i o n s
a r e o f t e n l a r g e r t h a n l o n g i t u d i n a l v a r i a t i o n s a l o n g t h e c e n t e r l i n e . These
data were obta ined wi th convent ional probes which, as d iscussed la ter , are
subject to asymmetr ica l wal l in ter ference when moved o f f c e n t e r l i n e and
M exceeds 0.85. A l though these t ransverse var ia t ions may be p a r t l y t h e r e s u l t
o f t r a n s o n i c w a l l - p r o b e i n t e r f e r e n c e , t h e c a l i b r a t i o n o f such v a r i a t i o n s i s
obv ious l y impor tan t , pa r t i cu la r l y f o r t es t i ng winged models. In the pas t ,
t ransonic tunnel operators have t r a d i t i o n a l l y concluded that i f (1) the tunnel
wal l parameters are set to minimize Mach number va r ia t i ons a long t he cen te r l i ne
and (2 ) the average o f t he cen te r l i ne p ressu res ag rees c lose ly w i th t he plenam
chamber p ressure ( fo r M < 1 1 , t hen t he t ransve rse va r ia t i ons i n Yach number
a re neg l i g ib le . Th i s conc lus ion i s based on the comparison between two averages,
and, in genera l , does no t j us t i f y t he assumpt ion o f neg l i g ib le t ransve rse
gradients . Thus, w ind tunne l ca l ib ra t ion shou ld inc lude o f f -cen ter l ine measure-
ments as a s tandard par t o f the ca l ibrat ion procedure. For th is reason, one o f
the primary advantages o f convent ional s ta t ic pressure probes i s m o b i l i t y as
contrasted to the long,s tat ic pressure,survey p ipe.
Quest ionna i re resu l ts a lso revea l tha t the most popu lar t ranson ic s ta t i c
pressure probe i s a 10 deg apex-angle cone-cy l inder wi th or i f ices located ten
o r more cy l inder d iameters (ca l ib res) downstream o f t h e s h o u l d e r . T h i s c r i t e r i o n
f o r o r i f i c e l o c a t i o n appears t o have or ig ina ted w i th the tes ts conducted by
Holder , e t a l . (Ref . 8 ) . These invest igators conducted a systemat ic, exper i -
mental study o f t h e e f f e c t s o f nose geometries and o r i f i c e l o c a t i o n on s t a t i c
pressure measurement a t !I = 1.6. A summary o f these da ta i s p resented in F ig . 3.D.3.
The conc lus ion i s t ha t t he measured s ta t i c p ressu re i s w i t h i n 0.5% o f t h e r e f e r -
ence pressure when 1 > 10d. As noted in the f igure, the re ference pressure,
36 0 -

External Diameter d = O . Z O ~ C M
Four 0.0LSCI)I Diameter a t 90' Intervals Collar Soldered eo
Static Tuk
(a) Long Ogive (b) Short Oglve
(c) Cone (b) Hemisphere (e) Square
General arrangement of the static tubes and the nose shapes tested.
P p . Messured static Prusure po = Static prusure mlssured by '40 kbc
- d l [ H = Total Head o f Prcr Sirearn -1 d = Diameter of static tuoe
L,. Distance of stscic holes Dshind smulder - b*
0 5 I5
10
Figure 3.D.3 VARIATION OF STATIC-PRESSURE READING WITH POSITION OF STATIC HOLES AND NOSE SHAPE A T H - 1.6, Ref. 8

which was assumed t o be t rue f rees t ream s ta t
og iva l nose and o r i f i c e s l o c a t e d 40 c a l i b r e s
High subsonic (H = 0.6 to 0 . 9 ) data ind
re tu rns to f rees t ream l eve l s (w i th in 0.5% o f
i c , was ob ta ined w i th t he l ong
downstream.
icate probe pressure genera l ly
q) a t l o / d v a l u e s o f 4 to 6
c a l i b r e s , Ref. 9. The e x a c t l o c a t i o n i s dependent on nose geometry. For
example, t ransonic data presented by Ri tch ie (Ref. IO) f o r a s t a t i c p r e s -
sure probe, wi th a nose corresponding to t he l ong og i ve shown i n Fig. 3.0.3,
i n d i c a t e n e g l i g i b l e measurement e r r o r when o r i f i c e s a r e l o c a t e d o n l y two
c a l i b r e s downstream o f the nose-cy l inder junc ture .
However, s ince the overexpansion a t the shoulder extends far ther
downstream in the superson ic case, Gracey (kef . 9) conc luded o r i f i ces
located 10 or more diameters downstream would sense freestream pressure with
"smal l -er ror" a t both subsonic and low supersonic speeds. The consensus o f
t ransonic tunnel operators seems to agree w i th Gracey.
As noted by Davis and Graham (Ref. 1 1 1 , in the past the data obta ined
by Estabrooks (Ref. 12) f o r a cone-cy1 inder has been used, almost universal ly,
as a standard for t ransonic interference-free data. Al though the purpose of
these measurements was t o i n v e s t i g a t e w a l l e f f e c t s , t h e r e s u l t s a r e a l s o
per t inent to p robe des ign and performance. Estabrooks obtained data on a 20°
apex ang le cone-cy l inder in the AEDC-PWT 16T tunne l w i th a model blockage r a t i o
o f 0.008% and M = 0.7 to 1.4. A cursory examinat ion of these data indicates
o r i f i c e s l o c a t e d seven c a l i b r e s downstream o f the cone-cy l inder junc ture , will
a l low accura te measurements o f f rees t ream s ta t i c p ressure th roughout the
t ransonic speed regime. The data were unaffected by varying freestream Reynolds
number per meter from 4.5 t o 12.7 mill ion (1.36 x IO < Re/ft < 3.87 X 10 ).
The fac t tha t f rees t ream s ta t i c p ressure cannot be measured a t any one loca t ion ,
as M + 1.0, will be es tab l i shed in the fo l low ing d iscuss ion .
6 6
88
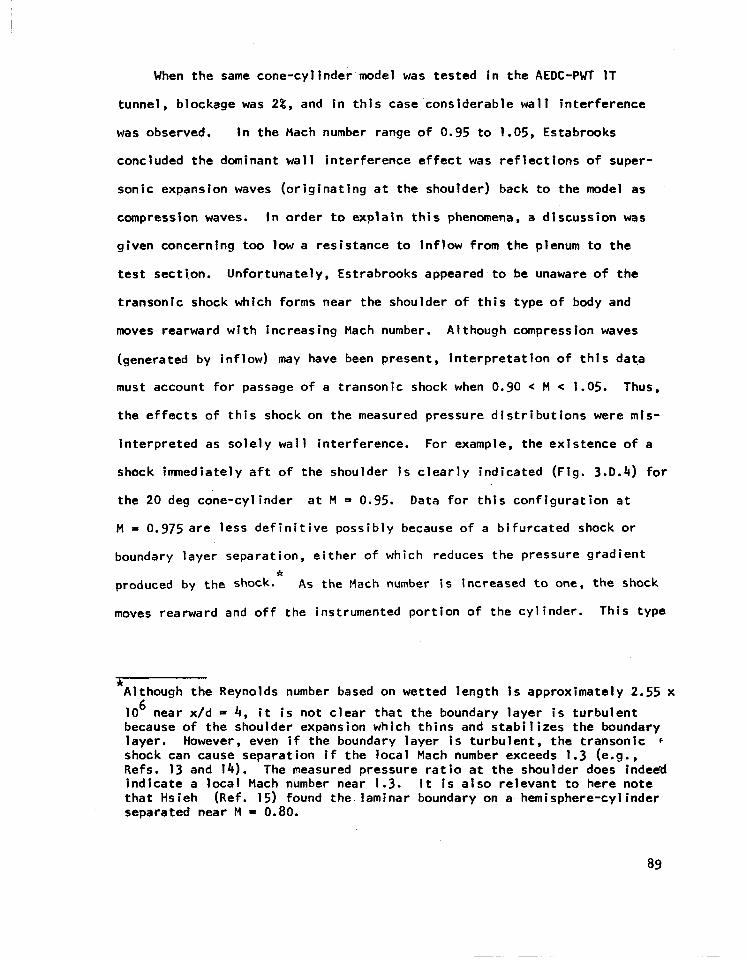
When t h e same cone-cyl inder model was t e s t e d i n t h e AEDC-PWT 1T
tunnel, blockage was 28, and i n t h i s case cons iderable wal l in ter ference
was observed. I n t h e Mach number range o f 0.95 t o 1 .OS, Estabrboks
concluded the dominant wal l interference ef fect was r e f l e c t i o n s o f s u p e r -
sonic expansion waves (o r i g ina t i ng a t t he shou lde r ) back to the model as
compression waves. In o r d e r t o e x p l a i n t h i s phenomena, a d iscuss ion was
given concerning too low a res is tance to in f low f rom the plenum t o t h e
test secti ,on. Unfortunately, Estrabrooks appeared to be unaware of t he
transonic shock which forms near the shoulder o f t h i s t y p e o f body and
moves.rearward w i th inc reas ing Mach number. Although compression waves
(generated by inflow) may have been p resen t , i n te rp re ta t i on o f t h i s da ta
must account f o r passage of a transonic shock when 0.90 M 1.05. Thus,
t h e e f f e c t s o f t h i s shock on the measured p ressu re d i s t r i bu t i ons were mis-
i n te rp re ted as so le ly wa l l in te r fe rence. For example, t he ex i s tence o f a
shock imnediately a f t o f t h e s h o u l d e r i s c l e a r l y i n d i c a t e d ( F i g . 3.D.4) f o r
the 20 deg cone-cy l inder a t M - 0.95. Data f o r t h i s c o n f i g u r a t i o n a t
M = 0.975 a r e l e s s d e f i n i t i v e p o s s i b l y because of a b i f u rca ted shock o r
boundary layer separation, either of which reduces the pressure gradient
produced by the shock. As the Mach number i s increased t o one, the shock
moves rearward and o f f t h e i n s t r u m e n t e d p o r t i o n o f t h e c y l i n d e r . T h i s t y p e
f:
* Although the Reynolds number based on wetted length is approximately 2.55 x
10 near x/d = 4, it i s n o t c l e a r t h a t t h e boundary l a y e r i s t u r b u l e n t because of the shoulder expansion which th ins and s t a b i l i z e s t h e boundary layer . However, even i f the boundary layer i s t u r b u l e n t , t h e t r a n s o n i c F
shock can cause separation i f the loca l Mach number exceeds 1.3 (e.g., Refs. 13 and 14). The measured p ressu re ra t i o a t t he shou lde r does indeed i n d i c a t e a l o c a l Mach number near 1.3. It i s a lso re levan t t o he re no te that Hsieh (Ref. 15) found the. laminar boundary on a. hemisphere-cylinder separated near M = 0.80.
6
89
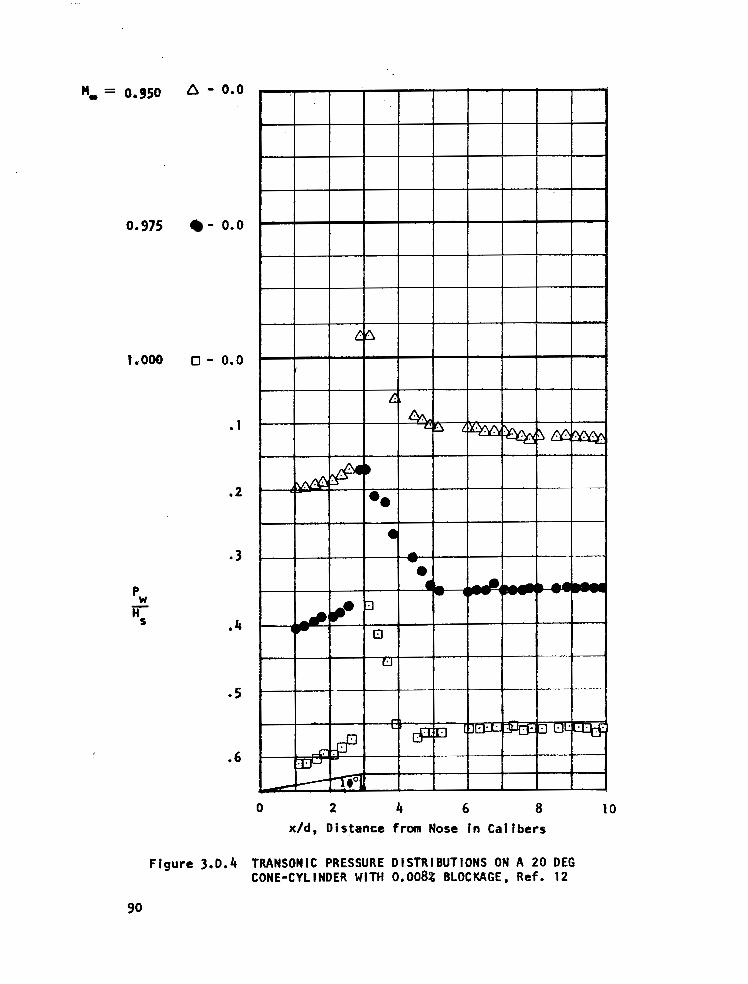
H, 0.950
0.975
1 .ooo
a - 0.0
- 0.0
0 - 0.0
. I
.2
* 3
.4
.5
.6
0 2 4 6 8 10 x/d, Distance from Nose in Ca l ibers
Figure 3.0.4 TRANSONIC PRESSURE DISTRIBUTIONS ON A 20 DEG CONE-CYLINDER WITH 0.008% BLOCKAGE, Ref. 12
90

of phenomena may be c l e a r l y seen in the sct i l leren photographs presented
by Page (Ref. 16) f o r a 14 deg apex cone-cy1 inder with a b l o c k a g e r a t l o
o f 0.005%. A ra the r genera l conc lus ion i s t ha t t he t ranson ic shock will
move o f f a c y l i n d r i c a l probe as M +l, and merge w i t h t h e s t i n g and/or sup-
p o r t shocks, provided there i s no wa l l in te r fe rence.
Movement o f a transonic shock on axisymmetrlc bodies can now be c a l -
cu la ted v ia t he computer program o f South and Jameson (Ref. 17). This
program provides a so lu t ion to the comple te po ten t ia l equat lons for steady
t ransonlc f low. Thus, i n o r d e r for these so lut ions to be app l i cab le to
rea l bodies there must be no boundary layer separation (e.g., Ref. 15).
wind tunnel probes, the body must be f r e e o f w a l l and i n t h e case o f
in ter ference.
The ex is tence
t ranson ic f low has
Cone-cylinder mode
w i t h M = 0 . 5 t o 1.
o f boundary layer separat ion on cone-cyl inders in
been investigated by Robertson and Chevalier (Ref. 18).
1s w i t h a b l o c k a g e r a t i o o f 0 .5% and 1.2% were tested
17 i n t h e AEDC-PWT 1T tunnel. These inves t i ga to rs
found that the boundary layer separated at the cone-cy1 inder juncture when
the cone apex angle was 40 deg or more and tl < 0.85. In general , as cone
apex angle increased,the Mach number f o r boundary layer attachment increased
Although surface pressures were only measured a d i s t a n c e o f f o u r c a l i b r e s
downstream of the shoulder , the f reest ream s tat ic pressure was a t t a i n e d i n
most cases w i th in l ess t han f ou r ca l i b res . Th i s was found t o be t r u e for
b o t h s i z e s o f models w i t h apex angles ranging from 20 t o 60 deg.
The pr imary except ion to th is observa t ion occurs when a t ransonic
shock locates near an o r i f i c e . If the shock i s f o r w a r d o f t h e o r i f i c e ,
91

t he measured s ta t i c p ressu re will tend to be higher than freestream. The
exact amount depends on s t r e n g t h o f t h e shock and d is tance from o r i f i c e .
Correspondingly, the pressure will be low i f the shock is loca ted near , bu t
downstream o f , the o r i f i ce . S ince the t ranson ic shock moves rearward with
increasing Mach number, a l l s t a t i o n s a l o n g a probe's stem are a f fec ted .
For example, schl ieren photographs obtained by Robertson and Chevalier
show the tra'nsonic shock on a 20 deg cone-cy1 inder model i n i t i a l l y forms
near the shoulder a t M = 0.8, and increases in s t rength and moves rearward
as Mach number increases. The r a t e o f movement o f t h i s shock i s a f f e c t e d
by model blockage and the extent o f the supersonic zone on a given model.
The e f f e c t o f wind tunnel blockage on movement o f the t ranson ic shock
may be seen i n t h e M = 1 data of Estabrooks (Ref. 12). By vary ing the
s ize o f cone-cy l inder models t o obta in wind tunnel b lockage ra t ios from 0.5%
t o 4%, the transonic shock moved forward from x/d = 5 to less than 4 a t
M =i 1. Th is e f fec t o f b lockage may a l s o be seen i n t h e s c h l i e r e n p i c t u r e s
o f Page (Ref. 16) which compare the t ransonic shock locat ions on the same
model i n two d i f f e r e n t s l o t t e d - w a l l t u n n e l s w i t h b l o c k a g e r a t i o s of 0.25%
and 0.005%. Further evidence o f t h i s phenomena may a l s o be found i n t h e
da ta o f Capone and Coates (Ref. 19) and Couch and Brooks (Ref. 2 0 ) . For
example, the surface pressure data of Capone and Coates provide an excel lent
i l l u s t r a t i o n o f t r a n s o n i c shock movement on a 20 deg cone-cy l inder . In th is
case, the model was tested in the Langley 16-Foot Transonic Tunnel and had a
b l o c k a g e r a t i o o f 0.198%. A sample o f t h i s da ta i s rep roduced i n F ig . 3.0.5.
Here we see the transonic shock move from x/d = 3.25 a t M = 0.90 back to x /d 3
10.5 a t M = 1.025. Measurements a t the nex t h igher Mach number, M - 1.04,
ind ica ted the shock had moved pas t the ins t rumented por t ion o f the cy l inder . *
* R e f l e c t i o n o f t h e bow shock back onto the cylinder was not observed u n t i l M 2 1.10.
92
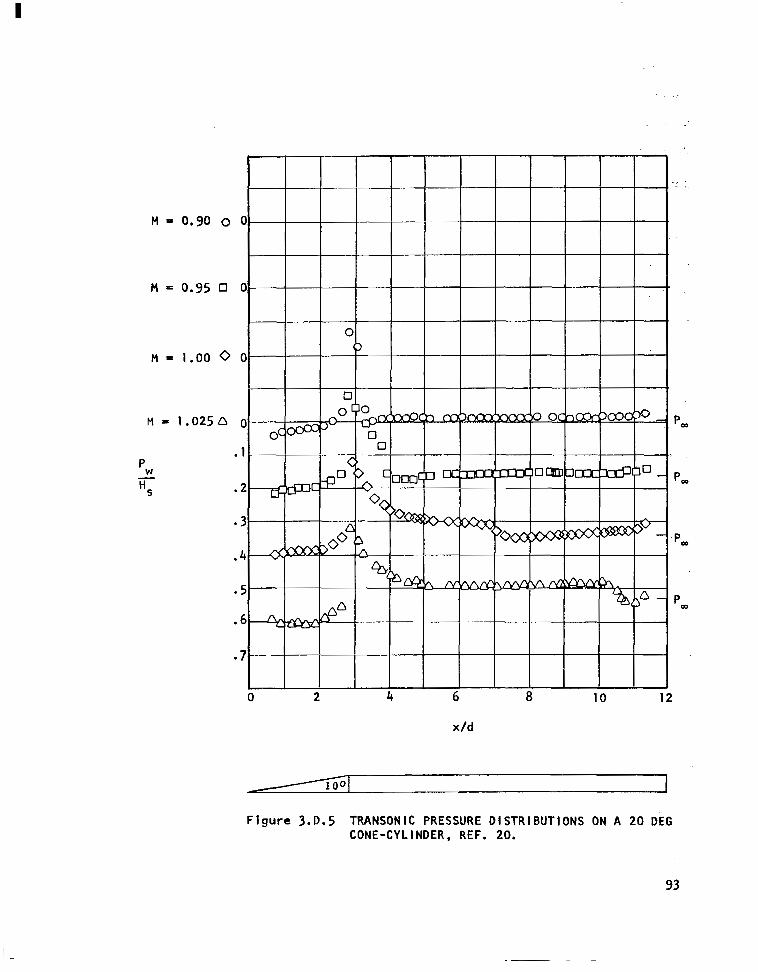
M = 0.90 0
M = 0.95 0
M = 1.00 0
M = 1 .0250
x/d
Figure 3.0.5 TRANSONIC PRESSURE D ISTRIBUTIONS ON A 20 DEG CONE-CYLINDER, REF. 20.
93

. . . . . . . . . . . ." . .. . . .. . .
S im i la r measurements f o r a 40 deg cone-cy1 inder, w i t h t h e same blockage,
showed the shock was a t x/d = 10.5 when M =I 1 .Ob. Thus, the larger expansion
a t t he cone-cy l i nde r j unc tu re and the correspondingly larger pocket o f super-
s o n i c f l o w r e s u l t e d i n a re tarded movement of the transonic shock.
Based on these var ious resul ts , i t appears that a 20 deg apex cone-
c y l i n d e r must have a cross-sect ional area less than 0.01% of the tunnel area
i n o rde r t o avo id re ta rd ing t he rea rward movement o f a t ransonic shock wi th
increasing Mach number. Th is conc lus ion i s based on measurements made o n l y a t
t unne l cen te r l i nes . When the probe i s moved o f f c e n t e r l i n e , c l o s e r t o a w a l l ,
even smaller sizes would be necessary to avo id wa l l in te r fe rence. A lso , some
asymmetry o f t h e shock may be expected. Thus, a non-per turb ing f low measure-
ment technique, such as a laser Doppler velocimeter, appears to be very
des i rab le f o r t unne l ca l i b ra t i ons i n t he range 0.95 < M < 1.05.
f
Recently, Neman and Klunker (Ref. 21) and South and K e l l e r (Ref. 22)
have per formed ca lcu lat ions for t ransonic f lows about a i r fo i ls and axisym-
metr ic bodies which include wind tunnel wal ls in the boundary condi t ions. These
c a l c u l a t i o n s show the shock moves forward when the open- jet boundary condi t ion
is app l ied , i .e . , Pw - - Poo . S im i la r l y , t he shock moves rearward, compared
t o t h e f r e e - a i r s o l u t i o n , when t h e s o l i d w a l l boundary c o n d i t i o n i s a p p l i e d .
I n l i g h t o f t h e f o r e g o i n g d i s c u s s i o n , t h i s i m p l i e s t h a t e i t h e r s l o t t e d o r
per fo ra ted wa l ls ac t more l i k e o p e n - j e t s as the s i ze o f t ranson ic models i s
increased. This phenomenon i s apparen t l y a resu l t o f l a rge r pocke ts o f super -
sonic f low which impress lower pressures at the wal ls. This in turn draws i n
more a i r from the plenum chamber and apparen t l y sh i f t s t he model f l o w p a t t e r n
toward the open-jet boundary condit ion.
* Th is may p a r t i a l l y e x p l a i n t h e t r a n s v e r s e Mach number gradients repor ted by some of the quest ionnaire respondents.
94
shown i n F i g . 3.D.6. The correspond
f o r 0.9 c M < 1.02. The o s c i l l a t i o n
cy l inder sur face p ressure , i s caused
"
t i o n a l IO deg cone-cyl inder having 0.021% tunnel blockage. These probes
ing sur face pressures are shown i n F
i n c a l c u l a t e d Mach number, based on
by passage o f the t ranson ic shock.
i t i s r e l e v a n t t o n o t e t h a t t r a n s o n i c shock e f f e c t s can be conf ined to a
As regards stat ic pressure probe design, smal l angle cones can be used
to m in im ize s t reng th o f t he t ranson ic shock. In addi t ion, the smal ler ex-
pansion angle will genera te less wa l l in te r fe rence fo r a given probe diameter
and the boundary l aye r will remain at tached at the cone-cyl inder juncture.
A separated boundary layer i s undes i rab le because it introduces disturbances
which are convected downstream a-nd can cause a d d i t i o n a l e r r o r s i n s t a t i c p r e s -
sure measurements (see Eq. 3.D.1, p. 98) . Thus, i n t he pas t t he IO deg apex
angle cone-cylinder probe has served as a convenient compromise between optimum
transonic performance and ease o f c o n s t r u c t ion.;:
The problem o f o r i f i c e - t r a n s o n i c shock interference, which i s character-
i s t i c o f c o n e - c y l i n d e r probes, may be avo ided by loca t ing o r i f i ces on very
small-angle cones. This was demonstrated by Sutton (Ref. 24) who compared
the t ransonic surface pressures on a 3 deg included-angle cone w i t h a conven-
a r e
ig . 3.D.7.
the
However , srna 1 1
Mach number range (e.g., AM = 0.02) when using a carefu l ly des igned 10 deg cone-
cy l inder probe at * tunne l cen ter l ine . In con t ras t , the 3 deg cone provides
a monotonical ly increasing pressure and decreasing Mach number throughout the
transonic range.
Unfor tunate ly , the 3 deg cone i s repo r ted by Gracey (Ref. 9) t o be
sens i t i ve to f low misa l ignment . For ang les o f a t tack between - + I deg, pressure
* The AGARD needle probe described in Reference 23 has a cone apex a n g l e o f approximately 12 deg and fou r 0.3 mm o r i f i c e s l o c a t e d 11 .3 c a l i b r e s down- stream o f the shou lder .
95
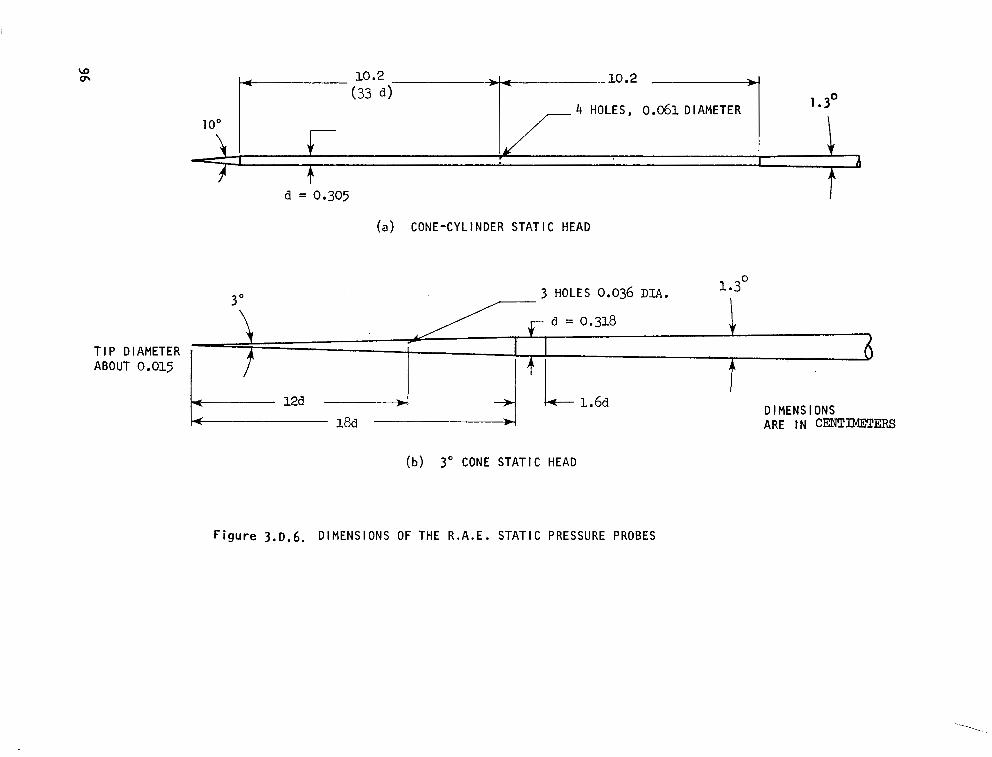
4 HOLES, 0.061 DIAMETER
d = 0.305
(a ) CONE-CYLINDER STATIC HEAD
3 HOLES 0.036 DIA. 1.3' 3"
T I P DIAMETER -
0g015 DIMENSIONS ARE tN (XN'TmERS
(b) 3" CONE STAT1 C HEAD
Figure 3.0.6. DIMENSIONS OF THE R.A.E. STATIC PRESSURE PROBES

+o .02 - 0'.90 0.b2 0.44 0.96 0.'98 1.60 1.b2 = MACH NUMBER ' '' DEDUCED FROM AM - MR PLENUM CHAMBER
0 - - " - STAT I C PRESSURE = M -M
H C 155 cm FROM 6 R e = 15.7 x 10 per meter THROAT. -0.02 I I I I I I I
(a) 10' CONE-CYLINDER STATIC HEAD = MACH NUMBER MH DEDUCED FROM
+o .02 1 1 I I I I I
0.90 0.92 0.94 0.96 0.98 1.00 1.02 I An
= fl -M H C
R e = 10.6 x 10 per meter 6
-0.02 I I I I I I I
(b) 3" CONE S T A T I C HEAD
S T A T I C HEAD PRESSURE
Figure 3.D.7. TRANSONIC CHARACTERISTICS OF THE TWO R.A .E . PROBES

measurements on a 3 deg cone In the Lang ley 8 - f t . Transonic Tunnel indicate
va r ia t i ons o f app rox ima te l y 0.02 qi near M = 1. These r e s u l t s were the same
for a 0.033 cm (0.013 i n . ) o r i f i c e l o c a t e d e i t h e r 12.7 o r 17.8 cm (5 o r 7 in.)
f rom the t ip . Thus, a small-angle cone can be used t o c a l i b r a t e w i n d t u n n e l s
near M = 1 , b u t i t s s e n s i t i v i t y t o f l o w a n g u l a r i t y can make i t d i f f i c u l t
t o r e s o l v e Mach number var iat ions as smal l as 0.001.n
Effects of Various Parameters on Stat ic Pressure Probes
Size :
As found by Couch and Brooks (Ref. 20) , cone-cy1 inder bodies with a tunnel
b l o c k a g e r a t i o o f o n l y 0.03% can have cyl inder surface pressures which depart
s ign i f i can t l y f rom f rees t ream s ta t i c nea r M = 1. Therefore, for accurate
tunne l ca l i b ra t i ons a long t he cen te r l i ne and near M = 1, s ta t ic pressure probes
with b lockage ra t ios larger than 0.01% a re no t recommended. The wa l l - i n te r fe rence -
f ree per formance o f such probes can be ca luc la ted us ing the South and Jameson
computer program (Ref. 17). I f f o r some reason a la rger p robe i s requ i red ,
cen te r l i ne b lockage e f fec ts can be estimated by theo re t i ca l ana lys i s , e.g.,
Refs. 21, 22 and 26. Wall ref lected disturbances can also be detected by having
o r i f i c e s a t more than one stat ion and checking monotonicity o f t h e d a t a w i t h
increasing distance from the nose. Pope and Goin (Ref. 6) suggest moving the
model o f f c e n t e r l i n e and/or using a sch l i e ren system.
Once the p robe d iamete r i s se lec ted , a t l eas t f ou r o r i f i ces w i t
d i a m e t e v o f 0.051 cm (.02 in.) should be located IO o r more c a l i b r e s
o f the nose-cyl inder juncture. Final ly, errors induced by o r i f i c e s
discussed in Sec t i on lll.D.4.
h a
downstream
i z e a r e
A Addi t iona l t ranson ic measurements o f f l o w a n g u l a r i t y w i t h a 3 deg con ica l probe are reported by Wright, et a l . (Ref. 25) .
98

Reynolds .Number:
' A t Reynolds numbers charac ter is t i c o f t ranson ic tunne ls ( i .e . , Re/m > 5
mi l l ion) , s ta t i c p ressure p robes a re usua l ly unaf fec ted by t h i s v a r i a b l e ,
provided the probe boundary layer is at tached.
Tu rbu 1 ence :
In c o n t r a s t t o t h e P i t o t probe, s ta t i c p ressu re
af fected by turbulence. The des i red quan t i t y 1s the
probe data can be
s tat ic pressure asso-
c i a t e d w i t h t h e mean f low. Bryer and Pankhurst (Ref. 27) no te tha t when the
tu rbu lence sca le i s la rge , compared to the probe dimensions, the measured
s t a t i c p r e s s u r e will tend t o be low and i s p r o p o r t i o n a l t o the dynamic
p ressure o f the tu rbu lence normal to an o r i f i c e . I f the tu rbu lence sca le i s
smal l , the measured s ta t i c p ressu re will be high. The fo l low ing equat ion
has been der ived by Siddon (Ref. 28) t o r e l a t e t h e e r r o r i n measured,mean
s ta t i c p ressu re t o t he dynamic pressure generated by a tu rbu len t f low.
- Pm - Pt = A p ( U + (ut) ')+
2
If t h e o r i f i c e s a r e l o c a t e d so there are no nose and/or
(3.D. 1)
support stem-induced
errors , then A = 0. B i s a measure o f t he c ross f l ow- induced e r ro r i n measured
s ta t i c p ressu re . When a probe i s i n c l i n e d a t an angle a i n a steady f low,
Eq. (3.0.1) may be w r i t t e n as
Pm - Pt = 2q(A cos a + B s i n a) 2 2
Th is t ype o f measurement was performed i n subsonic flow by Siddon w i t h
a standard, classical probe. The probe had: (1 ) a n e l l i p s o i d a l nose, (2)
a diameter o f 0.305 cm (0.12 i n . ) , and (3) s i x o r i f i c e s l o c a t e d 8 1/2 diam-
e t e r s downstream from the nose. For t h i s probe, B was found to be -0 .55.
99

A special probe, designed to measure unsteady crossflow and f l u c t u a t i n g
s ta t i c p ressure , was a lso tes ted by Siddon. Th is probe, which had a circum-
f e r e n t i a l s l i t fo r sens ing s ta t i c p ressure , was found . t o have a B value of
-0.23. Accord ing to S iddon, the d i f ference in B values i s p r i m a r i l y caused by
t h e d i f f e r e n c e i n o r i f i c e arrangement. Addit ional measurements i n a r o t a t i n g -
inc l fned nozz le, a turbulent channel f low, and a round tu rbu len t j e t i nd i ca ted
B varied over the range -0.46 t o -0.35. Thus, the magnitude of crossf low-
induced er rors var ies wi th probe des ign and turbulence sca le and i n t e n s i t y .
Bryer and Pankhurst (Ref. 27, p. 43) suggest that probes be c a l i b r a t e d i n
f lows w i th tu rbu lence c lose ly match ing those in wh ich the p robe will be used.
T h i s i s o b v i o u s l y an area which needs further research.
Yaw: - When s e v e r a l o r i f i c e s (4 o r more) are located around the probe clrcum-
ference, flow a n g u l a r i t y causes the measured s t a t i c p r e s s u r e t o be low. Th is
can be r e a d i l y seen from the p ressure d is t r ibu t ion about a c i r c u l a r c y l i n d e r
normal t o a f l o w (e.g., see Appendix I I I ) . Bryer and Pankhurst (Ref. 27)
no te t ha t t he yaw- induced s ta t i c p ressu re e r ro r o f t h i s t ype o f p robe i s
t y p i c a l l y 0.01 PaD when yawed 3 deg. The e r r o r , i n a p a r t i c u l a r case, i s
dependent on nose geometry and o r i f i c e l o c a t i o n . R i t c h i e ( k e f . 10) repor ted
yaw-induced er ro rs genera l l y inc rease w i th Mach number. Thus, f o r a g iven
a l l o w e d e r r o r i n measured s t a t i c p r e s s u r e , t h e p e r m i s s i b l e v a r i a t i o n i n f l o w
misalignment decreases. Gracey (Ref. 91, R i t c h i e (Ref. 101, and Rittenhouse
(Ref. 29) have repor ted on stat ic pressure probes designed t o minimize yaw
s e n s i t i v i t y . These probes u t i 1 i ze on l y t w o o r i f i c e s l o c a t e d 30 to 40 degrees
from the windward-meridian. Although these probes have smal l errors at
t ransonic speeds and yaw angles up t o 28 deg, they requi re knowledge o f t h e
s t ream d i rec t ion . S ince th is i s no t usua l l y known dur ing wind tunnel ca l ibra-
t ions , th is t ype o f p robe cannot be recommended. Hence, the conventional
100

probe with four or more orifices is preferred. Particularly since the flow
angularity in the central core of many contemporary transonic and supersonic
tunnels is less than one degree, the conventional probe will usually have
negligible error due to yaw.* For example, Ritchie (Ref. IO) found a two
degree angle o f attack caused less than 0.2% error in measured static pressure
through-out the transonic Mach number range. (These results were obtained
with a probe having an ogival nose (f = 12) and orifices located 12 1/2 calibres
from the nose.) However, this is another reason for minimizing flow angularity
in the empty tunnel, i.e., not only will model testing results be more represen-
tative of free-flight phenomena, but the tunnel calibration will be more accurate.
Lakes and Support Interference:
r
The effects of a support flare on base pressures have been investigated
by Chevalier (Ref. 30) over a Mach number range of 0.70 to 1.60. Based on
the experimental results at M = 1 , a flare located approximately I 5 flare
diameters downstream of the orifices will not interfere with static pressure
probe readings. An I I deg flare (semiangle) located at this distance from the
orifices will have negligible effect on the flow at the orifices throughout
the transonic speed regime. The required distance for no interference de-
creases with smaller flare angles and increasing Mach number.
Interference caused by a cylindrical strut normal to the probe axis has
been investigated by Krause and Gettelman (Ref. 31) for M = 0.3 to 0.9.
These authors found that a distance of 14 strut d
probe orifices and the strut was required for neg
these speeds .
iameters between static
liqible interference at
* It is conceivable that a static pressure probe could be calibrated for yaw errors. Static pressure readings could then be corrected for measured flow angles. However, most tunnels do not have sufficient flow angularity to warrant this procedure, and few operators would consider i t practical.
101
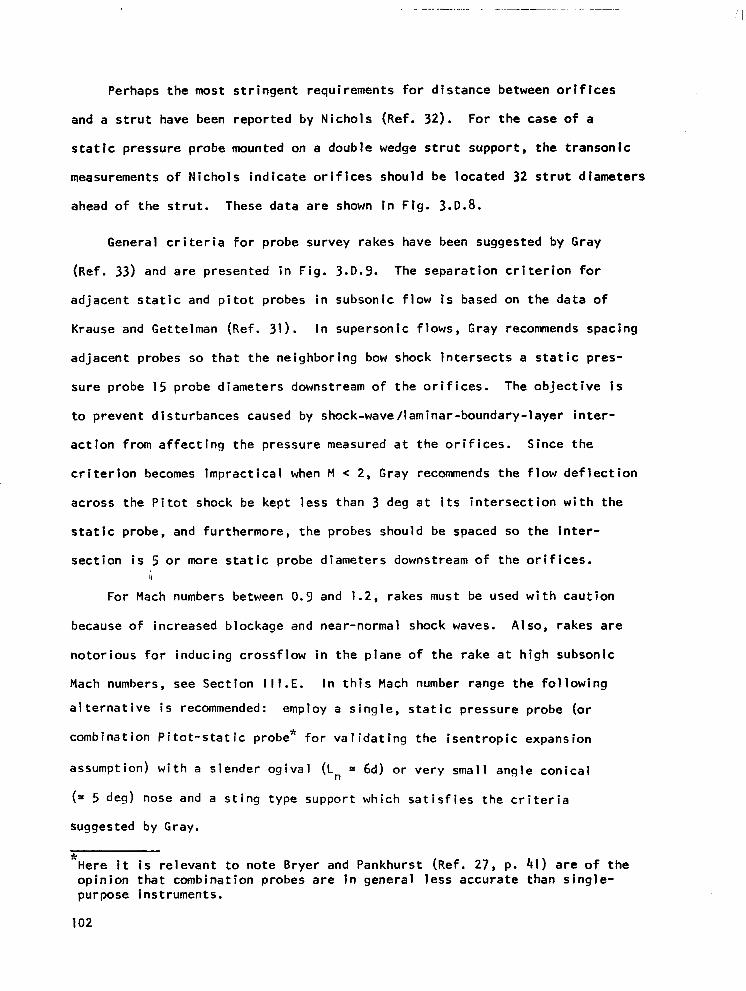
Perhaps the most s t r ingent requ i rements fo r d is tance between o r i f l c e s
and a s t r u t have been reported by Nichols (Ref. 32). For the case of a
s ta t i c p ressure p robe mounted on a double wedge s t ru t suppor t , the t ranson ic
measurements o f N i c h o l s i n d i c a t e o r i f i c e s s h o u l d be located 32 s t ru t d lamete rs
ahead o f t h e s t r u t . These data are shown i n F i g . 3.0.8.
General c r i te r ia fo r p robe survey rakes have been suggested by Gray
(Ref. 33) and are presented in F ig . 3.D.9. The s e p a r a t i o n c r i t e r i o n f o r
ad jacen t s ta t i c and p i t o t probes in subson ic f low i s based on the data o f
Krause and Gettelman (Ref. 31) . In supersonic f lows, Gray reconmends spacing
adjacent probes so that the ne ighbor ing bow shock i n t e r s e c t s a s t a t i c p r e s -
sure probe 15 probe diameters downstream o f t h e o r i f i c e s . The o b j e c t i v e is
to prevent d isturbances caused by shock-wave/laminar-boundary-layer i n t e r -
ac t ion f rom a f fec t ing the p ressure measured a t t h e o r i f i c e s . S i n c e t h e
c r i t e r i o n becomes impract ica l when M 2, Gray reconmends t h e f l o w d e f l e c t i o n
across the P i to t shock be kept less than 3 deg a t i t s i n t e r s e c t i o n w i t h t h e
s t a t i c probe, and furthermore, the probes should be spaced so t h e l n t e r -
s e c t i o n i s 5 o r more s t a t i c probe diameters downstream o f t h e o r i f i c e s . il
For Mach numbers between 0.9 and 1.2, rakes must be used w i t h c a u t i o n
because of increased blockage and near-normal shock waves. Also, rakes are
no to r ious f o r i nduc ing c ross f l ow i n t he p lane o f t he rake a t h igh subson ic
Mach numbers, see Section I I1 .E . I n t h i s Mach number range the fo l lowing
a l t e r n a t i v e i s recommended: employ a s ing le , s ta t i c p ressure p robe (o r
combinat ion P i to t -s ta t ic probe* for va l ida t ing the i sen t rop ic expans ion
assumption) with a s lender og iva l (L = ad) or very smal l angle conical
(x 5 deg) nose and a s t i n g t y p e s u p p o r t w h i c h s a t i s f i e s t h e c r i t e r i a
n
suggested by Gray.
.L Here i t i s r e l e v a n t t o n o t e B r y e r and Pankhurst (Ref. 27, p. 41) a r e o f the opin ion that combinat ion probes are in genera l less accurate than s ing le- purpose instruments.
102

0.4
0.3
p -P
q - w -
0.2
0.1
0
-0.1
d
W 0
H 0 -m a - 0.90
A - 1.00
8 12 16 20 24 28 32 36
I /S, DISTANCE FROM O R I F I C E To STRUT SHOULDER
Figure 3.D.8 EFFECT OF ORIFICE LOCATION U T Z I Z I U G A DOUBLE- WEDGE SUPFORT STRUT, REF. 32

. . ,. ..- ._.......I I _,, , , . ..I . .I,. -
l o 11° 16 d for for M > le6 1.6
Cylindrical support
For negligible support interference: l / D - > 14, all values of M
For negligible adjacent probe interference: M < 0.9: dd1> 6 / M - > 1.2: Determined by the intersection of bow wave with static probe
Figure 3. D. 9 GENERAL CRITERIA FOR PROBE SURVEY RAKES, Ref. 33
104

lll.D.3. Supersonic Static Pressure Probes
Although Barry (Ref. 34) has shown that supersonic Mach number ca l cu la -
t i o n s based on P i t o t and f rees t ream s ta t i c p ressure a re no t as accurate as
the Mach probes described in Sec t i on I I I .C, t h i s approach
because of i t s f a m i l i a r use i n subsonic flows and i t s ease
I n a d d i t i o n , i t does prov ide a method f o r c a l c u l a t i n g H wh
on the assumption o f an isentropic expansion from s t i l l i n g
section.
i s o f t e n used
o f cons t ruc t i on .
i c h does no t depend
chamber t o t e s t
Walter and Redman (Ref. 35) measured p ressu re d i s t r i bu t i ons on a 7 deg
included angle cone-cy1 inder at Mach numbers 1.55 and 2.87." These data
ind ica te the sur face p ressure on the cy l inder re tu rns to f rees t ream s ta t i c
beyond IO cal ibres f rom the shoulder. In general , as Mach numher increases
the overexpansion increases and longer distances from the shoulder are re-
quired. Increasing cone angle has a s i m i l a r e f f e c t .
P ressu re d i s t r i bu t i on da ta on cone-cy l i nde r - f l a re con f i gu ra t i ons a t
speeds up t o M = 4.5 have been reported by Washington and Humphrey (Ref. 36).
Data obtained on a b l u n t nosed, 10.3 deg cone-cy l inder a t M = 4.5 and zero
yaw ind i ca te t he su r face p ressu re re tu rns t o w i th in two percent of freestream
s t a t i c a t n i n e c a l i b r e s downstream of the shoulder.
I n t he case o f yaw, the da ta o f Reference 36 show t h e c i r c u m f e r e n t i a l l y
averaged pressure i s below f reestream stat ic. For a given yaw angle, the
average pressure decreases further as Mach number increases. In general ,
increas ing the number of o r i f i c e s about the circumference will decrease yaw
s e n s i t i v i t y . However, Gray (P.ef. 37) and others have noted that sur face
* This data is a lso presented in Reference 6 .
105
pressure on long cy1 inders, measured approximately 240 deg c i r c u m f e r e n t i a l l y
from the windward location, provides a close approximatfon to f reestream
s t a t i c for M less than 4.0. Thus, t h i s t y p e o f p r o b e can be used to e l i m i n a t e
yaw-induced e r r o r s i n s t a t i c p r e s s u r e .
As discussed previously, since most tunnels have small f low angulari ty
i n t h e empty tes t sec t i on , i t i s u n l i k e l y t h a t yaw induced e r r o r s will be
s i g n i f i c a n t . But t h i s must be determined by the user., If s ta t i c p ressu re
i s b e i n g used t o c a l i b r a t e Mach number and an accuracy of 0.1% i s d e s i r e d ,
then small yaw-induced errors may be important. In which case, a s t a t i c
probe w i t h two o r i f i c e s l o c a t e d c i r c u m f e r e n t i a l l y 70 - 80 deg apar t can provide
a more accurate measurement. This can be accomplished by rotat ing the probe
to l oca te t he windward generator (highest pressure) and then rotat ing the
probe u n t i l t h e two o r i f i c e s agree."
In order to avoid support- interference, Gray (Ref. 37) recomends the
cy l inder d iameter be c o n s t a n t f o r a t l e a s t 8 diameters downstream o f t h e
o r i f i c e s . Any subsequent enlargement in d iameter should be r e s t r i c t e d t o
no more than a 10 deg f l a r e ( semiang le ) . Add i t i ona l c r i t e r i a f o r rake
arrangements are given i n F i g . 3.D.9.
In the past , P i to t pressures and surface pressures on conical probes
have f requen t l y been used in superson ic f l ows t o ca l cu la te Mach number,
e.g., Refs. 38 and 39. Also, an ext remely accurate conica l s ta t ic pressure
probe i s briefly discussed by Pope and Goin (Ref. 6 ) . This probe design
has a short (1.78 cm) 8 deg c o n i c a l t i p f o l l o w e d by a long (16.26 cm) 1 deg
inc luded-angle cone. Or i f ices enc i rc le the 1 deg cone a t three locat ions.
" This assumes no or i f i ce- induced e r ro rs .
106

The e r r o r i n measured s t a t i c p r e s s u r e i s r e p o r t e d t o be o f t h e o r d e r o f 0.1%
of t rue f reest ream pressure when M = 1.8 t o 3.5. Thus, these data represent
some o f t h e most accurate s ta t ic -pressure measurements i n supersonic f low.
However, Gray (Ref. 37) has recent ly rev iewed the mer i ts and l i m i t a t i o n s
o f superson ic s ta t i c -p ressure probes. Cone-cy1 inder, sharp cone, and p lanar
probes were considered. Based on t h e e f f e c t s of Mach number, ang le o f a t tack ,
and Reynolds number, Gray concluded that the cone-cyl inder probe is, in general ,
super ior for use a t Mach numbers below 4.
I n t h i s Mach number range, t h e Reynolds numbers o f most supersonic tunnels
a re l a rge enough fo r v i scous co r rec t i ons t o be neg l i g ib le . Th i s e f fec t can be
est imated by ca lcu lat ing the equiva lent inv isc id pressure from an expression
suggested by Gray (Ref. 37) for cone-cyl i nders probes i n f lows w i th Mach number
less than 5.
(’w’meas = 1 + 0.25 , (‘w) i n v i s c i d
(3 .0 .3)
where - 3 x E M / (Rel /C ) 1 /2 0
C Z ( p /p ) (T /T ) , Chapman-Rubesin v iscos i ty parameter . w e e w
For a g iven conf igurat ion, the v iscous in teract ion coef f ic ient decreases wi th
increas ing Mach number. For example, the hypersonic experiments o f Peterson
and George (Ref. 40) i nd i ca te a c o e f f i c i e n t o f 0.08 i s a p p r o p r i a t e f o r a
20 deg cone-cyl inder probe at M = 7.2 and 14.0.
*
* These inves t i ga to rs , among others, ,have noted that stat ic-pressure probes should not be used i n f l o w s w i t h l a r g e a x i a l or transverse pressure gradients.
I n o r d e r to s imu l taneous ly m in im ize t he e f fec ts o f v i scous i n te rac t i on
and nose overexpansion a t supersonic speeds, it i s recommended t h a t o r i f i c e s
be l o c a t e d a t l e a s t 16 c a l i b r e s downstream of the shoulder. In cases where
c o r r e c t i o n i s j
Gray's d iscussi
p r e s s u r e f o r v i
i n v i s c i d , s t a t i
udged to be necessary, the interested reader may r e f e r , t o
on (Ref. 37) of a procedure for co r rec t i ng t he measured
scous i n t e r a c t i o n and ob ta in ing a b e t t e r e s t i m a t e o f t h e
c pressure.
S ince cone-cy l inder probes are re la t ive ly long, they not on ly have small
r i g i d i t y b u t a l s o cannot be used in p ressu re g rad ien ts . I n add i t i on , t hey
a r e s e n s i t i v e to yaw. For th is reason, shor ter supersonic s ta t ic pressure
probes have been investigated, e.g., Refs. 41, 42, and 43. This work has
focused on the idea o f des ign ing a probe t o have a t l e a s t one s t a t i o n where
the c i rcumferent ia l ly averaged surface pressure remains a cons tan t f rac t i on
o f f rees t ream s ta t i c rega rd less o f Mach number or angle o f inc idence.
The probes designed by Donaldson and Richardson (Ref. 41) and Pinckney
(Ref. 42) are convent iona, l bodies of revolut ion, whereas the probes of Smith
and Bauer (Ref. 43) have nonci rcu lar cross-sect ions. Measurements a t M = 0.2
ind icate the nonci rcu lar probes o f Smi th and 3auer a re comple te ly insens i t i ve
to f low ang les o f - +6 deg. Beyond t h i s a n g l e o f a t t a c k ranqe,boundary layer
separat ion becomes a factor,and errors increase rapidly. Since the yaw sensi-
t i v i t y o f conven t iona l , c i r cu la r p robes i nc rease w i th !lath number, these probes
may or may n o t o f f e r an advantage for supersonic appl icat ions. Pinckney
repor ts f rees t ream s ta t i c p ressure can be determined wi th h is cal ibrated probe
to w i t h i n 2 percent for inc idence angles o f 27 deg and M = 2.5 and 4.0. Bet te r
Richardson. Using a 50 deg in -
i f i c e s l o c a t e d 0.88 diameters
r e s u l t s have been repor ted by Dona
cluded angle cone-cyl inder probe w
ldson and
'4 th 24 or
108
downstream o f the shoulder, these investigators found the probe measured
0.793 POD,and the f rees t ream s ta t i c p ressure cou ld be determined to w i t h i n
1.2 percent over the Mach number range 1 . 1 to 2.5. These r e s u l t s were
obtained for zero yaw. By a d j u s t i n g t h e i r c a l i b r a t i o n f a c t o r t o 0.763, f ree-
s t ream s ta t i c cou ld be ca lcu la ted to w i t h i n 3 percent for incidence angles
up t o 18 deg i n any plane. This represents the smallest yaw s e n s i t i v i t y o f
any supersonic stat ic pressure probe known to the au thors . *
As i s w e l l known, theo re t i ca l so lu t i ons f o r su r face p ressu re d i s t r i bu -
t ions on probes can ass is t the p lacement o f or i f ices to measure f reestream
s ta t i c p ressu re . Based on comparisons o f measured and predic ted sur face
pressures on a hemisphere-cylinder probe, Hsieh (Ref. 44) concluded the
South and Jameson program (Ref. 17) can be used success fu l l y up to M = 1.3.
Beyond t h i s Mach number, a method o f c h a r a c t e r i s t i c s a l g o r i t h m i s recommended
for axisymmetric probes. A ra the r l a rge number o f such programs a r e c u r r e n t l y
ava i lab le . For examples, the interested reader may r e f e r t o t h e p a p e r
by Hsieh (Ref. 44). For non-axisymmetric probes, a number o f f i n i t e d i f -
ference so lut ions for three-d imensional , supersonic , inv isc id f lows are
ava i lab le , e.g., Marconi, e t a l . (Ref. 4 5 ) .
F i n a l l y , t h e use o f mu l t ip le p robes in rake arrangements fo r survey ing
superson ic tunne ls i s we l l known. Rakes can be success fu l l y employed t o
ca l ibrate supersonic tunnels by a p p l y i n g t h e d e s i g n c r i t e r i a o f Gray, Fig.
3 . 0 . 9 , and a v o i d i n g r e f l e c t i o n s o f how shock waves o f f t he t unne l wa l l s .
* Donaldson and Richardson also found a convent iona l , s ing le bore , in te rna l plenum provided less yaw s e n s i t i v i t y t h a n an annular plenum.
109

lll.D.4. Or i f i ce- Induced S ta t i c Pressure Er ro rs
E r r o r s i n s t a t i c p r e s s u r e measurements, caused by v a r i a t i o n s i n o r i f i c e
geometry, have been i n v e s t i g a t e d i n a number o f s tud ies , Refs. 46-52. The
re levant geomet r ic var iab les a re : (1) hole d iameter, (2) r a t i o o f h o l e d e p t h
to d iameter , ( 3 ) t h e r e l a t i v e s i z e o f t h e c a v i t y o r t u b e c o n n e c t i n g t o t h e
hole, (4) i n c l i n a t i o n o f h o l e a x i s r e l a t i v e t o t h e s u r f a c e n o r m a l , (5) the
c o n d i t i o n o f t h e h o l e e n t r y , i.e., whether the edges are square, rounded,
chamfered, o r have burrs .
Ideal ly, the measur ing hole should be i n f i n i t e s i m a l l y s m a l l so as t o
no t d is tu rb the ad jacent f low. Shaw (Ref. 47) no ted tha t the bas ic e r ro r
caused by f i n i t e - s i z e d o r i f i c e s c o n s i s t e d o f t h r e e c o n t r i b u t i o n s . F i r s t l y ,
d i p p i n g o f t h e s t r e a m l i n e s i n t o t h e o r i f i c e causes a divergence of stream-
l i nes wh ich resu l t s i n a higher pressure in subsonic f low. Secondly, an
eddy (or system o f edd ies) i s genera ted w i th in the ho le . (An approximate
analys is by Nest ler (Ref. 51) has shown how t h e t u r n i n g o f such an eddy
can generate increased pressures.) And f i n a l l y , a P i t o t e f f e c t o c c u r s a t t h e
downstream edge o f t he ho le . These th ree phenomena cause the measured pres-
su re t o be too high. Al though the sever i ty of these phenomena decrease w i t h
hole s ize, Rainbird (Ref. 49) observed that holes wi th d iameters less than
0.038 cm (.015 in.) are d i f f i c u l t t o produce w i t h sharp edges and n e g l i g i b l e
bur rs . A lso in shor t dura t ion tunne ls , the t ime requ i red fo r p ressure
e q u i l i z a t i o n i n t y p i c a l measurement systems becomes excessive.
Based on a s t u d y o f o r i f i c e e r r o r s i n t u r b u l e n t p i p e f l o w , Shaw (Ref. 47)
and F rank l i n and Wallace (Ref. 50) have v e r i f i e d t h a t t h e e f f e c t o f h o l e s i z e
sca les w i th t he l oca l wa l l shear s t ress ( T ~ ) and f l u i d d e n s i t y (p) and v i s -
c o s i t y (p), v iz . ,
110

In add
'meas ' t rue = , - - do ?w )
T P W
i t ion, the ac tua l magn i tude o f e r ro rs a re a f u n c t
(3.0.4)
ion o f a number o f
other parameters. For example, Shaw (Ref. 47) and Livesey, e t a l . (Ref. 48)
found the re la t i ve dep th o f t he , ho le t o a l so be a s ign i f i can t parameter . In
general, the measured pressure decreases towards the t rue value as the rat io
o f ho le leng th to diameter decreases. However, as hole length/diameter
decreases below 2 , Livesey, e t a l . noted a r e l a t i v e l y l a r g e C a v i t y (14 do)
behind the ho le caused a n e g a t i v e e r r o r i n measured s ta t i c p ressure . In con-
t ras t , Ra inb i rd (Ref. 49) and Shaw both used a cav i ty beh ind the ho le w i th a
diameter of only 2d0. With th is arrangement, Shawls da ta i nd i ca te a decreasing
s t a t l c p r e s s u r e e r r o r as the leng th o f the ho le decreases from 1 . 5 do t o
0 . 5 do. Shaw a l s o s y s t e m a t i c a l l y s t u d i e d t h e e f f e c t s o f b u r r s and d i s -
covered tha t bur rs o f the o rder of do/127 can cause e r ro rs as l a rge as occur
w i t h v a r i a t l o n s i n smooth ho le s ize , i .e . , the so l id curve in F ig . 3.0.10.
*
**
Rayle (Ref. 46) found, as expected, i nc l i n ing t he ax l s o f ho les t oward
the oncoming f low increases the measured pressure. By i n c l i n i n g t h e h o l e
downstream, a reduced pressure i s measured. Ray le a lso s tud ied the e f fec ts
o f vary ing edges o f an o r i f i ce . I n genera l , r ound ing o f t he edges r e s u l t e d
in h igher p ressure ; whereas, chamfering produced small negative errors. As
observed by Benedict (Ref. 53), the f low over a rounded edge does n o t
imed la te l y separa te bu t i ns tead i s gu ided i n to t he ho le w i th a r e s u l t i n g
recovery o f p a r t o f the dynamic pressure. In the case o f a chamfered or
countersunk hole, the f low will separate at the upstream sharp edge, but
* S im i la r l y , L i vesey , e t a l . a l so no te t ha t a cont rac t ion in tub ing d iameter (e do) will cause a higher pressure.
** Rainbi rd used a f i x e d r a t i o o f h o l e l e n g t h to o r i f i c e d i a m e t e r o f 3.
1 1 1

it a l s o
reduced
(0.015 i
va 1 ue.
accelerates a long the s loping downstream edge w h i c h r e s u l t s i n a
pressure. Rayle concluded a 0.076 cm (0.030 in.) h o l e wi th a 0.038 cm
n.) deep countersink should provide a s ta t i c p ressu re nea r t he t rue
F ina l l y , Ray le ' s exper imen ts .w i th wa te r and a i r f l ows cove red a
Mach number range o f 0 t o 0.8. This data demonstrates or i f
e r ro rs inc rease w i th Mach number.
A summary o f subsonic data obtained hy Frank1 in and Wa
ce-induced
lace (Ref. 50)
and the supersonic data obtained on a 25' apex-angle cone by Rainbird (Ref. 49)
i s presented in F ig . 3.0.10. Ra inb i rd suggested the sca t te r in h is da ta cou ld
b e a t t r i b u t e d t o v a r i a t i o n s i n t h e r a t i o o f hole diameter to boundary layer
displacement thickness. However, the subson ic da ta o f F rank l in and Wallace
f a i l e d t o i n d i c a t e any e f fec t o f t h i s ra t i o . Fu r the rmore , Nes t l e r (Re f . 51)
demonstrated or i f ice- induced er rors could not be c o r r e l a t e d by t h e r a t i o o f ho le
diameter to boundary layer momentum thickness. The problem i s compounded
f u r t h e r by the hypersonic w
I n t h i s case, the diameters
an 18 deg cone were var ied,
and 0.152 - 0 .635 cm (0.06
i nd tunnel data discussed by Cassanto (Ref. 52).
of square-edged and chamfered (60°) o r i f ices on
respect ive ly , f rom 0.076 - 0.635 crn ( 0 . 0 3 - 0.25 in.)
0.25 in.) . For a f reestream Mach number o f 8
('local
(dec reas ing s l i gh t l y - less than 3 percent - w i th inc reas ing d iameter ) . Thus,
t h e e f f e c t s o f Mach number on o r i f i c e - i n d u c e d e r r o r s i n s t a t i c p r e s s u r e needs
addi t ional research.
= 6.37), the measured pressure was i n s e n s i t i v e to o r i f i c e d i a m e t e r
Q u e s t i o n n a i r e r e s u l t s i n d i c a t e s t a t i c o r i f i c e d i a m e t e r s t y p i c a l l y r a n g e
from 0.025 cm (0.01 in.) on small-angle cones t o 0.228 cm (0.09 in.) on wind
tunne l wa l l s . I n o rde r t o m in im ize s ta t i c ho le e r ro rs * , i t i s recommended
t O f course, a flush-mounted pressure transducer i s p r e f e r a b l e whenever possible.
112

I
4
7 W
i
C
A d
d 0
0
I
0
d
0
0 0. 0
0
Franklin : M<@5 8s
Wallace
W / V
M of Rainbird ' 8 Cone Data
I

t h a t a square-edge o r i f i c e w i t h a diameter of 0.051 cm (0.020 in.) be adopted
as an industry standard. S
of o r i f i c e can be used with
can be used.- i n most f a c i l i t
r e s t r i c t e d t o t h e o r d e r o f
i nce Rainbird (Ref. 49) has demonstrated t h i s s i z e
s a t i s f a c t o r y r e s u l t s i n a blow-down tunnel , it
es. I d e a l l y , t h e l e n g t h o f t h e h o l e s h o u l d be
/2 o f an o r i f i c e d i a m e t e r , Ref. 47. However, such
t h i n w a l l o r i f i c e s a r e f r a g i l e and, thus , sub jec t to damage. Hence, Gray
(Ref. 33) recomnends the ho le l eng th be grea ter than two o r i f i ce d iameters .
The diameter of a connect ing l ine, behind the hole, should be r e s t r i c t e d t o
t h e o r d e r o f two o r i f i ce d iamete rs , Refs. 47, 49, 50 and 33.
O f cou rse , t hese l as t two c r i t e r i a p resuppose an i ns ta l l a t i on wh ich i s
access ib le from the back side, e.g., a tunne l wa i l . In the case o f a long,
s t a t i c p r e s s u r e s u r v e y p i p e , t u b i n g o f t h e a p p r o p r i a t e s i z e i s swaged or
sweat so lde red i n a rece iv ing ho le and then ground or machined down f l u s h
w i th t he ou ts ide su r face o f t he p ipe . Here again an o r i f i c e d i a m e t e r o f
0.051 cm (0.020 in.) can be used, and larger d iameter connect ing l ines may
be used to reduce response time.
In t he case o f a conventional stat ic-pressure probe, a r a t i o o f h o l e
dep th t o o r i f i ce d iamete r o f l ess t han one i s n o t o n l y p o s s i b l e b u t i s f r equen t l y
the case. For example, a p robe wa l l th ickness o f 0.033 cm (0.013 i n . ) i s t y p i c a l
f o r 0.318 cm (1/8 in.) OD sta in less s tee l tub ing. Therefore, the recommended
o r i f i c e s i z e would provide a h o l e l e n g t h t o d i a m e t e r r a t i o o f 0.65. Also,
s ta t i c p ressure e r ro rs o f p robes may be reduced by designing them t o have
l a m i n a r f l o w a t t h e o r i f i c e s . A l t h o u g h t h e e x i s t i n g c o r r e l a t i o n s o f o r i f i c e
e r r o r s a r e for turbu lent f lows, i t appears probable that a laminar f low will
* O f course, a flush-mounted pressure transducer i s p r e f e r a b l e whenever pos- s ib le .

dip into an orifice less than a turbulent flow. A laminar flow probe can
be obtained by properly sizing the probe and polishing the external sur-
face to 0.25 microns (1011 in.). For example, a 0.318 cm (1/8 in.) diameter
probe, with orifices located 10 calibres downstream, would have a local
Reynolds number of 1.25 million for a freestream unit Reynolds number of
39.4 million per meter. In general, if noise data is available for a given
facility, the correlation of Benek.and High (Ref. 54) can be used to
estimate Reynolds numbers at which boundary layer transition occurs in
order to judge whether a laminar flow probe is feas
Since the data of Shaw (Ref. 47) indicate stat
are very sensitive to burrs, considerable care must
ible.
ic pressure measurements
be taken to assure a
smooth, sharp-edged orifice. This may be done by beginning the hole with
drill bits several sizes smaller than the desired final hole size and
progressively increasing the hole size. Also, short flute drill bits should
be used to minimize flexing and a drill guide (of the same metal) clamped
over the orifice location can be of considerable help. Finally, slower rates
of dri 1 1 feed will produce smaller burrs, and pressurizing the hole, during
final drilling, with compressed air will aid the removal of burrs. Finishing
of the orifice can be done with a drill shank and an appropriate polish.
The finished orifice should be inspected for burrs with a microscope, and
when possible, measured objectively, e.g., a Talysurf instrument.
Consideration should be given to the possibility of using an electrical
discharge machine or a laser to manufacture smooth orifices. To the authors'
knowledge, no comparative study of different processes for production of
orifices has been made.
115
lll.D.5. A General Purpose Stat ic Pressure Probe
As discussed in Sect ion I I I.D. l , the long, s ta t ic pressure survey p ipe,
w i t h nose l o c a t e d i n t h e s e t t l i n g chamber, i s p r e f e r r e d for c e n t e r l i n e c a l i b r a -
t ions o f t ransonic tunnels . Th is ar rangement not on ly prov ides a large amount
o f s imultaneous data but a lso prevents the passage of a t ransonic shock over
t h e o r i f i c e s . However, the ques t ionna i re resu l ts ind ica te a la rge number o f
t r a n s o n i c t u n n e l o p e r a t o r s ( p r i m a r i l y s m a l l e r f a c i l i t i e s ) c o n t i n u e t o use
conventional probes. As ment ioned prev ious ly in Sect ion 111.0.2, an advantage
of i nexpens ive , c lass i ca l p robes i s t he i r mob i l i t y and the consequent ease
o f performing f low surveys o f f center l ine . For the benef i t o f tunne l opera tors
who wish to cont inue us ing th is t ype o f p robe, the fo l low ing p robe des ign i s
suggested for c a l i b r a t i n g t r a n s o n i c and supersonic tunnels.
The basic probe design i s presented i n F i g . 3.0.11. An ogive nose w i t h
a n e f f e c t i v e f i n e n e s s r a t i o o f 12 i s suggested f o r two reasons: (1) over-
expansion a t t h e nose is m in ima l (e.g., see Fig. 3.0.3) which a lso minimizes
the ex ten t o f t he superson ic pocke t a t superc r i t i ca l speeds and thus wal l
in te r fe rence, (2) at supersonic speeds, the bow shock i s a t t e n u a t e d by an og ive
nose shape (e.g., Ref. 19) ; thus , th is des ign a lso reduces wa l l in te r fe rence a t
supersonic speeds.
It should a lso be no ted tha t the nose des ign spec i f ies a d is t r ibuted
roughness f o r boundary layer t r ipping. The o b j e c t i v e o f t h i s f e a t u r e i s t o
prevent shock-induced, boundary layer separation a t a l l speeds. An add i t i ona l
benef i t i s reduced sens i t i v i t y to Reyno lds number. Examples o f a boundary layer
t r a n s i t i o n s t r i p on th i s t ype o f p robe may be found i n t h e r e p o r t by R i t c h i e
s t r i p r e q u i r e d f o r a p a r t i c u l a r
i a o f Braslow and Knox (Ref. 55)
(Ref. 10). The s i
a p p l i c a t i o n can be
and Braslow, e t a
116
ze o f g r i t and l e n g t h o f
designed v i a t h e c r i t e r
1. (Ref. 56).
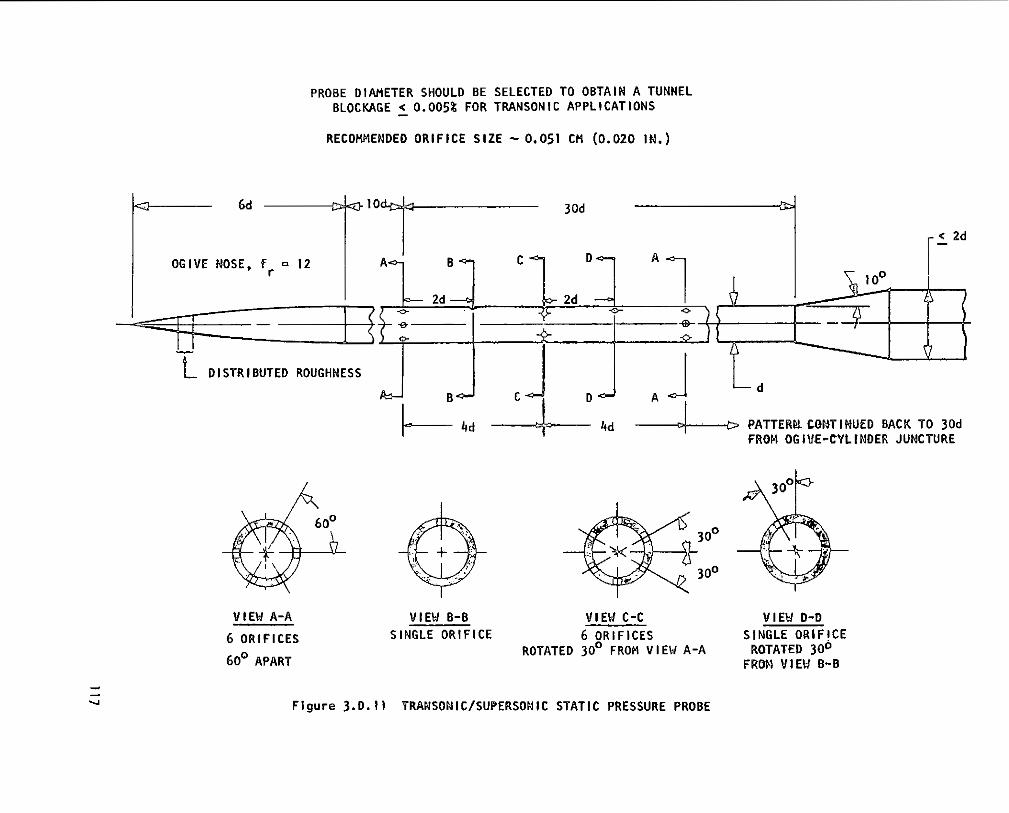
PROBE DIAHETER SHOULO BE SELECTED TO OBTAIN A TUNNEL BLOCKAGE < 0.005% FOR TRANSONIC APPLICATIONS
RECOPAENOEO O R I F I C E S I Z E - 0.051 CPl (0.020 IN.)
-
- e D l STR I BUTED ROUGHNESS
LC/+ PATTER& WE3VIWUED BACK TO 30d FROM OGIVE-CYLINDER JUNCTURE
A 30'
30'
VIEW 8-14 VIEW B-B VIEW C-C VIEW 0-0
6 ORIFICES S INGLE ORIFICE 6 O R I F I C E S S I N G L E O R I F I C E
60' APART ROTATED 30' FROM VIEW A-A
FROM VIEW 8-8 ROTATED 30'
F i g u r e 3.0.11 VRAWSONIC/SUPERSONlC STATIC PRESSURE PROBE
An orifice diameter of 0.051 cm (0.020 cm) is recomnended for static pres-
sure ports along the cylinder.* The probe is designed to obtain primary static
pressure data at stations having six orifices in order to average out the
effects of any probe asymmetries, orifice errors, and small flow inclinations.
The purpose of the single orifices is to assist in locating the position of
either a transonic shock and/or the reflection of a bow shock (or any other
disturbances) back onto the probe. The additional data will aid determination
of where surface pressure equals freestream static. This feature will allow
the probe to be used off centerline where wall interference increases.
Finally, the flare angle should be 10 deg or less in order to minimize
interference near Mach one. The effects of this flare, as we11 as the wall-
interference-free transonic performance of this probe, can be calculated
via the South-Jameson computer code (Ref. 17) . I n the Mach number range of
0.95 to 1.00, it is necessary to keep probe blockage <O.Ol% in order to
realize wall-interference-free performance at a tunnel centerline. I f the
probe is used with higher blockage and/or off centerline, wall proximity
effects on shock location and surface pressure distribution can be estimated
using the computer program of South and Keller (Ref. 2 2 ) . In the case of
supersonic applications (H > 1 . 3 ) . probe blockage can be two orders o f magni-
tude larger without any deleterious effects. It is only necessary to apply
the criteria of Gray (Fig. 3 . 0 . 3 ) and avoid wall reflections of bow shocks.
The interference-free performance can be computed with a number of existing
asisymmetric method of characteristics codes.
ij
A hardened, stainless steel is recommended for durability and corrosion resistance in order to maintain orifice integrity and minimize long-term abrasion by particles in the flow.
1II.D. References
1 . Dlck, R . 5 . : "The In f luence o f Several Cable-Type Supports Upon the S ta t i c
Pressures Along the Centerl ine Tube i n a Transonic Wind Tunnel,"AEDC-TN-54-26,
Feb. 1955.
2. Jackson, F. M . : "Supplemental Ca l ib ra t ion Resu l ts fo r the AEDC Propuls ion
Wind Tunnel (16T) ," AEDC-TR-70-163, Aug. 1970.
3. Jacocks, J. L. and Har t ley , M. 5 . : " C a l i b r a t i o n o f t h e AEDC-PWT 4-Ft.
Transonic Tunnel with Modified Wails," AEDC-TR-69-134, June 1969.
4. Jackson, F. M.: " C a l i b r a t i o n o f t h e AEDC-PIJT 16-Ft Transonic Tunnel a t
T e s t S e c t i o n U a l l P o r o s i t i e s o f 2 , 4, and 68." AEDC TR-76-13, Jan. 1976.
5. Isaacs. 0.: " C a l i b r a t i o n o f t h e R. A. E. Bedford 8 ft. x 8 f t . Wind Tunnel
a t Subsonic Speeds, I nc lud ing a Discussion of the Cor rec t ions App l ied t o
the Measured P r e s s u r e D i s t r i b u t i o n t o A l l o w f o r t h e D i r e c t and Blockage
E f f e c t s Due t o t h e C a l i b r a t i o n Probe Shape." ARC R. t M. No. 3583, Feb. 1968.
6 . Pope, A. and Goin, K. L . : High-speed Wind Tunnel Testing, Wiley, 1965.
7. Gunn, J. A. and Maxwell, H.: "Ca l i b ra t i on o f t he AEOC-PWT Aerodynamic Wlnd
Tunnel (4T) Mach Numbers 1.6 and 2.0 Nozzle Blocks." AEDC-TR-72-Ii1,
Sept. 1972.
8. Holder, 0. W . ; North, R . J.; and Chinneck, A.: "Experiments w i t h S t a t i c
Tubes i n a Supersonic Airstream, Parts i and 1 1 , " A.R.C. R. t M. No. 2782,
J u l y 1950.
9. Gracey, W . : "Measurement o f Stat ic Pressure on A i r c ra f t , " NACA TN 4184, Nov. 1957, and NACA Report 1364, 1958.
10. R i t c h i e , V . 5 . : "Several Methods f o r Aerodynamic Reduction of Static-
Pressure Sensing Errors for Aircraf t at Subsonic, Near-Sonic and Low
Supersonic Speeds," NASA TR R-18, Feb. 1959.
11 . Davis, J . W. and Graham, R. F.: "blind-Tunnel b l a l i I n te r fe rence E f fec ts for
20' Cone-Cylinders," A l A A Jour. Spacecraft and Rockets, Oct. 1973.
12. Estabrooks. B. B.: "Wal l - In ter ference Ef fects on Axisymmetric Bodies in
Transonic Wlnd Tunnels wi th Perforated Wal l Test Sect ions," AEDC-TR-59-12,
June 1959.
1 I 9

13.
14.
15.
16.
17.
18.
19.
20.
21.
22.
23.
Gadd, G. E.: "Interactions Between Normal Shock Llaves and Turbulent Boundary Layers,'' ARC R & t4 No. 3262, Feb. 1961.
Albers, E. E . ; Bacon, J. W . ; and Nason, B . 5 . : "An Experimental Inesti-
gation of Turbulent Viscous-Inviscid Interactions," AIAA Paper No. 71-565,
June 1971.
Hsieh, T.: "Hemisphere-Cylinder in Transonic, M_ = 0.7-1.0," AlAA Jour.,
Oct. 1975.
Page, W. A . : "Experimental Study of the Equivalence of Transonic Flow about Slender Cone-Cylinders of Circular and Elliptic Cross Section," NACA TN 4233, Apri 1 1958.
South, J. C., Jr. and Jameson, A.: "Relaxation Solutions for Inviscid Axisymmetric Transonic Flow Over Elunt or Pointed Bodies," Proc. AlAA
Computational Fluid Dynamics Conference, J u l y 1973.
Robertson, J. E. and Chevalier, H. L.: "Characteristics of Steady-State
Pressures on the Cylindrical Portlon of Cone-Cylinder Bodies at Transonic Speeds," AEDC-TDR-63-104, Aug. 1963.
Capone, F. J. and Coates, E . M . , Jr.: "Determination of Boundary-Reflected-
Disturbance Lengths in the Langley 16-Foot Transonic Tunnel," NASA TN 0-4153, Sept. 1967.
Couch, L. M. and Brooks, C. W., Jr.: "Effect of Blockage Ratio on Drag and
Pressure Distributions for Bodies of Revolution at Transonic Speeds,"
NASA TN 0-7331, NOV. 1973.
Nebman, P. A. and Klunker. E. E.: "Numerical Modelina of Tunnel-\.la11 and Body- Shape Effects on Transonic Flow Over Finite Lifting Wings," Aerodynamic Analyses Requiring Advanced Computers, Part 1 1 , NASA SP-347, Mar. 1975.
South, J. C . , Jr. and Keller. J. D.: "Axisymmetric Transonic Flow Including
Wind-Tunnel Wall Effects,'' Aerodynamic Rnalyses Requiring Advanced Computers,
Part 1 1 , NASA SP-347, Mar. 1975.
Sieverdling, C.; Maretto, L.; Lehthaus, F . ; and Lawaczeck: "Design and
Calibration of Four Probes for Use in the Transonic Turbine Cascade Testlng,"
Von Karman Institute for Fluid Dynamics, Tech. Note 100, May 1974.
120

I
24. Sutton, E. P.: "The Development of Slotted Working-Section Liners for Transonic Operation of the R.A.E. Bedford 3-Ft. Wind Tunnel," A.R.C. R. E; M. No. 3085, Mar. 1955.
25. Wright, R. H.; Ritchie, V. S.; and Pearson, A. 0.: "Characteristics of the Langley 8-Ft. Transonic Tunnel with Slotted Test Section,'' NACA Report 1389, July 1958.
26. Keller, J. D. and Wright, R. H.: "A Numerical Method of Calculating the Boundary-Induced Interference in Slotted or Perforated Wind Tunnels of
Rectangular Cross Section,'' NASA TR R-379, Nov. 1971.
27. Bryer, D. W. and Pankhurst, R. C.: Pressure-Probe Methods for Determining Wind Speed and Flow Direction, National Physical Laboratory, Her Majesty's Stationery Office, London, 1971.
28. Siddon, T. E. : "On the Response of Pressure Measuring Instrumentation in Unsteady Flow," UTIAS Report No. 136 (AD-682 2961, Jan. 1969.
29. Rittenhouse, L. E.: "Transonic Wind Tunnel Results for Five Pressure Probes Designed to Minimize Static-Pressure Sensing Errors," AEDC-TDR-62-48, March 1962.
30. Chevalier, H. L.: "Calibration of the PWT 16-Ft. Transonic Circuit with a Modified Model Support System and Test Section," AEDC TN-60-164, Aug. 1960.
31. Krause, L. N. and Gettelman, C. C.: "Effect o f Interaction Among Probes, Supports, Duct Walls and Jet Boundaries on Pressure Measurements in Ducts and Jets , ' I I . S.A. Jour., Vol . 9, Sept. 1953.
32. Nichols, J. H. : "Rake Interference Studies at Transonic Speeds,'' AEDC-TH- 56-1, Feb. 1956.
33. Gray, J. D.: "A Compendium of Flow Measurement Methods and Techniques," AEDC von Karman Gas Dynamics Facility, Notes prepared for a short course at the University of Tennessee Space Institute, Tullhaoma, Tenn., Nov. 1973.
34. Barry, F. W.: 88Determination of Mach Number from Pressure Measurements," ASME Trans. , Apr i i 1956.
35. Walter, L. W. and Redman, E. J.: "Needle Static-Pressure Probes Insensitive to Flow Inclination in a Supersonic Stream,'' NAVORD Report 3694, March 1954.
121
I
36. Washington, W. D. and Humphrey, J. A.: "Pressure Measurements on Four
Cone-Cy1 inder Flare Conf igurat ions at Supersonic Speeds," RD-TM-69-11
(AD 699 3591, Oct. 1969.
37. Gray, J. D.: "Eva1uation.of Probes f o r Measur ing Stat ic .Pressure in
Supersonic and Hypersonic Flow," AEDC-TR-71-265, Jan. 1972.
38. Norr is , J. D.: "Cal fbrat ion of Conical Pressure Probes for Determinat ion
o f Local Flow Conditions a t Mach Numbers from 3 t o 6," NASA TN 0-3076,
Nov. 1965.
39. Vahl, W. A. and Weirich, R. L . : "Ca l i b ra t i on o f 30° Included-Angle Cone
for Determining Local Flow Conditions i n Mach Number Range of 1.51 t o
3.51.," NASA TN 0-4679, Aug. 1968.
40. Peterson, C . W. and George, 0 . L.: "Wind Tunnel Pressure Probes: New
C a l i b r a t i o n s f o r New Geometries and Flow Environments," A I A A Jour.,
Vol. 13, No. 10, Oct. 1975.
41. Donaldson, 1 . S. and Richardson, D. J.: "A Shor t Stat ic Probe wi th Good
Incidence Character ist ics a t Supersonic Speed,'' A.R.C. Current Paper
No. 1099, 1970.
42. Pinckney, S. Z.: "A Short Static-Pressure Probe Design for Supersonic
Flow," NASA TU 0-7978, J u l y 1975.
43. Smith, A. H. 0 . and Bauer, A. D.: "Stat ic-Pressure Probes tha t a re
Theore t i ca l l y I nsens i t i ve t o P i t ch , Yaw and Mach Number," Jour. Fluid
Mech., Vol. 44, Par t 3 , pp. 513-528, 1970.
44. Hsieh, T.: "Hemisphere-Cy1 inde r i n Low Supersonic Flow," A l A A Jour.,
Dec. 1975.
45. Marconi, F.; Yaeger, L. and Hamilton, H. H.: "Computation o f High-
Speed I n v i s c i d Flows About Real Configurations," NASA SP-347, Mar. 1975.
46. Rayle, R. E.: " I n f l u e n c e o f O r i f i c e Geometry on Stat ic Pressure Measure-
ments," ASME Paper No. 59-A-234, Dec. 1959.
47. Shaw, R.: "The In f luence o f Ho le Dimensions on Stat ic Pressure Measure-
ments," Jour. F l u i d Hech., Vol. 7, P t . 4, A p r i l 1960.
122
48.
49.
50
55.
56.
57
Livesey, J. L.; Jackson, J. D.; and Southern, C. J.: "The S ta t i c Ho le
Error Problem: An Exper imental Invest lgat ion of E r r o r s f o r Holes of Varying Diameters and Depths,'' A i r c r a f t Engr., Yo1 34, Feb. 1962.
Rainbird, W. J.: "E r ro rs i n Measurement o f Mean S ta t i c P ressu re o f a
Moving F l u i d Due t o Pressure Holes," DME/NAE Q u a r t e r l y B u l l e t l n
No. 1967 (3) , Nat ' 1 . Res. Counc. Canada, Oct. 1967.
,F rank l in , R. E. and Wallace, J. M.: "Absolute Measurements of Stat ic- 'Hole
Error Using Flush Transducers," Jour. Fluid Mech., Vol 42, P t . 1,
June 1970.
Nest ler , D. E.: "Stat ic Pressure Port Errors in Hypersonfc Turbulent
Flow," A l A A Paper No. 71-270, Mar. 1971.
Cassanto, J. M . : "An Assessment of Pressure Port Erosion Effects," A l A A
Paper No. 75-150, Jan. 1975.
Benedict, R. P. : Fundamentals o f Temperature, Pressure, and Flow
Measurements, Wiley, New York, 1969.
Benek, J. A. and High, M. D . : "A Method For the Pred ic t ion o f the E f fec ts
o f Free-Stream D i sturbances on Boundary-Layer T rans i t i on ,I' AEDC-TR-73-158,
Oct. 1973, a l s o A l A A Jour., P. 1425, Oct. 1974.
Braslow, A. L. and Knox, E. C.: "Simp1 i f i e d Method for Determinat ion of
C r i t i c a l H e i g h t o f D i s t r i b u t e d Roughness Par t i c l es f o r Boundary-Layer
T r a n s i t i o n a t Mach Numbers from 0 t o 5," NACA TN 4363, 1958.
Braslow, A . L.; Hicks, R. M . and Harr is , R. V., Jr.: "Use of Grit-Type
Boundary-Layer-Trans i t ion Tr ips on Wind-Tunnel Model s ,I1 NASA TN 0-3579,
1966.
Parker, R. L., Jr.: l t F l 0 w Generatipn Propert ies of Five Transonic Wind
funnel Test Section Mal 1 Configurations, ' ' AEOC-TR-75-73, Aug- 1975.
. . I l l . E. MEASUREMENT OF FLOW ANGULARITY
The term yawmeter w i 1 1 . be used herein ' to denote probes designed to measure
f l o w a n g u l a r i t y i n e i t h e r two or three dimensional f lows. A w i d e v a r i e t y o f
yawmeters have been used ove r t he yea rs f o r d i f f e ren t app l i ca t i ons . The ones
whish have been used in t ranson ic t unne ls may be d iv ided in to th ree genera l
types: (1) pressure probes, (2) h o t w i r e o r film probes, (3) force models
instrumented wi th a very sens i t ive force ba lance." A d iscuss ion o f p ressure
probes i s g i v e n f i r s t and i s f o l l owed by a b r i e f d e s c r i p t i o n o f two examples
o f t h e l a t t e r t y p e s o f yawmeter.
r'
I
A recent review of the var ious types of pressure probes and a d iscuss ion
of the pros and cons o f each are g iven by Bryer and Pankhurst (Ref. 2 ) . These
authors c lassi fy pressure probe yawmeters i n t o two categories: (1) those
c o n s i s t i n g o f an arrangement o f open-ended tubes, and (2) those having a body
w i th p ressure sens ing o r i f i ces . These may be subdivided into probes designed
t o measure f low ang les in one plane (2-D) o r two (3-D).
III.E.l. D i f fe ren t i a l P ressu re Yawmeters: 2-D
For f l ow d i rec t i on measurements i n one plane, three types of yawmeter
geometries are most common, v i z . , two pressure taps on the surfaces of either
a wedge o r a c i r c u l a r c y l i n d e r and two tubes w i t h s l a n t e d i n l e t s . A large
v a r i e t y o f such probes are available from commercial manufacturers. The
c i r c u l a r c y l i n d e r yawmeters are not recommended fo r t ranson ic f l ows because
o f t he i r compara t i ve l y l a rge i n te r fe rence w i th t he f l ow and considerable
s e n s i t i v i t y t o Mach number, Ref. 2. Both the cy l inder and wedge have,greater
s u s c e p t i b i l i t y t o e r r o r i n the presence of v e l o c i t y g r a d i e n t s because of the
la rger separa t ion o f o r i f i ces . A lso , S ieverd ing , e t a l . (Ref . 3 ) have found
t h a t a 30° ( t o ta l ang le ) wedge-shaped yawmeter i s Reynolds number dependent
i n t h e Mach number range 0.8 t o 2.2. In contrast , the two- tube type o f yaw-
meter , genera l ly re fer red to as a Conrad probe, provides: ( 1 ) minimum f l o w
d is tu rbance, (2 ) adequate sens i t i v i t y wh ich i s re la t i ve ly f ree of Mach number
and Reynolds number e f f e c t s (Refs. 4 and 5). and ( 3 ) o r i f i c e s w h i c h a r e c l o s e
toge the r f o r nea r l y po in t measurement o f f l o w a n g u l a r i t y .
124
References 3 and 5 con ta in ca l i b ra t i on resu l t s f o r sma l l t ube t ype
yawmeters which were designed t o i n v e s t i g a t e t h e f l o w o u t o f t r a n s o n i c
t u r b i n e cascades and compressors. The o b j e c t i v e o f S i e v e r d i n g , e t a l .
(Ref. 3) was to invest igate several probe geometr ies and arrangements which
could be used to s imul taneously measure t o t a l , s t a t i c , and d i r e c t i o n a l i
pressures. The two-tube yawmeter, shown i n F i g . 3.E.1, was mounted on a rake
o f rec tangu lar c ross sec t ion (2.3 mn thickness normal t o f l o w and 6.0 m para1 le1 to f low) . The yawmeter was arranged to measure f l o w a n g u l a r i t y
normal to the p lane o f the rake . A small diameter (1.7 mm), truncated, 2S0'. '
t o t a l apex-angle cone probe was a l s o mounted on the rake. The separat ion
d is tance between the yawmeter and the conical probe was 16 mm and both nose
t i p s were located 22 mm ahead of the rake. The probes, w i th t h i s a r range-
ment, were c a l i b r a t e d i n t h e DFVLR/AVA Transonic Wind Tunnel ( I m x lm) .
The r e s u l t i n g s e n s i t i v i t y o f t h e yawmeter i s presented i n F i g . 3.E. l .
k .
. . .
0.8 M 2.2. *
"
A combinat ion P i to t probe and yawmeter was a l s o c a l i b r a t e d w i t h a
s i m i l a r arrangement, but two dif ferent companion probes were used. I n
one case, the companion probe was a 15 cone needle probe (1.5 mm OD) f o r
measuring s t a t i c p r e s s u r e , and the second companion probe was a 30' cone
probe (1.5 mm OD). The sens i t i v i t y o f the need le p robe was found t o be
l inear over the largest range o f angles o f yaw (%loo). The corresponding
s e n s i t i v i t y d a t a a r e a l s o shown in F ig . 3.E.1. The d i f f e rence i n t he ang le
s e n s i t i v i t y o f t h e t w o - t u b e yawmeter and the combination probe may be
a t t r i b u t e d t o t h e d i f f e r e n c e i n t h e i n l e t a n g l e .
0
Sieverdlng, et a l . (Ref. 3) a lso tested the yameter and needle probe
combinat ion in the smal l (135 rnm x 50 mm) V K I High Speed Cascade Tunnel C-2.
Sta t ic p ressure measurements a long the wal l o f t h i s f a c i l i t y , w i t h and w i th -
out the probes, ind icated s ign i f icant b lockage when Mach number exceeded 0.30; whereas, a s i n g l e AGARD needle probe (12.3O cone and 1.5 mm OD) w i t h a standard
elbow type support (3 mn OD) located 48 probe diameters downstream showed .
negl ig ib le b lockage. Hence, these authors conclude: i f a yawmeter (and/or
o ther probes) are to be used in t ransonic tunnels, the probes and support
A l though these authors d id not s ta te the ins ide d iameter of the tubing, . the r a t i o o f I .D . t o 0 . 0 . should be kept greater than 0.6 i n o r d e r t o m i n i m i z e loss o r change o f s e n s i t i v i t y w i t h i n c r e a s i n g f l o w a n g u l a r i t y , e.g., p. 19 of Ref. 2.
125

0.06
0.05
0.04
S :t Y
0.03
0.02
0.01
0
1 J a 1- Combination Probe,Ref.3
.a,.\ J 3 Tubes 0.8 mm OD
\ Two Tube Probe, Ref. 3
- Tubing - 1.575 mrn OD x 0.254 rnm Wall Lp=j 6 = 80"
2 Tubes 1 .O mm OD
I I I I I I I I I
0.4 0.6 0.8 1 .o 1.2 1 .4 1.6 1.8 2.0 2.2
M
Figure 3 . E. 1 . TWO D I MENS I ONAL YA\JMETERS

mechanism_sh.oy.jd .~ . - . .. . .be.c,a!ib_r_ated ~ i n a tunne l o f s i ze s im i l a r t o wh ich i t i s t o
be used. And most impor tan t ly fo r tunne l ca l ib ra t ions , ex t reme care must be
taken . . ...~ , in designing " ya.wmeter suppor ts in order to avoid induc ing ext raneous
f l ow angu la r i t y .
The f low ang le sens i t i v i t y da ta o f Buzze l l (Ref . 5 ) , ob ta ined w i th a combi-
n a t i o n P i t o t p r o b e and yawmeter, i s a l s o shown i n F i g . 3.E.1 f o r M = 0.4, 0.6,
and 0.8. These data were obtained wi th a cobra-sty led rake wi th three cornbina-
t i o n probes a l te rna t ing w i th four s ing le P i to t tubes . Aga in , th is inves t iga tor
fo l lowed the accepted pract ice o f locat ing the probe to measure angles normal t o
the p lane o f the rake . Mach number s e n s i t i v i t y checks i n d i c a t e d n e g l i g i b l e change
i n yawmeter s e n s i t i v i t y f o r 0 . 4 1 5 M 5 0.81. A f t e r t h i s was ascer ta ined, e ight
rakes were tested a t a mean Mach number of 0.6. The resu l t i ng sp read i n da ta
are shown i n F i g . 3 .E.1 .
*
V i d a l , e t a l . (Ref. 6) have recently reported using a two-tube yawmeter
t o measure f l o w a n g u l a r i t y i n a smal 1 (30.5 cm) t ransonic wind tunnel . The
ob jec t i ve o f t hese t es ts i s t o compare measurements o f f l o w a n g u l a r i t y and
s t a t i c p r e s s u r e w i t h c a l c u l a t e d i n t e r f e r e n c e - f r e e t r a n s o n i c f l o w s o l u t i o n s f o r a
given model, and thereby provide a c r i t e r i o n f o r a d j u s t i n g t u n n e l w a l l p o r o s i t y
t o a t t a i n w a l l - i n t e r f e r e n c e - f r e e f l o w . A p lanar yawmeter was used because an
a i r f o i l , which spans the tunnel , i s being used f o r developmental testing. The
yawmeter i s s i m i l a r t o t h e one shown in t he l ower r i gh t po r t i on o f F ig . 3 .E . l . and
was cons t ruc ted o f 0.0635 cm (0.025 in . ) OD t ub ing w i th each i n l e t chamfered
a t 45" . These au tho rs c la im tha t t he i r f l ow ang le sens i t i v i t y i s such t h a t w i t h
a p ressu re reso lu t i on o f 0.0007 N/cm2 (0.001 ps i ) they can " i n p r i n c i p l e "
reso lve ang les t o w i th in 0 .03 " i n t he Mach number range 0.55 t o 0.725. *+
As noted by Bryer and Pankhurst (Ref. 2), yawmeter s e n s i t i v i t y i n low
speed f lows has t r a d i t i o n a l l y been def ined as
S" a(AP/q)/a$ A
Y (3.E.1)
where AP is the p ressure d i f fe rence across the yawmeter. However, these
+These rakes were designed t o p l a c e s i x o f them CirCUmferent ia l lY in the s tator d ischarge p lane o f a compressor.
S i n c e t h e o r i g i n a l w r i t i n g o f t h i s s e c t i o n , t h e c a l i b r a t i o n and use o f a new yawmeter design has come t o o u r a t t e n t i o n , L i n d (Ref. 28). This 2-D y a m e t e r cons is t s of a two-hole, d i f f e ren t i a l p ressu re p robe p laced a t t he ve r tex of a forward-swept wing. A y a m e t e r s e n s i t i v i t y of 0.163 and an accuracy o f 0.01 deg i s claimed for low-speed flows (M, < 0.17).
**
- 1 27
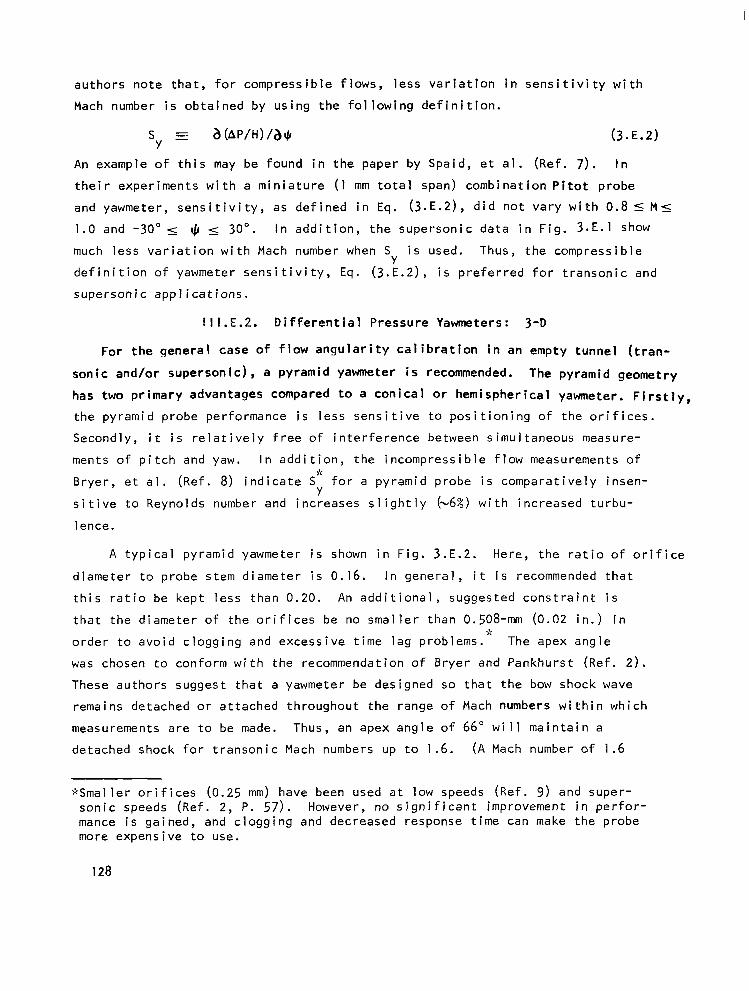
a u t h o r s n o t e t h a t , f o r c o m p r e s s i b l e f l o w s , l e s s v a r i a t i o n i n s e n s i t i v i t y w i t h
Mach number i s ob ta ined by us ing the fo l low ing de f in i t ion .
An example of t h i s may be found i n t h e paper by Spaid, e t a l . (Ref. 7 ) . I n
the i r exper iments w i th a m in ia tu re ( 1 mm t o t a l span) combination P i to t probe
and yawmeter, s e n s i t i v i t y , as d e f i n e d i n Eq. (3.E.21, d i d n o t v a r y w i t h 0.8 5 M s
1.0 and -30" 5 3, 5 30". I n add i t i on , t he superson ic da ta i n F ig . 3.E.1 show
much l e s s v a r i a t i o n w i t h Mach number when S i s used. Thus, the compressible
d e f i n i t i o n o f yawmeter s e n s i t i v i t y , Eq. (3.E.2), i s p r e f e r r e d f o r t r a n s o n i c and
supersonic appl icat ions.
Y
! l l . € .2 . D i f f e ren t i a l P ressu re Yawmeters: 3-D
For the general case of f l o w a n g u l a r i t y c a l i b r a t i o n i n an empty tunnel ( t ran-
sonic and/or supersonic), a pyramid yawmeter i s recommended. The pyramid geometry
has two primary advantages compared t o a con ica l or hemispherical yawmeter. ~ i r s t l ~ ,
the pyramid probe performance i s l e s s s e n s i t i v e t o p o s i t i o n i n g o f t h e o r i f i c e s .
Secondly, i t i s r e l a t i v e l y f r e e o f i n t e r f e r e n c e between simultaneous measure-
ments o f p i t c h and yaw. In addi t ion, the incompress ib le f low measurements o f
B r y e r , e t a l . (Ref. 8) i n d i c a t e S" f o r a pyramid probe i s comparatively insen-
s i t i v e t o Reynolds number and increases s l igh t ly ( "6%) w i th inc reased tu rbu-
1 ence.
d.
Y
A typical pyramid yawmeter i s shown i n F i g . 3.E.2. Here, t h e r a t i o o f o r i f i c e
diameter to probe stem diameter i s 0.16. In genera l , i t i s recommended t h a t
t h i s r a t i o be kept less than 0.20. An addi t ional , suggested const ra in t i s
t ha t t he d iamete r o f t he o r i f i ces be no smaller than 0.508-mm (0.02 in . ) in
o rder to avo id c logg ing and excessive t ime lag problems. The apex angle
was chosen t o conform with the recommendation o f B r y e r and Pankhurst (Ref. 2 ) .
These authors suggest that a yawmeter be designed so tha t t he bow shock wave
remains detached or a t tached throughout the range o f Mach numbers w i th in wh ich
measurements a r e t o be made. Thus, an apex angle o f 66" will main ta in a
detached shock f o r t r a n s o n i c Mach numbers up t o 1.6. ( A Mach number o f 1.6
-9.
*Sma l le r o r i f i ces (0.25 mm) have been used a t low speeds (Ref. 9) and super- sonic speeds (Ref. 2, P. 57) . However, no s i g n i f i c a n t improvement i n p e r f o r - mance i s gained, and c logg ing and decreased response time can make the probe more expensive to use.
128
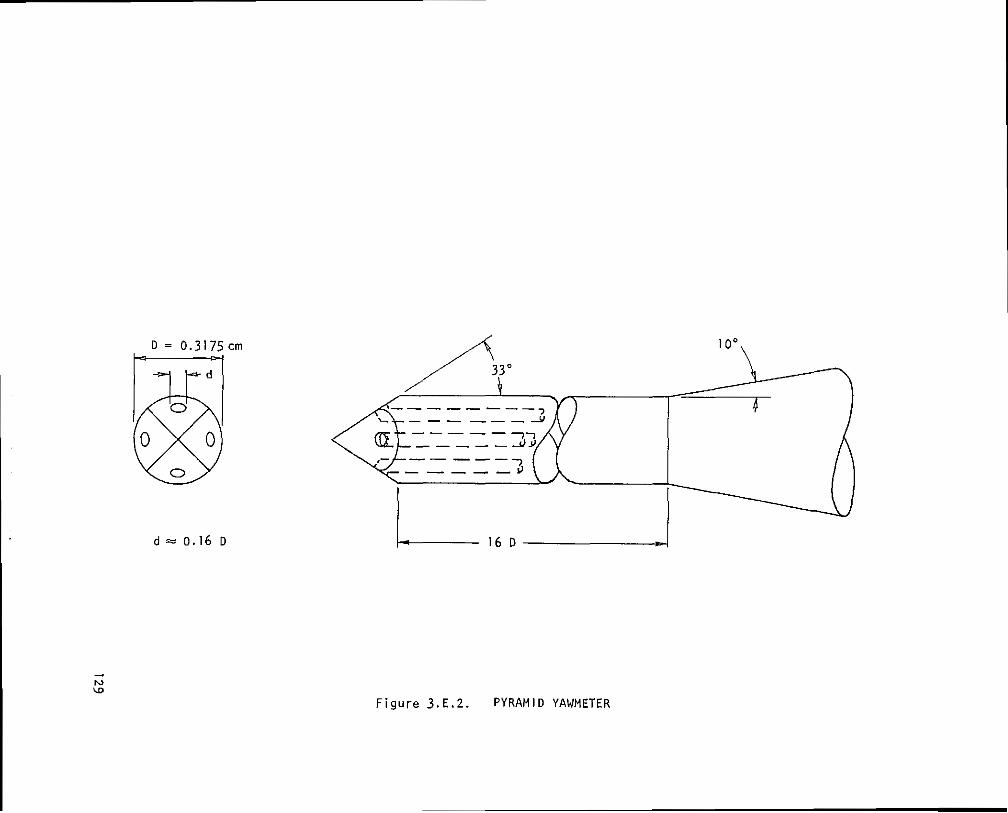
D = 0.3175crn -
d = 0.16 D
,/ 330 / & ,/ 330 /
I b 1 6 D " I
F i g u r e 3 . E . 2 . P Y R A M I D YAWMETER

I s chosen because this represents the upper limit o f ope ra t i on f o r t he maJor l t y
o f t ransonic tunnels . ) Beyond t h i s speed regime, the bow shock will be at tached,
and the probe can be used in supersonic f lows. The purpose of th is design
fea tu re i s t o avo id t he sudden changes t h a t can occur in the pressure response
o f sharp-nosed probes near the shock attachment Mach number. Furthermore,
Bryer and Pankhurst have noted that the maximum s e n s i t i v i t y o f most pointed
y m e t e r s i s o b t a i n e d w i t h an apex angle between 60 and 70 degrees.
F lna l ly , for use in t ransonic f lows the probe stem should extend down-
stream for a d i s tance o f a t l eas t 16 diameters. Downstream of t h i s s ta t i on ,
the stem can safely be enlarged by a IO c o n i c a l f l a r e t o mate w i t h t h e a v a i l -
able probe support. Provided a massive, transverse probe support i s no t used,
t h i s des ign wlll avo id in te r fe rence between probe and support a t t ranson ic
speeds.
0
The flow a n g l e s e n s i t i v i t y , a(AP/HS)/aY, o f c o n i c a l and hemispherical-nose
probes have been found t o i n c r e a s e w i t h Mach number and reach a maximum of about
0.025 a t M - 1.5 (e.9.. Ref. IO and Ref. 2) . Further increases in Mach number
r e s u l t i n d e c r e a s i n g s e n s l t i v i t y . F o r example, d a t a f o r a hemispherical yaw-
meter w i t h o r i f i c e s l o c a t e d 45' from the nose indicate a 50% loss i n s e n s i t i v i t y
a t H = 2.7, Fig. 35 o f Ref. 2. S i m i l a r l y , t h e o r e t i c a l c a l c u l a t i o n s f o r a 60'
con ica l yameter ind ica te a 70% loss a t M = 3.5, Fig. 3.E.3. I f we assume
s imi lar behavior for the pyramid probe and a maximum s e n s i t i v i t y o f 0.025, the
smal lest change in f low angle which can be detected by a pressure measuring
system w i t h a r e s o l u t i o n o f 3.45 x N/cmZ (0.005 p s i ) i s
*
In t he case o f a t ransonic tunnel wi th T = 37.8OC. Re/m = 19.7 x 10 , and
H = 1.0, t h e s e t t l i n g chamber pressure i s 13.79 N/cm (20 ps ia ) . Subs t i t u t i ng
t h i s v a l u e f o r H S i n Eq. (3). we f i n d t h a t a f low angle o f 0.01 degree can
t h e o r e t i c a l l y be resolved. In pract ice, the ef fects of probe andfor support
de f l ec t i ons , non iden t i ca l i n te rna l geometry o f t he t ub ing and passages which
6 S 2
* P i t o t probes located near the surface of wedges and cones to prov ide increased For t h i s reason, Barry (Ref. 11) and Zumwalt (Ref. 12) explored the use of
s e n s i t i v i t y a t h i g h s u p e r s o n i c Mach numbers. However, f o r most app l i ca t i ons ,
H = 3.5. the convent ional surface pressure yameters provide adequate sensi t iv i ty up t o
I30

.030
.025
,020
I I I I I I I I I
P -I
/ a EXPERIMENTAL DATA (Ref. 25
\ - CURVE FROM Ref. 10 -I
.005
0 0 I .o 2.0 3 . 0
MACH NUMBER
4.0
F i g u r e 3 . E . 3 . S E N S I T I V I T Y OF 60" CONICAL YAWMETER
5.0

connect two o r i f i c e s to a d i f fe ren t ia l p ressure t ransducer , v ib ra t ion , tu rbu lence,
etc., may prevent the a t ta inment o f such accuracy. However, the pyramid probe
can prov ide adequate any le reso lu t ion fo r ca l ib ra t ion of most wind tunnels.
Espec ia l l y i n l i gh t o f t he f ac t t ha t t he ma jo r i t y o f t unne l ope ra to rs a re
s a t i s f i e d with a ca l i b ra t i on o f ( t unne l -empty ) f l ow ang les accu ra te t o w i th in
0.1 degree.
If less-accurate, f low angular i ty measurements a re sa t i s fac to ry and a
simultaneous measurement of P i t o t p r e s s u r e i s d e s i r e d , t h e nose of the
pyramid yawmeter may be t runca ted and an o r i f i ce p laced i n t he cen te r o f the
nose,;: e.g., Ref. 9 . In the case o f subsonic tunnels , th is would prov ide a
convenient check on the un i fo rm i t y o f t o ta l p ressu re . In the case of supersonic
tunnels , th is permi ts Mach number t o be determined simultaneously, e.g., Refs.
1 4 and 15. Such a probe no t on ly m in imizes ca l ib ra t ion t ime bu t a lso e l im ina tes
any u n c e r t a i n t y i n l o c a l Mach number at which f low angles are measured.
I n summary, the suggested dimensional c r i t e r i a for a pyramid yawmeter
s h o u l d r e s u l t i n a probe which:
I . has a flow a n g l e s e n s i t i v i t y w h i c h i s r e l a t i v e l y i n s e n s i t l v e t o
extraneous flow var iables such as Reynolds number and turbulence,
2 . i s small enough t o map f low a n g u l a r i t y i n most t unne ls w i th h igh
r e s o l u t i o n and minimum interference,""
3. has f a s t enough pressure response for m o s t app l i ca t i ons ,
4 . has adequate s t r u c t u r a l s t i f f n e s s , and
5 . can be used to ca l ib ra te bo th t ranson ic and supersonic tunnels.
* I t i s recommended t h a t t h e l i p t h i c k n e s s be kep t t h in ( 0.005 cm) and the o r i f i c e be beveled a t an angle of 1 5 " or more i n o r d e r t o m i n i m i z e s e n s i t i v i t y of the P i t o t probe t o f low angu lar i t y .
;:::In large tunnels &3 f t ) where h i g h r e s o l u t i o n o f t h e f l o w a n g u l a r i t y f i e l d
s i z e s . I n any event, probe blockage should be less than 0.1 percent for i s no t requ i red , t he recommended pyramid probe may be scaled up t o l a r g e r
genera l ca l ibrat ions o f t ransonic tunnels . However, near M = I values an order of magnitude smaller may be necessary i n order t o avoid probe-wal l interference, see Ref. 1 3 .

YaKmgJer C a l i b r a t i o n , Rake Interfer-ence, and Blockage . . """ . .
As noted by Pope and Goin (Ref. 10, P. 134), a1 1 rea l yawmeters have
asymmetries and imperfect ions which cause the p robe to ind ica te a nonzero
AP a t $ = 0 . Thus, a yawmeter should a lways be cal ibrated in flow cond i t i ons .
s i m i l a r t o t h o s e i n w h i c h i t i s t o be used. The ca l i b ra t i on p rocedure f o r
d i f f e r e n t i a l p r e s s u r e yawmeters i s descr ibed in Refs . 10, 14, and 15 and will
not be repeated here. However, i t i s r e l e v a n t t o sound a note o f caut ion here.
When c a l i b r a t i n g a yawmeter, t h e c e n t e r o f r o t a t i o n s h o u l d b e a t t h e n o s e t i p .
A lso, carefu l measurements o f t he ang les be t
are essent ia l s ince these must be subtracted
the probe in o rde r t o de te rm ine f l ow angu la r
center1 ine.
W
i
In o rde r t o reduce t unne l ca l i b ra t i on t I
een yawmeter a x i s and tunne l ax is
f rom the f l ow ang les re la t i ve t o
t y w i t h r e s p e c t t o t h e t u n n e l
me, most opera tors p re fe r to
use probes i n rakes o r a r rays . However, Har t l ey and Nichols (Ref. 16)
conducted tests in the AEDC 16T Tunnel w i t h f i v e 7.62 cm (3 in . ) d iameter
hemispherical yawmeters mounted on a 2.44 m . ( 8 f t ) wide rake. The rake
c o n s i s t e d o f a 22" ( to ta l -ang le ) wedge w i t h a 7.62 cm ( 3 in . ) w ide base and
was center mounted on a s t ing suppor t . The yawmeters were mounted 0.61 m
(2 f t ) a p a r t w i t h t h e nose located approximately four diameters ahead o f t h e
leading edge o f t h e wedge. The to ta l w ind- tunnel b lockage o f the rake was
approximately 1%. These inves t iga tors found tha t the rake induced s ign i f i can t
ou t f low toward the t ips o f the rake . The induced f l ow angu la r i t y , a t t he t i ps
of the rake, increased f rom about 0 .5 " a t M = 0.6 t o over 1 " a t M = 1 . 1 . As
Mach number increased f r o m 1 . 1 t o 1.2, the induced f low angulari ty decreased
sharp ly and e x h i b i t e d n e a r - i n t e r f e r e n c e - f r e e c h a r a c t e r i s t i c s f o r 1.2 5 M 5 1.5. A wal l -mounted s t ru t suppor t , w i th the same wedge a n g l e o f 22", was a lso tes ted
and found t o induce even larger outf low from the w a l l toward the t ip .
In both cases, the support- induced f low angulari ty was ascertained by
mounting a s ingle probe on a long s t ing. The f i r s t s e c t i o n o f t h e s t i n g had
a d iamete r o f 5.715 cm (2.25 in.) and a length of approximately 16 probe
diameters. The second sec t i on o f s t i n g had a diameter o f 7.62 cm (3.0 in.)
and a l e n g t h o f o v e r 20 probe diameters which subsequently joined a conica l
f l a r e and t h e r e s t o f t h e s t
enab led ver t i ca l t raverses w
the b lockage o f the s ing le p
ing support mechanism. The st ing support system
i t h t h e s t i n g a t z e r o a n g l e of a t t a c k . I n a d d i t i o n ,
robe was o n l y 0.013%. Thus, t he arrangement assured
133
I
as near-interference-free,flow a n g u l a r i t y measurements as can be expected i n
a wind tunnel.
An addi t ional conclusion reached by Hart ley and N icho ls (Ref. 16) i s t h a t
the rake had n e g l i g i b l e e f f e c t on flow angles normal t o t h e p l a n e o f t h e r a k e
(;.e., w i t h t h e r a k e v e r t i c a l , t h e yaw data were Val i d and w i th the rake
ho r i zon ta l , t he p i t ch da ta were Val i d ) . Thus, based on these and other similar
resu l t s , i t i s p o s s i b l e t o use yawmeters i n a careful ly designed rake arrange-
ment t o make two dimenslonal measurements." However, for greatest accuracy,
a s ing le p robe j o ined t o a l ong s t i ng w i t h a support which is symmetrical about
the tunne l cen ter l ine i s recommended.""
F ina l l y , w i th rega rd t o w ind t unne l b lockage a t Mach numbers near 1 .O,
t he da ta o f Couch and Brooks (Ref. 13) i nd i ca te t ha t even w i th ex t remely
small values o f model blockage (<0.0003) wa l l in te r fe rence occurs . Thus,
yawmeters f o r measurements near Mach one must be designed wi th the utmost care,
viz., small probes and long s t ings, and the resu l t ing da ta shou ld be s c r u t i n i z e d
f o r any sudden o r unexpected variat ions around M = 1.0.
I I I .E.3. Hot-Wire/Fi lm Yameters
Two ho t -w i res i nc l i ned a t an angle wi th respect to each other and the
mean f l ow have long been used i n low speed flows t o measure f l o w a n g u l a r i t y
(Ref. 17). Three-wire probes have also been used extensively t o simultaneously
measure p i t c h and yaw in three d imensional f lows. In the past , hot -wi res have
no t been used in t ranson ic f l ows because they are so eas i l y b roken. However,
Hortsman and Rose (Ref. 18) have recent ly demonstrated that low aspect rat io
(,f/d-lOO) tungsten wire probes can be used in t ranson ic f l ows w i thou t a
p r o h i b i t i v e breakage problem. Also recently, Johnson and Rose (Ref. 19) have
reported using an X-array hot -wi re to measure Reynolds s t r e s s i n a supersonic
boundary layer and i n a shock-wave/boundary-layer i n t e r a c t i o n (Ref. 20).
Thus, a l t h o u g h m a t c h i n g t h e s e n s i t i v i t i e s o f two o r more w i res fo r accura te
;bDudzinski and Krause (Ref. 4 ) po in t ou t t ha t a r a k e w i t h c i r c u l a r arms i s unaffected by ang les o f a t tack . Whereas when nonzero yaw a n g l e s e x i s t i n subsonic and/or t ransonic f lows, noncircular arms can induce larger f low a n g u l a r i t y a t t h e nose o f t h e yawmeter and a lso c rea te undes i rab le s ide forces on the rake.
Ref. 16. **Another a l t e r n a t i v e would be t o c a l i b r a t e a rake fo l low ing the procedure of
m a n flow measurements can be a problem, there appears t o be no p r o h i b i t i v e
reason why two and three-wire probes cannot be used as yawmeters. In o rder
to avoid the problem o f m a t c h i n g s e n s i t i v i t i e s o f more than one wi re, Rosenberg
(Ref. 22) has success fu l l y used a s ing le w i re p robe mounted i n a ro ta tab le ho lder .
By r o t a t l n g an inc l ined-w i re about the ax is o f the p robe ’s stem and tak ing da ta
a t two d i s t i n c t o r i e n t a t i o n s , t h e t h r e e components o f v e l o c i t y and mass f l u x
can be determined a t a p o i n t i n a general three-dimensional f low.
*
I n a s tudy o f t he e f fec ts o f con tou r ing s lo t ted wa l l s t o reduce t ranson ic -
wa l l - In te r fe rence, Weeks (Ref. 23) has used a ho t - f i l m probe for accurate mea-
surement o f f l ow angu la r i t y . Th i s work i nvo l ved t he use o f a i r f o i l models which
spanned t h e t e s t s e c t i o n o f t h e AFFDL T r i s o n i c Gasdynamics F a c i l i t y . The
requi red p lanar measurements o f f l o w a n g u l a r i t y were obtained wl th a s p l i t - f i l m ,
22O t o ta l -ang le wedge which was manufactured by Thermo Systems, Inc., according
to an AFFDL design. This probe consists o f a quar tz rod 0.152 cm (0.06 i n . ) i n
d i a m e t e r w i t h t h e t i p ground t o a symmetrical wedge. As ind ica ted in F ig . 3.E.4, the rod extends forward 1.27 cm (0.5 in.) from a 0.3175 cm (0.125 in.) diameter
support tube. A p a i r o f p la t inum f i l m s , 0.102 cm (0.04 in.) long, are deposited
on each s i d e o f t h e apex o f t h e wedge. Four go ld - f i lm leads a re used t o complete
the two separate anemometer b r i d g e c i r c u i t s . The c a l i b r a t e d yaw s e n s i t i v i t y
o f t h i s p r o b e i s shown i n F i g . 3.E.4 f o r 0.85 ” < M < 0.95. Weeks c la ims tha t
t h i s probe will reso lve f l ow ang les t o w i th in 42 minutes of a rc (0.03O). The
p r i m a r y l i m i t a t i o n i s s t a t e d t o be probe v ibrat ion which was determined exper i -
menta l l y to induce e r ro rs 5 0.5 minutes o f arc.
I n summary, s ince hot - f i lm probes are ( 1 ) less d e l i c a t e , (2) less suscep-
t i b l e to contamination because o f t h e i r l a r g e r s i z e , and ( 3 ) can have co r ros ion
r e s i s t a n t c o a t i n g s , h o t - f i l m yawmeters a re super io r t o ho t -w i re yawmeters. Both
hot-wires and ho t - f i lms requ i re spec ia l i zed da ta p rocess ing equipment which may
be considered a disadvantage by potent ia l users. However, based on t h e r e s u l t s
obtained by Weeks, h o t - f i l m yawmeters appear t o o f f e r a v i a b l e a l t e r n a t i v e t o
d i f f e r e n t i a l p r e s s u r e yawmeters.””
The uses o f ho t -w i res and ho t - f i lms a re d i scussed fu r the r i n Appendix 1 .
* Reference 21 a lso d iscusses the fac t tha t the ca l ib ra t ion of a h o t - w i r e i s suscep t ib le t o change w i th t ime because o f con taminat ion and corrosion. This may r e q u i r e f r e q u e n t c a l i b r a t i o n checks.
A l though the authors are not aware o f any t r a n s i e n t measurements o f f l o w a n g l e s with a ho t -w i re / f i lm, there i s no inherent reason why t h i s t y p e o f yawmeter can not be used i n a cont inuous-traverse mode. This would provide the advantage of reduced tunnel cal ibrat ion t ime, e.g., see discussion o f force balance yawmeters.
**
135
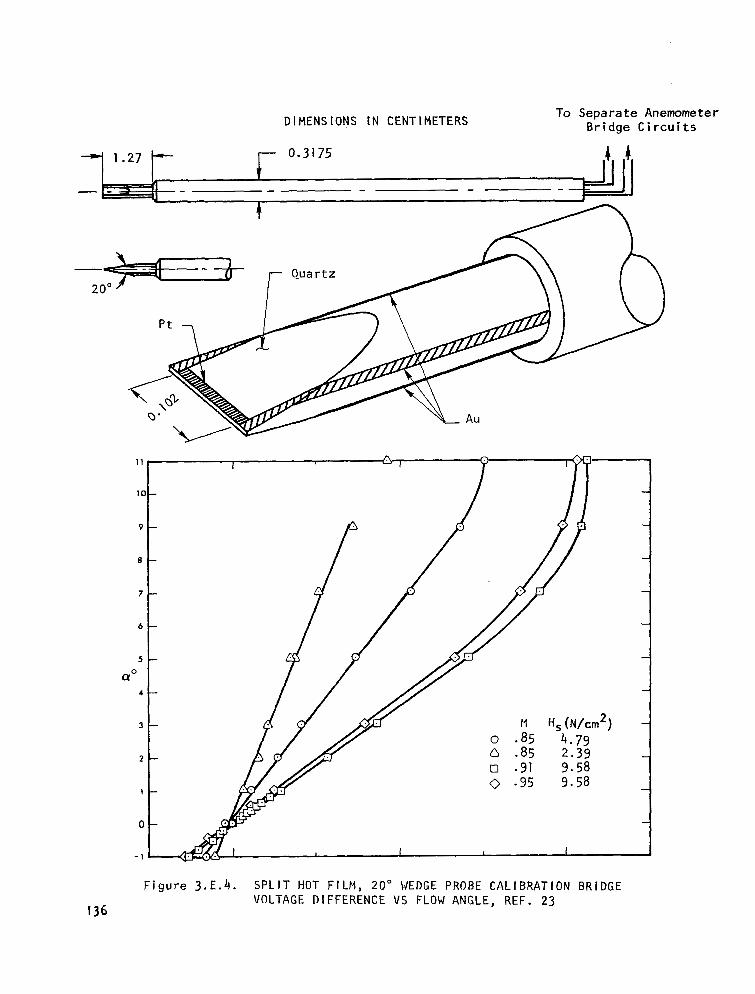
D I MENS IONS I N CENT I METERS To Separate Anemometer
Bridge C i r c u i t s
Figure 3 .E .4 . SPL IT HOT F I L M , 20" WEDGE PROBE CALIBRATION BRIDGE VOLTAGE DIFFERENCE vs FLOW ANGLE, REF. 23
136
Force Balance Yaweters
The basic procedure o f runn ing a wind tunnel force model u p r i g h t and
inver ted to de termine the average p i tch ang le i s we l l known and i s standard
pract ice in profess ional wind tunnel test ing. However, the use o f a small
wedge mounted on a sens i t i ve fo rce ba lance to ob ta in a measure o f tunnel-empty
f l ow ang les i s new. Maxwe1.1 and Luchuk (Ref. 25) have recent ly repor ted the
r e s u l t s o f t r a n s o n i c t e s t s w i t h t h i s t y p e o f yawmeter. The probe cons is ts o f
a 20' included-angle wedge, w i t h a 14.73 cm (5.80 in.) span, mounted on a
special ly-designed, two-component force balance, Fig. 3.E.5. The fo rce
balance was designed t o measure normal f o r c e and p i t c h i n g moment w i t h v e r y
th in , s t ra in-gauged sect ions for maximum s e n s i t i v i t y .
The probe was t e s t e d i n t h e AEDC Aerodynamic Wind Tunnel (4T) over the
Mach number range of 0.6 t o 1.3. The c a l i b r a t e d f l o w a n g l e s e n s i t i v i t i e s ,
based on v a r i a t i o n s o f normal f o rce and p i t c h i n g moment, are shown i n F i g . 3.E.6. Although the yaw s e n s i t i v i t y of the pitching-moment mode is approx imate ly 50%
l a rge r , Maxwell and Luchuk found tha t f low ang le measurements obtained from
e i t h e r mode were o f equal accuracy.
The wedge was supported by the 4T s ix-degree-of - f reedom, capt ive t ra jectory
system. This permi t ted the probe to be moved con t inuous ly w i th a v a r i e t y o f
movements. Maxwell and Luchuk conclude that f low direct ion data can be
obtained "wi th an a b s o l u t e a c c u r a c y t h a t i s l i t t l e d i f f e r e n t from the accuracy
wi th which the probe is a l igned." Furthermore, based on comparisons o f da ta
ob ta ined w i th t he p robe a t res t and i n mo t ion , re l i ab le and rap id measurements
can be made with the probe moving cont inuously wi th combined l i n e a r and r o l l i n g
motion. The estimated rms dev iat ions f rom a mean v a l u e o f flow angle was
I 0.023O a t a l l measured points . However, 24' sweeps i n p i t c h and yaw produced
l a r g e r v a r i a t i o n s , v i z . , - +O.O8O and +0.25', - respect ive ly . These data were
o b t a i n e d w i t h p i t c h and yaw rates which var ied, respect ive ly , from 1.16 t o 1.28
and 1.01 t o 1.36 deg/sec.
137
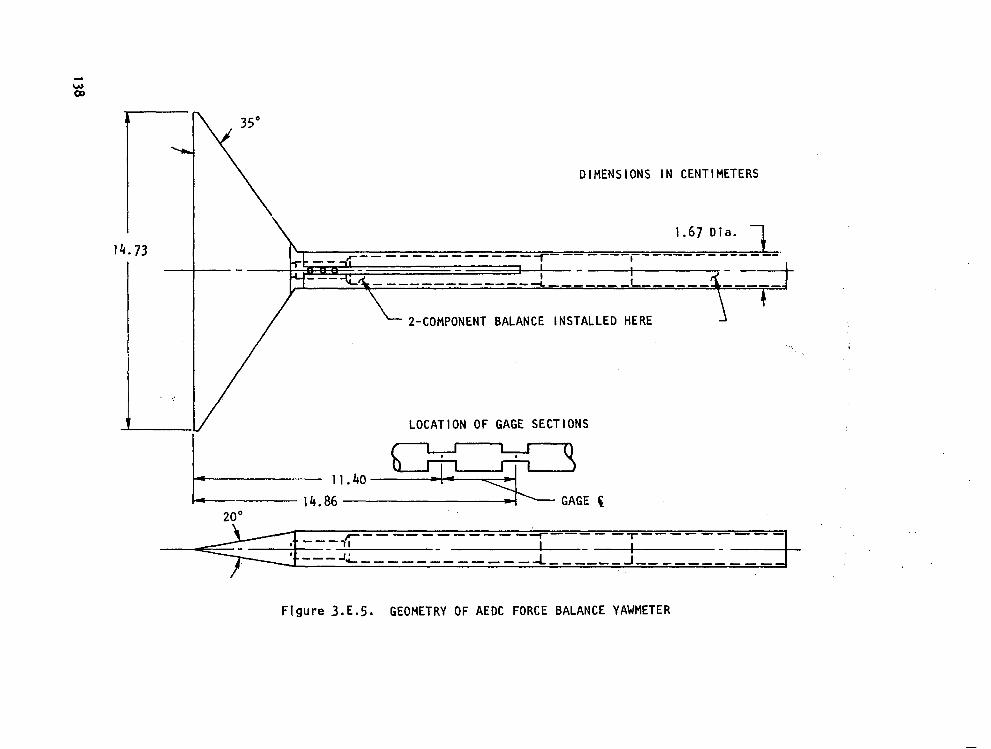
t
14.73
L
\
DIMENSIONS IN CENTIMETERS
1.67 D i a . 7 I' I
I """""""
" "- - I -L """_ I """_ $ ""_
\ ? 2-COMPONENT BALANCE INSTALLED HERE J
LOCATION OF GAGE SECTIONS
I
I
20°
Figure 3 . E . 5 . GEOMETRY OF AEDC FORCE BALANCE YAWMETER

0.5
.I
n irr
A 0
0.3
z 0.1 - I 0 k n
0
0.14
I CJ W n
-0.12 U z
V
W
C n.
i0:lO
LL LL ~ 0 . 0 8 V
W 0 rr 0 LL
0.04 L
f CNa J
- 8 U
5 0.6 0.7 0.8 0.9 1 .o 1 , 1
FREE STREAM MACH NUMBER, M
Figure 3 . E . 6 . S E N S I T I V I T Y OF THE AEDC FORCE BALANCE Y A m E T E R
1.2 1.3
Unfortunately, the Reynolds number dependence o f t h i s yawmeter was no t
invest igated. However,.some v a r i a t i o n o f t o t a l p r e s s u r e a t M = 0.6 i nd ica ted
a d e c r e a s i n g s e n s i t i v i t y w i t h i n c r e a s i n g u n i t Reynolds number. A t t h i s p o i n t ,
the re'ader may reca l l t ha t S ieve rd ing , e t a l . (Re f . 3 ) a l s o r e p o r t e d t h e i r
wedge shaped yawmeter e x h i b i t e d a Reynolds number dependence.* This impl ies
t h a t wedge shaped yawmeters should be c a l i b r a t e d as a f u n c t i o n o f Mach number
and Reynolds number. Hence, t h i s t y p e o f yawmeter will be more t e d i o u s t o
use. Addi t ional d isadvantages of the wedge force ba lance yawmeter i s h igher
i n i t i a l c o s t s and p i t c h and yaw must be measured separately.** However, a
force balance can be ca l i b ra ted t o re la te angu la r de f l ec t i on o f model and
suppor t to changes in loading. Th is prov ides a d i s t i n c t advantage over
d i f f e r e n t i a l p r e s s u r e and h o t - w i r e / f i l m yawmeters. In conc lus ion , the fo rce
balance yawmeter's advantage of rapid, continuous measurements o f f l o w a n g u l a r i t y
appears to outweigh the disadvantages.
* Ne i ther o f these yawmeters had a boundary layer t rans i t ion s t r ip . Thus, dependence o f wedge-yawmeter s e n s i t i v i t y on Reynolds number could conceivably be reduced by u t i l i z i n g a g r i t - t y p e , boundary layer t r ip.
A double, in tersect ing wedge probe wi th four component force balance has more r e c e n t l y been const ructed and t e s t e d a t AEDC (Summers, Ref. 26). T h i s yameter enab les p i tch and yaw da ta t o be obta ined s imul taneously in even less time. An improved design, which i s l e s s s e n s i t i v e to unsteady transonic f l ow , spec i f i es a small, symmetrical centerbody with f l a t p l a t e wings attached in or thogonal p lanes, Ref. 27. Recent exper ience wi th th is type o f yawmeter i n t h e AEDC 4T Tunnel indicates simultaneous measurements o f p i t c h and yaw can be obtained at 225 po in ts i n l ess t han s i x m inu tes and w i t h an accuracy of 0.01 degree.
**
140
I l l . E. References
1. Lennert, A. E.; Hornkohl, J. 0. and Kalb, H. T.: "App l ica t ion o f Laser
Ve loc imeters fo r Flow Measurements," Ins t rumenta t ion fo r
A i rbreath ing Propuls ion, Progress in Ast ronaut ics and Aeronautics,
A I M Vol. 34, M IT Press, 1972.
2. Bryer, D. W. and Pankhurst, R. C.: Pressure-Probes Methods fo r Determin ing
Wind Speed and Flow D i rec t i on , Her Ma jes ty 's S ta t ionery Of f i ce ,
London, 1971.
3 . Sieverding, C. ; Maretto, L; Lehthaus, F. and Lawaczeck, 0.: "Design and
C a l i b r a t i o n f o r Four Probes f o r Use in the Transon ic Turb ine
Cascade Tes t ing , I ' VKI TN 100 (AD 922 286) , May 1974.
4. Dudzlnski, T. J. and Krause, L. N . : "Flow-Direct ion Measurement w i t h
F ixed-Pos i t ion Probes," NASA TM X-1904, Oct. 1969.
5. Buzzel l , W. A . : "Cal ibrat ion Resul ts for Stat ionary Pressure Rakes Sensing
Yaw Angle Downstream o f an Ax ia l Compressor Stage," ARL TR 75-0104,
Apr i 1 1975.
6. V ida l , R. J.; Erickson, J. C . and C a t l i n , P. A . : "Experiments w i t h a Se l f -
Cor rec t ing Wind Tunnel," Windtunnel " ." . Deslgn and Testing Techniques,
AGARD-CP- 174, Oct. 1975. ~~
7. Spaid, F. W. ; Hurley, F. X . and Hellman, T. H . : "Miniature Probe for
Transonic Flow Direct ion Measurements," A l A A Jour. Vol. 13, No. 2,
Feb. 1975, P . 253.
8. Bryer, D. W . ; Walshe, D . E . ; and Garner, H. C . : "Pressure Probes Selected
f o r Three-Dimensional Flow Measurement," R.&M. No. 3037, 1958.
9. Schulze, W. M.; Ashby, J r . , G . C . ; and Erwin, J. R . : "Several Combination
Probes fo r Su rvey ing S ta t i c and Total Pressure and Flow Direct ion,"
NACA TN 2830, Nov. 1952.
10. Pope, A.; and Goin, K. L: ." High-speed - ~ ~ " Wind Tunnel Testing, Wiley, 1965.
1 1 . Barry, F. W.: "Comparison of F low-Direct ion Probes a t Supersonic Speeds,"
J. Aero. Sc i . , Sept. 1961, P. 750-752.
141
12. Zumwalt, G. W.: "Conical Probes fo r De te rm ina t ion of Local Mach Numbers
and Flow Di rec t ion in Superson ic Wing Tunnels," SCTM 355-60(71),
Sandla Corp., Nov. 1960.
14. Vahl, W. A. and Weir ich, R. L . : "Ca l ib ra t ion o f 30" Included-Angle Cone
for Determining Local Flow Condi t ions In Mach Number Range o f
1.51 t o 3.51," NASA TN D-4679, August 1968.
15. Norr is , J . D. : "Cal ibrat ion of Conical Pressure Probes for Determlnat ion
o f Local Flow Cond i t ions a t Mach Numbers from 3 t o 6," NASA TN D-3076, Nov. 1965.
16. Har t ley , M. S. ; and Nichols, J. H.: " E f f e c t s o f Rake Blockage on Flow
Angu la r i t y Measurements a t T ranson ic Mach Numbers i n t h e AEDC-PWT
16-Foot Transonic Tunnel," Twenty-Fifth Supersonic Tunnel Assoc.
Meeting, NASA Langley Research Center, May 1966 (referenced w i th ,
author 's permission).
19. Johnson, D. A. and Rose, W. C . : "Laser Velocimeter and Hot-wire Anemometer
Comparison I n a Supersonic Boundary Layer," A i A A Jour. (Tech. Notes),
Vol. 13, No. 4, A p r i l 1975.
20. Rose, W. C. and Johnson, D. A . : "Turbulence i n a Shock-Wave Boundary-Layer
In te rac t ion , " A i A A Jour., Vol. 13, No. 7, J u l y 195 21. Hot Wire-Hot Film-Ion Anemometer Systems, CAT/FORM 6560375, Thermo-Systems
inc . , 1975.
22. Rosenberg, R. E.: "A Three Dimensional Hot-wire Anemometry Technique
Employing a Single Wire Probe," ARL 71-0039, March 1971.
23. Weeks, T. M. : "Reduction of Transonic S lot ted Wal l in ter ference by Means
of Slat Contour ing," AFFDL-TR-74-139, March 1975.
142
24. Maxwell, H. and Luchuk, W.: "Evaluation o f a Wedge on a Force Balance
as a Flow Angle Probe," AEDC-TR-74-110, Feb. 1975.
25. Raney, D. J . : "Flow D i rec t i on Measurements i n Supersonic Wind Tunnels,"
Aero. Res. Coun. Lond. , Current Papers No. 262, 1956.
26. Summers, W. E.; personal comnunication, AEDC, Feb. 1976.
27. Luchuk, W.: "Flow Angle Measurements Using a 2-Inch Span Cruciform-Wing
Force Model," presented at 45th Semi-Annual STA meeting, Albuquerque,
N.M., A p r i l 1976 (referenced wi th author 's permission).
28. Lind, I . A. : "A Sensi t ive F low Trans i t ion Probe," KTH Aero Memo FI 175, TRITA-FPT-019, l n s t i t u t l o n e n f o r F l y g t e k n i k Stockholm, Sweden,
Ju ly 1975.
1II.F. MEASUREMENT OF UNSTEADY FLOW DISTURBANCES
The need for measurements o f f low unsteadiness was b r i e f l y reviewed i n
Sect ion ll.C.6. The p r i m a r y o b j e c t i v e o f n o i s e c a l i b r a t i o n o f a wind tunnel
i s t o o b t a i n a measure o f t h e f l u c t u a t i o n s in s t a t i c p r e s s u r e and flow angu-
l a r i t y t h a t e x i s t i n t h e empty tes t sec t i on . Here a review will be g iven
o f t he i ns t rumen ta t i on t ha t has been used to o b t a i n t h i s t y p e o f d a t a . How-
ever, before discussing sensors, it is germain to no te the ampl i tudes and
frequencies of unsteady s ta t ic pressure which character ize t ransonic tunnels .
I n t h e c e n t e r o f t r a n s o n i c t e s t s e c t i o n s t h e f l u c t u a t i n g p r e s s u r e c o e f -
f i c i e n t , d e f i n e d as
AC = - - <PI> P q
x 100 percent,
may range from 0.5% t o 5% depending on the tunnel configuration, Mach number,
and Reynolds number. Dougherty, e t a l . (Ref. 1) have noted a va lue o f 0.45% corresponds t o a l e v e l of sound which i s t yp . i ca I l y rad ia ted f rom tu rbu len t
boundary layers on sol id test sect ion wal ls. However, Har t zu i ke r , e t a l . (Ref. 2)
have po in ted ou t tha t AC actual ly decreases wi th increas ing Reynolds number and
ranges from 0.5% a t Re = 5.7 x IO t o an est imated 0.2% a t Rex = 1.1 - 1.7 x IO , see Fig. 3.F. I . McCanless and Boone (Ref. 3) have reviewed noise measurements
made in bo th pe r fo ra ted and s l o t t e d t e s t s e c t i o n s . These a u t h o r s n o t e t h a t i n
per forated-wal l tunnels center1 ine measurements o f AC tend t o be lower (40-609;)
than wal l measurements; whereas, the opposi te t rend i s found i n s l o t t e d - w a l l t u n -
nels. General ly, the edgetones generated by perforated-wall tunnels tend to make
these tunnels no is ier than s lo t ted-wal l tunnels . For example, AC d a t a f o r
twelve perforated-wall tunnels range from 1% t o 7.4%; whereas, d a t a f o r f i v e
s lo t ted-wal l tunnels show a range of 0.5% t o 2%) Ref. 3 . A peak i n AC i s
u s u a l l y measured between M = 0.70 and 0.80 fo r bo th pe r fo ra ted and s l o t t e d - w a l l
tunnels. The frequency spectra of noise at M = 0.80 i s presented i n F i g . 3.F.2
fo r n ine d i f f e ren t , con t i nuous t unne ls , Ref:2. These da ta a re representa t ive
o f so l i d , pe r fo ra ted , and s lo t ted-wa l l tunne ls and are presented in terms of the
Mabey spectrum parameter which i s discussed next.
P 6 8 X
P
* P
P
* Recent research indicates there are a number o f ways t o reduce the leve l o f noise qenerated by edgetones, Refs. 1 and 4..
1 44
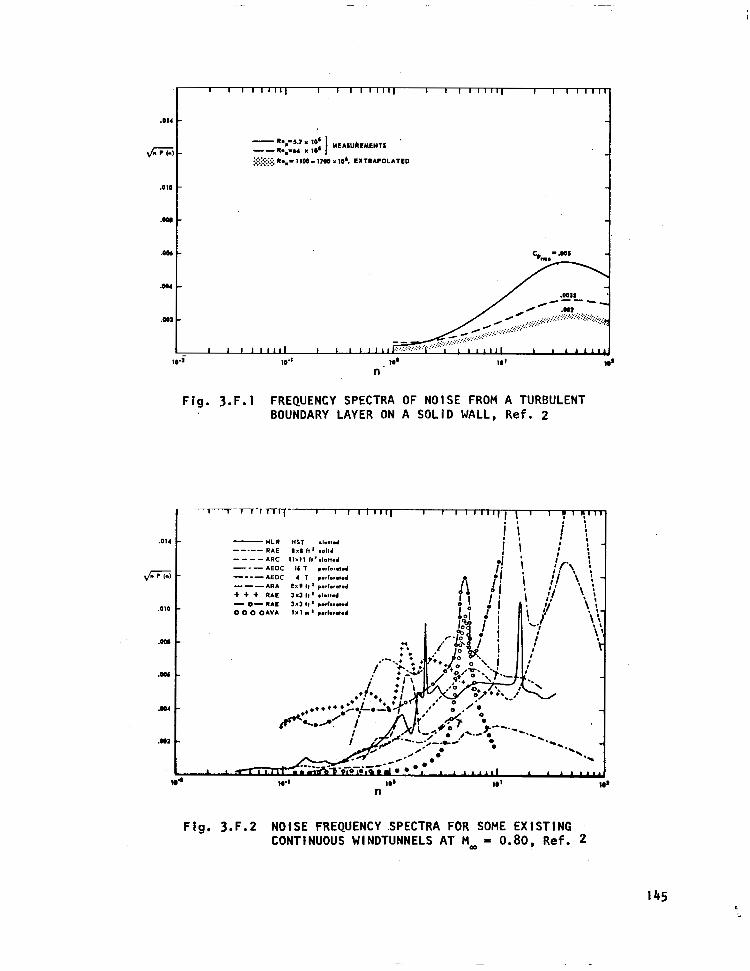
6
.OM
.m
,014
,010
.w1
.ffl
F ig. 3.F.1 FREQUENCY SPECTRA OF N O I S E FROM A TURBULENT BOUNDARY LAYER ON A S O L I D W A L L , R e f . 2
Fig. 3.F.2 NOISE FREQUENCY SPECTRA FOR SOME E X I S T I N G CONTINUOUS WINDTUNNELS AT HaD = 0.80, R e f . 2
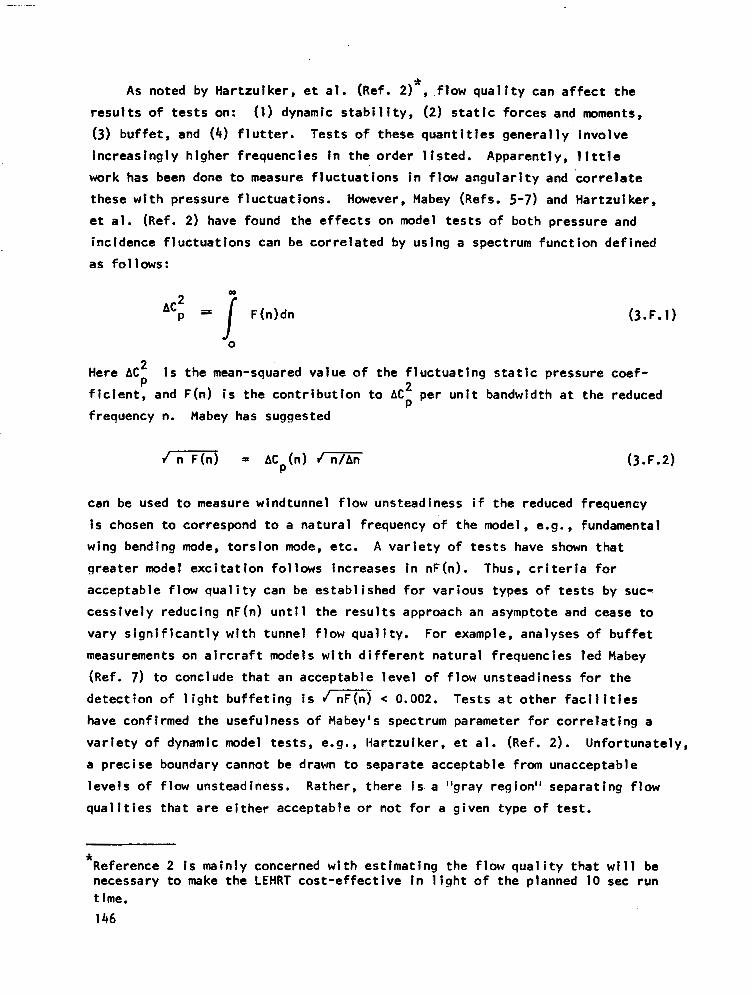
As noted by Har t tu iker , e t a l . (Ref. 2) , f low qua l i t y can a f . f ec t t he *
r e s u l t s of t e s t s on: (1) dynamic s t a b i l i t y , (2) s t a t i c f o r c e s and moments,
(3) b u f f e t , and (4) f l u t t e r . T e s t s o f t h e s e q u a n t i t i e s g e n e r a l l y i n v o l v e
increas ing ly h igher f requencies In t h e o r d e r l i s t e d . A p p a r e n t l y , l i t t l e
work has been done t o measure f l u c t u a t i o n s i n f l o w a n g u l a r i t y and c o r r e l a t e
these w i th p ressure f luc tua t ions . However, Mabey (Refs. 5-7) and Har t tu i ke r ,
e t a l . (Ref. 2) have found the e f f e c t s o n model tes ts o f bo th p ressure and
inc idence f luctuat ions can be co r re la ted by us ing a spect rum funct ion def ined
as fo l lows:
Here AC2 i s t h e mean-squared va lue o f the f l uc tua t i ng s ta t l c p ressu re coe f -
f i c i e n t , and F(n) i s t h e c o n t r i b u t i o n t o AC per un i t bandwidth a t the reduced P 2
P frequency n. Mabey has suggested
can be used t o measure windtunnel f low unsteadiness i f the reduced frequency
i s chosen to cor respond to a na tura l f requency o f the model, e.g., fundamental
wing bending mode, t o r s i o n mode, etc. A v a r i e t y o f t e s t s have shown t h e t
g rea ter model exc i ta t i on f o l l ows i nc reases i n nF (n ) . Thus, c r i t e r i a for
acceptab le f low qua l i t y can be es tab l i shed f o r va r ious t ypes o f t es ts by suc-
cess ive ly reducing nF(n) unt i l the resul ts approach an asymptote and cease to
va ry s ign i f i can t l y w i th t unne l f l ow qua l i t y . Fo r example, ana lyses o f bu f fe t
measurements on a i r c r a f t models w i t h d i f f e r e n t n a t u r a l f r e q u e n c i e s l e d Mabey
(Ref. 7) t o conclude that an accep tab le l eve l o f f l ow uns tead iness f o r t he
d e t e c t i o n o f l i g h t b u f f e t i n g i s e 0.002. T e s t s a t o t h e r f a c i l i t i e s
have confirmed the usefulness of Mabey's spectrum parameter f o r c o r r e l a t i n g a
v a r i e t y of dynamic model t es ts , e.g., Ha r t zu i ke r , e t a l . (Ref. 2 ) . Unfor tunate ly ,
a precise boundary cannot be drawn to separate acceptable from unacceptable
leve ls o f f low unsteadiness. Rather , there is a "gray region" separat ing f low
qua l i t i es t ha t a re e i t he r accep tab le o r no t f o r a g i ven t ype o f t es t .
* Reference 2 i s main ly concerned w i th es t imat ing the f low qua l i t y tha t will be necessary t o make the LEHRT c o s t - e f f e c t i v e i n l i g h t o f t h e p l a n n e d 10 sec run t ime.
146
However, the utility of including fluctuating pressure measurements in tunnel calibration i s now well established.
Condenser microphone measurements on the AEDC IO deg transition cone, in six different transonic tunnels, indicate 98 percent of the energy of back- ground pressure fluctuations are contained within 0-20 KHz, Ref. 8. However, since there i s presently no criterion for an upper limit on frequency beyond which boundary layer transition is unaffected, Westley (Ref. 9) recommends that the frequency range of noise measurements extend at least up to 30 KHz.
Thus, acoustic calibration of transonic tunnels requires instrumentation that can measure dynamic pressures with these ranges of amplitudes and frequen- cies. The sensors employed should also be relatively insensitive to vibrations of the mounting surface and durable enough not to be easily damaged by either particles in the ,flow or overloading.
III.F.1. Dynamic Pressure Measurements
A rather wide variety of instrumentation has been used to measure unsteady flow disturbances in wind tunnels. Condenser microphones, strain gage, and piezoelectric dynamic pressure transducers have been employed for noise measure- ments in stilling and plenum chambers, dlffusers, and on test section walls, and models and probes located on the centerline, Refs. 10-15. In addition, hot-wire anemometers have been used to measure flow disturbances in stilling chambers (e.g., Ref. 13) and in the test section of transonic tunnels (e.g., Refs. 9 and 16) and supersonic tunnels (e.g., Ref. 17). Also, laser Doppler velocimeters (LDV) are being used to measure turbulence by an ever increasing number of tunnel operators, Ref. 9.
Unfortunately, this lack of standardization makes it difficult to compare measured levels of flow disturbances. For example, Lewis and Dods (Ref. 18) noted significant variations in the frequency response of 12 different micro- phones and dynamic pressure transducers. In general, Lewis and Dods found small diameter transducers (0.1 to 0.3 cm) gave higher power-spectral-density values, at all frequencies, than larger diameter transducers (0.5 to 1 cm). Also, the high frequency portion of the spectrum of pressure fluctuations varles with the particular sensor, and as is well known, the rms values will be under- estimated when a significant portion of the high frequencies are attenuated. In
1 47
add i t ion , when measuring vo r t i c i t y w i th ho t -w i res , ho t - f i lms , o r an LDV, the
data may a lso vary because o f d i f fe rences in f requency response.
The comparison problem i s compounded fur ther by the choice o f sensor
mounting. Ideal ly, acoustic pressures should be measured w i t h no r e l a t i v e
motion between sensor and t h e t e s t medium, Ref. 19. However, s i n c e t h i s i s
n e i t h e r p r a c t i c a l n o r r e l e v a n t t o wind tunnel model t es t i ng , some representa-
t i v e l o c a t i o n on a probe, model or tunnel wal l must be selected.
The f i r s t measurements o f wa l l p ressure f luc tua t ions beneath tu rbu len t
boundary l a y e r s i n a wind tunnel were reported by Wi l lmar th i n 1956 (Ref. 20).
Wi l lmar th (Ref. 21) has recently reviewed the problems of dynamic pressure
measurements a t tunne l wa l ls and notes that most o f these measurements have
been made with f lush-mounted transducers. Hanly (Ref. 22) has recent ly s tud ied
t h e e f f e c t o f sensor f lushness on f luctuating-surface-pressure measurements a t
M = 1.68, 2.0, and 2.5. These t e s t s show spectral pressure measurements a re
ext remely sens i t ive to f lushness wi th prot rus ion caus ing greater er ror than
submergence. Hanly concludes that more repeatable data can be ob ta ined w i th
transducers mounted approximately 0.0254 cm (0.0l"in.) .beneath a surface o r i f i c e .
Thus, it is recmended tha t acous t ic measurements at tunnel wal ls conform to
t h i s c r i t e r i o n .
Also, it i s r e l e v a n t t o n o t e h e r e t h a t two or more wall-mounted transducers
can be used to determine usefu l corre la t ions between disturbances which may
e x i s t i n a tunnel, e.g., Refs. 11 and 25. I n add i t i on , Boone and McCanless
(Ref. 1 I ) have noted that wal l data can be used to ext rapolate, through M = 1,
measurements ob ta ined a t t he cen te r l i ne w i th probes o r models which may be
s u b j e c t t o o s c i l l a t i n g shocks and/or other model-induced unsteadiness near Mach
one. However, experience (Ref. 8) w i t h microphone measurements on a 10 deg cone
ind icates ( 1 ) t h i s i s n o t a problem and (2) the real advantage of a wall-mounted
sensor i s t h a t i t can be ca l i b ra ted w i th respec t t o cen te r l i ne measurements and
used as a permanent monitor for assessing any subsequent changes i n tunnel f low
unsteadiness.
Concern ing i ns ta l l a t i on o f sensors i n pe r fo ra ted wa l l s , C red le and Shadow
(Ref. 24) mounted a 0.635 cm (1 /4 i n . ) p iezoe lec t r i c microphone in t he cen te r
o f an area which was f i l l e d and sanded smooth. The rad ius o f the a rea was
148
approximately 40 microphone diameters. These inves t iga tors s ta ted :
"Th is ins ta l la t ion techn ique p rec luded the measurement o f pu re l y nea r - f i e l d i n f l u e n c e o f t h e most adjacent upstream holes and a l lowed fo r the measurement o f what might be considered as the rad ia l ly in tegrated average value o f p ressure f luc tua t ions a t the wa l l sur face . "
Credle and Shadow a l s o i n s t a l l e d an ident ical , but shielded, microphone in the
wa l l in o rder to mon i to r m ic rophone response to wa l l v ib ra t ion . In genera l ,
it i s cons ide red good t e s t i n g p r a c t l c e t o a s c e r t a i n t h e component o f a micro-
phone's output which i s due t o v i b r a t i o n . F i n a l l y , q u e s t i o n n a i r e r e s u l t s
indicated that strain-gage t ransducers are most o f t e n used f o r a c o u s t i c measure-
ments a t wind tunnel wal ls. Presumably, th is is because the instrumentat ion
requi red to process the s ignal f rom a s t r a i n gage i s r e a d i l y a v a i l a b l e a t most
wind tunnel s.
I n a d d i t i o n t o t u n n e l w a l l measurements, tunne l no ise ca l ib ra t ions requ i re
dynamic pressure data near the center of the test sect ion. Some o f t h e f i r s t
such measurements i n a transonic tunnel were reported by Cheval ier and Todd
(Ref. 25). I n t h e s e i n i t i a l t e s t s , dynamic pressure transducers were mounted
on a wedge, a wing probe, and an ogive-cy l inder . Later acoust ic measurements
i n t h e AEDC-PWT 16T and 165 tunnels were performed w i t h condenser microphones
and s t r a i n gage transducers mounted on a 10 deg included-angle cone, Ref. 10.
A var iety of other probe geometr ies have a l s o been used. For example,
an ogive-cy l inder and a f l a t p l a t e have been used i n some o f t h e NASA Ames
tunnels, Ref. 23. A 10 deg cone-cylinder probe has been used i n t h e 8 x 6 - f t . Supersonic Wind Tunnel a t NASA Lewis, Ref. 26. As p a r t o f a review of probes
f o r a c o u s t i c c a l i b r a t i o n , Boone and McCanless (Ref. 1 1 ) considered slender cones,
wedges, f l a t p l a t e s , hemispheres, and sha rp - t i pped , f l ow- th ru , c i r cu la r cy l i n -
ders. These authors recommended a 10 deg apex-angle conical probe for wind
tunnel acoust ic measurements because:
1. cones a re no t as s e n s i t i v e t o t i p f l o w as wedges and f l a t
p la tes ,
2. the t ransonic Mach number range, where unstable shock waves
occur, i s sma l le r f o r s lender cones t h a n f o r f l a t p l a t e s , f l o w -
thru cy1 i nders , and hemi spheres,
3. a slender cone introduces minimal d isturbance to the f low.
As noted by Credle and Shadow (Ref. 24), a smal ler angle cone i s p r e f e r r e d ,
but a 10 deg cone i s about the minimum angle which will a l l o w i n s t a l l a t i o n of
instrumentation under a laminar boundary layer. These same authors a lso re -
por ted tha t by 1970 the IO deg cone had become a s tandard dev ice a t AEDC f o r
ca l ibrat ing wind tunnel f low d is turbances.
Up t o t h i s t i m e t h e AEDC a c o u s t i c c a l i b r a t i o n cone had two f l a t s , l o c a t e d
180 deg apart , for f lush mount ing of sensors. By 1970 exper ience w i th t h i s cone
ind ica ted sa t is fac to ry no ise measurements could probably be made w i t h a completely
symmetrical cone and two 0.635 cm (1/4 in.) condenser microphones. Furthermore,
the sur face o f the cone was pol ished to an rms f i n i s h o f 3 microns and a
t rave rs ing P i to t p robe mechanism was mounted a f t o f t h e cone f o r boundary layer
t rans i t ion s tud ies , Ref . 27. This subsequently became known as the AEDC t r a n s i -
t ion cone and has now been used t o measure dynamic f l o w qua 1 i t y i n over I8 domestic and fo re ign tunne ls , Refs. 8, 28 and 29.
*
The work o f Dougherty w i t h t h e AEDC t r a n s i t i o n cone and the co r re la t i ons
o f Pate and Schueler (Ref. 30) and Benek and High (Ref. 31) have establ ished
a d i r e c t r e l a t i o n s h i p between AC and boundary layer t rans i t ion . In add i t ion
t o p r o v i d i n g a common measure o f dynamic f l o w q u a l i t y , Treon, e t a l . (Ref. 32)
reported data from the AEDC t r a n s i t i o n cone enabled better agreement t o be
ob ta ined i n a s e r i e s o f t e s t s on a t r a n s p o r t a i r c r a f t model. In these tests ,
the same model was t e s t e d i n t h e AEDC-PWT 16T, t he NASA Ames 1 1 - f t . Transonic
Wind Tunnel, and the Calspan 8 - f t . Transonic Tunnel, and d i f f e rences i n d rag
c o e f f i c i e n t s , measured at zero-normal-force, were found to be less when a
c o r r e c t i o n f a c t o r was used t o account for re lat ive Reynolds number e f f e c t s
between f a c i l i t i e s . An e f f e c t i v e Reynolds number for the Calspan and Ames
tunne ls , re la t i ve t o t he AEDC 16T tunnel , was def ined on t h e b a s i s o f a common,
boundary- layer- t rans i t ion length. Thus, t h e u t i l i t y o f a standard acoustic
ca l i b ra t i on dev i ce has been demonstrated. Subsequent t o a planned f l i g h t
c a l i b r a t i o n , t h i s d e v i c e will a l s o be u s e f u l i n c o r r e l a t i n g t u n n e l and f r e e - f l i g h t
condi t ions.
P
Because of the demonstrated u t i l i t y o f t h e AEDC t r a n s i t i o n cone and i t s
past use i n a number o f ma jor fac i l i t i es , West ley (Ref . 9) recommends noise and
tu rbu lence leve ls in t ranson ic tunne ls be measured w i t h two 10 deg cones f i t t e d ,
respec t i ve l y , w i th :
* Apparent ly , the sur face f in ish was l a t e r improved t o 0.25 microns, Ref. 8.
I50
1. s k i n - f r i c t i o n gages to determine t rans i t ion Reynolds numbers
and flush-mounted microphones t o measure no ise l eve l s on the
t e s t s e c t i o n c e n t e r l i n e ,
2. a crossed hot-wire anemometer mounted on t h e t i p (an ONERA
design) . The proposal to e l iminate the t ravers ing probe mechanism will reduce probe
induced noise and wind tunnel blockage. Although Westley's recommendation i s
no t spec i f i c , it i s assumed t h a t he i s n o t recommending f loat ing-e lement sk in-
f r i c t i o n balances but ra ther heat t ransfer dev ices such as t h i n - f i l m s or thermo-
couples for t r a n s i t i o n d e t e c t i o n , e.g., Refs. 11, 34 and 35. Wi th regard to
hot -wi re measurements, Westley expresses a concensus that these instruments
a re idea l fo r measur ing d is tu rbances in a wind tunnel test sect ion. Because
o f t h i s importance and the fac t tha t recent research has demonstrated hot-wires
can be used e f f e c t i v e l y i n some transonic test sect ions (Ref. 161, they are
discussed separately in Appendix 1 .
*
-=.--- A l t e rna te Acous t i c Ca l i b ra t i on Probes
Not only would the AEDC t r a n s i t i o n cone be expensive to reproduce, but
noise measurements on it a re suscep t ib le t o a number o f probe-induced errors.
Credle and Shadow (Ref. 24) observed that pressure gradients exist on a cone
a t subsonic and t ransonic speeds, and hence acoust ic measurements a r e i n f l u -
enced by bo th s ta t i c and to ta l p ressure g rad ien ts . A laminar boundary layer may
modulate acoustic disturbances which pass through i t t o an underlying sensor,
Ref. 9. Also, Siddon (Ref. 36) has shown tha t bo th ax ia l and l a t e r a l f l u c t u a -
t i o n s can cause e r r o r s i n measurements o f AC w i t h probes. Hence, other probe
a l t e r n a t i v e s may o f f e r some advantages fo r acous t i c ca l i b ra t i on o f w ind t unne ls .
The fo l low ing conc ise summary of Siddon's work (Ref. 36) i s e x t r a c t e d from
P
W i l l m a r t h ' s a r t i c l e (Ref. 21). ---" Siddon has repor ted cons t ruc t ion o f an
excel lent probe for unsteady stat ic-pressure measurements, and he has c a l i b r a -
ted i t in va r ious con t r i ved f l ows t o remwe the e r ro rs caused by t h e i n t e r a c t i o n
* Credle (Ref. 33) noted ear l ier that the t ravers ing probe suppor t s t ructure appeared to generate addi t ional no ise, based on comparisons w i th acous t i c data obtained on an ogive-cyl inder and the AEDC 10 deg cone w i t h f l a t s .
151
of the body o f t he p robe wi th s t reanwise and c ross- f low ve loc i ty f luc tua t ions .
The p ressu re i s t ransmi t ted to the diaphragm of a miniature condensor micro-
phone (0.25 dm diam.) ins ide the probe (0.305 cm diam.) through an annular
s l i t approximately 2 diameters downstream from the t i p o f the ba lsa wood,
s l
t o
co
so
t o
ve nose. A 0.318 cm (1/8 in.) col lar around the probe, downstream o f the
t, was c a r e f u l l y p o s i t i o n e d t o make the s teady p ressu re a t t he s l i t equa l
the f ree-s t ream s ta t i c p ressure when there i s no cross f low. The probe-
l a r compensation was checked a t z e r o a n g l e o f a t t a c k i n a f l o w w i t h s i n u -
d a l a x i a l v e l o c i t y f l u c t u a t i o n s and was found adequate.
"Siddon's unique achievement i s t h e development o f a compensation scheme
cancel the pressure f luc tuat ions produced by cross- f low f luctuat ions. H i s
scheme i s based upon an ea r l i e r t ransducer i n wh ich p iezoe lec t r i c f o rce -sens ing
elements were used t o measure l i f t f l u c t u a t i o n s o f a s m a l l a i r f o i l , w h i c h a r e
p r o p o r t i o n a l t o v e l o c i t y f l u c t u a t i o n s normal t o t h e a i r f o i l when the angle-of-
a t tack f l uc tua t i ons a re sma l l . I n t he p resen t case Siddon used an arrangement
o f f o u r p i e z o e l e c t r i c Bimorph p la te e lements in an I-beam c o n f i g u r a t i o n t o
measure the orthogonal bending moments produced by cross-flow-induced transverse
forces on the nose o f the probe. I f quasi-steady, slender-body, aerodynamic
theory i s app l i cab le , the t ransverse fo rce will be propor t iona l to the ins tan-
taneous t ransverse veloci ty at the nose. The two e lec t r i ca l s i gna ls rep resen t ing
the orthogonal components o f t r a n s v e r s e v e l o c i t y were each squared and summed
with analog-computer elements t o o b t a i n a s igna l p ropor t iona l t o the square o f
the t ransverse ve loc i ty . A f r a c t i o n o f t h i s s i g n a l was added to t he p ressu re
measured by the condensor microphone to g i ve (app rox ima te l y ) t he t rue s ta t i c -
e x i s t e d i n t h e absence o f the p robe. p ressure f luc tua t ions tha t wou ld have
"Siddon ca l ib ra ted the p robe in a
through a r o t a t i n g i n c l i n e d n o z z l e .
where the s ta t i c p ressu re i s cons tan t
t h e a x i s o f r o t a t i o n ) . A t t h a t p o i n t
f low produced by a j e t o f a i r passed
The probe s l i t was p l a c e d a t t h e p o i n t
( t h e i n t e r s e c t i o n o f t h e n o z z l e a x i s and
any f luc tua t ing p ressure s igna ls f rom the
condensor microphone were assumed t o be produced by cross-f low interact ion wi th
the probe. These s igna ls were cancel led by a d d i t i o n o f t h e p r o p e r f r a c t i o n o f
the square o f the t ransverse ve loc i ty .

"Siddon concluded that the error in the pressure produced by cross- f low
i n t e r a c t i o n i n t u r b u l e n c e was less than 20 percent. Thus, reasonably accurate
measurements o f f l uc tua t i ng p ressu re cou ld be made as long as the assumption o f
quasi-steady f low was n o t v i o l a t e d and the t ime lag between the t ransverse-force
signal from the probe nose and the pressure measured a t t h e a n n u l a r s l i t was
not impor tant . genera l ly , th . is requ: i res that the spat ia l sca le o f the pressure
" f luc t -ua t ions be much larger than the probe dimensions.* As a r e s u l t o f h i s
work Siddon was ab le t o conc lude t ha t i n many pract ical c i rcumstances where
o n l y root-mean-square pressure f luctuations were measured with probes
Strasberg's (Ref. 37), t h e . c o r r e c t i o n f o r c r o s s - f l o w i n t e r a c t i o n i s 1
be smal l . Owing to d i f f e rences i n t he co r rec ted and uncorrected wave
must use the corrected pressure when instantaneous values are desi red
when the corrected and uncorrected root-mean-square pressures are the
Thus, f o r a number o f aerodynamics and acoustic reasons, as w e l l
s i m p l i c i t y and economy, Westley (Ref. 9) notes that a number o f opera
t ransonic and supersonic tunnels are measur ing f luc tuat ing s ta t ic and
pressures. He recommends that these types of acoustic probes be deve
standardized. Dynamic stat ic pressure probes should be developed f o r
speed f lows and probably should fol low the Siddon type design.
1 i k e
k e l y t o
forms, one even
same."
as
o r s o f
p i t o t
oped and
h igh
I n t h e case o f dynamic P i t o t probes, a se r ies o f des ign s tud ies a t NASA
Langley has culminated i n a design which appears t o be s a t i s f a c t o r y f o r
acous t i c ca l i b ra t i on o f w ind t unne ls , Refs.38, 35 and 14. A schematic o f t h e
probe reported in Ref. 14 i s shown i n F i g . 3.F.3. B r i e f l y , i t c o n s i s t s o f
two 0.318 cm (1/8 in.) d iameter p iezoelectr ic t ransducers mounted i n tandem.
The probe diameter of 0.635 cm (1 /4 in . ) was se lected because mean pressure
measurements ind icate the pressure is near ly constant across the center o f a
f l a t - f aced d i sk i n superson ic f l ow . The diaphragm o f t h e exposed transducer i s
covered wi th a t h i n c o a t i n g o f RTV rubber t o reduce v u l n e r a b i l i t y t o damage by
p a r t i c l e s i n t h e f l o w . The purpose o f t he sh ie lded rea r t ransducer i s t o
serve as an acce le ra t ion (o r v ib ra t ion) mon i to r . The s ignal f rom th is t ransducer
i s sub t rac ted f rom the exposed transducer i n o r d e r t o a c c o u n t f o r t h e e f f e c t s
nThe u n d e r l i n i n g was inser ted by the p resent au thors to po in t ou t tha t the s ize o f t h e AEDC t r a n s i t i o n cone may induce e r ro rs in no ise measurements.
153
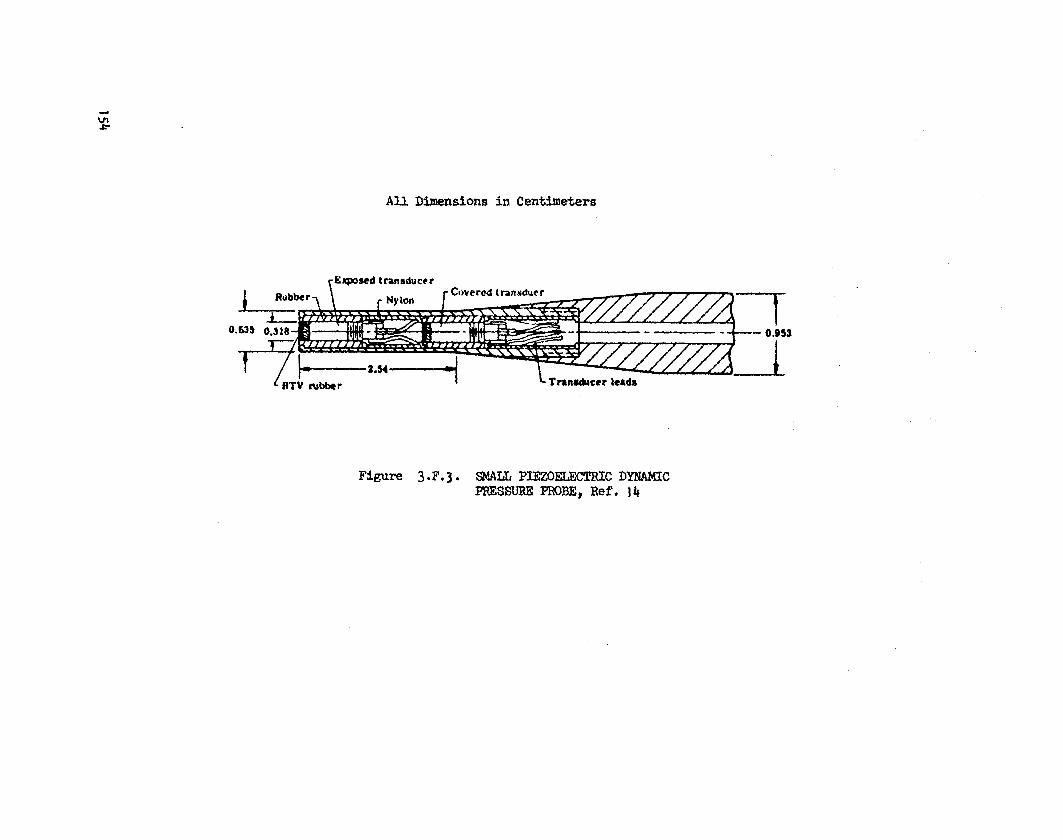
A U Dimensions in Centimeters
r E m s e d tnnrduccr
Figure 3 .F. 3 . SMALL PIEZOF&EC!i'RIC DYNAMIC PRESSURE PROBE, Ref. 14
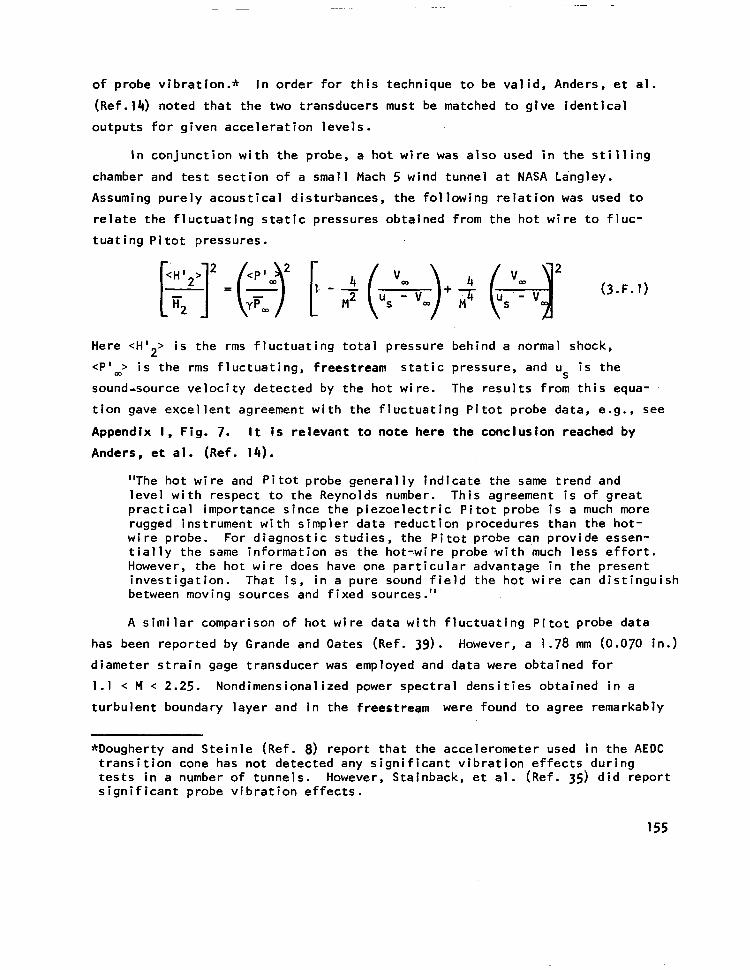
o f p r o b e v i b r a t i o n . * I n o r d e r f o r t h i s t e c h n i q u e t o be v a l i d , Anders, e t a l .
(Ref.14) noted that the two transducers must be matched t o g i v e i d e n t i c a l
ou tpu ts f o r g i ven acce le ra t i on l eve l s .
In con junc t ion w i th the p robe, a h o t w i r e was a l s o used i n t h e s t i l l i n g
chamber and t e s t s e c t i o n o f a small Mach 5 wind tunnel a t NASA Langley.
Assuming pu re l y acous t i ca l d i s tu rbances , t he f o l l ow ing re la t i on was used t o
re la te t he f l uc tua t i ng s ta t i c p ressu res ob ta ined f rom the ho t w i re t o f l uc -
t ua t i ng P i to t p ressu res .
Here <HI2> i s t h e rms f l uc tua t i ng t o ta l p ressu re beh ind a normal shock,
<PIoD> i s the rms f l uc tua t i ng , f rees t ream s ta t i c p ressu re , and u i s t h e
sound-source ve loc i t y de tec ted by the hot wire. The r e s u l t s f r o m t h i s equa-
t i o n gave e x c e l l e n t agreement w i th the f luc tua t ing P i to t p robe da ta , e.g., see
Appendix I , Fig. 7. It i s r e l e v a n t t o note here the conclusion reached by
Anders, e t a l . (Ref. 14).
S
"The h o t w i r e and P i t o t probe genera l ly ind icate the same t rend and leve l w i th respec t t o t he Reynolds number. This agreement i s o f g r e a t p rac t ica l impor tance s ince the p iezoe lec t r i c P i to t p robe i s a much more rugged instrument with simpler data reduction procedures than the hot- wire probe. For d iagnost ic studies, the Pi tot probe ca,n provide essen- t i a l l y t h e same informat ion as the hot-wire probe .wi th much l e s s e f f o r t . However, the hot wi re does have one p a r t i c u l a r advantage in the p resent i n v e s t i g a t i o n . T h a t i s , i n a pure sound f i e l d t h e h o t w i r e can d i s t i n g u i s h between moving sources and f i x e d sources."
A s i m i l a r comparison o f h o t w i r e d a t a w i t h f l u c t u a t i n g P i t o t p r o b e d a t a
has been reported by Grande and Oates (Ref. 39). However, a 1.78 rnm (0.070 in.)
d iameter s t ra in gage transducer was employed and data were obtained for
1.1 < M < 2.25. Nondimensionalized power spec t ra l dens i t i es ob ta ined i n a
tu rbu len t boundary l aye r and in the freestream were found to agree remarkably
*Dougherty and Ste in le (Ref . 8) report that the accelerometer used i n t h e AEDC t r a n s i t i o n cone has not detected any s i g n i f i c a n t v i b r a t i o n e f f e c t s d u r i n g t e s t s i n a number o f t unne ls . However, Sta inback, e t a l . (Ref . 35) d i d r e p o r t s i g n i f i c a n t p r o b e v i b r a t i o n e f f e c t s .
155
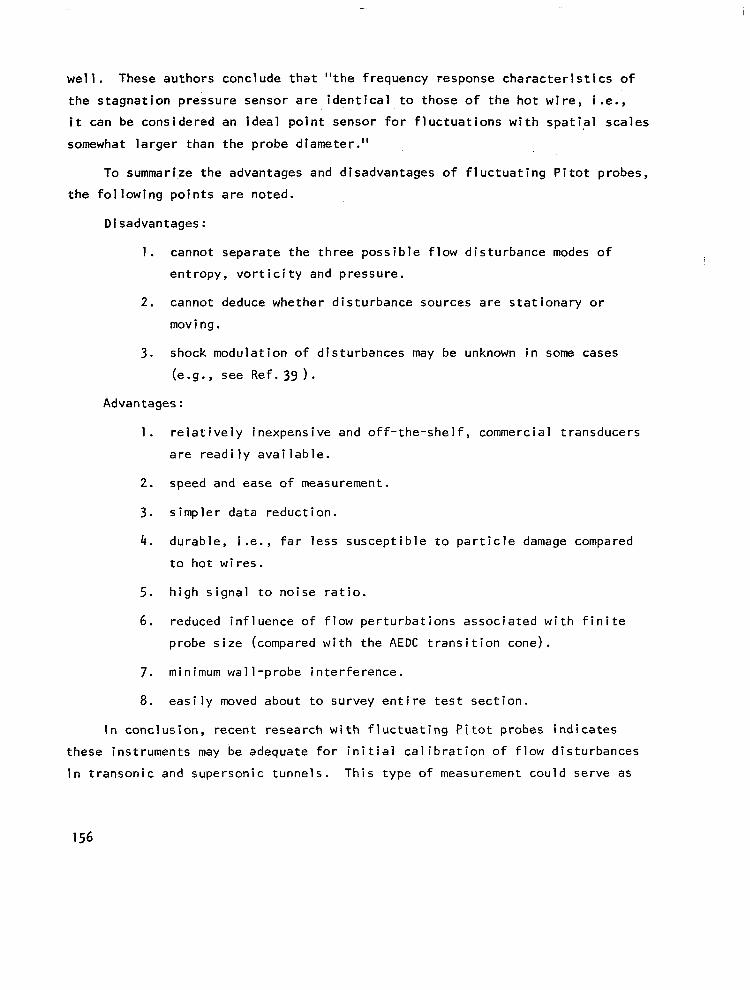
we1 1. These authors conclude that " the f requency response character ist ics o f
the s tagnat ion pressure sensor are ident ica l to those of the hot wi re , i .e . ,
it can be cons idered an ideal po int sensor for f luc tuat ions wi th spat ia l sca les
somewhat larger than the probe diameter. ' '
To summarize the advantages and disadvantages o f f l u c t u a t i n g P i t o t probes,
t he f o l l ow ing po in ts a re no ted .
D i sadvan tages :
1 . cannot separate the three poss ib le f low d is turbance modes o f
e n t r o p y , v o r t i c i t y and pressure.
2 . cannot deduce whether d isturbance sources are stat ionary or
movi ng.
3. shock modulat ion of d isturbances may be unknown i n some cases
(e.g., see Ref. 39 ) .
Advantages :
1 .
2.
3 .
4.
5.
6 .
7.
8.
re la t i ve ly inexpens ive and o f f - t h e - s h e l f , commercial transducers
a re read i l y ava i l ab le .
speed and ease o f measurement.
s impler data reduct ion.
durable, ;.e., f a r l e s s s u s c e p t i b l e t o p a r t i c l e damage compared
t o h o t w i r e s .
h i g h s i g n a l t o n o i s e r a t i o .
reduced in f l uence o f f l ow pe r tu rba t i ons assoc ia ted w i th f i n i t e
probe s ize (compared w i t h t h e AEDC t rans i t ion cone) .
minimum wal l -probe in ter ference.
e a s i l y moved about t o su rvey en t i re t es t sec t i on .
In conc lus ion , recent research w i th f luc tua t ing P i to t p robes ind ica tes
these instruments may be adequate f o r i n i t i a l c a l i b r a t i o n o f f l o w d i s t u r b a n c e s
i n t r a n s o n i c and supersonic tunnels. This type of measurement could serve as

a convenient and inexpensive standard to compare tunnel noise levels. I t 1s
a lso re levant to note that Dougherty of the Propulsion Wind Tunnel group a t
AEDC plans to use a f luctuat ing Pi tot probe to monitor f reestream disturbance
l e v e l s d u r i n g f l i g h t t e s t s w i t h t h e AEDC t r a n s i t i o n cone.
1 57

1II.F. References
1.
2.
3.
4.
5.
6.
7.
8.
9.
IO.
1 1 .
Dougherty, N. S. ; Anderson, C. F.; and Parker, R. L. : "An Experimental
I n v e s t i g a t i o n o f Techniques t o Suppress Edgetones from Perforated Wind
Tunnel Wa 1 1 s , I ' AEDC-TR-75-88, Aug . 1975.
Har tzu iker , J. P. ; Pugh, P. G . ; Lorenz-Meyer, W. ; and Fasso, G . E. : "On
the Flow Quali ty Necessary for the Large European High-Reynolds-Number
Transonic Windtunnel LEHRT," AGARD-R-644, March 1976.
McCanless, G. F. and Boone, J. R.: "Noise Reduction i n Transonic Wind
Tunnels ,I1 J. Acoust. SOC. Am., Vol . 56, No. 5, Nov. 1974.
Schutzenhofer, L. A. and Howard, P. W. : "Suppression o f Background Noise
i n a Transonic Wind-Tunnel Test Section,'' A l A A Jour., Nov. 1975.
Mabey, D. G.: "Flow Unsteadiness and Model V i b r a t i o n i n Wind Tunnels a t
Subsonic and Transonic Speeds," C.P. No. 1155, Aero. Res. Coun., 1971.
Habey, D. G . : ' #An Hypothes is fo r the Pred ic t ion o f F l igh t Penet ra t ion of
Wing Bu f fe t i ng from Dynamic Tests on Wind Tunnel Models," RAE TR 70189,
Oct. 1970.
Mabey, D. G . : "The In f luence o f Flow Unsteadiness on Windtunnel Measure-
ments at Transonic Speeds," RAE Tech. Memo. Aero. 1473, 1973.
Dougherty, N. S . and S te in le , F. W.: "Transi t ion Reynolds Number
Comparisons i n Several Major Transonic Tunnels," A I A A Paper No. 74-627,
J u l y 1974.
Westley, R.: "Problems of Noise Measurement i n Ground-Based F a c i l i t i e s
w i t h Forward-Speed Simulation (High-speed Wind Tunnel Noise) , I1 Appendix 5 o f AGARD-AR-83, Sept. 1975.
Riddle, C. D.: " I n v e s t i g a t i o n o f Free-Stream Fluctuat ing Pressures in the
16-Ft. Tunnels o f t he P ropu ls ion Wind Tunnel F a c i l i t y , " AEDC-TR-67-167,
Aug. 1967.
Boone, J. R. and McCanless, G . F.: "Evaluat ion o f the Acoust ic Sources o f
Background Noise i n Wind Tunnel F a c i l i t i e s , ' # NASA CR-98155.
12.
13.
14.
15.
16.
17.
18.
19.
20.
21.
22.
23.
Boone, J. R. and McCanless, G . F.: "App l ica t ion o f the Techniques for
Evaluat ing the Acoust ic Sources o f Background Noise i n Wind Tunnel
F a c i l i t i e s , " Tech. Rept. HSM-R05-69, Chrys ler Huntsv i l le Operat ions,
Mar. 1969.
Credle, 0 . P . : "An Evaluat ion o f the F luctuat ing A i rborne Envi ronments in
the AEDC-PWT 4-Ft. Transonic Tunnel," AEDC-TR-69-236, Nov. 1969.
Anders, J. R. ; Sta inback, P. C. ; Keefe, L. R. ; and Beckwith, I . E. : "Sound
and F luctuat ing Dis turbance Measurements i n t h e S e t t l i n g Chamber and Test
Section of a Small, Mach 5 Wind Tunnel," ICIASF '75, I n t ' l Congress on
Ins t rumenta t ion in Aerospace S i m u l a t i o n F a c i l i t i e s , Ottawa, Canada,
Sept. 22-24, 1975, publ ished by IEEE, 345 E. 47th St ree t , New York.
Anders, J. B.; Stainback, P. C.; Keefe, L. R.; and Beckwith, 1 . E . :
"F luctuat ing Ois turbances in a Mach 5 Wind Tunnel," Proc. A I A A 9 t h
Aerodynamics Testing Conference, June 1976.
Horstman, C. C. and Rose, bl. C.: "Hot Wire Anemometry in Transonic Flow,"
NASA TM X-62495, Dec. 1975.
Donaldson, J. C. and Wallace, J. P.: "Flow F luc tua t i on Measurements a t
Mach Number 4 in the Tes t Sec t ion o f the 12-Inch Supersonic Tunnel (D) ,I'
AEDC TR-71-143, Aug. 1971.
Lewis, T. L . and Dods, J. B.: "Wind-Tunnel Measurements of Surface-Pressure
F luc tua t i ons a t Mach Numbers o f 1.6, 2.0, and 2.5 Using 12 D i f f e r e n t
Transducers," NASA TN D-7087, Oct. 1972.
Fuchs, H. V . : "Measurement o f Pressure Fluctuations Within Subsonic
Turbulent Jets," J . Sound & Vib., Vol. 22, No. 3, 8 June 1972.
Wi 1 Imarth, W. W. : "Pressure Fluctuations Beneath Turbulent Boundary Layers,"
Annual Review o f F l u i d Mechanics, Vol. 7, Annual Review Inc., Palo Alto,
Cal if., 1975.
Wi 1 Imarth, GI. W. : "Unsteady Force and Pressure Measurements , I ' Annual Review
o f F l u i d Mechanics, Vol. 3 , Annual Review Inc., Pa lo A l to , Ca l i f . , 1971.
Hanly, R. D.: "Effects of Transducer Flushness on Fluctuating Surface
Pressure Measurements, A I A A Paper No. 75-534, Mar. 1975.
Dods, J. B. and Hanly, R. D . : "Evaluation o f Transonic and Supersonic Wind-
Tunnel Background Noise and Ef fec ts o f Sur face Pressure F luc tua t ion
Measurements," A l A A Paper No. 72-1004, Sept. 1972.
159

24.
25
26.
27
28. 1
29.
30
31
32
33
34.
Credle, 0. P. and Shadow, T. 0.: "Evaluation of the Overa l l Root-Mean-
Square F luctuat ing Pressure Levels in the AEDC PWT 16-Ft. Transonic Tunnel , I '
AEDC-TR-70-7, Feb. 1970.
Chevalier, H. L. and Todd, H. E.: "Measurement o f the Pressure Fluctuat ions
i n t he Tes t Sec t i on o f t he 16-Foot Transonic Circuit in the Frequency Range
from 5 t o 1000 cps," AEDC-TN-61-51 (AD 255 7631, May 1961.
b r a b i n u s , R. J. and Sanders, B. W. : "Measurements of F luctuat ing Pressures
i n 8-by 6-Foot Supersonic Wind Tunnel f o r Mach Number Range o f 0.56 t o
2.07,'' NASA TM X-2009, May 1970.
Credle, 0. P. and Carleton, W. E . : "Determination o f T rans i t i on Reynolds
Number in the Transonic Mach Number Range," AEDC-TR-70-218, Oct. 1970.
Dougherty, N. S . , Jr.: 'IPrepared Comment on Cone T rans i t i on Reynolds
Number Data Cor re la t ion Study,'l AGARD-CP-187, June 1975.
Wh i t f i e ld , J. and Dougherty, N. S . , Jr . : "A Survey o f T r a n s i t i o n Reynolds
Number Work a t AEDC," t o be presented at AGARD F l u i d Dynamics Panel
Symposium on Laminar-Turbulent Transition, Copenhagen, Denmark, May 1977.
Pate, S . R. and Schueler, C. J.: "Radiated Aerodynamic Noise Effects on
Boundary Layer Transi t ion in Supersonic and Hypersonic Mind Tunnels , ' I
A l A A Jour., Vol. 7, No. 7, Mar. 1969.
Benek, J. A. and High, M. D.: "A Method fo r t he P red ic t i on of the E f fec ts
o f Free-Stream Disturbances on Boundary-Layer Transit ion," AEDC-TR-73-158, Oct. 1973, a l so A l A A Jour., P. 1425, Oct. 1974.
Treon, S. L.; S te in le , F. M.; Hagerman, J. R.; Black, J. A., and Buf f ing ton ,
R. J.: "Further Correlat ion of Data f rom Inves t iga t ions o f a High-Subsonic-
Speed Transpor t A i rc ra f t Model i n Three Major Transonic Wind Tunnels," A l A A
Paper No.71-291, Mar. 1971.
Credle, 0. P.: "Perforated Wall Noise i n t h e AEDC-PWT 16-Ft. and 4-Ft.
Transonic Tunnel s , ' I AEDC-TR-7 1-21 6, Oct . 197 1 . He l le r , H. H. and Clemente, A . R.: "Fluctuat ing Surface - Pressure
Charac ter is t i cs on Slender Cones i n Subsonic, Supersonic, and Hypersonic
Mach-Number Flow," NASA CR-2449, Oct. 1974.
160
35. Stainback, P. C. ; Wagner, R. D. ; Owen, F. K. ; and Horstman, C. C. :
"Experimental Studies o f Hypersonic Boundary-Layer T rans i t i on and
E f f e c t s o f Wind-Tunnel Disturbances," NASA TN D-7453, Mar. 1974.
36. Siddon, T. E.: "On the Response of Pressure Measuring Instrumentation
i n Unsteady Flow," UTlAS Rept. No. 136, I n s t i t u t e for Aerospace Studies,
Univ. of Toronto, Jan. 1969.
37. Strasberg, M.: "Measurements o f t h e F l u c t u a t i n g S t a t i c and Total-Head
Pressures i n a Turbulent Wake," David Taylor Model Basin Rept. 1779, (AD 428 7001, Dec. 1963 (a1 so AGARD Rept. 464).
38. Stainback, P. C. and Wagner, R. D.: "A Comparison of Disturbance Levels
Measured i n Hypersonic Tunnels Using a Hot-wire Anemometer and a P i t o t
Pressure Probe,'' A l A A Paper No. 72-1003, Sept. 1972.
39. Grande, E. and Oates, G. C.: I'Response of Miniature Pressure Transducers
to F luc tua t ions in Superson ic Flow," Ins t rumenta t ion fo r A i rb rea th ing
."' Propuls ion Progress in Astronaut ics and Aeronautics, A l A A Vol. 34, MIT Press, 1972.
161.
.I.. . , .. .. . . .. . . . .. - . . . . . _. .. .._
111.6. TRANSONIC TUNNEL BOUNDARY CONDITIONS AND WALL INTERFERENCE
I I I.G.l. Conventional Ventilated Walls
The history of development of ventilated walls for transonic tunnels has been reviewed by Goethert (Ref. 1). The three primary milestones in this development were as follows:
1. Theoretical analyses in Germany, Italy, and Japan during the 1930's indicated tunnel walls with proper arrangement of longi- tudinal slots would provide wall-interference-free flow simulation. This work was interrupted by World War 1 1 .
2. During 1946, Wright and Ward (Ref. 2) developed a "subsonic theory for solid-blockage interference in circular wind tunnels with walls slotted in the direction of flow." Subsequently, a 12-in. diameter tunnel was designed with ten evenly spaced slots providing a total openness ratio of one-eighth. The tunnel was put into operation in 1947. This design did indeed prevent choking and enabled testing thru Mach one of a model with 8.5% blockage.
3. Unfortunately, the solid slats in slotted tunnels were found to cause significant reflecticns of bow shocks and expansion waves at supersonic speeds. Thus, around 1950 theoretical analyses at Cornel1 Aeronautical Laboratory* indicated better shock wave cancel lation could be achieved with small-grain porous walls, Goodman (Ref. 3). Unfortunately, exploratory tests showed such walls clog easily, and even worse, the porosity needed to vary with each change in Mach number and/or shock strength. As an outgrowth of this work, the now familiar perforated wall was selected as a convenient compromise.
The early mathematical models of tunnel-wall-interference were based on the governing differential equation for perturbation velocity potential in subsonic, compressible flow, e.g. ,'Baldwin, et el. (Ref. 4).
A The current name of this facility is Calspan.
162

I f the wa 1 1 is so
a4 - = 0 an
In the case of an boundary; thus
lid, the boundary condition for no flow through the wall is
at solid wall. (3-6.2)
open-jet, there can be no pressure difference across the
- = 0 at open boundary. a4 ax (3.G.3)
The corrections to measured values of model lift and pitching moment, which result when solving Eq. (3.6.1) with either solid or open-wall boundary conditions, are discussed in detail by Garner, et al. (Ref. 5). The theoretical results generally agree with experiments. In order to facilitate applications of thls type of boundary-induced corrections, Heyson (Ref. 6) has compiled solutions in the form of curves and charts.
In the case of ventilated walls, the boundary conditions become more complex. In fact, the central problem of theoretical analysis of transonic-wall-interference is selection of the appropriate boundary conditions to use with Eq. (3.G.l). This is still an area of active research, and only a brief review of boundary conditions for ventilated tunnels wi 1 1 be given here.
An approximate boundary condition for porous walls was derived by Goodman (Ref. 3, Part I I ) , viz.,
+ 1 R - 0 at ideal, porous wall.
This boundary condition was derived by assuming the average velocity normal to the wall is proportional to the pressure drop through the wall (a linearized approximation to viscous flow through the wall), and that the pressure outslde the wall is equal to freestream static. The value of R, for a given wall, i s
usually determined experimentally by measuring pressure drop and the associated mass flow through a wall sample (e.g. Ref. 71, i.e. ,

An approximate, uni form boundary condi t ion for s lot ted wal ls was der ived
by Baldwin, e t a l . (Ref. 4).
- a 4 + K - ax axan a20 = 0 a t i d e a l , s l o t t e d w a l l (3. G. 6)
where K i s r e l a t e d t o s l o t geometry by
DS wS K = - I n {CSC (E - 1 1 , DS
lr
and
Ds = dis tance between s lo t cen te rs ,
Ws = w i d t h o f s l o t s .
I n an attempt t o account for v iscous e f fects , Baldwin, e t a l . suggested
adding the porous boundary condi t ion to Eq. (3.6.6) and measuring R f o r t h e
s l o t o f i n t e r e s t .
- a+ + K - & + - 1 - a 4 = 0 a t v i s c o u s , s l o t t e d w a l l ax axan Rs an (3.6.8)
K e l l e r (Ref. 8) has recent ly suggested th is boundary condi t ion be extended t o
i nc lude va ry ing s lo t w id th by rep lac ing l / R S w i t h l / R s + aK/ax.
A f t e r more than two decades of testing and comparisons o f t h e o r y w i t h
exper imenta l resul ts , i t i s now genera l l y recogn ized t ha t app l i ca t i on o f t he
l i n e a r boundary condi t ions, wi th constant v
As an example o f t h i s d i sc repancy , a b r i e f
presented here.
Lowe (Ref. 9) measured the wal l poros i
a lues o f K and/or R, i s inadequate.
summary o f a t y p i c a l case i s
t y parameter f o r a w a l l w i t h 22.5%
p o r o s i t y and normal holes. The standard porosity parameter, R , was determined
exper imental ly by measur ing the stat ic pressure drop and mass f low across a
164
9- inch by 21- inch sect ion o f a s idewal l of the General Dynamics 4-foot High
Speed Wind Tunnel. Data were obtained for Mach numbers o f 0.5, 0.7, and 0.9
and a corresponding unit Reynolds number range o f 19.7 t o 37.7 mill ion (per
meter), Using the measured va lues o f R and t h e r e s u l t s o f 1 i near per tu rba t ion
theory obtained by Lo and Ol iver (Ref. IO), the upwash and stream1 ine curva-
tu re co r rec t i ons i nd i ca ted t he wa l l d id no t have t h e c h a r a c t e r i s t i c s o f an
open j e t . T h i s c o n t r a d i c t e d t h e r e s u l t s o f t e s t s w i t h an a i r c r a f t f o r c e model
which,when co r rec ted f o r open-boundary interference,agreed w i th da ta ob ta ined
w i t h t h e same model in the Lang ley 8 ' Transonic Pressure Tunnel (Ref. ll)*.
Thus, t h e r e s u l t s o f Lowe, as w e l l as others, indicate the measurement o f R and
use o f t h e c l a s s i c a l , l i n e a r p e r t u r b a t i o n t h e o r y i s n o t v e r y u s e f u l f o r c a l i b r a t -
ing the e f fects o f t ransonic wind tunnel wal ls . I f , in genera1, th is approach to
c o r r e c t i n g f o r w a l l i n t e r f e r e n c e had proven successful, measurements o f R f o r
porous and s lo t ted tunnels would have become a s tandard par t o f t ransonic tunnel
c a l i b r a t i o n .
I !
I
The cu r ren t consensus is : the t rue, t ransonic- tunnel boundary condi t ions
a re dependent on the loca l f low cond i t ions near the wa l l . Th is , in tu rn , means
a dependence on bo th tunne l opera t ing cond i t ions @the par t i cu la r model
con f igu ra t i on , e.g. , Newman and Klunker (Ref. 14). Recent e f f o r t s t o o b t a i n
improved boundary condit ions for f ixed (passive) wall condit ions include the
s tudy o f va r ia t i ons i n R between top and bottom perforated wal ls, Ref. 15, and
nonl inear boundary condi t ions for wal ls wi th normal holes, Ref. 16, and s l o t t e d
walls, e.g., Refs. 17 and 18. Of course, the bas ic ob ject ive o f these s tud ies i s
to a t ta in da ta cor rec t ion p rocedures wh ich can r e l i a b l y account for the e f fec ts o f
r e a l , v e n t i l a t e d w a l l s .
111.6.2. Adaptive Wall Studies
The d i f f i c u l t i e s i n a p p l y i n g t r a n s o n i c w a l l c o r r e c t i o n s , w h i c h do no t
reduce to s imp le mod i f i ca t ions o f speed and angle of a t t a c k , a r e w e l l known.
A l s o , one o f the conc lus ions ob ta ined w i th the convent iona l , l i near theory o f
w a l l e f f e c t s i s t h e i m p o s s i b i l i t y o f u s i n g u n i f o r m p o r o s i t y t o s i m u l t a n e o u s l y
* The r e c e n t , s u p e r c r i t i c a l a i r f o i l t e s t s o f E l a c k w e l l and Pounds (Ref. 12) i nd i ca te t he ac tua l boundary c o n d i t i o n s h i f t s toward the f ree- je t as poros i ty increases, i.e., the transonic shock moves fo rward fo r a given Mach number. This same t rend was also observed as a resu l t o f inc reased b lockage in the s u p e r c r i t i c a l c o n e - c y l i n d e r t e s t s o f Page (Ref. 13) .
-
165
e l im ina te t he e f fec ts o f wa l l i n te r fe rence on bo th no rma l f o rce and p i t c h i n g
moment, Ref. 16.
For these reasons, other procedures have been suggested and a r e c u r r e n t l y
being invest igated. The theory developed by F e r r i and Baronti (Ref. 19) and
Sears (Ref. 20) seems to o f fe r t he p romise o f be ing more co r rec t . These authors
suggested tha t the p ressure d is t r ibu t ion and the s t reaml ine de f lec t ion ang le be
measured a long the tunnel wal ls (outs ide the boundary layer) wi th a model i n
place. The scheme then i nvo l ves ca l cu la t i on o f ( I ) t he f l ow-de f lec t i on ang les
which correspond to the measured pressure data and (2) t h e p r e s s u r e d i s t r i b u t i o n
corresponding to the measured flow def lec t ion ang les . The d i f f e r e n c e between
the measured and ca l cu la ted p ressu re d i s t r i bu t i ons and s t reaml ine def lect ions
are then used t o accomplish one o f t h e f o l l o w i n g :
1 . determine the wal l poros i ty which e l iminates wal l
i n t e r f e r e n c e f o r a g iven ex te rna l p ressure d is t r ibu t ion ,
2. prov ide t he co r rec t p ressu re d i s t r i bu t i on ou ts ide
o f t he po rous wa l l f o r a g i v e n p o r o s i t y d i s t r i b u t i o n ,
3. determine wa l l con tours to con form w i th f ree-a i r
stream1 ines, o r
4. c a l c u l a t e t h e w a l l c o r r e c t i o n s t o be a p p l i e d t o t h e
exper imenta l resul ts .
One o f t h e advantages o f t h i s p r o c e d u r e i s t h a t it on ly requ i res t he
l i nea r i zed pe r tu rba t i on equa t ions t o be v a l i d near the wal l . This means the
procedure may be v a l i d as long as supersonic pockets do no t ex tend to the
tunnel wal ls. The primary advantage o f t h i s p r o c e d u r e i s t h a t i t uses data
to es tab l i sh t he app rop r ia te boundary conditions. However, as noted by F e r r i
and Baront i , the pr imary d isadvantages are the requi rements for "accurate
measurements of f l o w d e f l e c t i o n s and pressure var ia t ions a t severa l angular
pos i t i ons and a t many s ta t ions a long the tes t sec t ion . "
I n con junc t i on w i th t he t heo ry o f Fe r r i and Baronti , an experimental pro-
gram was begun i n t h e 15" T r i s o n i c Gasdynamics F a c i l i t y a t t h e Air Force F l i gh t
Dynamics Laboratory. Since Streamline angles can be measured more accurate ly
away from the wal l , the theory was subsequent ly modif ied to use f low angles and
s ta t i c p ressu res measured a t an in termediate "midf ie ld1 ' locat ion between the
model and wa l l . Fo r angu la r i t y measurements, a new ho t - f i lm , 20 deg-wedge probe
166

was designed and fab r i ca ted . Ca l i b ra t i on t es ts show it t o be capable of
reso lv ing f l ow ang les t o w i th in - +2 minutes o f a r c (Ref. 21). This probe,
t oge the r w i th a convent ional , cone-cylinder,static-pressure probe, provides
the inpu t requ i red by the Fer r i and Baronti theory.
R e s u l t s o f t h i s work have demonstrated the f e a s i b i l i t y o f changing
s lo t ted-wa l l con tour to m in imize t ranson ic -wa l l - in te r fe rence w i th the f low
over 6% t h i c k b i c o n v e x a i r f o i l s a t z e r o a n g l e - o f - a t t a c k . As expected, the
resul ts for nonzero angles-of -at tack ind icate the wal l contour will need t o be
changed as changes i n l i f t and/or model con f igu ra t i on a re made. The s tudy o f
l i f t i n g a i r f o i l models i s con t i nu ing . However, enough r e s u l t s a r e now a v a i l -
ab le to conc lude tha t th is approach o f fe rs a decided advantage over the pre-
vious approach o f measuring pressure drop and mass flow through a wa l l sample
and t h e n t r y i n g t o use l i n e a r boundary conditions to es t ima te wa1l-model
in te r fe rence fac to rs .
Work i s a l s o underway a t t h e U n i v e r s i t y o f Southampton (England), Ref. 22,
and ONERA (France), Ref. 23, on us ing ad jus tab le , so l i d wa l l s t o con fo rm w i th
f ree-a i r s t reaml ines.
V ida l , e t a l . (Ref . 24) have reported on recent progress with the Calspan
one- foo t , se l f -cor rec t ing tunne l . The conclusions regarding t ransonic cross-
f l o w c h a r a c t e r i s t i c s o f p e r f o r a t e d w a l l s a r e q u i t e I n t e r e s t i n g . The f o l l o w i n g
i s quoted from their paper.
"The usual theoret ical approach i s t o assume tha t the normal v e l o c i t y
component i n t h e i n v i s c i d s t r e a m i s l i n e a r l y r e l a t e d t o t h e v e l o c i t y
th rough the wa l l , wh ich i s l i near ly re la ted to the p ressure d rop across
the wa l l . Our r e s u l t s show t h a t n e i t h e r l i n e a r r e l a t i o n i s a p p l i c a b l e
and tha t t he wa l l boundary layer ampl i f ies the normal ve loc i ty in the
inv isc id s t ream by a fac to r rang ing a t leas t f rom 1.15 t o 6. I t does
no t appear t o be f e a s i b l e t o c a l i b r a t e t h i s boundary l aye r amp l i f i ca -
t i o n because t h e l a t t e r will depend, i n p a r t , on the upst ream h is tory
o f t h e boundary layer. The main advantage to the f lowmeter techn ique i s
t h a t it i s n o n i n t r u s i v e and does not produce d is turbances in the f lowf ie ld .
Th i s one advantage i s outweighed by the disadvantages c i ted above.
Consequent ly, the f lowmeter technique for inferr ing the normal veloci ty
component has been discarded, and we a re now us ing convent iona l p i tch
probes fo r t h i s de te rm ina t ion . "
Thus, this i s another case which shows the linear boundary condition at venti- lated, transonic walls is basically incorrect.
The basic technique used to correct wall porosity is as follows. First, theoretical estimates of the unconfined, longitudinal, disturbance-velocities, are made at a chosen distance from the tunnel wall. The wall porosities are
initially set to provide these distributions by monitoring the local static pressures with a long survey pipe. Second, the normal velocity components, at this same distance, are measured with small pitch probes and used as input for solutions of thc transonic, small-disturbance equation which assume unconfined flow. The resulting solutions provide new approximations for the longitudinal velocity distributions. The wall porosities and/or plenum pressures are then adjusted to provide this new velocity distribution.” Next, the normal com- ponents are again measured, and the process continues until the differences between all the normal velocity components, measured at successive iterations, are less than 0.0005 Vm. At this point, unconfined flow conditions are assumed to be achieved.
Experience with this iterative procedure has shown that the convergence criterion is unnecessarily stringent, and a better criterion is being con- sidered. However, for the case of an NACA 0012 airfoil at M = 0.55, a = 4O
and 6 O , and M = 0.725, a = 2O convergence was obtained in five to seven iterations. The significant result was the measured airfoil pressure distri- bution, obtained in the one-foot tunnel with wall control, agreed very well with data obtained with the same airfoil in the 8-foot tunnel.
Although the Calspan results are encouraging, there are still a large number of problems to overcome before three dimensional models can be similarly tested, i.e., adequate theoretical models o f 30 transonic flows and porosity
adjustment of all four walls.
* The perforated walls are divided into ten segments on the top and eight on the bottom. The four central segments in the top wall and the two central segments in the bottom wall are designed to provide an adjustable porosity with linear variation in the streamwise direction. Each segment has a separate plenum for individual control of suction or blowing.
168
Recently, Kemp (Ref. 25) has suggested a hyb r id scheme. He has proposed
us ing l im i ted adap t i ve -wa l l con t ro l t o reduce i n te r fe rence t o ana ly t i ca l l y
, co r rec tab le l eve l s . I n sumnary, reduc t ion o f t ranson ic -wa l l - in te r fe rence and
improved data-correction methods a r e a r e a s o f a c t i v e r e s e a r c h i n t h e USA, Canada,
and Europe. Considerable progress i s a n t i c i p a t e d i n t h e n e a r f u t u r e .
111.6.3. Boundary Layers and Wall Generated Noise
As noted by Pindzola, e t a l . (Ref. 161, s lot ted-wal l tunnels generate less
noise than do per fo ra ted wa l ls . An i l l u s t r a t i o n o f t h e i m p o r t a n c e o f t h i s
phenomena has been given by Cumning and Lowe (Ref. 11). I n t h e i r t e s t s , an F-111
a i r c r a f t model was t e s t e d i n t h e same tunnel with both porous and s l o t t e d w a l l s .
Near- interference-free data and minimum drag were obtained over a Mach number
o f 0.60 t o 0.80 w i th the s lo t ted wa l ls . Wi th t rans i t ion f ree , th is cor responded
t o an observed rearward movement of boundary l a y e r t r a n s i t i o n compared t o t h e
porous wal l tests. Thus, t h i s p rov ides a s p e c i f i c case of wal l -generated no ise
a f f e c t i n g boundary layer t rans i t ion on an a i r c r a f t model. f
I n the supersonic and hypersonic speed regimes Pate (Ref. 27) and Dougherty
(Ref. 28) have developed c o r r e l a t i o n s t o r e l a t e t u n n e l w a l l boundary layer
p roper t ies to rad ia ted no ise . " " And in the t ranson ic range, the recent tes ts
o f V i d a l , e t a l . (Ref. 24) and S ta r r (Ref. 29) rea f f i rm the essen t ia l ro le t he
boundary l aye r p lays i n de te rm in ing wa l l c ross f l ow cha rac te r i s t i cs . These t e s t s ,
among others, have also demonstrated that model-induced pressure gradients can
s ign i f i can t ly a l te r wa l l -boundary- layers in t ranson ic tunne ls . Th is means
empty-tunnel boundary-layer surveys must be supplemented by tak ing add i t i ona l
surveys with models i n p l a c e ( p a r t i c u l a r l y for high l i f t con f igu ra t i ons ) . I n
summary, w a l l boundary layer surveys are a necessa ry pa r t o f ca l i b ra t i ng bo th
t ransonic and supersonic tunnels.
A The new Na t iona l T ranson ic Fac i l i t y a t NASA Langley will have s l o t t e d w a l l s because they generate less noise and in te r fe rence a t subson ic speeds, Ref. 26. Parker (Ref. 30) a l s o found s l o t t e d w a l l s , as opposed to pe r fo ra ted wa l l s , provided a more un i fo rm center l ine Mach number d i s t r i b u t i o n up t o M - 1.1.
Tunnel noise measurements a re d i scussed i n g rea te r de ta i l i n Sec t i on I 1 I .F . **
169
A rev iew o f var ious means f o r measuring boundary layer profi les has been
given by Kenner and Hopkins (Ref. 31). These investigators obtained boundary
layer measurements on a supersonic tunnel wail (2.4 < HOD,< 3.4) with a s i n g l e
t ravers ing probe, three di f ferent rakes, and a 12 deg. wedge w i t h o r i f i c e s i n
the leading edge. The interested reader may c o n s u l t t h i s r e f e r e n c e f o r d e t a i l s
o f boundary layer probe designs and a d i scuss ion o f t he resu l t s t ha t can be
expected. Also, Allen (Ref. 32) has g i ven agenera l d i scuss ion o f t he e f fec ts
o f Mach number on P i t o t probe measurement e r r o r s i n t u r b u l e n t boundary layers.
111.6. References
1. Goethert, E. H. : Transonic Wind Tunnel Testing, Pergamon Press, 1961.
2. Wright, R. H. and Ward, V. G.: "NACA Transonic Wind-Tunnel Test Sections,"
NACA Report 1231 , June 1955 (supercedes NACA RH L8J06, 1948). 3. Goadman, T.. R.: "The Porous Wall Wind Tunnel: Part I1 - Interference Effect
on a Cylindrical Body in a Two;Dimensional Tunnel at Subsonic Speed," Rept. No. AD-594-A-3, 1950, "Part 1 1 1 - Reflection and Absorption of Shock Waves at Supersonic Speeds ,I' Rept. No. AD-706-A-l , Nov. 1950, "Part IV - Subsonic interference Problems in a Circular Tunnel," Rept. No. AD-706-A-2, Aug. 1951, Cornel1 Aero. Lab., inc.
4. Baldwin, B. S . ; Turner, J. 8.; and Knechtel, E. D.: "Wall Interference in Wind Tunnels with Slotted and Porous Boundaries at Subsonic Speeds," NACA TN 3176, May 1954.
5. Garner, H. C. ; Rogers, E. W. E. ; Acum, W. E. A. ; and Maskel 1 , E. C. : "Sub- sonic Wind Tunnel Wall Corrections," AGARDograph 109, Oct. 1966.
6. Heyson, H. H.: "Rapid Estimation of Wind-Tunnel Corrections with Application to Wind-Tunnel and Model Design," NASA TN 0-6416, Sept. 1971.
7. Pindzola, M. and Chew, W. L.: "A Summary of Perforated Wall Wind Tunnel Studies at the Arnold Engineering Development Center,'' AEDC-TR-60-9, August 1960.
8. Keller, J. D.: "Numerical Calculation of Boundary-induced Interference in Slotted or Perforated Wind Tunnels Including Viscous Effects in Slots," NASA TN 0-687 1 , Aug. 1 972.
9. Lowe, W. H.: "Subsonic Crossflow Calibration of a 22.5 Percent Perforated Wall," HST-TR-355-3, General Dynamics, presented at 39th STA Meeting, Mar. 1973.
10. Lo, C. F. and Oliver, R. H.: "Boundary Interference in a Rectangular Wind Tunnel with Perforated \Jal 1s ,I@ AEDC-TR-70-67, Apr 1 1 1970.
11. Cumming, D. P. and Lowe, W. H.: "Experimental Wall Interference Studies in a Transonic Wind Tunnel," AlAA Paper No. 71-292, Mar. 1971.
171
12.
13.
14.
15.
16.
17.
18.
19.
Blackwell , J. A., Jr. and Pounds, G . A.: "Wind Tunnel Wall Interference
Effects on a S u p e r c r i t i c a l A i r f o i l a t T r a n s o n i c Speeds,'' Paper No. 1,
Proc. A I M 9 t h Aerodynamic Testing Conference, June 1976.
Page, W. A.: "Experimental Study of the Equiva lence o f Transonic F low
about Slender Cone-Cylinders o f C i r c u l a r and E l l i p t i c Cross Section,"
NACA TN 4233, Apr i 1 1958.
Newman, P. A. and Klunker, E. B.: "Numerical Modeling of Tunnel-Wall
and Body-Shape E f fec ts on Transonic Flow Over F i n i t e L i f t i n g Wings,"
Par t 1 1 of Aerodynamic Analysis Requir ing Advanced Computers, NASA SP-
347, Mar. 1975.
Mokry, M.; Peake, 0. J.; and Bowker, A. J. : "Wall In te r fe rence on Two-
Dimensional Supercr i t ical Air fo i ls , Using Wal l Pressure Measurements t o
Determine the Porosi ty Factors for Tunnel F loor and Ceil ing," NRC-13894,
Na t ' l . Aero. Estab., Ottawa, Canada, Feb. 1974.
Pindzola, M. ; Binion, T. W.; and Cheval l ier , J. P.: "Design of Transonic
Working Sections," App. 8 o f A Fur ther Review o f Current"Research Aimed a t
the Design and Operation o f Large Wind Tunnel-s., AGARD-AR-83, Sept. 1975.
Berndt, S . B. and Sorensen, H. : "Flow Proper t ies o f S lo t ted Wal ls fo r
Transonic Test Sections," Paper No. 17, Windtunnel Design and Testing
Techniques, AGARD-CP-174, Mar. 1976.
Barnwell, R. W. : "Improvements in the S lo t ted-Wal l Boundary Conditions,' '
Paper No. 3, Proc. A l A A 9 t h Aerodynamic Test-ing-Conference, June 1976.
F e r r i , A. and Baront i , P.: "A Method for Transonic Wind-Tunnel Corrections,' '
AIM Jour., Jan.
20. Sears, W. R. : "Se
Feb.-Mar. 1974.
21. Weeks, T. M. : "Re d
973.
f Correct ing Wind Tunnels," Aeronautical Jour., Vol. 78,
uc t i on o f Transonic Slot ted Wal l Interference by Means
o f Slat Contouring,' ' AFFDL-TR-74-139, Mar. 1975.
22. Goodyer, M. J.: "The Low Speed Self Streamlining Windtunnel," Paper No.
13, Windtunnel Design and Testing Techniques, AGARD-CP-174, Mar. 1976-

23
24.
25 -
26.
27.
28.
29.
30
31.
32.
Cheval l ier , J. P. : "Souff ler ie Transsonique A Parois Auto-Adaptable,"
Paper No, 12, \J indtunnel~ Design and Testing Techniques, AGARD-CP-174,
Mar. 1976. ~ ~ ~-
Kemp, W. B., Jr.: "Toward the Correctable Interference Transonic Wind
Tunnel ,'I Proc. A l A A ~~ 9 th Aerodynamic- ~ - "" Testing Conference, June 1976.
HcKinney, L. W. and Howell, R. R . : "The Charac ter is t i cs o f the P lanned
Nat ional Transonic Fac i l i ty , ' ' Proc. A l A A 9 t h Aerodynamic Testing Conference,
June 1976. "-
Pate, S. R.: "Measurements and Cor re la t ions o f T r a n s i t i o n Reynolds Numbers
on Sharp Slender Cones a t H i g h Speeds," A l A A Jour., Sept. 1971.
Dougherty, N. S . : "Cor re la t ion of Transi t ion Reynolds Number w i t h Aero-
dynamic Noise Levels i n a Wind Tunnel a t Mach Numbers 2.0 - 3.0," A l A A
Jour., Dec. 1975. .
S tar r , R. F.: "Experiments t o Assess the In f luence o f Changes i n t h e Tunnel
Wall Boundary Layer on Transonic Wall Crossflow Characteristics,' ' W E
Tunnel Design and Testing Techniques, AGARD-CP-174, Mar; 1976-
Parker, R. L., Jr . : "Fiow Generat ion Propert ies o f Five Transonic Wind
Tunnel Test Section Wall Configurations, ' ' AEDC-TR-75-88, Aug. 1975.
Keener, E. R. and Hopkins, E. J.: "Accuracy o f Pi tot -Pressure Rakes f o r
Turbulent Boundary-Layer Measurements i n Supersonic Flow," NASA TN D-6229,
Mar. 1971.
A l len , J. M.: " E f f e c t s o f Mach Number on Pitot-Probe Displacement i n a
Turbulent Boundary Layer ,I' NASA TN D-7466, June 1974 (a lso see A l A A Jour.,
PP. 949-590, J u l y 1975).
173
1II.H. STANDARD MODELS
III.H.l. AGARD Force Models
The need for standard models was recognized ear ly by the AGARD Wind Tunnel
and Model Test ing Panel . In 1952, th is panel adopted AGARD Models A and B for
the purpose o f b u i l d i n g and t e s t i n g c a l i b r a t i o n models i n supersonic tunnels,
Ref. 1 . It was thought that th is would be "ex t remely use fu l in es tab l i sh ing
standards o f comparison between wind tunnels." It would a lso be u s e f u l i n
s tudy ing t he e f fec ts o f changes i n Reynolds number, turbulence, model s i z e and
model f ab r i ca t i on t o le rances .
AGARD Model A was an e x i s t i n g r o c k e t body w i t h f i n s w h i c h had been designed
by NACA and had the p r i o r des igna t ion of RH-IO. AGARD Model B i s a wing-body
combinat ion which consists of an og ive-cy l inder and a de l ta w ing w i th a sym-
m e t r i c a l , 4% c i r c u l a r - a r c a i r f o i l . I n 1954, the AGARD Model B was mod i f ied
to i n c l u d e v e r t i c a l and h o r i z o n t a l t a i l s u r f a c e s . T h i s c o n f i g u r a t i o n was desig-
nated AGARD Model C and was des igned "p r imar i l y f o r t es t i ng and c a l i b r a t i o n i n
the t ranson ic speed range.'' The purpose o f t h e t a i l was to have a model which
would be more s e n s i t i v e t o f low curva ture and wall r e f l e c t i o n s o f shock and/or
expansion waves.
The geomet r i ca l spec i f i ca t i ons f o r t he va r ious AGARD models a r e g i v e n i n
References 1 , 2 and 3 . The associated wind tunnel data i s presented i n Reference
4. Goethert (Ref. 5) a lso d iscusses some o f t h e e a r l y AEDC data ob ta ined fo r
AGARD Models B and C. The fo l low ing conc lus ion was der ived f rom these ear ly
tes ts . Based on comparisons of d a t a f o r models having 1 .15% and 0.01% blockage
i n t h e PWT 16T Transonic Tunnel, i t was conc luded tha t sa t i s fac to ry resu l t s
could be achieved in t ranson ic t unne ls i f a i r c r a f t models d i d n o t exceed about
1% b lockage ra t io . Responses t o t h e q u e s t i o n n a i r e i n d i c a t e t h i s r u l e o f thumb
has been adopted almost universal ly. However, f o r p rec i s ion t es t i ng , Goe the r t
(Ref. 5) recommended b lockage ra t ios be kept as small as 0.5% and w i t h a wing
span not exceeding ha l f the tunnel width.
These ear ly conc lus ions were based on t h e r e s u l t s o f t e s t i n g f o r c e models.
The more recent tes t ing o f the pas t Few years has employed models designed t o
measure pressure d is t r ibu t ions . I t i s now known t h a t a i r c r a f t models w i t h 1%
tunnel b lockage can exper ience cons iderable wal l in ter ference, especia l ly near
174

Mach one, even i n the bes t ven t i la ted tunne ls . Thus, cur ren t s tud ies o f t ran-
son ic wa l l i n te r fe rence requ i re t he use of pressure models to p rov ide t he
necessary data.
l l l .H .2 . Transonic Pressure Models: 2-D
In t he pas t , a number of a i r f o i l s have been used i n s tud ies of t ransonic
wa l l in te r fe rence. What f o l l o w s i s a b r i e f l i s t o f a i r f o i l s which have been
employed recent ly .
Weeks (Ref. 6) has used a symnetr ical , 6% c i r c u l a r - a r c a i r f o i l to study
wa l l i n te r fe rence i n a contoured, s lot ted-wal l tunnel . In France, an NACA
64 A010 a i r f o i l has been used a t ONERA (Ref. 7) for two-dimensional studies of
so l id , ad jus tab le wa l ls in t ranson ic tunne ls . Whereas, Calspan studies of wal ls
w i t h a d j u s t a b l e p o r o s i t y have u t i l i zed the symmet r ica l NACA 0012 a i r f o i l , Ref. 9. A 15.2 cm (6 in.) chord model has been tested in the Calspan 8 - f t Tunnel to
prov ide base l ine fo rce and pressure data which are wal l - interference-free. Also,
t h i s a i r f o i l has been found t o be l e s s s e n s i t i v e t o Reynolds number and tunnel
f low q u a l i t y . Thus, P indzo la , e t a l . (Ref. 10) have recommended the NACA 0012
a i r f o i l be adopted as a standard 2-D model i n o rde r t ha t t ranson ic wa l l deve lop -
ment work have a c m o n basis.
*
I I l.H.3. Transonic Pressure Models: 3-0
A 20 deg cone-cyl inder has been used i n a number o f t r a n s o n i c f a c i l i t i e s
( p a r t i c u l a r l y for M > 1) t o se lec t ope ra t i ona l va lues o f wa l l po ros i t y , wa l l
angle and plenum pumping. Davis and Graham (Ref. 1 1 ) have described a t y p i c a l
case wh ich i l l us t ra tes th is p rocedure . They have a lso rev iewed the wal l -
i n te r fe rence - f ree , t ranson ic da ta wh ich i s ava i l ab le f o r t h i s model geometry.
A t one time, i t was thought that if the wall parameters were selected to
g i v e minimum in te r fe rence on t h i s model, through Mach one, t h i s would be sat is-
f a c t o r y for t e s t i n g a l l t y p e s o f models. However, a number o f a i r c r a f t model
t e s t s have shown t h i s i s n o t t h e case. For example, Davis' (Ref. 12) transonic
t e s t s w i t h a n AGARD Model B i nd i ca ted be t te r agreement w i t h t h e AGARD reference
da ta cou ld be ob ta ined w i th d i f fe ren t wa l l se t t ings .

Thus, care must be exerc ised in se lec t ing a c a l i b r a t i o n model. I n p a r t i c -
u l a r , it i s now recognized that a c a l i b r a t i o n model must be ' % i m i l a r l l t o models
which are to be tes ted . Un fo r tuna te l y , p rec i se c r i t e r i a f o r how s i m i l a r have
no t ye t been defined. A l l t h a t may be s a i d a t t h i s t i m e i s : more than one type
o f s tandard ca l ib ra t ion model i s necessary f o r v a l i d t e s t i n g o f m i s s i l e , a i r f o i l ,
and a i r c r a f t models i n ex i s t i ng t ranson ic t unne ls .
The t e s t s o f Treon, e t a l . (Refs. 13 and 14) estab l ished the need f o r
i d e n t i c a l models and inst rumentat ion when comparing resu l t s f rom d i f f e ren t t un -
ne ls . In th is s tudy , a 0.0226-scale model of the Lockheed C-5A was t e s t e d i n
the Calspan 8- f t . , the NASA Ames 11-by 1 1 - f t . , and the AEDC 1 6 - f t . (16T) t ran -
sonic wind tunnels. The same comb ina t ion o f mde l - suppor t s t i ng and i n t e r n a l
force balance was used i n each o f the tunnels. This a l lowed analyses of sma l l d i f -
ferences i n blockage, buoyancy and Reynolds number ef fects which would not have
been poss ib le i f d i f f e r e n t models had been used. I n a d d i t i o n t o f o r c e s and
moments, seven o r i f i c e s on the fuselage were used t o measure l o c a l s t a t i c p r e s -
sure. This enabled comparisons o f buoyancy and model-induced changes i n
e f fec t i ve f rees t ream Mach number. The r e s u l t i n g c o r r e c t i o n s f o r r e l a t i v e buoyancy
and ef fect ive Reynolds numberk reduced the spread i n a x i a l f o r c e by 75 percent
f o r Mach number be low the drag r ise va lue? F ina l ly , these tests permi t ted
estimates of the "best expectancy agreement" between data obtained i n t h e t h r e e
f a c i l i t i e s .
The u t i l i t y o f t h e AEDC t r a n s i t i o n cone (Refs. 15-17) has been discussed
in Sec t i on 1 I I . F . and will no t be repeated here. However, it should be noted
tha t th is s tudy o f the e f fec ts o f tunne l env i ronment on boundary layer t ransi t ion
was a l s o based on the fundamental premise employed by Treon, e t a l . Namely,
the same model, instrumentat ion, and support mechanism are essent ia l fo r mean ing fu l
resu l t s .
A s i m p l i f i e d , b u t v e r s a t i l e , a i r c r a f t model has been t e s t e d i n t h e AEDC 16T and 4T t ransonic tunnels by Binion (Ref. 8). The model c o n s i s t s o f two geo-
me t r i ca l l y s im i l a r , cen te rbod ies w i th rec tangu la r -p lan fo rm wings. The center-
bodies have pointed, ogive-type noses and the wings have the NACA 63 A006 a i r f o i l
p ro f i le . The smal l e r body served as a t a i 1 and was mounted on a separate force
* A *
See p. 150.
Subsequent t o t h i s work, Binion and Lo (Ref. 15) showed, i n some cases, wall i n te r fe rence can overshadow the e f fects o f Reynolds number va r ia t i ons .
balance and sting. Four different model arrangements were tested in both tunnels, viz., the wing by itself, the tall by itself, and the wing with tail mounted close behind and at a more aft position.
After the force tests, the tests were repeated and pressure distributions were measured on the centerbodies and the wings. Angles of attack were repeated by duplicating the pressure difference across the model forebody which was initially calibrated as a functlon of a in the 16T.
The conclusions reached by Binion include the following. 1. Flow angulari.tY can be induced into the tunnel flaw which is a function
of model configuration, model attitude, and tunnel configuration. This flow angularity i s distinct from the usual upwash correction and varies nonlinearly with Mach number and model incldence. No existing theo- retical corrections can account for this phenomena.
2. The movable tail feature confirmed the expected dependence of wall interference on model configuration in the transonic regime. Also, the more-aft tail position encountered wall-reflected disturbances at supersonic Mach numbers.
3. The attainment of an interference-free value of lift does not ensure an interference-free flow field.
4. There i s no value of porosity, with the present AEDC 4T walls, which will yield interference-free pressure distributions for this aircraft model (0.9% blockage) when extensive regions of supercritical flaw exists. The magnitude of wall interference appears to be a function of size and extent of supersonic pockets and the model-induced pressure gradient at the wall.
A transonic transport model has been designed and developed at ONERA and has been offered as a standard for transonic tunnel calibrations. A family of five different sizes has been fabricated so that an appropriate size i s
available for even small tunnels. However, only the largest model provides for measurements of wing pressure distributlons. An equivalent body of revolution i s also available for the large model. A description of the model geometry may be found in Reference 19.
177
- .
Two s i z e s o f t h i s model ( l a r g e M 5 and 1/4 scale smal ler H3) have r e c e n t l y
been t e s t e d i n t h e AEDC 16T and 4T tunnels and the NASA Ames 1 1 - f t tunnel as
p a r t o f a cooperat ive program wi th ONERA. The stated purposes of t h i s s t u d y
were ' ' to prov ide an experimental data base for (1) t h e e v a l u a t i o n o f t h e o r e t i c a l
or emp i r i ca l wa l l - i n te r fe rence co r rec t i on f ac to rs and (2) the estab l ishment o f
gu ide l ines to a l low reasonab le se lec t ion o f w ind- tunne l - to -mode l s ize ra t ios
i n t h e t r a n s o n i c speed regime.'' The t e s t r e s u l t s and eva lua t ion a re repor ted
by B in ion (Ref. 19).
An unexpected r e s u l t o f t h e s e t e s t s was the observed sens i t i v i t y to Reyno lds
number. I n f a c t , t h e models were found t o be more s e n s i t i v e t o Reynolds number
when boundary l a y e r t r a n s i t i o n was f i xed t han w i th f ree t rans i t i on . A l so ,
g rea ter var ia t ion o f the da ta f rom tunne l - to - tunne l occur red w i th f i xed t rans i -
t i on . Wing pressure data from t h e l a r g e r model showed these di f ferences were
caused by d i f f e r e n c e s i n shock-boundary layer interactions and t r a i l i n g edge
separa t ion . F ina l l y , even though state-of- the-art manufactur ing to lerances
were used to fabr icate, the models , there appears to be s m a l l d i f f e r e n c e s i n t a i l
incidence between the two models. This precluded useful model-to-model compari-
sons o f p i t c h i n g moment. I n summary, the ONERA models were found t o be o v e r l y
s e n s i t i v e t o Reynolds number and t u n n e l f l o w q u a l i t y and e x h i b i t e d i n s u f f i c i e n t
model s i m i l a r i t y f o r a c c u r a t e s t u d i e s o f w a l l i n t e r f e r e n c e . Thus, the
ob jec t i ves o f t hese t es ts were not achieved.
Based on exper ience wi th the AEDC s i m p l i f i e d a i r c r a f t model and the ONERA
models, t h e f o l l o w i n g c r i t e r i a have evolved f o r a model t o s tudy t ranson ic wa l l -
interference problems.*
1 . The a i r c r a f t model should have a smal l cy l indr ica l cen terbody w i th
an ogive nose ( the centerbody must house a force ba lance and prov ide
a passage for sur face pressure 1 ines).
2. Surface pressures on the centerbody should be selected and c a l i b r a t e d
t o d i r e c t l y measure Mach number and a n g l e o f a t t a c k .
3. The wing should have an NACA 0012 a i r f o i l , z e r o t a p e r , and should be
a l igned w i th the cen terbody ax is . A v a r i a b l e sweep feature would be
d e s i r a b l e i n o r d e r t o s t u d y t h e e f f e c t o f l i f t on axia1, interference
gradients. ~ * ~ ~~ ~~~ ~
B in ion, T. W . , Jr., personal communication, AEDC, March 1977.
178
4. The horizontal tail should be separately ins.trumcnted and geometrically similar to the wing.
5. Standardization of instrunentation and sting configuration i s essential. 6. Both model forces and pressure distributions on wings and centerbody
should be measured.
Work is continuing at AEDC to develop a model with these features.
In sunwnary, a satlsfactory aircraft model for calibrating transonic wind tunnels does not yet exist. Until wall interference effects are clearly defined and separable from Reynolds number and flow quality effects, a simplified aircraft model is required. Once this objective i s realized, more realistic aircraft models, e.g., the ONERA transport models, can be utilfzed much more effectively for tunnel-to-tunnel comparisons.
179
1I I .H . References
1. "AGARD Wind Tunnel C a l i b r a t i o n Models,!' AGARD Spec i f i ca t i on 2, Sept. 1958. . .
2. F a i l , R. and Garner, H. C.: "Ca l ib ra t ton Models f o r Dynamic
AGARD Report 563,: 1968.
3 . Curry, W. H. , ed.: "The F i r s t F i f t e e n ' Years o f t h e Supersoni
Association,'' Sandia Laboratories, Sept. 1969.
4. H i l l s , R., ed.: "A.Review o f Measurements on AGARD C a l i b r a t i
AGARDograph 64, Nov. 1961.
5.
6.
7.
8.
9.
10.
11.
12.
13.
Stabi 1 i t y Tests ,I'
c Tunnel
on Model s ,'I
Goethert, B. H.: Transonic Wind Tunne.1 Testing, Pergamon, 1961.
Weeks, T. M.: "Reduction o f Transonic Slotted Wall Interference by Means
of Slat Contour ing," AFFDL-TR-74-139, March 1975.
Cheval l ier , J. P. : "Souff ler ie Transsonique a' Parois Auto-Adaptables,"
Wind Tunnel Design and Tes t ing~ Techniques, AGARD-CP-174, March 1976.
Binion, T. W . , Jr.: "An I n v e s t i g a t i o n o f Three-Dimensional Wall In te r fe rence
i n a Var iable Porosi ty Transonic Wind Tunnel , ' I AEDC-TR-74-74, Oct. 1974.
V ida l , R. J.; Erickson, J. C., Jr.; and Ca t l i n , P. A.: "Experiments w i t h
a Sel f -Correct ing Wind Tunnel,'' Wind Tunnel Design and Testing Techniques,
AGARD-CP- 174, March 1976.
Pindzola, M.; Binion, T. W . , J r . ; and Cheval l ier , J. P. : "Design o f Tran-
sonic Working Sections," A Fur ther Review o f Cur ren t Research Aimed a t
the Design and Operation o f Large Wind Tunnels, AGARD-AR-83, Sept. 1975
Davis, J. W. and Graham, R. F.: "Wind-Tunnel Wall In te r fe rence E f fec ts
f o r 20° Cone-Cylinders," A l A A Jour. Spacecraft 5 Rockets, Oct. 1973 (a 1 so see NASA TN 0-7432).
Davis, J. W.: "AGARD Model B Transonic Blockage Investigation," NASA
Marchall Space Fl ight Center, Huntsvi l le, Ala. , presented at 39th Semi-
Annual STA Meeting, Mar. 1973 (referenced wi th author 's permission).
Treon, S. L.; Ste in le , F. W.; Hofs te t te r , W. R.; and Hagerman, J. R. :
"Data Cor re la t ion f rom Inves t iga t ions o f a High-Subsonic Speed Transport
A i r c r a f t Model i n Three Major Transonic Wind Tunnels," A l A A Paper No. 69-794, Ju l y 1969.
180

14. Treon, S. L. ; Steinle, F. W. ; Hagerman, J. R. ; Black, J. A. ; and Buffington, R. J.: "Further Correlation of Data From Investigations of a High-Subsonic- Speed Transport Aircraft Model in Three Major Transonic Wind Tunnels," A I M Paper No. 71-291, March 1971.
15. Binion, T. W., Jr. and Lo, C. F.: "Appl fcation of Wall Corrections to Transonic Wind Tunnel Data," AlAA Paper No. 72-1009, Sept. 1972.
16. Dougherty, N. S., Jr. and Steinle, F. W.: "Transition Reynolds Number Ccnnpari sons in Several Ma Jor Transonic Tunnels ,I' AlAA Paper No. 74-627, July 1974.
17. Dougherty, N. S., Jr.: "Prepared Comment on Cone Transition Reynolds Number Data Correlation Study,'' AGARD-CP-187, June 1975.
18. Whitfield, J. and Dougherty, N. S., Jr. : "A Survey of Transition Reynolds Number Work at AEDC," to be presented as Paper No. 25 at AGARD Fluid Dynamics Panel Symposium on Laminar-Turbulent Transition, Copenhagen, Denmark, May 2-4, 1977.
19. Binion, T. W . , Jr.: "Tests of the ONERA Calibration Models in Three Transonic Wind Tunnels," AEDC-TR-76-133, Novo 1976-
181
1 1 1 . 1 . OPTICAL METHODS
1 1 1 . 1 . 1 . Supersonic Tunnels
The use of sch l i e ren and shadowgraph flow-visualization-methods t o d e t e c t
unwanted shocks i n a n empty t e s t - s e c t i o n i s w e l l known (Ref. 1 ) and, i n f a c t ,
may be designated a c lass ica l techn ique . Obviously, the observance of a shock
i n t h e empty- tunnel ind icates correct ive act ion is necessary. These means of
f l ow v i sua l i za t i on a re a l so he lp fu l i n assess ing t he pe r fo rmance af probes and
rakes and the i r i n te rac t i on w i th nea rby boundar ies . H igh qua l i t y p i c tu res a l so
enable f low separation on probes to be observed and thereby p rov ide add i t iona l
data to guide improved designs.
*
A t h i r d , c l a s s i c a l method f o r f l o w v i s u a l i z a t i o n i s t h e Mach-Zehnder
in ter ferometer . However, these instruments are seldom used fo r w ind tunne l
c a l i b r a t i o n because o f t h e i r c o s t and h y p e r s e n s i t i v i t y t o v i b r a t i o n and a l i g n -
ment er rors .
Deta i led d iscuss ions o f these methods may be found i n a ra the r l a rge
number of references. References 2 t h r u 4 are rep resen ta t i ve o f bo th o lde r
and newer l i t e r a t u r e w h i c h d e a l s w i t h t h e s e t h r e e methods o f f l o w v i s u a l i z a -
t i on .
111.1.2. Transonic Tunnels
As prev ious ly d isucssed in Sec t ion III.D., movement o f a transonic shock
on a s t a t i c p r e s s u r e p r o b e i s s t r o n g l y a f f e c t e d by blockage and wal l character-
i s t i c s . For example, the sch l ieren photographs o f Page (Ref. 5) a r e q u i t e
i n s t r u c t i v e as t o t h e e f f e c t s on a probe caused by varying tunnel b lockage f rom
0.25% to 0.005%.
In the case of superc r i t i ca l f l ow abou t a hemisphere-cyl inder probe, the
shadowgraphs o f Hsieh (Ref. 6 ) were very he lp fu l in de tec t ing boundary layer
separat ion and i n t e r p r e t i n g t h e measured pressure d i s t r i b u t i o n s .
* Most o f the respondents to the ques t ionna i re ind ica ted they rou t ine ly used one or both o f these techniques.
182
A t low supersonic speeds, schlierens and shadowgraphs are very usefu l
i n s tud ies o f the shock-cance l la t ion p roper t ies o f ven t i la ted wa l ls , e.g.,
Ref. 7. Also, Dougherty, e t a l . (Ref. 8) have ve ry e f fec t i ve l y used sch l i e ren
photographs to s tudy the sound f i e l d g e n e r a t e d by per fo ra ted wa l ls when ex-
posed to h igh-subsonic f lows.
111.1.3. Newer Methods
Newer o p t i c a l methods fo r f l ow v i sua l i za t i on i nc lude l ase r Dopp le r
velocimeters (LDV) , holographic velocimeters (HV) , and holographic in ter ferometry
( H I ) f o r dens i t y measurements. The primary advantage o f LDV's and HV's i s t h e i r
p o t e n t i a l t o measure three-dimensional f low f ie lds wi thout d isturbing the flow.
As we have seen, t h i s i s p a r t i c u l a r l y i m p o r t a n t i n t r a n s o n i c t u n n e l s near Mach
one.
The c u r r e n t s t a t e - o f - t h e - a r t o f LDV's and t h e i r a p p l i c a t i o n t o t u n n e l
c a l i b r a t i o n i s reviewed i n Appendix I I . Since the accuracy of current LDV s y s -
tems is approx imate ly 0.4 - 0.5%, they are not yet super ior to convent ional
probes which provide comparable accuracies of 0.1%.
The fundamentals of holographic velocimetry are reviewed by Shofner, et a l .
(Ref. 9). A very comprehensive review o f t h e use o f holography i n wind tunnel
t e s t i n g has been compiled by Havener (Ref. IO). Progress (up t o 1975) i n a u t o -
mating H I data reduct ion i s reported by Hannah and Havener (Ref. 11). Since
t h i s i s s t i l l a developing technology, appl icat ions of holography to empty-tunnel
c a l i b r a t i o n appears t o be i n t he f u tu re .
Sparks and Ezekiel (Ref. 12) have recent ly demonstrated the usefulness of
Laser Streak Velocimetry (LSV) f o r q u a n t i t a t i v e measurements o f low-speed v e l o c i t y
f i e l d s near models. This technique has the advantage of prov id ing, s imul taneously ,
v e l o c i t i e s on a plane as opposed to the po in t -by-po in t measurements requ i red w i th
LDV's. However, the accuracy o f LSV's i s cu r ren t l y i nsu f f i c i en t f o r empty - tunne l
c a l i b r a t i o n s . F i n a l l y , Sedney, e t a l . (Ref. 13) have given a rev iew of f low t ra-
cer techniques and the i r app l i ca t i ons i n superson ic - f l ow f ie ld d iagnos t i cs .
183
1 1 1 . 1 . References
1.
2.
3.
4.
5.
6.
7.
8 .
9.
10.
11.
12.
13.
pope, A.and Goin, K. L.: High-speed Wind Tunnel Testing., Wiley, 1965.
Ladenburg, R. W.; Lewis, B.; Pease, R. N.; and Taylor , H. S. (ed i tors) :
Physical Measurements i n Gas Dynamic and Combustion, P r ince ton Un ive rs i t y
Press, 1954.
V a s i l ' e r , A. L.: Schl ieren Methods, Transl. by A. Baruch, I s r a e l Program
f o r S c i e n t i f i c T r a n s l a t i o n s , Jerusalem, New York and London, 1971.
Merzkirch, \J.: Flow V isua l i za t i on , Academic Press, 1974.
Page, W. A.: "Experimental Study o f the Equivalence of Transonic Flow
About Slender Cone-Cylinders o f C i r c u l a r and E l l i p t i c Cross Section,''
NACA TN 4233, Apr i 1 1958.
Hsieh, T.: "Hemisphere-Cylinder i n Transonic Flow, Mm = 0.7 1.0," A l A A
Jour., Oct. 1975 (a l so A l A A Paper No. 75-83, Jan. 1975).
Goethert, B. H.: Transonic Wind Tunnel Testing, Pergamon, 1961.
Dougherty, N. S . , Jr.; Anderson, C. F.; and Parker, R. L., Jr. : "An
Exper imental Invest igat ion of Techniques to Suppress Edgetones From
Per forated Wind Tunnel Mal Is," AEDC-TR-75-88, Aug. 1975.
Shofner, F. M . ; Menzel, R . ; and Russel l , T. G.: "Fundamentals o f Holographic
Velocimetry," AFFDL-TR-68-140, Nov. 1968.
Havener, A. G.: "A Users Guild on Pulse Laser Holography f o r Wind Tunnel
Testing," ARL TR 75-0213, June 1975.
Hannah, B. W. and Havener, A. G. : "App l i ca t i ons o f Automated Holographic
I n t e r f e r o m e t r y , " I n t ' l Congress on Ins t rumenta t ion in Aerospace Simulation
Faci 1 i t ies, I EEE Pub. 75 CHO 993-6 AES , Sept. 1975.
Sparks, G. W., J r . and Ezekiel , S . : "Laser Streak Velocimeter for Two-
Dimensional Flows i n Gases," A l A A Jour., Vol. 15, No. 1, Jan. 1977.
Sedney, R.; Kitchens, C. W . , Jr.; and Bush, C. C.: "The Marriage of Opt ica l ,
Tracer and Surface Indicator Techniques in Flow Visual izat ion," BRL R-1763, USA B a l l i s t i c Research Laboratories, Feb. 1975.
184
1II.J. Humidity Measurements
The e f f e c t s of moisture condensation and the necess i ty fo r
have been discussed i n S e c t i o n Il.C.7. Measurement and monitor
mois ture content o f the tunnel f low 1s t he re fo re an essen t ia l p
c a l i b r a t i o n and operation.
a i r d r y i n g
i n g o f t h e
a r t o f t u n n e l
The mois tu re con ten t o f a gas i s expressed i n a number o f ways; r e l a t i v e
humid i t y ( ra t i o o f mo is tu re pa r t i a l p ressu re t o sa tu ra t i on p ressu re ) , dew
p o i n t (or f ros t po in t ) tempera ture a t a tmospher ic p ressure , spec i f i c humid i ty
(MSS o f water per mass o f d r y g a s ) , and volume r a t i o ( p a r t s o f w a t e r vapor
p e r m i l l i o n p a r t s o f a i r ) . The dew point or ice-point a t a tmospher ic pressure
i s t h e most commonly used form of expression for wind tunnel operat ions.
A number o f measurement systems a r e u t i l i z e d by f a c i l i t i e s r e s p o n d i n g
to the ques t ionna i re , ex tend ing f rom the v isua l observa t ion o f fog in the
tunnel f low t o completely automatic, continuously recording dew p o i n t system
All dew p o i n t measurement instruments can be c a l s s i f i e d a c c o r d i n g t o t h e bas
p r i n c i p l e s used.
One o f t h e more basic non-continuous dew p o i n t measurement instruments
opera tes on the p r inc ip le o f a l low ing a hand-pump pressur ized sample o f gas,
a t known pressure and temperature, t o expand t o room temperature (Ref. 1 ) . I f
the expansion reduces the sample temperature t o or below the dew p o i n t tempera-
tu res , fog i s c rea ted wh ich may be observed v isua l l y th rough a viewing window.
A t r i a l and e r r o r p r o c e d u r e i s r e q u i r e d t o d e t e r m i n e t h e i n i t i a l sample pres-
sure which will expand t o c r e a t e a j us t - v i s ib le f og - S ince a known r e l a t i o n -
s h i p e x i s t s between pressure and temperature ra t ios, the dew p o i n t can be
determined using ambient as the f inal pressure. These instruments are low in
cost, reasonably accurate and a re w ide l y used both as pr imary dew po in t mon i to rs
5 .
i c
185
and for monitor ing the accuracy o f less basic instruments. They prov ide on ly
p e r i o d i c or spot checks and are therefore not sat ls factory for f a c i l i t i e s
where r e l a t i v e l y sudd,en changes i n dew p o i n t can occur. A1 1 readings must
be manually recorded. Heasurements below about -4OC a r e d i f f i c u l t to make.
Cont inuous indicat ing and recording humidi ty sensors include the Dunmre
type which changes res i s tance i n a non - l i nea r f ash ion w i th re la t i ve humid i t y .
A modif ied form respdnds to dew po'int (Ref.' 2). Each sensor has a 1 imi ted
range, so tha t severa l a re requ i red i f the humidlty range i s la rge. The range
extends downward t o about -40 C.
An e l e c t r o l y t i c h u m i d i t y s e n s o r i s a l s o a v a i l a b l e . These sensors u t i l i z e
an element which electrolyzes water into hydrogen and oxygen, causing an
e l e c t r o l y s i s c u r r e n t t o flow. The e l e c t r o l y t i c i n s t r u m e n t i s u s u a l l y c a l i b r a t e d
i n p a r t s p e r m i l l i o n , with fu l l sca le ranges as low as 0 to 100 p a r t s p e r m i l l i o n .
This inst rument , l ike the res is tance dev ice, can be conf igured to bo th ind ica te
humid i ty and prov ide an e l e c t r i c a l s i g n a l f o r an external recording device.
Dew point temperatures can be determined by control l ing automat ical ly
the tempera ture o f a po l i shed meta l m i r ro r to the po in t tha t a t race film of
condensat ion (or f rost) is maintained. Several instruments based on t h i s
p r i n c i p l e have been developed. More recen t t ypes a re s imp l i f i ed i n t ha t t he
t h e r m - e l e c t r i c c o o l i n g e f f e c t i s used to c h i l l t h e mirror ( w i t h a u x i l i a r y
r e f r i g e r a t i o n If necessary). The condensation film is au tomat ica l l y ma in ta ined
by feedback control o f t he m i r ro r t empera tu re , u t i l i z i ng an op t i ca l sou rce
r e f l e c t r y l i g h t f r o m t h e c o o l e d mirror to a pa i r o f photo-de tec tors fo rming a
b r idge c i rcu i t . The dew point temperature i s measured by a thermocouple or
186

res is tance- tempera ture de tec tor a t tached d i rec t l y to the mi r ro r . The dew
p o i n t i s i n d i c a t e d by a meter o r o ther Ind ica tor , and the temperature sensor
output may a l s o be recorded, supplied to the wind tunnel data system, etc.
The range can extend t o as low as 200 OK (-100 OF).
A continuous-recording, dew po in t mon i to r has obvious advantages both
w i th regard to mon i to r ing and c o n t r o l o f - t u n n e l ineasurements. They can a l s o
prov ide Information on the performance of dryers and.other tunnel equipment.
I I I . J. References
1. Pope, A. ; and Goin, K. L.: High Speed Wind Tunnel TesTing., pp. 223-226,
John Wiley and Sons, New York.
2. Doeblin, E. 0.: Measurement Systems; Appl icat ion and Design, pp. 596-'598,
McGraw-Hi 1 1 , New York.
3. Fraade, I). J.: "Measuring Moisture in Gases," Instruments and Control
Systems, Apri 1 1963.
188

I
I V . ERROR AND UNCERTAINTY I N CALIBRATION MEASUREMENTS
Treatment o f accuracy and sources o f e r ro r i n exper imen ta l da ta i nvo l ves
p r i n c i p l e s o f s t a t i s t i c s and probab i l i t y . Unfor tunate ly , each branch o f
science tends t o develop special ized terminology, which impedes understanding
and communication i n comparing measurement r e s u l t s . An attempt will there-
f o r e be made t o d e f i n e and recmend bas ic terminology which may be used t o
advantage i n e v a l u a t i n g , d e f i n i n g and comnunicat ing cal ibrat ion accuracy.
As a f i r s t s tep , a de f i n i t i on and c lass i f i ca t i on o f va r ious t ypes o f e r ro rs
will be stated.
1V.A. Random Er ro r
E r ro rs may be c l a s s i f i e d i n two general categories: random and f ixed.
Random e r r o r i s f r e q u e n t l y r e f e r r e d t o by the engineer in less prec ise terms
as "scatter," "noise," etc., a l l imp ly ing t ha t repea ted measurements do not
y i e l d t h e same value. Most processes are such that i f a s u f f i c i e n t l y l a r q e
number o f measurements a re made and the frequency with which each v a l u e i s
measured i s p l o t t e d a g a i n s t t h e measured va lue , the resu l t ing p lo t ( the p roba-
b i l i t y d e n s i t y f u n c t i o n ) will approach the fami l iar be l l -shaped normal d is t r i -
bu t ion curve . In th is case, the a r i thmet ic mean va lue , o r average,
N xi -
i=l N (4.A .1)
occurs a t t he peak o f t he cu rve . When p lot ted in normal ized form, the area
under the curve i s u n i t y . The prec is ion , wh ich i s a measure o f t h e s c a t t e r
o r random e r r o r , i s s p e c i f i e d by the standard deviat ion,
a = i=l N-1
(4.A.2)
189

i f , t h e d i s t r i b u t i o n i s based on a s u f f i c i e n t l y l a r g e number o f measurements,
68 percen t o f t he measurements will l i e w i t h i n t h e range +1 u , 95.4 percent
w i t h i n - +2 u and 99.7 percen t w i th in 23 u . A wide!. f l a t d i s t r i b u t i o n t h e r e -
fore corresponds to measurements w i t h a large s tandard dev iat ion, a l a rge
amount o f s c a t t e r , a l a rge random e r r o r , or a l a c k o f p r e c i s i o n , a l l o f
wh ich re fe r t o t he same c h a r a c t e r i s t i c s o f t h e measurement. The random e r r o r
i s q u a n t a t i v e l y s t a t e d i n terms o f the s tandard dev ia t ion and error s ta tements
should always be spec i f i ed as 1 u , 2 u , etc.
1V.B . Fixed Error
-
A second fo rm o f measurement e r r o r i s r e f e r r e d t o as systemat ic er ror , f ixed
e r r o r or bias. This component o f e r r o r will be the same i n each o f many repeated
measurements. The magnitude and s i g n o f t h e b i a s may no t be known a p r i o r i s i n c e
these can be determined only by comparison w i t h t h e t r u e v a l u e o f t h e measured
quant i ty . A s one example, an undetected change i n t h e c a l i b r a t i o n o f an i n s t r u -
ment such as a pressure transducer will introduce a f i x e d b i a s o f unknown magni-
tude and sign. Upon de tec t i on , t h i s b ias or f i x e d e r r o r can be removed by
reca l ib ra t ion . S ince unknown f ixed er rors are not correctable, un less detected,
t he i r m in im iza t i on depends (1) upon c a r e f u l mon
pre-and post - test ca l ibrat ions o f instruments,
t i o n s of i ns t rumen ts p r i o r t o and dur ing tes ts ,
be a p p l i e d t o a basic instrument such as a pres S
t o r i n g o f r e s u l t s , (2) r o u t i n e
n place, (3 ) end-to-end c a l i b r a -
etc. This same philosophy can
ure t ransducer or t o t h e t u n n e l -
f l o w c a l i b r a t i o n . The object ive should be t o e l i m i n a t e a l l l a r g e , unknown
f i xed e r ro rs .
Some types o f unknown f i x e d errors cannot be read i l y e l im ina ted by
c a l i brat ion. An example might be the d rag o f a standard model, where no " t rue"
v a l u e i s known. F a c i l i t y - t o - f a c i l i t y comparisons al low only an es t ima te o f t he
probable maximum magnitude o f t he b ias . Cor rec t i on may be poss ib le on ly to the
extent that the compar ison tests a l low determinat ion o f and c o r r e c t i o n f o r t h e
cause (or causes) of the bias (or a por t ion thereo f ) .
The f i x e d e r r o r limit, which normally must be est imated, is the upper
limit on the f i xed e r ro r o r b ias , and may be symmetrical o r non-symmetrical,
i.e., i t may be 0, + o r 0, - rather than - +.
1V.C. Uncer ta in ty
The t o t a l u n c e r t a i n t y i n t e r v a l f o r a measurement represents the largest,
reasonably-expected error ( i .e. , the t rue value should fa l l in the uncertainty
i n t e r v a l ) and i s a combination o f the p rec is ion (s tandard dev ia t ion) and the
estimated bias.
A method described by Abernathy, e t a l . (Ref. 1) and recornended by the
Nat ional Bureau o f Standards expresses the uncertainty as the range centered
about the mean value and def ined as
U p + - ( B + t g 5 u ) (4.C.l)
Where U i s t h e u n c e r t a i n t y , B the b ias or f i x e d e r r o r 1 imit, and t i s t h e
95 th percent i le po in t fo r the S tudent "t" d i s t r i b u t i o n . The v a l u e o f t
depends on the number of va lues used i n computing u ; f o r a large number of
measurements the Student t d i s t r i b u t i o n i s i d e n t i c a l t o t h e normal d i s t r i b u -
t i on . The use o f t h e t fac to r inc reases the uncer ta in ty limit when small
samples a re used to ca l cu la te (o r , more accurate ly , to est imate) d . Abernathy,
e t a l . recommended t h a t a va lue o f 2.0 be used f o r t f o r 31 o r more samples
(compared t o 1.96 f o r an i n f i n i t e number). Reference ( 1 ) and most s t a t i s t i c s
t e x t s (e.g., Ref. 2) conta in tab les o f S tudent 's t d is t r ibut ions f rom which
t g 5 can be obta ined for less than 30 samples. S t a t i s t i c a l methods employing
the t d i s t r i bu t i on a re f requen t l y ca l l ed sma l l - samp le methods for obv ious
95
95
95
191
reasons. Al though th is example I s s i m p l i f i e d , it can be extended t o I n c l u d e
o the r e r ro r terms.
An add i t i ona l p rob lem i n accu ra te de te rm ina t ion o f measurement e r r o r ,
not discussed above, i s t h a t t h e measured proper t ies normal ly have small-
amp l i t ude va r ia t i ons w i th t ime . I n add i t i on t o ob ta in ing a s t a t i s t i c a l l y
adequate number o f samples, the sample i n t e r v a l must span a t l e a s t one com-
p l e t e c y c l e of the lowest-frequency component o f tunnel unsteadiness, as
discussed by Huh ls te in and Coe, (Ref. 3 ) .
1V.D. Error Propogat ion
I n e s s e n t i a l l y a l l cases, cal ibrat ion parameters are determined f rom
basic proper t ies which are measured and a known f u n c t i o n r e l a t i n g t h e measured
q u a n t i t i e s and the desired parameter. An obvious example would be the determina-
t i o n o f Mach number i n t he t es t sec t i on f rom measured pressures. Random error
sources would inc lude the prec is ion (s tandard dev iat ions) o f the pressure
measurements. S ta t i c p ressure p robe uncer ta in ty l im i ts may be estimated as
a f i x e d b i a s i n t h e absence of a ca l i b ra t i on . Ano the r f i xed b ias cou ld be
the est imated uncer ta in ty i n y . As an i l l u s t r a t i v e example, t h e random error
i n Mach number can be ca lcu lated f rom
where t h e v a r i a t i o n s i n H and P are taken to be uncorre la ted. The f i x e d
e r r o r or bias limit can s i m i l a r l y be ca l cu la ted from
S
(4.D.1)
(4 .D .2)
192

where and Bp are the est fmated uncer ta in ty 1 i m i t s f o r t h e r a t i o o f
spec i f i c hea ts and fo r t he s ta t i c p robe e r ro r , respec t i ve l y . Y
The r e s u l t s can be combined accord ing to Eq. (4.C.1) to determine the
t o t a l u n c e r t a i n t y i n t e r v a l f o r a s p e c i f i c ( p o i n t ) Mach number measurement.
(4.D.3).
The u n c e r t a i n t y i n t e r v a l o f an ind iv idua l p roper ty measurement, such as , .
a pressure, can also be estimated as above; where indiv idual error sources such
as the s tandard dev ia t ion o f the t ransducer , the exc i ta t ion power supply, the
ins t rumenta t ion ampl i f ie r and the ana log- to -d ig i ta l conver te r a re a l l taken
i n t o account. Normally, however, the calibration is performed end-to-end
u t i l i z i n g a l l components so t h a t a l l o f the above fac to rs a re taken in to
account and a t t r ibu ted to the p ressure t ransducer .
193

I V. Ref erences
1. Abernathy, R. B., e t a l and Thompson, J. W., Jr.: "Handbook; Uncer ta in ty
i n Gas Turbine Heasuremcnts," AEDC-TR-73-5, February 1973 (also CPlA No. 180).
2. b e l , P. G . : In t roduc t ion to Hathemat ica l S ta t i s t i cs , pp 402-403, John
Wiley and Sons, Inc., New York, 1966.
3. Huhlstein, L. Jr., and Coe, C. F.: " In tegra t ion Time Required t G Ex t rac t
Accurate Stat ic and Dynamic Data From Transonic Wind Tunnel Tests," A l A A
Paper 75-142, Pasadena, Cal i f . , Jan. 1975.
194

V. CONCLUSIONS AND RECOMMENDATIONS
V.A. Summary o f S ta te -o f - the-Ar t o f T ranson ic and Supersonic Wind Tunnel C a l i b r a t i o n
Reference has been made throughout the prev ious sect ions o f th is repor t
to in fo rmat ion ,ob ta ined from the quest ionnai re survey, l i terature search and,
personal contacts. A condensat.ion of t h i s i n f o r m a t i o n has been presented
where appropr ia te . Pr imar i l y , in fo rmat ion has been summarized i n an attempt
to de f i ne "bes t s ta te -o f - the -a r t " ca l i b ra t i on accu racy . , A t t e n t i o n has been
focused on the primary problems which were considered to be measurements o f ,
s tagnat ion and s ta t i c p ressu re and c a i c u l a t i o n o f Mach number. A concluding
sumnary o f t he ques t i onna i re resu l t s i s p resen ted he re for convenience.
Based on a judgment eva lua t ion o f da ta repor ted in the ques t ionna i res ,
the best , current , pressure-measurement accuracy (on the basis of standard
deviat ion) ranges from 0.025 t o 0.10 percent. These accuracies were repor ted
for both blowdown and continuous tunnels.
The survey showed that approximately twice as many transonic tunnels use
plenum chamber pressure for a reference to monitor Mach number, as opposed t o
tes t - sec t i on w a l l pressure. However, both types o f measurements a re used and
bo th requ i re a ca l i b ra t i on (s ) t o re la te t he assoc ia ted da ta t o s ta t i c p ressu re
measurements a long the cen ter l ine .
The most popular s ta t ic -pressure-probe is a 10 deg cone-cy l inder wi th
s t a t i c o r i f i c e s l o c a t e d t e n or more cy l inder d iameters downstream of the shoulder .
The ten-deg-cone appears t o be a t rade-o f f between the requirements to minimize
d i s tu rbance o f t he f l ow and, simultaneously, be e a s i l y f a b r i c a t e d and durable
enough t o be used r e p e a t e d l y i n a wind tunnel environment. Although a t h i g h
subsonic speeds a shock forms on the cy l inder and accurate measurement o f t h e
s t a t i c p r e s s u r e r e q u i r e s o r i f i c e s a t severa l s ta t ions , on ly a few of the probe
designs submit ted wi th the quest ionnaires have t h i s f e a t u r e . A smaller-angle
cone not o n l y has a lower, shock-attachment Mach number bu t i t also generates a
195

weaker t ransonic shock on the cyl inder and thus smal ler dev iat ions f rom f ree-
stream condit ions. O f the var ious s ta t ic probe des igns descr ibed in response
to the ques t ionna i re , a two-degree ( total- included angle) cone was the smal lest .
An a d d i t i o n a l s o u r c e o f e r r o r i n c a l i b r a t i n g t r a n s o n i c t u n n e l s is t he
neglect o f var ia t ions t ransverse to the f low. A lmost wi thout except ion, in
cases where measurements had been made, t,he quest ionnai res ind icated greater
Mach number gradients occur across the f low than a long the tunnel center l ine.
Th is may be most s ign i f i can t . i .n the de termina t ion o f d rag d ivergence and/or
b u f f e t o n s e t f o r t r a n s o n i c a i r c r a f t models. However, the present s ta te-of - the-
a r t o f wind'-tunnel test ing i s t o use o f f -cen ter l ine da ta exc lus ive ly as a diag-
nos t ic too l to de tec t unacceptab ly la rge var ia t ions . In wh ich case nozz le and/or
t e s t s e c t i o n c o n f i g u r a t i o n s a r e a l t e r e d .
The most popular f low-angular i ty-probes appear to be the 30-deg-cone f o r
simultaneous measurements o f p i t c h and yaw. Wedges o f v a r i o u s a n g l e s a r e o f t e n
used for planar measurements. I t appears feas ib le to des ign probes o f th is
type ( i .e. , d i f ferent ia l -pressure) which can resolve flow angles t o - +0.01 degree.
(Th is ob jec t i ve was proposed i n 1970 by the ad hoc A i r Force-NASA Committee on
Transonic Testing Techniques.) The quoted accuracy for f low ang le measurements
ranged from 0.01 deg t o 0.04 deg. A s p a t i a l v a r i a t i o n of +1/4 deg was f requen t l y
mentioned.
Quoted stagnat ion-temperature accuracy usual l y ranged from 1 t o 2 OC.
The m a j o r i t y o f r e p o r t i n g f a c i l i t i e s do not cont inuously monitor humidi ty.
In o rder to ach ieve a Mach number accuracy o f 0.001, humidi ty must be monitored
continuously.
Nearly 50% o f t he t unne ls have made noise measurements i n e i t h e r t h e
s t i l l i n g chamber, the tes sect ion and/or the plenum chamber. I n most cases,
e i t h e r m i n i a t u r e s t r a i n gauge transducers or condenser microphones were used
t o measure the noise data. The fo l lowing techniques have been employed t o
measure f reestream disturbances in t ransonic and/or supersonlc wind tunnels.
1. High-frequency-response pressure transducers mounted near
t h e t i p o f cones t o measure f l u c t u a t i n g s t a t i c p r e s s u r e s
beneath a laminar boundary layer.
I I I I I

2. Pressure transducers mounted on wedges w i t h t h e measurement
sur face a l igned w i th the flow.
3. Pressure transducers mounted o n t h e c y l i n d r i c a l p o r t i o n of
ogive-cyl inders. .
4. Pressure transducers mounted i n P i t o t probes t o measure
f l u c t u a t i o n s i n P i t o t p r e s s u r e .
5. Hot-wire and h o t - f i l m measurements.
Approximately 25% of the tunne ls repor ted hav ing made hot -w i re o r ho t -
film measurements of turbulence. However, i n t h e m a j o r i t y o f cases on ly ve ry
l i m i t e d c e n t e r l i n e and/or w a l l boundary layer measurements have been made.
Only a few' tunnels reported measurements o f f l u c t u a t i n g P i t o t p r e s s u r e .
The ma jo r i t y o f t he t unne ls repo r ted t ha t Sch l i e ren systems were o f
v a l u e i n d e t e c t i n g unwanted d is tu rbances in the tes t sec t ion . When combined
w i t h h i g h speed photography, t h i s method also provides data on f low unsteadi -
ness.
Most o f t h e r e s p o n d i n g f a c i l i t i e s have used one or more standard force
models du r ing ca l i b ra t i on . However, comparisons w i th re fe rence da ta a re
u s u a l l y o n l y q u a l i t a t i v e and a r e o f l i m i t e d use in p inpo in t i ng undes i rab le f l ow
c h a r a c t e r i s t i c s .
The w e l l known r u l e o f thumb t h a t t h e model cross sect ion should not
exceed 1% of the tunnel area for t ransonic test ing appears to be u n i v e r s a l l y
accepted. A consequence o f t h i s c r i t e r i o n i s t h a t v e r y few tunnel operators
a t tempt t o co r rec t f o r wa l l i n te r fe rence . Th i s a l so re f l ec ts t he l ack o f an
accepted theory fo r cor rec t ing fo r t ranson ic wa l l in te r fe rence.
F i n a l l y , t h e consensus on frequency o f w ind tunne l ca l ib ra t ion i s tha t a
tunnel should be r e c a l i b r a t e d o r a t l e a s t s p o t checked whenever:
1. tunne l con f igura t ion changes occur,
2. s ign i f i can t i ns t rumen ta t i on mod i f i ca t i ons a re made,
3. erroneous data i s being obtained, or
4. i n t h e absence o f any o f t h e above, once each year.
S ta t i c -p ressu re o r i f i ces shou ld a l so be inspected before recal ibrat ing.
197

.- "
o n t o t a l e r r o r s in t o t a l and s t a t
""<L AH AP H P - M
V.B. TRANSONIC TUNNELS
The goal o f Mach number c a l i b r a t i o n s i n transonic tunnels should be to
achieve an accuracy o f +O.OOl, p a r t i c u l a r l y i n t h e t r a n s o n i c d r a g r i s e r e g i m e :
0.75 < M < 1.0. For an a i r t e s t medium, t h i s r e q u i r e s t h e f o l l o w i n g c o n s t r a i n t
i c p ressu re measurements.
23 5 + M
However, changes i n Reynolds number (Sect ion 11 .8 .2 ) or humid i ty leve l (Sect ion
Il.C.7) can e a s i l y cause Mach number var ia t ions severa l t imes larger than 0.001.
For t h i s reason, considerable care should be taken to cal ibrate an empty-tunnel
over the en t i re range o f Reynolds number and humidi ty levels normal ly encountered
dur ing rou t ine opera t ions . Once the t unne l i s ca l i b ra ted for t yp i ca l , ope ra t i ng
humid i ty leve ls , a cont inuous moni tor ing o f humid i ty is prefer red, e.g., a s t r i p
reco rde r f o r subsequent reference. I n add i t i on , excess i ve spa t ia l va r ia t i ons of
to ta l p ressure (i .e. , AHS/HS > 0.001) ac ross t he s t i 1 1 ing chamber may r e q u i r e
c o r r e c t i v e a c t i o n , e.g., addi t ional screens, honeycombs, e t c . F i n a l l y , t h e
assumption o f an i sen t rop i c expans ion f rom the s t i l l i ng chamber t o t h e t e s t
section should be evaluated by d i r e c t measurements i n t h e t e s t s e c t i o n , b o t h on
and of f -center1 ine.
The long, stat ic-pressure, survey pipe i s w e l l e s t a b l i s h e d as the standard
f o r o b t a i n i n g c e n t e r l i n e measurements. Bes t resu l ts a re ach ieved w i th the nose
o f t he p ipe l oca ted we l l ups t ream i n t he se t t l i ng chamber; t h i s i s necessary in
order to p revent passage o f a t ranson ic shock over the length o f the p ipe. In
a l l cases, the resul t ing data should be ca re fu l l y i nspec ted f o r o r i f i ce - induced
er ro rs . Once the cen te r l i ne da ta i's determined t o b e f r e e o f o r i f i c e e r r o r s
(Sec t ion I I I .D . l . ) , s tandard p rocedure i s to use the s ta t i c p ressure da ta to
c a l i b r a t e e i t h e r plenum chamber pressure or w a l l s t a t i c t a p s . I f plenum pres-
sure i s used f o r Mach number cont ro l , the poss ib i 1 i t y of departures from empty-
tunne l ca l ib ra t ions shou ld be c a r e f u l l y examined i n cases o f (1) la rge (> 1%)
l i f t i n g models at h igh-subsonic speeds and (2) rap id l y va ry ing Mach number
cond i t ions such as occur during rapid changes i n model o r i e n t a t i o n . I f w a l l
s t a t i c t a p s a r e used f o r Mach number c o n t r o l , a t l e a s t one should be located on
198

each wa l l , ahead of the model locat ion, and averaged with a "piezometer ring";
t h i s average i s p r e f e r a b l e t o u s i n g o n l y a s ing le wa l l s ta t i c p ressu re .
Since a l o n g p i p e i s d i f f i c u l t t o move about the test sect ion and o f f -
cen te r l i ne da ta i s impor tan t f o r a i r c ra f t -mode l t es t i ng , it is recommended
that supplementary, of f -center l ine data be ob ta ined w i th a conven t iona l s ta t i c
pressure probe or r a k e o f such probes, when M i s not near one (Sec. I I I .D. 2) .
Since the wing span o f mos t t ranson ic a i r c ra f t models i s r e s t r i c t e d t o 60 per-
cent , or less, o f the tunnel width, both Mach number and f low angu lar i t y da ta
should be obtained over th is span i n t h e v e r t i c a l and hor izontal p lanes.
Of f -center l ine measurements o f f l o w a n g u l a r i t y a r e s e n s i t i v e i n d i c a t o r s
o f e r r o r s caused by nozzle contour, wal l set t ings, seal leaks, etc. The most
accurate measurements o f f l o w a n g u l a r i t y can be ob ta ined i n t he l eas t amount o f
t ime w i th a p robe cons is t ing o f two, orthogonal, symmetrical wings and a force
balance housed i n a small centerbody."
I n a d d i t i o n t o measurinq Mach number and f l o w a n g u l a r i t y o f f - c e n t e r l i n e ,
data should be taken at representat ive forward, center , and a f t s t a t i o n s i n
the useable test sect ion. I t i s suggested t h a t t h e r e s u l t i n g d a t a , a t a
g i ven s ta t i on , be expressed i n terms of s tandard dev iat ion f rom the mean o f
t h e c e n t e r l i n e measurements. This type o f data will provide more complete
in fo rmat ion on f low qua l i t y and should be considered when se lect ing wal l poro-
s i t y , w a l l a n g l e o r amount o f plenum evacuation.
Unfor tunate ly , no genera l cons t ra in ts ex is t as t o what are acceptable
o f f - c e n t e r l i n e v a r i a t i o n s . Jackson (AEDC) has suggested the fo l low ing c r i te r ia
f o r ''good" un i f o r m i t y i n c e n t e r 1 ine Mach number :
2 aM 5 0.005 f o r M < 1 ,
2 UM 20.01 for M > 1
In the pas t , a c r i t e r i o n f o r a c c e p t a b l e f l o w a n g u l a r i t y a l o n g t h e c e n t e r l i n e
has not been needed because a given model i s u s u a l l y r u n u p r i g h t and inver ted
i n o rde r t o es tab l i sh t he e f fec t i ve ang le o f i nc idence . Th i s i s a v a l i d and
* Acceptable accuracy can also be ob ta ined w i th conven t iona l , d i f f e ren t i a l - pressure probes, see Section 1II .E.
199
we l l -es tab l i shed t es t i ng p rac t i ce ; however, f l o w a n g u l a r i t y i n the yaw p lane
i s f requen t l y i gno red . To summarize, standard c r i t e r i a f o r f l o w u n i f o r m i t y
need to be developed for representat ive (preferably standard) models i n
var ious k inds o f tes ts , =.g., f o r c e , b u f f e t , f l u t t e r , e t c . These c r i t e r i a
should include standards for a c c e p t a b l e v a r i a t i o n s i n Mach number and flow
angu lar i t y , bo th on and o f f - c e n t e r l i n e .
Unsteady disturbance measurements in t ranson ic tunne ls shou ld be a
s tandard par t o f t unne l ca l i b ra t i on . Recent use o f h o t - w i r e s i n t h e t e s t
s e c t i o n o f a t ranson ic t unne l a t NASA Ames indicates these may be u s e f u l f o r
u n s t e a d y - f l o w c a l i b r a t i o n i n a t l e a s t some tunnels. However, as dynamic pres-
sure increases hot-wires become more vu lnerable to breakage and probably will
be imprac t i ca l f o r use i n t he new high-Reynolds-number f a c i 1 i t i e s ( e x c e p t in
t h e s e t t l i n g chamber). Based on extensive exper ience wi th the AEDC t r a n s i t i o n
cone i n twenty-one major windtunnels o f t he Un i ted S ta tes and Western Europe,
t h i s d e v i c e has become an " u n o f f i c i a l " t u n n e l a c o u s t i c c a l i b r a t i o n model and i s
cu r ren t l y cons ide red t o be the bes t ava i lab le d is tu rbance ca l ib ra t ion ins t rument
However, t h e r e i s a d e f i n i t e need f o r a less expensive instrument which can be
easi ly reproduced and used i n a l l s i z e s o f f a c i l i t i e s . The development o f f l u c t u -
a t ing P i to t p robes appears to meet t h i s need (Sect ion I 1 I . F ) . This type of
instrument can be used t o measure c e n t e r l i n e n o i s e and to ca l ibrate wal l -mounted,
dynamic pressure transducers. A wal l t ransducer(s) can then be used as a per-
manent mon i to r o f tunne l no ise . The wal l t ransducer(s) should be mounted approx i -
mately 0.025 cm (0.01 in.) below the p lane of the tunnel w a l l and, p re fe rab ly ,
should have a frequency response out to 30 kHz. By using two o r more w a l l -
mounted t ransducers, the d i rect ion o f propagat ion o f disturbances can be ascer-
ta i ned . Although there are no genera l c r i t e r i a f o r accep tab le l eve l s o f f l ow un-
steadiness, Mabey (RAE) has developed some no ise gu ide l ines fo r in te r fe rence-
f r e e f l u t t e r and bu f fe t tes ts (Sec t ion I I1.F.). The goal o f t ransonic tunnel ,
no i se - reduc t i on research i s t o reduce uns tead iness t o l eve l s cha rac te r i s t i c of
tu rbu len t boundary layers on sol id walls, i .e., AC < 0.005. P
An accepted measure o f w a v e - c a n c e l l a t i o n c h a r a c t e r i s t i c s o f v e n t i l a t e d
w a l l s i s t o o b t a i n p r e s s u r e d i s t r i b u t i o n d a t a on a 20 deg cone-cyl inder and com-
pare the resu l ts w i th wa l l - in te r fe rence- f ree da ta . It i s now apparent that the
200
t rad i t iona l assumpt ion of a l i n e a r boundary c o n d i t i o n a t v e n t i l a t e d , t r a n s o n i c
w a l l s i s erroneous. Thus, t h i s e x p l a i n s t h e f a i l u r e o f past at tempts to theo-
r e t i c a l l y c a l c u l a t e t h e e f f e c t s of wa l l i n te r fe rence on madel tes t ing . Measure-
ments o f t e s t - s e c t i o n - w a l l boundary layers, both wi th and w i thout models i n s i t u ,
are being made i n e f f o r t s to ga in a better understanding o f v e n t i l a t e d w a l l s
and the i r c ross- f low charac ter is t i cs . Cur ren t research on t r a n s o n i c w a l l i n t e r -
ference is focus ing on three areas: ( I ) t h e d e r i v a t i o n o f more exact boundary
condi t ions, (2) t h e development o f a se l f -cor rec t ing w ind tunne l w l th au tomat ic
c o n t r o l of l o n g i t u d i n a l l y v a r y i n g v e n t i l a t i o n , and (3) vary ing wal l contours
t o a t t a i n w a l l - i n t e r f e r e n c e - f r e e f l o w about models.
The NACA 0012 a i r f o i l i s c u r r e n t l y b e i n g used as a standard pressure model
i n two-dimensional tests. The ONERA t r a n s p o r t a i r c r a f t models have been tested
i n a number o f t ranson ic t unne ls and have been found to be ext remely sens i t ive
to f l o w q u a l i t y . AGARD has no t ye t adopted a s tandard , t ranspor t -a i rc ra f t model.
There i s c u r r e n t l y a genuine need f o r a s tandard, a i rcraf t , pressure model (or
models) t o a id t ranson ic w ind t unne l ca l i b ra t i on and data comparisons between
tunnel s.
Laser Doppler Velocimeters are an impor tan t add i t i on t o t he t oo l s ava i l ab
fo r w ind t unne l ca l i b ra t i on . The obvious advantage of an LDV i s it does n o t
pe r tu rb t he flow. A t Mach numbers near one, t h i s i s an important advantage.
addi t ion, an LDV can be used n o t o n l y f o r mean-flow v e l o c i t y measurements but
a lso can measure f l o w a n g u l a r i t y and turbulence intensi t ies greater than about
l e
In
one. LDV measurements o f v e l o c i t y and f l o w a n g u l a r i t y a r e c u r r e n t l y o n l y 1/4 t o
115 as accurate as the best conventional probes at high subsonic and low super-
sonic speeds. However, near Mach one an LDV i s expected to p rov ide super io r
data. A t th is t ime, the LDV i s no t be ing used t o r o u t i n e l y c a l i b r a t e empty-
tunnels. However, we a n t i c i p a t e such use i n t h e f u t u r e .
201
I

V . C. SUPERSONIC TUNNELS
Mach number in supersonic tunnels should be c a l i b r a t e d by measuring two
independent pressures i n t he t es t sec t i on . Accu ra te resu l t s can be obtained
by measuring P i to t p ressu res i n t he f rees t ream and behind the bow shock o f a
wedge. However, f rees t ream P i to t and s t a t i c p r e s s u r e s a r e p r e f e r a b l e t o o n l y
P i t o t d a t a and the assumption o f i s e n t r o p i c f l o w f r o m t h e s e t t l i n g chamber.
S ince t ransverse gradients in Mach number a r e t y p i c a l l y l a r g e r t h a n a x i a l
va r ia t i ons , it i s cons idered essent ia l to ca l ib ra te bo th Mach number and f l o w
a n g u l a r i t y o f f - c e n t e r l i n e . A t least three cross-sect ions should be surveyed
near the forward, center and a f t p o r t i o n s o f t h e u s e a b l e t e s t s e c t i o n . T h i s
t ype o f da ta can be ob ta ined mos t eas i l y w i th P i to t and s t a t i c probe rakes or
arrays mounted on a t ravers ing s t ing . Th is da ta shou ld be used t o c a l i b r a t e
a permanent Mach number probe which should be i ns ta l l ed i n superson ic t unne ls
fo r f requen t , rou t i ne checks on c a l i b r a t i o n . :n general, a c a l i b r a t e d Mach
number accuracy o f 0.5 t o 1% i s cons idered good. Industry standards need t o
be developed which define acceptable f low qual i t y f o r p a r t i c u l a r k i n d s of
t es t i ng , e.g., force and pressure tests of m i s s i l e s and a i r c r a f t models.
As i n t ranson ic t unne ls , cen te r l i ne no i se measurements should be obtained
and used t o c a l i b r a t e one or more, wail-mounted, dynamic-pressure transducers.
The AEDC t r a n s i t i o n cone i s c u r r e n t l y t h e o n l y f l o w d i s t u r b a n c e c a l i b r a t i o n
device which has been t e s t e d i n a l a rge number o f t unne ls . A smaller and less
expens ive no i se ca l i b ra t i on dev i ce i s needed to serve as a standard. Probes
designed to measure f luc tua t ing P i to t p ressures shou ld be c o n s i d e r e d f o r t h i s
purpose. Trad i t iona l P i to t surveys o f tunne l -wa l
es tab l i sh t he s i ze and geometry o f t h e i n v i s c i d f
o f f a c i 1 i ty no ise .
1 boundary layers not only
low bu t a lso a id cor re la t ions
In add i t i on t o keep ing t he t o ta l t empera tu re h igh enough t o a v o i d l i q u e -
f a c t i o n o f t h e t e s t gas, t h e e f f e c t s o f t y p i c a l l e v e l s o f w a t e r v a p o r i n t h e
t e s t gas should be c a r e f u l l y c a l i b r a t e d . As i s w e l l known, the p r imary e f fec t
of water condensation i s a loss o f t o t a l p r e s s u r e and a r i s e i n s t a t i c p r e s s u r e .
Also, var ious operators have observed tha t p ressure tes ts a re more s e n s i t i v e t o
humid i ty leve ls than force tests .
The number o f surveys o f s u p e r s o n i c f l o w f i e l d s w i t h a iaser Doppler veio-
c imeter i s inc reas ing as some e a r l i e r problems have been reso lved. In the fu tu re
t h i s new t o o l may enabie more accu ra te ca l i b ra t i ons of supersonic tunnels.
202
APPENDIX I
Hot Wires and Hot Films *
Introduction
' A hot-wire anemometer is a means of measuring fluctuations in localized areas of the flow at frequencies up to 200 KHz. The sensor may be a small- diameter wire suspended between needle-like prongs or a thin metallic film on an insulative substrate that may be shaped in various geometries. It responds to cooling effects and thus measures both kinematic and thermodynamic fluctuations of the flow.
The hot-wire has been a generally accepted standard for measuring fluctua- tions in wind tunnel flow since the work of Dryden and Kuethe in 1929 (Ref. l), Its use can be very tedious and thus has often been avoided. However, it has not been replaced because of its advantages that include: small sensor size, high frequency response and sensitivity to pressure, vorticity, and entropy fluctuations. Dr. Kovasznay (Ref. 2) opinioned in 1968 that the hot-wire has not been replaced by other methods because of its unique characteristics. Furthermore, significant developments in hot-wire methodology in the 1970's indicate continued use of this instrument in both specialized experiments and in wind tunnel calibrations.
Reference 3 is a recent textbook on hot-wire technology. References 4 and 5 provide further background and extended lists of references relative to measurements of fluctuating properties in wind tunnels. Reference 2 provides summaries of the early history and the technology up to 1968.
Useful application of hot-wires to incompressible flow is commonly dated as 1929 (Ref. 1). Experiments with hot wires in supersonic flows began in the mid 1940's. However, equipment and analysis techniques were not considered adequate until the mid 1950's (Refs. 6, 7, and 8 ) . Applications to transonic flows encountered particular difficulty in separating the components of the output signal (Refs. 3 and 8). Recent reports of progress (Refs. 9 and 10) have outlined approaches for practical applications in the high-subsonic and transonic test regime.
* This section has been contributed by C . J. Stalmach, Jr., Vought Corporation.
Equ i pment Descr i p t i o n and Operat-ion
The sensor i s e l e c t r i c a l l y h e a t e d t o m a i n t a i n e i t h e r a cons tan t cur ren t
or constant temperature ( resistance). In the case o f constant current , compen-
sa t ion fo r the thermal lag of the w i re i s ob ta ined by an ou tpu t amp l i f i e r
whose ga in w i th f requency i s ad jus ted (dur ing a square wave heat ing input ) to
compensate for decay o f the ou tpu t w i th inc reas ing f requency . For la rge aspect
r a t i o s ( U d - > 150) t h e w i r e e x h i b i t s a f i r s t o r d e r response tha t i s s imp le to
compensate e lec t ron ica l l y . Ad jus tment o f the non- l inear , compensating a m p l i f i e r
i s r e q u i r e d f o r each change i n mean f l o w c o n d i t i o n o r sensor.
I n t he case o f a constant temperature anemometer, a high-gain feedback
system provides power to t he w i re i n response to f l u c t u a t i o n s i n c o o l i n g
caused by the f low such that the wire resistance ( temperature) remains essen-
t i a l l y c o n s t a n t . The square o f t he vo l tage requ i red t o ma in ta in cons tan t w i re
r e s i s t a n c e i s a d i r e c t measure o f t he hea t t rans fe r between the sensor and i t s
environment. The constant temperature anemometer has several advantages compared
t o a constant current system including:
1 . ' thermal lag not a problem since sensor temperature i s cons tan t ,
2. automat ic adjustment to large changes i n mean f l ow cond i t i ons
which reduces accidental burnouts and cont inues da ta acqu is i t ion
dur ing mean f l o w changes,
3. d i r e c t DC output as a f u n c t i o n o f mean v e l o c i t y ,
4. compat ib le wi th film and low R/d wi re sensors that have
complex frequency response characteristics, and
5. output may be l i n e a r i z e d and temperature compensated.
The constant current approach was i n i t i a l l y p r e f e r r e d because i t provided
higher-frequency-response and s igna l - to -e lec t ron i c -no ise ra t i o . So l i d s ta te
e lec t ron ics , however, have permit ted the constant temperature systems to have
comparable performance and are the systems now genera l ly prefer red. An excep-
t i o n i s measurement o f tempera ture f luc tua t ions independent o f ve loc i ty and
dens i ty e f fec ts . Here a minimum wire temperature is requi red that i s best
achieved wi th a constant current operat ion. Modern commercial un i t s genera l l y
incorporate both c i rcu i ts . Reference 3 and l i t e r a t u r e f r o m commercial equip-
ment s u p p l i e r s p r o v i d e f u r t h e r d e t a i l s on the power systems and commonly used
sensor s t y 1 es.
204

Response to Mean Flow
A w i r e o r film sensor responds t o changes i n f l o w c o n d i t i o n s t h a t a f f e c t s
the heat t rans fer o f the sensor to i t s env i ronment . For s teady f low the sensor
response may be expressed a s
Nu -A+B & (1.1)
o r
E2 - [C+D ( P U ) ~ ] (Tw - Te) (1 .2)
where x=0.5 fo r c lass ica l ana lys is (K ing 's law) o f f low a round heated cy l inders .
F igure A.I.l shows the response o f a h o t w i r e t o t h e mean flow. For supersonic
flow, the Nussel t number i s evaluated behind the normal shock (Ref. 6 ) .
Response t o F l u c t u a t i o n s i n t h e Flow
The s imu l taneous reac t ion o f the heated sensor to dens i ty , ve loc i ty and
temperature i s the key both to the advantages and d i f f i c u l t i e s o f t h e h o t - w i r e
anemometer approach t o measur ing f low f luctuat ions. I t i s an advantage t o
have one sensor measure both kinematic and thermodynamic f l u c t u a t i o n s . I n
comparison, a laser Doppler velocimeter can o n l y measure t h e f l u c t u a t i n g v e l o c i -
t i e s and a microphone or pressure sensor responds only to the net sound o r
p ressure f luc tua t ions . Separa t ion o f the modes composing the output o f the
heated sensor i s n o t s i m p l e and, i n genera l , r equ i res a p r i o r i knowledge o f t h e
f l ow cha rac te r i s t i cs be ing sampled.
The choice o f techniques for separat ing the modes of a f l uc tua t i ng ho t -
w i r e s i g n a l i s somewhat dependent on the Mach number and Reynolds number of
t he t es t . A S i n d i c a t e d i n t h e summary curve of Fig. A . I . l , wire response to
mean f l o w i s w e l l d e f i n e d f o r t h e i n c o m p r e s s i b l e case. For isothermal, incorn-
p ress ib le f l ow , a ho t -w i re responds on ly to ve loc i ty changes. The sensor Out-
put i s w e l l behaved for supersonic Mach numbers as indicated by the lower curve
O f F ig . A. I .1 . The sensor output, however i s Mach number dependent between
these two bounds for the lower range o f w i re Reynolds number.
Test equipment and data analysis techniques are sufficiently developed t o
pe rm i t use fu l app l i ca t i ons f o r t unne l ca l i b ra t i ons ove r t he Mach range o f
i n t e r e s t i n t h i s r e p o r t (0.4 5 3 .5 ) . Research t o improve equipment and ana lys is
should cont inue however . In par t icu lar , addi t ional work needs t o be done i n
the a reas o f t ranson ic f l ow app l i ca t i ons and s e p a r a t i o n o f t h e s i g n a l i n t o i t s
component modes.
205
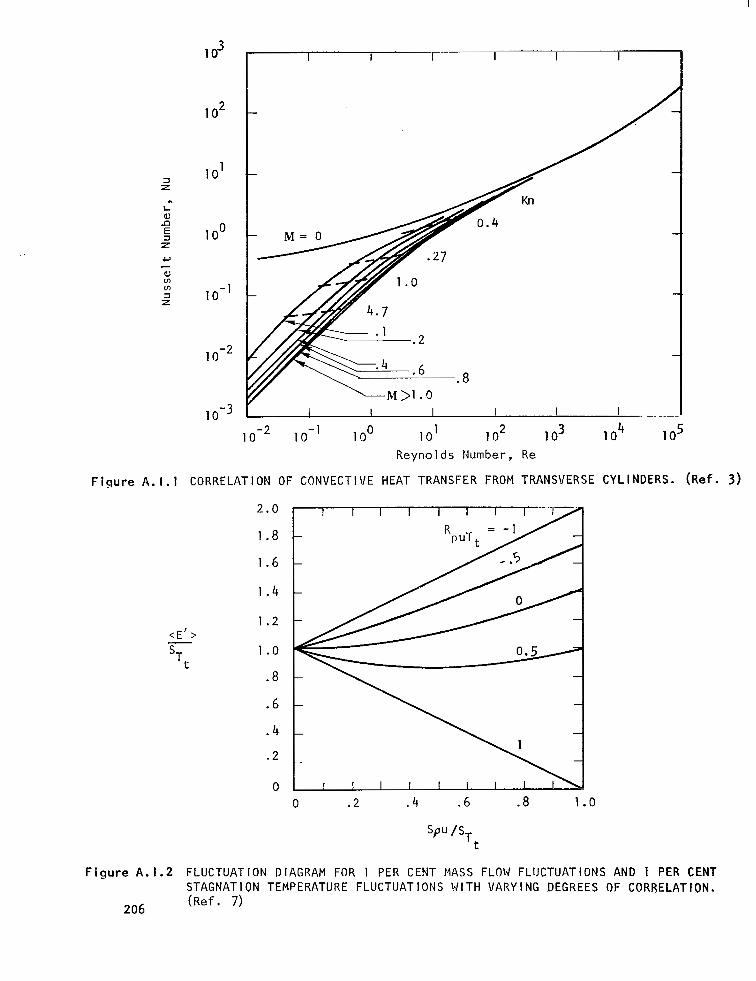
(Ref. 3 )
I t
2.0
1.8
1.6
1.4
1.2
1 .o
.8
. 6
. 4
. 2
0 0 .2 . 4 .6 .8 1 . O
F igure A. 1.2 FLUCTUATION DIAGRAM FOR 1 PER CENT MASS FLOW FLUCTUATIONS AND 1 PER CENT STAGNATION TEMPERATURE FLUCTUATIONS WITH VARYING DEGREES OF CORRELATION.
206 (Ref . 7)
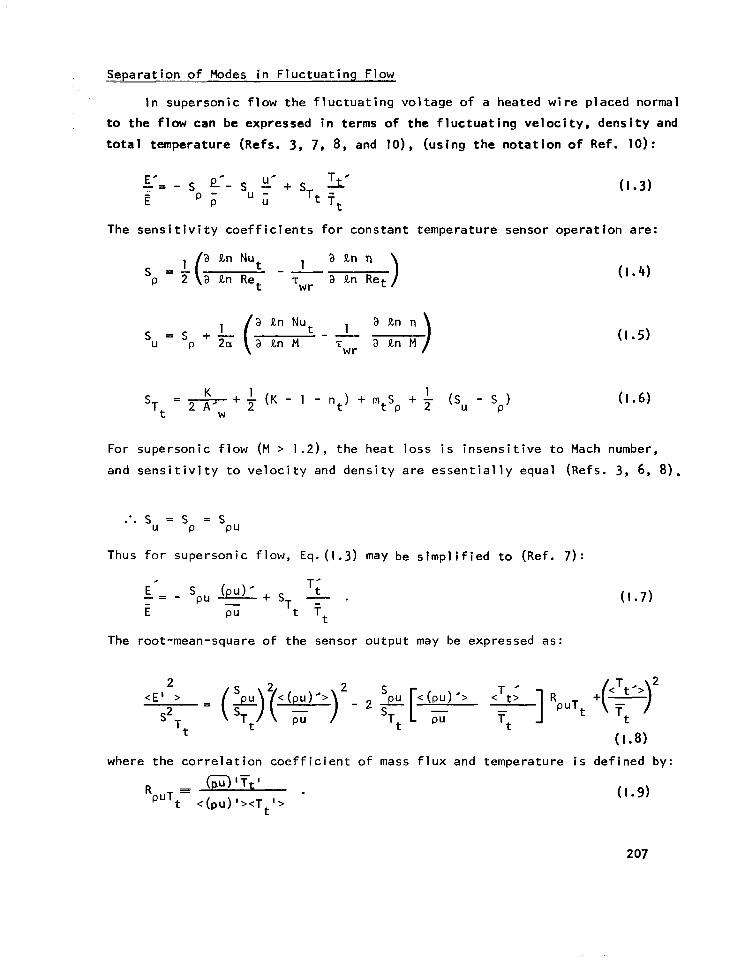
Separation ofModes in Fluctuating Flow
In supersonic flow the fluctuating voltage of a heated to the flaw can be expressed in terms of the fluctuating ve total temperature (Refs. 3, 7, 8, and lo), (using the notat
I wi re placed normal locity, density and ion o f Ref. 10) :
The sensitivity coefficients for constant temperature sensor operation are:
a Rn Nu 1 wr T a Rn Ret
a Rn Nut 1 wr ”
T a R n ~
+ - (K - 1 - nt) + rn s + - (sU - sP) 1 1 ’Tt 2 Asw 2 t P 2
= -
(I .5)
( I .6j
For supersonic flow (M > 1.2), the heat loss is insensitive to Mach number, and sensitivity to velocity and density are essentially equal (Refs. 3, 6, 8).
:. su = s = s P P U
Thus for supersonic flow, Eq.(1.3) may be simplified to (Ref. 7):
The root-mean-square of the sensor output may be expressed as:
where the correlation coefficient o f mass flux and temperature is defined by:
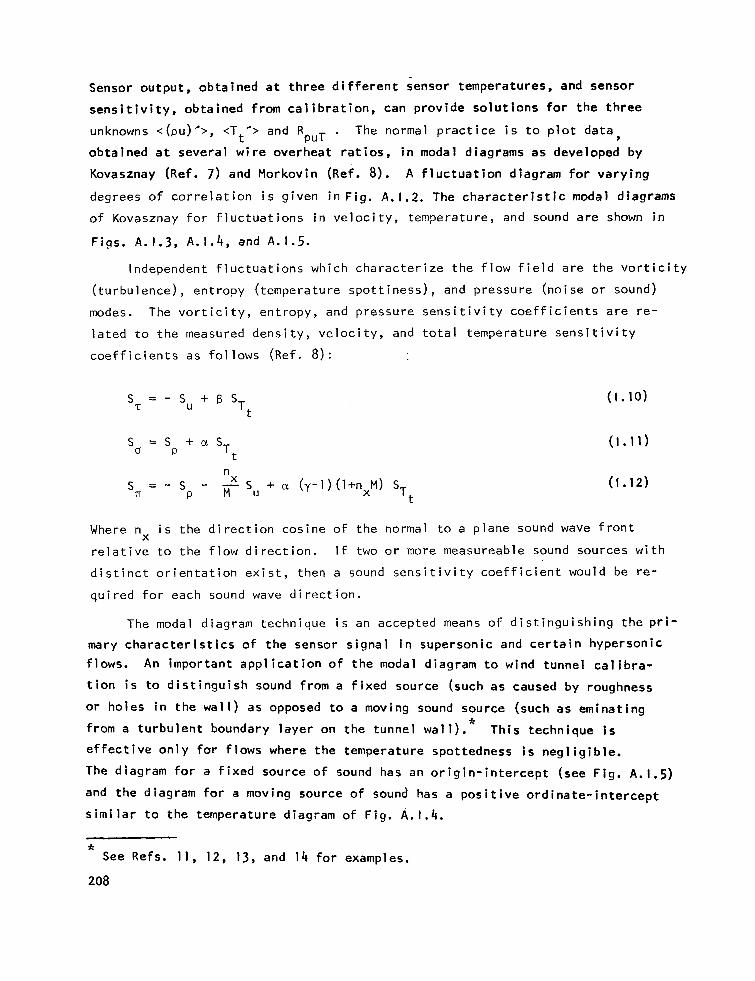
Sensor ou tpu t , ob ta ined a t th ree d i f fe ren t sensor tempera tures , and sensor
sens i t i v i t y , ob ta ined f rom ca l i b ra t i on , can p rov ide so lu t i ons for the th ree
unknowns <(pu)*>, <Ttc> and RpuT . The normal p r a c t i c e i s t o p l o t d a t a ,
o b t a i n e d a t s e v e r a l w i r e o v e r h e a t r a t i o s , i n modal diagrams as developed by
Kovasznay (Ref. 7) and Morkovin (Ref. 8). A f luc tua t ion d iagram fo r vary ing
degrees o f c o r r e l a t i o n i s g i v e n i n F i g . A.1.2. The c h a r a c t e r i s t i c modal diagrams
o f Kovasznay fo r f l uc tua t i ons i n ve loc i t y , t empera tu re , and sound are shown i n
Figs. A.1.3, A.1.4, and A.1.5.
Independent f l u c t u a t i o n s w h i c h c h a r a c t e r i z e t h e f l o w f i e l d a r e t h e v o r t i c i t y
( turbulence) , ent ropy ( temperature spot t iness) , and pressure (no ise or sound)
modes. The v o r t i c i t y , e n t r o p y , and p r e s s u r e s e n s i t i v i t y c o e f f i c i e n t s a r e r e -
l a t e d t o t h e measured d e n s i t y , v e l o c i t y , and t o t a l t e m p e r a t u r e s e n s i t i v i t y
c o e f f i c i e n t s as fo l lows (Ref. 8 ) :
Su + 8 ST t
s = s + U S T U P t
n - X Su + a (y-1) (l+nxM) ST M t
(1.10)
(1.11)
(I. 12)
Where nx i s t he d i rec t i on cos ine o f t he no rma l t o a plane sound wave f r o n t
r e l a t i v e t o t h e f l o w d i r e c t i o n . I f two o r more measureable sound sources wi th
d i s t i n c t o r i e n t a t i o n e x i s t , t h e n a sound s e n s i t i v i t y c o e f f i c i e n t would be re -
q u i r e d f o r each sound wave d i r e c t i o n .
The modal diagram technique i s an accepted means o f d i s t i ngu ish ing t he P r i -
mary cha rac te r i s t i cs o f t he senso r s igna l i n superson ic and cer ta in hypersonic flows. An impor tan t app l i ca t ion o f the modal diagram t o wind tunnel ca l ibra-
t i o n i s t o d i s t i n g u i s h sound from a f ixed source (such as caused by roughness
o r h o l e s i n t h e w a l l ) as opposed t o a moving sound source (such as eminating
from a t u r b u l e n t boundary layer on the tunnel wall) . This technique i s
e f f e c t i v e o n l y for f lows where the temperature spottedness i s n e g l i g i b l e .
The diagram f o r a f ixed source o f sound has an o r ig in - i n te rcep t ( see F ig . A. 1.5) and the diagram for a moving source o f sound has a p o s i t i v e o r d i n a t e - i n t e r c e p t
s i m i l a r to the temperature diagram of Fig. A.1.4.
*
* See Refs. 1 1 , 12, 13, and 14 f o r examples.
208

- < E ' >
S T t
// I
- 1
F i g u r e A. I . 3
2
I
0
0 1 2 'Tt
VELOCITY FLUCTUATIONS (VORTICITY MODE). (Ref. 7) FLUCTUATION DIAGRAM FOR 1 PERCENT TURBULENT
F i g u r e A . 1 . 4 FLUCTUATION DIAGRAH FOR I PER CENT TEMPERATURE SPOTTINESS (ENTROPY M O D E ) . (Ref. 7)
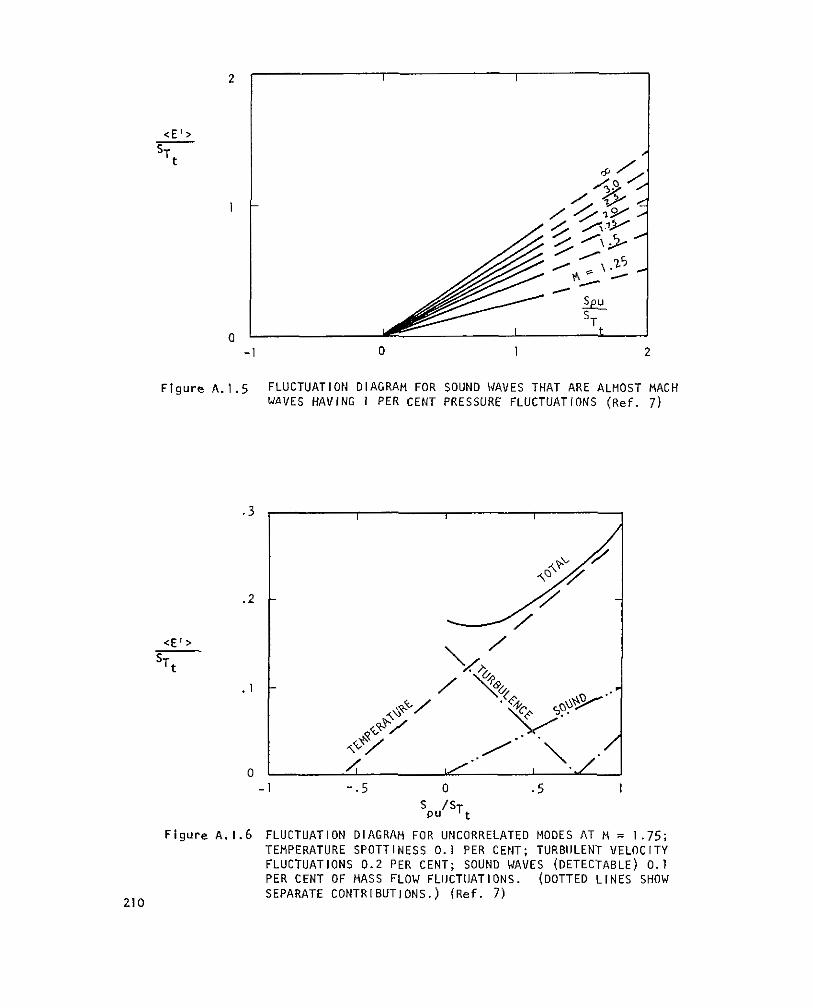
2
0 - I 0 I 2
~l~~~~ A . I . ~ FLUCTUATION DIAGRAM FOR SOUND WAVES THAT ARE ALMOST MACH WhVES HAVING 1 PER CENT PRESSURE FLUCTUATIONS (Ref. 7)
. 3
. 2
0 - 1 - .5 0 . 5 I
sPu’sT
F i g u r e A . 1 . 6 FLUCTUATION DIAGRAM FOR UNCORRELATED MODES AT M = 1 . 7 5 ; TEMPERATURE SPOTTINESS 0.1 PER CENT; TURBULENT VELOCITY FLUCTUATIONS 0.2 PER CENT; SOUND WAVES (DETECTABLE) 0.1 PER CENT OF MASS FLOW FLl lCTl lATIONS. (DOTTED LINES SHOW SEPARATE CONTRIBUTIONS.) (Ref. 7)
21 0
When the dominate mode i s sound, t h e f o i l c w i n g l s e n t r o p l c r e l a t i o n s
between pressure, density and temperature are appropr iate (Ref. 1 1 ) :
( 1 . 1 4 )
The resu l tan t ho t -w i re equat ion and c a l c u l a t i o n o f t h e f l u c t u a t i o n q u a n t i t i e s
i n t he f rees t ream a re g i ven i n References 11 and 12.
I n Reference 15. an app l ica t ion o f the d iagram approach i s shown which
i den t i f i es t empera tu re f l uc tua t i ons i n t he wake of a wedge i n hypersonic f low
where the ad jo in ing f rees t ream s igna l l eve l i s low. I f both temperature
f l u c t u a t i o n s and moving sound sources a re l i ke ly p resent (Ref. 161, the In te rp-
r e t a t i o n o f the dlagrams becomes more d i f f i c u l t . An example of a ho t -w i re
ou tpu t , in a case where a l l t h r e e modes,are p resen t i s shown I n F i g u r e A . 1 . 6 .
It i s r e a d i l y seen t h a t i n t h e absence o f one dominant mode, s e p a r a t i o n o f t h e
component modes can be a problem. References 7. 8, and 12 may be consulted
fo r more de ta i l s concern ing the modal diagram technique.
Transonic Flows
The m d a l diagram approach cannot be general ly appl ied for compressible
subsonic and transonic f lows (see Fig. A . l . 1 ) where t h e d e r i v a t i v e s o f t h e
Nusselt number and recove ry f ac to r w i th respec t t o Mach number are not zero,
and su # s f o r a i l overheat ra t ios (Refs. 3 , 8, and IO). Transonic opera-
t i o n a t h i g h dynamic pressures also increases problems with wire breakage. P
The above problems he lp exp la in t he l im i ted usage o f ho t -w i re systems i n
transonic wlnd tunnels. Recent developments, however, provide examples for
overcoming these d i f f i c u l t i e s . The sensor f a i l u r e problem may be a l l e v i a t e d
w i th t he use o f sho r te r w i res (Ud - I O O ) , w i res w i th i nsu la t i ve back ing o r
film sensors (Ref. IO, 17, and 18). Heat losses to end suppor ts or subst rate
and poss ib le i n te r fe rence e f fec ts necess i ta te t ha t each sensor be c a l i b r a t e d
in a representative f low environment. The s e n s i t i v i t y c o e f f i c i e n t s Sp and Su
21 1

have been systemat ica l ly measured in t ransonic f low by independent ly varying
dens i t y and v e l o c i t y (Refs. 9 and I O ) . These r e s u l t s e s t a b l i s h t h a t Sp and
Su a re approx imate ly equa l fo r a l l Mach numbers ( including the troublesome
transonic range) i f t he w i re ove rhea t ra t i o i s g rea te r t han 0.5 and t h e w i r e
Reynolds number i s g rea te r t han 20. Opera t i on w i th in t hese res t r i c t i ons aga in
permi ts the use o f the s impl i f ied express ion o f Eq. (1.7). For many t ransonic
w i n d t u n n e l s t h e t o t a l t e m p e r a t u r e f l u c t u a t i o n s a r e x g i i g i b l e r e l a t i v e to
the mass-f lux term. In t h i s case t he ho t -w i re d i rec t l y senses the f luc tua-
t i o n s o f the mass-f lux. I f the leve l o f temperature f luc tuat ion Is unknown I n
a f a c i l i t y (such as a new cryooenic tunnel ) the leve l may be ascer ta ined wi th a
sensor operated a t cons tan t cu r ren t and near the recovery temperature.
Reduct ion of mass-f lux measurements i n a t ranson ic f l ow i n to i t s e lemen ts
requires further assumptions, e.g., p o s s i b l e a p p l i c a t i o n o f t h e modal diagrams
or an independent measurement w i t h a laser velocimeter, pressure t ransducer or a specia l ho t - f i lm geometry. For boundary-layer f low. the pressure f luctuations
can genera l l y be neg lec ted re la t i ve to v o r t i c i t y . O p e r a t i n g w i t h i n t h e above
descr ibed w i re and f low domain, boundary l a y e r p r o f i l e s of v e l o c i t y . d e n s i t y
and Reynolds shear s t r e s s were successful ly obtained in Ref. 10 for a nominal
Hach number of 0.8. For operat ion in the t ransonic f reest ream, it appears that
t h e p r i n c i p l e of modal diagrams can be app l i ed to high-Reynolds-number f l o w
by ob ta in ing da ta a t severa l over -heat ra t ios , a l l be ing g rea ter than 0.5.
S t r a i g h t l i n e f a i r i n g s OF the data, extrapolated to the ordinate, would then
provide information on the dominate mode as in the supersonic case. Another
approach for separat ion o f the f l uc tua t i on modes i s t o employ a yet-to-be
defined f i I m sensor t h a t has two (or more) f i l m s and a geometry such t h a t one
film responds to the mass-f lux and a second f i lm responds to pressure (geo-
me t r i ca l l y sh ie lded f r o m v e l o c i t y ) . An a p p l i c a t i o n o f special sensor geometry,
f o r d i r e c t c o r r e l a t i o n measurements,has been repor ted for hypersonic, boundary-
layer flow (Ref. 17) .
Comparison of Hot Wire t o Other Systems
Hot-wire data have, i n genera l , compared w e l l w i t h measurements from
other devices. Agreement of v e l o c i t y p r o f i l e s o b t a i n e d w i t h hot w i r e and
lase r systems w i t h i n a shock-wave/boundary-layer in teract ion (Ref . 19) g ives
credence t o b o t h systems and tends to val idate the assumptions employed i n
21 2
data reduc t ion . In the f rees t ream o f many t ransonic and supersonic wind
tunnels the sound mode general ly dominates, and i n such cases good agree-
ment has been obtained between hot -wi re and pressure transducer measure-
ments (Refs. 14 and 20). An example comparison o f P i to t and ho t -w i re
measurements a t M = 5 i s shown i n F i g . A.1.7. For d iagnost ic measurements
of f lows wi th no ise dnminated d is turbances, a dynamic pressure transducer
may sense such f l u c t u a t i o n s w i t h much l e s s e f f o r t t h a n a hot -wi re system.
A dynamic Pi to t pressure survey may s a t i s f y many wind tunn-1 ca l ibrat ion
requirements. Another widely used C a l i b r a t i o n model i s t h e AEDC developed,
pressure-instrumented IOo cone. (See Sect ion 1 I I .F . 1 .). I n summary, the hot-wire can provide more informat ion than a dynamic
pressure transducer, e.g., it can d i s t i n g u i s h between moving and f ixed sources
o f sound w i t h a s i n g l e sensor. The w i re a l so p rov ides a higher frequency re-
sponse and, i n genera l , has a more omnidirect ional response to noise sources.
The smaller sensor of a ho t -w i re system i s i m p o r t a n t ( i n a d d i t i o n t o t h e
frequency aspect) i f l o c a l f l u c t u a t i n g measurements i n a shock o r boundary
layer a re requ i red . Fur ther , the w i re / f i lm sensor may be loca ted in a reas
hidden from the v iew o f a laser Doppler velocimeter.
Other Data Analysis Techniques
Other data-reduct ion techniques for the f luc tuat inq s ignal inc lude t ime
(au tocor re la t ion) and s p a t i a l ( l o c a t i o n and d i r e c t i o n ) c o r r e l a t i o n s o f t h e
s ignal . Spect ra l analys is prov ides the energy content a t each frequency.
These techniques and assoc ia ted e lec t ron ic equipment a r e f a i r l y common and are
described i n t h e l i t e r a t u r e . (Suggested references include 3 , 12, 14, and 21).
Sensor Choice and C a l i b r a t i o n Reouirements
In the past, the wire-breakage problem had encouraged m in im iz ing ca l i b ra -
t i o n time. Minimum c a l i b r a t i o n r e q u i r e s maximum use o f c o r r e l a t i o n s o f e x i s t -
i ng ca l i b ra t i on da ta and end- loss cor rec t ions to p red ic t the per fo rmance o f a
w i r e (Refs. 8, 12, 22, and 23). A more recent approach, that promises improved
da ta ga the r ing e f f i c i ency and data accuracy, i s t h e use of more durable, rugged
sensors. A rugged sensor may inc lude a f ine-d iameter shor t w i re (E/d - loo) ,
a w i r e backed by an i n s u l a t o r , o r a larger d iameter f i l m sensor (Refs. IO, 17, 18 and 24). The complex heat loss and possible support interferences w i th such
sensors requ i re i nd i v idua l senso r ca l i b ra t i ons and the use o f a constant tem-
perature system. 213

-+ I
3
Fully turbulent nozzle wall baundary layer
- -First -turbulen aTa*nce smt Oi
J I t
Figure A. I . 7 COMPARISON OF PITOT PROBE AM, HOT-WIRE
FLUCTUATIONS IN A CONVENTIONAL, MACH 5 NOZZLE, Ref. 14.
WSUREMENTS OF FREE-STREAM PRESSURE
214

C a l i b r a t i o n o f a heated sensor may, i n general, be o b t a i n e d i n s i t u b y
main ta in ing a constant Mach number and temperature and v a r y i n g t h e t o t a l
pressure (and thereby Reynolds number). For supersonic flow and f o r R > 20
i n t ranson ic f l ow , S = Su = S . Further discussions on such mean f l o w
approaches t o c a l i b r a t i o n and more-ref ined dynamic c a l i b r a t i o n s a r e g i v e n
i n References 3 , 8, 9, 14, 18, 25, and 26.
P PU
Rose and Horstman have success fu l l y used the rugged c lass of tungsten
ho t -w i res in a t ranson ic f l ow fo r ove r 16 hours without breakage. Commercially
a v a i l a b l e f i l m sensors (such as 0.002 t o 0.006-inch diameter cyl inders) should
a l so rece ive cons ide ra t i on f o r w ind t unne l ca l i b ra t i on because o f t h e f o l l o w i n g
advantages :
Yk
. s u p e r i o r r e s i s t a n c e t o p a r t i c l e damage,
. super ior res is tance to sur face contaminat ion and s t ra in gag ing ,
. higher sensor Reynolds numbers (pa r t i cu la r l y impor tan t i n t ranson ic
f low) .
Compared to the rugged c lass o f tungsten wi re sensor , the P lat inum-f i lm
Sensor has comparable c a p a b i l i t i e s i n maximum overhea t ra t i o (-one) and
frequency response ( - 150K Hz).
* Private communication

Summary o f Advantages and Disadvantages o f Hot Wire System
The advantages and disadvantages o f u s i n g a hot-wire system t o measure
t h e f l u c t u a t i n g f l o w p r o p e r t i e s d u r i n g a w ind t unne l ca l i b ra t i on a re sum-
marized as fo l lows.
Advantages
1 . Small sensor size
2. High frequency response
3. H i g h s e n s i t i v i t y
4. Sens i t i ve t o bo th k inemat i c and thermodynamic f l u c t u a t i o n s
5. D i s t i n g u i s h between moving and s ta t ionary no ise sources w i th a s ing le sensor ( in f lows where temperature spottedness i s n e g l i g i b l e )
6. Re1 i a b l e systems and sensors commercially available
7. Rugged sensors ava i l ab le , pa r t i cu la r l y film type
D i sadvan tages"
1 . Possib le f requent breakage o f f ine-wi re sensor (due to a i r loads, v i b r a t i o n s , p a r t i c l e impingement, burnout , ox idat ion, acc idents , e tc . )
2. Possib le fa lse s ignal (usual ly apparent ldue to s t ra in guaging, contamina- t ion , o r v ib ra t ion o f p robe.
3 . C a l i b r a t i o n may be r e q u i r e d i n s i t u ( f a c i l i t y t i m e may be expensive).
4. Separation o f s ignal into independent modes requires assumptions concern ing f low character is t ics or independent measurements
5. Analyses o f s i g n a l p a r t i c u l a r l y d i f f i c u l t f o r c o m p r e s s i b l e s u b s o n i c o r t ranson ic f l ow , un less res t r i c ted t o h ighe r Revno lds numbers and wire temperatures.
f: S i n c e t h e o r i g i n a l w r i t i n g o f t h i s s e c t i o n , a review of hot-wire anemometry by Comte-Bellot has been published (Ref. 27) . This re ference prov ides addi t ional d iscussion of problem areas.
216
E
K2
h
I
k
Kn
R
m
M
n
"X
Nu
NOMENCLATURE
constants
overheat parameters, 1/2 a En , w i r e d iameter
a En R~
wi re vo l tage
time-averaged, to ta l pressure behind a normal shock
hea t - t rans fe r coe f f i c i en t
w i r e c u r r e n t
d i n Rw/d En Tw
Knudsen number, n/d
w i re leng th
d Rn p/d Rn Tw
Mach number
d En k/d Rn Tw
d i r e c t i o n c o s i n e o f normal t o sound plane wave f r o n t r e l a t i v e t o f l o w d i r e c t i o n
Nusselt number, - hd k
s ta t i c p ressu re
res is tance
Reynolds number, p u d h
c o r r e l a t i o n c o e f f i c i e n t of mass-f lux and t o t a l temperature f l u c t u a t i o n s ,
sensor s e n s i t i v i t y c o e f f i c i e n t
temperature
a x i a l v e l o c i t y
exponent i n equa t ion 2
21 7

a
B
Y
n
x U
P
'w r
Superscripts
( 1 '
( 7
Subscripts
e
r
t
t2 T
U
W
U
P
P U
0
T
ratio of specific heats, 1.40 used for air
recovery factor, r'T t
molecular mean free path
vi scos i ty
dens i ty
temperature overheat, CTW - Tr)
Tr
root mean square
fluctuating value
time averaged
environment
recovery o f adiabatic wall
total or stagnation conditions
stagnation correction behind normal shock
temperature
velocity
wire
sound
dens i ty
mass flux
entropy
vorticity
218

A. 1. REFERENCES
1. H. L. Dryden and A. M. Kuethe: "E f fec t o f Turbu lence in Wind Tunnel
Measurements," NACA Tech, Rep. 342, 1930.
2.
3.
4.
5.
6.
7.
8.
9.
10.
"Advances i n Hot Wire Anemometry, Proceedings o f t he I n te rna t i ona l
Symposium on Hot Wire Anemometry," Edi ted by W. L. Meln ik and J. R.
Weske, U n i v e r s i t y o f Maryland, AFOSR No. 68 - 1492, USAF O f f i c e o f
S c i e n t i f i c Research, Ju ly , 1968.
V. A. Sandborn: Resistance Temperature'fransducers, Metropology Press,
Fort Cal l ins, Colorado, 1972.
V. A. Sandborn: "A Review of Turbulence Measurements i n Compressible - r Flow," NASA TH X-62,337, March 1974.
R. Westley: "Problems o f No ise Measurements In Ground-Based F a c i l i t i e s
w i t h Forward-Speed Simulation," Appendlx 5 o f "A Further Review o f Current
Research Aimed at the Design and Operation of Large Wind Tunnels,'' Second
Report o f the Min i laws Working Group,'AGARD-AR-83, Sept. 1975.
L. S. G . Kovasznay: "The Hot Wire Anemometer i n Supersonic Flow," Jour.
Aero. Sci., Vol. 17, No. 9, September, 1950.
L. S. G. Kovasznay: "Turbulence i n Supersonic Flow," Jour. Aero. Sci.,
Vol. 20, No. 10, October, 1953.
M. V. Morkovin: "Fluctuations and Hot Wire Anemometry i n Compressible
Flows,'' AGARDograph, 24, November, 1956.
W. C. Rose and E. P. McDaid: "Turbulence Measurement i n Transonic Flow,"
Proc. A l A A 9 t h Aerodynamic Testing Conference, June 1976.
C. C. Horstman and W. C. Rose: , "Hot Wire Anemometry i n Transonic Flow,"
NASA TM X-62,495, December 1975. 11. J. Laufer: "Aerodynamic Noise in Supersonic Wind Tunnels," Jour. Aero.
Sci., Vol. 28, No. 9, September 1961.
12. J. C. Donaldson and J. P. Wallace: "Flow Fluctuations Measurements a t
Mach number 4 i n the Tes t Sec t ion o f the 12 Inch Supersonic Tunnel (D) ,'I
AEDC-TR-71-143, August 1971.
13. M. C. F ischer and R. D. Wagner: "Trans i t ion and Hot H i r e Measuremen.ts i n
Hypersonic He1 ium Flow," A l A A Journal, Vol. 10, No. 10, October 1972.

14. J. B. Anders, P. C. Stainback, L. R. Keefe; and 1 . E. Beckwith: "Sound
and Fluctuat ing Disturbance Mea'surements i n t h e S e t t l i n g Chamber and
Test Section," ICIASF '75 Record, I n t ' l Congress,on Instrumentation i n
Aerospace Simulation Faci 1 i t i e s , Ottawa, Canada Sept. 22-24,: 1975, ,
publ ished by IEE, 345 E. 47th St reet , New York.
15. R. D. Wagner and L. M. Weinstein: "Hot Wire Anemometry i n Hypersonic
He1 ium Flow," NASA TN 0-7465, June 1974.
16. P. C. Stainback, e t a l : "Experimental Studies of Hypersonic Boundary - Layer Trans i t ion and E f f e c t s of Wind Tunnel Disturbances," NASA TN D-7453, NASA Langley Research Center, March 1974.
17. V. M iku l l a and C . C. Horstman: "Turbulence Stress Measurements i n a Non-
adiabatic Hypersonic Boundary Layer," A l A A Journal, Vol. 13, No. 12,
December 1975.
18. W. C. Rose: "The Behavior o f a Compressible Turbulent Boundary Layer i n
a Shock-Wave-Induced Adverse Pressure Gradient,'' NASA TN D-7092, NASA
Ames Research Center, March 1974.
19. w. C. Rose and D. A. Johnson: "Turbulence i n a Shock-Wave Boundary-Layer
In teract ion," A l A A Journal, Vol. 13, No. 7, J u l y 1975.
20. E. Grande and G. C. Oates: "Response of Miniature Pressure Transducers
to F luc tua t ions in Superson ic Flow," Instrumentation for Ai rbrea th ing
Propulsion, A I A A Series on Progress i n As t ronau t i cs and Aeronautics,
Vol. 34, 1972.
21. R. K. Otnes and L. Enochson: D i g i t a l Time Series Analysis, Wiley, New York,
1972-
22. W. Behrens: "Total Temperature Thermocouple Probe Based on Recovery
Temperature of Ci rcu lar Cy l inder , " In t . J. Heat and Mass Transfer,
Vol. 14, 1971.
23. C. F. Dewey, J r . : "Hot Wire Measurements i n Low Reynolds Number Hypersonic
Flows," ARS Journal, Vol. 28, No. 12, December 1961.
24. E. L. Doughman: "Development o f a Hot Wire Anemometer for Hypersonic
Turbulent Flows," The Review o f Sc ient i f ic Inst ruments, Vol . 43, No. 8, August 1972.
220
25. R. F. Rosenberg: "Some Aspects on Hot Wire Anemometry Leading to a
Specia l Cal ibrat ion Method f o r Hot Wire Probes," ARL 71-0038, USAF
Aerospace Research Laboratories, March 1971.
26. R. H. K l rchhof f and R. R. Sa far ik , "Turbu lence ca l ib ra t ion o f a Hot Wire
Anemometer," A l A A Journal, Vol. 12, No. 5, May 1974.
27. Comte-Bellot, G . : "Hot-Wire Anemometry," Annual Reviews o f F l u i d
Mechanics, Vol. 8 , Palo Alto, C a l i f . 1976.
22 1
APPEND I X I I LASER DOPPLER VELOCIMETER MEASUREMENTS
The development o f t h e l a s e r was q u i c k l y f o l l o y e d b y i t s a p p l i c a t i o n to
t h e measurement o f t h e v e l o c i t y o f a moving object by observ ing the Doppler
s h i f t i n the frequency of t h e i n c i d e n t l a s e r l i g h t . L i q u i d f low v e l o c i t i e s
were measured by Yeh and Cummins (Ref. 1) i n 1964, u t i l i z i n g Doppler rad iat ion
f rom smal l par t i c les en t ra ined in the f low. In 1965, the technique was ref ined
and measurements were made i n seeded gas f low by Foreman, George and Lewis
(Ref. 2). Since t h a t t i m e v e r y s i g n i f i c a n t advances have been made both in
the theoret ica l understanding o f the technique, and i n improved opt ica l ar range-
ments and signal processors. The Laser Doppler Velocimeter (LDV) technique has
been a p p l i e d t o measurements o f mean v e l o c i t y , t u r b u l e n t i n t e n s i t y and f low
d i r e c t i o n i n a v a r i e t y o f f l o w f i e l d s and i n b o t h l i q u i d s and gases. By 1970
the veloci ty range over which measurements had been made extended from 10’ 4
cm/sec t o 1000 m/sec (Ref. 3 ) . T h i s r a p i d r a t e o f development continues.
L i t e r a t u r e on t h e s u b j e c t i s now extensive; a b ib l iography (Ref. 4) publ ished
i n 1972 conta ins 190 references.
Laser velocimeter systems have been operated in severa l w ind tunnels ,
e.g., Refs. 3 , 5, 6, 7, 8, and t h e i r u n i q u e c a p a b i l i t i e s , e s p e c i a l l y for
n o n - i n t r u s i v e v e l o c i t y and turbulence surveys around models i n the tunnel ,
should insure their continued development and app l ica t ion . A l though to the
present, the LDV has not been w i d e l y a p p l i e d t o b a s i c t u n n e l c a l i b r a t i o n
measurements, t h i s c a p a b i l i t y has been demonstrated and t h e i r a v a i l a b i l i t y t o
the wind tunnel operator will probably lead to t h i s use. The discussion here-
i n will be r e s t r i c t e d p r i m a r i l y t o c o n s i d e r a t i o n o f the LDV technique for
a p p l i c a t i o n t o b a s i c f a c i l i t y f l o w c a l i b r a t i o n measurements such as mean
v e l o c i t y (Mach number) d i s t r i b u t i o n , t u r b u l e n c e i n t e n s i t y and f l o w a n g u l a r i t y .
Bas i c P r inc ip les
Considerat ion o f the advantages and disadvantages o f l ase r ve loc ime te r
techniques requi re some d i s c u s s i o n o f t h e b a s i c p r i n c i p l e s o f t h e system.
The p r i n c i p l e o f t h e LDV can be descr, ibed by both the Doppler effect and
by an interference-fr inge model. Since both approaches y i e l d t h e same basic
equations discussed i n t h i s r e p o r t , t h e f r i n g e model will be used s ince it
a ids v isua l i za t ion o f the phys ica l p r inc ip les invo lved. Severa l op t ica l
arrangements a re poss ib le , bu t cons idera t ions will be l i m i t e d t o t h e d u a l -
222
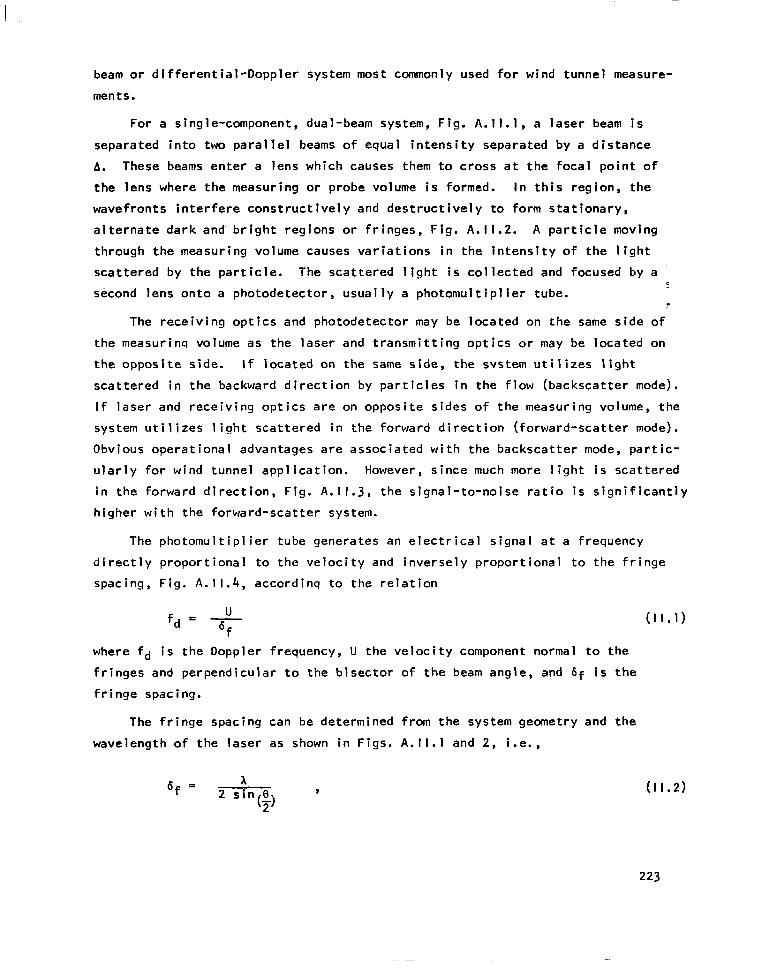
beam or d i f f e r e n t i a l - D o p p l e r system most commonly used for wind tunnel measure-
ments.
For a single-component, dual-beam system, Fig. A.II.l, a l a s e r beam i s
separated in to two p a r a l l e l beams o f equal in tens i ty separated by a d is tance
A. These beams enter a lens which causes them t o c r o s s a t t h e f o c a l p o i n t o f
the lens where the measuring or probe volume i s formed. I n t h i s r e g i o n , t h e
wave f ron ts i n te r fe re cons t ruc t i ve l y and d e s t r u c t i v e l y to form s ta t ionary ,
a l t e r n a t e d a r k and b r igh t reg ions or f r inges, F ig . A.11.2. A p a r t i c l e moving
through the measuring volume causes variations i n t h e i n t e n s i t y o f t h e l i g h t
sca t te red by the par t i c le . The s c a t t e r e d l i g h t i s c o l l e c t e d and focused by a
second lens onto a photodetector , usual ly a photomul t ip l ie r tube. r
The rece iv ing op t i cs and photodetector may be located on t h e same s i d e o f
the measurinq volume as the laser and t r a n s m i t t i n g o p t i c s o r may be located on
the opposi te s ide. If located on the same s ide , the svstem u t i l i z e s l i g h t
s c a t t e r e d i n t h e backward d i r e c t i o n by p a r t i c l e s i n t h e f l o w ( b a c k s c a t t e r mode).
I f laser and rece iv ing op t i cs a re on opposi te s ides of the measur ing volume, the
system u t i l i z e s 1 i gh t sca t te red i n t he f o rward d i rec t i on ( f o rward -sca t te r mode).
Obvious operational advantages are associated with the backscatter mode, p a r t i c -
u la r l y f o r w ind t unne l app l i ca t i on . However, s ince much more l i g h t i s scat tered
i n t he f o rward d i rec t i on , F ig . A . 1 1 . 3 , t he s igna l - to -no ise ra t i o i s s i g n i f i c a n t l y
h igher w i th the fo rward-sca t te r system.
The photomult ip l ier tube generates an e l e c t r i c a l s i g n a l a t a frequency
d i r e c t l y p r o p o r t i o n a l t o t h e v e l o c i t y and i n v e r s e l y p r o p o r t i o n a l t o t h e f r i n g e
spacing, Fig. A . 1 1 . 4 , a c c o r d i n q t o t h e r e l a t i o n
where fd i s the Dopp ler f requency , U t h e v e l o c i t y component normal to the
f r i n g e s and pe rpend icu la r t o t he b i sec to r o f t h e beam angle, and 8 f i s t h e
f r inge spacing.
The f r inge spac ing can be determined from the system geometry and the
wavelength o f t he l ase r as shown i n F i g s . A.II.l and 2, i.e.,
( I I .2)
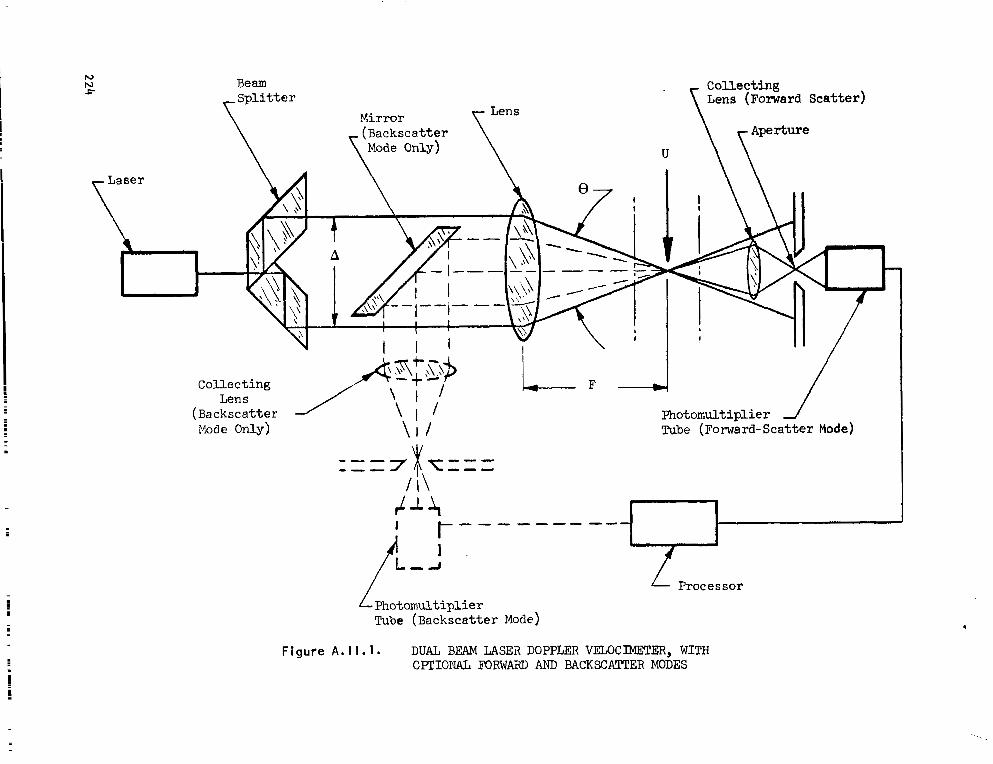
I
N N &
Ream
Collecting
/ i \
imatomutiplier Tube (Backscatter Mode)
L Processor
Figure A . I 1 . 1 . DUAL BEAM LASER DOPPLER VELOCIMETER, WITH CPPIOPIAL FORWARD AND MCKSCA!M!ER MODES
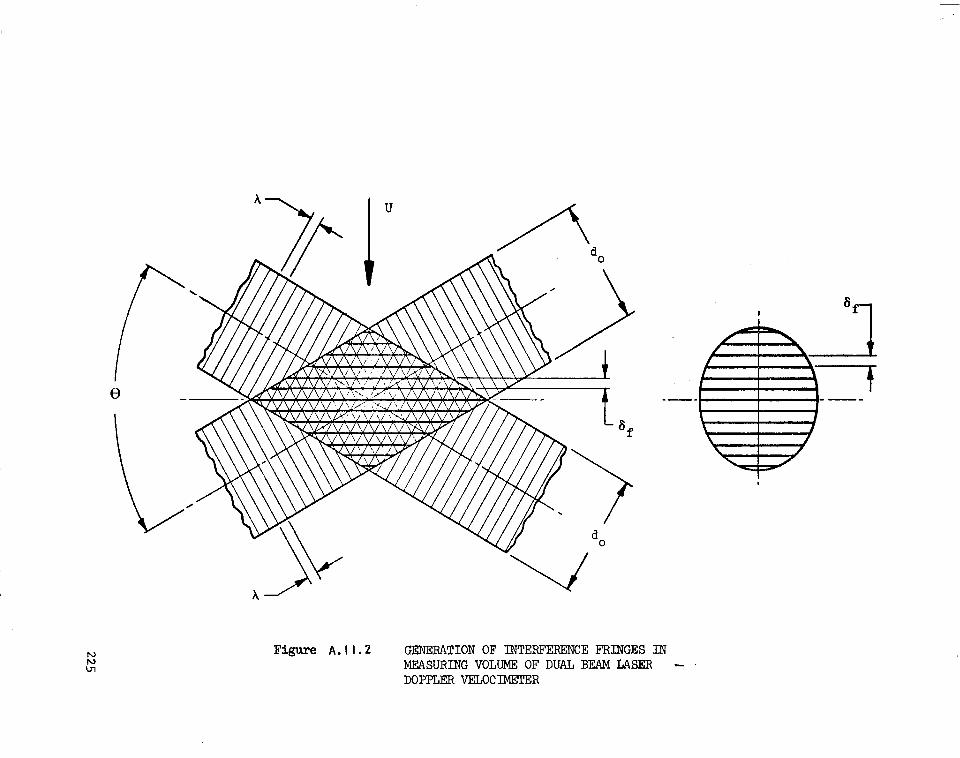
A-
Figure A. I I . 2 GENERATION OF INTERFERENCE FRINGES IN MEASURING VOLUME OF DUAL BEAM LASER - DOPPLER VELOCIMETER

Forward Scatter Scatter
Incident Light _c c
Figure A I I 3 LIGHT SCATTERED BY A SMALL PARTICLE
Elec t r ica l signal
Time
Figure A. I I . 4 LASER ANEMOMETER SIGNAL FROEl PHGT0DE;TECTOR
.
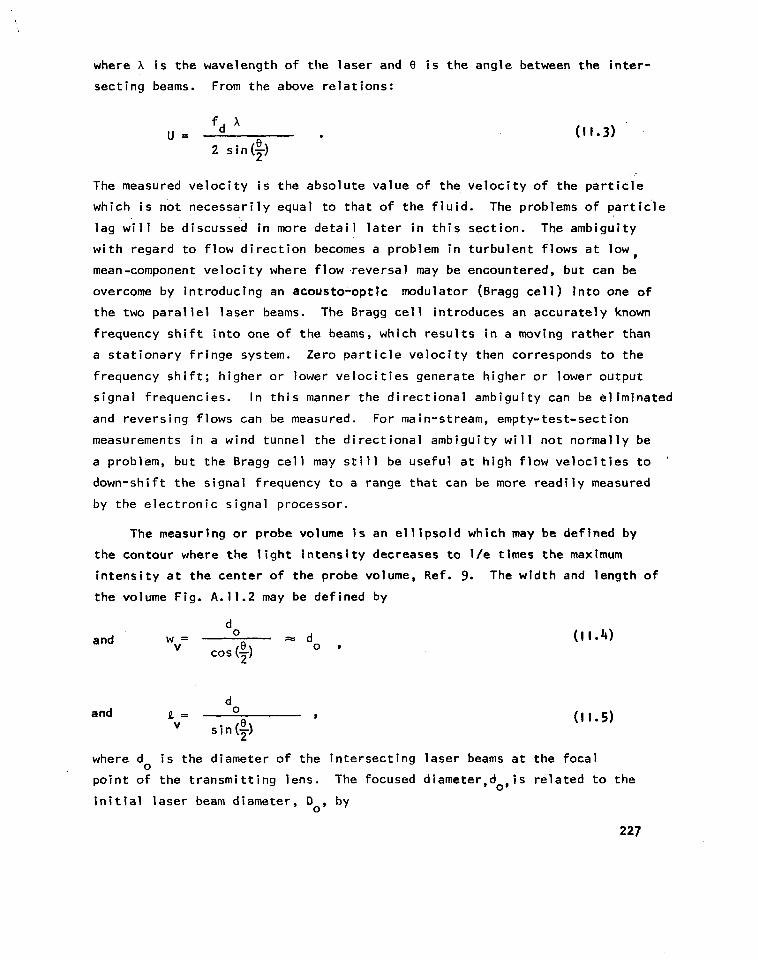
where X i s t he wave leng th o f t he l ase r and 0 i s t h e a n g l e between t h e i n t e r -
sect ing beams. From the above r e l a t i o n s :
The measured v e l o c i t y i s t h e a b s o l u t e v a l u e o f t h e v e l o c i t y o f t h e p a r t i c l e
which i s no t necessa r i l y equa l t o t ha t o f t h e f l u i d . The problems o f p a r t i c ' l e
lag will be d iscussed in more d e t a i l l a t e r i n t h i s s e c t i o n . The ambiguity
w i t h r e g a r d t o f l o w d i r e c t i o n becomes a problem i n t u r b u l e n t f l o w s a t l o w ,
mean-component v e l o c i t y where f low reversal may be encountered, but can be
overcome by i n t roduc ing an acousto-opt ic modulator (Bragg ce l l ) in to one of
the two para l le l laser beams. The Bragg ce l l in t roduces an accurate ly known
f r e q u e n c y s h i f t i n t o one o f t h e beams, which resul ts i n a moving rather than
a s t a t i o n a r y f r i n g e system. Zero pa r t i c l e ve loc i t y t hen co r responds t o t he
f requency sh i f t ; h igher o r lower ve loc i t ies genera te h igher o r lower ou tpu t
s igna l f requenc ies . In th is manner the d i rec t iona l ambigu i ty can be e l iminated
and revers ing f lows can be measured. For main-stream, empty-test-section
measurements i n a wind tunnel the d i rect ional ambigui ty will not normal ly be
a problem, but the Bragg cel l may s t i l l be u s e f u l a t h i g h f l o w v e l o c i t i e s t o '
down-shi f t the s ignal f requency to a range t h a t can be more r e a d i l y measured
by the e lect ron ic s ignal processor .
The measuring or probe volume is an e l l i p s o i d w h i c h may be defined by
the contour where t h e l i g h t i n t e n s i t y decreases t o l / e t i m e s t h e maximum
i n t e n s i t y a t t h e c e n t e r o f the probe volume, Ref. 9. The w id th and length o f
the volume Fig. A.11.2 may be def ined by
d
where do i s t he d iamete r o f t he i n te rsec t i ng l ase r beams a t t h e f o c a l
p o i n t of the t ransmi t t ing lens . The focused diameter,do,is related t o t h e
i n i t i a l l a s e r beam diameter, Do, by
227
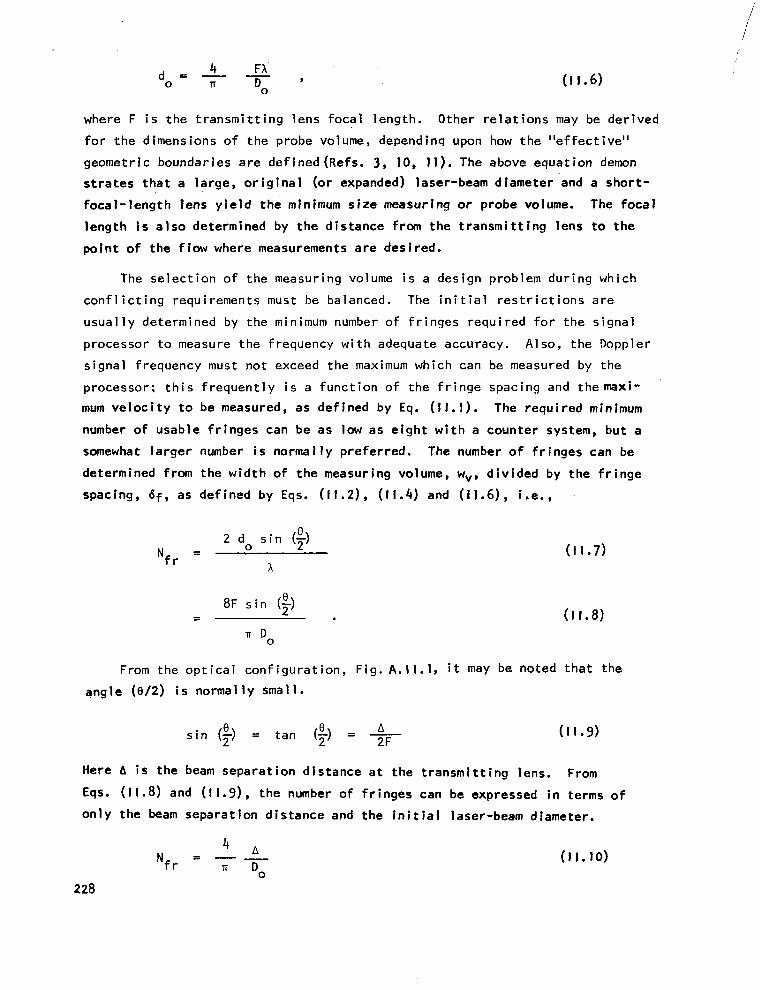
(I 1.6)
where F i s the t ransmi t t ing lens foca l leng th . Other re la t ions may be der ived
for the d imensions of the probe volume, dependinq upon how the "e f fec t i ve "
geometric boundaries are defined(Refs. 3 , 10, 1 1 ) . The above equat ion demon
s t r a t e s t h a t a l a r g e , o r i g i n a l ( o r expanded) laser-beam diameter and a sho r t -
f oca l - l eng th l ens y ie ld t he minimum size measuring or probe volume. The f o c a l
leng th i s a lso de termined by the d is tance from the t ransmi t t i ng l ens t o t he
p o i n t o f t h e f l o w where measurements are des i red.
The s e l e c t i o n o f t h e measuring volume i s a design problem during which
con f l i c t i ng requ i remen ts must be balanced. The i n i t i a l r e s t r i c t i o n s a r e
usual ly determined by the minimum number o f f r i nges requ i red f o r t he s igna l
processor to measure the frequency with adequate accuracy. Also, the Doppler
signal frequency must no t exceed the maximum which can be measured by the
p rocesso r : t h i s f requen t l y i s a func t i on o f t he f r i nge spac ing and t h e m x i -
mum v e l o c i t y t o be measured, as defined by Eq. (11.1) . The requi red minimum
number of usab le f r inges can be as low as e i g h t w i t h a counter system, but a
somewhat l a rge r number i s normal ly p re fe r red , The number o f fr inges can be
determined from the width of the measuring volume, wv, d i v i d e d by t h e f r i n g e
spacing, bf, as defined by Eqs. (I 1.2) , ( I 1.4) and ( i1.6), i.e., .
8F s i n (F) 0 - -
TI Do
(I 1.8)
From the op t i ca l con f i gu ra t i on , F ig . A.II.1, i t may be noted that the
angle (8/2) i s n o r m a l l y smal 1.
Here A i s t h e beam separa t ion d is tance a t the t ransmi t t ing lens . From
Eqs. (I I. 8) and (I I . 9 ) . the number o f f r i n g e s can be expressed i n terms o f
on ly the beam separat ion d istance and t h e i n i t i a l laser-beam diameter.
4 A Nfr = - - (11.10) TI Do
228
Again note that the number o f f r i n g e s can be increased by reducing the
unfocused beam diameter, Do, bu t th is in tu rn inc reases the p robe d iameter .
Increas ing the beam separation, A , f o r a f i x e d t r a n s m i t t i n g l e n s f o c a l
length, i s a n e f f e c t i v e means of increasing the number of f r inges .
Based on the preceeding equations, i t i s o f i n t e r e s t t o c a l c u l a t e t h e
dimensions o f t h e measuring volume and o t h e r c h a r a c t e r i s t i c s o f a velocimeter
system. Consider an Argon laser with a wavelength o f 514.5 nm and an input
beam diameter o f 1.5 mm. I f t h e t r a n s m i t t i n g l e n s f o c a l l e n g t h i s 1.5 m and
the beam spacing i s 100 mm, t he beam a n g l e i s 3.818". From Eq.' (11.6) the
focused beam diameter i s 0.65 mm which i s a l so t he maximum w id th o f t he p robe
volume. The leng th o f t he p robe volume i s , from Eq. (11.5) , 19.7 mm. The
f r inge spac ing i s 7.7 and the maximum number o f f r i n g e s i s 84. A t a
v e l o c i t y o f 300 m/sec., the Doppler frequency (Eq. ( 1 1 . 1 ) w i l l be 38.96 MHz. This system i s n o t n e c e s s a r i l y t y p i c a l , b u t i t i l l u s t r a t e s a p p l i c a t i o n o f t h e
system re la t ionships d iscussed prev ious ly .
To t h i s p o i n t t h e measurement of a s i n g l e v e l o c i t y component (normal t o
t h e f r i n g e p a t t e r n ) has been described. The f r i n g e p a t t e r n o f a s ing le -
component LDV can be r o t a t e d b y r o t a t i n g t h e t r a n s m i t t i n g o p t i c s . T h i s p e r -
m i t s t h e measurement o f v e l o c i t y components a t two or more angles such as
- +45 degrees to the nominal tunnel center l ine. From the two ve loc i ty component
measurements, t he ve loc i t y vec to r i n t he t unne l p lane normal t o t h e b i s e c t o r
o f t h e i n t e r s e c t i n g beams can be determined. Thus, flow angu lar i t y can be
measured i n a d d i t i o n t o v e l o c i t y and tu rbu lence in tens i ty .
Opt ical arrangements to y ie ld s imultaneous two-component measurements can
be r e a l i z e d by us ing two p a i r s o f i n t e r s e c t i n g beams, usua l l y w i th t he p lane
de f ined by the second p a i r o f beams normal t o t ha t de f i ned by the f i r s t
beam pa i r . Separa t i on o f t he two measurements can be achieved by s p l i t t i n g
a l ase r beam i n t o two p a i r s o f beams, each p a i r p o l a r i z e d 90" t o t h e o t h e r .
P o l a r i z e d f i l t e r s on the two photodetectors a l low each d e t e c t o r t o see on ly
t h e l i g h t s c a t t e r e d f r o m t h e f r i n g e s formed by two of the four beams a t t h e
i n t e r s e c t i o n p o i n t . Two wavelengths o f l a s e r l i g h t can a l s o be used f o r two
component measurements. The use o f an Argon ion laser i s p a r t i c u l a r l y con-
v e n i e n t f o r t h i s purpose since t w o s t rong co lo r hands, 488 nm (b lue) and 514.5 nm (g reen) a re ava i lab le . Opt ica l f i l te rs a l low separa t ion o f the
s c a t t e r e d l i g h t so each photodetector sees o n l y t h e l i g h t o f i n te res t .

A t h i r d v e l o c i t y component, p a r a l l e l to t h e b i s e c t o r o f t h e i n t e r s e c t i n g
beams, can a l so be measured simultaneously. For example, Orloff and Logan
(Ref. 12) have described an LDV system f o r measuring a l l t h r e e v e l o c i t y
components which employs backscattering and a reference-beam method.
Signal Processors
The ou tpu t s igna l f rom the photomul t ip l ie r tube, shown on F ig . A.11.4,
i s a f requency 'burst a t the Doppler f requency wi th ampl i tude modulated accord-
i ng t o t he i n tens i t y d i s t r i bu t i on ac ross t he f r i nges . Th i s amp l i t ude -modu la ted
envelope i s commonly r e f e r r e d t o as the "pedestal" and must be removed by h igh-
pass f i l t e r i n g o r o p t i c a l means before processing. The number o f c y c l e s o f
the doppler s ignal and the modulat ion intensity about the pedestal envelope
will vary accord ing to the loca t ion a t wh ich the par t i c le c rosses the p robe
volume, t h e s i z e o f t h e p a r t i c l e and the number o f p a r t i c l e s p r e s e n t a t one
t ime within the probe volume. Signal bursts of measurable ampli tude and the
minimum required number o f cyc les occu r a t random t ime in te rva ls , and phase
reversa ls dur ing a s ing le s igna l bu rs t will occur when m u l t i p l e p a r t i c l e s a r e
present . Several methods fo r p rocess ing the da ta f rom the photomul t ip l ie r have been
used. These include:
spectrum analyzers
photon corre la tors
f i l t e r banks
o f requency t rackers
0 counters
On ly the las t two types o f p rocessors p roduce essent ia l l y rea l - t ime ve loc i ty
i n f o r m a t i o n d i r e c t l y and a r e c u r r e n t l y used f o r most wind tunnel appl icat ions.
The frequency t racker, as the name implies, converts the Doppler
f requency received f rom the photodetector into a propor t ional , analog vo l tage.
The t r a c k e r c i r c u i t i s implemented using phase or f requency locked loops, or
a combination o f t h e two. Both types o f loops func t ion by comparing the
ou tpu t f requency o f a v o l t a g e - c o n t r o l l e d o s c i l l a t o r ( V C O ) o r a vol tage-to-
frequency converter (V/F) to the inpu t s igna l f requency , and b o t h u t i l i z e t h e
d i f f e r e n c e i n f r e q u e n c y t o m o d i f y o r a d j u s t t h e a c i n p u t v o l t a g e t o t h e i n -
ternal f requency generator. The dc vo l tage i s t h e n p r o p o r t i o n a l t o t h e i n p u t
f requency. A l ternat ive ly , the in ternal ly -generated f requency can be conver ted
t o a d i g i t a l s i g n a l by means o f a counter.

Tracker processors are character ized by the maximum frequency range,
capture bandwidth, dynamic range and slew rate. If the change i n v e l o c i t y
from one p a r t i c l e t o t h e n e x t exceeds the capture bandwidth or capture
range, the tracker will lose lock and n o t t r a c k t h e p a r t i c l e o r o t h e r
par t i c les wh ich a re ou ts ide the cap ture range.
Where Doppler s ignal t racking i s i n te r rup ted by a d rop-out , the las t
ou tpu t vo l tage leve l i s normal ly p laced in "hold". I f the s igna l re tu rns
dur ing the ho ld per iod , t rack ing i s resumed. If the s igna l i s no t recap-
tured dur ing the hold per iod, the search or sweep mode i s a c t i v a t e d u n t i l
the s ignal is re-acqui red. S ignals can be prov ided to external data systems
to reco rd mean v e l o c i t y and ac o r t u r b u l e n t f l u c t u a t i o n s i g n a l s , e.g., Ref.
13. Doppler frequencies can be measured from 2kHz t o 50 MHz. V e l o c i t y
changes over a 200: 1 range can be fol lowed, and in the search mode the
frequency slew rate can be as h igh as 400 MHz/ms. Data-va l ida t ion fea tures
are a lso normal ly incorporated. For example, one system requires t racking
f o r 8 Doppler cycles and ho ld ing f o r 2 add i t iona l cyc les w i thout d rop-out in
o r d e r t o be considered a va l id da ta po in t . Thus, f o r h e a v i l y seeded f lows,
da ta ra tes up t o 1 x 10 per second can be processed. 6
The counter o r burs t p rocessor fo r laser-anemometer s igna ls accura te ly
measures the t ime requi red for a p a r t i c l e i n t h e flow to t rave l ac ross a
f i x e d number o f f r i n g e s i n t h e measuring volume, i.e., a known distance.
From these two q u a n t i t i e s , a counter determines the Doppler frequency and
t h e r e b y t h e p a r t i c l e v e l o c i t y . The counter may be i nhe ren t l y a d i g i t a l i n -
strument, so d r i f t and c a l i b r a t i o n problems which may be associated wi th
analog processors, such as trackers, are avoided. Counter processors are
normal ly con f igured to y ie ld a d i r e c t d i g i t a l o u t p u t .
A counter funct ions by passing a laser s ignal burst through a thresh-
o ld leve l de tec tor wh ich , when the ad justable ampl i tude- threshold is ex-
ceeded, enables a zero-crossing detector such as a Schmidt t r i g g e r . Those
Doppler s ignals above the ampl i tude- th resho ld leve l a re then conver ted in to
a t r a i n o f square waves, w i t h a f requency equal to the or ig ianl s ignal
frequency.
Many e lect ron ic f requency-counters funct ion by count ing each c y c l e
o f t h e unknown s i g n a l f o r an accurate ly- f ixed t ime per iod, such as 0.1,
1.0 or IO seconds. The readings are then converted to the s ignal f requency
23 1
i n her tz . S ince the maximum number o f c y c l e s a v a i l a b l e from the passage o f
a par t i c le across the measur ing volume of a LDV is extremely smal l , the accu-
racy of the d i rect count ing procedure would be t o t a l l y inadequate. To avoid
t h i s problem counter processors are period measurement devices, i.e., pulses
from an accura te , h igh- f requency osc i l la to r o r c lock a re accumula ted in a
reg i s te r du r ing t he t ime i n te rva l co r respond ing t o a f i x e d number o f pu l ses
from the Schmid t t r i gge r . A l te rna t i ve l y , t he t ime i n te rva l s can be converted
to vol tage ampl i tudes which can be measured d i g i t a l l y . The t ime reso lu t ion
f o r t h e n period ranges from 2 t o IO x 10-9 seconds, depending upon the c lock
frequency, e.g., 500 MHz corresponds t o 2 x 10⁻⁹ seconds reso lu t i on . The
counter processor a lso normal ly inc ludes computat ional capabi l i t ies to conver t
t h e p e r i o d i n f o r m a t i o n i n t o e i t h e r f r e q u e n c y o r v e l o c i t y u n i t s f o r d i g i t a l
d isp lay. The computation t ime i s t y p i c a l l y about 1 x I O m 6 sec so t h a t , even
a t h i g h v e l o c i t i e s where the Doppler frequency i s IO t o 20 MHz, t h e t o t a l
a c q u i s i t i o n and computat ion t ime for one i n d i v i d u a l measurement can be as short
as 2 t o 3 x 10 sec. Data a c q u i s i t i o n r a t e s o f 100,000 readings/sec are
the re fo re t heo re t i ca l l y poss ib le (bu t f a r f rom common) w i t h moderate concentra-
t i o n o f p a r t i c l e s , Ref. 14.
-6
Counter processors include several data-val idation features to al low the
re jec t i on o f no i se bu rs ts , de tec t t he loss o f a b i t o r c y c l e d u r i n g a process-
i ng cyc le , re jec t s igna ls f rom l a rge pa r t i c l es , e t c . The primary technique
u t i l i z e d t o re jec t da ta sequences i n which one o r more cyc les may be missing
(cyc le ampl i tude be low threshold) cons is ts o f using two o r m r e r e g i s t e r s . The
c lock pu lses are gated in to both a h igh and low r e g i s t e r on t h e f i r s t c y c l e .
The c lock pu lses to the low r e g i s t e r a r e g a t e d o f f a f t e r NL cyc les , wh i le the
high register accumulates NH cycles. A comparater then computes t h e r a t i o o f
the two t ime intervals, which should be equa l , t o t he ra t i o NH/NL. I f the
e r r o r i s w i t h i n p r e - s e t l i m i t s , t h e measurement i s v a l i d a t e d .
Asher (Ref. 14) demonstrates the advantage o f an odd r a t i o , NL/NH, such
as 5/8 or 10/16 over even rat ios. Odd r a t i o s such as 5/8 a re commonly used.
A counter p rocessor us ing th ree d i f fe ren t reg is te rs has been used a t AEDC.
None o f these systems completely reject spurious signals, but they do greatly
reduce the p robab i l i t y o f such data being considered val id. Large part ic les,
which may be l a g g i n g t h e f l u i d f l o w t o an excessive degree, can be detected
if the to ta l input s ignal ampl i tude (pedesta l p lus Doppler f requency) exceeds

a pre-set limit. The ad jus tab le th resho ld leve l ( requ i red to enable a zero-
cross ing detector) can be used to r e j e c t s i g n a l s w i th inadequate ~ i g n a 1 - t ~ -
no i se ra t i o . Se t t i ng t he t h resho ld l eve l h igh , on t he o the r hand, can bias
the data acquired to l a r g e p a r t i c l e s by re jec t i ng l ow- leve l s igna ls from small
p a r t i c l e s .
Most counter processors also include functions such as a d i g i t a l i n d i c a t i o n
o f e i t he r t he da ta ra te ( va l i da ted da ta po in ts pe r second) o r p e r c e n t o f t o t a l
data s ignals processed that are val idated. An output i s normal ly prov ided to '
i nd i ca te each time a new d a t a p o i n t i s v a l i d a t e d and processed. A d i g i t a l
output can be made a v a i l a b l e t o a l l o w i n t r o d u c t i o n o f t h e d a t a d i r e c t l y i n t o
a computer o r o t h e r d i g i t a l r e c o r d i n g system. An analog vol tage output i s a l s o
normal ly ava i lab le .
Due to t he d i f f e rence i n ope ra t i ng p r i nc ip les , t he coun te r i s n o t l i m i t e d
by slew ra te o r t rack ing ra te per fo rmance. The counter i s an extremely wide-
band instrument, whi le the t racker i s i nhe ren t l y narrow-band. Assuming the
noise present i s broadband, the no ise re ject ion character is t ics of the t racker
i s s u p e r i o r t o t h a t o f t h e c o u n t e r . However, s ince the t racker operates in
the frequency domain, i t i s responsive to Doppler frequency spectrum broadening
r e s u l t i n g f r o m t h e f i n i t e d u r a t i o n o f t h e s i g n a l b u r s t . T h i s b r o a d e n i n g i s
s imi lar to the modulat ion s idebands generated when a car r ie r f requency i s
amplitude modulated. The presence of m u l t i p l e p a r t i c l e s i n t h e p r o b e volume
also generates phase reversals which cause spectrum broadening. Since the
standard deviat ion about the mean v e l o c i t y i s a measure o f turbulence and i s
re lated to the corresponding Doppler f requency deviat ion through Eq. ( l l . l ) , spect ra l broadening can in ter fere wi th turbulence measurements.
- P a r t i c l e S i z e and D i s t r i b u t i o n E f f e c t s
The s i ze , s i ze d i s t r i bu t i on , concen t ra t i on , and phys i ca l cha rac te r i s t i cs
o f t h e ' p a r t i c l e s i n a t ranson ic o r superson ic tunne l f low f ie ld a re o f g rea t
impor tance, whether the par t i c les a re na tura l l y p resent in the f low o r the
f l o w i s seeded. In the p resence o f ve loc i ty g rad ien ts o r tu rbu lence, a s i g n i f i -
c a n t v e l o c i t y l a g may e x i s t between t h e f l u i d m o t i o n and the pa r t i c l e mo t ion .
Lag e f f e c t s a r e most s i g n i f i c a n t a t high f requencies and i n r e g i o n s o f r a p i d
f l u i d a c c e l e r a t i o n o r d e c e l e r a t i o n , as across a shock o r expansion wave o r
along a streamline approaching a s tagnat ion po int . These environments, of
i n te res t i n f l ow f i e ld su rveys , wou ld no t no rma l l y be encountered i n empty t e s t
s e c t i o n c a l i b r a t i o n measurements, b u t t h e a b i l i t y of t h e p a r t i c l e s to f o l l o w r e l a t i v e l y s m a l l mean v e l o c i t y p e r t u r b a t i o n s and respond t o low-to-moderate
l e v e l s o f t u r b u l e n c e a r e o f i n t e r e s t .
233
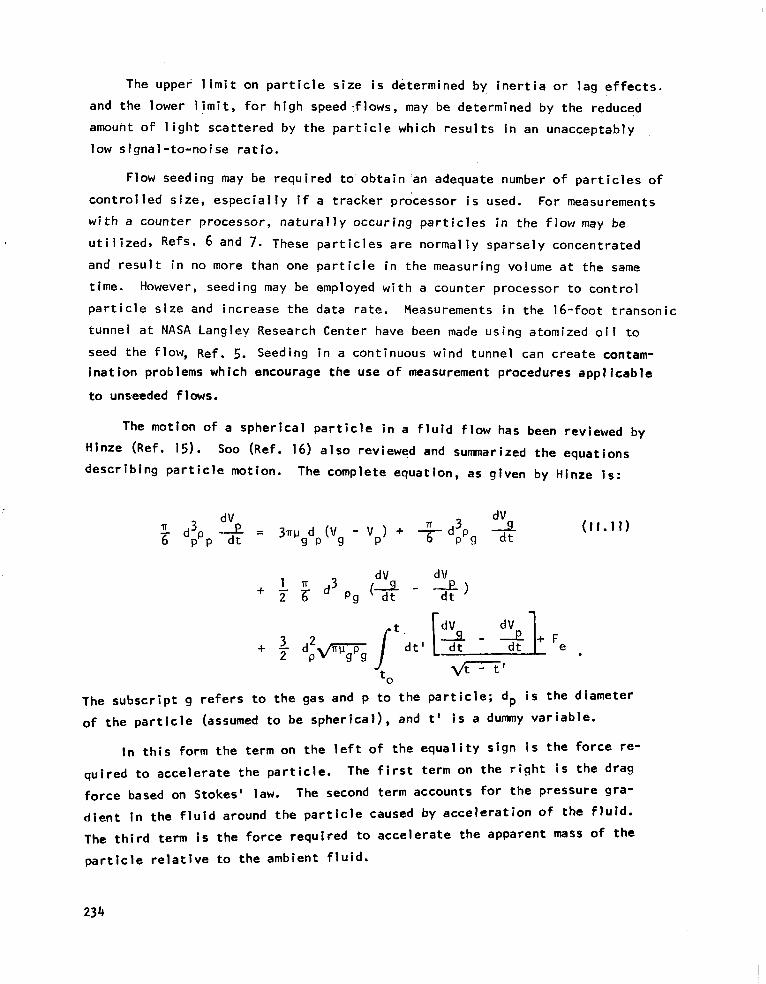
The upper limit on p a r t i c l e s i z e i s d e t e r m i n e d by i n e r t i a o r l a g e f f e c t s .
and the lower limit, for high speed:f lows, may be determined by the reduced
amount o f 1 igh t sca t te red by the par t i c le wh ich resu l ts in an unacceptably
low s ignal - to-noise ra t io .
Flow seeding may be requ i red t o ob ta in 'an adequate number o f p a r t i c l e s o f
con t ro l l ed s i ze , espec ia l l y i f a t racker p rocessor i s used. For measurements
w i t h a counter p rocessor , na tura l l y occur ing par t i c les in the f low may be
u t i l i z e d , Refs- 6 and 7. These par t ic les are normal ly sparse ly concentrated
and r e s u l t i n no more than one par t i c le in the measur ing volume a t t h e same
time. However, seeding may be employed w i t h a counter processor to cont ro l
p a r t i c l e s i z e and increase the data ra te. Measurements in the 16- foo t t ranson ic
tunne l a t NASA Langley Research Center have been made using atomized o i l to
seed the f low, Ref. 5. Seeding i n a continuous wind tunnel can create contam-
ination problems which encourage the use o f measurement procedures appl icable
to unseeded f lows.
The mo t ion o f a s p h e r i c a l p a r t i c l e i n a f l u i d f l o w has been reviewed by
Hinze (Ref. IS). So0 (Ref. 16) also reviewed and summarized the equat ions
descr ib ing par t i c le mot ion . The complete equation, as given by Hinze is:
+ 3 dp2VT& l t d t ' [% - %I+ Fe d r 7 '
t 0
The subscr ip t g r e f e r s t o t h e gas and p t o t h e p a r t i c l e ; dp i s t h e d i a m e t e r
o f t h e p a r t i c l e (assumed to be spher i ca l ) , and t ' i s a dummy va r iab le .
I n t h i s form the term on the l e f t o f t h e e q u a l i t y s i g n i s t h e f o r c e r e -
q u i r e d t o a c c e l e r a t e t h e p a r t i c l e . The f i r s t te rm on the r igh t i s the d rag
force based on Stokes' law. The second term accounts for the pressure gra-
d i e n t i n t h e f l u i d a round the par t i c le caused by a c c e l e r a t i o n o f t h e f l u i d .
The t h i r d term i s the force requi red to accelerate the apparent mass o f t h e
p a r t i c l e r e l a t i v e t o t h e a m b i e n t f l u i d .
234
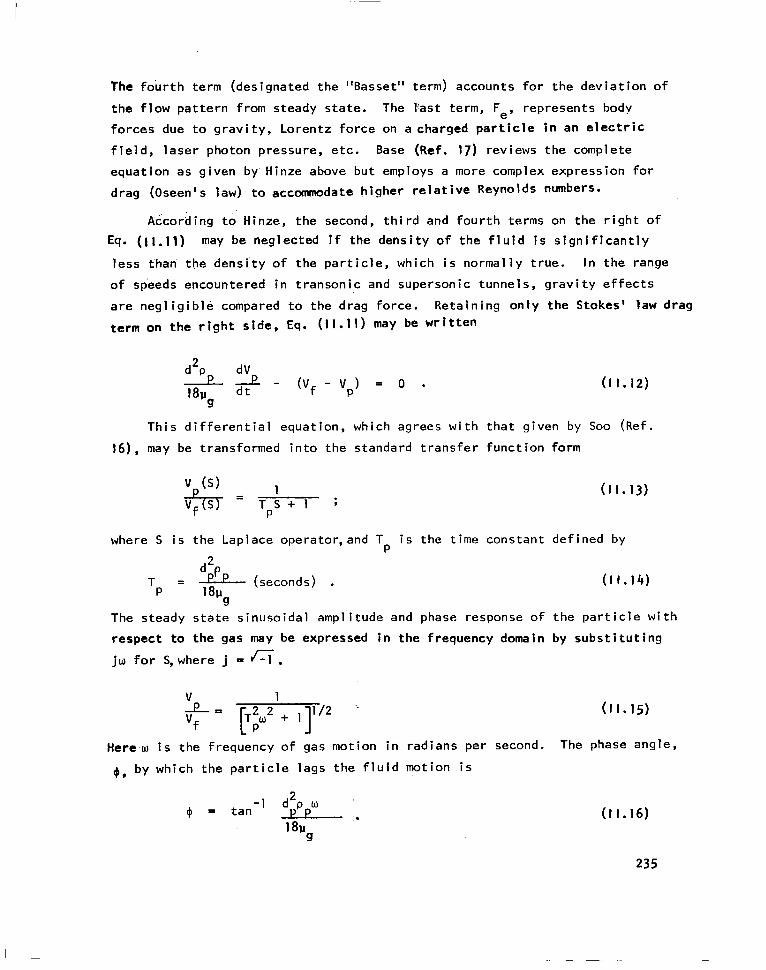
The fourth term (designated the "Basset" term) accounts f o r t h e d e v i a t i o n o f
t h e f l o w p a t t e r n from steady state. The Vast term, Fe, represents body
forces due to g rav i t y , Lo ren tz f o rce on a charged p a r t i c l e i n an e l e c t r i c
f ie ld , laser photon p ressure , e tc . Base (Ref. 17) reviews the complete
equat ion as given by Hinze above but employs a more complex express ion for
drag (Oseen's law) t o accommodate h igher re la t ive Reynolds numbers*
According t o Hinze, the second, t h i r d and four th terms on t h e r i g h t o f
Eq. (11.11) may be neglected if t h e d e n s i t y o f t h e f l u i d i s s i g n i f i c a n t l y
l ess t han t he dens i t y o f t he pa r t i c l e , wh ich i s no rma l l y t rue . I n t he range
o f speeds encountered i n t r a n s o n i c and superson ic tunne ls , g rav i ty e f fec ts
a r e n e g l i g i b l e compared to the drag force. Reta in ing on ly the Stokes ' law drag
term on t h e r i g h t s i d e , Eq. (11 .11) may be w r i t t e n
( I 1.12)
Th is d i f fe ren t ia l equat ion , wh ich agrees w i th tha t g iven by So0 (Ref.
16), may be t ransformed in to the s tandard t ransfer funct ion form
where S is the Laplace operator,and T is the t ime cons tan t de f ined by P
(11.14)
The steady state s inusoidal ampl i tude and phase response o f t h e p a r t i c l e w i t h
respect to the gas may be expressed i n the frequency domain by s u b s t i t u t i n g
j w f o r S, where j = 6.
Herew i s t he f requency o f gas mot ion in rad ians per second. The phase angle,
4 , b y w h i c h t h e p a r t i c l e l a g s t h e f l u i d m o t i o n i s
(11.16)
235
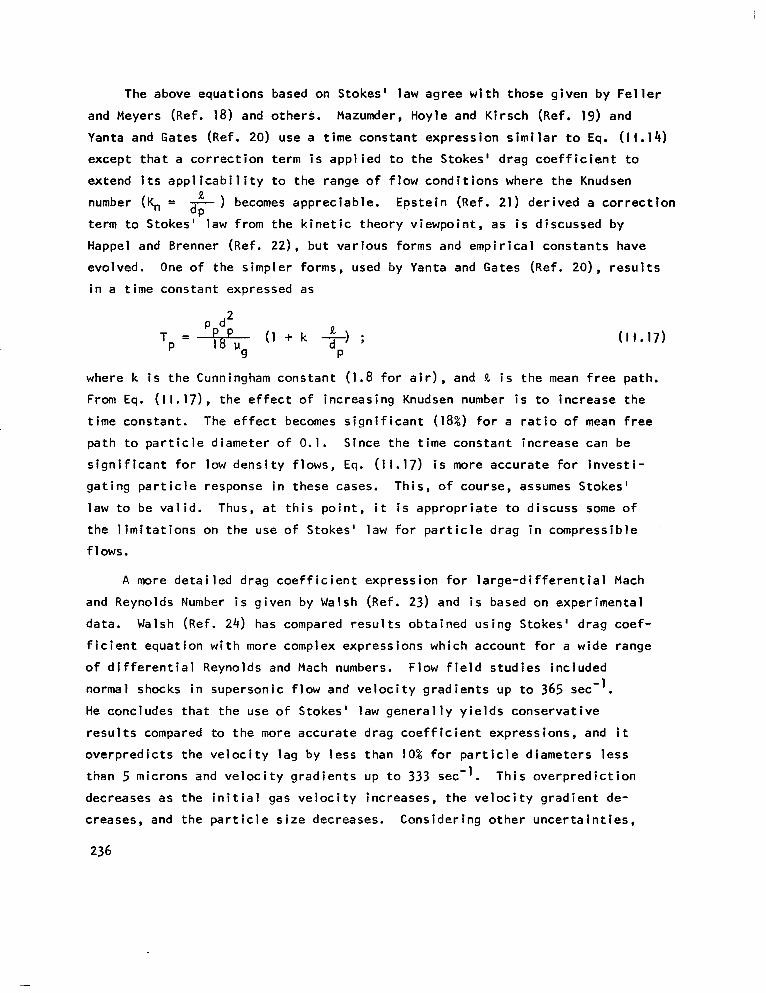
The above equations based on Stokes' law agree wi th those given by Fel ler
and Meyers (Ref. 18) and others. Mazumder, Hoyle and K i rsch (Ref. 19) and
Yanta and Gates (Ref. 20) use a t ime constant express ion s imi lar t o Eq. (I I. 14) except that a c o r r e c t i o n t e r m i s a p p l i e d t o t h e S t o k e s ' d r a g c o e f f i c i e n t t o
extend i t s a p p l i c a b i l i t y t o t h e range o f f low cond i t ions where the Knudsen
number (Kn = - ) becomes appreciable. Epstein (Ref. 21) der ived a c o r r e c t i o n
te rm to S tokes ' law f rom the k ine t ic theory v iewpo in t , as i s d iscussed by
Happel and Brenner (Ref. 22), but various forms and empir ical constants have
evolved. One of the s impler forms, used by Yanta and Gates (Ref. 2 0 1 , r e s u l t s
i n a time constant expressed as
a. dP
where k i s t h e Cunningham constant (1.8 f o r a i r ) , and 9. i s t h e mean f ree pa th .
From Eq. ( l l . l 7 ) , t h e e f f e c t o f i n c r e a s i n g Knudsen number i s to increase the
t ime constant. The e f f e c t becomes s i g n i f i c a n t (18%) f o r a r a t i o o f mean f r e e
p a t h t o p a r t i c l e d i a m e t e r o f 0.1. Since the t ime constant increase can be
s i g n i f i c a n t f o r low densi ty f lows, Eq. (11.17) i s more accu ra te f o r i nves t i -
ga t ing par t i c le response in these cases. This, o f course, assumes Stokes'
law t o be v a l i d . Thus, a t t h i s p o i n t , it i s a p p r o p r i a t e to discuss some o f
t h e l i m i t a t i o n s on the use o f S tokes ' law fo r par t i c le d rag in compress ib le
flows.
A more d e t a i l e d d r a g c o e f f i c i e n t e x p r e s s i o n f o r l a r g e - d i f f e r e n t i a l Mach
and Reynolds Number i s g i v e n by Walsh (Ref. 23) and i s based on experimental
data. Walsh (Ref. 24) has compared resul ts obta ined us ing Stokes ' drag coef -
f i c i e n t e q u a t i o n w i t h more complex expressions which account f o r a wide range
o f d i f f e r e n t i a l Reynolds and Mach numbers. Flow f i e ld s tud ies i nc luded
normal shocks in superson ic f low and v e l o c i t y g r a d i e n t s u p t o 365 sec".
He concludes that the use o f Stokes' law general ly y ie lds conservat ive
r e s u l t s compared t o t h e more accurate drag coef f ic ient express ions, and i t
overpred ic ts the ve loc i ty lag by less than 10% for pa r t i c l e d iamete rs l ess
than 5 microns and ve loc i t y g rad ien ts up t o 333 sec'l. Th is overpred ic t ion
decreases as the i n i t i a l gas ve loc i ty inc reases , the ve loc i ty g rad ien t de-
creases, and t h e p a r t i c l e s i z e decreases. Considering other uncertaint ies,

such as the shape o f t h e p a r t i c l e , t h e use o f S tokes ' d rag coe f f i c i en t i s
considered to be adequate for the purpose o f th is s tudy ; the except ion be ing
low dens i ty f lows for which Eq. (11.17) i s recommended.
The t ime constant def ined by Eq. (11.14) i s an ex t remely use fu l quant i t y
for s tudy ing the par t i c le lag p rob lem. As i n Eq. (I 1.151, i
define the frequency response o f t h e p a r t i c l e . I n t h e t i m e
t ime cons tan t i s a measure o f p a r t i c l e t r a n s i e n t response.
ve loc i t y l ag , for example, i s reduced t o I / e o f i t s i n i t i a l
constant , I /e in two t ime constants , e tc . The r e l a x a t i o n 1 2
t can be used to
domain, t h e
A s tep change i n
v a l u e i n one time
ength can also be
determined by the product of the t ime constant and the gas v e l o c i t y
i n o n e r e l a x a t i o n l e n g t h t h e p a r t i c l e l a g will reduce to l / e of i t s
ve loc i t y , e t c .
. As before,
i n i t i a l
Accord ing to Eq. ( I l . l h ) , t h e f i d e l i t y w i t h w h i c h p a r t i c l e m o t i o n r e p r e -
s e n t s f l u i d m o t i o n i n a s p e c i f i c f l o w c o n d i t i o n ( t e s t gas v i s c o s i t y known) can
be improved by reducing the part icle diameter and density. Diameter reduction
i s pa r t i cu la r l y e f fec t i ve s ince t he t ime cons tan t i nc reases acco rd ing t o diame-
t e r squared. As discussed previously, however, the minimum par t i c le d iameter
i s l i m i t e d by the minimum acceptab le s igna l - to -no ise ra t io .
An average p a r t i c l e d e n s i t y t o 1 gm/cm3 i s commonly used f o r f l o w s e e d i n g a t
cond i t i ons t yp i ca l o f t hose encoun te red i n t ranson ic and supersonic wind tunnels.
Seeding agents include diocty l phthalate (DOP), s i l i c o n e o i l , and polystyrene
l a t e x (Ref. 19). A rev iew o f the severa l t ypes o f genera tors fo r in t roduc ing
s e e d i n g p a r t i c l e s o f c o n t r o l l e d s i z e i s g i v e n by Mazumder, B lev ins and K i rsch
(Ref. 25). For seeding high temperature gas f l o w s , p a r t i c l e s w i t h h l a h e r m e l t i n g
points are necessary. Zirconium dioxide ( Z r Oz), which has a me l t i ng po in t
above 3000 K and a d e n s i t v o f 5.9 gm/cm, and aluminum ox ide (A12 03) have been
used for seeding high temperature gas f lows, e.g., Ref. 26.
To demonst ra te the e f fec ts o f par t i c le d iameters , the f requency response
of p a r t i c l e s w i t h a d e n s i t y o f 1 gm/cm3 and diameters ranging from 0.5 pm to
o f u s i n g
for p a r t
p a r t i c l e s w i t h a
f c l e s w i t h a dens
d iameter o f approx imate ly
i t y o f 1 gm/cm3 a r e shown
Io pm i s shown i n F i g . A.11.5 f o r Mach one f low and a stagnation temperature of
40 Ce ls ius ( I04 OF). These response data c l e a r l y d e m o n s t r a t e t h e d e s i r a b i l i t y
0 . 5 urn. The t ime constants
i n F i g . A.11.6 as a func t ion
237

w N .
0
1.0
0.5
0.1
Mach No. 1.0 T, = 40 Celsius Pp = 1 g/cc
Figure A . 1 1 . 5 EFFECT OF FARTICLE DIAMETER ON FREQUENCY PXSXINSE
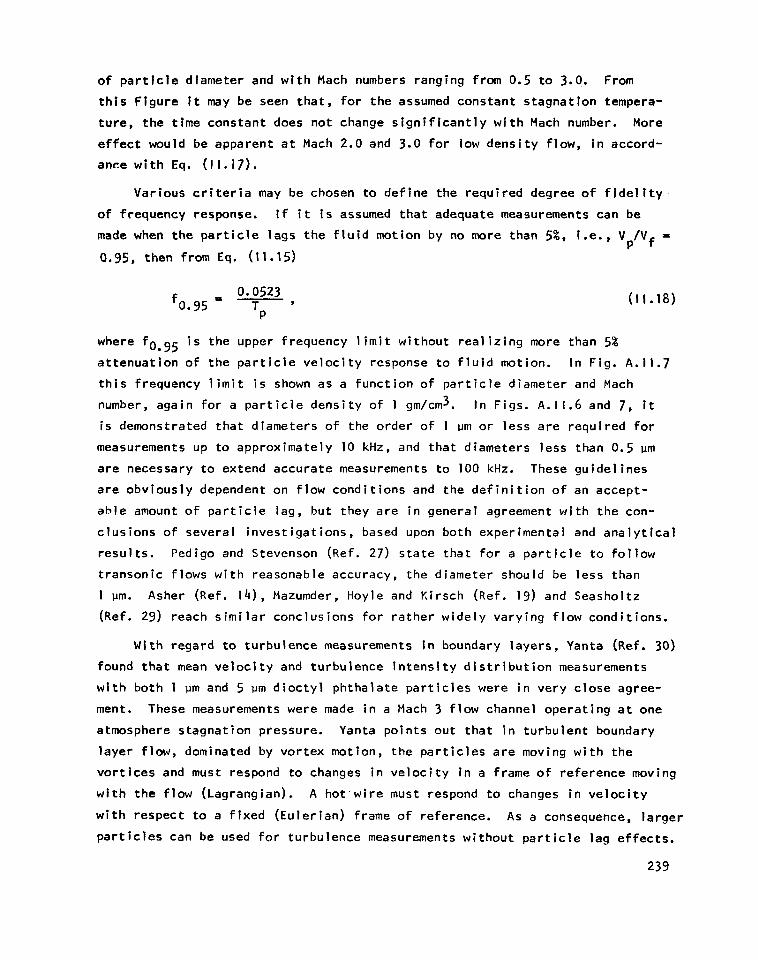
of pa r t i c l e d iamete r and w i t h Mach numbers ranging from 0.5 to 3.0,. From
t h i s F i g u r e it may be seen tha t , for the assumed constant s tagnat ion tempera-
ture, the t ime constant does no t change s i g n i f i c a n t l y w i t h Mach number. More
effect would be apparent a t Mach 2.0 and 3.0 f o r low densi ty f l o w , i n accord-
ance w i t h Eq. (11.17).
V a r i o u s c r i t e r i a may be chosen to de f ine the requ i red degree o f f l d e l i t y
of frequency response. I f it i s assumed t h a t adequate measurements can be
made when t h e p a r t i c l e l a g s t h e f l u i d m o t i o n b y no more than 5%, i.e., V /V = P f
0.0523
P f0.95 T '
e - (11.18)
where fo
a t tenuat 95 i s t h e upper frequency limit w i t h o u t r e a l i z i n g
i o n o f t h e p a r t i c l e v e l o c i t y r e s p o n s e t o f l u i d mot
more than 5% ion. In F ig . A . 1 1 . 7
th is f requency limit i s shown as a f u n c t i o n o f p a r t i c l e d i a m e t e r and Mach
number, aga in fo r a p a r t i c l e d e n s i t y o f 1 gm/cm3. In F igs. A . 1 1 . 6 and 7, it
i s demonstrated that d iameters of the order of 1 Urn o r l e s s a r e r e q u i r e d f o r
measurements up to approx imate ly 10 kHz, and that d iameters less than 0.5 pm
are necessary to extend accurate measurements t o 100 kHz. These gu ide l ines
are obv ious ly dependent on f l ow cond i t i ons and t h e d e f i n i t i o n of an accept-
ab le amount o f p a r t i c l e l a g , b u t t h e y a r e i n g e n e r a l agreement w i t h t h e con-
c lus ions o f severa l inves t iga t ions , based upon both experimental and a n a l y t i c a l
resul ts. Pedigo and Stevenson (Ref. 27) s t a t e t h a t f o r a p a r t i c l e t o f o l l o w
transonic f lows with reasonable accuracy, the diameter should be less than
1 vm. Asher (Ref. 1 4 ) , Mazumder, Hoyle and Kirsch (Ref. 19) and Seasholtz
(Ref. 29) reach s im i la r conc lus ions f o r ra the r w ide l y va ry ing f l ow cond i t i ons .
With regard to turbulence measurements in boundary layers, Yanta (Ref. 30)
found that mean v e l o c i t y and t u r b u l e n c e i n t e n s i t y d i s t r i b u t i o n measurements
w i th both 1 pm and 5 pm d i o c t y l p h t h a l a t e p a r t i c l e s were in very c lose agree-
ment. These measurements were made i n a Mach 3 f low channel operat ing at one
atmosphere stagnation pressure. Yanta points out that i n t u r b u l e n t boundary
layer flow, dominated by vor tex mot ion , the par t i c les a re moving w i t h t h e
v o r t i c e s and must respond t o changes i n v e l o c i t y i n a frame o f re fe rence moving
wi th the f low (Lagrangian). A h o t ' w i r e must respond to changes i n v e l o c i t y
w i th respec t to a f i xed (Eu le r ian ) frame o f reference. As a consequence, la rger
p a r t i c l e s can be used fo r t u rbu lence measurements w i t h o u t p a r t i c l e l a g e f f e c t s .
239
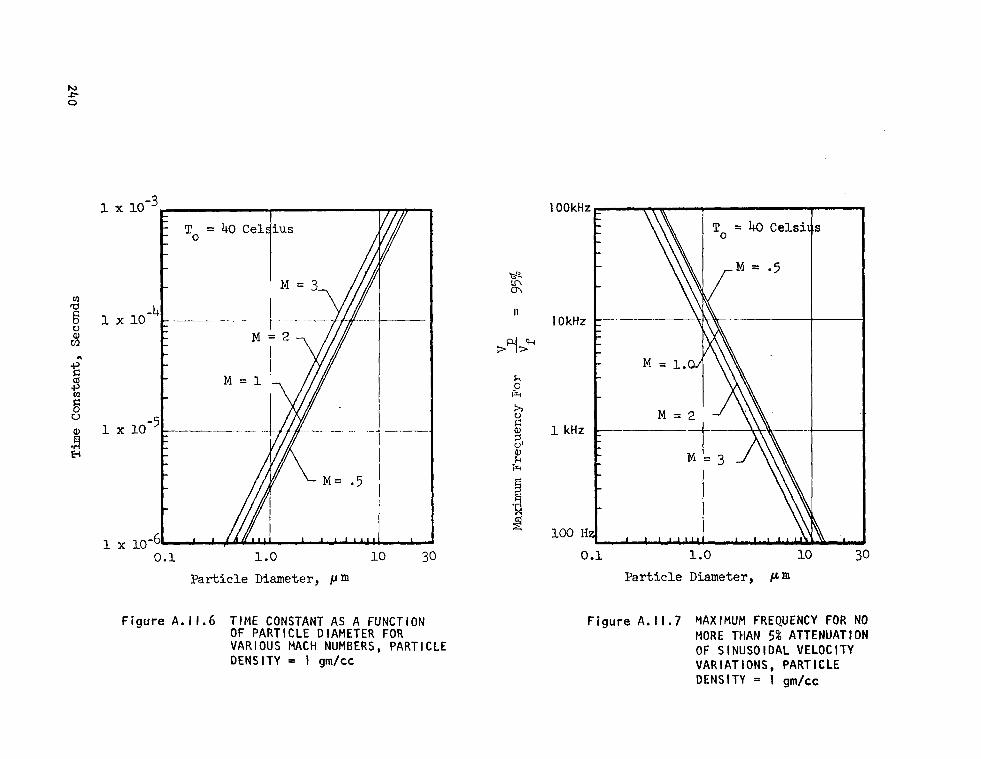
h) & 0
l x
l x
l x
l x
Parkj.de Diameter, p m
T
1 30
Figure A . 11.6 TIME CONSTANT AS A FUNCTION OF PARTICLE D IAMETER FOR VARIOUS MACH NUMBERS, PARTICLE D E N S I T Y = 1 gm/cc
0.1 1.0 10 P a r t i c l e Diameter, Pm
Figure A. I I .7 MAXIMUM FREQUENCY FOR NO MORE THAN 5% ATTENUATION OF S I N U S O I D A L V E L O C I T Y V A R I A T I O N S , P A R T I C L E D E N S I T Y = 1 gm/cc

I --
Data Analysis and Accuracy
The data normal ly obta ined wi th a laser velocimeter include the mean v e l o c i t y and t h e t u r b u l e n c e i n t e n s i t y i n one, two or three components. By special analyt ical techniques, the spectrum o f the turbulence can a lso be
der ived . An i n d i v i d u a l measurement obtained f rom the velocimeter, Ui, i s taken t o
represent the passage o f an ind iv idua l par t i c le th rough the measur ing volume
( i n d i v i d u a l r e a l i z a t i o n ) s i n c e t h i s occu'rence i s t y p i c a l o f high-speed flows and
counter-type processors. The i n d i v i d u a l measurement can dev iate f rom the t rue
mean v e l o c i t y due to turbulence, noise and system reso lu t ion . The a c q u i s i t i o n
o f a la rge number o f measurements are therefore necessary to improve the
accuracy o f b o t h t h e mean v e l o c i t y and turbulence measurements.
The mean velocity as determined from a la rge number o f i n d i v i d u a l measure-
ments i s N
i = 1 c u i
- = U N 9
(11.19)
where ti i s t h e number o f values measured f o r a s ing le test condi t ion,and U . i s
a s i n g l e v e l o c i t y measurement. I
The s t a n d a r d d e v i a t i o n o f t h e v e l o c i t y p r o b a b i l i t y d i s t r i b u t i o n f u n c t i o n
i s
( 1 I . 2 0 )
If t h e e f f e c t s of broadening o f the Doppler frequency spectrum due to
f i n i t e sample length and phase reversa ls ( t racker processor) o r , i n general,
apparen t ve loc i t y f l uc tua t i ons due: to no ise , e tc . , a re neg l ig ib ly smal l ,
t h e s t a n d a r d v e l o c i t y d e v i a t i o n i s e q u a l t o t h e root-mean-square turbulence
v e l o c i t y
cu = u ' ;
where U = U + u ' ,and the tu rbu lence in tens i ty i s 7 . - U'
U
( I 1.21)
24 1
Correction of the measured turbulence velocity for the effects of Doppler spectral broadening (as occurs with a tracker processor) is discussed, for example, by George in (Ref. 31)- The correction techniques for this type of bias are based on the white noise or broad-band characteristics of the
intensity modulation of the Doppler frequency; whereas, the turbulence is band-limited.
Flack and Thompson (Ref. 32) have identified ten different biases which influence individual-realization, velocimetry measurements of mean velocity
and turbulence. Magnitudes of the individual biases range from less than 0.1% to 31% for the turbulence component and from 0.1% to about 12% for the
mean velocity component. The larger errors are associated with high turbulence intensities. The largest bias is due to the probability, in a turbulent flow, that more high velocity particles will be measured than low velocity particles.
This bias occurs because the individual measurements are not randomly distributed. I f the scattering particles are uniformly distributed in the flow, the rate at which particles pass through the measuring volume is weighted linearly with velocity, Fig. A . 1 1 . 8 . This form of statistical bias is discussed
by Barnett and Bentley (Ref. 33) and by HcLaughl in and Tiederman (Ref. 34).
N ”
U - N 1 c u i -
i = l
( I I .22)
Barnett and Bentley derive the correction to the biased (arithmetic] mean in terms of the turbulence intensity as
N (I 1.23)
The correction to the arithmetic mean velocity for velocity bias i s therefore significant only when the turbulent intensity is large; a turbulent intensity of 10% would result in a 1% correction to the mean velocity. It should be emphasized that Eqs. 11.22 and 11.23 are based on a one dimensional analysis and may not be generally applicable to all flows.
242

f f Biased Average of Individual Measurements
Individual Measurements

The work t o d a t e o n i n d i v i d u a l r e a l i z a t i o n or v e l o c i t y b i a s i n g has a l s o
been r e s t r i c t e d t o c o n s t a n t - d e n s i t y , v e l o c i t y - f l u c t u a t i o n f l o w s such as turbu-
l e n t boundary layers. This work assumes un i fo rm dens i t y o f sca t te r i ng pa r t i c l es .
Fu r the r s tudy i s needed of o t h e r f l o w f i e l d s where the unsteadiness is dominated
by unsteady shocks, acoustic sources, etc. In such cases, significant density
var ia t ions occur , and dens i t y and v e l o c i t y f l u c t u a t i o n s may be correlated. For
empty-test-sect ion surveys of mean v e l o c i t y i n wind tunnels , turbulence is suf -
f i c i e n t l y low t h a t t h e c o n t r i b u t i o n o f v e l o c i t y b i a s i n g t o t h e t o t a l measure-
ment e r r o r would appear t o be minor.
Yanta (Ref. 9) and Yanta and Smith, (Ref. 35) d iscuss the problem of
determining the sample s ize, N, r e q u i r e d t o e s t a b l i s h t h e u n c e r t a i n t y i n a
measured value, such as mean v e l o c i t y , as a func t i on o f t he t u rbu lence i n ten -
s i t y . For example,
(11.24)
When Z i s t h e number o f s tandard dev ia t ions cor respond ing to a des i red con f i -
dence leve l (1.645, 1.96 and 2.58 f o r 90, 95 and 93-percent confidence 1 im i t s ,
respec t i ve l y ) , AU/U i s t h e e r r o r i n t h e mean value, and u l / r t h e t u r b u l e n c e
i n t e n s i t y .
"
The conf idence l im i ts fo r the s tandard dev ia t ion o f the ve loc i ty p rob-
a b i l i t y d i s t r i b u t i o n ( t h e rms tu rbu lence , u l ) i s g i ven by
22 N = ~ ( A u ' / u ' ) ~
(11.25)
Where Au' i s t he e r ro r i n magn i tude o f t he t u rbu lence , and Z and N are as
previously def ined.
I n t he case o f w ind tunne l ca l ib ra t ions , the measurement period should
be s u f f i c i e n t l y l o n g t o average the lowest frequency component o f t u n n e l f l o w
unsteadiness. Therefore, the required measurement per iod will extend from one
t o more than 10 seconds, which may be o f t h e same order of magnitude as the
t ime required to obtain the necessary number o f laser ve loc imeter measurements,
24 4
L
depending on the data rate. Some measurements i n t h e AEDC Tunnel 1-T requi red
several minutes per stat ion.
An e v a l u a t i o n o f t h e agreement between laser ve loc imeter and convent ional ,
w ind - tunne l - ca l i b ra t i on measurements can be made from tes ts in severa l w ind
tunnels. Meyers, et. al., in Ref. (5) found that f reest ream ve loc i t ies meas-
ured i n t h e 4.9 m (16-foot) Langley Transonic Tunnel compared t o t h e t u n n e l ' c a l i b r a t i o n measurements w i t h i n 22%; where the unce r ta in t y of t h e v e l o c i t y
based on the tunne l ca l ib ra t ion i s s ta ted to be +I%. Al though the par t i c les
used t o seed the f low ranged in s ize from 10 t o 15 microns, the authors d id
n o t c o n s i d e r p a r t i c l e l a g t o be a problem in t he t es t sec t i on ; a l t hough s ign i -
f i c a n t l a g was present in the f low acce le ra t ing sec t ion o f the tunne l .
t
Measurements i n t h e 0.3 m ( I - f o o t ) AEDC Tunnel 1T i n t h e Mach number
range from 0.6 t o 1.5 are repor ted by Smith e t a l . i n Ref. (8). The e r r o r
es t imate fo r the convent iona l ca l ib ra t ion da ta ranges from approximately two
pe rcen t a t Mach 0.6 t o 0.5 percent a t Mach 1.5. f l u l t i p le -po in t ax ia l su rveys
o f c e n t e r l i n e c a l i b r a t i o n d a t a , based on pressure measurements, were obtained
o n l y a t Mach numbers 0.6 and 0.8, w i t h a s ing le -po in t , p ressure-ca l ib ra t ion ,
v e l o c i t y measurement (a t t he same p o i n t on the tunne l cen ter l ine) o f 2.5 t o
2.7 percent. Comparison o f t h e a x i a l d i s t r i b u t i o n s o b t a i n e d by both techniques
a t M = 0.6 showed the best agreement w i t h an average d i f ference o f about 1.4
percent for a mean v e l o c i t y o f 216 rnps, and the uncer ta in ty bands overlapped.
A t Mach 0.8, the d i f fe rences ranged from about 0.3 t o 2.0 percent a t a mean
v e l o c i t y of approximately 280 mps. I n t e r e s t i n g l y , a l l of t h e v e l o c i t i e s meas-
ured wi th the laser velocimeter were h igher than the veloci t ies determined from
pressure and temperature measurements. No explanat ion was o f f e r e d f o r t h e
d i f f e r e n c e , b u t o b v i o u s l y p a r t i c l e l a g was not a fac to r . All measurements were
made w i t h n a t u r a l l y - p r e s e n t , l i g h t - s c a t t e r i n g p a r t i c l e s i n t h e f l o w .
F low a n g u l a r i t y measurements were a l so made w i t h t h e 2-component laser
ve loc imeter , which demonstrated the ab i l i ty to make a n g u l a r i t y measurements
w i th dev ia t ions rang ing f rom 2.015 degree t o 2.25 degrees. The dev ia t i ons a re
a f u n c t i o n o f t h e rms d e v i a t i o n s o f t h e component v e l o c i t i e s . No conventional
angu lar i t y da ta were presented for comparison.
This tes t demonst ra ted the capab i l i t y fo r measur ing the f law angu lar i t y
and an average o f t h e f l o w f l u c t u a t i o n s i n b o t h m a g n i t u d e and d i r e c t i o n .
The two tests descr ibed should be regarded as o p e r a t i o n a l f e a s i b i l i t y
demonstrat ions only and should not be regarded as the best accuracy currently
avai lable. Further, s ince the laser velocimeter data are compared t o conven-
t i o n a l c a l i b r a t i o n d a t a w i t h a stated accuracy of approximately 50.5 t o +2.0 - percent, an absolute evaluat ion of the laser velocimeter accuracy cannot be
made from these resul ts.
Measurements by Johnson (Ref. 3 6 ) , Johnson and Rose (Ref. 371, Yanta and
Lee (Ref. 38) and Bout ier and Lefevre (Ref. 391, prov ide add i t iona l eva lua t ions
o f t h e agreement between flow v e l o c i t y measurements by the laser velocimeter
and by conven t iona l P i to t and s t a t i c probes. These f rees t ream ve loc i ty measure-
ments a r e somewhat l i m i t e d i n scope since they are obtained from boundary layer
v e l o c i t y p r o f i l e measurements; nevertheless, agreement within 0.5% i s demonstra-
ted.
The laser ve loc imeter y ie lds a d i r e c t measurement o f f l o w v e l o c i t y , w h i l e
the Mach number i s r e q u i r e d f o r c a l i b r a t i o n o f wind tunnels. A second measure-
ment, the stagnation temperature, i s therefore required. Using the energy equa-
t i on , t he l oca l s ta t i c t empera tu re can then .be determined from the measured
v e l o c i t y
Where Tw is the tes t sec t ion tempera ture cor respond ing to Vm, To i s the s tag-
nation temperature, C i s the spec i f i c heat a t cons tan t p ressure , R i s t h e
gas constant, and y i s t h e r a t i o o f s p e c i f i c heats. The l o c a l Mach number P
can then be determined from
V W
M = am
"W
"m
( I I .28)
246
S e n s i t i v i t y c o e f f i c i e n t s f o r measurements o f b o t h v e l o c i t y and s tagnat ion
temperature are shown i n F i g . A.II .9 f o r a stagnat ion temperature of 40° Celsius.
From these data, measurement o f Mach numbers t o an accuracy o f +_O.OOl requi res
a v e l o c i t y measurement accuracy of about 0.1% i n t h e t r a n s o n i c speed range.
This accuracy i s n o t b e l i e v e d t o be w i th in t he s ta te -o f - the -a r t a t p resen t . v
Conclusions i
The advantages and disadvantages of the laser velocimeter may be summarized
as fo l lows:
Advantages
1 . No probe or o ther dev ice in t roduced in to the
pertubing.
2. Prov ides d i rec t , l i nea r measurement o f v e l o c
ti
3. Ab
4. Ab
5. Po
vo
6 . Ca
f low, i .e
i t y and ve
. , non-
l o c i t y f l u c t u a -
ns; no ca l i b ra t i on requ i red .
l i t y t o measure reversing f lows.
l i t y t o separate mean and f l u c t u a t i n g v e l o c i t i e s i n t o components.
n t measurements can be approached by proper control of measur ing
ume.
be r e a l i z e d as an i nhe ren t l y d ig i t a l i ns t rumen t .
- D i sadvantages 1 . 2.
3.
4.
5.
6 .
7.
Complex, expensive equipment required
Measurement o f h igh -ve loc i t y f l ows i n l a rge t unne ls w i th an a i r t e s t
medium presents spec ia l problems wi th regard to s ing le- to-noise ra t io ,
frequency response, and s e n s i t i v i t y o f equipment to t unne l v ib ra t i on ,
temperature, etc.
Further development needed t o improve s ignal processor , par t icu lar ly
w i t h r e g a r d t o d a t a v a l i d a t i o n f e a t u r e s , r e j e c t i o n of l a r g e p a r t i c l e s ,
etc.
L i g h t - s c a t t e r i n g p a r t i c l e s o f s i z e needed for good s ignal may not
f o l l o w f l o w i n r e g i o n s o f r a p i d v e l o c i t y change.
S i g n a l - t o - n o i s e r a t i o may prec lude accurate turbulence in tens i ty
measurements a t low levels, i .e., 0.1 t o 1.0 percent.
Cur ren t accuracy a t ta inab le i s no t as good as w i th convent iona l
techniques.
Takes excess ive t ime to make the surveys required for wind tunnel
c a l i b r a t i o n .
247
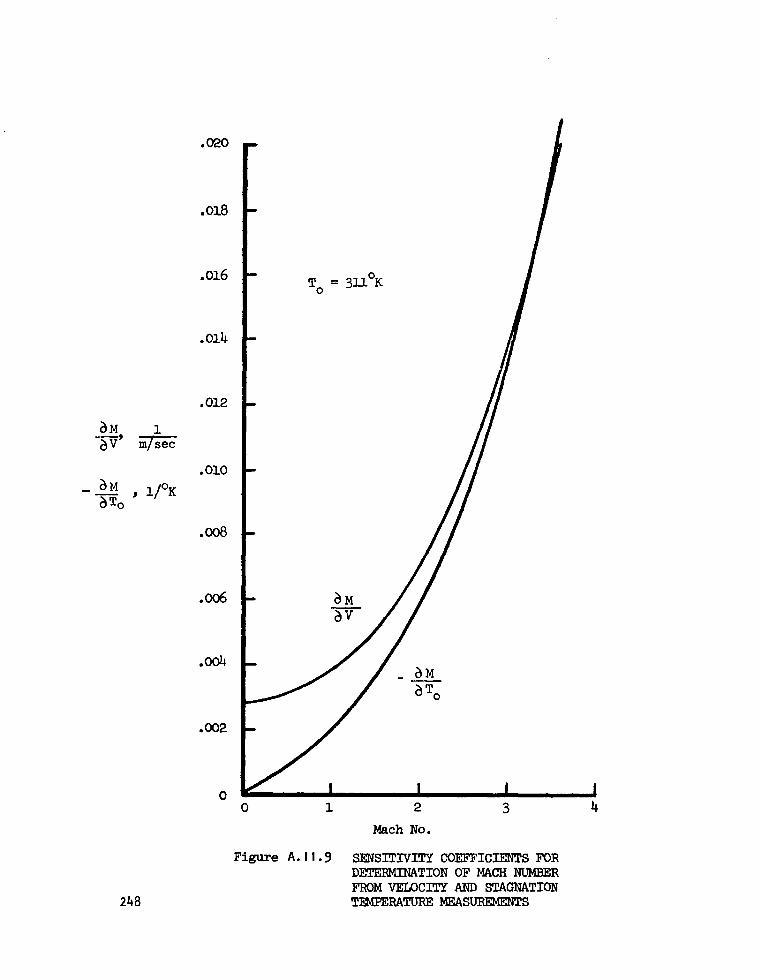
.WO
.018
,016
.014
.012
.010 - - " 1/OK
a T o
.008
.006
.004
.002
0
248
To = 3U°K I
0 1 2 3 4 Mach No.
Figure A. I I -9 SENSITIVITY COEFFICIENTS FOR DETERMINATION OF MACH NUMBER FROM VELOCITY AND STAGNATION TEMPERATURE MEASUREMENTS
Nomenclature
aaD f ree s t ream acous t ic ve loc i ty
=P spec i f i c heat a t cons tan t p ressure
i n i t i a l diameter o f l a s e r beam DO
d0
d P
F
Fe
fd
fo. 95
k
R
l l V
M
N
Nf
NH
NL
r
diameter o f l ase r beams a t t h e f o c a l p o i n t o f t h e t r a n s m i t t i n g l e n s
par t i c le . d iameter
foca l l eng th o f t kansmi t t i ng l ens
body fo rces on pa r t i c l e (Eq. 11.11)
Dopp 1 er frequency , Hz
frequency a t which pa r t i c l e mo t ion i s a t tenua ted 5% re la t i ve t o s teady s ta te s inuso ida l f l u id mo t ion
m Knudsen number
Cunningham constant (Eq. I I . 17)
mean f ree pa th
length o f measuring volume
Mach number
sample s i z e
number o f f r i n g e s i n measu'r ing volume
number o f pu l ses coun ted i n t he h igh . reg i s te r o f a counter processor
number of pulses counted i n t h e low r e g i s t e r o f a counter processor
R gas constant
S Lap1 ace opera t o r
TO stagnation temperature
249
TP
To3
t
t '
U
- U - uC
U'
Au I
V
V 9
P
"" W
V
2
- Greek
Y
A
bf
0
x
pP
a
250
t ime constant def ve loc i t y , seconds
i n l n g p a r t i c l e response to v a r i a t i o n s i n f l u i d flow :
. . freestream temperature
time, seconds
dumny v a r i a b l e (Eq. 1 1 . 1 1 )
v e l o c i t y component n o m 1 to f r i n g e p a t t e r n and t o b i s e c t o r of the angle formed by two In te rsec t i ng l ase r beams
mean v e l o c i t y
mean ve loc i t y , co r rec ted for v e l o c i t y b i a s
rms tu rbu lence ve loc i t y
error i n magnitude o f t u r b u l e n c e v e l o c i t y
gas flow v e l o c i t y
p a r t i c l e v e l o c i t y
f fees t ream ve 1 oc i t y
w id th o f measur ing ve loc i ty
number of s tandard dev iat ions corresponding to a des i red conf idence leve l (Eq. I I .24).
r a t i o of speci f fc heats
beam separa t ion d is tance a t the t ransmi t t ing op t ics
f r inge spac ing in measur ing volume
angle between laser beams a t the.ir i n t e r s e c t i o n t o form the measuring volume
wavelength o f l a s e r l i g h t
v i s c o s i t y o f gas
densi ty o f gas
d e n s i t y o f p a r t i c l e
s tandard dev iat ion of v e l o c i t y p r o b a b i l i t y - d i s t r i b u t i o n - f u n c t i o n
phase angle, degrees ..
angular velocity, radians per second
.-; . .
.. I . . .
I
25 1
REFERENCES
1.
2 .
3.
4.
5.
6.
7.
a.
9.
10.
1 1 .
12.
13.
14.
Yeh, Y. and Cummins, H. Z.: "Local ized F lu id F low Measurements w i t h .an He-Ne Laser Spectrometer,'' Vo1. 4 pp 176-178, 1964. . .
Foreman, J., W. ; George, W. W. and 'Lewis, R. 0.: "Measurement o f L o c a l i z e d f l o w V e l o c i t i e s i n Gases With a Laser-Doppler Flowmeter," Applied Physics ,Let ters, Vol . 7, pp 77-80, 1965. . .
Lennert, A. E.; Bragton, D. B.; Crosswy, F. L., e t a l : "Summary Report o f t h e Development of a Laser Velocimeter t o be Used i n AEDC Wind Tunnels", AEDC-TR-70-101, J u l y 1970.
Stevenson, W. H.; Pedigo, M. K. and Zamit, R. E.: "Bibliography on Laser Doppler Velocimeters: Theory, Design and Applications," U. S . Army Report No. RD-TR-72-8, 1972.
Meyers, J. F. ; Crouch, L. M.; F e l l e r , W. V . and Walsh, M. J . : "Laser Velocimeter Measurements i n a Large Transonic Wind Tunnel," Proceedings of the Minnesota Symposium on Laser Anemometry, Un ivers i ty o f M innesota , 1975.
Johnson, D. A.; Bochalo, W. D. and Modarress, D. : "Laser Velocimeter Supersonic and Transonic Wind Tunnel Studies," Proceedings o f t h e Minnesota Symposium on Laser Anemometry, U n i v e r s i t y o f Minnesota, 1975.
Lo, C . F: "Transonic Flow Field Measurements Using a Laser Velocimeter," Proceedings of the Minnesota Symposium on Laser Anemometry, U n i v e r s i t y o f Minnesota, 1975.
A E D C - ~ ~ - 7 1 - 1 65,
Yanta, W. J. : I '
TR 73-94, Naval
Tro l inger , J . D AGARDograph No.
Turbulence Measurements w i t h a Laser Doppler Velocimeter," , .
Ordnance Laboratory, White Oak, Md., 1973.
Meyers, J. F.: the Appl icat ion
.: "Laser Instrumentat ion for Flow Field Diagnost ics," 186, 1974.
" I nves t i ga t i on on Cal ibrat ions o f Bas ic Parameters for o f t h e Laser Doppler Velocimeter, NASA TN 0-6125, 1971.
O r l o f f , K i and Logan, S. E.: l lCofocal Backscatter Laser Velocimeter w i t h On-Axis Sensi t iv i ty , ' ' Appl ied Opt ics , \ I . 12, No. 10, 1973.
Fridman, J. D. Young, R. M.; Seavey, R. E. and O r l o f f , K. L.: "Modular High Accuracy Trackers f o r Dual Channel Laser Doppler Velocimeter,' ' Pro-. ceedings o f t h e U n i v e r s i t y o f Minnesota Symposium on Laser Anemometry, 1975.
Asher, J. A. : "Laser Velocimeter System Development and Testinq." Progress i n As t ronau t i cs and Aeronautics, V.34 pp 141-166, Massachusetts I n s t i t u t e o f Technology, 1974.

15-
16.
17.
18.
19.
20.
21.
22.
23 - 24.
25.
26.
27
28.
Hfnze, J. D.: T_u_rbglence,- A n . - I n t r o d u c t i o n t o i t s Mechanism and Theory, pp. 354-355, McGraw H i 1 1, New York, 1959.
Soo, S. L.: F l u i d Dynamics o f Mu l t iphase Systems, B l iasde l l Pub l ish ing Co., Walthan, Mass., 1967.
Base, T. E.: "The Mot ion o f Aeroso l Par t i c les in a Computed Turbulent F ~ O W Model t o Determine the Accuracy of a L.D.V. System," Proceedings of the Minnesota Symposium on Laser Anemometry, U n i v e r s i t y o f Minnesota, 1975.
F e l l e r , W. W. and Meyers, J. F.: "Development of a C o n t r o l l a b l e P a r t i c l e Generator for LV Seeding i n Hypersonic Wind Tunnels," Proceedings of Minnesota Symposium on Laser Anemometry, U n I v e r s i t y o f Mfnnesota, 1975.
Mazumder, M. K.; Hoyle, B. D. and Kirsch, K. J.: "Generation and F l u i d DynamIcs o f Sca t te r i ng Ae roso l i n Laser Doppler Velocimetry," Proceedings o f t h e Second In te rna t i ona l Workshop on Laser Velocimetry, Vol. I t , Purdue Un lvers i ty , March 1974.
Yanta, W. J. and Gates, D. F.: "The Use o f a Laser Doppler Velocimeter I n Supersonic Flows," A l A A Paper 71-287, Albuquerque, N.M., 1971.
Epstein, P. S.: Physical Review,V.23 (1324) p. 710.
Hoppel, T. and Brenner, H: Low Reynolds tJumber Hydrodynamics w i t h Spec ia l App l ica t ions to Par t i cu la te Media, pp 50-51, Prent ice-Hal l , EnciewiSod C l i f f s , N. J., 1965.
Walsh, M. J., "Drag Coeff Ic ient Equat ions for Small P a r t i c l e s i n H i g h Speed Flows," A I A A Journal, V 13, No. 11, Flov., 1575.
Walsh, M. J. : " In f luence o f Drag Coeff ic ient Equat ions on P a r t i c l e Motion Calculat ions," Proceedings of the t l innesota Symposium on Laser Anemometry, U n i v e r s i t y o f Minnesota, 1975.
Mazumder, M. K.; B lev ins, C . W. and Kirsch, K. J . : I'Wind Tunnel Flow Seeding f o r Laser VelocImeter Applications," Proceedings of the Minnesota Symposium as Laser Anemmetry, University of Minnesota, 1975.
Se l f , S. A . , "Boundary Layer Measurements i n High Veloci ty High Tempera- t u r e MHD Channel Flows," Proceedings o f t h e Second In te rna t i ona l Workshop on Laser Doppler Velocimetry, Purdue UnIvers i ty , 1974.
Pedfgo, M. K. and Stevenson, W. H . , "The Design o f a Laser Doppler Veloci- meter for Transonic Flows,'' Purdue University, Prepared f o r Army M i s s i l e C m a n d , AD-774 302, October 1373.
Haer t ig , J . , Informal Presentation, Proceedings of the Second In te rna t i ona l Workshop on Laser Doppler Velocimetry, Purdue University, 1974.
253
29
30
31.
32.
33.
34.
35
36.
37.
38.
39.
Seasholtz, R. G., "Laser Doppler Velocimeter Measurements in a Turbine Stator Cascade Facility," Proceedings of the Second International Work- shop on Laser Doppler Velocimetry, Purdue University, 1974.
Yanta, W. J . , "Laser Doppler Velocimeter Measurements of Turbulence Properties of a Mach 3 Turbulent Boundary Layer,'' Proceedings of the Second International Workshop on Laser Velocimetry, Purdue University, 1974.
George, W. K., "The Measurement of Turbulence Intensities Using Real-Time Laser Doppler Velocimetry," Proceedings of the Second International Work- shop on Laser Velocimetry, Purdue University, 1974.
Flack, R. D. and Thompson, H. D., "The LVD's Potential in Understanding Turbulent Structure,'' Proceedings of the Minnesota Symposium on Laser Anemometry, University of Minnesota, 1975.
Barnett, D. 0. and Bent Realization Laser Veloc Workshop on Laser Veloc
McLaughlin, D. K. and T
ley, H. T., "Statistical Bias of Individual imeters," Proceedings of the Second International imetry, Purdue University, 1974.
iederman, W. G., "Biasing Correction for Individual Realization of Laser Anemometer Measurements in Turbulent Flows,ll The physics of Fluids, Vol. 16, 1973.
Yanta, W. J. and Smith, R . A., "Measurement of Turbulence Transport Proper- ties with a Laser Doppler Velocimeter,'' AlAA Paper No. 73-169, Jan. 1973.
Johnson, D. A . , "Turbulence Measurements in a Mach 2.9 Boundary Layer Using Laser Velocimetry," AIAA Journal V 12 No. 5, pp 711-714, May 1974.
Johnson, D. A. and Rose, GI. C., "Turbulence Measurements in a Transonic Boundary Layer and Free-Shear Flow Using Laser Velocimetry and Hot-wire Anemometry Techniques," AIAA 9th Fluid and Plasma Dynamics Conference, Paper No. 76-399, July 1976.
Yanta, W. J. and Lee, R. E., "Measurements of Mach 3 Turbulence Transport Properties on a Nozzle Wall , I i AlAA Journal, V.14, No. 6, pp 725-729, June 1976.
Boutier. H. and Lefevre, J.: "Some Applications of Laser Anemometry in Wind-Tunnels," The Accuracy of Flow Measurements By Laser Doppler Methods, Proceedings o f LDA Symposium - Copenhagen, 1975. "
254
APPENDIX 1 1 1
EFFECTS OF VIBRATION OF A CYLINDRICAL PROBE
ON STATIC PRESSURE MEASUREMENTS
I I n t he p rocess o f co l l ec t i ng ma te r ia l f o r w r i t i ng abou t mean s t a t i c
pressure measurements, the quest ion arose as t o how measured data would be
a f f e c t e d b y v i b r a t i o n o f a probe. The problem o f e r r o r i n measured pressure
caused by unsteady cross-flow has been previously considered by Siddon
(Ref. 1 ) . The fo l lowing d iscuss ion is taken f rom th is re ference.
Some ins igh t i n to t he p rob lem o f a probe i n an unsteady cross-f low
can be obtained by use o f an i dea l i zed f l ow model tha t ignores v iscos i ty .
Consider a cy l indr ica l p ressure p robe o f d iameter d , sub jec ted to a uniform,
unsteady cross-veloci ty Vn(t) , see Fig. A.III.1. Any c o u p l i n g e f f e c t o f t h e
a x i a l v e l o c i t y U ( t ) i s neglected. Assuming the f l ow to be i r r o t a t i o n a l , t h e
approp r ia te po ten t i a l f unc t i on i s :
d2 4 = Vn ( r + r) COS n .
The unsteady form o f t h e Bernou
p (r, n , t ) - P t ( t ) =
l l i equat ion g ives:
"p (vn2 - v - v 2, + p at 1 a 4 2 r n
where,
P ( t ) i s t he p ressu re wh ich wou ld have occur red a t r = 0 i n t h e absence o f
the probe ( i .e . , the ' t rue ' pressure) . A t the sur face o f the probe (r = d/2) , the pressure equat ion becomes:
t
P (Tl,t) - P t ( d = - 1 (1 - 4 Sin 2 n ) + ptnd Cos n - 2 P 'n
(111.1)
The f i r s t term on the r ight hand s ide i s recogn ized as the p ressu re d i s t r i bu -
t i o n f o r s t e a d y p o t e n t i a l f l o w . The second term ar ises f rom unsteadiness.
For a pressure probe which registers the exact c i rcumferent ia l average o f
P(n , t ) , (e.g., by means o f a c i r c u m f e r e n t i a l s l i t ) t h e e r r o r will be:
P,(t) - P t ( t ) = - $ P vn 2 Y
.where P,(t) = measured unsteady s t a t i c p r e s s u r e .
I n t h i s i d e a l s i t u a t i o n t h e p a r t o f t h e p r e s s u r e d i s t r i b u t i o n a s s o c i a t e d
w i th t he acce le ra t i on t e rm Vn does n o t c o n t r i b u t e t o t h e e r r o r .
A real probe will not take an exact average over P( r l ) ; therefore, an
a d d i t i o n a l e r r o r p r o p o r t i o n a l t o in may a r i s e .
P,(t) - P t ( t ) = - 1 p Vn2 + K p i n d
Roughly speaking, the coeff ic ient K (<1) represents the f ract ional inaccuracy
of the average over P(n). I f we regard Vn as s inuso ida l , the \i e r r o r becomes
increasingly important wi th f requency (i - w V n ) . Never the less , fo r a 0.318
cm (1/8 in.) d iameter probe wi th an averaging inaccuracy o f 5% and V 3.05
m/sec (10 f t / s e c ) , K p i n d i s less than 5% of the V e r r o r a t 100 Hz.
n
n
n
n
Based on responses to the ques t ionna i re , many inves t i ga to rs have located
a s i n g l e row o f o r i f i c e s on e i t h e r t h e t o p o r s i d e o f a long p ipe fo r tunne l
ca l i b ra t i ons .By us ing Eq. ( I l l - I ) w i t h 11 = 0 ( o r i f i c e s on e i t h e r t o p or bottom)
and assuming the p ipe osc i l la tes s inusoida l ly , one can es t ima te t he e r ro r i n
measured, mean s ta t i c p ressu re , i . e . ,
P(0, t ) - P ( t ) = T p Vn ( t ) + p \ip(t) d. 1 2 t
Taking a time average over one c y c l e r e s u l t s i n
T T
t 2 T O n 0 - - P,(O) - P = - 1 V 2 ( t ) d t + i n ( t ) d t ,
( I 11.2)
( I 11.3)
where T = pe r iod o f o s c i l l a t i o n .
Before we can proceed any f u r t h e r , a cha rac te r i s t i c f requency and ampli tude
must be assumed. For calculat ion purposes we here assume a frequency o f 100 Hz.
256

Since we have previously established that it i s desirable to measure mean static pressure to within 6.89 N/m2 (0.001 psi), the amplitude of pipe oscillation wi 1 1 be calculated for the case P - Pt = 6.89 N/m . - 2
m
Hence, if the pipe oscillation is represented by
Displacemetjt E D = A sin wt;
then ' 8
' . Vn = b = Aw coswt
in = D = -AU srnwt. 2
Substituting into Eq. ( 1 1 1 . 3 ) , we have
2wt) PA w dt - 2 2
a*. 6.89 = - ( 1 1 1 . 4 )
It may be noted from Eq. ( 1 11-41 that the required amplitude increases as frequency decreases. For the particular case of w = 21rf = 2 0 0 ~ and p = 1.71 N sec2/m4 (0.00332 lbf sec /ft ) [Po = 2.41 x 10 N/m (35 psia), T = 311°K (560"R), M = 11, the amplitude required for significant pressure
error is
2 4 5 2
0
Therefore, a static pressure survey pipe with a single row of orifices, located on either the top or bottom, would have to oscillate at a frequency of 100 Hz and an amplitude of 0.639 cm in order to cause the measured pressure to be 6.89 N/m (0.001 psi) too high. 2
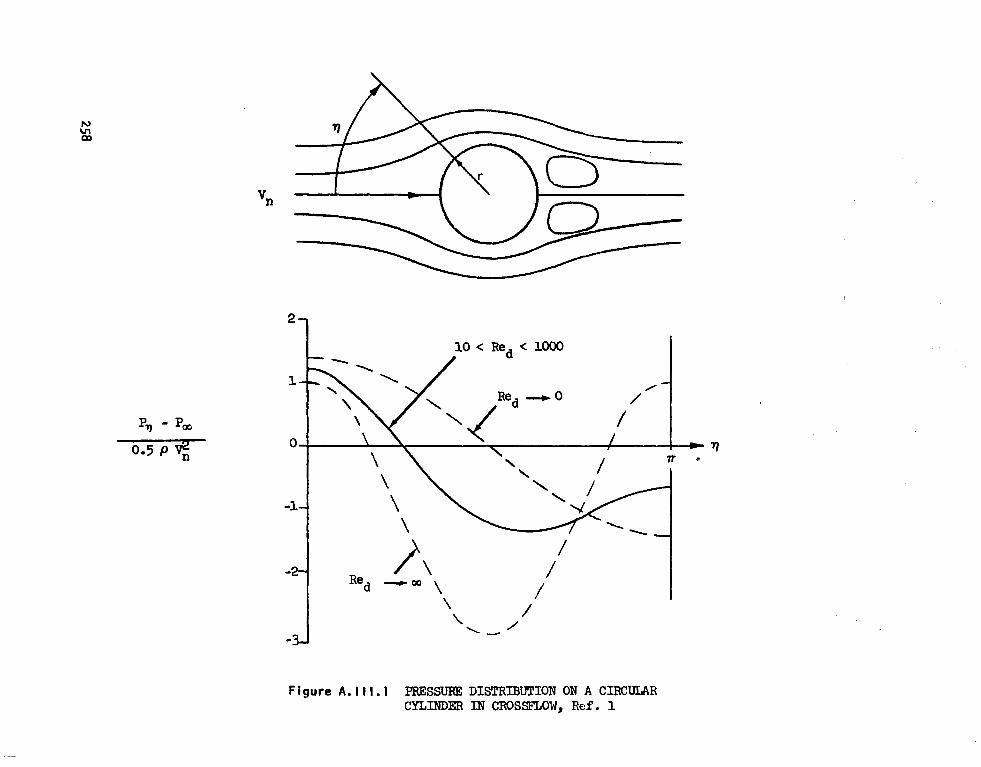
Figure A. I I I . 1 PFESSURE DISTRIBWION ON A CIRCULAR CYLINDER IN CRoSSFIX)W, Ref. 1
I -
Going through the same procedure wi th n = 90" ( o r i f i c e s on s ide o f p ipe ) ,
an ampl i tude o f 0.368 cm (0.145 i n . ) i s p r e d i c t e d t o cause the measured,
s t a t i c p r e s s u r e t o be low by 6.89 N/m (0.001 ps i ) . S ince large tens ion or 2
compression loads are usually placed on s ta t i c p ressure survey p ipes to m in i -
mize sag, it appears u n l i k e l y t h a t p i p e v i b r a t i o n i s a s i g n i f i c a n t s o u r c e o f
e r ro r . A l though th i s conc lus ion i s based on an inv isc id , incompress ib le
analys is , it i s c o n s i d e r e d t o be conservat ive ( i .e. , g ives a lower bound
es t ima te o f A) because o f t h e n e g l e c t o f pneumatic damping in tub ing which
connect o r i f i ces w i th p ressu re t ransducers .
A . I I I REFERENCES
1 . Siddon, T. E., "On the Response of Pressure Measuring Instrumentation i n Unsteady Flow," UTlAS Report No. 136, AD 682296, January 1969.
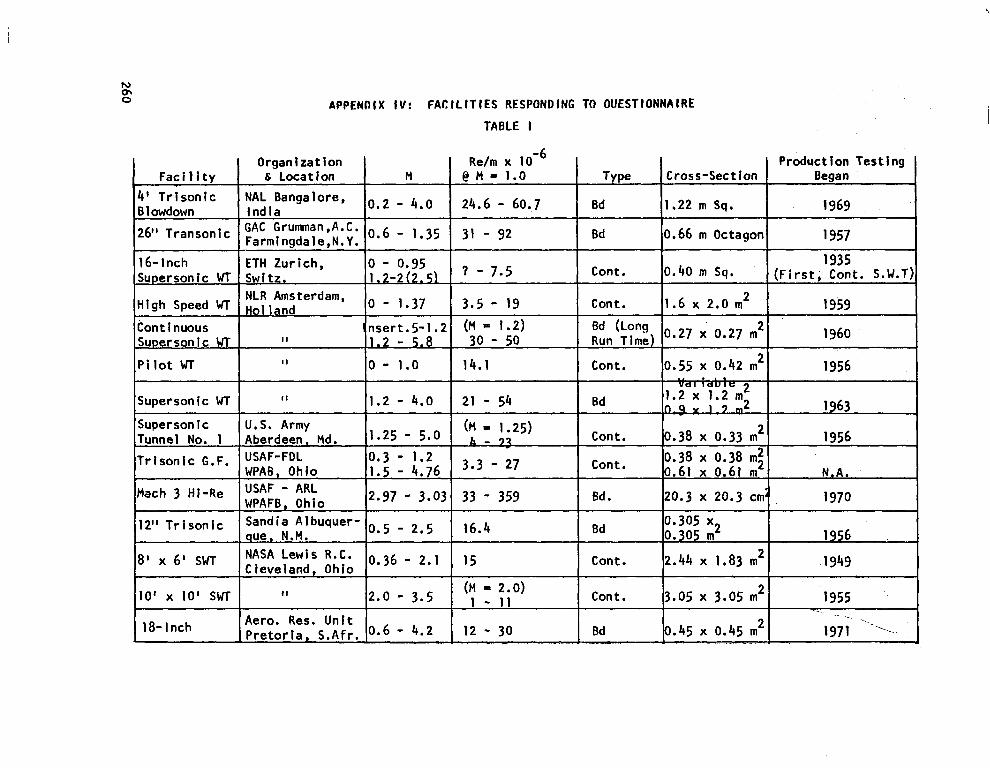
APPENOIX I V : FACILITIES RESPONDING TO OUESTIONNAIRE
Faci 1 i t y
4' T r ison lc B 1 owdown
26" Transonic
16-Inch .Supersonic W
High Speed WT
Continuous Supersonic WT
P i lo t WT
Supersonic WT
Supersonlc Tunnel No. 1 T r l son lc G.F.
Mach 3 Hi-Re
12" Tr i son i c
8 ' x 6' SwT
IO' x 10' SWT
18- Inch
Organlratlon & Locat ion M
Farm1nadale.N.Y.
ETH Zurich, 0 - 0.95 Swltz. I . 2-2 (2.5) NLR Amsterdam, Hol land - .37
nsert.5-1.2 1.2 - 5.8
0 - 1.0
1.2 - 4.0
I I
I I
II
U.S. Army Aberdeen, Md. 1.25 - 5.0 USAF-FDL 10.3 - 1.2 WPAB, Ohio 1.5 - 4.76 USAF - ARL WPAFB , Ohio 2.97 - 3.0:
Sandia Albuquer- que, N.M. 0.5 - 2.5
NASA Lewis R.C. o.36 - 2.1 Cleveland, Ohio
2.0 - 3.5
Aero. Res. U n i t Pretor ia , S . A f r . o * 6 - 4 * 2
II
TABLE I
Re/m x @ H - 1.0
24.6 - 60.7
31 - 92
7 - 7.5
3.5 - 19 (H = 1.2) 30 - 50
14.1
21 - 54
(M = 1.25) h - 7 1
3.3 - 27
33 - 359
16.4
15
(M = 2.0) 1 - 11
12 - 30 . . . . - . . . .
Productlon Testlng Began
0.66 m Octagon 1957
1935 Con t . 10.40 m sq . I (F i r s t . Cont. S.W.1
Cont. 1.6 x 2.0 m 2 1959 2
Run Tlme Bd 10.27 x 0.27 m I 1960
Cont. 10.55 x 0.42 m21 I 1956 v m u I e
1.2 x 1.2 m 2 Bd n . s Y 1 . 7 nl2 1963
Con t . 0.38 x 0.33 m 1956 2
Cont. 0.38 x 0.38 m: 0.61 x 0.61 m N.A.
Bd . 1970
Bd 0.305 x2 0.305 m 1956
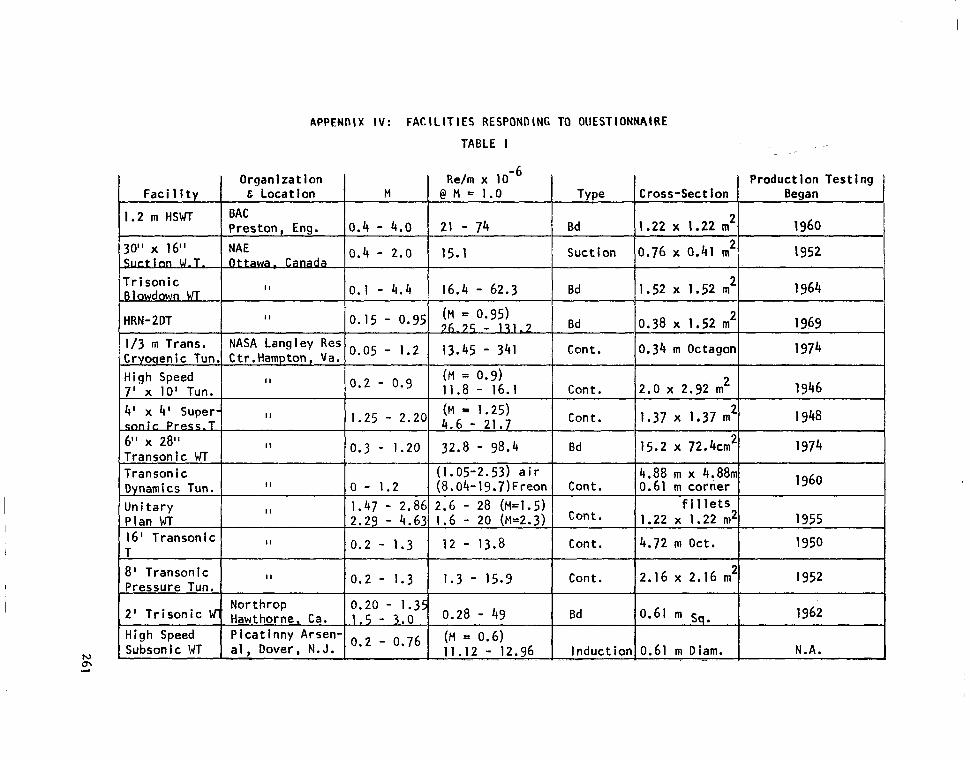
APPENDIX I V : FACILITIES RESPONDING TO OUESTIONNAIRE
TABLE I
Organlzatlon I Re/m x Faci I i t v I Location I M @ M = 1.0 I Tvne ,.
I .2 m HSWT BAC Preston, Eng. 21 - 74 0.4 - 4.0
30" x 16" 15.1 0.4 - 2.0 NAE S u c t l a n W . T . d a ,
Suction
Tr i sonic t3lowdown Wf 0.1 - 4.4 i d Bd
I I
HRN-PDT - Bd I I 0.15 - 0.95
l / 3 m Trans. Ctr.Hampton, Va. Cryoqenic Tun. NASA Langley Res 0.05 - 1.2 13.45 - 341 Cont.
High Speed 7 ' x IO' Tun.
( M = 0.9) I I Cont. 11.8 - 16.1 O n 2 -
6" x 28"
(1.05-2.53) a i r Transon i c Transonic Wl 32.8 - 98.4 0.3 - 1.20 I' Bd
Dynamics Tun.
Uni tary
Con t. I2 - 13.8 0.2 - 1 . 3 1 1 I 6 l Transonic
Conto 1.6 - 20 ("2.3) 2.29 - 4.63 Plan Wl 2.6 - 28 (k1.5) 1.47 - 2.86 II
I I 0 - 1.2 Cont. (8.04-19.7)Freon
T I I I I I
8 ' Transonic Pressure Tun.
I I 0.2 - 1.3 Cont. 1.3 - 15.3
Northrop 0.20 - 1.3 2 ' Trisonic 4 Hawthorne, Ca. 11 .5 - 3.0 7 0.28 - 49 Bd High Speed
Induct ion 11.12 - 12.96 a l , Dover, N.J. Subsonlc WT Picat inny Arsen- 0.2 - 0.76 (M = 0.6)
". . .
Production Testlng Cross-Sect ion
1.22 x 1.22 m
Began
0.76 x 0.41 m
2
2 1952
1.52 x 1.52 m 1964
0.38 x 1.52 m 2 1969
0.34 m Octagon 1974
2
1960
2
2.0 x 2.92 m 1946
1.37 x 1.37 m 2 1948
15.2 x 72.4cm 2 1974
'4.88 m x 4.88m i 0.61 m corner 1960
f i 1 l e t s
,
1.22 x 1.22 In2 1955
A.72 m Oct.
'2.16 x 2.16 rn
1950
'0.61 m Diarn.
1962 0.61 m sq.
1952
N.A.
2
. ..
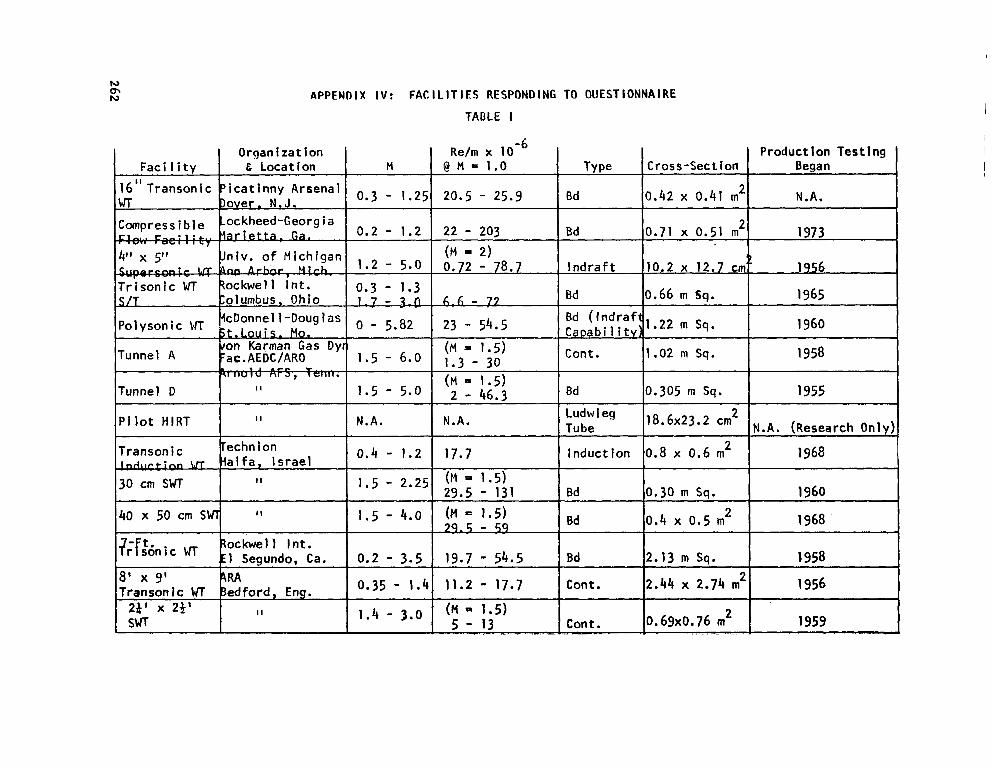
APPENDIX I V : FACILITIES RESPONDING TO OUESTIONNAIRE
TABLE I
Polysonic \-IT kcDonnel1 -Doug 1 as
U I S . Mo. Tunnel A ryz; , G ; : z
Tunnel D
ac.AEDC/ARO
I I
Pi lot HlRT
Transon i c echn i on
30 cm WT
40 x 50 cm S W l
? 3 k n i c ockwel I In t . 1 Sequndo. Ca.
Transonic W bedford, Eng. 24' x 23' I I I
SWr I
1
Productlon Testing TY Pe Cross-Section Began
Bd 0.42 x 0.41 m N.A. 2
Bd 0.71 x 0.51 m 1973
lnd ra f t 10.2 x 12.7 cm" 1956
2
7
Bd 10.66 m sq. I 1965
Cont. 11.02 m sq. I 1958 I I I I
Ludwi eg Tu be !18*6x23*2 cm 1N.A. (Research Only)
~ ~~ ~~
2
1 Induct ion 0.8 x 0.6 m 2 1968
i I Bd 0 .30 m Sa. 1960 I 1 0.4 x 0.5 m
2 1968
I Bd 2.13 m SQ. 1958
Cont. 0.69x0.76 m 2 1959 " . . , . . . " .. . .

APPENnlX I V : FACILITIES RESPONDING TO OUESTIONNAIRE
TABLE I
Organization Re/m x Faci 1 i t y @ M = 1.0 M & Location
WRE Salisbury, 3.3 - o.38 2 0.4 - 1.0 15-lnch SWT
s3 Bd W l
1.4 - 2.8 s. Aust.
2.8 - 5.0 I1 (M = 2.8) 16.4 - 65.6
I Transon wT i c WT I Aust. 1 0.4 - 1.4
3.28 - 6.56 ARL Me1 bourne,
Volvo Tro l lhat ten o,5 - 1.5 Sweden 23 - b9
WT9 I I (M = 1.5) 1.4 - 3.2 29 - 55 Boe i ng
19.7 - 45.9 - 4 * 0 Seatt le, Wash. Supersonic WF. (M = 1.2) Boe i ng
2D-TWT I1 26.25 - 77.1 0.2 - 1.25
Boe i ng Tranyznlc WT
I I 0. - 1 . 1 1
Lockheed Triqn,nic
Lockheed
HS - TWT
Saugus, Cal i f . 0.2 - 5.0 14.8 - 67.9
Hawker-Siddeley Hatfield.Enaland 10.2 - 11.5 0.5 - 1 . 1
8 ' Transonic 1.3 - 18 Calspan w-r 28 - 42 0 - 1 - 3 4 Buffalo, N.Y.
Type
0.305x0.406m2 Bd
Cross-Section
Cont. 0.38x0.38 m
Bd
2 0.5 x 0.5 m Bd
2 0.81x0.53 m Cont.
17.8x15.2 cm 2
Bd 0.5 x 0.5 m 2
Bd 1.22x1.22 rn 2
Bd 0.305x0.91 m
Cont.
2
2.44 m x 3.668 0.61 m corner
tr I l e t Bd 2
2
1.22x1.22 m
Cont. 0.76x0.61 m
Cont. 6' low Re; Interm.
Var iable Dia, zg'" 2.44 m Sq. - Tube,
0.81m-l.52m . .
Production Testing Began
1964
1956
1957
1966
1957
1952
1962
1957
1965
1944
19h0 1954
1956
1966
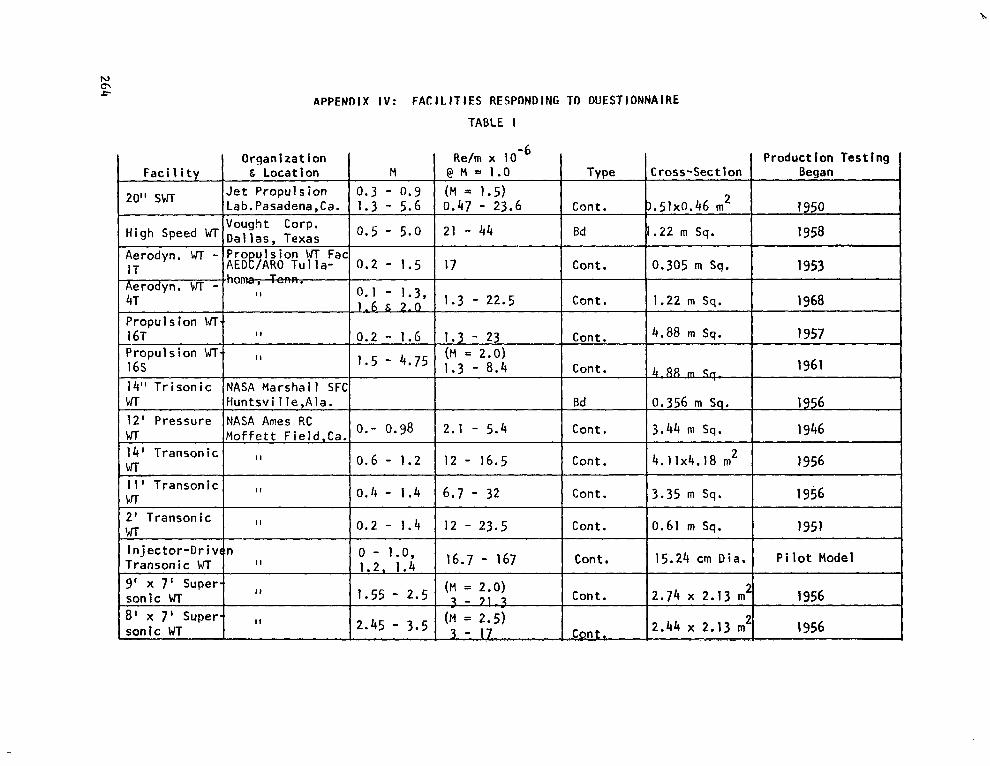
APPENDIX IV: FACILITIES RESPONDING TO OUESTIONNAIRE TABLE I
Faci 1 i ty
20'' SGrr
High Speed Wl
Aerodyn. WT - 1T Aerodyn. WT - 4T Propu 1 s ion Vf 16T Propulsion Wl 16s 14" Trisonic WT
-
12' Pressure wr 14' Transonic w-r 1 1 I Transonic LIT 2' Transonic w-r Injector-Driw Transonic Wl 9' x 7' Super sonic WT 8 ' x 7' Super sonic WT
Organization
Vought Corp. Dal las. Texas 10.5 - 5.0 Pro ulsion LIT Fac AED!/ARO Tulla- 10.2 - 1.5 ,ho-.
I I 0.1 - 1.3, 1.6 & 7.0
I t 0.2 - 1.6 I I 1.5 - 4.75
NASA Marshall SFC Huntsvi 1 le,Ala. NASA Ames RC Moffett Field,Ca. 0.- 0.98
1 0.4 - 1.4 I I 0.2 - 1.4
In 0 - 1.0, 1.2. 1.4 I I
II 1.55 - 2.5 2.45 - 3.5 I 1
Re/rn x Production Testing @ M = 1.0 Type Cross-Section Began (M = 1.5) 0.47 - 23.6 Cont. 3.51x0.46 rn 2 1950
17 I Cont. 10.305 m Sq. I 1953 I 1.3 - 22.5 1968 1.22 rn Sq. Cont.
I
1.3 - 23 1957 4.88 rn sq. Cont. (M = 2.0) 1.3 - 8.4 I961
4 - t u L a 3 . q - Cont.
Bd 1956 0.356 rn Sq.
2.1 - 5.4 1946 3.44 m Sq. Cont. I I I I
12 - 16.5 1956 3.35 m Sq. Cont. 6.7 - 32 1956 4.11x4.18 m Cont. 2
12 - 23.5
Pilot Model 15.24 crn Dia. Con t 16.7 - 167 1951 0.61 rn Sq. Cont.
(M = 2.0)
(M = 2.5) 7 - 7 1 . 7 Cont.
2.44 x 2.13 rn 2
1956 2.74 x 2.13 rn2
3 - . .. 17 , . . . . . . - 1956 - . . .. . . Con t ..
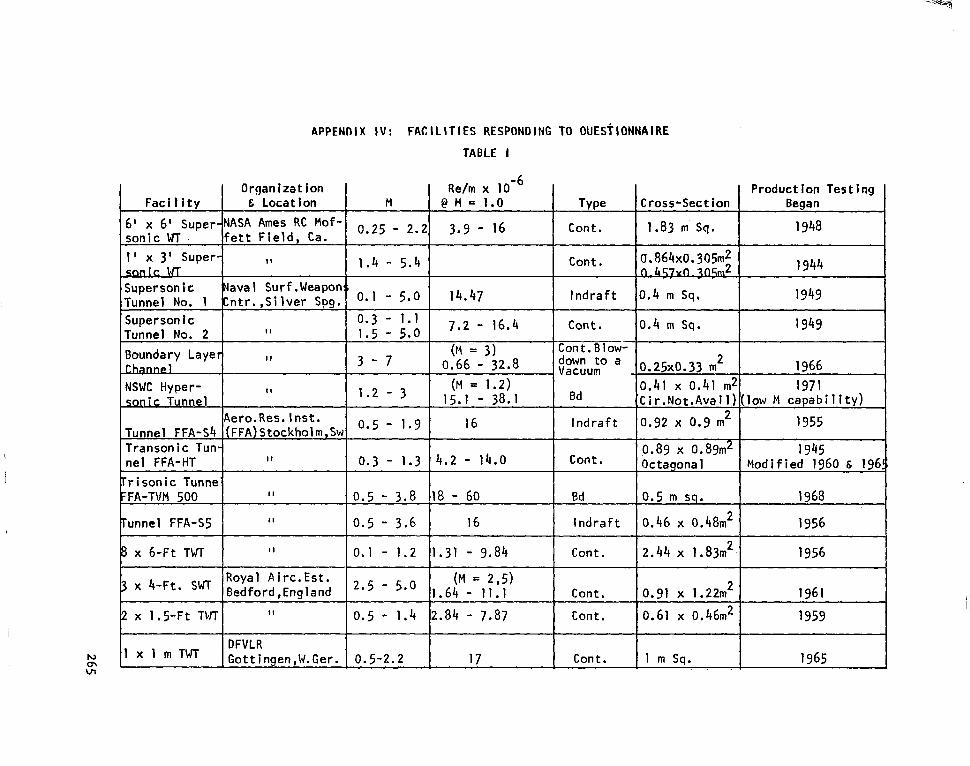
APPENDIX IV: FACILITIES RESPONDING TO OUESTIONNAIRE
TABLE I
Organitat ion Faci 1 i t y & Locat ion
61 x 61 Super-NASA Ames RC Mof- sonic WT f e t t F i e l d , Ca. 1 ' x 3 ' Super- I I
Supersonic Uaval Surf.Weapon Tunnel No. 1 Zntr.,Silver Spg. Supersonic Tunnel No. 2
Boundary Layer I I
NSWC Hyper- I I
sonic Tunnel
Tunnel FFA-Sb (FFA)Stockholrn,Sb Transon i c Tun- nel FFA-HT
C W T
II
1
Aero.Res.lnst.
I I I I
Tr i sonic Tonne; =FA-TVM 500
Tunnel FFA-S5
8 X 6-Ft TWT
I I
I I
I I
Royal Airc.Est. Bedford.Enqland x 4-Ft* '*
DFVLR Gottingen,W.Ger. x TWT
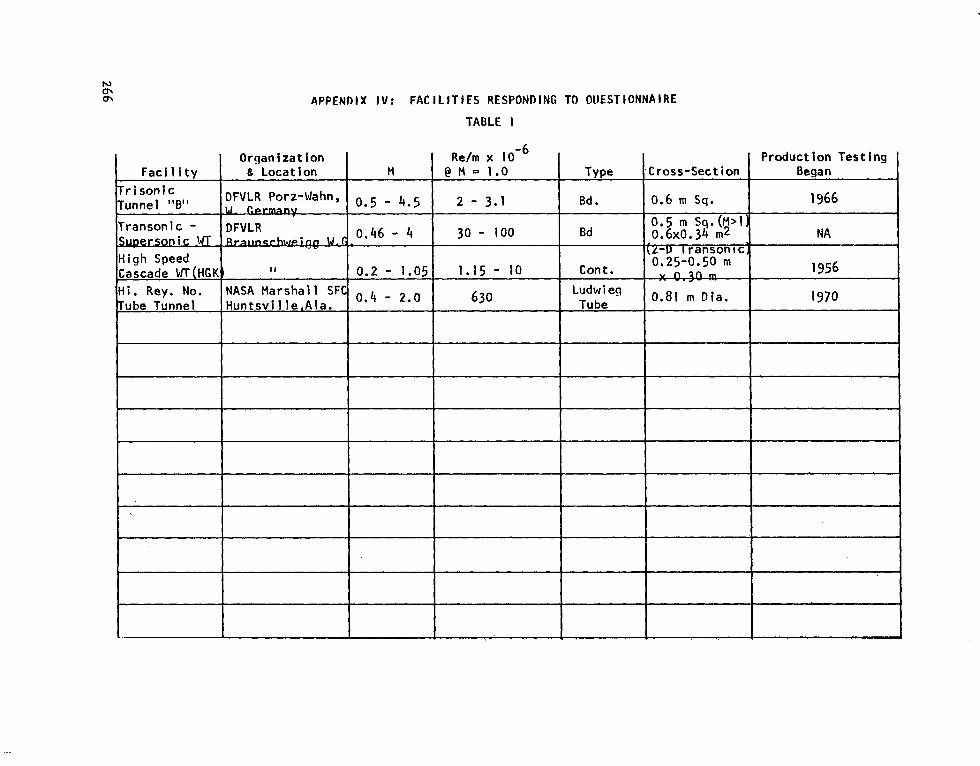
APPENDIX IV: FACILITI€S RESPONDING TO OUESTIONNAIRE TABLE I
Production Testing :ross-Section Began
I
0 . 6 rn Sq. I 1966 0.5 rn Sq.(M>I 0.6x0.34 rn2
0.25-0.50 m
0.81 m D la . 1970

APPENO I X IV (Cont Id)
TABLE I I : TEST SECTION CHARACTERISTICS
Venting of Plenum Chamber
EJector Flaps
Fac l l f t y
NAL (India)
GAC (NY)
ETH (Swi t z )
NLR (HST .Hal land)
NLR (CSST)
NLR (PT)
NLR (SST)
U . S . Army (SSTl)
WPAFB (TGF)
Cross-Section
1.22 m Sq.
0.66 m Octagon
Wall Anqle
lo t o -2O
Porosltv 20% sw 6 % T s B
12% & 6%
Perforated 300 Top & Bot. 1.27 cm, 90 SW
Slotted I 0. oso -Ejector Flaps ~ ~~
Sol i d 0.4 m Sq. I
12% T E B 0.13' Slot ted (T & B) 5 cm, 40 cm 1.6 x 2 m
0.27 x .27 m
2 -
2
Fixed Ejector Slots
Sol id I I
, ' l O % T & B 0.22O 0.55 x 0.42 m
1.2 x 1.2 m
0.38 x 0.33 m
0.38 x 0.38 mL
2
2
2
Slot ted (T & B ) 0.525 cm, 5.25 cm Flxed Ejector Slots
Sol i d
~ 4 - 12% O0 'EJector Flaps
t- WPAFB (M3HR)
Sand i a (TWT)
Sol id I 20.3 x 20.3 cm2
0.305 x 0.305 m2 I I
6% lo EJector Flaps Perforated [ 0.318 cm, 30'
2.44 x 1.83 m2 -"-- Perforated 2.54 cm, 30' Aux i 1 i a r y Pumps ' 6% O0
3.05 x 3.05 m2
0.45 x 0.'45 m 2
Sol i d I I ~
l A u x i l i a r y Pumps 0'.'6O T E B ARU (SWT) Perforated

APPENDIX IV (Cont'd)
TABLE I I : TEST SECTION CHARACTERISTICS
Fac i
BAC (HSWT)
0.58 cm, 4.7 cm S lo t ted 0.76 x 0.41 m lJAE (Su WT)
19% 1.6 cm, 90' Perforated 1.22 x 1.22 m
NAE (2DT) 0.38 X 1-52 m T E B 20.5% 1.27 cm, 90' (T B)
2 Perforated
9RA (TWT) 2.44 x 2.74 m2 Per forated
4 f M (SWT) 0.305 x 0.406 m2 So l i d
1.27 cm, 90' 22.5%
1 20.3 x 22.9 cm2 1 Per forated 0.185 cm, 90' I 22%
Volvo (WTl) 0.5 x 0.5 m 2 S lo t ted (T G B) 4 % T & B ?
I I I
Volvo (Wr9) 1 0.5 x 0.5 m2 I Sol i d
Boeing (SWT) 1 1.22 x 1.22 m2 1 Sol i d
Boe 1 ng 34.1% T&B (T & B) 0.305 X 0.91 m (2D-TWT)
1.03 cm, 90° Perforated 2
Wall Anqle
O0
lo
-0.5' to-. 25'
O0
O0
O0
O0
0.5'
0.21O
- O0
Venting of Plenum Chamber
Ejector Flaps
Ejector F 1 aps
Vent Inq to Atm.
9ux i 1 i a r y Pumps
Ejector Flaps
E jec tor F 1 aps
Elector Flaps
Ejector Flaps

APPENDIX IV (Cont'd)
TABLE I I : TEST SECTION CHARACTERISTICS
Hole Size/Angle o r Venting of Plenum Faci 1 i t y
Ejector Flaps O0 47.31 cm SW tJith insertsTdB p;fleTscorner (TWT)
Chamber Wall Anqle PorQsjtv Slot Width/Soaciu Wall Type Cross-Section 2.44 x 3 * 6 6 11% - 3.5% 7.45 cm,70.41 cm Slot ted
Lockheed (TWT)
Hawker
'*'' cm* 'O0 Perforated 1.22 x 1.22 m2
22% A u x i l i a r y Pumps '-0.75'
S lo t ted T&B Perf. InsertsO.10
2.54 cm, 10.80 cm Ejector Flaps -0.17' 3% cm, goo
6.35 cm, 148.6 cm 4.4% 0.067' SW 0.167OT~B Ejector Flaps
LRC (UPWT) 1.22 x 1.22 m Sol i d
LRC (16 ' TT) S lot ted 4.72 m Octagon Auxi I i a r y Pumps 0' - 0.75' 3.9% .62 cm, 1.95 rn p - LRC (8 ' TPT)
0.083' 0-125; to 1.727 cm 14 cm Slot ted 0.34 m Octagon LRC(1/3m TCT)
0,083' SW 3-6% T&E 3.18 cm, 43.20 cm Slot ted 2.16 x 2.16 mz no - o-,,h~TFR Fixed E jector S lots
Tapered from zero Ejector Flaps or Vent Ins to Atm.
LRC (HST) 4.8% 4.60 cm, 73.03 cm Slot ted 2.0 x 2 .92 m TF.R O0
A u x i l i a r y Pumps & Ejector Flaps
LRC (4 ' SPT)
12.5% 3.476 cm, 3.81 cm Slot ted 15.2 x 72.4 cm2 LRC (6" TWT)
Sol id I . 37 x 1.37 m
TL R Fixed Slots O0
Slot ted NC (2 l TWT) 0.61 m Sq.
PA(HSSWT) 10.61 m Dia. I Sol id I I IO0 10' I
' Ejector Flaps -2/3' t o +lo 10% 1.91 cm Holes 3.318 x 2.54 cm,
I PA (''I' Tbn)
Diffuser Pumping NA 0.25 - 8% 0.48 cm, 30' Perforated 0.42 x 0.41 m * Va 1 ve Cont r o 1 s
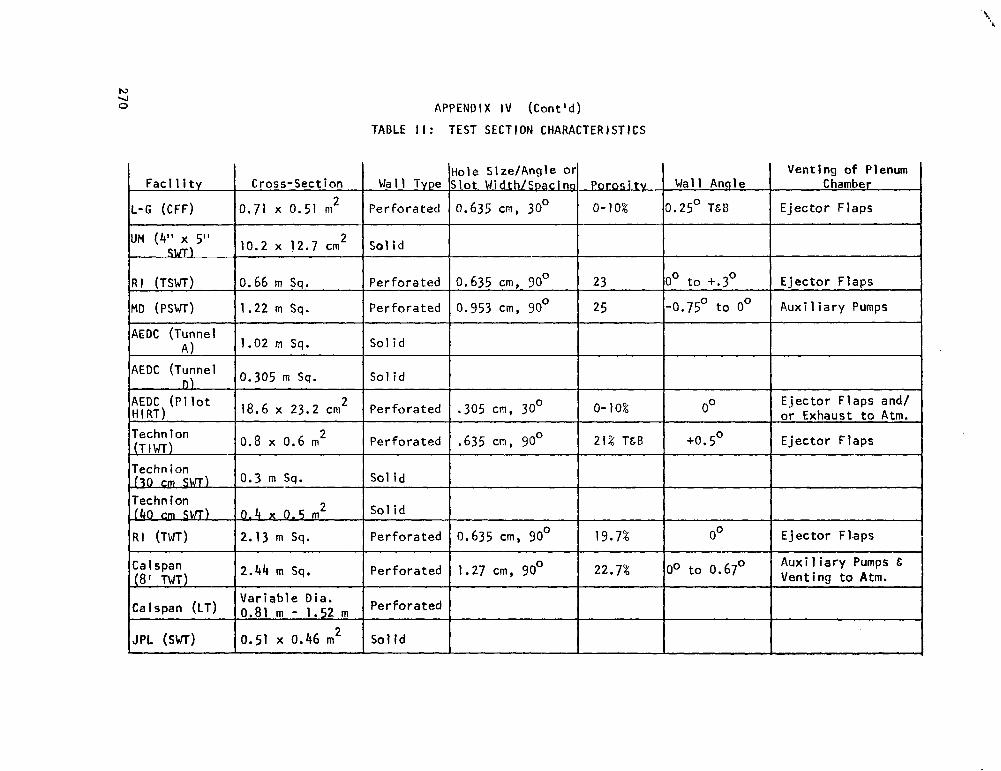
4 h,
0 APPENDIX I V (Cont Id)
TABLE I I : TEST SECTION CHARACTERISTICS
Faci 1 i t y Cross-Section 2
L-G (CFF) 0.71 x 0.51 m
1 UM (4" x 5" 10.2 x 12.7 cm
MD (PSWT) 1.22 m Sq. I I -
AEDC (Tunnel
AEDC ( P i l o t ol H I RT)
Techn ion (TIWT)
Techn ion
Techn ion n &haAm" RI ( T U )
0.305 m S q .
18.6 x 23.2 cm
0.8 x 0.6 rn
2
2
0.3 m Sq.
0.4 x 0.5 m
2.13 m Sq.
2
JPL (SWT) 0.51 x 0.46 m 2
Wall Type
Perforated
Sol i d
Perforated
Perforated
Sol i d
Sol i d
Perforated
Perforated
Sol i d
Sol i d
Perforated
Perforated
Perforated
Sol i d
Venting of Plenum Mal 1 Anqle
Ejector Flaps 0.25' T&B 0.635 cm, 30' 0- 10%
C harnber
0.635 cm, 90°
Auxi 1 i a r y Pumps -0.75' t o Oo 25 0.953 cm, 90'
E jector F laps oo t o +.3O 23
.305 cm, 30' O0 0- 10% Ejector F laps and/ o r Exhaust t o A t m .
.635 cm, YOo 1 21% TbB I +0.5' I Ejector Flaps
0.635 cm, 90° Ejec tor F I.aps O0 19.7%
1.27 cm, 90° 22.7% A u x i l i a r y Pumps E O0 to 0*670 Vent ing to Atm.

APPENDIX IV (Cont'd)
TABLE I t : TEST SECTION CHARACTERISTICS
Facl 1 i t y
VC (HSWT)
AEDC (AWT- 1 T)
AEDC (Am-4T)
AEDC (PWT- 16T)
AEDC (PWT-16s)
NASA Marshall (14'' TWT)
ARC (12' PWT)
ARC (14' TWT)
ARC ( 1 I ' TWT)
ARC (2' TWT)
ARC ( I -D TWT)
4RC (7 'x7 ' S W )
ARC(8Ix7' SWT)
N ARC (6'x6' SWT v,
Cross-Section
1.22 m Sq.
3.305 m, Sq.
1.22 m Sq. - 4.88 m Sq.
4.88 rn S q .
0.356 m Sq.
3.44 m S q .
4.11 x 4.18 m
-
2
3.35 m Sq.
0.61 m S q .
0.152 m Dia.
2.74 x 2.13 m 2
2.44 x 2.13 m
1.83 m Sq.
2
Hole Size/Angle 01 Wall Type Slot Width/SDacint
Perforated 1.04 cm, 90'
Perforated 0.318 cm, 30'
Perforated I 1.27 cm, 30'
I Perforated 1.905 cm, 30'
Sol i d
Sol i d
w i th i nse r t 'lotted b l . 7 4 cm, 26.4 cm
Sol i d
Sol i d
'lotted T&B11.03 cm, 28 cm wi th i nser t
Porositv 22.5%
6% and 0 -10%
0 - 10%
6%
03.4%
5.6%
5.8%
22% w i t h Th ro t t l e -Bars -
5.1%
Wall Anqle
80.33: T&B Q-h' cw -0.67' t o 0.5' TEB 1 to 0.55' T& B
-1' t o O.jOT&B
) .18O T&B
1.19O sw
bo t o 0.35'
O0
Venting of Plenum Chamber
Ejector Flaps
Ejector Flaps & Steam Eiector SYS. Ejector Flaps & Aux I l l a ry Pumps Ejector Flaps E Auxi 1 i a r y Pumps
Auxi 1 i a r y Pumps
Ejector Flaps
Ejector Flaps & Aux i l i a ry Pumps
Ejector Flaps
Auxi 1 i a r y Pumps
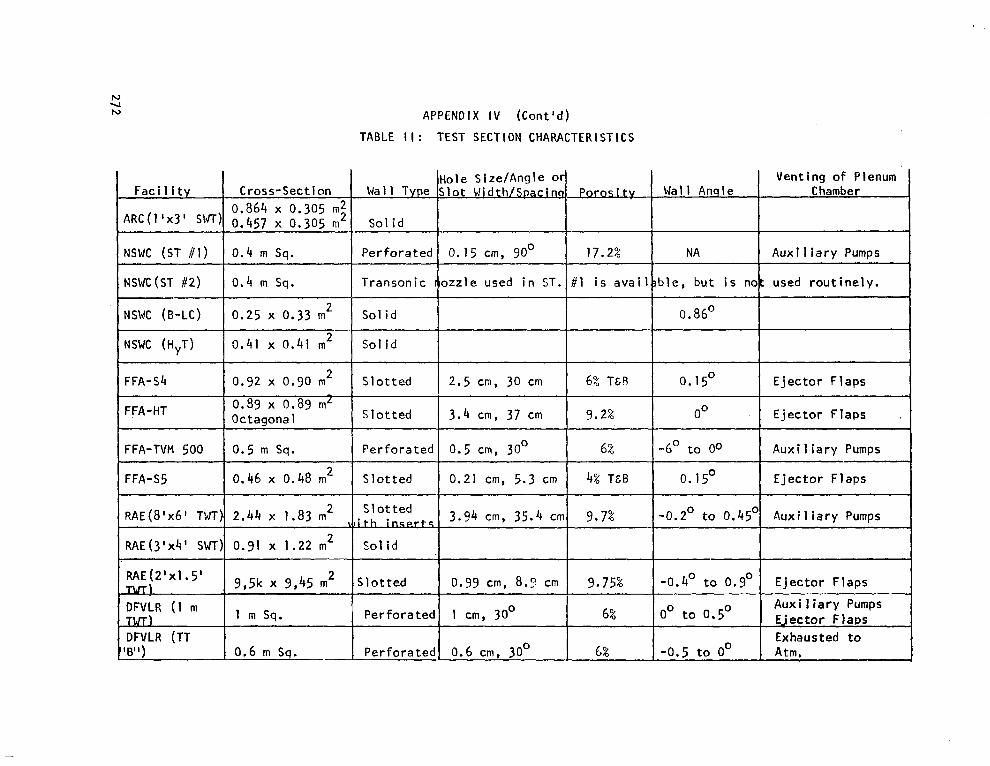
4 N
N
Faci 1 1 t y Cross-Section
I NSWC (ST # I ) I 0.4 m Sq. I NSWC(ST #2) I 0.4 m Sq.
NSWC (HyT) 0.41 x 0.41 m
FFA-Sb 0.92 x 0.90 m -
FFA-HT 0.89 x 0.89 mL Octaaona 1
d
FFA-TVM 500
0.46 x 0.48 m2 FFA-SS
0.5 m Sq.
2.44 x 1.83 m2 RAE(8Ix6' TWT)
RAE(3Ix4' SWr)l 0.91 x 1.22 m2 1
DFVLR (TT W 1 ) 0.6 m Sq. -
APPEND I X I V
TABLE I I : TEST SECT
(Cont Id )
ION CHARACTERIST ICs
Transonic Jozzle used i n ST.I#l i s a v a i l
So l id 1 Sol i d I S lo t ted I 2.5 cm, 30 cm I 6% TES
S l o t t e d
4% T&B 0.21 cm, 5.3 cm S lo t ted
6% 0.5 cm, 30' Perforated
9.2% 3.4 cm, 37 cm
Sol i d -
S l o t t e d 9.75% 0.99 cm, 8.9 cm
Perforatedl 1 cm, 30' 1 6%
Per forated 6% 0.6 cm, 30'
Venting of Plenum
0.86'
0.15' Ejector Flaps
O0 ' E jector Flaps
-6' t o 00
-0.2' to 0.45'
E jec tor Flaps 0.15'
Auxi 1 i a r y Pumps
A u x i l i a r y Pumps
-0.4' to v 0.9 Ejec tor Flaps Auxi 1 i a r y Pumps
Exhausted to
0' t o 0.5'

APPENDIX IV (Cont'd)
TABLE I I : TEST SECTION CHARACTER ISTICS
Facl l I t y
DFVLR (T-s WT)
DFVLR (HGK)
NASA Marshal 1 (HRNTT)
Hole Site/Angle or
Exhausted to Atm. 0.05' t o 0.1' 1 - 10% 0.8 cm, 6.8 cm
Venting of Plenum Cross-section Chamber Wall Anqlc Porosftv Slot Width/- Wail Type
0.5 m sq. (M > 1 ) 0.6 x 0.34 rn2 Slotted
x 0.30 .m so, id 0.25 - 0.50 m
Ejector Flaps 00 1.27 cm, 30' Perf. 0.81 m D i a . Varies 1-1 0:: along a x i s

T.D. Reed, T.C. Pope and J.M. Cooksey . 10. Work Unit No.
9. M a m i n Q Orp.nilrtion Narm ud Ad&-
Vought Corporation Dallas, Texas
"11. Contract or Grant No. NAS 2-8606
13. Type of Repon and Period Covered 12. Spotnoring A p n c v Nlnu md Address Contractor Report
National Aeronautics E Space Administration Washington, D.C. 20546
14. Smmroring Agmcy code
1 I
15. Supplemntarv Notes
1. Rmort No. 2. Gobwnmmr Accr*on No. NASA CR-2920
3. Rripient's cltabg No.
4. Title rd Subtitle 5. Rem13 Date
"Calibration of Transonic and Supersonic Wind Tunnels" November 19 7 7 6. F'erforming Orgmnization Coda
- I
- -
-
-
-
d
-
-
-
-
16. Abstraa
State-of-the art instrumentation and procedures for calibrating transonic (0.6 C M < 1.4) and supersonic (M 5 3.5) wind tunnels are reviewed and evaluated. Major emphasis is given to
and a questionnaire which was sent to 106 domestic and foreign facilities. Completed question- transonic tunnels. Background information was obtained via a literature search, personal contacts
naires were received for 88 tunnels dnd included government, industry and university-owned facilities. Continuous, blowdown and intermittent tunnels are considered. The required measurements of pressure, temperature, flow angularity, noise and humidity are discussed, and the effects of measurement uncertainties are summarized. Included is a comprehensive review of instrumentation
are noted and reconmendations for achieving improved data accuracy are made where appropriate. lt currently used to calibrate empty-tunnel flow conditions. The recent results of relevant research
is concluded, for general testing purposes, that satisfactory calibration measurements can be achieved in both transonic and supersonic tunnels. The goal of calibrating transonic tunnels to within 0.001 in centerline Mach number appears to be feasible with existing instrumentation. provided correct calibration procedures are carefully followed. A comparable accuracy can be achieved off-centerline with carefully designed, conventional probes, except near Mach 1. In the range 0.95 M < 1.05, the laser Doppler velocimeter appears to offer the most promise for improve calibration accuracy off-centerline. With regard to procedures. tunnel operators are cautioned to: (1) verify by measurements that expansions from a settling chamber to a test section are indeed isentropic, and (2) obtain calibra tions over the entire range of reynolds number and humidity levels. Also, it is suggested that calibration data should include off-centerline measurements of Mach number and flow angularity. Finally, three problem areas for transonic tunnels are identified and discussed, viz. (1) the lack of standard criteria for flow uniformity and unsteadiness, (2) the undesirable noise generated by ventilated walls, and (3) wall interference.
Wind tunnels, Calibration, Testing I UNCLASSIFIED-UNLIMITED
I I STAR Category 09
19. Scurity Clrit. (of this v t t 22. Rice' 21. NO. of p.pa 20. S M i w a a i f . (of chis p e t
UNCLASSIFIED $9.25 287 UNCLASSIFIED
'For ule bv thc N n i w l Tuhniul Infarmtion Smvii. Spriqtidd, Virginia 22161
*U.S. GOVEKtB.!ENT PRINTIKG OFFICE: 1977 - 735-078143
P
Copyright © 2022 FDOKUMEN