Settlement trough parameters for tunnels in Irish glacial tills
12
Settlement trough parameters for tunnels in Irish glacial tills B.A. McCabe a,⇑ , T.L.L. Orr b , C.C. Reilly b , B.G. Curran a a Department of Civil Engineering, National University of Ireland, Galway, Ireland b Department of Civil, Structural and Environmental Engineering, Trinity College Dublin, Ireland article info Article history: Received 1 December 2010 Received in revised form 30 May 2011 Accepted 9 June 2011 Available online 16 July 2011 Keywords: Transverse settlement profiles Glacial till Trough width Tunnelling Volume loss Boulders abstract Glacial till (or boulder clay) is the most widespread sediment on the island of Ireland. The behaviour of these tills, especially Dublin Boulder Clay, is now better understood as a result of ground investigations and associated testing for major construction projects, particularly in the east of the country over the past decade. Despite an increase in tunnelling activity in the country over the same time period, there is very little documented evidence on the settlements induced by tunnelling operations in glacial till. In this paper, transverse surface settlement data from two glacial till sites are presented. Four profiles are pre- sented for the ‘soft ground’ TBM-bored section of the Dublin Port Tunnel. Nine profiles are reported for pipe-jacked microtunnels constructed for a sewerage scheme in Mullingar in the Midlands; one of which was measured at the top of a railway embankment under which the pipeline passes. The measured set- tlements have been interpreted using a standard Gaussian error function, and trough width parameters show dependence on the fraction of the till, fine or coarse, that governs its behaviour. In addition, con- servative design estimates of maximum trough settlement and volume loss have been provided, and the impact of boulders is discussed. This paper provides the first empirical guidance for predicting surface settlements above tunnels in Irish soils. Ó 2011 Elsevier Ltd. All rights reserved. 1. Introduction Irish tunnelling experience has developed considerably since the Orr and Farrell (1996) report on tunnelling activity in the coun- try 15 years ago, at which time tunnels had yet to be used to carry roads or motorways. The Jack Lynch Tunnel under Cork’s River Lee was opened in May 1999; this submerged twin-bore tunnel is 610 m long and is estimated to have cost €133 m. The €752 m Dub- lin Port Tunnel (DPT), when opened in December 2006, became the longest urban tunnel in Europe (4.7 km twin bore) and the nation’s largest ever civil engineering project. An important coupled out- come of the DPT project was the improved grasp of both the stra- tigraphy and engineering properties of Dublin Boulder Clay that arose from handling the extensive geotechnical data generated (e.g. Long and Menkiti, 2007). Another highly significant project, the €660 m and 675 m long twin-bore submerged Limerick tunnel under the River Shannon, was opened in September 2010. In paral- lel with the development of large scale tunnels, the application of pipe-jacking to the construction of pipelines for utilities such as water, sewage and gas in a variety of soil and rock types has esca- lated. Curran (2010) interprets jacking force data for slurry-shield pipe-jacked microtunnels at eleven Irish sites encompassing a vari- ety of soil and rock types. Lochaden et al. (2008) report on successful efforts to model set- tlements above the DPT using finite element software, with the pre- dictions relatively insensitive to the constitutive soil model used. In practice, however, predictions of surface settlement troughs over tunnels in Irish soils have to date relied heavily on experience from the UK and beyond, such as the recommended Gaussian trough width parameters published by Mair and Taylor (1997) for tunnels in sands/gravels and clays with generally a small range of particle sizes, and the achievable volume losses suggested by Mair (1996) and others. Some Irish soils have particular characteristics that sig- nificantly affect their behaviour; for example, Irish boulder clays are often well-graded and composed of a wide range of particle sizes from clay-size to gravel-size, so that some of these soils are characterised as fine soils while others are characterised as coarse soils (Farrell, 2010). For this reason, it was deemed important to analyse tunnel-induced settlements in these soils, and also to con- sider the impact of boulders that are sometimes encountered. In this paper, settlement data is provided for (i) large diameter open-face shielded tunnels in glacial till for the DPT project, and (ii) small diameter closed-face pipe-jacked tunnels in a glacial till at Mullingar, Co. Westmeath; including data for a section of pipe- line passing beneath a high railway embankment. The inferred Gaussian parameters are an important record of Irish tunnelling-in- duced settlement experience and also, in the case of the Dublin Port Tunnel, supplement the limited data published internationally for tunnels with low cover to diameter ratios. All of the aforemen- 0886-7798/$ - see front matter Ó 2011 Elsevier Ltd. All rights reserved. doi:10.1016/j.tust.2011.06.002 ⇑ Corresponding author. Tel.: +353 91 492021; fax: +353 91 494507. E-mail address: [email protected] (B.A. McCabe). Tunnelling and Underground Space Technology 27 (2012) 1–12 Contents lists available at ScienceDirect Tunnelling and Underground Space Technology journal homepage: www.elsevier.com/locate/tust
Transcript of Settlement trough parameters for tunnels in Irish glacial tills

Tunnelling and Underground Space Technology 27 (2012) 1–12
Contents lists available at ScienceDirect
Tunnelling and Underground Space Technology
journal homepage: www.elsevier .com/ locate/ tust
Settlement trough parameters for tunnels in Irish glacial tills
B.A. McCabe a,⇑, T.L.L. Orr b, C.C. Reilly b, B.G. Curran a
a Department of Civil Engineering, National University of Ireland, Galway, Irelandb Department of Civil, Structural and Environmental Engineering, Trinity College Dublin, Ireland
a r t i c l e i n f o
Article history:Received 1 December 2010Received in revised form 30 May 2011Accepted 9 June 2011Available online 16 July 2011
Keywords:Transverse settlement profilesGlacial tillTrough widthTunnellingVolume lossBoulders
0886-7798/$ - see front matter � 2011 Elsevier Ltd. Adoi:10.1016/j.tust.2011.06.002
⇑ Corresponding author. Tel.: +353 91 492021; fax:E-mail address: [email protected] (B.A.
a b s t r a c t
Glacial till (or boulder clay) is the most widespread sediment on the island of Ireland. The behaviour ofthese tills, especially Dublin Boulder Clay, is now better understood as a result of ground investigationsand associated testing for major construction projects, particularly in the east of the country over the pastdecade. Despite an increase in tunnelling activity in the country over the same time period, there is verylittle documented evidence on the settlements induced by tunnelling operations in glacial till. In thispaper, transverse surface settlement data from two glacial till sites are presented. Four profiles are pre-sented for the ‘soft ground’ TBM-bored section of the Dublin Port Tunnel. Nine profiles are reported forpipe-jacked microtunnels constructed for a sewerage scheme in Mullingar in the Midlands; one of whichwas measured at the top of a railway embankment under which the pipeline passes. The measured set-tlements have been interpreted using a standard Gaussian error function, and trough width parametersshow dependence on the fraction of the till, fine or coarse, that governs its behaviour. In addition, con-servative design estimates of maximum trough settlement and volume loss have been provided, andthe impact of boulders is discussed. This paper provides the first empirical guidance for predicting surfacesettlements above tunnels in Irish soils.
� 2011 Elsevier Ltd. All rights reserved.
1. Introduction
Irish tunnelling experience has developed considerably sincethe Orr and Farrell (1996) report on tunnelling activity in the coun-try 15 years ago, at which time tunnels had yet to be used to carryroads or motorways. The Jack Lynch Tunnel under Cork’s River Leewas opened in May 1999; this submerged twin-bore tunnel is610 m long and is estimated to have cost €133 m. The €752 m Dub-lin Port Tunnel (DPT), when opened in December 2006, became thelongest urban tunnel in Europe (4.7 km twin bore) and the nation’slargest ever civil engineering project. An important coupled out-come of the DPT project was the improved grasp of both the stra-tigraphy and engineering properties of Dublin Boulder Clay thatarose from handling the extensive geotechnical data generated(e.g. Long and Menkiti, 2007). Another highly significant project,the €660 m and 675 m long twin-bore submerged Limerick tunnelunder the River Shannon, was opened in September 2010. In paral-lel with the development of large scale tunnels, the application ofpipe-jacking to the construction of pipelines for utilities such aswater, sewage and gas in a variety of soil and rock types has esca-lated. Curran (2010) interprets jacking force data for slurry-shieldpipe-jacked microtunnels at eleven Irish sites encompassing a vari-ety of soil and rock types.
ll rights reserved.
+353 91 494507.McCabe).
Lochaden et al. (2008) report on successful efforts to model set-tlements above the DPT using finite element software, with the pre-dictions relatively insensitive to the constitutive soil model used. Inpractice, however, predictions of surface settlement troughs overtunnels in Irish soils have to date relied heavily on experience fromthe UK and beyond, such as the recommended Gaussian troughwidth parameters published by Mair and Taylor (1997) for tunnelsin sands/gravels and clays with generally a small range of particlesizes, and the achievable volume losses suggested by Mair (1996)and others. Some Irish soils have particular characteristics that sig-nificantly affect their behaviour; for example, Irish boulder claysare often well-graded and composed of a wide range of particlesizes from clay-size to gravel-size, so that some of these soils arecharacterised as fine soils while others are characterised as coarsesoils (Farrell, 2010). For this reason, it was deemed important toanalyse tunnel-induced settlements in these soils, and also to con-sider the impact of boulders that are sometimes encountered. Inthis paper, settlement data is provided for (i) large diameteropen-face shielded tunnels in glacial till for the DPT project, and(ii) small diameter closed-face pipe-jacked tunnels in a glacial tillat Mullingar, Co. Westmeath; including data for a section of pipe-line passing beneath a high railway embankment. The inferredGaussian parameters are an important record of Irish tunnelling-in-duced settlement experience and also, in the case of the Dublin PortTunnel, supplement the limited data published internationally fortunnels with low cover to diameter ratios. All of the aforemen-
Nomenclature
AVN remote control tunnelling machine with slurry materialremoval
cu undrained shear strengthD tunnel diameter (including overcut)DBC Dublin Boulder ClayDPT Dublin Port Tunneli value of y corresponding to point of inflection of Gauss-
ian troughk Gaussian trough width parameterMH manholeN stability numberNTc stability number at collapse
N60 standard penetration test valuesv vertical settlement at any point in troughsmax vertical settlement over centreline of tunnel (at y = 0)rt tunnel internal support pressurerv vertical total stress at the depth of the tunnel axisTBM Tunnel Boring MachineVl volume lossVs volume of Gaussian settlement trough per metre lengthVt volume of tunnel per metre lengthy transverse horizontal distance from tunnel centrelinez0 depth to tunnel axis
2 B.A. McCabe et al. / Tunnelling and Underground Space Technology 27 (2012) 1–12
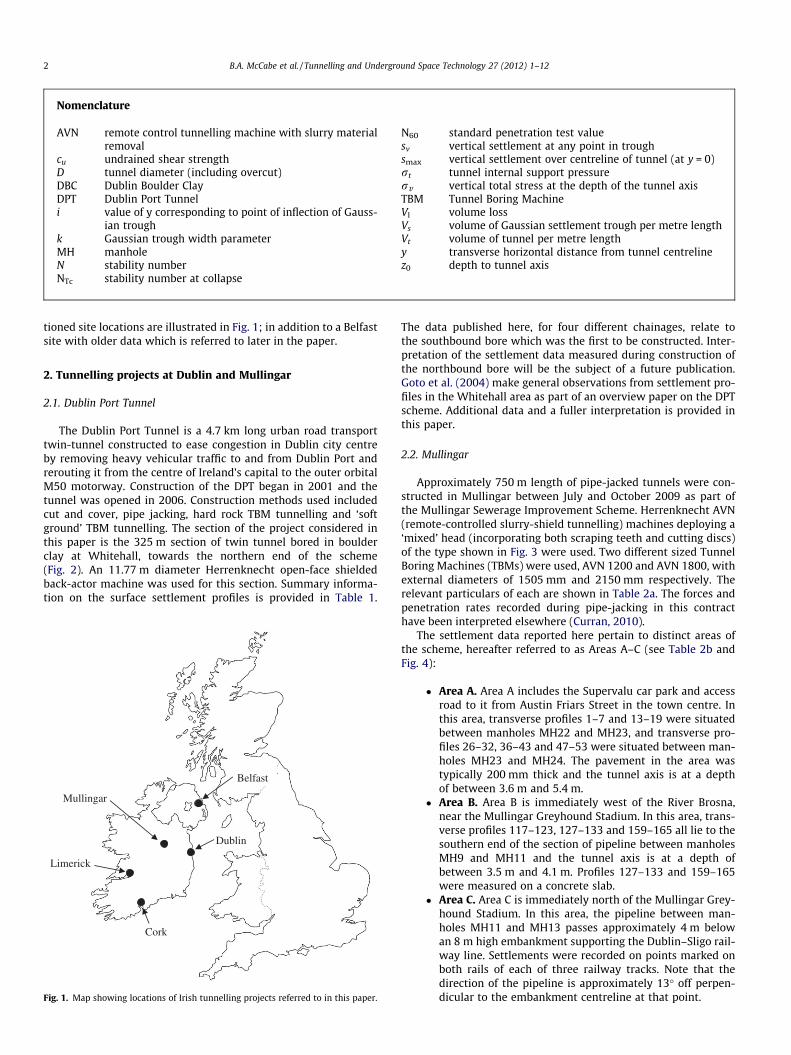
tioned site locations are illustrated in Fig. 1; in addition to a Belfastsite with older data which is referred to later in the paper.
2. Tunnelling projects at Dublin and Mullingar
2.1. Dublin Port Tunnel
The Dublin Port Tunnel is a 4.7 km long urban road transporttwin-tunnel constructed to ease congestion in Dublin city centreby removing heavy vehicular traffic to and from Dublin Port andrerouting it from the centre of Ireland’s capital to the outer orbitalM50 motorway. Construction of the DPT began in 2001 and thetunnel was opened in 2006. Construction methods used includedcut and cover, pipe jacking, hard rock TBM tunnelling and ‘softground’ TBM tunnelling. The section of the project considered inthis paper is the 325 m section of twin tunnel bored in boulderclay at Whitehall, towards the northern end of the scheme(Fig. 2). An 11.77 m diameter Herrenknecht open-face shieldedback-actor machine was used for this section. Summary informa-tion on the surface settlement profiles is provided in Table 1.
Mullingar
Dublin
Cork
Limerick
Belfast
Fig. 1. Map showing locations of Irish tunnelling projects referred to in this paper.
The data published here, for four different chainages, relate tothe southbound bore which was the first to be constructed. Inter-pretation of the settlement data measured during construction ofthe northbound bore will be the subject of a future publication.Goto et al. (2004) make general observations from settlement pro-files in the Whitehall area as part of an overview paper on the DPTscheme. Additional data and a fuller interpretation is provided inthis paper.
2.2. Mullingar
Approximately 750 m length of pipe-jacked tunnels were con-structed in Mullingar between July and October 2009 as part ofthe Mullingar Sewerage Improvement Scheme. Herrenknecht AVN(remote-controlled slurry-shield tunnelling) machines deploying a‘mixed’ head (incorporating both scraping teeth and cutting discs)of the type shown in Fig. 3 were used. Two different sized TunnelBoring Machines (TBMs) were used, AVN 1200 and AVN 1800, withexternal diameters of 1505 mm and 2150 mm respectively. Therelevant particulars of each are shown in Table 2a. The forces andpenetration rates recorded during pipe-jacking in this contracthave been interpreted elsewhere (Curran, 2010).
The settlement data reported here pertain to distinct areas ofthe scheme, hereafter referred to as Areas A–C (see Table 2b andFig. 4):
� Area A. Area A includes the Supervalu car park and accessroad to it from Austin Friars Street in the town centre. Inthis area, transverse profiles 1–7 and 13–19 were situatedbetween manholes MH22 and MH23, and transverse pro-files 26–32, 36–43 and 47–53 were situated between man-holes MH23 and MH24. The pavement in the area wastypically 200 mm thick and the tunnel axis is at a depthof between 3.6 m and 5.4 m.
� Area B. Area B is immediately west of the River Brosna,near the Mullingar Greyhound Stadium. In this area, trans-verse profiles 117–123, 127–133 and 159–165 all lie to thesouthern end of the section of pipeline between manholesMH9 and MH11 and the tunnel axis is at a depth ofbetween 3.5 m and 4.1 m. Profiles 127–133 and 159–165were measured on a concrete slab.
� Area C. Area C is immediately north of the Mullingar Grey-hound Stadium. In this area, the pipeline between man-holes MH11 and MH13 passes approximately 4 m belowan 8 m high embankment supporting the Dublin–Sligo rail-way line. Settlements were recorded on points marked onboth rails of each of three railway tracks. Note that thedirection of the pipeline is approximately 13� off perpen-dicular to the embankment centreline at that point.
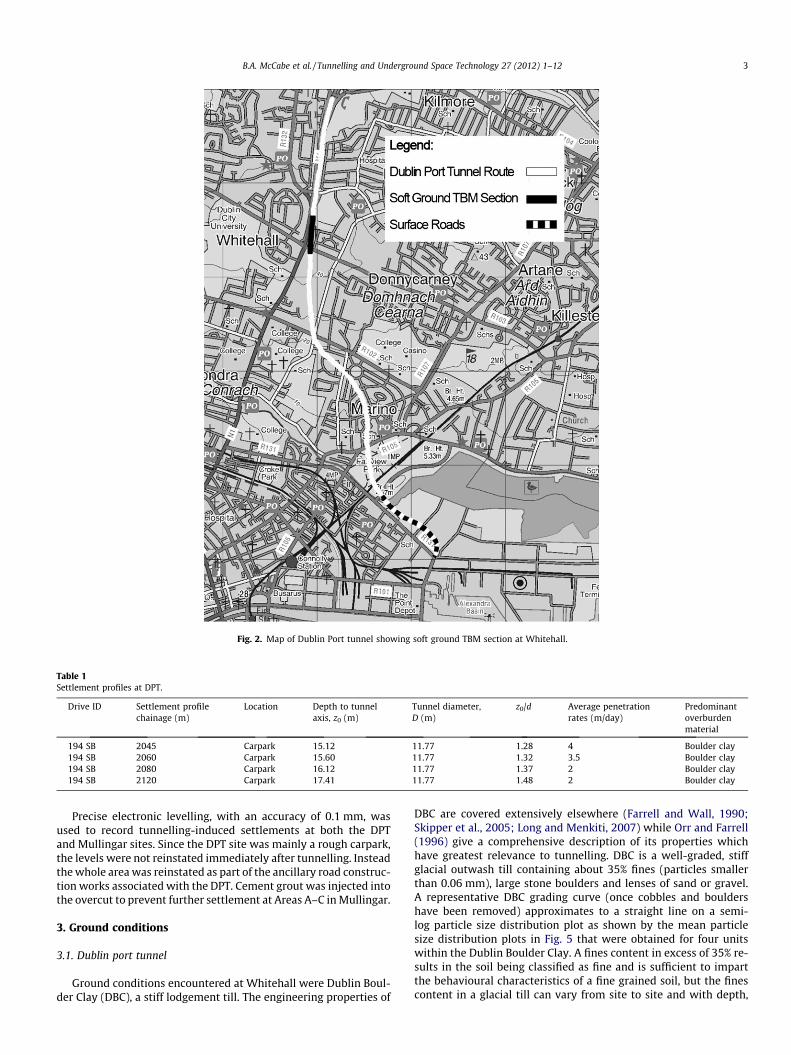
Fig. 2. Map of Dublin Port tunnel showing soft ground TBM section at Whitehall.
Table 1Settlement profiles at DPT.
Drive ID Settlement profilechainage (m)
Location Depth to tunnelaxis, z0 (m)
Tunnel diameter,D (m)
z0/d Average penetrationrates (m/day)
Predominantoverburdenmaterial
194 SB 2045 Carpark 15.12 11.77 1.28 4 Boulder clay194 SB 2060 Carpark 15.60 11.77 1.32 3.5 Boulder clay194 SB 2080 Carpark 16.12 11.77 1.37 2 Boulder clay194 SB 2120 Carpark 17.41 11.77 1.48 2 Boulder clay
B.A. McCabe et al. / Tunnelling and Underground Space Technology 27 (2012) 1–12 3
Precise electronic levelling, with an accuracy of 0.1 mm, wasused to record tunnelling-induced settlements at both the DPTand Mullingar sites. Since the DPT site was mainly a rough carpark,the levels were not reinstated immediately after tunnelling. Insteadthe whole area was reinstated as part of the ancillary road construc-tion works associated with the DPT. Cement grout was injected intothe overcut to prevent further settlement at Areas A–C in Mullingar.
3. Ground conditions
3.1. Dublin port tunnel
Ground conditions encountered at Whitehall were Dublin Boul-der Clay (DBC), a stiff lodgement till. The engineering properties of
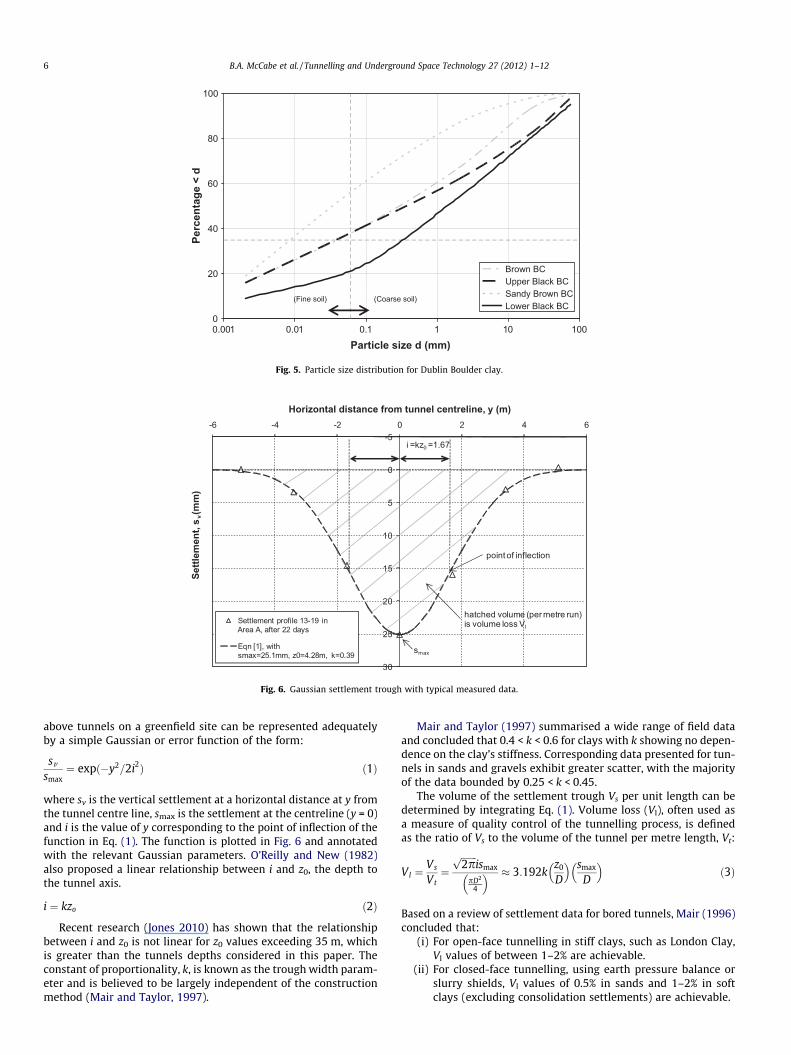
DBC are covered extensively elsewhere (Farrell and Wall, 1990;Skipper et al., 2005; Long and Menkiti, 2007) while Orr and Farrell(1996) give a comprehensive description of its properties whichhave greatest relevance to tunnelling. DBC is a well-graded, stiffglacial outwash till containing about 35% fines (particles smallerthan 0.06 mm), large stone boulders and lenses of sand or gravel.A representative DBC grading curve (once cobbles and bouldershave been removed) approximates to a straight line on a semi-log particle size distribution plot as shown by the mean particlesize distribution plots in Fig. 5 that were obtained for four unitswithin the Dublin Boulder Clay. A fines content in excess of 35% re-sults in the soil being classified as fine and is sufficient to impartthe behavioural characteristics of a fine grained soil, but the finescontent in a glacial till can vary from site to site and with depth,
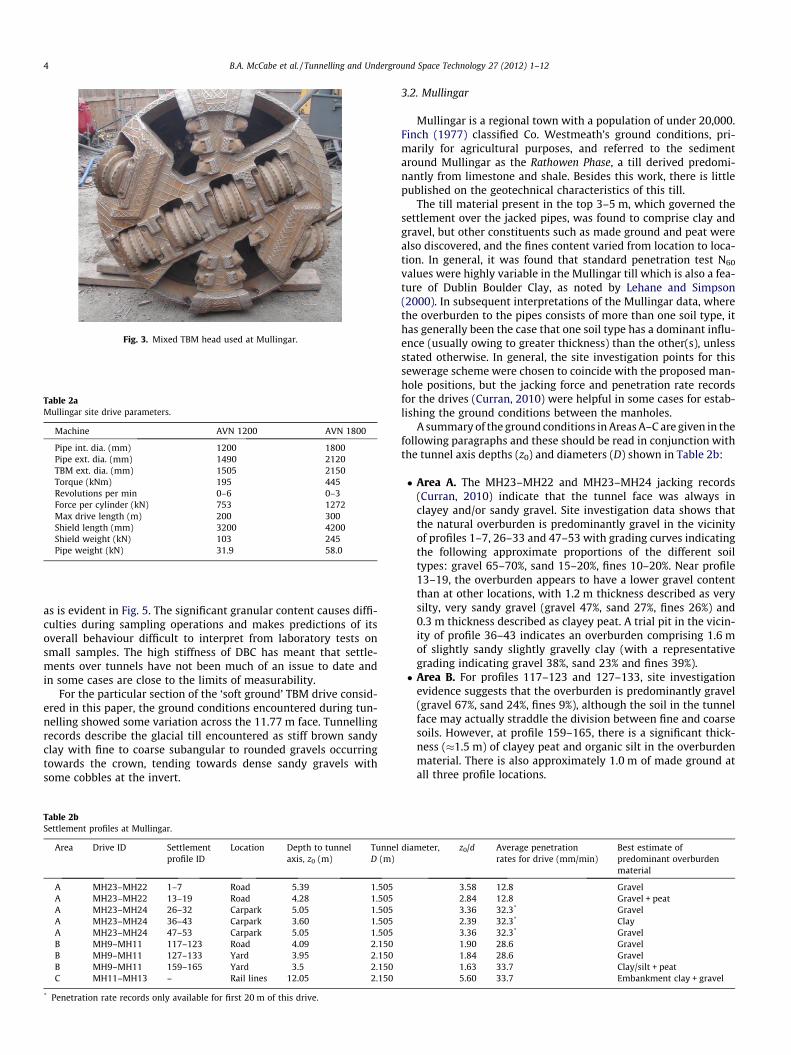
Fig. 3. Mixed TBM head used at Mullingar.
Table 2aMullingar site drive parameters.
Machine AVN 1200 AVN 1800
Pipe int. dia. (mm) 1200 1800Pipe ext. dia. (mm) 1490 2120TBM ext. dia. (mm) 1505 2150Torque (kNm) 195 445Revolutions per min 0–6 0–3Force per cylinder (kN) 753 1272Max drive length (m) 200 300Shield length (mm) 3200 4200Shield weight (kN) 103 245Pipe weight (kN) 31.9 58.0
4 B.A. McCabe et al. / Tunnelling and Underground Space Technology 27 (2012) 1–12
as is evident in Fig. 5. The significant granular content causes diffi-culties during sampling operations and makes predictions of itsoverall behaviour difficult to interpret from laboratory tests onsmall samples. The high stiffness of DBC has meant that settle-ments over tunnels have not been much of an issue to date andin some cases are close to the limits of measurability.
For the particular section of the ‘soft ground’ TBM drive consid-ered in this paper, the ground conditions encountered during tun-nelling showed some variation across the 11.77 m face. Tunnellingrecords describe the glacial till encountered as stiff brown sandyclay with fine to coarse subangular to rounded gravels occurringtowards the crown, tending towards dense sandy gravels withsome cobbles at the invert.
Table 2bSettlement profiles at Mullingar.
Area Drive ID Settlementprofile ID
Location Depth to tunnelaxis, z0 (m)
TunnelD (m)
A MH23–MH22 1–7 Road 5.39 1.505A MH23–MH22 13–19 Road 4.28 1.505A MH23–MH24 26–32 Carpark 5.05 1.505A MH23–MH24 36–43 Carpark 3.60 1.505A MH23–MH24 47–53 Carpark 5.05 1.505B MH9–MH11 117–123 Road 4.09 2.150B MH9–MH11 127–133 Yard 3.95 2.150B MH9–MH11 159–165 Yard 3.5 2.150C MH11–MH13 – Rail lines 12.05 2.150
* Penetration rate records only available for first 20 m of this drive.
3.2. Mullingar
Mullingar is a regional town with a population of under 20,000.Finch (1977) classified Co. Westmeath’s ground conditions, pri-marily for agricultural purposes, and referred to the sedimentaround Mullingar as the Rathowen Phase, a till derived predomi-nantly from limestone and shale. Besides this work, there is littlepublished on the geotechnical characteristics of this till.
The till material present in the top 3–5 m, which governed thesettlement over the jacked pipes, was found to comprise clay andgravel, but other constituents such as made ground and peat werealso discovered, and the fines content varied from location to loca-tion. In general, it was found that standard penetration test N60
values were highly variable in the Mullingar till which is also a fea-ture of Dublin Boulder Clay, as noted by Lehane and Simpson(2000). In subsequent interpretations of the Mullingar data, wherethe overburden to the pipes consists of more than one soil type, ithas generally been the case that one soil type has a dominant influ-ence (usually owing to greater thickness) than the other(s), unlessstated otherwise. In general, the site investigation points for thissewerage scheme were chosen to coincide with the proposed man-hole positions, but the jacking force and penetration rate recordsfor the drives (Curran, 2010) were helpful in some cases for estab-lishing the ground conditions between the manholes.
A summary of the ground conditions in Areas A–C are given in thefollowing paragraphs and these should be read in conjunction withthe tunnel axis depths (z0) and diameters (D) shown in Table 2b:
� Area A. The MH23–MH22 and MH23–MH24 jacking records(Curran, 2010) indicate that the tunnel face was always inclayey and/or sandy gravel. Site investigation data shows thatthe natural overburden is predominantly gravel in the vicinityof profiles 1–7, 26–33 and 47–53 with grading curves indicatingthe following approximate proportions of the different soiltypes: gravel 65–70%, sand 15–20%, fines 10–20%. Near profile13–19, the overburden appears to have a lower gravel contentthan at other locations, with 1.2 m thickness described as verysilty, very sandy gravel (gravel 47%, sand 27%, fines 26%) and0.3 m thickness described as clayey peat. A trial pit in the vicin-ity of profile 36–43 indicates an overburden comprising 1.6 mof slightly sandy slightly gravelly clay (with a representativegrading indicating gravel 38%, sand 23% and fines 39%).� Area B. For profiles 117–123 and 127–133, site investigation
evidence suggests that the overburden is predominantly gravel(gravel 67%, sand 24%, fines 9%), although the soil in the tunnelface may actually straddle the division between fine and coarsesoils. However, at profile 159–165, there is a significant thick-ness (�1.5 m) of clayey peat and organic silt in the overburdenmaterial. There is also approximately 1.0 m of made ground atall three profile locations.
diameter, z0/d Average penetrationrates for drive (mm/min)
Best estimate ofpredominant overburdenmaterial
3.58 12.8 Gravel2.84 12.8 Gravel + peat3.36 32.3* Gravel2.39 32.3* Clay3.36 32.3* Gravel1.90 28.6 Gravel1.84 28.6 Gravel1.63 33.7 Clay/silt + peat5.60 33.7 Embankment clay + gravel
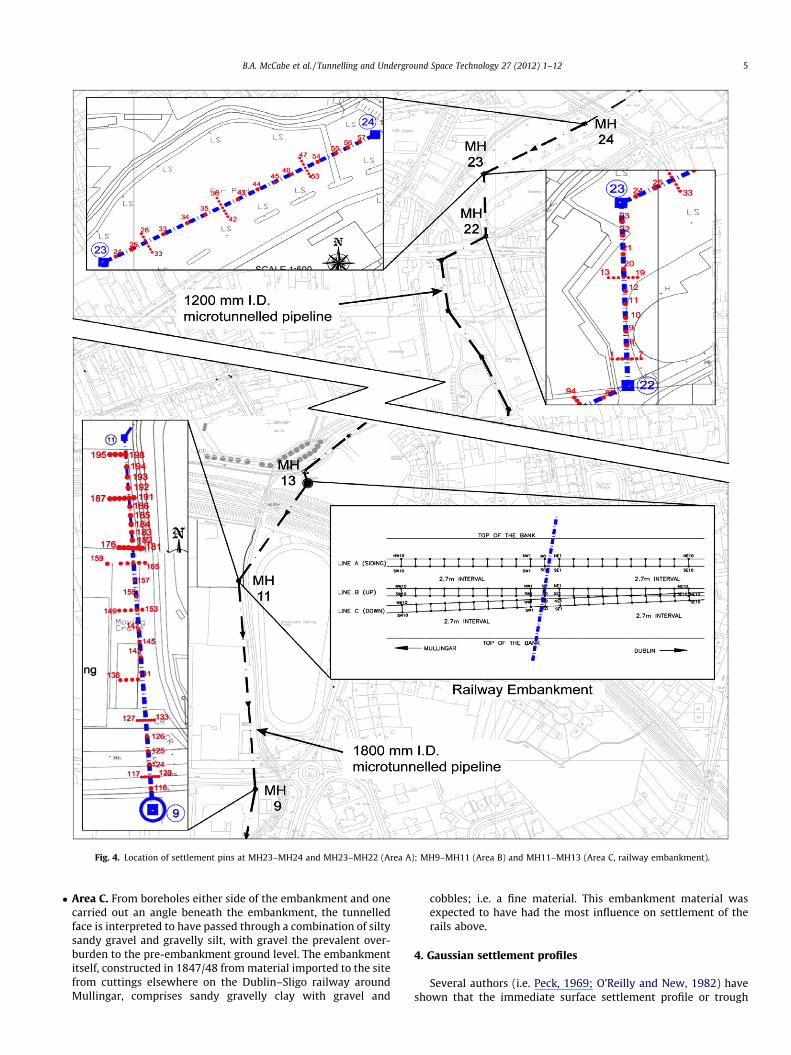
Fig. 4. Location of settlement pins at MH23–MH24 and MH23–MH22 (Area A); MH9–MH11 (Area B) and MH11–MH13 (Area C, railway embankment).
B.A. McCabe et al. / Tunnelling and Underground Space Technology 27 (2012) 1–12 5
� Area C. From boreholes either side of the embankment and onecarried out an angle beneath the embankment, the tunnelledface is interpreted to have passed through a combination of siltysandy gravel and gravelly silt, with gravel the prevalent over-burden to the pre-embankment ground level. The embankmentitself, constructed in 1847/48 from material imported to the sitefrom cuttings elsewhere on the Dublin–Sligo railway aroundMullingar, comprises sandy gravelly clay with gravel and
cobbles; i.e. a fine material. This embankment material wasexpected to have had the most influence on settlement of therails above.
4. Gaussian settlement profiles
Several authors (i.e. Peck, 1969; O’Reilly and New, 1982) haveshown that the immediate surface settlement profile or trough
0
20
40
60
80
100
0.001 0.01 0.1 1 10 100
Particle size d (mm)
Perc
enta
ge <
d
Brown BCUpper Black BCSandy Brown BCLower Black BC
(Fine soil) (Coarse soil)
Fig. 5. Particle size distribution for Dublin Boulder clay.
-5
0
5
10
15
20
25
30
-6 -4 -2 0 2 4 6
Set
tlem
ent,
sv(m
m)
Horizontal distance from tunnel centreline, y (m)
Settlement profile 13-19 inArea A, after 22 days
Eqn [1], with smax=25.1mm, z0=4.28m, k=0.39
i =kz0 =1.67
hatched volume (per metre run)is volume loss Vl
point of inflection
smax
Fig. 6. Gaussian settlement trough with typical measured data.
6 B.A. McCabe et al. / Tunnelling and Underground Space Technology 27 (2012) 1–12
above tunnels on a greenfield site can be represented adequatelyby a simple Gaussian or error function of the form:
sv
smax¼ expð�y2=2i2Þ ð1Þ
where sv is the vertical settlement at a horizontal distance at y fromthe tunnel centre line, smax is the settlement at the centreline (y = 0)and i is the value of y corresponding to the point of inflection of thefunction in Eq. (1). The function is plotted in Fig. 6 and annotatedwith the relevant Gaussian parameters. O’Reilly and New (1982)also proposed a linear relationship between i and z0, the depth tothe tunnel axis.
i ¼ kzo ð2Þ
Recent research (Jones 2010) has shown that the relationshipbetween i and z0 is not linear for z0 values exceeding 35 m, whichis greater than the tunnels depths considered in this paper. Theconstant of proportionality, k, is known as the trough width param-eter and is believed to be largely independent of the constructionmethod (Mair and Taylor, 1997).
Mair and Taylor (1997) summarised a wide range of field dataand concluded that 0.4 < k < 0.6 for clays with k showing no depen-dence on the clay’s stiffness. Corresponding data presented for tun-nels in sands and gravels exhibit greater scatter, with the majorityof the data bounded by 0.25 < k < 0.45.
The volume of the settlement trough Vs per unit length can bedetermined by integrating Eq. (1). Volume loss (Vl), often used asa measure of quality control of the tunnelling process, is definedas the ratio of Vs to the volume of the tunnel per metre length, Vt:
Vl ¼Vs
Vt¼
ffiffiffiffiffiffiffi2pp
ismax
pD2
4
� � � 3:192kz0
D
� � smax
D
� �ð3Þ
Based on a review of settlement data for bored tunnels, Mair (1996)concluded that:
(i) For open-face tunnelling in stiff clays, such as London Clay,Vl values of between 1–2% are achievable.
(ii) For closed-face tunnelling, using earth pressure balance orslurry shields, Vl values of 0.5% in sands and 1–2% in softclays (excluding consolidation settlements) are achievable.
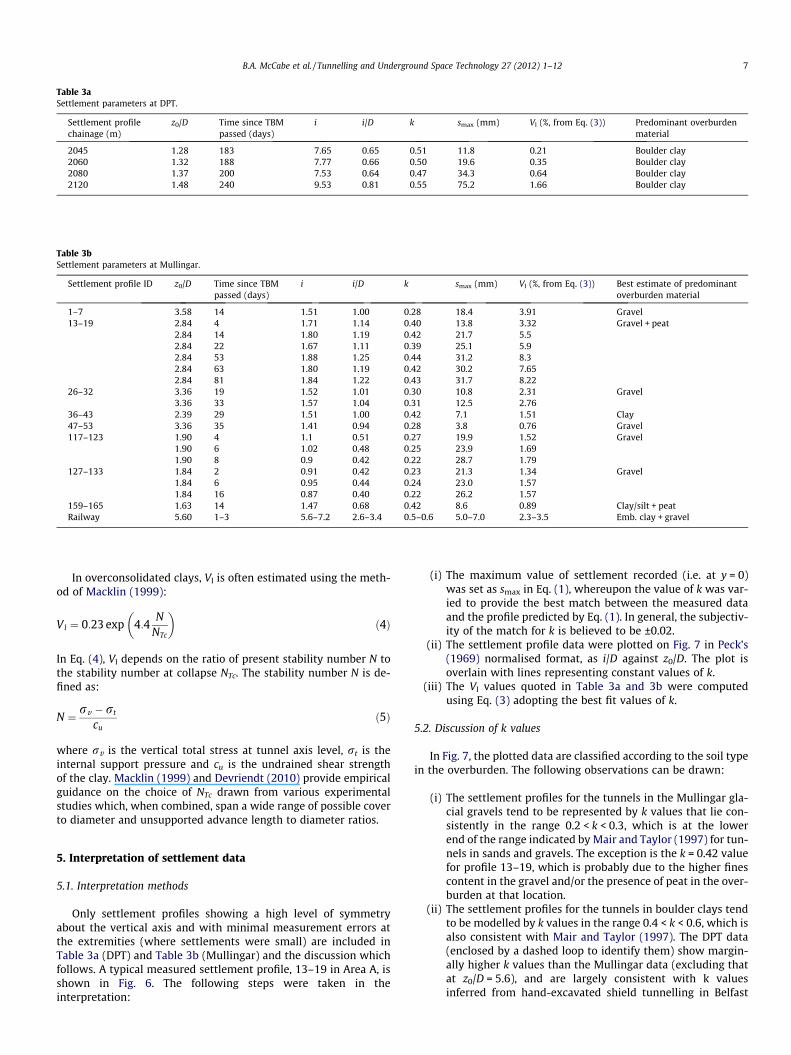
Table 3aSettlement parameters at DPT.
Settlement profilechainage (m)
z0/D Time since TBMpassed (days)
i i/D k smax (mm) Vl (%, from Eq. (3)) Predominant overburdenmaterial
2045 1.28 183 7.65 0.65 0.51 11.8 0.21 Boulder clay2060 1.32 188 7.77 0.66 0.50 19.6 0.35 Boulder clay2080 1.37 200 7.53 0.64 0.47 34.3 0.64 Boulder clay2120 1.48 240 9.53 0.81 0.55 75.2 1.66 Boulder clay
Table 3bSettlement parameters at Mullingar.
Settlement profile ID z0/D Time since TBMpassed (days)
i i/D k smax (mm) Vl (%, from Eq. (3)) Best estimate of predominantoverburden material
1–7 3.58 14 1.51 1.00 0.28 18.4 3.91 Gravel13–19 2.84 4 1.71 1.14 0.40 13.8 3.32 Gravel + peat
2.84 14 1.80 1.19 0.42 21.7 5.52.84 22 1.67 1.11 0.39 25.1 5.92.84 53 1.88 1.25 0.44 31.2 8.32.84 63 1.80 1.19 0.42 30.2 7.652.84 81 1.84 1.22 0.43 31.7 8.22
26–32 3.36 19 1.52 1.01 0.30 10.8 2.31 Gravel3.36 33 1.57 1.04 0.31 12.5 2.76
36–43 2.39 29 1.51 1.00 0.42 7.1 1.51 Clay47–53 3.36 35 1.41 0.94 0.28 3.8 0.76 Gravel117–123 1.90 4 1.1 0.51 0.27 19.9 1.52 Gravel
1.90 6 1.02 0.48 0.25 23.9 1.691.90 8 0.9 0.42 0.22 28.7 1.79
127–133 1.84 2 0.91 0.42 0.23 21.3 1.34 Gravel1.84 6 0.95 0.44 0.24 23.0 1.571.84 16 0.87 0.40 0.22 26.2 1.57
159–165 1.63 14 1.47 0.68 0.42 8.6 0.89 Clay/silt + peatRailway 5.60 1–3 5.6–7.2 2.6–3.4 0.5–0.6 5.0–7.0 2.3–3.5 Emb. clay + gravel
B.A. McCabe et al. / Tunnelling and Underground Space Technology 27 (2012) 1–12 7
In overconsolidated clays, Vl is often estimated using the meth-od of Macklin (1999):
Vl ¼ 0:23 exp 4:4N
NTc
� �ð4Þ
In Eq. (4), Vl depends on the ratio of present stability number N tothe stability number at collapse NTc. The stability number N is de-fined as:
N ¼ rv � rt
cuð5Þ
where rv is the vertical total stress at tunnel axis level, rt is theinternal support pressure and cu is the undrained shear strengthof the clay. Macklin (1999) and Devriendt (2010) provide empiricalguidance on the choice of NTc drawn from various experimentalstudies which, when combined, span a wide range of possible coverto diameter and unsupported advance length to diameter ratios.
5. Interpretation of settlement data
5.1. Interpretation methods
Only settlement profiles showing a high level of symmetryabout the vertical axis and with minimal measurement errors atthe extremities (where settlements were small) are included inTable 3a (DPT) and Table 3b (Mullingar) and the discussion whichfollows. A typical measured settlement profile, 13–19 in Area A, isshown in Fig. 6. The following steps were taken in theinterpretation:
(i) The maximum value of settlement recorded (i.e. at y = 0)was set as smax in Eq. (1), whereupon the value of k was var-ied to provide the best match between the measured dataand the profile predicted by Eq. (1). In general, the subjectiv-ity of the match for k is believed to be ±0.02.
(ii) The settlement profile data were plotted on Fig. 7 in Peck’s(1969) normalised format, as i/D against z0/D. The plot isoverlain with lines representing constant values of k.
(iii) The Vl values quoted in Table 3a and 3b were computedusing Eq. (3) adopting the best fit values of k.
5.2. Discussion of k values
In Fig. 7, the plotted data are classified according to the soil typein the overburden. The following observations can be drawn:
(i) The settlement profiles for the tunnels in the Mullingar gla-cial gravels tend to be represented by k values that lie con-sistently in the range 0.2 < k < 0.3, which is at the lowerend of the range indicated by Mair and Taylor (1997) for tun-nels in sands and gravels. The exception is the k = 0.42 valuefor profile 13–19, which is probably due to the higher finescontent in the gravel and/or the presence of peat in the over-burden at that location.
(ii) The settlement profiles for the tunnels in boulder clays tendto be modelled by k values in the range 0.4 < k < 0.6, which isalso consistent with Mair and Taylor (1997). The DPT data(enclosed by a dashed loop to identify them) show margin-ally higher k values than the Mullingar data (excluding thatat z0/D = 5.6), and are largely consistent with k valuesinferred from hand-excavated shield tunnelling in Belfast
0
1
2
3
4
5
6
7
0 0.5 1 1.5 2 2.5 3 3.5 4
No
rmal
ised
dep
th z
0/D
Normalised horizontal distance to point of inflection (i/D)
k = 0.2 k = 0.3 k = 0.5k = 0.4
k = 0.7
k = 0.6
Belfast data (Glossop et al. 1979) coarse soils
fine soils
some peat in overburden
range for Area C:railway embankment
DPT data All data is from Mullingar unless specified
Fig. 7. Plot of i/D against z0/D for Mullingar, DPT and Belfast sites.
0
1
2
3
4
5
6
0.000 0.005 0.010 0.015 0.020 0.025
Normalised maximum settlement smax/D
No
rmal
ised
dep
th z
0/D
points annotated with time (days) since TBM passed; see Table 3, arrows track variation over time
boulders encountered
4 19 33
2 6 16
4 6 8
1435
1-3
183
188
200 24014
29
coarse soils
fine soils
63 & 81
14 22 53
Fig. 8a. Normalised maximum surface settlement versus normalised tunnel depth for Mullingar and DPT sites.
8 B.A. McCabe et al. / Tunnelling and Underground Space Technology 27 (2012) 1–12
soft estuarine clay (sleech) published by Glossop et al.(1979). In general, there is no clear relationship betweenthe strength of these clays and the k value which modelsits settlement trough.
(iii) At Area C, the deviation of the tunnel alignment from per-pendicular to the embankment longitudinal axis wasapproximately allowed for by correcting the horizontal dis-tance measured along the rails by cos(13�). However, dueto the small smax values recorded, it was not possible toassess the k value relevant to the settlement profilesrecorded at the top of the railway embankment (z0/D = 5.6)to the same accuracy as the k values assessed from the otherdata. Interestingly, the inferred range 0.5 < k < 0.6 confirms
that the fine material in the embankment is more influentialin determining the shape of the settlement trough than theunderlying gravel overburden.
(iv) Some of the Mullingar data in Fig. 7 were recorded at a singlepoint in time, whereas in other cases ‘range’ bars are shownfor profile data where reliable profiles were recorded over aperiod of time (see Table 3a and 3b for full detail). In general,the ranges of k values shown were found to be small, withinthe range of natural variation and are not believed to be dueto systematic time effects.
(v) In clay soils incorporating significant consolidation settle-ments, there is evidence that Eq. (1) does not model theshape of a settlement trough well (e.g. Glossop et al.,

0
1
2
3
4
5
6
7
8
9
10
0 0.01 0.02 0.03 0.04 0.05
No
rmal
ised
dep
th z
0/D
Normalised maximum settlement smax/D
fine soils
coarse soils
Fig. 8b. Normalised maximum surface settlement versus normalised tunnel depthfor Mair and Taylor (1997) data.
B.A. McCabe et al. / Tunnelling and Underground Space Technology 27 (2012) 1–12 9
1979; Mair and Taylor, 1997). While there is insufficientdata to draw any inferences on consolidation settlementsin the fine soils at Mullingar, these are believed to be smalland the Gaussian functions capture the settlement troughsvery well. Likewise, consolidation settlements in stiff DBCare not considered significant to this analysis.
0
1
2
3
4
5
6
100.01000.0
Normalised surface settleme
No
rmal
ised
dep
th z
0/D
1-3
183 188 200
14
29
0.5% 1% 2% 5%
V l values
0.1%
Fig. 9a. Normalised surface settlement shape function versus norm
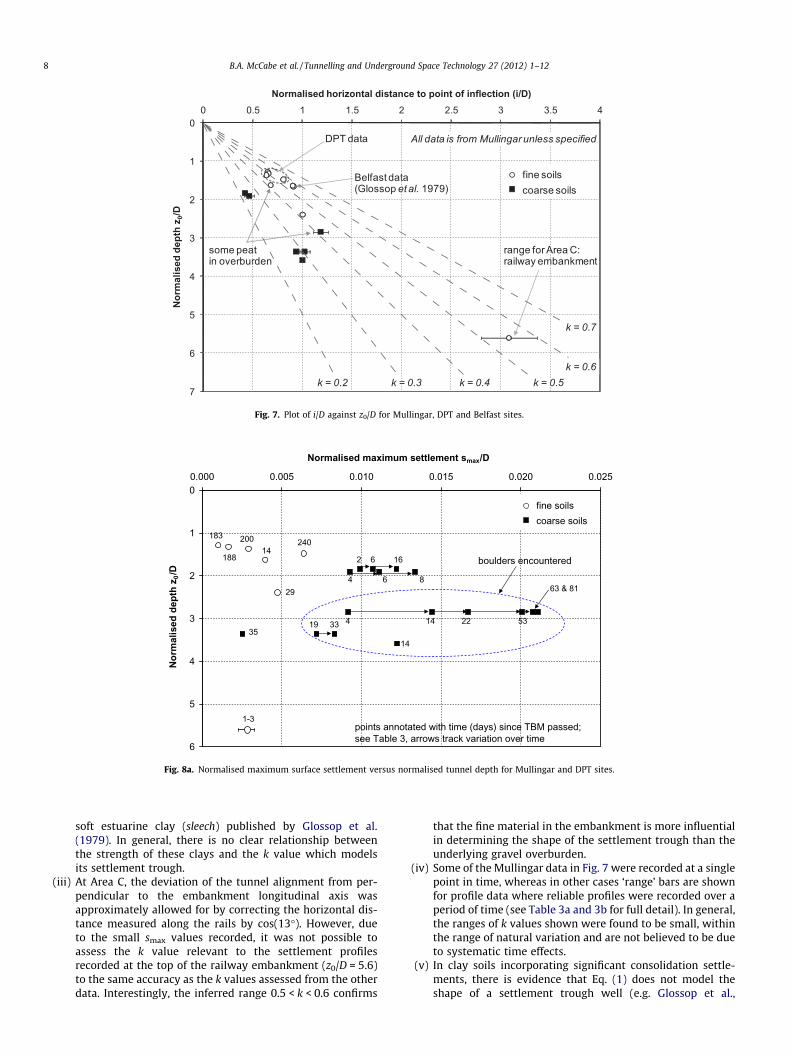
5.3. Discussion of maximum settlements
Values of smax, which are required along with k in Eq. (3) to pre-dict Vl show no obvious dependency on depth z0 when both areplotted in normalised form with respect to the tunnel diameterin Fig. 8a. Interestingly, the smax/D ranges for fine and coarse soiltypes are clearly distinct for these Irish data. In Fig. 8b, the authorshave recast the smax data for settlement profiles of tunnels in claysand sands/gravels tabulated by Mair and Taylor (1997) into thesame format as Fig. 8a, which shows that such a clear separationis not typical. Limiting values of smax/D are not theoretically justi-fiable based on Eq. (3) but are affected by the tunnelling method,the soil type and the geometry of the design situation, being line-arly dependent on Vl and inversely dependent on k and z0/D.
Higher smax/D values (between 0.007 and 0.022) are associatedwith the soils containing boulders for the Mullingar tunnelling, high-lighted in Fig. 8a. The times elapsing between the passing of the TBMand each set of settlement profile measurements are included onFig. 8a. The time dependence of smax in the coarse soils is somewhatunexpected. The authors believe that the most likely explanation re-lates to the bentonite lubricant used to support the excavation andprevent the ground from completely collapsing onto the pipeline.During drives in gravel, and especially where boulders were encoun-tered, a high concentration of bentonite was mixed with water,forming a bentonite fluid with Marsh Funnel times in excess of100 s. This highly viscous fluid would take a long time to dissipateand might explain the continued settlement over days and weeks.
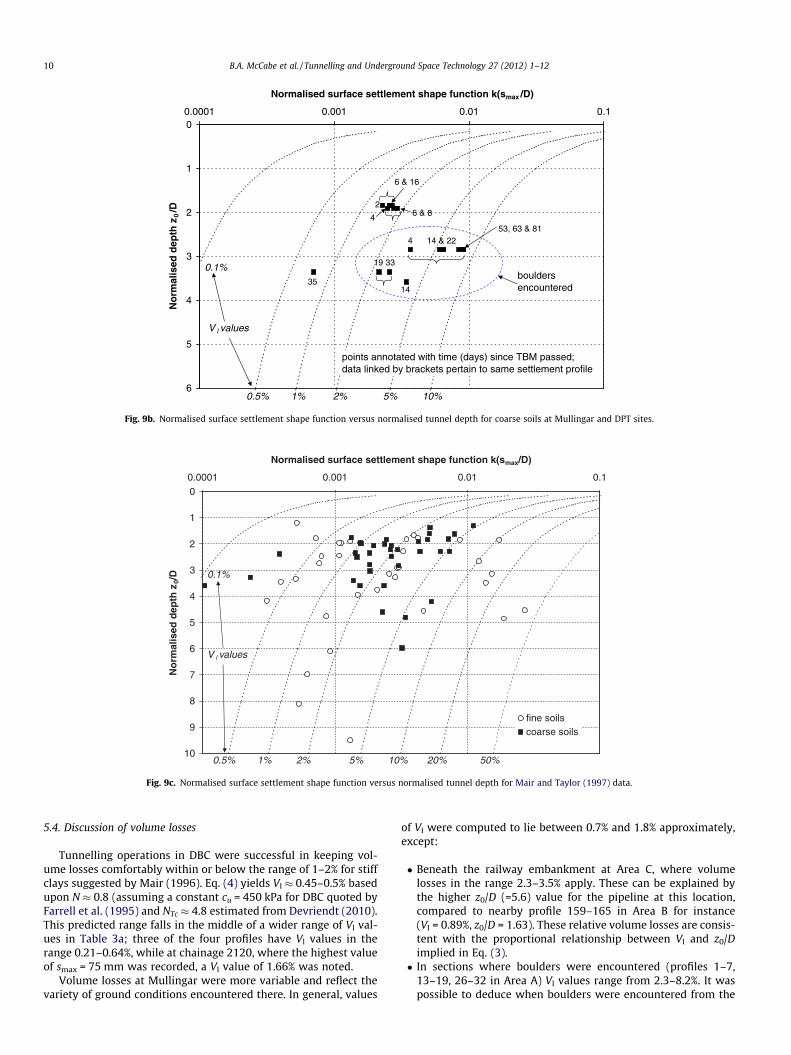
The data in Fig. 8a is reproduced in Fig. 9a (fine) and Fig. 9b(coarse) in an alternative format with the normalised surface set-tlement shape function k(smax/D) replacing smax/D on the horizon-tal axis, allowing contours of volume loss (based on Eq. (3)) to besuperimposed on these figures. The relevant values of volume losspertinent to each datapoint can be estimated visually from the Vl
contours in Figs. 9a and 9b. These datapoints show distinct rangesfor the volume losses when tunnelling in fine and coarse soils withVl generally less 1% in fine soils and generally greater than 1% incoarse soils. The data of Mair and Taylor (1997) is also providedin Fig. 9c for comparison.
1.010.0
nt shape function k(smax/D)
points annotated with time (days) since TBM passed; see Table 3
240
10%
alised tunnel depth for fine soils at Mullingar and DPT sites.
0
1
2
3
4
5
6
1.010.0100.01000.0
Normalised surface settlement shape function k(smax /D)
No
rmal
ised
dep
th z
0/D
points annotated with time (days) since TBM passed; data linked by brackets pertain to same settlement profile
4 14 & 22
19 33
2
4
1435
0.1%
0.5% 1% 2% 5% 10%
V l values
6 & 16
6 & 8
bouldersencountered
53, 63 & 81
Fig. 9b. Normalised surface settlement shape function versus normalised tunnel depth for coarse soils at Mullingar and DPT sites.
0
1
2
3
4
5
6
7
8
9
10
1.010.0100.01000.0
Normalised surface settlement shape function k(smax/D)
No
rmal
ised
dep
th z
0/D
fine soilscoarse soils
0.5% 1% 2% 5% 10% 20% 50%
0.1%
V l values
Fig. 9c. Normalised surface settlement shape function versus normalised tunnel depth for Mair and Taylor (1997) data.
10 B.A. McCabe et al. / Tunnelling and Underground Space Technology 27 (2012) 1–12
5.4. Discussion of volume losses
Tunnelling operations in DBC were successful in keeping vol-ume losses comfortably within or below the range of 1–2% for stiffclays suggested by Mair (1996). Eq. (4) yields Vl � 0.45–0.5% basedupon N � 0.8 (assuming a constant cu = 450 kPa for DBC quoted byFarrell et al. (1995) and NTc � 4.8 estimated from Devriendt (2010).This predicted range falls in the middle of a wider range of Vl val-ues in Table 3a; three of the four profiles have Vl values in therange 0.21–0.64%, while at chainage 2120, where the highest valueof smax = 75 mm was recorded, a Vl value of 1.66% was noted.
Volume losses at Mullingar were more variable and reflect thevariety of ground conditions encountered there. In general, values
of Vl were computed to lie between 0.7% and 1.8% approximately,except:
� Beneath the railway embankment at Area C, where volumelosses in the range 2.3–3.5% apply. These can be explained bythe higher z0/D (=5.6) value for the pipeline at this location,compared to nearby profile 159–165 in Area B for instance(Vl = 0.89%, z0/D = 1.63). These relative volume losses are consis-tent with the proportional relationship between Vl and z0/Dimplied in Eq. (3).� In sections where boulders were encountered (profiles 1–7,
13–19, 26–32 in Area A) Vl values range from 2.3–8.2%. It waspossible to deduce when boulders were encountered from the

0
500
1000
1500
2000
2500
3000
0 10 20 30 40 50 60 70
Jacked Distance (m)
Pre
ssu
re g
ener
atin
g C
utt
er H
ead
To
rqu
e (M
Pa)
0
5
10
15
20
25
30
Face
Res
ista
nce
(kN
)
Face Resistance
Max Torque
Fig. 10a. Interpreted face resistance and cutter head torque pressure for the drive from MH23 to MH22.
0
10
20
30
40
50
60
0 10 20 30 40 50 60 70
Jacked Distance (m)
Pen
etra
tio
n R
ate
(mm
/min
)
moving average (every 5 datapoints averaged)
Fig. 10b. Moving average of penetration rate for the drive from MH23 to MH22.
B.A. McCabe et al. / Tunnelling and Underground Space Technology 27 (2012) 1–12 11
interpreted face resistance, cutter head torque and penetrationrate records, such as those for drive MH23–MH22 adaptedfrom Curran (2010). Substantial increases in face resistanceare seen to occur for jacked distances in excess of 42 m(Fig. 10a) due to the presence of boulders, with a correspondingdrop in penetration rate (Fig. 10b). The higher penetration ratebeyond 50 m, reflecting a change in driving style, requires anincrease in hydraulic pressure providing the torque at the cutterhead beyond a standard target of approximately 10–12 MPa(Fig. 10a).
5.5. Simple design guidelines
While Figs. 9a and 9b provide a very convenient framework forsummarising the new data presented in this paper, both k and smax
must be estimated if these figures are to be used as design charts toestimate volume loss. Simplified expressions have been developed
hereunder to allow an estimate of volume loss based solely on thetunnel depth and soil type (assumed k value) only.
On the basis of Fig. 8a, conservative preliminary estimates ofsmax for Irish tills, using current tunnelling methods and in situa-tions where boulders do not adversely affect the tunnelling pro-cess, are proposed in the following equations:
smax ¼ 0:005D in fine soils ði:e: boulder claysÞ ð6Þ
smax ¼ 0:0125D in coarse soils ði:e: gravelsÞ ð7Þ
If boulders are encountered (as evidenced by measurements ofjacking forces and penetration rates during driving), larger valuesof smax may be appropriate, but are difficult to predict. Assuming,from Fig. 7, that k = 0.275 and k = 0.5 are representative troughwidth parameters for coarse and fine soils respectively, thenconservative estimates of Vl when using current tunnelling meth-ods may be made by substituting the relevant k value and eitherEqs. (6) and (7) as appropriate into Eq. (3) to arrive at:

12 B.A. McCabe et al. / Tunnelling and Underground Space Technology 27 (2012) 1–12
Vl ¼ 0:008z0
D
� �in fine soils ð8Þ
Vl ¼ 0:011z0
D
� �in coarse soils ð9Þ
While Eqs. (8) and (9), like any other empirical expressions,should be used with caution, they can provide a useful first esti-mate of likely volume loss due to tunnelling in Irish ground condi-tions using current tunnelling methods. Once again, these valuesmay be expected to increase if boulders are encountered.
6. Conclusions
This paper has aimed to collate Irish experience of settlementsabove tunnels in glacial tills, with a view to providing preliminarypre-contract estimates of the amount and extent of surface settle-ment that is likely to arise in a tunnelling contract. The followingconclusions may be drawn from this research:
1. For glacial till soils, it is important to establish whether the pre-dominant overburden material governing the settlement troughhas the characteristics of a fine or coarse material since the kvalues for each have been shown to be quite different. The cor-rect choice is important to obtain a reliable prediction of vol-ume loss.
2. The values of the trough width parameter, k, for coarse soils liein the range 0.2–0.3, which is at the low end of the range givenin the Mair and Taylor (1997) database for sands and gravels.
3. The values of k for fine soils lie in the range 0.4–0.6, which isconsistent with the Mair and Taylor (1997) database for clays.There is no obvious distinction between the k values obtainedfor tunnels in soft and stiff clays.
4. An increase in smax with time in the Mullingar coarse soils isbelieved to be related to dissipation of the bentonite fluid usedto support the overcut to the pipelines. There is no systematicvariation in k with time in these soils. None of the boulder claysreferred to were soft with the result that consolidation settle-ment was not a significant issue.
5. The data presented has enabled reasonably confident upperlimits to be placed on the smax values likely to be obtained fortunnels in fine and coarse soils using current tunnelling meth-ods, which is useful in obtaining a preliminary estimate of thevolume loss. However, the presence of boulders, as well asreducing the advance rate, can result in high values of smax
and high volume losses which are difficult to predict withaccuracy.
Acknowledgements
The authors would like to thank Nishimatsu Construction Co.Ltd. and Westmeath County Council for the permission to use
information presented in this paper relating to the Dublin PortTunnel and Mullingar Sewerage Improvement Scheme, respec-tively. Supplementary information provided by Mr. ConorO’Donnell of AGL Consulting is appreciated. The authors would alsolike to acknowledge J.B. Barry and Partners, Consulting Engineers,who employed Ciarán Reilly during the construction of the Mullin-gar Scheme, and Ward and Burke Construction, the microtunnel-ling contractors for the Mullingar Sewerage ImprovementScheme, who employed Brien Curran while carrying out a researchMasters at NUI Galway.
References
Curran, B.G., 2010. Analysis of Jacking Loads and Ground Movements forMicrotunnelling in Irish Ground Conditions. MEngSc. Thesis, Dept. of CivilEngineering, NUI Galway.
Devriendt, M., 2010. Risk analysis for tunnelling ground movement assessments. In:Proceedings of ICE Geotechnical Engineering, vol. 163, no. GE3, pp. 109–118.
Farrell, E.R., 2010. Lessons learned – problems to solve. In: Proceedings of theSymposium on Bridge and Infrastructure Research in Ireland, pp. 181–198(keynote).
Farrell, E., Lehane, B., O’Brien, S. and Orr, T. 1995. Stiffness of Dublin black boulderclay. Proc. XIth.ECSMFE, Copenhagen, 1, 1-109 – 1-117.
Farrell, E., Wall, D., 1990. Soils of Dublin. Transactions of the Institution of Engineersof Ireland, pp. 78–97.
Finch, T.F., 1977. Soils of Co. Westmeath, Soil Survey Bulletin No. 33, An ForasTalúntais.
Glossop, N.H., Saville, D.R., Moore, J.S., Benson, A.P., Farmer, I.W., 1979. Geotechnicalaspects of shallow tunnel construction in Belfast estuarine deposits. In: Proc.Tunnelling ’79, London, pp. 45–56.
Goto, J., Thompson, S., Squires, S., Mizuno, S., 2004. Dublin Port tunnel – excavationof a 11.8 m diameter urban motorway tunnel. In: Chinese Taipei TunnellingAssociation Conference, pp. D091–D098.
Jones, B.D., 2010. Low-volume-loss tunnelling for London ring main extension. In:Proceedings of ICE Geotechnical Engineering, vol. 163, no. GE3, pp. 167–185.
Lehane, B.M., Simpson, B., 2000. Modelling glacial till under triaxial conditions usinga BRICK soil model. Canadian Geotechnical Journal 37 (5), 1078–1088.
Lochaden, A.L.E., Farrell, E.R., Orr, T.L.L., 2008. Comparing numerically modelledtunnel induced ground movements with field measurements. In: Proceedings ofBCRI ’08 Symposium, NUI Galway.
Long, M., Menkiti, C.O., 2007. Geotechnical properties of Dublin Boulder Clay.Geotechnique 57 (7), 595–611.
Macklin, S.R., 1999. The prediction of volume loss due to tunnelling inoverconsolidated clay based on heading geometry and stability number.Ground Engineering 32 (4), 30–33.
Mair, R.J., 1996. Settlement effects of bored tunnels. In: Mair, R.J., Taylor, R. N.,(Eds.), Session Report, Proc. Int. Symposium on Geotechnical Aspects ofUnderground Construction in Soft Ground. London, Balkema, pp. 43-53.
Mair, R.J., Taylor, R.N., 1997. Bored tunnelling in the urban environment, state-of-the-art report and theme lecture. In: Proceedings of the 14th InternationalConference on Soil Mechanics and Foundation Engineering, vol. 4. Hamburg,Balkema, pp. 2353–2385.
O’Reilly, M.P., New, B.M., 1982. Settlements above tunnels in the United Kingdom:their magnitude and prediction. In: Proceedings of Tunnelling ’82 Symposium,London, pp. 173–181.
Orr, T.L.L., Farrell, E.R., 1996. Geotechnical aspects of tunnelling in soft ground inIreland. In: Mair, Taylor (Ed.), Geotechnical Aspects of UndergroundConstruction in Soft Ground, pp. 301–305.
Peck, R.B., 1969. Deep excavations and tunnelling in soft ground. In: Proceedings ofthe 7th International Conference on Soil Mechanics and FoundationEngineering, vol. 3. Mexico City, pp. 311–376.
Skipper, J., Follett, B., Menkiti, C., Long, M., Clarke-Hughes, J., 2005. The engineeringgeology and characterisation of Dublin Boulder Clay. In: Quarterly Journal ofEngineering Geology and Hydrogeology, pp. 171–187.