
Techno-Economic Assessment of Parabolic trough Steam ...
117
i Techno-Economic Assessment of Parabolic trough Steam Generation for Hospital By Dejene Assefa
-
Upload
khangminh22 -
Category
Documents
-
view
0 -
download
0
Transcript of Techno-Economic Assessment of Parabolic trough Steam ...

i
Techno-Economic Assessment of
Parabolic trough Steam Generation for
Hospital
By
Dejene Assefa
ii
Master of Science Thesis EGI-2011-
031MSCEKV839
Techno-Economic Assessment of Parabolic trough
Steam Generation for Hospital
Dejene Assefa
Approved
Date
Examiner
Professor Torsten Fransson
Supervisor
Dr.Tesfaye Dama
Mrs. Anneli Carlqvist
Commissioner Contact person
ABSTRACT
Hospitals are one of the most energy consuming centers in which thermal energy is utilized
for different medical equipments and others. Sterilizers, laundry and kitchens are the main
thermal energy utilizing equipments. In addition, large amount of hot water is utilized mainly
for showering and dish washing. The main sources of this thermal energy are fossil fuel for oil
fired boilers and solar irradiation for solar thermal steam generation system.
This project aims in analyzing the Technical performance of parabolic trough steam
generation and oil fired boiler steam generation system for Black lion general specialized
hospital which is located in Addis Ababa and to perform economic assessment on both
systems so as to make comparison test.
The result from technical feasibility study shows the parabolic trough can meet the steam
demand of the hospital at the required time, more than 8hour per day, as the hospital currently
require steam for different activities during the day time for 8hour per day. During cloudy day
the conventional back up steam generation system will meet the daily demand for few days of
the year. The economic assessment result shows that although the initial investment of
concentrated solar steam generation is high as compared to convention steam generation

iii
system, the reverse is observed in operation and maintenance cost, resulting solar thermal
steam generation break even (payback) to occur early, after 7 year the system let to operate
over the conventional oil fired steam generation. In addition the levelized cost of energy for
concentrated solar steam generation is found to be 58% higher than conventional steam
generation.
Hence, the result shows that parabolic trough is found to be more economical for steam
generation than oil fired boiler. If solar thermal steam generation (parabolic through) is
implemented, the fuel consumption and operational cost of the boiler can be reduced
appreciably.

iv
ACKNOWLEDGEMENT
I would like to express my sincere gratitude to my Examiner professor Torsten Fransson (KTH),
local supervisor Dr.Tesfaye Dama (AAU) and KTH Supervisor Mrs. Anneli Carlqvist for giving
me the opportunity to work on this title and for their continuous valuable comments, guidance
and encouragement so as to keep me along the project track till now. Without them this work is
not expected to be completed, as I always felt comfortable having them behind me.
I would like to take this opportunity to sincerely thank all Black lion Hospital technical Staffs
for their unlimited kind cooperation, who help me in providing valuable data and suggestions.
Last but not least, I would like to thank my family and friends who were always besides me.

v
TABLE OF CONTENTS
ABSTRACT................................................................................................................ II
ACKNOWLEDGEMENT............................................................................................ IV
CHAPTER 1 ............................................................................................................... 1
1 INTRODUCTION................................................................................................. 1
1.1 BACKGROUND.................................................................................................. 2
1.2 OBJECTIVE OF THE PROJECT............................................................................. 2
1.3 METHODOLOGY ............................................................................................... 3
1.3.1 Literature review ..................................................................................... 3
1.3.2 Modeling and simulation ......................................................................... 3
1.3.3 Financial and Economic Analysis............................................................ 3
CHAPTER 2 ............................................................................................................... 4
2 LITERATURE REVIEW....................................................................................... 4
2.1 SOLAR COLLECTORS........................................................................................ 4
2.1.1 Concentrating Solar Power ..................................................................... 5
2.1.2 Parabolic Trough..................................................................................... 6
2.2 LIMITATION OF PARABOLIC TROUGH TECHNOLOGY .............................................. 7
2.3 CONVENTIONAL STEAM GENERATION (BOILER) .................................................. 8
2.3.1 Boiler feed water: .................................................................................... 8
2.3.2 Water treatment: ..................................................................................... 9
2.3.3 Fuel supply system ................................................................................. 9
2.4 INTRODUCING TRANSYS SOFTWARE ............................................................. 10
2.4.1 Input parameters for parabolic trough Model ........................................ 11
2.5 HEAT TRANSFER FLUIDS (HTF) ...................................................................... 23
2.6 FINANCIAL ANALYSIS ...................................................................................... 24
2.7 LIFE CYCLE COST ANALYSIS. .......................................................................... 24
2.7.1 The Levelized Cost of Energy (LCOE).................................................. 25

vi
CHAPTER 3 ............................................................................................................. 27
3 GENERAL DESCRIPTION OF BLACK LION HOSPITAL ............................... 27
3.1 INTRODUCTION .............................................................................................. 27
3.2 SUPPLEMENTARY SERVICES HELD IN THE HOSPITAL OTHER THAN MEDICAL
SERVICES ............................................................................................................... 28
3.2.1 Laundry Service .................................................................................... 28
3.2.2 Kitchen Service ..................................................................................... 31
3.2.3 Sterilization Service .............................................................................. 32
3.2.4 Hot Water Service................................................................................. 34
3.3 UTILITIES....................................................................................................... 35
3.3.1 Cold Water Service ............................................................................... 35
3.3.2 Fuel Usage............................................................................................ 36
3.3.3 Electric Energy Usage .......................................................................... 36
3.4 ASSESSMENT OF BLACK LION BOILER .............................................................. 37
3.4.1 Efficiency of the boiler........................................................................... 40
3.5 ESTIMATION OF STEAM AND HOT WATER DEMAND OF THE HOSPITAL ................... 41
3.5.1 Hot water requirement for Shower ........................................................ 42
3.5.2 Steam and Hot water requirement for laundry ...................................... 43
3.5.3 Hot water for launder washing .............................................................. 44
3.5.4 Steam and Hot water requirement for Kitchen ...................................... 44
3.5.5 Steam requirement for Central sterilization........................................... 45
3.5.6 Steam requirement for hot water generation......................................... 45
3.5.7 Steam line losses.................................................................................. 46
CHAPTER 4 ............................................................................................................. 50
4 TRANSYS MODELING OF PARABOLIC TROUGH STEAM GENERATION .. 50
4.1 SOLAR THERMAL ELECTRIC COMPONENTS (STEC) MODEL FOR A PARABOLIC
TROUGH COLLECTOR............................................................................................... 50
4.2 PRE HEATER MODEL ...................................................................................... 51
4.3 EVAPORATOR MODEL..................................................................................... 52
4.4 STORAGE TANK ............................................................................................. 53

vii
4.4.1 Sizing of the Tank ................................................................................. 53
4.5 TRANSYS MODEL CONNECTIVITY................................................................... 55
4.6 SOLAR STEAM GENERATION MODEL RESULT.................................................... 56
4.7 DIRECT NORMAL IRRADIATION (DNI) FOR ADDIS ABABA.................................... 57
CHAPTER 5 ............................................................................................................. 59
5 SIMULATION RESULT..................................................................................... 59
5.1 SIMULATION RESULT FOR CLEAR DAY .............................................................. 60
5.2 SIMULATION RESULT FOR CLOUDY DAY............................................................ 66
CHAPTER 6 ............................................................................................................. 72
6 COST AND FINICIAL ANALYSIS OF PARABOLIC TROUGH AND FOSSIL
FUEL STEAM GENERATION SYSTEMS........................................................ 72
6.1 COSTS ASSOCIATED WITH PARABOLIC TROUGH SOLAR STEAM GENERATION ...... 72
6.1.1 Capital Costs......................................................................................... 72
6.1.2 Operation and Maintenance Costs........................................................ 74
6.2 COSTS ASSOCIATED WITH CONVENTIONAL (BOILER) STEAM GENERATION SYSTEM 75
6.2.1 Capital Costs......................................................................................... 75
6.2.2 Operation and Maintenance Costs........................................................ 77
6.3 RESULTS OF ECONOMIC ANALYSIS................................................................... 79
6.3.1 Life Cycle Cost...................................................................................... 79
6.3.2 Levelized Cost of Energy (LCOE) ......................................................... 81
CHAPTER 7 ............................................................................................................. 82
7 CONCLUSION .................................................................................................. 82
CHAPTER 8 ............................................................................................................. 83
8 RECOMMENDATION ....................................................................................... 83
9 REFERENCES.................................................................................................. 84
10 APPENDIXS...................................................................................................... 86

viii
INDEX OF FIGURES
Figure 2-1: Parabolic and central receiver concentrators [1]. ................................................................. 5
Figure 2-2: Parabolic trough [2] ............................................................................................................... 6
Figure 2-4: Solar collector TRANSYS 16 simulation model [Source: TRANSYS examples] ................ 11
Figure 2-5: Equation of time E in minutes as a function of Day of the year .......................................... 13
Figure 2-6: Solar angles on the earth globe [4] ..................................................................................... 14
Figure 2-7: Declination angle as a function of day of the year .............................................................. 15
Figure 2-8: Earth surface coordinate system [4] ................................................................................... 16
Figure 2-9: A single-axis tracking aperture where tracking rotation is about the tracking axis[4] ......... 17
Figure 2-10: Collector tracking through morning, showing digression of collector shading as the day
progresses [7] ........................................................................................................................................ 19
Figure 2-11: Row shading versus time of day, for June21 and December 21 ...................................... 20
Figure 2-12: End losses from an HCE[7].............................................................................................. 21
Figure 2-13: End loss as a function of incident angle ........................................................................... 22
Figure 3-2: Black lion Hospital Laundry Room and its machines.......................................................... 29
Figure 3-3: Black lion Hospital Kitchen room and its accessories......................................................... 31
Figure 3-4: Autoclaves in the sterilization room .................................................................................... 33
Figure 3-5: Storage type hot water generators at black lion hospital .................................................... 34
Figure 3-6: Cold water pumps ............................................................................................................... 36
Figure 3-7: Components of Black lion hospital oil fired Boiler system .................................................. 38
Figure 3-8: Sankey diagram for the boiler energy balance [3] .............................................................. 40
Figure 3-9: Steam, Hot water and condensate flow schematic diagram............................................... 42
Figure 4-1: Solar filed and steam line connection ................................................................................. 53
Figure 4-2: TRANSYS model component connectivity ......................................................................... 55
Figure 4-3: SAM Output of Daily average DNI for Addis Ababa ........................................................... 58
Figure 5-1: Heat transfer fluid Temperature [oC] and DNI [W/m2] for clear day of February 2. ....... 60
Figure 5-2: Heat transfer fluid and Steam output Temperature [0C] for clear day of February. ............ 62
Figure 5-3: Heat transfer fluid and Steam output Temperature [0C] for the month of February............ 64
Figure 5-4: Heat transfer fluid Temperature [oC] and DNI [W/m2] for cloudy day of January 11. ......... 66
Figure 5-5: Heat transfer fluid outlet Temperature and Steam Temperature for cloudy day of January
11........................................................................................................................................................... 68
Figure 5-6: Heat transfer fluid and Steam output Temperature [0C] for the month of January ............. 70
Figure 6-1: Life cycle cost analysis for parabolic trough and oil fired boiler.......................................... 79
Figure 6-2: Capital and operating cost analysis for parabolic trough and oil fired boiler ...................... 80
Figure 6-3: Levelized cost of energy (LCOE) for oil fired boiler and parabolic trough .......................... 81

ix
INDEX OF TABLES
Table 3-1: Steam and hot water requirement summary........................................................................ 41
Table 3-2: Recommended insulation thickness. [6]............................................................................... 47
Table 3-3: Insulation thickness for existing pipeline [6]] ........................................................................ 48
Table 3-4: Pipeline heat loss summary [6] ............................................................................................ 49
Table 6-1: Direct Costs for Concentrated Solar Steam Generation system [8] .................................... 73
Table 6-2: Indirect capital costs of Concentrated Solar steam generation system [8] .......................... 73
Table 6-3: Operation and maintenance cost of concentrated solar steam generation [8] .................... 74
Table 6-4: Direct Costs for Conventional steam generation system (source: Henan Sitong Boiler
Co.Ltd.) .................................................................................................................................................. 76
Table 6-5: Indirect capital costs of Conventional steam generation system[8] ..................................... 77
Table 6-6: Operation and maintenance cost of conventional steam generation [8].............................. 78

x
NOMENCLATURE LIST
A Coefficient
Aeff Solar field aperture area [m2]
B Coefficient
C Coefficient
Cmin The smaller capacitance rate between the steam and the HTF
[kW/K]
Cmax The bigger capacitance rate between the steam and the
HTF[kW/K]
Cp,HTF Average specific heat of HTF between inlet and outlet [kJ/kg-K]
Cp,steam Average specific heat of steam between inlet and outlet [kJ/kg-K]
D Coefficient
DHCE Diameter of the steel absorber tube [m]
E Equation of time E (in minutes)
EXP_UA Power law exponent to UA
f Focal length [m]
K Incident angle modifier
Lspacing Distance between the collector rows [m]
HTFsteamm , Mass flow rate of steam, HTF [kg/s]
NSCA Number of SCA loops in the solar field
absQ Absorbed energy [W]
dotQ Transferred power [W]
pipingQ Piping system heat losses [W]
netQ Net heat transfer between HTF and steam/water [W]
TambAmbient temperature [oC]
Tsteam Temperature of the steam [oC]
UA Overall heat transfer coefficient [W/K]
UAREF Reference overall heat transfer coefficient [W/K]
hfg Enthalpy of vaporization [KJ/Kg]

xi
Acronyms:
CL Cleanness
CSP Concentrating solar power
DNI Direct normal insolation [W/m2]
EL End loss
HCE Heat collecting elements
HTF Heat transfer fluid
LCOE Levelized cost of energy
Greek Letters:
Solar altitude angle [o]
Solar azimuth angle [o]
Declination angle [o]
outin TT , Difference between inlet and outlet temperature of the HTF from
the solar field and ambient temperature [OC]
Effectiveness
Efficiency [%]
SF Efficiency of the solar field [%]
Incidence angle [o]
Z Solar zenith angle [o]
Density [kg/m3]
Altitude angle [o]
The hour angle [o]

1
CHAPTER 1
1 INTRODUCTION
Today, the issue of sustainable development is not separately treated with clean energy
production and utilization. In this regard renewable energy resources play a great role in
shifting towards clean and green energy system. Hospitals are one of the most thermal energy
consuming sectors for different medical service equipments such as sterilizers, launders,
kitchen and showering. Among this hot water is mainly used for shower, laundry washing and
dish washing. The source of the used hot water is from the hot water generator (heat
exchanger) where steam from boiler and cold water from city supply exchanges heat. This
consumes large amount of fuel in the boiler and hot water generator takes high proportion of
the steam generated from the boiler hence the running cost. If the boiler can be substituted
with Concentrated Solar Steam generation system (parabolic trough) reduction of fuel cost
and CO2 –emission from the boiler would be appreciably.
Concentrated Solar Power systems (CSP) employ solar collectors to track the sun and use its
energy to produce steam. Parabolic troughs are currently the most common technology today
to concentrate the solar thermal energy onto absorbers and the thermal energy transferred to a
heat transfer fluid (HTF). These parabolic trough fields replace the boiler part of a
conventional Rankine Cycle power plant. The solar field area must however be large enough
to satisfy the steam demand. Heat exchangers are used to transfer heat energy from the HTF
to steam coming from the feed water heaters.
To date, all commercial (CSP) are hybrid solar/fossil plants. [1] The power plants have a
backup fossil-fired capability that can be used to supplement the solar thermal energy output
during periods of low solar irradiation. The fossil backup can also be used to produce steam
during overcast or nighttime periods. In this project the power cycle (Rankin cycle) will be
ignored as only steam generation from solar field is the desire to provide steam for various
uses in hospital.

2
1.1 Background
In the currently ever increasing cost of fossil fuels, renewable energy sources are the primary
solution for energy demand of the world. Using renewable energy sources has advantage of
no pollution, no greenhouse gas generation and there is no danger on the supply security of
the energy resource.
Black lion General specialized hospital is located in Addis Ababa, the capital city of Ethiopia.
It has around 800 beds and it gives multi services to the public as it is a governmental
hospital. The hospital currently uses diesel boilers for steam generation 365 a year and 9
hours a day, though due to several reasons usually it works for 4 to 5 hours a day. The steam
generated will be distributed to sterilizer, hot water generator and laundry drying machine.
The total steam consumed in hot water generator reaches two-third of the total steam
generated in the boiler and the remaining will be distributed to sterilizer and drying. The
hospital uses furnace oil for the generation of the steam, consumes 245 m3and pays
1,593,087.41 birr (96,550.00 dollar) in the fiscal year, 2008/09 [3]. If concentrated solar
steam generation system is implemented, the fuel consumption and operational cost of the
boiler can be reduced appreciably.
1.2 Objective of the project
The main objective of the project is to perform technical and economic analysis of CSP
parabolic trough steam generation in contrast to fossil fuel (diesel boiler) steam generation
system for medium size hospital application in selected site of Ethiopia (case study for black
lion hospital).
A major objective is the simulation work, to investigate the performance of CSP parabolic
trough in regard to the solar energy absorbed, temperature variation of the circulating water
and the instantaneous and total efficiency of the system as a function of time.

3
The specific objectives of the project are:
1. Modeling of the parabolic trough steam generation system using appropriate modeling
software.
2. Simulating the model using the proper simulation software (e.g. TRNSYS) to
investigate the performance of parabolic trough steam generation system
3. Making cost and financial analysis of the fossil fuel and CSP steam generating system
4. Discussion of the technical and economical feasibility oil fired boiler and parabolic
trough steam generation systems
1.3 Methodology
To achieve the above general and specific objectives the following methodologies are
adopted.
1.3.1 Literature review
Review about the potential of renewable energy in Ethiopia, techniques of renewable energy
technology (such as solar thermal systems) and review about parabolic trough technology.
Hospitals thermal energy demand and supply technical descriptions, benefits and limitations
as of today. The literatures available are from electronic media, journals, and books.
Secondary data are referred from previous and related research studies, existing statistical data
and interviewing hospital personnel’s
1.3.2 Modeling and simulation
After collecting the necessary weather data for the selected site (Addis Ababa), the system is
modeled and simulated using TRNSYS software.
1.3.3 Financial and Economic Analysis
Life cycle cost, payback period and LCOE of the two technological systems will be
determined and compared with each other. Finally based on the outcome, conclusions and
recommendations will be given.

4
CHAPTER 2
2 LITERATURE REVIEW
2.1 Solar Collectors
Solar thermal energy is often used for heating swimming pools, domestic heating water, and
space heating of buildings. Solar space heating systems can be classified as passive or active.
In passive solar heating for building heating the air is let to circulate over a solar heated
surface inside the building where less dense warm air tends to rise while more dense cooler
air moves downward as the heat transfer is due to natural convection. But in active heating
system it needs pump and fan for driving the heat transfer fluid and air respectively [1]
The solar collector is main component of solar thermal system. Currently different types of
collectors are available commercially based on the construction type.
Solar collectors can be either concentrating or Non-concentrating.
Non concentrating collectors – have a collector area (i.e. the area that intercepts the solar
irradiation) that is the same as the absorber area (i.e., the area absorbing the radiation).
Flat-plate collectors are the most common and are used when temperatures below about
800C are sufficient, such as for space heating.
Concentrating collectors – where the area intercepting the solar radiation is greater,
sometimes hundreds of times greater, than the absorber area. The concentrator helps to
collect large amount of solar incoming radiation within a limited collector area and
supplies to the absorber pipe.
Concentrating solar collectors are used for high temperature application. Concentrating
collectors reflects the solar radiation falling on the collector the absorber and this enable to
collect high amount of solar energy with small absorber area as the convection and radiation
losses are minimized, therefore it attains high temperature.
Currently three types of solar concentrators are commercially available, parabolic troughs,
parabolic dishes and central receivers. The working concept of the collectors is described in
Figure 2.1 schematically.

5
Figure 2-1: Parabolic and central receiver concentrators [1].
2.1.1 Concentrating Solar Power
Today international interest on renewable energy systems is getting higher especially in the
field of concentrating solar power as the conventional power generation becomes a treat for
global warming and environmental pollution. The development of Concentrated Solar Steam
generation, troughs, towers, and dishes initiates to harness solar energy for electricity
production and other applications with moderate generation efficiency, cost and reliability.
Table 2-1 shows commercial applications of CSP with different capacities.
Table 2-1: Annual capacity characteristics of Concentrating Solar Power system [1]
System Peak Efficiency Annual Efficiency Annual Capacity Factor
Trough 21% 10 to 12%(d)
14 to 18%(p)
24%(d)
25 to 70%(p)
Power Tower 23% 14 to 19%(p) 25 to 70%(p)
Dish/Engine 29% 18 to 23%(p) 25%(p)
(d)=demonstrated (p)=Projected based
on pilot scaling
Annual capacity factor refers to the fraction of the year the technology can deliver solar
energy at rated power.

6
2.1.2 Parabolic Trough
Parabolic trough collector has a linear parabolic-shaped reflector which tracks and focuses the
sun radiation onto a linear receiver where the HTF circulates inside. The tracking axis is east
to west to collect the maximum possible throughout the day time as shown in Figure 2-2.
Figure 2-2: Parabolic trough [2]
Due to its parabolic shape parabolic trough has the capacity to focus the sun radiation from
the sun 30 to 100 times its normal intensity on a receiver pipe and up to 400oC operating
temperature is obtained [1].Based on the heat demand from the solar field many collectors can
be installed in parallel aligned north-south horizontal axis. The plants are designed to operate
at full rated power using solar energy alone. But as a backup for the plant during
unavailability of solar radiation, conventional plants are also designed to meet the base
demand [2].The Heat Transfer fluid that circulates inside the solar field (primary cycle) is
heated and transferred to heat exchanger, including super heaters, evaporators and pre heaters,
where steam is generated for the power cycle or other applications such as the case at Black
Lion Hospital. The heat transfer fluid (HTF) in the primary cycle returns back to the receiver
and gets heated again to complete the cycle. At Black Lion hospital, the steam generated in
the secondary cycle could be fed to laundry, dishwasher and sterilizers.

7
2.2 Limitation of Parabolic trough technology
Despite its many benefits, solar thermal for power generation is still employed on a very
limited basis. The technology is still relatively new on the commercial market, and there are
disadvantages to solar thermal power generation that have delayed its growth. Primarily, the
efficiency of these plants is relatively low compared to that of traditional fossil fuel plants,
and their equipment and maintenance costs are higher due to the complexity and vulnerability
of the technology.
Many of the problems lie with the receiver tubes, which absorb the intensified solar radiation
reflected from the parabolic trough. A typical receiver tube consists of a stainless steel
absorber pipe which carries the heat transfer fluid, and a cylindrical glass envelope that is
concentric to and surrounds the absorber pipe. The annular space between the two serves as a
barrier to convective heat losses, and the absorber pipe is coated with a solar-selective
material that maintains a high absorptance while minimizing the emittance of infrared
radiation.
After serving for some years hydrogen will permeate through the stainless steel pipe and leaks
into the annulus of the receiver tubes. The high conductivity of the hydrogen creates high heat
transfer that alters functionality of the receivers and must either be punctured to release the
hydrogen or be completely replaced.
Damage to the glass envelopes is likely the most common problem in the field. The glass
envelopes are relatively fragile, and can break easily when exposed to severe weather
conditions or when pieces of the reflecting mirrors break off and fall onto the receiver tubes.
With a broken envelope, the absorber tube may be fully exposed to the ambient air, greatly
increasing thermal losses. The replacement of these highly expensive and easily damaged
components upon failure greatly increases the cost of operating and maintaining a CSP solar
field. [2]

8
2.3 Conventional Steam Generation (Boiler)
Conventional steam generation system uses boiler system which consists feed water tank,
boiler, end use devices (it may be turbine or other steam driven devices) and condensates
pump. The feed water tank supplies treated water for boiler/evaporator and regulated by
automatic valves with the steam demand. The steam generated will be distributed via steam
pipelines to the point of use. Along the pipeline the steam pressure is regulated as per the
demand. The water supplied for the boiler comes from feed water tank where condensate from
process and treated make up water are mixed and collected. To improve boiler efficiency,
feed water is heated in pre heaters using waste heat in flue gas.
Generally we have two types steam generation system (boiler), fire tube and water tube. Fire
tube boilers, feed water is converted into steam in the shell side where as hot flue gas passes
through the tubes and this type of boilers are used usually for low steam demand at low
pressure. In case of Water tube boilers, flue gases passes over the tube and water is converted
to steam inside the tube. (Reverse of Fire Tube system). Black lion hospital uses one three-
pass (3p) wet back fire tube boiler, 3000kg/hr steam generation capacity at a pressure of
12bar, with another one standby to satisfy the daily steam demand of different services in the
hospital.
2.3.1 Boiler feed water:
The boiler system comprises mainly of a feed water system, fuel system and Steam System.
The feed water system provides water to the boiler and regulates it automatically to meet the
steam demand. The water supplied to the boiler that is converted into steam is called feed
water. The two sources of feed water are:
• Condensate return from the processes and
• Makeup water (treated raw water)

9
2.3.2 Water treatment:
Proper treatment of makeup and feed water is necessary to prevent scale, other deposits and
corrosion in pre-boiler, boiler, steam and condensate systems, and to provide the required
steam purity. Absence of adequate treatment can lead to operational upsets or unscheduled
outages; it is also ill advised from the point of view of safety, economy, and reliability.
2.3.3 Fuel supply system
The fuel used for boilers is usually light oil or furnace oil, for better combustion usually the
fuel is pre-heated to a temperature of 1200 C using exhaust gas. Black lion hospital three pass
(3P) oil fired boiler is shown partly in Figure 2-3:
Figure 2-3: Black lion Hospital 3pass Fire Tube boiler picture [3]

10
2.4 Introducing TRANSYS Software
TRNSYS is an acronym for “Transient System Simulation program” which is developed by
the University of Wisconsin-Madison since the 1970’s (Klein SA et. al. 1996). TRNSYS is
written in ANSII standard Fortran-77 and its component library includes many of the
components commonly found in thermal energy systems. This includes a Solar Thermal
Electric Component (STEC) library that has been created under the Solar PACES umbrella as
well as components that are not ordinary considered part of a system. Such components are
utility subroutines that use to handle the weather and insolation data and output simulation
results.
TRNSYS relies on a modular structure and system concept, in which a system is defined as a
set of components that are interconnected to accomplish the specified task. Each model is the
functional relationship between its input and output quantities which are defined using
algebraic and first-order differential equations. Thus, system performance simulation can be
done by collectively simulating the performance of the interconnected components.
TRNSYS is an absolute and widespread simulation environment for the transient simulation
of different solar, HVAC and other conventional fuel power generation. Many researchers use
this software for investigation and system analysis to implement new ideas in the field of
Alternative Energy Systems. It has a variety of model components in its library including
design tools and control units. The DLL-based architecture let users to add custom component
models developed using all common programming languages such as (C, C++, PASCAL,
FORTRAN and mat lab [4].
Some of TRANSYS software applications areas are:
Solar thermal and PV systems
HVAC systems
Renewable energy systems
Cogeneration and fuel cells system

11
When any project is set up in TRNSYS, all model components are connected by links
graphically in the simulation studio and the input parameters will be set for each model as
shown in Figure 2.4:
Figure 2-4: Solar collector TRANSYS 16 simulation model [Source: TRANSYS examples]
2.4.1 Input parameters for parabolic trough Model
2.4.1.1 Direct Normal Insolation
Extraterrestrial solar radiation follows a direct line from the sun to the Earth. Since the earth’s
orbit is slightly elliptical, the intensity of solar radiation received outside the earth’s
atmosphere varies as the square of the earth-sun distance and due to this variation
Extraterrestrial solar radiation flux varies and it described by the following relation

12
Upon entering the earth’s atmosphere, some solar radiation is diffused by air, water
molecules, and dust within the atmosphere (Duffie and Beckman, 1991). The direct normal
insolation represents that portion of solar radiation reaching the surface of the Earth that has
not been scattered or absorbed by the atmosphere. The term “normal” refers to the direct
radiation as measured on a plane normal to its direction.
(2.1)
Where: ISC is the extraterrestrial solar irradiance constant (1367 W/m2)
N is the day number
2.4.1.2 Solar Time
In solar energy study there is an important distinction between standard time and solar time.
Solar time is a time based on the apparent angular motion of the sun across the sky, with solar
noon the time with the sun crosses the meridian of the observer .Standard time is described on
longitudes and is dependent on the standard meridian for each country. The relation between
solar time and standard time in min is given by.
Solar time = Standard time + 4(Lst + LLoc) +E (2.2)
Where: - Lst is the standard meridian for the local time zone
Lloc is the longitude of the location in question
E is equation of time in minutes, accounts for the small irregularities in day length that
occur due to the Earth’s elliptical path around the sun. The equation of time used here,
in minutes, comes from Spencer (as cited by Iqbal, 1983):
)2sin04089.02cos014615.0
sin032077.0cos001868.0000075.0(2.229
BB
BBE
(2.3)
Where: 365
3601 NB
2/365
360cos033.00.1 mW
NII SCext

13
The equation of time as a function of each day of the year is shown in Figure 2-5, minimum
and maximum irregularities occurs at February 18 and maximum at June 2 respectively.
0 50 100 150 200 250 300 350 400-15
-10
-5
0
5
10
15
20
Nth Day of the year
Equ
atio
n of
tim
e [m
in]
Figure 2-5: Equation of time E in minutes as a function of Day of the year
2.4.1.3 Hour Angle (ω)
One of the most important solar angle used to illustrate the earth's revolution with reference to
its polar axis is the hour angle (ω).Hour angle can be described as the angular distance
measured between the meridian of the viewer and the meridian whose plane enclose the sun
as shown in the figure 2.6. When the sun get to at its highest point in the sky or when it
become overhead, the hour angle become is zero at solar noon (12:00).. The hour angle
increases by 15 degrees every hour.

14
Figure 2-6: Solar angles on the earth globe [4]
Hour angle is given by the following equation.
oST 1512 , Where ST is solar time (2.4)
2.4.1.4 Declination Angle (δ)
In the earth’s globe, the plane that comprises the earth’s equator is called the equatorial plane.
The declination angel can be known by pinching a line between the center of the earth and the
sun. The angle between the pinched line and the earth's equatorial plane is called the
declination angle (δ) as shown in figure 2-6. The earth’s equatorial plane will inclined 23.45o
to a line pinched between the earth and sun, when the earth’s northern part of earth’s
revolving axis is liable toward the sun which is around June 21.During this time it is observed
that the noontime sun is at its maximum point in the sky and the declination angle (δ) attain
positive 23.45o.These condition called summer solstice which tells the beginning of summer
in the Northern Hemisphere.
Similarly winter solstice occurs around December 22 when the equatorial plane is slanted
relative to the earth-sun line in such a way that the northern hemisphere is slanted away from

15
the sun. During this time the noontime sun reaches at its minimum point in the sky and
declination angle reaches at its maximum negative value -23.45o. General conventions tell,
winter declination angles are negative. Declination (δ) can be found from the equation.
365
284360sin45.23
N (2.5)
Variation of declination with day of the year is shown in Figure 2-7.
0 50 100 150 200 250 300 350 400-0.5
-0.4
-0.3
-0.2
-0.1
0
0.1
0.2
0.3
0.4
0.5
Nth day of the year
dec
lin
atio
n a
ng
le(r
adia
n)
Figure 2-7: Declination angle as a function of day of the year
2.4.1.5 Solar altitude angle (α)
The angle specified between the ray from the sun and a horizontal plane enclose the viewer is
named as solar altitude angle. The equation for the solar altitude angle (α) is given in
Equation (4.10).
coscoscossinsinsin (2.6)

16
The sun’s altitude can be illustrated in terms of the solar zenith angle (θz), which is basically
the complement of the solar altitude angle.
oZ 90 (Degrees) (2.7)
This gives the equation for the solar altitude angle to be
coscoscossinsincos Z (2.8)
2.4.1.6 Solar azimuth angle (γ)
The additional angle which is most important to describe the position of the sun is the solar
azimuth angle. The angle measured in clockwise direction on the horizontal plane between the
north-directing coordinate axis and the projection of the sun’s central ray is called solar
azimuth angle. As of conventions, displacements east of south are negative and west of south
are positive. In figure 2-8, solar altitude, solar azimuth incidence angles are shown clearly
with their sign convention.
Figure 2-8: Earth surface coordinate system [4]
2.4.1.7 Angle of Incidence (θ)
The angle between the sun’s rays and a vector normal (perpendicular) to the aperture or
surface of the collector is the angle of incidence (θ). Knowing this angle is of critical
importance to the solar designer, since the maximum amount of solar radiation energy that
could reach a collector is reduced by the cosine of this angle.

17
Certain types of concentrating collector such as parabolic trough collectors are designed to
operate with tracking rotation about only one axis to minimize the angle of incidence of beam
radiation on their surfaces and thus maximize the incident beam radiation. Here a tracking
drive system rotates the collector about an axis of rotation until the sun central ray and the
aperture normal are coplanar. The angle of incidence (θ) is also shown in Figure 2.8 and 2.9.
Figure 2-9: A single-axis tracking aperture where tracking rotation is about the tracking axis [4]
For a plane rotated about a horizontal North-South axis with continuous adjustment to
minimize the angle of incidence is,
21
222 sincoscoscos Z (2.9)
2.4.1.8 Incidence angle Modifier
Measured efficiency of a parabolic trough collector decreases as the solar beam incident angle
increases. Collector efficiency is at a maximum only when the incident angle is zero. The
decrease in collector efficiency with increasing incident angle is caused by cosine

18
foreshortening of the collector aperture as well as other effects, such as the transmissivity of
the glass envelope or the absorption of the selective surface as a function of incidence angle.
The incident angle modifier K is the ratio of collector efficiency at any angle of incidence, to
that at normal incidence. It is measured experimentally by varying the angle of incidence
under noontime solar irradiance conditions with ambient temperature heat transfer fluid
passing through the collector. A regression analysis of the data is used to obtain an equation
of the form:
2cos CBK (2.10)
Where: K = Incident angle modifier; value ranges from 0 to1
θ = Solar beam incident angle (0 to 60 degrees)
B = Coefficient for linear term
C = Coefficient for nonlinear term
Test results for SEGS LS-2 SCA yield an incident angle modifier expression as given in
equation (4.15) [7]. The equation is applied for temperatures between ambient and 400oC, at
any insolation level from 100 to 1100 W/m2, and at any incident angle from 0 to 60 degrees.
200003137.00003512.0cos K (2.11)
2.4.1.9 Row Shading
Generally at any solar field the collectors are arranged in parallel rows. The distance between
the collector rows is LSpacing = 12.5 m at SEGs VI. Hence, in the morning, at sunrise, when the
first sunrays fall on the trough collector field, the first row may be unobstructed, but the
following rows are shaded by the first. During the sun’s path in the morning, partial shading
of the collectors occurs until a particular zenith angle is reached. The shading reduces the
effective width of the collector and thus reduces the effective aperture area of the collector on
which the solar beam radiation acts. Consequently, the absorbed solar energy is reduced as
well. After a certain zenith angle is reached, there is no mutual shading of the collectors
anymore as described very well in figure 2.10. The same phenomenon occurs, of course, in
the evening during sunset.

19
Figure 2-10: Collector tracking through morning, showing digression of collector shading as the day progresses [7]
The row shadow factor is the ratio of the effective mirror aperture width to the actual mirror
aperture width. This ratio can be derived from the geometry of the solar zenith angle, the
incidence angle, and the layout of the collectors in a field [7]:
cos
cos ZSpacing
W
LRS (2.12)
Where: RS = row Shadow factor
SpacingL = length of spacing between troughs
W = collector aperture width (5 [m] for LS-2)
θZ = Zenith angle
θ = angle of incidence
Where RS ∈ [0; 1] A value of 0 for means complete shading whereas a value of 1 for
means no shading of the collector.
0.1;
cos
cos;0.0maxmin
ZSpacing
W
LRS (2.13)
The above equation for row shading is plotted and shown in Figure 2.11 for Addis Ababa with
latitude 9.020 at summer solstice and the winter solstice.

20
0 5 10 15 200
0.2
0.4
0.6
0.8
1
1.2
Time [hr]
RS
June 21
December 21
Figure 2-11: Row shading versus time of day, for June21 and December 21
2.4.1.10 End losses
End losses occur at the ends of the HCEs, where, for a nonzero incidence angle, some length
of the absorber tube is not illuminated by solar radiation reflected from the mirrors. Figure 2-
12 depicts the occurrence of end losses for an HCE with a nonzero angle of incidence.

21
Figure 2-12: End losses from an HCE [7]
The end losses are a function of the focal length of the collector, the length of the collector,
and the incident angle (Lippke, 1995).The relationship between end loss and incident angle is
plotted and shown clearly in figure 2.13.
SCAL
fEL
tan1 (2.14)
Where: f = focal length of the collectors (5[m] for LS-2 collectors)
θ = incident angle
SCAL = length of a single solar collector assembly (50 [m] for LS-2 Collectors)

22
0 10 20 30 40 50 60 70 800.4
0.5
0.6
0.7
0.8
0.9
1
Incident angle[teta]
En
d l
oss
Figure 2-13: End loss as a function of incident angle
2.4.1.11 Piping Heat Loss
In chapter three, the steam distribution line heat loss is estimated to reach the exact demand at
the end use devices. Similarly the heat losses in all solar filed (HTF) piping are important
factors that have to be included in the model for better design. Usually this loss is
approximated as 20W/m2 per aperture area [7].
2
20m
WQpipe (2.15)

23
2.5 Heat Transfer Fluids (HTF)
The solar field heat transfer fluid (HTF) absorbs heat as it circulates through the heat
collection elements in the solar field and transports the heat to the secondary fluid where it is
used to run end use devices. Several types of heat transfer fluid are used for trough systems,
including hydrocarbon (mineral) s, synthetic s, silicone s and nitrate salts.
Today most CSP plants use Therminol VP-1 HTF. Therminol VP-1 liquid/vapor phase heat
transfer fluid is a high temperature medium that delivers process heat at temperatures up to
400OC with reliability and precise control [10].For this analysis Therminol HTF is selected
for the simulations of Black Lion Hospital, due to better stability in liquid phase at elevated
temperature and heat transfer properties. In addition it shows better performance in current
CSP plants.
Therminol VP-1 is a mixture of 73.5% diphenyl oxide/26.5% diphenyl, and as such can be
used in existing liquid, or vapor phase systems, for top-up or replacement of heat transfer
fluids of the same composition. Physical properties of Therminol VP-1 in liquid phase are
shown by the following interpolated formulas as a function of temperature (OC) [7].
3362 /25.108310367.200078116.090797.0 mkgTTTT (2.16)
kgkJT
TTTTh
/1498104172.4
109879.2109591.5002414.0411
3826
(2.17)
kmWT
TTTTk
./498.1102974.7
105034.21092257.11019477.8)(415
311275
(2.18)
][37.13*0006072.0*1058.1)( 210 ChhhT o (2.19)

24
2.6 Financial Analysis
2.7 Life Cycle Cost Analysis.
The Life cycle cost (LCC) analysis make up an economics tool to help in making investment
decisions mainly by identifying the breakeven point or payback period over the project life
time. For renewable energy solutions like solar and wind comparisons with that of
conventional energy solutions, the life cycle cost (LCC) approach is very important as most of
these renewable energy projects require high initial investment. Mostly renewable energy
solutions require high initial investment and low operational cost, whereas conventional
energy solutions require low investment cost and high operational cost hence renewable
solutions have low payback period over conventional solutions due to costs associated with
fossil fuel.
The LCC cost accounts capital cost, operational and maintenance cost throughout the project
life time.
LCC=Capital cost +Present worth of maintenance, Operating and Replacement cost
The present worth of money can be described as the equivalent sum of money as of today’s
value sometime at a point in the future. Similarly the future worth of money can be described
as equivalent sum of money in the future some time at a point for money expend today. The
value of money is affected by inflation rate and discount rate over time. Hence the present
worth and future worth of money can be estimated by
nd
FWPW
)1( 2.24
nePWFW )1(* 2.25
Where:
n = time period (years)
d = discount rate (% per annum)
e = inflation rate (% per annum)

25
Then, the life cycle cost (LCC) can be obtained by adding up the Present worth (PW) of all
capital cost and operational costs.
2.7.1 The Levelized Cost of Energy (LCOE)
The levelized cost of energy is expressed as the present value of all total CAPEX and OPEX
of the plant from the day of installation to the project economic life time expressed in birr per
total kWh of energy produced over the project life time.
The levelized cost of energy LCOE is estimated using the annual project cost for project
financed by be it cash, mortgage or loan.[8]
N
n nn
N
n nn
d
Qd
C
LCOE
0
0
1
1 2.20
Where: Cn is the cost in Year n, and Cn = 0 is the cost in year 0, equivalent to the capital cost.
Qn is the energy produced by the system in year n.
n is the project life time
d is the discount rate,
2.7.1.1 Real and nominal Levelized cost of Energy
For real LCOE, the real discount rate appears in the total energy output term [8]:
N
n nn
N
n n
nquiredN
n nn
d
Qd
Ror
d
C
LCOEreal
0
0
,Re
0
1
11 2.21

26
Similarly, for the nominal LCOE, the nominal discount rate appears in the total energy output
term:
Re ,
0 0
0min
1 1min
1
N N quired nnn nn n
N nnn
no al
RCor
d dno al LCOE
Q
d
2.22
The real discount rate and nominal discount rate are related by Equation below [8].
111min edd realalno 2.23
Where: alnod min is the nominal discount rate.
reald is the real discount rate.
e is the inflation rate.

27
CHAPTER 3
3 GENERAL DESCRIPTION OF BLACK LION HOSPITAL
3.1 Introduction
The current existing Black Lion Specialized hospital has been established for the memorial of
prince Mekonnen, Duke of Harar, who is the son of His Imperial Majesty Haile Silassie I; by
an organized committee comprised of higher government officials of that period, with the
fund contributed by the Ethiopian people, the budget allotted by the government and donation
from foreign countries.
The hospital totally holds 123000m2 area of land, and its buildings have settled on 45000m2
area; there are 1262 various rooms from the basement to the eighth floor. The hospital was
attempted to occupy 500 beds, and had modernly planned and accommodated and facilitated
without patients department; as well it had seven x-ray, nine surgical and two laboratory
diagnostic rooms[13]. Part of the hospital has been shown in figure 3.1.
Figure 3-1: North side view of Black lion Hospital

28
The hospital was the biggest in Ethiopia during establishment period and was regarded as an
exemplary hospital without any other superior one in the continent of Africa. Even at the
moment it is renowned and famed as service rendering, training providing and research
conducting intuition equipped and facilitated with modern medical equipments and highly
skilled medical professionals. In the 1980’s the set up partitions of rooms and the hospital was
compelled to accommodate more than 700 patients. As of that period, the hospital was made
to carry out duties by accepting unlimited number of patients beyond its capacity, and as a
consequence it has 800 beds for adults and pediatric patients to be treated as in patients
The hospital has provided the appropriate medical services in the internal medicine
gynecological and obstetrics, surgical and pediatrics departments from 2001-2005 to 295,642
patients of average who appeared as regular and emergency patients [13]. The number of
patients has increased to 363,623 in the year 2006 within the last five years, service provision
increased by 23%, of which 47% provided for pediatric patients [13].
In the year 2007 the number of employees is 1234: and among them 444 are medical
profession, 97 are contract employees of medical profession and 693 are employees of
management. Since the hospital commenced its service there are new buildings constructed on
the land under its position like the Ethio-Cuba Friendship Memorial park, Radio Therapy
Center, Diabetic center, Children’s Cardiac Center, National Rehabilitation Center and
Graduates School Expansion Program Training Center. This data is the same for the year
2008/09. But the exact number of patients during the fiscal year was not known.
3.2 Supplementary Services Held in the Hospital other than Medical
Services
3.2.1 Laundry Service
Laundry service is a large energy consuming process, which includes all types of linen for
children, Bed linen for patients, Catering linen for patients, Surgery room’s linen, Staff
uniforms and others. All the laundry machines are steam heating types. Steam is supplied

29
directly from the steam headers to with a common line and distributed to the individual
machines based on their consumption rate. There are two washing machines with 60kg/hr
steam and 120lit/cycle cold water consumption. One cycle takes from 50-60 minutes. Steam is
used to heat the cold water to a different temperature ranges based on the hot water
temperature demand of the prewash, wash, and rinse steps in each cycle. The condensate and
the wastewater from each machine have been discharged to the environment.
The drying process is carried out by drying machine and using wind and solar energy. There
is one drying machine in function with 55kg capacity and 90kg/hr steam consumption rate.
One cycle takes from 35-40 minutes. The condensate is discharged to the environment.
Figure 3-2: Black lion Hospital Laundry Room and its machines
Laundry machines in Black Linens ready for washing Natural drying
Dry linen store in Black lion Linen Carts in Black lion

30
The series of works carried out in laundry room and the machines are described by pictures in
figure 3.2.In addition, there is one drying machine, with a steam consumption rate of
100kg/hr, currently working and one another not operational. When there was rain the drying
process for blankets and bed linens were held by wind and ironing machines. Since ironing
machines have a tendency to remove water from clothes, they use these machines to dry
linens directly from washing machines and clothes which are not dried enough using wind
energy. Since no condensate return due to the non functionality of the system, the condensate
from the machines is discharged to the environment. The laundry has a constant schedule,
operating 9 hours a day and 7 days a week. There are 32 workers in the laundry service.
Minimum energy consumption was happened when drying process has been performed
without ironing (washing and then drying by solar energy). Therefore, the energy
consumption in the laundering process was the energy consumed by washing process only.
Thus the minimum energy consumption referred to one kilogram of dirty linen was
0.62kWh/kg (detail calculation is shown in Appendix F). Maximum energy consumption was
happened when drying process has been performed by ironing machines. The energy
consumption referred to one kilogram of dirty linen is the sum of energy consumption during
washing and ironing processes, which is 1.65 kWh/kg (detail calculation is shown in
Appendix F) .Though drying by natural convection using solar and wind requires no thermal
energy from the plant, it is time consuming and needs man power as it is done manually to
collect from filed. The energy consumption by the laundry process falls out of the range of
recommended energy index in medium hospitals hospital which is 2.5 to 4kWh/kg [12].
This makes the laundry service inefficient as the machines are not working at the desired level
due to frequent failure and this may be due to overloading and lack of preventive
maintenance. In this regard it is important to resize the laundry machines again so as deliver
better service for the patients and staffs.

31
3.2.2 Kitchen Service
The kitchen provides two properly balanced meals per day for the patients and staffs of the
hospitals when on duty excluding office staffs. The kitchen room with its machineries and
equipments has been shown in figure 3.3.
Figure 3-3: Black lion Hospital Kitchen room and its accessories
Black lion Hospital Kitchen
room
Dishwasher in Black lion
Hospital kitchen room
Kettles in Black lion Hospital
kitchen room

32
The hospital has a kitchen service for an average of 832 peoples per day. There are six
cooking machines three of them are 150lit capacity, two of them are 200lit capacity and the
rest with 300lit capacity. There are 74 workers for the kitchen service (37 per shift) and the
cooking activity starts at 7:00AM and ends at 4:00PM. There is no dish washing machine
rather the dish washing activity is done by manually by taking hot water from the cooking
machines.
The cooking kettles are steam types. Steam is supplied to the kettles from the steam header at
a pressure of 0.5bar. There are six kettles; three of them are with 27kg/hr steam consumption
capacities, two of them are with 36kg/hr steam consumption capacities, and the rest one with
a 58kg/hr steam consumption capacity.
The energy intensity of kitchen service can be expressed in kWh per bed per day and it was
found in black lion hospital as 1.75kWh/bed/day (detail calculation is shown in Appendix F)
which is in the range of the recommended energy intensity for medium size hospitals food
preparation kitchen, ranges from 0.6 to 2.0 kWh per bed per day [12].
Though the energy consumption in the kitchen falls near the higher limit of the recommended
range, dish washing is done manually in black lion hospital which is time consuming and not
safe from quality service point of view. Hence, it is quite important to resize the kitchen
kettles and dish washer for the hospital.
3.2.3 Sterilization Service
Sterilization is a process capable of rendering microorganisms on contaminated inert bodies
permanently inactive without altering the body properties. The strict requirements throughout
hospital for absolutely, equipment, instruments and materials, under potentially vast
contamination conditions, requires the general availability of sterilizing equipment located in
• Surgery and special departments
• Central sterilization department
• Pharmacy

33
• Laboratories
Black lion hospital has one central sterilizer. In the sterilization room there are three
autoclaves, the one is in function and the rests are out of function. Additionally one non
functional sterilizer is located down in ground floor laboratory room. The sterilizer room with
its autoclaves and other equipments has been shown in figure 3.4.
Figure 3-4: Autoclaves in the sterilization room
Autoclaves in Black lion
Store in Black lion Hospital
sterilizer room
Carts in Black lion Hospital
sterilizer room

34
The hospital has central sterilizer with only one working autoclave to sterilize instruments,
out of 3 large ones that are just sitting next to each other. The steam consumption of the
sterilizer unit is 138kg/hr at 5bar.
Based on feed backs from sterilizer operators, there is overload on the sterilizer machine
which is an indication of under sizing, of course as it is sensitive equipments its configuration
should be N+1 as a back up to assure service delivery. Hence it needs to maintain or replace
the existing non functional sterilizers.
3.2.4 Hot Water Service
Even if the hot water system mainly for showering and dish washing is already available but
due to lack of maintenance it had been out of service for the past 10 years. As a result the
hospital has not had hot water for over 10 years. The hot water generator system for the
hospital is shown in figure 3.5.
Figure 3-5: Storage type hot water generators at black lion hospital

35
The hot water storage capacity is not easy to get as it is old, but it is storage type. As far as the
distribution line is installed and the patients must get hot water for shower and dish washing
in the kitchen for proper treatment of the patients in the hospital. Hence the amount of hot
water and steam demand or hot water generation will be estimated based on the number of
patients.
3.3 Utilities
The utilities which the hospital uses are cold water for hand washing and shower for the
patients and other hospital utilization, fuel oil for laundry and electric energy for electric
appliances.
3.3.1 Cold Water Service
City tape water line is the only source of water for the hospital. The hospital consumes
average cold water volume of 18,000m3 per annum for boiler feed-water, shower and drinking
for patients, and other services. Out of which about 2555m3 water by volume is consumed by
the boiler [3]. The cold water supply pump system is placed in the boiler room as shown in
figure 3.6.

36
Figure 3-6: Cold water pumps
3.3.2 Fuel Usage
The energy source of the boiler is furnace oil. Currently the fuel is supplied by Libya Oil
Ethiopia Limited (OiLibya). On average 244829liters of fuel oil was consumed by the boiler
annually.
3.3.3 Electric Energy Usage
Electric energy is the source of energy for the hospital to operate electrical appliances
including:
• Lighting service
• Computer service
• Motors, belts and drives for end use devices
• Fans and pumps
• Workshop service
The average electric energy consumption of the hospital is about 984,105.7kWh per annum
from national grid.

37
3.4 Assessment of Black lion Boiler
A large fraction of a facility’s total energy usage begins in the boiler plant. The cost of boiler
fuel is typically the largest energy cost of a facility. For this reason, a relatively small
efficiency improvement in the boiler plant may produce greater overall savings than much
larger efficiency improvements in individual end users of energy. Also, most boiler plants
offer significant opportunities for improving efficiency. These reasons make the boiler plant a
good place to start the search for savings.
Black Lion is the largest hospital in Ethiopia using large amount of thermal energy (steam) for
different process purposes and for generating this large amount of energy it uses one three -
pass (3p) wet back fire tube boiler with another one standby. In doing so, it is necessary to
evaluate the performance of steam generating units (boilers) and to identify different energy
conservation opportunities, which can reduce the fuel consumption by increasing the
efficiency of the units.
The hospital’s three-pass (3p) wet back fire tube boiler has a 3000kg/hr steam generation
capacity at a pressure of 12bar, to satisfy the daily steam demand of different services in the
hospital. Boiler plant includes the systems such as: boiler feed water system and the water
treatment plant, fuel oil system, and the steam system. Some of the boiler room accessories
have been shown in figure 3.6.
The boiler works throughout the year without break (for 365 days). But the daily working
hours of the boiler were only four and half hours because the set boiler pressure was in the
range of 7.5-8.5bar. The burner was set to start combustion when the steam pressure reaches
7.5bar and stops its combustion process when the boiler pressure reaches 8.5bar. After it
reaches the maximum pressure setup then the boiler pressure is reduced back to a pressure of
7.5bar due to steam consumption of the end-use devices. To start and stop the combustion
process it takes 57minutes. Therefore, even though, daily working hours of the boiler was 9
hours but, the boiler effective operation hours were only 4.5 hours. On average the boiler
deliver 1.5ton steam for all activities which is 50% of its rated capacity [3]. But if the hot

38
water generator is working the existing boiler may not be enough, and this will be checked in
this project work.
Figure 3-7: Components of Black lion hospital oil fired Boiler system
Boiler feed water: The boiler system comprises mainly of a feed water system, fuel system
and Steam System. The feed water system provides water to the boiler and regulates it
Feed water tank
Fuel heaterBoiler chimney Hot water Generator
Water Treatment

39
automatically to meet the steam demand. The water supplied to the boiler that is converted
into steam is called feed water. The two sources of feed water are:
• Condensate return from the processes and
• Makeup water (treated raw water)
But for the case of black lion hospital the only source of feed water for the boiler was makeup
water due to the absence of condensate return and the temperature of makeup water (treated
raw water) was an ambient temperature 20oC. Since there is no condensate return system for
the steam system in the hospital due to system non functionality, make-up water is supplied to
the boiler directly after treatment. As a result there was no heat gained for the boiler from feed
water.
In black lion hospital though, the condensate return system is actually there but due to
incomplete maintenance the system was not functional for over the past 10 years. The
condensate from the end-use devices and the steam distribution lines did not recover.
Maintaining the system will save 489.983GJ of steam energy per annual. For maintenance
estimated cost of 73,161.6birr will be expected to be investing and 185,674.0birr will be
saved annually from the condensate recovery. The hospital can obtain a full Return on
Investment is 5.5 months from cost savings. [3]
Water treatment: Proper treatment of makeup and feed water is necessary to prevent scale,
other deposits and corrosion in pre-boiler, boiler, steam and condensate systems, and to
provide the required steam purity. Absence of adequate treatment can lead to operational
upsets or unscheduled outages; it is also ill advised from the point of view of safety, economy,
and reliability. As shown in figure 3.6 above the boiler has a water treatment plant.
Fuel supply system: the fuel from the fuel tank is pre-heated to a temperature of 1200 C using
electric energy before pumped to the burner.

40
3.4.1 Efficiency of the boiler
From boiler audit work done for black lion hospital [3], the thermal efficiency of the boiler
based on indirect method is found to be 78%. Burners of modern boilers can have combustion
efficiency of 95 % [13]. From the boiler combustion efficiency analysis conducted
combustion efficiency of the burner is about 80% [3]. This implies that the hospital burner
wastes about 15% of the energy input compared to the benchmark combustion efficiency.
This waste is a sign of concentration to the detail investigation of the causes of combustion
efficiency losses and measures must be taken to improve the energy efficiency of the burner
to save energy.
The Sankey diagram is very useful tool to represent an entire input and output energy flow in
any energy equipment or system such as boiler generation. The sankey diagram for the energy
balance of the hospital boiler can be presented as shown in figure 3.8.
Figure 3-8: Sankey diagram for the boiler energy balance [3]
41
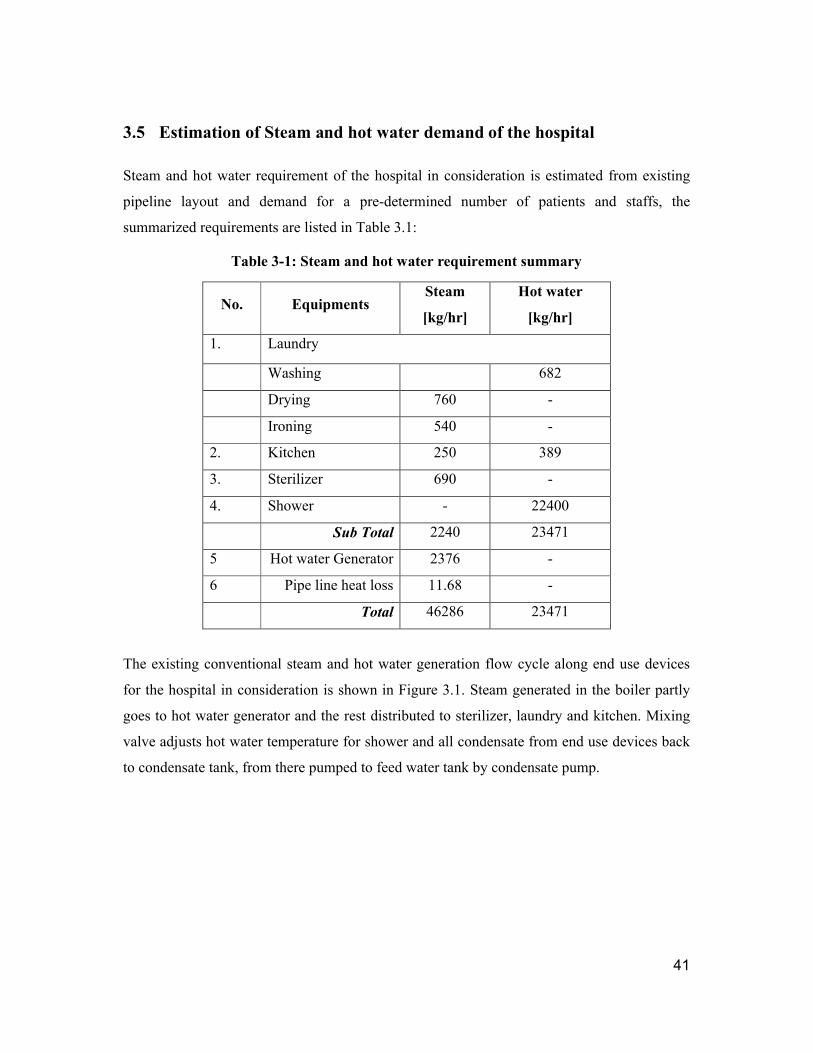
3.5 Estimation of Steam and hot water demand of the hospital
Steam and hot water requirement of the hospital in consideration is estimated from existing
pipeline layout and demand for a pre-determined number of patients and staffs, the
summarized requirements are listed in Table 3.1:
Table 3-1: Steam and hot water requirement summary
No. EquipmentsSteam
[kg/hr]
Hot water
[kg/hr]
1. Laundry
Washing 682
Drying 760 -
Ironing 540 -
2. Kitchen 250 389
3. Sterilizer 690 -
4. Shower - 22400
Sub Total 2240 23471
5 Hot water Generator 2376 -
6 Pipe line heat loss 11.68 -
Total 46286 23471
The existing conventional steam and hot water generation flow cycle along end use devices
for the hospital in consideration is shown in Figure 3.1. Steam generated in the boiler partly
goes to hot water generator and the rest distributed to sterilizer, laundry and kitchen. Mixing
valve adjusts hot water temperature for shower and all condensate from end use devices back
to condensate tank, from there pumped to feed water tank by condensate pump.

42
Figure 3-9: Steam, Hot water and condensate flow schematic diagram
The feed water demand is met by condensate collected from all end use devices (laundry,
kitchen, sterilizer and hot water generator) as of the existing conventional steam generation
system. In the existing steam distribution line steam traps are installed to remove condensates
and dirt’s from the system which protect foreign materials not to enter in to the boiler.
3.5.1 Hot water requirement for Shower
Hot water is used mainly for showering in each bed for the patient using the distribution lines
from the hot water generator, based on our country trend the individual consumption is
estimated as 40lit/day for each patient, with a recommended hot water temperature for shower
in the range of 50 to 60oC. For this project the average 55oC is taken. Assuming, a patient to
take shower a maximum of two times a day with a maximum duration 30min for single
shower.
Individual consumption=0.04m3/(bed*hr)
Total consumption=800 beds*0.04(bed*hr) =32m3/hr
Assuming a load factor of 0.7 (70% of the patients will take a shower at a time) [9], the design
consumption will be 0.7*32=22.4m3/hr

43
3.5.2 Steam and Hot water requirement for laundry
Beside the medical treatments in hospitals, laundry service for patients and staffs is available
in all medium and large size hospitals. The service is sometimes outsourced for small firms.
Based on references on energy usage index in hospitals, the daily demand of dry linen is
estimated to be 2 to 3 kg/patient for general hospitals. The thermal energy demand per process
ranges 2.5 to 4kWh/kg. For this project the average 2.5kg/patient is taken. [6]
The daily need of dry linen (source: Black lion technical staff) in general hospitals includes
♣ Beds lines and bathrooms linen (patients )
♣ Surgery rooms linen
♣ Staff uniforms
For patients (Bed+ bathroom) =2.5kg/patients
For 4 surgery rooms 25kg each=100kg
For 200 staff uniform 0.5kg each=100kg
Hence total dry linen required=2.5*800+100+100=2200kg/day
The complete laundry process may be described by three steps:
a) Washing: this is the first step where dirty linen is washed using hot water and it takes
about 30 % of the total energy involved in the laundry process
b) Drying: this is the second step where the water is removed from the washed linen, about
25% of the total energy demand of the process
c) Ironing: the final step is ironing, where the dried linen are folded using ironing machines
using dry steam, about 45 % of the total energy demand of the laundry process
Assuming 8 working hour per day for all laundry equipments:
Washer sizing
Linen process per hour=2200 kg/day*7day/56hour=275kg/hr
Assuming the washer to process 1.3 loads per hour (=1 cycle)
Loading capacity=275/1.3 (kg/hr / loads/hr) = 212kg per cycle
Dryer sizing
Dryer capacity in drying process shall be 1.4 to 1.5 times that of washing capacity due to
residual humidity during washing.

44
Washer capacity=1.45*212kg per cycle=307kg per cycle
Average load per hour for steam heated dryer is 1.3
Ironing machine sizing
Ironing machines are rated based on forwarding speed of the machine, considering the energy
index for ironing process it is taken the ironing machine with evaporative capacity 140kg/hr
with forwarding speed of 0-15m/min. The technical broacher and specification of all
machines is attached under the Appendixes with this report.
3.5.3 Hot water for launder washing
Usually washing process is accomplished in modern equipment at temperature not higher than
60°C, whereas in old machines the temperature is in the range of 70-80°C. For this analysis
modern machine is taken with supply temperature of 60°C.From the washing machine ( 4 in
number) specification total hot water consumption=4*140=560lit/cycle. The daily cycles are
10 per day, hence Total consumption=0.7m3/hr. In this project, laundry machines scheduled to
work 8 hour a day and four washing machines, four drying machines and three ironing
machines are assigned to carry out the task.
3.5.4 Steam and Hot water requirement for Kitchen
Energy usage Index for food preparation in kitchen shows that the average demand ranges
from 0.6 to 2.0 kWh/(bed*day)[6]. For this project average value 1.3kWh/bed is used.
Total amount thermal energy required=1.3 kWh/(bed*day)*800 beds =1040kWh/day
For 6 hour daily working schedule thermal energy demand is =174kW
Steam is supplied at 0.5bar for all models of kitchen equipments hence we can determine the
steam flow rate at this pressure
Mass of steam=174/[email protected]=174/2500kJ/kg=0.0952kg/s=250kg/hr
In this regard we recommend four steam kettle equipments of capacity 300litre, with steam
flow rate of 70kg/hr and brand Firex model PF300A to meet the requirement.
The hot water consumption for dish washing is 3liter/day/person. Total hot water demand for
6hour daily schedule and 800 beds will be 800*3=2400lit/day.
The recommended hot water temperature for dish washing is between 600 to 900.Based on the
requirement from suitable manufacturer a dish washing machine is selected having the

45
3000dish/hour capacity and hot water consumption 400litre/hour. At an average supply
temperature of 80oC density (ρ) =974kg/m3, hence hot water consumption=974*0.4=389kg/hr
3.5.5 Steam requirement for Central sterilization
Sterilizers are one of very important tools in hospital for protection of medical equipments,
instruments and materials from contamination. To accomplish this task usually a central
sterilization system is available in medium and large hospitals.
The capacity of sterilize in a give hospital depends on, the activities, number of beds and
number of departments. Considering Black lion activities and departments, and assuming that
the installed five sterilizers having 18cu-ft (595litre) capacity each are sufficient for the
current 800 bed in Black lion hospital.
From manufacturer catalogue the nearest standard 18cu-ft sterilizer of Brand tuttnauer model
H69 (see Appendices A) with steam supply pressure of 5bar and steam supply of 138kg/hr is
selected.
3.5.6 Steam requirement for hot water generation
Hot water is generated using steam from the boiler as a heating fluid, to know the total steam
demand, it needs to calculate the amount of steam that need to be supplied the hot water
generator using heat balance in the hot water generator.
From Heat balance Tcmhm pwfgs ..
3.1
Total hot water demand=23471kg/hr
Inlet temperature of cold water to the generator is 20oC.
Out let Temperature from the generator is 80oC.
The cold water properties (specific heat) can be evaluated at the mean temperature T=50oC.
(Cp@50oC=4.181kJ/kg.K)
The heat of evaporation of steam (hfg) at 7 bar=2065.3kJ/kg

46
fg
pws
h
Tcmm
..
hrkgm
hrkgm
s
s
/3.2375
/2.2065
50181.423471
.
.
Total amount of steam required in the heat exchanger for hot water generation is estimated to
be 2375.3kg/hr.
3.5.7 Steam line losses
In order to assure the delivery of the exact amount of steam required at end use device, steam
loss needs to be considered along the distribution line. Considering the existing installed
steam distribution line of the hospital, recommended insulation thickness for each pipe line
size is used to estimate line heat losses.
3.5.7.1 Pipeline Insulation
To avoid heat loss and reduced efficiency pipe work in heating systems should always be
insulated. Very hot systems, like hot water and steam systems should also be insulated to
avoid potential personal injuries.

47
Table 3-2: Recommended insulation thickness. [6]
Recommended minimum Thickness of Insulation (inches)
Nominal Pipe Size
NPS
(inches)
Temperature Range (oC)
50 - 90 90 – 120 120 - 150 150 - 230
Hot WaterLow Pressure
Steam
Medium
Pressure Steam
High Pressure
Steam
< 1" 1.0 1.5 2.0 2.5
1 1/4" - 2" 1.0 1.5 2.5 2.5
2 1/2" - 4" 1.5 2.0 2.5 3.0
5" - 6" 1.5 2.0 3.0 3.5
> 8" 1.5 2.0 3.0 3.5
Based on the temperature range pressure class the insulation thickness for the existing
pipeline is taken as follows in Table 3.3.

48
Table 3-3: Insulation thickness for existing pipeline [6]
No PipelinePipe Diameter
(mm)
Insulation
Thickness
(mm)
Material
1. To laundry 65 63.5 Fiber Glass
40 63.5 Fiber Glass
32 50.8 Fiber Glass
25 50.8 Fiber Glass
20 50.8 Fiber Glass
2. To sterilizer 40 63.5 Fiber Glass
32 50.8 Fiber Glass
25 50.8 Fiber Glass
3. To kitchen 80 63.5 Fiber Glass
50 63.5 Fiber Glass
32 50.8 Fiber Glass
4. Steam main 125 76.2 Fiber Glass
5. From Boiler 125 76.2 Fiber Glass
3.5.7.2 Pipeline Heat loss
Pipeline heat loss is calculated based on recommendations from well known manufacturer and
installer SpiraxSarco [6]. Length of pipe line for each end use device, pipe diameter and
insulation thickness is used to estimate heat loss from each pipe line. The steam distribution
lines for all units are shown under Appendix B of this report.

49
Table 3-4: Pipeline heat loss summary [6]
No. Pipeline Heat loss(w)
1. To laundry 16853
2. To sterilizer 9688
3. To kitchen 24309
4. Steam main 3440.5
5. From Boiler 12779
Total 67069.5
The total estimated heat loss from the pipe line is for bare pipe (without insulation),to
estimate heat loss after insulation, it is practical to assume 90% insulation efficiency,
Total heat loss=0.1*67069.5=6.7kw/hfg@7bar (2065.2)=11.68kg/hr
Total steam flow required=4616+11.68=4628kg/hr
Working pressure required=8bar considering 10% allowance
Here we have determined the pressure and steam required from the trough to end use devices
and hot water generator.

50
CHAPTER 4
4 TRANSYS MODELING OF PARABOLIC TROUGH STEAM
GENERATION
4.1 Solar Thermal Electric Components (STEC) Model for a Parabolic
Trough Collector
The STEC model for parabolic trough collector uses Lippke model [4].The model uses an
integrated efficiency equation as described below in equation 4.4 to account for HTF
temperature difference at collector inlet and outlet..Using equation 4.1, the required mass flow
rate of HTF to exist in the system so as to deliver the required net heat transfer to the steam
will be determined :
inoutp
net
TTC
QM
(4.1)
The net heat collected by the collector is described by using equation 4.2
pipeabsnet QQQ (4.2)
The total absorbed heat by the collector is estimated by using equation 4.3.
..DNIAQ effabs (4.3)
DNI
TTTTD
DNI
TTWSCC
DNI
TTBARSELK
inoutinout
inoutw
inout
2
3
1.
.
.2..
.2....
(4.4)
Equation 4.4 represents the heat absorber efficiency based on Lippke model [4], the input
variables in the equation can be described as follows;

51
The empirical factors A, B, C, Cw and D are describes the performance of the
collector. In this paper SEGS LS-2 collector is used for the analysis [4].
K is the incident angle modifier
EL and RS are end loss and shading factor respectively
ΔTin and ΔTout are the temperature difference between collector inlet and collector
outlet temperature with that of ambient temperature, respectively
DNI is the direct normal irradiation.
pipingQ is heat losses in the solar field piping .
4.2 Pre heater Model
The pre heater model used here is a zero capacitance sensible heat exchanger model in counter flow
heat exchange system...Water is assumed to be the cold side input having quality of zero. The property
of the water is taken from property data at the respective temperature and pressure. The overall heat
transfer coefficient is used to find effectiveness ECON .
This component works based on equations commonly used to describe the behavior of counter flow
heat exchangers. First, the derived effectiveness, ɳECON, relationship is shown (Schwarzbözl, 2006)[4].
)1exp(1
)1exp(1
max
min
minmax
min
max
min
min
C
C
C
UA
C
C
C
C
C
UA
ECON (4.5)
Where: minC and maxC represent the minimum and maximum thermal capacitance rates of the two
fluids passing through the heat exchanger respectively. The relationship for UA depends on the ratio
of the cold-side fluid mass flow rate to its reference mass flow rate, scaled by an exponent. This
exponent was set as 0.8 in this paper.

52
8.0
,
REFfeedwater
feedwater
REF m
m
UA
UA
(4.6)
Here, UA is allowed to be in the range fUARe*1.0 to fUARe*2 .User can specify REFfeerwatef mA ,Re ,
and expUA based on the requirement steam output and HTF temperature at receiver inlet for
specified heat exchanger conductance and hence pressure loss is scaled in a similar way where the user
has the freedom to specify a satisfactory exponent [4].UARef and PRef are design values of the heat
exchangers.
exp_
,
P
REFfeedwater
feedwater
REF m
m
P
P
(4.7)
Here P is allowed to be in the range of fPRe*1.0 to fPRe*2 .User can specify REFfeerwatem ,
and expP based on the requirement, hence pressure loss is scaled in a similar way where the user
has the freedom to specify a satisfactory exponent.
4.3 Evaporator Model
The TRANSYS Type 316 evaporator model is used to simulate water. The input variables are,
outlet temperatures demand and flow rate of both cold and hot side fluids. In addition to this,
a certain amount of modulated inlet water for complete evaporation (to have unity steam
quality).This model approached analytically and uses the fluid conductance to determine the
effectiveness. Water is set to be the cold side fluid, and is determined by its temperature,
quality and pressure. The method used here to describe heat transfer between the two streams
in the evaporator is effectiveness method using UA (Overall heat transfer Coefficient).
Overall heat transfer coefficient (UA) and Pressure loss are evaluated using Equ 4.6 and 4.7
[4].
hothot
evaporator Cpm
UA
exp1 (4.8)
)( , saturatedinhothothotEvaporatortrans TTmCpQ (4.9)

53
4.4 Storage Tank
The solar field model does not include thermal capacitance effects; consequently, a storage
tank has been implemented into the TRNSYS model (Type 4a) to account for the thermal
capacitance of the heat transfer fluid in the solar field and the expansion vessel as the specific
volume of the HTF is dependent on temperature. The storage tank is located between the solar
field and the evaporator (boiler) in this paper as described in the schematic diagram in figure
4.1.
Preh
eate
rEv
apor
ator
HTF Pump
Sola
r Fie
ld
storag Tank
Feed Pump
Figure 4-1: Solar filed and steam line connection
4.4.1 Sizing of the Tank
The storage tank is modeled using TRNSYS component Type 4a (TRNSYS 16). The HTF
circulating through a solar field has considerable thermal capacitance. During normal
operation throughout the day, the field runs at a quasi-steady condition and the thermal
capacitance effects of the solar field heat transfer fluid become less important. During
nighttime the HTF circulating pump continue to operate at a reduced flow to avoid thermal
shocking; hence stress the collectors during the following day start-up.
When the storage tank is sized, the governing equation behind the storage tank from an
energy balance over the tank is given by [7].
)(.)(tantan inenvlossoutinHTFHTFkk TTUATTcmdt
dTCM (4.10)

54
Where:
HTFc = Specific heat of HTF [kJ/kg-K]
inT = diameter of the steel absorber tube = 70 [mm]
outT =HTF temperature outlet to the tank [oC]
lossUA =heat loss coefficient from the tank [kW/K
kM tan = Mass of HTF in the tank [kg]
kC tan = heat capacity of HTF in the tank [kJ/kg-K]
HTFm =mass flow rate of HTF [kg/hr]
dt
dT=change in average temperature of the storage tank with time [oC/hr]
envT =temperature of ambient air surrounding the tank [oC]
The mass of HTF in the tank is assumed to be constant and the tank is sized to provide an
equivalent mass as the HTF exists in the solar field and expansion vessel. These can be
evaluated by using receiver tubes (LS-2 collector) and expansion vessel volumes multiplied
by the density of HTF at solar field outlet temperature.
)()...4
.tan
2
tan outletkoutletSCASCAHCE
k TVTNLD
M
(4.11)
Where:
SFM = the mass of the HTF in the solar field [kg]
HCED = diameter of the steel absorber tube = 70 [mm]
SCAL = length of one solar collector assembly (SCA) loop = 47 [m]

55
SCAN = number of SCA loops in the solar field = 47
kVtan =volume of expansion vessel=0.35[m3]
ρ = density of heat transfer fluid (Therminol VP-1), from equation (4.20) = 751 [kg/m3]
This gives the total mass of the HTF in the tank to be equal to 6,789.00kg.
4.5 TRANSYS model connectivity
The desired TRANSYS model for steam generation for this paper includes parabolic trough,
weather data processor and storage tank in the solar field model. The steam generation side
includes pre-heater, evaporator and feed pump as shown in Figure 4.2.In this model the hot
water generator is common for both existing fossil fuel steam generation system and proposed
Solar steam generation system, hence it is not useful to include here in the simulation as the
main target is to rate this two technologies. The steam generated from the evaporator will be
sent to hot water generator and end use devices in both cases.
Figure 4-2: TRANSYS model component connectivity

56
For this solar field model Type 9a is used to read the weather data. Type 16 g, a solar
radiation processor with total horizontal and normal beam radiation known, is used to find the
azimuth and zenith angles which are the inputs to the parabolic trough model.
The expansion vessel is modeled by storage tank component, part of the standard TRNSYS
library, which serves to compensate for variation in the volume of the heat transfer fluid
throughout the day, since the specific volume of the HTF is dependent on temperature.
The pre-heater Type 315 uses to raise the condensate temperature to evaporator saturated
temperature at 8bar using counter flow heat exchanger analysis. Similarly Evaporator model
Type 316 uses to convert saturated water to saturated steam which is the main objective of
this work.
4.6 Solar Steam Generation model Result
Based on STEC components in put parameters requirement for the simulation collector area,
HTF mass flow rate and overall heat transfer coefficients of the heat exchangers (counter
flow) are determined considering different assumptions.
As described in the objective, the main target of solar collector model is to generate
5000kg/hr saturated steam at 8bar.Condensate collected from end use devices (sterilizer,
kitchen, hot water generator and laundry) in the vented condensate tank will pumped to pre-
heater. Since the condensate collector tank is vented to atmosphere, the temperature of in the
tank considering line loss reaches 800 and 1bar.
Recommended pinch point temperature difference ranges 10-150C which is important
parameter to set the inlet and out let HTF temperature. The outlet temperature of the HTF
from the pre-heater affects the solar field area, the boiler pressure of the steam, and the
thermal efficiency. With the increase of this temperature, the solar field area decreases while
the boiler pressure and the thermal efficiency increase.
For different temperature difference between inlet and outlet of the trough collector area and
thermal efficiency is checked using mat lab (Appendix E), optimal thermal efficiency of
62.76% and collector area 11000m2 is found for 3000C at outlet and 1500C at inlet to the

57
trough for HTF Maximum temperature after the trough for the selected HTF can reach 4000C
in liquid state, hence for this work 3000C is set for HTF outlet from the collector, and also
considering thermal efficiency and pinch point, 1500C is set at the inlet of the collector. In
addition to these, for this paper type of collectors chosen is LS -2. These collectors are chosen
because a lot of research has been done on this collectors and enough information is found
with respect to others.
Collector Area
The required steam temperature, pressure and flow rate at the evaporator and pre heater are
known at inlet and outlet. Hence the total energy needed by to raise temperature from pre-
heater inlet to evaporator outlet at the given pressure can be determined. Using equation (4.1
to 4.4), the collector area (Aeff) is found to be 11000m2.Single SCA of LS-2 is 235 m2. This
gives the total number of SCA needed for the solar field to be 47.
Overall Heat transfer coefficient
Since all temperatures and required energy from the evaporator and pre-heater is known,
using logmean temperature difference for counter flow the overall heat transfer
coefficient( )/( KkWUAREF ) for evaporator and pre-heater is found to be 60.36kW/K and
10.10kW/k respectively.
4.7 Direct Normal Irradiation (DNI) for Addis Ababa
The most important input for the simulation model is the direct normal irradiation at Addis
Ababa. The data is taken from SWERA weather data [9].The maximum daily average occurs
on February 2 and minimum daily average on January 11, Figure 4.3. These days are,
therefore, used as clear and cloudy day representatives respectively for system simulation.
Clear day in this context is a representative day for occurrence of relatively higher daily
average DNI from the days of the year considered.

58
Jan Feb Mar Apr May Jun Jul Aug Sep Oct Nov Dec0
100
200
300
400
500
Dir
ect
No
rmal
Rad
iati
on
(W
h/m
²)
Addis Ababa Daily Averages DNI
Figure 4-3: SAM Output of Daily average DNI for Addis Ababa

59
CHAPTER 5
5 SIMULATION RESULT
The TRNSYS program is used in order to simulate the solar steam generation model as
described in chapter four. The behavior of the parabolic trough depends on the site
meteorological conditions such as solar radiation and wind speed. These data are provided to
the TRNSYS component (Type 9a) by the meteorological data file and the component is
connected to the solar radiation processor (Type16g) that interpolates the solar radiation data
at time steps of one hour and at any incident angle. The meteorological site selected for this
analysis was Addis Ababa, Ethiopia, as the hospital is located at the capital city. The trough
gets DNI data from the data reader and the solar azimuth and solar zenith angles from
radiation data processor.
The hot HTF from the central receiver is continuously charged to hot thermal storage tank
from which a controlled amount of HTF is sent to the steam generator (Evaporator) where
saturated steam is required for hot water generator and hospital equipments through the
existing steam distribution line. Type 65a online system plotter is used for plotting of
simulation results that are used for result analysis. The simulation is done for clear day,
cloudy day, monthly and annual. The monthly and annual results are shown in Appendix G of
this paper.

60
5.1 Simulation result for Clear Day
Figure 5-1: Heat transfer fluid Temperature [oC] and DNI [W/m2] for clear day of February 2.

61
For the clear day simulation the available DNI ranges from 0 to 3800W/m2.During the periods
11:00AM to 19:00AM the available DNI is somewhat tends to be constant within a small
range. The HTF out let temperature from parabolic trough shows similar temperature profile
within the same period of time, this shows that the simulation result seems practical and
enough to generate saturated steam at 8bar and 1700C constantly which meet the required
steam flow rate for daily activity of the hospital.

62
Figure 5-2: Heat transfer fluid and Steam output Temperature [0C] for clear day of February.

63
From the clear day simulation result it is observed that the plant works for more than 9 hours
(from 10:00AM to 19:00AM) saturated steam at 8bar and 1700C constantly (the flat part of
the red curve) which meet the required steam flow rate for daily activity of the hospital as
clearly shown in figure 5.2. During four hours periods from 9:00AM to 10:00AM and
19:00AM to 20:00AM the plant output is not constant as the available DNI for this range of
time is not sufficient to heat up the HTF enough to generate steam at the required temperature.
The Heat transfer fluid temperature from the trough for the clear day simulations varies in the
range of 800C to 3000C (blue curve) where the highest occurs at start up of the
system(3000C).The peak HTF temperature occurs at 15:00 as expected, which align with the
peak DNI time.

64
Figure 5-3: Heat transfer fluid and Steam output Temperature [0C] for the month of February

65
From the monthly simulation result shown in figure 5.3, for which the clear day occurs it is
observed that the plant works for the whole days of the month for more than 9 hours (from
10:00AM to 19:00AM) saturated steam at 8bar and 1700C constantly which meet the required
steam flow rate for daily activity of the hospital in the entire days of the month.

66
5.2 Simulation result for Cloudy Day
Figure 5-4: Heat transfer fluid Temperature [oC] and DNI [W/m2] for cloudy day of January 11.

67
As shown in Figure 5.4 for the cloudy day simulation, the maximum available DNI is not
sufficient to heat up the heat transfer fluid enough to generate saturated steam at 8bar and
1700C to meet the required steam flow rate for daily activity of the hospital, rather the heat
transfer fluid temperature is shown to be below the feed water temperature. As this days are
very few, conventional steam generation systems (oil fired boiler) is used as backup, like the
existing system in the hospital should be installed to meet the daily steam flow demand.

68
Figure 5-5: Heat transfer fluid outlet Temperature and Steam Temperature for cloudy day of January 11

69
From the cloudy day simulation result it is observed that the plant has not the capability to
generate saturated steam at 8bar and 1700C to meet the required steam flow rate for daily
activity of the hospital. As shown in Figure 5.4, the HTF out let temperature from the trough
is below the feed water which is practically impossible to generate steam. Hence for such
days therefore oil fired boilers steam generation systems should be installed as backup to
achieve the required daily steam flow.

70
Figure 5-6: Heat transfer fluid and Steam output Temperature [0C] for the month of January

71
From the monthly simulation result shown in figure 5.6, for which the cloudy day occurs it is
observed that the plant works for the whole days of the month except January 11 and to some
extent January 12, for more than 9 hours (from 10:00AM to 19:00AM) saturated steam at
8bar and 1700C constantly which meet the required steam flow rate for daily activity of the
hospital in the remaining 28 days of the month. Hence the oil fired back up boiler will fill this
gap for 2 days in which the available DNI is not sufficient to heat up the heat transfer fluid
enough to generate saturated steam at 8bar and 1700C.

72
CHAPTER 6
6 COST AND FINICIAL ANALYSIS OF PARABOLIC TROUGH AND
FOSSIL FUEL STEAM GENERATION SYSTEMS
In this chapter economics of parabolic through steam generation system and conventional
steam generation system (fossil fuel boiler) will be analyzed and comparative analysis of the
two systems will be done. Economic analysis plays a vital role in the decision of using these
systems after the technical feasibility is identified.
6.1 Costs associated with Parabolic Trough Solar Steam Generation
The costs associated with parabolic trough solar steam generation system can be divided
mainly in two categories:
Capital costs: include equipment purchases cost and installation work of the system.
Operation and maintenance (OM) costs: include equipment, labor and other
miscellaneous expenditures during the life time of the project after the system is
installed and let to operate.
6.1.1 Capital Costs
The capital costs represent all expenditures associated with the purchase of equipment and
installation works of the project. These costs are classified as direct and indirect costs.
6.1.1.1 Direct Capital Cost
The direct capital cost represents expenditure for specific equipment or installation service.
The direct costs for CSP system are solar field, storage, HTF and steam generating units. Site
pre parathion for installation and labor costs are also direct costs. All costs referred in this
paper are in birr (Ethiopian currency).The direct capital costs associated with solar thermal
systems are listed in Table 6.1:

73
Table 6-1: Direct Costs for Concentrated Solar Steam Generation system [8]
No. Item description Unit Cost Total(birr)
1 Site preparation for 11000m2 51birr/m2 561,000.00
2 Solar Field for 11000m2 5100birr/m2 56,100,000
3 HTF System for 3525kW 2550birr/kW 8,988,750.00
4 Storage for 3525kW 680birr/kW 2,397,000.00
Sub Total 68,046,750.00
Contingency10% 6804675
Total Direct Cost 74,851,425.00
Total Direct Cost($USD) 4403025.00
6.1.1.2 Indirect Capital Cost
Indirect cost is normally not identified in a specific term like the direct cost of equipment and
installation services; rather it includes all other costs that can be included throughout the
installation period or after plant start up. Concentrated solar steam generation system indirect
capital costs includes; Engineer, Procure, Project, Land, Miscellaneous and Sales taxes. The
Indirect capital costs associated with solar thermal systems are listed in Table 6.2:
Table 6-2: Indirect capital costs of Concentrated Solar steam generation system [8]
No. Item description Total
1 Engineer, Procure and construction -16% of direct cost 11,976,228.00
2 Project, land and miscelanious-3.5% of direct cost 2,619,800.00
Total Indirect capital Cost 14,596,028.00
Total Indirect capital Cost($USD) 858589.88
The Total capital cost of the system will be the sum of direct and indirect capital costs found
as 89,447,452.88birr or 5261614.8$USD. This cost is used to calculate the levelized energy
cost and other key financial indexes.

74
6.1.2 Operation and Maintenance Costs
The cost associated with Concentrated Solar steam generation system after installation plant
start up is Operation and Maintenance (OM) costs. These represent all expenditures on
equipment and services throughout the project life.
OM Fixed cost per year: Annual fixed first year cost typically include all recurring
costs except for water-related costs.
Variable OM cost: For parabolic trough steam generation system, variable OM costs
include cost of chemicals for water treatment and water purchases, and usually
proportional to annual energy production of the plant.
The operational and maintenance costs associated with solar thermal systems are listed in
Table 6.3:
Table 6-3: Operation and maintenance cost of concentrated solar steam generation [8]
No. Item description Unit Cost Total(birr)
1 Annual fixed operation &maintenance cost 850birr/kW 2,996,250.00
2 Annual variable operation &maintenance cost 119birr/MWh 1,216,180.00
Total operation &maintenance cost 4,212,430.00
Total operation &maintenance cost($USD) 247790.00
The source of all capital costs related to concentrated solar steam generations is SAM 2009
cost database.

75
6.2 Costs associated with conventional (boiler) steam generation system
The costs associated with conventional steam generation system can be divided mainly in two
categories:
Capital costs: include equipment purchases cost and installation work of the system.
Operation and maintenance (OM) costs: include spare parts, fuel, labor and other
miscellaneous expenditures during the life time of the project after the system is
installed and let to operate.
6.2.1 Capital Costs
The capital costs represent all expenditures associated with the purchase of equipment and
installation works of the project. These costs are classified as direct and indirect costs.
6.2.1.1 Direct Capital Cost
The direct capital cost represents expenditure for specific equipment or installation service.
The direct cost for conventional steam generation system includes fire tube boiler, feed tank,
and condensate pump and pre heater. All costs referred in this paper are in birr (Ethiopian
currency).The direct capital costs associated with conventional (oil fired boiler) steam
generation systems are listed in Table 6.4:

76
Table 6-4: Direct Costs for Conventional steam generation system (source: Henan Sitong Boiler Co.Ltd.)
SerialNo. Equipment Name Unit Specification Qty Price (USD)
One set Oil fired boiler with 5ton/hr capacity
1 Mainframe set WNS5-1.25-Q 1 46224.96
2 Steam Header set SCI-273-1.25 1 462.25
3 Burner set BGN350P 1 6163.33
4 BFW Pump set 1 616.33
5 Water Treatment set FLECKφ400 1 847.46
6 Pressure Gauge block 0~2.5MPa. class 2.5 2 770.42
7BEnt Pipe of Pressure
Gaugepiece Factory Standard 1 24.65
8Three-way Cock of
Pressure Gauge piece PN1.6 2 27.73
9 Spring Type Safety Valve piece PN1.6.DN50 2 7.70
10 Main Steam Valve piece PN1.6.DN80 1 123.27
11 Drain Valve piece PN1.6.DN50 2 46.22
12 Pressure Controller set 3 89.37
13 Feed Water Valve piece PN1.6.DN40 1 77.04
14 Check Valve piece PN1.6.DN40 1 35.44
15 Pressure Controller Seat piece 1 40.06
16 Water Level Sensor set 2 30.82
17 Water Level Gauge set 2 184.90
18 Auxiliary Steam Valve piece PN1.6.DN40 1 123.27
Sub Total 55895.22
Contingency (10%) 5589.50
Total in $USD 61484.74
Total in Eth.Birr 1,045,240.6
6.2.1.2 Indirect Capital Cost
Indirect cost is normally not identified in a specific term like the direct cost of equipment and
installation services; rather it includes all other costs that can be included throughout the
installation period or after plant start up. Conventional steam generation system indirect
capital costs includes; Engineer, Procure, Project, Land, Miscellaneous and Sales taxes. The
Indirect capital costs associated with conventional (oil fired boiler) steam generation systems
are listed in Table 6.5:

77
Table 6-5: Indirect capital costs of Conventional steam generation system [8]
No. Item description Total(birr)
1 Engineer, Procure and construction -16% of direct cost 167238.9
2 Project, land and miscelanious-3.5% of direct cost 36583.40
Total Indirect capital Cost 203822.30
Total Indirect capital cost in $USD 11989.547
The Total capital cost of the system will be the sum of direct and indirect capital costs found
as 1,249,062.90 birr or 73474.30 $USD. This cost is used to calculate the levelized energy
cost and other key financial indexes.
6.2.2 Operation and Maintenance Costs
The cost associated with Conventional steam generation system after plant start up is
Operation and Maintenance (OM) costs. These represent all expenditures on equipment and
services throughout the project life.
OM Fixed cost per year: Annual fixed first year cost typically include all recurring
costs except for fuel cost.
Variable OM cost: For convention steam generation system, variable OM costs
include cost of fuel.
Boiler Fuel Specification
Furnace Oil of ASTM Grade 6
HHV of the oil is 42.39MJ/kg
Density of oil 0.9g/cc
The lower heating value of furnace oil is most important to rate efficiency of steam boilers.
Hence the LHV can be estimated using the following equation
]/)[*94.8(*44.2 2 kgMJFhHHVLHV
Where: h2 is the mass fraction of hydrogen in the fuel (12%)
F is Humidity of the fuel (50%)

78
2.44 is a mean value for heat of vaporization in [MJ/kg H2O] at 25ºC
The efficiency of boiler can be estimated using the direct method by equation
LHV of the furnace oil become 39.93MJ/kg
LHVm
hhm
fuel
feedgsteam
)(
LHV
hhmm feedsteam
fuel
)(
The efficiency of oil fired boiler is around 92% .The enthalpy at feed water inlet and saturated
steam from boiler out let at 8bar is taken from saturated steam table as 84.72kJ/kg and
2768.0kJ/kg respectively. Hence mass of fuel can be found as;
hkgm fuel /3603993092.0
)72.842768(5000
The plant works 8hour per day and 2920hour per annual and the total amount of fuel used per
year is estimated to be 1051200kg or 1168m3.Currently light furnace oil price in Addis Ababa
is 14.17 birr/liter (source: Oilbya limited Ethiopia branch) and escalation rate is 5%.Annual
fuel cost become 17,169,600.00birr.The operational and maintenance costs associated with
conventional (oil fired boiler) steam generation systems are listed in Table 6.6:
Table 6-6: Operation and maintenance cost of conventional steam generation [8]
No. Item description Unit Cost Total(birr)
1 Annual fixed operation &maintenance cost 5birr/kW 20,000.00
2 Annual variable operation &maintenance cost - 17,169,600.00
Total operation &maintenance cost 17,189,600.00
The source (reference) of all costs except direct cost (package boiler with accessories) to
conventional steam generations is SAM cost database. The source of packaged boiler cost is
Henan Siltang Boiler Co.Ltd.

79
6.3 Results of Economic analysis
6.3.1 Life Cycle Cost
The life cycle cost of concentrated solar steam generation and conventional steam generation
as shown in Figure 6-1, shows the true cost incurred over the project lifetime for the same
service provide. The finical parameters used for this project work is found from National
Bank of Ethiopia (NBE). As per the bank, inflation rate and nominal discount rate is 5% and
12% respectively. Similarly furnace oil (light oil) fuel escalation rate is 5% as of Oilbiya
Ethiopia limited branch head office. Regarding the project life time analysis period is set to be
30 year as most industrial oil fired boilers and Concentrated solar troughs life time is in the
range of 30 to 40 Years.
Figure 6-1: Life cycle cost analysis for parabolic trough and oil fired boiler
The preference between concentrated solar steam generation and that of Conventional steam
generation system should be made based on comparative life cycle costing where the solution
with a lower cost over the project life is selected. An indicator of attractiveness is the years to
breakeven, which is when the cumulative LCC of Concentrated solar steam generation
becomes lower than the cumulative LCC of Conventional steam generation. The shorter the
years to breakeven, the more attractive the concentrated steam generation solution becomes
and the higher the cost savings over the project life. As seen in Figure 6-1 above, breakeven

80
occurs early 7 year after letting the system in to operation. This makes concentrated solar
steam generation system very attractive over conventional steam generation system.
Figure 6-2: Capital and operating cost analysis for parabolic trough and oil fired boiler
The reason behind break even to occur early stage of the project life time is better explained
in Figure 6-2, where the operating cost for oil fired boiler is very high as compared to
parabolic trough steam generation. Although the initial investment of parabolic trough steam
generation is very high, the operating cost of oil fired steam generation offsets the high initial
cost of concentrated solar steam generation system.

81
6.3.2 Levelized Cost of Energy (LCOE)
The real levelized cost of energy (LCOE) estimated using equation 6.2 and found to be
1.30birr/kWh and 3.10birr/kWh for concentrated solar steam generation (Parabolic trough)
and convention steam generation(oil fired boiler) systems respectively as shown in Figure 6.3.
Figure 6-3: Levelized cost of energy (LCOE) for oil fired boiler and parabolic trough
The LCOE give an indication of the actual cost of steam generation using either of the
concentrated steam generation or conventional steam generation systems and it is also an
indication of how the two systems rate each other. The higher LCOE for conventional steam
generation is due to high operational costs incurred throughout the 30years project life time.

82
CHAPTER 7
7 CONCLUSION
Technical and economic assessment of parabolic trough steam generation and conventional
steam generation system has been done for Hospital application in consideration of Black lion
General and specialized hospital located in Addis Ababa.
The hospital uses furnace oil for the generation of the steam, consumes 245 m3and pays
1,593,087.41 birr (96,550.00 dollar) in the fiscal year, 2008/09. As described in chapter 3,
currently the hot water generator is not functional, if the hot water generator let to operational
the steam demand also increases hence, the fuel consumption will become twice as that of the
existing consumption. In addition to this the steam demand can’t be met by the currently
installed 3ton/hr boiler hence it should be either substituted by parabolic trough or needs to be
upgrade.
The result from technical feasibility study shows the parabolic trough can meet the steam
demand of the hospital at the required time, more than 8hour per day, as the hospital currently
require steam for different activities during the day time for 8hour per day. During cloudy day
the conventional back up steam generation system will meet the daily demand for few days of
the year. Similarly the economic analysis shows that although the initial investment of
concentrated solar steam generation is high as compared to convention steam generation
system, the reverse is observed in operation and maintenance cost, resulting concentrated
solar steam generation break even (payback) to occur early, after 7 year the system let to
operate over the conventional steam generation. One of the key economic parameters in rating
two or more technologies, levelized cost of energy for concentrated solar steam generation is
found to be 58% higher than conventional steam generation. Hence, the result shows that
parabolic trough is found to be more economical for steam generation than oil fired boilers if
enough DNI is available in the site.

83
CHAPTER 8
8 RECOMMENDATION
In the technical and economic assessment result, it is found that if concentrated solar steam
generation (parabolic through) is implemented, the fuel consumption and operational cost of
the boiler can be reduced appreciably. It is thus recommended that the government and
hospital management to consider this outcome for its implementation so as to overcome the
high operational cost of the existing boiler by using the parabolic trough steam generation
system.
Though enough space is available within the hospital compound, in this work detail site
preparation for installation is not done as this needs the management decision to prepare
suitable space for parabolic trough installation such as dismantling small buildings, like stores
and others. In addition to this even if the hospital has condensate recovery system; currently it
is not functional due to lack of proper maintenance. Hence it needs condensate return pipes
repair and maintenance, Pump replacement, Condensate return control systems maintenance
and Steam traps assembly units replacement for each equipment to recover the condensate, so
that large amount of heat can be recovered.
Though this work is done for hospital located in Addis Ababa, there are also other places like
Afar and Somali regions in Ethiopia where high solar radiation (DNI) is available for long
period over the year. These places are the best locations for concentrated solar steam
generation as this place has more clear days than Addis Ababa. Hence solar thermal systems
can be used for hospitals and universities in these regions as this institutions require steam for
different activities.

84
9 REFERENCES
[1] P.L. Panda T. Fujita,J.W. Lucas,Assessment of Solar Thermal Parabolic Dish
Technology for Electrical Power Generation, September 15, 1985 Prepared for
US.Department of Energy.
[2] Mekuanent Mesfin “Modeling, Simulation and Performance Evaluation of Parabolic
Trough Solar Collector Power Generation System”, Department of Mechanical
Engineering, Addis Ababa University, September, 2009
[3] Amare Desalegn “Energy Audit of Black lion hospital Utility Boiler”, Department of
Mechanical Engineering, Addis Ababa University, October, 2010
[4] Schwarzbözl, Peter and Zentrum, Deutsches. A TRNSYS Model Library for Solar
Thermal Electric Components (STEC). A Reference Manual, Release 3.0,2006.
[5] Pipeline Insulation data, Available at: https://www.engineering toolbox.com.visted last
April 25, 2011.
[6] Pipeline Heat loss data, Available at: https://www.spiaxsarco.com.visited last March 20,
2011.
[7] Angelam Pantnode “Simulation and Performance Evaluation of Parabolic Trough Solar
Power Plant”, University of Dwisconsin-madison, January, 2006

85
[8] Sam User Guide, SAM Software, Available at:
https://www.nrel.gov/analysis/sam.visited last April 3, 2011.
[9] Weather Data. Available at: http://swera.unep.net. Visited last April 3, 2011.
[10] Therminol HTF Information Available at: http://twt.mpei.ac.ru.
[11] Engineering Equation Solver (EES). Middleton, WI: F-Chart Software, 2005, Available
at http://www.fchart.com.
[12] PFE via Nizza “A Guide for Energy Management in Hospitals” Booklet V, 128 00198
Roma, December 1989
[13] Tikur Anbessa Specialized Hospital A34 Years Journey /From 1973-2008/”,
Journal, April 2008

86
10 APPENDIXS
A. Laundry and Kitchen Equipments Technical Specification
Washing machine Specification
Brand Grandimpanti
Model WFM55
Capacity 51.8kg
Hot water consumption 140lit/cycle
Number of units 4
Drying machine Specification
Brand Grandimpanti
Model EM75
Loading capacity 75kg
Working Pressure 6bar
Steam flow 190kg/hr
Number of units 4
Ironing machine Specification
Brand BMM Weston
Model BMM Weston 850 Steam heating
Working Pressure 6bar
Steam flow 180kg/hr
Number of units 3
Dish Washing Machine specification
Model LN70COLGED
Capacity 3000dish/hour
Hot water consumption 400lit/hour

87
B. Steam distribution layout of the Hospital
Figure: Pipeline layout from steam Main to Sterilizer Units
Figure: Pipeline layout from steam Main to Laundry Units

88
Figure: Pipeline layout from steam main to Kitchen Units
Figure: Pipeline layout from steam header to hot water generator

89
C. Heat Transfer Fluid Properties
Table: Heat Transfer Fluids
Name Type Min HTF
Temp [OC]
Max Operating
Temp [OC]
Freeze
Point
Comments
Solar Salt Salt 260 600 220
Caloria
Mineral
Hydrocarbon -20 300
-40 Used in first Luz
trough plant,
SEGS I
Hitec XL Nitrate salt 150 500 120 New generation
Therminol
VP-1
Mixture of
Biphenyl and
Diphenyl
Oxide
50 400 12
Standard for
current generation
HTF systems
Hitec Nitrate Salt 175 500 140 For high-
temperature
systems
Dowtherm Q Synthetic -30 330 -50 New generation
Dowtherm
RP
Synthetic -20 350 -40 New generation

90
D. STEC Evaporator and Pre heater Input,Output parameters
Table: STEC Pre heater (Type 315) configuration
Parameters Input Output
MODE only mode 2 for counter
flow is available
THI inlet temperature hot side THO hot side outlet temperature
UAREF reference overall heat
transfer coefficient
FLWH mass flow hot side FLWH hot side mass flow rate
DPREF reference pressure loss TCI inlet temperature cold side TCO Cold side outlet temperature
FLWCREF cold side reference
mass flow
FLWC cold side mass flow FLWC cold side mass flow
EXP_UA power law exponent XCI cold side quality QT heat transfer rate
EXP_DP power law exponent PCO outlet pressure for cold side EFF Exchanger effectiveness
CPH specific heat for hot side XCO Outlet quality for cold side
PCI Pressure for cold side inlet
Table: STEC Evaporator (Type 316) configuration
Parameters Input Output
UAREF reference overall heat transfer coefficient
THI inlet temperature hot
side
THO outlet temperature hot
side
BD blow down fraction FLHI mass flow hot side FLHO mass flow hot side
DPREF reference pressure
loss
TCI inlet temperature cold
side
TCO cold side outlet
temperature
FLWCREF reference mass
flow cold side
PCO cold side outlet
pressure
PCI cold side inlet pressure
EXP_UA power law
exponent
XCI cold side quality XCO cold side outlet quality
EXP_DP power law
exponent
CPH hot side specific heat FLCDM cold side mass
flow demand
FLCO cold side mass flow
Qdot Transferd power
EFF Exchanger
Effectiveness

91
E. Mat lab Code for collector Area
Aref= 73.6; % Thermal Efficiency of a LS-2 SCACR =0.94; % Clean ReflectivityCl =0.94; % Cleanliness Solar FieldA = Aref*(CR/0.94)*Cl*(1+Cl)/2;B=-0.004206;C = 7.44;Cw = 0;D = -0.0958;
f = 1.8; % [m] Focal Length of the SCALsca = 47; % [m^2] Length of one SCAtheta = 0;
% Shading of Parallel Rows% This factor can be taken to be equal to 1 because at solar non, no SCA shades other SCA.% sh = min (max(0,(12.5/5)*cos(zenith(h))/cos(teta(h))),1.0);sh =1; %Ws = 3; % [m/s] Wind SpeedT_amb = 16.5; % [oC] Ambient TemperatureT_in=150;T_out=300DNI = 0.806; % [W/m^2] Direct normal InsolationA_sca = 235; % [W/m^2] Aperture area of one SCA
% Incident Angle ModifierK= cos(theta) - 0.0003512*theta -0.00003137*(theta)^2;
% End LossesM = 1 - (f*tan(theta)/Lsca);
DeltaT_in = T_in -T_amb; % [oC] Diff. between collector inlet temp. and ambient temp.
DeltaT_out = T_out-T_amb; %[oC] Diff. between collector outlet temp. and ambient temp.
%Efficiencyeta_SF = K*M*sh*(A + B*((DeltaT_in+DeltaT_out)/2)) + (C+ Cw*Ws)* ... (((DeltaT_in+DeltaT_out)/(2000*DNI)))+D*(DeltaT_in*DeltaT_out + ... ((DeltaT_out-DeltaT_in)^2)/3)/(1000*DNI);
Qnet =3254;%Average Temperature of the Solar Field Inlet and Outlet TemperaturesTavg_sf = (T_out + T_in)/2;
xx=(0.02*Tavg_sf/225);yy = (2.57*10^3)*Tavg_sf/275;zz=DNI*eta_SF/100;
% Effective Area of the Solar FieldAeff= (Qnet +yy)/(zz-xx);

92
% Piping Heat LossQpipe =(xx *Aeff + yy);
% Total Number of Collector in the Solar FieldTN_coll = Aeff/A_sca;
% Absorbed EnergyQabs = Aeff*zz;
% Specific Heat of HTF at Average Temperature Cp_HTF = (0.0007755*Tavg_sf^2 + 2.484*Tavg_sf+ 1511)/1000;
% Reference Maximum Flow Rate of the HTF to Achieve Tout mHTF_T= (Qnet/(Cp_HTF*(T_out -T_in))) ;

93
F. Laundry and kitchen Energy Consumptions
Laundry energy Consumption
1. Washing the Dirty Linen
cycleperloadinglinene
cyclepernconsumptioEnergywashingfornconsumptioenergyAverag
kg
kgkJhsteamofkg
55
/2048*/60
kgkWh /62.0
2. Drying the Dirty Linen
cycleperloadinglinene
cyclepernconsumptioEnergydryingfornconsumptioenergyAverag
kg
kgkJhsteamofkg
55
/2048*/90
kgkWh /93.0
3. Ironing the Dirty Linen
cycleperloadinglinene
cyclepernconsumptioEnergyironingfornconsumptioenergyAverag
kg
kgkJhsteamofkg
55
/2048*/100
kgkWh /03.1

94
The Average Energy Intensity of Kitchen Service
Average number of peoples having meal=832
Daily Energy consumption of kitchen service=1455.3kWh
servicemealhavingpeopelsofnumberavaerage
nserviceonofkitcheyconsumptidailyenergensityenergyAveragDaily int
832
3.1455 kWh
daybedkWh /75.1

95
G. Monthly and Annual simulations
March

96
April

97
May

98
June

99
July

100
August

101
September

102
October

103
November

104
December

105
Annual

106