Techno-economic assessment of microalgae production ...
10
Techno-economic assessment of microalgae production, harvesting and drying for food, feed, cosmetics, and agriculture Bárbara Vázquez-Romero a,b , José Antonio Perales a,b , Hugo Pereira c,d , Maria Barbosa e , Jesús Ruiz a,b, ⁎ a Departamento de Tecnologías del Medio Ambiente, Instituto Universitario de Investigaciones Marinas (INMAR), Campus de Excelencia Internacional del Mar (CEIMAR), Universidad de Cádiz, 11510 Puerto Real, Cádiz, Spain b Alga Development Engineering and Services, S.L., 11500 El Puerto de Santa María, Cádiz, Spain c GreenCoLab - Associação Oceano Verde, Universidade do Algarve, Campus de Gambelas, 8005-139, Portugal d Necton S.A., Belamandil s/n, 8700-152 Olhão, Portugal e Wageningen University, P.O. Box 16, 6700 AA Wageningen, the Netherlands HIGHLIGHTS • Production of Nannochloropsis and Tisochrysis + Phaeodactylum at 1-ha in Portugal • Nannochloropsis production results in 28 t/ha/y and a cost of 53 €/kg DW. • Tisochrysis + Phaeodactylum production results in 13 t/ha/y and a cost of 105 €/ kg DW. • Scale up to 10-ha could reduce production cost in 18% for Nannochloropsis. • Tisochrysis + Phaeodactylum commerciali- sation could result in a 22% greater in- come. GRAPHICAL ABSTRACT ABSTRACT ARTICLE INFO Editor: Jan Vymazal The objective of this techno-economic analysis is to define the costs for an industrial microalgae production process, comparing different operation strategies (Nannochloropsis oceanica cultivation during the whole year or cultivation of two species, where Phaeodactylum tricornutum and Tisochrysis lutea alternate), production scales (1 and 10 ha), har- vesting technologies (centrifugation or ultrafiltration) and drying methods (freeze-drying or spray drying). This study is based on an industrial scale process established in the south of Portugal. The strategy of cultivating N. oceanica all year round is more attractive from an economic perspective, with production costs of 53.32 €/kg DW and a productiv- ity of 27.61 t/y for a scale of 1 ha, a 49.31% lower cost and two-fold productivity than species alternation culture strat- egy. These results are for biomass harvested by centrifugation (10.65% biomass cost) and freeze-drying (20.15% biomass cost). These costs could be reduced by 7.03% using a combination of ultrafiltration and spray drying, up to 17.99% if expanded to 10 ha and 10.92% if fertilisers were used instead of commercial nutrient solutions. The study shows potentially competitive costs for functional foods, food, and feed additives, specialised aquaculture prod- ucts (live feed enrichment) and other high value applications (e.g., cosmetics). Keywords: Microalgae Production cost Industrial scale Tubular photobioreactor Cost analysis Science of the Total Environment 837 (2022) 155742 Abbreviations: EU, European Union; DW, Dry Weight; PBR, Photobioreactors; PHT, Phaeodactylum Tricornutum; TISO, Tisochrysis Lutea; NAS, Nannochloropsis Oceanica; HRT, Hydraulic Retention Time; UV, Ultraviolet; UF, Ultrafiltration; PMMA, Polymethyl Methacrylate; CAPEX, Capital Expenditures; OPEX, Operational Expenditures; PE, Photosynthetic Efficiency; MEC, Major Equipment Cost. ⁎ Corresponding author at: Alga Development Engineering and Services, S.L., 11500 El Puerto de Santa María, Cádiz, Spain. E-mail address: [email protected] (J. Ruiz). http://dx.doi.org/10.1016/j.scitotenv.2022.155742 Received 4 January 2022; Received in revised form 24 April 2022; Accepted 2 May 2022 Available online 6 May 2022 0048-9697/© 2022 The Authors. Published by Elsevier B.V. This is an open access article under the CC BY license (http://creativecommons.org/licenses/by/4.0/). Contents lists available at ScienceDirect Science of the Total Environment journal homepage: www.elsevier.com/locate/scitotenv
-
Upload
khangminh22 -
Category
Documents
-
view
1 -
download
0
Transcript of Techno-economic assessment of microalgae production ...
Science of the Total Environment 837 (2022) 155742
Contents lists available at ScienceDirect
Science of the Total Environment
j ourna l homepage: www.e lsev ie r .com/ locate /sc i totenv
Techno-economic assessment of microalgae production, harvesting anddrying for food, feed, cosmetics, and agriculture
Bárbara Vázquez-Romero a,b, José Antonio Perales a,b, Hugo Pereira c,d, Maria Barbosa e, Jesús Ruiz a,b,⁎
a Departamento de Tecnologías del Medio Ambiente, Instituto Universitario de Investigaciones Marinas (INMAR), Campus de Excelencia Internacional del Mar (CEIMAR),Universidad de Cádiz, 11510 Puerto Real, Cádiz, Spainb Alga Development Engineering and Services, S.L., 11500 El Puerto de Santa María, Cádiz, Spainc GreenCoLab - Associação Oceano Verde, Universidade do Algarve, Campus de Gambelas, 8005-139, Portugald Necton S.A., Belamandil s/n, 8700-152 Olhão, Portugale Wageningen University, P.O. Box 16, 6700 AA Wageningen, the NetherlandsH I G H L I G H T S G R A P H I C A L A B S T R A C T
• Production of Nannochloropsis andTisochrysis + Phaeodactylum at 1-ha inPortugal
• Nannochloropsis production results in 28t/ha/y and a cost of 53 €/kg DW.
• Tisochrysis + Phaeodactylum productionresults in 13 t/ha/y and a cost of 105 €/kg DW.
• Scale up to 10-ha could reduce productioncost in 18% for Nannochloropsis.
• Tisochrysis+ Phaeodactylum commerciali-sation could result in a 22% greater in-come.
Abbreviations: EU, European Union; DW, Dry Weight; PRetention Time; UV, Ultraviolet; UF, Ultrafiltration; PMMAMajor Equipment Cost.⁎ Corresponding author at: Alga Development Engineerin
E-mail address: [email protected] (J. Ruiz).
http://dx.doi.org/10.1016/j.scitotenv.2022.155742Received 4 January 2022; Received in revised form 2Available online 6 May 20220048-9697/© 2022 The Authors. Published by Elsevi
A B S T R A C T
A R T I C L E I N F OEditor: Jan Vymazal
The objective of this techno-economic analysis is to define the costs for an industrial microalgae production process,comparing different operation strategies (Nannochloropsis oceanica cultivation during the whole year or cultivationof two species, where Phaeodactylum tricornutum and Tisochrysis lutea alternate), production scales (1 and 10 ha), har-vesting technologies (centrifugation or ultrafiltration) and drying methods (freeze-drying or spray drying). This studyis based on an industrial scale process established in the south of Portugal. The strategy of cultivating N. oceanica allyear round is more attractive from an economic perspective, with production costs of 53.32 €/kg DWand a productiv-ity of 27.61 t/y for a scale of 1 ha, a 49.31% lower cost and two-fold productivity than species alternation culture strat-egy. These results are for biomass harvested by centrifugation (10.65% biomass cost) and freeze-drying (20.15%biomass cost). These costs could be reduced by 7.03% using a combination of ultrafiltration and spray drying, up to17.99% if expanded to 10 ha and 10.92% if fertilisers were used instead of commercial nutrient solutions. Thestudy shows potentially competitive costs for functional foods, food, and feed additives, specialised aquaculture prod-ucts (live feed enrichment) and other high value applications (e.g., cosmetics).Keywords:MicroalgaeProduction costIndustrial scaleTubular photobioreactorCost analysis
BR, Photobioreactors; PHT, Phaeodactylum Tricornutum; TISO, Tisochrysis Lutea; NAS, Nannochloropsis Oceanica; HRT, Hydraulic, Polymethyl Methacrylate; CAPEX, Capital Expenditures; OPEX, Operational Expenditures; PE, Photosynthetic Efficiency; MEC,
g and Services, S.L., 11500 El Puerto de Santa María, Cádiz, Spain.
4 April 2022; Accepted 2 May 2022
er B.V. This is an open access article under the CC BY license (http://creativecommons.org/licenses/by/4.0/).

B. Vázquez-Romero et al. Science of the Total Environment 837 (2022) 155742
1. Introduction
The European Union (EU) adopted a bioeconomy strategy in 2012(European Commission, 2012), which was updated in 2018 (EuropeanCommission, 2018). This strategy aims to support the innovative use of bi-ological resources to meet the growing demand in the food, energy, and in-dustrial sectors, creating new employment, innovation, and services for agrowing population. In this context, microalgae are raising high expecta-tions as a resource for various commercial sectors (food, feed, cosmetics,nutraceuticals, fertilisers, bioenergy, and bio-based products (Fernándezet al., 2021)). CO2 absorption and O2 production, the content of variouscompounds of interest, high productivity, the possibility of using wasteflows for its cultivation, and the fact that it does not compete with agricul-ture for resources are reasons for this increased interest. At the same time,they contribute to addressing global and local challenges (climate changeand sustainable development) while also committing to some of the Sus-tainable Development Goals set out in the Agenda 2030 of the EU (UNGeneral Assembly, 2015).
Despite the growing interest and potential of microalgae as an innova-tive sector within the EU bioeconomy, the production volume and marketsize are still small. An estimated production volume of 25,000 t per year(Fernández et al., 2021) and a value of the marine biotechnology market(the main component being microalgae) of 2.4 billion euros was estimated(Enzing et al., 2014).
Currently, microalgae are being sold as whole algae or for extraction oftheir compounds marketed mainly for high-value products (e.g., food sup-plements or nutraceuticals (Russell et al., 2022)). In contract, productswith high production volume and low market value (such as biofuels(Dasan et al., 2019)) are still not commercialised. This is due, on the onehand, to various constraints limiting the expansion of the sector, such ashigh production costs and technological limitations, variability in biomasssupply, and gaps in scientific knowledge of large-scale cultivation ofmicroalgae (Araújo et al., 2021). In addition, the complexity and non-existence of somenational and EU regulations are not boosting the develop-ment of this sector (Araújo, 2019). On the other hand, establishing a pro-duction cost is not straightforward, which is evident in the variability ofthe results of different studies (2.90 €/kg (Schipper et al., 2021), 5.96 €/kg (Norsker et al., 2011), 12.40 €/kg (Tredici et al., 2016), 69 €/kg(Acién et al., 2012a), 290 €/kg (Oostlander et al., 2020)). Due to the scalesof work, assumptions, and lack of homogeneity in the analysis procedurefrom different sources. For this reason, it is necessary to do a case-by-casestudy, such as the present one, supported by empirical data, following thesame methodology for each of the simulations.
To enable large-scale economic production of microalgae-based prod-ucts, the production and biorefinery process (separation of the differentbiochemical compounds) must become an industrialised process in whichprocess stability, reliability, product quality, sustainability, and economicviability, are guaranteed.
In this work, we performed a techno-economic evaluation of anindustrial-scale process to produce autotrophic microalgae in closed culti-vation systems (vertically stacked tubular photobioreactors (PBRs)). Tothis end, the effect on costs from varying different inputs was modelled(microalgae strain, final product format and technologies for harvestingand drying, and scale). This resulted in different projections with a detailedcost breakdown. The analysis is based on experimental data obtained in theBBI-JU MAGNIFICENT Project (ID: 745754).
2. Methods
This study focused on developing a techno-economic assessment of thewhole process of microalgae production and subsequent harvesting anddrying stages to obtain a final biomass product. The process established isthoroughly described in this section (Description of the process). The toolfor analysis was built with Microsoft Excel® spreadsheet application, inwhich the inputs are introduced (see General inputs), and results are auto-matically obtained through built-in calculations, allowing the study of
2
different scenarios. A detailed description of themodel calculationmethod-ology can be found in the Supplementary material.
2.1. Description of the process
The scheme simulated in this study is a process developed with the BBI-JU project MAGNIFICENT, based on Necton S.A.'s commercial facilities(South Portugal), but is not a representation of Necton's processes and pro-duction cost. Some modifications were made to adapt the original processto a more industrialised scale, explained throughout this section.
The process was divided into five stages, as shown in SupplementaryFig. 1: 1) Inoculation, 2) Pre-treatment of seawater, 3) Microalgae cultiva-tion, 4) Harvesting, and 5) Drying. Each process stage is controlled andmonitored simultaneously, with real-time data obtained with the SCADAsystem.
2.1.1. InoculationA facility section dedicated to microalgae inoculation was considered
(10% of the total culture volume). In this case, closed flat-panel PBRswere considered. These are described in more detail in the section onCultivation systems (General inputs). Three different microalgae strains;Phaeodactylum tricornutum (PHT), Tisochrysis lutea (TISO), andNannochloropsis oceanica (NAS), were grown in these systems, dependingon the strategy to be followed.
2.1.2. Pre-treatmentThe pre-treatment starts with the pumping of the water from the Ria
Formosa (Portugal) to the settlement tanks, with a maximum hydraulicretention time (HRT) of 72 h (experimental data obtained withinMAGNIFICENT Project). Each tank incorporated a level probe. From thispoint, the water was pumped to the filtering unit using ultrafiltration(UF) membrane technology (0.03 μm). It was then disinfected with ultra-violet (UV) lamps, providing a dose of approximately 44.6 MJ/cm2
(Atlántica-agua http://www.atlantica-agua.com). Finally, the water wasnutrient-enriched in a mixing tank (HRT = 30 s) (Benvenuti et al., 2017).The culture medium used was NutriBloom® Plus, the commercial mediumdeveloped in-house by Necton, added at a concentration of 2 mL/L of cul-ture. The carbon source used was commercial CO2, injected into the PBRson demand using a pH-control system. The Necton facility commonlyoperates using a semi-continuous cultivation approach, but a continuous re-gime was adopted for this study, as it is the most productive regime. Thedaily dilution rates were 7.17 ± 2.37% for PHT, 8.83 ± 2.68% for TISOand 9.90 ± 0.64% for NAS, according to experimental data.
2.1.3. Microalgae cultivationVertically stacked tubular PBRswere considered for cultivation (15m3),
using pumps to circulate the culture through the tubes. ABS polymer beadswere used at a concentration of 1.8 kg of beads per cubic meter of culture(NAS and PHT) and 7 kg per cubic meter in the case of TISO to avoid bio-fouling. In addition, to ensure that the culture did not exceed the maximumtemperature set point of 27 °C (PHT), 35 °C (TISO) and 35 °C (NAS), watersprinklers along the top of the PBRs, were used. After passing through thephotosynthetic stage, cultures were degassed inside a tank by a cascade ap-proach preventing O2 accumulation.
Once the culture leaves the PBRs, it passes through a mesh vessel (HRT=7.5min) where the anti-fouling beads are retained. This tank is equippedwith a probe that measures the water level. The culture then moves on tothe next stage, harvesting.
2.1.4. HarvestingAs a harvesting method, centrifugation was used to obtain microalgae
paste. In addition, this study also simulates an alternative scenario with adifferent harvesting process, UF through membranes.

B. Vázquez-Romero et al. Science of the Total Environment 837 (2022) 155742
2.1.5. DryingTwo drying alternatives were analysed. The first is freeze-drying the
paste from the centrifuge, obtaining a productwith 1.5%moisture. The sec-ond option is spray drying the concentrate fromUF, inwhich afinal product(powder format) with 5% moisture content is obtained.
2.2. General inputs
2.2.1. Microalgae strainsThe production of three species of microalgae was studied: NAS, TISO
and PHT. We considered two possible strategies for their cultivationbased on experimental data. Thefirst strategy aimed to exclusively cultivateNAS whole year-round, as this species has proven suitability to grow underall weather conditions found in Algarve. The second strategy pursued thealternate cultivation of TISO (from June to November) and PHT (from De-cember to May). TISO requires higher temperatures to grow (12–35 °C),while PHT benefits from colder weather (5–27 °C). This alternation allowsan almost uninterrupted production, otherwise unachievable for thesestrains. Experimental data on TISO and PHT strains are reported in thestudy by Pereira et al. (Pereira et al., 2021).
2.2.2. LocationThe projections were simulated in the south of Portugal, specifically
Olhão (37°01′40″N 7°50′20″W). It is located within the “Ria Formosa”Nat-ural Park, an area that extends along the leeward shore of the Algarve.Area-specific data were collected for inputs to this model: climatic condi-tions (irradiance and temperature) (Source: EnergyPlus database), electric-ity, freshwater and, treating wastewater costs, as well as the salary and thecontribution of employees (Supplementary Table 3).
2.2.3. ScaleTwo production scales were studied: 1 and 10 ha to determine the im-
pact of economies of scale on the final cost of biomass. The extrapolationof the purchase cost for equipment from Supplementary Table 6 to othernon-specified capacities was based on the scale factor rules (Eq. (1))(Sinnott and Towler, 2013).
Cost B ¼ Cost A∙Size BSize A
� �n
(1)
where:Cost B represents the purchase cost of the equipment to be scaled, with a
Size B capacity.Cost A represents the cost of the Size A reference equipment A.Finally, n is the corresponding scaling factor for each piece of equip-
ment, collected in Supplementary Table 6.
2.2.4. Cultivation systemsThe simulation has been carried out for cultivation in vertically stacked tu-
bular PBRs. Each PBR includes 80 polymethyl methacrylate (PMMA) tubeswith 63 mm outer diameter and 7 mm wall thickness. These are attached toa stainless-steel structure, with 14 fences per PBR. Each PBR is 48.5 m long,with a height of 1.7 m. The vertical distance between the tubes is 200 mm.The culture circulates (0.45 m/s) through one circulation pump per PBR.The system has a degasser (5 m3) to eliminate the excess oxygen, located inthe extreme where pumping for culture circulation is performed.
Each module (PBR + gaps+degasser) corresponds to a total groundarea of 400 m2 and a volume of 38 L per m2 of ground area. These PBRsare the same as in the study by Pereira et al. (Pereira et al., 2021), exceptfor the total area. Pereira et al. (Norsker et al., 2011) considered an areaof 340 m2. For our industrial approach, a slightly greater distance betweenmodule of reactors was preferred.
Although inside the tubes there are anti-fouling beads, which restrictsbiofouling, cleaning is required four times a year, with hydrochloric acid(0.001 v/v), caustic soda (0.0003 v/v) and sodium hypochlorite (0.001 v/v). In addition, for each PBR, there is an O2, pH and temperature probes.
3
The inoculumproduction is carried out inflat panel type reactors. Thesepanels are transparent plastic bags (LDPE) supported by a stainless-steelstructure. Each flat panel (1 m3) is 10 m long, 1 m high, and 0.1 m wide.The distance between row of 0.51 m. The bags are replaced every twoweeks (except for NAS, for which this is done weekly). The flat panelshave an aeration system at the bottom (tubes of aeration) to homogeniseand degas the culture. Air blowers supply the airflow at a rate of 0.65 v/v/min (experimental data). A probe in each flat panel monitors the O2
and temperature conditions of the culture.
2.2.5. Harvesting technologiesThe model has integrated two options of technologies for harvesting:
centrifugation and UF. The centrifugation process separates the microalgaefrom the water by driving force and can concentrate the biomass to 22%DW for TISO, 24% DW for PHT, and 32% DW for NAS, with a harvestingefficiency between 90 and 95% (experimental data). UF concentrates thebiomass at 5.21% DW (experimental data), with an efficiency of 99%(Fasaei et al., 2018). The biomass not recovered in the harvesting units isconsidered lost. UF membranes also require cleaning with hydrochloricacid at 33% and sodium hypochlorite at 13%. Each filtration cycle filters20 m3, consuming 1.3 L of HCl and 0.9 L of NaClO.
2.2.6. Drying technologiesThe dehydration of the biomass can be carried out in two ways, spray-
drying, or freeze-drying. The selected method depends on the harvestingprocess. When the centrifuge is used, then the dehydration is performedby freeze-drying, as this process requires a higher percentage of solids.When the filtration membranes are chosen as harvesting technology,spray drying is then used to remove water.
The spray dryer removes 95% of the water in the final product (experi-mental data). This process is based on a temperature increase which allowsthe incoming air to dry and atomise the concentrated microalgae culture.The temperature reached is 240 °C, with the average inlet air being 17.73±4.77 °C. In this stage, to heat the air for atomised biomass drying, gas nat-ural was used, with an 80%efficiency from steam generation by gas heating(Fasaei et al., 2018).
The freeze-drying process works by freezing the material and then re-ducing the surrounding pressure to allow the water frozen in the materialto sublimate directly from the solid phase to the gaseous phase withoutpassing through the liquid state. It removes 98.50% of the water in themicroalgae paste, and this process lasts for 24 h.
3. Result & discussion
The results of the techno-economic analysis of this study are presentedin the following sections. Seven projections were simulated (Table 1),grouped into 4 cases. The aim is to determine each simulation's costs andidentify the strengths and weaknesses to achieve an industrialised and eco-nomically feasible process.
In the first case, the same process was simulated as in the experimentalfacilities (MAGNIFICENT Project), with the objective to study two opera-tion strategies (1a-alternating two species of microalgae and 1b-cultivation of a single strain of microalgae). The second case focuses on bio-mass processing, comparing the two harvesting technologies (2a-centrifu-gation and 2b-UF membranes). The drying process is also compared,using two alternatives, 2c-spray dryer, and 1b-freeze dryer. Once the mostbeneficial process from a cost standpoint is chosen, it is compared in case3 at 1 ha (1b) and 10 ha (3a) scales. Finally, one more case, case 4, was pro-posed to see the influence of the culturemedium source (4a use of fertilisersor 1b use of commercial nutrient solution).
Case 1. Culture strategy – Single specie vs species alternation
Two scenarioswere evaluated to compare different operating strategies.Firstly, alternation of microalgae strains (case 1a); production of PHT dur-ing the coldest months (from December to May) in combination with

Table 1Summary of projected cases.
Case Microalgaestrain
Upstream Downstream Source ofnutrients
Scale
1 Culture strategy – single specie vs species alternation1a TISO+PHT PBR+
centrifugationFreeze dryer Commercial 1 ha
1b NAS PBR+centrifugation
Freeze dryer Commercial 1 ha
2 Processing2a NAS PBR+
centrifugation– Commercial 1 ha
2b NAS PBR+ UF – Commercial 1 ha2c NAS PBR+ UF Spray dyer Commercial 1 ha1b NAS PBR+
centrifugationFreeze dryer Commercial 1 ha
3 Scale3a NAS UF Spray dyer Commercial 10 ha2c NAS UF Spray dyer Commercial 1 ha4 Culture medium4a NAS UF Spray dyer Fertilisers 10 ha3a NAS UF Spray dyer Commercial 10 ha
B. Vázquez-Romero et al. Science of the Total Environment 837 (2022) 155742
production of TISO during the hottest months (from June to November).This strategy pursues year-round production using two strains with limitedproductive seasons (Pereira et al., 2021). And secondly, cultivation of asingle microalgae strain (case 1b); exclusive production of NAS
Fig. 1. Equipment and operational cost co
4
throughout the year. Both scenarios follow the process proposed in thisstudy (Supplementary Fig. 1).
For the first strategy (species alternation culture strategy: TISO+PHT),our projections determine an annual productivity of 12.94 t/ha/y with abiomass cost of 105.19 €/kg DW (dry biomass). This scenario requires aninvestment cost of 7.72 M€ for the 1-ha facility. The total cost is 1.36 M€/y, and 41% of this cost belongs to CAPEX. The equipment with themost significant influence on CAPEX is the PBR, representing 71.18% ofthe total MEC (Fig. 1) and 29.50% of the cost of biomass. OPEX representsthe remaining 59% of the total cost, with labour (23.06% of OPEX) present-ing the main contribution to operational costs (Fig. 1). The energy (electric-ity and natural gas) required per kilogram of biomass is 131.30 kWh.
Different results are obtained for the second strategy (singlemicroalgae:NAS). In this case, the estimated productivity case is 27.61 t/ha/y (twicethan in case 1a) at the cost of 53.32 €/kg DW (49% lower than in case1a). The increase in production is due to the high value of photosyntheticefficiency (PE) of NAS (1.02%), which is derived from the experimentalresults, compared to PHT (0.81%) and TISO (0.38%), that species-specificPE is used during the cultivation season. This increase in production forNAS implies a rise in the cost of investment (6.50%) and the annual cost(8.18%), as larger equipment is needed to pump and process more waterand biomass flows. However, as shown, the higher productivity compen-sates for this and biomass cost decreases.
The equipment with the most significant impact on capital costs are stillthe PBRs (66.83% of the totalMEC, Fig. 2) and representing 27.219%of thecost of biomass, with a percentage similar to the previous one (Fig. 1).
ntribution for case 1a (TISO+PHT).
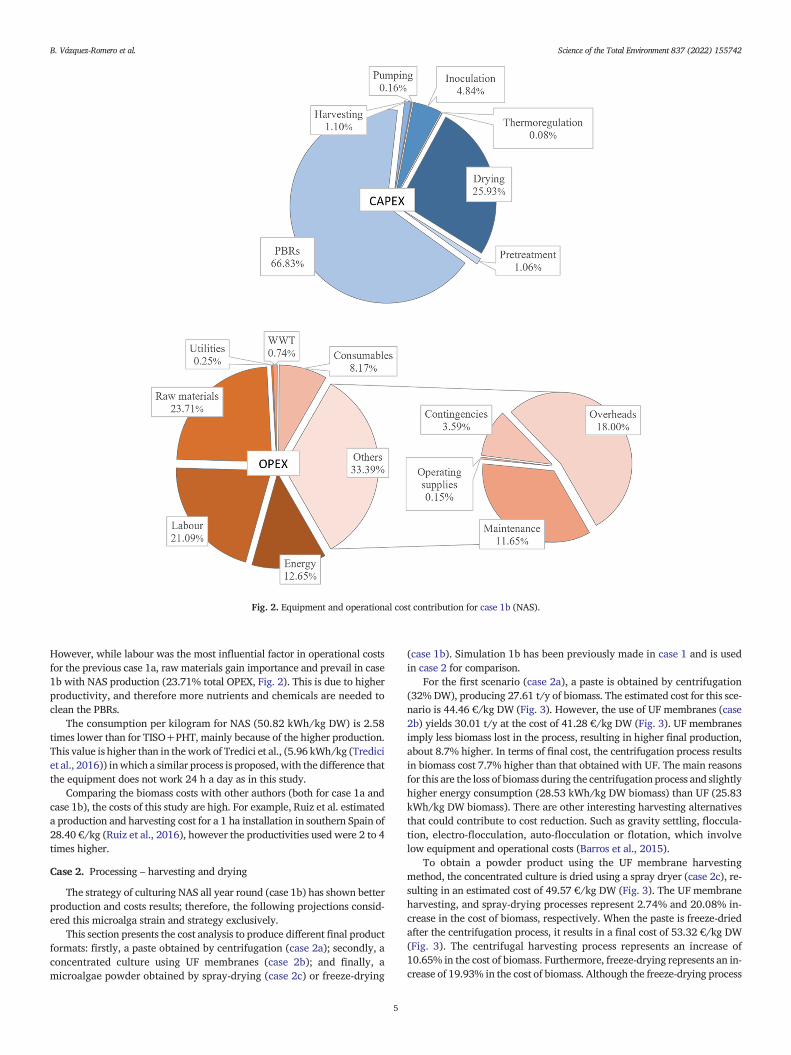
Fig. 2. Equipment and operational cost contribution for case 1b (NAS).
B. Vázquez-Romero et al. Science of the Total Environment 837 (2022) 155742
However, while labour was the most influential factor in operational costsfor the previous case 1a, raw materials gain importance and prevail in case1b with NAS production (23.71% total OPEX, Fig. 2). This is due to higherproductivity, and therefore more nutrients and chemicals are needed toclean the PBRs.
The consumption per kilogram for NAS (50.82 kWh/kg DW) is 2.58times lower than for TISO+PHT, mainly because of the higher production.This value is higher than in thework of Tredici et al., (5.96 kWh/kg (Trediciet al., 2016)) inwhich a similar process is proposed,with the difference thatthe equipment does not work 24 h a day as in this study.
Comparing the biomass costs with other authors (both for case 1a andcase 1b), the costs of this study are high. For example, Ruiz et al. estimateda production and harvesting cost for a 1 ha installation in southern Spain of28.40 €/kg (Ruiz et al., 2016), however the productivities used were 2 to 4times higher.
Case 2. Processing – harvesting and drying
The strategy of culturing NAS all year round (case 1b) has shown betterproduction and costs results; therefore, the following projections consid-ered this microalga strain and strategy exclusively.
This section presents the cost analysis to produce different final productformats: firstly, a paste obtained by centrifugation (case 2a); secondly, aconcentrated culture using UF membranes (case 2b); and finally, amicroalgae powder obtained by spray-drying (case 2c) or freeze-drying
5
(case 1b). Simulation 1b has been previously made in case 1 and is usedin case 2 for comparison.
For the first scenario (case 2a), a paste is obtained by centrifugation(32% DW), producing 27.61 t/y of biomass. The estimated cost for this sce-nario is 44.46 €/kg DW (Fig. 3). However, the use of UF membranes (case2b) yields 30.01 t/y at the cost of 41.28 €/kg DW (Fig. 3). UF membranesimply less biomass lost in the process, resulting in higher final production,about 8.7% higher. In terms of final cost, the centrifugation process resultsin biomass cost 7.7% higher than that obtained with UF. The main reasonsfor this are the loss of biomass during the centrifugation process and slightlyhigher energy consumption (28.53 kWh/kg DW biomass) than UF (25.83kWh/kg DW biomass). There are other interesting harvesting alternativesthat could contribute to cost reduction. Such as gravity settling, floccula-tion, electro-flocculation, auto-flocculation or flotation, which involvelow equipment and operational costs (Barros et al., 2015).
To obtain a powder product using the UF membrane harvestingmethod, the concentrated culture is dried using a spray dryer (case 2c), re-sulting in an estimated cost of 49.57 €/kg DW (Fig. 3). The UF membraneharvesting, and spray-drying processes represent 2.74% and 20.08% in-crease in the cost of biomass, respectively. When the paste is freeze-driedafter the centrifugation process, it results in a final cost of 53.32 €/kg DW(Fig. 3). The centrifugal harvesting process represents an increase of10.65% in the cost of biomass. Furthermore, freeze-drying represents an in-crease of 19.93% in the cost of biomass. Although the freeze-drying process

Fig. 3. Production capacity and cost for the different formats of final products (1 ha).
B. Vázquez-Romero et al. Science of the Total Environment 837 (2022) 155742
is considered more expensive than spray drying according to the literature(Milledge and Heaven, 2013) (Molina Grima et al., 2003) (Ansari et al.,2018), in this study both processes imply an increase in cost of 20%. How-ever, the spray drying process consumes more energy (36.45 kWh/kg DW)than freeze-drying (22.29 kWh/kg DW). Biomass losses in centrifugationwere the reason for the higher biomass cost in case 1b (centrifugation +freeze-drying). An alternative to these two drying methods could be sun
Fig. 4. Equipment and operational cos
6
drying with potentially lower cost and energy consumption (Kim, 2015).However, exclusively the original existing processes of the commercial in-stallation of Necton S.A. are applied.
Case 3. Production scale – 1 ha vs 10 ha
In order to evaluate the production scale effect, the scale of the produc-tion facilitywas increased from1 to 10 ha. Similar processes and conditions
t contribution for case 3a (10 ha).

B. Vázquez-Romero et al. Science of the Total Environment 837 (2022) 155742
simulated in case 2c were selected for 10 ha, considering only the produc-tion of NAS, and processing using UF and spray-drying.
The result of this projection (case 3a) shows a production of 300 t/y, tentimes greater than the homologous case on 1 ha (case 2c). The biomass costis reduced, from the scale effect, by 18.01% (40.65 €/kg DW).
Among this total cost, 19.83 €/kg DW corresponds to CAPEX. The mostimportant contributor to the investment (81.61M€) is the PBR,with 66.62%of the total MEC (Fig. 4) and 32.50% of the cost of biomass. As for opera-tional expenses, 20.83 €/kg DW of the total biomass cost correspond toOPEX. Maintenance and raw materials (culture medium for microalgae)are the most significant expenses, with 16.22 and 34.14%, respectively, ofthe total OPEX (Fig. 4). This scenario presents an energy consumption of62.71 kWh/kg DW biomass, similar to 1 ha, as the increase of scale impliesreplicating modules in most cases (62.28 kWh/kg DW of biomass).
Case 4. Culture medium - commercial nutrient solution vs fertiliser
Additionally, the last projection for 10 ha of production (case 4a) hasbeen included to evaluate the identified effect of rawmaterials. In all previ-ous cases (case 3a), a commercial culturemedium (NutriBloom®Plus)wasused to enrich seawater as a source of nutrients for microalgae growth.
Fig. 5. Figure above: Operational cost contribution for case 3a (10 ha).
7
However, at an industrial scale usually, bulk fertilisers are used; in thiscase (case 4a), urea and triple superphosphate were considered such asthe study by Schipper et al. (Schipper et al., 2021). The use of these macro-nutrients would be a good strategy exclusively as long asmicronutrients es-sential for the growth of the microalgae (i.e. metals) were naturally presentin seawater (Millero et al., 2008). Studies have even used seawater (due toits ion concentration) to replace part of the freshwater and nutrients in theculture media, opening a way to reduce the costs of medium preparation(Jung et al., 2015). Furthermore, according to the study of Meyer (Meyer,2012), the low concentrations of these minor nutrients represent less than5% of the total cost. As a result, in case of 4a, the cost of biomass is reducedby 10.92% (36.21 €/kg DW) compared to case 3a (40.65 €/kg DW). As inthe previous cases, the element with the most significant weight in theCAPEX (54.76% of the total cost) is the PBR (66.62% of the MEC) and rep-resents 36.49% of the biomass cost. As for OPEX (45.24% of the total cost),maintenance (20.62% of OPEX) is estimated to be the main contributor tothe operating costs.
Under this scenario, raw materials reduce their weight, going from34.14% (case 3a) to 19.88% of OPEX (case 4a). The difference is significantin terms of OPEX: commercial culture solution accounts for 19.60% of raw
Figure below: Operational cost contribution for case 4a (fertilisers).

Table 2Income estimates based on the selling prices of each species (centrifugation+1 ha).
Microalgae specie Production (t/y DW) Estimated income (M€/y)
NAS 27.61 (Case 1b) 1.304TISO+PHT 12.94 (Case 1a) 1.125
B. Vázquez-Romero et al. Science of the Total Environment 837 (2022) 155742
materials (Fig. 5), but if fertilisers are used (Fig. 5), they account for only1.40% of raw materials.
3.1. Commercialisation
Currently, two business cases for the exploitation of microalgae areidentified; bulk products or commodities (chemicals, food and feed); andspecialities markets (high-value products) for food additives, cosmetics,and nutraceuticals (Ruiz et al., 2016) (MALGAS, 2014).
Commercialisation is mainly dedicated to the specialitymarket, as it is alower volume, high-cost niche where microalgae can be competitive. How-ever, the most important product from microalgae biotechnology in termsof production quantity and economic value remains the microalgae bio-mass itself (Pulz and Gross, 2004). In the food market (including humanhealth and wellbeing), microalgae biomass is mainly sold in powder orcompressed forms (Pulz and Gross, 2004). Moreover, the animal feed mar-ket is booming, both in aquaculture and livestock farming (Pulz and Gross,2004). Even so, there is no risk of market saturation by new products frommicroalgae. When comparing the size of the different markets for whichmicroalgae are intended, for example, the biofuel market requires hugeproductions, in the order of 107 t/y, the food market about 104 t/y, the ag-ricultural market 105 t/year and the animal feed market 106 t/y, far awayfrom the global capacity of microalgae biomass (104 t/y) (Acién et al.,2012b). Therefore, in commodities, a risk of market saturation is not ex-pected, mainly due to volume and possible legislation constraints. In theshort term, improved production systems, especially the development ofnew technologies, and the improvement of highly productive strains, areexpected to greatly increase the production capacity and the range of appli-cations to which microalgae can contribute to the near future (Fernándezet al., 2021) (Enzing et al., 2014) (Araújo, 2019).
Fig. 6 shows typical market price ranges for different applications ofmicroalgae biomass. The dashed line shows the production cost for case4a, showing a price within the range for natural food, functional foods, ad-ditives, aquaculture, and agricultural applications. It is also worthy consid-ering the selling price of each species, as in terms of income, some scenariosmay bemore beneficial than others. Supplementary Table 8 shows themar-ket selling prices for the species studied in this study. The selling prices ofeach species (as frozen paste) must be multiplied by the annual productionfor TISO+PHT (case 1a) or NAS (case 1b) to analyse the potential incomefrom our scenarios. Despite the higher NAS production, 2.13 times morethan TISO+PHT, the income is higher for the two alternating microalgae
25.10 €/kg
46.62 €/kg
116.5
13.45 €/kg-
22.41 €/kg
8.97
Biomass cost
from this
study
36.21 €/kg
0
20
40
60
80
100
120
140
160
Natural food Functional foods Add
Mar
ket
pri
ce (
€/k
g)
Fig. 6. Typical range of market prices for different applications of microalgae biomass (acost benchmark of case 4a of this study. [1] MALGAS, “Guía: Oportunidades de negociop. 86, 2014.
8
strains (see Table 2) because they can be presently sold at a higher price.The prices collected in Supplementary Table 8 are for frozen paste; how-ever, this study does not consider the freezing process. In any case, the esti-mation ismade on the income and not on profit, inwhich all costs should beconsidered.
3.2. Short-term improvements of the microalgae production process
Microalgae can contribute substantially to the bioeconomy. However,due to a still low production capacity and relatively high productioncosts, the current commercial applications are limited. In the short term,both technical and economic improvements are expected to support the ex-pansion of the sector. In this section, four large factors have been studied(productivity, CAPEX, OPEX, and scale), to assess its effect to achieve a po-tentially competitive cost of biomass.
– The productivity, and therefore the improvement of PE, has beenrecognised by many studies as the most important factor in reducingcosts (Schipper et al., 2021; Norsker et al., 2011; Ruiz et al., 2016). IfPE doubled from 1.02 to 2.04% (a realistic value as the maximumachieved has been 8–10% total light (Melis, 2009)), the biomass costswould decrease to 23.78 €/kg DW (34.43%).
– In all the cases simulated in this study, PBRs are the most important el-ement in capital costs, representing 66.62–90.29% of CAPEX. If the costof PBR was roughly halved from 1 M€/ha (cost in our study) to 0.51 M€/ha (Norsker et al., 2011), a biomass cost of 20.87 €/kg DW could beachieved (12.24% reduction).
– Concerning the operational cost, the rawmaterials are themost influen-tial elements in most of the simulated cases. They range from17.65–34.14% of OPEX. The use of waste streams to supply nutrientsto the microalgae is one of the alternatives to lower costs (Gouveiaet al., 2016). However, it may limit the final applications of biomass.If the cost of nutrients (N and P) and CO2 were zero, assuming thatthe source of these compounds are waste streams of water and gases,
5 €/kg
134.48 €/kg
€/kg
44.83 €/kg
>8.97€/kg
itives Aquaculture Agricultural applications
dapted from [1]. Prices updated to 2021). The dashed line indicates the productionalrededor de las microalgas,” AST Ingeniería S.L. AST Ingeniería S.L., Asturias (España),

B. Vázquez-Romero et al. Science of the Total Environment 837 (2022) 155742
the cost of biomass could be 17.26 €/kg DW (17.30% reduction).– Finally, an enlargement of the scale to 100 ha would lead to an increasein annual production and a decrease in costs. A biomass cost reductionof 31.75% from 10 to 100 ha is considered, similarly to a previous studyfrom Schipper et al. (Schipper et al., 2021). A cost of 11.77 €/kg DWwould be reached.The result of simultaneously applying all these combinations to the last
simulated case (case 4a), would result in a reduction of the biomass cost by67.50% (11.77 €/kg).
4. Conclusions
The techno-economic analysis has helped identify bottlenecks, the mostappropriate flow charts, and scales for the market objective. In our case,production in vertically stacked tubular PBR combined with UF andspray-drying was selected as the most promising strategy. However, thebiochemical analysis of the freeze- vs. spray-dried biomass was not con-ducted and considered in the present study, which might impact the finalbiomass value. An industrial facility (10 ha) located in Portugal could pro-duce 300.10 t per year ofNannochloropsis at the cost of 36.21 €/kg DW, po-tentially competitive in some niche markets.
PBR cost was the element with the most significant weight in the invest-ment in the seven scenarios, varying between 67 and 90% of the total equip-ment cost, representing approximately 27 to 36% of the final biomass cost.When establishing a production strategy (NAS all year round or TISO+PHTin alternation), the parameter that mainly controls the final cost is the PE.Therefore, NAS, with a higher PE (1.02%) as demonstrated by empiricaldata, achieves lower biomass costs. Despite having a lower selling price thanTISO and PHT, a higher incomewas estimated due to the high annual produc-tion. The UF+ spray dryer strategy involves lower costs (7.03% reduction ofbiomass cost) than centrifuge+freeze dryer. In theNAS culture scenario, a risefrom 1 to 10 ha represents an 17.99% reduction in the final cost of biomass.This reduction ismainly related to the cost of personnel per area that decreaseswith the scale (with a contribution in theOPEX reduced from21.25 to 5.47%).The commercial culture medium accounts for 19.60% of the operating costs;in case fertilisers were used, it would only account for 1.40% of the total oper-ating costs. With the use of fertilisers instead of the commercial culture me-dium, the final cost of biomass would be reduced by 10.92%.
To contribute to the expansion of the microalgae market, a multidisci-plinary approach is needed, combining different factors. Simultaneously in-creasing PE, reducing the cost of PBR, using both liquid and gaseous wastestreams and scaling up to 100 ha could reduce the cost by a further 67.50%.
CRediT authorship contribution statement
Bárbara Vázquez-Romero: Conceptualization, Methodology, Valida-tion, Formal analysis, Writing – original draft, Writing – review & editing,Visualization. José Antonio Perales: Conceptualization, Methodology,Validation, Writing – review& editing, Supervision.Hugo Pereira:Valida-tion, Investigation.Maria Barbosa: Conceptualization, Writing – review&editing, Resources, Funding acquisition, Project administration. JesúsRuiz: Conceptualization, Methodology, Validation, Writing – review &editing, Supervision.
Declaration of competing interest
The authors declare that they have no known competing financial inter-ests or personal relationships that could have appeared to influence thework reported in this paper.
Acknowledgements
This research was funded by the project ‘Microalgae As a Green sourceof Nutritional Ingredients for Food/Feed and Ingredients for Cosmetics by
9
cost-Effective New Technologies’ (MAGNIFICENT), funded by the Bio-based Industries Joint Technology Initiative under the EU Horizon 2020Research and Innovation Program (project 745754).
This work has also been carried out with the support of a Pre-doctoralContract for Research Staff for Industrial Theses (220-2017) financed bythe University of Cadiz and the company Algades (Alga Development, Engi-neering and Services, SSL).
Appendix A. Supplementary data
Supplementary data to this article can be found online at https://doi.org/10.1016/j.scitotenv.2022.155742.
References
Acién, F.G., Fernández, J.M., Magán, J.J., Molina, E., 2012. Production cost of a realmicroalgae production plant and strategies to reduce it. Biotechnol. Adv. 30,1344–1353. https://doi.org/10.1016/J.BIOTECHADV.2012.02.005.
Acién, F.G., Fernández-Sevilla, J.M., Molina-Grima, E., 2012. Contribución de las microalgasal desarrollo de la bioeconomía. Mediterráneo Econ. 309–332.
Ansari, F.A., Gupta, S.K., Nasr, M., Rawat, I., Bux, F., 2018. Evaluation of various cell dryingand disruption techniques for sustainable metabolite extractions from microalgae grownin wastewater: a multivariate approach. J. Clean. Prod. 182, 634–643. https://doi.org/10.1016/j.jclepro.2018.02.098.
Araújo, R., 2019. Report on the community of practice workshop: algae production in Europe:status, challenges and future developments, Brussels. https://ec.europa.eu/jrc.
Araújo, R., Vázquez Calderón, F., Sánchez López, J., Azevedo, I.C., Bruhn, A., Fluch, S., GarciaTasende, M., Ghaderiardakani, F., Ilmjärv, T., Laurans, M., Mac Monagail, M., Mangini,S., Peteiro, C., Rebours, C., Stefansson, T., Ullmann, J., 2021. Current status of thealgae production industry in Europe: an emerging sector of the blue bioeconomy.Front. Mar. Sci. 7, 1–24. https://doi.org/10.3389/fmars.2020.626389.
Barros, A.I., Gonçalves, A.L., Simões, M., Pires, J.C.M., 2015. Harvesting techniques applied tomicroalgae: a review. Renew. Sust. Energ. Rev. 41, 1489–1500. https://doi.org/10.1016/j.rser.2014.09.037.
Benvenuti, G., Ruiz, J., Lamers, P.P., Bosma, R., Wijffels, R.H., Barbosa, M.J., 2017. Towardsmicroalgal triglycerides in the commodity markets. Biotechnol. Biofuels https://doi.org/10.1186/s13068-017-0873-2.
Dasan, Y.K., Lam, M.K., Yusup, S., Lim, J.W., Lee, K.T., 2019. Life cycle evaluation ofmicroalgae biofuels production: effect of cultivation system on energy, carbon emissionand cost balance analysis. Sci. Total Environ. 688, 112–128. https://doi.org/10.1016/J.SCITOTENV.2019.06.181.
Enzing, C., Ploeg, M., Barbosa, M., Sijtsma, L., 2014. Microalgae-based products for the foodand feed sector: an outlook for Europe. JRC Sci. Policy Rep., 19–37 https://doi.org/10.2791/3339.
European Commission, 2012. Innovating for sustainable growth: a bioeconomy for Europe.Ind. Biotechnol, pp. 57–61 https://doi.org/10.1089/ind.2012.1508.
European Commission, 2018. A Sustainable Bioeconomy for Europe: Strengthening the Con-nection Between Economy, Society and the Environment. https://doi.org/10.2777/478385.
Fasaei, F., Bitter, J.H., Slegers, P.M., van Boxtel, A.J.B., 2018. Techno-economic evaluation ofmicroalgae harvesting and dewatering systems. Algal Res. 31, 347–362. https://doi.org/10.1016/j.algal.2017.11.038.
Fernández, F.G.A., Reis, A., Wijffels, R.H., Barbosa, M., Verdelho, V., Llamas, B., 2021. Therole of microalgae in the bioeconomy. Nat. Biotechnol. 61, 99–107. https://doi.org/10.1016/j.nbt.2020.11.011.
Gouveia, L., Graça, S., Sousa, C., Ambrosano, L., Ribeiro, B., Botrel, E.P., Neto, P.C., Ferreira,A.F., Silva, C.M., 2016. Microalgae biomass production using wastewater: treatment andcosts. Scale-up considerations. Algal Res. 16, 167–176. https://doi.org/10.1016/j.algal.2016.03.010.
Jung, J.Y., Lee, H., Shin, W.S., Sung, M.G., Kwon, J.H., Yang, J.W., 2015. Utilization of seawa-ter for cost-effective cultivation and harvesting of Scenedesmus obliquus. BioprocessBiosyst. Eng. 38, 449–455. https://doi.org/10.1007/s00449-014-1284-4.
Kim, S.K., 2015. Handbook of Marine Microalgae: Biotechnology Advances, Handb. Mar.Microalgae Biotechnol. Adv, pp. 1–585 https://doi.org/10.1016/C2013-0-19117-9.
MALGAS, 2014. Guía: Oportunidades de negocio alrededor de las microalgas. AST Ing. S.L,p. 86.
Melis, A., 2009. Solar energy conversion efficiencies in photosynthesis: minimizing the chlo-rophyll antennae to maximize efficiency. Plant Sci. 177, 272–280. https://doi.org/10.1016/J.PLANTSCI.2009.06.005.
Meyer, M., 2012. Economic analysis of energy and matter generation from microalgae-An en-vironmental LCC model for hydrogen and biogas production from Chlamydomonasreinhardtii, Institutionen för energi och teknik. SLU, Uppsala, Sweden. http://stud.epsilon.slu.se.
Milledge, J.J., Heaven, S., 2013. A review of the harvesting of micro-algae for biofuel produc-tion. Rev. Environ. Sci. Biotechnol. 12, 165–178. https://doi.org/10.1007/s11157-012-9301-z.
Millero, F.J., Feistel, R., Wright, D.G., McDougall, T.J., 2008. The composition of standard sea-water and the definition of the reference-composition salinity scale. Deep-Sea Res. IOceanogr. Res. Pap. 55, 50–72. https://doi.org/10.1016/j.dsr.2007.10.001.

B. Vázquez-Romero et al. Science of the Total Environment 837 (2022) 155742
Molina Grima, E., Belarbi, E.H., Acién Fernández, F.G., Robles Medina, A., Chisti, Y.,2003. Recovery of microalgal biomass and metabolites: process options and eco-nomics. Biotechnol. Adv. 20, 491–515. https://doi.org/10.1016/S0734-9750(02)00050-2.
Norsker, N.H., Barbosa, M.J., Vermuë, M.H., Wijffels, R.H., 2011. Microalgal production - aclose look at the economics. Biotechnol. Adv. 29, 24–27. https://doi.org/10.1016/j.biotechadv.2010.08.005.
Oostlander, P.C., van Houcke, J., Wijffels, R.H., Barbosa, M.J., 2020. Microalgae productioncost in aquaculture hatcheries. Aquaculture 525, 735310. https://doi.org/10.1016/j.aquaculture.2020.735310.
Pereira, H., Sá, M., Maia, I., Rodrigues, A., Teles, I., Wijffels, R.H., Navalho, J., Barbosa, M.,2021. Fucoxanthin production from tisochrysis lutea and Phaeodactylum tricornutumat industrial scale. Algal Res. 56, 102322. https://doi.org/10.1016/j.algal.2021.102322.
Pulz, O., Gross, W., 2004. Valuable products from biotechnology of microalgae. Appl.Microbiol. Biotechnol. 65, 635–648. https://doi.org/10.1007/s00253-004-1647-x.
Ruiz, J., Olivieri, G., De Vree, J., Bosma, R., Willems, P., Reith, J.H., Eppink, M.H.M., Kleinegris,D.M.M., Wijffels, R.H., Barbosa, M.J., 2016. Towards industrial products from microalgae.Energy Environ. Sci. 9, 3036–3043. https://doi.org/10.1039/c6ee01493c.
10
Russell, C., Rodriguez, C., Yaseen, M., 2022. High-value biochemical products & applicationsof freshwater eukaryotic microalgae. Sci. Total Environ. 809, 151111. https://doi.org/10.1016/J.SCITOTENV.2021.151111.
Schipper, K., Al-Jabri, H.M.S.J., Wijffels, R.H., Barbosa, M.J., 2021. Techno-economics ofalgae production in the arabian peninsula. Bioresour. Technol. 331, 125043. https://doi.org/10.1016/j.biortech.2021.125043.
Sinnott, R.K., Towler, G., 2013. Chemical Engineering Design. 2nd ed. Elsevier Ltd.Tredici, M.R., Rodolfi, L., Biondi, N., Bassi, N., Sampietro, G., 2016. Techno-economic analysis
of microalgal biomass production in a 1-ha Green Wall panel (GWP®) plant. Algal Res.19, 253–263. https://doi.org/10.1016/j.algal.2016.09.005.
UN General Assembly, 2015. Transforming our World: The 2030 Agenda for Sus-tainable De-velopment - Resolution A/RES/70/1 Adopted by the General Assemblyon 25 September2015. https://doi.org/10.1891/9780826190123.ap02.