Light utilization in microalgae:
245
THÈSE Pour obtenir le grade de DOCTEUR DE LA COMMUNAUTE UNIVERSITE GRENOBLE ALPES Spécialité : Biologie Végétale Arrêté ministériel : 7 août 2006 Présentée par Serena FLORI Thèse dirigée par Giovanni FINAZZI et codirigée par Dimitris PETROUTSOS préparée au sein du Laboratoire de Physiologie Cellulaire et Végétale dans l'École Doctorale Chimie et Science du Vivant Light utilization in microalgae: the marine diatom Phaeodactylum tricornutum and the green algae Chlamydomonas reinhardtii . Thèse soutenue publiquement le 15 Septembre 2016 devant le jury composé de : Mme Christelle, BRETON Professeur à l’Université Grenoble Alpes (Président) Mme Claire, REMACLE Professeur à l’Université de Liège, Belgique (Rapporteur) M Maurizio, RIBERA D’ALCALA' Directeur de Recherche SZN, Italy (Rapporteur) Mme Xenie, JOHNSON Ingénieur CEA Cadarache (Examinateur) M Jun, MINAGAWA Professeur National Institute for Basic Biology, Japan (Examinateur) M Dimitris, PETROUTSOS CR1 CNRS Grenoble (Co-encadrant de thèse) M Giovanni, FINAZZI Directeur de Recherche CNRS Grenoble (Directeur de thèse)
-
Upload
khangminh22 -
Category
Documents
-
view
1 -
download
0
Transcript of Light utilization in microalgae:

THÈSE
Pour obtenir le grade de
DOCTEUR DE LA COMMUNAUTE UNIVERSITE GRENOBLE ALPES
Spécialité : Biologie Végétale
Arrêté ministériel : 7 août 2006
Présentée par
Serena FLORI Thèse dirigée par Giovanni FINAZZI et codirigée par Dimitris PETROUTSOS préparée au sein du Laboratoire de Physiologie Cellulaire et Végétale dans l'École Doctorale Chimie et Science du Vivant
Light utilization in microalgae:
the marine diatom Phaeodactylum tricornutum and
the green algae Chlamydomonas reinhardtii.
Thèse soutenue publiquement le 15 Septembre 2016 devant le jury composé de :
Mme Christelle, BRETON Professeur à l’Université Grenoble Alpes (Président)
Mme Claire, REMACLE Professeur à l’Université de Liège, Belgique (Rapporteur)
M Maurizio, RIBERA D’ALCALA' Directeur de Recherche SZN, Italy (Rapporteur)
Mme Xenie, JOHNSON Ingénieur CEA Cadarache (Examinateur)
M Jun, MINAGAWA Professeur National Institute for Basic Biology, Japan (Examinateur)
M Dimitris, PETROUTSOS CR1 CNRS Grenoble (Co-encadrant de thèse)
M Giovanni, FINAZZI Directeur de Recherche CNRS Grenoble (Directeur de thèse)

1
Pour ma famille…

2

3
Index 3
Summary English 6
Résumé Français 7
Chapter 1 9
1.1 Introduction 11
1.2 From light perception to light utilization 11
1.3 The photosynthetic process 12
1.4 “Too much of a good thing…” 16
1.5 Photoprotection 17
1.6 Short-term responses 18
1.6.1 Non-photochemical quenching 18
1.6.1.1 Energy-dependent quenching qE 18
1.6.1.1.1 Xanthophyll cycle and its variants 19
1.6.1.1.2 Light-harvesting complex protein superfamily and its variants 20
1.6.1.2 State transitions, qT 21
1.6.1.3 Energy spillover as photoprotective mechanism 22
1.6.1.4 Photoinhibition, qI 23
1.7 Long-term responses 23
1.8 AIM of the thesis 24
Chapter 2 25
2.1 Introduction 27
2.2 The chloroplast 27
2.2.1 Case of study Phaeodactylum tricornutum (Bohlin, 1897) 33
2.3 Energetic interactions between chloroplasts and mitochondria 36
2.3.1 Preface 36
2.3.2 Energetic coupling between plastids and mitochondria drives CO2 assimilation in diatoms 37
2.3.2.1 Results 39
2.3.2.2 Conclusions 45
2.3.2.3 Materials and methods 55
2.3.3 Perspectives 61
2.4 Phaeodactylum periplastidial compartment 64
2.4.1 Preface 62
2.4.2 Ultrastructure of the periplastidial compartment of the diatom Phaeodactylum tricornutum 63

4
2.4.2.1 Results and discussion 68
2.4.2.2 Materials and methods 81
2.4.3 Perspectives 82
2.5 Ultrastructure of diatoms photosynthetic membranes 83
2.5.1 Preface 83
2.5.2 Chloroplast thylakoid architecture optimizes photosynthesis in diatoms 84
2.5.2.1 Results and discussion 85
2.5.2.2 Conclusions 92
2.5.2.3 Materials and methods 93
2.5.3 Perspectives 108
Chapter 3 111
3.1 Protocols 113
3.2 Electron microscopy samples preparation 113
3.2.1 Results and discussion 115
3.3 Immunolabeling protocol 116
3.3.1 Immunolabeling protocol through Tokuyasu technique 116
3.3.2 Results and discussion 118
3.4 Tomographic studies 119
3.4.1 The Gatan 3View2XP analysis 119
3.4.1.1 Results and discussion 120
3.4.2 Focused Ion Beam – Scanning Electron Microscopy (FIB-SEM) analysis 120
3.4.2.1 Results and discussion 121
3.5 Data processing and 3-Dimentional reconstruction 122
3.5.1 Results and discussion 122
3.6 Three-Dimentional analysis of the thylakoid membranes 123
3.6.1 Results and discussion 123
3.7 The Atomic Force Microscopy (AFM) 126
3.7.1 Thylakoid membranes preparation for AFM 127
3.7.2 Protocol for the purification of intact chloroplasts of P. tricornutum 128
3.7.3 Improved protocol of isolated thylakoid membranes preparation 129
3.7.4 Experimental procedure INSERM Marseille 130
3.7.4.1 Results and discussion 130
3.7.5 Experimental procedure SSL Grenoble 131
3.7.5.1 Results and discussion 131

5
Chapter 4 133
4.1 Introduction 135
4.2 Chlamydomonas reinhardtii 135
4.2.1 LHCSR 136
4.2.2 A facultative acetate flagellate 137
4.2.3 Photoreceptors 140
4.2.3.1 Phototropin 141
4.2.4 Okazaki large spectrograph 142
4.3 Blue light perception by phototropin mediates regulation of photosynthetic light harvesting 143
4.3.1 Preface 143
4.3.2 A blue light photoreceptor mediates the feedback regulation of photosynthesis 144
4.3.2.1 Results and discussion 146
4.3.2.2 Conclusions 154
4.3.2.3 Materials and methods 155
4.3.3 Perspectives 164
4.4 Carbon metabolism controls photoprotection in Chlamydomonas via the light harvesting
complex stress response protein LHCSR3 165
4.4.1 Introduction 165
4.4.2 Results 167
4.4.3 Materials and methods 176
4.4.4 Discussion 177
Chapter 5 181
5.1 Concluding remarks 183
5.2 List of acronyms 186
5.3 List of publications 199
5.4 List of figures 190
5.5 Supplemetary materials 210
5.6 References 211
5.7 Acknowledgements 242

6
Summary
Light utilization in microalgae: the marine diatom Phaeodactylum tricornutum and the
green algae Chlamydomonas reinhardtii.
Microalgae have developed distinct approaches to modulate light absorption and utilization by their
photosystems in response to environmental stimuli. In this Ph.D Thesis, I characterised different
strategies employed by freshwater (Chlamydomonas reinhardtii) and marine algae (Phaeodactylum
tricornutum) to optimise their acclimation to the environment.
In the first part of this work, I used spectroscopic, biochemical, electron microscopy analysis and 3-
dimentional reconstitution to produce a model of the entire cell of the marine diatom
Phaeodactylum tricornutum. This model has been used to address the following questions: i. how
the cellular organelles interact to optimise CO2 assimilation via ATP/NADPH exchanges? ii. how is a
secondary chloroplast structured to facilitate exchanges with the cytosol via its four membranes
envelope barrier? and iii. how have diatoms shaped their photosynthetic membranes to optimise
light absorption and downstream electron flow?
In the second part, I have focused on the regulation of light harvesting and dissipation in C.
reinhardtii by studying the role of perception of light colour and metabolism on excess light
dissipation via the Non-Photochemical Quenching of energy (NPQ). Using biochemical and
spectroscopic approaches, a molecular link between photoreception, photosynthesis and
photoprotection was found in C. reinhardtii via the role of the photoreceptor phototropin on excess
absorbed energy dissipation (NPQ). I also demonstrated that besides light, downstream metabolism
can also affect this acclimation process.
Overall this Ph.D work reveals the existence and integration of different signal pathways in the
regulation of photoprotective responses by microalgae living in the ocean and in the land.

7
Résumé
L'utilisation de la lumière chez les microalgues : la diatomée marine Phaeodactylum
tricornutum et l'algue verte Chlamydomonas reinhardtii.
Les microalgues ont développé des approches distinctes pour moduler l'absorption de la lumière et
son utilisation par leurs photosystèmes en réponse à des stimuli environnementaux. Dans ce
rapport de Thèse je présente les différentes stratégies employées par une algue d'eau douce
(Chlamydomonas reinhardtii) et une algue marine (Phaeodactylum tricornutum) pour optimiser leur
acclimatation à l'environnement.
Dans la première partie de ce rapport, je propose un modèle de cellules entières de la diatomée
marine Phaeodactylum tricornutum obtenue par analyses spectroscopiques et biochimiques ainsi
que par l’obtention d’images par microscopie électronique et reconstitution 3-D. Ce modèle a été
utilisé pour répondre aux questions suivantes i. comment les chloroplastes et les mitochondries sont
organisés pour optimiser l'assimilation du CO2 par échange ATP / NADPH ii. comment est structuré
un chloroplaste secondaire pour faciliter les échanges avec le cytosol à travers les quatre
membranes qui le délimitent et iii. comment sont structurées les membranes photosynthétiques
afin d’optimiser l'absorption de lumière et le flux d'électrons.
La deuxième partie de ce rapport porte sur la régulation de la lumière et de sa dissipation chez C.
reinhardtii grâce à l'étude d'une part du rôle de la perception de la couleur de la lumière et d'autre
part du métabolisme sur la dissipation de l'excès de lumière par quenching non photochimique
(NPQ). En utilisant des approches biochimiques et spectroscopiques, on a mis en évidence un lien
moléculaire entre la photoréception, la photosynthèse et la photoprotection chez C. reinhardtii via
le rôle du photorécepteur phototropine, démontrant ainsi que le métabolisme, en plus de la
lumière, peut aussi affecter ce processus d'acclimatation.
En conclusion, ce travail de thèse révèle l'existence et l'intégration des différentes voies de
signalisation dans la régulation des réponses photoprotectrices mises en place chez les microalgues
marines et d'eau douce.

8

9
Chapter 1

10

11
1.1 Introduction
I realized my Ph.D thanks to a Marie Curie ITN grant in the frame of the AccliPhot network. The main
aim of the AccliPhot consortium was to investigate and understand short-term acclimation
mechanisms in photosynthetic organisms integrating theoretical and experimental research from
academia and industry. My Ph.D program took place in the Cell and Plant Physiology Laboratory
(LPCV, BIG) at CEA Grenoble. The experimental work, divided into two main tasks, aimed at
understanding how the different processes linked to photosynthesis (light absorption, dissipation
electron flow and carbon assimilation for metabolism) are regulated to allow microalgae to
successfully acclimate to their environment.
1.2 From light perception to light utilization
Microalgae are an ensemble of marine and freshwater organisms adapted to live in differentiated
aquatic environment and are at the basis of the trophic network. Although they represent only a
small percentage of the biomass on Earth, these organisms (also called “primary producers”)
contribute significantly to the global primary productivity (Field et al., 1998). Their activity influences
the major biogeochemical cycles, playing a crucial role in CO2 sequestration from the atmosphere
(through the so-called biological pump). Via photosynthesis, they can alter CO2 concentrations
enriching the surrounding environment with oxygen, thereby influencing global climate. Under
favourable conditions, light can trigger exponential growth mechanisms called "algal blooms" in
which the density of these species can reach several millions cells per milliliter. In aquatic
environment, microalgae undergoes strong variations of incident irradiance due to its transport
along the water column and to the effect of water mixing (induced by wind or currents). Light
variability can influence photosynthetic organisms, which must regulate their photosynthetic
apparatus in order to adapt to the limiting, saturating or over-saturating light input. Acclimation to
low irradiance requires an increased efficiency in light-harvesting achieved by de novo synthesis of
photosynthetic pigments (Sukenik et al., 1987). On the other hand, oversaturating irradiance leads
to damaged photosynthetic apparatus (Bowler et al., 1992; Osmond et al., 1997; Anderson et al.,
1998) resulting in the redirection of the energy into dissipative processes with an overall reduction
in the photosynthetic yield.
When light excites a chlorophyll (Chl) molecule, it enters in a fist singlet-state excitation (1Chl*). This
“energy rich” state i. can be used to drive photosynthesis (qP, Figure 1.1), ii. can relax into the
ground state via chlorophyll fluorescence (Figure 1.1) or iii. can be dissipated in the form of heat

12
(through non radiative thermal emission, in a process that is the basis of Non-Photochemical
Quenching, NPQ, Figure 1.1). In both plants and microalgae, the rapid regulation of these
mechanisms is an essential component for the successful acclimation to their environmental niche.
1.3 The photosynthetic process
The first route, and the most advantageous one, is the use of this energy to drive photochemistry,
i.e. shuttling electrons through the photosynthetic electron transport chain. In photyosynthetic
eukaryotes, this process occurs in a specific organelle, the chloroplast, which contains a membrane
system (the thylakoids), which are the sites of photosynthetic electron transport and an aqueous
matrix (the stroma), where CO2 is assimilated into carbohydrates.
While some phototrophic prokaryotes (Béjà et al., 2000; Kolber et al., 2000) perform an ancestral,
anoxygenic type of photosynthesis (Whitmarsh, 1999), most photosynthetic organisms use water
as an electron donor to reduce CO2 and produce carbohydrates generating oxygen as secondary
product. Consistent with this event, photosynthesis permits the proliferation of life on Earth and
the overall process can be represented as follows (Figure 1.2).
Figure 1.2 – Representation of the oxygenic photosynthesis
nH2O + nCO2 + Light → (CH2O)n +
nO2
Figure 1.1 – Fate of the excited chlorophyll. Representation of the possible relaxation pathways of the singlet excited state of
chlorophyll (1Chl*). (1) fluorescence (2) photochemistry (qP) or (3) dissipation as heat (or NPQ; from Muller et al., 2001).

13
The major players in the photosynthetic process are two multiproteic complexes called
photosystems I (PSI) and II (PSII). Their structure is design into two distinct units, one devoted to the
light-harvesting processes (the antenna complexes) and one (the core-complexes) the site of
photochemical reactions. PSI and PSII are structurally different, however they share common
features like some chlorophyll binding proteins, responsible for light absorption and special
chlorophylls pair located in the core complexes, which drive electron transport.
Photosynthetic organisms belonging to viridiplantae (plants and green algae) possess the antenna
complexes composed by proteins members of the light-harvesting complexes (LHC) superfamily.
These proteins binds a high concentration of light-harvesting pigments (chlorophylls a and b and
carotenoids) at various stoichiometries as a consequence of adaptation to different environmental
conditions (Green & Durnford, 1996; Nelson & Ben-Shem, 2005). These antenna complexes are
encoded by the nuclear genome and they are associated with photosystems I (LHCI or LHCA) and
with photosystems II (LHCII or LHCB). In the model plant Arabidopsis thaliana four isoforms are
associated with PSI (LHCA1-4) and six with PSII (LHCB1-6; Jansson, 1999). Microalgae, on the other
hand, possess a more complex organization of LHC. In the model organism Chlamydomonas
reinhardtii, the LHCI antenna is larger than plants with nine LHCAs subunits (Büchel, 2015) and nine
genes encode for the LHCII. In diatoms, the peripheral antennae are mainly composed of
fucoxanthin chlorophyll proteins (FCP), which bind chlorophyll c instead of b and fucoxanthin
instead of lutein. Due to the homology of FCP genes with LHC genes of higher plants (Apt et al.,1994;
Eppard & Rhiel, 1998), the FCP are commonly placed into the CBP family (Chlorophyll Binding
Proteins, Dittami et al., 2010). However, the specific characterization of these LHC complexes to
photosystem I or II in diatoms is still matter of debate (for a recent review see Büchel, 2015).
The photosystems core-complexes include reaction centres and internal (core) antennae. These
proteins are well conserved during evolution and present only small differences between organisms.
The PSII core-complex for example, contain two similar proteins (D1 and D2) which directly bind
pigments (special pair of chlorophyll a, P680), electron transport cofactors (2 pheophytins, 2
plastoquinones and a non-heme iron) and two proteins of the internal antenna (CP43 and CP47). In
viridiplantae, the PSI core complex contains 14 subunits. The “central” part is composed by the
subunits PsaA, B and C (three large proteins associated with the cofactors A0, A1, FX, FA and FB) and
special pair of chlorophylls (P700) responsible for the photochemical conversion (Nelson & Yocum,
2006).

14
The light phase of photosynthesis starts with the absorption of photons by the antenna complexes
of the photosystems (LHCI and LHCII). Once a photon is captured by this “net-trap” the energy is
transferred in a down-hill reaction to specific Chl a molecules in the PSs core complexes (P700 and
P680, respectively for PSI and PSII) thanks to the specific arrangement of pigments within the
antennas. When these pigments become excited, they perform charge separation to feed a chain of
redox reactions. This ultimately generates reducing power in the form of nicotinamide adenine
dinucleotide phosphate (NADPH) molecules. At the same time, charge separation (in PSI and PSII)
and the protonation/deprotonation reactions that occur on the two side of the thylakoid
membranes during electron transfer, lead to the generation of an electro-chemical potential
gradient (pH) between the stroma and the lumen (internal aqueous space) side of the thylakoid
membranes. This gradient is used to synthesize adenosine triphosphate (ATP), according to the
Mitchell’s theory. A schematic representation of the pathway for photosynthetic electron flow is
presented in Figure 1.3.
Figure 1.3 – Schematic representation of the pathway for the photosynthetic linear electron flow. Black rows represent the
electrons pathway through the major components of the photosynthetic electron flow chain: photosystem II (PSII), the
plastoquinone (PQ) the cytochrome b6f complex (Cyt b6f) the plastocyanin (PC), the light harvesting complex of the photosystems
I (LHCI), the photosystems I (PSI), the ferredoxin (Fd), the enzyme Fd-NADP+-oxidoreductase (FNR) and the ATP synthase. Red
rows represent the protons pathway.

15
At the level of PSII, excited P680 transfers an electron to a pheophytin, the primary electron
acceptor molecule. Afterwards, the electron is delivered to secondary quinone acceptors (QA and
QB), and is carried through a chain of transporters molecules (according to their redox potential). In
parallel, excitation of the primary electron donor of PSI (P700) transfers an electron to the primary
PSI acceptors A0, and then again to a chain of electron transporters (A1, ferredoxin (Fd) and the
enzyme Fd-NADP+-oxidoreductase, FNR), ultimately leading to the reduction of NADP+ to NADPH
on the stroma side. Electrons flow between PSII to PSI occurs via two soluble electron carriers PQ
and PC, which reduce and oxidize the Cyt b6f complex, respectively, during the so called “Z-scheme”
(Hill & Bendall, 1960).
The ATP and NADPH provided by the light phase are used during the light-independent phase
(erroneously described dark phase). This stage (where the light is not directly needed) comprise a
series of reactions indicated with the name Calvin-Benson-Bassham Cycle (CBB, Benson & Calvin,
1950; Benson, 2002; Bassham, 2003) in which atmospheric CO2 is reduced to carbohydrates to
sustain cellular metabolism. The synthesis of the 3-carbon molecule (glyceraldehyde 3-phosphate,
GAP) is catalyzed by the enzyme Ribulose-1,5-Bisphosphate Carboxylase/Oxygenase (RuBisCo)
located in the stroma of the chloroplast. Thanks to the uptake of CO2 the Ribulose-5-phosphate
(Ru5P) is regenerated at the end of the process to preserve the cyclic characteristic of the CBB cycle.
This process requires ATP and NADPH in a stoichiometry of 1.5. However, the linear electron flow
described above produces ATP at lower amounts (likely 1.3, e.g. Allen 2002; Petersen et al., 2012).
Therefore, photosynthetic organisms must adjust and optimize the ATP/NADPH ratio in order to
produce biomass. In viridiplantae, it is believed that the higher demand for ATP than for NADPH,
leads to the rerouting of photosynthetic electrons around PSI in a cyclic electron flow. This process
involves the transfer of electrons from the ferredoxin back to the Cyt b6f complex, producing a
proton gradient (and thus ATP) during the reduction of PC. PSII is not involved in this process and as
consequence, this alternative pathway does not lead to the production of NADPH or O2. On the
other hand, in diatoms, our recent results (see section 2.5) show that optimization of the
photosynthetic ATP/NADPH ratio is achieved through an extensive interaction between the
photosynthetic and the respiratory process, which occurs in the mitochondria.

16
1.4 “Too much of a good thing…”
Citing Barber & Anderson, 1992 “light can be bad for photosynthesis”. Indeed, as mentioned above,
the excited Chl a has several ways to relax to its ground state, one of them is fluorescence.
Fluorescence consists in the emission of an energy photon at longer wavelength (and lower energy)
than the absorbed photon. Changes in the quantum yield of fluorescence allow calculating the
capacity of PSII reaction centres to drive photosynthesis (Genty et al., 1989) and nowadays these
parameters are a common proxy used to evaluate photochemical efficiency. The three fates of light
described by Muller and coworkers are in competition and the relative yield of fluorescence is
dependent on the efficiency of the other two pathways (qP and NPQ; Niyogi, 1999; Muller et al.,
2001). Using in vivo fluorometers (called pulse amplitude modulation, PAM) changes in fluorescence
emission in dark adapted and illuminated cells can be measured providing information on changes
in the efficiency of photochemistry (qP) and heat dissipation (Non photochemical quenching; NPQ).
The PAM principles are based on the selective amplification of the fluorescence signal emitted by
the Chl a after excitation using different light sources and modulated light frequency pulses (Baker,
2008). Measuring the progressive reduction of chlorophyll fluorescence in response to illumination
we can have information about the activation of NPQ mechanisms. The analysis starts with dark-
adapted cells and a short (200 ms long) saturating pulse. During this condition, cells, as consequence
of the transient reduction of QA, re-emit the maxium amount of absorbed energy in the form of
fluorescence (Fm; maximal fluorescence of dark-adapted cells). Then saturating pulses are applied
in parallel with illumination. After each pulse, the maximal fluorescence of light-adapted cells (Fm’)
is recorded. The activation of thermal dissipation mechanisms (NPQ) can be quantified by the
decrease of Fm’. The amplitude of NPQ, according to Bilger and Björkman (1990), is related to the
differences between these two conditions (dark- versus light-adapted cells) and calculated as: (Fm/
Fm') – 1).

17
1.5 Photoprotection
The highly variable nature of the environment surrounding photosynthetic organisms exposes them
to possibly dangerous situations. In particular, light, which is the driving force for life strongly affects
the performance and growth of photosynthetic organisms. While low light can limit growth by
limiting the photosynthetic performances, excess light can led to the production of reactive oxygen
species (see e.g. Niyogi & Truong, 2013; Finazzi & Minagawa, 2014). Plants and algae can optimize
energy capture and conversion efficiency under different light conditions by adapting their
photosynthetic apparatus thanks to a variety of short and long-term responses.
Short-term responses act in the timescale of seconds to minutes and allow reversible responses of
the photosynthetic machinery. Under high light exposure, excessive photon flux leads to the over-
excitation of the light-harvesting complexes. This increases the possible accumulation of chlorophyll
triplets (Chl*), which in turn trigger the production of reactive oxygen species (ROS; Krieger-Liszkay
et al., 2008), i.e. dangerous compounds for the cell. To reduce this risk, photosynthetic organisms
can increase the thermal dissipation of the excess light. This is typically achieved via NPQ, which
represents a major strategy for rapid regulation of photosynthesis.
On the other hand, long-term responses are also observed and involve ultrastructural changes in
the cell and in most cases de-novo synthesis or breakdown of proteins, pigments and redox
cofactors. For instance, during limiting light conditions, photosynthetic cells tend to increase their
light-harvesting capacity to maximize light capture. This requires an increased biosynthesis of
photosynthetic pigments (Sukenik et al., 1987), as well as the increased expression of the genes
encoding for the light harvesting proteins (LHC in plants). Conversely, plants tend to decrease the
size of the LHC proteins in high light (Anderson et al., 1995) to avoid absorption of excess light. This
leads to a feedback regulation, where the level of irradiance regulate the antenna size of
photosystems on the long-term scale of several hours/days (Smith et al., 1990; Melis, 1991;
Ballottari et al., 2007). In the following, I will shortly describe the molecular mechanisms of both
the short and long-term responses.
18
1.6 Short-term responses
1.6.1 Non-photochemical quenching
The NPQ is the major fast responses to light stimuli. In plants, it has been reported that three NPQ
components can be distinguished based on their different relaxation kinetics (Horton et al., 1996;
Dall’Osto et al., 2005; Joliot & Finazzi, 2010). The fastest component is the energy-dependent
component, qE. In plants qE relax in around one minute. The next one is state transitions qT, which
relaxes within minutes. Finally, the photoinhibitory quenching qI, shows the slowest relaxation
kinetics. The exact contribution of each component can vary depending on photosynthetic
organisms and environmental conditions. As a general rule, qE is the major component from
moderate to high light conditions, development of qT is supposed to play a role in balancing light
quality excitation between the two photosystems. Therefore, this process is prominent under low
light, where photosynthesis is limited by absorption. Finally, qI becomes predominant when light is
oversaturated and exceeds the photosynthetic capacity.
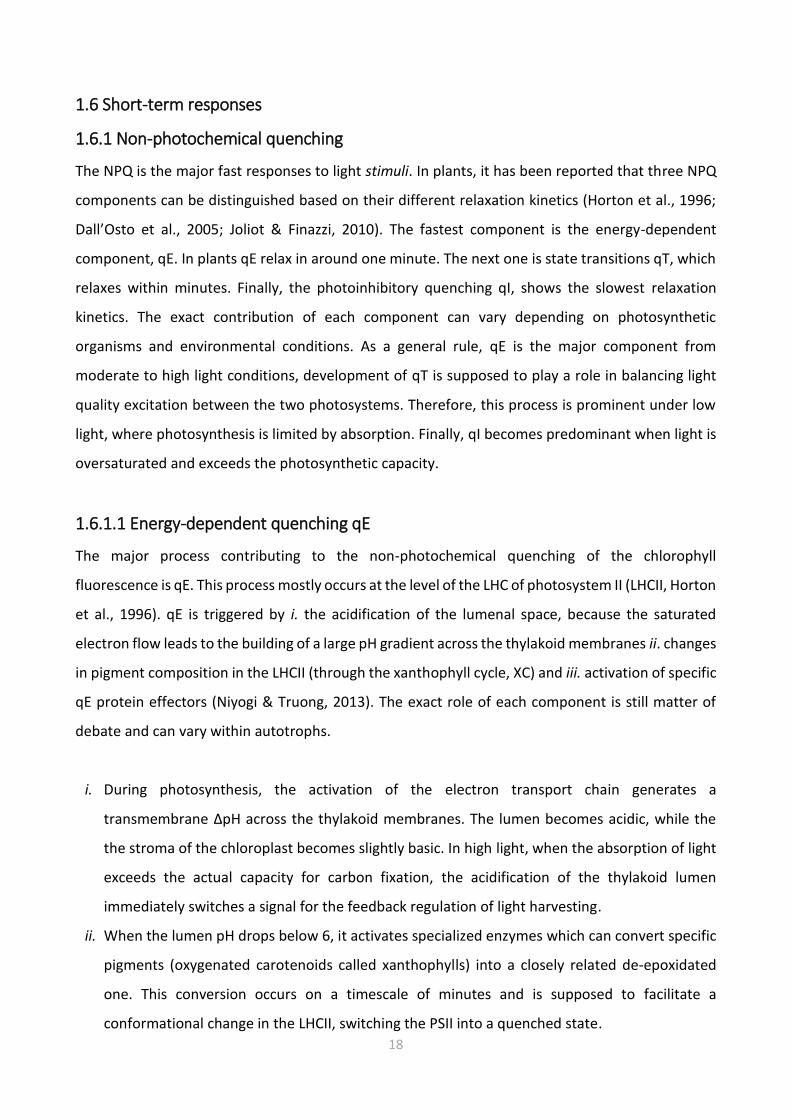
1.6.1.1 Energy-dependent quenching qE
The major process contributing to the non-photochemical quenching of the chlorophyll
fluorescence is qE. This process mostly occurs at the level of the LHC of photosystem II (LHCII, Horton
et al., 1996). qE is triggered by i. the acidification of the lumenal space, because the saturated
electron flow leads to the building of a large pH gradient across the thylakoid membranes ii. changes
in pigment composition in the LHCII (through the xanthophyll cycle, XC) and iii. activation of specific
qE protein effectors (Niyogi & Truong, 2013). The exact role of each component is still matter of
debate and can vary within autotrophs.
i. During photosynthesis, the activation of the electron transport chain generates a
transmembrane ∆pH across the thylakoid membranes. The lumen becomes acidic, while the
the stroma of the chloroplast becomes slightly basic. In high light, when the absorption of light
exceeds the actual capacity for carbon fixation, the acidification of the thylakoid lumen
immediately switches a signal for the feedback regulation of light harvesting.
ii. When the lumen pH drops below 6, it activates specialized enzymes which can convert specific
pigments (oxygenated carotenoids called xanthophylls) into a closely related de-epoxidated
one. This conversion occurs on a timescale of minutes and is supposed to facilitate a
conformational change in the LHCII, switching the PSII into a quenched state.
19
iii. The decrease in lumenal pH also results in the protonation of specific PSII-proteins that vary
within organisms and evolution.
1.6.1.1.1 Xanthophyll cycle and its variants
As mentioned above, the pigments contained in the light harvesting complexes are extremely
variable between organisms. Carotenoids are key players in acclimation/regulation processes
because they can directly contribute to both light harvesting (between 350 and 750 nm of the visible
spectrum) and photoprotection, through the xanthophyll cycle. In plants, light-harvesting proteins
binds lutein, neoxanthin, violaxanthin (Vx) and β-carotene. During NPQ, the violaxanthin de-
epoxidase enzyme (VDE) converts violaxanthin to zeaxanthin (Zx) through antheraxanthin; whereas
under low light intensities the conversion of Zx again into Vx is catalyzed by a zeaxanthin epoxidase
(ZEP; Hager, 1967). Diatoms LHC antennae (FCP) bind different pigments like fucoxanthin,
chlorophyll a/c (Beer et al., 2006) and xantophylls (Büchel & Wilhelm, 1993; Hiller et al., 1993).
These microalgae possess not only the Vx/Zx cycle but also the diadinoxanthin cycle (Lohr, 2011)
which comprises a one-step de-epoxidation that converts diadinoxanthin (Dd) into diatoxanthin (Dt)
through the activity of the enzyme diadinoxanthin de-epoxidase (DDE, active at low pH). It was
demonstrated by Goss and coworkers in 2006 that the accumulation of the photoprotective
pigment diatoxanthin is linearly correlated with the extent of qE in diatoms. The reverse reaction is
catalysed by the diatoxanthin epoxidase enzyme (DTE) and consists in the back conversion of Dt into
Dd activated under low light conditions.
20
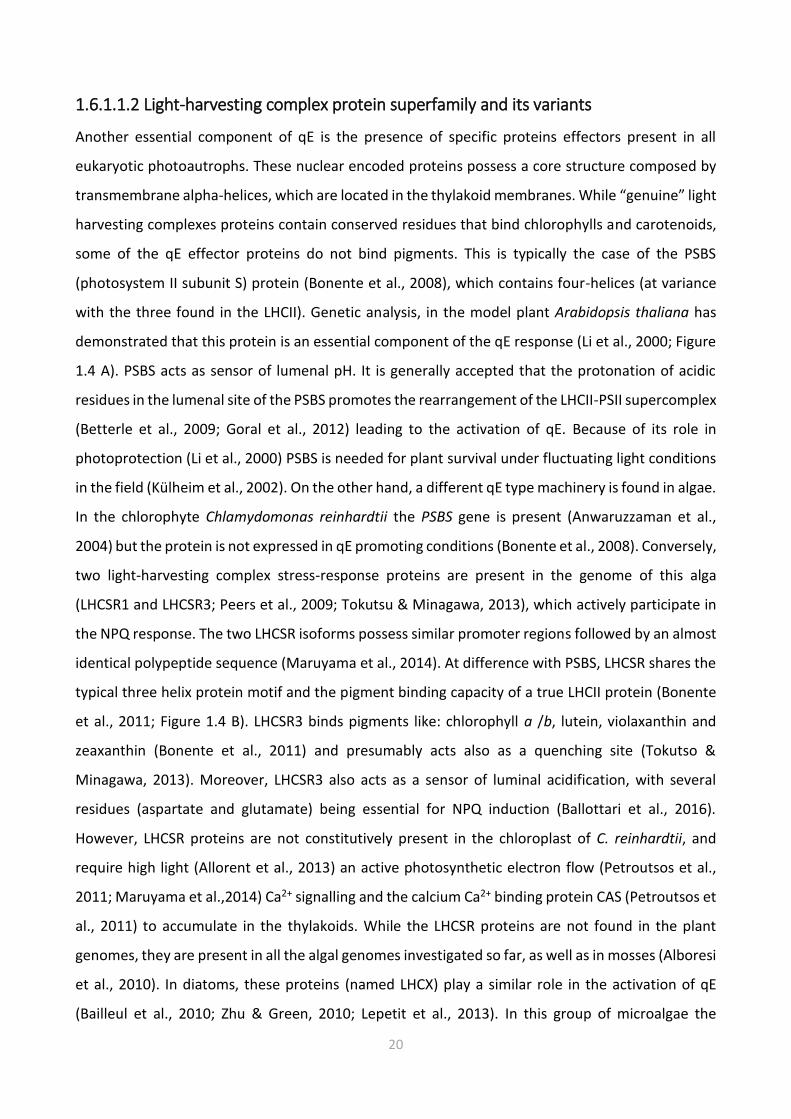
1.6.1.1.2 Light-harvesting complex protein superfamily and its variants
Another essential component of qE is the presence of specific proteins effectors present in all
eukaryotic photoautrophs. These nuclear encoded proteins possess a core structure composed by
transmembrane alpha-helices, which are located in the thylakoid membranes. While “genuine” light
harvesting complexes proteins contain conserved residues that bind chlorophylls and carotenoids,
some of the qE effector proteins do not bind pigments. This is typically the case of the PSBS
(photosystem II subunit S) protein (Bonente et al., 2008), which contains four-helices (at variance
with the three found in the LHCII). Genetic analysis, in the model plant Arabidopsis thaliana has
demonstrated that this protein is an essential component of the qE response (Li et al., 2000; Figure
1.4 A). PSBS acts as sensor of lumenal pH. It is generally accepted that the protonation of acidic
residues in the lumenal site of the PSBS promotes the rearrangement of the LHCII-PSII supercomplex
(Betterle et al., 2009; Goral et al., 2012) leading to the activation of qE. Because of its role in
photoprotection (Li et al., 2000) PSBS is needed for plant survival under fluctuating light conditions
in the field (Külheim et al., 2002). On the other hand, a different qE type machinery is found in algae.
In the chlorophyte Chlamydomonas reinhardtii the PSBS gene is present (Anwaruzzaman et al.,
2004) but the protein is not expressed in qE promoting conditions (Bonente et al., 2008). Conversely,
two light-harvesting complex stress-response proteins are present in the genome of this alga
(LHCSR1 and LHCSR3; Peers et al., 2009; Tokutsu & Minagawa, 2013), which actively participate in
the NPQ response. The two LHCSR isoforms possess similar promoter regions followed by an almost
identical polypeptide sequence (Maruyama et al., 2014). At difference with PSBS, LHCSR shares the
typical three helix protein motif and the pigment binding capacity of a true LHCII protein (Bonente
et al., 2011; Figure 1.4 B). LHCSR3 binds pigments like: chlorophyll a /b, lutein, violaxanthin and
zeaxanthin (Bonente et al., 2011) and presumably acts also as a quenching site (Tokutso &
Minagawa, 2013). Moreover, LHCSR3 also acts as a sensor of luminal acidification, with several
residues (aspartate and glutamate) being essential for NPQ induction (Ballottari et al., 2016).
However, LHCSR proteins are not constitutively present in the chloroplast of C. reinhardtii, and
require high light (Allorent et al., 2013) an active photosynthetic electron flow (Petroutsos et al.,
2011; Maruyama et al.,2014) Ca2+ signalling and the calcium Ca2+ binding protein CAS (Petroutsos et
al., 2011) to accumulate in the thylakoids. While the LHCSR proteins are not found in the plant
genomes, they are present in all the algal genomes investigated so far, as well as in mosses (Alboresi
et al., 2010). In diatoms, these proteins (named LHCX) play a similar role in the activation of qE
(Bailleul et al., 2010; Zhu & Green, 2010; Lepetit et al., 2013). In this group of microalgae the
21
induction of some LHCX isoforms is strongly correlated with light changes (Bailleul et al., 2010;
Lepetit et al., 2013; Nymark et al., 2013). However, amongst the four isoforms identified in the
genome of the pennate diatom P. tricornutum (Bowler et al., 2008) only three are inducible (Taddei
et al., 2016) while one, LHCX1, is constitutively expressed and contributes to a constant qE capacity
(Bailleul et al., 2010).
1.6.1.2 State transitions, qT
Another component of the non-photochemical quenching is state transitions, a mechanism that
redistributes the excitation energy between photosystems (Allen, 1992). In plants and green algae,
the physical segregation of PSII and PSI imposes the existence of different antennae systems, which
excite the two photosystems independently. State transitions optimize the relative absorption
capacity of PSs via a redox regulated migration of antenna complexes between the two PSs. In
particular, under light conditions that promote a preferential excitation of PSII (compared to PSI)
the reduced state of the PQ pool will activate a protein kinase (Stt7/STN7) via its binding to the Cyt
b6f complex. The kinase phosphorylates some light-harvesting complex of PSII (LHCII), which migrate
laterally towards PSI increasing its absorption capacity during the so called state 1 to state 2
transition. The reverse reaction is driven by a protein phosphatase (PPH1/TAP38) that
dephosphorylates the LHCII associated with PSI and allows its re-association with PSII (state 2 to
state 1 transition). This mechanism, is absent in diatoms (Owens, 1986), of moderate amplitude in
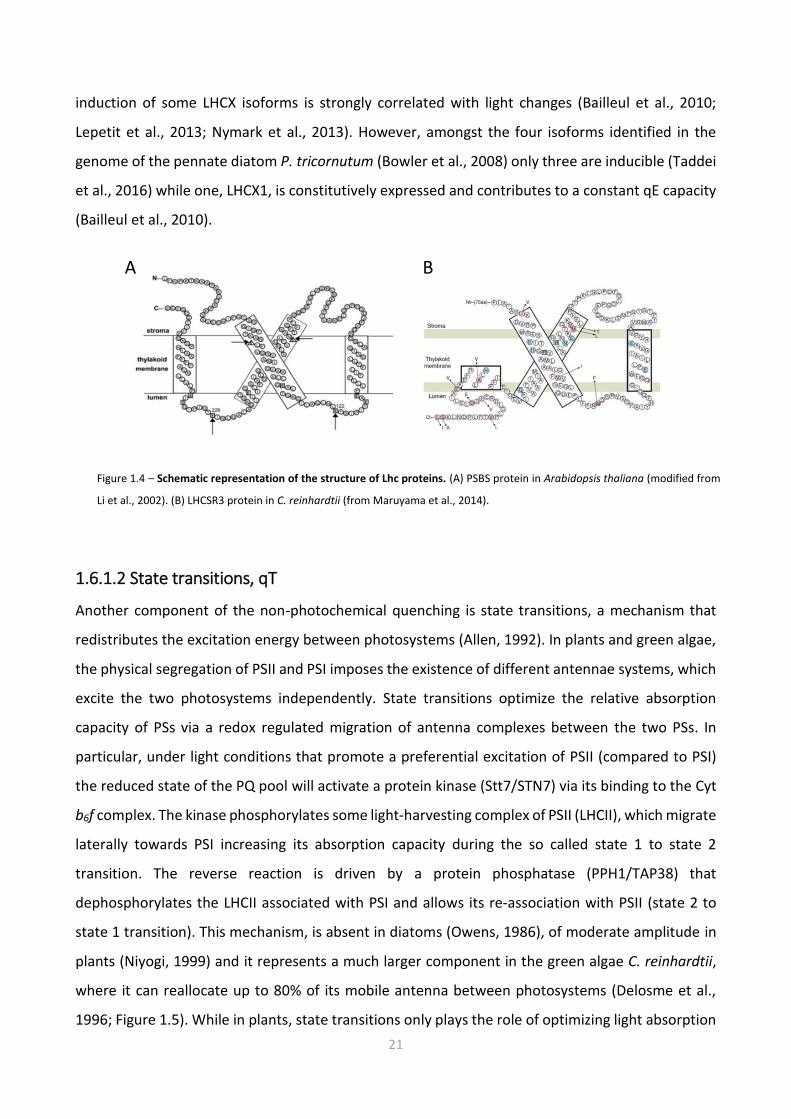
plants (Niyogi, 1999) and it represents a much larger component in the green algae C. reinhardtii,
where it can reallocate up to 80% of its mobile antenna between photosystems (Delosme et al.,
1996; Figure 1.5). While in plants, state transitions only plays the role of optimizing light absorption
Figure 1.4 – Schematic representation of the structure of Lhc proteins. (A) PSBS protein in Arabidopsis thaliana (modified from
Li et al., 2002). (B) LHCSR3 protein in C. reinhardtii (from Maruyama et al., 2014).
A B
22
in low light, in Chamydomonas this process also contributed to photoprotection in high light
(Allorent et al., 2013) and it is still debated whether it involves a different mechanism than the
simple physical displacement of LHCII between the two photosystems (Nawrocki et al., 2016; Ünlü
et al., 2014; Nagy et al., 2014).
In other organisms, such as red algae and cyanobacteria, different NPQ mechanisms are observed,
which reflect the specific features of the light harvesting complexes of these organisms (the
phycobilisomes, PBS). In these peculiar situation another mechanisms of PSII fluorescence
quenching called energy spillover seems to play a major photoprotective role (Kowalczyk et al.,
2013).
1.6.1.3 Energy spillover as photoprotective mechanism
In red algae and cyanobacteria, the “classic” NPQ effectors (i.e. the xanthophyll cycle and PSBS
proteins) are missing. Therefore, these organisms possess peculiar responses to cope with a
changing light environment. Cyanobacteria contain specific stromal-exposed antennae called
phycobilisomes, which bind an orange carotenoid protein (OCP; Kirilovsky & Kerfeld, 2012) shown
to be an essential component of NPQ in this group. In red algae (which also possess the PBSs, but
lack the PSBS or OCP proteins) most of the energy absorbed by the PBS is transferred from
photosystem II to photosystem I through the energy spillover (direct energy transfer). Kowalczyk
and coworkers demonstrated that the excitonic flux at PSII level controls the amount of energy
transfer toward PSI via a still unknown mechanism. Overall, despite the fact that all these
photosynthetic organisms are able to dissipate excess light at the level of PSII, the molecular
mechanisms differ significantly between cyanobacteria, red alga, green algae and plants.
Figure 1.5 – LHCII fractions in C. reinhardtii. EM picture of the purified thylakoid membranes obtained after sucrose gradient
fractionation during state 1 (A). State 2 condition (B), in this picture large aggregates are visible (Iwai et al., 2010).
A B

23
In diatoms, the two photosystems share similar antennas (FCPs), although recent data suggest that
the two photosystems could contain specialized antennae pools (Veith et al., 2009). The similarity
between FCPs translates into a more homogeneous absorption spectrum of the two photosystems
than in plants. Thus, diatoms do not perform light driven state transitions (Owens, 1986), and have
succeeded in optimizing light utilization achieving an efficient excitation energy balance at both
limiting and saturating light conditions. Consistent with the peculiar structure of their thylakoids,
which is intermediate between the unstructured situation seen in cyanobacteria (and red algae) and
the highly structured one observed in plants (and green algae) the possible photoprotection of PSII
via energy spillover was tested in this project of thesis (see section 2.5).
1.6.1.4 Photoinhibition, qI
The slowest contribution of the non-photochemical quenching is attributed to photoinhibition of
the photosystems due to prolonged overexcitation of the photosynthetic machinery. This process
describes the degradation and disassembly of the core subunit of the photosystem II (PsbA or D1
protein; Aro et al., 1993; Barber & Andersson, 1992) leading to a general decrease of its
photosynthetic quantum yield (Krause, 1988). Overall, the extent of photoinhibition depends on the
balance between PSII photodamage and repair (Murata et al., 2007). Despite the fact that the
degradation of the D1 proteins is a fast process (Neidhardt et al., 1998; Sundby et al., 1993), high
amounts of reactive oxygen species (ROS) can enhance the degradation of this protein (Murata et
al., 2007) leading to a decrease in photosynthetic quantum yield in excess light.
1.7 Long-term responses
Prolonged stress exposure plants and algae leads to multiple responses that modify and fine tune
the photosynthetic apparatus. Long-term photoprotective responses involve the expression and/or
repression of nuclear and chloroplast specific genes, with the ultimate goal of preventing
photoinihibition in chronic high light or enhancing absorption in a shade environment.
To mention only a few examples, multiple signal cascades control the accumulation of light-
harvesting antennae complexes, chloroplast movement, changes in the PSII/PSI ratios and in
proportion of stacked and unstacked thylakoids membranes. These responses are mainly mediated
by the de-novo synthesis and/or degradation of the protein complexes involved in the light
harvesting and electron flow processes (Falkowski & LaRoche 1991; Raven & Geider, 2003).
24
1.8 AIM of the thesis
In nature, photosynthetic organisms need to optimize energy capture and conversion efficiency
adjusting their photosynthetic apparatus in response to environmental stimuli. In particular
microalgae have developed distinct approaches to modulate light absorption and utilization
capacity of their photosystems. During my Ph.D thesis I aimed to investigate the mechanisms of light
utilization in two algal model organisms: the marine diatom Phaeodactylum tricornutum and the
freshwater green alga Chlamydomonas reinhardtii. In the first project, I focused on the structure/
function relationship using the pennate species Phaeodactylum tricornutum as a model. Due to the
simplified structure of its chloroplast, with no apparent structural segregation between PSII and PSI
(see Chapter 2) we tested the possibility of the existence of the energy spillover. Using several
complementary approaches (spectroscopy, biochemistry, immunolabelling and three-dimentional
(3D) reconstitution) we generate a comprehensive 3D map of the photosynthetic membranes and
complexes. This multidisciplinary study reveals i. how diatoms regulate exchanges of ATP/NADPH
between chloroplast and mitochondria (see section 2.3). ii. how the external membranes system
(the envelope) organized and operate for the transfer of compounds produced in other intracellular
compartments (see section 2.4). iii. how these organisms have adapted their internal membrane
system (the thylakoids) in order to optimize photosynthesis (see section 2.5).
In the second project, novel insights into the regulation of photoprotection mediated by both
perception of light colour and metabolism in the green alga Chlamydomonas reinhardtii were
obtained (see Chapter 4). We first showed the existence of a molecular link between
photoreception, photosynthesis and photoprotection. Our data show that Chlamydomonas is able
to detect changes in light wavelength thanks to photoreceptors, and this also affects photorotection
via the regulation of the induction of the protein LHCSR3 (see section 4.3). Moreover, we
demonstrate that besides light, downstream metabolism can affect the NPQ capacity of C.
reinhardtii, via negative feedback of the LHCSR3 accumulation in the thylakoids (see section 4.4).
Overall, these projects underline how the different processes linked to photosynthesis (light
absorption, dissipation electron flow and carbon assimilation for metabolism) are tightly
interconnected to achieve a successful acclimation to the environment of microalgae.

25
Chapter 2

26

27
2.1 Introduction
This chapter is organized in four sections. In the first section (section 2.2), I will give an introduction
and on the chloroplast origin and on the structural arrangements of the photosynthetic membranes
(the thylakoids) in the chloroplast. In the second section (section 2.3) the article “Energetic Coupling
Between Plastids and Mitochondria Drives CO2 Assimilation in Diatoms” will be presented.
Afterwards, in the third section (section 2.4) I will introduce the article “Ultrastructure of the
Periplastidial Compartment of the Diatom Phaeodactylum tricornutum”. Finally (in section 2.5) the
manuscript in preparation “Chloroplast thylakoid architecture optimizes photosynthesis in diatoms”
will be presented.
2.2 The chloroplast
The chloroplast is a specific organelle of plants and algae. It contains the molecular machinery that
performs photosynthesis. Chloroplasts represent a particular form of plastids, which are dynamic
organelles that can differentiate in response to environmental stimuli and developmental stage. The
typical plastids found in plants are (Figure 2.1) i. the undifferentiated form called proplastid ii. the
etioplast, i.e. the progenitor of the chloroplast iii. the chloroplast, the photosynthetic organelle iv.
the chromoplast, mostly containing carotenoids v. the gerontoplast, the senescent form of the
chloroplast vi. the amyloplast, the starch storage reservoir and vii. the elaioplast, the lipids storage
plastid.
Figure 2.1– Representation of the principal plastids found in plants. The proplastid, etioplasts, chloroplasts,
chromoplasts, gerontoplasts, amyloplasts and elaioplasts are represented. Grey lines show possible route of plastids
differentiation (modified from https://commons.wikimedia.org/w/index.php?curid=28879042).

28
The chloroplast originated between 1.6 and 0.6 billion years ago (Yoon et al., 2004; Cavalier-Smith,
2006; Figure 2.2 A) when a cyanobacterial type of organism (α-proteobacterium-like ancestor) was
engulfed by a eukaryote host. This endosymbiosis led to primary plastids characterized by two
limiting membranes derived from the inner and outer membranes of the gram-negative
cyanobacterium (Jarvis & Soll, 2001). These membranes control the exchanges between the plastid
and the rest of the cell. This symbiotic event permitted the evolution of autotrophic organisms and
the proliferation of oxygenic life on Earth. Primary plastids are found in three major lineages:
Glaucophytes, red algae (Rhodophytes) and green algae (like Chlorophytes and Charophytes;
Keeling, 2004). The latest is believed to be the progenitor of modern plants. During evolution both
the red (Figure 2.2 B) and green lineage have been engulfed independently by another eukaryotic
cell leading to the origin of secondary plastids between 1.2 and 0.55 billion years ago (Yoon et al.,
2004; Cavalier-Smith, 2006; Figure 2.2 B). Over time, the engulfed host cell was reduced to a multiple
membrane-bound plastid. In fact, these membranes represent i. the remaining of the phagocytosis
of the primary alga plus ii. the two previous membranes of the gram-negative cyanobacterium.
Seven major lineages possess secondary plastids: Euglenids, Chlorarachniophytes, Cryptomonads,
Haptophytes, Heterokonts (diatoms), Dinoflagellates and Apicomplexa (Keeling, 2004).
Figure 2.2 – Schematic representation of primary and secondary symbiosis. (A) Primary endosymbiosis. (B) Secondary
endosymbiosis.
A B

29
In general, the chloroplast structure is about 3–5 μm in diameter and contains three distinct sub-
compartments:
i. The chloroplast envelope (Figure 2.3 A) is the site of the synthesis and translocation of many
components (ions and metabolites) between the cytosol and the chloroplast. In primary
plastids, the envelope is formed by two layers which surround the organelle. These
membranes (the inner and outer membranes) are reminiscent of the symbiont's host.
ii. The stroma (Figure 2.3 B) is the soluble phase contained in the chloroplasts where most of
the enzymes required for carbon fixation, amino acids or vitamins synthesis are located. It
also contains the chloroplast DNA and the ribosomes for protein synthesis.
iii. The thylakoids (from the greek word thylakoides = sac; Menke, 1962) is a network of internal
membranes, which hosts the proteins performing the light-phase of photosynthesis.
Thylakoids form one continuous compartment within the chloroplast (Mustárdy & Garab,
2003; Staehelin, 2003). These membranes, typically enriched in galactolipids, present a
lateral heterogeneity, already noticed in 1960 by Menke. He introduced two distinct terms
to describe the sub-compartments of the chloroplast in plants: the “sac-like” appressed
thylakoids and the large thylakoids. The first one, now called grana (singular granum) are
made of stacks of thylakoid membranes with a diameter of 300-600 nm and a thickness of
~4 nm (Kirchhoff et al., 2011; Figure 2.3 C). The second term is referred to the connecting
membranes now called stroma lamellae (Figure 2.3 D). Every single thylakoid vesicle contains
an aqueous space that is named the lumen. The diameter of this space can vary depending
on the conditions (Kirchhoff et al., 2011).

30
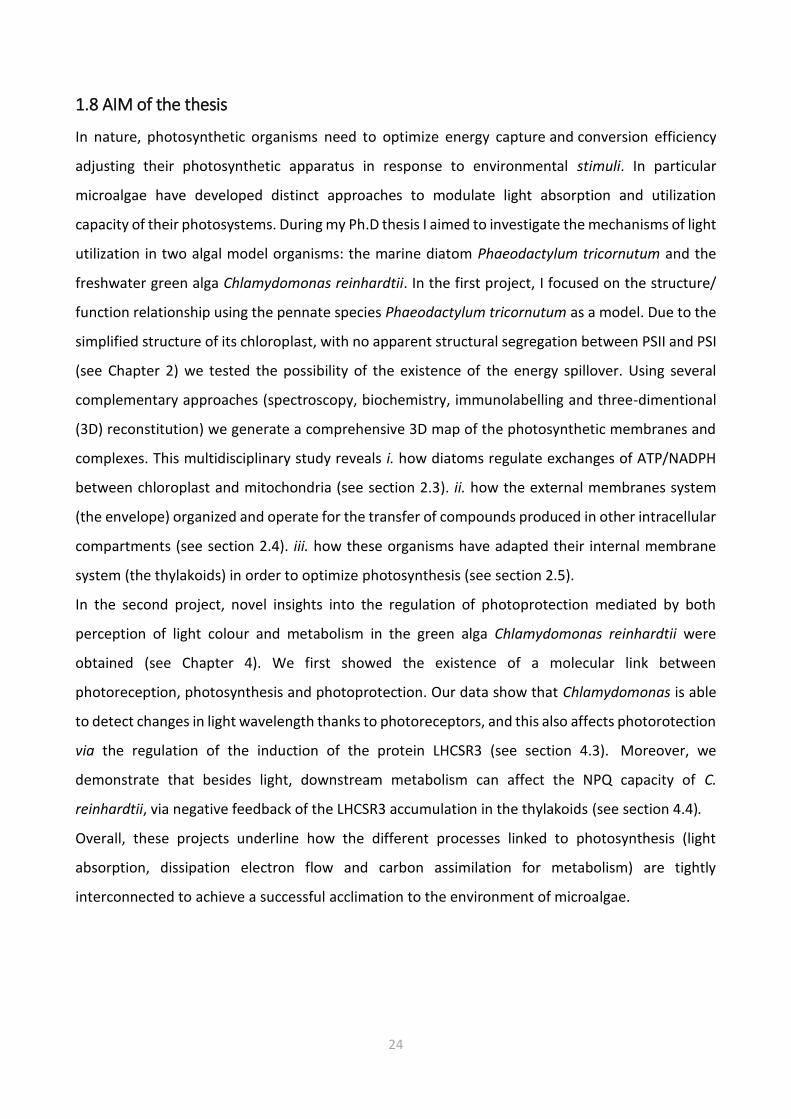
The exact three-dimensional architecture of the grana in plant is still a matter of debate and several
models have been proposed to interpret the structural arrangements of thylakoid in plant
chloroplasts (reviewed in Daum et al., 2011). The first one, the fork model (Arvidsson & Sundby,
1999; Figure 2.4 A) considers that grana as repetitive units of three disks formed by symmetrical
invaginations of a thylakoid pair. The second (Shimoni et al., 2005; Figure 2.4 B) considers grana as
formed by paired membranes emerging from bifurcations of stroma lamellae connected by
membranes upwards and downwards. Finally the helix model, probably the most correct one,
proposes that stroma lamellae rotate around the grana stacks as a right-handed helix, connecting
every granum with multiple stroma lamellae (Paolillo et al., 1967; Paolillo, 1970; Mustardy & Garab
2003; Mustardy et al., 2008; Daum et al., 2011; Austin & Staehelin, 2011; Ruban & Johnson, 2015;
Figure 2.4 C).
2 µm
Figure 2.3 – Chloroplast details of Arabidopsis thaliana. (A) the envelope, (B) the stroma, (C) a grana and (D) stroma
lamellae. The thylakoid lumen is not visible at this magnification.
C D
A
B
31
These membranes are densely populated by proteins, which occupy up to 70% of the total
membrane area (Kirchhoff et al., 2002). These proteins are the key players of photosynthesis (see
section 1.3): the photosystem II (PSII), the cytochrome b6f complex (Cyt b6f), the photosystem I (PSI)
and the ATP-synthase. In plants, extensive biochemical, fractionation and immunolocalisation
studies have shown that PSI and the ATP synthase complexes accumulate preferentially in the
stroma exposed membrane (the stroma lamellae and the grana margins) due to the steric hindrance
of their stromal protrusions (Dekker & Boekema, 2005; Amunts et al., 2008; Junge et al., 2009).
Conversely, PSII which has flat stromal surfaces, is mostly localized in the grana, while the
cytochrome b6f complex, which functionally connects PSI and PSII, has a more homogeneous
localization in these compartments (reviewed in Albertsson, 2001; Kouřil et al., 2012; Figure 2.5).
This heterogeneous distribution of photosynthetic complexes has deep consequence on light
harvesting and electron flow. Most likely, the main reason for segregating the photosystems in two
different domains of the membranes is to prevent a physical contact beween them, which will lead
to excitation energy spillover (section 1.6.1.3) from PSII (which has the photochemical trap of the
higher energy) to PSI (which has a lower energy trap).
Figure 2.4 – Current models of the structural arrangements of thylakoids in plant chloroplast. (A) the fork model of Arvidsson &Sundby,
1999. (B) the bifurcated model of Shimoni et al., 2005 (picture from Daum et al. 2011). (C) the right-handed helix model predicted by
Paolillo 1970 (picture from Ruban & Johnson, 2015).
A B C

32
A second reason for the formation of stacked grana in plants is the necessity to increase the light
harvesting capacity of the chloroplast (Barber, 1980) creating extreme folding surfaces to
concentrate the maximum amount of antenna complexes in the smallest volume. Consistent with
this idea, changes in light intensity can largely affect the spatial organization of thylakoid
membranes. This flexible interconnected networks can rapidly vary its architectural organization
adjusting the number of layers within the grana stacks under low light conditions (Anderson, 1986),
or increment the unstacking of grana discs under high light conditions (Fristedt et al., 2009; Khatoon
et al., 2009; Herbstova et al., 2012). These structural rearrangements, in plants, tend also to
facilitate light harvesting but also photoprotective mechanisms like turnover of photodamaged D1
(Herbstova et al., 2012; Kirchhoff, 2013) or state transitions (see section 1.6.1.2).
One of the main goal of this Ph.D thesis was to understand the structure of a secondary chloroplast
and to investigate the functional consequences of this structure on the photosynthetic light
absorption, electron flow and ATP and NADPH synthesis and consumption. Our structural,
biophysical and biochemical results unveil for the first time these complex structures in diatoms
using the model organism Phaeodactylum tricornutum.
Figure 2.5 – Representation of the thylakoid membranes in plants. (A) the grana stack mostly enriched in PSII (B) the stroma
lamellae enriched in PSI. The Cyt b6f is equally distributed between the two regions.

33
2.2.1 Case of study Phaeodactylum tricornutum (Bohlin, 1897)
Phaeodactylum tricornutum is a pennate diatom (Heterokonts) wich displays different
morphotypes, i.e. fusiform, triradiate and oval (Figure 2.6). Cells of this pleiomorphic species are
∼10 μm in diameter and a large part of their volume is occupied by a single chloroplast (3-9 μm).
Within this plastid the three classical main subcompartments (Figure 2.7 A) can be easily identified:
i. the envelope ii. the stroma and iii. the thylakoids. However, diatom chloroplast exhibit peculiar
differences.
i. The envelope system is formed by two internal membranes the inner and the outer envelope
membranes (iEM and oEM, Botte & Marechal, 2014; Petroutsos et al., 2014; Figure 2.7 B; 1-
2) of the secondary symbiont's chloroplast, sourrounded by the periplastidial membrane
(PPM, Figure 2.7 B; 3) and the chloroplast endoplasmic reticulum membrane (cERM, Figure
2.7 B; 4). Between the PPM and oEM lies a minimized symbiont cytoplasm, the periplastidial
compartment (PPC, Grosche et al., 2014; see section 2.3).
Figure 2.6 – Morphotypes of P. tricornutum. (1) Fusiform, (2) oval and (3) triradiate.
1
2
3
10 µm

34
ii. The chloroplast stroma containing most of the enzymes needed for carbon fixation (as the
RuBisCO). In algae, this essential enzyme is concentrated in a specialized region called the
pyrenoid (Holdsworth, 1971; Lacoste-Royal & Gibbs, 1987; Borkhsenious et al., 1998; Figure
2.7 D). Moreover, the stroma also contains the chloroplast DNA and the ribosomes for
protein synthesis.
iii. Unlike higher plants, diatoms thylakoids do not possess a clear distinction between grana
and stroma lamellae. Their membranes are generally organized in stacks of three lipid
bilayers oriented parallel to the envelope membranes (Figure 2.7 A,B,C). A single stack of
thylakoids forms the girdle lamella that encircles the whole structure (Figure 2.7 C). Only
near the pyrenoid region we found that the tips of thylakoids from multiple stacks merged,
oriented perpendicularly towards the envelope (Figure 2.7 A, B, C).
A
B
C
D
Figure 2.7 – Chloroplast details of P. tricornutum. (A) Whole cell view, the envelope is highlighted in red, the thylakoids in
white and the stroma space in black. (B) Details of the envelope. in this picture the four membranes are visible. (C) Detail of
the girdle lamella which surround the chloroplast (D) Pyrenoid region with the typical enlarged 2 lipid bilayers in the center.

35
As explained above, the main reasons to investigate the the structural organization of secondary
plastids were to understand:
i. how diatoms regulate exchanges of ATP/NADPH between chloroplast and mitochondria
(see section 2.3).
ii. how external membranes system (the envelope) are organized and operate for the transfer
of compounds produced in other intracellular compartments (see section 2.4).
iii. how these organisms have adapted their internal membrane system (the thylakoids) in
order to optimize photosynthesis (see section 2.5).
Thanks to a multidisciplinary approach, we provide relevant information to answer these questions.
36
2.3 Energetic interactions between chloroplasts and mitochondria
2.3.1 Preface
The article Bailleul et al., 2015 presented in this section represents my first contribution to the
characterization of the model diatom Phaeodactylum tricornutum. This work is part of a
collaboration between different laboratories in Europe, which was coordinated by my host
laboratory.
In photosynthesis, the efficient conversion of CO2 into organic matter requires the optimization of
the ATP/NADPH ratio (Allen, 2002). In most photosynthetic organisms (i.e. viridiplantae), this
optimization relies principally on processes localized within the plastid (for more information see
Shikanai, 2007; Allen, 1975; Asada, 2000; Cardol et al., 2008; Ort & Baker, 2002). However, in
diatoms, all the mechanisms described so far, seems to be not relevant to balance this ratio. Thus,
the main question addressed in this project was how diatoms regulate photosynthetic process being
one of the most successful group of microalgae in the ocean.
In the article below, we were able to show that diatoms regulate ATP/NADPH ratio through
energetic interactions between plastids and mitochondria. The hypothesis proposed in this study
explain the optimization of carbon fixation through the re-routing of reducing power (NADPH)
generated in the plastid towards mitochondria (the site of respiration) and the import of
mitochondrial ATP into the chloroplast. These extensive exchanges are mediated by the physical
contacts between the two organelles, which I was able to document by studying the structure of
chloroplast and mitochondria in intact P. tricornutum cells. The interesting results here obtained
convinced me to pursue the structural characterization of the chloroplast membranes, which will
be presented in the two following sections. In conclusion, the cross-talk chloroplast-mitochondria
in diatoms facilitate the optimization of carbon fixation demonstrating the high photosynthetic
efficiency achieved by these organisms worldwide.

37
2.3.2 Energetic coupling between plastids and mitochondria drives CO2 assimilation in
diatoms
Benjamin Bailleul1,2,3,4,, Nicolas Berne1, Omer Murik4, Dimitris Petroutsos5, Judit Prihoda4, Atsuko
Tanaka4, Valeria Villanova6, Richard Bligny5, Serena Flori5, Denis Falconet5, Anja Krieger-Lizkay7,
Stefano Santabarbara8, Fabrice Rappaport3, Pierre Joliot3, Leila Tirichine4, Paul Falkowski2, Pierre
Cardol1, Chris Bowler4,, Giovanni Finazzi5,
1 Genetics and Physiology of Microalgae, Department of Life Sciences and PhytoSYSTEMS, University
of Liège, B-4000 Liège, Belgium
2 Environmental Biophysics and Molecular Ecology Program, Department of Marine and Coastal
Sciences and Department of Earth and Planetary Sciences, Rutgers University, New Brunswick, NJ
08901, USA
3 Institut de Biologie Physico-Chimique (IBPC), UMR 7141, Centre National de la Recherche
Scientifique (CNRS), Université Pierre et Marie Curie, 13 Rue Pierre et Marie Curie, 75005 Paris,
France
4 Ecology and Evolutionary Biology Section, Institut de Biologie de l'Ecole Normale Supérieure
(IBENS), Centre National de la Recherche Scientifique (CNRS), UMR 8197, INSERM U1024, 46 Rue
d'Ulm, 75005 Paris, France
5 Laboratoire de Physiologie Cellulaire et Végétale, UMR 5168, Centre National de la Recherche
Scientifique (CNRS), Commissariat à l'Energie Atomique et aux Energies Alternatives (CEA),
Université Grenoble Alpes, Institut de Recherche en Sciences et Technologies pour le Vivant, CEA
Grenoble, 38054 Grenoble cedex 9, France
6 Fermentalg SA, F-33500 Libourne, France
7 Institute for Integrative Biology of the Cell (I2BC), Commissariat à l'Energie Atomique et aux
Energies Alternatives (CEA), Centre National de la Recherche Scientifique (CNRS), Université Paris-
Sud, Institut de Biologie et de Technologie de Saclay, F-91191 Gif-sur-Yvette cedex, France
8 Istituto di Biofisica, Consiglio Nazionale delle Ricerche, Via Celoria 26, 20133 Milan, Italy

38
Abstract
Over the past ~ 35 million years, diatoms have been one of the most successful classes of
photosynthetic marine eukaryotes, and are believed to have contributed to climate cooling by
absorbing carbon dioxide from the atmosphere and sequestering it via the biological carbon pump
(Falkowski, 2004). Today the proportion of planetary primary production performed by diatoms is
equivalent to that of terrestrial rainforests (Field et al., 1998). In photosynthesis, the efficient
conversion of CO2 into organic matter requires a tight control of the ATP/NADPH ratio which, in
other photosynthetic organisms, relies principally on a range of plastid-localized ATP generating
processes (Shikanai, 2007; Asada, 2000; Cardol, et al., 2008; Ort & Baker, 2002). Here we show that
diatoms regulate ATP/NADPH through extensive energetic exchanges between plastids and
mitochondria. This interaction comprises the rerouting of reducing power generated in the plastid
towards mitochondria and the import of mitochondrial ATP into the plastid, and is mandatory for
optimized carbon fixation and growth. We propose that the process may underlie the ecological
success of diatoms in the ocean.
In oxygenic photosynthesis, light drives a linear electron flow from water to NADPH by the two
photosystems (PSI and PSII), and the generation of an electrochemical proton gradient (or proton
motive force, PMF) across the thylakoid membranes which fuels ATP synthesis by an ATP synthase.
Although the ratio of ATP/NADPH generated by linear electron flow is not entirely resolved
(Petersen et al., 2012; Allen, 2002), it is considered to be insufficient to fuel CO2 import into the
plastid and assimilation by the Calvin cycle (Allen, 2002; Lucker et al., 2013). Additional ATP must
therefore be produced by alternative electron pathways, i.e., electron flow processes that generate
a PMF without net NADPH synthesis. In Viridiplantae (including green algae and higher plants), these
alternative electron pathways are mostly chloroplast localized and comprise cyclic electron flow
(CEF) around PSI (Shikanai, 2007) and/or the water-to-water cycles (Allen, 1975), i.e., flows of
electrons resulting from the oxidation of water at PSII and rerouted to an oxidase activity. The latter
oxidases include the Mehler reaction at the PSI acceptor side (Asada,2000; Radmer & Kok, 1976;
Badger, 1985), the activity of the plastoquinone terminal oxidase downstream of PSII (Cardol et al.,
2008), and the oxygenase activity of RuBisCO (photorespiration; Ort & Baker, 2002). Although genes
encoding the majority of components for these processes appear to be present in diatoms (Prihoda
et al., 2012; Bowler et al., 2008; Grouneva, et al., 2011), it is currently unknown what mechanisms

39
are utilized to balance the ATP/NADPH ratio. We therefore investigated the question using the
model species Phaeodactylum tricornutum.
2.3.2.1 Results
The PMF generated across thylakoid membranes comprises an electric field (ΔΨ) and a proton
gradient (ΔpH). The ΔΨ can be probed in vivo by measuring the Electro-Chromic Shift (ECS) of
photosynthetic pigments, i.e., a modification of their absorption spectrum caused by changes in the
transmembrane electrical field in the plastid (Witt, 1979). An ECS signal is present in P. tricornutum
(Figure 2.8 A), and an analysis of the ECS signal relaxation after light exposure (Supplementary Figure
2.13) reveals that it comprises two components displaying different spectra (Figure 2.8 A). One
follows a linear dependence on the amplitude of the ΔΨ whereas the other follows a quadratic
relationship (Figure 2.8 B). The existence of a “quadratic ECS” is predicted by theory (Witt, 1979)
but has only been observed so far in mutants of green algae with altered pigment composition (Joliot
& Joliot, 1989). The peculiar existence of two different ECS probes in wild-type P. tricornutum cells
allows an absolute quantification of the electrical field, providing a valuable tool to analyze the PMF
in a living cell (see methods).
We plotted the amplitude of the quadratic vs linear ECS signals during the relaxation of a light-
induced PMF and obtained, as expected, a parabola (Figure 2.8 C, D and Supplementary Figure 2.13).
However, the ECS signals did not reach the minimum of the parabola in the dark, but rather
remained positive. This indicates that a PMF is maintained across the thylakoid membrane of
diatoms even without illumination (ΔΨd, Figure 2.8 C). The ΔΨd can be dissipated with an uncoupler
(FCCP), but also by anaerobiosis or inhibition of mitochondrial respiration by Antimycin A (AA) to
block Complex III in the so-called cyanide-sensitive respiratory pathway, combined with
salicylhydroxamic acid (SHAM) to inhibit the alternative oxidase (AOX) in the cyanide-insensitive
respiratory pathway (Figure 2.8 D). These results suggest that the PMF present in the diatom plastid
in the dark is generated by the chloroplast ATPase by hydrolysis of ATP derived from mitochondria
(Figure 2.8 E; Diner & Joliot, 1976). Furthermore, the extent of the ΔΨd observed in P. tricornutum
is larger than that previously reported in green algae (Finazzi & Rappaport, 1998), suggesting that
the ATP exchange could be more efficient in diatoms.

40
Figure 2.8 – ECS allows measuring the proton motive force in P. tricornutum. (A) Deconvolution of the experimental Electro-
Chromic Signal (ECS) spectrum (black) into linear (blue) and quadratic (red) spectral components, as described in Methods. (B)
Schematic representation of polar and polarizable pigments, and theoretical dependencies of their associated ECS responses
upon the electric field. Green “+” and “-“: ΔΨ. Blue and red “+” and “-“: pigment dipoles. Red arrows: pigment polarization
induced by ΔΨ. (C,D) Relationship between quadratic and linear ECS in control (C) and in uncoupler (8 nM FCCP, black squares),
anaerobic (red circles), and respiratory inhibitors (AA, 5 µM, and SHAM, 1 mM, blue circles) treated cells (D). Green arrow: value
of the dark electric field (ΔΨd). (E) Schematic representation of the plastid-mitochondria energetic interactions in the dark. Red
arrows: respiratory electron flows. Green dashed line: putative ATP/ADP exchange pathway between the organelles. PS =
photosystem, b6f = cytochrome b6f, ATPase = ATPase/synthase, I/ III/ IV = respiratory complexes I, III and IV, and AOX =
Alternative Oxidase.
41
To evaluate what mechanism regulates ATP/NADPH in the light in P. tricornutum, we first used the
linear ECS to probe the CEF capacity. CEF turned out to represent only a very low fraction of the
maximum electron flow capacity (Figure 2.9 A and Supplementary Figure 2.14 A, C) and was
insensitive to changes in the photosynthetic flux (Figure 2.9 A). Thus, it appears very unlikely that
CEF could regulate ATP/NADPH levels. Next we explored the water-to-water cycle using membrane-
inlet mass spectrometry (MIMS) on cells incubated with O2 (Diner & Joliot, 1976). O2 consumption
increased with light, being ~2.5-fold higher at saturating light intensities than in the dark
(Supplementary Figure 2.14 B, D). We also found that the light-stimulated O2 consumption was
blocked by DCMU, which inhibits O2 production by PSII (Supplementary Figure 2.14 B, D), indicating
that this process is fed by electrons generated by PSII. O2 consumption increased linearly with O2
production, in agreement with earlier findings in another diatom species (Waring et al., 2010),
indicating that a constant proportion (~10%) of the electron flow from PSII is rerouted to an O2
consuming pathway, regardless of light intensity (Figure 2.9 B).
To test whether the O2 consuming pathway occurs in the plastid or relies on mitochondrial activity,
we used increasing concentrations of mitochondrial inhibitors to titrate respiration and tested
possible consequences on photosynthesis. We reasoned that if mitochondrial respiration consumes
reducing equivalents generated in the plastid to generate additional ATP, any mitochondrial
dysfunction should negatively impact photosynthesis. We found that this was indeed the case, as
photosynthetic electron transfer rates (ETRPSII) linearly followed changes in respiration (Figure 2.9 C
and Supplementary Figure 2.15). We conclude that a partial rerouting of the photosynthetic flow
towards mitochondrial respiration rather than CEF optimizes photosynthesis in diatoms, providing
commensurate ATP per NADPH at all irradiances (Figure 2.9 D).

42
The increasing sensitivity of photosynthesis to alternative oxidase (AOX) inhibitor with light (Figure
2.10 A) suggests that the cyanide-insensitive respiration becomes prominent in high light. This
prompted us to generate AOX knockdown cell lines of P. tricornutum. Two independent clones were
selected based on reduced AOX protein accumulation (Figure 2.10 B) and decreased activity
(measured as the SHAM-sensitive, AA insensitive component of respiration; Supplementary Figure
2.16 A). The AOX contribution, representing ~50% of dark respiration in wild-type cells
(Supplementary Figure 2.15 E), was decreased 2-fold in the two knockdown lines. Confocal
microscopy confirmed the mitochondrial localization of the targeted gene product (Supplementary
Figure 2.17 A). The reduced AOX activity in the knockdown lines paralleled a diminished PMF in the
Figure 2.9 –Mitochondria-plastid energetic interactions in P. tricornutum. (A) Relationship between CEF capacity and total
electron flow (TEF). (B) Relationship between oxygen uptake (U0) and gross photosynthesis (E0) as measured by MIMS. (C)
Dependency of photosynthetic activity (ETRPSII) on respiration rates. Closed circles: SHAM + AA; open circles: SHAM +
Myxothiazol treatments (see Methods). (D) Schematic representation of possible plastid-mitochondria metabolic interactions
in the light. Same as in Figure 2.8 E + Blue lines: photosynthetic linear (light blue arrow), and cyclic (dark blue dashed line) flows.
Yellow dashed arrow: exchange of reducing equivalents between the organelles.

43
dark (ΔΨd), despite the fact that overall dark respiration was slightly higher (Supplementary Figure
2.16 B). This effect was strongly enhanced by addition of AA (Supplementary Figure 2.16 B). The
decreased AOX activity also correlated with a decreased photosynthetic capacity, especially under
high light intensities (similar to SHAM-treated wild-type cells; Figure 2.10 A), and a diminished
growth rate (Figure 2.10 C), which was exacerbated further by inhibiting Complex III using AA
(Supplementary Figure 2.16 C). The growth and photosynthetic phenotypes were not due to
changes in the accumulation of the photosynthetic complexes, for which we detected comparable
levels of representative proteins in all cell lines (Figure 2.10 B). The only exception was a small
decrease in the Cytochrome b6f content in the knockdown cell lines, which nonetheless did not
decrease its catalytic efficiency (Supplementary Figure 2.18).
Figure 2.10 – Phenotypic traits of AOX mutants in P. tricornutum. (A) Relative sensitivity of photosynthesis (ETRPSII) to the
presence of inhibitors of respiration: AA (blue), SHAM (red) and AA+SHAM (black) (n = 2 ± S.E), or to the knock-down of AOX (n
= 5 ± S.D.). Green and magenta are used for kd-c5 and kd-c9, respectively, in all panels. (B) Western blot analysis of
photosynthetic and respiratory complexes. (C) Growth rates of the wild type (dark blue) and AOX mutants (n = 7 ± S.D.). (D) In
vivo assessment of NADPH redox changes as a function of irradiance, in wild-type and AOX mutants (n = 3 ± S.D.). (E) In vivo
31P-NMR evaluation of the NTP content in wild-type and AOX mutants, in the dark or in low light (with or without AA).

44
Our working model presented in Figure 2.9 D predicts that disruption of the plastid-mitochondria
interaction in the knockdown cell lines should lead to the accumulation of NADPH and a decreased
cellular content of ATP in the light. In vivo assessments of the pools of NADPH and ATP in wild-type
and knockdown cell lines indeed confirmed an increase in the NADPH/NADP+ ratio with light
intensity (Figure 2.10 D and Supplementary Figure 2.19 A) accompanied by a net decrease of cellular
ATP levels (Figure 2.10 E and Supplementary Figure 2.19 B), both of which were more drastic in AOX
knockdown cells compared to wild-type cells. These observations confirm that mitochondrial
respiration is directly involved in the adjustment of the ATP to NADPH ratio in the plastid.
We then examined the generality of our findings in other diatom species. The similar ECS features
(linear and quadratic components) in Thalassiosira pseudonana and Thalassiosira weissflogii,
Fragilaria pinnata and Ditylum brightwelii (Figure 2.11 A) were used to confirm the presence of a
PMF in the plastids in the dark at the expense of hydrolysis of ATP supplied by the mitochondria in
all cases (Figure 2.11 B). Moreover, a negligible contribution of CEF (Supplementary Figure 2.20) and
a significant involvement of mitochondrial respiration to photosynthesis (Supplementary Figure
2.21) were found in all these species. The involvement of mitochondrial respiration in the
optimization of photosynthesis therefore appears be a general and conserved feature in diatoms.
Figure 2.11 – ATP transfer from mitochondria to plastid in representative diatoms. (A) Spectra of the linear (blue) and quadratic
(red) ECS probes in T. weissflogii (black), T. pseudonana (blue), F. pinnata (red), and D. brightweli (green). Blue and red vertical
dashed lines represent the wavelengths used for linear and quadratic ECS, respectively. (B) Relationship between the quadratic
and the linear ECS in control conditions (open green squares) and in the presence (closed green circles) of respiratory inhibitors
AA and SHAM (representative of at least 3 independent experiments for each diatom). ΔΨd is represented as a horizontal arrow.

45
2.3.2.2 Conclusions
We conclude that ATP limits photosynthetic carbon assimilation in diatoms, as suggested in other
photosynthetic organisms (Allen, 2002), but that at variance with the Viridiplantae, optimization of
diatom photosynthesis does not rely on plastid-localized processes. Instead, constitutive energetic
interactions between diatom mitochondria and plastids ensure the sharing of reducing equivalents
and ATP to fuel CO2 assimilation in the light (Figure 2.9 D). While the process we have uncovered
has some similarities to the export of reducing equivalents from the plastids towards mitochondria
in plants and green algae, the fundamental difference is that in these latter organisms the process
serves as a valve to dissipate excess electrons (Kinoshita et al., 2011), and can only participate in the
regulation of ATP/NADPH ratio when the chloroplast capacity to make extra ATP is genetically
disrupted (Dang et al., 2014; Lemaire et al., 1988; Cardol et al., 2009). We propose that the presence
of triose phosphate transporters such as the malate shuttle (Kinoshita et al., 2011), which are
encoded in diatom genomes (Prihoda et al., 2012), as well as the very tight physical interactions
observed in diatoms between plastids and mitochondria (Supplementary Figure 2.17 B), may make
these energetic interactions possible between the two organelles. Because diatom plastids are
surrounded by four membranes, rather than two as in Viridiplantae (Bowler et al., 2008) it will be
of interest to elucidate the configuration of such transporters. More generally, the coupling of
respiratory and photosynthetic activities in diatoms should be explored in the context of resource
utilization in the ocean and as a means to boost the production of useful metabolites for
biotechnology.

46
Supplementary Figures
Supplementary Figure 2.12 – Deconvolution of the quadratic and linear ECS in P. tricornutum. (A) Absorption difference (ΔI/I)
kinetics followed at different wavelengths in P. tricornutum, after a series of six saturating laser flashes, in anaerobic conditions.
Solid lines correspond to the global fit of the experimental data with a sum of two exponential decays, with time constants t and
2t respectively, as expected for linear and quadratic dependencies (see Methods). (B) ΔI/I spectra are shown at different times
during ECS relaxation. All spectra were normalized to 1 at 520 nm for better comparison. The observation that the blue and green
parts of the spectrum are homothetic during relaxation, while changes are seen in the red most part of it, reflects the presence
of the two ECS components, having different relaxation kinetics.
Supplementary Figure 2.13 – Separation of c-type cytochromes signals, and linear and quadratic ECS signals in P. tricornutum.
(A) Kinetics of ΔI/I changes at 520, 554 and 566 nm during a ~10ms pulse of saturating red light (4500 µmol. quanta.m-2.s-1)
and the subsequent dark relaxation (top: control conditions, bottom: AA+SHAM). (B) Kinetics of of ecslin, ecsquad changes and
c-type cytochrome redox state, from kinetics in panel a, after deconvolution as explained in Methods. (C, D) Relationship
between the quadratic and the linear ECS, before (ecslin, ecsquad, panel c) and after (ECSlin, ECSquad, panel D) correction for
the dark electric field (see Methods). Dark yellow and magenta circles correspond to control and AA+SHAM conditions,
respectively. The green arrow indicates the value of the ΔΨd in control conditions.

47
Supplementary Figure 2.14 – Cyclic electron flow and water-to-water cycles in P. tricornutum. (A) Representative traces
of changes in linear ECS (normalized as explained in Methods) to evaluate linear and cyclic electron flow. Cells were
illuminated with 1870 µmol quanta.m-2.s-1 of red light, in absence (closed circles) and presence (open circles) of DCMU
and then transferred to the dark. Traces represent changes in the linear ECS. (B) Representative traces of the 16O2 and
18O2 concentrations at the offset of a 280 µmol quanta/m2/s blue light. In panels A and B, light and dark periods are
represented by white and black boxes, respectively. (C) The photochemical rate corresponding to TEF and CEF can be
estimated by measuring the initial slope of the ECS decay, as explained above25 (see Methods) at difference irradiances
(n = 2-4 ± S.D.). (D) Light- dependencies of oxygen uptake (U0, open circles) and gross photosynthesis (E0, closed circles)
in control conditions (dark) and in the presence of DCMU (red) (n = 2 ± S.E.).

48
Supplementary Figure 2.15 – ΔΨd and photosynthesis under respiratory inhibition. (A,B,C) Dependency of the ETRPSII (A), ΔΨd
(B) and dark respiration (C), expressed as a % of the values measured in untreated P. tricornutum wt cells, and following inhibition
of the cyanide sensitive respiratory pathway with different concentrations of Antimycin A, in the presence of saturating SHAM
(1 mM). Experimental data were fitted with a monoexponential decay function. (D,E) Effect of AA, SHAM and AA+SHAM on
ETRPSII (D), ΔΨd and dark respiration (E), expressed as % of control, in wild-type cells of P. tricornutum. [SHAM]: 1mM. [AA]:
5µM. (n = 2-4 ± S.D.). (F) Relationship between ΔΨd and mitochondrial respiration in samples poisoned with increasing
concentrations of AA in the presence of SHAM (from panels B and C).

49
Supplementary Figure 2.16 – Dark respiration, PMF and growth in AOX mutants in P. tricornutum. (A) Respiratory activity of
wild type and AOX knockdown lines. Total respiration rate (red bars) and the contribution of the AOX capacity (white bars, see
Methods) were normalized to wild-type values. (n = 5 ± S.D.). (B) ECS-based measurements of ΔΨdark in wild type and AOX
knockdown lines, in control conditions (dark), in the presence of AA (grey), and in the presence of AA+SHAM (white). (n = 2-3 ±
S.D.). (C) Growth curves of wild type and AOX knockdown cell lines in the presence/absence of AA (2µM). AA was added every
day and cells were grown in continuous light to prevent them from dying in the dark because of lack of respiration. (n = 3 ± S.D.).
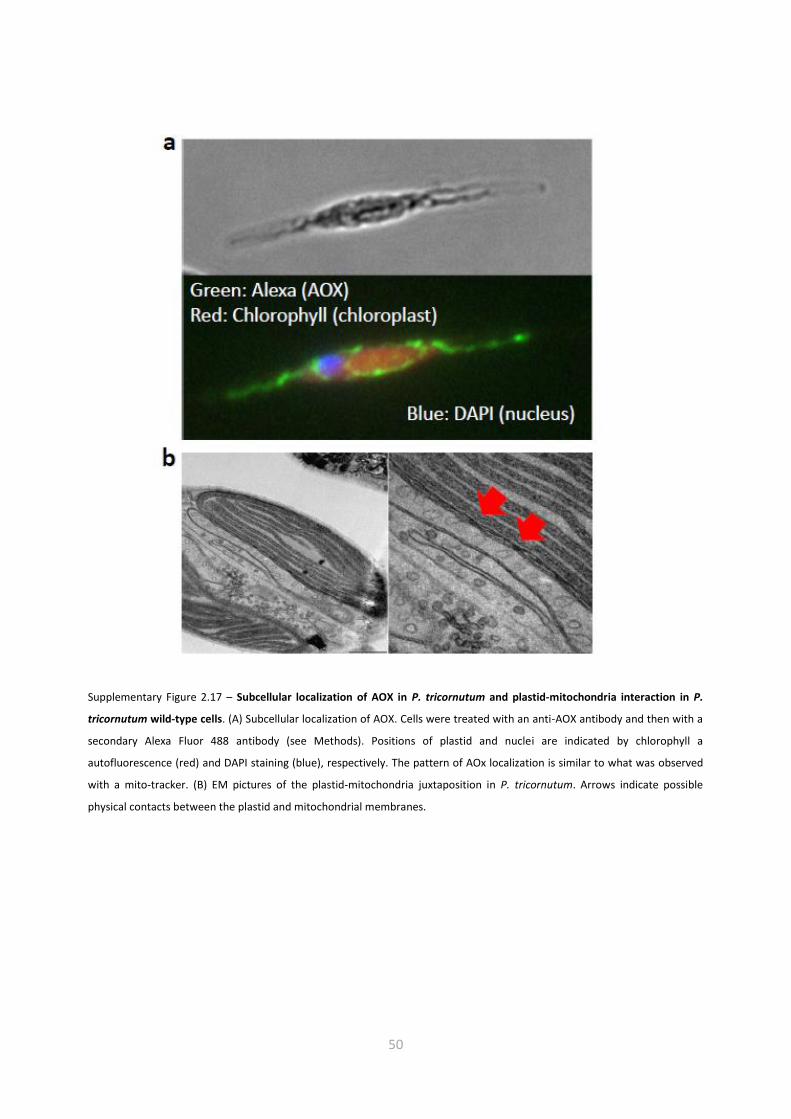
50
Supplementary Figure 2.17 – Subcellular localization of AOX in P. tricornutum and plastid-mitochondria interaction in P.
tricornutum wild-type cells. (A) Subcellular localization of AOX. Cells were treated with an anti-AOX antibody and then with a
secondary Alexa Fluor 488 antibody (see Methods). Positions of plastid and nuclei are indicated by chlorophyll a
autofluorescence (red) and DAPI staining (blue), respectively. The pattern of AOx localization is similar to what was observed
with a mito-tracker. (B) EM pictures of the plastid-mitochondria juxtaposition in P. tricornutum. Arrows indicate possible
physical contacts between the plastid and mitochondrial membranes.

51
Supplementary Figure 2.18 – Cytochrome b6f turnover in Pt1 and AOX mutants. (A) Schematic representation of the electron
flow reaction steps in the cytochrome b6f complex, which can be evaluated by spectroscopic measurements. (B) Slow phase of
ECSL indicating cytochrome b6 (blue) and time resolved redox changes of cytochrome c/f (red) in wild type Pt1 and AOX
knockdown mutants. P. tricornutum cells were exposed to saturating single turnover laser flashes given 10 s apart. Data were
normalized to the amplitude of the fast phase of the ECSlin signal. Cyt. c and ECSlin were deconvoluted as explained in Methods.
(n = 4 ± S.D.). Cell concentration was 2. 10 7 cells mL-1. Note that both the slow phase of the ECSlin and reduction of cytochrome
c/f were completely abolished by the plastoquinone competitive inhibitor DBMIB 10 µM (black arrow).

52
Supplementary Figure 2.19 – In vivo changes in the NADPH redox state and ATP in wild type and AOX knockdown mutants.
(A) Changes in NADPH at different light intensities. Light and dark periods are represented by white and black boxes,
respectively. Light intensities were 50, 100, 200 and 400 µmol. quanta m-2 s-1 (green, blue, red, and black traces, respectively).
Chl concentration was ~5 µg mL-1. (B) Representative spectra from cells of wild type (left panel) and AOX knockdown C5 (middle
panel) and C9 (right panel) in the dark (red), light (green) and light + AA (blue) conditions are shown, with normalization to the
internal standard (methylenediphosphonate; pH 8.9). The positions of the α, β and γ phosphates of NTPs are shown. Inserts
show the quantification of the NTP content in wild-type and AOX knockdown mutant cells, as reported in Supplementary Figure
2.14 E (± S.D.).

53
Supplementary Figure 2.20 – Cyclic electron flow in representative diatoms. (A) Linear (closed circles) and cyclic (in the presence
of DCMU) electron flows were measured at different light intensities, as in Supplementary Figure 2.13, in Thalassiosira weissflogii
(black), Thalassiosira pseudonana (blue) and Fragilaria pinata (red). (B) CEF was plotted against LEF. The red line corresponds to
CEF = 5% of the maximal total electron flow. (n = 3-5 ± S.D.).

54
Supplementary Figure 2.21 –ΔΨd and photosynthesis under conditions of respiratory inhibition in representative
diatoms. Dark respiration (A,B,C,D), ΔΨd (E,F,G,H) and ETRPSII (I,J,K,L ), in conditions of different levels of inhibition of
the respiratory pathway with saturating Antimycin A, and/or saturating SHAM. Panels a, e and i: T. weissflogii (black).
Panels B, F and J: T. pseudonana (blue). Panels C, G and K: F. pinnata (red). Panels D, H and l: D. brightwelii (green). (
n= 2-6 ± S.D.).

55
2.3.2.3 Materials and methods
Growth conditions: Wild type and AOX transformant lines of Phaeodactylum tricornutum Pt1.86
(CCMP 2561) were grown in artificial sea water (ASW; Vartanian et al., 2009). Thalassiosira
pseudonana (CCMP 1335), Thalassiosira weissflogii (CCMP 1336), Fragilaria pinnata (CCAP 1029/2)
and Ditylum brightwelii (CCMP 359) were grown in F/2 medium, supplemented with silica (Guillard,
1975). All strains were grown at 19 ± 1 °C, in semi-continuous batch culture with moderate shaking.
The photoperiod was 12 h light/12 h dark, and light irradiance was 70 µmol quanta m-2 s-1. Cell
concentration was determined daily with a Z2 Coulter Counter analyzer (Beckman Coulter), to
ensure all the experiments were performed with cells in exponential phase. For biophysical
measurements, cells were concentrated by centrifugation and resuspended in their growth medium
(supplemented with 10% w/v Ficoll to prevent cell sedimentation), and kept in the dark at least 30
minutes before measurements.
Inhibitors: 3-(3,4-dichlorophenyl)-1,1-dimethyl-urea (DCMU), Carbonyl cyanide-4-
(trifluoromethoxy)phenylhydrazone (FCCP), Antimycin A (AA), Myxothiazol and salicylhydroxamic
acid (SHAM) (Sigma-Aldrich, Munich, Germany) were dissolved in ethanol, whereas Hydroxylamine
(HA), glucose, glucose oxidase and catalase (Sigma-Aldrich, Munich, Germany) were dissolved in
deionized water. FCCP was used at a very low concentration (8 nM, Figure 2.9 B) to allow the
disruption of the dark PMF without preventing the light-induced generation of PMF needed to
quantify the ΔΨd. AA and Myxothiazol were used at 5µM, unless otherwise stated (Figure 2.9 B and
Supplementary Figure 2.15). DCMU was used at a concentration of 15µM. In every measurement
involving HA or SHAM, the lowest inhibitor concentration to induce a full inhibition of PSII activity
or maximum inhibition of respiration, respectively, was used. The range of concentrations used was
30-100µM and 500-1000µM for HA and SHAM, respectively. Anaerobic conditions were obtained
through incubation with catalase (1000 U/mL), glucose (10 mM) and glucose oxidase (2 mg/mL).
Note that AA has been described as an inhibitor of cyclic electron flow, affecting the NDH-related
pathway (Joët et al., 2001). However, this potential effect was ruled out in diatoms, where no
change in cyclic electron flow was noticed upon addition of AA, consistently with the fact that genes
encoding for the NDH complex are invariably lacking in diatom chloroplast genomes. AA and
Myxothiazol were preferred to potassium cyanide to block the cyanide sensitive pathway of
respiration, because potassium cyanide also affects RuBiCO activity (Wishnick & Lane, 1969),
ascorbate peroxidase (Nakano & Asada, 1987) and Cu/Zn superoxide dismutase (Asada et al., 1974).

56
Deconvolution of linear and quadratic ECS components: To deconvolute the linear and quadratic
contributions to the ECS signals, cells were left for an hour in the cuvette to reach complete
anaerobiosis. In these conditions, the ATP synthase activity is slowed down, and long-living ECS
signals are no longer contaminated with other light-induced absorption changes (principally c-type
cytochromes redox change signals). Light stimulation of cells was achieved with a series of 6 laser
single turnover (duration ~7 ns) saturating flashes, provided by a laser dye (LDS 144 698) pumped
by a double frequency Nd-YAG laser (Quantel, Brilliant, France). We considered that the relaxation
of the electric field generated by the light stimulus is described by the exponential function: ΔΨ=
ΔΨ0 .exp(-t/t), where t is time, ΔΨ0 is the initial electric field generated by the light, and t is the
electric field decay lifetime. The linear and quadratic components of the ECS are theoretically
proportional to ΔΨ and ΔΨ2 respectively. Therefore, the ΔI/I spectro- temporal matrixes (from 460
to 600 nm) can be described by a sum of two exponentials: y (λ ,t) = A(λ).exp(-t/t) + B(λ).exp(-2.t/t)
+ C(λ). The kinetics of ECS relaxation were fitted by a global routine, which considers the lifetime t
as a global (wavelength independent) variable, and the amplitudes of linear and quadratic
components (A and B, respectively) as local (wavelength dependent) variables. A non-decaying
component (C) was also included in the fit to account for a small fraction of residual signal at long
delay times. The plot of the A and B amplitudes as a function of the wavelength provides the Decay
Associated Spectra of the linear and quadratic contributions to the ECS signal, respectively, which
are reported in Figure 2.17 A. The fit was performed using a home-made software, which uses the
MINUIT package, developed and distributed by CERN, Geneva, Switzerland, implemented in
FORTAN77. It minimizes the reduced sum of squared residues between the model function and the
experimental data, employing a two-steps protocol involving an initial search that utilises the
Simplex method (Nelder-Mead algorithm) and a refined search using the Levenberg-Marquardt
algorithm as described in Santabarbara et al., 2009. The quality of the fit description was judged on
the basis of reduced sum of squared residues statistics, visual inspection of the fit residuals,
residuals autocorrelation and stability of the solutions upon random perturbation of the best-fit.
Measurements of c-type cytochromes and linear and quadratic ECS: Absorption difference signals
were measured at different wavelengths with a Joliot-type spectrophotometer (JTS-10, Biologic,
France), equipped with a white probing LED and the appropriate interference filters (3 to 8 nm
bandwidth). For ΔΨd measurements, the PMF was increased using a ~10ms pulse of saturating (4500
µmol quanta.m-2.s-1) red light (see Supplementary Figure 2.14 for representative ECS kinetics). For

57
P. tricornutum, ECS signals were evaluated using 3 wavelengths, to eliminate contribution from c-
type cytochromes (see Supplementary Figure 2.14). The latter was calculated as Cyt. c = [554]-
0.4.[520]-0.4.[566], where [554], [520] and [566] are the absorption difference signal at 554 nm,
520 nm and 566 nm, respectively. The very similar relaxation of c-type cytochromes in aerobic and
anaerobic conditions, despite very different ECS relaxations (Supplementary Figure 2.14 B),
demonstrates the validity of the Cyt. c deconvolution procedure. Then ecslin and ecsquad (ECS signals
before correction for the ΔΨd) were estimated form the following relationships: ecslin=[520]-
0.25.Cyt. c and ecsquad=[566]+0.15.Cyt. c. For the other diatoms, appropriate wavelengths were
chosen for calculating ecslin and ecsquad (red and blue lines in Figure 2.11) to minimize the
cytochrome contributions. ECS data were then normalized to the ecslin increase upon a saturating
laser flash (i.e., 1 charge separation per photosystem, see Melis, 1982). The relationships between
ecsquad and ecslin were fitted with the parabolic equation ecsquad+ a. ΔΨd 2 = a.(ecslin+ ΔΨd)2, where
ΔΨd is the electric component of the PMF in the dark (expressed in charge separation per PS) and a
is constant for all the experiments related to a diatom species (see Supplementary Figure 2.14 C).
The ecslin and ecsquad values represent ECS changes relative to dark values. Therefore, we corrected
them for the dark electric field. This leads to ECSlin = ecslin + ΔΨd, and ECSquad = ecsquad + a.ΔΨd2, i.e.
absolute values of the ECS signals. This simply corresponds to a shift of the x and y axis to allow the
minimum of the parabola to coincide with the origin of the axes (see Supplementary Figure 2.15 D),
and leads to ECSquad = a.ECSlin2. This leads to evaluation of ΔΨd as the minimal ECSlin value of the
experimental data (for example, the ΔΨd in P. tricornutum as ~ 5 charge separations by PS, i.e., 100
mV12 , Figure 2.8 C and Supplementary Figure 2.14 D). The presence of linear and quadratic ECS
components allows measuring the absolute value of the ΔΨ in the dark (ΔΨd). Indeed the amplitude
of the linear ECS response (ecslin) observed upon a light stimulus increasing the ΔΨ is constant, i.e.
independent on the value of the field pre-existing the illumination (ΔΨd). Conversely, the amplitude
of the quadratic ECS response (ecsquad) is a function of the value of the ΔΨd. Therefore, plotting the
amplitude of the ecsquad vs ecslin allows quantifying the absolute value of the electric field in the dark
(ΔΨd).
Cyt b6f turnover was measured though the slow phase (phase B; Joliot & Delosme, 1974) of the
linear ECS, which reflects b6f-catalysed charge transfer across the membranes, and through the
reduction rate of the c-type cytochromes (c6/f), using the 3 wavelengths deconvolution procedure
described above. Measurements were performed after a saturating laser flash.

58
Measurements of photosynthetic flows: For calculation of the total electron flow (TEF, the sum of
linear and cyclic electron flows) and cyclic electron flow (CEF) capacities, we measured the
photochemical rates in the absence and presence, respectively, of DCMU. In brief, under steady
state illumination conditions, the ECS signal results from concomitant transmembrane potential
generation by PSII, the cytochrome b6f complex and PSI and from transmembrane potential
dissipation by the plastid ATP synthase When light is switched off, PS activities stop immediately,
while ATP synthase and cytochrome b6f complex activities remain (transiently) unchanged.
Therefore, the difference between the slopes of the linear ECS signal (ECSlin) measured in the light
and after the light is switched off (sD-sL) is proportional to the rate of PSI and PSII photochemistry
(i.e. to the rate of “total” electron flow, Supplementary Figure 2.13 A). Because the linear ECS has
been normalized to the amplitude of the linear ECS signal induced by a saturating laser flash (Nakano
& Asada, 1987; see above), the difference of slopes evaluates the number of charge separations per
photosystem and per second. The rate of CEF can be evaluated using the same approach under
conditions where PSII activity is inhibited by DCMU, and dividing this slope by the linear ECS signal
induced by a saturating laser flash in the presence of PSII inhibitors (1 charge separation per PSI;
Bailleul et al., 2010). This was done using saturating concentrations of DCMU, which block PSII
oxidation by PSI and of hydroxylamine, to avoid charge recombination within PSII.
Fluorescence-based measurements: Fluorescence-based photosynthetic parameters were
measured with a fluorescence imaging setup described in Johnson et al., 2009. Photosynthetic
electron transfer rate ETRPSII and NPQ were calculated, respectively, as (Fm’-F)/Fm’.I and (Fm-
Fm’)/Fm’, where F and Fm’ are the steady state and maximum fluorescence intensities in light
acclimated cells (respectively), Fm is the maximal fluorescence intensity in dark-adapted cells, and I
is the light irradiance in µmol quanta.m-2.s-1 (Genty et al., 1989; Bilger & Björkman, 1990). The light
saturation curves of ETRPSII were fitted with the exponential rise function P = Pmax (1- exp(E/Ek)),
where Pmax is the maximal photosynthetic electron transport rate and Ek is the optimal light.
ΔETR/ETR (Figure 2.10 A) was calculated as (ETRref-ETR).100/ ETRref, the reference being the wt in
control conditions.
Membrane inlet mass spectrometer (MIMS) measurements: Samples were introduced in a 3 mL
thermostated cuvette, which was connected to a Quadrupole Mass Spectrometer (QMS 200,
Pfeiffer Vacuum Prisma, Asslar, Germany) by a stainless steel vacuum tube (0.125 inch) passing

59
through a water trap filled with ethanol and dry ice. The sample was separated from the tube via a
gas permeable inlet system (PTFE membrane). 18O2 was added as a bubble to the algal suspension,
and the bubble was removed prior to the experiment. The measurements of the partial pressure of
16O2 (P16O2, m/z = 32), 18O2 (P18O2, m/z =36) and Argon (m/z =40) were performed after the cuvette
was sealed. A blue LED source was connected to the cuvette, and the light irradiance was manually
adjustable in the 0 to ~800 µmol quanta.m-2.s-1 range. The temperature was kept at 19 ± 1 °C in the
cuvette during the experiment.
To calculate gross O2 production (E0) and uptake (U0), respectively, production and consumption by
the cells, we adapted the equations from Peltier & Thibault, 1985:
U0 = (Δ[18O]/Δt + k[18O]).([18O]+[16O]/[18O])
E0 = (Δ[16O]/Δt + k[16O]) + U0.([18O]+[16O]/[16O])
Where k is the rate constant of O2 decrease measured in the absence of algae. We normalized O2 to
Argon- a biologically inert gas with very similar solubility properties, which decreases the sensitivity
of O2 measurements to fluctuations by ~80% (Kana, 1994). The gas concentrations were calibrated
by measuring air-equilibrated O2 concentration (stirring deionized water in the open cuvette for at
least 5 hours) and background O2 (bubbling with N2).
Respiration rates were measured as O2 exchange rates using a Clark-type oxygen electrode at 19°C
(Hansatech Instrument, King’s Lynn, UK). AOX capacity was measured as SHAM-sensitive respiration
in conditions where the cyanide-sensitive pathway was beforehand inhibited (AA, 5µM).
ATP/NADPH in vivo measurements: NADP+/NADPH redox changes were followed in living cells
using a dual PAM (Walz, Germany). NADPH fluorescence was measured at 460 nm, upon excitation
in the near UV. Chlorophyll a concentration was ~ 5 µg. mL-1. ATP content was measured using an
in vivo (Santabarbara et al., 2009) P- AMX 400 NMR spectrometer equipped with a 25-mm
multinuclear probe tuned at 161.9 MHz, and a home-made lighting system, as described in
Rivasseau et al., 2009. The relative ATP content was estimated in vivo from the surface of α-, β- and
γ-phosphorus resonance peaks corresponding to the three phosphates of NTPs, which dominate the
NMR spectra with inorganic phosphate and polyphosphates (Bligny & Douce, 2001).
Western blots and immunolocalization: Protein samples (5-10 µg) were loaded on 13% SDS-
PAGE gels and blotted to nitrocellulose. Primary AOX antibody was customly designed (Sdix, USA,

60
1:4000 dilution). All other antisera used were obtained from Agrisera (Vännäs, Sweden). The blots
were developed with ECL detection reagent and images of the blots were obtained using a CCD
imager (Chemidock MP Imaging, Bio-Rad). Immunolocalization of AOX was generally done as
described in (Bailleul et al., 2010). Briefly, cells were fixed with 2% formaldehyde in culture media for
20 minutes, washed 3 times with marine phosphate buffer (mPBS, see Van de Meene & Pickett-
Heaps, 2004) and premeabelized by 1% Triton X-100 in mPBS for 10 minutes. The cells were washed
again, blocked for 30 minutes in 1% BSA in mPBS and incubated over night at room
temperature with anti-AOX antibody from rabbit (custom design, Sdix, USA, 1:200 dilution in mPBS).
The cells then were rinsed with mPBS and incubated with donkey Alexa 488-conjugated anti-rabbit
IgG antibody (Life Technologies, USA, at 1:100 dilution in mPBS) for 2 h at room temperature. Cells
were then stained with 0.5µg/ml DAPI (4’,6’-diamidino-2-phenylindole, Life technologies) for 10 min
and mounted with Vectashield (Vector Laboratories, Inc., USA) after a rinse. Finally the cells were
observed using a Leica SP5 confocal microscope (Leica Microsystems, Germany).
Electron microscopy: For transmission electron microscopy (TEM), P. tricornutum cells were fixed
in 0.1 M cacodylate buffer (Sigma-Aldrich) pH 7.4 Containing 2.5% glutaraldehyde (TAAB), 2%
formaldehyde (Polysciences, Inc.) for one hour at room temperature and then prepared according
to a modified protocol from Deerinck et al. (http://ncmir.ucsd.edu/ sbfsem-protocol). After the
dehydration steps, the cells were infiltrated with ethanol/Epon resin mixture (2/3-1/3 for one hour
and 1/3-2/3 for one hour) and finally embedded in Epon in a 60°C oven for 48 hours or longer.
Ultrathin sections (60 nm) were prepared with a diamond knife on an UC6 Leica ultramicrotome and
collected on 200 µm mesh nickel grids before examining on a JEOL 1200 EX electron microscope.
Contributions
B.B., L.T., C.B., G.F. designed the study. B.B., N.B., O.M., D.P., J.P., A.T., V.V., R.B., S.F., D.F., A.K-L,
S.S., F.R., P.J., L.T., P.C., G.F. performed experiments. B.B., N.B., O.M., D.P., R.B., A.K-L, F.R., P.J., L.T.,
P.F., P.C., C.B., G.F. analyzed the data. B.B., C.B., G.F. wrote the manuscript, and all authors revised
and approved it.

61
2.3.3 Perspectives
The presented work discloses the energetic interactions between chloroplast and mitochondria that
are required for optimization of photosynthesis in diatoms. Since its publication I have performed
new structural studies, taking advantage of the FIB-SEM technology, thereby addressing new
questions. According to literature, the number and size of mitochondria, in this group of algae,
remain a mystery. Round and collaborators in 1990 proposed that its morphology follow a long
structure localized in the cytoplasm. The lacking of comparative studies on mitochondria structure
in diatoms switched on our curiosity and comprehensive studies have been performed. Our recent
3D reconstitution of an intact cell of P. tricornutum indicate that every cell contain a single
chloroplast, but also a single mitochondrion, which is highly ramified and sits on the chloroplast.
This mitochondria is partially sandwiched between the chloroplast and the nucleus and reinforces
our conclusion about the physical exchanges between the two organelles but also raises the
important question on the mechanism of these exchanges. The optimization of protocols for
scanning electron microscopy should address this question. One approach to move a step forward
will be the improvement of the 3D reconstitution of Phaeodactylum tricornutum cells enhancing the
resolution of the chloroplast and mitochondria-fused membranes. Furthermore, an interesting
point will be to visualize these “fusion junction” and elucidate the configuration of the transporters
that underline the energetic exchanges reported in the paper presented here. A promising strategy
is the use of cryo-EM tomography linked with the correlative light EM (CLEM), to localize the carriers
within the fusion membranes. Combining molecular and structural techniques, in a comprehensive
approach, will be possible to identify these transporters and finally unravel the structural
arrangement of the machineries that optimize photosynthesis in diatoms.

62
2.4 Phaeodactylum periplastidial compartment
2.4.1 Preface
The article presented in this section focuses on the periplastidial compartment of the model
organism Phaeodactylum tricornutum.
Diatoms plastids derives from the engulfment of a red alga by another eukaryotic cell, followed by
reduction of symbiont cell structures. In the pennate diatom Phaeodactylum tricornutum, like in all
the other photosynthetic organisms studied so far, most plastid proteins are encoded in the nucleus
and imported through these membranes. However, consistent with the fact that four membranes
(instead of two in plants and green algae) constitute the chloroplast envelope of diatoms, the
translocation of many components between the cytosol and the chloroplast should require a
different transport machinery. So far it is not clear if transport through the periplastidial
compartment (PPC) could occur via membrane translocators or via unknown vesicular trafficking
systems. Consistent with the latter, a vesicular network (VN) was observed in the PPC of
Ochromonas danica (Gibbs, 1979), a Chrysomonad close to, but distinct from diatoms.
Ultrastructural studies also support the existence of a VN in the PPC in diatoms (Bedoshvili et al.,
2009) but their location within the cell has not been assessed so far. Taking advantage of ultrathin
sections of disrupted P. tricornutum cells obtained using the focus ion beam-scanning electron
microscopy (FIB-SEM; see section 3.4.2) we revealed the presence of a vescicular network in the
PPC of Phaeodactylum tricornutum. This network represents a potential candidate for the trafficking
process mentioned above. Moreover, we saw direct membrane contacts between the periplastidial
membrane (PPM) and the nuclear inner envelope membrane at the level of the chloroplast-nucleus
isthmus. Overall, this study not only provides insights into the subcellular organization of membrane
compartments in diatoms, but also allows corroborates previous hypotheses for the protein import,
i.e. a process that is fundamental to understand the function, biogenesis and dynamics of secondary
plastids, at the structural level.

63
2.4.2 Ultrastructure of the Periplastidial Compartment of the Diatom Phaeodactylum
tricornutum
Serena Floria, Pierre-Henri Jouneaub, Giovanni Finazzia, Eric Maréchala, and Denis Falconeta
aLaboratoire de Physiologie Cellulaire et Végétale; Unité Mixte de Recherche 5168 CNRS – CEA –
INRA – Université Grenoble Alpes; Institut de Recherche en Sciences et Technologies pour le Vivant;
CEA-Grenoble; 17 rue des Martyrs; 38054 Grenoble Cédex 9, France
bLaboratoire d'Etudes des Matériaux par Microscopie Avancée; Institut Nanosciences et Cryogénie;
Service de Physique des matériaux et Microstructures; CEA-Grenoble; 17 rue des Martyrs; 38054
Grenoble Cédex 9, France
Abstract
Diatoms contain a secondary plastid that derives from a red algal symbiont. This organelle is limited
by four membranes. The two outermost membranes are the chloroplast endoplasmic reticulum
membrane (cERM), which is continuous with the host outer nuclear envelope, and the periplastidial
membrane (PPM). The two innermost membranes correspond to the outer and inner envelope
membranes (oEM and iEM) of the symbiont’s chloroplast. Between the PPM and oEM lies a
minimized symbiont cytoplasm, the periplastidial compartment (PPC). In Phaeodactylum
tricornutum, PPC-resident proteins are localized in “blob-like-structures”, which remain associated
with plastids after cell disruption. We analyzed disrupted Phaeodactylum cells by focused ion beam
scanning electron microscopy, revealing the presence of a vesicular network (VN) in the PPC, at a
location consistent with blob-like structures. Presence of a VN in the PPC was confirmed in intact
cells. Additionally, direct membrane contacts were observed between the PPM and nuclear inner
envelope membrane at the level of the chloroplast-nucleus isthmus. This study provides insights
into the PPC ultrastructure and opens perspectives on the function of this residual cytoplasm of red
algal origin.

64
Diatoms constitute a major group of phytoplankton in oceans and freshwater ecosystems, and are
so ecologically successful that they are responsible for up to one fourth of global primary
productivity (Field et al., 1998). Based on comprehensive surveys of oceanic biodiversity, diatoms
are spread globally and are the most diverse photosynthetic eukaryotic lineage (de Vargas et al.,
2015; Massana et al., 2015). A striking feature of diatoms is their sophisticated ultrastructure, inside
highly packed cells, including a chloroplast bounded by four membranes, known as a ‘secondary’ or
‘complex plastid’. Our understanding of the structure of this organelle and its relationship with the
rest of the cell is fragmentary. Plastid-mitochondrion metabolic interactions were recently shown
to optimize bioenergetic coupling, being one of the reasons for diatoms’ performance in ecosystems
(Bailleul et al., 2015; see section 2.3). The stroma of diatoms’ chloroplast is also the site of
production of fatty acids, which are precursors for the biosynthesis of all membrane and storage
glycerolipids, but it is still unknown how these fatty acids and glycerolipids can traffic across and
inside subcellular membranes to reach their final destination (Abida et al., 2015). Important
shuttling of proteins, lipids and other metabolites is therefore expected to occur through the four
membranes limiting the plastid. Diatom glycerolipids are considered a promising feedstock for
biofuels and other lipid-derived chemicals (Levitan et al., 2014). It is therefore essential, but
challenging, to advance knowledge on the subcellular organization and connectivity of membranes
within diatom cells.
The secondary plastid derives from the engulfment of a red alga by another eukaryotic cell, followed
by the reduction of the symbiont subcellular structures (Cavalier-Smith, 2003; McFadden, 2014;
McFadden & van Dooren, 2004; Nisbet et al., 2004). Such secondary plastids are found in groups
that are distant from diatoms (Heterokonta), like Cryptophyta, Haptophyta, Chromerida or
Apicomplexa (Cavalier-Smith, 2003; Dorrell & Smith, 2011; Gibbs, 1962a, b, c, 1979, 1981; Maréchal
& Cesbron-Delauw, 2001; Petroutsos et al., 2014). Secondary plastids are therefore chimeric
organelles, combining host and symbiont-derived structures. The outermost membrane, termed the
‘chloroplast endoplasmic reticulum membrane’ (cERM, Figure 2.22; Gibbs, 1979) is supposed to
derive from the host phagocytic membrane (Cavalier-Smith, 2003; McFadden & van Dooren 2004;
Nisbet et al., 2004) and is therefore expected to be phospholipid rich (Abida et al., 2015; Petroutsos
et al., 2014).

65
In diatoms, the cERM is directly connected to the host outer nuclear envelope membrane (oNE) and
the ER (Bouck, 1969; Kroth et al., 2008). In other groups, like Apicomplexa, the cERM and the
endomembrane system are not continuous and transfers of material occurs via vesicular trafficking
(Heiny et al., 2014; van Dooren et al., 2001; van Dooren et al., 2000). Underneath, the ‘periplastidial
membrane’ (PPM, Figure 2.22) is considered to derive from the symbiont plasma membrane
(Grosche et al., 2014), although an alternative origin from the host ER has been recently proposed
(Gould et al., 2015). The nature of the two innermost membranes of the chloroplast is not debated,
being reminiscent of the galactolipid-rich chloroplast envelope of the symbiont, called the ‘outer’
and ‘inner envelope membranes’ (oEM and iEM, Figure 2.22; Botté & Maréchal, 2014; Petroutsos
Figure 2.22 – Chimeric organization of the secondary plastid in diatoms. The scheme shows a fusiform cell of Phaeodactylum.
The plastid is limited by 4 membranes. The chloroplast endoplasmic reticulum membrane (cERM), shown in blue, is continuous
with the outer nuclear envelope membrane. The periplastidial membrane (PPM) is shown red. The outer and inner envelope
membrane (oEM and iEM), shown in light green, are tightly apposed. The presence of a specific periplastidial compartment (PPC)
is based on the detection of blob-like structures observed by confocal microscopy, in which protein precursors fused to GFP and
crossing only the cERM and the PPM reside. The presence of VN in this PPC is addressed here. C, chloroplast; N, nucleus; M,
mitochondrion.

66
et al., 2014). Between the PPM and oEM lies a minimized symbiont cytoplasm, the ‘periplastidial
compartment’ (PPC, Figure 2.22; Grosche et al., 2014). The cytoplasmic remains of the red algal
symbiont show different degrees of reduction. Cryptophytes like Guillardia theta contain a
minimized version of the nucleus in the PPC, called the nucleomorph (Curtis et al., 2012), whereas
other groups including diatoms have completely lost the symbiont nucleus.
Phaeodactylum tricornutum is by far the most studied pennate diatom, following the complete
sequencing and annotation of its genome (Bowler et al., 2008), the development of molecular tools
for gene expression and functional characterizations (Apt et al., 1996; De Riso et al., 2009; Falciatore
et al., 1999; Siaut et al., 2007) and the production of reference data for membrane lipidomic studies
(Abida et al., 2015). P. tricornutum is pleiomorphic, with three major morphotypes, i.e. fusiform
(shown in Figure 2.22), triradiate and oval. A series of axenic strains have been collected in various
marine environments worldwide, including Pt1, which has been analyzed here (De Martino et al.,
2007). Subcellular localization of proteins in the secondary plastid of P. tricornutum relies on
confocal imaging of cells expressing the green fluorescent protein (GFP) fused to various addressing
sequences (Gould et al., 2006; Grosche et al., 2014; Gruber et al., 2007; Hempel et al., 2009; Kilian
& Kroth, 2005; Moog et al., 2011; Peschke et al., 2013; Sommer et al., 2007).
Most plastid proteins in P. tricornutum are nuclear encoded: their sequences contain a bipartite
topogenic signal (Bts), comprising an N-terminal signal peptide (Sp), a chloroplast-like transit
peptide (Ctp) and an amino acid motif at the cleavage site of the Sp, termed the ASAFAP motif
(Gould et al., 2006; Gruber et al., 2007; Kilian & Kroth, 2005; Moog et al., 2011). Three major
translocating systems are involved to import plastid proteins harboring a Bts (Supplementary Figure
2.29). Firstly, a sec61 complex operates by co-translational mediation of pre-proteins across the cER
(Bolte et al., 2009). Secondly, the symbiont endoplasmic reticulum-associated degradation (ERAD)
machinery has evolved to give rise to a translocon called the ‘symbiont-specific ERAD-like
machinery’, or SELMA (Felsner et al., 2011; Hempel et al., 2007; Hempel et al., 2009; Lau et al., 2015;
Sommer et al., 2007; Stork et al., 2012; Stork et al., 2013). Thirdly, transport across the oEM and
iEM involves components related to the classic chloroplast translocon, i.e. TOC and a TIC
respectively (Bullmann et al., 2010; Heinz & Lithgow, 2014; Schleiff & Becker, 2011; Schleiff et al.,
2011; Sommer et al., 2011; Stork et al., 2013; Wunder et al., 2007).
Following docking of ribosomes at the surface of the secondary plastid, the Sp determines the
targeting via the cERM and PPM (Supplementary Figure 2.29). The presence of a phenylalanine (F)
or an aromatic residue at position +1 of the Ctp determines the transport across the oEM and the

67
iEM. In the absence of such aromatic amino acid, proteins remain resident in the PPC (Gould et al.,
2006; Gruber et al., 2007; Kilian & Kroth 2005; Moog et al., 2011). A recent study has shown that
pre-proteins could be N-glycosylated prior their transport through the PPM (Supplementary Figure
2.29), probably by the action of an oligosaccharide transferase (OST; Peschke et al., 2013). An
important question is then posed by this discovery, regarding the possibility to import some of the
plastid proteins, most notably folded glycoproteins, via membrane translocators or via unknown
vesicular trafficking systems.
The evidence for a protein to reside (or be blocked) inside the PPC lies on the detection of GFP
fusions inside single spot-like structures at the periphery of the plastid, called “blob-like-structures’
(Gould et al., 2006; Gruber et al., 2007; Kilian & Kroth, 2005; Moog et al., 2011). The presence of
membrane vesicles in blob-like structures was considered as possible based on the arrest of protein
import by treatment with Brefeldin A (Kilian & Kroth, 2005), however in following studies, this
hypothesis was never confirmed. Consistently with the absence of vesicles, no PPC-specific
component involved in vesicular lipid trafficking, such as Rabs, SNAREs, COPI, COPII, chlathrin,
calveolin, ESCRT, GEFs or GAPs could be predicted (Moog et al., 2011).
In a comprehensive electron microscopy study of the chrysomonad Ochromonas danica, a vesicular
network (VN) was observed in the PPC (Gibbs, 1979). This VN has been initially called a periplastidial
reticulum (Gibbs ,1979). This network did not extend around the whole chloroplast of O. danica, but
was found restricted to particular locations, close to the nucleus (Gibbs, 1979). Apparent increase
of this VN after treatment with cycloheximide and disappearance after treatment with
chloramphenicol suggested a relation with protein import (Gibbs, 1979). This study is often
considered a reference to suggest that the PPC of diatoms may contain a VN, but the detection of
membrane translocators and the lack of putative PPC proteins acting in lipid trafficking have been
repeatedly used as an argument to consider the presence of vesicles as unlikely, or generated by
unknown components (Gould et al., 2006; Moog et al., 2011; Peschke et al., 2013; Sommer et al.,
2007). Ultrastructural study of chloroplasts in diatoms other than Phaeodactylum has supported the
existence of a VN in the PPC (Bedoshvili et al., 2009), but location within the cell and conservation
in the diatom phylum have not been assessed. The ultrastructure of the PPC needs therefore to be
characterized in P. tricornutum. We analyzed by electron microscopy series of ultrathin sections of
P. tricornutum cells, revealing the presence of a VN in the PPC, at a location corresponding to blob-
like structures.

68
2.4.2.1 Results and Discussion
Since blob-like structures remain associated to chloroplasts after cell disruption (Kilian & Kroth,
2005), we took advantage of this property and analyzed by electron microscopy series of ultrathin
sections of disrupted P. tricornutum cells (Figure 2.23 A and B). Series of thin sections allow the
detection of membrane connectivity in the three dimensions. Here, the thickness of section slices
was 4 nm, and 200 to 600 sections were collected per sample, allowing the ultrastructure scanning
of single organelles (chloroplast, mitochondrion or nucleus) from tangential sections (edges) to
cross sections (Figure 2.23 C).
Figure 2.23 – (A) Electron micrograph of an intact Phaeodactylum cell. (B) Disrupted cell. (C) Lateral view of the serial scanning
method. Slices or section are 4 nm-thin, and allow the detection of membrane continuity between successive cross sections. For
200 sections, the depth of the scanning is 1 µm. In the disrupted cell shown in Figures 2.10, 2.11 and 2.12, the tangential view of
the nucleus is in section 1, and that of the chloroplast is in section 136. C, chloroplast; M, mitochondrion; N, nucleus; Pyr, pyrenoid;
Thyl, thylakoids.

69
Focusing on a disrupted unpacked cell, the scanning of the region between a nucleus and a
secondary plastid is shown in Figures 2.24, 2.25 and 2.26. In these series, the identity of the
membranes is assessed by the connectivity in the two dimensions of the sections and the
conservation from one section to the following, i.e. the third dimension. To help trace membrane
identity and connectivity between sections, schematic representations are also shown: sections 1’,
48’, 140’, 145’, 152’, 178’, 184’ and 208’.
Firstly, Figure 2.24 shows the most tangential region of the nucleus. Section 1 corresponds to the
edge of this organelle, i.e. a tangential view of the oNE. Section 16 shows the tangential view of the
iNE. The following sections, e.g. 30, 44 or 48, are transverse views of the nucleus, containing the
chromatin, and allowing the visualization of nuclear pores (Figure 2.24, section 48, NP). The
uncondensed chromatin indicates that the cell is in interphase. In section 120, the cross section of
the nuclear envelope is slightly irregular and shows a constricted area (Figure 2.24, section 120,
dashed circle). In this constricted region of the nucleus the oNE is connected to the cERM (Figure
2.24, sections 136, bold dark arrows). In section 140, this oNE-cERM isthmus gets larger (Figure 2.24,
sections 140, bold dark arrows) and irregular tangential sections of the PPM are visualized facing
directly the iNE. Here, and in following sections, the oEM and the iEM appear as closely apposed
membranes.

70
Figure 2.24 – Serial electron micrograph scanning of a Phaeodactylum disrupted cell at the level of the cERM–oNE isthmus. The
outer nuclear envelope is shown in blue from a tangential section (1) to the level of sub-spherical nucleus (48 and 48’), where it
is lined with the inner nuclear envelope (iNE) shown in purple. The nucleus then forms a constricted area shown in dashed lines
(120). In the vicinity of the chloroplast, the oNE becomes continuous with the chloroplast endoplasmic reticulum membrane
(cERM). The edges of the isthmus are shown with arrows. M, mitochondrion; N, nucleus; NP, nuclear pore.

71
Secondly, Figure 2.25 shows a focus in the region where the iNE faces directly the PPM. In sections
142, 144 and 145 the PPM is less irregular and shows an increased apposition with the iNE. A
vesicular network (VN) appears between the PPM and the oEM/iEM. The PPM/iNE membrane
contact site expands from sections 148 to 152, becoming as large as the oNE-cERM isthmus.
Figure 2.25 – Serial electron micrograph scanning of a Phaeodactylum disrupted cell at the level of the iNE-PPM membrane contact.
The outer nuclear envelope (oNE) is shown in blue in continuity with the cERM. The inner envelope membrane (iNE) is shown in purple
and gets in very tight contact with the irregular periplastidial membrane (PPM; from 142 and further). A vesicular network (VN) fills the
space between the PPM and the two innermost membranes of the chloroplast, the outer and inner envelope membranes (oEM and
iEM, respectively), shown in light green. C, chloroplast; M, mitochondrion; N, nucleus; Thyl, thylakoids.

72
Thirdly, Figure 2.26 allows visualizing the expansion of the VN in regions where the oEM and cERM
are not connected. From sections 158 to 160 and 162, the oNE-cERM isthmus and the PPM/iNE
membrane contact site are clearly visible, whereas section 174 shows disconnected cross sections
of the chloroplast and the nucleus (Figure 2.26, sections 174, star). The VN is still visible, indicating
that the VN is close, but not strictly dependent on the nucleus-chloroplast isthmus. In sections 176
and 178, direct connections between the VN and the PPM are visible (Figure 2.26, section 178/178’,
bold arrow), whereas no link between the VN and the oEM could be detected. The VN is visible in
sections 188, 192 and is tangentially observed in section 200. Section 208 shows a second
connection between the nucleus and the chloroplast (Figure 2.26, section 208/208’, bold arrows),
but this time without any VN.
Thus this series illustrates that at the level of a large cERM-oNE isthmus a PPM/iNE membrane
contact site is established and a VN appears between the PPM and the oEM, connected to the PPM
but not to the oEM. The VN in the PPC is therefore at a location corresponding to that of blob-like
structures observed by confocal microscopy in Phaeodactylum cells broken by osmotic shock, and
initially reported to possibly contain membrane vesicles (Kilian & Kroth, 2005).
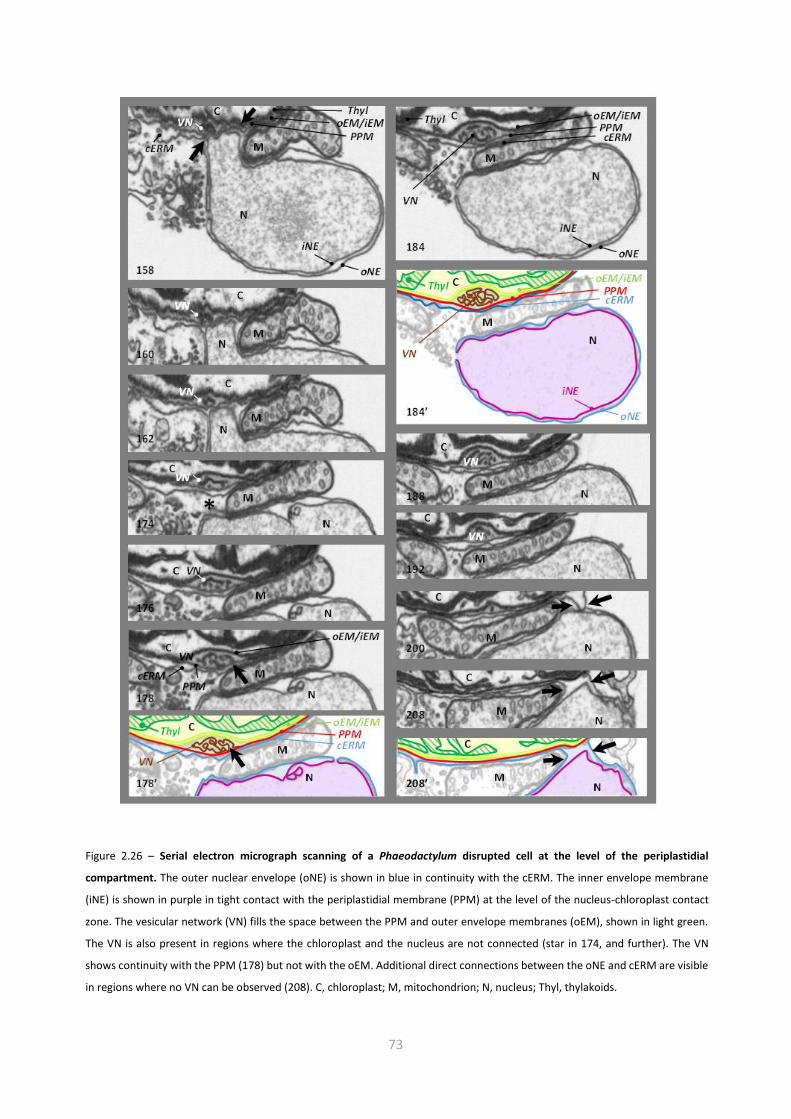
73
Figure 2.26 – Serial electron micrograph scanning of a Phaeodactylum disrupted cell at the level of the periplastidial
compartment. The outer nuclear envelope (oNE) is shown in blue in continuity with the cERM. The inner envelope membrane
(iNE) is shown in purple in tight contact with the periplastidial membrane (PPM) at the level of the nucleus-chloroplast contact
zone. The vesicular network (VN) fills the space between the PPM and outer envelope membranes (oEM), shown in light green.
The VN is also present in regions where the chloroplast and the nucleus are not connected (star in 174, and further). The VN
shows continuity with the PPM (178) but not with the oEM. Additional direct connections between the oNE and cERM are visible
in regions where no VN can be observed (208). C, chloroplast; M, mitochondrion; N, nucleus; Thyl, thylakoids.

74
Based on this analysis of disrupted and unpacked cells, we sought to establish whether the VN could
be detected in intact cells. Figure 2.27 shows three examples. In cell 1, the VN lies within a groove
between the PPM and the oEM, and appears therefore at two opposite locations of the chloroplast
periphery in the vicinity of the nucleus (Figure 2.27 A, sections 203, 320 and 332, black arrows), in
particular at the level of the nucleus-choroplast isthmus (sections 332, star). In cell 2, the VN appears
more distant from the nucleus (Figure 2.27 B, sections 235, 330 and 378, black arrow). In cell 3, the
VN appear close to the nucleus, but not in the area where the chloroplast-isthmus occurs. Overall,
the VN is therefore most often present close to the chloroplast-nucleus isthmus, where it might play
a functional and structural role, although other locations are possible. Using the complete set of
sections of cell 1 (Figure 2.27 A) we used the volume viewer of Fiji image analysis tools (Schindelin
et al., 2012) to reconstitute cross sections perpendicular to the main axis of the cell (Figure 2.27 D).

75
Figure 2.27 – Serial electron micrograph scanning of Phaeodactylum intact cells at the level of the periplastidial compartment.
Three cells are shown (cell 1, 2 and 3) in A, B and C. (A) magnified cross-section of cell 1 is shown in (D) corresponding to the video
provided in supplementary data. The vesicular network (VN) within the periplastidial compartment is shown with arrows. Ch,
chloroplast; m, mitochondrion; N, nucleus; ob, oil body.

76
The three-dimensional organization of the VN can thus be viewed in Supplementary Materials Video
A (http://dx.doi.org/10.1016/j.protis.2016.04.001). The ultrastructure of the VN in Phaeodactylum
is therefore similar to that of the VN observed in the Ochromonas, although in this chrysomonad,
the VN was only located close to the nucleus and appeared to have some direct connection with the
oEM in addition to the PPM (Gibbs, 1979).
We also examined previously published Phaedoctylum electron micrographs. In most cases, it is
barely possible to identify the limiting membranes of the chloroplast. In the in-depth study of
dividing cells published recently (Tanaka et al., 2015), one can see in some of sections, membrane
vesicular or reticulated structures in the periphery of the chloroplast, the precise nature of which
could not be assessed at that time, and which might be a VN within the PPC. In other diatoms like
Thalassiosira proshkinae, Attheya ussurensis, Chaetoceros muelleri, Aullacoseira baicalensis,
Synedra acus, a similar VN structure could be observed at the periphery of chloroplasts (Bedoshvili
et al. 2009). A PPM/iNE direct contact could also be observed in Thalassiosira proshkinae and
Chaetoceros muelleri (Bedoshvili & Likhoshvai, 2012). Thus, the organization of the PPC
characterized here in Phaeodactylum is likely conserved in both pennate and centric diatoms.
Probably the most important result of this study is that the PPC of diatoms is not empty. A residual
cytoplasm exists, containing vesicles. None of the proteins that were reported to reside, or possibly
reside, in the PPC could be predicted to act in vesicle formation, like SNAREs, Rabs, COPI, COPII,
chlathrin, calveolin, ESCRT, GEFs or GAPS (Moog et al., 2011). The VN must therefore be generated
by an unknown process. The identification of the proteins generating the VN in the PPC represents
therefore an important challenge for future works.
The glycerolipid composition of each of the four membranes that surround the plastid is unknown,
but the present study will be also crucial in future investigation related to membrane lipid
biogenesis. It is difficult to speculate on the location of the classical lipids found in the envelope of
primary chloroplasts in secondary plastids i.e. galactoglycerolipids (monogalactosyldiacylglycerol,
MGDG and digalactosyldiacylglycerol, DGDG), sulfoquinovosyldiacylglycerol (SQDG) and
phosphatidyldiacylgycerol (PG; Abida et al., 2015; Boudiere et al., 2014; Petroutsos et al., 2014) or
if phospholipids of the ER or nuclear envelope are also present and in the same proportions in the
cERM. Lipid composition of the PPM could be related to that of the cERM, by importing
phosphoglycerolipids, or to that of the oEM, by importing chloroplast lipids. In photosynthetic
organisms, it is usually considered that in standard conditions phospholipids are mostly present in
the endomembrane system, whereas non-phosphorus glycolipids are in the plastid. The analysis of

77
isolated secondary plastids has been possible in Apicomplexa, which is non-photosynthetic and
disconnected from the nucleus (Botte et al., 2013) and in that peculiar case, presence of
galactoglycerolipids could not be shown (Botté et al., 2008; Botte & Marechal, 2014; Botte et al.,
2013), whereas plastid membranes were clearly enriched in phosphoglycerolipids and even sterols
(Botte et al., 2013). Galactolipids could be detected in the photosynthetically active secondary
plastid of a Chromerida by immunofluorescence confocal imaging (Botte et al., 2011). The
comprehensive analysis of the lipidome of Phaeodactylum has shown the presence of MGDG,
DGDG, SQDG and even a form of SQDG acylated on its polar head (Abida et al., 2015). Based on our
observations, we speculate that galactoglycerolipids are present in the iEM and oEM and that
phosphoglycerolipids and betaine lipids are likely present in the cERM and the PPM. Membrane lipid
transfers might occur at the level of membrane contact sites, such as that observed here between
the PPM and the INE, or via dedicated platforms, such as the VN, or by other non-vesicular systems
between adjacent membranes.
The continuity between the PPM and the VN suggests that the biogenesis of the VN depends on the
PPC and not on the oEM. A summary of a possible scenario for the origin of the PPM and VN is thus
given in Figure 2.28.
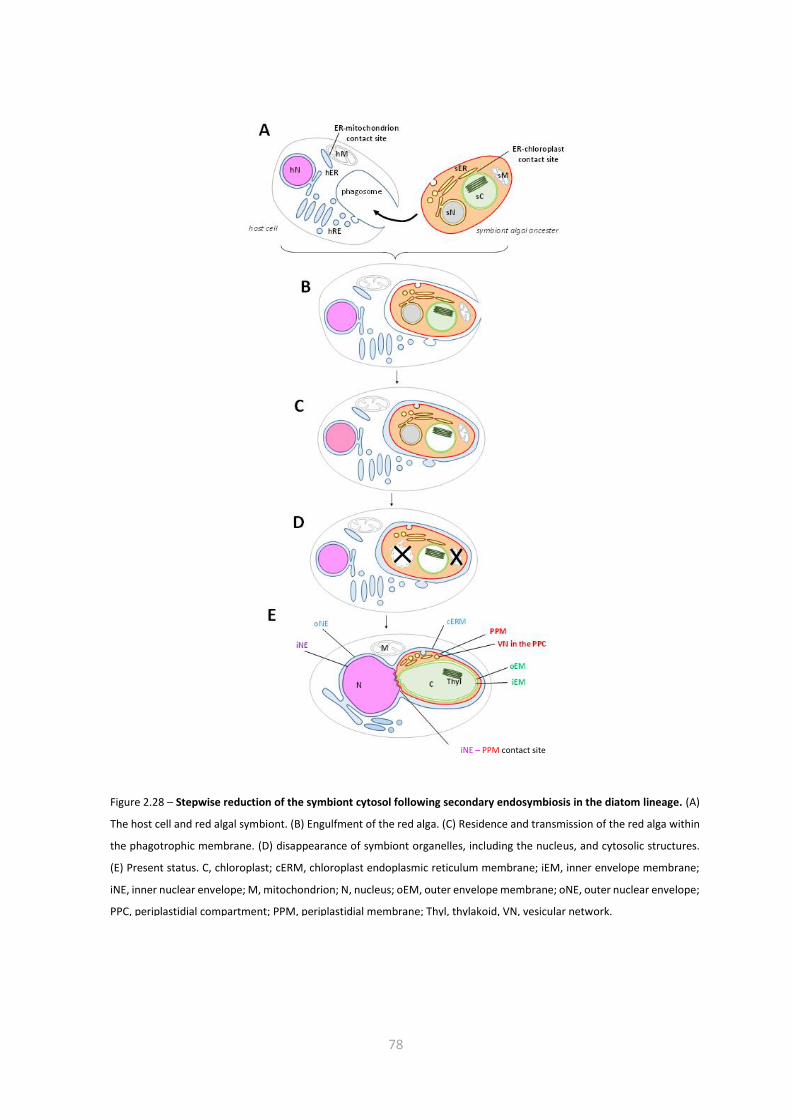
78
Figure 2.28 – Stepwise reduction of the symbiont cytosol following secondary endosymbiosis in the diatom lineage. (A)
The host cell and red algal symbiont. (B) Engulfment of the red alga. (C) Residence and transmission of the red alga within
the phagotrophic membrane. (D) disappearance of symbiont organelles, including the nucleus, and cytosolic structures.
(E) Present status. C, chloroplast; cERM, chloroplast endoplasmic reticulum membrane; iEM, inner envelope membrane;
iNE, inner nuclear envelope; M, mitochondrion; N, nucleus; oEM, outer envelope membrane; oNE, outer nuclear envelope;
PPC, periplastidial compartment; PPM, periplastidial membrane; Thyl, thylakoid, VN, vesicular network.
iNE – PPM contact site

79
Important questions raised by the present study lie in the molecular organization and the function
of the membrane compartments we have unraveled. Are there structural proteins involved in the
opening of a circular isthmus connecting the oNE and the cERM? What are the components
maintaining the iNE and the PPM closely apposed inside the opened oNE-cERM isthmus? Is the
iNE/PPM membrane contact site involved in the exchange of metabolites, ions, proteins or nucleic
acids? The plastid of diatoms seem to encode its required set of tRNAs and rRNAs (Oudot-Le Secq
et al., 2007), but other transfers of RNAs might occur. Retrograde signaling from the chloroplast to
the nucleus (Lepetit et al., 2013) might also occur at the level of this chloroplast-nucleus isthmus.
What are the proteins involved in the elaboration of the VN? How are the PPM and VN physically
connected? What is the function of the VN? The VN could be an important platform for the import
of some protein precursors, most importantly those that are folded and glycosylated after crossing
the cERM and PPM (Peschke et al., 2013). Protein transport from the VN to the oEM would therefore
need a non-vesicular process. This study provides therefore novel insights into the PPC
ultrastructure, opening fascinating perspectives to comprehend the origin of the secondary plastid
in diatoms, its protein and membrane lipid biogenesis and its sophisticated relationship with other
cell compartments.

80
Supplementary Figure
Supplementary Figure 2.29 – Protein import across the four chloroplast limiting membrane and via the
periplastidial compartment. Following mRNA transcription (1) and translation (2), plastid protein precursors
harbor a bipartite topogenic signal (Bts). A sec61 complex operates very early by co-translational mediation of
pre-proteins across the cERM (3) and release an unfolded protein precursor in the lumen of the chloroplast ER
(cER). This unfolded protein can be directed to the next membrane (4). Pre-proteins can also be N-glycosylated
prior their transport through the PPM (5), probably by the action of an oligosaccharide transferase (OST). A
translocon called the ‘symbiont-specific ERAD-like machinery’ (SELMA) is located in the PPM. In the SELMA, Derlin
proteins, sDer1-1 and sDer1-2, interact together and with the Bts. Components of a symbiont ERAD machinery,
i.e. sCdc48 ubiquitin-dependent AAA-ATPases, and their cofactors sUfd1 and sNP14, reside in the PPC. In the
absence of an aromatic amino acid at position +1 of the Ctp (+1=X), proteins remain resident in the PPC. Presence
of a phenylalanine or an aromatic residue (+1=F) determines the transport across the oEM and the iEM. Transport
across the oEM and iEM involves components related to the chloroplast translocon, i.e. TOC and a TIC
respectively. The TOC core component derives from a prokaryotic Omp85 sequence. Important TIC subunits well
characterized in plant and alga chloroplasts are conserved in the iEM, i.e. Tic20, Tic22, Tic62 and Tic110. Cleavage
of the Bts (8) by a transit peptide peptidase (TPP) releases mature proteins in the stroma (9). In this scheme the
transfer of folded proteins is not deciphered. Possible routes via a vesicle network (VN) in the PPC are shown.

81
2.4.2.2 Materials and methods
Phaeodactylum tricornutum cultivation: The Pt1 Phaeodactylum tricornutum strain (CCAP 1055/3)
was obtained from the Culture Collection of Algae and Protozoa, Scottish Marine institute, UK.
Culture was grown in exponential phase in ESAW (Enriched Seawater, Artificial Water) medium,
using 50 mL single-use flasks with 100 rpm shaking (Certomat BS-1 incubator; Sartorius stedim
biotech), a low light intensity of 20 µmol photon m-2.s-1 and a 12/12 hour light/dark photoperiod at
19°C.
Sample preparation for electron microscopy: Cells of P. tricornutum were harvested at logarithmic
phase before the offset of the light period at 5000 x g, 10 min, 4 °C. Cells were then fixed in 0.1 M
cacodylate buffer (Sigma-Aldrich), pH 7.4, containing 2.5% glutaraldehyde (TAAB), 2% formaldehyde
(Polysciences) for 1 h at room temperature and prepared according to a modified protocol from T.
J. Deerinck (http://ncmir.ucsd.edu/sbem-protocol).
Focused ion beam – scanning electron microscopy (FIB-SEM): Focused ion beam (FIB) tomography
has been realized in a Zeiss NVision 40 dual-beam microscope. In this technique, the Durcupan
embedded cells of P. tricornutum were cut in cross-section, slice by slice, with a Ga+ ion beam (of
700 nA at 30 kV), and each slice was imaged in scanning electron microscopy (SEM) at 5 kV using
the in-column EsB back-scatter detector. For each slice, a thickness of 4 nm has been removed, and
the SEM images are recorded with a pixel size of 4 nm. The image stack is then registered by cross-
correlation using the StackReg plugin in the Fiji software. This procedure gives us directly an image
the 3D structure of the sample with an isometric voxel size of 4x4x4 nm3.
Video A - The three-dimensional organization of the vesicular network (arrow) in cross sections of
Phaeodactylum tricornutum. (http://dx.doi.org/10.1016/j.protis.2016.04.001).
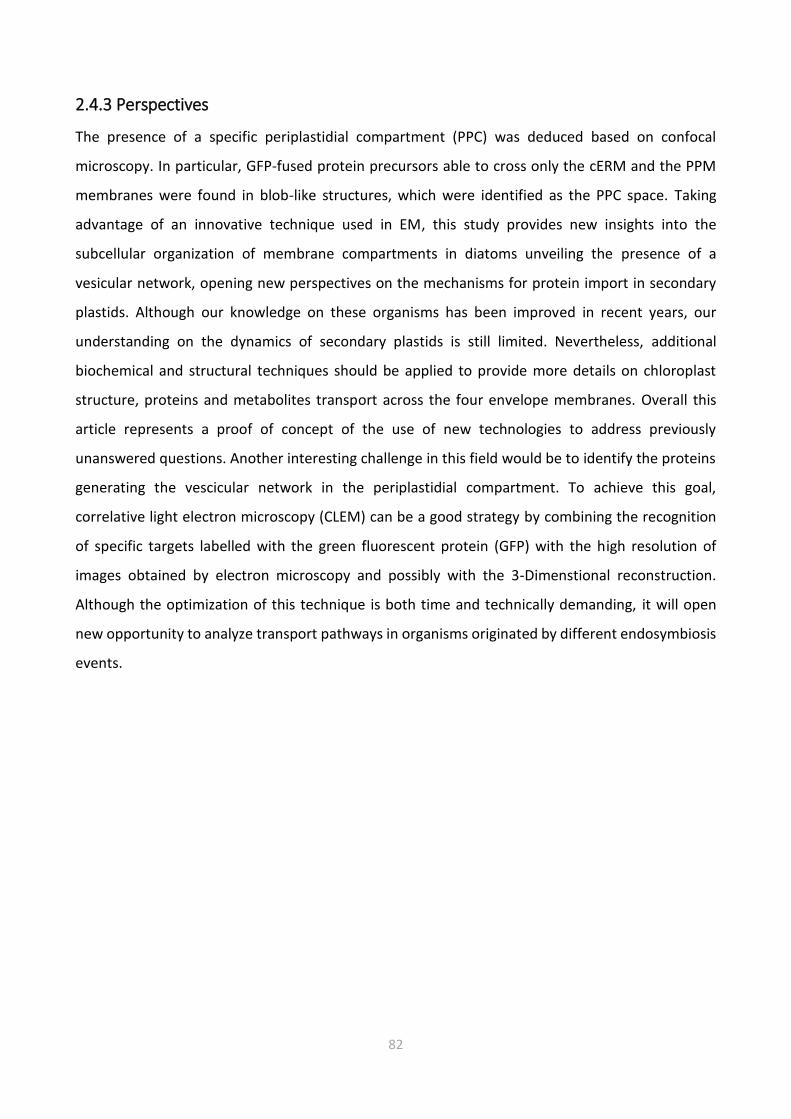
82
2.4.3 Perspectives
The presence of a specific periplastidial compartment (PPC) was deduced based on confocal
microscopy. In particular, GFP-fused protein precursors able to cross only the cERM and the PPM
membranes were found in blob-like structures, which were identified as the PPC space. Taking
advantage of an innovative technique used in EM, this study provides new insights into the
subcellular organization of membrane compartments in diatoms unveiling the presence of a
vesicular network, opening new perspectives on the mechanisms for protein import in secondary
plastids. Although our knowledge on these organisms has been improved in recent years, our
understanding on the dynamics of secondary plastids is still limited. Nevertheless, additional
biochemical and structural techniques should be applied to provide more details on chloroplast
structure, proteins and metabolites transport across the four envelope membranes. Overall this
article represents a proof of concept of the use of new technologies to address previously
unanswered questions. Another interesting challenge in this field would be to identify the proteins
generating the vescicular network in the periplastidial compartment. To achieve this goal,
correlative light electron microscopy (CLEM) can be a good strategy by combining the recognition
of specific targets labelled with the green fluorescent protein (GFP) with the high resolution of
images obtained by electron microscopy and possibly with the 3-Dimenstional reconstruction.
Although the optimization of this technique is both time and technically demanding, it will open
new opportunity to analyze transport pathways in organisms originated by different endosymbiosis
events.

83
2.5 Ultrastructure of diatoms photosynthetic membranes
2.5.1 Preface
This article (Flori et al., 2016 manuscript in preparation) represents a significant part of my Ph.D
work and focuses on the ultrastructure of the chloroplasts in the model organism Phaeodactylum
tricornutum. In particular, this study addresses the question of how thylakoid membranes are 3-
dimentionally structured in their native environment.
Unlike plants, photosynthesis in diatoms occurs within chloroplasts originated by a secondary
endosymbiosis event, where no differentiation in the photosynthetic membranes between
appressed regions (Grana= rich in photosystem II) and non-appressed regions (Stroma lamellae=
rich in photosystem I) was reported. The more homogeneous thylakoid structure in diatoms, should
promote mixing of the photosynthetic complexes, physical interaction between them and
consequent energy spillover from PSII to PSI, ultimately impacting light capture and photosynthetic
electron transport. In both higher plants and microalgae, light harvesting and electron flow rely on
chloroplast's architecture. The completely different structural features of diatoms photosynthetic
membranes could have deeply modified the light responses and electron flow properties in these
organisms. So far, none of the existing model for plants chloroplast topology can interpret the
available pictures of thylakoids in diatoms. In this comprehensive study, the 3D structure of
Phaeodactylum tricornutum plastid reveals how secondary endosymbiosis algae have optimally
shaped light harvesting and photosynthetic electron flow. Using in vivo absorption spectroscopy,
limited energy spillover was found, suggesting that photosystems are largely segregated in the
thylakoids. Biochemical and immunolocalization analyses support this conclusion revealing a refined
compartmentation of photosystems between the external and the innermost thylakoid membranes.
The model here proposed explains how absorbed light can be partitioned between the
photosystems without generating restricted diffusion domains limiting electron transfer, as
required for optimum photosynthesis. Thus, this study provides insights into structural and
functional features of diatoms challenging the common view that photosynthetic membranes are
loosely organized in chloroplasts derived form a secondary endosymbiosis.

84
2.5.2 Chloroplast thylakoid architecture optimizes photosynthesis in diatoms
Serena Flori1, Pierre-Henri Jouneau2, Benjamin Bailleul3, Benoit Gallet4, Leandro Estrozi4, Christine
Moriscot4, Olivier Bastien1, Simona Eicke5, Alexander Schober6, Carolina Rio Bartulos6, Eric
Maréchal1, Peter G. Kroth6, Dimitris Petroutsos1, Samuel Zeeman5, Cécile Breyton4, Guy Schoehn4,
Denis Falconet1, Giovanni Finazzi1.
1 Université Grenoble Alpes (UGA), Laboratoire de Physiologie Cellulaire et Végétale, UMR 5168,
Centre National de la Recherche Scientifique (CNRS), Commissariat à l’Energie Atomique et aux
Energies Alternatives (CEA), Institut National Recherche Agronomique (INRA), Institut de
Biosciences et Biotechnologie de Grenoble (BIG), Grenoble, 38100 France
2 UGA, Laboratoire d'Etudes des Matériaux par Microscopie Avancée; Institut Nanosciences et
Cryogénie; Service de Physique des matériaux et Microstructures. Grenoble, France.
3UMR 7141 CNRS, Université Pierre et Marie Curie, Institut de Biologie Physico-Chimique (IBPC),
Paris, France
4 UGA, UMR 5075 CNRS, CEA, UGA, Institut de Biologie Structurale, Grenoble, France.
5Plant Biochemistry, Department of Biology, ETH Zurich, CH-8092, Zürich, Switzerland
6Department of Biology, University of Konstanz, 78457 Konstanz, Germany
Abstract
Photosynthesis allowed open ocean colonisation by phytoplankton and plant establishment on the
land. Unlike plants, we are still unlocking the mechanisms evolved by phytoplankton to optimize
their photosynthesis. Here, we reveal the unexpected complexity of plastid structure in diatoms,
prominent marine eukaryotes. Biochemical and immunolocalization analyses reveal segregation of
photosystems (PSs) in the loosely stacked thylakoid membranes typical of secondary plastids.
Isolation of PSs within subdomains minimize physical contacts between them, thus optimizing their
light utilization. However, 3D tomography shows that these domains are connected by intermingling
thylakoids, to ensure fast equilibration of electron carriers and improve photosynthetic electron
flow. Overall, we propose a revised topology of diatom plastid that accounts for optimum
performances of secondary endosymbiotic algae in modern oceans.

85
Photosynthesis is the unique process converting sunlight energy into organic matter, feeding the
entire planetary food chain. Photosynthesis is nearly equally accomplished on the land, which is
dominated by plants, and in the ocean, which is mostly colonised by microbial phototrophs. Plant
chloroplasts are derived from a cyanobacterium-like organism via primary endosymbiosis, while the
majority of phytoplankton chloroplasts derive from a red eukaryotic microalgae via secondary
endosymbiosis. The different phylogenetic origins have led to distinct structural chloroplast designs.
Primary plastids contain a two membranes envelope, while four membranes are generally found in
secondary plastids (Cavalier-Smith, 2003). Primary plastids also contain differentiated thylakoid
domains where the two PSs, which are responsible for light photochemical utilization, are localized.
PSII is in the appressed grana stacks, while PSI is found in the non-appressed stroma lamellae. The
physical segregation of PSI and PSII avoids energy withdrawal from PSII via the thermodynamically
unavoidable transfer to PSI (energy spillover; Dekker & Boekema, 2005). In turn, the physical
confinement of the two PSs imposes the need for long-range diffusionof intermediary electron
carriers (plastoquinones, plastocyanins or soluble cytochromes) within the crowded thylakoid
membranes and restricted luminal space. The constraints on diffusion capacity is kinetically limiting
maximum photosynthetic electron flow (Kirchhoff et al., 2004, 2011). No thylakoid subdomains are
visible in secondary plastids, where available electron micrographs show loose stacks of three
thylakoids with few anastomoses in some species (Bedoshvili et al., 2009). The mechanisms for
optimizing light absorption and downstream electron flow in these marine algae has not been
rigorously studied, despite them contributing ~20% of the planetary photosynthesis (Field et al.,
1998). Here we combine functional analyses with 3D ultrastructural imaging to unveil a
sophisticated thylakoid membrane network, which orchestrates photosynthesis via subtle
subthylakoid segregation of the PSs.
2.5.2.1 Results and discussion
In diatoms, the reported loose thylakoid structure should result in random distribution of PSII and
PSI, thereby favoring energy spillover via physical contacts. We tested this hypothesis by measuring
changes in the absorption capacity of PSI upon inhibition of PSII photochemistry in the pennate
diatom Phaeodactylum tricornutum. We reasoned that if PSI and PSII are in contact (Figure 2.30 A),
inhibition of PSII photochemistry should increase utilization of PSII absorbed light by PSI, thus

86
enhancing its activity. Consistent with this idea, a faster PSI activity was observed in red algae upon
inhibition of PSII (Ley & Butler, 1977; Kowalczyk et al., 2013), and interpreted as a signature of
spillover in these organisms, which are considered as the ancestors of secondary plastids.
Conversely, no change in activity is expected if PSI and PSII are physically separated and do not share
their excitation energy, as in plants (Figure 2.30 B).
We found that in P. tricornutum the inhibition of PSII with 3-(3,4-dichlorophenyl)-1,1-dimethylurea
(DCMU) and hydroxylamine (HA, Figure 2.30 C) did not accelerate significantly the rates of PSI
(Figure 2.30 E), as revealed by the very mild increase in the oxidation rate of P700 (the primary
electron donor to PSI, Figure 2.30 D) and, ultimately, of the total PSI donors pool. (Figure 2.30 E).
Figure 2.30 - Experimental design to assess energy spillover in diatoms. (A) Consequences of energy spillover from PSII to PSI on
PSI activity: common antenna case. (B) Consequences of energy spillover from PSII to PSI on PSI activity: independent antenna case.
(C) Fluorescence emission kinetics confirm full inhibition of PSII by DCMU and HA. (D) Kinetics of P700 oxidation in the light. (E)
Kinetics of cyt c oxidation in the light. (F) Kinetics of oxidation of the entire pool of PSI electron donors in the light. A cyt c/PSI ratio
of 3 was assumed (Supplementary Figure 2.34). Light intensity was 1100 µmol photons m-2 s-1. Solid blue squares: control; empty
red circles: DCMU 40µM, blue tringles: DCMU 40µM + HA 0.2 mM. Mean ± SEM (n = 6, for 3 biological samples). FCP: Fucoxanthin
Chlorophyll light harvesting antenna Protein. F0: mimimum fluorescence emission (active PSII). Fm: maximum fluorescence emission
(inactive PSII).

87
Similar results were found in cells exposed to limiting or saturating light intensities (Supplementary
Figure 2.35). The observed increase (less than 15 %) is much smaller than the two-fold effect
reported in red algae (Kowalczyk et al., 2013), suggesting that, although detectable (Yokono et al.,
2015), spillover is limited in P. tricornutum. Two possibilities can account for this finding: i. the
existence of interaction barriers (due to lipid/biochemical surroundings) preventing energy
exchange between the PSs or ii. the physical segregation of PSI and PSII in different thylakoid
domains. To distinguish between them, we immunolocalized the two PSs in intact cells prepared
with the Tokuyasu protocol (Tokuyasu, 1973), an optimal method to preserve membrane structures
(Supplementary Figure 2.36). We found that PSI was preferentially localized in the “peripheral”
stromal-facing thylakoid membranes (Figure 2.31 A and Figure 2.31 C, green sectors). Conversely,
PSII was mostly found in the “core” thylakoid membranes (Figure 2.31 B and Figure 2.31 C, violet).
These findings were substantiated by a statistical analysis (principal component analysis) of 149
images (Figure 2.31 D, E and F, Table S1, Table S2).
Figure 2.31 - Immunolocalization of PSI and PSII in the thylakoid membranes of P. tricornutum. (A) Localization of PSII
using an antibody against the PsbA (D1) subunit. (B) Localization of PSI using an antibody against the PsaC subunit. (C) EM
picture of P. tricornutum thylakoid membranes; showing four areas: the internal part (CORE, violet) the external, peripheral
one (PERIPH., green), the pyrenoid (Orange) and the envelope (blue). (D), (E), (F) Principal Component Analysis of PSI and
PSII immunolocalization. Analysis was performed on 149 images (violet dots: localization of PSII; green triangles:
localization of PSI). The first two components represent more than 93% of the variance (Table S1). See methods for further
explanation. Green arrow: peripheral variable. Violet arrow: core variable. Orange arrow: Pyrenoid variable. Blue arrow:
envelope variable.

88
We complemented the immunolocalization analyses with biochemical fractionation. In grana-
containing thylakoids (see e.g. Berthold et al., 1981), PSI is located in the stromal-exposed thylakoid
lamellae and more accessible to mild detergents than PSII, which is contained in the appressed
membranes of the grana. Chloroplasts isolated from P. tricornutum cells were solubilized using
increasing concentration of the mild detergent digitonin. Supernatant and pellet were recovered
after centrifugation, and analyzed for PSII and PSI by immunoblotting. We found (Supplementary
Figure 2.37) that the detergent concentration required to solubilize PSI was lower (0.2%) than that
needed to extract PSII (0.5%), supporting their differing locations in stroma-accessible and less
accessible membranes of the diatom chloroplasts, respectively.
Since it optimally preserves membrane structures, the Tokuyasu method allowed us to observe
unexpected, and previously undescribed features of the P. tricornutum thylakoids. We detected
regions where membranes are apparently interconnected (Supplementary Figure 2.38, A and B) and
regions where additional layers abruptly “disappear” in cross sections (Supplementary Figure 2.38
C, red arrows) as if tilting out of the micrograph plane. These pictures suggested the existence of a
more complex 3D thylakoid network than the simple layout of 3 loosely juxtaposed thylakoids
proposed so far. We thus collected 1200 ultrathin sections with focused ion-beam scanning electron
microscopy (FIB-SEM) to reconstruct the 3D structure of the entire P. tricornutum cell (Figure 2.32
A, Video B). We first observed the organelles and their interactions (Supplementary Figure 2.39):
the mitochondrion (red) appears as a continuous network of membranes sitting on the chloroplast
(green, Supplementary Figure 2.39 A). The mitochondrion is partially sandwiched between the
plastid and the nucleus (blue, Supplementary Figure 2.39, A and B), the two latter directly in contact
at a single point (Supplementary Figure 2.39 C, Video C). We confirmed the presence of parallel
layers of thylakoids in the plastid, but also revealed the presence of connecting thylakoids (green)
linking the different thylakoid layers (Figure 2.32 B violet). These “bridging” thylakoids were distinct
from the chloroplast lipoprotein particles, the plastoglobules (Supplementary Figure 2.40).

89
Figure 2.32 - Three-dimensional organisation of thylakoid membranes in P. tricornutum cells. (A) 3D reconstruction of an
intact P. tricornutum cell, based on FIB-SEM images. (B) Reconstruction of thylakoid membranes in the region indicated by
the yellow box in (A). (C) Magnification of the region indicated by the yellow box in B. The greater depth in the “z” direction
highlights the presence of several connecting thylakoids. Data are representative of three different tomograms.
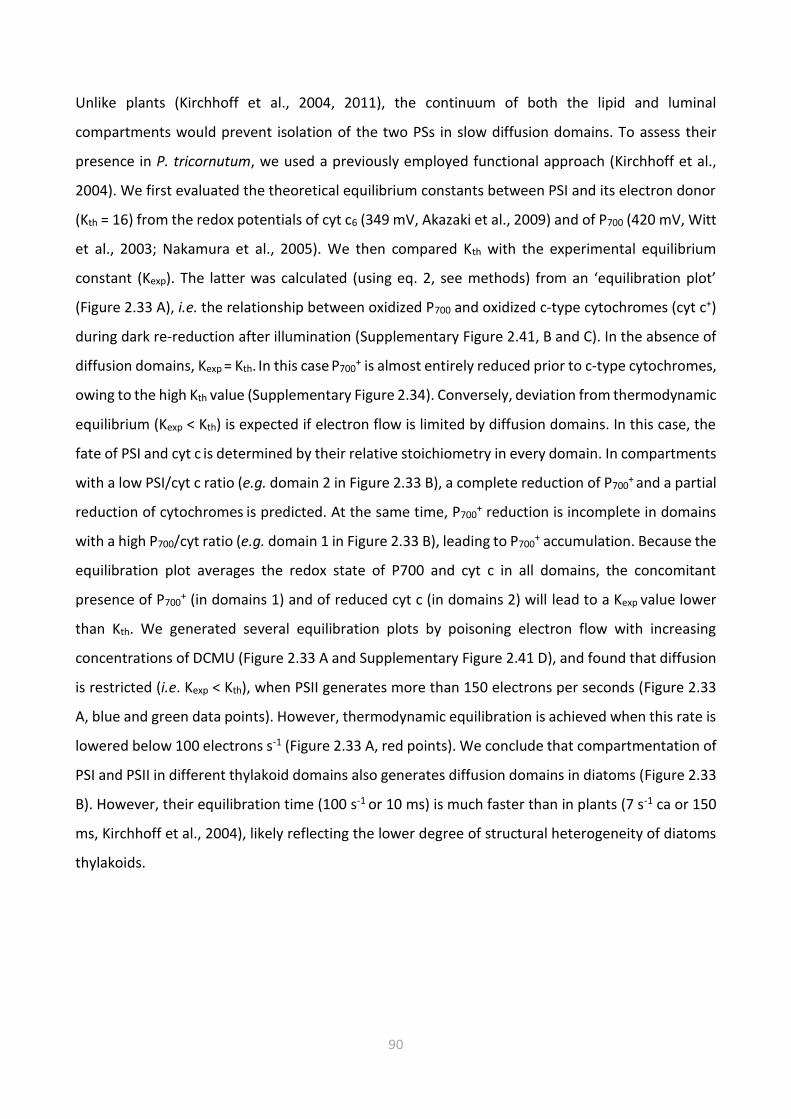
90
Unlike plants (Kirchhoff et al., 2004, 2011), the continuum of both the lipid and luminal
compartments would prevent isolation of the two PSs in slow diffusion domains. To assess their
presence in P. tricornutum, we used a previously employed functional approach (Kirchhoff et al.,
2004). We first evaluated the theoretical equilibrium constants between PSI and its electron donor
(Kth = 16) from the redox potentials of cyt c6 (349 mV, Akazaki et al., 2009) and of P700 (420 mV, Witt
et al., 2003; Nakamura et al., 2005). We then compared Kth with the experimental equilibrium
constant (Kexp). The latter was calculated (using eq. 2, see methods) from an ‘equilibration plot’
(Figure 2.33 A), i.e. the relationship between oxidized P700 and oxidized c-type cytochromes (cyt c+)
during dark re-reduction after illumination (Supplementary Figure 2.41, B and C). In the absence of
diffusion domains, Kexp = Kth. In this case P700+ is almost entirely reduced prior to c-type cytochromes,
owing to the high Kth value (Supplementary Figure 2.34). Conversely, deviation from thermodynamic
equilibrium (Kexp < Kth) is expected if electron flow is limited by diffusion domains. In this case, the
fate of PSI and cyt c is determined by their relative stoichiometry in every domain. In compartments
with a low PSI/cyt c ratio (e.g. domain 2 in Figure 2.33 B), a complete reduction of P700+ and a partial
reduction of cytochromes is predicted. At the same time, P700+ reduction is incomplete in domains
with a high P700/cyt ratio (e.g. domain 1 in Figure 2.33 B), leading to P700+ accumulation. Because the
equilibration plot averages the redox state of P700 and cyt c in all domains, the concomitant
presence of P700+ (in domains 1) and of reduced cyt c (in domains 2) will lead to a Kexp value lower
than Kth. We generated several equilibration plots by poisoning electron flow with increasing
concentrations of DCMU (Figure 2.33 A and Supplementary Figure 2.41 D), and found that diffusion
is restricted (i.e. Kexp < Kth), when PSII generates more than 150 electrons per seconds (Figure 2.33
A, blue and green data points). However, thermodynamic equilibration is achieved when this rate is
lowered below 100 electrons s-1 (Figure 2.33 A, red points). We conclude that compartmentation of
PSI and PSII in different thylakoid domains also generates diffusion domains in diatoms (Figure 2.33
B). However, their equilibration time (100 s-1 or 10 ms) is much faster than in plants (7 s-1 ca or 150
ms, Kirchhoff et al., 2004), likely reflecting the lower degree of structural heterogeneity of diatoms
thylakoids.

91
Figure 2.33 - Structural arrangement of the photosynthetic membranes in P. tricornutum. (A) Equilibrium plots for the
components of the high potential chain. Redox signals of cyt c and P700 in the light were plotted against each other. The
dotted lines represent simulations corresponding to different values of the equilibrium constant. The rate of electron flow
is calculated from data in Supplementary Figure 2.40. (B) Cartoon representing a possible arrangement of the photosynthetic
complexes in a likely 3 thylakoid layers arrangement of the photosynthetic membranes in P. tricornutum. The different PSI
and PSII localization within the peripheral (green) and the core membranes (violet) is shown. PSI: photosystem 1; PSII:
photosystem 2, FCP: fucoxanthin chlorophyll antenna protein, Cytb6f: cytochrome b6f complex.

92
2.5.2.2 Conclusions
Overall, our 3D reconstruction of P. tricornutum with FIB-SEM reveals an intricate network of the
photosynthetic membranes (Figure 2.32, Supplementary Figure 2.40), reversing previous ideas
(Spetea et al., 2012) that photosynthetic membranes of secondary endosymbiosis chloroplasts are
loosely structured. Biochemical and immunolocalization analyses further reveal a subtle
compartmentation of the PSs between the peripheral and core thylakoid membranes (Figure 2.33
B). Their location is compatible with the proposed lipid composition of the two fractions, because
the core membranes are apparently enriched in lipids that favor PSII stability and function (Lepetit
et al., 2012). The observed thylakoid structure accounts for optimum partitioning of absorbed light
between the photosystems (very limited spillover), thus providing a rationale for the previously-
observed high capacity of PSII to dissipate excess light thermally (Lavaud et al., 2002). Indeed, no
such response is expected if surplus energy in PSII were to be dissipated via spillover to PSI, as in
red algae (Kowalczyk et al., 2013). Moreover, the thylakoid structures avoid restriction of electron
flow. On one side, the inter-thylakoid membrane bridges (Figure 2.32, Supplementary Figure 2.40)
provide a continuum of the membranous and luminal compartments, avoiding diffusional
limitations. On the other side, possibly because of the loose thylakoid stacking, the size of the
thylakoid lumen (7.1 ± 15 nm, average of 100 estimates from 6 different preparations) is much larger
than in plants (4.5 nm, Kirchhoff et al., 2011), where it is equal to that of plastocyanin, and thus
limits its diffusion between PSI and the cyt b6f (Kirchhoff et al., 2004). Conversely the lumen size in
diatoms is twice larger than the size of the soluble electron carrier, cyt c6 (~ 33 x 23 Å, Akazaki et al.,
2009). This should facilitate diffusion of this redox carrier, and contribute to the very fast redox
equilibration in diatoms. Consistently, lumen widening (up to values similar to those measured in
diatoms), has been shown in high light exposed plants to facilitate electron flow and reduce
photodamage (Kirchhoff et al., 2011). Overall, optimal absorption with no kinetic limitation of
photosynthesis likely represents the strategy evolved in diatoms to implement their photosynthetic
performances in the ocean.
Our data also show the intimate physical contacts between all the organelles. This not only reveals
the cellular framework for the extensive energetic exchanges between chloroplast and
mitochondria recently reported (Bailleul et al., 2015), but also pinpoints a site at which redox
signalling between the plastid and the nucleus could occur (e.g. Lepetit et al., 2013). In line with this
hypothesis, recent results in plants suggest that chloroplast evaginations (i.e. stromules) transiently

93
connect to the nucleus for metabolic exchanges and retrograde signalling between these
compartments (Dietz et al., 2016).
2.5.2.3 Materials and Methods
Phaeodactylum tricornutum cultivation. The Phaeodactylum tricornutum Pt1 strain (CCAP 1055/3)
was obtained from the Culture Collection of Algae and Protozoa, Scottish Marine institute, UK. Cells
were grown in the ESAW (Enriched Seawater, Artificial Water) medium ( Berges et al., 2001), in 50
mL flasks in a growth cabinet (Certomat BS-1, Sartorius Stedim, Germany), at 19°C, a light intensity
of 20 µmol photon m-2.s-1, a 12/12 hours light/dark photoperiod and 100 rpm shaking . Cells were
collected in exponential phase, concentrated to a density of 2 * 107 cells mL-1 and used for
experimental characterization.
Spectroscopic measurements. Spectroscopic analysis was performed at room temperature, using a
JTS-10 spectrophotometer (Biologic France). To assess energy spillover from PSII to PSI, redox
changes of P700 and of its electron donor pool were followed. In diatoms, a c-type cytochrome is the
PSI electron donor, replacing plastocyanin as the electron donor to PSI. We will refer to the latter as
cytochrome c6 (as in Inda et al., 1999), instead of alternative nomenclatures proposed earlier (e.g.
cytochrome cx, Weigel et al., 2003; cytochrome c6A, Howe et al., 2006). We will also define the pool
of photosynthetic type proteins (cyt c6 + cyt f of the cytochrome b6f complex) as “cyt c”. Indeed, due
to the absorption features, it is not possible to distinguish spectroscopically cyt c6 form cytochrome
f. Because of the high equilibrium constant between P700 and the cytochrome pool, kinetic analysis
was extended also to the latter, to quantify the whole amount of electrons that was delivered to PSI
in the presence and absence of PSII activity. P700 redox changes were measured at 705 nm. To verify
that the possible contribution of fluorescence emission was not interfering with the measurements,
experiments were repeated at 820 nm (where fluoresce emission is not detected). Similar results
were obtained at both wavelengths, indicating that interference from fluorescence emission was
negligible. Cyt c was calculated as [554]-0.4.[520]-0.4.[566], where [554], [520] and [566] are the
absorption difference signals at 554 nm, 520 nm and 566 nm, respectively (Bailleul et al., 2015).
Indeed, due to the absorption features, it is not possible to distinguish spectroscopically cyt c6 form
cytochrome f.
Kinetics of oxidation of P700, cyt c and of the total donors to PSI oxidation result from concomitant
electron injection by PSII and withdrawal by PSI. Therefore, to calculate the true PSI oxidation rates,

94
we calculated first their respective reduction rates, which were evaluated as the slope of signal
relaxation upon switching the light off (Supplementary Figure 2.34 B, SD slope). By adding this slope
to the apparent oxidation rates, which we evaluated from the slope in the light (Dl), we obtained
the absolute oxidation kinetics (see Supplementary Figure 2.34 for an example in the case of the
total PSI electron donors pool). This procedure is needed because, by inhibiting PSII activity, DCMU
modifies the reduction rates of cyt c and P700, This leads to an apparent increase of the PSI and cyt
c oxidation rates, which mimics the occurrence of energy spillover.
Inhibition of PSII by DCMU and HA was probed measuring the changes in chlorophyll emission from
F0 (minimum fluorescence level in which QA, the primary quinone acceptor of PSII is oxidized) to the
Fm level, in which QA is fully reduced because PSII activity is blocked. As shown in Figure 2.30 C and
Supplementary Figure 2.35 A, addition of DCMU alone cannot fully reduce QA in the short time (4
ms) employed to measure oxidation of P700 and of cyt c, expecially at low light. Because induction
of spillover required the full reduction of QA, this inhibitor alone could not be sufficient to probe
energy spillover in all the experimental conditions employed in this work (e. g. low light in
Supplementary Figure 2.35). On the other hand, complete reduction of QA is achieved in the
presence of HA, because this inhibitor prevents reoxidation of reduced QA in PSII (Cheniae & Martin,
1971). By ensuring QA reduction (Fm level) at the beginning of illumination (Figure 2.30 C,
Supplementary Figure 2.35 B and C, dark), HA ensures optimum condition to evaluate spillover even
in low light (Supplementary Figure 2.35 A).
To evaluate the equilibrium constants between cytochrome c and P700 the following equation was
used to relate redox changes of P700 and of cyt c to the equilibrium constant K:
ox
ox
Pcytc
PcytcK
700
700
.
. [1]
where [cytc], [cytcox], [P700] and [P700ox] represent the concentration, at equilibrium, of the oxidized
and reduced form of the cyt c and P700 pools.
From equation [1] the relationship between the relative amount of oxidized P700 and of cyt c can be
derived as:
)1.(1
.
Kx
xKy , [2]

95
with ox
ox
cytccytc
cytcy
[3]
and
700700
700
PP
Px
ox
ox
[4]
Chloroplast purification. To purify intact chloroplasts from P. tricornutum, cells were harvested by
centrifugation at 5000 g, 10 min, 4 °C allowing to get a pellet, which was then resuspended gently
with 10 mL of isolation buffer (0.5 M Sorbitol; 50 mM Hepes-KOH; 6 mM EDTA; 5 mM MgCl2; 10 mM
KCl; 1 mM MnCl2; 1% Poly Vinyl Pyrrolidone 40 [K30]; 0.5% BSA; 0.1% cysteine, pH 7.2-7.5) and
passed slowly through a French Press at 9,000 bars. Ten milliliters of the isolation buffer were added
to the mixture of broken cells on ice in the dark before centrifugation at 300 g for 8 min to remove
intact cells. The supernatant was collected and centrifuged at 2,000 g for 10 min at 4 °C. The pellet
was gently dissolved with a soft paint-brush in 2 ml of washing buffer (0.5 M Sorbitol; 30 mM Hepes-
KOH; 6 mM EDTA; 5 mM MgCl2; 10 mM KCl; 1 mM MnCl2; 1% PVP 40 [K30]; 0.1% BSA, pH 7.2-7.5)
and loaded on a discontinuous Percoll gradient (10%, 20%, 30%) in the same buffer. The mixture of
broken cells and plastids was centrifuged in an ultracentrifuge (with SW41Ti rotor) at 10 000 g for
35 min. The chloroplast fraction accumulated in the 20 % layer of the Percoll gradient. The band was
collected and diluted in the washing buffer (without BSA) and centrifuged again at 14,000 g for 10
min at 4°C. Chloroplasts intactness was tested with a Clark electrode (Hansatek, UK) using sodium
ferricyanide as an electron acceptors. Oxygen evolution in saturating light was measured before and
after an osmotic shock (induced by incubation for 5 min in the washing buffer without sorbitol). The
ratio between the two rates was used to evaluate intactness, which turned out to be > 80% in our
case.
Membrane solubilization and immunoblot analysis. To solubilize the two different chloroplast
compartments (INTERNAL and EXTERNAL), digitonin (C56H92O29, Sigma Aldrich) was prepared at
different concentrations (0.2-0.5-1.5%). Chloroplasts were incubated for up to 30 min at 4°C with
the detergent and centrifuged at 11,000 g for 5 min (Beckmann rotor TLA-100). Both the
supernatant and the pellet were collected and their protein content evaluated by immunoblot
analysis. Samples (0.75 µg of protein) were loaded on 7% or 13% SDS-PAGE gels and blotted onto
nitrocellulose membranes. Antisera against PSI (PsaC, PSI-C core subunit of photosystem I, Agrisera,

96
Sv) and PSII (PsbA, D1 protein of PSII, Agrisera, Sv) were detected by ECL using a CCD (charge-
coupled device) imager (Chemidock MP Imaging, Bio-Rad, USA).
Sample preparation for immunolocalization using the Tokuyasu protocol. Cells of P. tricornutum
were fixed in a double-strength fixative (4% (w/v) formaldehyde, 0.4% (v/v) glutaraldehyde) in
PHEM buffer (PIPES 60 mM, HEPES 25 mM, EGTA 10 mM, MgCl2 2 mM; pH 7) in an equal volume to
the culture medium (ESAW), and then diluted into a standard strength fixative (2% (w/v)
formaldehyde (EMS, USA) and 0.2% (v/v) glutaraldehyde (EMS, USA)). After 15 min, fresh standard
strength fixative was replaced and fixation proceeded for 30 min at room temperature, under
agitation. Cells were washed 3 times with 50 mM glycine in PHEM buffer and after centrifugation
were embedded in 12% gelatin in PHEM. The gelatin-embedded blocks were cryo-protected in 2.3
M sucrose in rotating vials at 4°C (overnight). Samples vitrification was obtained in liquid nitrogen
following the plunge and freezing technique (9). Thin sections (80 nm) were prepared at -110°C with
a diamond knife (Diatome) and the blocks were prepared with an ultracryomicrotome (UC7, Leica
Microsystems, Germany). Ribbons were picked-up with a drop of 1% (w/v) methylcellulose/1.15 M
sucrose in PHEM buffer. Sections were thawed and transferred to Formvar carbon-coated nickel
grids.
Immunolabelling was performed using an automated system (Leica microsystems EM IGL). The
sucrose/methyl cellulose mixture was removed washing the grids with PBS 3 times for 2 min. Then
the free aldehyde groups were inactivated on phosphate buffer saline solution (PBS) + 0.05 M
glycine, pH 7.4, 15 min. The hydrophobic areas were blocked with the Aurion blocking solution for
30 min before washing three times in PBS + 0.1% BSA-c pH 7.4 for 2 min. The grids were incubated
for 60 to 90 min in the diluted primary antibody (1-5 μg/ml in PBS + 0.1% BSA-c pH 7.4). Negative
controls were incubated only with BSA-c buffer. After six washing steps (PBS + 0.1% BSA-c pH 7.4
for 5 min) the grids were incubated for 90 to 120 min in the diluted secondary antibody coupled to
ultrasmall 6 nm gold particles in PBS (1:20 in PBS + 0.1% BSA-c pH 7.4). The grids were then
extensively washed (6 times for 5 min in PBS + 0.1% BSA-c pH 7.4 and 6 times for 2 min in PBS, pH
7.4). Samples were post-fixed with 2% glutaraldehyde in PBS, pH 7.4, for 5 min and finally washed
(3 times in PBS, pH 7.4, for 2 min and 6 times with deionized water for 2 min). Sections were
enhanced with silver (Aurion R-Gent SE-EM) for 25 min and again washed on deionized water (6
times for 2 min). Finally, samples were contrasted with heavy metal treatment (4% neutral uranyl
acetate for 5 min followed by 0.4% uranyl acetate in 2% methylcellulose for 5 min at 0°C), then

97
washed on liquid droplets (PBS, pH 7.4) and dried. For observation, grids were incubated 5 min on
2% uranyl oxalate (pH 7) and transferred to a mixture of 1.6% methyl cellulose and 0.4% uranyl
acetate on ice, the excess of the viscous solution was drained away and the grids were let to dry.
Grids were examined in an electron Tecnai 12 microscope (FEI, USA).
FIB-SEM analysis. P. tricornutum cells were fixed in 0.1 M cacodylate buffer (Sigma-Aldrich), pH 7.4,
containing 2.5% glutaraldehyde (TAAB), 2% formaldehyde (Polysciences) for 1 h at room
temperature and prepared according to a modified protocol from (https://ncmir.ucsd.edu/sbem-
protocol). Focused ion beam (FIB) tomography was performed with a Zeiss NVision 40 dual-beam
microscope. In this technique, the Durcupan (Sigma-Aldrich) resin embedded cells of P. tricornutum
were cut in cross-section, slice by slice, with a Ga+ ion beam (of 700 nA at 30 kV), and each slice was
imaged in scanning electron microscopy (SEM) at 5 kV using the in-column EsB back-scatter
detector. For each slice, a thickness of 4 nm was removed, and the SEM images were recorded with
a pixel size of 4 nm. The image stack is then registered by cross-correlation using the StackReg plugin
in the Fiji software. For 3D reconstitution a stack of 600 images were analyzed with FIJI Image J
software and projected in 3-dimension (x,y,z axis) using the AVIZO (FEI, USA) and CHIMERA
softwares (https://www.cgl.ucsf.edu/chimera/, UCSF, USA).
Principal components analysis (PCA). The principal components analysis (PCA) is an exploratory
technique that is used both to describe the structure of high dimensional data by reducing its
dimensionality (Lebart et al., 2000) and to detect any groupings in the data set (Takeuchi et al.,
2003). It is a linear transformation that converts n original variables (here, the localization) into n
new variables (the principal components), which (i) are ordered by the amount of variance explained
(ii) are uncorrelated and (iii) explain all variation in the data. We performed PCA considering four
possible subcellular compartments for our antibodies: the internal and external thylakoid
membranes, as well as the pyrenoid and the envelope, to account for possible aspecific labelling.
This led to a 4-dimension localization space (INTERNAL, EXTERNAL, PYRENOID and ENVELOPE) of the
149 images where values are the number of immunolabeling in the given localization. First, the
localization space of each of the 149 images is normalized, by subtracting the mean and dividing by
the standard deviation of values for each localization.
To represent the distribution of these normalized dimensional data for the 149 images, the direction
(a 4-dimensional vector) giving the largest possible variance of the distribution (that is, accounts for

98
as much of the variability in the data as possible) is selected as the direction for the first principal
component. Then, the direction (another 4-dimensional vector) orthogonal to the previous one(s)
giving the largest possible variance of the distribution is selected as the direction for the second
principal component. The repetition of this procedure automatically selects vectors representing
the scatter of the distribution from major ones to minor ones. Based on singular values
decomposition, PCA is a principal axis rotation of the original variables that preserves the variation
in the data. Therefore, the total variance of the original variables is equal to the total variance of
the principal components. The principal component coefficients correspond to the percentage of
explained variance. All statistical analysis has been done with the R software (R Development Core
Team, 2008).
Logistic regression. The logistic regression is the appropriate regression analysis to conduct when
the dependent variable is dichotomous and is assumed to be a stochastic event. Logistic regression
is used to describe data and to explain the relationship between one dependent binary variable and
one or more independent variables. The two major assumptions are: (i) that the outcome must be
discrete, otherwise explained as, the dependent variable should be dichotomous in nature (ii) there
should be no high intercorrelations (as demonstrated by Tabachnick & Fidell, 2012), the assumption
is met for values less than 0.9) among the predictors.
The two type of antibody are variables that can have only two possible discrete values: PsaC=PSI or
PsbA=PSII. We use a model dose-response relationship where the predictors are the multiple
continuous variables: number of immunolabeling in the different localizations (INTERNAL,
EXTERNAL, PYRENOID and ENVELOP). Since probabilities have a limited range and regression models
could predict off-scale values below zero or above 1, it makes better sense to model the probabilities
of getting a given antibody on a transformed scale; this is what is done in logistic regression analysis
(Hosmer et al., 2013). A linear model for transformed probabilities can be set up as
kk xxpit ...)(log 110 in which )1
log()(logp
ppit
is the log odds. Each xi is the number
of gold beads in the localization i and statistics about the coefficients alphai will provide insight
about the impact of the localization I on the probability to get a given antibody. The analysis of
deviance table and the Akaike information criterion allows the identification of the relevant
predictors (Dalgaard, 2002).

99
The table of correlations shows that there are no strong intercorrelations between the variables
(supplementary materials). Starting from a complete model (supplementary materials) and based
on the variables coefficients p-values (Pr(>|z|)), we see that we can recursively delete the two
variables ENV and PYR without significantly reduce the Akaike information criterion (AIC; Akaike,
1974) which is a common measure of the relative quality of a statistical model for a given set of
data. The final model demonstrates that the relevant variables to predict the antibody are the
number of immunolabeling in INTERNAL (p-value=5.54e-06) and EXTERNAL (p-value<0.0032) area.
Bootstrap procedure allows the evaluation of the average percentage of wrong prediction: 9.4% of
the image will have a wrong immunolabeling (Table S2).
Appendix: output results of the Logistic regression from the R software.
Original model: Antibody = CORE = PERIPHERAL + ENVELOP + PYRENOID > summary(glm(ANTIBODY~INT+EXT+ENVELOP+PYRENOID,binomial)) Call: glm(formula = ANTIBODY ~ CORE + PHERIPHERAL + ENVELOP + PYRENOID, family = binomial) Deviance Residuals: Min 1Q Median 3Q Max -3.0638 -0.4587 0.2385 0.6176 3.1801 Coefficients: Estimate Std. Error z value Pr(>|z|) (Intercept) 1.99757 0.96646 2.067 0.0387 * CORE -0.07048 0.01541 -4.574 4.79e-06 *** PERIPHERAL 0.04284 0.01628 2.632 0.0085 ** ENVELOP -0.01526 0.03754 -0.407 0.6843 PYRENOID -0.01797 0.02578 -0.697 0.4858 --- Signif. codes: 0 ‘***’ 0.001 ‘**’ 0.01 ‘*’ 0.05 ‘.’ 0.1 ‘ ’ 1 (Dispersion parameter for binomial family taken to be 1) Null deviance: 205.42 on 148 degrees of freedom Residual deviance: 114.74 on 144 degrees of freedom AIC: 124.74 Number of Fisher Scoring iterations: 5 > glm1 <- glm(ANTIBODY~CORE+PERIPHERAL+ENVELOP+PYRENOID,binomial) > > glm2 <- glm(ANTIBODY~CORE+PERIPHERAL+PYRENOID,binomial) > > anova(glm1,glm2,test="Chisq") Analysis of Deviance Table Model 1: ANTIBODY ~ CORE + PERIPHERAL + ENVELOP + PYRENOID Model 2: ANTIBODY ~ CORE + PERIPHERAL + PYRENOID Resid. Df Resid. Dev Df Deviance Pr(>Chi) 1 144 114.74 2 145 114.90 -1 -0.1633 0.6861 Second model: Antibody = CORE = PERIPHERAL + PYRENOID > summary(glm2) Call: glm(formula = ANTIBODY ~ CORE + PERIPHERAL + PYRENOID, family = binomial) Deviance Residuals: Min 1Q Median 3Q Max -3.0994 -0.4713 0.2454 0.5992 3.1901 Coefficients: Estimate Std. Error z value Pr(>|z|) (Intercept) 1.91291 0.93737 2.041 0.04128 * CORE -0.06995 0.01530 -4.573 4.8e-06 *** PERIPHERAL 0.04323 0.01618 2.672 0.00754 ** PYRENOID -0.01621 0.02531 -0.640 0.52194 ---

100
Signif. codes: 0 ‘***’ 0.001 ‘**’ 0.01 ‘*’ 0.05 ‘.’ 0.1 ‘ ’ 1 (Dispersion parameter for binomial family taken to be 1) Null deviance: 205.42 on 148 degrees of freedom Residual deviance: 114.90 on 145 degrees of freedom AIC: 122.9 Number of Fisher Scoring iterations: 5 > drop1(glm2,test="Chisq") Single term deletions Model: ANTIBODY ~ CORE + PERIPHERAL + PYRENOID Df Deviance AIC LRT Pr(>Chi) <none> 114.90 122.90 CORE 1 143.08 149.08 28.1799 1.105e-07 *** PERIPHERAL 1 122.73 128.73 7.8320 0.005133 ** PYRENOID 1 115.32 121.32 0.4215 0.516171 --- Signif. codes: 0 ‘***’ 0.001 ‘**’ 0.01 ‘*’ 0.05 ‘.’ 0.1 ‘ ’ 1 > Final model: Antibody = CORE + PERIPHERAL > glm3 <- glm(ANTIBODY~INT+EXT,binomial) > > anova(glm2,glm3,test="Chisq") Analysis of Deviance Table Model 1: ANTIBODY ~ CORE + PERIPHERAL + PYRENOID Model 2: ANTIBODY ~ CORE + PERIPHERAL Resid. Df Resid. Dev Df Deviance Pr(>Chi) 1 145 114.90 2 146 115.32 -1 -0.42154 0.5162 > > summary(glm3) Call: glm(formula = ANTIBODY ~ CORE + PERIPHERAL, family = binomial) Deviance Residuals: Min 1Q Median 3Q Max -3.0857 -0.4916 0.2485 0.5906 3.2036 Coefficients: Estimate Std. Error z value Pr(>|z|) (Intercept) 1.67779 0.86027 1.950 0.05114 . CORE -0.06803 0.01497 -4.543 5.54e-06 *** PERIPHERAL 0.04612 0.01562 2.953 0.00315 ** --- Signif. codes: 0 ‘***’ 0.001 ‘**’ 0.01 ‘*’ 0.05 ‘.’ 0.1 ‘ ’ 1 (Dispersion parameter for binomial family taken to be 1) Null deviance: 205.42 on 148 degrees of freedom Residual deviance: 115.32 on 146 degrees of freedom AIC: 121.32 Number of Fisher Scoring iterations: 5 > drop1(glm3,test="Chisq") Single term deletions Model: ANTIBODY ~ CORE + PERIPHERAL Df Deviance AIC LRT Pr(>Chi) <none> 115.32 121.32 CORE 1 143.52 147.52 28.2010 1.093e-07 *** PERIPHERAL 1 125.06 129.06 9.7361 0.001807 ** --- Signif. codes: 0 ‘***’ 0.001 ‘**’ 0.01 ‘*’ 0.05 ‘.’ 0.1 ‘ ’ 1 > >

101
Supplementary Figures
Supplementary Figure 2.34 - PSI/cytochrome c stoichiometry and oxidation kinetics in P. tricornutum. Cyt c/PSI
stoichiometry. Cells were exposed to a saturating single turnover laser flash to generate 1 turnover per PSI and the amount
of oxidized c-type cytochrome was calculated 300µs after the flash (i.e. when P700 is fully rereduced by the cytochromes)
This amount was normalized to the total amount of cyt c oxidized in continuous light in the presence of DCMU (20µM).
Because the flash oxidizes 33% of the cyt c type cytochromes, we conclude there are ~3 c-type cytochromes per PSI. (B)
procedure employed to evaluate the rates of PSI oxidation in the light in the case of the total donors to PSI pool. Open bar:
light on. Closed bar: light off. The slope measured after the light is switched off (SD) allows calculating the dark rereduction
rates of the PSI donor pool in the control (closed blue squares), DCMU treated samples (closed red circles) and DCMU + HA
treated samples (closed green triangles). The sum of this rate plus the apparent oxidation rate in the light (SL) .provides the
real rate of oxidation of the total donors to PSI oxidation kinetics, (open symbols). See methods for further description.

102
Supplementary Figure 2.35 - Light energy spillover in P. tricornutum cells exposed to different light intensities. (A)
Fluorescence emission kinetics in the presence of DCMU 40 µM and HA 0.2 mM. Squares: control, triangles: DCMU; circles:
DCMU and HA; open symbols 150 µm photons m-2 s-1; closed symbols: 300 µm photons m-2 s-1. (B) Fluorescence emission
kinetics in the presence of DCMU 40 µM and HA 0.2 mM. Squares: control, triangles: DCMU; circles: DCMU and HA; open
symbols: 590 µm photons m-2 s-1; closed symbols: 1100 µm photons m-2 s-1 (C) Kinetics of oxidation of the entire pool of PSI
electron donors at a light intensity of 150 µm photons m-2 s-1. (D) Kinetics of oxidation of the entire pool of PSI electron
donors at a light intensity of 300 µm photons m-2 s-1in the light. (E) Kinetics of oxidation of the entire pool of PSI electron
donors at a light intensity of 590 µm photons m-2 s-1. (F) Kinetics of oxidation of the entire pool of PSI electron donors at a
light intensity of 1100 µm photons m-2 s-1Solid blue squares: control; empty red circles: DCMU 40µM, blue tringles: DCMU
40µM + HA 0.2 mM. Mean ± SEM (n = 2). FCP: Fucoxanthin Chlorophyll light harvesting antenna Protein. F0: mimimum
fluorescence emission (active PSII). Fm: maximum fluorescence emission (inactive PSII). Closed bar: actinic light off. Open
bar: actinic light on.
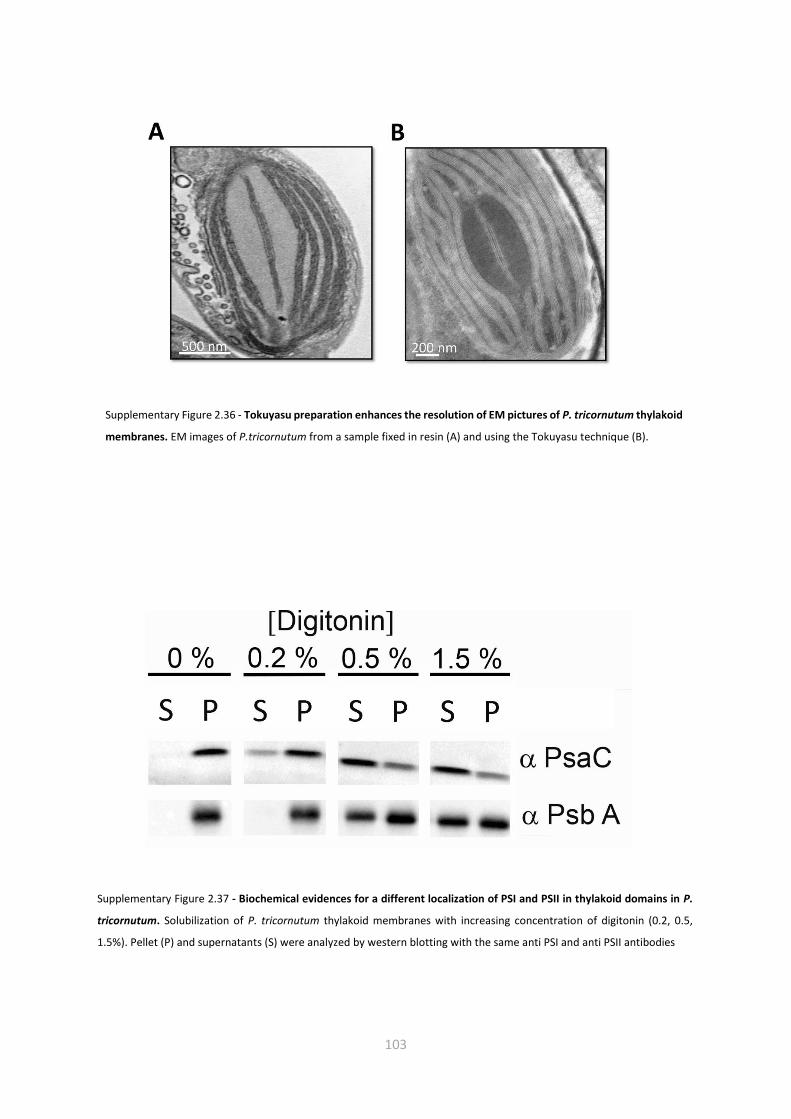
103
Supplementary Figure 2.36 - Tokuyasu preparation enhances the resolution of EM pictures of P. tricornutum thylakoid
membranes. EM images of P.tricornutum from a sample fixed in resin (A) and using the Tokuyasu technique (B).
Supplementary Figure 2.37 - Biochemical evidences for a different localization of PSI and PSII in thylakoid domains in P.
tricornutum. Solubilization of P. tricornutum thylakoid membranes with increasing concentration of digitonin (0.2, 0.5,
1.5%). Pellet (P) and supernatants (S) were analyzed by western blotting with the same anti PSI and anti PSII antibodies

104
Supplementary Figure 2.38 - Peculiar structural features of thylakoid membranes in P. tricornutum cells fixed using the
Tokuyasu technique. (A) EM images of P.tricornutum using the Tokuyasu technique reveal the existence of crosspoints between
the thylakoid layers. (B) Magnification of the thylakoid layers intersections in the region indicated by the yellow box in A. (C)
“Truncated” thylakoid membranes are observed in P. tricornutum cells prepared with the Tokuyasu technique. Red arrows point
thylakoid layers that comprise an additional fourth membrane, which abruptly disappears, suggesting the existence of 3D
interconnection between different layers of thylakoids

105
Supplementary Figure 2.39 - Physical contacts between the organelles in P. tricornutum cells. The chloroplast (green),
mitochondrion (red), and nucleus (blue) structures, obtained from 3D reconstruction of intact diatom cells, are shown under
different rotation angles (A to C), to highlight the physical contact between the organelles
Supplementary Figure 2.40 - 3D structure of the thylakoid membranes in P. tricornutum cells. Same colour code as in Figure
2.31. Note that the linking membranes (red arrows) can be clearly differentiated form the plastoglobules (black arrows), which
appear as globular structures.

106
Comp. 1 Comp. 2 Comp. 3 Comp. 4
Standard
deviation
10.9997641 9.8433476 3.64706862 1.67398543
Proportion of
Variance
0.5170947 0.4140845 0.05684487 0.01197586
Cumulative
Proportion
0.5170947 0.9311793 0.98802414 1.00000000
Supplementary Figure 2.41 - Spectroscopic features of the cytochrome c6 and P700 components of the electron flow chain
in P. tricornutum cells. (A) Fluorescence induction kinetics in the absence and in the presence of increasing DCMU
concentrations. The progressive inhibition of PSII is highlighted by the increased rate of fluorescence rise. (B) Redox
kinetics of P700 upon illumination. (C) Redox kinetics of cyt c6 upon illumination. The rate of electron transfer were changed
by addition of increasing concentrations of DCMU as in (A). Closed bar: actinic light off. Open bar: actinic light on.
Table S1 - Principal Component Analysis Results. The first two components represent more than 93% of the variance

107
Video B - Focus Ion Beam Scanning Electron Microscopy (FIB-SEM) based 3D reconstitution of a whole cell of P. tricornutum.
Video C - 3D structure of the chloroplast (green) mitochondrion (red) and nucleus (blue) in P. tricornutum cells.
INT EXT ENVELOP PYRENOID
INT 1.00000000 0.099003554 0.200634040 -0.01200587
EXT 0.09900355 1.000000000 0.005308018 0.15697362
ENVELOP 0.20063404 0.005308018 1.000000000 -0.03471890
PYRENOID -0.01200587 0.156973620 -0.034718900 1.00000000
Table S2 - Correlation table of the number of immunolabeling in the four possible localizations

108
2.5.3 Perspectives
The model proposed here provides a rationale for several observations concerning photosynthesis
in Phaeodactylum tricornutum, opening new stimulating questions on the ecological success of
diatoms worldwide.
The first question I would like to answer is whether this structural arrangement is conserved in
different diatoms: are the thylakoid membranes always structured as in P. tricorntum? Is the
mitochondrion always sitting on the chloroplast, with physical contacts?
Diatoms grow in very different environments, characterized by changing light and nutrient
conditions. Therefore, it is conceivable that the situation observed in P. tricornutum grown in
laboratory conditions might not represent a real paradigm for diatoms. Consistent with this
possibility, I have sometimes observed that the Fv/Fm parameter can drop below 0.5 in P.
tricornutum cultures. The quantum yield of PSII could simply reveal that some photodamage has
occurred to this complex (e.g. by nutrient starvation) but could also reveal the occurrence of a larger
spillover to PSI. A systematic analysis of cultures grown under different conditions could help solving
this problem.
Another important question is the role of membrane compartmentation of the PSs in the physiology
of the algae. Previous work has underlined that the observed variability in the NPQ response of
diatoms (Lavaud & Lepetit, 2013) is inversely proportional to their capacity to recover from
photoinhibition via the synthesis of the D1/D2 subunits of PSII (Lavaud et al., 2016). In plants, the
PSII repair cycle requires the re-location of this complex in the stroma exposed unstacked lamellae
to enhance its accessibility of proteases (Nath et al., 2013). Assuming a similar mechanisms in
diatoms, one would expect the migration of PSII from the inner thylakoid membranes to the outer
ones to be a committed step of the repair process. It is tempting to speculate that possible
differences in the PSII and PSI localization within the membranes could hinder or facilitate PSII repair
after photoinhibition, thereby directly modulating photoprotection and consequently
photoacclimation responses via NPQ. A comparative analysis of diatom species with a different NPQ
capacity and or PSII repair could help solving this problem.
Then, particular attention should be given to the pyrenoid region. As recently shown in
Chlamydomonas reinhardtii (Engel et al., 20015) the photosynthetic membranes form a peculiar
array within this structure, possibly to facilitate the CO2 assimilation. Our 3D structure of the
chloroplast form P. tricornutum also reveal interesting features of the pyrenoid, which however
cannot be entirely solved because of the low resolution of this structure. The possibility to increase

109
3D resolution by lower the voxel size to 2 nm should help answering the question of the
arrangement of photosynthetic membranes around the pryrenoid in chloroplasts issued form a
secondary endosymbiosis.
Finally, our analysis also pinpoints the existence of a physical connection between the chloroplast
and the nucleus. This interaction reminds the transient connections observed in higher plants, which
are mediated by stromules. It is possible therefore to speculate that this junction could play a similar
role (i.e. the exchange of signals and proteins). In the previous work (see section 2.4) we highlight
the presence of a chloroplast-nucleus isthmus in which the inner nuclear envelope (iNE) is in contact
with the periplastidial membrane (PPM). In this area, the vesicular network (probably the machinery
involved in the trafficking of proteins and other metabolites) appear to be close to the nucleus, but
not in the area where the chloroplast-isthmus occurs. Further investigation is needed to understand
the functional and structural role of this “bridge”. An example is to test high-light stress conditions
which can enhance the plastid-to-nucleus retrograde signalling (as in Lepetit et al., 2013).

110

111
Chapter 3

112
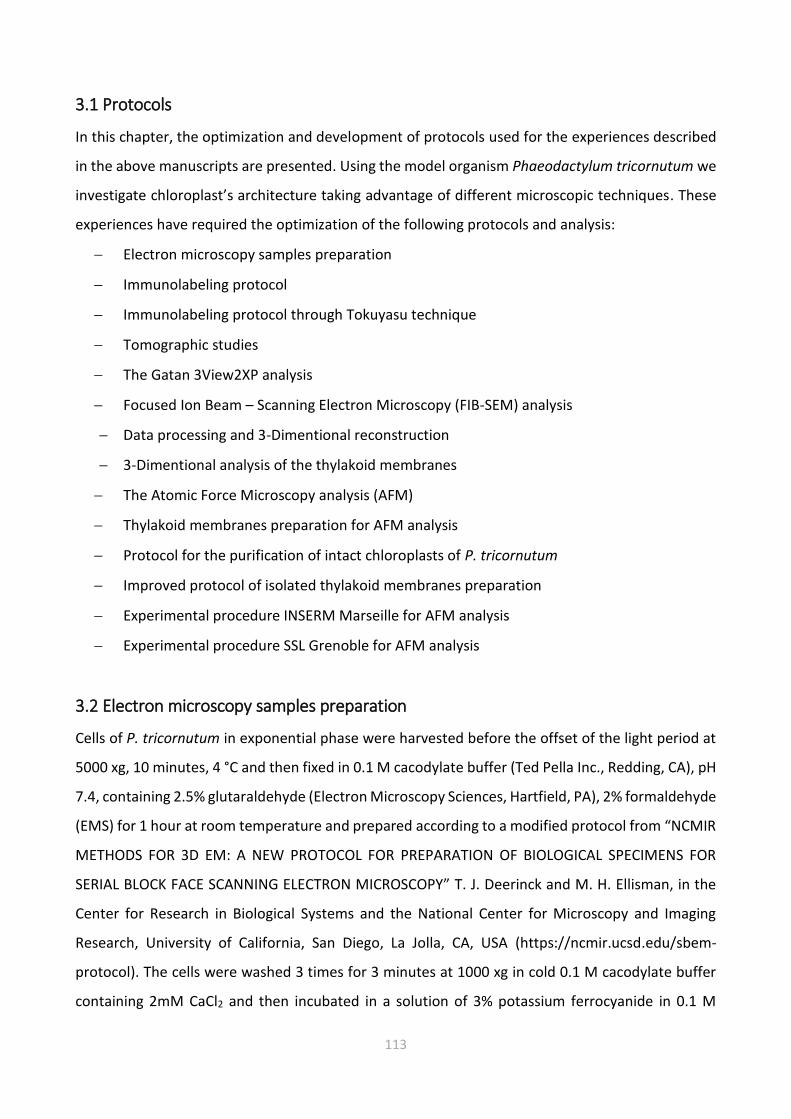
113
3.1 Protocols
In this chapter, the optimization and development of protocols used for the experiences described
in the above manuscripts are presented. Using the model organism Phaeodactylum tricornutum we
investigate chloroplast’s architecture taking advantage of different microscopic techniques. These
experiences have required the optimization of the following protocols and analysis:
Electron microscopy samples preparation
Immunolabeling protocol
Immunolabeling protocol through Tokuyasu technique
Tomographic studies
The Gatan 3View2XP analysis
Focused Ion Beam – Scanning Electron Microscopy (FIB-SEM) analysis
Data processing and 3-Dimentional reconstruction
3-Dimentional analysis of the thylakoid membranes
The Atomic Force Microscopy analysis (AFM)
Thylakoid membranes preparation for AFM analysis
Protocol for the purification of intact chloroplasts of P. tricornutum
Improved protocol of isolated thylakoid membranes preparation
Experimental procedure INSERM Marseille for AFM analysis
Experimental procedure SSL Grenoble for AFM analysis
3.2 Electron microscopy samples preparation
Cells of P. tricornutum in exponential phase were harvested before the offset of the light period at
5000 xg, 10 minutes, 4 °C and then fixed in 0.1 M cacodylate buffer (Ted Pella Inc., Redding, CA), pH
7.4, containing 2.5% glutaraldehyde (Electron Microscopy Sciences, Hartfield, PA), 2% formaldehyde
(EMS) for 1 hour at room temperature and prepared according to a modified protocol from “NCMIR
METHODS FOR 3D EM: A NEW PROTOCOL FOR PREPARATION OF BIOLOGICAL SPECIMENS FOR
SERIAL BLOCK FACE SCANNING ELECTRON MICROSCOPY” T. J. Deerinck and M. H. Ellisman, in the
Center for Research in Biological Systems and the National Center for Microscopy and Imaging
Research, University of California, San Diego, La Jolla, CA, USA (https://ncmir.ucsd.edu/sbem-
protocol). The cells were washed 3 times for 3 minutes at 1000 xg in cold 0.1 M cacodylate buffer
containing 2mM CaCl2 and then incubated in a solution of 3% potassium ferrocyanide in 0.1 M

114
cacodylate buffer and 4mM CaCl2 with an equal volume of 4% aqueous osmium tetroxide (EMS) for
1 hour, on ice. Then the cells where washed 3 times for 3 minutes at 1000 xg with ddH2O and
incubated for 20 minutes, at room temperature in a fresh filtered thiocarbohydrazide (TCH) solution
(0.1 g thiocarbohydrazide in 10 ml ddH2O gently swirling at 60° C in the oven for 1 hour). The cells
were then rinsed 3 x 3 minutes 1000 xg in ddH2O at room temperature and placed in 2% osmium
tetroxide in ddH2O for 30 minutes, at room temperature. After 3 washing steps of 3 minutes at room
temperature in ddH2O the cells were transferred in 1% aqueous uranyl acetate overnight at 4°C. The
next day cells of P. tricornutum were then washed 3 x 3 minutes 1000 xg in ddH2O at room
temperature. In the meantime a solution containing 0.066 g of lead nitrate in 10 ml of aspartic acid
solution (dissolving 0.998 g of L-aspartic acid (Sigma-Aldrich) in 250 ml of ddH2O) was prepared
adjusting the pH to 5.5 with 1N KOH. The lead aspartate solution was then placed in the oven at
60°C for 30 minutes. The cells were then transferred in the lead aspartate solution and returned in
the oven for 30 minutes. The heavy metal contrast performed on P. tricornutum’s cells was
controlled at the optical microscope (Figure 3.1 A). After a washing step with ddH2O cells were
dehydrated 20-30 minutes at 20%, 50%, 70%, 90%, 100%, 100% ethanol (anhydrous) and then
placed in anhydrous ice-cold acetone and left at room temperature for 30 minutes. Inclusion of resin
was performed after a centrifugation to remove the supernatant. The Durcupan ACM resin (EMS)
was prepared mixing 11.4 g part A with 10 g part B for 2 hours then adding 0.3 g of part C for 1hour
and finally with 0.05-0.1 g of part D for 1 hour. After the dehydration steps, the cells were infiltrated
with acetone/Durcupan resin mixture (2/3–1/3 two times for 1 h and 1/3–2/3 for 1 h) and
embedded in 100% Durcupan 2 times for 2 hours and finally into fresh 100% Durcupan in the oven
at 60°C for 48 hours (Figure 3.1 B). Ultrathin sections (60 nm) were prepared with a diamond knife
on an UC6 Leica ultramicrotome and collected on 200 mM mesh nickel grids before examining on a
JEOL 1200 EX electron microscope in collaboration with Denis Falconet (LPCV).
A B
Figure 3.1 – Samples preparation for EM. (A) Heavy metal contrast on P. tricornutum’s cells. (B) Final specimen embedded in
resin.

115
3.2.1 Results and discussion
The optimization of the procedure of sample preparation has required extensive effort due the
scattered character and the not exhaustive amount of information available in literature. Different
staining conditions (uranyl acetate, osmium tetroxide, potassium ferrocyanide) resins (epon,
durcupan, LR-white) were tested starting from protocols for mammalian cells or plants. Overall, the
final protocol, which combines sample fixation, heavy metal staining, dehydration steps and
embedding in resin, has led to good contrast and high lateral resolution as visible in Figure 3.2.
1µm
Figure 3.2 – P. tricornutum during cell division

116
3.3 Immunolabeling protocol
In order to understand the localization of the photosynthetic complexes in the thylakoid membranes
of the model organism Phaeodactylum tricornutum different experiments were performed to
optimize the dilution factor of the antibodies and the thickness of the gold marbles.
Starting from a protocol described in Vardi et al., 2008 we used sections of the specimen placed in
grids with different dilutions of primary antibodies: anti PsaC | PSI-C core subunit of photosystem I
(1:30/1:100) and anti PsbC | CP43 protein of PSII (1:10/1:50) in Phosphate Buffered Saline (PBS)–
5% and Bovine Serum Albumin (BSA). Then grids were incubated for 90 min with the secondary
antibody anti rabbit IgG (1:20) AURION Immunogold Reagents, with 25 nm nanogold particles.
Where the antibody binds, electrons from the microscope are scattered by the gold, leaving a black
spot visible in the picture (Figure 3.3 A).
3.3.1 Immunolabeling protocol through Tokuyasu technique
Using the facilities of the integrated structural biology platform (IBS) in Grenoble we used an epoxy-
free procedure to enhance antibody accessibility and prevent distortion effect, called Tokuyasu
(Tokuyasu, 1973). This technique allows the study of the thylakoid membranes directly in their
biological environment after a rapid and in situ vitrification (Figure 3.3 B). Cells of P. tricornutum
were fixed in a double-strenght fixative (4% (w/v) formaldehyde, 0,4% (v/v) glutaraldehyde) in
PHEM buffer (PIPES 60 mM, HEPES 25 mM, EGTA 10 mM, MgCl2 2mM; pH 7) in an equal volume to
the culture medium (ESAW), and then diluted into a standard strength fixative (2% (w/v)
formaldehyde (EMS) and 0,2% (v/v) glutaraldehyde, (EMS)). After 15 minutes, fresh standard
strength fixative was replaced and fixation proceeded for 30 minutes at room temperature, under
agitation. Cells were washed 3 times with 50 mM glycine in PHEM buffer and after centrifugation
were embedded in 12% gelatin in PHEM. The gelatin-embedded blocks were cryo-protected in 2,3M
sucrose in rotating vials at 4°C (overnight). Samples vitrification was obtained in liquid nitrogen
following the plunge and freezing technique. Thin sections (80 nm) were prepared at -110°C with a
diamond knife (Diatome) and the the blocks were prepared with an ultracryomicrotome (UC7,Leica,
Microsystems). Ribbons were picked-up with a drop of 1% (w/v) methylcellulose/1,15 M sucrose in
PHEM buffer. Sections were thawed and transferred to Formvar carbon-coated nickel grids.
The immunolabelling was performed using an automated system (Leica EM IGL). The
sucrose/methyl cellulose mixture was removed washing the grids with PBS 3 times for 2 minutes.
Then the free aldehyde groups were inactivated on PBS + 0.05 M glycine, pH 7.4, 15 minutes. The

117
hydrophobic areas were blocked with the Aurion Blocking Solution for 30 minutes. Then three
washing steps on PBS + 0.1% BSA-c pH 7.4 for 2 minutes were performed. The primary antibody was
diluted 1-5 μg/ml in PBS + 0.1% BSA-c pH 7.4 and the grids were incubated for 60 to 90 minutes.
Negative controls were incubated only with BSA-c buffer. Then six washing steps on PBS + 0.1% BSA-
c pH 7.4 for 5 minutes were performed. The secondary antibody with ultrasmall 6 nm gold particle
was diluted in PBS (1:20) + 0.1% BSA-c pH 7.4 and grids were incubated for 90 to 120 minutes. Then
six washing steps on PBS + 0.1% BSA-c pH 7.4 for 5 minutes and additional six washing steps on PBS
pH 7.4 for 2 minutes were realized. After a post fixation with 2% glutaraldehyde in PBS pH 7.4 for 5
minutes, three washing steps on PBS pH 7.4 for 2 minutes and six wash with deionized water for 2
minutes were performed. Sections were enhanced with silver (Aurion R-Gent SE-EM) for 25 minutes
and again washed on deionized water six times for 2 minutes. Subsequently, a first heavy metal
contrast was performed on 4% neutral uranyl acetate for 5 minutes followed by another heavy
metal contrast with 0.4% uranyl acetate in 2% methylcellulose (on ice) for 5 minutes. Grids were let
dry, using a loop and filter paper, after switching to a fresh droplet of PBS pH 7.4. Before
observation, grids were left 5 minutes on 2% uranyl oxalate (pH 7) and transferred to a mixture of
1,6% methyl cellulose and 0,4% uranyl acetate on ice, the excess of the viscous solution was drained
away and the grids were let to dry. Grids were examined in an electron Tecnai 12 microscope (FEI).

118
3.3.2 Results and discussion
The traditional EM technique used for immunolocalization show a limited bind affinity with the
incubated antibody (Figure 3.3 A) while the images obtained using the “clean” procedure Tokuyasu
(Figure 3.3 B), displayed a reduced distortion effect, and an enhanced antibody accessibility. As
shown in the pictures below (Figure 3.3 C) the incubated antibody is more often detected inside the
thylakoid membranes leaving numerous black spots in the EM picture. The analysis was performed
using the epoxy-free technique and the automated system for immunolabeling on more than 300
images and 10.000 gold particles were counted on the thylakoids of Phaeodactylum tricornutum.
C
A B
Figure 3.3 – Immunolocalization protocols. (A) Classic technique of immunolocalization using intact cells of P. tricornutum.
(B) Tokuyasu technique (C) Tokuyasu technique of immunolocalization using intact cells of P. tricornutum.

119
3.4 Tomographic studies
This method was adopted to fill the “2D-3D gap” limited by the thickness of the samples. Image
stacks were acquired automatically at high lateral resolution using two different techniques.
A first analysis was performed at the Technische Hochschule Zürich (ETH) using the Gatan 3View2XP
within the I.T.N. Marie Curie in collaboration with Samuel Zeeman and Simona Eicke.
A second analysis was performed in the Laboratoire d'Etudes des Matériaux par Microscopie
Avancée LEMMA of CEA Grenoble using a Focused ion beam scanning electron microscopy (FIB-
SEM) in collaboration with Pierre-Henri Jouneau.
Durcupan embedded cells of Phaeodactylum tricornutum were analysed using the following
techniques.
3.4.1 The Gatan 3View2XP analysis
The Gatan 3View2XP Microscope is an electron microscopy (Figure 3.4 A) equipped with an
automatic diamond knife which develops serial block-face sections using a beam of electrons to scan
across a surface (Figure 3.4 B) and reconstruct the different section to generate a high-resolution
tomogram. All the images resulted (Figure 3.4 C) were optimized with specific software (FIJI ImageJ)
and the three-dimensional reconstruction were performed with AMIRA® software (Figure 3.4 D).
Gatan 3View2XP Microscope in Zurich
B A C D
Figure 3.4 – The Gatan 3View2XP procedure. (A) Gatan 3View2XP Microscope in Zurich. (B) Image acquisition. (C) Automatic
2D images stack acquisition. (D) 3D reconstruction.

120
3.4.1.1 Results and discussion
This study reports the recording of several tomograms of intact cells of Phaeodactylum tricornutum.
The analysis of approximately 2000 slice images reveal a complex interconnected networks of
thylakoids membranes. Unfortunately, despite repetitive analysis the four acquired tomograms
were not satisfying for the following segmentation and 3-D reconstruction analysis. Nevertheless a
pioneering collaboration was establish in the laboratory of advance microscopy for the study of new
materials in nanotechnology at CEA Grenoble using the Focused Ion Beam – Scanning Electron
Microscopy (FIB-SEM) to characterize the connections between thylakoids and reveal the real
chloroplast architecture in diatoms.
3.4.2 Focused Ion Beam – Scanning Electron Microscopy (FIB-SEM) analysis
Focused ion beam tomography has been realized using a Zeiss NVision 40 dual-beam microscope
(Figure 3.5 A) which possess a Ga+ ion beam (of 700 nA at 30 kV). The main devices composing this
system are an ion column, an electron optic column and a field emission gun. After protecting an
area of the specimen with a layer of platinum or carbon, a section is abrade by the FIB to expose a
face of the sample free of artefact associated to mechanical sectioning. Then a cascade of Ga+ ions
is focused through to a needle tip that starts to erode a limited area of the sample and the newly
layer exposed is imaged by a SEM (Figure 3.5 B). Each slice was imaged in a scanning electron
microscopy (SEM) at 5 kV using the in-column EsB back-scatter detector. For each slice, a thickness
of 4 nm has been removed and the SEM images were recorded with a pixel size of 4 nm. The images
stack (Figure 3.5 C) is then registered by cross-correlation using the StackReg plugin in the Fiji
software. This procedure gives us directly an image in 3D with an isometric voxel size of 4x4x4 nm.
For the projection in 3-Dimension (x,y,z axis) different software were used (Figure 3.5 D).

121
3.4.2.1 Results and discussion
During this investigation, three tomograms of intact cells of Phaeodactylum tricornutum were
recorded. The first analysis was performed on a broken cell; this event led us to discover some
particular features concerning the periplastidial reticulum in P. tricornutum (section 2.3). The
second analysis of approximately 600 images revealed a complex and highly structured network of
membranes (section 2.3 and 2.4). The third tomogram was performed to reduce the thickness of
the slices at 2 nm, the resulted images were recorded with pixel size of 2 nm. The implemented
voxel size didn’t improve the resolution of the thylakoid membranes in the pictures that appeared
blurred probably due to the affinity of these membranes to bind the heavy-metal ions of the
osmium. Nevertheless combining other techniques for sample preparation (like the freeze fracture
technique) it is possible to reduce the risk of distort information due to invasive steps (chemical
fixations, dehydration, etc) providing more details for the 3-D analysis of the chloroplast structure.
FIB-SEM microscope
B A C D
Figure 3.5 – The FIB-SEM procedure. (A) The Zeiss NVision 40 dual-beam microscope http://www.southampton-
nanofab.com/fabrication/fib.php. (B) Image acquisition. (C) Automatic 2D images stack acquisition. (D) 3D
reconstruction.
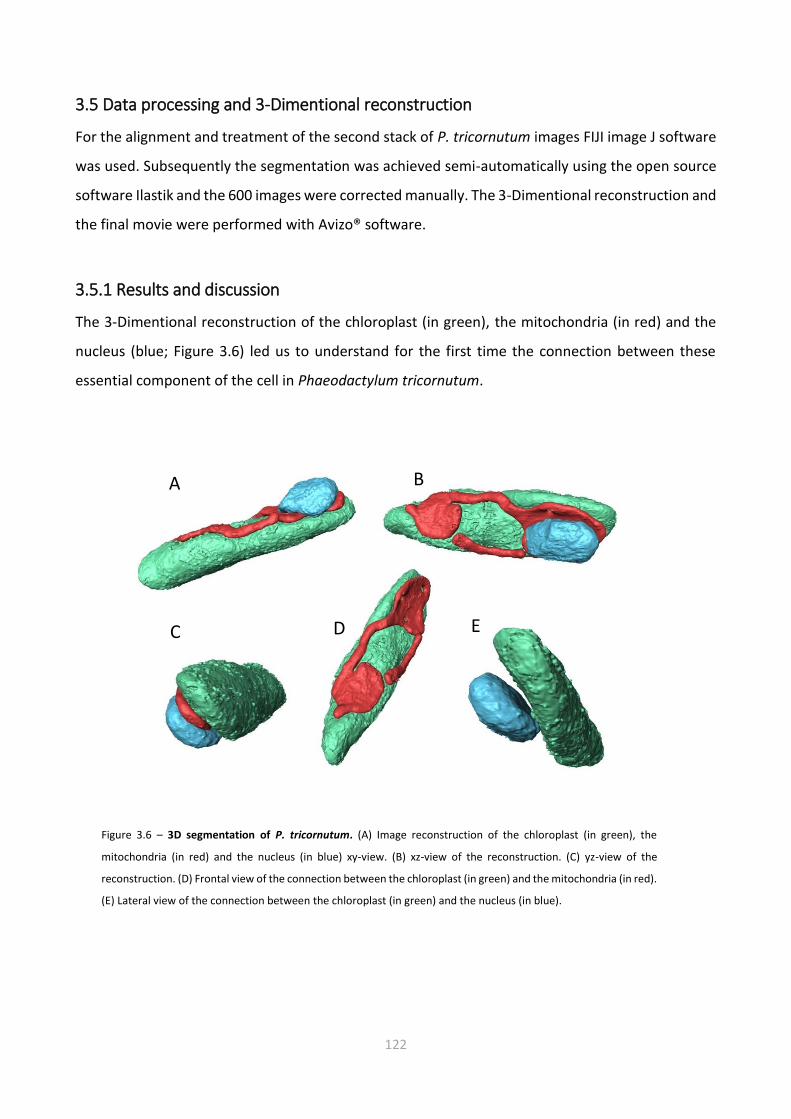
122
3.5 Data processing and 3-Dimentional reconstruction
For the alignment and treatment of the second stack of P. tricornutum images FIJI image J software
was used. Subsequently the segmentation was achieved semi-automatically using the open source
software Ilastik and the 600 images were corrected manually. The 3-Dimentional reconstruction and
the final movie were performed with Avizo® software.
3.5.1 Results and discussion
The 3-Dimentional reconstruction of the chloroplast (in green), the mitochondria (in red) and the
nucleus (blue; Figure 3.6) led us to understand for the first time the connection between these
essential component of the cell in Phaeodactylum tricornutum.
A B
C D E
Figure 3.6 – 3D segmentation of P. tricornutum. (A) Image reconstruction of the chloroplast (in green), the
mitochondria (in red) and the nucleus (in blue) xy-view. (B) xz-view of the reconstruction. (C) yz-view of the
reconstruction. (D) Frontal view of the connection between the chloroplast (in green) and the mitochondria (in red).
(E) Lateral view of the connection between the chloroplast (in green) and the nucleus (in blue).

123
3.6 Three-Dimentional analysis of the thylakoid membranes
The second stack of acquired images of P. tricornutum was also used to unveil the 3-Dimentional
architecture of the photosynthetic membranes. The analysis (represented in Figure 3.7) was
performed following these steps: the alignment and treatment of the 600 images was performed
with the software FIJI image J and then converted in .ccp4 files (.ccp4 is the abbreviation for
collaborative computational project number 4 and is the file format of electron density data used in
structural biology) for the subsequent volumetric analysis with CHIMERA software.
3.6.1 Results and discussion
The 3-D analyses performed with CHIMERA software disclose for the first time the complex dynamic
structure of the thylakoid membranes in P. tricornutum. The study leads to a completely different
opinion of the undifferentiated plastid issued by a secondary endosymbiosis. The connecting
membranes founded between the thylakoid layers (Figure 3.8 A) form a basket structure near the
pyrenoid region (Figure 3.8 B). So far, much of our understanding of P. tricornutum comes from
conventional transmission electron microscopy (TEM) studies. Analyzing microalgae ultrastructure
with these innovative techniques led us to scratch just the surface like Paolillo did in 1970 with serial
section of EM pictures revealing the presence of right-handed lamellae in the thylakoids of plants.
If we consider that nowadays the exact three-dimensional architecture of the grana in plant (for
review Daum et al., 2011) is still matter of debate, we are just at the beginning.

124
Figure 3.7 – Sequential images analysis. From the whole segmentation on the left (with the chloroplast, the mitochondria
and the nucleus) to the study of the photosynthetic membranes of P. tricornutum (in violet) on the right.

125
A
B
Figure 3.8 – Images analysis with CHIMERA software. (A) Detail of the thylakoid membranes. The violet areas
correspond to the internal membranes while the green areas correspond to the external membranes. (B) Sequential
images analysis of the “basket” structure near the pyrenoid region of P. tricornutum. Similar to the stroma lamellae of
plants, these structures connect different layers of the thylakoids and differ from the plastoglobules present in these
pictures.

126
3.7 The Atomic Force Microscopy (AFM)
This method was chosen to better understand the topology of the thylakoid membranes and to
improve the resolution at nanoscale level of the organization of photosynthetic complexes, in non
fixed membranes.
The heart of the AFM (Figure 3.9 A) is a sharp tip attached to a flexible Si3N4 cantilever that scans
the sample. During the scan, the probes touch the sample, controlled by the piezoelectric material
that apply a force on the cantilever base and makes it vibrate. The movements of the probe over
the surface, thanks to the laser focused on the cantilever give back a signal that is reflected to a
detector (Figure 3.9 B). As result the vertical bending (deflection) of the cantilever gives us a
measurement of the movement of the probe and, consequently, information about the surface of
the sample. Different techniques allow studying the topography of membranes proteins directly in
their biological environment (contact mode, tapping mode and noncontact mode). For the analysis
we used the contact mode (CM-AFM) where the force between the tip of the cantilever and the
probe is constant, commonly used for analysis of flat membranes (for more information see Liu &
Sheuring, 2013) and Tapping Mode where the tip touch the sample only intermittently reducing
dragging forces during the scanning (Tamayo & Garcia, 1996). The samples were deposited on a
mica holder, due to the fact that the tip and the samples are immersed in a buffer solution the mica
surface is attached to a teflon plate and subsequent to a metal plate (Figure 3.9 C).
Cyper AFM in the Science Surface Laboratory
A B C
Components of the AFM Details of the sample holder
Figure 3.9 – The AFM procedure. (A) The Cyper AFM Microscope in the Science Surface Laboratory. (B) Major component
of the AFM technique (laser, focus lens, sample, x y z piezo scanner, tip, cantilever, mirror, detector, controller amplifier
and computer). (C) Details of the samples holder (from the bottom to the top: metal plate, teflon plate, mica holder and
the sample).

127
A first investigation was performed at the Institut National de Santé et de la Recherche Médicale
INSERM Marseille in collaboration with Simon Scheuring and Nikolay Buzhynskyy.
A second investigation was performed in the SSL (Science Surface Laboratory) of the European
Synchrotron Radiation Facility (ESRF) of Grenoble in collaboration with Luca Costa.
Isolated thylakoid membranes of Phaeodactylum tricornutum were analysed using the following
techniques.
3.7.1 Thylakoid membranes preparation for AFM
Different procedures were taken into consideration to prepare isolated thylakoid membranes for
atomic force microscopy analysis. A first set of experiments was set up with a technique created in
1998 by Wittpoth and collaborators. This protocol was designed for two marine centric diatoms
Odontella sinensis and Coscinodiscus granii with a silicified cell wall and as expected, some
difficulties had emerged. In fact, this protocol was not adequate to open cells of P. tricornutum. To
solve this problem, different setups, pressures and centrifugation steps were tested to improve the
quality of the obtained memebranes. Unfortunately no substantial improvements were achieved
and a second set of experiments was established according to Martinson et al., 1998 (Figure 3.10
A). The procedure was the followed. Cells were harvested and concentrated at 2000 xg for 10
minutes (Multifuge X1R Thermo Scientific) and then resuspended in buffer 1 (2 M sorbitol, 20 mM
MES-NaOH (pH 6), 5 mM ε-aminocaproic acid (ACA), 1 mM benzamidine (BAM), 1 mM MgCl2).
Afterwards, the following sequence of sonication (15 sec burst, 30 sec cool, 15 sec burst at 105 W)
and centrifugation (750 xg for 5 minutes) were realized 6 times. The supernatants were collected
and centrifuged for 15 minutes at 12400 rpm in a Sorvall RC5 centrifuge with a SS-34 rotor in 50 mL
polycarbonate tubes. The crude membrane pellets were resuspended in buffer 2 (2 M sorbitol, 20
mM MESNaOH (pH 6), 5 mM ACA, 1 mM BAM) homogenised and centrifuged again. Pellets were
resuspended homogenised and gently transferred into four 13 ml ultracentrifuge tubes SW32Ti
Beckman and overlaid with the gradient buffers 3 (5 mM MES-NaOH (pH 6), 5 mM ACA, 1 mM BAM,
with sorbitol at 3.2M and 2.5 M). Thylakoids were purified by flotation in Beckman SW32Ti swinging
bucket rotor after one hour at 32000 rpm, recovered, diluted in the washing buffer 6 (containing: 5
mM MES-NaOH (pH 6), 5 mM ACA, 1 mM BAM) and centrifuged for 15 minutes at 12400 rpm in a
Sorvall RC5 centrifuge with a SS-34 rotor in 50 mL polycarbonate tubes. Pellets were frozen at -80°C
and used for the first analysis with the AFM.

128
3.7.2 Protocol for the purification of intact chloroplasts of P. tricornutum
In order to improve the preparation of isolated thylakoid membranes first of all we developed a
protocol for the purification of intact chloroplasts of P. tricornutum which was combined with the
protocol for the fractionation of Arabidopsis thaliana chloroplasts (Salvi et al., 2004) following the
procedure highlighted in Figure 3.10 B. Cells were harvested (2*106 cells/mL) before the offset of
the light period at 5000 xg, 10 min, 4 °C, and then concentrated at 2500 xg, 10 min, 4 °C. The pellet
was resuspended gently with 10 mL of Isolation buffer (0.5 M Sorbitol; 50mM Hepes -KOH ph8;
6mM EDTA; 5mM MgCl2; 10mM KCl; 1mM MnCl2; 1% PVP 40 (K30); ph 7,2-7,5. And fresh 0,5% BSA;
0,1% Cystein) and passed slowly through a French Press 700 scale parts (9000 bar). The mixture of
broken cells was fill up with additional 10 mL of Isolation buffer on dark and ice and centrifuged at
300 xg for 8 minutes. Only the supernatant was collected and centrifuged at 2000 xg, 10 min, 4 °C.
Using a soft paint-brush the pellet was gently dissolved into 2 ml of washing buffer (0,5 M Sorbitol;
30mM Hepes-KOH ph8; 6mM EDTA; 5mM MgCl2; 10mM KCl; 1mM MnCl2; 1% PVP 40 (K30); ph 7,2-
7,5. And fresh 0,1% BSA) and loaded (max 2mL) to one Percoll gradient (0,5 M Sorbitol; 30mM
Hepes-KOH ph8; 6mM EDTA; 5mM MgCl2; 10mM KCl; 1mM MnCl2; 0,1% PVP 40 (K30); ph 7,2-7,5.
Percoll at desired concentration 10%, 20%, 30%). The mixture of broken cells and plastids was
centrifuged in a Ultra-centrifuge (with SW41Ti rotor) at 9000 rpm 35 min. The two bands resulted
were collected and dissolved in the washing buffer (without BSA, 5-6 mL each) centrifuging at 9000
rpm, 10 min, 4°C. The resulted pellet was then resuspend in a hypotonic buffer (10mM MOPS-NaOH
pH 7.8; 4mM MgCl2; 1mM PMSF; 1mM benzamidine; 0.5mM ε-aminocaproic acid) and loaded in a
sucrose gradient (10mM MOPS-NaOH pH 7.8; 4mM MgCl2 with sucrose at 0.93 M, 0.6 M and 0.3 M)
and centrifuge it at 20000 rpm for 1.10 hours. The bottom fraction resulting from the sucrose
gradient was washed (max 4-5 mL of washing buffer) at 25000 rpm for 1.10 hours and collected for
the subsequent analysis at INSERM of Marseille.

129
3.7.3 Improved protocol of isolated thylakoid membranes preparation
In collaboration with Nikolay Buzhynskyy we improved the protocol previous developed adding
another step of French press (Figure 3.10 C). The resulting sucrose gradient performed contained 3
fractions: the upper fraction corresponding to light membrane fragments, the middle fraction
which is supposed to contain stack of thylakoids and the bottom fraction of intact chloroplasts. The
aliquot of the middle fraction was additionally homogenized to create isolated membrane stacks.
This sample were directly transferred and analyzed at the INSERM of Marseille.
A B C
Figure 3.10 – Experimental protocols for sample preparation for AFM analysis. (A) Thylakoid membranes preparation
following the protocol of Martinson et al., 1998. (B) Developed protocol for the purification of intact chloroplasts of P.
tricornutum. (C) Improved protocol of isolated thylakoid membranes preparation.

130
3.7.4 Experimental procedure INSERM Marseille
The AFM analysis was performed according to Scheuring & Sturgis, 2009. Membranes were initially
diluted 50 times with the adsorption buffer (10 mM Tris buffer 150 mM KCl and 25 mM MgCl2).
Afterwards, 40 µl of the solution were deposited on mica surface (freshly cleaved) and incubated
for 30 minutes. Non-bound membranes were washed away with recording buffer (10 mM Tris-HCl
buffer 150 mM KCl pH 7.5). The acquisition of the data were performed with a commercial
Nanoscope-E contact-mode AFM (from Digital Instruments, Santa Barbara, CA, USA) equipped with
a low-noise laser, and a 160 lm scanner (J-scanner) using oxide-sharpened Si3N4 cantilevers with a
length of 100 lm (k = 0.09 N/m; Olympus Ltd., Tokyo, Japan).
3.7.4.1 Results and discussion
During this investigation several analyses were performed. The first one has provided details of
thylakoid membranes revealing the presence of some flat zones (attributable to lipid membranes)
surrounded by protruding and corrugated areas where small fragments are attached forming dense
aggregates (Figure 3.11 A). The second analysis with the improved protocol (protocol for the
purification of intact chloroplasts of P. tricornutum) reveals membranes on mica surface carrying a
number of protruding elements (potentially assigned to the protein complexes of interest, Figure
3.11 B). During the third analysis, the sample (prepared with the improved protocol of isolated
thylakoid membranes) shows membranes patch carried protruding corrugations probably
constitute of protein domains (10-20 nm in size, Figure 3.11 C). However, despite several tests, the
continuous scanning of the tip led to the gradual destruction of the membranes probably related to
the quality of the samples. Indeed to avoid potential damage of the thylakoid membranes during
the transport, we establish another collaboration in Grenoble at the Science Surface Laboratory.

131
3.7.5 Experimental procedure SSL Grenoble
During the second investigation fresh samples obtained with the developed protocol were diluted
50 times in the adsorption buffer (10 mM Tris buffer 150 mM KCl and 25 mM MgCl2). Then, ~30µl
of the solution were deposited on mica surface (freshly cleaved) and incubated for 30-45 minutes.
Non-bound membranes were washed away with recording buffer (10 mM Tris-HCl buffer 150 mM
KCl pH 7.5). Buffers at pH 7.4 and pH 8 were also tested. The analyses were performed in Contact
Mode and in Tapping Mode (see Hansma et al., 1994). The acquisition of the data was performed
with a Cypher AFM (Asylum Research, Santa Barbara, CA, USA) in Amplitude-Modulation mode AFM
(one of the most common technique) using BL-AC40 (BL-AC40 Olympus Ltd. Tokyo, Japan), Si3N4
cantilevers with nominal stiffness of 0.150 N/m.
3.7.5.1 Results and discussion
During this analysis we achieved to have fresh preparation of thylakoids membranes and it was
possible to identify three different regions: lipid bilayer, debris of membranes and packed
membranes (Figure 3.12 A 1,2,3, respectively). After many tests, several interesting structures were
observed at nm scale, probably protein domains organized in filaments with a regular orderliness
A B C
Figure 3.11 – Results procedure INSERM Marseille. (A) First analysis of the sample prepared with the protocol of
Martinson et al., 1998. (B) Second analysis of the sample prepared with the developed protocol for the purification of
intact chloroplasts of P. tricornutum. (C) Sample analysis prepared with the improved protocol of isolated thylakoid
membranes.

132
(Figure 3.12 B). Nevertheless, as verified in different occasions, the continuous scanning of the tip
damaged the delicate membranes.
Overall, we concluded that the study with the Atomic Force Microscopy was not adequate for our
purposes. The development of the procedure for sample preparation has required extensive effort
due to the different organization of the thylakoid membranes in diatoms which has deeply modified
the starting procedure (for review see Scheuring & Sturgis, 2009) adding repetitive purification
steps. We consider that these additional steps might modify the natural assembly of the proteins in
their natural environment. However, the advantage of this technique to study protein complexity
and assembly in native membranes opens many possibilities for the future. The AFM should be
employed as a supplementary tool to study the natural supramolecular organization of membranes.
A future perspective can consider the application of the protocols here developed to plan new
experiments and implement the knowledge on this technique.
B A
1 2
3
Figure 3.12 – Results procedure SSL Grenoble. (A) First analysis showing three different regions in the thylakoid
membranes: (1) lipid bilayer (2) debris of membranes (3) packed membranes. (B) Details of the photosynthetic membranes
of P. tricornutum showing ordered protein domains.

133
Chapter 4

134

135
4.1 Introduction
This chapter is organized in three sections. In the first one (section 4.2) I will introduce the model
organism Chlamydomonas reinhardtii and present some specific features of this alga. In particular,
I will focus on the protein LHCSR3 (Light Harvesting Complex-Stress Related 3) which is the effector
of the qE component of NPQ. I wil also describe acetate assimilation in C. reinhardtii and finish with
a description of the nature and function of photoreceptors. In the second section (section 4.3) the
article “A Blue Light Photoreceptor Mediates the Feedback Regulation of Photosynthesis” will be
presented. In the third section (section 4.4), I will present data about the metabolic regulation of
NPQ and LHCSR3 in Chlamydomonas reinhardtii.
4.2 Chlamydomonas reinhardtii
The model organism studied in this part of my Ph.D manuscript is the unicellular green alga
Chlamydomonas reinhardtii (Greek chlamys: cloak and monas: solitary) belonging to the phylum
Chlorophyta. It is a 10 µm fresh-water biflagellate that became one of the most widely studied
photosynthetic unicellular organism thanks to its easily synchronization, rapid growth (doubling
time ~ 8-12 hours), sequenced genome (Merchant et al., 2007) and the availability of numerous
strains and mutants (http://www.chlamycollection.org/). C. reinhardtii possesses two equal apical
flagella that allow it to swim and a cell wall composed by glycoproteins. A single chloroplast occupies
a large volume of the cytoplasm (up to 50%, Figure 4.1). Unlike plants, the chloroplast of C.
reinhardtii shows poorly stacked thylakoid membranes (Figure 4.1; see Engel et al., 2015 for a recent
publication). The pyrenoid is also visible at the periphery of the chloroplast. Near the chloroplast, a
primitive eye, the eyespot, recognizable as an orange spot (rich of carotenoids) mediates the
perception of the light. This eye is essential for phototaxis (the ability to swim toward or away from
a light source). C. reinhardtii is a widespread freshwater species, commonly found in temporary soil
pools, eutrophic lakes, etc. In these habitats, the cells can experience drastic changes in light
intensity (from total darkness to excessive photon flux intensities within few minutes). To cope with
light fluctuations, C. reinhardtii has evolved a series of physiological photoacclimatative mechanisms
to adjust its photosynthetic rate and to survive.

136
4.2.1 LHCSR
As mentioned earlier (section 1.6.1.1) the qE component of non-photochemical fluorescence
quenching (NPQ) is the most efficient and rapid mechanism to regulate photosynthesis under
excessive photon flux densities. In the green alga Chlamydomonas reinhardtii qE induction requires
the nuclear-encoded chloroplast localized proteins LHCSRs (Ligh-Harvesting Complex Stress Related
proteins, previously called Li818 Light Induced protein 818; Peers et al., 2009). Three genes encoding
two LHCSRs isoforms are present in the genome of C. reinhardtii (Merchant et al., 2007). The
LHCSR3.1 (Cre08.g367500) and LHCSR3.2 (Cre08.g367400) genes, which are 99% identical (775 out
of the 780 base pairs) encode for the same 259 amino acid polypeptide LHCSR3, while the LHCSR1
gene (Cre08.g365900) encodes for the LHCSR1 isoform. The proteins LHCSR1 and LHCSR3 have more
than 80% identity (Bonente et al., 2011). In 2009, Peers and colleagues demonstrated that knock-
out mutants of LHCSR3.1 and LHCSR3.2 have a largely reduced qE (Peers et al., 2009), concluding
that LHCSR3 is the main qE effector protein in C. reinhardtii. In the double mutant of LHCSR3 and
LHCSR1 no qE is detectable (Berteotti et al., 2016). LHCSR3 is a three helix protein located in the
thylakoid membranes, which possess chlorophylls (Chl a/b) and carotenoids binding motifs (lutein,
violaxanthin and zeaxanthin; Bonente et al., 2011). At variance with PSBS (the qE protein effector in
higher plants; Li et al., 2000), which is contitutively accumulated in the thylakoids, LHCSR3 is induced
by high light (Gagné & Guertin, 1992). However, LHCSR3 transcripts accumulate under
environmental conditions inducing photo-oxidative stress, limitation of carbon dioxide (Miura et al.,
2004), sulphur (Zhang et al., 2004) or iron (Naumann et al., 2007), as well as high light (Ledford et
Figure 4.1 – EM picture of Chlamydomonas reinhardtii. In green the chloroplast of Chlamydomonas is highlited (modified from
http://remf.dartmouth.edu/imagesindex.html).
137
al., 2004). Accumulation of LHCSR3 also requires active photosynthesis together with the Ca2+
binding protein CAS and Ca2+ signaling events (Petroutsos et al., 2011). This was later confirmed at
the transcript level by Maruyama et al., 2014 who carefully studied the expression of LHCSR1,
LHCSR3.1 and LHCSR3.2 at low and high light in the absence and presence of photosynthetic and
Ca2+ signaling inhibitors. Yamano et al. (2008) showed that the transcription of LHCSR1 was
repressed by low CO2 while LHCSR3.2 and LHCSR3.1 were induced under low CO2. LHCSR1
transcriptional repression by low CO2 was confirmed by Brueggemann et al., 2012 in a RNAseq study
of cells shifted from high to low CO2 conditions. Similarly, Fang et al., 2012 found that transcription
of both LHCSR3.1 and LHCSR3.2 is upregulated in low CO2 conditions and is under control of the
CIA5 transcription factor that regulates transcription of genes for acclimation to low CO2 such as
inorganic carbon transporters and carbonic anhydrases.
LHCSRs proteins in C. reinhardtii possess a dual role acting as sensors of lumen acidification and as
quenching site. Indeed LHCSR3 contains residues sensing luminal acidification (Ballottari et al.,
2016), like PSBS. However, unlike PSBS, it also possess several pigment molecules (Bonente et al.,
2011) and presumably act as a direct site of high light quenching (Tokutso & Minagawa, 2013; Ahn
et al., 2008).
4.2.2 A facultative acetate flagellate
Chlamydomonas ability to survive in adverse conditions relies also to its metabolic flexibility and in
particulal to its capacity to use organic carbon source via respiration in the dark (heterotrophy), to
use inorganic carbon consuming CO2 (photoautotrophy) or to combine the two carbon sources
(mixotrophy). Depending on the prevailing mode of carbon assimilation, this versatile unicellular
microalga is able to adjust its photosynthetic efficiency. It is well known, that the combination of
both inorganic (CO2) and an external organic carbon substrates leads to a synergetic effect of the
two processes that enhances the productivity and growth of microalgae (Bhatnagar et al., 2010).
For this reason, the central carbon metabolism play a crucial role balancing the production of
energetic compounds (i.e carbohydrates and lipids) and photosynthetic efficiency.
The tricarboxylic acid cycle (TCA, also called Krebs cycle or citric acid cycle) is a key component of
the central carbon metabolism, in which organic molecules are break down to produces reducing
equivalents (NADH and FADH2 ) to fuel the electron transport chain for cellular respiration.
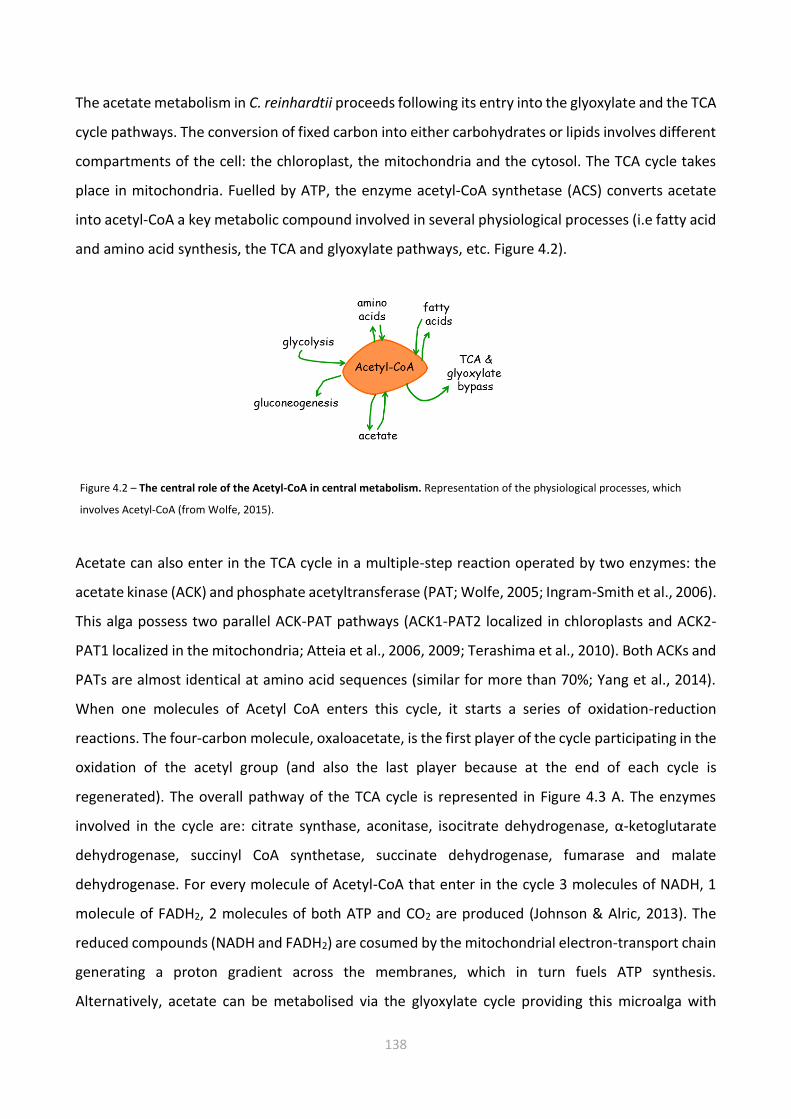
138
The acetate metabolism in C. reinhardtii proceeds following its entry into the glyoxylate and the TCA
cycle pathways. The conversion of fixed carbon into either carbohydrates or lipids involves different
compartments of the cell: the chloroplast, the mitochondria and the cytosol. The TCA cycle takes
place in mitochondria. Fuelled by ATP, the enzyme acetyl-CoA synthetase (ACS) converts acetate
into acetyl-CoA a key metabolic compound involved in several physiological processes (i.e fatty acid
and amino acid synthesis, the TCA and glyoxylate pathways, etc. Figure 4.2).
Acetate can also enter in the TCA cycle in a multiple-step reaction operated by two enzymes: the
acetate kinase (ACK) and phosphate acetyltransferase (PAT; Wolfe, 2005; Ingram-Smith et al., 2006).
This alga possess two parallel ACK-PAT pathways (ACK1-PAT2 localized in chloroplasts and ACK2-
PAT1 localized in the mitochondria; Atteia et al., 2006, 2009; Terashima et al., 2010). Both ACKs and
PATs are almost identical at amino acid sequences (similar for more than 70%; Yang et al., 2014).
When one molecules of Acetyl CoA enters this cycle, it starts a series of oxidation-reduction
reactions. The four-carbon molecule, oxaloacetate, is the first player of the cycle participating in the
oxidation of the acetyl group (and also the last player because at the end of each cycle is
regenerated). The overall pathway of the TCA cycle is represented in Figure 4.3 A. The enzymes
involved in the cycle are: citrate synthase, aconitase, isocitrate dehydrogenase, α-ketoglutarate
dehydrogenase, succinyl CoA synthetase, succinate dehydrogenase, fumarase and malate
dehydrogenase. For every molecule of Acetyl-CoA that enter in the cycle 3 molecules of NADH, 1
molecule of FADH2, 2 molecules of both ATP and CO2 are produced (Johnson & Alric, 2013). The
reduced compounds (NADH and FADH2) are cosumed by the mitochondrial electron-transport chain
generating a proton gradient across the membranes, which in turn fuels ATP synthesis.
Alternatively, acetate can be metabolised via the glyoxylate cycle providing this microalga with
Figure 4.2 – The central role of the Acetyl-CoA in central metabolism. Representation of the physiological processes, which
involves Acetyl-CoA (from Wolfe, 2015).

139
additional metabolic versatility. The glyoxylate cycle, is a five-steps reactions in which two enzymes
(isocitrate lyase and malate synthase) bypass the two decarboxylation steps in the TCA cycle and
permit the direct assimilation of carbon from Acetyl-CoA (Figure 4.3 B).
Starting from the initial observation that C. reinhardtii cells grown in presence of light and acetate
(TAP medium) show no NPQ capacity (Finazzi et al., 2006), we have reinvestigated the link between
acetate and photoprotection, as described in section 4.4
A
B
Figure 4.3 – Schematic representation of acetate assimilation in Chlamydomonas reinhardtii. (A) The tricarboxylic
acid cycle. (B) the glyoxylate cycle.

140
4.2.3 Photoreceptors
Light is a crucial factor for photosynthetic organisms and its variability in time and space establishes
their survival and performance in their natural environment. Its triple role can be briefly summarized
as i. energy source for photosynthesis ii. environmental information converted by photoreceptor
proteins into biological signals and iii. potential damage, when light absorbed overcomes the
capacity for CO2 fixation. Photosynthetic organisms evolved different strategies to cope with light
fluctuating environments, which rely on sophisticated light-sensing system: the photoreceptors. A
photoreceptor is a molecule that absorbs light and transduce its energy into a biological signal
(Shropshire Jr. & Mohr, 1983). Typically, five types of photoreceptors (Figure 4.4) exist in plants: the
UV Resistence locus 8 that absorb in the UV-B region at around 280-315 nm (Jenkins, 2014); the
cryptochromes, that mediate the blue region (390-500 nm; Chaves et al.2011) as the phototropins
(PHOT; Christie, 2007) and the members of the Zeitlupe protein family (Suetsugu & Wada, 2013);
and finally the phytochromes, capable of absorbing the red (600–700 nm) and far-red regions (700–
800 nm, Chen & Chory, 2011).
Figure 4.4 – Photoreceptor proteins. Scheme of the five types of photoreceptors found in plants (Heijde & Ulm, 2012)
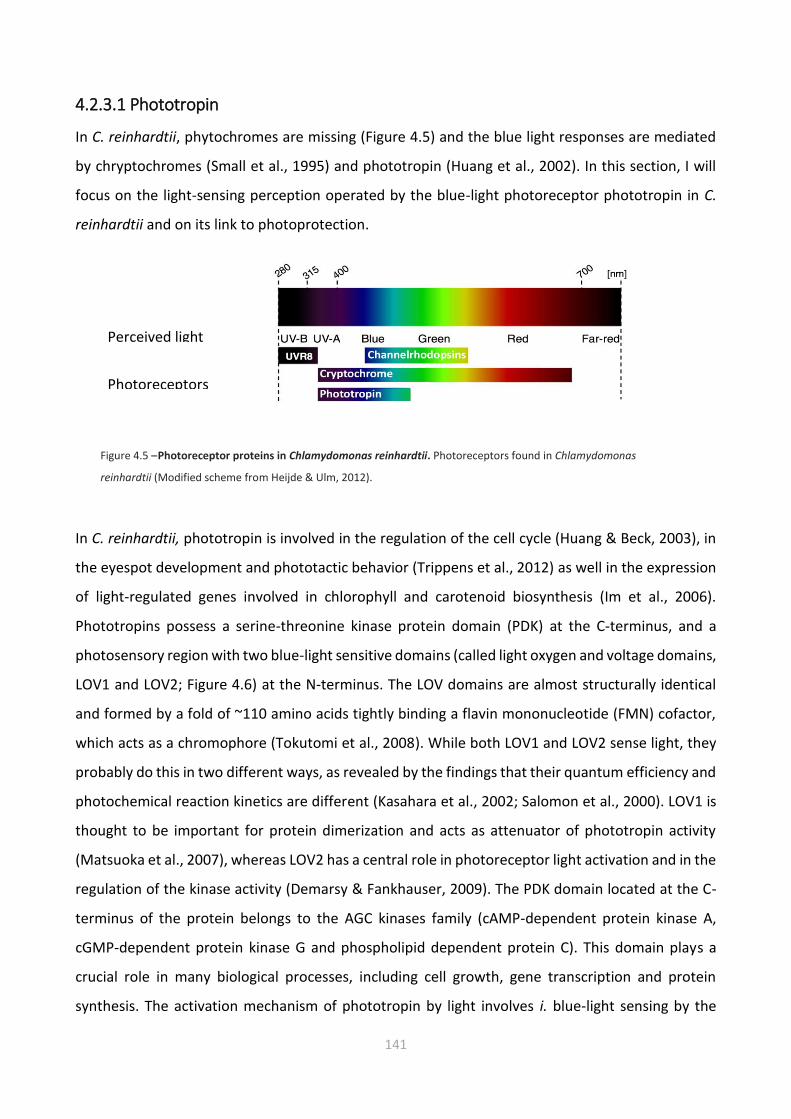
141
4.2.3.1 Phototropin
In C. reinhardtii, phytochromes are missing (Figure 4.5) and the blue light responses are mediated
by chryptochromes (Small et al., 1995) and phototropin (Huang et al., 2002). In this section, I will
focus on the light-sensing perception operated by the blue-light photoreceptor phototropin in C.
reinhardtii and on its link to photoprotection.
In C. reinhardtii, phototropin is involved in the regulation of the cell cycle (Huang & Beck, 2003), in
the eyespot development and phototactic behavior (Trippens et al., 2012) as well in the expression
of light-regulated genes involved in chlorophyll and carotenoid biosynthesis (Im et al., 2006).
Phototropins possess a serine-threonine kinase protein domain (PDK) at the C-terminus, and a
photosensory region with two blue-light sensitive domains (called light oxygen and voltage domains,
LOV1 and LOV2; Figure 4.6) at the N-terminus. The LOV domains are almost structurally identical
and formed by a fold of ~110 amino acids tightly binding a flavin mononucleotide (FMN) cofactor,
which acts as a chromophore (Tokutomi et al., 2008). While both LOV1 and LOV2 sense light, they
probably do this in two different ways, as revealed by the findings that their quantum efficiency and
photochemical reaction kinetics are different (Kasahara et al., 2002; Salomon et al., 2000). LOV1 is
thought to be important for protein dimerization and acts as attenuator of phototropin activity
(Matsuoka et al., 2007), whereas LOV2 has a central role in photoreceptor light activation and in the
regulation of the kinase activity (Demarsy & Fankhauser, 2009). The PDK domain located at the C-
terminus of the protein belongs to the AGC kinases family (cAMP-dependent protein kinase A,
cGMP-dependent protein kinase G and phospholipid dependent protein C). This domain plays a
crucial role in many biological processes, including cell growth, gene transcription and protein
synthesis. The activation mechanism of phototropin by light involves i. blue-light sensing by the
Figure 4.5 – Photoreceptor proteins in Chlamydomonas reinhardtii. Photoreceptors found in Chlamydomonas
reinhardtii (Modified scheme from Heijde & Ulm, 2012).
Perceived light
Photoreceptors
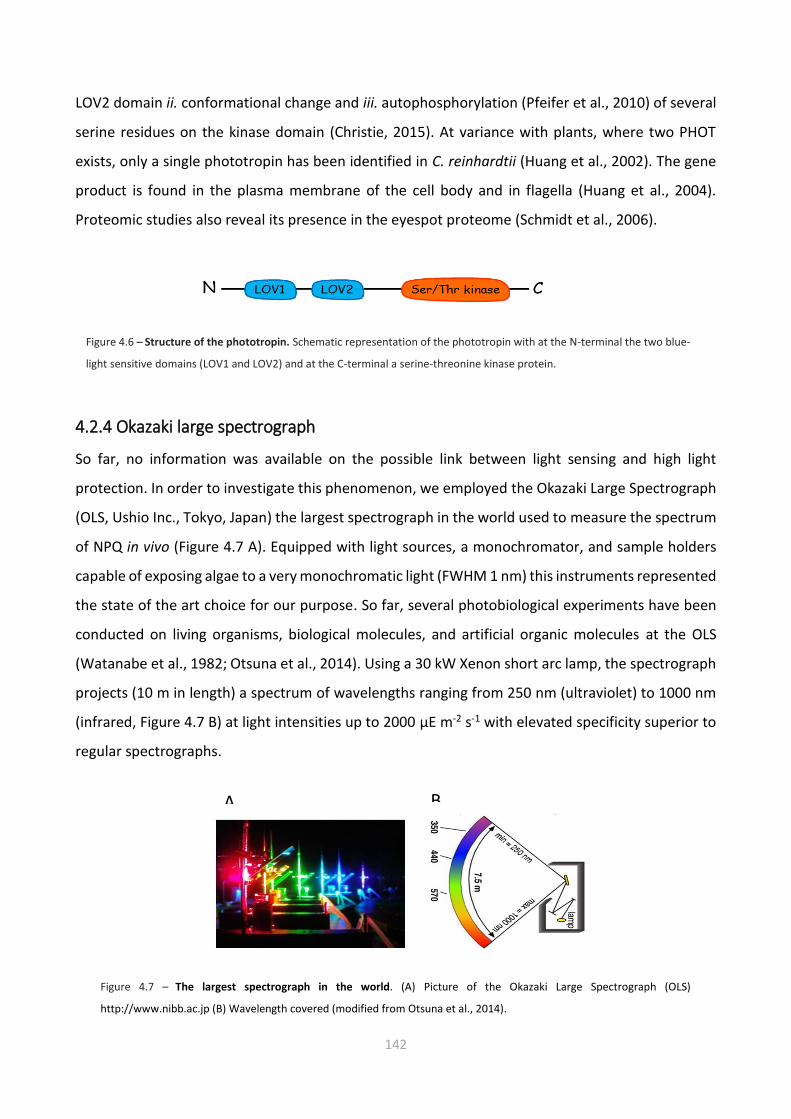
142
LOV2 domain ii. conformational change and iii. autophosphorylation (Pfeifer et al., 2010) of several
serine residues on the kinase domain (Christie, 2015). At variance with plants, where two PHOT
exists, only a single phototropin has been identified in C. reinhardtii (Huang et al., 2002). The gene
product is found in the plasma membrane of the cell body and in flagella (Huang et al., 2004).
Proteomic studies also reveal its presence in the eyespot proteome (Schmidt et al., 2006).
4.2.4 Okazaki large spectrograph
So far, no information was available on the possible link between light sensing and high light
protection. In order to investigate this phenomenon, we employed the Okazaki Large Spectrograph
(OLS, Ushio Inc., Tokyo, Japan) the largest spectrograph in the world used to measure the spectrum
of NPQ in vivo (Figure 4.7 A). Equipped with light sources, a monochromator, and sample holders
capable of exposing algae to a very monochromatic light (FWHM 1 nm) this instruments represented
the state of the art choice for our purpose. So far, several photobiological experiments have been
conducted on living organisms, biological molecules, and artificial organic molecules at the OLS
(Watanabe et al., 1982; Otsuna et al., 2014). Using a 30 kW Xenon short arc lamp, the spectrograph
projects (10 m in length) a spectrum of wavelengths ranging from 250 nm (ultraviolet) to 1000 nm
(infrared, Figure 4.7 B) at light intensities up to 2000 μE m-2 s-1 with elevated specificity superior to
regular spectrographs.
Figure 4.7 – The largest spectrograph in the world. (A) Picture of the Okazaki Large Spectrograph (OLS)
http://www.nibb.ac.jp (B) Wavelength covered (modified from Otsuna et al., 2014).
A B
Figure 4.6 – Structure of the phototropin. Schematic representation of the phototropin with at the N-terminal the two blue-
light sensitive domains (LOV1 and LOV2) and at the C-terminal a serine-threonine kinase protein.

143
4.3 Blue light perception by phototropin mediates regulation of photosynthetic light
harvesting
4.3.1 Preface
The article presented in this chapter (Petroutsos et al., under revision in Nature) focuses on the
model organism C. reinhardtii. In this section, we want to understand if besides light intensity, is
there a role of the light quality in the induction of qE and LHCSR3?
This article clearly describe how the blue light perceived by the photoreceptor phototropin (PHOT)
controls photoprotection by inducing the expression of the qE effector protein LHCSR3 in high light.
More in detail, this control occurs via two steps: first, blue light is perceived by the photosensory
regions (LOV domains) of this photoreceptor, probably activating PHOT via a conformational
change. Then, a signal is transduced via the kinase domain of the activated PHOT. LHCSR3 induction
by PHOT results in light dissipation in photosystem II, indicating that light sensing, utilization, and
dissipation is a linked process in C. reinhardtii.

144
4.3.2 A blue light photoreceptor mediates the feedback regulation of photosynthesis
Dimitris Petroutsos1, Ryutaro Tokutsu2-4, Shinichiro Maruyama5, Serena Flori1, Andre Greiner6,
Leonardo Magneschi1,7, Loic Cusant1, Tilman Kottke8, Maria Mittag9, Peter Hegemann6, Giovanni
Finazzi1, Jun Minagawa2-4
1Laboratoire de Physiologie Cellulaire et Végétale, UMR 5168, Centre National de la Recherche
Scientifique (CNRS), Commissariat à l’Energie Atomique et aux Energies Alternatives (CEA),
Université Grenoble Alpes, Institut National Recherche Agronomique (INRA), Institut de Biosciences
et Biotechnologies de Grenoble, (BIG), CEA Grenoble, F-38054 Grenoble cedex 9, France
2Division of Environmental photobiology, National Institute for Basic Biology (NIBB), Nishigonaka 38,
Myodaiji, Okazaki 444-8585, Japan
3Department of Basic Biology, School of Life Science, the Graduate University for Advanced Studies
(SOKENDAI), Okazaki 444-8585, Japan
4Core Research for Evolutional Science and Technology (CREST), Japan Science and Technology
Agency (JST), Saitama 332-0012, Japan
5Department of Environmental Life Sciences, Graduate School of Life Sciences, Tohoku University,
Sendai 980-8578, Japan
6Humboldt University of Berlin, Institute of Biology, Experimental Biophysics. Invalidenstraße 42,
D-10115, Berlin, Germany
7Institute of Plant Biology and Biotechnology, University of Münster, Münster 48143, Germany
8Physical and Biophysical Chemistry, Bielefeld University, 33615 Bielefeld, Germany
9Institute of General Botany and Plant Physiology, Friedrich Schiller University, 07743 Jena, Germany
Abstract
In plants and algae, light serves both as the energy source for photosynthesis and as a biological
signal triggering cellular responses via specific sensory photoreceptors. Red light is perceived by
bilin-containing phytochromes, blue light by the flavin-containing cryptochromes (CRYs) and/or
phototropins (PHOTs; Jiao et al., 2007),the latter containing two photosensory LOV (light, oxygen,
or voltage) domains (Christie, 2007). Photoperception spans several orders of light intensity (Briggs,
2014) ranging from far below the threshold for photosynthesis to values beyond the capacity of
photosynthetic CO2 assimilation. Excess light may cause oxidative damage and cell death unless it is
prevented by enhanced thermal dissipation (energy quenching, qE), a key photoprotective response
145
(Li et al., 2009). Here, we show the existence of a molecular link between photoreception,
photosynthesis, and photoprotection in the green alga Chlamydomonas reinhardtii. We show that
PHOT controls qE by inducing the expression of the qE effector protein LHCSR3 (Light-Harvesting
Complex Stress-Related Protein3) in high light. This control requires blue light perception by LOV
domains, LHCSR3 induction through PHOT kinase, and light dissipation in photosystem II via LHCSR3.
phot mutants display severely reduced fitness under excessive light conditions, indicating that light
sensing, utilization, and dissipation is a concerted process playing a vital role in microalgal
acclimation to environments of variable light intensities.
In oxygenic photosynthesis, light absorption by pigments (chlorophylls and carotenoids) embedded
in the light harvesting complexes (LHCs) transfers energy to reaction centres, triggers electron flow
from H2O to NADPH, and generates a proton motive force across the chloroplast thylakoid
membranes that is used for ATP synthesis. The generated ATP and NADPH molecules are consumed
for CO2 fixation in the Calvin-Benson cycle (Eberhard et al., 2008). Whenever light is absorbed
beyond the CO2 assimilation capacity, over-excitation of the photosystems leads to photodamage
and possibly to cell death. Such negative consequences are prevented by non-photochemical
quenching (NPQ), an intricate photoprotective process that dissipates excess absorbed energy. The
major component of NPQ is high energy quenching (qE), which occurs at the LHCs of photosystem
II (Horton et al., 1996). qE is driven by lumenal acidification under excess light, which modifies the
LHCII pigment composition via the xanthophyll cycle and activates specific qE protein effectors
(Niyogi & Truong, 2013). In the active state, these protein effectors (PSBS in plants and the light-
harvesting complex stress-related (LHCSR) proteins in green algae; Peers et al., 2009; Tokutsu &
Minagawa, 2013) increase the energy dissipation capacity of LHCII via a still unresolved mechanism
(Ruban et al., 2007; Ahn et al., 2008). While plants constitutively express PSBS, the green alga
Chlamydomonas reinhardtii only accumulates LHCSR3 (the major qE effector) following
environmental stresses, including excess light and nutrient starvation (Finazzi & Minagawa, 2014).
LHCSR3 induction requires Ca2+ signalling and active photosynthesis (Petroutsos et al., 2011;
Maruyama et al., 2014) but the molecular mechanism behind this process is largely unknown.
146
4.3.2.1 Results and discussion
To gain insight into how LHCSR3 induction is regulated, we measured the light colour dependency
(action spectrum) of qE induction in C. reinhardtii. Low light-acclimated cells were exposed for 4
hours to highly intense monochromatic light at different wavelengths between 400 and 720 nm,
provided by the Okazaki Large Spectrograph (Watanabe et al., 1982), to induce LHCSR3. Then,
kinetics of NPQ development were followed under saturating white light for 5 min (Figure 4.8 A).
The extent of NPQ observed at the end of illumination was used to evaluate the action spectrum of
qE (Figure 4.8 B) corresponding to the fraction of NPQ that is rapidly reversible in the dark. This
spectrum was comparable to the spectrum of LHCSR3 accumulation (Figure 4.8 C), confirming the
tight link between energy dissipation and LHCSR3 induction in this alga (Peers et al., 2009). We found
that blue light was more effective than red light in inducing the qE response (Figure 4.8 A and B) and
LHCSR3 accumulation (Figure 4.8 C), although the cells absorbed both almost equally (Figure 4.8 B,
grey area). This finding suggests that a blue light-absorbing molecule (likely a blue light receptor) is
involved in LHCSR3 accumulation in high light. To test this hypothesis, we compared NPQ kinetics
(Figure 4.8 A), the action spectra of qE (Figure 4.8 B) and the induction of LHCSR3 (Figure 4.8 C) in
wild-type (WT) and mutant C. reinhardtii cells lacking blue light receptors, either the animal-like
cryptochrome (aCRY; Beel et al., 2012), or phototropin (PHOT; Zorin et al., 2009). acry cells
(Supplementary Figure 4.12 A) showed WT levels of qE (Figure 4.8 B) and LHCSR3 accumulation
(Figure 4.8 C) throughout the entire light spectrum, including red light, where aCRY acts (Beel et al.,
2012) in the absence of phytochromes in C. reinhardtii (Merchant et al., 2007). Conversely, phot cells
(Supplementary Figure 4.12 B) specifically lacked blue light induction of qE (Figure 4.8 B) and LHCSR3
accumulation (Figure 4.8 C), and therefore were more prone to photodamage (Figure 4.8 D). phot
cells also showed a largely compromised induction of LHCSR3 and NPQ in high intensity white light
at variance with WT and acry cells (Supplementary Figure 4.12 C, D and E). Their ability to
accumulate photoprotective carotenoids via the xanthophyll cycle was, however, similar to that of
WT and acry cells (Supplementary Figure 4.12 F and G). The phenotype of phot was similar to that
of npq4 (Figure 4.8 B and D), a deletion mutant of LHCSR3 (Peers et al., 2009) that we used as a qE
lacking strain. PHOT-mediated blue light control of LHCSR3 accumulation was highly specific.
Accumulation of representative subunits of the major photosynthetic complexes was comparable
in all cell lines and wavelength-insensitive (Supplementary Figure 4.13). The photosynthetic electron
transport rate (ETR) was somewhat reduced in phot cells, especially upon high light exposure
(Supplementary Figure 4.12 H and I). Since photosynthesis is required for proper LHCSR3

147
accumulation (Petroutsos et al., 2011; Maruyama et al., 2014) the lower electron flow capacity of
phot cells could diminish LHCSR3 induction. To evaluate this hypothesis, we titrated ETR in WT cells
using variable concentrations of the herbicide 3-(3,4-dichlorophenyl)-1,1-dimethylurea (DCMU),
which inhibits electron transfer in photosystem II. Addition of DCMU progressively reduced the ETR
to a much lower extent in WT cells than in DCMU-free phot cells (Supplementary Figure 4.10 A).
However, accumulation of LHCSR3 remained larger in DCMU-treated WT cells than in DCMU-
untreated phot cells (Supplementary Figure 4.14 B). We therefore excluded the possibility that the
diminished ETR observed in phot cells was the cause of the impaired LHCSR3 accumulation. We
concluded instead that the impaired photoprotection in phot was the cause of the reduced ETR
(Supplementary Figure 4.12 I) and enhanced photosensitivity (Fig 4.8 D), indicating that PHOT is a
central actor of photoprotection in this alga.
Figure 4.8 – PHOT controls induction of LHCSR3 and qE and is crucial for survival in high light in C. reinhardtii. (A)
Development of NPQ in WT (137c), phot and acry mutants during illumination with high intensity white light (750 µmol
photons m-2 s-1). Before the measurements, cells were exposed for 4 h to different wavelengths of actinic light (250 µmol
photons m-2 s-1) provided by the Okazaki Large Spectrograph (Watanabe et al., 1982) to induce LHCSR3, and dark acclimated
for 30 min. (B) Action spectra of qE induction in WT (black), acry (green) npq4 (blue) and phot (red) strains by 4h illumination
with different wavelengths of actinic light (250 µmol photons m-2 s-1). Grey area, absorption spectrum of WT cells. Data
shown as mean ± SD (n = 3). (C) Immunoblot analysis of LHCSR3 accumulation. ATPB was used as loading control. (D)
Erlenmeyer flasks containing WT, acry, phot and npq4 after 16 h of light of 20, 200 and 750 µmol photons m-2 s-1.

148
Phototropins are ubiquitous in plants and algae, and their function in light perception involves two
structurally similar LOV domains (LOV1 and LOV2) at the N terminus and downstream signalling via
a C-terminal Ser/Thr kinase domain (Christie, 2007). We dissected the role of the different PHOT
domains in LHCSR3 induction using existing mutants (Trippens et al., 2012; Figure 4.9 A).
Complementation of phot with the full-length cDNA of PHOT (strain PPHOT) restored PHOT protein
(Supplementary Figure 4.15 A), LHCSR3.1 and LHCSR3.2 transcripts (both encoding for LHCSR3,
Peers et al., 2009, Figure 4.9 B) and LHCSR3 protein (Figure 4.9 C) to a certain extent, which was
nonetheless sufficient to largely rescue resistance to high light stress, (Figure 4.9 D and
Supplementary Figure 4.15 B). Moreover, introduction of the LHCSR3.1 gene into phot under the
control of the strong, PHOT-independent PsaD promoter (strain PLHCSR3) also rescued qE and
LHCSR3 levels (Supplementary Figure 4.16). Thereby, the univocal relationship between PHOT,
LHCSR3 and photoprotection was confirmed. Conversely, complementation of phot with the
truncated gene carrying only the photosensory domains LOV1 and LOV2 (strain PLOV) did not rescue
either the protein or photosensitivity (Figure 4.9 C, D and Supplementary Figure 4.15 B). Finally,
complementation with the kinase domain (strain PKIN) fully restored expression of LHCSR3 and
photoprotection (Figure 4.9 C, D and Supplementary Figure 4.15 B).

149
Figure 4.9 – Role of the different PHOT domains in controlling LHCSR3. (A) Schematic drawings of constructs used for the
complementation of phot mutant. BLE, bleomycin resistance cassette; LOV, the light, oxygen, or voltage photosensory
domain and KINASE, and the kinase domain of the PHOT gene. (B) LHCSR3.1 and LHCSR3.2 mRNA accumulation in WT (cw15-
302), phot, and phot complemented with full-length PHOT (PPHOT), with the photosensory domains (PLOV) or with the kinase
domain (PKIN) in low light (LL) or high light (HL). Mean values relative to an endogenous control gene encoding G protein
subunit-like protein (GBLP) are calculated from three biological replicates and normalized to WT HL samples and shown as
mean ± SD (n = 3). (C) Immunoblot analysis of LHCSR3 accumulation in the WT control and in the different phot mutants.
ATPB was used as loading control. (D) Erlenmeyer flasks containing WT, phot, PPHOT, PLOV and PKIN after 20 h exposure to
light of 20, 200 or 750 µmol photons m-2 s-1.

150
In this line, however, LHCSR3 accumulation became light-color-independent (Figure 4.10 A and B),
at variance with the WT (Figure 4.8 A, C) and the PPHOT strain (phot complemented with full-length
PHOT; Figure 4.10 A and B). This indicates that removal of the LOV domains fully unleashed
inhibition of the kinase activity as previously reported in plants (Kong et al., 2007). Deregulation of
the PHOT kinase activity (PKIN) or removal of the kinase domain (phot, PLOV) did not alter LHCSR3
phosphorylation levels (Supplementary Figure 4.17), ruling out any link between PHOT and LHCSR3
phosphorylation. We also found that LHCSR3 accumulation remained light intensity-dependent in
the PKIN strain (Figure 4.10 C, D), suggesting that in addition to PHOT, high light photosynthesis was
required for accumulation of LHCSR3. In agreement with this interpretation, in another mutant
generated by inserting an additional copy of the kinase domain into WT C. reinhardtii cells (WTKIN,
Supplementary Figure 4.18) LHCSR3 accumulation also became largely wavelength-independent but
was still light intensity-sensitive. Moreover, accumulation of LHCSR3 was fully blocked upon
inhibition of photosynthesis by DCMU in the PKIN and WTKIN strains (Figure 4.10 C, D,
Supplementary Figure 4.18 E). Additionally, LHCSR3 was not accumulated in the far-red part of the
spectrum in all cell lines (720 nm; Figure 4.8 C, Figure 4.10 A, B, Supplementary Figure 4.18 C, D).
This light is not absorbed by C. reinhardtii cells (Figure 4.8 B, grey area) and therefore does not
activate photosynthesis.

151
Figure 4.10 – PHOT-dependent control of LHCSR3 expression requires blue light perception by LOV, signal transduction by
the C-terminal kinase domain of PHOT and photosynthesis. (A) Action spectrum of LHCSR3 accumulation in PPHOT (phot
complemented by full-length PHOT) and PKIN (phot complemented by the kinase domain of PHOT). ATPB was used as loading
control. (B) Densitometric quantification of LHCSR3 accumulation in PPHOT and PKIN (data normalized with ATPB) of Figure
4.10 A. Values are normalized to 475 nm and shown as mean ± SD (n = 3). (C) LHCSR3.1 and LHCSR3.2 mRNA accumulation
in PKIN at LL and HL in the presence and absence of the PSII inhibitor DCMU. Values are normalized to HL and shown as mean
± SD (n = 3). (D) LHCSR3 protein accumulation in PK in LL and HL in the presence or absence of DCMU for 4h.

152
In Arabidopsis, PHOTs regulate the blue light-induced increase in cytosolic free Ca2+ (Harada et al.,
2003; Babourina et al., 2002). Since PHOT controls LHCSR3 expression in C. reinhardtii (Figure 4.8)
and Ca2+ is required for the accumulation of LHCSR3 (Petroutsos et al., 2011), a link between PHOT,
Ca2+, and LHCSR3 can be conceived. However, a ten-fold elevation of extracellular Ca2+ to 3.4 mM
did not restore LHCSR3 accumulation in the phot mutant (Supplementary Figure 4.19 A). This finding
led us to conclude that Ca2+ signalling is not modulating LHCSR3 in the absence of PHOT. We
hypothesise that other second messengers (the cyclic nucleotides cAMP or cGMP) act as signalling
molecules downstream of PHOT. We tested this hypothesis using a pharmacological approach and
found that treatment of phot cells with 3-isobutyl-1-methylxanthine (IBMX), an inhibitor of
cAMP/cGMP-phosphodiesterases, rescued LHCSR3 expression (Figure 4.11 A and Supplementary
Figure 4.19 B). We confirmed this effect by incubating phot cells with dibutyrylated cGMP and cAMP
(db-cGMP and db-cAMP; Figure 4.11 A), suggesting that in C. reinhardtii, cyclic nucleotides are not
only critical in mating and phototaxis (Merchant et al., 2007) but are also involved in
photoprotection through regulating LHCSR3 expression. On the other hand, induction of LHCSR3 in
IBMX-treated WT or phot cells remained light intensity-dependent (Figure 4.11 A), implying that
cAMP/cGMP require a high-light-photosynthesis-related signal to be effective on LHCSR3
accumulation.
While extensive research has focused on the nature and functions of the molecular actors involved
in the sensing (photoreceptors) and utilization (photosynthetic complexes) of environmental light,
the present work uncovers the molecular linkage between these two essential functions of
photosynthetic organisms (Figure 4.11 B). Blue light perceived by phototropin controls
photoprotection of the photosynthetic machinery (qE) in a green alga. The LOV domain of PHOT
provides blue light sensitivity while its kinase domain performs signal transduction, possibly via a
cyclic nucleotides monophosphate-signalling cascade. At some point downstream of PHOT, this
signal integrates with another regulatory signal from the chloroplast that carries information about
the amount of absorbed light that is not used by photosynthesis. This signal relies on photosynthetic
electron transfer (Petroutsos et al., 2011; Maruyama et al., 2014) via an unknown mechanism. The
integrated signal affects accumulation of LHCSR3.1/LHCSR3.2 transcripts (Figure 4.9 B), mainly due
to activation of transcription and partially due to stabilisation of the transcripts (Supplementary
Figure 4.20). This contrasts with plant PHOTs that have been suggested to destabilize transcripts
(Folta & Kaufman, 2003) while little evidence exists for their role in activation of transcription

153
(Christie, 2007). The LHCSR3 polypeptide is then imported into the chloroplast thylakoids, where it
modulates qE (Figure 4.11 B).
Figure 4.11 – Possible signal transduction pathway for HL-induced expression of LHCSR3. (A) Immunoblot analyses of LHCSR3
accumulation in WT (cw15-302) cells and in phot cells treated with the phosphodiesterase inhibitor IBMX, db-cAMP or db-cGMP
after exposure to LL or HL for 20 h. (B) Schematic representation of the negative feedback regulation of photosynthesis
(photoreception–photosynthesis–photoprotection link) in C. reinhardtii. cp, chloroplast; cNMP: cyclic nucleotides mono
phosphate (cAMP or cGMP); ET, electron transport; nuc, nuclear; PSII, photosystem II.

154
4.3.2.2 Conclusions
Because LHCSR3 is “an ancient light harvesting protein” (Peers et al., 2009) found only in “lower
plants” including green unicellular eukaryotic algae (chlorophytes), and mosses (Niyogi & Truong,
2013) as well as in Chromalveolata (algae derived by secondary endosymbiosis ) we hypothesise
that the molecular link for photoreception-photosynthesis-photoprotection discovered in this study
has evolved in the environment in which photosynthesis started during evolution, namely the water
columns, where blue light dominates the available spectrum. Consistent with this hypothesis,
photoprotection in cyanobacteria, which are thought to share a common ancestry with chloroplasts,
also relies on blue light. The cyanobacterial NPQ protein effector OCP (Orange Carotenoid Protein)
binds a single blue light-absorbing carotenoid, and NPQ in cyanobacteria is also triggered by high
intensity blue light (Kirilovsky & Kerfeld, 2013). Evidences also show a link between blue light and
photoprotection in diatoms (Costa et al., 2013) via a still uncharacterised mechanism. On the other
hand, the blue light-dependent control of photoprotection was apparently lost during colonisation
of the land, where a new qE process evolved, which is based on a constitutively expressed protein
(PSBS; Li et al., 2009). Land plants, however, seem to carry a remnant of ancestral qE control by blue
light, called ‘qM’, because blue light still affects NPQ in these organisms, but only via the PHOT-
triggered chloroplast movements that avoid high light (Cazzaniga et al., 2013).
The transition from water to the land was paralleled by the emergence of a second PHOT gene. Seed
plants contain PHOT1, responding to low intensity blue light signals, and PHOT2, triggering high
intensity blue light responses. Unicellular green algae, like Chlorella variabilis, Ostreococcus tauri,
and C. reinhardtii, only contain one PHOT gene, which is the ortholog of PHOT2 (Galván-Ampudia &
Offringa, 2007). However, in C. reinhardtii blue light triggers different biological responses
depending on the photon fluence rate. Low intensity blue light (e.g. 1 µmol photons m-2 s-1) triggers
gametogenesis at low nitrogen abundance (Huang & Beck, 2003) and gene expression (Im et al.,
2006) whereas blue light at higher intensities desensitizes the eyespot (Trippens et al., 2012) and
induces LHCSR3 expression (e.g. 60 μmol photon m-2 s-1, Supplementary Figure 4.21). Thus, we
conclude that the same PHOT that ensures low light responses can trigger higher light signalling
when acting in synergy with the photosynthetic signal. We propose that while the transition from
the motile life form of algae to the sessile character of land plants led to an increased specialisation
of the function of photoreceptors, this process occurred at the expense of some essential functions
in water, likely the regulation of photoprotection reported here.
155
4.3.2.3 Materials and methods
Chemicals: Chemicals were purchased from Sigma (DCMU) and Enzo (3-isobutyl-1-methylxanthine
(IBMX), dibutyryl cyclic AMP (db-cAMP), and dibutyryl cyclic GMP (db-cGMP)). Stock solutions of
DCMU were prepared in ethanol (40 mM) or H2O (40 µM); IBMX was dissolved in DMSO at 250 mM;
db-CAMP and db-GMP were dissolved in H2O.
Strains and conditions: C. reinhardtii strains were grown under 20 µmol photons m-2 s-1 in Tris-
acetate-phosphate (TAP) media (Gorman & Levine, 1965) at 23 oC. In all experiments cells were
transferred to Sueoka's high salt medium (Sueoka, 1960) at 2 million cells/mL and exposed to light
intensities as described in the text and figure legends. Two C. reinhardtii WT strains, the cw15-302
and 137c, were used as indicated in the Figure legends. The phot mutant was previously generated
using a homologous recombination strategy (Zorin et al., 2009). For the different complemented
lines of phot, PsaD promoter and terminator were used for the expression of full-length PHOT cDNA
(strain PPHOT; clone PPHOT3 or PPHOT4), the LOV domains (strain PLOV; clone PLOV1) and the
kinase domain (strain PKIN; clone PKIN1), N-terminally fused to the Zeocin resistance marker sh-Ble,
(Trippens et al., 2012). Using the same strategy, overexpression of the PHOT kinase domain in the
WT background resulted in the strain WTKIN (Trippens et al., 2012). For the PHOT-independent
expression of LHCSR3, the PsaD promoter and terminator were fused to a full-length genomic
LHCSR3.1 gene. The generated construct with the aphVII marker gene was introduced into phot by
electroporation with NEPA21 Super Electroporator (NEPAGENE, Japan). The transformants,
PLHCSR3(B5) and PLHCSR3(G6), were screened for their resistance to 10 μg/mL hygromycin. The
acry mutant, originally delivered in a SAG73.72 genetic background (Beel et al., 2012), was back-
crossed three times to WT strain 137c. Unless otherwise stated, LL conditions corresponded to 20
µmol photons m-2 s-1 while HL conditions corresponded to 250 µmol photons m-2 s-1 of white light.
All experiments were repeated three times to verify their reproducibility, unless otherwise stated.
Pigment and mRNA quantification: Extraction and quantification of chlorophyll and xanthophylls,
calculation of the de-epoxidation state DES, and mRNA quantification by quantitative PCR were
performed as described previously (Maruyama et al., 2014; Allorent et al., 2013). A gene encoding
G protein subunit-like protein (GBLP; Schloss, 1990) was used as the endogenous control, and
relative expression values relative to GBLP (Figure 2b and 3c) were calculated from three biological
replicates, each of which contained three technical replicates. The primers used were LHCSR3.1 (5'-

156
CACAACACCTTGATGCGAGATG-3' and 5'- CCGTGTCTTGTCAGTCCCTG-3'), LHCSR3.2 (5'-
TGTGAGGCACTCTGGTGAAG-3' and 5'-CGCCTGTTGTCACCATCTTA-3'), GBLP (5'-
CAAGTACACCATTGGCGAGC-3' and 5'-CTTGCAGTTGGTCAGGTTCC-3'), and 18S rRNA (5’-
AGCATGAGAGATGGCTACCACATC-3’ and 5’-CATTCCAATTACCAGACGCGAAGC-3’). The mRNA
stability experiments were performed in the presence of the transcription inhibitor actinomycin D
(Wako, Japan) at 160 µg/mL (Gera & Baker, 1998). RT-PCR was performed using Light cycler 96
(Roche) with AptaTaqDNA GM with ROX (Roche).
Immunoblotting: Protein samples of whole cell extracts (0.5 µg chlorophyll, unless stated
otherwise) were loaded on 7% or 13% SDS-PAGE gels and blotted onto nitrocellulose membranes.
Antisera against D1, D2 and ATPB were from Agrisera (Vännäs, Sweden); previously described were
antisera against C. reinhardtii aCRY (Beel et al., 2012), PHOT (LOV1 domain; Zorin et al., 2009), and
all others (Takahashi et al., 2006; Iwai et al., 2010). ATPB was used as a loading control. An anti-
rabbit horseradish peroxidase–conjugated antiserum was used for detection. The blots were
developed with ECL detection reagent, and images of the blots were obtained using a CCD imager
(ChemiDoc MP System, Bio-Rad). For the densitometric quantification of LHCSR3 data were
normalized with ATPB. LHCSR3 appears as a double band in some of the western blots (i.e. Figure
4.10 and Supplementary Figures 4.13, 4.15, 4.17, 4.18, 4.19). The upper band represents the
phosphorylated form of LHCSR3 (see Supplementary Figure 4.17). The extent of LHCSR3
phosphorylation was determined using a Phos-tag-based method as described (Longoni et al.,
2015). For the de-phosphorylation of LHCSR3 whole cell extracts (1 µg total chlorophyll) were
treated with either 20 U of calf intestine phosphatase (Promega) or 200 U of lambda protein
phosphatase (New England Biolabs) in the presence of 0.05 (v/v) Triton X-100, at 30oC for 1h.
Fluorescence-based measurements: Fluorescence-based photosynthetic parameters were
measured with a fluorescence imaging setup previously described (Johnson et al., 2009). The
photosynthetic electron transfer rate (ETR) was calculated as (Fm’-F)/Fm’ * 0.84 * 0.5 * I (Petroutsos
et al., 2009). qE was estimated as the fraction of NPQ that is rapidly inducible in the light and
reversible in the dark, using the following equation: (Fm-Fm’)/Fm’. F and Fm’ are the fluorescence
yields in steady state light and after a saturating pulse in the actinic light, respectively, Fm is the
maximal fluorescence yield in dark-adapted cells, and I is the light irradiance in µmol photons m-2 s-
1 (Petroutsos et al., 2009). Before NPQ measurements cells were exposed to high intensity light for

157
4 h unless otherwise mentioned to induce LHCSR3 and dark acclimated for 30 min. For NPQ
measurements actinic light was set at 750 µmol photons m-2 s-1. For action spectra measurements,
5 mL of concentrated cells (2 * 107 cells mL-1) were placed in a petri dish and exposed to intense
(250 µmol photons m-2 s-1) monochromatic light (The spectral half width is 5.5 nm or less), provided
by the Okazaki Large Spectrograph (Watanabe et al., 1982) for 4 h. Samples were then collected and
subjected to immunoblotting (0.1 mL) as well as qE measurement (0.2 mL) with a fluorescence
video-imaging system (Fluorocam, Photon System Instruments, Bruno, Czech Republic).
Contributions
D.P., R.T., J.M. and G.F. designed the study. D.P., R.T., S.M., S.F., L.M., L.C., J.M. and G.F. performed
the experiments. D.P., R.T., S.M., A.G., L.M., T.K., M.M., P.H., J.M. and G.F. provided strains and
analysed the data. D.P., R.T., J.M. and G.F. wrote the manuscript, and all authors revised and
approved it.

158
Supplementary Figures
Supplementary Figure 4.12 – Photosynthetic properties of acry and phot mutants. (A) Immunoblot analysis of aCRY accumulation
in WT (137c) and acry cells. The two strains were grown as described previously (Beel et al., 2012). Cells were harvested at the
beginning of the light phase (LD2 phase; Beel et al., 2012). Whole cell samples with 2 µg of chlorophylls were loaded on each
lane. (B) Immunoblotting analysis of PHOT in WT (cw15-302) and phot after 4 h exposure to high intensity white light. (C)
Immunoblot analysis of LHCSR3, and ATPB in WT (137c), phot and acry in LL and after 4 h exposure to high intensity white light
(HL). ATPB was used as loading control. (D) and (E), NPQ induction kinetics of WT (137c) and acry (D) and WT (cw15-302) and
phot (E) after 4 h exposure to high intensity white light. qE was recorded for 16 min upon illumination with 440 µmol photons m-
2 s-1 (white bar) followed by 2 min of darkness (black bar), to follow qE relaxation. f and g, Xanthophyll cycle de-epoxidation state
(DES) indicating the ratio ([zeaxanthin] + 1/2 [antheraxanthin])/([zeaxanthin] + [antheraxanthin] + [violaxanthin]) in WT (137c)
and acry (f) and WT and phot (g) cells after exposure HL for 4 h. (H) and (I), Electron transfer rate (ETR) of WT (137c) and acry (h)
and WT (cw15-302) and phot (i) cells exposed at 20, 240 and 750 µmol photons m-2 s-1 for 10 h. ETR (µmol photons m-2 s-1) was
measured at actinic illumination of 41 µmol photons m-2 s-1. Mean ± SD (n = 3).

159
Supplementary Figure 4.13 –Accumulation of major photosynthetic complexes is unaltered in the phot cells upon exposure
to different wavelengths of visible light. (A) Immunoblot analyses of ATPB, PsaA/B, D1, D2 and CP26 accumulation in WT
(137c), phot and acry cells after 4 h exposure at 250 µmol photons m-2 s-1 of monochromatic light at the different wavelengths
of the visible spectrum. (B) Immunoblot analyses of major photosynthetic complexes of PSII, Cyt b6f and PSII in WT, phot and
acry after 4 h exposure at 250 µmol photons m-2 s-1 of white light.
Supplementary Figure 4.14 – Diminished LHCSR3 induction in phot is not caused by diminished photosynthesis. (A)
Comparison of ETR in DCMU-titrated WT cells and DCMU-untreated phot cells exposed to HL for 3 h. ETR (µmol photons m-2
s-1) was measured upon exposure to light of 170 µmol photons m-2 s-1. Mean ± SD (n = 3). (B) Immunoblotting analysis of
LHCSR3 accumulations in the WT and phot samples described in Extended Data Figure 4a. ATPB was used as a loading control.

160
Supplementary Figure 4.15 – PHOT protein levels pigment content in phot mutants. (A) Immunoblotting analyses of PHOT
accumulation in WT (cw15-302) and the PPHOT (phot complemented by a full-length PHOT). PPHOT expresses a fused PHOT-
BLE protein, which has a higher molecular weight than the WT PHOT protein. (B) Total cellular chlorophyll (a+b) content in
WT, phot, PPHOT, PLOV and PKIN cells exposed to light of 20, 200 or 750 µmol photons m-2 s-1 for 20 h as in Figure 4.9 D.
Diminished chlorophyll content is a signature of pigment bleaching following photo-damage.
Supplementary Figure 4.16 – PHOT-independent LHCSR3 expression restores photoprotection in the phot mutant. Relative
qE and LHCSR3 expression in WT (cw15-302), phot, and two phot transformant lines expressing the LHCSR3.1 gene under the
control of the PsaD promoter (PLHCSR3(B5) and PLHCSR3(G6)) in LL and HL conditions. ATPB was used as loading control. qE
values were normalized to WT cells in HL conditions, and shown as mean ± SD (n = 3).

161
Supplementary Figure 4.17 – Phosphorylation levels of LHCSR3 in phot, PPHOT, PLOV, PKIN, stt7 and WT. Assessment of the
phosphorylation levels of LHCSR3 in WT (cw15-302), phot and in the different complemented lines (PPHOT, PLOV, PKIN) by a
mobility shift detection of phosphorylated proteins (phos-tag). The upper and lower bands correspond to the phosphorylated
and non-phosphorylated forms of LHCSR3 (“P-LHCSR3” and “LHCSR3”), respectively, which was confirmed by treatment of
the samples with either calf intestinal phosphatase (CIP) or lambda protein phosphatase (λPP). The stt7 mutant (Depège et
al., 2003) was used to test the involvement of the chloroplastic serine/threonine kinase STT7 in the LHCSR3 phosphorylation.
In this mutant LHCSR3 was mostly in the non-phosphorylated form while a STT7-independent phosphorylation was also
evidenced in agreement with recent findings (Bergner et al., 2015).
Supplementary Figure 4.18 – Phenotypic traits of the WTKIN genotype. (A) Immunoblot analyses of LHCSR3 accumulation
after exposure to 240 µmol photons m-2 s-1 of white light for 20 h in WT (137c) and WTKIN cells and schematic drawings of
the PHOT gene constructs in the two lines. ATPB was used as loading control. (B) Erlenmeyer flasks containing WT and WTKIN
(expressing the kinase domain of PHOT in the WT background) after 20 h exposure to white light of 20, 200 and 750 µmol
photons m-2 s-1. (C) Action spectrum of LHCSR3 accumulation in WT and WTKIN. ATPB was used as a loading control. (D)
Densitometric quantification of LHCSR3 accumulation in WT (137c) and WTKIN (data normalized to ATPB). (E) LHCSR3 protein
accumulation in WTKIN at LL and HL in the absence and presence of the PSII inhibitor DCMU.

162
Supplementary Figure 4.19 – Second messengers involved in the PHOT-dependent regulation of LHCSR3 expression. (A)
Immunoblotting analyses of LHCSR3 accumulation after exposure to high intensity of white light for 20 h in WT (cw15-302)
and phot cells under control conditions (0.34 mM Ca2+) or in the presence of increased Ca2+ concentration (3.4 mM Ca2+). (B)
Statistical analyses of LHCSR3 accumulation in high-light treated (HL) WT or phot cells in the absence (control) and presence
of IBMX, db-cGMP and db-cAMP (see conditions as in Figure 4.11 A). Data are normalized to LHCSR3 levels of WT control
cells). Mean ± SD (n = 3-6). Asterisks indicate statistical significant difference from WT control cells.
Supplementary Figure 4.20 – LHCSR3.1 and LHCSR3.2 transcripts stability in WT and phot cells.Relative amounts of LHCSR3.1
and LHCSR3.2 mRNA in WT (cw15-302; black) and in phot (red) were quantified by quantitative PCR. Cells exposed for 20 h to
470 nm LED light at 100 μmol photons m-2 s-1 were transfered to darkness at t=0 and treated with actinomycin D to stop
further mRNA synthesis. mRNA samples were collected at 0, 0.25, 0.5, 1, 2, and 4 h after transition to darkness. LHCSR3.1
and LHCSR3.2 transcript amounts were normalised to the amounts of 18S rRNA as the endogenous control and their values
were set at 100% at t=0 (n=3, mean ± s.d.).

163
Supplementary Figure 4.21 – qE and LHCSR3 induction requires high light in C. reinhardtii. (A) Action spectrum of qE
induction in WT cells as a function of the light intensity. (B) Immunoblot analysis of LHCSR3 accumulation in darkness (D) and
under white (WL), blue (470 nm) and red (660 nm) light of low (LL; 20 µmol photons m-2 s-1) and high intensity (HL; 250 µmol
photons m-2 s-1). ATPB was used as loading control.

164
4.3.3 Perspectives
Light is an essential factor for microalgae not only because it fuels carbon assimilation via the Calvin-
Benson-Bassham cycle, but also because it acts as a signal in several processes related to growth
and environmental responses. In this work, we have addressed the double role of light in regulating
the photoprotective responses in C. reinhardtii. By using biochemical and spectroscopic approaches
coupled with genetic analysis we have identified the molecular actors for this regulation revisiting
the fundamental concepts of photoprotection in microalgae. Based on these promising results we
hypothesized that other signals could exist which link light utilization for metabolism and light
dissipation via NPQ. This was the starting point for the investigation presented in the following
section.

165
4.4 Carbon metabolism controls photoprotection in Chlamydomonas via the light
harvesting complex stress response protein LHCSR3
Flori et al., Manuscript in preparation.
4.4.1 Introduction
Photosynthesis is one of the most highly integrated and regulated process to efficient use of
sunlight, while minimizing the damaging effects of excess light (Paul & Foyer, 2001). Among other
photosynthetic organisms, Chlamydomonas reinhardtii, a member of the green algal lineage, has
served as a model organism to study photosynthesis, mainly due to its ability, when grown
heterotrophically in the dark, to maintain a normal green chloroplast that retains the capacity to
perform oxygenic photosynthesis when illuminated. This has allowed the isolation of several
photosynthetic mutants that would otherwise not be viable under phototrophic conditions
(Grossman et al., 2007). Besides heterotrophic growth with acetate, Chlamydomonas may use
carbon dioxide (CO2) for photoautotrophy, and both carbon sources for mixotrophic growth (Harris,
1989). CO2 is fixed via the Calvin-Benson-Bassham cycle in Chlamydomonas (Bassham et al., 1950).
However like other aquatic phototrophs, this alga is often exposed to restricted CO2 supplies
because CO2 diffusion is slower in water than in air. To overcome this problem Chlamydomonas
possesses a CO2-concentrating mechanism (CCM), that combines a series of carbonic anhydrases
(CAs) to interconvert CO2 and HCO3- with a complex series of ion pumps to actively transport HCO3-
concentrating CO2 at the site of fixation by RuBisCo within the pyrenoid (reviewed in Wang et al.,
2015).
Acetate is incorporated into acetyl-CoA either as a one-step reaction, catalyzed by acetyl-CoA
synthetase (ACS), or in two steps via acetate-phosphate, a reaction catalyzed by acetate kinase
(ACK) and phosphate acetyltransferase (PAT; Wolfe, 2005). Chlamydomonas possess two parallel
ACK-PAT pathways. Proteomic analyses have indicated that ACK1-PAT2 is localized in chloroplasts
while ACK2-PAT1 is found in the mitochondria (Atteia et al., 2009; Terashima et al., 2010). Their
localization was recently confirmed by their expression in Chlamydomonas as Venus fusion proteins
(Yang et al., 2014). After binding to CoA, acetate reacts with oxaloacetate in the first step of the
tricarboxylic acid (TCA) cycle and is then completely metabolized by this pathway, to generate 3
molecules of NADH, 1 molecule of FADH2, 2 molecules of both ATP and CO2. The reduced
compounds (NADH and FADH2) are consumed by the mitochondrial electron-transport chain

166
generating a proton gradient across the membranes, which produces additional ATP. Alternatively,
acetate is metabolized by the glyoxylate cycle, as originally proposed by Kornberg and Krebs in 1957
to explain microbial growth on two-carbon compounds as the sole carbon source (Kornberg & Krebs,
1957). Three of the five enzymes that make up the pathway (citrate synthase, aconitate hydratase
and malate dehydrogenase) are also found in the TCA cycle. The concerted action of the other two
enzymes, isocitrate lyase and malate synthase, specific to the glyoxylate cycle, bypasses the two
oxidative steps in which CO2 is evolved, and explains formation of C4 acids from acetate. The C4
acids may then enter the gluconeogenesis cycle via phosphoenolpyruvate carboxykinase (Plancke
et al., 2014). With the exception of the cytosolic isocitrate lyase all other enzymes of the glyoxylate
cycle are localized in peroxisomal microbodies (Lauersen et al., 2016).
In Chlamydomonas both acetate assimilation and the induction of CCM triggered by inorganic
carbon limitation are ATP-demanding processes. Therefore, alternative electron flow processes are
switched on during phototrophic and mixotrophic growth conditions, to provide the extra ATP
needed. This is typically the case of cyclic electron flow (CEF) around PSI, which is enhanced under
low Ci, acetate assimilation (Lucker & Kramer, 2013). CEF starts from electrons accumulated at the
acceptor side of PSI (reduced ferredoxin or NADPH), because of the ATP shortage. It recycles these
electrons towards the intersystem electron transport chain, namely, the PQ pool or the cytochrome
b6/f complex. By generating a thylakoid trans-membrane proton gradient, CEF produces the “extra”
ATP for CO2 assimilation (Allen, 2002) and is also involved in the establishment of nonphotochemical
quenching (NPQ; Munekage et al., 2002).
NPQ is a photoprotective mechanism that dissipates absorbed light energy whenever absorbed
beyond the CO2 assimilation capacity (Li et al., 2009). The major component of NPQ is high energy
quenching (qE), which mainly occurs at the light harvesting complexes of photosystem II (Horton et
al., 1996). qE is driven by lumenal acidification under excess light, which modifies the LHCII pigment
composition via the xanthophyll cycle and activates specific qE protein effectors (Niyogi & Truong,
2013). In vascular plants qE is modulated by the constitutively expressed protein PSBS (Li et al.,
2000), while in Chlamydomonas qE requires the Light Harvesting Complex Stress-Response protein
3 (LHCSR3), a nucleus-encoded, chloroplast localized, inducible protein (Peers et al., 2009). LHCSR
was originally identified as a light-induced transcript (called Li818; Gagné & Guertin, 1992). LHCSR3
transcripts accumulate under conditions known to induce photo-oxidative stress, including
deprivation of carbon dioxide (Miura et al., 2004), sulphur (Zhang et al., 2004) or iron (Naumann et
al., 2007), as well high light (Ledford et al., 2004). LHCSR3 induction requires Ca2+ signalling and

167
active photosynthesis (Petroutsos et al., 2011; Maruyama et al., 2014), but the molecular
mechanism behind this process is largely unknown. As discussed above LHCSR3 transcription is
under the control of the blue-light photoreceptor (see section 4.3).
Several biological processes have been described to be under nutritional control in Chlamydomonas,
as exemplified by the control of sexuality by nitrogen (Sager & Granick, 1954), and the modulation
of lipid biosynthesis by nitrogen, phosphorus or iron availability (Urzica et al., 2013). The metabolic
status of the cells also defines different biological responses, as evidenced by the different strategies
of acclimation of Chlamydomonas to Fe deficiency followed under phototrophic or mixotrophic
conditions (Höhner et al., 2013). Because of its role in controlling the ATP cellular demand, acetate
should deeply also affect photosynthetic responses (CO2 assimilation, CEF and consequently NPQ)
in Chlamydomonas. In this work we investigated the role of acetate and, more generally, of carbon
metabolism in regulating photoprotection in this alga. We found that acetate is a potent inhibitor
of NPQ, via a direct transcriptional control on the expression of the LHCSR3.
4.4.2 Results
LHCSR3 accumulation and NPQ capacity in Chlamydomonas are affected by acetate.
Previous results have indicated a very low NPQ capacity in Chlamydomonas cells grown in low light
in the presence of acetate (Finazzi et al., 2006) at variance with the high NPQ observed in cells
exposed to high light in minimal medium without acetate (Niyogi et al., 1997). Because the NPQ
capacity relies on the slow (t1/2 of about two hours, Allorent et al., 2013) accumulation of LHCSR3
(the protein effector of the qE; Peers et al., 2009), we considered the possibility that acetate could
exert a regulatory role on LHCSR3 itself. To test this possibility, we incubated Chlamydomonas cells
overnight in HSM (in the absence and presence of acetate 20 mM) in LL (20 µmol photons m-2 s-1)
and shifted them to HL (250 µmol photons m-2 s-1) for 4h. After 4 hours cells were collected and
analyzed for their cellular LHCSR3 content and NPQ capacity.
We found that acetate largely repressed NPQ in HL-treated cells (Figure 4.22 A) and this correlated
with a complete inhibition of LHCSR3 accumulation (Figure 4.22 B). Interestingly the presence of
acetate abolished even the very low steady state NPQ observed in LL adapted cells (Figure 4.22 A).
Since active photosynthetic electron flow is required for proper expression of LHCSR3 at the protein
(Petroutsos et al., 2011) and transcript level (Maruyama et al., 2014) it was important to investigate
if inhibition of LHCSR3 by acetate was due to a cease of photosynthesis in the presence of acetate
or due to a more direct role of this metabolite on LHCSR3. We measure photosynthetic electron

168
transfer rate (ETR) in the presence and absence of acetate (Figure 4.22 C) and found that in LL
conditions acetate had no impact on the photosynthetic performance of the cells whereas under HL
conditions acetate grown cells had an ETR of ca. 35% lower compared to the phototrophic grown
ones. This drop of photosynthetic activity in the presence of acetate is in agreement with previous
findings (Fett & Coleman, 1994b) but cannot justify the complete abolishment of LHCSR3 expression
since even a maintenance of 15% of ETR under high light is sufficient for proper accumulation of
LHCSR3 (see section 4.3, Supplementary Figure 4.14 A).
In order to investigate if the inhibition of LHCSR3 by acetate occurs at the transcriptional level we
used a strain that expresses the firefly luciferase under control of the LHCSR3.1 promoter in the WT
background. This strain exhibits a WT-like NPQ induction (Figure 4.22 D) and LHCSR3 accumulation
(Figure 4.22 E) after 4h exposure to HL in minimal medium. A LL to HL shift experiment revealed that
luminescence (i.e. the accumulation of luciferase, which is in turn reflects LHCSR3 gene induction)
was largely increased (here 46 fold induction) with fast kinetics, being complete after 1 hour of high
light exposure. This time lenght is consistent with previous data obtained by measuring LHCSR3
mRNA accumulation in the WT (section 4.3). A comparison of luciferase activity levels in control (in
minimal medium) and acetate-treated cells (Figure 4.22 G) indicates that acetate almost completely
inhibits LHCSR3 expression similar to DCMU. Its effect was almost identical to that of DCMU, a
photosynthesis inhibitor that was used as a positive control. Indeed this herbicide was previously
shown to block LHCSR3 gene expression by qPCR (Maruyama et al., 2014).

169
Figure 4.22 – Acetate inhibits NPQ and LHCSR3 induction. (A) NPQ induction kinetics of WT cells after overnight incubation
in minimal medium at LL (20 µmol photons m-2 s-1) or after 4 h exposure to HL (250 µmol photons m-2 s-1) in the presence
and absence of acetate. NPQ was recorded for 16 min upon illumination with 440 µmol photons m-2 s-1 (white bar) followed
by 4 min of darkness (black bar), to follow NPQ relaxation. (B) Immunoblot analysis of LHCSR3, and ATPB of the samples
described in (A). ATPB was used as loading control. (C) Electron transfer rate (ETR) of the samples described in (A). ETR
(µmol photons m-2 s-1) was measured at actinic illumination of 41 µmol photons m-2 s-1. Mean ± SD (n = 3). (D) NPQ induction
kinetics of LHCSR3 Prom::Luc cells after 4h exposure to HL (250 µmol photons m-2 s-1). (E) Immunoblot analysis of LHCSR3,
and ATPB of LHCSR3 Prom::Luc cells after 4h exposure to HL. ATPB was used as loading control. (F) Luminescence kinetics
of LHCSR3 Prom::Luc cells exposed to HL. (G) Fold induction of LHCSR3 based on luminescence measurements of LHCSR3
Prom::Luc cells exposed to HL for two hours in minimal medium (control), acetate-containing medium or poisoned by
DCMU. Data are normalized to the fold induction of control cells. Figure summarizes data of three to five experiments
(average, SD).

170
In a different approach, we pre-incubated cells overnight in HL minimum medium to reach full
accumulation of LHCSR3. We then added acetate and followed the kinetics of NPQ and LHCSR3 while
keeping the cells in HL. Despite the exposure to HL, a condition that favors NPQ and LHCSR3
induction in control cells, acetate was still able to decrease NPQ (Figure 4.23 A) and photosynthetic
activity measured as ETR (Figure 4.23 B). The decreased NPQ capacity was progressive and
paralleled by a reduction of the cellular LHCSR3 content (Figure 4.23 C and D). The effect of acetate
on LHCSR3 was specific as evidenced by the fact that another component of PSII, the D1 protein
levels remain unaltered even 24 h after acetate was added, i.e. when most of the LHCSR3 had
already disappeared.
Figure 4.23 – Acetate triggers LHCSR3 degradation in HL. WT cells were incubated overnight in minimal (control) medium
in HL (250 µmol photons m-2 s-1) to reach the maximum accumulation of LHCSR3. Acetate was added (20 mM) and cells
remained to HL for another 24h. (A) NPQ capacity (NPQ max) and (B) ETR kinetics in cells remaining in minimal (control)
medium or having received 20 mM acetate. (C) Immunoblot analysis of LHCSR3, D1 and ATPB of cells described in (A). ATPB
was used as loading control. (D) Densitometric analyses of LHCSR3 normalised to ATPB (1 = LHCSR3 in control conditions at
t=0).

171
Previous data have shown that LHCSR3 gene expression stops abruptly after a HL to LL transition
(t1/2 < 0.5 hour). Because LHCSR3 is absent in LL treated cells, we reasoned that the decline of NPQ
and LHCSR3 during the HL to LL transition could offer an excellent opportunity to investigate LHCSR3
protein turnover. We started from cells that were we pre-loaded with LHCSR3 thanks to an
overnight incubation in HL. After transferring them in LL conditions, samples were collected for 24
hours and LHCSR3 levels and NPQ capacity were measured (Figure 4.24 A and B). We found that
LHCSR3 is a relatively stable protein that degrades slowly (t1/2 > 8h). Moreover, its degradation
turned out to be independent in the presence of acetate. Interestingly even after 24 h after the shift
to LL phototrophic cells (control) still retain a significant NPQ capacity (ca 50%) which is however
abolished by acetate (Figure 4.24 C), despite the fact that this compound did not impact the
photosynthetic performance of the cells (Figure 4.24 D).
Figure 4.24 – Acetate is not involved in LHCSR3 protein stability. Cells acclimated to LL (20 µmol photons m-2 s-1; t = -16h)
were shifted to HL (250 µmol photons m-2 s-1) overnight to reach the maximum accumulation of LHCSR3. Acetate was added
(20 mM) and cells were transferred back to LL for another 24h. (A) Immunoblot analysis of LHCSR3, and ATPB of cells
described in (B). ATPB was used as loading control. (B) Densitometric analyses of LHCSR3 normalised to ATPB (1 = LHCSR3
in control conditions at t=0). (C) NPQ capacity (NPQ max) and (D) ETR kinetics in cells remaining in minimal (control) medium
or having received 20 mM acetate.

172
Acetate modulation of LHCSR3 reveals a metabolic control of NPQ in Chlamydomonas.
The data shown above indicate that acetate is a potent inhibitor of photoprotection in
Chlamydomonas, because it reduces the expression of the LHCSR3 gene. This impacts LHCSR3
protein accumulation during LL to HL transitions (Figure 4.22) but also during HL conditions (Figure
4.23). Overall, these data show that LHCSR3 and NPQ are under control of acetate metabolism by
the cell. To gain further insights into the link between acetate metabolism we tested the effect of
this metabolite in the following mutants with altered acetate metabolisms: (i) dum11, defective in
complex III (ubiquinol cytochrome c oxidoreductase) and thus unable to oxidize the reducing power
produced by glycolysis, the pentose phosphate pathway and/ or TCA. This mutant can still produce
some ATP via electron transport mediated through complex I (NADH dehydrogenase) and the
alternative oxidase (AOX). The low ATP production in this mutant may be responsible for the
absence of growth under heterotrophic conditions and the slower growth under mixotrophic
conditions (Colin et al., 1995). (ii) icl, is a mutant lacking isocitrate lyase, a key enzyme of the
glyoxylate cycle. This cycle plays an essential role in cell growth on acetate, and is important for
gluconeogenesis as it bypasses the two oxidative steps of the tricarboxylic acid (TCA) cycle in which
CO2 is evolved. Although its respiratory complexes are unaltered, the icl mutant cannot grow on
acetate in the dark while it shows reduced acetate assimilation and respiration in the light (Plancke
et al., 2014). (iii) ack1, ack2 and the double mutant ack1ack2 lack either the chloroplastic (ACK1) or
the mitochondrial (ACK2) or both the acetate kinases respectively. Acetate kinase catalyzes the
phosphorylation of acetate to acetyl-P which is further converted to acetyl-CoA by phosphate
acetyltransferase.
We found (Figure 4.25 A) that acetate was not able to inhibit LHCSR3 induction in the dum11 and icl
mutants in LL to HL shift experiments, indicating that impaired respiration of this compound was
enough to make it ineffective. Moreover, no LHCSR3 degradation was observed when acetate was
added in HL acclimated cells at variance with the WT (Figure 4.25 B). On the other hand, the three
ack mutants tested showed a WT-like phenotype (Figure 4.25 A) suggesting that acetate entry via
the acetyl CoA synthase was probably sufficient to promote its metabolism and therefore the
control over LHCSR3 gene induction.

173
Figure 4.25 – Differential response of LHCSR3 to acetate in selected metabolic mutants. (A) WT and mutant cells
acclimated to LL (20 µmol photons m-2 s-1) were shifted to HL (250 µmol photons m-2 s-1) for 4h in the presence and absence
of acetate. Immunoblot analysis of LHCSR3, and ATPB. (B) WT and mutant cells were incubated overnight in minimal
(control) medium in HL (250 µmol photons m-2 s-1) to reach the maximum accumulation of LHCSR3. Acetate was added (20
mM) and cells remained to HL for another 24h. The figure shows the immunoblot analyses of LHCSR3 and ATPB at the
indicated time points.

174
A key role of CO2 and CCM in the regulation of the LHCSR3 gene
Overall, the data of Figure 4.25 indicate that acetate controls LHCSR3 accumulation via a metabolic
control, which involves respiration. Indeed, in both the icl and the dum11 LHCSR3 accumulation in
HL becomes acetate-insensitive. In these mutants respiration is compromised and therefore ATP
levels are low, explaining their inability to grow heterotrophically on acetate. However they do grow
on acetate mixotrophically, although their growth rates are compromised (Plancke et al., 2014; Colin
et al., 1995). Therefore, acetate enters the cell in the mutants, suggesting that this metabolite per
se is not the signaling molecule that triggers the inhibition of LHCSR3 transcription. Because acetate
assimilation rate in icl and dum11 mutants is slow, respiratory CO2 released by these mutants should
be lower in these mutants. The low CO2 concentration could explain the differential response of
LHCSR3 in WT and icl and dum11 mutants. Indeed, the promoter region of LHCSR3.1 contains a
conserved sequence motif termed EEC, an enhancer element for low CO2 responses (Maruyama et
al., 2014) also present in other low CO2-inducible gene promoters in C. reinhardtii (Kucho et al.,
2003; Yoshioka et al., 2004). In order to test this hypothesis, we performed LL to HL shift
experiments in WT and the mutants icl, dum11, ack1, ack2, ack1ack2 in control medium (minimal)
and in medium supplemented with 2.5 mM bicarbonate. We found that NaHCO3 suppressed LHCSR3
accumulation not only in WT and ack mutants but also in the acetate-insensitive in icl and dum11
(Figure 4.26) pointing a control of CO2 on LHCSR3 either direct or via CCM.
Figure 4.26 – Bicarbonate inhibits LHCSR3 expression in WT and metabolic mutants. WT and mutant cells acclimated to
LL (20 µmol photons m-2 s-1) were shifted to HL (250 µmol photons m-2 s-1) for 4h in the presence and absence of 2.5 mM
NaHCO3. The figure shows the immunoblot analysis of LHCSR3, and ATPB.

175
We tested the effect of CO2 on LHCSR3 expression in the LHCSR3 Prom::Luc strain in LL to HL shift
experiments for 2h where the culture medium was supplemented with saturating concentration of
bicarbonate (2.5 mM NaHCO3) and we saw that transcription of LHCSR3 is inhibited by NaHCO3
(Figure 4.27 A) to a similar extend of DCMU- or acetate-triggered inhibition (Figure 4.22 G). The shift
from LL to HL induces the mitochondrial carbonic anhydrases CAH4/5 indicating an activation of
CCM under HL conditions (Figure 4.27 B). Accumulation of protein levels of CAH4/5 perfectly follow
the accumulation pattern of LHCSR3 protein, i.e. no expression in LL, high expression in HL,
suppression in HL by acetate and bicarbonate (Figure 4.27 B). Moreover the mutant cia5, lacking a
master regulator of CCM (Moroney et al., 1989; Fukuzawa et al., 2001) is unable to accumulate any
detectable protein levels of either LHCSR3 or CAH4/5 (Figure 4.27 B). These data show a close
interconnection of LHCSR3 and CCM which is further supported by earlier findings that CCM is
inhibited by acetate (Fett & Coleman, 1994b; Moroney et al., 1987). Based on the above-mentioned
reasoning we hypothesized that acetate-metabolism-derived intracellular CO2 inactivates CCM and
blocks LHCSR3 transcription.
Figure 4.27 – LHCSR3 is under control of CCM. (A) Fold induction of LHCSR3 based on luminescence measurements of
LHCSR3 Prom::Luc cells exposed to HL for two hours in minimal medium (control) and NaHCO3-containing medium. Data
are normalized to the fold induction of control cells. Figure summarizes data of three to five experiments (average, SD). (B)
Immunoblot analyses of LHCSR3, CAH4/5 and ATPB in WT and cia5 cells shifted from LL (20 µmol photons m-2 s-1) to HL (250
µmol photons m-2 s-1) in the absence (control) and presence of acetate (20 mM) or NaHCO3 (2.5 mM).
176
4.4.3 Materials and methods
Chemicals: Stock solutions of DCMU were prepared in ethanol (40 mM). DCMU was used at a final
concentration of 40 µM.
Strains and conditions: C. reinhardtii strains were grown under 20 µmol photons m-2 s-1 in Tris-
acetate-phosphate (TAP) media (Gorman & Levine, 1965) at 23 oC containing 17.5 mM acetate. In
all experiments cells were transferred to Sueoka's high salt medium (Sueoka, 1960) at 2 million
cells/mL and exposed to light intensities as described in the text and figure legends. The strain 137c
was used as wild type strain of C. reinhardtii. The mutants icl, dum11, ack1, ack2 and ack1ack2 are
described in the text. We used a pgrl1 strain backcrossed four times with the wild-type strain CC124
(Kukuczka et al., 2014). The 137c expressing the firefly luciferase under control of LHCSR3.1
promoter (LHCSR3 Prom::Luc) was kindly provided by the lab of Jun Minagawa (Okasaki, Japan).
Unless otherwise stated, LL conditions corresponded to 20 µmol photons m-2 s-1 while HL conditions
corresponded to 250 µmol photons m-2 s-1 of white light.
Immunoblotting: Protein samples of whole cell extracts (0.5 µg chlorophyll) were loaded on 4-20%
SDS-PAGE gels and blotted onto nitrocellulose membranes. Antisera against D1, CAH4/5, ATPB were
from Agrisera (Vännäs, Sweden). Anti-LHCSR3 was a kind gift from M. Hippler (University of
Muenster). An anti-rabbit horseradish peroxidase–conjugated antiserum was used for detection.
The blots were developed with ECL detection reagent, and images of the blots were obtained using
a CCD imager (ChemiDoc MP System, Bio-Rad). LHCSR3 appears as a double band in some of the
western blots. The upper band represents the phosphorylated form of LHCSR3.
Luminescence measurements: For the firefly luciferase activity measurements, 100 µL of cell
suspension at 2 million cells/mL was mixed with 100 µL ONE-Glo™ Luciferase Assay mixture
(Promega) containing luciferin, the substrate of firefly luciferase. Luminescence was recorded after
20 minutes of incubation with the Luciferase Assay mixture using a Spark® 10M luminescence
microplate reader (Tecan).
Fluorescence-based measurements: Fluorescence-based photosynthetic parameters were
measured with a fluorescence imaging setup previously described (Johnson et al., 2009). The
photosynthetic electron transfer rate (ETR) was calculated as (Fm’-F)/Fm’ * 0.84 * 0.5 * I (Petroutsos
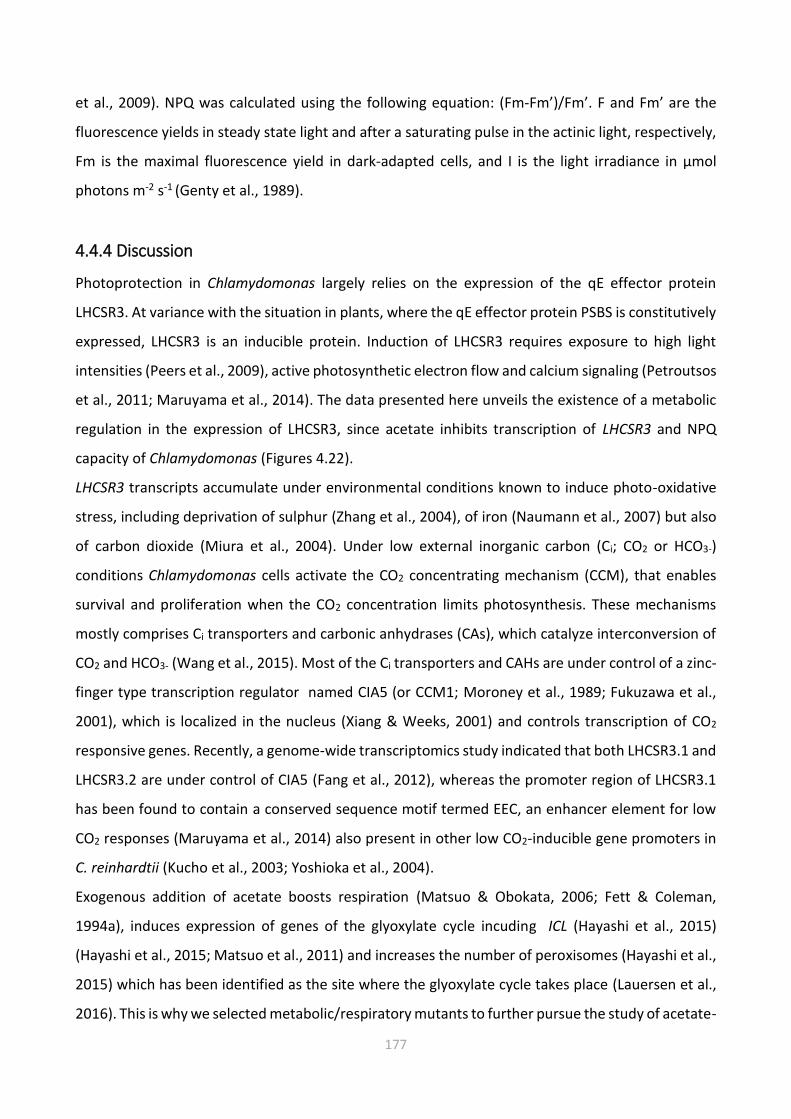
177
et al., 2009). NPQ was calculated using the following equation: (Fm-Fm’)/Fm’. F and Fm’ are the
fluorescence yields in steady state light and after a saturating pulse in the actinic light, respectively,
Fm is the maximal fluorescence yield in dark-adapted cells, and I is the light irradiance in µmol
photons m-2 s-1 (Genty et al., 1989).
4.4.4 Discussion
Photoprotection in Chlamydomonas largely relies on the expression of the qE effector protein
LHCSR3. At variance with the situation in plants, where the qE effector protein PSBS is constitutively
expressed, LHCSR3 is an inducible protein. Induction of LHCSR3 requires exposure to high light
intensities (Peers et al., 2009), active photosynthetic electron flow and calcium signaling (Petroutsos
et al., 2011; Maruyama et al., 2014). The data presented here unveils the existence of a metabolic
regulation in the expression of LHCSR3, since acetate inhibits transcription of LHCSR3 and NPQ
capacity of Chlamydomonas (Figures 4.22).
LHCSR3 transcripts accumulate under environmental conditions known to induce photo-oxidative
stress, including deprivation of sulphur (Zhang et al., 2004), of iron (Naumann et al., 2007) but also
of carbon dioxide (Miura et al., 2004). Under low external inorganic carbon (Ci; CO2 or HCO3-)
conditions Chlamydomonas cells activate the CO2 concentrating mechanism (CCM), that enables
survival and proliferation when the CO2 concentration limits photosynthesis. These mechanisms
mostly comprises Ci transporters and carbonic anhydrases (CAs), which catalyze interconversion of
CO2 and HCO3- (Wang et al., 2015). Most of the Ci transporters and CAHs are under control of a zinc-
finger type transcription regulator named CIA5 (or CCM1; Moroney et al., 1989; Fukuzawa et al.,
2001), which is localized in the nucleus (Xiang & Weeks, 2001) and controls transcription of CO2
responsive genes. Recently, a genome-wide transcriptomics study indicated that both LHCSR3.1 and
LHCSR3.2 are under control of CIA5 (Fang et al., 2012), whereas the promoter region of LHCSR3.1
has been found to contain a conserved sequence motif termed EEC, an enhancer element for low
CO2 responses (Maruyama et al., 2014) also present in other low CO2-inducible gene promoters in
C. reinhardtii (Kucho et al., 2003; Yoshioka et al., 2004).
Exogenous addition of acetate boosts respiration (Matsuo & Obokata, 2006; Fett & Coleman,
1994a), induces expression of genes of the glyoxylate cycle incuding ICL (Hayashi et al., 2015)
(Hayashi et al., 2015; Matsuo et al., 2011) and increases the number of peroxisomes (Hayashi et al.,
2015) which has been identified as the site where the glyoxylate cycle takes place (Lauersen et al.,
2016). This is why we selected metabolic/respiratory mutants to further pursue the study of acetate-
178
triggered inhibition of LHCSR3 (Figure 4.25). The acetate-insensitive phenotype of icl and dum11 in
terms of LHCSR3 induction allows excluding the possibility that acetate acts as a signal per se
because both icl and dum11 do assimilate acetate but at slow rates. The hypothesis that metabolic
CO2 produced by acetate assimilation inhibited LHCSR3 via intracellular gas exchanges sounded
more plausible. A remote control of photosynthetic genes by the mitochondrial respiratory chain
had been demonstrated in Chlamydomonas for the case of psaE mRNA (Matsuo & Obokata, 2006).
Similarly, acetate repressed the expression of the genes encoding the small and large Rubisco
subunits (Goldschmidt-Clermont, 1986). Acetate also inhibited CCM and carbonic anhydrases
expression and it had been suggested that this could be due to respiratory CO2 produced by acetate
assimilation mimicking high CO2 conditions in the cell (Eriksson et al., 1998; Fett & Coleman, 1994a).
This could also explain the sensitivity of LHCSR3 to acetate. Indeed several lines of evidence already
existed supporting a very tight interconnection of LHCSR3 and CCM: i. LHCSR3 gene is induced under
low CO2 (Miura et al., 2004), ii. a genome-wide transcriptomics study identified both LHCSR3.1 and
LHCSR3.2 as being under control of CIA5, the master regulator of CCM genes (Fang et al., 2012), iii.
the promoter region of LHCSR3.1 contains an enhancer element for low CO2 responses (Maruyama
et al., 2014) also present in other low CO2-inducible gene promoters in C. reinhardtii (Kucho et al.,
2003; Yoshioka et al., 2004). Our data confirmed this close interconnection of LHCSR3 and CCM
because NaHCO3 transcriptionally inhibits LHCSR3 (Figure 4.26 A), the mitochondrial CAH4/5
perfectly co-expresses with LHCSR3 in LL to HL experiments in the presence and absence of acetate
or bicarbonate and finally the mutant cia5 does not expressed LHCSR3 (Figure 4.26 B). Addition of
bicarbonate in the acetate-insensitive mutants icl and dum11 rendered them WT-like because
LHCSR3 was completely inhibited.
Contrary to plants that are ready to perform NPQ any time they experience excess light conditions
thanks to constitutive expression of the qE effector protein PSBS (Li et al., 2000) and to marine
diatoms that perform NPQ due to the constitutively expressed LHCX1 protein (Bailleul et al., 2010),
Chlamydomonas relies to the relatively slowly induced protein LHCSR3. That leaves a time window
of approximately two hours during which cells need to freshly synthesize LHCSR3 and therefore are
not efficiently photoprotected by qE. It has been demonstrated that state transitions, another
component of NPQ, cover this photoprotective gap in Chlamydomonas (Allorent et al., 2013).
However, our data show that, once expressed, LHCSR3 is fairly stable and gets slowly degraded with
a t1/2 that exceeds 8 h (Figure 4.24 A, B). This means that the cells will be ready to perform NPQ
when brought back to high light. Indeed, after 8h in LL the cells retain 75% of their NPQ capacity

179
which remains at 50% after 24 h in LL.
When acetate is added to cells that have been acclimated to HL and cellular LHCSR3 levels are
already at their maximum accumulation, the protein LHCSR3 starts getting degraded even though
the cells still remain at HL conditions that would certainly benefit from efficient photoprotection
(Figure 4.23). Nonetheless, no significant photoinhibition is detected, as evidenced by the finding
that the D1 levels remained unaltered upon high light exposure in the presence of acetate (Figure
4.23 C). This apparent contradiction can be explained by the suggestion (Roach et al., 2013) that
acetate changes the energetics of PSII and that mixotrophic cells are less susceptible to
photoinhibition because they produce less 1O2 compared to phototrophic cells. The drop in
photosynthetic activity measured as ETR observed at the same conditions (Figure 4.22 B) could be
an indication of enhancement of CEF in the presence of acetate, as has been suggested by others
(Lucker & Kramer, 2013; Johnson & Alric, 2013). It seem therefore that acetate promotes a
metabolic shift in Chlamydomonas (i.e. enhanced photoprotection capacity, modified redox
potential of the PSI acceptor side, same as in Roach et al. 2013 and higher CEF) which reminds the
situation described in photosynthetic anaerobic bacteria. In these organisms, the main purpose of
photosynthesis is not to assimilate CO2 but rather to generate ATP for housekeeping purposes
(Finazzi, 2005). This is a condition that can also be expected in this alga when grown in the presence
of an environment rich in organic carbon, were light penetration and oxygen concentration could
be relative low.

180

181
Chapter 5

182

183
5.1 Concluding remarks
The chloroplast likely represents the most sophisticated light-harvesting and energy collector
systems in nature. This flexible “molecular machine” can optimally perform under extremely
variable environments (changes in nutrients, temperature, light quality or quantity). Within the
chloroplast, three main sub-compartments can be easily identified i. the envelope, a membrane
system that control exchanges of metabolites and proteins with the rest of the cell ii. the stroma
the soluble space which hosts the enzymes required for carbon fixation and iii. the thylakoids, the
internal membrane network. The presence of these chloroplast subcompartments reflects the
necessity to confine different photosynthetic steps (i.e. light-harvesting, electron flow, carbon
assimilation) in different compartments with different physio-chemical properties (light absorbing
pigments must work in a nonpolar environment while CO2 assimilation requires an aqueous space).
A rapid and efficient interaction between these compartments is needed for optimum
photosynthesis. My main contribution to the first part of this Ph.D project has been to investigate
the physical strategies established by the diatom P. tricornutum to optimize the interaction between
its different cells subcompartments.
At the cellular level, we observe contact points between the nucleus and the chloroplast (see Flori
et al., in preparation, Chapter 2), which likely mediate a direct exchange of metabolites and “signals“
as required for a proper dialog between the site where most of the photosynthetic genes are
expressed (the nucleus) and the site where the gene products must operate (the chloroplast).
Understanding the nature of these exchanges, as well as their possible involvement in retrograde
signalling (i.e. signalling the redox state of the chloroplast to the nucleus to modify its gene
expression profile) will constitute a major step in understanding cellular communication.
We also see contacts between the chloroplast and the mitochondria, which likely facilitate the
exchange of reducing equivalents and ATP between the two organelles to optimise CO2 assimilation
in the light (Baileul et al., 2015). Investigating the nature of the protein exchangers present in these
“junctions” by targeted proteomic analysis, will constitute a major achievement to elucidate the
molecular mechanisms behind these energy exchanges. This is now possible thanks to the possibility
to isolate intact chloroplast in P. tricornutum, which not only opens new stimulating opportunity of
studying the different subcompartments of the chloroplast (envelope, thylakoids, etc.) still a
mystery in diatoms, but also allow purifying patches of chloroplast envelope fused to mitochondrial
memebranes.

184
At the subcellular level, we observe extensive contacts between the periplastidial membrane (PPM)
and the inner nuclear envelope (iNE; Flori et al., 2016). A vesicular network (VN) fills the space
between the PPM and the two innermost envelope membranes (oEM and iEM) and could be an
important platform for the import of protein precursors to the chloroplast. The identification of the
proteins generating the VN represents therefore an important challenge for future works. To
achieve this goal a biochemical and structural approach should be applied through the correlative
light electron microscopy technique (CLEM).
Finally, we see “linking membranes” connecting the different thylakoid layers, which optimize
electron flow by facilitating the diffusion of the soluble electron carriers between the two
photosystems. Thanks to this rapid connection, the two photosystems can be kept apart, to avoid
useless energy spillover between them.
Overall, the major outcome of this part of my thesis was to reveal the sophisticated arrangement of
the cellular compartment and to relate this structure to the global function and flexibility of a
diatoms cell. A large spectrum of future investigations is possible. The new protocols I have
developed during my Ph.D are now ready to be exploited to study cell grown in standard conditions
and in conditions allowing rearrangements or modification of the cellular complexes (e.g. low light
VS high light, nutrient starvation, etc.). In principle, it could be possible to use these findings to
elucidate how microalgae interact with their environment and respond to stress conditions.
In the second part of this project, I have focused more on the “biological” mechanisms of the
signalling between the different cell compartments focusing on the green alga C. reinhardtii. By
integrating action spectra, genetic screening and spectroscopic analysis, we explored that different
signals are involved in the regulation of photoprotection in this widespread model organism. In the
first study, addressing the question if light colour is involved in the regulation of NPQ in C. reinhardtii
we highlight the link between light sensing and dissipation via the photoreceptor phototropin.
We also reveal a feedback regulation between carbon assimilation for metabolism and
photoprotection. In fact, depending on the prevailing mode of carbon assimilation (phototrophy vs
mixotrophy, i.e. simultaneous utilisation of light and reduced carbon), this flexible microalga is able
to adjust its photosynthetic machinery and to sustain growth under extreme and differentiated
conditions. To obtain these results, I have established an innovative small-scale approach to
investigate the regulation of photoprotective responses. Using the Biolog® microplates, I have been
able to investigate the effect of 190 metabolites on growth, photosynthesis and photoprotection.
This pioneering approach can open an interesting perspective for the future. In fact, the scale-up of

185
this metabolomic approach can confirm the experimental evidences obtained using the Biolog®
technology. The selection, in liquid, of other central carbon metabolites involved in TCA and/or
aminoacid metabolism was already tested, but due to the lack of time, the entire set of metabolites
(190) was not verified entirely and this approach was not included in this manuscript of thesis.
Furthermore, by combining these results with a data base reconstituting the metabolism in
photosynthetic organisms (e.g. ChloroKB database) it will be possible to identify other key metabolic
regulators of LHCSR3 and NPQ in Chlamydomonas reinhardtii.

186
5.2 List of acronyms
AA Antimycin A
ACS acetyl-CoA synthetase
ACK Acetate kinase
ADP Adenosine di-phosphate
AFM Atomic force microscopy
AIC Akaike information criterion
AOX Alternative oxidase
ATP Adenosine tri-phosphate
CAs Carbonic anhydrases
CBB Calvin-Benson-Bassham cycle
CBP Chlorophyll binding proteins
CCM CO2-concentrating mechanism
CEF Cyclic electron flow
cERM Chloroplast endoplasmic reticulum
Chl Chlorophyll
Cyt Cytochrome
DCMU 3-(3,4-dichlorophenyl)-1,1-dimethylurea
Dd Diadinoxanthin
DDE Diadinoxanthin de-epoxidase
DGDG Digalactosyl-diacyl- glycerol
Dt Diatoxanthin
DTE Diatoxanthin epoxidase
ECS Electrochromic shift
EM Electron microscopy
ENV Envelope
ER Endoplasmic reticulum
ESAW Enriched Seawater medium
ETR Electron transport rate
FADH2 Flavin adenine dinucleotide
FCCP (Trifluoromethoxy) phenylhydrazone
FCP Fucoxanthin chlorophyll-a/c binding proteins
Fd Ferredoxin
FIB-SEM Focus ion beam-scanning electron microscopy
FNR Fd-NADP+-oxidoreductase
Fm Maximal fluorescence after dark acclimation
Fm′ Maximal fluorescence in the light acclimated state
Fv Variable Fluorescence after dark acclimation
GAP Glyceraldehyde 3-phosphate
HA Hydroxylamine
HL High light

187
HSM High salt medium (Sueoka's buffer)
IBMX 3-isobutyl-1-methylxanthine
IEM Inner envelope membrane
LEF Linear electron flow
LHCI Light harvesting complex I
LHCII Light harvesting complex II
LHCSRs Light harvesting complex stress related proteins
Li818 Light Induced protein 818
LL Low light
LOV Light oxygen and voltage domain
MGDG Monogalactosyl-diacyl- glycerol
NADH Nicotinamide adenine dinucleotide
NADPH Nicotinamide adenine dinucleotide phosphate
NPQ Non-photochemical quenching
OCP Orange carotenoid protein
OEM Outer envelope membrane
OLS Okazaki large spectrograph
PAM Pulse amplitude modulation
PAT Phosphate acetyltransferase
PBSs Phycobilisomes
PC Plastocyanin
PCA Principal components analysis
PDK Serine-threonine kinase protein domain
PG Phosphatidyldiacylgycerol
PHOT Phototropin
PMF Proton motive force
PPC Periplastidial compartment
PPM Periplastidial membrane
PQ Plastoquinone
PSI Photosystem I
PSII Photosystem II
PSBS PSII subunit S protein
PYR Pyrenoid
Q Quinone
qP Photochemical quenching
qE High-energy-state quenching
qI Photoinhibitory quenching
qT Quenching related to state transitions
ROS Reactive oxygen species
RuBisCo Ribulose-1,5-bisphosphate carboxylase/oxygenase
Ru5P Ribulose-5-phosphate
SDS-PAGE Sodium dodecyl sulphate - polyAcrylamide gel electrophoresis

188
SHAM Salicylhydroxamic acid
SQDG Sulfoquinovosyldiacylglycerol
TAP Tris-acetate phosphate buffer
TCA Tricarboxylic acid cycle
TEF Total electron flow
TEM transmission electron microscopy
VDE Violaxanthin de-epoxidase
VN Vesicular network
Vx Violaxanthin
WT Wild type
XC Xanthophyll cycle
ZEP Zeaxanthin epoxidase
Zx Zeaxanthin
ΔΨ Electric field
ΔpH Proton gradient
189
5.3 List of publications
This thesis is based on the following publications and manuscripts:
Chapter 2
Section 2.3.2 Benjamin Bailleul, Nicolas Berne, Omer Murik, Dimitris Petroutsos, Judit
Prihoda, Atsuko Tanaka, Valeria Villanova, Richard Bligny, Serena Flori, Denis
Falconet, Anja Krieger-Liszkay, Stefano Santabarbara, Fabrice Rappaport, Pierre
Joliot, Leila Tirichine, Paul G. Falkowski, Pierre Cardol, Chris Bowler, Giovanni Finazzi
2015 “Energetic Coupling Between Plastids and Mitochondria Drives CO2 Assimilation
in Diatoms" Nature……………………………………………………………………………………….……….37
Section 2.4.2 Serena Flori, Pierre-Henri Jouneau, Giovanni Finazzi, Eric Maréchal and Denis
Falconet “Ultrastructure of the Periplastidial Compartment of Phaeodactylum
tricornutum” Protist……………………………………………………………………………………………….63
Section 2.5.2 Serena Flori, Pierre-Henri Jouneau, Benjamin Bailleul, Benoit Gallet, Leandro Estrozi,
Christine Moriscot, Olivier Bastien, Simona Eicke, Alexander Schober, Carolina Rio
Bartulos, Eric Maréchal, Peter G. Kroth, Dimitris Petroutsos, Samuel Zeeman, Cécile
Breyton, Guy Schoehn, Denis Falconet, Giovanni Finazzi “Chloroplast thylakoid
architecture optimizes photosynthesis in diatoms“ manuscript in
preparation……………………………………………………………………………………………………………84
Chapter 4
Section 4.3.2 Dimitris Petroutsos, Ryutaro Tokutsu, Shinichiro Maruyama, Serena Flori, Andre
Greiner, Leonardo Magneschi, Loic Cusant, Tilman Kottke, Maria Mittag, Peter
Hegemann, Jun Minagawa, Giovanni Finazzi “A Blue Light Photoreceptor Mediates
the Feedback Regulation of Photosynthesis“ paper under revision to Nature………144
Section 4.4 Serena Flori and collaborators “Carbon metabolism controls photoprotection in
Chlamydomonas via the light harvesting complex stress response protein LHCSR3”
manuscript in preparation….………………….……………………………………………………………165

190
5.4 List of figures
Chapter 1
Figure 1.1 – Fate of the excited chlorophyll. Representation of the possible relaxation pathways of
the singlet excited state of chlorophyll (1Chl*). (1) fluorescence (2) photochemistry (qP) or (3)
dissipation as heat (or NPQ; from Muller et al., 2001)……………………………………………………………………12
Figure 1.2 – Representation of the oxygenic photosynthesis………………………………………………..…....12
Figure 1.3 – Schematic representation of the pathway for the photosynthetic linear electron flow.
Black rows represent the electrons pathway through the major components of the photosynthetic
electron flow chain: photosystem II (PSII), the plastoquinone (PQ) the cytochrome b6f complex (cyt
b6f) the plastocyanin (PC), the light harvesting complex of the photosystems I (LHCI), the
photosystems I (PSI), the ferredoxin (Fd), the enzyme Fd-NADP+-oxidoreductase (FNR) and the ATP
synthase. Red rows represent the protons pathway……………………………………………………………………...14
Figure 1.4 – Schematic representation of the structure of LHC proteins. (A) PSBS protein in
Arabidopsis thaliana (modified from Li et al., 2002) (B) LHCSR3 protein in C. reinhardtii (from
Maruyama et al., 2014). ……………………………………………………………………………………………………………....21
Figure 1.5 – LHCII fractions in C. reinhardtii. (A) EM picture of the purified thylakoid membranes
obtained after sucrose gradient fractionation during state 1. (B) and during state 2, in this picture
large aggregate are visible (Iwai et al., 2010)…………………………………………………………………………….….22
Chapter 2
Figure 2.1 – Representation of the principal plastids found in plants. The proplastid, etioplasts,
chloroplasts, chromoplasts, gerontoplasts, amyloplasts and elaioplasts are represented. Grey lines
show possible route of plastids differentiation (modified from
https://commons.wikimedia.org/w/index.php?curid=28879042)...................................................27

191
Figure 2.2 – Schematic representation of primary and secondary symbiosis. (A) Primary
endosymbiosis (B) Secondary endosymbiosis. ……………………………………………………………………………...28
Figure 2.3 – Chloroplast details of Arabidopsis thaliana. (A) the envelope (B) the stroma (C) a
granum and (D) stroma lamellae. The thylakoid lumen is not visible at this magnification…….……..30
Figure 2.4 – Current models of the structural arrangements of thylakoids in plant chloroplast. (A)
the fork model of Arvidsson &Sundby, 1999. (B) the bifurcated model of Shimoni et al., 2005 (picture
from Daum et al., 2011). (C) the right-handed helix model predicted by Paolillo 1970 (picture from
Ruban & Johnson, 2015)…………………………………………………………………………………………………………….…31
Figure 2.5 – Representation of the thylakoid membranes in plants. (A) the grana stack mostly
enriched in PSII. (B) the stroma lamellae enriched in PSI. The cyt b6f is equally distributed between
the two regions……………………………………………………………………………………………………………………….……32
Figure 2.6 – Morphotypes of P. tricornutum. (1) Fusiform, (2) oval and (3) triradiate……………....…33
Figure 2.7 – Chloroplast details of P. tricornutum. (A) Whole cell view, the envelope is highlighted
in red the thylakoids in white and the stroma space in black. (B) Details of the envelope. in this
picture the four membranes are visible. (C) Detail of the girdle lamella which surround the
chloroplast. (D) Pyrenoid region with the typical enlarged 2 lipid bilayers in the center……….……..34
Figure 2.8 – ECS allows measuring the proton motive force in P. tricornutum. (A) Deconvolution of
the experimental Electro-Chromic Signal (ECS) spectrum (black) into linear (blue) and quadratic (red)
spectral components, as described in Methods. (B) Schematic representation of polar and
polarizable pigments, and theoretical dependencies of their associated ECS responses upon the
electric field. Green “+” and “-“: ΔΨ. Blue and red “+” and “-“: pigment dipoles. Red arrows: pigment
polarization induced by ΔΨ. (C,D) Relationship between quadratic and linear ECS in control (C) and
in uncoupler (8 nM FCCP, black squares), anaerobic (red circles), and respiratory inhibitors (AA, 5
µM, and SHAM, 1 mM, blue circles) treated cells (D). Green arrow: value of the dark electric field
(ΔΨd). (E) Schematic representation of the plastid-mitochondria energetic interactions in the dark.
Red arrows: respiratory electron flows. Green dashed line: putative ATP/ADP exchange pathway
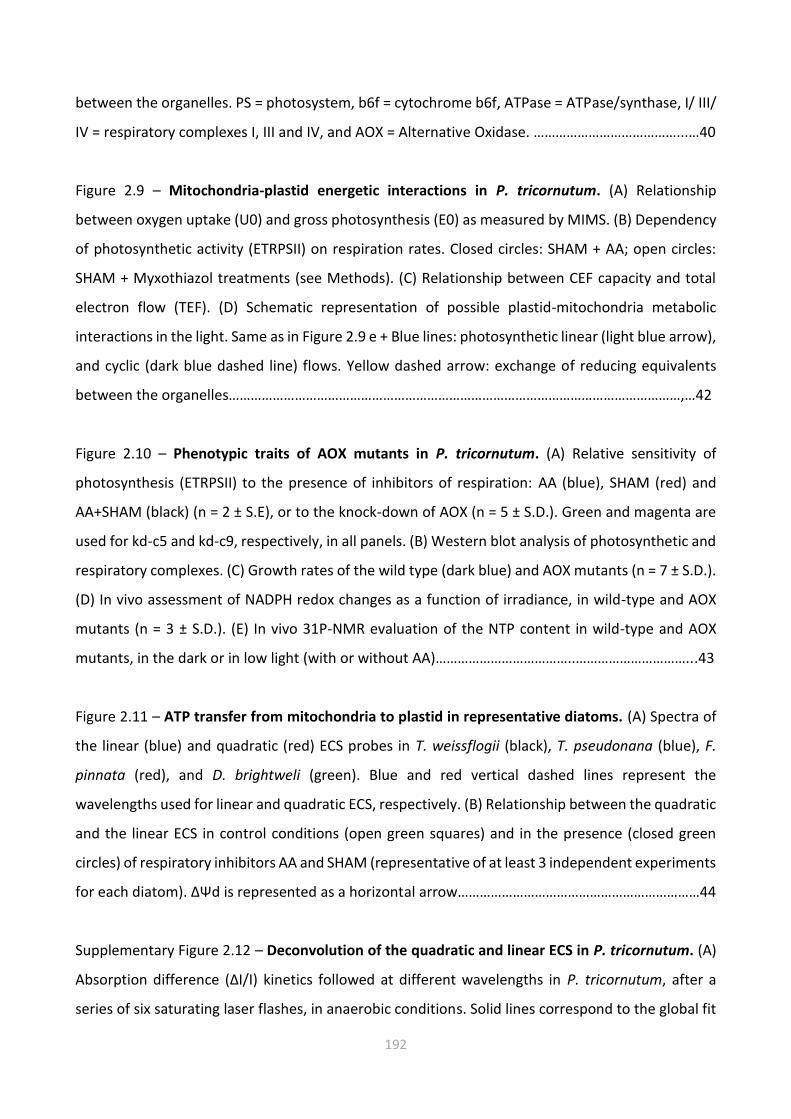
192
between the organelles. PS = photosystem, b6f = cytochrome b6f, ATPase = ATPase/synthase, I/ III/
IV = respiratory complexes I, III and IV, and AOX = Alternative Oxidase. …………………………………...…40
Figure 2.9 – Mitochondria-plastid energetic interactions in P. tricornutum. (A) Relationship
between oxygen uptake (U0) and gross photosynthesis (E0) as measured by MIMS. (B) Dependency
of photosynthetic activity (ETRPSII) on respiration rates. Closed circles: SHAM + AA; open circles:
SHAM + Myxothiazol treatments (see Methods). (C) Relationship between CEF capacity and total
electron flow (TEF). (D) Schematic representation of possible plastid-mitochondria metabolic
interactions in the light. Same as in Figure 2.9 e + Blue lines: photosynthetic linear (light blue arrow),
and cyclic (dark blue dashed line) flows. Yellow dashed arrow: exchange of reducing equivalents
between the organelles……………………………………………………………………………………………………………,…42
Figure 2.10 – Phenotypic traits of AOX mutants in P. tricornutum. (A) Relative sensitivity of
photosynthesis (ETRPSII) to the presence of inhibitors of respiration: AA (blue), SHAM (red) and
AA+SHAM (black) (n = 2 ± S.E), or to the knock-down of AOX (n = 5 ± S.D.). Green and magenta are
used for kd-c5 and kd-c9, respectively, in all panels. (B) Western blot analysis of photosynthetic and
respiratory complexes. (C) Growth rates of the wild type (dark blue) and AOX mutants (n = 7 ± S.D.).
(D) In vivo assessment of NADPH redox changes as a function of irradiance, in wild-type and AOX
mutants (n = 3 ± S.D.). (E) In vivo 31P-NMR evaluation of the NTP content in wild-type and AOX
mutants, in the dark or in low light (with or without AA)………………………………..…………………………...43
Figure 2.11 – ATP transfer from mitochondria to plastid in representative diatoms. (A) Spectra of
the linear (blue) and quadratic (red) ECS probes in T. weissflogii (black), T. pseudonana (blue), F.
pinnata (red), and D. brightweli (green). Blue and red vertical dashed lines represent the
wavelengths used for linear and quadratic ECS, respectively. (B) Relationship between the quadratic
and the linear ECS in control conditions (open green squares) and in the presence (closed green
circles) of respiratory inhibitors AA and SHAM (representative of at least 3 independent experiments
for each diatom). ΔΨd is represented as a horizontal arrow…………………………………………………………44
Supplementary Figure 2.12 – Deconvolution of the quadratic and linear ECS in P. tricornutum. (A)
Absorption difference (ΔI/I) kinetics followed at different wavelengths in P. tricornutum, after a
series of six saturating laser flashes, in anaerobic conditions. Solid lines correspond to the global fit

193
of the experimental data with a sum of two exponential decays, with time constants t and 2t
respectively, as expected for linear and quadratic dependencies (see Methods). (B) ΔI/I spectra are
shown at different times during ECS relaxation. All spectra were normalized to 1 at 520 nm for better
comparison. The observation that the blue and green parts of the spectrum are homothetic during
relaxation, while changes are seen in the red most part of it, reflects the presence of the two ECS
components, having different relaxation kinetics………………………………………………………………………….46
Supplementary Figure 2.13 – Separation of c-type cytochromes signals, and linear and quadratic
ECS signals in P. tricornutum. (A) Kinetics of ΔI/I changes at 520, 554 and 566 nm during a ~10ms
pulse of saturating red light (4500 µmol. quanta.m-2.s-1) and the subsequent dark relaxation (top:
control conditions, bottom: AA+SHAM). (B) Kinetics of of ecslin, ecsquad changes and c-type
cytochrome redox state, from kinetics in panel a, after deconvolution as explained in Methods. (C,
D) Relationship between the quadratic and the linear ECS, before (ecslin, ecsquad, panel c) and after
(ECSlin, ECSquad, panel D) correction for the dark electric field (see Methods). Dark yellow and
magenta circles correspond to control and AA+SHAM conditions, respectively. The green arrow
indicates the value of the ΔΨd in control conditions…………………………………………………………………….46
Supplementary Figure 2.14 – Cyclic electron flow and water-to-water cycles in P. tricornutum. (A)
Representative traces of changes in linear ECS (normalized as explained in Methods) to evaluate
linear and cyclic electron flow. Cells were illuminated with 1870 µmol quanta.m-2.s-1 of red light, in
absence (closed circles) and presence (open circles) of DCMU and then transferred to the dark.
Traces represent changes in the linear ECS. (B) Representative traces of the 16O2 and 18O2
concentrations at the offset of a 280 µmol quanta/m2/s blue light. In panels A and B, light and dark
periods are represented by white and black boxes, respectively. (C) The photochemical rate
corresponding to TEF and CEF can be estimated by measuring the initial slope of the ECS decay, as
explained above25 (see Methods) at difference irradiances (n = 2-4 ± S.D.). (D) Light- dependencies
of oxygen uptake (U0, open circles) and gross photosynthesis (E0, closed circles) in control
conditions (dark) and in the presence of DCMU (red) (n = 2 ± S.E.)………………………………………………..47
Supplementary Figure 2.15 – ΔΨd and photosynthesis under respiratory inhibition. (A,B,C)
Dependency of the ETRPSII (A), ΔΨd (B) and dark respiration (C), expressed as a % of the values
measured in untreated P. tricornutum wt cells, and following inhibition of the cyanide sensitive

194
respiratory pathway with different concentrations of Antimycin A, in the presence of saturating
SHAM (1 mM). Experimental data were fitted with a monoexponential decay function. (D,E) Effect
of AA, SHAM and AA+SHAM on ETRPSII (D), ΔΨd and dark respiration (E), expressed as % of control,
in wild-type cells of P. tricornutum. [SHAM]: 1mM. [AA]: 5µM. (n = 2-4 ± S.D.). (F) Relationship
between ΔΨd and mitochondrial respiration in samples poisoned with increasing concentrations of
AA in the presence of SHAM (from panels B and C).…………………..………………………………………………….48
Supplementary Figure 2.16 – Dark respiration, PMF and growth in AOX mutants in P. tricornutum.
(A) Respiratory activity of wild type and AOX knockdown lines. Total respiration rate (red bars) and
the contribution of the AOX capacity (white bars, see Methods) were normalized to wild-type values.
(n = 5 ± S.D.). (B) ECS-based measurements of ΔΨdark in wild type and AOX knockdown lines, in
control conditions (dark), in the presence of AA (grey), and in the presence of AA+SHAM (white). (n
= 2-3 ± S.D.). (C) Growth curves of wild type and AOX knockdown cell lines in the presence/absence
of AA (2µM). AA was added every day and cells were grown in continuous light to prevent them
from dying in the dark because of lack of respiration. (n = 3 ± S.D.)………………………………..…………….49
Supplementary Figure 2.17 – Subcellular localization of AOX in P. tricornutum and plastid-
mitochondria interaction in P. tricornutum wild-type cells. (A) Subcellular localization of AOX. Cells
were treated with an anti-AOX antibody and then with a secondary Alexa Fluor 488 antibody (see
Methods). Positions of plastid and nuclei are indicated by chlorophyll a autofluorescence (red) and
DAPI staining (blue), respectively. The pattern of AOx localization is similar to what was observed
with a mito-tracker. (B) EM pictures of the plastid-mitochondria juxtaposition in P. tricornutum.
Arrows indicate possible physical contacts between the plastid and mitochondrial membranes….50
Supplementary Figure 2.18 – Cytochrome b6f turnover in Pt1 and AOX mutants. (A) Schematic
representation of the electron flow reaction steps in the cytochrome b6f complex, which can be
evaluated by spectroscopic measurements. (B) Slow phase of ECSL indicating cytochrome b6 (blue)
and time resolved redox changes of cytochrome c/f (red) in wild type Pt1 and AOX knockdown
mutants. P. tricornutum cells were exposed to saturating single turnover laser flashes given 10 s
apart. Data were normalized to the amplitude of the fast phase of the ECSlin signal. Cyt. c and ECSlin
were deconvoluted as explained in Methods. (n = 4 ± S.D.). Cell concentration was 2. 10 7 cells mL-
1. Note that both the slow phase of the ECSlin and reduction of cytochrome c/f were completely

195
abolished by the plastoquinone competitive inhibitor DBMIB 10 µM (black arrow)………………………51
Supplementary Figure 2.19 – In vivo changes in the NADPH redox state and ATP in wild type and
AOX knockdown mutants. (A) Changes in NADPH at different light intensities. Light and dark periods
are represented by white and black boxes, respectively. Light intensities were 50, 100, 200 and 400
µmol. quanta m-2 s-1 (green, blue, red, and black traces, respectively). Chl concentration was ~5 µg
mL-1. (B) Representative spectra from cells of wild type (left panel) and AOX knockdown C5 (middle
panel) and C9 (right panel) in the dark (red), light (green) and light + AA (blue) conditions are shown,
with normalization to the internal standard (methylenediphosphonate; pH 8.9). The positions of the
α, β and γ phosphates of NTPs are shown. Inserts show the quantification of the NTP content in
wild-type and AOX knockdown mutant cells, as reported in Figure 3e (± S.D.)……………………………..52
Supplementary Figure 2.20 – Cyclic electron flow in representative diatoms. (A) Linear (closed
circles) and cyclic (in the presence of DCMU) electron flows were measured at different light
intensities, as in Supplementary Figure 2.34, in Thalassiosira weissflogii (black), Thalassiosira
pseudonana (blue) and Fragilaria pinata (red). (B) CEF was plotted against LEF. The red line
corresponds to CEF = 5% of the maximal total electron flow. (n = 3-5 ± S.D.)……………………………….55
Supplementary Figure 2.21 –ΔΨd and photosynthesis under conditions of respiratory inhibition in
representative diatoms. Dark respiration (A,B,C,D), ΔΨd (E,F,G,H) and ETRPSII (I,J,K,L ), in conditions
of different levels of inhibition of the respiratory pathway with saturating Antimycin A, and/or
saturating SHAM. Panels a, e and i: T. weissflogii (black). Panels B, F and J: T. pseudonana (blue).
Panels C, G and K: F. pinnata (red). Panels D, H and l: D. brightwelii (green). ( n= 2-6 ± S.D.)………..53
Figure 2.22 – Chimeric organization of the secondary plastid in diatoms. The scheme shows a
fusiform cell of Phaeodactylum. The plastid is limited by 4 membranes. The chloroplast endoplasmic
reticulum membrane (cERM), shown in blue, is continuous with the outer nuclear envelope
membrane. The periplastidial membrane (PPM) is shown red. The outer and inner envelope
membrane (oEM and iEM), shown in light green, are tightly apposed. The presence of a specific
periplastidial compartment (PPC) is based on the detection of blob-like structures observed by
confocal microscopy, in which protein precursors fused to GFP and crossing only the cERM and the
PPM reside. The presence of VN in this PPC is addressed here. C, chloroplast; N, nucleus; M,

196
mitochondrion. ……………………………………………………………………………………………………………………….….65
Figure 2.23 – (A) Electron micrograph of an intact Phaeodactylum cell. (B) Disrupted cell. (C) Lateral
view of the serial scanning method. Slices or section are 4 nm-thin, and allow the detection of
membrane continuity between successive cross sections. For 200 sections, the depth of the
scanning is 1 µm. In the disrupted cell shown in Figures 2.10, 2.11 and 2.12, the tangential view of
the nucleus is in section 1, and that of the chloroplast is in section 136. C, chloroplast; M,
mitochondrion; N, nucleus; Pyr, pyrenoid; Thyl, thylakoids………………………………………………….………68
Figure 2.24 – Serial electron micrograph scanning of a Phaeodactylum disrupted cell at the level
of the cERM–oNE isthmus. The outer nuclear envelope is shown in blue from a tangential section
(1) to the level of sub-spherical nucleus (48 and 48’), where it is lined with the inner nuclear envelope
(iNE) shown in purple. The nucleus then forms a constricted area shown in dashed lines (120). In the
vicinity of the chloroplast, the oNE becomes continuous with the chloroplast endoplasmic reticulum
membrane (cERM). The edges of the isthmus are shown with arrows. M, mitochondrion; N, nucleus;
NP, nuclear pore………………………………………………………………………………………………………………….………70
Figure 2.25 – Serial electron micrograph scanning of a Phaeodactylum disrupted cell at the level
of the iNE-PPM membrane contact. The outer nuclear envelope (oNE) is shown in blue in continuity
with the cERM. The inner envelope membrane (iNE) is shown in purple and gets in very tight contact
with the irregular periplastidial membrane (PPM; from 142 and further). A vesicular network (VN)
fills the space between the PPM and the two innermost membranes of the chloroplast, the outer
and inner envelope membranes (oEM and iEM, respectively), shown in light green. C, chloroplast;
M, mitochondrion; N, nucleus; Thyl, thylakoids………………………………………………………………………..…..71
Figure 2.26 – Serial electron micrograph scanning of a Phaeodactylum disrupted cell at the level
of the periplastidial compartment. The outer nuclear envelope (oNE) is shown in blue in continuity
with the cERM. The inner envelope membrane (iNE) is shown in purple in tight contact with the
periplastidial membrane (PPM) at the level of the nucleus-chloroplast contact zone. The vesicular
network (VN) fills the space between the PPM and outer envelope membranes (oEM), shown in light
green. The VN is also present in regions where the chloroplast and the nucleus are not connected
(star in 174, and further). The VN shows continuity with the PPM (178) but not with the oEM.

197
Additional direct connections between the oNE and cERM are visible in regions where no VN can be
observed (208). C, chloroplast; M, mitochondrion; N, nucleus; Thyl, thylakoids………………………..….73
Figure 2.27 – Serial electron micrograph scanning of Phaeodactylum intact cells at the level of the
periplastidial compartment. Three cells are shown (cell 1, 2 and 3) in A, B and C. (A) magnified cross-
section of cell 1 is shown in (D) corresponding to the video provided in supplementary data. The
vesicular network (VN) within the periplastidial compartment is shown with arrows. Ch, chloroplast;
m, mitochondrion; N, nucleus; ob, oil body……………………………………………………………………………..……75
Figure 2.28 – Stepwise reduction of the symbiont cytosol following secondary endosymbiosis in
the diatom lineage. (A) The host cell and red algal symbiont. (B) Engulfment of the red alga. (C)
Residence and transmission of the red alga within the phagotrophic membrane. (D) disappearance
of symbiont organelles, including the nucleus, and cytosolic structures. (E) Present status. C,
chloroplast; cERM, chloroplast endoplasmic reticulum membrane; iEM, inner envelope membrane;
iNE, inner nuclear envelope; M, mitochondrion; N, nucleus; oEM, outer envelope membrane; oNE,
outer nuclear envelope; PPC, periplastidial compartment; PPM, periplastidial membrane; Thyl,
thylakoid, VN, vesicular network………………………………………………………………………………………….….....78
Supplementary Figure 2.29 – Protein import across the four chloroplast limiting membrane and
via the periplastidial compartment. Following mRNA transcription (1) and translation (2), plastid
protein precursors harbor a bipartite topogenic signal (Bts). A sec61 complex operates very early by
co-translational mediation of pre-proteins across the cERM (3) and release an unfolded protein
precursor in the lumen of the chloroplast ER (cER). This unfolded protein can be directed to the next
membrane (4). Pre-proteins can also be N-glycosylated prior their transport through the PPM (5),
probably by the action of an oligosaccharide transferase (OST). A translocon called the ‘symbiont-
specific ERAD-like machinery’ (SELMA) is located in the PPM. In the SELMA, Derlin proteins, sDer1-
1 and sDer1-2, interact together and with the Bts. Components of a symbiont ERAD machinery, i.e.
sCdc48 ubiquitin-dependent AAA-ATPases, and their cofactors sUfd1 and sNP14, reside in the PPC.
In the absence of an aromatic amino acid at position +1 of the Ctp (+1=X), proteins remain resident
in the PPC. Presence of a phenylalanine or an aromatic residue (+1=F) determines the transport
across the oEM and the iEM. Transport across the oEM and iEM involves components related to the
chloroplast translocon, i.e. TOC and a TIC respectively. The TOC core component derives from a

198
prokaryotic Omp85 sequence. Important TIC subunits well characterized in plant and alga
chloroplasts are conserved in the iEM, i.e. Tic20, Tic22, Tic62 and Tic110. Cleavage of the Bts (8) by
a transit peptide peptidase (TPP) releases mature proteins in the stroma (9). In this scheme the
transfer of folded proteins is not deciphered. Possible routes via a vesicle network (VN) in the PPC
are shown…………………………………………………………………………………………………………………………………….80
Figure 2.30 - Experimental design to assess energy spillover in diatoms. (A) Consequences of
energy spillover from PSII to PSI on PSI activity: common antenna case. (B) Consequences of energy
spillover from PSII to PSI on PSI activity: independent antenna case. (C) Fluorescence emission
kinetics confirm full inhibition of PSII by DCMU and HA. (D) Kinetics of P700 oxidation in the light. (E)
Kinetics of cyt c oxidation in the light. (F) Kinetics of oxidation of the entire pool of PSI electron
donors in the light. A cyt c/PSI ratio of 3 was assumed (Supplementary Figure 2.34). Light intensity
was 1100 µmol photons m-2 s-1. Solid blue squares: control; empty red circles: DCMU 40µM, blue
tringles: DCMU 40µM + HA 0.2 mM. Mean ± SEM (n = 6, for 3 biological samples). FCP: Fucoxanthin
Chlorophyll light harvesting antenna Protein. F0: mimimum fluorescence emission (active PSII). Fm:
maximum fluorescence emission (inactive PSII)…………………………………………………………………………..86
Figure 2.31 - Immunolocalization of PSI and PSII in the thylakoid membranes of P. tricornutum. (A)
Localization of PSII using an antibody against the PsbA (D1) subunit. (B) Localization of PSI using an
antibody against the PsaC subunit. (C) EM picture of P. tricornutum thylakoid membranes; showing
four areas: the internal part (CORE, violet) the external, peripheral one (PERIPH., green), the
pyrenoid (Orange) and the envelope (blue). (D), (E), (F) Principal Component Analysis of PSI and PSII
immunolocalization. Analysis was performed on 149 images (violet dots: localization of PSII; green
triangles: localization of PSI). The first two components represent more than 93% of the variance
(Table S1). See methods for further explanation. Green arrow: peripheral variable. Violet arrow:
core variable. Orange arrow: Pyrenoid variable. Blue arrow: envelope variable…………………………….87
Figure 2.32 - Three-dimensional organisation of thylakoid membranes in P. tricornutum cells. (A)
3D reconstruction of an intact P. tricornutum cell, based on FIB-SEM images. (B) Reconstruction of
thylakoid membranes in the region indicated by the yellow box in (A). (C) Magnification of the region
indicated by the yellow box in B. The greater depth in the “z” direction highlights the presence of
several connecting thylakoids. Data are representative of three different tomograms…………………..89

199
Figure 2.33 - Structural arrangement of the photosynthetic membranes in P. tricornutum. (A)
Equilibrium plots for the components of the high potential chain. Redox signals of cyt c and P700 in
the light were plotted against each other. The dotted lines represent simulations corresponding to
different values of the equilibrium constant. The rate of electron flow is calculated from data in
Supplementary Figure 2.40. (B) Cartoon representing a possible arrangement of the photosynthetic
complexes in a likely 3 thylakoid layers arrangement of the photosynthetic membranes in P.
tricornutum. The different PSI and PSII localization within the peripheral (green) and the core
membranes (violet) is shown. PSI: photosystem 1; PSII: photosystem 2, FCP: fucoxanthin chlorophyll
antenna protein, Cytb6f: cytochrome b6f complex…………………………………………………………………………91
Supplementary Figure 2.34 - PSI/cytochrome c stoichiometry and oxidation kinetics in P.
tricornutum. Cyt c/PSI stoichiometry. Cells were exposed to a saturating single turnover laser flash
to generate 1 turnover per PSI and the amount of oxidized c-type cytochrome was calculated 300µs
after the flash (i.e. when P700 is fully rereduced by the cytochromes) This amount was normalized
to the total amount of cyt c oxidized in continuous light in the presence of DCMU (20µM). Because
the flash oxidizes 33% of the cyt c type cytochromes, we conclude there are ~3 c-type cytochromes
per PSI. (B) procedure employed to evaluate the rates of PSI oxidation in the light in the case of the
total donors to PSI pool. Open bar: light on. Closed bar: light off. The slope measured after the light
is switched off (SD) allows calculating the dark rereduction rates of the PSI donor pool in the control
(closed blue squares), DCMU treated samples (closed red circles) and DCMU + HA treated samples
(closed green triangles). The sum of this rate plus the apparent oxidation rate in the light (SL)
.provides the real rate of oxidation of the total donors to PSI oxidation kinetics, (open symbols). See
methods for further description………………………………………………………………………………………………….101
Supplementary Figure 2.35 - Light energy spillover in P. tricornutum cells exposed to different light
intensities. (A) Fluorescence emission kinetics in the presence of DCMU 40 µM and HA 0.2 mM.
Squares: control, triangles: DCMU; circles: DCMU and HA; open symbols 150 µm photons m-2 s-1;
closed symbols: 300 µm photons m-2 s-1. (B) Fluorescence emission kinetics in the presence of DCMU
40 µM and HA 0.2 mM. Squares: control, triangles: DCMU; circles: DCMU and HA; open symbols:
590 µm photons m-2 s-1; closed symbols: 1100 µm photons m-2 s-1 (C) Kinetics of oxidation of the
entire pool of PSI electron donors at a light intensity of 150 µm photons m-2 s-1. (D) Kinetics of
oxidation of the entire pool of PSI electron donors at a light intensity of 300 µm photons m-2 s-1in

200
the light. (E) Kinetics of oxidation of the entire pool of PSI electron donors at a light intensity of 590
µm photons m-2 s-1. (F) Kinetics of oxidation of the entire pool of PSI electron donors at a light
intensity of 1100 µm photons m-2 s-1Solid blue squares: control; empty red circles: DCMU 40µM,
blue tringles: DCMU 40µM + HA 0.2 mM. Mean ± SEM (n = 2). FCP: Fucoxanthin Chlorophyll light
harvesting antenna Protein. F0: mimimum fluorescence emission (active PSII). Fm: maximum
fluorescence emission (inactive PSII). Closed bar: actinic light off. Open bar: actinic light on……….102
Supplementary Figure 2.36 - Tokuyasu preparation enhances the resolution of EM pictures of P.
tricornutum thylakoid membranes. EM images of P.tricornutum from a sample fixed in resin (A) and
using the Tokuyasu technique (B)……………………………………………………………………………………………….103
Supplementary Figure 2.37 - Biochemical evidences for a different localization of PSI and PSII in
thylakoid domains in P. tricornutum. Solubilization of P. tricornutum thylakoid membranes with
increasing concentration of digitonin (0.2, 0.5, 1.5%). Pellet (P) and supernatants (S) were analyzed
by western blotting with the same anti PSI and anti PSII antibodies……………………………………………103
Supplementary Figure 2.38 - Peculiar structural features of thylakoid membranes in P. tricornutum
cells fixed using the Tokuyasu technique. (A) EM images of P.tricornutum using the Tokuyasu
technique reveal the existence of crosspoints between the thylakoid layers. (B) Magnification of the
thylakoid layers intersections in the region indicated by the yellow box in A. (C) “Truncated”
thylakoid membranes are observed in P. tricornutum cells prepared with the Tokuyasu technique.
Red arrows point thylakoid layers that comprise an additional fourth membrane, which abruptly
disappears, suggesting the existence of 3D interconnection between different layers of
thylakoids…………………………………………………………………………………………………………………………………..104
Supplementary Figure 2.39 - Physical contacts between the organelles in P. tricornutum cells. The
chloroplast (green), mitochondrion (red), and nucleus (blue) structures, obtained from 3D
reconstruction of intact diatom cells, are shown under different rotation angles (A to C), to highlight
the physical contact between the organelles…………………………………………………………………………….105

201
Supplementary Figure 2.40 - 3D structure of the thylakoid membranes in P. tricornutum cells. Same
colour code as in Figure 2.31. Note that the linking membranes (red arrows) can be clearly
differentiated form the plastoglobules (black arrows), which appear as globular structures………105
Supplementary Figure 2.41 - Spectroscopic features of the cytochrome c6 and P700 components of
the electron flow chain in P. tricornutum cells. (A) Fluorescence induction kinetics in the absence
and in the presence of increasing DCMU concentrations. The progressive inhibition of PSII is
highlighted by the increased rate of fluorescence rise. (B) Redox kinetics of P700 upon illumination.
(C) Redox kinetics of cyt c6 upon illumination. The rate of electron transfer were changed by addition
of increasing concentrations of DCMU as in (A). Closed bar: actinic light off. Open bar: actinic light
on……………………………………………………………………………………………………………………………………………….106
Chapter 3
Figure 3.1 – Samples preparation for EM. (A) Heavy metal contrast on P. tricornutum’s cells. (B)
Final specimen embedded in resin……………………………………………………………………………………………...114
Figure 3.2 – P. tricornutum during cell division……………………………………………………………………………115
Figure 3.3 – Immunolocalization protocols. (A) Classic technique of immunolocalization using intact
cells of P. tricornutum. (B) Tokuyasu technique (C) Tokuyasu technique of immunolocalization using
intact cells of P. tricornutum………………………………………………………………………………………………………118
Figure 3.4 – The Gatan 3View2XP procedure. (A) Gatan 3View2XP Microscope in Zurich. (B) Image
acquisition. (C) Automatic 2D images stack acquisition. (D) 3D reconstruction…………………………..119
Figure 3.5 – The FIB-SEM procedure. (A) The Zeiss NVision 40 dual-beam microscope
http://www.southampton-nanofab.com/fabrication/fib.php. (B) Image acquisition. (C) Automatic
2D images stack acquisition. (D) 3D reconstruction……………………………………………………………………121
Figure 3.6 – 3D segmentation of P. tricornutum. (A) Image reconstruction of the chloroplast (in
green), the mitochondria (in red) and the nucleus (in blue) xy-view. (B) xz-view of the reconstruction.
(C) yz-view of the reconstruction. (D) Frontal view of the connection between the chloroplast (in

202
green) and the mitochondria (in red). (E) Lateral view of the connection between the chloroplast (in
green) and the nucleus (in blue)………………………………………………………………………………………….……..122
Figure 3.7 – Sequential images analysis. From the whole segmentation on the left (with the
chloroplast, the mitochondria and the nucleus) to the study of the photosynthetic membranes of P.
tricornutum (in violet) on the right……………………………………………………………………………………….……124
Figure 3.8 – Images analysis with CHIMERA software. (A) Detail of the thylakoid membranes. The
violet areas correspond to the internal membranes while the green areas correspond to the external
membranes. (B) Sequential images analysis of the “basket” structure near the pyrenoid region of P.
tricornutum. Similar to the stroma lamellae of plants, these structures connect different layers of
the thylakoids and differ from the plastoglobules present in these pictures……………………….…….125
Figure 3.9 – The AFM procedure. (A) The Cyper AFM Microscope in the Science Surface Laboratory.
(B) Major component of the AFM technique (laser, focus lens, sample, x y z piezo scanner, tip,
cantilever, mirror, detector, controller amplifier and computer). (C) Details of the samples holder
(from the bottom to the top: metal plate, teflon plate, mica holder and the sample)……………..…126
Figure 3.10 – Experimental protocols for sample preparation for AFM analysis. (A) Thylakoid
membranes preparation following the protocol of Martinson et al., 1998. (B) Developed protocol
for the purification of intact chloroplasts of P. tricornutum. (C) Improved protocol of isolated
thylakoid membranes preparation……………………………………………………………………………………………..129
Figure 3.11 – Results procedure INSERM Marseille. (A) First analysis of the sample prepared with
the protocol of Martinson et al., 1998. (B) Second analysis of the sample prepared with the
developed protocol for the purification of intact chloroplasts of P. tricornutum. (C) Sample analysis
prepared with the improved protocol of isolated thylakoid membranes……………….……………………131
Figure 3.12 – Results procedure SSL Grenoble. (A) First analysis showing three different regions in
the thylakoid membranes: (1) lipid bilayer (2) debris of membranes (3) packed membranes. (B)
Details of the photosynthetic membranes of P. tricornutum showing ordered protein domains..…132

203
Chapter 4
Figure 4.1 – EM picture of Chlamydomonas reinhardtii. In green the chloroplast of Chlamydomonas
is highlited (modified from http://remf.dartmouth.edu/imagesindex.html)..................................136
Figure 4.2 – The central role of the Acetyl-CoA in central metabolism. Representation of the
physiological processes, which involves Acetyl-CoA (from Wolfe, 2015)……………………………….……138
Figure 4.3 – Schematic representation of acetate assimilation in Chlamydomonas reinhardtii. (A)
The tricarboxylic acid cycle. (B) the glyoxylate cycle……………………………………………………………….….139
Figure 4.4 – Photoreceptor proteins. Scheme of the five types of photoreceptors found in plants
(Heijde & Ulm, 2012)......................................................................................................................140
Figure 4.5 – Photoreceptor proteins in Chlamydomonas reinhardtii. Photoreceptors found in
Chlamydomonas reinhardtii (Modified scheme from Heijde & Ulm, 2012)...................................141
Figure 4.6 – Structure of the phototropin. Schematic representation of the phototropin with at the
N-terminal the two blue-light sensitive domains (LOV1 and LOV2) and at the C-terminal a serine-
threonine kinase protein...............................................................................................................142
Figure 4.7 – The largest spectrograph in the world. (A) Picture of the Okazaki Large Spectrograph
(OLS) http://www.nibb.ac.jp (B) Wavelength covered (modified from Otsuna et al., 2014)………142
Figure 4.8 – PHOT controls induction of LHCSR3 and qE and is crucial for survival of C. reinhardtii
in high light. (A) NPQ in WT (137c), phot and acry after exposure for 4 h to different wavelengths of
light (250 µmol photons m-2 s-1). Representative dataset of an experiment replicated three times.
(B) qE induction in WT (black), acry (green) npq4 (blue) and phot (red) strains by 4h illumination with
different wavelengths of light (250 µmol photons m-2 s-1). n=3, mean ± s.d. Grey area, absorption
spectrum of WT cells. (C) Immunoblot analysis of LHCSR3 accumulation (ATPB is the loading control).
Representative dataset of an experiment replicated three times. (D) Erlenmeyer flasks containing
WT, acry, phot and npq4 after 16 h of exposure to light of 20, 200 and 750 µmol photons m-2 s-1.
Representative photos from an experiment replicated three times…………………………………………..147

204
Figure 4.9 – Role of the different PHOT domains in controlling LHCSR3. (A) Domains of the PHOT
gene in WT and complemented phot lines. LOV, photosensory domain; KINASE, kinase domain; BLE,
bleomycin resistance cassette. (B) LHCSR3.1 and LHCSR3.2 mRNA accumulation in WT (cw15-302),
phot, and phot complemented lines exposed to low light (LL) or high light (HL). Values relative to an
endogenous control gene (GBLP) were normalized to WT HL samples (n=3, mean ± s.d.). (C)
Immunoblot analysis of LHCSR3 in WT and phot mutants (ATPB is the loading control).
Representative dataset of an experiment replicated six times. (D) Erlenmeyer flasks containing WT,
phot, PPHOT, PKIN and PLOV after 20 h exposure to light of 20, 200 or 750 µmol photons m-2 s-1.
Representative pictures from an experiment replicated four times…………………………………………..149
Figure 4.10 – PHOT-dependent control of LHCSR3 expression requires blue light perception by
LOV, signal transduction by the C-terminal kinase domain of PHOT and photosynthesis. (A) Action
spectrum of LHCSR3 accumulation in PPHOT and PKIN (ATPB is the loading control). Representative
dataset of an experiment replicated three times. (B) Densitometric quantification of LHCSR3
accumulation of Figure 4.10 A Values are normalized to 475 nm (n=3, mean ± s.d.). (C) LHCSR3.1
and LHCSR3.2 mRNA accumulation in PKIN at LL and HL in the presence and absence of the PSII
inhibitor DCMU. Values are normalized to HL (n=3, mean ± s.d.). (D) LHCSR3 protein accumulation
in PKIN at LL and HL in the presence or absence of DCMU for 4h. Representative dataset of an
experiment replicated three times………………………………………………………………………………………………151
Figure 4.11 – Possible signal transduction pathway for HL-induced expression of LHCSR3. (A)
Immunoblot analyses of LHCSR3 accumulation in WT (cw15-302) and phot cells treated with the
phosphodiesterase inhibitor IBMX, db-cAMP or db-cGMP after 20 h at LL or HL. Representative
dataset of an experiment replicated five times. (B) Schematic representation of the photoreception-
photosynthesis-photoprotection link in C. reinhardtii. cp: chloroplast; eye: eyespot; cNMP: cyclic
nucleotides mono phosphate (cAMP or cGMP); ET: electron transport; nuc: nucleus; PSII:
photosystem II……………………………………………………………………………………………………………………………153
Supplementary Figure 4.12 – Photosynthetic properties of acry and phot mutants. (A) Immunoblot
analysis of aCRY accumulation in WT (137c) and acry cells. The two strains were grown as described
previously16. Cells were harvested at the beginning of the light phase (LD2 phase16). Whole cell

205
samples with 2 µg of chlorophylls were loaded on each lane. (B) Immunoblot analysis of PHOT in WT
(cw15-302) and phot after 4 h exposure to high intensity white light. (C) Immunoblot analysis of
LHCSR3, and ATPB in WT (137c), phot and acry in LL and after 4 h exposure to high intensity white
light (HL). ATPB was used as a loading control. Representative dataset of an experiment replicated
five times. (D and E) NPQ induction kinetics of WT (137c) and acry (D) and WT (cw15-302) and phot
(E) after 4 h exposure to high intensity white light. qE was recorded for 16 min upon illumination
with 440 µmol photons m-2 s-1 (white bar) followed by 2 min of darkness (black bar), to measure qE
relaxation. Representative dataset of an experiment replicated 4 and 7 times (for d and e,
respectively). (F and G) DES indicates the xanthophyll cycle de-epoxidation state ([zeaxanthin] + 1/2
[antheraxanthin])/([zeaxanthin] + [antheraxanthin] + [violaxanthin]) in WT (137c) and acry (F) and
WT (cw15-302) and phot (G) cells after exposure to HL for 4 h (n=3, mean ± s.d.). (H and I) Electron
transfer rate (ETR) of WT (137c) and acry (H) and WT (cw15-302) and phot (I) cells exposed at 20,
240 and 750 µmol photons m-2 s-1 for 10 h. ETR (µmol photons m-2 s-1) was measured at actinic
illumination of 41 µmol photons m-2 s-1 (n=3, mean ± s.d.)……………………………………………………………158
Supplementary Figure 4.13 – Accumulation of major photosynthetic complexes is unaltered in the
phot cells upon exposure to different wavelengths of visible light. (A) Immunoblot analyses of
ATPB, PsaA/B, D1, D2 and CP26 accumulation in WT (137c), phot and acry cells after 4 h exposure
at 250 µmol photons m-2 s-1 of monochromatic light at the different wavelengths of the visible
spectrum. (B) Immunoblot analyses of major photosynthetic complexes of PSII, Cyt b6f and PSII in
WT, phot and acry after 4 h exposure at 250 µmol photons m-2 s-1 of white light. Representative
dataset of an experiment replicated three times…………………………………………………………………………159
Supplementary Figure 4.14 – Diminished LHCSR3 induction in phot is not caused by diminished
photosynthesis. (A) Comparison of ETR in DCMU-titrated WT cells and DCMU-untreated phot cells
exposed to HL for 3 h. ETR (µmol photons m-2 s-1) was measured upon exposure to light of 170 µmol
photons m-2 s-1 (n=3, mean ± s.d.). (B) Immunoblot analyses of LHCSR3 accumulations in the WT and
phot samples described in Supplementary Figure 4.14 A. ATPB was used as a loading control.
Representative dataset of an experiment replicated five times……………………………………………………159
Supplementary Figure 4.15 – PHOT protein levels pigment content in phot mutants. (A)
Immunoblot analyses of PHOT accumulation in WT (cw15-302) and the PPHOT (phot complemented

206
by a full-length PHOT). PPHOT expresses a fused PHOT-BLE protein, which has a higher molecular
weight than the WT PHOT protein. ATPB served as a loading control. Representative dataset of
experiment replicated four times. (B) Total cellular chlorophyll (a+b) content in WT, phot, PPHOT,
PKIN and PLOV cells exposed to light of 20, 200 or 750 µmol photons m-2 s-1 for 20 h as in Figure 2d
(n=3, mean ± s.d.). Diminished chlorophyll content is a signature of pigment bleaching following
photo-damage……………………………………………………………………………………………………………………………160
Supplementary Figure 4.16 – PHOT-independent LHCSR3 expression restores photoprotection in
the phot mutant. Relative qE and LHCSR3 expression under HL conditions in WT (cw15-302), phot,
and two phot transformant lines expressing an additional copy of the LHCSR3.1 gene under the
control of the PsaD promoter (PLHCSR3(B5) and PLHCSR3(G6)). ATPB was used as a loading control.
qE values were normalized to WT cells (n=3, mean ± s.d.)…………………………………………………………160
Supplementary Figure 4.17 – Phosphorylation levels of LHCSR3 in phot, PPHOT, PLOV, PKIN, stt7
and WT. Assessment of the phosphorylation levels of LHCSR3 in WT (cw15-302), phot and in the
different complemented lines (PPHOT, PLOV, PKIN) by a mobility shift detection of phosphorylated
proteins (phos-tag). The upper and lower bands correspond to the phosphorylated and non-
phosphorylated forms of LHCSR3 (“P-LHCSR3” and “LHCSR3”), respectively, as confirmed by
treatment of the samples with either calf intestinal phosphatase (CIP) or lambda protein
phosphatase (λPP). The stt7 mutant41 was used to test the involvement of the chloroplastic
serine/threonine kinase STT7 in the LHCSR3 phosphorylation. In this mutant LHCSR3 was mostly in
the non-phosphorylated form while a STT7-independent phosphorylation was also evidenced in
agreement with recent findings42. Representative dataset of an experiment replicated three
times……………………………………………………………………………………………………………………………………….…161
Supplementary Figure 4.18 – Phenotypic traits of the WTKIN genotype. (A) Immunoblot analyses
of LHCSR3 accumulation after exposure to 240 µmol photons m-2 s-1 of white light for 20 h in WT
(137c) and WTKIN cells and schematic drawings of the PHOT gene constructs in the two lines. ATPB
was used as a loading control. (B) Erlenmeyer flasks containing WT and WTKIN (expressing the
kinase domain of PHOT in the WT background) after 20 h exposure to white light of 20, 200 and 750
µmol photons m-2 s-1. Representative pictures from an experiment replicated three times. (C) Action
spectrum of LHCSR3 accumulation in WT and WTKIN. ATPB was used as a loading control. (D)

207
Densitometric quantification of LHCSR3 accumulation in WT (137c) and WTKIN (data normalized to
ATPB). (E) LHCSR3 protein accumulation in WTKIN at LL and HL in the absence and presence of the
PSII inhibitor DCMU. Representative dataset of experiment replicated three times……………………161
Supplementary Figure 4.19 – Second messengers involved in the PHOT-dependent regulation of
LHCSR3 expression. (A) Immunoblotting analyses of LHCSR3 accumulation after exposure to high
intensity of white light for 20 h in WT (cw15-302) and phot cells under control conditions (0.34 mM
Ca2+) or in the presence of increased Ca2+ concentration (3.4 mM Ca2+). Representative dataset of
an experiment replicated three times. (B) Statistical analyses of LHCSR3 accumulation in high-light
treated (HL) WT or phot cells in the absence (control) and presence of IBMX, db-cGMP and db-cAMP
(see conditions as in Figure 4.11). Data are normalized to LHCSR3 levels of WT control cells (n=5,
mean ± s.d.). Asterisks indicate statistical significant difference from WT control cells (t-test,
P<0.0001)……………………………………………………………………………………………………………………………………162
Supplementary Figure 4.20 – LHCSR3.1 and LHCSR3.2 transcripts stability in WT and phot
cells.Relative amounts of LHCSR3.1 and LHCSR3.2 mRNA in WT (cw15-302; black) and in phot (red)
were quantified by quantitative PCR. Cells exposed for 20 h to 470 nm LED light at 100 μmol photons
m-2 s-1 were transfered to darkness at t=0 and treated with actinomycin D to stop further mRNA
synthesis. mRNA samples were collected at 0, 0.25, 0.5, 1, 2, and 4 h after transition to darkness.
LHCSR3.1 and LHCSR3.2 transcript amounts were normalised to the amounts of 18S rRNA as the
endogenous control and their values were set at 100% at t=0 (n=3, mean ± s.d.)………………………162
Supplementary Figure 4.21 – qE and LHCSR3 induction requires high light in C. reinhardtii. (A)
Action spectrum of qE induction in WT cells as a function of the light intensity. (B) Immunoblot
analysis of LHCSR3 accumulation in darkness (D) and under white (WL), blue (470 nm) and red (660
nm) light of low (LL: 20 µmol photons m-2 s-1) and high intensity (HL: 250 µmol photons m-2 s-1). ATPB
was used as a loading control. Representative dataset of an experiment replicated two times……163
Figure 4.22 – Acetate inhibits NPQ and LHCSR3 induction. (A) NPQ induction kinetics of WT cells
after overnight incubation in minimal medium at LL (20 µmol photons m-2 s-1) or after 4 h exposure
to HL (250 µmol photons m-2 s-1) in the presence and absence of acetate. NPQ was recorded for 16
min upon illumination with 440 µmol photons m-2 s-1 (white bar) followed by 4 min of darkness

208
(black bar), to follow NPQ relaxation. (B) Immunoblot analysis of LHCSR3, and ATPB of the samples
described in (A). ATPB was used as loading control. (C) Electron transfer rate (ETR) of the samples
described in (A). ETR (µmol photons m-2 s-1) was measured at actinic illumination of 41 µmol photons
m-2 s-1. Mean ± SD (n = 3). (D) NPQ induction kinetics of LHCSR3 Prom::Luc cells after 4h exposure to
HL (250 µmol photons m-2 s-1). (E) Immunoblot analysis of LHCSR3, and ATPB of LHCSR3 Prom::Luc
cells after 4h exposure to HL. ATPB was used as loading control. (F) Luminescence kinetics of LHCSR3
Prom::Luc cells exposed to HL. (G) Fold induction of LHCSR3 based on luminescence measurements
of LHCSR3 Prom::Luc cells exposed to HL for two hours in minimal medium (control), acetate-
containing medium or poisoned by DCMU. Data are normalized to the fold induction of control cells.
Figure summarizes data of three to five experiments (average,
SD)……………………………………………………………………………………………………………………………………….….…169
Figure 4.23 – Acetate triggers LHCSR3 degradation in HL. WT cells were incubated overnight in
minimal (control) medium in HL (250 µmol photons m-2 s-1) to reach the maximum accumulation of
LHCSR3. Acetate was added (20 mM) and cells remained to HL for another 24h. (A) NPQ capacity
(NPQ max) and (B) ETR kinetics in cells remaining in minimal (control) medium or having received
20 mM acetate. (C) Immunoblot analysis of LHCSR3, D1 and ATPB of cells described in (A). ATPB was
used as loading control. (D) Densitometric analyses of LHCSR3 normalised to ATPB (1 = LHCSR3 in
control conditions at t=0)…………………………………………………………………………………………….………….…170
Figure 4.24 – Acetate is not involved in LHCSR3 protein stability. Cells acclimated to LL (20 µmol
photons m-2 s-1; t = -16h) were shifted to HL (250 µmol photons m-2 s-1) overnight to reach the
maximum accumulation of LHCSR3. Acetate was added (20 mM) and cells were transferred back to
LL for another 24h. (A) Immunoblot analysis of LHCSR3, and ATPB of cells described in (B). ATPB
was used as loading control. (B) Densitometric analyses of LHCSR3 normalised to ATPB (1 = LHCSR3
in control conditions at t=0). (C) NPQ capacity (NPQ max) and (D) ETR kinetics in cells remaining in
minimal (control) medium or having received 20 mM acetate…………………………………………………..171
Figure 4.25 – Differential response of LHCSR3 to acetate in selected metabolic mutants. (A) WT
and mutant cells acclimated to LL (20 µmol photons m-2 s-1) were shifted to HL (250 µmol photons
m-2 s-1) for 4h in the presence and absence of acetate. Immunoblot analysis of LHCSR3, and ATPB.
(B) WT and mutant cells were incubated overnight in minimal (control) medium in HL (250 µmol

209
photons m-2 s-1) to reach the maximum accumulation of LHCSR3. Acetate was added (20 mM) and
cells remained to HL for another 24h. The figure shows the immunoblot analyses of LHCSR3 and
ATPB at the indicated time points…………………………………………………………………………………………..….173
Figure 4.26 – Bicarbonate inhibits LHCSR3 expression in WT and metabolic mutants. WT and
mutant cells acclimated to LL (20 µmol photons m-2 s-1) were shifted to HL (250 µmol photons m-2 s-
1) for 4h in the presence and absence of 2.5 mM NaHCO3. The figure shows the immunoblot analysis
of LHCSR3, and ATPB………………………………………………………………………………………………………………….174
Figure 4.27 – LHCSR3 is under control of CCM. (A) Fold induction of LHCSR3 based on luminescence
measurements of LHCSR3 Prom::Luc cells exposed to HL for two hours in minimal medium (control)
and NaHCO3-containing medium. Data are normalized to the fold induction of control cells. Figure
summarizes data of three to five experiments (average, SD). (B) Immunoblot analyses of LHCSR3,
CAH4/5 and ATPB in WT and cia5 cells shifted from LL (20 µmol photons m-2 s-1) to HL (250 µmol
photons m-2 s-1) in the ansence (control) and presence of acetate (20 mM) or NaHCO3 (2.5 mM)...175

210
5.5 Supplementary Materials
Video A - The three-dimensional organization of the vesicular network (arrow) in cross sections of
Phaeodactylum tricornutum...........................................................................................................81
Video B - Focus Ion Beam Scanning Electron Microscopy (FIB-SEM) based 3D reconstitution of a
whole cell of P. tricornutum………………………………………………………………………………………………………107
Video C - 3D structure of the chloroplast (green) mitochondrion (red) and nucleus (blue) in P.
tricornutum cells…………………………………………………………………………………………………………………….…107
Table S1 - Principal Component Analysis Results. The first two components represent more than
93% of the variance…………………………………………………………………………………………………………………..106
Table S2 - Correlation table of the number of immunolabeling in the four possible
localizations……………………………………………………………………………………………………………………………..107

211
5.6 References
Abida, H., Dolch, L.-J., Mei, C., Villanova, V., Conte, M., Block, M.A., Finazzi, G., Bastien, O.,
Tirichine, L., Bowler, C., et al. (2015). Membrane glycerolipid remodeling triggered by
nitrogen and phosphorus starvation in Phaeodactylum tricornutum. Plant Physiology, 118.
Ahn, T.K., Avenson, T.J., Ballottari, M., Cheng, Y.-C., Niyogi, K.K., Bassi, R., and Fleming, G.R.
(2008). Architecture of a charge-transfer state regulating light harvesting in a plant antenna
protein. Science 320, 794-797.
Akaike, H. (1974). A new look at the statistical model identification. IEEE transactions on
automatic control 19, 716-723.
Akazaki, H., Kawai, F., Hosokawa, M., Hama, T., Chida, H., Hirano, T., Lim, B.-K., Sakurai, N.,
Hakamata, W., and Park, S.-Y. (2009). Crystallization and structural analysis of cytochrome
c6 from the diatom Phaeodactylum tricornutum at 1.5 Å resolution. Bioscience,
biotechnology and Biochemistry 73, 189-191.
Albertsson, P.-Å.A. (2001). A quantitative model of the domain structure of the
photosynthetic membrane. Trends in Plant Science, 349.
Alboresi, A., Gerotto, C., Giacometti, G.M., Bassi, R., and Morosinotto, T. (2010).
Physcomitrella patens mutants affected on heat dissipation clarify the evolution of
photoprotection mechanisms upon land colonization. Proceedings of the National Academy
of Sciences 107, 11128-11133.
Allen, J.F. (1975). Oxygen reduction and optimum production of ATP in photosynthesis. 599-
600.
Allen, J.F. (1992). Protein phosphorylation in regulation of photosynthesis. Biochimica et
Biophysica Acta (BBA) - Bioenergetics 1098, 275-335.
Allen, J.F. (2002). Photosynthesis of ATP electrons, proton pumps, rotors, and poise. Cell 110,
273-276.
Allorent, G., Tokutsu, R., Roach, T., Peers, G., Cardol, P., Girard-Bascou, J., Seigneurin-Berny,
D., Petroutsos, D., Kuntz, M., Breyton, C., et al. (2013). A dual strategy to cope with high light
in Chlamydomonas reinhardtii. The Plant Cell 25, 545-557.
Amunts, A., Nelson, N., and Dumas, R. (2008). Functional organization of a plant
photosystem I: Evolution of a highly efficient photochemical machine. Plant Physiology and
Biochemistry 46, 228-237.

212
Anderson, J.M. (1986). Photoregulation of the composition, function, and structure of
thylakoid membranes. Annual Review of Plant Biology 37, 93.
Anderson, J.M., Chow, W.S., and Park, Y.-I. (1995). The grand design of photosynthesis:
acclimation of the photosynthetic apparatus to environmental cues. Photosynthesis
Research 46, 129-139.
Anderson, J.M., Park, Y.-I., and Chow, W.S. (1998). Unifying model for the photoinactivation
of photosystem II in vivo under steady-state photosynthesis. Photosynthesis Research 56, 1-
13.
Anwaruzzaman, M., Chin, B.L., Li, X.-P., Lohr, M., Martinez, D.A., and Niyogi, K.K. (2004).
Genomic analysis of mutants affecting xanthophyll biosynthesis and regulation of
photosynthetic light harvesting in Chlamydomonas reinhardtii. Photosynthesis Research 82,
265-276.
Apt, K.E., Bhaya, D., and Grossman, A.R. (1994). Characterization of genes encoding the light-
harvesting proteins in diatoms: biogenesis of the fucoxanthin chlorophylla/c protein
complex. Journal of Applied Phycology 6, 225-230.
Apt, K.E., Korth-Pancic, P.G., and Grossman, A.R. (1996). Stable nuclear transformation of
the diatom Phaeodactylum tricornutum. Molecular & general genetics 252,5, 572-579.
Aro, E.-M., Virgin, I., and Andersson, B. (1993). Photoinhibition of photosystem II.
inactivation, protein damage and turnover. Biochimica et Biophysica Acta (BBA) -
Bioenergetics 1143, 113-134.
Arvidsson, P.-O.A. and Sundby, C.A., (1999). A model for the topology of the chloroplast
thylakoid membrane. Australian Journal of Plant Physiology, 687.
Asada, K. (2000). The water–water cycle as alternative photon and electron sinks.
Philosophical Transactions of the Royal Society of London B: Biological Sciences 355, 1419-
1431.
Asada, K., Takahashi, M.-a., and Nagate, M. (1974). Assay and inhibitors of spinach
superoxide dismutase. Agricultural and Biological Chemistry 38, 471-473.
Atteia, A., Adrait, A., Brugière, S., Tardif, M., van Lis, R., Deusch, O., Dagan, T., Kuhn, L.,
Gontero, B., Martin, W., et al. (2009). A proteomic survey of Chlamydomonas reinhardtii
mitochondria sheds new light on the metabolic plasticity of the organelle and on the nature
of the α-proteobacterial mitochondrial ancestor. Molecular Biology and Evolution 26, 1533-
1548.

213
Atteia, A., van Lis, R., Gelius-Dietrich, G., Adrait, A., Garin, J., Joyard, J., Rolland, N., and
Martin, W. (2006). Pyruvate formate-lyase and a novel route of eukaryotic ATP synthesis in
Chlamydomonas mitochondria. The Journal of Biological Chemistry 281, 9909-9918.
Austin, J.R., II, and Staehelin, L.A. (2011). Three-dimensional architecture of grana and
stroma thylakoids of higher plants as determined by electron tomography. Plant Physiology
155, 1601-1611.
Babourina, O., Newman, I., and Shabala, S. (2002). Blue light-induced kinetics of H+ and Ca2+
fluxes in etiolated wild-type and phototropin-mutant Arabidopsis seedlings. Proceedings of
the National Academy of Sciences 99, 2433-2438.
Badger, M.R. (1985). Photosynthetic oxygen exchange. Annual Review of Plant Physiology
36, 27-53.
Bailleul, B., Rogato, A., de Martino, A., Coesel, S., Cardol, P., Bowler, C., Falciatore, A., and
Finazzi, G. (2010). An atypical member of the light-harvesting complex stress-related protein
family modulates diatom responses to light. In Proceedings of the National Academy of
Sciences. 107 (42), 18214-18219.
Bailleul, B., Berne, N., Murik, O., Petroutsos, D., Prihoda, J., Tanaka, A., Villanova, V., Bligny,
R., Flori, S., Falconet, D., et al. (2015). Energetic coupling between plastids and mitochondria
drives CO2 assimilation in diatoms. Nature 524, 366-369.
Baker, N.R. (2008). Chlorophyll Fluorescence: A probe of photosynthesis in vivo. Annual
review of Plant Biology 59, 89-113.
Ballottari, M., Dall'Osto, L., Morosinotto, T., and Bassi, R. (2007). Contrasting behavior of
higher plant photosystem I and II antenna systems during acclimation. Journal of Biological
Chemistry 282(12), 8947-8958.
Ballottari, M., Truong, T.B., De Re, E., Erickson, E., Stella, G.R., Fleming, G.R., Bassi, R., and
Niyogi, K.K. (2016). Identification of pH-sensing sites in the light harvesting complex stress-
related 3 protein essential for triggering Non-photochemical quenching in Chlamydomonas
reinhardtii. Journal of Biological Chemistry 291, 7334-7346.
Barber, J. (1980). An explanation for the relationship between salt-induced thylakoid
stacking and the chlorophyll fluorescence changes associated with changes in spillover of
energy from photosystem II to photosystem I. FEBS Letters 118, 1-10.
Barber, J., and Andersson, B. (1992). Too much of a good thing: light can be bad for
photosynthesis. Trends in Biochemical Sciences 17, 61-66.

214
Bassham, J.A., Benson, A.A., and Calvin, M. (1950). The Path of Carbon in Photosynthesis VIII.
The Role of Malic Acid.
Bassham, J.A. (2003). Mapping the carbon reduction cycle: a personal retrospective.
Photosynthesis Research 76, 35-52.
Bedoshvili, Y., D., and Likhoshway, Y., V. (2012). The cell ultrastructure of diatoms -
implications for phylogeny? INTECH Open Access Publisher.
Bedoshvili, Y.D., Popkova, T.P., and Likhoshway, Y.V. (2009). Chloroplast structure of diatoms
of different classes. Cell and Tissue Biology, 297.
Beel, B., Prager, K., Spexard, M., Sasso, S., Weiss, D., Müller, N., Heinnickel, M., Dewez, D.,
Ikoma, D., Grossman, A.R., et al. (2012). A flavin binding cryptochrome photoreceptor
responds to both blue and red light in Chlamydomonas reinhardtii. The Plant Cell 24, 2992-
3008.
Beer, A., Gundermann, K., Beckmann, J., and Büchel, C. (2006). Subunit composition and
pigmentation of fucoxanthin−chlorophyll proteins in diatoms: evidence for a subunit
involved in diadinoxanthin and diatoxanthin binding. Biochemistry 45, 13046-13053.
Benson, A.A. (2002). Paving the path. Annual Review of Plant Biology 53, 1.
Benson, A. A., and Calvin, M. (1950). Carbon dioxide fixation by green plants. Annual Review
of Plant Physiology 1, 25-42.
Berges, J.A., Franklin, D.J., and Harrison, P.J. (2001). Evolution of an artificial seawater
medium: improvements in enriched seawater, artificial water over the last two decades.
Journal of Phycology 37, 1138-1145.
Bergner, S.V., Scholz, M., Trompelt, K., Barth, J., Gäbelein, P., Steinbeck, J., Xue, H., Clowez,
S., Fucile, G., and Goldschmidt-Clermont, M. (2015). State transitions7-dependent
phosphorylation is modulated by changing environmental conditions, and its absence
triggers remodeling of photosynthetic protein complexes. Plant Physiology 168, 615-634.
Berteotti, S., Ballottari, M., and Bassi, R. (2016). Increased biomass productivity in green
algae by tuning non-photochemical quenching. Scientific reports 6.
Berthold, D.A., Babcock, G.T., and Yocum, C.F. (1981). A highly resolved, oxygen-evolving
photosystem II preparation from spinach thylakoid membranes. FEBS Letters 134, 231-234.
Betterle, N., Ballottari, M., Zorzan, S., de Bianchi, S., Cazzaniga, S., Dall'Osto, L., Morosinotto,
T., and Bassi, R. (2009). Light-induced dissociation of an antenna hetero-oligomer is needed

215
for non-photochemical quenching induction. Journal of Biological Chemistry 284, 22, 15255-
15266.
Bhatnagar, A., Chinnasamy, S., and Das, K.C. (2010). Mixotrophic algae for the production of
algae biofuel feedstock on wastewater. Patent number: WO2010123848A3.
Bilger, W., and Björkman, O. (1990). Role of the xanthophyll cycle in photoprotection
elucidated by measurements of light-induced absorbance changes, fluorescence and
photosynthesis in leaves of Hedera canariensis. Photosynthesis Research 25, 173-185.
Bligny, R., and Douce, R. (2001). NMR and plant metabolism. Current Opinion in Plant Biology
4, 191-196.
Bohlin, K.H. (1897). Zur morphologie und biologie einzelliger algen.
Bolte, K., Bullmann, L., Hempel, F., Bozarth, A., Zauner, S., and Maier, U.-G. (2009). Protein
targeting into secondary plastids. Journal of Eukaryotic Microbiology 56, 9-15.
Bonente, G., Ballottari, M., Truong, T.B., Morosinotto, T., Ahn, T.K., Fleming, G.R., Niyogi,
K.K., and Bassi, R. (2011). Analysis of LhcSR3, a protein essential for feedback de-excitation
in the green alga Chlamydomonas reinhardtii. PLoS Biology 9, 1-17.
Bonente, G., Howes, B.D., Caffarri, S., Smulevich, G., and Bassi, R. (2008). Interactions
between the photosystem II subunit PsbS and xanthophylls studied in vivo and in vitro.
Journal of Biological Chemistry 283,13, 8434-8445.
Boonyareth, M., Saranak, J., Pinthong, D., Sanvarinda, Y., and Foster, K.W. (2009). Roles of
cyclic AMP in regulation of phototaxis in Chlamydomonas reinhardtii. Biologia, 1058.
Borkhsenious, O.N., Mason, C.B., and Moroney, J.V. (1998). The intracellular localization of
ribulose-1,5-bisphosphate carboxylase/oxygenase in Chlamydomonas reinhardtii. Plant
Physiology 116, 1585-1591.
Botté, C., Saïdani, N., Mondragon, R., Mondragón, M., Isaac, G., Mui, E., McLeod, R.,
Dubremetz, J.-F., Vial, H., Welti, R., et al. (2008). Subcellular localization and dynamics of a
digalactolipid-like epitope in Toxoplasma gondii. Journal of Lipid Research 49(4), 746-762.
Botté, C.Y., Yamaryo-Botté, Y., Janouskovec, J., Rupasinghe, T., Keeling, P.J., Crellin, P.,
Coppel, R.L., Maréchal, E., McConville, M.J., and McFadden, G.I. (2011). Identification of
plant-like galactolipids in Chromera velia, a photosynthetic relative of malaria parasites. The
Journal of Biological Chemistry 286, 29893-29903.
Botté, C.Y., Yamaryo-Botté, Y., Rupasinghe, T.W.T., Mullin, K.A., MacRae, J.I., Spurck, T.P.,
Kalanon, M., Shears, M.J., Coppel, R.L., Crellin, P.K., et al. (2013). Atypical lipid composition

216
in the purified relict plastid (apicoplast) of malaria parasites. Proceedings of the National
Academy of Sciences 110, 7506-7511.
Botté, C.Y., and Maréchal, E. (2014). Plastids with or without galactoglycerolipids. Trends in
Plant Science 19, 71-78.
Bouck, G.B. (1969). Extracellular Microtubules. The origin, structure, and attachment of
flagellar hairs in Fucus and Ascophyllum antherozoids. The Journal of Cell Biology, 446.
Boudière, L., Michaud, M., Petroutsos, D., Rébeillé, F., Falconet, D., Bastien, O., Roy, S.,
Finazzi, G., Rolland, N., Jouhet, J., et al. (2014). Review: glycerolipids in photosynthesis:
composition, synthesis and trafficking. Biochimica et Biophysica Acta (BBA) - Bioenergetics
1837, 470-480.
Bowler, C., Montagu, M.V., and Inze, D. (1992). Superoxide dismutase and stress tolerance.
Annual Review of Plant Physiology and Plant Molecular Biology 43, 83-116.
Bowler, C., Allen, A.E., Badger, J.H., Grimwood, J., Jabbari, K., Kuo, A., Maheswari, U.,
Martens, C., Maumus, F., Otillar, R.P., et al. (2008). The Phaeodactylum genome reveals the
evolutionary history of diatom genomes. Nature 456, 239-244.
Briggs, W.R. (2014). Phototropism: some history, some puzzles, and a look ahead. Plant
Physiology 164, 13-23.
Brueggeman, A.J., Gangadharaiah, D.S., Cserhati, M.F., Casero, D., Weeks, D.P., and Ladunga,
I. (2012). Activation of the carbon concentrating mechanism by CO2 deprivation coincides
with massive transcriptional restructuring in Chlamydomonas reinhardtii. The Plant Cell 24,
1860-1875.
Büchel, C. (2015). Evolution and function of light harvesting proteins. Journal of Plant
Physiology 172, 62-75.
Büchel, C., and Wilhelm, C. (1993). In vivo analysis of slow chlorophyll fluorescence induction
kinetics in algae: progress, problems and perspectives. Photochemistry & Photobiology 58,
137.
Bullmann, L., Haarmann, R., Mirus, O., Bredemeier, R., Hempel, F., Maier, U.G., and Schleiff,
E. (2010). Filling the gap, evolutionarily conserved Omp85 in plastids of Chromalveolates.
Journal of Biological Chemistry 285(9), 6848-6856.
Cardol, P., Bailleul, B., Rappaport, F., Derelle, E., Béal, D., Breyton, C., Bailey, S., Wollman,
F.A., Grossman, A., and Moreau, H. (2008). An original adaptation of photosynthesis in the

217
marine green alga Ostreococcus. Proceedings of the National Academy of Sciences 105,
7881-7886.
Cardol, P., Alric, J., Girard-Bascou, J., Franck, F., Wollman, F.-A., and Finazzi, G. (2009).
Impaired respiration discloses the physiological significance of state transitions in
Chlamydomonas. Proceedings of the National Academy of Sciences 106, 15979-15984.
Cavalier-Smith, T. (2003). Genomic reduction and evolution of novel genetic membranes and
protein-targeting machinery in eukaryote-eukaryote chimaeras (meta-algae). Philosophical
Transactions of the Royal Society: Biological Sciences 358, 1429, 109-134.
Cavalier-Smith, T. (2006). Cell evolution and Earth history: stasis and revolution.
Philosophical Transactions of the Royal Society of London: Biological Sciences 361, 1470,
969-1006.
Cazzaniga, S., Dall' Osto, L., Kong, S.-G., Wada, M., and Bassi, R. (2013). Interaction between
avoidance of photon absorption, excess energy dissipation and zeaxanthin synthesis against
photooxidative stress in Arabidopsis. The Plant Journal: For Cell And Molecular Biology 76,
568-579.
Chaves, I., Pokorny, R., Byrdin, M., Hoang, N., Ritz, T., Brettel, K., Essen, L.-O., van der Horst,
G.T., Batschauer, A., and Ahmad, M. (2011). The cryptochromes: blue light photoreceptors
in plants and animals. Annual review of plant biology 62, 335-364.
Chen, M., and Chory, J. (2011). Phytochrome signaling mechanisms and the control of plant
development. Trends in Cell Biology, 664.
Cheniae, G. M., and Martin, I. F. (1971). Effects of Hydroxylamine on Photosystem II I. Factors
Affecting the Decay of O2. Evolution in Plant Physiology 47, 568-575.
Christie, J.M. (2007). Phototropin blue-light receptors. Annual review of plant biology 58, 21-
45.
Christie, J.M., Blackwood, L., Petersen, J., and Sullivan, S. (2015). Plant flavoprotein
photoreceptors. Plant & Cell Physiology 56, 401-413.
Colin, M., Dorthu, M.P., Duby, F., Remacle, C., Dinant, M., Wolwertz, M.R., Duyckaerts, C.,
Sluse, F., and Matagne, R.F. (1995). Mutations affecting the mitochondrial genes encoding
the cytochrome oxidase subunit I and apocytochrome b of Chlamydomonas reinhardtii. .
Molecular and General Genetics MGG 249: 179–184.

218
Costa, B.S., Jungandreas, A., Jakob, T., Weisheit, W., Mittag, M., and Wilhelm, C. (2013). Blue
light is essential for high light acclimation and photoprotection in the diatom Phaeodactylum
tricornutum. Journal of experimental botany 64, 483-493.
Curtis, B.A.A., Tanifuji, G.A., Burki, F.A., Gruber, A.A., Irimia, M.A., Maruyama, S.A., Arias,
M.C.A., Ball, S.G.A., Gile, G.H.A., Hirakawa, Y.A., et al. (2012). Algal genomes reveal
evolutionary mosaicism and the fate of nucleomorphs. Nature, 59.
Dalgaard, P. (2002). Introductory Statistics with R Springer–Verlag New York.
Dall'Osto, L., Caffarri, S., and Bassi, R. (2005). A mechanism of nonphotochemical energy
dissipation, independent from PsbS, revealed by a conformational change in the antenna
protein CP26. The Plant Cell 17, 1217-1232.
Dang, K.-V., Plet, J., Tolleter, D., Jokel, M., Cuiné, S., Carrier, P., Auroy, P., Richaud, P.,
Johnson, X., and Alric, J. (2014). Combined increases in mitochondrial cooperation and
oxygen photoreduction compensate for deficiency in cyclic electron flow in Chlamydomonas
reinhardtii. The Plant Cell 26, 3036-3050.
Daum, B., Kuhlbrandt, W., and Gilliham, M. (2011). Electron tomography of plant thylakoid
membranes. Journal of Experimental Botany 62, 2393-2402.
De Martino, A., Meichenin, A., Shi, J., Pan, K., and Bowler, C. (2007). Genetic and phenotypic
characterization of Phaeodactylum tricornutum (Bacillariophyceae) accessions. Journal of
Phycology, 992.
De Riso, V., Raniello, R., Maumus, F., Rogato, A., Bowler, C., and Falciatore, A. (2009). Gene
silencing in the marine diatom Phaeodactylum tricornutum. Nucleic acids research, 37, 14,
e96-e96.
de Vargas, C., Audic, S., Henry, N., Decelle, J., Mahé, F., Logares, R., Lara, E., Berney, C., Le
Bescot, N., Probert, I., et al. (2015). Ocean plankton. Eukaryotic plankton diversity in the
sunlit ocean. Science 348, 1261605-1261605.
Dekker, J.P., and Boekema, E.J. (2005). Supramolecular organization of thylakoid membrane
proteins in green plants. Biochimica et Biophysica Acta (BBA) - Bioenergetics 1706, 12-39.
Delosme, R., Olive, J., and Wollman, F.-A. (1996). Changes in light energy distribution upon
state transitions: an in vivo photoacoustic study of the wild type and photosynthesis mutants
from Chlamydomonas reinhardtii. Biochimica et Biophysica Acta (BBA) - Bioenergetics 1273,
150-158.

219
Demarsy, E., and Fankhauser, C. (2009). Higher plants use LOV to perceive blue light. Current
Opinion in Plant Biology 12, 69-74.
Depège, N., Bellafiore, S., and Rochaix, J.-D. (2003). Role of chloroplast protein kinase Stt7 in
LHCII phosphorylation and state transition in Chlamydomonas. Science 299, 1572-1575.
Dietz, K.-J., Turkan, I., and Krieger-Liszkay, A. (2016). Redox-and reactive oxygen species-
dependent signalling in and from the photosynthesizing chloroplast. Plant physiology 171,
1541-1550.
Diner, B., and Joliot, P. (1976). Effect of the transmembrane electric field on the
photochemical and quenching properties of photosystem II in vivo. Biochimica et Biophysica
Acta (BBA) - Bioenergetics 423, 479-498.
Dittami, S.M., Michel, G., Collén, J., Boyen, C., and Tonon, T. (2010). Chlorophyll-binding
proteins revisited - a multigenic family of light-harvesting and stress proteins from a brown
algal perspective. BMC Evolutionary Biology 10, 1-14.
Dorrell, R.G., and Smith, A.G. (2011). Do red and green make brown? Perspectives on plastid
acquisitions within chromalveolates. Eukaryotic cell 10, 856-868.
Eberhard, S., Finazzi, G., and Wollman, F.-A. (2008). The dynamics of photosynthesis. Annual
Review of Genetics, 463.
Engel, B.D., Schaffer, M., Kuhn Cuellar, L., Villa, E., Plitzko, J.M., and Baumeister, W. (2015).
Native architecture of the Chlamydomonas chloroplast revealed by in situ cryo-electron
tomography. Elife 4.
Eppard, M., and Rhiel, E. (1998). The genes encoding light-harvesting subunits of Cyclotella
cryptica (Bacillariophyceae) constitute a complex and heterogeneous family. Molecular and
General Genetics MGG 260, 335-345.
Eriksson, M., Villand, P., Gardeström, P., and Samuelsson, G. (1998). Induction and regulation
of expression of a low-CO2-induced mitochondrial carbonic anhydrase in Chlamydomonas
reinhardtii. Plant Physiology 116: 637–641.
Falciatore, A., Casotti, R., Leblanc, C., Abrescia, C., and Bowler, C. (1999). Transformation of
nonselectable reporter genes in marine diatoms. Marine Biotechnology 1, 239-251.
Falkowski, P.G., Katz, M.E., Knoll, A.H., Quigg, A., Raven, J.A., Schofield, O., and Taylor, F.J.R.
(2004). The evolution of modern eukaryotic phytoplankton. Science 305, 5682, 354.
Falkowski, P.G., and LaRoche, J. (1991). Acclimation to spectral irradiance in algae. Journal
of Phycology 27, 8-14.

220
Fang, W., Si, Y., Douglass, S., Casero, D., Merchant, S.S., Pellegrini, M., Ladunga, I., Liu, P.,
and Spalding, M.H. (2012). Transcriptome-wide changes in Chlamydomonas reinhardtii gene
expression regulated by carbon dioxide and the CO2-concentrating mechanism regulator
CIA5/CCM1. The Plant Cell 24, 1876-1893.
Felsner, G., Sommer, M.S., Gruenheit, N., Hempel, F., Moog, D., Zauner, S., Martin, W., and
Maier, U.G. (2011). ERAD components in organisms with complex red plastids suggest
recruitment of a preexisting protein transport pathway for the periplastid membrane.
Genome Biology and Evolution 3, 140-150.
Fett, J.P. and Coleman, J.R. (1994a). Regulation of periplasmic carbonic anhydrase expression
in Chlamydomonas reinhardtii by acetate and pH. Plant Physiology 106: 103–108.
Fett, J.P. and Coleman, J.R. (1994b). Regulation of periplasmic carbonic anhydrase
expression in Chlamydomonas reinhardtii by acetate and pH. Plant Physiology 106: 103–108.
Field, C.B., Behrenfeld, M.J., Randerson, J.T., and Falkowski, P. (1998). Primary production of
the biosphere: integrating terrestrial and oceanic components. Science 281, 237-240.
Finazzi, G., and Rappaport, F. (1998). In vivo characterization of the electrochemical proton
gradient generated in darkness in green algae and its kinetic effects on cytochrome b6f
turnover. Biochemistry 37, 9999-10005.
Finazzi, G. (2005). The central role of the green alga Chlamydomonas reinhardtii in revealing
the mechanism of state transitions. Journal of Experimental Botany 56: 383–388.
Finazzi, G., Johnson, G.N., Dall'Osto, L., Zito, F., Bonente, G., Bassi, R., and Wollman, F.-A.
(2006). Nonphotochemical quenching of chlorophyll fluorescence in Chlamydomonas
reinhardtii. Biochemistry 45, 1490-1498.
Finazzi, G., and Minagawa, J. (2014). High light acclimation in green microalgae in non-
photochemical quenching and thermal energy dissipation in plants, algae and cyanobacteria.
Advances in Photosynthesis and Respiration-Including Bioenergy and Related Processes, 40,
24.
Flori, S., Jouneau, P.-H., Finazzi, G., Maréchal, E., and Falconet, D. (2016). Ultrastructure of
the periplastidial compartment of the diatom Phaeodactylum tricornutum. Protist 167, 254-
267.
Folta, K.M., and Kaufman, L.S. (2003). Phototropin 1 is required for high-fluence blue-light-
mediated mRNA destabilization. Plant molecular biology 51, 609-618.
221
Fristedt, R., Willig, A., Granath, P., Crèvecoeur, M., Rochaix, J.-D., and Vener, A.V. (2009).
Phosphorylation of photosystem II controls functional macroscopic folding of photosynthetic
membranes in Arabidopsis. The Plant Cell 21, 3950-3964.
Fukuzawa, H., Miura, K., Ishizaki, K., Kucho, K.-I., Saito, T., Kohinata, T., and Ohyama, K.
(2001). Ccm1, a regulatory gene controlling the induction of a carbon-concentrating
mechanism in Chlamydomonas reinhardtii by sensing CO2 availability. Proceedings of the
National Academy of Sciences 98: 5347–5352.
Gagné, G., and Guertin, M. (1992). The early genetic response to light in the green unicellular
alga Chlamydomonas eugametos grown under light/dark cycles involves genes that
represent direct responses to light and photosynthesis. Plant Molecular Biology 18, 429-445.
Galván-Ampudia, C.S., and Offringa, R. (2007). Plant evolution: AGC kinases tell the auxin
tale. Trends in Plant Science 12, 541-547.
Genty, B., Briantais, J.-M., and Baker, N.R. (1989). The relationship between the quantum
yield of photosynthetic electron transport and quenching of chlorophyll fluorescence.
Biochimica et Biophysica Acta (BBA) 990: 87–92.
Gera, J.F., and Baker, E.J. (1998). Deadenylation-dependent and-independent decay
pathways for α1-tubulin mRNA in Chlamydomonas reinhardtii. Molecular and cellular
biology 18, 1498-1505.
Gibbs, S.P. (1962a). The ultrastructure of the chloroplasts of algae. Journal of Ultrastructure
Research 7, 418-435.
Gibbs, S.P. (1962b). Nuclear envelope-chloroplast relationships in algae. The Journal of Cell
Biology 14, 433-444.
Gibbs, S.P. (1962c). Chloroplast development in Ochromonas danica. The Journal of Cell
Biology 15, 343-361.
Gibbs, S.P. (1979). The route of entry of cytoplasmically synthesized proteins into
chloroplasts of algae possessing chloroplast ER. Journal of Cell Science 35, 253-266.
Gibbs, S.P. (1981). The chloroplast of some algal groups may have evolved from
endosmbiotic eukaryotic algae. Annals of the New York Academy of Sciences 361, 193.
Goldschmidt-Clermont, M. (1986). The two genes for the small subunit of RuBP
Carboxylase/oxygenase are closely linked in Chlamydomonas reinhardtii. Plant Molecular
Biology 6: 13–21.

222
Goral, T.K., Johnson, M.P., Duffy, C.D.P., Brain, A.P.R., Ruban, A.V., and Mullineaux, C.W.
(2012). Light-harvesting antenna composition controls the macrostructure and dynamics of
thylakoid membranes in Arabidopsis. The Plant Journal 69, 289-301.
Gorman, D.S., and Levine, R. (1965). Cytochrome f and plastocyanin: their sequence in the
photosynthetic electron transport chain of Chlamydomonas reinhardii. Proceedings of the
National Academy of Sciences 54, 1665-1669.
Goss, R., Lepetit, B., and Wilhelm, C. (2006). Evidence for a rebinding of antheraxanthin to
the light-harvesting complex during the epoxidation reaction of the violaxanthin cycle.
Journal of Plant Physiology 163, 585-590.
Gould, S.B., Sommer, M.S., Kroth, P.G., Gile, G.H., Keeling, P.J., and Maier, U.-G. (2006).
Nucleus-to-nucleus gene transfer and protein retargeting into a remnant cytoplasm of
cryptophytes and diatoms. Molecular Biology and Evolution 23, 2413-2422.
Gould, S. B., Maier, U.-G., and Martin, William F. (2015). Protein import and the origin of red
complex plastids. Current Biology 25, R515-R521.
Green, B.R., and Durnford, D.G. (1996). The chlorophyll-carotenoid proteins of oxygenic
photosynthesis. Annual Review of Plant Physiology and Plant Molecular Biology 47, 685-714.
Grosche, C., Hempel, F., Bolte, K., Zauner, S., and Maier, U.G. (2014). The periplastidal
compartment: a naturally minimized eukaryotic cytoplasm. Current Opinion in Microbiology
22, 88-93.
Grossman, A.R., Croft, M., Gladyshev, V.N., Merchant, S.S., Posewitz, M.C., Prochnik, S., and
Spalding, M.H. (2007). Novel metabolism in Chlamydomonas through the lens of genomics.
Current Opinion in Plant Biology 10: 190–198.
Grouneva, I., Rokka, A., and Aro, E.-M. (2011). The thylakoid membrane proteome of two
marine diatoms outlines both diatom-specific and species-specific features of the
photosynthetic machinery. Journal of Proteome Research 10, 5338-5353.
Gruber, A., Vugrinec, S., Hempel, F., Gould, S.B., Maier, U.-G., and Kroth, P.G. (2007). Protein
targeting into complex diatom plastids: functional characterisation of a specific targeting
motif. Plant Molecular Biology 64(5), 519-530.
Guillard, R.R. (1975). Culture of phytoplankton for feeding marine invertebrates. In Culture
of marine invertebrate animals. (Springer, 29-60).
Hager, A. (1967). Studies on the backward-reactions in the xanthophyll-cycle of Chlorella,
Spinacia and Taxus. Planta 76, 138-148.

223
Hansma, P.K., Cleveland, J.P., Radmacher, M., Walters, D.A., Hillner, P.E., Bezanilla, M., Fritz,
M., Vie, D., Hansma, H.G., Prater, C.B., et al. (1994). Tapping mode atomic force microscopy
in liquids. Applied Physics Letters 64, 1738-1740.
Harada, A., Sakai, T., and Okada, K. (2003). Phot1 and phot2 mediate blue light-induced
transient increases in cytosolic Ca2+ differently in Arabidopsis leaves. Proceedings of the
National Academy of Sciences 100, 8583-8588.
Harris, E.H. (1989). An overview of the genus Chlamydomonas. In the Chlamydomonas
sourcebook (Elsevier), 1–24.
Hayashi, Y., Sato, N., Shinozaki, A., and Watanabe, M. (2015). Increase in peroxisome number
and the gene expression of putative glyoxysomal enzymes in Chlamydomonas cells
supplemented with acetate. Journal of Plant Research 128: 177–185.
Hasegawa, E., Hayashi, H., Asakura, S., and Kamiya, R. (1987). Stimulation of in vitro motility
of Chlamydomonas axonemes by inhibition of cAMP-dependent phosphorylation. Cell
Motility & the Cytoskeleton 8, 302.
Heijde, M., and Ulm, R. (2012). UV-B photoreceptor-mediated signalling in plants. Trends in
Plant Science 17, 230-237.
Heiny, S.R., Pautz, S., Recker, M., and Przyborski, J.M. (2014). Protein Traffic to the
Plasmodium falciparum apicoplast: evidence for a sorting branch point at the golgi. Traffic
15, 1290-1304.
Heinz, E., and Lithgow, T. (2014). A comprehensive analysis of the Omp85/TpsB protein
superfamily structural diversity, taxonomic occurrence, and evolution. Frontiers in
Microbiology 5, 1-13.
Hempel, F., Bozarth, A., Sommer, M.S., Zauner, S., Przyborski, J.M., and Maier, U.-G. (2007).
Transport of nuclear-encoded proteins into secondarily evolved plastids. Biological
Chemistry 388, 899-906.
Hempel, F., Bullmann, L., Lau, J., Zauner, S., and Maier, U.G. (2009). ERAD-derived preprotein
transport across the second outermost plastid membrane of diatoms. Molecular Biology and
Evolution 26, 1781-1790.
Herbstova, M., Tietz, S., Kinzel, C., Turkina, M.V., and Kirchhoff, H. (2012). Architectural
switch in plant photosynthetic membranes induced by light stress. Proceedings of the
National Academy of Sciences 109, 20130-20135.

224
Hill, R., and Bendall, F.A.Y. (1960). Function of the Two Cytochrome Components in
Chloroplasts: A Working Hypothesis. Nature 186, 136.
Hiller, R.G., Wrench, P.M., Gooley, A.P., Shoebridge, G., and Breton, J. (1993). The major
intrinsic light-harvesting protein of Amphidinium: characterization and relation to other
light-harvesting proteins. Photochemistry and Photobiology 57(1), 125-131.
Holdsworth, R.H. (1971). The isolation and partial characterization of the pyrenoid protein
of Eremosphaera viridis. The Journal of Cell Biology 51, 499-513.
Horton, P., Ruban, A.V., and Walters, R.G. (1996). Regulation of light harvesting in green
plants. Annual Review of Plant and Plant Molecular Biology, 47: 655–684.
Hosmer, J.D.W., Lemeshow, S., and Sturdivant, R.X. (2013). Applied Logistic Regression. John
Wiley & Sons.
Höhner, R., Barth, J., Magneschi, L., Jaeger, D., Niehues, A., Bald, T., Grossman, A., Fufezan,
C., and Hippler, M. (2013). The metabolic status drives acclimation of iron deficiency
responses in Chlamydomonas reinhardtii as revealed by proteomics based hierarchical
clustering and reverse genetics. Molecular Cell Proteomics 12: 2774–2790.
Howe, C.J., Schlarb-Ridley, B.G., Wastl, J., Purton, S., and Bendall, D.S. (2006). The novel
cytochrome c6 of chloroplasts: a case of evolutionary bricolage? Journal of Experimental
Botany 57, 13-22.
Huang, K., Merkle, T., and Beck, C.F. (2002). Isolation and characterization of a
Chlamydomonas gene that encodes a putative blue-light photoreceptor of the phototropin
family. Physiologia Plantarum 115, 613-622.
Huang, K., and Beck, C.F. (2003). Phototropin is the blue-light receptor that controls multiple
steps in the sexual life cycle of the green alga Chlamydomonas reinhardtii. Proceedings of
the National Academy of Sciences 100, 6269-6274.
Huang, K., Kunkel, T., and Beck, C.F. (2004). Localization of the blue-light receptor
phototropin to the flagella of the green alga Chlamydomonas reinhardtii. Molecular Biology
of The Cell 15, 3605-3614.
Im, C.-S., Eberhard, S., Kaiyao, H., Beck, C.F., and Grossman, A.R. (2006). Phototropin
involvement in the expression of genes encoding chlorophyll and carotenoid biosynthesis
enzymes and LHC apoproteins in Chlamydomonas reinhardtii. Plant Journal 48, 1-16.
Inda, L.A., Erdner, D.L., Peleato, M.L., and Anderson, D.M. (1999). Cytochrome c6 isolated
from the marine diatom Thalassiosira weissflogii. Phytochemistry 51, 1-4.
225
Ingram-Smith, C., Martin, S.R., and Smith, K.S. (2006). Acetate kinase: not just a bacterial
enzyme. Trends in Microbiology 14, 249-253.
Iwai, M., Yokono, M., Inada, N., and Minagawa, J. (2010). Live-cell imaging of photosystem II
antenna dissociation during state transitions. Proceedings of the National Academy of
Sciences 107, 2337-2342.
Jansson, S. (1999). A guide to the Lhc genes and their relatives in Arabidopsis. Trends in Plant
Science 4, 236-240.
Jarvis, P., and Soll, J. (2001). Review: Toc, Tic, and chloroplast protein import. Biochimica et
Biophysica Acta (BBA) - Molecular Cell Research 1541, 64-79.
Jenkins, G.I. (2014). The UV-B photoreceptor UVR8: from structure to physiology. The Plant
Cell, 21.
Jiao, Y., Lau, O.S., and Deng, X.W. (2007). Light-regulated transcriptional networks in higher
plants. Nature Reviews Genetics 8, 217-230.
Joët, T., Cournac, L., Horvath, E.M., Medgyesy, P., and Peltier, G. (2001). Increased sensitivity
of photosynthesis to antimycin A induced by inactivation of the chloroplast ndhB gene.
Evidence for a participation of the NADH-dehydrogenase complex to cyclic electron flow
around photosystem I. Plant Physiology 125, 1919-1929.
Johnson, X., and Alric, J. (2013). Central carbon metabolism and electron transport in
Chlamydomonas reinhardtii: metabolic constraints for carbon partitioning between oil and
starch. Eukaryotic Cell 12, 776-793.
Johnson, X., Vandystadt, G., Bujaldon, S., Wollman, F.-A., Dubois, R., Roussel, P., Alric, J., and
Béal, D. (2009). A new setup for in vivo fluorescence imaging of photosynthetic activity.
Photosynthesis Research 102, 85-93.
Joliot, P., and Delosme, R. (1974). Flash-induced 519 nm absorption change in green algae.
Biochimica et Biophysica Acta (BBA)-Bioenergetics 357, 267-284.
Joliot, P., and Joliot, A. (1989). Characterization of linear and quadratic electrochromic
probes in Chlorella sorokiniana and Chlamydomonas reinhardtii. Biochimica et Biophysica
Acta (BBA)-Bioenergetics 975, 355-360.
Joliot, P.A., and Finazzi, G. (2010). Proton equilibration in the chloroplast modulates
multiphasic kinetics of non-photochemical quenching of fluorescence in plants. Proceedings
of the National Academy of Sciences 107, 12728-12733.

226
Junge, W., Sielaff, H., and Engelbrecht, S. (2009). Torque generation and elastic power
transmission in the rotary FOF1-ATPase. Nature 459, 364-370.
Kana, T.M., Darkangelo, C., Hunt, M.D., Oldham, J.B., Bennett, G.E., and Cornwell, J.C. (1994).
Membrane inlet mass spectrometer for rapid high-precision determination of N2, O2, and
Ar in environmental water samples. Analytical Chemistry 66, 4166-4170.
Kasahara, M., Swartz, T.E., Olney, M.A., Onodera, A., Mochizuki, N., Fukuzawa, H., Asamizu,
E., Tabata, S., Kanegae, H., Takano, M., et al. (2002). Photochemical Properties of the Flavin
Mononucleotide-Binding Domains of the Phototropins from Arabidopsis, Rice, and
Chlamydomonas reinhardtii. Plant Physiology 129, 762-773.
Keeling, P.J. (2004). Diversity and evolutionary history of plastids and their hosts. American
Journal of Botany 91, 1481-1493.
Khatoon, M., Inagawa, K., Pospíšil, P., Yamashita, A., Yoshioka, M., Lundin, B., Horie, J.,
Morita, N., Jajoo, A., Yamamoto, Y., et al. (2009). Quality control of photosystem II: Thylakoid
unstacking is necessary to avoid further damage to the D1 protein and to facilitate D1
degradation under light stress in spinach thylakoids. Journal of Biological Chemistry 284,
25343-25352.
Kilian, O., and Kroth, P.G. (2005). Identification and characterization of a new conserved
motif within the presequence of proteins targeted into complex diatom plastids. Plant
Journal 41, 175-183.
Kinoshita, H., Nagasaki, J., Yoshikawa, N., Yamamoto, A., Takito, S., Kawasaki, M., Sugiyama,
T., Miyake, H., Weber, A.P., and Taniguchi, M. (2011). The chloroplastic 2-
oxoglutarate/malate transporter has dual function as the malate valve and in
carbon/nitrogen metabolism. The Plant Journal 65, 15-26.
Kirchhoff, H., Mukherjee, U., and Galla, H.J. (2002). Molecular architecture of the thylakoid
membrane: lipid diffusion space for plastoquinone. Biochemistry, 4872.
Kirchhoff, H., Schöttler, M.A., Maurer, J., and Weis, E. (2004). Plastocyanin redox kinetics in
spinach chloroplasts: evidence for disequilibrium in the high potential chain. Biochimica et
Biophysica Acta (BBA) - Bioenergetics 1659, 63-72.
Kirchhoff, H., Hall, C., Wood, M., Herbstova, M., Tsabari, O., Nevo, R., Charuvi, D., Shimoni,
E., and Reich, Z. (2011). Dynamic control of protein diffusion within the granal thylakoid
lumen. Proceedings of the National Academy of Sciences 108, 20248-20253.

227
Kirchhoff, H. (2013). Architectural switches in plant thylakoid membranes. Photosynthesis
research 116, 2-3, 481-487.
Kirilovsky, D., and Kerfeld, C.A. (2012). The orange carotenoid protein in photoprotection of
photosystem II in cyanobacteria. Biochimica et Biophysica Acta (BBA) - Bioenergetics 1817,
158-166.
Kirilovsky, D., and Kerfeld, C.A. (2013). The orange carotenoid protein: a blue-green light
photoactive protein. Photochemical & Photobiological Sciences 12, 1135-1143.
Kolber, Z.S., Van Dover, C.L., Niederman, R.A., and Falkowski, P.G. (2000). Bacterial
photosynthesis in surface waters of the open ocean. Nature 407, 177-179.
Kong, S.-G., Kinoshita, T., Shimazaki, K.-i., Mochizuki, N., Suzuki, T., and Nagatani, A. (2007).
C-terminal kinase fragment of Arabidopsis phototropin 2 triggers constitutive phototropin
responses. The Plant Journal 51(5), 862-873.
Kornberg, H.L. and Krebs, H.A. (1957). Synthesis of cell constituents from C2-units by a
modified tricarboxylic acid cycle. Nature.
Kucho, K.-I., Yoshioka, S., Taniguchi, F., Ohyama, K., and Fukuzawa, H. (2003). Cis-acting
elements and DNA-binding proteins involved in CO2-responsive transcriptional activation of
Cah1 encoding a periplasmic carbonic anhydrase in Chlamydomonas reinhardtii. Plant
Physiology 133: 783–793.
Kouřil, R., Dekker, J.P., and Boekema, E.J. (2012). Supramolecular organization of
photosystem II in green plants. Biochimica et Biophysica Acta (BBA) -Bioenergetics 1817, 1,
2-12.
Kowalczyk, N., Rappaport, F., Boyen, C., Wollman, F.-A., Collén, J., and Joliot, P. (2013).
Photosynthesis in Chondrus crispus: The contribution of energy spill-over in the regulation
of excitonic flux. Biochimica et Biophysica Acta (BBA) - Bioenergetics 1827, 834-842.
Krause, G.H. (1988). Photoinhibition of photosynthesis. An evaluation of damaging and
protective mechanisms. Physiologia Plantarum 74, 566-574.
Krieger-Liszkay, A., Fufezan, C., and Trebst, A. (2008). Singlet oxygen production in
photosystem II and related protection mechanism. Photosynthesis Research 98, 551-564.
Kroth, P.G., Chiovitti, A., Gruber, A., Martin-Jezequel, V., Mock, T., Parker, M.S., Stanley,
M.S., Kaplan, A., Caron, L., Weber, T., et al. (2008). A Model for carbohydrate metabolism in
the diatom Phaeodactylum tricornutum deduced from comparative whole genome analysis.
PLoS ONE 3, 1-14.

228
Kukuczka, B., Magneschi, L., Petroutsos, D., Steinbeck, J., Bald, T., Powikrowska, M., Fufezan,
C., Finazzi, G., and Hippler, M. (2014). Proton gradient regulation5-like1-mediated cyclic
electron flow is crucial for acclimation to anoxia and complementary to nonphotochemical
quenching in stress adaptation. Plant Physiology 165: 1604–1617.
Külheim, C., Ågren, J., and Jansson, S. (2002). Rapid regulation of light harvesting and plant
fitness in the field. Science 297, 5578, 91.
Lacoste-Royal, G., and Gibbs, S.P. (1987). Immunocytochemical localization of ribulose-1,5-
bisphosphate carboxylase in the pyrenoid and thylakoid region of the chloroplast of
Chlamydomonas reinhardtii. Plant Physiology 83, 602-606.
Lau, J.B., Stork, S., Moog, D., Sommer, M.S., and Maier, U.G. (2015). N-terminal lysines are
essential for protein translocation via a modified ERAD system in complex plastids.
Molecular Microbiology, 609.
Lauersen, K.J., Willamme, R., Coosemans, N., Joris, M., Kruse, O., and Remacle, C. (2016).
Peroxisomal microbodies are at the crossroads of acetate assimilation in the green microalga
Chlamydomonas reinhardtii. Algal Research 16: 266–274.
Lavaud, J., Rousseau, B., van Gorkom, H.J., and Etienne, A.-L. (2002). Influence of the
diadinoxanthin pool size on photoprotection in the marine planktonic diatom
Phaeodactylum tricornutum. Plant Physiology 129 (3), 1398-1406.
Lavaud, J., and Lepetit, B. (2013). An explanation for the inter-species variability of the
photoprotective non-photochemical chlorophyll fluorescence quenching in diatoms. BBA -
Bioenergetics 1827, 294-302.
Lavaud, J., Six, C., and Campbell, D.A. (2016). Photosystem II repair in marine diatoms with
contrasting photophysiologies. Photosynthesis Research, 189.
Ledford, H., Baroli, I., Shin, J., Fischer, B., Eggen, R., and Niyogi, K. (2004). Comparative
profiling of lipid-soluble antioxidants and transcripts reveals two phases of photo-oxidative
stress in a xanthophyll-deficient mutant of Chlamydomonas reinhardtii. Molecular Genetics
and Genomics 272, 470-479.
Lebart, L., Piron, A., Lebart, M., Morineau, A., and Piron, M. (2000). Statistique exploratoire
multidimensionnelle; Dunod, Paris, 3e édition.
Lemaire, C., Wollman, F.-A., and Bennoun, P. (1988). Restoration of phototrophic growth in
a mutant of Chlamydomonas reinhardtii in which the chloroplast atpB gene of the ATP

229
synthase has a deletion: an example of mitochondria-dependent photosynthesis.
Proceedings of the National Academy of Sciences 85, 1344-1348.
Lepetit, B., Goss, R., Jakob, T., and Wilhelm, C. (2012). Molecular dynamics of the diatom
thylakoid membrane under different light conditions. Photosynthesis research 111(1-2),
245-257.
Lepetit, B., Sturm, S., Rogato, A., Gruber, A., Sachse, M., Falciatore, A., Kroth, P.G., and
Lavaud, J. (2013). High light acclimation in the secondary plastids containing diatom
Phaeodactylum tricornutum is triggered by the redox state of the plastoquinone pool. Plant
Physiology 161, 853-865.
Levitan, O., Dinamarca, J., Hochman, G., and Falkowski, P.G. (2014). Diatoms: a fossil fuel of
the future. Trends in Biotechnology, 117.
Ley, A.C., and Butler, W.L. (1977). Energy transfer from photosystem II to photosystem I in
Porphyridium cruentum. Biochimica et Biophysica Acta (BBA) 462, 290-294.
Li, X.-P., Bjorkman, O., Shih, C., Grossman, A.R., Rosenquist, M., Jansson, S., and Niyogi, K.K.
(2000). A pigment-binding protein essential for regulation of photosynthetic light harvesting.
Nature 403, 391-395.
Li, X.-P., Phippard, A., Pasari, J., and Niyogi, K.K. (2002). Structure–function analysis of
photosystem II subunit S (PsbS) in vivo. Functional Plant Biology 29, 1131-1139.
Li, Z., Wakao, S., Fischer, B.B., and Niyogi, K.K. (2009). Sensing and responding to excess light.
Annual Review of Plant Biology 60, 239-260.
Liu, L.-N., and Scheuring, S. (2013). Investigation of photosynthetic membrane structure
using atomic force microscopy. Trends in Plant Science 18(5), 277-286.
Lohr, M. (2011). Carotenoid metabolism in phytoplankton. Phytoplankton Pigments:
Characterization, Chemotaxonomy and Applications in Oceanography, 113-161.
Longoni, P., Douchi, D., Cariti, F., Fucile, G., and Goldschmidt-Clermont, M. (2015).
Phosphorylation of the light-harvesting complex II isoform Lhcb2 is central to state
transitions. Plant Physiology 169, 2874-2883.
Lucker, B., and Kramer, D.M. (2013). Regulation of cyclic electron flow in Chlamydomonas
reinhardtii under fluctuating carbon availability. Photosynthesis Research 117, 449-459.
Maréchal, E., and Cesbron-Delauw, M.F. (2001). The apicoplast: a new member of the plastid
family. Trends in Plant Science 6, 200-205.

230
Martinson, T.A., Ikeuchi, M., and Plumley, F.G. (1998). Oxygen-evolving diatom thylakoid
membranes. Biochimica et Biophysica Acta (BBA) - Bioenergetics 1409(2), 72-86.
Maruyama, S., Tokutsu, R., and Minagawa, J. (2014). Transcriptional regulation of the stress-
responsive light harvesting complex genes in Chlamydomonas reinhardtii. Plant & Cell
Physiology 55, 1304-1310.
Massana, R., Gobet, A., Audic, S., Bass, D., Bittner, L., Boutte, C., Chambouvet, A., Christen,
R., Claverie, J.-M., Decelle, J., et al. (2015). Marine protist diversity in European coastal
waters and sediments as revealed by high-throughput sequencing. Environmental
Microbiology, 4035.
Matsuo, M. and Obokata, J. (2006). Remote control of photosynthetic genes by the
mitochondrial respiratory chain. The Plant Joural 47: 873–882.
Matsuo, M., Hachisu, R., Tabata, S., Fukuzawa, H., and Obokata, J. (2011). Transcriptome
analysis of respiration-responsive genes in Chlamydomonas reinhardtii: mitochondrial
retrograde signaling coordinates the genes for cell proliferation with energy-producing
metabolism. Plant and Cell Physiology 52: 333–343.
Matsuoka, D., Iwata, T., Zikihara, K., Kandori, H., and Tokutomi, S. (2007). Primary processes
during the light-signal transduction of phototropin. Photochemistry & Photobiology 83, 122-
130.
McFadden, G.I. (2014). Origin and evolution of plastids and photosynthesis in eukaryotes.
Cold Spring Harbor perspectives in biology 6, 4, a016105.
McFadden, G.I., and van Dooren, G.G. (2004). Evolution: red algal genome affirms a common
origin of all plastids. Current Biology 14, R514-R516.
Melis, A. (1982). Kinetic analysis of P-700 photoconversion: effect of secondary electron
donation and plastocyanin inhibition. Archives of Biochemistry and Biophysics 217, 536-545.
Melis, A. (1991). Dynamics of photosynthetic membrane composition and function.
Biochimica et Biophysica Acta (BBA) - Bioenergetics 1058, 87-106.
Menke, W. (1962). Structure and Chemistry of Plastids. Annual Review of Plant Physiology
13, 27.
Merchant, S.S., Prochnik, S.E., Vallon, O., Harris, E.H., Karpowicz, S.J., Witman, G.B., Terry,
A., Salamov, A., Fritz-Laylin, L.K., Marechal-Drouard, L., et al. (2007). The Chlamydomonas
genome reveals the evolution of key animal and plant functions. Science 318, 245-251.

231
Miura, K., Yamano, T., Yoshioka, S., Kohinata, T., Inoue, Y., Taniguchi, F., Asamizu, E.,
Nakamura, Y., Tabata, S., and Yamato, K.T. (2004). Expression profiling-based identification
of CO2-responsive genes regulated by CCM1 controlling a carbon-concentrating mechanism
in Chlamydomonas reinhardtii. Plant Physiology 135, 1595-1607.
Moog, D., Stork, S., Zauner, S., and Maier, U.-G. (2011). In silico and in vivo investigations of
proteins of a minimized eukaryotic cytoplasm. Genome Biology and Evolution 3, 375-382.
Moroney, J.V., Kitayama, M., Togasaki, R.K., and Tolbert, N.E. (1987). Evidence for inorganic
carbon transport by intact chloroplasts of Chlamydomonas reinhardtii. Plant Physiology 83:
460–463.
Moroney, J.V., Husic, H.D., Tolbert, N.E., Kitayama, M., Manuel, L.J., and Togasaki, R.K.
(1989). Isolation and characterization of a mutant of Chlamydomonas reinhardtii deficient in
the CO2 concentrating mechanism. Plant Physiology 89: 897–903.
Müller, P., Li, X.-P., and Niyogi, K.K. (2001). Non-photochemical quenching. A response to
excess light energy. Plant Physiology 125, 1558-1566.
Munekage, Y., Hojo, M., Meurer, J., Endo, T., Tasaka, M., and Shikanai, T. (2002). PGR5 is
involved in cyclic electron flow around photosystem I and is essential for photoprotection in
Arabidopsis. Cell 110: 361–371.
Murata, N., Takahashi, S., Nishiyama, Y., and Allakhverdiev, S.I. (2007). Photoinhibition of
photosystem II under environmental stress. Biochimica et Biophysica Acta (BBA) -
Bioenergetics 1767, 414-421.
Mustardy, L., Buttle, K., Steinbach, G., and Garab, G. (2008). Three-dimensional architecture
of the granum-stroma thylakoid membrane system revealed by electron tomography.
Photosynthesis. Energy from the Sun. Springer Netherlands, 767-770.
Mustardy, L., and Garab, G. (2003). Granum revisited. A three-dimensional model - where
things fall into place. Trends in Plant Science 8, 117-122.
Nagy, G., Ünnep, R., Zsiros, O., Tokutsu, R., Takizawa, K., Porcar, L., Moyet, L., Petroutsos, D.,
Garab, G., Finazzi, G., et al. (2014). Chloroplast remodeling during state transitions in
Chlamydomonas reinhardtii as revealed by noninvasive techniques in vivo. Proceedings of
the National Academy of Sciences 111, 5042-5047.
Nakamura, A., Suzawa, T., Kato, Y., and Watanabe, T. (2005). Significant species-dependence
of P700 redox potential as verified by spectroelectrochemistry: Comparison of spinach and
Theromosynechococcus elongatus. FEBS letters 579, 2273-2276.

232
Nakano, Y., and Asada, K. (1987). Purification of ascorbate peroxidase in spinach
chloroplasts; its inactivation in ascorbate-depleted medium and reactivation by
monodehydroascorbate radical. Plant and cell physiology 28, 131-140.
Nath, K., Jajoo, A., Poudyal, R.S., Timilsina, R., Park, Y.S., Aro, E.-M., Nam, H.G., and Lee, C.H.
(2013). Towards a critical understanding of the photosystem II repair mechanism and its
regulation during stress conditions. FEBS Letters, 3372.
Naumann, B., Busch, A., Allmer, J., Ostendorf, E., Zeller, M., Kirchhoff, H., and Hippler, M.
(2007). Comparative quantitative proteomics to investigate the remodeling of bioenergetic
pathways under iron deficiency in Chlamydomonas reinhardtii. Proteomics 7, 3964-3979.
Nawrocki, W.J., Santabarbara, S., Mosebach, L., Wollman, F.-A., and Rappaport, F. (2016).
State transitions redistribute rather than dissipate energy between the two photosystems in
Chlamydomonas. Nature Plants 2, 16031.
Neidhardt, J., Benemann, J.R., Zhang, L., and Melis, A. (1998). Photosystem-II repair and
chloroplast recovery from irradiance stress: relationship between chronic photoinhibition,
light-harvesting chlorophyll antenna size and photosynthetic productivity in Dunaliella salina
(green algae). Photosynthesis Research 56, 175-184.
Nelson, N., and Ben-Shem, A. (2005). The structure of photosystem I and evolution of
photosynthesis. BioEssays 27, 914-922.
Nelson, N., and Yocum, C.F. (2006). Structure and function of photosystems I and II. Annual
Review of Plant Biology 57, 521-565.
Nisbet, R.E.R., Kilian, O., and McFadden, G.I. (2004). Diatom genomics: genetic acquisitions
and mergers. Current Biology 14, R1048-R1050.
Niyogi, K.K. (1999). Photoprotection revisited: genetic and molecular approaches. Annual
Review of Plant Physiology and Plant Molecular Biology 50, 333-359.
Niyogi, K.K., Bjorkman, O., and Grossman, A.R. (1997). Chlamydomonas xanthophyll cycle
mutants identified by video imaging of chlorophyll fluorescence quenching. The Plant Cell 9:
1369–1380.
Niyogi, K.K., and Truong, T.B. (2013). Evolution of flexible non-photochemical quenching
mechanisms that regulate light harvesting in oxygenic photosynthesis. Current Opinion in
Plant Biology 16, 307-314.
Nymark, M., Valle, K.C., Hancke, K., Winge, P., Andresen, K., Johnsen, G., Bones, A.M., and
Brembu, T. (2013). Molecular and photosynthetic responses to prolonged darkness and

233
subsequent acclimation to re-illumination in the diatom Phaeodactylum tricornutum. PLoS
ONE 8, 1-19.
Ort, D.R., and Baker, N.R. (2002). A photoprotective role for O2 as an alternative electron
sink in photosynthesis? Current Opinion in Plant Biology 5, 193-198.
Osmond, B., Badger, M., Maxwell, K., Björkman, O., and Leegood, R. (1997). Too many
photons: photorespiration, photoinhibition and photooxidation. Trends in Plant Science 2,
119-121.
Otsuna, H., Shinomiya, K., and Ito, K. (2014). Parallel neural pathways in higher visual centers
of the Drosophila brain that mediate wavelength-specific behavior. Frontiers In Neural
Circuits 8, 8-8.
Oudot-Le Secq, M.-P., Grimwood, J., Shapiro, H., Armbrust, E.V., Bowler, C., and Green, B.R.
(2007). Chloroplast genomes of the diatoms Phaeodactylum tricornutum and Thalassiosira
pseudonana: comparison with other plastid genomes of the red lineage. Molecular Genetics
and Genomics 277(4), 427-439.
Owens, T.G. (1986). Light-Harvesting Function in the Diatom Phaeodactylum tricornutum: II.
Distribution of excitation energy between the photosystems. Plant Physiology 80, 739-746.
Paolillo, D.J., Falk, R.H., and Reighard, J.A. (1967). The effect of chemical fixation on the
fretwork of chloroplasts. Transactions of the American Microscopical Society 225.
Paolillo, D.J., Jr. (1970). The three-dimensional arrangement of intergranal lamellae in
chloroplasts. Journal of Cell Science 6, 243-255.
Paul, M.J. and Foyer, C.H. (2001). Sink regulation of photosynthesis. Journal of Experimental
Botany 52: 1383.
Peers, G., Truong, T.B., Ostendorf, E., Busch, A., Elrad, D., Grossman, A.R., Hippler, M., and
Niyogi, K.K. (2009). An ancient light-harvesting protein is critical for the regulation of algal
photosynthesis. Nature 462, 518-521.
Peltier, G., and Thibault, P. (1985). Uptake in the light in Chlamydomonas: evidence for
persistent mitochondrial respiration. Plant Physiology 79, 225-230.
Peschke, M., Moog, D., Klingl, A., Maier, U.G., and Hempel, F. (2013). Evidence for
glycoprotein transport into complex plastids. Proceedings of the National Academy of
Sciences 110, 10860-10865.

234
Petersen, J., Förster, K., Turina, P., and Gräber, P. (2012). Comparison of the H+/ATP ratios
of the H+-ATP synthases from yeast and from chloroplast. Proceedings of the National
Academy of Sciences 109, 11150-11155.
Petroutsos, D., Terauchi, A.M., Busch, A., Hirschmann, I., Merchant, S.S., Finazzi, G., and
Hippler, M. (2009). PGRL1 participates in iron-induced remodeling of the photosynthetic
apparatus and in energy metabolism in Chlamydomonas reinhardtii. The Journal of Biological
Chemistry 284, 32770-32781.
Petroutsos, D., Busch, A., Jan, xdf, en, I., Trompelt, K., Bergner, S.V., Weinl, S., Holtkamp, M.,
Karst, U., et al. (2011). The chloroplast calcium sensor CAS is required for photoacclimation
in Chlamydomonas reinhardtii. The Plant Cell 23, 2950-2963.
Petroutsos, D., Amiar, S., Abida, H., Dolch, L.-J., Bastien, O., Rébeillé, F., Jouhet, J., Falconet,
D., Block, M.A., McFadden, G.I., et al. (2014). Review: Evolution of galactoglycerolipid
biosynthetic pathways – From cyanobacteria to primary plastids and from primary to
secondary plastids. Progress in Lipid Research 54, 68-85.
Pfeifer, A., Mathes, T., Lu, Y., Hegemann, P., and Kottke, T. (2010). Blue light induces global
and localized conformational changes in the kinase domain of full-length phototropin.
Biochemistry 49, 1024-1032.
Plancke, C. et al. (2014). Lack of isocitrate lyase in Chlamydomonas leads to changes in
carbon metabolism and in the response to oxidative stress under mixotrophic growth. The
Plant Journal 77: 404–417.
Prihoda, J., Tanaka, A., De Paula, W.B.M., Allen, J.F., Tirichine, L., Bowler, C., and Teige, M.
(2012). Chloroplast-mitochondria cross-talk in diatoms. Journal of Experimental Botany 63,
1543-1557.
Radmer, R.J., and Kok, B. (1976). Photoreduction of O2 primes and replaces CO2 assimilation.
Plant Physiology 58, 336-340.
Raven, J.A., and Geider, R.J. (2003). Adaptation, acclimation and regulation in algal
photosynthesis. Photosynthesis in Algae (Springer, 385-412).
Rivasseau, C., Seemann, M., Boisson, A., Streb, P., Gout, E., Douce, R., Rohmer, M., and
Bligny, R. (2009). Accumulation of 2-C-methyl-D-erythritol 2, 4-cyclodiphosphate in
illuminated plant leaves at supraoptimal temperatures reveals a bottleneck of the
prokaryotic methylerythritol 4-phosphate pathway of isoprenoid biosynthesis. Plant, Cell &
Environment 32, 82-92.

235
Roach, T., Sedoud, A., and Krieger-Liszkay, A. (2013). Acetate in mixotrophic growth medium
affects photosystem II in Chlamydomonas reinhardtii and protects against photoinhibition.
Biochimica et Biophysica Acta (BBA) 1827: 1183–1190.
Round, F.E. (1990). The diatoms: biology & morphology of the genera / F. E. Round, R. M.
Crawford, D. G. Mann. Cambridge University Press.
Ruban, A.V., Berera, R., Ilioaia, C., Stokkum, I.H.M.v., Kennis, J.T.M., Pascal, A.A., Amerongen,
H.v., Robert, B., Horton, P., and Grondelle, R.v. (2007). Identification of a mechanism of
photoprotective energy dissipation in higher plants. Nature 450, 7169, 575-578.
Ruban, A.V., and Johnson, M.P. (2015). Visualizing the dynamic structure of the plant
photosynthetic membrane. Nature Plants 1, 15161.
Sager, R. and Granick, S. (1954). Nutritional control of sexuality in Chlamydomonas reinhardi.
The Journal of General Physiology 37: 729–742.
Salomon, M., Christie, J.M., Knieb, E., Lempert, U., and Briggs, W.R. (2000). Photochemical
and mutational analysis of hte FMN-binding domains of the plant blue light receptor,
phototropin. Biochemistry, 9401.
Salvi, D., Rolland, N., Joyard, J., and Ferro, M. (2008). Purification and proteomic analysis of
chloroplasts and their sub-organellar compartments. Methods in Molecular Biology 432, 19-
36.
Santabarbara, S., Redding, K.E., and Rappaport, F. (2009). Temperature dependence of the
reduction of P700+ by tightly bound plastocyanin in vivo. Biochemistry 48, 10457-10466.
Scheuring, S., and Sturgis, J.N. (2009). Atomic force microscopy of the bacterial
photosynthetic apparatus: plain pictures of an elaborate machinery. Photosynthesis
Research 102, 2-3, 197-211.
Schindelin, J., Arganda-Carreras, I., Frise, E., Kaynig, V., Longair, M., Pietzsch, T., Preibisch, S.,
Rueden, C., Saalfeld, S., Schmid, B., et al. (2012). Fiji: an open-source platform for biological-
image analysis. Nature Methods 9, 676-682.
Schleiff, E., and Becker, T. (2011). Common ground for protein translocation: access control
for mitochondria and chloroplasts. Nature Reviews Molecular Cell Biology 12, 48-59.
Schleiff, E., Maier, U.G., and Becker, T. (2011). Omp85 in eukaryotic systems: one protein
family with distinct functions. Biological Chemistry 392, 21-27.
Schloss, J.A. (1990). A Chlamydomonas gene encodes a G protein β subunit-like polypeptide.
Molecular and General Genetics 221, 443-452.

236
Schmidt, M., Gessner, G., Luff, M., Heiland, I., Wagner, V., Kaminski, M., Geimer, S., Eitzinger,
N., Reissenweber, T., Voytsekh, O., et al. (2006). Proteomic analysis of the eyespot of
Chlamydomonas reinhardtii provides novel insights into its components and tactic
movements. The Plant Cell, 1908.
Shikanai, T. (2007). Cyclic electron transport around photosystem I: genetic approaches.
Annual Review of Plant Biology 58, 199-217.
Shimoni, E., Rav-Hon, O., Ohad, I., Brumfeld, V., and Reich, Z. (2005). Three-dimensional
organization of higher-plant chloroplast thylakoid membranes revealed by electron
tomography. The Plant Cell, 2580.
Shropshire, W., Jr., and Mohr, H. (1983). Photomorphogenesis. Encyclopedia of Plant
Physiology. New Series.
Siaut, M., Heijde, M., Mangogna, M., Montsant, A., Coesel, S., Allen, A., Manfredonia, A.,
Falciatore, A., and Bowler, C. (2007). Molecular toolbox for studying diatom biology in
Phaeodactylum tricornutum. Gene 406, 23-35.
Small, G.D., Min, B., and Lefebvre, P.A. (1995). Characterization of a Chlamydomonas
reinhardtii gene encoding a protein of the DNA photolyase/blue light photoreceptor family.
Plant Molecular Biology 28, 443-454.
Smith, B.M., Morrissey, P.J., Guenther, J.E., Nemson, J.A., Harrison, M.A., Allen, J.F., and
Melis, A. (1990). Response of the photosynthetic apparatus in Dunaliella salina (Green Algae)
to irradiance stress. Plant Physiology 93, 1433-1440.
Sommer, M.S., Daum, B., Gross, L.E., Weis, B.L.M., Mirus, O., Abram, L., Maier, U.-G.,
Kühlbrandt, W., and Schleiff, E. (2011). Chloroplast Omp85 proteins change orientation
during evolution. Proceedings of the National Academy of Sciences 108, 13841-13846.
Sommer, M.S., Gould, S.B., Lehmann, P., Gruber, A., Przyborski, J.M., and Maier, U.-G.
(2007). Der1-mediated preprotein import into the periplastid compartment of
chromalveolates? Molecular Biology and Evolution 24, 918-928.
Spetea, C., Pfeil, B.E., Schoefs, B. (2012). Phylogenetic analysis of the thylakoid ATP/ADP
carrier reveals new insights into its function restricted to green plants. Frontiers in Plant
Science 9, 2-110.
Staehelin, L.A. (2003). Chloroplast structure: from chlorophyll granules to supra-molecular
architecture of thylakoid membranes. Photosynthesis Research 76, 185-196.

237
Stork, S., Moog, D., Przyborski, J.M., Wilhelmi, I., Zauner, S., and Maier, U.G. (2012).
Distribution of the SELMA translocon in secondary plastids of red algal origin and predicted
uncoupling of ubiquitin-dependent translocation from degradation. Eukaryotic Cell 11, 1472-
1481.
Stork, S., Lau, J., Moog, D., and Maier, U.-G. (2013). Three old and one new: protein import
into red algal-derived plastids surrounded by four membranes. Protoplasma, 1013.
Sueoka, N. (1960). Mitotic replication of deoxyribonucleic acid in Chlamydomonas reinhardi.
Proceedings of the National Academy of Sciences 46, 83-91.
Suetsugu, N., and Wada, M. (2013). Evolution of three LOV blue light receptor families in
green plants and photosynthetic stramenopiles: phototropin, ZTL/FKF1/LKP2 and
aureochrome. Plant & Cell Physiology 54, 8-23.
Sukenik, A., Bennett, J., and Falkowski, P. (1987). Light-saturated photosynthesis —
Limitation by electron transport or carbon fixation? Biochimica et Biophysica Acta (BBA) -
Bioenergetics 891, 205-215.
Sundby, C., McCaffery, S., and Anderson, J.M. (1993). Turnover of the photosystem II D1
protein in higher plants under photoinhibitory and nonphotoinhibitory irradiance. The
Journal of Biological Chemistry 268, 25476-25482.
Tabachnick, B.G., and Fidell, L.S., (2012). Using multivariate statistics (Pearson, London, ed.
6).
Taddei, L. et al. (2016). Multisignal control of expression of the LHCX protein family in the
marine diatom Phaeodactylum tricornutum. Journal of Experimental Botany.
Takahashi, H., Iwai, M., Takahashi, Y., and Minagawa, J. (2006). Identification of the mobile
light-harvesting complex II polypeptides for state transitions in Chlamydomonas reinhardtii.
Proceedings of the National Academy of Sciences 103, 477-482.
Takeuchi, F., Futamura, Y., Yoshikura, H., and Yamamoto, K. (2003). Statistics of
trinucleotides in coding sequences and evolution. Journal of Theoretical Biology 222, 139-
149.
Tamayo, J., and Garcia, R. (1996). Deformation, contact time, and phase contrast in tapping
mode scanning force microscopy. Langmuir 12, 4430-4435.
Tanaka, A., De Martino, A., Amato, A., Montsant, A., Mathieu, B., Rostaing, P., Tirichine, L.,
and Bowler, C. (2015). Ultrastructure and membrane traffic during cell division in the marine
pennate diatom Phaeodactylum tricornutum. Protist 166, 506.
238
R Development Core Team. R (2008). A language and environment for statistical
computing. (R Foundation for Statistical Computing, Vienna) ISBN 3-900051-07-0),
http://www.R-project.org.
Terashima, M., Specht, M., Naumann, B., and Hippler, M. (2010). Characterizing the
anaerobic response of Chlamydomonas reinhardtii by quantitative proteomics. Molecular
and Cellular Proteomics 9: 1514–1532.
Ting, C.S., and Owens, T.G. (1993). Photochemical and nonphotochemical fluorescence
quenching processes in the diatom Phaeodactylum tricornutum. Plant Physiology 101, 1323-
1330.
Tokutomi, S., Matsuoka, D., and Zikihara, K. (2008). Review: Molecular structure and
regulation of phototropin kinase by blue light. Biochimica et Biophysica Acta (BBA) - Proteins
and Proteomics 1784, 133-142.
Tokutsu, R., and Minagawa, J. (2013). Energy-dissipative supercomplex of photosystem II
associated with LHCSR3 in Chlamydomonas reinhardtii. Proceedings of the National
Academy of Sciences 110, 10016-10021.
Tokuyasu, K.T. (1973). A technique for ultramicrotomy of cell suspensions and tissues. The
Journal of Cell Biology 57, 551-565.
Trippens, J., Greiner, A., Schellwat, J., Neukam, M., Rottmann, T., Lu, Y., Kateriya, S.,
Hegemann, P., and Kreimer, G. (2012). Phototropin influence on eyespot development and
regulation of phototactic behavior in Chlamydomonas reinhardtii. The Plant Cell 24, 4687-
4702.
Ünlü, C., Drop, B., Croce, R., and van Amerongen, H. (2014). State transitions in
Chlamydomonas reinhardtii strongly modulate the functional size of photosystem II but not
of photosystem I. Proceedings of the National Academy of Sciences 111, 3460-3465.
Urzica, E.I., Vieler, A., Hong-Hermesdorf, A., Page, M.D., Casero, D., Gallaher, S.D., Kropat, J.,
Pellegrini, M., Benning, C., and Merchant, S.S. (2013). Remodeling of membrane lipids in
iron-starved Chlamydomonas. Journal of Biological Chemistry 288: 30246–30258.
Van de Meene, A.M., and Pickett-Heaps, J.D. (2004). Valve morphogenesis in the centric
diatom Rhizosolenia setigera (Bacillariophyceae, Centrales) and its taxonomic implications.
European Journal of Phycology 39, 93-104.
239
van Dooren, G.G., Schwartzbach, S.D., Osafune, T., and McFadden, G.I. (2001). Translocation
of proteins across the multiple membranes of complex plastids. Biochimica et Biophysica
Acta (BBA) 1541, 34-53.
Van Dooren, G.G., Waller, R.F., Joiner, K.A., Roos, D.S., and McFadden, G.I. (2000). Traffic
jams: protein transport in Plasmodium falciparum. Parasitology Today 16, 421-427.
Vardi, A., Bidle, K.D., Kwityn, C., Hirsh, D.J., Thompson, S.M., Callow, J.A., Falkowski, P., and
Bowler, C. (2008). A diatom gene regulating nitric-oxide signaling and susceptibility to
diatom-derived aldehydes. Current Biology: CB 18, 895-899.
Vartanian, M., Desclés, J., Quinet, M., Douady, S., and Lopez, P.J. (2009). Plasticity and
robustness of pattern formation in the model diatom Phaeodactylum tricornutum. New
Phytologist 182, 429-442.
Veith, T., Brauns, J., Weisheit, W., Mittag, M., and Büchel, C. (2009). Identification of a
specific fucoxanthin-chlorophyll protein in the light harvesting complex of photosystem I in
the diatom Cyclotella meneghiniana. Biochimica et Biophysica Acta (BBA) - Bioenergetics
1787, 905-912.
Wang, Y., Stessman, D.J., and Spalding, M.H. (2015). The CO2 concentrating mechanism and
photosynthetic carbon assimilation in limiting CO2: how Chlamydomonas works against the
gradient. The Plant Journal 82: 429–448
Waring, J., Klenell, M., Bechtold, U., Underwood, G.J.C., and Baker, N.R. (2010). Light-
induced responses of oxygen photoreduction, reactive oxygen species production and
scavenging in two diatom species. Journal of Phycology 46, 1206-1217.
Watanabe, M., Furuya, M., Miyoshi, Y., Inoue, Y., Iwahashi, I., and Matsumoto, K. (1982).
Design and performance of the Okazaki large spectrograph for photobiological research.
Photochemistry & Photobiology 36, 491.
Weigel, M., Pesaresi, P., and Leister, D. (2003). Tracking the function of the cytochrome c6-
like protein in higher plants. Trends in Plant Science 8, 513-517.
Whitmarsh, J. Govindjee (1999) The photosynthetic process. Singhal GS, Renger G, Sopory
SK, Irrgang KD and Govindjee, Concepts in Photobiology. Photosynthesis and
Photomorphogenesis, 11-51.
Wishnick, M., and Lane, M.D. (1969). Inhibition of Ribulose Diphosphate Carboxylase by
cyanide inactive ternary complex of enzyme, ribulose diphosphate, and cyanide. Journal of
Biological Chemistry 244, 55-59.

240
Witt, H. (1979). Energy conversion in the functional membrane of photosynthesis. Analysis
by light pulse and electric pulse methods: The central role of the electric field. Biochimica et
Biophysica Acta (BBA) - Reviews on Bioenergetics 505, 355-427.
Witt, H., Bordignon, E., Carbonera, D., Dekker, J.P., Karapetyan, N., Teutloff, C., Webber, A.,
Lubitz, W., and Schlodder, E. (2003). Species-specific differences of the spectroscopic
properties of P700: analysis of the influence of non-conserved amino acid residues by site-
directed mutagenesis of photosystem I from Chlamydomonas reinhardtii. Journal of
Biological Chemistry 278, 46760-46771.
Wittpoth, C., Kroth, P.G., Weyrauch, K., Kowallik, K.V., and Strotmann, H. (1998). Functional
characterization of isolated plastids from two marine diatoms. Planta 206 (1), 79-85.
Wolfe, A.J. (2005). The acetate switch. Microbiology and molecular biology reviews 69, 12-
50.
Wunder, T., Martin, R., Löffelhardt, W., Schleiff, E., and Steiner, J.M. (2007). The invariant
phenylalanine of precursor proteins discloses the importance of Omp85 for protein
translocation into cyanelles. BMC Evolutionary Biology 7, 236-236.
Xiang, Y. and Weeks, D.P. (2001). The Cia5 gene controls formation of the carbon
concentrating mechanism in Chlamydomonas reinhardtii. Proceedings of the National
Academy of Sciences 98: 5341–5346.
Yamano, T., Miura, K., and Fukuzawa, H. (2008). Expression analysis of genes associated with
the induction of the carbon-concentrating mechanism in Chlamydomonas reinhardtii. Plant
Physiology 147, 340-354.
Yang, W., Catalanotti, C., D'Adamo, S., Wittkopp, T.M., Ingram-Smith, C.J., Mackinder, L.,
Miller, T.E., Heuberger, A.L., Peers, G., Smith, K.S., et al. (2014). Alternative acetate
production pathways in Chlamydomonas reinhardtii during dark anoxia and the dominant
role of chloroplasts in fermentative acetate production. The Plant Cell, 4499–4518.
Yokono, M., Nagao, R., Tomo, T., and Akimoto, S. (2015). Regulation of excitation energy
transfer in diatom PSII dimer: How does it change the destination of excitation energy?
Biochimica et Biophysica Acta (BBA)-Bioenergetics 1847, 1274-1282.
Yoon, H.S., Hackett, J.D., Ciniglia, C., Pinto, G., and Bhattacharya, D. (2004). A molecular
timeline for the origin of photosynthetic eukaryotes. Molecular Biology and Evolution 21,
809-818.

241
Yoshioka, S., Taniguchi, F., Miura, K., Inoue, T., Yamano, T., and Fukuzawa, H. (2004). The
novel Myb transcription factor LCR1 regulates the CO2-responsive gene Cah1, encoding a
periplasmic carbonic anhydrase in Chlamydomonas reinhardtii. The Plant Cell 16: 1466–
1477.
Zhang, Z., Shrager, J., Jain, M., Chang, C.-W., Vallon, O., and Grossman, A.R. (2004). Insights
into the survival of Chlamydomonas reinhardtii during sulfur starvation based on microarray
analysis of gene expression. Eukaryotic Cell 3, 1331-1348.
Zorin, B., Lu, Y., Sizova, I., and Hegemann, P. (2009). Nuclear gene targeting in
Chlamydomonas as exemplified by disruption of the PHOT gene. Gene 432, 91-96.
Zhu, S.-H., and Green, B.R. (2010). Photoprotection in the diatom Thalassiosira pseudonana:
Role of LI818-like proteins in response to high light stress. Biochimica et Biophysica Acta
(BBA) - Bioenergetics 1797, 1449-1457

242
5.7 Acknowledgements
This Ph.D project has brought me around the world! It is difficult to describe how this experience
deeply changed my person. I had the chance to visit incredible places and discover different cultures.
This journey led me also to connect with incredible people who has inspired me and helped me
during these 3 years.
All my gratitude goes to these people.
First of all, I would like to thank Dr. Christelle Breton, Prof. Claire Remacle, Dr. Xenie Johnson, Dr.
Maurizio Ribera D’Alcalà and Prof. Jun Minagawa for accepting to valuate my work of thesis.
I would like to deeply thank my Ph.D supervisor Dr. Giovanni Finazzi who gave me the opportunity
to join the AccliPhot consortium. During this period, thanks to his supervision he taught me how to
become an independent scientist. I will always be grateful to him for this choice.
To Dr. Dimitris Petroutsos, for the constant support and help during these years.
Many thanks also to Dr. Denis Falconet for the everyday kindness and for refreshing my passion for
science.
I would like to take the opportunity also to thank the director of the Cell and Plant Physiology
Laboratory Dr. Norbert Rolland who accepted me in the Lab.
To all the colleagues at the PCV Lab and CEA. My gratitudes goes especially to: Cecile Giustini, Gilles
Curien, Marcel Kuntz, Leonardo Magneschi, Michel Matringe, Lucas Moyet, Daniel Salvi, Fabrizio
Iacono and Eric Marechal. A “super merci” also goes to Sophie, Danielle and Nassima always there
for any questions.
A special thank goes to Martino, Valeria and Matteo my buddies in this busy journey called Ph.D! It
was AWESOME to find you here. Thanks for every minute spent together!!
To my “French” family: Xenia, Raquel, Lucilla, Valeria B. and the group of Españoles + Italianos 2.0.
To the AccliPhot team that turns every meeting in a funny adventure!
Finally, to “the pillars of my heart” my family for the continuous support over the years.
Now is the moment to find new adventures and discover new seas!

243