History of glacial terminations from the Tiber River, Rome: Insights into glacial forcing mechanisms
18
See discussions, stats, and author profiles for this publication at: https://www.researchgate.net/publication/216826873 History of Glacial terminations from the Tiber River, Rome: Insights into Glacial forcing mechanisms Article · June 2008 DOI: 10.1029/2007PA001543 CITATIONS 23 READS 23 3 authors: Some of the authors of this publication are also working on these related projects: Paleoceanography of the Brazilian Equatorial Margin (BEM) View project NextData View project Fabrizio Marra National Institute of Geophysics and Volcanology 158 PUBLICATIONS 2,473 CITATIONS SEE PROFILE Florindo Fabio National Institute of Geophysics and Volcanology 322 PUBLICATIONS 3,940 CITATIONS SEE PROFILE Enzo Boschi University of Bologna 414 PUBLICATIONS 8,512 CITATIONS SEE PROFILE All content following this page was uploaded by Florindo Fabio on 04 February 2015. The user has requested enhancement of the downloaded file. All in-text references underlined in blue are added to the original document and are linked to publications on ResearchGate, letting you access and read them immediately.
Transcript of History of glacial terminations from the Tiber River, Rome: Insights into glacial forcing mechanisms

Seediscussions,stats,andauthorprofilesforthispublicationat:https://www.researchgate.net/publication/216826873
HistoryofGlacialterminationsfromtheTiberRiver,Rome:InsightsintoGlacialforcingmechanisms
Article·June2008
DOI:10.1029/2007PA001543
CITATIONS
23
READS
23
3authors:
Someoftheauthorsofthispublicationarealsoworkingontheserelatedprojects:
PaleoceanographyoftheBrazilianEquatorialMargin(BEM)Viewproject
NextDataViewproject
FabrizioMarra
NationalInstituteofGeophysicsandVolcanology
158PUBLICATIONS2,473CITATIONS
SEEPROFILE
FlorindoFabio
NationalInstituteofGeophysicsandVolcanology
322PUBLICATIONS3,940CITATIONS
SEEPROFILE
EnzoBoschi
UniversityofBologna
414PUBLICATIONS8,512CITATIONS
SEEPROFILE
AllcontentfollowingthispagewasuploadedbyFlorindoFabioon04February2015.
Theuserhasrequestedenhancementofthedownloadedfile.Allin-textreferencesunderlinedinblueareaddedtotheoriginaldocument
andarelinkedtopublicationsonResearchGate,lettingyouaccessandreadthemimmediately.

History of glacial terminations from the Tiber River, Rome:
Insights into glacial forcing mechanisms
Fabrizio Marra,1 Fabio Florindo,1 and Enzo Boschi1
Received 14 September 2007; revised 28 December 2007; accepted 1 February 2008; published 30 April 2008.
[1] We document the aggradational history of the Tiber River delta through the last 17,000 years by means of17 new 14C ages from peat or wood collected from the delta sediment. An abrupt change in sediment clast size,grading from gravel to clay, occurred between 13.63 (±0.20) and 12.80 (±0.15) ka, indicating that it wassynchronous with the last glacial termination, with no appreciable phase lag. Knowing this phase relationshipenables us to reduce the magnitudes of age uncertainties for aggradational sections corresponding to glacialterminations IX through III, which we had dated previously by 40Ar/39Ar methods. Glacial terminations VIII,VI, and IV precede beyond 95% confidence the ages predicted by Northern Hemisphere summer insolationmaxima. Additionally, we find that each of these seven glacial terminations follows particularly mild insolationminima, which we suggest may be regarded as the preconditioning factor to trigger a glacial termination.
Citation: Marra, F., F. Florindo, and E. Boschi (2008), History of glacial terminations from the Tiber River, Rome: Insights into
glacial forcing mechanisms, Paleoceanography, 23, PA2205, doi:10.1029/2007PA001543.
1. Introduction
[2] During the last decade, we have studied aggradationalcoastal sections of the Tiber River and performed 40Ar/39Arage assessment of volcanic interbeds to provide a chronol-ogy for glacial terminations that is independent of orbitalforcing assumptions [Karner and Renne, 1998; Karner andMarra, 1998; Marra et al., 1998; Karner et al., 2001a;Florindo et al., 2007]. Here we report new 14C ages of peatand wood collected from the Tiber River delta alluvialsediments, which we use to estimate the phase relationshipbetween the sedimentary response and the last glacialtermination (glacial termination I (TI)), for which sea levelchange is the presumed forcing mechanism. We then applythis phase model to 40Ar/39Ar chronologies we have devel-oped for older depositional sequences in order to refine theages for past glacial terminations TIII to TIX.
2. Radioisotopic Constraints to the Tiber RiverSedimentary Record
[3] The alluvial sediments of the Tiber River delta havebeen sampled in great detail recently during drilling cam-paigns performed by the municipality of Rome for civilengineering purposes [Corazza et al., 1999; Bozzano et al.,2000]. We have performed detailed stratigraphic analysis ofthe clastic sediments in these cores and sampled severalintervals for 14C age assessment (Table 1). We have inte-grated this new information with data from other studies[Belluomini et al., 1986; Lambeck et al., 2004] to map thesubsurface stratigraphy of the fluvial channel through thecoastal plain and the delta (Figures 1a and 1b).
[4] Results of the chronostratigraphic study show that afining upward succession of clastic sediment fills the valleyincision created by the Tiber River during the last glacialperiod. Its thickness increases from 60 m in northern Rometo over 100 m near the coast (Figure 1b). A coarse-grained(centimeter- to decimeter-sized) gravel bed approximately10 m in thickness is at the base of the sedimentarysuccession throughout this area. The gravel abruptly gradesupward to sandy clay, which constitutes the remainder ofthe valley fill. The granulometric change occurs verticallyover a few centimeters (Figure 2), jumping several divisionsof sediment classified in the Unified Soil ClassificationSystem, passing from well-graded clean gravel and sandfor the basal gravel layer to high-plasticity silt and clay withorganic clay for the overlying clayey section [Bozzano etal., 2000]. This conformable bedding contact indicates arapid reduction in the competence (maximum size of solidtransport) of the Tiber River. Gravel does not occur in theoverlying alluvial sediments of the Tiber River, with theexception of a discontinuous, few centimeter thick layer ofsandy gravel (with clast diameter �1 cm) that is present30–35 m above the gravel-clay contact in downtown Rome[Bozzano et al., 2000; Corazza et al., 1999].[5] Fifteen new (plus two previously performed [Florindo
et al., 2007]) 14C ages (Table 1) on wood or peat from theriver sediment enable us to estimate the timing of theaggradation within a large sector of the terminal portionof the Tiber River basin (Figures 1a and 1b). The 14C ageswere performed at the Beta Analytic Laboratory (Florida,United States). Conventional 14C ages (Table 1, secondcolumn) have been calibrated (Table 1, third column) usingINTCAL 98 [Stuiver et al., 1998]. All the 14C agesmentioned hereafter in the text are calibrated B.P.(referenced to 1950 A.D.) and given in kiloannum. The14C ages indicate that the deposition of the gravel bedstarted soon after the Last Glacial Maximum (LGM)(�19 ka) [Bard et al., 1990] and terminated during or
PALEOCEANOGRAPHY, VOL. 23, PA2205, doi:10.1029/2007PA001543, 2008ClickHere
for
FullArticle
1Istituto Nazionale di Geofisica e Vulcanologia, Rome, Italy.
Copyright 2008 by the American Geophysical Union.0883-8305/08/2007PA001543$12.00
PA2205 1 of 17

immediately after the occurrence of meltwater pulse 1A(MWP-1A) (14.17–13.61 ka), when sea level rose onaverage 3–5 m per century for several centuries [Peltierand Fairbanks, 2006; Stanford et al., 2006]. In particular,the abrupt transition from coarse gravel to clay occurredbetween 13.630 (±0.200) (age of the youngest samplecollected no more than 1.1 m below the top of the gravelbed in the main Tiber River valley) and 12.797 (±0.152) ka(age of the oldest sample collected 1 m above the base of theclay section in the main Tiber River valley; see Figure 1c).The uncertainty in the depth of the sample collected in thegravel layer is because the gravel is a loose deposit and thesampled core has a length of 1.1 m. To be conservative,we assume the maximum depth for this sample relative tothe base of the gravel bed (see Figure 2c).[6] Elsewhere, a sample collected within the transition
zone between the coarser basal layer and the clay sectionwithin a tributary valley of the Tiber River (GrottaperfettaValley, Figure 1b, stratigraphic section C) yielded an age of14.151 (±0.355) ka, indicating that the start of fine-grainedsedimentation was nearly synchronous (within 1 ka)throughout the investigated area, independent of distancefrom the river mouth or elevation at which the samples weretaken. According to previous studies [Belluomini et al.,1986; Ammerman et al., 2000; Lambeck et al., 2004],subsequent aggradation of the clay section occurred primar-ily in the time span 13–6 ka, and at this latter age, thesediment elevation in the coastal plain was close to thepresent-day sea level.[7] It is important to note that the deposition of gravel
marks a unique time in the depositional history of the TiberRiver, occurring during a �5 ka interval between the LGM(�19 ka) [Bard et al., 1990] and TI (�14 ka) [Stanford etal., 2006]. Gravel deposition has not occurred again in thispart of the basin since �14 ka. As mentioned above, noborehole among the hundreds drilled within the alluvialvalley of the Tiber River recovered any sediment with agranulometry larger than 1 cm above the basal gravel bed
[Mortari et al., 1979; Bozzano et al., 1997, 2000; Corazzaet al., 1999]. Therefore the transportation by the Tiber Riverof gravel with diameter of the pebbles >5 cm requiredexceptional hydrologic conditions that did not repeat duringHolocene time.
3. Climate Significance of the Gravel-ClaySedimentary Transition
[8] The chronology of the last deglacial alluvial sectionfrom the Tiber River matches well with the curves of sealevel rise [e.g., Bard et al., 1996], as well as with that of arecently constructed stacked benthic foraminiferal d18Orecord dated by orbital tuning to 65�N June insolation[Lisiecki and Raymo, 2005] (Figure 1c). In particular, thetiming of the sedimentary transition from gravel to clayappears nearly synchronous to the sudden increase in sealevel rise occurring during MWP-1A [Fairbanks, 1989;Bard et al., 1990, 1996]. The MWP-1A has been recentlydated by U/Th methods to occur between 14.17 and 13.61ka, with a peak rate of sea level rise close to 13.86 ka[Stanford et al., 2006]. This latter age matches the youngestage determination of 13.63 (±0.20) ka at the top of thegravel bed in the Tiber River section (Figure 1c). Weinterpret this age concordance to verify that the transitionin the Tiber River from coarse- to fine-grained sedimenta-tion coincides with the last glacial termination.[9] Clast provenance also supports our interpretation that
the basal gravel of the Tiber River section should beregarded as an indicator of the deglaciation event. Theseclasts were interpreted by Conato et al. [1980] to haveoriginated from the carbonate rocks of the Apennine Moun-tains, a fold-and-thrust belt reaching elevations up to 2000m above sea level (asl). The carbonates are located about 50km east of the present-day Tyrrhenian Sea coast (Figure 1a).The fact that this coarse material reached the delta of theTiber River only between 19 and 14 ka indicates that only inthat time interval did the river have competence necessary
Table 1. The 14C Age Determinations on the Sedimentary Deposits of the Tiber Rivera
Sample
ConventionalRadiocarbon Age,
years B.P.Calibrated Age,
years B.P.Elevation,m asl Depth, m 13C/12C Material
C1 4990 ± 70 5755 ± 155 �1.0 +36.5 �28.2% woodB1 6590 ± 40 7500 ± 70 �5.7 +39.3 �27.8% woodD1 7380 ± 40 8230 ± 90 �12.2 +30.8 �23.4% woodC2 7610 ± 60 8400 ± 60 �12.6 +14.9 �28.5% peatC3 7960 ± 70 8810 ± 210 �15.3 +12.2 �28.4% peatB2 8090 ± 40 9045 ± 55 �18.6 +26.4 �26.2% woodB3 8150 ± 60 9135 ± 135 �20.9 +24.1 �27.1% woodD2 9140 ± 120 10,267 ± 308 �20.5 +22.5 �25.0% peatC4 9270 ± 70 10,440 ± 200 �20.0 +7.5 �27.3% woodC5 9570 ± 70 10,915 ± 245 �24.0 +3.5 �26.6% woodB4 10,150 ± 60 11,870 ± 440 �37.5 +7.5 �25.7% woodA1 10,736 ± 77 12,797 ± 152 �61.0 +0.5 na peatD3 10,830 ± 40 12,825 ± 175 �39 +4 �30.3% woodB5 11,610 ± 40 13,630 ±200 �46.5 �1.5 �28.4% woodC6 12,210 ± 90 14,151 ± 355 �30.0 �2.5 �27.0% sedimentA2 12,400 ± 80 14,513 ± 184 �63.5 �2.0 na woodC7 14,050 ± 70 16,840 ± 400 �35.0 �7.5 �28.9% woodaThe distance of the dated sample from the contact between gravel and clay (positive above) is reported in the fifth column. Samples are labeled
according to boreholes location and stratigraphic elevation, as reported in Figure 1. A, Tiber Valley (Ponte Galeria); B, Tiber Valley (Valco San Paolo andTorrino); C, Grottaperfetta Valley; D, Tiber Valley (Corso Vittorio Emanuele).
PA2205 MARRA ET AL.: TIBER RIVER GLACIAL TERMINATIONS HISTORY
2 of 17
PA2205

Figure 1. (a) Digital model of the greater area of Rome and the terminal tract of the Tiber River systems(courtesy of European Space Agency/European Space Research Institute). (b) Investigated stratigraphicsections (A, B, C, and D) of the youngest depositional sequence of the Tiber River showing (red circles)the calibrated radiocarbon ages (in kiloannum; those marked with asterisks are from work by Belluominiet al. [1986]) of the sedimentary deposits (see also Table 1). These ages show that deposition within thefluvial valleys was synchronous in response to sea level rise following the Last Glacial Maximum. Agesconstraining the time of deposition of the basal gravel layer are also reported on the stratigraphiccolumn, represented horizontally within inset C. (c) The age of the sedimentary switch from gravel toclay (pink-shaded vertical bar: 12.95–13.83 ka; see text) is constrained by several samples of organicsediment collected within the top portion of the gravel layer and within the basal portion of theoverlying clay sediment. This age is compared to the sea level record [Bard et al., 1996], to the age ofmeltwater pulse 1A [Fairbanks, 1989] (black horizontal bar: 14.17–13.61 ka [Stanford et al., 2006]),and to the d18O record [Lisiecki and Raymo, 2005]. These data suggest that the sedimentary switchoccurred in response to increased rate of sea level rise during the last glacial termination (TI).
PA2205 MARRA ET AL.: TIBER RIVER GLACIAL TERMINATIONS HISTORY
3 of 17
PA2205

to transport such a load. We believe the gravel depositionduring the early stages of the deglaciation is most reason-ably explained by exceedingly high discharge in the TiberRiver drainage caused by rapid melting of the Apennineglaciers combined with increased regional rainfall. Com-bined with this increased discharge, glacial melting wouldhave exposed and mobilized glacial till, thereby increasingsediment supply to the drainage basin. Additionally, low-
ered base level during the LGM would have led to a steepergradient and hence greater competence for that portion ofthe river valley that now is at the present-day coastline.These conditions would have worked in concert during the19–14 ka interval, until the accelerated rise in sea levelduring the glacial termination led to a rapid drop incompetence of the Tiber River and, consequently, to thestart of sandy clay deposition. The 14C age constraints on
Figure 2. Three examples of the sedimentary transition from gravel to clay in as many aggradationalsections of the Tiber River. (a) Ponte Galeria Formation, Unit 1, Casele Infernaccio site [Marra et al.,1998]. The gravel-clay transition identifies TVIII at the beginning of MIS 19. A tephra layer occurringbetween the gravel and the clay recovered in a borecore drilled in Rome [Florindo et al., 2007] is dated at802 ± 8 ka (1s, full errors). (b) Borecores of the Istituto Nazionale di Geofisica well drilled in southernRome [Florindo et al., 2007]. A 1.5 m thick pyroclastic flow deposit dated at 649 ± 3 ka (1s, full errors)occurs at the sedimentary transition that identifies TVI at the beginning of MIS 15. (c) Cores of theborehole drilled in the valley of the modern Tiber River at San Paolo locality (section B in Figure 1b),recovering the gravel-clay transition.
PA2205 MARRA ET AL.: TIBER RIVER GLACIAL TERMINATIONS HISTORY
4 of 17
PA2205

this sedimentary switch show that it was coincident with orimmediately followed MWP-1A. It is possible that follow-ing MWP-1A, the Older Dryas cooling event [Bjorck et al.,1998] led to decreased regional rainfall, which would havedecreased the competence of the Tiber River.
4. Extending the Sedimentary Model to theOlder Tiber River Depositional Sequences
[10] We have studied thoroughly the alluvial sections ofthe Tiber River delta [Karner and Marra, 1998; Marra etal., 1998; Karner et al., 2001a; Florindo et al., 2007]. It hasbeen our observation that all large-scale sedimentationevents (i.e., accumulation of tens of meters of alluvialsediment) share this general stratigraphy of basal coarsegravel passing abruptly upward to clay (see Figure 2).Having ruled out other mechanisms that could lead to rapidchanges in deposition [Marra et al., 1998; Karner et al.,2001b], we interpret rapid eustatic sea level rise associatedwith the catastrophic discharge of glacial meltwater to beresponsible for changes in competence of the Tiber River.[11] We emphasize that smaller meltwater pulses that
accompany each termination [e.g., Siddall et al., 2006a]and which provide unique signatures to each glacial termi-nation would not lead to the persistent competence decreaseidentified in the alluvial sections of the Tiber River delta.Rather, those meltwater pulses may have led to morecomplex sedimentary architectures for seaward portions ofthe delta. By comparison, the delta sediments that we havestudied are near or at full interglacial sea level. With thisinterpretation, we believe it is appropriate to apply the TImodel of zero phase lag to the older alluvial sections of theTiber River delta.
5. Age Assessment for Glacial TerminationsIX Through III
[12] Although past glacial terminations may have had adifferent story with respect to TI [e.g., Siddall et al., 2006a]each glacial termination encompasses a well-constrainedtime window on the oxygen isotope curve created fromforaminifera tests, composed of the glacial maximum peakand the following highstand peak. With the only exceptionof marine oxygen isotope stage (MIS) 11, this time spanencompasses 10–13 ka [e.g., Bassinot et al., 1994]. Thesedimentary switch must occur within this time interval, andthe actual difference in time with what is considered to bethe glacial termination (conventionally, the flex in the curve,corresponding to its first derivative) cannot exceed fewkiloannum (±6.5 ka at maximum, for what is said in thefollowing of this section). Also, importantly, any possibletectonic effect on changing the hydrologic regime of theriver near its mouth and affecting the deposition of gravel(i.e., sudden lowering causing the cessation of graveldeposition) must occur within this time span: Therefore itcan only anticipate the sedimentary switch of few kilo-annum, shifting it closer to the glacial maximum. Finally,isostatic effects at this latitude are to be considered small[e.g., Lambeck et al., 1994] and cannot affect the describedsedimentary switch from gravel to clay.
[13] Ages of the glacial terminations assumed from theastronomical calibration of the d18O record following thetraditional Milankovich theory are usually provided withoutany associated error [e.g., Lisiecki and Raymo, 2005].However, this error can be estimated [e.g., Karner et al.,2002] to be around ±5 ka. Therefore the age of occurrenceof the sedimentary switch during a glacial termination canbe assumed to equal the age predicted by the astronomicalcalibration of the isotopes record for the glacial termination,when a maximum associated error of ±10 to ±11.5 ka,including error associated with the tuning of the curve(±5 ka) and the uncertainty of the occurrence of thesedimentary switch between the lowstand and the highstand(±5 to ±6.5 ka) is considered. This error is in the same orderas that associated with 40Ar/39Ar dating of volcanic layers.[14] Our previous model for assigning a 40Ar/39Ar chro-
nology to termination events preserved in the Tiber Riverdelta alluvial sections was conservative. We had calculatedage intervals for termination events on the basis of the40Ar/39Ar ages of pyroclastic deposits that bracketedthe switch from coarse- to fine-grained sedimentation. Therealization that there is no appreciable phase lag between thesedimentary transition and the glacial termination enables usto improve by better than a factor of 2 the age uncertainty forthe timing of the terminations.[15] Here we present a revised sedimentary data set
(Figure 3) that we have reconstructed on the basis of newfield data that help clarify the occurrence of the tephralayers within the different sedimentary cycles and recognizethe presence of several parasequences that provide furtherlinks with the eustatic fluctuations and, indirectly, with thed18O record. A parasequence, as defined in the sequencestratigraphy, corresponds to a full transgression cycle,including erosion caused by sea level fall and depositionduring the following sea level rise. Therefore unconformity-bounded sedimentary units, as those shown in Figure 3,represent the physical remnant of this eustatic event.Figure 3 summarizes our data for MIS 19–7. For thedetailed stratigraphic features and the correlation to theMIS, we direct the readers to our previous works.
5.1. MIS 21
[16] No radioisotopically dated aggradational sectionolder than that correlated to MIS 20–19 (Ponte Galeria 1(PG1) unit) [Marra et al., 1998] is present in the delta of theTiber River. The Monte Ciocci–Monte delle Piche aggrada-tional unit [Marra, 1993] was tentatively correlated to MIS22–21 [Karner et al., 2001a] on the basis of its stratigraphicrelationship with respect to the younger PG1 unit.
5.2. MIS 19
[17] A complex stratigraphic pattern, the consequence ofmainly synsedimentary tectonics [Karner et al., 2001a;Florindo et al., 2007], characterizes the deposits correlatedto MIS 19 (PG1 sequence) [Marra et al., 1998]. Thecorrelation through different areas is achieved by meansof paleomagnetic study of the clay section of this aggrada-tional unit that is deposited before the Matuyama/Brunhesmagnetic reversal [Marra et al., 1998; Florindo et al.,2007]. Moreover, two tephra layers dated 802 ± 8 ka (1s,full errors) and 783 ± 7 ka (1s, full errors) [Karner et al.,
PA2205 MARRA ET AL.: TIBER RIVER GLACIAL TERMINATIONS HISTORY
5 of 17
PA2205

2001b] occur above the basal gravel horizon of the finingupward succession in Rome and allow correlation to MIS19. The lowest tephra layer occurs exactly at the transitionfrom gravel to clay, and its age is an excellent timeconstraint to TIX.
5.3. MIS 17
[18] We have reevaluated the climate significance of theage for one tephra layer at the base of the gravel bed in thesecond aggradational section of the Ponte Galeria Forma-tion (PG2 unit) [Marra et al., 1998]. The PG2 unit ischaracterized by a bipartition of the basal gravel layer thatwas interpreted the consequence of synsedimentary tectoniclowering of the delta area [Marra et al., 1998]. A tephralayer, dated 758 ± 8 ka (1s full errors) [Karner et al.,2001b], is present near the base of the early gravel layer. Inprevious works [Marra et al., 1998; Florindo et al., 2007],this tephra layer was suspected of being significantlyreworked, since it predates the start of MIS 17 by about46 ka. However, when positioned on the oxygen isotopesrecord, the age inferred for the start of aggradation of thePG2 sequence, in the case that the tephra layer is notreworked, falls close to a significant warm peak (substage18.3) [Bassinot et al., 1994] that precedes the larger peak ofMIS 17. When positioned on the insolation curve (seesection 5.4), this age matches the condition here proposedto trigger a deglaciation (first maximum of insolation after a
mild minimum (mild minima equals insolation minima oflow intensity) on the 65�N summer insolation curve). Thusthe age of 758 ± 8 ka should be considered a marker for theinitiation of substage 18.3, and we use it to date TVIII.Although there is no radioisotopic constraint to the uppergravel layer of the PG2 unit, on the basis of the lack of anyevident erosion on top of the clay section (‘‘middle clay’’)[Marra et al., 1998], we interpret the deposition of thisgravel as the completion of the early eustatic event, ratherthan a second transgressive cycle occurring during MIS 17.Differently, the occurrence of a novel transgression istestified to by the presence of an oxydated layer of sandon top of the second set of gravel (‘‘beach sand’’ [Marra etal., 1998]), indicating a regression of the coastline preced-ing the deposition of the ‘‘Venerupis senescens’’ clay layer,of littoral environment, that closes the PG2 unit. Wecorrelate this second transgressive event to MIS 18.2–17.
5.4. MIS 15
[19] The aggradational history of the deposits correlatedto MIS 15 is well constrained by one tephra layer occur-ring exactly at the gravel-clay transition, dated 649 ± 3 ka(1o, full errors) [Florindo et al., 2007] and by two moretephra layers, dated 614 ± 7 and 605 ± 9 ka (1s, fullerrors) interbedded in the upper portion of the clay deposit(highstand system tract deposit [Marra et al., 1998]).Another tephra layer, dated at 588 ± 7 ka (1s, full errors;
Figure 3. Schematic of the composite geologic section (horizontal not to scale) showing thelithostratigraphic features of the aggradational deposits of the Tiber River depositional sequences anddated volcanic layers used to construct the age model for glacial terminations. Geochronologic data areresumed in Tables 2a and 2b.
PA2205 MARRA ET AL.: TIBER RIVER GLACIAL TERMINATIONS HISTORY
6 of 17
PA2205

unpublished age), occurs at the base of fluvial lacustrinedeposits that fill an incision within the highstand system tractdeposits of MIS 15 and allows correlation of this para-sequence to substage 15.1 (Figure 3).
5.5. MIS 13
[20] Deposits correlated to MIS 13 (‘‘Valle Giulia’’ unit[Marra and Rosa, 1995]) are present along the Tiber Rivervalley in Rome and in the Fosso Galeria stream valley[Karner and Marra, 1998]. One tephra layer (500 ± 5 ka,1s, full errors [Karner and Renne, 1998]) in the upperportion of the sedimentary deposits postdates the occurrenceof TVI. A newly investigated outcrop along the Tiber Valleyin Rome (Figure 3, top right corner) allows us to add onegeochronologic constraint to this aggradational unit. Thepresence of the ‘‘Tufo del Palatino’’ pyroclastic flow deposit(528 ± 5 ka, 1s, full errors [Karner et al., 2001b]) at thebase of the clay section and above the gravel of the ‘‘ValleGiulia’’ unit allows us to date with a good approximationthe sedimentary switch and thus TVI. The large time span(approximately 28 ka) between the age of the higher portionof the deposits (dated at about 500 ka) and the age of thoseat the base accounts for the long duration of MIS 13, whichshows two peaks in the isotopes curve (substages 13.3 and13.13 [Bassinot et al., 1994]).
5.6. MIS 11
[21] Age of deposition of the sedimentary unit correlated toMIS 11 is well constrained by three tephra layers [Karner andMarra, 2003]. The lowest one of these tephra layers occursimmediately above the transition from gravel to clay, and itsage (437 ± 7 ka, 1s, full errors) is used here to date TV.
5.7. MIS 9
[22] The pyroclastic flow deposit of ‘‘Tufo Lionato’’(366 ± 5 ka, 1s, full errors; age revised for this work) fillsthe paleoincisions at the base of the sedimentary deposits(‘‘Aurelia’’ Formation [Conato et al., 1980]) whose corre-lation to MIS 9 is granted by the ‘‘sealing’’ of anotherpyroclastic flow deposit (‘‘Upper Tufo Giallo di Sacrofano’’285 ± 3 ka, 1s, full errors [Karner and Renne, 1998]). Onthe basis of these observations, emplacement of ‘‘TufoLionato’’ is considered to precede the aggradation withinthe paleovalleys incised during lowstand of MIS 10 [Marraand Rosa, 1995]. However, since the basal gravel layer ofthe Aurelia Formation has not been observed so far inoutcrop, its direct relationship with the Tufo Lionato pyro-clastic flow is not determined. Therefore the age of thepyroclastic flow is to be considered a close postquam forTIV, whereas the age of 285 ± 3 ka is an antequam foroccurrence of substage 8.5 [Marra, 2004].
5.8. MIS 7
[23] Two tephra layers occur within the deposit of the‘‘Vitinia’’ unit [Conato et al., 1980] in the delta of the TiberRiver and allow for its correlation to MIS 7 [Karner andMarra, 1998]. However, strong evidence of reworking(rounding of the volcanic scoria clasts and mixing withother sedimentary material) suggests discarding the age ofthe first tephra layer above the gravel in favor of thatdetermined for the layer (a primary air fall deposit) imme-
diately above the former one (253 ± 10 ka, 1s, full errors[Karner and Renne, 1998]) whose stratigraphic positionalso indicates a strict vicinity to the sedimentary switch. Wealso note that in agreement with the occurrence of a secondprominent peak in the isotopic curve, evidence of a para-sequence similar to those recognized for MIS 15 and MIS 9is found within the highstand system tract deposit correlatedto MIS 7. However, no radioisotopic constraint on thesedimentary record is so far available for the precise timingof this transgressive event matching substage 7.3 (Figure 3).
5.9. MIS 5
[24] No tephra layer occurs within the ‘‘Tyrrhenian’’deposits [Conato et al., 1980] of the Tiber River correlatedto MIS 5; therefore no age constraint for TII is availablefrom the Roman sedimentary record. In Figure 4b, we reportdifferent independent ages for TII from literature, spanning135.8 ± 0.8 ka (provided by combined 230Th and 231Paages on uplifted Barbados coral terraces [Gallup et al.,2002]) to 142 ka (provided by U/Th dating at Devil0s Hole[Winograd et al., 1992]).
5.10. MIS 1
[25] A peat layer and a wood fragment intercalated 0.5 mabove and 2.0 m below the gravel-clay transition, respec-tively, were recovered in a borehole drilled within thesedimentary succession of the Tiber River close to thealluvial coastal plain (Figure 1a (A, B, D, C)). They weredated by 14C method at 12.80 ± 0.15 and 14.51 ± 0.18 kaB.P. (F. Bozzano, personal communication, in work byFlorindo et al. [2007]). Another wood fragment was recov-ered 1.1 m within the top of the gravel layer (Figure 2c) in adifferent, 10 km more inland borehole (B, Figure 1). Wedated it at 13.63 ± 0.20 ka (Table 1). A peat layer recoveredwithin the clay section 1 m above the gravel top in a thirdborehole, 5 km more inland in downtown Rome (D,Figure 1), yielded an age of 12.82 ± 0.17 ka (Table 1).Finally, a peat layer was recovered at the transition betweena basal coarser bed and the overlying clay section in aborehole drilled in the Grottaperfetta Valley (C, Figure 1)within the alluvial deposit of a tributary of the Tiber River.It yielded an age of 14.15 ± 0.35 ka. These five radiocarbonages allowed us to constrain the sedimentary switch be-tween 13.63 ± 0.20 and 12.82 ± 0.17 ka. It is remarkablethat the oldest extreme of this time span corresponds to theage of the peak in sea level rise (13.86 ka) during the lastglacial termination determined by Stanford et al. [2006].
6. Discussions
6.1. Sensitivity of the Tiber River Delta to Sea LevelChange
[26] What has become evident to us through detailedstudy of the delta sections is that the exposed portions ofthe Tiber delta sediments consistently preserve the narrowtime window encompassing the glacial terminations, butthey seem to have only minor sensitivity to higher-frequencyand lower-amplitude sea level fluctuations, such as thoseinduced by millennial-scale variability [e.g., Siddall et al.,2007]. We interpret the notable absence of all but a fewsmall parasequences (e.g., MIS 8.6/8.5 and 7.4/7.3)
PA2205 MARRA ET AL.: TIBER RIVER GLACIAL TERMINATIONS HISTORY
7 of 17
PA2205

(Figure 3) to be an artifact of the relatively short timeinterval during which accommodation space is created andfilled prior to delta progradation during sea level high-stands. With regard to the exceptional cases, average sealevel fluctuations during substages 8.6 and 7.4 are esti-mated to have been as large as 50 and 80 m below sea
level (bsl), respectively Siddall et al., 2006b, and refer-ences therein]. Relatively thin (roughly 1 m) beds ofgravel (clast diameter �2 cm) are at the base of boththe parasequences correlated to these isotopic events(Figure 3), suggesting that a sustained sea level fall of�80 m bsl approximates the threshold for the deposition
Figure 4. (a) Ages in kiloannum (red lines; gray shaded area represents associated full errors at2s) for glacial terminations, determined by the 40Ar/39Ar dating of volcanic layers occurring withinthe depositional sequences of the Tiber River [Karner and Renne, 1998; Karner et al., 2001a;Florindo et al., 2007], compared to those (green dotted lines) predicted by the orbital tuning of thed18O curve [Lisiecki and Raymo, 2005]. A green shaded area, representing an arbitrarily assigned ±5 kaerror (see text), is associated with those termination ages for which the mismatch with the Tiber Riversedimentary record exceeds the errors associated with both data sets. Different independent ages for TIIfrom work by (1) Winograd et al. [1992], (2) Gallup et al. [2002], and (3) Petit et al. [1991] are shown.The 14C ages (13,630 ± 0.200 through 12,797 ± 0.152 ka (this work)) for TI from the youngestdepositional sequence of the Tiber River are also shown. Numbering of substages in the oxygen isotopesrecord is from work by Bassinot et al. [1994]. (b) Comparison of the Tiber River glacial termination ageswith the 65�N summer mean insolation curve [Laskar et al., 2004]. Mean insolation (inW/m2) is computedusing the Laskar solution 2004 for the astronomical computation of the insolation quantities over thesummer period (between orbital positions 90� and 180�) from times of 0 to 1000 ka B.P. for a latitude of65�N (solar constant = 1365 W/m2). The blue line joins the minima of insolation (represented by circles).Blue circles represent relatively strong minima (below the dashed red trend line; see text); full red circlesrepresent the first relatively weak minimum (above the dashed red line) following one or more strongminimum. The occurrence of one such mild minimum is considered the potential trigger for adeglaciation. Red open circles are relatively weak minima that are ineffective to this process.
PA2205 MARRA ET AL.: TIBER RIVER GLACIAL TERMINATIONS HISTORY
8 of 17
PA2205

of the much larger gravel layers that are present at the baseof the sedimentary sequences.
6.2. Timing of Glacial Terminations
[27] As with the Holocene analog, the switch from coarse-to fine-grained deposition in the exposed portions of theTiber delta must postdate the glacial maxima (or in the caseof marine sediment, the positive peaks in foraminiferal d18Ocurves). Therefore the 40Ar/39Ar ages obtained from theTiber delta sections can be compared with termination ages
determined by other dating methods. In Figures 4 and 5, andTables 2a and 2b we compare the Tiber chronology withdifferent ages for glacial terminations on the basis of theapplication of planetary orbital theory to date isotopicchanges in foraminifera tests. While age errors assigned toorbitally dated sediment records vary widely in magnitude,we assume an age error of ±5 ka to encompass physicalfactors such as ocean mixing time and sampling densitywhen assigning orbital chronologies to marine sedimentrecords.
Figure 5. (a) Comparison of the radioisotopic ages for glacial termination (black vertical lines; shadedarea represents the full error at 2s) to the correspondent astronomical ages after different calibrations. Themismatch of the 40Ar/39Ar ages for TVIII, TVII, and TIII with respect their astronomical ages(independent from the calibration method) exceeds the errors associated with both data sets. See alsoTables 2a and 2b. (b) The radioisotopic ages are also compared to the time intervals (horizontal red bars),separating a mild minimum (red dots) from the subsequent maximum of insolation, during whichdeglaciations should occur after the model proposed in this paper. (c) A crossplot showing the excellentfit between these data sets. (d) The crossplot between the radioisotopic and the astronomical ages (thosefrom work by Lisiecki and Raymo [2005] are used for comparison) is also shown, evidencing the lesser fitfor TVIII, TVII, and TIII.
PA2205 MARRA ET AL.: TIBER RIVER GLACIAL TERMINATIONS HISTORY
9 of 17
PA2205

[28] As shown in Tables 2a and 2b, and Figures 4a and 5,ages from the Tiber delta for TIX, TVI, TV, and TIII areconsistent with the corresponding time window for theglacial termination identified in the orbitally dated d18Orecord. However, three alluvial sections of the Tiber deltaprovide ages that differ significantly from those of thecorresponding glacial terminations (i.e., TVIII [Marra etal., 1998], TVII [Florindo et al., 2007] TIV (this work),Tables 2a and 2b, and Figures 4a and 5e), even when fullerrors are considered for the 40Ar/39Ar ages. For these threeterminations, the 40Ar/39Ar ages predate by more than 10 kathe orbital age.[29] Whereas we do not believe that cause for the
deposition of these gravel beds may be a different onethan the occurrence of a deglaciation, it still may be thatthe correspondent age determinations are affected by anundetermined error or that the dated volcanic layers arethoroughly reworked. Alternatively, a different forcingmechanism than that provided by the so far acknowledgedastronomical tuning of the oxygen isotopes record shouldbe invoked to justify the occurrence of glacial terminations
at these ages. In section 6.3, we propose a forcingmechanism to glacial terminations according to this secondpossibility.
6.3. Mild Minima Insolation Forcing Mechanism
[30] Peak summertime insolation at 65�N is widely at-tributed to be the driving mechanism behind glacial termi-nations, despite general agreement that climate change mustalso be influenced by a variety of terrestrial forcing factors.In accordance with Huybers [2006], we have evaluatedmean summer insolation to be the best candidate to testour independent set of ages for glacial terminations. There-fore we plotted the Tiber delta glacial termination ages ontothe mean summertime (21 June–21 September) insolationat 65�N, using the orbital solution developed by Laskar etal. [2004] (Figure 4b). We noted the following insolationpattern leading up to the glacial terminations: a series ofinsolation minima of high intensity (full blue circles inFigure 4b) followed by a relatively weak insolation mini-mum (full red circles in Figure 4b). The glacial terminationoccurs during the following rise in insolation, and full
Table 2a. Summary of the Pleistocene Sedimentary Successions of the Tiber River and Their Radioisotopic Constraints Providing Their
Correlation to the Marine Isotopic Stages and to the Glacial Terminationsa
Marine Isotopic Stage Formation/Unit Radioisotopic Constraints, ka ± 1sb Glacial Termination Age, ka ± 2sMIS 21–? Monte Ciocci–Monte delle Piche Formation na TX? na
[Marra, 1993]MIS 19 Ponte Galeria Formation, unit 1 783 ± 7 TIX 802 ± 16
[Marra et al., 1998] 802 ± 8MIS 18.3 Ponte Galeria Formation, unit 2 758 ± 8 TVIII 758 ± 16
[Marra et al., 1998]MIS 15 Santa Cecilia Formation 605 ± 9 TVII 649 ± 9
[Karner and Marra, 1998] 614 ± 7649 ± 3
MIS 15.3 Santa Cecilia Formation (subunit) (this work) 561 ± 1588 ± 7c
MIS 13 Valle Giulia Formation 488 ± 2; TVI 528 ± 10[Marra and Rosa, 1995] 500 ± 5
528 ± 5MIS 11 San Paolo Formation 407 ± 4; 416 ± 6 TV 437 ± 14
[Marra and Rosa, 1995] 429 ± 2; 437 ± 7MIS 9 Aurelia Formation [Conato et al., 1980] 366 ± 5c TIV 366 ± 10MIS 8.5 Aurelia Formation (subunit) [Marra, 2004] 285 ± 3MIS 7 Vitinia Formation [Conato et al., 1980] 253 ± 5; 266 ± 4 TIII 253 ± 10MIS 5 Tyrrhenian Formation [Conato et al., 1980] na TII naMIS 1 Tiber River unit (this work) See Table 1 TI 13.39 ± 0.44
aSee also Figure 3.bAll 40Ar/39Ar ages recalculated from work by Karner and Renne [1998] and Karner et al. [2001b].cPreviously unpublished.
Table 2b. The 40Ar/39Ar ages (2s, full errors) for Glacial Terminations III Through IX Provided by the Sedimentary Record of the Tiber
River Compared to Different Correspondent Astronomical Agesa
TIII TIV TV TVI TVII TVIII TIX
Lisiecki and Raymo [2005] 238 � 248 332 � 342 �14 419 � 429 528 � 538 616 � 626 �14 707 � 717 �25 785 � 795SPECMAP 239 � 249 332 � 342 �14 418 � 428 526 � 536 616 � 626 �14 688 � 698 �44Huybers and Wunsch [2004] 230 � 248 322 � 342 �14 408 � 430 521 � 543 614 � 632 �8 706 � 720 �2240Ar/39Ar age 243 � 263 356 � 376 423 � 451 518 � 538 640 � 658 742 � 774 786 � 818Insolation forcing 244 � 255 374 � 383 428 � 437 535 � 547 653 � 661 770 � 778 808 � 816
aData are taken from work by Lisiecki and Raymo [2005], Huybers and Wunsch [2004], and Imbrie et al. [1984]. An arbitrary error of ±5 ka is associatedhere with the astronomical ages for which no indication is reported in the literature. The mismatches exceeding several kiloannum, out of the errorsassociated with both data sets, are reported in the second column for each glacial termination: The negative value indicates that the 40Ar/39Ar age predatesthe astronomical age. SPECMAP, Mapping Spectral Variability in Global Climate Project.
PA2205 MARRA ET AL.: TIBER RIVER GLACIAL TERMINATIONS HISTORY
10 of 17
PA2205

interglacial sea level is reached by the next insolationmaximum. This pattern indicates a zero phase lag relativeto Northern Hemisphere summertime insolation for most ofthe glacial terminations.[31] Each radioisotopically dated sedimentary proxy of
past glacial termination (i.e., each dated aggradationalsection of the paleo-Tiber River) matches a maximum ofinsolation that follows one such mild minimum (consideringfull errors at 2s). The dashed trend line plotted in Figure 4bfits the pattern that we describe and represents a potential‘‘threshold’’ of insolation above which an insolation mini-mum is warm enough to initiate a deglaciation. However,termination I clearly fails to fit this pattern: The threshold ofinsolation is surpassed by two minima during the last glacialperiod, without any glacial termination being apparentlytriggered. These facts possibly indicate that this modelcould be part of the solution and that a more complexmechanism has to be considered in order to justify theoccurrence of all glacial terminations. In particular, accord-ing to the simple empirical observation of a direct relation-ship between insolation and modern temperature [Huybers,2006], this threshold does not take into account the internaldynamics of the climate system (e.g., albedo, thickness ofglaciers, variations in thermohaline circulation, and changesin the biosphere). While a more thorough discussion of TI isaddressed in section 6.5, future studies should be undertak-en to quantify how these internal dynamics of the paleo-climate system affect the proposed mechanism, since it isbeyond the scope of this paper to do so.
6.4. Comparison to Other Models of Termination Ages
[32] It is important to note that independently from errorsassociated with the tuning of the isotopes record, theoccurrence of the maximum following one mild minimaon the insolation curve is mathematically determined; henceno significant error is associated with its age. However, alsoat this lesser flexibility, Figures 5b and 5c show that thedirect correlation between the occurrence of the ‘‘mildminima’’ on the 65�N summer mean insolation curves andthe radiometric data set provided by the sedimentary suc-cession of the paleo-Tiber River is straightforward. All theages proposed for glacial terminations III through IXoverlap at 2s (vertical shaded bars in Figures 5a and 5b)the time interval (horizontal red bars in Figure 5b) com-posed of the mild minimum (red dot in Figure 5b) andthe following maximum of insolation. The crossplot inFigure 5c provides a mean to test the good fit betweenthe radioisotopic ages for glacial terminations proposed inthis paper and the timing of the identified intervals capableto trigger a deglaciation in the 65�N summer mean insola-tion curve.[33] Comparison with different data sets of ages for
glacial terminations [Imbrie et al., 1984; Huybers andWunsch, 2004; Lisiecki and Raymo, 2005] provided bythe astronomical tuning of the d18O record is shown inFigure 5a. Following the mild minima hypothesis, glacialterminations IX, VIII, and VII occur during one maximumof insolation preceding that to which they are associated bythe astronomical tuning of the isotopes record. In particular,TIX and TVII are shifted back by one precession cycle,
whereas TVIII falls two cycles before its astronomicaltuning–provided occurrence. Only the age of TIX (802 ±16 ka, full errors at 2s), when considered at its youngestextreme of the associated full errors, overlaps to the agepredicted by the astronomical tuning of the isotopes record(790 ka [Lisiecki and Raymo, 2005]). The 40Ar/39Ar ages ofTVIII (758 ± 16 ka, full errors at 2s) and TVII (649 ± 9 ka,full errors at 2s), even at the youngest extreme of theassociated full errors, largely predate the ages provided bythe astronomical tuning of the isotopes record (712 and 621ka, respectively [Lisiecki and Raymo, 2005]) and alsopredate by 15 and 12 ka, respectively, the oxygen isotopesage of the glacial maximum that should precede them.A crossplot of the astronomical ages for glacial termina-tions provided by Lisiecki and Raymo [2005] and thecorresponding 40Ar/39Ar ages proposed in this paper isshown in Figure 5d. Three ‘‘outliers’’ corresponding toTIV, TVI, and TVII are evidenced. Therefore if gravel isdeposited in response to ice melting and if the datedvolcanic layers are not reworked, the astronomical tuningdoes not provide reliable ages for these glacial terminations.In contrast, these ages are in good agreement with the mildminima hypothesis. However, the 40Ar/39Ar age providedby the sedimentary deposits of the paleo-Tiber River for thefollowing TVI agrees with the mild minima model as wellas with the age provided by the astronomical tuning,suggesting that the gravel layers are reliable proxies of theglacial terminations.[34] Similarly as for TIX, the 40Ar/39Ar age for TV at its
extremes overlaps both with the isotopes age as well as withthe maximum of insolation following the mild minimumthat should trigger this termination. However, while themaximum of insolation with which TV is associated by theastronomical tuning is one of the smallest maximums in thewhole curve, posing the Milankovitch theory [e.g., Karnerand Marra, 2003], the correlation with the occurrence of amild minimum provides a causative effect for the glacialtermination.[35] The 40Ar/39Ar age for TIV (366 ± 10 ka, full errors at
2s) is about 20 ka off that provided by the astronomicaltuning (337 ka), mirroring what was said about TVIII.Independent U/Th ages from corals in a raised MIS 9 reefat Henderson Island suggest an initiation age of 334 ± 4 kafor this stage [Siddall et al., 2006b, and references therein];considering the two radiometric ages at their closest ex-treme, a minimum mismatch of 18 ka should be inferred.However, if we consider that after the proposed model theactual timing of deglaciation should match the age of therelated maximum of insolation on the 65�N summer record(i.e., 372 ka), we have a much larger mismatch of 34 ka, atleast.[36] Therefore a confirmation of the U/Th age of 334 ±
4 ka for TIV would seriously pose questions about theability of the mild minima model to predict this termination.Presently, stratigraphic interpretation of the Aurelia Forma-tion in Rome conflicts with the coral stratigraphy in thesubequatorial south Pacific. As mentioned before, however,the sedimentary record of the Aurelia Formation is the onethat has the poorest observational constraints among thosewe have investigated, and the possibility that the gravel
PA2205 MARRA ET AL.: TIBER RIVER GLACIAL TERMINATIONS HISTORY
11 of 17
PA2205

deposition largely postdated the emplacement of the pyro-clastic flow we have dated at 366 ± 10 ka cannot beexcluded. Finally, the 40Ar/39Ar age for the following TIIIoverlaps to the d18O age and reflects what was said aboutTVI.[37] In the light of what is evidenced above, we do not
believe it is reliable to state that the sedimentary model wepropose works only when the ages that it provides forglacial terminations agree with those provided by theoxygen isotopes record. This is much more unlikely con-sidering that all the ages provided by the Tiber Riversequences for terminations IX through III fit into theproposed mild minima mechanism.[38] Since several authors have recently considered obliq-
uity as the major factor in pacing the Pleistocene glacialterminations [e.g., Huybers and Wunsch, 2005, and refer-ences therein], we have tested our ages also to the obliquityrecord (Figure 6). Most of the radioisotopic ages at their fullerror extent match one obliquity maximum. However, if wewant to be conservative in applying the limit of 2s errors,this is not the case for the ages of TVII and TV. Alsoneglecting these mismatches, there is in any case noapparent relationship between occurrence of obliquity max-ima and the occurrence of the radioisotopically determinedterminations. Indeed, TIX and TVIII match two consecutiveobliquity maxima, while TVII skips one maximum, TVIskips two maxima, and so on. This is an effect alreadycommented by Huybers and Wunsch [2005] when consid-ering obliquity as the pacing factor on the terminations.These authors suggested that ‘‘the climate state skips one ortwo obliquity beats before deglaciating, thus giving quan-tized glacial cycle duration of either 80 or 120 ka’’. Incontrast to this hypothesis, the mild minima mechanismprovides a strict causative effect to the occurrence of glacialterminations IX through III.[39] Regarding the most recent terminations, we do not
have any radiometric constraint on the deposits associatedwith MIS 5, and therefore we are not able to estimate anyindependent age for TII. This is due both to the fact that thedeposits of this succession are scarcely exposed and to thelack in this area of any volcanic activity providing datablematerial in the time span 150–70 ka [Marra et al., 2003].To fill this gap, in Figure 4b and in the following Figure 7,we show the ages of 133 ka provided for TII by the Vostokice core [Petit et al., 1999], the age of 135.8 ± 0.8 ka
provided by combined 230Th and 231Pa ages on upliftedBarbados coral terraces [Gallup et al., 2002], and theterrestrial age of 142 ka proposed by the Devil0s Hole cavestratigraphy [Winograd et al., 1992]. All these ages occurbefore to the maximum of insolation following the mildminimum detected on the summer insolation curve. Differ-ently, the astronomical ages of 128–130 ka [Huybers andWunsch, 2004; Lisiecki and Raymo, 2005] appear in betteragreement with the mild minima mechanism when summerinsolation is considered to be the main controlling factor.This is not surprising to us, since our model and theastronomical tuning should predict the same age for glacialterminations whenever the same maximum of insolation isthe target point. In this regard, we remark that it is not ourintention to provide ages that are more precise than thosepredicted by the astronomical tuning (the associated errorswith the 40Ar/39Ar ages are in the same order as thoseassociated with the astronomical tuning). Our sedimentarymodel allows us to detect whenever the astronomical tuningassociates a glacial termination with a different maximum ofinsolation than our model does (i.e., for TIV, TVII, andTVIII) (see Figure 5), since in this case the difference in agebetween the maxima is larger than the errors associated withboth dating methods.
6.5. Termination I: A Delayed Deglaciation?
[40] While the proposed mechanism of the mild minimaoccurrence to trigger glacial terminations is well supportedby the older sequences of the Tiber River, the timing of thelast glacial termination (TI) fails to be predicted by themodel. Indeed, the threshold of insolation is surpassed bytwo minima during the last glacial period, without anyglacial termination being apparently triggered. However,the basic inference for the triggering process described insection 6.3 should be considered just the starting point for aclimate model; the actual mechanism that leads to deglaci-ation would probably involve many complex factors.[41] For example, the presence of a mild minimum at
92 ka with which no glacial termination is associated shouldbe regarded as a ‘‘too early’’ occurrence: The glacial periodhad not initiated, and the ice sheets had not reached a largeextension yet. This is in full agreement with data of sealevel fluctuations [Bard et al., 1990] for that time span,indicating that a moderate fall (�20 m) had occurred until92 ka. As mentioned in section 6.1, the limit on theamplitude in sea level oscillations that are detectable by
Figure 6. The 40Ar/39Ar ages for glacial terminations IX to III (horizontal bars represent associated fullerrors at 2s) are compared to the obliquity record [Laskar et al., 2004]. No particular fit is evidenced.
PA2205 MARRA ET AL.: TIBER RIVER GLACIAL TERMINATIONS HISTORY
12 of 17
PA2205

the paleo-Tiber sedimentary record should be considered ataround 80 m bsl. Actually, one of the four agents that weinvoked to cause the deposition of gravel into the Tiberdelta is the strong difference in elevation between theApennines (source of clastic material) and the coastline,which is provided when the sea level fall reaches itsmaximum (>100 m) during a glacial period. Moreover, anincomplete glaciation hardly would have caused the forma-tion of large glaciers at the moderate latitude of theApennines, eliminating two other fundamental factors forgravel formation and transportation. From the above con-siderations, combined with the existence of a basal gravellayer in the aggradational sections correlated to MIS 19 and
MIS 17, descends the notion that sea level fall duringprevious stages, composed of MIS 20 and MIS 18 forwhich the occurrence of minor amplitude glacio-eustaticfluctuations is debated [Siddall et al., 2006b, and referencestherein], should have reached at least –80 m asl.[42] Whereas the lack of a full glaciation at around 90 ka
is documented, and therefore there is no need to explainwhy the following mild minimum could not trigger anyglacial termination, it may be interesting to reason aboutwhy other mild minima that occurred early after a glacialtermination or after less pronounced minima than that at 92ka (e.g., those related to TVIII and TIV) (see Figure 4)could trigger a deglaciation. Figures 4b and 5b clearly show
Figure 7. The 40Ar/39Ar ages for glacial terminations (red lines; horizontal red bars represent associatedfull errors at 2s) are tested against insolation curves fore different months of the year. The mild minima(red dots) identified on the summer mean insolation at 65�N curve (first row) are reported on the curvesfor the other months, evidencing the phase lag. Astronomical ages for glacial terminations (from work byLisiecki and Raymo [2005] as well as independent ages for TII are also shown (dotted lines; see alsoFigure 4 for symbols explanation). Two segmented lines joining the consecutive maxima and theconsecutive minima, respectively, are drawn for each insolation curve. Each inversion of the trend of themaxima of insolation (first ascending segment after one or more descending segment) is marked in red;dashed segments indicate those that are not associated with a radioisotopic age for glacial termination.
PA2205 MARRA ET AL.: TIBER RIVER GLACIAL TERMINATIONS HISTORY
13 of 17
PA2205
that the 92 ka mild minimum is the only one to occur afterone single minimum of insolation following the previousglacial termination. Therefore in order to explain the lack ofa full glaciation before 92 ka, similarly to what alreadyobserved by Raymo [1997], we refer to the notion that therepetition of insolation minima, independent from theiramplitude and their spacing, is a key factor on forming alarge ice cover. This could be the reason why glaciationsoccurred before and were then terminated by the mildminima associated with TVIII and TIV but not before themild minimum at 92 ka.[43] This reasoning does not apply to the mild minimum
at 41 ka: It is obvious that a complete ice sheet was formedin the Northern Hemisphere by that time. Therefore the lackof a glacial termination after the occurrence of this mini-mum needs to be explained in a different way.
6.6. Nodes Paradox
[44] When the paleo-Tiber ages for glacial terminationsare plotted against the insolation records at 65�N fordifferent months of the years (Figure 7), it becomes appar-ent that the radioisotopic ages (vertical red lines with thehorizontal bars representing the associated full error at 2s)matches nodes of the insolation curves. Remarkably, theastronomical ages that are inconsistent with the 40Ar39/Arages (dotted vertical bars in Figure 7) are also those thathave the largest mismatch with respect to the nodes. In orderto highlight the nodes, two segmented curves are used inFigure 7 to join each consecutive maximum and eachconsecutive minimum. The nodes are the effect of nearlycontemporaneous occurrence of small-amplitude maximaand minima of insolation. It is therefore straightforward thatthe mild minima determined on the summer mean insolationcurve (red full circles in Figure 7a) occur in proximity ofthese nodes. It can be observed that these nodes arepersistent ones throughout the year (meaning that they dooccur at the same age independent from the month at which
insolation is estimated). While the relationship between thedeglaciations and the occurrence of high (warmer) values ofinsolation minima is straightforward, the tendency for themaxima of insolation to have the lowest values (colder) alsoin proximity of the termination ages is not. In this sense, theastronomical ages more consistently match the late ascend-ing portion of the upper segmented curve that joins themaxima of insolation. However, this apparent paradox ispartially resolved by noting that also the ages for glacialterminations predicted by the mild minima model (horizon-tal red bars in Figure 7) display an almost systematicoverlapping with the increasing portions of the uppersegmented curves (each red tract that follows a minimumin the upper segmented curve in Figure 7), representing thefirst inversion (increase) in the trend of the maxima ofinsolation. More simply, the maximum of insolation thatfollows a mild minimum is higher than the previousmaximum. However, this notion does not apply to TV,TVII, and TIX, which occur during a maximum of insola-tion that represents the smallest one of several consecutivemaxima. Even though the related age overlaps the followingincreasing tract of the segmented curve, this curve isconstructed by connecting discrete points, and the interme-diate tract has no physical reality. In other words, this wouldimply a ‘‘predictive’’ capability for the model, which isobviously a scientific absurdity, unless we consider that thesegmented curve represents the potential trend of a signalhaving a lower frequency than the 65�N summer meaninsolation has. In other words, deglaciation would besensible to a slower and more global insolation signal thanthe simple summer insolation at 65�N (e.g., annual insola-tion [see Huybers, 2006, and reference therein]). In thiscase, the occurrence of the mild minima of insolation, asdefined by the trend line in Figure 4b, should be consideredthe preconditioning factor to trigger a deglaciation, but it
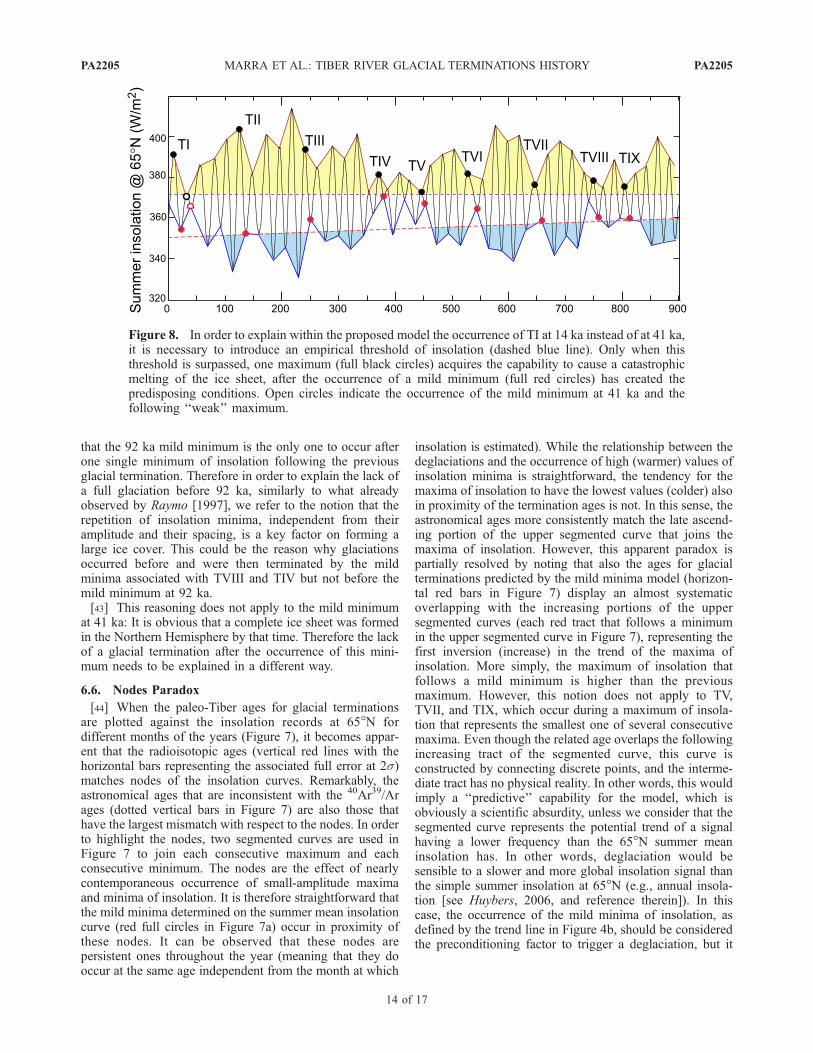
Figure 8. In order to explain within the proposed model the occurrence of TI at 14 ka instead of at 41 ka,it is necessary to introduce an empirical threshold of insolation (dashed blue line). Only when thisthreshold is surpassed, one maximum (full black circles) acquires the capability to cause a catastrophicmelting of the ice sheet, after the occurrence of a mild minimum (full red circles) has created thepredisposing conditions. Open circles indicate the occurrence of the mild minimum at 41 ka and thefollowing ‘‘weak’’ maximum.
PA2205 MARRA ET AL.: TIBER RIVER GLACIAL TERMINATIONS HISTORY
14 of 17
PA2205

would require a series of complementary factors: a neces-sary condition but not a sufficient one.[45] In contrast, if we want to sustain the full validity of
the proposed model, we are forced to say that the occur-rence of one mild minimum is in any case the triggeringfactor for the glacial termination, whatever the relativeamplitude of the following maximum of insolation is.However, this does not necessarily imply that a deglaciationoccurs whatever the absolute value of the maximum ofinsolation is. The existence of a threshold of insolationunder which a maximum could not trigger a glacial termi-nation may be considered a quite obvious notion, but it isnot easily quantifiable.
6.7. A Weak Maximum?
[46] It is apparent that the maximum of insolation thatfollows the weak insolation minimum at 41 ka is quitemoderate (Figure 8). With its 371 W/m2, it is the lowest-intensity maximum of insolation on the summer meaninsolation curve during the last million years (black opencircle in Figure 8), and it causes an increment of insolationwith respect to the previous minimum as small as 5.0 W/m2.Only the maximum associated with TV closely approachesit, with a value of insolation of 472.5 W/m2 and a relativeincrement of 6 W/m2. However, if we consider that thefaintest maximum has also a longer duration (41 to 33 kaagainst 452 to 446 ka (the time elapsed between theminimum and the maximum)), the rate at which insolationincreased to reach the maximum at 33 ka is smaller than thatcharacterizing TV. Therefore the occurrence of such a low-intensity maximum of insolation at 33 ka might be regardedas a negligible deviation from a steady decreasing trend ofinsolation between 60 and 20 ka, and it is reasonable toassume that it was too faint a maximum to trigger a
deglaciation. Moreover, we speculate whether the actualvalue of insolation at that age might have been reducedfurther by the huge eruption of the Ignimbrite Campana,occurring in the Phlegrean Fields 39,490–39,170 years B.P.[Giaccio et al., 2005, and references therein], enhancing thesolar albedo of the atmosphere-surface system. Indeed, itwas the largest volcanic eruption in the Mediterraneanregion over the past 200,000 years.
6.8. Termination X: A Causality Problem?
[47] Another relevant observation descending from theproposed model is the lack of a mild minimum in theinsolation curve that might be associated with glacialtermination X (Figure 9). Regarding this, it is remarkablethat no sedimentary succession of the paleo-Tiber delta hasa direct age constraint allowing us to attribute an age olderthan 800 ka to it. This fact is in agreement with an earlyinterpretation of ours [Marra et al., 1998] that ‘‘rather thanshowing pronounced stratigraphic change at stage 22 assuggested by Shackleton and Opdyke [1976], the TiberRiver delta reflects pronounced sea level oscillations begin-ning at MIS 20.’’ Later on, we [Karner et al., 2001b] havetried to reconcile the Roman stratigraphy to the currentbelief about beginning of ‘‘Glacial Pleistocene’’ by corre-lating the older Monte Ciocci–Monte delle Piche aggrada-tional section to MIS 22–21 (866 ka [Lisiecki and Raymo,2005]). However, no precise geochronologic constraintexists on this sedimentary unit, but the presence of Hyalineabalthica suggests a lower Pleistocene age [Conato et al.,1980]. On the basis of biostratigraphic data, the depositionof this unit was previously tentatively correlated to a sealevel fluctuation [Marra, 1993] corresponding to the end ofa cooling event on the isotopic curve of Shackleton and Hall[1984], dated at around 1.4 ma. The presence of a unique
Figure 9. The trend line of Figure 4b separating strong from mild minima is extended to the past2000 ka. No occurrence of mild minima is evidenced before 850 ka and until 1500 ka. Therefore afterthe proposed model and assuming a constant trend line for the threshold of insolation during the past2000 ka, the occurrence of TX is expected at around 1510 ka, rather than during MIS 21 (866 ka[Lisiecki and Raymo, 2005]).
PA2205 MARRA ET AL.: TIBER RIVER GLACIAL TERMINATIONS HISTORY
15 of 17
PA2205

mild minimum in the time span 0.8–2.0 ma at around 1.5 ma(Figure 9) suggests that the previous interpretation of asignificant older age for the Monte Ciocci–Monte dellePiche succession in work by Marra [1993] may be correct.
7. Conclusions
[48] Evidence from the last glacial termination in theTiber River sedimentary record provided a means to recon-struct a complete set of independent 40Ar/39Ar age deter-minations for Pleistocene glacial terminations IX throughIII. Three out of these ages are significantly different ones(beyond 95% confidence) from those predicted by orbitaltuning of the oxygen isotopes record. In particular, webelieve that ages provided by the paleo-Tiber sedimentarysections for TVII and TVIII pose a strong challenge to theclassical tuning methods.[49] In order to explain occurrence of all the glacial
terminations at the radioisotopic ages we have determined,we tentatively propose an alternative tuning mechanism tothe mean summer insolation of the Northern Hemisphere.On the basis of our model, the occurrence of particularlyweak (mild) minima of insolation leads to a greater insta-bility of the ice sheet. This in turn makes the ice sheet proneto catastrophic melting during any subsequent maximum ofinsolation.[50] Although the excellent fit of the radioisotopically
dated sedimentary record of the Tiber River with theoccurrence of the mild minima defined above is intriguing,much further independent evidence has to be provided inorder to validate the proposed mechanism. In particular, theproposed model has the following limitations:[51] 1. It implies that a very strict threshold of insolation
on the order of few W/m2 discriminates between the minimathat are capable of triggering a deglaciation and those thatare not. This may be regarded as a physically implausiblesensitivity of climate to an insolation-forcing mechanism.
[52] 2. Similar to the previous point, the model requiresthat an arbitrary threshold of insolation between 441 and442 W/m2 be surpassed by a maximum of insolation inorder to trigger a glacial termination, in order to satisfy theoccurrence of both TI and TV.[53] 3. The 40Ar/39Ar age for TIV that supports this model
(366 ± 10 ka) conflicts with the only U/Th age (334 ± 4 ka)so far available for the same termination.[54] On the contrary, the major outcome of the postulated
forcing mechanism for initiation of glacial terminations isthat it enables us to say what the condition is that confers toone maximum, among a series of maxima of insolation, thepotentiality to cause a deglaciation. Moreover, this forcingmechanism accounts for variable duration and periodicity ofglacial cycles, which were not answered satisfactory byclassical astronomical tuning until now, representing themajor cause of criticism to the traditional Milankovitchtheory. The basic inference for the triggering processdescribed above should be considered just the starting pointfor a climate model. A sort of predisposing factor, precedingthe actual mechanism that leads to deglaciation, wouldprobably involve many other complex elements thatrule the internal dynamics of the climate system. However,data presented in this paper suggest that the occurrence of aweak minimum is the necessary condition to trigger adeglaciation, whereas other factors might possibly induceits delaying.
[55] Acknowledgments. This work benefited from thorough discus-sion and significant contributions by D. B. Karner. We thank Heiko Palike,Eelco J. Rohling, and Mark Siddall for the critical review of our work andfor providing insightful suggestions and comments. We also thank WarnerMarzocchi and Mario Sprovieri for discussion. We are grateful to WalterAlvarez for addressing this research topic; Paul Renne and the BerkeleyGeochronology Center for continued support through last 15 years; andFrancesca Bozzano, Francesca Cinti, and Patrizia Cologgi for supportingthe radiocarbon dating. Leonardo Lombardi is thanked for initiating us intothe study of the paleo-Tiber and for the continuous sharing of hisknowledge on the geology of Rome.
ReferencesAmmerman, A. J., J. Miller, and S. Ramsay(2000), The mid-Holocene environment ofthe Velabrum in Rome, in Quaderno, vol. 8,pp. 9–20, Soc. Preistoria Protostoria Friuli-Venezia Giulia, Trieste, Italy.
Bard, B., E. Hamelin, and R. Fairbanks (1990),U-Th ages obtained by mass spectrometry incorals from Barbados: Sea level during the past130000 years, Nature , 346 , 456 – 458,doi:10.1038/346456a0.
Bard, E., E. Hamelin, M. Arnold, L.Montaggioni,G. Cabioch, G. Faure, and F. Rougerie(1996), Deglacial sea-level record from Tahiticorals and the timing of global meltwater dis-charge, Nature, 382, 241–244, doi:10.1038/382241a0.
Bassinot, F. C., L. D. Labeyrie, E. Vincent,X. Quidelleur, N. J. Shackleton, andY. Lancelot(1994), The astronomical theory of climate andthe age of the Brunhes-Matuyama magneticreversal, Earth Planet. Sci. Lett., 126, 91 –108, doi:10.1016/0012-821X(94)90244-5.
Belluomini, G., G. P. Iuzzolini, L. Manfra,R. Mortari, and M. Zalaffi (1986), Evoluzionerecente del delta del Tevere, Geol. Rom., 25,213–234.
Bjorck, S., M. J. C. Walker, L. C. Cwynar,S. Johnsen, K. L. Knudsen, J. J. Lowe,B. Wohlfarth, and the INTIMATE Members(1998),Anevent stratigraphy for theLastTermi-nation in the North Atlantic region based on theGreenland ice-core record: A proposal by theINTIMATE group, J. Quat. Sci., 13, 283 –292, doi:10.1002/(SICI)1099-1417(199807/08)13:4<283::AID-JQS386>3.0.CO;2-A.
Bozzano, F., R. Funiciello, M. Gaeta, F. Marra,and G. Valentini (1997), Recent alluvial depos-its in Rome (Italy): Morpho-stratigraphic,mineralogical and geomechanical characterisa-tion, paper presented at the International Sym-posium on Engineering, Geology, and theEnvironment, Int. Assoc. for Eng. Geol.,Athens, 23–27 June.
Bozzano, F., A. Andreucci, M. Gaeta, andR. Salucci (2000), A geological model of theburied Tiber River valley beneath the historicalcentre of Rome, Bull. Eng. Geol. Environ., 59,1–21, doi:10.1007/s100640000051.
Conato, V., D. Esu, A. Malatesta, and F. Zarlenga(1980), New data on the Pleistocene of Rome,Quaternaria, 22, 131–176.
Corazza, A., M. Lanzini, C. Rosa, and R. Salucci(1999), Caratteri stratigrafici, idrogeologici e
geotecnici delle alluvioni Tiberine nel settoredel centro storico di Roma, Quaternio, 12,215–235.
Fairbanks, R. G. (1989), A 17,000 years glacio-eustatic sea-level record: Influence of glacialmelting rates on the Younger Dryas eventand deep-ocean circulation, Nature, 342,637–642, doi:10.1038/342637a0.
Florindo, F., D. B. Karner, F. Marra, P. R. Renne,A. P. Roberts, and R. Weaver (2007), Radio-isotopic age constraints for glacial terminationsIX and VII from aggradational sections of theTiber River delta in Rome, Italy, Earth Planet.Sc i . Let t . , 256 , 61 – 80, doi :10.1016/j.epsl.2007.01.014.
Gallup, C. D., H. Cheng, F. W. Taylor, and R. L.Edwards (2002), Direct determination of thetiming of sea level change during terminationII, Science, 295, 310 – 313, doi:10.1126/science.1065494.
Giaccio, B., I. Hajdas, M. Peresani, F. G. Fedele,and R. Isaia (2005), The Campanian Ignim-brite (c.40 ka B. P.) and its relevance for thetiming of the Middle to Upper Palaeolithicshift: Timescales and regional correlations, inWhen Neanderthals and Modern Humans Met,Tubingen Publications in Prehistory, edited by
PA2205 MARRA ET AL.: TIBER RIVER GLACIAL TERMINATIONS HISTORY
16 of 17
PA2205

N. Conrad, pp. 343–365, Kerns-Verlag, Tu-bingen, Germany.
Huybers, P. (2006), Early Pleistoicene glacial cy-cles and the integrated summer insolation for-cing, Science, 313, 508 –511, doi:10.1126/science.1125249.
Huybers, P., and C. Wunsch (2004), A depth-derived Pleistocene age model: Uncertainty es-timates, sedimentation variability, and non-linear climate change, Paleoceanography, 19,PA1028, doi:10.1029/2002PA000857.
Huybers, P., and C. Wunsch (2005), Obliquitypacing of the late Pleistocene glacial termi-nations, Nature, 434, 491–494, doi:10.1038/nature03401.
Imbrie, J., J.D.Hays,D.G.Martinson,A.McIntyre,A. C. Mix, J. J. Morley, N. G. Pisias, W. L.Prell, and N.J. Shackleton (1984). The orbitaltheory of Pleistocene climate: Support from arevised chronology of the marine d18O record,in Milankovitch and Climate, Part 1, edited byA. L. Berger, pp. 269–305, Springer, Norwell,Mass.
Karner, D. B., and F. Marra (1998), Correlationof fluviodeltaic aggradational sections withglacial climate history: A revision of the clas-sical Pleistocene stratigraphy of Rome, Geol.Soc. Am. Bull., 110, 748–758, doi:10.1130/0016-7606(1998)110<0748:COFASW>2.3.CO;2.
Karner, D. B., and F. Marra (2003), 40Ar/39Ardating of glacial termination Vand the durationof marine isotopic stage 11, in Earth’s Climateand Orbital Eccentricity: The Marine IsotopeStage 11 Question, Geophys. Monogr. Ser.,vol. 137, edited by A. W. Droxler, R. Z. Poore,and L. H. Burckle, pp. 61 –66, AGU, Wa-shington, D. C.
Karner, D. B., and P. R. Renne (1998), 40Ar/39Argeochronology of Roman province tephra inthe Tiber River Valley: Age calibration of Mid-dle Pleistocene sea-level changes, Geol. Soc.Am. Bull., 110, 740–747, doi:10.1130/0016-7606(1998)110<0740:AAGORV>2.3.CO;2.
Karner, D. B., F. Marra, and P. R. Renne (2001a),The history of the Monti Sabatini and AlbanHills volcanoes: Groundwork for assessingvolcanic-tectonic hazards for Rome, J. Volca-nol . Geotherm. Res . , 107 , 185 – 215,doi:10.1016/S0377-0273(00)00258-4.
Karner, D. B., F. Marra, F. Florindo, and E.Boschi (2001b), Pulsed uplift estimated fromterrace elevations in the coast of Rome: Evi-dence for a new phase of volcanic activity?,Earth Planet Sci. Lett., 188, 135 – 148,doi:10.1016/S0012-821X(01)00325-9.
Karner, D. B., J. Levine, B. P. Medeiros, andR. A. Muller (2002), Constructing a stackedbenthic d18O record, Paleoceanography,17(13), 1030, doi:10.1029/2001PA000667.
Lambeck, K., F. Antonioli, A. Purcell, andS. Silenzi (2004), Sea-level change along theItalian coast for the past 10,000 yr, Quat. Sci.Rev., 23, 1567–1598, doi:10.1016/j.quascirev.2004.02.009.
Laskar, J., P. Robutel, F. Joutel, and M. Gasti-neau (2004), A long-term numerical solutionfor the insolation quantities of the Earth, As-tron. Astrophys., 428, 261–285, doi:10.1051/0004-6361:20041335.
Lisiecki, L. E., and M. E. Raymo (2005), APliocene-Pleistocene stack of 57 globally dis-tributed benthic d18O records, Paleoceanogra-phy, 20, PA1003, doi:10.1029/2004PA001071.
Marra, F. (1993), Stratigrafia e assetto geologico-strutturale dell’area romana tra il Tevere e ilRio Galeria, Geol. Rom., 29, 515–535.
Marra, F. (2004), Reply to comment byG. Giordano, A. Esposito, D. De Rita,M. Fabbri, I. Mazzini, A. Trigari, C. Rosa,and R. Funiciello on ‘‘The sedimentation alongthe Roman coast between middle and upperPleistocene: The interplay of eustatism,tectonics and volcanism - new data andreview,’’ Quaternio, 17(2/2), 643–645.
Marra, F., and C. Rosa (1995), Stratigrafiae assetto geologico dell’area Romana, in LaGeologia di Roma, Mem. Descr. CartaGeol. d’Ital., vol. 50, edited by R. Funiciello,pp. 49–118, Istituto Poligrafico e Zecca delloStato, Rome.
Marra, F., F. Florindo, and D. B. Karner (1998),Paleomagnetism and geochronology of earlyMiddle Pleistocene depositional sequencesnear Rome: Comparison with the deep sead18O climate record, Earth Planet. Sci. Lett.,159 , 147 – 164 , do i : 10 . 1016 /S0012 -821X(98)00071-5.
Marra, F., C. Freda, P. Scarlato, J. Taddeucci,D. B. Karner, P. R. Renne, M. Gaeta, D. M.Palladino, R. Trigila, and G. Cavarretta(2003), Post-caldera activity in the AlbanHills Volcanic District (Italy): 40Ar/39Ar geo-chronology and insights into magma evolu-tion, Bull. Volcanol., 65, 227–247.
Mortari, R., S. Talone, and S. Trastulli (1979),Una stratigrafia geotecnica nelle alluvioni re-centi del Tevere presso Ponte Galeria, Boll.Soc. Geol. Ital., 98, 109–118.
Peltier, W. R., and R. G. Fairbanks (2006), Glo-bal ice volume and Last Glacial Maximumduration from an extended Barbados sea-levelrecord, Quat. Sci. Rev., 25, 3322 – 3337,doi:10.1016/j.quascirev.2006.04.010.
Petit, J. R., et al. (1999), Climate and atmo-spheric history of the past 420,000 years fromthe Vostok ice core, Antarctica, Nature, 399,429–436, doi:10.1038/20859.
Raymo, M. E. (1997), The timing of major cli-mate terminations, Paleoceanography, 12(4),577–585, doi:10.1029/97PA01169.
Shackleton, N. J., and M. A. Hall (1984), Oxy-gen and carbon isotope stratigraphy of DeepSea Drilling Project. Hole 552A: Plio-Pleisto-cene glacial history, Initial Rep. Deep SeaDrill. Proj., 81, 599–609.
Shackleton, N. J., and N. D. Opdyke (1976),Oxygen isotope and paleomagnetic stratigra-phy of Pacific core V28–239 late Pliocene tolatest Pleistocene, in Investigation of LateQuaternary Paleo-Oceanography and Paleo-Climatology, edited by R. M. Cline and J. D.Heys, Mem. Geol. Soc. Am., 145, 216–219.
Siddall,M.,E.Bard,E.J.Rohling,andC.Hemleben(2006a),Sea-levelreversalduringTerminationII,Geology, 34(10), 817 – 820, doi:10.1130/G22705.1.
Siddall, M., J. Chappell, and E.-K. Potter(2006b), Eustatic sea level during past inter-glacials, in The Climate of Past Interglacials,edited by F. Sirocko et al., pp. 75–92, Else-vier, Amsterdam.
Siddall, M., T. F. Stocker, T. Blunier, R. Spahni,J. Schwander, J.-M. Barnola, and J. Chappellaz(2007), Marine Isotope Stage (MIS) 8 millen-nial variability stratigraphically identical toMIS 3, Paleoceanography, 22, PA1208,doi:10.1029/2006PA001345.
Stanford, J. D., E. J. Rohling, S. E. Hunter, A. P.Roberts,S.O.Rasmussen,E.Bard, J.McManus,and R. G. Fairbanks (2006), Timing of melt-water pulse 1a and climate responses to melt-water injections, Paleoceanography, 21,PA4103, doi:10.1029/2006PA001340.
Stuiver, M., P. J. Reimer, and T. F. Braziunas(1998), High-precision radiocarbon age cali-bration for terrestrial and marine samples,Radiocarbon, 40(3), 1127–1151.
Winograd, I. J., T. B. Coplen, J. M. Landwehr,A. C. Riggs, K. R. Ludwig, B. J. Szabo, P. T.Kolesar, and K. M. Revesz (1992), Continuous500,000-year climate record from vein calcitein Devils Hole Nevada, Science, 258, 255–260, doi:10.1126/science.258.5080.255.
�������������������������
E. Boschi, F. Florindo, and F. Marra, IstitutoNazionale di Geofisica e Vulcanologia, Via diVigna Murata 605, I-00143, Rome, Italy.([email protected])
PA2205 MARRA ET AL.: TIBER RIVER GLACIAL TERMINATIONS HISTORY
17 of 17
PA2205