Major Glacial-Drift Aquifers - North Dakota State Water ...
106
The Hydrogeology of Major Glacial-Drift Aquifers in Burleigh, Emmons, and Kidder Counties, North Dakota By David R. Larson North Dakota Ground-Water Studies Number 93 - Part II North Dakota State Water Commission
-
Upload
khangminh22 -
Category
Documents
-
view
0 -
download
0
Transcript of Major Glacial-Drift Aquifers - North Dakota State Water ...

The Hydrogeology of
Major Glacial-Drift Aquifersin Burleigh, Emmons, and Kidder Counties,
North DakotaBy
David R. Larson
North Dakota Ground-Water Studies
Number 93 - Part IINorth Dakota State Water Commission

THE HYDROGEOLOGY OF
MAJOR GLACIAL-DRIFT AQUIFERS IN
BURLEIGH, EMMONS, AND KIDDER COUNTIES,
NORTH DAKOTA
By
David R. Larson, HydrogeologistNorth Dakota State Water Commission
NORTH DAKOTA GROUND-WATER STUDIES
NUMBER 93 - PART II
Published By
North Dakota State Water CommissionState Office Building
900 East BoulevardBismarck, North Dakota 58505
1987

CONTENTS
ABS TRACT ••••••••••••••••••••••••••INTRODUCTION ••
Purpose ••Study Area Location •••••Previous Investigations.Methods of Investigation •••••••••••••••••Location-Numbering System ••
PHYSIOGRAPHY ••••••••••••••••••••CLIMATE •••••••OCCURRENCE AND QUALITY OF GROUND WATER ••••••
General Concepts ••••••••••••••••••••Water Quality .••.•.•.•......•.•..•..Aquifer Properties ..•••.•••••.•....•..•.••.•..
GEOLOGIC UNITS AND THEIR HYDROLOGIC PROPERTIES ••Bedrock Formations •••••••••••••••
Pierre Aquifer ••••••••••••••Fox Hills, Hell Creek, and Cannonball Aquifers ••
Glacial-Drift Sediments and Aquifers •••••••••••••••••Strasburg Aquifer - Emmons County •••••••••••••••Glacial-Drift Aquifers - Burleigh County •••••••••••••••
Long Lake Aquifer ••••••••Glencoe Channel Aquifer ••McKenzie Aquifer ....•.•.......•..Random Creek Aquifer ••••••••••••••Lower Apple Creek Aquifer ••Upper Apple Creek Aquifer ••••Wing Channel Aquifer •••••••••••
Glacial-Drift Aquifers - Kidder County ••Tappen Aquifer .•..•.•..•................Marstonmoor Plain Aquifer •••••••••••••••Undifferentiated Surficial ("Robinson")Aquifer .
Kidder County Aquifer Complex ••••••••••GROUND-WATER RESOURCE DEVELOPMENT ••••••••••••••••RECOMMENDATIONS FOR FURTHER STUDy •••••••••••REFERENCES CITED ...................•......•.
ILLUSTRATIONS
1333568
1010151516182020212122252729343946475050555865
7375939597
Plate1. Map showing the glacial-drift aquifers and
locations of test holes and observation wellsof this study - Emmons County ••••••••••••••••••••••••••••••
ii
(in poc

2. Map shollringthe glacial-drift aquifers,potenticlmetric surface, and lines ofcross-sections - Burleigh County ••••••••••••••••••••••••••• (in pocket)
3. Bedrock topography map of Burleigh County,North Dakota••••.••.•.••••••••••••••••••••••.••••••••••••••
4. EstimatEld potential yield of the glacial-driftaquifers - Burleigh County .............•........••.......••
5. Map showing the surficial aquifers, water-levelelevaticms, and lines of cross-sections -Kidder C:ounty ....•.........................................
6. Map sho\tringKidder County Aquifer Complex,lines of cross-sections, and water-levelelevations - Kidder County •••••••••••••••••••••••••••••••••
7. Bedrock topography map of Kidder County,North Dclkota••••••••••••••••..•.••••••••..•••••••••••••••••
8. EstimatE!d potential yield of all glacial-driftaquiferE; - Kidder County .
9. Hydrogecllogic cross-sections showing glacial-driftaquifer~1 - Burleigh County •••••••••••••••••••••••••••••••••
10. Hydrogeologic cross-sections showing glacial-driftaquifer!; - Kidder County ............................•......
Figure1. Location map and outline of study area •••••••••••••••••••••
II
II
"
II
II
"
n
n
4
2. Well nUlubering system 9
3. Map shol/ringlocation of study area and thephysiogl~aphic units of North Dakota •••••••••••••••••••••••• 11
4. Normal annual precipitation (inches)/normalannual 1~emperat.ure (OF) •••••.••••••••••••••••••••••••••••••• 12
5. Diagram for classifying the quality of water forirriqati~on ••••••••••.•••••.•.•••.•••••••••••.••.••••••••••• 19
6. Hydrogrclph of observation wells @ 132-77-270001and 2701>02 - Strasburg Aquifer ••••••••••••••••••••••••••••• 28
Hi

7. Hydrograph of observation well @ l37-76-050CC -Long Lake Aquifer ••••••..•••••••••.••••.••.•.•.•••••••.••• 33
8. Oiagram for classifying the quality of water forirrigation - Burleigh County ••••••••••••••.•••••••.••..•.•• 35
9. Hydrograph of observation well @ 137-76-050CC -Glencoe Channel Aquifer ••••••.•••••••••••..•.•..•••.•••.... 38
10. Hydrographand 140002
II. Hydrographand 24AAA2
12. Hydrographand 13BBC2
13. Hydrographand 06BBB2
of observation wells @ 138-77-140001- McKenzie Aquifer .•.•••.••••••••.•••••.•.•••••• 41
of observation wells @ 138-77-24AAAI- McKenzie Aquifer •....•••..•..••.•..•....•••••• 42
of observation wells @ 138-77-l3BBCl- McKenzie Aquifer •..••••.•..•••••...••••••..•.• 43
of observation wells @ l38-77-06BBBI- McKenzie Aquifer .••••.••.••.•.•••.•.••••.••••• 44
14. Hydrograph of observation well @ 139-78-2100A -Lower Apple Creek Aquifer ..•••••••..•.••.••.••••••...••.••• 49
15. Hydrograph of observation well @ l40-77-23AOO -Upper Apple Creek Aquifer ..•••.•••.••.••••.•.••..•.•••••••. 52
16. Hydrograph of observation well @ l42-74-l8BCC -Wing Channel Aquifer •••.•...••••.•..••••••••.••.•••.••.••.• 56
17. Hydrograph of observation well @ 139-7l-17BBBI -Kidder County Aquifer ComplexHydrograph of observation well @ l39-7l-l7BBB2 -Tappen Aquifer •••...••••••...••.•.•.•••••••...••..•••••.••• 60
18. Hydrograph of observation wells @ 140-71-190001 -and 190002 - Kidder County Aquifer ComplexHydrograph of observation well @ 140-71-190003 -Tappen aqui fer •••...••.•••..•..••.•••.•••.•••.••.•••••.•••. 61
19. Hydrograph of observation well @ 140-7l-280AAI -Kidder County Aquifer ComplexHydrograph of observation well @ 140-7l-280AA2 -Tappen Aqui fer •••••••.•.••••••••••••••••••••••...•.•••••••• 62
20. Hydrograph of observation well @ l39-71-llAAA2 -Tappen Aquifer ••.•.•.•..•.•.•••..•••••.•••••.•••••.••••••.. 64
iv

21. oiagram for classifying the quality of water forirrigation - Kidder county ..•••.••••••••••••••••••••••••••• 66
22. Hydrogrclph of observation well @ 142-71-130001 -Kidder County Aquifer ComplexHydrograph of observation well @ 142-71-130002 -Marstonmoor Plain Aquifer ..••••.•..••••••••••••••••••• ••••• 67
23. Hydrograph of observation well @ 142-70-16BA02 -Kidder County Aquifer ComplexHydrograph of observation well @ 142-70-16BA03 -Marstonmoor Plain Aquifer •••••••••••••••••••••••• •••••••••• 68
24. Hydrograph of observation well @ 141-71-200001 -Kidder County Aquifer ComplexHydrograph of observation well @ 141-71-200002 -:~Marston:moor Plain Aquifer •••••.••.••••••.•••••••••••• •••••• 69
25. Hydrograph of observation well @ 142-72-16BBB2 -"Robinson" Aquifer •••••••.••••••••••••••••••••• •••••••••••• 74
26. Hydrograph of observation well @ 138-73-080001 -Kidder County Aquifer Complex •••••••••••••••••••••• •••••••• 78
27. Hydrograph of observation well @ 141-71-340001 -Kidder County Aquifer Complex .••••••••.•••••••••••••• •••••• 80
28. Hydrograph of observation well @ 139-71-17BBB1 -Kidder County Aquifer ComplexHydrograph of observation well @ 139-71-17BBB2 -Tappen Aquifer ••••••••••.•••••.•••.•••••••••••••• ••••·••••• 83
29. Hydrograph of observation well @ 142-71-130001 -Kidder County Aquifer ComplexHydrograph of observation well @ 142-71-130002 -Marstonmoor Plain Aquifer •••••.••.••.•••••••••••••••• •••••• 84
30. Hydrograph of observation wells @ 138-72-03BAA1,03BAA2, and 03BAA3 - Kidder County AquiferComplex ••.•••.••••••••...•••••.•••••.••.••••••••••••••••••• 86
31- Hydrog:raphand 06BAA3
32. Hydrographand 24BBB2
33. Hydrographand 35D002
of observation wells @141-70-06BAA1_ Kidder County Aquifer Complex .•••••••••.•••••. 87
of observation wells @ 139-72-24BBB1_ Kidder County Aquifer Complex •••••••••••••••• 88
of observation wells @ 142-71-350001_ Kidder County Aquifer Complex ••••••••••••••••• 89
v

34.
35.
Table1.
Hydrograph of observation well @ l40-70-27CCC2 _Kidder County Aquifer Complex •••••••••••••••••••••••••••••
Hydrograph of observation well @ 141-70-170002 _Kidder County Aquifer Complex ••••••••••••••••••••••••••••••
Normal and total annual precipitation (inches) •••••••••••••
91
92
132. Total pan evaporation (inches) ••••••••••••••••••••••••••••• 14
3.
4.
Major chemical constituents in water, theireffects upon usability for domestic supply,and the recommended concentration limits •••••••••••••••••••
Summary of occurrence of sand and gravel intervals _Kidder County Aquifer Complex ••••••••••••••••••••••••••••••
17
76
5. Domestic and livestock water use ••••••••••••••••••••••••••• 93
6. Reported annual water use - irrigation ••••••••••••••••••••• 94
vi

THE HYDROGEOLOGYOF MAJOR GLACIAL-DRIFTAQUIFERSIN BURLEIGH,EMMONS,AND
KIDDERCOUNTIES,NORTHDAKOTA
ByDavid R. Larson
ABSTRACT
Glacial-drift aquifers comprise an important ground-water resource in
Burleigh, Kidd1er,and Emmons Counties. Ground-water studies for these counties
identified and described these aquifers. Data gathered during this study further
defined the hydrological character of the aquifers and the suitability of ground
water for irrigation.
The study area includes about 1,461 square miles in portions of Burleigh,
Kidder, and Emmons Counties, North Dakota. Glaciofluvial sand and gravel
deposits of tbe Coleharbor Group constitute the aquifer complex. Thickness
of individual layers of sand and gravel ranges from less than 10 feet to 165 feet.
Test hole!s drilled at 14 sites in Emmons County defined the hydrogeology
of the Strasburg aquifer in areas not drilled in for the county study. Ten
observation wells installed at 7 of the 14 sites included one Z-well and one 3-well
site. These new data points verified the hydrology of the three-zone Strasburg
aquifer; that of ground-water flow downward to the lower zone.
Additional test-hole and water-level data resulted in some adjustments
to aquifer boundaries and the pattern of ground-water flow in the Burleigh County
part of the study area.
In Kidder County, new data supported extending the boundaries of the
Marstonmoor Plain aquifer from northwestern Stutsman County into the Pettibone
area in northeast Kidder County. Additional data in east-central Kidder County
defined an unconfined aquifer herein named the Tappen aquifer. In northwestern
Kidder County" additional data identified an unconfined aquifer herein named
1

the "Robinson" aquifer. The additional subsurface and water-level data further
defined the hydrogeology of the Kidder County aquifer complex. The complex
includes as many as five separate sand and gravel intervals the total thickness
of which ranges from about 10 feet to over 2.00 feet. The intervals are
hydraulically interconnected to various degrees along the main trend of the aquifer
complex.
Further investigation can be done in the study area on surface-water/
ground-water interaction, the flow relationship between the drift aquifers and
the adjacent bedrock, the role of the moraines in recharging the glacial-drift
aquifers, and the ground-water flow system within the Kidder County aquifer
complex.
2

INTRODUCTION
Purpose
Aquifers comprising an important ground-water resource occur in the
glacial-drift deposits of Burleigh, Kidder, and Emmons Counties. Published
ground-water studies for these counties identified and first described on a
county-wide basis the nature and extent of the glacial-drift aquifers and the
quality of water available from them.
The purpose of this study is twofold: to gain a better perception of the
hydrogeology of the principal glacial-drift aquifer system in Kidder and Burleigh
Counties, and to verify the conclusions of the Emmons County study regarding
the Strasburg aquifer. Three study objectives were established to meet the study
purpose and to utilize the data obtained during the study:
1. further define the areal extent, characteristics, hydrology, potentialyield.s, and water quality of the glacial-drift aquifers
z. evaluate the suitability of the ground water for irrigation use
3. pres.ent the data gathered during this study as the basis for more detailedcomprehensive studies of less extensive areas within the boundariesof the aquifers.
Further study is needed so that the ground-water resource can be developed
and managed. to achieve optimum beneficial use. This is particularly relevant
to Kidder County where the effects on the ground-water resource of a possible
U. S. Bureau of Reclamation project need to be analyzed at the appropriate time.
Study Area Location
The study area encompasses about 1,461square miles in portions of Burleigh,
Kidder, and Emmons Counties (figure 1). This area includes the broad valleys
and some of the surrounding uplands in north-central, central, and southwest
3

Kidder County and southern Burleigh County, extending northward along Apple
Creek to the Wing-Arena area in northeast Burleigh County. In Emmons County
the study area includes the valley that extends southwest from Long Lake in
Burleigh County to Dutton Slough, Badger Creek, and Lake Oahe. The study
area also includes the extreme northwest corner of Emmons County adjacent
to Lake Oahe, and the valley extending from Horsehead Flats to Strasburg and
into Campbell County, South Dakota.
I
II------'
I
II
EMMONS COUNTY II
II
III
IiI___ ...J
;)
I
(I
~,t\,------
i----------r---------I BURLEIGH COUNTY KIDDER COUNTY
I iI
FIGURE I. LOCATION MAP AND OUTLINE OF STUDY AREA
4

Previous Investigations
The ground-water resources of the study area have been mentioned or
reported on to varying degrees since the late 1800's. Darton (1896) discussed
the occurrenc,e of artesian water found east of Bismarck. Simpson (19Z9)included
information cln the ground-water resources of Burleigh, Kidder, and Emmons
Counties in his statewide summary. A report on municipal water supplies in
North Dakota. (Abbott and Voedisch, 1938) includes records and water quality
analyses for !)09 wells across the state, one of which is in Burleigh County and
eight each in Kidder and Emmons Counties. Fischer (195Z)reported on the geology
of Emmons County, emphasizing the Fox Hills Formation. Robinove, Langford,
and Brookhart (1958)discussed the occurrence of saline water in some aquifers
and streams in the study area. Paulson (196Z)summarized information on the
occurrence and availability of ground water in glacial drift and bedrock formations.
He mentions the buried valley that extends southeastward in Burleigh County
from McKen2:ieto Long Lake and then to the northeast into Kidder County.
Randich (196~nreported the results of a localized study of the geology and
ground-water resources in the Linton-Strasburg area.
A coun,ty ground-water study presents the results of an extensive
investigation into the occurrence and availability of ground water in the county,
the nature of the aquifers present, the geology of the county, and total water
use in tbe county categorized by type of use. The Kidder County study (Bradley
et al., 1963; Randich et al., 196Z,and Rau et al., 196Z)and supplements (Brown,
1968; and Na]plin,1971)and the Burleigh County study (Kume and Hansen, 1965;
Randich, 1965; and Randich and Hatchett, 1966) are first and third in a series
that includes each county in North Dakota. The Emmons County study (Bluemle,
5

1984; and Armstrong, 1975and 1978) occurs later in the series.
Methods of Investigation
Three principal sources of data support this study: published ground-water
studies for Burleigh, Emmons, and Kidder Counties; unpublished test-hole logs,
well driller's reports, and water-quality analyses on file; and field work done
from 1976 to 1983 for this study. The field work included drilling test holes,
constructing observation wells, collecting water samples for chemical analysis,
and periodically measuring water levels in an observation-well network.
Supplementing the results of this field work are test holes and observation wells
used in some aquifer tests conducted in the study area in 1976, 1982, and 1983.
Test holes were drilled from 1977 to 1980 at 282 locations using forward
rotary drill rigs. The driller and site geologist each prepared lithologic logs for
the test holes. Spontaneous potential and resistivity logs were run in each test
hole. Gamma and neutron logs were run in ten test holes. The lithologic and
geophysical logs provide subsurface control on the thickness and stratigraphy
of the glacial drift.
Single observation wells were constructed at most sites where a significant
thickness of aquifer material was found. In many cases where multiple layers
of such material were encountered, wells were constructed in each layer in
separate bore holes. Both lithologic and geophysical logs helped to determine
which sites were completed with multiple wells and at what depths the screens
were set. A total of 142 wells were constructed at 113of the 282 test-hole sites.
Multiple wells were installed at 24 of the 113 sites, and 11 existing single-well
installations had one or more additional wells constructed.
Most of the observation wells were constructed with 1%" diameter ABS
(Acrylonitrile-Butadiene-Styrene) or PVC (PolyVinyl Chloride) pipe; 2" diameter
6

steel pipe was used in two wells. A 3-, 5-, or 6-foot long l~" diameter galvanized
steel screen and attached check valve were joined to the bottom of the pipe.
The screens were most commonly 0.018 or 0.012 inch slot size. The components
of an observation well were assembled on the ground and then lowered into the
drill hole. The screen was set at the desired depth, the well back-flushed with
clear water to clean the aquifer material and bore hole of drilling fluid, and
compressed air pumped into the well to collapse the formation around the screen.
The annulus was filled to ground level with drill cuttings. Each new observation
well was pumped for several hours to assure a good hydrologic connection between
the well and the aquifer. Pumping was accomplished with an airline connected
to a small, trailer-mounted air compressor driven by a gasoline engine.
Water samples were collected from 17 existing observation wells, the 142
wells constructed for this study, and 18 other observation wells constructed at
aquifer test sites in the study area; also from the roadside spring at Crystal
Springs. Both specific conductance and water temperature were measured in
the field for each sample collected. Three-part water samples were collected
in plastic bottles at each site:
1) 250 milliliter - raw2) 500 milliliter - filtered3) 500 milliliter - filtered and acidified
Filtration with a nitrogen-drive system and 0.45 micron filter removed suspended
sediment from the water sample. A two milliliter ampule of concentrated nitric
acid was added to stabilize the metals to reduce the likelihood of forming
precipitates or colloids. The samples were delivered to the State Water
Commission Laboratory in Bismarck for analysis of the major anions and cations.
Unpublished water-quality data on file supplement these anlyses.
7

Water levels in a network of observation wells were measured periodically
over the course of the study.' The network consisted of 205 wells at 151 sites.
A hydrograph for each well was prepared to show water-level fluctuations. The
elevation of the top of each observation well was established by a field survey.
The elevation of test-hole sites was interpolated from 7%' topographic quadrangle
maps. Reference datum for land-surface elevation is National Geodetic Vertical
Datum (NGVD).
Annual water use as authorized by the various water permits in the study
area was determined from the yearly reports submitted by the water-permit
holders. Domestic and livestock water use was estimated from population figures.
Climatic data were taken from the annual summary for North Dakota published
by the National Oceanic and Atmospheric Administration.
Location-Numbering System
The system used for identifying the location of an observation well or test
hole is based on the federal system of rectangular surveys of public lands (figure
2). The first and second series of numbers denote the township north of a baseline
and range west of the Fifth Principal Meridian, respectively. The third series
of numbers designates the section. The first, second, and third letters after
the section number indicate, respectively, the quarter section, quarter-quarter
section, and quarter-quarter-quarter section (lO-acre tract) lettered consecutively
A through D counterclockwise beginning with the northeast quarter.
8

FIGURE 2 WELL NUMBERING SYSTEM
9

PHYSIOGRAPHY
The study area (figure 3) lies within the Glaciated Missouri Plateau section
of the Great Plains Province (Fenneman, 1931) and in the Missouri Coteau and
Coteau Slope Districts (Kume and Hansen, 1965). Much of the study area in all
three counties is characterized by the gently rolling topography of outwash and
lake plains. The hummocky features of collapsed glaciofluvial sediments occur
locally. Rough morainal topography outlines the study area in Kidder County
and much of Burleigh County. Stream eroded bedrock topography borders the
study area in Emmons County and southwestern Burleigh County. The study
area also includes the rugged morainal topography north of Pettibone where
glacial deposits bury a deep bedrock valley.
Nonintegrated drainage characterizes the Missouri Coteau District.
Relatively short ephemeral or intermittent streams drain into the numerous
sloughs and potholes occupying limited drainage basins. There is no regional
outlet. Drainage in the Coteau Slope District occurs in a mostly integrated system
of intermittent and a few permanent streams with regional discharge westward
to the Missouri River. However, some drainage in this District is internal with
short ephemeral or intermittent streams discharging into undrained depressions.
CLIMATE
The climate of the study area is semiarid continental, characterized by
short summers, long and cold winters, slight to moderate precipitation, and wide
fluctuations of temperature. The inconstancy of weather patterns across the
10

o
(Mod",." "0'" CI.~to" -19621
K 0 T A
MAN
..SCALI..,'.
lo4.t'11'I9_"----,'----~
~; j G,on' )
80WMon •- _ Adom.
--- __ ~ SIO"'.---------SOU T H
c
c
•..
0'
2/ GOld.ni ~"..Ir-I
II
I
•.....•.....
FIGURE 3. MAP SHOWING LOCATION OF STUDY AREA AND THE PHYSIOGRAPHIC UNITS OF NORTH DAKOTA

study area arises from the interactions of three major air masses moving from
the polar region, the northern Pacific, or the Gulf of Mexico.
The occurrence and pattern of precipitation varies considerably both during
a year and from year to year. However, relatively widespread and prolonged
rains typically occur in the spring. Summer rainfall is mostly from isolated
thunderstorms or storm cells associated with frontal systems. Normal annual
precipitation across the study area ranges from about 15" in the west to 16" in
the east and 17" in the south (figure 4). Total annual precipitation between 1976
r-------r------I
I I I__.J ! • i, I Tullle •• Pettlbollt --" 16.83 16.69"/39.'
) L I
\ I 'I I I\ I. I\t. I St"" I8i••••or~k 16.89740.8° I
7~6"/41.40 i I
..~- __--_-------J" I
) I( I, I\ I
\ ,t_ ~/ 17.2&"/42.&° I
I I\ I
\\ I'-- 1
FIGURE 4. NORMAL ANNUAL PRECIPITATION CInches)NORMAL ANNUAL TEMPERATURE (OF)
(NOAA. 1976-1982)
12

and 198Z varied from more than 7" below normal to over 9" above normal (table
1).
Table 1. NORMAL AND TOTAL ANNUAL PRECIPITATION (Inches)(Normal. annual precipitation is the annual precipitation averagedover the 30-year period 1951-1980)
Station 1976 1977 1978 1979 1980 1981 1982 Normal
Bismarck 11.17 18.54 16.95 11.81 16.39 14.46 18.07 15.36Bismarck
12ENE 12.89 20.79 16.65 13.68 17.63 14.91 (17.80)Linton 9.69 26.87 19.46 12.12 17.25Moffit 3SE 10.05 23.62 15.88 14.85 18.01 15.39 20.49Pettibone 9.93 19.29 14.66 15.58 18.32 15.74 18.93 16.69Steele 12.60 20.57 15.79 17.62 20.54 16.89Tuttle 11.14 18.73 17.72 14.08 17.49 16.11 17.83 16.83
(NOAA, 1976-1982)
About 70% of the normal annual precipitation falls between April and August,
the time of crop germination and growth. However, this precipitation varies
markedly across the study area in total amount, intensity,and areal extent; typical
of the pattern elfsummer rainfall.Temperature also exhibits a pattern of variability with a wide range of
daily, seasonal, and annual temperature extremes which contrast sharply with
average annual temperatures. The average annual temperature for the study
area (figure 4) decreases from the south (4Z.5°F) to the east (39.6°F), but the
range between annual temperature extremes commonly exceeds lZ0°F and usually
exceeds 130°F. Summer temperatures of 90°F or above and winter temperatures
of -ZO°F and below are typical. The freeze-free period is the number of days
between the b.st freeze of spring and the first one of fall. The length of the
freeze-free period averages between lZO and 130 days, but ranges from less than
13

110days to more than 160 days. The freeze-free period approximates the length
of the growing season. Frost in the ground can remain beyond the last freeze
of spring. Movement of water downward past the soil profile does not begin
until the frozen ground has thawed.
Ground water in the glacial-drift aquifers in the study area is derived
predominantly from precipitation and surface water infiltrating through the
soil profile. The amount of precipitation entering the ground-water system is
strongly influenced by evapotranspiration. Evapotranspiration is the process
whereby water enters the atmosphere through plant transpiration and evaporation
from the land surface and open bodies of water. The rate of evapotranspiration
responds to a variety of factors relating to climate, vegetative cover, the degree
of saturation of the soil profile, and the longevity of the water supply available
for transpiration and evaporation. The amount of water moving into the
atmosphere varies both seasonally, peaking during the summer, and from one
year to the next. Annual evaporation as measured with evaporation pans at the
Mandan Experiment Station (table 2) typically exceeds normal annual precipitation.
TABLE 2. TOTAL PAN EVAPORATION (Inches)(Measured at the Mandan Experiment Station Using 48" Pan)
1976 1977 1978 1979 1980 1981 1982
Total Inches 48.83 38.43 36.93 27.35 47.54 40.46 33.16Months
Included April- May- May- June- Apri1- April- May-Sept. Sept. Sept. Sept. Sept. Sept. Sept.
(NOAA, 1976-1982)
14

OCCURRENCE AND QUALITY OF GROUND WATER
General Concepts
All ground water in the glacial-drift aquifers of the study area essentially
is derived from precipitation. Part of the precipitation returns directly to the
atmosphere by evaporation, part runs off into streams, and the rest percolates
into the soil profile. Some of the soil water evaporates or is transpired by plants.
Water in excess of the maximum retention capacity of a soil infiltrates downward
to the zone of saturation.
Ground. water moves from recharge to discharge areas as a consequence
of gravity and pressure. This movement is typically slow, traversing only a few
feet per year. The rate of ground-water movement is governed by the hydraulic
conductivity of the material through which the water moves and by the prevailing
hydraulic gradiEmt. Hydraulic conductivity is by definition the capacity of a
rock or unconsolidated deposit to transmit water. The magnitude of hydraulic
conductivity de:pends on the grain-size distribution of sediment particles for
unlithified formations, and also on the nature and extent of secondary permeability
features in consolidated formations. Deposits of materials with a large hydraulic
conductivity constitute aquifers; deposits with a small hydraulic conductivity
restrict ground-water movement.
Changes in the rate of recharge to or discharge from an aquifer cause
water-level fluc:tuations in wells completed in the aquifer. The fluctuations
generally indicate a change in the amount of water stored in the aquifer. In
addition, changes in surface load or atmospheric pressure cause minor water-level
changes in wells completed in a confined aquifer.
Shallow aquifers in the study area are usually recharged in the spring, early
summer, and falll when soil moisture in excess of evapotranspiration requirements
15

is present due to direct infiltration of precipitation, snowmelt, or runoff. Aquifers
that are confined by deposits of fine-grained sediment are recharged more slowly
by seepage from the confining beds or by water moving downgradient from
recharge areas through overlying confining units or aquifers.
Water Quality
Ground water contains varying concentrations of dissolved mineral matter
initially acquired as the water falls through the atmosphere and later as the
water moves through the soil and sediments underlying the land surface. Dissolved
minerals in the water vary in type and concentration due primarily to the
composition and solubility of the various deposits encountered and the length
of time the water is in contact with the different deposits. The temperature,
pressure, and acidity of the water also affect dissolution rates and dissolved
mineral concentrations. The concentration of dissolved minerals generally
correlates directly to the residence time of the water in the ground.
The suitability of ground water for various uses is determined mostly by
the kind and amount of the various chemical constituents present, and to a lesser
extent by the water's physical properties. Different water-quality criteria may
be emphasized depending on use. The most prevalent uses of ground water in
the study area are domestic and farmstead supply and irrigation. The criteria
of concern and the recommended limits are indicated in Table 3. The constituents
used in this report to characertize the suitability of the ground water for drinking
purposes are: hardness and the concentrations of iron, manganese, sulfate, and
total dissolved solids.
The suitability of ground water for irrigation is evaluated in terms of its
effect on the productivity and quality of crops and on the physicochemical
properties of the irrigated soils. Four indices are used to evaluate the suitability:
16

TABlE 3• MAJOR CHEMICAL CONSTITUENTS IN WATER, THEIR BFFECTSUPON USABILITY FOR DOHESTIC SUPPLY, AND THE RECOMMENDEDCONCENTRATION LIM1".rS
Constituent Effects upon Usability
U. S. Public HealthService (1962) Recommended
Drinking-Water limits
Calcium (Ca)Magnesium (Mg)
Sodium (Na)
Both retard the suds-forming action of soapand detergent; high concentrations ofm.agnesium have a laxative effect.
Htgh concentrations may affect people onsodium-restricted diets
Iron (Fe)
Manganese (Mn)
Sulfate (S04)
Chloride (cO
More than 0.1 mg/l will precipitate whenexposed to air; stains plumbing fixtures,l.aundry, and cooking utensils, causesturbidity, and impacts tastes and colorsto food and drink.
More than 0.2 mg/l precipitates when exposedto air; causes undesirable taste and darkstains on fabric and porcelain fixtures.
More than 500 mg/l tastes bitter and may bea laxative.
More than 250 mg/l may impart a salty taste;greatly excessive concentrations may bephysiologically harmful.
0.3 mg/l
0.05 mg/l
250 mg/l
250 mg/l
Fluoride (F) Optimum concentration helps prevent toothdE!cay; higher concentrations cause mottledtE!eth.
Recommended limitsdepend on annualaverage of maximumdaily temperatures.Limits range from 0.6mg/l at 32°C to 1.7mq/l at lOoC.
Total DissolvedSolids (TDS)
Melre than 45 mg/l may cause methemoglobinemiain: infants; more than 100 mg/l may causea bitter taste and physiological distress.
More than 500 mg/l is not desirable ifbetter quality water is available; personsmay become accustomed to water containing2000 mg/l or more.
17
45 mg/l
500 1I1g/1

1) salinity hazard determines the likelihood of anincrease in salinity of the soil water; it ismeasured as total dissolved solids or specificconductance.
2) sodium hazard indicates the likelihood ofsodium concentrations in the soil increasingto the level where it adversely affects the soilstructure and causes high alkalinity in the soilwater; it is calculated as the sodium adsorptionratio (SAR) from the milliequivalent concentrationsof the sodium, calcium, and magnesium cations.
3) residual sodium carbonate (RSC) indicates the likelihoodof cation-exchange with sodium occurring in the soilprofile thereby decreasing soil permeability; it iscalculated from the milliequivalent concentrations ofthe bicarbonate and carbonate anions and calcium andmagnesium cations.
4) the potential toxicity of certain trace elements usuallyindicated by the concentration of boron.
The first two indices are divided into four classes each - low, medium, high,
and very high hazard - and combined into a system for classifying the quality
of irrigation water (figure 5). The indices used in this report are percent sodium,
SAR, RSC, and the irrigation classes for salinity and sodium hazards.
Aquifer Properties
The water-yielding capability of an aquifer is evaluated using the properties
of the aquifer, especially hydraulic conductivity, transmissivity, and storage
coefficient or specific yield. These aquifer properties together with the saturated
volume of an aquifer as determined from interpretation of field data are used
to quantify the volume of water stored in the aquifer. The amount of water
available from an aquifer to wells is generally estimated as half the amount
of water in storage. The yield to wells can be approximated using the aquifer
properties, water level measurements, and certain assumptions concerning well
construction.
18

FIGURE 5
[»IAGRAM FOR CLASSI FYING THE QUALI TV
OF WATER FOR IRRI GATION
4
VERY HIGH
3
HIGH
C 3 - S4
SALIN ITY HAZARD
C2-84
2
MEDI UMLOW
C 1- S 4
100
C4-S4..•.C 1- 83
0~ota: C2-83...J 2
c:t ~ N;C
~ 00-.J UJ ~
II( :. Go- cr:0
C3-S3(I)Q C 1- 82ot:.~Q0 C2-S2fI)
C3-S 2
•0 -~ C 1- S I
C 2 - 8 I
C 3 - S I
C4-SI
SOURCE:
USDA -HANDBOOK 60
19

'The hydraulic conductivity, transmissivity, and storage coefficient or specific
yield of an aquifer can be derived by two different approaches. These properties
can be quantified through analysis and interpretation of aquifer-test data.
However, the results of an aquifer test are valid only for a small area around
the test site. The second approach for deriving these properties is as follows:
hydraulic conductivity - empirical values of hydraulicconductivity as determined for various associations of sediment grainsizes are applied to similar units described in a lithologic log.
transmissivity - the hydraulic conductivity of eachlithologic unit is multiplied by the saturated thickness of that unit; totaltransmissivity is the sum of the transmissivities of the separate units.
storage coefficient or specific yield - several valuesare taken from a range of values characteristic for the type of aquiferbeing evaluated.
As is the case for the area of validity for aquifer-test results, the results obtained
through the second approach are valid only for a small area sUlToundinga test-hole
site. This is due to the characertistic heterogeneity of glacial-drift aquifers.
GEOLOGIC UNITS AND THEIR HYDROLOGIC PROPERTIES
Bedrock Formations
The Pierre, Fox Hills, and Hell Creek Formations of Late Cretaceous age
and the Cannonball Formation of Tertiary (Paleocene) age directly underlie the
glacial drift of the study area.
GENERALIZED STRATIGRAPHY OF GEOLOGIC UNITS
System
Quaternary
Tertiary
Late Cretaceous
Formation
Glacial drift
Cannonball Fm.
Hell Creek Fm.
Fox Hills Fm.
pierre Fm.
20
Dominant Lithology
Clay, silt, sand, and gravel
Marine sandstone and shale
Claystone, sandstone, andsiltstone
Sandstone, shale, and siltstone
Shale
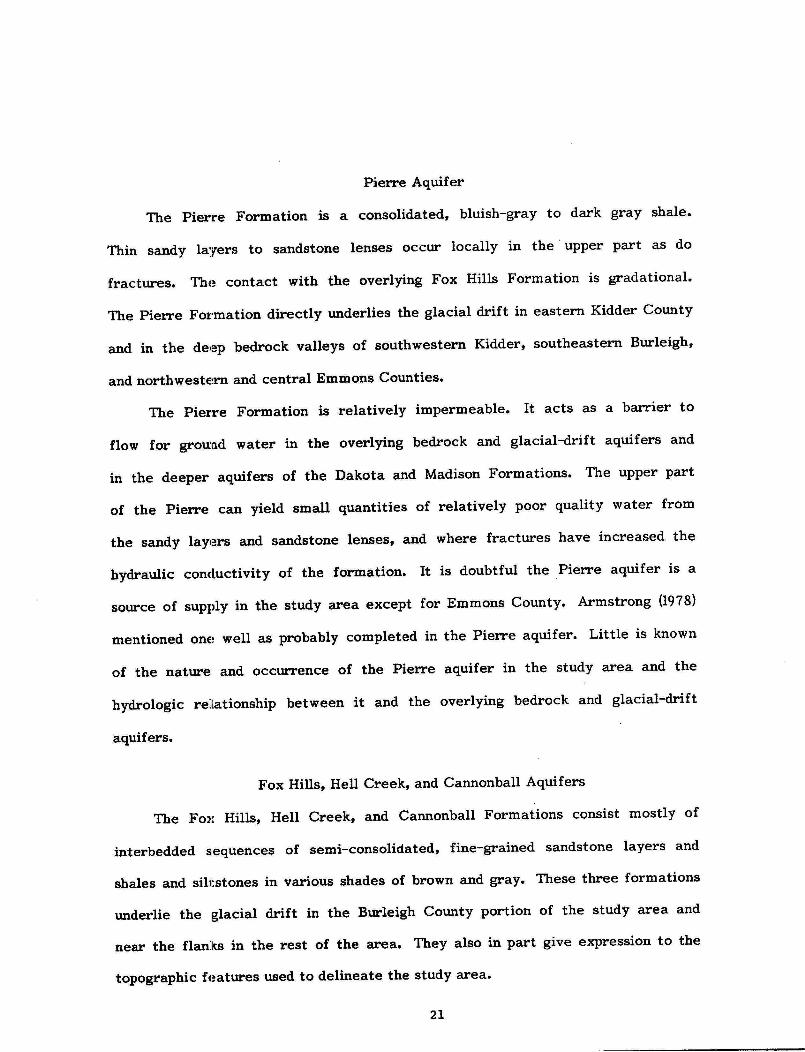
PieITe Aquifer
The Pierre Formation is a consolidated, bluish-gray to dark gray shale.
Thin sandy layers to sandstone lenses occur locally in the upper part as do
fractures. The contact with the overlying Fox Hills Formation is gradational.
The PieITe Formation directly underlies the glacial drift in eastern Kidder County
and in the delep bedrock valleys of southwestern Kidder, southeastern Burleigh,
and northwestElrn and central Emmons Counties.
The Pierre Formation is relatively impermeable. It acts as a baITier to
flow for ground water in the overlying bedrock and glacial-drift aquifers and
in the deeper aquifers of the Dakota and Madison Formations. The upper part
of the PieITe can yield small quantities of relatively poor quality water from
the sandy laYfers and sandstone lenses, and where fractures have increased the
hydraulic conductivity of the formation. It is doubtful the Pierre aquifer is a
source of supply in the study area except for Emmons County. Armstrong (1978)
mentioned one well as probably completed in the Pierre aquifer. Little is known
of the nature and occurrence of the Pierre aquifer in the study area and the
hydrologic re:lationship between it and the overlying bedrock and glacial-drift
aquifers.
Fox Hills, Hell Creek, and Cannonball Aquifers
The Fm: Hills, Hell Creek, and Cannonball Formations consist mostly of
interbedded sequences of semi-consolidated, fine-grained sandstone layers and
shales and siltstones in various shades of brown and gray. These three formations
underlie the glacial drift in the Burleigh County portion of the study area and
near the flanks in the rest of the area. They also in part give expression to the
topographic features used to delineate the study area.
21

The sandstone layers constitute aquifers that can yield a few tens of gallons
per minute where adequate thicknesses occur. Small quantities of water may
be available where shale or siltstone layers are fractured. These bedrock aquifers
are a source for domestic and livestock water supplies where the glacial-drift
aquifers are thin or absent. Recharge to the bedrock aquifers is principally by
direct infiltration of precipitation where the aquifers crop out and by lateral
flow eastward from the regional recharge area in western North Dakota and
eastern Montana (Thorstenson, et al., 1979). The head difference between aquifers
in the Fox Hills, Hell Creek, and Cannonball Formations and deeper aquifers
in the Dakota and Madison Formations indicates slow upward leakage of water
across the intervening confining formations (Thorstenson et al., 1979). In some
locales in the study area, the Fox Hills, Hell Creek, and Cannonball aquifers
may be recharged by water from adjacent glacial-drift aquifers. However, this
hydrologic relationship is not well known. Discharge from the bedrock aquifers
in the study area is generally by flow of water into the glacial deposits and by
pumping of wells. Along the edges of the study area where the bedrock aquifers
are at or near land surface, the water moves from higher elevations toward stream
valleys.
The water in the bedrock aquifers is typically high in sodium with bicarbonate
and sulfate the dominant anions, and concentrations of total dissolved solids
ranging from about 500 mg/l to 2,500 mg/l. Water from the bedrock aquifers
often influences the quality of water found in the glacial-drift aquifers.
Glacial-Drift Sediments and Aquifers
Unconsolidated sediments of the Coleharbor Group unconformably overlie
the bedrock in the study area. Thickness of these sediments in the study area
22

as determined by test drilling can be summarized as follows:
Bur1ei9h CountyEmmonsCountyKidder CountyEntire Study Area
Range0' - 320'0' - 536'
16' - 670'0' - 670'
Average107'195'210'169'
Three broad textural facies have been recognized for the Coleharbor Group
(Bluemle, 1979) based on depositional environments. These are:
till facies - nonstratified, unsorted mixtures ofclay particles through boulders deposited directlyfrom glacial ice. The coarser grained fractionoccurs in a clay-silt matrix and consists of angularto subrounded fragments of igneous, metamorphic,and carbonate rocks, shale, and lesser amountsof lignite.
sand and gravel facies - poorly sorted deposits ofmostly sand and gravel characteristic of aglaciofluvial environment, and well sorted depositsof sand with some gravel associated with a lakeshore environment.
silt and day facies - deposits of silty clay, clayeysilt, and fine sand laminae typical of a lacustrineenvironment.
The Coleharbor Group has been and continues to be reworked by erosion,
particularly by wind, rain, and mass wasting. The sediments produced include
alluvial and colluvial deposits on hillslopes and in valleys or other depressions,
fluvial deposits along stream courses, and eolian deposits of dune fields and loess.
Together these sediments comprise the Oahe Formation which is late Pleistocene
to Holocene in age.
The sediments of the Coleharbor Group represent at least six major episodes
of glaciation in the study area. The two oldest glaciations are thought to be
late pre-Wisconsinan, possibly Illinoian in age, and each probably includes several
advances of the ice margin (Bluemle, 1984). These two glaciations very likely
23

covered the entire study area. Subsequent glacial advances are all Wisconsinan
in age. The Napoleon advance is early Wisconsinan; the Long Lake and related
Cat Tail Creek and Zeeland advances, the Burnstad, and the Streeter advances
are all late Wisconsinan (Bluemle, 1984; Rau et al., 1962). Each advance covered
less area than the previous one. The moraines associated with the last glaciation
are found only in eastern Kidder County. Each advance deposited till and
prolgacial glaciofluvial and lacustrine deposits and shaped the landforms associated
with glaciation. The sediments and landforms of one advance were eroded, buried,
or otherwise modified by the overriding ice sheet, proglacial processes, and
periglacial environment of subsequent advances and the period of weathering
between advances. The sediments and landforms of the more recent advances
are better preserved and more evident than those of older advances which lie
ahead of the younger ice margins.
The aquifer complex under investigation consists chiefly of outwash sand
and gravel carried by meltwater flowing from the ice margins. These glaciofluvial
sediments occupy former meltwater channels which aggraded and coalesced
to form broader, sheetlike deposits. Advances of ice margins subsequent to
sediment deposition eroded, buried, reworked, or otherwise modified the existing
glaciofluvial deposits. The outwash sand and gravel of the last ice advance in
the study area, the Streeter advance, remained unaltered by direct glacial action.
It has been affected only by proglacial processes, periglacial climate, and
post-glacial erosion.
Individual layers of sand and gravel range in thickness from about 5 to
165 feet with thicknesses of 20 to 60 feet common. Within the main aquifer
complex the number of layers present varies from one to five or six. The number
24

of layers varies almost randomly and the correlation of individual units over
other than relatively short distances is tenuous because of the depositional
environment. Individual sand and gravel layers can be hydraulically connected
and respond as a hydrologic unit to changes in hydraulic head. Proper management
of ground-watE~r resources will be an important impetus for future study of the
"Kidder County aquifer complex". The aquifer units proposed in this report are
defined with an eye toward resource management and are based on hydraulic
responses monitored in the existing observation-well network.
Strasburg Aquifer - Emmons County
The principal glacial-drift aquifer in Emmons County is the Strasburg aquifer
(plate 1) described by Armstrong (1978). This aquifer underlies about 98 square
miles of west-central to south-central Emmons County. It occupies a bedrock
valley interpreted to be a diversion channel of the ancestral Missouri River (Kume
and Hansen, 1965, p. 68 and Bluemle, 1984). Armstrong (1978)divided the aquifer
into lower, middle, and upper sand and gravel zones separated by till, silt, and
clay. Cumulative total thickness varies considerably, ranging from almost 0
feet near the aquifer edges to 2.75feet in the thickest part.
The lower and middle zones are hydrologically confined; the upper zone
is typically unconfined to leaky confined where buried by a relatively thin veneer
of till, silt, or clay. The three zones are apparently three separate hydrologic
units, but response of the aquifer system as a whole to high-capacity wells may
reveal the lower and middle zones are hydraulically connected in at least parts
of the aquifer (Armstrong, 1978). Recharge to the aquifer is mostly by infiltration
of precipitation and runoff which moves downward and laterally in response to
25

prevailing hydraulic gradients to the middle and lower zones. Discharge is mostly
be evapotranspiration and wells. Some discharge in the southern part of the
aquifer is by flow into South Dakota and Rice lake. In the northern part of the
aquifer, discharge occurs into Beaver Creek and Lake Oahe or the sediments
filling the Missouri River valley now flooded by Lake Oahe.
The sustained yield of a properly constructed well is determined by the
thickness, lithology, hydraulic conductivity, and areal extent of the aquifer and
the drawdown available in the well. Yield from the thicker part of the Strasburg
aquifer is summarized as follows (Armstrong, 1978, p. 23)
Aquifer ZoneUpperMiddleLower
Range of Yieldgenerally <100gpm
50 to >500 gpm500-1000 gpm
Yield from the middle zone varies considerably due to abrupt changes in the
thickness, lithology, and extent of the aquifer. Yield from the three zones together
would probably be less than 1,000 gpm because the areas of each zone suitable
for maximum yield do not coincide. An estimated 750,000 acre-feet of the water
in the Strasburg aquifer is available to wells (Armstrong, 1978).
The quality of water varies both vertically and areally within the Strasburg
aquifer system (Armstrong, 1978, p. 23). The water is generally very hard and
a calcium bicarbonate type. However, in the northern part of the aquifer and
where the Fox Hills aquifer adjoins the Strasburg aquifer the water is generally
a sodium bicarbonate type. Total dissolved solids ranged from 362 to 1,720 mg/l
for 56 samples. The salinity hazard of the water relative to irrigation use is
typically high; sodium hazard typically low to medium. The sodium bicarbonate
type water generally has a higher salinity hazard than the calcium bicarbonate
type water (Armstrong, 1978, p. 25).
Some additional test drilling was done in the Strasburg aquifer as part of
26

this study. Test holes were drilled at fourteen sites (plate 1). Ten observation
wells were constructed at seven of the sites including one site with two wells
and one site with three. The test-hole sites are in five areas along the Strasburg
aquifer: between Rice Lake and Strasburg, just north of Strasburg, southwest
of Linton, and across the Horsehead Valley at 133-78-24 and 26. The additional
data further defined the geology of the Strasburg aquifer in areas not drilled
in for the c01mty study and allowed for better correlation of the three zones
across these areas. Water levels measured in the observation wells constructed
during this study verified the hydrology of the Strasburg aquifer as presented
in the Emmons County ground-water report. The water levels indicate ground
water moves downward from the upper to lower zones as well as laterally from
a ground-water divide near Strasburg.
The total amount of water appropriated from the Strasburg aquifer by
1983 was 1330 acre-feet annually. Reported annual water use for the period
1973-1983 totaled about 1510acre-feet. The recovery of water levels in observation
wells 132-77-27DDDI and 27DDD2 near current irrigation development indicates
a minimal impact on the aquifer system (figure ~). However, the cone of
depression generated by pumping for the city of Strasburg would fluctuate in
response to any changes in the rate of withdrawal.
Glacial-Drift Aquifers - Burleigh County
The glacial-drift aquifers found in the Burleigh County portion of the study
area were first delineated by Randich and Hatchett (1966) on the basis of
geographic and hydrogeologic characteristics. This study includes the following
27

FIGURE 6
Hydrograph of Observation Wells - Strasburg Aquifer
Obs Well 132-077-270001Obs Well 132-077-270002
Land-Surface Elev=1750ft NGVOLand-Surface Elev=1750ft NGVO
30
1984198319821981198019791978
~ ~.......•..•••.•
• ,.' .~II ,, , , '1-I , I ' ,, , , " 1 I, ! I ,I, •I , I il II I I ,I , , , fI ~ II I , ,,I I I , I, I , • II I ,
II, , , , ,
I I I II , • I ,,I I \ ,I I \ I
I , II , , ,, I ;I I , II I , ,I I I II , , ,I I I ,I I I I, r , ,I I I r- .. ' , I
"oi I I! : I
I I •, ,I I ,,I , ,, I ,I I II, I III , I• •I,I ,
I
;
I,II'III'
Legend "
-
~$
Obs Well 132-077-270001; SI=317-329ftI
•,
• 9_1? ~_.w~J Lt~? _-:9_~?::?JJJ. P..!?J:.;_ ~I::??_-:~ ~!t_,-rT I
0- r • T TOO- . -. .
110
50
120
130
40
0)0 60a
'+-"-::J
V1-0
70ca
---1~00) 80CD
"-0)-a~
I 900-I..c-0-0) 1000
28

of the aquifers found in the Burleigh County ground-water study:
Long Lake aquiferGlencoe Channel aquiferMcKenzie aquiferRandom Creek aquiferLower and Upper Apple Creek aquifersWing Channel aquifer
These aquifers (plate Z) occur in surficial and buried-valley outwash deposits
which occupy BL system of valleys incised into bedrock (plate 3). Some of the
valleys were the eastern pre-glacial courses of the ancestral Heart and Cannonball
Rivers; others were modified by glaciation. Although the nomenclature of Randich
and Hatchett (1966) for the glacial-drift aquifers established separate entities,
the aquifers are more or less hydraulically connected because of the mode of
deposition. The existing nomenclature is used in this report for consistency in
aquifer identification, but the aquifer boundaries are somewhat modified.
Long Lake Aquifer
The Long Lake aquifer (plate Z) was originally defined as a glacial-drift
aquifer underlying about 3Z square miles in southeastern Burleigh County (Randich
and Hatchett, 1966). Armstrong (1978) included as part of this aquifer the sand
and gravel units found within a narrow, partially buried bedrock valley that trends
south and west from Long Lake into Emmons County (plate 1). In Emmons County
it follows Badger Creek to Lake Oahe. Armstrong (1978, p. Z5) gives a full
description of the Emmons County portion of Long Lake aquifer. The valleys
incised into bedrock occupied by the Long Lake aquifer in Emmons and Burleigh
Counties are interpreted to be part of the drainage system of the preglacial
Heart and Canrlonball Rivers (Kume and Hansen, 1965 and Bluemle, 1984).
29

Additional test drilling in the Long Lake aquifer done for this study indicates
the aquifer occupies two bedrock valleys in Burleigh County (plate 3). The valleys
separate about five miles west of the Kidder County line and rejoin about five
miles NNW of Moffit. The northern valley is about five miles long, trends almost
due west, and is relatively shallow. The southern valley follows the trend of
Long Lake around a bedrock high. It is more deeply incised into bedrock than
is the northern valley. The main part of the Long Lake aquifer occurs within
the sediments in the southern bedrock valley.
Interpretation of the new data shows the Long Lake aquifer underlies about
46 square miles in southeastern Burleigh County (plate 2). The top of the aquifer
lies 19 to 186 feet below land surface. Aquifer thickness encountered in test
drilling varies from 3 to 97 feet and averages 36 feet. The aquifer material
consists typically of medium sand to medium gravel, but can range from very
fine sand to coarse gravel. The aquifer in the northern valley is predominantly
very fine to medium sand, indicative of a lower energy depositional environment.
However, at two locations beds 8 and 14 feet thick of the coarse sand to medium
gravel of outwash were found. The Long Lake aquifer directly overlies the bedrock
over most of its area (plate 9). However, in some localities intervening till or
silty clay is present. At some other locations, till or lacustrine silts and clays
separate the aquifer into more than one layer. The aquifer is predominantly
overlain by silt and clay deposited from glacial Lake McKenzie. These sediments
produce the confined conditions within Long Lake aquifer. The aquifer apparently
is locally unconfined over a small area on the eastern flank near the Emmons
County line where the aquifer lies within 20' of land surface. The results of
30

an aquifer test in the Emmons County portion of the aquifer yielded transmissivity
values ranging :rrom 6,000 to 8,700 ft2/day and a storage coefficient of 0.0002.
Transmissivity values can be estimated over the areal extent of the aquifer from
test-hole logs using the thickness and an estimated hydraulic conductivity for
the various sand or gravel units encountered. The transmissivity values thus
calculated range from about 300 to 7,200 ft2/day, with an average value of 2,400
ft2/day. An e~itimated 159,000 acre-feet of water are available from storage,
based on a spedfic yield of 0.15, an average thickness of 36 feet, and an areal
extent of 46 square miles.
The principal sources of recharge to the Long Lake aquifer are: direct
infiltration of precipitation, underflow from the adjacent glacial-drift aquifer
system in Kidder County and the Fox Hills aquifer, lateral flow from the surficial
outwash and other drift deposits bordering the Long Lake aquifer, and Long Lake
itself. Long Lake is divided by low earthen dams into three units. Spillways
maintain slightly different water levels in each unit. Flow relationships between
the three surface-water units in the Long Lake National Wildlife Refuge and
the Long Lake aquifer can be established by comparing surface-water elevations
and water-level elevations in nearby observation wells. Such comparison shows
a downward gradient exists during the summer to early fall, indicating leakage
from Long LakE!into the aquifer.
Discharge from the Long Lake aquifer is by evapotranspiration, seepage
into Long Lake Creek, infiltration into Long Lake during the late fall to spring,
underflow into the adjacent McKenzie aquifer, and wells. Domestic and stock
wells discharge a relatively small amount of water. By 1983, appropriations for
irrigation total.ed 2141acre-feet for 1414acres. However, reported annual water
31

use for the period 1973-1983 totaled about 1390 acre-feet. The hydrograph of
observation well 137-76-05DCC (figure 7) indicates recovery of the aquifer system
to the seasonal irrigation pumping, suggesting no adverse impacts on the aquifer
with the current level of development.
The yield of a well is related in part to such aquifer properties as thickness,
hydraulic conductivity, and areal extent. Well yields of the Long Lake aquifer,
as estimated from test-hole and observation-well data, range from less than
50 gpm to more than 500 gpm (plate 4). Yields exceeding 1000 gpm may be
obtained locally where the aquifer is thickest and has a high hydraulic conductivity.
However, aquifer extent and battiers to ground-water flow preclude sustaining
such yields for long periods of time. Sustained well yields in the northern valley
of the aquifer probably will not exceed 200 gpm. This part of the aquifer is of
limited thickness and areal extent and has a relatively low hydraulic conductivity.
The slope of the potentiometric surface indicates ground-water movement
year-round into the Long Lake aquifer from the equivalent glacial-drift aquifer
in Kidder County and from the Long Lake aquifer in Emmons County. Water
levels measured in observation wells near the northwest end of Long Lake suggest
recharge to the Long Lake aquifer from the adjacent Fox Hills Formation. This
flow relationship is somewhat masked by drawdowns in this part of the Long
Lake aquifer during the summer. A ground-water divide occurs in the northern
valley of the aquifer near 137-76-03ABB and also in the Emmons County part
of the aquifer (Armstrong, 1978, p.26).
Water in the Long Lake aquifer is predominantly hard to very hard and
of a sodium-bicarbonate type. The water quality can be summarized as follows:
32

o
5
Q)u0
"I- 10L:J
U')-0c:0
.....J~0Q) 15CDLQ)
-+-0
~I0
-+-f
..r:: 20-+-n.Q)
Cl
25
30
FIGURE 7
Hydrograph of Observation Well - Long Lake Aquifer
Obs Well 137-076-05DCC; Land-Surface Elev=1721.9ft NGVD
,/ / / If IV
II ( / / I 7 I/
~
r\~
~~
Legend• Obs Well 137-076-05DCC; SI=108-111ft. ••• I' •• I . I ..- -,- .......
1978 1979 1980 1981
33
1982 1983 1984

Fe(mg/1)Mn (mg/1)S04 (mg/1)TDS (mg/l)%NaSARRSC
Range
0.00 - 3.500.18 - 1.80
112 - 550696 -140047 96
3.2 27.9o 11
Average
0.780.60
2871028
7310.4
6
Irrigation classifications range from C3-51 to C3-54 (figure 8). The salinity hazard
is high; the sodium hazard is typically medium to high.
The water along the northern valley of the aquifer exhibits certain
water-quality characteristics somewhat different from the general pattern. The
sodium hazard ranges from low (51) to medium (52) although the salinity hazard
remains high (C3). The water is of a sodium-sulfate type and very hard.
Glencoe Channel Aquifer
The Glencoe Channel aquifer as delineated by Randich and Hatchett (1966)
and Armstrong (1978)encompasses about 27 square miles in south-central Burleigh
County (plate 2) and the northwestern corner of Emmons County (plate 1). A
broad bench to the northwest of the bend in the Glencoe valley and 30 to 80
feet higher than the valley floor was included within the aquifer boundaries of
Randich and Hatchett (1966, p.52). Test drilling done for this study in this area
encountered very little saturated material. The new data indicate the aquifer
underlies about 22 square miles (plate 2) and occurs for the most part within
the glaciofluvial sediments filling the bedrock valley. The bedrock valley (plate
3) is a proglacial melt-water channel incised into the Hell Creek and Fox Hills
Formations by melt-water drainage from the Napoleon ice (Kume and Hansen,
1965). The width of this valley varies from one to three miles at its top and
34

FIGURE 8
DIAGFtAMFOR CLASSIFYING THE QUALITY
OF WATER FOR IRRIGATIONBURLEIGH COUNTY
4
VERY HIGH
Long Lake AquiferGlencoe ChanneI AquiferMc kenzie AquiferRandom Creek AquiferLower Apple Creek AquifetUJ»perApple Creek AquiferWing Channel Aquifer
3
HIGH
HAZARD •••+•)(•35
SALIN ITY
2
MEDIUMLOW
7 2250
CONDUCTIVITY- MICROMHOS/CM. (ECX 106 ) AT 25° C.
C 1- S 4
100
owo...G-ar:oenoC
2:)
ooen
...•
•o..J
NOTIE1 THt: POINTS SHOWN FOR EACH AQUIFER REPRESENT THE AVERAGECOMDUCTIVITY "HO SA" VALUES IN IEACtl CATEGORY
SOURCE:
USDA - HANDBOOK 60

narrows rather abuptly to less than one-half mile at its base.
The Glencoe Channel aquifer occurs as units of sand and gravelly sand.
Total thickness of the aquifer ranges from 5 to 147 feet and averages 60 feet.
Due to the stratigraphy of the valley-fill sediments, the aquifer consists of two
zones, an upper and a lower, which are hydraulically interrelated (plate 9).
The upper zone occurs in the central and south-central part of the Glencoe
valley, beginning about three miles southwest of the McKenzie aquifer and ending
within two miles of the Emmons County line. The zone pinches out at both ends
by a rapid facies change to silty clay. The zone consists predominantly of very
fine to fine and medium sand and may represent in part eolian deposition within
the valley (Kume and Hansen, 1965, p. 65). The top of this zone lies 2 to 83 feet
below land surface. Thickness of the zone ranges from 5 to 112feet and averages
about 42 feet. Test-hole data indicate that 10 to 40 feet of silt and clay commonly
separate the upper zone into two layers. The data suggest the deeper layer is
leaky confined for the most part and the surficial layer is unconfined.
Transmissivity values estimated from test-hole logs range from about 100 to
6,900 ft2/day and average approximately 1,500 ft2/day. The range of values
arises more from the variable thickness of the upper zone than from variations
in hydraulic conductivity. Few water levels are available for the upper zone.
Those that do exist indicate ground-water flow from the upper to the lower zone.
The lower zone directly overlies the Fox Hills Formation. It consists of
coarse sediments, typically medium and coarse sand to medium gravel. This
zone lies 97 to 163 feet below land surface. Thickness ranges from 22 to 85 feet
and averages 47 feet. Beds of lacustrine silts and clays locally separate the
lower zone into as many as five units, but these coalesce within a short distance.
36
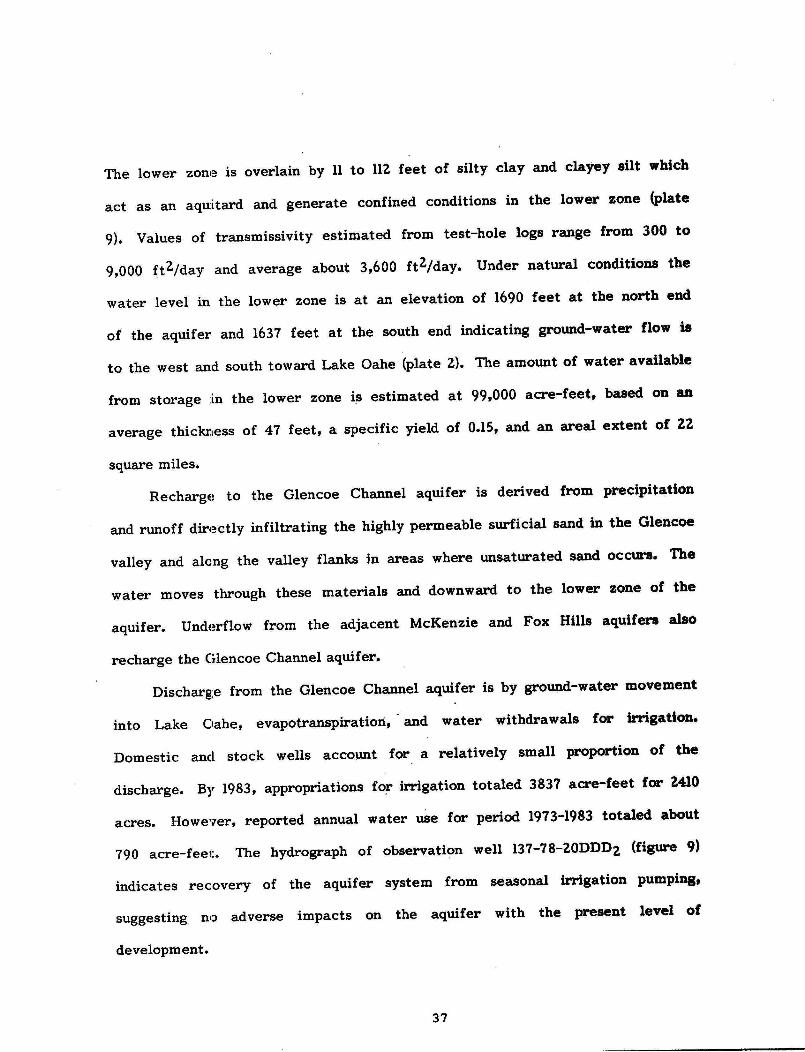
The lower zonle is overlain by 11to llZ feet of silty clay and clayey silt which
act as an aquitard and generate confined conditions in the lower zone (plate
9). Values of transmissivity estimated from test-hole logs range from 300 to
9,000 ftZ/day and average about 3,600 ftZ/day. Under natural conditions the
water level in the lower zone is at an elevation of 1690 feet at the north end
of the aquifer and 1637 feet at the south end indicating ground-water flow i.
to the west and south toward Lake Oahe (plate Z). The amount of water available
from storage in the lower zone i~ estimated at 99,000 acre-feet, based on an
average thickness of 47 feet, a specific yield of 0.15, and an areal extent of ZZ
square miles.
Recharge to the Glencoe Channel aquifer is derived from precipitation
and runoff dir1ectlyinfiltrating the highly permeable surficial sand in the Glencoe
valley and along the valley flanks in areas where unsaturated sand occurs. The
water moves through these materials and downward to the lower zone of the
aquifer. Underflow from the adjacent McKenzie and Fox Hills aquifers also
recharge the Glencoe Channel aquifer.
Discharge from the Glencoe Channel aquifer is by ground-water movement
into Lake Oahe, evapotranspiration,' and water withdrawals for inigation.
Domestic and stock wells account for a relatively small proportion of the
discharge. By 1983, appropriations fo~ irrigation totaled 3837 acre-feet for Z4l0
acres. Howe'lTer,reported annual water use for period 1973-1983totaled about
790 acre-feet. The hydrograph of observation well l37-78-Z0DDDZ(figure 9)
indicates recovery of the aquifer system from seasonal inigation pumping,
suggesting n,::>adverse impacts on the aquifer with the present level of
development.
37

FIGURE 9
Hydrograph of Observation Well - Glencoe Channel Aquifer
Obs Well 137-078-200002; Land-Surface Elev=1721.5ft NGVO50
55
1984198319821981198019791978
;1 / (/ r(/ !\ l
/
/ I~
u~
I
Legend• Obs Well 137-078-200002; SI==178-181ft
. , T I • , I . . ...
75
80
0)u0
Lf-60I.....
:J(f)
-UC0
.....J
~00)
65CDI.....0)
-+-0
~I0
-+-I...c 70-+-G-O)a
38

Yields to wells in the Glencoe Channel aquifer, as estimated from test-hole
and observation well data, range from less than 50 gpm near the edge of the
aquifer to over 500 gpm along the aquifer's axis (plate 4). The level of development
the aquifer will be able to support is limited by its narrow, elongate shape.
Water in the Glencoe Channel aquifer is mostly hard to very hard. All
samples indicated a sodium-bicarbonate type water. The water quality can be
summarized as follows:
Range Average
Fe (mg/1) 0.00 - 2.30 0.85Mn(mg/1) 0.01 - 1.00 0.37S04(mg/1) 0.8 - 607 318TDS(mg/1) 1140 -1860 1338%Na 72 97 85SAR 9.2 40.7 17.5RSC 7 19 12
Irrigation classifications range from C3-SZ to C4-S4 (figure 8). The salinity
hazard is predominantly high (C3); the sodium hazard is high to very high (S3-S4).
McKenzie Aquifer
The McKenzie aquifer delineated by Randich and Hatchett (1966) included
approximately 63 square miles. Additional test drilling redefined the margins
of the aquifer and reduced its areal extent to about 49 square miles (plate Z).
A bedrock high of about 1.5 square miles approximately two miles SSWof McKenzie
elevates the land surface near the center of the aquifer (plate 3). The top of
the aquifer lies Zl to ZOOfeet below land surface. The top of the aquifer is found
at shallower depths along portions of the eastern flank. The aquifer consists
predominantly of gravelly sand (plate 9). Total thickness ranges from less than
10 feet to 16;~feet and averages about 54 feet. The aquifer directly overlies
39

the Fox Hills Formation although an intervening silty clay unit can occur locally.
Beds of silty clay locally separate the aquifer into several units, each of variable
thickness, which coalesce within a relatively short distance. Water-level trends
noted on hydrographs of dual-well monitoring sites indicate a similar hydrologic
response in aquifer units separated by relatively thin beds of silty clay (figures
10 and 11). Where the silty clay interval is relatively thick, the aquifer is divided
into two units which are hydraulically· separate (figures 12 and 13). The silty
clay confines the aquifer over most of its areal extent. Unconfined conditions
do occur locally in very localized areas along the aquifer edges. The most
pronounced of these is north of Random Creek valley where 73 feet of surficial
outwash act as a conduit for recharging the central part of the McKenzie aquifer.
The results of two aquifer tests within one mile of each other yielded the
following transmissivity values. The range of values from test 1 was 3,300 to
5,700 ft2/day and from test 2 was 2,800 to 4,300 ft2/day (Randich and Hatchett,
1966) with averages of 4,300 and 3,300 ft2/day, respectively. Values of
transmissivity extending over most of the McKenzie aquifer were estimated
from test-hole data. These values vary from a low of around 300 ft2/day where
the aquifer is thin to about 13,200 ft2/day, and average approximately 6,200
ft2/day. Values for storage coefficient derived from the aquifer tests range
from .00007 to .00040 for test 1 and .00017 to .00073 for test 2 (Randich and
Hatchett, 1966) with averages of .00022 and .00042, respectively. An estimated
254,000 acre-feet of water are available from storage, assuming a specific yield
of 0.15, an areal extent of 49 square miles, and an average thickness of 54 feet.
The McKenzie aquifer is recharged by precipitation and runoff infiltrating
40

o
5
FIGURE 10
Hydrograph of Observation Wells - McKenzie Aquifer
Obs Well 138-077-140001; Land-Surface Elev=1720.4ft NGVOObs Well 138-077-140002; Land-Surface Elev=1721.0ft NGVD
cvu0- 10L:J
(/)
"UC0
~~0cv 15mLcv
-+-0
~I0...•....I..c 20...•....a.cv 10
25
Legend• Obs Well 138-077-140001; SI=98-101ft
• 9..'2.:>_.w ~-' Ll~?_:J~?L:J~J~P"Q.?J_ ?-'=~1?_:-,g,~]!!30-
1978 1979 1980 198141
1982 1983 1984

FIGURE 11
Hydrograph of Observation Wells - McKenzie Aquifer
5
10
(I)ua
t= 15:JVl-0Ca
.-J
~o(I) 20
CDL(I)
,.f-a
~Io+-I
:£ 250-(I)
o
30
Obs Well 138-077 -24AAA 1;Obs Well 138-077 -24AAA2;
II,
Land-Surface Elev=1720.7ft NGVDLand-Surface Elev=1720.4ft NGVD
•••••/ I
~~ I
IIIIIII
"••1
35·
Legend• Obs Well 138-077-24AAA1; SI=197-200ft
• Q~2__~ ~JL1_~?_-=-_Q? 7_-=-.?:.'!~.t~~_~~_~L=:J ?_~::.l ~Ji1
1978 1979 1980 1981
42
1982 1983 1984

15
20
Q)u0- 25L:J
(/)
"UC0
-.J
~0Q) 30lDLQ)-0
~I0-I..c 35-0...Q)
0
40
45
FIGURE 12
Hydrograph of Observation Wells - McKenzie Aquifer
Obs Well 138-077-13BBC1; Land-Surface Elev=1733.5ft NGVDObs Well 138-077-13BBC2; Land-Surface Elev=1732.6ft NGVD
;-,.•. 'v'
Legend• Obs Well 138-077-1388Cl; SI=218-221ft
• Q~~-.w~-'U_~~_:-_q?7-:J~ ~g 9?:.;_~I.::~_~::-_?411.
1978 1979 1980
43
1981 1982 1983 1984

o
5
<l>U0- 10L::JIf)-0c:0
.....J
~0Q) 15enLQ)
-+-03:
I0-+-I
..c 20-+-0-Q)
0
25
FIGURE 13
Hydrograph of Observation Wells - McKenzie Aquifer
Obs Well 138-077-06BBB1; Land-Surface Elev=1700.8ft NGVDObs Well 138-077-068882; Land-Surface Elev=1700.2ft NGVD
Legend• Obs Well 138-077-068881; SI=148-15lft
• 9J? .:>_.w ~JL1..~~_-:Q??_-:Q§J!~J!~i._~!=::.4~_-:.?Aft.30-
1978 1979 1980
44
1981 1982 1983 1984

through perme~able material found along much of the edges of the aquifer and
in the Random Creek valley. The recharge water moves through these materials
and downward into the main body of the aquifer. At the height of the irrigation
season, the downward gradient can be reversed locally for short periods of time.
Another SOurCI~of recharge is the lateral flow from the adjacent Long Lake and
Fox Hills aquifers. Overall movement of water within the aquifer is to the
northwest.
Discharge from the aquifer is by upward seepage into McKenzie Slough,
evapotranspiration, lateral flow into the adjacent Glencoe Channel and Lower
Apple Creek aquifers, and pumping of wells. Total appropriations for irrigation
by 1983 were 6176 acre-feet for 4648 acres. Reported annual water use for the
period 1973-19·S3 totaled about 4200 acre-feet. The hydrographs of observation
wells in the McKenzie aquifer (figures 10, 11,12, and 13) indicate overall recovery
of the aquifer system from the effects of seasonal irrigation pumping. The trend
suggests no adverse impacts on the system with the current level of development.
However, the density of irrigation wells may be locally at an optimum level
between seasonal recovery and long-term gradual decline of water levels.
Yields to wells as estimated from test-hole and observation-well data range
from around SO gpm near the flanks of the aquifer where it is thin to over 500
gpm in the Cl~nter of the aquifer (plate 4). Yields greater than 1000 gpm may
be available locally where the aquifer is thickest. Development of such wells
will be limited by the variable thickness of the aquifer and the occurrence of
interfingering beds of silt and clay.
Water in the McKenzie aquifer is predominantly very hard and of a
sodium-bicarbonate type. The water quality can be summarized as follows:
45

Fe(mg/1)Mn(mg/1)S04(mg/1)TDS{mg/1)%NaSARRSC
Range
0.05 - 4.400.04 - 1.50
100 - 780571 -1560
5 900.2 19.1o 11
Average
0.970.47
3401152
729.57
Irrigation indices range from C2-S1 to C4-S1 (figure 8). The salinity hazard is
mostly high (C3); the sodium hazard medium to high (S2-S3).
Random Creek Aquifer
The Random Creek aquifer underlies about 4.5 square miles of the study
area (plate 2) in southeastern Burleigh County south of Sterling. It generally
follows the Random Creek valley and consists of gravelly sand. Based on the
additional test drilling, the boundaries of the west end of the aquifer indicated
by Randich and Hatchett (1966) were moved to the north about one-half mile.
Subsurface data for the aquifer in this area show the top of the aquifer lies 20
to 32 feet below land surface and thickness to vary between 7 and 49 feet. The
aquifer is confined by units of till or silty clay. The slope of the potentiometric
surface to the southwest (plate 2) indicates ground-water flow along the trend
of Random Creek valley. Very little flow is found in Random Creek because
most of the water is moving within the aquifer (Randich and Hatchett, 1966,
p.72).
Recharge to the aquifer comes from infiltrating precipitation and runoff,
and through leakage from adjacent bedrock or drift deposits on the surrounding
uplands. Discharge is mostly by lateral flow into the McKenzie aquifer and by
evapotranspiration, and to a lesser extent by low-yield domestic and stock wells.
46

The few water quality analyses available indicate a very hard, sodium sulfate
type water with a high salinity hazard (C3) and low to medium sodium hazard
(figure 8).
Lower Apple Creek Aquifer
The Lower Apple Creek aquifer includes the permeable sediments within
the bedrock valley (plate 3) that follows Apple Creek (Randich and Hatchett,
1966). The aquifer underlies about, 21 square miles of the study area (plate 2)
in central Burleigh County. Top of the aquifer lies from about 10 feet to 89 feet
below land surface. Total thickness ranges between less than 10 feet to 112feet
and averages 47 feet (plate 9). Sand comprises most of the aquifer with layers
of gravelly sand common at most sites. The Fox Hills and Hell Creek Formations
directly underlie the aquifer, although silty clay may locally separate the bedrock
and aquifer. Silty clay and till divide the aquifer into two units which coalesce
within a shOlrt distance. Silty clay also confines the aquifer. Values of
transmissivity estimated from test-hole data range from 200 to 9,000 ft2/day
and average 2:,600 ft2/day. About 95,000 acre-feet of water are estimated to
be available from storage, using an areal extent of 21 square miles, a specific
yield of 0.15, and an average thickness of 47 feet.
Recharge to the Lower Apple Creek aquifer is derived from precipitation
and runoff infiltrating permeable surficial materials on the adjacent uplands.
Recharge is aLIsoderived from seepage of water moving down the Apple Creek
drainage syst€~m and from the intermittent streams that end on the aquifer along
the southeastern edge of the valley. Lateral flow from the McKenzie and Upper
Apple Creek aquifers and adjacent and underlying bedrock aquifers also recharge
47

the Lower Apple Creek aquifer. Ground-water flow is to the west (plate 2).
Discharge from the Lower Apple Creek aquifer consists of lateral flow
along the aquifer out of the study area, seepage into Apple Creek,
evapotranspiration, and wells. By 1983, appropriations for irrigation totaled
2480 acre-feet for 1654 acres. However, reported annual water use for the period
1973-1983 tota,led about 2210 acre-feet. The hydrograph of observation well
139-78-21DDA (figure 14) suggests that the aquifer is not adversely affected by
the current level of development.
Potential yields to wells as estimated from test-hole and observation-well
data vary from less than 50 gpm along the aquifer flanks and in areas where
the aquifer is thin to more than 500 gpm along the eastern edge near the McKenzie
aquifer (plate 4). Well yields are anticipated to decrease toward the western
end of the aquifer due to narrowing of the bedrock valley.
Water from the Lower Apple Creek aquifer in the study area is mainly
a sodium-bicarbonate type and very hard. The water quality can be summarized
as follows:
Fe(mg/l)Mn(mg/l)s04 (mg/l)TDS(mg/l)%NaSARRSC
Range
0.08 - 4.300.01 - 0.80
150 - 300802 -122047 793.8 11.12 9
Average
1.900.31
2561050
708.66
Irrigation classifications range from C3-Sl to C3-S3 (figure 8). Salinity hazard
is high (C3); sodium hazard low to high (Sl-S3).
48

o
5
FIGURE 14
HydrogrClph of Observation Well - Lower Apple Creek Aquifer
Obs Well 139-078-21DDA; Land-Surface Elev=1698.6ft NGVD
Q)u0
'+- 10I....:JIf)-0C0
.-J
~w.n Destroyed
0Q)
15l:DI....Q)-0
~I0-I..r: 20-0..Q)
0
25
Legend• Obs Well 139-078-21DDA; SI=108-114ft
301978 1979 1980 1981
49
1982 1983 1984

Upper Apple Creek Aquifer
The Upper Apple Creek aquifer underlies about 20 square miles of the study
area (plate 2) in central Burleigh County. It for the most part occupies the valleys
of the West and East Branch of Apple Creek (Randich and Hatchett, 1966) which
are somewhat incised into the bedrock (plate 3). The aquifer also underlies Rice
Lake and apparently trends to the southeast toward Clear Lake. The glacial-drift
aquifers in the area centered around Clear Lake are not included in this study,
but warrant further investigation to determine the hydrogeological relationships
between the Random Creek and Upper Apple Creek aquifers.
The top of the Upper Creek aquifer lies at land surface in some parts of
the Apple Creek valley to 48 feet below land surface. Average depth to the
aquifer is 10 feet. Total thickness varies between 11and 70 feet and averages
26 feet. Sand and gravelly sand comprise most of the aquifer. Till or silty clay
units of variable thickness are common within the shallow bedrock valley of
Apple Creek. These units generate confined conditions over much of the aquifer
from Rice Lake southward to the juncture with the McKenzie and Lower Apple
Creek aquifers. North of Rice Lake confined conditions exist along the center
of the aquifer where several feet of silty clay or till overlie the sand and gravel.
However, there is a transition to water-table conditions during the summer in
some of the confined areas as water levels fall below the aquitard. Unconfined
conditions are common along the flanks of the aquifer. The northern boundary
of the aquifer is marked by an apparent ground-water divide with the Wing Channel
aquifer and delineated by an intermittent stream about three miles SSW of Wing
in 142-76-22. Values of transmissivity as estimated from test-hole data vary
50

from 2,400 to 7,100 ft2/day and average about 4,200 ft2/day. The range of
transmissivity values stems mostly from the varying thickness of the aquifer.
Water-level elevations measured in observation wells in the Upper Apple Creek
aquifer range from around 1870 feet toward the north end and 1788 feet toward
the west end" indicating ground-water flow down the Apple Creek valley-fill
sediments (plate 2). About 50,000 acre-feet are estimated to be available from
storage. This is based on a specific yield of 0.15, an average thickness of 26
feet, and an areal extent of 20 square miles.
The Upper Apple Creek aquifer is recharged primarily by infiltrating
precipitation and lateral flow from the outwash deposits on the surrounding
uplands. Other sources of recharge are lateral flow from the adjacent bedrock
aquifer and seepage from Apple Creek and Rice Lake.
Discharge from the aquifer is mostly by seepage into Apple Creek and
Rice lake, subsurface flow into the Lower Apple Creek aquifer and possibly the
northern end of the McKenzie aquifer, evapotranspiration, and low-capacity
domestic and stock wells. Total appropriations for irrigation by 1983 were 833
acre-feet for 639 acres. Little development has occurred, however, due to the
difficulty in developing a well of sufficient capacity for irrigation. Reported
annual water use for the period 1973-1983 totaled about 86 acre-feet. The
hydrograph of observation well l40-77-23ADD (figure 15), which is similar to
hydrographs of the other observation wells in the aquifer, indicates slow response
to changes in the amount of water in storage in the aquifer.
51

o
5
(()u0't-
10L:::l
l.I1-0C0
-.J
~0(()
15COL(()
+-03:I0+-I
.J: 20+-0...(()
0
25
30
FIGURE 15
Hydrograph of Observation Well - Upper Apple Creek Aquifer
Obs Well 140-077-23ADD; Land-Surface Elev=1800.65ft NGVD
Legend• Obs Well 140-077-23ADD; SI::23-26ft
1978 1979 1980
52
1981 1982 1983 1984

Potential yields to wells estimated from test-hole and observation-well
data vary from less than 50 gpm over much of the aquifer to about ISO-ZOO gpm
at a few localE!s in the center of the aquifer where a maximum thickness is found
(plate 4).
Water in the Upper Apple Creek aquifer is predominantly very hard and
a sodium-bicarbonate type with concentrations of the calcium and magnesium
cations increasing somewhat in the northern end of the aquifer. The water quality
can be summarized as follows:
Range Average
Fe (mg/l) 0.39 - 1.10 0.73Mn(mg/l ) 0.55 - 1.20 0.95S04(mg/l) 210 - 360 303TtlS(mg/l) 563 -1030 837Ula 32 93 63SJl,R 2.1 20.7 10.0RSC 0 8 3
Irrigation indkes range from C3-5l to C3-54 (figure 8). The salinity hazard is
high (C3)~sodil~mhazard low and very high (51and 54).
Wing Channel Aquifer
The Wing Channel aquifer underlies about 13 square miles of the study area
in northeastern Burleigh County (plate Z). It occurs in the glacial drift filling
the incised channel (plate 3) of the pre-glacial Wing River (Kume and Hansen,
1965, p. 67). The southwest end of the aquifer is topographically and geologically
connected with the north end of the Upper Apple Creek aquifer, but is
hydrologically separated by an apparent ground-water divide. The Wing Channel
aquifer extends into Kidder County at least three miles based on test holes in
53

the area. Its areal extent in Kidder County and relationships to the in Kidder
County aquifer complex are undetermined.
The top of the Wing Channel aquifer varies from 6 to 16Z feet below land
surface. The aquifer consists of fairly coarse material, medium-grained sand
to coarse-grained gravel, except in the connecting valley with the Upper Apple
Creek aquifer where silty sand commonly occurs. Total thickness of the aquifer
ranges from 9 to 144 feet and averages 35 feet. Till and silty clay locally separate
the aquifer material into as many as three units. The slightly permeable materials
produce confined conditions over much of the aquifer. Water-table conditions
are found where the till or clay are absent and the gravelly sand is exposed at
land surface. Values of transmissivity estimated from test-hole logs vary from
300 to 9,300 ftZ/day with an average of 3,000 ftZ/day. Water levels measured
within the aquifer at two sites suggest ground-water flow is to the east into
Kidder County with an upward hydraulic gradient (plate Z). An estimated 44,000
acre-feet of water are available from storag~, based on an areal extent of 13
aquare miles, a specific yield of 0.15, and an average thickness of 35 feet.
Recharge to the Wing Channel aquifer is mainly from infiltrating
precipitation and runoff, seepage from the streams and lakes overlying the aquifer,
and subsurface flow from the adjacent Cannonball and Hell Creek aquifers.
Discharge is mostly by lateral flow into the adjacent drift aquifer in Kidder
County, seepage into the streams and lakes overlying the aquifer,
evapotranspiration, and to some extent by small-capacity wells. The most
significant ground-water development in the aquifer is the municipal supply for
54

the city of Whig. Reported annual use at Wing for the period 1973 to 1983 ranged
from 10 to 28 acre-feet with an average of 19 acre-feet. Potential yield of the
aquifer commonly is less than 100 gpm due to restricted width of the aquifer.
However, several hundred gallons per minutes may be available from the thicker~
parts of the aquifer. The hydro graph of observation well l42-74-l8BCC (figure
16)indicates only small changes in the amount of water in storage in the aquifer.
The water in the Wing Channel aquifer is very hard. The dominant anion
is bicarbonate, but there is no predominant cation in the aquifer. The calcium,
magnesium, and sodium ions combine in various ratios to form the dominant
cations. The water quality can be summarized as follows:
Range Average
FE! (rng/1) 0.04 - 0.50 0.20Mn(rng/1) 0.01 - 1.50 0.77S04(rng/1) 12 - 320 153TDS(rng/1) 323 - 802 542%J.Ila 21 37 31SJffi 1.2 2.2 1.6RSC 0 2 1
Irrigation indices range from C2-Sl to C3-Sl (figure 8). Salinity hazard is mediuim
to high (C2-C3); sodium hazard is all low (S1).
Glacial-Drift Aquifers - Kidder County
The Kidder County ground-water study (Bradley et al., 1963) considered
the occurrence of ground water in the unconsolidated Quaternary deposits on
the basis of type of deposit. The types of deposits distinguished included: surficial
and buried-valley outwash deposits, ice-contact deposits, till with associated
sand and grav'el, and other unconsolidated deposits such as lacustrine and eolian
55
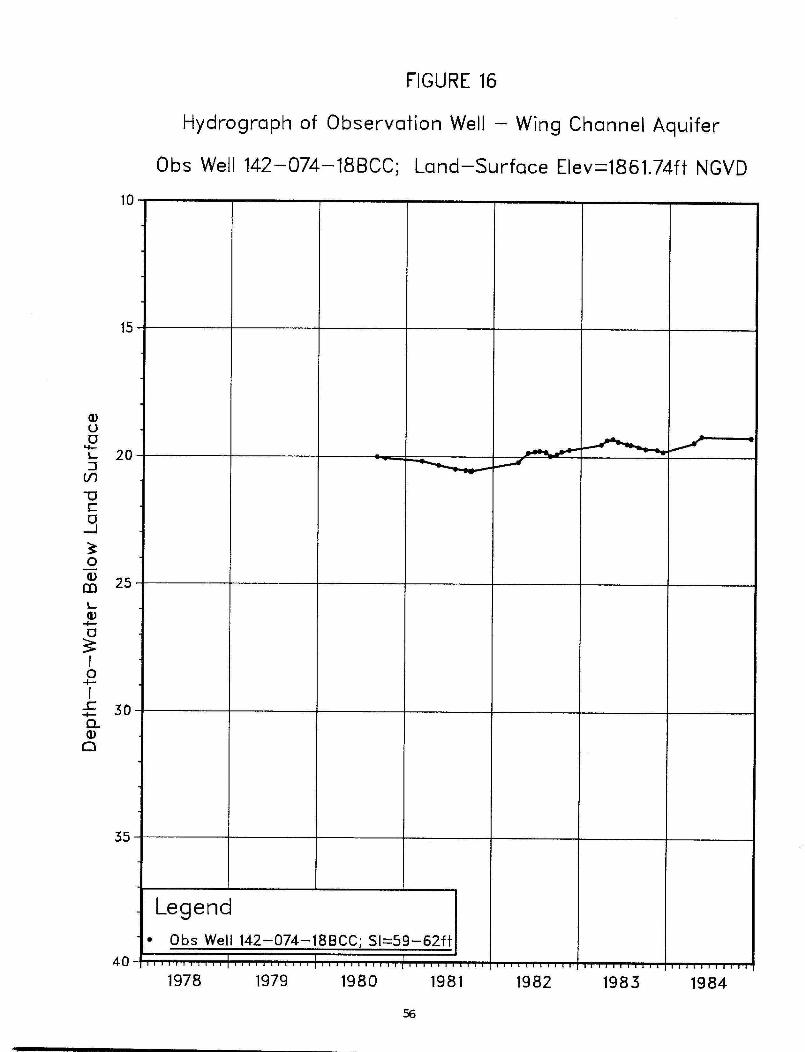
10
15
FIGURE 16
Hydrograph of Observation Well - Wing Channel Aquifer
Obs Well 142-074-188CC; Land-Surface Elev=1861.74ft NGVD
(I)u0
Lf- 20I.-:J
lI1-0C0
--.J
~0(I) 25(DI.-(I)
-+-0
~I0+-I
...r:: 30-+-0..(I)
a
35
40
.....-.. --- ~ .•..--...T-
Legend• Obs Well 142-074-18BCC; SI=59-62ft
- , , , , T'- , , I .. .- .- , . --..-.---r .-1978 1979 1980
56
1981 1982 1983 1984

sediments. 'Ibf~ outwash deposits, in particular the buried outwash, comprise
a system of glacial-drift aquifers in Kidder County. This aquifer system currently
supplies high-capacity inigation wells and offers considerable potential for
additional inigation development. The aquifer system is comprised of from
one to five layers of sand and gravel more or less hydraulically connected.
However, the geology of the aquifer system, the paths of ground-water flow,
and the interaction between ground water and surface water are not well
understood. This study further defines the geology and ground-water flow system
of the glacial-drift aquifers based on the additional data gathered during the
study.
The intervals of coarse sediment are subdivided into surficial and nonsurficial
aquifers. These aquifers are hydraulically interrelated over most of the study
area. The surficial aquifers occur where outwash or eolian deposits are sufficiently
thick for saturated conditions to exist under the prevailing topography and
hydrologic regime. The outline of the surficial aquifers as mapped (plate 5)
generally show~jwhere these conditions occur. The surficial aquifers are delineated
on the presen<:e or absence of unoxidized surficial sand and gravel. Included
are some near--surface outwash deposits in which the water level is sufficiently
low to create unconfined conditions. The role of the unsaturated deposits in
the recharge a,nd discharge of the surficial aquifers is not well understood and
requires furthE~r study. The surficial aquifers identified in this study are the
Tappen, Marsto,nmoor Plain, and "Robinson" aquifers.
The nons'Urficial intervals of sand and gravel not included in the surficial
aquifers form the Kidder County aquifer complex. The discussion of the aquifer
complex follows that of the surficial aquifers.
57

Tappen Aquifer
The surficial aquifer located in east-central Kidder County is here named
the Tappen aquifer (plate 5). It is delineated on the occurrence of unoxidized
surficial sand and gravel. Included are some near-surface outwash deposits in
which the water level is sufficiently low to produce unconfined conditions. The
Tappen aquifer underlies an area of about 64 square miles. It extends from the
Dawson area to about three miles east of Tappen and from the Lake Etta-Henry
Lake area to Stony Lake. A narrow arm of the aquifer trends eastward toward
Crystal Springs, but this segment is not well defined. The Tappen aquifer varies
in width from about one-half to about five miles.
The Tappen aquifer consists primarily of sand and gravelly sand. Aquifer
thickness varies from 5 to 120 feet and averages 26 feet (plate 10). Till and
lacustrine silty clay directly underlie the aquifer. Depth to water below land
surface is around six feet in the Tappen area and in general increases toward
the edges of the aquifer. Maximum depth to water is 57 feet; average depth
for the whole aquifer is 25 feet.
Two aquifer tests conducted at sites about one mile apart yielded the
following transmissivity values: range of values from the first test is 5,100 to
5,900 ft2/day; from the second test 3,000 to 4,200 ft2/day. Average values are
5,500 and 3,600 ft2/day, respectively. A third test near Henry Lake gave values
of 16,000 to 24,100 ftZ/day which reflect the very coarse material comprising
the aquifer at the location. Transmissivity values for the remaining area of
the Tappen aquifer as estimated from test-hole logs vary from 300 to 6,700 ft2/day
and average 2,500 ft2/day. Water levels measured in 19 observation wells in
the aquifer show a general east-to-west movement of ground water (plate 5).
58

Recharge to the Tappen aquifer is primarily from infiltrating precipitation.
Lateral flow of water from the surficial outwash on the uplands to the east and
south of the aquifer is also a source of recharge. Seepage from ephemeral bodies
of surface water adds to the total recharge during the spring. Head relationships
with the underlying Kidder County aquifer complex, indicated at a dual-well
site 139-71-17BBB(figure 17), show a net upward flow of water into the Tappen
aquifer in the area from southeast of Harker Lake to just south of 1-94 between
Dawson and Tappen (plate 5). Another source of recharge may be the water
withdrawn from the underlying Kidder County aquifer complex and applied to
cropland. Water in excess of soil- and crop-moisture requirements percolates
downward into the surficial aquifer. This process may playa part in causing
the vertically decreasing head relationships between the Tappen aquifer and
the deeper Kidder County aquifer complex evident north of 1-94 (plate 5) at
observation-well sites 140-71-19DDD(figure 18)and 140-71-28DAA (figure 19).
Discharge from the Tappen aquifer is mainly through evapotranspiration
and by seepage and subsequent evaporation of water from depressions in the
land surface. The degree of permanence of water bodies in such depressions
is determined in part by the difference between the rate of water seepage and
rate of evapotranspiration. Net downward flow discharges water from the Tappen
aquifer into the underlying aquifer units in the area north of 1-94 and a small
area north of Henry Lake. Water-level elevations at multi-well sites in these
two areas decrease with depth (plate 5). Small-capacity domestic and stock
wells add a small proportion to the total discharge. Total appropriations for
irrigation by 1983 were 2,511 acre-feet for 1,674 acres. Reported annual water
use for the period 1973-1983 totaled about 5,210 acre-feet. Hydrographs of
59

o
5
FIGURE 17
Hydrograph of Observation Wells
Kidder County Aquifer ComplexObs Well 139-071-17BBB1; Land-Surface Elev=1757.93ft NGVD
Tappen AquiferObs Well 139-071-17BBB2; Land-Surface Elev=t758.68ft NGVD
Q)0a
'+- 10!....::J
U1""0
Ca.-J
~0Q)
15CD!....Q)
-+-a~
I0 .- -- ....•.•..•-+-I .•......
.c 20-+-n..Q)
0
25
Legend• Obs Well 139-071-178881; SI=151-154ft
• 9)?~_.w~JLt~~_-:Q~1:--l"~~J!~.?.;_?)::~A:-_~~J.t30
1978 1979 1980
60
1981 1982 1983 1984

15
Q)oo
'+-L:::J
V)-0Co
....J~oQ)
CDLQ)
-+-o3:Io-+-I
..c-+-Q..Q)
o
FIGURE 18
Hydrograph of Observation Wells
Kidder County Aquifer ComplexObs Well 140-071-190001; Land-Surface Elev=1757.02ft NGVOObs Well 140-071-190002; Land-Surface Elev=1756.34ft NGVO
Tappen AquiferObs Well 140-071-190003; Land-Surface Elev=1756.10ft NGVO
10
,#t
J.~ .••..•~ _ -, " •••.••..J~ t- _ ~ •••• .t-.~,,~ ~.• ~JI: "4... .• - - _.••• ; - .lr.r.••~ -~ - .•.-~ •• ,-, ....••••.... -It
.:. tII' I ~•••••• ~ &~ , I ., I ,"', •
•~ ," ,II- •• ,." ,.IL~,', rt • ". • II• I 'T' " I • I • r
" I ' I ' I. I I 'I~ •• ~ I I' I I I, " I loll,. • 'I I. I' I " I
~ f ::~ " ~ ~ : i ~: : :I I I 111 I' I' I I I I I I• t I III , I ~ I , " I ,
20 ....• : ./: :: f ~ : : ! : : : :
1--'" i (-' ,Iii/f 1(/',\1 /11 (/1\1(/\111~\ ~j ~ 1 · I; r ::
25 ~ '~ : I!
l V \,30
35
40
45 -Legend
• Obs Well 140-071-19DDD1; SI=117-123ft
• Obs Well 140-071-19DDD2' SI=83-86ft------------------------------~--------------.• 9p~_W~!U1Q:__OJJ=_1~QQP~~.?1==16__:L9JL
50 , ,
1978,
1979f I
1980I Tf'
1981
61
f'
1982 1983 1984

FIGURE 19
o
Hydrograph of Observation Wells
Kidder County Aquifer ComplexObs Well 140-071-28DAA 1; Land-Surface Elev=1766.92ft NGVD
Tappen AquiferObs Well 140-071-28DAA2; Land-Surface Elev=1766.95ft NGVD
5
1984198319821981198019791978
,,-.-.- ---., ~~~...............•., • .AI • ..,...' --- ---.-- •.•... ~~.•.......•.-....Ll/ -_ ...•._..~. , •... --\I
~•-1 I r y-.. V / /'\-....... r Ir .-' "
I ( J / J
V
II
- Legend• Obs Well 140-071-28DAA1; SI=62-68ft• 9_~,:;_)Y5lJl_1_~g_-:9X!:-1 ?J~~tg.~_.?J::~_C?::-:. ~ _~ U. . • I' ,
I . . J' . . . , I ..
35
40
10
a>uaLf-LJlfl
15-aca
-..J
~0a> 20IIILa>+-a
~I0 25+-[
...L+-Q..a>a
30
62

observation wells monitoring the Tappen aquifer (figures 17, 18, 19, and 20), show
a water-level fluctuation of less than three feet from 1978 to 1984. The
hydrographs indicate the minimum of an annual cycle occurs during the fall.
Superimposed on the annual cycle is a general downward trend of water levels
between 1978 and 1981and a slight upward trend from 1981 to 1984. This trend
reflects small changes in the amount of water in storage. The hydrographs suggest
a minimum impact on the aquifer from the present level of development. Because
of the unconfined nature of the aquifer, however, the density of the current
observation-wen network may not be adequate to assess the effects of development
completely.
The potential yield of the Tappen aquifer was estimated from saturated
thickness and hydraulic conductivity of the aquifer as derived from test-hole
and observation-well data. The estimated potential yield varies from less than
50 gpm to over 500 gpm and is more a function of saturated thickness than
variations in hydraulic conductivity. An estimated 160,000 acre-feet of water
are available fJrom storage based on an areal extent of 64 square miles, a specific
yield of 0.15, and an average thickness of 26 feet.
The Tappen aquifer contains a very hard, predominantly calcium-bicarbonate
type water. The water quality can be summarized as follows:
Fe(mg/1)Mn(mg/1)S04(mg/1)TDS(mg/1)%NaSAR
RSC
Range
0.00 - 1.900.01 - 1. 90
27 -128289 -541
5 - 450.2 2.7o 1.7
63
Average
0.240.86
72401
160.70.2

o
FIGURE 20
Hydrograph of Observation Well - Tappen Aquifer
Obs Well 139-071-11AAA2; Land-Surface Elev=1782.55ft NGVD
5
(!)(J0'f- 10L:J
U1""'0
C0
--.J
~0Q)
15CDLQ)-0
~I0 •-I
.£: 20-0...Q)0
2S
Legend• Obs Well 139-071-11AAA2; SI=43-46ft
30 -1978 1979 1980 1981
641982 1983 1984

Irrigation classifications are mostly C2-S1 with a few analyses of C3-S1 when
the specific conductance exceeded 750 umhos (figure 21). Salinity hazard is
predominantly medium (C2); sodium hazard is low (Sl).
Marstonmoor Plain Aquifer
The outwash plain in northeastern Kidder County (Rau et al., 1962, p. 34)
and northwestern Stutsman County (Winters, 1963, p. 43) comprises an unconfined
aquifer defined by Huxel, Jr. and Petri (1965, p. 20) as the Marstonmoor Plain
aquifer. The aquifer as defined does not include the deeper units of sand and
gravel located in the area. Huxel, Jr. and Petri (1965) noted the Marstonmoor
Plain aquifer extended into Kidder County. Thirteen test holes drilled for this
study help define the Kidder County part of this aquifer (plate 5). In general
the aquifer is delineated on the presence or absence of unoxidized surficial sand
and gravel. In this study, near-surface outwash deposits are included in the aquifer
where relativel.y thin layers of till or silty clay separate the surficial from the
near-surface deposits. Water-level trends over an in'igation season suggest the
Marstonmoor Plain aquifer is somewhat hydraulically connected with the underlying
aquifer intervals of the Kidder County aquifer complex (figures 22 and 23). Also
included in the Marstonmoor Plain aquifer in this study are the surficial sand
and gravel deposits generally located between Kunkel Lake and Horsehead Lake.
The part of the aquifer is here designated the Kunkel Lake segment. Water-level
trends in the two observation wells at 141-71-20DDD (figure 24) show that this
segment is somewhat hydraulically isolated from the deeper Kidder County aquifer.
It may underlie part or all of Kunkel Lake. The Kunkel Lake segment may be
65

FIGURE 21
DIAGRAM FOR CLASSIFYING THE QUALITY
OF WATER FOR IRRIGATION
KIDDER COUNTY100
28 C 1- S 4
Co4-SI
4
VERY HIGH
•• Tappen Aqui ferx Marstonmoor Plain Aquifer• Robinson Aquifer• Kidder County Aquifer Complex
•
ell - S I
3
HIGH
HAZARD
C3-S4
C4-S4
SALINITY
2
MEOI UM
C2-S4
LOW
2 7 2250
CONOUCTIVITY- MICROMHOs/cM. (ECX 106) AT 2!5° C.
SOURCE:
USDA -HANDBOOK 60NOTE' THE POINTS FOR EACH AQUIFER REPRESENT THE AVERAGE
CONDUCTIVITY AND SAR VAL.UES IN EACH CATEGORY
C1- S 3
0t-o(a::
..J 2c( ::) N
;a:~ 0
0..J UJ t-oe :I! 0..- a::
0VI0 C 1- S 2c:2::)00VI
66

o
5
Q)u0
'+- 10L::J
tf)'"UC
.3~0Q) 15CDLQ)+-0?;
I0+-I
..c 20+-(LQ)
0
25
FIGURE 22
Hydrograph of Observation Wells
Kidder County Aquifer ComplexObs Well 142-071-130001; Land-Surface Elev=1766.80ft NGVO
Marstonmoor Plain AquiferObs Well 142-071-130002; Land-Surface Elev=1766.87ft NGVO
Legend• Obs Well 142-071-130001; SI=155-161ft
• 9_~.?_~'~JU:t?~97_l-::-]i9J~~-~~_~L:::~_4~~7}J_30
1978 1979 1980 1981
67
1982 1983 1984

FIGURE 23
10
Hydrograph of Observation Wells
Kidder County Aquifer ComplexObs Well 142-070-16BAD2; Land-Surface Elev==1806.96ftNGVD
Marstonmoor Plain AquiferObs Well 142-070-16BAD3; Land-Surface Elev==1806.89ftNGVD
1984198319821981198019791978
~.•..•.•..••.•.•. ..•..•.•... -- .•......•• --~~........... .•..•. -- .•...•..•..~ - .•.....•.. - ~ V'I('• V-- \ r- r
~
Legend• Obs Well 142-070-16BAD2; SI==69-75ft
• Q.~~-_\Y~JL1_~?::9J..Q:: !~_~~J~~_;_?J:=:~~_~?_~ft" , I " , I
I , -,-- , , ,
35
15
40
Q)U0
'+-20L
:Jl/)-0C0
--.J
~0Q)
25CDLQ)
-I-
0~
I0
-I-
I...r: 30-I-0..Q)
0
68

15
20
FIGURE 24
Hydrograph of Obsel"vation Wells
Kidder County Aquifer ComplexObs Well 141-071-200001; Land--Surface Elev=1769.71ftNGVO
Marstonmoor Plain AquiferObs Well 141-071-200002; Land-Surface Elev=1769.42ft NGVO
cuuat 25:J
(/)
-0Ca
-...l
~oQ) 30co!.....Q)
-+-a~Io-+-I
:£ 350-Q)
o
40
--.•...•......"""..,.-. ----. ---a. ~ ...•..- --a -- . .. ----
Legend• Obs Well 141-071-20DDD1; SI=158-164ft
• 9_~~_~.~JU:H:-_q?J :::?S~g_Q!?_~!._~L:::~~--=?_~it_
••••••••••--', '~----~ '.',"- II,...••. -- .......•
45 -1978 1979 1980 1981
69
1982 1983 1984

connected to the rest of the aquifer to the northeast along topographic lows
north of Kunkel Lake where at least the lower part of the surficial outwash
deposits may be saturated. The surficial sand and gravel on the topographic
highs are typically oxidized, but provide a pathway to the surficial aquifer for
infiltrating meltwater and precipitation. The Marstonmoor Plain aquifer underlies
a total area of about 67 square miles in northeastern Kidder County.
Test-hole data indicate the Marstonmoor Plain aquifer consists mostly
of gravelly sand to sandy gravel (plate 10). The aquifer overlies till except in
some areas of the Kunkel Lake segment where lacustrine silt and clay occurs.
Thickness of the aquifer varies from less than 5 feet to 80 feet, and averages
about 26 feet. The thinnest part of the aquifer usually occurs near the base
of oxidized sections of surficial outwash and directly overlying unoxidized till
or silty clay. Depth to water ranges from 4 feet to 32 feet. Water-level elevations
in observation wells and lakes indicate an overall east-to-west movement of
ground water in the main part of the aquifer (plate 5). The flow pattern is less
well defined in the Kunkel Lake segment of the aquifer because fewer data points
are available. Here the apparent pattern of ground-water flow is from the
southeast to the west and north. Values of transmissivity estimated from test-hole
logs vary from 400 to 9,400 ft2/day and average 3,200 ft2/day. The range of
transmissivity values is more the result of variations in saturated thickness rather
than different hydraulic conductivities of the aquifer material. An estimated
167,000 acre-feet of water are available from storage, based on an average
thickness of 26 feet, an areal extent of 67 square miles, and a specific yield
of 0.15.
70

There are two primary sources of recharge to the Marstonmoor Plain aquifer:
infiltration of precipitation and meltwater, and lateral flow of ground water
from the uplands surrounding the aquifer. Seepage from bodies of surface water
that are full in. the spring may add to the total recharge. The western third of
the main part of the aquifer is recharged by a net vertically upward component
of ground-water flow as indicated at the double-well monitoring site 142-71-13DDD
(figure 22). The recharge area may be delineated by the lakes around the town
of Lake Williams. Another possible source of recharge may be the water withdrawn
from deeper aquifers for irrigation. Water in excess of soil-moisture and crop
requirements would move downward toward the saturated zone. This mechanism
may play a part in the vertically decreasing heads evident between the
Marstonmoor Plain aquifer and the deeper Kidder County aquifer complex in
the Pettibone area of the main part of the aquifer and the Kunkel Lake segment
of the aquifer.
The principal paths of discharge from the aquifer are evapotranspiration,
withdrawals of ground water for irrigation and ground-water seepage into sloughs
and lakes. Discharge also occurs as net vertical flow downward to the underlying
Kidder County aquifer complex, both in the part of the aquifer around Pettibone
(figure 23) and in the Kunkel Lake segment of the aquifer (figure 24). The
permanent lakes around Pettibone suggest the presence of local flow systems
which remain to be defined. Small-capacity domestic and stock wells add a small
proportion to the total discharge. The Marstonmoor Plain aquifer as defined
here is typically not thick enough to support irrigation wells. Most of the irrigation
development within the Kidder County area of the aquifer is supplied by the
underlying san.d and gravel units of the Kidder County aquifer complex. However,
71

near the Stutsman County line where the aquifer thickens towards the east, the
aquifer does support some irrigation. By 1983, appropriations totaled 1,478
acre-feet for 1,030 acres. Reported annual water use for the period 1973 to 1983
totaled about 4,300 acre-feet. Head relationships between the surficial
Marstonmoor Plain aquifer and the underlying Kidder County aquifer complex
indicate downward leakage of water during the irrigation season. Hydrographs
of observation wells screened in the Marstonmoor Plain aquifer (figures 2.2., 23,
and 2.4) show a small total water-level fluctuation for the period of record. The
low of an annual cycle occurs in late fall. Superimposed on the annual cycle
is a general downward trend of water levels from 1978 to 1981 and an upward
trend after 1981. The hydrographs suggest little impact on the aquifer from the
current level of development of the underlying glacial-drift aquifers. No
observation wells were constructed for this study within the area of irrigation
development of the Marstonmoor Plain aquifer. There is a need for some
observation wells to complement those in Stutsman County.
Water quality of the Marstonmoor Plain aquifer is characterized by six
samples. All samples indicated a very hard, calcium-carbonate type water. The
water quality can be summarized as follows:
Fe(mg/l)Mn(mg/l)S04(mg/l)TDS(mg/l)%NaSARRSC
Range
0.06 - 3.100.72 - 1.10
21 - 65294 -419
3 80.1 0.3o
72
Average0.720.89
44353
60.2o
All six water samples show an irrigation classification of medium salinity hazard
(e2) and low (51)sodium hazard (figure 21).
Undifferentiated Surficial Aquifer
Surficial outwash deposits occur in the northwestern part of the study area
from Robinson westward toward the county line (plate 5). Aquifers are present
within these deposits where saturated conditions prevail. The surficial aquifers
are poorly defined over much of this area. The only observation well in an
unconfined aquifer in this part of the study area is about two miles southwest
of Robinson at 142-72-16BBB (plate 5). This aquifer is tentatively named the
"Robinson" aqu.ifer. It most likely extends out of the study area northward to
the Willow Lake area.
The "Robinson" aquifer underlies about six square miles of the study area
along a northwest-southeast trend. The aquifer occurs as surficial outwash
overlying till and consists of 15 to 20 feet of saturated gravelly sand.
Transmissivity values are directly related to the saturated thickness of the aquifer.
The transmissilvity of the thicker parts of the aquifer is about 2,900 ft2fday.
Depth to water is about 15 to 16 feet below land surface (figure 25). An estimated
10,000 acre-feet of ground water are available from storage based on an areal
extent of 6 Bquare miles, a specific yield of 0.15, and an average saturated
thickness of 17 feet.
The "Robinson" aquifer is recharged mostly by infiltrating precipitation
and surface runoff moving downward to the zone of saturation. Lateral flow
from the surrounding outwash deposits also recharge the aquifer. Discharge
73

FIGURE 25
Hydrograph of Observation Well -" Robinson" Aquifer
Obs Well 142-072-168882; Land-Surface Elev=1778.79ft NGVDo
1984198319821981198019791978
..
~. --..~
f --~
Legend•
Obs Well 142-072-168882; SI==30-33ft, , , j j , -, , ,
5
25
30
IDU0
Y-10L
::JIf)
-0C0-l
~0ID 15CDLID
+-0
~I0
+-I
-C 20+-D-ID0
74
is mostly through evapotranspiration and lateral outflow. Some irrigation
development has, occurred in the aquifer. By 1983, appropriations totaled 405
acre-feet for 270 acres. Reported annual water use for the period 1977, the
initial year of irrigation, to 1983 totaled about 643 acre-feet. The hydrograph
for observation well 142-72-l6BBB2 (figure 25) shows a slight annual fluctuation
of less than a foot. The hydrograph shows little response to the irrigation
development somewhat more than a half mile to the south. This is to be expected
in an unconfined aquifer. A water sample from observation well l42-72-l6BBB2
suggests the water in the "Robinson" aquifer is a very hard,
calcium/magnes:lum-bicarbonate type water. Analysis of the water sample gave
the following results:
Fe (mg/UMn(mg/l)S04(mg/l)TDS(mg/l)%NaSARRSC
0.470.22
61430
150.6o
The irrigation classification is C2-Sl: medium salinity hazard (C2), and low (S1)
sodium hazard (figure 21).
Kidder County Aquifer Complex
The near-surface and subsurface intervals of sand, gravelly sand, and sandy
gravel distributed within the glacial drift of Kidder County are more or less
hydraulically interconnected. The intervals comprise an aquifer system designated
the Kidder County aquifer complex. The extent of this study's data base with
respect to the hydrogeological complexity of the glacial-drift aquifer system
is not sufficiently comprehensive to delineate separate hydrologic or aquifer
75

units. Certain relationships are apparent, however, and are considered in the
following discussion.
The Kidder County aquifer complex underlies about 470 square miles of
the study area (plate 6). Test-hole data show that the top of the complex lies
10 to 508 feet below land surface and averages 67 feet below land surface.
Thickness of the aquifer complex varies from 4 to 222 feet with an average of
52 feet. The test-hole data also indicate that the aquifer complex is typically
made up of one, two, or three intervals of sand and gravel (table 4), although
as many of five intervals may be present (plate 10). Till and/or lacustrine silty
TABLE 4. SUMMARY OF OCCURRENCE OFSAND AND GRAVEL INTERVALS - KIDDER COUNTY AQUIFER COMPLEX
Number of Number of Test-Hole Sites , of Total Total Thickness of all IntervalsIntervals Where Found Occurrence Range Average1 82 45 4' - 166' 27'2 62 34 9' - 159' 54'3 25 14 30' - 222' 102'4 6 3 71' - 109' 89'5 7 4 49' - 222' 126'
day deposits separate the sand and gravel units where more than one is present.
Where one unit is present, till or silty clay occur between land surface and the
aquifer and between bedrock and the aquifer. The slowly permeable till and
lacustrine sediments act as aquitards and generate leaky confined conditions
in most of the aquifer intervals. Water-level changes measured at sites with
two or more observation wells show the separate intervals respond to water
withdrawals from the complex. This indicates the intervals are more or less
hydraulically connected throughout much of the aquifer complex.
The PieITe Formation directly underlies the aquifer complex along the
76

trend of the bw:ied valley in southwestern and central Kidder County and most
of the study area in northeastern Kidder County. In the remaining part of the
study area, the Fox Hills Formation lies adjacent to the aquifer complex. The
hydrologic relationship between the bedrock, in particular the Fox Hills Formation,
and the aquifer complex remains to be studied in Kidder County. However, the
work of ThorstE!nson et ale (1979) and water-level elevations of about 1800 feet
msl in wells at Steele suggest the Fox Hills is a regional discharge area with
lateral flow of water from the bedrock into the drift aquifers.
The deepest interval of the aquifer complex consists of gravelly sand (plate
10) which occw~s at or near the base of the buried bedrock valley trending
southwest-north'~ast across Kidder County (plates 6 and 7). This valley is
interpreted to be part of the preglacial Cannonball River system (Rau et al.,
1962). Till and lacustrine silty clay deposits truncate the interval into two separate
areas: south and north. Traces of western source material are found in the
gravelly sand of both areas, implying that the two areas formed a continuous
deposit at one time.
The south area extends about 20 miles from near Dawson to the Burleigh
County line. The area averages 1.4 miles in width and has an areal extent of
about 27 squar'~ miles. Ground water is not withdrawn from this interval for
irrigation, but is from overlying intervals. The response of the deepest interval
to irrigation vdthdrawals, as shown by the hydrograph of observation well
138-73-08DDDl (figure 26), indicates a good hydraulic connection with shallower
aquifer units in the complex.
The north area underlies about 12 square miles between Stony Lake and
Kunkel Lake. It is located just southeast of some irrigation development. There
77

FIGURE 26
Hydrograph of Observation Well Kidder County Aqulfe
Obs Well 138-073--080001; Land--·Surfuce Elev=1732.67f1 NGVD
o
5
Q)ua
'+- 10L:::lIf)-uca
-.J
~0Q)
15CDLQ)-a
~I0-I
.£: 20-Q.Q)
0
25
Legend• Obs Well 138-073-080001; SI=207-213ft
30-1978 1979 1980 1981 1982 1983 1984

is no development within the boundaries of the area. Minor annual fluctuations
in water leve:ls are noted in observation wells monitoring this interval as
represented by observation well 141-71-34DDDI (figure 27). The slight response
may be due to intervening aquitards within the aquifer complex decreasing the
response to stress on the aquifer system and also to the offset of irrigation
development to the northwest.
A third area with a deep aquifer may occur north of Pettibone in a drift
filled bedrock valley that is also buried by the Streeter Moraine. The beds of
sand and gravel encountered in test drilling in this area are relatively thin and
may be only discontinuous, isolated bodies of coarse sediment associated with
till. The natw~e and extent of the bedrock valley, as well as the stratigraphy
of the glacial material filling it, are poorly defined.
Several aquifer tests have been conducted at sites scattered along the
main trend of the aquifer complex. The results of the tests characterize the
aquifer properties at four sites and substantiate the hydraulic relationships within
the aquifer complex suggested by different water levels measured in separate
observation wells at multi-well sites. Both the aquifer tests and hydrographs
indicate the leaky confined nature of the different aquifer intervals within the
main part of the aquifer complex. The range of values for transmissivity
calculated from the results of the aquifer tests are summarized as follows:
Location of AquiferTest
Transmissivity (ft2/day)Range Average
138-72-3ABD138-72-11ABB141-71-09DDA142-70-16DBD
10,400 -5,500 -3,500 -4,300 -
24,00010,700
7,20014,300
14,7007,8005,6008,600
79

FIGURE 27
Hydrograph of Observation Well - Kidder County Aquifer Complex
Obs Well 141-071-340001; Land':"'Surface Elev=1800.44ft NGVD40
45
Q)ua'I- 50L::J
(J')
-0Ca
-.J~0Q) 55[J)
LQ)-a?;I0-I
...c 60-a..Q)
0
65
70
~-- •.... ~ ~ .-.~ "Y"
Legend• Obs Well 141-071-340001; SI=332-338ft
I I' , . . , , ,1978 1979 1980 1981
80
1982 1983 1984

Values of transmissivity estimated from test-hole data cover most of the Kidder
County aquifer complex and were calculated using the entire thickness of all
aquifer intervals. The range of these values is 100 to 30,200 ft2/day with an
average of 4,800 ft2/day. Values for storage coefficient were calculated in the
first two aquifer tests. The range of values was 7.9 x 10⁻⁶ to 8.2 x 10⁻⁴ for the
first test and 3.2 x 10⁻³ to 8.3 x 10⁻³ for the second with average values of 2.1
x 10-4 and 4.9 x 10⁻³, respectively.
Local, intermediate, and regional flow systems are very likely to occur
within the Kidder County aquifer complex. The intermediate and regional flow
systems origin.ate in different areas of the Missouri Coteau which lies to the
north and east of the study area. A comprehensive analysis of the origins, paths,
and culminations of the three categories of flow systems is beyond the scope
of this study. The impact of irrigation withdrawals on the overall flow systems
is undetermined.
The principal source of recharge to the Kidder County aquifer system is
the infiltration of precipitation. The water moves into the aquifer complex by
downward floVl' from the overlying surficial aquifers and other glacial material,
and by lateral flow from the surrounding uplands of diverse glacial deposits.
Ground-water inflow from the Fox Hills Formation also recharges the aquifer
complex. Wat,er within the complex moves between aquifer intervals in response
to prevailing hydraulic gradients and intrinsic geological properties of the glacial
drift as a wholl~.
Water-level elevations of late June, 1982 (plate 6) were mapped in an effort
to identify the flow patterns within the aquifer complex prior to irrigation pumping
for the season. The elevations suggest recharge water moves into the buried
81

outwash from the terminal and stagnation moraines surrounding the study area.
The Tappen aquifer is a source of recharge over much of its area with a difference
of 1 to 8 feet between water levels measured at multi-well sites. The Marstonmoor
Plain has water-level elevations 2 to 3 feet higher than the underlying aquifer
complex over much of the area of the surficial aquifer.
Ground water discharges through several avenues from the Kidder County
aquifer complex. Net upward flow across the confining till and silty clay units
into the surficial aquifers occurs in some areas. Two areas were identified in
this study by dual-well sites two miles west of Tappen at 139-71-17BBB(figure
28) and just north of South Lake at 142-71-13DDD (figure 29, and plate 6).
Differences in water-level elevations between the aquifer complex and the surficial
aquifer at these sites are about 4 and 6 feet, respectively. Discharge from the
aquifer complex most likely plays an important role in maintaining the sloughs
and lakes within the study area. It is not known if these are discharge areas
for local, intermediate, or regional flow systems. Lateral flow to the southwest
discharges ground water from an apparent ground-water divide south of Dawson
and from the Lake George-Henry Lake area into the Long Lake aquifer of
southeastern Burleigh County. The Horsehead Lake basin apparently is a major
discharge area for water flowing north from the ground-water divide at Dawson
and water moving south and west from the Pettibone area. Small-capacity
domestic and stock wells add a relatively small proportion to the total discharge
of the aquifer complex. Total appropriations for irrigation supplies by 1983 were
18,231acre-feet annually for 12,166acres. Reported annual water use for irrigation
during the period 1973-1983totaled about 26,700 acre-feet.
82

FIGURE 28
Hydrograph of Observation Wells
Kidder County Aquifer ComplexObs Well~139-071-17BBB1; Land-Surface Elev=1757.93ft NGVD
Tappen AquiferObs Well 139-071-17BBB2; Land-Surface Elev=1758.68ft NGVD
o
5
1984198319821981198019791978
1/\ L/i /'~
~r"
PV 1 I V !/
•••••• ••••••• ~.,.......•.•... .....•.••..- -......... •.•... •......... •••... .•......
Legend• Obs Well 139-071-178881; S\=151-154ft
• 9.~~.~~JU_~~.-:p_~1=-.12 ~ J!~f.;_.?_I::?~=-.~~JJ .I I I
' . . . .....
25
30
Q)u0
'+- 10~:J
U1-0C0
.-J
~0Q) 15CD~Q)-0
~I0-I..c 20-0...
Q)
0
83

o
5
Q)ua
'+- 10L:l
U1~-aca
....J
~0Q)
15alLQ)-a?;I0-I..c 20-a.Q)0
25
30 -
FIGURE 29
Hydrograph of Observation Wells
Kidder County Aquifer ComplexObs Well 142-071-13DDDt; Land-Surface Elev=1766.80ft NGVD
Marstonmoor Plain AquiferObs Well 142-071-t3DDD2; Land-Surface Elev=1766.87ft NGVD
....\ ...•...•..... ",.,"" .....•.•••• - ••••••••••• 11.. _" _ •••.. ~"-...-- .•...•'
Legend• Obs Well 142-071-130001; SI=155-161ft
• Obs Well 142-071-130002; SI=34-37ft-----------------------~---------------------1978 1979 1980
84
1981 1982 1983 1984

Observation wells monitor the impact of current irrigation development
on the aquifer complex. The maximum measured water-level decline near
irrigation wells is about 50 feet during the irrigation season. Water levels generally
recover from the seasonal low to seasonal pre-pumping levels. Hydrographs
typical for observation wells monitoring the aqufier complex are shown in figures
28 through 33 (see also figures 18, 19, 22, 23, and 24).
The yield of a well is partly related to properties of the aquifer in which
it is completed such as saturated thickness, hydraulic conductivity, areal extent,
and ground-water flow system. Test-hole and observation-well data can establish
the order of :magnitude for well yield of the Kidder County aquifer complex.
The estimates range from less than 50 gpm to greater than 500 gpm (plate 8).
Yields exceeding 1,000 gpm may be possible locally where a high hydraulic
conductivity combines with a great saturated thickness to produce favorable
hydrologic conditions. The capability of the aquifer complex to sustain such
a high yield would require a detailed hydrogeological investigation of the site
and surrounding area. Plate 8 shows the potential yield available from the
glacial-drift aquifers as a whole, including the surficial aquifers.
The amount of water available from storage within the aquifer complex
can be estimated from the areal extent and average thickness of the aquifer
and an estimated specific yield. Using an areal extent of 470 square miles, an
average thickness of 53 feet, and a specific yield of 0.15, an estimated 2,391,000
acre-feet of water are available from storage.
Water in the Kidder County aquifer complex is predominantly hard to very
hard. The type of water varies both are ally and with depth. The trend along
the aquifer complex is calcium-bicarbonate and calcium/sodium-bicarbonate
in the north to sodium/calcium-bicarbonate and sodium-bicarbonate in the south.
85

FIGURE 30
Hydrograph of Observation Wells - Kidder County Aquifer Complex
1
I'"I'"
......••.•~ \~ 1.- '., '.I ,
----,-~- -- 11-
~----+
/f"--- L--t --~-
iI
I ~ ••~~~",,: ,.,. ~~ ",l-" !" I', """"I '. \,
"-t--- ~I-~-+------I
III--,---
I
I' ~JII..l
~ \, ,,4-----~/1, I
I, ,~'
10
Obs Well 138-072--03BAA 1; Land--Surface Elev=1756.54ft NGVDObs Well 138-072-03BAA2; Land-Surface Elev=1756.47ft NGVDObs Well 138-072--03BAA3; Lond--Swfoce Elev=1757.29ft NGVD
.~ iI
15 ----~---- - ----~--- __ I__ .. -+ -- ..-..
40
(]I)uo
'+-L::J
(f)25 ------0
Co-1
~oQ) 30
£D
20
L(]I)
+-o
~I
E 35I
-L+-Q.(]I)
o
45Legend
• Obs Well 138-072-03BAA1; SI=146-149ft
• 9.~.?__VY~_IU_~?_~_Q??_--:~~J~~~?2_?J~~Q ?}.u _•. 9!>.?_Vj~U J~§::-_OJJ- Q~ ~ t:~~~?l =:2_ ~ ~ -=- ~~~ f_t
50
1978 1979 1980 1981 1982 1983 198486

FIGURE 31
Hydrograph of Observation \Nells -- Kidder County Aquifer Complex
Obs Well 141--070-06BAA 1"Obs Well 141-070-06BAAj;
30
35
Land-Surface Elev=1802.03ft NGVDLand-Surface Elev=1801.06ft NGVD
Q)0a
'+- 40L:J
Vl-0Ca
.-1
~0Q) 45CDLQ)-a
~I0-I..c 50-a..
Q)
0
55
Legend• Obs Well 141-070-06BAA1; SI=137-143ft
• Q.1?;;_.w~J!._t4.!-=-_q? Q -=-_q?_~~_~?_;_?I.:=:!9_~:::!Q§}}60
1978 1979 1980 1981
87
1982 1983 1984

FIGURE 32
Hydrograph of Observation Wells - Kidder County Aquifer Complex
Obs Well 139-072-24BBB1; Land-Surface Elev=1767.99ft NGVDObs Well 139-072-24BBB2; Land-Surface Elev=1767.84ft NGVD
20
25
(1)
u0
'+- 30l.....J
(f)
-0C0-1
~0(1) 35CDl.....(1)
-+-0
~I0-+-,
...c 40-+-0...(1)
Cl
45
Legend• Obs Well 139-072-248881; SI=197-203ft
• Q.~~-~~JU_~~_-:.9_~?_-=?±~!3_~?L?J::~?_-=~_~lL_50
1978 1979 1980 1981
88
1982 1983 1984

FIGURE 33
Hydrograph of Observation Wells - Kidder County Aquifer Complex
Obs Well 142-071-35DDD1; Land-Surface Elev=1763.65ft NGVDObs Well 142-071-35DDD2; Land-Surface Elev=1763.64ft NGVD
o
5
Q)oo't 10::J
V')
1JC
.9~o
~ 15L-Q)~o
~Io~I
:E 200..Q)C
25
..••.•... - ~~..... -- .•.-......•. "" ...•.••••••
Legend• Obs Well 142-071-350001; SI=177-183ft
• 9..~;;_.w!'JU_.c!~::97..1:-_~~.P..P.Q~j_?J==_~~.::~_~ft_30
1978 1979 1980 1981
89
1982 1983 1984

The trend with depth is toward the sodium-bicarbonate type water. The overall
quality of the water can be summarized as follows:
Range AverageFe (mg/L 0.00 - 6.30 0.58Mn(mg/l) 0.06 - 2.30 0.95S04(mg/1) 5.4 - 1020 128TDS(mg/1) 323 - 1420 651%Na 5 - 92 38SAR 0.2- 18.5 3.0RSC 0 - 11 2
~igation indices range from C2-S1 to C4-S3 (figure 21), but are predominantly
C2-S1to C3-S1.
At a few locations within the main part of the Kidder County aquifer
complex, shallow relatively isolated sand and gravel units overlie the main part
of the aquifer complex. Two such units are monitored by observation wells located
at 139-72-24BBB2 and 142-71-35DDD2 (plate 6). Water levels in the two shallow
wells at these sites show a slight seasonal fluctuation compared to the main
part of the aquifer complex (see figures 32 and 33, respectively). Till and silty
clay apparently isolate an area south and southwest of Tappen from the irrigation
stresses imposed on the main part of the aquifer complex. Water levels in
observation wells in this area on the flank of the aquifer exhibit a seasonal
fluctuation of one-half foot or less.
Sand and gravel units within the stagnation moraine in the eastern part
of the study area are also separate from the main aquifer complex. Water levels
in observation wells in two such units at 140-70-27CCC2 (figure 34) and
141-70-17DDD2(figure 35) fluctuate about two feet or less annually. The quality
of the water is considerably different from that found within the aquifer complex.
90

FIGURE 34
Hydrograph of Observation Well - Kidder County Aquifer Complex
Obs Well 140-070-27CCC2; Land-Surface Elev=1784.43ft NGVD
10
15
Q)u0
'+- 20L:J
tf)-0C0
---1~0Q) 25CDLQ)
-+--0
~I0
-+--I
..c 30-+--0..Q)
0
35
40
--A~
V
Legend• Obs Well 140-070-27CCC2; SI=75-78ft
" I I ' T , T ,
1978 1979 1980 1981
91
1982 1983 1984

FIGURE 35
Hydrograph of Observation Well - Kidder County Aquifer Complex
Obs Well 141-070-17DDD2; Land-Surface Elev=1817.03ft NGVDo
5
1984198319821981198019791978
...~
-/\..~~
V
Legend• Obs Well 141-070-170002; SI=69-72ft
. . • I • I ••• I . . . . ..
25
30
Q)U0
'+-- 10!....:J
(f')-0 .C0
--1~0Q)
15CD!....Q)
+-03:I0+-I
...r:: 20+-Q.Q)
a
92

Water from observation well l40-70-27CCC2 is a sodium/magnesium-sulfate
type with a total dissolved solids concentration of 7,330 mg/l and very high salinity
and sodium hazards. Water from observation well l4l-70-l7DOD2 is a
sodium-sulfate type. The sample had a total dissolved solids concentration of
1,150 mg/l, a high salinity hazard (C3), and a medium sodium hazard (S2). The
extent of the sand and gravel units within the area of stagnation moraine and
the ground-water flow systems associated with them are not well defined.
GROUND-WATER RESOURCE DEVELOPMENT
The major uses of ground water in the study area are: domestic and livestock
supplies, municipal or public supplies, and irrigation. Irrigation constitutes the
major use of ground water in the study area compared to all other uses.
Most farmsteads and rural residences in the study area have at least one
well for domestic or livestock supplies. Very few records are available regarding
the quantity of water used yearly for such supplies. The annual was use may
be approximated from population figures (Table 5). The quantities thus
approximated give magnitudes
Table 5. Domestic and Livestock Water Use
UseIndividual
Requirements(gpd)
population(rounded)
Estimated QuantityUsed (rounded)
(gpd)
Ruraldomesticl/
CattleCows-dairyHogsSheeppoultry
1001535
21.50.04
4,40067,4002/
3,200216,4002/7,100217,7003/
440,0001,011,000
112,00013,00011,000
300
l/includes population of unincorporated towns and villages2/based on a 1977-81 average prorated areally from county
population figures to study area3/based on average of 1978 and 1974 population figures prorated areally
93

of water use only. Actual daily ground-water use for domestic and livestock
supplies will vary from the estimated quantities due to the approximation method
employed, seasonal variations in farming operations, and an unknown proportion
of the livestock water originating from surface water.
The cities in the study area depend on ground water for their source of
supply. Four of these cities have distribution systems: Wing, Strasburg, Steele,
and Tuttle. The residents of the other cities rely on private wells to supply water,
and are included in the rural domestic category in Table 5. The wells for Wing
and Strasburg are completed in the Wing Channel and Strasburg aquifers. Reported
water use for 1973-1983 for these two municipalities is 215.9 and 1019.7acre-feet,
:respectively. The wells for Steele and Tuttle are completed in the Fox Hills
aquifer. Water use is not included in this report on the glacial-drift aquifers.
A total of 47,359 acre-feet of ground water was reported as used for
irrigation in the study area during the period 1973-1983 (table 6). The annual
TABLE 6. Reported Annual Water Use - Irrigation(in acre-feet)
Year Burleigh Emmons Kidder Annual Total
1973 417 137 2347 29011974 464 128 2178 27701975 329 80 2013 24221976 905 2 3342 42491977 1646 662 4158 64661978 250 80 3704 40341979 598 273 2467 33381980 1519 315 5225 70591981 302 422 4031 47551982 575 192 2473 32401983 897 272 4956 6125
Total 7902 2563 36,894 47,359
94

total use ranges from 2,422 acre-feet in 1975 to 7,059 acre-feet in 1980, and
averages 4,305 acre-feet. Kidder County reported the greatest annual irrigation
use, a trend that is expected to continue.
RECOMMENDATIONSFOR FURTHER STUDY
Three principal elements of the ground-water flow system in the study
area remain for future investigation.
A) The areas and sources of recharge and areas of discharge should be
further identified, particularly with regard to the moraines surrounding
the study area and the bedrock aquifers underlying the drift aquifers.
B) The relationships between surface water and ground water are not well
understood in the study area. Further study is needed to define the
dynamic interactions between ground water and surface water.
C) This study indicates the complexities of the ground-water flow system
with:in the Kidder County aquifer complex. Additional work is necessary
to better delineate the aquifer entities within the glacial drift and
define the effects of the heterogeneities within the drift on the flow
of ground water within and between aquifer intervals. Aquifer
simulation should be an integral part of such further study. A rpsult
of such study will be improved assessments of the impacts from proposed
and current water-resource development on ground-water flow systems
in the area of development.
The U. S. Bureau of Reclamation investigated the feasibility of
a federally sponsored irrigation project in Kidder County. At least
95

part of the total water requirements could be supplied by ground water.
Projects with 50,000 and 120,000 acres were evaluated, which correspond
to water demand of about 75,000 and 180,000 acre-feet. Further
investigation as outlined in A, B, and C will be necessary in order to
address the effects of such projects on the total water resource.
96
References Cited
Abbott, G.A., and F.W. Voedisch, 1938, The municipal ground-watersupplies of North Dakota: North Dakota Geological Survey, Bulletin#11, 99 p.
Armstrong, C.A., 1975, Ground-water basic data for Emmons County,North Dakota: North Dakota State Water Commission, County Ground-WaterStudies #23, part II, 375 p.
Armstrong, C.A., 1978, Ground-water resources of Emmons County, NorthDakota: North Dakota State Water Commission, County Ground-WaterStudies #23, part III, 43 p.
Bluemle, J.P., 1979, Geology of Dickey and LaMoure Counties, NorthDakota: North Dakota State Water Commission, County Ground-WaterStudies #28, part I, 72 p.
Bluemle, J.P., 1984, Geology of Emmons County, North Dakota: NorthDakota Sta.te Water Commission, County Ground-Water Studies #23,part I, 69 p.
Bradley, E., L.R. Petri, and D.G. Adolphson, 1963, Geology and ground-waterresources of Kidder County, North Dakota, part III, ground waterand chemical quality of water: North Dakota State Water Commission,County Ground-Water Studies #1, 38 p.
Brown, D.W., 1968, Preliminary ground-water availability map of KidderCounty, North Dakota: U. S. Geological Survey, open-file releaseMay 15, 1968.
Clayton, L., 1962, Glacial geology of Logan and McIntosh Counties,North Dakota: North Dakota Geological Survey, Bulletin #37,84 p.
Darton, N.H., 1896, Preliminary report on artesian waters of a portionof the Dakotas: U. S. Geological Survey, 7th Annual Report, part2, p. 661-670.
Fenneman, N.M., 1931,Physiography of western United States: NewYork, McGraw Hill Book Co.
Fischer, S.P., 1952, The geology of Emmons County, North Dakota:North Dakota Geological Survey, Bulletin #26, 47 p.
Huxel, C.J., Jr., and L.R. Petri, 1965, Geology and ground-water resourcesof Stutsman County, North Dakota, part III, ground water and itschemical quality: North Dakota State Water Commission, CountyGround-Water Studies #2, 58 p.
97

Kume, J. and D.E. Hansen, 1965, Geology and ground-water resourcesof Burleigh County, North Dakota, part I, geology: North DakotaState Water Commission, County Ground-Water Studies #3, III p.
Naplin, C.E., 1971,Geology and ground-water resources of Kidder County:North Dakota State Water Commission, County Ground-Water Studies#1, addendum, 56 p.
National Oceanic and Atmospheric Administration (NOAA), 1976-1982,Climatological Data for North Dakota.
Paulson, Q.E., 1962, Ground water - a vital North Dakota resource:North Dakota State Water Commission, Information Series Bulletin#1, 26 p.
Randich, P.G., 1963, Geology and ground-water resources of the Linton-Strasburg area, Emmons County, North Dakota: North Dakota StateWater Commission, Ground-Water Studies #50, 53 p.
Randich, P.G., 1965, Geology and ground-water resources of BurleighCounty, North Dakota, part II, ground-water basic data: NorthDakota State Water Commission, County Ground-Water Studies #3,273 p.
Randich, P.G., L.R. Petri, and D.G. Adolphson, 1962, Geology and ground-water resources of Kidder County, North Dakota, part II, ground-waterbasic data: North Dakota State Water Commission, County Ground-WaterStudies #1, 134p.
Randich, P.G. and J.L. Hatchett, 1966, Geology and ground-water resourcesof Burleigh County, North Dakota, part III, ground-water resources;North Dakota State Water Commission, County Ground-Water Studies#3, 92 p.
Rau, J.L., W.E. Bakken, J. Chmelik, and B.J. Williams, 1962, Geologyand ground-water resources of Kidder County, North Dakota, partI, geology: North Dakota State Water Commission, County Ground-WaterStudies #1, 70 p.
Robinove, C.J., R.H. Langford, and J.W. Brookhart, 1958, Saline-waterresources of North Dakota: U. S. Geological Survey, Water-SupplyPaper 1428, p. 9-25.
Simpson, H.E., 1929, Geology and ground-water resources of NorthDakota, with a discussion of the chemical character of the waterby H.B. Riffenburg: U. S. Geological Survey, Water-Supply Paper598, p. 148-149.
98

Thorstenson, D.C., D.W. Fisher, and M.G. Croft, 1979, The geochemistryof the Fox Hills-basal Hell Creek aquifer in southwestern NorthDakota and northwestern South Dakota: Water Resources Research,
15:6, 1479-1498.
U. S. Department of Agriculture, 1954, Diagnosis and improvement ofsaline and alkali soils: U. S. Salinity Laboratory Staff, USDA,Handbook 60, 160p.
Winters, H.A., 1963, Geology and ground-water resources of StutsmanCounty, North Dakota, part I, geology: North Dakota State WaterCommission, County Ground-Water Studies #2, 84 p.
99