Morphology and Hydrology of a Glacial Stream- White River ...
75
Morphology and Hydrology of a Glacial Stream- White River, Mount Rainier Washington GEOLOGICAL SURVEY PROFESSIONAL PAPER 422-A
-
Upload
khangminh22 -
Category
Documents
-
view
0 -
download
0
Transcript of Morphology and Hydrology of a Glacial Stream- White River ...

Morphology and Hydrology
of a Glacial Stream-
White River, Mount Rainier
Washington
GEOLOGICAL SURVEY PROFESSIONAL PAPER 422-A

Morphology and Hydrology
of a Glacial Stream-
White River, Mount Rainier
WashingtonBy ROBERT K. FAHNESTOCK
PHYSIOGRAPHIC AND HYDRAULIC STUDIES OF RIVERS
GEOLOGICAL SURVEY PROFESSIONAL PAPER 422-A
A study of the hydraulic and morphologic
processes by which a valley train is formed
by a proglacial-stream
UNITED STATES GOVERNMENT PRINTING OFFICE, WASHINGTON : 1963

UNITED STATES DEPARTMENT OF THE INTERIOR
STEWART L. UDALL, Secretary
GEOLOGICAL SURVEY
William T. Pecora, Director
First printing 1963 Second printing 1967
For sale by the Superintendent of Documents, U.S. Government Printing Office Washington, D.C. 20402 - Price 55 cents (paper cover)

CONTENTSPage
Abstract_---------------_--_---______._____..... AlIntroduction. __--_-_-__-_-____-_._._____._._.______ 1Description of study area_---____-_-______..______.__ 2
Physical features.______________________________ 2Climate and vegetation..________________________ 5Geology.______________________________________ 5Emmons Glacier___--_-______-._________________ 6
Characteristics of White River channels.-_--_-_____._ 8Discharge __ ---------____-_______________.____ 10Width, depth, velocity, and area____-_____________ 12Shape.--------------__________________________ 15Mode of change.-____--__-__________.._._.._._. 16Water-surface slope, hydraulic roughness, and flow
characteristics.. -----------_________________.. 18Transportation, erosion, and deposition on the valley
train. _---_--___-__________.._.__________..___ 19Character of the source materials____--__-_-..____ 19
Morainic debris.--.----________-____________ 19Mudflow deposits. -----________________._.__ 20Valley-train deposits._-._--_-______--________ 22
Analyses of particle size.________________________ 23Sieve analyses..-___________________________ 23Pebble counts._--_-----____________________ 24
Transportation of bedload.______________________ 26Methods of measurement and analysis of data. _ _ 26
Antidunes_ _____________________________ 27Analysis of competence of the White River. 29
Transportation of suspended load.________________ 32Size of material in suspension.___-__--__-____ 32Concentration and discharge_________________ 32
Transportation, erosion, and deposition on the valley train Continued
Valley train elevation change._-------------------Methods of measurement- -------------------Computation of net elevation and volume change- Elevation change on cross sections of the valley
train.__________--________---_-_--_---__-Source of deposits__ ----------------------
Channel pattern,___________________-_____-___-----_Description of pattern___-__---------------------
Changes during the period of study._____-_--_Features of the White River channel patterns __
Analysis of pattern____ - -------------------------Channels numbe"r, persistence, and location
on the valley train._______________________Relation of pattern to channel characteristics.___ Relation of pattern to elevation change__----_-
Causes of a braided pattern- ---------------------Erodible banks -----------------------------Rapid variation in discharge_________----_--_Slope____________-__-___---------_-------Abundant load- ----------------------------
Related problems-_________________-----------------Longitudinal profile of valley and equilibrium in a
regrading glacial stream. ----------------------Influence of glacier regimen on development of a
valley train ----------------------------------Summary. -----------------------------------------References cited- __-----_-__--_----_------.---------Index ---------------------------------------------
Page
A33 3335
36404242424951
515356575758585958
59
59606669
ILLUSTRATIONS
FIGUREPage
1. Emmons Glacier and the White River study area, Mount Rainier__.__-_-_____-_-___-------------------- A32. Study area and distribution of active glaciers on Mount Rainier, 1913 and 1958. ________ _____-_.___---_ 43. Map showing approximate positions of Emmons Glacier ice front, 1930-58, line of profile, and kettles in 1959 __ 74. Profiles of valley train and former glacier surface._________-_______-_---------_---_-------_------------- 85. Small kettle___-------_----...__________________.________.______________-.--__----------_------- 96. Diagrammatic cross section through kettle...____________-__---__---_-------------------------------- 97. Gage height record of White River________________________________--__---_-------------------------- 128. Relation of mean velocity, mean depth, and width to discharge of White River channels.--.----------------- 139. Relation of average width-depth ratios to discharge.__________________-__---_--------------------------- 16
10. Cross sections of several White River channels snowing width-depth ratio, shape factor, and Froude number.__ 1711. Cross sections of White River channels showing adjustment to load and discharge-__-____------------------ 1812. Standing waves in a White River channel- _______________________-____--_----------------------------- 1813. Distribution of deposits on and near White River,valley train._____________________---_--_--------------- 1914. Tills.-------------_--___....________________________________________-.________------_-----_----- 2015. Cutbank in mudflow sequence _-_______________________________________-_--_----------__------------ 2016. Detail of cutbank in mudflow sequence ____________________--____-_-_---_--------_-_----------------- 2117. Mudflow deposit_________________________________________-___--_-__-----_---------------------- 2118. Mudflow truncated in foreground by stream. ___________________________--__----------_---------------- 2119. Boulder front on surface of mudflow._-_-_________________-_____-----_-------------------------------- 2120. Cutbank in valley train.._________________________________________----_------____-------- 2221. Cutbank in valley train._________________________.________________..___----___---------_--_---------- 22
OT

IV CONTENTS
PaceFIGURE 22. Small stream depositing fines which bury coarser deposits--_-_--_-----_-_---___--__-__-_-_______-________ A23
23. Relation of size of material to distance below glacier_______-___-_____---_--__________-_-_-_____-_______ 2524. Relation of size of material to slope.________________________-_--___--____-______-_-__--_____-.______._ 2625. Sampling bed load with screen.-___________________-______--__-_---__--___--__-____--__-_-_-_--__-_ 2726. Large load moving over rough bed in shallow channel_____---_-_--___-_-----__-__----__-_______--__--_-_ 2727. Antidunes..____________________________________________ ___________ 2828. Measurement of amplitude and wavelength of antidunes --------------------_-------------------_-----_ 2829. Longitudinal cross section and plan view of antidunes--.------------------------------------.----------- 2830. Relation of particle size to velocity. __________________^___-_-______________..__-_-------_-_-_-_____-___ 2931. Relation of particle size to tractive force...____________________________________________________________ 3132. Diurnal variation in suspended sediment concentration with discharge_____-_-__-----_-___-_--____-_____._ 3333. Relation of suspended sediment concentration to discharge_____________-_--_-_--__-___-___-________-____. 3434. Relation of suspended sediment concentration to discharge 50 feet downstream from the division into two chan-
nels--_-----_------_----_--_____-____-__________-_________-___------_-___---_-_-----_-_-__-____-_ 3435. White River valley train showing locations of cross sections, areas for volume estimates, and widening._________ 3436. Erosion and deposition on cross sections.----.--------------------------------------------------------- 3737. Erosion and deposition on cross section 3._.__.________________________________________________________ 3938. Valley train near head of West Emmons Creek...____._____________-_-_--_____-___-----______---______- 4139. Pattern changes, 1:00 to 2:00 p.m., July 18, 1958-..___________-_____________________ 4440. Panorama of the White River valley train. ______.______-__-__-______---_-_--_----_-__-_-__-_- ______ 4641. Meanders and nose on White River_--__-_-__--__-____--__-----.-------------------------------------- 4742. Meander pattern of White River_-_.-___----.--_____-_-___-_-_----------_._--__.____-________ 4743. Upper reach of White River_._. ______._._____-_.___,-__.___._______._-__--________...__.___-.. 4844. Relict braided pattern of August 4, 1958------------------_-----------__--__---_-__-_---___-___. 4945. White River near cross section 10, July 21, 1959---_-__-----_--___--_-------------------_-__----------- 5046. Relict braided pattern of the White River, September 3, 1958_-__-___--__-___._.___-______-_.____. 5147. White River nose_______._-________________._____________________________ 5248. A braided reach of White River.__________________________-_-____-_----------___--_-____-____----_-_- 5349. Relation of discharge range to number of channels at cross sections.______-----________-____-_____-_______ 5450. Hydrograph and number of channels at selected cross sections_______-__-----_______--___-_______---__-_ 5551. Imbrication of boulders on a bar.____________________-_-____.______-___----__-___--____-___-__--_-_-__ 5652. Braided pattern during the degradation of the valley train..- ____._____.__-________-______-__-__----_--_ 57
TABLES
Page TABLE 1. Channel parameters of the White River and other streams_____.____._...__._____-_____.---_--_--------- A14
2. Size distribution of valley-train materials---_______-_-__--_----_-------------3. Suspended load of White River, August 1958_-________-__________________4. Cross section surveys of the White River valley train, 1957-60.____.___-_---.__5. Changes in elevation and volume of the valley train of the White River, 1957-60.6. Number of channels at each cross section of the White River, 1958-59-----------7. Characteristics of the White River channels, 1958-59_________-____._--_-----8. Bedload of the White River, July-August 1958_-.-._--_-.______-___
24323536436264
SYMBOLS
a A b
D
Coefficient in w=aQb Area of channel cross section Exponent in w=aQb Coefficient in d=cQf
A
Mean depth = * w
Maximum depthSediment size, intermediate diameter of particleMedian diameter
Froude number =~r=
Exponent in d=cQf Acceleration due to gravity
k Lm n'
Q8
Vo.6
V,
wy
Coefficient in v=kQmStream lengthExponent in v=kQmRoughness parameter from modified Manning equationDischarge in cubic feet per secondWater surface slope
Mean velocity=-j
Current meter velocity, 0.6 depth Float velocity at surface Channel width at water surface Specific weight of water Tractive force =yds

PHYSIOGRAPHIC AND HYDRAULIC STUDIES OF RIVERS
MORPHOLOGY AND HYDROLOGY OF A GLACIAL STREAM WHITE RIVER,MOUNT RAINIER, WASHINGTON
By ROBERT K. FAHNESTOCK
ABSTRACT
This is a study of the processes by which a valley train is formed by a proglacial stream. The area investigated is the White River valley on the northeast flank of Mount Rainier, between the present terminus of Emmons Glacier and the moraine marking the terminal position in 1913. Five square miles of the 7.5-square-mile drainage basin above this moraine are presently covered by active ice.
Measurements of channel characteristics were made in 112 channels developed in noncohesive materials. Channel widths ranged from 0.7 to 60 feet, mean depths from about 0.03 foot to 2.08 feet, and mean velocities from 0.3 to 9 feet per second for discharges of about 0.01 to 430 cfs. The relations between these variables can be expressed by the equations: w=aQb , d=cQf, and v = kQ m . The exponents for White River channels were found to be similar to the average of those for streams in the Southwestern States. In contrast, Brandywine Creek, Pa., with cohesive bank materials, had higher velocity exponents and extremely low width exponents. Width and depth of channels in noncohesive materials may change by scour and deposition as well as by flow at different depths in predetermined channels. White River channels, with steep slopes in coarse noncohesive materials, were narrower, slightly shallower, and had much higher flow velocities than the channels of Brandywine Creek in cohesive materials.
Slope of the valley train was related to particle size and dis charge. Pebble counting demonstrated a systematic decrease of 60 mm in median diameter of the valley train deposits in a distance of 4,200 feet downstream from the source areas. Dis charge was essentially constant through this reach, the stream received no major additions. Discharges of 200 to 500 cubic feet per second were capable of transporting almost all sizes of materials present and thus modified the form of the valley train.
Data on the velocities required to transport coarse materials in White River showed that a curve in which diameter is pro portional to velocity to the 2.6 power approximates the relation better than the traditional sixth power law in which diameter is proportional to velocity to the 2.0 power. The few samples contained suspended-load concentrations up to 17,000 ppm.
The most graphic evidence of the large amount of material transported by the White River was the amount eroded and deposited on the valley train itself. Measurements indicated an average net increase in elevation of 1.2 feet during 1958 and a net decrease of 0.12 foot in 1959.
Description and analysis of the change in pattern of the White River were difficult at high flows because of the rapidity of the change. However, a marked change from a meandering pattern
to a braided pattern took place with the onset of the high summer flows and the pattern returned to meanders with the low flows of fall.
Explanations offered in the literature for the cause of braided patterns include erodible banks, rapid and large variation in discharge, slope, and abundant load. The common element in all explanations seems to be a movement of bed load in such quantity or of such coarseness that there is deposition within the channel, causing the diversion of flow from one channel into other channels in a valley wide enough to provide freedom to braid. White River braiding took place most actively at large loads and discharges.
Although examples of braiding by an aggrading stream are common, the White River and the Sunwapta River, Alberta, have reaches in which degradation took place while the stream had a braided pattern. The conclusion is reached that both braided and meandering reaches can occur along the same stream, which may be aggrading, poised, or degrading. The pattern alone does not conclusively define the regimen of the stream.
The regimen of the glacier has long-term effects in providing debris to the stream; short-term effects of weather and runoff determine the current hydraulic characteristics, rate of deposition and erosion, and channel pattern.
INTRODUCTION
This is a study of the processes by which a valley train is formed by a proglacial stream. The term valley train, as used here, is an outwash plain laterally constricted by valley walls. Studies of such distinctly different geologic environments improve the under standing of past geologic events and knowledge of the interrelations of hydraulic and morphologic variables. Comparisons of data from distinctly different environ ments make possible the evaluation of the sensitivity of hydraulic parameters to environment.
It is hard to imagine a more radical departure from normal stream regimen than a glacierized drainage basin (fig. 1). Diurnal fluctuations in discharge bring bankfull or overbank flow for brief periods to many short reaches of the stream. As a large part of the precipitation falls as snow, it may be years before heavy accumulations at high elevations are reflected in changes of position of the glacier and in runoff.
Al

A2 PHYSIOGRAPHIC AND HYDRAULIC STUDIES OF RIVERS
Most of the runoff occurs during the months of June, July, and August, which in many environments would be the period of extreme low water. The presence of the Emmons Glacier makes it possible to study the relation of stream and glacial regimen. The stream pattern changes rapidly in response to changes in discharge which cause much shifting of debris on the valley train. The coarseness of the materials being transported, the high stream gradient, and the rapid flow provide situa tions in which the influence of these factors can be measured under extreme conditions.
Hjulstrom (1935) and Sundborg (1954) in their detailed studies of river systems summarized con temporary knowledge of sediment transport and open- channel hydraulics and applied this knowledge to natural channels, which had low velocities, tranquil or subcritical flow, relatively fine bed materials, and low slopes. Leopold and Maddock (1953) presented a method of quantitative analysis of channel character istics of natural streams. They limited their discussion to a number of rivers in the Great Plains and the Southwest. Wolman (1955) applied the method to a stream in a more humid region. In a recent investi gation where these methods were used, Miller (1958) studied high mountain streams in regions which had at one time supported glaciers. All of these channels differed from laboratory channels and from the rapid streams which issue from glaciers to flow with steep gradients and constantly changing channel patterns to the sea. Hjulstrom led an expedition during the summers of 1951 and 1952 to study the alluvial outwash plains (sandurs) of Iceland and the mechanics of braided streams. The stream studied by Hjulstrom is much larger and has more gentle gradients than the White River and pattern changes appear to take place much less rapidly than on the White River valley train.
The first section of this report describes the regional setting and the recent history of the Emmons Glacier. The second and third sections cover the hydrology and hydraulic characteristics of White River channels and the transportation, erosion, and deposition of materials of the valley train. The fourth section is a description and analysis of the channel pattern change on the valley train. The fifth section is a discussion of the related problems, the application of the concept of equilibrium to valley train formation and the influence of the glacier regime on valley train formation.
The present report is a modification of a thesis 1 submitted to Cornell University. Work in the field was performed by the author as a member of the Geo logical Survey under the general supervision of C. C. McDonald, Chief, General Hydrology Branch. The
i Fahnestock, Robert, K., 1960, Morphology and Hydrology of a glacial stream: Ithaca, N.Y., Cornell University, doctoral thesis.
field assistants were T. G. Bond in 1958 and P. V. D. Gott in 1959. Cornell University professors Marvin Bogema, R. A. Christman, P. G. Mayer, and C. M. Nevin, graduate committee members; E. H. Muller and L. L. Ray, committee chairmen; and M. G. Wolman, U.S. Geological Survey, made many helpful suggestions in regard to the field\M9rk and the manuscript.
John Savini, U.S. Geological Survey, was extremely helpful in the field through his aid with problems of stream gaging and in preparation of streamflow records. Ann M. Fahnestock, the author's wife, provided material support in the fieldwork, maintenance of camp, and preparation of the original manuscript.
DESCRIPTION OF STUDY AREA
PHYSICAL FEATURES
The White River study area lies within Mount Rainier National Park on the northeast flank of Mount Rainier (figs. 1 and 2), west of the crest of the Cascade Mountains, 80 miles south southeast of Seattle, Wash. The area of most intensive study was the 1-mile reach of the stream between the present terminus of the Emmons Glacier and the valley loop moraine, which marks the 1913 terminus. The study area is reached from the White River Campground by a truck trail leading up the left bank of the Inter Fork and by a trail across the moraines. This area was selected be cause it is accessible and includes both a site for a gage where the stream is confined to one channel and a reach where at times the channel pattern changes rapidly. Measurements to determine the relation of size of material and slope were made in several other areas.
An area of 7.5 square miles (M. F. Meier, written communication, 1958) is tributary to the gage at the moraine (fig. 2). Of this area, 5 square miles was covered by active glacier ice, 4.4 square miles by the Emmons Glacier, and 0.6 square mile by that part of the Frying Pan Glacier thought to contribute to the White River above the gage. Flow from the Frying Pan Glacier, which does not pass through the study area, enters the White River about 3 miles below the gage by way of Frying Pan Creek.
In the period 1957-59 the Emmons Glacier (fig. 2) extended from its source area on the summit of Mount Rainier at an elevation of more than 14,000 feet to an elevation of about 5,300 feet through a valley carved into the northeast flank of the mountain. The depth of this erosion is suggested by the following data: The surface of the glacier is about 2,000 feet lower than the summit of Little Tahoma Peak (fig. 1) on a line trans verse to the valley; and the terminus in 1910 was at an elevation of about 4,700 feet near the present stream-
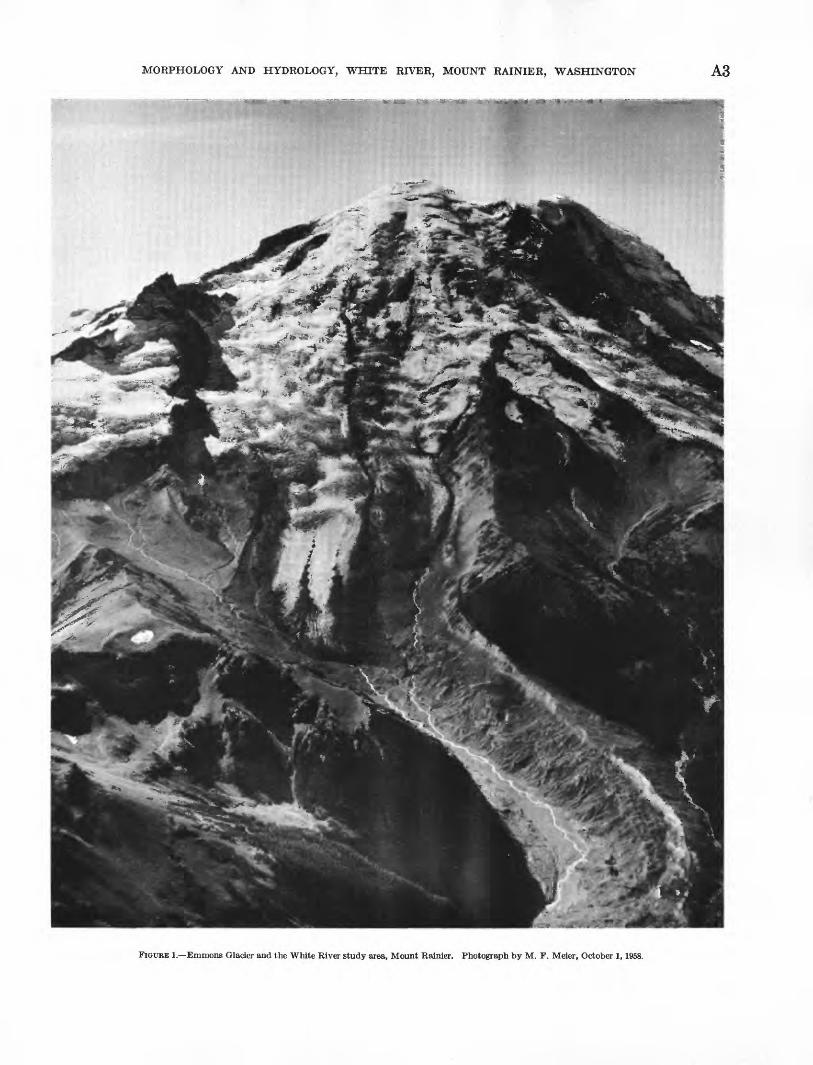
MORPHOLOGY AND HYDROLOGY, WHITE RIVER, MOUNT RAINIER, WASHINGTON A3
FIGURE 1. Emmons Glacier and the White River study area, Mount Rainier. Photograph by M. F. Meier, October 1,1958.

A4 PHYSIOGRAPHIC AND HYDRAULIC STUDIES OF RIVERS
121° 40'
Inter Glacier
Antler-/
MT RAINIER "
EXPLANATION
United States Geological Survey streamflow gaging stationAREA OF THIS REPORT
Drainage basin boundary
Glacier position, 1913, U.S. Geological Survey map Mt. Rainier National Park, Wash
Glacier position, 1958, M. F. Meier (written communication)
FIGURE 2. Study area and distribution of active glaciers on Mount Rainier, 1913 and 1958.

MORPHOLOGY AND HYDROLOGY, WHITE RIVER, MOUNT RAINIER, WASHINGTON A5
gaging station, which is some 1,700 feet lower than the adjacent Yakima Park, Baker Point, and Antler Peak (fig. 2). The White River is tributary to Puget Sound through the Stuck and Puyallup Rivers.
A stream-gaging station equipped with a water-stage recorder is 1 mile below the glacier at the moraine; another station, White River at Greenwater, Wash., is 28 miles downstream, just above the junction with the Greenwater River and 2 miles below the junction with the West Fork White River. The source of the West Fork White River is the Winthrop Glacier, which emanates from the same icefield as the Emmons Glacier.
CLIMATE AND VEGETATION
The position of Mount Rainier on the west side of the Cascade crest is of great climatic significance. The prevailing winds, moisture-laden westerlies from the Pacific Ocean, are cooled as they rise to cross the Cas cade Mountains, causing heavy precipitation. The proximity of the Pacific Ocean has a moderating effect on the temperature in both summer and winter.
On Mount Rainier, approximately 75 percent of the precipitation falls from October through May. Yearly snowfall at the higher elevations of the mountain has not been measured, but records kept on the southwest side of the mountain at Paradise (elev 5,400 ft) indicate an average precipitation of 100 inches (including 50 ft of snow) and at Longmire (elev 2,160 ft) approximately 78 inches (including 15 ft of snow). Brockman (1947, p. 2) noted that "while no records are available for Yakima Park (northeast side of the mountain) . . . the snowfall is considerably less." The maximum depth of snow on the ground at Yakima Park is from 40 to 50 percent that at Paradise, which is almost 1,000 feet lower.
The vegetation of Mount Rainier National Park varies with elevation from that of the humid transitional zone of the Puget Sound Lowland to that of the Arctic- Alpine Zone above 6,500 feet (Brockman, 1947). How ever, in the area studied there is no vegetation on the valley train owing to the incessant reworking of the surface. Scattered trees as much as 57 (Sigafoos and Hendricks, 1961, p. 4) years in age grow on the adjacent ablation moraine, which is underlain by stagnant ice. Older trees are found on the adjacent lateral moraines. The vegetation is too sparse to have any appreciable effect on the runoff characteristics of the drainage basin. On the valley train below the 1910-13 moraine, how ever, alder has found a footing and scattered groups of evergreen and poplar trees are growing. Older trees grow on terraces, the lowest of which is about 2 to 5 feet above the present valley train. Some trees on channel islands and banks have been killed where
deposition has raised the bed of the stream above its former banks.
GEOLOGY
The bedrock formations of the drainage basin range widely in appearance, composition, and occurrence. These formations provide the glacier, and thus the stream, with rocks having a wide range of abrasion resistance and specific gravity. The average specific gravity of 29 specimens from the ablation moraine was 2.5, ranging from 1.9 to 3.5 as determined in the field by means of a spring scale.
The lavas, agglomerates, and mudflows of the Mount Rainier volcanics of Coombs (1936) lie on a rugged erosion surface cut into the Keechelus andesite series. According to Coomb's (1936) description of the rocks and their occurrence, the Keechelus andesitic series, composed of massive tuffs, breccias, and porphyries with subordinate andesite flows, felsites, basalts, hornfels, and sediments, was intruded by the Sno- qualmie granodiorite. The reaction zone produced by this intrusion is the source of additional rock types. A more detailed examination of the geology of Mount Rainier National Park is currently (1959) being made by Waters, Hobson, and Fisk of Johns Hopkins University.
Emmons Glacier and the White River have cut through the Mount Rainier volcanics into the Keech elus andesitic series, but the distribution of these formations is obscured by the presence of the glacier and its deposits, and by the large areas of talus on the slopes above the most recent lateral moraines. The Snoqualmie granodiorite is not known to crop out upstream from the gaging station, but some of the rocks found in the valley train may be from the reaction zone between the granodiorite and the Keechelus. Apparently the varied lithology of the bedrock does not influence the present longitudinal profile of the stream, for only two small patches of bedrock, neither of which is in the present streambed, are known to crop out within the valley train. Variations in the resistance of the bedrock to erosion by the glacier are apparent in the domes and hollows of the glacier surface and the resulting crevasse pattern of the glacier (fig. 1).
An unusual event in the geologic history of the northeast side of the mountain is the volcanic mudflow (greater than 0.25 cubic mile) described by Crandell and Waldron (1956). It issued from the northeast flank of the mountain and flowed down both forks of the White River, spreading out in the Puget Sound Lowland to points beyond Enumclaw, some 45 miles downstream. Carbon-14 analyses of wood samples from the mudflow have dated it at about 4,800 years ago.

A6 PHYSIOGRAPHIC AND HYDRAULIC STUDIES OF RIVERS
The glacial geology of the White River valley has been studied by D. R. Crandell, R. D. Miller, D. R. Mullineaux, and H. H. Waldron of the U.S. Geological Survey, but their findings are not yet published. Evidence of the extent of the Emmons Glacier in Pleistocene time is the glaciated character of the White River valley for many miles downstream. Crandell and others (oral communication) have found a number of lateral moraines at various elevations within the valley and are attempting to correlate them with deposits in other valleys.
The massive plug of debris that blocks the valley about 1 mile below the glacier terminus is evidence of the extent of the glacier at intervals over the last 1,000 years. It is composed of several moraines of different ages. The dating of these moraines by tree-ring count is reported in Sigafoos and Hendricks (1961). Crandell (oral communication) and Sigafoos and Hendricks found that trees about 60 to 80 years old are growing on the innermost stabilized moraine; whereas, less than 100 feet toward the glacier, trees about 50 years old are growing on an ablation moraine on top of stagnant ice.
EMMONS GLACIER
The study area has been uncovered by the stagnation and melting of the Emmons Glacier since its position was recorded by some of the earliest observers. One of the first authors to record his observations on the "White River Glacier" as it was then called, was S. F. Emmons, who with A. D. Wilson made the second successful ascent of the mountain in 1870. Emmons in a letter to his chief (King, 1871) seems to have been overenthusiastic and exaggerated the glacier's dimen sions, stating:The main White River glacier, the greatest of the whole, pours straight down from the rim of the crater in a northeasterly direction, and pushes its extremity farther out into the valley than any of the others. Its greatest width on the steep slope of the mountain must be four or five miles, narrowing towards its extremity to about a mile and a half; its length can be scarcely less than ten miles.
The map of Mount Rainier and its glaciers by Sarvent and Evans dated 1896, (plate 68, in Russell, 1898, p. 363) shows the Emmons Glacier terminus in approximately the same position as shown by the 1913 U.S. Geological Survey map (fig. 2). The 1896 map, however, shows two streams issuing from the glacier one as shown on the 1913 map and the second flowing into the Inter Fork at the left side of the glacier terminus. F. E. Matthes (1914) stated:The youngest moraine, fresh looking as if deposited only yester day, lies but 50 feet above the glaciers' surface and a scant 100 feet distant from its edge; the older ridges subdued in outline and already tinged with verdure lie several hundred feet higher on the slope.
Matthes gave the length of the Emmons Glacier as about 5% miles and its width as 1% miles in its upper half. The area of active ice, measured from the 1913 map as approximately 5.3 square miles, had decreased to 4.4 square miles in 1958 (M. F. Meier, written com munication). Most of the 0.9 square mile decrease represents areas of ablation moraine and valley train underlain by slowly melting stagnant ice. Matthes' (1914) estimate of 8.5 square miles could not be verified by rechecking with the 1913 map.
Periodically since 1930 the U.S. National Park Service has studied the position of the glacier terminus; the data show the rate of recession of the point at which the stream emerged from under the glacier to be about 75 feet per year. The positions of the glacier (fig. 3) are sketched from Park Service data and photographs provided by V. R. Bender, park naturalist. In 1943 an ice tunnel was discovered to have caved in upstream from the ice face being measured; the caving produced a second point from which the ice faces receded both upstream and downstream. This second point was near the present junction of East and West Emmons Creeks; thus, an ice mass was left bridging the valley until at least 1953.
Rigsby (1951) spent 6 weeks in 1950 studying ice petrof abrics and glacier motion on the Emmons Glacier. He determined the rate of motion to be as much as 0.75 foot per day in the center of the glacier," about half a mile above the position of the terminus in 1958 (fig. 2).
The general advance of glaciers of the Cascade Mountains (Hubley, 1956, and Harrison, 1956a and 1956b) had also started on the Emmons Glacier by 1953. The National Park Service has measured this advance periodically since 1953 and has found that it averaged about 160 feet per year from 1953 through 1957 and continued in 1962. In 1957 Arthur Johnson, of the U.S. Geological Survey, began taking a yearly series of phototheodolite pictures from which topo graphic maps of the glacier might be made by terrestrial photogrammetry. ' Volumetric computations as well as measurements of the change in position of the glacier terminus will be possible when these maps are available.
The present location of the valley train is in the approximate position of the clear ice shown by the 1913 U.S. Geological Survey map. The debris-covered ice along the valley train appears to have changed little in elevation since the 1913 map, emphasizing the role played by the debris in insulating the ice along the sides of the glacier tongue. The approximate elevation change of the clear ice is shown in figure 4. Down- wasting is almost overshadowed by the combination of caving and melting, and by erosion and melting from below by streams of water and air that flowed through ice tunnels in this central part of the glacier. In 1959,

MORPHOLOGY AND HYDROLOGY, WHITE RIVER, MOUNT RAINIER, WASHINGTON A7
Line of profile
West Emmons Creek
CONTOUR INTERVAL 20 FEET DATUM IS ARBITRARY
EXPLANATON
Ice tunnel
Edge of valley train
Kettle
9
Streamflow gaging station
EMMONS GLACIER
FIGURE 3. Map showing approximate positions of Emmons Glacier ice front, 1930-58, from National Park Service glacier surveys, line of profile (fig. 4), and inset mapshowing kettles in 1959.

A8 PHYSIOGRAPHIC AND HYDRAULIC STUDIES OF RIVERS
1100 -i
1000 -
900 -
Q 800
700 -
600 -
500 -
^ 400 -
^ 300
200 -
100 -i
Approximate surface of Emmons Glacier, 1913, from U.S. Geological Survey map of Mt. Rainier National
, 1:62500.
-Glacier terminus, 1958
\\\\
Profile of valley train from 1958 planetable map of Fahnestock and Bond \
200
CROSS SECTIONS 1
\
\ 12\
2000 4000
DISTANCE FROM GLACIER, IN FEET
FIGURE 4. Profiles of valley train and former glacier surface. Vertical exaggeration X4.
6000
an ice tunnel about 10 feet wide was observed to double in width and height throughout its length by melting due to the flow of warm air. There was no apparent change in elevation of the debris-covered ice above the tunnel. Melting from below soon leads to collapse of tunnels, producing ice blocks that rapidly waste away. Such ice blocks are the source of many well-rounded boulders of ice deposited on bars downstream.
The presence of the numerous kettles shown in figures 3, 5, and 6 is evidence that at least some part of the valley train is deposited on ice. These kettles appeared during August 1958 when the stream with its heavy load of debris had shifted for a few days from the areas of valley train underlain by ice. Several new kettles were seen in June 1959; they developed rapidly in size, occasionally coalescing to form larger kettles. By June 25, 1959, the development of kettles demanded atten tion, and on this day they were mapped by planetable methods. (Inset map fig. 3.) The kettles were mapped again on July 31, after they had been filled with debris by the stream. All were filled in during 5 hours on July 20, 1959, with the exception of one which the stream did not reach. This kettle was filled in a few hours on July 23. Cracks in the ground and incipient
kettles formed within 24 hours after the most actively enlarging kettles had been filled. It was evident that material was disappearing from the bottom of the kettle because they became no shallower by the caving of their banks. The kettles that could be waded had cross sections similar to those shown in figures 5 and 6. Noticeable sifting out of the fine materials occurred as the kettles formed, the coarser materials being con centrated toward the bottom of the funnel-shaped depression. It is probable that this cross section was characteristic of all kettles not receiving materials from through-flowing streams.
CHARACTERISTICS OF WHITE RIVER CHANNELS
Streams may vary in discharge of water, size and amount of sediment load, width, depth, velocity, slope of water .surface, hydraulic roughness and pattern of their channels. It was possible to measure each of these variables for the White River with the exception of the amount of sediment in transport. Leopold and Maddock (1953, p. 33) suggested that discharge and sediment load are the result of the climatic and geologic environment within the basin and that the other variables adjust to these imposed conditions.

MORPHOLOGY AND HYDROLOGY, WHITE RIVER, MOUNT RAINIER, WASHINGTON A9
FIGUBE 5. Small kettle. Note the absence of finer material and concentration of the coarser material toward the center.
FIGUEE 6. Diagrammatic cross section through kettle, figure 5.
They also presented a method for the analysis of channel characteristics that permits comparisons with variation in discharge at the same channel cross section and successive cross sections downstream. Wolman (1955), Leopold and Miller (1956), Miller (1958), Brush (1961), and Wolman and Brush (1961) have applied this method to the analysis of a variety of natural streams and flume channels.
The shape of a channel is reported to be a function of the type of materials that make up its bed and banks
(Blench, 1956; Schumm, 1960; Wolman and Brush, 1961), and of the quantity of water and sediment transported by the stream, including possibly their distribution in time. Where a stream flows on its own deposits, the earlier water and sediment discharges have determined the size and disposition of the material composing the bed and banks. Streams will adjust in different ways to increases or decreases in discharge of sediment and water, in accordance with the character of bank materials. It is thought that two streams

A10 PHYSIOGRAPHIC AND HYDRAULIC STUDIES OF RIVERS
with the same mean annual discharge will develop somewhat different channel characteristics if the flow distribution for one is uniform throughout the year and for the other is the product of periodic flooding.
The bed and bank materials of the White River, to be described in detail later, are deficient in silt- and clay-size materials and are therefore noncohesive and relatively easily eroded. They provide abundant bed and suspended loads. Observations indicate that a change in the channel shape by erosion or deposition, or both, accompanies any change in discharge. As this was not true for those streams previously described by Leopold and Maddock (1953) and Wolman (1955), some of their data may not be strictly comparable with those of the White River. In spite of this, comparisons can be made that reflect and help define the differences in characteristics of channels in readily credible materials and channels in more resistant materials.
DISCHARGE
Measurements of channel characteristics were made in 112 channels that were selected as representative of a wide variety of channel sizes and shapes. It was necessary to make discharge measurements with rea sonable accuracy a criterion that eliminated channels in which bed-load movement was extremely heavy and which were rapidly changing their shape. Of these representative channels, 81 were included in the 48 measurements of total discharge (table 7) made for the primary purpose of rating the gaging station. This station was established on June 19, 1958, at the point where the stream flows through the moraine (figs. 2 and 3). Although this position did not provide the most desir able hydraulic characteristics for the stage-discharge relation because of the shifting control, it was the only position where the stream was confined to one channel and could be expected to flow past the gage at all times.
The frequent changes in the stage-discharge relation were caused by scour and fill in the vicinity of the gage as a result of the large bed load and mean velocities up to 9 feet per second. Frequent measurements of dis charge were required to compute these changes.
Without doubt the variation in the stage-discharge relation introduced inaccuracies in discharges deter mined from the recorded stage, but the frequency of discharge measurements and adjustment of the stage- discharge relation probably kept these errors within reasonable limits. The adjustments were made by John Savini according to standard Geological Survey methods for gaging streams with shifting control. He utilized numerous discharge measurements, tempera ture records, and records from the nearest gaging sta tion, White River at Greenwater, Wash., as well as records from the station recording runoff at South
Cascade Glacier, in the northern Cascade Mountains, to compute the adjustments.
Discharge measurements were made in reaches of the stream where 1 to 4 channels were found. At the time of highest discharge, measurements could not be made in multiple channels because streamflow shifted rapidly from one channel to another during the period of meas urement. The channels in which rating measurements were made, although typical of the White River in general, are not representative of some of the widest, shallowest channels, in which much of the flow was around boulders, preventing accurate measurements. These wide, shallow channels were extremely unstable and often divided into several narrower channels.
A number of measurements were made to obtain data for channels with a wide range in discharge and shape. Measurements were made also in very small channels with a discharge of 1 cfs or less, for comparison with the larger channels of the White River and with data obtained for flume channels by Wolman and Brush (1961).
Most measurements of discharge were made by an expedient method, adopted to reduce the wear and tear on equipment and personnel. Several current meters were broken, and feet and shins were bruised by the coarse material being transported by the stream. The velocity and depth were determined at 10 to 15 stations rather than the 20 or more stations customarily used to average out variations in flow across the channel. The Price type-A current meter was used at 0.6 depth for 20 to 35 seconds rather than at 0.2 and 0.8 depth for the usual 40 to 70 seconds. Whatever inaccuracies were introduced by these expedients were in part off set by the fact that the shorter period of measurement gave less opportunity for changes in stage to affect the accuracy. A pigmy current meter was used to measure the velocity in small channels. When the pigmy meter could be used at only a few stations because of extremely shallow water, an accurate cross section was measured with a steel tape, and this area was used with adjusted float velocities to compute the discharge. The mean velocity in a vertical was taken as 0.6 of the float velocity, on the basis of 20 discharge measurements where both current meter and float velocity data were available for the same channel.
The estimated error in current-meter measurements of discharge ranged from 5 percent at moderate dis charges to 15 percent at high and low discharges. The accuracy of discharges estimated from gage heights for use in the study of stream pattern depends both on the accuracy of the rating measurements and on the length of time elapsed between such rating measurements and the event for which discharge was estimated. The pos sible error is as much as 25 percent of the estimated discharge.

MORPHOLOGY AND HYDROLOGY, WHITE RIVER, MOUNT RAINIER, WASHINGTON All
The hydrograph (fig. 50) computed by Savini shows the fluctuations in discharge and differences in runoff for the summers of 1958 and 1959. The year 1958 was unusual for the Pacific Northwest because snowfall was light during the winter of 1957-58 and the summer was warm with long spells of clear weather, which produced high ice melt. By midsummer, areas of the mountain at high elevations, which had not been uncovered be fore in the memory of local inhabitants, were free of snow. Winds blowing over such areas raised a column of dust above the southwestern side of the mountain during July and August. The snow and ice on the mountain were brown from fallen dust, which served to increase melting by lowering the albedo of the snow and ice.
In 1959, snow at all elevations lasted much longer; many areas that were uncovered the previous summer remained under snow. Melt water produced during the summer was considerably less than in 1958 (hydro- graph, fig. 50). The average flow for July 1959 was about 20 percent less, for August about 35 percent less, than for the same months of 1958. The variations from the long-term mean for average temperature and total precipitation for the periods October 1957 to September 1958 and October 1958 to September 1959 at Longmire on the southwestern side of the mountain, and at Stampede Pass 20 miles to the north, might be considered representative of the difference in weather in 1958 and 1959. These two stations were the nearest for which records were available. In 1958, the temperature at Longmire averaged 2.7°F, and at Stampede Pass, 2.6°F, above the long-term mean. In 1959, the temperature averaged 0.2 °F above the mean at Longmire and 1.0 °F below the long-term mean at Stampede Pass. Precipitation records for Longmire show a deficiency of 5.41 inches over the long-term mean in 1958 and a surplus of 24.44 inches in 1959. At Stampede Pass a precipitation deficiency of 19.25 inches in 1958 and a surplus of 29.15 inches in 1959 were recorded. At both locations the 1959 total was in creased in an extraordinarily rainy September by 9.72 inches of precipitation at Longmire and 11.20 inches at Stampede Pass.
The order of magnitude of the winter flow given by discharge measurements 21a, 49, and 50 (table 7), made in November 1958 and 1959, is 20 to 40 cfs. The gagewell froze in late October and the gaging station remained inoperative for low flows until May, so that these measurements are the only flow data available for this period.
The reasons that the melting snow of April, May, and June do not produce flows at the moraine gage (figs. 2, 3) as high as those produced by the melting of July and August may be the following: (a) Unlike nonglacierized
drainage basins, which usually have lost their snow cover by late June, more than 70 percent of the White River drainage basin above the moraine has a year- round snow and ice cover. The warm weather of the summer months produces rapid melting, (b) Flow continues throughout the winter. It is thought to result from ground-water discharge as well as from subglacial melting, as the daily mean temperature often falls below freezing for periods of several days. Thus, in the spring, ground-water recharge must take place before snowmelt can produce much direct runoff, (c) The albedo of snow is much higher than that of ice (Sauberer and Dirmhirn in Hubley, 1957, p. 77, table 5), so that the same amount of radiation produces more melt water per unit area from exposed ice than from snow and the area of exposed ice enlarges through out the melt season, (d) Cloud cover is a factor that should be considered, although records are not avail able for analysis. The shielding from radiation of the heavier cloud cover of spring may well be offset by heavier precipitation. Summer precipitation was slight in both 1958 and 1959.
No records or field evidence of flooding prior to 1957 were found for the study area. As the surface of the valley train is constantly changing owing to lateral shifting of channels and deposition, all evidence might well be obscured a few years after a flood. That floods do occur in the downstream part of the basin is suggested to even a casual observer by the size of Mud Mountain Dam on White River, 47 miles down stream. It is the highest earth-cored rock-fill dam in the world, with a flood storage capacity of 106,000 acre-feet.
The highest discharges from June 1958 to October 1959 were recorded during the summers and were about 20 times the discharges measured in winter. These discharges, although capable of radically altering the appearance of the valley train, can hardly be considered floods because of the relatively small dis charges and the limited reaches in which overbank flow occurred.
In the fall and winter of 1959, there were two severe storms at Mount Rainier. On October 22 a rainfall of 5.5 inches in 24 hours was recorded at Paradise on the southwestern side of the mountain. It produced a rise of about 4 feet at the staff gage at Longmire (fig. 2) and a rise of about 1 foot at the station on the White River at the moraine. A second storm on November 22, 1959, produced a rise of about 1.2 feet in the White River; the peak flow was estimated by Savini to be about 1,000 cfs. Where the flow was concentrated in one channel at the gage, boulders estimated to be as large as 8X8X5 feet were undermined and moved; however, photographs taken by Savini 1 week after

A12 PHYSIOGRAPHIC AND HYDRAULIC STUDIES OF RIVERS
this storm show no major changes in the valley train deposits, although some scour is evident in that part of the valley train within 100 yards above the gage. The effects of flooding were much more evident on the Inter Fork, the West Fork, and other tributaries where roads and bridges were washed out.
Surveys run in June 1960 showed that there was several feet of deposition over parts of the valley train. This storm may have produced a greater proportion of overbank flow than usual, but in most of the area the flow was probably contained in definite channels. The frequency of recurrence of such a flow cannot be established with such a short period of record; but on the White River at Greenwater, Wash., 28 miles down stream (fig. 2), with 30 years of record, such a storm was estimated to have a recurrence interval of 45 years. There was a third major storm during Decem ber, but its effects were not separable from those of the other storms when the area was revisted in June 1960.
Diurnal fluctuations in discharge for the White River range from an estimated 10 cfs on a winter day to more than 700 cfs after several consecutive warm summer days. Figure 7 is a reproduction of the water- stage recorder chart for July 21-23, 1958, which shows three types of fluctuations recorded by the gage: (1) diurnal, (2) intermediate, (3) minor. The largest is the diurnal fluctuation, which reaches its peak in the late afternoon and its low point in the early morning. Its magnitude, on July 22, was about 0.65 foot. This represents a change in discharge from 140 cfs to approxi mately 600 cfs. The fluctuations of intermediate size, such as the one at 2 p.m. on July 22, with a magnitude of 0.3 foot and a duration of about 1 hour, could repre sent either bar formation and removal that temporarily
altered the stage-discharge relation, or periodic storage and release of water from the crevasse system of the glacier. Other more probable explanations for such variations are the storage and release of water by the formation and destruction of antidunes, or a change in bed roughness in the vicinity of the gage similar to that described by Dawdy (1961). The minor fluctuations of 0.1 foot and 5-minute duration, superimposed upon the other fluctuations, are thought to be related to the movement of small amounts of material or to changes in position of standing waves in the control section of the gaging station, although it is possible that some of these minor fluctuations reflect changes in discharge.
WIDTH, DEPTH, VELOCITY, AND AREAIn the process of measuring discharge, the width,
depth, velocity, and cross-sectional area of flow were determined. Widths ranged from about 0.7 foot at 0.01 cfs to a maximum of 60 feet at 330 cfs (channels 38 and 25, table 7). Mean depths of the White River ranged from 0.03 foot to 2.08 feet for discharges of 0.01 to 430 cfs (channels 38 and 88, table 7). Mean veloci ties of the White River ranged from 0.3 to 9 feet per second for discharges of 0.01 to 300 cfs (channels 38 and 83, table 7).
These values, plotted against their respective dis charges on logarithmic paper, using the method of Leopold and Maddock (1953), showed a straight-line relation for the channels of the White River (fig. 8). For such a straight line, the relation between the variables can be expressed in terms of the following equations:
w=aQ" d=cQf
Numbers indicate magnitude of fluctuations discussed in text
JULY 21, 1958 JULY 22, 1958 JULY 23, 1958
FIGURE 7. Gage height record of the White River at moraine gage for July 21-23,1958.

MORPHOLOGY AND HYDROLOGY, WHITE RIVER, MOUNT RAINIER, WASHINGTON A13100
0.01 0.05 0.1 0.5 1 5 10
DISCHARGE, IN CUBIC FEET PER SECOND
100 500 1000
FIGURE 8. Relation of mean velocity, mean depth, and width to discharge of the White River channels.
The exponents &,/, and m, which represent the slopes of the respective lines, and the coefficients a, c, and k, which represent the intercepts at a discharge point equal to 1 cfs, are parameters characteristic of a given situation and remain constant for that situation.
Values of the parameters determined for the White River, and those for other rivers for which values could be determined from the literature, are summa rized in table 1. Changes in width, depth, and veloc-
681-370 O 63 3
ity in relation to discharge were compared using the values for changes "at-a-station," because the scatter caused by measuring in a number of different chan nels is thought to be analogous to that shown by Wolman (1955) to be caused by measuring at different points in the vicinity of a gaging station. The wide range of values in table 1, and in some cases lack of informa tion about the parameters, is due to the great diver sity of streams considered. Only one paper (Wolman,

A14 PHYSIOGRAPHIC AND HYDRAULIC STUDIES OF RIVERS
TABLE 1. Channel parameters of the White River and other streams
Stream
White River 2... __ . ...Southwest and Great
Plains: » Median... _____Range ................
Brandy-wine Creek: 4
Ephemeral streams: «
Range _________Flume channels: '
Z>so 0.0022 foot.. ......DM 0.0066 foot.. ......
At a statjon
Intercepts
a
4.0
26
54 (37-80)
10 (3-26)
4.2 2.0
c
0.22
.15
.23 (. 12-. 52)
.1(.03-. 2)
.18
.27
k
1.1
.37
.10 (.022-. 16)
1 (. 7-1. 5)
1.3 1.8
Exponents
b
0.38
.26 (. 03-. 59)
.04 (.0-.08)
«.26
.50
.33
/
0.33
.40 (.06-. 63)
.41(.32-46)
1.33
.39
.52
m
0.27
.34(.07-55)
.55(. 48-. 69)
.32
.16
.16
Values at 100 cfs
width
24
67 (45-90)
45 (20-80)
depth
1.0
1.5(1.1-2.0)
.5 (.25-. 9)
velocity
4.2
1.3(.7-2.0)
3.3 (2.5-5.0)
Downstream l
Intercepts
a
4.0
4.0(1.1-7)
5.7
5.2
4.2 2.0
c
0.22
.5 (-1-.9)
.19
.11
.18
.27
k
1.1
.9 (.6-1.2)
1.04
1.5
1.3 1.8
Exponents
b
0.38
.5
.57
.50
.50
.33
/
0.33
.4
.4
.28
.39
.52
m
0.27
.1
.03
.22
.16
.16
Data based on
112 channels.
20 stations.
7 stations.
9 stations.
29 channels. 13 channels.
1 Values based on mean annual discharge except for White River and flume channels.2 White River: sandy gravel bed and banks, no vegetation, adjust at all stages,
Q=0.01-400 cfs.» Leopold and Maddock (1953): streams of Southwestern States and Great Plains,
bed and bank material not noted.« Wolman (1955): Brandywine Creek, cohesive banks, gravel and sand bed, little
scour or fill. Q=5-2,000 cfs.
1955) limits the discussion of the variables and param eters to a single stream and its tributaries. The study of flume channels by Wolman and Brush (1961) sup plies data considered comparable to data from the White River. It must be noted that some of the variation of White River channels is due to the slopes, which are higher than those for any of the other streams reported.
Values of the exponents for White River channels were found to be similar to the average of those found for streams of the Southwestern States (table 1) by Leopold and Maddock (1953). The value for b, the width exponent, was 0.38 for the White River whereas the average for Southwestern streams was 0.26. The value of 0.38 lies well within the range of values ob served for Southwestern streams. In contrast, the Brandywine Creek stations (table 1) have the extremely low values for b of 0.04 to 0.08, which are thought to reflect the cohesive nature of bank materials.
The value of/, the depth exponent, was 0.33 for the White River, which is close to the 0.40 average for Southwestern streams and the 0.41 for Brandywine Creek, although the manner in which depths change is dissimilar. Width and depth of streams flowing in noncohesive materials may increase or decrease by scour and deposition, or by changes in effective bound ary roughness as well as by changes in discharge. Streams in cohesive bank materials change primarily by flowing at different depths in a channel determined by previous discharges.
The value of m, velocity exponent, for the White River was 0.27, which was not materially different from the 0.34 average of the Southwestern streams data but differed considerably from the value of 0.55 for Brandywine Creek.
According to Leopold and Maddock (1953, page 9),
'Leopold and Miller (1956): ephemeral streams, sandy bed, silty clay banks, adjust at low flows. Q=0.15-800 cfs.
« Unadjusted median values (Leopold and Miller, 1956 p. 15).' Wolman and Brush (1961): flume channels, uniform sand in bed and banks,
adjust readily to equilibrium.
Width and depth for a given discharge vary widely from one cross section to another, and therefore, the intercept values of a, c, and k, [the values at a discharge of 1 cfs] will vary. Further work is necessary to determine the factors which govern these variations and to determine the extreme limits.
A comparison of these intercepts, computed from the studies listed in table 1, may allow insight into their significance. The value of the parameter a for White River channels is 4.0. That is, a width of about 4 feet was measured for channels with a discharge of 1 cfs. A similar value can be determined by projection of the line of the graph (fig. 8) for White River channels of much higher discharges. Other intercepts for White River channels are mean depth c, 0.22 foot, and mean velocity k, 1.1 feet per second.
The corresponding values for discharges of 1 cfs for Southwestern streams are: width, 26 feet; depth, 0.15 foot; and velocity, 0.26 foot per second. Intercepts for Brandywine Creek, averaged from values projected from discharges of 30 cfs or less, are width 54 feet, depth 0.23 foot, and velocity 0.1 foot per second.
It is apparent that a width of 26 feet, and especially one of 54 feet, is unrealistic for a discharge of 1 cfs. The extremely low values of velocity, 0.1 to 0.26 foot per second, are those of a stream incapable of moving any of its bed or bank materials. The Brandywine Creek data would seem to indicate that the extreme values of width and velocity cannot be explained en tirely by error introduced through extrapolation, since the extrapolation is not large, but reflect instead the failure of the channel to adjust to small discharges.
It is interesting to note that the intercept values for ephemeral streams (Leopold and Miller, 1958) 9 feet wide, 0.1 foot deep, with a velocity of 1 foot per second, show neither extreme widths nor extremely small velocities, but present a picture of a stream

(MORPHOLOGY AND HYDROLOGY, WHITE RIVER, MOUNT RAINIER, WASHINGTON A15
able to transport material and determine its channel shape at discharges near 1 cfs.
If stream channels adjust readily to changes in dis charge as do White River channels, then there is no reason to expect a difference between at-a-station and downstream relations. Wolman and Brush (1961, table 5) found that there was no difference for channels in noncohesive materials where the materials were at or above the point of incipient motion. A comparison based on this conclusion is made in table 1 between White River data, flume data, and data from other stream systems.
The values (table 1) of the intercepts a, c, and k for White River (at-a-station) were 4.0, 0.22, and 1.1; the exponents, b, /, and ra, were 0.38, 0.33 and 0.27. These values are similar to the ranges in downstream values of a, 1.1-7; c, 0.1-0.9; and k, 0.6-1.8 and the ranges of *6, 0.33-0.57; /, 0.28-0.52; and m, 0.03-0.22 for the other streams discussed. This much greater similarity for all types of channels represents adjust ment in all cases. In White River, ephemeral, and flume channels it represents adjustment to changing discharge in short reaches of the stream, and in the other streams it represents adjustment to the mean annual or larger discharges, which increase downstream.
A more realistic picture, at least in the case of streams in cohesive materials, is given by the evaluation of width, depth, and velocity at a discharge of frequent occurrence. Table 1 contains a summary of the values obtained for the intercepts and the average or median values of width, depth, and velocity at a discharge of 100 cfs. Brandywine Creek, with a discharge of 100 cfs, has average values of 67 feet for width, 1.5 feet for depth, and 1.3 feet per second for velocity. The White River has an average width of 24 feet, a depth of 1.0 foot, and a velocity of 4.2 feet per second at a discharge of 100 cfs. White River channels, in coarse noncohesive materials, have been shown to be narrower and slightly shallower and to have much higher velocities than the channels of Brandywine Creek, with cohesive bank materials. The higher velocities in White River channels, which are due to the high slope, permit smaller cross-sectional areas to carry the same flows.
SHAPE
Individual elements of the cross-sectional shape of White River channels have been described in the pre ceding section in relation to the flow that produced that shape. The shape of the channel cross section8 now will be illustrated and the elements of shape compared by considering the width-depth ratio and a shape factor.
Width-depth ratio. Width-depth ratio that is, the ratio of top width to mean depth may be a more useful and valid criterion for comparison of individual channels, as well as comparison of the relation of channel shape to bed and bank material, than the consideration of regression and intercepts alone. In no instance have several channels been lumped for computational pur poses, as is sometimes the practice, for it is felt that only if channels are treated individually can width- depth ratios be used to characterize channel shape. White River channels have a mean width-depth ratio of 23.1 (table 7). The range of width-depth ratios of the 112 channels is from 10 to 71, with a standard deviation of 9.9.
It has been suggested previously that White River channels were readily able to adjust their width, depth, and velocity at all the discharges measured. Figure 9 shows that the mean width-depth ratio for White River channels changed less with discharge than did the width- depth ratio of any of the other streams with which it has been compared. The values of width and depth for the White River were obtained from figure 8; those for the other streams were extrapolated, interpolated, or read directly from data provided in the respective studies. White River channels differ from those of other rivers not only in the constancy of width-depth ratios but also in their relatively small value. The high width-depth ratio for the other types of streams at dis charges of 10 cfs or less is to be expected because these flows are unusually low for these streams and the flows occupy a channel developed at much higher discharges.
Shape factor. In addition to the use of width-depth ratio for comparison of channels, one might use as a shape factor the ratio of maximum depth to mean depth. Considerations of geometry show that a tri angular channel would have a shape factor of 2; a parabolic channel, 1.5; and a rectangular channel, 1.0. The mean shape factor for White River channels is 1.62, and the standard deviation is 0.26. That is, although most cross sections are nearly parabolic, some tend to be triangular. This relation seems to hold for channels of all sizes. As maximum depths have not been reported in the other publications listed in table 1, a comparison with other types of streams cannot be made. Only with further use can the value of this shape factor as an indicator of channel shape be esti mated. It must be recognized, however, that a shape factor of 1.5 is a necessary, but not sufficient, condition to prove that a channel is parabolic in cross section. Although it is possible that a variety of weird cross sec tions could have a shape factor of 1.5, it is probable that a channel in alluvial materials that has such a shape factor is nearly parabolic.

Al 6 PHYSIOGRAPHIC AND HYDRAULIC STUDIES OF RIVERS
240Channel Width-depth ratios at d ischarges (cfs) of
10 100
DISCHARGE, IN CUBIC FEET FFR SECOND
1000
FIGURE 9. Relation of average width-depth ratios to discharge. Channel type numbers refer to table 1 footnotes, where channels are described.
Figure 10 illustrates the manner in which shape factor and width-depth ratio represent the shape of some White River channels. Neither width-depth ratio nor shape factor indicates the irregularity of the cross section.
MODE OF CHANGE
The rapid adjustment to increasing flow and therefore increasing bed load in non-cohesive materials appears to take place by increasing width and depth in the follow ing manner. The initial channel widens and may even grow shallower, until at some point the critical tractive force is less than that necessary for transport of the bed load. The material deposited causes further widen ing and a decrease in the tractive force. Deposition or cutting of adjacent channels eventually brings the bar above water, resulting in the development of two channels similar in shape to the original channel but adjusted to the higher flow condition. Additional flow repeats the sequence of events in either or both of the new channels.
Adjustment of the White River channel shape at low discharges takes place by both erosion and deposition
With decreasing discharge, the adjustment might take place as follows:1. The bed load decreases sharply.2. The velocities, especially near the bank, are lower
due to presence of shallower water at the sides of the channels and occasional boulders in the channel near the bank. These boulders remain after being undermined and dislodged from the bank when the surrounding finer materials were removed by velocities incapable of moving the boulders. As a result of these lower velocities, deposition of the coarser fraction of the suspended load takes place at the sides of the channel.
3. At the same time, velocities remain high enough to permit scour in the center part of the channel as the depth decreases with the decreasing discharge. The result is that similar channel shapes are pos sible for widely different discharges, whether increasing or decreasing.
Wolman and Brush (1961) noted that in flume channels, at a constant slope and with a constant intro duction of load at the same rate that material was being

MORPHOLOGY AND HYDROLOGY, WHITE RIVER, MOUNT RAINIER, WASHINGTON
.Horizontal reference line
A17
^Channel 81; n/:c/=22; shape factor^ 1.3; F=0.94
Horizontal reference line
Channel 82; n/:c/=20; shape factor^ 1.9; = 1.27
Channel 26 w.d-5Q; shape factor^ 2.2; F=0.85
Channel 55; w.d=l8; shape factor= 1.5; F=0.61
Channel 41; w.d=\&, shape factor= 1.5; F=0.81
Channel 45; w.d 2\\ shape factor=1.2;
5
F=0.79
10 FEET
FIGURE 10. Cross sections of several White River channels showing width-depth ratio, shape factor, and Froude number. Water surface assumed level except in upper cross sections of channels 81 and 82; maximum difference in water surface elevation: channel 81, 0.6 foot; channel 82, 0.6 foot.

A18 PHYSIOGRAPHIC AND HYDRAULIC STUDIES OF RIVERS
-Horizontal reference line
A.
Horizontal reference line
High- water marks7%. High-water marks
B.
I I I J__I10 FEET
I
FIGURE 11. Cross sections of White River channels showing adjustment to load and discharge. A, Main channel of White River at cross section 7, July 7,1958; dashed lines show cross section l hour later. P, Cross section of a channel to the right of the main channel between cross sections 6 and 7, July 16,1959; dashed line indicates the same cross section on July 25,1959.
transported out of the reach, the adjustment to a dis charge larger than the initial channel could accommodate was primarily by widening, with little or no change in depth. Figure 11 shows several cross sections where a similar process appears to have operated in White River channels. In the channel at cross section 7, where a large bed load was noted, the rate of widening at one point was so great that the rodman asked the instru ment man to hurry his shots, as the bank for a period was receding faster than the rodman was approaching.
WATER-SURFACE SLOPE, HYDRAULIC ROUGHNESS, AND FLOW CHARACTERISTICS
The water-surface slopes, in White River channels with discharges greater than 10 cfs, range from about 0.01 to 0.08 foot per foot. The greater variation in the slopes of smaller channels was due, at least in part, to the difficulty of measuring small differences in elevation over the short reaches in which these small channels were relatively uniform in character.
Figure 10, showing some of the channel cross sections, illustrates one of the difficulties encountered in making accurate measurements of slope. The water surface, because of the type of flow in most White River chan nels, is neither flat nor horizontal normal to the direc tion of flow, making it difficult to estimate the average water-surface elevation at any point along the channel. Two estimates of elevation were included in every measurement of water-surface slope.
The uneven water surfaces shown in figure 12 and channels 81 and 82, figure 10, are characteristic of chan nels in which the Froude number, FIGUBK 12 Standing waves in a White River channel.
is approximately 1 or larger. At a Froude number of 1.0, the transition to shooting flow takes place (Robert- son and Rouse, 1941; Chow, 1959, page 13). Many of the White River channels have Froude numbers which approach 1.0 (table 7). It must be noted that the other channels are shown in figure 10 with an even water surface only because the cross sections were drawn assuming a horizontal water surface.
The Froude number for the main anabranches of braided reaches ranged from about 0.8 to 1.5, most being greater than 0.9. Froude numbers for single channels containing the entire flow of the river, and with few exceptions for smaller anabranches with dis charges larger than 10 cfs, ranged from 0.5 to 0.9. The

MORPHOLOGY AND HYDROLOGY, WHITE RIVER, MOUNT RAINIER, WASHINGTON A19
high Froude numbers associated with the main channels of braided reaches are thought to reflect their relative instability.
Other flow phenomena, such as antidunes and ex tremely rough water, are discussed in the section on transport and may be seen in figures 27 and 28.
TRANSPORTATION, EROSION, AND DEPOSITION ON THE VALLEY TRAIN
CHARACTER OF THE SOURCE MATERIALS
The original source of the materials now being trans ported and deposited by the White River was the highly diverse bedrock of the area, described briefly in the section on geology. From 1957 to 1959, however, the stream did not flow on bedrock at any point from its source at the glacier terminus to a point several miles below the gage. The materials transported by the river consisted of supraglacial, englacial, and subglacial debris. Although the stream had some load before it issued from the glacier, most of its load was derived by erosion of morainic debris, mudflow deposits, and earlier valley-train deposits in the reach immediately below the glacier. These deposits range widely in form, credibil ity, and size distribution. Their areal distribution can be seen in figures 1 and 13.
MORAINIC DEBRIS
Dense till and loose debris, the result of the two modes of deposition, compose the morainic debris. The dense till, which stands in vertical walls up to 15 feet high, has been compacted by the weight of overriding ice. The author saw no ice beneath this till, which may be the lodgment till described by Flint (1957, p. 120). In most places the dense till is overlain by loose debris deposited from melting ice. Where still under lain by melting ice this loose debris shifts continually and rolls easily underfoot (fig. 14). The ablation debris mantles both the active snout and the stagnant ice of the glacier and forms the medial and lateral moraines. Both the dense till and the loose debris are composed of materials from clay size to occasional boulders as large as 10 feet in intermediate diameter, but material of the dense till appears to be more rounded than the angular ablation debris. The supra- glacial ablation deposits are characterized by irregular topography. Locally they appear to have been sorted. Occasionally material of one size predominates, as in some pockets of coarse boulders that contain no fine materials; apparently continual shifting due to the melting of underlying ice has "sifted out" the fines. Walking in such areas is treacherous, owing to the delicate balance of some of the large boulders and the large spaces between them. Within this loose morainic
EXPLANATION
Ice tunnel
Edge of valley train
Debris-covered stagnant ice or ablation moraine
Valley train, mudflows, and till are in places underlain by ice
6OO
EMMONS GLACIER
Base mapped in July, 1958
0
CONTOUR INTERVAL 20 FEET DATUM IS ARBITRARY
FIGUKE 13. Distribution of deposits on and near the White River valley train.
debris there are occasional small patches of bedded deposits. Ablation debris stands at what must be its normal angle of repose in banks cut by the stream. In

A20 PHYSIOGRAPHIC AND HYDRAULIC STUDIES OF RIVERS
**-r^;^~r * v » ;_4< T ;3. «PJ«!«,»-, *r
J4V- \,, **- . JMc
FIGURE 14. Tills. Ablation moraine underlain by till compacted by overriding ice.
contrast to the dense till, the ablation debris offers very little resistance to stream erosion.
MUDFLOW DEPOSITS
The extent and character of mudflow deposits in the area are indicative of rainfall of high intensity or long
duration, during which the steep faces of stagnant ice were washed clean and large amounts of morainic debris fell, slumped, or flowed from the ice. This movement was evidently concentrated in amphi- theatrelike basins, from which the debris-laden mud flowed onto moraine and valley-train deposits, forming fans that were often truncated by stream erosion. Minor mudflows also occurred during periods of intense melting.
Mudflow deposits (figs. 15-19) are dense and unsorted and usually occur in fans composed of a series of flows. The top part of each flow is sorted material usually of sand size. Levees and boulder fronts (figs. 18, 19, and 38) are surficial features similar to those described by Sharp (1942), and Sharp and Nobles, (1953). The levees are depositional features thought to have formed when coarse debris at the sides of the flow lost mobility while material in the center of the flow continued. The height of the levees is usually emphasized by subsequent erosion by small streams. The boulder fronts are similar to the levees; they were apparently formed when coarse materials lost mobility and formed a dam
^^jfagpii^.-y^^satsg^9i^!-:^ia^. ^' j* s* *** _if^j& i' r i* ' - =*
.* :- * ' / £ -r " -"' * - -
i'. M
v^-ir-
FIGURE 15. Cutbank in mudflow sequence. Note stream deposits at the top of each mudflow layer. The noncohesive materials in the stream deposits have fallen frombetween the more cohesive clayey layers.

MORPHOLOGY AND HYDROLOGY, WHITE RIVER, MOUNT RAINIER, WASHINGTON A21
in the path of flow, stopping the flow or diverting part of it.
FIGURE 16. Detail of cutbank in mudflow sequence.
Most sizes of debris apparently were present in these mudflow deposits. Boulders 2 to 3 feet in maximum diameter were moved by mudflows about 2 feet deep. In the course of the fieldwork, a bank of mudflow material 3 feet high, undercut as much as 3 feet by the stream, was observed to support the weight of a person jumping on it, probably because of the presence of a large percent of clay-size material (fig. 17), whereas the moraine and valley-train deposits were observed not to withstand more than 6 inches to a foot of undercutting without collapsing under their own weight.
In places the wind had moved the finer fraction of stabilized mudflow and morainic deposits and produced deflation pavements and small drifts or dunes. Where there was shifting of the supraglacial materials as a result of melting, a new supply of fine debris was continually brought to the surface. Gusty winds
FIGURE 18. Mudflow truncated in foreground by stream. Note ice faces in wall of amphitheater in background, coarse material in levees, boulder fronts on surface of mudflow to the right rear of man.
FIGURE 17. Mudflow deposit. This material stands although undercut as muchas 3 feet. FIGURE 19. Boulder front on surface of mudflow shown in figures 15 and 16.

A22 PHYSIOGRAPHIC AND HYDRAULIC STUDIES OF RIVERS
reworked these materials and produced "dust devils" and occasional dust clouds.
numerous
VALLEY-TRAIN DEPOSITS
Valley-train materials provide a source of load to the stream throughout its length. Much of the material deposited downstream from the junction of East and West Emmons Creeks had previously been eroded from valley-train deposits upstream. Because such deposits are also a source of material, they are discussed here in relation to the other source materials, although the size of the materials in the valley train is discussed in detail in the section on pebble counts.
The valley-train materials are as large as 3 feet in diameter and are angular to subrounded. The fine gravel and smaller sizes show little rounding. Bed ding can^usually not be traced for more than a few feet (figs. 20, 21). Sand carried by the stream fills most interstices between the coarser particles as soon as the coarse particles come to rest. In places coarge particles appear to be widely scattered at the surface because the most recent streams on the surface were small ones which deposited fine materials, burying the coarser deposits of earlier streams (fig. 22). Even with such burial, coarse materials invariably occur close to the surface if not on the surface at any point.
Hjulstrom (1935, p. 326-327) suggested that empirical data show that a 10-cm-diameter particle can be trans ported by a stream without erosion over a bed of silt and clay or over a bed of material 3 to 4 cm in diameter and larger, but not over material ranging from 0.0001 to 4 cm. A 5-cm particle could be transported over silt and clay, and materials 2 cm and larger, but not over material from 0.0001 to 2 cm. He concluded that
FIGURE 20. Cutbank in valley train. Note concentration of fine debris at surface. Vertical bank is due to stream erosion of materials with apparent cohesion.
FIGURE 21. Cutbank in valley train. Note poised boulders, a possible lag concen tration at surface. Mixing of sizes is apparent in the top of the sandy layer half way up the bank. Bedding is limited in its horizontal extent.
it would be unusual to find such coarser materials on top of the finer ones noted and suggested:
Should this be the case, two alternatives appear:1. The coarser material was not brought there by running water.
In this case there may be a clearly denned contact surface.2. The coarser material was brought there by a stream which
eroded away the finer material, but had no time to erode it away entirely before the velocity of the water diminished and deposition occurred. There is a border zone where the two kinds of material are mixed.
Evidence of the correctness of Hjulstrom's conclu sions is offered by figures 15-22. Figures 15-19 show mudflow deposits from the stagnant ice adjacent to the valley train. Figure 15 shows large boulders deposited immediately above undisturbed thinly bedded sands, which could not have been done by running water. Figure 20, a typical valley-train deposit, shows concen tration of fine materials only at the top, although fines are mixed throughout the rest of the deposit. Figure 21 shows the mixed border zones mentioned in alternative 2 above.
The nearly vertical cutbanks of valley-train deposits, to 10 feet in height, demonstrate an apparent cohesion yet may give way when a person steps-close to the edge. After drying, the banks lose this ability to stand vertically and assume an angle of repose. Drying rarely occurs, however; the gravel is usually damp within a few inches of the surface. After a few humid cloudy days without precipitation, the surface of the valley train becomes darkened by moisture thought to be the result of decreased evaporation at the surface.

MORPHOLOGY AND HYDROLOGY, WHITE RIVER, MOUNT RAINIER, WASHINGTON A23
FIGURE 22. Small stream depositing fines which bury coarser deposits. Note antidunes.
At times, drops of water are actually seen on the surface of the material. It is thought that this moisture is either brought to the surface by capillary action or results from condensation. Deposits of a white sub stance which tastes somewhat like sodium bicarbonate form on rocks lying on the wettest areas of the valley train, suggesting that capillary action is present.
Cohesion due to the moisture in the deposits appears to be weakened by the addition of more water. Bank erosion is thus due, at least in part, to the saturation of a "cohesive" bank by the wash of a wave; material is left overhanging until it caves. The rate of bank erosion appears to depend on the saturation of vertical banks as well as the vigor of attack by the current.
ANALYSES OF PARTICLE SIZE
Size analyses of the three types of materials help to explain the differences in appearance, erodibility, and stability. The results, while based on a few samples, suggest that analysis of the finer sizes could be quite helpful in determining the mode of deposition of materials of questionable origin.
SIEVE ANALYSES
With the exception of the valley-train materials, two sieve analyses of the finer fraction (less than 53 mm or 2.1 inches) of each of the three types of source material showed no consistent differences. The valley-train deposits were deficient in the smaller sizes. Analyses by Richard Arnold (written communication) of the fraction less than 2 mm in size of one sample of the valley train and one of the mudflow, using a combined sieve analysis and bottom-withdrawal tube method, led him to conclude that the stream deposit showed a washing out of silt and clay size materials. He found that 40 percent of the mudflow material was silt and clay (less than 0.105 mm) as opposed to 10 percent of the valley-train material.
These results help to explain why dry moraine and mudflow materials when disturbed are much dustier than the valley-train materials. In addition, small clear streams emerge at various points on the valley train some from kettles developed in the valley train and others from springs in abandoned channels

A24 PHYSIOGRAPHIC AND HYDRAULIC STUDIES OF RIVERS
whereas small streams from ice faces and mudflow areas are usually very muddy.
PEBBLE COUNTS
Size changes with distance from the glacier were observed in the valley-train materials. To measure these changes by sieve analysis was impractical because of the large samples that would have been required because of the coarseness of the materials. Pebble counting was adopted as the most rapid and accurate method of measurement. By means of pebble counts size classifications were made of randomly selected particles from the surface of the deposits, in order to develop size-distribution curves. For a detailed discus sion of the technique used, see Wolman (1954).
Pebble counting demonstrated a systematic decrease in median diameter of the valley-train materials with distance from the source. Sampling at each cross sec
tion was limited to the area that appeared to have the coarsest materials at the surface, because very small streams, present almost everywhere on the valley train at some time during the summer, tended to bury the coarser deposits thought to be more characteristic of the load of the main channel (fig. 22). The sample sites were selected near the center of the valley train in order to minimize the effects of local bank erosion of coarser materials. Sizes less than 4 mm in diame ter were not differentiated, and this size class is shown in table 2 only to indicate the percentage of area cov ered by finer material. Comparisons are, thus, based on the fraction greater than 4 mm in diameter.
The range in median diameter of samples was from 180 mm to 120 mm (0.59 to 0.39 foot) in table 2. A median diameter of 180 mm was found for material sampled near cross section 2 on a valley slope of 0.11 foot per foot, 2,350 feet below the glacier, whereas a
TABLE 2. Size distribution of valley-train materials
[Percentages and "Dso, ~Dts, and Dvs are based on samples more than 4 mm in size]
Miles from
source
Valley slope (ft/ft)
Percent in size range (mm)
From..TO .
4 8
8 16
16 32
32 64
64 128
128 256
256 512
512 1024
1024+ <4
Dso (mm)
D25 (mm)
D75(mm) Location
White River between Emmons Glacier and moraine
0.36.43.64.83.95
1.121.23
0.20.20.11.075.05.04.03.03
0or112110
020
341
0
6
414
161Q
71210
IQ
16
162091
152514QC
25QO
Qf\
29Q»7
47Qo
29222400
oc
1^115
64520000
02000000
488
1110
43
180177180175165145125120
71951067771944073
300270270270255200188160
Cross section 2.
White River below moraine
1.72.24.5
14.824.828.4
0.066.055.018.018.027.0085
010000
0
101
15
02
45g
155
10
129707
55KO
29
47oo
4355
19
00
20000
000000
3104
213
25
2101 t\f\
130105115143
150Q4
84738394
320230215130155185
Just below moraine.
Near lumber company gate.Below West Fork River junction.
West Fork White River below Winthrop Glacier
7.514.0
0.024.020
10
00
51
2000
Q-|
544121
21
00
00
42
110on
6264
165125
Below end of road.
Carbon River below Carbon Glacier
0.93.59.0
0.058.034.015
100
061
15
17
111ft
42
343927
4100
5
410
000
104
23016094
1459162
350250145
} £ mile above end of road.Ipsut Creek campground.
Nisqually River below Nisqually Glacier
0.5
2.84.3
0.128.094.057.040
2
72
44 4
5
114
19 20
9*;QQ
21OO
IQ410
17111727
Oln
one
1 M
240
14017061
130
630520360380
Above Glacier Bridge.Above Power Plant Bridge.Longmire campground.

MORPHOLOGY AND HYDROLOGY, WHITE RIVER, MOUNT RAINIER, WASHINGTON A25
median diameter of 120 mm was recorded for materi als at cross section 12 on a slope of 0.03 foot per foot, 6,600 feet from the glacier. The change of 60 mm in median diameter for the valley-train materials over a distance of some 4,200 feet can hardly be explained by diminution of the materials by wear. Stream mate rials batter each other, but a one-third reduction in median diameter by this means would seem quite unlikely, and this change would strongly suggest that selective transport must have produced radical changes in size.
In general, the median diameter of the valley-train materials decreases with distance below the glacier (fig. 23). Increases in median diameters such as those at pebble count sites 1.7, 25, and 28 miles downstream from the glacier call for a logical explanation. The major increase at the 1.7-mile site can be readily accounted for by the presence of a new source of extremely coarse material in the massive valley-loop moraine through which the stream flows 1.2 miles below the glacier. An explanation for the size increase at the 25-mile locality developed when D. R. Crandell (oral communication) reported a previously unknown moraine about 17 miles downstream from the Emmons Glacier. This suggests that size analysis of valley-train materials may offer clues to the presence of moraines. Time did not permit investigation of the cause of the
even greater increase in size between the 25- and 28-mile sampling sites on the White River or the cause of the increase in median diameter at the 4.3-mile locality on the Nisqually River.
The relation between median diameter of material and valley slope shown in figure 24 demonstrates that slope decreases very rapidly with decreasing median diameter.
Both the Carbon and the Nisqually Rivers have histories of frequent and destructive floods. On the Nisqually River the average intermediate diameter of the 10 largest boulders deposited on and near the Glacier Bridge parking lot by the 1955 flood was 9 feet; one maximum diameter was 24 feet. Such extremely coarse deposits were avoided in sampling, but it is apparent from the scatter of points for the Nisqually River that in selecting pebble-count sites some of these deposits were included. A much more extensive and systematic sampling would be necessary to characterize these streams.
The relation between transportation, declivity, and discharge discussed at length by Gilbert (1877) has been summarized by Lane (1955b, p. 6) in the form of the proportionality.
where Qs and Qw are quantity of sediment and water,
Carbon RiverI
New source of material
0.1 0.2 0.3 0.8 1 23 5
DISTANCE FROM GLACIER, IN MILES
FIGURE 23. Relation of size of material to distance below glacier.
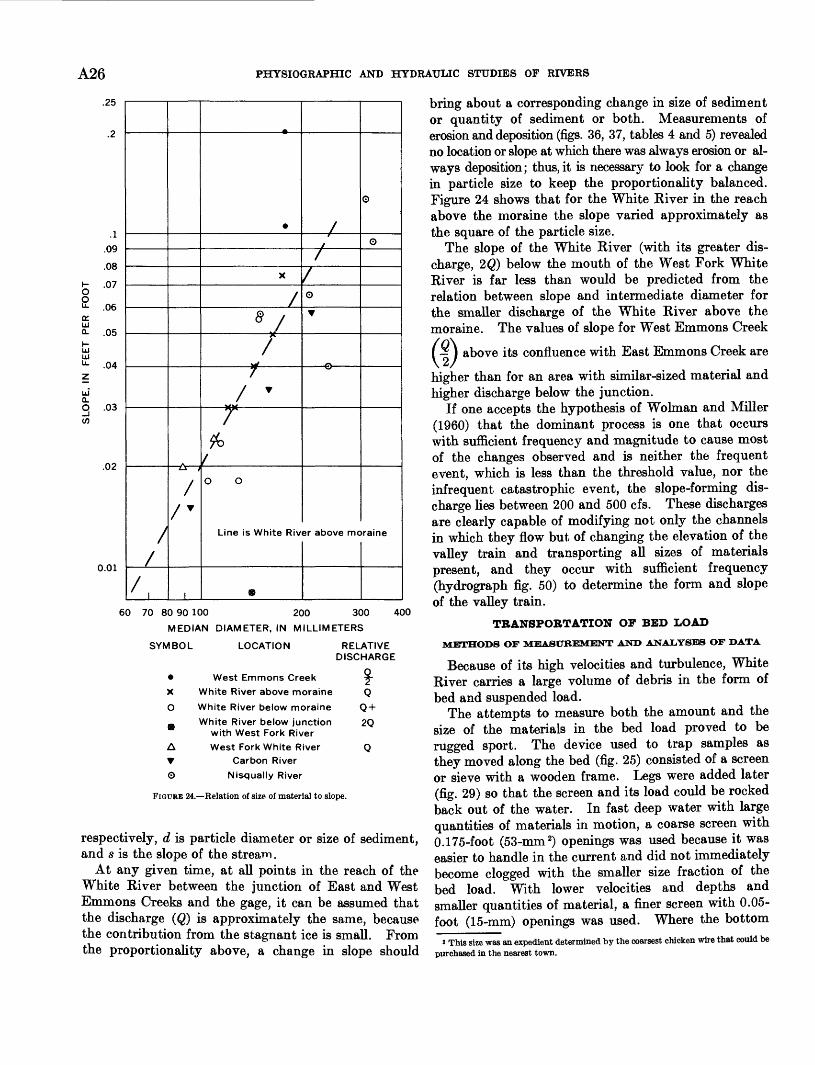
A26 PHYSIOGRAPHIC AND HYDRAULIC STUDIES OF RIVERS
.^o
.2
.1
.09
HR
8 'u;li f\c
{£.UQ- .05
u uli f\A
zUJ Q.g .03 </)
.02
0.01
//
/'
1
X
/8 /
/in
/^j
// TT
0 0
Line is White Riv
0
.
/
/*
O
T
0
er above me
©
O
>raine
60 70 80 90 100 200 300
MEDIAN DIAMETER, IN MILLIMETERS
400
SYMBOL LOCATION RELATIVE DISCHARGE
X
O
O
A
West Emmons Creek
White River above moraine Q
White River below moraine Q +
White River below junction 2Q with West Fork River
West Fork White River Q T Carbon River
0 Nisqually River
FIGURE 24. Relation of size of material to slope.
respectively, d is particle diameter or size of sediment, and s is the slope of the stream.
At any given time, at all points in the reach of the White River between the junction of East and West Emmons Creeks and the gage, it can be assumed that the discharge (Q) is approximately the same, because the contribution from the stagnant ice is small. From the proportionality above, a change in slope should
bring about a corresponding change in size of sediment or quantity of sediment or both. Measurements of erosion and deposition (figs. 36, 37, tables 4 and 5) revealed no location or slope at which there was always erosion or al ways deposition; thus, it is necessary to look for a change in particle size to keep the proportionality balanced. Figure 24 shows that for the White River in the reach above the moraine the slope varied approximately as the square of the particle size.
The slope of the White River (with its greater dis charge, 2<2) below the mouth of the West Fork White River is far less than would be predicted from the relation between slope and intermediate diameter for the smaller discharge of the White River above the moraine. The values of slope for West Emmons Creek
(- I above its confluence with East Emmons Creek are 2/
higher than for an area with similar-sized material andhigher discharge below the junction.
If one accepts the hypothesis of Wolman and Miller (1960) that the dominant process is one that occurs with sufficient frequency and magnitude to cause most of the changes observed and is neither the frequent event, which is less than the threshold value, nor the infrequent catastrophic event, the slope-forming dis charge lies between 200 and 500 cfs. These discharges are clearly capable of modifying not only the channels in which they flow but of changing the elevation of the valley train and transporting all sizes of materials present, and they occur with sufficient frequency (hydrograph fig. 50) to determine the form and slope of the valley train.
TEANSPOETATION OP BED LOAD
METHODS OF MEASUREMENT AND ANALYSES OF DATA
Because of its high velocities and turbulence, White River carries a large volume of debris in the form of bed and suspended load.
The attempts to measure both the amount and the size of the materials in the bed load proved to be rugged sport. The device used to trap samples as they moved along the bed (fig. 25) consisted of a screen or sieve with a wooden frame. Legs were added later (fig. 29) so that the screen and its load could be rocked back out of the water. In fast deep water with large quantities of materials in motion, a coarse screen with 0.175-foot (53-mm 2) openings was used because it was easier to handle in the current and did not immediately become clogged with the smaller size fraction of the bed load. With lower velocities and depths and smaller quantities of material, a finer screen with 0.05- foot (15-mm) openings was used. Where the bottom
2 This size was an expedient determined by the coarsest chicken wire that could be purchased in the nearest town.

MORPHOLOGY AND HYDROLOGY, WHITE RIVER, MOUNT RAINIER, WASHINGTON A27
FIGURE 25. Sampling bed load with screen. Sample is from the antidune phase of transportation.
was rocky it was difficult to be sure that material was not being swept under the screen. This was a greater problem with the finer material trapped by the 0.05- foot screen. Velocities at sample sites were measured with a current meter or with floats. Often, when a sample was trapped, part would be lost in the struggle to remove it from the current and bring it to the bank, making it necessary to discard the sample. The small number of successful measurements of the amount of bed load (table 8) indicates the difficulties encountered. The method showed promise, and with better equipment and concentrated effort, much additional information on bed-load transportation might be obtained.
Figure 26 shows the extremely rough water asso ciated with quantities of coarse bed load moving in a shallow channel with rough bottom. This is thought to be shooting or supercritical flow, for it shoots into the air over the top of obstacles instead of flowing around them. The boulders battering each other in such a reach make a terrific din and shake the ground for as much as 15 feet back from the bank. This shaking occasionally dislodges material poised on the banks. If one overcomes his awe of the noise, these rough,
FIGURE 26. Large load moving over rough bed in shallow channel. Note flow overboulders.
shallow reaches can be waded more easily than those that are quieter, but deeper and swifter.
During the measurements of amount of bed load, its movement was observed to be discontinuous both in position in the channel and in time. Only at the highest discharges were large quantities of material in motion. Occasionally the materials could be traced to nearby bank erosion, but usually the source of the ma terial was not readily apparent. With the exception of the measurements made on the troughs and crests of one set of antidune ripples, no conclusions as to the amount of bed-load movement were drawn because of the scarcity of data.
ANTIDUNES
The antidune phase of transportation has been de scribed by Langbein (1942, p. 618), who in analyzing data from Gilbert's flume experiments concluded that:
* * * the effect of sediment-load (particularly the finer sizes) is to decrease the amount of kineticity required for the formation of sand waves. According to Strickler, the Chezy friction-co efficient C varies as (R/d) 1 '6 where R is the hydraulic radius and d is the median diameter of the bed material. Hence critical slope varies as (d/R) 1/3 and is reduced by fines and increased hy draulic radius. Accordingly, sand waves would be expected
to be frequent flood-adjuncts under conditions of steep slopes and fine sediments * * *.
Langbein's conclusion that the occurrence of anti- dunes is favored by the presence of fine materials is borne out by the observations along White River. Gilbert (1914, p. 32) noted however "Where the debris is very coarse, as in the outwash plains of glaciers, a din of clashing boulders is added to the roar of the water." Although in transport phases other than anti- dune a similar din was heard on the White River (fig. 26), the boulders transported in the antidune phase were rolling silently on a bed of sand.

A28 PHYSIOGRAPHIC AND HYDRAULIC STUDIES OF RIVERS
Antidunes were observed when discharge increased markedly in a channel with predominantly sandy bed materials. Measurements of velocity, depth, slope, wavelength, size, and amount of the coarse fraction of bed load were made for the set of antidunes shown in figures 25 and 27-29 (table 8). Combing of the crests, men tioned by both Pierce (1917) and Gilbert (1914), is shown by the downstream dunes (fig. 27).
The average of three float velocities taken over a 100-foot reach exhibiting antidunes was 9.4 feet per second; a mean velocity of about 8.2 feet per second. Depths for troughs were found to differ consistently with those for crests. The average of 23 depth meas urements made in troughs was 0.9 foot, the range from 0.6 to 1.0 foot. The average depth of 22 crest measurements was 1.2 feet, the range from 0.9 to 1.6
feet. Using a depth of 1 foot as the average over the reach in which the velocity was measured, the Froude number equals 1.45, clearly in the range of supercritical flow. The difference in depth between trough and crest is thought to result from: (a) a piling up of the water due to convergence of flow in the plan view, at the crests, and (b) the increase in depth over a rise in the channel bottom that occurs with supercritical flow (Rouse, 1946). The slope, measured using a steel tape and hand level, was 0.012 foot per foot lower than average for this valley train. For other evidence of the nature of the flow see the piling up of the water against the observer in figure 28. Amplitudes of the dunes observed were as much as 1 foot; wavelengths averaged about 8 feet.
FIGURE 27. Antidunes showing combing of crests on downstream dunes. Flow is FIGURE 28. Measurement of amplitude and wavelength of antidunes. Yardsticks from left foreground to right background. used for scale.
Trough Crest Trough
Note apparent convergence of flow at crests
^Relative amounts of sampl caught in 12 seconds
FIGURE 29. Longitudinal cross section and plan view of antidunes shown In figures 25, 27, and 28.

MORPHOLOGY AND HYDROLOGY, WHITE RIVER, MOUNT RAINIER, WASHINGTON A29
Two samples were taken of the load, one on the crest of a dune, the other in the trough. The samples consisted of that material which did not pass through a 15-mm (0.05-foot) mesh screen. As one would expect from a type of sandwave that exhibits scour on the downstream side and deposition on the upstream, the rates of transport for trough and crest differed. The rates of transport of pebbles and cobbles were about 50 pounds per minute per foot width for the trough and about 20 pounds for the crest, based on 12-second sample periods. Such short sample periods can give only an estimate of the amount of material in motion. The difference of about 30 pounds would represent material deposited on the front of the dune and the 20 pounds in transport on the crest would represent material being carried through the reach. Because material is carried through the section without stopping, the rate of movement of antidunes cannot be used to estimate the amount of material in transport as bed load, as is sometimes done in the case of dunes and ripples. (Simons and others, 1961.)
The median diameter of material greater than 0.05 foot in diameter for the trough sample was 27 mm, that for the crest sample was 24 mm. This small difference determined from only one set of samples is not significant. Most of the material in transport was thought to be sand.
Often the antidunes appeared to remain stationary or to move only a foot or two upstream before dying out and being replaced by a new set Measurements of the rate of movement were not made owing to the discontinuous nature of the movement, but were estimated at 1 to 2 feet per minute.
ANALYSIS OF COMPETENCE OF THE WHITE RIVER
Attempts to measure the largest materials in trans port were more successful than attempts to measure bed load using the same screens. Some of the largest boulders were caught by hand, and if they could not be lifted from the water, they were rolled onto bars for measurement. Measurements were made of the largest boulders deposited on bars and the velocity in the channel immediately upstream from these bars. The wide range of materials available to White River provided an excellent opportunity to measure compe tence as all sizes at or near the range of competence of the stream were readily available. For a summary of the size ranges see table 2.
Figure 30 is a graph of the maximum size particle moving at a given velocity. Several factors that must be kept in mind when using such graphs are: the method of velocity measurement, the condition of the bed over which the particle was transported, and the conditions under which the data were gathered.
Z.U
1.0
.6
.4
.3
.2
0.1
.06
.04
.03
.02
.008
.006
.004
.003
.002
.001
0.0008
0.0006
0.0004
0.0003
a 0002
EXPLANATION
Wh te River
_ *
_ Screened; velocity, measured at 0.6depth with current meter
o
Screened; velocity measured with surface * 8floats and adjusted to 0.6 depth
/
Caught on bar; velocity measured with surface / /floats and adjusted to 0.6 depth . //
Hjulstrom (1935) ' /
' //
~ Nev
A
n (1946)
, / / ^^L
c,<^^ y/$j^' |/r- <^ //
- /<§
\ \ \
/Cj
//
/
/If/ />///f1
/f//
?
1 1 1
*.;*o
jf«#«/
-^f-»r°
t li
f 1
1
1
\ \
" 1 ///^
200-2 0.3 0.5 0.8 1 2 3 4 5 6 8 10
VELOCITY, IN FEET PER SECOND
FIGURE 30. Relation of particle size to velocity.
Velocities must not only be accurately measured, but. must be comparable, preferably the velocities actually impinging on the particle.
Methods used to measure velocity ranged from the use of surface floats and current meters to mean veloc ities based on measurements of cross-sectional area of flow and discharge. Most of the values for White River point velocities were obtained by measurements with a Price type-A current meter set at 0.6 depth (normal setting for average velocity in a vertical section of a shallow turbulent stream). These current-meter velocities for White River were taken over a period of 20 seconds or a little more, about the practical maximum for the shifting channels being measured. As the greatest depth for any velocity observation was 2.1 feet, the maximum setting of the current meter was 0.8 foot from the bottom. As the particles in transit were up to 1.8 feet in intermediate diameter, the velocities measured were those in the immediate

A30 PHYSIOGRAPHIC AND HYDRAULIC STUDIES OF RIVERS
vicinity of the moving particle in question. When current-meter measurements of point velocity could not be made, surface floats (inflated paper bags bal lasted with sand) were used. Their velocities were adjusted to 0.6-depth velocities using the formula:
0.6 depth velocity=0.87 X float velocity The coefficient of 0.87 was based on 40 measurements where both float and current-meter velocities were available. The value of 0.87 falls within the usual range of 0.85 to 0.95 (Hoyt and Grover, 1916).
The relation of particle size to velocity (figure 30) indicates that the boulders from White River were moving at lower stream velocities than would be predicted from the other data cited. White River data show that boulders up to 1.8 feet in intermediate diameter moved in currents of about 7 fps. For comparison, data that Nevin (1946) selected from Gilbert (1914), the U.S. Waterways Experiment Station (1935), Rubey (1937), and his own traction-tube experiments have been used to define bed velocity and critical traction velocity lines shown in> figure 30. Projections of these lines intersect at a velocity of about 9 fps and a particle diameter of about 0.8 feet. It appears from White River data that for coarse materials the critical traction velocity (velocity measured near the bed or mean velocity in shallow flow, Nevin, p. 665) gives lower velocities and therefore is closer to the effective velocity than the bed velocity computed with Rubey's formula. The projection of the calculated bed-velocity curve is based on the assumption that the size of particles in motion is a function of the square of the effective velocity (sixth power law).
Parts of Hjulstrom's curves (1935, p. 298) which separate the zones of erosion, transportation, and deposition are also shown in figure 30. Most data for White River boulders in motion plot in the zone of deposition that is defined by projections of these curves; however, these curves were based on average velocity and uniform bed materials.
Hjulstrom's curves, based on Schaffernak's (1922, p. 14) data for uniform materials from 8 to 70 mm, indicate that size is proportional to the 2.6 power of velocity, the power found by Nevin (1946), who used average velocity. Such a line (slope of 2.6) fits the White River data better than one with a slope of 2.0 (the "sixth power law" expressed in terms of linear dimensions); thus, it is suggested that for materials having inter mediate diameters larger than 0.1 foot, streams may have greater competence than some applications of the "sixth power law" would predict.
The White River has larger particles in motion than would be predicted by either of the curves shown in figure 30 because the measured velocities were transport ing and not necessarily eroding velocities. Most experi
ments related to erosion and traction velocities have been made in laboratory flumes with uniform materials less than 0.1 foot in diameter, usually sand. The few experiments that have been made with mixed grain sizes show that the mobility of such materials is quite different from that of uniform materials. Gilbert (1914, p. 178) stated:
* * * when such hollows are partly filled by the smaller grains its [the coarser particle's] position is higher and it can withstand less force of current. In other words, the larger particles are moved more readily on the smoother bed * * *. The promotion of mobility applies not only to the starting of the grain but to its continuance in motion.
Ippen and Verma (1953) noted a similar effect of bed roughness. Thus because of the large range of particle sizes in the bed and banks of White River channels, one can expect the erosion of particles larger than those pre dicted by formulas based on data for uniform materials.
Another factor that must be considered when attempt ing to determine the significance of the largest boulders within a deposit are the methods by which such boulders may be set in motion by velocities far less than those that would disturb them from a bed composed solely of boulders of the same size. Some of these methods have not been considered in laboratory experiments. From the pictures of the White River source materials (figs. 14-22) it is obvious that coarse materials are not limited to the bed of the stream. Boulders of all sizes are'-poised in and on the cutbanks, ready for launching by any cur rent that can erode the finer supporting materials. The relative instability of bank materials when compared to bed materials is due to the large gravity component which tends to make the material roll or slide down the bank. This gravity force component acting with force of the flow produces a resultant force much larger than the force acting on similar materials on the bed. Lane (1955a) suggests that the force on the bank materials be taken as the limiting force for stable canal design. Boulders on the bed may be set in motion by the blows from other boulders loosened from the banks. Finer materials may be scoured from under boulders setting them in motion. Boulders that are not moved from the bed on one day may tumble into the stream from the cutbank of the next day's channel as a result of the rapid cutting and filling that takes place in the White River. Illustrations of the rapidity of this change will be given in the section on pattern change (fig. 39).
The relation of size (fig. 31) to tractive force is similar to the relation of size to velocity as the sampled materials were coarser than would be predicted from experimental data on uniform materials. Lane's (1955a) data on the Z)75 (the diameter for which 75 percent of the material is smaller) of the material through which stable canals were constructed falls in a

MORPHOLOGY AND HYDROLOGY, WHITE RIVER, MOUNT RAINIER, WASHINGTON A31
1000
400
v»*v
i
©
©
.©
XX
XX
Xx x
XX
X
0
X
XX
X
©
EXPLANATION
Vicksburg Waterways data from Nevin (1946, p. 666)
©Gilbert data from Nevin (1946, p. 667)
White River data (mean depths)
XLane (1955a, fig. 2, p. 1244) D75 of stable
canal-bottom material
1 1 1
100
50
10
0.5
0.10.004 0.01 0.05 0.1 0.5 1
TRACTIVE FORCE, IN POUNDS PER SQUARE FOOT
FIGURE 31. Relation of particle size to tractive force.
line between the tractive forces calculated by Nevin (1946) and the White River data, suggesting that the total increase in mobility due to presence of mixed sizes must be limited.
Studies by White (1940) and by Kalinske (1942) emphasized the importance of turbulence in the initia tion of motion of particles on the bed of natural streams. White (p. 332) stated:
If the turbulence extends up to and into the walls * * * then a speed variation of 2 to 1 implies a stress variation of 4 to 1, and the maximum drag is four times the mean.
The so called effective velocity and the tractive force are only indicators of the degree of turbulence and of the probable maximum values of the velocity which may impinge upon a particle. Turbulence may well play the dominant role in the entrainment of materials

A32 PHYSIOGRAPHIC AND HYDRAULIC STUDIES OF RIVERS
so small that channel boundary layer effects are impor tant. Turbulence is probably also quite important in the entrainment and transport of coarser materials, for the momentum, acquired from threads of current with higher velocities, helps the particle to keep moving in rough or soft parts of the bed or when the particle is under the influence of the slower threads of current. It must be noted that because the force exerted is proportional to the square of the velocity, the effects of the higher-than-average velocities are propor tionally greater than the effects of those lower than average. The higher the turbulence, the more effec tive a given mean velocity will be. The White River's high turbulence favors high competence.
TRANSPORTATION OF SUSPENDED LOAD
A few suspended-load samples (table 3) were taken by using a US DH-48 depth-integrating sampler to determine the relative amount and size of the material being carried in suspension. Most of the silt and clay in suspension is probably carried out of the area studied and some of it undoubtedly reaches Puget Sound as the "milk" of the White River.
The appearance of the river water varies greatly. Rarely during the summer is the river white as there is
TABLE 3. Suspended load of White River, August 1958
Sample No.
1..... -2.. ......... ..3.............4.. 5 6*- 7».. ..........8-- 9...-.- ....10-.- 11« 12. . 13 14 15 -. 16.... 17.... ___ .18' 19... 20-.. 21 22.. ..........23.... ....24.... ..25 26 - 27 28 29 30 31.. .32 33 34.... ..35--
Date
8/19/588/19/588/19/588/19 588/19588/19/588/19/588/19/588/19588/19/588/19/588/19/588/19588/19/588/22/588/22/588/22/588/25/588/28/588/28/588/28/588/28/588/28/588/28/588/28/588/28/588/28/588/28/588/28/58
8/28/588/28/588/28/588/28/588/28/58
Time
0720081009501005113511451330133015451547173017301945194516501650170014450830122012251220122512151225
152015201520152015201715
17151715
Chan nel'
1ft
1817171ft
2019192020192322
464646464646474747474747AQ
484848
Sta tion 2
54
14
5514145555145514
151521.591 <\
272717
222200
281520.52630
Water Tem pera ture (°F)
36.536.536.536.538.038.038.038.037.537.536.036.0
36.535.036.036.036.036.036.036.037.037.037.037.037.037.036.036.036.036.0
Depth(feet)
1.11.11.351.351.71.71.41.41.41.41.61.61.21.31.61.5
Veloc ity
(fps)
6.026.024.464.464.514.515.965.865.865.866.296.296.97
4.505.63
Dis charge (cfs)»
120110180180220240240240270270240240200200320320320700200165165165165165165190190190190190190
165165165
Con- cen- tra- tion
(ppm)
520687
2,6101,6501,8603,6302,9852,3603,0703,4804,0491,8302,5801,030
14,60015,50014,10017,220
9892,0602,1801,4101,5401,0601,2603,1904,5502,6802,9302,4902,7202,8002,1901,9101,560
1 Sampling done before or after discharge measurement in channel described in table 7.
2 Station number refers to a point on the channel cross section.3 Discharge estimated from gage height record and is given for sum of all channels. « Median diameter of 0.13 mm. s Median diameter of 0.066 mm. 8 Median diameter of 0.19 mm. 7 Median diameter of 0.082 mm.
usually a brownish color to the water and at highest flows the river has the appearance of fluid mud. The color differences seem to be due to the nature of the materials being attacked by the stream at a given time combined with the contributions of countless muddy rills that flow from the melting stagnant ice. After a period of cloudy cool weather the stream becomes milky in appearance. On close inspection, grains of sand can be seen carried upward in rising threads of current,, indicative of the sand being moved along the bottom. Such a condition will change with time because the amount of sand readily available for traction load decreases rapidly as it is removed from around and between the coarser particles, armoring the stream bottom.
SIZE OF MATERIAL, IN SUSPENSION
When the suspended load is derived primarily from valley-train materials, the proportion of finer size is less than when moraines or mudflows are the dominant source materials. This might well explain the relative coarseness of the two samples of fairly low concentra tion, Nos. 6 and 11 (table 3), which have median di ameters of 0.13 and 0.19 mm for concentrations of 3,600 and 4,000 ppm respectively. The relatively fine median diameter of 0.082 for the sample with the highest con centration, No. 18, would seem to indicate the large contribution of the tiny muddy rills from the melting ice faces. These rills pick up silt, clay, and sand from the slumping and flowage of oversaturated ablation moraine on the melting stagnant ice. One or 2 days after being washed clean by rain the ice faces are covered again with a thin film of debris and with dust that is airborne in all but the wettest weather. All material picked up with the US DH-48 sampler was less than 2 mm in di ameter, but in the most turbulent reaches coarser mate rials are carried in suspension.
CONCENTRATION AND DISCHAROE
Figure 33 shows the relation of sediment concentra tion to discharge for all the samples taken. Figure 32 shows the relation of suspended sediment concentration to the diurnal fluctuations in discharge for a day of moderate flow. The change in sediment concentration where the stream was divided into two channels of un equal discharges in shown in figure 34. Approximately one-fifth of the total flow is in the smaller channel. The samples were taken about 50 feet downstream from the point of division. It must be noted that the differences in sediment concentrations of samples taken at about the same time in large and small channels (fig. 34) are about the same magnitude as the variations across the channel (fig. 32); thus, the variation could be the result of the change hi discharge due to the division, or the

MORPHOLOGY AND HYDROLOGY, WHITE RIVER, MOUNT RAINIER, WASHINGTON A33
300
250
O
200
150
100
EXPLANATION
X
Average of sediment concentra at a given time
Stations 15-17
A
Stations 20.5-22
Stations 26-30
Discharge 8 a.m. to 8 p.m. Aug. 28, 1958
/
/
\
S
\
tion
s*
20of
A 22
"25
24
1
27
26 XA 29
§ 31 28
B 30
1
32
N A 33 X
35 ^
1
\
\
\
1
4500
4000
3500
3000
2500
2000 p < cc
1500
1000
500SAM 9 10 11 12 1 23 456 7 8 PM
FIGTJKE 32. Diurnal variation in suspended sediment concentration with discharge. Stations and sample numbers re fer to table 3.
result of sampling water-sediment mixtures that had already been differentiated upstream from the division point. Only a much more extensive program of sus pended-sediment sampling could define the cause of variation in sediment concentration observed in the White River. The data and tentative analysis are presented here only to indicate the order of magnitude of suspended load carried in suspension and some possible causes of the variations.
VALLEY-TRAIN ELEVATION CHANGE
The most graphic evidence of the great amount of material transported by the White River is the amount of erosion and deposition on the valley train itself. Measurements of the elevation changes due to erosion and deposition can give only minimum figures for trans port because much of the material once set in motion is carried from the area. Measurements of elevation change are used later, in the study of the significance of channel pattern and in the study of the conditions of equilibrium.
METHODS OF MEASUREMENT
During late August, 1957, cross sections were sur veyed across the White River valley train between the
terminus of the Emmons Glacier and its enclosing mo raine some 6,600 feet downstream (fig. 35 and table 4). These cross sections were surveyed using a transit as a level to establish elevation and to determine hori zontal distance. The maintenance of horizontal and vertical control was a serious problem as both the valley train and the moraine were, at least in part, resting on stagnant ice. Primary control was set up by sur veying level circuits from bench mark 100 (fig. 35), established on bedrock at the base of Baker Point, both downstream to the gagehouse and upstream to bench mark "C." Bench mark "C" (fig. 35) was established on bedrock near the channel of West Em mons Creek by the National Park Service for use in their studies of Emmons Glacier. During the survey ing of the line of levels, the elevations of a series of reference points near each cross section were established.
On subsequent surveys of cross sections, the height of instrument, referred to as HI, was established by computing an HI from each "known" reference point in the vicinity and taking the average of those that agreed within a tenth of a foot. Differential settling was assumed when the movement was more than 0.1 foot as the reference points were usually separated by

A34 PHYSIOGRAPHIC AND HYDRAULIC STUDIES OF RIVERS
^uwuu
i nnrift
5000
1000
500
snn
_
-
-
_
-
1 1 1 1 1 1
A
11
" .7
D
V
19
.2
1
1 1 !
18
MM30 50 100 500 1000
DISCHARGE, IN CUBIC FEET PER SECOND
EXPLANATION
Average of samples
15-17
V20-25
26-31
D 32-35
FIGURK 33. Relation of suspended sediment concentration to discharge. Stations and sample numbers refer to table 3.
Ice tunnel
Edge of valley train
Area for volume estimates
1 West Emmons Creek
1 East Emmons Creek
EMMONS GLACIER
Base mapped in July, 1958
30030 50 100 500 1000
0 500 I , , , . I
1000 FEET __I
DISCHARGE, IN CUBIC FEET PER SECOND
FIGURE 34. Relation of suspended sediment concentration to discharge 50 feet down stream from the division into two channels. Lines connect samples taken at same time. Stations and sample numbers refer to table 3.
CONTOUR INTERVAL 20 FEET DATUM IS ARBITRARY
FIGURE 35. White River valley train showing locations of cross sections, areas for volume estimates, and widening.
20 feet or more. Points showing movement were that reference points could be painted on large bouldersnot used. Horizontal control was established by: (a) along the line, and beyond the ends of the line, (c)driving center stakes; (b) locating cross sections so measuring magnetic azimuths; (d) painting marks on

MORPHOLOGY AND HYDROLOGY, WHITE RIVER, MOUNT RAINIEE, WASHINGTON A35
bedrock high along the right valley wall and building cairns along the lateral moraine on the left.
COMPUTATION OF NET ELEVATION AND VOLUME CHANGE
The net elevation change at each cross section during a period was determined as follows. Cross-sectional areas of erosion and deposition were measured from the cross section surveys at the beginning and end of the period (table 4; fig. 37) and a mean depth was determined by dividing that area by the length of cross section over which the areas had been computed. The net elevation changes (table 5) are shown graphi cally in figure 36. These changes do not include the erosion that took place as a result of the widening of the valley train. The area involved in this widening could not be computed because the height of the terrace or bank that had been cut away was not known. The width of the valley train was measured during each survey but could not be considered in calculating the net area of change. Attempts were made to extend the cross sections beyond the edge of the valley train in 1959, after the plotting of the cross sections surveyed in 1957 and 1958 showed the impor tance of this widening. During the 1959 season, how ever, there was not as much widening as in 1958; so the computations for all periods were made using the original lengths of the cross sections. This simplifica tion should not have seriously affected the computation of net elevation change, as similar elevation changes took place on the newly added part of a cross section. The changes in length of cross sections are given in table 4.
The method used in computing volume of erosion and deposition is similar to the, end-area method used by surveyors in computing cut and fill. As shown in figure 35, the area of valley train measured halfway to adjacent cross sections was determined from the plane- table map and multiplied by the net elevation change. This method allowed computations for the cross sec tions at the ends of the valley train. The total net volume change was divided by the sum of the map areas to determine a weighted mean elevation change for the whole valley train for each period (table 5).
Checks on the net errors in elevation are provided by resurveys of parts of cross sections that had not changed and by comparing the net change over several periods between surveys with the sum of the net changes for each period. The net change for five parts of different cross sections (total length of 670 feet), which showed no evidence of change, averaged 0.03 foot and ranged from +0.12 to 0.13 foot for individual parts. These parts where no change had taken place had not been reached by the stream during the period; footprints, and marks made by the base of the rod, were still present after a month or more.
The net elevation change over several periods should equal the sum of the changes for the periods. For ex ample, for cross section 3, the elevation changes are + 0.9, +1.9 and 1.0 for periods 1, 2, and 3 (table 5). The sum is +1.8, or 0.1 foot less than the +1.9 feet cal culated for period 4, the sum of periods 1, 2, and 3. Because periods 4, 8, 9, and 10 are composed of periods of shorter duration, similar checks are provided for all periods at each cross section and for the sum of the
TABLE 4. Cross section survey of the While River valley train, 1957-60
Cross section No. (fig. 35)
0 -------- _ ---------1W.._ .. --..-..IE - ..- .......2. - - .. 3».. ...................4 __ ..-.---- ......f>..... ..................6- ̂ -7 . . ...10 _-... _.._...___11 .... -. .-...._12 _- .. ..13.... .. .._.14 ... . ..........
Duration of periods and dates of surveys
Period 10
Period 4 Period 9
Period 8
Period 1 Period 2 Period 3 Period 5 Period 6 Period 7 Period 11
8/ 1/57 8/28/57
8/22/57 8/21/57 8/19/57 8/20/57 8/20/57 8/20/57
7/15/58 7/15/58
7/15/58 7/ 2/58 7/ 7/58 7/8/58 71 1/58 7/ 9/58
8/ 5/58 8/5/58
8~/ 6/58 8/ 6/58 8/ 6/58 8/ 7/58 8/ 8/58 8/ 8/58
9/ 2/58 9/ 2/58
8729/58 8/28/58 8/28/58 8/25/58 8/28/58 8/28/58 9/ 4/58 9/ 4/58
71 1/59 7/ 3/59 71 1/59 6/21/59 6/21/59 6/21/59 6/20/59 6/20/59 6/20/59 6/19/59 6/19/59 6/19/59
7/26/59 7/26/59 7/26/59 7/25/59 7/25/59 7/25/59 7/24/59 7/24/59 7/24/59
8/19/59 8/19/59 8/19/59 8/25/59 8/25/59
8726/59 8/26/59 8/26/59 8/25/59 8/25/59 8/26/59 8/19/59 8/20/59
6/ 8/60 6/10/60 6/ 8/60 6/10/60 6/10/60 6/10/60 6/10/60 6/ 9/60 6/ 9/60 6/ 9/60 6/ 9/60 6/ 1/60 6/ 3/60
Valley train
Dimensions
Width (feet)
115162 182 240 290 300 425 435 440 290 360 170 151 400
Slope (feet per
foot)
0.16 .14 .16 .11 .075 .06 .05 .04 .04 .03 .03 .03 .055 .018
Surface area
(square feet)
180,000 320,000
" 340"566 200,000 150,000 110,000 110,000 50,000
Distance from
glacier in 1958 (feet)
13,000 11,000
1,2502,350 3,500 3,700 4,500 5,150 5,400 6,000 6,250 6,600
11,60078,500
Widening (feet)
Period4
50 65
..- .-..
3474
0 0
Period 9
0 10 0
a-52 14 0 0
3-14 <70
6 10 6
0
1 Approximate distance upstream from cross section 2 is given for 0 and 1W.2 Narrowing caused by mud flows from adjacent stagnant ice.8 Cross section 3 also surveyed 7/25/58, periods 2a and 2b, figures 36 and 37. 2a=7/15-25/58 and 2b=7/25-8/5/58.4 Estimated.

A36 PHYSIOGRAPHIC AND HYDRAULIC STUDIES OF RIVERS
TABLE 5. Changes in elevation and volume of the valley train of the White River, 1957 60 [See table 3 for dates of periods and figure 36 for plot of data for cross sections 2-12. Italic figures show discrepancy as compared to the sum of the individual periods.]
110
2
1
3
1
4(1+2+3)
12
5
10
6
1
7
1
8(6+7)
2
9(5+8)
12
10(4+9)
24
11
10
Elevation change (feet)
Cross section 0. __._.._..______.____1W____. _. ____________1E_. __________________2_____________________3__.-.. _____-__-__---.4___._ _ _. .....___5___ ______-____ _6____. ________________7___ ___ _- __10__._. _..__-......___11. _______________ ____12. ___._____.._._. ____13_. ___..-....._.-_.._14. ___________________
-0.6-1- Q
+ 1. 1-1- Q
+ 1.0+.30
+ .5
-0. 11 +1. 9
+ .9+ .1+ .8-.3+ .3+ .4
-0.2-1.0
0-4- Q-.300
+ .2
-0.9+ 1.9
+ 2.0+ 1.9+ 1.4
04- ^
+ 1.1
+ 0. 5_ 2
+ .4+ . 1+ .9-.3-.3-.2
-0.2-. 1+ .4-. 2_ 4.-.3+ .7+ .2-.5
-0.3-.20-.3-. 1+ .1+ .1+ .2+ .7
-1.2-.5_ 2-.4__ Q
+ .3- 4-.5-. 1+ .7+ .8+ .1
+0.2-.5
0-.4+ .6+ .3+ .100-.2
-0.7+ 1.4
+ 2.1+ 1.5+ 2.0+.4+ .3
+ 1.1
0+ .4
+ 3.34-94.+ 1.4+ .6+ .4-1- Q+ .6-.5-. 4
-1.0
Total volume change (10> cubic feet) 2
All cross sections _ - + 900 + 1, 100 -200 + 1, 800 + 300 -200 -200 -400 -200 + 1, 700 + 1, 800
Average elevation change (feet) !
All cross sections _ _ ___ + 0.6 + 0.7 -0.2 + 1.2 + 0.2 -0.1 -0. 1 -0.3 -0. 1 + 1.2 + 1.2
1 Survey in midperiod showed deposition of 3.6; subsequent erosion of 1.7 gave net for period of 1.0.2 Total volume change and average elevation change are based on cross sections 2, 3, 5-7,10-12.
net changes of all cross sections. The italicized values in table 5 for periods 4, 8, 9, and 10 are those which differed by 0.1 foot from the sum of the included periods. An error of 0.1 foot can be produced by rounding the calculations to tenths. The frequency with which an error of 0.1 occurs, as well as the limit in accuracy imposed by the ruggedness of the terrain surveyed, suggests that 0.1 foot is about the limit of accuracy for procedures outlined. The fact that larger errors are infrequent (bold type in table 5) attests to the general reliability of the procedure used to determine elevation change.
In estimating volume change there is also the possi bility of error in the determination of area. No check is available for this. In addition, the assumption has to be made that the elevation change for the cross section applies to all points within the area of valley train (fig. 35) in which the cross section is centered. The main purpose of volume determination is the cal culation of an average elevation change for the entire area weighted to allow for differences in spacing of the cross sections. The discrepancies that appear when the volume changes for cumulative periods are compared with the sum of those for the component periods are the same discrepancies noted in the section on elevation change.
EUEVATION CHANGE ON CROSS SECTIONS OF THE VAM-EYTRAIN
Eleven cross sections (table 4) were surveyed in 1957 (figs. 35, 36, 37). When resurveyed in early July 1958, it was discovered that two-thirds of cross section 0 had been overridden by a slight advance of the glacier. The controls for Nos. 4 and 8 had been eroded or buried and these cross sections could not be resurveyed. Although other controls were lost, enough points re mained or were reestablished to allow all other cross sections to be resurveyed with reasonable certainty that the elevation changes were not due to faulty location or faulty HI.
These 8 cross sections (Nos. 2, 3, 5-7, 10-12) were resurveyed 3 times in 1958 between July 1 and 15, be tween August 5 and 8, and between August 28 and September 2 and 3 times in 1959 between June 19 and 21, July 24 and 26, and August 25 and 26. No. 3 was also surveyed on July 25, 1958, by plane- table methods because striking deposition had taken place (fig. 37). In addition, 4 new cross sections were established, 3 of them upstream from No. 2 and the 4th in the vicinity of No. 4, which had been lost in 1958 (fig. 35). Nos. 13 and 14, established on September 4, 1958, were resurveyed on August 19 and 20, 1959. Dates on which each cross section was surveyed are
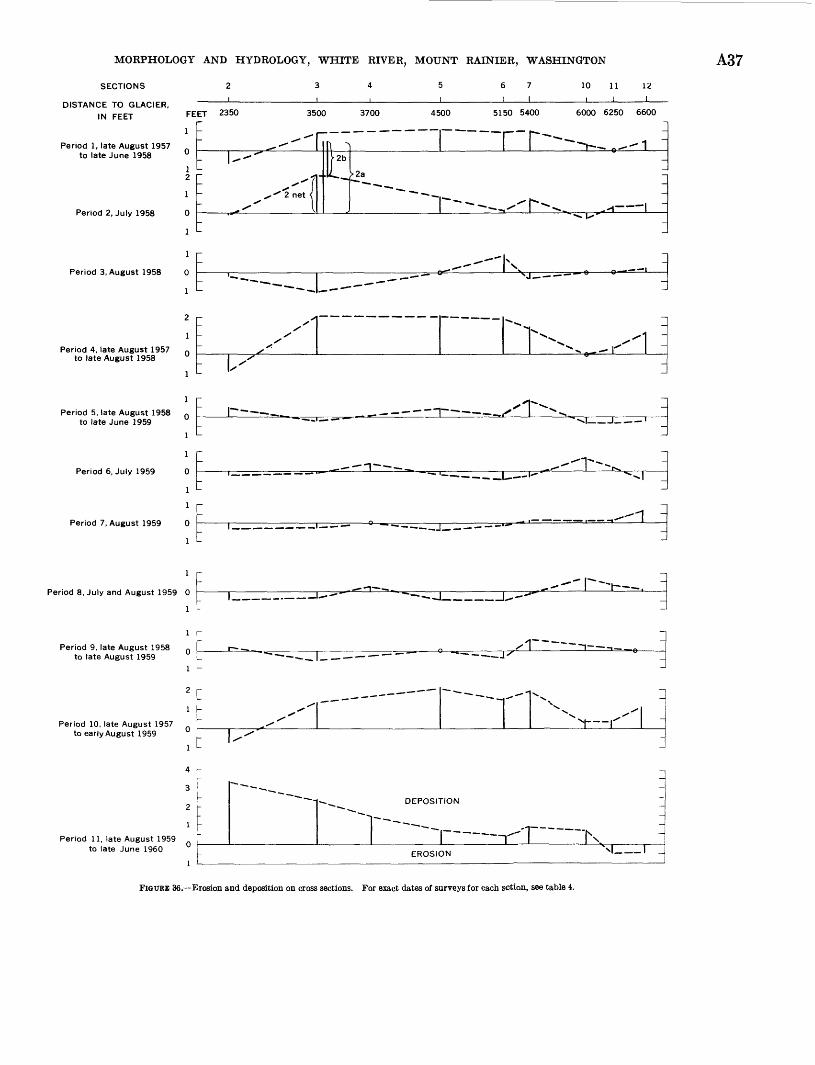
MORPHOLOGY AND HYDROLOGY, WHITE RIVER, MOUNT RAINIER, WASHINGTON A37SECTIONS
DISTANCE TO GLACIER,
IN FEET
Period 1, late August 1957 to late June 1958
Period 2, July 1958
Period 3, August 1958
10 11
I I
12
I
FEET 2350
13500 3700 4500 5150 5400 6000 6250 6600
n .-,
Period 4, late August 1957 n to late August 1958
Period 5, late August 1958 to late June 1959
Period 6, July 1959
Period 7, August 1959
1
1
0
1
1 r0
1
.^r*
Period 8, July and August 1959 0
1
'I --.
Period 9, late August 1958 Q to late August 1959
Period 10, late August 1957 to early August 1959
Period 11, late August 1959 to late June 1960
DEPOSITION
'JL
EROSION
FIGURE 36. Erosion and deposition on cross sections. For exact dates of surveys for each sction, see table 4.

A38 PHYSIOGRAPHIC AND HYDRAULIC STUDIES OF RIVERS
indicated in table 4. Most cross sections were re- surveyed in early June 1960 to measure the changes brought about by the winter storms of 1959-60.
In period 1 deposition took place at all cross sections with the exception of No. 11, which showed no net change, and No. 2, where there was a net degradation of 0.6 foot (tables 4, 5). If the East and West Emmons Creeks portions of No. 2 are analyzed separately, the picture is different. East Emmons Creek, its flow pri marily derived from the active snout of the glacier, showed sufficient net erosion to offset the net deposition of West Emmons Creek. Most of the change for this period is thus thought to have taken place during late June and early July 1958. When the valley train was first visited in mid-June 1958, all the stakes in the centers of the cross sections were in place, and the area appeared as it had in late August 1957. Within 10 days, before surveys could be made, the channel pattern had changed, and half the center points were lost. The average elevation change for all cross sections was an increase of about 0.6 foot, at Nos. 3, 5, 6, and 7, averaging about 1 foot.
In period 2, the last 2 to 3 weeks in July, deposition was predominant at most cross sections, with the exception of minor reductions in surface elevation at Nos. 2 and 10. The greatest erosion and deposition for any cross section in any period took place during the firsvt part of period 2 between July 15 and 20, 1958, at No. 3 (fig. 37). Deposition raised the elevation of the valley train an average of 3.6 feet. Activity noted on July 17 was accompanied by rapid pattern changes, rough water similar to that in figure 26, and the roar of clashing boulders. On July 20 East and West Emmons Creeks, which join just below cross section 2, ceased flowing over the valley train near cross section 2 and entered a tunnel beneath stagnant ice on the right side of the valley train, for 6 or 7 days (July 20 to July 26 or 27); the stream emerged near cross section 5. Within 10 days after returning to the valley train, the stream had removed an estimated 450,000 cubic feet of its earlier deposits, most of it in tke first few days. This volume estimate was based 01 three cross sections surveyed after the erosion had '-aken place. The 1.7 feet of erosion at No. 3 was computed from the difference between the surveys made on Juh 25, when the stream was in the ice tunnel, and on Augus: 5. Two additional cross sections were surveyed on August 5 in areas of obvious erosion between No. 3 and the constriction below No. 2. The lower line of tht cross section was surveyed on the ground surface aid the upper line was inferred from erosion remnant. On July 28, during the removal of this material, one-third of the valley train in this reach was cove-ed with water flowing in at least 4 channels in the ncinity of cross
section 3 (fig. 52). An average increase in elevation for all cross sections of 0.7 foot took place during period 2.
During period 3, the last 3 weeks in August, there were only minor changes at most cross sections, with the exception of I foot of erosion at No. 3 (fig. 37), which was a continuation of the erosion that had begun during the last week of period 2, and deposition of 0.9 foot at No. 6. The net for the period was about 0.2 foot, and the erosion and deposition served to bring Nos. 3 and 6 back into relative agreement with adjacent cross sections.
In period 4, the aggregate of changes during periods 1, 2, and 3 showed net deposition at. all cross sections with the exception of No. 2, which lost 0.9 foot, and No. 10, which showed no change. Nos. 3 (fig. 37) and 7 received about 1.9 feet of material and No. 6, 1.4 feet. No. 5 gained 2 feet, and two small remnants of moraine that partly blocked the valley 200 feet downstream from the cross section were almost completely buried by the deposition that took place between Nos. 5 and 6. The average net gain in elevation was about 1.2 feet over an area of about 1,500,000 square feet. Approximately 1,800,000 cubic feet of material was deposited during 1958.
In period 5, early September 1958 through mid-June 1959, there was minor deposition and erosion at most cross sections. The exceptions were Nos. 2 and 7, which received 0.5 and 0.9 foot of deposition respec tively. The net for the period was about 0.2 foot of deposition.
Period 6, mid-June through August 1959, showed net erosion for all cross sections (Nos. 2-7) above the constriction at Panorama Point (fig. 35) with the excep tion of No. 4, which gained 0.4 foot. No. 10 gained 0.7 foot and No. 12 lost 0.5 foot. The net change for the period, excluding changes on No. 4, was a loss of about 0.1 foot. No. 4 was not used in computations of volume and elevation change because data were not available for all periods.
Period 7, the month of August 1959, showed minor changes on all cross sections with the exception of No: 12, which gained 0.7 foot. The net for the period was a degradation of about 0.1 foot.
Period 8, mid-June to late August, 1959, showed erosion on most cross sections: 1.2 feet on cross section 0, 0.5 foot for No. 1 West Emmons Creek, and 0.2 foot for No. 1 East Emmons Creek. The last two sections were established to evaluate these reaches as possible sources for materials deposited in the valley train. Exceptions to the erosion were Nos. 4, 11, and 12, where minor deposition had taken place, and No. 10 which had received 0.7 foot of material. The net for

MORPHOLOGY
widening
AND HYDROLOGY, WHITE RIVER, MOUNT RAINIER, WASHINGTON
widening
A39
-August 28, 1957 yuy 15, 1958
PERIOD 4
August 28, 1957 to September 2,1958 Average deposition 1.9 feet
PERIOD 3
August 5,1958 to September 2,1958 Average erosion 1.0 foot
PERIOD 2b
July 25, 1958 to August 5, 1958 Average erosion 1.8 feet
PERIOD 2a
July 15,1958 to July 25, 1958 Average deposition 3.6 feet
PERIOD 1
August 28, 1957 to July 15, 1958 Average deposition 0.9 foot
n rVERTICAL EXAGGERATION x 10
Note -. Widening not included in computation of average elevation change
FIGUBE 37.-Erosion and deposition on cross section 3 from August 28,1957, thru September 2,1958.

A40 PHYSIOGRAPHIC AND HYDRAULIC STUDIES pF RIVERS
the period, excluding the cross sections that had not been previously surveyed, was about 0.3 foot.
In period 9, the aggregate of changes for the year ending in late August 1959 showed minor changes on most cross sections. The exceptions were No. 3, which lost 0.5 foot, and No. 7, which gained 0.6 foot. The net elevation change for this year was about 0.1 foot, an estimated loss of about 200,000 cubic feet of material, or roughly, 10 percent of the volume change for the previous year.
In period 10, the aggregate of changes over 2 years of study ending in late August 1959 showed a gain in elevation at all cross sections except No. 2, which lost 0.7 foot. The greatest gains, made in the first year of the study, were retained through the second year. Gains on cross sections 3, 5, 6, and 7 were 1.4, 2.1, 1.5, and 2.0 feet respectively. The ijet gain for the 2 years was about +1.2 feet or about 1,700,000 cubic feet. The two years are similar in that the greatest rate of change occurred from late June through late July, the time of greatest discharge (fig. 50). During the periods from late August to June of both 1958 and 1959, there was net deposition, although in 1958 most of, if not all, the deposition during this period took place during late June.
Surveys were made in June 1960 to check on the erosion and deposition that took place during three major storms of October, November, and December 1959. One of these storms produced the second highest flow of record at White River near Greenwater, Wash. Major deposition was recorded on cross sections Nos. 2 and 3 with 3.3 and 2.4 feet, respectively. No. 4 received 1.4 feet of material and all other cross sections lesser amounts. The average net elevation change for the period was 1.2 feet. This large average eleva tion change may be more apparent than real as Nos. 2 and 3 are more heavily weighted in this average because their elevation changes were multiplied by large areas in computing the volume and average elevation change. Most of the deposition on No. 2 was on the right end of the section and it is thought that mudflows from stagnant ice along East Emmons Creek were the major source of the deposits. Since these deposits were local ized at the cross section, the calculated average eleva tion change for the period was larger than the true elevation change.
Additional evidence of general alluviation of the valley train was observed in the fate of kettle pools. Morning Glory Pool, in the adjacent moraine, so- named for its beautiful color in 1957, still deserved this name in early June 1958. At this time it was brimming with potable clear water, the surface of which was several feet above the adjacent valley train. Periodic invasion by debris-laden streams built a birds-
foot delta into the pond, gradually filling it (fig. 40). By the end of August 1958 the same thing was occurring along the left edge of the valley train, in two other ponds in the next 300 yards upstream. The rise in the level of the valley train threatened ponds that had been considered completely out of reach in 1957.
SOURCE OF DEPOSITS
A search was made to determine the source of the 1,650,000 cubic feet of material deposited over the 2 years. The streams, as they issue from beneath the glacier, usually appeared to carry less debris than further down downstream and were often potable. East Emmons Creek, which flowed from the active snout of the Emmons Glacier after receiving a tributary from Frying Pan Glacier, did not deafen the observer with a din of clashing boulders. West Emmons Creek before reaching the area shown on the map (fig. 35) flowed for about 1 mile from the left lobe of the glacier (fig. 1) over, under, and through debris covered stagnant ice, valley train, and mudflow deposits (fig. 38) on a very steep gradient (as steep as 0.20 ft per ft). It was usually the muddier of the two creeks and the one which was thought to be the main supplier of material. Evidence supporting this conclusion was provided by the erosion recorded during the summer of 1959 on cross sections 0 and 1 of West Emmons Creek which on slopes of 0.16 and 0.14 foot per foot lost 1.2 feet and 0.5 foot of material respectively. During the same period cross section 1 on East Emmons Creek lost only 0.2 foot. During period 1 a comparison of the two creeks at cross section 2 showed that the net erosion for the cross section was due to a large amount of erosion by East Emmons Creek while West Emmons had been depositing material, which might be expected of a stream carrying an abundant load derived farther upstream.
During the summer of 1958, conditions appear to have been especially favorable for the deposition of large quantities of material in a short period of time. An unusually high melt of ice and snow occurred during the summer and conditions on upper West Emmons Creek provided a large load. This area is thought to be the major source of the material deposited on the valley train.
In June 1958, West Emmons Creek began flowing over the ridge of debris-covered stagnant ice which connected the left side of the advancing glacier with stagnant ice along the left side of the valley train. Prior to this diversion over the ice ridge, the stream had flowed relatively quietly under the ridge in one or more ice tunnels. These tunnels must have been blocked in early June by debris or collapse. They may have been blocked in part by materials from a mud-

MORPHOLOGY AND HYDROLOGY, WHITE RIVER, MOUNT RAINIER, WASHINGTON A41
IOl ,g
'> iQ
o .S £9
CCj -^** 01
II
3*H> >>
ai<B >
_<c ^
(9 *«> S

A42 PHYSIOGRAPHIC AND HYDRAULIC STUDIES OF RIVERS
flow that had descended on top of snow, probably during the spring, and flowed as far as cross section 5, where remnants of the snow it had buried and protected were still melting in late June. When the stream began flowing over the ridge, it reached its former bed on the downstream side of the ice ridge after plunging in a spectacular cascade, called during field studies "choco late falls" after the color of the water. This cascade was about 70 feet high at first but within a few days the stream with its load of debris had cut deeply into the ice. The rate of cutting was estimated at 5-10 feet per day. Within a few weeks the stream had cut down leaving a vertical-walled ice gorge shown in figure 1 and, in part on the map, figure 35. High on the sides of this gorge, parts of abandoned meanders could be seen at various levels. They appeared as debris-covered terraces or, when undercut, as shelves. The roar of the stream within the gorge made it im possible to be heard at its margin.
The high melt of late June, acting with the changes in gradient brought about by this stream diversion over the ice and the rapid erosion, delivered large quantities of debris to the upper reaches of the valley train. (Note the changes in cross sections 2 and 3 during the second period, table 5.) This material was subsequently removed and distributed over most of the valley train. The change in gradient (knickpoint) at the site of the falls was almost entirely removed by early August, and the lower discharges of August 1958 and of the summer of 1959, on the lowered gradient, brought far less material to the valley train.
Above the ice ridge, West Emmons Creek is very unpredictable, frequently disappearing under the valley train into previously unknown tunnels; this disappear ance indicates that the valley train in this area is underlain by stagnant ice. One day it is a formidable stream to cross, and the next day it may not even be present on the surface (figure 38).
An additional source of material was provided by widening of the valley train by erosion of the deposits along its margins. The changes in width which were recorded for the 2 years are shown in table 4, and the area of maximum widening has been sketched on the map, figure 35. Here the channel widening reached a maximum of about 100 feet when the stream removed a bank 10 feet high and found access to an area of kettles behind.
Negative changes in length of cross section (table 4) that is, narrowing took place by slumping of banks and by the addition of material from the areas of stag nant ice. Widening of the valley train took place by lateral erosion and filling of depressions that had been separated from the valley train by moraine or mudflow deposits. The pond, well back from the river, shown
in the foreground of figure 39 A (photographed July 18, 1958), is the pond (elevation 56.0) at the edge of the valley train in figure 46, mapped September 3, 1958. The pond had become part of the valley train by the time the widening was mapped the next summer. The materials added to the valley train by this lateral ero sion are estimated to make up about 10 percent of the total deposition. Since widening showed much less con tinuity than erosion or deposition, extrapolations to the areas between cross sections in order to calculate volume were not thought justified.
It is interesting to note that the maximum widening (fig. 35) took place not at the narrowest point of the valley train but at the outside of the valley curve toward the east, at the junction of the White River valley with the valley of Inter Fork (fig. 2). The coarser fraction of the large quantity of material furnished by stream cutting of the high banks in this area was deposited first as a bar within 100 yards downstream from the cut banks. This bar may well have served to protect the constriction down stream from erosion during the highest flows of the summer.
In summary, the abundant discharge and high gra dients of both East and West Emmons Creeks, with assistance from unique conditions on West Emmons Creek and widening of the valley train, provided an abundant load during 1958. The high gradients on the Emmons Creeks with the flows of 1959 continued to supply materials to the valley train but in greatly re duced quantities, and erosion exceeded deposition for most of the valley train. There was a slight flattening of the valley profile, owing to the predominance of erosion above the junction of the two creeks and deposi tions over most of the downstream part of the valleytrain.
CHANNEL PATTERN
The description and analysis of the pattern change of White River channels presents a problem owing to the rapidity with which the changes take place. Slight changes in water-surface elevation which caused the stream to occupy or abandon old streambeds provided as much change in appearance of the channel pattern and valley train as major erosion and deposition (fig. 39). In order to analyze the mechanism of pattern change panoramic photographs (fig. 40) and time-lapse motion pictures were taken (Fahnestock, 1959), planetable maps and cross sections surveyed, and measurements of channel characteristics and elevation change were made.
DESCRIPTION OP PATTERN
CHANGES DURING THE PERIOD OF STUDY
To record the change in pattern of White River chan nels during the summers, panoramas like figure 40 were

MORPHOLOGY AND HYDROLOGY, WHITE RIVER, MOUNT RAINIER, WASHINGTON A43
TABLE 6. Number of channels at each cross section of the White River, 1958-59
[Data from panoramas!
Date Time Discharge (cu ft/sec)
Cross section
3 5 6 7 10 11 12
1958
June: 18- ...... _ .....18 ___ .....-.- . 19...................26 _ ........ .......
July: 1 ....................
7 _ .................7 8... __ ............11 ................14..... __ .. .......
15 .. ....... _ ....16 ..............17. ........18 .. __ .... ....21 ___ ..........
24. ____ ...........25 .... ...... ... .28 28. ___ . . .......29...................
31 ................
Aug: 2.. __ _____ . ....3 ___ .... ......4.... ____ __..__5. ........ ......
6 _ _._.__7 ...... ___ .....8. __ . _ ......8.. _ ... ___ .... ...9 ............ ...
11.. - ___ . _ .....13 ................14 ...................15 .......... .....18...................
19. . ____ . ___ .20 ......... ___ .22 _ .......... ___ .25... ... ___ ........28 ...............
29............. __ ..
Sept: 2 ______ _ . .4.. _____ .. ... .30.... ___ .... . . .
0930183010151040
0905
1020 1945 2030 1220 1400
0945 0915 1715 1050 1525
0745 0740 1220 1900 0745
1030
1005 1920 1230 1900
1810 0830 1100 1900 1500
0910 1245
1815 1720
1820 0835 1755 0840 0820
1120
0830 1545 1130
190
100
210 310 320 410240
200 260 370 340 330
370 370 430 600 430
320
210 210 195 280
370 220 210 340 490
300 310
280 250
210 210 500 300 120
170
170 180 100
1 2 21
1
2 2 2 2 2
1 1 3 3
»0
»0 10 4 4 3
1
1 1 2 1
1 1 2 2 1
1 1 1 1 1
1 1 1 1
1
1 1 1
36 5 2
1
2 3 4 3 3
4 2 6 2 3
3 2 6 7 3
2
5 4 3 5
4 4 4 5 3
5 1 4 3 1
21 2 1 2
2
2 2 1
2 6 6 5
3
6 5 8 7 6
37 8
11 5
25 7 4 6
6
4 3 2 4
5 6 98 7
6 4 8 7 6
5 6 6 8 7
8
7 9 2
5 6 6 9
6
7 6 8 5 5
35 7 137
6 6 5 5 4
6
5 3 3 4
5 5 7 9 10
6 6 6 5 4
35 8 7 8
7
6 7 2
3 6 5 3
2
2 4 6 2 5
2 36 7 3
5 4 3 6 6
2
21 2 2
35 4 3 4
1 1 4 1 3
2 4 5 3 2
2
11 1
36 5 2
1
1 2 3 1 5
21 4 5 1
4 4 2 5 4
2
1 11 1
2 3 3 2 2
11 3 1 2
3 36 21
2
1 1 1
2 3 3 3
3
2 3 2 4 2
2 1 3 2 2
3 2 2 2 1
1
1 1 1 1
3 2 2 2 2
2 1 2 1 1
1 2 3 1 2
2
2 2 2
Date Time Discharge (cu ft/sec)
Cross section
3 5 6 7 10 11 12
1959
June: 18 ___ .... ____ ..20 _ .... __ .... ....26 ___ ..30. __ .... ... _ .. .
July: 7... ... ... .... .......
9 .. ___ ........10 ................
12.... __ . __ ...13 ................
15 ... __ .... __ .16 17 18- 19 ___ .... __ .
19- _ .......... __ .20 20- __ ... .........21..... ____ _ _ 24.... _ . ...........
24. ___ __ - .2626. ____ _ ____ .30. __ ... ___ ._.._.
Aug: 1. __ .... __
3 ... 4 .......... ___ .5 .. 6 . _ . . 7- _ -...... .
8.. ....... ..... 9 .. ___ .10 . _ ....11- _ . _ ... __ ..10
14..... .......... . ...17.....- .- __ ...18. __ .... __ . .....20- _ . __ ...... ...24 _ ...... __ . .....
25... ___ .... ......28 __ .29 . ____ .......
Nov: 27
1535 0930 1400 1000
1815
1830 1415
1630 1600
1230 1910 2000 1325 0940
2000 1250 1930 1930 0915
1940 1045 1800 1315
1815
1642 1600 1450 1345 1420
1505 1520 1430 1725 1710
1530 1445 1505 0945 1000
1035 1705 1510
1200
130 140 120 90
100
140 140
190 150
160 230 230 250 220
420 370 290 280 430
420 490 380 230
280
170 180 230 220 240
250 210 220 170 180
220 170 140 100 150
120 160 180
40
1 2 2 1
1
1 1 2 2 2
1 1 121
1 2 2 2 1
2 2 2
2
1 1 1 11
1 1 11 1
1 1 1 1 1
1 1 1
1
1 2 1 1
1
1 2 1 2 2
1 1 2 2 2
3 3 4 3 2
6 2 2 3
3
3 3 4 3 3
3 3 3 3 2
3 3 3 2 2
1 2 2
2
3 3 2 1
1
3 3 34 4
3 3 5 3 2
4 4 4 4 5
4 35 5
3
3 2 2 3 2
1 1 3 1 1
2 2 2 2 2
3 2 2
3
3 3 4 3
2
4 4 4 5 4
5 6 6 3 4
5 4 5 6 5
4 4 5 5
4
2 3 2 3 2
3 3 3 3 3
4 3 3 3 2
2 3 2
2
3 2 2 2
2
3 34
3
34
3 2 4 3 4
4 4
5
4 2 3 2 3
3 4 3 2 3
2 2 2 2 3
2 3
3
2 2 2 2
2
3 3 3
3
3 3
4 2 3 2 5
3 3
4
3 2 3 3 3
5 4 3 2 3
3 3 2 2 2
2 2
3
2 2 3 3
2
3 3 3
4
4 4
3 2 3 3 2
2 3
3
3 3 2 2 3
3 3 3 3 3
3 2 2 2 2
2 3
2
i The ch annel at cross section 3 was flowing through an ice tunnel.
taken as frequently as several times per day when chan nels were changing rapidly and every 3 to 4 days when there was little or no change. Table 6 summarizes the number of channels in the vicinity of each cross section and the estimated total discharge for White River at the time each panorama was photographed. In addi tion, figure 50 shows the number of channels at the odd numbered cross sections in relation to changes in discharge.
Both tranquil and shooting turbulent flow commonly occur in natural channels. Wolman and Brush (1961) have shown that meandering began with the onset of shooting flow in some of their flume channels in non- cohesive sand materials. They suggested that because
these meanders occur at much higher Froude numbers than those of major rivers they are not dynamically similar in all respects and, therefore, termed the former ' 'pseudomeanders .''
Photographs of White River taken after extended periods of low flow (less than 200 cfs) show what appears to be a meandering pattern from the junction of West and East Emmons Creeks to the gage. As the flows in these meanders have relatively high Froude numbers (table 7), they are not dynamically similar to common meanderings with much lower Froude num bers. The meanders of the White River shown in figures 41 to 43 may approach the condition of pseudo- meanders in a natural channel.

A44 PHYSIOGRAPHIC AND HYDRAULIC STUDIES OF RIVERS
A. 1:00 p. m.
1:15 p. m.
FIGTOE 39. Pattern changes, 1:00 to 2:00 p.m., July 18, 1958. A, 1:00 p.m.; B, 1:15 p.m.; C, 1:30 p.m.; D, 1:45 p.m.; E, 2:00 p.m. Discharge is about 350 cfs. Arrowsindicate new channels or bars which have appeared since the previous photograph.

MORPHOLOGY AND HYDROLOGY, WHITE RIVER, MOUNT RAINIER, WASHINGTON A45
C. 1:30 p. m.
D. 1:45 p. m.
E. 2:00 p. m.

05
-«
FIGU
RK 4
0. P
anor
ama
of th
e W
hite
Riv
er v
alle
y tr
ain,
Jul
y 18
,195
8, a
t 10
:50
a.m
. D
isch
arge
abo
ut 3
40 c
fs.
Not
e ke
ttle
bein
g fil
led
in c
ente
r fo
regr
ound
.

MORPHOLOGY AND HYDROLOGY, WHITE RIVER, MOUNT RAINIER, WASHINGTON A47
LONGITUDINAL PROFILE OF MAIN CHANNEL85 EXPLANATION
Flow around rocks
VERTICAL EXAGGERATION v 5
Arrow size represents relative flow
Form line on water surface
200 FEET
DATUM IS ARBITRARY
FIGURE 41. Meanders and nose on the White River near cross section 5, August 13,1968. Plane table map by Fahnestock and Bond.
tunnel along the right valley wall and joined West Emmons Creek through several channels, occupied at different times, which entered the valley train between Nos. 4 and 5. Braiding occurred more frequently below the junction than upstream from it.
When first visited in 1958 (June 18), there was a braided pattern with two or more channels (table 6; fig. 49) from the vicinity of cross section No. 5 to the constriction at the moraine. From the junction of East and West Emmons Creeks to No. 5 the flow was along the right side of the valley train in one channel, which received several small tributaries from the ice tunnel noted in 1957. By afternoon on the 18th there were more channels at all cross sections, and some flow had shifted to the left side of the valley train. By June 26, the flow upstream from No. 5 had shifted almost entirely from the right to the left side of the valley train; from Nos. 6 to 10 there were several channels; and farther downstream the flow had shifted to the right, concentrating in one channel. This situation remained, with minor changes,
FIGURE 42. Meander pattern of the White River, September 30, 1958. Discharge until about July 8, when the number of channels is approximately 110 cfs. Photograph by John Savini. . in -r^ *.\. *. t
increased at all cross sections. During the next lewDuring August 1957, East and West Emmons days the flow was concentrated into fewer channels,
Creeks did not always join near cross section No. 2. and most channels were in the left half of the valley At times East Emmons Creek flowed through an ice train between Nos. 5 and 7.
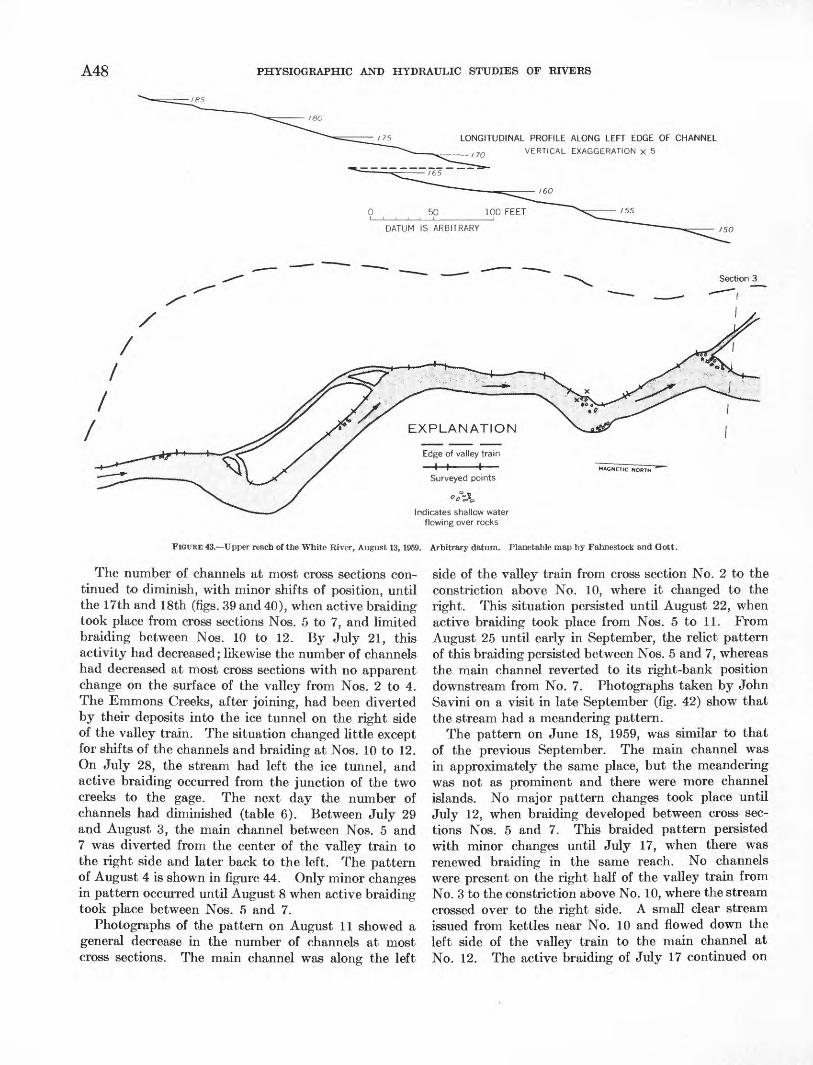
A48 PHYSIOGRAPHIC AND HYDRAULIC STUDIES OF RIVERS
LONGITUDINAL PROFILE ALONG LEFT EDGE OF CHANNELVERTICAL EXAGGERATION x 5
DATUM IS ARBITRARY
Section 3
Indicates shallow water flowing over rocks
FIGUKE 43. Upper reach of the White River, August 13, 1959. Arbitrary datum. Planetable map by Fahnestock and Oott.
The number of channels at most cross sections con tinued to diminish, with minor shifts of position, until the 17th and 18th (figs. 39 and 40), when active braiding took place from cross sections Nos. 5 to 7, and limited braiding between Nos. 10 to 12. By July 21, this activity had decreased; likewise the number of channels had decreased at most cross sections with no apparent change on the surface of the valley from Nos. 2 to 4. The Emmons Creeks, after joining, had been diverted by their deposits into the ice tunnel on the right side of the valley train. The situation changed little except for shifts of the channels and braiding at Nos. 10 to 12. On July 28, the stream had left the ice tunnel, and active braiding occurred from the junction of the two creeks to the gage. The next day the number of channels had diminished (table 6). Between July 29 and August 3, the main channel between Nos. 5 and 7 was diverted from the center of the valley train to the right side and later back to the left. The pattern of August 4 is shown in figure 44. Only minor changes in pattern occurred until August 8 when active braiding took place between Nos. 5 and 7.
Photographs of the pattern on August 11 showed a general decrease in the number of channels at most cross sections. The main channel was along the left
side of the valley train from cross section No. 2 to the constriction above No. 10, where it changed to the right. This situation persisted until August 22, when active braiding took place from Nos. 5 to 11. From August 25 until early in September, the relict pattern of this braiding persisted between Nos. 5 and 7, whereas the main channel reverted to its right-bank position downstream from No. 7. Photographs taken by John Savini on a visit in late September (fig. 42) show that the stream had a meandering pattern.
The pattern on June 18, 1959, was similar to that of the previous September. The main channel was in approximately the same place, but the meandering was not as prominent and there were more channel islands. No major pattern changes took place until July 12, when braiding developed between cross sec tions Nos. 5 and 7. This braided pattern persisted with minor changes until July 17, when there was renewed braiding in the same reach. No channels were present on the right half of the valley train from No. 3 to the constriction above No. 10, where the stream crossed over to the right side. A small clear stream issued from kettles near No. 10 and flowed down the left side of the valley train to the main channel at No. 12. The active braiding of July 17 continued on

MORPHOLOGY AND HYDROLOGY, WHITE RIVER, MOUNT RAINIER, WASHINGTON
-.-,.-,,__.,,_. -^mA49
FIGURE 44. Relict braided pattern of August 4,1958. .Discharge is approximately 220 cfs. Note stream through ice tunnel.
the 18th, and pattern changes were rapid between Nos. 10 to 12 on the 19th. Fig. 45 shows changes between July 19 and 21 in channels near No. 10. The braided pattern persisted with shifting channels and bar development in the reach between Nos. 5 and 7, and on July 24 vigorous braiding took place from No. 3 to the gage, although no streams were present on the right half of the valley train above No. 10. This pattern persisted with minor modifications and a decrease in the number of channels until the middle of August, when the gradual development of a meander ing pattern became apparent, although a number of islands remained. This meandey pattern continued to develop into September. October, November, and December storms may have caused the stream to revert temporarily to a braided pattern after each storm.
FEATURES OF THE WHITE RIVER CHANNEL PATTERNS
Features of the White River patterns are shown in figures 41 and 46 to 48. Figure 46 shows the braided pattern and water-surface profile near cross section 7 Inspection of the panoramas suggests the flows of August 20-25 were probably responsible. For a detailed map of the feature called topographic nose,
see figure 47 (August 26). On that date the nose, which had already developed, was gradually being modi fied. The depths of water are shown by means of bot tom and water-surface contours. Such features appear to be a type of small alluvial fan and are quite common on the valley train. Other examples are shown in figures 48 and 41. In each example there is a relatively deep and swift reach upstream which is confined by either cutbanks or "levees." At the end of this reach, the water spreads and flows in several directions in sheets or in a num ber of poorly defined channels. When the feature first develops, boulders rolled through the swift reach are deposited with a great amount of noise and splashing on the bars at the end of the chute. Often the deposition of these bars blocks other channels (right foreground, fig. 39), forming pools. A delta is then built into the pool from the main stream and from the blocked stream with fine material settling out in the deeper and quieter portions of the pool. These deposits are the only concentrations of fine materials on the valley train.
The subsequent history of the nose depends on the amount of water and sediment delivered to it. Often a decrease in load occurs at some time after deposition of the nose with a consequent channeling of the deposits

A50 PHYSIOGRAPHIC AND HYDRAULIC STUDIES OF RIVERS
A'
Cross section 10
EXPLANATION
Position of main channel July 19; other channels did not change
FEET O-i
SECTION A-A'50
VERTICAL EXAGGERATION x 5
BFEET28-,
B'
SECTION OF LEVEE B-B'0 5 10
NO VERTICAL EXAGGERATION
FIGURE 45. White River near cross section 10, July 21,1959. Planetable map by Fahnestock and Gott.
and concentration of flow. If sufficient material is available as a result of this scour, the nose may then be left in the form of cut banks and levees and a second nose deposited downstream.
The term "nose" has been used here, as these features actually project above the general slope of the valley train. It is possible to sit on the streambank near one of these features and watch the water rolling boulders at eye level only a few feet away across the stream. These noses or alluvial fans may be similar in some respects to the horseshoe bars described by Hjulstrom (1952, p. 340).
Contrary to what might be considered normal behavior for a stream, White River channels are often not in depressions but along the top of a ridge. This ridge is formed by the natural levees like those shown in figures 45 and 48. Striking changes in alinement and pattern are caused by deposition of levees that shift the position of the channel, confine it, or block off a channel entrance, thus diverting the flow to another channel as if a valve had been closed. These levees may be similar to the features described by F. E. Matthes (1930, p. 109). Levees may be formed also by the coalescing of bars in a bed of the river, confining

MORPHOLOGY AND HYDROLOGY, WHITE RIVER, MOUNT RAINIER, WASHINGTON A51
EXPLANATION
Well-defined channel
Poorly defined channel
LONGITUDINAL PROFILE OF MAIN CHANNEL
VERTICAL EXAGGERATION x 10
Main channel Arrow size reflects relative flow
Area of "nose" mapped August 26,1958
43.8DATUM IS ARBITRARY
FIGURE 46. Relict braided pattern of the White River, September 3,1968. Planetable map by Fahnestock and Bond.
the flow to a narrower and deeper channel. These bars appear to be similar to those described by Hjulstrom (1935, p. 340). Hjulstrom pointed out that the thal- weg of a glacial stream is not necessarily on the outside of these bends, as in a normal channel, but may occur in the middle or on the inside of the bend. Bars are formed quite rapidly under favorable conditions (fig. 39). Time-lapse photography is quite useful in record ing and analyzing the changes which take place.
Figures 41 to 43 show reaches of meandering channel. Water-surface slopes are shown for both figures 41 and 43, and the depth of water is shown along the thalweg in figure 41. It is interesting to note the common riffles or crossovers and pools are missing but there are periodic changes in slope which correspond to bends in the plan view. The water surface shows alternations of steep and gentle slopes as does the channel bottom. The gentle slopes are characterized by swift, relatively smooth flow, whereas that in the steeper part appears to be much more turbulent and the bottom much rougher. The fact that along the thalweg there appears to be little if any shallowing in the steeper reaches may well be misleading, as the mean depth may be less because of the greater irregu larity of the bed in these sections.
The "meanders" have the peculiar appearance of a series of bends connected by short straight reaches with swift quiet flow. The steeper parts a're usually associated with bends. From the sketch maps (figures
41, 43, 45, 46 and 48), it is apparent that no greater sinuosity is associated with the meanders than with the anastomosing channels. As Leopold and Wolman (1957) observed in several rivers, individual anabranches may meander, and meandering and braiding reaches may alternate along the stream channel.
ANALYSIS OF PATTERN
CHANNELS NUMBER, PERSISTENCE, AND LOCATION ON THE VALLEY TRAIN
Figure 49 shows the number of channels at each cross section for each discharge range. The com plexity of the problem of determining the cause of braiding and variation in number of channels is well illustrated by this figure. The direct relation between the number of channels and discharge at each cross section is qualified by the number of times that a particular discharge has occurred, probably because the more frequently a discharge occurs the more likely it is to occur at least once under optimum conditions for braiding, and because a lower discharge tends for a time at least to occupy most if not all of the channels of the preceding high flow. It is also qualified, as shown by figure 50, by the time of occurrence and duration of the particular discharge. If a lower dis charge occurs for several consecutive days following a higher discharge, the number of channels gradually
diminishes.

A52 PHYSIOGRAPHIC AND HYDRAULIC STUDIES OF RIVERS
EXPLANATION
Surface contour Interval 0.5 foot
Bottom contour Interval I foot
O O
Line of profile
Edge of waterVERTICAL EXAGGERATION x 10
DATUM IS ARBITRARY
FIGURE 47. White River nose. August 26,1958. For location see figure 46. Planetable map by Fahnestock and Bond.
The best correlation in figure 49 is that of number of channels with location on the valley train. This corre lation appears to be in part a function of the width of the valley train at that point. The factor of slope must be considered, but its role is obscured by the decrease in number of channels below the constriction between cross sections 7 and 10. One might surmise that opti mum conditions exist at cross sections 6 and 7 from the large number of channels. These cross sections have valley slopes of 0.04. This large number of channels occurs less frequently at the cross sections both up stream and downstream from Nos. 5 and 6, which are on higher and lower valley slopes. It is thought that slope may be a dominant factor and that the deposition which took place on Nos. 3 through 7 in 1958 may account for most of the material brought into this reach by the stream. This deposition deprived the stream of a heavy bed load farther downstream and lessened the likelihood of its braiding at Nos. 10, 11 and 12.
An alternative explanation to account for the number of bifurcations in a given reach emphasizes the impor tance of valley train width in conjunction with the dis tance below the glacier and distance between cross sec
tions. Two cross sections only a few feet apart are likely to have the same number of channels at the same time, and the number of chances a stream has to bi furcate is directly proportional to the length of reach and the number of channels within the reach. A chan nel along the valley wall is limited in its freedom to divide or migrate in the direction of the valley wall. This control operates where the valley wall is uncon- solidated, by heavily loading the impinging stream, and causing the deposition of a bar which diverts the flow from the wall. Thus, the longer the cross section and the farther it is downstream from a constriction, the greater the freedom to braid.
Constrictions exist at the junction of the East and West Emmons Creeks and between cross sections Nos. 7 and 10. Although from these considerations Nos. 3 and 11 should have a similar number of channels, No. 11 should have more because there are usually more channels upstream from the constriction. Fewer chan nels at No. 3 than at No. 11 might also be favored by the higher valley slope (0.075 ft per ft) as the com petency and capacity of the stream are likely to be greater than on the lower slopes at No. 11. Inspection

MORPHOLOGY AND HYDROLOGY, WHITE RIVER, MOUNT RAINIER, WASHINGTON A53
0 10 20 30 40 50 60 70 80 90 100 110 120 FEET
DATUM IS ARBITRARY
FIGURE 48 A braided reach of the White River between cross sections 5 and 6. Longitudinal cross section of thalweg and cross section of channel surveyed August 8.Planetable map, August 7,1959, by Fahnestock and Gott.
of figure 50 and table 6 verifies the number of channels, for the two cross sections are similar, No. 11 having slightly more channels than No. 3. The relatively large number of channels at No. 10 is due at least in part to the persistence downstream of some of the many chan nels at No. 7 in spite of the effect of the constriction.
RELATION OF PATTERN TO CHANNEL CHARACTERISTICS
It appears that channel pattern and the hydraulic characteristics of the channels should be related. Leopold and Wolman (1957, p. 63) found that
When streams of different patterns are considered in terms of hydraulic variables, braided patterns seem to be differentiated from meandering ones by certain combinations of slope, dis charge, and width-to-depth ratio. Straight channels, however, have less diagnostic combinations of these variables. The regular spacing and alternation of shallows and deeps is charac teristic, however, of all three patterns.
Their plot of the relation between slope and discharge (Leopold and Wolman, 1957, figure 46, p. 59) for the three types of channels braided, meandering, and straight showed that the line s=0.06 #°-44 divided meandering channels from braided ones for the streams that they studied. A braided pattern occurred on
higher slopes for a given discharge and at a higher discharge for a given slope than did a meandering pattern. No clear-cut relation was found for "straight" channels although most of. them lay above the line.
It was hoped that a study of the White River chan nels might aid in explaining the mechanism which produced this separation. A similar plot of the White River channels for which slope data were available showed, however, no such systematic division. All White River channels lay above the line in the braid region. The "pseudomeanders" of the White River occur on slopes and at discharges similar to those of the other patterns. The description of these "mean ders" as straight .channels joined by bends may be quite appropriate. An increase in discharge did produce a pronounced tendency to braid as is shown by the seasonal change from meandering to braiding (figs. 40, 42).
Leopold and Wolman (1957, p. 53) described the formation of a braided pattern in this way:A mode of formation of a braided channel was demonstrated by a small stream in the laboratory. The braided pattern developed after deposition of an initial central bar. The bar consisted of coarse particles, which could not be transported under local

3 SG SOw £ 'I
»2. S 5'
^ a.
|(O1
ffl
S
!oi P« sr8-
I"5
S a
§
3S" a sr o^
5 aff
IP
1
§
» SV
S
15T P5
S" <? " ^
2. S ^ o g S 1 NUMBER OF CHANNELSS o " 21. <o j-i o
M "*"
in I M<- % - b a «- + p^ o r^ *j o" to 0 o " m D ^ +
tn 1 trf
7 ^M +
CO ' M
* <5i ^ P a " +w o u1 w § +
01 * *.0. +
1 tn
7 ,^M +
(A ' fO
* w ^ o S o. + £ tn * b g- 1 oj° 0 « * § ^ +
04 1 ^ 01 "*"
1 tn
7 K-
M +
in ' M-t^ S P a w + £ o ' 9 5' ' wo o * a A +
tn 1 tn
7 H-
in ' M ro g ~ o §. w + So ^ o 5" ' w O o "^ 00 D ^ 4.
o ' -f tn "*"
1 o,
7 _M +
W ' M (0 _L
CT» o ^. to 'cn S ' b 5' ' w0 o w ^ *. +
" tn +
1 tn
7 M +
S 1 § 1 1 | ¥
tn 1 tn
i
\t
N
1 (Jl - 1
' 5!
J 1
+ 1
I S
J> 1O
o
"
i c I
55
-̂
1
3
C
"-1 M Ok
'?
f a> x
K
! 8' E
j «
1- < 100 Cfs 4
Discharge ranges,
n Number of photographs taken

Cro
ss s
ectio
n 11
/\
X J1-tr K T
1- yi/\
Cro
ss
sect
ion
7
/\/\
1 /\/
\ V\
Cro
ss s
ectio
n 5
/""
"V*s
/\A
\l\
Cro
ss
sect
ion
3
g O I s
400
O
CO O
3g 3
007
U
J £
CO
UJQ
C|U
J2
00
gu.
100
JUN
EJU
LY19
58A
UG
US
TS
EP
TEM
BE
R
400
300
200
100
JUN
EJU
LY19
59A
UG
US
TS
EP
TEM
BE
R
FIG
URE
50.
Hyd
rogr
aph
of d
isch
arge
and
num
ber
of c
hann
els
at s
elec
ted
cros
s se
ctio
ns.

A56 PHYSIOGRAPHIC AND HYDRAULIC STUDIES OF RIVERS
conditions existing in that reach, and of finer material trapped among these coarser particles. This coarse fraction became the nucleus of the bar which subsequently grew into an island. Both in the laboratory-river and in its natural counterpart, Horse Creek near Daniel, Wyo., gradual formation of a central bar deflected the main current against the channel banks causing them to erode.
Time-lapse photography of White River channels showed the development of similar bars which had similar effects upon adjacent banks. Leopold and Wolman (1957) in their description of the formation of these central bars noted that materials were rolled across the surface of the bar and deposited in the quiet water downstream. Not all boulders in White River channels reached this quiet water, however. Figure 51 shows the "imbricate" structure of boulders which were rolled into position. Deposition of these bars usually occurred at high flows when the abundant bed load, set in motion by the increased velocity, com bined with the increased discharge to cause rapid widening and shallowing of the channel and the for mation of central bars. These bars became islands due to scour of adjacent channels or to a decrease in dis charge. Incipient bars may be seen developing in figure 10 (channel 26), in both channels of figure 11, and in figure 39. An increase in slope occurred in the vicinity of these bars which had divided the channel.
A braided pattern may also result from reoccupation of old channel beds. This was an important mecha nism in the formation of White River patterns. The major islands of the braided pattern shown in figures 39, 44, and 46 had such an origin. A pattern developed in this manner does not show an appreciable increase in slope for the divided channel over that for a single channel.
Leopold and Wolman (1957) and Rubey (1952) cite an increased width-depth ratio with channel di-
FIGURE 51. Imbrication of boulders on a bar. Man points in the direction of flow.
vision. It is possible, however, that this increase may be more apparent than real, owing to the method of computing width-depth ratio. Channel widths are the measured top-surface width of the channel. The depths used in computing the width-depth ratio are mean hydraulic depths computed by dividing cross- sectional area of flow by top width. Therefore, if several channels are lumped into one computation the resulting width-depth ratio may be several times larger than if the channels were treated individually.
White River channels, having a wide range of dis charges, have similar shapes. Maximum depths in anabranches may be as great as in the undivided chan nels. Bifurcation thus has no necessary effect on channel shape. Because a width-depth ratio based on the sum of anabranch widths does not give the same picture of channel shape as a width-depth ratio based on individual channels, it is thought that all channels should be treated as individuals even if lo cated in a braided reach.
RELATION OF PATTERN TO ELEVATION CHANGE
The concept of a braiding stream as an instrument of aggradation is generally accepted. A braided stream as an agent of degradation may not be quite as familiar.
Mackin (1956) mentioned braiding in a "stable or slowly degrading reach." Leopold and Wolman (1957, p. 53) stated:Braiding is not necessarily an indication of excessive total load. A braided pattern, once established, may be maintained with only slow modifications. The stability of the features in the braided reaches of Horse Creek suggests that rivers with braided patterns may be as close to quasi-equilibrium as are rivers pos sessing meandering or other patterns.
At two places during the White River study degradation and braiding were closely associated.
Degradation took place at cross section 3 during period 2b, July 25 to August 5, 1958 (table 5), when there was a net erosion of 1.9 feet. Figure 52 shows that at least half of the valley train at cross section 3 is covered by water in 3 or 4 channels. This photo graph, the only record of the channel pattern for this period, shows that the stream which removed the material was braided.
Cross sections Nos. 5, 6, and 7 showed a net elevation loss for period 6, June 20-July 25, 1959, of 0.2, 0.4, and 0.3 foot, respectively (table 5). As this degrada tion took place over less than half the length of the cross sections and as these calculated values are based on the entire length, the loss in elevation in the vicinity of the stream was at least twice as great. During this same period, there were from 1 to 6 channels at No. 5, 1 to 5 at No. 6, and 2 to 6 at No. 7 (table 6 and fig. 50). The greatest number of channels at each cross section

MORPHOLOGY AND HYDROLOGY, WHITE RIVER, MOUNT RAINIER, WASHINGTON A57
FIGURE 52. Braided pattern during the degradation of the valley train between cross sections 2 and 4. Arrows indicate the ends of cross section 3. 4:00 p.m., July 28,1958.
occurred during the highest discharges of the summer, when one would expect the greatest elevation change to take place. Active braiding was again associated with net degradation.
A similar situation appears to exist on the Sunwapta River below Athabaska Glacier, Alberta, Canada. There the recession of the glacier from its terminal moraine has created a small lake which serves as a settling basin to clarify the water of the river as it leaves the glacier. This river, as a result of lack of load, has cut 3 to 4 feet below the level of its former valley train, which now forms a terrace. This mechanism of terrace formation was described by Ray (1935). The terrace along the Sunwapta River is now beginning to develop a sparse vegetation of grasses and small plants. The stream, observed in September 1959 at a low stage, had numerous islands and reaches with multiple chan nels. It appeared as though it had braided actively with the higher discharges of the summer.
These three examples illustrate braiding of a degrad ing stream. It is concluded that both braided and meandering reaches can occur along the same stream, which may be aggrading, poised, or degrading. Braid ing is an indication of channel instability and does not conclusively define the regimen of the stream.
CAUSES OF A BRAIDED PATTERN
Several explanations have been offered for the phenomenon of braided channels by numerous authors who have dealt with the subject. Explanations are quoted for examination in light of the findings on the White River. At the risk of oversimplification it appears that they can be summarized under the head ings: erodible banks, rapid and large variation in discharge, slope, abundant load, and local incompetence.
ERODIBLE BANKS
Fisk (1943, p. 46) suggested that the character of the Mississippi River reflects that material through which it flows. He stated that the Mississippi has 1. A tendency to braid where bank caving is active. Bank
caving is active where sediments are easliy erodible. Sands are the most easily erodible sediments, less permeable sedi ments are tougher.
2. Tendency to braid where slope is steep and sediments easily erodible, and where slope is excessively low and load great.
Friedkin (1945, p. 16) in his model studies of meander ing, produced braiding in one test. He reported:This stream at first developed a series of bends, but erosion of banks was so rapid that the channel in the bendway became as shallow as the [point] bars. The flow overran the bars and dis-

A58 PHYSIOGRAPHIC AND HYDRAULIC STUDIES OF RIVERS
persed through the channel . . . No sand was fed at the entrance of this stream; braiding resulted solely from excessive bank erosion. As the channel shoaled and the bed of the river raised, the slope became steeper.
Mackin (1956) in describing the braiding of the Wood River of Idaho stated that the river
. . . meanders in a forest for many miles, braids in a 3-mile segment where the valley floor is prairie, and returns to a meandering habit where the river re-enters a forest. The river is stable or slowly degrading in all three segments. The essential cause of the drastic difference in channel characteristics in adjoining segments is a difference in bank resistance due to presence or absence of bank vegetation.
Much of the material in transport by the White River is probably derived from bank erosion; but this factor alone, although it may occasionally develop a braided pattern, is insufficient to cause the active braiding of White River channels. Frequently at the same time and discharge, both braided and meandering reaches were present on the valley train. At times the number of channels was increasing in one area while decreasing in another. Braiding and meandering were not limited to specific parts of the valley train. All such changes on the White River cannot be explained in terms of changing erodibility of banks but must reflect other factors that are more easily changed. It is possible that winnowing by the high flows of 1958 may have slightly decreased the erodi bility of the reach of the White River between cross sections 2 and 4, giving it a stability in 1959 relative to 1958. A more probable explanation for this relative "stability" is that in 1959 less bed load was transported through this reach, affording less oppor tunity for deposition within the channel.
RAPID VARIATION IN DISCHARGE
Doeglas (1951) stated that none of the frequently mentioned causes of braiding ("greater slope, loose debris, or greater discharge") accounted for the pattern of some rivers during the Pleistocene. He suggested (p. 297):
Large and sudden variations in the runoff seem to form braided rivers. A more regular runoff throughout the year gives a meandering river. The gradient and the available sedimentary material seem to be of little importance.
The White River does show a tendency toward adjustment to higher discharges where they are con tinued for a period of several days. In both 1958 and 1959, a discharge sufficient to produce radical changes in pattern at some profiles during June and early July produced relatively minor changes in August; for example, the number of channels at cross sections 3 and 5 during August 1958 varied from zero to 7 (fig. 50). The change in discharge and previous flow history appear to be almost as important as quantity of water
in producing changes in pattern. This may be an illustration of Doeglas' idea of discharge variation as a cause of braiding. It is a likely mechanism for de riving more load for the same discharge and might work as follows in a White River channel. During a period of low flow, the fine sediments would be win nowed from the bed of the channel in some places and deposited in others, but coarser sediments would be left on the bed. With a significant increase in dis charge, these coarser sediments would start to move and new supplies of finer materials would be uncovered. The increased discharge might also reoccupy aban doned channels and set in motion all the materials deposited in them by waning stages of the former stream. This excess of load would cause local deposi tion, which in turn would result in scour of adjacent banks and an increase in load. A more gradual increase in flow might allow the stream to develop a channel that could transport the increased load without forming bars and developing a braided pattern.
The frequency with which braided reaches are inter spersed with meandering reaches (Leopold and Wolman, 1957, and Mackin, 1956) and laboratory studies (Friedkin, 1945; and Leopold and Wolman, 1957) during which braiding was produced with no variation in discharge would seem to indicate that rapid dis charge variation is eliminated as a cause for braiding in most streams.
SLOPE
The suggestion that change in slope alone is sufficient to cause braiding does not explain phenomena observed along the White River. Braiding developed on slopes which range from 0.01 to 0.20, but only coincident with bed-load movement of coarse materials. The river frequently braids in one part of the valley train on slopes both higher and lower than slopes of other parts where it has only one channel. In some cases, slope may serve to aid the stream in setting in motion enough material to form a braided pattern. In others, it may serve only to maintain velocities so high that the deposition of bars does not take place.
ABUNDANT LOAD
Hjulstrom (1952, p. 310) stated:
A fundamental fact for understanding the braiding of rivers is the great sedimentary load which they carry.
Russell (1939, p. 1200, 1201) stated:
Available load seems to be the factor separating meandering from braided streams. A smaller load, in proportion to carrying capacity, at the moment, makes for meandering, a larger load for braiding * * * Those [streams] flowing through sandy or gravelly flood plains are more readily overloaded and therefore tend to anastomose, or display the effects of braiding.

MORPHOLOGY AND HYDROLOGY, WHITE RIVER, MOUNT RAINIER, WASHINGTON A59
Rubey (1952) in his report on the Hardin and Brussels quadrangles in Illinois suggested that the form of the Mississippi and Illinois Rivers in that area resembled a braided stream more closely than a meandering one, stating (p. 123)
* * * they follow somewhat crooked courses, it is true, but the curves are due not to meander growth but to diversion of the channel by large alluvial islands.
He noted (p. 124)
It is probably a significant fact that the islands are larger and more numerous at the mouths of tributary streams * * * An alternative interpretation explains most of the islands much more satisfactorily. Tributary streams commonly have steeper gradients and carry more debris per unit volume of water than the river; hence they deposit part of their load as deltas and as submerged bars across the tributary mouths. Some of the sand bars and flats built at times of flood stand well above the water level at low and normal stages of the river * * * some of the willow bars grow larger and higher until they become "timber islands" the surface of which is built to the level of the mainland flood plain and covered with dense growths of large hardwood trees. Once an island reaches this stage it becomes an essentially permanent feature.
The pattern changes of the White River in 1958, which were both more frequent and more widespread than those in 1959, illustrate the role that abundant bed load played when it was introduced to the section of valley train under observation. That the material was not derived by bank erosion within the area is evident from the net gain in elevation for the valley train (1.2 ft for the year, table 5). In 1959 the de crease in activity and relatively little braiding in the reach between cross sections 2 and 5 suggest that the braiding that did take place was largely caused by bed load derived within the reaches under observation. The net loss of elevation on cross sections 5 to 7 during the summer of 1959 suggests that material was derived from both bed and banks and that braiding occurred in a degrading reach of the stream.
To the writer's knowledge, it has not been suggested that a braided channel pattern can be developed with out an appreciable bed load. The common element in all the above explanations appears to be a movement of bed load exceeding local competence or capacity, and consequent deposition within the channel causing the diversion of flow from one channel into one or more other channels. Observations of braiding by the White River suggest that the rate of change of the pattern in a stream which is not restricted by resistant banks is con trolled by the amount of bed load. From observations of White River and the suggestions of authors cited, braiding is favored by the presence of erodible banks and fluctuations in discharge.
RELATED PROBLEMS
LONGITUDINAL PROFILE OF VALLEY AND EQUILIBRIUM IN A REGRADING GLACIAL STREAM
Many similarities exist between the White River as it deposits and reworks the materials of the valley train and the graded streams described by Gilbert (1877), Davis (1902), Kesseli (1941), Mackin (1948) and others. Mackin (1948, p. 471) defined a graded stream as * * * one in which, over a period of years, slope is delicately adjusted to provide, with available discharge and with prevailing channel characteristics, just the velocity required for the trans portation of the load supplied from the drainage basin. The graded stream is a system in equilibrium; its diagnostic charac teristic is that any change in any of the controlling factors will cause a displacement of the equilibrium in a direction that will tend to absorb the effect of the change.
He emphasized the idea of a system in long-term equilibrium while recognizing similar short-term changes in the regimen. Rubey (1952), Leopold and Maddock (1953), and Wolman (1955) have discussed the equilib rium adjustment of the channel cross section. Wolman (1955, p. 41) applied the term "quasi-equilibrium" to adjustments made by streams that were not related to the length of time a set of conditions exists. This term is perhaps unnecessary, as the diagnostic characteristic of a graded stream cited by Mackin above is just this tendency to adjust.
Mackin (1948, p. 477) recognized the similarities between streams that were raising the level of their beds and graded streams and suggested (p. 478) that the term "aggrading" be restricted to upbuilding at grade. The White River, during the period of study, would appear to fit this definition in the reach from the junction of the Emmons Creeks to the gage. As it appears to be cutting down upstream from the junction, it then could be described as a regrading stream showing adjustment between the variables of slope, channel, cross section, discharge, bed material size, and load.
INFLUENCE OF GLACIER REGIMEN ON THE DEVELOPMENT OF A VALLEY TRAIN
Emmons Glacier has retreated about 1 mile since 1910, most of this distance since 1930, and has advanced about 0.1 mile recently as shown in figure 3. The stream in 1958 and 1959 has deposited upon and eroded the valley train, resulting in net deposition in 1958 and net erosion in 1959. This response of the stream is probably related to the difference in weather and availability of material in the two years. It is apparent that the response is not related to the glacial advance of approximately 100 feet during this period. Observa tions of the stream, at the point at which it issues

AGO PHYSIOGRAPHIC AND HYDRAULIC STUDIES OF RIVERS
from the glacier and downstream, suggest that most of its load is derived by erosion downstream from the glacier. The effect of the stream on the valley train would then seem to be a function of the amount of water provided by glacial melt rather than a function of the load introduced directly to the stream from the glacier.
The glacial regimen would seem to be related to the valley-train deposits only through the quantity of water that it makes available to the stream and the debris that it has deposited, subject to erosion by the stream. For example, the melting back of Emmons Glacier has uncovered large quantities of debris which are now available to the stream. Continued advance of the Emmons Glacier may radically alter the availability of this material and thus cause changes downstream. Similarly, changes in position of the termini of conti nental glaciers of the past must have radically altered the availability of debris to their drainage streams. Such effects are probably restricted to the immediate vicinity of the glacier, as a stream on alluvium will derive a load within a short distance and this load will be determined by its discharge, gradient, and availability of readily erodible material.
If periods of glacial advance and retreat can be considered analogous to winter and summer on the White River, advance (winter) would provide much smaller discharges and less debris; and retreat (summer) larger discharges and more debris. This is obviously a great oversimplification, as there were winters and summers, in the glacial climate. An additional assump tion would be a constant rate of glacier flow because fluctuation in the glacier flow rate might change the position of the terminus without changing the discharge. The removal of a continental glacier from a drainage basin could well bring a decrease in the discharge of the stream, bringing to a close the deposition of a valley train.
While the regimen of Emmons Glacier has long-term effects in providing debris to the stream, the short-term effects of weather and runoff determine the rate of deposition and erosion, the hydraulic characteristics, and the pattern of the stream.
SUMMARY
1. Channels of the White River, developed in coarse noncohesive materials, are narrower, slightly shallower, and have higher velocities of flow on higher slopes at discharges of similar magnitude than channels with cohesive bank materials as exemplified by Brandywine Creek.
2. The extreme values of the intercepts (in the equations w=aQ b and v=kQm) for width and velocity, and the rate of change of width-depth ratio with dis
charge extrapolated for data on Brandywine Creek, may reflect the failure of the channel to adjust to small discharges and indicate a relation of intercept to bank material.
3. Although the stream had some load before it issued from the glacier terminus, most of its load was provided by erosion of morainic debris, mudflow, and valley-train deposits in the reach below the glacier.
4. Analysis of a sample of mudflow and valley-train deposits showed that 40 percent of the mudflow mate rial was less than 0.105 mm in comparison to 10 percent of the valley-train material, indicating removal of the finer fraction from the valley-train materials. Meas urements demonstrated a systematic decrease in median diameter of the valley-train materials coarser than 4 mm with distance from the source. The change of 60 mm in median diameter for the valley train materials that took place over a distance of some 4,200 feet is attributed to selective transportation. Increases in median diameter such as those 1.7 and 25 miles below the glacier terminus occur at new sources of coarse material.
5. If one accepts the hypothesis of Wolman and Miller (1960) that the dominant process occurs with sufficient frequency and magnitude to cause most of the changes observed, and is neither the frequent event, which is less than the threshold value, nor the infre quent catastrophic event, then it follows that the slope forming discharge for White River channels in this reach lies between 200 and 500 cubic feet per second.
6. When conditions are such that antidunes are developed, much material is carried through the section without deposition. The rate of movement of anti- dunes, therefore, cannot be used to estimate the total bed load, as is sometimes done with dunes.
7. Measurements of competency in White River channels as well as data from Hjulstrom (1935) and Nevin (1946) suggest that for coarse materials the "sixth power law" should be the 7.8 power law. Loga rithmic plotting shows that a line with a slope of 2.6 fits the White River data better than one with a slope of 2.0 (the "sixth power law" expressed in terms of linear di mensions rather than mass).
8. Evidence of the great amount of material trans ported by the White River is provided by the amount of erosion and deposition on the valley train. The average net elevation change for all profiles in 1958 was + 1.2 feet and in 1959, 0.1 foot. The abundant discharge and high gradients of both East and West Emmons Creeks, together with the unique conditions described for West Emmons Creek, and the widening of the valley train, provided this abundant load during the summer of 1958. The high gradients of the Emmons Creeks combined with the lower flows of 1959

MORPHOLOGY AND HYDROLOGY, WHITE RIVER, MOUNT RAINIER, WASHINGTON A61
supplied materials to the valley train in greatly reduced quantities, so that erosion exceeded deposition.
9. The channel pattern changed from "meandering" to braided with the onset of high summer discharges and returned to "meandering" with the lower dis charges of late summer and fall.
10. Flows in the "meanders" of the White River have relatively high Froude numbers. The "meanders" are a series of bends connected by short straight reaches of swift quiet flow; steeper gradients are usually as sociated with bends. It is apparent that there is no greater sinuosity associated with the meanders than with the anastomosing channels.
11. The wider the valley train and the farther it is downstream from a constriction, as exists at the junc tion of the Emmons Creeks, the more numerous the channels Avhen braiding occurs.
12. Leopold and Wolman (1957) described the formation of a braided pattern in a flume channel by the deposition of a center bar which subsequently be came in island. Observations of the White River show that a braided pattern may also result from the reoccupation of numerous old channels due to dep osition within the main channel as well as to high- flows which raise the water surface. This was an important mechanism in the formation and alteration of White River channel patterns. A pattern de
veloped in this manner does not show an appreciable increase in slope for the divided reach as did the channel divided by the deposition of & center bar.
13. Both braided and meandering reaches can occur along White River in reaches where it is aggrading, poised, or degrading. The pattern alone does not conclusively define the regimen of the stream.
14. Braided channel patterns cannot be developed without bed load. The common element in all ex planations of braiding appears to be a movement of bed load with local deposition within the channel, causing the diversion of flow from one channel into one or more other channels, or the deposition of chan nel bars and the development of islands. The rate of pattern change appears to be directly related to the amount of bed load.
15. The White River is a regrading stream showing- adjustment between the variables of slope, channel cross section, discharge, load, and size of the bed and bank materials.
16. Observations of the White River show that al though the regimen of the glacier has long-term ef fects in providing debris to the stream, the short-term effects of weather and runoff determine the rate of deposition and erosion, the hydraulic characteristics, and the pattern of the stream.

TA
BL
E 7
. C
hara
cter
isti
cs o
f th
e W
hite
Riv
er c
hann
els,
195
8-59
Cha
nnel
N
o.
1.
2
3.... ...
.....
4 ______ ..
5
6
8..... ..
....
.9
_
___ -
10
11.
12 13
14
15
16
17
18
19
20.
21.
22 _
_____ .
23
24
.
25.
26
27
28
29
30
31
32
33
34 35.
36.
07 38
3
9
40
41...
---
---
42.-
4o- --
----
----
44
- -----
45 -
46
... -
----
--
47
48
49
50- ---
51 52 53
54
55-
66
Dat
e
1958
6/
307/
1 7/
21
7/21
7/
21
7/13
8/
3 8/
38/
7 8/
7
8/7
8/15
8/
15
8/18
8/
18
8/18
8/
19
8/19
8/
19
8/19
8/19
8/
19
8/19
8/
20
8/20
8/21
8/
21
8/21
8/
21
8/25
8/25
8/
25
8/25
8/
25
8/25
8/25
8/
25
8/25
8/
25
8/25
8/26
8/26
8/
26
8/26
8/
28
8/28
8/
28
8/28
8/
29
8/29
8/29
9/
3
9/3
9/30
9/30
11/2
5
Ho
ur
Fro
m
1745
09
45
1750
17
50
1750
1500
15
00
1145
11
45
1145
16
48
1600
18
45
1845
1845
09
00
0900
14
15
1415
1415
18
55
1855
15
45
1545
0855
08
55
1030
10
30
1230
0925
1400
1445
1310
1425
To
1900
12
05
1935
19
35
1935
1608
16
08
1230
12
30
1230
1930
19
30
1930
09
20
0920
14
45
1445
1445
19
20
1920
16
30
1630
0915
09
15
1100
11
00
1010
1435
1520
1350
1505
Dis
char
ge(c
fs)
134.
0 12
4.0
183.
5 96
.7
12.8 .1
75
190.
0 35
.3
79.5
73
.7
85.3
42
.0
8.39
26
.7
18.6
163.
0 23
.7
134.
0 49
.6
211.
0
2.1
32.9
17
2.0
10.4
33
3.0
72.9
20
7.0
69.3
20
9.0 .07
.29
.02
.045
.2
3 .1
7
.22
.063
.0
05
.074
.2
5'
72.5
199.
0 9.6
2.9
13
0.0
147.
0 19
4.0
183.
0 1.
50
1.79 .7
6 93
.7
96.2
108.
0
106.
0
30.7
Wid
th
(fee
t)
18.0
18
.0
35.0
25
13 1.
5 25
18
22
21 18
15
.5
8.5
10
10.5
25
15
25
33
29 6 16
30
10
60 32
31
24
32 1.3
2.0 .78
.95
1.50
2.
75
2 1.10
.6
3 2.
40
4.10
16.8
27 9 5 24 28
28
28 7.8
6.5
4.5
24 24
22
22
15
Mea
n de
pth
(fee
t)
1.44
1.
47
.88
.87
.45
.078
1.
31
.58
.94
.84
.98
.72
.44
.96
.51
1.10
.6
4 1.
06
.56
1.21 .20
.56
.99
.50
1.01 .637
1.
18
.87
1.10
.0
5
.13
.04
.047
.1
5 .1
21
.093
.0
64
.027
.1
02
.202
0.93
1.31
.4
0 .2
7 1.
13
1.11
1.
27
1.24
.1
1 .1
9
.17
1.09
1.13
1.25
1.26
.65
Are
a (s
quar
e fe
et)
25.9
26
.4
30.8
21
.7
5.8 .117
32
.7
10.4
20
.6
17.7
17.7
11
.2
3.75
9.
6 5.
4
27.5
9.
6 26
.4
18.6
35
.0
1.2
9.0
29.7
5.
0 60
.7
20.0
36
.6
20.8
35
.2
.065
.266
.0
32
.045
.2
26
.333
.186
.0
70
.017
.2
46
.830
15.6
35.3
3.
6 1.
35
27.2
31.1
35
.5
34.8
.8
83
1.26 .7
6 26
.1
27.2
27.5
27.8
9.8
Mea
n ve
loci
ty
(fee
t pe
r se
c.)
5.17
4.
70
5.95
4.
45
1.93
1.5
5.80
3.
29
3.86
4.
16
4.82
3.
76
2.24
2.
78
3.46
5.93
2.
55
5.09
2.
67
6.03
1.75
3.
65
5.77
2.
0 5.
49
3.65
5.
16
3.34
5.
95
1.10
1.1 .5
1.
0 1.
0 .5 1.20
.9
.3
.3
.3 4.67
5.67
2.
66
2.15
4.
78
4.73
5.
46
5.27
1.
7 1.
3
1.0
3.59
3.53
3.96
3.92
2.93
Wat
er
surf
ace
slop
e (f
eet p
er
foot
)
0.01
4
.045
.0
28
.029
.023
.0
18
.030
.020
.0
29
.032
.0
22
.029
.027
.0
31
.023
.0
32
.026
.0
45
.025
.0
27
.024
.013
.0
26
.055
.0
092
.004
.002
5 .0
057
.015
.0
017
.001
7
.022
.032
.0
29
.039
.004
.0
30
.011
Fro
ude
num
be
r
0.76
.7
2 .9
0 .8
4 .5
1
« .9
5 .8
9 .7
4 .7
0 .8
0
.86
.78
.59
.50
.85
.98
.56
.95
.85
.90
.43
.86
1.02
.5
0 .9
6
.81
.92
.63
1.00
«.85
.5
3
0.43
«.
81
«.46
.
25
«.69
«.
63
.3
2
«. 16
6 «.
118
.85
.88
.74
.72
.79
.79
.84
.83
.90
.53
».4
3
.61
.58
.62
.61
.64
Max
i
mum
dep
th
(fee
t)
2.5
2.5
1.4
1.6
1.0
1.9
0.8
1.
5 1.
1
1.6
1.1 .5
1.5 .8 1.9
1.2
2.0 .9
1.7 .4
1.0
1.4 .9
1.8
1.4
2.1
1.2
1.6 .14
.16
.10
.08
.18
.19
.15
.11
.05
.17
.34
1.4
1.9 .6
.5
1.4
1.7
1.7
1.8 .24
.29
.25
1.9
1.9
1.0
1.9
1.4
Shap
e fa
ctor 1.7
1.7
1.6
1.8
2.2
1.4
1.4
1.6
1.3
1.6
1.5
1.1
1.6
1.6
1.7
1.9
1.9
1.6
1.4
2.0
1.8
1.4
1.8
1.8
2.2
1.8
1.
4 1.
4 2.
7
1.2
2.4
1.7
1.2
1.6
1.6
1.7
1.8
1.7
1.7
1.5
1.4
1.5
1.8
1.2
1.5
1.3
1.4
2.2
1.5
1.5
1.5
1.5
1.5
1.5
1.2
Ro
ug
h
ness
fa
ctor
n
'
.021
.067
.0
62
.054
.046
.0
42
.066
.038
.0
74
.054
.0
56
.047
.045
.0
45
.071
.0
49
.049
.0
62
.064
.0
44
.028
.040
.0
56
.045
.0
40
.045
.013
.0
20
.055
.0
45
.70
.045
.056
.0
52
.059
.013
.0
68
.048
Wid
th-
dep
th
rati
o 12
12
40
29
29 19
19
31
23
25 18
22
42
10
20 23
23
24
58
24 30
29
30
20
60 50
26
28
29
25 15
19
20
10
23 22
17
23
24
20 18 21
22
18
21 25
22
23
71
34 26
22 21
18
18
23
Dis
tance
ab
ove
gage
(f
eet)
5 40
0
1,30
0
800
2,00
0 1,
300
900
900
1,50
0
1,00
0
1,00
0
900
1,50
0
250
250
220
220
220
220
250
250 50
Bot
tom
con
ditio
n »
d
o
. .
-d
o ..
. ..
...
d
o
-do .
--do -
d
o ~
0.00
5-0.
04' p
avem
ent.
<.0
5' ..
..
<.0
5' p
avem
ent _
_
<0
.05
'
Dun
e ri
pple
s sa
nd -
. .-
-.d
o .
Cob
bles
, gr
avel
.
....
.do
---
----
----
..
do
- --
----
--
-...d
o --
----
---
San
dy ---
----
--
Roc
ky
Cob
bles
, gra
vel,
smal
l bon
lder
s.
Cob
bles
, sm
all,
boul
ders
. C
obbl
es,
grav
el,
smal
l bo
ulde
rs.
Gra
vel,
cobb
les.
Cob
bles
, w
avel
Dis
char
ge
mea
sure
m
ent
No.
1 2 3 3 3 3a
4 4 5 5 5 5a 6 6 6 7 7 8 8 8 9 9 10
10 11
11
12
12 13 13
13
13
14 15
16
17 18
19
20
21
21a
Rem
arks
(2).
Bou
lder
s ro
lling
thr
ough
se
ctio
n.
Smal
l ana
bran
ch.
Flow
in
crea
sed
duri
ng
mea
sure
m
ent.
3
(2).
Bou
lder
s ro
lling
thr
ough
sec
tion.
2 Fl
ow d
ecre
ased
aft
er m
easu
rem
ent.
Bou
lder
s ro
lling
thr
ough
sec
tion.
Muc
h m
ater
ial
mov
ing
alon
g bo
ttom
.^ «
Cha
nnel
26
loos
ing
flow
to
chan
nel
27 d
urin
g m
easu
rem
ent.
4 D
isch
arge
shi
ftin
g.
Smal
l cle
ar s
trea
m, l
ittl
e lo
ad.3
(3). (3).
Cle
ar w
ater
str
eam
.8("
). C
lear
wat
er s
trea
m.'
(').
(3). (3). (").
(3).
Muc
h m
ater
ial
mov
ing,
un
ifor
m
dept
h.
Flow
fas
t, tu
rbul
ent.
Flow
fai
rly
unif
orm
.
Flow
fas
t, un
ifor
m, s
light
ly m
uddy
. M
ater
ial
mov
ing
alon
g bo
ttom
. Fl
ow f
ast a
nd f
airl
y un
ifor
m.
Flow
ver
y sm
ooth
. C
hute
on
one
side
.
Whi
te w
ater
.
Do.
Flow
fai
rly
unif
orm
.
Do.
Cle
ar,
som
e sh
ore
ice,
wel
l fr
ozen
.'
Oi
bO

57-_
_-__
___.
_K
Q
10 60 61__
__. _
____
_6
2...........
63..-.
..--
...
64._
__. _
____
_65
--_-
_._ _
66...........
67.-
-. _
..__.
68.-
--.-
..--
.fiQ 7
0...........
71..-
- --.
.72...........
73--
----
.---
.74
-___
. ......
75.
76..... .
....
.77.-
..
. .
78
79.. ...
---_
__8
0..
. . _
____
__
81
82..
____
____
_
83
84 ........
85
.
86.. ..
.87
88- .
89
90-
91
92 -
-..
93
94
95
96
97..
98
..
....
99
_
__._
._
100 ..
101.
.. .......
102.
___ ..
.10
3... .......
10
4
10
5
10
6
1
07
10
8
......
109
.
110. .-
.
111.
.. ..
... -
11
2
...
.
1969 1/9
75/
27
6/18
6/19
6/19
6/19
6/30
6/30
7/2
7/2
7/2
7/9
7/0 7/9
7/10
7/10
7/11
7/11
7/11
7/13
7/15
7/15
7/17
7/17
7/19
7/1
0
7/21
7/21
7/21
7/21
7/21
7/24
7/30
7/31
7/31
7/31
8/1
8/3
8/5
8/5
8/9
8/13
8/13
8/17
8/24
8/24
8/24
8/24
8/28
8/28
9/22
9/22
11/1
0
11/1
0
11/2
7
11/2
7
1215
1230
1830
1840
1100
1520
1536
0930
1040
1100
1400
1505
1530
1715
1820
1850
0934
1233
1345
1730
1833
1435
1530
1714
1728
1543
1617
0945
1415
1640
1855
1800
1830
1449
1135
1300
1540
1022
1108
1410
1600
1055
1300
1230
1310
1210
1230
1235
1305
1225
1255
1845
1930
1534
1543
1035
1050
1110
1440
1457
1512
1554
1735
1822
1850
1920
1603
1453
1514
1548
1728
1744
1802
1811
1630
1655
1055
1545
1715
1930
1848
1855
1605
1200
1330
1600
1038
1123
1502
1620
1155
1350
1305
1315
1225
1245
1305
1313
5.39
48.8
2
135.
357
.48
53.5
389
.18
100.
3010
.210
9.96
7.79
4.28
108.
948.
773.
16
143.
9817
3. 3
0.4
145.
9
84.1
118.
812
7.8
46.9
175.
978
.5
211.
9
298.
02.
516
.0
18.0
26.0
432.
023
8.0
223.
0
281.
0
170.
027
3.0
182.
0 .96
177.
020
1.0
55.1
180.
0
170.
0
133.
08.
014
5.0
14.0
149.
0
165.
086
.0 1.7
19.0 7.0
39.0 3.0
8 23 19 28 16 16 19 7 30 14 13 26 14 6.5
39 23 2.5
24.5
31 20 19.5
14.5
34 23 24 23 29 7 16 16 28 28 29 29 30 30 28 7.2
31 28 11.2
24 20 24 9 32.5
11 27 32 20 6 16 10 15 6
.44
.72
1.33 .66
.81
1.01
1.15 .47
.86
.34
.34
1.01 .41
.42
.94
1.38 .16
1.18 .68
1.07
1.36 as
1.00
1.01
1.12
1.18
1.13 .23
.41
.53
.51
2.08
1.05
1.47
1.69
1.60
1.53
1.24 .211
1.08
1.34 .94
1.35
1.48
1.12 .37
.94
.53
1.10
1.00
1.23 .38
.53
.33
.93
.48
3.5
16.5
25.2
18.4
13.0
16.2
21.9
3.3
25.8
5
4.8
4.45
26.4 5.8
2.7
36.7
31.7 .4
29.0
21.2
21.4
26.4
12.7
34.0
23.2
26.8
27.1
32.7 1.6
6.5
5.8
8.2
58.2
29.4
42.5
49.1
48.1
46.0
34.6 1.52
33.5
37.5
10.5
32.3
29.6
26.8 3.3
30.4 5.8
29.8
32.1
24.7 2.3
8.6
3.3
14.0 2.9
1.54
2.96
5.37
3.12
4.12
5.54
4.58
3.09
4.25
1.62 .96
4.66
1.51
1.17
3.93
5.47 .92
5.03
3.97
5.55
4.84
3.69
5.17
3.38
5.73
7.83
9.12
1.56
2.4
3.05
3.48
7.43
8.10
5.25
5.73
5.61
5.92
5.27 .631
5.21
5.37
5.25
5.23
5.58
4.96
2.51
4.76
2.46
5.17
5.14
3.48 .74
2.20
2.11
2.78
1.03
.018
.017
.017
.022
.023
.016
.016
.018
.018
.016
.016
.011
.011
.022
.024
.014
.016
.014
.058
.033
.033
.020
.002
.027
.053
.062
.025
.017
.003
5.0
58.0
20
.41
.61
.83
.68
.81
.97
.75
.79
.81
.49
.29
.82
.41
.32
.71
.82
.40
.82
.85
.94
.73
.69
.91
.59 <u
1.27
1.51 .57
.66
.74
.86
.91
1.38 .76
.78
.78
.84
.83
.24 ss .82
.95
.79
.81
.83
.73
.86
.59
.87
.91
.55
.47
.53
.65
.51
.26
8. 1.0
2.1
1.1
1.0
1.5
1.6 .8 1.5 .6 .5 1.4 .7 .6 1.5
1.9 .3 1.8
1.1
1.9
1.8
1.4
1.6
1.8
1.5
2.3
1.8 .4 .6 .9 .8 3.2
2.2
2.8
3.0
2.9
2.9
2.0 .28
2.2
2.0
1.7
1.8
2.5
1.7 .6 1.4 .8 2.0
1.9
2.0 .5 .7 .5 1.7 .7
1.8
1.4
1.6
1.7
1.2
1.5
1.4
1.7
1.7
1.8
1.5
1.4
1.7
1.4
1.6
1.4
1.9
1.5
1.6
1.8
1.3
1.6
1.6
1.8
1.3
1.9
1.6
1.7
1.5
1.7
1.6
1.5
2.1
1.9
1.8
1.8
1.9
1.6
1.3
2.0
1.5
1.8
1.3
1.7
1.5
1.6
1.5
1.5
1.8
1.9
1.5
1.3
1.3
1.5
1.8
1.5
.042
.042
.071
.054
.051
.060
.042
.039
.028
.048
.047
.030
.046
.041
.033
.021 04
0.0
32
.046
.067
.066
.046
.036
.048
.063
.085
.042
.045
.018
.070
.054
18 32 14 42 20 16 16 15 35 41 38 26 34 16 42 17 16 21 46 19 14 16 34 23 22 20 26 30 39 21 31 13 27 20 17 19 20 25 35 29 21 12 18 14 22 24 34 21 24 32 16 16 30 30 16 12
30 200
150
300
500
240
300
200
250
250
300
180
280
160
100
150 25 50
.... .do .
____
.__-
-..
Bou
lder
s.. .
.........
Gra
vel,
cobb
les .
_ .
Co
bb
les.
bold
ers.
Cob
bles
, bo
ulde
r^,
grav
el.
22 22 23 24 24 24 25 25 26 26 26 27 27 27 28 29 30 30 30 31 31 32 32 33 33 34 35 36 37 38 39 40 41 42 43 44 45 45 46 47 48 48 49 49 50 50
2 ft
of s
now
on
vall
ey t
rain
.
mud
dy.
No
bed
load
mov
emen
t, r
ough
.F
low
sw
ift,
enla
rged
dur
ing
p.m
.
Flo
w s
wif
t.B
ould
ers
roll
ing.
Flo
w f
ast
and
unif
orm
.
Chu
te
alon
g le
ft
edge
dr
aini
ngke
ttle
s.
Und
erfl
t st
ream
.C
lear
str
eam
.
Flo
w s
wif
t.D
o.R
ocks
to
0.
5 ft
ro
llin
g th
roug
hse
ctio
n.
Bou
lder
s ro
llin
g, s
hook
gro
und.
Flo
w s
wif
t.
Flo
w s
wif
t.
Flo
w s
hift
ed s
omew
hat
into
ch.
82 d
urin
g m
easu
rem
ent.
M
ater
ial
8-10
in.
mov
ing.
Cob
bles
and
bou
lder
s m
ovin
g al
ong
bott
om.
Mud
dy,
boul
ders
an
d
cobb
les
mov
ing.
Flo
w t
urb
ule
nt.
Cob
bles
rol
ling
, fl
ow t
urb
ule
nt.
Flo
w
fast
, tu
rbule
nt,
ve
ry
tiig
hsl
ope.
S
tand
ing
wav
e in
se
ctio
n,
flow
swif
t.
Occ
asio
nal
boul
der
roll
ing.
Cha
nnel
sl
ight
ly
unde
rflt
an
dsp
read
out
. M
ater
ial
mov
ing
alon
g bo
ttom
.
Do.
Wat
er
mil
ky.
Up
to
4 ft
sn
ow,
2 ft
sho
re i
ce.8
D
o.
Flo
od o
f N
ov.
22 w
iden
ed c
ontr
olar
ea.6
D
o.
1 L
arge
st m
ater
ial
pres
ent
is g
iven
as
bott
om c
ondi
tion
.2
Wat
er t
empe
ratu
re m
easu
red
and
wit
hin
35°-
39°
rang
e.3
Pig
my
curr
ent
met
er u
sed.
4 M
easu
rem
ent
of l
oad
mad
e in
rea
ch a
t ti
me
of d
isch
arge
mea
sure
men
t,
mea
sure
men
t.
* W
ater
tem
per
atu
re m
easu
red
and w
ithi
n'32
°-34
° ra
nge.
«
Bas
ed o
n fl
oat
velo
citi
es.
See
tabl
e 3
for
dat
a on
loa
dO
i CO

A64 PHYSIOGRAPHIC AND HYDRAULIC STUDIES OF RIVERS
TABLE 8. Bed load of the White River [Asterisk (*) indicates L, length; W, width; H, height]
Date, timeChannelwidth (feet)
Depth (feet)
Max. Mean
Tractive force
Maximum velocity (fps)
Point Float
Meanvelocity
(fps)
Slope(feetper
foot)
Load
Dimensions* 5 largest boulders
vicci/ (L) (W) (H)
(Lbs per min
per ft)
Discharge(cfs) Remarks
Screen-Caught Samples
7/8/58, 1730 hrs.. .. ......
7/8/58, 1730 hrs... ..........
7/8/58, 1730 hrs.- ...........
8/3/58, 1500-1600 hrs....
8/5/58, 1500-1600 hrs.._
8/3/58
8/3/58
8/7/58, 1540 hrs. .......
8/9/58, 1730-1800 hrs.
8/15/58, 1648 hrs. ......
8/20/58, 1545-1 630 hrs... ..
8/21/58, 0835-0915 hrs
8/21/58, 1115 hrs.
7/13/59, 0934 hrs..... ..
7/9/59, 1645 hrs... ..........
7/9/59, 1710 hrs.............
is
25
27
15.5
60
31
09
20
26
26
1 9
.9
1.7
1.2
1.05
1.4
1.1
1.3
1 9
1.3
1.0
.58
1 Q
2.7
s.66
.7
2.87
79
1.01
1 IS
1.1
1.07
1.01
1.01
0 79
.57
.53
1 i<*
2 f\A
81.03
1 90
1 99
9 ftft
fit
2.04
1 91
1 81
1.24
1.07
1.07
1 ft 9
1 ft 9
1 ft 9
4.5
6 0
4 9
4 0
1 7.5
6.8
Q QO
7.6
7 9
5.0
5.9
9 4
9 4
9 4
5.0
6 C
Q 0
7.1
8 a
10
U0.2
8 Q
1 A 1
9 9
Q {*
3 An
5 0
5.6
K 79
5.95
5.55
4 AA
0.012
fit 9
019
.045
.025
noo
09Q
/y>7
noo
(11 ft
019
097
1 ft
.017
.017
.32 .29 .18
.32 .25 .21
.32 .25 .18
.29 .25 .16
.37 .33 .16
.37 .25 .19
.25 .23 .15
.29 .21 .17
.25 .21 .17
.38 .34 .25
.38 .33 .21
.29 .26 .21
.39 .25 .16
.29 .25 .16oe 09 9C
.27 .22 .17
.25 .22 .16
.31 .18 .13
.13 .10 .07
40 37 20.50 .36 .19 .47 .36 .22 .48 .35 .31 .42 .35 .30
.35 .28 .20
. 36 . 25 . 11
.29 .25 .16OO OO OO
.24 .24 .18
.27 .23 .18
.25 .22 .19
.30 .19 .17
1.3 1.1 1.11.3 1.1 .9 1.3 .9 .9 1.1 .8 .8 1.1 .8 .6
7 7 K
.9 .6 .5
.8 .6 .4
.7 .6 .4
.7 .6 .3Q9 9K 1 K
.31 .23 .20
.21 .18 .13
.23 .18 .17
.19 .18 .18
8 7 AR
.8 .6 .50
.65 .6 .45
.65 .57 .30
.68 .55 .40
8 7 1
.7 .7 .5
.6 .5 .3
.45 .45 .27
.45 .45 .15QC CK Af\
.70 .43 .35
.53 .35 .30
.45 .35 .35
.45 .35 .30
9 7K 7
.8 .7 .6
.9 .6 .5
.9 .6 .5
.7 .6 .6
6 f A
20
50
7
114
44
Q9
107
1ft
09
35
4.9
330
206
119
109
109
0.05 ft screen.
pie; 0.05 ft screen.
ment 4; 0.05 ft screen.
ment 4; 0.05 ft screen.
smooth and gravelly.
Q measurement.
section about sta. 9; shook ground.
Sta. 21-23; channel 68; materialmoving was small.
Sta. 23-25; channel 68; 0.04 ftscreen.
See footnotes at end of table.
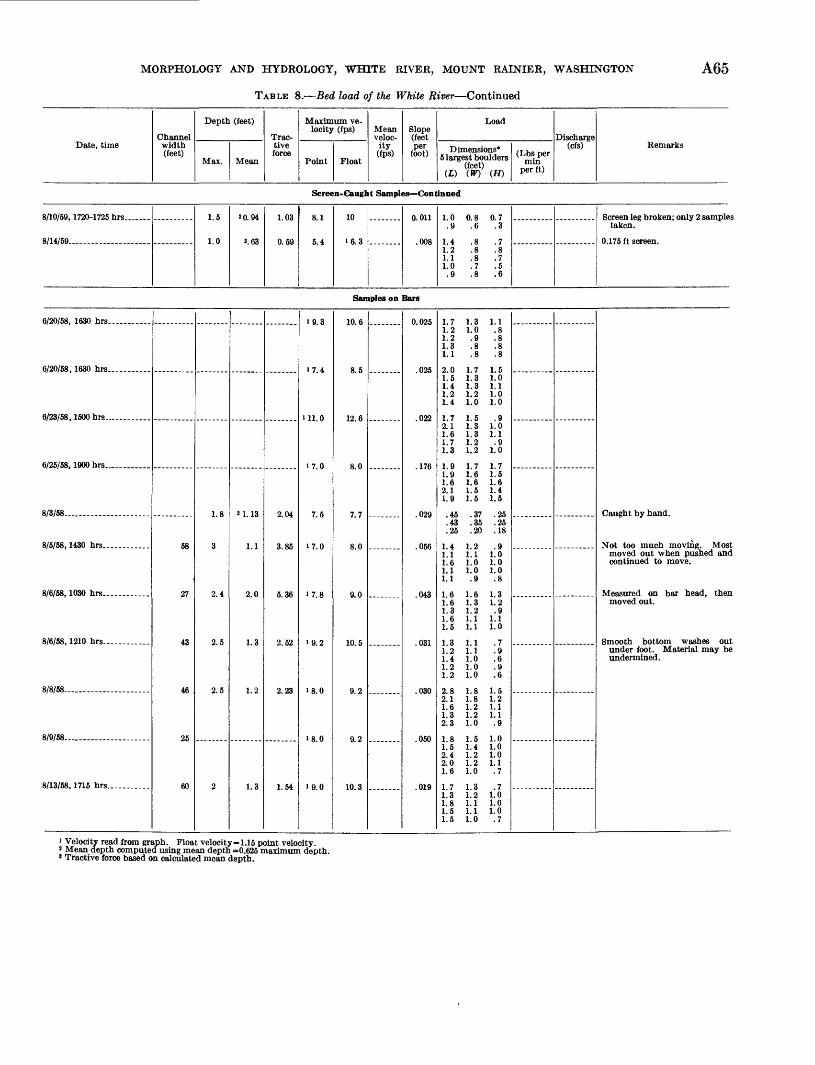
MORPHOLOGY AND HYDROLOGY, WHITE RIVER, MOUNT RAINIER, WASHINGTON
TABLE 8. Bed load of the White River Continued
A65
Date, timeChannel width (feet)
Depth (feet)
Max. Mean
Trac tive force
Maximum ve locity (fps)
Point Float
Mean veloc ity (fps)
Slope (feet per
foot)
Load
Dimensions* 5 largest boulders
(feet) (L) (W) (H)
(Lbs per min
per ft)
Discharge (cfs) Remarks
Screen-Caught Samples Continued
8/10/59, 1720-1725 hrs..
8/14/59 .
1.5
1.0
20.94
2.63
1.03
0.59
8.1
5.4
10
»6.3
0.011
.008
1. 0 0. 8 0. 7 .9 .6 .3
1.4 .8 .71.2 .8 .8 1.1 .8 .7 1.0 .7 .5 .9 .8 .6
Screen leg broken; only 2 samples taken.
0.175 ft screen.
Samples on Bars
6/20/58, 1630 hrs. ....
6/20/68, 1630 hrs.. ......
6/23/68, 1600 hrs. . .......
6/25/68, 1900 hrs... ......
8/3/68 _ ._....._.
8/5/68,1430 hrs...........
8/6/68, 1030 hrs .
8/6/68, 1210 hrs
8/8/58
8/9/68 .. ... . ..........
8/13/68, 1715 hrs. ....
68
27
43
46
25
60
1 Q
3
2.4
2.5
2.5
2
9110
2 n
1.3
1 9
1 Q
9 ClA.
3.86
5.36
2 CO
2 (>0
1.64
19.3
»7.4
Ul.O
17.0
7.5
17.0
17.8
'9.2
i & fl
«9.0
10.6
8 C
12.6
8 n
7.7
8 ft
9.0
10.5
9 9
Q 9
in Q
0.025
.025
.022
029
nee
043
ftqi
030
Hen
019
1.7 1.3 1.11.2 1.0 .8 1.2 .9 .8 1.3 .8 .8 1.1 .8 .8
2.0 1.7 1.51.5 1.3 1.0 1.4 1.3 1.1 1.2 1.2 1.0 1.4 1.0 1.0
1.7 1.5 .92.1 1.3 1.0 1.6 1.3 1.1 1.7 1.2 .9 1.3 1.2 1.0
1.9 1.7 1.71.9 1.6 1.5 1.6 1.6 1.6 2.1 1.5 1.4 1.9 1.5 1.5
.45 .37 .25
.43 .35 .25
.25 .20 .18
1.4 1.2 .91.1 1.1 1.0 1.6 1.0 1.0 1.1 1.0 1.0 1.1 .9 .8
1.6 1.6 1.31.6 1.3 1.2 1.3 1.2 .9 1.6 1.1 1.1 1.5 1.1 1.0
1.3 1.1 .71.2 1.1 .9 1.4 1.0 .6 1.2 1.0 .9 1.2 1.0 .6no f o fe
2.1 1.8 1.2 1.6 1.2 1.1 1.3 1.2 1.1 2.3 1.0 .9
1.8 1.5 1.01.5 1.4 1.0 2.4 1.2 1.0 2.0 1.2 1.1 1.6 1.0 .7
1.7 1.3 .71.3 1.2 1.0 1.8 1.1 1.0 1.5 1.1 1.0 1.5 1.0 .7
Not too much moving. Mosmoved out when pushed anc continued to move.
Measured on bar head, thermoved out.
Smooth bottom washes ouunder foot. Material may tx undermined.
1 Velocity read from graph. Float velocity=1.15 point velocity.2 Mean depth computed using mean depth =0.625 maximum depth. 8 Tractive force based on calculated mean depth.

A66 PHYSIOGRAPHIC AND HYDRAULIC STUDIES OF RIVERS
SELECTED BIBLIOGRAPHY
Arnborg, Lennart, 1955a, Hydrology of the glacial river Austur- fljot, chap. 7 of The Hoffellssandur a glacial outwash plain: Geog. Annaler, v. 37, nos. 3-4, p. 185-201.
1955b, Ice marginal lakes at H off ells jokull, chap, 8 of The Hoffellssandur a glacial outwash plain: Geog. Annaler, v. 37, nos. 3-4, p. 202-228.
Blench, Thomas, 1956, Scale relations among sand-bed rivers including models: Am. Soc. Civil Engineers Proc., Paper 881, p. 19-25.
Brockman, C. F., 1947, Flora of Mount Rainier National Park: National Park Service, 170 p.
Brush, L. M., 1961, Drainage basins, channels, and flow char acteristics of selected streams in central Pennsylvania: U.S. Geol. Survey Prof. Paper 282-F, p. 145-181.
Chow, V. T., 1959, Open channel hydraulics: New York, Mc- Graw Hill, 680 p.
Coombs, H. A., 1936, The geology of Mount Rainier National Park: Washington [State] Univ. Pubs, in Geology, v. 3, no. 2, p. 131-212.
Crandell, D. R., and Waldron, H. H., 1956, A recent volcanic mudflow of exceptional dimensions from Mount Rainier, Washington: Am. Jour. Sci., v. 254, no. 6, p. 349-363.
Davis, W. M., 1902, Base level, grade and peneplain: Jour. Geology, v. 10, no. 1, p. 77-111.
Dawdy, D., 1961, Depth-discharge relation of alluvial streams discontinuous rating curves: U.S. Geol. Survey Water-Sup ply Paper 1498-C, 16 p.
Doeglas, D. J., 1951, Meanderende en verwilderde rivieren (Meandering and braided rivers): Geologie en Mijnbouw, v. 13, no. 9, p. 297-299.
Fahnestock, R. K., 1959, Dynamics of stream braiding as shown by means of time lapse photography (abs.): Geol. Soc. America Bull., v. 70, no. 12, pt. 2, p. 1599.
Fisk, H. N., 1943, Summary of the geology of the lower alluvial valley of the Mississippi River: Vicksburg, Miss., U.S. Army Corps of Engineers, U.S. Waterways Exper. Sta., 30 October1943.
1944, Geological investigation of the alluvial valley of the lower Mississippi River: Vicksburg, Miss., U.S. Army, Corps of Engineers, U.S. Waterways Exper. Sta., December1944.
Flint, R. F., 1957, Glacial and Pleistocene geology: New York,John Wiley and Sons, 555 p.
Friedkin, J. F., 1945, A laboratory study of meandering ofalluvial rivers: Vicksburg, Miss., U.S. Army, Corps ofEngineers, U.S. Waterways Exper. Sta., 1 May 1945.
Frodin, Gustaf, 1954, The distribution of late glacial subfossilsandurs in northern Sweden: Geog. Annaler, v. 36, no. 1, p.112-134.
Gilbert, G. K., 1877, Report on the geology of the Hejjry Moun tains: U.S. Geog. Geol. Survey Rocky Mtn. Region (Powell), 160 p.
1914, The transportation of debris by running water:U.S. Geol. Survey Prof. Paper 86, 263 p.
Harrison, A. E., 1956a, Glacial activity in the western UnitedStates: Jour. Glaciology, v. 2, no. 19, p. 666-668.
1956b. Fluctuations of the Nisqually Glacier, Mount Rainier, Washington, since 1750: Jour. Glaciology, v. 2, no. 19, p. 675-683.
Hjulstrom, Filip, 1935, Studies of the morphological activity of rivers as illustrated by the river Fyris: Univ. Upsala [Sweden] Geol. Inst. Bull., v. 25, p. 221-527.
1952, The geomorphology of the alluvial outwash plains of Iceland and the mechanics of braided rivers: Internat. Geog. Congr., 17th, Washington 1952, Proc., p. 337-342.
1954a, An account of the expedition and its aims; chap. 1 of The Hoffellssandur a glacial outwash plain: Geog. Annaler, v. 36, no. 1, p. 135-145.
1954b, Geomorphology of the area surrounding the Hoffellssandur, chap. 4 of The Hoffellssandur a glacial outwash plain: Geog. Annaler, v. 36, no. 1, p. 169-189.
1955, The ground water, chap. 9 of The Hoffellssandur a glacial outwash plain: Geog. Annaler, v. 37, nos. 3-4, p.234-245.
Hoppe, Gunnar, and others, 1959, Glacialmorfologi och isrorelser i ett lapplandskt fjallomrade (Glacial morphology and inland-ice movement in a mountain area of Swedish Lap land): Geog. Annaler, v. 41, no. 1, p. 1-14.
Hoyt, J. C., and Grover, N. C., 1916, River discharge: 4th ed., John Wiley and Sons.
Hubley, R. C., 1956, Glaciers of the Washington Cascade and Olympic Mountains; their present activity and its relation to local climatic trends: Jour. Glaciology, v. 2, no. 19, p. 669-674.
1957, An analysis of surface energy during the ablation season on Lemon Creek Glacier, Alaska: Am. Geophys. Union Trans., v. 38, no. 1, p. 68-85.
Ippen, A. T., and Verma, R. P., 1953, The motion of discrete particles along the bed of a turbulent stream, in Proc. Minn. Internat. Hydraulics Convention: Joint meeting of Am. Soc. Civil Engineers and Tnternat. Assoc. for Hydraulic Research.
Jdnsson, J6n, 1954, Outline of the geology of the Hornafjordur region, chap. 2 of The Hoffellssandur a glacial outwash plain: Geog. Annaler, v. 36, no. 1, p. 146-161.
1955a, Tillite in the basalt formation in East Iceland, chap. 5 of The Hoffellssandur a glacial outwash plain: Geog. Annaler, v. 37, nos. 3-4, p. 170-175.
1955b, On the formation of frontal glacial lakes, chap. 8of The Hoffellssandur a glacial outwash plain: Geog.Annaler, v. 37, nos. 3-4, p. 229-233.
Kalinske, A. A., 1942, The role of turbulence in river hydraulics:Hydraulics Conf., 2d, State Univ. Iowa 1942, Proc., Iowa,State Univ. Bull. 27.
Kesseli, J. E., 1941, Concept of the graded river: Jour. Geology,v. 49, no. 6, p. 561-588.
King, Clarence, 1871, On the discovery of actual glaciers onthe mountains of the Pacific slope: Am. Jour. Sci., 3d ser.,v. 1, no. 3, p. 157-167.
Lane, E. W., 1937, Stable channels in erodible materials: Am.Soc. Civil Engineers Trans., v. 102, p. 123-194.
1955a, Design of stable channels: Am. Soc. Civil Engi neers Trans., v. 120, p. 1234-1260.
1955b, The importance of fluvial morphology in hydraulic engineering: Am. Soc. Civil Engineers Proc., v. 81, paper no. 745, 17 p.
Langbein, W. B., 1942, Hydraulic criteria for sand-waves: Am. Geophys. Union Trans., v. 23, pt. 2, p. 615-618.
Leopold, L. B., and Maddock, Thomas, Jr., 1953, The hy draulic geometry of stream channels and some physio graphic implications: U.S. Geol. Survey Prof. Paper 252, 57 p.

MORPHOLOGY AND HYDROLOGY, WHITE RIVER, MOUNT RAINIER, WASHINGTON A67
Leopold, L. B., and Miller, J. P., 1956, Ephemeral streams hydraulic factors and their relation to the drainage net: U.S. Geol. Survey Prof. Paper 282-A, 37 p.
Leopold, L. B., and Wolman, M. G., 1957, River channel patterns braided, meandering and straight: U.S.. Geol. Survey Prof. Paper 282-B, p. 39-85.
Mackin, J. H., 1948, Concept of a graded river: Geol. Soc. America Bull., v. 59, no. 5, p. 463-511.
1956, Cause of braiding by a graded river (abs.): Geol.Soc. America Bull., v. 67, no. 12, pt. 2, p. 1717-1718.
Matthes, F. E., 1914, Mount Rainier and its glaciers: NationalPark Service, 48 p.
1930, Geologic history of the Yosemite valley: U.S.Geol. Survey Prof. Paper 160, 137 p.
Matthes, G. H., 1941, Basic aspects of stream meanders: Am.Geophys. Union Trans. 22d Ann. Mtg., pt. 3, p. 632-636.
Miller, J. P., 1958, High mountain streams effects of geologyon channel characteristics and bed material: Socorro, N.Mex., New Mexico Inst. Mining and Technology, StateBur. Mines and Mineral Resources memo. 4, 53 p.
Nevin, C. M., 1946, Competency of moving water to transportdebris: Geol. Soc. America Bull., v. 57, no. 7, p. 651-674.
Pierce, R. C., 1917, The measurement of silt-laden streams:U.S. Geol. Survey Water Supply Paper 400, 42 p.
Ray, L. L., 1935, Some minor features of valley glaciers andvalley glaciation: Jour. Geology, v. 43, no. 4, p. 297-322.
Rigsby, G. P., 1951, Crystal fabric studies on Emmons Glacier,Mt. Rainier: Jour. Geology, v. 59, no. 6, p. 590-598.
Robertson, J. M., and Rouse, H., 1941, On the four regimes ofopen-channel flow: Civil Eng., v. 11, no. 3, p. 169-171.
Rouse, Hunter, 1946, Elementary mechanics of fluids: NewYork, John Wiley and Sons.
Rubey, W. W., 1937, The force required to move particles ona stream bed: U.S. Geol. Survey Prof. Paper 189-E,p. 121-141.
1952, Geology and mineral resources of the Hardin andBrussels quadrangles (111.): U.S. Geol. Survey Prof. Paper218, 179 p.
Russell, I. C., 1898, Glaciers of Mount Rainier: U.S. Geol.Survey Ann. Rept. 18, pt. 2, p. 349-415.
Russell, R. J., 1939, Louisiana stream patterns: Am. Assoc.Petroleum Geologists Bull., v. 23, no. 8, p. 1199-1227.
Schaffernak, F., 1922, Neue Grundlagen fur die Berechnungder Geschiebefuhrung in Flusslaufen: Deuticke, Leipzigund Wien.
Schumm, S. A., 1960, The shape of alluvial channels in relationto sediment type: U.S. Geol. Survey Prof. Paper 352-B,p. 17-30.
Sharp, R. P., 1942, Mudflow levees: Jour. Geomorphology,v. 5, no. 3, p. 222-227.
Sharp, R. P., and Nobles, L. H., 1953, Mudflow of 1941 atWrightwood, Southern California: Geol. Soc. AmericaBull., v. 64, no. 5, p. 547-560.
Sigafoos, R. S., and Hendricks, E. L., Botanical evidence of themodern history of Nisqually Glacier, Washington: U.S.Geol. Survey Prof. Paper 387-A, 20 p.
Simons, D. B., Richardson, E. V., and Haushild, W. L., 1961,Studies of flow in alluvial channels Flume studies usingmedium sand (0.45 min): U.S. Geol. Survey Water-SupplyPaper 1498-A, 76 p.
Sundborg, Ake, 1954, Map of the Hoffellssandur, chap. 3 ofThe Hoffellssandur a glacial outwash plain: Geog. An-naler, v. 36, no. 1, p. 162-168.
1955, Meteorological observations, chap. 6 of TheHoffellssandur a glacial outwash plain: Geog. Annaler, v.37, nos. 3-4, p. 176-184.
1956, The river Klaralven: Geog. Annaler, v. 38, nos.2-3, p. 127-316.
Tanner, W. F., 1960, Helicoidal flow, a possible cause of meandering: Jour. Geophys. Research, v. 65, no. 3, p. 993-995.
Tiffany, J. B., Jr. and Nelson, G. A., 1939, Studies of meandering of model streams: Am. Geophys. Union Trans., v. 20, pt. 4, p. 644-649.
U.S. Waterways Experiment Station, 1935, Studies of river bed materials and their movement, with special reference to the lower Mississippi River: Vicksburg, Miss., Paper 17, 161 p.
White, C. M., 1940, Equilibrium of grains on bed of streams: Royal Society (London) Proc., ser. A, v. 174, no. 950, p. 322-334.
Wolman, M. G., 1954, A method of sampling coarse river-bed material: Am. Geophys. Union Trans., v. 35, no. 6, p. 951-956.
1955, The natural channel of Brandy wine Creek, Penn sylvania: U.S. Geol. Survey Prof. Paper 271, 56 p.
Wolman, M. G., and Brush, L. M., 1961, Experimental study of factors controlling the size and shape of stream channels in coarse noncohesive sands: U.S. Geol. Survey Prof. Paper 282-G, p. 183-210.
Wolman, M. G., and Miller, J. P., 1960, Magnitude and fre quency of forces in geomorphic processes: Jour. Geology, v.
68, no. 1, p. 54-74.


INDEX
A PageAblation deposits, topography and character. -_ A19Abstract -- ---- ----------- 1Access to area....... .__._........._... 2Acknowledgments___ _ _ _ _ 2Analyses of particle size -.....--.-.--.-.---..-.. iS
pebble counts ............................ 24sieve analyses--..-......................... 23size-distance relation__................... 25size-slope relation............__.......... 25
Analyses of valley-train materials, size distribu tion................................ 24,25
Antidunes..---...------.--.--..-..._--._-... 12,23, «7measurement in White River __.... _... 28particle size in crest and troughs_......... 28
Area, relation to discharge--.--------------.-._ 12
B Bed load, sieve analyses..._.-.... -.-....... 26, S9
transportation of..._---------_......... 26Blench, Thomas, and Schumm, S. A., cited..,.. 9 Boulder fronts, in mudflow deposits_.--_.__.. 20 Braided pattern, abundant load...... ---------- 58
causes..-..-----__....................... 67credible banks__......................... 57formation of_.-.-..----.....-............ 53,56of degrading glacial stream_.............. 56rapid discharge variation._............... 58slope....-.-- ------------.-------.-..-.-. 68
Braiding......----.--._.._.-....-.-.-.-_---_-- 48Brandywine Creek----.--.------.-......------ 15
channel parameters___--_-_-_-_.......____ 14,15Brockman, C. F., cited...----.---.-.-.....-.... 5
Carbon River valley train, size distribution in. - 24,25 Channel parameters, White River and other
streams....-.-------._..._....._.--- lgChannel pattern, braided_.__.............. 53Channel shape...-.------.------------_......-- 9Climate.----------------------.--.--........... 5Coombs, H. A., cited..._--- _--_-____-_- 5Ciandell, D. R., and Waldron H . H., cited. _ 5
D Debris, materials of__ . ................... 19Depth, relation to discharge_................ 12Discharge fluctuations..._.------............... 12,55
relation to width, depth, velocity, and area. 12 Doeglas, D. J., quoted_...................... 58
E East Emmons Creek........................... 40,47Effective velocity, White River......... ...... 31Emmons Qlacier............................... 40
description..... --.-.. ............ ..._.. gerosion by.........---..............._...... 5history.-.-----.--. ..................... 3,6,7kettles - -.-_ -.___..._.. 7,8,9,40 positions.... ..... ...................... eprofiles of valley train and former glacier
surface... - ..-..-.............. 8relation of stream and glacial regimen _ - - _ - 2 setting and recent history......_-....._._-- 2,e
Emmons Glacier regimen relation to streamregimen..._..................._ 2
relation to valley-train deposits__......... 59
Page Emmons, S. F., quoted__.__..._------- A6Ephemeral streams, parameters............... 14Equilibrium in regrading glacial stream........ 59
F Fieldwork...................Fisk,H. N., quoted.........Flooding.. Flume channels, parameters. Friedkin, J. F., quoted......Froude numbers.-----------Frying Pan Glacier.........
flow from_--_-.-_._-.-
QGeology of area.... 5Gilbert, G. K., quoted.............. - .. 27,30Glacierized drainage basin, comparison with
normal...----.-.------.--.-------.- 1regimen............. .-.-.... ........... 1,3
Glacier regimen, influence on valley train.--.. 59
H HjulstrSm, Filip, cited............. 2,2 ,30,51,58Hydrograph, 1958-59 ---------------------- 11
Iceland, sandurs of.......-.-.-.. --.-.....-.- 2Ice tunnels.-. .----.--------------- 6,8,38,40,47,48Imbrication.. _---_-----_--.---------------- 56Inter Fork. __- ___ . - - 2
flooding effects.._............-...-.---... 12Investigations, previous...----,---------------- 2
Johnson, Arthur, cited.
KKettles..------------------.---------- ----- 46,48
deposition in...-.-..-..-_.--------- ------ 40formation of_ --- . 8
Keechelus andesites.--.-----.------------------ 5
Lane, E. W., quoted.--.---.----.-------------- t6Langbein, W. B., quoted...-.- -.-.-....-... 27Leopold, L. P., and Maddock, Thomas, cited.- 2
8,10,14Leopold, L. B., and Miller, J. P., cited -... 14 Leopold, L. B., and Wolman, M. G., cited. 51,53,56 Levees, in mudflow deposits_. _.__._. 20,21,41
natural___________...- 50 Lodgement till. -------- . _ - 19Longitudinal profile of regrading glacial stream. 59 Longmire, weather records, 1958-59------------- 11
M Mackin,J.H.,cited ------------------------ 56,58Matthes, F. E., quoted. . _-_ 6Measurement methods and data analyses ... t6 Miller.J. P., cited.....------------------------- 2Moraines, dating of__...... -.-.... -- 6Morainic debris, features of. ___. - - .-- 19 Mount Rainier________.. .... 5
PageMount Rainier Continued
active glaciers on__._.._.-.-----.-- A2,3,4Mount Rainier National Park.... ---------- 2
geology of... --------------------------- 5vegetation of. _ -- . 5
Mount Rainier volcanics, rocks of ------------ 5Mudflow..--------------------------------- 40Mudflow deposits, features of._... ----- to
particlesize...---------------------------- 21West Emmons Creek...-------------------- 40
NNatural levees_................... - .-... 50Nevin, C. M., cited.-.-. ------------- 30Nisqually River valley train, size distribution
in.. ---------------------------- 24,25
Particle size of material in suspension _ ...... 32Particle size-tractive force, measurement in
White River.....--------------- 30Particle size-velocity relation, White River..... 30Pseudomeanders... 43,53
R
Regrading glacial stream, longitudinal profileand equilibrium- 59
Rigsby, G. P., cited -------------------- 6Rouse, Hunter, cited------------------------- 28Rubey, W. W., cited.--.-.--- ---------- 56,59Russell, R. J., quoted-. --------------------- 58
Sarvent and Evans, cited 6Sauberer and Dirmhirn, cited.. ------------- 11Selected bibliography......--------------------- 66Sigafoos and Hendricks, cited.. - _ 5,6 Simons, D. B., and others cited..-------------- 29Size distribution, valley train materials....----- 24Snoqualmie granodiorite ------------------- 5Source materials of the load ... ... 19Source materials, particle size, analyses of . tS
relative stability of....------------------- 21Source rocks, types. - ------- 6Southwestern States, channel parameters------ 14Stampede Pass, weather records, 1958-59 ...- 11 State-discharge relation ---------------------- 12
changes due to scour and fill --------- 10adjustments by Savini_ __. 10,11hydrographs. ---------------------------- 11,55
Storm effects -------------------------------- 11,4"Stream-gaging stations, locations - - - - ... 3,5,10Summary.. & Sundborg, Ake, cited ... ~- 2Sunwapta River 57 Supercritical flow.. 27 Suspended load, concentration-discharge rela
tion.... -.-. --- ---- 32particle size 32 transportation of. &
Till. 19
A69

A70 INDEX
Page Time-lapse photography--...----.----------- A51,56Topographip nose, or alluvial fans... 47,49,50 Tractive force, White River.. . 31 Transportation, erosion, deposition on valley
train.-....-. - 19Turbulence, White River___ - 31
U
U.S. National Park Service, glacier studies. _- Emmons Glacier..._.__------ -.
Valley profile, changes during period of study.. 42Valley train, channel pattern change.._ 2, If
definition....._____.___-..-. . - 1deposition over_____.-.-._-..-.. 12 materials of 2,79morainic debris____.____.. 19 mudflow deposits___________... 20 particle-size analysis..- .. ...- is present location...._ . 6source materials of the load__.__----- 19widening of_......... -__-_._-_--------- 4,42
Valley-train deposits..._____________ ii apparent cohesion in___ ___. _____. 22,23 as bed-load source..-_____.___.. 19,22 particle size_____________--... 22
Valley train formation, equilibrium__ _. __ 2 influence of glacier regime....____.--.. 2,69
Valley-train materials, size-distance relations... 25,26 size-valley-train-slope relation........___ 25,27
Vegetation........___...__________ 5,6Velocity, relation to discharge. _________ 12 Velocity measurements___________ 10,27,29 Volcanic mudflow, age_____________ 5
Waterfall ------------------------------- A42
Water surface slope_ 47,51,62 West Emmons Greek_...- 47 West Emmons Creek valley train -... . 40,41,42 West Fork White River 3,5
flooding effects...___ . 12 White, C. M., quoted.. 31White River Campground_ ... .-.._ 2 White River channel characteristics:
adjustment to load and discharge..-...-. 16,17,18 1958-59.. - 10,62comparisons___------ . - 14,15cross sections, width-depth ratio, shape factor
and Froude number.................__ 17,18discharge magnitude_ --...._.- 11flow characteristics..-.___ -____.. 18 Froude number...___________.. 17,18hydrology and hydraulic characteristics. ----- 2, 8hydraulic roughness.-... .... 18mode of change_____-.-_______ 16 parameters..____.___________ 13,74 shape.. . 15,16,17shape factor______ -..-.. 16, 17 slope-discharge relation.--...--.-------------- 53standing waves____-..----.-..--__.... 18velocity measurements.-.__-.__-------- 10water surface slope..- __.--..-.---_ . 18 width-depth ratio..... . .. ... 16, 17
White River channel pattern:analysis..__.____________------- 51braided pattern, causes. ... . -- 67changes during 1958-59_____________ 42
method of study___..__-----_.- 42description._______...___....___.. 4%
While River channel pattern Con. Page features of:
deltas... . A49levees...... ____ . ... ______ 49,50pools.. . . . 8,40,46,48,49topographic nose ___________ 47, 49, 50
location on valley train.. .. ________ 52meanders...---.----.- _ .-.. __ .. __ 43number and persistence of channels _____ 51 relation between number of channels and dis
charge ________________ 51, 55relation to channel characteristics ______ 6$relation to elevation change. _________ 66relation to width of valley train ________ 52
White River drainage basin, snow and ice cover _ 11White River sediment transport, analysis of com
petence.... . _ .. . ___ . ___ 29bed load, July-Aug. 1958....---- __ . __ .... 64erosion by .......... ________ 5particle size- velocity relations.. ________ #9tractive force.. _____ ... _____ .. ___ 89velocity measurements... ____ _____ 27,29
White River study area, physical features. __ 8,8,4White River valley, glacial geology. ______ 6White River valley train elevation and volume
change ________________ SScomputation of. _______________ 35cross-section surveys ____________ S3measurement methods ___________ SSon surveyed cross sections. _________ S6size distribution in... ____________ 24source of deposits, 1957-60.. _________ 40
Width, relation to discharge __________ 12Width-depth ratio, computation of... ___ __ 56
relation to discharge _____________ 16Winthrop Glacier... ...... _ . ___ . _____ 5Wolman, M. G., cited... ........ 2,10,18,14Wolman, M. G., and Brusn, L. M., cited.. 10, 15, 16, 43Wolman, M. G., and Miller, J. P., cited. 26
Yakima Park, climate.
A U.S. GOVERNMENT PRINTING OFFICE : 1967 O - 256-9