PHYSICO-CHEMICAL CHARACTERIZATION OF STREAM ...
15
GSJ: Volume 8, Issue 3, March 2020, Online: ISSN 2320-9186 www.globalscientificjournal.com PHYSICO-CHEMICAL CHARACTERIZATION OF STREAM W ATER IN MAICHEW AREA, SOUTHERN TIGRAY , ETHIOPIA. Kaleab Adhena 1 , Samuel Estifanos 2 , Miruts Hagos 3 and Berhanu Abraha 4 1 Aksum University, Shire Campus. School of Mines, Department of Geology.Email: [email protected] 2 Mekelle University, School of Earth Sciences, corresponding Author (P.O. Box: 1318, Mekelle, Ethiopia). Email; [email protected]. 3 Mekelle University, School of Earth Sciences. Email: [email protected] . 4 Bahir Dar University, Department of Biology. Email: [email protected] Key words:Brewery effluent, physicochemical parameters, stream water, Water quality index ABSTRACT The study evaluated the quality of stream water of Maichew area,Ethiopia. Water samples were collected from eight sites and 39 physicochemical and bacteriological parameters were analyzed to determine the anthropogenic contribution to the river water quality. CO 3 , PO 4 , F, NO 2 , NH 4 , Mn, and Cu content are marginal to detection limits in all sites. The mean values of Turbidity, EC, Alkalinity, pH, DO, BOD, COD, TDS and Chloride content were 12.10NTU, 743.37μs/cm, 143.77, 7.85, 4.14, 21.80, 44.17, 530.10, and 9.21mg/L respectively. Zinc and arsenic are relatively higher on water samples under direct impact of Raya brewery effluent and Maichew particle board factories. The mean concentrations of Zn, As, Ba, B, Cd, Pb and Se were found to be 5.881, 0.663, 0.217, 0.196, 0.361, 0.117 and 0.032 mg/l respectively. Based on WHO standards, the surface water is not safe for drinking and bathing. Overall water quality index (OWQI) result of one site indicated “Good” while a site near brewery effluent fallsin “Heavily polluted” class. Most part showed fair quality status with OWQI values ranging from 57.90 to 62.42 showing the need for treatment before any use. Hence, undergoing proper managerial procedures is recommended to maintain safe water. GSJ: Volume 8, Issue 3, March 2020 ISSN 2320-9186 648 GSJ© 2020 www.globalscientificjournal.com
-
Upload
khangminh22 -
Category
Documents
-
view
0 -
download
0
Transcript of PHYSICO-CHEMICAL CHARACTERIZATION OF STREAM ...
GSJ: Volume 8, Issue 3, March 2020, Online: ISSN 2320-9186
www.globalscientificjournal.com
PHYSICO-CHEMICAL CHARACTERIZATION OF STREAM WATER IN MAICHEW AREA, SOUTHERN TIGRAY, ETHIOPIA. Kaleab Adhena1, Samuel Estifanos2, Miruts Hagos3 and Berhanu Abraha4
1Aksum University, Shire Campus. School of Mines, Department of Geology.Email: [email protected] 2Mekelle University, School of Earth Sciences, corresponding Author (P.O. Box: 1318, Mekelle, Ethiopia). Email; [email protected]. 3Mekelle University, School of Earth Sciences. Email: [email protected] . 4Bahir Dar University, Department of Biology. Email: [email protected]
Key words:Brewery effluent, physicochemical parameters, stream water, Water quality index
ABSTRACT The study evaluated the quality of stream water of Maichew area,Ethiopia. Water samples were collected from eight sites and
39 physicochemical and bacteriological parameters were analyzed to determine the anthropogenic contribution to the river water quality. CO3, PO4, F, NO2, NH4, Mn, and Cu content are marginal to detection limits in all sites. The mean values of Turbidity, EC, Alkalinity, pH, DO, BOD, COD, TDS and Chloride content were 12.10NTU, 743.37μs/cm, 143.77, 7.85, 4.14, 21.80, 44.17, 530.10, and 9.21mg/L respectively. Zinc and arsenic are relatively higher on water samples under direct impact of Raya brewery effluent and Maichew particle board factories. The mean concentrations of Zn, As, Ba, B, Cd, Pb and Se were found to be 5.881, 0.663, 0.217, 0.196, 0.361, 0.117 and 0.032 mg/l respectively. Based on WHO standards, the surface water is not safe for drinking and bathing. Overall water quality index (OWQI) result of one site indicated “Good” while a site near brewery effluent fallsin “Heavily polluted” class. Most part showed fair quality status with OWQI values ranging from 57.90 to 62.42 showing the need for treatment before any use. Hence, undergoing proper managerial procedures is recommended to maintain safe water.
GSJ: Volume 8, Issue 3, March 2020 ISSN 2320-9186 648
GSJ© 2020 www.globalscientificjournal.com
INTRODUCTION
Surface water pollution is a major challenge worldwide, which is caused by both natural processes and anthropogenic activities (Noori et al., 2010). In general evaluation of surface water quality in drinking water sources is important as they can be serving as one of the main pathways for the dissemination of toxic chemicals and pathogenic microorganisms (Lodder et al., 2010; Ouyang, 2005). There are numerous sources of pollutants that could deteriorate the quality of water resources (Tamiru, 2004). Identifying the source(s) of contamination and developing appropriate management strategies is essential to minimize potential public health risks (Carroll et al., 2006). The surface water quality can be affected by both point and nonpoint sources of pollution (Nnane et al.,2011). Point source pollution occurs from a single identifiable source such as effluents from industries and wastewater treatment plants (Hill, 2010), whereas nonpoint sources include runoff associated with a particular land use pattern such as urban (e.g., storm water, sewage overflows), agriculture (e.g., fertilizers, pesticides, animal manure), or forestry land uses (Bu et al., 2014). Entry of these sources into water can represent the improper discharge of toxic chemicals; therefore, water quality monitoring and sanitary risk identification are essential to protect the population from waterborne diseases and to develop appropriate preventive measures. In environmental systems, surface water is affected by multiple sources of chemical, physical or biological nature. It is important to understand the spatial and temporal variations in physico-chemical parameters for assessment and management (Razmkhah et al., 2010).
Likewise, in Maichew (the study area), where there is no such environmental protection practice, there are a number of pollutant sources that continuously deteriorate the quality of surface and ground water. The naturally active rivers found in the study area are commonly used for car washing purpose which could easily affect the physicochemical characteristics of the river water (Figure 1). Maichew particle board factory and Raya brewery are active point sources of effluent from which samples are taken to investigate presence of toxic heavy metals compared to municipal runoff and wastes.
It is obvious that good water quality is crucial for protecting people from chronic and/or acute health problems (Mahananda, 2010). In Maichew area, surface water is mostly used for domestic and agriculture purposes regardless of the quality. Therefore, current research work aims at dealing with the physico-chemical characterization of the surface water at Maichew drainage and the potential sources of pollution.
GSJ: Volume 8, Issue 3, March 2020 ISSN 2320-9186 649
GSJ© 2020 www.globalscientificjournal.com
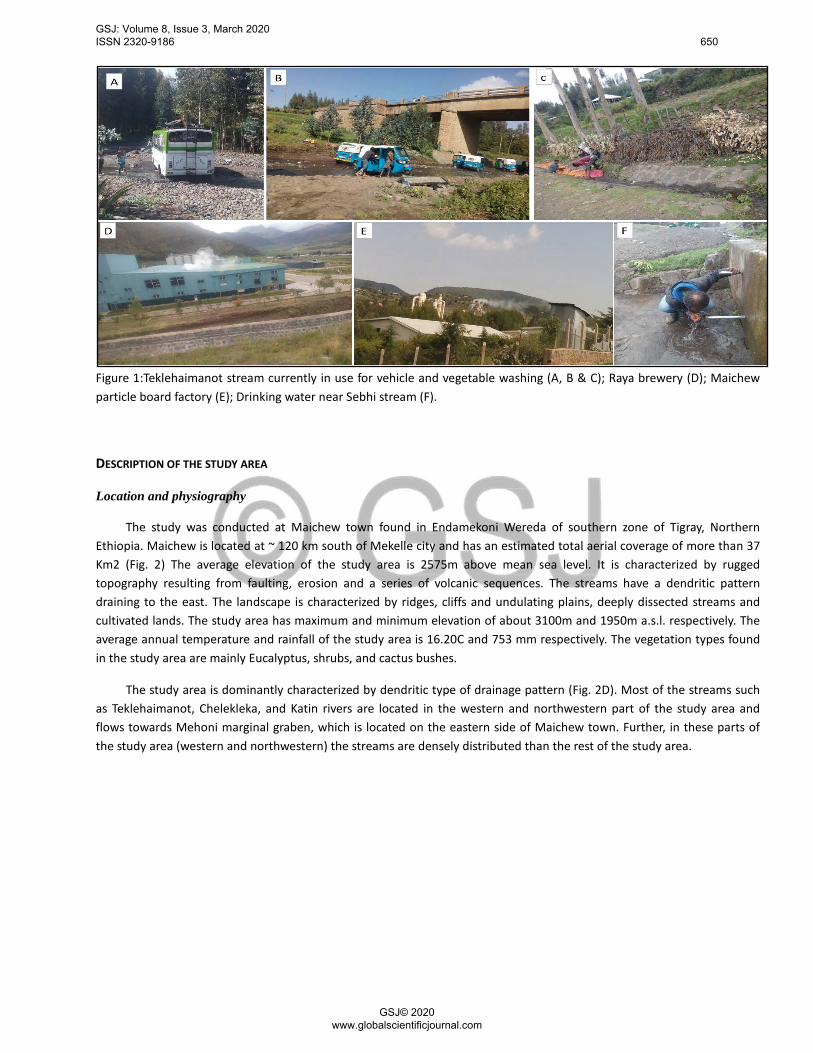
Figure 1:Teklehaimanot stream currently in use for vehicle and vegetable washing (A, B & C); Raya brewery (D); Maichew particle board factory (E); Drinking water near Sebhi stream (F).
DESCRIPTION OF THE STUDY AREA
Location and physiography
The study was conducted at Maichew town found in Endamekoni Wereda of southern zone of Tigray, Northern Ethiopia. Maichew is located at ~ 120 km south of Mekelle city and has an estimated total aerial coverage of more than 37 Km2 (Fig. 2) The average elevation of the study area is 2575m above mean sea level. It is characterized by rugged topography resulting from faulting, erosion and a series of volcanic sequences. The streams have a dendritic pattern draining to the east. The landscape is characterized by ridges, cliffs and undulating plains, deeply dissected streams and cultivated lands. The study area has maximum and minimum elevation of about 3100m and 1950m a.s.l. respectively. The average annual temperature and rainfall of the study area is 16.20C and 753 mm respectively. The vegetation types found in the study area are mainly Eucalyptus, shrubs, and cactus bushes.
The study area is dominantly characterized by dendritic type of drainage pattern (Fig. 2D). Most of the streams such as Teklehaimanot, Chelekleka, and Katin rivers are located in the western and northwestern part of the study area and flows towards Mehoni marginal graben, which is located on the eastern side of Maichew town. Further, in these parts of the study area (western and northwestern) the streams are densely distributed than the rest of the study area.
GSJ: Volume 8, Issue 3, March 2020 ISSN 2320-9186 650
GSJ© 2020 www.globalscientificjournal.com
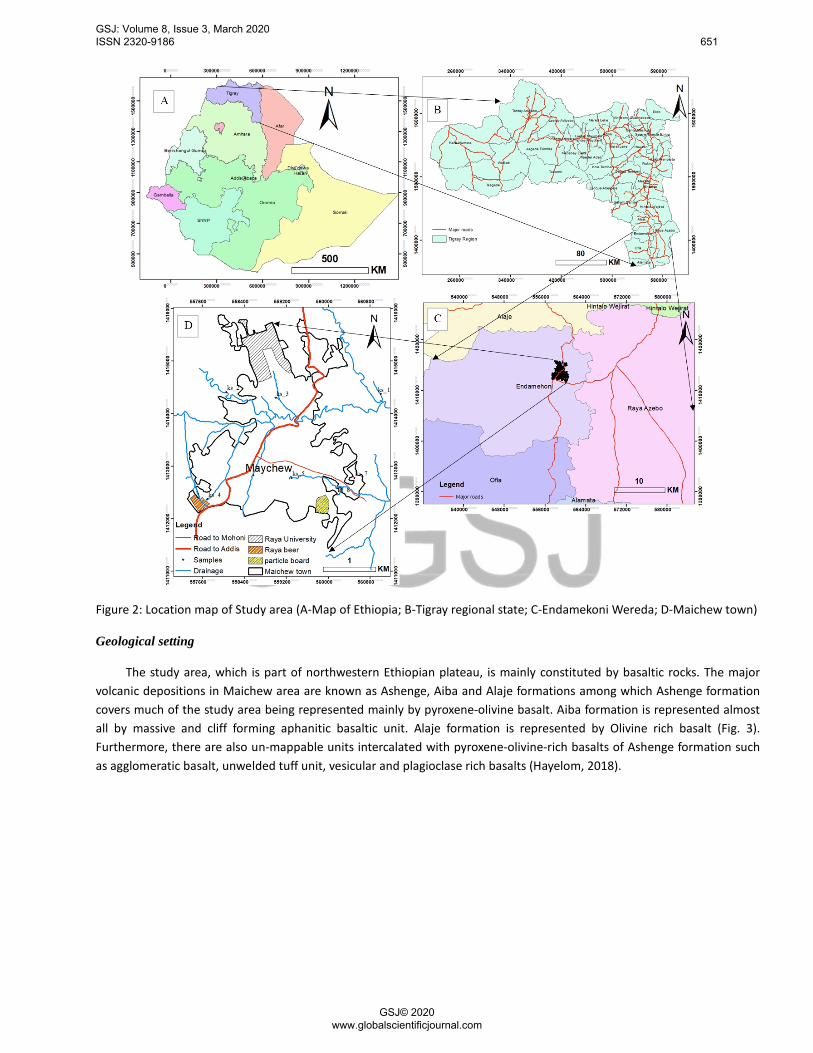
Figure 2: Location map of Study area (A-Map of Ethiopia; B-Tigray regional state; C-Endamekoni Wereda; D-Maichew town)
Geological setting
The study area, which is part of northwestern Ethiopian plateau, is mainly constituted by basaltic rocks. The major volcanic depositions in Maichew area are known as Ashenge, Aiba and Alaje formations among which Ashenge formation covers much of the study area being represented mainly by pyroxene-olivine basalt. Aiba formation is represented almost all by massive and cliff forming aphanitic basaltic unit. Alaje formation is represented by Olivine rich basalt (Fig. 3). Furthermore, there are also un-mappable units intercalated with pyroxene-olivine-rich basalts of Ashenge formation such as agglomeratic basalt, unwelded tuff unit, vesicular and plagioclase rich basalts (Hayelom, 2018).
GSJ: Volume 8, Issue 3, March 2020 ISSN 2320-9186 651
GSJ© 2020 www.globalscientificjournal.com
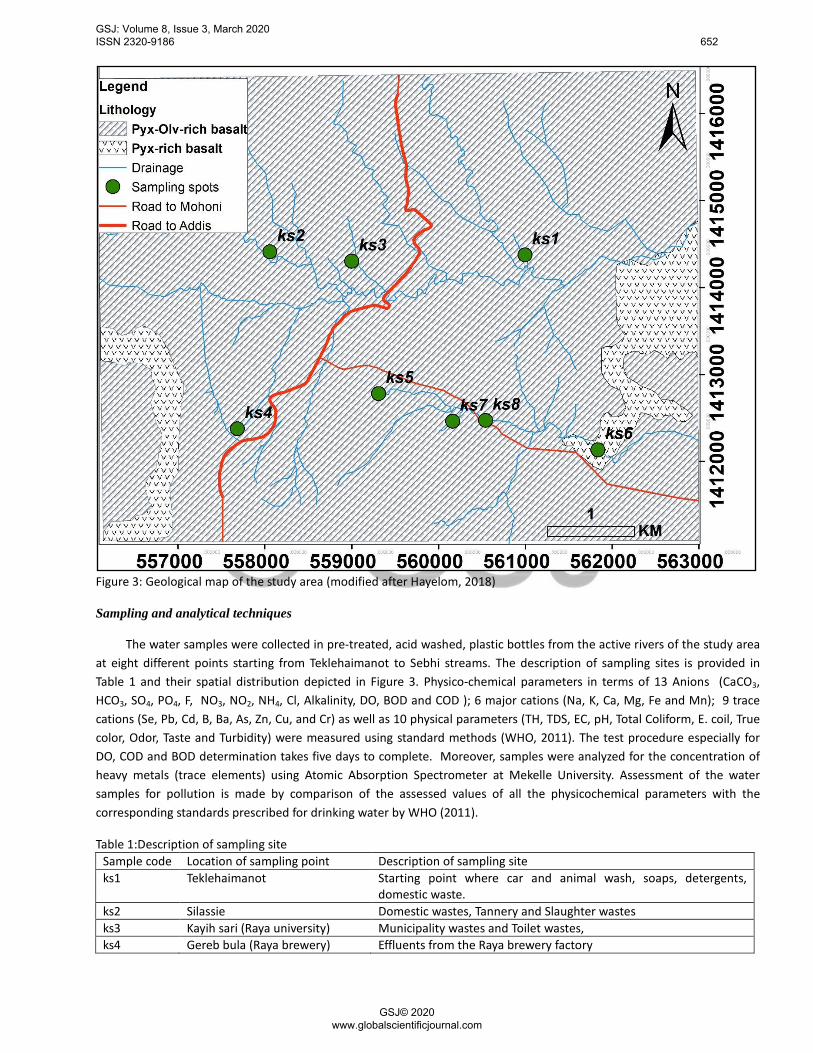
Figure 3: Geological map of the study area (modified after Hayelom, 2018)
Sampling and analytical techniques
The water samples were collected in pre-treated, acid washed, plastic bottles from the active rivers of the study area at eight different points starting from Teklehaimanot to Sebhi streams. The description of sampling sites is provided in Table 1 and their spatial distribution depicted in Figure 3. Physico-chemical parameters in terms of 13 Anions (CaCO3, HCO3, SO4, PO4, F, NO3, NO2, NH4, Cl, Alkalinity, DO, BOD and COD ); 6 major cations (Na, K, Ca, Mg, Fe and Mn); 9 trace cations (Se, Pb, Cd, B, Ba, As, Zn, Cu, and Cr) as well as 10 physical parameters (TH, TDS, EC, pH, Total Coliform, E. coil, True color, Odor, Taste and Turbidity) were measured using standard methods (WHO, 2011). The test procedure especially for DO, COD and BOD determination takes five days to complete. Moreover, samples were analyzed for the concentration of heavy metals (trace elements) using Atomic Absorption Spectrometer at Mekelle University. Assessment of the water samples for pollution is made by comparison of the assessed values of all the physicochemical parameters with the corresponding standards prescribed for drinking water by WHO (2011).
Table 1:Description of sampling site Sample code Location of sampling point Description of sampling site ks1 Teklehaimanot Starting point where car and animal wash, soaps, detergents,
domestic waste. ks2 Silassie Domestic wastes, Tannery and Slaughter wastes ks3 Kayih sari (Raya university) Municipality wastes and Toilet wastes, ks4 Gereb bula (Raya brewery) Effluents from the Raya brewery factory
GSJ: Volume 8, Issue 3, March 2020 ISSN 2320-9186 652
GSJ© 2020 www.globalscientificjournal.com
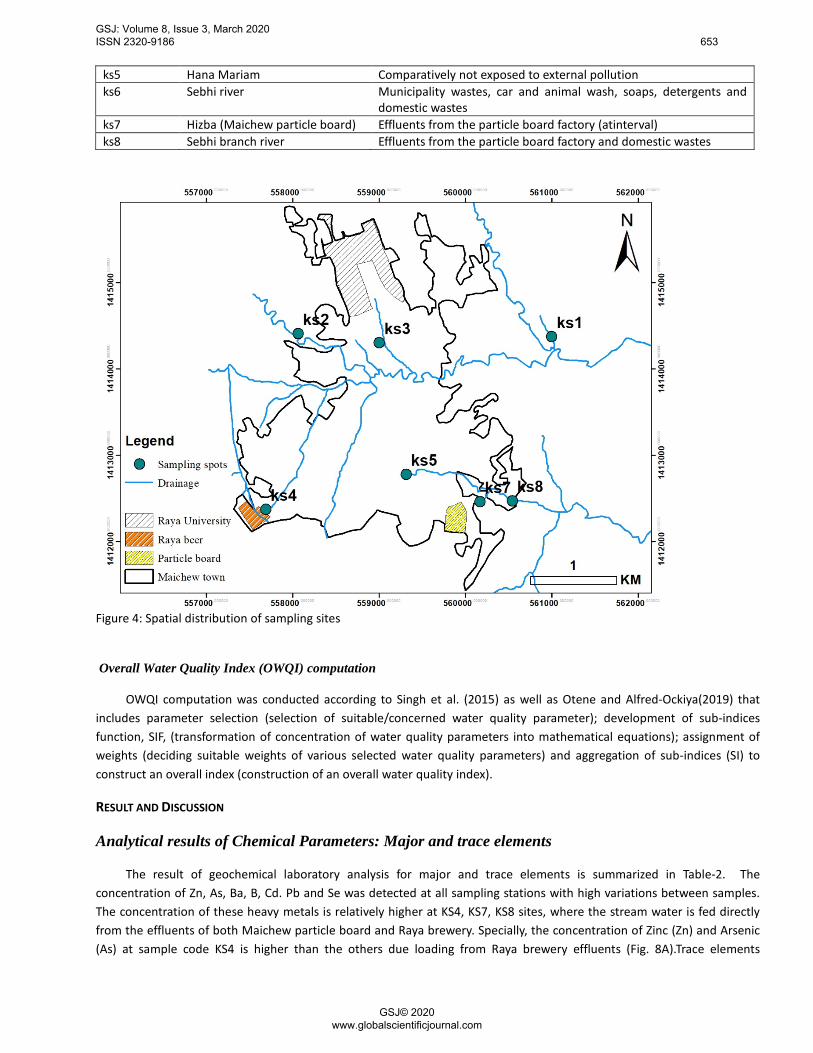
ks5 Hana Mariam Comparatively not exposed to external pollution ks6 Sebhi river Municipality wastes, car and animal wash, soaps, detergents and
domestic wastes ks7 Hizba (Maichew particle board) Effluents from the particle board factory (atinterval) ks8 Sebhi branch river Effluents from the particle board factory and domestic wastes
Figure 4: Spatial distribution of sampling sites
Overall Water Quality Index (OWQI) computation
OWQI computation was conducted according to Singh et al. (2015) as well as Otene and Alfred-Ockiya(2019) that includes parameter selection (selection of suitable/concerned water quality parameter); development of sub-indices function, SIF, (transformation of concentration of water quality parameters into mathematical equations); assignment of weights (deciding suitable weights of various selected water quality parameters) and aggregation of sub-indices (SI) to construct an overall index (construction of an overall water quality index).
RESULT AND DISCUSSION
Analytical results of Chemical Parameters: Major and trace elements
The result of geochemical laboratory analysis for major and trace elements is summarized in Table-2. The concentration of Zn, As, Ba, B, Cd. Pb and Se was detected at all sampling stations with high variations between samples. The concentration of these heavy metals is relatively higher at KS4, KS7, KS8 sites, where the stream water is fed directly from the effluents of both Maichew particle board and Raya brewery. Specially, the concentration of Zinc (Zn) and Arsenic (As) at sample code KS4 is higher than the others due loading from Raya brewery effluents (Fig. 8A).Trace elements
GSJ: Volume 8, Issue 3, March 2020 ISSN 2320-9186 653
GSJ© 2020 www.globalscientificjournal.com
concentration at KS4 was found in the order of Zn>As>Cu>Ba>B>Cd>Pb>Cr>Se. Similar result was reported by Oguzie and Okhagbuzo (2010). Kowsalya et al. (2010) showed higher values for Zn and Cu in brewery effluents. Zinc commonly cause health problem according its amount from little effect to an extremely harmful. The effect stage begins at a level 10-15 times higher than the amount required for good health. Taking zinc in a little bit high amount even for a short time can cause stomach cramps, nausea, and vomiting. Taken longer, it can cause anemia and decrease the levels of your good cholesterol. Heavy metals, such as copper, lead, mercury and selenium get into water from many sources, including industries, automobile exhaust, mines and even natural soil. Cadmium in stream water that is used for irrigation can be absorbed by crops (Inyang et al.2012).
Therefore, the water is certainly unfit for drinking purposes without any form of treatment according to WHO standards. Obviously, industries are common sources of environmental pollution if their waste material is not properly managed. According to the physico-chemical analyses results found by this study, research work needs to be conducted confirmed so that it would be possible to advise the industries found in Maichew town, especially Raya brewery to manage their waste material (water) properly.
Table 2: Laboratory Analysis for Major and Trace Elements Statistical summary & references
Na (mg/l)
K (mg/l)
Ca (mg/l)
Mg (mg/l)
Total Fe (mg/l)
Mn (mg/l)
Cr (mg/l)
Cu (mg/l)
Min 3.00 0.20 17.80 9.40 0.12 0.01 0.02 0.13
Max 43.50 2.84 258.10 136.30 1.77 0.81 0.74 1.94
Mean 10.11 0.66 59.96 31.67 0.41 0.13 0.31 0.45
St. dev 13.68 0.89 81.19 42.88 0.56 0.28 0.30 0.61
WHO max 358.00 12.00 200.00 150.00 1.00 0.50 0.50 3.00 Brewery Effluent (Inyang et al. 2012) - - - - 0.46 0.02 0.16 0.11
Statistical summary & references Zn (mg/l) As
(mg/l) Ba (mg/l) B (mg/l) Cd
(mg/l) Pb (mg/l)
Se (mg/l)
Min 0.02 0.01 0 0 0 0 0 Max 22.5 2.57 1.23 0.89 0.92 0.62 0.07 Mean 5.88 0.66 0.22 0.2 0.36 0.12 0.03 St. dev 7.08 0.82 0.41 0.3 0.35 0.21 0.02 WHO max (mg/l) 15 0.5 2 5 0.05 0.1 0.05 Brewery Effluent (Inyang et al. 2012) 004 - 0.31 - 0.04 0.03
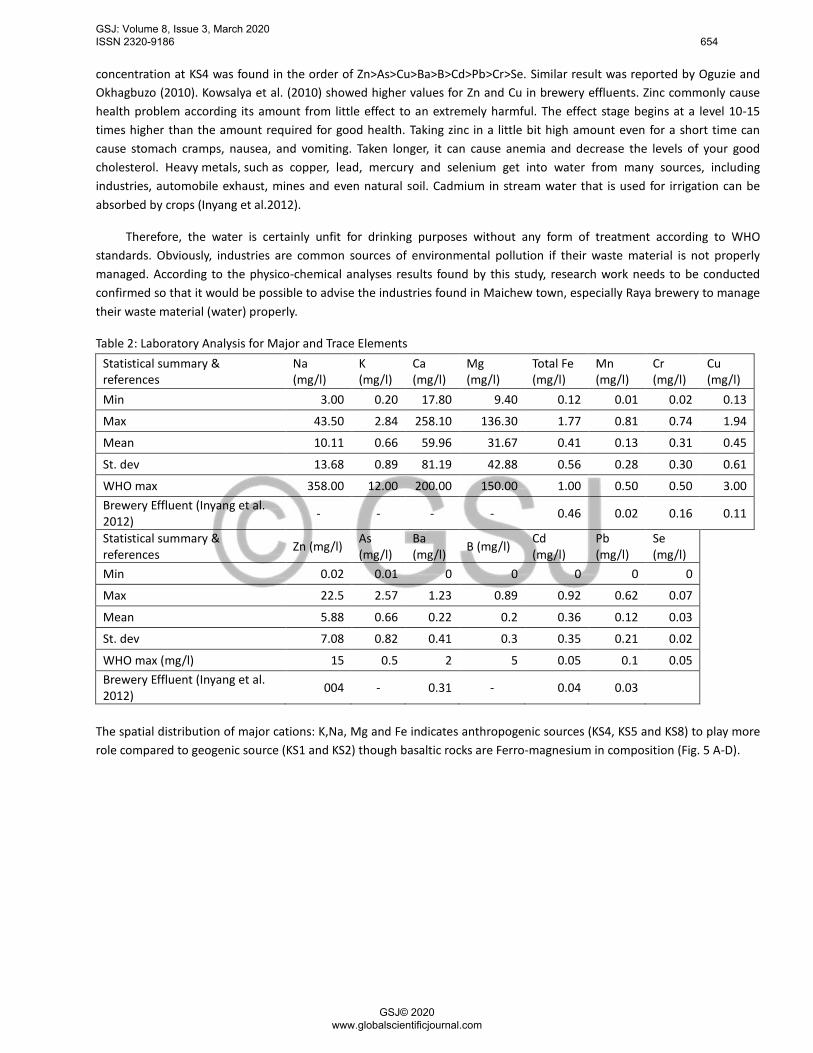
The spatial distribution of major cations: K,Na, Mg and Fe indicates anthropogenic sources (KS4, KS5 and KS8) to play more role compared to geogenic source (KS1 and KS2) though basaltic rocks are Ferro-magnesium in composition (Fig. 5 A-D).
GSJ: Volume 8, Issue 3, March 2020 ISSN 2320-9186 654
GSJ© 2020 www.globalscientificjournal.com
Figure 5: Spatial post plots of major elements
Analytical results of Chemical Parameters: Anions
The result of geochemical laboratory analysis for anions is summarized in Table 3. Minimum amount of DO is found from sample code KS2, KS4 and KS1 respectively than the others as shown on Table 1. In general, DO content of water sample ranges from 2.87mg/l to 7.51mg/l and mean average of 4.14 mg/l. As DO level decreases; bad odors, colors and tastes reduce the acceptability of water. The lowest DO value indicates not good healthy condition for the community (Jena et al.,2003). High temperature and addition of sewage and other waste might be responsible for the low value of DO (Pradeep, 2012). The water quality at downstream is comparatively more disturbed than the upstream due to release of domestic sewages, washing of motor vehicles, bank side abuses by people, surface run off and agricultural tail water to river system (Pradhan et al., 2009).
GSJ: Volume 8, Issue 3, March 2020 ISSN 2320-9186 655
GSJ© 2020 www.globalscientificjournal.com
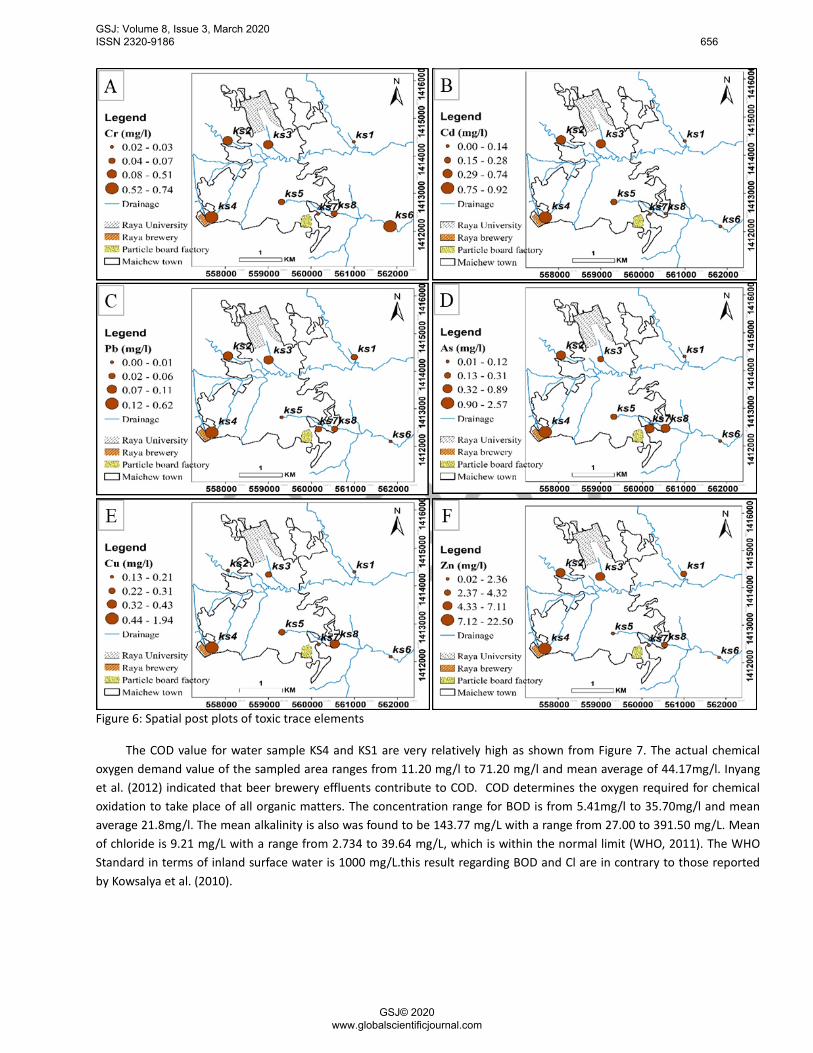
Figure 6: Spatial post plots of toxic trace elements
The COD value for water sample KS4 and KS1 are very relatively high as shown from Figure 7. The actual chemical oxygen demand value of the sampled area ranges from 11.20 mg/l to 71.20 mg/l and mean average of 44.17mg/l. Inyang et al. (2012) indicated that beer brewery effluents contribute to COD. COD determines the oxygen required for chemical oxidation to take place of all organic matters. The concentration range for BOD is from 5.41mg/l to 35.70mg/l and mean average 21.8mg/l. The mean alkalinity is also was found to be 143.77 mg/L with a range from 27.00 to 391.50 mg/L. Mean of chloride is 9.21 mg/L with a range from 2.734 to 39.64 mg/L, which is within the normal limit (WHO, 2011). The WHO Standard in terms of inland surface water is 1000 mg/L.this result regarding BOD and Cl are in contrary to those reported by Kowsalya et al. (2010).
GSJ: Volume 8, Issue 3, March 2020 ISSN 2320-9186 656
GSJ© 2020 www.globalscientificjournal.com
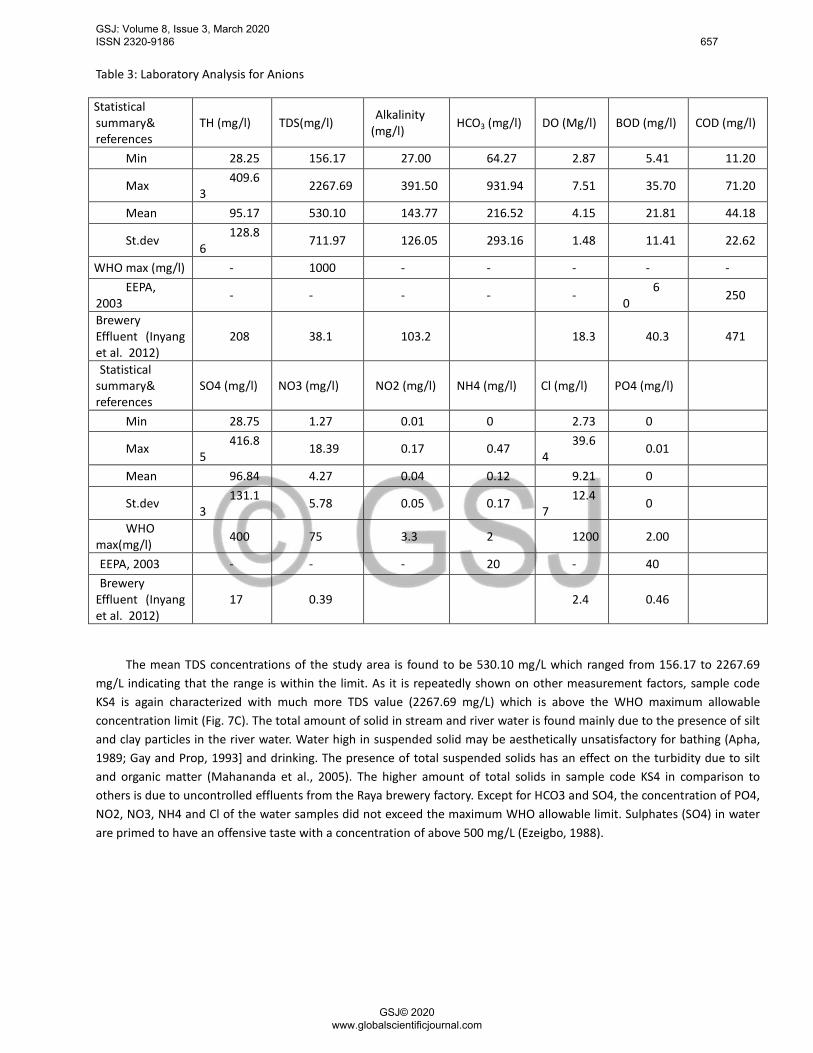
Table 3: Laboratory Analysis for Anions
Statistical summary& references
TH (mg/l) TDS(mg/l) Alkalinity (mg/l) HCO3 (mg/l) DO (Mg/l) BOD (mg/l) COD (mg/l)
Min 28.25 156.17 27.00 64.27 2.87 5.41 11.20
Max 409.63 2267.69 391.50 931.94 7.51 35.70 71.20
Mean 95.17 530.10 143.77 216.52 4.15 21.81 44.18
St.dev 128.86 711.97 126.05 293.16 1.48 11.41 22.62
WHO max (mg/l) - 1000 - - - - - EEPA,
2003 - - - - - 60
250
Brewery Effluent (Inyang et al. 2012)
208 38.1 103.2 18.3 40.3 471
Statistical summary& references
SO4 (mg/l) NO3 (mg/l) NO2 (mg/l) NH4 (mg/l) Cl (mg/l) PO4 (mg/l)
Min 28.75 1.27 0.01 0 2.73 0
Max 416.85 18.39 0.17 0.47 39.6
4 0.01 Mean 96.84 4.27 0.04 0.12 9.21 0
St.dev 131.13 5.78 0.05 0.17 12.4
7 0 WHO
max(mg/l) 400 75 3.3 2 1200 2.00 EEPA, 2003 - - - 20 - 40 Brewery
Effluent (Inyang et al. 2012)
17 0.39 2.4 0.46
The mean TDS concentrations of the study area is found to be 530.10 mg/L which ranged from 156.17 to 2267.69 mg/L indicating that the range is within the limit. As it is repeatedly shown on other measurement factors, sample code KS4 is again characterized with much more TDS value (2267.69 mg/L) which is above the WHO maximum allowable concentration limit (Fig. 7C). The total amount of solid in stream and river water is found mainly due to the presence of silt and clay particles in the river water. Water high in suspended solid may be aesthetically unsatisfactory for bathing (Apha, 1989; Gay and Prop, 1993] and drinking. The presence of total suspended solids has an effect on the turbidity due to silt and organic matter (Mahananda et al., 2005). The higher amount of total solids in sample code KS4 in comparison to others is due to uncontrolled effluents from the Raya brewery factory. Except for HCO3 and SO4, the concentration of PO4, NO2, NO3, NH4 and Cl of the water samples did not exceed the maximum WHO allowable limit. Sulphates (SO4) in water are primed to have an offensive taste with a concentration of above 500 mg/L (Ezeigbo, 1988).
GSJ: Volume 8, Issue 3, March 2020 ISSN 2320-9186 657
GSJ© 2020 www.globalscientificjournal.com
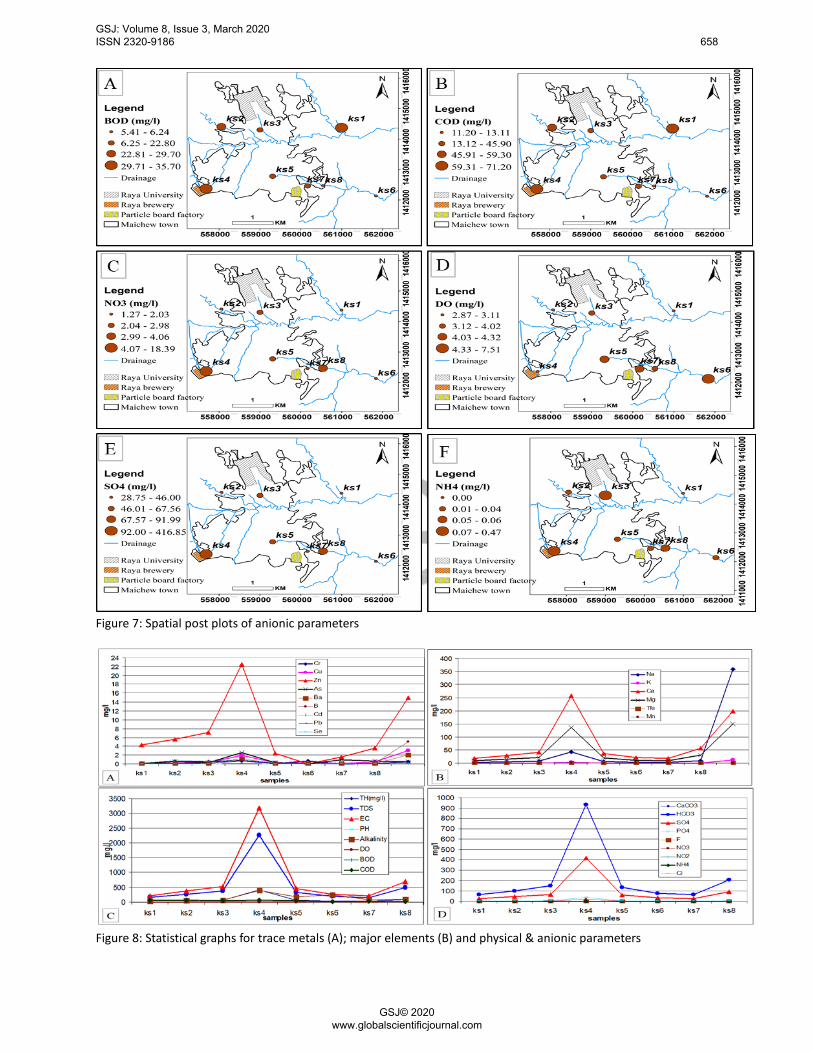
Figure 7: Spatial post plots of anionic parameters
Figure 8: Statistical graphs for trace metals (A); major elements (B) and physical & anionic parameters
GSJ: Volume 8, Issue 3, March 2020 ISSN 2320-9186 658
GSJ© 2020 www.globalscientificjournal.com
Analytical results of biophysical parameters
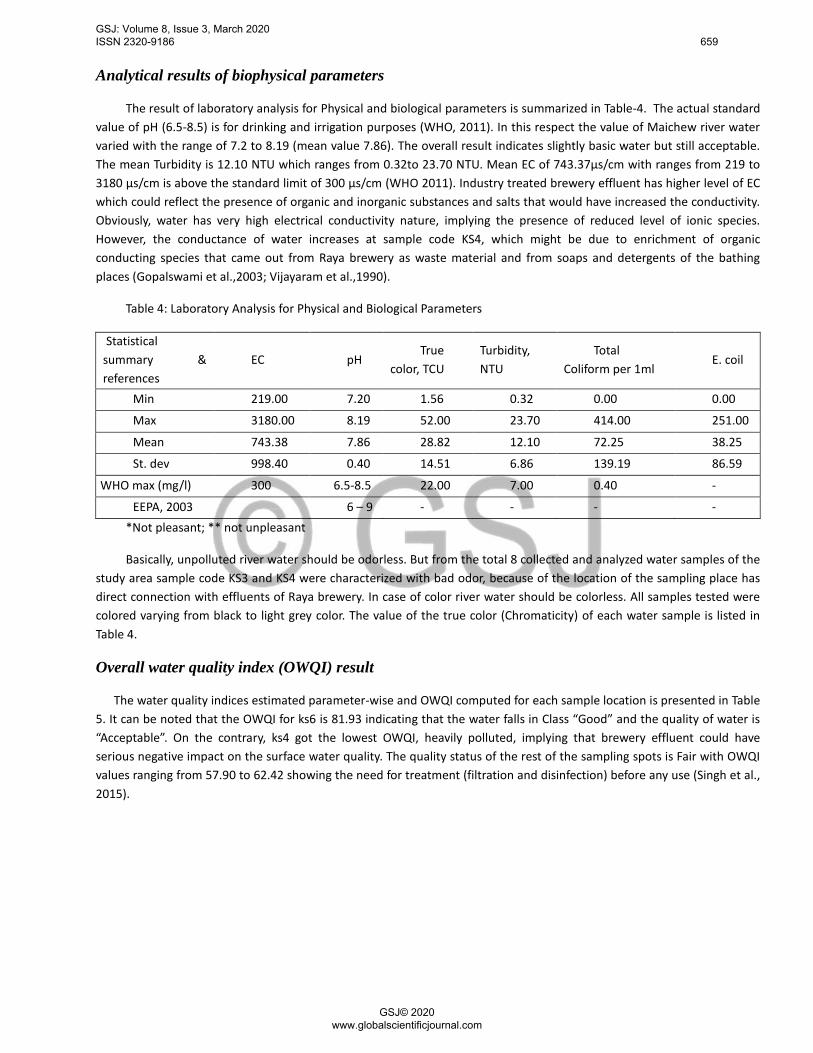
The result of laboratory analysis for Physical and biological parameters is summarized in Table-4. The actual standard value of pH (6.5-8.5) is for drinking and irrigation purposes (WHO, 2011). In this respect the value of Maichew river water varied with the range of 7.2 to 8.19 (mean value 7.86). The overall result indicates slightly basic water but still acceptable. The mean Turbidity is 12.10 NTU which ranges from 0.32to 23.70 NTU. Mean EC of 743.37μs/cm with ranges from 219 to 3180 μs/cm is above the standard limit of 300 μs/cm (WHO 2011). Industry treated brewery effluent has higher level of EC which could reflect the presence of organic and inorganic substances and salts that would have increased the conductivity. Obviously, water has very high electrical conductivity nature, implying the presence of reduced level of ionic species. However, the conductance of water increases at sample code KS4, which might be due to enrichment of organic conducting species that came out from Raya brewery as waste material and from soaps and detergents of the bathing places (Gopalswami et al.,2003; Vijayaram et al.,1990).
Table 4: Laboratory Analysis for Physical and Biological Parameters
Statistical summary & references
EC pH True
color, TCU Turbidity, NTU
Total Coliform per 1ml
E. coil
Min 219.00 7.20 1.56 0.32 0.00 0.00
Max 3180.00 8.19 52.00 23.70 414.00 251.00
Mean 743.38 7.86 28.82 12.10 72.25 38.25
St. dev 998.40 0.40 14.51 6.86 139.19 86.59
WHO max (mg/l) 300 6.5-8.5 22.00 7.00 0.40 -
EEPA, 2003 6 – 9 - - - - *Not pleasant; ** not unpleasant
Basically, unpolluted river water should be odorless. But from the total 8 collected and analyzed water samples of the study area sample code KS3 and KS4 were characterized with bad odor, because of the location of the sampling place has direct connection with effluents of Raya brewery. In case of color river water should be colorless. All samples tested were colored varying from black to light grey color. The value of the true color (Chromaticity) of each water sample is listed in Table 4.
Overall water quality index (OWQI) result
The water quality indices estimated parameter-wise and OWQI computed for each sample location is presented in Table 5. It can be noted that the OWQI for ks6 is 81.93 indicating that the water falls in Class “Good” and the quality of water is “Acceptable”. On the contrary, ks4 got the lowest OWQI, heavily polluted, implying that brewery effluent could have serious negative impact on the surface water quality. The quality status of the rest of the sampling spots is Fair with OWQI values ranging from 57.90 to 62.42 showing the need for treatment (filtration and disinfection) before any use (Singh et al., 2015).
GSJ: Volume 8, Issue 3, March 2020 ISSN 2320-9186 659
GSJ© 2020 www.globalscientificjournal.com
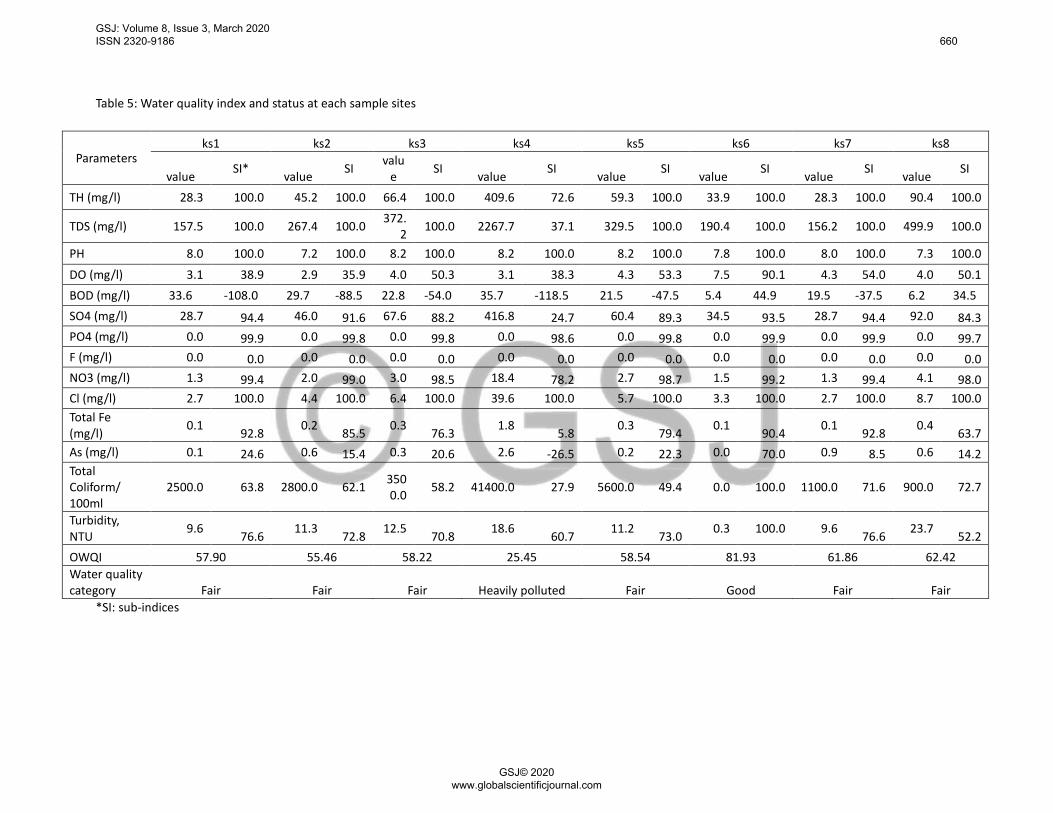
Table 5: Water quality index and status at each sample sites
*SI: sub-indices
Parameters ks1 ks2 ks3 ks4 ks5 ks6 ks7 ks8
value SI* value SI value SI value SI value SI value SI value SI value SI
TH (mg/l) 28.3 100.0 45.2 100.0 66.4 100.0 409.6 72.6 59.3 100.0 33.9 100.0 28.3 100.0 90.4 100.0
TDS (mg/l) 157.5 100.0 267.4 100.0 372.2 100.0 2267.7 37.1 329.5 100.0 190.4 100.0 156.2 100.0 499.9 100.0
PH 8.0 100.0 7.2 100.0 8.2 100.0 8.2 100.0 8.2 100.0 7.8 100.0 8.0 100.0 7.3 100.0
DO (mg/l) 3.1 38.9 2.9 35.9 4.0 50.3 3.1 38.3 4.3 53.3 7.5 90.1 4.3 54.0 4.0 50.1 BOD (mg/l) 33.6 -108.0 29.7 -88.5 22.8 -54.0 35.7 -118.5 21.5 -47.5 5.4 44.9 19.5 -37.5 6.2 34.5 SO4 (mg/l) 28.7 94.4 46.0 91.6 67.6 88.2 416.8 24.7 60.4 89.3 34.5 93.5 28.7 94.4 92.0 84.3 PO4 (mg/l) 0.0 99.9 0.0 99.8 0.0 99.8 0.0 98.6 0.0 99.8 0.0 99.9 0.0 99.9 0.0 99.7 F (mg/l) 0.0 0.0 0.0 0.0 0.0 0.0 0.0 0.0 0.0 0.0 0.0 0.0 0.0 0.0 0.0 0.0 NO3 (mg/l) 1.3 99.4 2.0 99.0 3.0 98.5 18.4 78.2 2.7 98.7 1.5 99.2 1.3 99.4 4.1 98.0 Cl (mg/l) 2.7 100.0 4.4 100.0 6.4 100.0 39.6 100.0 5.7 100.0 3.3 100.0 2.7 100.0 8.7 100.0 Total Fe (mg/l) 0.1 92.8 0.2 85.5 0.3 76.3 1.8 5.8 0.3 79.4 0.1 90.4 0.1 92.8 0.4 63.7 As (mg/l) 0.1 24.6 0.6 15.4 0.3 20.6 2.6 -26.5 0.2 22.3 0.0 70.0 0.9 8.5 0.6 14.2 Total Coliform/ 100ml
2500.0 63.8 2800.0 62.1 3500.0 58.2 41400.0 27.9 5600.0 49.4 0.0 100.0 1100.0 71.6 900.0 72.7
Turbidity, NTU 9.6 76.6 11.3 72.8 12.5 70.8 18.6 60.7 11.2 73.0 0.3 100.0 9.6 76.6 23.7 52.2 OWQI 57.90 55.46 58.22 25.45 58.54 81.93 61.86 62.42 Water quality category Fair Fair Fair Heavily polluted Fair Good Fair Fair
GSJ: Volume 8, Issue 3, March 2020 ISSN 2320-9186 660
GSJ© 2020 www.globalscientificjournal.com
Conclusion Maichew river water, besides its direct use by the community, is the one among the basic source of Raya valley ground
water with direct contact with brewery effluent is severely affected in most the physicochemical parameters including even water. This is a showcase for its series consequences if not managed. As shown by the results of this study, most of the water parameters do not comply with the tolerance limit prescribed by WHO standards and not safe for drinking and bathing. Stream those which are expected to originate from the local geology. Hence, it is time to undergo proper managerial procedures to keep health of the water for the surrounding area and further for the Raya valley community.
Acknowledgement Our acknowledgment goes to Mr. Adhena Abera who contributed a great help during sample collection and Mr. Yohannes for transportation service. Mekelle University, School of Earth Sciences is thanked for providing laboratory services for analysis of the water samples.
Reference [1] R. Noori., M.S. Sabahi, A.R. Karbassi, A. Baghvand, and H.T. Zadeh, “Multivariate Statistical Analysis Of Surface Water Quality Based On Correlations
And Variations In The Data Set,” Desalination, 260(1-3), pp. 129-136, 2010. [2] W.J. Lodder, H.H.J.L.Van Den Berg, S.A. Rutjes, and A.M. de Roda Husman, “Presence Of Enteric Viruses In Source Waters For Drinking Water
Production In The Netherlands,” Appl. Environ. Microbiol., 76(17), pp. 5965-5971, 2010. [3] Y. Ouyang, “Evaluation of River Water Quality Monitoring Stations by Principal Component Analysis,” Water Research, 39(12), pp. 2621-2635, 2005. [4] A. Tamiru, L. Dagnachew, A. Tenalem, T. Yirga, W. Solomon, and M. Nuri, “Assessment of Pollution Status and Groundwater Vulnerability Mapping of
The Addis Ababa Water Supply Aquifers. Ethiopia,” (unpublished). 2004 [5] S.P. Carroll, L.A. Dawes, A. Goonetilleke, and M. Hargreaves, Water Quality Profile of An Urbanizing Catchment–Ningi Creek Catchment. 2006 [6] D.E. Nnane, J.E. Ebdon, and H.D. Taylor, “Integrated Analysis of Water Quality Parameters for Cost-Effective Faecal Pollution Management In River
Catchments,” Water Research, 45(6), pp. 2235-2246, 2011. [7] M.K. Hill, Understanding environmental pollution. Cambridge University Press, 2010. [8] H. Bu, W. Meng, and Y. Zhang, “Spatial and Seasonal Characteristics of River Water Chemistry in The Taizi River in Northeast China,” Environmental
Monitoring and Assessment, 186(6), pp. 3619-3632, 2014. [9] H. Razmkhah, A. Abrishamchi, and A. Torkian, “Evaluation of Spatial and Temporal Variation in Water Quality by Pattern Recognition Techniques: A
Case Study on Jajrood River (Tehran, Iran),” Journal of Environmental Management, 91(4), pp. 852-860, 2010. [10] M.R. Mahananda, B.P. Mohanty, and N.R. Behera, “Physico-chemical analysis of surface and ground water of Bargarh District, Orissa, India,” International
Journal of Research and Reviews in Applied Sciences, 2(3), pp. 284-295, 2010. [11] M. Hayelom, “Geological and Geochemical Studies of Flood Basalts (Aiba and Ashenge Basalts) In Maichew Area, Tigray, Northern Ethiopia: Implication
for Their Petrogenesis,” MSc thesis, School Of Graduate Studies, School Of Earth Sciences, Addis Abeba University, Ethiopia. 2018. [12] World Health Organization (WHO), “Guidelines for Drinking-Water Quality,” WHO Press, Geneva, Switzerland, 4th edition , 2011 [13] S. Singh, N.C. Ghosh, G. Krishan, R. Galkate, T. Thomas, and R.K. Jaiswal, “Development of An Overall Water Quality Index (OWQI) For Surface Water
in Indian Context,” Current World Environment, 10(3), pp. 813-822, 2015. [14] B.B. Otene, and J.F. Alfred-Ockiya, “Assessment Of Water Quality Index (WQI) and Suitability For Consumption Of Elele-Alimini Stream, Port Harcourt,”
GSJ: Volume 7, Issue 2, pp. 839-847, 2019. [15] F.A. Oguzie, and G.A. Okhagbuzo, “Concentrations of Heavy Metals In Effluent Discharges Downstream Of Ikpoba River In Benin City, Nigeria,” African
Journal of Biotechnology, 9(3), 2010. [16] R. Kowsalya, C.M. Noorjahan, C.M. Karrunakaran, M. Deecaraman, and M. Vijayalakshmi, “Physico-Chemical Characterization Of Brewery Effluent
And Its Degradation Using Native Fungus Aspergillus Niger,” I Control Pollution, 26(2), pp. 171-176, 1970. [17] U.E. Inyang, E.N. Bassey, and J.D. Inyang, “Characterization of Brewery Effluent Fluid,” Journal of Engineering and Applied Sciences, 4, pp. 67-77, 2012. [18] B. Jena, R. Sudarshana, and S.B. Chaudhuary, “Studies on Water Quality Parameters Around Sagar Island, Sundarbans,” Nature, Environment and Pollution
Technology, 2(3), pp. 329-332, 2003. [19] V. Pradeep, C. Deepika, G. Urvi, and S. Hitesh, “Water Quality Analysis of An Organically Polluted Lake By Investigating Different Physical And
Chemical Parameters,” International J of Research in Chemistry and Environment, 2(1), pp. 105-111, 2012. [20] U.K. Pradhan, P.V. Shirodkar, and B.K. Sahu, “Physico-Chemical Characteristics of The Coastal Water Off Devi Estuary, Orissa And Evaluation of Its
GSJ: Volume 8, Issue 3, March 2020 ISSN 2320-9186 661
GSJ© 2020 www.globalscientificjournal.com
Seasonal Changes Using Chemometric Techniques,” Current Science, pp.1203-1209, 2009. [21] R. Kowsalya, C.M. Noorjahan, C.M. Karrunakaran, M. Deecaraman And M. Vijayalakshmi, “Physico-Chemical Characterization Of Brewery Effluent
And Its Degradation Using Native Fungus Aspergillus Niger,” Jr. of Industrial Pollution Control26 (2), pp. 171-176, 2010. [22] APHA, “Standard Method for Examination of Water And Waste Water,” American Public Health Association, Washington, D.C. 1989. [23] Gay and Proop, Aspects of River Pollution, Butterworths Scientific Publication, London. 1993. [24] H.B. Mahananda, M.R. Mahananda, and B.P. Mohanty, “Studies on The Physico-Chemical and Biological Parameters of a Fresh Water Pond Ecosystem as
An Indicator of Water Pollution,” Ecology Environment and Conservation, 11(3/4), 537, 2005. [25] H.L. Ezeigbo, “Quality of water source in Anambra State,” Nig J Min Geol, 22, pp. 93-103, 1988. [26] P.M. Gopalswami, P.E. Kumar, and A.R. Kulandaivelu, “Study on The Quality of Water In The Bhavani River,” Asian Journal of Chemistry, 15(1), 306, 2003. [27] K. Vijayram, L. James, and P. Loganathan, “Distribution of trace heavy metals in two distributaries of river Cauvery,” Indian J Environ Prot, 10, pp. 350-352,
1990. [28] EEPA, “Provisional standard for industrial pollution control in Ethiopia. Ecologically Sustainable Industrial Development (ISID) Project,”
US/ETH/99/068 Ethiopia, EPA/UNIDO, Addis Ababa, Ethiopia, 2003.
GSJ: Volume 8, Issue 3, March 2020 ISSN 2320-9186 662
GSJ© 2020 www.globalscientificjournal.com