Bacteriological studies on Ostrea edulis and Crassostrea gigas

KATHMANDU UNIVERSITY JOURNAL OF SCIENCE, ENGINEERING AND TECHNOLOGY VOL. 6, No. I, MARCH, 2010, pp 50-59
50
PHYSICO-CHEMICAL AND BACTERIOLOGICAL INVESTIGATION ON THE RIVER CAUVERY OF KOLLEGAL STRETCH IN
KARNATAKA
Venkatesharaju K.*, Ravikumar. P., Somashekar. R. K., Prakash. K. L. Department of Environmental Sciences, Bangalore University, Bangalore- 560 056.
*Corresponding author: [email protected]
Received 01July, 2009; Revised 28 February, 2010
ABSTRACT Cauvery River is the major river system of south India was studied for 19 prime physico-chemical and 2 bacteriological parameters at six locations of the Kollegal stretch, for a period of Two years (2006–2008) at monthly intervals. Over the years of time, river has been subjected to human interference regularly and water quality was to be getting deteriorated profoundly. Major anthropogenic activities practiced in and around the stretch: agriculture, abstraction of water for irrigation and drinking, washing cloths and utensils, discharging of sewage waste, sand dredging, boating, fishing, open defecation and religious ritual activities along the stretch were generating serious threat to the biota of the river by altering the physicochemical and biological concentration of the river system. The seasonal and yearly trends were discussed to comprehend anthropogenic interferences on the river stretch. Correlation analysis was also been tried in between physico-chemical parameters. The pH, Conductance, Alkalinity and Hardness levels indicate the moderate quality of water. The values of DO, BOD and COD levels indicate the absence of major organic pollution sources. Seasonal and yearly averages of plant nutrients like phosphate, nitrates, potassium and also sulphates at drain out falls and mixing zones, were not showing any significant variation in their concentration indicate no sign of problems like eutrophication, which is generally raise due to agricultural and sewage wastes. The other possibility is that since there are no major industries in the project area, the major source of organic pollutants is only the domestic source. Population density spread over sparsely located villages like Dasanapura and Harle certainly contributes towards total and fecal coliforms as excreta of the villagers due to lack of toilets in their houses. Thus present study concludes that river water was not polluted; all results are within permissible limit when compared with Bureau of Indian Standards (BIS) and National River water quality standards. INTRODUCTION Rivers are vital and vulnerable freshwater systems that are critical for the sustenance of all life. However, the declining quality of the water in these systems threatens their sustainability and is therefore a cause for concern. Rivers are waterways of strategic importance across the world, providing main water resources for domestic, industrial, and agricultural purposes (Faith, 2006). The maintenance of healthy aquatic ecosystem is depended on the physico-chemical properties and biological diversity. A regular monitoring of water bodies with required number of parameters with reference to the quality of water not only prevents the outbreak of diseases and occurrence of hazards but checks the water from further deterioration. Bacteriological assessment, particularly for coliforms – the indicators of contamination by faecal matters- is therefore routinely carried out to ascertain the quality and potability of water to ensure prevention of further dissemination of pathogens through agency of water
KATHMANDU UNIVERSITY JOURNAL OF SCIENCE, ENGINEERING AND TECHNOLOGY VOL. 6, No. I, MARCH, 2010, pp 50-59
51
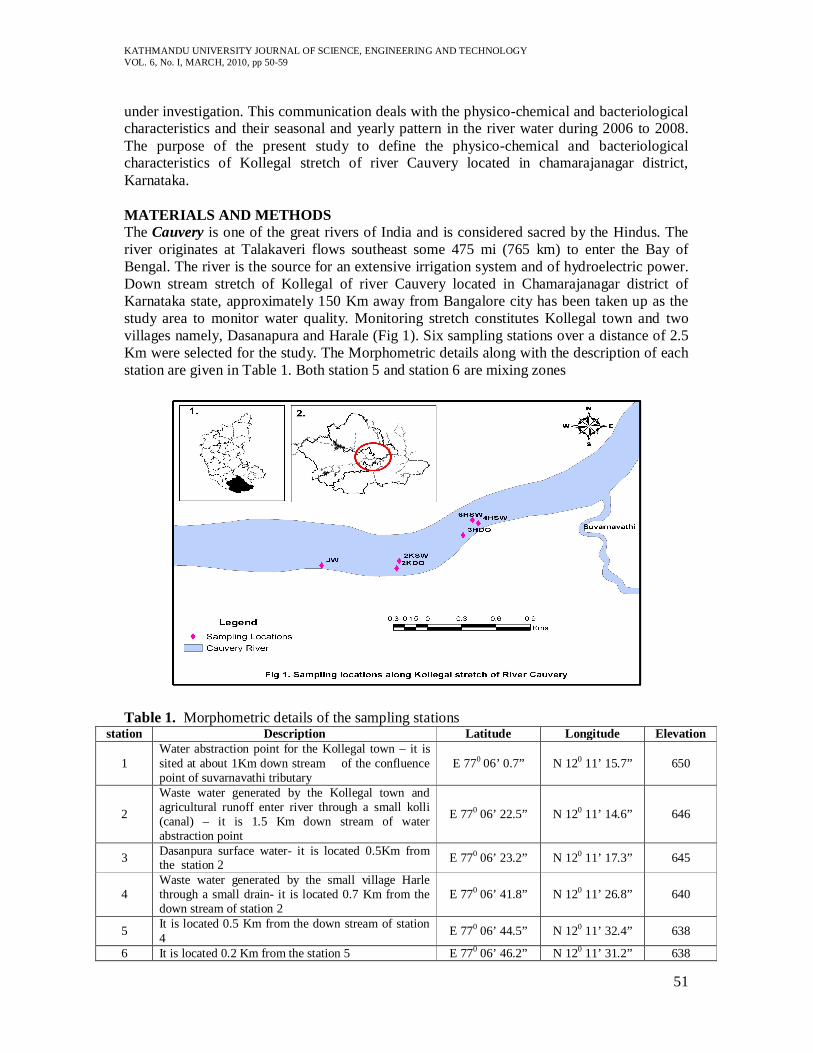
under investigation. This communication deals with the physico-chemical and bacteriological characteristics and their seasonal and yearly pattern in the river water during 2006 to 2008. The purpose of the present study to define the physico-chemical and bacteriological characteristics of Kollegal stretch of river Cauvery located in chamarajanagar district, Karnataka. MATERIALS AND METHODS The Cauvery is one of the great rivers of India and is considered sacred by the Hindus. The river originates at Talakaveri flows southeast some 475 mi (765 km) to enter the Bay of Bengal. The river is the source for an extensive irrigation system and of hydroelectric power. Down stream stretch of Kollegal of river Cauvery located in Chamarajanagar district of Karnataka state, approximately 150 Km away from Bangalore city has been taken up as the study area to monitor water quality. Monitoring stretch constitutes Kollegal town and two villages namely, Dasanapura and Harale (Fig 1). Six sampling stations over a distance of 2.5 Km were selected for the study. The Morphometric details along with the description of each station are given in Table 1. Both station 5 and station 6 are mixing zones
Table 1. Morphometric details of the sampling stations station Description Latitude Longitude Elevation
1 Water abstraction point for the Kollegal town – it is sited at about 1Km down stream of the confluence point of suvarnavathi tributary
E 770 06’ 0.7” N 120 11’ 15.7” 650
2
Waste water generated by the Kollegal town and agricultural runoff enter river through a small kolli (canal) – it is 1.5 Km down stream of water abstraction point
E 770 06’ 22.5” N 120 11’ 14.6” 646
3 Dasanpura surface water- it is located 0.5Km from the station 2 E 770 06’ 23.2” N 120 11’ 17.3” 645
4 Waste water generated by the small village Harle through a small drain- it is located 0.7 Km from the down stream of station 2
E 770 06’ 41.8” N 120 11’ 26.8” 640
5 It is located 0.5 Km from the down stream of station 4 E 770 06’ 44.5” N 120 11’ 32.4” 638
6 It is located 0.2 Km from the station 5 E 770 06’ 46.2” N 120 11’ 31.2” 638

KATHMANDU UNIVERSITY JOURNAL OF SCIENCE, ENGINEERING AND TECHNOLOGY VOL. 6, No. I, MARCH, 2010, pp 50-59
52
Sampling was carried out over a two year period (April 2006 to march 2008) in a month interval. Totally 144 surface water samples were collected from six different locations. 2L capacity of plastic cans for physico-chemical samples, 300ml glass bottles for BOD samples and 100ml autoclavable plastic bottles for bacteriological samples were used to collect surface water samples. For BOD, special care has been taken to avoid the entrapment of atmospheric oxygen during collection. Collected samples were brought to the laboratory carefully by preserving at -40c using thermo coal box containing ice caps. 21 various physicochemical and bacteriological parameters including pH, Temperature, Turbidity, Electrical Conductivity, Total Dissolved Solids, Total Hardness, Calcium Hardness, Magnesium Hardness, Total alkalinity, Sodium, Potassium, Sulphates, Phosphates, Nitrates, Dissolved Oxygen, Biochemical oxygen Demand, Chemical Oxygen Demand, Total coliforms and Faecal coliforms selected for study were analyzed using standard methods (APHA, 2005). National River water quality standards and Bureau of Indian Standards (BIS) for river water quality has been considered for comparison of surface water quality of Cauvery River of Kollegal stretch.
RESULTS AND DISCUSSION The seasonal and annual averages of physico-chemical and bacteriological characteristics are given in Table 2 and Table 3 respectively. Correlation coefficients between various physico-chemical parameters are showed in Table 4.
pH is an important factor that determines the suitability of water for various purposes, including toxicity to animals and plants. In the present study, pH was found faintly alkaline in all the six sites through out the study and Yearly averages indicate increasing trend in all the sites except the site 2 showed a slight decrease in its value. It might be due to increasing draining of domestic effluent water to the river and microbial activities. pH values in all the sites showed the same seasonal trend with summer minima and winter maxima (Table 1). The winter maxima are due to decreased decomposition rate owing to reduced microbial activity and increased algal productivity. The summer minima are due to increased decomposition rate, leading to acidification and lowered pH (Chetana and Somashekar, 1997). In the correlation analysis pH showed significant negative correlation with BOD, COD, TDS, Sulphates and Chlorides and had positive correlation with DO, Sodium and potassium. The clarity of natural body of water is an important determinant of its condition and productivity. Turbidity in water is caused by suspended and colloidal matter such as clay, silt, finely divided organic and inorganic matter, and plankton and other microscopic organisms. The present study indicates higher monsoon values and lower summer values in case of abstraction point, surface water and mixing zones. It could be owing to sedimentation during summer seasons and the turbulence arising out of flood-like situations observed during the rainy season. While in case of drain out falls summer maxima and monsoon minima were found with slighter variation. Higher summer values might be due to sand dredging using diesel motor and pumps. Yearly averages showed an increasing trend at S1, S3, S5 and S6 while trivial decreasing trend at site 2 and 4. Significant positive correlation was found with EC, TDS, SO4, PO4, NO3, BOD and COD and had negative correlation with DO and Hardness.

KATHMANDU UNIVERSITY JOURNAL OF SCIENCE, ENGINEERING AND TECHNOLOGY VOL. 6, No. I, MARCH, 2010, pp 50-59
53
Table 2. Seasonal averages of physico-chemical and biological characteristics in the Kollegal stretch of river Cauvery.
Stn Seas ons
Parameters
Temp pH Turb EC TDS TA TH Ca Mg Na K Cl F SO4 PO4 NO3 DO BOD COD TC FC
1
Sum. 29.7 7.91 4.2 390.4 212.6 181.4 199.6 100.5 24.2 21.2 4.9 64.5 0.3 85.7 0.25 4.56 6.5 2.1 20.3 329 125
Rain 26.8 8.12 8.8 267.6 141.3 167.7 145.8 76.5 16.9 11.0 3.2 54.1 0.4 44.0 0.9 9.96 8.6 1.9 16.3 297 97
Wint 23.5 8.21 6.4 302.5 172.9 171.1 167.3 87.1 19.6 14.8 4.4 60.1 0.3 65.1 0.44 6.95 9.6 1.5 12.3 223 63
2
Sum. 30.5 7.46 21.3 418.6 220.7 186.6 188.5 96.9 22.3 15.0 4.7 65.8 0.4 165.9 0.86 11.02 6.2 3.1 29.9 435 179
Rain 27.4 7.86 20.3 281.3 166.0 175.1 144.4 76.6 16.6 10.5 3.0 62.3 0.5 98.5 1.73 10.43 7.9 2.7 27.9 347 148
Wint 23.5 8.25 7.1 327.7 195.9 180.4 159.6 84.6 18.3 20.2 4.3 56.6 0.4 118.5 1.47 8.56 8.9 2.1 21.9 250 103
3
Sum. 29.9 7.87 3.4 384.3 212.9 190.5 190.0 96.8 22.7 18.8 4.9 60.6 0.1 79.2 0.24 4.08 6.5 2.3 21.9 325 136
Rain 27.2 8.01 7.3 261.3 153.7 166.1 145.7 79.9 16.1 13.3 3.3 56.6 0.3 43.6 0.59 8.24 8.8 1.5 17.6 298 90
Wint 23.2 8.22 4.9 299.5 172.3 177.0 163.8 83.9 16.1 16.0 4.3 58.8 0.2 59.0 0.39 5.98 9.6 1.8 15.3 224 69
4
Sum. 30.5 7.55 22.5 419.9 223.6 191.1 165.2 82.4 20.2 16.8 4.1 69.9 0.4 198.7 0.81 11.22 6.3 3.7 32.6 430 195
Rain 27.2 7.85 21.8 280.0 159.0 183.1 121.8 60.7 14.9 11.9 3.7 62.9 0.4 115.4 1.59 10.67 7.8 3.1 30.6 351 159
Wint 22.9 8.15 9.8 338.1 198.3 178.1 149.5 75.1 18.2 14.1 3.8 58.8 0.4 148.6 1.38 9.02 8.9 2.5 25.6 261 107
5
Sum. 29.8 8.01 3.3 381.7 209.6 171.0 196.1 99.9 23.5 19.2 4.8 65.5 0.2 82.4 0.37 3.3 6.6 2.3 19.9 310 128
Rain 26.5 8.17 8.8 261.3 151.2 169.9 138.9 79.7 14.4 14.5 3.5 51.2 0.3 36.3 0.87 7.92 8.1 1.8 17.6 269 87
Wint 22.9 8.31 5.8 314.1 179.3 173.5 170.3 87.4 20.2 16.7 4.2 57.8 0.3 48.0 0.67 5.89 9.5 1.1 11.3 219 68
6
Sum. 29.6 7.99 4.2 379.6 205.9 176.3 193.8 95.2 24.0 19.4 4.9 62.6 0.3 79.2 0.36 3.83 6.6 2.3 20.9 348 134
Rainy 26.4 8.16 8.6 263.7 152.7 178.2 140.1 70.0 17.1 13.5 3.8 50.2 0.4 38.9 0.84 8.69 8.3 1.7 17.6 274 94
Wint. 22.9 8.31 6.1 317.0 185.6 182.0 169.2 83.6 20.9 16.2 4.5 55.7 0.3 51.2 0.52 6.39 9.8 1.3 11.3 234 70
Note: All values are expressed in mg/l except for Turbidity, pH, Colour & Conductivity and coliforms expressed in CFU/100ml; TA – Alkalinity; TC-Total coliforms; FC-Faecal coliforms
Temperature of water may not be as important in pure water because of the wide range of temperature tolerance in aquatic life, but in polluted water, temperature can have profound effects on dissolved oxygen (DO) and biological oxygen demand (BOD).The fluctuation in river water temperature usually depends on the season, geographic location, sampling time and temperature of effluents entering the stream (Ahipathy, 2006). Summer maxima and winter minima were observed at all the sites with the marginal variations. Yearly averages indicates increasing trend at all the sites with the difference of 0.90c. Temperature showed significant positive correlation with Cl and also showed slight positive correlation with EC, BOD and COD, and significant negative correlation with pH. Conductivity is a measure of the ability of an aqueous solution to carry an electric current. This ability depends on the presence of ions; on their total concentration, mobility, and valence; and on the temperature of measurement. In the present study site 1 and site 4 showed higher values of Electrical conductance and total dissolved solids in contrast to other sites. Increasing levels of conductivity and cations are the products of decomposition and mineralization of organic materials (Abida, 2008). In all the stations minima observed in rainy season due to dilution with rain water and maxima in summer owing to evaporation and reduced discharge of sewage water to the river. Not significant variations of yearly averages were found both in case of Electrical conductance and Total Dissolved Solids. EC showed significant positive correlation with TDS, chlorides, sulphates, phosphates, nitrates, BOD,

KATHMANDU UNIVERSITY JOURNAL OF SCIENCE, ENGINEERING AND TECHNOLOGY VOL. 6, No. I, MARCH, 2010, pp 50-59
54
COD and had negative correlation with Total hardness, Calcium hardness, Sodium and DO significantly.
Table 3. Annual averages of physico-chemical and biological characteristics in the Kollegal stretch of river Cauvery
Stns Year
PARAMETERS Temp pH Tur EC TDS TA TH Ca Mg Na K Cl F SO4 PO4 NO3 DO BOD COD TC FC
1
2006-07 26.6 8.02 6.1 339.1 172.7 175.9 142.5 69.4 17.8 13.6 4.1 67.8 0.3 61.2 0.55 6.1 8.7 1.7 15.9 261 83
2007-08 26.8 8.14 6.9 301.2 178.5 170.7 199.3 106.7 22.6 17.8 4.3 51.4 0.4 68.6 0.5 8.3 7.7 2 16.6 304 107
2006-08 26.7 8.08 6.5 320.1 175.6 173.3 170.9 88 20.2 15.7 4.2 59.6 0.3 64.9 0.53 7.2 8.2 1.8 16.3 283 95
2
2006-07 27.1 7.92 21.2 367.7 191.5 178.5 136.9 66.3 17.2 13.4 4.2 71.5 0.4 139.3 1.27 9.1 7.7 2.3 23.6 342 135
2007-08 27.3 7.79 20.8 317.4 196.8 182.9 191.4 105.8 20.9 17.1 3.8 51.8 0.5 116 1.42 10.9 7.5 2.9 29.6 346 153
2006-08 27.2 7.86 21 342.5 194.2 180.7 164.2 86 19.1 15.3 4 61.6 0.4 127.6 1.35 10 7.6 2.6 26.6 344 144
3
2006-07 26.8 7.98 4.8 319.6 218.6 174.3 158.11 78.8 19.4 14.1 4.3 71.8 0.2 58.7 0.42 6.4 8.5 1.8 17.6 307 107
2007-08 27 8.09 5.6 310.5 177.9 181.5 172.89 95 19 17.9 4 45.6 0.2 62.5 0.4 5.8 8.1 2 18.9 257 90
2006-08 26.8 8.03 5.2 315.0 177.9 177.9 165.5 86.9 19.2 16 4.2 58.7 0.2 60.6 0.41 6.1 8.3 1.9 18.3 282 98
4
2006-07 26.8 7.73 21.2 336.8 195.2 179.5 128.8 60.94 14.9 12.8 4.2 73.2 0.4 148.6 1.14 9.8 8 2.9 28.3 333 146
2007-08 27 7.97 21 355.2 192.1 188.7 204.3 83.36 25 15.8 3.5 54.6 0.4 159.8 1.37 10.8 7.4 3.3 30.9 362 162
2006-08 26.9 7.85 21.1 346.0 193.6 184.1 145.5 72.72 20 14.3 3.9 63.9 0.4 154.2 1.26 10.3 7.7 3.1 29.6 347 154
5
2006-07 26.2 8.09 5 332.3 179.8 171.5 142.5 73.1 16.9 14.7 4.2 65.7 0.3 49.7 0.88 5.5 8.4 1.7 16.3 259 89
2007-08 26.6 8.23 7 305.7 180.3 171.4 194.3 104.8 21.8 18.9 4.1 50.6 0.3 61.5 0.39 5.9 7.8 1.8 16.7 272 99
2006-08 26.4 8.16 6 319.0 180.0 171.5 168.4 89 19.4 16.8 4.2 58.2 0.3 55.6 0.64 5.7 8.1 1.7 16.5 266 94
6
2006-07 26.1 8.07 6.1 343.9 183.4 179.3 142.5 67.5 18.3 14.5 4.6 64.5 0.4 54.3 0.73 6.1 8.4 1.7 15.6 280 96
2007-08 26.5 8.23 6.5 296.3 177.4 178.4 192.9 98.3 23.1 18.2 4.2 47.8 0.3 58.6 0.42 6.5 8 1.9 17.6 290 101
2006-08 26.3 8.15 6.3 320.1 180.4 178.8 167.7 82.9 20.7 16.4 4.4 56.2 0.3 56.4 0.57 6.3 8.2 1.8 16.6 285 99
Note: All values are expressed in mg/l except for Turbidity, pH, Colour & Conductivity and coliforms expressed in CFU/100ml; TA – Alkalinity; TC-Total coliforms; FC-Faecal coliforms
Chlorides occur naturally in all types of waters. High concentration of chlorides is considered to be the indicators of pollution due to organic wastes of animal or industrial origin. Chlorides are troublesome in irrigation water and also harmful to aquatic life. (Rajkumar, 2004). The levels of chlorides in the present investigation chloride values are maximum in summer and minimum in winter. Yearly averages between the locations ranged from 56.2mg/ L to 63.9mg/L. and the values are well within prescribed limit (250mg/L) and showing no significant variations. Chloride showed positive correlation with Temperature, turbidity, EC, Sodium, potassium, sulphates, nitrates, BOD and COD and had significant negative correlation with pH. Seasonal values of both monovallent Sodium and Potassium of the present analysis showed summer maxima and winter minima. station1, 5 and 6 were showed higher concentration in contrast to station2,3 and 4. This could be due to washing cloths utensils and bathing using soaps and detergents directly with river water. Yearly averages of sodium and potassium showed increasing trend in all the sites and ranges between 14.3 to 16.8mg/L and 3.9 to

KATHMANDU UNIVERSITY JOURNAL OF SCIENCE, ENGINEERING AND TECHNOLOGY VOL. 6, No. I, MARCH, 2010, pp 50-59
55
4.4mg/L respectively. Correlation analysis indicates Sodium has significant negative correlation with chloride, sulphate, nitrate, BOD and COD and potassium also had significant negative correlation with chloride, sulphate, BOD and COD. Table 4. Correlation coefficients between the physico-chemical parameters in the Kollegal stretch of river Cauvery.
Para
meter. Temp pH Turb EC TDS TA TH Ca Mg Na K Cl F SO4 PO4 NO3 DO BOD COD
Temp 1 pH -0.86 1
Turb 0.57 -0.89 1 EC 0.50 -0.85 1.00 1
TDS 0.37 -0.77 0.94 0.93 1 TA 0.45 -0.77 0.77 0.74 0.82 1 TH -0.58 0.90 -0.96 -0.93 -0.97 -0.86 1 Ca -0.42 0.82 -0.94 -0.93 -0.95 -0.93 0.95 1 Mg -0.35 0.02 0.21 0.26 0.27 0.39 -0.16 -0.41 1 Na -0.81 0.95 -0.88 -0.86 -0.69 -0.71 0.80 0.80 -0.11 1 K -0.78 0.88 -0.83 -0.80 -0.75 -0.48 0.83 0.64 0.26 0.77 1 Cl 0.84 -0.92 0.87 0.85 0.69 0.51 -0.79 -0.67 -0.14 -0.91 -0.94 1 F 0.17 -0.48 0.71 0.77 0.55 0.38 -0.50 -0.64 0.46 -0.68 -0.37 0.59 1
S04 0.65 -0.93 0.99 0.98 0.92 0.78 -0.96 -0.92 0.16 -0.91 -0.86 0.91 0.68 1 P04 0.41 -0.78 0.98 0.99 0.96 0.69 -0.93 -0.91 0.25 -0.77 -0.79 0.80 0.73 0.95 1 N03 0.67 -0.91 0.95 0.95 0.80 0.71 -0.86 -0.87 0.20 -0.97 -0.78 0.91 0.80 0.97 0.89 1
DO -0.39 0.76 -0.97 -0.98 -0.95 -0.66 0.91 0.88 -0.23 0.74 0.80 -0.79 -0.73 -0.94 -1.00 -
0.87 1 BOD 0.65 -0.94 0.99 0.97 0.93 0.83 -0.98 -0.94 0.16 -0.90 -0.85 0.88 0.62 1.00 0.94 0.94 -0.92 1 COD 0.64 -0.94 0.98 0.95 0.95 0.84 -0.99 -0.94 0.14 -0.87 -0.86 0.85 0.55 0.98 0.93 0.91 -0.92 1.00 1
± .811 critical value .05 (two-tail)
± .917 critical value .01 (two-tail)
Figure 1. Location wise variation in between Total and Faecal coliforms.
TC
TC
TC
TC
TCTC
FC
FC
FC
FC
FC FC
0
50
100
150
200
250
300
350
400
Site1 Site2 Site3 Site4 Site5 Site6
Location
No.
of C
FU/1
00m
l

KATHMANDU UNIVERSITY JOURNAL OF SCIENCE, ENGINEERING AND TECHNOLOGY VOL. 6, No. I, MARCH, 2010, pp 50-59
56
FLUORIDE (F–) concentration is an important aspect of hydrogeochemistry, because of its impact on human health. The recommended concentration of F– in drinking water is 1.50 mg/l. Low F– content (< 0.60 mg/l) causes dental caries, whereas high (>1.20 mg/l) fluoride levels result in fluorosis. Hence, it is essential to have a safe limit of F– concentration of between 0.60 and 1.20 mg/l in drinking water. The Bureau of Indian Standards (BIS) prescribed a limit between 1.0 and 1.5 mg/l. Fluoride not showed any significant seasonal and annual averages trend in their values and also well below the permissible limit (1.6mg/L). It was not exhibited correlation with any parameters significantly. The Alkalinity of natural waters is due primarily to the salts of weak acids, although weak or strong bases may also contribute. Bicarbonate represents the major form of alkalinity, with that carbonate and hydroxide alkalinity also. In the present investigation total alkalinity reveals summer maximum and monsoon minimum values and yearly averages showed increasing trend at station2 and 4 in contrast to other stations. Alkalinity was found to have significant positive correlation with TDS, Total and Calcium hardness and had significant negative correlation with pH, BOD and COD. Hardness of water is an important consideration in determining the suitability of water for domestic and industrial uses. Hardness is caused by multivalent metallic cations and with certain anions present in the water to form scale. The principal hardness-causing cations are the divalent calcium, magnesium, strontium, ferrous iron and mangnous ions. In the present study Total hardness of all the sites showed summer maxima due to reduced inflow and evaporation, and monsoon minima was due to increasing inflow and dilution. Increasing trend of yearly averages was observed at all the sites with the range of 142.5 to 170.9mg/L. Total hardness found to have significant positive correlation with pH, calcium, potassium and DO and had negative correlation with turbidity, EC, alkalinity, Sulphate, phosphate, BOD and COD. The Sulphate content of natural waters is an important consideration in determining their suitability for public and industrial supplies. Sulphate values of the current study were found to be that maximum in summer and minimum in rainy season in all the 6 locations. Yearly averages exhibit increasing trend in all the locations except site2 and values varied between 55.6 and 154.2mg/L. Sulphate has been positively correlated with phosphates, nitrates, BOD and COD, and had negative correlation with DO also. Phosphate and Nitrate determinations are important in assessing the potential biological productivity of surface waters. Increasing concentration of phosphorus and nitrogen compounds in lakes and reservoirs leads to eutrophication. Phosphates and nitrates of all the sites showed monsoon maxima and summer minima this could be due to agricultural runoff during rainy season and utilization as nutrients by algae and other aquatic plants. There was significant increasing trend is observed at site1 and site4, could be due to sewage water with agricultural wastes especially paddy debris. Both they had correlated each other positively and also had significant positive correlation with BOD and COD and negatively with DO.

KATHMANDU UNIVERSITY JOURNAL OF SCIENCE, ENGINEERING AND TECHNOLOGY VOL. 6, No. I, MARCH, 2010, pp 50-59
57
Dissolved oxygen content is one of the most important factors in stream health. Its deficiency directly affects the ecosystem of a river due to bioaccumulation and biomagnifications. The oxygen content in water samples depends on a number of physical, chemical, biological and microbiological processes. DO values also show lateral, spatial and seasonal changes depending on industrial, human and thermal activity. Oxygen is the single most important gas for most aquatic organisms; free oxygen (O2) or DO is needed for respiration. DO levels below 1 ppm will not support fish; levels of 5 to 6 ppm are usually required for most of the fish population. The average value of DO levels (6.5mg/l) indicates the average quality of river water (APHA 2005). DO values were found maximum during winter and minimum during summer, which might be due to natural turbulence and higher algal productivity produces O2by photosynthesis in rainy period and active utilization in bacterial decomposition of organic matter. Rajkumar (2004) and Jitendra (2008) also reported winter maximum and summer minimum DO values in their study. yearly averages varied between 7.6 to 8.3mg/L and showed increasing trend in case of all the sites, Which may caution increasing accumulation of organic load and human activities with the river system. DO showed significant positive correlation with pH, hardness, sodium and potassium and had negative correlation with turbidity, EC, TDS, sulphate, phosphate, nitrates, BOD and COD also.
Biological oxygen demand is a measure of the oxygen in the water that is required by the aerobic organisms. The biodegradation of organic materials exerts oxygen tension in the water and increases the biochemical oxygen demand (Abida, 2008). Rivers with low BOD have low nutrient levels; therefore, much of the oxygen remains in the water. Unpolluted, natural waters will have a BOD of 5 mg/l or less. BOD directly affects the amount of dissolved oxygen in rivers and streams. The greater the BOD, the more rapidly oxygen is depleted in the stream. This means less oxygen is available to higher forms of aquatic life. The consequences of high BOD are the same as those for low dissolved oxygen: aquatic organisms become stressed, suffocate, and die. Sources of BOD include leaves and woody debris; dead plants and animals; animal manure; effluents from pulp and paper mills, wastewater treatment plants, feedlots, and food-processing plants; failing septic systems; and urban storm water runoff (USEPA 1997). Seasonal analysis reveals that BOD values are more during summer fallowed by monsoon and winter. Similar treads also reported by Ahipathi (2006) open defecation near by river and Discharging of Sewage waste water generated by Kollegala town and Harale village to up stream river at S2 and S4 resulting higher BOD values of 2.6 and 3.1mg/L respectively and steadily reduced in the down stream sites of mixing zone. The yearly averages showed marginal increasing trend with the range of 1.7 to 3.1mg/L of BOD levels in every location, which indicates the absence of major organic pollution sources in the study area. Correlation analysis of BOD exhibit significant positive correlation with turbidity, conductance, TDS, Alkalinity, Chlorides, Sulphates, Phosphates, Nitrates, and COD, and had negative correlation with pH, Hardness, Sodium and potassium. Chemical oxygen demand (COD) is a measure of the oxidation of reduced chemicals in water. It is commonly used to indirectly measure the amount of organic compounds in water. The measure of COD determines the quantities of organic matter found in water. This makes COD useful as an indicator of organic pollution in surface water (King et al., 2003 and Faith, 2006). In the conjunction with the BOD test, the COD test is helpful in indicating toxic conditions and the presence of biologically resistant organic substances (Sawyer et al., 2003).

KATHMANDU UNIVERSITY JOURNAL OF SCIENCE, ENGINEERING AND TECHNOLOGY VOL. 6, No. I, MARCH, 2010, pp 50-59
58
Seasonal averages of COD values discloses summer maxima and winter minima and drain out falls of S2 and S4 exhibited higher concentration in contrast to S1, S2, S5and S6. Slight increasing trend was observed in yearly averages, with the range of 16.3 to 29.6mg/L among the different locations. Correlation analysis reveals that COD was found have significant positive correlation with turbidity, EC, TDS, Alkalinity, Chlorides, Sulphates, Nitrates, Phosphates and BOD, and had negative correlation with pH, Hardness, Sodium, potassium, and dissolved oxygen. Both Total and Faecal coliforms in the present investigation exhibits more counts during summer fallowed by monsoon and winter. Summer maxima might be due to discharging of domestic wastes containing faecal matters to the river body and open defecation along the sides of river bank. Winter minima might be due to cold climatic condition, which is not been supportive for bacterial duplication in a greater extent. Yearly averages showed increasing trend at S1, S2, S3 and S4. while mixing zones S5and S6 showed slight decrease in their counts .location wise distribution of Total and Faecal coliforms (Fig. 2) showed that Total coliforms counts recorded higher 362 at S4 and lower 266 at S5, and Faecal coliforms recorded higher 154 at S4 and lower 85 at S1. So in all the stations Total and Faecal coliforms of counts river water are beyond the permissible limit and was not suitable for drinking purpose without pretreatment. CONCLUSION Thus the present study was concluded that river water of the study area was not polluted in respect to physico- chemical assessment. But bacteriological studies attributed river water was not fit for drinking purposes due to higher coliforms counts, which require continuous monitoring and treatment process if the water is to be used for drinking purposes. Some steps and awareness programs must need to educate local villagers to safeguard the Precious River and its surrounding. REFERENCES 1. Abida B. and Harikrishna, 2008. Study on the Quality of Water in Some Streams of
Cauvery River, E-Journal of Chemistry, 5, (2): 377-384.
2. Ahipathi M.V., and Puttaiah, E.T., 2006. Ecological Characteristics of Vrishabhavathi River in Bangalore (India), Environmental Geology, 49: 1217-1222.
3. APHA-AWWA-WEF. 1998. Standard methods for the examination of water and wastewater, 20th edition. Washington DC, USA: American Public Health Association.
4. Chetana S.A.and Somasekhar R.K., 1997. Ecological study on the riverine ecosystem of Karnataka. I. Physico-chemical characteristics of river Cauvery. J Environ Pollut, 4(1):57–63
5. Clair N. Sawyer, Perry L. McCarty and Gene F. Parkin. 2003. Chemistry for Environmental Engineering and Science, 5th edition,Tata McGraw-Hill, pp. 625-630.
6. Faith Ngwenya, 2006. Water Quality Trends in the Eerste River, Western Cape, 1990-2005.A mini thesis submitted in partial fulfillment of the requirements for the degree

KATHMANDU UNIVERSITY JOURNAL OF SCIENCE, ENGINEERING AND TECHNOLOGY VOL. 6, No. I, MARCH, 2010, pp 50-59
59
of Magister Scientiae, Integrated Water Resources Management in the Faculty of Natural Science, University of the Western Cape. pp. 41.
7. Jitendra, S., Agrawal, D.K., and Shradha, P., 2008. Seasonal Variations in Different Physico-Chemical Characteristics of Yamuna River Water Quality in Proposed Lakhwar hydropower project influence Area. Research India Publications, International Journal of Applied Environmental Sciences, ISSN 0973-6077 3, (1):107–117.
8. King, J. M., Scheepers, A.C.T., Fisher, R.C., Reinecke, M.K. & Smith, L.B. 2003. River Rehabilitation: Literature Review, Case studies and Emerging Principles. WRC Report No. 1161/1/03.
9. Rajkumar, S., Velmurugan, P., Shanthi, K., Ayyasamy, P.M., and Lakshmanaperumalasamy, P. 2004. Water Quality of Kodaikanal lake, Tamilnadu in Relation to Physico-Chemical and Bacteriological Characteristics, Capital Publishing Company, Lake 2004, pp. 339-346.
10. USEPA, 1997. Manual on Monitoring Water Quality. EPA 841-B-97-003.
Copyright © 2022 FDOKUMEN