Slowly adapting stretch-receptor organs: Periodic stimulation with and without perturbations
15
Biol. Cybernetics33, 8145 (1979) Biological Cybernetics by Springer-Verlag 1979 Slowly Adapting Stretch-Receptor Organs: Periodic Stimulation with and without Perturbations* J. F, Vibert** and J. P. Segundo Department of Anatomyand Brain Research Institute, Universityof California,Los Angeles,USA Abstract. The length of isolated slowly adapting stretch-receptor organs (SAO) from crayfish was sub- mitted to approximately sinusoidal modulations of 0.030-0.800ram at frequencies of about 0.2, 1.0 or 3.0cps. Sines were imposed either by themselves ("clean") or mixed with ("perturbed by") fast irregular length fluctuations or "jitter". The amplitude of the latter remained within a specified fraction of the modulation, usually two-thirds (or x0.66), though from one twentieth to twice (or x 0.05-2.00) were ex- plored. The afferent impulse discharge was recorded: rate over bins of about 1/10 of the period was plotted as function of ongoing time. Within stationary epochs, average cycles were analyzed primarily in terms of lengths and discharge intensities. Each point in the displays corresponded to a particular bin along the average cycle, the abscissa and the ordinate being the length and the corresponding discharge rate, respec- tively; points were numbered in the order of their generation. Similar displays were constructed for rate vs velocity, rate vs acceleration, and rate-change vs velocity. Experiments without jitter. The non-perturbed state. With 0.2 and 1.0 cps, the rate vs length display had a "clockwise loop with a flat extension to the left". The SAO at its shortest did not discharge and remained silent for some time. As length augmented, it even- tually started firing, reaching maximum rate while being stretched (lead) or at maximum length. While length decayed, the organ fired less, slowing down, stopping at a length greater than where it had started, and then remaining silent until the end of the cycle. With 3.0 cps, the display had a "counterclockwise loop with a flat extension on the left". The SAO did not discharge at its shortest, and fired more during re- laxation than during stretching, peaking when relaxing * Supported by grants from NIH and NSF ** Visiting investigatorfrom H6pital Saint Antoine,Universit6de Paris, Facult6 de Mddecine, F-75012 Paris, France (lag) and stopping at a length greater than where it had started. Artificial introduction of time separations between length and rate converted displays into accep- tably straight lines only in a few, usually 0.2 cps, cases. The rate vs length relation exhibited consistent depar- tures from monotonic increase and from linearity: departures were large fractions of the overall swings involving flat extensions, leads, lags, saturation effects, asymmetric rate sensitivities, and "locking" (which was frequent with 1.0 or 3.0 cps and could conceivably be more common with faster modulations). Other experi- mental paradigms have demonstrated multivalued steady-state-rate-length relations. The variability from cycle to cycle of the rate in a particular bin was high or low for bins with low or high rates, respectively. "Rate vs velocity" plots were counter-clockwise loops with a base upon the abscissae, higher rates when velocity was decaying than when augmenting, and maxima at non-negative velocities. "Rate-change vs velocity" plots showed shortening associated with either dis- charge decreases or small changes, and lengthenings associated with discharge increases, greater when aug- menting if at 0.2 cps or when decaying if at 3.0 cps. "Rate vs stimulus acceleration" plots were, for the three tested frequencies, counterclockwise loops with a base upon the abscissae and higher rates when acceler- ation was decaying than when augmenting, suggesting a particular role in sensing accelerations. The sensi- tivity to length was evaluated by comparing the rate- swings at each frequency using identical bin-widths and depths. This procedure is considered to be most meaningful physiologically. Sensitivity was con- tingent upon the bin-width: with small bins (30 and 120ms) it was highest for 3.0cps, with intermediate bins (160 ms) it was highest for 1.0 cps, and with larger bins it was practically uniform. Differences involved factors of under x 1.7. Experiments with jitter. The perturbed state. Jitter changed radically the "rate vs length" displays, con- 0340-1200/79/0033/0081/$03.00
-
Upload
independent -
Category
Documents
-
view
0 -
download
0
Transcript of Slowly adapting stretch-receptor organs: Periodic stimulation with and without perturbations
Biol. Cybernetics 33, 8145 (1979) Biological Cybernetics �9 by Springer-Verlag 1979
Slowly Adapting Stretch-Receptor Organs: Periodic Stimulation with and without Perturbations*
J. F, Vibert** and J. P. Segundo Department of Anatomy and Brain Research Institute, University of California, Los Angeles, USA
Abstract. The length of isolated slowly adapting stretch-receptor organs (SAO) from crayfish was sub- mitted to approximately sinusoidal modulations of 0.030-0.800ram at frequencies of about 0.2, 1.0 or 3.0cps. Sines were imposed either by themselves ("clean") or mixed with ("perturbed by") fast irregular length fluctuations or "jitter". The amplitude of the latter remained within a specified fraction of the modulation, usually two-thirds (or x0.66), though from one twentieth to twice (or x 0.05-2.00) were ex- plored. The afferent impulse discharge was recorded: rate over bins of about 1/10 of the period was plotted as function of ongoing time. Within stationary epochs, average cycles were analyzed primarily in terms of lengths and discharge intensities. Each point in the displays corresponded to a particular bin along the average cycle, the abscissa and the ordinate being the length and the corresponding discharge rate, respec- tively; points were numbered in the order of their generation. Similar displays were constructed for rate vs velocity, rate vs acceleration, and rate-change vs velocity.
Experiments without jitter. The non-perturbed state. With 0.2 and 1.0 cps, the rate vs length display had a "clockwise loop with a flat extension to the left". The SAO at its shortest did not discharge and remained silent for some time. As length augmented, it even- tually started firing, reaching maximum rate while being stretched (lead) or at maximum length. While length decayed, the organ fired less, slowing down, stopping at a length greater than where it had started, and then remaining silent until the end of the cycle. With 3.0 cps, the display had a "counterclockwise loop with a flat extension on the left". The SAO did not discharge at its shortest, and fired more during re- laxation than during stretching, peaking when relaxing
* Supported by grants from NIH and NSF ** Visiting investigator from H6pital Saint Antoine, Universit6 de Paris, Facult6 de Mddecine, F-75012 Paris, France
(lag) and stopping at a length greater than where it had started. Artificial introduction of time separations between length and rate converted displays into accep- tably straight lines only in a few, usually 0.2 cps, cases. The rate vs length relation exhibited consistent depar- tures from monotonic increase and from linearity: departures were large fractions of the overall swings involving flat extensions, leads, lags, saturation effects, asymmetric rate sensitivities, and "locking" (which was frequent with 1.0 or 3.0 cps and could conceivably be more common with faster modulations). Other experi- mental paradigms have demonstrated multivalued steady-state-rate-length relations. The variability from cycle to cycle of the rate in a particular bin was high or low for bins with low or high rates, respectively. "Rate vs velocity" plots were counter-clockwise loops with a base upon the abscissae, higher rates when velocity was decaying than when augmenting, and maxima at non-negative velocities. "Rate-change vs velocity" plots showed shortening associated with either dis- charge decreases or small changes, and lengthenings associated with discharge increases, greater when aug- menting if at 0.2 cps or when decaying if at 3.0 cps. "Rate vs stimulus acceleration" plots were, for the three tested frequencies, counterclockwise loops with a base upon the abscissae and higher rates when acceler- ation was decaying than when augmenting, suggesting a particular role in sensing accelerations. The sensi- tivity to length was evaluated by comparing the rate- swings at each frequency using identical bin-widths and depths. This procedure is considered to be most meaningful physiologically. Sensitivity was con- tingent upon the bin-width: with small bins (30 and 120ms) it was highest for 3.0cps, with intermediate bins (160 ms) it was highest for 1.0 cps, and with larger bins it was practically uniform. Differences involved factors of under x 1.7.
Experiments with jitter. The perturbed state. Jitter changed radically the "rate vs length" displays, con-
0340-1200/79/0033/0081/$03.00
82
verting all of them into clockwise folium-like loops, which implied a shift from lag to lead at 3.0cps. Introduction of appropriate lags brought points accep- tably ctose to straight, positively sloped segments : this occurred often at 0.2cps, sometimes at 1.0cps, and exceptionally at 3.0cps. Jitter altered the variability profile along the cycle, decreasing peak variability and not affecting or increasing the minimum; variability along the cycle was thus reduced and uniformed and identification of stimuli on the basis of discharges was improved. Jitter amplitude was an important issue. The larger ones, about the modulation size, increased the lowest bin-rates, particularly at 0.2 and 1.0 cps, and increased the peaks at 0,2cps, decreasing them at 1.0 and 3.0cps. The smaller jitter, about 1/10 of the modulation, affected the lowest rates little, but in- creased the peak rate at 0.2 cps, decreasing it at 1.0 and 3.0cps; display shapes changed little. A qualitative model of the SAO involves subsystems with linear features, as well as rectification, stiction-like and saturation-like properties. Depending upon back- ground length, modulation depth, jitter and several other issues, the organ can perform frankly non- linearly, piece-wise linearly or linearly. Within each context, a particular stimulus is of interest and can be referred to as the "signal" ; others are aot, and can be referred to as "noise", azting as "perturbationr Srnall, erratic perturbations influence strongly transduction of large steps or sines, simplifying and making it more proportionate. Large regular perturbations act upon small signals too, but their influence has been explored less extensively.
Introduction
Sensory transduction in crustacean stretch receptor organs converts mechanical fluctuations of length and ter~sion into modulations of impulse generation in afferent fibers. Successive publications have described this conversion and proposed formal models (e.g., Borsellino etal., 1965; Brown and Stein, 1966; Bufio and Fuentes, 1978 ; Bufio et al., 1978 ; Burkhardt, 1958, 1959; Chaplain et al., 1971; Eyzaguirre and Kuffler, 1955a, b; Fields, 1966, 1976; Krauhs and Mirolli, 1975 ; Krnjevic and van Gelder, 1961 ; Nakajima, 1964; Nakajima and Onodera, 1909a, b; Nja and Walloe, 1973; Page and Sokolove, 1972; Teorell, 1971; Terzuolo and Knox, 1971; Terzuolo and Washizu, t932; Vibert etal., 1979; Wendler, t963; Wendler and Burkhardt, t96t).
The present communication has the primary pur- pose of expanding i on the transduction of con- linuously varying periodic stimuli, listing its features and exploring somewhat unclear issues (e.g., sensi- tivity}, and ii on the influence exerted by length jitters
of different amplitudes, discussing perturbations with- in a broader context. Secondly, it will comment on a largely qualitative model. A simitar study of the rap- idly adapting receptor is in progress (Diez-Martlnez etal,, in preparation).
Material and Methods
Slowly adapting receptors (SAO's) of Procambarus cIarkii of either sex were studied in October, November and December: organs were 8-12ram long in speci- mens of 10-13 cm. Procedures for dissecting, mounting and recording have been described elsewhere (Bufio et al., [978; Segundo etal., 1976), The organ was an- chored at its caudal end with a pin through the hard exoskeleton into the paraffin, and its length was varied by displacing with the shaker (see below) a small forceps that clamped the organ between its sensory innervation and the cephalic insertion (Bufio etal., 1978); the main observations did not depend qualita- tively on this placement. The average or "background" length was adjusted under the microscope to within physiological bounds.
The consensus is that tension rather than length provides the effective stimulus. The case is based on compartsons of paired relations between length, ten- sion, generator potential, firing rate and ongoing time (e,g,, Brown and Stein, 1966 ; Krnjevic and van Gelder, 1961; Nakajima and Onodera, 1966b; Terzuolo and Washizu, 1962). However, the receptor's role is ex- plained often in terms of lengths and positions (e.g., Alexandrovicz, 1967; Fields et al., 1967; Page and Sokolove, 1972), and Mill (1976) has pointed out sensibly that the distinction investigators make between length and tension is not necessarily that made by the animal itself, Moreover, the "microscopic" physical changes that act upon the neurons are as yet obscure (e.g., Wendler, 1963), Hence, neither length nor tension can be ignored, and we started with length for reasons of technical simplicity.
Stimuli consisted of modulations of length obtain- ed by way of a LTV Ling Altec electromagnetic shaker whose input was provided by a Ling Wideband power amplifier driven by a Wavetek Model 133 LF Trigger Generator and a Hewlett-Packard 8057A Precision Noise Generator. The actual stimulus was monitored with a Grass displacement sensor, The shaker was driven with periodic sinusoidal output from the Wavetek, When the latter is used exclusively, modu- lation can be referred to as ~ "non-perturbed', or "undisturbed", and when mixed with band-limited (at 200 cps) gaussian white noise from the generator, as "noisy", "with jitter", "with dither", or "perturbed" (Burro etal., 1978 ; Segundo etal., 1976). Three modu- lation frequencies (0.2, 1.0, and 3.0cps) were chosen
83
E
C9 Z ,060 Z m 32 F- (_9 Z .020 w d
2 6
A
W
n,"
6/ 2
TIME (s)
13. v
w
r r
16
4 -
.020 .060
C D
,o~o .,2o
LENGTHENING (mm)
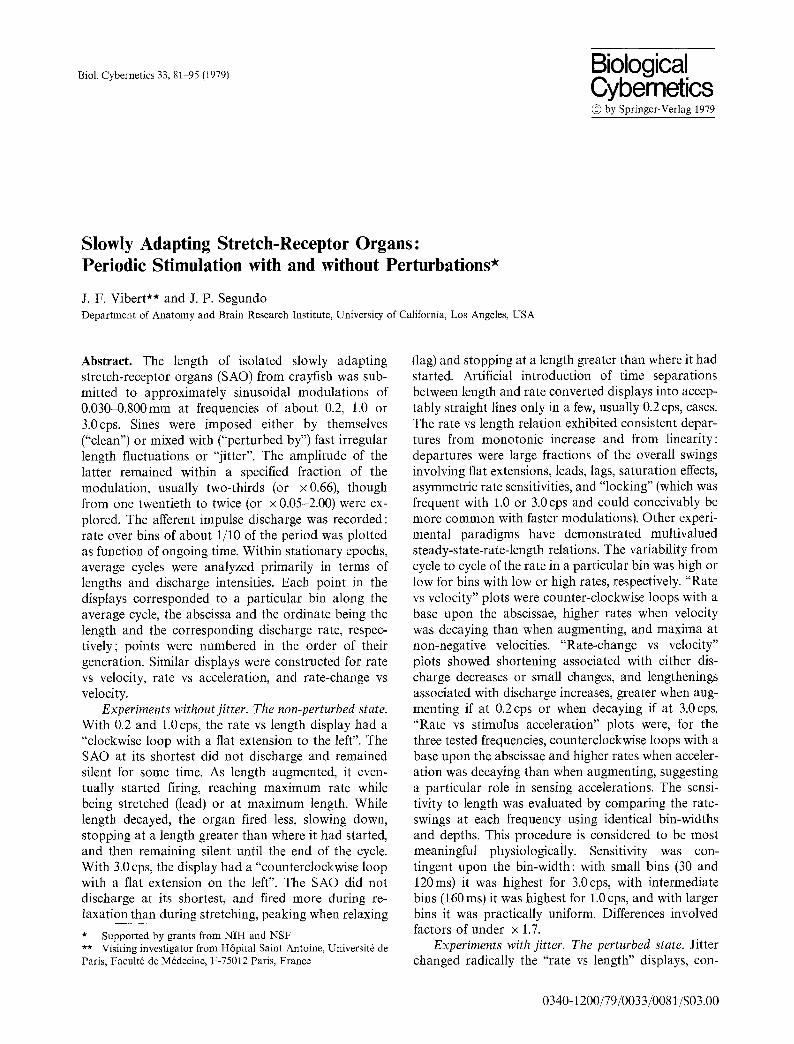
Fig. 1A-D. Periodic length modulation at"0.2 cps" in the unperturbed state. Discharge intensity vs stimulus magnitude. Unless otherwise indicated explicitly, graphs refer to the unperturbed state without jitter and are Lissajous displays where the abscissae is mean length in mm (zero at maximum relaxation), and the ordinate is mean afferent firing rate in ips, both corresponding to the same particular part (i.e., bin) of the cycle, and averaged across all cycles (see Methods). The order in which points are generated is indicated by the arrows. In A and B of Figs. 1-4, the abscissae is time along the cycle and the ordinate is length in A or afferent rate in B. C is the most common form of Lissajous display for ~'0.2'" cps, with a "flat extension" and a "clockwise loop". The flat extension is absent in D, but there are always zero-valued bins. The actual modulation frequencies and cycle durations were: A-C 0,17 cps, 5.892 s; D 0.23 cps, 4.227 s. Bin widths were 500, 100 or 30 ms for frequencies close to 0.2, 1.0 or 3.0 cps, respectively, unless otherwise noted
and results are contingent to this restricted choice; furthermore, in every case there was some deviation from the desired values and the ones actually applied are clarified in the respective figure legends. There is no data as to which are the functionally significant stimulus frequencies in intact crayfish (the 0.0 to 30.0cps range has been accepted for cat spindles, Goodwin et al., 1975). The peak-to-peak amplitude of the periodic modulation, as measured through an x 60 magnification dissecting microscope, was from 0.030 to 0.800mm. Length modulations were judged to be within the physiological range, involving 3-10 Too of the overall receptor length. Responses were always clear, suggesting low thresholds, for these modulation frequencies at least. Values should be compared with the estimated deformations of about 2.5 nm per half- sarcomere imposed upon cat soleus spindles by Goodwin et al. (1975). The jitter was adjusted so that when used without the periodic modulation, the bounds within which it remained when observed through the microscope were judged to be about 95 % of the time those of a prespecified fraction of the periodic
modulation (e.g., x 0.50). Unless stated explicitly, the jitter involved amplitudes which remained about 95 Too of the time within two-thirds (x 0.66) of the modu- lation depth. In other words, plus and minus one-third (x0.33) of the depth of a sinusoidal modulation provided bounds symmetric with respect to its average, such that the probability of the noise being between them was about 0.95. This is the meaning in this communication of expressions such as "the jitter was x 0.66 of the modulation". The transfer by the shaker was not linear, so length variations were not pro- portionate with the generator outputs. Consequently, sines resulted in length waveforms as those in Figs. 1 A, 2A, and 3A, and the Gaussian white noise resulted in waveforms that, though still irregular and rapidly varying, had predominant frequencies in their spectra. These deviations were aggravated when the derivatives of length (velocity, acceleration) were observed. The length cycles were average along portions with sta- tionary discharges. When modulation was "clean", the individual cycles practically did not differ from the average; when jitter was introduced, the individual
E E ,080
(_D Z
Z W -r" F - (_9 Z .o2o m _1
A
.2
40
8. . m
W
rt"
,io
TIME (s)
B
.2 i
1,0
40 t C c
D
8
,020 .080
D 2O
5 r
010 .020
LENGTHENING (mm)
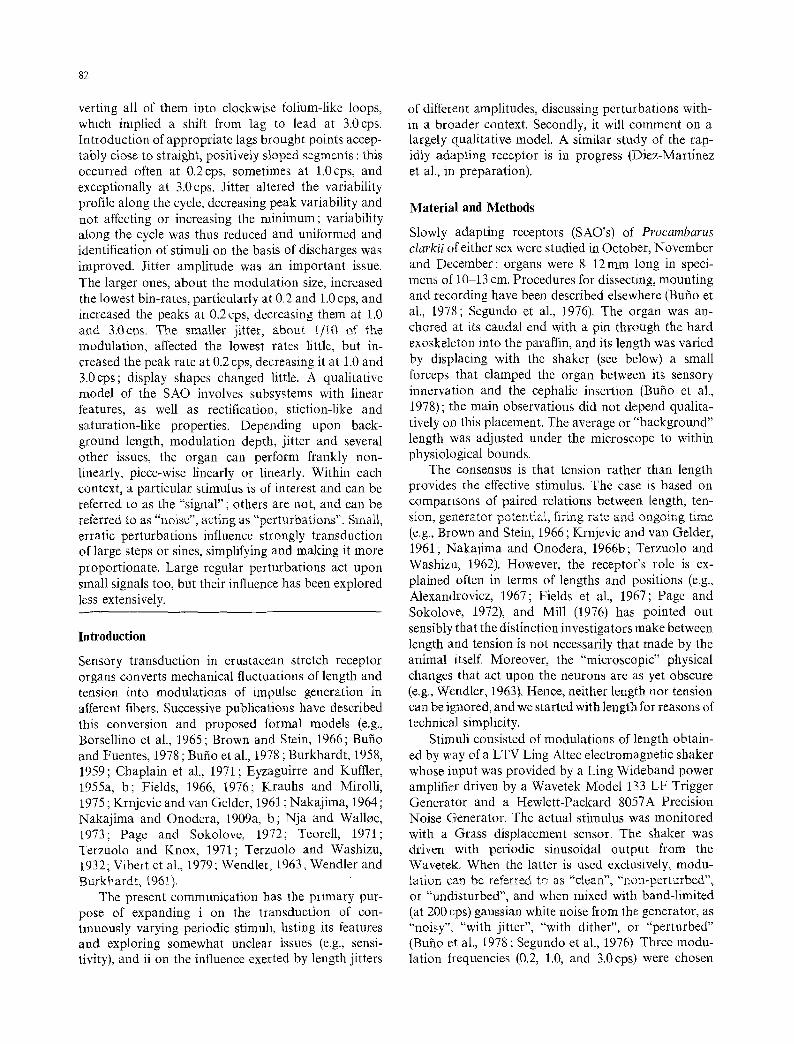
Fig. 2A-D. Modulation at "1.0 cps". Average length vs rate. C is the most common form with a "flat extension" and a "clockwise loop". There is no flat extension in D, but zero-valued bins remain. Modulat ion frequencies and cycles: A-C 1.01 cps, 0.992 s; D 1.01 cps, 0.994 s
A
.o8o .32o
32
~
W
rY
TIME (s) .080 ,320
E E
v
(.9 Z - - .060 Z W - l- F--
Z LLI ,020 ._J
C D
32
,c
8
.020 .060
LENGTHENING (mm)
Q.. 12
W
r'~
D
.020 ,080
52 32
8
,020 ,080
LENGTHENING (mm)
F
.020 ,080
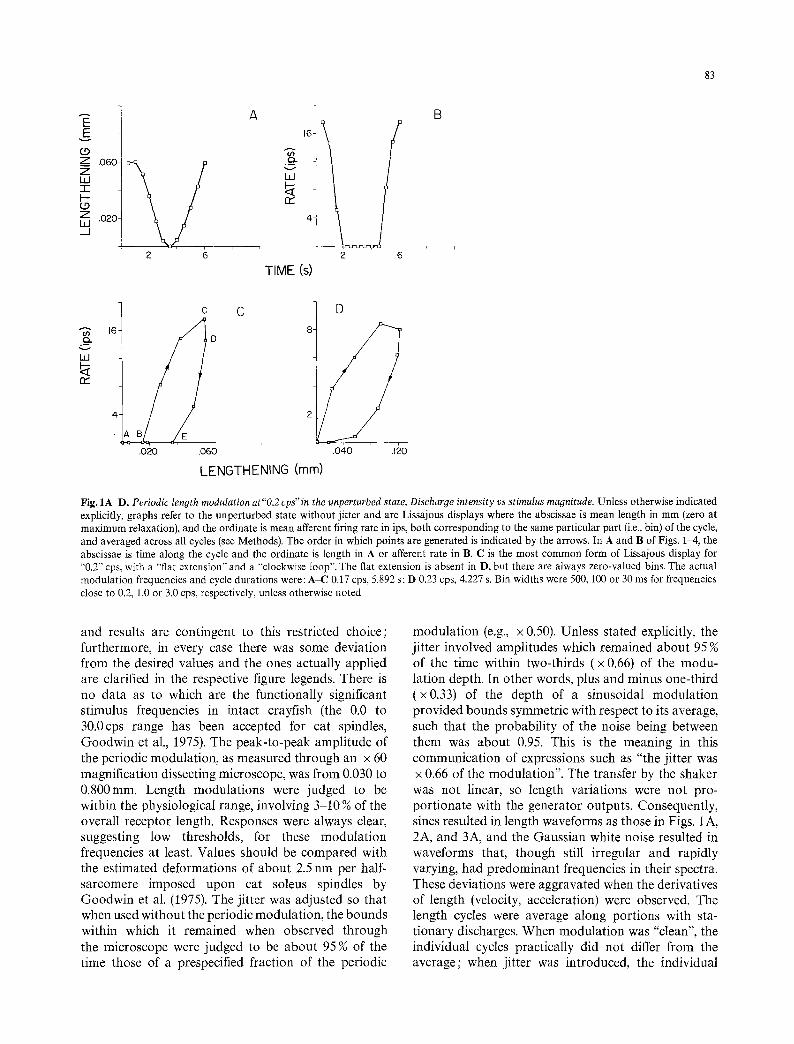
Fig. 3A-F. Modulation at "0.3 cps". Average length vs rate. C is the most common form with a "flat extension" and a "counterclockwise loop". The extension is small in D, a clockwise loop is added to the right in E, and the loop is clockwise in F; zero-valued bins are always present. Frequencies and cycle durations :A-C 3.11 cps,0.322 s; D (bin width, 60ms) 3.05 cps, 0.328 s; E 3.05 cps, 0.328 s; F 3.06 cps, 0.327 s
85
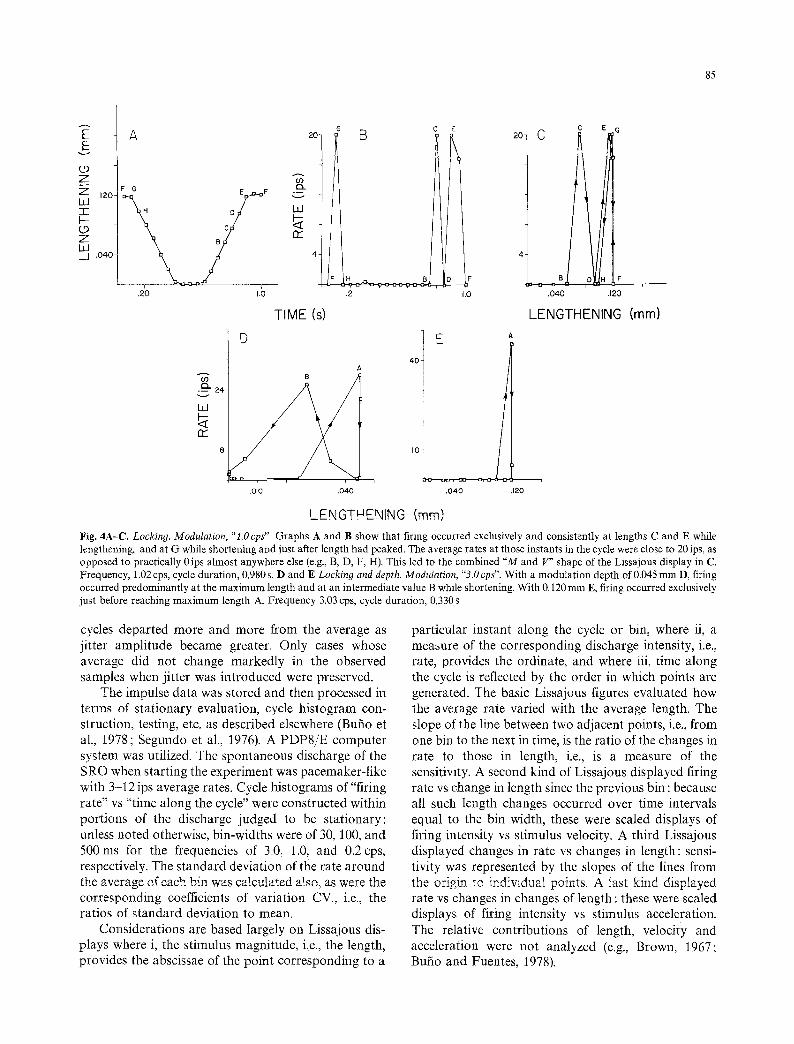
F A 20] G B C E 2 C C EG
_ _ . _ g ~ ~ _ F
, 2 0 1,0 . 2 1,0 . 0 4 0 ,120
.120
. . ~ , 0 4 0
TIME (s)
D
A B
LENGTHENING (ram)
E A
~176 !
Ld i
8 I0
r , , i , i
,010 .040 , 0 4 0 ,120
LENGTHENING (mm) Fig. 4A-C. Locking. Modulation, "l.Ocps". Graphs A and B show that firing occurred exclusively and consistently at lengths C and E while lengthening, and at G while shortening and just after length had peaked. The average rates at those instants in the cycle were close to 20ips, as opposed to practically 0ips almost anywhere else (e.g., B, D, F, H). This led to the combined "M and V" shape of the Lissajous display in C. Frequency, 1.02 cps, cycle duration, 0.980 s. D and E Locking and depth. Modulation, "3.0 cps". With a modulation depth of 0.045 mm D, firing occurred predominantly at the maximum length and at an intermediate value B while shortening. With 0.120 mm E, firing occurred exclusively just before reaching maximum length A. Frequency 3.03 cps, cycle duration, 0.330 s
cycles departed more and more from the average as jitter amplitude became greater. Only cases whose average did not change markedly in the observed samples when jitter was introduced were preserved.
The impulse data was stored and then processed in terms of stationary evaluation, cycle histogram con- struction, testing, etc. as described elsewhere (Bufio et al., 1978; Segundo et al., 1976). A PDP8/E computer system was utilized. The spontaneous discharge of the SRO when starting the experiment was pacemaker-like with 3-12 ips average rates. Cycle histograms of"firing rate" vs "time along the cycle" were constructed within portions of the discharge judged to be stationary: unless noted otherwise, bin-widths were of 30, 100, and 500 ms for the frequencies of 3.0, 1.0, and 0.2cps, respectively. The standard deviation of the rate around the average of each bin was calculated aIso, as were the corresponding coefficients of variation CV., i.e., the ratios of standard deviation to mean.
Considerations are based largely on Lissajous dis- plays where i, the stimulus magnitude, i,e., the length, provides the abscissae of the point corresponding to a
particular instant along the cycle or bin, where ii, a measure of the corresponding discharge intensity, i.e., rate, provides the ordinate, and where iii, time along the cycle is reflected by the order in which points are generated. The basic Lissajous figures evaluated how the average rate varied with the average length. The slope of the line between two adjacent points, i.e., from one bin to the next in time, is the ratio of the changes in rate to those in length, i.e., is a measure of the sensitivity. A second kind of Lissajous displayed firing rate vs change in length since the previous bin : because all such length changes occurred over time intervals equal to the bin width, these were scaled displays of firing intensity vs stimulus velocity. A third Lissajous displayed changes in rate vs changes in length: sensi- tivity was represented by the slopes of the lines from the origin to individual points. A last kind displayed rate vs changes in changes of length : these were scaled displays of firing intensity vs stimulus acceleration. The relative contributions of length, velocity and acceleration were not analyzed (e.g., Brown, 1967; Bufio and Fuentes, 1978).
86
Results
I. Experiments without Jitter. The Non-perturbed State
The basic average Lissajous plots involved on the ordinate bin-rate from the first-order afferent and on the abscissae SAO length: they thus displayed dis- charge intensity vs stimulus magnitude. Portions of A and B of Figs. 1-4 illustrate the differences between the shapes of the average cycles of stimulus magnitude and of discharge intensity. At 0.2 cps (Fig. 1), the Lissajous exhibited a consistent "loop" (BCDEB) that developed clockwise, and a slightly less consistent "extension" to the left (BAB) that coincided with the abscissae. The loop, generated while the organ was relatively stretch- ed, was either ellipse-like, or if flattened at one end folium-like, and presented two portions : an upper one (BCD) convex up and to the left (i.e., towards higher rates and smaller lengths) corresponded to the later part of the augmenting-length half-cycle ; a lower one (DEB), up and to the left concave and usually includ- ing a segment EB flattened against the abscissae, corresponded to the intermediate part of the decaying- length half-cycle. The zero-valued extension BAB fol- lowed the latter and corresponded to late shortening and early lengthening. At 1.0cps (Fig_ 2), the display had a "loop" and an "extension" similar in shapes, senses and consistencies to those at 0.2 cps. The exten- sion sometimes was a very flat loop that developed counter-clockwise. In one instance, a small "counter- clockwise loop" was added to the right of the main one; in another, occurring after successive lengthen- ings, and therefore perhaps overstretched, there was only a counter-clockwise triangle with base on the abscissae and vertex at the upper right.
At 3.0cps (Fig. 3C and D), the display had a consistent "counter-clockwise loop" at the greater lengths, plus an "extension" flattened against the ab- scissae at the smallest lengths. Occasionally, a rounded "clockwise loop" was added at the greatest lengths (Fig. 3E). One preparation showed just the clockwise
loop-plus-extension which characterized 0.2 and 1.0 cps (Fig. 3F). All bin-rates differed from zero only in a few cases, and mainly at 0.2 and 1.0 cps.
The occurrence of individual impulses at about the same instants in most cycles, i.e., "locking", was partic- ularly clear at the higher frequencies, and created special features. A case with a 1.0 cps 0.120 mm modu- lation (Fig. 4A-C) and with the usual flat extension showed at the greater lengths an "M" (BCDEF) swept from left to right and an inverted "V" (FGH) swept from right to left (coinciding largely with the rightmost portion of the M): the M and the V indicated that the cell fired consistently when the receptor passed each of three large lengths in a particular direction, i.e., C and E while lengthening, and G while shortening. Another case with a 1.0cps 0.tS0mm modulation fired con- sistently and exclusively around the shortest length. Two cases at 3.0 cps exhibited a flat extension and an inverted "V" : the Vwas in one (depth 0.180ram) at the left and swept from right to left, and in the other (depth 0.030 ram) at the right and swept from left to right, indicating that the cell fired only when the receptor was approaching minimum and maximum lengths, respectively. Yet another case at 3.0cps (depth 0.045 mm) fired very intensely at about 75 % of maxi- mum length when increasing, but very sparsely elsewhere.
Increasing the modulation depth sharpened the locking. At 3.0cps, for example, with 0.045mm (Fig. 4D) firing predominated moderately (i.e., with an average rate of 24 ips vs 4 ips elsewhere) at the maxi- mum A and at an intermediate length B while relax- ing; with 0.120ram (Fig. 4E), on the other hand, firing happened only at the maximum length A (rate about 50ips). If locking was clear-cut to begin with, depth increases were ineffectual, however. It is likely that locking and related phenomena would be even more apparent at modulation frequencies (e.g., around 7.0cps) closer to the overall average firing rate of the undisturbed organ, as noted by Brown and Stein (1966) and Diez Martinez et al. (in preparation).
Table 1. Sensitivity
in width 30 ms
Freq cps
120 160 350 480
0.2 1.0 3.0 0.2 1.0 3.0 02
Peak 20.5 31.2 33.4 14.2 16.5 16_6 12.6
Minimum 0 0 0 0 0 0 0 Swing 20.5 31.2 33.4 14.2 16,4 16,6 12.6 Proportion ~ 1,00 1.56 1.65 1.00 1.60 1.70 1.00
1.0 3.0 0,2 L0 3.0 0.2 t,6 3,0
15.0 12.4 11.8 14.2 - - 11.9 10.5 0 0 0 0 - - 0 1.7
15.0 12.4 11.8 14.2 - - 11.9 8.8 1.19 0.99 1.00 1.22 1.00 0.75
a Swing at the frequency divided by the swing at 0.2 cps
A 2o 2o] C / ~ ,6 i
o2o .o;o .o8o .~;o 04o .,~o
87
20 I 61D E
4 4
. & o - .o;o .o20 ' .o;o
LENGTHENING (mm)
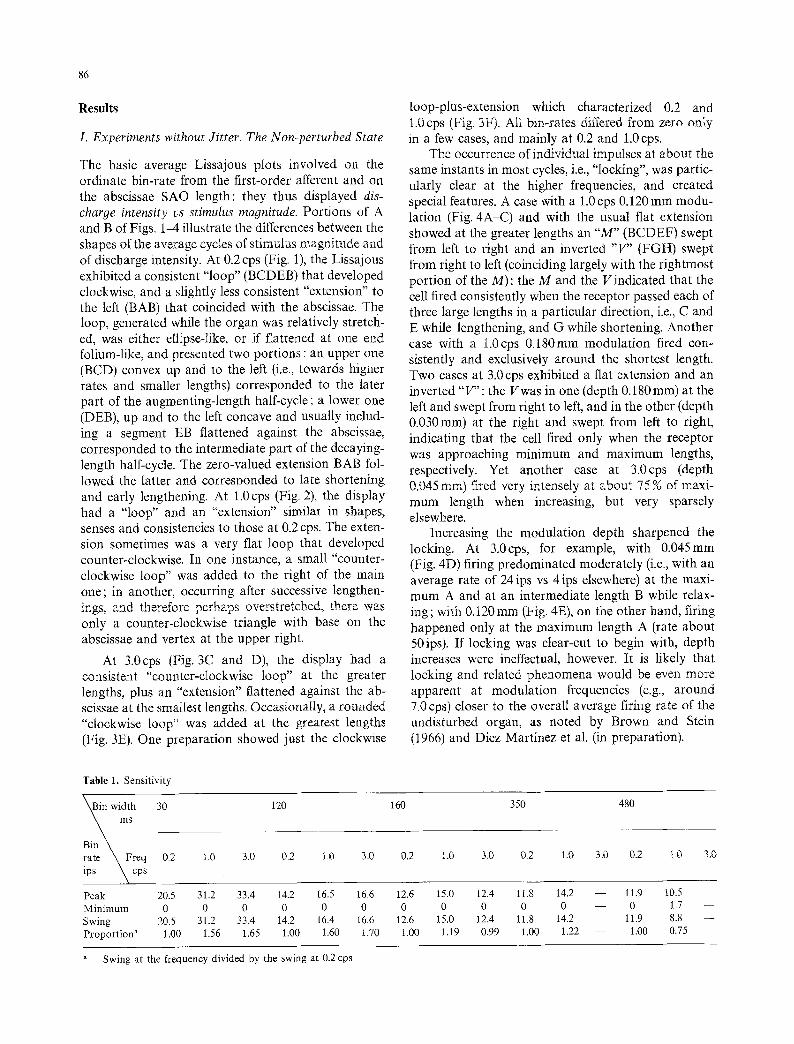
Fig. 5A-C. Artificial introduction of a time separation between length and rate. Illustrated are the consequences of the separations that optimized the attempted conversion to a linear plot. The ordinate of each point in the original plot (open squares) was assigned an abscissa that corresponded with a later instant in the cycle : shifts were half of A, three-quarters of B, or one whole cycle C. The resulting graphs (dotted squares) indicate that the procedure was more successful at 0.23 cps (cycle 4.267 s) and where there was no flat extension B than at 0.17 cps (cycle 5.731 s) where there was an extension A or at 1.03 cps (cycle 0.975 s) C. D and E Artificial introduction of a time separation between length and rate, exclusively within loops (extensions were ignored). Comparisons of the original graphs (open squares) with the resulting ones (dotted squares) illustrates the improvement by assigning each ordinate to an abscissae later in the cycle by three-quarters at 0.17 cps (cycle 5.731 s) D or by one-half at 1.02 cps (cycle 980 s) E
The sensitivity of the receptor to length at different frequencies was evaluated (at set background lengths and modula t ion depths) by compar ing the min imum- to-peak swings in impulse generat ion intensity utiliz- ing identical bin-widths: relevant values are listed in Table 1. It is not meaningful to use for cycle histo- g rams bin-widths greater than one-half cycle, e.g., than 500 ms for 1.0 cps ( though it still can be licit to utilize them in other contexts). For each frequency (and more so for the high ones), peak rates decreased as bin- widths increased; m i n i m u m rates remained close to 0 until bins became substantial p ropor t ions of the cycle (e.g., 350 ms for 1.0 cps). Fo r each bin-width, the great- est peak cor responded to 3.0cps with 30 or 120ms bins, to 1.0cps with 160 or 350ms, and to 0.2cps with 480ms. The rate swings reflected largely the peaks, since the min ima depar ted little f rom 0. Larger swings at the higher frequency with small bins, or at the lower frequency with large bins, reflected more precise lock- ings, or more mainta ined intense discharges, respec-
tively. The ratios f rom the swing at a certain frequency to that at 0.2 cps (arbitrarily chosen as s tandard) were within the 0.75-1.70 range. These results imply that any evaluat ion of sensitivity is cont ingent upon the span over which firing intensity is measured : at the shortest bins it was highest for 3.0cps, and at in- termediate ones for 1.0cps. Fur thermore , sensitivities vary also with modula t ion depth, waveform and back- g round stretch, but this was not explored.
Arti f ic ial introduction o f a time separation (Fig. 5), either positive or negative, between length and bin-rate modified the loop shapes, either s imply broadening them if if one sign, or successively flattening them, convert ing them into figures-of-eight, and reversing them if in the other. The resulting points were not close to straight lines, only in par t because the procedure could not eliminate the zero-rate portions. The rare cases with few zero bin-rates were flattened considera- bly, and points were closer to straight lines than in general (Fig. 5B) : the most successful t ime separat ions

88
2,0
A ,6
I0-
"G
v
CE []
~ , �9 ,
[,2
,4 1,2
2 0 -
~
IM
cr
1.0-
>
6
C D E 8.0
i 2.0
i
�9 2 1.0 . 0 8 0 , 3 2 0
TIME (s)
Fig. 6A and B. Variability of the rate in individual bins across different cycles. On the abscissae, time along the cycle; on the ordinate coefficient of variation (CV) (left axis, triangles) or mean rate for the same case (right axis, squares). Higher points on one graph correspond to lower ones on the other. A 0.19 cps, 5.176 s; B 1.02 cps, 0.980 s. C -E Comparison of the non-perturbed (open squares) and the perturbed states (black circles). Variabilities of the rate in individual bins across different cycles. On the abscissae, time along the cycle; on the ordinate coefficient of variation (CV). C 0.17cps, 5.731s; D 1.00cps, 0.994s; E 3.03 cps, 0.330s
were shifts of the rate to times later in the cycle by from one-half to one-bin duration. Introducing separations restricted to the loops while ignoring the extensions (Fig. 5D and E) sometimes flattened the loop with the shifted points acceptably close to a straight line (Fig. 5E) : such changes were common with 0.2 cps and ra re with 1.0 cps, but never found with 3.0 cps. "Successful" cases implied a piece-wise linear length-rate relation with two segments, one horizontal and the other positively sloped.
The variability of the firing intensity from cycle to cycle in an individual bin, and therefore corresponding to particular stimulus conditions (e.g., to where length was 0.080 beyond minimum and increasing) was mea- sured by the coefficient of variation CV of the rate, i.e., by calculating in a particular bin and across all cycles the ratio of the standard deviation to the mean. This explored the component of the multivaluedness in the length-discharge relation that has been referred to as "spontaneous" (Macadar et al., 1978). For 29 out of 31 cases so explored (about 97 % of them), the bins with high or low CV's were among those with low or high rates, respectively (Fig. 6A and B).
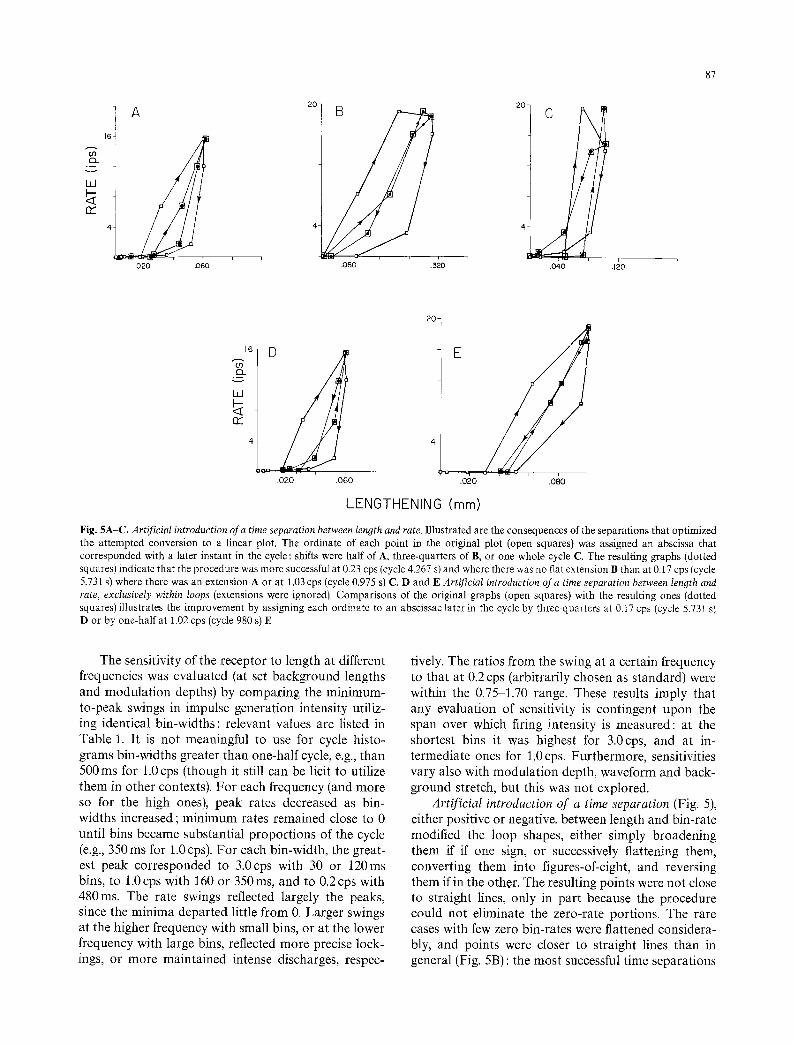
Average Lissajous displays of firing rate in a bin as function of the change in length from the preceding bin plotted discharge intensity vs stimulus velocity (see Methods). At 0.2 cps (Fig. 7A), a "counter-clockwise loop" developed trapeze-like, with the larger base on the abscissae and tilted to the right. As the velocity augmented from its most negative value, i.e., from the fastest relaxation, there was usually very little or no discharge while it remained negative or positive but small, i.e., when the organ was either relaxing or slowly lengthening. Firing commenced when velocity was more positive, i.e., when lengthening became faster, and peaked close to the maximum positive velocity, i.e., to the fastest lengthening. The rate decreased monotonically along the half-cycle where velocity de- cayed, slowly while it was positive, i.e., when the organ was lengthening, and rapidly while velocity was neg- ative, i.e., when the organ was relaxing. Discharge ceased close to the most negative velocity, i.e., to the fastest relaxation. The same description is essentially valid for 1.0 cps (Fig. 7B). An occasional addition was a small "clockwise loop" in the large velocity-high rate region. The 3.0 eps display (Fig. 7C) also was charac-
89
Q. .I v W
Of
A
16
4
-,020 0 ,020
B
-.400 0 ,400
VELOCITY (mmIs)
40- C
8"
-I,333 0 1,333
Fig. 7A-C. Discharge intensity vs stimulus velocity. On the abscissae, change in length from the preceding bin divided by bin-width, i.e., average stimulus velocity in mm/s. On the ordinate, firing rate in ips. Open square: clean modulation; black circles, noisy modulation. A 0.17 cps, 5.893 s; B 0.99 cps, 1.010s; C 3.06cps, 0.327 s
e~
W
Z 4 < ZIZ (.,) o-
W ,~-4-
n-
A
/ L ,040 C) .040
5
0- -5-
B
O
-20
- 1 ,000 0 I.OOC - L 333
VELOCITY (ram/s)
C
& 1,333
D
32 i S
R -,, & if,
ACCELERATION (mm/s Z)
w
re-
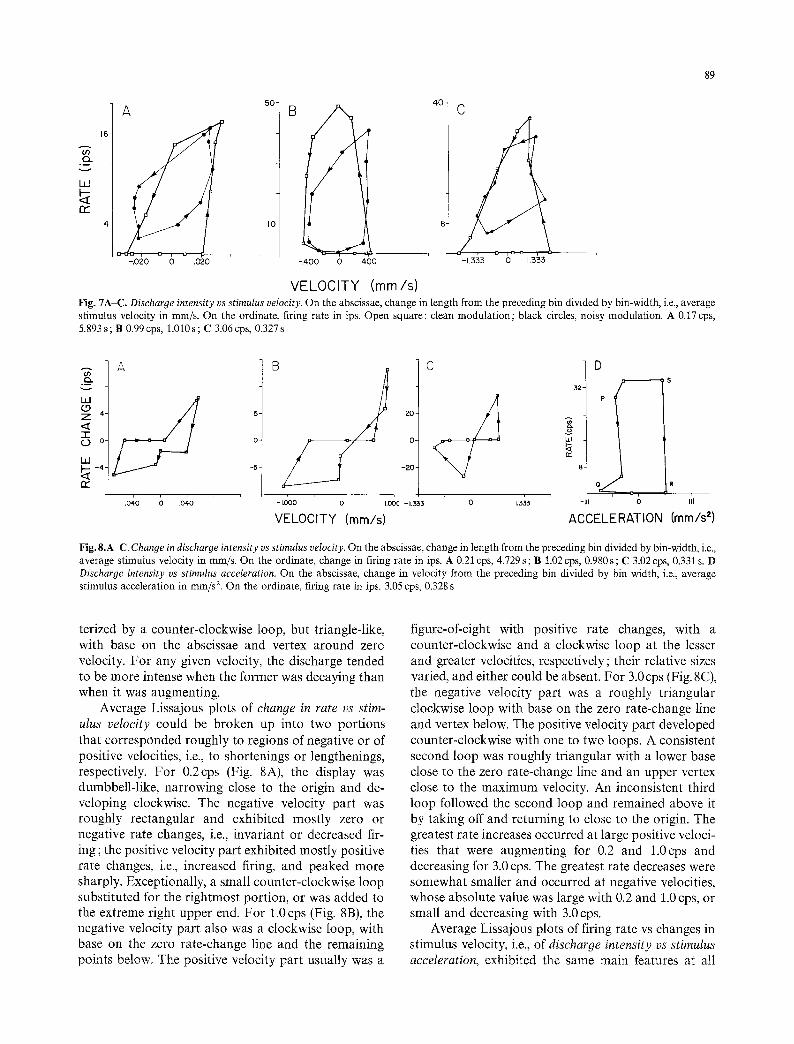
Fig. 8.A-C. Change in discharge intensity vs stimulus velocity. On the abscissae, change in length from the preceding bin divided by bin-width, i.e., average stimulus velocity in mm/s. On the ordinate, change in firing rate in ips. A 0.21 cps, 4.729 s; B 1.02 cps, 0.980 s; C 3.02 cps, 0.331 s. D Discharge intensity vs stimulus acceleration. On the abscissae, change in velocity from the preceding bin divided by bin width, i.e., average stimulus acceleration in mm/s 2. On the ordinate, firing rate in ips. 3.05 cps, 0.328 s
terized by a counter-clockwise loop, but triangle-like, with base on the abscissae and vertex around zero velocity. For any given velocity, the discharge tended to be more intense when the former was decaying than when it was augmenting.
Average Lissajous plots of change in rate vs stim- ulus velocity could be broken up into two portions that corresponded roughly to regions of negative or of positive velocities, i.e., to shortenings or lengthenings, respectively. For 0.2cps (Fig. 8A), the display was dumbbell-like, narrowing close to the origin and de- veloping clockwise. The negative velocity part was roughly rectangular and exhibited mostly zero or negative rate changes, i.e., invariant or decreased fir- ing; the positive velocity part exhibited mostly positive rate changes, i.e., increased firing, and peaked more sharply. Exceptionally, a small counter-clockwise loop substituted for the rightmost portion, or was added to the extreme right upper end. For 1.0 cps (Fig. 8B), the negative velocity part also was a clockwise loop, with base on the zero rate-change line and the remaining points below. The positive velocity part usually was a
figure-of-eight with positive rate changes, with a counter-clockwise and a clockwise loop at the lesser and greater velocities, respectively; their relative sizes varied, and either could be absent. For 3.0cps (Fig. 8C), the negative velocity part was a roughly triangular clockwise loop with base on the zero rate-change line and vertex below. The positive velocity part developed counter-clockwise with one to two loops. A consistent second loop was roughly triangular with a lower base close to the zero rate-change line and an upper vertex close to the maximum velocity. An inconsistent third loop followed the second loop and remained above it by taking off and returning to close to the origin. The greatest rate increases occurred at large positive veloci- ties that were augmenting for 0.2 and 1.0cps and decreasing for 3.0 cps. The greatest rate decreases were somewhat smaller and occurred at negative velocities, whose absolute value was large with 0.2 and 1.0 cps, or small and decreasing with 3.0 cps.
Average Lissajous plots of firing rate vs changes in stimulus velocity, i.e., of discharge intensity vs stimulus acceleration, exhibited the same main features at all
90
cO s .m v
Ld
r'r"
16-
24
A
.020 ,060
D
f
20 B
J .o;,o ' .2oo
,020 ,060 ,200 ,800
I
40- C
8
.020 ,060
32] F
8 ~ , ,
,O20 .060
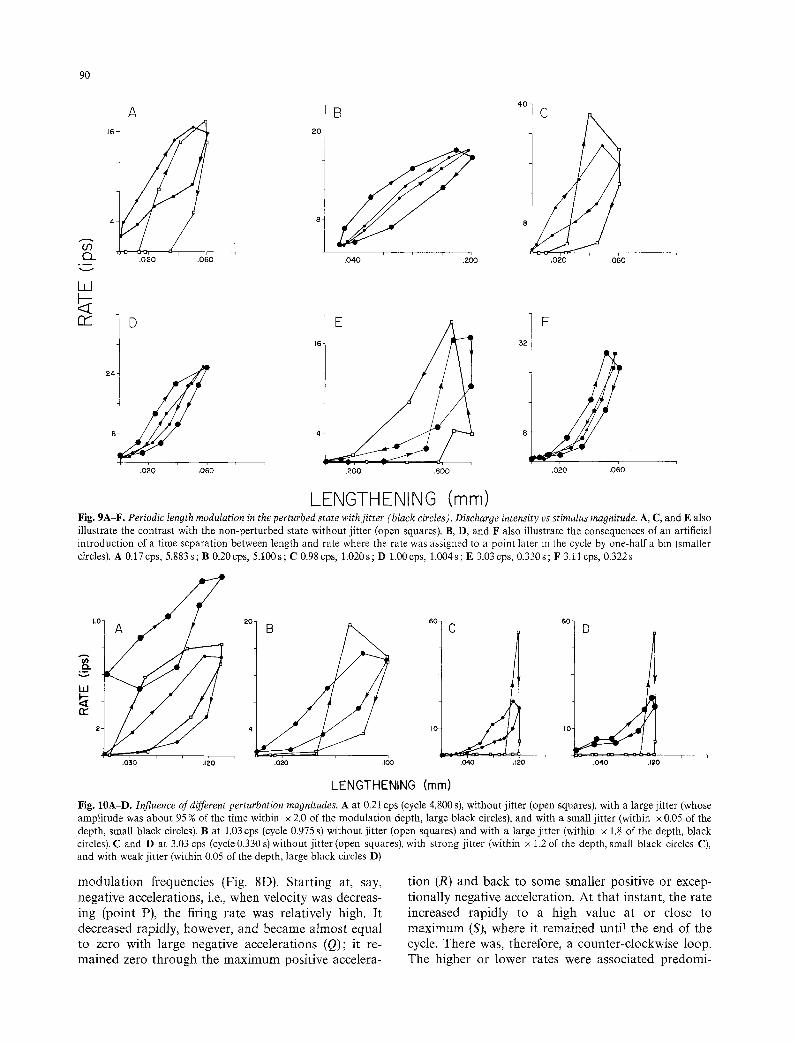
LENGTHENING (mm) Fig. 9A-F. Periodic length modulation in the perturbed state with jitter (black circles). Discharge intensity vs stimulus magnitude. A, C, and E also illustrate the contrast with the non-perturbed state without jitter (open squares). B, D, and F also illustrate the consequences of an artificial introduction of a time separation between length and rate where the rate was assigned to a point later in the cycle by one-half a bin (smaller circles). A 0.17 cps, 5.883s; B 0.20cps, 5.100s; C 0.98 cps, 1.020s; D 1.00cps, 1.004s; E 3.03 cps, 0.330s; F 3.11 cps, 0.322s
,.o 20- B - 6~ C 601 \ D
2 4 IC ~ I0
.030 ~,2o .o2o . ,~ .o4o .12o .04o .,2o
LENGTHENING (ram)
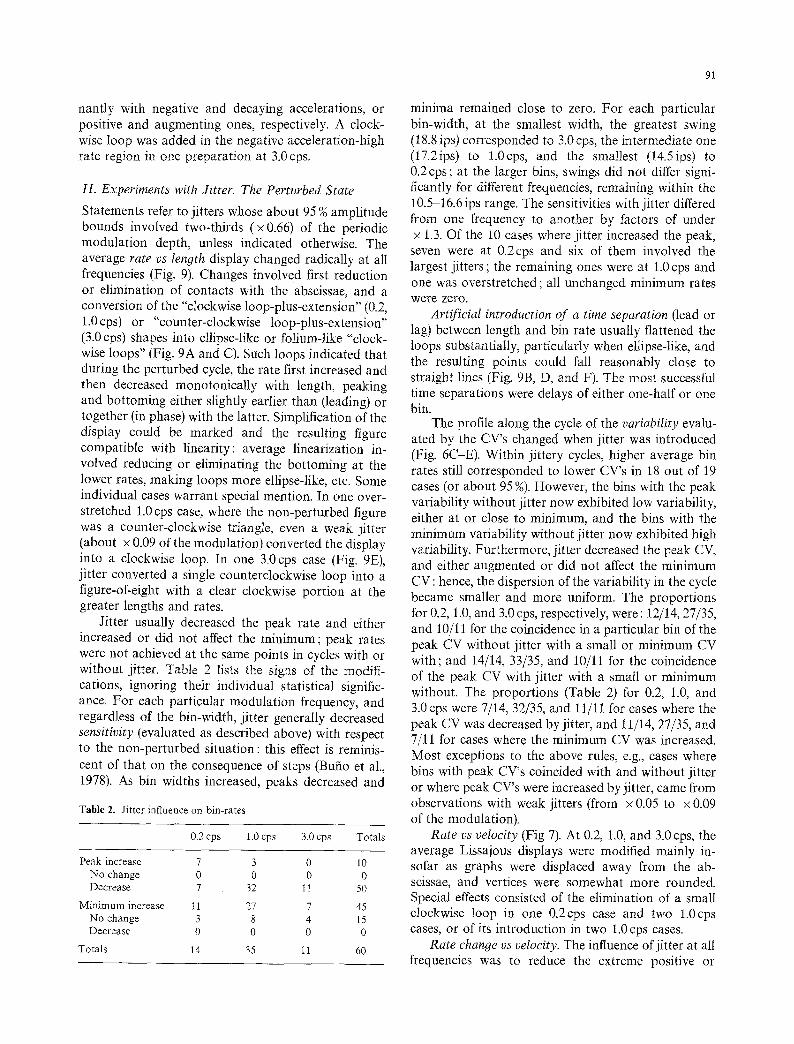
Fig. 10AD. Influence of different perturbation magnitudes. A at 0.21 cps (cycle 4.800 s), without jitter (open squares), with a large jitter (whose amplitude was about 95 % of the time within x 2.0 of the modulation depth, large black circles), and with a small j itter (within x 0.05 of the depth, small black circles). B at 1.03 cps (cycle 0.975 s) without j i tter (open squares) and with a large j itter (within x 1.8 of the depth, black circles). C and D at 3.03 cps (cycle 0.330 s) without jitter (open squares), with strong jitter (within x 1.2 of the depth, small black circles C), and with weak jitter (within 0.05 of the depth, large black circles D)
modulation frequencies (Fig. 8D). Starting at, say, negative accelerations, i.e., when velocity was decreas- ing (point P), the firing rate was relatively high. It decreased rapidly, however, and became almost equal to zero with large negative accelerations (Q); it re- mained zero through the maximum positive accelera-
tion (R) and back to some smaller positive or excep- tionally negative acceleration. At that instant, the rate increased rapidly to a high value at or close to maximum (S), where it remained until the end of the cycle. There was, therefore, a counter-clockwise loop. The higher or lower rates were associated predomi-
91
nantly with negative and decaying accelerations, or positive and augmenting ones, respectively. A clock- wise loop was added in the negative acceleration-high rate region in one preparation at 3.0 cps.
t t . Experiments with Jitter. The Perturbed State
Statements refer to jitters whose about 95 % amplitude bounds involved two-thirds (x 0.66) of the periodic modulation depth, unless indicated otherwise. The average rate vs length display changed radically at all frequencies (Fig. 9). Changes involved first reduction or elimination of contacts with the abscissae, and a conversion of the "cIockwise loop-plus-extension" (0.2, 1.0cps) or "counter-clockwise loop-plus-extension" (3.0 cps) shapes into ellipse-like or folium-tike "clock- wise loops" (Fig. 9A and C). Such loops indicated that during the perturbed cycle, the rate first increased and then decreased monotonically with length, peaking and bottoming either slightly earlier than (leading) or together (in phase) with the latter. Simplification of the display could be marked and the resulting figure compatible with linearity: average linearization in- volved reducing or eliminating the bottoming at the lower rates, making loops more ellipse-like, etc. Some individual cases warrant special mention. In one over- stretched 1.0 cps case, where the non-perturbed figure was a counter-clockwise triangle, even a weak jitter (about x 0.09 of the modulation) converted the display into a cIockwise loop. In one 3.0 cps case (Fig. 9E), jitter converted a single counterclockwise loop into a figure-of-eight with a clear clockwise portion at the greater lengths and rates.
Jitter usually decreased the peak rate and either increased or did not affect the minimum; peak rates were not achieved at the same points in cycles with or without jitter. Table 2 lists the signs of the modifi- cations, ignoring their individual statistical signific- ance. For each particular modulation frequency, and regardless of the bin-width, jitter generally decreased sensitivity (evaluated as described above) with respect to the non-perturbed situation: this effect is reminis- cent of that on the consequence of steps (Bufio et al., 1978). As bin widths increased, peaks decreased and
Table 2. Jitter influence on bin-rates
0.2 cps 1.0 cps 3.0 cps Totals
Peak increase 7 3 0 10 No change 0 0 0 0 Decrease 7 32 11 50
Min imum increase 11 27 7 45 No change 3 8 4 15 Decrease 0 0 0 0
Totals 14 35 11 60
minima remained close to zero. For each particular bin-width, at the smallest width, the greatest swing (18.8 ips) corresponded to 3.0 cps, the intermediate one (17.2ips) to 1.0cps, and the smallest (14.5ips) to 0.2cps; at the larger bins, swings did not differ signi- ficantly for different frequencies, remaining within the 10.5-16.6 ips range. The sensitivities with jitter differed from one frequency to another by factors of under x 1.3. Of the 10 cases where jitter increased the peak, seven were at 0.2 cps and six of them involved the largest jitters ; the remaining ones were at 1.0 cps and one was overstretched; all unchanged minimum rates were zero.
Artificial introduction of a time separation (lead or lag) between length and bin rate usually flattened the loops substantially, particularly when ellipse-like, and the resulting points could fall reasonably close to straight lines (Fig. 9B, D, and F). The most successful time separations were delays of either one-half or one bin.
The profile along the cycle of the variability evalu- ated by the CV's changed when jitter was introduced (Fig. 6C-E). Within jittery cycles, higher average bin rates still corresponded to lower CV's in 18 out of 19 cases (or about 95 %). However, the bins with the peak variability without jitter now exhibited low variability, either at or close to minimum, and the bins with the minimum variability without jitter now exhibited high variability. Furthermore, jitter decreased the peak CV, and either augmented or did not affect the minimum CV : hence, the dispersion of the variability in the cycle became smaller and more uniform. The proportions for 0.2, 1.0, and 3.0 cps, respectively, were: 12/14, 27/35, and 10/11 for the coincidence in a particular bin of the peak CV without jitter with a small or minimum CV with; and 14/14, 33/35, and 10/11 for the coincidence of the peak CV with jitter with a small or minimum without. The proportions (Table 2) for 0.2, 1.0, and 3.0 cps were 7/14, 32/35, and 11/11 for cases where the peak CV was decreased by jitter, and 11/14, 27/35, and 7/11 for cases where the minimum CV was increased. Most exceptions to the above rules, e.g., cases where bins with peak CV's coincided with and without jitter or where peak CV's were increased by jitter, came from observations with weak jitters (from x 0.05 to x 0.09 of the modulation).
Rate vs velocity (Fig 7). At 0.2, 1.0, and 3.0 cps, the average Lissajous displays were modified mainly in- sofar as graphs were displaced away from the ab- scissae, and vertices were somewhat more rounded. Special effects consisted of the elimination of a small clockwise loop in one 0.2cps case and two 1.0cps cases, or of its introduction in two 1.0cps cases.
Rate change vs velocity. The influence of jitter at all frequencies was to reduce the extreme positive or
92
negative rate changes, to smooth vertices, and to make small loops less apparent. The general dumbbell-like or more complex shapes (see Fig. 8) were preserved.
The following were the results of changing jitter amplitude. With 0.2cps (Fig. 10A), the largest noises (from x 1.0 to x 2.0 of the modulation) increased bin rates, raising the graph and eliminating contacts with the abscissae; the upper perimeter of the clockwise loop became close to a straight line. The smaller noises (from x0.05 to x0.15 of the modulation) simply flattened the loop. Peak rates were increased by the stronger jitters and reduced or not affected by the smaller ones. With 1.0cps (Fig. 10B), the largest noises (from x 1.0 to x 1.8 of the modulation) increased the lowest rates, eliminating contacts with the abscissae. The smaller noises (from x0.05 to x0.15 of the modulation) did not affect the rates at the smallest lengths, but increased the rates at intermediate lengths. The clockwise-loop-plus-extension remained, but the passages between loop and extension became smooth- er. With 3.0cps, the largest noises (• 1.2 of the modulation) increased the lowest rates, eliminating all contact with the abscissae, and produced just a clock- wise loop (Fig. 10C); also intermediate noises (from x0.13 to x0.95 of the modulation), that did not
eliminate all contacts with the abscissae, changed the display to a clockwise loop. A weak noise (x 0.05 of the modulation) simply lowered and flattened the counterclockwise loop (Fig. 10D). All noises reduced the peak rates at 1.0 and 3.0 cps.
Numerous variables like background length, mod- ulation shape, depth and frequency, noise characteris- tics, etc. affected the results and interacted with one another. Each warrants a more extensive study than that carried out here. We simply mentioned some observations that illustrated qualitatively their partici- pation, suggesting also that these effects are more complicated than anticipated by a naive intuition.
Discussion
In the undisturbed condition, and with 0.2 and 1.0 cps modulations (Figs. 1, 2, and 5), the usual "clockwise loop-plus-extension" Lissajous of rate vs length showed that the SAO did not discharge at its shortest, almost regardless of background length, depth, etc. As length augmented, the SAO first remained silent, but then started firing and accelerated, reaching its maximum rate either at maximum length (in phase) or just before it was achieved, i.e., while the organ was still being stretched (lead), and finally slowing down. During the half-cycle where length decayed, the organ fired less intensely: it slowed down, then stopped at a length greater than that at which it had started, and finally remained silent for the rest of the cycle. At 3.0 cps
(Fig. 3), the usual Lissajous was a "counterclockwise loop-plus-extension" where the SAO was silent for a substantial period, fired less during stretching than during relaxation, peaked after maximum length, i.e., when the organ was relaxing (lag) and stopped at a length smaller than that at which had started; when present, an additional clockwise loop indicated that around maximum length the SAO could discharge more during stretching than during relaxation, and that the rate could lead the length. Our finding leads with 0.2 and 1.0cps and lags only with 3.0cps may not be incompatible with Brown and Stein's (1966) results, since they did not stress leads over 1.0 cps.
The relation between length and firing in the undisturbed SAO was never exclusively monotonic, and was exceptionally compatible with linearity; de- partures from either characteristic thus were the rule. Their magnitudes were substantial fractions (one-third for example) of the overall swings in length and/or rate. The deviations from the prevailing increasing trend, i.e., regions with non-positive slopes as flat extensions, leads and lags, were clear-cut even though subordinate to the prevailing monotonicity. The deviations from linearity were multiple and marked. The saturation or limiting effect implied by the silent period was remark- ably consistent even at slow and shallow modulations, and difficult to eliminate, particularly at 3.0 cps: it is prominent also in mammalian muscle spindles (Hnllinger et al., 1977). The asymmetry of the sensi- tivity to stimulus velocity whereby equal velocities of opposite signs did not provoke symmetric rate changes was very apparent (Fig. 7A-C). The similarity at the three frequencies tested of the asymmetric rate vs acceleration plots (Fig. 8D) is worthy of notice. Bufio et al. (1978) reported the asymmetric rate sensitivity and also called attention to the fact that when the undisturbed receptor remains at a fixed length after a step, a stiction-like feature becomes apparent, arresting adaptation and producing a multivalued length- discharge relation. Finally, interactions between cyclic processes produce special effects as phase-lockings and limit cycles which were quite apparent in this study (Figs. 4 and 10C and D); particularly notable when periods are of similar magnitudes, it is licit to anti- cipate their existence and of even greater importance at higher modulation frequencies, since they are inevit- able consequences of the topological notions involved (Winfree, 1977).
Several models for transduction in the SAO have been published. For example, Borsellino et al. (1966), observing rates during sinusoidal stretches, were satis- fied that criteria for linear behavior were met; they then postulated that a holding device should parti- cipate and proposed a resonating second-order system. Brown and Stein (1966), observing rates after step-
93
stretches, proposed the transfer function a F ( 1 - k ) s k
(where a and k relate to sensitivity and rate decay, respectively; F is the gamma function ; s is frequency) : though predictions compared well with several experi- mental results, the authors noted the presence of non- linearities and the difficulties they implied. With good sense, Chaplain et al. (1971) suggested breaking up transduction into the successive stages of mechanical consequences, mechano-electrical conversion of these into generator potentials, and modulation of impulse generation by the latter. They proposed a composite model that kept complexities in sight : for example, the mechanical stage required parallel and considerably non-linear "spring- and dashpot" and "spring" parts, the mechano-electrical stage required a "proportional- plus-derivative" element, and impulse generation was modelled by different equations for transmembrane potential fluctuations and for impulse initiation. The paper by Baker and Hartline (1978) is important in terms of their analysis of the latter. Linear models are, of course, parsimonious and appealing, and encountering nonlinearities is unattractive, jarring our desire for simplicity and complicating analytical formulations. Nonlinearities are an integral part of this transduction, however, as recognized now practically unanimously, and their existence need not be stressed further (e.g., Brown and Stein, 1966 ; Bufio et al., 1978 ; Chaplain et al., 1971 ; Terzuolo and Knox, 1971). It is still useful to reiterate which these nonlinearities are, to insist upon their magnitudes, and to examine how the system's operation varies under several influences. As modu- lation frequency increased, for example, nonlinearities became more apparent.
Implicit in any model, and probably in the thinking of most physiologists, is the possibility of formulating an explicit differential system that would represent the SAO under most circumstances. For situations such as this one, we agree with the recommendation of Thorn (1972) that, having admitted a priori the existence of an underlying differential model (and thus justified quan- tification), it becomes advisable at least initially to reduce calculations to the minimum and to con- centrate on drawing predominantly qualitative con- clusions. A relatively general and largely qualitative model can be thus obtained, plausibly applicable over a broad operational domain. Locally, i.e., under more or less restrictive constraints, the model can become quite precise and simple (e.g., with some coefficients becoming zero, for example). It is in this vein that a model is suggested that includes i, a linear subsystem resembling a first-order lead-lag in the profile of its response to steps and a second-order underdamped one in its frequency-phase relation, and responsible for brisk responses to transients, subsequent adaptations and phase effects; ii, a rectifier that allows for larger
responses to lengthenings than to shortenings; iii, a component with stiction-like properties that arrests returns to asymptotes producing multivaluedness ; and finally, iv, a limiting component. The present experi- ments did not prove that a particular factor at a certain stage is responsible for any of the features: it seems reasonable to suggest that visco-elasticity in the mechanical stage, or impulse generation, contribute to rate-sensitivity, or to limiting, respectively. The point will be discussed further when a similar examination of the rapidly adapting organ is described (Diez Martinez et al., in preparation).
Stimulus transduction at the SAO depends upon several factors such as modulation depth, frequency and shape, background length, presence and form of jitter, presence and form of inhibition, etc. Under some circumstances, as with clean length sines or steps (see above, Bufio et al., 1978), nonlinearities are apparent and of major magnitude. Under other circumstances, as with slow noisy periodic and shallow modulations, the transfer can be acceptably linear (Fig. 9B). Under yet other circumstances, perhaps intermediate between the former, the relation is piecewise linear (Fig. 5E). Each characteristic appears over an operational do- main that seems broad. However, recognition of more than a few of the parameters that define them is as yet vague: there is, for example, an across-frequency gradation of receptor properties, with 1.0cps inter- mediate between the other two, that deserves further exploration.
Changes in any of the factors mentioned above can be referred to as a "perturbation" (Graham and McRuer, 1967). One particular need for thinking in terms of perturbations is imposed by the usual ongoing convergence upon the receptor of numerous events, all of which produce changes in the specific energy form to which it is sensitive and each of which has its own degree of significance. If over a certain period a particular stimulus is of interest within a certain context, all others can be considered as "pertur- bations" insofar as transduction of the first is con- cerned. This notion holds regardless of whether the others, too, can be of interest within the same or other times or contexts.
The magnitude ratio of the "interesting" to the "perturbing" stimuli, i.e., the signal-to-noise ratio, is of prime importance. In certain situations, the interesting stimuli are large and simple (e.g., steps, maintained lengths or slow periodic modulations), and the per- turbation is irregular and erratic, smaller than the former and with numerous frequency components. This case was explored in stretch receptors by Bufio et al. (1978) and above, and in the utricle by Macadar et al. (1975). The perturbation, approximately gaussian white noise, was designed to represent intercurrent,
94
independent and equivalently weak factors such as environmental vibrations, saccades, and pulsations: the conclusion was that, even when much smaller than the signal, perturbations were very influential and modified transduction markedly, often making it more proportionate. The importance of the signal-to- perturbation ratio is implicit also in that, even though weak perturbations sufficed to change responses to slow stimuli, marked linearization required larger ones.
The effects of one same perturbation are dependent on the features of the interesting stimuli: for example, modifications by jitter of the 3.0 cps effects were quali- tative (i.e., shifts from "counterclockwise loop-plus- extension" to "clockwise loop"), but those of the 1.0 and 0.2cps effects, only quantitative (Figs. 9 and t0). In other situations, the uninteresting perturbation exhibits greater amplitude and predominance of fre- quency components than the interesting signal. For example, small, fast stimuli may occur at different maintained tail flexions or superimposed upon slow, large oscillations. This case has not been examined experimentally in detail, but the evidence supports the idea that the interaction between input components works both ways (e.g., Figs. 3, 5, and 6 in Bufio et al., 1978). Goodwin et al. (1975), modulating cat spindles sinusoidally under 50 gm at high frequencies, noted that sensitivity was reduced by addition of a second sine of over 50 gm.
Variabilities along different bins in a cycle and across the same bin in different cycles were decreased and uniformized by jitter, against the intuitive expec- tation that because it irregularizes individual intervals, it should also increase other fluctuations. The benefits of these reductions in terms of retrospective identifi- cation of stimuli on the basis of afferent discharges was noted by Bufio et al. (1978).
Brown and Stein (1966, Fig. 8A) encountered in- creases in sensitivity of x 5.0 on passing from 0.02 to 5.0 cps, and of x 2.5 from 2.0 to 3.0 cps. They used the reciprocal of the interval (referred to as "instantaneous rate") as a measure; thus, they evaluated firing in- tensity by having a fixed number (two) of successive impulses and measuring their variable span. It is likely, however, that the next-order cells have a fixed span or "period of integration" over which they read the variable number (and pattern) of arriving impulses (Segundo et al., 1966). For this reason, it was felt to be more meaningful to evaluate the intensity by fixing the span (i.e., the bin width) and co unting impulses therein. Furthermore, between-frequency comparisons are meaningful if they involve homogeneous conditions, e.g., identical bin widths, for all. The procedure used here indicated that on passing from 0.2 to 3.0 cps with small bins (e.g., 30 ms) there was indeed an increase in sensitivity, but with larger bin widths (e.g., 160ms),
there was no change. Hence, separate "next-order" cells, having different periods of integration, would be particularly sensitive to different modulation frequen- cies. Rate estimates over two successive impulses are comparable to those over bins of the order of the minimum intervals and therefore, short; furthermore, they are not homogeneous, being "biased in favor" of the higher frequencies where the shortest intervals are more likely. The difference between our sensitivity ratios ( x 1.7) and those reported by Brown and Stein (1966) ( x 2.5) could conceivably be due in part also to dissimilarities in background length or depth.
Jitter commonly increased the minimum bin rates and decreased the peak values, thus reducing the corresponding swing and sensitivity. This refers to the sensitivity averaged along the entire cycle, and the higher value in the non-perturbed state reflects simply the overcompensation of the lack of sensitivity at the shorter lengths (i.e., along the extension) by the high sensitivity at the greater lengths (throughout the loop) (Figs. 9 and 10). Recurrent inhibition exerts an in- fluence similar to that of jitter (Vibert et al., 1979). Strictly speaking, as measured here, the sensitivity to length, i.e., the change in rate per unit change in length, reflects also the separate contributions, which vary at different modulation frequencies, of the derivatives of length with respect to time.
References
Alexandrowicz, J.S. : Receptor organs in thoracic and abdominal muscles of crustacea. Biol. Rev. 42, 288-326 (1967)
Baker, C.L., Hartline, D.K. : Non-linear systems analysis of re- petitive firing behavior in the crayfish stretch receptor. Biol. Cybernetics 29, 105-113 (1978)
Borsellino, A., Poppele, R.E., Terzuolo, C.A.: Transfer functions of the slowly adapting stretch receptor organ of crustacea. In: Cold Spring Harbor Symp. Quant Biol. 30, 581,-586 (1_965)
Brown, M.C.: Some effects of receptor muscle contraction on the responses of slowly adapting abdominal slretch receptors of the crayfish. J. Exp. Biol. 46, 445458 (1967)
Brown, M.C., Stein, R.B. : Quantitative studies on the slowly adapt- ing stretch receptors of the crayfish. Kybernetik 3, 175-185 (1966)
Bufio, W, Jr., Fuentes, J. : Differential effects of length jitter on tonic and phasic crayfish stretch receptor components. Neurosci. Lett Suppl. 1,111 (1978)
Bufio, W_, Jr., Fuentes, J., Segundo, J.P.: Crayfish stretch-receptor organs : effects of length-steps with and without perturbations. Biol. Cybernetics 31, 99 110 (1978)
Burkhardt, D : Die Sinnesorgane des Skeletmuskels und die nerv6se Steuerung der Muskelt~tigkeit Ergeb. Biol. 20, 24-66 (1958)
Burkhardt, D. : Die Erregungs~org~nge sensibler Ganglienzellen in Abh~ingigkeit yon der Temperatur. Biol. Zentralbl. 78, 22-62 (1959)
Chaplain, R.A, Michaelis, B, Coenen, R.: Systems analysis of biological receptors. I. Quantitative description of the input- output characteristics of the slowly-adapting stretch receptor of the crayfish. Kybernetik 9, 85-95 (1971)
95
Eyzaguirre, C., Kuffler, S.W. : Processes of excitation with dendrites and in the soma of single isolated sensory nerve cells of the lobster and crayfish. J. Gen. Physiol. 39, 87-119 (1955a)
Eyzaguirre, C., Kuffler, S.W. : Further study of soma, dendrite and axon excitation in single neurons. J. Gen. Physiol. 39, 121-153 (1955b)
Fields, H.L.: Proprioceptive control of posture in the crayfish abdomen. J. Exp. Biol. 44, 455-468 (1966)
Fields, H.L.: Crustacean abdominal and thoracic muscle receptor organs. In: Structure and function of proprioceptors in the invertebrates. Mill, P.J., ed. New York : Wiley 1976
Fields, H.L., Evoy, W.M., Kennedy, D.: Reflex role played by efferent control of an invertebrate stretch receptor. J. Neurophysiol. Biol. 30, 859-874 (1967)
Goodwin, G.M., Hullinger, M., Matthews, P.B.C.: The effects of fusimotor stimulation during small amplitude stretching on the frequency-response of the primary ending of the mammalian muscle spindle. J. Physiol. (London) 253, 175-206 (1975)
Graham, D., McRuer, D.: Analysis of nonlinear control systems. New York : Wiley & Sons 1967
Hullinger, M., Matthews, P.B.C., Noth, J.: Effects of combining static and dynamic fusimotor stimulation on the response of the muscle spindle primary ending to sinusoidal stretching. J. Physiol. (London) 267, 839-856 (i977)
Krnjevic, K., van Gelder, N.M. : Tension changes in crayfish stretch receptors. J. Physiol. (London) 159, 310-325 (1961)
Macadar, O., Wolfe, G.E., Budelli, R., Segundo, J.P. : Multivalued stimulus-response relation in isolated elasmobranch utricles. Biol. Cybernetics 31, 111-118 (1978)
Macadar, O., Wolfe, G.E., O'Leary, D.P., Segundo, J.P. : Response of the elasmobrach utricle to maintained spatial orientation, tran- sitions, and jitter. Exp. Brain Res. 22, 1-12 (1975)
Mill, P.J. : Summary. In : Structure and function of proprioceptors in the invertebrates, p. 665. Mill, P.J., ed. London : Chapman and Hail 1976
Nakajima, S.: Adaptation in stretch receptor neurons of crayfish. Science 146, 1168-1170 (1964)
Nakajima, S., Onodera, K. : Membrane properties of the stretch receptor neurones of crayfish with particular reference to mecha- nisms of sensory adaptation. J. Physiol. (London) 200, 161-185 (196%)
Nakajima, S., Onodera, K. : Adaptation of the generator potential in the crayfish stretch receptors under constant length and con- stant tension. J. Physiol. (London) 200, 187-204 (1969b)
Njfi, A., Walloe, L. : In situ performance of slowly adapting stretch receptor of the crayfish. J. Neurophysiol. 36, 1062-1070 (1973)
Page, C.M., Sokolove, P.G. : Crayfish muscle receptor organ : role in regulation of postural flexion. Science 175, 647-650 (1972)
Segundo, J.P., Perkel, D.H., Moore, G.P.: Spike probability in neurones : influence of temporal structure in the train of synap- tic events. Kybernetik 3, 67 82 (1966)
Segundo, J.P., Tolkunov, B.F., Wolfe, G.E. : Relation between trains of action potentials across an inhibitory synapse. Influence of presynaptic irregularity. Biol. Cybernetics 24, 169-179 (1976)
Teorell, T. : A biophysical analysis of mechanoelectrical transduc- tion. In: Handbook of sensory physiology, Vol. 1, pp. 291-339. Berlin, Heidelberg, New York: Springer 1971
Terzuolo, C.A., Knox, C.K.: Static and dynamic behavior of the slowly adapting stretch receptor organ of Crustacea. In: Handbook of sensory physiology, Vol, 1, pp. 500 522. Berlin, Heidelberg, New York: Springer 1971
Terzuolo, C.A., Washizu, Y.: Relation between stimulus strength, generator potential, and impulse frequency in stretch receptor of Crustacea. J. NeurophysioI. 25, 56-66 (1962)
Thom, R.: Stabilit6 structurelle et morphogenbse. Massachusetts: Benjamin Inc. 1972
Vibert, J.F., Davis, M., Segunde, J.P.: Recurrent inhibition: Its influence upon transduction and afferent discharges in slowly- adapting stretch receptor organs. Biol. Cybernetics (in press)
Wendler, L. : Uber die Wirkungskette zwischen Reiz und Erregung (Versuche an den abdominalen Streckreceptoren dekapoder Krebse). Z. Vergl. Physiol. 47, 279-315 (1963)
Wendler, L., Burkhardt, D. : Zeitlich abklingende Vorg~inge in der Wirkungskette zwischen Reiz und Erregung (Versuche an den abdominalen Streckreceptoren dekapoder Krebse). Z. Naturforsch. 16b, 464-469 (1961)
Winfree, A.T. : Some principles and paradoxes about phase control of biological oscillations. J. Interdiscip. Cycle Res. 8, 1-14 (1977a)
Received: February 2, 1979
Dr. J. P. Segundo Department of Anatomy University of California Los Angeles, CA 90024, USA