Physico-Chemical Assessment of Euphrates River between Heet and Ramadi Cities, Iraq
Upload
independentCategory
view
7download
0
STUDY OF PHYSICO-CHEMICAL PARAMETERS ANDPLANKTON DIVERSITY OF GARGA RESERVOIR OF
BOKARO DISTRICT, JHARKHAND, INDIA
FARHAT SABA AND D.N.SADHU
Department of ZoologyVinoba Bhave University, Hazaribagh
Abstract:- The present study is on “ Physico-chemicalparameters and plankton diversity of Garga Reservoir ofBokaro District (Jharkhand )”. The study was carried onfrom July’2012 to June’2013 at four selected sampling stations.
Monthly variations of Physico-Chemical characteristics of water of Garga were studied and it revealed that the water quality is fairly homogenous and suitable for drinking and pisciculture.
Study of planktons showed 12 species of Phytoplanktons belonging to 7 classes and 11 species ofZooplanktons belonging to 4 different classes.
Key Words: Garga Reservoir, Physico-chemical Parameters,Planktons.
Introduction:-

India is bestowed with plenty of diverse aquatic resources’ both natural and man made, supporting huge and diverse biodiversity, including the fish fauna thereby supporting the livelihood concerns of millions of people. Among the inland open waters the reservoirs whichcame into being due to damming of various rivers are unique ecosystems offering tremendous scope for increasing inland fish production.
The state of Jharkhand has an area of 129,040 sq.km and is drained by many perennial rivers like Koel, Damodar, Brahmani,Kharkhai, Swarnrekha,,Ajay etc.
River Garga a hill stream is an important tributary of river Damodar across which the Garga Dam has been constructed at Bokaro (23.29º N 86.09º E). The secondary data on reservoir fisheries indicated 141 reservoirs in the state with total expanse at 50313 ha.
Bokaro is an industrial area located in the easternpart of India at 23.29º N 86.09º E.It is located on the southern bank of river Damodar with Garga, one of its tributaries meandering along thesouthern and eastern outskirts of the city .On the north the city is flanked by the high range of the parasnath Hills and on the south just beyond the river Garga , it is enveloped by the hillocks.
GARGA RESERVOIR:-
Location:-

It is located around 12 km from the city center (23.67ºN86.10º E) near to railway station on the NH-23. It is a picnic spot for the citizen of Bokaro. The green surroundings and variety of aquatic habitat residing in and around Garga Dam lure school expeditions to the area. The reservoir was constructed in 1973 for the use of the steel plant as well as for a water supply for the people. Now it is also used for fish culture practices by private sector.
Morphometry of the reservoir:-
The salient feature of the morphometry of the reservoir is presented in table 1. Basin of the reservoir is concave towards the surface .the shorelineis irregular. Garga reservoir has a maximum area 1474.4ha and it has maximum depth of 718 feet. The total length of reservoir is 2 km with the widest strength of1.2 km.
Meteorological Observation:-
Air temperature: - The minimum air temperature varied from 4ºC to 28ºC while the maximum air temperature ranged from 17.6ºC to 41ºC.
Rainfall: - Yearly rainfall varied from 80 to 140 cm occurring mostly during June to August.
Hydrological Feature:-
Water Level: - Minimum reservoir level during the period of investigation was 758 feet and the highest level was 770 feet.

Water Inflow and Outflow:- The main inflow into the reservoir is from river Garga throughout the year. The yearly inflow was from 2280 to 4880 million gallon. Outflow was through the spillways and the powerhouses. It ranged from 2190 to 4380 million gallon yearly.
Table 1. Salient feature of the morphometry of Garga Reservoir.
1). Elevation at top of dam = 778 feet
2). Maximum reservoir level = 770 feet
3). Maximum reservoir area = 1474.4 ha
4). Dead storage area = 172.24 ha
5). Average area = 823.32 ha
6). Catchments area = 1408 ha
7). Gross storage capacity = 19450947.30 m³

8). Live storage capacity = 17177920.20 m³
9). Maximum reservoir depth = 718 feet
10). Mean depth = 352 feet
11). Total inflow = 2280 to 4880 million gallon.
12). Total outflow = 2190 to 4380 million gallon.

INDIA
INDIA
STUDY AREA
INDIA

Material and MethodsStudy site – The area selected for the present
study is Garga reservoir of Bokaro.it is 12 Km
from the City centre (23.67ºN 86.10º E) near to
the Railway station on the NH 23.
Study Period – The investigation was carried out
for a period of 12 month from July’12 to
June’13.
I. Physio-chemical parameters of water:-
Temperature was measured with the help ofcentigrade thermometer. Transparency wasrecorded with sacchi disk. pH was determine byusing a pH meter. Specific conductivity wasestimated by using a conductivity meter. Standard methodologies of APHA (2005), Jhingran etal (1967), Dey and others were followed to measuredissolved oxygen, free carbon dioxide, totalalkalinity, total hardness, dissolved phosphate andnitrate.
Samples were collected on monthly basis.
II. Plankton Analysis:-

In the present study, plankton sampling was taken
monthly for one year (July 2012 June 2013) at
four different sampling sites (North, South, East
and West).
Collection: - Plankton net (mesh size 25µm) was
swept from 1 to 4m depth and planktons collected
were transferred into separate plastic
bottle/containers. 50 lit of water were sieved
through plankton net to obtain planktons.
Fixation: - Planktons were fixed and preserved in
4% formalin.
Identification: - 1ml of the plankton sample was
transferred into a Sedgwick rafter plankton
counting slide. The chamber was covered and
plankton was examined under low power of a
microscope.
The number of plankton taxon (N) per liter is
given by the equation.
N = A X C X 100 = A X C X 1000
V 50
A= no. of plankton in 1ml of the sub sample
filling the Sedgwick-rafter chamber.

C = ml of the plankton setting volume of plankton.
V = volume of the water sample filtered = 50
litter.
Results and Discussion:-
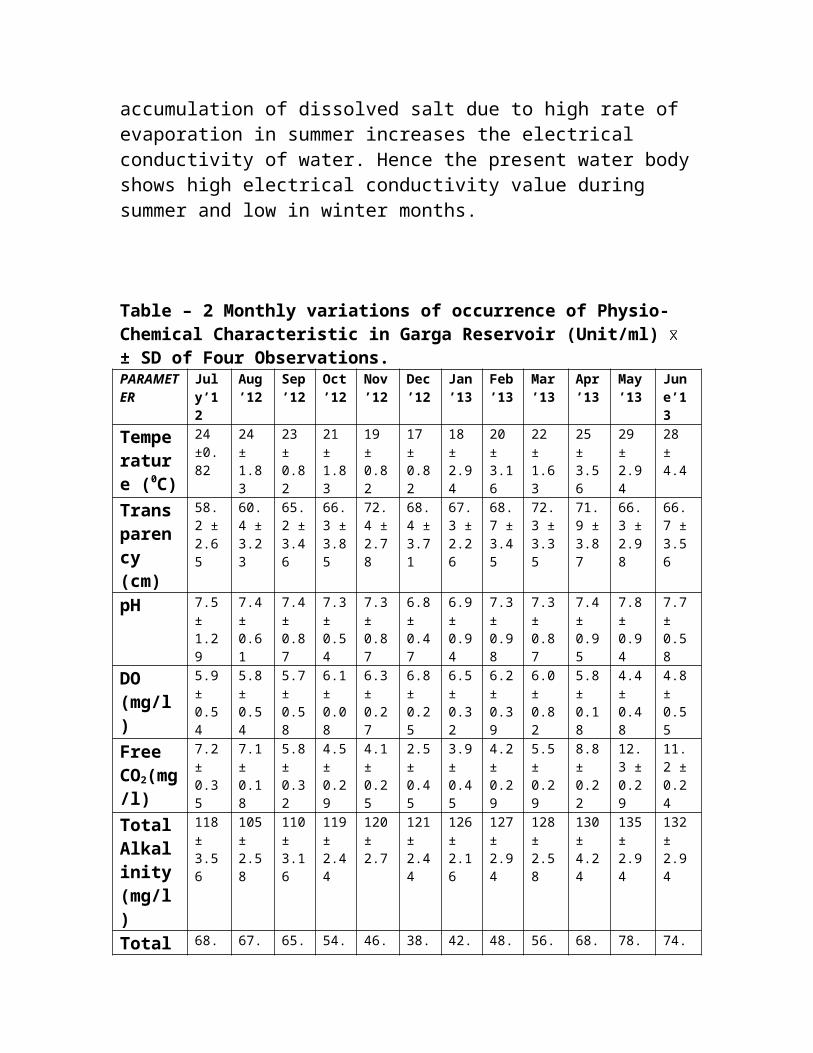
Physio – chemical parameters: - The monthly variations of physio- chemical factors of water of Garga Reservoir are presented in table-2 and seasonal variations have been represented in table 3. The consideration of the physio – chemical factors in the present study is basic in understanding the trophic dynamics of water bodies.
Water temperature: - Surface water temperature ranged from 17ºC to 29ºC.The temperature raises gradually from early post monsoon to the pre- monsoon month.
Temperature is a physical factor that alters the quality of the water and considered as an important factor in controlling the fluctuation of plankton and functioning of the aquatic ecosystem [1].The surface water temperature confirmed to tropical character and was distinctly influenced byair temperature. Monthly fluctuations in the surface water temperature were correlated to that of ambient temperature. In the present investigation the season wise analysis showed that the average air and watertemperature in reservoir was maximum during

summers, comparatively less during monsoon and least during winter season. Transparency: - Transparency ranged from 58.2cm to 72.3cm. It was maximum in the month of November, March and April, ensuring a high water column taking part in the primary process.
pH: - The pH ranged from 6.8 to 7.8 during the study period. pH dropped to slightly acidic in themonth of December 2012, and kept fluctuating irrespective of the months.
The hydrogen ion concentration of natural water is an important environmental factor. The variation in pH is linked with the species composition and life processes of animal and plant communities inhabiting them.
The proper determination of pH may give indirect information about free CO2 content, alkalinity and dissolved oxygen content. The changes in pH of water will bring about subtle changes in the functional and structural variationsin the organisms of the water body.
In the present study, season wise analysis of pH in the reservoir showed maximum value in summer and minimum value in winter. Highest value in summer appeared to be influenced by water level, density of phytoplankton and increased dissolved oxygen.

The pH of Garga reservoir was found to be alkaline throughout study period (July’12 to June’13) except in December’12 and January’13. The annual fluctuations are small indicating good buffering capacity. High pH in the reservoir may bedue to an increased utilization of CO2 in photosynthesis.
The water having pH range of 6.5 to 9.0 are most suitable for aqua culture. Thus the present water body shows higher pH value and can be used for fresh water fish culture by local fisherman.
Dissolved Oxygen: - In the present study DO ranged between 4.4 mg/l and 6.8 mg/l. Maximum DO was observed in the post monsoon months. Dissolved oxygen in water is of great limnologicalsignificance as it regulates many metabolic processof aquatic organisms. Variations in dissolved oxygen in fresh water bodies give a good measure oftheir trophic state. Oxygen contain is important for direct need of many organisms and effects the solubility of many nutrients and there for the productivity of aquatic ecosystem.
In present investigation DO concentration in the reservoir exerted a seasonal change. During thewinter months higher oxygen concentration in the reservoir indicated higher autotrophic activity andlow organic and inorganic load during 2012 -13.The decrease in the amount of DO in summer may be attributed to high temperature due to which the oxygen holding capacity of water decreases.

Free Carbon dioxide: - CO2 content ranged from 2.5 mg/l to 12.3 mg/l. It was minimum in the post monsoon month and maximum in May.
The CO2 was present in the water of the Garga reservoir throughout the period of study. The fluctuation in CO2 values correspond directly with standing crop of phytoplankton. Free carbon dioxidewas found to be least in winter months (Nov’12 to Feb’13) due to greater utilization of it for photosynthetic activity by the phytoplankton.
In some reservoir absence of free carbon dioxide has also been reported which is apparently due to higher photosynthetic activity and higher pHresulting in the conversion of carbon dioxide into bicarbonate (HCO3) and carbonate (CO3).
Total alkalinity: - It was noted between 105 mg/l to 135 mg/l. The main sources of natural alkalinityare rocks containing carbonate, bicarbonate and hydroxide compounds that are abundantly present.
Total alkalinity is used as a measure of productivity. Natural water bodies in tropics usually shows a wide range of fluctuations in totalalkalinity values depending upon the location and season.
Water having total alkalinity from 1 to 15 mg/l considered as nutrient poor, 16 to 60 mg/l as moderately rich, and more then 60 mg/l as nutrient rich. Evidently Garga reservoir water in the present study may be categorized as nutrient rich.

Total alkalinity in the Garga reservoir remained always high indicating high photosynthetic rate.
In the present study the lower alkalinity values were recorded during monsoon (111.75 mg/l) which may be due dilution effect. Maximum value wasin summer which may be attributed to increased rateof decomposition, during which CO3 librated which reacts with water to form HCO3.
Total hardness: - Total hardness refers to the concentration of calcium and magnesium. It ranged between 38.7 mg/l to 78.7 mg/l. This indicates thatwater is soft.
The hardness of water is mainly due to the presence of various salts of Ca and Mg and it is used to classify waters as hard or soft. Degrees ofhardness are as follows:- 0 – 75 mg/l = Soft 75 – 150mg/l = Moderately hard 150 – 300 mg/l = Hard Above 300 mg/l = Very hard In the present investigation the total hardness varied from 38.7 mg/l to 78.7 mg/l which indicated that water is soft and is suitable for drinking and irrigation purpose after the treatment.
Higher values of total hardness during summerseason of present reservoir water can be attributedto decrease in water volume and increase in the rate of evaporation at high temperature.

Phosphate: - In the present study phosphate level varied from 0.18mg/l to 0.81 mg/l. In monsoon months nutrients are brought in by the rain water from the surrounding area.
The phosphate is one of the most important major nutrients that is required to biota. The living organisms carry out various vital activitiesin the presence of this element for the synthesis of nucleic acid and release of energy in the form of ATP. Hence it has been regarded as a limiting factor.
In the present study, PO4 content in the Garga reservoir fluctuated between 0.18 mg/l to 0.81 mg/l. Highest seasonal mean values were reported during monsoon and lowest during winter. High phosphate during monsoon might be due to influx of rain water containing fertilizer from fields which bring phosphate from catchments area.
Nitrate: - The nitrate content in the reservoir ranged from 9.8 mg/l to 16.7 mg/l. highest values of nitrates were recorded in summer.
Nitrate is normally the most common form of combined inorganic and organic nitrogen in lakes and streams. It moves freely through soil along with subsurface water. The concentration and rate of supply of nitrate is intimately connected with the pond use practices of surrounding. It is also agood indicator of contamination from natural and

human activities. Levels above 45 mg/l are considered harmful to aquatic organisms.
Nitrates were reported in lower quantities inGarga reservoir which might be due to utilization by phytoplankton and macrophytes. Nitrate was foundin better quantity during monsoon and post monsoon. Specific Conductance: - The electrical conductivityvalue ranged between 209µmhos/cm and 252 µmhos/cm. The EC values showed marked seasonal variation being maximum during summer and minimum during winter season.
It depends on the nature and concentrationof ionized salts. The more conductivity of water the lesser is its resistance to electric flow, there by indicating higher concentration of dissolved salts and higher trophic status of the system. Electric conductivity is used as an index to select the suitability of water for agriculturalpurpose.
Irrigation water according to the electrical conductivity is classified as E.C < 250 excellent, 250 to 750 Good, 750 to 2000 permissible, 2000 to 3000 doubtful, >3000 Unsuitable. Following this criteria the water of Garga Reservoir is good for irrigation purpose. The relation of E.C with temperature could be explained on the basis of the fact that solubility of mineral and other inorganic matter increase withincrease in water temperature. Moreover the
accumulation of dissolved salt due to high rate of evaporation in summer increases the electrical conductivity of water. Hence the present water bodyshows high electrical conductivity value during summer and low in winter months.
Table – 2 Monthly variations of occurrence of Physio-Chemical Characteristic in Garga Reservoir (Unit/ml) ± SD of Four Observations.PARAMETER
July’12
Aug’12
Sep’12
Oct’12
Nov’12
Dec’12
Jan’13
Feb’13
Mar’13
Apr’13
May’13
June’13
Temperature (0C)
24 ±0.82
24 ± 1.83
23 ± 0.82
21 ± 1.83
19 ± 0.82
17 ± 0.82
18 ± 2.94
20 ± 3.16
22 ± 1.63
25 ± 3.56
29 ± 2.94
28 ± 4.4
Transparency (cm)
58.2 ±2.65
60.4 ±3.23
65.2 ±3.46
66.3 ±3.85
72.4 ±2.78
68.4 ±3.71
67.3 ±2.26
68.7 ±3.45
72.3 ±3.35
71.9 ±3.87
66.3 ±2.98
66.7 ±3.56
pH 7.5± 1.29
7.4± 0.61
7.4± 0.87
7.3± 0.54
7.3± 0.87
6.8± 0.47
6.9± 0.94
7.3± 0.98
7.3± 0.87
7.4± 0.95
7.8± 0.94
7.7± 0.58
DO (mg/l)
5.9± 0.54
5.8± 0.54
5.7± 0.58
6.1± 0.08
6.3± 0.27
6.8± 0.25
6.5± 0.32
6.2± 0.39
6.0± 0.82
5.8± 0.18
4.4± 0.48
4.8± 0.55
Free CO2(mg/l)
7.2± 0.35
7.1± 0.18
5.8± 0.32
4.5± 0.29
4.1± 0.25
2.5± 0.45
3.9± 0.45
4.2± 0.29
5.5± 0.29
8.8± 0.22
12.3 ±0.29
11.2 ±0.24
TotalAlkalinity(mg/l)
118± 3.56
105± 2.58
110± 3.16
119± 2.44
120± 2.7
121± 2.44
126± 2.16
127± 2.94
128± 2.58
130± 4.24
135± 2.94
132± 2.94
Total 68. 67. 65. 54. 46. 38. 42. 48. 56. 68. 78. 74.

Hardness (mg/l)
3 ±5.99
2 ±8.15
7 ±3.64
3 ±10.02
7 ±7.69
7 ±8.74
6 ±8.01
9 ±5.3
4 ±7.5
9 ±11.83
7 ±6.26
2 ±4.38
PO4(mg/l)
0.42 ±0.029
0.61 ±0.025
0.81 ±0.029
0.73 ±0.036
0.28 ±0.036
0.18 ±0.04
0.25 ±0.042
0.33 ±0.018
0.58 ±0.033
0.56 ±0.039
0.49 ±0.036
0.38 ±0.032
NO3(mg/l)
13.9 ±0.37
13.8 ±0.25
12.9 ±0.39
12.1 ±0.49
12.6 ±0.32
14.4 ±0.42
16.7 ±0.59
16.2 ±0.58
10.8 ±0.36
9.8± 0.52
10.2 ±0.32
11.8 ±0.54
Specific conductance (µmhos/cm)
231± 11.11
230± 12.73
229± 16.33
222± 8.12
214± 6.06
209± 19.94
212± 17.17
218± 15.98
224± 14.33
231± 9.83
252± 22.01
243± 11.22
Table – 3 Seasonal variations in physico –chemical parameters of water of Garga Reservoir from July 2012 to June 2013.
Season Parameters
Summer(March’13 – June’13)
Monsoon(July’12 – Oct’12)
Winter(Nov.’12 – Feb’13)
Temperature (0C)
26 23 18.5
Transparency (cm)
69.3 ± 3.24 62.53 ± 3.86 69.2 ± 2.22
pH 7.55 ± 0.23 7.4 ± 0.08 7.08 ± 0.26DO (mg/l) 5.25 ± 0.77 5.88 ± 0.17 6.45 ± 0.26Free CO2(mg/l) 9.45 ± 3.01 6.15 ± 1.27 3. 68 ± 0.79Total Alkalinity (mg/l)
128.75 ± 6.5 124.25 ± 7.04 113.5 ± 8.89
Total Hardness(mg/l)
69.55 ± 9.64 63.88 ± 6.47 44.23 ± 4.51

PO4(mg/l) 0.5 ± + 0.09 0.64 ± 0.17 0.26 ± 0.06NO3(mg/l) 10.65 ± 0.87 13.18 ± 0.85 14.98 ± 1.87Specific conductance (µmhos/cm)
237.5 ± 12.45 228 ± 4.58 213.25 ± 3.77
Planktons – Planktons were collected monthly from July’12 to June’13 and phytoplanktons and zooplanktons were identified.
Phytoplankton:-
The monthly variations in the occurrence of phytoplankton in Garga Reservoir have been noticed and presented in the table 4.
Totally 12 different species of phytoplankton belonging to 7 different classes werenoticed.
Cyanophycea: - It was represented by two genera namely Anabaena and Spirulina. They were observed onlyin December and January.
Chlorophycea :- In it 4 genera were observed namely Oedogonium sp., Spirogyra sp., Volvox sp. and Ulothrix sp.Oedogonium appeared irregularly throughout the study period. Sprirogyra sp.was found from December’12 to June ’13. Volvox was seen only in December’12 and January’13. Ulothrix was observed fromNovember’12 to June’13.
Bacillariophycea: - It was represented by two genera namely Nitzschia sp. and Navicula. Nitzschia appeared only

in the month of October and November where as Navicula was observed in December and January.
Charaphycea: - It was represented by 1 genus namely Chara. It was observed from December’12 to June’13.it was more numerous from April to June.
Rhodophycea: - Only one genus Batrachospermum was observed from February to June. It was numerous in June’13.
Dinoflagellates :-Ceratium represented this class and was maximum in September. It was not observed in November, December, January and March.
Euglenoides :- Euglena was observed throughout the year except September, November and December.
Maximum number of phytoplanktons was found in May and June.

Table – 4 Monthly variations of occurrence of Phytoplankton in Garga Reservoir (Unit/ml) ± SD of Four Observations.PHYTOPLANKTON
July’12
Aug’12
Sep’12
Oct’12
Nov’12
Dec’12
Jan’13
Feb’13
Mar’13
Apr’13
May’13
June’13
CYANOPHYCEAAnabaena 2 ±
0.82
3 ±1.41
Spirulina 5 ±1.83
5 ±1.41
CHLOROPHYCEAOedogonium 1 ±
0.82
1 ±0.82
2 ±0.82
2 ±1.15
2 ±1.41
1 ±0
1 ±1.63
1 ±0.82
Spirogyra 2 ±0.82
2 ±1.41
3 ±1.41
5 ±2.94
7 ±1.63
7 ±2.92
6 ±1.83
Volvox 3 ±1.41
3 ±1.41
Ulothrix 2 ±0.82
1 ±1.41
3 ±1.41
2 ±1.15
3 ±0.82
5 ±1.41
5 ±2.94
6 ±3.67
BACILLARIOPHYCEANitzschia 2 ±
0.82
1 ±0.82
Navicula 1 ±0
1 ±1.15
CHARAPHYCEAChara 1 ±
1.42 ±0.8
2 ±1.6
3 ±1.4
4 ±2.1
4 ±0.8
5 ±1.4

1 2 3 1 6 2 1RHODOPHYCEABatrachospermum
1 ±0.82
2 ±0.82
2 ±1.15
3 ±1.63
5 ±2.16
DIANOFLAGELLATESCeratium 2 ±
0.82
4 ±0.82
5 ±3.56
3 ±1.41
1 ±0.82
1 ±1.41
1 ±0.82
2 ±0.82
EUGLENOIDSEuglena 1 ±
1.41
2 ±0.82
2 ±0.82
1 ±0.82
1 ±0
2 ±1.15
3 ±1.41
2 ±0.82
1 ±0.82
Total No. of Individuals
4 7 7 7 5 15 22 10 16 22 23 26
Total No. of Species
3 3 2 3 3 7 9 6 6 6 7 7
Percentage composition: - Percentage composition ofvarious classes of phytoplanktons is represented intable 5. It revealed maximum percentage of Chlorophycea (46.34%) and minimum percentage of Rhodophycea (7.93%).
Table – 5 Percentage composition of various classes of Phytoplankton of Garga Reservoir, Bokaro
Month
Cyanophycea
Chlorophycea
Bacillariophycea
Charaphycea
Rhodophycea
Dianoflagellates
Euglenoids
Total
July’12
1 2 1 4
Aug’12
1 4 2 7

Sep’12
2 5 7
Oct’12
2 3 2 7
Nov’12
4 1 5
Dec’12
7 6 1 1 15
Jan’13
8 10 1 2 1 22
Feb’13
5 2 1 1 1 10
Mar’13
9 3 2 2 16
Apr’13
12 4 2 1 3 22
May’13
13 4 3 1 2 23
Jun’13
13 5 5 2 1 26
Total
15 76 5 21 13 19 15 164
% 9.15% 46.34% 3.05% 12.8% 7.93% 11.59% 9.15%
Diversity indices of phytoplankton:
Phytoplankton community characteristics such as species richness, evenness and diversity where calculated in the Garga reservoir during July’12 toJune’13 and presented in the table 6.
The Margalef index (R1) of phytoplankton was minimum (0.514) during September’12 and maximum

(1.737) during February’13. The Menhinick index (R2) was maximum (1.581) during February’13 and minimum (0.756) during August and September’12. Evenness indices E1, E2, E3, E4, and E5 refer to how the species abundances are distributed among the species. The Alatalo evenness (E5) is preferredover others. It was maximum (2.81) during July’12 and minimum (0.339) during May’13.
The Simpson’s Index (n) for the phytoplankton community was ranging from 0.167 in July ’12 to 0.6in November’12. The Shannon index (H’) of phytoplankton was low during the month of November’12 (0.501) and high during the month of February’13(1.36). While the values of Hill’s firstdiversity (N1) ranged between 1.651 in November’12 and 3.899 in February’13. The Hill’s second diversity (N2) ranged from 1.667 in November’12 to 5.988 in July’12.

Table – 6 Monthly variations of the various diversity indices for the Phytoplanktons observed in Garga Reservoir, Bokaro (Jharkhand)Indices Jul
y’12
Aug’12
Sep’12
Oct’12
Nov’12
Dec’12
Jan’13
Feb’13
Mar’13
Apr’13
May’13
June’13
Richness
No
3 3 2 3 2 4 5 5 4 5 5 5
R1
1.443
1.028
0.514
1.028
0.621
1.108
1.294
1.737
1.082
1.294
1.276
1.228
R2
1.5 0.756
0.756
1.134
0. 894
1.033
1.066
1.581
1 1.066
1.043
0.981
Evenness
E1
0.929
0.816
0.863
0.983
0.723
0.783
0.762
0.845
0.836
0.79
0.771
0.81
E2
0.925
0.817
0.909
0.981
0.826
0.74
0.682
0.78
0.797
0.713
0.692
0.737
E3
0.888
0.726
0.819
0.972
0.651
0.654
0.603
0.725
0.729
0.642
0.615
0.671
E4
2.158
1.224
1.05
1.427
1.01
0.958
0.916
1.049
1.141
0.852
0.53
0.891
E5
2.81
1.378
1.111
1.646
1.025
0.937
0.88
1.066
1.206
0.794
0.339
0.851
Diversity
λ 0.167
0.333
0.524
0.238
0.6 0.352
0.32
0.244
0.275
0.329
0.545
0.305
H’
1.02
0.896
0.598
1.079
0.501
1.085
1.226
1.36
1.158
1.271
1.24
1.303
N1
2.775
2.451
1.819
2.944
1.651
2.961
3.41
3.899
3.186
3.567
3.458
3.683
N2
5.988
3 1.91
4.2 1.667
2.838
3.122
4.091
3.636
3.039
1.833
3.283
No No. of speciesR1 Margalef indexR2 Mehnick’s indexE1 Pielou evennessE2 Sheldon evennessE3 Help evennessE4 Hill evennessE5 Alatalo indexλ Simpson’s evenness

H’ Shannon evennessN1 Hill’s first diversityN2 Hill’s second diversity

Zooplankton:-
The monthly variations in the occurrence of zooplankton in Graga Reservoir have noticed and presented in the table 7.
Totally 11 different species of zooplankton belonging to four different classes were noticed.Rotifera :- 3 genera namely Brachionous, Caudatus, B.falcatusand Conochilus arboreus were observed.b.caudatus was more numerous in June whereas B.falcatusand Conochilus arboreus were more in February.
Cladorera: - It was represented by 4 genera namely Ceriodaphnia cornuta, Moina micrura,Moina brachiata and Diaphanosoma sarsi.Ceriodaphnia cornuta was found more in number during January 2013. it was observed from November’12 to April’13. Moina micrura was more numerous during December’12 and January’13. Moina brachiata was seen only in December’12 and January’13. Daiphanosoma showed irregular presence throughout the year.
Copepods: - This class was represented by 3 genera namely Cyclops, Nauplius, and Heliodiaptomus viduus. Cyclops sp.was observed from November’12 to June’13. It wasnumerous from April ’13 to June’13. Nauplius sp.was observed throughout the year except in November’12 and June’13. Heliodiaptomus viduus was observed November’12 and February’13.

Nauplius was found more in number during February 2013.
Ostracoda :-
Stenocypris sp. was the only representative genes during the investigation period. It was minimum in October’12 and showed continuous presence from March’13 to June’13.
Maximum numbers of zooplanktons were found in January’13 and February’13.
Table – 7 Monthly variations of occurrence of Zooplankton inGarga Reservoir (Unit/ml) ± SD of Four Observations.ZOOPLANKTON
July’12
Aug’12
Sep’12
Oct’12
Nov’12
Dec’12
Jan’13
Feb’13
Mar’13
Apr’13
May’13
June’13
ROTIFERABrachionus caudatus
3 ±1.41
1 ±0.82
1 ±0.82
1 ± 1.41
2 ±0.82
2 ±1.41
4 ±0.82
5 ±1.83
B. falacatus
2 ±1.41
3 ±0.82
4 ±1.83
6 ± 2.58
2 ±0.82
5 ±1.83
4 ±2.16
2 ±0.82
2 ±0.82
1 ± 0.82
Conochilus arboreus
4 ±2.58
3 ±0.82
2 ±0.82
1 ±0.82
1 ±1.15
CLADOCERACeriodaphnia Cornuta
4 ±1.83
6 ±2.58
15± 5.89
4 ±1.41
2 ± 1.83
1 ±0.82

Moina micrura
6 ±2.16
4 ± 1.83
1 ±0.82
1 ±1.41
2 ±0.82
3±0.82
Moina brachiata
1 ±0.82
2 ± 1.41
Diaphanosoma sarsi
2 ±1.41
1 ±0.82
2 ±1.63
2 ±0.82
3 ±1.63
5 ±1.82
COPEPODSCyclops 1 ±
1.41
1 ±0.82
1 ± 0
3 ±1.63
3 ±1.41
4 ±0.82
4 ±1.41
5 ±1.63
Nauplius 1 ± 0.82
1 ±1.41
2 ±1.82
1 ± 1.41
4 ±2.45
3 ± 1.63
7 ±2.83
2 ±1.41
1 ±0.82
1 ±1.41
Heliodiaptomus viduus
3 ±0.82
3 ±1.41
OSTRACODAStenocypris
1 ± 0.82
2 ±1.41
3 ±1.41
3 ±1.63
4 ±2.16
Total No. of Individuals
6 5 6 8 12 19 26 27 21 18 20 24
Total No. of Species
3 3 2 3 5 6 6 7 9 9 8 7
Percentage composition:- Percentage composition of various classes of zooplanktons is represented in

table 8. It revealed maximum percentage of Cladocera (34.89%) and minimum percentage of Ostracoda (6.77%).
Table – 8 Percentage composition of various classes of Zooplankton of Garga Reservoir, Bokaro
Month Rotifera Cladocera
Copepoda Ostracoda
Total
July’12 5 1 6Aug’12 4 1 5Sep’12 4 2 6Oct’12 6 1 1 8Nov’12 2 6 4 12Dec’12 1 13 5 19Jan’13 1 21 4 26Feb’13 9 5 13 27Mar’13 9 5 5 2 21Apr’13 6 4 5 3 18May’13 7 5 5 3 20Jun’13 7 8 5 4 24Total 61 67 51 13 192% 31.77% 34.89% 26.56% 6.77%
Diversity indices of Zooplankton:
Monthly variations in Richness, Evenness and Diversity of zooplankton of Garga reservoir were computed and entered in table 9.
The Margalef index (R1) was maximum in April’13 (1.038) and minimum in July and September’12(0.558). The Menhinick index (R2) was low in February’13 (0.577) and high during October’12 (1.061).

The Alatalo evenness (E5) of zooplankton was maximum in September’12 (1.284) and minimum in October’12 (0.489).
The Simpson’s index (n) varied from 0.222 in April’13 to 0.667 in July’12. The Shannon index (H’) was found to be in the range of 0.451 in July’12 to 1.355 in April’13. the values Hill’s first diversity (N1) ranged between 1.57 in July’12to 3.88 in April’13. The values of Hill’s second diversity (N2) ranged between 1.5 in July’12 to 4.5in April’13.
Among the diversity indices, N1 is measure of abundant species and N2 is measuring of very abundant species.
Table – 9 Monthly variations of the various diversity indices for the Zooplankton observed in Garga Reservoir, Bokaro (Jharkhand)
Indices July’12
Aug’12
Sep’12
Oct’12
Nov’12
Dec’12
Jan’13
Feb’13
Mar’13
Apr’13
May’13
June’13
Richness
No
2 2 2 3 3 3 3 3 4 4 4 4
R1
0.558
0.621
0.558
0.962
0.805
0.679
0.614
0.607
0.985
1. 038
1.001
0.944
R2
0.816
0.894
0.816
1.061
0.866
0.688
0.588
0.577
0.873
0.943
0.894
0.816
Evenness
E1
0.651
0.723
0.918
0.671
0.922
0.697
0.534
0.938
0.955
0.978
0.971
0.976
E2
0.785
0.826
0.945
0.696
0.918
0.717
0.599
0.934
0.94
0.97
0.96
0.967
E3
0.57
0.651
0.89
0.545
0.877
0.576
0.399
0.902
0.919
0.96
0.947
0.956
E 0.9 1.0 1.1 0.7 1.0 0.9 0.9 1.0 0.9 1.1 1.1 1.0

4 55 1 34 34 89 03 66 8 8 6 24 98E5
0.877
1.025
1.284
0.489
1.141
0.819
0.923
1.124
0.973
1.215
1.168
1.132
Diversity
λ 0.667
0.6 0.467
0.652
0.333
0.515
0.576
0.33
0.271
0.222
0.232
0.236
H’
0.451
0.501
0.636
0.736
1.012
0.766
0.586
1.03
1.323
1.355
1.345
1.352
N1
1.57
1.651
1.89
2.089
2.753
2.152
1.797
2.803
3.758
3.88
3.841
3.868
N2
1.5 1.667
2.143
1.533
3 1.943
1.736
3.026
3.684
4.5 4.318
4.246
No No. of speciesR1 Margalef indexR2 Mehnick’s indexE1 Pielou evennessE2 Sheldon evennessE3 Help evennessE4 Hill evennessE5 Alatalo indexλ Simpson’s evennessH’ Shannon evennessN1 Hill’s first diversityN2 Hill’s second diversity


Conclusion –
The result showed that water of Garga reservoir is
suitable for drinking, irrigation and fish
culture. Plankton study was carried out to
understand its relation with water quality
parameters and fish production. Among
phytoplantons Chlorophycea was more prominent and
among zooplanktons Cladocera and Rotifera showed
dominance.
Acknowledgement:-
Authors are thankful to Dr. Professor GurdeepSingh, Vice Chancellor of Vinoba Bhave University,Hazaribagh, Jharkhand, India for his usefulsuggestions.
REFERENCES
1.P.K. Goel, R.K. Trivedy, and S.V. Bhave, “ Studies on the limnology of a fresh water bodies southwestern Maharashtra”, Indian J. Environ. Prot. 5(1), 19-25.1985.
2.S.M. Karikal, “ Limnobiotic study on the Bhutnal reservoir from Bijapur area”. Ph.D.

thesis, submitted to Karnatak Univ. Dharwad, 1995.
3.S.A.Abbasi, K.S. Bhaliya, Kunhi, A.V.M, and R.S. Soni, “ Studies on limnology of Kuttadi Lake (North Kerala)”, Eco. Env. Cons., vol 2, pp.17-27, 1996.
4.B.N. Sunkad, and H.S. Patil, “ Physico-chemicalcharacteristics of Fort lake of Belgaum(Karnatak)”, Abst. Nat. Symp. Karnatak Univ. Dharwad, pp.68, 2001.
5.L.R. Bhat, P.Laccoul, H.D.Lekhak. and P.K. Jha,“ Physico-chemical characteristics and phytoplankton of Toudah Lake, Kathmandu,”. Poll. Res., 18(4), p.353-358, 1999.
6.Adoni, A.D., Joshi, G., Gosh, K., Chowasia, S.K., Vaishya, A.K., Yadav, M. and H.G. Verma :Work book on Limnology. Pratibha Publishers, Sagar, India, (1985).
7.Alatalo, R.V. : Problems in the measurement ofevenness in ecology, Oikos, (37) 199-204 (1981).
8.Chandran Bohra and Arvind Kumar : Plankton diversity in the wetlands of Jharkhand : in Arvind Kumar(Edt.), Biodiversity and environment, A.P.H. Pub. Corp., New Delhi (2004).
9.Mohammad A. Hussein, Ahmad H. Obuidallah, Ama AMahmoud, Heba M Fangary. Population dynamics offreshwater snails ( Mollusca : Gastropoda) at

Quna Governorate, Upper Egypt. Acad. J. Biolog.Sci., 2011; 3 (1) :11- 22.
10. Strayer DL, Hattala K, Kahnle. A Effects of an invasive bivalve( Dreissena polymorpha) on fish populations in the Hudson river estuary. Can J Fish Aquat Sci 2004; 61 :924-941.
Copyright © 2022 FDOKUMEN