Nectar and pollen feeding by insect herbivores and implications for multitrophic interactions
MARINE ECOLOGY PROGRESS SERIESMar Ecol Prog Ser
Vol. 368: 23–40, 2008doi: 10.3354/meps07565
Published September 25
INTRODUCTION
The purpose of the present study was to (1) objec-tively identify co-occurrence patterns of organismsbelonging to different trophic levels, i.e. identify whichand how many are the typical plankton assemblagesin the lagoon area; (2) derive the spatio-temporal suc-
cession of these plankton assemblages; and (3) identifyenvironmental variables shaping plankton assemblages.
These goals are crucial because they might provideboth a deeper understanding of ecosystem functioningand information on water quality status. Indeed, inpelagic marine ecosystems, plankton represents thebase of trophic chains, and the structure of plankton
© Inter-Research 2008 · www.int-res.com*Corresponding author. Email: [email protected]
Analysis of multitrophic plankton assemblages inthe Lagoon of Venice
Vinko Bandelj1, Giorgio Socal2, Young-Seuk Park3, Sovan Lek4, Joan Coppola2, Elisa Camatti2, Elisa Capuzzo2, Luisella Milani5, Cosimo Solidoro1,*
1Istituto Nazionale di Oceanografia e di Geofisica Sperimentale (OGS), Borgo Grotta Gigante – Brisciki 42/c, Sgonico – Zgonik (TS) 34010, Italy
2ISMAR CNR Istituto Scienze Marine, Sezione di Venezia, Castello 1364/a, Venezia 30122, Italy3Department of Biology, Kyung Hee University, Hoegi-dong, Dongdaemun-gu, Seoul 130-701, ROK
4Laboratoire Dynamique de la Biodiversité (LADYBIO), UMR CNRS 5172, Université Paul Sabatier, 118 route de Narbonne, Toulouse cédex 4 31062, France
5Regional Environment Protection Agency of Friuli Venezia Giulia (ARPA FVG), Osservatorio Alto Adriatico, Via Cairoli 14, Palmanova (UD) 33057, Italy
ABSTRACT: The paper illustrates the spatial and temporal succession of multitrophic planktonassemblages in the Lagoon of Venice and relates them to biogeochemical properties. Five communi-ties were identified by recognizing patterns of co-occurrence of phyto-, protozoo- and metazooplank-ton organisms through a classification procedure combining self-organizing maps and cluster analy-sis. The complexity of time and space co-variation of 47 plankton taxa was thus compressed to thevariation of only one qualitative variable. Biogeochemical observations provided information for anecological description of the environment in which different biocenoses develop. Our results providean objectively derived typology of plankton assemblages and an ideal representation of their typicalsuccession in time and space. This can be used to better understand the dynamics of the planktoncommunity, and as a reference term for the identification and evaluation of anomalous situations, asrequired by implementation of the EU Water Framework Directive. Our results indicated the impor-tance of seasonality in ruling succession among different biocenoses. River inflows, exchanges withthe sea, remineralization processes and benthic–pelagic coupling were all important factors in shap-ing plankton communities and defining their spatial extension. Autotrophy prevailed in late winter tospring in inner areas of the lagoon, whereas heterotrophy prevailed in late summer to early winterand generally in areas close to the inlets. Diatoms, including resuspended benthic species, dominatedautotrophic compartments, and copepods Acartia spp. were the most abundant mesoplankton organ-isms. Our results also point out the prominent role of protozooplankton in the trophodynamic of theLagoon of Venice.
KEY WORDS: Plankton communities · Self-organizing map · Lagoon of Venice · Trophic food webs ·EU Water Framework Directive · Typology · Microzooplankton
Resale or republication not permitted without written consent of the publisher
OPENPEN ACCESSCCESS

Mar Ecol Prog Ser 368: 23–40, 2008
communities (composition, abundance and biomass)is important in defining paths, modality and transferefficiency of mass and energy flows inside trophicwebs. Plankton is also a key element in the assessmentof aquatic ecosystems’ quality status (Reynolds 1997)because of its trophic role and relatively fast responseto alterations of environmental variables, which mightnot be emphasized by longer living biological ele-ments, such as benthic organisms (Gibson et al. 2000).
Integrated analysis of multitrophic plankton assem-blages are particularly valuable: they consider differ-ent types of relationships occurring in real biocenosesat the same time, such as competition and predation,which cannot be accounted for when the analysis islimited to a single species or trophic level, but that con-cur in defining the realized niches of interacting popu-lations. In addition, while the presence of a single spe-cies might provide some information on environmentalconditions, much less information can be inferred fromthe absence of a single species, which might be due tomany different reasons (Jongman et al. 1995). Further-more, the lack of ecophysiological studies on single-species–environment relationships heavily limits theinterpretation of plankton diversity at the species level(Cloern & Dufford 2005).
The objectives of this paper are also of primaryimportance in view of new regulations enforced bywater conservation authorities (i.e. the EU WaterFramework Directive 2000/60/EC available at: http://ec.europa.eu/environment/water/water-framework/index_en.html and EU Marine Strategy FrameworkDirective 2008/56/EC available at: http://ec.europa.eu/environment/water/marine/index_en.htm), since theserequire both the definition of the typology of waterbodies and the identification of reference conditionsfor each of the typology classes. However such re-quirements pose the problem of how to define andcharacterize such classes objectively, i.e. how manyclasses there are, where the boundaries among classesare, how to associate each class to a given point inspace and time, and how to identify species assem-blages characterizing each class.
The methodology here proposed is a possible answerto these very questions. We used a combination of aself-organizing map (SOM) (Kohonen 1982, 2001) andcluster analysis in order to analyze the abundances ofphyto-, protozoo- and metazooplankton, as well astheir distribution along gradients of biogeochemicalvariables. SOM has several advantages as compared toother numerical techniques commonly used in classifi-cation or gradient analysis: it does not rely on any par-ticular a priori assumption on dataset structure, is notaffected by the presence of outliers, and can efficientlycope with datasets including a reasonable number ofmissing data. SOM was already successfully used in
several ecological applications (e.g. Lek & Guégan1999, Giraudel & Lek 2001, Park et al. 2004), as well asin oceanographic (Richardson et al. 2002, Liu et al.2006) and biogeochemical (Solidoro et al. 2007) ones.The use of the 2-step procedure with application of ahierarchical clusterization method to SOM resultsaccounts for some weak points of the SOM algorithm(Park et al. 2004, Solidoro et al. 2007).
Our results enable us to develop an objectively derivedtypology of plankton assemblages, which can be usedas a reference term for different moments and areas ofthe lagoon, and therefore for identification and evalua-tion of anomalous situations, as required by the imple-mentation of the EU Water Framework Directive.
MATERIALS AND METHODS
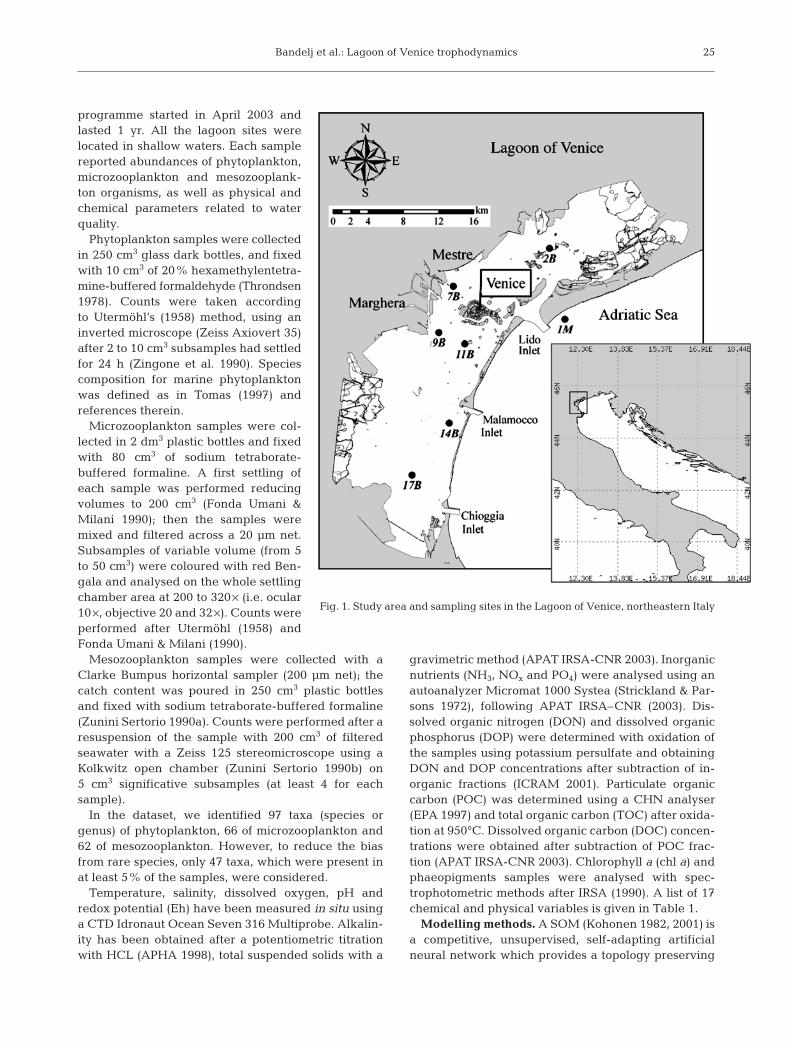
Study site. The study site was the Lagoon of Venice,which is a large Mediterranean lagoon with an areaof ca. 500 km2, located in the Northern Adriatic Sea(Fig. 1). It is surrounded by heavily inhabited shores,important coastal industrial areas, fisheries, maricul-ture, and tourist activities, and it encloses sites of greathistorical and artistic value (Ravera 2000). There are 12major tributaries, which carry annually ca. 35 m3 s–1 offreshwater in the lagoon (Zuliani et al. 2005). Nitrogenand phosphorus loads are in order of 4000 TN yr–1 and230 TP yr–1, respectively (Collavini et al. 2005). Threeinlets connect the lagoon to the sea, with a yearly aver-aged exchange of ca. 8000 m3 s–1 (Gacic et al. 2005).A complex network of channels, originating from theinlets, divides the lagoon in 4 major subbasins and in alarge number of landscape units. Average water depthis less than 1 m in the flats, while it reaches up to 10 min channels connecting the 3 inlets with Venice and theMarghera harbour. General circulation results fromthe superposition of tide, wind, and topographic con-trol (Solidoro et al. 2004, Gacic et al. 2005), and theeffective renewal of water is on the order of a few daysfor the area closest to the inlets and up to 30 d for theinner area (Solidoro et al. 2004, Cucco & Umgiesser2006). Due to the complexity of interactions and thevariety of stressors simultaneously occurring, the lagoonpresents high variability in most environmental para-meters and high habitat heterogeneity (Ravera 2000).Indeed, different partitions have been proposed inorder to identify homogeneous areas (Solidoro et al.2004, Marchini & Marchini 2006).
Field data. Data were collected monthly at 6 sitesinside the lagoon and at 1 site near the shore justoutside the Lido inlet (Fig. 1) within the programmeICSEL (Integrazione delle Conoscenze del SistemaEcologico Lagunare), funded by the Venice WaterAutorithy through the Consorzio Venezia Nuova. The
24
Bandelj et al.: Lagoon of Venice trophodynamics
programme started in April 2003 andlasted 1 yr. All the lagoon sites werelocated in shallow waters. Each samplereported abundances of phytoplankton,microzooplankton and mesozooplank-ton organisms, as well as physical andchemical parameters related to waterquality.
Phytoplankton samples were collectedin 250 cm3 glass dark bottles, and fixedwith 10 cm3 of 20% hexamethylentetra-mine-buffered formaldehyde (Throndsen1978). Counts were taken accordingto Utermöhl’s (1958) method, using aninverted microscope (Zeiss Axiovert 35)after 2 to 10 cm3 subsamples had settledfor 24 h (Zingone et al. 1990). Speciescomposition for marine phytoplanktonwas defined as in Tomas (1997) andreferences therein.
Microzooplankton samples were col-lected in 2 dm3 plastic bottles and fixedwith 80 cm3 of sodium tetraborate-buffered formaline. A first settling ofeach sample was performed reducingvolumes to 200 cm3 (Fonda Umani &Milani 1990); then the samples weremixed and filtered across a 20 µm net.Subsamples of variable volume (from 5to 50 cm3) were coloured with red Ben-gala and analysed on the whole settlingchamber area at 200 to 320 × (i.e. ocular10 ×, objective 20 and 32 ×). Counts wereperformed after Utermöhl (1958) andFonda Umani & Milani (1990).
Mesozooplankton samples were collected with aClarke Bumpus horizontal sampler (200 µm net); thecatch content was poured in 250 cm3 plastic bottlesand fixed with sodium tetraborate-buffered formaline(Zunini Sertorio 1990a). Counts were performed after aresuspension of the sample with 200 cm3 of filteredseawater with a Zeiss 125 stereomicroscope using aKolkwitz open chamber (Zunini Sertorio 1990b) on5 cm3 significative subsamples (at least 4 for eachsample).
In the dataset, we identified 97 taxa (species orgenus) of phytoplankton, 66 of microzooplankton and62 of mesozooplankton. However, to reduce the biasfrom rare species, only 47 taxa, which were present inat least 5% of the samples, were considered.
Temperature, salinity, dissolved oxygen, pH andredox potential (Eh) have been measured in situ usinga CTD Idronaut Ocean Seven 316 Multiprobe. Alkalin-ity has been obtained after a potentiometric titrationwith HCL (APHA 1998), total suspended solids with a
gravimetric method (APAT IRSA-CNR 2003). Inorganicnutrients (NH3, NOx and PO4) were analysed using anautoanalyzer Micromat 1000 Systea (Strickland & Par-sons 1972), following APAT IRSA–CNR (2003). Dis-solved organic nitrogen (DON) and dissolved organicphosphorus (DOP) were determined with oxidation ofthe samples using potassium persulfate and obtainingDON and DOP concentrations after subtraction of in-organic fractions (ICRAM 2001). Particulate organiccarbon (POC) was determined using a CHN analyser(EPA 1997) and total organic carbon (TOC) after oxida-tion at 950°C. Dissolved organic carbon (DOC) concen-trations were obtained after subtraction of POC frac-tion (APAT IRSA-CNR 2003). Chlorophyll a (chl a) andphaeopigments samples were analysed with spec-trophotometric methods after IRSA (1990). A list of 17chemical and physical variables is given in Table 1.
Modelling methods. A SOM (Kohonen 1982, 2001) isa competitive, unsupervised, self-adapting artificialneural network which provides a topology preserving
25
Fig. 1. Study area and sampling sites in the Lagoon of Venice, northeastern Italy
Mar Ecol Prog Ser 368: 23–40, 2008
non-linear projection of multivariate data sets in alower dimensional, usually 2-dimensional, space (map).The final result is a clusterization of all samples in agiven number of groups and the identification of one‘best descriptor’ for each of the groups. The classifica-tion is based on an iterative algorithm which takes intoconsideration similarity among samples, as describedby the parameters associated with the samples. Thebest descriptors are not the median nor the average,nor the results of any simple operation performed onthe samples associated with a group, but they are aresult of the learning phase. Furthermore, the bestdescriptors are ordered on the low-dimensional space,based on their multivariate similarity. Therefore, aSOM acts at the same time as a classification, ordina-tion, and information compression procedure.
The method does not need any a priori assumption onthe distribution of the data, nor a subdivision of the datain input and output datasets, as in supervised neuralnetworks. In unsupervised neural networks the trainingphase is a process in which the network learns to clas-sify by recognizing similar patterns in the samples.
The first step in a SOM algorithm is the choice of themap units’ number and how they are arranged on themap grid. Then, an n-dimensional model vector isassociated to each map unit, where n is the number ofvariables in the input sample, so that each unit can beseen as a synthetic sample. Initial values are assignedeither randomly or in agreement with purposely de-signed algorithms (e.g. the linear initialization, Koho-nen 2001). The ensemble of the j-th components of allmodel vectors defines the j-th component plane of themap, which depicts the distribution of the componentsalong the SOM. Then the learning phase begins: (1) anobserved sample is drawn from the input dataset and
compared to every map unit; (2) the map unit with thelowest distance (usually Euclidean distance) from theinput data is identified and labeled best-matching unit(BMU); (3) the values of the BMU and, to a smallerextent, of a specified number of neighboring map unitsare adjusted to become more similar to the input sam-ple according to a predefined learning function:
mi(t + 1) = mi(t) + h(dci,α(t)) [x (t) – mi(t)]
where mi is the i-th map unit, and h is a distance func-tion, which decreases with increasing distance dci be-tween the map unit c (BMU) and the map unit i, andwith decreasing learning rate factor α(t). The learningrate factor decreases with increasing number of learn-ing cycles t. Then (4) the procedure (1) to (3) is re-peated for all data, and (5) the whole procedure (1) to(4) is repeated several times until a quasi steady condi-tion is reached. During the first iterations (rough train-ing phase) the number of adjusted neighbouring unitsand the learning rate are large; thus, the convergenceis fast and a global ordination is achieved. In the lastiterations (fine-tuning phase) the learning rate is verysmall and only the BMU is updated at each step, caus-ing a local adjustment of the values on the SOM. In theend, each input sample is linked to one map unit thatbest represents it, and each map unit is linked to a listof observed samples. Map units close in the 2-dimen-sional grid are similar, and thus a local order arises onthe map and the spatial distribution of each variablealong its component plane is as smooth as possible.
There is no theoretical proof of convergence (Koho-nen 2001), and different replicates of the learning pro-cedure result in slightly different outputs because ofdata presentation to model vectors in random order.Thus, the whole procedure is run many times and the
26
Table 1. Medians of physical and chemical variables (not used in self-organizing map, SOM, training). Highest median values are in bold, lowest in italics
Variable Abbreviation Unit Cluster 1 Cluster 2 Cluster 3 Cluster 4 Cluster 5
Temperature temp °C 9.6 23.7 26.4 25.3 8.1Salinity sal psu 29.6 31.2 33.4 36.3 33.7Oxygen saturation OXSAT % 97.8 96.7 94.0 88.9 94.9Dissolved oxygen DOX ppm 9.53 7.01 6.42 6.13 8.90pH pH 7.92 8.05 8.03 7.99 7.97Redox potential Eh mV 405 402 384 412 405Alkalinity alk mE dm–3 3100 3000 2900 3000 2900Total suspended solids TSS mg dm–3 15.0 14.4 30.4 22.7 14.4Ammonium NH4 µg dm–3 67.1 7.1 5.5 8.0 97.2Nitrates NOx µg dm–3 500.0 93.1 44.6 18.5 290.0Dissolved organic nitrogen DON µg dm–3 130.0 180.0 198.6 260.0 96.0Phosphates PO4 µg dm–3 5.00 5.10 3.57 4.06 3.20Dissolved organic phosphorus DOP µg dm–3 9.86 22.20 24.15 21.19 8.12Particulate organic carbon POC mg dm–3 0.355 0.682 0.804 0.535 0.319Dissolved organic carbon DOC mg dm–3 2.52 2.39 2.70 2.29 2.55Chlorophyll a chl a µg dm–3 1.4 2.8 6.6 2.8 1.1Phaeopigments phaeo µg dm–3 0.8 0.4 1.6 1.3 0.4

Bandelj et al.: Lagoon of Venice trophodynamics
best solution retained. Quality measures for accuracyof the SOM (mean quantization error) (Sun 2000) andfor goodness of local ordination (topographic error)(Kaski 1997) can be used as guidelines. Also, there isno theoretical rule for choosing the size of the map,even if an intermediate level of compression is oftenpreferred. In fact, while a map which is too large is notvery useful in interpretation, because there are toomany units and few samples for unit, a map which istoo small might not leave enough degrees of freedomand forcedly associate with the same group data thatare not similar. Most of the available software pack-ages (including SOM-Toolbox for Matlab used in thepresent study) provide empirical suggestions and de-fault options for the selection of map size and opti-mized values for the training parameters (Vesanto etal. 1999).
In our application data on taxa abundances wereused in the SOM training, while physical and chemicalparameters were used for interpretation of the trainedmap. Prior to analysis the species abundances werelogarithmically transformed [ln(abundance + 1)] to re-duce variation and skewness of abundance and nor-malized to the interval (0,1) (Legendre & Legendre1998) to give the same weight to different taxa regard-less of their abundance. Map units were initializedwith linear initialization (Kohonen 2001), since thisgives a quicker convergence (Liu et al. 2006), andSOM toolbox default values were used for other para-meters (Vesanto et al. 1999).
Each map unit represented a different syntheticplankton assemblage. In order to achieve a clearer andmore robust representation of the system dynamics,clusters of similar units were considered rather thanthe units themselves, i.e. to associate synthetic plank-ton assemblages to pieces of the map. Therefore, acluster analysis was applied on non-empty map units(Vesanto & Alhoniemi 2000). The hierarchical cluster-ing algorithm was used, based on Ward’s minimumvariance (Legendre & Legendre 1998).
Environmental variables, dominant and character-istic taxa. After training of the SOM, dominant andcharacteristic taxa were discriminated using the valuesassociated with map units. In each cluster the taxadefined as dominant were those which presented thehighest abundances. Thus, we can argue that domi-nant taxa substantially contributed to the biomasscycling and to the characterization of the most impor-tant trophic relations. In order to identify these taxa,the median values of the most abundant phototrophicorganisms of each cluster were compared and the onewith the lowest value identified. Then all taxa with anabundance higher than that value were considered asdominant. In this way different clusters had differentnumbers of dominant taxa. To obtain characteristic
taxa of each cluster all taxa values were subdivided in5 classes of 20 percentiles, and the median value ofeach taxon in each cluster was assigned to theseclasses. In each cluster the characteristic taxa werethose falling in the highest class and thus showing themaximum abundances compared to the rest of themap. The abundances of the characteristic taxa couldbe much smaller than those of dominant species, sotheir role in energy transfers through the trophic foodwebs might not be relevant. Conversely, their pres-ence could be seen as an indicator of particular envi-ronmental conditions. Taxa that were both dominantand characteristic played a very prominent role in thebiologic interpretation of their assemblages.
Since in SOM a list of samples is associated witheach map unit, it was also possible to compute andassociate with each unit a representative value of envi-ronmental variables not used in the SOM training(Park et al. 2003). The ordination and clustering weredefined over plankton abundances; therefore, differ-ences among representative values of environmentalvariables provided information about the environmen-tal requirements of different plankton assemblages, asin indirect gradient analysis, and the ensemble of envi-ronmental variables associated with a cluster repre-sented a community multivariate ecological space.The list of samples associated with each map unit alsomade it possible to retrieve information on spatial andtemporal occurrences of each cluster (plankton com-munity), i.e. about months and sampling sites whereeach cluster was mainly present.
RESULTS
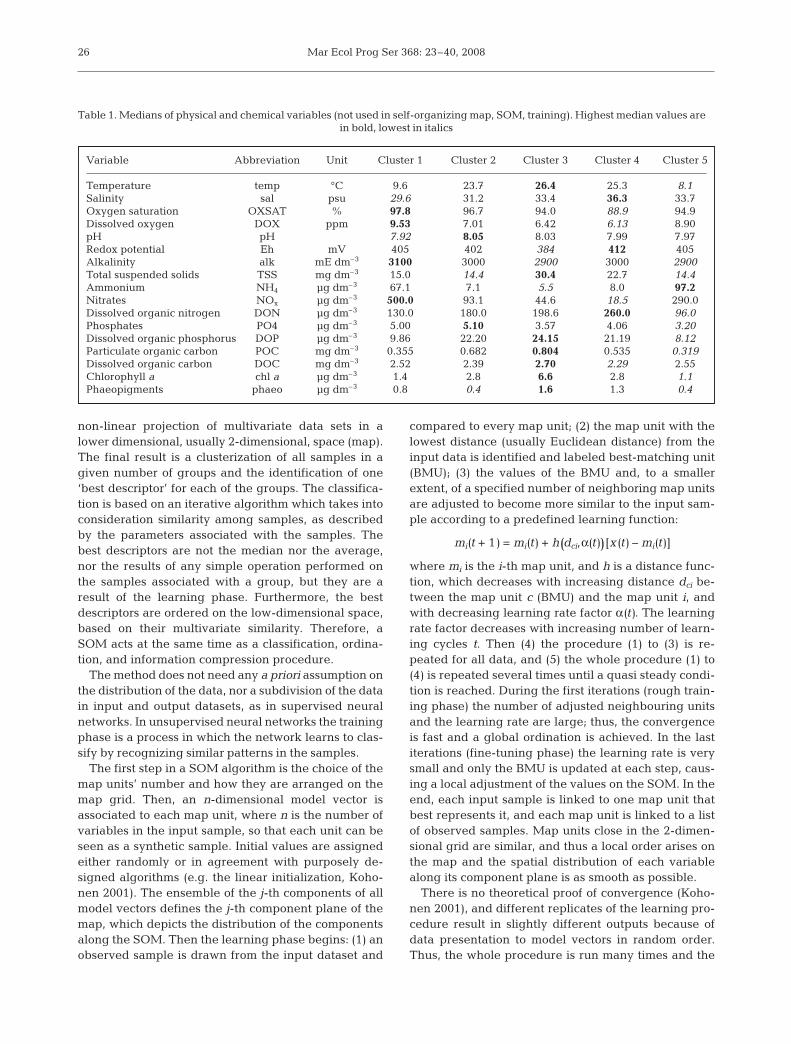
We trained 5 maps of different sizes, each one with10 replicates. We chose the map with 20 units arrangedin a 5 × 4 rectangular grid (Fig. 2), which had a meanquantization error of 1.37 and a topographic error of0.00. In this way we achieved a 4-fold compression ofthe information stored in the input dataset. This wasconsistent with the main goal of the present study, i.e.the identification of a small number of characteristicplankton communities. Larger maps did not show asignificant reduction of the mean quantization errorvalues.
A visual inspection of the map (Fig. 2) revealed thatmost samples fell in map units along the borders of themap, and suggested a first dividing of the map in dif-ferent areas. A clear temporal structure emerged, witha counterclockwise distribution of months samples onthe map, from cold months in the upper part of the mapto warm months in the lower part. The existence of aspatial structure was less clear; however, a gradientfrom northern inner areas to southern marine areas of
27
Mar Ecol Prog Ser 368: 23–40, 2008
the lagoon could be recognized from left to right on themap (Fig. 2).
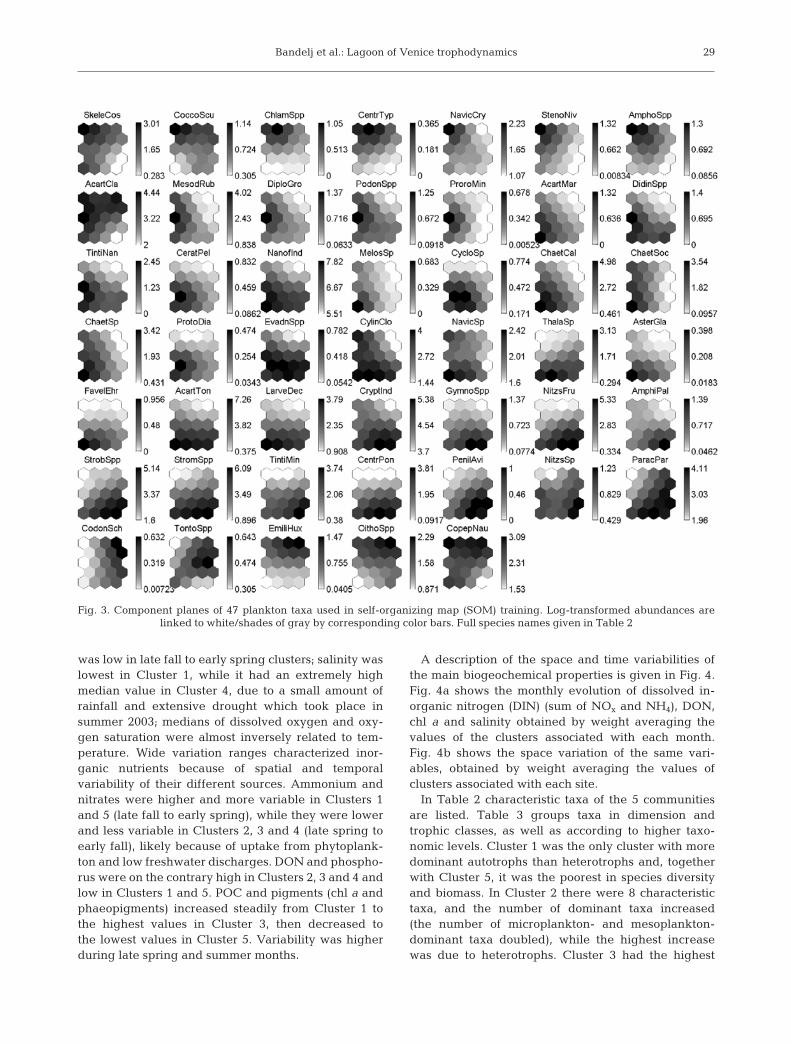
The spatial distribution of 47 taxa on the SOM unitsoffered a first indication of the spatio-temporal dis-tribution of plankton organisms and revealed correla-tions among them (Fig. 3). For instance, only 2 species(Emiliania huxleyi and Oithona spp.) showed theirmaximum values in the upper right corner of the SOMmap, whereas there were many taxa (Cylindrothecaclosterium, Melosira sp., Cyclotella sp., Chaetoceroscalcitrans, Asterionellopsis glacialis, Didinium spp.
and Acartia margalefi) with the maximumin the lower left corner and the minimumin the upper right corner.
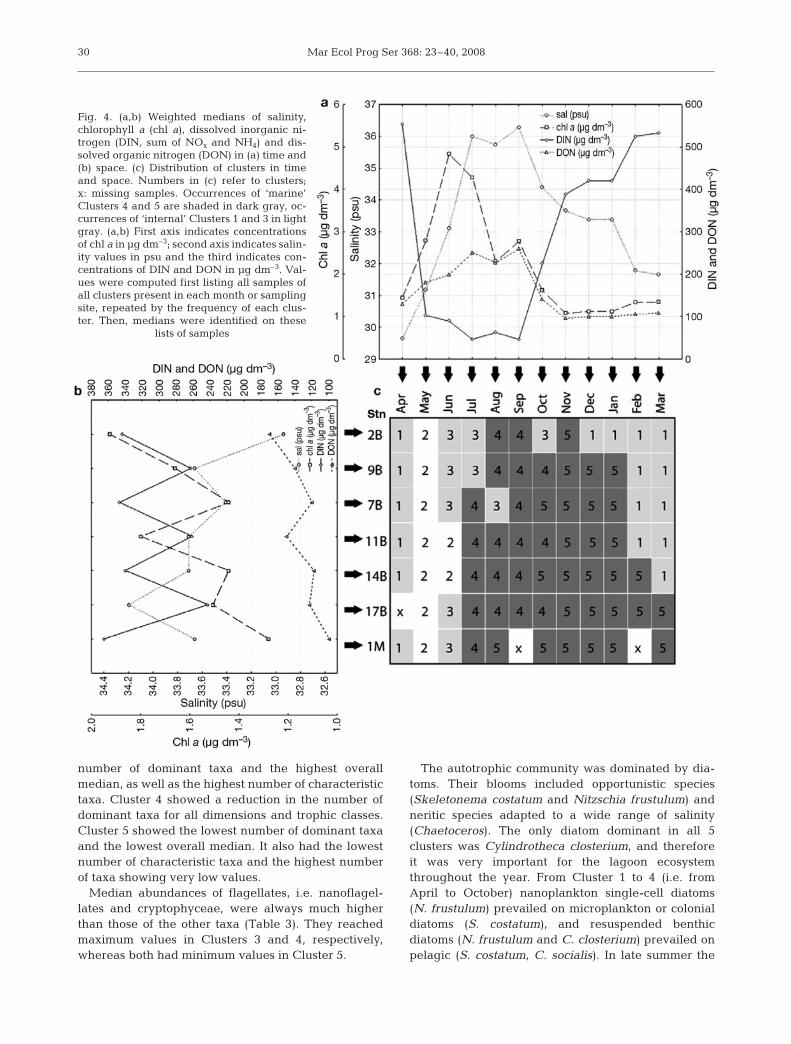
Cluster analysis divided the SOM unitsin 5 groups (Fig. 2). The dendrogram sepa-rated first the upper central (Clusters 1, 2and 5) and lower parts (Clusters 3 and 4) ofthe SOM. Fig. 4c details the association be-tween samples and clusters and illustratesthe succession of clusters in time andspace. In April 2003 all valid samples be-longed to Cluster 1. In May Cluster 1 wasreplaced by Cluster 2. In June all samplesfell in Cluster 3, except Stns 11B and 14B.Cluster 3 was replaced by Cluster 4 in July,and this cluster covered the main part ofthe lagoon until September. In AugustCluster 3 characterized Stn 7B, whileStn 1M belonged to Cluster 5. In Septem-ber all valid samples belonged to Cluster 4.In October one sample (Stn 2B) was associ-ated with Cluster 3, three samples to Clus-ter 4 and three to Cluster 5. In NovemberCluster 5 covered all the study sites, beingthe dominant cluster until January 2004. InDecember and November Cluster 1 reap-peared in Stn 2B and then progressivelyspread in the lagoon until March, whenCluster 5 lasted only in Stns 17B and 1M.
The 1-way ANOVA on environmentalvariables in the 5 clusters gave non-signif-icant differences (F-test, p > 0.05) for pH,Eh, alkalinity, phosphates and DOC. Otherenvironmental variables, i.e. temperature,salinity, oxygen concentration and satura-tion, TSS, NOx, NH4, DON, DOP, POC,and pigments (Table 1), showed differ-ences among clusters, suggesting theexistence of relationships between thosevariables and plankton assemblages. Tem-perature, salinity and oxygen values werein agreement with clusters’ spatio-temporalinterpretation: temperature was high inlate spring to early fall clusters, while it
28
Cluster 5
No. of map units
Dis
tanc
e b
etw
een
clus
ters
12
11B414B42B47B49B42B111B22B2
11B514B517B51M52B57B59B514B6
11B717B72B89B8
11B914B92B9
14B71M77B711B8
7B99B9
11B1017B109B10
14B817B817B9
2B27B29B211B314B37B39B3
2B12
empty11B6
2B1017B61M6
2B67B69B62B7
9B77B8
1
2
3
4
51M4
11B1114B117B11
11B1214B121M127B129B127B1
17B111M119B11
17B12
1M814B101M107B10
2B11
11B114B117B11M19B114B217B217B31M3
10
9
8
7
6
5
4
3
2
1
017 11 16 18 1 2 6 7 3 8 4 5 9 10 14 19 15 20
Cluster 1 Cluster 2
Cluster 3 Cluster 4
a
b
Fig. 2. (a) Dendrogram on map units. Units go from top to bottom and fromleft to right on the map. Map unit 13 was excluded from clusterization be-cause it had no sample associated. (b) Ordination of samples on the self-organizing map (SOM). Each sample is indicated by the name of thesampling site and the number of month of sampling (e.g. sample of Decem-ber in Stn 2B is 2B12). Clusters are shown with white/shades of gray and
corresponding number
Bandelj et al.: Lagoon of Venice trophodynamics
was low in late fall to early spring clusters; salinity waslowest in Cluster 1, while it had an extremely highmedian value in Cluster 4, due to a small amount ofrainfall and extensive drought which took place insummer 2003; medians of dissolved oxygen and oxy-gen saturation were almost inversely related to tem-perature. Wide variation ranges characterized inor-ganic nutrients because of spatial and temporalvariability of their different sources. Ammonium andnitrates were higher and more variable in Clusters 1and 5 (late fall to early spring), while they were lowerand less variable in Clusters 2, 3 and 4 (late spring toearly fall), likely because of uptake from phytoplank-ton and low freshwater discharges. DON and phospho-rus were on the contrary high in Clusters 2, 3 and 4 andlow in Clusters 1 and 5. POC and pigments (chl a andphaeopigments) increased steadily from Cluster 1 tothe highest values in Cluster 3, then decreased tothe lowest values in Cluster 5. Variability was higherduring late spring and summer months.
A description of the space and time variabilities ofthe main biogeochemical properties is given in Fig. 4.Fig. 4a shows the monthly evolution of dissolved in-organic nitrogen (DIN) (sum of NOx and NH4), DON,chl a and salinity obtained by weight averaging thevalues of the clusters associated with each month.Fig. 4b shows the space variation of the same vari-ables, obtained by weight averaging the values ofclusters associated with each site.
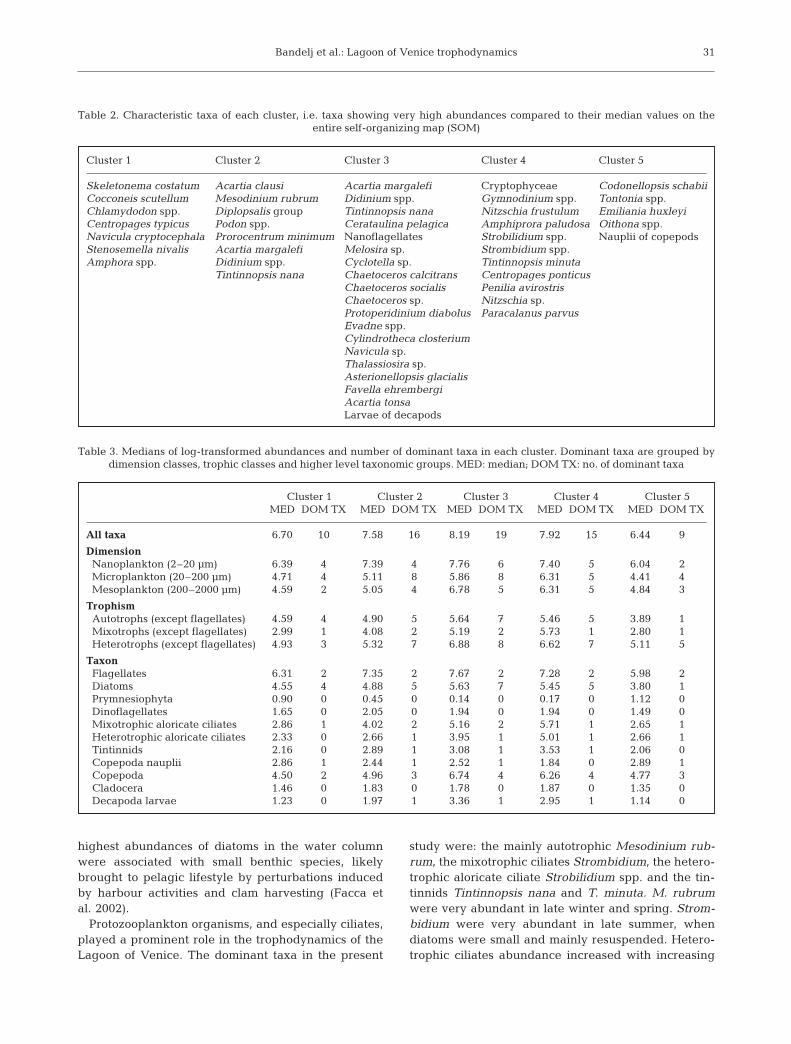
In Table 2 characteristic taxa of the 5 communitiesare listed. Table 3 groups taxa in dimension andtrophic classes, as well as according to higher taxo-nomic levels. Cluster 1 was the only cluster with moredominant autotrophs than heterotrophs and, togetherwith Cluster 5, it was the poorest in species diversityand biomass. In Cluster 2 there were 8 characteristictaxa, and the number of dominant taxa increased(the number of microplankton- and mesoplankton-dominant taxa doubled), while the highest increasewas due to heterotrophs. Cluster 3 had the highest
29
Fig. 3. Component planes of 47 plankton taxa used in self-organizing map (SOM) training. Log-transformed abundances are linked to white/shades of gray by corresponding color bars. Full species names given in Table 2
Mar Ecol Prog Ser 368: 23–40, 2008
number of dominant taxa and the highest overallmedian, as well as the highest number of characteristictaxa. Cluster 4 showed a reduction in the number ofdominant taxa for all dimensions and trophic classes.Cluster 5 showed the lowest number of dominant taxaand the lowest overall median. It also had the lowestnumber of characteristic taxa and the highest numberof taxa showing very low values.
Median abundances of flagellates, i.e. nanoflagel-lates and cryptophyceae, were always much higherthan those of the other taxa (Table 3). They reachedmaximum values in Clusters 3 and 4, respectively,whereas both had minimum values in Cluster 5.
The autotrophic community was dominated by dia-toms. Their blooms included opportunistic species(Skeletonema costatum and Nitzschia frustulum) andneritic species adapted to a wide range of salinity(Chaetoceros). The only diatom dominant in all 5clusters was Cylindrotheca closterium, and thereforeit was very important for the lagoon ecosystemthroughout the year. From Cluster 1 to 4 (i.e. fromApril to October) nanoplankton single-cell diatoms(N. frustulum) prevailed on microplankton or colonialdiatoms (S. costatum), and resuspended benthicdiatoms (N. frustulum and C. closterium) prevailed onpelagic (S. costatum, C. socialis). In late summer the
30
Fig. 4. (a,b) Weighted medians of salinity,chlorophyll a (chl a), dissolved inorganic ni-trogen (DIN, sum of NOx and NH4) and dis-solved organic nitrogen (DON) in (a) time and(b) space. (c) Distribution of clusters in timeand space. Numbers in (c) refer to clusters;x: missing samples. Occurrences of ‘marine’Clusters 4 and 5 are shaded in dark gray, oc-currences of ‘internal’ Clusters 1 and 3 in lightgray. (a,b) First axis indicates concentrationsof chl a in µg dm–3; second axis indicates salin-ity values in psu and the third indicates con-centrations of DIN and DON in µg dm–3. Val-ues were computed first listing all samples ofall clusters present in each month or samplingsite, repeated by the frequency of each clus-ter. Then, medians were identified on these
lists of samples
Bandelj et al.: Lagoon of Venice trophodynamics
highest abundances of diatoms in the water columnwere associated with small benthic species, likelybrought to pelagic lifestyle by perturbations inducedby harbour activities and clam harvesting (Facca etal. 2002).
Protozooplankton organisms, and especially ciliates,played a prominent role in the trophodynamics of theLagoon of Venice. The dominant taxa in the present
study were: the mainly autotrophic Mesodinium rub-rum, the mixotrophic ciliates Strombidium, the hetero-trophic aloricate ciliate Strobilidium spp. and the tin-tinnids Tintinnopsis nana and T. minuta. M. rubrumwere very abundant in late winter and spring. Strom-bidium were very abundant in late summer, whendiatoms were small and mainly resuspended. Hetero-trophic ciliates abundance increased with increasing
31
Table 2. Characteristic taxa of each cluster, i.e. taxa showing very high abundances compared to their median values on the entire self-organizing map (SOM)
Cluster 1 Cluster 2 Cluster 3 Cluster 4 Cluster 5
Skeletonema costatum Acartia clausi Acartia margalefi Cryptophyceae Codonellopsis schabiiCocconeis scutellum Mesodinium rubrum Didinium spp. Gymnodinium spp. Tontonia spp.Chlamydodon spp. Diplopsalis group Tintinnopsis nana Nitzschia frustulum Emiliania huxleyiCentropages typicus Podon spp. Cerataulina pelagica Amphiprora paludosa Oithona spp.Navicula cryptocephala Prorocentrum minimum Nanoflagellates Strobilidium spp. Nauplii of copepodsStenosemella nivalis Acartia margalefi Melosira sp. Strombidium spp.Amphora spp. Didinium spp. Cyclotella sp. Tintinnopsis minuta
Tintinnopsis nana Chaetoceros calcitrans Centropages ponticusChaetoceros socialis Penilia avirostrisChaetoceros sp. Nitzschia sp.Protoperidinium diabolus Paracalanus parvusEvadne spp.Cylindrotheca closteriumNavicula sp.Thalassiosira sp.Asterionellopsis glacialisFavella ehrembergiAcartia tonsaLarvae of decapods
Table 3. Medians of log-transformed abundances and number of dominant taxa in each cluster. Dominant taxa are grouped by dimension classes, trophic classes and higher level taxonomic groups. MED: median; DOM TX: no. of dominant taxa
Cluster 1 Cluster 2 Cluster 3 Cluster 4 Cluster 5MED DOM TX MED DOM TX MED DOM TX MED DOM TX MED DOM TX
All taxa 6.70 10 7.58 16 8.19 19 7.92 15 6.44 9
DimensionNanoplankton (2–20 µm) 6.39 4 7.39 4 7.76 6 7.40 5 6.04 2Microplankton (20–200 µm) 4.71 4 5.11 8 5.86 8 6.31 5 4.41 4Mesoplankton (200–2000 µm) 4.59 2 5.05 4 6.78 5 6.31 5 4.84 3
TrophismAutotrophs (except flagellates) 4.59 4 4.90 5 5.64 7 5.46 5 3.89 1Mixotrophs (except flagellates) 2.99 1 4.08 2 5.19 2 5.73 1 2.80 1Heterotrophs (except flagellates) 4.93 3 5.32 7 6.88 8 6.62 7 5.11 5
TaxonFlagellates 6.31 2 7.35 2 7.67 2 7.28 2 5.98 2Diatoms 4.55 4 4.88 5 5.63 7 5.45 5 3.80 1Prymnesiophyta 0.90 0 0.45 0 0.14 0 0.17 0 1.12 0Dinoflagellates 1.65 0 2.05 0 1.94 0 1.94 0 1.49 0Mixotrophic aloricate ciliates 2.86 1 4.02 2 5.16 2 5.71 1 2.65 1Heterotrophic aloricate ciliates 2.33 0 2.66 1 3.95 1 5.01 1 2.66 1Tintinnids 2.16 0 2.89 1 3.08 1 3.53 1 2.06 0Copepoda nauplii 2.86 1 2.44 1 2.52 1 1.84 0 2.89 1Copepoda 4.50 2 4.96 3 6.74 4 6.26 4 4.77 3Cladocera 1.46 0 1.83 0 1.78 0 1.87 0 1.35 0Decapoda larvae 1.23 0 1.97 1 3.36 1 2.95 1 1.14 0
Mar Ecol Prog Ser 368: 23–40, 2008
temperature, organic nutrient concentrations and nano-plankton abundances. In late summer months theywere probably the main consumers.
Copepods of the genus Acartia were dominant in thelagoon throughout the year, the most abundant speciesbeing A. clausi and A. tonsa, whose median valuesshowed a clear inverse relation. A. clausi was domi-nant in all 5 clusters, with very reduced values in sum-mer Clusters 3 and 4, while A. tonsa was not dominantin Clusters 5 and 1. Consequently, it was possible toargue that whereas A. tonsa is limited to confinedinner areas and to warm months, where it showsextremely high abundances, A. clausi is always pre-sent in the lagoon at lower abundances, probablytransported by inflowing marine waters. The turningpoints in their succession in the lagoon are May toJune and October, similar to observations alreadyreported for other systems (Jeffries 1962, Lawrence etal. 2004). The other cogener A. margalefi, which usedto be the dominant copepod in polyhaline areas up tothe 1990s, was never dominant, and the characteristicin Clusters 2 and 3 was present only at abundancesmuch lower than those of A. tonsa. It is still unclear towhich extent the introduction of A. tonsa, observed inthe lagoon since 1992 (Bianchi et al. 2000), contributedto the decline of A. margalefi, given that there arealso notices of the simultaneous disappearance ofthis species from other Italian estuarine and lagoonsystems (Bianchi et al. 2000, Ribera D’Alcalà et al.2004), indicating that larger scale changes might beresponsible.
The highest abundances of copepods nauplii werefrom late fall to spring and early summer. Single-speciescounts would have been needed to clarify this infor-mation. Other abundant consumer species were Para-calanus parvus, the small cyclopoid copepods Oithonaspp., and the large copepod Centropages typicus,frequently associated with Acartia clausi in Mediter-ranean coastal areas (Ribera D’Alcalà et al. 2004).
DISCUSSION
The SOM-based classification procedure identified5 multitrophic plankton assemblages. They consitutean objectively derived typology and the space andtime succession of clusters synthesized the typicalsuccession among different biocenoses occurring inthe lagoon.
In order to give an ecological meaning to cluster suc-cession each of the clusters was interpreted in terms ofthe biological properties of its samples. Biogeochemi-cal properties provided additional information for thedescription of the abiotic environment in which plank-ton communities develop.
An analysis of Fig. 4c highlights the importance ofseasonality in ruling the transition from one pattern toanother: Cluster 1 was present mainly in late winter tospring, Cluster 2 in late spring, Cluster 3 in early sum-mer, Cluster 4 in late summer to early fall and Cluster 5in late fall to winter. A seasonal succession can berecognized by weighted averages of clusters’ biogeo-chemical properties (Fig. 4a), which indicates thatthere was a maximum of chl a and POC all over thelagoon in spring, likely associated with plankton bloomssustained by nutrient-rich river outflow. Then, in latespring and early summer, there was a decrease in theconcentration of dissolved inorganic nutrients, proba-bly due to planktonic uptake and an increment of dis-solved organic nutrients, which reached their maximaat the end of the summer. Concurrently, concentrationof nitrate was at its minimum value. In winter therewas a maximum concentration of DIN because of DONremineralization and fresh nitrate and phosphatesupply by river discharges.
The spatial characterization was less clear. Thelagoon is highly dynamic, and a given site can experi-ence quite different situations at different moments,for example, because of the tidal phase, changes inprevailing winds, or intensity of freshwater and nutri-ents inputs. As a result most biogeochemical propertiesexhibit a large spatio-temporal variability even ifinner–outer and north–south gradients of nutrients,chlorophyll, and plankton abundances are usually ob-served (Solidoro et al. 2004). Therefore, it might beappropriate to consider not only a stiff subdivision ofthe lagoon based on average conditions of observedproperties, but also functional and time-varying subdi-visions in ‘internal’ versus ‘marine’ waters. In fact,Clusters 1 and 3 were associated mainly with ‘internal’sites (e.g. Stns 2B and 9B), low salinity, and high-inorganic nutrient waters, while Clusters 4 and 5 wereassociated mainly with ‘external’ sites (e.g. Stns 1Mand 17B), high salinity, and low-inorganic nutrientwaters. Therefore, it makes sense to consider Clus-ters 4 and 5 as ‘marine’ (dark gray in Fig. 4c) and Clus-ters 1 and 3 as ‘internal’ (light gray Fig. 4c). Cluster 2did not exhibit a well-defined spatial characterizationbecause of the small number of samples.
The composition of plankton communities changedin space and time, too, e.g. the number of autotrophicorganisms, which may rely on abundant inorganicnutrients brought by rivers, was higher in Cluster 1than Cluster 5, which was richer in heterotrophicorganisms and thus more similar to marine waters.Similar conclusions can be made on differences be-tween Clusters 3 and 4. Fig. 4c emphasizes how thespatial boundary between ‘marine’ and ‘internal’ con-ditions, and therefore the spatial extension of differentplankton assemblages, is not fixed but changes in time.
32

Bandelj et al.: Lagoon of Venice trophodynamics
Plankton assemblages were described on a charac-teristic and dominant taxa basis. Characteristic taxaprovided information on the occurrence of peculiarwater types, and the number of characteristic taxagave a qualitative indication of which clusters are themost favorable to the development of complex plank-ton communities. Dominant taxa allowed us to makesome speculations on main energy paths and on thestructure and functioning of food webs.
Unfortunately, and in spite of their importance inmicrobial food webs (Azam et al. 1983, Legendre &Rassoulzadegan 1995), the trophic behaviour of nano-flagellates and cryptophyceae was not unambiguouslyidentified in available data, so that they includedautotrophic, mixotrophic, and heterotrophic organisms.The 2 groups were, however, considered in our analy-sis, because they still may provide some suggestionson the relative importance of the smallest planktonorganisms in fuelling energy towards higher trophiclevels. Similarly there was no information on prevail-ing trophic behaviour at the time of sampling for mixo-trophic organisms, e.g. Strombidium spp. and Meso-dinium rubrum. However, we believe that, in a multi-trophic analysis, a clear identification of single-speciestrophism, while useful for interpretation, is not crucial.
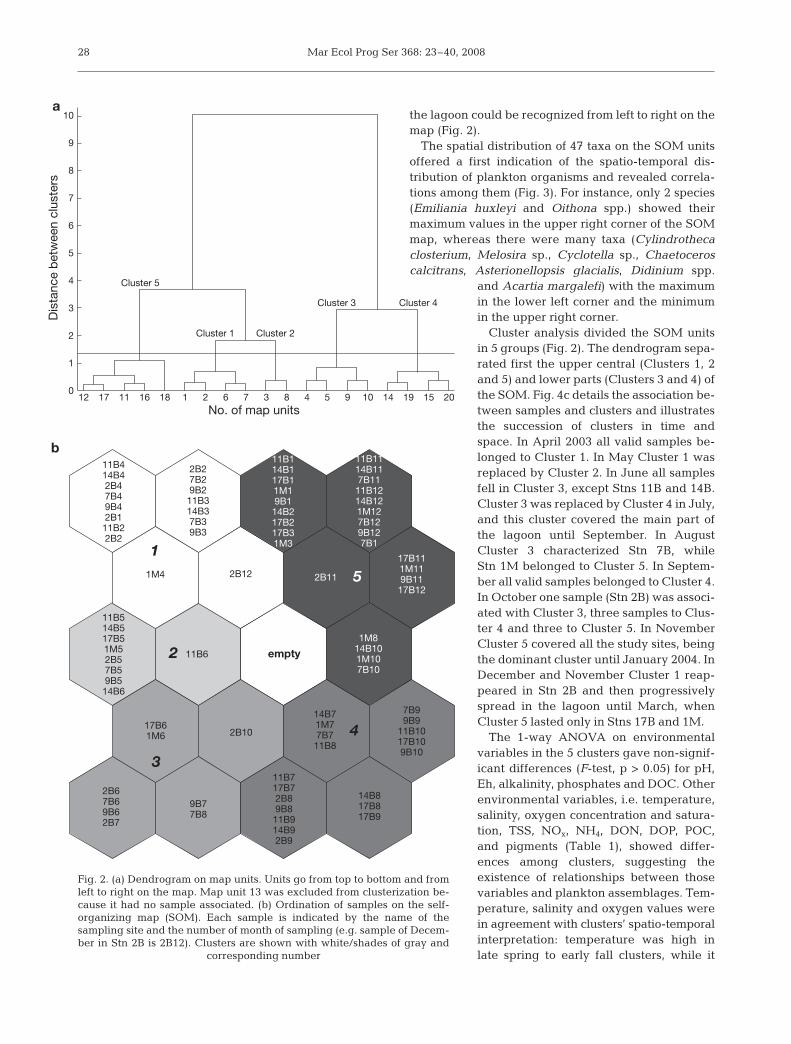
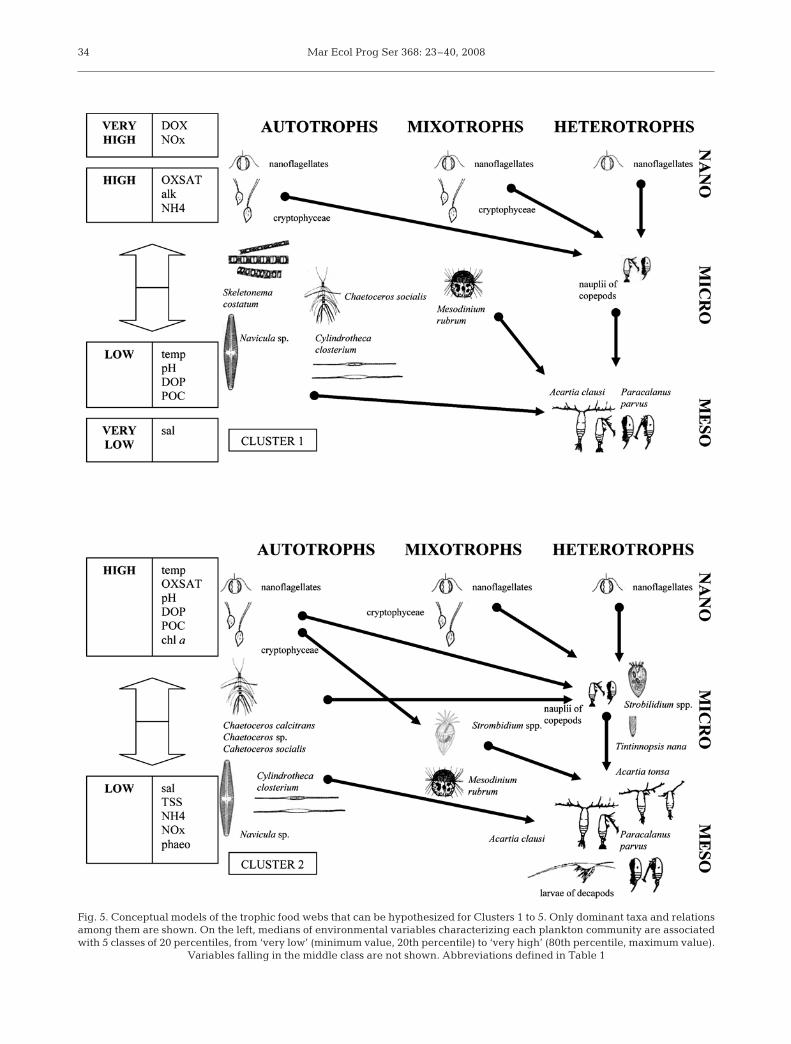
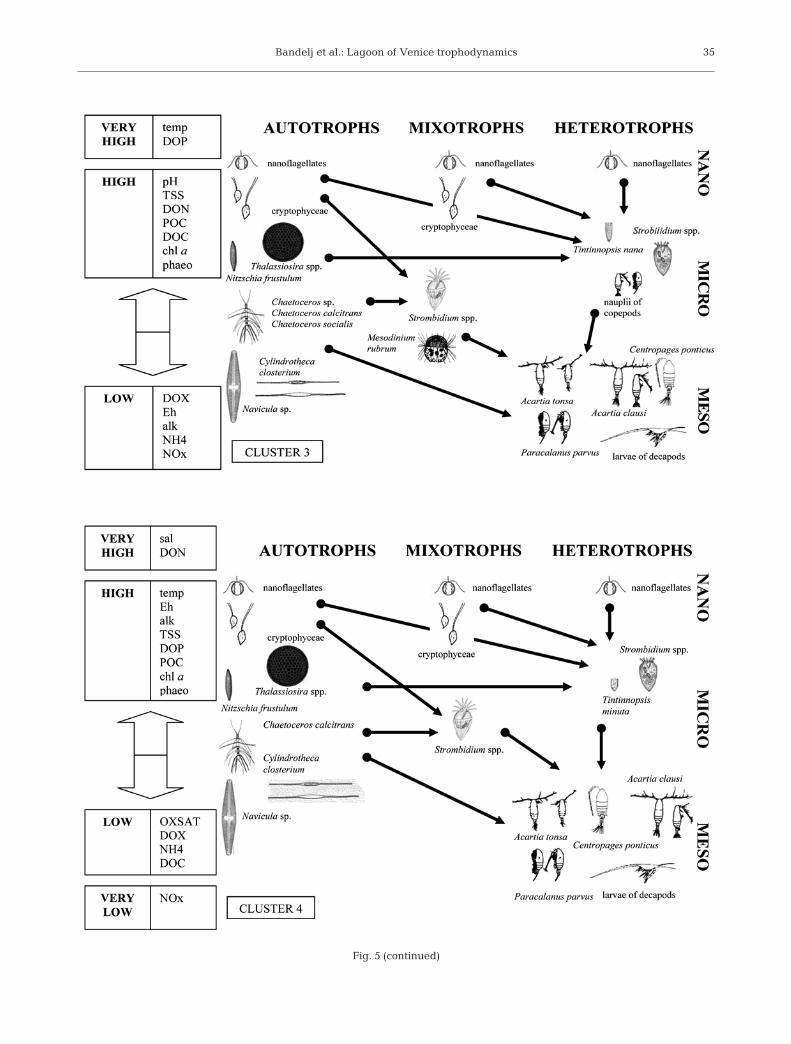
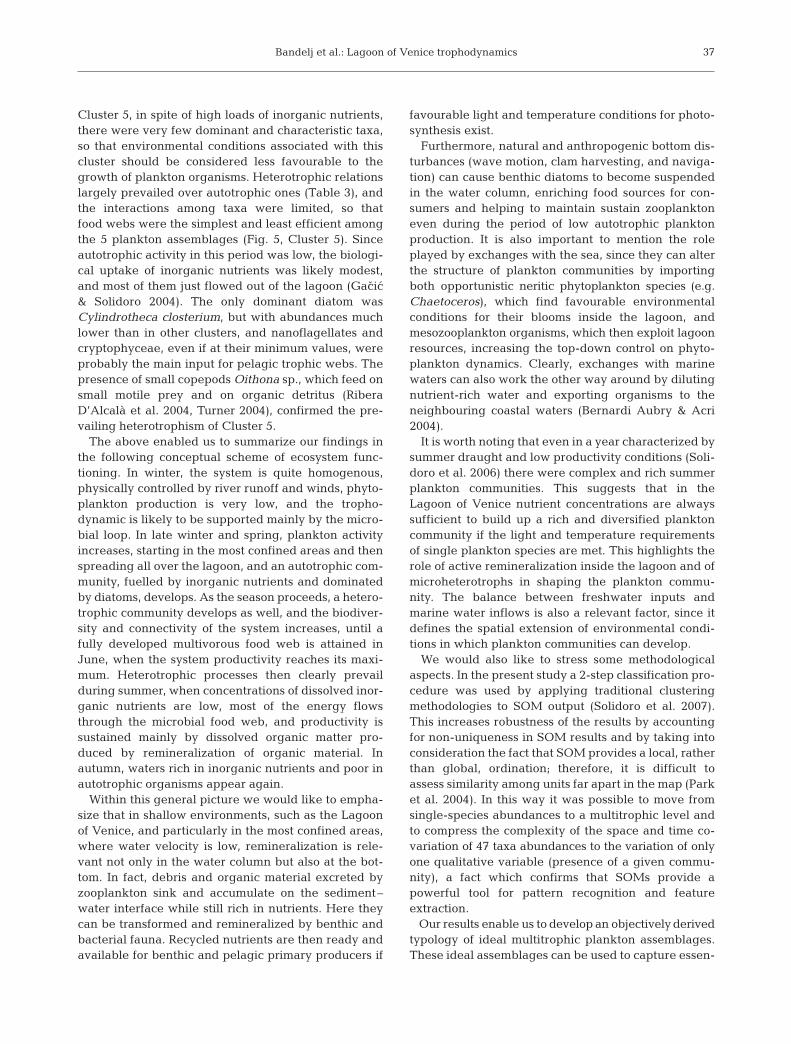
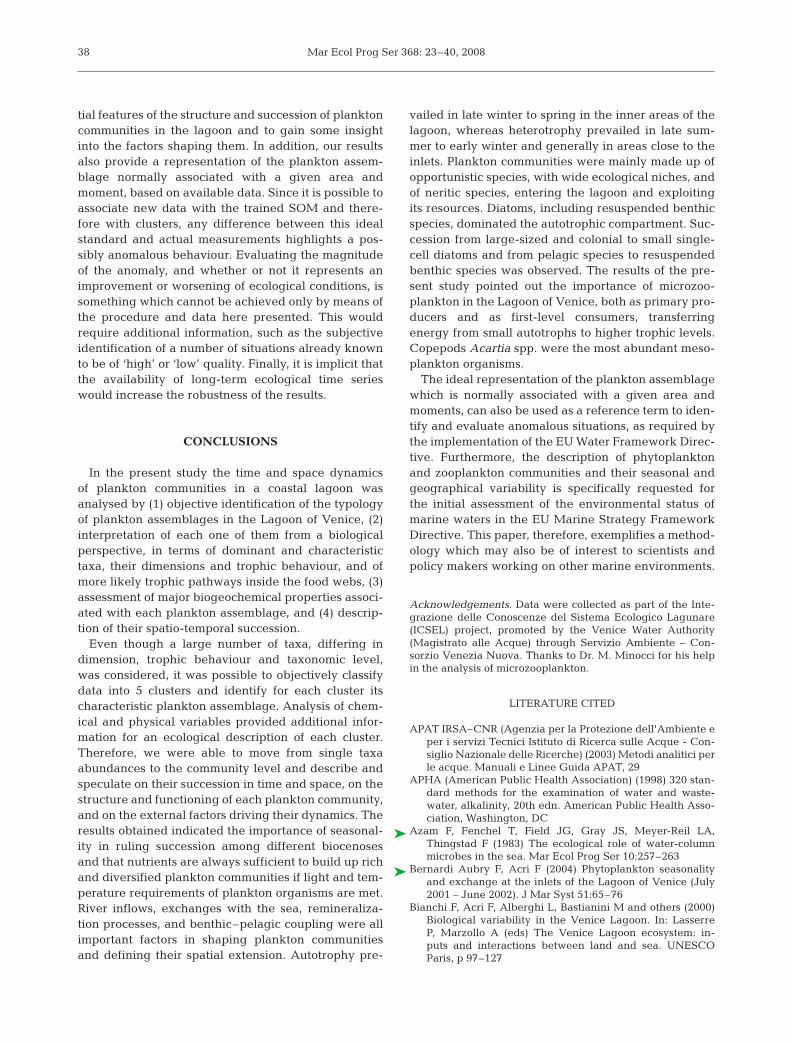
In Fig. 5 a scheme is presented for each of the 5typical situations identified by the classification proce-dure. Each scheme provides a synthetic graphicalrepresentation of the plankton community structureby indicating the main biotic components (dominanttaxa), ordered from both a dimensional and a trophicperspective, and by drawing more likely trophic path-ways inside the food web. The schemes also providea qualitative description of the abiotic conditions foreach plankton community.
The analysis of plankton assemblages, together withthe variation in time and space of biogeochemicalproperties, gave the following ecological description ofcluster succession. In late winter to early spring theincrease in the photoperiod and high loads of dissolvedinorganic nutrients brought mainly by high river dis-charges set up the proper conditions for an earlydiatom bloom. The maximum oxygen saturation valuesand the presence of some very large diatoms in Clus-ter 1 provided evidence of this bloom, even if chl avalues were not very high (Table 1). This is the onlycommunity in which the number of dominant auto-trophs was higher than the number of dominant het-erotrophs and it appeared to be the only situation inwhich the system was clearly dominated by a herbivo-rous web (Legendre & Rassoulzadegan 1995). The lackof dominant microplankton consumers and the lownumber and low median abundances of dominant spe-cies (Table 3) suggest that energy and biomass fluxeswere modest. Furthermore, the number of connections
between the microbial and the grazing food webs(Fig. 5, Cluster 1) were quite low. The simplest andmost efficient path connecting primary producers totop predators went from abundant primary producers,e.g. Skeletonema costatum and Mesodinium rubrum,to the stock of nauplii of copepods and to adult Acartiaclausi and Paracalanus parvus. Cannibalism is com-mon among copepods (Turner 2004); thus, abundantnauplii of copepods could be another source of foodfor adult copepods.
In May the reduction in the supply of dissolved inor-ganic nutrients from rivers (Table 1), the depletion ofnutrients due to early phytoplankton blooms, and sea-sonal warming abiotic conditions for a new assem-blage (Fig. 5, Cluster 2). In this community the numberof dominant plankton taxa (Table 3) was higher than inCluster 1, suggesting that biomass and energy fluxesthrough the food webs were more relevant than in theprevious months. Concentration of DOP, POC andchl a increased, and high abundance of nanoflagellates,cryptophyceae, and mixotrophic and heterotrophicmicroplankton revealed active circulation in the micro-bial loop (Liu et al. 2005) and the occurrence of majorenergy transfers from microbial food webs towardshigher trophic levels.
The large-sized Mesodinium rubrum and large dia-toms competed for nutrients and constituted the mainfood for top plankton consumers, whereas smallerdiatoms were the most probable food source for het-erotrophic microplankton, especially ciliates. Theseorganisms in turn likely represent an important sourcefor copepods in environments where particle concen-tration is high (Liu et al. 2005), as in our case. Tin-tinnopsis nana, which feeds on autotrophic flagellatesand small diatoms, and copepods nauplii also con-tributed to biomass and energy transfers between themicrobial and the grazing food webs. Trophic path-ways from primary producers to top consumers wereless efficient than in Cluster 1, due to a higher numberof trophic connections (Fig. 5, Cluster 2).
Cluster 3, present in early summer, was crucial forthe entire lagoon system productivity. This was theassemblage with the highest number of dominant(Fig. 5, Cluster 3) and characteristic taxa (Table 2) andthe highest number of dominant diatoms. The system’sbiodiversity and connectivity increased to reach a fullydeveloped multivorous food web (Legendre & Ras-soulzadegan 1995), characterized by both abundantsmall organisms involved mainly in the microbial loopand abundant larger organisms involved mainly in theherbivorous food web. Concentrations of DOP, DOC,POC, chl a, and phaeopigments were at their highestlevels (Table 1), confirming both high photosyntheticand grazing activity. The cluster was present in theinnermost areas of the lagoon, where moderate con-
33
Mar Ecol Prog Ser 368: 23–40, 200834
Fig. 5. Conceptual models of the trophic food webs that can be hypothesized for Clusters 1 to 5. Only dominant taxa and relationsamong them are shown. On the left, medians of environmental variables characterizing each plankton community are associatedwith 5 classes of 20 percentiles, from ‘very low’ (minimum value, 20th percentile) to ‘very high’ (80th percentile, maximum value).
Variables falling in the middle class are not shown. Abbreviations defined in Table 1
Bandelj et al.: Lagoon of Venice trophodynamics 35
Fig. 5 (continued)

Mar Ecol Prog Ser 368: 23–40, 2008
centrations of fresh inorganic nutrients from riverswere available, but high or very high concentrations ofdissolved organic nutrients also revealed an increaseas compared to Clusters 1 and 2 in the importance ofremineralized nutrients in fuelling this community’splankton food webs. On the other hand, the accumula-tion of dissolved organic matter might also indicate adecoupling between primary production and demolitionprocesses mediated by microbial activity (Thingstad etal. 1997, Fonda Umani et al. 2007). In the environmentof Cluster 3, with high loads of suspended solids andorganic particles, Acartia tonsa is known to be highlycompetitive (Purcell et al. 1994). A. tonsa could bepreyed upon by larger consumers, such as other cope-pods and gelatinous predators (Purcell et al. 1994) andmost probably constitute an important food source forfishes. In fact, juvenile fish stages migrate into thelagoon in spring, stay inside the lagoon during thesummer, and migrate back to the open sea for repro-duction in fall (Ravera 2000).
In late summer, along with maximum concentrationsof DON, high concentrations of DOP and low values ofoxygen saturation (Table 1), a decrease in the abun-dance of autotrophs, a decrease in biodiversity, andmaximum abundances of microzooplankton wereobserved (Table 3). Given that inorganic nutrients andespecially nitrates were low, it can be said that the foodwebs in Cluster 4 most probably relied mainly onabundant organic nutrients and remineralization, a
fact which underlines the relevance of nutrient recy-cling in the Lagoon of Venice. This suggests anincrease in the activities of the microbial loop and ofheteretropic organisms, which can exert control onautotroph dynamics through both predation and rem-ineralization (Duarte et al. 2000). Autotrophic pro-cesses were supported mainly by smaller organismsand by resuspended small benthic diatoms, such asNitzschia frustulum. The central role in Cluster 4 wasplayed by ciliates (Fig. 5, Cluster 4). Among them, thepotentially mixotrophic Strombidium and the aloricateStrobilidium spp. were the most abundant hetero-trophic protozooplankton organisms. In the tintinnidscommunity, Tintinnopsis nana, which characterizedClusters 2 and 3, was replaced in Cluster 4 by T. min-uta. Microheterotrophs are known to play an importantrole both as recyclers, because of high remineraliza-tion rates, and as consumers, since they react fasterthan mesozooplankton to increments in abundances ofthe smallest prey and channel a fraction of the produc-tion of pico- and nanoplankton to larger zooplankton.(Sieburth et al. 1978). Within the mesozooplanktoncommunity the main consumers in Cluster 4 werecopepods of the genus Acartia, Paracalanus parvus,and larger organisms, such as the copepod Centro-pages ponticus and decapods larvae (Fig. 5, Cluster 4).
From November to January all samples were asso-ciated with Cluster 5, except Stn 2B in December andJanuary, where Cluster 1 was observed again. In
36
Fig. 5 (continued)
Bandelj et al.: Lagoon of Venice trophodynamics
Cluster 5, in spite of high loads of inorganic nutrients,there were very few dominant and characteristic taxa,so that environmental conditions associated with thiscluster should be considered less favourable to thegrowth of plankton organisms. Heterotrophic relationslargely prevailed over autotrophic ones (Table 3), andthe interactions among taxa were limited, so thatfood webs were the simplest and least efficient amongthe 5 plankton assemblages (Fig. 5, Cluster 5). Sinceautotrophic activity in this period was low, the biologi-cal uptake of inorganic nutrients was likely modest,and most of them just flowed out of the lagoon (Gacic& Solidoro 2004). The only dominant diatom wasCylindrotheca closterium, but with abundances muchlower than in other clusters, and nanoflagellates andcryptophyceae, even if at their minimum values, wereprobably the main input for pelagic trophic webs. Thepresence of small copepods Oithona sp., which feed onsmall motile prey and on organic detritus (Ribera D’Alcalà et al. 2004, Turner 2004), confirmed the pre-vailing heterotrophism of Cluster 5.
The above enabled us to summarize our findings inthe following conceptual scheme of ecosystem func-tioning. In winter, the system is quite homogenous,physically controlled by river runoff and winds, phyto-plankton production is very low, and the tropho-dynamic is likely to be supported mainly by the micro-bial loop. In late winter and spring, plankton activityincreases, starting in the most confined areas and thenspreading all over the lagoon, and an autotrophic com-munity, fuelled by inorganic nutrients and dominatedby diatoms, develops. As the season proceeds, a hetero-trophic community develops as well, and the biodiver-sity and connectivity of the system increases, until afully developed multivorous food web is attained inJune, when the system productivity reaches its maxi-mum. Heterotrophic processes then clearly prevailduring summer, when concentrations of dissolved inor-ganic nutrients are low, most of the energy flowsthrough the microbial food web, and productivity issustained mainly by dissolved organic matter pro-duced by remineralization of organic material. Inautumn, waters rich in inorganic nutrients and poor inautotrophic organisms appear again.
Within this general picture we would like to empha-size that in shallow environments, such as the Lagoonof Venice, and particularly in the most confined areas,where water velocity is low, remineralization is rele-vant not only in the water column but also at the bot-tom. In fact, debris and organic material excreted byzooplankton sink and accumulate on the sediment–water interface while still rich in nutrients. Here theycan be transformed and remineralized by benthic andbacterial fauna. Recycled nutrients are then ready andavailable for benthic and pelagic primary producers if
favourable light and temperature conditions for photo-synthesis exist.
Furthermore, natural and anthropogenic bottom dis-turbances (wave motion, clam harvesting, and naviga-tion) can cause benthic diatoms to become suspendedin the water column, enriching food sources for con-sumers and helping to maintain sustain zooplanktoneven during the period of low autotrophic planktonproduction. It is also important to mention the roleplayed by exchanges with the sea, since they can alterthe structure of plankton communities by importingboth opportunistic neritic phytoplankton species (e.g.Chaetoceros), which find favourable environmentalconditions for their blooms inside the lagoon, andmesozooplankton organisms, which then exploit lagoonresources, increasing the top-down control on phyto-plankton dynamics. Clearly, exchanges with marinewaters can also work the other way around by dilutingnutrient-rich water and exporting organisms to theneighbouring coastal waters (Bernardi Aubry & Acri2004).
It is worth noting that even in a year characterized bysummer draught and low productivity conditions (Soli-doro et al. 2006) there were complex and rich summerplankton communities. This suggests that in theLagoon of Venice nutrient concentrations are alwayssufficient to build up a rich and diversified planktoncommunity if the light and temperature requirementsof single plankton species are met. This highlights therole of active remineralization inside the lagoon and ofmicroheterotrophs in shaping the plankton commu-nity. The balance between freshwater inputs andmarine water inflows is also a relevant factor, since itdefines the spatial extension of environmental condi-tions in which plankton communities can develop.
We would also like to stress some methodologicalaspects. In the present study a 2-step classification pro-cedure was used by applying traditional clusteringmethodologies to SOM output (Solidoro et al. 2007).This increases robustness of the results by accountingfor non-uniqueness in SOM results and by taking intoconsideration the fact that SOM provides a local, ratherthan global, ordination; therefore, it is difficult toassess similarity among units far apart in the map (Parket al. 2004). In this way it was possible to move fromsingle-species abundances to a multitrophic level andto compress the complexity of the space and time co-variation of 47 taxa abundances to the variation of onlyone qualitative variable (presence of a given commu-nity), a fact which confirms that SOMs provide apowerful tool for pattern recognition and featureextraction.
Our results enable us to develop an objectively derivedtypology of ideal multitrophic plankton assemblages.These ideal assemblages can be used to capture essen-
37
Mar Ecol Prog Ser 368: 23–40, 2008
tial features of the structure and succession of planktoncommunities in the lagoon and to gain some insightinto the factors shaping them. In addition, our resultsalso provide a representation of the plankton assem-blage normally associated with a given area andmoment, based on available data. Since it is possible toassociate new data with the trained SOM and there-fore with clusters, any difference between this idealstandard and actual measurements highlights a pos-sibly anomalous behaviour. Evaluating the magnitudeof the anomaly, and whether or not it represents animprovement or worsening of ecological conditions, issomething which cannot be achieved only by means ofthe procedure and data here presented. This wouldrequire additional information, such as the subjectiveidentification of a number of situations already knownto be of ‘high’ or ‘low’ quality. Finally, it is implicit thatthe availability of long-term ecological time serieswould increase the robustness of the results.
CONCLUSIONS
In the present study the time and space dynamicsof plankton communities in a coastal lagoon wasanalysed by (1) objective identification of the typologyof plankton assemblages in the Lagoon of Venice, (2)interpretation of each one of them from a biologicalperspective, in terms of dominant and characteristictaxa, their dimensions and trophic behaviour, and ofmore likely trophic pathways inside the food webs, (3)assessment of major biogeochemical properties associ-ated with each plankton assemblage, and (4) descrip-tion of their spatio-temporal succession.
Even though a large number of taxa, differing indimension, trophic behaviour and taxonomic level,was considered, it was possible to objectively classifydata into 5 clusters and identify for each cluster itscharacteristic plankton assemblage. Analysis of chem-ical and physical variables provided additional infor-mation for an ecological description of each cluster.Therefore, we were able to move from single taxaabundances to the community level and describe andspeculate on their succession in time and space, on thestructure and functioning of each plankton community,and on the external factors driving their dynamics. Theresults obtained indicated the importance of seasonal-ity in ruling succession among different biocenosesand that nutrients are always sufficient to build up richand diversified plankton communities if light and tem-perature requirements of plankton organisms are met.River inflows, exchanges with the sea, remineraliza-tion processes, and benthic–pelagic coupling were allimportant factors in shaping plankton communitiesand defining their spatial extension. Autotrophy pre-
vailed in late winter to spring in the inner areas of thelagoon, whereas heterotrophy prevailed in late sum-mer to early winter and generally in areas close to theinlets. Plankton communities were mainly made up ofopportunistic species, with wide ecological niches, andof neritic species, entering the lagoon and exploitingits resources. Diatoms, including resuspended benthicspecies, dominated the autotrophic compartment. Suc-cession from large-sized and colonial to small single-cell diatoms and from pelagic species to resuspendedbenthic species was observed. The results of the pre-sent study pointed out the importance of microzoo-plankton in the Lagoon of Venice, both as primary pro-ducers and as first-level consumers, transferringenergy from small autotrophs to higher trophic levels.Copepods Acartia spp. were the most abundant meso-plankton organisms.
The ideal representation of the plankton assemblagewhich is normally associated with a given area andmoments, can also be used as a reference term to iden-tify and evaluate anomalous situations, as required bythe implementation of the EU Water Framework Direc-tive. Furthermore, the description of phytoplanktonand zooplankton communities and their seasonal andgeographical variability is specifically requested forthe initial assessment of the environmental status ofmarine waters in the EU Marine Strategy FrameworkDirective. This paper, therefore, exemplifies a method-ology which may also be of interest to scientists andpolicy makers working on other marine environments.
Acknowledgements. Data were collected as part of the Inte-grazione delle Conoscenze del Sistema Ecologico Lagunare(ICSEL) project, promoted by the Venice Water Authority(Magistrato alle Acque) through Servizio Ambiente – Con-sorzio Venezia Nuova. Thanks to Dr. M. Minocci for his helpin the analysis of microzooplankton.
LITERATURE CITED
APAT IRSA–CNR (Agenzia per la Protezione dell'Ambiente eper i servizi Tecnici Istituto di Ricerca sulle Acque - Con-siglio Nazionale delle Ricerche) (2003) Metodi analitici perle acque. Manuali e Linee Guida APAT, 29
APHA (American Public Health Association) (1998) 320 stan-dard methods for the examination of water and waste-water, alkalinity, 20th edn. American Public Health Asso-ciation, Washington, DC
Azam F, Fenchel T, Field JG, Gray JS, Meyer-Reil LA,Thingstad F (1983) The ecological role of water-columnmicrobes in the sea. Mar Ecol Prog Ser 10:257–263
Bernardi Aubry F, Acri F (2004) Phytoplankton seasonalityand exchange at the inlets of the Lagoon of Venice (July2001 – June 2002). J Mar Syst 51:65–76
Bianchi F, Acri F, Alberghi L, Bastianini M and others (2000)Biological variability in the Venice Lagoon. In: LasserreP, Marzollo A (eds) The Venice Lagoon ecosystem: in-puts and interactions between land and sea. UNESCOParis, p 97–127
38
Bandelj et al.: Lagoon of Venice trophodynamics
Cloern JE, Dufford R (2005) Phytoplankton community eco-logy: principles applied in San Francisco Bay. Mar EcolProg Ser 285:11–28
Collavini F, Bettiol C, Zaggia L, Zonta R (2005) Pollutant loadsfrom the drainage basin to the Venice Lagoon (Italy).Environ Int 31:939–947
Cucco A, Umgiesser G (2006) Modeling the Venice Lagoonresidence time. Ecol Model 193:34–51
Duarte CM, Agustí S, Gasol JM,Vaqué D,Vazquez-DominguezE (2000) Effect of nutrient supply on the biomass structureof planktonic communities: an experimental test on aMediterranean coastal community. Mar Ecol Prog Ser206:87–95
EPA (Environmental Protection Agency) (1997) Methods fordetermination of chemical substances in marine and estu-arine environmental matrices, 2nd edn. EPA 600/R-97/072,Cincinnati, OH
Facca C, Sfriso A, Socal G (2002) Changes in abundance andcomposition of phytoplankton and microphytobenthos dueto increased sediment fluxes in the Venice Lagoon, Italy.Estuar Coast Shelf Sci 54:773–792
Fonda Umani S, Milani L (1990) Microzooplankton. In:Innamorati M, Ferrari I, Marino D, Ribera D’Alcalà M (eds)Metodi nell’ecologia del plankton marino. Nova Thalassia11:251–263
Fonda Umani S, Del Negro P, Larato C, De Vittor C and oth-ers (2007) Major inter-annual variations in microbialdynamics in the Gulf of Trieste (northern Adriatic Sea)and their ecosystem implications. Aquat Microb Ecol 46:163–175
Gacic M, Solidoro C (2004) Lagoon of Venice. Circulation,water exchange and ecosystem functioning. J Mar Syst51:33–47
Gacic M, Kovacevic V, Mancero Mosquera I, Mazzoldi A,Cosoli S (2005) Water fluxes between the Venice Lagoonand the Adriatic Sea. In: Fletcher CA, Spencer T (eds)Flooding and environmental challenges for Venice and itslagoon: state of knowledge. Cambridge University Press,Cambridge, p 431–444
Gibson GR, Bowman ML, Gerritsen J, Snyder BD (2000)Estuarine and coastal marine waters: bioassesment andbiocriteria technical guidance. EPA 822-B-00-024. USEPA,Washington, DC
Giraudel JL, Lek S (2001) A comparison of self-organizingmap algorithm and some conventional statistical methodsfor ecological community ordination. Ecol Model 146:329–339
ICRAM (Istituto Centrale per la Ricerca scientifica e tecnolog-ica Applicata al Mare) (2001) Metodologie analitiche diriferimento. Azoto e fosforo totali. ICRAM, Rome
IRSA (Istituto di Ricerca sulle Acque) (1990) Metodi di analisiper acque di mare. Quad Ist Ric Acque 59:570–571
Jeffries HP (1962) Succession of two Acartia species inestuaries. Limnol Oceanogr 7:354–364
Jongman RHG, ter Braak CJF, Van Tonngeren OFR (1995)Data analysis in community and landscape ecology.Cambridge University Press, Cambridge
Kaski S (1997) Data exploration using self-organizing maps,PhD thesis, Helsinki University of Technology
Kohonen T (1982) Analysis of a simple self-organizing pro-cess. Biol Cybern 44:135–140
Kohonen T (2001) Self-organizing maps, 3rd edn. Springer-Verlag, Heidelberg
Lawrence D, Valiela I, Tomasky G (2004) Estuarine calanoidcopepod abundance in relation to season, salinity, andland-derived nitrogen loading, Waquoit Bay, MA. EstuarCoast Shelf Sci 61:547–557
Legendre P, Legendre L (1998) Numerical ecology, 2nd edn.Elsevier Science BV, Amsterdam
Legendre L, Rassoulzadegan F (1995) Plankton and nutrientdynamics in marine waters. Ophelia 41:153–172
Lek S, Guégan JF (1999) Artificial neural networks as a toolin ecological modelling, an introduction. Ecol Model 120:65–73
Liu H, Dagg MJ, Wu CJ, Chiang KP (2005) Mesozooplanktonconsumption of microplankton in the Mississippi Riverplume, with special emphasis on planktonic ciliates. MarEcol Prog Ser 286:133–144
Liu Y, Weisberg RH, Mooers CNK (2006) Performance evalu-ation of the self-organizing map for feature extraction.J Geophys Res 111:C05018. doi:10.1029/2005JC003117
Marchini A, Marchini C (2006) A fuzzy logic model to recog-nize ecological sectors in the Lagoon of Venice based onthe benthic community. Ecol Model 193:105–118
Park YS, Céréghino R, Compin A, Lek S (2003) Applicationsof artificial neural networks for patterning and predictingaquatic insect species richness in running waters. EcolModel 160:265–280
Park YS, Chon TS, Kwak IS, Lek S (2004) Hierarchical com-munity classification and assessment of aquatic ecosys-tems using artificial neural networks. Sci Total Environ327:105–122
Purcell JE, White JR, Roman MR (1994) Predation by gelati-nous zooplankton and resource limitation as potential con-trols of Acartia tonsa copepod populations in ChesapeakeBay. Limnol Oceanogr 39:263–278
Ravera O (2000) The Lagoon of Venice: the result of bothnatural factors and human influence. J Limnol 59:19–30
Reynolds CS (1997) Vegetation processes in the pelagic: amodel for ecosystem theory. In: Kinne O (ed) Excellence inecology, Book 9. International Ecology Institute, Olden-dorf/Luhe
Ribera D’Alcalà M, Conversano F, Corato F, Licandro P andothers (2004) Seasonal patterns in plankton communitiesin a pluriannual time series at a coastal Mediterranean site(Gulf of Naples): an attempt to discern recurrences andtrends. Sci Mar 68:65–83
Richardson AJ, Pfaff MC, Field JG, Silulwane NF, ShillingtonFA (2002) Identifying characteristic chlorophyll a profilesin the coastal domain using artificial neural network.J Plankton Res 24:1289–1303
Sieburth JMcN, Smetacek V, Lenz J (1978) Pelagic ecosystemstructure: heterotrophic compartments of the planktonand their relationship to plankton size fractions. LimnolOceanogr 23:1256–1263
Solidoro C, Pastres R, Cossarini G, Ciavatta S (2004) Seasonaland spatial variability of water quality parameters in thelagoon of Venice. J Mar Syst 51:7–18
Solidoro C, Pastres R, Cossarini G, Melaku Canu D, CiavattaS (2006) Order and chaos in the natural world: exploringand understanding variability in the lagoon of Venice. IntJ Ecodynamics 1:1–9
Solidoro C, Bandelj V, Barbieri P, Cossarini G, Fonda UmaniS (2007) Understanding dynamic of biogeochemical prop-erties in the northern Adriatic Sea by using self-organiz-ing maps and k-means clustering. J Geophys Res 112:C07S90
Strickland JD, Parsons TT (1972) A practical handbook of sea-water analysis, 2nd edn. Fish Res Board Can Bull 167,Ottawa
Sun Y (2000) On quantization error of self-organizing mapnetwork. Neurocomputing 34:169–193
Thingstad TF, Hagström Å, Rassoulzadegan F (1997) Accu-mulation of degradable DOC in surface waters: Is it
39
Mar Ecol Prog Ser 368: 23–40, 2008
caused by a malfunctioning microbial loop? LimnolOceanogr 42:398–404
Throndsen J (1978) Preservation and storage. In: Sournia A(ed) Phytoplankton manual. UNESCO, Paris, p 69–74
Tomas CR (1997) Identifying marine phytoplankton. Acade-mic Press, San Diego, CA
Turner JT (2004) The importance of small planktonic cope-pods and their roles in pelagic marine food webs. ZoolStud 43:255–266
Utermöhl H (1958) Zur Vervollkommnung der quantitativenPhytoplankton-Methodik. Mitt Int Ver Theor Angew Lim-nol 9:1–38
Vesanto J, Alhoniemi E (2000) Clustering of the self-organizingmap. IEEE Trans Neural Netw 11:586–600
Vesanto J, Himberg J, Alhoniemi E, Parhankangas J (1999)Self-organizing map in Matlab: the SOM Toolbox. In: ProcMATLAB DSP Conf 1999, Espoo, Finland, November16–17. Espoo, p 35–40. Available at: http://lib.tkk.fi/Diss/2002/isbn951226093X/article2.pdf
Zingone A, Honsell G, Marino D, Montresor M, Socal G(1990) Fitoplankton. Nova Thalassia 11:183–198
Zuliani A, Zaggia L, Collavini F, Zonta R (2005) Freswaterdischarge from the drainage basin to the–Venice Lagoon(Italy). Environ Int 31:929–938
Zunini Sertorio T (1990a) Campionamento dello zooplankton.Nova Thalassia 11:265–275
Zunini Sertorio T (1990b) Stima della densità zooplanktonica.Nova Thalassia 11:285–288
40
Editorial responsibility: Matthias Seaman,Oldendorf/Luhe, Germany
Submitted: October 30, 2006; Accepted: May 6, 2008Proofs received from author(s): September 18, 2008
Copyright © 2022 FDOKUMEN