Physico-Chemistry of Elechi Creek in the Upper Bonny ...
17
Journal of Geoscience and Environment Protection, 2017, 5, 181-197 http://www.scirp.org/journal/gep ISSN Online: 2327-4344 ISSN Print: 2327-4336 DOI: 10.4236/gep.2017.58015 Aug. 7, 2017 181 Journal of Geoscience and Environment Protection Physico-Chemistry of Elechi Creek in the Upper Bonny Estuary, Rivers State, Nigeria Amauche Sabastine Ngah 1 , Solomon Braide 2 , Collins Chiadi Dike 1 1 Institute of Geosciences and Space Technology, Rivers State University of Science and Technology, Port Harcourt, Nigeria 2 Institute of Pollution Studies, Rivers State University of Science and Technology, Port Harcourt, Nigeria Abstract The physico-chemistry of tidal Elechi Creek in the upper Bonny Estuary was investigated to assess the toxicity of the water body as this could have ad- verse effects on the native organisms that form part of the ecosystem and to evaluate the extent and magnitude of petroleum hydrocarbon and heavy metal concentration in the water body. Standard field procedures were adopted in sample collection while laboratory analysis was carried out also following standard methods. Parameters measured include pH, temperature, dissolved oxygen (DO), biological oxygen demand (BOD), electrical con- ductivity, salinity and total dissolved solids (TDS). Heavy metals namely Copper (Cu), Lead (Pb), Zinc (Zn), nitrate (NO 3 ), sulphate (SO 4 ), Ammonia (NH 4 ), and Total Hydrocarbon Concentration (THC) in the surface water body were also determined on samples collected from five (5) sampling sta- tions spread along the creek in both dry and wet seasons. The results showed that the surface water body is oligohaline with low acidity, pH val- ues ranging from 6.2 to 7.6. Temperature varies from 27˚C to 30˚C. Dis- solved Oxygen (DO) concentration ranges from 2.9 to 7.5 mg/l which is adequate for aquatic organism with Biological Oxygen Demand (BOD) val- ues varying from 0.45 to 7.0 mg/l. The values of total dissolved solids (TDS) vary from 11,700 mg/l to 26,250 mg/l with the highest mean value obtained at the study station located downstream. The mean nutrient concentration showed that the study area is not eutropic. Anthropogenic activities were very high at the sites throughout the period of the study and may have re- sulted in the stress conditions of the area. Pollution trend along the study stations showed that no one station is unpolluted. The study recommends the introduction of enforceable and stringent waste management plans to highlight and discourage direct discharge of untreated waste and storm wa- ter runoff into an aquatic environment. How to cite this paper: Ngah, A.S., Braide, S. and Dike, C.C. (2017) Physico-Chemi- stry of Elechi Creek in the Upper Bonny Estuary, Rivers State, Nigeria. Journal of Geoscience and Environment Protection, 5, 181-197. https://doi.org/10.4236/gep.2017.58015 Received: March 10, 2017 Accepted: August 4, 2017 Published: August 7, 2017 Copyright © 2017 by authors and Scientific Research Publishing Inc. This work is licensed under the Creative Commons Attribution International License (CC BY 4.0). http://creativecommons.org/licenses/by/4.0/ Open Access
-
Upload
khangminh22 -
Category
Documents
-
view
0 -
download
0
Transcript of Physico-Chemistry of Elechi Creek in the Upper Bonny ...

Journal of Geoscience and Environment Protection, 2017, 5, 181-197 http://www.scirp.org/journal/gep
ISSN Online: 2327-4344 ISSN Print: 2327-4336
DOI: 10.4236/gep.2017.58015 Aug. 7, 2017 181 Journal of Geoscience and Environment Protection
Physico-Chemistry of Elechi Creek in the Upper Bonny Estuary, Rivers State, Nigeria
Amauche Sabastine Ngah1, Solomon Braide2, Collins Chiadi Dike1
1Institute of Geosciences and Space Technology, Rivers State University of Science and Technology, Port Harcourt, Nigeria 2Institute of Pollution Studies, Rivers State University of Science and Technology, Port Harcourt, Nigeria
Abstract
The physico-chemistry of tidal Elechi Creek in the upper Bonny Estuary was investigated to assess the toxicity of the water body as this could have ad-verse effects on the native organisms that form part of the ecosystem and to evaluate the extent and magnitude of petroleum hydrocarbon and heavy metal concentration in the water body. Standard field procedures were adopted in sample collection while laboratory analysis was carried out also following standard methods. Parameters measured include pH, temperature, dissolved oxygen (DO), biological oxygen demand (BOD), electrical con-ductivity, salinity and total dissolved solids (TDS). Heavy metals namely Copper (Cu), Lead (Pb), Zinc (Zn), nitrate (NO3), sulphate (SO4), Ammonia (NH4), and Total Hydrocarbon Concentration (THC) in the surface water body were also determined on samples collected from five (5) sampling sta-tions spread along the creek in both dry and wet seasons. The results showed that the surface water body is oligohaline with low acidity, pH val-ues ranging from 6.2 to 7.6. Temperature varies from 27˚C to 30˚C. Dis-solved Oxygen (DO) concentration ranges from 2.9 to 7.5 mg/l which is adequate for aquatic organism with Biological Oxygen Demand (BOD) val-ues varying from 0.45 to 7.0 mg/l. The values of total dissolved solids (TDS) vary from 11,700 mg/l to 26,250 mg/l with the highest mean value obtained at the study station located downstream. The mean nutrient concentration showed that the study area is not eutropic. Anthropogenic activities were very high at the sites throughout the period of the study and may have re-sulted in the stress conditions of the area. Pollution trend along the study stations showed that no one station is unpolluted. The study recommends the introduction of enforceable and stringent waste management plans to highlight and discourage direct discharge of untreated waste and storm wa-ter runoff into an aquatic environment.
How to cite this paper: Ngah, A.S., Braide, S. and Dike, C.C. (2017) Physico-Chemi- stry of Elechi Creek in the Upper Bonny Estuary, Rivers State, Nigeria. Journal of Geoscience and Environment Protection, 5, 181-197. https://doi.org/10.4236/gep.2017.58015 Received: March 10, 2017 Accepted: August 4, 2017 Published: August 7, 2017 Copyright © 2017 by authors and Scientific Research Publishing Inc. This work is licensed under the Creative Commons Attribution International License (CC BY 4.0). http://creativecommons.org/licenses/by/4.0/
Open Access

A. S. Ngah et al.
DOI: 10.4236/gep.2017.58015 182 Journal of Geoscience and Environment Protection
Keywords Physico-Chemistry, Elechi Creek, Rivers State, Nigeria
1. Introduction
Water is an indispensable natural resource without which there would have been no life on earth. The importance of water to man cannot be over emphasized. Man can survive longer without food than without water. Water is freely availa-ble through rainfall and other components of the hydrologic cycle. Until recent-ly, man has tended to take this abundant natural resource for granted [1]. The increased concern on the rapid ecological changes in the natural environment has provided major challenges to the scientific community [2]. The emerging empirical facts have shown the susceptibility and sensitivity of ecological assem-blages which have been ignored especially the open water body dwelling com-munities in brackish and other waters of Niger Delta. The first sign of pollution in an aquatic system includes toxic algal blooms and associated deoxygenation of surface water.
Studies have been undertaken on macrofauna in Bonny and other Niger Delta environment [3] [4] [5] [6]. These studies have provided information on the physicochemistry, Benthos; [7] [8] and [9] on benthos, [10] on intertidal macro-fauna while [11] on fisheries of Bonny estuary. A good surface water quality has dissolved oxygen (DO) values exceeding 2 mg/l [12]. This fact underpins the necessity of a thorough evaluation of the physicochemistry of Elechi Creek, a busy and actively tidal creek in Port Harcourt.
The study is on the creeks stretching from Abonnema wharf to Mgbouosimini waterfront. It attempts to establish possible effects of anthropogenic activities on the physicochemical parameters of the creek and provide mitigating measures with a view to preserving the environment. It also tries to generate an index us-ing developed water quality index from observed temporal and spatial variation in some physicochemical parameters in the area.
Assessment of water is not only for suitability for human consumption but also in relation to its agricultural, industrial, recreational, commercial uses and, from environmental point of view, its ability to sustain aquatic life. Water quali-ty monitoring is therefore a fundamental tool in the management of freshwater resources. To achieve the aim of this study, the following evaluations were made: water quality, extent and magnitude of petroleum hydrocarbon and heavy metal concentration, relationship between the physicochemical characteristics and the aim of identifying zones within the study area that could show acute toxicity to native organisms.
2. Description of the Study Area
The study was conducted in a brackish wetland of Bonny estuary between Ab-

A. S. Ngah et al.
DOI: 10.4236/gep.2017.58015 183 Journal of Geoscience and Environment Protection
onnema wharf and Mgboushimini. The creek lies Southwest of Port Harcourt between longitude 04˚46'743"N and 007˚00'557"E; 04˚48'217"N and 006˚48'989"E (Figure 1). It is protected from strong wave actions prevalent in the main Bonny River Channel and the current flow velocity is minimal (about 3 m/s). Tidal am-plitude is about 1.20 m. A detailed description of the hydrology of the system is contained elsewhere [13].
The area enjoys tropical equatorial climate. Two main seasons are dominant namely, the rainy season (March to November) and the dry season (December to February) Annual rainfall in the area is about 2405.20 mm (Gobo, 1988). Annual mean air temperature is 29.7˚C with the highest monthly mean temperature at 31.3˚C (in August), and the lowest monthly mean temperature at 27.5˚C (in January). The surface seawater temperature varies between 25.9˚C and 30.6˚C, and the salinity of the surface water varies between 8‰ and 20‰. The tidal var-iations range between 0.43 m and 1.67 m with a mean tidal variation of 0.90 m. The water current flows in directions, flooding (inundation) during high tide and receding at low tide regimes. The mud (sediment) had a dark appearance with hydrogen sulphide as the major byproduct of sulphate reducing bacteria. The soil type is mainly clay (Chikoko). The intertidal flat consists of moderately sorted sand to silty clay with patches of hard “Chikoko” sediment types [10].
Vegetation in the area is characteristically mangrove, with the dominant types being red mangrove (Rhizophora racemosa), white mangrove (Avicennia afri-cana) and black mangrove (Laguncularia racemosa). The area is also inhabited by other plants (e.g. fern-Achrostichum aureum and grass-Paspalum vargina-tum). Animals found in the area include (mud skipper Periophthalmus sp., fid-der crabs Uca tangeri and Periwinkles). The vegetation of the head water and stream banks are intact, and had been referred to as un-degraded stream systems [14] [15].
3. Materials and Method
Five study stations were established along the creek from Abonnema wharf to Mgbousimini, (Figure 1). They include: 1) Abonnema Wharf station (ABWS 1 & 2). Activities here are mostly boat
transportation and sale of petroleum products. 2) Elechi Beach station (EBS 1 & 2). Activities here include lifting of petroleum
products and waste disposal. 3) AGIP Jetty Station (AJS 1 & 2). Activities include ship transportation and
runoff. 4) Mgboushimini Station (MBS 1 & 2); influenced by effluent from slaughter,
burnt tyres, market and solid waste disposal. 5) Control Station (CS 1 & 2); characterised by relatively low human activity.
Sample collection was done according to standard procedures. Water samples were collected in both dry season (November-December 2012 and January 2013) and peak wet season (August and September 2013).

A. S. Ngah et al.
DOI: 10.4236/gep.2017.58015 184 Journal of Geoscience and Environment Protection
Figure 1. Map of study area.

A. S. Ngah et al.
DOI: 10.4236/gep.2017.58015 185 Journal of Geoscience and Environment Protection
Surface water samples were collected on a monthly interval at ebbing tide during the study period. Water samples were taken at about 30 cm below the water surface by a horizontal water bottle made of polyvinyl chloride.
One sample was collected at each of these locations, two replicate samples from each group stations.
At each sampling station, in situ measurement of unstable parameters such as temperature was made while the elevation and the sampling location were geo-referenced.
The parameters measured are Temperature (in situ), pH, Conductivity, Dis-solved Oxygen, Biological Oxygen Demand (BOD), Total Dissolved solid (TDS), Salinity, Total hydrocarbon concentration (THC), and Heavy metals. The sam-ples were taken to the laboratory of the Institute of Pollution Studies, Rivers State University of Science and Technology, Port Harcourt, where the analysis took place following standard analytical procedures.
4. Results
Surface Water pH The result of the mean surface water pH of the study area showed that the
surface water is weakly acidic to weakly alkaline with values ranging from 6.40 in AJS in dry season to 7.60 in EBS in the wet season. This is expected since in the dry season, there is some fresh water influence in the study area while the alka-line seawater dominates.
The spatial and temporal variation in surface water pH is presented in the Figure 2.
Surface Water Temperature The results of surface water temperature range from 27.6˚C to 30˚C. The
highest temperature was recorded in January, dry season and the lowest value was recorded in August, wet season, Figure 3.
Surface Water Electrical Conductivity (EC) The results of mean EC of surface water in the study sites showed that the
maximum value was recorded in January, 2013, dry season; as 28,250 (μs/cm) at Abonnema Wharf station (ABWS) site. The minimum value was obtained in September 2013 wet season, as 12,775 (μs/cm) at Mgboushimini sample sites
Figure 2. Variation of surface water pH in the study stations.
0
2
4
6
8
ABWS EBS AJS MBS CS
Nov.
Dec
Jan
Aug
Sept

A. S. Ngah et al.
DOI: 10.4236/gep.2017.58015 186 Journal of Geoscience and Environment Protection
(MBS). The difference between the maximum and the minimum values was 15,475 (μs/cm). Spatial and temporal variations in the EC are presented in Fig-ure 4.
Considerable spatial and temporal changes in values were observed at the sampling sites throughout the study periods. The temporal change showed a de-cline in the EC values at MBS sites, but was more pronounced at the ABWS site. Except for the month of December 2012 (dry season), the values obtained at MBS sites showed a continuous decline for the periods of the study.
Surface Water Salinity (‰) The results of the measurements of mean salinity of the surface water shows
that the values ranged between 7.00(‰) and 17.20(‰) ± 10.20(‰). The varia-tion in the level of salinity is quite high. The highest level of salinity was record-ed in August 2013 (wet season), at the Abonnema Wharf study sites as 17.20(‰), while the least value was recorded in September 2013 (wet season), at MBS study site as 7.00(‰). On a general note, salinity levels fluctuates. Howev-er, higher values were recorded at Abonnema Wharf study site than other sites. Figure 5 shows the variations of the salinity of the sampling sites.
Dissolved Oxygen (DO) concentration of Surface Water Samples The results showed that the values of the DO vary between 2.85 mg/l and 7.50
mg/l. The minimum value of DO was recorded at Elechi Beach in November 2012 (dry season), while the maximum value was recorded at the MBS site in Au-gust 2013 (wet season). The concentration of DO during the periods of
Figure 3. Variations in surface water temperature in the study stations.
Figure 4. Variations of electrical conductivity in study stations.
2526272829303132
ABWS EBS AJS MBS CS
Nov
Dec
Jan
Aug
Sept
0
10000
20000
30000
ABWS EBS AJS MBS CS
Nov
Dec
Jan
Aug
Sept

A. S. Ngah et al.
DOI: 10.4236/gep.2017.58015 187 Journal of Geoscience and Environment Protection
the study did not follow any particular pattern. Figure 6 shows variations in the DO across the study stations.
Biological Oxygen Demand (BOD) of Surface Water of the Sampling Sites The (BOD) results of the surface water show that the values ranged between
0.45 and 7.50 mg/l within the periods of the study. The least value was recorded in November 2012 dry season, at ABWS study sites while the highest value was recorded in August 2013 wet season at MBS Study Sites with a value of 7.50 mg/l. The spatial and temporal variation of mean BOD concentration is pre-sented in the Figure 7.
The results do show some pattern of the distribution of BOD5. Hence, the values increased steadily at the stations.
Total Dissolved Solid (TDS) Concentration of Surface Water in Sampling Sites
Results show that the values ranged between 10,185 and 26,250 (mg/l) within the periods of the study. The least value was recorded in August 2013 wet sea-son, at MBS study sites while the highest value of 26,250 mg/l was recorded in January 2013 dry season at ABWS which could be attributed to the human activ-ity taking place in the study site. The spatial and temporal variation of mean To-tal Dissolved Solid (TDS) concentration is presented in the Figure 8.
Concentration of Nitrate (NO3) in Surface Water
Figure 5. Variation of salinity in surface water in the study stations.
Figure 6. Variation of surface water DO (mg/l) across the study stations.
0
5
10
15
20
ABWS EBS AJS MBS CS
Nov
Dec
Jan
Aug
Sept
012345678
ABWS EBS AJS MBS CS
Nov
Dec
Jan
Aug
Sept

A. S. Ngah et al.
DOI: 10.4236/gep.2017.58015 188 Journal of Geoscience and Environment Protection
The result showed that the Nitrate (mg/l) concentrations of the surface water ranged between 0.15 and 2.51 mg/l, with a difference of 1.45 mg/l. The mini-mum value was obtained at the control site in August 2013 wet season while; the maximum value was obtained at EBS in January 2013 dry season. The spatial and temporal variations in the concentrations of Nitrate are presented in Figure 9.
The Nitrate levels of the study area did not show any common trend across the various study stations. The concentration of nitrate varied between 0.15 - 2.45 mg/l in the study period. The highest concentration of nitrate was recorded
Figure 7. Variation of surface water BOD (mg/l) in the study stations.
Figure 8. Variations of surface water TDS (mg/l) in study stations.
Figure 9. The spatial and temporal variation of surface water nitrate (mg/l) in study stations.
012345678
ABWS EBS AJS MBS CS
Nov
Dec
Jan
Aug
Sept
0
10000
20000
30000
ABWS EBS AJS MBS CS
Nov
Dec
Jan
Aug
Sept
0
0.5
1
1.5
2
2.5
3
ABWS EBS AJS MBS CS
Nov
Dec
Jan
Aug
Sept

A. S. Ngah et al.
DOI: 10.4236/gep.2017.58015 189 Journal of Geoscience and Environment Protection
at the CS with a value of 2.50 mg/l in the month of August 2013 wet season. Concentration of Sulphate (mg/l) in Surface Water of Sampling Sites The result indicates that the concentrations of Sulphate ranged from 244.50
mg/l at CS in December 2012 dry season, to 581.50 mg/l at ABWS in December 2012 dry season; with a difference of 337.00 mg/l. The concentration of Sulphate of the surface water was generally high. There was no common trend in the le-vels of the distribution of the heavy metal across the study sites. The spatial and temporal variations of Sulphate (mg/l) in the study areas are presented in the Figure 10.
Except for the peak of 581.50 mg/l, at ABWS, the concentrations of Sulphate varied during the period of the study.
Concentration of Ammonia (mg/l) in Surface Water of Sample Sites The results indicates that the concentrations of ammonia ranged from <0.05 -
0.15 (mg/l). There was no common trend in the levels of the distribution of ammonia. The spatial and temporal variations of Ammonia (mg/l) in the study areas are presented in the Figure 11.
Copper (Cu) (mg/l) The lowest value recorded was <0.01 = 0.0001 (mg/l) while the highest value
Figure 10. Sulphate concentration (mg/l) in surface water of the the study stations.
Figure 11. Variations of ammonia (mg/l) in surface water of the study stations.
0
100
200
300
400
500
600
700
ABWS EBS AJS MBS CS
Nov
Dec
Jan
Aug
Sept
0
0.05
0.1
0.15
0.2
ABWS EBS AJS MBS CS
Nov
Dec
Jan
Aug
Sept

A. S. Ngah et al.
DOI: 10.4236/gep.2017.58015 190 Journal of Geoscience and Environment Protection
was 0.04 (mg/l). The relative values of Cu did not vary much with the stations and the months. The values were relatively low across the sampling sites and the periods. The lowest and highest values are distributed across the sampling sites and the sampling periods. Variations in the concentrations of Cu across the study sites did not follow any definite pattern. The spatial and temporal varia-tions of the concentrations of Cu in the study area are shown in the Figure 12.
Zinc (Zn) Concentration (mg/l) in Surface Water of Sampled Sites The concentrations of Zn (mg/l) in surface water of the sampling sites range
from 0.04 to 0.09 (mg/l). The lowest value of 0.044 (mg/l) was recorded in the months of December 2012 dry season. The spatial and temporal variation of the concentration of Zn is presented in the Figure 13.
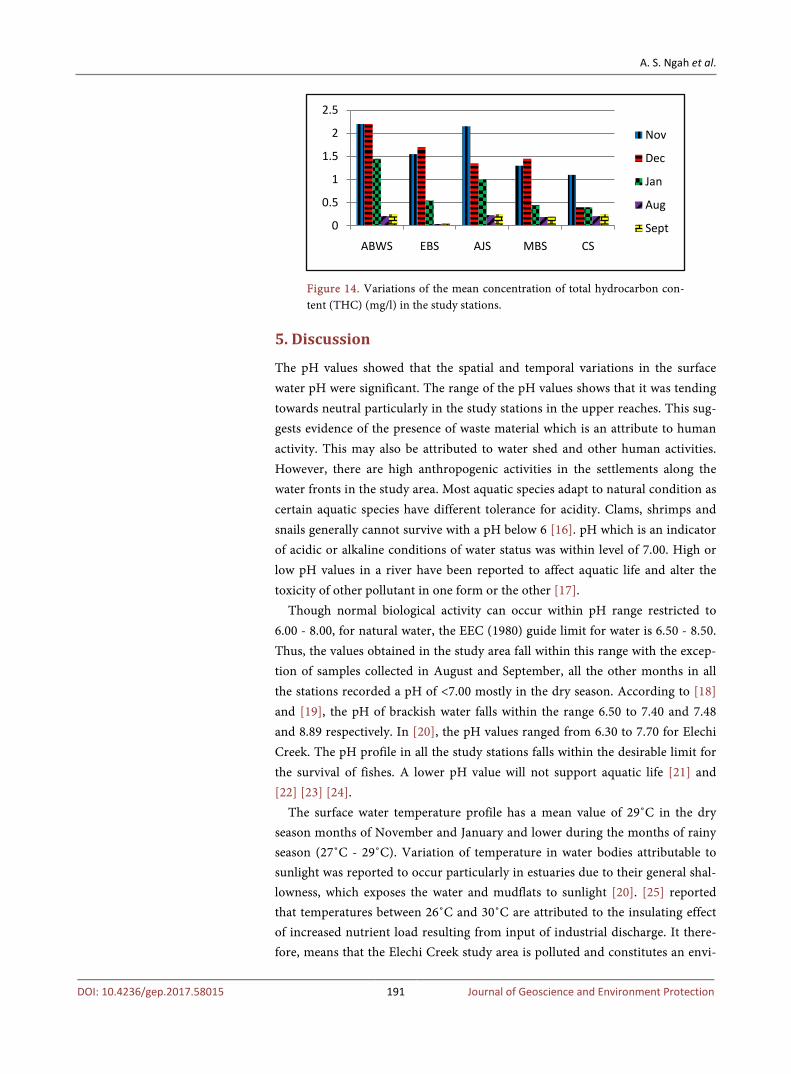
Concentration of Total Hydrocarbon Content (mg/l) The values of the concentrations of THC range from 0.05 to 2.20 (mg/l). The
lowest value of 0.05 (mg/l) was recorded in the months of August 2013 wet sea-son. The spatial and temporal variation of the concentration of THC is pre-sented in the Figure 14.
Figure 12. The spatial and temporal variations of the concentrations of copper (mg/l) in surface water of the study stations.
Figure 13. Zinc concentration (mg/l) in the study stations.
00.020.040.060.08
0.10.120.14
ABWS EBS AJS MBS CS
Nov
Dec
Jan
Aug
Sept
0
0.02
0.04
0.06
0.08
0.1
ABWS EBS AJS MBS CS
Nov
Dec
Jan
Aug
Sept
A. S. Ngah et al.
DOI: 10.4236/gep.2017.58015 191 Journal of Geoscience and Environment Protection
Figure 14. Variations of the mean concentration of total hydrocarbon con-tent (THC) (mg/l) in the study stations.
5. Discussion
The pH values showed that the spatial and temporal variations in the surface water pH were significant. The range of the pH values shows that it was tending towards neutral particularly in the study stations in the upper reaches. This sug-gests evidence of the presence of waste material which is an attribute to human activity. This may also be attributed to water shed and other human activities. However, there are high anthropogenic activities in the settlements along the water fronts in the study area. Most aquatic species adapt to natural condition as certain aquatic species have different tolerance for acidity. Clams, shrimps and snails generally cannot survive with a pH below 6 [16]. pH which is an indicator of acidic or alkaline conditions of water status was within level of 7.00. High or low pH values in a river have been reported to affect aquatic life and alter the toxicity of other pollutant in one form or the other [17].
Though normal biological activity can occur within pH range restricted to 6.00 - 8.00, for natural water, the EEC (1980) guide limit for water is 6.50 - 8.50. Thus, the values obtained in the study area fall within this range with the excep-tion of samples collected in August and September, all the other months in all the stations recorded a pH of <7.00 mostly in the dry season. According to [18] and [19], the pH of brackish water falls within the range 6.50 to 7.40 and 7.48 and 8.89 respectively. In [20], the pH values ranged from 6.30 to 7.70 for Elechi Creek. The pH profile in all the study stations falls within the desirable limit for the survival of fishes. A lower pH value will not support aquatic life [21] and [22] [23] [24].
The surface water temperature profile has a mean value of 29˚C in the dry season months of November and January and lower during the months of rainy season (27˚C - 29˚C). Variation of temperature in water bodies attributable to sunlight was reported to occur particularly in estuaries due to their general shal-lowness, which exposes the water and mudflats to sunlight [20]. [25] reported that temperatures between 26˚C and 30˚C are attributed to the insulating effect of increased nutrient load resulting from input of industrial discharge. It there-fore, means that the Elechi Creek study area is polluted and constitutes an envi-
0
0.5
1
1.5
2
2.5
ABWS EBS AJS MBS CS
Nov
Dec
Jan
Aug
Sept

A. S. Ngah et al.
DOI: 10.4236/gep.2017.58015 192 Journal of Geoscience and Environment Protection
ronmental risk. The temperature obtained (30˚C) according to Delince (1992); 30˚C - 35˚C is tolerable to fish, [23] suggested the levels of temperature as 28˚C - 32˚C.
Conductivity which is a method of obtaining an estimate of dissolved solid ranged 3.80 - 10.0 µ/cm, described as extremely poor in chemicals [26]. [27] recommended the desirable range 100 - 2000 mS/cm and acceptable range 30 - 5000 mS/cm. The mean electrical conductivity (EC) profile was generally higher at ABWS than other sites. There are several factors that affect the conductivity of a water body. These include concentration or number of ions, mobility of ions, oxidation state (valence) and temperature of the water. Conductivity also in-creases as result of heavy metal ions released from pollutants such as acid mine drainage. However, the range of EC obtained in the study show marked devia-tion with the range recorded by [14] [20] at the Elechi Creek which is attributed to series of anthropogenic activities in the study area and seawater influence. The mean value obtained for this study range 19,773 µs/cm to 24,052 µs/cm in dry season and 13,663 µs/cm to 25,325 µs/cm in wet season. These changes, af-fects the general condition of the water and aquatic lives.
The salinity values recorded at the various sampling sites during the study showed that the values ranged from 7.00(‰) to 17.20(‰). The values obtained in the study areas are higher than the range [28] reported in Rumueme Creek. Similar low values have been reported by [29] and [30] in the main channel of the Bonny estuary, these coincide with the rainy season, when fresh water dis-charge was heaviest. Similarly, [31] also reported that low salinity in Bonny tidal basin is influenced by fresh water discharge.
Dissolved oxygen (DO) is a measure of the degree of pollution by organic matter, the destruction of organic substances as well as the self purification ca-pacity of the water body. The DO of Elechi Creek mean values range from 3.23 mg/l to 4.65 mg/l in the dry season and 6.25 mg/l to 6.53 mg/l in the wet season at the study area. [21] recommended that fish can die if exposed to less than 0.3 mg/l of DO for a long period of time, minimum concentration of 1.0 mg/l. DO is essential to sustain fish for long period and 5.0 mg L-1 are adequate in fish-ponds. DO in liquid provides a source of oxygen needed for the oxidation of or-ganic matter when the concentration is high and lack of it causes the water body to become dead or devoid of aquatic life [32].
The results of Dissolved Oxygen (DO) concentration of the surface water samples showed that DO concentrations were generally high as values of DO ranged from 2.85 - 7.45 mg/l recorded in the study area. The high DO values recorded in the study area can be attributed to the agitation of the surface water within the creek channel due to channel precipitation and run-off discharge es-pecially in the wet season. Similar observation was also made that high DO val-ues were attributed to the extreme turbulent effect of the rains, for which the Niger Delta has been noted for. The relationship between the concentration of organic materials and DO in marine water has been a concern and has been in-

A. S. Ngah et al.
DOI: 10.4236/gep.2017.58015 193 Journal of Geoscience and Environment Protection
vestigated. High levels of organic matter are usually associated with low DO concentrations. The fall in DO in November 2012, dry season, at EBS can there-fore, be attributed to the organic waste discharged from domestic wastes and others materials discharged from the waterfall settlements. Similarly, the low DO values recorded at AJS in November and December 2012 dry season may be as a result of the utilization of available oxygen by petroleum hydrocarbon dis-charged into the water surface at the Agip Jetty [33]. The general overall trend/values of dissolved oxygen in all the study sites, when compared to [20] are very low, which clearly suggest a deterioration of the environment and therefore, poses an environmental risk. If a water body is capable of supporting aquatic life, the dissolved oxen standard will be a minimum of 5.00 mg/l [34].
Biological oxygen demand (BOD5) is the commonest used index in water quality management; it represents the amount of oxygen required for the bio-logical decomposition of organic matter under aerobic condition. It is perhaps an expression of how much oxygen is needed for microbes to oxidize a given quantity of organic matter [35]. The mean value of (BOD5) in the study stations range from 1.02 mg/l to 1.78 mg/l in the dry season and 1.40 mg/l to 5.38 in the wet seasons the lowest mean value of (BOD5) was recorded at the Abonnema wharf station (ABWS) and Elechi beach station (EBS). [36] reported that (BOD5) range of 2 to 4 mg L-1 does not show pollution while levels beyond 5 mg L-1 are indicative of serious pollution. According to [23] the (BOD5) level between 3.0 - 6.0 ppm is optimum for normal activities of fishes; 6.0 - 12.0 ppm is sublethal to fishes and >12.0 ppm can usually cause fish kill due to suffocation. BOD5 at EBS, MBS and CS in the wet season show values higher than 5.0 mg/l which range between 6.90 - 7.50 mg/l. On the other hands, the Biological Oxygen Demand (BOD5) of the surface water samples at these study sites ranged from 0.45 to 7.50 mg/l. BOD5 values of 1.35 to 6.90 mg/l suggesting the “clean water” according to the classification scheme of surface water by Pratt et al. (1971). The higher BOD5 concentrations above 6.20 mg/l at EBS, MBS and CS suggest some degree of pollution. This trend as discussed above for DO could indicate a level of pollu-tion by organic matter or petroleum hydrocarbons the affected sites (Kinney et al., 1969). The low BOD5 values may have been influenced by the tidal flow of water from the Bonny River which effectively flushes and dilutes oxidizable or-ganic matter out of the study area. This is probably as a result of regular intro-duction of organic matters into the study area from human and faecal matter on a daily bases. According to [18] and [37], the contamination of water with faeces increases the (BOD5) because it contains mainly organic matter making oxygen less available to desirable organisms.
The results also showed low nutrient concentration for example, Nitrate (NO3) ranged from (<0.05 to 2.80 mg/l). The highest mean levels were recorded at ABWS and MBS. These values are lower than the range of 4.50 to 11.00 mg/l recorded by [14] in water samples in the upper reaches of the Elechi Creek Bon-ny estuary. The higher values show a build-up of the Nitrate in the surface water

A. S. Ngah et al.
DOI: 10.4236/gep.2017.58015 194 Journal of Geoscience and Environment Protection
especially at MBS and ABWS. The values recorded at these sites can be attri-buted to the discharge of organic matter from sewage effluence of the waterfront settlement. It could also be explained that the lower mean values of other study sites could be due to relative uptake of nitrate by growing mats of algae which were found covering the exposed mud flats at low tide. The overall low concen-tration of nitrate in these five areas indicates that they are below the threshold limit of 45.00 mg/l [38]. Thus, it can be concluded that these areas are not con-taminated with nitrate. These values are well below the internationally accepted value of 45.00 mg/L indicator for nitrate ion contamination and thus this water is not polluted with Nitrate.
Heavy metal concentrations were generally low throughout the stations at Elechi Creek. The low concentration of heavy metal reported in the study sta-tions may be attributed to lack of industrial discharges into the Elechi Creek. It is possible that the abundant suspended matter and high pH may have effectively scavenged metals through adsorption and precipitation [20].
The results showed that the values obtained for the present studied suggest that the water quality status of Elechi Creek is reasonably influenced by various discharges of effluents into the creek in terms of heavy metal concentrations.
6. Conclusion
Change in physico-chemical characteristics of the Elechi Creek could be attri-buted to the various anthropogenic activities taking place in the study area. These changes are also increasing risk hazard and continued discharge of waste into the Creek without proper management will pose environmental issues in the future. The seasonal variation was such that most of the physico-chemical parameters showed a higher concentration in dry season.
Acknowledgements
The authors are grateful to the Institute of Geosciences and Space Technology (IGST), Rivers State University of Science and Technology, Port Harcourt, Nige-ria for providing the platform for this research.
References [1] Ayoade, J.O. (1975) Water Resources and Their Development in Nigeria. Hydro-
logical Science-Bulletien-des Science Hydrologiques, XX, 412.
[2] Chindah, A.C. and Braide, S.A. (2001) Meiofuna Occurance and Distribution in Different Substrate Types of Bonny Brackish Wetland of the Niger Delta. Journal of Applied Sciences and Environmental Management, 5, 33-41.
[3] IPS (1989) Environmental Data Acquisition at Some NNPC Operational Areas. Vol.III Biological Studies. Rivers State University of Science and Technology Port Harcourt Nigeria. Institute of Pollution Studies, SUST/IPS/TR/89/03, 393 p.
[4] IPS (1990) Baseline Ecological Studies of Bonny South (Field) Location. Final Re-port Rivers State University of Science and Technology Port Harcourt Nigeria. In-stitute of Pollution Studies, RSUST/IPS/TR/89/02, 288 p.

A. S. Ngah et al.
DOI: 10.4236/gep.2017.58015 195 Journal of Geoscience and Environment Protection
[5] IPS (1991b) Baseline Ecological Studies of Bonny South (Field) Location Client: Shell Development Company of Nigeria (1989).
[6] IPS (1992) Environmental Impact Assessment Study of the Nitrogenous Fertilizer Factory Complex, Onne, Rivers State Nigeria. Rivers State University of Science and Technology Port Harcourt Nigeria Institute of Pollution Studies. RSUST/IPS/91/06, 411 p.
[7] Onwuteaka, J.N. (1992) The Diversity and Association of Polychaete Fauna in Niger Delta. Ph.D. Thesis, University of Port Harcourt, Port Harcourt.
[8] Ombu, E.I (1987) The Impact of the Okrika Oil Terminal on the Littoral Benthos of the Central Bonny Estuary, Nigeria. Ph.D. Thesis, Rivers State University, Port Harcourt.
[9] Ekweozor, I.K.E., Ombo, E.I. and Ugbome, A.P. (1989) The Effect of Chronic Oil Pollution in the Central Bonny Estuary. The Petroleum Industry and the Nigerian Environment. Proceedings of 1987, 198-207.
[10] Hart, A.I. and Chindah, A.C. (1998) Preliminary Study on the Benthic Microfauna Associated with Different Microhabitants in Mangrove Forest of Bonny Estuary, Niger Delta, Nigeria. Acta Hydrbiol, 40, 9-15.
[11] Chindah, A.C. and Osuamkpe, A. (1994) The Fish Assemblage of the Lower Bonny River, Niger Delta, Nigeria. African Journal of Ecology, 32, 56-65. https://doi.org/10.1111/j.1365-2028.1994.tb00555.x
[12] Rosenberg, R. (1980) Effect of Oxygen Deficiency on Benthic Macrofauna in Fjords. In: Freeland, J., Parmer, D.M. and Levings, C.D., Eds., Fjord Oceanography, Plenum Publishing Corp, New York, 499-514. https://doi.org/10.1007/978-1-4613-3105-6_45
[13] NEDECO (1961) The Waters of the Niger Delta. Netherland Engineering Consult, The Hague, 112 p.
[14] Chindah, A.C., Braide, S.A., Amadi, A. and Osuankpe, A. (1993) Investigation into the Epipelic Algal Community of Elechi Creek at Bonny Estuary, Niger Delta, Nige-ria. International Journal of Biochemphysics, 2, 119-124.
[15] Wilcox, B.H.P. (1980) Angiosperm Flora of the Mangrove Ecosystem of the Niger Delta. In: Wilcox, B.H.R. and Powell, C.B., Eds., The Mangrove Ecosystem of the Niger Delta, Proceedings of a Workshop, University of Port Harcourt, Port Har-court, 34-44.
[16] Umejuru, O. (2007) Juvenile Crawfish (Procambarus clarkii) Lc50 Mortality from South Louisiana, Crude/ Peanut and Mineral Oil. Louisiana State University, Baton Rouge.
[17] Morrison, G., Fatoki, O.S., Persson, L. and Ekberg, A. (2001) Assessment of the Impact of Point Source Pollution from the Keiskammahoek Sewage Treatment Plant on the Keiskamma River-pH, Electrical Conductivity, Oxygen Demanding Substance (COD) and Nutrients. Water SA, 27, 475-480. https://doi.org/10.4314/wsa.v27i4.4960
[18] Imevbore, A.M.A. (1983) The Investigation of Faecal Pollution in the Surface Water of the Niger Delta of Nigeria. Final Report Niger Delta Basin Development Author-ity, 3, 4-94.
[19] Zhang, J., Yan, J. and Zhang, Z.F. (1995) Nationwide River Chemistry Trend in China: Huanghe and Changjian. Ambio, 24, 275-279.
[20] Obire, O., Tamuno, D.C. and Wemedo, S.A. (2003) Physico-Chemical Quality of Elechi Creek in Port Harcourt. Journal of Applied Sciences & Environmental Man-

A. S. Ngah et al.
DOI: 10.4236/gep.2017.58015 196 Journal of Geoscience and Environment Protection
agement, 7, 43-49. https://doi.org/10.4314/jasem.v7i1.17164
[21] Ekubo, A.A. and Abowei, J.F.N. (2011) Review of Some Water Quality Management Principles Inculture Fisheries. Research Journal of Applied Sciences, Engineering and Technology, 3, 1342-1357.
[22] Santhosh, B. and Singh, N.P. (2007) Guidelines for Water Quality Management for Fish Culture in Tripura, ICAR Research Complex for NEH Region, Tripura Center, Publication No.29.
[23] Bhatnagar, A., Jana, S.N., Garg, S.K., Patra, B.C., Singh, G. and Barman, U.K. (2004) Water Quality Management in Aquaculture. In: Course Manual of Summer School on Development of Sustainable Aquaculture Technology in Fresh and Saline Wa-ters. CCS Haryana Agricultural, Hisar (India), 203-210.
[24] Chapman, P.M., Power, E.A. and Burton Jr., G.A. (1992) Integrative Assessments in Aquatic Ecosystems. In: Burton, G.A. and Leons Jr., M.I., Eds., Sediment Toxicity Assessments, Leons, Chelsea, 313-341.
[25] Alabaster, J.S. and Lloyd, R. (1980) Water Quality for Fresh Fish. Butterworts, Lon-don, 283 p.
[26] Sikoki, F.D. and Veen, J.V. (2004) Aspects of Water Quality and the Potential for Fish Production of Shiroro Reservoir Nigeria. Living System Sustainable Develop-ment, 2, 7 p.
[27] Stone, N.M. and Thomforde, H.K. (2004) Understanding Your Fish Pond Water Analysis Report. Cooperative Extension Program, University of Arkansas at Pine Bluff, Pine Bluff.
[28] Umesi, N., Disiru, C.N.G., Nwogbidi, K.C. and Wokoma, O.A.F. (2013) Effects of Organic Diversity of Littoral Benthos in Sites around the Rumueme Creek in the Upper Bonny Esturay. Journal Leena and Luna International, Oyama, Japan 2013.
[29] Ogamba, E.N., Inyang, I.R. and Seiyahboh, E.I. (2010) A Predictive Model of the Inter Relationship between Physicochemical Parameter and Plankton Productivity in Elechi Creek Complex in the Niger-Delta of Nigeria. African Journal of Applied Zoology & Environmental Biology, 12.
[30] Daka, E.R. (1990) Studies on the Fouling Community in the upper Bonny Estuary of Southern Nigeria. Master’s Thesis, Rivers State University, Port Harcourt.
[31] Dangana, L.B. (1980) Hydrogeomorphological Control of the Mangrove Environ-ment in Parts of Rivers State. In: Wilcox, B.H.R. and Powell, C.B., Eds., The Man-grove Ecosystem of the Niger Delta, University of Port Harcourt, Port Harcourt.
[32] Chukwu, O. (2008) Analysis of Groundwater Pollution from Abattoir Waste in Minna, Nigeria. Research Journal of Diary Science, 2, 74-77.
[33] Kinny, J.P., Buton, D.K. and Schell, D.M. (1969) Kinetic Dissipation and Biodegra-dation of Crude Oil in Alaska’s Cook Inlet. Proceeding Joint Conference on Preven-tion and Control of Oil Spills APT, Washington DC, 333-340.
[34] Pueblo of Isleta (2002) Surface Water Quality Standards. First Adopted January 24, 1992, Tribal Resolution 92-14, Amended March 18 2002, Tribal Resolution 02-064.
[35] Chukwu, O. (2008) Analysis of Groundwater Pollution from Abbatoir Waste in Minna, Nigeria. Research Journal of Diary Science, 2, 74-77.
[36] Clerk, R.B. (1986) Marine Pollution. Clarandon Press, Oxford, 256 p.
[37] Ekundayo, J.A. (1977) Environmental Consequences of the Pollution of the Lagos Lagon. Bulletin Science Association of Nigeria, 3, 290-299.

A. S. Ngah et al.
DOI: 10.4236/gep.2017.58015 197 Journal of Geoscience and Environment Protection
[38] Jagessar, R.C. and Sooknundun, L. (2009) Determination of Nitrate Anion in Waste Water from Nine Selected Areas of Coastal Guyana via a Spectrophotometric Me-thod. http://www.arpapress.com/Volumes/Vol7Issue2/IJRRAS_7_2_15.pdf
Submit or recommend next manuscript to SCIRP and we will provide best service for you:
Accepting pre-submission inquiries through Email, Facebook, LinkedIn, Twitter, etc. A wide selection of journals (inclusive of 9 subjects, more than 200 journals) Providing 24-hour high-quality service User-friendly online submission system Fair and swift peer-review system Efficient typesetting and proofreading procedure Display of the result of downloads and visits, as well as the number of cited articles Maximum dissemination of your research work
Submit your manuscript at: http://papersubmission.scirp.org/ Or contact [email protected]