Seismic Retrofit of Tuttle Creek Dam
12
Case Study Seismic Retrofit of Tuttle Creek Dam Francke C. Walberg, M.ASCE 1 ; Timothy D. Stark, F.ASCE 2 ; Peter J. Nicholson 3 ; Gonzalo Castro, M.ASCE 4 ; Peter M. Byrne 5 ; Paul J. Axtell, M.ASCE 6 ; John C. Dillon 7 ; William B. Empson 8 ; Joseph E. Topi 9 ; David L. Mathews 10 ; and Glen M. Bellew 11 Abstract: This paper discusses the seismic retrofit of Tuttle Creek Dam near Manhattan, Kansas, including investigations, seismic analyses, design, construction, and stabilization techniques used. Original plans called for stabilization of the upstream and downstream slopes and in- stallation of an upstream cutoff wall to reduce underseepage. However, constructability and dam safety issues, along with the results of refined seismic deformation analyses, led to cancellation of the jet grouted upstream slope stabilization and cutoff wall. Downstream slope stabilization was to be accomplished by jet grouting or soil mixing, but ultimately was accomplished using a self-hardening cement-bentonite (C-B) slurry to construct transverse shear walls. A total of 351 transverse shear walls were constructed along the downstream toe by primarily clamshell equip- ment. Typical shear walls are 13.7 m long, 1.2 m wide, and extend 18.9 m deep or about 6.1 m into the coarse foundation sands. The walls are spaced at 4.3 m on center along the downstream toe for a replacement ratio of about 29%. In addition to the transverse shear walls, the relief well collection ditch along the downstream toe was replaced with a buried collector system to further improve downstream stability and underseepage control. DOI: 10.1061/(ASCE)GT.1943-5606.0000818. © 2013 American Society of Civil Engineers. CE Database subject headings: Jet grouting; Soil mixing; Core walls; Shear walls; Soil mechanics; Soil permeability; Soil liquefaction; Earthquakes; Displacement; Slope stability; Kansas; Dams; Case studies; Seismic effects. Author keywords: Jet grouting; soil mixing; cutoff walls; shear walls; soil mechanics; permeability; liquefaction; earthquake induced displacement; slope stability. Introduction Tuttle Creek Dam is a U.S. Army Corps of Engineers (USACE) project, located on the Big Blue River in the Kansas River Basin (see Fig. 1). It is part of a system that provides a comprehensive plan for flood control, water supply, and supplemental release for naviga- tion of the Missouri River. Construction started in 1952 and was completed in 1961. Reservoir filling began in 1962 and the multi- purpose pool (MPP) elevation was first reached in 1963. Tuttle Creek Dam is a zoned earthfill embankment (Lane and Fehrman 1960) and is located about 10 km (6 mi) north of Manhattan in east central Kansas. The embankment is 2,300 m (7,500 ft) long and about 43 m (137 ft) high, with a crest width of 15.2 m (50 ft). There is a gated, concrete chute emergency spillway on the left abutment. The 290 m (952 ft) wide spillway structure consists of a concrete gravity section with 6.4 m (21 ft) by 12 m (40 ft) tainter gates, a 183 m (600 ft) long concrete apron and an unlined discharge chute to the valley floor. The regulating outlet works structure consists of a tower with gated twin horseshoe 6 m (20 ft) diameter conduits and a stilling basin near the right abutment. The top of the dam is at elevation 353.3 m (1,159 ft m.s.l.) and the original ground surface is about 312.4 m (1,025 ft m.s.l.) across the valley. The MPP level is elevation 327.9 m (1,075 ft m.s.l.). The full pool, or top of the flood control pool, is elevation 346.5 m (1,136 ft m.s.l.). The reservoir capacity is over 2.5 million megaliters (2 million acre-ft) at flood control pool. A typical cross section of the dam is shown in Fig. 2. Most of the construction materials for the embankment shells (shale and lime- stone fills upstream and downstream, berm fill downstream) came from the required excavation for the outlet works and the spillway. The majority of the downstream shell consists of hydraulically placed sand or sand and gravel obtained from a downstream borrow pit. The lower portion was constructed of cleaner and coarser sands and gravels to serve as a horizontal drainage blanket under the embankment. Most of the sand fill was hydraulically deposited but 1 Senior Consultant, URS Corporation, 8300 College Blvd., Overland Park, KS 66210. E-mail: [email protected] 2 Professor, Univ. of Illinois at Urbana-Champaign, 205 N. Mathews Ave., IL 61801, (corresponding author). E-mail: [email protected] 3 President, Nicholson Consulting, LLC, 22029 State Road 7, Boca Raton, FL 33428. 4 Senior Principal, Geotechnical Engineers, Inc. (GEI) Consultants, Inc., GEI Consultants, Inc., 400 Unicorn Park Drive, Woburn, MA 01801. 5 Professor, University of British Columbia, 6250 Applied Science Lane, Vancouver, British Columbia, Canada. 6 Principal Engineer, Dan Brown and Associates, 10134 Glenwood, Overland Park, KS 66212. 7 Chief, Cost Estimating Section, U.S. Army Corps of Engineers, Kansas City District, 601 E 12th St., Kansas City, MO 64106. 8 Senior Levee Safety Program Risk Manager, Risk Manage- ment Center-West-Denver, Institute for Water Resources, U.S. Army Corps of Engineers, 12596 W. Bayaud Ave., Ste. 400, Lakewood, CO 80288. 9 Senior Geologist, Geotechnical Design and Dam Safety Section, U.S. Army Corps of Engineers, Kansas City District, 301 E. 12th St., Kansas City, MO 64106. 10 Chief, Engineering Division, U.S. Army Corps of Engineers, Kansas City District, 601 E 12th St., Kansas City, MO 64106. 11 Chief, Geotechnical Design and Dam Safety Section, U.S. Army Corps of Engineers, Kansas City District, 601 E 12th St., Kansas City, MO 64106. Note. This manuscript was submitted on June 6, 2011; approved on August 8, 2012; published online on August 20, 2012. Discussion period open until November 1, 2013; separate discussions must be submitted for individual papers. This paper is part of the Journal of Geotechnical and Geoenvironmental Engineering, Vol. 139, No. 6, June 1, 2013. ©ASCE, ISSN 1090-0241/2013/6-975–986/$25.00. JOURNAL OF GEOTECHNICAL AND GEOENVIRONMENTAL ENGINEERING © ASCE / JUNE 2013 / 975 J. Geotech. Geoenviron. Eng. 2013.139:975-986. Downloaded from ascelibrary.org by GRAINGER ENGINEERING LIB E on 05/27/13. Copyright ASCE. For personal use only; all rights reserved.
-
Upload
independent -
Category
Documents
-
view
1 -
download
0
Transcript of Seismic Retrofit of Tuttle Creek Dam
Case Study
Seismic Retrofit of Tuttle Creek DamFrancke C. Walberg, M.ASCE1; Timothy D. Stark, F.ASCE2; Peter J. Nicholson3; Gonzalo Castro, M.ASCE4;
Peter M. Byrne5; Paul J. Axtell, M.ASCE6; John C. Dillon7; William B. Empson8; Joseph E. Topi9;David L. Mathews10; and Glen M. Bellew11
Abstract: This paper discusses the seismic retrofit of Tuttle Creek Dam near Manhattan, Kansas, including investigations, seismic analyses,design, construction, and stabilization techniques used. Original plans called for stabilization of the upstream and downstream slopes and in-stallation of an upstream cutoff wall to reduce underseepage. However, constructability and dam safety issues, along with the results of refinedseismic deformation analyses, led to cancellation of the jet grouted upstream slope stabilization and cutoff wall. Downstream slope stabilizationwas to be accomplished by jet grouting or soil mixing, but ultimately was accomplished using a self-hardening cement-bentonite (C-B) slurry toconstruct transverse shear walls. A total of 351 transverse shear walls were constructed along the downstream toe by primarily clamshell equip-ment. Typical shear walls are 13.7 m long, 1.2 m wide, and extend 18.9 m deep or about 6.1 m into the coarse foundation sands. The walls arespaced at 4.3m on center along the downstream toe for a replacement ratio of about 29%. In addition to the transverse shear walls, the relief wellcollection ditch along the downstream toe was replaced with a buried collector system to further improve downstream stability and underseepagecontrol. DOI: 10.1061/(ASCE)GT.1943-5606.0000818. © 2013 American Society of Civil Engineers.
CE Database subject headings: Jet grouting; Soil mixing; Core walls; Shear walls; Soil mechanics; Soil permeability; Soil liquefaction;Earthquakes; Displacement; Slope stability; Kansas; Dams; Case studies; Seismic effects.
Author keywords: Jet grouting; soil mixing; cutoff walls; shear walls; soil mechanics; permeability; liquefaction; earthquake induceddisplacement; slope stability.
Introduction
Tuttle Creek Dam is a U.S. Army Corps of Engineers (USACE)project, located on the Big Blue River in theKansas River Basin (seeFig. 1). It is part of a system that provides a comprehensive plan forflood control, water supply, and supplemental release for naviga-tion of the Missouri River. Construction started in 1952 and wascompleted in 1961. Reservoir filling began in 1962 and the multi-purpose pool (MPP) elevation was first reached in 1963. TuttleCreek Dam is a zoned earthfill embankment (Lane and Fehrman1960) and is located about 10 km (6 mi) north of Manhattan in eastcentral Kansas. The embankment is 2,300 m (7,500 ft) long andabout 43 m (137 ft) high, with a crest width of 15.2 m (50 ft). Thereis a gated, concrete chute emergency spillway on the left abutment.The 290 m (952 ft) wide spillway structure consists of a concretegravity sectionwith 6.4m (21 ft) by 12m (40 ft) tainter gates, a 183m(600 ft) long concrete apron and an unlined discharge chute to the
valley floor. The regulating outlet works structure consists of a towerwith gated twin horseshoe 6 m (20 ft) diameter conduits and astillingbasin near the right abutment. The topof the dam is at elevation353.3 m (1,159 ft m.s.l.) and the original ground surface is about312.4m (1,025 ft m.s.l.) across the valley. TheMPP level is elevation327.9m (1,075 ftm.s.l.). The full pool, or top of theflood control pool,is elevation 346.5m (1,136 ftm.s.l.). The reservoir capacity is over 2.5million megaliters (2 million acre-ft) at flood control pool.
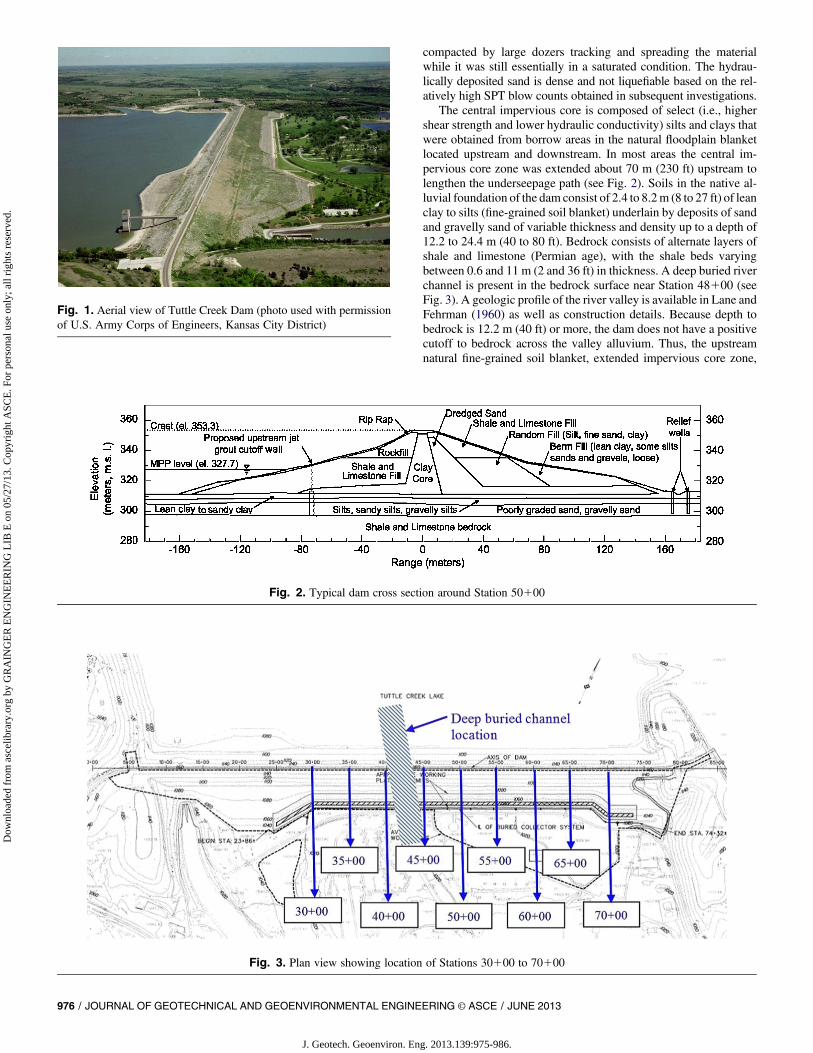
A typical cross section of the dam is shown in Fig. 2. Most of theconstruction materials for the embankment shells (shale and lime-stone fills upstream and downstream, berm fill downstream) camefrom the required excavation for the outlet works and the spillway.The majority of the downstream shell consists of hydraulicallyplaced sand or sand and gravel obtained from a downstream borrowpit. The lower portion was constructed of cleaner and coarser sandsand gravels to serve as a horizontal drainage blanket under theembankment. Most of the sand fill was hydraulically deposited but
1Senior Consultant, URS Corporation, 8300 College Blvd., OverlandPark, KS 66210. E-mail: [email protected]
2Professor, Univ. of Illinois at Urbana-Champaign, 205 N. MathewsAve., IL 61801, (corresponding author). E-mail: [email protected]
3President, Nicholson Consulting, LLC, 22029 State Road 7, BocaRaton, FL 33428.
4Senior Principal, Geotechnical Engineers, Inc. (GEI) Consultants,Inc., GEI Consultants, Inc., 400 Unicorn Park Drive, Woburn, MA 01801.
5Professor, University of British Columbia, 6250 Applied ScienceLane, Vancouver, British Columbia, Canada.
6Principal Engineer, Dan Brown and Associates, 10134 Glenwood,Overland Park, KS 66212.
7Chief, Cost Estimating Section, U.S. Army Corps of Engineers,Kansas City District, 601 E 12th St., Kansas City, MO 64106.
8Senior Levee Safety Program Risk Manager, Risk Manage-ment Center-West-Denver, Institute for Water Resources, U.S. Army
Corps of Engineers, 12596 W. Bayaud Ave., Ste. 400, Lakewood,CO 80288.
9Senior Geologist, Geotechnical Design and Dam Safety Section,U.S. Army Corps of Engineers, Kansas City District, 301 E. 12th St.,Kansas City, MO 64106.
10Chief, Engineering Division, U.S. Army Corps of Engineers,Kansas City District, 601 E 12th St., Kansas City, MO 64106.
11Chief, Geotechnical Design and Dam Safety Section, U.S. ArmyCorps of Engineers, Kansas City District, 601 E 12th St., Kansas City,MO 64106.
Note. This manuscript was submitted on June 6, 2011; approved onAugust 8, 2012; published online on August 20, 2012. Discussion periodopen until November 1, 2013; separate discussions must be submitted forindividual papers. This paper is part of the Journal of Geotechnical andGeoenvironmental Engineering, Vol. 139, No. 6, June 1, 2013. ©ASCE,ISSN 1090-0241/2013/6-975–986/$25.00.
JOURNAL OF GEOTECHNICAL AND GEOENVIRONMENTAL ENGINEERING © ASCE / JUNE 2013 / 975
J. Geotech. Geoenviron. Eng. 2013.139:975-986.
Dow
nloa
ded
from
asc
elib
rary
.org
by
GR
AIN
GE
R E
NG
INE
ER
ING
LIB
E o
n 05
/27/
13. C
opyr
ight
ASC
E. F
or p
erso
nal u
se o
nly;
all
righ
ts r
eser
ved.
compacted by large dozers tracking and spreading the materialwhile it was still essentially in a saturated condition. The hydrau-lically deposited sand is dense and not liquefiable based on the rel-atively high SPT blow counts obtained in subsequent investigations.
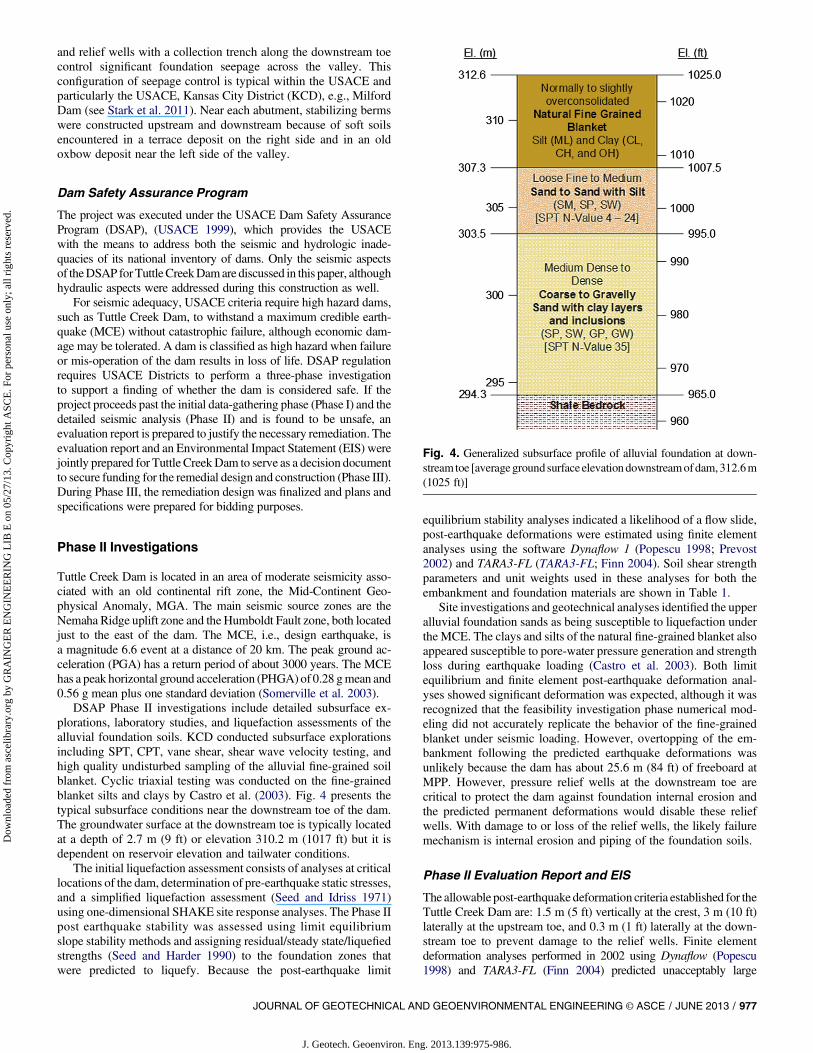
The central impervious core is composed of select (i.e., highershear strength and lower hydraulic conductivity) silts and clays thatwere obtained from borrow areas in the natural floodplain blanketlocated upstream and downstream. In most areas the central im-pervious core zone was extended about 70 m (230 ft) upstream tolengthen the underseepage path (see Fig. 2). Soils in the native al-luvial foundation of the dam consist of 2.4 to 8.2m (8 to 27 ft) of leanclay to silts (fine-grained soil blanket) underlain by deposits of sandand gravelly sand of variable thickness and density up to a depth of12.2 to 24.4 m (40 to 80 ft). Bedrock consists of alternate layers ofshale and limestone (Permian age), with the shale beds varyingbetween 0.6 and 11 m (2 and 36 ft) in thickness. A deep buried riverchannel is present in the bedrock surface near Station 48100 (seeFig. 3). A geologic profile of the river valley is available in Lane andFehrman (1960) as well as construction details. Because depth tobedrock is 12.2 m (40 ft) or more, the dam does not have a positivecutoff to bedrock across the valley alluvium. Thus, the upstreamnatural fine-grained soil blanket, extended impervious core zone,
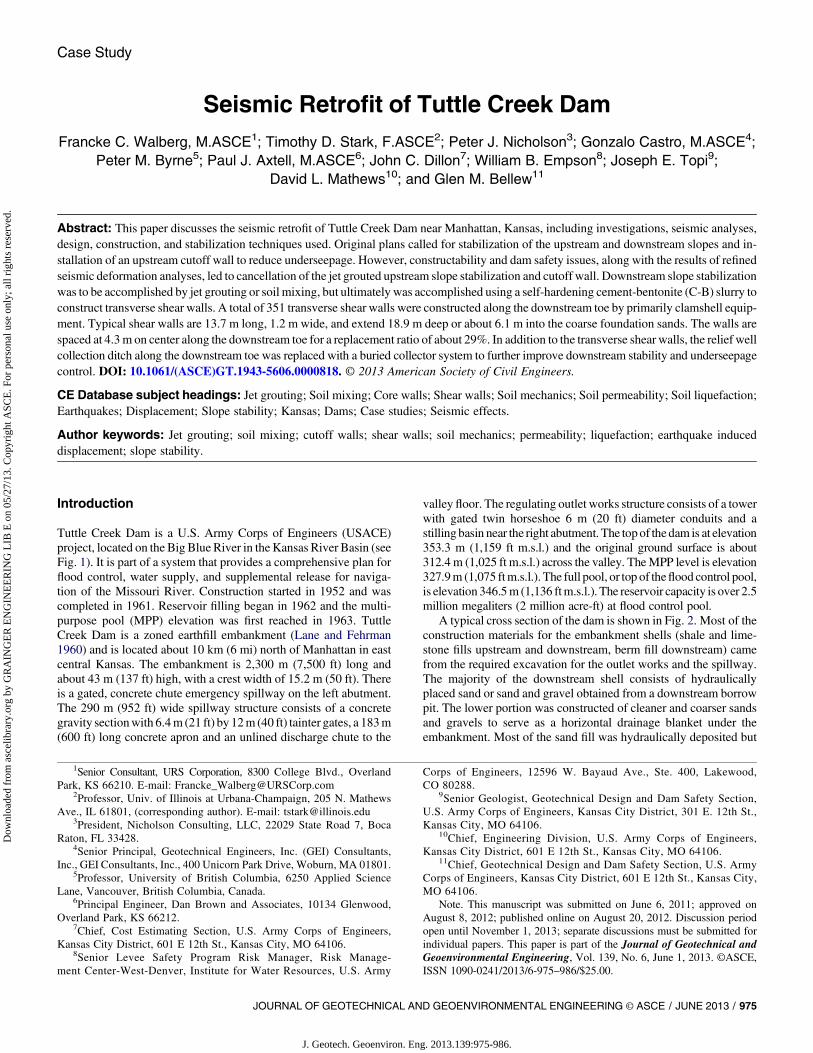
Fig. 1. Aerial view of Tuttle Creek Dam (photo used with permissionof U.S. Army Corps of Engineers, Kansas City District)
Fig. 2. Typical dam cross section around Station 50100
Fig. 3. Plan view showing location of Stations 30100 to 70100
976 / JOURNAL OF GEOTECHNICAL AND GEOENVIRONMENTAL ENGINEERING © ASCE / JUNE 2013
J. Geotech. Geoenviron. Eng. 2013.139:975-986.
Dow
nloa
ded
from
asc
elib
rary
.org
by
GR
AIN
GE
R E
NG
INE
ER
ING
LIB
E o
n 05
/27/
13. C
opyr
ight
ASC
E. F
or p
erso
nal u
se o
nly;
all
righ
ts r
eser
ved.
and relief wells with a collection trench along the downstream toecontrol significant foundation seepage across the valley. Thisconfiguration of seepage control is typical within the USACE andparticularly the USACE, Kansas City District (KCD), e.g., MilfordDam (see Stark et al. 2011). Near each abutment, stabilizing bermswere constructed upstream and downstream because of soft soilsencountered in a terrace deposit on the right side and in an oldoxbow deposit near the left side of the valley.
Dam Safety Assurance Program
The project was executed under the USACE Dam Safety AssuranceProgram (DSAP), (USACE 1999), which provides the USACEwith the means to address both the seismic and hydrologic inade-quacies of its national inventory of dams. Only the seismic aspectsof theDSAP forTuttleCreekDamare discussed in this paper, althoughhydraulic aspects were addressed during this construction as well.
For seismic adequacy, USACE criteria require high hazard dams,such as Tuttle Creek Dam, to withstand a maximum credible earth-quake (MCE) without catastrophic failure, although economic dam-age may be tolerated. A dam is classified as high hazard when failureor mis-operation of the dam results in loss of life. DSAP regulationrequires USACE Districts to perform a three-phase investigationto support a finding of whether the dam is considered safe. If theproject proceeds past the initial data-gathering phase (Phase I) and thedetailed seismic analysis (Phase II) and is found to be unsafe, anevaluation report is prepared to justify the necessary remediation. Theevaluation report and an Environmental Impact Statement (EIS) werejointly prepared for Tuttle CreekDam to serve as a decision documentto secure funding for the remedial design and construction (Phase III).During Phase III, the remediation design was finalized and plans andspecifications were prepared for bidding purposes.
Phase II Investigations
Tuttle Creek Dam is located in an area of moderate seismicity asso-ciated with an old continental rift zone, the Mid-Continent Geo-physical Anomaly, MGA. The main seismic source zones are theNemaha Ridge uplift zone and the Humboldt Fault zone, both locatedjust to the east of the dam. The MCE, i.e., design earthquake, isa magnitude 6.6 event at a distance of 20 km. The peak ground ac-celeration (PGA) has a return period of about 3000 years. The MCEhas a peak horizontal ground acceleration (PHGA) of 0.28 gmean and0.56 g mean plus one standard deviation (Somerville et al. 2003).
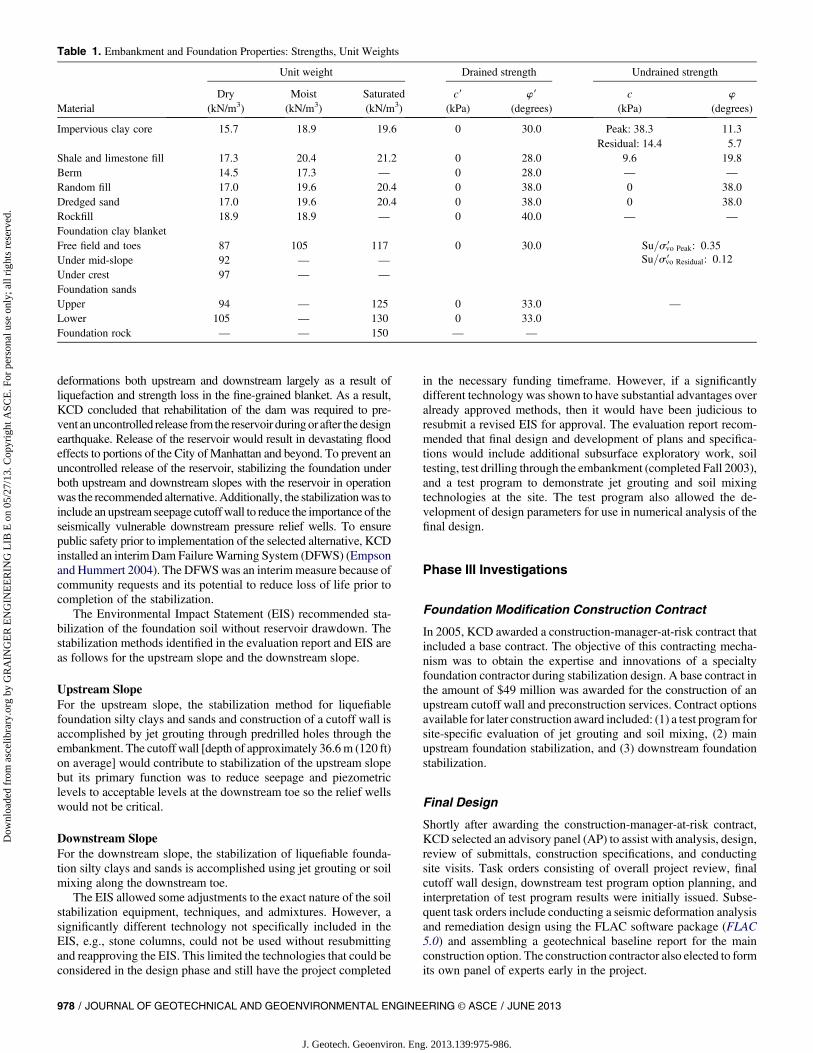
DSAP Phase II investigations include detailed subsurface ex-plorations, laboratory studies, and liquefaction assessments of thealluvial foundation soils. KCD conducted subsurface explorationsincluding SPT, CPT, vane shear, shear wave velocity testing, andhigh quality undisturbed sampling of the alluvial fine-grained soilblanket. Cyclic triaxial testing was conducted on the fine-grainedblanket silts and clays by Castro et al. (2003). Fig. 4 presents thetypical subsurface conditions near the downstream toe of the dam.The groundwater surface at the downstream toe is typically locatedat a depth of 2.7 m (9 ft) or elevation 310.2 m (1017 ft) but it isdependent on reservoir elevation and tailwater conditions.
The initial liquefaction assessment consists of analyses at criticallocations of the dam, determination of pre-earthquake static stresses,and a simplified liquefaction assessment (Seed and Idriss 1971)using one-dimensional SHAKE site response analyses. The Phase IIpost earthquake stability was assessed using limit equilibriumslope stability methods and assigning residual/steady state/liquefiedstrengths (Seed and Harder 1990) to the foundation zones thatwere predicted to liquefy. Because the post-earthquake limit
equilibrium stability analyses indicated a likelihood of a flow slide,post-earthquake deformations were estimated using finite elementanalyses using the software Dynaflow 1 (Popescu 1998; Prevost2002) and TARA3-FL (TARA3-FL; Finn 2004). Soil shear strengthparameters and unit weights used in these analyses for both theembankment and foundation materials are shown in Table 1.
Site investigations and geotechnical analyses identified the upperalluvial foundation sands as being susceptible to liquefaction underthe MCE. The clays and silts of the natural fine-grained blanket alsoappeared susceptible to pore-water pressure generation and strengthloss during earthquake loading (Castro et al. 2003). Both limitequilibrium and finite element post-earthquake deformation anal-yses showed significant deformation was expected, although it wasrecognized that the feasibility investigation phase numerical mod-eling did not accurately replicate the behavior of the fine-grainedblanket under seismic loading. However, overtopping of the em-bankment following the predicted earthquake deformations wasunlikely because the dam has about 25.6 m (84 ft) of freeboard atMPP. However, pressure relief wells at the downstream toe arecritical to protect the dam against foundation internal erosion andthe predicted permanent deformations would disable these reliefwells. With damage to or loss of the relief wells, the likely failuremechanism is internal erosion and piping of the foundation soils.
Phase II Evaluation Report and EIS
The allowable post-earthquake deformation criteria established for theTuttle Creek Dam are: 1.5 m (5 ft) vertically at the crest, 3 m (10 ft)laterally at the upstream toe, and 0.3 m (1 ft) laterally at the down-stream toe to prevent damage to the relief wells. Finite elementdeformation analyses performed in 2002 using Dynaflow (Popescu1998) and TARA3-FL (Finn 2004) predicted unacceptably large
Fig. 4. Generalized subsurface profile of alluvial foundation at down-stream toe [averageground surface elevationdownstreamofdam,312.6m(1025 ft)]
JOURNAL OF GEOTECHNICAL AND GEOENVIRONMENTAL ENGINEERING © ASCE / JUNE 2013 / 977
J. Geotech. Geoenviron. Eng. 2013.139:975-986.
Dow
nloa
ded
from
asc
elib
rary
.org
by
GR
AIN
GE
R E
NG
INE
ER
ING
LIB
E o
n 05
/27/
13. C
opyr
ight
ASC
E. F
or p
erso
nal u
se o
nly;
all
righ
ts r
eser
ved.
deformations both upstream and downstream largely as a result ofliquefaction and strength loss in the fine-grained blanket. As a result,KCD concluded that rehabilitation of the dam was required to pre-vent anuncontrolled release from the reservoir duringor after thedesignearthquake. Release of the reservoir would result in devastating floodeffects to portions of the City of Manhattan and beyond. To prevent anuncontrolled release of the reservoir, stabilizing the foundation underboth upstream and downstream slopes with the reservoir in operationwas the recommended alternative.Additionally, the stabilizationwas toinclude an upstream seepage cutoffwall to reduce the importance of theseismically vulnerable downstream pressure relief wells. To ensurepublic safety prior to implementation of the selected alternative, KCDinstalled an interimDam FailureWarning System (DFWS) (Empsonand Hummert 2004). The DFWSwas an interimmeasure because ofcommunity requests and its potential to reduce loss of life prior tocompletion of the stabilization.
The Environmental Impact Statement (EIS) recommended sta-bilization of the foundation soil without reservoir drawdown. Thestabilization methods identified in the evaluation report and EIS areas follows for the upstream slope and the downstream slope.
Upstream SlopeFor the upstream slope, the stabilization method for liquefiablefoundation silty clays and sands and construction of a cutoff wall isaccomplished by jet grouting through predrilled holes through theembankment. The cutoff wall [depth of approximately 36.6m (120 ft)on average] would contribute to stabilization of the upstream slopebut its primary function was to reduce seepage and piezometriclevels to acceptable levels at the downstream toe so the relief wellswould not be critical.
Downstream SlopeFor the downstream slope, the stabilization of liquefiable founda-tion silty clays and sands is accomplished using jet grouting or soilmixing along the downstream toe.
The EIS allowed some adjustments to the exact nature of the soilstabilization equipment, techniques, and admixtures. However, asignificantly different technology not specifically included in theEIS, e.g., stone columns, could not be used without resubmittingand reapproving the EIS. This limited the technologies that could beconsidered in the design phase and still have the project completed
in the necessary funding timeframe. However, if a significantlydifferent technology was shown to have substantial advantages overalready approved methods, then it would have been judicious toresubmit a revised EIS for approval. The evaluation report recom-mended that final design and development of plans and specifica-tions would include additional subsurface exploratory work, soiltesting, test drilling through the embankment (completed Fall 2003),and a test program to demonstrate jet grouting and soil mixingtechnologies at the site. The test program also allowed the de-velopment of design parameters for use in numerical analysis of thefinal design.
Phase III Investigations
Foundation Modification Construction Contract
In 2005, KCD awarded a construction-manager-at-risk contract thatincluded a base contract. The objective of this contracting mecha-nism was to obtain the expertise and innovations of a specialtyfoundation contractor during stabilization design. A base contract inthe amount of $49 million was awarded for the construction of anupstream cutoff wall and preconstruction services. Contract optionsavailable for later construction award included: (1) a test program forsite-specific evaluation of jet grouting and soil mixing, (2) mainupstream foundation stabilization, and (3) downstream foundationstabilization.
Final Design
Shortly after awarding the construction-manager-at-risk contract,KCD selected an advisory panel (AP) to assist with analysis, design,review of submittals, construction specifications, and conductingsite visits. Task orders consisting of overall project review, finalcutoff wall design, downstream test program option planning, andinterpretation of test program results were initially issued. Subse-quent task orders include conducting a seismic deformation analysisand remediation design using the FLAC software package (FLAC5.0) and assembling a geotechnical baseline report for the mainconstruction option. The construction contractor also elected to formits own panel of experts early in the project.
Table 1. Embankment and Foundation Properties: Strengths, Unit Weights
Unit weight Drained strength Undrained strength
Dry Moist Saturated c9 w9 c w
Material (kN/m3) (kN/m3) (kN/m3) (kPa) (degrees) (kPa) (degrees)
Impervious clay core 15.7 18.9 19.6 0 30.0 Peak: 38.3 11.3Residual: 14.4 5.7
Shale and limestone fill 17.3 20.4 21.2 0 28.0 9.6 19.8Berm 14.5 17.3 — 0 28.0 — —
Random fill 17.0 19.6 20.4 0 38.0 0 38.0Dredged sand 17.0 19.6 20.4 0 38.0 0 38.0Rockfill 18.9 18.9 — 0 40.0 — —
Foundation clay blanketFree field and toes 87 105 117 0 30.0 Su=s9vo Peak: 0:35
Su=s9vo Residual: 0:12Under mid-slope 92 — —
Under crest 97 — —
Foundation sandsUpper 94 — 125 0 33.0 —
Lower 105 — 130 0 33.0Foundation rock — — 150 — —
978 / JOURNAL OF GEOTECHNICAL AND GEOENVIRONMENTAL ENGINEERING © ASCE / JUNE 2013
J. Geotech. Geoenviron. Eng. 2013.139:975-986.
Dow
nloa
ded
from
asc
elib
rary
.org
by
GR
AIN
GE
R E
NG
INE
ER
ING
LIB
E o
n 05
/27/
13. C
opyr
ight
ASC
E. F
or p
erso
nal u
se o
nly;
all
righ
ts r
eser
ved.
Jet Grout Cutoff Wall
Design
The jet grouted upstream cutoff wall was to be 0.3m (10 ft) wide andconstructed 73 m (240 ft) upstream of the dam centerline. At thislocation, it would create a barrier from near the upstream tip of theextended impervious core zone to foundation bedrock. The requireddepth and height of the wall would also be less than if it were con-structed at the centerline. Additionally, this location would avoidrerouting traffic from the highway located at the dam crest. Pre-drilling through the shale and limestone embankment fill wouldallow construction to be accomplished with overlapping jet groutcolumns.
Specifications for the cutoff wall required a minimum 1,170 kPa(170 psi) strength and a differential hydraulic head across the wall of11.9 m (39 ft) at MPP. The objective was to reduce downstreampiezometric levels so the seismically sensitive pressure relief sys-tem along the downstream toe would no longer be necessary. Thecutoff wall was to be constructed using multiple (at least two) rowsof jet grout columns. The wall was to penetrate a minimum of 0.3 m(1 ft) into the bedrock except between stations 47175 and 48150where a 3 m (10 ft) bedrock socket was required because of thepresence of the deep buried channel and to ensure bedrock wasencountered, as opposed to boulders suspended in the soil matrix.During Phase III exploratory drilling, the buried channel was foundto extend deeper than originally thought, from elevation 283.5 m(930 ft) to about elevation 278 m (913 ft). The channel has an ir-regular bedrock surface and large slump blocks were found to bepresent above bedrock.
At the proposed location, the cutoff wall would have to tie not onlyinto bedrock, but also the extended portion of the impervious core.Constructing a cutoff wall with overlapping jet grout columns wouldalso require precise borehole alignment to ensure overlap of adjacentcolumns to form a continuous barrier. Additionally, the column di-ameter would have to be constant through the variable soft to stiffclays and silts to loose to dense sands and gravels of the foundation.Thus, site-specific correlations between jet grout energy and columndiameter had to be developed and the energy varied to account forthe considerable variation in foundation strata. An additional chal-lenge of the jet grouted cutoffwallwas that, in accordwith theEIS, thereservoir had to be maintained, which meant that as the cutoff wallprogressed, piezometric levels upstream of the wall would increasetoward the reservoir head and thus high gradients would be encoun-tered as wall closure approached. Finally, contract specifications wereprepared, which emphasized the criticality of performing the jetgrouting so the embankment and natural fine-grained blanket werenot damaged by ground fracturing. Prevention of ground fracturingwas a major concern for the Tuttle Creek Dam because of the im-portant and fragile underseepage control system.
The contractor proposed utilizing high capacity pumps to pro-duce column diameters of 2.6 m (8.5 ft) and two rows of columns tocreate the 3 m (10 ft) thick wall. The proposed column diameterswere larger than any that the contractor had constructed previously.Field trials to establish jet grout parameters, column diametermeasurements and uniformity, energy correlations, and assessmentof quality of treated soil, were undertaken as described in the fol-lowing section.
Field Trials: Downstream Parametric Columns
In the spring of 2006, field trials for the cutoff wall and slope sta-bilization began about 152 m (500 ft) downstream of the dam underthe base contract and the Test ProgramOption (TPO) awarded to the
contractor by the KCD. The main objective of the TPO was to in-vestigate the viability of jet grouting and soil mix technologies be-fore beginning production of the upstream and downstreamfoundation ground improvement. At this location, trials with variousparameters could be conducted without risk to dam safety (note thatthe in situ stress conditions were significantly different from theexpected values below the upstream slope of the dam). The con-tractor’s goal of the parametric columns was to achieve a columndiameter of 2.6 m (8.5 ft) and a minimum unconfined compressivestrength of 1,170 kPa (170 psi). The contractor used a specific energyapproach with the objective of correlating specific energy to columndiameter. For example, the specific energy, E, in MJ/m, for triple-fluid jet grouting the specific energy is calculated by adding theenergy imparted by the water and air eroding jets [see Eq. (1)]:
EJG-Triple ¼ ðPW � QW þ PA � QAÞVS
ð1Þ
where PW and PA are the water and air pressures in MPa, respec-tively, QW and QA are the water and airflow rates in m3/hour, re-spectively, andVs is the jet withdrawal speed inm/hour. Use of theseunits will yield values of EJG-Triple in MJ/m.
Under the base contract a total of 18 parametric jet grout columnswere constructed primarily using triple fluid (air, water, and grout)jet grouting, although nine were constructed using double fluidtechnique (only air and grout). Column properties and diameterswere checked by making cores of completed columns with sonicdrilling and conventional core drillingwith a double tube core barrel.The contractor experienced considerable difficulty in constructingthe downstream parametric columns including maintaining spoilreturn, instability of the excavated column roof, and settlement of thesoilcrete after column completion. The contractor reported thatmany of the triple fluid columns achieved a 2.6 m (8.5 ft) diameter;however, several columns had diameters up to 3.7m (12 ft) while thedouble fluid column diameters were from 2.1 to 2.4 m (7 to 8 ft).These reported diameters were all in the portion of the column above12 m (40 ft) depth. Below 12 m (40 ft) in the denser sands andgravels, and in the deeper stiff clay layer, column diameters weresignificantly smaller than 2.6 m (8.5 ft). These results suggest thatupstream jet grouting, where stresses and material strength anddensities are increased, would require greater energy by increasingwater, air, and/or grout pressures or by decreasing jet withdrawalspeed or station time of the jet grout monitor at each elevation step.
Under the TPO, 27 soil mix columns were also constructed in thedownstream test area adjacent to 27 jet grout columns. The down-stream test areawas approximately 56.4m (185 ft) wide and 103.7m(340 ft) long (seeStark et al. 2009 for details). The top of the columnswere about elevation 310 m (1016 ft), and unlike the case of theupstream field trial, parametric columns for the cutoff wall (de-scribed in the next section) did not extend to bedrock, but rather werecarried only to elevation 299 m (980 ft). After the jet grout columnswere complete and subsequent coring of the columns had beenconducted, the groundwater within the cement-bentonite (C-B)slurry wall surrounding the test area was lowered to 11.3 m (37ft) below ground surface (b.g.s.), i.e., elevation 301.4 m (989 ft), toallow excavation of the soil surrounding the columns. Stark et al.(2009) describe the excavation and sectioning of some of the jetgrout columns to determine column integrity and homogeneity. Thesectioned jet grout test columns contained more than 40 to 50%native soil that was not broken up and evacuated during the jetgrout process.Most of the inclusionswere greater than 75 to 100mm(3 to 4 in.) in size and some were much larger. The observedinclusions in the completed jet grout columns included significant
JOURNAL OF GEOTECHNICAL AND GEOENVIRONMENTAL ENGINEERING © ASCE / JUNE 2013 / 979
J. Geotech. Geoenviron. Eng. 2013.139:975-986.
Dow
nloa
ded
from
asc
elib
rary
.org
by
GR
AIN
GE
R E
NG
INE
ER
ING
LIB
E o
n 05
/27/
13. C
opyr
ight
ASC
E. F
or p
erso
nal u
se o
nly;
all
righ
ts r
eser
ved.

amounts and large pieces of both fine-grained (silts and clays) andcoarse-grained (fine sands and sands) soils.
In summary, the significant amount and large size of the soilinclusions found in the completed jet grout columns suggested thatblockage of the annulus between the boring casing and jet groutingdrill rod should be expected when constructing large-diameter col-umns. Blockage or insufficient spoil return will also lead to accu-mulation of high pressures in the subsurface and possible groundfracturing. Because high water, grout, and air pressures are used toconstruct these columns, some air bubbles were observed at theground surface during downstream jet grouting, although not to theextent observed in the reservoir during subsequent upstream param-etric columns.
In addition to sectioned jet grout columns, three jet-assisted soil-mixed columns were also sectioned. The sectioned jet-assisted soil-mixed columns did not have significant or measurable inclusions,and were thoroughly mixed. This indicated a high degree of mixingwas achieved during column construction (Stark et al. 2009).However, the soil mix technology available to the contractor wasalso jet-assisted, with a single axis in which grout was introducedinto the soil mix column under high pressure. As a result, this soilmixing technology posed risks similar to jet grouting and wassubsequently viewed as a dam safety risk.
Field Trials: Upstream Parametric Columns
The results of the downstream parametric columns were not com-pletely representative of the results that would be obtained on theupstream slope for a variety of reasons, including the fact that the insitu earth and water pressures are greater upstream than down-stream. As a result, in early July 2006, the contractor was permittedto move to the work platform on the upstream slope to constructadditional trial columns to develop correlations of column diameter,energy, and material type. These parametric columns were con-structed from the cutoff wall work platform constructed at elevation333.8 m (1095 ft), immediately downstream from the proposedcutoff wall alignment on the left side of the embankment. Predrillingwith a sonic drill rig was conducted through the upstream em-bankment and a 254 mm (10 in.) diameter PVC casing was installedin unhardened grout backfilled boreholes from the work platform tothe proposed top of the jet grout column. Prior to commencement ofjet grouting, the hardened grout was removed from the casing in-terior by a 203 mm (8 in.) drill bit, leaving a 25 mm (1 in.) wideannulus of hardened grout in the casing prior to drilling the hole tobedrock for the jet grouting of the column. The column constructionbegan 0.3 m (1 ft) below the top of the bedrock and extended intothe extended impervious core zone at elevation 314.0 m (1030 ft)as would be required for cutoff wall construction. Seventeenparametric columns were installed between Station 65150 andStation 67100 on the upstream side of the dam. The triple anddouble fluid jet grout parameters for the upstream field trials areshown in Table 2.
The first six columns (fivetriple fluid, one double fluid) wereconstructed without significant incident at diameters of 2.6 m(8.5 ft). However, during construction of the seventh column (atriple fluid column), loss of spoil return occurred repeatedly duringjet grouting and the contractor was unable to restore continuousspoil return. For this column, the water pressure and grout pressurewere both about 440 bars (44 MPa, 6380 psi). When spoil returnwas lost, water and grout were being injected at the rate of about800 L/min (200 gal./min) while the air pressure was beingmaintained at 12 bars (1.2MPa, 175 psi). Spoil return was lost eventhough steps, e.g., repeated stroking of the hole, spraying waterinto top of the hole, and temporarily stopping construction, were
performed multiple times to restore spoil return. After about 100min from when continuous spoil return was first lost, air bubblingwas observed in the reservoir just upstream of the work area. Afterthis observation, the contractor abandoned the column and groutedthe drill hole. The air bubbling in the reservoir appeared fromapproximately Station 65100 to 67100 (see Fig. 3) and wassuggestive of the possibility that ground fracture may have oc-curred toward the reservoir. It is possible that ground fracturingmay have propagated downstream and/or laterally as well; or not atall. The bubbling subsided after about 48 h, suggesting a largevolume of air was stored under high pressure prior to the air bubblesappearing in the reservoir. The air was probably stored in the per-vious sand foundation materials, and then released along fracturesthrough the embankment and/or natural fine-grained blanket intothe reservoir.
The loss of spoil return and the injection of large volumes of airand fluids under high pressure can fracture in situmaterials becausepressure builds up almost instantaneously after a loss of spoilreturn. Fluid injection pressures, which normally are dissipatedwith head losses in the hydraulic system and in the erosion process,can result in bottom hole pressures far exceeding those required toinitiate ground fracturing when spoil return is interrupted evenintermittently.
While air escaping into the reservoir may have indicated damageto the embankment and/or the natural fine-grained blanket, themanifestation of damage, e.g., increased seepage or gradient, canoccur long after the fracturing occurred, particularly at higher res-ervoir levels. As a result, KCD carefully monitored the downstreamrelief wells and toe area for signs of internal erosion, sand boils, andincreased seepage for three weeks, including continuous surveil-lance during the first 24 h. Piezometers were also carefully moni-tored to identify any changes in foundation piezometric levels. Noabnormal reading or observations were made, so the heightenedsurveillance was reduced after about three weeks. No change in thereservoir level occurred during this period.
Suspension of jet grouting was directed by the KCD to assesspossible ground fracturing and to develop techniques for preventingsimilar incidents. A revised plan of action for spoil blockage alloweda loss of spoil return for 30 s before action to remove the blockage,e.g., stroking the hole with the jet grout drill rod, was required. Withimplementation of the revised response plan, conditional upstreamjet grouting resumed four days later with a double fluid column. The
Table 2. Jet Grout Parameters for Upstream Parametric Columns(1 bar5 100 kPa)
Triple fluid Double fluid
Three nozzles Two nozzles
1: Water(0.45–0.55/0.18–0.22)
1: Grout(0.5–0.65/0.20–0.26)
Nozzles (number anddiameter cm/in.)
2: Grout(0.55–0.70/0.22–0.28)
2: Air (0.21/0.08)
3: Air (0.21/0.08)
Cement/water ratio 0.9–1.0 0.620.9Water pressure (bars) 440–480 —
Water flow rate (L/min) 340–345 —
Grout pressure (bars) 250–440 430–445Grout flow rate (L/min) 448 300–500Air pressure (bars) 7–15 6–12Airflow rate (L/min) 7,700 4,000–7,000Withdrawal rate (m/hr) 8.4 6.8Specific energy (MJ/m) 82–175 179–183
980 / JOURNAL OF GEOTECHNICAL AND GEOENVIRONMENTAL ENGINEERING © ASCE / JUNE 2013
J. Geotech. Geoenviron. Eng. 2013.139:975-986.
Dow
nloa
ded
from
asc
elib
rary
.org
by
GR
AIN
GE
R E
NG
INE
ER
ING
LIB
E o
n 05
/27/
13. C
opyr
ight
ASC
E. F
or p
erso
nal u
se o
nly;
all
righ
ts r
eser
ved.
grout injection pressure was about 450 bar (45 MPa, 6525 psi), andthe air pressure was about 12 bars (1.2 MPa, 175 psi). During jetgrouting, air bubbling was again observed in the reservoir just up-stream of the column. After observation of the air bubbling, jetgrouting was terminated and the hole was grouted. Spoil return hadbeen quite viscous and somewhat sporadic, but with nomore than 10to 15 s lapses. The revised plan of action was not implemented be-fore air bubbling was observed in the reservoir because the maxi-mum blockage time was less than the 30 s threshold. It becameapparent that when spoil return was lost, ground fracturing wasoccurring because of continued injection of incompressible fluids.This required development of a new action plan that would requireadditional steps to prevent ground fracturing.
The new action plan involved installation of real-time in-strumentation to quickly detect pore pressure changes in the vicinityof jet grouting and two major adjustments in the jet grouting pro-cedure. The first adjustment involved a larger borehole annulus byusing a 254 mm (10 in.) casing and 228.6 mm (9 in.) drill bit to drillout the hardened grout in the casing prior to jet grouting instead ofa 203.2 mm (8 in.) drill bit. A larger drill bit resulted in the groutannulus being reduced from 25 mm to 12.5 mm (1 in. to 0.5 in.),which created additional space for evacuation of the jet groutingspoil. The second adjustment involved the jet grouting procedurebringing the monitor up into the casing before starting the air andfluid circulation and then moving it to the bottom of the hole insteadof starting at the bottom of the hole. This initiated spoil return ata much lower pressure rather than initiating return at the bottom ofthe drill hole under a full column of native soil. After installation ofan array of vibrating wire piezometers with real-time readouts alongwith open tube devices, jet grouting was resumed in late September2006. The first three jet grout columnswere completedwith sporadicor periodic short losses of spoil return, accompanied by brief, im-mediate increases in piezometric pressure. There were no visible airreleases into the reservoir. However, during construction of thefourth column, spoil return was lost shortly after beginning jetgrouting and air bubbling again occurred in the reservoir. This airrelease occurred in close proximity to the prior air release at Station65100 to 67100 and occurred within about 10 s of the loss of spoilreturn. Instrumentation installed to monitor the jet grouting processshowed an immediate pore pressure increase following any in-terruption in spoil return. Indications of ground fracturing includedhardened grout observed in the spoil return of a subsequentlyconstructed column and a subsequent sonic core encountered groutin the natural fine-grained blanket downstream of an adjacentcolumn.
Afterward, the changes required to achieve acceptable ensuranceof spoil return and no ground fracturing could not be agreed uponwithin the terms of the contract, and KCD had to decide whether to
terminate the cutoff wall or accept dam safety risks from potentialdamage to the upstream fine-grained blanket and the extended im-pervious core zone of the dam. Considerations included not only theresults of the jet grouting field trial, but also results of the down-stream TPO for ground improvement (both jet grout and deep soilmixing), dam safety risk analysis, and recently completed seismicdeformation analyses that showed upstream deformations werewithin acceptable limits.
Dam Safety Concerns and Jet GroutingConsiderations
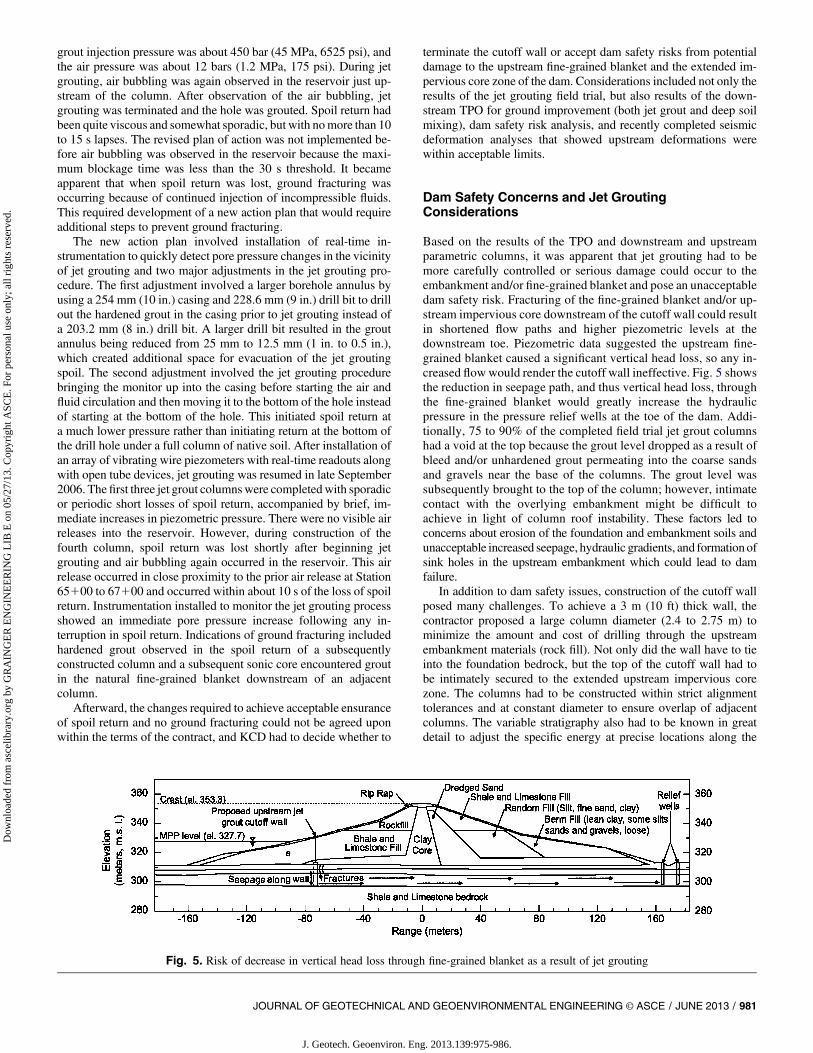
Based on the results of the TPO and downstream and upstreamparametric columns, it was apparent that jet grouting had to bemore carefully controlled or serious damage could occur to theembankment and/or fine-grained blanket and pose an unacceptabledam safety risk. Fracturing of the fine-grained blanket and/or up-stream impervious core downstream of the cutoff wall could resultin shortened flow paths and higher piezometric levels at thedownstream toe. Piezometric data suggested the upstream fine-grained blanket caused a significant vertical head loss, so any in-creased flowwould render the cutoff wall ineffective. Fig. 5 showsthe reduction in seepage path, and thus vertical head loss, throughthe fine-grained blanket would greatly increase the hydraulicpressure in the pressure relief wells at the toe of the dam. Addi-tionally, 75 to 90% of the completed field trial jet grout columnshad a void at the top because the grout level dropped as a result ofbleed and/or unhardened grout permeating into the coarse sandsand gravels near the base of the columns. The grout level wassubsequently brought to the top of the column; however, intimatecontact with the overlying embankment might be difficult toachieve in light of column roof instability. These factors led toconcerns about erosion of the foundation and embankment soils andunacceptable increased seepage, hydraulic gradients, and formationofsink holes in the upstream embankment which could lead to damfailure.
In addition to dam safety issues, construction of the cutoff wallposed many challenges. To achieve a 3 m (10 ft) thick wall, thecontractor proposed a large column diameter (2.4 to 2.75 m) tominimize the amount and cost of drilling through the upstreamembankment materials (rock fill). Not only did the wall have to tieinto the foundation bedrock, but the top of the cutoff wall had tobe intimately secured to the extended upstream impervious corezone. The columns had to be constructed within strict alignmenttolerances and at constant diameter to ensure overlap of adjacentcolumns. The variable stratigraphy also had to be known in greatdetail to adjust the specific energy at precise locations along the
Fig. 5. Risk of decrease in vertical head loss through fine-grained blanket as a result of jet grouting
JOURNAL OF GEOTECHNICAL AND GEOENVIRONMENTAL ENGINEERING © ASCE / JUNE 2013 / 981
J. Geotech. Geoenviron. Eng. 2013.139:975-986.
Dow
nloa
ded
from
asc
elib
rary
.org
by
GR
AIN
GE
R E
NG
INE
ER
ING
LIB
E o
n 05
/27/
13. C
opyr
ight
ASC
E. F
or p
erso
nal u
se o
nly;
all
righ
ts r
eser
ved.
column. Field trials and the TPO showed that stability of the columnroof had to be maintained and complete mixing of materials attainedto avoid windows in the wall. Based on these concerns, it was notclear the that the proposed cutoff wall would not have gaps andwould achieve the 11.9 m (39 ft) head drop required in the specifi-cations (see Stark et al. 2009).
Because of these jet grouting challenges, dam safety risks, andthe inability to control these risks, long-term cutoff wall perfor-mance (Rice and Duncan 2009 a,b), and results of the seismic de-formation analysis described in the next section, the KCD decidedto abandon upstream jet grouting, which meant forgoing the up-stream cutoff wall and upstream slope stabilization.
Seismic Deformation Analysis
Initial seismic deformation analyses estimated using Dynaflow(Popescu 1998) and TARA3-FL (TARA3-FL; Finn 2004) predictedlarge displacements of the existing unremediated dam, which jus-tified the retrofit of both upstream and downstream slopes.
The design ground motion for the deformation analyses is theCastaic accelerogram from the 1971 San Fernando, Californiaearthquake, N69Wcomponent, scaled to a peak acceleration of 0:3g.The depth andmagnitude of the earthquake are 14 km (9mi) and 6.5,respectively. The original accelerogram has a peak acceleration andduration of 0:27g and 40 s, respectively. The resulting time historymatches the 84th percentile acceleration spectra for the MCE ina range near the fundamental period of the dam (0.3 to 0.6 s). Thescaling and development of the design ground motion is discussedin Somerville et al. (2003). The design ground motion is consideredto be conservative because the response spectra of the design eventplots mostly above the evaluation mean plus sigma design responsespectrum for the range of natural period of the dam, and yielded themost damaging response.
Later, the KCD appointed an advisory panel to assist witha seismic deformation analysis of the unremediated dam using thesoftware FLAC (FLAC 5.0) and the calibrated UBCSAND andUBCTOT constitutive models (Perlea 2006). The application ofthe FLAC-UBCSAND analysis led to much smaller permanentdisplacements than those previously predicted for the existing dam,such that upstream remediation was not required and a betterunderstanding of the remediation required for the downstreamslope was obtained. The permanent deformations predicted usingFLAC are at least an order of magnitude lower than the valuesestimated using the software Dynaflow (Popescu 1998) andTARA3-FL (TARA3-FL). The reason for this difference is theconstitutive soil models used for the foundation materials, and inparticular the fine-grained blanket, were more representative of theconditions at Tuttle Creek. For example, the main difference be-tween the TARA3 and FLAC analyses is that TARA3 (Finn 2004)utilizes a hyperbolic stress-strain model for the fine-grainedblanket that could not effectively model the undrained shear be-havior, which involves dilation at low effective stresses and highapplied-stress ratios. The high applied-stress ratios resulted inunreasonably large strains and low blanket strength, which causedthe predicted deformations to be extremely large because thehyperbolic model cannot replicate the concave stress-strain be-havior that results from dilation. Another difference is that theTARA3model uses an accumulated shear strain, and not maximumshear strain, to estimate shear strength, which results in an un-drained residual strength being applied to a substantial portion ofthe fine-grained blanket and runaway permanent displacements inthe blanket. In short, TARA3 did not properly accommodate thestrain softening behavior of the fine-grained blanket.
Some of the limitations with the Dynaflow analysis (Popescu1998) include prediction of liquefaction triggering, no calibrationwith laboratory results, and no apparent mechanism for in-corporating a liquefied strength back-calculated from flow failurecase histories (Stark and Mesri 1992). As a result, once liquefactiontriggered in both the foundation sands and fine-grained blanket, theshear strength dropped to an extremely low value, e.g., zero, whichresulted in the development of large permanent displacements. TheFLAC-UBCSAND analysis and results are described in Stark et al.(2012) but the estimated permanent deformations are summarizedas:• Crest settlement of about 0.6 m (2 ft);• Permanent deformations at the upstream toe of less than about
0.6 m (2 ft); and• Permanent deformations at the downstream toe of about 1.5m (5 ft),
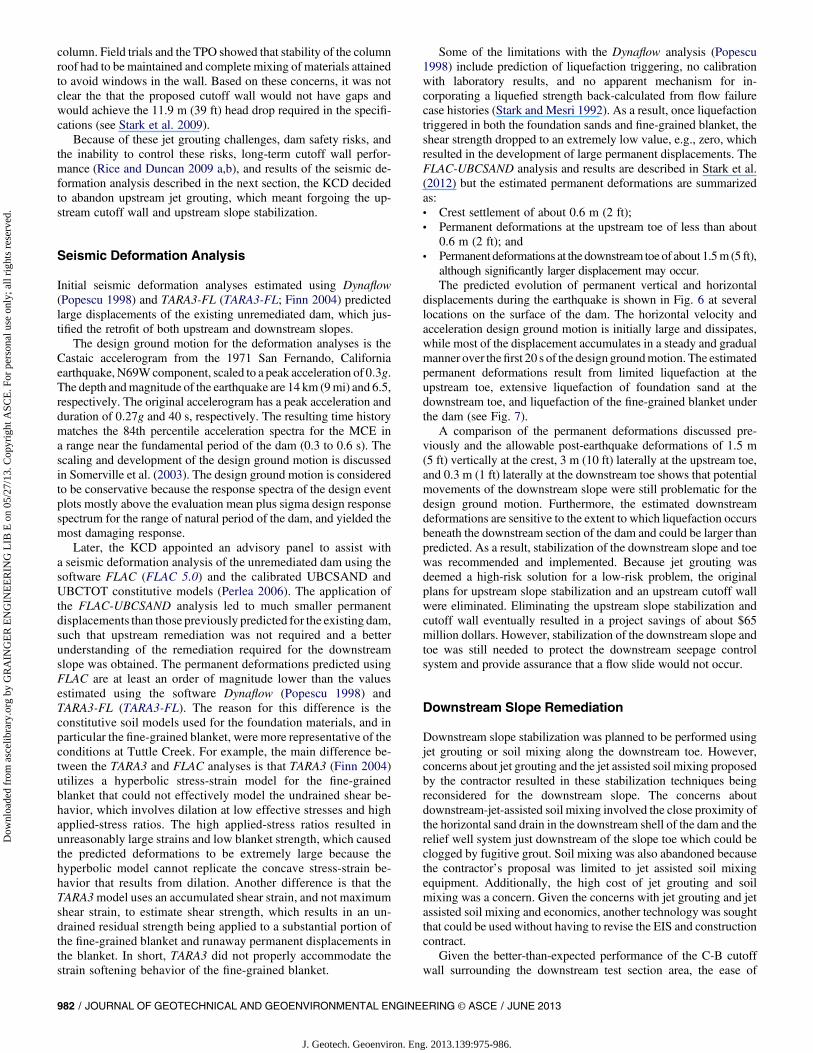
although significantly larger displacement may occur.The predicted evolution of permanent vertical and horizontal
displacements during the earthquake is shown in Fig. 6 at severallocations on the surface of the dam. The horizontal velocity andacceleration design ground motion is initially large and dissipates,while most of the displacement accumulates in a steady and gradualmanner over thefirst 20 s of the design groundmotion. The estimatedpermanent deformations result from limited liquefaction at theupstream toe, extensive liquefaction of foundation sand at thedownstream toe, and liquefaction of the fine-grained blanket underthe dam (see Fig. 7).
A comparison of the permanent deformations discussed pre-viously and the allowable post-earthquake deformations of 1.5 m(5 ft) vertically at the crest, 3 m (10 ft) laterally at the upstream toe,and 0.3 m (1 ft) laterally at the downstream toe shows that potentialmovements of the downstream slope were still problematic for thedesign ground motion. Furthermore, the estimated downstreamdeformations are sensitive to the extent to which liquefaction occursbeneath the downstream section of the dam and could be larger thanpredicted. As a result, stabilization of the downstream slope and toewas recommended and implemented. Because jet grouting wasdeemed a high-risk solution for a low-risk problem, the originalplans for upstream slope stabilization and an upstream cutoff wallwere eliminated. Eliminating the upstream slope stabilization andcutoff wall eventually resulted in a project savings of about $65million dollars. However, stabilization of the downstream slope andtoe was still needed to protect the downstream seepage controlsystem and provide assurance that a flow slide would not occur.
Downstream Slope Remediation
Downstream slope stabilization was planned to be performed usingjet grouting or soil mixing along the downstream toe. However,concerns about jet grouting and the jet assisted soil mixing proposedby the contractor resulted in these stabilization techniques beingreconsidered for the downstream slope. The concerns aboutdownstream-jet-assisted soil mixing involved the close proximity ofthe horizontal sand drain in the downstream shell of the dam and therelief well system just downstream of the slope toe which could beclogged by fugitive grout. Soil mixing was also abandoned becausethe contractor’s proposal was limited to jet assisted soil mixingequipment. Additionally, the high cost of jet grouting and soilmixing was a concern. Given the concerns with jet grouting and jetassisted soil mixing and economics, another technology was soughtthat could be used without having to revise the EIS and constructioncontract.
Given the better-than-expected performance of the C-B cutoffwall surrounding the downstream test section area, the ease of
982 / JOURNAL OF GEOTECHNICAL AND GEOENVIRONMENTAL ENGINEERING © ASCE / JUNE 2013
J. Geotech. Geoenviron. Eng. 2013.139:975-986.
Dow
nloa
ded
from
asc
elib
rary
.org
by
GR
AIN
GE
R E
NG
INE
ER
ING
LIB
E o
n 05
/27/
13. C
opyr
ight
ASC
E. F
or p
erso
nal u
se o
nly;
all
righ
ts r
eser
ved.
construction, ease in verifying stabilization limits, and possibleeconomic benefits, it was decided to use transverse C-B walls forstabilization of the downstream slope. Historically, most C-B wallshave been used for permeability reduction and seepage controlrather than as a structural element, so some design and testing wasrequired to obtain a C-B mix that could meet the wall strengthrequirements. The technical issues to be addressed were to de-termine the configuration of the slurry walls to stabilize the down-stream slope without impacting foundation underseepage, developa suitable construction technique, and find a C-B slurry mix thatwould yield the desired static and seismic performance of the wall.Some of the concerns about self-hardening slurry were: typicalunconfined compressive strength (UCS) is less than about 700 kPa
(100 psi) at an age of 28 days, brittle stress-strain behavior, unknownlarge displacement strength, and maintaining slurry workabilityduring construction.
To achieve the desired structural capacity of the walls, a UCS of680 kPa (98 psi) in 28 days was required. A seismic deformationanalysis was performed using the calibrated FLAC model describedpreviously to evaluate the impact of the transverse shear walls ondownstream slope deformation. This analysis shows that the un-reinforced and relatively brittle shear walls would be exposed tolarge shear strains during or immediately after the design seismicevent. Such loading may crack the shear walls, after which thefrictional resistance of the cracked section would govern the abilityof the shear walls to resist gravitational forces induced by the slope.
Fig. 6. Time histories of (a) horizontal, (b) vertical, (c) horizontal acceleration design motion, and (d) horizontal velocity design motion
JOURNAL OF GEOTECHNICAL AND GEOENVIRONMENTAL ENGINEERING © ASCE / JUNE 2013 / 983
J. Geotech. Geoenviron. Eng. 2013.139:975-986.
Dow
nloa
ded
from
asc
elib
rary
.org
by
GR
AIN
GE
R E
NG
INE
ER
ING
LIB
E o
n 05
/27/
13. C
opyr
ight
ASC
E. F
or p
erso
nal u
se o
nly;
all
righ
ts r
eser
ved.
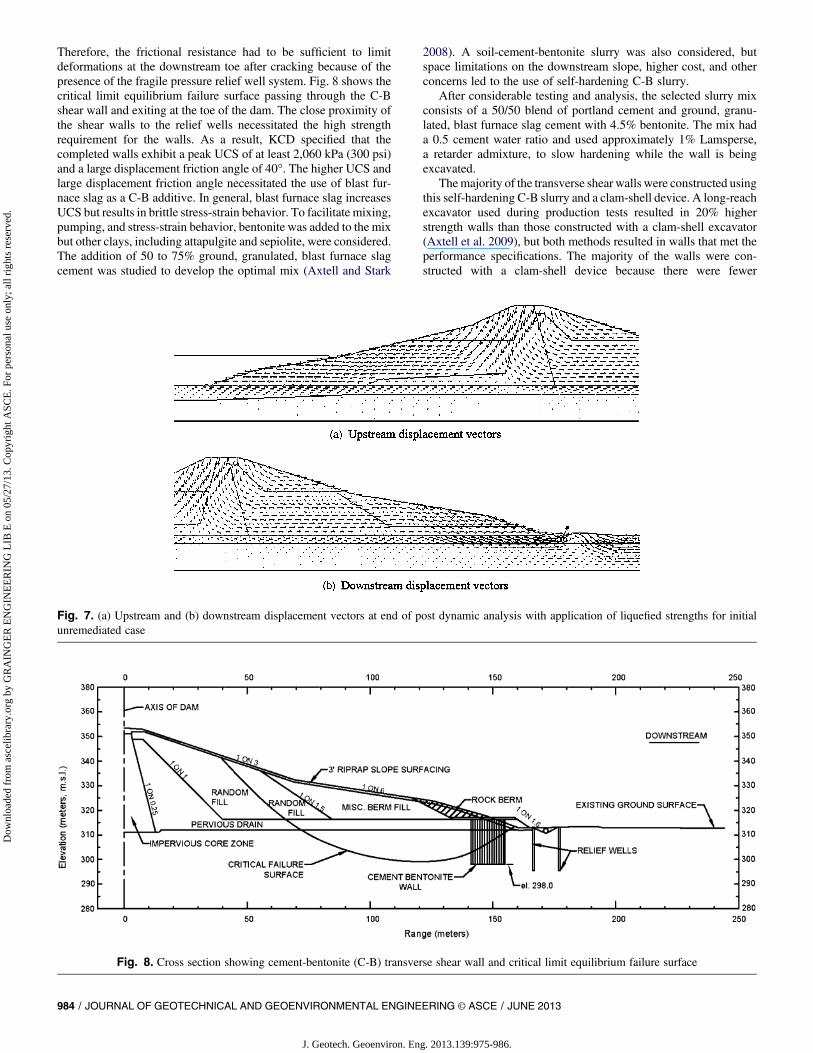
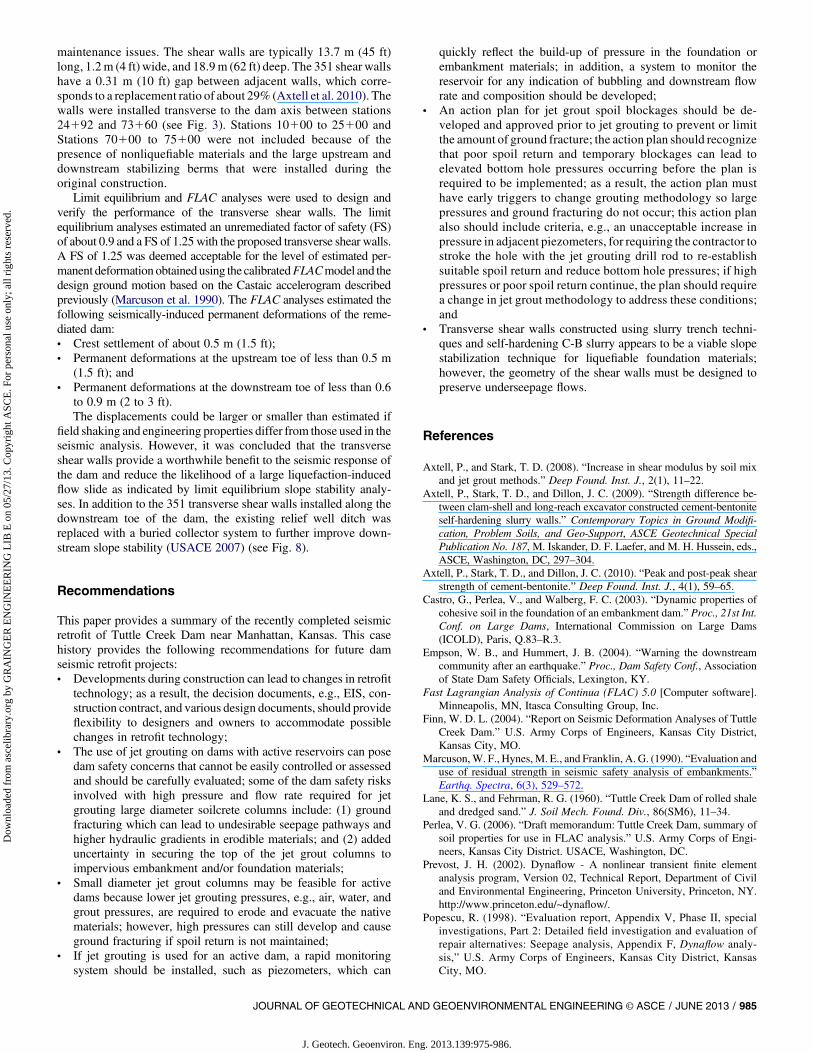
Therefore, the frictional resistance had to be sufficient to limitdeformations at the downstream toe after cracking because of thepresence of the fragile pressure relief well system. Fig. 8 shows thecritical limit equilibrium failure surface passing through the C-Bshear wall and exiting at the toe of the dam. The close proximity ofthe shear walls to the relief wells necessitated the high strengthrequirement for the walls. As a result, KCD specified that thecompleted walls exhibit a peak UCS of at least 2,060 kPa (300 psi)and a large displacement friction angle of 40�. The higher UCS andlarge displacement friction angle necessitated the use of blast fur-nace slag as a C-B additive. In general, blast furnace slag increasesUCS but results in brittle stress-strain behavior. To facilitate mixing,pumping, and stress-strain behavior, bentonite was added to the mixbut other clays, including attapulgite and sepiolite, were considered.The addition of 50 to 75% ground, granulated, blast furnace slagcement was studied to develop the optimal mix (Axtell and Stark
2008). A soil-cement-bentonite slurry was also considered, butspace limitations on the downstream slope, higher cost, and otherconcerns led to the use of self-hardening C-B slurry.
After considerable testing and analysis, the selected slurry mixconsists of a 50/50 blend of portland cement and ground, granu-lated, blast furnace slag cement with 4.5% bentonite. The mix hada 0.5 cement water ratio and used approximately 1% Lamsperse,a retarder admixture, to slow hardening while the wall is beingexcavated.
Themajority of the transverse shear walls were constructed usingthis self-hardening C-B slurry and a clam-shell device. A long-reachexcavator used during production tests resulted in 20% higherstrength walls than those constructed with a clam-shell excavator(Axtell et al. 2009), but both methods resulted in walls that met theperformance specifications. The majority of the walls were con-structed with a clam-shell device because there were fewer
Fig. 7. (a) Upstream and (b) downstream displacement vectors at end of post dynamic analysis with application of liquefied strengths for initialunremediated case
Fig. 8. Cross section showing cement-bentonite (C-B) transverse shear wall and critical limit equilibrium failure surface
984 / JOURNAL OF GEOTECHNICAL AND GEOENVIRONMENTAL ENGINEERING © ASCE / JUNE 2013
J. Geotech. Geoenviron. Eng. 2013.139:975-986.
Dow
nloa
ded
from
asc
elib
rary
.org
by
GR
AIN
GE
R E
NG
INE
ER
ING
LIB
E o
n 05
/27/
13. C
opyr
ight
ASC
E. F
or p
erso
nal u
se o
nly;
all
righ
ts r
eser
ved.
maintenance issues. The shear walls are typically 13.7 m (45 ft)long, 1.2m (4 ft) wide, and 18.9m (62 ft) deep. The 351 shear wallshave a 0.31 m (10 ft) gap between adjacent walls, which corre-sponds to a replacement ratio of about 29% (Axtell et al. 2010). Thewalls were installed transverse to the dam axis between stations24192 and 73160 (see Fig. 3). Stations 10100 to 25100 andStations 70100 to 75100 were not included because of thepresence of nonliquefiable materials and the large upstream anddownstream stabilizing berms that were installed during theoriginal construction.
Limit equilibrium and FLAC analyses were used to design andverify the performance of the transverse shear walls. The limitequilibrium analyses estimated an unremediated factor of safety (FS)of about 0.9 and a FS of 1.25 with the proposed transverse shear walls.A FS of 1.25 was deemed acceptable for the level of estimated per-manent deformation obtainedusing the calibratedFLACmodel and thedesign ground motion based on the Castaic accelerogram describedpreviously (Marcuson et al. 1990). The FLAC analyses estimated thefollowing seismically-induced permanent deformations of the reme-diated dam:• Crest settlement of about 0.5 m (1.5 ft);• Permanent deformations at the upstream toe of less than 0.5 m
(1.5 ft); and• Permanent deformations at the downstream toe of less than 0.6
to 0.9 m (2 to 3 ft).The displacements could be larger or smaller than estimated if
field shaking and engineering properties differ from those used in theseismic analysis. However, it was concluded that the transverseshear walls provide a worthwhile benefit to the seismic response ofthe dam and reduce the likelihood of a large liquefaction-inducedflow slide as indicated by limit equilibrium slope stability analy-ses. In addition to the 351 transverse shear walls installed along thedownstream toe of the dam, the existing relief well ditch wasreplaced with a buried collector system to further improve down-stream slope stability (USACE 2007) (see Fig. 8).
Recommendations
This paper provides a summary of the recently completed seismicretrofit of Tuttle Creek Dam near Manhattan, Kansas. This casehistory provides the following recommendations for future damseismic retrofit projects:• Developments during construction can lead to changes in retrofit
technology; as a result, the decision documents, e.g., EIS, con-struction contract, and various design documents, should provideflexibility to designers and owners to accommodate possiblechanges in retrofit technology;
• The use of jet grouting on dams with active reservoirs can posedam safety concerns that cannot be easily controlled or assessedand should be carefully evaluated; some of the dam safety risksinvolved with high pressure and flow rate required for jetgrouting large diameter soilcrete columns include: (1) groundfracturing which can lead to undesirable seepage pathways andhigher hydraulic gradients in erodible materials; and (2) addeduncertainty in securing the top of the jet grout columns toimpervious embankment and/or foundation materials;
• Small diameter jet grout columns may be feasible for activedams because lower jet grouting pressures, e.g., air, water, andgrout pressures, are required to erode and evacuate the nativematerials; however, high pressures can still develop and causeground fracturing if spoil return is not maintained;
• If jet grouting is used for an active dam, a rapid monitoringsystem should be installed, such as piezometers, which can
quickly reflect the build-up of pressure in the foundation orembankment materials; in addition, a system to monitor thereservoir for any indication of bubbling and downstream flowrate and composition should be developed;
• An action plan for jet grout spoil blockages should be de-veloped and approved prior to jet grouting to prevent or limitthe amount of ground fracture; the action plan should recognizethat poor spoil return and temporary blockages can lead toelevated bottom hole pressures occurring before the plan isrequired to be implemented; as a result, the action plan musthave early triggers to change grouting methodology so largepressures and ground fracturing do not occur; this action planalso should include criteria, e.g., an unacceptable increase inpressure in adjacent piezometers, for requiring the contractor tostroke the hole with the jet grouting drill rod to re-establishsuitable spoil return and reduce bottom hole pressures; if highpressures or poor spoil return continue, the plan should requirea change in jet grout methodology to address these conditions;and
• Transverse shear walls constructed using slurry trench techni-ques and self-hardening C-B slurry appears to be a viable slopestabilization technique for liquefiable foundation materials;however, the geometry of the shear walls must be designed topreserve underseepage flows.
References
Axtell, P., and Stark, T. D. (2008). “Increase in shear modulus by soil mixand jet grout methods.” Deep Found. Inst. J., 2(1), 11–22.
Axtell, P., Stark, T. D., and Dillon, J. C. (2009). “Strength difference be-tween clam-shell and long-reach excavator constructed cement-bentoniteself-hardening slurry walls.” Contemporary Topics in Ground Modifi-cation, Problem Soils, and Geo-Support, ASCE Geotechnical SpecialPublication No. 187, M. Iskander, D. F. Laefer, and M. H. Hussein, eds.,ASCE, Washington, DC, 297–304.
Axtell, P., Stark, T. D., and Dillon, J. C. (2010). “Peak and post-peak shearstrength of cement-bentonite.” Deep Found. Inst. J., 4(1), 59–65.
Castro, G., Perlea, V., and Walberg, F. C. (2003). “Dynamic properties ofcohesive soil in the foundation of an embankment dam.” Proc., 21st Int.Conf. on Large Dams, International Commission on Large Dams(ICOLD), Paris, Q.83–R.3.
Empson, W. B., and Hummert, J. B. (2004). “Warning the downstreamcommunity after an earthquake.” Proc., Dam Safety Conf., Associationof State Dam Safety Officials, Lexington, KY.
Fast Lagrangian Analysis of Continua (FLAC) 5.0 [Computer software].Minneapolis, MN, Itasca Consulting Group, Inc.
Finn, W. D. L. (2004). “Report on Seismic Deformation Analyses of TuttleCreek Dam.” U.S. Army Corps of Engineers, Kansas City District,Kansas City, MO.
Marcuson,W. F., Hynes,M. E., and Franklin, A. G. (1990). “Evaluation anduse of residual strength in seismic safety analysis of embankments.”Earthq. Spectra, 6(3), 529–572.
Lane, K. S., and Fehrman, R. G. (1960). “Tuttle Creek Dam of rolled shaleand dredged sand.” J. Soil Mech. Found. Div., 86(SM6), 11–34.
Perlea, V. G. (2006). “Draft memorandum: Tuttle Creek Dam, summary ofsoil properties for use in FLAC analysis.” U.S. Army Corps of Engi-neers, Kansas City District. USACE, Washington, DC.
Prevost, J. H. (2002). Dynaflow - A nonlinear transient finite elementanalysis program, Version 02, Technical Report, Department of Civiland Environmental Engineering, Princeton University, Princeton, NY.http://www.princeton.edu/~dynaflow/.
Popescu, R. (1998). “Evaluation report, Appendix V, Phase II, specialinvestigations, Part 2: Detailed field investigation and evaluation ofrepair alternatives: Seepage analysis, Appendix F, Dynaflow analy-sis,” U.S. Army Corps of Engineers, Kansas City District, KansasCity, MO.
JOURNAL OF GEOTECHNICAL AND GEOENVIRONMENTAL ENGINEERING © ASCE / JUNE 2013 / 985
J. Geotech. Geoenviron. Eng. 2013.139:975-986.
Dow
nloa
ded
from
asc
elib
rary
.org
by
GR
AIN
GE
R E
NG
INE
ER
ING
LIB
E o
n 05
/27/
13. C
opyr
ight
ASC
E. F
or p
erso
nal u
se o
nly;
all
righ
ts r
eser
ved.
Rice, J.D., andDuncan, J.M. (2009a). “Findingsofcasehistorieson the long-termperformance of seepage barriers in dams.” J. Geotech. Eng., 136(1), 2–16.
Rice, J. D., and Duncan, J. M. (2009b). “Deformation and cracking ofseepage barriers in dams due to changes in the pore pressure regime.”J. Geotech. Eng., 136(1), 16–25.
Seed, H. B., and Harder, L. F. (1990). “SPT based analysis of cyclic porepressure generation and undrained residual strength,” Proc., H. BoltonSeed Mem. Symp., BiTech Publishers, Ltd., Vancouver, BC, Canada,Vol. 2, 3512376.
Seed, H. B. and Idriss, I. M. (1971). “Simplified procedure for evalua-ting soil liquefactionpotential.” J. Soil.Mech.Foun.Div., 97(9), 124921273.
Somerville, P., Walberg, F. C., and Perlea, V. G. (2003). “Seismic hazardanalysis and selection of design earthquake for a dam in Kansas. Proc.21st Int. Conf. on Large Dams, International Commission on LargeDams (ICOLD), Paris, Vol. 3, 473–495.
Stark, T. D., Axtell, P. J., Lewis, J. R., Dillon, J. C., Empson, W. B., Topi,J. E.,Walberg, F. C. (2009). “Soil inclusions in jet grout columns.”DeepFound. Inst. J., 3(1), 44–55.
Stark, T. D., Lewis, J. R., Castro, G., Walberg, F. C., and Mathews, D. L.(2011). “Liquefaction subsurface investigation for Milford Dam.” Can.Geotech. J., 48(10), 1504–1519.
Stark, T. D., Beaty, M. H., Byrne, P. M., Castro, G., Walberg, F. C., Perlea,V. G., Axtell, P. J., Dillon, J. C., Empson,W. B., Mathews, D. L. (2012).“Seismic deformation analysis of Tuttle Creek Dam.” Can. Geotech. J.,49(3), 323–343.
Stark, T. D., and Mesri, G. (1992). “Undrained shear strength of liquefiedsands for stability analyses.” J. Geotech. Eng., 118(11), 1727–1747.
TARA3-FL [Computer software]. Dept. of Civil Engineering, Univ. ofBritish Columbia, Canada.
U.S. Army Corps of Engineers (USACE). (1999). “Engineering and designfor civil works projects.” Engineer Manual ER 1110-2-1150, U.S. ArmyCorps of Engineers, Washington, DC.
U.S. Army Corps of Engineers (USACE). (2007). “Tuttle Creek Dam:Foundation modification project: Downstream stabilization and buriedcollector system, plans and specifications.” U.S. Army Corps ofEngineers, Kansas City District, Kansas City, MO.
986 / JOURNAL OF GEOTECHNICAL AND GEOENVIRONMENTAL ENGINEERING © ASCE / JUNE 2013
J. Geotech. Geoenviron. Eng. 2013.139:975-986.
Dow
nloa
ded
from
asc
elib
rary
.org
by
GR
AIN
GE
R E
NG
INE
ER
ING
LIB
E o
n 05
/27/
13. C
opyr
ight
ASC
E. F
or p
erso
nal u
se o
nly;
all
righ
ts r
eser
ved.