Newtown Creek WWFP - NYC.gov
563
-
Upload
khangminh22 -
Category
Documents
-
view
0 -
download
0
Transcript of Newtown Creek WWFP - NYC.gov
New York City Department of Environmental Protection Waterbody/Watershed Facility Plan
Newtown Creek
i June 2011
TABLE OF CONTENTS
Page
EXECUTIVE SUMMARY .............................................................................................................................................. ES-1
1.0 INTRODUCTION ............................................................................................................................................... 1-1
1.1 WATERBODY/WATERSHED ASSESSMENT AREA..................................................................... 1-2
1.2 REGULATORY CONSIDERATIONS ............................................................................................... 1-5
1.2.1 Clean Water Act ................................................................................................................... 1-5
1.2.2 Federal CSO Policy .............................................................................................................. 1-7
1.2.3 New York State Policies and Regulations ............................................................................ 1-9
1.2.4 Interstate Environmental Commission................................................................................ 1-13
1.2.5 Administrative Consent Order ............................................................................................ 1-14
1.3 CITY POLICIES AND OTHER LOCAL CONSIDERATIONS ....................................................... 1-14
1.3.1 New York City Waterfront Revitalization Program ........................................................... 1-14
1.3.2 New York City Comprehensive Waterfront Plan ............................................................... 1-15
1.3.3 Department of City Planning Actions ................................................................................. 1-15
1.3.4 New York City Economic Development Corporation ........................................................ 1-15
1.3.5 Local Law ........................................................................................................................... 1-16
1.3.6 Bathing Beaches ................................................................................................................. 1-16
1.4 REPORT ORGANIZATION ............................................................................................................. 1-16
2.0 WATERSHED CHARACTERISTICS ............................................................................................................... 2-1
2.1 HISTORICAL CONTEXT OF WATERSHED URBANIZATION .................................................... 2-1
2.2 LAND USE CHARACTERIZATION ................................................................................................. 2-2
2.2.1 Existing Land Use ................................................................................................................ 2-2
2.2.2 Zoning .................................................................................................................................. 2-5
2.2.3 Neighborhood and Community Character ............................................................................ 2-6
2.2.4 Proposed Land Uses ............................................................................................................. 2-6
2.2.5 Consistency with the Waterfront Revitalization Program and Comprehensive
Waterfront Plan .................................................................................................................. 2-10
2.3 REGULATED SHORELINE ACTIVITIES ...................................................................................... 2-11
2.3.1 USEPA and DEC Database Search Results ........................................................................ 2-13
2.3.2 Effects of Regulated Activities on Newton Creek .............................................................. 2-27
3.0 EXISTING SEWER SYSTEM FACILITIES ...................................................................................................... 3-1
3.1 Bowery Bay WWTP ............................................................................................................................ 3-1
3.1.1 WWTP Process Information ................................................................................................. 3-4
3.1.2 Bowery Bay WWTP Wet Weather Operating Plan .............................................................. 3-5
3.1.3 Other Bowery Bay WWTP Operational Constraints ............................................................ 3-9
3.2 Newtown Creek WPTP ...................................................................................................................... 3-10
3.2.1 Newtown Creek WPTP Process Information ..................................................................... 3-11
3.2.2 Newtown Creek WPTP Wet Weather Operating Plan ........................................................ 3-13
3.2.3 Other Operational Constraints ............................................................................................ 3-15
3.3 NEWTOWN CREEK WATERSHED COLLECTION SYSTEM ..................................................... 3-15
3.3.1 Combined Sewer System .................................................................................................... 3-15
3.3.2 Stormwater System ............................................................................................................. 3-19
3.4 SEWER SYSTEM MODELING ....................................................................................................... 3-19
3.4.1 Hydraulic Modeling Framework ........................................................................................ 3-20
3.4.2 Application of Model to Collection System ....................................................................... 3-20
3.4.3 Baseline Design Condition ................................................................................................. 3-23
3.5 DISCHARGE CHARACTERISTICS ............................................................................................... 3-25
3.5.1 Characterization of Discharged Volumes, Baseline Condition ........................................... 3-25
3.5.2 Baseline Pollutant Concentrations ...................................................................................... 3-27
3.5.3 Baseline Pollutant Loads ..................................................................................................... 3-29
3.5.4 Effect of Urbanization on Drainage ................................................................................... 3-29
3.5.5 Toxics Discharge Potential.................................................................................................. 3-32
New York City Department of Environmental Protection Waterbody/Watershed Facility Plan
Newtown Creek
ii June 2011
4.0 WATERBODY CHARACTERISTICS ............................................................................................................... 4-1
4.1 CHARACTERIZATION METHODOLOGY ...................................................................................... 4-1
4.1.1 Compilation of Existing Data ............................................................................................... 4-2
4.1.2 Biological and Habitat Assessments ..................................................................................... 4-6
4.1.3 Other Data Gathering Programs ......................................................................................... 4-12
4.1.4 Receiving Water Quality Modeling .................................................................................... 4-21
4.2 PHYSICAL WATERBODY CHARACTERISTICS ......................................................................... 4-23
4.2.1 General ............................................................................................................................... 4-23
4.2.2 Hydrodynamics .................................................................................................................. 4-24
4.2.3 Sediments ........................................................................................................................... 4-24
4.2.4 Shoreline ............................................................................................................................. 4-24
4.2.5 Waterbody Access .............................................................................................................. 4-32
4.3 EXISTING WATERBODY USES .................................................................................................... 4-32
4.4 OTHER POINT SOURCES AND LOADS ....................................................................................... 4-36
4.5 CURRENT WATER QUALITY CONDITIONS .............................................................................. 4-37
4.5.1 Measured Water Quality – Existing Data ........................................................................... 4-37
4.5.2 Receiving Water Modeling Analysis .................................................................................. 4-42
4.5.3 Pollutants of Concern ......................................................................................................... 4-43
4.5.4 Other Pollutants and Water Quality Issues ......................................................................................... 4-43
4.6 BIOLOGY .......................................................................................................................................... 4-52
4.6.1 Wetlands ............................................................................................................................. 4-54
4.6.2 Benthic Invertebrates .......................................................................................................... 4-54
4.6.3 Epibenthic Invertebrates ..................................................................................................... 4-57
4.6.4 Phytoplankton and Zooplankton ......................................................................................... 4-61
4.6.5 Ichthyoplankton .................................................................................................................. 4-62
4.6.6 Adult and Juvenile Fish ...................................................................................................... 4-68
4.6.7 Inter-Waterbody Comparison ............................................................................................. 4-68
4.6.8 Fish and Aquatic Life Uses ................................................................................................ 4-72
4.7 SENSITIVE AREAS ......................................................................................................................... 4-78
5.0 WATERBODY IMPROVEMENT PROJECTS .................................................................................................. 5-1
5.1 CSO PROGRAMS 1950 TO 1992 ........................................................................................................ 5-1
5.2 CITYWIDE CSO ABATEMENT ORDERS (1992, 1996, 2005, 2008, 2009) ..................................... 5-2
5.3 BEST MANAGEMENT PRACTICES (BMPS) ................................................................................... 5-4
5.3.1 CSO Maintenance and Inspection Program .......................................................................... 5-4
5.3.2 Maximum Use of Collection System for Storage ................................................................. 5-7
5.3.3 Maximize Flow to WPTP ..................................................................................................... 5-7
5.3.4 Wet Weather Operating Plan ................................................................................................ 5-9
5.3.5 Prohibition of Dry Weather Overflow .................................................................................. 5-9
5.3.6 Industrial Pretreatment .......................................................................................................... 5-9
5.3.7 Control of Floatable and Settleable Solids .......................................................................... 5-10
5.3.8 Combined Sewer System Replacement .............................................................................. 5-11
5.3.9 Combined Sewer/Extension ................................................................................................ 5-11
5.3.10 Sewer Connection and Extension Prohibitions ................................................................... 5-11
5.3.11 Septage and Hauled Waste ................................................................................................. 5-12
5.3.12 Control of Runoff ............................................................................................................... 5-12
5.3.13 Public Notification .............................................................................................................. 5-12
5.3.14 Annual Report ..................................................................................................................... 5-13
5.4 CITYWIDE CSO PLAN FOR FLOATABLES ABATEMENT ......................................................... 5-13
5.4.1 Program Description ........................................................................................................... 5-13
5.4.2 Pilot Floatables Monitoring Program .................................................................................. 5-14
5.4.3 Interim Floatable Controls in Newtown Creek ................................................................... 5-14
5.4.4 Shoreline Cleanup Pilot Program ........................................................................................ 5-14
5.5 LONG-TERM CSO CONTROL PLANNING (LTCP) Project .......................................................... 5-15
5.6 NEWTOWN CREEK WATER QUALITY FACILITY PLAN .......................................................... 5-15
5.6.1 Phase I Aeration Facility ..................................................................................................... 5-18
5.6.2 Phase II Kent Avenue Throttling Facility ........................................................................... 5-18
5.6.3 Phase III USA/Study/LTCP ................................................................................................ 5-18
New York City Department of Environmental Protection Waterbody/Watershed Facility Plan
Newtown Creek
iii June 2011
5.6.4 Phase IV Sewer System Storage and CSO Storage Tank ................................................... 5-18
5.6.5 Project Benefits ................................................................................................................... 5-19
5.7 NEWTOWN CREEK WWTP ENHANCED TRACK 3 FACILITY ................................................. 5-19
5.8 2004 INNER HARBOR CSO FACILITY PLAN ............................................................................... 5-20
5.8.1 Facility Design and Implementation Schedule ................................................................... 5-22
5.9 ECOSYSTEM RESTORATION......................................................................................................... 5-23
5.10 NYC GREEN INFRASTRUCTURE PLAN ....................................................................................... 5-24
5.11 DEP ENVIRONMENTAL BENEFIT PROJECTS ............................................................................. 5-27
5.12 NEWTOWN CREEK SEWER BUILDOUT ...................................................................................... 5-28
5.13 NEWTOWN CREEK SUPERFUND SITE ........................................................................................ 5-28
6.0 PUBLIC PARTICIPATION AND AGENCY INTERACTION .......................................................................... 6-1
6.1 HARBOR-WIDE GOVERNMENT STEERING COMMITTEE ......................................................... 6-1
6.2 NEWTOWN CREEK WATER QUALITY FACILITY PLANING PROJECT ................................... 6-3
6.3 NEWTOWN CREEK WWTP FACILITIES PLANNING AND USA PROJECT ............................... 6-3
6.3.1 Newtown Creek WWTP Facilities Planning Public Participation ........................................ 6-3
6.3.2 Use and Standards Attainment (USA) Project Public Participation ...................................... 6-4
6.3.3 Use and Standards Attainment (USA) Project Public Opinion Survey ................................. 6-7
6.4 WATERBODY/WATERSHED FACILITY PLAN LOCAL STAKEHOLDER TEAM AND
STAKEHOLDER MEETINGS ........................................................................................................... 6-10
6.5 ADMINISTATIVE CONSENT ORDER ............................................................................................ 6-15
6.6 SPDES PERMITTING AUTHORITY ................................................................................................ 6-15
6.7 FINALIZATION OF PUBLIC OPINION .......................................................................................... 6-16
7.0 EVALUATION OF ALTERNATIVES ............................................................................................................... 7-1
7.1 REGULATORY FRAMEWORK FOR EVALUATION
OF ALTERNATIVES ........................................................................................................................... 7-1
7.1.1 Water Quality Objectives ..................................................................................................... 7-1
7.1.2 Range of Alternatives ........................................................................................................... 7-2
7.1.3 “Presumption” and “Demonstration” Approaches ................................................................ 7-3
7.1.4 Cost/Performance Consideration .......................................................................................... 7-4
7.1.5 Consideration of Non-CSO Inputs ........................................................................................ 7-4
7.1.6 Consideration of Other Parameters ....................................................................................... 7-4
7.2 SCREENING OF CSO CONTROL TECHNOLOGIES ...................................................................... 7-5
7.2.1 Watershed-Wide Controls or Non-Structural Control .......................................................... 7-8
7.2.2 Inflow Control .................................................................................................................... 7-10
7.2.3 Green Infrastructure ........................................................................................................... 7-12
7.2.4 DEP Sewer System Optimization ....................................................................................... 7-12
7.2.5 Sewer Separation ................................................................................................................ 7-13
7.2.6 Storage and Conveyance .................................................................................................... 7-14
7.2.7 Treatment ........................................................................................................................... 7-19
7.2.8 Receiving Water Improvement ........................................................................................... 7-26
7.2.9 Solids and Floatables Control ............................................................................................. 7-28
7.2.10 CSO Control Technology Evaluation Summary ................................................................ 7-35
7.3 WATER QUALITY IMPROVEMENT ALTERNATIVES .............................................................. 7-39
7.3.1 Baseline Conditions ............................................................................................................ 7-41
7.3.2 Alternative 1: CSO Facility Plan ....................................................................................... 7-42
7.3.3 Alternative 2: High Level Aeration and Floatables Control ............................................... 7-49
7.3.4 Alternative 3: Alternative 2 and Bending Weirs/Regulator Modifications ......................... 7-50
7.3.5 Alternative 4: Alternative 3 and Dutch Kills Relief Sewer................................................. 7-55
7.3.6 Alternative 5: Alternative 2, St. Nicholas Relief Sewer, and Inflatable Dams ................... 7-57
7.3.7 Alternative 6: High Level Aeration, Inflatable Dams, St. Nicholas Relief Sewers, Dutch Kills
Relief Sewer, and Additional 96-Inch Interceptor .............................................................. 7-58
7.3.8 Alternative 7: High Level Aeration, Inflatable Dams, St. Nicholas Relief Sewer, Dutch Kills
Relief Sewer, and 9 MG Storage Tank ............................................................................... 7-58
7.3.9 Alternative 8-11and 100% Reduction Alternative: CSO Capture Tunnels ......................... 7-59
7.3.10 Dredging ............................................................................................................................. 7-76
7.3.11 High Level Sewer Separation ............................................................................................. 7-76
7.4 EVALUATION OF ALTERNATIVES ............................................................................................. 7-78

New York City Department of Environmental Protection Waterbody/Watershed Facility Plan
Newtown Creek
iv June 2011
7.4.1 CSO Reduction ................................................................................................................... 7-78
7.4.2 Water Quality Benefits of Alternatives Plans ..................................................................... 7-83
7.4.3 Cost Analysis ...................................................................................................................... 7-88
8.0 WATERBODY/WATERSHED FACILITY PLAN ............................................................................................ 8-1
8.1 OVERVIEW ......................................................................................................................................... 8-1
8.2 WATERBODY/WATERSHED FACILITY PLAN COMPONENTS.................................................. 8-2
8.2.1 Brooklyn Pumping Station Operational Control .................................................................... 8-2
8.2.2 Bending Weirs ........................................................................................................................ 8-2
8.2.3 Floatables Control .................................................................................................................. 8-3
8.2.4 Enhanced Zone II Aeration ................................................................................................... 8-3
8.2.5 Continued Implementation of Programmatic Controls ........................................................... 8-4
8.2.6 Construction Costs ................................................................................................................. 8-4
8.3 POST-CONSTRUCTION COMPLIANCE MONITORING ................................................................ 8-6
8.3.1 Receiving Water Monitoring ................................................................................................ 8-6
8.3.2 Floatables Monitoring Program ............................................................................................ 8-8
........................................................................................................................................... 8.3.3
Analysis 8-10
8.3.4 Reporting ............................................................................................................................ 8-11
8.4 OPERATIONAL PLAN ..................................................................................................................... 8-11
8.5 SCHEDULE ........................................................................................................................................ 8-12
8.6 CONSISTENCY WITH FEDERAL CSO POLICY ........................................................................... 8-12
8.7 ANTICIPATED WATERBODY/WATERSHED PLAN BENEFITS ................................................ 8-14
8.7.1 Dissolved Oxygen ............................................................................................................... 8-16
8.7.2 Aesthetics............................................................................................................................ 8-16
8.7.3 Bacteria ............................................................................................................................... 8-16
8.8 GREEN STRATEGY ASSESSMENTS AND IMPLEMENTATION ............................................... 8-16
9.0 WATER QUALITY STANDARDS REVIEW .................................................................................................... 9-1
9.1 WATER QUALITY STANDARDS REVIEW ..................................................................................... 9-1
9.1.1 Numeric Water Quality Standards .......................................................................................... 9-2
9.1.2 Narrative Water Quality Standards ........................................................................................ 9-3
9.1.3 Attainability of Water Quality Standards ............................................................................... 9-4
9.1.4 Attainment of Narrative Water Quality Standards ............................................................... 9-10
9.1.5 Water Uses Restored ............................................................................................................ 9-11
9.1.6 Practical Considerations ..................................................................................................... 9-112
9.2 WATER QUALITY STANDARDS REVISION ................................................................................ 9-12
9.2.1 Overview of Use Attainability and Recommendations ........................................................ 9-12
9.2.2 DEC Requirements for Variances to Effluent Limitations ................................................... 9-13
9.2.3 Manner of Compliance with the Variance Requirements ..................................................... 9-15
9.2.4 Future Considerations .......................................................................................................... 9-18
10.0 REFERENCES .................................................................................................................................................. 10-1
11.0 GLOSSARY .............................................................................................................................................. 11-1
APPENDIX A NEWTOWN CREEK WPCP WWOP
APPENDIX B BOWERY BAY WPCP WWOP
APPENDIX C NEW YORK CITY WATERWAYS STUDE
APPENDIX D NEWTOWN CREEK STAKEHOLDER MEETING MINUTES
New York City Department of Environmental Protection Waterbody/Watershed Facility Plan
Newtown Creek
Table of Contents v June 2011
LIST OF FIGURES
Page
Figure ES-1 Newtown Creek Waterbody/Watershed Facility Plan ........................................................................... ES-3
Figure ES-2 Newtown Creek Waterbody/Watershed Facility Plan Schedule ........................................................... ES-4
Figure ES-3 Projected Attainment of Dissolved Oxygen Criteria versus Cost for Evaluated Alternatives .............. ES-8
Figure ES-4 Newtown Creek Waterbody/Watershed Facility Plan ........................................................................... ES-9
Figure ES-5 Newtown Creek Waterbody/Watershed Facility Plan Implementation Schedule ............................... ES-12
Figure ES-6 Projected Summer Days Atteining 3.0 mg/L at Bottom ...................................................................... ES-13
Figure 1-1 City-Wide Assessment Areas ................................................................................................................... 1-3
Figure 1-2 Newtown Creek WB/Ws Facility Plan Study Area .................................................................................. 1-3
Figure 1-3 Long-term CSO Control Planning Procedures ....................................................................................... 1-12
Figure 1-4 Best Use Water Classification ................................................................................................................ 1-12
Figure 2-1 Comparison of Undeveloped and Developed Conditions Surrounding Newtown Creek ......................... 2-3
Figure 2-2 Land Use and Water Traffic on Newtown Creek ..................................................................................... 2-4
Figure 2-3 Newtown Creek Generalized Land Use Map ........................................................................................... 2-7
Figure 2-4 Newtown Creek Generalized Zoning Map ............................................................................................... 2-8
Figure 2-5 Neighborhoods Adjacent to Newtown Creek ........................................................................................... 2-9
Figure 2-6 Newtown Creek SMIA and Costal Zone Boundary ............................................................................... 2-12
Figure 3-1 Newtown Creek Watershed and WPCP Service Areas ............................................................................ 3-2
Figure 3-2 Bowery Bay WPCP Existing Facility Layout .......................................................................................... 3-3
Figure 3-3 Bowery Bay WPCP Process Flow Diagram ............................................................................................. 3-6
Figure 3-4 Newtown Creek WPCP Facility Layout .................................................................................................. 3-7
Figure 3-5 Newtown Creek WPCP Process Flow Diagram ..................................................................................... 3-12
Figure 3-6 Newtown Creek Sewershed-Sewer System Components ...................................................................... 3-21
Figure 3-7 Watershed Loading Comparisons Baseline Conditions ......................................................................... 3-28
Figure 4-1 Newtown Creek Past and Present Monitoring Programs ......................................................................... 4-4
Figure 4-2 Newtown Creek Hydrodynamic (Dye and Velocity) Survey Locations .................................................. 4-5
Figure 4-3 Newtown Creek Air Curtain Pilot Study Water Quality Sampling Locations ......................................... 4-8
Figure 4-4 Newtown Creek In-Stream Aeration Pilot Study Water Quality Sampling Locations ............................. 4-9
Figure 4-5 Harbor-Wide Ichthyoplankton Sampling Stations (2001) ...................................................................... 4-13
Figure 4-6 East River FSAP Sampling Stations (2001) ........................................................................................... 4-14
Figure 4-7 Harbor-Wide Epibenthic Recruitment and Survival Sampling Stations (2001) ..................................... 4-15
Figure 4-8 Tributary Benthos Characterization Sampling Stations (2002) .............................................................. 4-16
Figure 4-9 Subtidal Benthos and Ichthyoplankton Characterization Sampling Stations (2003) .............................. 4-17
Figure 4-10 Tributary Toxicity Characterization Sampling Stations (2003) ............................................................. 4-18
Figure 4-11 Newtown Creek Biological FSAP Sampling Locations ......................................................................... 4-19
Figure 4-12 Newtown Creek and Bowery Bay Collection Systems Flow Monitoring & Field Sampling
Locations ................................................................................................................................................ 4-20
Figure 4-13 2005/2006 Bathymetric Survey Waterbody Bottom Contours ............................................................... 4-25
Figure 4-14 Newtown Creek Receiving Water Quality Model Grid ......................................................................... 4-26
Figure 4-15 Newtown Creek Mathematical Modeling Framework ........................................................................... 4-27
Figure 4-16 Newtown Creek Bridges ........................................................................................................................ 4-29
Figure 4-17 Newtown Creek Typical Shoreline Features .......................................................................................... 4-31
Figure 4-18 Newtown Creek WPCP Promenade ....................................................................................................... 4-33
Figure 4-19 Street-end Parks and Proposed Public Walkway in the Vicinity of Newtown Creek ............................. 4-34
Figure 4-20 Typical Businesses Located Near Newtown Creek ................................................................................ 4-35
Figure 4-21 Sediment Mounds at Head Ends of English Kills and Maspeth Creek .................................................. 4-39
Figure 4-22 Floatables Containment Booms and Water Clarity in East Branch and English Kills ........................... 4-40
Figure 4-23 Waste and Debris in and around Newtown Creek .................................................................................. 4-41
Figure 4-24 Newtown Creek Dissolved Oxygen (1984 to 2003) Percent of Samples Less Than 3.0 mg/L .............. 4-44
Figure 4-25 Newtown Creek Dissolved Oxygen (1984 to 2003) Distribution of Measurements by Location .......... 4-45
Figure 4-26 Newtown Creek Dissolved Oxygen (1984 to 2003) Average and Range by Location .......................... 4-46
Figure 4-27 Modeled Baseline Dissolved Oxygen Percent of Days with DO > 3 mg/L ........................................... 4-47
New York City Department of Environmental Protection Waterbody/Watershed Facility Plan
Newtown Creek
Table of Contents vi June 2011
Figure 4-28 Modeled Monthly Geometric Mean Fecal Coliform Percent of Months with Geometric
Mean < 2,000 per 100 mL ...................................................................................................................... 4-48
Figure 4-29 Modeled Monthly Geometric Mean Total Coliform Percent of Months with Geometric
Mean < 10,000 per 100 mL .................................................................................................................... 4-49
Figure 4-30 Newtown Creek Dissolved Oxygen Deficit Components ...................................................................... 4-50
Figure 4-31 Map of Greenpoint Oil Plumes from Riverkeeper Inc. .......................................................................... 4-53
Figure 5-1 Newtown Creek Water Quality CSO Facility Plan ................................................................................ 5-17
Figure 5-2 Newtown Creek WPCP Secondary Treatment Layout........................................................................... 5-21
Figure 6-1 Newtown Creek USA Project Stakeholder Meeting No. 4 Draft Waterfront Projects
and Activities Handout ............................................................................................................................. 6-9
Figure 7-1 Newtown Creek Dissolved Oxygen Components .................................................................................... 7-6
Figure 7-2 Inflatable Dam System ........................................................................................................................... 7-16
Figure 7-3 Sewer Separation Alternatives ............................................................................................................... 7-17
Figure 7-4 Storage Tunnel Schematic...................................................................................................................... 7-18
Figure 7-5 Schematic Diagrams of the Three Vortex Technologies Tested at CAVF ............................................. 7-23
Figure 7-6 US Filter Actiflo HRPCT ....................................................................................................................... 7-24
Figure 7-7 Proposed Flushing Tunnels to Dutch Kills, English Kills and East Branch ........................................... 7-30
Figure 7-8 Containment Boom ................................................................................................................................ 7-31
Figure 7-9 Skimmer Boat and Boom In Maspeth Creek .......................................................................................... 7-32
Figure 7-10 Conceptual Schematic of Hinged Baffle ................................................................................................ 7-37
Figure 7-11 Conceptual Schematic of Bending Weir ................................................................................................ 7-38
Figure 7-12 CSO Facility Plan CSO Storage Tank .................................................................................................... 7-44
Figure 7-13 CSO Facility Plan Zone I Aeration ........................................................................................................ 7-45
Figure 7-14 CSO Facility Plan St. Nicholas Weir Relief Sewer ................................................................................ 7-46
Figure 7-15 CSO Facility Plan Kent Avenue Throttling Gate ................................................................................... 7-47
Figure 7-16 CSO Facility Plan Regulator B1/B1A Modifications............................................................................. 7-48
Figure 7-17 Proposed Bending Weir Modifications and Regulator B1 ..................................................................... 7-54
Figure 7-18 Proposed 72-Inch Relief Sewer and Regulator Modifications Adjacent to Dutch Kills ......................... 7-56
Figure 7-19 Proposed 101.5 MG CSO Capture Tunnel Routing, Drop Shafts and Pump Station ............................. 7-62
Figure 7-20 Proposed 128 MG CSO Capture Tunnel Routing, Drop Shafts and Pump Station ................................ 7-63
Figure 7-21 Proposed 132.5 MG CSO Capture Tunnel Routing, Drop Shafts and Pump Station ............................. 7-64
Figure 7-22 Proposed 145 MG CSO Capture Tunnel Routing, Drop Shafts and Pump Station ................................ 7-65
Figure 7-23 Proposed 107 MG CSO Capture Tunnel Routing, Drop Shafts and Pump Station ................................ 7-66
Figure 7-24 Proposed 72 MG CSO Capture Tunnel w/HRPCT Routing, Drop Shafts and Pump Station ................ 7-67
Figure 7-25 Proposed 40 MG CSO Capture Tunnel Routing, Drop Shafts and Pump Station .................................. 7-68
Figure 7-26 Proposed 24.5 MG CSO Capture Tunnel w/HRPCT Routing, Drop Shafts and Pump Station ............. 7-69
Figure 7-27 Proposed 134 MG CSO Capture Tunnel Routing, Drop Shafts and Pump Station ................................ 7-70
Figure 7-28 Newtown Creek WPCP Average Annual Daily Flow for Different Collection System Conditions ...... 7-72
Figure 7-29 Number of Days that Newtown Creek WPCP Average Daily Flow is Within Stated Range ................ 7-73
Figure 7-30 HLSS Outfall NCB-083 Tributary Area ................................................................................................ 7-77
Figure 7-31 Proposed Aeration Area and Blower Building Locations ...................................................................... 7-81
Figure 7-32a Dissolved Oxygen Transect Plots Summer Days Attaining 3.0 mg/L at Bottom ................................... 7-85
Figure 7-32b Dissolved Oxygen Transect Plots Summer Days Attaining 3.0 mg/L at Bottom ................................... 7-86
Figure 7-33a Fecal Coliform Transect Plots Annual Attainment of Class I Fecal Coliform Standard
Geometric Mean ≤ 2,000 Cts./100 mL .................................................................................................. 7-90
Figure 7-33b Fecal Coliform Transect Plots Annual Attainment of Class I Fecal Coliform Standard
Geometric Mean ≤ 2,000 Cts./100 mL .................................................................................................. 7-91
Figure 7-34a Total Coliform Transect Plots Annual Attainment of Class I Total Coliform Standard
Geometric Mean ≤ 10,000 Cts./100 mL ................................................................................................ 7-92
Figure 7-34b Total Coliform Transect Plots Annual Attainment of Class I Total Coliform Standard Geometric Mean ≤
10,000 Cts./100 mL ............................................................................................................................... 7-93
Figure 7-35 Knee of the Curve Analysis CSO Volume and Event Reductions vs. Cost ........................................... 7-94
Figure 7-36 Knee of the Curve Analysis Dissolved Oxygen Criteria Attainment vs. Cost ....................................... 7-95
Figure 8-1 Newtown Creek Waterbody/Watershed Facility Plan .............................................................................. 8-5
Figure 8-2 Harbor Survey Monitoring Locations In and Around Newtown Creek ................................................... 8-7

New York City Department of Environmental Protection Waterbody/Watershed Facility Plan
Newtown Creek
Table of Contents vii June 2011
Figure 8-3 Waterbody/Watershed Facility Plan Implementation Schedule ............................................................. 8-13
Figure 8-4 Waterbody/Watershed Facility Plan Projected Seasonal Attainment of Class SD Dissolved
Oxygen Standards .................................................................................................................................. 8-17
Figure 8-5 Waterbody/Watershed Facility Plan Comparison of Projected Average and Maximum
Total and Fecal Coliform Counts ........................................................................................................... 8-18
Figure E-1 Standard Attainment Locations .................................................................................................. Appendix D
Figure E-2 Annual Attainability of SB/SC Total Coliform Criteria ............................................................. Appendix D
Figure E-3 Recreation Season Attainability of SB/SC Total Coliform Criteria ........................................... Appendix D
Figure E-4 Annual Attainability of SB/SC Fecal Coliform Criteria ............................................................ Appendix D
Figure E-5 Recreation Season Attainability of SB/SC Fecal Coliform Criteria ........................................... Appendix D
Figure E-6 Recreation Season Attainability of Enterococci Criteria ............................................................ Appendix D
New York City Department of Environmental Protection Waterbody/Watershed Facility Plan
Newtown Creek
Table of Contents viii June 2011
LIST OF TABLES
Page
Table ES-1 Urbanization of Newtown Creek Watershed ......................................................................................... ES-2
Table ES-2 CSO & Stormwater Discharges ............................................................................................................ ES-4
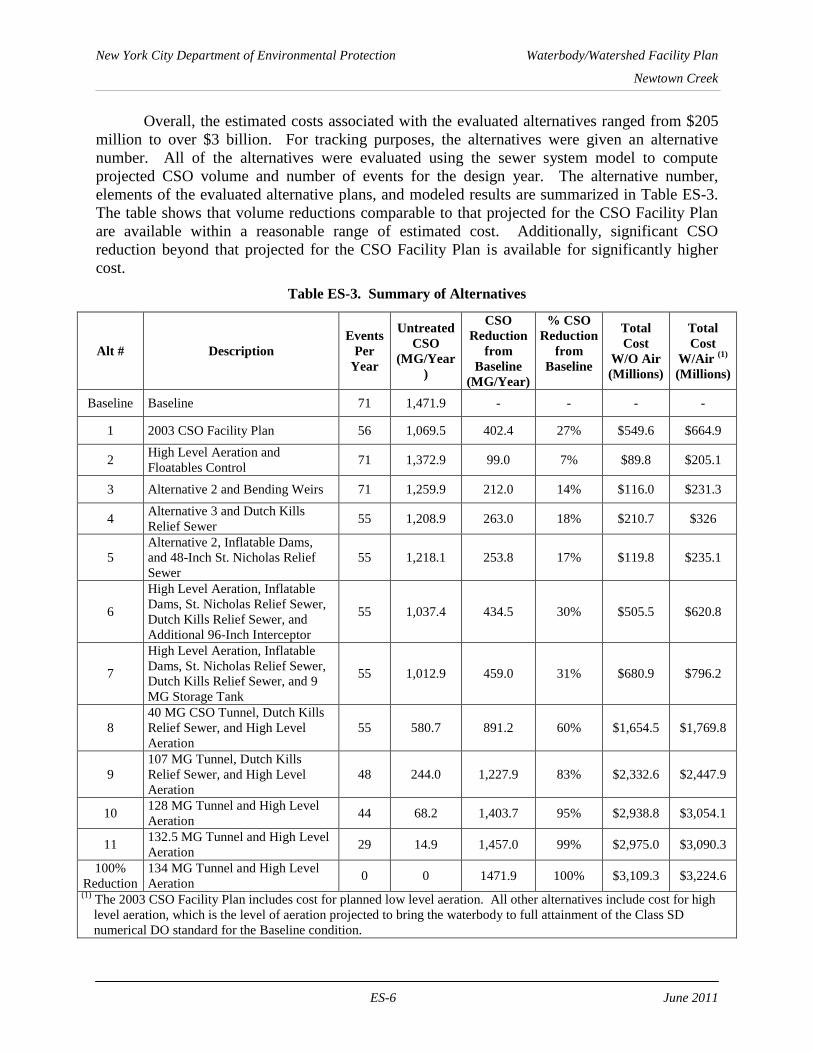
Table ES-3 Summary of Alternatives ...................................................................................................................... ES-6
Table 1-1 New York State Numeric Surface Water Quality Standards (Saline) ...................................................... 1-9
Table 1-2 New York State Narrative Water Quality Standards .............................................................................. 1-11
Table 1-3 Interstate Environmental Commission Numeric Water Quality Standards ............................................ 1-13
Table 1-4 Locations of the Nine Minimum Elements of Long-Term Control Planning ......................................... 1-17
Table 2-1 Land Use Summary by Category ............................................................................................................. 2-5
Table 2-2 RCRA Sites in the Bowery Bay WWTP Service Area in Close Proximity to Newtown Creek
(December 2006) ................................................................................................................................ 2-13
Table 2-3 USTs in the Bowery Bay WWTP Service Area in Close Proximity to Newtown Creek
(January 2002) ....................................................................................................................................... 2-15
Table 2-4 DEC Open Spills in the Bowery Bay WWTP Service Area in the Vicinity of Newtown Creek
(December 2006) ................................................................................................................................... 2-18
Table 2-5 RCRA Sites in the Newtown Creek WWTP Service Area in Close Proximity to Newtown Creek
(December 2006) ................................................................................................................................... 2-19
Table 2-6 USTs in the Newtown Creek WWTP Service Area in Close Proximity to Newtown Creek
(January 2002) ....................................................................................................................................... 2-20
Table 2-7 MOSFs in the Newtown Creek WWTP Service Area in Close Proximity to Newtown Creek
(January 2002) ....................................................................................................................................... 2-23
Table 2-8 CBS USTs in the Newtown Creek WWTP Service Area in Close Proximity to Newtown Creek
(January 2002) ....................................................................................................................................... 2-24
Table 2-9 CBS ASTs in the Newtown Creek Service Area in Close Proximity to Newtown Creek
(January 2002) ....................................................................................................................................... 2-24
Table 2-10 Open LTANKS Sites in the Newtown Creek Service Area in Close Proximity to Newtown Creek
(April 2006) ........................................................................................................................................... 2-25
Table 2-11 Open Spills in the Newtown Creek WWTP Service Area in Close Proximity to Newtown Creek
(April 2006) ........................................................................................................................................... 2-25
Table 2-12 Permitted Discharges to Newtown Creek and its Tributaries Newtown Creek WWTP
(December 2006) ................................................................................................................................... 2-27
Table 3-1 Select Bowery Bay WWTP SPDES Effluent Permit Limits .................................................................... 3-4
Table 3-2 Wet Weather Operating Plan for Bowery Bay WWTP ............................................................................ 3-8
Table 3-3 Select Newtown Creek WWTP Effluent Permit Limits ......................................................................... 3-11
Table 3-4 Wet Weather Operating Plan for Newtwon Creek WWTP .................................................................... 3-13
Table 3-5 CSO Discharge to Newtown Creek from the Bowary Bay WWTP Service Area .................................. 3-16
Table 3-6 Newtown Creek CSOs from the Newtown Creek WWTP Service Area ............................................... 3-18
Table 3-7 Newtown Creek WWTP Stormwater Discharges to Newtown Creek ................................................... 3-19
Table 3-8 Comparison of Annual 1988 and Long-Term Statistics JFK Rainfall Record (1970-2002) .................. 3-25
Table 3-9 Newtown Creek CSO Discharge Summary for Baseline Condition ...................................................... 3-26
Table 3-10 Newtown Creek Stormwater Discharge Summary for Baseline Condition ........................................... 3-26
Table 3-11 Sanitary and Stormwater Discharge Concentrations, Baseline Condition ............................................. 3-27
Table 3-12 Annual CSO and Stormwater Discharge Loadings, Baseline Condition ................................................ 3-29
Table 3-13 Effects of Urbanization on Watershed Yield ......................................................................................... 3-30
Table 3-14 Effects of Urbanization on Watershed Loadings.................................................................................... 3-30
Table 3-15 Permitted Significant Industrial Users within the Newtown Creek Drainage Area (November 2004) .. 3-33
Table 4-1 SPDES Permittees Adjacent to Newtown Creek.................................................................................... 4-36
Table 4-2 Abundance of Benthic Organisms Collected From Newtown Creek and TOC Content of Sediment
At Each Sampling Location ................................................................................................................... 4-55
Table 4-3 Weight of Epibenthic Organisms Collected From Suspended Single or Multi-Plate Arrays ................. 4-59
Table 4-4 Total Number of All Species Collected From Suspended Multi-Plate Arrays ....................................... 4-60
Table 4-5 Total Weight of All Species Collected From Suspended Multi-Plate Arrays ........................................ 4-60

New York City Department of Environmental Protection Waterbody/Watershed Facility Plan
Newtown Creek
Table of Contents ix June 2011
Table 4-6 Phytoplankton Species Collected in Newtown Creek .................................................................. 4-63&4-64
Table 4-7 Microzooplankton Species Collected in Newtown Creek ...................................................................... 4-65
Table 4-8 Seasonal Distribution of Fish Eggs and Larvae Collected in Newtown Creek ...................................... 4-66
Table 4-9 Total Number of Fish Eggs and Larvae Collected in Newtown Creek .................................................. 4-67
Table 4-10 Total Number Juvenile and Adult Fish and Invertebrate Bycatch Collected from Middle of
Newtown Creek ..................................................................................................................................... 4-70
Table 4-11 Abundance of Benthic Organisms Collected and TOC Content of Sediment ....................................... 4-74
Table 4-12 Weight of Epibenthic Organisms Collected from Suspended Single or Multi-Arrays Place
Near the Mouth of Gowanus Canal ........................................................................................................ 4-75
Table 4-13 Total Number of All Species Collected From Suspended Multi-Plate Arrays Placed Near
The Mouth of Gowanus Canal ............................................................................................................... 4-76
Table 4-14 Total Weight of All Species Collected From Suspended Multi-Plate Arrays Placed Near
The Mouth of Gowanus Canal ............................................................................................................... 4-76
Table 4-15 Seasonal Distribution of Fish Eggs and Larvae Collected in Newtown Creek and Gowanus Canal ..... 4-77
Table 5-1 CSO Consent Order Milestone Dates for Capital Projects ....................................................................... 5-3
Table 5-2 CSO Maintenance and Inspection Programs in Newtown Creek (2009) ................................................. 5-5
Table 5-3 Interceptor Cleaning in Newtown Creek (2009) ...................................................................................... 5-7
Table 5-4 WWTP 2009 Performance ....................................................................................................................... 5-8
Table 5-5 Newtown Creek Wet Weather Operating Plans for WWTPs along the Newtown Creek Waterbody ...... 5-9
Table 5-6 Floatable Material Collected in Newtown Creek (2009)........................................................................ 5-11
Table 5-7 Citywide Green Infrastructure Opportunities, Strategies, and Technologies ......................................... 5-25
Table 5-8 DEP Retrofit Demonstration Projects .................................................................................................... 5-26
Table 7-1 New York State Numerical and Narrative Surface Water Quality Standards for Newtown
Creek and its Tributaries .......................................................................................................................... 7-2
Table 7-2 Preliminary Screening of Technologies ................................................................................................... 7-7
Table 7-3 Comparison of Solids and Floatable Control Technologies ................................................................... 7-34
Table 7-4 Screening of CSO Control Technologies ............................................................................................... 7-35
Table 7-5 Newtown Creek Discharge Summary for Baseline Conditions ............................................................. 7-41
Table 7-6 Summary of Alternative 1 ...................................................................................................................... 7-43
Table 7-7 Summary of Alternative 2 ...................................................................................................................... 7-50
Table 7-8 Bending Weir Collection System Configurations Evaluated ................................................................. 7-52
Table 7-9 Bending Weir InfoWorks Modeling Results .......................................................................................... 7-53
Table 7-10 Summary of Alternative 3 ...................................................................................................................... 7-55
Table 7-11 Summary of Alternative 4 ...................................................................................................................... 7-57
Table 7-12 Summary of Alternative 5 ...................................................................................................................... 7-58
Table 7-13 Summary of Alternative 6 ...................................................................................................................... 7-58
Table 7-14 Summary of Alternative 7 ...................................................................................................................... 7-59
Table 7-15 Outfalls Captured by Tunnel Alternative ............................................................................................... 7-71
Table 7-16 Alternative Plans Annual Combined Sewer Overflows ......................................................................... 7-74
Table 7-17 Summary of Alternatives 8 - 11 and 100% Reduction Alternative ........................................................ 7-76
Table 7-18 Alternative Elements .............................................................................................................................. 7-80
Table 7-19 Overflow Reductions for Alternative Plans ........................................................................................... 7-82
Table 7-20 Change from Baseline CSO volume to the East River ........................................................................... 7-83
Table 7-21 Minimum Percent of Time That DO Concentrations Exceed 3.0 mg/L ................................................. 7-84
Table 7-22 Floatables Reductions for Alternative Plans .......................................................................................... 7-88
Table 7-23 Attainment(1) of DEC Class SD and IEC Class B-2 Dissolved Oxygen Criteria by Select
Alternatives ............................................................................................................................................ 7-97
Table 8-1 Recommended Plan PTPC ....................................................................................................................... 8-4
Table 8-2 Current Harbor Survey Laboratory Protocols .......................................................................................... 8-8
Table 8-3 Rainfall Statistics, JFK Airport, 1988 and Long-Term Average .............................................................. 8-9
Table 8-4 Nine Elements of Long-Term CSO Control ........................................................................................... 8-14
Table 8-5 Waterbody/Watershed Plan Reductions from Baseline.......................................................................... 8-15
Table 9-1 New York State Numeric Surface Water Quality Standards (Saline) ...................................................... 9-2
Table 9-2 Interstate Environmental Commission Classifications, Criteria and Best Uses ....................................... 9-3
Table 9-3 New York State Narrative Water Quality Standards ................................................................................ 9-3
New York City Department of Environmental Protection Waterbody/Watershed Facility Plan
Newtown Creek
Table of Contents x June 2011
Table 9-4 Interstate Environmental Commission Narrative Regulations ................................................................. 9-4
Table 9-5 Annual Attainability of Class SD Dissolved Oxygen Criteria for Design Year – Newtown Creek ......... 9-5
Table 9-6 Annual Attainability of Class I Dissolved Oxygen Criteria for Design Year – Newtown Creek ............. 9-6
Table 9-7 Annual Attainability of Class I Total Coliform Criteria for Design Year ................................................ 9-7
Table 9-8 Attainability of SB/SC Total Coliform Criteria for Design Year ............................................................. 9-8
Table 9-9 Annual Attainability of SB/SC Fecal Coliform Criteria for Design Year ................................................ 9-8
Table 9-10 Recreation Season Attainability of Enterococci Bacteria for Design Year – Newtown Creek ................ 9-9

New York City Department of Environmental Protection Waterbody/Watershed Facility Plan
Newtown Creek
ES-1 June 2011
EXECUTIVE SUMMARY
The New York City Department of Environmental Protection (DEP) has prepared this
Newtown Creek Waterbody/Watershed (WB/WS) Facility Plan Report as required by the
Administrative Order on Consent between the DEP and the New York State Department of
Environmental Conservation (DEC).
Designated as DEC Case #CO2-20000107-8 (January 14, 2005, as modified April 14,
2008 as DEC Case #CO2-20070101-1 and September 3, 2009 as DEC Case #CO2-20090318-30)
and also known as the Combined Sewer Overflow (CSO) Consent Order, the Administrative
Consent Order requires the DEP to submit an “approvable WB/WS Facility Plan” for Newtown
Creek to the DEC by June 2007.
Newtown Creek is one of 18 waterbodies that together encompass the entirety of the
waters of the City of New York. The CSO Consent Order also requires that, by 2017, the DEP
complete a final, City-wide CSO Long-Term Control Plan (LTCP) incorporating the plans for all
watersheds within the City of New York.
Purpose
The purpose of this WB/WS Facility Plan is to take the first step toward the development
of a Long Term Control Plan for Newtown Creek. This WB/WS Facility Plan assesses the
ability of existing infrastructure to attain the existing water quality standards in Newtown Creek.
Where these facilities will not result in attainment of the existing standards, certain additional
alternatives have been evaluated.
Context
This WB/WS Plan is one element of the City’s extensive multi-phase approach to CSO
control that was started in the early 1970’s. As described in more detail in Section 5, New York
City has been investing in CSO control for decades. DEP has already built or is planning to
build over $3.4 billion in targeted grey infrastructure to reduce CSO volumes. This does not
include millions spent annually on the Nine Minimum Controls that have been in place since
1994 to control CSOs.
Regulatory Setting
This WB/WS Plan has been developed in fulfillment of and pursuant to the 2005 CSO
Consent Order requirements. It represents one in a series of several WB/WS Facility Plans that
will be developed prior to development of a final approvable Citywide LTCP. All WB/WS
Facility Plans, including the Newtown Creek WB/WS Facility Plan, contain all the elements
required by the USEPA of LTCP.
Goal of the Plan
The goal of this WB/WS Facility Plan is to reduce CSO overflows to Westchester Creek
through a cost-effective reduction in CSO volume and pollutants to attain existing water quality
standards. This WB/WS Facility Plan assesses the effectiveness of CSO controls now in place
within New York City and those that are required by the CSO Consent Order to be put in place,
to attain water quality that complies with the DEC water quality standards. Where existing or
New York City Department of Environmental Protection Waterbody/Watershed Facility Plan
Newtown Creek
ES-2 June 2011
proposed controls are expected to fall short of attaining water quality standards, this WB/WS
Facility Plan also assesses certain additional cost-effective CSO control alternatives and
strategies (i.e., water quality standards revisions) that can be employed to provide attainment
with the water quality standards. The goal of the LTCP will be to quantify effectiveness of the
WB/WS Facility Plan recommended CSO controls and to evaluate additional CSO controls
necessary to attain existing water quality standards and/or highest attainable appropriate use.
Adaptive Management Approach
Post-construction compliance monitoring discussed in detail in Section 8, is an integral
part of this WB/WS Facility Plan and provides the basis for adaptive management for Newtown
Creek. Monitoring will commence just prior to implementation of CSO controls and will
continue for several years thereafter in order to quantify the difference once controls are fully
implemented. Any performance gap identified by the monitoring program can then be addressed
through design modifications, operational adjustments, or additional controls. If further CSO
reductions are needed to attain water quality standards, the DEP will identify and implement
additional technically feasible and cost-effective alternatives under the Long-Term Control Plan.
If it becomes clear that the implemented plan will not result in full attainment of applicable
standards, DEP will pursue the necessary regulatory mechanism for a Variance and/or Water
Quality Standards Revision.
If additional controls are required, best engineering practices and protocols established by
the DEP and the City of New York for capital expenditures require that certain evaluations are
completed prior to the construction of additional CSO controls Depending on the technology
implemented and the engineer’s cost estimate for the project, these evaluations may include pilor
testing, detailed facility planning, preliminary design, and value engineering. Each of these steps
provides additional opportunities for refinement and adaptation so that the fully implemented
program achieves the goals of the original WB/WS Facility Plan.
Waterbody Background
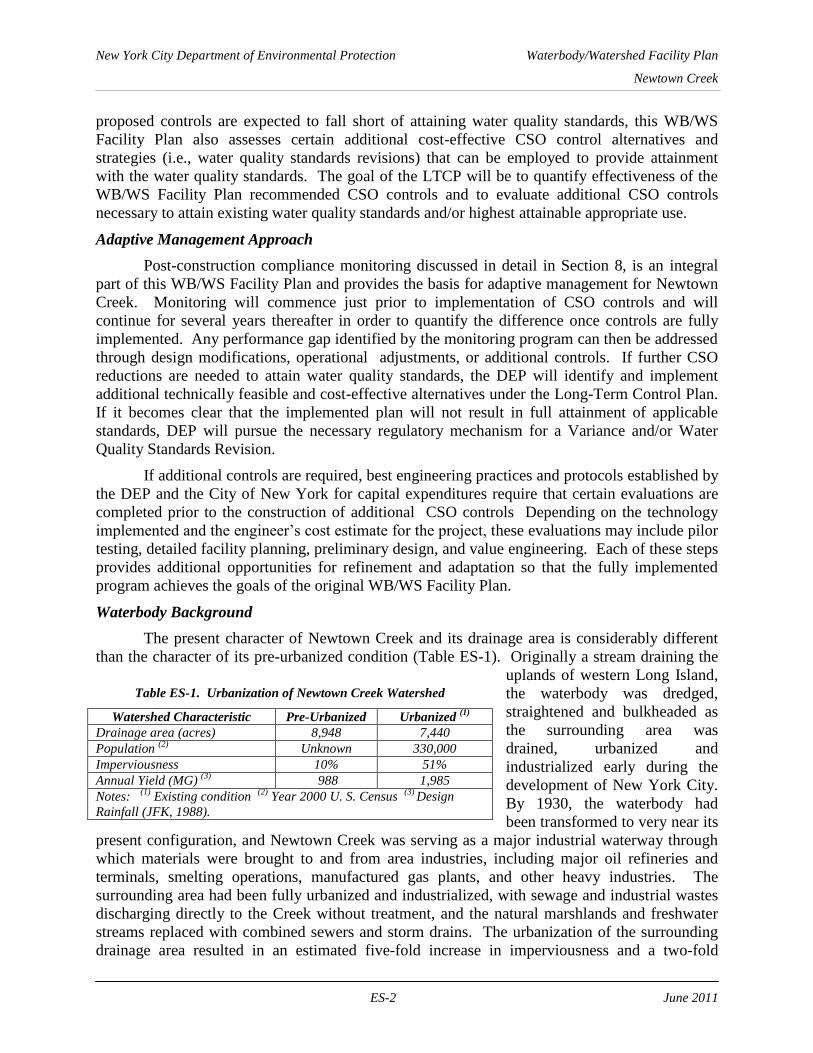
The present character of Newtown Creek and its drainage area is considerably different
than the character of its pre-urbanized condition (Table ES-1). Originally a stream draining the
uplands of western Long Island,
the waterbody was dredged,
straightened and bulkheaded as
the surrounding area was
drained, urbanized and
industrialized early during the
development of New York City.
By 1930, the waterbody had
been transformed to very near its
present configuration, and Newtown Creek was serving as a major industrial waterway through
which materials were brought to and from area industries, including major oil refineries and
terminals, smelting operations, manufactured gas plants, and other heavy industries. The
surrounding area had been fully urbanized and industrialized, with sewage and industrial wastes
discharging directly to the Creek without treatment, and the natural marshlands and freshwater
streams replaced with combined sewers and storm drains. The urbanization of the surrounding
drainage area resulted in an estimated five-fold increase in imperviousness and a two-fold
Table ES-1. Urbanization of Newtown Creek Watershed
Watershed Characteristic Pre-Urbanized Urbanized (1)
Drainage area (acres) 8,948 7,440
Population (2)
Unknown 330,000
Imperviousness 10% 51%
Annual Yield (MG) (3)
988 1,985
Notes: (1)
Existing condition (2)
Year 2000 U. S. Census (3)
Design
Rainfall (JFK, 1988).

New York City Department of Environmental Protection Waterbody/Watershed Facility Plan
Newtown Creek
ES-3 June 2011
33%
46%
70%
87%
0%
20%
40%
60%
80%
100%
Section 1 Section 2 Section 3 Section 4
Bottom D.O.
23%
54%
44%
74%
0%
20%
40%
60%
80%
100%
Section 1 Section 2 Section 3 Section 4
Top D.O.
Figure ES-1. Percent of DO Samples < 3.0 mg/L
increase in the annual runoff volume to the waterbody. Stripped of the surrounding buffers of
marshland and its natural freshwater flow, the waterbody was deprived of any natural response
mechanisms that might have helped absorb the increased hydraulic and pollutant loads. The
Creek’s limited circulation and exchange with the East River allowed pollutants to build up
within the Creek, and water quality deteriorated to such an extent that Newtown Creek was
notorious as a polluted waterway.
Efforts to address water quality in Newtown Creek date back to the 1960s, when New
York City was constructing wastewater pollution control plants (WPCPs) to treat sewage and
industrial wastes during dry weather and to capture a portion of the combined sewage generated
during wet weather. Two WPCPs service the Newtown Creek drainage area: the Bowery Bay
WPCP, which began operating in 1938, and the Newtown Creek WPCP, which began operating
in 1967.
Currently, about 330,000 people live within the Newtown Creek’s 7,441-acre drainage
area, over 83 percent of which is served by combined sewers draining to either the Bowery Bay
or the Newtown Creek WPCPs. In addition to combined sewer overflows, the Creek takes flow
from numerous storm and highway drains and other DEC permitted industrial discharges.
Newtown Creek has benefited from several citywide programs, including the City-Wide
Floatables Plan, which addresses
discharges of street litter with catch basin
controls and a program to remove
floatables in the Creek with tributary
skimmer vessels and the installation of
floatables booms within English Kills, East
Branch, and Maspeth Creek. Under the
2004 Inner Harbor CSO Facility Plan, the
DEP completed other actions, such as
regulator improvements and maximizing
wet-weather flow to the WPCPs. In
addition to these citywide programs, the
Newtown Creek WPCP is currently
undergoing a nearly $4 billion upgrade to
full secondary treatment to provide 85
percent BOD5 and TSS removal during dry
weather, and treatment capacity of up to
700 mgd during wet weather, and
construction of the Zone I aeration facility
from the 2003 CSO Facility Plan was
completed in 2008. Other projects from the
2003 CSO Facility Plan that have also
continued to move forward during concurrent with waterbody/watershed planning includes
design of the Zone 2 Aeration Facilities, construction of the Kent Avenue Throttling Facility, and
the installation of inflatable dams at Regulator B-6 along the Kent Avenue Interceptor to
maximize storage in the Newtown Creek WPCP collection system.

New York City Department of Environmental Protection Waterbody/Watershed Facility Plan
Newtown Creek
ES-4 June 2011
The State of New York has designated Newtown Creek as a Class SD waterbody, with a
designated best use of fishing, with waters suitable for fish survival. Water quality standards
specific to Class SD waters require that dissolved oxygen concentrations shall not be less than
3.0 mg/L at any time. Since there is no recreational use classification of Newtown Creek, there
are no numerical recreational use water quality standards applied to the waterbody. Narrative
standards address aesthetic conditions such as floatables and odors.
In 1998, DEC designated Newtown Creek as a high-priority waterbody for TMDL
development with its inclusion on the Section 303(d) list of impaired waterbodies. The cause of
the listing was dissolved oxygen/oxygen demand due to CSOs. Despite the advances described
above, Newtown Creek remained on the 303(d) list in 2010, again due to low dissolved oxygen
concentrations from wet-weather discharges, but the list was updated to acknowledge
contributions from urban runoff and storm sewers in addition to CSO. Figure ES-1 demonstrates
how measured dissolved oxygen levels in Newtown Creek were below 3.0 mg/L during the
majority of the sampling events from 1984 to 2003.
Modeling analyses performed herein indicate
that, under the baseline conditions in a typical
precipitation year of 82 rainfall events, there would be
approximately 71 CSO events lasting 6 to 7 hours on
average and discharging a total of 1,408 MG to
Newtown Creek and its tributaries (Table ES-2).
Separately sewered and direct drainage stormwater
inputs contribute an additional 577 MG per year, or roughly 29 percent of the total wet-weather
discharge volume to Newtown Creek. As demonstrated on Figure ES-2, the calculated impact of
these inputs on dissolved oxygen in the Creek is significant, with minimum-calculated dissolved
oxygen concentrations less than 3.0 mg/L throughout much of the Creek.
Planning
undertaken by the DEP
prior to initiation of its
WB/WS Facility Planning
Project culminated in the
2003 CSO Facility Plan,
which was subsequently
incorporated into the 2005
Consent Order. The 2003
Plan consists of a host of
planned CSO controls for
Newtown Creek such as
in-stream aeration, sewer
system modifications,
regulator improvements,
interceptor throttling, and
a 9 MG CSO storage tank,
implementation of which has continued throughout the WB/WS planning. Despite inclusion in
the Consent Order and the ongoing implementation, the 2003 CSO Facility Plan is not
considered the final conceptual design for Newtown Creek and the Consent Order allows the
Table ES-2. CSO & Stormwater Discharges
Type
Number
of Events
Total Annual
Volume (MG)
CSO 71 1,408
Stormwater
82 577
Total - 1985
Figure ES-2. Model-Calculated Minimum Dissolved Oxygen (Baseline)

New York City Department of Environmental Protection Waterbody/Watershed Facility Plan
Newtown Creek
ES-5 June 2011
DEP to propose final modifications to the scope of the projects set forth in the 2003 CSO Facility
Plan through the completion of an approvable WB/WS Facility Plan for Newtown Creek, which
was submitted to the DEC in June 2007 (DEC, 2004b). The present document incorporates
comments received from DEC on the June 2007 Newtown Creek WB/WS Facility Plan.
Therefore, the WB/WS Facility Plan developed herein reviews these projects, and also examines
the extent to which additional or alternative cost effective control measures may result in water
quality standards being met.
In September 2010, Newtown Creek was included on the EPA’s Superfund National
Priority List. Pesticides, metals, PCBs, and volatile organic compounds (VOCs), which are
potentially harmful contaminants that can easily evaporate into the air, have been detected at the
Creek. The Superfund cleanup process is complex, and involves numerous steps taken to assess
sites, place them on the National Priorities List, and establish and implement appropriate cleanup
plans. This is the long-term cleanup process.
Waterbody/Watershed Planning Analyses
Acknowledging that the 2003 CSO Facility Plan is not a final conceptual design, all
elements of the plan were reviewed with the updated sewer system and water quality models to
quantify the projected benefits of the proposed plan. Through this analysis it was determined
that several elements of the 2003 CSO Facility Plan are either not feasible (raising the weir in
regulator B1) or do not provide any benefit in terms of CSO reduction (Kent Avenue Throttling
Facility) and consequently water quality and still others could be cost effectively optimized to
further reduce CSOs (St. Nicholas Weir Relief Sewer). It was therefore concluded that the 2003
CSO Facility Plan is not practical to implement as planned, however it does provide another
benchmark, in addition to the baseline condition, for comparing CSO reduction and water quality
improvement alternatives. Therefore, the DEP considers the projected CSO reduction offered by
the 2003 CSO Facility Plan as the minimum acceptable level of CSO reduction. As such, the
WB/WS Plan elements shall provide for at least as much projected CSO volume reduction, and
be projected to have at least comparable water quality benefits.
Herein, a range of CSO control alternatives have been examined to reduce CSO pollution
impacts to Newtown Creek. The evaluated range of alternatives includes the as planned 2003
CSO Facility Plan elements, other “Low Cost” alternatives that address aesthetics issues without
reducing CSO volume, collection system improvements to maximize flow to the WPCP and/or to
transfer CSO to the East River, and CSO storage facilities to capture up to 100 percent of the
typical year CSO volume generated in the drainage area during wet weather. All alternatives
include implementation of City-Wide programs such as the City-Wide Comprehensive CSO
Floatables Plan and the 14 BMPs for CSO Control (per the SPDES permits) to maximize use of
existing systems and facilities for CSO capture and pollutant reduction as well as floatables
control beyond what is specifically accounted for in the City-Wide Comprehensive CSO
Floatables Plan through CSO volume reduction or through specific floatables control
technologies. In addition, with the exception of the CSO Facility Plan, all of the alternatives
analyzed include an operational protocol that allows the Brooklyn Pump Station to pump up to
400 MGD during wet weather.
New York City Department of Environmental Protection Waterbody/Watershed Facility Plan
Newtown Creek
ES-6 June 2011
Overall, the estimated costs associated with the evaluated alternatives ranged from $205
million to over $3 billion. For tracking purposes, the alternatives were given an alternative
number. All of the alternatives were evaluated using the sewer system model to compute
projected CSO volume and number of events for the design year. The alternative number,
elements of the evaluated alternative plans, and modeled results are summarized in Table ES-3.
The table shows that volume reductions comparable to that projected for the CSO Facility Plan
are available within a reasonable range of estimated cost. Additionally, significant CSO
reduction beyond that projected for the CSO Facility Plan is available for significantly higher
cost.
Table ES-3. Summary of Alternatives
Alt # Description
Events
Per
Year
Untreated
CSO
(MG/Year
)
CSO
Reduction
from
Baseline
(MG/Year)
% CSO
Reduction
from
Baseline
Total
Cost
W/O Air
(Millions)
Total
Cost
W/Air (1)
(Millions)
Baseline Baseline 71 1,471.9 - - - -
1 2003 CSO Facility Plan 56 1,069.5 402.4 27% $549.6 $664.9
2 High Level Aeration and
Floatables Control 71 1,372.9 99.0 7% $89.8 $205.1
3 Alternative 2 and Bending Weirs 71 1,259.9 212.0 14% $116.0 $231.3
4 Alternative 3 and Dutch Kills
Relief Sewer 55 1,208.9 263.0 18% $210.7 $326
5
Alternative 2, Inflatable Dams,
and 48-Inch St. Nicholas Relief
Sewer
55 1,218.1 253.8 17% $119.8 $235.1
6
High Level Aeration, Inflatable
Dams, St. Nicholas Relief Sewer,
Dutch Kills Relief Sewer, and
Additional 96-Inch Interceptor
55 1,037.4 434.5 30% $505.5 $620.8
7
High Level Aeration, Inflatable
Dams, St. Nicholas Relief Sewer,
Dutch Kills Relief Sewer, and 9
MG Storage Tank
55 1,012.9 459.0 31% $680.9 $796.2
8
40 MG CSO Tunnel, Dutch Kills
Relief Sewer, and High Level
Aeration
55 580.7 891.2 60% $1,654.5 $1,769.8
9
107 MG Tunnel, Dutch Kills
Relief Sewer, and High Level
Aeration
48 244.0 1,227.9 83% $2,332.6 $2,447.9
10 128 MG Tunnel and High Level
Aeration 44 68.2 1,403.7 95% $2,938.8 $3,054.1
11 132.5 MG Tunnel and High Level
Aeration 29 14.9 1,457.0 99% $2,975.0 $3,090.3
100%
Reduction
134 MG Tunnel and High Level
Aeration 0 0 1471.9 100% $3,109.3 $3,224.6
(1) The 2003 CSO Facility Plan includes cost for planned low level aeration. All other alternatives include cost for high
level aeration, which is the level of aeration projected to bring the waterbody to full attainment of the Class SD
numerical DO standard for the Baseline condition.

New York City Department of Environmental Protection Waterbody/Watershed Facility Plan
Newtown Creek
ES-7 June 2011
In addition to sewer system modeling, water quality modeling analyses were performed
to project the expected water quality benefits of each of the evaluated alternatives. These
analyses considered all alternatives to the CSO Facility Plan with and without high level
aeration, which is defined as the level of aeration projected to bring the waterbody into full
attainment of the Class SD numerical DO standards under Baseline conditions. This step was to
determine the relative impact of CSO volume reduction on water quality.
Dissolved Oxygen Improvements
Figure ES-3 shows dissolved oxygen attainment versus cost for each Alternative, with
and without high level aeration. The CSO Facility Plan is included with the planned low level
aeration.
The figure shows that without aeration, dissolved oxygen levels are not projected to attain
the Class SD criterion of 3.0 mg/L for any alternative including 100% CSO Removal. It also
shows that higher levels of attainment can be achieved beyond what is projected for the CSO
Facility Plan (including planned aeration) through either a higher level of aeration (even with
little or no CSO volume reduction) or through further reductions in CSO volume alone. This
figure shows a clear inflection point, where the change in incremental cost of the control
alternative per change in performance of the control alternative changes most rapidly, at
Alternative 2. This inflection point is known as the knee-of-the-curve, and is used to identify the
where higher levels of control cease to be cost effective. Based on this analysis, high level
aeration, with only minimal reduction in CSO volume, provides the largest water quality benefit
on a per dollar basis.
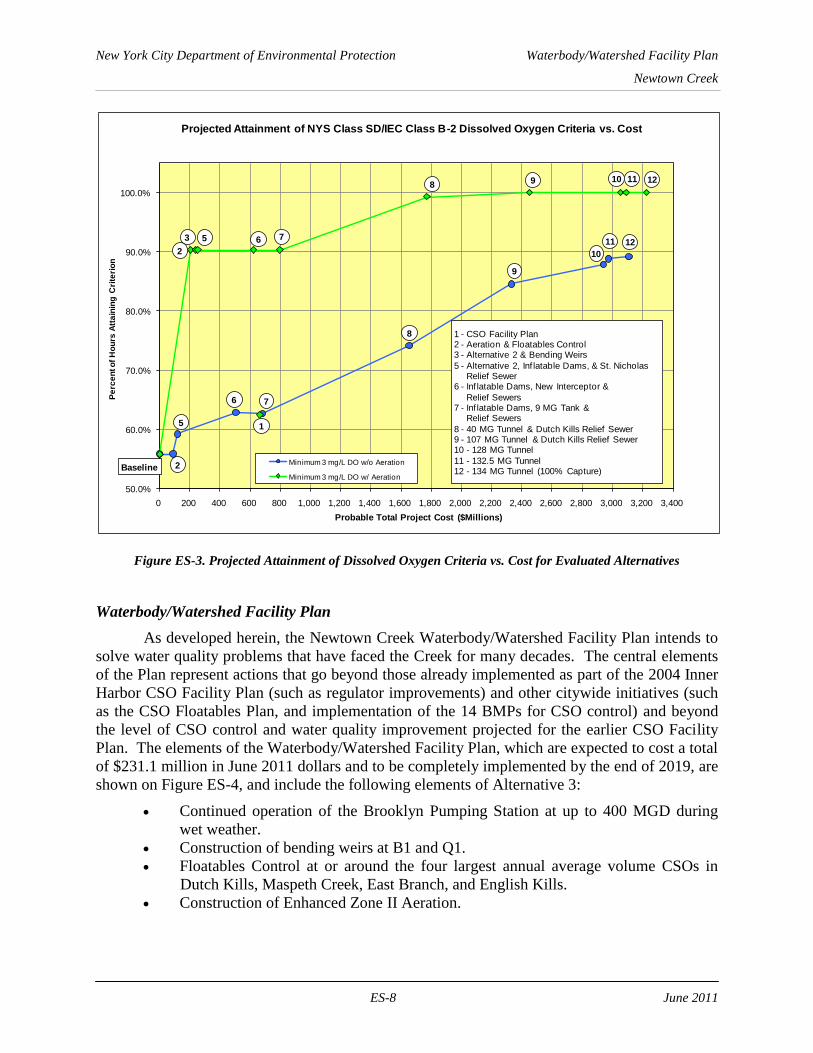
New York City Department of Environmental Protection Waterbody/Watershed Facility Plan
Newtown Creek
ES-8 June 2011
Figure ES-3. Projected Attainment of Dissolved Oxygen Criteria vs. Cost for Evaluated Alternatives
Waterbody/Watershed Facility Plan
As developed herein, the Newtown Creek Waterbody/Watershed Facility Plan intends to
solve water quality problems that have faced the Creek for many decades. The central elements
of the Plan represent actions that go beyond those already implemented as part of the 2004 Inner
Harbor CSO Facility Plan (such as regulator improvements) and other citywide initiatives (such
as the CSO Floatables Plan, and implementation of the 14 BMPs for CSO control) and beyond
the level of CSO control and water quality improvement projected for the earlier CSO Facility
Plan. The elements of the Waterbody/Watershed Facility Plan, which are expected to cost a total
of $231.1 million in June 2011 dollars and to be completely implemented by the end of 2019, are
shown on Figure ES-4, and include the following elements of Alternative 3:
Continued operation of the Brooklyn Pumping Station at up to 400 MGD during
wet weather.
Construction of bending weirs at B1 and Q1.
Floatables Control at or around the four largest annual average volume CSOs in
Dutch Kills, Maspeth Creek, East Branch, and English Kills.
Construction of Enhanced Zone II Aeration.
50.0%
60.0%
70.0%
80.0%
90.0%
100.0%
0 200 400 600 800 1,000 1,200 1,400 1,600 1,800 2,000 2,200 2,400 2,600 2,800 3,000 3,200 3,400
Pe
rce
nt o
f H
ou
rs A
tta
inin
g C
rite
rio
n
Probable Total Project Cost ($Millions)
Projected Attainment of NYS Class SD/IEC Class B-2 Dissolved Oxygen Criteria vs. Cost
Minimum 3 mg/L DO w/o Aeration
Minimum 3 mg/L DO w/ Aeration
3
10
9
8
7
6
5
1098
7
6
5
2
1
Baseline
1 - CSO Facility Plan2 - Aeration & Floatables Control3 - Alternative 2 & Bending Weirs
5 - Alternative 2, Inf latable Dams, & St. Nicholas Relief Sewer
6 - Inf latable Dams, New Interceptor &
Relief Sewers7 - Inf latable Dams, 9 MG Tank &
Relief Sewers
8 - 40 MG Tunnel & Dutch Kills Relief Sewer9 - 107 MG Tunnel & Dutch Kills Relief Sewer10 - 128 MG Tunnel
11 - 132.5 MG Tunnel12 - 134 MG Tunnel (100% Capture)
2
1211
1211
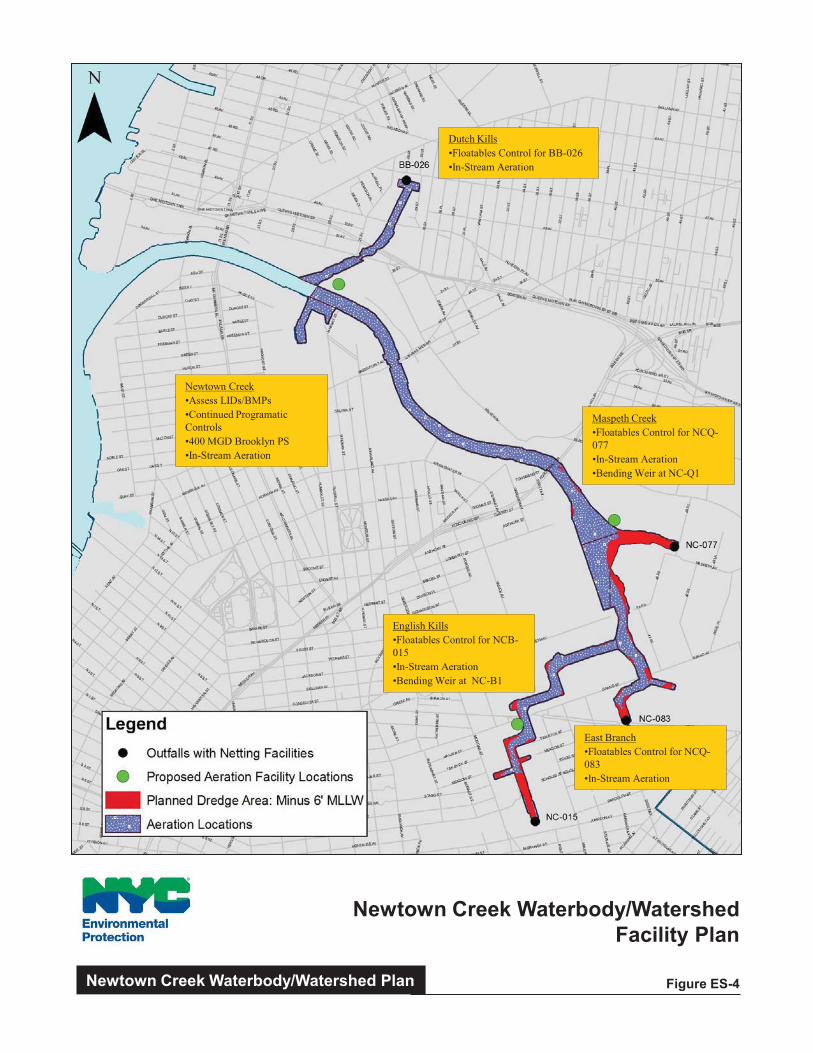
Newtown Creek Waterbody/WatershedFacility Plan
Figure ES-4Newtown Creek Waterbody/Watershed Plan
Dutch Kills•Floatables Control for BB-026•In-Stream Aeration
Maspeth Creek•Floatables Control for NCQ-077•In-Stream Aeration•Bending Weir at NC-Q1
East Branch•Floatables Control for NCQ-083•In-Stream Aeration
English Kills•Floatables Control for NCB-015•In-Stream Aeration•Bending Weir at NC-B1
Newtown Creek•Assess LIDs/BMPs•Continued Programatic Controls•400 MGD Brooklyn PS•In-Stream Aeration
New York City Department of Environmental Protection Waterbody/Watershed Facility Plan
Newtown Creek
ES-10 June 2011
In addition, the City will continue to implement the NYC Green Infrastructure Plan
concurrently with this Waterbody/Watershed Facility Plan, and will build green infrastructure in
the Newtown Creek areas. The LTCPs will incorporate and analyze that effort.
Bending Weirs
As discussed in Section 7.3.4, two locations for bending weirs were identified to provide
considerable CSO reductions. These two locations, Regulator B1 (which overflows to outfall
NCB-015) and Regulator Q1 (which overflows to outfall NCQ-077), discharge the second and
third largest CSO volumes under Baseline conditions. Bending weirs at these locations also can
readily divert wet weather flow into the Morgan Avenue Interceptor and then to the WWTP for
treatment. Each regulator will be retrofitted with bending weirs, installed on top of the regulator
weirs, and modifications made to the regulator orifices to convey additional flow to the WWTP.
A 3 foot tall 140 foot long fixed weir equipped with a two foot tall bending weir is proposed for
Regulator B-1 and the orifices will be expanded from the existing 8-ft by 3-ft to 10-ft by 3-ft. At
Regulator Q1, the bending weir will be 2 feet tall and the orifice would be expanded from the
existing 2-ft square opening to a 3.5-ft square opening. The estimated cost of the bending weirs
and regulator modifications is $26.2 million in June 2011 dollars.
Floatables Control
Only minor CSO volume reduction is expected during the Waterbody/Watershed Facility
Plan implementation, which focuses on attaining the existing Class SD narrative and numerical
water quality standards. Therefore, the DEP will construct floatables control facilities to address
floatables at or near the four CSOs with the largest baseline annual overflow volumes (BB-026,
NCQ-077, NCB-083, and NCB-015). The feasibility of siting and maintaining such facilities on
or around these outfalls will be determined during detailed facility planning. The estimated
capital cost of installing facilities to control floatables from the four outfalls with largest baseline
annual overflow volume is $89.8 million in June 2011 dollars.
Enhanced Zone II Aeration
As discussed in Section 7.3.3, the CSO Facility Plan proposed two zones of aeration,
sized to increase the minimum dissolved oxygen level in Newtown Creek to 1 mg/L.
Construction of Zone I in upper English Kills was completed by the Consent Order milestone of
December 2008. Zone II aeration, which is included in the Consent Order with a completion
milestone of June 2014, was to include aeration of lower English Kills, East Branch and Dutch
Kills. However, the Waterbody/Watershed Facility Plan calls for enhancing Zone II to provide
enough oxygen to the water column to attain the existing Class SD numerical DO standard
throughout the Creek. The DEP has identified constructed Zone I aeration site as a pilot facility
to evaluate the effectiveness of aeration. Through this effort the DEP has developed site specific
information about transfer efficiency and other related factors that influence the final aeration of
the waterbody. Based on the results of the pilot study and follow-up water quality modeling,
modeling projections show that 19,000 scfm of air would be required to bring the waterbody into
compliance with Class SD numerical DO criteria under baseline conditions. Modeling also
projects that to be successful the system would need to be deployed throughout a majority of the
waterbody, including the shipping channels. Such an enhanced aeration system will require
multiple blower buildings and a vast network of aeration piping. Information from the pilot
study will be used during detailed facility planning and design of Enhanced Zone II Aeration to

New York City Department of Environmental Protection Waterbody/Watershed Facility Plan
Newtown Creek
ES-11 June 2011
determine the number of blower facilities, system sizing requirements, and any necessary
upgrades to the Zone I facility currently being constructed. Aeration will first be implemented in
Lower English Kills, followed by East Branch and portions of Newtown Creek. The final
aeration project under the Enhanced Zone II Aeration program will be installed at the mouth of
Dutch Kills and additional portions of Newtown Creek. The estimated cost of Enhanced Zone II
Aeration is $115.3 million in June 2011 dollars.
Continued Implementation of Programmatic Controls
As discussed in detail in Section 5.0 DEP currently operates several programs designed to
reduce CSO to a minimum and provide treatment levels appropriate to protect waterbody uses.
As the effects of the LTCP become understood through long-term monitoring, ongoing programs
will be routinely evaluated based on receiving water quality considerations. Floatables reduction
plans, targeted sewer cleaning, real-time level monitoring, and other operations and maintenance
controls and evaluations will continue, in addition to the following:
The 14 BMPs for CSO control required under the City’s 14 SPDES permits. In
general, the BMPs address operation and maintenance procedures, maximum use of
existing systems and facilities, and related planning efforts to maximize capture of
CSO and reducing contaminants in the combined sewer system, thereby reducing
water quality impacts.
The City-Wide Comprehensive CSO Floatable Plan (HydroQual, 2005a) will
provide substantial reductions in floatables discharges from CSOs throughout the
City and will provide for compliance with appropriate DEC and IEC requirements.
Like the Waterbody/Watershed Facility Plan, the Floatables Plan is a living
program that is expected to change over time based on continual assessment and
changes in related programs.
Implementation Schedule
The Newtown Creek Waterbody/Watershed Facility Plan implementation schedule is
provided in Figure ES-5. As discussed, the Newtown Creek Waterbody/Watershed Facility Plan
is phased such that some elements of the plan are instituted before others with all elements
implemented by May 2019. If, after implementation of each phase of the plan, monitoring data
and advances in technology determine new opportunities may be more effective, later elements
of the plan may be revised to provide the most cost effective solution to water quality issues.
Post-Construction Monitoring
Post-construction monitoring will be integral to assessment of the control elements of the
Waterbody/Watershed Facility Plan. Monitoring will consist of collecting relevant sampling
data from the waterbody, as well as collecting relevant precipitation data and data characterizing
the operation of the sewer system and related control facilities. Analysis of these data will
provide an indication of how the controls are performing irrespective of natural wet-weather
variations. Due to the dynamic nature of both natural precipitation and receiving water
conditions, a period of ten years will be necessary to generate the minimal amount of field data
necessary to perform meaningful statistical analyses for water quality standards review and for
any formal use-attainability analyses that may be indicated.
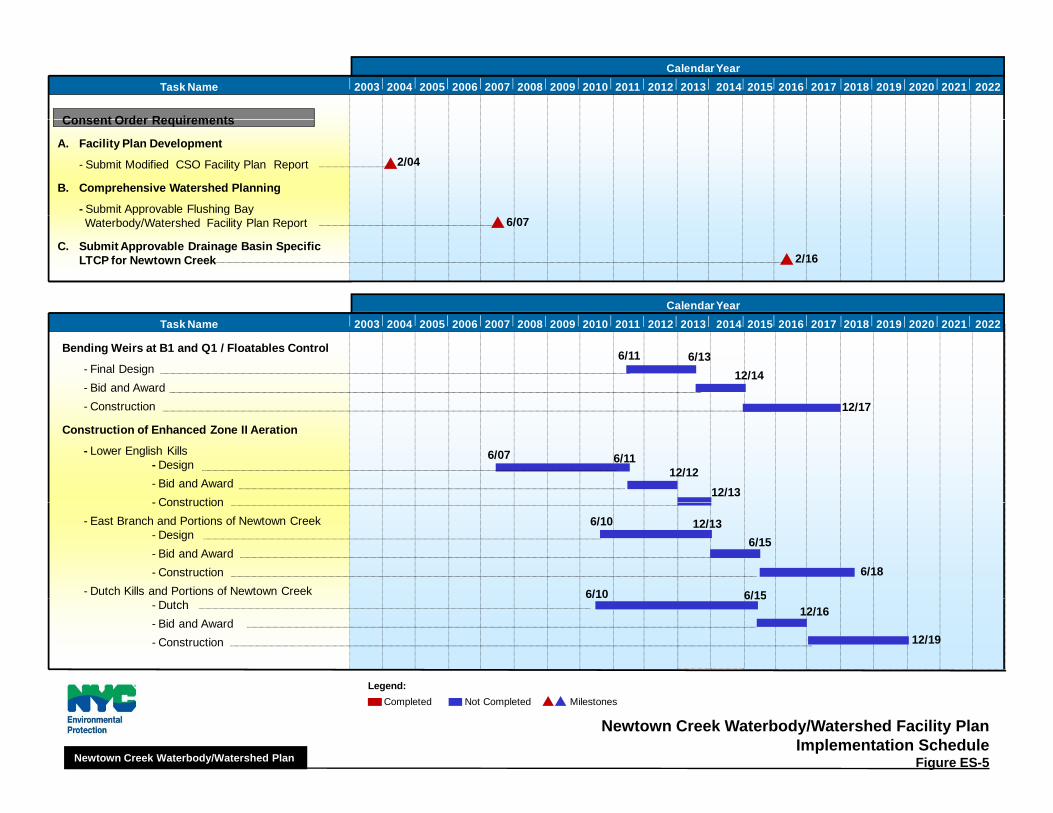
2003 2004 2005 2006 2007 2008 2009 2010Task Name
Calendar Year
2011 2012 2013 2014
Consent Order Requirements
2015 2016 2017 2018 2019 2020 2021 2022
A. Facility Plan Development
- Submit Modified CSO Facility Plan Report
B. Comprehensive Watershed Planning
- Submit Approvable Flushing Bay
2/04
Consent Order Requirements
Waterbody/Watershed Facility Plan Report
C. Submit Approvable Drainage Basin Specific LTCP for Newtown Creek
6/07
Calendar Year
2/16
June 2012
Estimated; LTCP is Due 6 Months after WB/WS Facility Plan Approval*2003 2004 2005 2006 2007 2008 2009 2010Task Name 2011 2012 2013 2014
6/11
2015 2016 2017 2018 2019 2020 2021 2022
Bending Weirs at B1 and Q1 / Floatables Control
- Final Design- Bid and Award- Construction
6/13
12/14
12/17 June 2012- Construction
Construction of Enhanced Zone II Aeration
- Lower English Kills- Design - Bid and Award - Construction
12/17
12/13
6/1112/12
6/07
- Construction- East Branch and Portions of Newtown Creek
- Design- Bid and Award- Construction
- Dutch Kills and Portions of Newtown Creek
6/18
12/13
6/15
6/10
6/156/10
Legend:
- Dutch- Bid and Award- Construction 12/19
6/1512/16
Newtown Creek Waterbody/Watershed Facility PlanImplementation Schedule
Figure ES-5Newtown Creek Waterbody/Watershed Plan
Completed Not Completed Milestones
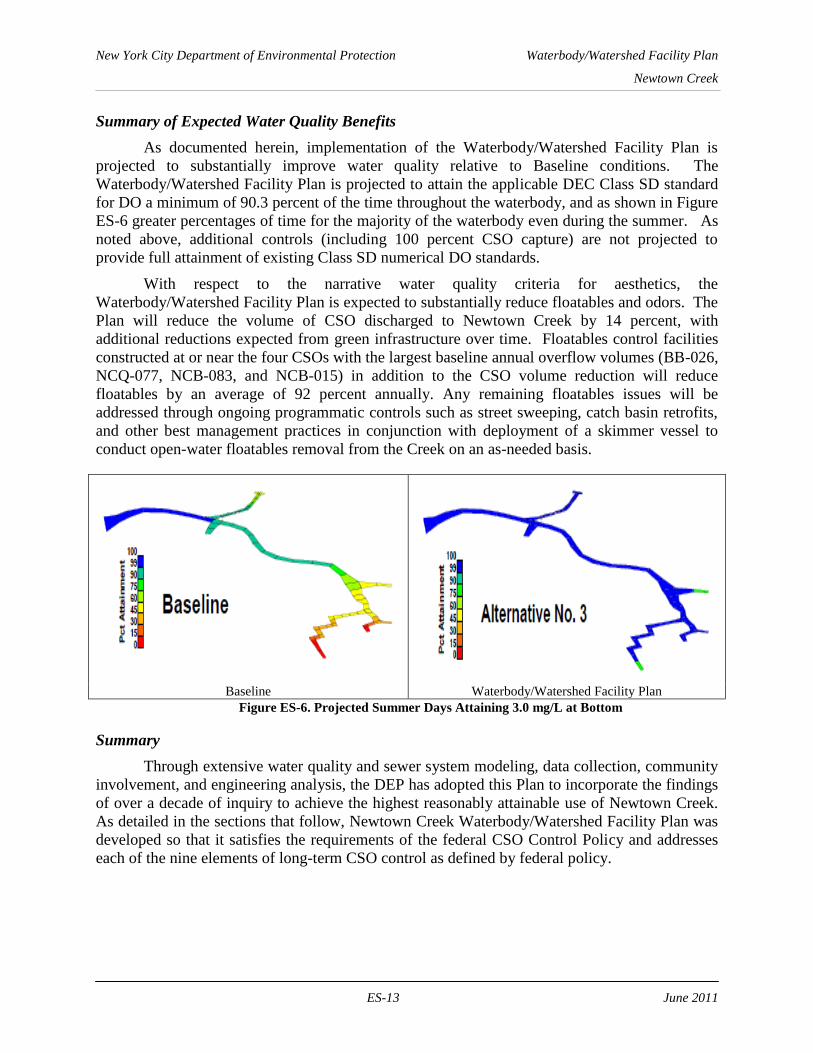
New York City Department of Environmental Protection Waterbody/Watershed Facility Plan
Newtown Creek
ES-13 June 2011
Summary of Expected Water Quality Benefits
As documented herein, implementation of the Waterbody/Watershed Facility Plan is
projected to substantially improve water quality relative to Baseline conditions. The
Waterbody/Watershed Facility Plan is projected to attain the applicable DEC Class SD standard
for DO a minimum of 90.3 percent of the time throughout the waterbody, and as shown in Figure
ES-6 greater percentages of time for the majority of the waterbody even during the summer. As
noted above, additional controls (including 100 percent CSO capture) are not projected to
provide full attainment of existing Class SD numerical DO standards.
With respect to the narrative water quality criteria for aesthetics, the
Waterbody/Watershed Facility Plan is expected to substantially reduce floatables and odors. The
Plan will reduce the volume of CSO discharged to Newtown Creek by 14 percent, with
additional reductions expected from green infrastructure over time. Floatables control facilities
constructed at or near the four CSOs with the largest baseline annual overflow volumes (BB-026,
NCQ-077, NCB-083, and NCB-015) in addition to the CSO volume reduction will reduce
floatables by an average of 92 percent annually. Any remaining floatables issues will be
addressed through ongoing programmatic controls such as street sweeping, catch basin retrofits,
and other best management practices in conjunction with deployment of a skimmer vessel to
conduct open-water floatables removal from the Creek on an as-needed basis.
Baseline Waterbody/Watershed Facility Plan
Figure ES-6. Projected Summer Days Attaining 3.0 mg/L at Bottom
Summary
Through extensive water quality and sewer system modeling, data collection, community
involvement, and engineering analysis, the DEP has adopted this Plan to incorporate the findings
of over a decade of inquiry to achieve the highest reasonably attainable use of Newtown Creek.
As detailed in the sections that follow, Newtown Creek Waterbody/Watershed Facility Plan was
developed so that it satisfies the requirements of the federal CSO Control Policy and addresses
each of the nine elements of long-term CSO control as defined by federal policy.
New York City Department of Environmental Protection Waterbody/Watershed Facility Plan
Newtown Creek
ES-14 June 2011
NO TEXT ON THIS PAGE
New York City Department of Environmental Protection Waterbody/Watershed Facility Plan
Newtown Creek
1-1 June 2011
1.0 Introduction
The City of New York owns and operates 14 wastewater treatment plants (WWTPs) and their associated collection systems. The system contains approximately 450 combined sewer overflows (CSOs) located throughout the New York Harbor complex. The New York City Department of Environmental Protection (DEP) operates and maintains the wastewater collection system and WWTPs and has executed a comprehensive watershed-based approach to address the impacts of these CSOs on water quality and uses of the waters of New York Harbor. As illustrated in Figure 1-1, multiple waterbody assessments are being conducted that consider all causes of non-attainment of water quality standards and identify opportunities and requirements for maximizing beneficial uses. This Waterbody/Watershed (WB/WS) Facility Plan Report provides the details of the assessment and the actions that will be taken to improve water quality in Newtown Creek (Item 11 on Figure 1-1).
New York City’s environmental stewardship of the New York Harbor began in 1909 with water quality monitoring “to assess the effectiveness of New York City’s various water pollution control programs and their combined impact on water quality” that continues today (annual DEP NY Harbor Water Quality Survey Reports, 2000-2007). CSO abatement has been ongoing since at least the 1950s, when conceptual plans were first developed for the reduction of CSO discharges into Spring Creek, other confined tributaries in Jamaica Bay, and the East River. From 1975 through 1977, the City conducted a harbor-wide water quality study funded by a Federal Grant under Section 208 of the Water Pollution Control Act Amendments of 1972. That study confirmed tributary waters in the New York Harbor were negatively impacted by CSOs. In addition, occurrences of dry weather discharges– which DEP has since eliminated – were also confirmed. In 1984 a Citywide CSO abatement program was developed that initially focused on establishing planning areas and defining how facility planning should be accomplished. As part of that plan, the City was divided into eight individual project areas that together encompass the entirety of the New York Harbor. Four open water project areas (East River, Jamaica Bay, Inner Harbor and Outer Harbor), and four tributary project areas (Flushing Bay, Paerdegat Basin, Newtown Creek, and Jamaica Tributaries) were defined. For each project area, water-quality CSO Facility Plans were developed as required under the State Pollutant Discharge Elimination System (SPDES) permits for each WWTP. The SPDES permits for each WWTP, administered by the New York State Department of Environmental Conservation (DEC), apply to CSO outfalls as well as plant discharges and contain conditions for compliance with applicable federal and New York State requirements for CSOs.
In 1992, DEP entered into an Administrative Consent Order with DEC which incorporated into the SPDES permits a provision stating that the consent order governs DEP’s obligations for its CSO program. The 1992 Order was modified in 1996 to add a catch basin cleaning, construction, and repair program. A new Consent Order became effective in 2005 that superseded the 1992 Consent Order and its 1996 modifications with the intent to bring all CSO-related matters into compliance with the provisions of the Federal Clean Water Act (CWA) and New York State Environmental Conservation Law. The new Order contains requirements to evaluate and implement CSO abatement strategies on an enforceable timetable for 18 waterbodies and, ultimately, for Citywide long-term CSO control. DEP and DEC also entered into a separate Memorandum of Understanding (MOU) to facilitate water quality standards (WQS) reviews in accordance with the federal CSO control policy. The 2005 Order was subsequently modified in 2008 and 2009.
New York City Department of Environmental Protection Waterbody/Watershed Facility Plan
Newtown Creek
1-2 June 2011
This Newtown Creek WB/WS Facility Plan Report is explicitly required by item VIII.B.1, Appendix A of the 2005 Consent Order, and is intended to be consistent with the United States Environmental Protection Agency’s (USEPA) CSO Control Policy promulgated in 1994. The policy requires municipalities to develop a long term plan for controlling CSOs (i.e. a Long Term Control Plan or LTCP). The CSO policy became law in December 2000 with the passage of the Wet Weather Water Quality Act. The approach to developing the LTCP is specified in USEPA’s CSO Control Policy and Guidance Documents, and involves the following nine minimum elements:
1. System Characterization, Monitoring and Modeling
2. Public Participation
3. Consideration of Sensitive Areas
4. Evaluation of Alternatives
5. Cost/Performance Consideration
6. Operational Plan
7. Maximizing Treatment at the Treatment Plant
8. Implementation Schedule; and
9. Post Construction Compliance Monitoring Program
Subsequent sections of this WB/WS Facility Plan report will discuss each of these elements in more depth, along with the simultaneous coordination with State Water Quality Standard (WQS) review and revision as appropriate.
1.1 WATERBODY/WATERSHED ASSESSMENT AREA
Newtown Creek is an estuarine tributary of the East River, located between Community District 1 in Brooklyn and Community Districts 2 and 5 in Queens, and the sewershed also includes sections of Brooklyn Community Districts 3, 4, 8, and 16. The headwaters of the Creek begin at Johnson Avenue in Brooklyn, flowing downstream in a northwest direction to where it enters the East River. Land uses within a quarter mile radius of the Creek are predominantly industrial and commercial, however, moving upland into the watershed, residential uses predominate. Figure 1-2 illustrates the Newtown Creek assessment area. The Creek has several tributaries (Dutch Kills, Whale Creek Canal, and Maspeth Creek), branches (East Branch and English Kills) and turning basins but no freshwater sources. The tributaries and upstream end of the Creek are narrow, bulk headed and shallow with water quality mostly influenced by the watershed. The downstream reach deepens and broadens into the East River and its water quality is influenced most by New York Harbor conditions.

City-WideAssessment Areas
Figure 1-1Newtown Creek Waterbody/Watershed Plan

Newtown Creek WB/WS Facility PlanStudy Area
Figure 1-2Newtown Creek Waterbody/Watershed Plan
New York City Department of Environmental Protection Waterbody/Watershed Facility Plan
Newtown Creek
1-5 June 2011
The Newtown Creek watershed is approximately 10,741 acres and is drained almost entirely by storm and combined sewers. The watershed has been permanently altered by urbanization such that there is no freshwater flow to the Creek other than stormwater and CSO during wet weather. Sewer systems in the watershed are located in the service areas of the Bowery Bay and Newtown Creek WWTPs, with areas north of the Creek within the Bowery Bay service area and areas south of the Creek serviced by the Newtown Creek WWTP. The Bowery Bay WWTP discharges to the upper East River. The Newtown Creek WWTP primarily discharges to the East River, but sometimes overflows during wet weather to Whale Creek Canal. There are 22 CSO outfalls in addition to the Whale Creek Canal overflow and well over 100 stormwater discharges to Newtown Creek, of which 13 CSO outfalls discharge from the Bowery Bay WWTP service area and nine CSO outfalls discharge from the Newtown Creek WWTP service area. The CSO outfalls are located throughout the length of the waterbody and several significant CSO outfalls are located at the head ends of English Kills, East Branch, Maspeth Creek and Dutch Kills.
The legal definitions of waterbodies are codified in Title 6 of the New York State Code of Rules and Regulations. Table I of 6 NYCRR 890.6 lists waterbodies of the Interstate Sanitation District, and includes Newtown Creek under Item 54. The Newtown Creek waterbody is classified by New York State as Class SD saline surface water with best uses designated for fishing and fish survival. Class SD waters have natural or man-made conditions limiting attainment of higher standards.
1.2 REGULATORY CONSIDERATIONS
The waters of the City of New York are primarily subject to New York State regulation, but must also comply with the policies of the United States Environmental Protection Agency (USEPA), as well as water quality standards established by the Interstate Environmental Commission (IEC). The following sections detail the regulatory issues relevant to long-term CSO planning.
1.2.1 Clean Water Act
Although federal laws protecting water quality were passed as early as 1948, the most comprehensive approach to clean water protection was enacted in 1972, with the adoption of the Federal Water Pollution Control Act Amendments commonly known as the Clean Water Act (CWA) including the amendments adopted in 1977. The CWA established the regulatory framework to control surface water pollution, and gave the USEPA the authority to implement pollution control programs. Among the key elements of the CWA was the establishment of the National Pollutant Discharge Elimination System (NPDES) permit program, which regulates point sources that discharge pollutants into waters of the United States. CSOs and municipal separate storm sewer systems (MS4) are also subject to regulatory control under the NPDES program. In New York State, the NPDES permit program is administered by DEC, through its SPDES program. New York State has had an approved SPDES program since 1975.
The CWA requires that discharge permit limits be based on receiving water quality standards (WQS) established by the State of New York. These standards should “wherever attainable, provide water quality for the protection and propagation of fish, shellfish and wildlife and for recreation in and on the water and take into consideration their use and value of public water supplies, propagation
New York City Department of Environmental Protection Waterbody/Watershed Facility Plan
Newtown Creek
1-6 June 2011
of fish, shellfish, and wildlife, recreation in and on the water, and agricultural, industrial, and other purposes including navigation” (40 CFR 131.2). The standards must also include an antidegradation policy for maintaining water quality at acceptable levels, and a strategy for meeting those standards must be developed for those waters not achieving WQS. The most common type of strategy is the development of a Total Maximum Daily Load (TMDL). TMDLs determine what level of pollutant load would be consistent with meeting WQS. TMDLs also allocate acceptable loads among the various sources of the relevant pollutants which discharge to the waterbody.
Section 305(b) of the CWA requires states to periodically report the water quality of waterbodies under their respective jurisdictions, and Section 303(d) requires states to identify impaired waters where specific designated uses are not fully supported. The DEC Division of Water addresses these requirements by following its Consolidated Assessment and Listing Methodology (CALM). The CALM includes monitoring and assessment components that determine water quality standards attainment and designated use support for all waters of New York State. Waterbodies are monitored and evaluated on a five-year cycle. Information developed during monitoring and assessment is inventoried in the Waterbody Inventory/Priority Waterbody List (WI/PWL). The WI/PWL incorporates monitoring data, information from state and other agencies, and public participation. The Waterbody Inventory refers to the listing of all waters, identified as specific individual waterbodies, within the state that are assessed. The Priority Waterbodies List is the subset of waters in the Waterbody Inventory that have documented water quality impacts, impairments or threats. The Priority Waterbodies List provides the candidate list of waters to be considered for inclusion on the Section 303(d) List.
Due to low dissolved oxygen (DO) levels and the presence of oxygen demanding substances, Newtown Creek is included in the 2010 New York State 303d list, where it can be found under Part 3c – Waterbodies for which TMDL Development may be Deferred Pending Implementation/Evaluation of Other Restoration Measures. A TMDL may not be required and may in fact delay the ability to meet the DO requirements as compared to the various control measures currently being developed and implemented which include this WB/WS Facility Plan. The Newtown Creek waterbody is classified by New York State as Class SD saline surface water with best uses designated for fishing and fish survival. Class SD waters have natural or man-made conditions limiting attainment of higher standards.
Another important component of the CWA is the protection of uses. USEPA regulations state that a designated use for a waterbody may be refined under limited circumstances through a Use Attainability Analysis (UAA) which is defined as “a structured scientific assessment of the chemical,
biological, and economic condition in a waterway” (USEPA, 2000). In the UAA, the DEC would demonstrate that one or more of a limited set of circumstances exists to make such a modification. It could be shown that the current designated use cannot be achieved through implementation of applicable technology-based limits on point sources, or cost-effective and reasonable best management practice for non-point sources. Additionally, a determination could be made that the cause of non-attainment is due to natural background conditions or irreversible human-caused conditions. Another circumstance might be to establish that attaining the designated use would cause substantial environmental damage or substantial and widespread social and economic hardship. If the findings of a UAA suggest authorizing the revision of a use or modification of a WQS is
New York City Department of Environmental Protection Waterbody/Watershed Facility Plan
Newtown Creek
1-7 June 2011
appropriate, the analysis and the accompanying proposal for such a modification must go through the public review and participation process and the USEPA approval process.
1.2.2 Federal CSO Policy
The first national CSO Control Strategy was published by USEPA in the Federal Register on September 8, 1989 (54 FR 37370). The goals of that strategy were to minimize impacts to water quality, aquatic biota, and human health from CSOs by ensuring that CSO discharges comply with the technology and water quality based requirements of the CWA. On April 19, 1994, USEPA officially noticed the CSO Control Policy (59 FR 18688), which established a consistent national approach for controlling discharges from all CSOs to the waters of the United States. The CSO Control Policy provides guidance to permittees and NPDES permitting authorities such as DEC on the development and implementation of a LTCP in accordance with the provisions of the CWA to attain water quality standards in accordance with the CWA. On December 15, 2000, amendments to Section 402 of the CWA (known as the Wet Weather Water Quality Act of 2000) were enacted incorporating the CSO Control Policy by reference.
USEPA has stated that its CSO Control Policy represents a comprehensive national strategy to ensure that municipalities, permitting authorities, water quality standards authorities and the public engage in a comprehensive and coordinated planning effort to achieve cost-effective CSO controls that ultimately meet appropriate health and environmental objectives and requirements (USEPA, 1995a). Four key principles of the CSO Control Policy ensure that CSO controls are cost effective and meet the objectives of the CWA:
1. Clear levels of control are provided that would be presumed to meet appropriate health and environmental objectives;
2. Sufficient flexibility is allowed to municipalities to consider the site-specific nature of CSOs and to determine the most cost effective means of reducing pollutants and meeting CWA objectives and requirements;
3. A phased approach to implementation of CSO controls is acceptable; and
4. Water quality standards and their implementation procedures may be reviewed and revised, as appropriate, when developing CSO control plans to reflect the site-specific wet weather impacts of CSOs.
In addition, the CSO Control Policy clearly defines expectations for permittees, WQS authorities, and NPDES permitting and enforcement authorities. Permittees were expected to have implemented USEPA’s nine minimum controls (NMCs) by 1997, after which long-term control plans should be developed. The NMCs are embodied in the 14 Best Management Practices (BMPs) required by DEC as discussed in Section 5.3, and include:
1. Proper operations and maintenance of combined sewer systems and combined sewer overflow outfalls;
2. Maximum use of the collection system for storage;

New York City Department of Environmental Protection Waterbody/Watershed Facility Plan
Newtown Creek
1-8 June 2011
3. Review and modification of pretreatment requirements to determine whether non-domestic sources are contributing to CSO impacts;
4. Maximizing flow to the Publicly Owned Treatment Works (POTWs);
5. Elimination of CSOs during dry weather;
6. Control of solid and floatable material in CSOs;
7. Pollution prevention programs to reduce contaminants in CSOs;
8. Public notification; and
9. Monitoring to characterize CSO impacts and the efficacy of CSO controls.
WQS authorities should review and revise, as appropriate, State WQS during the CSO long-term planning process. NPDES permitting authorities should consider the financial capability of permittees when reviewing CSO control plans.
In July 2001, USEPA published Coordinating CSO Long-Term Planning with Water Quality
Standards Reviews, additional guidance to address questions and describe the process of integrating development of CSO long-term control plans with water quality standards reviews (USEPA, 2001d). The guidance acknowledges that the successful implementation of an LTCP requires coordination and cooperation among CSO communities, constituency groups, states and USEPA using a watershed approach. As part of the LTCP development, USEPA recommends that WQS authorities review the LTCP to evaluate the attainability of applicable water quality standards. The data collected, analyses and planning performed by all parties may be sufficient to justify a water quality standards revision if a higher level of designated uses is attainable or if existing designated uses are not reasonably attainable. If the latter is true, then the USEPA allows the State WQS authorities to consider several options:
Apply site-specific criteria;
Apply criteria at the point of contact rather than at the end-of-pipe through the establishment of a mixing zone, waterbody segmentation, or similar;
Apply less stringent criteria when it is unlikely that recreational uses will occur or when water is unlikely to be ingested;
Consider subcategories of uses, such as precluding swimming during or immediately following a CSO event or developing a CSO subcategory of recreational uses; and
Consider a tiered aquatic life system with subcategories for urban systems.
If the waterbody supports a use with more stringent water quality requirements than the designated use, USEPA requires the State to revise the designated use to reflect the higher use being supported. Conversely, USEPA requires that a UAA be performed whenever the state proposes to reduce the level of protection for the waterbody. States are not required to conduct UAAs when adopting more stringent criteria for a waterbody. Once water quality standards are revised, the CSO
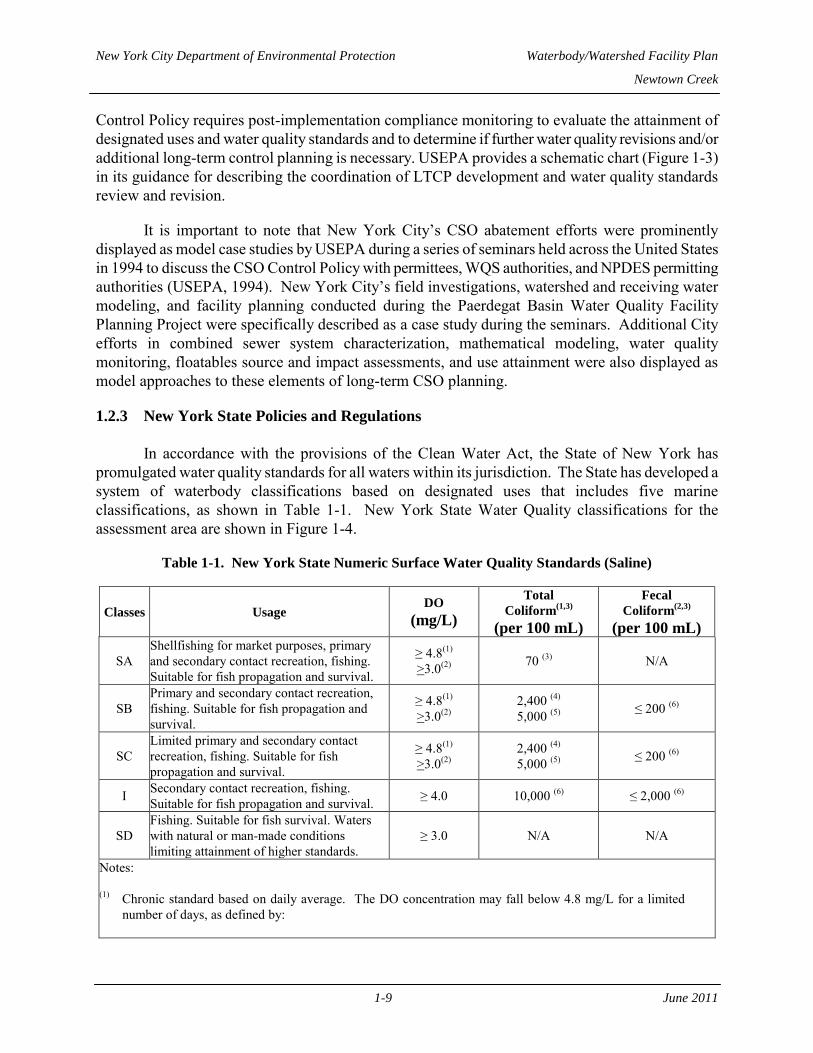
New York City Department of Environmental Protection Waterbody/Watershed Facility Plan
Newtown Creek
1-9 June 2011
Control Policy requires post-implementation compliance monitoring to evaluate the attainment of designated uses and water quality standards and to determine if further water quality revisions and/or additional long-term control planning is necessary. USEPA provides a schematic chart (Figure 1-3) in its guidance for describing the coordination of LTCP development and water quality standards review and revision.
It is important to note that New York City’s CSO abatement efforts were prominently displayed as model case studies by USEPA during a series of seminars held across the United States in 1994 to discuss the CSO Control Policy with permittees, WQS authorities, and NPDES permitting authorities (USEPA, 1994). New York City’s field investigations, watershed and receiving water modeling, and facility planning conducted during the Paerdegat Basin Water Quality Facility Planning Project were specifically described as a case study during the seminars. Additional City efforts in combined sewer system characterization, mathematical modeling, water quality monitoring, floatables source and impact assessments, and use attainment were also displayed as model approaches to these elements of long-term CSO planning.
1.2.3 New York State Policies and Regulations
In accordance with the provisions of the Clean Water Act, the State of New York has promulgated water quality standards for all waters within its jurisdiction. The State has developed a system of waterbody classifications based on designated uses that includes five marine classifications, as shown in Table 1-1. New York State Water Quality classifications for the assessment area are shown in Figure 1-4.
Table 1-1. New York State Numeric Surface Water Quality Standards (Saline)
Classes Usage DO
(mg/L)
Total
Coliform(1,3)
(per 100 mL)
Fecal
Coliform(2,3)
(per 100 mL)
SA Shellfishing for market purposes, primary and secondary contact recreation, fishing. Suitable for fish propagation and survival.
≥ 4.8(1) >3.0(2) 70 (3) N/A
SB Primary and secondary contact recreation, fishing. Suitable for fish propagation and survival.
≥ 4.8(1) >3.0(2)
2,400 (4) 5,000 (5) ≤ 200 (6)
SC Limited primary and secondary contact recreation, fishing. Suitable for fish propagation and survival.
≥ 4.8(1) >3.0(2)
2,400 (4) 5,000 (5) ≤ 200 (6)
I Secondary contact recreation, fishing. Suitable for fish propagation and survival. ≥ 4.0 10,000 (6) ≤ 2,000 (6)
SD Fishing. Suitable for fish survival. Waters with natural or man-made conditions limiting attainment of higher standards.
≥ 3.0 N/A N/A
Notes: (1) Chronic standard based on daily average. The DO concentration may fall below 4.8 mg/L for a limited
number of days, as defined by:
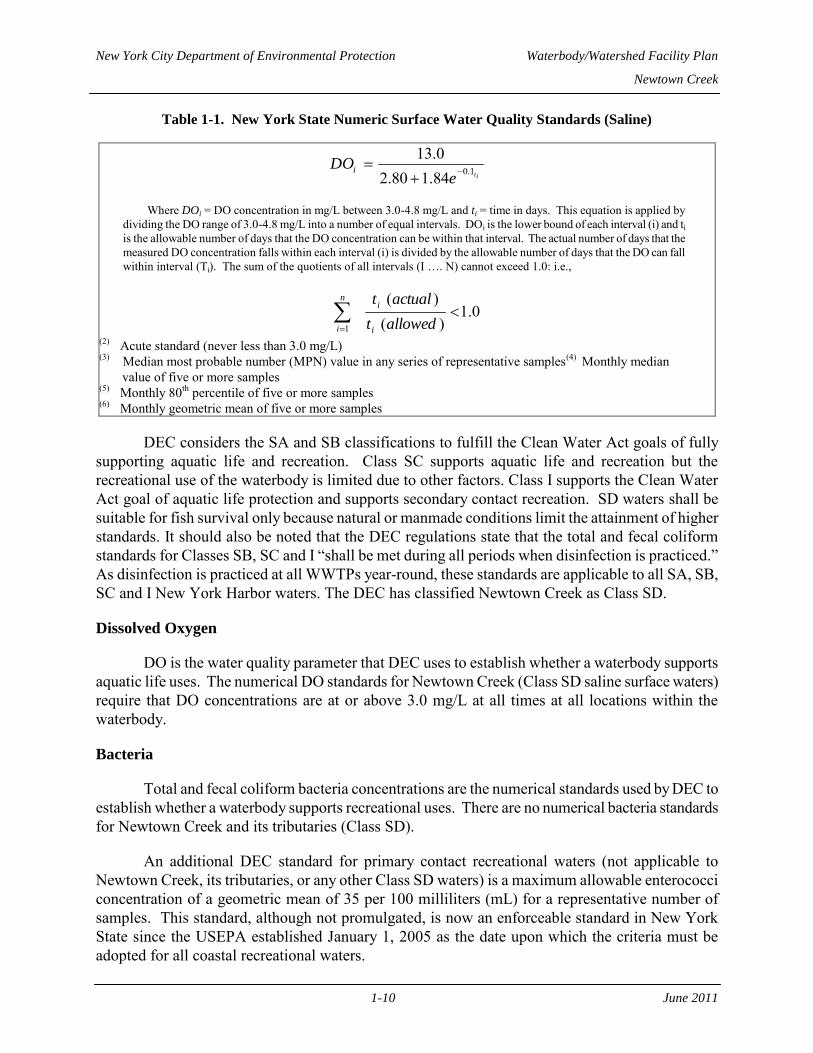
New York City Department of Environmental Protection Waterbody/Watershed Facility Plan
Newtown Creek
1-10 June 2011
Table 1-1. New York State Numeric Surface Water Quality Standards (Saline)
iteDOi 1.084.180.2
0.13
Where DOi = DO concentration in mg/L between 3.0-4.8 mg/L and ti = time in days. This equation is applied by dividing the DO range of 3.0-4.8 mg/L into a number of equal intervals. DOi is the lower bound of each interval (i) and ti is the allowable number of days that the DO concentration can be within that interval. The actual number of days that the measured DO concentration falls within each interval (i) is divided by the allowable number of days that the DO can fall within interval (Ti). The sum of the quotients of all intervals (I …. N) cannot exceed 1.0: i.e.,
0.1)(
)(
1
allowedt
actualt
i
in
i
(2) Acute standard (never less than 3.0 mg/L) (3) Median most probable number (MPN) value in any series of representative samples(4) Monthly median
value of five or more samples (5) Monthly 80th percentile of five or more samples (6) Monthly geometric mean of five or more samples
DEC considers the SA and SB classifications to fulfill the Clean Water Act goals of fully supporting aquatic life and recreation. Class SC supports aquatic life and recreation but the recreational use of the waterbody is limited due to other factors. Class I supports the Clean Water Act goal of aquatic life protection and supports secondary contact recreation. SD waters shall be suitable for fish survival only because natural or manmade conditions limit the attainment of higher standards. It should also be noted that the DEC regulations state that the total and fecal coliform standards for Classes SB, SC and I “shall be met during all periods when disinfection is practiced.” As disinfection is practiced at all WWTPs year-round, these standards are applicable to all SA, SB, SC and I New York Harbor waters. The DEC has classified Newtown Creek as Class SD.
Dissolved Oxygen
DO is the water quality parameter that DEC uses to establish whether a waterbody supports aquatic life uses. The numerical DO standards for Newtown Creek (Class SD saline surface waters) require that DO concentrations are at or above 3.0 mg/L at all times at all locations within the waterbody.
Bacteria
Total and fecal coliform bacteria concentrations are the numerical standards used by DEC to establish whether a waterbody supports recreational uses. There are no numerical bacteria standards for Newtown Creek and its tributaries (Class SD).
An additional DEC standard for primary contact recreational waters (not applicable to Newtown Creek, its tributaries, or any other Class SD waters) is a maximum allowable enterococci concentration of a geometric mean of 35 per 100 milliliters (mL) for a representative number of samples. This standard, although not promulgated, is now an enforceable standard in New York State since the USEPA established January 1, 2005 as the date upon which the criteria must be adopted for all coastal recreational waters.
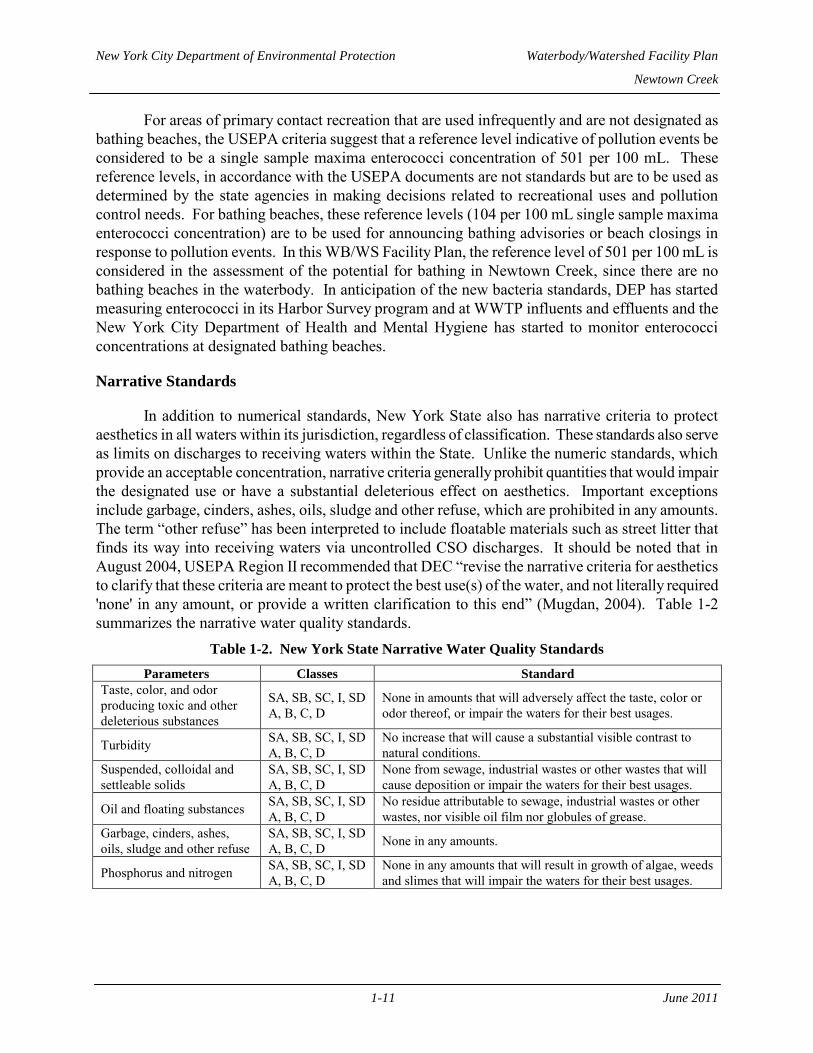
New York City Department of Environmental Protection Waterbody/Watershed Facility Plan
Newtown Creek
1-11 June 2011
For areas of primary contact recreation that are used infrequently and are not designated as bathing beaches, the USEPA criteria suggest that a reference level indicative of pollution events be considered to be a single sample maxima enterococci concentration of 501 per 100 mL. These reference levels, in accordance with the USEPA documents are not standards but are to be used as determined by the state agencies in making decisions related to recreational uses and pollution control needs. For bathing beaches, these reference levels (104 per 100 mL single sample maxima enterococci concentration) are to be used for announcing bathing advisories or beach closings in response to pollution events. In this WB/WS Facility Plan, the reference level of 501 per 100 mL is considered in the assessment of the potential for bathing in Newtown Creek, since there are no bathing beaches in the waterbody. In anticipation of the new bacteria standards, DEP has started measuring enterococci in its Harbor Survey program and at WWTP influents and effluents and the New York City Department of Health and Mental Hygiene has started to monitor enterococci concentrations at designated bathing beaches.
Narrative Standards
In addition to numerical standards, New York State also has narrative criteria to protect aesthetics in all waters within its jurisdiction, regardless of classification. These standards also serve as limits on discharges to receiving waters within the State. Unlike the numeric standards, which provide an acceptable concentration, narrative criteria generally prohibit quantities that would impair the designated use or have a substantial deleterious effect on aesthetics. Important exceptions include garbage, cinders, ashes, oils, sludge and other refuse, which are prohibited in any amounts. The term “other refuse” has been interpreted to include floatable materials such as street litter that finds its way into receiving waters via uncontrolled CSO discharges. It should be noted that in August 2004, USEPA Region II recommended that DEC “revise the narrative criteria for aesthetics to clarify that these criteria are meant to protect the best use(s) of the water, and not literally required 'none' in any amount, or provide a written clarification to this end” (Mugdan, 2004). Table 1-2 summarizes the narrative water quality standards.
Table 1-2. New York State Narrative Water Quality Standards
Parameters Classes Standard
Taste, color, and odor producing toxic and other deleterious substances
SA, SB, SC, I, SD A, B, C, D
None in amounts that will adversely affect the taste, color or odor thereof, or impair the waters for their best usages.
Turbidity SA, SB, SC, I, SD A, B, C, D
No increase that will cause a substantial visible contrast to natural conditions.
Suspended, colloidal and settleable solids
SA, SB, SC, I, SD A, B, C, D
None from sewage, industrial wastes or other wastes that will cause deposition or impair the waters for their best usages.
Oil and floating substances SA, SB, SC, I, SD A, B, C, D
No residue attributable to sewage, industrial wastes or other wastes, nor visible oil film nor globules of grease.
Garbage, cinders, ashes, oils, sludge and other refuse
SA, SB, SC, I, SD A, B, C, D None in any amounts.
Phosphorus and nitrogen SA, SB, SC, I, SD A, B, C, D
None in any amounts that will result in growth of algae, weeds and slimes that will impair the waters for their best usages.

Agree on the data and analyses tosupport LTCP
STEP 4
Issue permit requiringimplementation of Nine
STEP 1
Implement theNMCs and
STEP 2
Establish acoordination teamt LTCP
STEP 3
development and alternative
evaluation, and WQS reviews
implementation of NineMinimum Controls (NMCs)
and LTCP developmentevaluate their
efficacy
to oversee LTCPdevelopment and
WQS review
STEP 5
Responsible Entity
Water Quality Agency(s)(NPDES and WQS Authorities
NPDES Authority withCoordination Team
CSO Community
Collect dataand develop draft
LTCP, with thepublic involved
WQS AuthoritySTEP 6
Implement post-construction
STEP 11
Review and acceptdraft LTCP and
evaluate attainabilityof WQS
Implement and, through WQ
monitoring, evaluateeffectiveness of priority
controls (e.g. for sensitiveareas) and controls
common to allalternatives
pcompliance
monitoring toevaluate attainment
of WQSWQS revisionsmay be needed
WQS attainable.no revisionnecessary
Review andapprove LTCP,
and modify permit
Propose revisionsand revise WQS,
if needed
Revise LTCP,as appropriate
ImplementLTCP
STEP 9STEP 7 STEP 8 STEP 10
Long Term CSO ControlPlanning Procedures
Figure 1-3Newtown Creek Waterbody/Watershed Plan
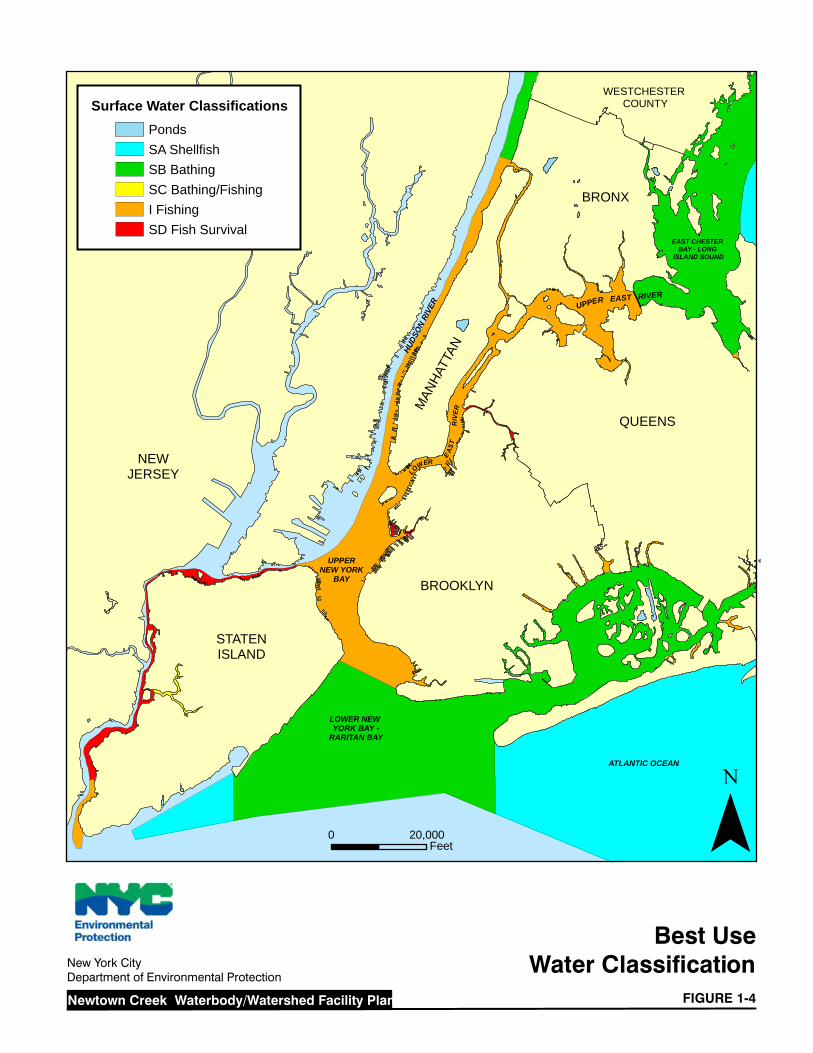
New York CityDepartment of Environmental Protection
Newtown Creek Waterbody/Watershed Facility Plan FIGURE 1-4
Best UseWater Classification
0 20,000Feet
STATENISLAND
BRONX
Surface Water Classifications
PondsSA ShellfishSB BathingSC Bathing/FishingI FishingSD Fish Survival
¯
UPPERNEW YORK
BAY
LOWER NEW YORK BAY -
RARITAN BAY
HU
DS
ON
RIV
ER
NEWJERSEY
BROOKLYN
QUEENSM
ANHA
TTAN
LO
WER E
AS
T
R
IVE
R
UPPER EAST RIVER
ATLANTIC OCEAN
EAST CHESTER BAY - LONG
ISLAND SOUND
WESTCHESTER COUNTY

New York City Department of Environmental Protection Waterbody/Watershed Facility Plan
Newtown Creek
1-13 June 2011
1.2.4 Interstate Environmental Commission (IEC)
The states of New York, New Jersey, and Connecticut are signatory to the Tri-State Compact that designated the Interstate Environmental District and created the IEC. The Interstate Environmental District includes all tidal waters of greater New York City. Originally established as the Interstate Sanitation Commission, the IEC may develop and enforce waterbody classifications and effluent standards to protect waterbody uses within the Interstate Environmental District. The applied classifications and effluent standards are intended to be consistent with those applied by the signatory states. There are three waterbody classifications defined by the IEC, as shown in
Table 1-3. Interstate Environmental Commission Numeric Water Quality Standards
Class Usage DO
(mg/L) Waterbodies
A
All forms of primary and secondary contact recreation, fish propagation, and shellfish harvesting in designated areas
≥ 5.0
East R. east of the Whitestone Br.; Hudson R. north of confluence with the Harlem R; Raritan R. east of the Victory Br. into Raritan Bay; Sandy Hook Bay; lower New York Bay; Atlantic Ocean
B-1
Fishing and secondary contact recreation, growth and maintenance of fish and other forms of marine life naturally occurring therein, but may not be suitable for fish propagation.
≥ 4.0
Hudson R. south of confluence with Harlem R.; upper New York Harbor; East R. from the Battery to the Whitestone Bridge; Harlem R.; Arthur Kill between Raritan Bay and Outerbridge Crossing.
B-2 Passage of anadromous fish, maintenance of fish life
≥ 3.0
Arthur Kill north of Outerbridge Crossing; Newark Bay; Kill Van Kull
In general, IEC water quality regulations require that all waters of the Interstate Environmental District are free from floating and settleable solids, oil, grease, sludge deposits, and unnatural color or turbidity to the extent necessary to avoid unpleasant aesthetics, detrimental impacts to the natural biota, or use impacts. The regulations also prohibit the presence of toxic or deleterious substances that would be detrimental to fish, offensive to humans, or unhealthful in biota used for human consumption. The IEC also restricts CSO discharges to within 24 hours of a precipitation event, consistent with the DEC definition of a prohibited dry weather discharge. Beyond that restriction, however, IEC effluent quality regulations do not apply to CSOs if the combined sewer system is being operated with reasonable care, maintenance, and efficiency.
Although IEC regulations are intended to be consistent with State water quality standards, the three-tiered IEC system and the five New York State marine classifications in New York Harbor do not overlap exactly; for example, the Class A DO numeric criterion (5 mg/L) differs from New York State's Class I criterion (4 mg/L). Primary contact recreation is defined in the IEC regulations as recreational activity that involves significant ingestion risk, including but not limited to wading, swimming, diving, surfing, and waterskiing. It defines secondary contact recreation as activities in
New York City Department of Environmental Protection Waterbody/Watershed Facility Plan
Newtown Creek
1-14 June 2011
which the probability of significant contact with the water or water ingestion is minimal including but not limited to boating, fishing and shoreline recreational activities involving limited contact with surface waters. However, the Newtown Creek waterbody is listed as a Class B-2 waterbody by the IEC, with a never-less-thank 3 mg/L DO standard consistent with the existing New York State Class SD classification.
1.2.5 Administrative Consent Order
New York City’s 14 WWTP SPDES permits include conditions which require compliance with Federal and State CSO requirements. DEP was unable to comply with deadlines included within their 1988 SPDES permits for completion of CSO abatement projects initiated in the early 1980s. As a result, DEP entered into an Administrative Consent Order with DEC on June 26, 1992 which was incorporated into the SPDES permits with a provision stating that the Consent Order governs DEP’s obligations for its CSO program. It also required that DEP implement CSO abatement projects within nine facility planning areas in two tracks: those areas where DO and coliform standards were being contravened (Track One), and those areas where floatables control was necessary (Track Two). The 1992 Order was modified on September 19, 1996 to add catch basin cleaning, construction, and repair programs.
DEP and DEC negotiated a new Consent Order, signed January 14, 2005, that supersedes the 1992 Order and its 1996 Modifications, with the intent to bring all DEP CSO-related matters into compliance with the provisions of the Clean Water Act and Environmental Conservation Law. The new Order contains requirements to evaluate and implement CSO abatement strategies on an enforceable timetable for 18 waterbodies and, ultimately, for Citywide long-term CSO control in accordance with USEPA CSO Control Policy. This Order was recently modified and signed on April 14, 2008 and again on September 3, 2009. DEP and DEC also entered into a separate MOU to facilitate water quality standards reviews in accordance with the CSO Control Policy.
1.3 CITY POLICIES AND OTHER LOCAL CONSIDERATIONS
New York City’s waterfront is approximately 578 miles long, encompassing 17 percent of the total shoreline of the State. This resource is managed through multiple tiers of zoning, regulation, public policy, and investment incentives to accommodate the diverse interests of the waterfront communities and encourage environmental stewardship. The local regulatory considerations are primarily applicable to proposed projects and do not preclude the existence of non-conforming waterfront uses. However, evaluation of existing conditions within the context of these land use controls and public policy anticipate the nature of long-term growth in the watershed.
1.3.1 New York City Waterfront Revitalization Program
The New York City Waterfront Revitalization Program (WRP) is the City's principal coastal zone management tool and is implemented by the Department of City Planning (DCP). The WRP establishes the City’s policies for development and use of the waterfront and provides a framework for evaluating the consistency of all discretionary actions in the coastal zone with City coastal management policies. Projects subject to consistency review include any project located within the coastal zone requiring a local, state, or federal discretionary action, such as a Uniform Land Use Review Procedure (ULURP) or a City Environmental Quality Review (CEQR). An action is
New York City Department of Environmental Protection Waterbody/Watershed Facility Plan
Newtown Creek
1-15 June 2011
determined to be consistent with the WRP if it would not substantially hinder and, where practicable, would advance one or more of the 10 WRP policies. The New York City WRP is authorized under the New York State Waterfront Revitalization and Coastal Resource Act of 1981 which, in turn, stems from the Federal Coastal Zone Management Act of 1972. The original WRP was adopted in 1982 as a local plan in accordance with Section 197-a of the City Charter, and incorporated the 44 state policies, added 12 local policies, and delineated a coastal zone to which the policies would apply. The program was revised in 1999, and the new WRP policies were issued in September 2002. The revised WRP condensed the 12 original policies into 10 policies: (1) residential and commercial redevelopment; (2) water-dependent and industrial uses; (3) commercial and recreational boating; (4) coastal ecological systems; (5) water quality; (6) flooding and erosion; (7) solid waste and hazardous substances; (8) public access; (9) scenic resources; and (10) historical and cultural resources.
1.3.2 New York City Comprehensive Waterfront Plan
The City’s long-range goals are contained in the Comprehensive Waterfront Plan (CWP). The CWP identifies four principal waterfront functional areas (natural, public, working, and redeveloping) and promotes use, protection, and redevelopment in appropriate waterfront areas. The companion Borough Waterfront Plans (1993-1994) assess local conditions and propose strategies to guide land use change, planning and coordination, and public investment for each of the waterfront functional areas. The CWP has been incorporated into local law through land use changes, zoning text amendments, public investment strategies, and regulatory revisions, which provide geographic specificity to the WRP and acknowledge that certain policies are more relevant than others in particular portions of the waterfront.
1.3.3 Department of City Planning Actions
The DCP was contacted to identify any projects either under consideration or in the planning stages that could substantially alter the land use in the vicinity of Newtown Creek. DCP reviews any proposal that would result in a fundamental alteration in land use, such as zoning map and text amendments, special permits under the Zoning Resolution, changes in the City Map, the disposition of City-owned property, and the siting of public facilities. In addition, DCP maintains a library of Citywide plans, assessments of infrastructure, community needs evaluations, and land use impact studies. These records were reviewed and evaluated for their potential impacts to waterbody use and runoff characteristics, and the DCP community district liaison for the Community District was contacted to determine whether any proposals in process that required DCP review might impact the WB/WS Plan.
1.3.4 New York City Economic Development Corporation
The Economic Development Corporation (EDC) was contacted to identify any projects either under consideration or in the planning stages that could substantially alter the land use in the vicinity of Newtown Creek. The EDC is charged with dispensing City-owned property to businesses as a means of stimulating economic growth, employment, and tax revenue in the City of New York while simultaneously encouraging specific types of land use in targeted neighborhoods. As such, EDC has the potential to alter land use on a large scale.
New York City Department of Environmental Protection Waterbody/Watershed Facility Plan
Newtown Creek
1-16 June 2011
Additionally, the EDC serves as a policy instrument for the Mayor’s Office, and recently issued a white paper on industrial zoning (Office of the Mayor, 2005) intended to create and protect industrial land uses throughout the City. The policy directs the replacement of the current In-Place Industrial Parks (IPIPs) with Industrial Business Zones (IBZs) that more accurately reflect the City’s industrial areas. Policies of this nature can have implications on future uses of a waterbody as well as impacts to collection systems. Accordingly, a thorough review of EDC policy and future projects was performed to determine the extent to which they may impact the WB/WS Plan. La Guardia airport is included in the Steinway Industrial Business Zone.
1.3.5 Local Law
Local law is a form of municipal legislation that has the same status as an act of the State Legislature. The power to enact local laws is granted by the New York State Constitution, with the scope and procedures for implementation established in the Municipal Home Rule Law. In New York City, local laws pertaining to the use of the City waterways and initiatives associated with aquatic health have been adopted beyond the requirements of New York State. Recent adoptions include Local Law 71 of 2005, which required the development of the Jamaica Bay Watershed Protection Plan (JBWPP) and Local Law 5 of 2008 which requires City-owned buildings or City-funded construction to include certain sustainable practices, as well as requiring the City to draft a sustainable stormwater management plan by October 1, 2008. These initiatives are discussed in Section 5 in detail.
1.3.6 Bathing Beaches
Bathing beaches in New York City are regulated, monitored and permitted by the City and State under Article 167 of the New York City Health Code and Section 6-2.19 of the New York City Sanitary Code. Siting requirements imposed by State and City codes must be considered to evaluate the potential use of a waterbody for primary contact recreation. These requirements include minimum distances from certain types of regulated discharges (such as CSO outfalls), maximum bottom slopes, acceptable bottom materials, minimum water quality levels, and physical conditions that ensure the highest level of safety for bathers.
1.4 REPORT ORGANIZATION
This report has been organized to clearly describe the proposed WB/WS Facility Plan that supports a Long-Term CSO Control Planning process and the environmental factors and engineering considerations that were evaluated in its development. The nine elements of long-term CSO control planning are listed in Table 1-4 along with relevant sections within this document for cross-referencing.
Section 1 describes general planning information and the regulatory considerations in order to describe the setting and genesis of the LTCP and the CSO Control Policy. Sections 2, 3, and 4 describe the existing watershed, collection system, and waterbody characteristics, respectively. Section 5 describes related waterbody improvement projects within the waterbody and the greater New York Harbor. Section 6 describes the public participation and agency interaction that went into the development of this WB/WS Facility Plan, as well as an overview of DEP’s public outreach program. Sections 7 and 8 describe the development of the plan for the waterbody. Section 9
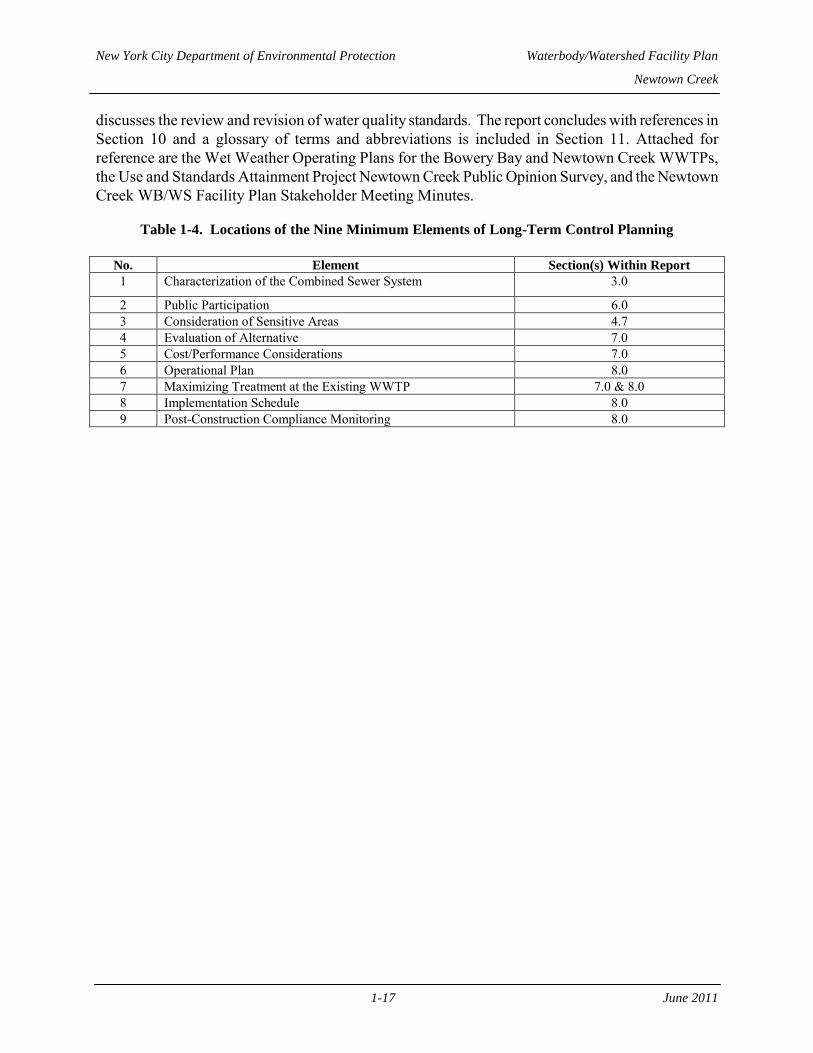
New York City Department of Environmental Protection Waterbody/Watershed Facility Plan
Newtown Creek
1-17 June 2011
discusses the review and revision of water quality standards. The report concludes with references in Section 10 and a glossary of terms and abbreviations is included in Section 11. Attached for reference are the Wet Weather Operating Plans for the Bowery Bay and Newtown Creek WWTPs, the Use and Standards Attainment Project Newtown Creek Public Opinion Survey, and the Newtown Creek WB/WS Facility Plan Stakeholder Meeting Minutes.
Table 1-4. Locations of the Nine Minimum Elements of Long-Term Control Planning
No. Element Section(s) Within Report
1 Characterization of the Combined Sewer System 3.0 2 Public Participation 6.0 3 Consideration of Sensitive Areas 4.7 4 Evaluation of Alternative 7.0 5 Cost/Performance Considerations 7.0 6 Operational Plan 8.0 7 Maximizing Treatment at the Existing WWTP 7.0 & 8.0 8 Implementation Schedule 8.0 9 Post-Construction Compliance Monitoring 8.0

New York City Department of Environmental Protection Waterbody/Watershed Facility Plan
Newtown Creek
2-1 June 2011
2.0 Watershed Characteristics
For the purposes of this Waterbody/Watershed Facility Plan, the Newtown Creek
waterbody and watershed includes Newtown Creek, Dutch Kills, Maspeth Creek, East Branch
and English Kills waterbodies and watersheds and their associated tributary sewersheds.
Newtown Creek is tributary to the East River, and none of its tributary waterbodies receive any
natural freshwater flow. The Creek was originally a stream draining the uplands of western Long
Island. The natural tributary watershed of Newtown Creek was approximately 5,322 acres, based
on topography. However, sewer system construction and other alterations have extensively
modified the original drainage area, which is now approximately 7,650 acres of largely
impervious urban landscape. Urbanization has also modified the course and channel of
Newtown Creek, most notably filling the inland streams, and widening and deepening the
downstream end. The Creek generally extends in a northwest direction from the English Kills
headwaters at Johnson Avenue. Much of the Creek defines the border between the boroughs of
Brooklyn and Queens. Most of the area to the north and west of the watershed drains to the East
River, while areas to south and east drain toward Flushing or Jamaica Bay.
The following paragraphs present the historical context of changes in the Newtown Creek
watershed, current and future land use, and shoreline characteristics that have impacted pollutant
loadings from the watershed to the waterbody.
2.1 HISTORICAL CONTEXT OF WATERSHED URBANIZATION
Dutch explorers completed the first survey of Newtown Creek in 1613-14 and it was
acquired from the local Mespatches tribe shortly thereafter. The Creek area, once used primarily
for agriculture, became an important industrial zone following the Revolutionary War. Farmland
was replaced by glue and tin factories, rope works, tanneries and the Sampson Oil Cloth Factory.
Commerce along the Creek eventually shifted to shipbuilding, with hundreds of boats
built in the Pre-Civil War era. In the Post-Civil War era, the industrial revolution began and
textile manufacturing and oil refining replaced shipbuilding in the area. The first kerosene
refinery and the first modern oil refinery in the United States transformed the Creek into an
industrial waterway. By the end of the 19th
century, Long Island City had the highest
concentration of industry in the United States. By 1880, there were at least 50 petroleum
refineries on the Queens side of the creek alone. The influx of industry was accompanied by
infrastructure development including the Long Island Railroad Hub (1861), the Queensboro
Bridge (1909) and the IRT subway line (1917). In 1865 the city surveyor, J.S. Stoddard,
recommended against plans to run sewer lines to the Creek. His advice went unheeded and the
city began dumping raw sewage directly into the Creek.
By the 1920s and 30s, Newtown Creek was channelized and deepened to accommodate
heavier shipping traffic, thus emerging as a major shipping hub for the Northeast United States.
Raw materials were imported from all over the world while manufactured products were
exported domestically. The Creek became home to such businesses as sugar refineries,
canneries, copper wiring plants and petroleum and oil refineries. The Creek soon became one of
the dirtiest bodies of water in America as industries had free reign to dispose of unwanted
byproducts.
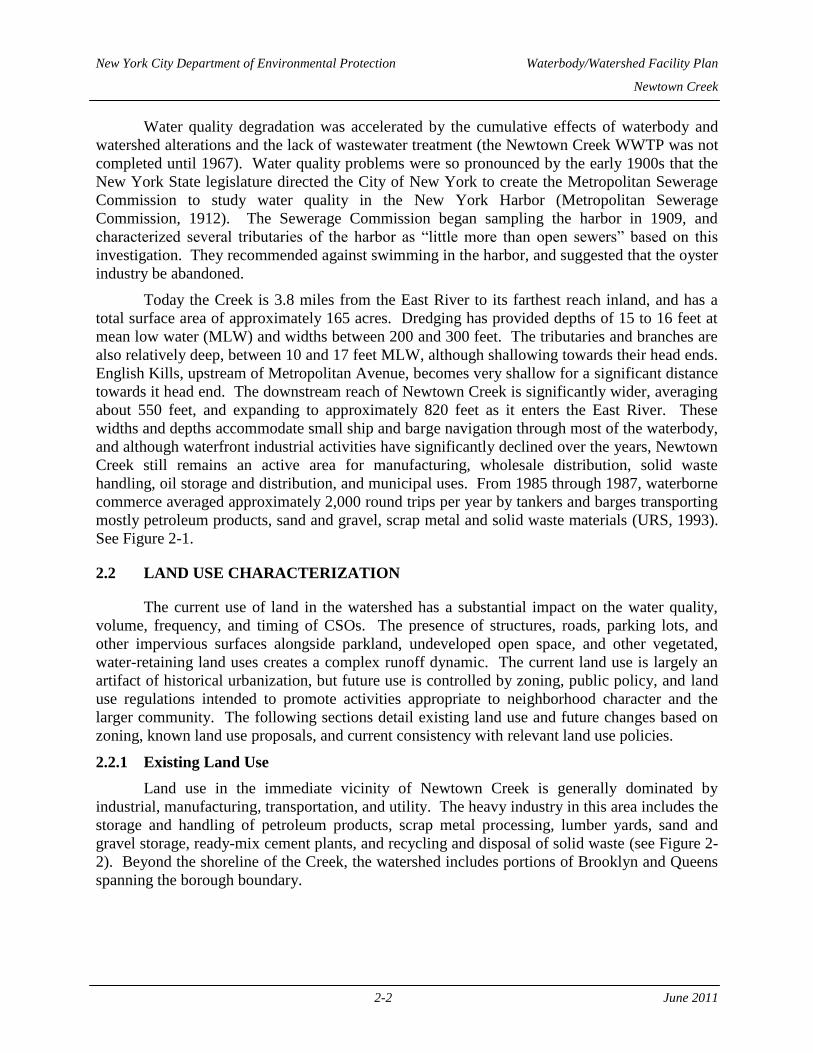
New York City Department of Environmental Protection Waterbody/Watershed Facility Plan
Newtown Creek
2-2 June 2011
Water quality degradation was accelerated by the cumulative effects of waterbody and
watershed alterations and the lack of wastewater treatment (the Newtown Creek WWTP was not
completed until 1967). Water quality problems were so pronounced by the early 1900s that the
New York State legislature directed the City of New York to create the Metropolitan Sewerage
Commission to study water quality in the New York Harbor (Metropolitan Sewerage
Commission, 1912). The Sewerage Commission began sampling the harbor in 1909, and
characterized several tributaries of the harbor as “little more than open sewers” based on this
investigation. They recommended against swimming in the harbor, and suggested that the oyster
industry be abandoned.
Today the Creek is 3.8 miles from the East River to its farthest reach inland, and has a
total surface area of approximately 165 acres. Dredging has provided depths of 15 to 16 feet at
mean low water (MLW) and widths between 200 and 300 feet. The tributaries and branches are
also relatively deep, between 10 and 17 feet MLW, although shallowing towards their head ends.
English Kills, upstream of Metropolitan Avenue, becomes very shallow for a significant distance
towards it head end. The downstream reach of Newtown Creek is significantly wider, averaging
about 550 feet, and expanding to approximately 820 feet as it enters the East River. These
widths and depths accommodate small ship and barge navigation through most of the waterbody,
and although waterfront industrial activities have significantly declined over the years, Newtown
Creek still remains an active area for manufacturing, wholesale distribution, solid waste
handling, oil storage and distribution, and municipal uses. From 1985 through 1987, waterborne
commerce averaged approximately 2,000 round trips per year by tankers and barges transporting
mostly petroleum products, sand and gravel, scrap metal and solid waste materials (URS, 1993).
See Figure 2-1.
2.2 LAND USE CHARACTERIZATION
The current use of land in the watershed has a substantial impact on the water quality,
volume, frequency, and timing of CSOs. The presence of structures, roads, parking lots, and
other impervious surfaces alongside parkland, undeveloped open space, and other vegetated,
water-retaining land uses creates a complex runoff dynamic. The current land use is largely an
artifact of historical urbanization, but future use is controlled by zoning, public policy, and land
use regulations intended to promote activities appropriate to neighborhood character and the
larger community. The following sections detail existing land use and future changes based on
zoning, known land use proposals, and current consistency with relevant land use policies.
2.2.1 Existing Land Use
Land use in the immediate vicinity of Newtown Creek is generally dominated by
industrial, manufacturing, transportation, and utility. The heavy industry in this area includes the
storage and handling of petroleum products, scrap metal processing, lumber yards, sand and
gravel storage, ready-mix cement plants, and recycling and disposal of solid waste (see Figure 2-
2). Beyond the shoreline of the Creek, the watershed includes portions of Brooklyn and Queens
spanning the borough boundary.
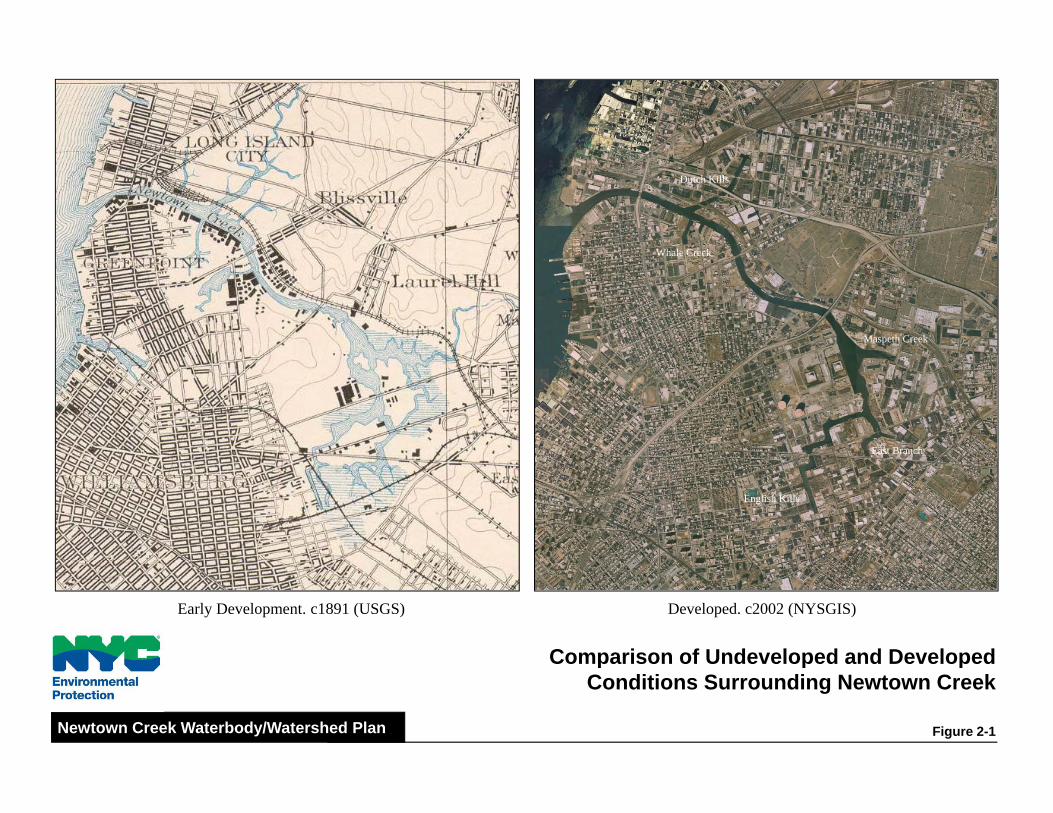
Dutch Kills
Whale Creek
Maspeth Creek
Whale Creek
East Branch
English Kills
Comparison of Undeveloped and Developed
Early Development. c1891 (USGS) Developed. c2002 (NYSGIS)
Comparison of Undeveloped and DevelopedConditions Surrounding Newtown Creek
Figure 2-1Newtown Creek Waterbody/Watershed Plan

© 2006 Pictometry International Corp.
© 2006 Pictometry International Corp.
Land Use and Water TrafficOn Newtown Creek
Figure 2-2Newtown Creek Waterbody/Watershed Plan

New York City Department of Environmental Protection Waterbody/Watershed Facility Plan
Newtown Creek
2-5 June 2011
There is currently one developed park adjacent to the Creek. The Newtown Creek Nature
Walk is a public walkway, being implemented in three phases. Phase 1 is a quarter–mile in
length and was completed in 2010. Phase 2 will be completed in 2013, and the development of
Phase 3 is currently in progress. Even with the nature walk, there is very limited recreational
access to the waterbody. There are several tracts of vacant land and miles of rusting unused
railroad tracks, dilapidated docks, bulkheads and factories.
The Greenpoint industrial area encompasses the Brooklyn shoreline from McGuiness
Blvd. to the Brooklyn Queens Expressway and includes the Newtown Creek Wastewater
Treatment Plant. A large Keyspan Energy facility occupies the Brooklyn shoreline north of the
mouth of English Kills.
Several cemeteries are located in the Queens portion of the watershed. The larger
cemeteries near Newtown Creek include Calvary Cemetery, New Calvary Cemetery, Mount
Zion Cemetery, Mount Olivet Cemetery, and Lutheran Cemetery. The Sunnyside Railyards line
the northern boundary of the Queens watershed.
Generalized land use in the Newtown Creek drainage area (Figure 2-3) is dominated by a
mix of industrial and commercial uses. The relative distribution of land uses in the watershed
and riparian area (within a 1/4-mile radius) is summarized in Table 2-1. The Calvary Cemetery
(open space) and residential uses constitute a very small portion of the land uses adjacent to the
waterbody. However, moving upland into the watershed, residential use increases significantly.
Table 2-1. Land Use Summary by Category
Land Use Category
Watershed Area, %
Riparian Area, %
(Within 1/4 Mile Radius) (1)
Residential 32.91 2.37
Open Space 25.56 0.99
Industrial & Manufacturing 19.19 79.98
Transportation & Utility 5.40 5.56
Mixed Use & Other 5.14 7.85
Vacant Land 4.44 0.05
Public Facilities & Institutions 4.43 1.44
Commercial 2.93 1.76 (1)
Riparian areas include all blocks wholly or partially within a quarter mile of Newtown Creek. See Figure 2-3.
2.2.2 Zoning
The Zoning Resolution of the City of New York regulates the size of buildings and
properties, the density of populations, and the locations that trades, industries, and other
activities are allowed within the City limits. The Resolution divides the City into districts,
distinguishing residential, commercial, and manufacturing districts having use, bulk, and other
controls. Residential districts are defined by the allowable density of housing, lot widths, and
setbacks, with a higher number generally indicating a higher allowable density (e.g., single-
family detached residential districts include R1 and R2, whereas R8 and R10 allow apartment
buildings).
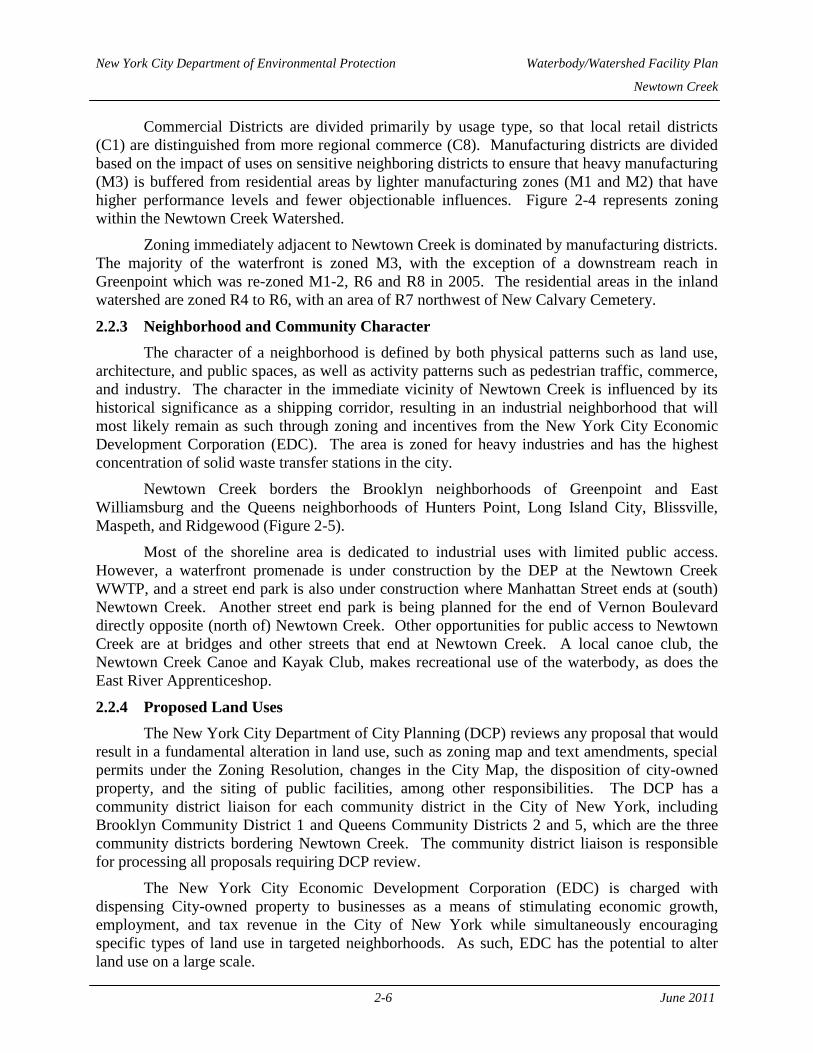
New York City Department of Environmental Protection Waterbody/Watershed Facility Plan
Newtown Creek
2-6 June 2011
Commercial Districts are divided primarily by usage type, so that local retail districts
(C1) are distinguished from more regional commerce (C8). Manufacturing districts are divided
based on the impact of uses on sensitive neighboring districts to ensure that heavy manufacturing
(M3) is buffered from residential areas by lighter manufacturing zones (M1 and M2) that have
higher performance levels and fewer objectionable influences. Figure 2-4 represents zoning
within the Newtown Creek Watershed.
Zoning immediately adjacent to Newtown Creek is dominated by manufacturing districts.
The majority of the waterfront is zoned M3, with the exception of a downstream reach in
Greenpoint which was re-zoned M1-2, R6 and R8 in 2005. The residential areas in the inland
watershed are zoned R4 to R6, with an area of R7 northwest of New Calvary Cemetery.
2.2.3 Neighborhood and Community Character
The character of a neighborhood is defined by both physical patterns such as land use,
architecture, and public spaces, as well as activity patterns such as pedestrian traffic, commerce,
and industry. The character in the immediate vicinity of Newtown Creek is influenced by its
historical significance as a shipping corridor, resulting in an industrial neighborhood that will
most likely remain as such through zoning and incentives from the New York City Economic
Development Corporation (EDC). The area is zoned for heavy industries and has the highest
concentration of solid waste transfer stations in the city.
Newtown Creek borders the Brooklyn neighborhoods of Greenpoint and East
Williamsburg and the Queens neighborhoods of Hunters Point, Long Island City, Blissville,
Maspeth, and Ridgewood (Figure 2-5).
Most of the shoreline area is dedicated to industrial uses with limited public access.
However, a waterfront promenade is under construction by the DEP at the Newtown Creek
WWTP, and a street end park is also under construction where Manhattan Street ends at (south)
Newtown Creek. Another street end park is being planned for the end of Vernon Boulevard
directly opposite (north of) Newtown Creek. Other opportunities for public access to Newtown
Creek are at bridges and other streets that end at Newtown Creek. A local canoe club, the
Newtown Creek Canoe and Kayak Club, makes recreational use of the waterbody, as does the
East River Apprenticeshop.
2.2.4 Proposed Land Uses
The New York City Department of City Planning (DCP) reviews any proposal that would
result in a fundamental alteration in land use, such as zoning map and text amendments, special
permits under the Zoning Resolution, changes in the City Map, the disposition of city-owned
property, and the siting of public facilities, among other responsibilities. The DCP has a
community district liaison for each community district in the City of New York, including
Brooklyn Community District 1 and Queens Community Districts 2 and 5, which are the three
community districts bordering Newtown Creek. The community district liaison is responsible
for processing all proposals requiring DCP review.
The New York City Economic Development Corporation (EDC) is charged with
dispensing City-owned property to businesses as a means of stimulating economic growth,
employment, and tax revenue in the City of New York while simultaneously encouraging
specific types of land use in targeted neighborhoods. As such, EDC has the potential to alter
land use on a large scale.

Newtown CreekNewtown CreekGeneralized Land Use Map
Figure 2-3Newtown Creek Waterbody/Watershed Plan
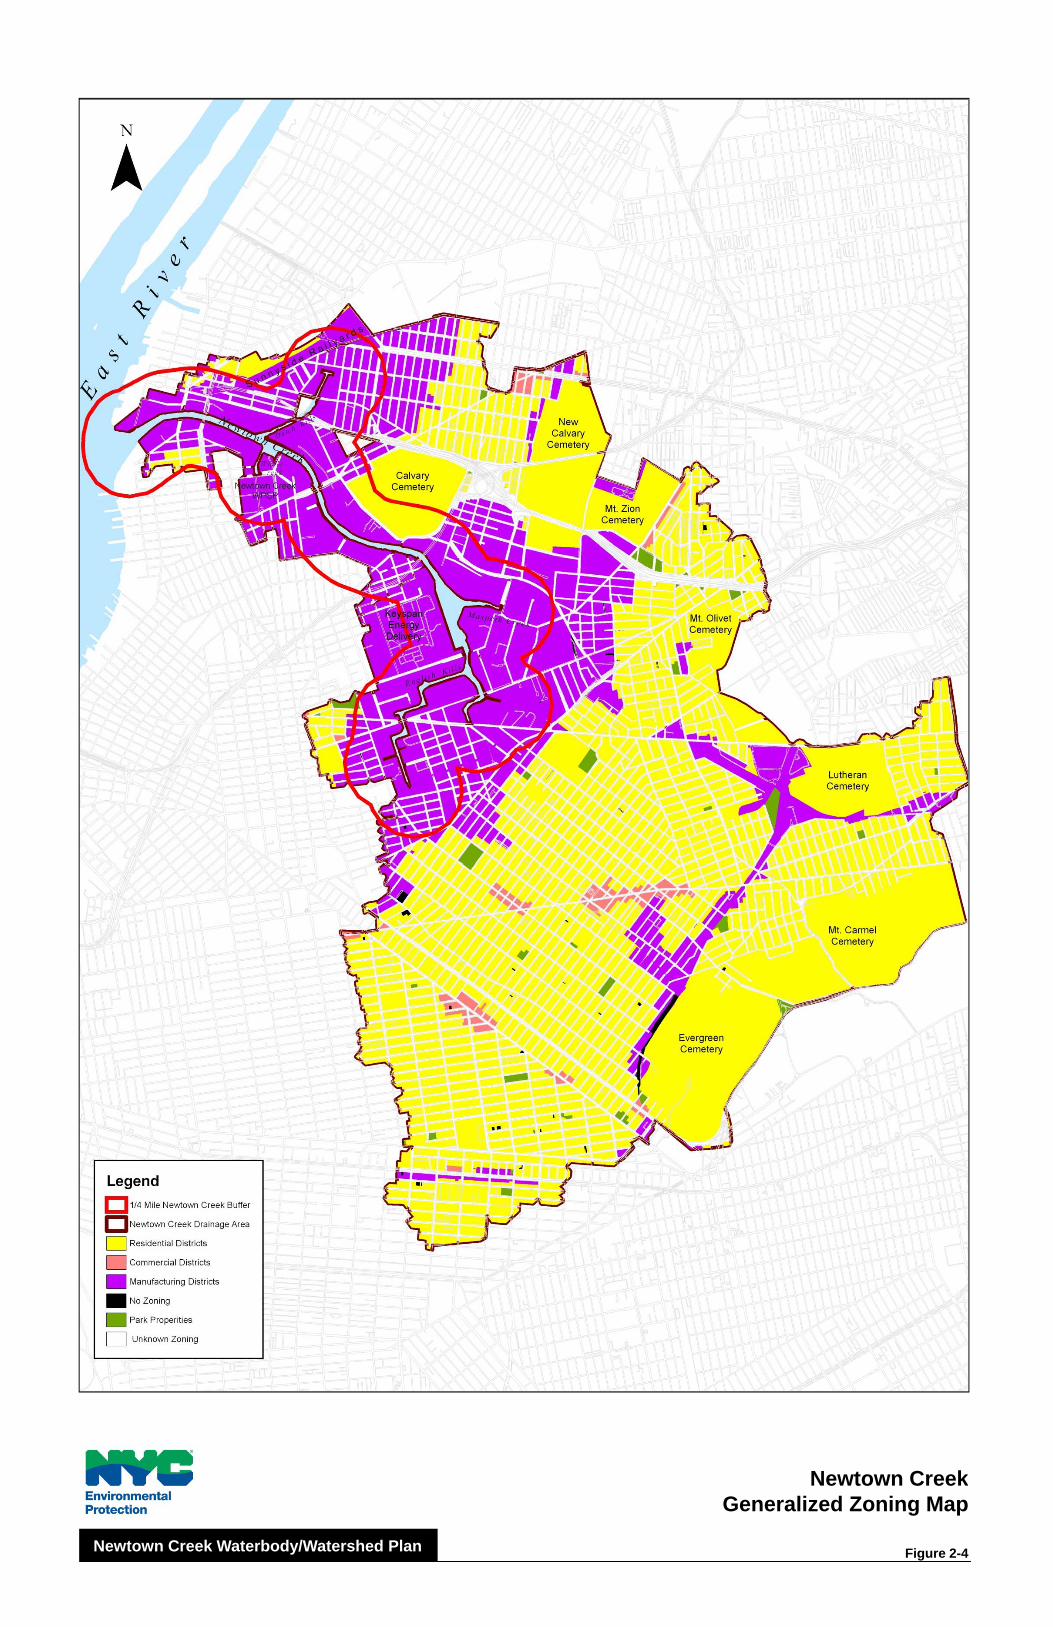
Newtown CreekNewtown CreekGeneralized Zoning Map
Figure 2-4Newtown Creek Waterbody/Watershed Plan
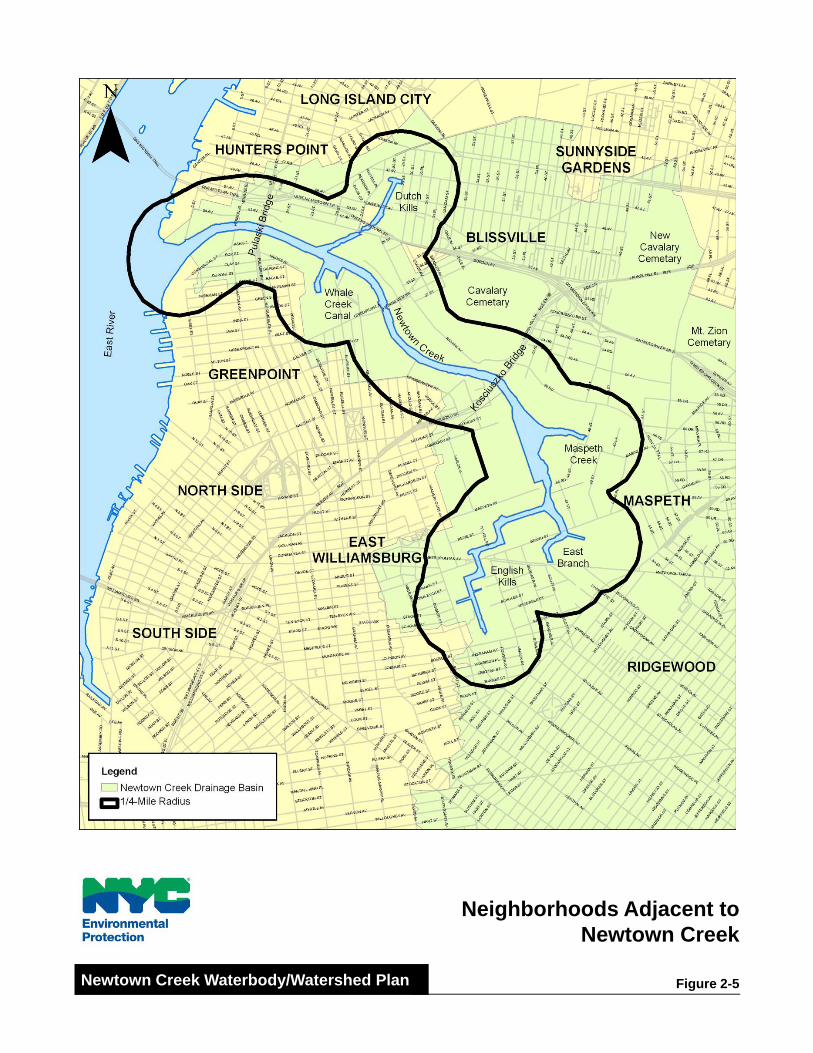
Neighborhoods Adjacent toNewtown Creek
Figure 2-5Newtown Creek Waterbody/Watershed Plan
New York City Department of Environmental Protection Waterbody/Watershed Facility Plan
Newtown Creek
2-10 June 2011
Both the DCP and the EDC were contacted to identify any projects either under
consideration or in the planning stages that could substantially alter the land use in the vicinity of
Newtown Creek. At the time of inquiry, the three DCP liaisons had no waterfront projects under
review. The Brooklyn Community Board 1 liaison stated that work is proceeding on the review
of zoning for sites under the control of DEP and the Department of Sanitation.
In August 2005, the DEC had several projects in the vicinity of Newtown Creek in the
early stages of development. There are three brownfield sites in the vicinity of Newtown Creek
that are tax delinquent and are being considered for industrial redevelopment. These include
Morgan Oil Terminal (200 Morgan Avenue), BCF Oil (362 Maspeth Ave) and a site south of
Calvary Cemetery. Another project near English Kills at the intersection of Grand St and 47th
street will involve the expansion of an existing recycling facility and the restoration of existing
bulkheading. The EDC has long-term plans to accommodate industrial users within the existing
zoning in the vicinity of Newtown Creek, particularly as industrial uses throughout other parts of
New York City are pushed out through market forces, gentrification, and environmental
regulations.
None of the currently proposed land uses and significant new facilities identified within
the Newtown Creek waterbody/watershed assessment area will substantially change existing land
uses, nor increase the dry weather flow in the collection system significantly.
2.2.5 Consistency with the Waterfront Revitalization Program and Comprehensive
Waterfront Plan
Although the New York City WRP policies are intended to be used to evaluate proposed
actions to promote activities appropriate to various waterfront locations, evaluating the
consistency of existing land use with those policies can be used to anticipate future waterfront
conditions. Ten policies are included in the program: (1) residential and commercial
redevelopment; (2) water-dependent and industrial uses; (3) commercial and recreational
boating; (4) coastal ecological systems; (5) water quality; (6) flooding and erosion; (7) solid
waste and hazardous substances; (8) public access; (9) scenic resources; and (10) historical and
cultural resources.
Newtown Creek is entirely within the Coastal Zone Boundary. In addition, all but the
downstream reaches of Newtown Creek are within the Newtown Creek Significant Maritime and
Industrial Area (SMIA) designated by the WRP (Figure 2-6). An SMIA is an area well-suited to
support water-dependent and industrial uses in New York City. These waterfront areas support
waterborne cargo, industrial activity, and municipal and public utility services. Newtown Creek
is one of six SMIAs recognized as of the 2002 WRP (NYCDCP, 2002). The major criteria used
to delineate these areas include: concentrations of M2 and M3 zoned land; suitable hydrographic
conditions for maritime related uses; presence or potential for intermodal transportation; marine
terminal and pier infrastructure; concentrations of water-dependent and industrial activity; good
transportation access and proximity to markets; or availability of publicly-owned land. Public
investment within the SMIAs should be targeted to improve transportation access and maritime
and industrial operations. In-kind, in-place bulkhead replacement and maintenance and
maintenance dredging are essential to the operation and preservation of working waterfront uses
and are consistent with the intent of the policy. Since SMIAs are ideally suited for water-
dependent uses, priority would be given to maritime uses or uses that incorporate water-
dependent activities. However, the SMIAs encompass much of the city’s land zoned for heavy
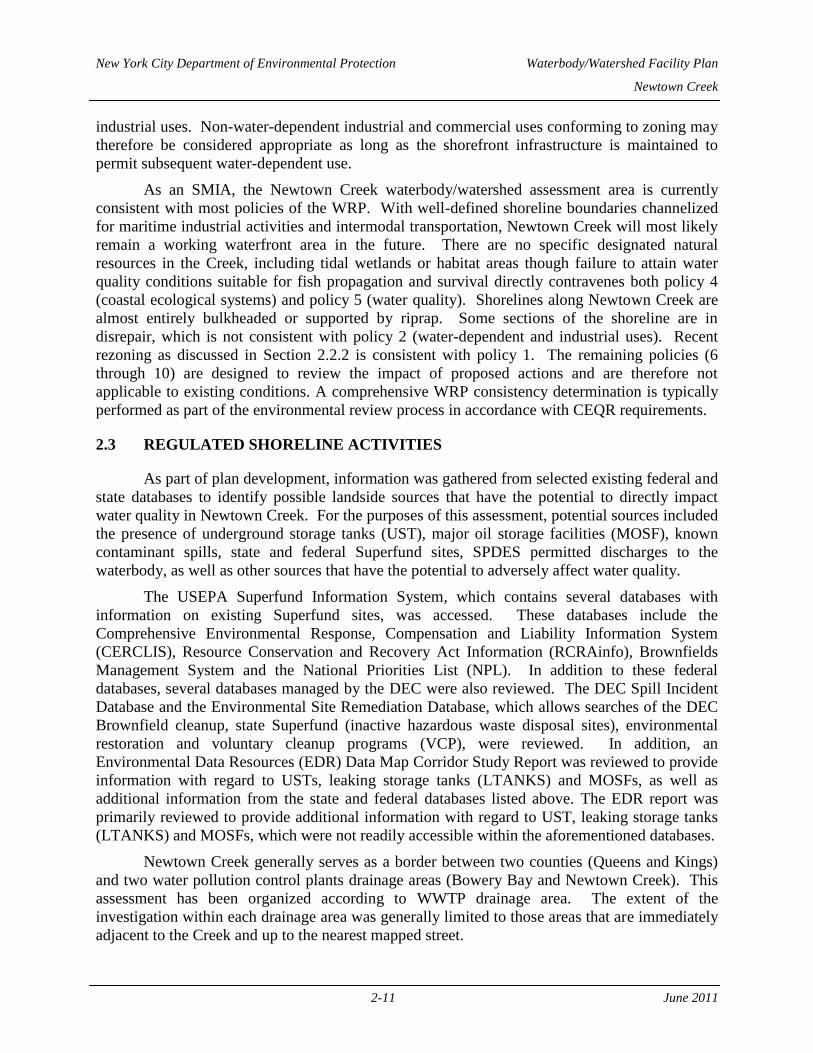
New York City Department of Environmental Protection Waterbody/Watershed Facility Plan
Newtown Creek
2-11 June 2011
industrial uses. Non-water-dependent industrial and commercial uses conforming to zoning may
therefore be considered appropriate as long as the shorefront infrastructure is maintained to
permit subsequent water-dependent use.
As an SMIA, the Newtown Creek waterbody/watershed assessment area is currently
consistent with most policies of the WRP. With well-defined shoreline boundaries channelized
for maritime industrial activities and intermodal transportation, Newtown Creek will most likely
remain a working waterfront area in the future. There are no specific designated natural
resources in the Creek, including tidal wetlands or habitat areas though failure to attain water
quality conditions suitable for fish propagation and survival directly contravenes both policy 4
(coastal ecological systems) and policy 5 (water quality). Shorelines along Newtown Creek are
almost entirely bulkheaded or supported by riprap. Some sections of the shoreline are in
disrepair, which is not consistent with policy 2 (water-dependent and industrial uses). Recent
rezoning as discussed in Section 2.2.2 is consistent with policy 1. The remaining policies (6
through 10) are designed to review the impact of proposed actions and are therefore not
applicable to existing conditions. A comprehensive WRP consistency determination is typically
performed as part of the environmental review process in accordance with CEQR requirements.
2.3 REGULATED SHORELINE ACTIVITIES
As part of plan development, information was gathered from selected existing federal and
state databases to identify possible landside sources that have the potential to directly impact
water quality in Newtown Creek. For the purposes of this assessment, potential sources included
the presence of underground storage tanks (UST), major oil storage facilities (MOSF), known
contaminant spills, state and federal Superfund sites, SPDES permitted discharges to the
waterbody, as well as other sources that have the potential to adversely affect water quality.
The USEPA Superfund Information System, which contains several databases with
information on existing Superfund sites, was accessed. These databases include the
Comprehensive Environmental Response, Compensation and Liability Information System
(CERCLIS), Resource Conservation and Recovery Act Information (RCRAinfo), Brownfields
Management System and the National Priorities List (NPL). In addition to these federal
databases, several databases managed by the DEC were also reviewed. The DEC Spill Incident
Database and the Environmental Site Remediation Database, which allows searches of the DEC
Brownfield cleanup, state Superfund (inactive hazardous waste disposal sites), environmental
restoration and voluntary cleanup programs (VCP), were reviewed. In addition, an
Environmental Data Resources (EDR) Data Map Corridor Study Report was reviewed to provide
information with regard to USTs, leaking storage tanks (LTANKS) and MOSFs, as well as
additional information from the state and federal databases listed above. The EDR report was
primarily reviewed to provide additional information with regard to UST, leaking storage tanks
(LTANKS) and MOSFs, which were not readily accessible within the aforementioned databases.
Newtown Creek generally serves as a border between two counties (Queens and Kings)
and two water pollution control plants drainage areas (Bowery Bay and Newtown Creek). This
assessment has been organized according to WWTP drainage area. The extent of the
investigation within each drainage area was generally limited to those areas that are immediately
adjacent to the Creek and up to the nearest mapped street.
Newtown Creek SMIA andCostal Zone Boundary
Figure 2-6Newtown Creek Waterbody/Watershed Plan
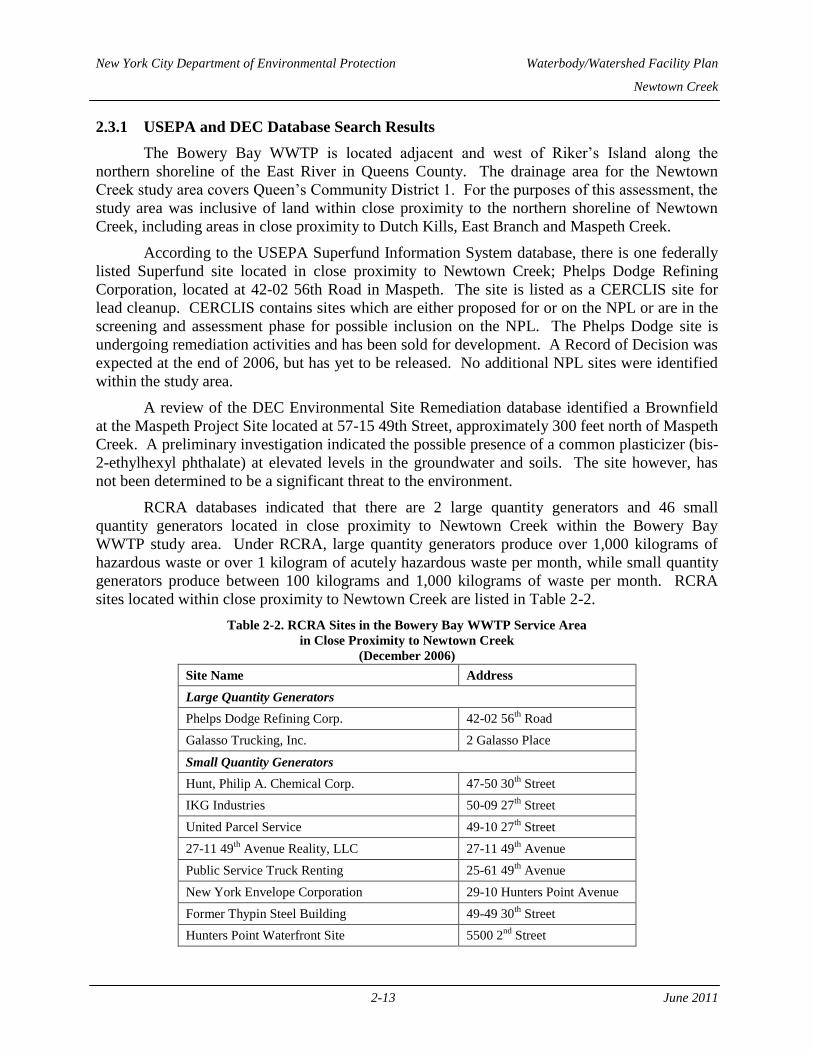
New York City Department of Environmental Protection Waterbody/Watershed Facility Plan
Newtown Creek
2-13 June 2011
2.3.1 USEPA and DEC Database Search Results
The Bowery Bay WWTP is located adjacent and west of Riker’s Island along the
northern shoreline of the East River in Queens County. The drainage area for the Newtown
Creek study area covers Queen’s Community District 1. For the purposes of this assessment, the
study area was inclusive of land within close proximity to the northern shoreline of Newtown
Creek, including areas in close proximity to Dutch Kills, East Branch and Maspeth Creek.
According to the USEPA Superfund Information System database, there is one federally
listed Superfund site located in close proximity to Newtown Creek; Phelps Dodge Refining
Corporation, located at 42-02 56th Road in Maspeth. The site is listed as a CERCLIS site for
lead cleanup. CERCLIS contains sites which are either proposed for or on the NPL or are in the
screening and assessment phase for possible inclusion on the NPL. The Phelps Dodge site is
undergoing remediation activities and has been sold for development. A Record of Decision was
expected at the end of 2006, but has yet to be released. No additional NPL sites were identified
within the study area.
A review of the DEC Environmental Site Remediation database identified a Brownfield
at the Maspeth Project Site located at 57-15 49th Street, approximately 300 feet north of Maspeth
Creek. A preliminary investigation indicated the possible presence of a common plasticizer (bis-
2-ethylhexyl phthalate) at elevated levels in the groundwater and soils. The site however, has
not been determined to be a significant threat to the environment.
RCRA databases indicated that there are 2 large quantity generators and 46 small
quantity generators located in close proximity to Newtown Creek within the Bowery Bay
WWTP study area. Under RCRA, large quantity generators produce over 1,000 kilograms of
hazardous waste or over 1 kilogram of acutely hazardous waste per month, while small quantity
generators produce between 100 kilograms and 1,000 kilograms of waste per month. RCRA
sites located within close proximity to Newtown Creek are listed in Table 2-2.
Table 2-2. RCRA Sites in the Bowery Bay WWTP Service Area
in Close Proximity to Newtown Creek
(December 2006)
Site Name Address
Large Quantity Generators
Phelps Dodge Refining Corp. 42-02 56th
Road
Galasso Trucking, Inc. 2 Galasso Place
Small Quantity Generators
Hunt, Philip A. Chemical Corp. 47-50 30th
Street
IKG Industries 50-09 27th
Street
United Parcel Service 49-10 27th
Street
27-11 49th
Avenue Reality, LLC 27-11 49th
Avenue
Public Service Truck Renting 25-61 49th
Avenue
New York Envelope Corporation 29-10 Hunters Point Avenue
Former Thypin Steel Building 49-49 30th
Street
Hunters Point Waterfront Site 5500 2nd
Street
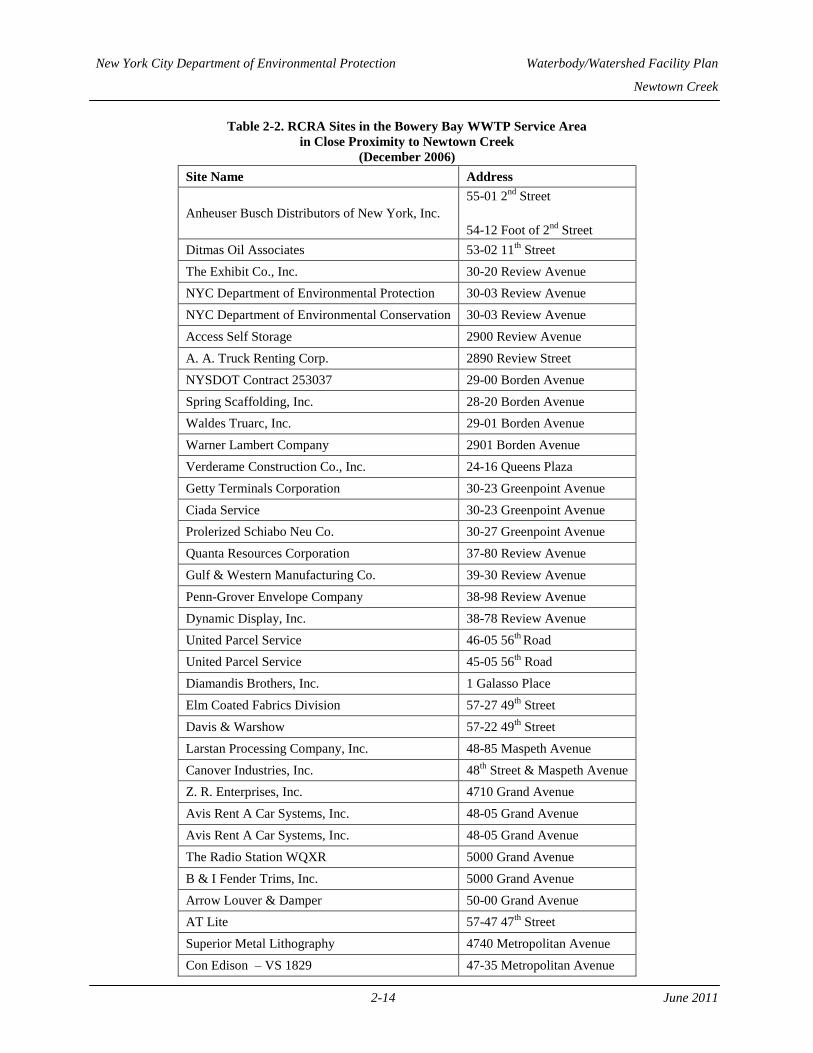
New York City Department of Environmental Protection Waterbody/Watershed Facility Plan
Newtown Creek
2-14 June 2011
Table 2-2. RCRA Sites in the Bowery Bay WWTP Service Area
in Close Proximity to Newtown Creek
(December 2006)
Site Name Address
Anheuser Busch Distributors of New York, Inc.
55-01 2nd
Street
54-12 Foot of 2nd
Street
Ditmas Oil Associates 53-02 11th
Street
The Exhibit Co., Inc. 30-20 Review Avenue
NYC Department of Environmental Protection 30-03 Review Avenue
NYC Department of Environmental Conservation 30-03 Review Avenue
Access Self Storage 2900 Review Avenue
A. A. Truck Renting Corp. 2890 Review Street
NYSDOT Contract 253037 29-00 Borden Avenue
Spring Scaffolding, Inc. 28-20 Borden Avenue
Waldes Truarc, Inc. 29-01 Borden Avenue
Warner Lambert Company 2901 Borden Avenue
Verderame Construction Co., Inc. 24-16 Queens Plaza
Getty Terminals Corporation 30-23 Greenpoint Avenue
Ciada Service 30-23 Greenpoint Avenue
Prolerized Schiabo Neu Co. 30-27 Greenpoint Avenue
Quanta Resources Corporation 37-80 Review Avenue
Gulf & Western Manufacturing Co. 39-30 Review Avenue
Penn-Grover Envelope Company 38-98 Review Avenue
Dynamic Display, Inc. 38-78 Review Avenue
United Parcel Service 46-05 56th
Road
United Parcel Service 45-05 56th
Road
Diamandis Brothers, Inc. 1 Galasso Place
Elm Coated Fabrics Division 57-27 49th
Street
Davis & Warshow 57-22 49th
Street
Larstan Processing Company, Inc. 48-85 Maspeth Avenue
Canover Industries, Inc. 48th
Street & Maspeth Avenue
Z. R. Enterprises, Inc. 4710 Grand Avenue
Avis Rent A Car Systems, Inc. 48-05 Grand Avenue
Avis Rent A Car Systems, Inc. 48-05 Grand Avenue
The Radio Station WQXR 5000 Grand Avenue
B & I Fender Trims, Inc. 5000 Grand Avenue
Arrow Louver & Damper 50-00 Grand Avenue
AT Lite 57-47 47th
Street
Superior Metal Lithography 4740 Metropolitan Avenue
Con Edison – VS 1829 47-35 Metropolitan Avenue

New York City Department of Environmental Protection Waterbody/Watershed Facility Plan
Newtown Creek
2-15 June 2011
Table 2-2. RCRA Sites in the Bowery Bay WWTP Service Area
in Close Proximity to Newtown Creek
(December 2006)
Site Name Address
Atlantic Express Corporation 46-81 Metropolitan Avenue
Exxon Co. USA – Maspeth Terminal 4763 Metropolitan Avenue
Demaco Division of Howden Food Equipment 46-25 Metropolitan Avenue
The DEC Petroleum Bulk Storage (PBS) database identified 48 USTs within the Bowery
Bay WWTP drainage area of Newtown Creek. These sites contain USTs that are either in-
service or closed. The storage capacity of the USTs ranged from 350 to 20,000 gallons and
stored leaded or unleaded gasoline, diesel, Nos. 1, 2, 4, 5 and/or 6 fuel oil, or other materials.
The UST sites are identified in Table 2-3.
Table 2-3. USTs in the Bowery Bay WWTP Service Area in Close Proximity to Newtown Creek
(January 2002)
Site Address
Tank
Capacity
(Gallons) Product Stored
Number
of Tanks Status I G Federal
Electrical
Supply
47-20 30th Street 4,500 No.1, 2 or 4 Fuel Oil 1 In Service
Patent
Construction
Systems
50-09 27th Street 3,000
1,500
No.1, 2 or 4 Fuel Oil
No.1, 2 or 4 Fuel Oil
1
1
Closed, In Place
Closed, In Place
Honey
Fashions, LTD. 27-11 49th Avenue 5,000 No.1, 2 or 4 Fuel Oil 1 Closed, Removed
Black Bear
Company 27-10 49th Avenue
550
4,000
Other
Unleaded Gasoline
1
4
Administratively Closed
Administratively Closed
Black Bear
Company
27-10 Hunters Point
Boulevard
550
5,000
8,050
Used Oil
Unleaded Gasoline
Unleaded Gasoline
1
3
1
In Service
Closed, In Place/Removed
Closed, In Place/Removed
Public Service
Truck Renting 25-61 49th Avenue 4,000 Diesel 2 In Service
29-10 Hunters
Point Avenue
29-10 Hunters Point
Avenue 20,000 No.1, 2 or 4 Fuel Oil 1 In Service
Thypin Steel
Co., Inc. 49-49 30th Street 2,000 Unleaded Gasoline 1 Closed, Removed
Fink Baking
Corp. 5-35 54th Avenue 550 Leaded Gasoline 5 Closed, In Place
Horizon 25
Real Estate
Corp.
25-25 Borden
Avenue 2,500 No.1, 2 or 4 Fuel Oil 1 In Service
Access Self
Storage
29-00 Review
Avenue
10,000
550
10,000
No.1, 2, or 4 Fuel Oil
Unleaded Gasoline
No.1, 2 or 4 Fuel Oil
1
2
1
Closed, Removed
Closed, Removed
In Service
AA Truck
Renting Corp.
28-90 Review
Avenue 4,000 Diesel 3 In Service
29-01 Borden
Avenue
29-01 Borden
Avenue 5,000 No.1, 2 or 4 Fuel Oil 2 In Service
Korean Trade &
Distribution
Center of New
York
34-35 Review
Avenue
1,500
2,000
3,000
No.1, 2 or 4 Fuel Oil
No.1, 2 or 4 Fuel Oil
Diesel
1
1
1
Closed, In Place
Closed, In Place
Closed, Removed
Local 804 D &
W Employees
34-21 Review
Avenue 1,080 No.1, 2 or 4 Fuel Oil 1
Converted to Non-
Regulated Use

New York City Department of Environmental Protection Waterbody/Watershed Facility Plan
Newtown Creek
2-16 June 2011
Table 2-3. USTs in the Bowery Bay WWTP Service Area in Close Proximity to Newtown Creek
(January 2002)
Site Address
Tank
Capacity
(Gallons) Product Stored
Number
of Tanks Status Nanco
Contracting
Corp.
37-30 Review
Avenue
4,000
4,000
Unleaded Gasoline
Diesel
1
1
Administratively Closed
Administratively Closed
Caravan
Transportation,
Inc.
37-30 Review
Avenue 4,000 Diesel 2 In Service
New York
Paving, Inc.
37-18 Railroad
Avenue 4,000 Diesel 2 In Service
Hugo Neu
Schnitzer East
30-27 Greenpoint
Avenue
2,000
1,100
2,000
No.1, 2 or 4 Fuel Oil
Leaded Gasoline
Diesel
1
1
1
Closed, In Place/Removed
Closed, In Place/Removed
Closed, In Place/Removed
Review Ave
Properties, Inc.
36-08 Review
Avenue 3,000 No.1, 2 or 4 Fuel Oil 1 Closed, In Place
Phoenix
Beverages, Inc.
37-88 Review
Avenue
4,000
4,000
Diesel
Unleaded Gasoline
1
1
In Service
In Service
The Catalano
Co.
34-02 Laurel Hill
Boulevard 5,000 No.1, 2 or 4 Fuel Oil 1 In Service
United Parcel
Service 46-05 56th Road 550 Unleaded Gasoline 5 Closed, Removed
J & J Farms
Creamery, Inc. 57-48 49th Street 4,000 No.1, 2 or 4 Fuel Oil 1 Closed, In Place
Davis &
Warshow 57-22 49th Street 2,000 Diesel 1 Administratively Closed
Display
Systems 57-13 49th Street 5,000 No.1, 2 or 4 Fuel Oil 1 In Service
Wallace
Packaging
Corp.
57-01 49th Street 5,000 No.1, 2 or 4 Fuel Oil 2 Closed, In Place/
Removed
E Greene & Co,
Inc 57-00 49th Street 1,600 Diesel 1 Administratively Closed
57-00 49th
Street 57-00 49th Street
550
3,000
Diesel
No.1, 2 or 4 Fuel Oil
3
1
Closed, In Place
Closed, In Place
Ben-Jo General
Trucking, Inc. 56-85 49th Street
550
1,080
275
Diesel
No.1, 2 or 4 Fuel Oil
No.1, 2 or 4 Fuel Oil
3
1
1
In Service
Converted to Non-
Regulated Use
Converted to Non-
Regulated Use
Eldorado
Coffee, LTD 56-75 49th Street 2,000 No.1, 2 or 4 Fuel Oil 1 Closed, In Place
PJL Realty
Corp. 56-72 49th Place 5,000 No.1, 2 or 4 Fuel Oil 2 Closed, Removed
Goffa
International 58-29 48th Street 3,000 No.1, 2 or 4 Fuel Oil 1 In Service
Cipico
Construction,
Inc.
58-08 48th Street 1,000
2,000
Unleaded Gasoline
Diesel
1
1
In Service
In Service
Queens District
5 Garage 58-02 48th Street
2,500
4,000
1,000
Unleaded Gasoline
Diesel
Lube Oil
1
2
1
In Service
In Service
In Service
Canover
Industries, Inc 57-85 48th Street 2,500 No.1, 2 or 4 Fuel Oil 1 Administratively Closed
Geyser Realty,
LLC 57-65 48th Street 7,500 No.1, 2 or 4 Fuel Oil 1 In Service
Geyser Realty,
LLC 57-65 48th Street
2,500
7,500
No.1, 2 or 4 Fuel Oil
No.1, 2 or 4 Fuel Oil
1
1
Closed, In Place
Closed, In Place

New York City Department of Environmental Protection Waterbody/Watershed Facility Plan
Newtown Creek
2-17 June 2011
Table 2-3. USTs in the Bowery Bay WWTP Service Area in Close Proximity to Newtown Creek
(January 2002)
Site Address
Tank
Capacity
(Gallons) Product Stored
Number
of Tanks Status Canover
Industries, Inc 57-65 48th Street 7,500 No.1, 2 or 4 Fuel Oil 1 Administratively Closed
Avis Rent A
Car Systems,
Inc.
48-05 Grand Avenue 4,000
500
Unleaded Gasoline
Other
4
1
Closed, In Place/Removed
Closed, In Place/Removed
At Lite LTG
Equipment, Inc. 57-47 47th Street 5,000 No.1, 2 or 4 Fuel Oil 1 Closed, In Place
Boro Timber
Co. 57-45 47th Street
4,000
4,000
Unleaded Gasoline
Diesel
1
2
Closed, In Place
Closed, In Place
A Lamanna
Trucking Co. 57-05 47th Street 4,500 Diesel 1 Closed, Removed
Island Trans
Corp. 57-00 47th Street
4,000
4,000
1,080
6,000
Diesel
Other
Other
No.1, 2 or 4 Fuel Oil
1
2
1
1
In Service
Closed, Removed
Closed, Removed
In Service
Bengro Realty 47-40 Metropolitan
Avenue 3,000 No.1, 2 or 4 Fuel Oil 1 Closed, Removed
Amboy Bus
Co., Inc.
46-81 Metropolitan
Avenue
4,000
4,000
2,200
6,050
Diesel
Unleaded Gasoline
Leaded Gasoline
Diesel
2
1
1
1
In Service
In Service
Closed, In Place
Closed, In Place
Williams
Maspeth
Terminals, Inc.
46-73 Metropolitan
Avenue 200,000 No.5 or 6 Fuel Oil 1 Administratively Closed
Ara Smith’s
Transfer Corp.
46-25 Metropolitan
Avenue 500 Diesel 5 Closed, Removed
A review of the EDR report identified several MOSFs within the Bowery Bay study area.
MOSFs are facilities that may be onshore facilities or vessels that have a petroleum storage
capacity of 400,000 gallons or greater. According to the EDR Report, there is one active and one
non-active MOSF in the study area. The active site is the Getty Terminals Corporation located at
30-23 Greenpoint Avenue in Long Island City, and is situated immediately north of Newtown
Creek. The USTs and above-ground storage tanks (ASTs) at the facility have a total capacity of
2,887,648 gallons and store diesel and No. 1, 2 or 4 fuel oil. In addition, Getty Terminals has
one active chemical bulk storage (CBS) AST that has a capacity of 8,000 gallons and four ASTs
that have a total capacity of 1,437,700 gallons. Ditmas Oil at 53-02 11th Street in Long Island
City, immediately north of Newtown Creek was also identified as a MOSF, however, this facility
was listed as inactive and no additional information was provided.
The LTANKS database, provided by EDR, identified 26 leaking storage tank sites in the
Bowery Bay WWTP study area. The LTANKS list identifies leaking USTs (LUST) or leaking
ASTs. LUSTs identified within close proximity to Newtown Creek discharged No. 2 or 4 fuel
oil, unknown petroleum, gasoline or diesel as a result of tank test failures, tank failures and tank
overfills. As of December 2006, all 26 identified leaks had been closed. Based on a review of
available information, no other open spills were reported in the study area.
A review of the DEC SPILL databases indicated that 121 spills have occurred within the
past 10 years. Of these 121 spills, five remained open as of December 2006 and are listed in
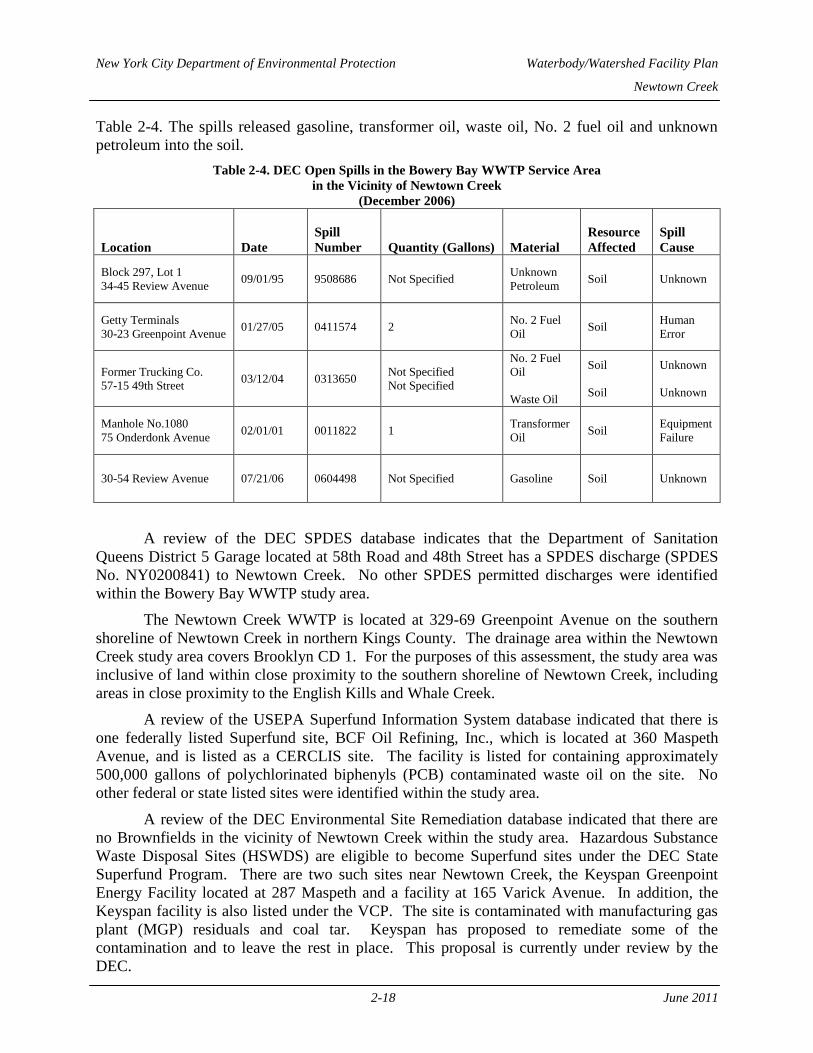
New York City Department of Environmental Protection Waterbody/Watershed Facility Plan
Newtown Creek
2-18 June 2011
Table 2-4. The spills released gasoline, transformer oil, waste oil, No. 2 fuel oil and unknown
petroleum into the soil.
Table 2-4. DEC Open Spills in the Bowery Bay WWTP Service Area
in the Vicinity of Newtown Creek
(December 2006)
Location Date
Spill
Number Quantity (Gallons) Material
Resource
Affected
Spill
Cause
Block 297, Lot 1
34-45 Review Avenue 09/01/95 9508686 Not Specified
Unknown
Petroleum Soil Unknown
Getty Terminals
30-23 Greenpoint Avenue 01/27/05 0411574 2
No. 2 Fuel
Oil Soil
Human
Error
Former Trucking Co.
57-15 49th Street 03/12/04 0313650
Not Specified
Not Specified
No. 2 Fuel
Oil
Waste Oil
Soil
Soil
Unknown
Unknown
Manhole No.1080
75 Onderdonk Avenue 02/01/01 0011822 1
Transformer
Oil Soil
Equipment
Failure
30-54 Review Avenue 07/21/06 0604498 Not Specified Gasoline Soil Unknown
A review of the DEC SPDES database indicates that the Department of Sanitation
Queens District 5 Garage located at 58th Road and 48th Street has a SPDES discharge (SPDES
No. NY0200841) to Newtown Creek. No other SPDES permitted discharges were identified
within the Bowery Bay WWTP study area.
The Newtown Creek WWTP is located at 329-69 Greenpoint Avenue on the southern
shoreline of Newtown Creek in northern Kings County. The drainage area within the Newtown
Creek study area covers Brooklyn CD 1. For the purposes of this assessment, the study area was
inclusive of land within close proximity to the southern shoreline of Newtown Creek, including
areas in close proximity to the English Kills and Whale Creek.
A review of the USEPA Superfund Information System database indicated that there is
one federally listed Superfund site, BCF Oil Refining, Inc., which is located at 360 Maspeth
Avenue, and is listed as a CERCLIS site. The facility is listed for containing approximately
500,000 gallons of polychlorinated biphenyls (PCB) contaminated waste oil on the site. No
other federal or state listed sites were identified within the study area.
A review of the DEC Environmental Site Remediation database indicated that there are
no Brownfields in the vicinity of Newtown Creek within the study area. Hazardous Substance
Waste Disposal Sites (HSWDS) are eligible to become Superfund sites under the DEC State
Superfund Program. There are two such sites near Newtown Creek, the Keyspan Greenpoint
Energy Facility located at 287 Maspeth and a facility at 165 Varick Avenue. In addition, the
Keyspan facility is also listed under the VCP. The site is contaminated with manufacturing gas
plant (MGP) residuals and coal tar. Keyspan has proposed to remediate some of the
contamination and to leave the rest in place. This proposal is currently under review by the
DEC.
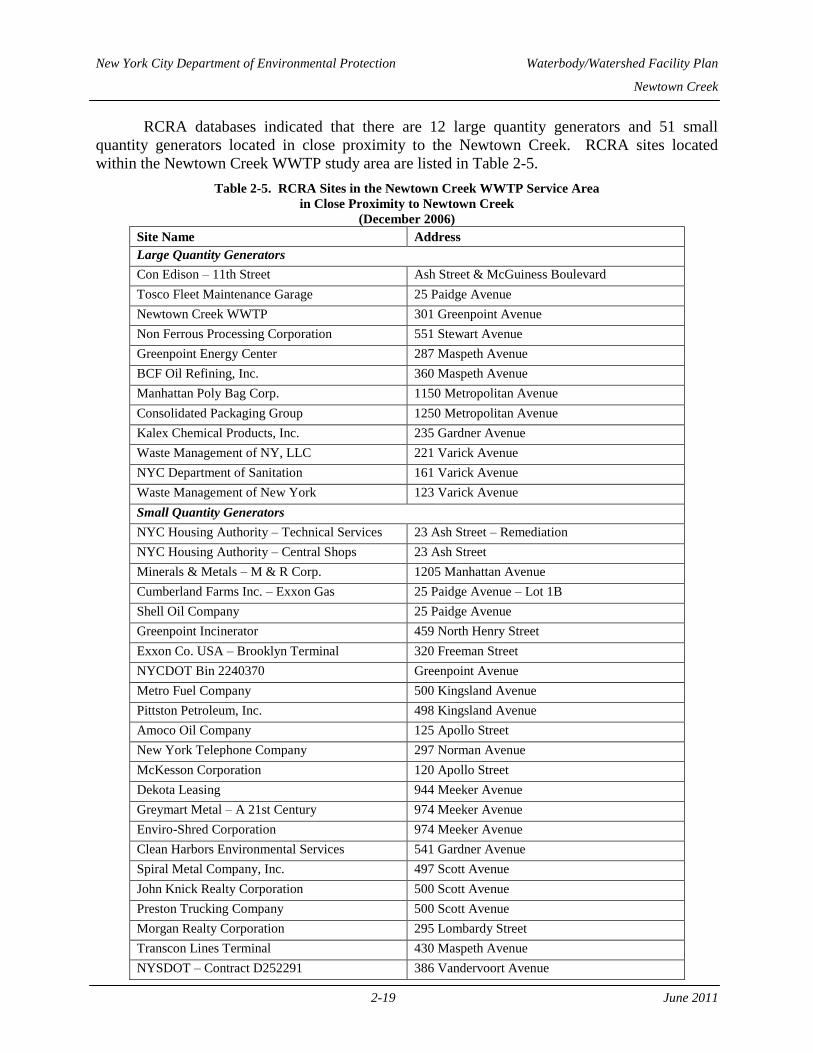
New York City Department of Environmental Protection Waterbody/Watershed Facility Plan
Newtown Creek
2-19 June 2011
RCRA databases indicated that there are 12 large quantity generators and 51 small
quantity generators located in close proximity to the Newtown Creek. RCRA sites located
within the Newtown Creek WWTP study area are listed in Table 2-5.
Table 2-5. RCRA Sites in the Newtown Creek WWTP Service Area
in Close Proximity to Newtown Creek
(December 2006)
Site Name Address
Large Quantity Generators
Con Edison – 11th Street Ash Street & McGuiness Boulevard
Tosco Fleet Maintenance Garage 25 Paidge Avenue
Newtown Creek WWTP 301 Greenpoint Avenue
Non Ferrous Processing Corporation 551 Stewart Avenue
Greenpoint Energy Center 287 Maspeth Avenue
BCF Oil Refining, Inc. 360 Maspeth Avenue
Manhattan Poly Bag Corp. 1150 Metropolitan Avenue
Consolidated Packaging Group 1250 Metropolitan Avenue
Kalex Chemical Products, Inc. 235 Gardner Avenue
Waste Management of NY, LLC 221 Varick Avenue
NYC Department of Sanitation 161 Varick Avenue
Waste Management of New York 123 Varick Avenue
Small Quantity Generators
NYC Housing Authority – Technical Services 23 Ash Street – Remediation
NYC Housing Authority – Central Shops 23 Ash Street
Minerals & Metals – M & R Corp. 1205 Manhattan Avenue
Cumberland Farms Inc. – Exxon Gas 25 Paidge Avenue – Lot 1B
Shell Oil Company 25 Paidge Avenue
Greenpoint Incinerator 459 North Henry Street
Exxon Co. USA – Brooklyn Terminal 320 Freeman Street
NYCDOT Bin 2240370 Greenpoint Avenue
Metro Fuel Company 500 Kingsland Avenue
Pittston Petroleum, Inc. 498 Kingsland Avenue
Amoco Oil Company 125 Apollo Street
New York Telephone Company 297 Norman Avenue
McKesson Corporation 120 Apollo Street
Dekota Leasing 944 Meeker Avenue
Greymart Metal – A 21st Century 974 Meeker Avenue
Enviro-Shred Corporation 974 Meeker Avenue
Clean Harbors Environmental Services 541 Gardner Avenue
Spiral Metal Company, Inc. 497 Scott Avenue
John Knick Realty Corporation 500 Scott Avenue
Preston Trucking Company 500 Scott Avenue
Morgan Realty Corporation 295 Lombardy Street
Transcon Lines Terminal 430 Maspeth Avenue
NYSDOT – Contract D252291 386 Vandervoort Avenue
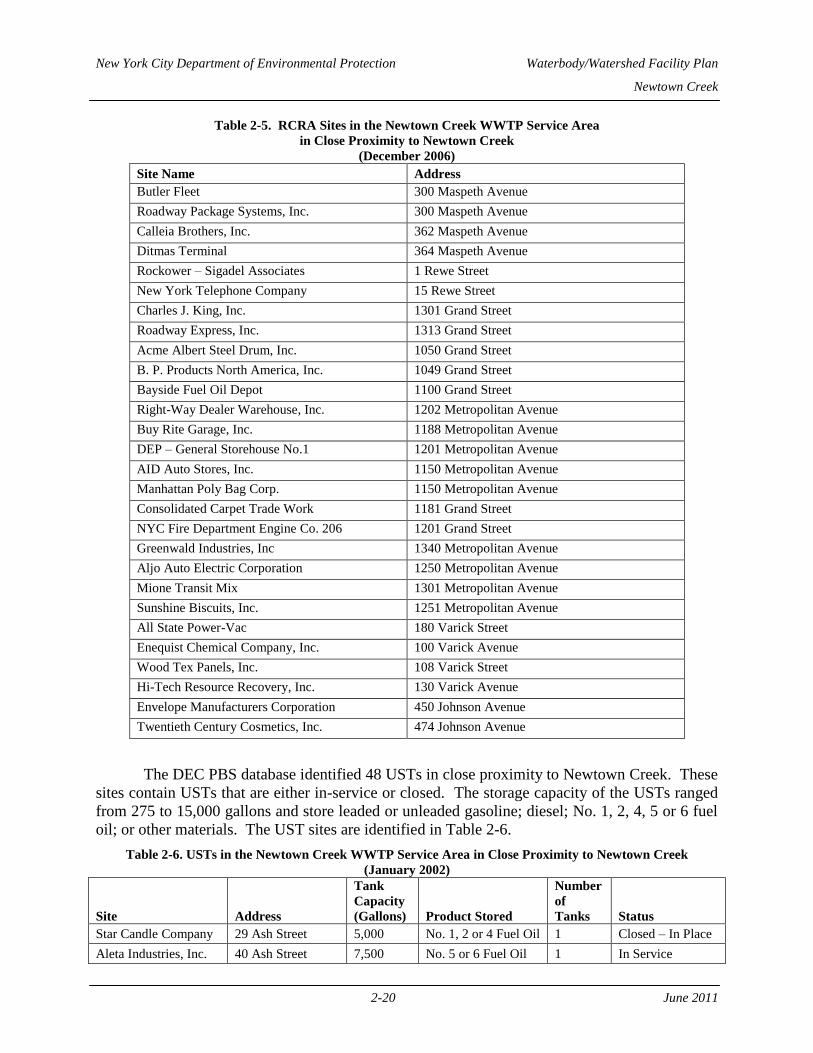
New York City Department of Environmental Protection Waterbody/Watershed Facility Plan
Newtown Creek
2-20 June 2011
Table 2-5. RCRA Sites in the Newtown Creek WWTP Service Area
in Close Proximity to Newtown Creek
(December 2006)
Site Name Address
Butler Fleet 300 Maspeth Avenue
Roadway Package Systems, Inc. 300 Maspeth Avenue
Calleia Brothers, Inc. 362 Maspeth Avenue
Ditmas Terminal 364 Maspeth Avenue
Rockower – Sigadel Associates 1 Rewe Street
New York Telephone Company 15 Rewe Street
Charles J. King, Inc. 1301 Grand Street
Roadway Express, Inc. 1313 Grand Street
Acme Albert Steel Drum, Inc. 1050 Grand Street
B. P. Products North America, Inc. 1049 Grand Street
Bayside Fuel Oil Depot 1100 Grand Street
Right-Way Dealer Warehouse, Inc. 1202 Metropolitan Avenue
Buy Rite Garage, Inc. 1188 Metropolitan Avenue
DEP – General Storehouse No.1 1201 Metropolitan Avenue
AID Auto Stores, Inc. 1150 Metropolitan Avenue
Manhattan Poly Bag Corp. 1150 Metropolitan Avenue
Consolidated Carpet Trade Work 1181 Grand Street
NYC Fire Department Engine Co. 206 1201 Grand Street
Greenwald Industries, Inc 1340 Metropolitan Avenue
Aljo Auto Electric Corporation 1250 Metropolitan Avenue
Mione Transit Mix 1301 Metropolitan Avenue
Sunshine Biscuits, Inc. 1251 Metropolitan Avenue
All State Power-Vac 180 Varick Street
Enequist Chemical Company, Inc. 100 Varick Avenue
Wood Tex Panels, Inc. 108 Varick Street
Hi-Tech Resource Recovery, Inc. 130 Varick Avenue
Envelope Manufacturers Corporation 450 Johnson Avenue
Twentieth Century Cosmetics, Inc. 474 Johnson Avenue
The DEC PBS database identified 48 USTs in close proximity to Newtown Creek. These
sites contain USTs that are either in-service or closed. The storage capacity of the USTs ranged
from 275 to 15,000 gallons and store leaded or unleaded gasoline; diesel; No. 1, 2, 4, 5 or 6 fuel
oil; or other materials. The UST sites are identified in Table 2-6.
Table 2-6. USTs in the Newtown Creek WWTP Service Area in Close Proximity to Newtown Creek
(January 2002)
Site Address
Tank
Capacity
(Gallons) Product Stored
Number
of
Tanks Status
Star Candle Company 29 Ash Street 5,000 No. 1, 2 or 4 Fuel Oil 1 Closed – In Place
Aleta Industries, Inc. 40 Ash Street 7,500 No. 5 or 6 Fuel Oil 1 In Service

New York City Department of Environmental Protection Waterbody/Watershed Facility Plan
Newtown Creek
2-21 June 2011
Table 2-6. USTs in the Newtown Creek WWTP Service Area in Close Proximity to Newtown Creek
(January 2002)
Site Address
Tank
Capacity
(Gallons) Product Stored
Number
of
Tanks Status
Greenpoint Incinerator N. Henry Street &
Kingsland Avenue 5,000 No. 1, 2 or 4 Fuel Oil 1 In Service
Exxon Company, USA 320 Freeman Street 4,000 No. 1, 2 or 4 Fuel Oil 1 Administratively
Closed
Yellow Freight
Systems
460 Kingsland
Avenue
1,000
275
550
Other
Other
Diesel
1
1
3
Closed –
Removed
In Service
Closed –
Removed
Safeway Steel
Products
370 Greenpoint
Avenue
550
550
Leaded Gasoline
Other
1
2
Closed –
Removed
Temporarily Out
of Service
New York Telephone
Co.
297 Norman
Avenue
2,000
2,000
4,000
2,500
Leaded Gasoline
Leaded Gasoline
Unleaded Gasoline
Diesel
1
1
1
1
Closed – In Place
Closed –
Removed
In Service
In Service
United Kingsway
Carpet Cleaning, Inc.
301 Norman
Avenue
3,000
1,000
No. 1, 2 or 4 Fuel Oil
Diesel
1
1
Closed –Removed
Closed –Removed
Peerless Importers 942 Meeker
Avenue 550 Diesel 3 Closed –Removed
Peerless Importers 944 Meeker
Avenue 550 Diesel 3 Closed –Removed
Off Site Free Product
Recovery
972 Meeker
Avenue 4,000 Other 1 In Service
Recovery Well G UST 1000 Meeker
Avenue 4,000 Empty 1 Closed –Removed
Mc Aley Associates,
Inc.
515 Garner
Avenue 550 Unleaded Gasoline 4 In Service
Emil Realty, Inc.
541 Gardner
Avenue & 75
Thomas Street
550
4,000
Unleaded Gasoline
Diesel
2
1
Closed – In Place
Closed – In Place
Off Site Free Product
Recovery
564 Gardner
Avenue 4,000 Other 1 In Service
Waste Management of
New York, LLC 475 Scott Avenue 4,000 Diesel 1 Closed - In Place
Lehigh Carting Co.,
Inc. 485 Scott Avenue
15,000
550
No. 1, 2 or 4 Fuel Oil
Diesel
1
3
Closed – In Place
Closed –Removed
P-I-E Nationwide, Inc.
Vacant Truck
Terminal
500 Scott Avenue 1,000 Leaded Gasoline 4 Closed –Removed
Non Ferrous
Processing Corp.
551 Stewart
Avenue 5,000 No. 1, 2 or 4 Fuel Oil 1
Closed – In Place/
Removed
Tose-Fowler, Inc.
Vacant Truck
Terminal
295 Lombardy
Street 500 Diesel 4 Closed –Removed
Acme Steel Corp. 211 Lombardy
Street 8,000 No. 1, 2 or 4 Fuel Oil 2 Closed – In Place
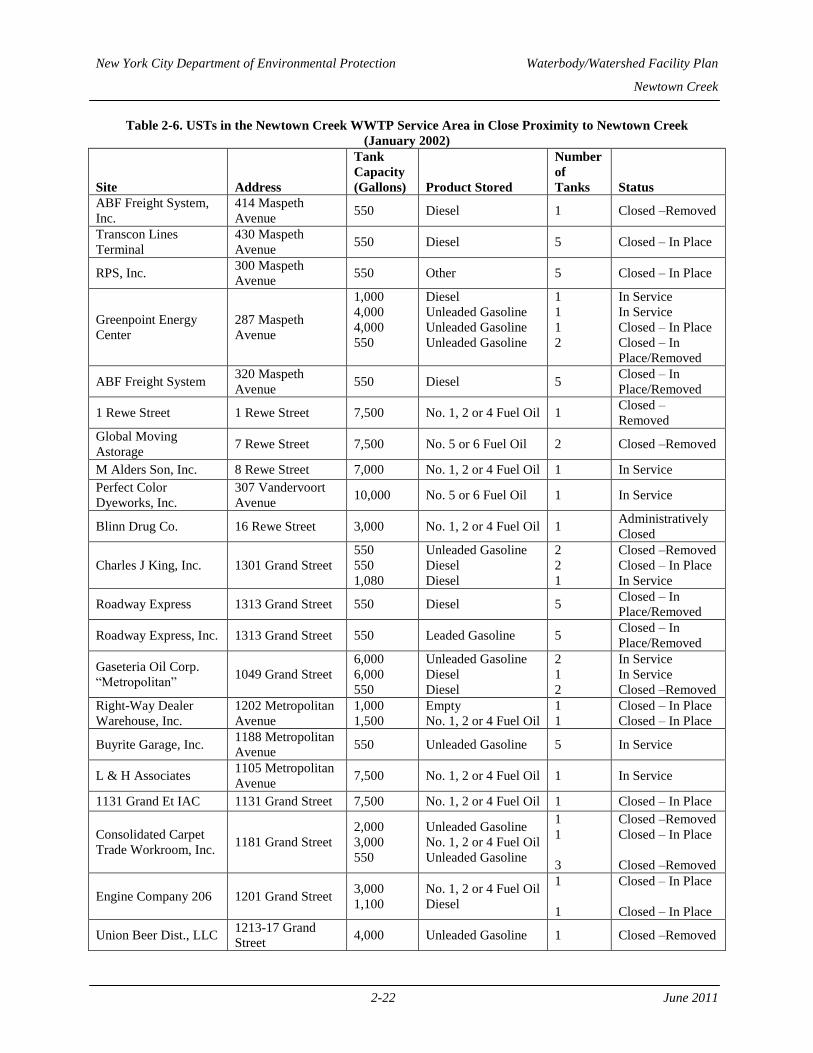
New York City Department of Environmental Protection Waterbody/Watershed Facility Plan
Newtown Creek
2-22 June 2011
Table 2-6. USTs in the Newtown Creek WWTP Service Area in Close Proximity to Newtown Creek
(January 2002)
Site Address
Tank
Capacity
(Gallons) Product Stored
Number
of
Tanks Status
ABF Freight System,
Inc.
414 Maspeth
Avenue 550 Diesel 1 Closed –Removed
Transcon Lines
Terminal
430 Maspeth
Avenue 550 Diesel 5 Closed – In Place
RPS, Inc. 300 Maspeth
Avenue 550 Other 5 Closed – In Place
Greenpoint Energy
Center
287 Maspeth
Avenue
1,000
4,000
4,000
550
Diesel
Unleaded Gasoline
Unleaded Gasoline
Unleaded Gasoline
1
1
1
2
In Service
In Service
Closed – In Place
Closed – In
Place/Removed
ABF Freight System 320 Maspeth
Avenue 550 Diesel 5
Closed – In
Place/Removed
1 Rewe Street 1 Rewe Street 7,500 No. 1, 2 or 4 Fuel Oil 1 Closed –
Removed
Global Moving
Astorage 7 Rewe Street 7,500 No. 5 or 6 Fuel Oil 2 Closed –Removed
M Alders Son, Inc. 8 Rewe Street 7,000 No. 1, 2 or 4 Fuel Oil 1 In Service
Perfect Color
Dyeworks, Inc.
307 Vandervoort
Avenue 10,000 No. 5 or 6 Fuel Oil 1 In Service
Blinn Drug Co. 16 Rewe Street 3,000 No. 1, 2 or 4 Fuel Oil 1 Administratively
Closed
Charles J King, Inc. 1301 Grand Street
550
550
1,080
Unleaded Gasoline
Diesel
Diesel
2
2
1
Closed –Removed
Closed – In Place
In Service
Roadway Express 1313 Grand Street 550 Diesel 5 Closed – In
Place/Removed
Roadway Express, Inc. 1313 Grand Street 550 Leaded Gasoline 5 Closed – In
Place/Removed
Gaseteria Oil Corp.
“Metropolitan” 1049 Grand Street
6,000
6,000
550
Unleaded Gasoline
Diesel
Diesel
2
1
2
In Service
In Service
Closed –Removed
Right-Way Dealer
Warehouse, Inc.
1202 Metropolitan
Avenue
1,000
1,500
Empty
No. 1, 2 or 4 Fuel Oil
1
1
Closed – In Place
Closed – In Place
Buyrite Garage, Inc. 1188 Metropolitan
Avenue 550 Unleaded Gasoline 5 In Service
L & H Associates 1105 Metropolitan
Avenue 7,500 No. 1, 2 or 4 Fuel Oil 1 In Service
1131 Grand Et IAC 1131 Grand Street 7,500 No. 1, 2 or 4 Fuel Oil 1 Closed – In Place
Consolidated Carpet
Trade Workroom, Inc. 1181 Grand Street
2,000
3,000
550
Unleaded Gasoline
No. 1, 2 or 4 Fuel Oil
Unleaded Gasoline
1
1
3
Closed –Removed
Closed – In Place
Closed –Removed
Engine Company 206 1201 Grand Street 3,000
1,100
No. 1, 2 or 4 Fuel Oil
Diesel
1
1
Closed – In Place
Closed – In Place
Union Beer Dist., LLC 1213-17 Grand
Street 4,000 Unleaded Gasoline 1 Closed –Removed
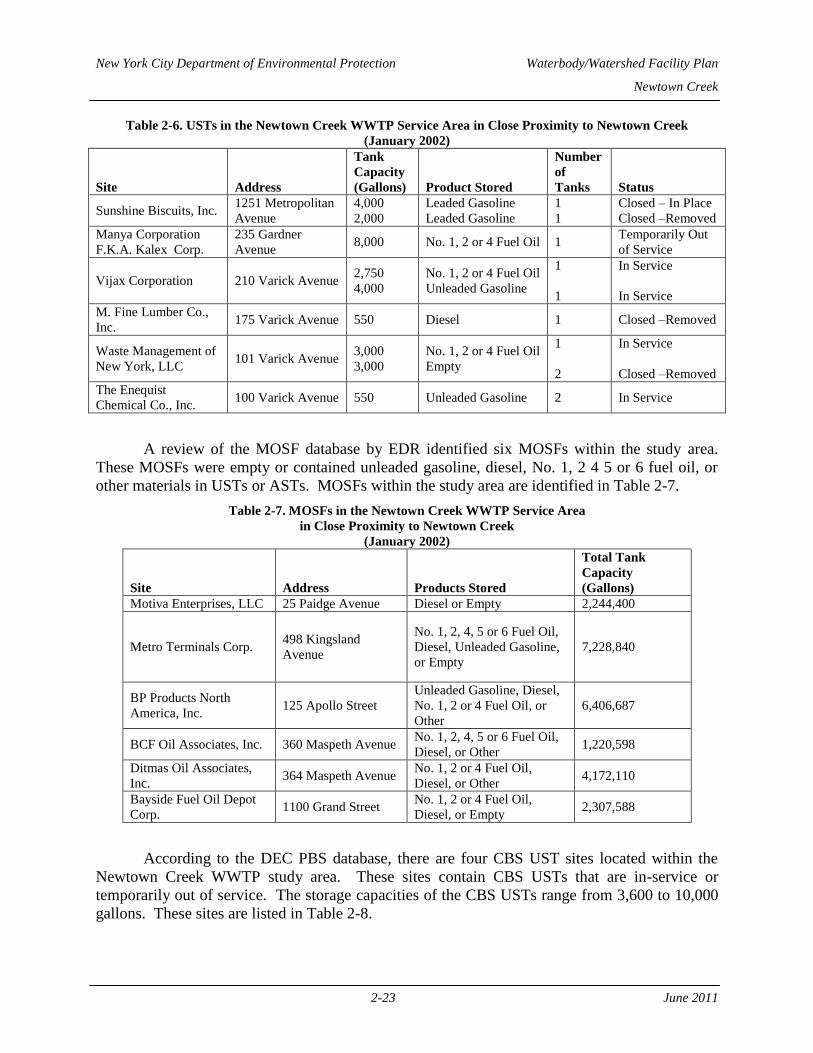
New York City Department of Environmental Protection Waterbody/Watershed Facility Plan
Newtown Creek
2-23 June 2011
Table 2-6. USTs in the Newtown Creek WWTP Service Area in Close Proximity to Newtown Creek
(January 2002)
Site Address
Tank
Capacity
(Gallons) Product Stored
Number
of
Tanks Status
Sunshine Biscuits, Inc. 1251 Metropolitan
Avenue
4,000
2,000
Leaded Gasoline
Leaded Gasoline
1
1
Closed – In Place
Closed –Removed
Manya Corporation
F.K.A. Kalex Corp.
235 Gardner
Avenue 8,000 No. 1, 2 or 4 Fuel Oil 1
Temporarily Out
of Service
Vijax Corporation 210 Varick Avenue 2,750
4,000
No. 1, 2 or 4 Fuel Oil
Unleaded Gasoline
1
1
In Service
In Service
M. Fine Lumber Co.,
Inc. 175 Varick Avenue 550 Diesel 1 Closed –Removed
Waste Management of
New York, LLC 101 Varick Avenue
3,000
3,000
No. 1, 2 or 4 Fuel Oil
Empty
1
2
In Service
Closed –Removed
The Enequist
Chemical Co., Inc. 100 Varick Avenue 550 Unleaded Gasoline 2 In Service
A review of the MOSF database by EDR identified six MOSFs within the study area.
These MOSFs were empty or contained unleaded gasoline, diesel, No. 1, 2 4 5 or 6 fuel oil, or
other materials in USTs or ASTs. MOSFs within the study area are identified in Table 2-7.
Table 2-7. MOSFs in the Newtown Creek WWTP Service Area
in Close Proximity to Newtown Creek
(January 2002)
Site Address Products Stored
Total Tank
Capacity
(Gallons)
Motiva Enterprises, LLC 25 Paidge Avenue Diesel or Empty 2,244,400
Metro Terminals Corp. 498 Kingsland
Avenue
No. 1, 2, 4, 5 or 6 Fuel Oil,
Diesel, Unleaded Gasoline,
or Empty
7,228,840
BP Products North
America, Inc. 125 Apollo Street
Unleaded Gasoline, Diesel,
No. 1, 2 or 4 Fuel Oil, or
Other
6,406,687
BCF Oil Associates, Inc. 360 Maspeth Avenue No. 1, 2, 4, 5 or 6 Fuel Oil,
Diesel, or Other 1,220,598
Ditmas Oil Associates,
Inc. 364 Maspeth Avenue
No. 1, 2 or 4 Fuel Oil,
Diesel, or Other 4,172,110
Bayside Fuel Oil Depot
Corp. 1100 Grand Street
No. 1, 2 or 4 Fuel Oil,
Diesel, or Empty 2,307,588
According to the DEC PBS database, there are four CBS UST sites located within the
Newtown Creek WWTP study area. These sites contain CBS USTs that are in-service or
temporarily out of service. The storage capacities of the CBS USTs range from 3,600 to 10,000
gallons. These sites are listed in Table 2-8.

New York City Department of Environmental Protection Waterbody/Watershed Facility Plan
Newtown Creek
2-24 June 2011
Table 2-8. CBS USTs in the Newtown Creek WWTP Service Area
in Close Proximity to Newtown Creek
(January 2002)
Site Address
Tank
Capacity
(Gallons)
Number
of Tanks Status
Motiva Enterprises,
LLC 25 Paidge Avenue 4,000 1 In Service
Exxon Company,
USA 320 Freeman Street 4,000 2
Temporarily Out of
Service
BP Amoco Oil
Company 125 Apollo Street 4,000 1 In Service
Manya Corporation
F.K.A. Kalex
Chemical
235 Gardner Avenue
3,600
10,000
2
1
Temporarily Out of
Service
Temporarily Out of
Service
In addition, the PBS database revealed seven CBS AST sites located within the Newtown
Creek WWTP study area. These sites contain CBS ASTs that are in-service or not specified.
The storage capacity of the CBS ASTs ranges from 185 to 12,500 gallons. The CBS ASTs in
proximity to the Newtown Creek WWTP study area are summarized in Table 2-9.
Table 2-9. CBS ASTs in the Newtown Creek Service Area in Close Proximity to Newtown Creek
(January 2002)
Site Address
Tank
Capacity
Number
of
Tanks Product Stored Status
Motive
Enterprises, LLC 25 Paidge Avenue
4,000
5,000
5,014
10,000
1
1
1
1
Xylene
Xylene
Xylene
Xylene
In Service
In Service
In Service
In Service
Metro Terminals
Corp.
498 Kingsland
Avenue
6,000
4,000
185
2
1
1
Xylene
Vinyl Acetate
Monomer
Xylene
In Service
In Service
In Service
BP Amoco Oil
Company 125 Apollo Street
4,000
500
2
3
Organorhodium
complex
Methanol
In Service
In Service
Newtown Creek
Water Pollution
Plant
301 Greenpoint
Avenue 8,000 4 Ferric Chloride In Service
Ditmas Oil
Associates, Inc.
364 Maspeth
Avenue 12,500 1 Xylene In Service
Grand Chromium
Plating Corp.
209 Morgan
Avenue 1,500 1 Hydrochloric Acid Not Specified
Enequist
Chemical
Company, Inc.
100 Varick
Avenue
3,000
6,000
1
2
1
Nitric Acid
Sodium Hydroxide
Hydrochloric Acid
In Service
In Service
In Service
The LTANKS database identified 26 leaking storage tank sites within the study area.
Leaking USTs and ASTs discharged No. 2 fuel oil, diesel and gasoline as a result of tank
overfills, tank failures and test tank failures. As of December 2006, eight of the 26 identified
leaks remained open and are summarized in Table 2-10.

New York City Department of Environmental Protection Waterbody/Watershed Facility Plan
Newtown Creek
2-25 June 2011
Table 2-10. Open LTANKS Sites in the Newtown Creek Service Area
in Close Proximity to Newtown Creek
(April 2006)
Location Date DEC Spill
Number
Quantity
Released
(Gallons)
Material
Spilled
Source
Affected Cause
46-25 Metropolitan Avenue 07/07/1992 9204008 <1 Diesel Soil Tank
Overfill
Engine Company 206
FDNY
1201 Grand Street
03/02/2001 0012768 Not
Specified
No. 2 Fuel
Oil Soil
Tank
Failure
Waste Management of New
York
123 Varick Avenue
08/04/1998 9805562 20 Diesel Soil Tank
Failure
Motiva Enterprises
25 Paidge Avenue 05/23/1990 9002114
Not
Specified Gasoline Groundwater
Tank
Failure
New York Department of
Sanitation
259 North Henry Street
02/22/2001 0012519 Not
Specified
No. 2 Fuel
Oil Soil
Test Tank
Failure
Newtown Creek WWTP
301 Greenpoint Avenue 09/23/1999 9907560
Not
Specified
No. 2 Fuel
Oil Soil
Tank
Failure
Keyspan Energy
287 Maspeth Avenue 01/07/1993 9211562
Not
Specified Gasoline Soil
Test Tank
Failure
Cibro Terminals
1100 Grand Street 10/10/1990 9007551 5,000
No. 2 Fuel
Oil
Surface
Water
Tank
Failure
A review of the DEC SPILL databases indicated that 161 spills have occurred within the
past 20 years. Of these 161 spills, 18 remained open as of December 2006 and are summarized
in Table 2-11. The majority of these spills affected soil, however, contamination to groundwater
and surface water was also noted. The largest spill in the study area occurred in 1978 at the
Amoco Oil Company. The spill resulted in the release of 17 million gallons of petroleum
products. Remediation activities are still ongoing.
Table 2-11. Open Spills in the Newtown Creek WWTP Service Area
in Close Proximity to Newtown Creek
(April 2006)
Location Date
Spill
Number
Quantity
(Gallons) Material
Resource
Affected Spill Cause
Amoco Oil Company
Meeker Avenue 09/02/1978 N/A 17 million
Petroleum
Products Surface Water Unknown
520 Kingsland Avenue 08/03/01 0104811 Not
Specified
Unknown
Petroleum Soil
Human
Error
Verizon Facility
297 Norman Avenue 08/24/01 0105605
Not
Specified
Hydraulic
Oil Soil
Equipment
Failure
Keyspan Greenpoint
287 Maspeth Avenue 09/13/01 0106270 200 Diesel Soil
Equipment
Failure
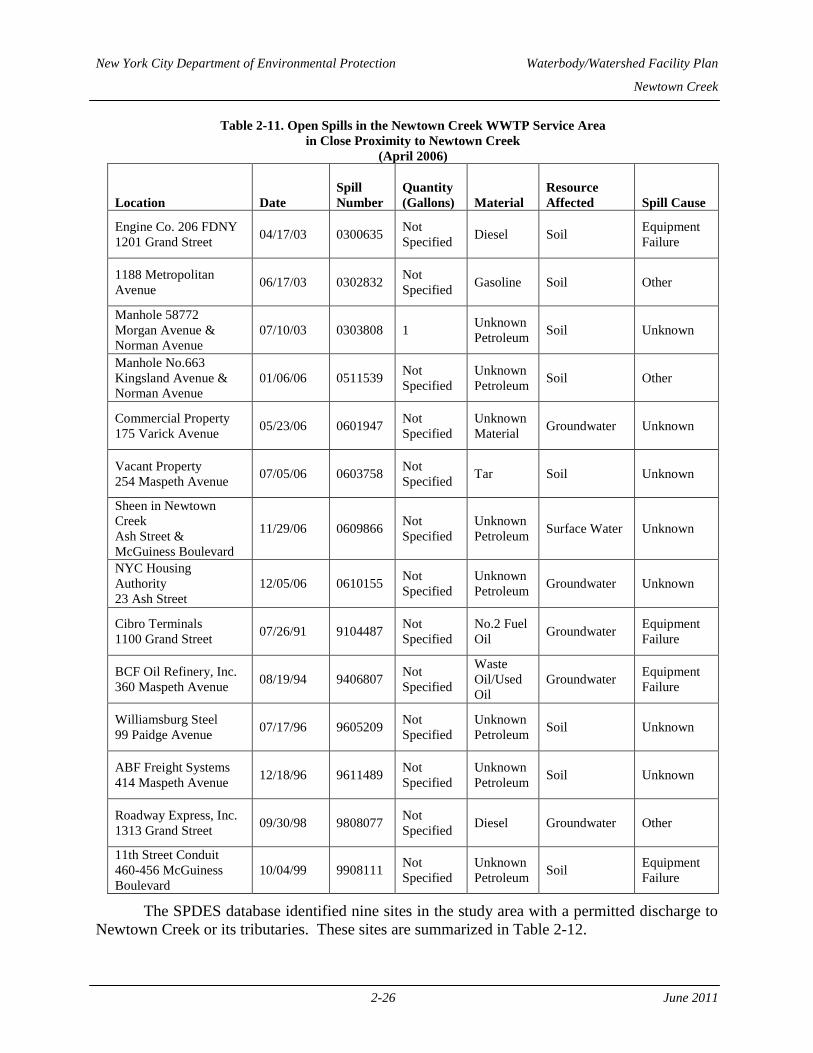
New York City Department of Environmental Protection Waterbody/Watershed Facility Plan
Newtown Creek
2-26 June 2011
Table 2-11. Open Spills in the Newtown Creek WWTP Service Area
in Close Proximity to Newtown Creek
(April 2006)
Location Date
Spill
Number
Quantity
(Gallons) Material
Resource
Affected Spill Cause
Engine Co. 206 FDNY
1201 Grand Street 04/17/03 0300635
Not
Specified Diesel Soil
Equipment
Failure
1188 Metropolitan
Avenue 06/17/03 0302832
Not
Specified Gasoline Soil Other
Manhole 58772
Morgan Avenue &
Norman Avenue
07/10/03 0303808 1 Unknown
Petroleum Soil Unknown
Manhole No.663
Kingsland Avenue &
Norman Avenue
01/06/06 0511539 Not
Specified
Unknown
Petroleum Soil Other
Commercial Property
175 Varick Avenue 05/23/06 0601947
Not
Specified
Unknown
Material Groundwater Unknown
Vacant Property
254 Maspeth Avenue 07/05/06 0603758
Not
Specified Tar Soil Unknown
Sheen in Newtown
Creek
Ash Street &
McGuiness Boulevard
11/29/06 0609866 Not
Specified
Unknown
Petroleum Surface Water Unknown
NYC Housing
Authority
23 Ash Street
12/05/06 0610155 Not
Specified
Unknown
Petroleum Groundwater Unknown
Cibro Terminals
1100 Grand Street 07/26/91 9104487
Not
Specified
No.2 Fuel
Oil Groundwater
Equipment
Failure
BCF Oil Refinery, Inc.
360 Maspeth Avenue 08/19/94 9406807
Not
Specified
Waste
Oil/Used
Oil
Groundwater Equipment
Failure
Williamsburg Steel
99 Paidge Avenue 07/17/96 9605209
Not
Specified
Unknown
Petroleum Soil Unknown
ABF Freight Systems
414 Maspeth Avenue 12/18/96 9611489
Not
Specified
Unknown
Petroleum Soil Unknown
Roadway Express, Inc.
1313 Grand Street 09/30/98 9808077
Not
Specified Diesel Groundwater Other
11th Street Conduit
460-456 McGuiness
Boulevard
10/04/99 9908111 Not
Specified
Unknown
Petroleum Soil
Equipment
Failure
The SPDES database identified nine sites in the study area with a permitted discharge to
Newtown Creek or its tributaries. These sites are summarized in Table 2-12.
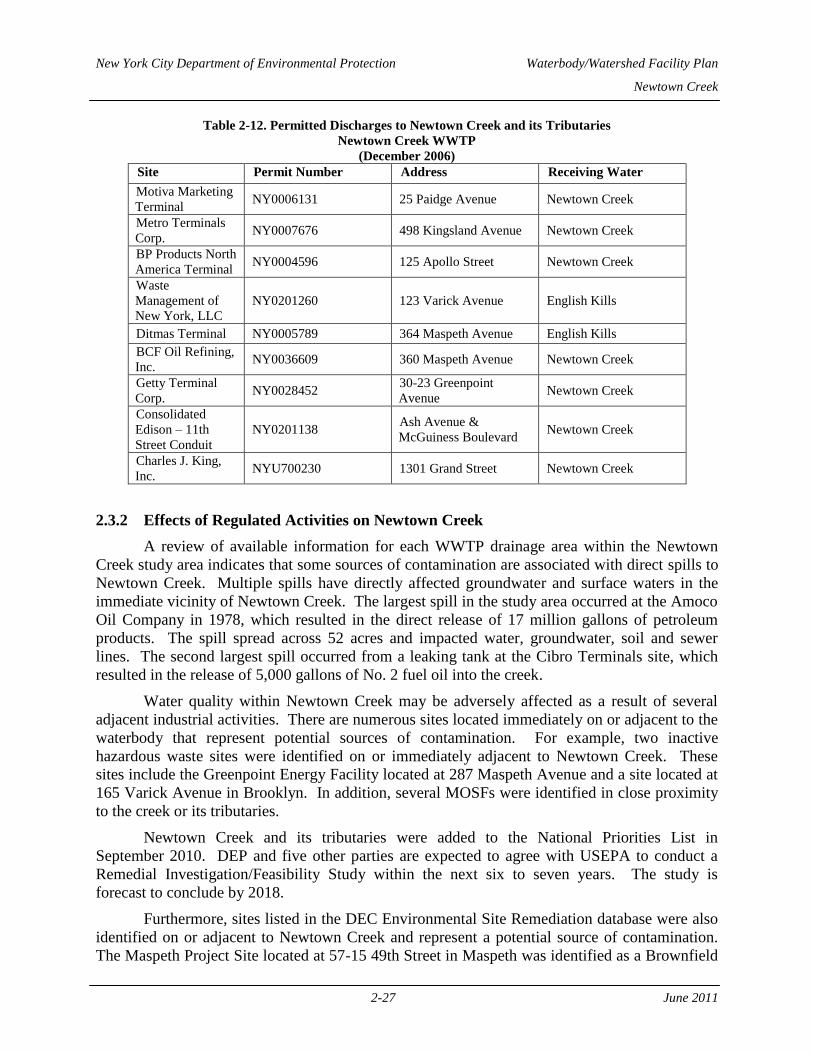
New York City Department of Environmental Protection Waterbody/Watershed Facility Plan
Newtown Creek
2-27 June 2011
Table 2-12. Permitted Discharges to Newtown Creek and its Tributaries
Newtown Creek WWTP
(December 2006)
Site Permit Number Address Receiving Water
Motiva Marketing
Terminal NY0006131 25 Paidge Avenue Newtown Creek
Metro Terminals
Corp. NY0007676 498 Kingsland Avenue Newtown Creek
BP Products North
America Terminal NY0004596 125 Apollo Street Newtown Creek
Waste
Management of
New York, LLC
NY0201260 123 Varick Avenue English Kills
Ditmas Terminal NY0005789 364 Maspeth Avenue English Kills
BCF Oil Refining,
Inc. NY0036609 360 Maspeth Avenue Newtown Creek
Getty Terminal
Corp. NY0028452
30-23 Greenpoint
Avenue Newtown Creek
Consolidated
Edison – 11th
Street Conduit
NY0201138 Ash Avenue &
McGuiness Boulevard Newtown Creek
Charles J. King,
Inc. NYU700230 1301 Grand Street Newtown Creek
2.3.2 Effects of Regulated Activities on Newtown Creek
A review of available information for each WWTP drainage area within the Newtown
Creek study area indicates that some sources of contamination are associated with direct spills to
Newtown Creek. Multiple spills have directly affected groundwater and surface waters in the
immediate vicinity of Newtown Creek. The largest spill in the study area occurred at the Amoco
Oil Company in 1978, which resulted in the direct release of 17 million gallons of petroleum
products. The spill spread across 52 acres and impacted water, groundwater, soil and sewer
lines. The second largest spill occurred from a leaking tank at the Cibro Terminals site, which
resulted in the release of 5,000 gallons of No. 2 fuel oil into the creek.
Water quality within Newtown Creek may be adversely affected as a result of several
adjacent industrial activities. There are numerous sites located immediately on or adjacent to the
waterbody that represent potential sources of contamination. For example, two inactive
hazardous waste sites were identified on or immediately adjacent to Newtown Creek. These
sites include the Greenpoint Energy Facility located at 287 Maspeth Avenue and a site located at
165 Varick Avenue in Brooklyn. In addition, several MOSFs were identified in close proximity
to the creek or its tributaries.
Newtown Creek and its tributaries were added to the National Priorities List in
September 2010. DEP and five other parties are expected to agree with USEPA to conduct a
Remedial Investigation/Feasibility Study within the next six to seven years. The study is
forecast to conclude by 2018.
Furthermore, sites listed in the DEC Environmental Site Remediation database were also
identified on or adjacent to Newtown Creek and represent a potential source of contamination.
The Maspeth Project Site located at 57-15 49th Street in Maspeth was identified as a Brownfield

New York City Department of Environmental Protection Waterbody/Watershed Facility Plan
Newtown Creek
2-28 June 2011
site. Initial investigations have identified the possible contamination of groundwater and soils by
a common plasticizer. In addition, Keyspan Energy located at 287 Maspeth Avenue in Brooklyn
was listed as a VCP site contaminated with MGP residuals and coal tar.
The Phelps Dodge site is still undergoing remediation and has historically had elevated
levels of heavy metals in the soil and groundwater plumes. In addition, heavy metals in creek
sediments were also indicated in the preliminary investigation.
New York City Department of Environmental Protection Waterbody/Watershed Facility Plan Report
Newtown Creek
3-1 June 2011
3.0 Existing Sewer System Facilities
The Newtown Creek watershed is primarily of sewersheds tributary to two different
WWTPs; the Bowery Bay and Newtown Creek WWTPs. Figure 3-1 presents the Newtown
Creek watershed in relation to the Bowery Bay and Newtown Creek WWTP service areas.
During significant rainfall events, Newtown Creek receives discharges of combined sewage via
reliefs from the combined sewer system, as well as discharges of stormwater runoff mainly from
storm sewers and minor direct overland runoff. This section presents a description of the
existing sewer system facilities, the collection system, and characteristics of sewer system
discharges to Newtown Creek (Figure 3-2).
3.1 BOWERY BAY WWTP
The Bowery Bay WWTP is a secondary treatment facility with a DDWF capacity of 150
MGD and a maximum flow capacity of 300 MGD. The Bowery Bay WWTP is permitted by the
DEC under SPDES permit number NY-0026158. The facility is located at 43-01 Berrian Blvd.,
Astoria, NY, 11105 in the Astoria section of Queens, on a 34.6 acre site adjacent to the Rikers
Island Channel, leading into the Upper East River, bounded by Berrian Blvd. and Steinway
Street. The Bowery Bay WWTP serves an area of approximately 14,089 acres in the Northwest
section of Queens, including the communities of Kew Garden Hills, Rego Park, Forest Hills,
Forest Hills Gardens, North Corona, South Corona, Lefrak City, Elmhurst, East Elmhurst,
Jackson Heights, Maspeth, Woodside, Sunnyside Gardens, Sunnyside, Hunters Point, Long
Island City, Astoria, Astoria Heights, Steinway, Ravenswood, and Roosevelt Island. The total
sewer length, including sanitary, combined, and interceptor sewers, that feeds into the Bowery
Bay WWTP is 398 miles. The Bowery Bay WWTP has been providing full secondary treatment
up to 225 MGD since 1978. Processes include primary screening, raw sewage pumping, grit
removal and primary settling, air activated sludge capable of operating in the step aeration mode,
final settling, and chlorine disinfection. The Bowery Bay WWTP has a DDWF capacity of 150
MGD, and is designed to receive a maximum flow of 300 MGD (2 times DDWF) with 225
MGD (1.5 times DDWF) receiving secondary treatment as required by the SPDES permit.
Flows over 225 MGD receive primary treatment and disinfection. The daily average flow during
Fiscal Year 2008 was 105 MGD, with a dry weather flow average of 95 MGD. Table 3-1
summarizes the Bowery Bay WWTP permit limits.
The Bowery Bay plant went into operation in 1939 as a 40 MGD primary treatment plant
and has undergone a series of upgrades and expansions since that time. In 1940, secondary
treatment was implemented using the step aeration process. In 1954, the plant's capacity was
increased to 120 MGD and then again in 1971 to 150 MGD. In 1991, sludge dewatering
facilities were added. In December 1999, construction was completed for the Basic Step Feed
BNR retrofit at Bowery Bay. This included the installation of baffles in each pass of the aeration
tanks to create anoxic zones, submersible mixers in each anoxic zone to prevent solids settling,
froth-control chlorine spray hoods for filament suppression, and fine bubble membrane diffusers
to provide necessary oxygen transfer rates. Currently, Bowery Bay is undergoing upgrades to
replace and refurbish aged and outdated facilities and provide additional biological nutrient
removal capability.
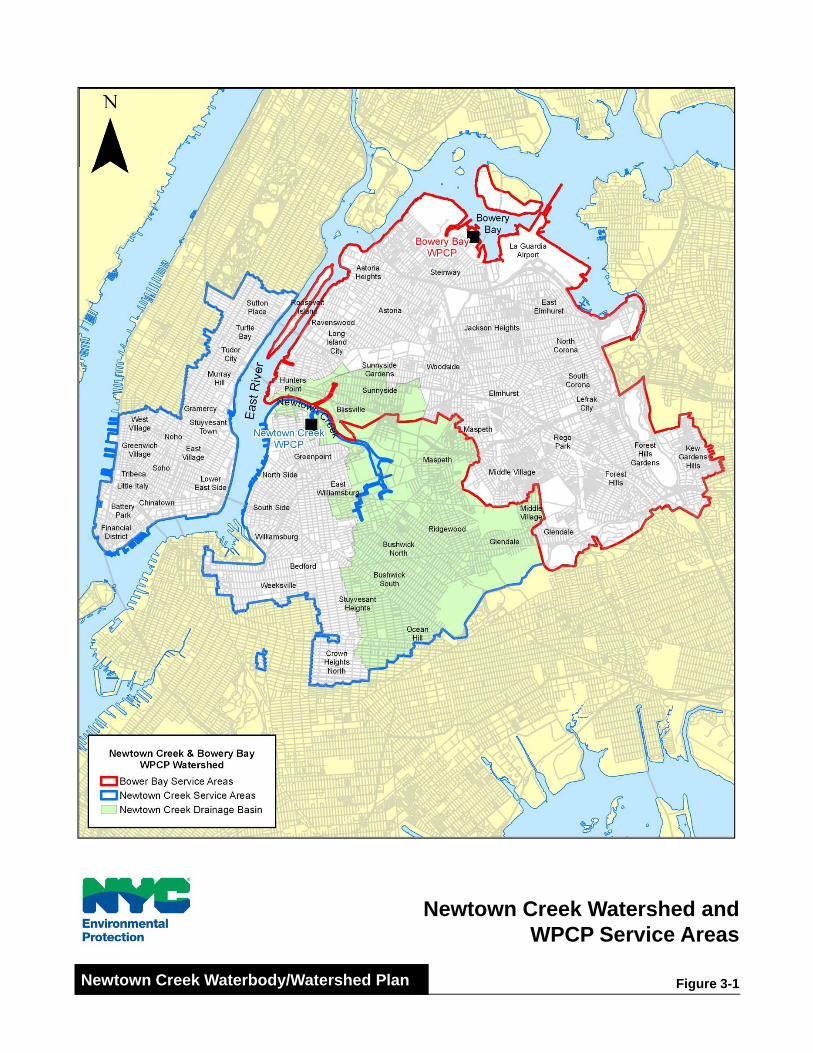
Newtown Creek Watershed andWPCP Service Areas
Figure 3-1Newtown Creek Waterbody/Watershed Plan

Bowery Bay WPCPExisting Facility Layout
Figure 3-2Newtown Creek Waterbody/Watershed Plan
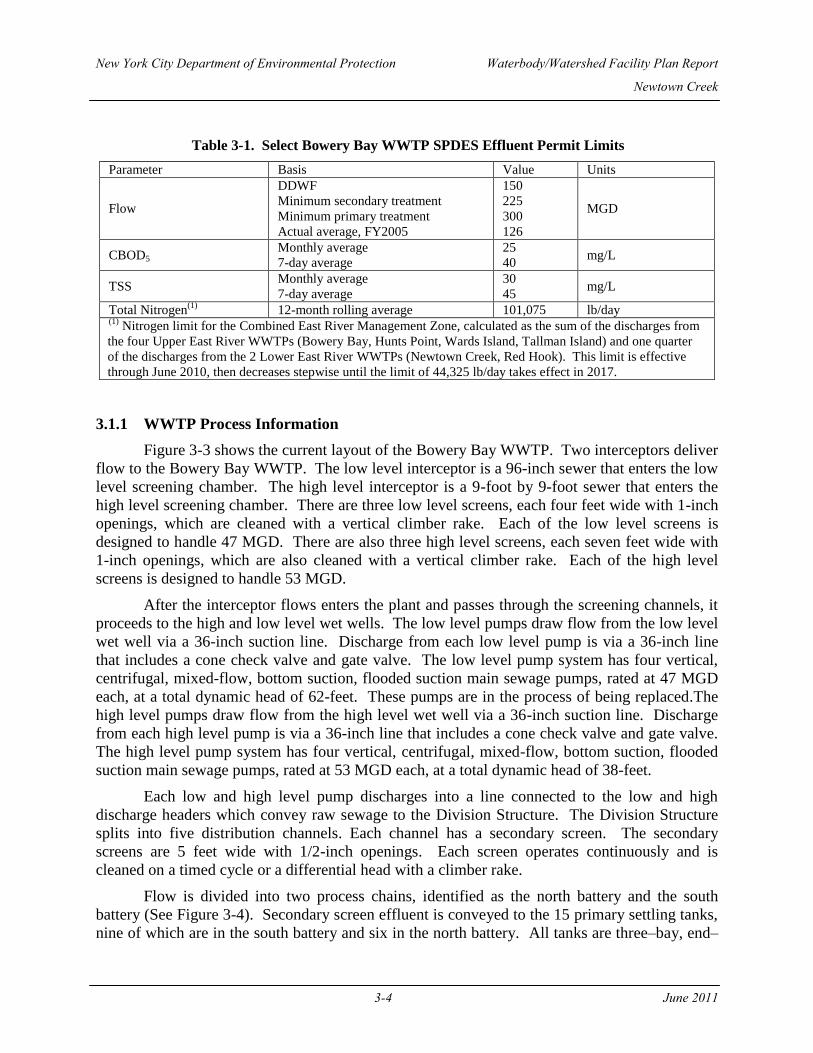
New York City Department of Environmental Protection Waterbody/Watershed Facility Plan Report
Newtown Creek
3-4 June 2011
Table 3-1. Select Bowery Bay WWTP SPDES Effluent Permit Limits
Parameter Basis Value Units
Flow
DDWF
Minimum secondary treatment
Minimum primary treatment
Actual average, FY2005
150
225
300
126
MGD
CBOD5 Monthly average
7-day average
25
40 mg/L
TSS Monthly average
7-day average
30
45 mg/L
Total Nitrogen(1)
12-month rolling average 101,075
lb/day (1)
Nitrogen limit for the Combined East River Management Zone, calculated as the sum of the discharges from
the four Upper East River WWTPs (Bowery Bay, Hunts Point, Wards Island, Tallman Island) and one quarter
of the discharges from the 2 Lower East River WWTPs (Newtown Creek, Red Hook). This limit is effective
through June 2010, then decreases stepwise until the limit of 44,325 lb/day takes effect in 2017.
3.1.1 WWTP Process Information
Figure 3-3 shows the current layout of the Bowery Bay WWTP. Two interceptors deliver
flow to the Bowery Bay WWTP. The low level interceptor is a 96-inch sewer that enters the low
level screening chamber. The high level interceptor is a 9-foot by 9-foot sewer that enters the
high level screening chamber. There are three low level screens, each four feet wide with 1-inch
openings, which are cleaned with a vertical climber rake. Each of the low level screens is
designed to handle 47 MGD. There are also three high level screens, each seven feet wide with
1-inch openings, which are also cleaned with a vertical climber rake. Each of the high level
screens is designed to handle 53 MGD.
After the interceptor flows enters the plant and passes through the screening channels, it
proceeds to the high and low level wet wells. The low level pumps draw flow from the low level
wet well via a 36-inch suction line. Discharge from each low level pump is via a 36-inch line
that includes a cone check valve and gate valve. The low level pump system has four vertical,
centrifugal, mixed-flow, bottom suction, flooded suction main sewage pumps, rated at 47 MGD
each, at a total dynamic head of 62-feet. These pumps are in the process of being replaced.The
high level pumps draw flow from the high level wet well via a 36-inch suction line. Discharge
from each high level pump is via a 36-inch line that includes a cone check valve and gate valve.
The high level pump system has four vertical, centrifugal, mixed-flow, bottom suction, flooded
suction main sewage pumps, rated at 53 MGD each, at a total dynamic head of 38-feet.
Each low and high level pump discharges into a line connected to the low and high
discharge headers which convey raw sewage to the Division Structure. The Division Structure
splits into five distribution channels. Each channel has a secondary screen. The secondary
screens are 5 feet wide with 1/2-inch openings. Each screen operates continuously and is
cleaned on a timed cycle or a differential head with a climber rake.
Flow is divided into two process chains, identified as the north battery and the south
battery (See Figure 3-4). Secondary screen effluent is conveyed to the 15 primary settling tanks,
nine of which are in the south battery and six in the north battery. All tanks are three–bay, end–
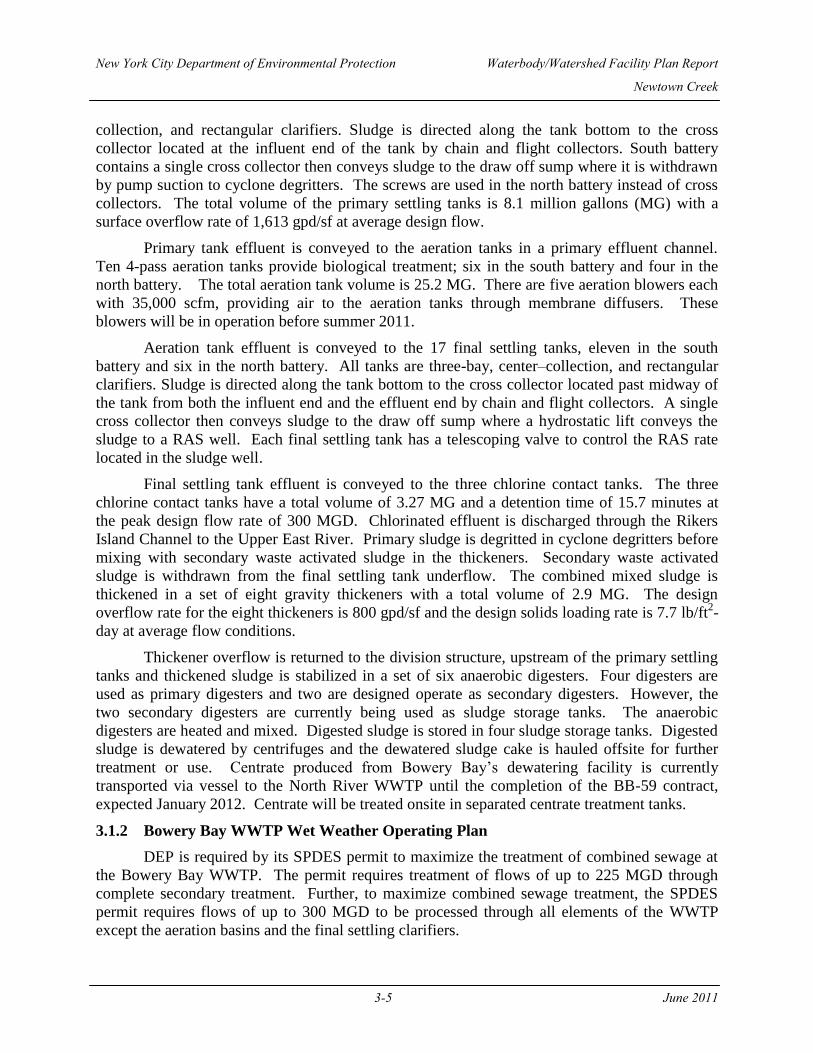
New York City Department of Environmental Protection Waterbody/Watershed Facility Plan Report
Newtown Creek
3-5 June 2011
collection, and rectangular clarifiers. Sludge is directed along the tank bottom to the cross
collector located at the influent end of the tank by chain and flight collectors. South battery
contains a single cross collector then conveys sludge to the draw off sump where it is withdrawn
by pump suction to cyclone degritters. The screws are used in the north battery instead of cross
collectors. The total volume of the primary settling tanks is 8.1 million gallons (MG) with a
surface overflow rate of 1,613 gpd/sf at average design flow.
Primary tank effluent is conveyed to the aeration tanks in a primary effluent channel.
Ten 4-pass aeration tanks provide biological treatment; six in the south battery and four in the
north battery. The total aeration tank volume is 25.2 MG. There are five aeration blowers each
with 35,000 scfm, providing air to the aeration tanks through membrane diffusers. These
blowers will be in operation before summer 2011.
Aeration tank effluent is conveyed to the 17 final settling tanks, eleven in the south
battery and six in the north battery. All tanks are three-bay, center–collection, and rectangular
clarifiers. Sludge is directed along the tank bottom to the cross collector located past midway of
the tank from both the influent end and the effluent end by chain and flight collectors. A single
cross collector then conveys sludge to the draw off sump where a hydrostatic lift conveys the
sludge to a RAS well. Each final settling tank has a telescoping valve to control the RAS rate
located in the sludge well.
Final settling tank effluent is conveyed to the three chlorine contact tanks. The three
chlorine contact tanks have a total volume of 3.27 MG and a detention time of 15.7 minutes at
the peak design flow rate of 300 MGD. Chlorinated effluent is discharged through the Rikers
Island Channel to the Upper East River. Primary sludge is degritted in cyclone degritters before
mixing with secondary waste activated sludge in the thickeners. Secondary waste activated
sludge is withdrawn from the final settling tank underflow. The combined mixed sludge is
thickened in a set of eight gravity thickeners with a total volume of 2.9 MG. The design
overflow rate for the eight thickeners is 800 gpd/sf and the design solids loading rate is 7.7 lb/ft2-
day at average flow conditions.
Thickener overflow is returned to the division structure, upstream of the primary settling
tanks and thickened sludge is stabilized in a set of six anaerobic digesters. Four digesters are
used as primary digesters and two are designed operate as secondary digesters. However, the
two secondary digesters are currently being used as sludge storage tanks. The anaerobic
digesters are heated and mixed. Digested sludge is stored in four sludge storage tanks. Digested
sludge is dewatered by centrifuges and the dewatered sludge cake is hauled offsite for further
treatment or use. Centrate produced from Bowery Bay’s dewatering facility is currently
transported via vessel to the North River WWTP until the completion of the BB-59 contract,
expected January 2012. Centrate will be treated onsite in separated centrate treatment tanks.
3.1.2 Bowery Bay WWTP Wet Weather Operating Plan
DEP is required by its SPDES permit to maximize the treatment of combined sewage at
the Bowery Bay WWTP. The permit requires treatment of flows of up to 225 MGD through
complete secondary treatment. Further, to maximize combined sewage treatment, the SPDES
permit requires flows of up to 300 MGD to be processed through all elements of the WWTP
except the aeration basins and the final settling clarifiers.
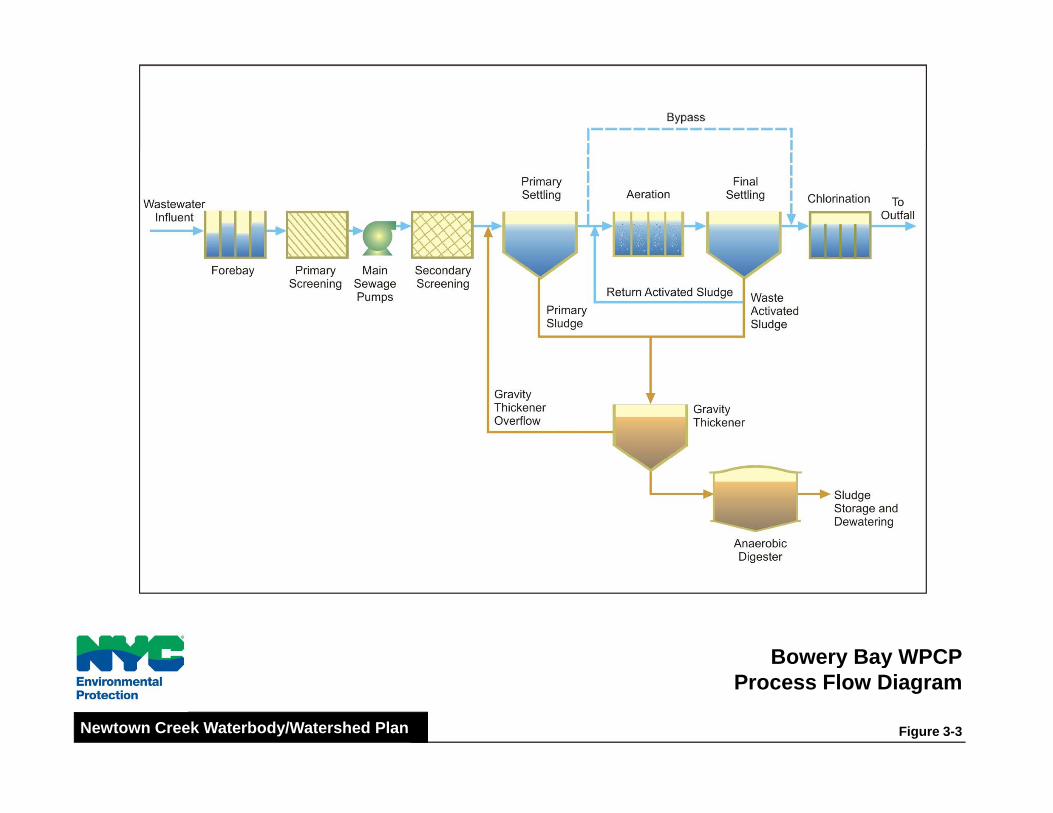
Bowery Bay WPCPBowery Bay WPCPProcess Flow Diagram
Figure 3-3Newtown Creek Waterbody/Watershed Plan

Newtown Creek WPCPFacility Layout
Figure 3-4Newtown Creek Waterbody/Watershed Plan
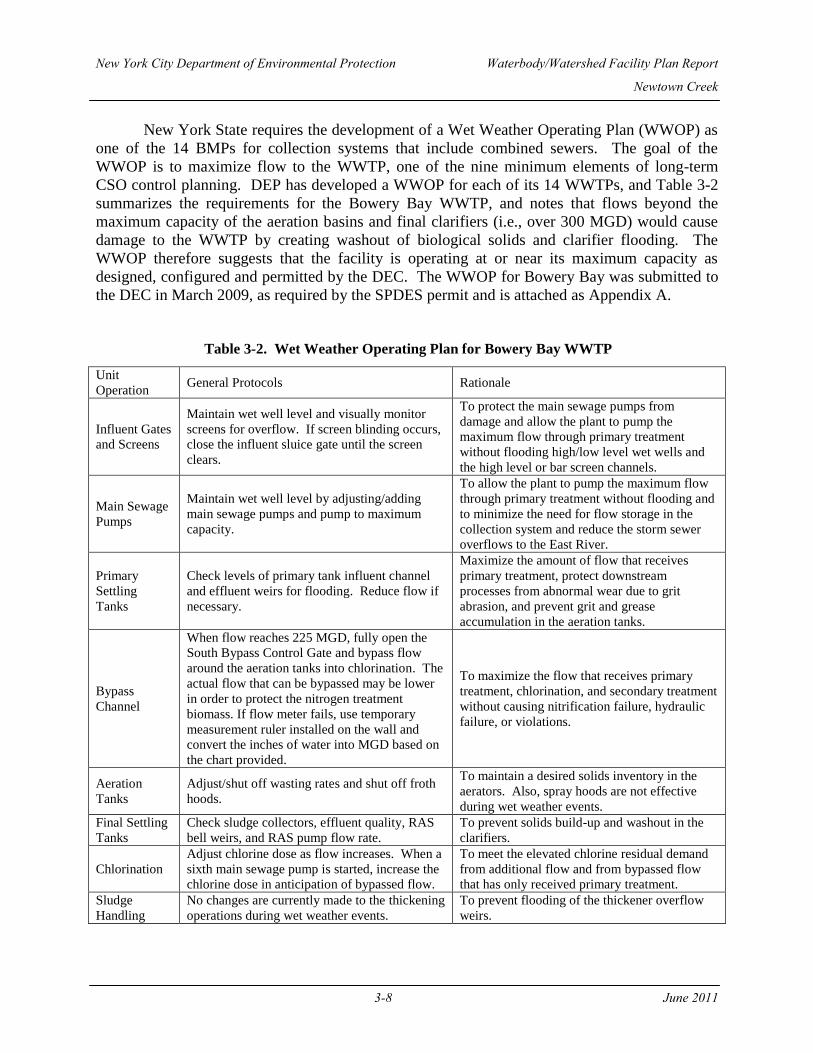
New York City Department of Environmental Protection Waterbody/Watershed Facility Plan Report
Newtown Creek
3-8 June 2011
New York State requires the development of a Wet Weather Operating Plan (WWOP) as
one of the 14 BMPs for collection systems that include combined sewers. The goal of the
WWOP is to maximize flow to the WWTP, one of the nine minimum elements of long-term
CSO control planning. DEP has developed a WWOP for each of its 14 WWTPs, and Table 3-2
summarizes the requirements for the Bowery Bay WWTP, and notes that flows beyond the
maximum capacity of the aeration basins and final clarifiers (i.e., over 300 MGD) would cause
damage to the WWTP by creating washout of biological solids and clarifier flooding. The
WWOP therefore suggests that the facility is operating at or near its maximum capacity as
designed, configured and permitted by the DEC. The WWOP for Bowery Bay was submitted to
the DEC in March 2009, as required by the SPDES permit and is attached as Appendix A.
Table 3-2. Wet Weather Operating Plan for Bowery Bay WWTP
Unit
Operation General Protocols Rationale
Influent Gates
and Screens
Maintain wet well level and visually monitor
screens for overflow. If screen blinding occurs,
close the influent sluice gate until the screen
clears.
To protect the main sewage pumps from
damage and allow the plant to pump the
maximum flow through primary treatment
without flooding high/low level wet wells and
the high level or bar screen channels.
Main Sewage
Pumps
Maintain wet well level by adjusting/adding
main sewage pumps and pump to maximum
capacity.
To allow the plant to pump the maximum flow
through primary treatment without flooding and
to minimize the need for flow storage in the
collection system and reduce the storm sewer
overflows to the East River.
Primary
Settling
Tanks
Check levels of primary tank influent channel
and effluent weirs for flooding. Reduce flow if
necessary.
Maximize the amount of flow that receives
primary treatment, protect downstream
processes from abnormal wear due to grit
abrasion, and prevent grit and grease
accumulation in the aeration tanks.
Bypass
Channel
When flow reaches 225 MGD, fully open the
South Bypass Control Gate and bypass flow
around the aeration tanks into chlorination. The
actual flow that can be bypassed may be lower
in order to protect the nitrogen treatment
biomass. If flow meter fails, use temporary
measurement ruler installed on the wall and
convert the inches of water into MGD based on
the chart provided.
To maximize the flow that receives primary
treatment, chlorination, and secondary treatment
without causing nitrification failure, hydraulic
failure, or violations.
Aeration
Tanks
Adjust/shut off wasting rates and shut off froth
hoods.
To maintain a desired solids inventory in the
aerators. Also, spray hoods are not effective
during wet weather events.
Final Settling
Tanks
Check sludge collectors, effluent quality, RAS
bell weirs, and RAS pump flow rate.
To prevent solids build-up and washout in the
clarifiers.
Chlorination
Adjust chlorine dose as flow increases. When a
sixth main sewage pump is started, increase the
chlorine dose in anticipation of bypassed flow.
To meet the elevated chlorine residual demand
from additional flow and from bypassed flow
that has only received primary treatment.
Sludge
Handling
No changes are currently made to the thickening
operations during wet weather events.
To prevent flooding of the thickener overflow
weirs.
New York City Department of Environmental Protection Waterbody/Watershed Facility Plan Report
Newtown Creek
3-9 June 2011
3.1.3 Other Bowery Bay WWTP Operational Constraints
The DEC and the DEP entered into a Nitrogen Control Consent Order that updated the
New York City SPDES permits to reduce nitrogen. The Consent Order was partly a result of the
Long Island Sound Study, which determined that a 58.5 percent load reduction of nitrogen
discharge would be needed to meet their water quality standards.
A Phase I Modified BNR Facility Plan, which outlines the DEP modified nitrogen
program to upgrade five of its WWTPs that discharge into the Upper East River (Bowery Bay,
Hunts Point, Tallman Island, Wards Island) and Jamaica Bay (26th Ward) for nitrogen removal,
has agreed upon and was executed on February 1, 2006. The critical BNR upgrade items for
Phase I construction at all five of the plants are as follows:
1. Aeration tank equipment modifications:
-Baffles for the creation of anoxic/switch zones and pre-anoxic zones
-Mixers in the anoxic zones
2. Process aeration system upgrades:
-New blowers or retrofit of existing blowers
-New diffusers (fine bubble)
-Air distribution control equipment
-Metering and dissolved oxygen (DO) monitoring and control
3. RASWAS systems:
-Expanded capacity or upgrade of existing RAS/WAS system, as applicable
4. Froth control system:
-Implemented to prevent or control filamentous growth
5. Chemical addition facilities:
-Sodium hypochlorite for froth control (RAS and surface chlorination)
-Sodium Hydroxide for nitrification and pH buffering (except at Tallman Island)
6. Final settling tanks (Upgrades implemented on a plant specific basis):
-Maximize solids removal
-Allow for increased RAS flow requirements
-Handle higher solids loading from the aeration tanks
DEP is also required to perform interim measures during the Phase I construction period
to reduce the levels of nitrogen being discharged into the East River. At the Bowery Bay and
Tallman Island WWTPs these measures include transport of digested sludge and/or centrate for
processing at another DEP WWTP or an out-of-city facility via shipping with DEP marine
vessels or contract services. This requirement to transship took effect July 1, 2009 and will
remain in force through the end of Phase I BNR construction.

New York City Department of Environmental Protection Waterbody/Watershed Facility Plan Report
Newtown Creek
3-10 June 2011
Phase II upgrades are also a part of the agreed-upon Nitrogen Facility Plan. The Phase II
plan was submitted to DEC on December 31, 2009. A major component of Phase II upgrades is
expected to be supplemental carbon addition facilities to promote denitrofication and further
reduce nitrogen discharges into the Upper East River. Phase II upgrades are projected to be
online by January 1, 2016.
Concurrent with the BNR upgrades, the DEP continues to perform upgrade work as part
of the Plant Upgrade Program at the Upper East River WWTPs and the 26th Ward WWTP.
Plant upgrades are required to stabilize or replace equipment that has reached its intended design
life to ensure reliable plant performance that is in compliance with the existing SPDES permits
for each WWTP.
3.2 NEWTOWN CREEK WWTP
The Newtown Creek WWTP is a secondary treatment plant with a DDWF capacity of
310 MGD. The Newtown Creek WWTP is permitted by the DEC under SPDES permit number
NY-0026204. The facility is located at 329 Greenpoint Avenue, Brooklyn, NY, 11222 in the
Greenpoint section of Brooklyn, on a 53 acre site adjacent to Newtown Creek, leading into the
East River, located between Provost Street and North Henry Street. The Newtown Creek
WWTP serves an area of approximately 16,656 acres on the Lower East Side and Lower
Manhattan, Northeast Brooklyn, and Western Queens, including the communities of West
Village, Greenwich Village, Soho, Little Italy, Tribeca, East Village, Noho, Lower East Side,
Stuyvesant Town, Gramercy, Murray Hill, Tudor City, Turtle Bay, Sutton Place, Chinatown,
Civic Center, Battery Park, Financial District, Greenpoint, North Side, Southside, Williamsburg,
East Williamsburg, Bedford Stuyvesant, Bushwick, Ridgewood, Glendale, Maspeth, Middle
Village, Blissville, Ocean Hill, and Weeksville (Figure 3-1). The total sewer length, including
sanitary, combined, and interceptor sewers, that feeds into the Newtown Creek WWTP is 593
miles.
The Newtown Creek WWTP is currently under construction and will be capable of
providing full secondary treatment in 2008. Processes include primary screening, raw sewage
pumping, grit removal, air activated sludge (capable of operating in the step aeration mode post-
construction), final settling, and chlorine disinfection. Figure 3-4 shows the current layout of the
Newtown Creek WWTP and identifies the facilities currently under construction or to be
constructed in the near future. The Newtown Creek WWTP has a DDWF capacity of 310 MGD,
and is designed to receive a maximum flow of 700 MGD (2.25 times DDWF) with all of it
(because there is no bypass at Newtown Creek, all flow must pass through the aeration tanks)
receiving secondary treatment. The daily average flow during 2004 was 229 MGD, with a dry
weather flow average of 211 MGD. During severe wet weather events in 2004, the plant treated
580 to 625 MGD. Table 3-3 summarizes the Newtown Creek WWTP permit limits.

New York City Department of Environmental Protection Waterbody/Watershed Facility Plan Report
Newtown Creek
3-11 June 2011
Table 3-3. Select Newtown Creek WWTP Effluent Permit Limits
Parameter Basis Value Units
Flow
DDWF
Maximum secondary treatment
Maximum primary treatment
Actual average, 2004
310
700 (1)
700 (2)
229
MGD
CBOD5 Monthly average
7-day average
25
40 mg/L
TSS Monthly average
7-day average
30
45 mg/L
Total Nitrogen 12-month rolling average 108,375 (3)
lb/day (1)
There is no bypass in place at Newtown Creek, all flow passes through the aeration tanks. (2)
The DEP has an agreement with the DEC to provide for treatment beyond the 2XDDWF normally seen at
other WWTPs.
(3) Nitrogen limit for the Combined East River Management Zone, calculated as the sum of the discharges from
the four Upper East River WWTPs (Bowery Bay, Hunts Point, Wards Island, Tallman Island) and one quarter
of the discharges from the 2 Lower East River WWTPs (Newtown Creek, Red Hook). This limit is effective
through November 2009, then decreases stepwise until the limit of 44,325 lb/day takes effect in 2017.
The Newtown Creek WWTP opened in 1967 with a modified aeration capacity of 310
MGD to provide 60 percent removal of biochemical oxygen demand and 70 percent removal of
suspended solids. The plant is currently being upgraded to meet the wastewater treatment
standards of the Clean Water Act within the constraints of a USEPA Consent Order. Facility
upgrading will result in construction of additional wastewater treatment facilities to provide
secondary treatment and improve the plant's ability to handle combined sanitary and storm flows
in wet weather. The annual average dry weather flow will remain at 310 MGD, but the plant will
be required to provide 85 percent removal of biochemical oxygen demand and 85 percent
removal of suspended solids. For the upgrade, the site area will be enlarged from 36 acres to
approximately 53 acres. For the expansion, the City of New York DEP acquired three adjoining
properties and demapped two streets.
3.2.1 Newtown Creek WWTP Process Information
Figure 3-5 shows the current process treatment for the Newtown Creek WWTP. The
plant receives wastewater from two service areas: Brooklyn/Queens and Manhattan. The
Brooklyn/Queens flow enters the Brooklyn/Queens pump station that is located at the plant. The
Manhattan flow is pumped from the Manhattan Pump Station, located at Avenue D between East
12th Street and East 13th Street, into the main plant influent conduit where it joins the
Brooklyn/Queens pump station flow and internal plant recycles. Throttling gates are being
constructed at the Manhattan Pump Station junction chamber. Additional throttling gates will
also be constructed on the Kent Avenue interceptor feeding the Brooklyn/Queens Pump Station.
The main sewage pumps at both pump stations will be replaced with 100 MGD pumps (five at
each pump station).
Plant influent flow from the Manhattan and Brooklyn/Queens Pump Stations passes
through four primary screen channels. Each screen channel is 8-feet by 12¼-feet and contains a
screen with 1-inch clear openings between the bars.
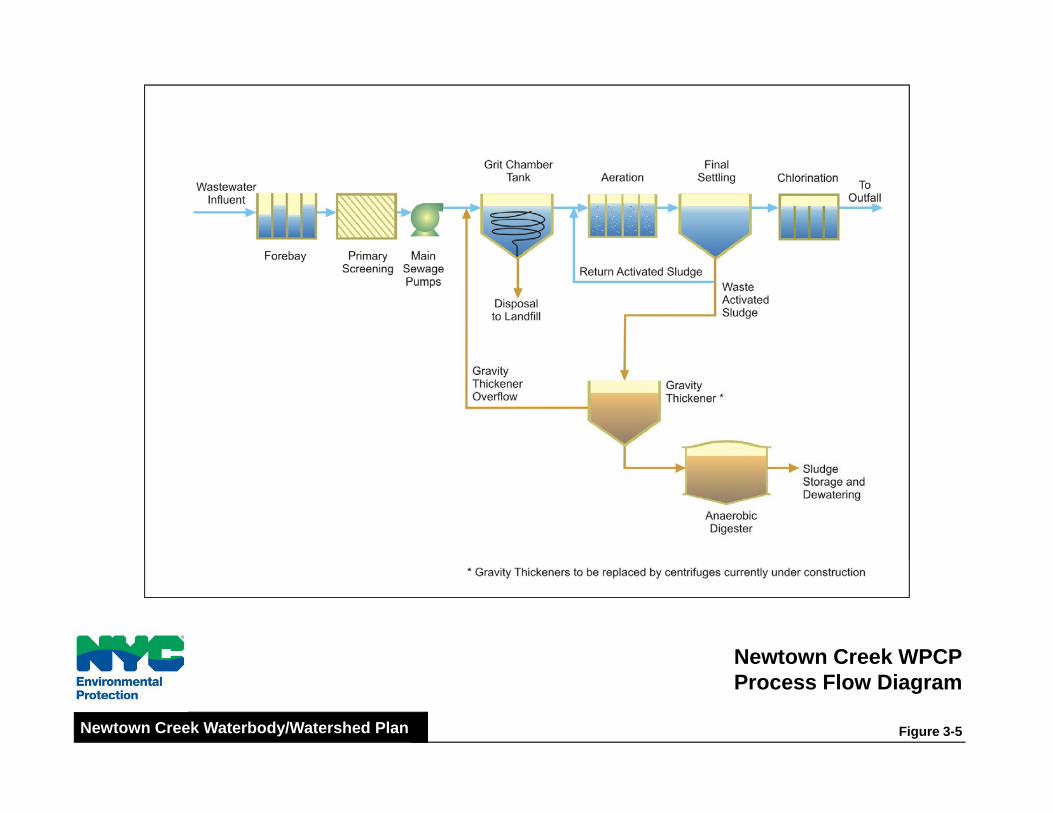
Newtown Creek WPCPNewtown Creek WPCPProcess Flow Diagram
Figure 3-5Newtown Creek Waterbody/Watershed Plan
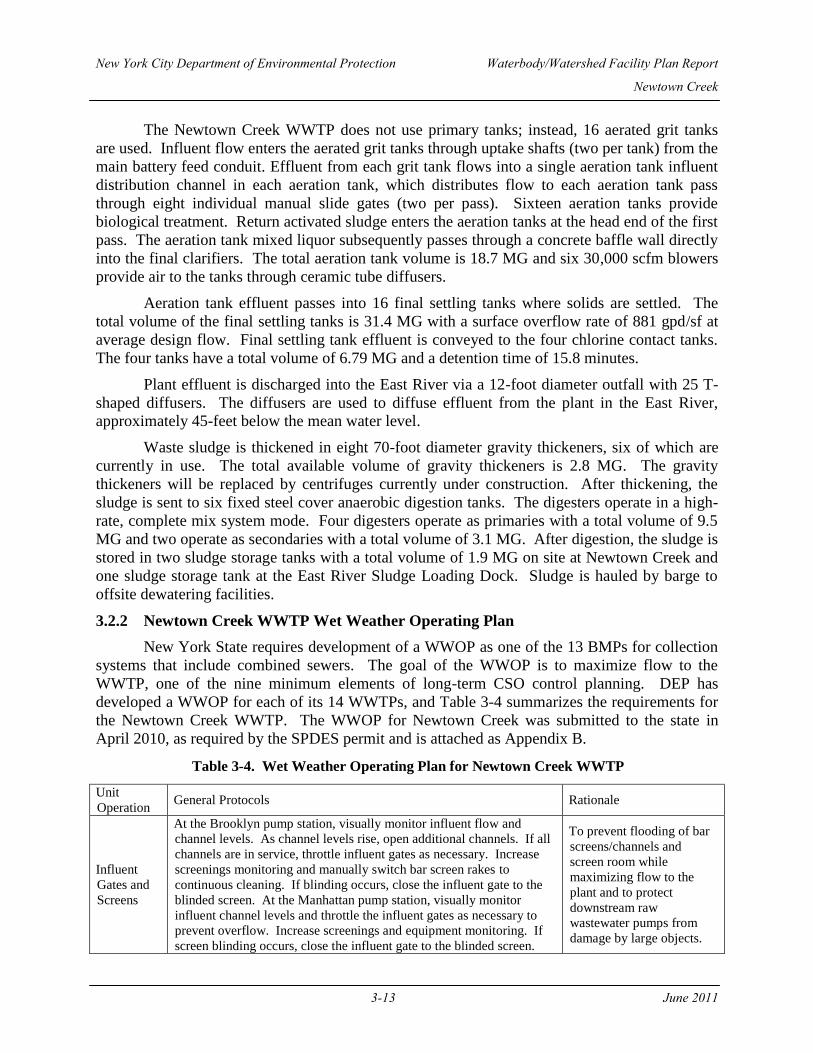
New York City Department of Environmental Protection Waterbody/Watershed Facility Plan Report
Newtown Creek
3-13 June 2011
The Newtown Creek WWTP does not use primary tanks; instead, 16 aerated grit tanks
are used. Influent flow enters the aerated grit tanks through uptake shafts (two per tank) from the
main battery feed conduit. Effluent from each grit tank flows into a single aeration tank influent
distribution channel in each aeration tank, which distributes flow to each aeration tank pass
through eight individual manual slide gates (two per pass). Sixteen aeration tanks provide
biological treatment. Return activated sludge enters the aeration tanks at the head end of the first
pass. The aeration tank mixed liquor subsequently passes through a concrete baffle wall directly
into the final clarifiers. The total aeration tank volume is 18.7 MG and six 30,000 scfm blowers
provide air to the tanks through ceramic tube diffusers.
Aeration tank effluent passes into 16 final settling tanks where solids are settled. The
total volume of the final settling tanks is 31.4 MG with a surface overflow rate of 881 gpd/sf at
average design flow. Final settling tank effluent is conveyed to the four chlorine contact tanks.
The four tanks have a total volume of 6.79 MG and a detention time of 15.8 minutes.
Plant effluent is discharged into the East River via a 12-foot diameter outfall with 25 T-
shaped diffusers. The diffusers are used to diffuse effluent from the plant in the East River,
approximately 45-feet below the mean water level.
Waste sludge is thickened in eight 70-foot diameter gravity thickeners, six of which are
currently in use. The total available volume of gravity thickeners is 2.8 MG. The gravity
thickeners will be replaced by centrifuges currently under construction. After thickening, the
sludge is sent to six fixed steel cover anaerobic digestion tanks. The digesters operate in a high-
rate, complete mix system mode. Four digesters operate as primaries with a total volume of 9.5
MG and two operate as secondaries with a total volume of 3.1 MG. After digestion, the sludge is
stored in two sludge storage tanks with a total volume of 1.9 MG on site at Newtown Creek and
one sludge storage tank at the East River Sludge Loading Dock. Sludge is hauled by barge to
offsite dewatering facilities.
3.2.2 Newtown Creek WWTP Wet Weather Operating Plan
New York State requires development of a WWOP as one of the 13 BMPs for collection
systems that include combined sewers. The goal of the WWOP is to maximize flow to the
WWTP, one of the nine minimum elements of long-term CSO control planning. DEP has
developed a WWOP for each of its 14 WWTPs, and Table 3-4 summarizes the requirements for
the Newtown Creek WWTP. The WWOP for Newtown Creek was submitted to the state in
April 2010, as required by the SPDES permit and is attached as Appendix B.
Table 3-4. Wet Weather Operating Plan for Newtown Creek WWTP
Unit
Operation General Protocols Rationale
Influent
Gates and
Screens
At the Brooklyn pump station, visually monitor influent flow and
channel levels. As channel levels rise, open additional channels. If all
channels are in service, throttle influent gates as necessary. Increase
screenings monitoring and manually switch bar screen rakes to
continuous cleaning. If blinding occurs, close the influent gate to the
blinded screen. At the Manhattan pump station, visually monitor
influent channel levels and throttle the influent gates as necessary to
prevent overflow. Increase screenings and equipment monitoring. If
screen blinding occurs, close the influent gate to the blinded screen.
To prevent flooding of bar
screens/channels and
screen room while
maximizing flow to the
plant and to protect
downstream raw
wastewater pumps from
damage by large objects.

New York City Department of Environmental Protection Waterbody/Watershed Facility Plan Report
Newtown Creek
3-14 June 2011
Table 3-4. Wet Weather Operating Plan for Newtown Creek WWTP
Unit
Operation General Protocols Rationale
Main
Sewage
Pumps
At both the Brooklyn and Manhattan pump stations, all wet weather
events require an increase in screenings and channel monitoring from
two times per eight hours to continuous monitoring. Manually switch
bar screen rakes to continuous cleaning “hand” operation at the local
control panel for each unit (1.5-2 minutes per cycle in continuous
cleaning mode). Monitor discharge receiving bin level. When
receiving bin is full, empty bin into large contractor bin using forklift.
Return receiving bin and shovel any screening that discharged to the
floor during emptying back into the bin. Monitor the large contractor
bin, notify supervisoer when approaching 75% full for bin to be called
in to the contractor for change-out. Visually inspect equipment.
Confirm that cleaning rakes are properly meshing with bar screens, and
screens have not blinded and are operating properly. If blinding of bar
screen occurs, notify supervisor and close influent gate to the blinded
screen until screen is cleared and/or high flows decrease
To protect downstream raw
wastewater pumps from
damage by large objects.
Primary
Settling
Tanks
For the Brooklyn pump station, monitor wet well elevation. As the wet
well level rises, place pumps in service and increase speed of variable
speed pumps as necessary to maintain a wet well wastewater elevation
of approximately -16 feet. Pump to maximum capacitry of the
pumping station of the differnece between the maximum plant flow
capacity with process units out of service and the Manhattan Pump
Station pumping capacity, whichever is lower. All adjustments are
made manually by Operator (STW/SSTW) in the pump control room
based on maintaining wet well level within desired operating ranage.
Restrict flow through influent throttling gate if pumping rate is
maximized and wet well level continues to rise (see Section 2.1.2 for
influent throttling gate operations). For the Manhattan pump station,
monitor wet well elevation. As the wet well level rises, place pumps in
service and increase speed of variable speed pumps as necessary.
Pump a minimum of 300 MGD during a wet weather event. All
adjustments are made manually by Operator (STW/SSTW) in the
pump control room based on maintaining wet well elvel within desired
operating range. Restrict flow through influent throttling gates if
pumping rate is maximized and wet well level continues to rise (see
Section 2.1.3 for influent throttling gate operations).
Maximize flow to
treatment plant and
minimize need for flow
storage in collection
system and associated
storm overflow from
collection system into
river.
Bypass
Channel
Monitor the grit roll-off containers. Notify Supervisor (Watch
Engineer) when approaching 75% full and request additional
containers, as determined by Supervisor. Operate up to four Grit
Houses as determined by Supervisor based on plant experience.
Maintain a maximum number of detritors on line in accordance with
Section 1.4.3.
Protect downstream
mechanical equipment and
pumps from abrasion and
accompanying abnormal
wear. Prevent
accumulation of grit in
aeration tanks.
Aeration
Tanks There is no bypass in place at Newtown Creek N/A
Final
Settling
Tanks
Flow rates determine aeration tank influent pass gate settings
automatically, when influent flow exceeds 400 MGD, open the D pass
gate to 100% and then close the B pass gate.
Gate positions are
automatically set to park
solids to prevent solids
washout in the final tanks.
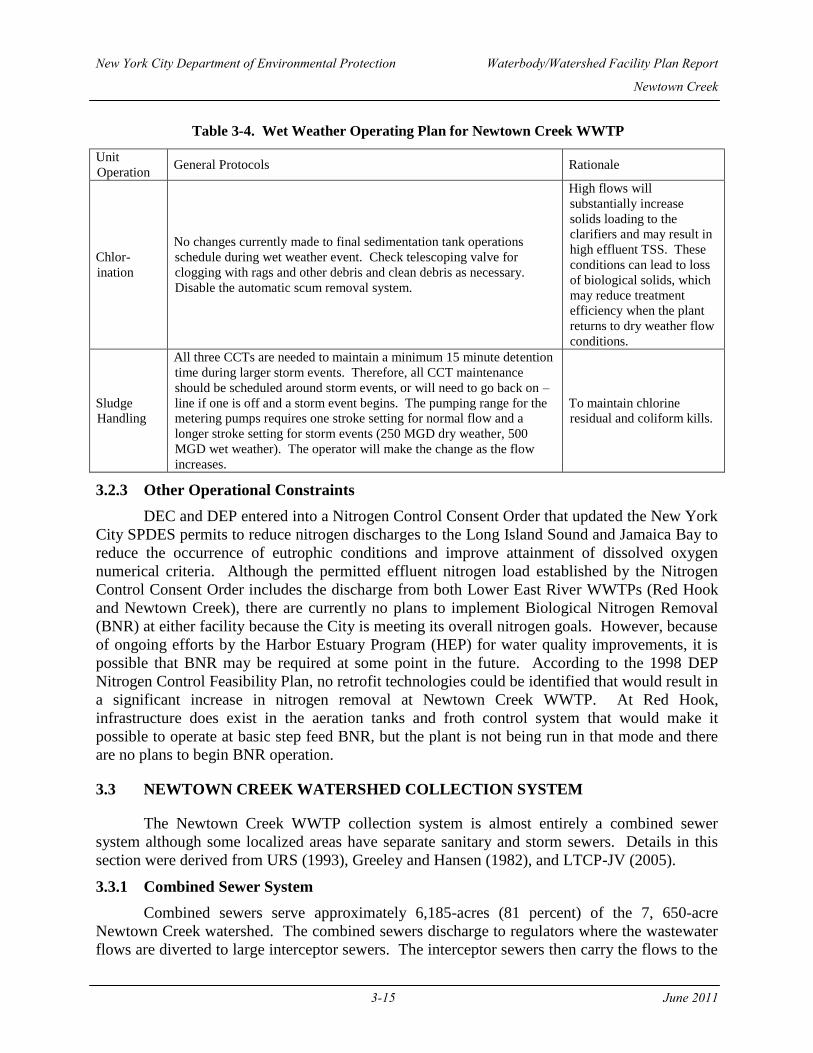
New York City Department of Environmental Protection Waterbody/Watershed Facility Plan Report
Newtown Creek
3-15 June 2011
Table 3-4. Wet Weather Operating Plan for Newtown Creek WWTP
Unit
Operation General Protocols Rationale
Chlor-
ination
No changes currently made to final sedimentation tank operations
schedule during wet weather event. Check telescoping valve for
clogging with rags and other debris and clean debris as necessary.
Disable the automatic scum removal system.
High flows will
substantially increase
solids loading to the
clarifiers and may result in
high effluent TSS. These
conditions can lead to loss
of biological solids, which
may reduce treatment
efficiency when the plant
returns to dry weather flow
conditions.
Sludge
Handling
All three CCTs are needed to maintain a minimum 15 minute detention
time during larger storm events. Therefore, all CCT maintenance
should be scheduled around storm events, or will need to go back on –
line if one is off and a storm event begins. The pumping range for the
metering pumps requires one stroke setting for normal flow and a
longer stroke setting for storm events (250 MGD dry weather, 500
MGD wet weather). The operator will make the change as the flow
increases.
To maintain chlorine
residual and coliform kills.
3.2.3 Other Operational Constraints
DEC and DEP entered into a Nitrogen Control Consent Order that updated the New York
City SPDES permits to reduce nitrogen discharges to the Long Island Sound and Jamaica Bay to
reduce the occurrence of eutrophic conditions and improve attainment of dissolved oxygen
numerical criteria. Although the permitted effluent nitrogen load established by the Nitrogen
Control Consent Order includes the discharge from both Lower East River WWTPs (Red Hook
and Newtown Creek), there are currently no plans to implement Biological Nitrogen Removal
(BNR) at either facility because the City is meeting its overall nitrogen goals. However, because
of ongoing efforts by the Harbor Estuary Program (HEP) for water quality improvements, it is
possible that BNR may be required at some point in the future. According to the 1998 DEP
Nitrogen Control Feasibility Plan, no retrofit technologies could be identified that would result in
a significant increase in nitrogen removal at Newtown Creek WWTP. At Red Hook,
infrastructure does exist in the aeration tanks and froth control system that would make it
possible to operate at basic step feed BNR, but the plant is not being run in that mode and there
are no plans to begin BNR operation.
3.3 NEWTOWN CREEK WATERSHED COLLECTION SYSTEM
The Newtown Creek WWTP collection system is almost entirely a combined sewer
system although some localized areas have separate sanitary and storm sewers. Details in this
section were derived from URS (1993), Greeley and Hansen (1982), and LTCP-JV (2005).
3.3.1 Combined Sewer System
Combined sewers serve approximately 6,185-acres (81 percent) of the 7, 650-acre
Newtown Creek watershed. The combined sewers discharge to regulators where the wastewater
flows are diverted to large interceptor sewers. The interceptor sewers then carry the flows to the

New York City Department of Environmental Protection Waterbody/Watershed Facility Plan Report
Newtown Creek
3-16 June 2011
WWTP. Flows that exceed interceptor or plant capacity are bypassed at the regulators to the
receiving waters as CSOs. Figure 3-6 presents the major components of the drainage system,
including pump stations, interceptor sewers, regulators, CSO outfalls, storm outfalls, and
associated area delineations. As shown in Figure 3-6, the sewershed is comprised of two distinct
subareas, one draining to the Bowery Bay WWTP, and the other to the Newtown Creek WWTP.
The following describes the combined sewer system in each of these subareas.
Bowery Bay WWTP Sub-Area The portion of the Newtown Creek sewershed draining to the Bowery Bay WWTP is
north of the lower reach of the Creek in Queens. The drainage area tributary to the Creek is
approximately 968-acres (737-acres with combined sewers) and includes the Borden Avenue
Pumping Station, and 13 active CSOs. This sub-area is part of the Low Level portion of the
Bowery Bay WWTP service area. The Low Level service area contains 46 regulators, of which
19 interconnected regulators discharge to the Newtown Creek during wet weather through the 13
CSOs. Of these 13 CSOs, 6 discharge to the tributary Dutch Kills (BB-004, 009, 010, 026, 040,
and 042), and 6 discharge to Newtown Creek (BB-011, 012, 013, 014, 015, and 043). An
additional 2-feet, 8-inches x 4-foot outfall, BB-049, is listed in the Bowery Bay WWTP SPDES
permit as discharging to Dutch Kills near 21st Street, but no further information is available such
as which regulator it is connected to. This outfall is shown on Figure 3-6 to be located adjacent
to Newtown Creek and not Dutch Kills, based on the latitude and longitude provided in the
SPDES permit. Table 3-5 presents a listing of the permitted CSO outfalls’ locations, dimensions,
and associated regulators and drainage areas.
Table 3-5. CSO Discharges to Newtown Creek from the Bowery Bay WWTP Service Area
Regulator Regulator Location Waterbody Outfall(3)
Outfall Size Drainage
Area (ac)
BB-L1 Greenpoint Ave. &
Newtown Creek
Newtown Creek, north
shore, west of Dutch Kills BB-011 24” diameter 17
BB-L2 35
th Street W/O Review
Ave.
Newtown Creek, north
shore, west of Dutch Kills BB-012 24” diameter 13
BB-L3 Borden Ave. & Dutch
Kills Dutch Kills, eastern shore BB-004 6’-6” x 3’-3" 12
BB-L3B 30
th Street & Huntington
Ave. Dutch Kills, eastern shore BB-009
11’-0" x 4’-
6” 280
- BB-L3A Borden Pump Station
Influent
Tributary to BB-L3B
through Borden P.S.
- BB-L37 Hunter Point Ave. &
Van Dam Street Tributary to BB-L3B
- BB-L38 Hunter Point Ave. & 30
th
Street Tributary to BB-L3B
- BB-L41 Borden Ave. & 30
th
Street Tributary to BB-L3B
BB-L3C Behind Borden P.S. Dutch Kills, eastern shore BB-010 30” diameter 25
BB-L4 (1)
47
th Ave. between 28
th &
29th
Streets Dutch Kills, head end BB-026 9’-0” x 4’-6” 296
- BB-L39 47th
Ave. & 30th
Street Tributary to BB-L4
- BB-L40 47th
Ave. & 31st Street Tributary to BB-L4
- BB-L42 27
th Street & Skillman
Ave. Tributary to BB-L4
BB-L5 49th
Ave. & 27th
Street Dutch Kills, western shore BB-040 24” diameter 8

New York City Department of Environmental Protection Waterbody/Watershed Facility Plan Report
Newtown Creek
3-17 June 2011
Table 3-5. CSO Discharges to Newtown Creek from the Bowery Bay WWTP Service Area
Regulator Regulator Location Waterbody Outfall(3)
Outfall Size Drainage
Area (ac)
BB-L6 Borden Ave. & 27
th
Street Dutch Kills, western shore BB-042 12” diameter 1
BB-L7 E/S 11
th Street, S/O 53
rd
Ave.
Newtown Creek, north
shore, east of Dutch Kills BB-043 54” diameter 37
BB-L8 W/S 11
th Street & S/O
53rd
Ave.
Newtown Creek, north
shore, east of Dutch Kills BB-013 72” diameter 31
BB-L9 Vernon Blvd., S/O 54th
Ave.
Newtown Creek, north
shore, east of Dutch Kills BB-014 22” diameter 12
BB-L10 5th Street & 55th Ave. Newtown Creek, north
shore, east of Dutch Kills BB-015 15” diameter 5
Total Combined Sewer Area (Acres) 737 (1)
Dry weather flow from BB-L40 bypasses BB-L39 and is sent to BB-L-42 at Equalizing Chamber No. 2. (2)
Outfall BB-049 is listed in SPDES Permit No. NY- 0026158 as being a 2’-8” x 4’ outfall discharging into
Dutch Kills near 21st St., however, no further information was available to determine the listed parameters.
(3) An additional 2-feet, 8-inches x 4-foot outfall, BB-049, is listed in the Bowery Bay WWTP SPDES permit as
discharging to Dutch Kills near 21st Street, but no further information is available such as which regulator it is
connected to.
The Borden Avenue Pump Station, located at Borden Avenue and Review Street,
operates within the Bowery Bay WWTP Low Level service area and is within the Newtown
Creek sewershed. The Borden Avenue Pump Station has one online and two standby pumps for a
total capacity of 3.9 MGD, and the average dry weather flow is 453,000 gallons per day (gpd).
The Long Island City Interceptor is a principal element of the Bowery Bay Low Level
service area. All of the Newtown Creek overflows from the Bower Bay WWTP service area are
from this interceptor, which begins running north along the west side of Dutch Kills, turning east
and crossing north of Dutch Kills, and then south along the east side of Dutch Kills back towards
Newtown Creek. The interceptor continues east along the north side of Newtown Creek to the
mouth of the Creek before heading north to the Bowery Bay WWTP where discharges are
diverted to the East River.
Newtown Creek WWTP Sub-Area The portions of the Newtown Creek sewershed draining to the Newtown Creek WWTP
are south and the east of the Creek in Brooklyn, and northwest of the Creek in Queens. The
tributary drainage area is approximately 6,473-acres (5,455-acres with combined sewers),
includes three pumps stations, and has 10 CSOs. The Brooklyn portion contains 22 regulators,
five of which along with an overflow weir at St. Nicholas Avenue and Troutman Street and a
high relief at Ash Street and McGuiness Boulevard discharge during wet weather to Newtown
Creek. The Queens portion contains two regulators, which also discharge during wet weather to
Newtown Creek. Of these 10 CSOs, five discharge to Newtown Creek (NCQ-029, and NCB-
021, 22, 23, and 24), and five discharge to its tributaries: English Kills (NCB-015), East Branch
(NCB-019 and 83), Whale Creek (NCB-002) and Maspeth Creek (NCQ-077). Outfall NCB-002
is the overflow from Newtown Creek WWTP to Whale Creek Canal. Table 3-6 presents
information on these CSO outfalls.

New York City Department of Environmental Protection Waterbody/Watershed Facility Plan Report
Newtown Creek
3-18 June 2011
The 49th
Street and Glendale Pump Stations operate within the Newtown Creek portion of
the Newtown Creek sewershed. The 49th
Street Pump Station, located at 49th
Street and 57th
Avenue, is a sanitary pumping station. The station has one online and two standby pumps for a
total capacity of 7.9 MGD, and an average dry weather flow of 280,000 gpd. Although this is a
sanitary pumping station, the station discharges via the secondary interceptor from Queens to the
combined Morgan Avenue Interceptor for conveyance to the Newtown Creek WWTP.
The Glendale Pump Station, located at Cooper Avenue, west of 76th
Street, is a storm
pumping station. The station has two online pumps with a total capacity of 1.2 MGD, and
pumps to the downstream combined sewer system.
The Brooklyn/Queens pump station, which is located at the WWTP, was built in 1967.
With a rated capacity of 300 MGD, the station accepts wastewater from the Brooklyn and
Queens portions of the tributary area through the Kent Avenue and Morgan Avenue Interceptors.
The five existing 70 MGD pumps are planned to be replaced with five new 107 MGD pumps
under Contract NC-36; however, there is currently no planned change in rated capacity.
There are two principal interceptors serving the Newtown Creek portion of the Newtown
Creek sewershed, the Kent Avenue Interceptor and the Morgan Avenue Interceptor. The Kent
Avenue Interceptor also accepts flow from the West Street Interceptor and together they serve
the northeast portion of Brooklyn. The Morgan Avenue Interceptor serves the northwest side of
Brooklyn and the southeast portion of Queens and accepts flow from the 49th
Street Pumping
Station through the Secondary Interceptor from Queens. The Kent and Morgan Avenue
Interceptors join just upstream of the Brooklyn/Queens pump station carrying wastewater
directly to the Newtown Creek WWTP.
Table 3-6. Newtown Creek CSOs from the Newtown Creek WWTP Service Area
Regulator Regulator Location Waterbody Outfall Outfall Size Drainage
Area(ac)
NC-Q1 W/O Russel Street Maspeth Creek, head end NCQ-
077
2 @ 11’-0”
x 7’-0" 1,107
NC-Q2 56th
Rd &43rd
Street Newtown Creek, north shore,
east of Maspeth Creek
NCQ-
029
66"
diameter 91
NC-B1, B1A Johnson Ave. W/O
Porter Ave. English Kills, head end
NCB-
015
2 @ 15’-8”
x 10’-0" 2,275
NC-St. Nich
Weir
Metropolitan Ave. &
Troutman Ave. East Branch, head end
NCB-
083
206” x 157”
arch 1,901
NC-B2 Metropolitan Ave. &
Onderdonk Ave. East Branch, head end
NCB-
019
36"
diameter 29
NC-B16 E/O Franklin Street Newtown Creek, south shore
near mouth of Creek
NCB-
023
24"
diameter 15
NC-B15 Dupont St. &
Commercial St.
Newtown Creek, south shore
near mouth of Creek
NCB-
024
18"
diameter 1.8
NC-B17 McGuiness Blvd., N/O
Ash Street
Newtown Creek, south shore
east of Newtown Creek
WWTP
NCB-
022
4’-6” x 6’-
3" 23
High Relief McGuiness Blvd., N/O
Ash Street
Newtown Creek, south shore
east of Newtown Creek
WWTP
NCB-
021
36”
diameter 15
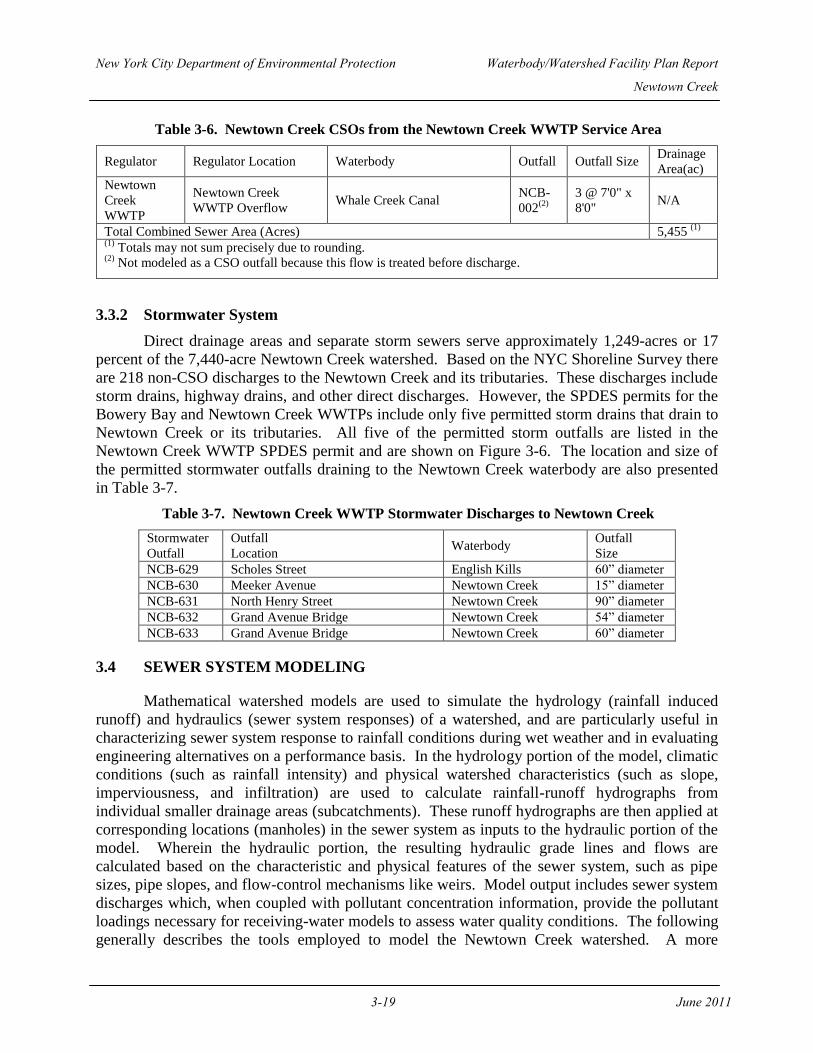
New York City Department of Environmental Protection Waterbody/Watershed Facility Plan Report
Newtown Creek
3-19 June 2011
Table 3-6. Newtown Creek CSOs from the Newtown Creek WWTP Service Area
Regulator Regulator Location Waterbody Outfall Outfall Size Drainage
Area(ac)
Newtown
Creek
WWTP
Newtown Creek
WWTP Overflow Whale Creek Canal
NCB-
002(2)
3 @ 7'0" x
8'0" N/A
Total Combined Sewer Area (Acres) 5,455 (1)
(1)
Totals may not sum precisely due to rounding. (2)
Not modeled as a CSO outfall because this flow is treated before discharge.
3.3.2 Stormwater System
Direct drainage areas and separate storm sewers serve approximately 1,249-acres or 17
percent of the 7,440-acre Newtown Creek watershed. Based on the NYC Shoreline Survey there
are 218 non-CSO discharges to the Newtown Creek and its tributaries. These discharges include
storm drains, highway drains, and other direct discharges. However, the SPDES permits for the
Bowery Bay and Newtown Creek WWTPs include only five permitted storm drains that drain to
Newtown Creek or its tributaries. All five of the permitted storm outfalls are listed in the
Newtown Creek WWTP SPDES permit and are shown on Figure 3-6. The location and size of
the permitted stormwater outfalls draining to the Newtown Creek waterbody are also presented
in Table 3-7.
Table 3-7. Newtown Creek WWTP Stormwater Discharges to Newtown Creek
Stormwater
Outfall
Outfall
Location Waterbody
Outfall
Size
NCB-629 Scholes Street English Kills 60” diameter
NCB-630 Meeker Avenue Newtown Creek 15” diameter
NCB-631 North Henry Street Newtown Creek 90” diameter
NCB-632 Grand Avenue Bridge Newtown Creek 54” diameter
NCB-633 Grand Avenue Bridge Newtown Creek 60” diameter
3.4 SEWER SYSTEM MODELING
Mathematical watershed models are used to simulate the hydrology (rainfall induced
runoff) and hydraulics (sewer system responses) of a watershed, and are particularly useful in
characterizing sewer system response to rainfall conditions during wet weather and in evaluating
engineering alternatives on a performance basis. In the hydrology portion of the model, climatic
conditions (such as rainfall intensity) and physical watershed characteristics (such as slope,
imperviousness, and infiltration) are used to calculate rainfall-runoff hydrographs from
individual smaller drainage areas (subcatchments). These runoff hydrographs are then applied at
corresponding locations (manholes) in the sewer system as inputs to the hydraulic portion of the
model. Wherein the hydraulic portion, the resulting hydraulic grade lines and flows are
calculated based on the characteristic and physical features of the sewer system, such as pipe
sizes, pipe slopes, and flow-control mechanisms like weirs. Model output includes sewer system
discharges which, when coupled with pollutant concentration information, provide the pollutant
loadings necessary for receiving-water models to assess water quality conditions. The following
generally describes the tools employed to model the Newtown Creek watershed. A more
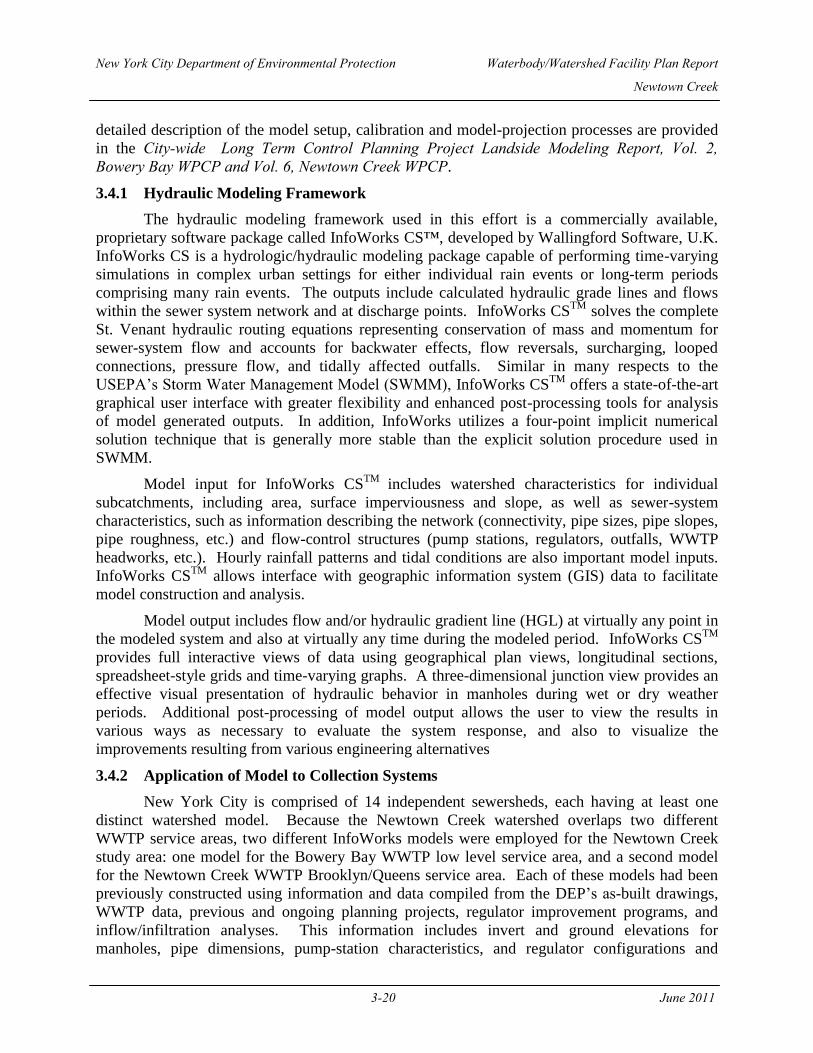
New York City Department of Environmental Protection Waterbody/Watershed Facility Plan Report
Newtown Creek
3-20 June 2011
detailed description of the model setup, calibration and model-projection processes are provided
in the City-wide Long Term Control Planning Project Landside Modeling Report, Vol. 2, Bowery Bay WPCP and Vol. 6, Newtown Creek WPCP.
3.4.1 Hydraulic Modeling Framework
The hydraulic modeling framework used in this effort is a commercially available,
proprietary software package called InfoWorks CS™, developed by Wallingford Software, U.K.
InfoWorks CS is a hydrologic/hydraulic modeling package capable of performing time-varying
simulations in complex urban settings for either individual rain events or long-term periods
comprising many rain events. The outputs include calculated hydraulic grade lines and flows
within the sewer system network and at discharge points. InfoWorks CSTM
solves the complete
St. Venant hydraulic routing equations representing conservation of mass and momentum for
sewer-system flow and accounts for backwater effects, flow reversals, surcharging, looped
connections, pressure flow, and tidally affected outfalls. Similar in many respects to the
USEPA’s Storm Water Management Model (SWMM), InfoWorks CSTM
offers a state-of-the-art
graphical user interface with greater flexibility and enhanced post-processing tools for analysis
of model generated outputs. In addition, InfoWorks utilizes a four-point implicit numerical
solution technique that is generally more stable than the explicit solution procedure used in
SWMM.
Model input for InfoWorks CSTM
includes watershed characteristics for individual
subcatchments, including area, surface imperviousness and slope, as well as sewer-system
characteristics, such as information describing the network (connectivity, pipe sizes, pipe slopes,
pipe roughness, etc.) and flow-control structures (pump stations, regulators, outfalls, WWTP
headworks, etc.). Hourly rainfall patterns and tidal conditions are also important model inputs.
InfoWorks CSTM
allows interface with geographic information system (GIS) data to facilitate
model construction and analysis.
Model output includes flow and/or hydraulic gradient line (HGL) at virtually any point in
the modeled system and also at virtually any time during the modeled period. InfoWorks CSTM
provides full interactive views of data using geographical plan views, longitudinal sections,
spreadsheet-style grids and time-varying graphs. A three-dimensional junction view provides an
effective visual presentation of hydraulic behavior in manholes during wet or dry weather
periods. Additional post-processing of model output allows the user to view the results in
various ways as necessary to evaluate the system response, and also to visualize the
improvements resulting from various engineering alternatives
3.4.2 Application of Model to Collection Systems
New York City is comprised of 14 independent sewersheds, each having at least one
distinct watershed model. Because the Newtown Creek watershed overlaps two different
WWTP service areas, two different InfoWorks models were employed for the Newtown Creek
study area: one model for the Bowery Bay WWTP low level service area, and a second model
for the Newtown Creek WWTP Brooklyn/Queens service area. Each of these models had been
previously constructed using information and data compiled from the DEP’s as-built drawings,
WWTP data, previous and ongoing planning projects, regulator improvement programs, and
inflow/infiltration analyses. This information includes invert and ground elevations for
manholes, pipe dimensions, pump-station characteristics, and regulator configurations and

Newtown Creek Sewershed-Sewer System Components
Figure 3-6Newtown Creek Waterbody/Watershed Plan

NO TEXT ON THIS PAGE

New York City Department of Environmental Protection Waterbody/Watershed Facility Plan Report
Newtown Creek
3-23 June 2011
dimensions.
Model elements include WWTP headworks, interceptors, branch interceptors, major
trunk sewers, all sewers greater than 60-inches in diameter plus other smaller, significant sewers,
and control structures such as pump stations, diversion chambers, tipping locations, reliefs,
regulators and tide gates. These models were previously calibrated and validated using flow and
hydraulic-elevation data collected during the Inner and Outer Harbor CSO Facility Planning
Projects, as well as more recent data collected in the past several years for facility planning.
Field verifications were conducted by the DEP during its Use and Standards Attainability (USA)
Project and ongoing facility planning projects to confirm and re-measure system components
where data or information gaps existed.
Conceptual alternative scenarios representing no-action and other alternatives were
simulated for the design condition (1988 JFK rainfall). Tidally influenced discharges were
calculated on a time-variable basis. Pollutant concentrations selected from field data and best
professional judgment were assigned to the sanitary and stormwater components of the combined
sewer discharges to calculate variable pollutant discharges. Similar assignments were made for
stormwater discharges. Discharges and pollutant loadings were then post-processed and used as
inputs to the receiving-water model of Newtown Creek, described in Section 4.
3.4.3 Baseline Design Condition
Watershed modeling can be an important tool in evaluating the impact of proposed
physical changes to the sewer system and/or of proposed changes to the operation of the system.
In order to provide a basis for these comparisons, a “Baseline design condition” was developed.
This Baseline condition reflects a set of conditions that are expected to be similar in all
subsequent comparisons so that the impact of the specific proposed changes can be determined.
In general, the Baseline condition represents the watershed and sewer system in its current
condition, with certain exceptions specifically used for planning purposes. These exceptions are:
Dry-weather flow rates reflect year 2045 projections. For planning purposes, the
2045-projected dry-weather flow rates at each regulator reflect expected future
population and water-use patterns in the study area. The total projected dry-weather
flow rates are 109 MGD at Bowery Bay WPCP, and 268 MGD at Newtown Creek
WPCP.
The Sustained wet-weather treatment capacity of the Bowery Bay WPCP was 236,
and wet-weather treatment capacity of the Newtown Creek WPCP was 585 MGD,
based on top-ten-storm analyses for each WPCP as reported to DEC in the 2003 BMP
Annual Report. Bowery Bay WWTP has been upgraded to 300 MGD to meet the 2x
DDWF requirement, and Newtown Creek WWTP is currently being upgraded to
include full secondary treatment of 700 MGD. There are no primary treatment
facilities at Newtown Creek WWTP.
Documented sediment values were included in the model where known, however, if
there was no information available, sedimentation in the sewers was assumed to be
removed.

New York City Department of Environmental Protection Waterbody/Watershed Facility Plan Report
Newtown Creek
3-24 June 2011
The Brooklyn Pump Station (P.S.) capacity is 400 MGD. The Newtown Creek
WPCP Enhanced Track 3 Facility Plan and the Newtown Creek CSO Facility Plan
dictate a capacity of 300 MGD. However, as noted above, it is intended that the
Newtown Creek WPCP be upgraded to accommodate 300 MGD from the Manhattan
service area, as well as to accept up to 400 MGD from the Brooklyn Pump Station,
for a total of 700 MGD.
Additionally, establishing the future Bowery Bay and Newtown Creek WWTPs dry
weather sewage flows is a critical step in the WB/WS Planning analysis since one key element in
the City’s CSO control program is the use of the WWTPs to reduce CSO discharges. Increases
in sanitary sewage flows associated with increased populations will reduce the amount of CSO
flow that can be treated at the existing WWTPs since the increased sanitary sewage flows will
use part of the WWTP wet weather capacity.
Dry weather sanitary sewage flows used in the Baseline modeling were escalated to
reflect anticipated growth within the City. At the direction of the Mayor’s Office, NYCDCP has
made assessments of the growth and movement of the City’s population between the year 2000
census and 2010 and 2030 (NYCDCP, 2006). This information is contained in a set of
projections made for 188 neighborhoods within the City. DEP has escalated these populations
forward to 2045 by assuming the rate of growth between 2045 and 2030 would be 50 percent of
the rate of growth between 2000 and 2030. These populations were associated with each of the
landside modeling sub-catchment areas tributary to each CSO regulator using geographical
information system (GIS) calculations. Dry weather sanitary sewage flows were then calculated
for each of these sub-catchment areas by associating a conservatively high per capita sanitary
sewage flow with the population estimate. The per capita sewage flow was established as the
ratio of the year 2000 dry weather sanitary sewage flow for each WWTP service area and the
year 2000 population of each WWTP area.
Increasing the sewage flows for the Bowery Bay WWTP low level system from the
current 2005 flow of 29 MGD to an estimated 35 MGD and from the Newtown Creek Brooklyn
system from the current 2005 flow of 71 MGD to an estimated 83 MGD will properly account
for the potential reduction in wet weather treatment capacity associated with projections of a
larger population.
In addition to the above watershed/sewer-system conditions, a comparison between
model calculations also dictates that the same meteorological (rainfall) conditions are used in
both WWTP drainage areas. In accordance with the Federal CSO Control Policy a
typical/average rainfall year was used.
Long-term rainfall records measured in the New York City metropolitan area were
analyzed to identify potential rainfall design years to represent long-term, annual average
conditions. Annual statistics were compiled included:
Total rainfall depth and number of storms;
Average storm volume and intensity;
Total and average storm duration; and
Average inter-event time
New York City Department of Environmental Protection Waterbody/Watershed Facility Plan Report
Newtown Creek
3-25 June 2011
A more detailed description of these analyses is provided under separate cover
(HydroQual, 2004). Although no year was found having the long-term average statistics for all
of these parameters, the rainfall record measured at the National Weather Service gage at John F.
Kennedy (JFK) International Airport during calendar year 1988 is representative of overall, long-
term average conditions in terms of annual total rainfall and storm duration. In addition, the JFK
1988 rainfall record includes high-rainfall conditions during the July (recreational) and
November (shellfish) periods, which are useful for evaluating potential CSO impacts on water
quality during those particular periods. As a result, the JFK 1988 rainfall record was selected as
an appropriate design condition for which to evaluate sewer system response to rainfall. The
JFK 1988 record has also been adopted by New York Harbor Estuary Program and the New
Jersey Department of Environmental Protection for water-quality and CSO performance
evaluations. Table 3-8 summarizes some of the statistics for 1988 and a long-term (1970-2002)
record at JFK.
Table 3-8. Comparison of Annual 1988 and Long-Term Statistics JFK Rainfall Record (1970-2002)
Rainfall Statistic 1988 Statistics Long-Term Median
(1970-2002)
Annual Total Rainfall Depth (inches)
Return Period (years)
40.7
2.6
39.4
2.0
Annual Average Storm Volume (inches) 0.41 0.35
Average Storm Intensity (inch/hour)
Return Period (years)
0.068
11.3
0.057
2.0
Annual Total Duration of Storms (hours) 612 681
Annual Average Number of Storms
Return Period (years)
100
1.1
112
2.0
Average Storm Duration (hours)
Return Period (years)
6.12
2.1
6.08
2.0
Annual Average Time Between Storms (hours) 88 78
3.5 DISCHARGE CHARACTERISTICS
As indicated in Section 3.4, sewer-system modeling is useful to characterize flows and
pollutant loads discharged from various outfalls in the drainage area. Because long-term
monitoring of outfalls is difficult and expensive, and sometimes not accurate in tidal areas,
sewer-system models that have been calibrated to available measurements of water levels and
flows can offer a useful characterization of discharge quantities. Sewer-system models can also
be used to estimate the relative percentage of sanitary sewage and rainfall runoff discharged from
a CSO. This is particularly helpful when developing CSO pollutant concentrations, since this
sanitary/runoff split for the discharge volume can be used to develop CSO concentrations and
subsequently loadings. This method of utilizing concentrations associated with sanitary and
runoff is somewhat more reliable than developing CSO concentrations based on pollutant
concentrations measured in combined sewage (e.g., the event mean concentrations, EMC), which
are particularly variable.
3.5.1 Characterization of Discharged Volumes, Baseline Condition
The calibrated watershed models described in Section 3.4 were used to characterize
discharges to Newtown Creek for the Baseline condition. Table 3-9 summarizes the results with
statistics relating to the annual CSO discharges from each point-source outfall for the Baseline

New York City Department of Environmental Protection Waterbody/Watershed Facility Plan Report
Newtown Creek
3-26 June 2011
condition. The four largest CSO outfalls, which together account for over 90 percent of the
annual average CSO volume, are located at the head ends of East Branch (40.1 percent), Maspeth
Creek (19.8 percent), English Kills (17.8 percent), and Dutch Kills (12.7 percent).
Table 3-9. Newtown Creek CSO Discharge Summary for Baseline Condition (1) (2)
Outfall (3)
Annual CSO Discharge
Volume (MG)
Percentage of CSO
Volume Number of
Discharges
NCB-083 586.2 39.8% 71
BB-026 186.8 12.7% 47
NCQ-077 261.5 17.8% 49
NCB-015 307.8 20.9% 33
BB-013 39.2 2.7% 44
NCQ-029 18.1 1.2% 48
BB-043 13.9 0.9% 40
BB-009 35.2 2.4% 35
NCB-022 8.4 0.6% 42
BB-014 3.2 0.2% 35
BB-042 2.3 0.2% 29
BB-011 2.8 0.2% 24
BB-040 0.9 0.1% 21
BB-015 3.1 0.2% 39
BB-010 1.6 0.1% 16
NCB-023 0.2 0.0% 5
NCB-019 0.4 0.0% 7
BB-012 0.2 0.0% 5
BB-004 0.1 0.0% 4
NCB-024 0.0 0.0% 0
Total CSO 1471.9 100% (1)
Baseline condition reflects design precipitation record (JFK, 1988) and sanitary flows projected for year 2045
(Bowery Bay WWTP: 236 MGD, Newtown Creek WWTP: 585 MGD). (2)
Totals may not sum precisely due to rounding. (3)
CSO Outfalls BBL-049 and NCB-021 are not incorporated into the model due to lack of as-built data. The
adjacent drainage areas are distributed to nearby outfalls. Outfall 002 is the Newtown Creek WWTP high relief that
discharges to Whale Creek Canal. This flow is treated before discharge and is built into the water quality model
runs.
Table 3-10 summarizes the results with statistics relating to the annual stormwater
discharges from each point-source outfall for the Baseline condition.
Table 3-10. Newtown Creek Stormwater Discharge Summary for Baseline Condition (1) (2)
Outfall (3)(4)
Discharge Volume
(MG)
Percentage of
Stormwater Volume Number of Discharges
NCB-629 62.1 10.8% 71
NCB-631 55.9 9.7% 71
NCB-632 51.9 9.0% 71
NC Non-Permitted 324.1 56.2% 71
BB Non-Permitted 82.7 14.3% 71
Total Stormwater 576.7 100%
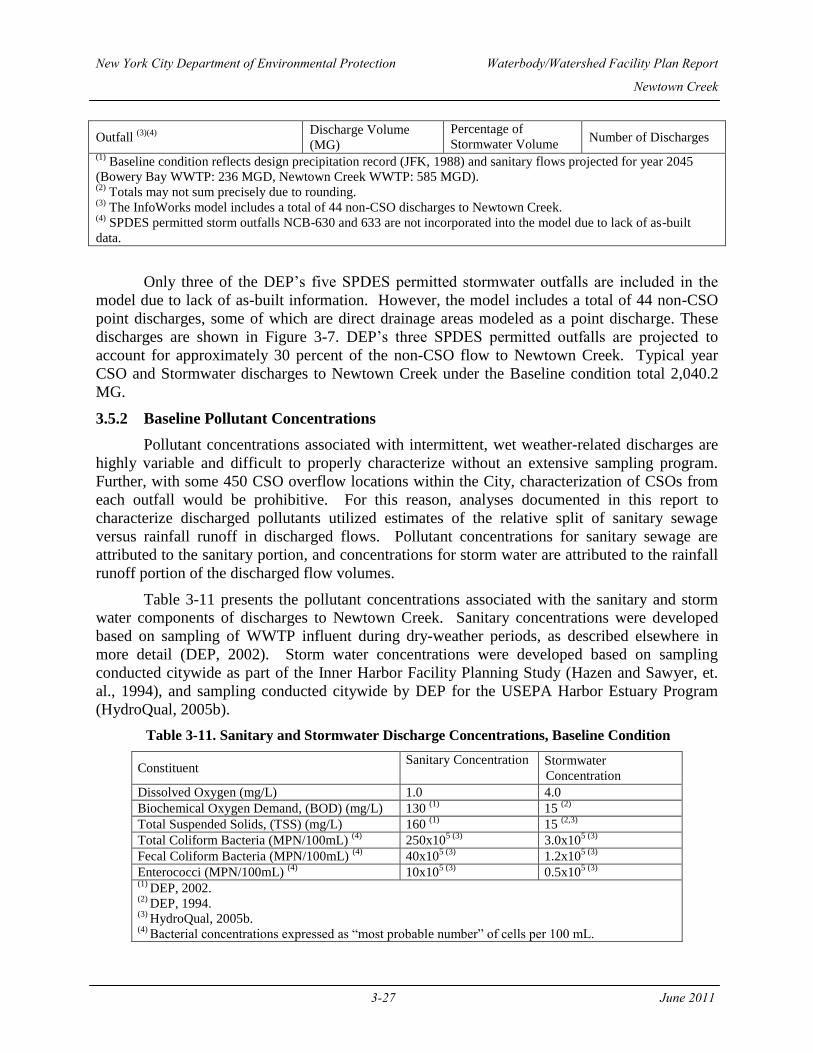
New York City Department of Environmental Protection Waterbody/Watershed Facility Plan Report
Newtown Creek
3-27 June 2011
Outfall (3)(4)
Discharge Volume
(MG)
Percentage of
Stormwater Volume Number of Discharges
(1) Baseline condition reflects design precipitation record (JFK, 1988) and sanitary flows projected for year 2045
(Bowery Bay WWTP: 236 MGD, Newtown Creek WWTP: 585 MGD). (2)
Totals may not sum precisely due to rounding. (3)
The InfoWorks model includes a total of 44 non-CSO discharges to Newtown Creek. (4)
SPDES permitted storm outfalls NCB-630 and 633 are not incorporated into the model due to lack of as-built
data.
Only three of the DEP’s five SPDES permitted stormwater outfalls are included in the
model due to lack of as-built information. However, the model includes a total of 44 non-CSO
point discharges, some of which are direct drainage areas modeled as a point discharge. These
discharges are shown in Figure 3-7. DEP’s three SPDES permitted outfalls are projected to
account for approximately 30 percent of the non-CSO flow to Newtown Creek. Typical year
CSO and Stormwater discharges to Newtown Creek under the Baseline condition total 2,040.2
MG.
3.5.2 Baseline Pollutant Concentrations
Pollutant concentrations associated with intermittent, wet weather-related discharges are
highly variable and difficult to properly characterize without an extensive sampling program.
Further, with some 450 CSO overflow locations within the City, characterization of CSOs from
each outfall would be prohibitive. For this reason, analyses documented in this report to
characterize discharged pollutants utilized estimates of the relative split of sanitary sewage
versus rainfall runoff in discharged flows. Pollutant concentrations for sanitary sewage are
attributed to the sanitary portion, and concentrations for storm water are attributed to the rainfall
runoff portion of the discharged flow volumes.
Table 3-11 presents the pollutant concentrations associated with the sanitary and storm
water components of discharges to Newtown Creek. Sanitary concentrations were developed
based on sampling of WWTP influent during dry-weather periods, as described elsewhere in
more detail (DEP, 2002). Storm water concentrations were developed based on sampling
conducted citywide as part of the Inner Harbor Facility Planning Study (Hazen and Sawyer, et.
al., 1994), and sampling conducted citywide by DEP for the USEPA Harbor Estuary Program
(HydroQual, 2005b).
Table 3-11. Sanitary and Stormwater Discharge Concentrations, Baseline Condition
Constituent Sanitary Concentration Stormwater
Concentration
Dissolved Oxygen (mg/L) 1.0 4.0
Biochemical Oxygen Demand, (BOD) (mg/L) 130 (1)
15 (2)
Total Suspended Solids, (TSS) (mg/L) 160 (1)
15 (2,3)
Total Coliform Bacteria (MPN/100mL) (4)
250x105 (3)
3.0x10⁵ (3)
Fecal Coliform Bacteria (MPN/100mL) (4)
40x105 (3)
1.2x10⁵ (3)
Enterococci (MPN/100mL) (4)
10x105 (3)
0.5x10⁵ (3)
(1)
DEP, 2002. (2)
DEP, 1994. (3)
HydroQual, 2005b. (4)
Bacterial concentrations expressed as “most probable number” of cells per 100 mL.
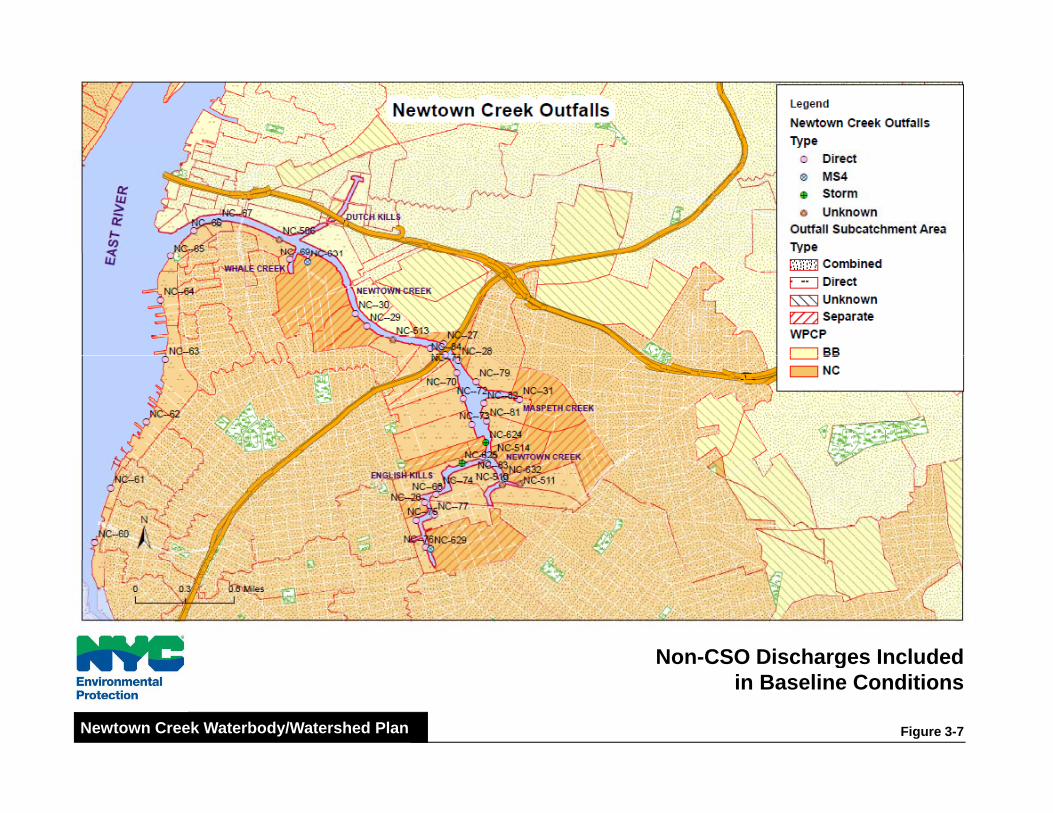
Non-CSO Discharges IncludedNon CSO Discharges Includedin Baseline Conditions
Figure 3-7Newtown Creek Waterbody/Watershed Plan
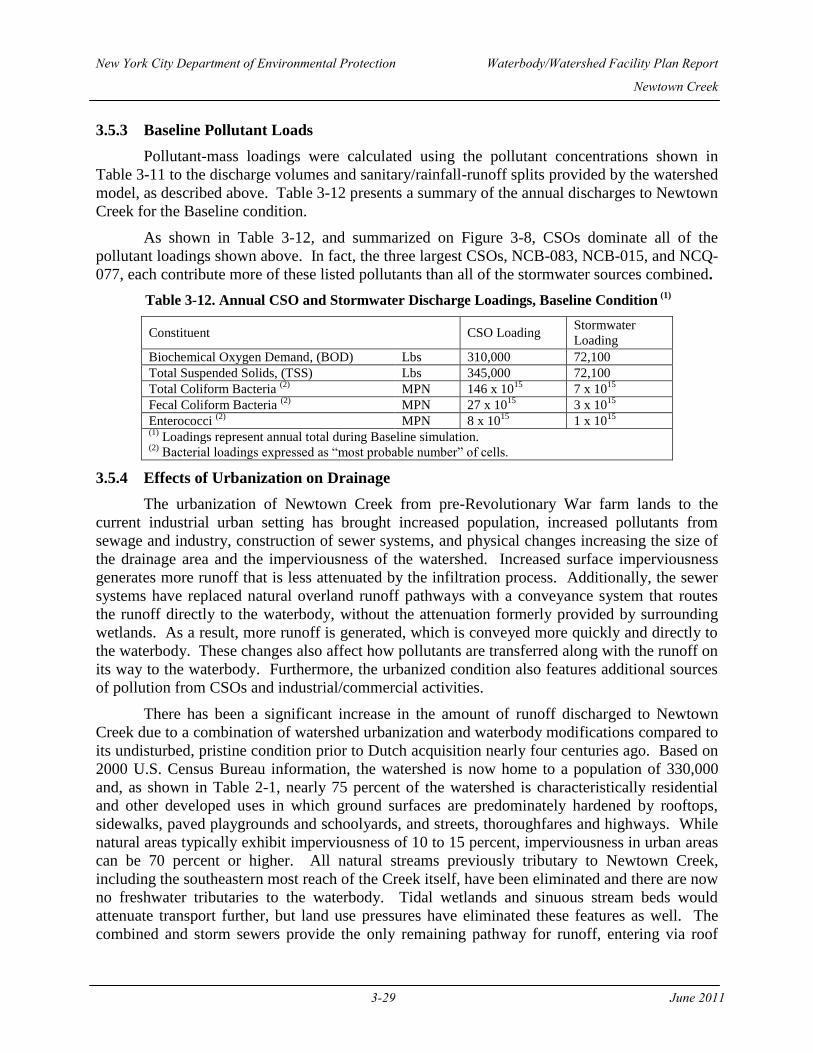
New York City Department of Environmental Protection Waterbody/Watershed Facility Plan Report
Newtown Creek
3-29 June 2011
3.5.3 Baseline Pollutant Loads
Pollutant-mass loadings were calculated using the pollutant concentrations shown in
Table 3-11 to the discharge volumes and sanitary/rainfall-runoff splits provided by the watershed
model, as described above. Table 3-12 presents a summary of the annual discharges to Newtown
Creek for the Baseline condition.
As shown in Table 3-12, and summarized on Figure 3-8, CSOs dominate all of the
pollutant loadings shown above. In fact, the three largest CSOs, NCB-083, NCB-015, and NCQ-
077, each contribute more of these listed pollutants than all of the stormwater sources combined.
Table 3-12. Annual CSO and Stormwater Discharge Loadings, Baseline Condition (1)
Constituent CSO Loading Stormwater
Loading
Biochemical Oxygen Demand, (BOD) Lbs 310,000 72,100
Total Suspended Solids, (TSS) Lbs 345,000 72,100
Total Coliform Bacteria (2)
MPN 146 x 1015
7 x 10¹⁵
Fecal Coliform Bacteria (2)
MPN 27 x 1015
3 x 10¹⁵
Enterococci (2)
MPN 8 x 10¹⁵
1 x 10¹⁵
(1)
Loadings represent annual total during Baseline simulation. (2)
Bacterial loadings expressed as “most probable number” of cells.
3.5.4 Effects of Urbanization on Drainage
The urbanization of Newtown Creek from pre-Revolutionary War farm lands to the
current industrial urban setting has brought increased population, increased pollutants from
sewage and industry, construction of sewer systems, and physical changes increasing the size of
the drainage area and the imperviousness of the watershed. Increased surface imperviousness
generates more runoff that is less attenuated by the infiltration process. Additionally, the sewer
systems have replaced natural overland runoff pathways with a conveyance system that routes
the runoff directly to the waterbody, without the attenuation formerly provided by surrounding
wetlands. As a result, more runoff is generated, which is conveyed more quickly and directly to
the waterbody. These changes also affect how pollutants are transferred along with the runoff on
its way to the waterbody. Furthermore, the urbanized condition also features additional sources
of pollution from CSOs and industrial/commercial activities.
There has been a significant increase in the amount of runoff discharged to Newtown
Creek due to a combination of watershed urbanization and waterbody modifications compared to
its undisturbed, pristine condition prior to Dutch acquisition nearly four centuries ago. Based on
2000 U.S. Census Bureau information, the watershed is now home to a population of 330,000
and, as shown in Table 2-1, nearly 75 percent of the watershed is characteristically residential
and other developed uses in which ground surfaces are predominately hardened by rooftops,
sidewalks, paved playgrounds and schoolyards, and streets, thoroughfares and highways. While
natural areas typically exhibit imperviousness of 10 to 15 percent, imperviousness in urban areas
can be 70 percent or higher. All natural streams previously tributary to Newtown Creek,
including the southeastern most reach of the Creek itself, have been eliminated and there are now
no freshwater tributaries to the waterbody. Tidal wetlands and sinuous stream beds would
attenuate transport further, but land use pressures have eliminated these features as well. The
combined and storm sewers provide the only remaining pathway for runoff, entering via roof
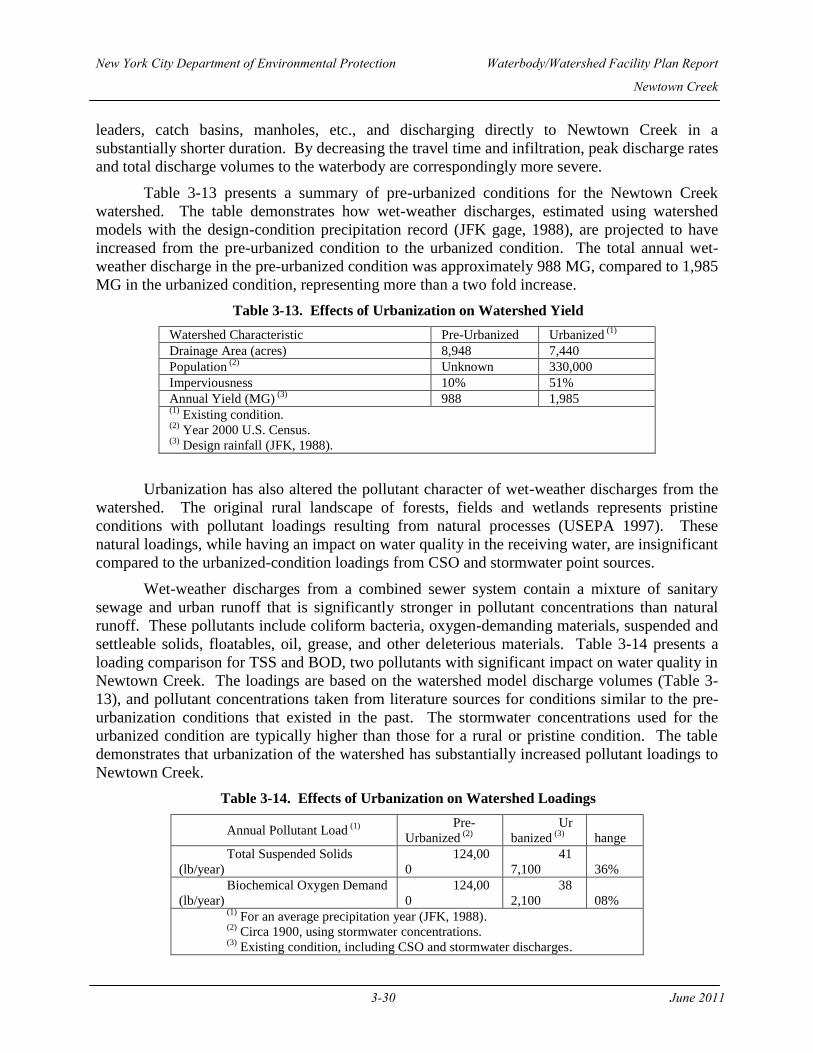
New York City Department of Environmental Protection Waterbody/Watershed Facility Plan Report
Newtown Creek
3-30 June 2011
leaders, catch basins, manholes, etc., and discharging directly to Newtown Creek in a
substantially shorter duration. By decreasing the travel time and infiltration, peak discharge rates
and total discharge volumes to the waterbody are correspondingly more severe.
Table 3-13 presents a summary of pre-urbanized conditions for the Newtown Creek
watershed. The table demonstrates how wet-weather discharges, estimated using watershed
models with the design-condition precipitation record (JFK gage, 1988), are projected to have
increased from the pre-urbanized condition to the urbanized condition. The total annual wet-
weather discharge in the pre-urbanized condition was approximately 988 MG, compared to 1,985
MG in the urbanized condition, representing more than a two fold increase.
Table 3-13. Effects of Urbanization on Watershed Yield
Watershed Characteristic Pre-Urbanized Urbanized (1)
Drainage Area (acres) 8,948 7,440
Population (2)
Unknown 330,000
Imperviousness 10% 51%
Annual Yield (MG) (3)
988 1,985 (1)
Existing condition. (2)
Year 2000 U.S. Census. (3)
Design rainfall (JFK, 1988).
Urbanization has also altered the pollutant character of wet-weather discharges from the
watershed. The original rural landscape of forests, fields and wetlands represents pristine
conditions with pollutant loadings resulting from natural processes (USEPA 1997). These
natural loadings, while having an impact on water quality in the receiving water, are insignificant
compared to the urbanized-condition loadings from CSO and stormwater point sources.
Wet-weather discharges from a combined sewer system contain a mixture of sanitary
sewage and urban runoff that is significantly stronger in pollutant concentrations than natural
runoff. These pollutants include coliform bacteria, oxygen-demanding materials, suspended and
settleable solids, floatables, oil, grease, and other deleterious materials. Table 3-14 presents a
loading comparison for TSS and BOD, two pollutants with significant impact on water quality in
Newtown Creek. The loadings are based on the watershed model discharge volumes (Table 3-
13), and pollutant concentrations taken from literature sources for conditions similar to the pre-
urbanization conditions that existed in the past. The stormwater concentrations used for the
urbanized condition are typically higher than those for a rural or pristine condition. The table
demonstrates that urbanization of the watershed has substantially increased pollutant loadings to
Newtown Creek.
Table 3-14. Effects of Urbanization on Watershed Loadings
Annual Pollutant Load (1)
Pre-
Urbanized (2)
Ur
banized (3)
C
hange
Total Suspended Solids
(lb/year)
124,00
0
41
7,100
3
36%
Biochemical Oxygen Demand
(lb/year)
124,00
0
38
2,100
3
08% (1)
For an average precipitation year (JFK, 1988). (2)
Circa 1900, using stormwater concentrations. (3)
Existing condition, including CSO and stormwater discharges.
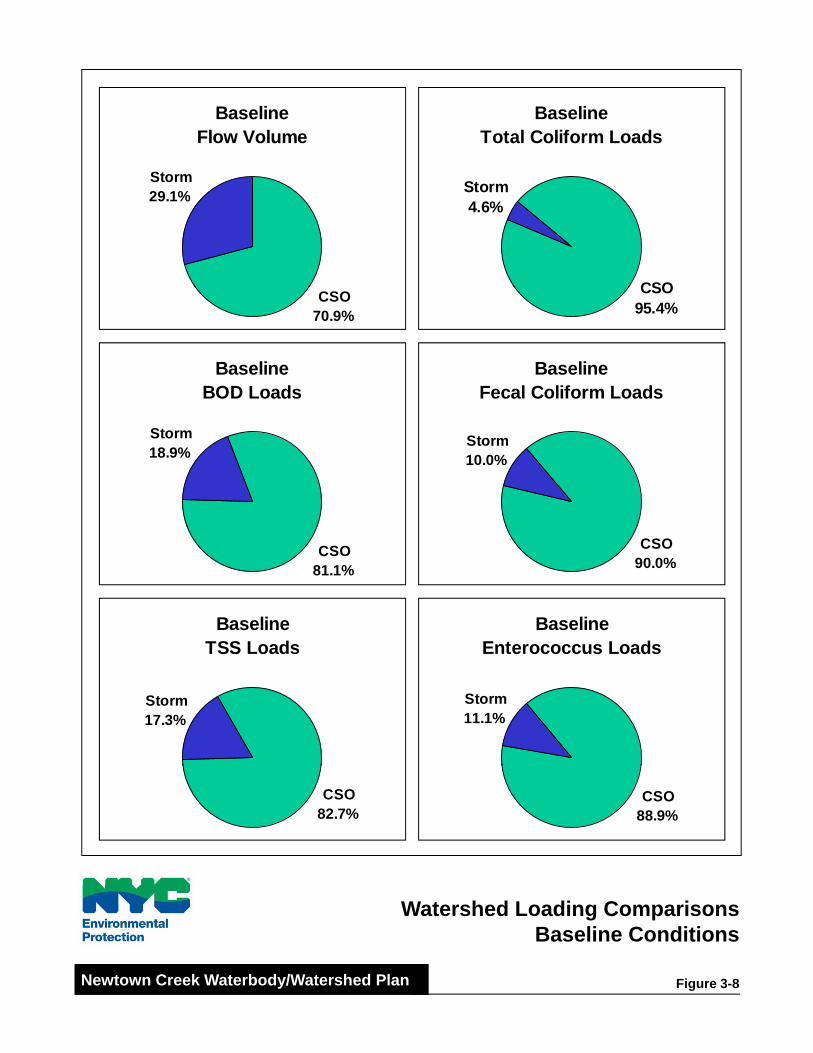
BaselineFlow Volume
BaselineTotal Coliform Loads
Storm29.1%
CSO
Storm4.6%
BaselineFecal Coliform Loads
CSO70.9%
CSO95.4%
BaselineBOD Loads
Storm10.0%
Storm18.9%
CSO90.0%
BaselineTSS Loads
BaselineEnterococcus Loads
CSO81.1%
TSS Loads
Storm17.3%
Enterococcus Loads
Storm11.1%
CSO82.7%
CSO88.9%
Watershed Loading ComparisonsBaseline Conditions
Figure 3-8Newtown Creek Waterbody/Watershed Plan
New York City Department of Environmental Protection Waterbody/Watershed Facility Plan Report
Newtown Creek
3-32 June 2011
3.5.5 Toxics Discharge Potential
Early efforts to reduce the amount of toxic contaminants being discharged to the New
York City open and tributary waters focused on industrial sources and metals. For industrial
source control in separate and combined sewer systems, USEPA requires approximately 1,500
municipalities nationwide to implement Industrial Pretreatment Programs (IPPs). The intent of
the IPP is to control toxic discharges to public sewers that are tributary to sewage treatment
plants by regulating Significant Industrial Users (SIUs). If a proposed Industrial Pretreatment
Program is deemed acceptable, USEPA will decree the local municipality a Control Authority.
DEP has been a Control Authority since January 1987, and enforces the IPP through Chapter 19
of Title 15 of the Rules of the City of New York (Use of the Public Sewers), which specifies
excluded and conditionally accepted toxic substances along with required management practices
for several common discharges such as photographic processing waste, grease from restaurants
and other non-residential users, and perchloroethylene from dry cleaning. DEP has been
submitting annual reports on its activities since 1996. The 310 SIUs that were active at the end
of 2004 discharged an estimated average total mass of 38.2 lbs/day of the following metals of
concern: arsenic, cadmium, copper, chromium, lead, mercury, nickel, silver and zinc.
As part of the IPP, DEP analyzed the toxic metals contribution of sanitary flow to CSOs
by measuring toxic metals concentrations in WWTP influent during dry weather in 1993. This
program determined that only 2.6 lbs/day (1.5 percent) of the 177 lbs/day of regulated metals
being discharged by regulated industrial users were bypassed to CSOs. Of the remaining 174.4
lbs, approximately 100 lbs ended up in biosolids, and the remainder was discharged through the
main WWTP outfalls. Recent data suggest even lower discharges. In 2004, the average mass of
total metals discharged by all regulated industries to the New York City WWTPs would translate
into less than 1 lb/day bypassed to CSOs from regulated industries if the mass balance calculated
in 1993 is assumed to be maintained. A similarly developed projection was cited by the 1997
DEP report on meeting the nine minimum CSO control standards required by federal CSO
policy, in which DEP considered the impacts of discharges of toxic pollutants from SIUs
tributary to CSOs (DEP, 1997). The report, audited and accepted by USEPA, includes
evaluations of sewer system requirements and industrial user practices to minimize toxic
discharges through CSOs. It was determined that most regulated industrial users (of which SIUs
are a subset) were discharging relatively small quantities of toxic metals to the NYC sewer
system.
According to the 2004 data, there were 20 SIUs within the Newtown Creek sewershed
(Table 3-15). Of these, 12 discharged an average daily flow of approximately 472,000 gallons
per day to the Bowery Bay WWTP in 2004, which is less than 2 percent of the existing dry
weather flow from the low level system. The other eight SIUs discharged an average daily flow
of approximately 119,000 gallons per day to the Newtown Creek WWTP in 2004, which is less
than 0.2 percent of the existing dry weather flow from Brooklyn and Queens. Considering how
infrequently CSO discharges occur in comparison to the continuous operation of these WWTPs,
a significantly smaller portion is actually bypassed as CSO. As a result of the virtually
insignificant potential for toxic discharge from SIUs, DEC has not listed Newtown Creek as
being impaired by toxic pollutants associated with CSO discharges.

New York City Department of Environmental Protection Waterbody/Watershed Facility Plan Report
Newtown Creek
3-33 June 2011
Table 3-15. Permitted Significant Industrial Users within the Newtown Creek Drainage
Area (November 2004)
SIU ID Address SIU ID Address
Bowery Bay WWTP
69 36001 48th Ave. 149 30000 47
th Ave.
84 30000 47th Ave. 153 59002 Borden Ave.
101 30000 47th Ave. 198 31000 47
th St.
121 30000 47th Ave. 208 48009 37
th St.
137 30000 47th Ave. 230 47009 30
th St.
149 30000 47th Ave. 260 39030 Review Ave.
Newtown Creek WWTP
14 1288 Willoughby Ave. 45 323 Mofat St.
15 1261 Willoughby Ave. 47 16033 Centre St.
18 58015 57th Dr. 62 58029 57
th Dr.
19 59030 56th Rd. 158 44022 54
th Ave.
New York City Department of Environmental Protection Waterbody/Watershed Facility Plan Report
Newtown Creek
3-34 June 2011
NO TEXT ON THIS PAGE

New York City Department of Environmental Protection Waterbody/Watershed Facility Plan Report
Newtown Creek
4-1 June 2011
4.0. Waterbody Characteristics
Tributary to the East River, Newtown Creek is a tidally influenced, estuarine waterbody
experiencing a semi-diurnal tidal cycle varying between 5 and 7 feet. The Creek is 3.8 miles
long from the East River to its farthest reach inland and has five tributaries or branches: Dutch
Kills, Whale Creek, Maspeth Creek, English Kills, and East Branch. The tributaries and
upstream end of the creek are narrow, bulkheaded and shallow with water quality mostly
influenced by the watershed. The downstream reach deepens and broadens into the East River
and its water quality is influenced most by New York Harbor conditions. The Creek has been
dredged to varying depths of about 15 to16 feet at MLW and widths between 200 and 300 feet.
The tributaries and branches of the creek are also relatively deep, between 10 and 17 feet MLW,
although shallowing towards their head ends where sediments are often exposed at low tides.
The downstream reach of Newtown Creek is significantly wider than English Kills and the other
tributaries, averaging about 550 feet, and expanding to approximately 820 feet at its confluence
with the East River. While there are DEC designated tidal wetlands in Newtown Creek the
shoreline of Newtown Creek is almost entirely bulkheaded or supported by riprap with some
sections in disrepair and others entirely collapsed. The Creek and its branches cover 165 acres at
mean water. The peak tidal depth-averaged current velocity in the system varies from 0.4 feet
per second in English Kills to 1.2 feet per second at the confluence of the Newtown Creek with
the East River (LMS, 1993). Non-tidal flow enters Newtown Creek from CSOs, storm sewers
and direct drainage. There are no measurable upstream freshwater flows in either Newtown
Creek or its branches.
The following sections describe the physical, chemical, and ecological conditions in the
Newtown Creek and its tributaries and branches.
4.1. CHARACTERIZATION METHODOLOGY
The DEP‟s comprehensive watershed-based approach to long-term CSO control planning
follows the USEPA‟s guidance for monitoring and modeling (USEPA, 1999a). The watershed
approach represents a holistic approach to understanding and addressing all surface water,
ground water, and habitat stressors within a geographically defined area, instead of addressing
individual pollutant sources in isolation. The guidance recommends identifying appropriate
measures of success based on site-specific conditions to both characterize water quality
conditions and measure the success of long-term control plans based on site-specific conditions,
and in a manner that illustrates trends and results over time. The measures of success are
recommended to be objective, measurable, and quantifiable indicators that illustrate trends and
results over time. USEPA‟s recommended measures of success are administrative
(programmatic) measures, end-of-pipe measures receiving waterbody measures, and ecological,
human health, and use measures. USEPA further states that collecting data and information on
CSOs and CSO impacts provides an important opportunity to establish a solid understanding of
the “baseline” conditions and to consider what information and data are necessary to evaluate
and demonstrate the results of CSO control. USEPA acknowledges that, since CSO controls
must ultimately provide for the attainment of water quality standards, the analysis of CSO
control alternatives should be tailored to the applicable standards such as those for DO and
New York City Department of Environmental Protection Waterbody/Watershed Facility Plan Report
Newtown Creek
4-2 June 2011
coliform bacteria. Since the CSO Control Policy recommends periodic review and revision of
water quality standards, as appropriate, investigations should reflect the site-specific, wet-
weather impacts of CSOs. DEP has implemented its CSO facility-planning projects consistently
with this guidance and has developed these categories of information on waterbodies such as the
Newtown Creek.
In accordance with this approach, the waterbody/watershed assessment of the Newtown
Creek, its tributaries and branches, and its watershed required a compilation of existing data,
identification of data gaps, collection of new data, and cooperation with field investigations
being conducted by other agencies. Deficiencies in existing data sets were identified and
sampling programs were developed to address those data gaps. Waterbody/watershed
characterization activities were conducted following the USA Project‟s Waterbody Work Plan.
These efforts yielded valuable information for characterizing the Newtown Creek, its tributaries
and branches, and its watershed, as well as for supporting mathematical modeling and
engineering efforts. The following describes these activities.
4.1.1. Compilation of Existing Data
In order to properly characterize the Newtown Creek, its tributaries and branches, and its
watershed, a comprehensive approach was conducted to identify past and ongoing data-
collection efforts that focused on or included the Newtown Creek and the East River. The effort
facilitated a compilation of existing biological, water quality and sediment data, and watershed
information wherever availaable. Several sources of water quality and sediment data were
available for the Newtown Creek. The DEP has conducted facility planning in the Newtown
Creek since at least 1980, with the promulgation of the Newtown Creek WPCP 201 Facilities
Plan. Facilities planning has been ongoing since that time, resulting in a large body of pertinent
data. At the time of the writing of this report, the DEP was conducting several ongoing
programs yielding watershed and waterbody data.
The DEP studies from which existing data is available are summarized below, and
associated monitoring and sampling locations are presented on Figures 4-1 through 4-11. A
discussion on receiving water modeling follows at the end of this subsection.
Harbor Survey ProgramDEP‟s Harbor Survey Program has been monitoring water
quality in New York Harbor since 1909. The Harbor Survey has been monitoring water quality
near the mouth of Newtown Creek since 1968, and in the Creek at Station E2A from 1984 to
1999. Three additional stations were added in the Creek in 2003, one near the mouth of Whale
Creek (NC3), one halfway between the Kosciuszko and JJ Bryne Memorial bridges (NC2), and
one near the mouth of Maspeth Creek (NC1). An additional station (NC0) was added in English
Kills in July of 2004. Sampling occurs at Harbor Survey stations on a monthly basis during
winter months and weekly during summer months. Harbor Survey monitoring locations are
shown on Figure 4-1.
2004 Inner Harbor CSO Facility Planning Project
The receiving waters of the Inner Harbor were sampled to provide background
information on existing water quality conditions and data for development of a mathematical
water quality model for use in Inner Harbor CSO facility planning. Samples were taken from 10
stations in the Inner Harbor and from five stations in Gowanus Canal using mainly existing
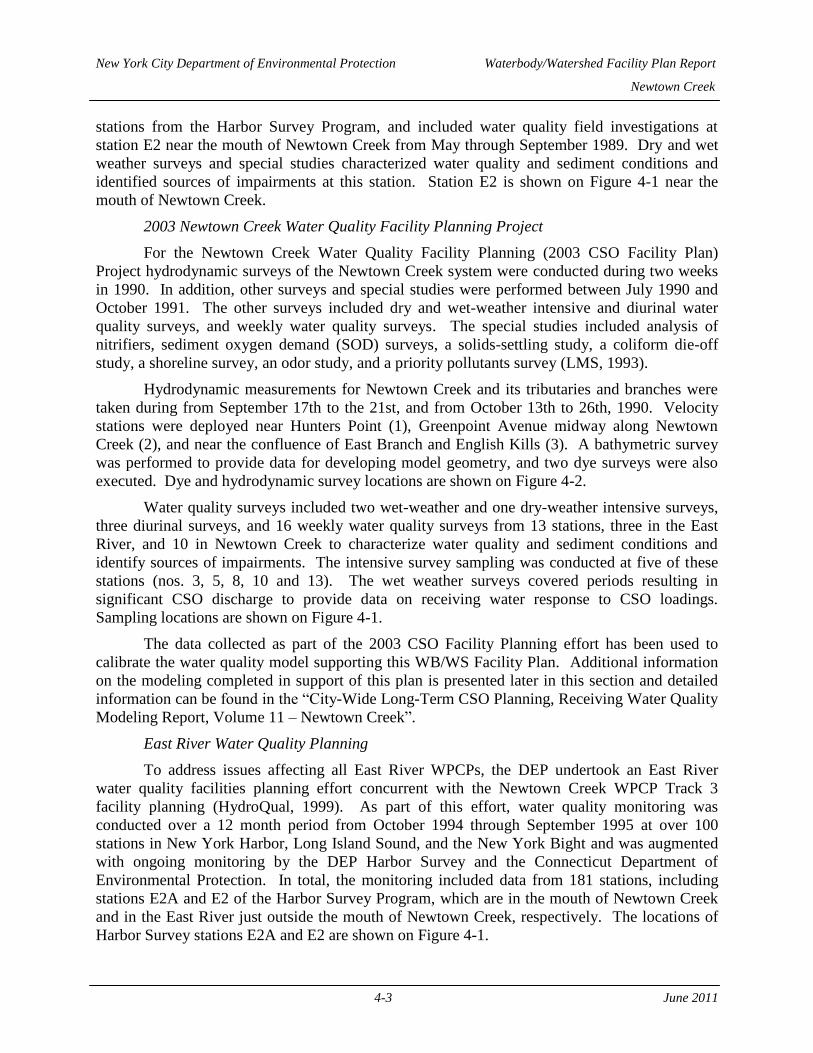
New York City Department of Environmental Protection Waterbody/Watershed Facility Plan Report
Newtown Creek
4-3 June 2011
stations from the Harbor Survey Program, and included water quality field investigations at
station E2 near the mouth of Newtown Creek from May through September 1989. Dry and wet
weather surveys and special studies characterized water quality and sediment conditions and
identified sources of impairments at this station. Station E2 is shown on Figure 4-1 near the
mouth of Newtown Creek.
2003 Newtown Creek Water Quality Facility Planning Project
For the Newtown Creek Water Quality Facility Planning (2003 CSO Facility Plan)
Project hydrodynamic surveys of the Newtown Creek system were conducted during two weeks
in 1990. In addition, other surveys and special studies were performed between July 1990 and
October 1991. The other surveys included dry and wet-weather intensive and diurinal water
quality surveys, and weekly water quality surveys. The special studies included analysis of
nitrifiers, sediment oxygen demand (SOD) surveys, a solids-settling study, a coliform die-off
study, a shoreline survey, an odor study, and a priority pollutants survey (LMS, 1993).
Hydrodynamic measurements for Newtown Creek and its tributaries and branches were
taken during from September 17th to the 21st, and from October 13th to 26th, 1990. Velocity
stations were deployed near Hunters Point (1), Greenpoint Avenue midway along Newtown
Creek (2), and near the confluence of East Branch and English Kills (3). A bathymetric survey
was performed to provide data for developing model geometry, and two dye surveys were also
executed. Dye and hydrodynamic survey locations are shown on Figure 4-2.
Water quality surveys included two wet-weather and one dry-weather intensive surveys,
three diurinal surveys, and 16 weekly water quality surveys from 13 stations, three in the East
River, and 10 in Newtown Creek to characterize water quality and sediment conditions and
identify sources of impairments. The intensive survey sampling was conducted at five of these
stations (nos. 3, 5, 8, 10 and 13). The wet weather surveys covered periods resulting in
significant CSO discharge to provide data on receiving water response to CSO loadings.
Sampling locations are shown on Figure 4-1.
The data collected as part of the 2003 CSO Facility Planning effort has been used to
calibrate the water quality model supporting this WB/WS Facility Plan. Additional information
on the modeling completed in support of this plan is presented later in this section and detailed
information can be found in the “City-Wide Long-Term CSO Planning, Receiving Water Quality
Modeling Report, Volume 11 – Newtown Creek”.
East River Water Quality Planning
To address issues affecting all East River WPCPs, the DEP undertook an East River
water quality facilities planning effort concurrent with the Newtown Creek WPCP Track 3
facility planning (HydroQual, 1999). As part of this effort, water quality monitoring was
conducted over a 12 month period from October 1994 through September 1995 at over 100
stations in New York Harbor, Long Island Sound, and the New York Bight and was augmented
with ongoing monitoring by the DEP Harbor Survey and the Connecticut Department of
Environmental Protection. In total, the monitoring included data from 181 stations, including
stations E2A and E2 of the Harbor Survey Program, which are in the mouth of Newtown Creek
and in the East River just outside the mouth of Newtown Creek, respectively. The locations of
Harbor Survey stations E2A and E2 are shown on Figure 4-1.
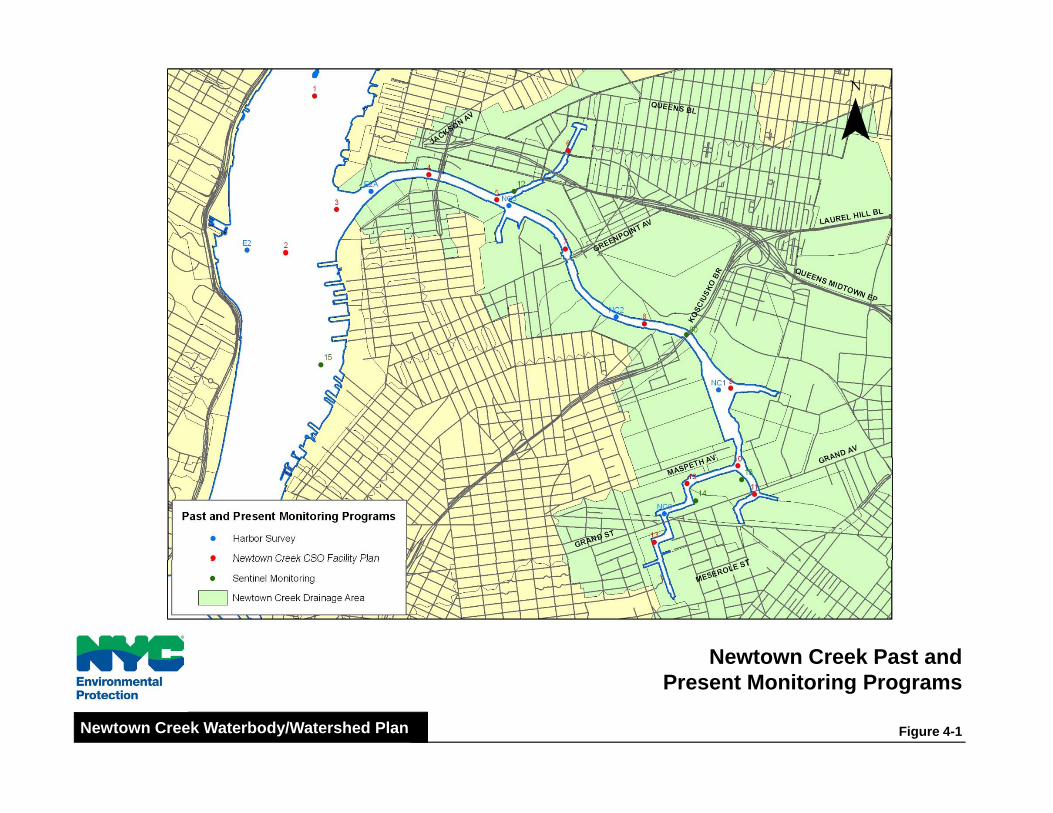
Newtown Creek Past andNewtown Creek Past andPresent Monitoring Programs
Figure 4-1Newtown Creek Waterbody/Watershed Plan
Newtown Creek HydrodynamicNewtown Creek Hydrodynamic(Dye and Velocity) Survey Locations
Figure 4-2Newtown Creek Waterbody/Watershed Plan
New York City Department of Environmental Protection Waterbody/Watershed Facility Plan Report
Newtown Creek
4-6 June 2011
Air Curtain Pilot Study
An air curtain pilot study was conducted in English Kills, which is tributary to Newtown
Creek, between November and December 1993 under the DEP‟s City-Wide Floatables Study.
Water quality sampling was conducted in English Kills over the period from November 9
through 12, 1993, and measurements included salinity, temperature, DO, suspended solids, and
priority pollutants. The first day of sampling was conducted to obtain baseline data and
sampling over the following three days was conducted with the air system active to ascertain the
affects on DO content of the receiving water and to determine the impacts of the system on
resuspension of sediment pollutants. Further sampling occurred at additional stations in
Newtown Creek and East Branch on November 12, 1993. A follow-up survey was conducted
on November 17, 1993 to assess water quality conditions in English Kills and Newtown Creek
after the operation of the system was ended. The locations of the sampling stations in Newtown
Creek and English Kills are shown on Figure 4-3.
In-Stream Aeration Pilot Study
An in-stream aeration pilot study was conducted by the DEP in 1996 to evaluate the
water quality effects of a diffused aeration system being considered as part of Newtown Creek
CSO Facility Planning (LMS, 1997). The pilot study included continuous monitoring, intensive
surveys, and routine surveys. Three continuous monitoring stations were deployed in English
Kills from April 2nd
or 3rd
through September 12, 1996 to obtain data inside and outside of the
diffuser arrays. Intensive monitoring was conducted four times (April 18, June 6, August 19,
and September 5, 1996) utilizing a Data Acquisition System (DAS) located on board a boat to
obtain vertical profiles and longitudinal and lateral transects for temperature, conductivity, DO,
and turbidity from English Kills and Newtown Creek proper. Grab samples were also collected
from CSO Facility Planning stations 8, 10, 12, and 13 and analyzed for hydrogen sulfide, BOD5
(total and filtered), TSS, total volatile suspended solids (TVSS), total organic carbon (TOC), and
dissolved organic carbon (DOC). Routine surveys by boat utilizing the DAS were later added to
obtain an alternative data set for DO, temperature, conductivity, and pH. The routine survey
locations were concentrated in upper English Kills, and stations were changed when pilot
diffuser configurations were modified.
Routine sampling was conducted from June 13, to September 6, 1996, once per week
during weeks where intensive monitoring was completed, and twice per week otherwise. CSO
Facility Planning stations are shown on Figure 4-1 and continuous and intensive monitoring sites
are shown on Figure 4-4.
Sentinel Monitoring Program
The DEP‟s Sentinel Monitoring Program is a targeted program to sample localized areas
of high pathogen levels. As part of this program, water quality data was collected quarterly at
four stations in the Newtown Creek from 1999 to 2003 for Fecal Coliform analysis. Sentinel
Monitoring Program sampling stations are shown on Figure 4-1.
4.1.2. Biological and Habitat Assessments
USEPA has for a long time indicated that water quality based planning should follow a
watershed based approach. Such an approach considers all factors impacting water quality
including both point and nonpoint (watershed) impacts on the waterbody. A key component of
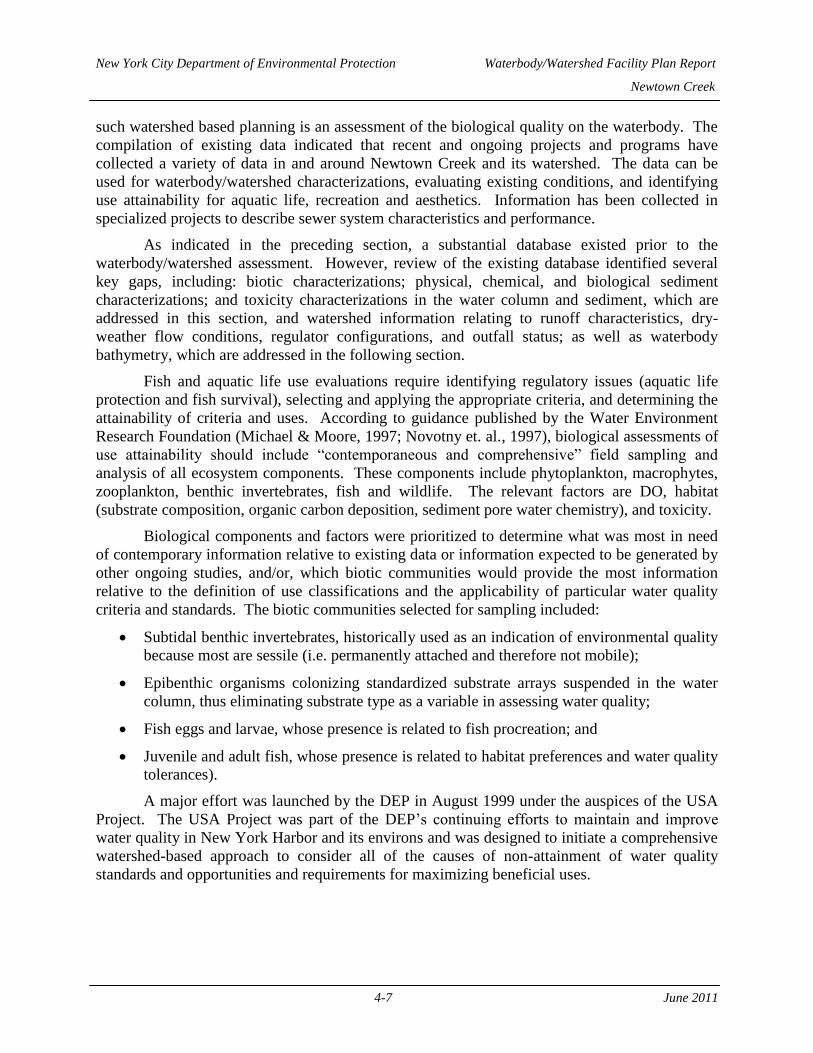
New York City Department of Environmental Protection Waterbody/Watershed Facility Plan Report
Newtown Creek
4-7 June 2011
such watershed based planning is an assessment of the biological quality on the waterbody. The
compilation of existing data indicated that recent and ongoing projects and programs have
collected a variety of data in and around Newtown Creek and its watershed. The data can be
used for waterbody/watershed characterizations, evaluating existing conditions, and identifying
use attainability for aquatic life, recreation and aesthetics. Information has been collected in
specialized projects to describe sewer system characteristics and performance.
As indicated in the preceding section, a substantial database existed prior to the
waterbody/watershed assessment. However, review of the existing database identified several
key gaps, including: biotic characterizations; physical, chemical, and biological sediment
characterizations; and toxicity characterizations in the water column and sediment, which are
addressed in this section, and watershed information relating to runoff characteristics, dry-
weather flow conditions, regulator configurations, and outfall status; as well as waterbody
bathymetry, which are addressed in the following section.
Fish and aquatic life use evaluations require identifying regulatory issues (aquatic life
protection and fish survival), selecting and applying the appropriate criteria, and determining the
attainability of criteria and uses. According to guidance published by the Water Environment
Research Foundation (Michael & Moore, 1997; Novotny et. al., 1997), biological assessments of
use attainability should include “contemporaneous and comprehensive” field sampling and
analysis of all ecosystem components. These components include phytoplankton, macrophytes,
zooplankton, benthic invertebrates, fish and wildlife. The relevant factors are DO, habitat
(substrate composition, organic carbon deposition, sediment pore water chemistry), and toxicity.
Biological components and factors were prioritized to determine what was most in need
of contemporary information relative to existing data or information expected to be generated by
other ongoing studies, and/or, which biotic communities would provide the most information
relative to the definition of use classifications and the applicability of particular water quality
criteria and standards. The biotic communities selected for sampling included:
Subtidal benthic invertebrates, historically used as an indication of environmental quality
because most are sessile (i.e. permanently attached and therefore not mobile);
Epibenthic organisms colonizing standardized substrate arrays suspended in the water
column, thus eliminating substrate type as a variable in assessing water quality;
Fish eggs and larvae, whose presence is related to fish procreation; and
Juvenile and adult fish, whose presence is related to habitat preferences and water quality
tolerances).
A major effort was launched by the DEP in August 1999 under the auspices of the USA
Project. The USA Project was part of the DEP‟s continuing efforts to maintain and improve
water quality in New York Harbor and its environs and was designed to initiate a comprehensive
watershed-based approach to consider all of the causes of non-attainment of water quality
standards and opportunities and requirements for maximizing beneficial uses.
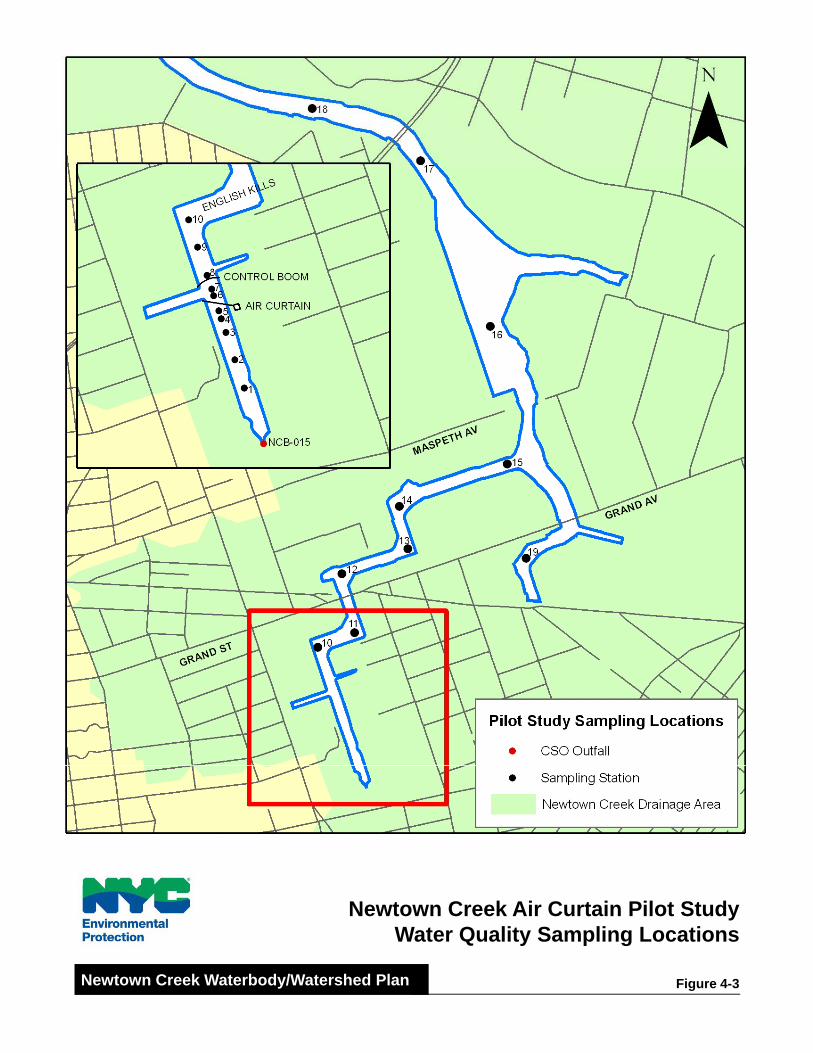
Newtown Creek Air Curtain Pilot StudyWater Quality Sampling Locations
Figure 4-3Newtown Creek Waterbody/Watershed Plan

Newtown Creek In-Stream Aeration Pilot StudyWater Quality Sampling Locations
Figure 4-4Newtown Creek Waterbody/Watershed Plan
New York City Department of Environmental Protection Waterbody/Watershed Facility Plan Report
Newtown Creek
4-10 June 2011
Under the USA Project, biological components and factors were prioritized to determine
what information was most needed relative to existing data or information expected to be
generated by other ongoing studies, and/or which biotic communities would provide the most
information relative to the definition of use classifications and the applicability of particular
water quality criteria and standards. The biotic communities selected for field sampling included
subtidal benthic invertebrates (which, being largely immobile, have historically been used as
indicators of environmental quality); epibenthic organisms colonizing standardized substrate
arrays suspended in the water column (thus eliminating substrate type as a variable in assessing
water quality); fish eggs and larvae (their presence being related to fish procreation); and
juvenile and adult fish (their presence being a function of habitat preferences and/or DO
tolerances).
The waterbody/watershed assessment conducted a biological Field Sampling and
Analysis Program (FSAP) designed to fill ecosystem data gaps for Newtown Creek. DEP‟s
FSAPs were designed and implemented in conformance with the USEPA‟s Quality Assurance
Project Plan guidance (USEPA, 1998, 2001a, 2001b), its standard operation and procedure
guidance (USEPA, 2001c), and in consultation with USEPA‟s Division of Environmental
Science and Assessment in Edison, NJ. The FSAPs collected information to identify uses and
use limitations within waterbodies assessing aquatic organisms and factors that contribute to use
limitations (DO, substrate, habitat, and toxicity). Some of these FSAPs were related to use
limitations (DO, substrate, habitat and toxicity). Some of these FSAPs were related to specific
waterbodies; others to specific ecological communities or habitat variables throughout the
harbor; and still others to trying to answer specific questions about habitat and/or water quality
effects on aquatic life. Several FSAPs were conducted by DEP during the USA Project that
included investigation of Newtown Creek.DEP conducted its Harbor-Wide Ichthyoplankton
FSAP in 2001 to identify and characterize ichthyoplankton communities in the open waters and
tributaries of New York Harbor (HydroQual, 2001b). Information developed by this FSAP
identified what species are spawning, as well as where and when spawning may be occurring in
New York City‟s waterbodies. The FSAP was executed on a harbor-wide basis to assure that
evaluations would be performed at the same time and general water quality conditions for all
waterbodies. Sampling was performed at 50 stations throughout New York Harbor, its
tributaries, and at reference stations outside the Harbor complex. The locations of sampling
stations are shown on Figure 4-5. Two stations were located within Newtown Creek and one
station was located in the East River just outside the mouth of the Creek. Samples were
collected using a fine-mesh plankton net with two replicate tows taken at 50 stations in March,
May and July 2001, including all three stations in and around the Newtown Creek. In August
2001, 21 of the stations, including one in Newtown Creek, were re-sampled to evaluate
ichthyoplankton during generally the worst case temperature and DO conditions.
DEP conducted an East River Waterbody Biology FSAP in 2001 to help evaluate the use
and standards attainment in the East River and its tributaries, including Newtown Creek, by (1)
identifying and characterizing the benthic invertebrate communities and bottom sediment
composition through benthos sampling, and by (2) inventorying the presence or abundance of
fish in the target waterbodies through otter trawling and gill netting (HydroQual, 2001e).
Information developed under objective (1) of this FSAP identified whether infaunal benthic
invertebrates are more limited by physical habitat or by DO concentrations in the water column.
New York City Department of Environmental Protection Waterbody/Watershed Facility Plan Report
Newtown Creek
4-11 June 2011
The locations of sampling stations used to support the analyses completed under objective (1) are
shown on Figure 4-6. Additionally, information developed under objective (2) of this FSAP
identified the effect of DO and water quality on the abundance of fish in the East River and its
tributaries. The locations of sampling station used to support the analyses completed under
objective (2) are also shown on Figure 4-6.
The DEP conducted a Harbor-Wide Epibenthic Recruitment and Survival FSAP in 2001
to characterize the abundance and community structure of epibenthic organisms in the open
waters and tributaries of New York Harbor (HydroQual, 2001c). The recruitment and survival of
epibenthic communities on hard substrates was evaluated because these sessile organisms are
good indicators of long-term water quality. This FSAP provided a good indication of both intra-
and inter-waterbody variation in organism recruitment and community composition. Artificial
substrate arrays were deployed at 37 stations throughout New York Harbor, its tributaries, and at
reference stations outside the Harbor complex. The locations of sampling stations are shown on
Figure 4-7. Two stations were located within Newtown Creek and one station was located in the
East River just outside the mouth of the Creek. The findings of earlier waterbody-specific
FSAPs in Paerdegat Basin and the Bronx River indicated that six months was sufficient time to
characterize the peak times of recruitment, which are the spring and summer seasons. Therefore
arrays were deployed in April 2001 at two depths (where depth permitted) and retrieved in
September 2001.
A special field investigation was conducted during the summer of 2002 under the
Tributary Benthos Characterization FSAP to evaluate benthic substrate characteristics in New
York Harbor tributaries, including Newtown Creek. The goals of the FSAP were to assist in the
assessment of physical habitat components and their impacts on overall habitat suitability and
water quality, and to assist in the calibration of the water quality models as they compute bottom
sediment concentrations of TOC (HydroQual, 2002c). TOC is an indicator of high ammonium
(NH4) and hydrogen sulfide (H2S) concentrations, and as such is a surrogate for overall substrate
quality. Physical characteristics of benthic habitat directly and critically relate to the variety and
abundance of the organisms living on the waterbody bottom. These benthic organisms represent
a crucial component of the food web and, therefore, directly affect the survival and propagation
of fish. Samples were collected from 103 stations in New York Harbor tributaries using a Petite
Ponar® grab sampler in July 2002. The locations of sampling stations are shown on Figure 4-8.
Ten of the stations were located in the Newtown Creek, its tributaries, and branches. Two
samples from each station were tested for TOC, grain size, and percent solids.
A Subtidal Benthos and Ichthyoplankton Characterization FSAP was executed by the
DEP during the summer of 2003 (HydroQual, 2003a). There were several main objectives of the
FSAP that included: (1) reinforcing relationships between fish propagation and habitat; (2)
assessing aquatic life improvements in Gowanus Canal since the DEP‟s reactivation of the
Gowanus Canal Flushing Tunnel; and (3) characterizing benthic invertebrate fauna in Newtown
Creek, Coney Island Creek, and Sheepshead Bay. Earlier FSAPs conducted benthic and
ichthyoplankton sampling in Newtown Creek, however only one station (NEWTB01, Figure 4-
6), was sampled for benthos under a 2001 FSAP (HydroQual, 2001e), and sediment sampling
results from the 2002 FSAP (HydroQual 2002c), reveal considerable variations in TOC and grain
size within Newtown Creek, and in some cases between replicates at the same station. This, the
total length and configuration of the creek, and its more than 20 CSOs, prompted obtaining

New York City Department of Environmental Protection Waterbody/Watershed Facility Plan Report
Newtown Creek
4-12 June 2011
additional data to describe and evaluate differences in benthic life in Newtown Creek. Therefore
Ichthyoplankton sampling and characterization was conducted at one station in Newtown Creek
during dry and wet weather conditions to reinforce relationships between fish propagation and
physical and water quality habitat, and benthos sampling was conducted using a Petite Ponar®
grab sampler at several other stations in the Newtown Creek. Benthic samples from each station
were tested for TOC, grain size, and percent solids, while additional samples were collected for
characterizing benthic invertebrate communities, with the purpose of comparing benthic taxa and
numbers of organisms in different reaches of Newtown Creek with those of other waterbodies,
and relative to within-creek distribution of sediment characteristics and CSOs. The locations of
sampling stations are shown on Figure 4-9. Six stations were located in the Newtown Creek, its
tributaries, and branches. All field investigations were conducted during June and July of 2003.
DEP conducted a Tributary Toxicity Characterization FSAP in 2003 to determine
whether toxicity is a significant issue of concern for DEP‟s waterbody evaluations (HydroQual,
2003b). Water column and sediment samples were collected from a total of twenty locations in
Newtown Creek, Gowanus Canal, Flushing Bay and Creek, the Bronx River, and Westchester
Creek. Four stations were located in the Newtown Creek, its tributaries and branches (Figure 4-
10). Water column toxicity was tested using 7-day survival and growth toxicity tests with
Sheepshead minnow and 7-day survival, growth and consistency toxicity tests with mysid
shrimp. Sediment chronic toxicity was evaluated using 28-day whole sediment chronic toxicity
tests with the amphipod Leptocheirus plumulosus. Survival, growth and fecundity of the species
were evaluated. In addition to the toxicity tests, sediment samples were collected using an
Ekomar dredge sampler and tested for TOC, percent solids, and grain size to help determine the
benthic substrate characteristics of the subtidal sediments related to sediment toxicity (if any).
Sampling was conducted in August 2003.
As described above, numerous physical, chemical, and biological FSAPs were executed
by DEP to fill several key data groups. The FSAPs were executed according to procedures
defined in a Field and Laboratory Standard Operating Procedure (SOP) that was revised and
enhanced as new investigations were identified and additional procedures were required. The
SOP follows USEPA‟s Quality Assurance Project Plan (QAPP) guidelines to assure quality
assurance and quality control (QA/QC). Data collected during these FSAPs were compiled in a
relational database with QA/QC. Figure 4-11 provides a composite map of the biological FSAP
sampling station locations in the Newtown Creek, its tributaries, and branches.
4.1.3. Other Data Gathering Programs
The DEP also conducted other field investigations in addition to the FSAPs discussed in
the preceding section as part of the Newtown Creek waterbody/watershed assessment and other
ongoing DEP projects to fill gaps in watershed characteristics. Runoff characteristics (such as
percent imperviousness or runoff coefficients) and dry weather flow conditions were investigated
by monitoring sewer system flows. In 2003, the DEP conducted monitoring at several locations
in the Newtown Creek and Bowery Bay service areas, including areas tributary to the Newtown
Creek. Also in 2003, field inspections were conducted of regulators, tide gates, outfalls, and
other system components in the Newtown Creek and Bowery Bay service areas tributary to
Newtown Creek. The locations of the monitoring investigations are shown on Figure 4-12.

Harbor-Wide IchthyoplanktonSampling Stations (2001)
Figure 4-5Newtown Creek Waterbody/Watershed Plan

East River FSAPSampling Stations (2001)
Figure 4-6Newtown Creek Waterbody/Watershed Plan

Harbor-Wide Epibenthic Recruitmentand Survival Sampling Stations (2001)
Figure 4-7Newtown Creek Waterbody/Watershed Plan
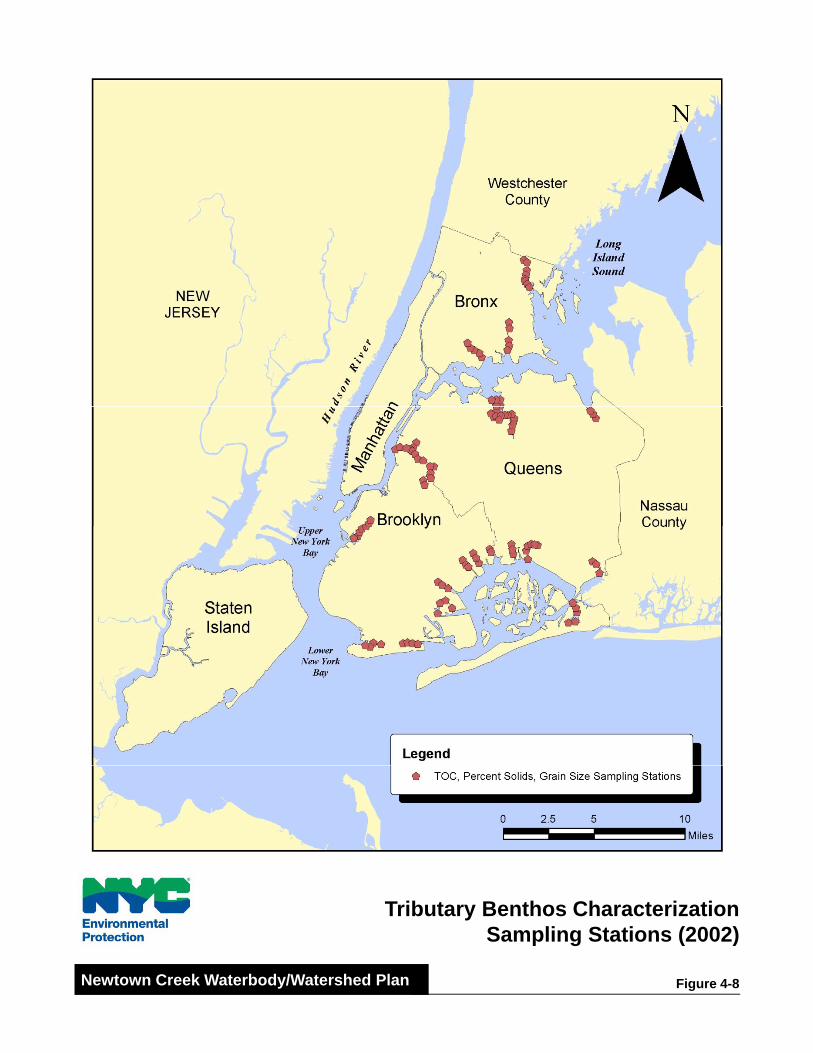
Tributary Benthos CharacterizationSampling Stations (2002)
Figure 4-8Newtown Creek Waterbody/Watershed Plan
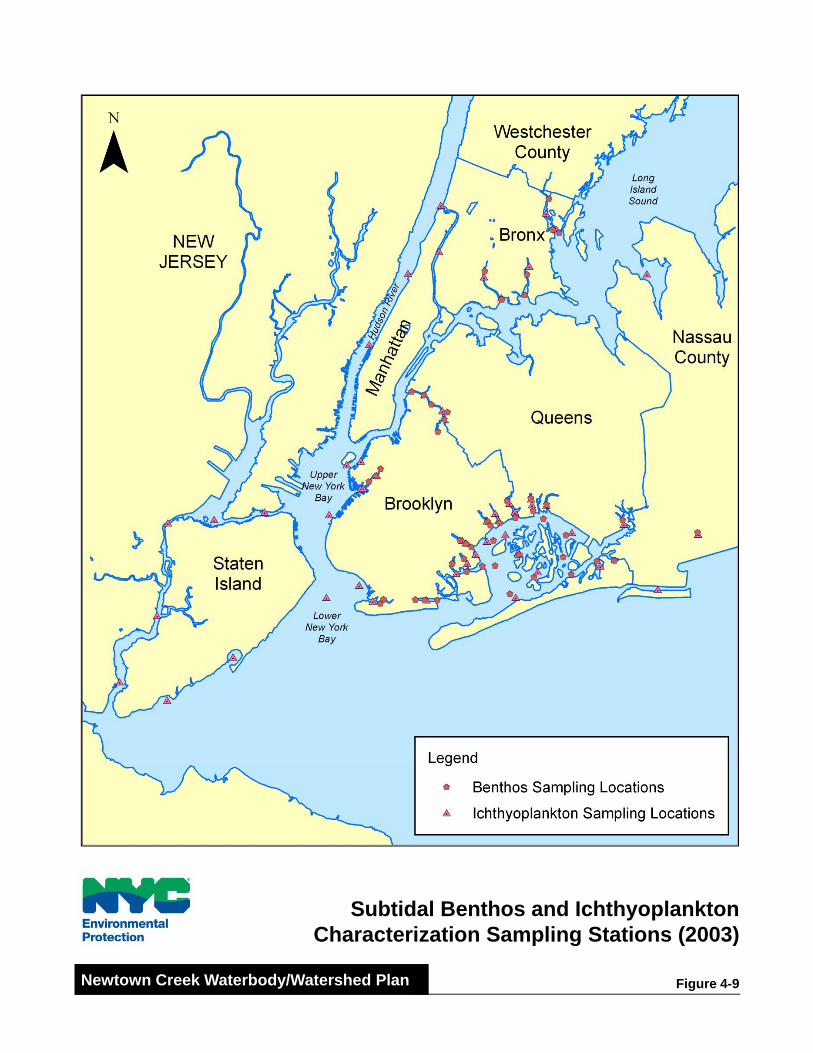
Subtidal Benthos and IchthyoplanktonCharacterization Sampling Stations (2003)
Figure 4-9Newtown Creek Waterbody/Watershed Plan
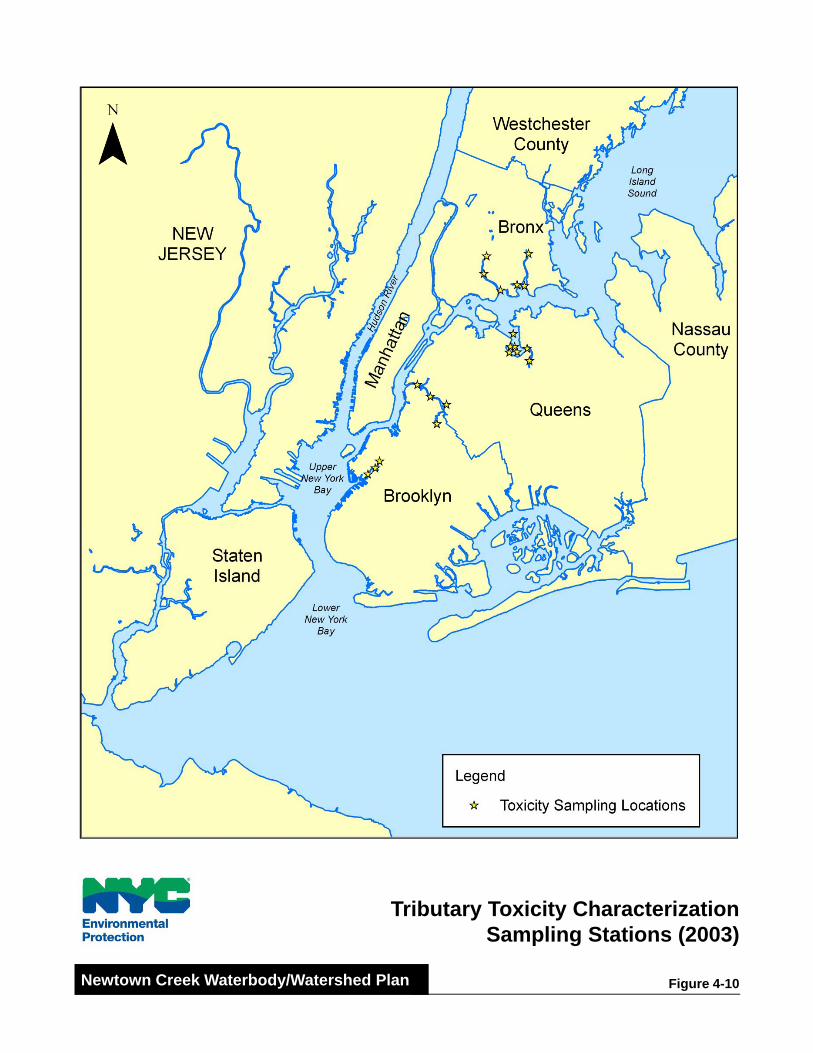
Tributary Toxicity CharacterizationSampling Stations (2003)
Figure 4-10Newtown Creek Waterbody/Watershed Plan
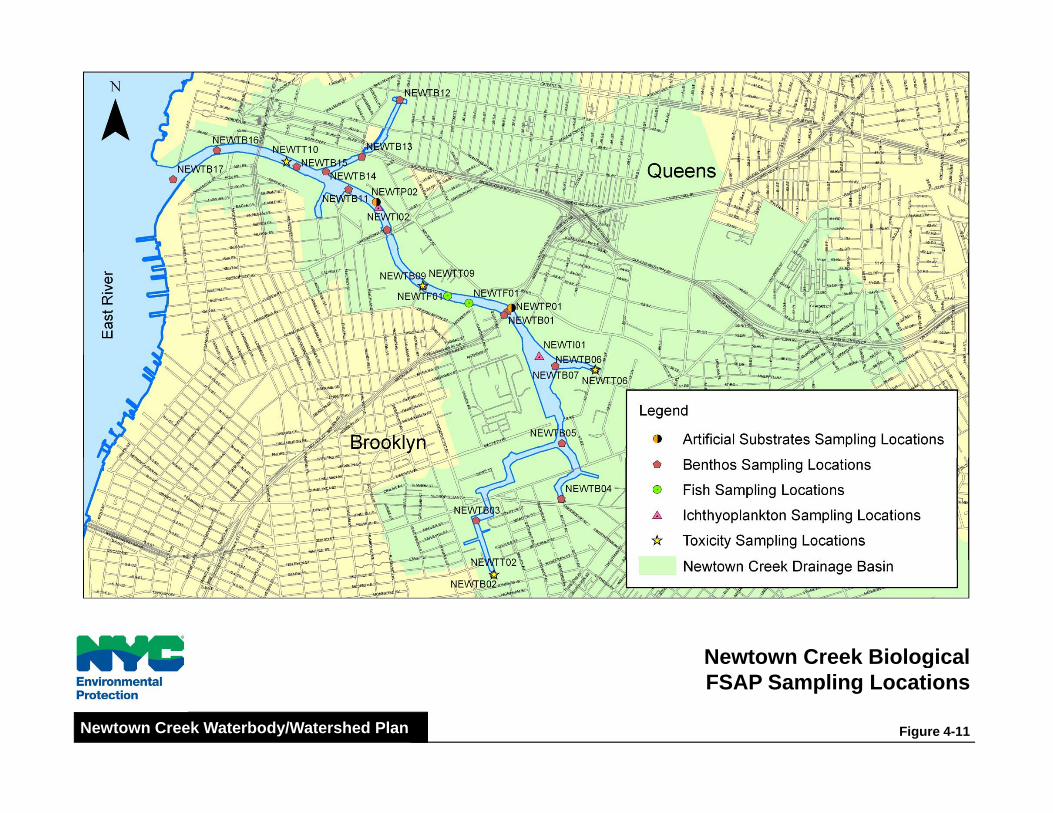
Newtown Creek BiologicalNewtown Creek BiologicalFSAP Sampling Locations
Figure 4-11Newtown Creek Waterbody/Watershed Plan

Newtown Creek and Bowery Bay Collection SystemsFlow Monitoring & Field Sampling Locations
Figure 4-12Newtown Creek Waterbody/Watershed Plan

New York City Department of Environmental Protection Waterbody/Watershed Facility Plan Report
Newtown Creek
4-21 June 2011
Following long-term control plan guidance, the DEP‟s waterbody/watershed assessments
required characterizations of combined sewer and stormwater discharges to calculate pollutant
loads and assess impacts on receiving waters during wet weather events. Sanitary sewage is a
component of combined sewage, but very little recent coliform bacteria data were available to
characterize New York City‟s sanitary sewage. Moreover, the federal Beaches Environmental
Assessment and Coastal Health (BEACH) Act of 2000 requires adoption of state water quality
standards for enterococci in coastal recreational waters, but very little local data is available for
enterococci. Therefore, a sampling program was conducted during the summer of 2002 to
collect total and fecal coliform bacteria and enterococci data that would be reasonably
representative of New York City‟s sanitary sewage. Influent sampling of all 14 DEP WPCPs,
including Bowery Bay and Newtown Creek, was conducted. Each WPCP was sampled on at
least five distinct days, with samples collected several times during the day and on a random
basis such that no WPCP was sampled on two successive days or on the same day of the week.
At least one day of dry weather (preferably two or more) was required prior to the sampling
event to assure that sample collection represented sanitary sewage only.
A hydrographic survey was completed in 1999 as part of the Dredging Feasibility Study
performed under the Newtown Creek CSO Facility Planning Project (URS, 2000b). The survey
was conducted in areas affected by larger CSOs in an attempt to determine the location and
extent of sediment deposits, and covered English Kills, Dutch Kills, Maspeth Creek, and East
Branch. However, because tidal effects and other activities in the study area likely affected
bathymetry after 1999, a new bathymetric survey was commissioned as part of this
waterbody/watershed assessment and was conducted in December 2005 to characterize contours
throughout the tributaries and the head end of the creek. During that survey, parts of the
tributaries were inaccessible due to the frozen conditions and the survey was suspended and later
completed in the beginning of June 2006. Figure 4-13 shows the bottom contours within the
2005/2006 surveyed areas.
4.1.4. Receiving Water Modeling
Receiving water models are used to simulate both the movement of the water
(hydrodynamics) and biological/chemical processes (water quality) within a waterbody.
Receiving water models are particularly useful for characterizing a waterbody‟s response to
hypothetical scenarios, such as design environmental conditions and engineering alternatives,
and evaluating the resulting compliance with water quality standards and criteria. Major inputs
to the receiving water models include landside discharges, exchange at the open boundaries of
the waterbody, and other physical and kinetic forcing functions. This section generally describes
the tools employed for receiving water modeling of the Newtown Creek waterbody/watershed
assessment area. A detailed description of these receiving water models and their calibration is
provided in the “City-Wide Long-Term CSO Planning, Receiving Water Quality Modeling
Report, Volume 11 – Newtown Creek”.
The DEP constructed a receiving water model during its Newtown Creek Water Quality
(CSO) Facility Planning Project to simulate hydrodynamics and water quality in the Newtown
Creek, its tributaries and branches. Figure 4-14 depicts the segmentation of the receiving water
model. The model is three dimensional, as each grid shown in the figure has 5 layers in the
vertical to effectively simulate depth-variable DO mechanisms such as reaeration and sediment
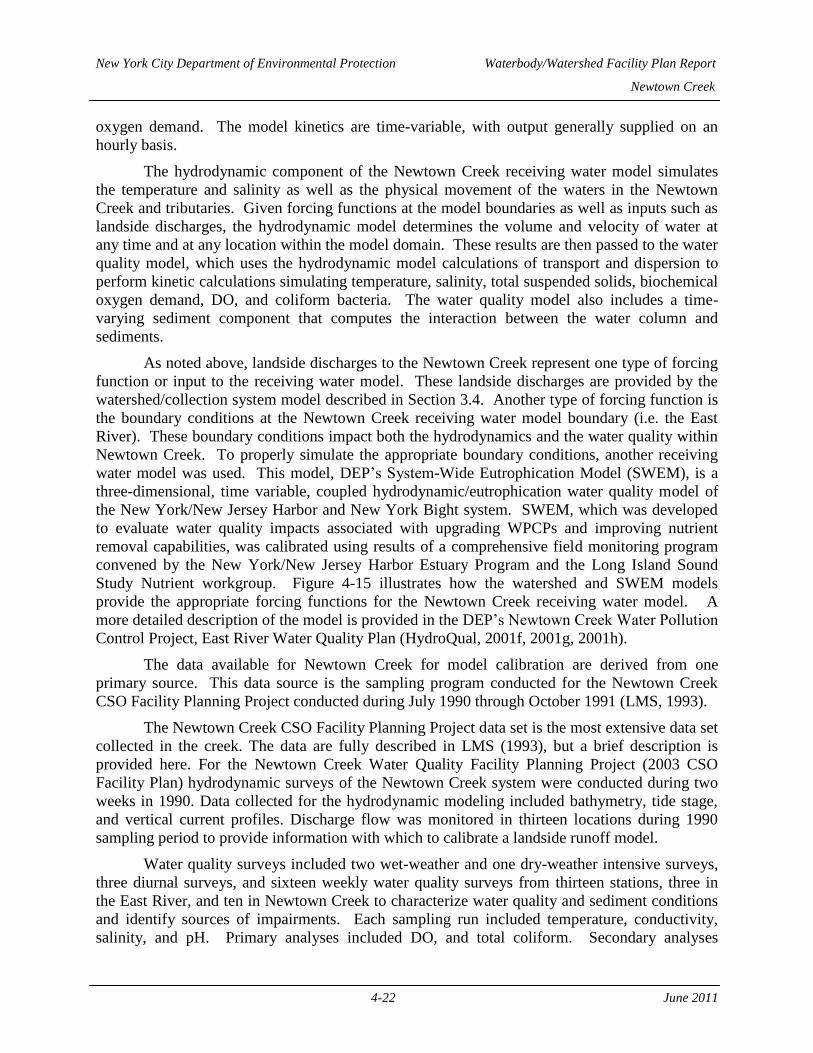
New York City Department of Environmental Protection Waterbody/Watershed Facility Plan Report
Newtown Creek
4-22 June 2011
oxygen demand. The model kinetics are time-variable, with output generally supplied on an
hourly basis.
The hydrodynamic component of the Newtown Creek receiving water model simulates
the temperature and salinity as well as the physical movement of the waters in the Newtown
Creek and tributaries. Given forcing functions at the model boundaries as well as inputs such as
landside discharges, the hydrodynamic model determines the volume and velocity of water at
any time and at any location within the model domain. These results are then passed to the water
quality model, which uses the hydrodynamic model calculations of transport and dispersion to
perform kinetic calculations simulating temperature, salinity, total suspended solids, biochemical
oxygen demand, DO, and coliform bacteria. The water quality model also includes a time-
varying sediment component that computes the interaction between the water column and
sediments.
As noted above, landside discharges to the Newtown Creek represent one type of forcing
function or input to the receiving water model. These landside discharges are provided by the
watershed/collection system model described in Section 3.4. Another type of forcing function is
the boundary conditions at the Newtown Creek receiving water model boundary (i.e. the East
River). These boundary conditions impact both the hydrodynamics and the water quality within
Newtown Creek. To properly simulate the appropriate boundary conditions, another receiving
water model was used. This model, DEP‟s System-Wide Eutrophication Model (SWEM), is a
three-dimensional, time variable, coupled hydrodynamic/eutrophication water quality model of
the New York/New Jersey Harbor and New York Bight system. SWEM, which was developed
to evaluate water quality impacts associated with upgrading WPCPs and improving nutrient
removal capabilities, was calibrated using results of a comprehensive field monitoring program
convened by the New York/New Jersey Harbor Estuary Program and the Long Island Sound
Study Nutrient workgroup. Figure 4-15 illustrates how the watershed and SWEM models
provide the appropriate forcing functions for the Newtown Creek receiving water model. A
more detailed description of the model is provided in the DEP‟s Newtown Creek Water Pollution
Control Project, East River Water Quality Plan (HydroQual, 2001f, 2001g, 2001h).
The data available for Newtown Creek for model calibration are derived from one
primary source. This data source is the sampling program conducted for the Newtown Creek
CSO Facility Planning Project conducted during July 1990 through October 1991 (LMS, 1993).
The Newtown Creek CSO Facility Planning Project data set is the most extensive data set
collected in the creek. The data are fully described in LMS (1993), but a brief description is
provided here. For the Newtown Creek Water Quality Facility Planning Project (2003 CSO
Facility Plan) hydrodynamic surveys of the Newtown Creek system were conducted during two
weeks in 1990. Data collected for the hydrodynamic modeling included bathymetry, tide stage,
and vertical current profiles. Discharge flow was monitored in thirteen locations during 1990
sampling period to provide information with which to calibrate a landside runoff model.
Water quality surveys included two wet-weather and one dry-weather intensive surveys,
three diurnal surveys, and sixteen weekly water quality surveys from thirteen stations, three in
the East River, and ten in Newtown Creek to characterize water quality and sediment conditions
and identify sources of impairments. Each sampling run included temperature, conductivity,
salinity, and pH. Primary analyses included DO, and total coliform. Secondary analyses
New York City Department of Environmental Protection Waterbody/Watershed Facility Plan Report
Newtown Creek
4-23 June 2011
included fecal coliform, TSS, and BOD5. Tertiary sampling included filtered BOD5, thirty-day
BOD, volatile suspended solids, enterococci, chlorophyll-a, sulfides, oil and grease, ammonia,
total Kjeldahl nitrogen, nitrate-nitrite, and total phosphorus. The intensive survey sampling was
conducted at five of these stations (nos. 3, 5, 8, 10 and 13). The wet weather surveys covered
periods resulting in significant CSO discharge to provide data on receiving water response to
CSO loadings. The wet and dry weather intensive surveys were used for model calibration and
validation.
Additional detail on the Newtown Creek receiving water model, its calibration and
validation is presented in the “City-Wide Long-Term CSO Planning, Receiving Water Quality
Modeling Report, Volume 11 – Newtown Creek”.
Subsequent sections of this report describe how the Newtown Creek receiving water
models were used to characterize certain scenarios and evaluate expected compliance with water
quality standards and criteria.
4.2. PHYSICAL WATERBODY CHARACTERISTICS
This section describes the physical characteristics of Newtown Creek. Section 4.21
presents the overall dimensions, depths, branches and classification of Newtown Creek. Section
4.2.2 briefly describes the hydrodynamic features that affect Newtown Creek. Section 4.2.3
discusses the character of the Creek‟s benthos and substrate. Section 4.2.4 summarizes the
shoreline characteristics throughout the Creek. Section 4.2.5 describes waterbody access to the
Creek.
4.2.1. General
The Newtown Creek waterbody assessment area is herein considered to extend from its
confluence with the lower East River at the westernmost neighborhoods of Greenpoint and
Hunters Point to its upstream end in the neighborhood of Maspeth (see Figure 4-14). The entire
waterbody is classified as a saline tributary to the Lower East River according to Title 6 of the
NYCRR, Chapter X, Part 890. Though this classification implies that the Creek is a tributary,
the only significant inflows to the waterbody are wet-weather discharges from CSO and
stormwater.
Newtown Creek consists of a main stem and its branches, Dutch Kills, Whale Creek
Canal, Maspeth Creek and English Kills. The main stem is approximately 15,700 feet long from
its confluence with the East River to the end of the southern arm of the East Branch; Whale
Creek Canal is approximately 750 feet long; Dutch Kills is approximately 2,450 feet long;
Maspeth Creek is approximately 1,300 feet long; and English Kills is approximately 4,600 feet
long.
Numerous bridges cross Newtown Creek and its tributaries (see Figure 4-16). The main
branch of Newtown Creek has one fixed bridge, the Koscuiszko Bridge, which is elevated high
above the Creek and does not restrict shipping traffic, and three moveable bridges, the Pulaski
bascule bridge, the Greenpoint Avenue bascule bridge (J. J. Bryne Memorial Bridge), and the
Grand Street swing span bridge. The Pulaski and J. J. Bryne open regularly for shipping traffic.
Dutch Kills is crossed by four moveable bridges, the Long Island Rail Road (LIRR) “DK” swing
bridge, the LIRR “Cabin M” draw bridge, the Borden Avenue retractile bridge, and the Hunters
New York City Department of Environmental Protection Waterbody/Watershed Facility Plan Report
Newtown Creek
4-24 June 2011
Point Avenue bascule bridge, and one fixed bridge carrying the Long Island Expressway. There
were also two moveable bridges over English Kills, a bascule bridge at Metropolitan Avenue,
and the LIRR Bushwick Branch draw bridge at Montrose Avenue. However, a fixed steel bridge
has replaced the old wooden draw bridge at Montrose Avenue.
Newtown Creek averages about 200 – 250 feet wide and ranges in depth from 21 to 25
feet at MLW. Whale Creek is about 200 feet wide and ranges in depth from 18 to 21 feet at
MLW. Dutch Kills Creek is about 200 feet wide and ranges in depth from 6 to 15 feet at MLW.
The remaining branches of Newtown Creek vary in width from 125 to 250 feet and depths are
18-feet or less at MLW decreasing to about 6 feet at their upstream ends. Figure 4-13 illustrates
Newtown Creek bathymetry.
4.2.2. Hydrodynamics
Newtown Creek is a tidal waterbody opening to the Lower East River and as such
experiences a semi-diurnal tidal cycle with a vertical tidal range that varies from 2.0 to 6.2 feet
with a mean of 3.9 feet based on National Oceanic and Atmospheric Administration (NOAA)
tidal predictions at Hunters Point for 2006. As a narrow, dead-end tributary with no freshwater
inflow other than intermittent, wet-weather discharges, the Canal has low current speeds and a
limited exchange with the Lower East River.
The peak depth-averaged current velocity in Newtown Creek varies from 0.4 ft/sec in
English Kills to 1.2 ft/sec at the confluence with the Lower East River. Newtown Creek‟s
limited capacity for exchange and dispersal has led to significant water-quality degradation and
low DO during summertime periods and wet-weather events.
4.2.3. Sediments
Newtown Creek‟s limited capacity for exchange produces a stilling effect that allows
suspended solids materials to settle to the bottom of the waterbody.
Both CSO and stormwater discharge directly into the Creek and its branches. Heavier
solids and organic material discharged during wet-weather from these sources have created
sediments throughout Newtown Creek; particularly at the upstream branches in Maspeth Creek,
East Branch and English Kills. Sediment mounds have been created at the CSO discharge points
and will continue to grow in size due to inadequate flushing of the Creek.
Portions of the mounds become exposed during low tide and allowing noxious odors to
be released from the anaerobic decay of the highly organic material. Beyond the sediment
mounds sediments continually build up due to CSO and stormwater discharges into the Creek as
well as transport and subsequent settling of solids from the Lower East River. The sediments
contain metals, PCBs, dioxins/furans, and PAHs.
Currently, no maintenance dredging is performed in Newtown Creek. The USACE is
investigating covering the sediment mounds with dredge spoils to prevent release of hazardous
and toxic materials to the overlying waters.
4.2.4. Shoreline
The shorelines of Newtown Creek have been entirely altered, consisting of bulkheads
with some rip-rap. The shorelines are generally bulkheaded with wood, steel, cement or stone.
Typical shoreline features are shown in Figure 4-17.
2005/2006 Bathymetric SurveyWaterbody Bottom Contours
Figure 4-13Newtown Creek Waterbody/Watershed Plan
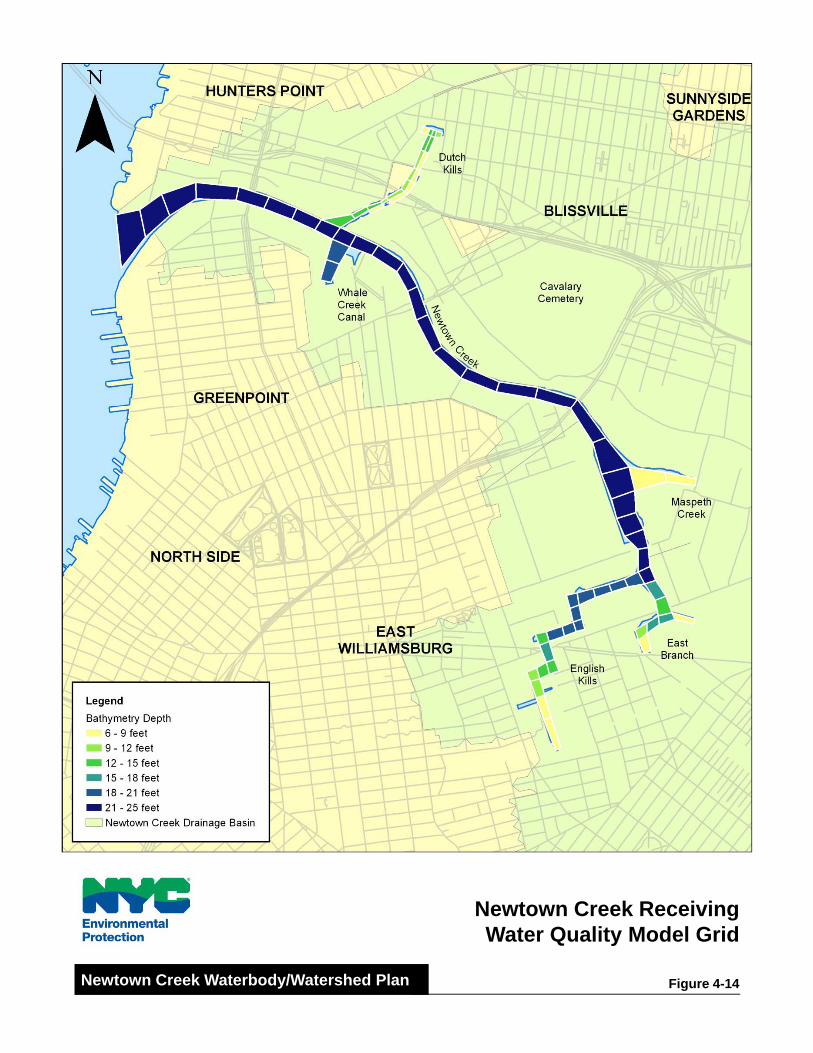
Newtown Creek ReceivingWater Quality Model Grid
Figure 4-14Newtown Creek Waterbody/Watershed Plan
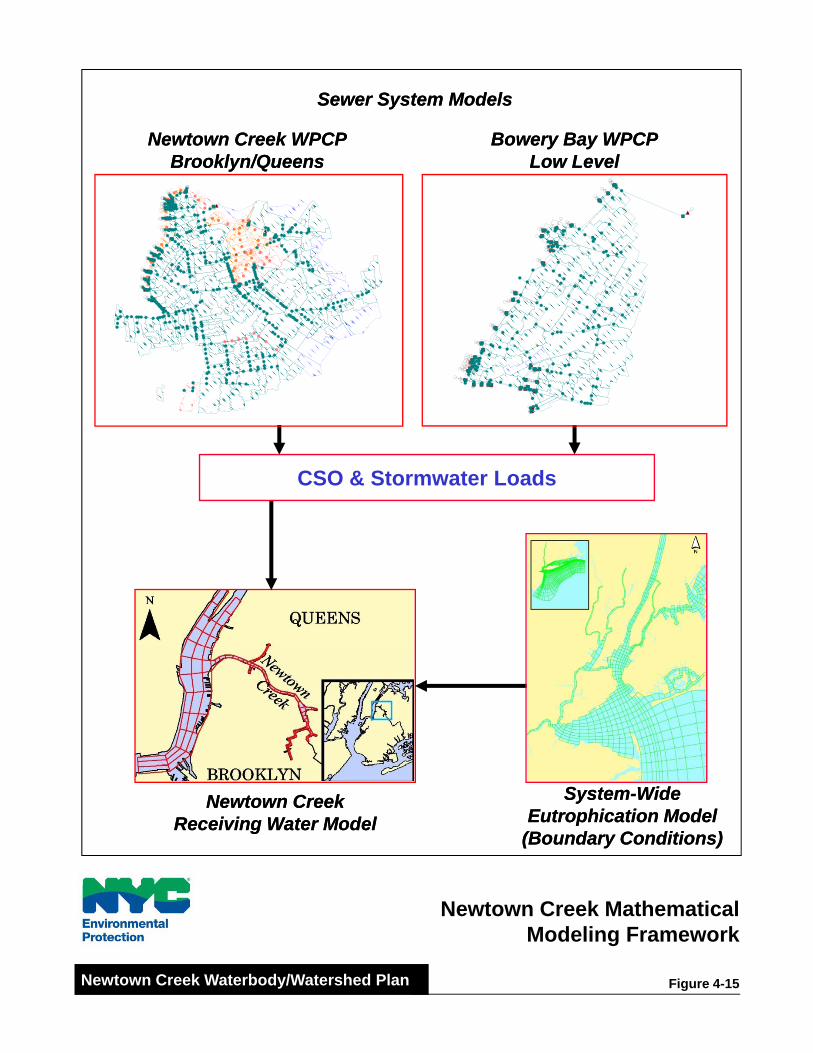
Sewer System ModelsSewer System Models
Newtown Creek WPCPNewtown Creek WPCPBrooklyn/QueensBrooklyn/Queens
Bowery Bay WPCPBowery Bay WPCPLow LevelLow LevelBrooklyn/QueensBrooklyn/Queens Low LevelLow Level
CSO & Stormwater Loads
Newtown CreekNewtown CreekReceiving Water ModelReceiving Water Model
SystemSystem--WideWideEutrophication ModelEutrophication Model
(Boundary Conditions)(Boundary Conditions)
Newtown Creek MathematicalModeling Framework
Figure 4-15Newtown Creek Waterbody/Watershed Plan

NO TEXT ON THIS PAGE

Newtown Creek Bridges
Figure 4-16Newtown Creek Waterbody/Watershed Plan

NO TEXT ON THIS PAGE
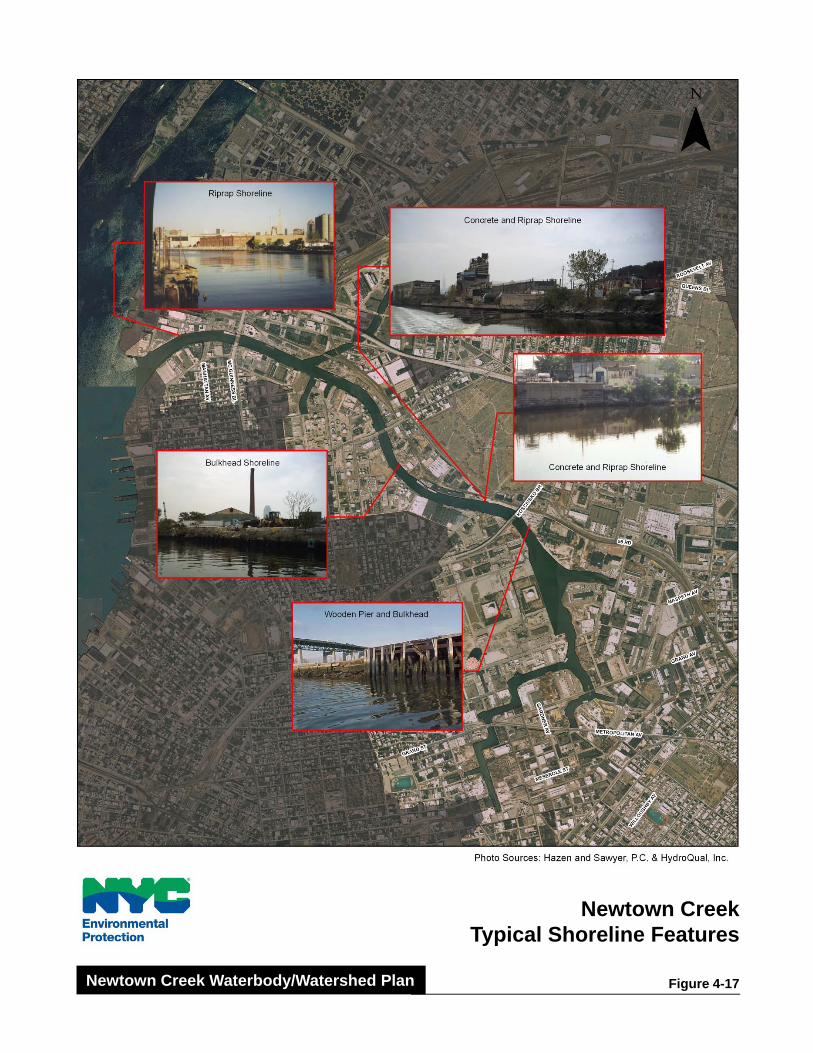
Newtown CreekTypical Shoreline Features
Figure 4-17Newtown Creek Waterbody/Watershed Plan
New York City Department of Environmental Protection Waterbody/Watershed Facility Plan Report
Newtown Creek
4-32 June 2011
Most shorelines of Newtown Creek are zoned manufacturing and are owned by private
commercial and industrial users, which include many scrap metal and recycling operations. The
Creek was formerly home to several oil refinery operators and the former home of a Phelps-
Dodge copper smelter. Several improvement projects are currently underway along the
Newtown Creek.
A 5,000 square foot park is being developed at the end of Vernon Boulevard on the
Queens side of Newtown Creek. Across Newtown Creek, on the Brooklyn side another street-
end park is being developed at the end of Manhattan Avenue and a promenade is being
constructed as part of the upgrades to the Newtown Creek WPCP. A significant portion of the
promenade is planned to be completed by spring of 2007.
4.2.5. Waterbody Access
Public waterbody access to Newton Creek and its branches is limited by the commercial
and industrial development along the waterbody. Most city streets terminate before Newtown
Creek at the location of businesses abutting the Creek.
There are no marinas or recreational boat moorings in Newtown Creek. There are no
beaches, parks or other recreationally oriented facilities on the Creek. Pedestrian and bike access
is available on all of the bridges which cross the waterbody except the Kosciuszko and railroad
bridges.
Development of the parks at the ends of Vernon Boulevard on the Queens side and
Manhattan Avenue on the Brooklyn side of the Creek will give public access to the waterbody as
well as provide recreationally oriented facilities on Newtown Creek. The promenade will
provide significant improvement to the adjacent shoreline and additional public access.
Renderings of the proposed promenade are included in Figure 4-18. In addition to these
elements, the Greenpoint-Williamsburg Waterfront Access Plan has been approved to become
part of the zoning text, and envisions a continuous shore public walkway running from the end of
Manhattan Avenue on the southern side of Newtown Creek in Greenpoint to the end of N. 3rd
Street in Williamsburg. The locations of the street-end parks and the proposed public walkway
are shown on Figure 4-19.
4.3. EXISTING WATERBODY USES
Newtown Creek was heavily developed for maritime commerce by the mid 1800‟s.
Currently, usage of Newtown Creek is primarily commercial and industrial with a mixture of oil
storage facilities, scrap metal and recycling, asphalt and cement plants, rail yards, warehouses
and the like. Water-dependent uses have diminished from historic levels as large industries such
as Exxon-Mobil and Phelps Dodge have closed their facilities. Some typical businesses on
Newton Creek are (Figure 4-20):
BP-Amoco Oil Company – south side of Newtown Creek at Apollo Street,
Diamond Asphalt – south side of Newtown Creek at Paidge Avenue,
Peerless Importers – south side of Newtown Creek at Bridgewater Street, and
Republic Auto Repair – north side of Newtown Creek at 11th Street.

Newtown Creek WPCPNewtown Creek WPCPPromenade
Figure 4-18Newtown Creek Waterbody/Watershed Plan
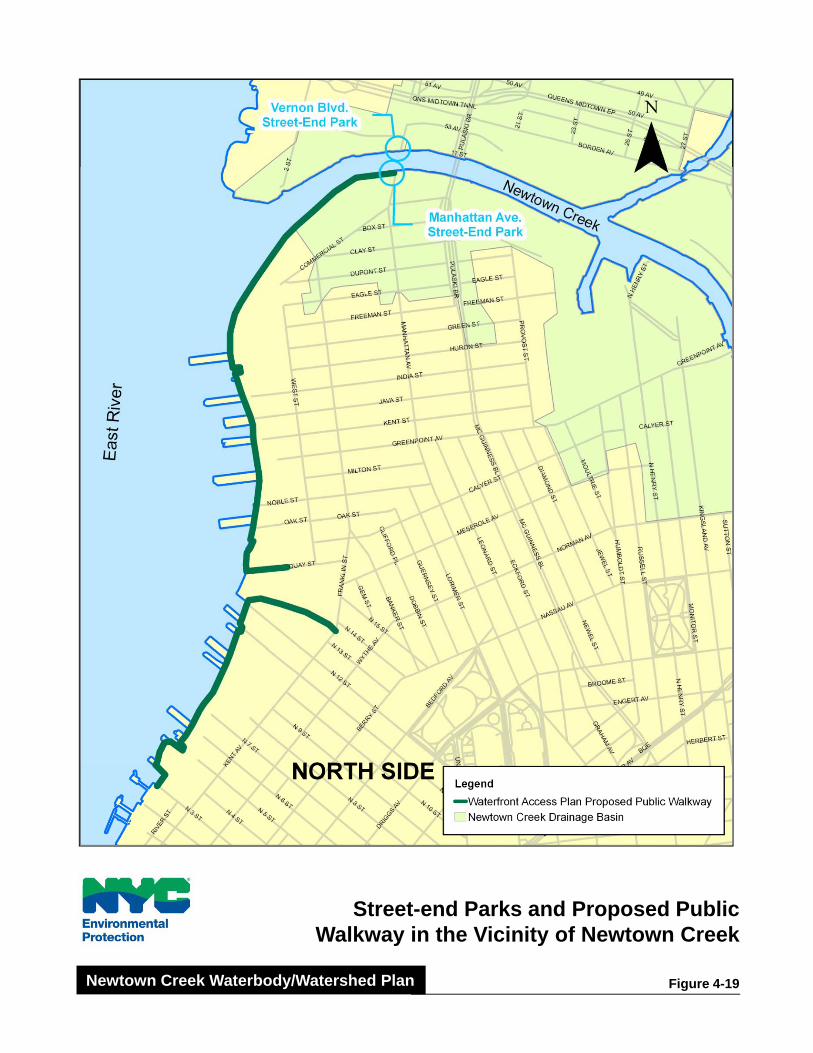
Street-end Parks and Proposed PublicWalkway in the Vicinity of Newtown Creek
Figure 4-19Newtown Creek Waterbody/Watershed Plan

Typical Businesses LocatedNear Newtown Creek
Figure 4-20Newtown Creek Waterbody/Watershed Plan

New York City Department of Environmental Protection Waterbody/Watershed Facility Plan Report
Newtown Creek
4-36 June 2011
Limited recreational uses such as private boating, fishing/crabbing, and scuba diving
occur within the Creek. Most shorelines are bulkheaded and public access to the waterbody is
limited to views from bridges and the few street-ends that abut Newtown Creek.
4.4. OTHER POINT SOURCES AND LOADS
Sections 2.3 and 3.3 discuss existing combined and storm sewer discharges, non-point
sources, and other potential sources of loading to the Newtown Creek, its tributaries, and
branches. In addition to those sources, the DEP Shoreline Survey Program has identified
numerous point source discharges to the waterbody/watershed assessment area. The DEP has
been surveying the shoreline to catalog outfalls since 1988 and has been producing the SPDES-
mandated Shoreline Survey report since 1991, identifying each outfall as a City-owned sewer,
highway drain, storm sewer, combined sewer outfall, or other SPDES-permitted discharge line,
etc. Approximately 218 non-CSO direct discharges (outfalls) to the Newtown Creek waterbody
were identified by the Shoreline Survey. Some (5) of these outfalls are SPDES permitted
stormwater discharges and are addressed in Section 3. The Shoreline Survey Program classified
most (172) of the remaining outfalls as “general”, many (29) as “storm or highway drains”, and
the rest (12) as “direct discharge”. According to the 2003 New York City Shoreline Survey
Program report for the Newtown Creek WPCP drainage area, a dry weather discharge at an
outfall discharging to the Newtown Creek, or one of its tributaries or branches has been
identified 32 times since 1989. The report indicates that 17 of these discharges have been abated
by the DEC and 14 abated by the DEP, with one discharge not abated. The report indicates that
this discharge was scheduled for abatement in 1990, however, the 2003 report does not list it as
being abated, nor does it indicate that further dry weather discharge has been identified from this
outfall. No further information was available at the time of the writing of this report.
The New York State SPDES database lists 13 permitted sites in the vicinity of Newtown
Creek, its tributaries and branches. Table 4-1 presents the SPDES permittees and the permitted
discharges associated with each. While these sites could represent potential sources of toxics-
related pollutants, they do not appear to represent significant sources of pollution that would
affect DO levels in the waterbody.
Table 4-1. SPDES Permittees Adjacent to Newtown Creek
SPDES No. Facility Name Permitted Discharge
NY0201138 Consolidated Edison Co. of New York
Groundwater Infiltration & Stormwater
NY0006131 Motva Enterprises LLC Stormwater Runoff
NY0200441 Buckeye Pipe Line Co. Long Island Recovery Well Carbon Treatment
NY0026204 Newtown Creek WPCP Treated Effluent (Whale Creek Outfall)
NY0007676 Metro Terminals Corporation Stormwater Loading Rack, Yard
NY0028452 Getty Terminals Corporation Stormwater
NY0004596 Amoco Oil Company Stormwater, Truck Washwater, Hydrostatic Test Water,
Ground Water Remediation Carbon
NY0200841 NYC Dept. of Sanitation Queens
District 5/5 Garage
Terminal Faciliities for Motor Freight Transportation
Runoff
NY0007641 Bayside Fuel Oil Depot Hydrostatic Test Water, Stormwater Runoff From PBS
CTM
NY0201260 Waste Management of New York
LLC Treated Stormwater Yard Runoff

New York City Department of Environmental Protection Waterbody/Watershed Facility Plan Report
Newtown Creek
4-37 June 2011
Table 4-1. SPDES Permittees Adjacent to Newtown Creek
SPDES No. Facility Name Permitted Discharge
Notes: (1)
The USEPA PCS database (updated July 21st, 2006) lists 3 additional permittees (Astoria Carting
NYU700090, Charles J. King Inc. NYU700230, and Metro Auto Salvage NYU700200) but does not have
permitted discharge data for these facilities. (2)
Mobile Oil NY0110060 is a Class 10 remediation site, which is not considered a “significant” discharger by the
DEC and therefore is only required to monitor and retain information on site.
Overall, the total contribution of flow from these additional point sources was determined
to be insignificant relative to CSO and stormwater inputs addressed in Section 3 of this report.
4.5. CURRENT WATER QUALITY CONDITIONS
As described in Section 1.2.1, the Newtown Creek appears on the DEC Section 303(d)
List of Impaired Waters due to DO/oxygen demand from urban runoff, storm sewers and CSO
inputs. The following sections describe the current water quality conditions which support this
listing using both existing water quality data and model simulations. The advantage of using
observed data it is the most reliable source of information; a water quality model may not capture
all of the dynamic features of the sewer system and natural water system (i.e. loading spikes,
localized circulation patterns, etc.). However, data collection is not continuous and may be
somewhat limited. The advantage of a model calculation is that it has a greater spatial resolution
(horizontal and vertical) and better represents temporal variability and overall system response.
The model also has the ability to distinguish seasonal impacts which may be important
depending on the parameter and criteria to be evaluated.
Calculated water column concentrations are the result of three major modeling
components:
The sewer system model, which quantifies flow discharges and pollutant loadings to the
Newtown Creek, its tributaries, and branches;
The hydrodynamic receiving water model, which defines the water circulation patterns
within the Basin; and
The receiving water quality model, which calculates the fate of pollutants and their
impact on water quality parameters such as DO.
The analysis of current water quality conditions based on observed measurements and the
model analysis of baseline conditions described below.
4.5.1. Measured Water Quality – Existing Data
As described in Section 4.1, the DEP has conducted a number of field investigations in
Newtown Creek since 1980. These investigations have documented water quality problems such
as low DO and aesthetics problems including exposed sediments, odors, and floatables.
Sampling data along with water quality modeling results show that aquatic life, and
aesthetics are frequently impaired throughout the year, and that conditions degrade even further
during and following wet weather events when CSOs and storm discharges occur. Because of
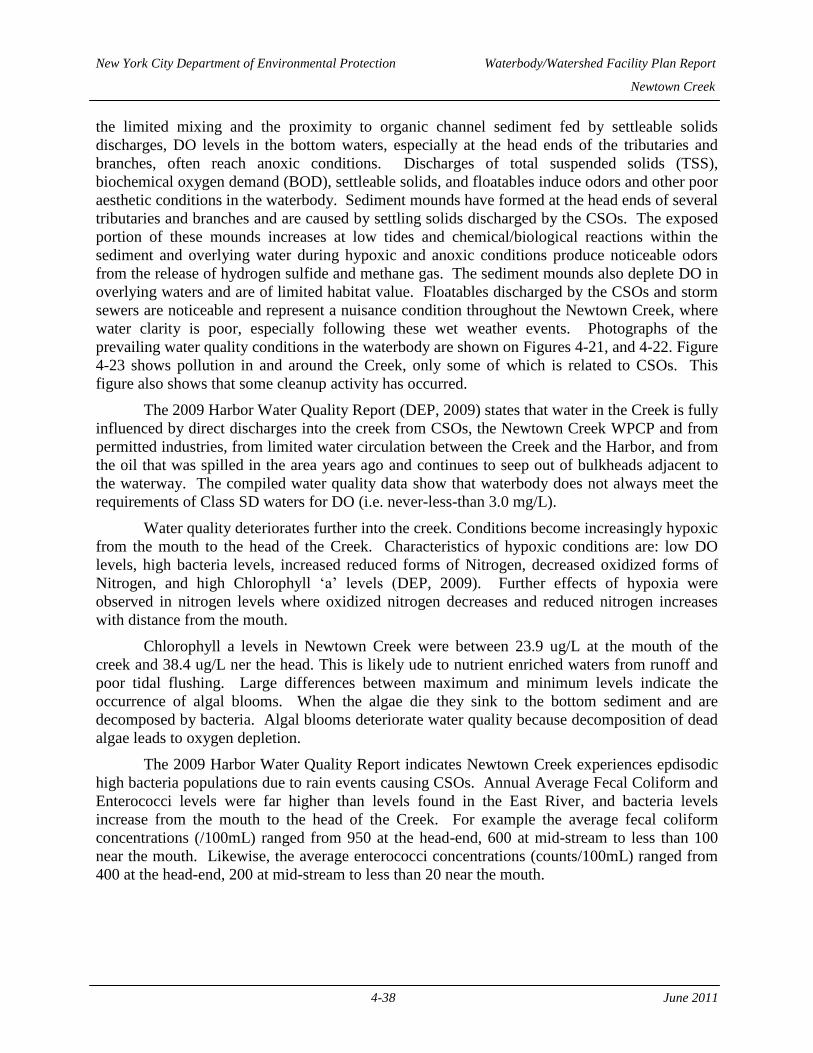
New York City Department of Environmental Protection Waterbody/Watershed Facility Plan Report
Newtown Creek
4-38 June 2011
the limited mixing and the proximity to organic channel sediment fed by settleable solids
discharges, DO levels in the bottom waters, especially at the head ends of the tributaries and
branches, often reach anoxic conditions. Discharges of total suspended solids (TSS),
biochemical oxygen demand (BOD), settleable solids, and floatables induce odors and other poor
aesthetic conditions in the waterbody. Sediment mounds have formed at the head ends of several
tributaries and branches and are caused by settling solids discharged by the CSOs. The exposed
portion of these mounds increases at low tides and chemical/biological reactions within the
sediment and overlying water during hypoxic and anoxic conditions produce noticeable odors
from the release of hydrogen sulfide and methane gas. The sediment mounds also deplete DO in
overlying waters and are of limited habitat value. Floatables discharged by the CSOs and storm
sewers are noticeable and represent a nuisance condition throughout the Newtown Creek, where
water clarity is poor, especially following these wet weather events. Photographs of the
prevailing water quality conditions in the waterbody are shown on Figures 4-21, and 4-22. Figure
4-23 shows pollution in and around the Creek, only some of which is related to CSOs. This
figure also shows that some cleanup activity has occurred.
The 2009 Harbor Water Quality Report (DEP, 2009) states that water in the Creek is fully
influenced by direct discharges into the creek from CSOs, the Newtown Creek WPCP and from
permitted industries, from limited water circulation between the Creek and the Harbor, and from
the oil that was spilled in the area years ago and continues to seep out of bulkheads adjacent to
the waterway. The compiled water quality data show that waterbody does not always meet the
requirements of Class SD waters for DO (i.e. never-less-than 3.0 mg/L).
Water quality deteriorates further into the creek. Conditions become increasingly hypoxic
from the mouth to the head of the Creek. Characteristics of hypoxic conditions are: low DO
levels, high bacteria levels, increased reduced forms of Nitrogen, decreased oxidized forms of
Nitrogen, and high Chlorophyll „a‟ levels (DEP, 2009). Further effects of hypoxia were
observed in nitrogen levels where oxidized nitrogen decreases and reduced nitrogen increases
with distance from the mouth.
Chlorophyll a levels in Newtown Creek were between 23.9 ug/L at the mouth of the
creek and 38.4 ug/L ner the head. This is likely ude to nutrient enriched waters from runoff and
poor tidal flushing. Large differences between maximum and minimum levels indicate the
occurrence of algal blooms. When the algae die they sink to the bottom sediment and are
decomposed by bacteria. Algal blooms deteriorate water quality because decomposition of dead
algae leads to oxygen depletion.
The 2009 Harbor Water Quality Report indicates Newtown Creek experiences epdisodic
high bacteria populations due to rain events causing CSOs. Annual Average Fecal Coliform and
Enterococci levels were far higher than levels found in the East River, and bacteria levels
increase from the mouth to the head of the Creek. For example the average fecal coliform
concentrations (/100mL) ranged from 950 at the head-end, 600 at mid-stream to less than 100
near the mouth. Likewise, the average enterococci concentrations (counts/100mL) ranged from
400 at the head-end, 200 at mid-stream to less than 20 near the mouth.
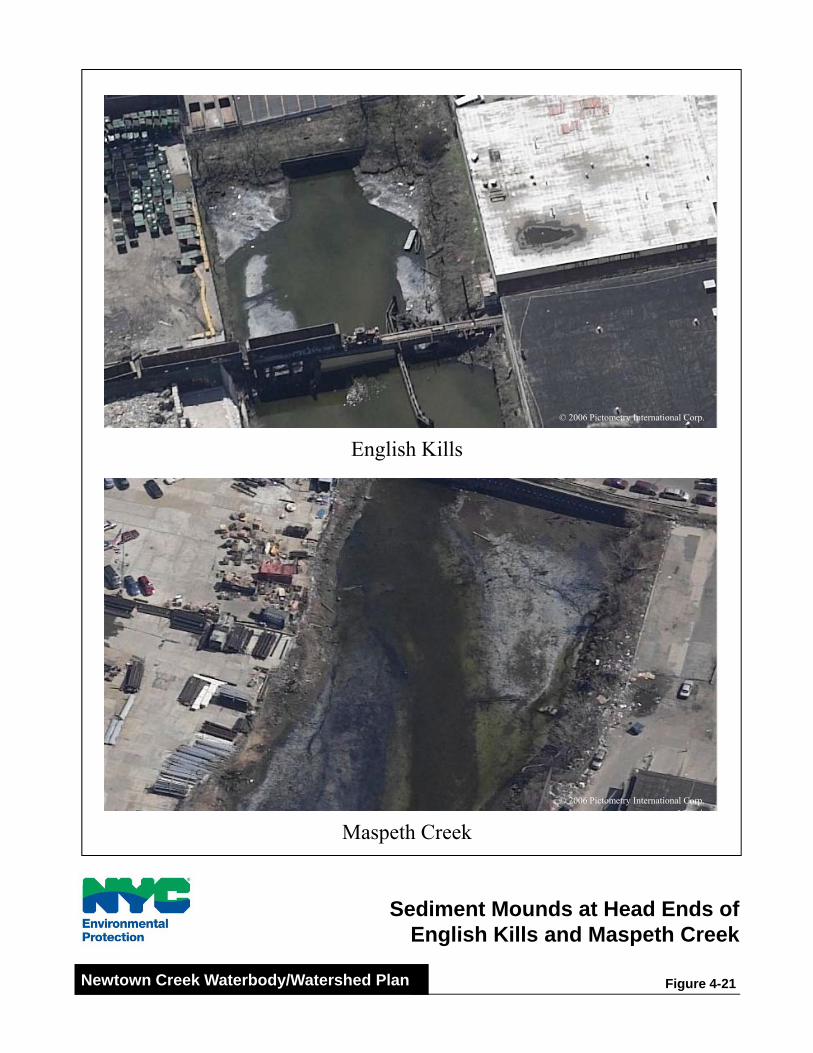
English Kills
© 2006 Pictometry International Corp.
Maspeth Creek
© 2006 Pictometry International Corp.
Sediment Mounds at Head Ends ofEnglish Kills and Maspeth Creek
Figure 4-21 Newtown Creek Waterbody/Watershed Plan
© 2006 Pi I i l C
East Branch© 2006 Pictometry International Corp.
English Kills
© 2006 Pictometry International Corp.
Floatables Containment Booms and Water Clarityin East Branch and English Kills
Figure 4-22 Newtown Creek Waterbody/Watershed Plan
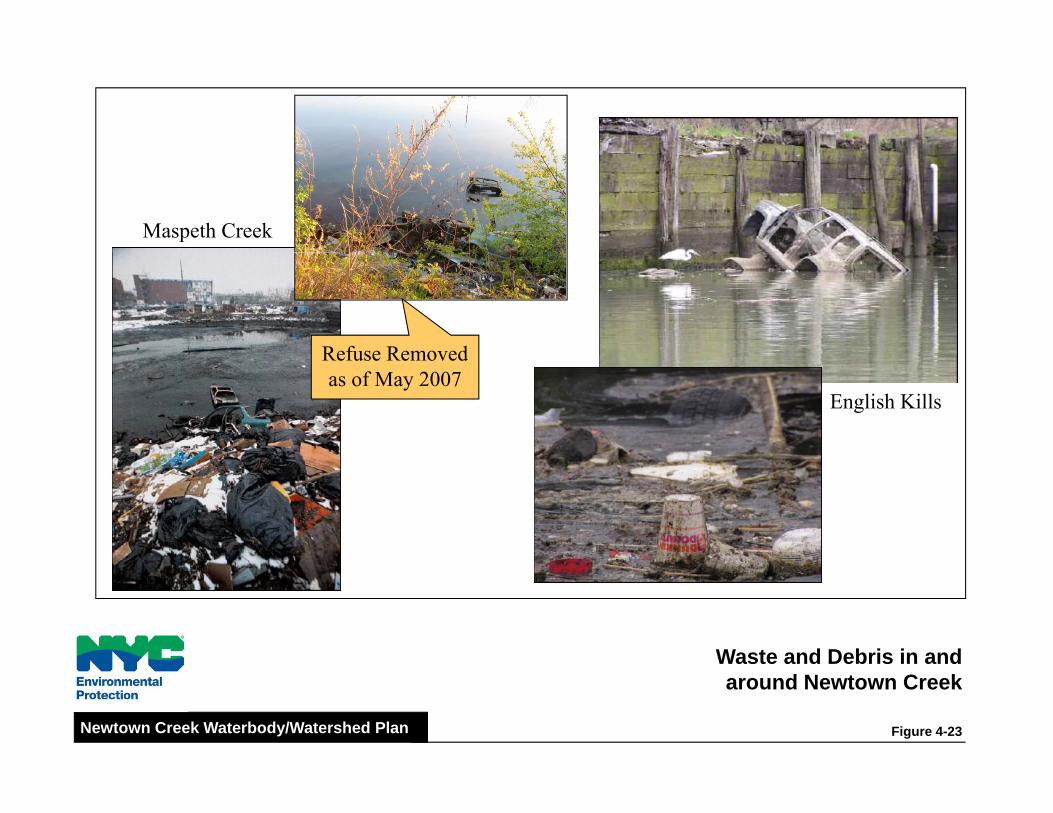
Maspeth Creek
Refuse Removed
English Kills
Refuse Removed as of May 2007
Waste and Debris in andWaste and Debris in andaround Newtown Creek
Figure 4-23Newtown Creek Waterbody/Watershed Plan

New York City Department of Environmental Protection Waterbody/Watershed Facility Plan Report
Newtown Creek
4-42 June 2011
Lawler, Matusky, & Skelly (1993) summarized the field investigations conducted in 1990
during Newtown Creek CSO Facility Planning. During these earlier investigations, DO was
typically measured as being hypoxic or anoxic throughout the waterbody, especially in the
bottom waters and farther from the mouth of the Creek (see Figure 4-24). Of all samples
collected during the CSO Facility Planning, 51 percent were below the DEC DO criteria. DO
levels below the DEC standard were observed during both wet and dry weather surveys, and
were especially low when water temperatures were higher and for two to three-days following
CSO events. In general, the lowest DO concentrations were observed at the head ends of the
tributaries, with conditions in the main branch of the Creek improving toward the East River.
A DO histogram of all available data in the Newtown Creek, its tributaries and branches
is shown on Figure 4-25. The figure shows the percentage of data observations between DO
intervals of 1.0 mg/L. The observed data were grouped into four spatial sections: (1) Newtown
Creek from the mouth to just upstream of Dutch Kills, including Whale Creek Canal, (2) Dutch
Kills, (3) Newtown Creek from Dutch Kills to Maspeth Creek, and (4) the head end of the Creek,
including Maspeth Creek, East Branch, and English Kills. The figure demonstrates the
longitudinal distribution of observed data. The percentage of data below 3.0 mg/L at the near-
mouth, Dutch kills, mid-creek, and head-end are 27, 50, 54, and 79 percent respectively. Note
also, that more than 35 percent of all samples for the entire waterbody are below 1.0 mg/L.
Figure 4-26 shows the average and range of DO levels for each section of the waterbody.
Sample locations for this analysis are shown on Figure 4-1. The number of data points used in
this analysis are as follows:
Section 1 – 112 data points
Section 2 – 54 data points
Section 3 – 333 data points
Section 4 – 547 data points
4.5.2. Receiving Water Modeling Analysis
As stated in Section 4.1.4, mathematical modeling is a useful tool to evaluate the impacts
of engineering alternatives and other factors on water quality and uses in a particular waterbody.
The mathematical modeling framework developed for the Newtown Creek waterbody/watershed
assessment area (Figure 4-15) includes a “landside” (rainfall-runoff/collection system) model for
the watershed, a receiving water model with hydrodynamic and water quality components for the
waterbody, and the SWEM model to establish the boundary conditions in the East River.
A critical issue in evaluating engineering alternatives and assessing the attainment of
water quality and water use goals is the selection of a representative condition for which the
criteria and standards can be evaluated. Using this representative “Baseline” condition allows a
host of different engineering alternatives to be evaluated on a common basis so that differences
in impacts are attributable to differences in alternatives. Because water quality conditions in the
Newtown Creek waterbody are impacted by wet weather factors, selection of a precipitation
condition directly affects the evaluation of whether water quality goals are attained. The
selection of a rainfall “design year” can be arbitrary, but for planning purposes, a long-term,
annual average condition is appropriate and is consistent with the CSO policy (USEPA, 1995a).
The design year should also reflect population and water use conditions that are consistent with
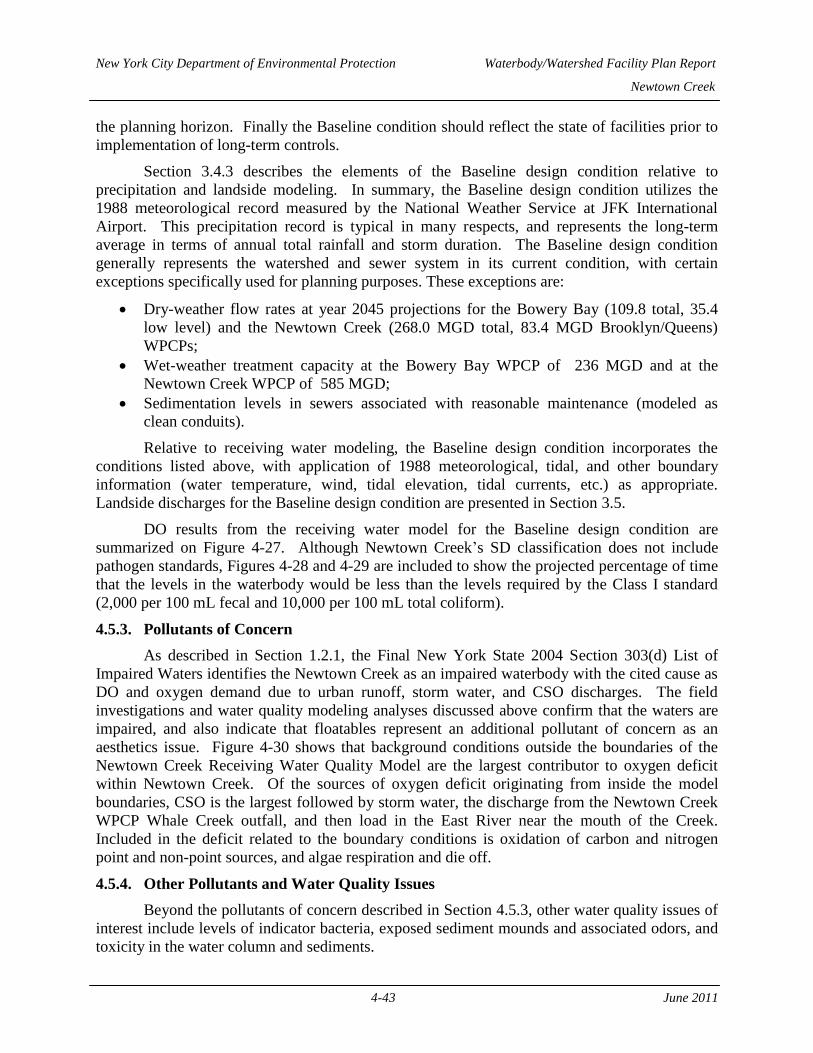
New York City Department of Environmental Protection Waterbody/Watershed Facility Plan Report
Newtown Creek
4-43 June 2011
the planning horizon. Finally the Baseline condition should reflect the state of facilities prior to
implementation of long-term controls.
Section 3.4.3 describes the elements of the Baseline design condition relative to
precipitation and landside modeling. In summary, the Baseline design condition utilizes the
1988 meteorological record measured by the National Weather Service at JFK International
Airport. This precipitation record is typical in many respects, and represents the long-term
average in terms of annual total rainfall and storm duration. The Baseline design condition
generally represents the watershed and sewer system in its current condition, with certain
exceptions specifically used for planning purposes. These exceptions are:
Dry-weather flow rates at year 2045 projections for the Bowery Bay (109.8 total, 35.4
low level) and the Newtown Creek (268.0 MGD total, 83.4 MGD Brooklyn/Queens)
WPCPs;
Wet-weather treatment capacity at the Bowery Bay WPCP of 236 MGD and at the
Newtown Creek WPCP of 585 MGD;
Sedimentation levels in sewers associated with reasonable maintenance (modeled as
clean conduits).
Relative to receiving water modeling, the Baseline design condition incorporates the
conditions listed above, with application of 1988 meteorological, tidal, and other boundary
information (water temperature, wind, tidal elevation, tidal currents, etc.) as appropriate.
Landside discharges for the Baseline design condition are presented in Section 3.5.
DO results from the receiving water model for the Baseline design condition are
summarized on Figure 4-27. Although Newtown Creek‟s SD classification does not include
pathogen standards, Figures 4-28 and 4-29 are included to show the projected percentage of time
that the levels in the waterbody would be less than the levels required by the Class I standard
(2,000 per 100 mL fecal and 10,000 per 100 mL total coliform).
4.5.3. Pollutants of Concern
As described in Section 1.2.1, the Final New York State 2004 Section 303(d) List of
Impaired Waters identifies the Newtown Creek as an impaired waterbody with the cited cause as
DO and oxygen demand due to urban runoff, storm water, and CSO discharges. The field
investigations and water quality modeling analyses discussed above confirm that the waters are
impaired, and also indicate that floatables represent an additional pollutant of concern as an
aesthetics issue. Figure 4-30 shows that background conditions outside the boundaries of the
Newtown Creek Receiving Water Quality Model are the largest contributor to oxygen deficit
within Newtown Creek. Of the sources of oxygen deficit originating from inside the model
boundaries, CSO is the largest followed by storm water, the discharge from the Newtown Creek
WPCP Whale Creek outfall, and then load in the East River near the mouth of the Creek.
Included in the deficit related to the boundary conditions is oxidation of carbon and nitrogen
point and non-point sources, and algae respiration and die off.
4.5.4. Other Pollutants and Water Quality Issues
Beyond the pollutants of concern described in Section 4.5.3, other water quality issues of
interest include levels of indicator bacteria, exposed sediment mounds and associated odors, and
toxicity in the water column and sediments.

Top D O
54%
74%
40%
60%
80%
100%
Top D.O.
Bottom D.O.
23%
44%
0%
20%
40%
Section 1 Section 2 Section 3 Section 4
46%
70%
87%
40%
60%
80%
100%
33%46%
0%
20%
Section 1 Section 2 Section 3 Section 4
Newtown Creek Dissolved Oxygen (1984 to 2003)Percent of Samples Less Than 3.0 mg/L
Figure 4-24Newtown Creek Waterbody/Watershed Plan
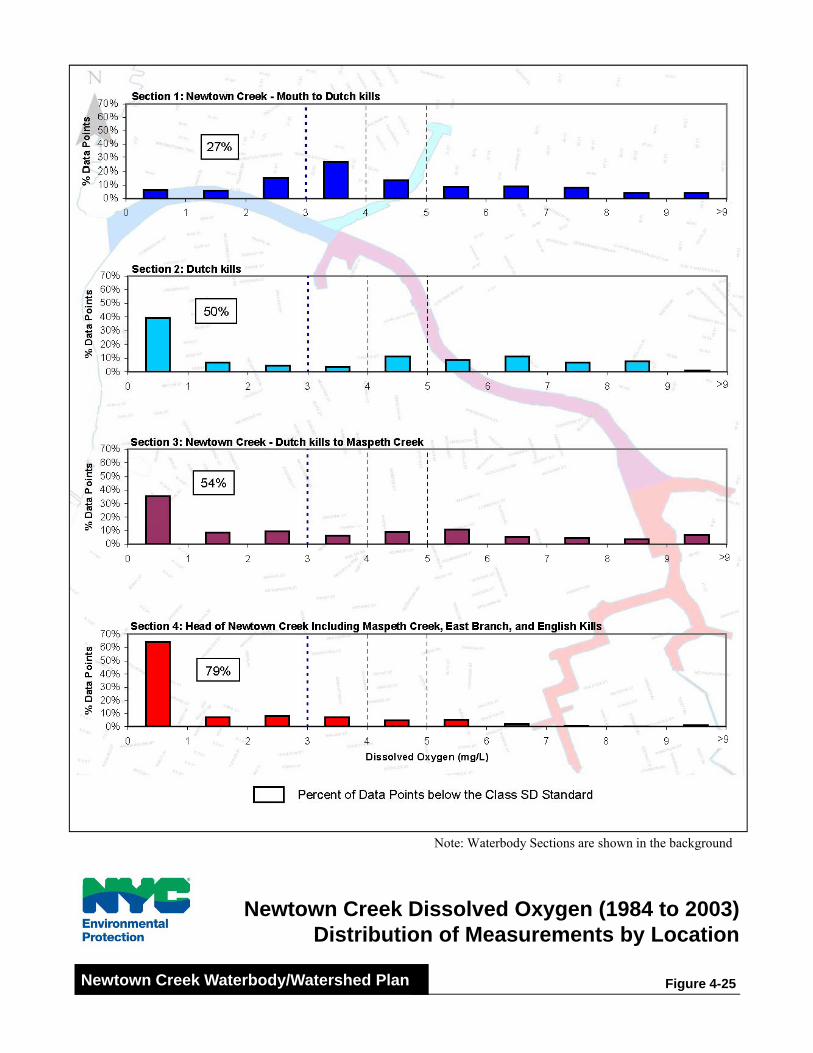
Note: Waterbody Sections are shown in the background
Newtown Creek Dissolved Oxygen (1984 to 2003)Distribution of Measurements by Location
Figure 4-25 Newtown Creek Waterbody/Watershed Plan
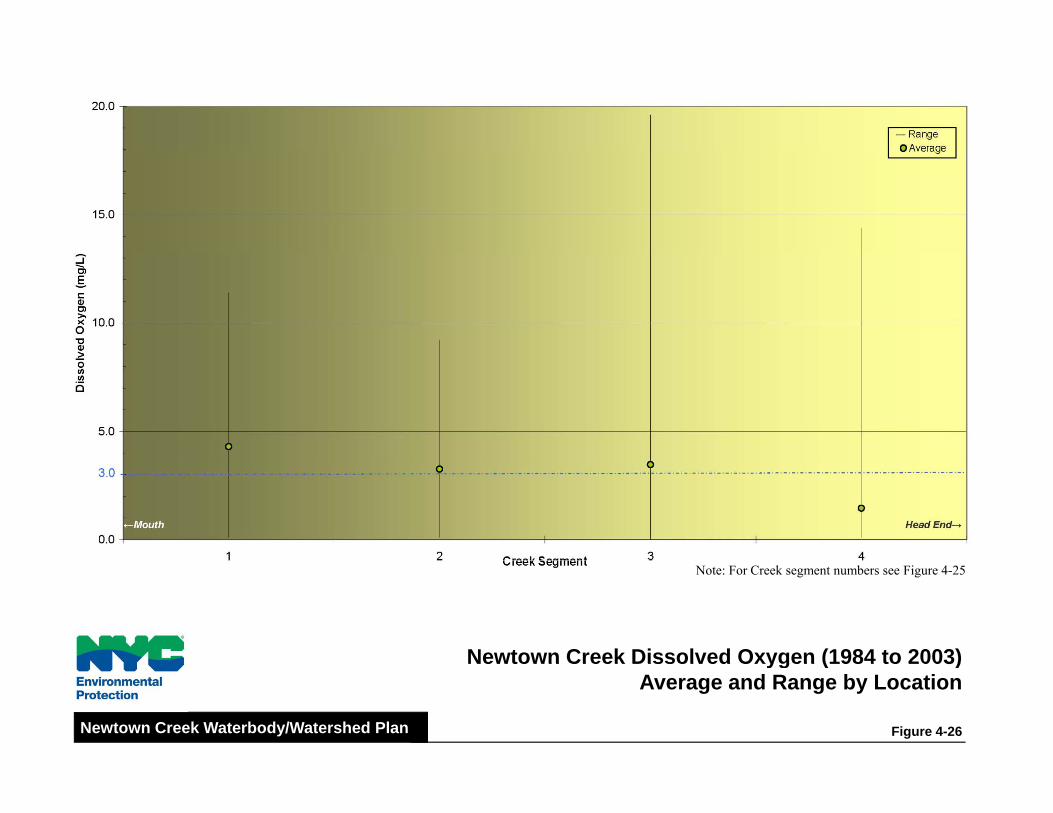
Newtown Creek Dissolved Oxygen (1984 to 2003)
Note: For Creek segment numbers see Figure 4-25
Newtown Creek Dissolved Oxygen (1984 to 2003)Average and Range by Location
Figure 4-26Newtown Creek Waterbody/Watershed Plan

Modeled Baseline Dissolved OxygenPercent of Days with DO > 3 mg/L
Figure 4-27Newtown Creek Waterbody/Watershed Plan
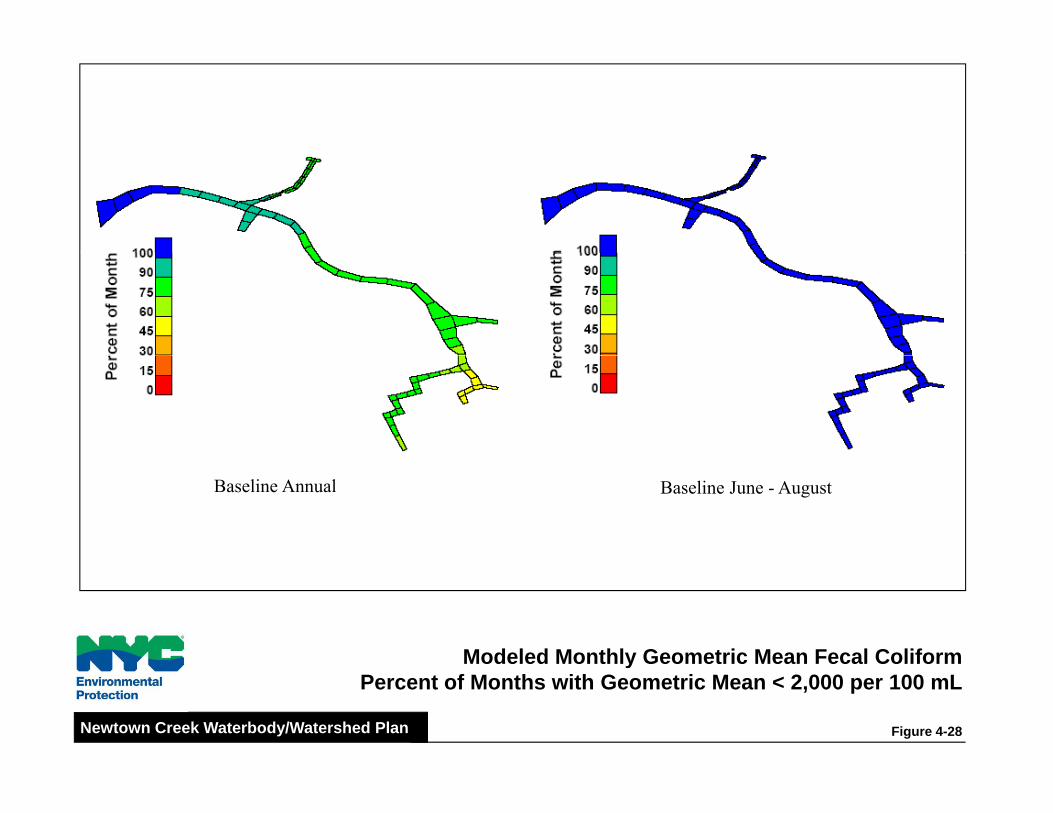
Baseline Annual Baseline June - August
Modeled Monthly Geometric Mean Fecal ColiformModeled Monthly Geometric Mean Fecal ColiformPercent of Months with Geometric Mean < 2,000 per 100 mL
Figure 4-28Newtown Creek Waterbody/Watershed Plan
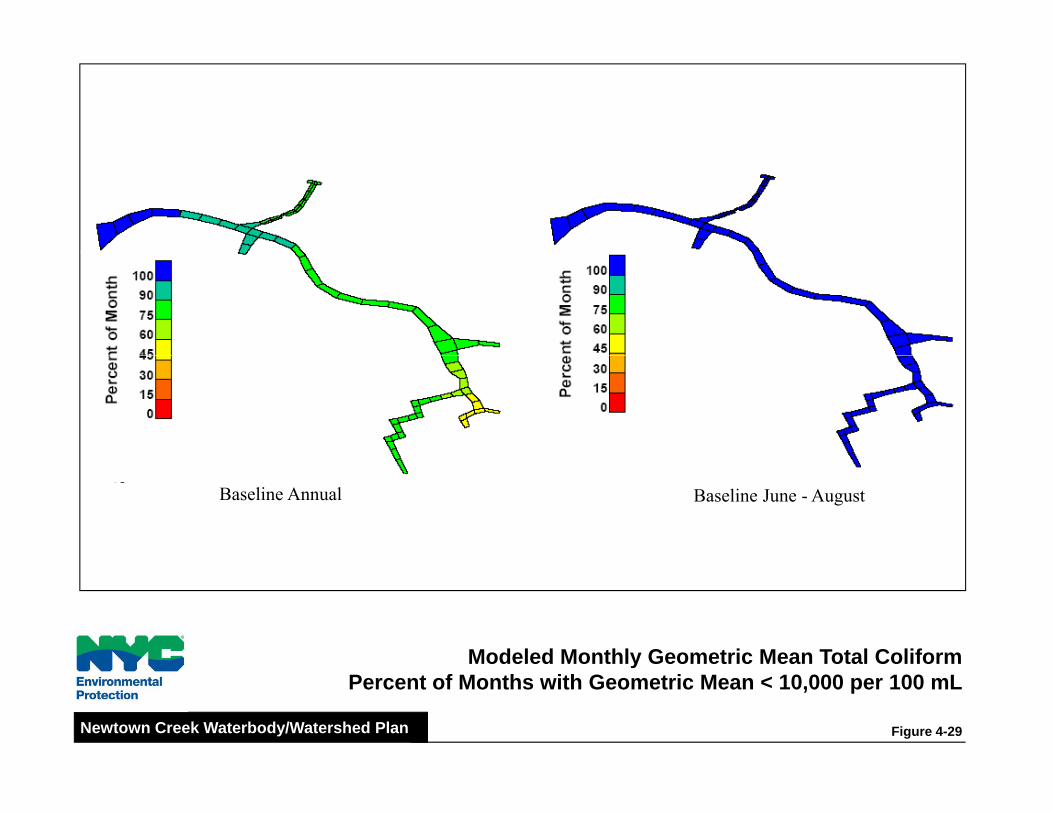
Baseline Annual Baseline June - August
Modeled Monthly Geometric Mean Total ColiformModeled Monthly Geometric Mean Total ColiformPercent of Months with Geometric Mean < 10,000 per 100 mL
Figure 4-29Newtown Creek Waterbody/Watershed Plan

August 1988 DO Deficit
Components
Newtown CreekNewtown CreekDissolved Oxygen Deficit Components
Figure 4-30Newtown Creek Waterbody/Watershed Plan

New York City Department of Environmental Protection Waterbody/Watershed Facility Plan Report
Newtown Creek
4-51 June 2011
Indicator Bacteria
The Newtown Creek water body classification of SD does not support recreational uses
and hence no indicator bacteria standards are applicable. However, indicator bacteria can
provide a measure of water quality.
CSO Sediment Mounds and Odors
The CSO sediment mounds in the tributaries and branches of Newtown Creek represent
an aesthetic issue, primarily due to the odors that are released when the sediments are exposed at
low tide. In addition, SOD contributes to the hypoxic and anoxic conditions that persist in the
Newtown Creek waterbody.
Superfund Designation
Newtown Creek and its tributaries were added to the National Priorities List in
September 2010. DEP and five other parties are expected to agree with USEPA to conduct a
Remedial Investigation/Feasability Study (RI/FS) within the next 6 to seven years. The study is
forecast to conclude in 2017 or 2018. Recommendations of the RI/FS will be coordinated with
the WB/WS Facility Plan recommended alternatives.
Water Column and Sediment Toxicity
Toxicity tests performed in 2003 as described in Section 4.1.2 used indicator organisms
to determine toxicity to organisms, regardless of the cause. Results for the water column tests
showed that growth was significantly reduced in the mysid shrimp toxicity tests at 1 of 4 stations
(NEWTT-02 on Figure 4-11), although there was 98 percent survival at all 4 stations. Results of
the sediment test showed less than 3 percent of the organisms surviving after 10 days at 3 of 4
stations, and both growth and survival were significantly different from the control at the 4th
station (NEWTT-10 on Figure 4-11).
These sediment toxicity test findings are consistent with the sediment quality analysis
completed during the 2000 Dredging Feasibility Study (URS, 2000b), which detailed results of
the laboratory analysis of 21 sediment cores that were collected on November 22 and 23, 1999.
Under this study, the sediment cores were analyzed for full Toxicity Characteristic Leaching
Procedures (TCLP) and Resource Conservation and Recovery Act (RCRA) characteristics.
Based on the NYCDEC Technical & Operational Guidance Series (TOGS) 5.1.9, In-Water and
Riparian Management of Sediment and Dredged Material, the results indicate that the Newtown
Creek sediments would be classified by the DEC as “Class C – High Contamination (Acute
Toxicity to aquatic life)” (DEC, 2004a). Class C dredged material is expected to be acutely toxic
to aquatic biota and therefore, dredging and disposal requirements may be stringent, most likely
requiring environmental dredging and upland disposal. For Class C dredged material, it is the
responsibility of the dredging permit applicant to ensure that the dredged material is not a
regulated hazardous material as defined in 6NYCRR Part 371 “Identification and Listing of
Hazardous Wastes”.
Under 6NYCRR Part 371, the summary data from the TCLP analysis shows that tested
levels are all below the maximum concentration for exhibiting the characteristic of toxicity.
Therefore the sediments in Newtown Creek would not be classified as a hazardous waste.
Greenpoint Oil Plumes
New York City Department of Environmental Protection Waterbody/Watershed Facility Plan Report
Newtown Creek
4-52 June 2011
Based on the 1996 Newtown Creek WPCP Upgrade Final Environmental Impact
Statement (FEIS), in September 1978 the U.S. Coast Guard found a large oil slick on Newtown
Creek and later determined it to be seeping from a bulkhead at the end of Meeker Avenue. Later
investigations determined that the oil was from one of several distinct underground oil plumes.
The oldest and largest plume, termed the Mobil Off-Site Oil Plume, was determined to be from
the former Mobil refinery. This plume has since migrated away from the original spill site. This
spill has been estimated at approximately 13 million gallons covering an estimated area of 52
acres. A recovery system consisting of seven recovery wells and a ground water treatment
system was put in place and is still operating.
The Amoco Plume is located under their bulk storage facility located west of Appollo
Street, adjacent to the Newtown Creek. The plume was originally estimated to be 2.2 million
gallons. A recovery system consisting of two recovery wells and a ground water treatment
system was installed in 1980 and is still operational.
The Mobil On-Site Plume is located on the site of Mobil‟s North Henry Street Terminal
has been determined to have originated from several sources on that site. This plume has been
estimated to be around 2 million gallons. A recovery system consisting of seven recovery wells,
a ground water treatment system and on-site recovered oil storage was installed and is still
operational.
The total volume of oil spilled and the size of the plumes continue to be debated. What is
known is that the plumes continue to migrate on the water table and regional aquifer due to
seasonal fluctuations in groundwater levels and tidal influence. Several maps of the plumes exist
from different sources, but due to the dynamic nature of separate phase oil movement in the
subsurface, they only represent a general location at a given time. One such map from the
Riverkeeper Inc. is included as Figure 4-31.
On February 8, 2007 the NYC Attorney General‟s office announced that it was sending
five companies, ExxonMobil Corporation, BP PLC, Chevron Corporation, Keyspan Energy, and
Phelps Dodge Corporation, Notices of Intent to Sue under the federal Resource Conservation and
Recovery Act (RCRA), accusing the companies of “imminent and substantial endangerment to
health and the environment” in and around Newtown Creek. These efforts are intended to speed
the remediation efforts and to force these companies to do more to clean up the Creek and
affected neighborhood.
4.6. BIOLOGY
Newtown Creek supports aquatic communities which are similar to those found
throughout the NY/NJ Harbor in areas of comparable water quality and sediment type in portions
of its length. These aquatic communities contain typical estuarine species but these communities
have been highly modified by physical changes to the original watershed, shoreline, and to water
and sediment quality. In addition to seasonally reduced DO due to organic matter loading,
Newtown Creek has degraded water quality due to chemical contaminant loading. These
changes represent constraints to Newtown Creek in reaching its full potential to support a diverse
aquatic life community and to provide a fishery resource for anglers.
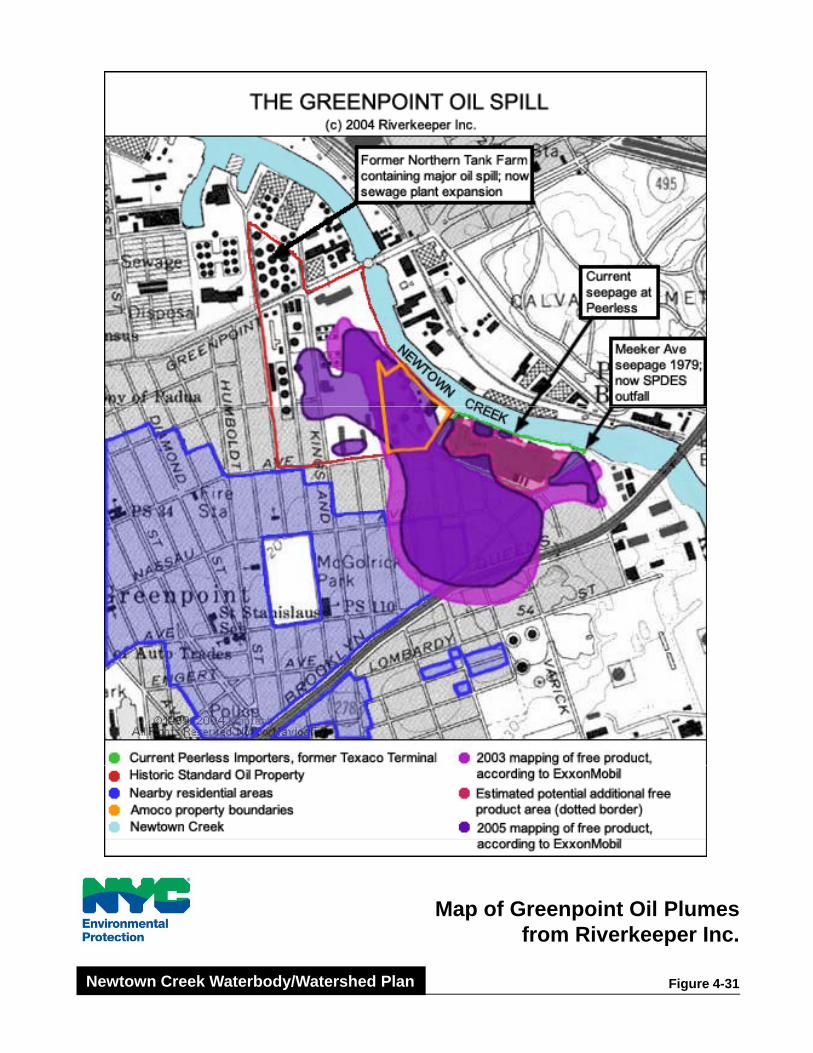
Map of Greenpoint Oil Plumesfrom Riverkeeper Inc.
Figure 4-31Newtown Creek Waterbody/Watershed Plan

New York City Department of Environmental Protection Waterbody/Watershed Facility Plan Report
Newtown Creek
4-54 June 2011
Adverse physical effects on aquatic habitats interact with water and sediment quality to
limit the diversity and productivity of aquatic systems. Water and sediment quality can be
limiting to aquatic life when they are below thresholds for survival, growth, and reproduction.
However, when these thresholds are reached or exceeded, physical habitat factors may continue
to limit diversity and productivity. Improvements to water and sediment quality can enhance
aquatic life use in degraded areas such as Newtown Creek, but major irreversible changes to the
watershed and the waterbody place limits on the extent of these enhancements. In addition,
because Newtown Creek is part of a much larger modified estuarine/marine system, which is a
major source of recruitment of aquatic life to Newtown Creek, its ability to attain use standards
is closely tied to overall ecological conditions in the NY/NJ Harbor.
This section describes existing aquatic communities in Newtown Creek and provides
comparison to aquatic communities found in the nearby Gowanus Canal. This baseline
information provides the foundation for assessing the response of aquatic life to CSO treatment
alternatives for Newtown Creek.
4.6.1. Wetlands
There are no wetlands located along Newtown Creek based on a review of United States
Fish and Wildlife Service National Wetland Inventory (NWI) wetland maps. The Creek itself
has been given the designation of estuarine, subtidal with an unconsolidated bottom (E1BUL).
The head of Newtown Creek (East Branch) and its branching tributaries, English Kills, Maspeth
Creek and Dutch Kills, have been identified as estuarine, subtidal with an unconsolidated bottom
excavated by human activities (E1BULx).
4.6.2. Benthic Invertebrates
The benthic community consists of a wide variety of small aquatic invertebrates, such as
worms, mollusks and crustaceans, which live burrowed into or in contact with bottom sediments.
Benthic organisms cycle nutrients from the sediment and water column to higher trophic levels
through feeding activities. Suspension feeders filter particles out of the water column and
deposit feeders consume particles on or in the sediment. The sediment is modified by the
benthos through bioturbation and formation of fecal pellets (Wildish and Kristmanson, 1997).
Grain size, chemistry, and physical properties of the sediment are the primary factors
determining which organisms inhabit a given area of the substrate. Because benthic organisms
are closely associated with the sediment and have limited mobility, the benthic community
structure reflects local water and sediment quality.
Benthic inventories have been conducted in Newtown Creek as part of the East River
Field Sampling and Analysis Program (Hydroqual 2001e, Figure 4-6); and as part of the Subtidal
Benthos and Ichthyoplankton Characterization Field Sampling and Analysis Program
(Hydroqual, 2003a, Figure 4-9). In 2001 and 2003, benthic sampling was conducted at the
mouth of Newtown Creek in the East River, along several points in Newtown Creek and in two
of its tributaries (Maspeth Creek and English Kills). Subtidal benthic samples were collected
using a Ponar® Grab. One sediment sample per station was taken for analysis of sediment grain
size and total TOC content. Results of both the 2001 and 2003 sampling events are presented in
Table 4-2 and are discussed below, starting with the headwater areas of the Creek.
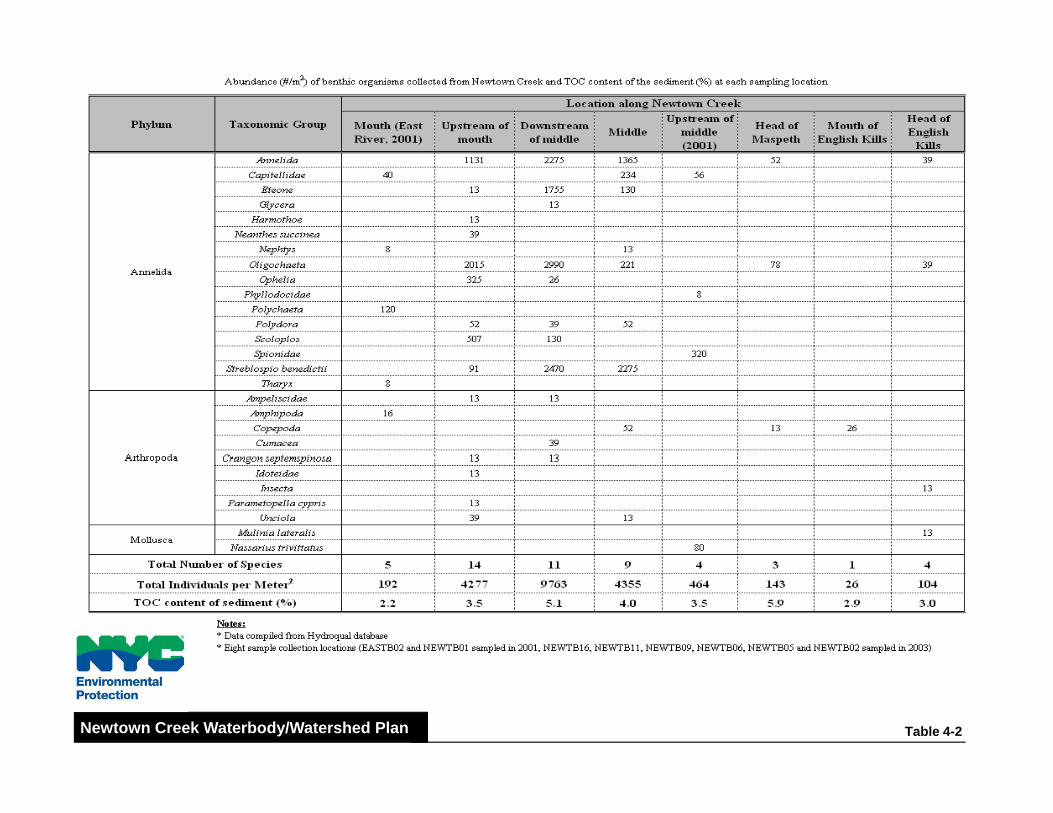
Table 4-2Newtown Creek Waterbody/Watershed Plan
New York City Department of Environmental Protection Waterbody/Watershed Facility Plan Report
Newtown Creek
4-56 June 2011
The sampling site at the head of English Kills had a benthic community with low
abundance species diversity and; comprised almost entirely of two types of worms, Annelida sp.
(i.e. phylum for segmented worms) and Oligochaeta (a subclass within the Annelida phylum).
Worms are important indicators of pollution because of their tolerance to organic enrichment
(Gosner 1978, Weiss 1995). Most of the worms found in the Newtown Creek complex have
been documented to be tolerant of organic pollution. Insects and one species of mollusk,
Mulinia lateralis, were the only other organisms collected at this site and were present in low
numbers (13/m2).
Low diversity and abundance were also observed at sampling sites located at the mouth
of English Kills and the head of Maspeth Creek. The sampling site at the mouth of the English
Kills showed a limited benthic community comprised entirely of Copepoda (i.e. crustaceans in
the Arthropoda phylum). The sampling location at mouth of Maspeth Creek showed a benthic
community with similarly low diversity and slightly higher abundance. The site was comprised
entirely of Annelida sp., Oligochaeta, and Copepoda.
The fourth sampling site was located upstream of the midpoint in the Creek, east of
where the Brooklyn-Queens Expressway crosses over the Creek. At this location, the benthic
community had similar diversity but greater abundance than the three upstream locations. The
benthic community was comprised almost entirely of the pollution tolerant polychaete worms,
Spionidae sp., Capitellidae and Phyllodicidae. One species of mollusk, Nassarius trivittatus,
was also collected at this location. Similar to the polychaete species, this mollusk is also
considered to be a pollution-tolerant organism.
The midpoint of Newtown Creek was the fifth sampling location along the waterway.
This location had the second greatest abundance of benthic invertebrates of all locations sampled
along the Creek and its tributaries. The benthic community was comprised almost entirely of
worms. Streblospio benedictii and other Annelida sp. were the most abundant (2,275/m2 and
1,365/m2). Capitellidae polychaetes, Eteone, Polydora, Nephtys and Oligochaeta worms were
also present. All of the polychaete species are pollution tolerant organisms. Two arthropod
species, Copepoda and Unciola, were also found in a low density (65/m2).
The sixth sampling site was located downstream of the midpoint in the Creek, west of
where the Brooklyn-Queens Expressway crosses over the Creek. At this location, the benthic
community was observed to have the highest density in Newtown Creek (9,763/m2) and the
second highest number of species (11). Similar to the midpoint of the Creek, Streblospio
benedictii and other Annelida sp. were the most abundant (2,470/m2 and 2,990/m
2). Annelida
sp., Eteone, Scoloplos, Polydora, Ophelia and Glycera worms were also present. All of these
polychaete species are pollution tolerant organisms. In addition to the abundant Annelid
community at this location, three species of arthropods were also collected.
The seventh sampling station was located along the waterway upstream of the mouth of
Newtown Creek. This location had the third greatest abundance and highest species diversity of
all locations sampled along the Creek and its tributaries. Ninety-eight percent of the benthic
community was comprised of worms. Oligochaeta and Annelida sp. were the most abundant
(2,015/m2 and 1,131/m
2). Scoloplos and Ophelia also had relatively large populations (507/m
2
and 325/m2). Streblospio benedictii, Neanthes succinea, Eteone and Harmothoe worms were
also present. In addition to the abundant Annelid community at this location, five species of

New York City Department of Environmental Protection Waterbody/Watershed Facility Plan Report
Newtown Creek
4-57 June 2011
arthropods were also collected. This sampling location had the greatest number and abundance
of non-annelid species collected in Newtown Creek.
The benthic community in the East River at the mouth of Newtown Creek, the eighth
sampling location, was slightly higher in diversity and similar in abundance (197/m2) to the
benthic community living in the upper portion of the Creek but was lower in both diversity and
abundance than the benthic community in the middle to lower portions of the Creek. In the East
River, polychaete worms were again the dominant organisms, Capitellidae, Nephtys, Tharyx and
an unidentified polychaete species were collected. Amphipods were also present in low numbers
(16/m2).
The benthic community in Newtown Creek was relatively high in numbers of individuals
and low to moderate in number of species (see Table 4-2, which includes various levels of
taxonomic breakdown). Annelid worms were the dominant organisms, comprising 98.02 percent
of the individuals in the community. The pattern of abundance and composition of benthic
species, in combination with their documented pollution tolerance, are indicators of degraded
benthic habitat quality in Newtown Creek. Based on the greater number of taxa and the presence
of amphipods, the habitat quality in the middle to lower portion of the Creek appears to be better
than in the upper reaches
The benthic community structure in Newtown Creek is similar to that described in studies
of the effects of organic pollution on the benthos. In areas of high levels of organic enrichment
benthic communities are composed of a few small, rapidly breeding, short-lived species with
high genetic variability (Pearson and Rosenberg 1978). The Intergovernmental Oceanographic
Commission (IOC) of the United Nations Educational Scientific and Cultural Organization
(UNESCO) suggested that stress to the benthic community will be greatest in sediment with
TOC greater than 3 % (Hyland et al 2000). All sampling locations in Newtown Creek had
sediment TOC greater than 3 percent, except for the location at the mouth of English Kills where
TOC was 2.9 percent (Table 4-2). Almost all of the organisms collected in Newtown Creek are
pollution tolerant, and with the exception of the station upstream of the mouth, increases in
species diversity were attributed to greater numbers of identified annelid species. TOC content
of the sediment is likely contributing to benthic community impairment in Newtown Creek. The
station located in the East River had a lower TOC content, but few organisms were collected.
Impairment of the benthic community at this site may be due to factors other than TOC. Within
the Creek the relationship of diversity (number of species) to the level of TOC is not consistent
among stations, suggesting other factors are influencing the quality of benthic habitat.
4.6.3. Epibenthic Invertebrates
Epibenthos live on or move over the substrate surface. Epibenthic organisms include
sessile suspension feeders (mussels and barnacles), free swimming crustaceans (amphipods,
shrimp, and blue crabs) and tube-dwelling polychaete worms found around the base of attached
organisms. Epibenthic organisms require hard substrate, they cannot attach to substrates
composed of soft mud and fine sands (Dean and Bellis 1975). In general, the main factors that
limit the distribution of epibenthic communities are: the amount of available hard substrate for
settlement, species interactions, and water exchange rates. In Newtown Creek, pier piles and
bulkheads provide the majority of underwater substrates that can support epibenthic
communities. The epibenthic communities living on underwater structures impact the ecology of
New York City Department of Environmental Protection Waterbody/Watershed Facility Plan Report
Newtown Creek
4-58 June 2011
the near shore zone. Suspension feeding organisms continuously filter large volumes of water,
removing seston (particulate matter which is in suspension in the water) and releasing organic
particles to the sediment. This flux of organic particles (from feeding and feces) enriches the
benthic community living in the sediment below piers and bulkheads (Zappala, 2001).
The epibenthic community was studied in Newtown Creek as part of the Harborwide
Epibenthic Recruitment and Survival FSAP (Hydroqual 2001c). Epibenthic arrays, consisting of
multiple 8-inch x 8-inch synthetic plates, were deployed in April 2001 in the upper and middle-
portion of Newtown Creek and in the East River near the mouth of the Creek. Plates were
retrieved in June (3 months - spring) and September (6 months). A third set of plates was
deployed in June 2001 and retrieved in September (3 months – summer). Upon retrieval, the
arrays were inspected and weighed and motile organisms clinging to or stuck in the arrays (i.e.,
crabs and fish) were counted and identified.
In Newtown Creek , 18 taxa were identified on the epibenthic arrays (Table 4-3). The
major groups found were sea squirts, tunicates, hydroids, and barnacles. Worms, crabs, and
mussels were also found in lesser quantities. The sampling location in upper Newtown Creek
had the least number of species collected and lowest weights of organisms. The epibenthic
community was dominated by barnacles at this location. The sampling location in the middle of
the Creek had greater diversity and abundance than the upstream location, but both the number
of species collected and the weights
of organisms were approximately half of what was collected in the East River near the
mouth of Newtown Creek. The epibenthic community in the middle of the creek was dominated
by sea squirts and hydroids and the community in the East River had similar dominant species
but also had tunicates, crabs, and worms.
The number of species collected from the top and bottom arrays was identical at the site
near the upper portion of the Creek and both 3-month and 6-month plates had very low diversity
and abundance (Tables 4-4 and 4-5). Weights of organisms were greater on the top arrays than
on the bottom arrays. There was an increase in the total weight of organisms on the top plate
between 3-months and 6-months but this appears to have been caused by an increase in barnacles
on the plate. In the middle of Newtown Creek, the number of species was similar between 3-
month and 6-month plates but the weight of organisms was much lower on plates that were in the
Creek during the summer months. There was a similar decline in the weights of species during
the summer months on top plates deployed in the East River near the mouth of Newtown Creek,
but the number of species and weight of organisms increased on the bottom plates. At this
sampling location, epibenthic diversity and abundance was greater on the top arrays than on the
bottom arrays during the two 3-month deployments but was similar between the two arrays after
the 6-month deployment. Typically, epibenthic communities in the NY/NJ Harbor exhibit a
vertical distribution on pier piles and bulkheads (Zappala 2001). This vertical distribution
coincides with changes in water level, salinity and DO associated with the tides and water
stratification. The low diversity and abundance of epibenthic organisms on the bottom plate at
the upstream location and the loss of organism biomass during the summer months in the middle
of the Creek, suggests that one of these factors may be limiting the epibenthic community in
Newtown Creek. These limiting factors along with the potential for lower recruitment due to
greater distance from the East River and NY/NJ Harbor complex may account for the differences
in the observed epibenthic community in Newtown Creek compared to the nearby East River.

Table 4-3Newtown Creek Waterbody/Watershed Plan
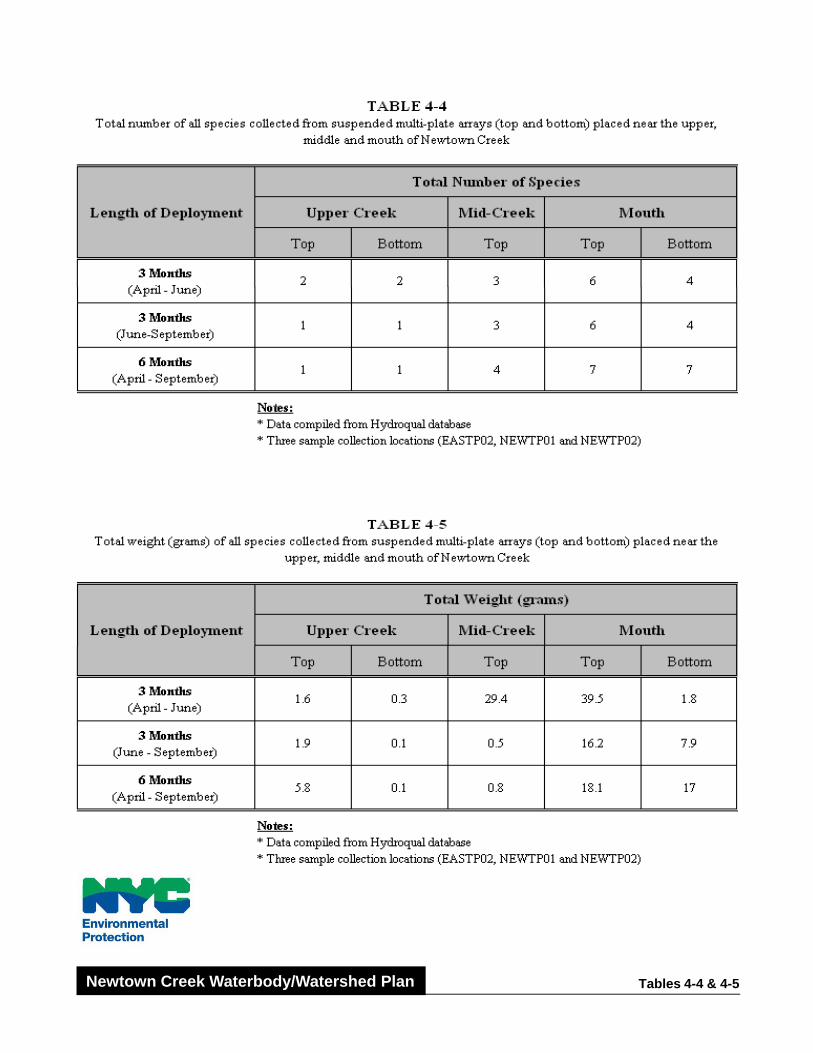
Tables 4-4 & 4-5Newtown Creek Waterbody/Watershed Plan
New York City Department of Environmental Protection Waterbody/Watershed Facility Plan Report
Newtown Creek
4-61 June 2011
4.6.4. Phytoplankton and Zooplankton
As part of the New York Harbor Water Quality Survey, DEP collected plankton samples
at a station in the mouth of Newtown Creek (E2A) in the spring, summer and fall from 1991 to
1999. Eighty-six samples were collected during this time period. In addition, the phytoplankton
and zooplankton communities of the lower East River were investigated in the 1980s (Hazen and
Sawyer, 1981). The East River is the source of plankton to Newtown Creek.
Phytoplankton
Phytoplankton are the dominant primary producers in the East River. Factors that affect
phytoplankton community structure include: temperature, light, nutrients, and grazing by other
organisms. Phytoplankton are also affected by all hydrodynamic forces in a waterbody.
Resident times of phytoplankton species within the NY/NJ Harbor are short and these organisms
move quickly through the system, limiting the time they are available to grazers (NYSDOT
2004).
A total of 64 species of phytoplankton were collected in the mouth of Newtown Creek
over the course of the DEP sampling (Table 4-6). Diatoms were the dominant class of
phytoplankton, followed by dinoflagellates and green algae. The most frequently collected
species were Nannochloris atomus (green algae), Skeletonema costatum (diatom), Peridinium
sps (dinoflagellates), Rhizosolenia delicatula (diatom), and Prorocentrum redfieldii
(dinoflagellate). Hazen and Sawyer (1981) found that the East River phytoplankton community
was dominated by diatoms and Skeletonema costatum comprised 25 percent of the community in
May, July, August, and September.
Three toxic species of phytoplankton were collected in Newtown Creek over the course
of the DEP sampling. Prorocentrum micans (dinoflagellate) is associated with diarrhetic
shellfish poisoning and was collected six times. Prorocentrum minimum (dinoflagellate) is
associated with toxic shellfish poisoning and shellfish kiss, however was only collected once.
Pseudo nitzchia pungens (diatom) is associated with amnesic shellfish poisoning and was
collected five times. Although these species are present, they do not represent a threat because
shellfish are excluded from the Creek due to poor substrate conditions. These and related species
known to be toxic have been found throughout NY Harbor, but have not been associated with
mortalities of aquatic life.
Zooplankton
A total of 15 species of zooplankton were collected in the mouth of Newtown Creek over
the course of the DEP sampling (Table 4-7). Protozoans and copepods comprised the
zooplankton community. Tintinnopsis sp. (Protozoa) and copepod nauplii were the most
frequently collected forms.
Hazen and Sawyer (1981) identified 26 zooplankton species in the East River. The
zooplankton community was composed of three different groups based on biological and life
cycle characteristics: holoplankton (organisms planktonic throughout their life cycle);
meroplankton (free swimming larvae of benthic organisms) and tychoplankton (benthic
organisms swept into the water column) (Hazen and Sawyer, 1981). Holoplankton comprised
about 70 percent of the abundance of the zooplankton community and was dominated by larval
and adult forms of the copepods Acartia clausiand A. tonsa (Hazen and Sawyer 1981). Barnacle

New York City Department of Environmental Protection Waterbody/Watershed Facility Plan Report
Newtown Creek
4-62 June 2011
larvae were dominant in the meroplankton. The tychoplankton was comprised of amphipods,
isopods and benthic protozoans.
The difference in the composition of the zooplankton measured by the two studies may
be due to the fact that the DEP study was targeting phytoplankton, and zooplankton collections
were incidental, whereas the study conducted by Hazen and Sawyer (1981) specifically targeted
the zooplankton community.
4.6.5. Ichthyoplankton
Because fish propagation is integral to defining use classifications and attainment of
associated water quality standards and criteria, ichthyoplankton sampling was conducted to
identify any fish species spawning in Newtown Creek or using its waters during the planktonic
larval stage. Ichthyoplankton sampling was conducted as part of the Harborwide
Ichthyoplankton FSAP (Hydroqual 2001b, Figure 4-5). Sampling was conducted in the upper
reach of Newtown Creek in March, May, July and August 2001. March and May were chosen
based on spawning of a variety of important species, and July and August were chosen to
observe activity during anticipated worst case DO conditions.
A total of 18 ichthyoplankton taxa were collected in Newtown Creek and the nearby East
River. As expected, the community structure varied seasonally (Table 4-8). The greatest
number of species was collected in July, with large numbers of wrasse eggs and goby larvae. In
May, diversity was relatively high and very large numbers of cunner and tautog eggs were
collected. Fewer species were collected in March and August, which may be related to spawning
activity. However, relatively high numbers of sculpin larvae, fourbeard rockling eggs and winter
flounder larvae were collected in March, while a total of only eight larvae were collected in
August.
The ichthyoplankton community structure also varied spatially within Newtown Creek
and the nearby East River (Table 4-9). The sampling location in upper Newtown Creek had the
lowest diversity and abundance. Diversity was similar between the sampling locations in the
middle of the Creek and in the East River near the mouth of the Creek, but the number of
organisms collected was much greater in the East River. Almost all of the numerically dominant
ichthyoplankton species (cunner, wrasse, tautog, fourbeard rockling, menhaden) were collected
in the East River near the mouth of Newtown Creek. Sculpin were more evenly distributed
between the Creek and the East River and gobies were most prevalent in the middle of the Creek.
American sand lance was collected in the greatest numbers at the head of the Creek, but the total
number was modest compared to the most abundant species.
Ichthyoplankton drift in the water column, thus, their occurrence at a specific location
may not correspond to the spawning location. Given the strong tidal currents in the East River
and the short residence time for the water moving through the river, ichthyoplankton in the
vicinity of Newtown Creek may have traveled a substantial distance from where they were
spawned. Because the duration of the egg stage is short (about two days after fertilization)
compared to the larval stage (2-3 months depending on species) there is a relatively higher
degree of confidence that an egg found in the upper Newtown Creek may have been spawned
there. Very few eggs were collected in upper Newtown Creek, almost all of the eggs were
collected at the station in the East River near the mouth of Newtown Creek. This suggests
limited spawning in Newtown Creek.
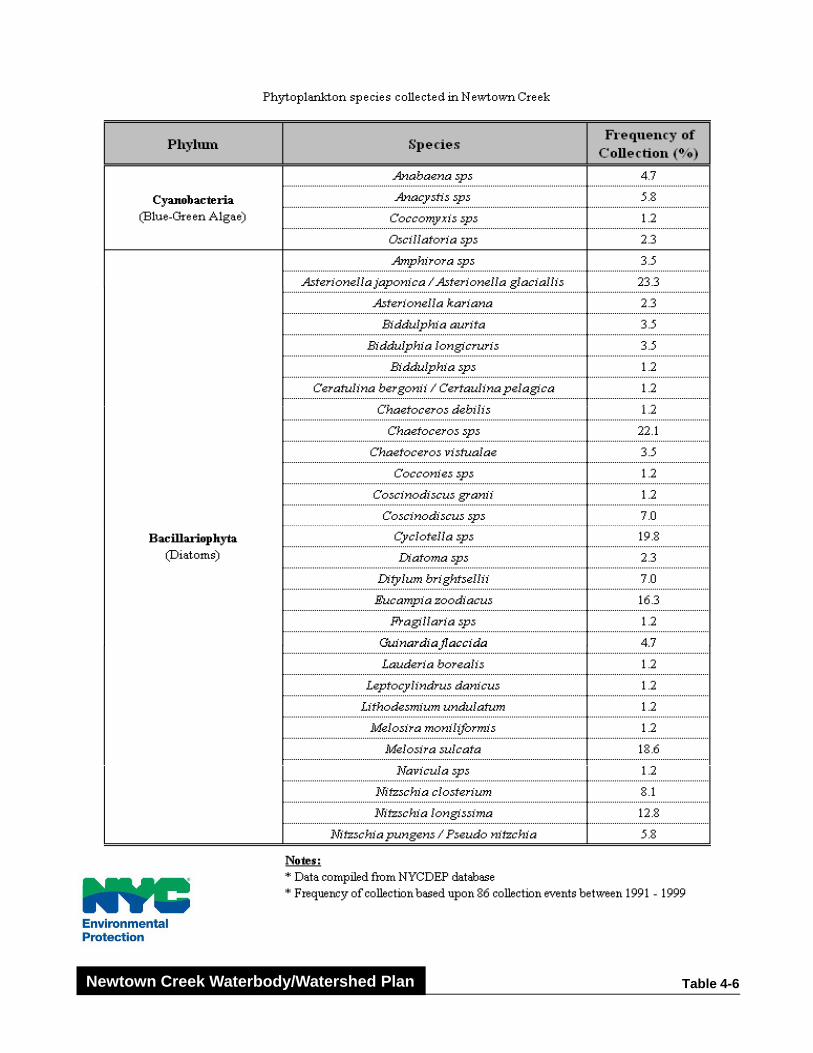
Table 4-6Newtown Creek Waterbody/Watershed Plan

Table 4-6 ContinuedNewtown Creek Waterbody/Watershed Plan

Table 4-7Newtown Creek Waterbody/Watershed Plan

Table 4-8Newtown Creek Waterbody/Watershed Plan

Table 4-9Newtown Creek Waterbody/Watershed Plan

New York City Department of Environmental Protection Waterbody/Watershed Facility Plan Report
Newtown Creek
4-68 June 2011
4.6.6. Adult and Juvenile Fish
The fish community of Newtown Creek was sampled as part of the East River FSAP
(Hydroqual 2001, Figure 4-6). Sampling was conducted in the middle of the Creek in August,
when bottom water DO concentrations are at their lowest. Sampling gear included an otter trawl
to catch bottom oriented species and a gill net suspended in the water column to capture pelagic
species.
A total of 3 fish species were collected with an otter trawl from the Newtown Creek in
August 2001 (Table 4-10). Nine weakfish, three striped bass and one winter flounder were
collected. Low numbers of invertebrates including blue crabs, brown shrimp, a ctenophore, a
mud snail and a hermit crab were collected as incidental catch. This shows that the fish
community is very sparse in Newtown Creek during the summer.
4.6.7. Inter-Waterbody Comparison
The aquatic communities and water quality of Newtown Creek were compared with those
found in the Gowanus Canal (Canal) in order to further evaluate the potential of Newtown Creek
to support fish propagation and survival, and to evaluate the interactions of the tributaries with
the adjacent waterbody. The FSAP conducted in 2001 included sampling stations located in the
Gowanus Canal and Newtown Creek. This study characterized the historic land use, regional
contamination, existing water quality and aquatic communities of these two tributaries of the
East River. The following sections briefly compare the results from these two tributaries.
The history, development and environmental issues surrounding Newtown Creek and
Gowanus Canal are similar. Both waterbodies were formerly long tidal creeks with surrounding
wetlands and freshwater inflow from an undeveloped upland. Brooklyn was settled during the
1600‟s by the Dutch farming settlements. As the settlements grew, demands on the water bodies
increased. During the 1700‟s and into the 1800‟s the Creek and Canal were modified to support
fishing, farming, and general commercial and industrial activities. By the mid-1800‟s the
physical and ecological characteristics were permanently altered by dredging, straightening,
bulk-heading and landfills. Wetlands and open space in the area were replaced with urban
developments. The urban developments eliminated the natural watershed for both the Creek and
Canal. Widespread paving, building development and city-wide sewers came to replace the
freshwater stream flow into the two tidal tributaries. Natural tidal or freshwater wetlands no
longer exist within the immediate riparian area of either waterbody.
Due to the urbanization of the greater Brooklyn area, many environmental complications
have arisen in Newtown Creek and the Gowanus Canal. In the July 2004 New York Harbor
Water Quality Report (Harbor Report), the New York City Department of Environmental
Protection (DEP) repeatedly compared the levels of environmental degradation in Newtown
Creek to those of Gowanus Canal. On a broad scale, both tributaries are highly susceptible to
non-point pollution, including runoff from impermeable paved surfaces, deposition of airborne
mercury, nutrients, soot and particulate matter, and leaching from former industrial sites and
historic landfills.
The Harbor Report also specifically identifies Newtown Creek and Gowanus Canal as
exhibiting “hot spots” of historic pollution, being general “problem areas” for Enterococcus
faecium, and having frequent spikes in fecal coliform associated with heavy rainfall and CSO
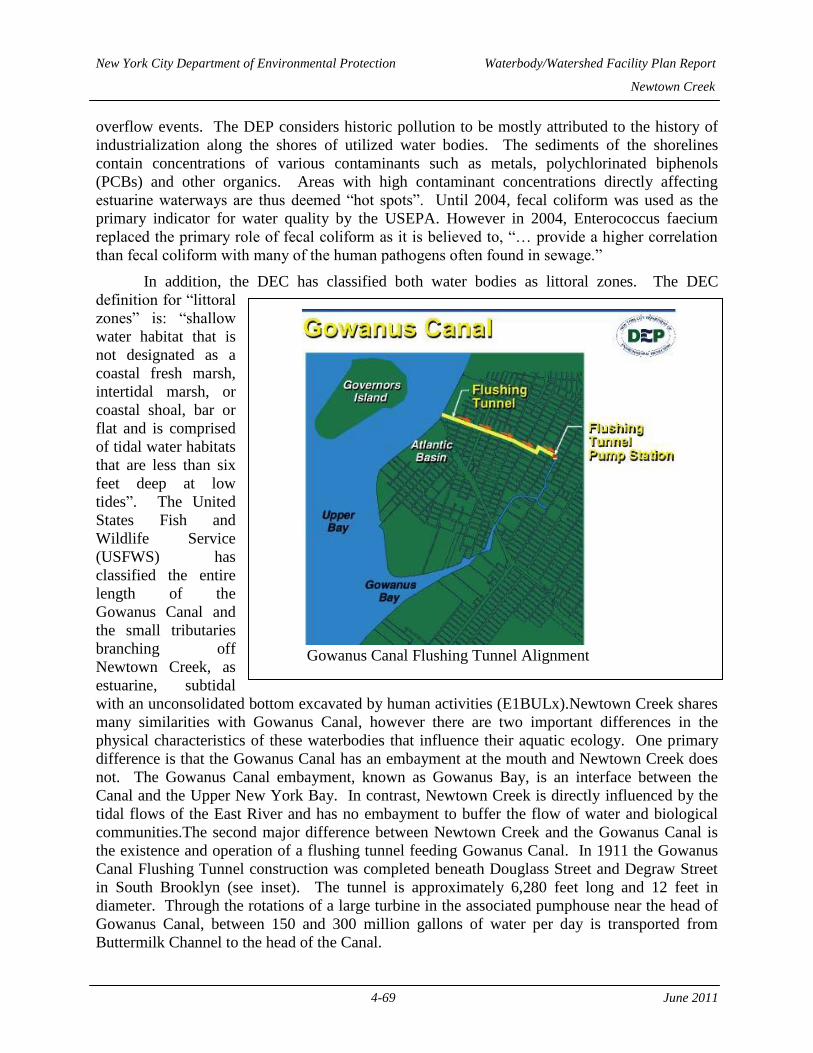
New York City Department of Environmental Protection Waterbody/Watershed Facility Plan Report
Newtown Creek
4-69 June 2011
Gowanus Canal Flushing Tunnel Alignment
overflow events. The DEP considers historic pollution to be mostly attributed to the history of
industrialization along the shores of utilized water bodies. The sediments of the shorelines
contain concentrations of various contaminants such as metals, polychlorinated biphenols
(PCBs) and other organics. Areas with high contaminant concentrations directly affecting
estuarine waterways are thus deemed “hot spots”. Until 2004, fecal coliform was used as the
primary indicator for water quality by the USEPA. However in 2004, Enterococcus faecium
replaced the primary role of fecal coliform as it is believed to, “… provide a higher correlation
than fecal coliform with many of the human pathogens often found in sewage.”
In addition, the DEC has classified both water bodies as littoral zones. The DEC
definition for “littoral
zones” is: “shallow
water habitat that is
not designated as a
coastal fresh marsh,
intertidal marsh, or
coastal shoal, bar or
flat and is comprised
of tidal water habitats
that are less than six
feet deep at low
tides”. The United
States Fish and
Wildlife Service
(USFWS) has
classified the entire
length of the
Gowanus Canal and
the small tributaries
branching off
Newtown Creek, as
estuarine, subtidal
with an unconsolidated bottom excavated by human activities (E1BULx).Newtown Creek shares
many similarities with Gowanus Canal, however there are two important differences in the
physical characteristics of these waterbodies that influence their aquatic ecology. One primary
difference is that the Gowanus Canal has an embayment at the mouth and Newtown Creek does
not. The Gowanus Canal embayment, known as Gowanus Bay, is an interface between the
Canal and the Upper New York Bay. In contrast, Newtown Creek is directly influenced by the
tidal flows of the East River and has no embayment to buffer the flow of water and biological
communities.The second major difference between Newtown Creek and the Gowanus Canal is
the existence and operation of a flushing tunnel feeding Gowanus Canal. In 1911 the Gowanus
Canal Flushing Tunnel construction was completed beneath Douglass Street and Degraw Street
in South Brooklyn (see inset). The tunnel is approximately 6,280 feet long and 12 feet in
diameter. Through the rotations of a large turbine in the associated pumphouse near the head of
Gowanus Canal, between 150 and 300 million gallons of water per day is transported from
Buttermilk Channel to the head of the Canal.

Benthic Comparison
Table 4-10Newtown Creek Waterbody/Watershed Plan
New York City Department of Environmental Protection Waterbody/Watershed Facility Plan Report
Newtown Creek
4-71 June 2011
The fresh, oxygenated water brought to the head of the Canal also brings in a wide
variety of biota from the Buttermilk Channel. The Flushing Tunnel was in operation from 1911
until the 1960‟s when a mechanical failure took place. The tunnel sat dormant for over thirty
years. Dredging and repairs to the Flushing Tunnel began in 1992 and concluded with the restart
of operations in April 1999. The tunnel now operates 24 hours per day, seven days per week
bringing Upper Bay water to the head of the Gowanus Canal. Newtown Creek lacks an exterior
source of water which could enhance water quality and provide organisms which could take
advantage of enhanced water quality.
Benthic sampling was conducted in Gowanus Canal as part of the Subtidal Benthos and
Ichthyoplankton Characterization Field Sampling and Analysis Program (Hydroqual 2003a).
Three locations in the Canal were sampled: the head of the Canal near the flushing tunnel, the
middle of the Canal, and upstream of the mouth of the Canal (Figure 4-9). Results of this
sampling effort demonstrate the influence of the flushing tunnel on the biological communities
of the Canal. The location at the head of the Canal had the greatest number of species collected
(20). Arthropods and mollusks comprised approximately half of the species collected and
Annelid worms comprised the other half. Species diversity and abundance were similar between
the middle of the Canal and the location upstream of the mouth of the Canal, but both locations
had approximately half the number of species as were collected near the flushing tunnel, and the
benthic community was dominated by Annelid worms at both downstream locations.
The number of benthic species collected at the head of Gowanus Canal was over five
times the number of species collected at the upstream locations of Newtown Creek and twice that
collected from locations in the middle of the Creek (Table 4-11). Species composition was
similar at the “middle” sampling locations in Gowanus Canal and Newtown Creek. The benthic
community at the sampling locations “upstream of the mouth” of Newtown Creek was more
diverse than at the similar sampling location in Gowanus Canal. The greater diversity was due to
a greater number of Arthropod species, but overall both communities were dominated by
Annelid worms. This suggests that the flushing tunnel greatly improves the conditions at the
head of Gowanus Canal compared to Newtown Creek. The effects may diminish toward the
middle of the Canal, as the benthic community in the middle of the two waterbodies was similar.
As in Newtown Creek, the epibenthic community was sampled in Gowanus Bay using
multi-plate arrays as part of the Harborwide Epibenthic Recruitment and Survival FSAP
(Hydroqual 2001c). Epibenthic arrays were deployed in one location in Gowanus Bay, near the
mouth of Gowanus Canal. Not surprisingly, the total number of species and weights of
organisms on the top and bottom plates were very similar to those found in the East River near
the mouth of Newtown Creek (Table 4-12). Both sites had similar species diversity on both top
and bottom plates (10-13 species) and both were dominated by sea squirts and tunicates. At both
locations, species composition was similar between the top and bottom plates, but the total
weight of organisms was much greater on the top plates (Tables 4-13 and 4-14). Similarities
between the epibenthic communities are likely due to the fact that both sampling locations were
located in open water areas (East River and Gowanus Bay) compared to the upper reaches of the
Creek and the Canal, where water quality conditions are expected to be more limiting.
The ichthyoplankton community in Gowanus Canal and Bay was sampled in 2003 as part
of the Subtidal Benthos and Ichthyoplankton Characterization Field Sampling and Analysis
Program (Hydroqual 2003a). Ichthyoplankton were collected in June and July from two
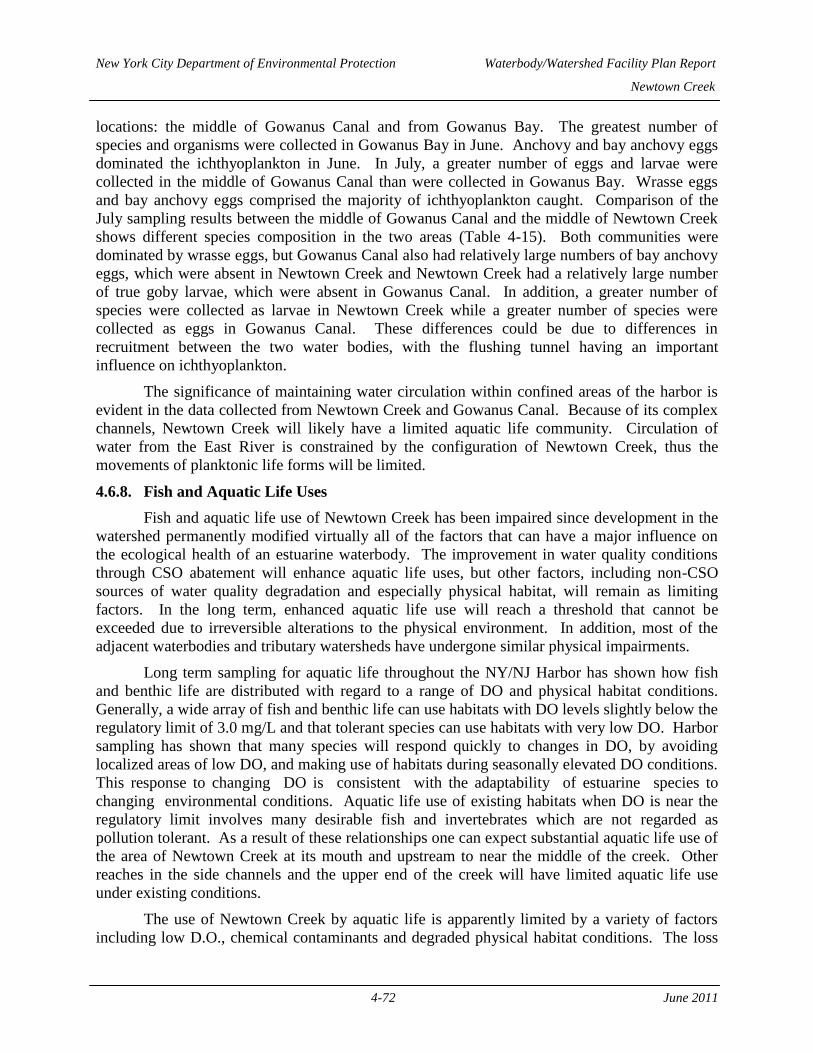
New York City Department of Environmental Protection Waterbody/Watershed Facility Plan Report
Newtown Creek
4-72 June 2011
locations: the middle of Gowanus Canal and from Gowanus Bay. The greatest number of
species and organisms were collected in Gowanus Bay in June. Anchovy and bay anchovy eggs
dominated the ichthyoplankton in June. In July, a greater number of eggs and larvae were
collected in the middle of Gowanus Canal than were collected in Gowanus Bay. Wrasse eggs
and bay anchovy eggs comprised the majority of ichthyoplankton caught. Comparison of the
July sampling results between the middle of Gowanus Canal and the middle of Newtown Creek
shows different species composition in the two areas (Table 4-15). Both communities were
dominated by wrasse eggs, but Gowanus Canal also had relatively large numbers of bay anchovy
eggs, which were absent in Newtown Creek and Newtown Creek had a relatively large number
of true goby larvae, which were absent in Gowanus Canal. In addition, a greater number of
species were collected as larvae in Newtown Creek while a greater number of species were
collected as eggs in Gowanus Canal. These differences could be due to differences in
recruitment between the two water bodies, with the flushing tunnel having an important
influence on ichthyoplankton.
The significance of maintaining water circulation within confined areas of the harbor is
evident in the data collected from Newtown Creek and Gowanus Canal. Because of its complex
channels, Newtown Creek will likely have a limited aquatic life community. Circulation of
water from the East River is constrained by the configuration of Newtown Creek, thus the
movements of planktonic life forms will be limited.
4.6.8. Fish and Aquatic Life Uses
Fish and aquatic life use of Newtown Creek has been impaired since development in the
watershed permanently modified virtually all of the factors that can have a major influence on
the ecological health of an estuarine waterbody. The improvement in water quality conditions
through CSO abatement will enhance aquatic life uses, but other factors, including non-CSO
sources of water quality degradation and especially physical habitat, will remain as limiting
factors. In the long term, enhanced aquatic life use will reach a threshold that cannot be
exceeded due to irreversible alterations to the physical environment. In addition, most of the
adjacent waterbodies and tributary watersheds have undergone similar physical impairments.
Long term sampling for aquatic life throughout the NY/NJ Harbor has shown how fish
and benthic life are distributed with regard to a range of DO and physical habitat conditions.
Generally, a wide array of fish and benthic life can use habitats with DO levels slightly below the
regulatory limit of 3.0 mg/L and that tolerant species can use habitats with very low DO. Harbor
sampling has shown that many species will respond quickly to changes in DO, by avoiding
localized areas of low DO, and making use of habitats during seasonally elevated DO conditions.
This response to changing DO is consistent with the adaptability of estuarine species to
changing environmental conditions. Aquatic life use of existing habitats when DO is near the
regulatory limit involves many desirable fish and invertebrates which are not regarded as
pollution tolerant. As a result of these relationships one can expect substantial aquatic life use of
the area of Newtown Creek at its mouth and upstream to near the middle of the creek. Other
reaches in the side channels and the upper end of the creek will have limited aquatic life use
under existing conditions.
The use of Newtown Creek by aquatic life is apparently limited by a variety of factors
including low D.O., chemical contaminants and degraded physical habitat conditions. The loss

New York City Department of Environmental Protection Waterbody/Watershed Facility Plan Report
Newtown Creek
4-73 June 2011
of extensive fringing wetlands, diverse natural shorelines, and benthic habitat suitable for
colonization, has substantially reduced biological diversity. Improvement in DO and a reduction
in the discharge of organic matter will result in an improvement in the sediments through
reduction in the percentage of TOC in the sediment. A reduction in TOC has been shown to
correlate well with an increase in benthic diversity in the substrate (NYCDOT, 2004). A review
of organic enrichment of estuaries and marine waters by Pearson and Rosenberg (1978) and a
recent review by Hyland et al (2000) under the auspices of the United Nations Educational,
Scientific and Cultural Organization confirm the general applicability of the relationship of TOC
to benthic diversity. However, as long as the substrate is dominated by fine grain material, many
invertebrate species will be excluded. Although the productivity of soft sediments can be high,
because of a lack of diversity in the benthic community, many fishes will make limited use of the
habitat due to a lack of their preferred prey.
Potential gains in aquatic life use in Newtown Creek are contingent upon improvements
in water quality, sediment quality and physical habitat. The aquatic life community in Gowanus
Canal improved quickly after the restart of the flushing tunnel, illustrating the importance of both
adequate D.O. and a source of aquatic life recruitment. However, Gowanus Canal remains
limited by the conditions in Gowanus Bay and the degraded physical habitat conditions
represented by the continuous bulkheading, which provides little physical habitat diversity.
Newtown Creek with improved D.O. conditions would have more diversity and numbers of
individuals in the community, but it would still be a relatively poor habitat for aquatic life.
Use of Newtown Creek by aquatic life in the near future will be limited by the poor water
and sediment quality that prevents aquatic life from recolonizing the area. If these limitations
can be corrected or minimized, angling on limited basis would be possible. Desirable species
can be expected to move into the creek. Many of the target species for anglers in the NY/NJ
Harbor, striped bass, bluefish, and weakfish are transient on a daily time scale so that angling
success is not closely tied to water quality once the regulatory limit is approached or slightly
exceeded.
Currently, there is a strong interest in the enhancement of waterfront amenities
harborwide which, in part, reflects the public recognition that water quality has improved over
past conditions and that the aquatic resources can be used with some limitations. The cumulative
effects of improving conditions for water quality and physical habitat throughout the NY/NJ
Harbor minimizes the residual effects of small areas with temporary seasonal declines in water
quality on the ecosystem scale. There are continuing trends of improving water quality in
adjacent waterbodies such as the East River. While these trends in water quality improvement
continue, the significance of small areas of non-compliance with water quality standards will be
minimized.
The extensive development of the shorelines for industrial, commercial and residential
uses in Newtown Creek is a factor which places limits on aquatic habitat availability and quality.
In a highly modified system such as Newtown Creek, the protection and use of aquatic resources
need to reflect that water quality and habitat will always be less than ideal due to irreversible
changes in the watershed.

Table 4-11Newtown Creek Waterbody/Watershed Plan
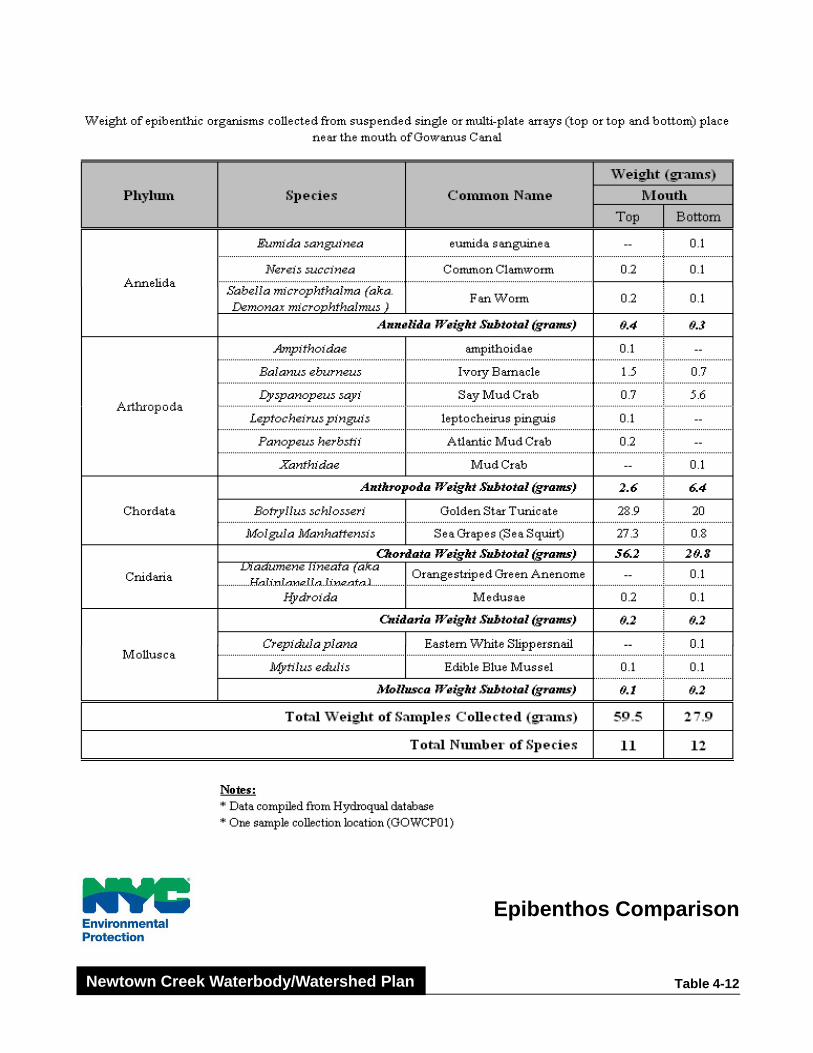
Epibenthos Comparison
Table 4-12Newtown Creek Waterbody/Watershed Plan
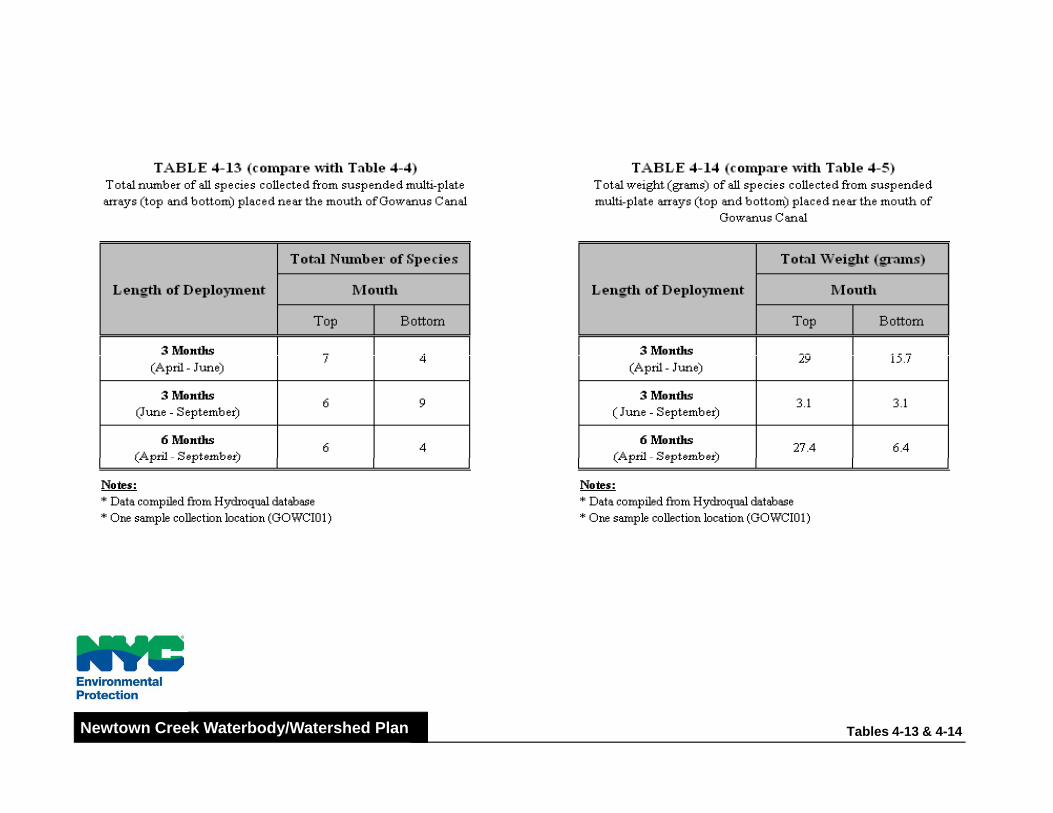
Tables 4-13 & 4-14Newtown Creek Waterbody/Watershed Plan
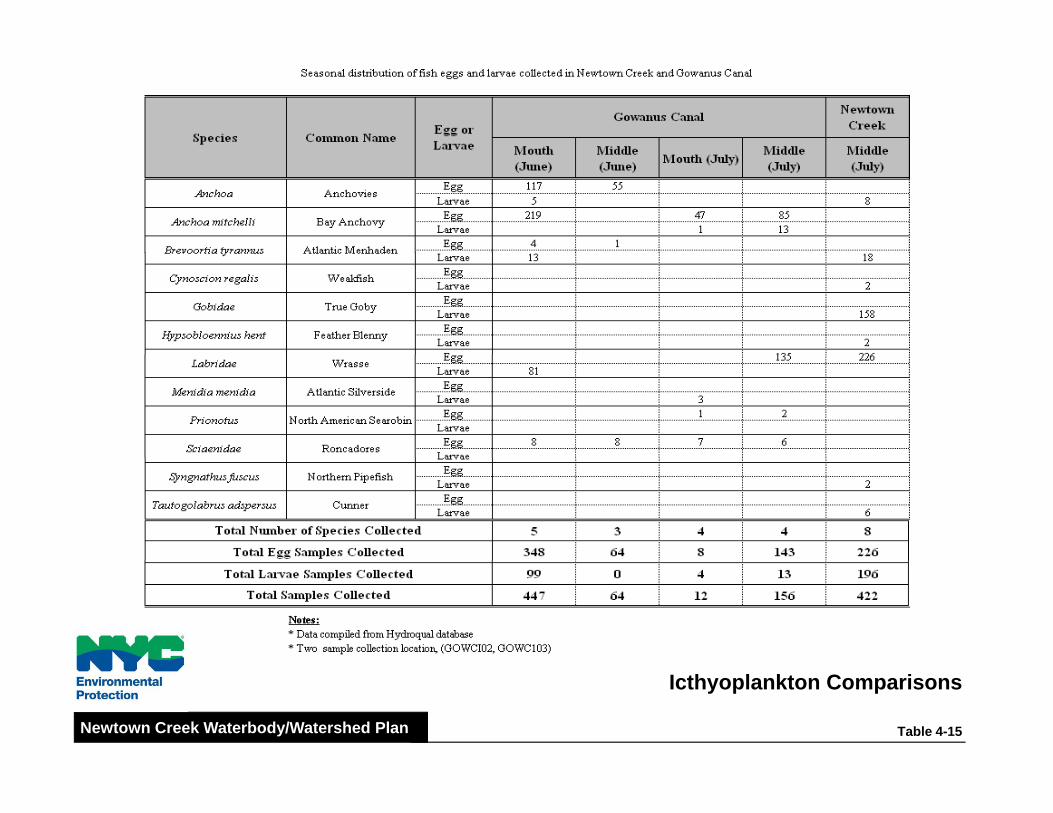
Icthyoplankton Comparisons
Table 4-15Newtown Creek Waterbody/Watershed Plan

New York City Department of Environmental Protection Waterbody/Watershed Facility Plan Report
Newtown Creek
4-78 June 2011
4.7. SENSITIVE AREAS
Federal CSO Policy requires that the long-term CSO control plan give the highest priority
to controlling overflows to sensitive areas. For such areas, the CSO Policy indicates the LTCP
should: (a) prohibit new or significantly increased overflows; (b) eliminate or relocate overflows
that discharge to sensitive areas if physically possible, economically achievable, and as
protective as additional treatment, or provide a level of treatment for remaining overflows
adequate to meet standards; and (c) provide assessments in each permit term based on changes in
technology, economics, or other circumstances for those locations not eliminated or relocated
(USEPA, 1995a). The policy defines sensitive areas as:
Waters designated as Outstanding National Resource Waters (ONRW);
National Marine Sanctuaries;
Public drinking water intakes;
Waters designated as protected areas for public water supply intakes;
Shellfish beds;
Waters with threatened or endangered species and their habitat;
Water with primary contact recreation; and
Additional areas determined by the Permitting Authority (i.e. the DEC).
The last item in the list was derived from the policy statement that the final determination
should be the prerogative of the NPDES Permitting Authority. The Natural Resources Division
of the DEC was consulted during development of the assessment approach, and provided
additional sensitive areas for CSO abatement prioritization based on local environmental issues
(Vogel, 2005). Their response listed the following: Jamaica Bay; Bird Conservation Areas;
Hudson River Park; „important tributaries‟ such as the Bronx River in the Bronx, and Mill
Richmond, Old Place, and Main Creeks in Staten Island; the Raritan Bay shellfish harvest area;
waterbodies targeted for regional watershed management plans (Newtown Creek and Gowanus
Canal).
The federal CSO Control Policy specifies a consideration of sensitive areas at a variety of
steps in developing and implementing a long-term control plan (USEPA, 1994). The following
reviews the CSO Control Policy‟s sensitive areas specifications in further detail and their
applicability to long-term control planning for the Newtown Creek waterbody.
There are no Outstanding National Resource Waters, National Marine Sanctuaries, public
drinking water intakes or their designated protection areas, or shellfish beds within the Newtown
Creek waterbody.
There are no threatened or endangered species or their designated critical habitat within
the Newtown Creek waterbody.
The Newtown Creek, its tributaries and branches, are not designated by the State of New
York for recreational uses. There are no primary contact recreation waters such as bathing
beaches in the waterbody.
The majority of riparian areas are zoned for industrial or manufacturing uses, and all of
the waterbody, except for the mouth of Newtown Creek, is included in the Newtown Creek
Significant Maritime and Industrial Area. As discussed in Section 2.2, an SMIA is a designated

New York City Department of Environmental Protection Waterbody/Watershed Facility Plan Report
Newtown Creek
4-79 June 2011
area in which industrial or maritime activity is encouraged, such as waterborne and airborne
cargo and passenger transportation, industrial activity, and municipal and public utility services.
These designated uses imply an absence of sensitive areas. Working waterfront uses have
locational requirements that make portions of the coastal zone especially valuable as industrial
areas. This most likely precludes future designation for primary contact recreational uses in the
waterbody due to the potential use conflict it would represent.
The DEC‟s determination that the Newtown Creek waterbody as a whole is a sensitive
area. The sensitive area designation is intended to provide a prioritization for controlling
overflows. For such an area, the LTCP should either (a) prohibit new or significantly increased
overflows or (b) eliminate or relocate overflows that discharge to sensitive areas if physically
possible and economically achievable, unless elimination or relocation creates more
environmental impact than continued discharge, with additional treatment as necessary to meet
water quality standards. However, the designation does not assist in prioritizing outfalls or
evaluating alternatives to addressing CSO discharges within the waterbody itself and therefore,
prioritization of goals, and selection of control alternatives and their implementation can be
driven by those that most reasonably attain maximum benefit to water quality throughout the
Newtown Creek, its tributaries, and branches. Additionally, this waterbody/watershed
assessment and planning effort includes alternatives which prohibit new or significantly
increased overflows, and eliminates or relocates overflows that discharge to the waterbody in
accordance with the requirements of Federal CSO Policy for sensitive areas.

New York City Department of Environmental Protection Waterbody/Watershed Facility Plan Report
Newtown Creek
4-80 June 2011
NO TEXT ON THIS PAGE
New York City Department of Environmental Protection Waterbody/Watershed Facility Plan Report
Newtown Creek
5-1 June 2011
5.0. Waterbody Improvement Projects
New York City is served primarily by a combined sewer system. Approximately 70
percent of the City is comprised of combined sewers totaling 4,800 miles within the five
boroughs. The sewer system drains some 200,000 acres and serves a population of
approximately 8 million New Yorkers. Approximately 460 outfalls are permitted to discharge
during wet-weather through CSOs to the receiving waters of the New York Harbor complex.
These discharges result in localized water-quality problems such as periodically high levels of
coliform bacteria, nuisance levels of floatables, depressed DO, and, in some cases, sediment
mounds and unpleasant odors.
The City of New York is committed to its role as an environmental steward of the New
York Harbor and began addressing the issue of CSO discharges in the 1950s. To date, DEP has
spent or committed over $2.1 billion in its Citywide CSO abatement program. As a result of this
and other ongoing programs, water quality has improved dramatically over the past 30 years
(DEP Harbor Survey Annual Reports). Implementation of many of these solutions within the
current DEP 10-year capital plan will continue that trend as DEP continues to address CSO-
related water quality issues through its Citywide CSO Floatables program, pump station and
collection system improvements, and the ongoing analysis and implementation of CSO
abatement solutions. The following sections present the history of DEP CSO abatement and
describe the current and ongoing programs in detail.
5.1. CSO PROGRAMS 1950 TO 1992
Early CSO assessment programs began in the 1950s and culminated with the Spring
Creek Auxiliary WWTP, a 12-million gallon CSO retention facility, constructed on a tributary to
Jamaica Bay. Completed in 1972, this project was one of the first such facilities constructed in
the United States. Shortly thereafter, New York City was designated by the USEPA to conduct
an Area-Wide Wastewater Management Plan authorized by Section 208 of the then recently
enacted CWA. This plan, completed in 1979, identified a number of urban tributary waterways
in need of CSO abatement throughout the City. During the period from the mid-1970s through
the mid-1980s New York City's resources were devoted to the construction of wastewater
treatment plant upgrades.
In 1983, DEP re-invigorated its CSO facility-planning program in accordance with DEC-
issued SPDES permits for its WWTPs with a project in Flushing Bay and Creek. In 1985, a
Citywide CSO Assessment was undertaken which assessed the existing CSO problem and
established the framework for additional facility planning. From this program, the City was
divided into eight areas, which together cover the entire harbor area. Four area-wide projects
were developed (East River, Jamaica Bay, Inner Harbor and Outer Harbor) and four tributary
project areas were defined (Flushing Bay, Paerdegat Basin, Newtown Creek, and the Jamaica
tributaries). Detailed CSO Facility Planning Projects were conducted in each of these areas in
the 1980s and early 1990s and resulted in a series of detailed, area-specific plans.
In 1989, DEP initiated the Citywide Floatables Study in response to a series of medical
waste and floating material wash-ups and resulting bathing beach closures in New York and New
New York City Department of Environmental Protection Waterbody/Watershed Facility Plan Report
Newtown Creek
5-2 June 2011
Jersey in the late 1980s. This comprehensive investigation determined that medical wastes were
a small component of the full spectrum of material found in metropolitan area waters and beach
wash-ups and that the likely source of the medical wastes was illegal dumping. The study also
found that, aside from natural materials and wood from decaying piers and vessels, the primary
component of the floatable material is street litter in surface runoff that is discharged to area
waters via CSOs and storm sewers. The Floatables Control Program is discussed in Section 5.4.
5.2. CITYWIDE CSO ABATEMENT ORDERS (1992, 1996, 2005, 2008, 2009)
In 1992, DEC and DEP entered into the original CSO Administrative Consent Order
(1992 ACO). As a goal, the 1992 ACO required DEP to develop and implement a CSO
abatement program to effectively address the contravention of water quality standards for
coliforms, DO, and floatables attributable to CSOs. The 1992 ACO contained compliance
schedules for the planning, design and construction of the numerous CSO projects in the eight
CSO planning areas. The 1992 ACO was modified in 1996 to add a program for catch basin
cleaning, construction, and repair to further control floatables.
The Flushing Bay and Paerdegat Basin CSO Retention Tanks were included in the 1992
ACO. In addition, two parallel tracks were identified for CSO planning purposes. Track 1
addressed DO (aquatic life protection) and coliform bacteria (recreation) issues. Track 2
addressed floatables, settleable solids and other water use impairment issues. The 1992 ACO
also provided for an Interim Floatables Containment Program to be implemented consisting of a
booming and skimming program in confined tributaries, skimming in the open waters of the
harbor, and an inventory of street catch basins where floatable materials enter the sewer systems.
Open waters are defined as the Inner and Outer Harbors as well as Jamaica Bay.
In accordance with the 1992 ACO, DEP continued to implement its work for CSO
abatement through the facility-planning phase into the preliminary engineering phase. Work
proceeded on the planning and design of eight CSO retention tanks located on confined and
highly urbanized tributaries throughout the City. The number of planned retention tank facilities
was reduced from eight to six during the CSO facility planning phase. The Interim Floatables
Containment Program was fully developed and implemented. The Corona Avenue Vortex
Facility (CAVF) pilot project for the floatables and settleable solids control was designed and
implemented. The City’s 141,000 catch basins were inventoried and a re-hooding program for
floatables containment was implemented and substantially completed. Reconstruction and re-
hooding of the remaining basins were completed in 2009.
For CSOs discharging to the open waters of the Inner and Outer Harbors areas, efforts
were directed to the design of sewer system improvements and wastewater treatment plant
modifications to increase the capture of combined sewage for processing at the plants. For the
Jamaica Tributaries, efforts focused on correction of illegal connections to the sewer system and
evaluation of sewer separation as control alternatives. For Coney Island Creek, attention was
directed to corrections of illegal connections and other sewer system/pumping station
improvements. These efforts and the combination of the preliminary engineering design phase
work at six retention tank sites resulted in amendments to some of the original CSO Facility
Plans included in the 1992 ACO and the development of additional CSO Facility Plans in 1999.
DEP and DEC negotiated a new Consent Order that was signed January 14, 2005 that
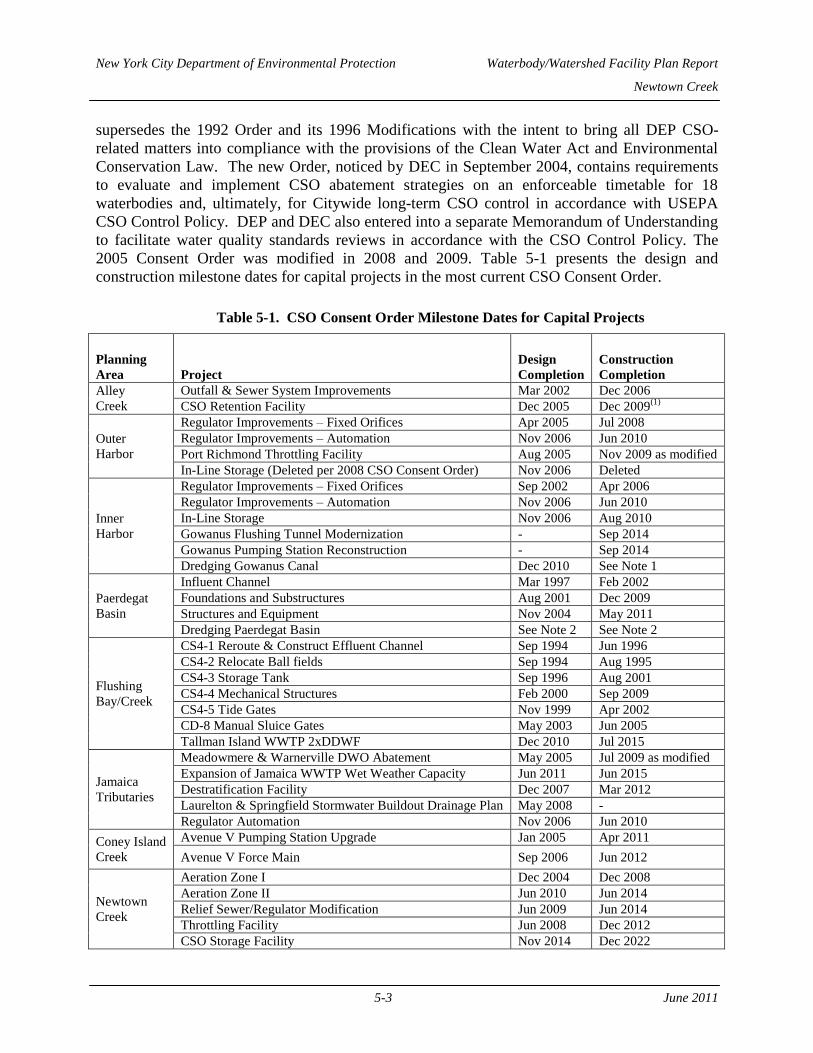
New York City Department of Environmental Protection Waterbody/Watershed Facility Plan Report
Newtown Creek
5-3 June 2011
supersedes the 1992 Order and its 1996 Modifications with the intent to bring all DEP CSO-
related matters into compliance with the provisions of the Clean Water Act and Environmental
Conservation Law. The new Order, noticed by DEC in September 2004, contains requirements
to evaluate and implement CSO abatement strategies on an enforceable timetable for 18
waterbodies and, ultimately, for Citywide long-term CSO control in accordance with USEPA
CSO Control Policy. DEP and DEC also entered into a separate Memorandum of Understanding
to facilitate water quality standards reviews in accordance with the CSO Control Policy. The
2005 Consent Order was modified in 2008 and 2009. Table 5-1 presents the design and
construction milestone dates for capital projects in the most current CSO Consent Order.
Table 5-1. CSO Consent Order Milestone Dates for Capital Projects
Planning
Area Project
Design
Completion
Construction
Completion
Alley
Creek
Outfall & Sewer System Improvements Mar 2002 Dec 2006
CSO Retention Facility Dec 2005 Dec 2009(1)
Outer
Harbor
Regulator Improvements – Fixed Orifices Apr 2005 Jul 2008
Regulator Improvements – Automation Nov 2006 Jun 2010
Port Richmond Throttling Facility Aug 2005 Nov 2009 as modified
In-Line Storage (Deleted per 2008 CSO Consent Order) Nov 2006 Deleted
Inner
Harbor
Regulator Improvements – Fixed Orifices Sep 2002 Apr 2006
Regulator Improvements – Automation Nov 2006 Jun 2010
In-Line Storage Nov 2006 Aug 2010
Gowanus Flushing Tunnel Modernization - Sep 2014
Gowanus Pumping Station Reconstruction - Sep 2014
Dredging Gowanus Canal Dec 2010 See Note 1
Paerdegat
Basin
Influent Channel Mar 1997 Feb 2002
Foundations and Substructures Aug 2001 Dec 2009
Structures and Equipment Nov 2004 May 2011
Dredging Paerdegat Basin See Note 2 See Note 2
Flushing
Bay/Creek
CS4-1 Reroute & Construct Effluent Channel Sep 1994 Jun 1996
CS4-2 Relocate Ball fields Sep 1994 Aug 1995
CS4-3 Storage Tank Sep 1996 Aug 2001
CS4-4 Mechanical Structures Feb 2000 Sep 2009
CS4-5 Tide Gates Nov 1999 Apr 2002
CD-8 Manual Sluice Gates May 2003 Jun 2005
Tallman Island WWTP 2xDDWF Dec 2010 Jul 2015
Jamaica
Tributaries
Meadowmere & Warnerville DWO Abatement May 2005 Jul 2009 as modified
Expansion of Jamaica WWTP Wet Weather Capacity Jun 2011 Jun 2015
Destratification Facility Dec 2007 Mar 2012
Laurelton & Springfield Stormwater Buildout Drainage Plan May 2008 -
Regulator Automation Nov 2006 Jun 2010
Coney Island
Creek
Avenue V Pumping Station Upgrade Jan 2005 Apr 2011
Avenue V Force Main Sep 2006 Jun 2012
Newtown
Creek
Aeration Zone I Dec 2004 Dec 2008
Aeration Zone II Jun 2010 Jun 2014
Relief Sewer/Regulator Modification Jun 2009 Jun 2014
Throttling Facility Jun 2008 Dec 2012
CSO Storage Facility Nov 2014 Dec 2022
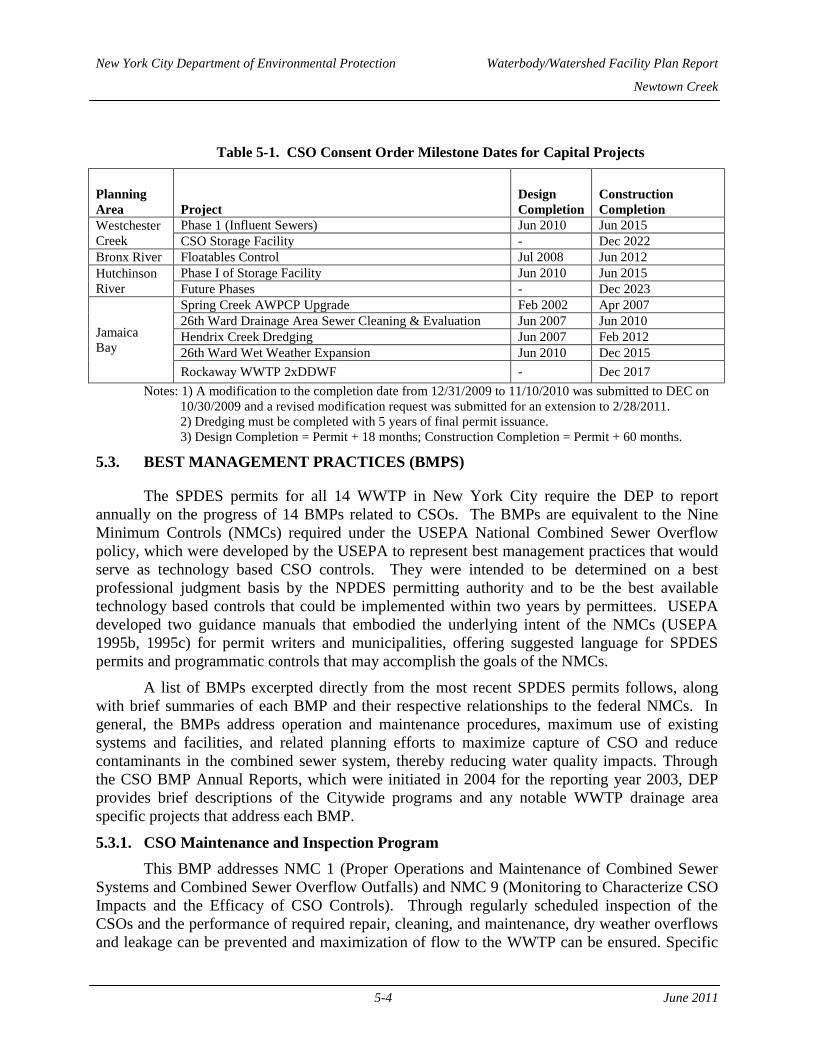
New York City Department of Environmental Protection Waterbody/Watershed Facility Plan Report
Newtown Creek
5-4 June 2011
Table 5-1. CSO Consent Order Milestone Dates for Capital Projects
Planning
Area Project
Design
Completion
Construction
Completion
Westchester
Creek
Phase 1 (Influent Sewers) Jun 2010 Jun 2015
CSO Storage Facility - Dec 2022
Bronx River Floatables Control Jul 2008 Jun 2012
Hutchinson
River
Phase I of Storage Facility Jun 2010 Jun 2015
Future Phases - Dec 2023
Jamaica
Bay
Spring Creek AWPCP Upgrade Feb 2002 Apr 2007
26th Ward Drainage Area Sewer Cleaning & Evaluation Jun 2007 Jun 2010
Hendrix Creek Dredging Jun 2007 Feb 2012
26th Ward Wet Weather Expansion Jun 2010 Dec 2015
Rockaway WWTP 2xDDWF - Dec 2017
Notes: 1) A modification to the completion date from 12/31/2009 to 11/10/2010 was submitted to DEC on
10/30/2009 and a revised modification request was submitted for an extension to 2/28/2011.
2) Dredging must be completed with 5 years of final permit issuance.
3) Design Completion = Permit + 18 months; Construction Completion = Permit + 60 months.
5.3. BEST MANAGEMENT PRACTICES (BMPS)
The SPDES permits for all 14 WWTP in New York City require the DEP to report
annually on the progress of 14 BMPs related to CSOs. The BMPs are equivalent to the Nine
Minimum Controls (NMCs) required under the USEPA National Combined Sewer Overflow
policy, which were developed by the USEPA to represent best management practices that would
serve as technology based CSO controls. They were intended to be determined on a best
professional judgment basis by the NPDES permitting authority and to be the best available
technology based controls that could be implemented within two years by permittees. USEPA
developed two guidance manuals that embodied the underlying intent of the NMCs (USEPA
1995b, 1995c) for permit writers and municipalities, offering suggested language for SPDES
permits and programmatic controls that may accomplish the goals of the NMCs.
A list of BMPs excerpted directly from the most recent SPDES permits follows, along
with brief summaries of each BMP and their respective relationships to the federal NMCs. In
general, the BMPs address operation and maintenance procedures, maximum use of existing
systems and facilities, and related planning efforts to maximize capture of CSO and reduce
contaminants in the combined sewer system, thereby reducing water quality impacts. Through
the CSO BMP Annual Reports, which were initiated in 2004 for the reporting year 2003, DEP
provides brief descriptions of the Citywide programs and any notable WWTP drainage area
specific projects that address each BMP.
5.3.1. CSO Maintenance and Inspection Program
This BMP addresses NMC 1 (Proper Operations and Maintenance of Combined Sewer
Systems and Combined Sewer Overflow Outfalls) and NMC 9 (Monitoring to Characterize CSO
Impacts and the Efficacy of CSO Controls). Through regularly scheduled inspection of the
CSOs and the performance of required repair, cleaning, and maintenance, dry weather overflows
and leakage can be prevented and maximization of flow to the WWTP can be ensured. Specific
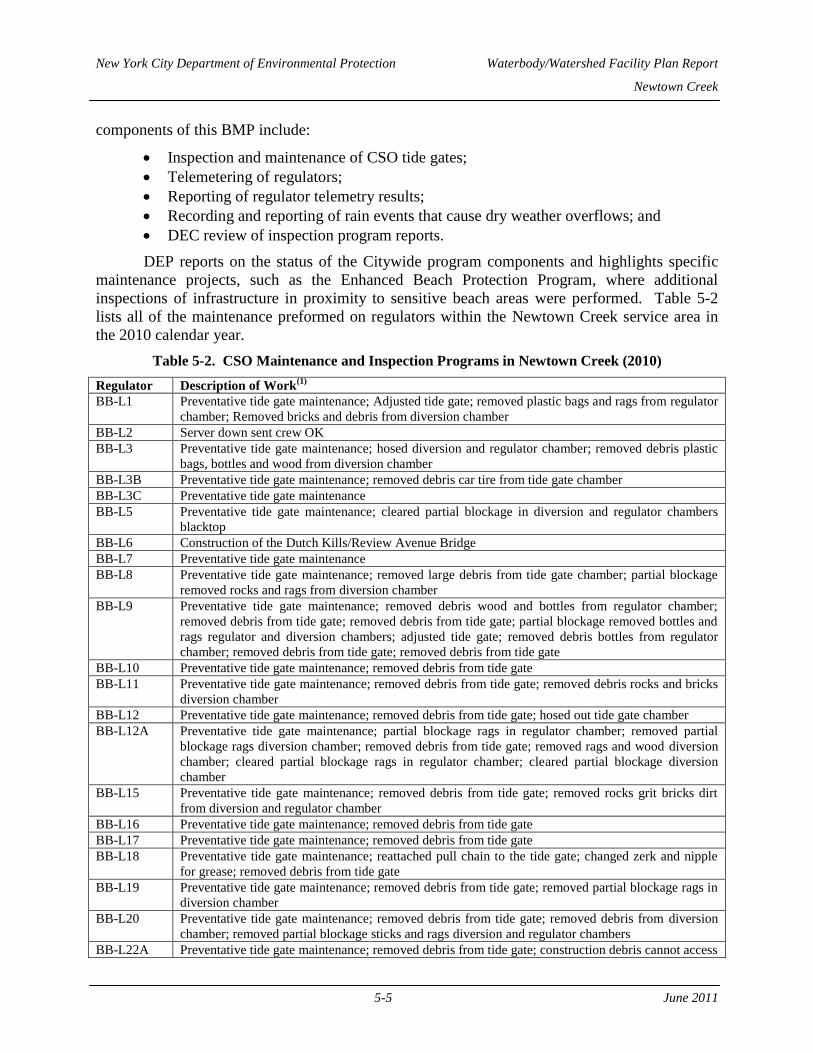
New York City Department of Environmental Protection Waterbody/Watershed Facility Plan Report
Newtown Creek
5-5 June 2011
components of this BMP include:
Inspection and maintenance of CSO tide gates;
Telemetering of regulators;
Reporting of regulator telemetry results;
Recording and reporting of rain events that cause dry weather overflows; and
DEC review of inspection program reports.
DEP reports on the status of the Citywide program components and highlights specific
maintenance projects, such as the Enhanced Beach Protection Program, where additional
inspections of infrastructure in proximity to sensitive beach areas were performed. Table 5-2
lists all of the maintenance preformed on regulators within the Newtown Creek service area in
the 2010 calendar year.
Table 5-2. CSO Maintenance and Inspection Programs in Newtown Creek (2010)
Regulator Description of Work(1)
BB-L1 Preventative tide gate maintenance; Adjusted tide gate; removed plastic bags and rags from regulator
chamber; Removed bricks and debris from diversion chamber
BB-L2 Server down sent crew OK
BB-L3 Preventative tide gate maintenance; hosed diversion and regulator chamber; removed debris plastic
bags, bottles and wood from diversion chamber
BB-L3B Preventative tide gate maintenance; removed debris car tire from tide gate chamber
BB-L3C Preventative tide gate maintenance
BB-L5 Preventative tide gate maintenance; cleared partial blockage in diversion and regulator chambers
blacktop
BB-L6 Construction of the Dutch Kills/Review Avenue Bridge
BB-L7 Preventative tide gate maintenance
BB-L8 Preventative tide gate maintenance; removed large debris from tide gate chamber; partial blockage
removed rocks and rags from diversion chamber
BB-L9 Preventative tide gate maintenance; removed debris wood and bottles from regulator chamber;
removed debris from tide gate; removed debris from tide gate; partial blockage removed bottles and
rags regulator and diversion chambers; adjusted tide gate; removed debris bottles from regulator
chamber; removed debris from tide gate; removed debris from tide gate
BB-L10 Preventative tide gate maintenance; removed debris from tide gate
BB-L11 Preventative tide gate maintenance; removed debris from tide gate; removed debris rocks and bricks
diversion chamber
BB-L12 Preventative tide gate maintenance; removed debris from tide gate; hosed out tide gate chamber
BB-L12A Preventative tide gate maintenance; partial blockage rags in regulator chamber; removed partial
blockage rags diversion chamber; removed debris from tide gate; removed rags and wood diversion
chamber; cleared partial blockage rags in regulator chamber; cleared partial blockage diversion
chamber
BB-L15 Preventative tide gate maintenance; removed debris from tide gate; removed rocks grit bricks dirt
from diversion and regulator chamber
BB-L16 Preventative tide gate maintenance; removed debris from tide gate
BB-L17 Preventative tide gate maintenance; removed debris from tide gate
BB-L18 Preventative tide gate maintenance; reattached pull chain to the tide gate; changed zerk and nipple
for grease; removed debris from tide gate
BB-L19 Preventative tide gate maintenance; removed debris from tide gate; removed partial blockage rags in
diversion chamber
BB-L20 Preventative tide gate maintenance; removed debris from tide gate; removed debris from diversion
chamber; removed partial blockage sticks and rags diversion and regulator chambers
BB-L22A Preventative tide gate maintenance; removed debris from tide gate; construction debris cannot access
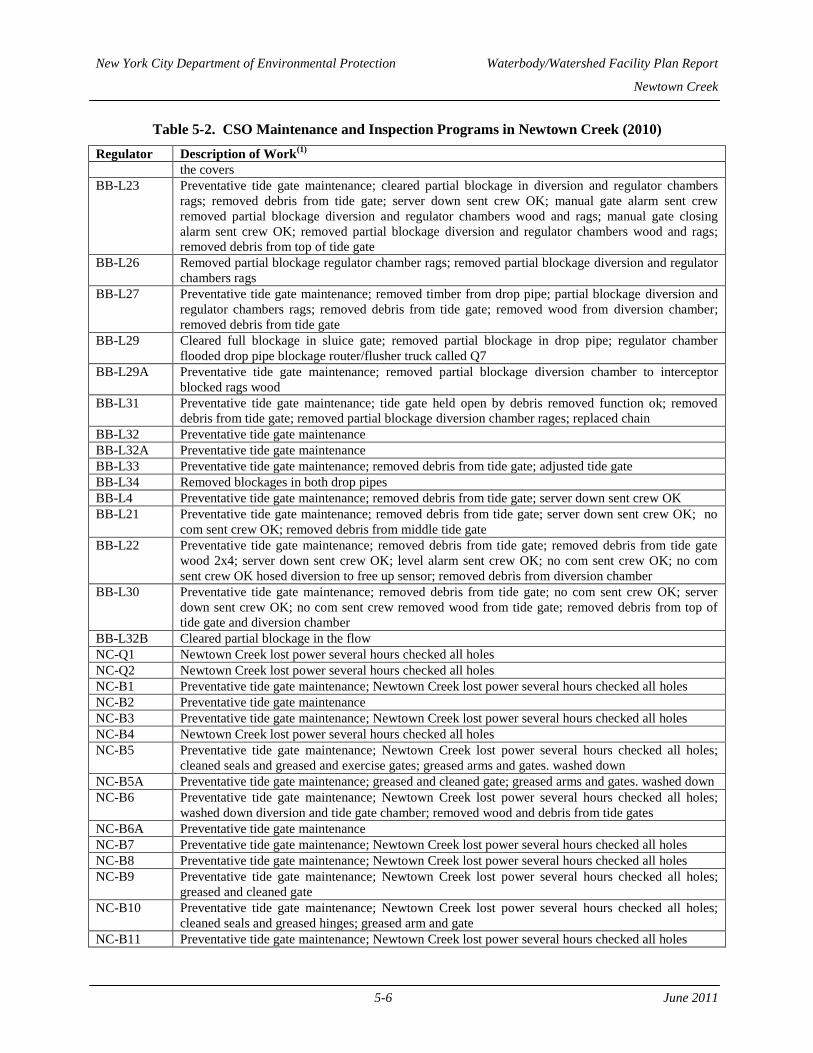
New York City Department of Environmental Protection Waterbody/Watershed Facility Plan Report
Newtown Creek
5-6 June 2011
Table 5-2. CSO Maintenance and Inspection Programs in Newtown Creek (2010)
Regulator Description of Work(1)
the covers
BB-L23 Preventative tide gate maintenance; cleared partial blockage in diversion and regulator chambers
rags; removed debris from tide gate; server down sent crew OK; manual gate alarm sent crew
removed partial blockage diversion and regulator chambers wood and rags; manual gate closing
alarm sent crew OK; removed partial blockage diversion and regulator chambers wood and rags;
removed debris from top of tide gate
BB-L26 Removed partial blockage regulator chamber rags; removed partial blockage diversion and regulator
chambers rags
BB-L27 Preventative tide gate maintenance; removed timber from drop pipe; partial blockage diversion and
regulator chambers rags; removed debris from tide gate; removed wood from diversion chamber;
removed debris from tide gate
BB-L29 Cleared full blockage in sluice gate; removed partial blockage in drop pipe; regulator chamber
flooded drop pipe blockage router/flusher truck called Q7
BB-L29A Preventative tide gate maintenance; removed partial blockage diversion chamber to interceptor
blocked rags wood
BB-L31 Preventative tide gate maintenance; tide gate held open by debris removed function ok; removed
debris from tide gate; removed partial blockage diversion chamber rages; replaced chain
BB-L32 Preventative tide gate maintenance
BB-L32A Preventative tide gate maintenance
BB-L33 Preventative tide gate maintenance; removed debris from tide gate; adjusted tide gate
BB-L34 Removed blockages in both drop pipes
BB-L4 Preventative tide gate maintenance; removed debris from tide gate; server down sent crew OK
BB-L21 Preventative tide gate maintenance; removed debris from tide gate; server down sent crew OK; no
com sent crew OK; removed debris from middle tide gate
BB-L22 Preventative tide gate maintenance; removed debris from tide gate; removed debris from tide gate
wood 2x4; server down sent crew OK; level alarm sent crew OK; no com sent crew OK; no com
sent crew OK hosed diversion to free up sensor; removed debris from diversion chamber
BB-L30 Preventative tide gate maintenance; removed debris from tide gate; no com sent crew OK; server
down sent crew OK; no com sent crew removed wood from tide gate; removed debris from top of
tide gate and diversion chamber
BB-L32B Cleared partial blockage in the flow
NC-Q1 Newtown Creek lost power several hours checked all holes
NC-Q2 Newtown Creek lost power several hours checked all holes
NC-B1 Preventative tide gate maintenance; Newtown Creek lost power several hours checked all holes
NC-B2 Preventative tide gate maintenance
NC-B3 Preventative tide gate maintenance; Newtown Creek lost power several hours checked all holes
NC-B4 Newtown Creek lost power several hours checked all holes
NC-B5 Preventative tide gate maintenance; Newtown Creek lost power several hours checked all holes;
cleaned seals and greased and exercise gates; greased arms and gates. washed down
NC-B5A Preventative tide gate maintenance; greased and cleaned gate; greased arms and gates. washed down
NC-B6 Preventative tide gate maintenance; Newtown Creek lost power several hours checked all holes;
washed down diversion and tide gate chamber; removed wood and debris from tide gates
NC-B6A Preventative tide gate maintenance
NC-B7 Preventative tide gate maintenance; Newtown Creek lost power several hours checked all holes
NC-B8 Preventative tide gate maintenance; Newtown Creek lost power several hours checked all holes
NC-B9 Preventative tide gate maintenance; Newtown Creek lost power several hours checked all holes;
greased and cleaned gate
NC-B10 Preventative tide gate maintenance; Newtown Creek lost power several hours checked all holes;
cleaned seals and greased hinges; greased arm and gate
NC-B11 Preventative tide gate maintenance; Newtown Creek lost power several hours checked all holes
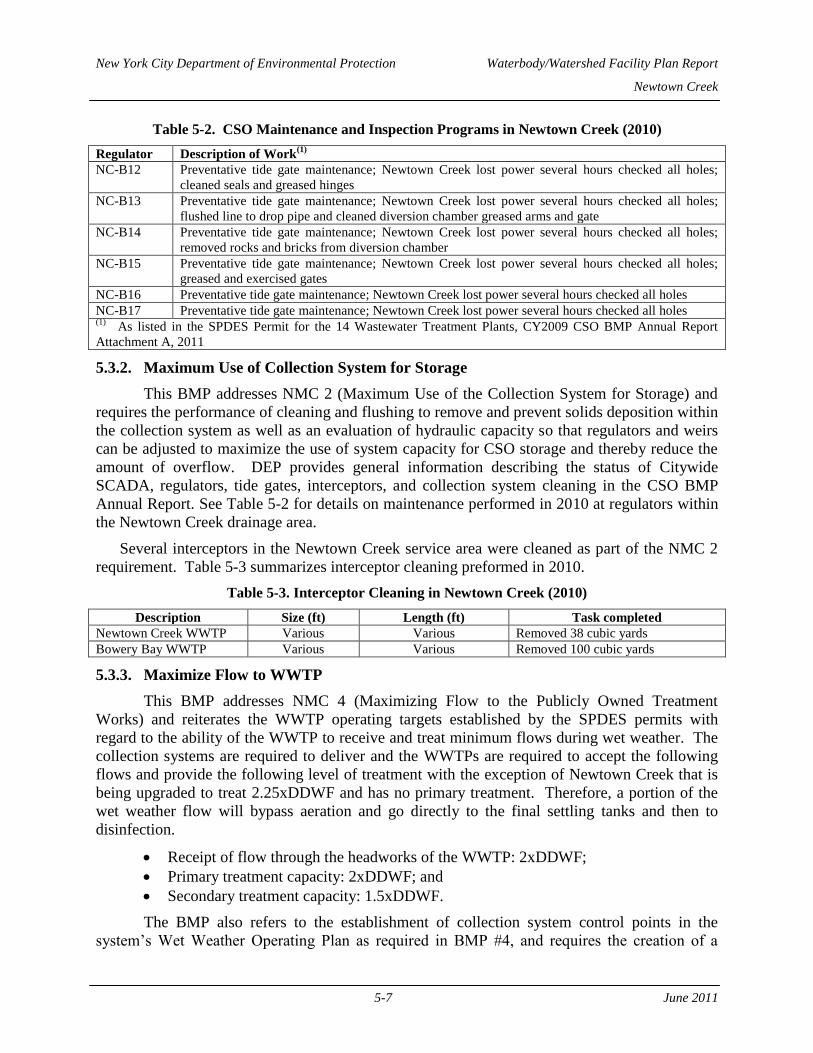
New York City Department of Environmental Protection Waterbody/Watershed Facility Plan Report
Newtown Creek
5-7 June 2011
Table 5-2. CSO Maintenance and Inspection Programs in Newtown Creek (2010)
Regulator Description of Work(1)
NC-B12 Preventative tide gate maintenance; Newtown Creek lost power several hours checked all holes;
cleaned seals and greased hinges
NC-B13 Preventative tide gate maintenance; Newtown Creek lost power several hours checked all holes;
flushed line to drop pipe and cleaned diversion chamber greased arms and gate
NC-B14 Preventative tide gate maintenance; Newtown Creek lost power several hours checked all holes;
removed rocks and bricks from diversion chamber
NC-B15 Preventative tide gate maintenance; Newtown Creek lost power several hours checked all holes;
greased and exercised gates
NC-B16 Preventative tide gate maintenance; Newtown Creek lost power several hours checked all holes
NC-B17 Preventative tide gate maintenance; Newtown Creek lost power several hours checked all holes (1)
As listed in the SPDES Permit for the 14 Wastewater Treatment Plants, CY2009 CSO BMP Annual Report
Attachment A, 2011
5.3.2. Maximum Use of Collection System for Storage
This BMP addresses NMC 2 (Maximum Use of the Collection System for Storage) and
requires the performance of cleaning and flushing to remove and prevent solids deposition within
the collection system as well as an evaluation of hydraulic capacity so that regulators and weirs
can be adjusted to maximize the use of system capacity for CSO storage and thereby reduce the
amount of overflow. DEP provides general information describing the status of Citywide
SCADA, regulators, tide gates, interceptors, and collection system cleaning in the CSO BMP
Annual Report. See Table 5-2 for details on maintenance performed in 2010 at regulators within
the Newtown Creek drainage area.
Several interceptors in the Newtown Creek service area were cleaned as part of the NMC 2
requirement. Table 5-3 summarizes interceptor cleaning preformed in 2010.
Table 5-3. Interceptor Cleaning in Newtown Creek (2010)
Description Size (ft) Length (ft) Task completed
Newtown Creek WWTP Various Various Removed 38 cubic yards
Bowery Bay WWTP Various Various Removed 100 cubic yards
5.3.3. Maximize Flow to WWTP
This BMP addresses NMC 4 (Maximizing Flow to the Publicly Owned Treatment
Works) and reiterates the WWTP operating targets established by the SPDES permits with
regard to the ability of the WWTP to receive and treat minimum flows during wet weather. The
collection systems are required to deliver and the WWTPs are required to accept the following
flows and provide the following level of treatment with the exception of Newtown Creek that is
being upgraded to treat 2.25xDDWF and has no primary treatment. Therefore, a portion of the
wet weather flow will bypass aeration and go directly to the final settling tanks and then to
disinfection.
Receipt of flow through the headworks of the WWTP: 2xDDWF;
Primary treatment capacity: 2xDDWF; and
Secondary treatment capacity: 1.5xDDWF.
The BMP also refers to the establishment of collection system control points in the
system’s Wet Weather Operating Plan as required in BMP #4, and requires the creation of a
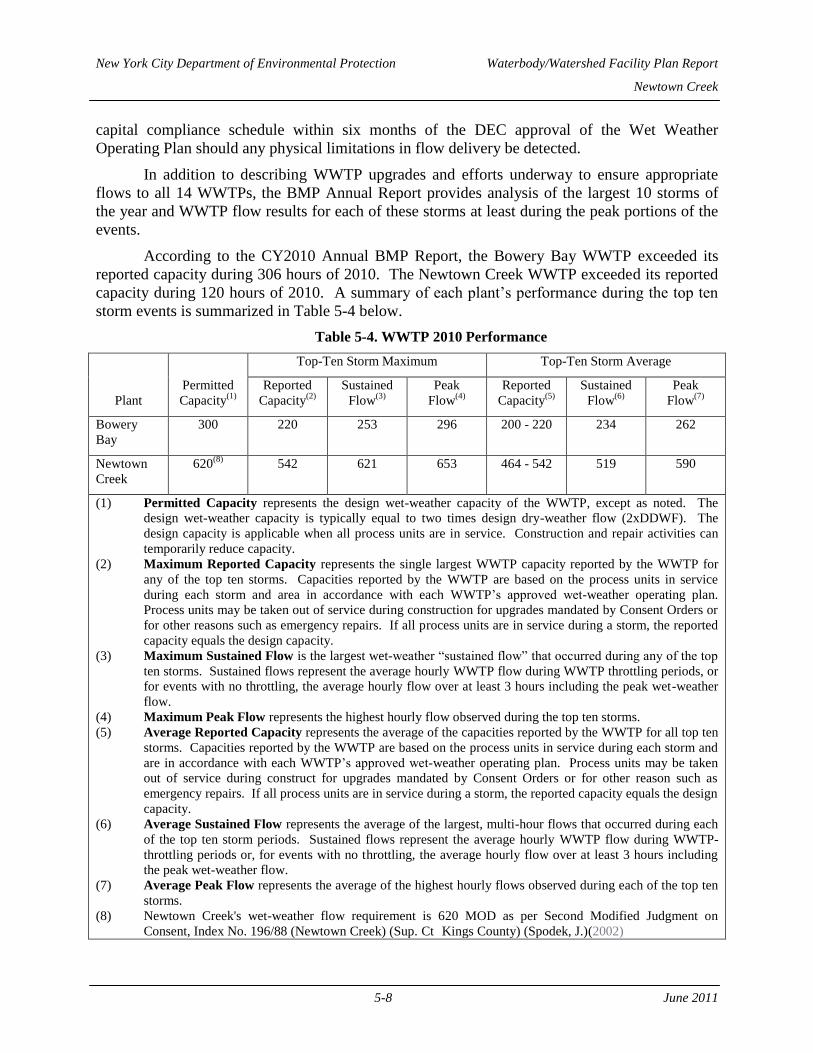
New York City Department of Environmental Protection Waterbody/Watershed Facility Plan Report
Newtown Creek
5-8 June 2011
capital compliance schedule within six months of the DEC approval of the Wet Weather
Operating Plan should any physical limitations in flow delivery be detected.
In addition to describing WWTP upgrades and efforts underway to ensure appropriate
flows to all 14 WWTPs, the BMP Annual Report provides analysis of the largest 10 storms of
the year and WWTP flow results for each of these storms at least during the peak portions of the
events.
According to the CY2010 Annual BMP Report, the Bowery Bay WWTP exceeded its
reported capacity during 306 hours of 2010. The Newtown Creek WWTP exceeded its reported
capacity during 120 hours of 2010. A summary of each plant’s performance during the top ten
storm events is summarized in Table 5-4 below.
Table 5-4. WWTP 2010 Performance
Plant
Permitted
Capacity(1)
Top-Ten Storm Maximum Top-Ten Storm Average
Reported
Capacity(2)
Sustained
Flow(3)
Peak
Flow(4)
Reported
Capacity(5)
Sustained
Flow(6)
Peak
Flow(7)
Bowery
Bay
300 220 253 296 200 - 220 234 262
Newtown
Creek
620(8)
542 621 653 464 - 542 519 590
(1) Permitted Capacity represents the design wet-weather capacity of the WWTP, except as noted. The
design wet-weather capacity is typically equal to two times design dry-weather flow (2xDDWF). The
design capacity is applicable when all process units are in service. Construction and repair activities can
temporarily reduce capacity.
(2) Maximum Reported Capacity represents the single largest WWTP capacity reported by the WWTP for
any of the top ten storms. Capacities reported by the WWTP are based on the process units in service
during each storm and area in accordance with each WWTP’s approved wet-weather operating plan.
Process units may be taken out of service during construction for upgrades mandated by Consent Orders or
for other reasons such as emergency repairs. If all process units are in service during a storm, the reported
capacity equals the design capacity.
(3) Maximum Sustained Flow is the largest wet-weather “sustained flow” that occurred during any of the top
ten storms. Sustained flows represent the average hourly WWTP flow during WWTP throttling periods, or
for events with no throttling, the average hourly flow over at least 3 hours including the peak wet-weather
flow.
(4) Maximum Peak Flow represents the highest hourly flow observed during the top ten storms.
(5) Average Reported Capacity represents the average of the capacities reported by the WWTP for all top ten
storms. Capacities reported by the WWTP are based on the process units in service during each storm and
are in accordance with each WWTP’s approved wet-weather operating plan. Process units may be taken
out of service during construct for upgrades mandated by Consent Orders or for other reason such as
emergency repairs. If all process units are in service during a storm, the reported capacity equals the design
capacity.
(6) Average Sustained Flow represents the average of the largest, multi-hour flows that occurred during each
of the top ten storm periods. Sustained flows represent the average hourly WWTP flow during WWTP-
throttling periods or, for events with no throttling, the average hourly flow over at least 3 hours including
the peak wet-weather flow.
(7) Average Peak Flow represents the average of the highest hourly flows observed during each of the top ten
storms.
(8) Newtown Creek's wet-weather flow requirement is 620 MOD as per Second Modified Judgment on
Consent, Index No. 196/88 (Newtown Creek) (Sup. Ct Kings County) (Spodek, J.)(2002)

New York City Department of Environmental Protection Waterbody/Watershed Facility Plan Report
Newtown Creek
5-9 June 2011
5.3.4. Wet Weather Operating Plan
In order to maximize treatment during wet weather events, WWOPs are required for each
WWTP drainage area. Each WWOP should be written in accordance with the DEC publication
entitled Wet Weather Operations and Wet Weather Operating Plan Development for Wastewater
Treatment Plants, and should contain the following components:
Unit process operating procedures;
CSO retention/treatment facility operating procedures, if relevant for that drainage
area; and
Process control procedures and set points to maintain the stability and efficiency of
biological nutrient removal (BNR) processes, if required.
This BMP addresses NMC 1 (Proper Operations and Maintenance of Combined Sewer
Systems and Combined Sewer Overflow Outfalls) and NMC 4 (Maximizing Flow to the Publicly
Owned Treatment Works). The DEP provides a schedule of plan submittal dates as part of the
BMP Annual Report. The submittal dates listed in the CY2010 CSO BMP Annual Report for
facilities in Newtown Creek are provided in Table 5-5.
Table 5-5. Wet Weather Operating Plans for WWTPs along the Newtown Creek Waterbody
Facility
Original Submissions
to DEC
Revisions Submitted to
DEC DEC Approval Status
Bowery Bay
WWTP July 2003 Sept. 2004, March 2009
March 2009 version Conditionally
Approved (May 2009)
Newtown Creek
WWTP(1) June 2003
April 2005, March 2009,
April 2010
April 2010 version Approved (July
2010) (1)
Requirement per Second Modified Judgment on Consent, Index No. 196/88 (Newtown Creek) (Sup. Ct. Kings
County) (Spodek, 1.)(2002).
5.3.5. Prohibition of Dry Weather Overflow
This BMP addresses NMC 5 (Elimination of CSOs During Dry Weather) and NMC 9
(Monitoring to Characterize CSO Impacts and the Efficacy of CSO Controls) and requires that
any dry weather flow event be promptly abated and reported to DEC within 24 hours. A written
report must follow within 14 days and contain information per SPDES permit requirements.
The status of the shoreline survey, the Dry Weather Discharge Investigation report, and a
summary of the total bypasses from the treatment and collection system are provided in the CSO
BMP Annual Report.
5.3.6. Industrial Pretreatment
This BMP addresses three NMCs: NMC 3 (Review and Modification of Pretreatment
Requirements to Determine Whether Nondomestic Sources are Contributing to CSO Impacts);
NMC 7 (Pollution Prevention Programs to Reduce Contaminants in CSOs); and NMC 9
(Monitoring to Characterize CSO Impacts and the Efficacy of CSO Controls). By regulating the
discharges of toxic pollutants from unregulated, relocated, or new SIUs tributary to CSOs, this
BMP addresses the maximization of persistent toxics treatment from industrial sources upstream
of CSOs. Specific components of this BMP include:
New York City Department of Environmental Protection Waterbody/Watershed Facility Plan Report
Newtown Creek
5-10 June 2011
Consideration of CSOs in the calculation of local limits for indirect discharges of
toxic pollutants;
Scheduled discharge during conditions of non-CSO, if appropriate for batch
discharges of industrial wastewater;
Analysis of system capacity to maximize delivery of industrial wastewater to the
WWTP, especially for continuous discharges;
Exclusion of non-contact cooling water from the combined sewer system and
permitting of direct discharges of cooling water; and
Prioritization of industrial waste containing toxic pollutants for capture and treatment
by the POTW over residential/commercial service areas.
The CSO BMP Annual Report addresses the components of the industrial pretreatment
BMP through a description of the Citywide program.
5.3.7. Control of Floatable and Settleable Solids
This BMP addresses NMC 6 (Control of Solid and Floatable Material in CSOs), NMC 7
(Pollution Prevention Programs to Reduce Contaminants in CSOs), and NMC 9 (Monitoring to
Characterize CSO Impacts and the Efficacy of CSO Controls) by requiring the implementation
of four practices to eliminate or minimize the discharge of floating solids, oil and grease, or
solids of sewage origin which cause deposition in receiving waters, i.e.:
Catch Basin Repair and Maintenance: This practice includes inspection and
maintenance schedules to ensure proper operation of basins;
Catch Basin Retrofitting: By upgrading basins with obsolete designs to contemporary
designs with appropriate street litter capture capability, this program is intended to
increase the control of floatable and settleable solids, Citywide;
Booming, Skimming and Netting: This practice establishes the implementation of
floatables containment systems within the receiving waterbody associated with
applicable CSO outfalls. Requirements for system inspection, service, and
maintenance are established, as well; and
Institutional, Regulatory, and Public Education - A one-time report must be submitted
examining the institutional, regulatory, and public education programs in place
Citywide to reduce the generation of floatable litter. The report must also include
recommendations for alternative City programs and an implementation schedule that
will reduce the water quality impacts of street and toilet litter.
The CSO BMP Annual Report provides summary information regarding the status of the
catch basin and booming, skimming, and netting programs Citywide.
Several catch basin cleaning and hooding activities took place in the Newtown Creek
drainage area in 2010 as described in the CY2010 CSO BMP Annual Report. Averages of 906
and 1,725 catch basins were cleaned in Brooklyn and Queens, respectively, each month. In
2010, hoods were replaced in 113 and 109 of the catch basins within the Bowery Bay and
Newtown Creek drainage areas, respectively. As part of its floatables plan, the DEP maintains
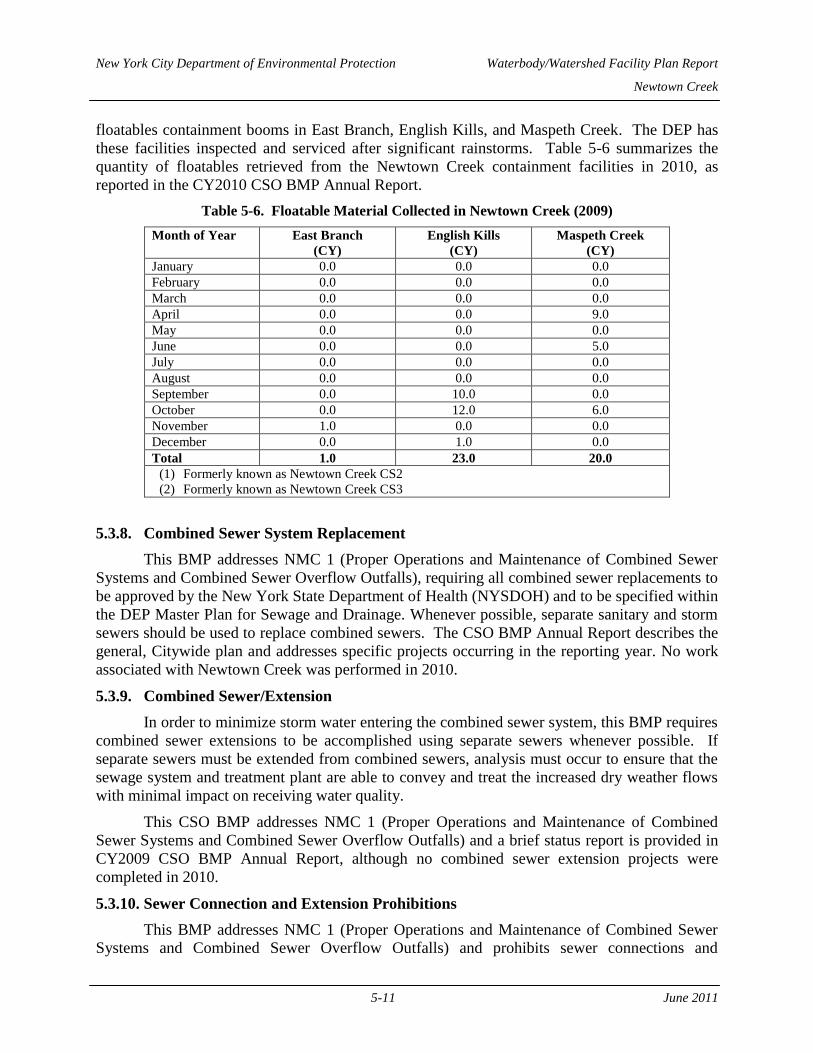
New York City Department of Environmental Protection Waterbody/Watershed Facility Plan Report
Newtown Creek
5-11 June 2011
floatables containment booms in East Branch, English Kills, and Maspeth Creek. The DEP has
these facilities inspected and serviced after significant rainstorms. Table 5-6 summarizes the
quantity of floatables retrieved from the Newtown Creek containment facilities in 2010, as
reported in the CY2010 CSO BMP Annual Report.
Table 5-6. Floatable Material Collected in Newtown Creek (2009)
Month of Year East Branch
(CY)
English Kills
(CY)
Maspeth Creek
(CY)
January 0.0 0.0 0.0
February 0.0 0.0 0.0
March 0.0 0.0 0.0
April 0.0 0.0 9.0
May 0.0 0.0 0.0
June 0.0 0.0 5.0
July 0.0 0.0 0.0
August 0.0 0.0 0.0
September 0.0 10.0 0.0
October 0.0 12.0 6.0
November 1.0 0.0 0.0
December 0.0 1.0 0.0
Total 1.0 23.0 20.0
(1) Formerly known as Newtown Creek CS2
(2) Formerly known as Newtown Creek CS3
5.3.8. Combined Sewer System Replacement
This BMP addresses NMC 1 (Proper Operations and Maintenance of Combined Sewer
Systems and Combined Sewer Overflow Outfalls), requiring all combined sewer replacements to
be approved by the New York State Department of Health (NYSDOH) and to be specified within
the DEP Master Plan for Sewage and Drainage. Whenever possible, separate sanitary and storm
sewers should be used to replace combined sewers. The CSO BMP Annual Report describes the
general, Citywide plan and addresses specific projects occurring in the reporting year. No work
associated with Newtown Creek was performed in 2010.
5.3.9. Combined Sewer/Extension
In order to minimize storm water entering the combined sewer system, this BMP requires
combined sewer extensions to be accomplished using separate sewers whenever possible. If
separate sewers must be extended from combined sewers, analysis must occur to ensure that the
sewage system and treatment plant are able to convey and treat the increased dry weather flows
with minimal impact on receiving water quality.
This CSO BMP addresses NMC 1 (Proper Operations and Maintenance of Combined
Sewer Systems and Combined Sewer Overflow Outfalls) and a brief status report is provided in
CY2009 CSO BMP Annual Report, although no combined sewer extension projects were
completed in 2010.
5.3.10. Sewer Connection and Extension Prohibitions
This BMP addresses NMC 1 (Proper Operations and Maintenance of Combined Sewer
Systems and Combined Sewer Overflow Outfalls) and prohibits sewer connections and

New York City Department of Environmental Protection Waterbody/Watershed Facility Plan Report
Newtown Creek
5-12 June 2011
extensions that would exacerbate recurrent instances of either sewer back-up or manhole
overflows. Wastewater connections to the combined sewer system downstream of the last
regulator or diversion chamber are also prohibited. The CSO BMP Annual Report contains a
brief status report for this BMP and provides details pertaining to chronic sewer back-up and
manhole overflow notifications submitted to DEC when necessary.
For the calendar year 2010, no letter of notification was submitted to DEC concerning
chronic sewer backups or manhole overflows which would prohibit additional sewer connections
or sewer extensions.
5.3.11. Septage and Hauled Waste
The discharge or release of septage or hauled waste upstream of a CSO (i.e., scavenger
waste) is prohibited under this BMP. Scavenger wastes may only be discharged at designated
manholes that never drain into a CSO, and only with a valid permit. This BMP addresses NMC
1 (Proper Operations and Maintenance of Combined Sewer Systems and Combined Sewer
Overflow Outfalls). The CSO BMP Annual Report summarizes the three scavenger waste
acceptance facilities controlled by DEP, all of which are downstream of CSO regulators, and the
regulations governing discharge of such material at the facilities.
5.3.12. Control of Run-off
This BMP addresses NMC 7 (Pollution Prevention Programs to Reduce Contaminants in
CSOs) by requiring all sewer certifications for new development to follow DEP rules and
regulations, to be consistent with the DEP Master Plan for Sewers and Drainage, and to be
permitted by DEP. This BMP ensures that only allowable flow is discharged into the combined
or storm sewer system. The CSO BMP Annual Report refers to the DEP permit regulations
required of new development and sewer connections.
5.3.13. Public Notification
This BMP requires easy-to-read identification signage to be placed at or near CSO
outfalls with contact information for DEP to allow the public to report observed dry weather
overflows. All signage information and appearance must comply with the Discharge Notification
Requirements listed in the SPDES permit. This BMP also requires that a system be in place to
determine the nature and duration of an overflow event, and that potential users of the receiving
waters are notified of any resulting, potentially harmful conditions. The BMP does allow the
New York City Department of Health and Mental Hygiene (NYCDHMH) to implement and
manage the notification program.
BMP # 13 addresses NMC 8 (Public Notification) as well as NMC 1 (Proper Operations
and Maintenance of Combined Sewer Systems and Combined Sewer Overflow Outfalls) and
NMC 9 (Monitoring to Characterize CSO Impacts and the Efficacy of CSO Controls). DEP
provides the status of the CSO signage program in the CSO BMP Annual Report and lists those
former CSO outfalls that no longer require signs. DEP is currently developing improvements to
the CSO signs to increase their visibility and to include information relative to wet-weather
warnings as required by the EPA CSO Policy. In addition, descriptions of new educational
signage and public education-related partnerships are described. The NYCDHMH CSO public
notification program is also summarized.
New York City Department of Environmental Protection Waterbody/Watershed Facility Plan Report
Newtown Creek
5-13 June 2011
5.3.14. Annual Report
This BMP requires an annual report summarizing implementation of the BMPs, including
lists of all existing documentation of implementation of the BMPs, be submitted by April 1st of
each year. This BMP addresses all nine minimum controls. As of April 2011, the most recent
BMP Annual Report submitted was for calendar year 2010.
5.4. CITYWIDE CSO PLAN FOR FLOATABLES ABATEMENT
In the late 1980s, New York City initiated the Citywide Floatables Study, a multi-year
investigation of floatables in New York Harbor (HydroQual, 1993, 1995a). In addition to
examining floatables characteristics, this study investigated potential sources of floatables,
floatables circulation and beach-deposition patterns throughout the Harbor, and potential
structural and non-structural alternatives for floatables control. Findings of the study showed
that the primary source of floatables (other than natural sources) in the Harbor was urban street
litter carried into waterways along with rainfall runoff.
DEP developed a floatables abatement plan (Floatables Plan) for the CSO areas of New
York City in June 1997 (HydroQual, 1997). The Floatables Plan was updated in 2005
(HydroQual, 2005b) to reflect the completion of some proposed action elements and the addition
of a monitoring program, as well as changes appurtenant to SPDES permits and modifications of
regional WB/WS Facility Plans and CSO Facility Plans. The DEC approved the updated
Floatables Plan on March 17, 2006.
The objectives of the Floatables Plan are to provide substantial control of floatables
discharges from CSOs throughout the City and to provide for compliance with appropriate DEC
and IEC requirements pertaining to floatables.
5.4.1. Program Description
The Citywide CSO Floatables Plan consists of the following action elements:
Monitor Citywide street litter levels and inform the New York City Department of
Sanitation (DSNY) and/or the New York City Mayor’s Office of Operations when
changes in litter levels at or in City policies would potentially result in increased
discharges of CSO floatables;
Continue the three-year cycle to inspect catch basins Citywide for missing hoods and
to replace missing hoods to prevent floatables from entering the sewer system. In
addition, proceed with the retrofit, repair, or reconstruction of catch basins requiring
extensive repairs or reconstruction to accommodate a hood;
Maximize collection system storage and capacity;
Maximize wet-weather flow capture at WWTPs;
Capture floatables at wet-weather CSO storage/treatment facilities;
Capture floatables at end-of-pipe and in-water facilities, including the Interim
Floatables Containment Program (IFCP) booms and nets. As part of this effort,
booms are installed in the Newtown Creek tributaries Maspeth Creek, East Branch
New York City Department of Environmental Protection Waterbody/Watershed Facility Plan Report
Newtown Creek
5-14 June 2011
and English Kills;
Continue the Illegal Dumping Notification Program (IDNP) in which DEP field
personnel report any observed evidence of illegal shoreline dumping to the Sanitation
Police section of DSNY, who have the authority to arrest dumpers who, if convicted,
are responsible for proper disposal of the material;
Engage in public outreach programs to increase public awareness of the consequences
of littering and the importance of conserving water;
As new floatables-control technologies emerge, continue to investigate their
applicability, performance, and cost-effectiveness in New York City;
Provide support to DEC to review and revise water-quality standards to provide for
achievable goals; and
Develop a floatables-monitoring program to track floatables levels in the Harbor and
inform decisions to address both short- and long-term floatables-control requirements.
Overall, implementation of the Floatables Plan is expected to control approximately 96
percent of the floatable litter generated in New York City (HydroQual, 1997). The Floatables
Plan is a living program that will undergo various changes over time in response to ongoing
assessment of the program itself as well as changing facility plans associated with other ongoing
programs. A key component of the Floatables Plan is self-assessment, including a new
Floatables Monitoring Program to evaluate the effectiveness of Plan elements and to provide for
actions to address both short- and long-term floatables-control requirements (see Section 8).
Evidence of increasing floatables levels that impede uses could require the addition of new
floatables controls, expansion of BMPs, and modifications of WB/WS Facility Plans and/or
drainage-basin specific LTCPs, as appropriate.
5.4.2. Pilot Floatables Monitoring Program
In late 2006, work commenced to develop the Floatables Monitoring Program to track
floatables levels in New York Harbor (HydroQual, 2007a). This pilot work which was
performed to develop a monitoring procedure and an associated visual floatables rating system
based on a five-point scale (very poor, poor, fair, good, very good), involved observations at a
number of different sites. At each site, observations were made for up to three categories: on the
shoreline, in the water near the shoreline; and in the water away from the shoreline.
5.4.3. Interim Floatable Controls in Newtown Creek
There are booms installed in East Branch, English Kills, and Maspeth Creek. The
volume of floatables contained from those locations is provided in Table 5-7 above.
5.4.4. Shoreline Cleanup Pilot Program
As part of the Environmental Benefits Projects (EBP) program established under the
Long Island Sound (LIS) Consent Judgment, DEP has implemented a beach clean-up program to
clean up shorelines in areas where floatables are known to occur due to CSO overflows and
stormwater discharges as well as careless behavior and illegal dumping. This project was
undertaken in connection with the settlement of an enforcement action taken by New York State
and the DEC for violations of New York State law and DEC regulations. DEP has conducted
New York City Department of Environmental Protection Waterbody/Watershed Facility Plan Report
Newtown Creek
5-15 June 2011
cleanups at several areas deemed to benefit from these efforts including:
Coney Island Creek, Brooklyn
Kaiser Park, Brooklyn
Sheepshead Bay (Kingsborough Community College), Brooklyn
Cryders Lane (Little Bay Park), Queens
Flushing Bay, Queens.
Owls Head, Brooklyn
These cleanup efforts will consist of two primary methods of cleanup.
Workboat Assisted Cleanup - Mechanical Cleanup – Where debris is caught up in
riprap on the shoreline, a high-pressure pump will be used to spray water onto the
shoreline to dislodge and flush debris and floatables from the riprap back into the. A
containment boom placed in the water around the site will allow a skimmer vessel to
collect the material for proper disposal.
Workboat Assisted Cleanup – At a few locations where the shoreline is not readily
accessible from the land side a small workboat with an operator and crewmembers
collects debris by hand or with nets and other tools. The debris will be placed onto
the workboat for transport to a skimmer boat for ultimate disposal.
Manual Cleanup – At some locations simply raking and hand cleaning will provide
the most efficient cleanup method. Debris will then be removed and placed into
plastic garbage bags, containers, or dumpsters and then loaded onto a pickup truck for
proper disposal.
This pilot program had a four year duration and was completed during the Summer of
2010.
5.5. LONG-TERM CSO CONTROL PLANNING (LTCP) PROJECT
In June 2004, DEP authorized the LTCP Project. This work integrates all Track I and
Track II CSO Facility Planning Projects and the Comprehensive Citywide Floatables Abatement
Plan, incorporates on-going USA Project work in the remaining waterbodies, and develops
WB/WS Facility Plan reports and the LTCP for each waterbody area. The LTCP Project
monitors and assures compliance with applicable Administrative Consent Orders. This
document is a work product of the LTCP Project.
5.6 NEWTOWN CREEK WATER QUALITY FACILITY PLAN
The Newtown Creek Water Quality Facility Planning Project was initiated in July 1990
as one of several tributary area studies that were part of the city-wide CSO abatement program;
and concluded in its original scope in January 1993 with the completion of the Draft Facilities
Plan. With this planning, the NYCDEP identified and evaluated CSO and non CSO control
alternatives with a goal to select the most cost-efficient plan for improvement of water quality in
New York City Department of Environmental Protection Waterbody/Watershed Facility Plan Report
Newtown Creek
5-16 June 2011
the Newtown Creek and its tributaries to that mandated by their Class SD water quality
classification. Initially, all reasonable measures for reducing CSO discharges and thus
improving water quality in the waterbody were evaluated under a preliminary screening process.
Alternatives that clearly were not applicable in the planning area were initially eliminated. Next,
under a secondary screening process, options were evaluated to determine the overall "utility" of
the option based on the long- and short-term community impacts, water quality benefits, stand-
alone capability, and cost (URS, 1993). Based on conclusions of this initial study, additional
work tasks were authorized and additional studies were completed. Project reports submitted to
describe these additional studies include:
Receiving Water Modeling (LMS, 1993)
Feasibility Study for Non-CSO Abatement Alternatives (URS, 1994)
Addendum to the Facilities Plan Report (URS, 1995a and 1995b)
1996 Aeration Pilot Study Model Report – Draft (LMS, 1997)
Final Report Aeration Pilot Study (February 1998)
Addendum to Facilities Plan Report Phase 1 Aeration Facilities – Draft (URS, 1999)
Subsurface Investigation Report (URS, 2000a)
Dredging Feasibility Study (URS, 2000b)
Sewer System Modeling Technical Memorandum (URS, 2001)
Updated Facility Plan (URS, 2002)
Final Facility Plan Report (URS, 2003)
During these studies, DEP evaluated the effectiveness of CSO abatement alternatives
such as maximizing CSO treatment, inline and offline CSO storage, and other treatment
alternatives. Non-CSO abatement alternatives were also evaluated, including re-contouring the
waterbody through dredging, in-stream supplemental waterbody aeration, and flushing tunnels.
A knee-of-the-curve approach was employed to develop the facility plan, which combines
several of those alternatives (URS, 2003).
The 2003 CSO Facility Plan is based on water quality improvement needs, and
achievable water quality improvements and as such, it is comprised of projects that focus on the
two outfalls that contribute the greatest volume of CSO to the head end of Newtown Creek and
on improving water quality in the upstream branch and tributaries where the water quality is
most impaired (Figure 5-1). In addition, NYCDEP has taken a phased adaptive management
approach to implementing the 2003 CSO Facility Plan, such that the Facility Plan is being
implemented in four phases as described in the following subsections.

Newtown Creek WaterQuality CSO Facility Plan
Figure 5-1Newtown Creek Waterbody/Watershed Plan
New York City Department of Environmental Protection Waterbody/Watershed Facility Plan Report
Newtown Creek
5-18 June 2011
5.6.1 Phase I Aeration Facility
Raising the DO concentration in Newtown Creek above 1.0 mg/L was established as a
goal for the aeration system to eliminate hydrogen sulfide production. The Newtown Creek
complex was divided into two zones, with aeration facilities to be installed sequentially. The
Zone I aeration facility was to be located in the Upper English Kills, and Zone II was to include
aeration in Lower English Kills, East Branch, and Dutch Kills. Zone I was expected to serve as a
demonstration and evaluation stage prior to constructing Zone II. It was estimated that a mass
oxygen transfer of 400 lbs/day for the English Kills and 100 lbs/day for the East Branch and
Dutch Kills would be necessary if well-mixed. This translates to aeration requirements of 1500
cfm in the Upper English Kills; 900 cfm in the Lower English Kills; 150 cfm in Dutch Kills; and
600 cfm in East Branch.
The 2005 Consent Order included these aeration facilities as enforceable milestones in
Appendix A. Zone I aeration facilities were to be complete by December 2008 and Zone II
aeration facilities were to be complete by June 2014. Zone I has been in operation since early
2009 and a preliminary evaluation was submitted in February 2010.
5.6.2 Phase II Kent Avenue Throttling Facility
Throttling of the Kent Avenue Interceptor to limit maximum allowable flow from this
interceptor to the Brooklyn Pump Station to 200 MGD was expected to allow more flow through
the Morgan Avenue Interceptor, thereby reducing CSO to the English Kills. Although an
increase in CSO to the East River would occur, a net overall reduction would be realized. The
facility was to include a 9-foot by 10-foot roller gate at a minimum opening of 15 inches on the
Kent Avenue Interceptor, 650 feet upstream from the confluence of the Kent Avenue Interceptor
with the Morgan Avenue Interceptor. Due to construction sequencing and coordination issues,
final design and construction of this gate has been included in the Track 3 Facility Plan upgrades
to the Newtown Creek WWTP currently underway.
The 2005 Consent Order requires the Kent Avenue Throttling Facility to be complete by
December 2012.
5.6.3 Phase III USA Study/LTCP
Phase III includes upgrading watershed models to more accurately simulate the dynamic
hydraulic conditions in the combined sewer systems draining to the Newtown Creek. DEP used
these upgraded models to re-evaluate all components of the 2003 CSO Facility Plan and other
water quality improvement projects. This WB/WS Facility Plan Report is the result of that re-
evaluation, and acknowledges that the 2003 CSO Facility Plan was only one component of the
NYCDEP's multi-phase program to address the impacts of CSOs and WPCPs on harbor and
tributary waterbodies. Further it acknowledges that the 2005 Consent Order recognizes that
there is not a final conceptual design for the facilities proposed for Newtown Creek, and allows
the NYCDEP to propose final modifications to the scope of the projects set forth in the 2003
CSO Facility Plan (DEC, 2004b).
5.6.4 Phase IV Sewer System Storage and a CSO Storage Tank
To induce collection system storage, the overflow weir at Regulator B1 was to be raised
by 3.67 feet to approximately local Mean High Water (MHW), and the sluice gate was to be
enlarged from 24 square feet to 30 square feet by removing the existing gate thimbles and
New York City Department of Environmental Protection Waterbody/Watershed Facility Plan Report
Newtown Creek
5-19 June 2011
enough of the remaining concrete to match the required 5-foot width and replacing with new
flush-mounted gates. In addition, a new 36-inch relief sewer was to be constructed from the
Saint Nicholas Weir parallel to the existing sewer to the intersection of Flushing and Gardner
Avenues, where the existing sewer increases to 94-inch x 97-inch. Combined, the regulator
modification and new sewer would divert additional flow to a new 9 million gallon CSO storage
facility expected to be constructed at the intersection of Johnson and Morgan Avenues.
Although the 2003 Facility Plan proposed reevaluating the Phase IV elements upon
completion of USA project evaluations, these elements were included as enforceable milestones
in Appendix A of the 2005 CSO Consent Order. The sewer system improvements were to be
completed by June 2014 and the CSO storage tank was to be completed by December 2022.
5.6.5 Projected Benefits
The modeling supporting the 2003 facility plan used a 4-month projection scenario from
June 1990 to September 1990 rather than the 1988 precipitation year, and so the 2003 Facility
Plan was reevaluated using the modeling framework described in Sections 3 and 4. Nonetheless,
the 2003 facility planning projected a decrease in CSO volume of 79% and a reduction of TSS
and BOD5 load of 89% and 85%, respectively for the 9 MG tank with flow-through. Phase III
describes facility planning that would not directly result in measurable CSO reductions or water
quality improvements.
The proposed aeration and CSO reduction were projected to increase compliance with the
existing dissolved oxygen standards. Although the surface waters throughout the Creek are
projected to be in full compliance, the bottom waters in the downstream extent of the Creek were
projected to be only partially in compliance as a result of the CSO facility plan. Overall, the
proposed facility plan was expected to attain nearly all of the improvement in DO concentration
standards compliance that are possible through 100% removal of the discharges from the two
CSO outfalls targeted by the plan (i.e., NC-015 and NC-083).
For more detailed modeling results of the 2003 Newtown Creek CSO Facility Plan, refer
to Section 7.
5.7. NEWTOWN CREEK WWTP ENHANCED TRACK 3 FACILITY PLAN
In 1988, the DEP and the DEC entered into a Judgment on Consent,which directed that
the Newtown Creek WWTP be upgraded to secondary treatment. This 1988 Judgment was
modified in 1995 to include a revised schedule, provisions for a new Facility Plan, requirements
for nutrient removal, Ten States Standards treatment of wet weather flows, and planning for
increased treatment capacity. The 1995 Newtown Creek Faciltiy Plan update presented two
process alternatives (Track 1 and Track 2) for upgrading the Newtown Creek WWTP to achieve
secondary treatment standards for removal of BOD, and suspended solids, and for additional
nitrogen removal. The plan was accepted by the DEC; however formal approval was withheld
pending DEP's selection of a single alternative. The two track approach detailed in the 1995
Plan included evaluation of the effectiveness of step denitrification (Track 1) as compared to
biofilter polishing (Track 2) through a program of demonstration testing to determine the DEP's
selection of a single alternative.
Concurrent with the two-track testing and evaluation, the DEP undertook further testing

New York City Department of Environmental Protection Waterbody/Watershed Facility Plan Report
Newtown Creek
5-20 June 2011
of treatment enhancement methods that could be implemented over the short-term. During this
time the DEP was also conducting an East River water quality facility planning effort to address
issues affecting all East River WWTPs. Water quality modeling conducted as part of this effort
indicated that the nitrogen removal requirement included in the Consent Order would be less
effective in achieving DO improvements in western Long Island Sound than determined by the
previous (NC WWTP JV, 1998) modeling efforts.
Based on the results of this demonstration testing, the DEP proposed a "Track 3"
alternative in 1998. The Track 3 alternative proposed a design employing modified step-feed
that would meet all 1995 Consent Order requirements except nitrogen removal. The Newtown
Creek Track 3 Facility Plan noted that the nitrogen removal requirements were included in the
1995 Consent Order to satisfy nitrogen reduction goals adopted by the Long Island Sound Study
(LISS). It further noted that based on the updated water quality information, the nitrogen
removal facilities included in the 1995 Newtown Creek Facility Plan would not likely meet those
goals. The Track 3 Facility Plan recognized that the DEP is still committed to the LISS Phase III
Proposal to alleviate hypoxia in western Long Island Sound, and noted that nitrogen control
facilities would be best developed in the context of water quality planning initiatives, which were
being undertaken on a time frame consistent with the LISS Phase III Proposal.
The Track 3 alternative was subsequently rejected by the DEC in 1999 due to concerns
that the proposed upgrade would not consistently and reliably achieve secondary treatment
standards and that it did not adequately address the reduction of nitrogen in discharges from the
DEP's East River WWTPs. To address these concerns, the DEP subsequently submitted an
Enhanced Track 3 Facility Plan, which compiled additional supporting information and included
several enhancements to the Track 3 Plan. The Enhanced Track 3 Plan presents new information
about the ability of modified step-feed process to provide reliable secondary treatment, includes
flexibility for future treatment requirements, provides improved secondary screening,
improvements to grit tanks, improved grit handling, additional grit tank capacity, and a number
of treatment and operational enhancements (Figure 5-2). A Final Environmental Impact
Statement was issued in 1996 and a Supplemental Environmental Impact Statement was issued
on June 6, 2003. Formal approval of the Newtown Creek Enhanced Track 3 Facility Plan by the
DEC was granted in May 2004.
5.8. 2004 INNER HARBOR CSO FACILITY PLAN
The 2004 Inner Harbor CSO Facility Plan (Hazen and Sawyer, 1993) focused on
quantifying and assessing the impacts of CSO discharges to the lower portions of the Hudson
and East Rivers, Upper New York Bay, and Gowanus Bay and Canal. The project’s study area
included all of the North River, Newtown Creek and Red Hook WWTP service areas, which
together comprise over 160 CSOs. Field investigations and mathematical modeling were
conducted for receiving waters and their watersheds. Engineering alternatives for abating CSO
discharges were evaluated and recommendations were made for improving receiving water
quality.
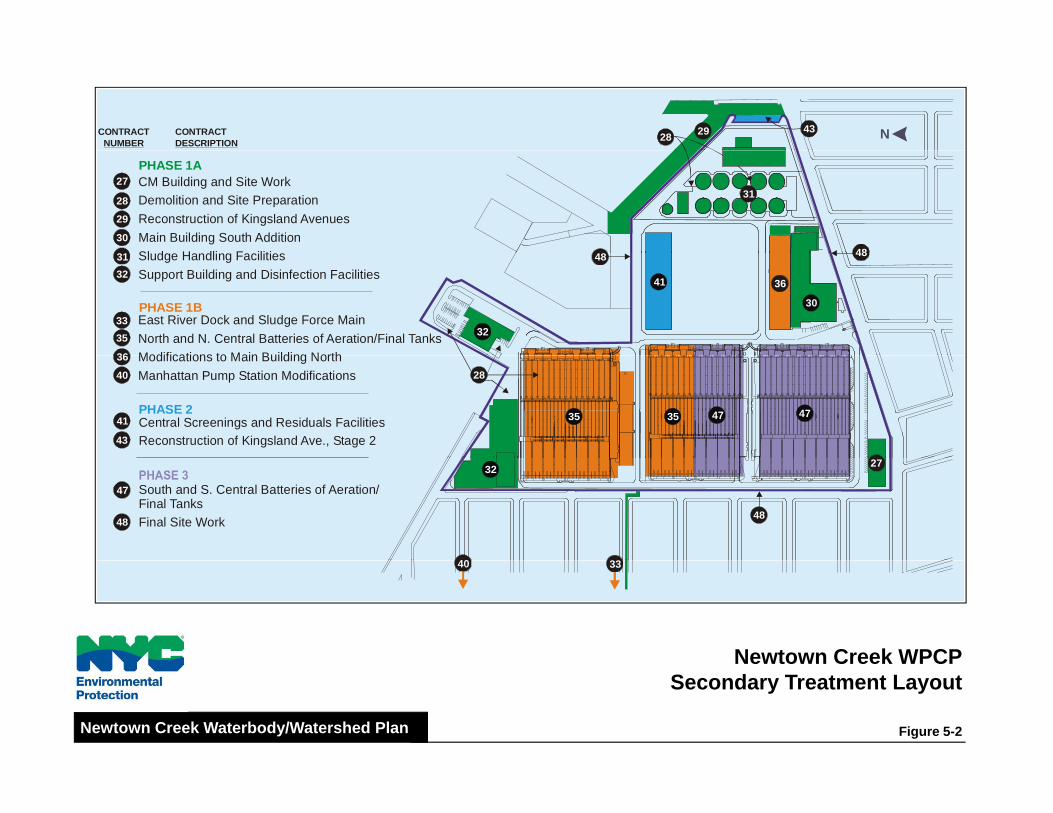
DESCRIPTIONCONTRACT
NUMBERCONTRACT 29
28 N43
27
28
29
30
PHASE 1ACM Building and Site WorkDemolition and Site PreparationReconstruction of Kingsland AvenuesMain Building South AdditionSl d H dli F iliti
31
48
32
31
35
36
PHASE 1B
Sludge Handling FacilitiesSupport Building and Disinfection Facilities
32
30
36
48 48
33 East River Dock and Sludge Force MainNorth and N. Central Batteries of Aeration/Final TanksModifications to Main Building North
41
2840
43
36
41 Central Screenings and Residuals FacilitiesReconstruction of Kingsland Ave., Stage 2
PHASE 235 47 47
Modifications to Main Building NorthManhattan Pump Station Modifications
35
32
48
47 South and S. Central Batteries of Aeration/ Final TanksFinal Site Work
27
40 33
48
Newtown Creek WPCP
40 33
Newtown Creek WPCPSecondary Treatment Layout
Figure 5-2Newtown Creek Waterbody/Watershed Plan
New York City Department of Environmental Protection Waterbody/Watershed Facility Plan Report
Newtown Creek
5-22 June 2011
Water quality and engineering assessments concluded that the flushing and dispersive
abilities of the Hudson River, East River and Upper New York Bay minimized the effects of
CSOs on water quality for these areas. CSOs were not found to be a major component of water
quality impairments. In 1993, the Inner Harbor CSO Facility Plan was finalized and
recommended system-wide regulator improvements, maximizing wet weather flow to WWTPs,
and inducing in-line storage (Hazen and Sawyer, 1993). The plan was submitted to the DEC and
accepted.
The Inner Harbor CSO Facility Plan was subsequently modified by the DEP and detailed
in a report submitted to the DEC in April 2003 (DEP, 2003). The revised plan and modified
schedule was approved by DEC in May 2003. Additional revisions to themodified CSO
facility plan were submitted to DEC in February 2004. No modifications were made to elements
of the plan influencing Newtown Creek water quality. The following describes the current 2004
Inner Harbor CSO Facility Plan, and its implementation schedule.
5.8.1. Facility Design and Implementation Schedule
The original Inner Harbor CSO Facility Plan was organized as a three-phase plan for
open waters, along with a rehabilitation strategy for Gowanus Canal. The open waters plan,
included regulator improvements, new throttling facilities to maximize the wet weather flows to
the WWTPs, and in-line storage to increase CSO capture within the Newtown Creek WWTP
sewershed. The basic elements of the original plan remained the same; however, details of their
components were changed by the 2003 modification.
Phase I of the 2004 Inner Harbor CSO Facility Plan is addressing regulator improvements
and a total of 123 regulators are being improved throughout the Inner Harbor planning area. The
DEP will automate regulators at 29 locations under the DEP’s Citywide SCADA Project and
convert 72 other regulators from mechanical to more efficient fixed orifices. The construction
contract for the conversion of the 72 mechanical regulators was completed in January 0f 2006.
In addition, 22 other regulators have been converted to fixed orifices under the NYSDOT Route
9A Project. These numbers include seven regulators that discharge to Newtown Creek during
wet weather, of which two were recommended for no action, four were recommended to be fixed
orifice, and one was recommended for automation.
Phase II of the 2004 Inner Harbor CSO Facility Plan is for maximizing wet weather flow
to WWTPs by design and construction of throttling facilities. This will maximize the use of
available in-line storage, reduce CSOs, and consolidate CSO discharges to fewer locations.
Throttling facilities were recommended in the original facility plan at the North River, Newtown
Creek, and Red Hook WWTPs, and the Manhattan Pumping Station, which feeds the Newtown
Creek WWTP. Throttling facilities, consisting of independent automatic gates located upstream
of WWTP forebays, were intended to reduce WWTP operational problems and maximize wet
weather flows. By constructing throttling facilities, harmful effects of using existing WWTP
inlet gates to control wet weather flows would be eliminated. Operating throttling facilities
would enable interceptor storage capacities to be fully utilized and WWTP flows to be
maximized by back-flooding the interceptor system. The Red Hook WWTP has a manually
operated throttling gate that was installed during construction of the secondary processes. The
modified plan includes constructing new throttling facilities at the Manhattan Pump Station and
the Newtown Creek WWTP and developing a WWOP for the North River WWTP. The
New York City Department of Environmental Protection Waterbody/Watershed Facility Plan Report
Newtown Creek
5-23 June 2011
Manhattan Pump Station throttling facility and the Newtown Creek throttling facilities are being
implemented under the Newtown Creek WWTP Enhanced Track 3 Facility Plan discussed
above. At the time of the writing of this report, the final design of the Manhattan Pump Station
throttling facility was approximately 90 percent complete, and the Newtown Creek WWTP
throttling facilities were designed and the contract for its construction was awarded. The
throttling facilities will provide up to 3.0 MG of in-system storage in the Manhattan and
Brooklyn collections systems.
Phase III of the 2004 Inner Harbor CSO Facility Plan is for inducing in-line storage to
increase CSO capture. It was originally planned to be accomplished by either raising weir
elevations in diversion chambers or by installing inflatable dams within combined sewers. The
original facility plan recommended weir raising due to their lower costs and maintenance.
However, the plan was modified from raising weirs to installing inflatable dams due to flooding
concerns. Inflatable dams, while more expensive and complicated to construct and maintain,
have a built-in system that allows the dams to deflate when water levels rise beyond a pre-set
level. The modified facility plan includes installation of two inflatable dams: one for Regulator
B-6 in the Newtown Creek WWTP-Brooklyn service area, which will store up to 2.0 MG; and
one for Regulator R-20 in the Red Hook WWTP service area that will have the capacity to store
up to 2.2 MG. Regulator B-6 is connected to an outfall that discharges to the East River, and
therefore the added in-system storage will have little impact on the water quality in Newtown
Creek. In accordance with the 2005 Administrative Consent Order, final design of Phase III was
completed November, 30 2006. The bid documents are scheduled for advertisement in
December 2006.
5.9. ECOSYSTEM RESTORATION
The City is a non-federal local sponsor for the USACE Hudson-Raritan Estuary (HRE)
Ecosystem Restoration Project. The HRE project comprises 13 representative sites within the
New York and New Jersey Port District, which is delineated as the surrounding greater
metropolitan New York City region within an approximate 25-mile radius of the Statue of
Liberty in the New York-New Jersey harbor, and which is located in the Hudson-Raritan
Estuary. One of these sites is Newtown Creek.
Through this project, the full range of problems and opportunities for ecological
restoration in the HRE will be explored and examined, including but not limited to
environmental restoration and protection relating to water resources and sediment quality. The
study will also recommend initiatives most appropriate for others to lead. A holistic watershed
approach will be used to identify overall ecosystem objectives. This will require an intensive
effort for agency coordination and public involvement to ensure participation and input from all
interested parties. It will also require an intensive effort to inventory and consolidate all available
data, studies, and information from all levels of government and private concerns.
Restoration opportunities in Newtown Creek include sediment removal to improve DO
levels, enhance benthic habitat, and reduce odors; wetland restoration; shoreline softening; and
rounding of sharp angles to increase circulation and reduce sedimentation. Maspeth Creek has
been identified as the largest wetland restoration opportunity with potential for shoreline
softening at adjacent stream banks along the main channel. Wetland restoration opportunities

New York City Department of Environmental Protection Waterbody/Watershed Facility Plan Report
Newtown Creek
5-24 June 2011
have also been identified for terminal sections and corners of English Kills and at the East
Branch turning basin. Sediment removal has been identified for sections of Maspeth Creek,
Dutch Kills, English Kills, and the East Branch. Rounding of sharp angles has been identified
for sections of the English Kills and East Branch. Limited shoreline softening, other than that
associated with Maspeth Creek, may be identified during the feasibility study (Newtown Creek,
2006).
After completion of the Newtown Creek Dredging Feasibility Study in 2000, the DEP
met with USACE staff to discuss the DEP’s planned water quality improvement facilities and to
share the DEP’s ideas for ecosystem restoration in Newtown Creek. The DEP followed up this
meeting with a letter that re-affirmed the components of the water quality improvement program,
transmitted the Dredging Feasibility Study, and detailed the DEP’s ideas for ecosystem
restoration. The letter notified USACE that the DEP had no plans to move forward with
dredging but requested that it be further evaluated along with the DEP’s restoration concepts as
part of the overall ecosystem restoration study, and if necessary, implemented through the HRE
(Gaffoglio, 2001). The Draft Comprehensive Plan was released in March 2009 and that the
USACE has held Public meetings and solicited Public Comments on the Plan since then and is
working with other agency partners and environmental stakeholder groups to produce the final
Comprehensive Restoration Plan for the Estuary.Irrespective of the future direction of the
USACE program, DEP considers environmental dredging a legitimate CSO abatement
alternative and a necessary first step to ecological restoration. Dredging is evaluated in Section
7.0.
5.10. NYC GREEN INFRASTRUCTURE PLAN
On September 28, 2010, Mayor Bloomberg and DEP Commissioner Caswell Holloway
unveiled the NYC Green Infrastructure Plan which presents a “green strategy” for CSO drainage
areas that includes cost-effective grey infrastructure strategies, reduced flows to the WWTP, and
10 percent capture of impervious surfaces with green infrastructure. The green infrastructure
component of the plan builds upon and reinforces strong support for green approaches to address
water quality concerns. A key goal of the NYC Green Infrastructure Plan is to manage the first
inch of runoff from 10 percent of the impervious surfaces in combined sewer watersheds through
detention and infiltration source controls over the next 20 years.
The NYC Green Infrastructure Plan builds upon and extends the commitments made
previously in Mayor Bloomberg’s PlaNYC to create a livable and sustainable New York City
and, specific to water quality, open up 90 percent of the City’s waterways for recreation.
PlaNYC included initiatives to promote green infrastructure implementation, including the
formation of an Interagency Best Management Practices (BMP) Task Force, development of
pilot projects for promising strategies, and providing incentives for green roofs toward these
goals.
The Sustainable Stormwater Management Plan (SSMP) released in December 2008 was
developed as a result of the Interagency BMP Task Force’s efforts to identify promising BMPs
for New York City. The SSMP provided a framework for testing, assessing, and implementing
pilot installations to control stormwater at its source as well as strategies to promote innovative
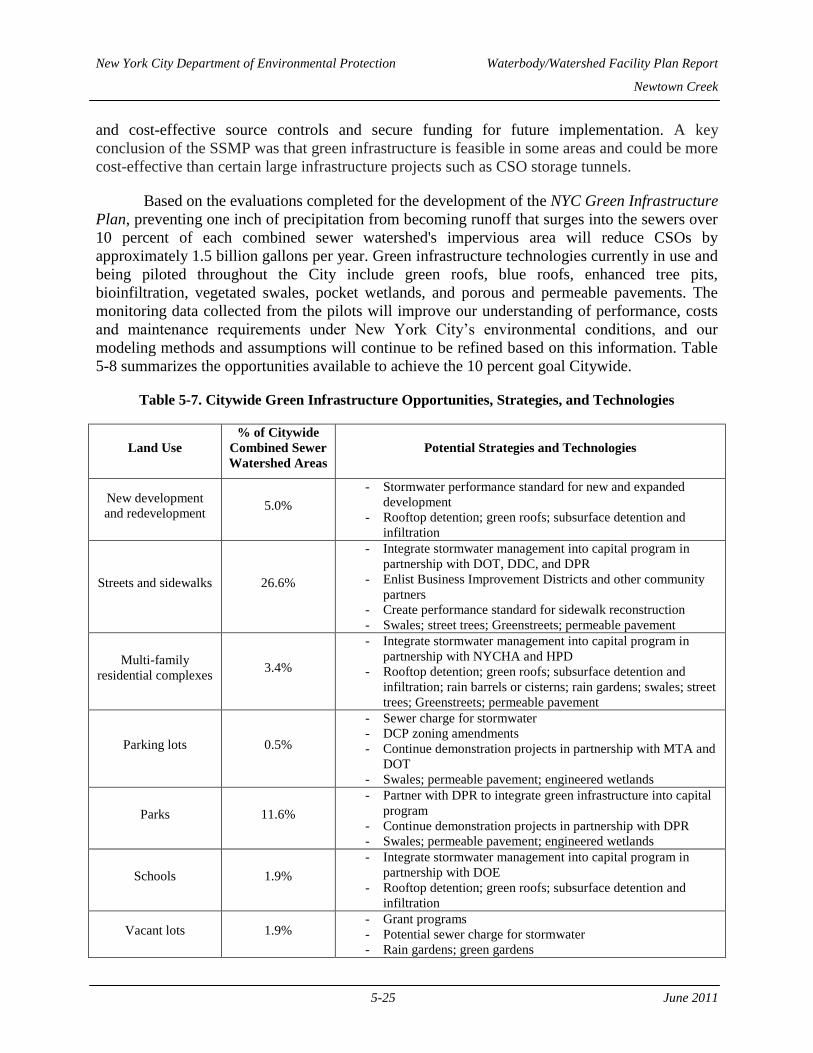
New York City Department of Environmental Protection Waterbody/Watershed Facility Plan Report
Newtown Creek
5-25 June 2011
and cost-effective source controls and secure funding for future implementation. A key
conclusion of the SSMP was that green infrastructure is feasible in some areas and could be more
cost-effective than certain large infrastructure projects such as CSO storage tunnels.
Based on the evaluations completed for the development of the NYC Green Infrastructure
Plan, preventing one inch of precipitation from becoming runoff that surges into the sewers over
10 percent of each combined sewer watershed's impervious area will reduce CSOs by
approximately 1.5 billion gallons per year. Green infrastructure technologies currently in use and
being piloted throughout the City include green roofs, blue roofs, enhanced tree pits,
bioinfiltration, vegetated swales, pocket wetlands, and porous and permeable pavements. The
monitoring data collected from the pilots will improve our understanding of performance, costs
and maintenance requirements under New York City’s environmental conditions, and our
modeling methods and assumptions will continue to be refined based on this information. Table
5-8 summarizes the opportunities available to achieve the 10 percent goal Citywide.
Table 5-7. Citywide Green Infrastructure Opportunities, Strategies, and Technologies
Land Use
% of Citywide
Combined Sewer
Watershed Areas
Potential Strategies and Technologies
New development
and redevelopment 5.0%
- Stormwater performance standard for new and expanded
development
- Rooftop detention; green roofs; subsurface detention and
infiltration
Streets and sidewalks 26.6%
- Integrate stormwater management into capital program in
partnership with DOT, DDC, and DPR
- Enlist Business Improvement Districts and other community
partners
- Create performance standard for sidewalk reconstruction
- Swales; street trees; Greenstreets; permeable pavement
Multi-family
residential complexes 3.4%
- Integrate stormwater management into capital program in
partnership with NYCHA and HPD
- Rooftop detention; green roofs; subsurface detention and
infiltration; rain barrels or cisterns; rain gardens; swales; street
trees; Greenstreets; permeable pavement
Parking lots 0.5%
- Sewer charge for stormwater
- DCP zoning amendments
- Continue demonstration projects in partnership with MTA and
DOT
- Swales; permeable pavement; engineered wetlands
Parks 11.6%
- Partner with DPR to integrate green infrastructure into capital
program
- Continue demonstration projects in partnership with DPR
- Swales; permeable pavement; engineered wetlands
Schools 1.9%
- Integrate stormwater management into capital program in
partnership with DOE
- Rooftop detention; green roofs; subsurface detention and
infiltration
Vacant lots 1.9% - Grant programs
- Potential sewer charge for stormwater
- Rain gardens; green gardens

New York City Department of Environmental Protection Waterbody/Watershed Facility Plan Report
Newtown Creek
5-26 June 2011
Table 5-7. Citywide Green Infrastructure Opportunities, Strategies, and Technologies
Land Use
% of Citywide
Combined Sewer
Watershed Areas
Potential Strategies and Technologies
Other public
properties 1.1%
- Integrate stormwater management into capital programs
- Rooftop detention; green roofs; subsurface detention and
infiltration; rain barrels; permeable pavement
Other existing
development 48.0%
- Green roof tax credit
- Sewer charges for stormwater
- Continue demonstration projects and data collection
- Rooftop detention; green roofs; subsurface detention and
infiltration; rain barrels or cisterns; rain gardens; swales; street
trees; Greenstreets; permeable pavement
To begin implementation, the City has already created a Green Infrastructure Task Force
to design and build stormwater controls into planned roadway reconstructions and other publicly
funded projects. In addition, the City recognizes that partnerships with numerous community and
civic groups and other stakeholders will be necessary to build and maintain green infrastructure
throughout the City. DEP will provide resources and technical support so that communities can
propose, build, and maintain green infrastructure projects.
Over the next year, the City will take on a number of other concrete steps to begin early
implementation of the NYC Green Infrastructure Plan such as demonstrating green infrastructure
installations on a variety of land uses (see Table 5-9); launching a comprehensive program to
increase optimization of the existing system; piloting sewer charges for stormwater for stand-
alone parking lots; refining DEP models by including new impervious cover data and extending
predictions to ambient water quality; identifying alternative funding for additional elements of
the plan; and replacing all CSO outfall signs to reduce potential exposure.
Table 5-8. DEP Retrofit Demonstration Projects
Green
Infrastructure Pilot Location Type Status
Construction
Completion
Rain Barrel give-
away program
Jamaica
Bay 1,000 rain barrels Completed 2008-2009
5 tree pits/5 swales* Jamaica
Bay
Tree pits and streetside swales in the
right-of-way Completed Fall 2010
MTA constructed
wetland/parking lot*
Jamaica
Bay Biofiltration
In
Construction Spring 2011
Blue roof/green roof
comparison*
Jamaica
Bay Blue/green roofs Completed August 2010
DEP rooftop
detention
Newtown
Creek Various Blue roof technologies Completed Winter 2011
High Density
residential retrofit
Bronx
River
Variety of on-site BMPs at a New York
City Housing Authority development
In
Construction Spring 2011

New York City Department of Environmental Protection Waterbody/Watershed Facility Plan Report
Newtown Creek
5-27 June 2011
Table 5-8. DEP Retrofit Demonstration Projects
Green
Infrastructure Pilot Location Type Status
Construction
Completion
DOT parking lots* Jamaica
Bay
Detention/bioinfiltration/porous
pavement Design Spring 2011
North/South Conduit Jamaica
Bay
Detention/bioinfiltration in roadway
median
In
construction Spring 2011
Shoelace Park Bronx
River Detention/bioinfiltration
Redesign
underway Spring 2011
* This project was undertaken in connection with the settlement of an enforcement action taken by New York State
and DEC for violations of New York State Law and DEC Regulations.
5.11. DEP ENVIRONMENTAL BENEFIT PROJECTS
In connection with the settlement of an enforcement action taken by New York State and
DEC for violations of New York State law and DEC regulations, DEP submitted a Nitrogen
Consent Judgment Environmental Benefit Project (EBP) Plan to DEC in January 2007 that
proposed a stormwater pilot study in the Jamaica Bay drainage area. This project will use
Nitrogen Consent Judgment EBP funds to conduct a three year pilot study program to implement
and monitor several stormwater treatment technologies and volume reduction stormwater BMPs
for potential application within the Jamaica Bay watershed. The goals of Jamaica Bay Watershed
Stormwater Pilot Project include documenting the quality of New York City stormwater and
refining the specific capture rates and treatment efficiencies that may be expected locally. Once
this information has been gathered, effective stormwater strategies would be developed for
potential future applications.
The project is expected to cost approximately $1.75 million and will include infiltration
swales for street-side and parking lot applications, parking lot curb water capture systems,
enhanced tree pits, and a commercial green roof and a blue roof comparison installation (see
Table 5-5). The EBP is being conducted through an innovative collaborative effort between DEP
and the Gaia Institute. DEP entered into a contract with the Gaia Institute to complete the pilot
study. The Gaia Institute is a 501(c)3 not-for-profit corporation, located on City Island in the
Bronx, that explores how human activities can be attenuated to increase ecological productivity,
biodiversity, environmental quality, and economic well being.
In connection with the settlement of an enforcement action taken by New York State and
DEC for violations of New York State law and DEC regulations, DEP also submitted a CSO
EBP Work Plan DEC in March 2008 (approved by the DEC in April 2008) that is expected to
partially mitigate the impacts of stormwater and CSO discharges in the New York Harbor
Estuary through stormwater BMP implementation. Practices such as bio-infiltration swales,
enlarged street tree pits with underground water storage, constructed wetlands, and others would
be evaluated. The CSO EBP Work Plan proposes pilots in the Bronx River, Flushing Bay and
Creek, and Gowanus Canal watersheds using the $4 million which has been placed in an EBP
Fund.
New York City Department of Environmental Protection Waterbody/Watershed Facility Plan Report
Newtown Creek
5-28 June 2011
5.12. NEWTOWN CREEK SEWER BUILDOUT
This BMP addresses NMC 1 (Proper Operations and Maintenance of Combined Sewer
Systems and Combined Sewer Overflow Outfalls), requiring all combined sewer replacements to
be approved by the New York State Department of Health (NYSDOH) and to be specified within
the DEP Master Plan for Sewage and Drainage. Whenever possible, separate sanitary and storm
sewers should be used to replace combined sewers. This project generally involves the
construction of a new storm sewer drainage system serving the area, bulkheading the existing
CSO structure, and leaving the existing sewerage to carry sanitary wastewater. DEP completed a
hydraulic analysis to determine the feasibility of a drainage plan for separate storm and sanitary
sewers in the Newtown Creek drainage area. This area would be approximately 60 acres
bounded by Meeker Avenue, Morgan Avenue, Lombardy Street and Scott Avenue. Two new
storm outfalls directly discharging to Newtown Creek would be located at Meeker and Scott
Avenue. Design is expected to commence in fiscal year 2012 with construction funding
scheduled for fiscal year 2013. Final schedules for construction have not yet been established.
5.13 NEWTOWN CREEK SUPERFUND SITE
Newtown Creek and its tributaries were added to Comprehensive Environmental
Remediation Certification and Liability Act (CERCLA) National Priorities List, commonly
known as Superfund, in September 2010. As a result, the EPA launched a serious of actions to
develop a remedy for the Creek and its tributaries. As part of an Administrative Order of Consent
with the EPA, New York City and five agreed to conduct a Remedial Investigation and
Feasibility Study to identify the appropriate remedy. The anticipated project timeframe for
completing the investigation and study is approximately 6-7 years. The preferred remedy is
expected to be selected in 2017-2018 and include dredging.
New York City Department of Environmental Protection Waterbody/Watershed Facility Plan Report
Newtown Creek
6-1 June 2011
6.0. Public Participation and Agency Interaction
One of the nine elements of a long-term control plan is a public participation and agency
interaction process that actively involves the affected public and regulators in decision-making to
select long-term CSO controls. USEPA guidance states that establishing early communications
with both the public and regulatory agencies is an important first step in the long-term planning
approach and crucial to the success of a CSO control program (USEPA, 1995a). The DEP is
committed to involving the public and regulators early in the planning process by describing the
scope and goals of its facility planning projects and continuing public involvement during its
development, evaluation, and selection of plan elements.
The CSO Control Policy emphasizes that state water quality standards authorities,
permitting authorities, USEPA regional offices, and permittees should meet early and frequently
throughout the long-term planning process. It also describes several issues involving regulatory
agencies that could affect the development of the long-term control plan, including the review
and appropriate revision of water quality standards, and agreement on the data, analyses,
monitoring, and modeling necessary to support the development of the long-term control plan.
Toward that end, a Harbor-Wide Government Steering Committee was convened by the DEP
consisting of city, state, interstate, and federal stakeholders representing regulatory, planning,
and public concerns in the New York Harbor watershed.
DEP has also formed local and city-wide citizen advisory committees, has involved other
municipal officials, local community government representatives, permitting agencies, and the
general public in its planning process. Public meetings were conducted to present technical
information and obtain input from interested individuals and organizations. Potential CSO
alternatives, costs (to DEP and to the public via water usage rates) and benefits were discussed
before completing engineering evaluations. Comments were sought regarding the selection of a
recommended plan. This process has been executed by DEP during the Newtown Creek Facility
Planning Project. DEP regularly met with its Advisory Committee on Water Quality to discuss
the goals, progress and findings of its ongoing planning projects such as the
waterbody/watershed assessment of Newtown Creek. A local stakeholder team was specifically
convened by DEP to participate in the waterbody/watershed assessment of Newtown Creek.
The following section describes the formation and activities of DEP’s Harbor-Wide
Government Steering Committee, its Citizen’s Advisory Committee on Water Quality, and the
Newtown Creek Waterbody/Watershed Stakeholder Team that represented DEP’s public
participation and agency interaction components of its waterbody/watershed assessment of
Newtown Creek.
6.1. HARBOR-WIDE GOVERNMENT STEERING COMMITTEE
DEP convened a Harbor-Wide Government Steering Committee to ensure overall
program coordination and integration of management planning and implementation activities by
holding quarterly meetings, exploring regulatory issues, prioritizing planning and goals,
developing strategies, reviewing and approving assessment-related work plans, and coordinating
actions. A Steering Committee was comprised of city, state, interstate and federal stakeholders

New York City Department of Environmental Protection Waterbody/Watershed Facility Plan Report
Newtown Creek
6-2 June 2011
representing regulatory, planning and public concerns in the New York Harbor Watershed. The
Citizens Advisory Committee on Water Quality (CAC), which reviews and comments on DEP
water quality improvement programs is represented on the Steering Committee and separately
monitors and comments on the progress of CSO projects, among other DEP activities.
Federal government members of the Harbor-Wide Government Steering Committee
included representatives of the USEPA, USACE, and the National Park Service. USEPA Region
2 was represented by its Deputy Director and its Water Quality Standards Coordinator. The
USACE was represented by its Chief of the Technical Support Section, Planning Division, New
York District. The National Park Service member was a representative of its Division of Natural
Resources at the Gateway National Recreational Area.
The State of New York was represented by the central and regional offices of the DEC.
The Central Office of the DEC in Albany was represented by its Associate Director of the
Division of Water, the Director of the Bureau of Water Assessment and Management Branch of
the Division of Water, and the Director of the Bureau of Water Compliance in the Division of
Water. The Region II office of the DEC was represented by the Regional Engineer for the
Region II Water Division.
Several departments of the City of New York were represented on the Harbor-Wide
Government Steering Committee. The Deputy Commissioner of the Bureau of Environmental
Engineering and its Director of Planning and Capital Budget represented the DEP. The
Department of City Planning was directed by its Director of Waterfront/Open Space. The New
York City Department of Parks and Recreation was represented by the Chief of its Natural
Resources Group.
Public interests were represented on the Steering Committee by the General Counsel of
Environmental Defense at the New York headquarters and the Real Estate Board of New York.
These two members also co-chaired the Citizens Advisory Committee on Water Quality. In
2006 these positions have been changed after a few years’ hiatus of the CAC.
Interstate interests were represented by the Executive Director and Chief Engineer of the
IEC. The IEC is a joint agency of the states of New York, New Jersey and Connecticut. The
IEC was established in 1936 under a Compact between New York and New Jersey and approved
by Congress. The State of Connecticut joined the IEC in 1941. The mandates of the IEC are
governed by the Tri State Compact, Statutes, and the IEC’s Water Quality Regulations. Its
responsibilities and programs include activities in areas such as air pollution, resource recovery
facilities, and toxics; however, the IEC’s continuing emphasis is on water quality, an area in
which the IEC is a regulatory and enforcement agency. The IEC’s area of jurisdiction runs west
from Port Jefferson and New haven on Long Island Sound, from Bear Mountain on the Hudson
River down to Sandy Hook, New jersey (including Upper and Lower New York Bays, Newark
Bay, Arthur Kill and Kill Van Kull), the Atlantic Ocean out to Fire island Inlet on the southern
shore of Long island, and the waters abutting all five boroughs of New York City.
The Steering Committee was responsible for reviewing the methodology and findings of
DEP water quality-related projects, and to offer recommendations for improvement. The
Steering Committee reviewed and approved the waterbody work plan developed by the USA
Project (HydroQual, 2001i), and was fully briefed on the on-going assessments and analyses for
each waterbody. Among the recommendations provided by the Steering Committee was the
New York City Department of Environmental Protection Waterbody/Watershed Facility Plan Report
Newtown Creek
6-3 June 2011
investigation of cost-effective engineering alternatives that improve water quality conditions to
remove harbor waters from the State of New York 303(d) List, to pursue ecosystem water quality
restoration actions with USACE, and to coordinate use attainment evaluations with the DEC.
Representatives of the DEC reported that its agency was awaiting the results of the DEP
waterbody/watershed assessment before completing the 303(d) evaluations.
6.2. NEWTOWN CREEK WATER QUALITY FACILITY PLANNING PROJECT
The Newtown Creek Water Quality Facility Planning (CSO Facility Plan) Project
presented to Brooklyn Community Board No. 1 on November 19, 2002. From the slides
prepared for that meeting, background information on the study area was presented including the
area, the number of CSO outfalls, the waterbody classification, and existing water quality issues.
The presentation then turned to the elements of the CSO Facility Plan; aeration, CSO storage
tank, relief sewer, and regulator modifications. The presentation included additional detailed
discussion of siting the CSO storage tank, including the preferred site and the next steps for site
acquisition. The presentation finished with a discussion of potential dredging and ecosystem
restoration through being a local sponsor to the Army Corp of Engineers.
Also, efforts have continued for siting the 9 MG CSO Storage Tank, which is planned for
construction at the intersection of Johnson and Morgan Avenues. Although the construction of
the CSO storage tank has been deferred beyond the current 10-year Capital Plan, the DEP is
continuing with efforts pertaining to CEQR and ULURP in order to acquire the preferred site for
the tank. As part of this effort, a draft EAS has been completed, reviewed, updated, and is
undergoing final review, the goal being to gain a Negative Declaration from the reviewing body.
No formal public participation has taken place, but there has been continuing dialog with the
local community board. If a Positive Declaration is made by the reviewing body, an EIS would
have to be completed and the formal public participation process required for an EIS would be
undertaken.
The ULURP process is only just underway. An informal pre-application meeting has
been held, but no formal meeting has been scheduled. A formal public review process will not
start until the application is certified as complete, which is most likely a year or two away.
6.3. NEWTOWN CREEK WWTP FACILITIES PLANNING AND USA PROJECT
There were extensive public participation activities for the Newtown Creek WWTP
Facilities Planning Project from 1995 to 1998, and for the Newtown Creek Use and Standards
Attainment (USA) Project from 2003 to 2004.
6.3.1. Newtown Creek WWTP Facilities Planning Public Participation
In the late 1990’s a number of activities were underway at the Newtown Creek WWTP
that called for public participation and inclusion of the public’s concerns in the planning
processes. These activities included the Interim Upgrade Projects program; the secondary
treatment upgrade; acquisition of property; and preparation of an environmental impact
statement. The public participation program for the Newtown Creek Plant Facilities Planning
project was carried out under the direction of the DEP Division of Intergovernmental
Coordination.

New York City Department of Environmental Protection Waterbody/Watershed Facility Plan Report
Newtown Creek
6-4 June 2011
A CAC, composed of major stakeholders, provided an independent appraisal of the
project. They dealt with issues involving the Interim Upgrading Program, the Facilities Planning
process for the secondary treatment plant upgrade, plant operation, and other issues of interest.
To assist the committee in performing its role, the DEP also funded an independent consulting
engineer to advise them.
In addition to numerous regularly scheduled meetings and informal meetings held
throughout the planning process, a series of 10 formal public meetings, hearings and open houses
were scheduled to discuss specific topics. Newspaper advertisements in three different
languages, flyers, posters and mailings were used to generate interest in a scheduled event.
Handouts, posters and slide presentations were employed to disseminate project-related
information. DEP staff members were on-hand at the various meetings to answer questions and
to provide individuals with the information needed to understand the issues being discussed.
The Program Manager and the Program Coordinator coordinated activities to ensure that
dialogue was maintained between all parties. They promoted opportunities in which the
community could have an active voice in the decision-making process. They also scheduled
meetings for the DEP engineering staff, plant personnel and citizens to discuss Plant related
issues and identify mutually agreeable solutions.
As a result of the DEP’s aggressive outreach approach to the community and the
community’s efforts to work with the DEP, the Interim Upgrade Projects program and the
Facilities Planning effort were successful in involving the public in the planning process. As a
result, there were no delays to the project, such as those from lawsuits that could have been
brought by groups representing members of the affected community. More importantly, the
planning process incorporated the public’s opinions in the facility design. For instance, the DEP
complied with the CAC’s request to replace trees removed from the Plant property because of
construction by planting trees within the neighborhood around the Plant at locations selected by
the Committee. Another example is that the DEP investigated at the community’s request, then
included in the Plant upgrade, a project whereby a new sludge force main will be constructed so
that sludge can be pumped directly from the Plant to waiting sludge boats at the East River
Sludge Loading Dock. When the new force main is completed the existing East River Sludge
Storage Tank will be demolished. Perhaps the most visible example of the success of the
program is inclusion of the River Walk in the Plant upgrade. Responding to the community’s
request for riverfront access, the DEP included a landscaped River Walk that sweeps around the
new Support Building allowing the public access to both Newtown Creek and the Whale Creek
Canal.
6.3.2. Use and Standards Attainment (USA) Project Public Participation
DEP’s Use and Standards Attainment (USA) Project was conducted for waterbodies
throughout New York Harbor to address compliance with water quality standards and designated
uses. The goals of the USA Project were to:
define, through a public process, more specific and comprehensive long-term
beneficial use goals for each waterbody, including habitat, recreational, wetlands and
riparian goals, in addition to water quality goals, thus maximizing the overall
environmental benefit;

New York City Department of Environmental Protection Waterbody/Watershed Facility Plan Report
Newtown Creek
6-5 June 2011
develop technical, economic, public and regulatory support for prioritizing and
expediting implementation of projects and actions needed to attain the defined goals;
and
provide the technical, scientific and economic bases to support the regulatory process
needed to define water quality standards for the highest reasonably-attainable use and
to allow these water quality standards to be attained upon implementation of
recommended projects.
To support these goals within the Newtown Creek waterbody/watershed, a stakeholder
team specific to the assessment area was assembled, and four meetings were held from
September 2003 to May 2004 (DEP, 2003a, 2003b, 2004a, 2004b).
The first meeting included stakeholder introductions. Information was provided to the
stakeholders on the State Water Quality Standards and the Newtown Creek’s classification, and
an introductory review of ongoing and planned projects affecting the Creek was given. The
current USA Project activities were reviewed, indicating that the Newtown Creek assessment
was underway with the Project Team having reviewed existing water quality data and historic
records, and having developed land use and shoreline characterizations. The stakeholders were
also informed that additional Newtown Creek water quality sampling had been performed to
supplement DEP’s ongoing water sampling programs; and that this data was currently being
analyzed. It was also explained that the ongoing mathematical watershed and waterbody
modeling was being conducted to fill in gaps between sampling stations and sampling periods, as
well as to simulate future water quality under a variety of engineering alternatives, and that
projecting the long-term water quality benefits of alternatives allows the DEP to identify the
option that is most cost-effective and consistent with waterbody uses. The stakeholders were
asked to review the land use map and a blank map included in the handout and mark them with
information on uses of the creek and activities along the creek, such as: Where are people using
the water (e.g. for kayaking or fishing)? Where is there public access to the creek? Where are
businesses using the waterbody to support themselves? Where are there problems, such as
exposed sediments or illegal dumping? The marked up maps were to be collected at the second
meeting and compiled for presentation at the third meeting.
At the second meeting, information was gathered from the stakeholders on the riparian
and waterbody uses, and the USA Project’s waterbody/watershed assessment objectives, work
plan for Newtown Creek, and its schedule were further discussed. Information was disseminated
on the field investigations, past and present DEP water quality monitoring, and biological field
monitoring conducted by the USA Project. The analysis phase of the assessment was detailed
from assembling waterbody-related data, through the construction of predictive mathematical
models of Newtown Creek and its watershed, the development of preliminary approaches to
attain goals, the evaluation of waterbody/watershed control alternatives, recommendations for
waterbody classifications, and the development of a preliminary waterbody/watershed plan. In
addition to the discussion of the USA Project, two other presentations were made to the
stakeholders. The first was an introductory presentation of the DEP’s ongoing $2.2 billion
reconstruction and secondary treatment upgrade of the Newtown Creek WWTP, describing the
existing WWTP characteristics and features, the benefits of the upgrade and reconstruction, and
the construction schedule. The second was a presentation describing the Newtown Creek CSO

New York City Department of Environmental Protection Waterbody/Watershed Facility Plan Report
Newtown Creek
6-6 June 2011
Facility Plan, including the characteristics of the combined sewer system and Newtown Creek
water quality, the features and benefits of the CSO Facility Plan, and its implementation
schedule.
At the third meeting, updated maps existing land uses in the waterbody/watershed
assessment area and of Newtown Creek waterfront resources, including planned and proposed
beneficial use projects around the Newtown Creek, were reviewed and input was taken from the
stakeholders. A list of recognized water quality and riparian problems/impairments in the
assessment area was reviewed. The water quality list included sediment mounds,
pathogens/coliforms, odors, oil slicks, floatables, discoloration, dissolved oxygen, and benthic
habitat, and the riparian problems/impairments included illegal dumping, minimal public access
and brownfields. Stakeholder team members added lack of vegetation and deteriorating
bulkheads to the riparian list and identified several areas on the map where illegal dumping, oils
slicks, water discoloration, and limited wetland colonization had been observed in and on the
waterbody. A list of suggested waterbody use goals for Newtown Creek was also reviewed. The
following are comments and discussions recorded.
For recreational boating, it was noted that the East River Apprentice Shop and East River
Kayak were launching water craft at the end of Manhattan Avenue and that one team member
was using a private launch on Commercial Street.
Tours and environmental education were added as a use goal, along with access to nature
and education. It was noted that the Urban Divers were giving tours of the waterbody.
Recreational fishing was noted as occurring at the bus depot on Commercial Street,
Manhattan Avenue, the lot 100 pier, the Pulaski Bridge and Gantry Street Park. The use of signs
in several languages, posted to identify the potential dangers of fishing was suggested.
Attaining swimmable water was discussed and the Stakeholder Team reached a
consensus that the bathing standard would be unreasonable to achieve in the foreseeable future
and that primary contact recreation in Newtown Creek represents a potential use conflict with
current and potential commercial/industrial maritime uses of the waterbody that would otherwise
benefit the local community. Secondary contact recreation was recognized as being more
consistent with these maritime uses.
General use goals were identified - improved habitat (both aquatic and terrestrial),
improved water quality towards fishable/swimmable, removed odors, remediated sediment,
commercial/industrial maritime uses, transportation, secondary contact and “passive”- dangling
one's feet in the water - recreation.
Finally, a status report on the waterbody/watershed assessment was provided, describing
coordination with the U.S. Army Corps of Engineers, characteristics of the waterbody, watershed
and riparian land uses, and ongoing assessment activities including water quality monitoring and
data analysis, and computer modeling of the watershed and waterbody.
During the fourth meeting, the Newtown Creek Waterfront Projects and Activities map
shown in Figure 6-1 was reviewed, which distinguishes between active and inactive piers and
also maps locations of dumping and oil slicks that were identified by stakeholder team members
at the third meeting. Stakeholder team members had no further corrections or comments. Also,
New York City Department of Environmental Protection Waterbody/Watershed Facility Plan Report
Newtown Creek
6-7 June 2011
the list of Newtown Creek Water Use Goals developed previously by the stakeholder team was
reviewed as follows:
Commercial and industrial maritime uses are ongoing and desired to continue;
Transportation uses such as ferries and excursions are compatible with the waterbody;
Boating and incidental contact with water is the most appropriate use for the
waterbody (secondary contact recreation);
Swimming is seen as a conflict with commerce, and, because of existing water
quality, is unlikely in the short-term, although the goal is to attain
fishable/swimmable compliance;
Improved aquatic habitat is desired, including improvements in the water column
(mainly dissolved oxygen) and remediation of sediment. For terrestrial environments,
naturalization of shorelines is desired where compatible with upland uses; and
Abatement of nuisances such as odors and floatables is desired.
The meeting also included a presentation on waterbody/watershed assessment planning
describing the Newtown Creek’s current designated use and regulatory issues, field
investigations, preliminary water quality, biology and toxicity results, watershed and receiving
water mathematical models, and a summary of combined sewer overflow discharges to Newtown
Creek. The presentation included a description of how the models are used to simulate
engineering alternatives and calculate compliance with water quality standards, along with the
status of the waterbody/watershed assessment itself. The stakeholders were also informed that
USA Project planning for Newtown Creek would be delayed in order to evaluate the
effectiveness of in-stream aeration being piloted in Newtown Creek. No further meetings were
scheduled.
6.3.3. Use and Standards Attainment (USA) Project Public Opinion Survey
The DEP conducted a telephone survey in order to assess and measure the use of
waterbodies in New York City, and obtain feedback from New York City residents about their
attitudes towards the water resources in their community and elsewhere. Surveys addressed
Citywide issues as well as those for local waterbodies. Primary and secondary waterbody survey
results (dependent on residential location within watersheds) were analyzed discretely and
summarized to provide additional insight into the public’s waterbody uses and goals in addition
to those identified via other public participation programs run by the DEP.
Survey interviews were conducted using Computer Assisted Telephone Interviews
(CATI) among residents of the five New York City boroughs that were 18 years or older.
Residents were asked about specific waterways depending on their zip code. A total of 7,424
interviews with New York City residents were conducted during these telephone surveys and a
total of 8,031 primary waterway responses were recorded. Questionnaire development involved
a pre-test prior to the full field application of the survey to ensure that the survey covered all
relevant issues and it was presented in a way that would be clear to all respondents. The pre-test
was conducted via a series of five focus groups representing residents of each of the five New
York City boroughs. Final presentation of results involved editing, cleaning, and weighting
collected data. The weights were applied to the data to correct for unequal probability of
New York City Department of Environmental Protection Waterbody/Watershed Facility Plan Report
Newtown Creek
6-8 June 2011
household selection due to households with more than one telephone number, and different
numbers of individuals available to be interviewed at different households. Post-stratification
weighting was also applied for each waterbody to balance the sample data to 2000 U.S. Census
population data that takes into account household composition, age, gender, and race/ethnicity.
The survey data was then projected to actual population counts from the 2000 U.S. Census so
that areas could easily be combined to yield an appropriate weighted sample for all five boroughs
of New York City.
The telephone survey included 7,424 interviews with New York City residents. A
minimum of 300 interviews for each of the 26 watersheds was included within the scope of the
USA project. The survey was analyzed to quantify the extent of existing uses of the waterbody
and riparian areas, and to record interest in future uses. Elements of the survey focused on
awareness of the waterbody, uses of the waterbody and riparian areas, recreational activities
involving these areas and how enjoyable these activities were, reasons why residents do not
partake in recreational activities in or around the waterbody, overall perceptions of New York
City waterbodies; and what improvements have been recognized or are desired. Results of the
survey for Newtown Creek and summarized below and detailed results are included as Appendix
C.
Waterbody Awareness
Approximately 42 percent of the Newtown Creek area residents that participated in the
survey were aware of Newtown Creek but only 3 percent could identify Newtown Creek as their
primary waterbody without prompting or aid in their response. On an unaided basis, area
residents most often mentioned the East River as the waterway closest to their home.
Water and Riparian Uses
Approximately 18 percent of the Newtown Creek area residents that participated in the
survey visit waterbodies in their communities or elsewhere in New York City on a regular basis
and 42 percent occasionally visit waterbodies. The remaining percentage of area residents rarely
visit waterbodies (26 percent) or not at all (14 percent). This is about the same as New York
City residents in general. Sixty percent of the Newtown Creek area residents regularly or
occasionally visit city waterbodies, while an identical 60 percent of all New York City residents
regularly or occasionally visit city waterbodies. Only 4 percent of area residents have visited
Newtown Creek at some point and 3 percent have done so in the prior 12 months. Among those
area residents who are aware of Newtown Creek but have never visited it, 33 percent responded
that there was no particular reason for not doing so, 34 percent cited waterbody conditions and
25 percent cited riparian conditions. When area residents cite negatives about the water as the
reason for never having visited Newtown Creek, the specific issues are pollution (13 percent),
odors (11 percent), and trash in the water/unclean water (8 percent). When New York City
residents cite water negatives as the reason for never having visited the primary waterway in
their assessment area, the specific issue most often mentioned is pollution (5 percent).
None of the interviewed Newtown Creek residents have participated in water activities
there, but 1 percent has participated in land activities there.

Newtown Creek USA Project Stakeholder Meeting No. 4Newtown Creek USA Project Stakeholder Meeting No. 4Draft Waterfront Projects and Activities Handout
Figure 6-1Newtown Creek Waterbody/Watershed Plan
New York City Department of Environmental Protection Waterbody/Watershed Facility Plan Report
Newtown Creek
6-10 June 2011
Improvements Noted
Approximately 43 percent of area residents indicated that they have noticed
improvements in New York City waterways in general in the past five years, but less than 0.5
percent have noticed improvements specifically at Newtown Creek. Improvements in the water
(quality, appearance and color) of New York City waterways were most frequently noted by area
residents (22 percent). If funds were available, area residents would most like to see
improvements to the water (quality, appearance and odor) at Newtown Creek. Sixty-seven
percent of the area residents responding indicated that water quality was extremely important (29
percent) or somewhat important (38 percent).
Approximately 48 percent of the area residents who identified any improvement reported
that they would be willing to pay between $10 and $25 a year for that improvement while 16
percent indicated that would not be willing to pay anything for improvements. For those that
specifically cited water quality improvements as the most important improvement, 47 percent
indicated they would be willing to pay between $10 and $25 a year for that improvement and 18
percent were not willing to pay anything.
When asked which waterway should be improved if funds were available to improve only
one New York City waterway, 8 percent of area residents cited Newtown Creek as the waterway
to be improved. In comparison, approximately 18 percent of New York City residents cited the
waterbody in their own assessment area as the one that should be improved.
6.4. WATERBODY/WATERSHED FACILITY PLAN LOCAL STAKEHOLDER
TEAM AND STAKEHOLDER MEETINGS
A stakeholder team for Newtown Creek, consisting of community and environmental
leaders from Queens Community Boards 2 and 5, and Brooklyn Community Board 1, was
assembled in 2006. The current group is largely made up of the same individuals that were
assembled for the USA Project’s public participation. Four stakeholder meetings were held from
October 2006 to May 2007. Minutes of these meetings are included in Appendix D.
Meeting No. 1
At the first meeting, held October 25, 2006 the DEP introduced the project and indicated
that the DEP is currently working to draft individual Waterbody/Watershed plans for CSOs,
including one for Newtown Creek and that all plans must be submitted to the DEC by June 2007.
Following the introduction, CSOs were defined, locations of Citywide CSOs and the DEP’s
WWTPs were shown, and a general background and description of the LTCP was given,
including the history of CSO policy and previous water quality planning. It was noted that the
preparation of the LTCP is a requirement of the 2005 Consent Order with the DEC, which also
sets schedules for completion of specific water quality improvement projects, including the
elements of the Newtown Creek CSO Facility Plan. It was further noted that each WB/WS plan
would be developed with a group of stakeholders like the one assembled, and that their help
would be enlisted to identify the existing and desired uses for a waterbody and to help to define
waterbody characteristics.
The general introduction was followed by an introduction to the Newtown Creek
waterbody and watershed, including the urbanized area, the number of permitted CSO and storm
New York City Department of Environmental Protection Waterbody/Watershed Facility Plan Report
Newtown Creek
6-11 June 2011
outfalls, the current water quality classification, and the WWTP collection systems serving the
area. The significant marine and industrial uses in the area, as well as the limited public access
were noted, and previous water quality sampling programs within Newtown Creek were
discussed, including sampling locations, frequencies, sample parameters, and sample results.
The major water quality issues were identified and preliminary baseline modeling results were
shared, showing modeled baseline annual overflow volumes and frequency of discharge to the
waterbody from each CSO.
The topic then moved on to planning, detailing the CSO Facility Plan elements that were
submitted to the state in 2003: a tank at the head of English Kills, relief sewer from the East
Branch, and a throttling gate, among others. It was noted that one element, a full-scale aeration
facility, was currently under construction in upper English Kills and that a second phase of
aeration was planned for lower English Kills, East Branch, and Dutch Kills. The discussion
finished up by outlining some of the elements that might become part of the WB/WS plan,
including dredging and flushing tunnels. Several stakeholders asked why separately sewered
systems, particularly for new construction, were not included on the list of abatement
alternatives, and it was noted that such a system would be costly and would not necessarily lead
to improved water quality. A stakeholder expressed concern that low impact development
alternatives (LIDs) were not included and it was noted that efforts were currently underway to
understand the effects of LIDs on a watershed level and that the timeline required to develop a
citywide policy on LIDs, which necessitates interagency evaluations and regulatory actions, will
extend beyond the June 2007 milestone for delivery of an approvable WB/WS Facility Plan to
DEC. It was further noted that a separate but related effort to create a Citywide policy on LIDs,
by the DEP along with the Mayor’s Office of Sustainability was underway.
Meeting No. 2
At the second meeting, held on December 13, 2006 a brief review of the waterbody and
issues affecting it was given, and an update on the activities of stakeholder teams for other
waterbodies was provided. It was noted that four stakeholder teams have completed their tasks
of advising DEP on the WB/WS facility plans and that even though all of the completed project
areas had significant prior facility planning, some changes have been made to the preexisting
plans during the LTCP process.
Next sampling locations and dissolved oxygen data from 1990 and 2003 was presented.
Both data sets showed that the Creek often does not attain the current DO standard and that DO
levels get worse with distance away from the East River. Modeling results were then presented
which also projected that the DO standards cannot be met 100 percent of the time even with
complete removal of CSOs. Although there is no pathogen standard related to the waterbody’s
current SD classification, modeled fecal coliform levels were presented, which showed that fecal
coliform levels would be less than 2,000 counts per 100 mL, the next highest water quality
standard, if all CSO was removed.
Following the discussion of water quality, previous and ongoing projects and programs
were discussed as well as current planning. It was noted that the timetable for the CSO Facility
Plan projects is stipulated in the consent order and that the DEP was working to implement these
measures and adhere to that schedule, but that other alternatives currently being evaluated under
the Waterbody/Watershed Plan would be considered for the final plan if the alternatives are
New York City Department of Environmental Protection Waterbody/Watershed Facility Plan Report
Newtown Creek
6-12 June 2011
proven to produce equal water quality in a more efficient way or better water quality for a similar
investment.
Lastly, current waterbody uses were reviewed based on this stakeholder group’s input
during the USA Project’s public participation. It was noted that during the USA project
meetings, some stated current uses included boating and recreational fishing at the bus depot on
Commercial Street, Manhattan Avenue, the lot 100 pier, the Pulaski Bridge and Gantry State
Park and that use goals included improved habitat, the removal of odors, and secondary contact
recreation, such as boating. It was noted that area residents want improved access for boating, as
well. During these earlier public participation meetings, this stakeholder group stated that
primary contact recreation in Newtown Creek was unreasonable to achieve and that it represents
a use conflict with current and potential industrial uses. However during this meeting, some of
the current stakeholders said that primary recreation, swimming, should always be considered as
the ultimate goal. Stakeholders also advocated for restored wetlands in the tidal inlets and
education programs.
On several occasions during the meeting stakeholders asked about LIDs and the inter-
agency project on LIDs run by the Mayor’s Office of Sustainability. It was noted that the DEP is
currently working towards a possible implementation of these alternatives and is carrying out a
study to analyze and quantify the effect of LIDs on a watershed scale in the Jamaica Bay
Watershed Protection Plan (JBWPP). Further, DEP is also working with the Mayor’s Office of
Sustainability and Long Term Planning on an interagency effort to implement LIDs, but that
both of these projects are on a longer timeframe than the LTCP. The stakeholders were notified
that the DEP will work to fold the findings of the JBWPP into the LTCP at a later date.
Stakeholders requested that a representative from the Mayor’s Office of Sustainability give a
presentation at the next meeting, and the DEP team agreed to ask.
Meeting No. 3
A third meeting was held on March 21st, 2007. The meeting began with a recap of the
previous meeting, and a brief review of the waterbody and issues affecting it. It was noted that
the DEP received a letter from the Newtown Creek Alliance (NCA) regarding their concerns and
goals for the waterbody. The NCA is a local community organization whose goal is to improve
the environmental and economic conditions in and around Newtown Creek. The NCA requests
were discussed at the meeting. The requests and the discussion follow:
NCA requested that representatives from the Mayor’s Office of Sustainability, and
the New York City Department of Transportation, Buildings, and City Planning be
present at the stakeholder meetings. It was noted that the Mayor’s Office of
Sustainability was invited to the meeting, but that they could not attend.
NCA requested that the WB/WS Facility Plan incorporate explicit provisions for
integration of alternative stormwater management technologies. It was discussed that
the DEP is looking at opportunities for piloting source controls to determine their
effectiveness and applicability in New York City, but that this could not occur before
the June 2007 deadline for the WB/WS Facility Plans.

New York City Department of Environmental Protection Waterbody/Watershed Facility Plan Report
Newtown Creek
6-13 June 2011
NCA requested that they be able to present opportunities and propositions for
alternative stormwater management technologies at the next stakeholder meeting. In
response NCA was invited to present and was afforded time at the end of the meeting.
NCA requested that there be an explicit commitment in the WB/WS Facility Plan to
continuing analysis of alternative stormwater management practices and to public
participation beyond the June 2007 submission date. It was noted that the DEP is
working with the Mayor’s Office of Sustainability and other NYC departments to
review low impact development alternatives. A commitment will be included in the
WB/WS Facility Plan to fold the results of these efforts into the CSO LTCP. Also the
DEP is considering bi-annual public participation meetings after June 2007. These
meetings would include all stakeholders and would be in addition to meetings
required as part of the LTCP process. In response to a stakeholder question, Sue
McCormick of the DEC discussed the differences between a WB/WS Facility Plan
and a LTCP. The WB/WS Facility Plan is due in June 2007 and will include interim
measures to address compliance with existing standards before a LTCP can be drafted
and implemented. The LTCP due for Newtown Creek in 2017 will address the gap
between the WB/WS Facility Plan and the attainment of CWA standards.
NCA requested that the water quality designation for Newtown Creek be raised from
its current water quality designation to Class I. Sue McCormick (DEC) indicated that
marine standards as a whole were up for revision and that the response period is open.
She indicated that more information is available online at the DEC’s Environmental
Notice Bulletin.
The meeting then moved to focus on the alternatives for water quality improvement that
have been reviewed as part of the WB/WS Facility Plan. The discussions of each alternative
included projected annual CSO volume reduction, projected water quality improvements, and an
estimate of the capital cost of instituting the alternative. The alternatives discussed included:
Dredging;
In-stream aeration;
The elements of the 2003 CSO Facility Plan;
A new interceptor to the Newtown Creek WWTP;
Flushing tunnels; and
Multiple CSO storage tunnel layouts and sizes, including one that would capture 100
percent of the CSO in the typical year.
It was noted that removing 100 percent of the typical year CSO would not bring the
waterbody into compliance with the existing standards. A review of the modeled dissolved
oxygen deficit component analysis showed that the majority of dissolved oxygen deficit is due to
sources outside of the Newtown Creek. The next largest contributor to oxygen deficit is
Newtown Creek CSOs. Other sources of deficit include stormwater, the Newtown Creek
WWTP discharge, and East River load.

New York City Department of Environmental Protection Waterbody/Watershed Facility Plan Report
Newtown Creek
6-14 June 2011
Stakeholders expressed interest in wetland construction and questioned whether dredging
conflicted with that. It was noted that dredging provides many benefits and that it did not
conflict with wetlands. However, the dredging proposed is in close proximity to CSOs, and that
wetlands established at these locations would be subject to sediment buildup and scouring.
The meeting wrapped up with a presentation by Kate Zidar (NCA), which provided a
background on their efforts and outlined their main goals for the LTCP. These goals included
interagency collaboration on stormwater management, pilot projects for source control, habitat
restoration, and safe access to the Creek.
Meeting No. 4
The fourth and final Newtown Creek Stakeholder team meeting was held on May 23rd,
2007. The meeting opened with introductions and a review of the previous meeting’s notes.
Stakeholders asked for a revision that would better reflect the group’s aspiration for primary
contact recreation standards. The change was made and the finalized notes are included in
Appendix D of this report. Stakeholders were also notified that the draft WB/WS Facility Plan
being presented at this meeting would be completed and submitted to the DEC for review by the
end of June and that the plan would be made available to Stakeholders in electronic form shortly
thereafter.
Prior to continuing with the WB/WS Plan presentation, a Stakeholder was granted time to
share part of a documentary describing the current water quality in Newtown Creek and uses of
the creek, including swimming. The presentation then resumed with a quick review of Newtown
Creek’s existing conditions, historical sampling data and baseline modeled conditions. Baseline
water quality modeling projects that the majority of the DO deficit in Newtown Creek is from
sources outside Newtown Creek and as such removing 100% of CSOs from Newtown Creek
would not bring the Creek into compliance with the current water quality standards.
Next stakeholder goals were reviewed, including improved habitat, removal of odors, and
an upgrade to Water Quality Standard Class I, which allows for secondary contact recreation.
The remainder of the presentation focused on the development of and the elements
included in the Waterbody/Watershed Facility Plan. The plan was developed by first analyzing
available CSO abatement technologies, a group of which were retained for waterbody specific
evaluation which paired down the available technologies even further. The remaining
alternatives were then grouped into ten potential waterbody/watershed plans for final qualitative
and quantitative comparison and analysis considering constructability, operation and
maintenance concerns, cost, CSO volume and event reductions, and water quality. Section 7 of
this report explains this process in more detail.
The final element of the WB/WS Plan presentation was to review the specific elements of
the Waterbody/Watershed Facility Plan, including the costs and benefits associated with each
element. The discussion was basically a summary of the information found in Section 8 of this
report.
After the WB/WS Plan presentation, a representative from the DEP’s Bureau of
Environmental Planning and Assessment (BEPA), presented on the DEP’s work with LIDs. The
presentation noted that the Mayor signed Local Law 71 in 2005, requiring DEP to develop a plan
to address the issue of disappearing wetlands in Jamaica Bay. The ensuing Jamaica Bay Wildlife
New York City Department of Environmental Protection Waterbody/Watershed Facility Plan Report
Newtown Creek
6-15 June 2011
Protection Plan stipulates the exploration of different stormwater capture pilots. The data from
these projects will be collected for three years after construction and the findings used to inform
Citywide projects. The types of pilots already underway were reviewed, including: street side
swales; porous pavement; enhanced tree openings, and constructed urban wetlands. Green roofs
are also being reviewed for their application in different use districts. It was stressed that the
application of many of these methods requires an in-depth understanding of specific site
conditions. Other projects discussed included the Mayor’s PLANYC, which includes the use of
oysters and oyster habitat for water cleansing and the distribution of rain barrels to private
property owners. Throughout the presentation representatives of BEPA and the Mayor’s Office
of Long Term Planning and Sustainability answered stakeholder questions on LIDs/BMPs,
including questions on siting issues, incentives, new development, and potential modifications to
the Waterfront Access Plan. A representative of the NCA indicated an interest in speaking to the
Mayor’s Office of Long Term Planning and Sustainability about specific projects in the
Newtown Creek watershed. It was noted that an Interagency BMP Taskforce is being formed
which will focus on developing a citywide approach to LIDs but more detailed discussions might
be warranted.
Following the LIDs presentation, additional footage from the documentary was played
and the meeting was adjourned.
6.5. ADMINISTRATIVE CONSENT ORDER
The Administrative Consent Order was published for public comments on September 8,
2004, as part of the overall responsiveness effort on behalf of the DEC. The public comment
period, originally limited to 30 days, was extended twice to November 15, 2004, to allow for
additional commentary. Comments were received from public agencies, elected officials, private
and non-profit organizations, and private individuals. In total, DEC received in excess of 600
official comments via letter, facsimile, or e-mail during the comment period. All comments
received were carefully reviewed and evaluated, then categorized by thematic elements deemed
similar in nature by DEC. Each set of similar comments received a specific focused response.
Many of the comments received, although differing in detail, contained thematic elements
similar in nature regarding DEC and DEP efforts toward CSO abatement, water quality issues,
standards, and regulatory requirements.
None of the comments received changed the terms of the Order, but the volume of
commentary was interpreted by DEC to indicate that “NYC citizenry places CSO abatement as a
high ongoing priority” (DEC, 2005). The terms of the Order offer numerous opportunities for
public participation and input for future CSO abatement measures and regulatory decisions, such
as the requirement to comply with federal CSO policy with regard to public participation during
the plan development.
6.6. SPDES PERMITTING AUTHORITY
Any facilities built as part of this Waterbody/Watershed Facility Plan would be subject to
the conditions of the Newtown Creek WWTP SPDES permit. Any action by the DEP that
results in changes to their SPDES permits will be available for public comments when these
permits are publicly noticed.
New York City Department of Environmental Protection Waterbody/Watershed Facility Plan Report
Newtown Creek
6-16 June 2011
6.7. FINALIZATION OF PUBLIC PARTICIPATION
Following DEC review of this Waterbody/Watershed Facility Plan, a public information
meeting and a formal public comment period will be held by the DEC to solicit public comment.
New York City Department of Environmental Protection Waterbody/Watershed Facility Plan
Newtown Creek
7-1 June 2011
7.0. Evaluation of Alternatives
As noted in Section 5 of this report, the DEP has been engaged for many years in water-
quality improvement projects and CSO facility planning for the Newtown Creek waterbody and
watershed. Indeed, aspects of the Newtown Creek Facility Plan (URS, 2003), the components of
which were included in the 2005 Consent Order, are already being implemented. For example,
notice to proceed with construction was granted for the Zone 1 Aeration Facility on December
16, 2005 and this project was certified complete as of December 31, 2008. The design of the
Kent Avenue Throttling Facility was completed in January 2007 and DEP issued an Order to
Commence Work on December 13, 2007; the work is projected to be completed prior to the
December 2012 consent order milestone.
Despite DEP’s continuing implementation efforts, the Consent Order recognizes that this
is not a final conceptual design for Newtown Creek facilities and allows the DEP to propose final
modifications to the scope of the projects set forth in the 2003 CSO Facility Plan through the
completion of an approvable Waterbody/Watershed Facility Plan for Newtown Creek to be
submitted to the DEC by June 2007 (DEC, 2004b). The WB/WS Facility Plan developed herein
builds upon these projects, and also examines the extent to which additional or alternative cost
effective control measures may result in water quality standards being met. The present
document incorporates comments received from the DEC on the June 2007 Newtown Creek
WB/WS Facility Plan.
This section presents the evaluation of technologies alternatives for CSO control,
including analyses that were performed in accordance with federal CSO LTCP guidance.
Section 7.1 summarizes the regulatory framework for the evaluation of alternatives. Section 7.2
identifies and provides an initial screening of a full spectrum of CSO control technologies
successfully applied elsewhere. The CSO control technologies that pass through initial screening
are then examined in detail in Section 7.3 to create various alternatives that can be evaluated for
effectiveness in mitigating CSOs in Newtown Creek. Section 7.4 presents a performance versus
cost analysis of the feasible alternatives retained in 7.3, as well as a 100% reduction alternative,
based on projected CSO volumes and frequencies and attainment of existing water quality
standards. Section 7.5 describes the selected Waterbody/Watershed Facility Plan including the
basis of selection and the costs and benefits of this Plan.
7.1 REGULATORY FRAMEWORK FOR EVALUATION OF ALTERNATIVES
The evaluation of alternatives to address CSO discharges and associated water quality
impacts involves regulatory considerations in addition to those presented in Section 1. The
following subsections present a summary of these considerations.
7.1.1. Water Quality Objectives
As previously described in Sections 1.2.1 and 4.5, Newtown Creek is listed on the Draft
2010 DEC “Section 303(d) List of Impaired Waters” due to DO/Oxygen Demand, and the listed
sources of oxygen demand are urban runoff, storm sewers and CSO. The DEC has designated
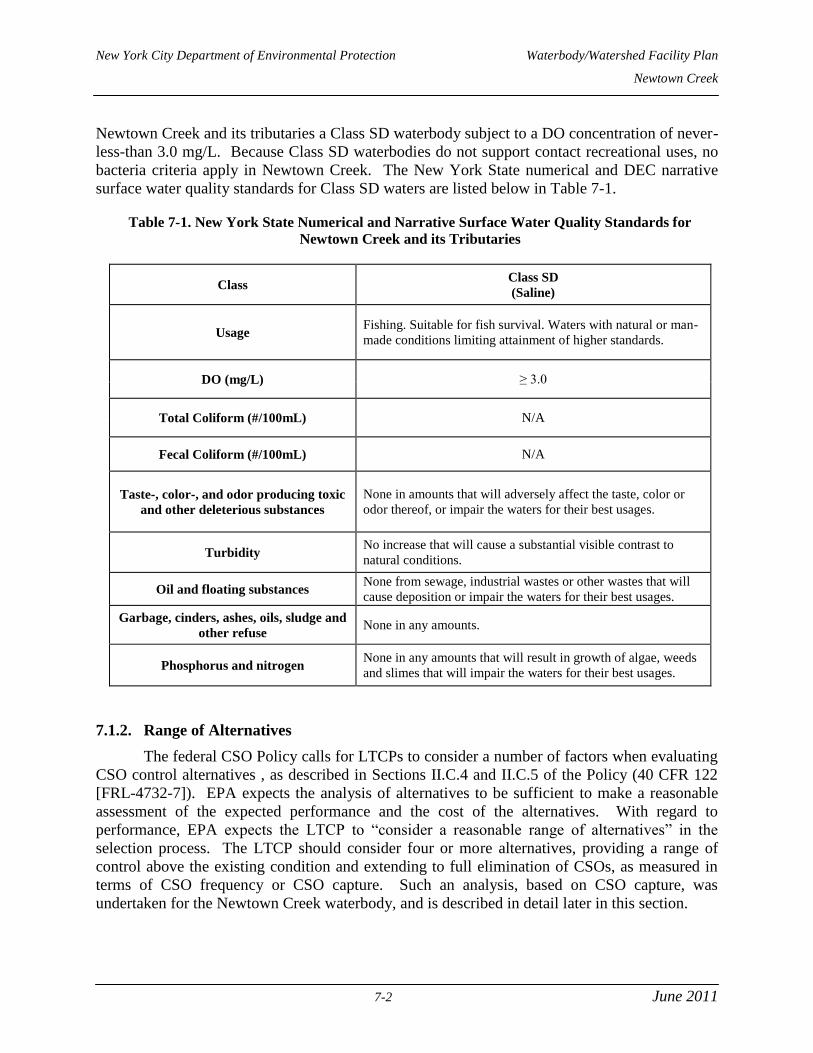
New York City Department of Environmental Protection Waterbody/Watershed Facility Plan
Newtown Creek
7-2 June 2011
Newtown Creek and its tributaries a Class SD waterbody subject to a DO concentration of never-
less-than 3.0 mg/L. Because Class SD waterbodies do not support contact recreational uses, no
bacteria criteria apply in Newtown Creek. The New York State numerical and DEC narrative
surface water quality standards for Class SD waters are listed below in Table 7-1.
Table 7-1. New York State Numerical and Narrative Surface Water Quality Standards for
Newtown Creek and its Tributaries
Class
Class SD
(Saline)
Usage Fishing. Suitable for fish survival. Waters with natural or man-
made conditions limiting attainment of higher standards.
DO (mg/L) ≥ 3.0
Total Coliform (#/100mL) N/A
Fecal Coliform (#/100mL) N/A
Taste-, color-, and odor producing toxic
and other deleterious substances
None in amounts that will adversely affect the taste, color or
odor thereof, or impair the waters for their best usages.
Turbidity No increase that will cause a substantial visible contrast to
natural conditions.
Oil and floating substances
None from sewage, industrial wastes or other wastes that will
cause deposition or impair the waters for their best usages.
Garbage, cinders, ashes, oils, sludge and
other refuse None in any amounts.
Phosphorus and nitrogen
None in any amounts that will result in growth of algae, weeds
and slimes that will impair the waters for their best usages.
7.1.2. Range of Alternatives
The federal CSO Policy calls for LTCPs to consider a number of factors when evaluating
CSO control alternatives , as described in Sections II.C.4 and II.C.5 of the Policy (40 CFR 122
[FRL-4732-7]). EPA expects the analysis of alternatives to be sufficient to make a reasonable
assessment of the expected performance and the cost of the alternatives. With regard to
performance, EPA expects the LTCP to “consider a reasonable range of alternatives” in the
selection process. The LTCP should consider four or more alternatives, providing a range of
control above the existing condition and extending to full elimination of CSOs, as measured in
terms of CSO frequency or CSO capture. Such an analysis, based on CSO capture, was
undertaken for the Newtown Creek waterbody, and is described in detail later in this section.
New York City Department of Environmental Protection Waterbody/Watershed Facility Plan
Newtown Creek
7-3 June 2011
7.1.3. “Presumption” and “Demonstration” Approaches
Whether a particular alternative provides sufficient control can be determined in two
different manners. In the “Presumption Approach,” alternatives that meet any of a number of
discharge-based criteria may be “presumed” to provide sufficient CSO control as to meet the
water-quality based requirements of the CWA. These discharge-based criteria, which are
applicable to an entire combined-sewer system (i.e., a WWTP drainage area) and not necessarily
to the drainage area of a particular waterbody include:
i. No more than an average of four overflow events per year, provided that the
permitting authority may allow up to two additional overflow events per year. For
the purpose of this criterion, an overflow event is one or more overflows from a
Combined Sewer System (CSS) as the result of a precipitation event that does not
receive a minimum treatment specified below;
ii. The elimination or the capture for treatment of no less than 85 percent by volume of
the combined sewage collected in the CSS during precipitation events on a system-
wide annual average basis; or
iii. The elimination or removal of no less than the mass of the pollutant [...] for the
volumes that would be eliminated or captured for treatment under item ii above.
The Presumption Approach further dictated that combined sewer flows remaining after
implementation of the Nine Minimum Controls and within the criteria listed above should
receive a minimum of:
Primary clarification (Removal of floatables and settleable solids may be achieved
by any combination of treatment technologies or methods that are shown to be
equivalent to primary clarification);
Solids and floatables disposal; and
Disinfection of effluent, if necessary, to meet WQS, protect designated uses and
protect human health, including removal of harmful disinfection chemical
residuals, where necessary.
In the “Demonstration Approach,” alternatives providing sufficient CSO control are those
that, through modeling and/or other analyses, are expected to provide sufficient CSO control to
meet the water-quality based requirements of the CWA. The criteria associated with the
Demonstration Approach are:
i. The planned control program is adequate to meet WQS and protect designated uses of
the waterbody, unless WQS or uses cannot be met as a result of natural background
conditions or pollution sources other than CSOs;
ii. The CSO discharges remaining after implementation of the planned control program
will not preclude the attainment of WQS or the receiving water's designated uses or
contribute to their impairment. Where WQS and designated uses are not met in part
because of natural background conditions or pollution sources other than CSOs, a
total maximum daily load, including a waste load allocation and a load allocation, or
other means should be used to apportion pollutant loads;
New York City Department of Environmental Protection Waterbody/Watershed Facility Plan
Newtown Creek
7-4 June 2011
iii. The planned control program will provide the maximum pollution reduction benefits
reasonably attainable; and
iv. The planned control program is designed to allow cost effective expansion or cost
effective retrofitting if additional controls are subsequently determined to be
necessary to meet WQS or designated uses.
7.1.4. Cost/Performance Consideration
EPA expects the permittee to use the costs associated with each of these alternatives to
demonstrate the relationships among a comprehensive set of reasonable control alternatives that
correspond to the different ranges specified in Section II.C.4 of the federal CSO policy. This
should include an analysis to determine where the increment of pollution reduction achieved in
the receiving water diminishes compared to the increased costs. This analysis, often known as
“knee of the curve,” should be among the considerations used to help guide selection of controls
for Newtown Creek.
7.1.5. Consideration of Non-CSO Inputs
Load sources other than CSOs were included in the receiving water modeling to assess
water-quality conditions. These other inputs consist of stormwater, WWTP discharge, water
entering the waterbody via tidal exchange with the East River, and background conditions from
the System-Wide Eutrophication Model outside the boundaries of the Newtown Creek Receiving
Water Model. The water quality parameter of concern with Non-CSO inputs is oxygen deficit.
As shown in Figure 7-1, background conditions in the open waters are the largest contributor to
oxygen deficit within Newtown Creek. Oxygen deficit related to CSOs is the next largest, and
increases near the head ends of Dutch Kills, Maspeth Creek, East Branch, and English Kills near
the four largest outfalls. Other sources of oxygen deficit within the drainage area are considered
to be insignificant, and pollutant reduction alternatives focused on CSO.
7.1.6. Consideration of Other Parameters
Other parameters such as existing waterbody uses and stakeholder goals for waterbody
use were taken into account when determining the necessary level of CSO control. Other
parameters considered as part of the evaluations of alternatives for Newtown Creek include the
following:
Waterbody Use: As discussed in Section 2, the Newtown Creek is within the Coastal
Zone Boundary, and all but the downstream reaches have been designated a Significant
Maritime and Industrial Area through the Waterfront Revitalization Program, where public
investment be targeted to improve transportation access and maritime and industrial
operations. This most likely precludes future designation for primary contact
recreational uses in the waterbody due to the potential use conflict it would represent.
Aquatic Life Uses: Aquatic life in the Newtown Creek waterbody was characterized
under the USA project and is described in detail in Section 4.
Sensitive Areas: As discussed in Section 7, DEC, as the permitting authority, has
determined that the Newtown Creek waterbody as a whole is a sensitive area. The
New York City Department of Environmental Protection Waterbody/Watershed Facility Plan
Newtown Creek
7-5 June 2011
sensitive area designation is intended to provide a prioritization for controlling overflows.
For such an area, the LTCP should either (a) prohibit new or significantly increased
overflows or (b) eliminate or relocate overflows that discharge to sensitive areas if
physically possible and economically achievable, unless elimination or relocation creates
more environmental impact than continued discharge, with additional treatment as
necessary to meet water quality standards. However, the designation does not assist in
prioritizing outfalls or evaluating alternatives to addressing CSO discharges within
the waterbody itself. Additionally, this waterbody/watershed assessment and planning
effort includes alternatives which prohibit new or significantly increased overflows,
and eliminates or relocates overflows that discharge to the waterbody in accordance
with the requirements of Federal CSO Policy for sensitive areas.
Stakeholder Goals: Stakeholder goals for the waterbody include fishing, boating,
boat access, restored wetlands, education programs, integration of alternative
stormwater management technologies, improved habitat (aquatic and terrestrial), odor
reduction, "passive" recreation, and upgrading the DEC water quality designation to
Class I, and were determined through the public participation effort described in
Section 6. As discussed there, some stakeholders also indicated that primary
recreation, swimming, should always be considered as the ultimate goal, but previous
comments from this stakeholder team during the USA Project acknowledged that
primary contact recreation in Newtown Creek was unreasonable because it is a use
conflict with current and potential industrial uses of the waterbody.
7.2. SCREENING OF CSO CONTROL TECHNOLOGIES
A wide range of CSO control technologies was considered for application to New York
City’s CSS. An effort was made to include all technologies that have been successfully applied
to CSO control, and no technologies were excluded prior to initial screening. The technologies
are grouped into the following general categories:
Watershed-Wide Non-Structural Controls
Inflow Control
Green Infrastructure
Sewer System Optimization
Sewer Separation
Storage
Treatment
Receiving Water Improvement
Solids and Floatables Control
Technologies included in each category are summarized in Table 7-2 below and further
described in subsections that follow.

August 1988 DO Deficit
Components
Newtown CreekNewtown CreekDissolved Oxygen Deficit Components
Figure 7-1Newtown Creek Waterbody/Watershed Plan
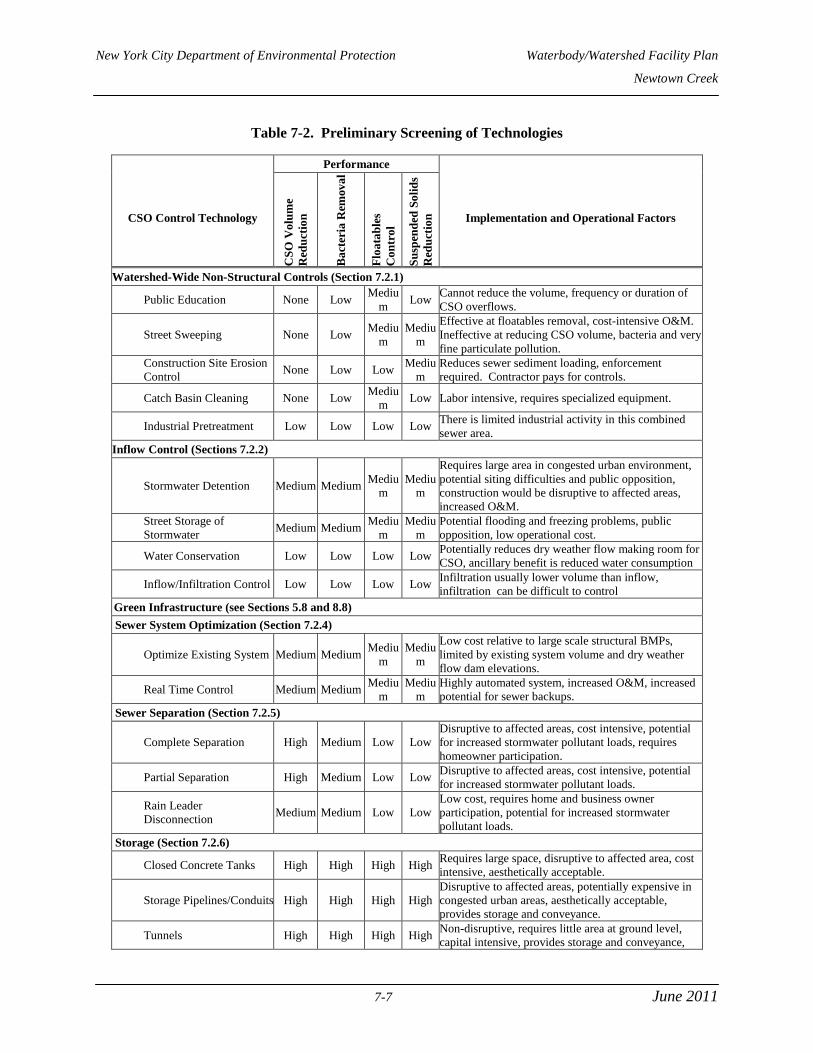
New York City Department of Environmental Protection Waterbody/Watershed Facility Plan
Newtown Creek
7-7 June 2011
Table 7-2. Preliminary Screening of Technologies
CSO Control Technology
Performance
Implementation and Operational Factors
CS
O V
olu
me
Red
uct
ion
Ba
cter
ia R
emov
al
Flo
ata
ble
s
Co
ntr
ol
Su
spen
ded
So
lid
s
Red
uct
ion
Watershed-Wide Non-Structural Controls (Section 7.2.1)
Public Education None Low Mediu
m Low
Cannot reduce the volume, frequency or duration of
CSO overflows.
Street Sweeping None Low Mediu
m
Mediu
m
Effective at floatables removal, cost-intensive O&M.
Ineffective at reducing CSO volume, bacteria and very
fine particulate pollution.
Construction Site Erosion
Control None Low Low
Mediu
m
Reduces sewer sediment loading, enforcement
required. Contractor pays for controls.
Catch Basin Cleaning None Low Mediu
m Low Labor intensive, requires specialized equipment.
Industrial Pretreatment Low Low Low Low There is limited industrial activity in this combined
sewer area.
Inflow Control (Sections 7.2.2)
Stormwater Detention Medium Medium Mediu
m
Mediu
m
Requires large area in congested urban environment,
potential siting difficulties and public opposition,
construction would be disruptive to affected areas,
increased O&M.
Street Storage of
Stormwater Medium Medium
Mediu
m
Mediu
m
Potential flooding and freezing problems, public
opposition, low operational cost.
Water Conservation Low Low Low Low Potentially reduces dry weather flow making room for
CSO, ancillary benefit is reduced water consumption
Inflow/Infiltration Control Low Low Low Low Infiltration usually lower volume than inflow,
infiltration can be difficult to control
Green Infrastructure (see Sections 5.8 and 8.8)
Sewer System Optimization (Section 7.2.4)
Optimize Existing System Medium Medium Mediu
m
Mediu
m
Low cost relative to large scale structural BMPs,
limited by existing system volume and dry weather
flow dam elevations.
Real Time Control Medium Medium Mediu
m
Mediu
m
Highly automated system, increased O&M, increased
potential for sewer backups.
Sewer Separation (Section 7.2.5)
Complete Separation High Medium Low Low
Disruptive to affected areas, cost intensive, potential
for increased stormwater pollutant loads, requires
homeowner participation.
Partial Separation High Medium Low Low Disruptive to affected areas, cost intensive, potential
for increased stormwater pollutant loads.
Rain Leader
Disconnection Medium Medium Low Low
Low cost, requires home and business owner
participation, potential for increased stormwater
pollutant loads.
Storage (Section 7.2.6)
Closed Concrete Tanks High High High High Requires large space, disruptive to affected area, cost
intensive, aesthetically acceptable.
Storage Pipelines/Conduits High High High High
Disruptive to affected areas, potentially expensive in
congested urban areas, aesthetically acceptable,
provides storage and conveyance.
Tunnels High High High High Non-disruptive, requires little area at ground level,
capital intensive, provides storage and conveyance,
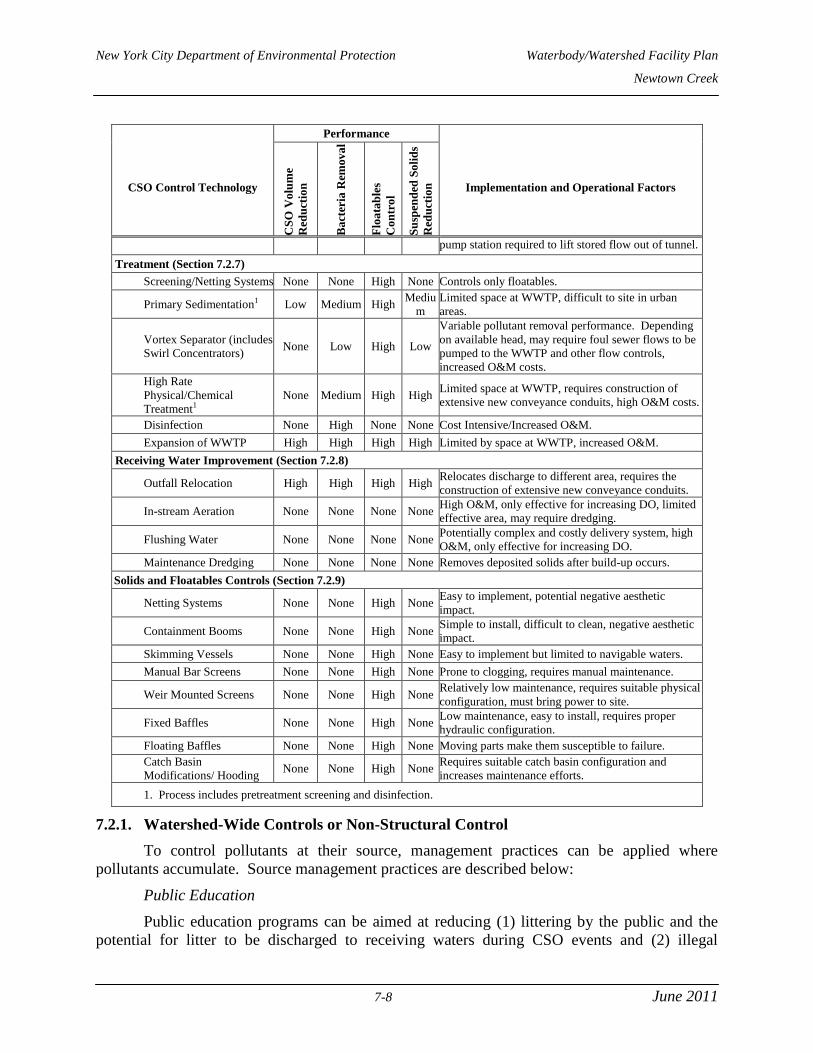
New York City Department of Environmental Protection Waterbody/Watershed Facility Plan
Newtown Creek
7-8 June 2011
CSO Control Technology
Performance
Implementation and Operational Factors
CS
O V
olu
me
Red
uct
ion
Ba
cter
ia R
emov
al
Flo
ata
ble
s
Co
ntr
ol
Su
spen
ded
So
lid
s
Red
uct
ion
pump station required to lift stored flow out of tunnel.
Treatment (Section 7.2.7)
Screening/Netting Systems None None High None Controls only floatables.
Primary Sedimentation1 Low Medium High Mediu
m
Limited space at WWTP, difficult to site in urban
areas.
Vortex Separator (includes
Swirl Concentrators) None Low High Low
Variable pollutant removal performance. Depending
on available head, may require foul sewer flows to be
pumped to the WWTP and other flow controls,
increased O&M costs.
High Rate
Physical/Chemical
Treatment1
None Medium High High Limited space at WWTP, requires construction of
extensive new conveyance conduits, high O&M costs.
Disinfection None High None None Cost Intensive/Increased O&M.
Expansion of WWTP High High High High Limited by space at WWTP, increased O&M.
Receiving Water Improvement (Section 7.2.8)
Outfall Relocation High High High High Relocates discharge to different area, requires the
construction of extensive new conveyance conduits.
In-stream Aeration None None None None High O&M, only effective for increasing DO, limited
effective area, may require dredging.
Flushing Water None None None None Potentially complex and costly delivery system, high
O&M, only effective for increasing DO.
Maintenance Dredging None None None None Removes deposited solids after build-up occurs.
Solids and Floatables Controls (Section 7.2.9)
Netting Systems None None High None Easy to implement, potential negative aesthetic
impact.
Containment Booms None None High None Simple to install, difficult to clean, negative aesthetic
impact.
Skimming Vessels None None High None Easy to implement but limited to navigable waters.
Manual Bar Screens None None High None Prone to clogging, requires manual maintenance.
Weir Mounted Screens None None High None Relatively low maintenance, requires suitable physical
configuration, must bring power to site.
Fixed Baffles None None High None Low maintenance, easy to install, requires proper
hydraulic configuration.
Floating Baffles None None High None Moving parts make them susceptible to failure.
Catch Basin
Modifications/ Hooding None None High None
Requires suitable catch basin configuration and
increases maintenance efforts.
1. Process includes pretreatment screening and disinfection.
7.2.1. Watershed-Wide Controls or Non-Structural Control
To control pollutants at their source, management practices can be applied where
pollutants accumulate. Source management practices are described below:
Public Education
Public education programs can be aimed at reducing (1) littering by the public and the
potential for litter to be discharged to receiving waters during CSO events and (2) illegal
New York City Department of Environmental Protection Waterbody/Watershed Facility Plan
Newtown Creek
7-9 June 2011
dumping of contaminants in the sewer system that could be discharged to receiving waters
during rain events. Public education programs cannot reduce the volume, frequency or duration
of CSO overflows, but can help improve CSO quality by reducing floatable debris in particular.
Public education and information is an integral part of any LTCP. Public education is also an
ongoing DEP program (DEP, 2005b).
Street Sweeping
The major objectives of municipal street cleaning are to enhance the aesthetic appearance
of streets by periodically removing the surface accumulation of litter, debris, dust and dirt, and to
prevent these pollutants from entering storm or combined sewer systems. Common methods of
street cleaning are manual, mechanical and vacuum sweepers, and street flushing. Studies on the
effect of street sweeping on the reduction of floatables and pollutants in runoff have been
conducted. New York City found that street cleaning can be effective in removing floatables.
Increasing street cleaning frequency from two times per week to six times per week reduced
floatables by approximately 42 percent on an item count basis at a very high cost. A significant
quantity of floatables was found to be located on sidewalks that were not cleanable by
conventional equipment (HydroQual, 1995b). However, in spite of these limitations, the
Department of Sanitation of New York City (DSNY) does have a regular street sweeping
program targeting litter reduction. DSNY also has an aggressive enforcement program targeting
property owners to minimize the amount of litter on their sidewalks. These programs are
described in New York City’s Citywide Comprehensive CSO Floatables Plan (DEP, 2005a).
Studies, funded by the National Urban Renewal Program (NURP) during the late 1970s
to the early 1980s, reported that street sweeping was generally ineffective at removing pollutants
and improving the quality of urban runoff (MWCOG, 1983;EPA, 1983). The principal reason
for this is that mechanical sweepers, employed at that time, could not pick up the finer particles
(diameter < 60 microns). Studies have shown that these fine particles contain a majority of the
target pollutants on city streets that are washed into sewer systems (Sutherland, 1995). In the
early 1990s new vacuum-assisted sweeper technology was introduced that can pick up the finer
particles along city streets. A recent study showed that these vacuum-assisted sweepers have a
70 percent pickup efficiency for particles less than 60 microns (Sutherland, 1995).
Street sweeping only affects the pollutant concentration in the runoff component of
combined sewer flows. Thus, a street sweeping program is ineffective at reducing the volume
and frequency of CSO events. Furthermore, the total area accessible to sweepers is limited.
Areas such as sidewalks, traffic islands, and congested street parking areas cannot be cleaned
using this method.
Although a street sweeping program employing high efficiency sweepers could reduce
the concentrations of some pollutants in CSOs, bacteriological pollution originates primarily
from the sanitary component of sewer flows. Thus, minimal reductions in fecal coliform and E.
coli concentrations of CSOs would be expected.
Construction Site Erosion Control
Construction site erosion control involves management practices aimed at controlling the
washing of sediment and silt from disturbed land associated with construction activity. Erosion
control has the potential to reduce solids concentrations in CSOs and reduce sewer cleanout
New York City Department of Environmental Protection Waterbody/Watershed Facility Plan
Newtown Creek
7-10 June 2011
operation and maintenance (O&M) costs. For applicable projects, New York City’s CEQR
requirements addresses potential impacts associated with sediment runoff as well as required
measures to be employed to mitigate any potential impacts.
Catch Basin Cleaning
The major objective of catch basin cleaning is to reduce conveyance of solids and
floatables to the combined sewer system by regularly removing accumulated catch basin
deposits. Methods to clean catch basins include manual, bucket, and vacuum removal. Cleaning
catch basins can only remove an average of 1-to 2 percent of the five day biochemical oxygen
demand (BOD5) produced by a combined sewer watershed (EPA, 1977). As a result catch basins
cannot be considered an effective pollution control alternative for BOD5 removal.
New York City has an aggressive catch basin hooding program to contain floatables
within catch basins and remove the material through catch basin cleaning (Citywide
Comprehensive CSO Floatables Plan, Modified Facility Planning Report, City of New York,
Department of Environmental Protection, July 2005). While catch basins can be effective in
reducing floatables in combined sewers, catch basin cleaning does not necessarily increase
floatables retention in the catch basin. Results of a pilot scale study showed that floatables
capture improves as material accumulates in the catch basin (HydroQual, 2001f). During a rain
event, the accumulated floatables can dissipate the hydraulic load entering a catch basin, thereby
reducing turbulence in the standing water and reducing the escape of floatables. Thus, while
hooding of catch basins will improve floatables capture, the hooding program is not expected to
result in a major increase in catch basin cleaning.
Industrial Pretreatment
Industrial pretreatment programs are geared toward reducing potential contaminants in
CSO by controlling industrial discharges to the sewer system. DEP has an industrial
pretreatment program in place as discussed in Section 3 of this report.
7.2.2. Inflow Control
Inflow control involves eliminating or retarding stormwater inflow to the combined
sewer system, lowering the magnitude of the peak flow through the system, thereby reducing
overflows. Methods for inflow control are described below:
Stormwater Detention
Stormwater detention utilizes a surface storage basin or facility to capture stormwater
before it enters the combined sewer system. Typically, a flow restriction device is added to the
catch basin to effectively block stormwater from entering the basin. The stormwater is then
diverted along natural or man-made drainage routes to a surface storage basin or “pond-like”
facility where evaporation and/or natural soil percolation eventually empties the basin. Such
systems are applicable for smaller land areas, typically up to 75 acres, and are more suitable for
non-urban areas. Stormwater blocked from entering catch basins would be routed along streets
to the detention pond which would be built in the urban environment. Extensive public
education and testing is required to build support for this control and to address public concerns
New York City Department of Environmental Protection Waterbody/Watershed Facility Plan
Newtown Creek
7-11 June 2011
such as potential unsafe travel conditions, flood damage, damage to roadways. Such a system is
not considered viable for a highly congested urban area such as New York City.
Street Storage of Stormwater
Street storage of stormwater utilizes the City’s streets to temporarily store stormwater on
the road surface. Typically, the catch basin is modified to include a flow restriction device. This
device limits the rate at which surface runoff enters the combined sewer system. The excess
stormwater is retained on the roadway entering the catch basin at a controlled rate. Street storage
can effectively reduce inflow during peak periods and can decrease CSO volume. It also can
promote street flooding and must be carefully evaluated and planned to ensure that unsafe travel
conditions and damage to roadways does not occur. For these reasons, street storage of
stormwater is not considered a viable CSO control technology is New York City.
Water Conservation
Water conservation is geared toward reducing the dry weather flow in the combined
sewer system, thereby increasing the system's ability to accommodate more stormwater and
reduce CSO discharges. Water conservation includes measures such as installing low flow
fixtures, public education to reduce wasted water, leak detection and correction, and other
programs. The City of New York has an on-going water conservation and public education
program. The DEP’s ongoing efforts to save water that reduce inflows to the combined sewers
include installing individual water meters on water service lines to encourage conservation and
equipping fire hydrants with special locking devices. Water conservation programs have resulted
in the reduction of water consumption Citywide by approximately 230 MGD over a 10-year
period or a reduction of 43 gallons per person per day from 1996 to 2006 (DEP, 2007). This
change equates to a 17.5 percent reduction in overall daily water consumption, even as the
population increased by approximately nine percent. The water consumption on a daily per
capita basis decreased by 24.5 percent. Water conservation, as a CSO control technology, is
effectively implemented to a satisfactory level, and New York City has achieved significant
reductions in wastewater flow through its existing water conservation program.
As described above, reduced flow strategies are expected to require little incremental
expenditure as water consumption and wastewater flows have been on the decline in recent
years. Furthermore, the combination of automated meter reading, the ability of customers to
track water usage, and national water efficient fixture standards is expected to keep flows stable.
Additional conservation measures, such as toilet and other fixture rebate programs, are expected
to have only nominal costs associated with them, and would be necessary only if the declining
trend reverses.
Infiltration/Inflow (I/I) Reduction
Infiltration and inflow is ground water and other undesired water that enters the
collection system through leaking pipe joints, cracked pipes, and manholes. Excessive amounts
of infiltration and inflow take up the hydraulic capacity of the collection system. In contrast, the
inflow of surface drainage is intended to enter the CSS the combined system. Sources of inflow
that might be controlled include leaking or missing tide gates and inflow in the separate sanitary
system located upstream of the combined sewer system.
New York City Department of Environmental Protection Waterbody/Watershed Facility Plan
Newtown Creek
7-12 June 2011
DEP conducted an Infiltration/Inflow (I/I) analyses Citywide during the late 1980s and
early 1990s, and follow-up Sewer System Evaluation Surveys (SSES) where indicated. These
investigations identified areas of excessive I/I by comparing measured nighttime flow rates to
estimates of water usage developed from a derived per capita water usage rate and data from
available records.
The Bowery Bay SSES identified an average of 40.2 MGD of infiltration, but despite a
comprehensive track down program, the sources of less than 4 percent of the I/I anticipated were
positively identified in the field. The sewer system was generally found to be in adequate
condition, and diver inspections did not locate any obvious sources of infiltration. Because of the
lack of success in locating sources during TV programs in other DEP sewer studies, only 15,000
feet of sewers were recommended for inspection, the results of which were identifying only
about 2.5 percent of the expected infiltration. The SSES determined that it would be more cost-
effective to simply transport and treat the excess I/I flow rather than attempting to reduce it, and
therefore recommended no further rehabilitation in the Bowery Bay collection system (URS,
1986, 1990, 1992). It should also be noted that sanitary flows to the WWTPs have been
significantly reduced over the last 15 years and the Bowery Bay WWTP is currently well below
its design capacity and additional I/I controls is not projected to result in appreciable CSO
reductions but will be reevaluated as part of the Drainage Basin Specific LTCP.
The Newtown Creek collection system was evaluated during the 201 Facilities Plan
(Greeley and Hansen, 1982). SSES was recommended for several locations in the Manhattan
portion of the Newtown Creek WWTP service area, but none in the Brooklyn and Queens
portions. Infiltration and inflow have been determined not to be significant problems in the
service areas tributary to the Newtown Creek waterbody complex, and were not identified as
inducing CSO. Therefore, mitigating I/I is unlikely to result in appreciable reductions in CSO
discharges to surrounding waters. Nonetheless, I/I control will be reevaluated during the
development of the Drainage Basin Specific LTCP.
7.2.3. Green Infrastructure
See Sections 5.9 and 8.8.
7.2.4. DEP Sewer System Optimization
This CSO control technology involves making the best use of existing facilities to limit
overflows. The techniques are described below:
Optimize Existing System
This approach involves evaluating the current standard operating procedures for facilities
such as pump stations, control gates, inflatable dams, weir modifications, and treatment facilities
to determine if improved operating procedures can be developed to provide benefit in terms of
CSO control.
Real Time Control (RTC)
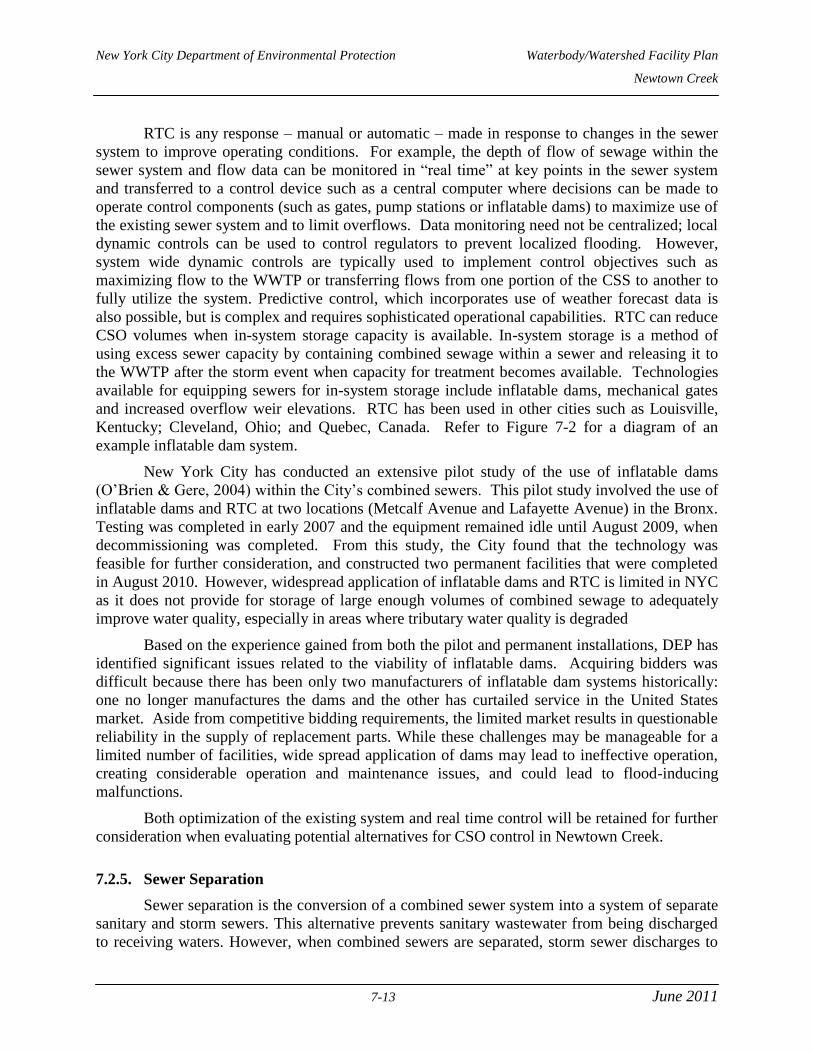
New York City Department of Environmental Protection Waterbody/Watershed Facility Plan
Newtown Creek
7-13 June 2011
RTC is any response – manual or automatic – made in response to changes in the sewer
system to improve operating conditions. For example, the depth of flow of sewage within the
sewer system and flow data can be monitored in “real time” at key points in the sewer system
and transferred to a control device such as a central computer where decisions can be made to
operate control components (such as gates, pump stations or inflatable dams) to maximize use of
the existing sewer system and to limit overflows. Data monitoring need not be centralized; local
dynamic controls can be used to control regulators to prevent localized flooding. However,
system wide dynamic controls are typically used to implement control objectives such as
maximizing flow to the WWTP or transferring flows from one portion of the CSS to another to
fully utilize the system. Predictive control, which incorporates use of weather forecast data is
also possible, but is complex and requires sophisticated operational capabilities. RTC can reduce
CSO volumes when in-system storage capacity is available. In-system storage is a method of
using excess sewer capacity by containing combined sewage within a sewer and releasing it to
the WWTP after the storm event when capacity for treatment becomes available. Technologies
available for equipping sewers for in-system storage include inflatable dams, mechanical gates
and increased overflow weir elevations. RTC has been used in other cities such as Louisville,
Kentucky; Cleveland, Ohio; and Quebec, Canada. Refer to Figure 7-2 for a diagram of an
example inflatable dam system.
New York City has conducted an extensive pilot study of the use of inflatable dams
(O’Brien & Gere, 2004) within the City’s combined sewers. This pilot study involved the use of
inflatable dams and RTC at two locations (Metcalf Avenue and Lafayette Avenue) in the Bronx.
Testing was completed in early 2007 and the equipment remained idle until August 2009, when
decommissioning was completed. From this study, the City found that the technology was
feasible for further consideration, and constructed two permanent facilities that were completed
in August 2010. However, widespread application of inflatable dams and RTC is limited in NYC
as it does not provide for storage of large enough volumes of combined sewage to adequately
improve water quality, especially in areas where tributary water quality is degraded
Based on the experience gained from both the pilot and permanent installations, DEP has
identified significant issues related to the viability of inflatable dams. Acquiring bidders was
difficult because there has been only two manufacturers of inflatable dam systems historically:
one no longer manufactures the dams and the other has curtailed service in the United States
market. Aside from competitive bidding requirements, the limited market results in questionable
reliability in the supply of replacement parts. While these challenges may be manageable for a
limited number of facilities, wide spread application of dams may lead to ineffective operation,
creating considerable operation and maintenance issues, and could lead to flood-inducing
malfunctions.
Both optimization of the existing system and real time control will be retained for further
consideration when evaluating potential alternatives for CSO control in Newtown Creek.
7.2.5. Sewer Separation
Sewer separation is the conversion of a combined sewer system into a system of separate
sanitary and storm sewers. This alternative prevents sanitary wastewater from being discharged
to receiving waters. However, when combined sewers are separated, storm sewer discharges to
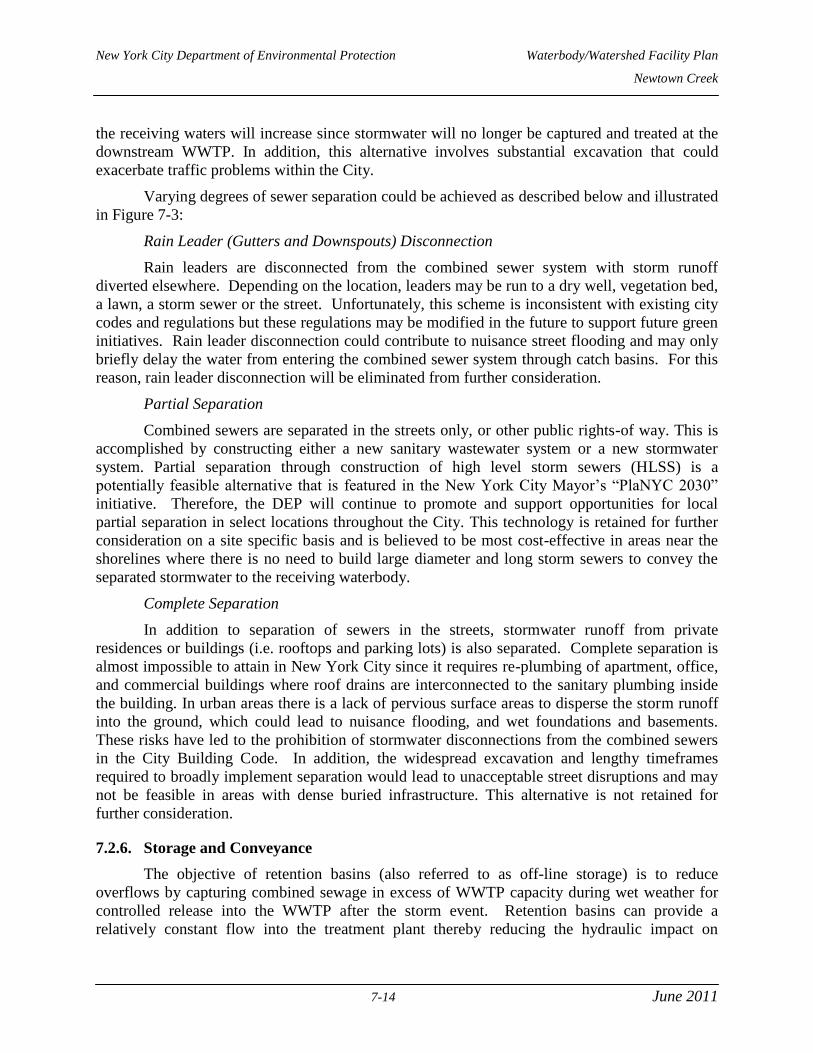
New York City Department of Environmental Protection Waterbody/Watershed Facility Plan
Newtown Creek
7-14 June 2011
the receiving waters will increase since stormwater will no longer be captured and treated at the
downstream WWTP. In addition, this alternative involves substantial excavation that could
exacerbate traffic problems within the City.
Varying degrees of sewer separation could be achieved as described below and illustrated
in Figure 7-3:
Rain Leader (Gutters and Downspouts) Disconnection
Rain leaders are disconnected from the combined sewer system with storm runoff
diverted elsewhere. Depending on the location, leaders may be run to a dry well, vegetation bed,
a lawn, a storm sewer or the street. Unfortunately, this scheme is inconsistent with existing city
codes and regulations but these regulations may be modified in the future to support future green
initiatives. Rain leader disconnection could contribute to nuisance street flooding and may only
briefly delay the water from entering the combined sewer system through catch basins. For this
reason, rain leader disconnection will be eliminated from further consideration.
Partial Separation
Combined sewers are separated in the streets only, or other public rights-of way. This is
accomplished by constructing either a new sanitary wastewater system or a new stormwater
system. Partial separation through construction of high level storm sewers (HLSS) is a
potentially feasible alternative that is featured in the New York City Mayor’s “PlaNYC 2030”
initiative. Therefore, the DEP will continue to promote and support opportunities for local
partial separation in select locations throughout the City. This technology is retained for further
consideration on a site specific basis and is believed to be most cost-effective in areas near the
shorelines where there is no need to build large diameter and long storm sewers to convey the
separated stormwater to the receiving waterbody.
Complete Separation
In addition to separation of sewers in the streets, stormwater runoff from private
residences or buildings (i.e. rooftops and parking lots) is also separated. Complete separation is
almost impossible to attain in New York City since it requires re-plumbing of apartment, office,
and commercial buildings where roof drains are interconnected to the sanitary plumbing inside
the building. In urban areas there is a lack of pervious surface areas to disperse the storm runoff
into the ground, which could lead to nuisance flooding, and wet foundations and basements.
These risks have led to the prohibition of stormwater disconnections from the combined sewers
in the City Building Code. In addition, the widespread excavation and lengthy timeframes
required to broadly implement separation would lead to unacceptable street disruptions and may
not be feasible in areas with dense buried infrastructure. This alternative is not retained for
further consideration.
7.2.6. Storage and Conveyance
The objective of retention basins (also referred to as off-line storage) is to reduce
overflows by capturing combined sewage in excess of WWTP capacity during wet weather for
controlled release into the WWTP after the storm event. Retention basins can provide a
relatively constant flow into the treatment plant thereby reducing the hydraulic impact on
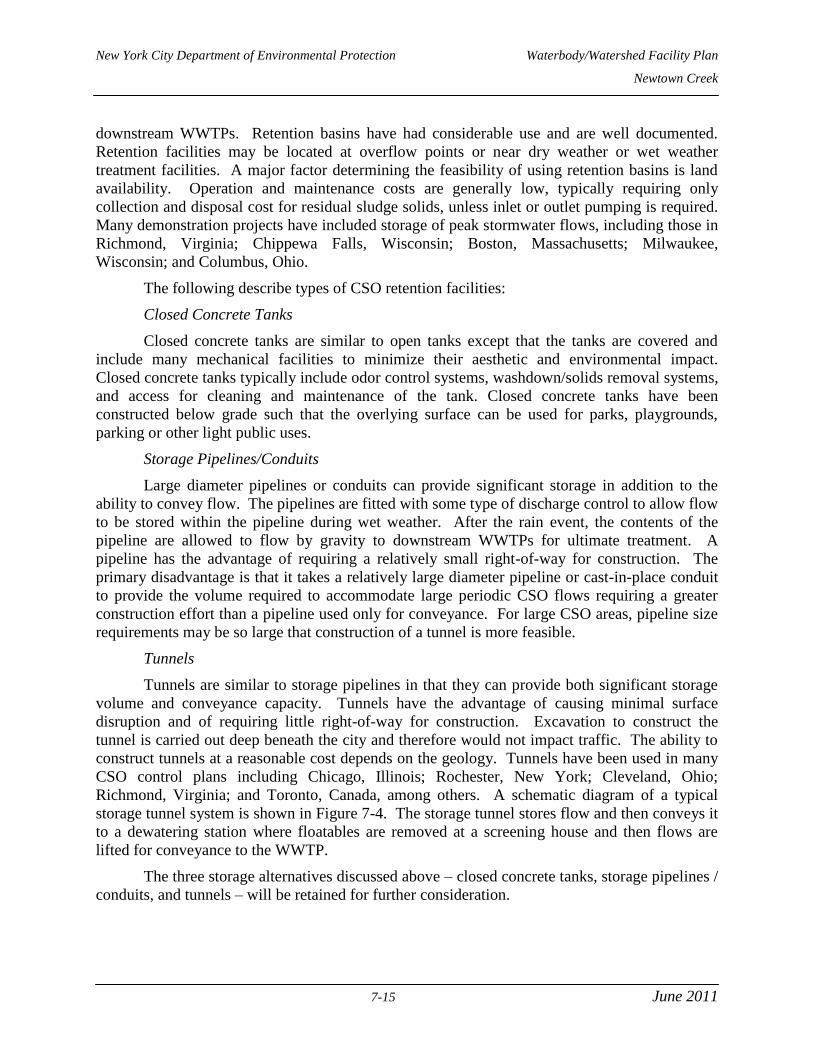
New York City Department of Environmental Protection Waterbody/Watershed Facility Plan
Newtown Creek
7-15 June 2011
downstream WWTPs. Retention basins have had considerable use and are well documented.
Retention facilities may be located at overflow points or near dry weather or wet weather
treatment facilities. A major factor determining the feasibility of using retention basins is land
availability. Operation and maintenance costs are generally low, typically requiring only
collection and disposal cost for residual sludge solids, unless inlet or outlet pumping is required.
Many demonstration projects have included storage of peak stormwater flows, including those in
Richmond, Virginia; Chippewa Falls, Wisconsin; Boston, Massachusetts; Milwaukee,
Wisconsin; and Columbus, Ohio.
The following describe types of CSO retention facilities:
Closed Concrete Tanks
Closed concrete tanks are similar to open tanks except that the tanks are covered and
include many mechanical facilities to minimize their aesthetic and environmental impact.
Closed concrete tanks typically include odor control systems, washdown/solids removal systems,
and access for cleaning and maintenance of the tank. Closed concrete tanks have been
constructed below grade such that the overlying surface can be used for parks, playgrounds,
parking or other light public uses.
Storage Pipelines/Conduits
Large diameter pipelines or conduits can provide significant storage in addition to the
ability to convey flow. The pipelines are fitted with some type of discharge control to allow flow
to be stored within the pipeline during wet weather. After the rain event, the contents of the
pipeline are allowed to flow by gravity to downstream WWTPs for ultimate treatment. A
pipeline has the advantage of requiring a relatively small right-of-way for construction. The
primary disadvantage is that it takes a relatively large diameter pipeline or cast-in-place conduit
to provide the volume required to accommodate large periodic CSO flows requiring a greater
construction effort than a pipeline used only for conveyance. For large CSO areas, pipeline size
requirements may be so large that construction of a tunnel is more feasible.
Tunnels
Tunnels are similar to storage pipelines in that they can provide both significant storage
volume and conveyance capacity. Tunnels have the advantage of causing minimal surface
disruption and of requiring little right-of-way for construction. Excavation to construct the
tunnel is carried out deep beneath the city and therefore would not impact traffic. The ability to
construct tunnels at a reasonable cost depends on the geology. Tunnels have been used in many
CSO control plans including Chicago, Illinois; Rochester, New York; Cleveland, Ohio;
Richmond, Virginia; and Toronto, Canada, among others. A schematic diagram of a typical
storage tunnel system is shown in Figure 7-4. The storage tunnel stores flow and then conveys it
to a dewatering station where floatables are removed at a screening house and then flows are
lifted for conveyance to the WWTP.
The three storage alternatives discussed above – closed concrete tanks, storage pipelines /
conduits, and tunnels – will be retained for further consideration.
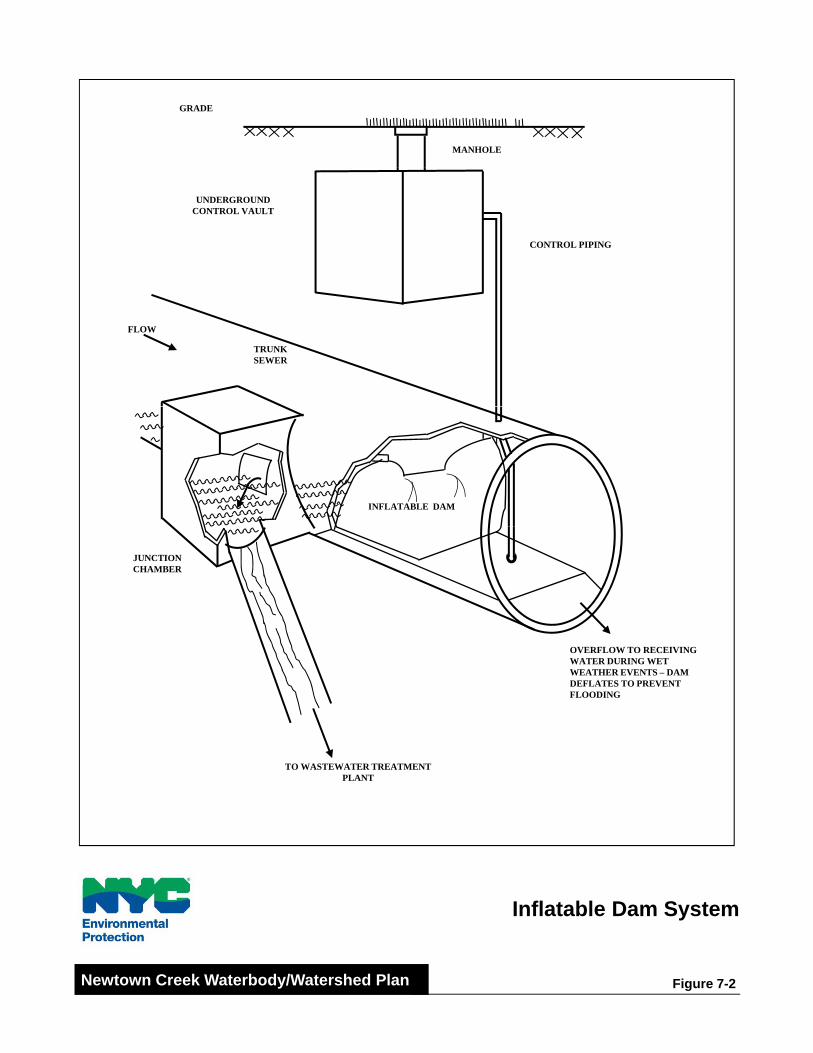
GRADE
MANHOLE
UNDERGROUND CONTROL VAULT
CONTROL PIPING
TRUNK SEWER
FLOW
INFLATABLE DAM
JUNCTIONCHAMBER
TO WASTEWATER TREATMENT
OVERFLOW TO RECEIVING WATER DURING WET WEATHER EVENTS – DAM DEFLATES TO PREVENT FLOODING
TO WASTEWATER TREATMENT PLANT
Inflatable Dam System
Figure 7-2 Newtown Creek Waterbody/Watershed Plan
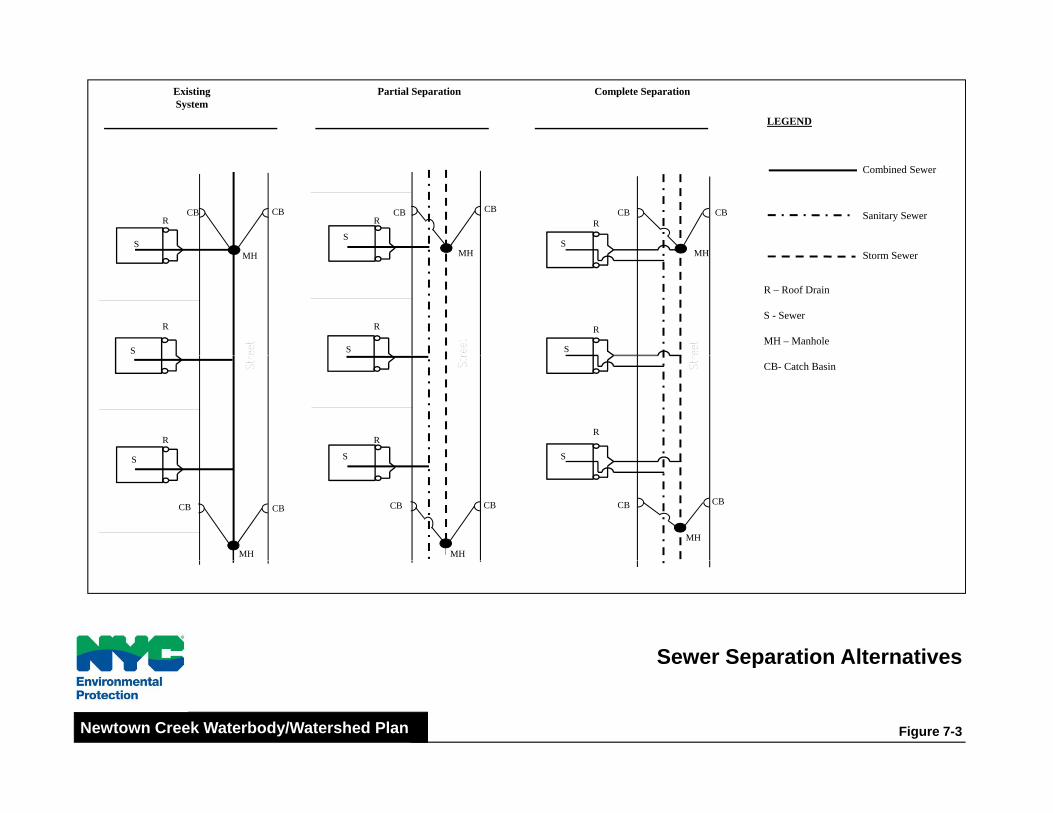
Complete SeparationPartial SeparationExistingSystem
LEGEND
R
SMH
CBR
SMH
CBCBR
S
MH
CBCB
Combined Sewer
Sanitary Sewer
St S
CB
R
S
MHMH MH
R
Storm Sewer
R – Roof Drain
S - Sewer
MH – ManholeR
S S
R
S
R
S
CB- Catch Basin
R
S
MH
S
CB
MH
CBCB
S
MH
CBCB
S
CB
Sewer Separation AlternativesSewer Separation Alternatives
Figure 7-3Newtown Creek Waterbody/Watershed Plan
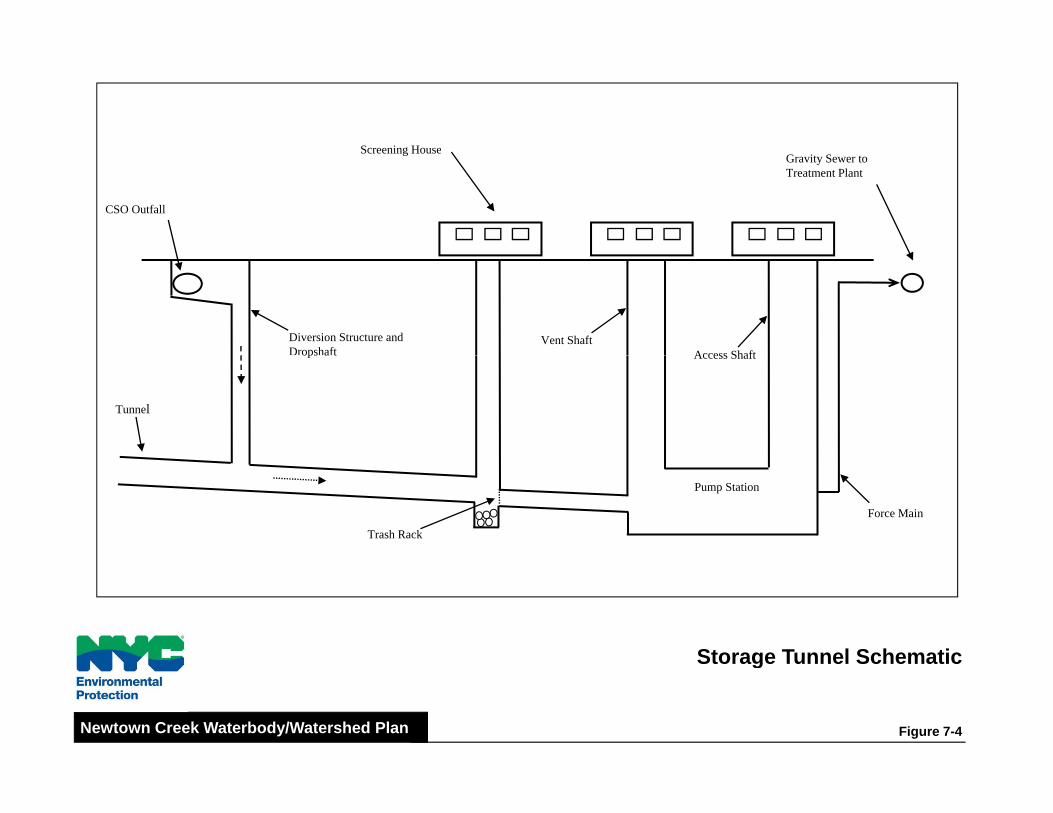
Screening HouseScreening House
CSO Outfall
Gravity Sewer to Treatment Plant
Access ShaftVent ShaftDiversion Structure and
Dropshaft Access Shaftops a t
Tunnel
Trash Rack
Pump Station
Force Main
Storage Tunnel SchematicStorage Tunnel Schematic
Figure 7-4Newtown Creek Waterbody/Watershed Plan
New York City Department of Environmental Protection Waterbody/Watershed Facility Plan
Newtown Creek
7-19 June 2011
7.2.7. Treatment
CSO Treatment alternatives include technologies intended to separate solids and/or
floatables from the combined sewer flow, disinfect for pathogen treatment, or provide secondary
treatment for some portion of the combined flow. The following are types of treatment
technologies:
Screening
The major objective of screening is to provide high rate solids/liquid separation for
combined sewer floatables and debris thereby preventing floatables from entering receiving
waters. The following categories of screens are applicable to CSO outfall applications:
- Trash Racks and Manually Cleaned Bar Racks – Trash racks are intended to remove large
objects from overflow and have a clear spacing of between 1.5 to 3.0 inches. Manually
cleaned bar racks are similar to trash racks and have clear spacings of between 1.0 to 2.0
inches. Both screens must be manually raked and the screenings must be allowed to
drain before disposal.
- Netting Systems – Netting systems are intended to remove floatables and debris at CSO
outfalls. A system of disposable mesh bags is installed in either a floating structure at the
end of the outfall or in an underground chamber on the land side of the outfall. Nets and
captured debris must be periodically removed using a boom truck and disposed of in a
landfill.
- Mechanically Cleaned Bar Screens – Mechanically cleaned bar screens typically have
clear spacing between 0.25 and 1.0 inches. Bars are mounted 0 to 39 degrees from the
vertical and rake mechanisms periodically remove material trapped on the bar screen.
Facilities are typically located in a building to house collected screenings that must be
collected after a CSO event and then transported to a landfill.
- Fine Screens – Fine screens in CSO facilities typically follow bar screens and have
openings between 0.010 and 0.5 inches. Flow is passed through the openings and solids
are retained on the surface. Screens can be in the shape of a rotary drum or linear
horizontal or vertical screens. Proprietary screens such as ROMAG have been
specifically designed for wet weather applications. These screens retain solids on the dry
weather side of the overflow diversion structure so they can be conveyed to the
wastewater treatment plant with the sanitary wastewater thereby minimizing the need for
on-site collection of screenings for truck transport.
Due to the widely varying nature of CSO flow rates, even mechanically cleaned screens
are subject to blinding under certain conditions. Manually cleaned screens for CSO control at
remote locations have not been widely applied due to the need to clean screens, and the potential
to cause flooding if screens blind. Mechanically cleaned screens have had much greater
application at CSO facilities. In addition to maintaining the screens, the screening must be
housed in a building to address aesthetic concerns and odor facilities may be required as well.
Fine screens have had limited application for CSOs in the United States. ROMAG reports that
over 250 fine screens have been installed in Europe and several fine screens have been installed
in the United States (EPA, 1999a).
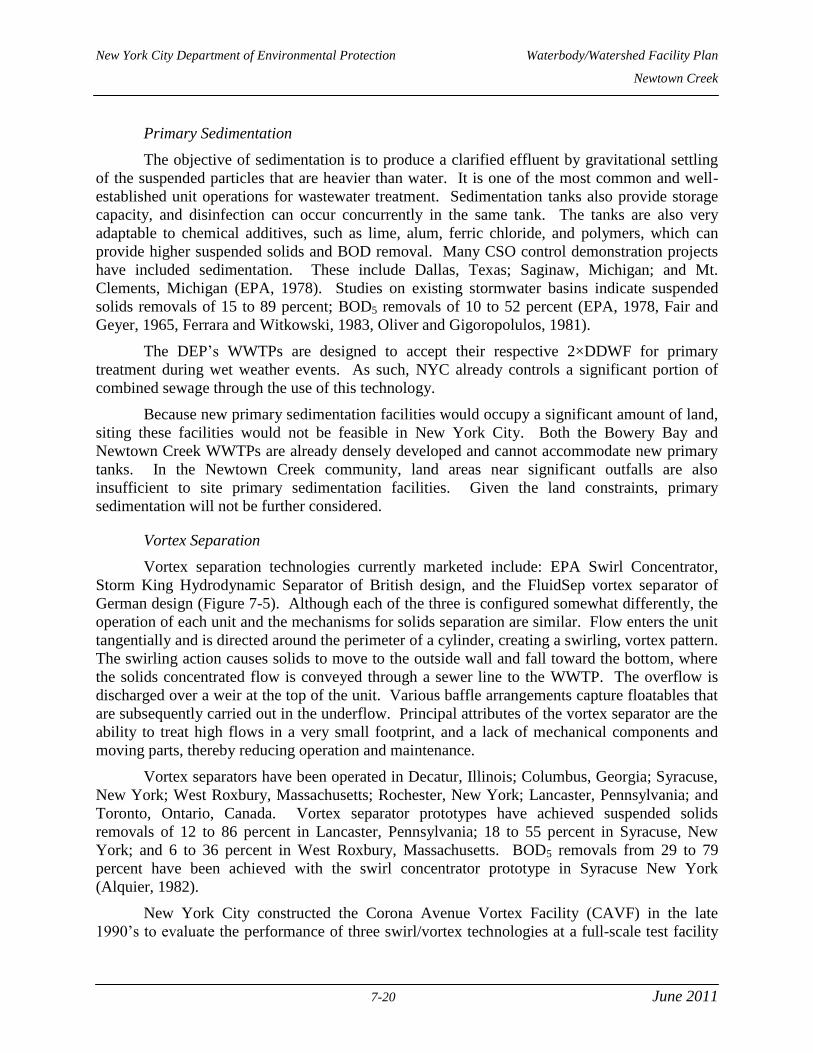
New York City Department of Environmental Protection Waterbody/Watershed Facility Plan
Newtown Creek
7-20 June 2011
Primary Sedimentation
The objective of sedimentation is to produce a clarified effluent by gravitational settling
of the suspended particles that are heavier than water. It is one of the most common and well-
established unit operations for wastewater treatment. Sedimentation tanks also provide storage
capacity, and disinfection can occur concurrently in the same tank. The tanks are also very
adaptable to chemical additives, such as lime, alum, ferric chloride, and polymers, which can
provide higher suspended solids and BOD removal. Many CSO control demonstration projects
have included sedimentation. These include Dallas, Texas; Saginaw, Michigan; and Mt.
Clements, Michigan (EPA, 1978). Studies on existing stormwater basins indicate suspended
solids removals of 15 to 89 percent; BOD5 removals of 10 to 52 percent (EPA, 1978, Fair and
Geyer, 1965, Ferrara and Witkowski, 1983, Oliver and Gigoropolulos, 1981).
The DEP’s WWTPs are designed to accept their respective 2×DDWF for primary
treatment during wet weather events. As such, NYC already controls a significant portion of
combined sewage through the use of this technology.
Because new primary sedimentation facilities would occupy a significant amount of land,
siting these facilities would not be feasible in New York City. Both the Bowery Bay and
Newtown Creek WWTPs are already densely developed and cannot accommodate new primary
tanks. In the Newtown Creek community, land areas near significant outfalls are also
insufficient to site primary sedimentation facilities. Given the land constraints, primary
sedimentation will not be further considered.
Vortex Separation
Vortex separation technologies currently marketed include: EPA Swirl Concentrator,
Storm King Hydrodynamic Separator of British design, and the FluidSep vortex separator of
German design (Figure 7-5). Although each of the three is configured somewhat differently, the
operation of each unit and the mechanisms for solids separation are similar. Flow enters the unit
tangentially and is directed around the perimeter of a cylinder, creating a swirling, vortex pattern.
The swirling action causes solids to move to the outside wall and fall toward the bottom, where
the solids concentrated flow is conveyed through a sewer line to the WWTP. The overflow is
discharged over a weir at the top of the unit. Various baffle arrangements capture floatables that
are subsequently carried out in the underflow. Principal attributes of the vortex separator are the
ability to treat high flows in a very small footprint, and a lack of mechanical components and
moving parts, thereby reducing operation and maintenance.
Vortex separators have been operated in Decatur, Illinois; Columbus, Georgia; Syracuse,
New York; West Roxbury, Massachusetts; Rochester, New York; Lancaster, Pennsylvania; and
Toronto, Ontario, Canada. Vortex separator prototypes have achieved suspended solids
removals of 12 to 86 percent in Lancaster, Pennsylvania; 18 to 55 percent in Syracuse, New
York; and 6 to 36 percent in West Roxbury, Massachusetts. BOD5 removals from 29 to 79
percent have been achieved with the swirl concentrator prototype in Syracuse New York
(Alquier, 1982).
New York City constructed the Corona Avenue Vortex Facility (CAVF) in the late
1990’s to evaluate the performance of three swirl/vortex technologies at a full-scale test facility
New York City Department of Environmental Protection Waterbody/Watershed Facility Plan
Newtown Creek
7-21 June 2011
(133 MGD each). The purpose of the test was to demonstrate the effectiveness of the vortex
technology for control of CSO pollutants, primarily floatables, oil and grease, settleable solids
and total suspended solids. The two-year testing program, completed in late 1999, evaluated the
floatables-removal performance of the facility for a total of 22 wet weather events. Overall, the
results indicated that the vortex units provided virtually no reductions in total suspended solids
and an average floatables removal of approximately 60 percent during the tested events. Based
on the results of the testing, DEP concluded that widespread application of the vortex technology
is not effective for control of CSOs and is not a cost effective way to control floatables. As such,
the application of this technology will be limited and other methods to control floatable
discharges into receiving waters will need to be assessed. DEP is planning to decommission the
CAVF in accordance with all applicable laws and regulations.
Also, the performance of vortex separators has been found to be inconsistent in other
demonstrations. A pilot study in Richmond, Virginia showed that the performance of two vortex
separators was irregular and ranged from <0 percent to 26 percent floatables removal with an
average removal efficiency of about 6 percent (Greeley and Hansen, 1995). The suspended
solids removal performance of vortex separators is a strong function of influent TSS
concentrations. A high average influent TSS concentration will yield a higher percent removal.
As a result, if influent CSO is very dilute with stormwater, the overall TSS removal will be low.
Suspended solids removal in the beginning of a storm event may be better if there is a
pronounced first flush period with high solids concentrations (City of Indianapolis, 1996).
Removal effectiveness is also a function of the hydraulic loading rate with better performance
observed at lower loading rates. Furthermore, one of the advantages of vortex separation – the
lack of moving parts – requires sufficient driving head.
Based on the poor results of the testing at the Corona Vortex Facility Evaluation of
Corona Avenue Vortex Facility, City of New York Department of Environmental Protection,
September 29, 2003, 2-volumes; Corona Avenue Vortex Facility Underflow Evaluation, City of
New York, Department of Environmental Protection, October 2005), and the general lack of
available head, vortex separators have been removed from further consideration in New York
City in general and from consideration within the Newtown Creek watershed.
High Rate Physical Chemical Treatment (HRPCT)
High rate physical/chemical treatment is a traditional gravity settling process enhanced
with flocculation and settling aids to increase loading rates and improve performance. The
pretreatment requirements for high rate treatment are screening and degritting, identical to that
required prior to primary sedimentation. The first stage of HRPCT is coagulant addition, where
ferric chloride, alum or a similar coagulant is added and rapidly mixed into solution. Degritting
may be incorporated into the coagulation stage with a larger tank designed for gravity settling of
grit material. The coagulation stage is followed by a flocculation stage where polymer is added
and mixed to form floc particles that will settle in the following stage. Also in this stage
recycled sludge or micro sand from the settling stage is added back in to improve the flocculation
process. Finally, the wastewater enters the gravity settling stage that is enhanced by lamella
tubes or plates. Disinfection, which is not part of the HRPCT process, typically is completed
after treatment to the HRPCT effluent. Sludge is collected at the bottom of the clarifier and
New York City Department of Environmental Protection Waterbody/Watershed Facility Plan
Newtown Creek
7-22 June 2011
either pumped back to the flocculation stage or wasted periodically when sludge blanket depths
become too high. The two principal manufacturers of HRPCT processes are Infilco Degremont
Incorporated (IDI), which manufacturers the DensaDeg process, and US Filter, which
manufactures the Actiflo process.
IDI offers the DensaDeg 2D and 4D processes, both of which require screening upstream.
The 2D process requires upstream grit removal as well, but the 4D process integrates grit
removal into the coagulation stage. Otherwise the 2D and 4D processes are identical. DensaDeg
performance varies with surface overflow rate and chemical dosages, but in general removal
rates of 80 to 95 percent for TSS and 30 to 60 percent for BOD can be expected. Phosphorous
and nitrogen can also be removed with this process, although the removal efficiencies are
dependent on the solubility of these compounds present in the wastewater. Removal efficiencies
are also dependent on start-up time. Typically the DensaDeg process requires approximately 30
minutes before optimum removal rates are achieved to allow for the build-up of sludge solids.
US Filter Actiflo process is different from the DensaDeg process in that fine sand is used
to ballast the sludge solids. As a result, the solids settle faster, but specialized equipment must
be incorporated in the system to accommodate the handling of sand throughout the system.
Figure 7-6 shows the components of a typical US Filter Actiflo system. The process does require
screening upstream. Grit removal is recommended, but since the system uses microsand as
ballast in the process, the presence of grit is tolerable in the system. If grit removal does not
precede the process, the tanks must be flushed of accumulated grit every few months to a year,
depending on the accumulation of grit and system run times.
Actiflo performance varies with surface overflow rate and chemical dosages, but in
general removal rates of 80 to 95 percent for TSS and 30 to 60 percent for BOD are typical.
Phosphorous and nitrogen are also removable with this process, although the removal
efficiencies are dependent on the solubility of these compounds present in the wastewater.
Phosphorous removal is typically between 60 and 90 percent, and nitrogen removal is typically
between 15 and 35 percent. Removal efficiencies are also dependent on start-up time. Typically
the Actiflo process takes about 15 minutes before optimum removal rates are achieved.
Pilot testing of HRPCT was performed at the 26th
Ward WWTP in Brooklyn, and
consisted of evaluating equipment from three leading HRPCT manufacturers from May through
August 1999. The three leading processes tested during the pilot test were the Ballasted Floc
ReactorTM
from Microsep/US Filter, the ActifloTM
from Kruger, and the Densadeg 4DTM
from
Infilco Degremont. Pilot testing suggested good to excellent performance on all units, often in
excess of 80 percent for TSS and 50 percent for BOD5. However, operational challenges
suggested the need for further testing, which was to be performed in a demonstration-scale
facility. Facility planning at that time did not reveal any opportunities to apply HRPCT for CSO
abatement in New York City, so the demonstration project was indefinitely postponed. For the
purposes of this technology evaluation, it is presumed that the operational challenges would be
overcome once testing was re-initiated and, therefore, HRPCT will be retained for further
consideration.
Schematic Diagrams of the Three VortexSchematic Diagrams of the Three VortexTechnologies Tested at CAVF
Figure 7-5Newtown Creek Waterbody/Watershed Plan

Sludge
HydrocycloneSludge to Hydrocyclone to Remove Microsand for Reuse
Hydrocyclone
Polymer Micro-Sand
Coagulant
Raw Wastewater
Plate Settler With
Clarified Water
M M
M
Scraper
Flocculation StageCoagulation Stage
US Filter Actiflo HRPCTUS Filter Actiflo HRPCT
Figure 7-6Newtown Creek Waterbody/Watershed Plan
New York City Department of Environmental Protection Waterbody/Watershed Facility Plan
Newtown Creek
7-25 June 2011
Disinfection
The major objective of disinfection is to control the discharge of pathogenic
microorganisms in receiving waters. As described in Sections 1 and 4, disinfection of CSO is
not required for Newtown Creek, a Class SD waterbody.
Disinfection of combined sewer overflow is included as part of many CSO treatment
facilities, including those in Washington, D.C.; Boston, Massachusetts; Rochester, New York;
and Syracuse, New York. The disinfection methods considered for use in combined sewer
overflow treatment are chlorine gas, calcium or sodium hypochlorite, chlorine dioxide, peracetic
acid, ozone, ultraviolet radiation, and electron beam irradiation (EPA, 1999c and 1999d). The
chemicals are all oxidizing agents that are corrosive to equipment and in concentrated forms are
highly toxic to both microorganisms and people. Each is described below.
- Chlorine gas – Chlorine gas is extremely effective and relatively inexpensive. However,
it is extremely toxic and its use and transportation must be monitored or controlled to
protect the public. Chlorine gas is a respiratory irritant and in high concentrations can be
deadly. Therefore, it is not well suited to populous or potentially non-secure areas.
- Calcium or Sodium Hypochlorite – Hypochlorite systems are common in wastewater
treatment installations. For years, large, densely populated metropolitan areas have
employed hypochlorite systems in lieu of chlorine gas for safety reasons. The system
uses sodium hypochlorite in a liquid form much like household bleach and is similarly
effective as chlorine gas although more expensive. It can be delivered in tank trucks and
stored in aboveground tanks. The storage life of the solution is 60 to 90 days.
- Chlorine Dioxide – Chlorine dioxide is an extremely unstable and explosive gas and any
means of transport is potentially very hazardous. Therefore, it must be generated on site.
The overall system is relatively complex to operate and maintain compared to more
conventional chlorination.
- Ozone – Ozone is a strong oxidizer and must be applied to CSO as a gas. Due to the
instability of ozone, it must also be generated on site. The principle advantage of ozone
is that there is no trace residual chlorine remaining in the treated effluent. Disadvantages
associated with ozone use as a disinfectant is that it is relatively expensive, with the cost
of the ozone generation equipment being the primary capital cost item. Operating costs
can be high depending on power costs, since ozonation is a power intensive system.
Ozonation is also relatively complex to operate and maintain compared to chlorination.
Ozone is not considered practical for CSO applications because it must be generated on
site in an intermittent fashion in response to variable and fluctuating CSO flow rates.
- UV Disinfection – UV disinfection uses light with wavelengths between 40 and 400
nanometers for disinfection. Light of the correct wavelength can penetrate cells of
pathogenic organisms, structurally altering DNA and preventing cell function. As with
ozone, the principle advantage of UV disinfection is that no trace chlorine residual
remains in the treated effluent. However, because UV light must penetrate the water to
be effective, the TSS level of CSOs can affect the disinfection ability. As such, to be
effective UV must be preceded by thorough separation of solids from the combined
sewage. Pretreatment by sedimentation, high-rate sedimentation, and/or filtration maybe
New York City Department of Environmental Protection Waterbody/Watershed Facility Plan
Newtown Creek
7-26 June 2011
required to reduce suspended solids concentrations to less than 20 to 40 mg/L or so
depending on water quality goals.
Disinfection reduces potential public health impacts from CSOs but needs to be used in
conjunction with other technologies, as it cannot reduce CSO volume, settleable solids, or
floatables. In order to protect aquatic life in the receiving waters, dechlorination facilities would
need to be installed whenever chlorination is used as a disinfectant. Dechlorination would be
accomplished by injection of sodium bisulfite in the flow stream before discharge of treated CSO
flow to waterways. Dechlorination with sodium bisulfite is rapid; hence no contact chamber is
required. However, even with the addition of dechlorination, DEP believes that there could be a
residual of as much as 1 mg/L from a CSO disinfection facility with a potential to form other
harmful disinfection byproducts. Newtown Creek and its tributaries are not designated for either
primary or secondary contact uses and therefore have no pathogen standard. For this reason,
disinfection is not necessary to obtain water quality standards.
Expansion of WWTP Treatment
DEP developed WWOPs for the Bowery Bay and Newtown Creek WWTPs (see
Appendices A and B) per DEC requirements. These WWOPs provided recommendations for
maximizing treatment of flow during wet weather events. The reports outlined three primary
objectives in maximizing treatment for wet-weather flows: (1) consistently achieve primary
treatment and disinfection for wet weather flows up to 2xDDWF; (2) consistently provide
secondary treatment for wet weather flows up to 1.5xDDWF before bypassing the secondary
treatment system; and, (3) do not appreciably diminish the effluent quality or destabilize
treatment upon return to dry weather operations.
7.2.8. Receiving Water Improvement
Receiving waters can also be treated directly with various technologies that improve
water quality. Below are described the different treatment options that could aid in improving
water quality in conjunction with CSO control measures:
Outfall Relocation
Outfall relocation involves moving a combined sewer outfall to another location. For
example, an outfall may be relocated away from a sensitive area to prevent negative impacts to
that area. In general, outfall relocation is not considered a feasible alternative in New York City,
due in part to extensive construction, disruption to City streets and high construction costs.
However, it may be feasible for a collection system to be modified such that CSO is
shifted to a different existing outfall that may have better mixing characteristics or the capability
to better handle a CSO discharge. For example, moving a CSO discharge from poorly mixed or
narrow channel/tributary to a well-mixed/open waters area would improve water quality in a
particular waterbody.
This alternative is not feasible for Newtown Creek where there is no way to reroute
outfalls to the East River. Therefore, this alternative will not be retained for further
consideration.
New York City Department of Environmental Protection Waterbody/Watershed Facility Plan
Newtown Creek
7-27 June 2011
In-Stream Aeration
In-stream aeration would improve the DO content of the Creek by adding air directly to
the water column via diffusers placed within the waterbody. Air could be added in large enough
volumes to bring any waterbody into compliance with ambient water quality standards.
However, depending on the amount of air that would be required to be transferred into the water
column, the facilities necessary and the delivery systems required could be extensive and
impractical. An alternative would be to deliver a lower volume of air and control short term
anoxic conditions that may result from intermittent wet weather overflows. DEP continues to
investigate in-stream aeration as a method of meeting DO standards at the recently constructed
English Kills in-stream aeration facility. The first of three years of testing was completed in the
summer of 2009 and preliminary data analysis was completed in February 2010.
Flushing Water
The addition of flushing water at the head end of dead end waterbodies improves mixing
and the dissolved oxygen content of the waterbody by adding water with a higher dissolved
oxygen concentration directly to the waterbody. Water with higher concentrations of dissolved
oxygen could possibly be added in large enough volumes to increase dissolved oxygen in the
waterbody to meet the ambient water quality standards. However, depending on the amount of
the water that would be required to be transferred into the water column and the source of that
water, the facilities and delivery systems necessary could be extensive and impractical. The
Gowanus Canal Flushing Tunnel, which was reactivated in 1999, is an example of this
technology.
The routing of potential Newtown Creek Flushing Tunnels along with the locations and
sizes of the pumping stations were developed in a previous study (URS, 1994), which are shown
on Figure 7-7. Two tunnels would be constructed, each with a water intake located along the East
River. One tunnel would go to Dutch Kills and have a 70 cfs pumping station near the terminus
at the head end of Dutch Kills. The other tunnel is proposed to go to English Kills and then on to
East Branch with 150 cfs pumping stations near the head ends of each tributary. Both tunnels
were routed as much as possible under existing rights-of-way to minimize the potential costs
associated with easement acquisition. However, due to the number of dead end tributaries to
Newtown Creek and their distance from the East River the flushing water option would require
around three miles of tunnels, two water intakes, and three pumping stations. In addition, the
background conditions in the East River are not substantially better than the target water quality
and thus flushing requires larger flushing volumes. Due to these constraints, providing flushing
water as the sole means to attain the current water quality standards is prohibitively expensive
and does not reduce CSO and this alternative was not retained for further analysis.
Environmental Dredging
The maintenance dredging technology is essentially the dredging of settled CSO solids
from the bottom of waterbodies periodically. The settled solids would be dredged from the
receiving waterbody as needed to prevent use impairments such as access by recreational
boaters, as well as abate nuisance conditions such as odors. The concept would be to conduct
dredging periodically or routinely to prevent the use impairment/nuisance conditions from
occurring. Dredging would be conducted as an alternative to structural CSO controls such as
New York City Department of Environmental Protection Waterbody/Watershed Facility Plan
Newtown Creek
7-28 June 2011
storage. Bottom water quality between dredging operations would likely not improve and
bottom habitat would degrade following each dredging.
This technology allows CSO settleable solids to continue to exit the sewer system and
settle in the waterbody generally immediately downstream of the outfall, and without regular or
periodic dredging the solids usually accumulate with leaves and other detritus into a “CSO
mound". This CSO mound would then be dredged and removed from the water environment.
The assumption is that dredging would occur prior to the CSO mound creating an impairment or
nuisance condition. Generally, it is envisioned that maintenance dredging would be performed
prior to a CSO mound building to an elevation that it becomes exposed at low tide or mean lower
low tide. The extent and depth of dredging would depend on the rate of accretion, or build-up of
settleable solids, and preferred years between dredging.
Dredging can be accomplished by a number of acceptable methods. Methods of dredging
generally fall into either floating mechanical or hydraulic techniques, with a variety of variants
for both techniques. The actual method of dredging selected would depend on the physical
characteristics (grain size, viscosity, etc.) of the sediments that require removal, the extent of
entrained pollutants (metals, etc), and the local water currents, the depth and width of the
waterbody and other conditions such as bridges that could interfere with dredge/barge access. It
is likely that CSO sediments would require removal with a closed bucket mechanical dredge or
an auger/suction-head hydraulic dredge. Removal techniques, however, would be site specific.
After removal of CSO sediments, the material would likely be placed onto a barge for
transport away from the site. On-site dewatering may be considered as well. Sediments would
then be off-loaded from the barge and shipped by land methods to a landfill that accepts New
York Harbor sediments. Recently, harbor sediments have been shipped to a landfill facility
licensed to accept such sediments.
7.2.9. Solids and Floatables Control
Technologies that provide solids and floatables control do not reduce the frequency or
magnitude of CSO overflows, but can reduce the presence of aesthetically objectionable items
such as plastic, paper, polystyrene and sanitary “toilet litter” matter, etc. These technologies
include both end-of-pipe technologies such as netting and screens, as well as BMPs such as catch
basin modifications and street cleaning which could be implemented upstream of outfalls in the
drainage area. Each of these technologies is summarized below:
Netting Devices
Netting devices can be used to separate floatables from CSOs by passing the flow
through a set of netted bags. Floatables are retained in the bags, and the bags are periodically
removed for disposal. Netting systems can be located in-water at the end of the pipe, or can be
placed in-line to remove the floatables before discharge to the receiving waters. Netting alone
will not reduce CSO discharges and, therefore, will only be considered as a supplemental
treatment.
Containment Booms
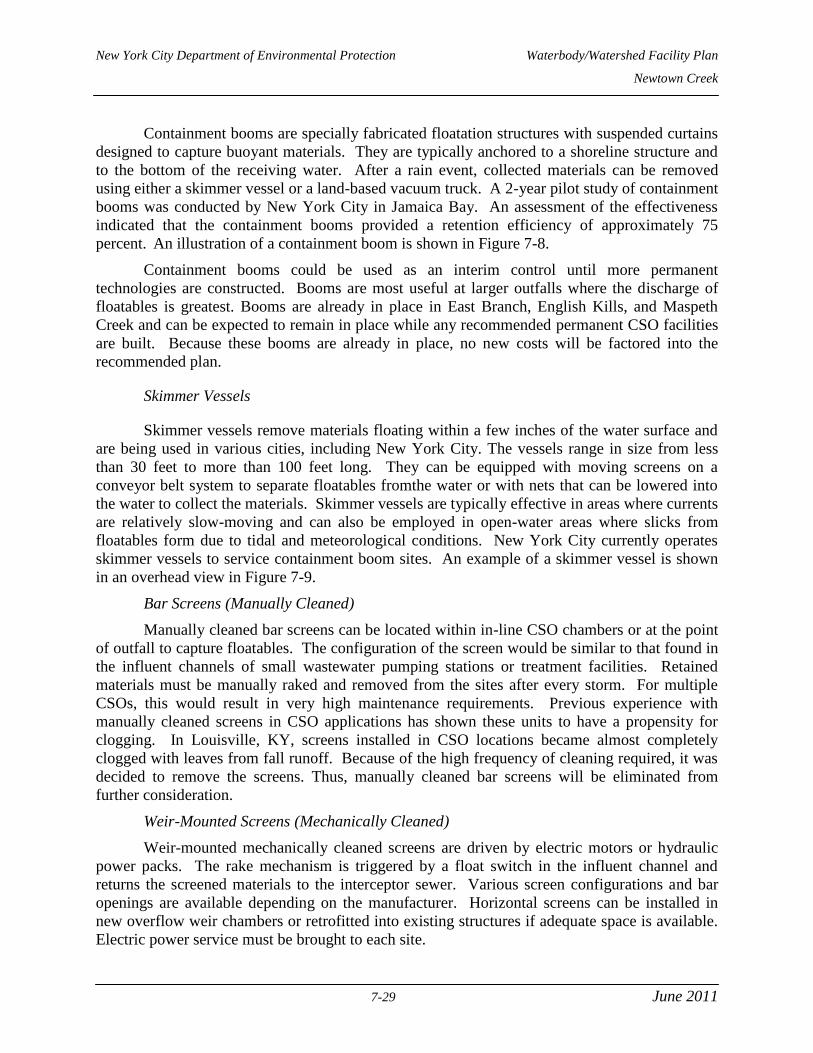
New York City Department of Environmental Protection Waterbody/Watershed Facility Plan
Newtown Creek
7-29 June 2011
Containment booms are specially fabricated floatation structures with suspended curtains
designed to capture buoyant materials. They are typically anchored to a shoreline structure and
to the bottom of the receiving water. After a rain event, collected materials can be removed
using either a skimmer vessel or a land-based vacuum truck. A 2-year pilot study of containment
booms was conducted by New York City in Jamaica Bay. An assessment of the effectiveness
indicated that the containment booms provided a retention efficiency of approximately 75
percent. An illustration of a containment boom is shown in Figure 7-8.
Containment booms could be used as an interim control until more permanent
technologies are constructed. Booms are most useful at larger outfalls where the discharge of
floatables is greatest. Booms are already in place in East Branch, English Kills, and Maspeth
Creek and can be expected to remain in place while any recommended permanent CSO facilities
are built. Because these booms are already in place, no new costs will be factored into the
recommended plan.
Skimmer Vessels
Skimmer vessels remove materials floating within a few inches of the water surface and
are being used in various cities, including New York City. The vessels range in size from less
than 30 feet to more than 100 feet long. They can be equipped with moving screens on a
conveyor belt system to separate floatables fromthe water or with nets that can be lowered into
the water to collect the materials. Skimmer vessels are typically effective in areas where currents
are relatively slow-moving and can also be employed in open-water areas where slicks from
floatables form due to tidal and meteorological conditions. New York City currently operates
skimmer vessels to service containment boom sites. An example of a skimmer vessel is shown
in an overhead view in Figure 7-9.
Bar Screens (Manually Cleaned)
Manually cleaned bar screens can be located within in-line CSO chambers or at the point
of outfall to capture floatables. The configuration of the screen would be similar to that found in
the influent channels of small wastewater pumping stations or treatment facilities. Retained
materials must be manually raked and removed from the sites after every storm. For multiple
CSOs, this would result in very high maintenance requirements. Previous experience with
manually cleaned screens in CSO applications has shown these units to have a propensity for
clogging. In Louisville, KY, screens installed in CSO locations became almost completely
clogged with leaves from fall runoff. Because of the high frequency of cleaning required, it was
decided to remove the screens. Thus, manually cleaned bar screens will be eliminated from
further consideration.
Weir-Mounted Screens (Mechanically Cleaned)
Weir-mounted mechanically cleaned screens are driven by electric motors or hydraulic
power packs. The rake mechanism is triggered by a float switch in the influent channel and
returns the screened materials to the interceptor sewer. Various screen configurations and bar
openings are available depending on the manufacturer. Horizontal screens can be installed in
new overflow weir chambers or retrofitted into existing structures if adequate space is available.
Electric power service must be brought to each site.
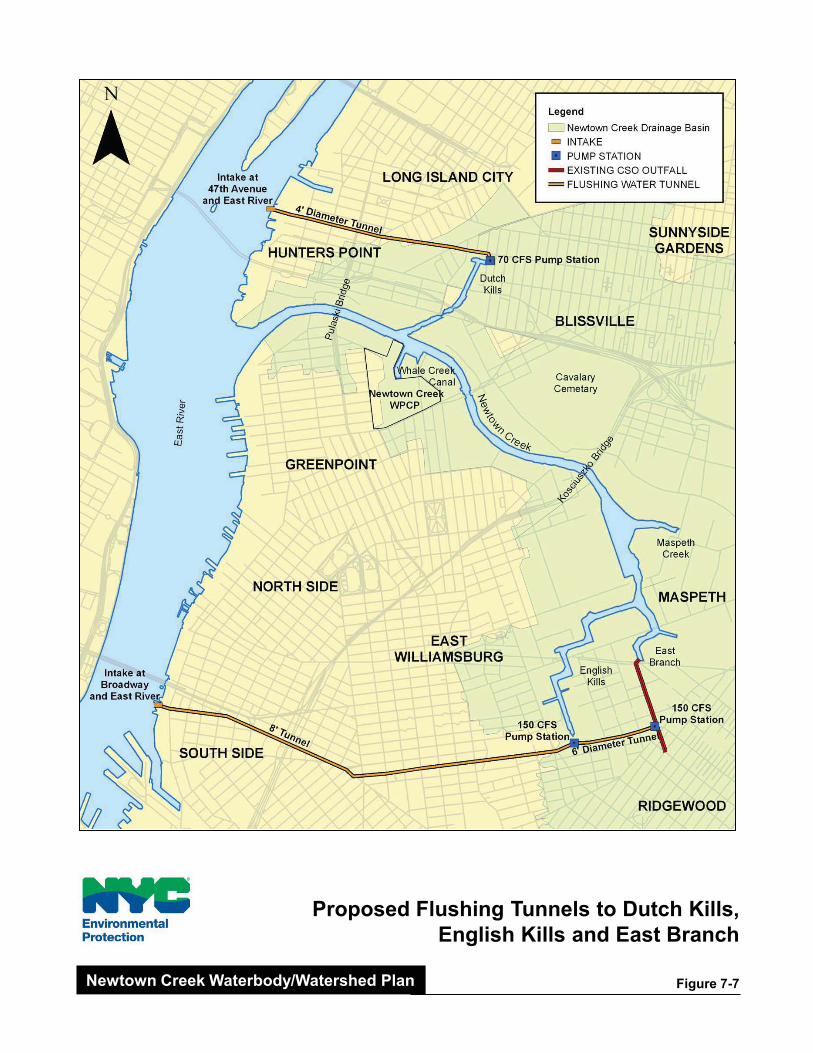
Proposed Flushing Tunnels to Dutch Kills,English Kills and East Branch
Figure 7-7Newtown Creek Waterbody/Watershed Plan
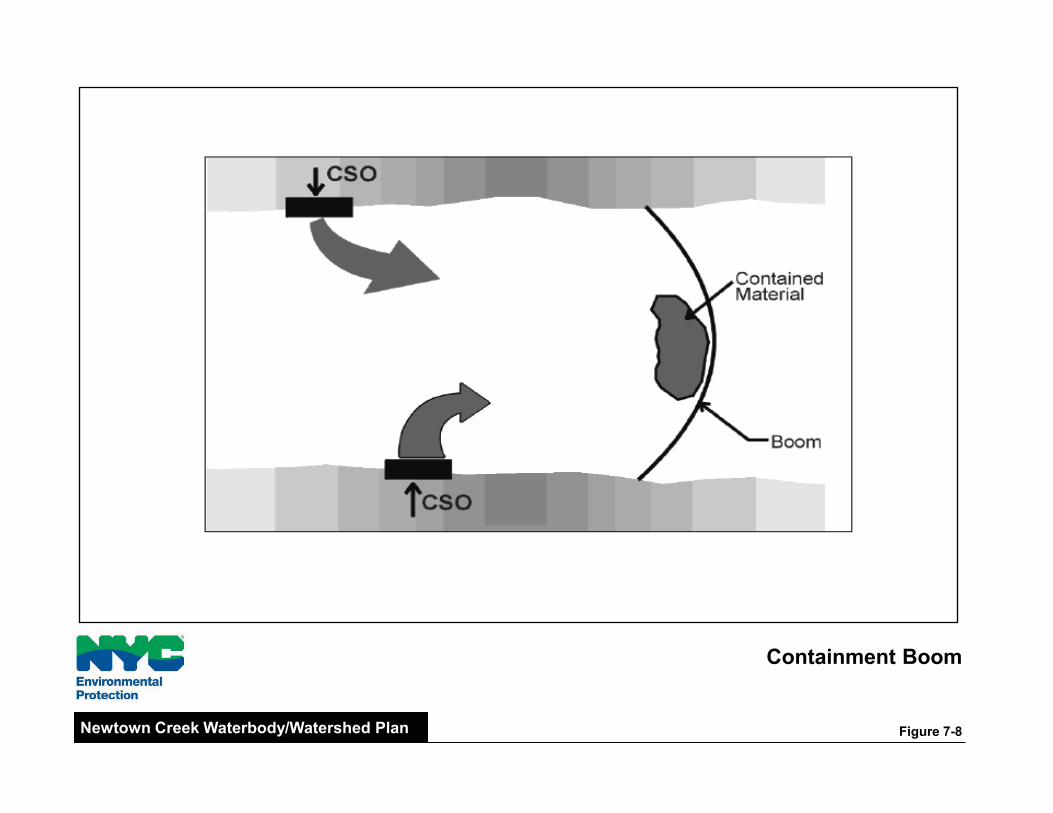
Containment Boom
Figure 7-8Newtown Creek Waterbody/Watershed Plan
Skimmer Boat and BoomIn Maspeth Creek
Figure 7-9Newtown Creek Waterbody/Watershed Plan
©2006 Microsoft Corporation ©2006 Pictometry International Corp.
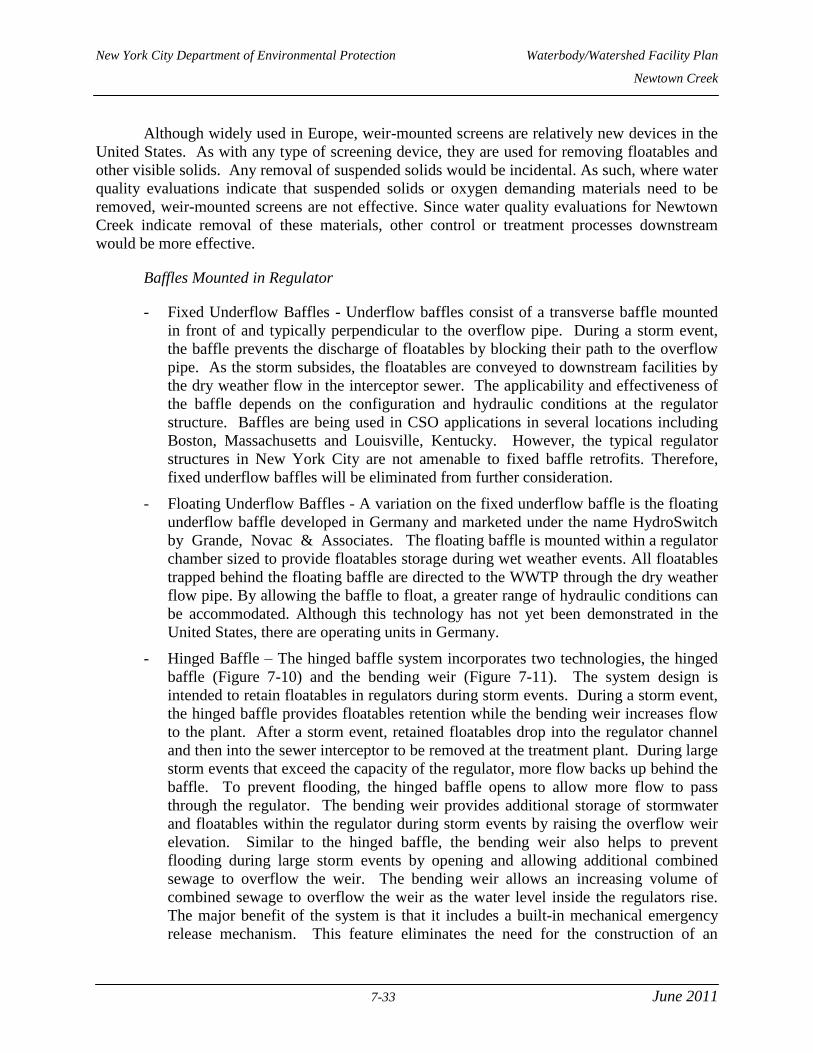
New York City Department of Environmental Protection Waterbody/Watershed Facility Plan
Newtown Creek
7-33 June 2011
Although widely used in Europe, weir-mounted screens are relatively new devices in the
United States. As with any type of screening device, they are used for removing floatables and
other visible solids. Any removal of suspended solids would be incidental. As such, where water
quality evaluations indicate that suspended solids or oxygen demanding materials need to be
removed, weir-mounted screens are not effective. Since water quality evaluations for Newtown
Creek indicate removal of these materials, other control or treatment processes downstream
would be more effective.
Baffles Mounted in Regulator
- Fixed Underflow Baffles - Underflow baffles consist of a transverse baffle mounted
in front of and typically perpendicular to the overflow pipe. During a storm event,
the baffle prevents the discharge of floatables by blocking their path to the overflow
pipe. As the storm subsides, the floatables are conveyed to downstream facilities by
the dry weather flow in the interceptor sewer. The applicability and effectiveness of
the baffle depends on the configuration and hydraulic conditions at the regulator
structure. Baffles are being used in CSO applications in several locations including
Boston, Massachusetts and Louisville, Kentucky. However, the typical regulator
structures in New York City are not amenable to fixed baffle retrofits. Therefore,
fixed underflow baffles will be eliminated from further consideration.
- Floating Underflow Baffles - A variation on the fixed underflow baffle is the floating
underflow baffle developed in Germany and marketed under the name HydroSwitch
by Grande, Novac & Associates. The floating baffle is mounted within a regulator
chamber sized to provide floatables storage during wet weather events. All floatables
trapped behind the floating baffle are directed to the WWTP through the dry weather
flow pipe. By allowing the baffle to float, a greater range of hydraulic conditions can
be accommodated. Although this technology has not yet been demonstrated in the
United States, there are operating units in Germany.
- Hinged Baffle – The hinged baffle system incorporates two technologies, the hinged
baffle (Figure 7-10) and the bending weir (Figure 7-11). The system design is
intended to retain floatables in regulators during storm events. During a storm event,
the hinged baffle provides floatables retention while the bending weir increases flow
to the plant. After a storm event, retained floatables drop into the regulator channel
and then into the sewer interceptor to be removed at the treatment plant. During large
storm events that exceed the capacity of the regulator, more flow backs up behind the
baffle. To prevent flooding, the hinged baffle opens to allow more flow to pass
through the regulator. The bending weir provides additional storage of stormwater
and floatables within the regulator during storm events by raising the overflow weir
elevation. Similar to the hinged baffle, the bending weir also helps to prevent
flooding during large storm events by opening and allowing additional combined
sewage to overflow the weir. The bending weir allows an increasing volume of
combined sewage to overflow the weir as the water level inside the regulators rise.
The major benefit of the system is that it includes a built-in mechanical emergency
release mechanism. This feature eliminates the need for the construction of an
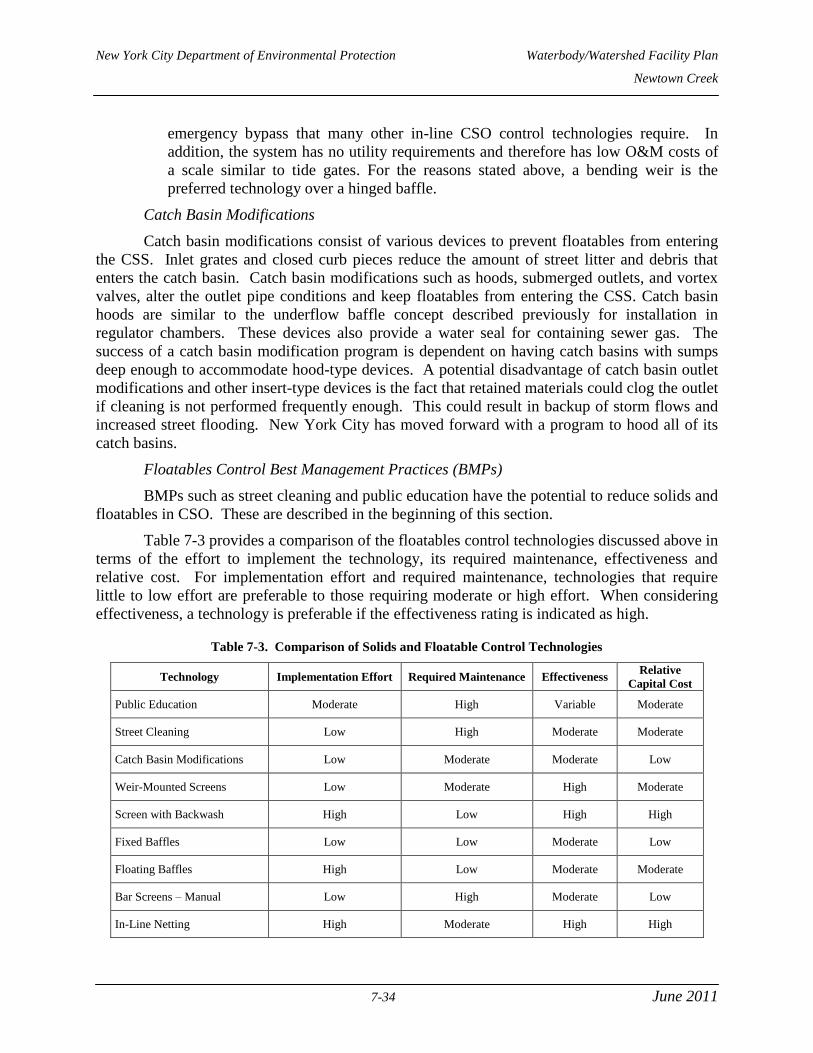
New York City Department of Environmental Protection Waterbody/Watershed Facility Plan
Newtown Creek
7-34 June 2011
emergency bypass that many other in-line CSO control technologies require. In
addition, the system has no utility requirements and therefore has low O&M costs of
a scale similar to tide gates. For the reasons stated above, a bending weir is the
preferred technology over a hinged baffle.
Catch Basin Modifications
Catch basin modifications consist of various devices to prevent floatables from entering
the CSS. Inlet grates and closed curb pieces reduce the amount of street litter and debris that
enters the catch basin. Catch basin modifications such as hoods, submerged outlets, and vortex
valves, alter the outlet pipe conditions and keep floatables from entering the CSS. Catch basin
hoods are similar to the underflow baffle concept described previously for installation in
regulator chambers. These devices also provide a water seal for containing sewer gas. The
success of a catch basin modification program is dependent on having catch basins with sumps
deep enough to accommodate hood-type devices. A potential disadvantage of catch basin outlet
modifications and other insert-type devices is the fact that retained materials could clog the outlet
if cleaning is not performed frequently enough. This could result in backup of storm flows and
increased street flooding. New York City has moved forward with a program to hood all of its
catch basins.
Floatables Control Best Management Practices (BMPs)
BMPs such as street cleaning and public education have the potential to reduce solids and
floatables in CSO. These are described in the beginning of this section.
Table 7-3 provides a comparison of the floatables control technologies discussed above in
terms of the effort to implement the technology, its required maintenance, effectiveness and
relative cost. For implementation effort and required maintenance, technologies that require
little to low effort are preferable to those requiring moderate or high effort. When considering
effectiveness, a technology is preferable if the effectiveness rating is indicated as high.
Table 7-3. Comparison of Solids and Floatable Control Technologies
Technology Implementation Effort Required Maintenance Effectiveness Relative
Capital Cost
Public Education Moderate High Variable Moderate
Street Cleaning Low High Moderate Moderate
Catch Basin Modifications Low Moderate Moderate Low
Weir-Mounted Screens Low Moderate High Moderate
Screen with Backwash High Low High High
Fixed Baffles Low Low Moderate Low
Floating Baffles High Low Moderate Moderate
Bar Screens – Manual Low High Moderate Low
In-Line Netting High Moderate High High
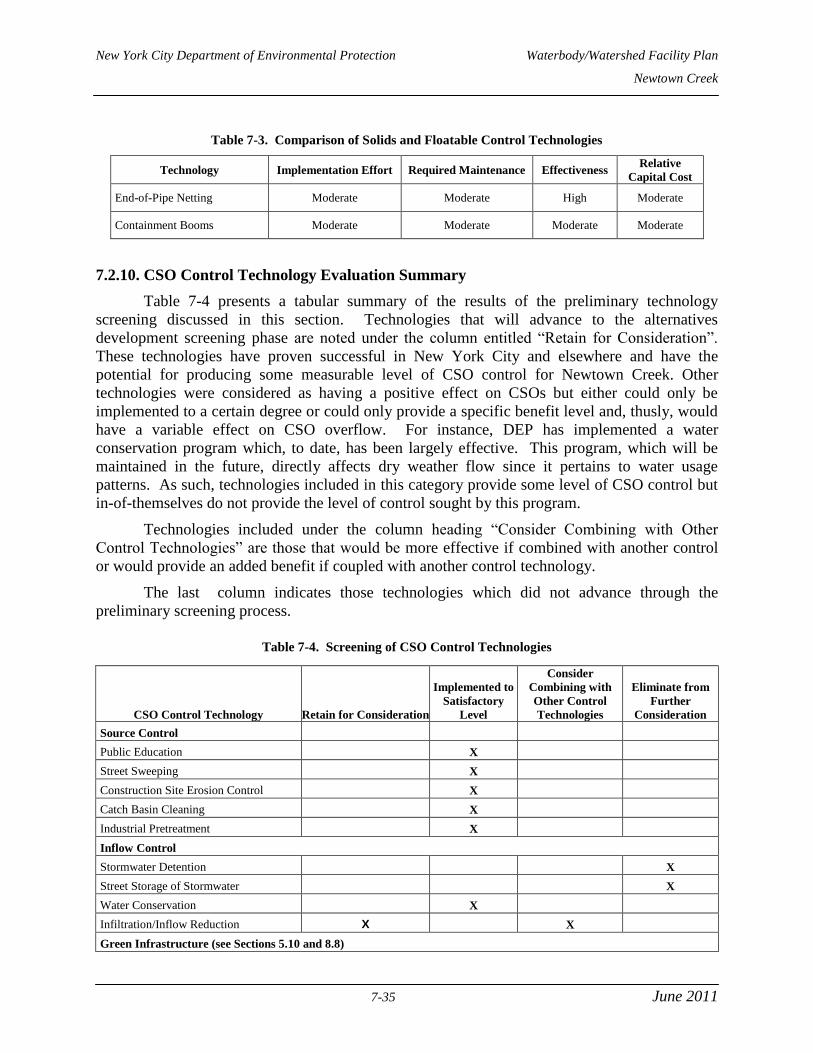
New York City Department of Environmental Protection Waterbody/Watershed Facility Plan
Newtown Creek
7-35 June 2011
Table 7-3. Comparison of Solids and Floatable Control Technologies
Technology Implementation Effort Required Maintenance Effectiveness Relative
Capital Cost
End-of-Pipe Netting Moderate Moderate High Moderate
Containment Booms Moderate Moderate Moderate Moderate
7.2.10. CSO Control Technology Evaluation Summary
Table 7-4 presents a tabular summary of the results of the preliminary technology
screening discussed in this section. Technologies that will advance to the alternatives
development screening phase are noted under the column entitled “Retain for Consideration”.
These technologies have proven successful in New York City and elsewhere and have the
potential for producing some measurable level of CSO control for Newtown Creek. Other
technologies were considered as having a positive effect on CSOs but either could only be
implemented to a certain degree or could only provide a specific benefit level and, thusly, would
have a variable effect on CSO overflow. For instance, DEP has implemented a water
conservation program which, to date, has been largely effective. This program, which will be
maintained in the future, directly affects dry weather flow since it pertains to water usage
patterns. As such, technologies included in this category provide some level of CSO control but
in-of-themselves do not provide the level of control sought by this program.
Technologies included under the column heading “Consider Combining with Other
Control Technologies” are those that would be more effective if combined with another control
or would provide an added benefit if coupled with another control technology.
The last column indicates those technologies which did not advance through the
preliminary screening process.
Table 7-4. Screening of CSO Control Technologies
CSO Control Technology Retain for Consideration
Implemented to
Satisfactory
Level
Consider
Combining with
Other Control
Technologies
Eliminate from
Further
Consideration
Source Control
Public Education X
Street Sweeping X
Construction Site Erosion Control X
Catch Basin Cleaning X
Industrial Pretreatment X
Inflow Control
Stormwater Detention X
Street Storage of Stormwater X
Water Conservation X
Infiltration/Inflow Reduction X X
Green Infrastructure (see Sections 5.10 and 8.8)

New York City Department of Environmental Protection Waterbody/Watershed Facility Plan
Newtown Creek
7-36 June 2011
Table 7-4. Screening of CSO Control Technologies
CSO Control Technology Retain for Consideration
Implemented to
Satisfactory
Level
Consider
Combining with
Other Control
Technologies
Eliminate from
Further
Consideration
Sewer System Optimization
Optimize Existing System X
Real Time Control X
Sewer Separation
Complete Separation X
Partial Separation X X
Rain Leader Disconnection X
Storage and Conveyance
Closed Concrete Tanks X
Storage Pipelines/Conduits X
Tunnels X
Treatment
Screening X X
Primary Sedimentation X
Vortex Separator X
High Rate Physical Chemical Treatment X
Disinfection X
Expansion of WWTP X
Receiving Water Improvement
Outfall Relocation X
In-stream Aeration X X
Flushing Water X
Environmental Dredging X
Solids and Floatable Controls
Netting Systems X X
Containment Booms X
Manual Bar Screens X
Weir Mounted Screens X
Fixed baffles X
Floating Baffles X
Hinged Baffles (Bending Weir) X X
Catch Basin Modifications X
The technologies successfully moving through the preliminary screening process will be
formed into alternatives that will be further screened in subsequent subsections of this section.
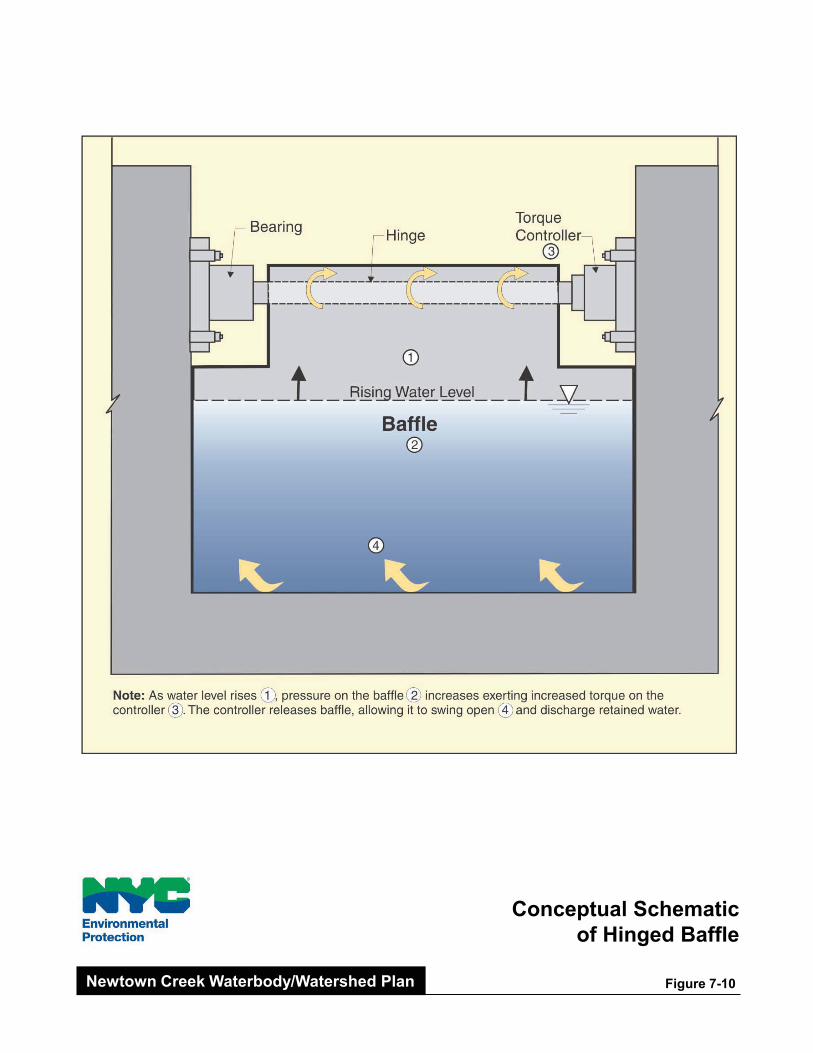
Conceptual Schematicof Hinged Baffle
Figure 7-10Newtown Creek Waterbody/Watershed Plan
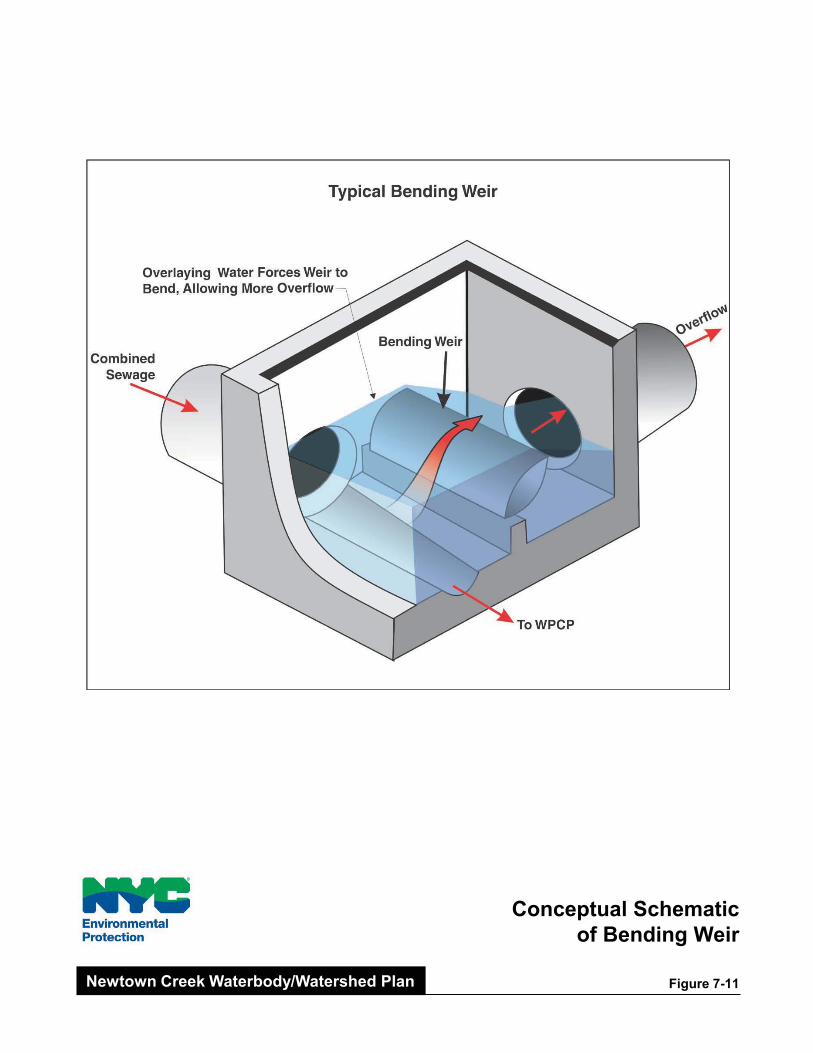
Conceptual Schematicof Bending Weir
Figure 7-11Newtown Creek Waterbody/Watershed Plan
New York City Department of Environmental Protection Waterbody/Watershed Facility Plan
Newtown Creek
7-39 June 2011
7.3. WATER QUALITY IMPROVEMENT ALTERNATIVES
The analysis of feasible alternatives will review the control technologies that were
retained from Table 7-4 to “consider a reasonable range of alternatives” as expected by federal
CSO policy. Full-year model simulations were performed for each engineering alternative
selected, and each of these alternatives was then evaluated in terms of compliance with
applicable water quality criteria, designated uses, and overall improvement from the established
Baseline condition. Compliance with fish and aquatic-life uses was evaluated by comparing
projected DO conditions to the applicable New York State numerical criterion. Compliance with
recreational uses was evaluated by comparing projected indicator bacteria levels to New York
State numerical criteria for secondary recreation. Aesthetics and riparian uses were evaluated by
comparing projected levels of floatables, odors and other aesthetic conditions (based on CSO
volume reduction) to narrative water quality standards.
The Baseline Newtown Creek tributary sewer systems characteristics, overflow volumes,
and outfall and regulator configurations as described in Section 3 were thoroughly reviewed and
evaluated in concert with the existing waterbody characteristics and uses. From this evaluation it
was determined that there are a number of conditions that could be addressed through abatement
of CSOs and improvements to water quality, which would benefit the Newtown Creek
waterbody, and which warranted further consideration. Therefore, the CSO technologies,
remaining after the technology screening described above, were reviewed to determine the
applicability of each to address the conditions existing in the watershed.
The retained technologies, summarized below, are considered to be feasible insofar as
there is no fatal flaw or obvious cost-benefit limitation, and implementation is expected to result
in substantial improvements to water quality.
Baseline (Section 7.3.1). The future “no build” case is not a retained technology as such
because water quality goals are not currently attained. However, the Baseline serves as a
metric for the other alternatives.
Treatment (Sections 7.3.1 and 7.3.9). All of the Newtown Creek alternatives (except for
the Baseline Condition) include ongoing Bowery Bay WWTP stabilization construction
to the plant headworks (pumps, screens, etc.) and the Newtown Creek WWTP upgrades
to provide full secondary treatment to provide for treatment of flows up to the permitted
flows on a sustained basis (described in Section 7.3.1). Additionally, HRPCT was
determined to be a viable option and is explored in conjunction with other CSO capture
tunnel alternatives (Sections 7.3.9).
Sewer System Optimization (Sections 7.3.2 through 7.3.9). The hydraulic capacity of the
Morgan Avenue Interceptor limits the amount of flow transported to the Newtown Creek
WWTP from areas tributary to Regulator B1. Any alternative implemented to maximize
the flow through the Morgan Avenue Interceptor and away from Newtown Creek would
require reducing headloss into and through the Morgan Avenue Interceptor, increasing
the driving head through the interceptor, and/or adding additional conveyance to the
WWTP from Regulator B1. Alternatives that were devised to increase flow to the WWTP

New York City Department of Environmental Protection Waterbody/Watershed Facility Plan
Newtown Creek
7-40 June 2011
through the Morgan Avenue Interceptor include RTC by way of a Kent Avenue
Throttling Facility (Section 7.3.2), modifications to Regulator B1 (Sections 7.3.2 and
7.3.4 through 7.3.8), and St. Nicholas Weir Relief Sewer alternatives (Sections 7.3.2 and
7.3.6 through 7.3.8). Bending weirs, devised as a potential modification to Regulator B1,
were also considered at Regulator Q1 to reduce overflows to outfall NCQ-077 (Sections
7.3.4 and 7.3.5). An additional relief sewer alternative, in conjunction with regulator
modifications, was devised as a means to reduce overflows to Dutch Kills (Sections
7.3.5, 7.3.7 through 7.3.9). Additionally, ongoing upgrades to the Brooklyn Pumping
Station (described in Section 7.3.3), which will maximize the wet weather flow delivered
to the WWTP, was included in all alternatives (except for the Baseline and CSO Facility
Plan).
Storage (Sections 7.3.2, 7.3.6 through 7.3.9). Inline storage, deep storage tunnel
alternatives, and CSO storage tanks were retained to reduce discharges. Storage tanks
were considered at outfalls with large annual overflow volumes and available land in the
vicinity of the outfalls (Sections 7.3.2 and 7.3.8). Inline storage was considered as an
alternative to drive more flow to the WWTP during smaller rainfall events (Sections 7.3.6
through 7.3.8). For very large reduction volumes, deep storage tunnels were determined
to be the only feasible approach, and therefore various tunnel alternatives were developed
to provide various level of CSO reduction in Newtown Creek and its tributaries (Section
7.3.9).
Solids and Floatables Controls (Sections 7.3.3 through 7.3.6). Floatables control
technologies at the four outfalls contributing the largest volume of CSO to Newtown
Creek were evaluated.
Sewer Separation (Section 7.3.11). High Level Sewer Separation (HLSS) is an ongoing
program in DEP and was evaluated for the Newtown Creek drainage area. Receiving
Water Improvements (Sections 7.3.2 through 7.3.8). Aeration was included in all
alternatives besides the Baseline as a means to improve DO in Newtown Creek.
Environmental maintenance dredging (Section 7.3.10) was also considered to reduce
odors but has been deferred to the recent superfund listing. Dredging will be re-evaluated
as part of the future LTCP when more information regarding the status of the site and the
effects of dredging is available via the remedial investigations. This list of feasible
alternatives retained from the preliminary screening represents a toolbox from which a
suitable technology may be applied to a particular level of CSO abatement. As suggested
in USEPA guidance for long-term CSO control plans, water quality modeling was
performed for a “reasonable range” of CSO volume reductions, from no reduction up to
100 percent CSO abatement. The technologies employed at each level of this range were
selected based on engineering judgment and established principles. For example, any of
the storage technologies may be employed to achieve a certain reduction in CSO
discharged, but the water quality response would be the same, so the manner of achieving
that level of control is a matter of balancing cost-effectiveness and feasibility. In that
sense the alternatives discussed below each represents an estimate of the optimal manner
of achieving that particular level of control. All costs presented in this section are in June
2011 dollars.

New York City Department of Environmental Protection Waterbody/Watershed Facility Plan
Newtown Creek
7-41 June 2011
7.3.1. Baseline Conditions
Baseline conditions for the Bowery Bay and Newtown Creek sewer systems were
described previously in Sections 3.4 and 3.5, and are repeated below. Table 7-5 presents an
overview of the annual average CSO discharge volume and frequency at each outfall.
1. Dry-weather flow rates reflect year 2045 projections. For planning purposes, the 2045-
projected dry-weather flow rates at each regulator reflect expected future population and
water-use patterns in the study area. The total projected dry-weather flow rates are 109
MGD at Bowery Bay WPCP, and 268 MGD at Newtown Creek WPCP.
2. The Sustained wet-weather treatment capacity of the Bowery Bay WPCP was 236 MGD,
and wet-weather treatment capacity of the Newtown Creek WPCP was 585 MGD, based
on top-ten-storm analyses for each WPCP as reported to DEC in the 2003 BMP Annual
Report. Bowery Bay WWTP has been upgraded to 300 MGD to meet the 2x DDWF
requirement, and Newtown Creek WWTP is currently being upgraded to include full
secondary treatment of 700 MGD. There are no primary treatment facilities at Newtown
Creek WWTP.
3. Documented sediment values were included in the model where known, however, if there
was no information available, sedimentation in the sewers was assumed to be removed.
4. The Brooklyn Pump Station (P.S.) capacity is 400 MGD. The Newtown Creek WPCP
Enhanced Track 3 Facility Plan and the Newtown Creek CSO Facility Plan dictate a
capacity of 300 MGD. However, as noted above, it is intended that the Newtown Creek
WPCP be upgraded to accommodate 300 MGD from the Manhattan service area, as well
as to accept up to 400 MGD from the Brooklyn Pump Station, for a total of 700 MGD.
Table 7-5. Newtown Creek Discharge Summary for Baseline Conditions
(1) (2)
Outfall Discharge Volume
(MG)
Percentage of CSO
Volume Number of Discharges
Combined Sewer
NCB-083 586.2 39.8% 71
BB-026 186.8 12.7% 47
NCQ-077 261.5 17.8% 49
NCB-015 307.8 20.9% 33
BB-013 39.2 2.7% 44
NCQ-029 18.1 1.2% 48
BB-043 13.9 0.9% 40
BB-009 35.2 2.4% 35
NCB-022 8.4 0.6% 42
BB-014 3.2 0.2% 35
BB-042 2.3 0.2% 29
BB-011 2.8 0.2% 24
BB-040 0.9 0.1% 21
BB-015 3.1 0.2% 39
BB-010 1.6 0.1% 16
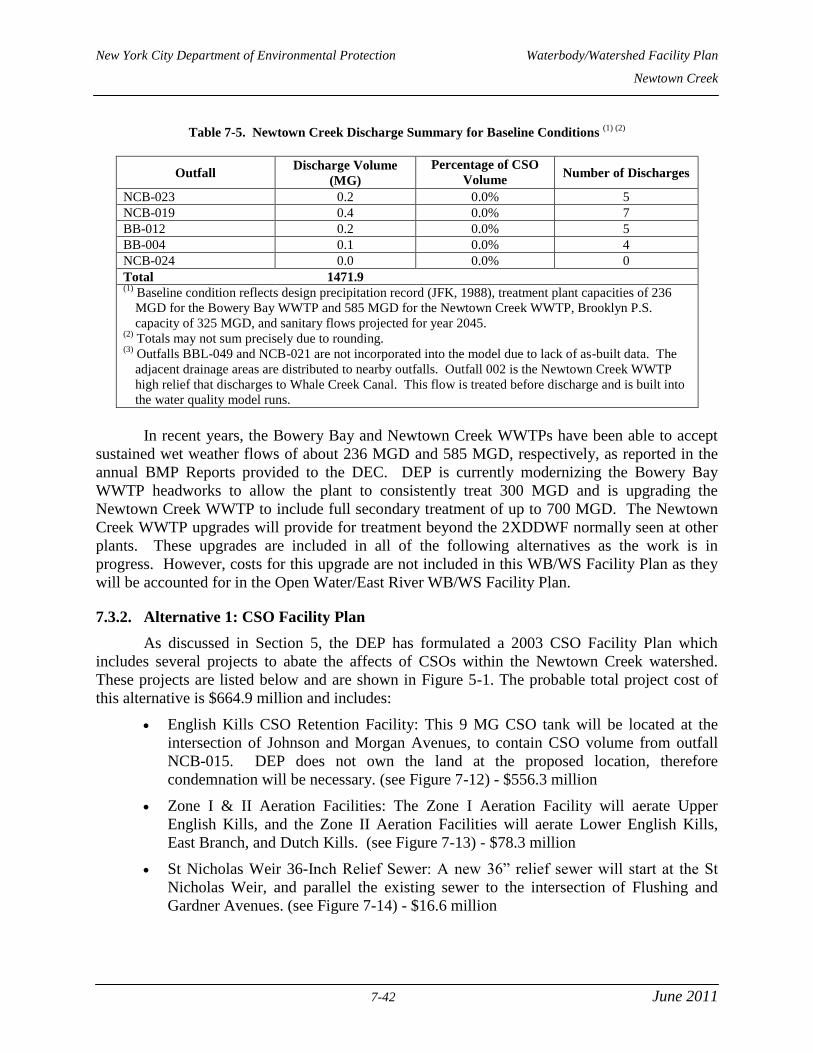
New York City Department of Environmental Protection Waterbody/Watershed Facility Plan
Newtown Creek
7-42 June 2011
Table 7-5. Newtown Creek Discharge Summary for Baseline Conditions (1) (2)
Outfall Discharge Volume
(MG)
Percentage of CSO
Volume Number of Discharges
NCB-023 0.2 0.0% 5
NCB-019 0.4 0.0% 7
BB-012 0.2 0.0% 5
BB-004 0.1 0.0% 4
NCB-024 0.0 0.0% 0
Total 1471.9 (1)
Baseline condition reflects design precipitation record (JFK, 1988), treatment plant capacities of 236
MGD for the Bowery Bay WWTP and 585 MGD for the Newtown Creek WWTP, Brooklyn P.S.
capacity of 325 MGD, and sanitary flows projected for year 2045. (2)
Totals may not sum precisely due to rounding. (3)
Outfalls BBL-049 and NCB-021 are not incorporated into the model due to lack of as-built data. The
adjacent drainage areas are distributed to nearby outfalls. Outfall 002 is the Newtown Creek WWTP
high relief that discharges to Whale Creek Canal. This flow is treated before discharge and is built into
the water quality model runs.
In recent years, the Bowery Bay and Newtown Creek WWTPs have been able to accept
sustained wet weather flows of about 236 MGD and 585 MGD, respectively, as reported in the
annual BMP Reports provided to the DEC. DEP is currently modernizing the Bowery Bay
WWTP headworks to allow the plant to consistently treat 300 MGD and is upgrading the
Newtown Creek WWTP to include full secondary treatment of up to 700 MGD. The Newtown
Creek WWTP upgrades will provide for treatment beyond the 2XDDWF normally seen at other
plants. These upgrades are included in all of the following alternatives as the work is in
progress. However, costs for this upgrade are not included in this WB/WS Facility Plan as they
will be accounted for in the Open Water/East River WB/WS Facility Plan.
7.3.2. Alternative 1: CSO Facility Plan
As discussed in Section 5, the DEP has formulated a 2003 CSO Facility Plan which
includes several projects to abate the affects of CSOs within the Newtown Creek watershed.
These projects are listed below and are shown in Figure 5-1. The probable total project cost of
this alternative is $664.9 million and includes:
English Kills CSO Retention Facility: This 9 MG CSO tank will be located at the
intersection of Johnson and Morgan Avenues, to contain CSO volume from outfall
NCB-015. DEP does not own the land at the proposed location, therefore
condemnation will be necessary. (see Figure 7-12) - $556.3 million
Zone I & II Aeration Facilities: The Zone I Aeration Facility will aerate Upper
English Kills, and the Zone II Aeration Facilities will aerate Lower English Kills,
East Branch, and Dutch Kills. (see Figure 7-13) - $78.3 million
St Nicholas Weir 36-Inch Relief Sewer: A new 36” relief sewer will start at the St
Nicholas Weir, and parallel the existing sewer to the intersection of Flushing and
Gardner Avenues. (see Figure 7-14) - $16.6 million
New York City Department of Environmental Protection Waterbody/Watershed Facility Plan
Newtown Creek
7-43 June 2011
Kent Avenue Throttling Facility: This facility will limit the maximum flow through
the Kent Ave Interceptor to the Brooklyn Pumping Station to 200 MGD. This facility
will include a 9’ x 10’ roller gate at a minimum opening of 15” on the Kent Ave
Interceptor, 650’ upstream of the junction of the Kent Ave Interceptor and the
Morgan Ave Interceptor. (see Figure 7-15) - $10.1 million
Modifications to Regulator B1: In order to increase the hydraulic capacity of this
regulator, the overflow weir will be raised from –4.61 ft BSD to 0.94 ft BSD. In
addition, the sluice gate opening will be enlarged from 24 ft2 to 30 ft
2. (see Figure 7-
16) - $3.7 million
This CSO Facility Plan with the aforementioned elements was simulated in the sewer
system and water quality models, and along with the Baseline conditions, is used as a basis to
evaluate other CSO abatement alternatives. Sewer system modeling shows that the CSO Facility
Plan provides a 27% CSO volume reduction, and a 21% reduction in CSO events, while water
quality modeling shows that the CSO Facility Plan would attain the Class SD Standard 3.0 mg/L
only for approximately 62% of the year. A summary of Alternative 1 is presented in Table 7-6
below.
Table 7-6. Summary of Alternative 1 Component PTPC ($ Million)
English Kills 9 MG CSO Retention Facility $556.3
Zone I and II Aeration Facilities $78.3
St. Nicholas Weir 36-Inch Relief Sewer $16.6
Kent Ave Throttling Facility $10.1
Modifications to Regulator B1 $3.7
Total $664.9
As discussed in Section 5, the Consent Order acknowledges that Newtown Creek does
not have a final conceptual design, and allows for modifications to the 2003 CSO Facility Plan.
One step in the Waterbody/Watershed analysis was to review the effectiveness of the CSO
Facility Plan elements based on the updated models, to determine if and how much benefit is
provided by the individual elements. It was determined as part of these findings some of the
elements of the CSO Facility were impractical and/or unnecessary.
The modifications proposed to Regulator B1 and its corresponding tide gate chamber
B1A were reviewed using the updated model. Modeling analysis projected that the weir in Tide
Gate Chamber B1A could be raised beyond the 0.1 BHD proposed in the 2003 CSO Facility Plan
to 1.94 BHD without causing surcharging of the upstream sewers during the typical year, and to
divert more wet weather flow to the WWTP and away from English Kills. Subsequently, a
drainage plan analysis was performed to determine the corresponding increase in weir length
required, such that the higher weir elevation does not increase the design water surface elevation
in the upstream sewers. Through this analysis it was determined that raising the weir to the
elevation proposed by the 2003 CSO Facility Plan would require over 400 linear feet of weir
length, and therefore raising this weir is no longer considered a feasible option.
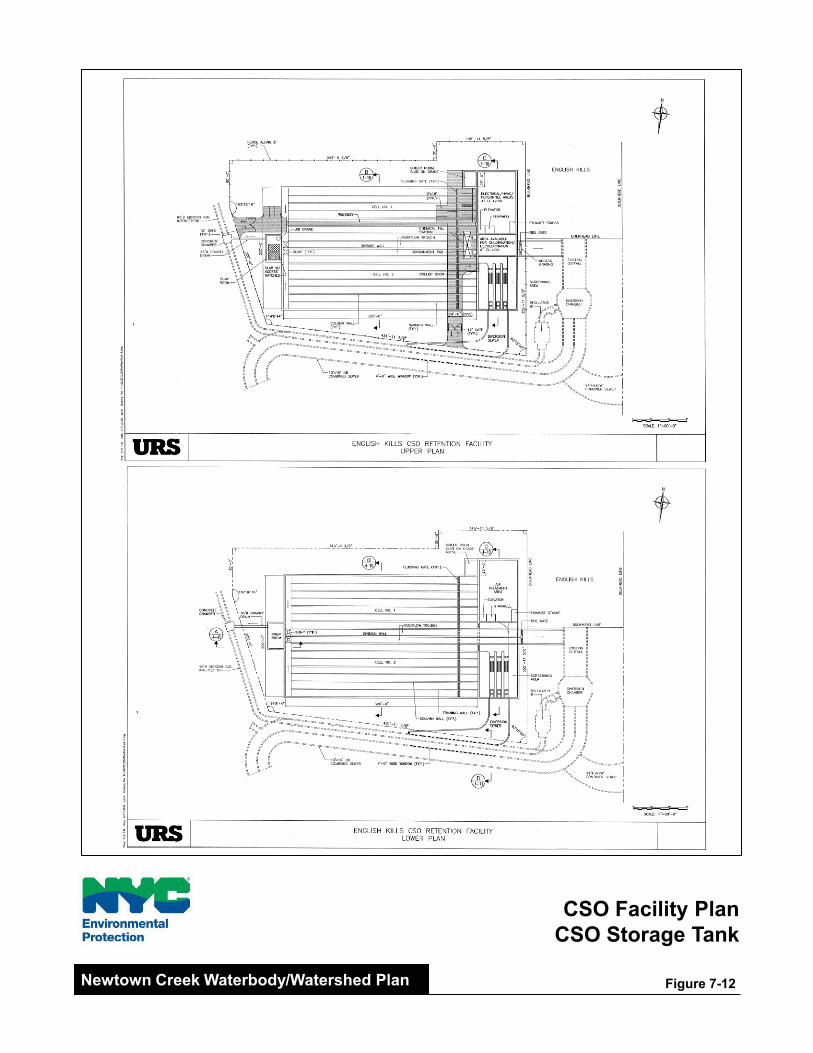
CSO Facility PlanCSO Storage Tank
Figure 7-12Newtown Creek Waterbody/Watershed Plan
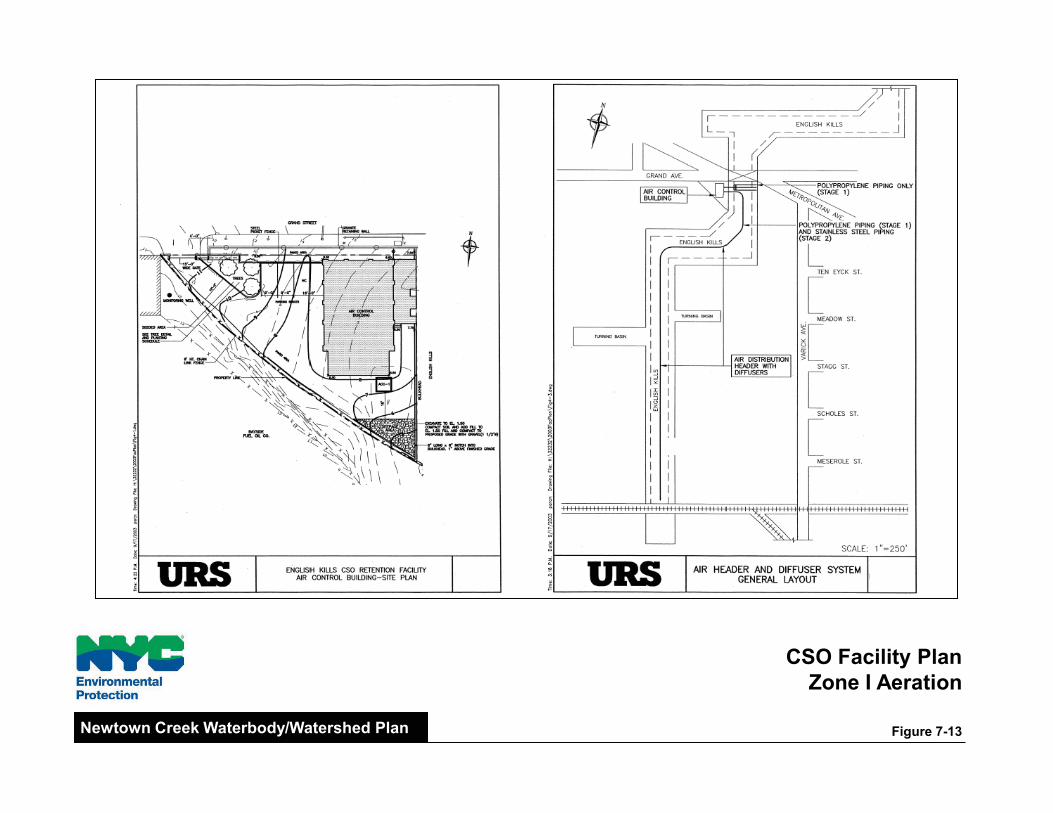
CSO Facility PlanZone I Aeration
Figure 7-13Newtown Creek Waterbody/Watershed Plan

CSO Facility PlanSt. Nicholas Weir Relief Sewer
Figure 7-14Newtown Creek Waterbody/Watershed Plan
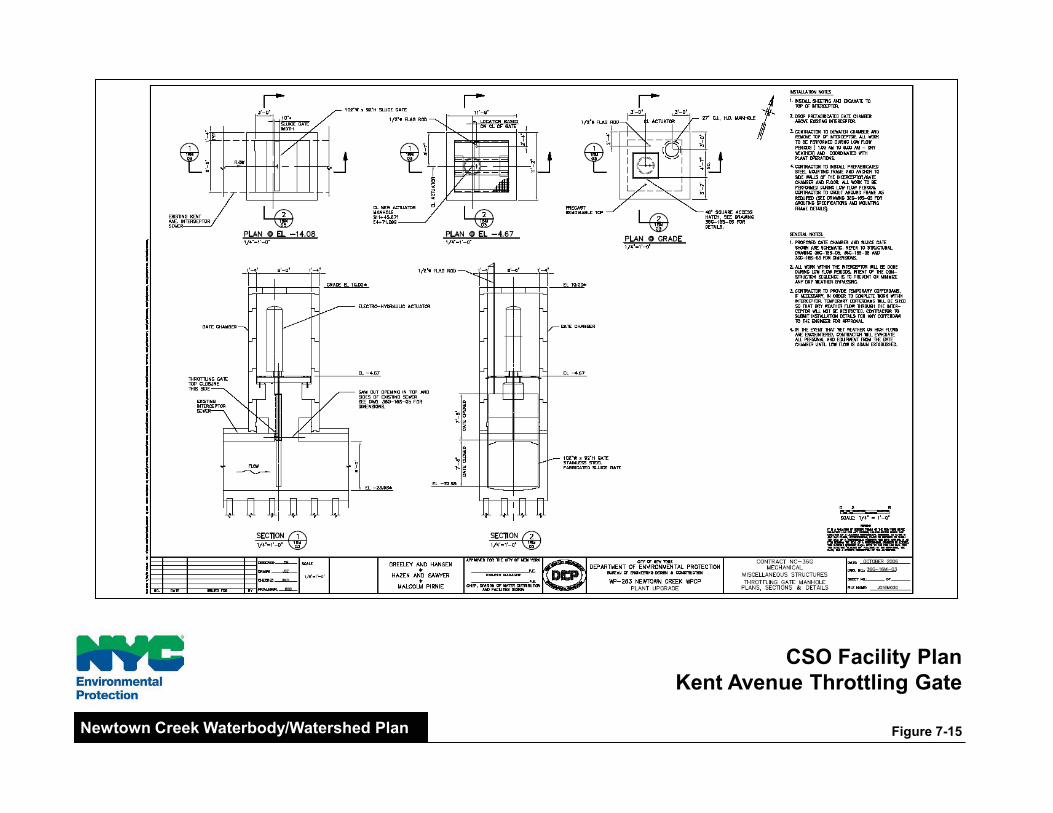
CSO Facility PlanKent Avenue Throttling Gate
Figure 7-15Newtown Creek Waterbody/Watershed Plan
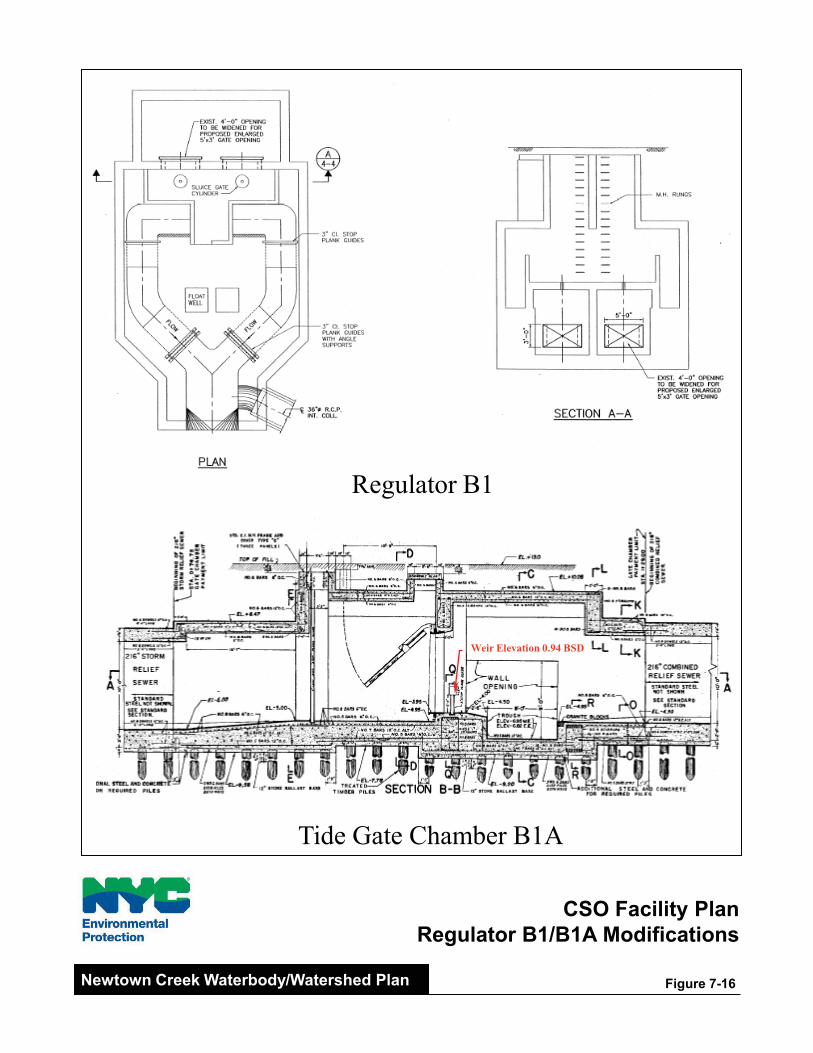
CSO Facility PlanRegulator B1/B1A Modifications
Figure 7-16Newtown Creek Waterbody/Watershed Plan
Weir Elevation 0.94 BSD
Tide Gate Chamber B1A
Regulator B1
New York City Department of Environmental Protection Waterbody/Watershed Facility Plan
Newtown Creek
7-49 June 2011
The Kent Avenue Throttling Facility is being constructed as part of the NC WWTP
Enhanced Track 3 Upgrade. This Kent Avenue throttling gate facility is being constructed under
Newtown Creek Contract 36 and is located west of the Interim Water Meter Building, south of
the south battery aeration tank. A second throttling facility is upstream of the Kent Ave and
Russell St interceptor combined manhole and is located just south of the Main Building. These
facilities are used to throttle the flow during peak flow events to prevent the Brooklyn pump
station from flooding. The common throttling gate is used to prevent flooding of the pump
station and the Kent Ave throttling gate is use to control how much flow is allowed in from the
Kent Ave interceptor as compared to the Russell street interceptor. Upon completion of Track 3,
the DEP intends to update is WWOP to include more details on operation of the throttling
facilities and new MSP stations intended to maximize wet weather flows to the plant and reduce
CSOs into Newtown Creek.
Based on the sewer system model results, alternatives to the other CSO Facility Plan
elements were devised to more effectively reduce CSO discharge and improve water quality in
Newtown Creek. These alternatives are presented in the following sections.
7.3.3. Alternative 2: Enhanced Aeration and Floatables Control
The updated sewer system modeling results indicated that a modified aeration plan could
effectively improve DO in Newtown Creek beyond what is proposed in the 2003 CSO Facility
Plan. An enhanced aeration alternative has been devised to improve the water quality in
Newtown Creek by increasing the dissolved oxygen concentrations through either directly
adding compressed air into the water column through a submerged diffuser grid or potentially
using an oxygenation system that would inject supersaturated water back into the creek via
submerged nozzles. This enhanced aeration system would target a minimum dissolved oxygen
level of 3 mg/L to comply with existing water quality standards as opposed to the aeration
system proposed in the 2003 Facility Plan that would have only targeted a dissolved oxygen
level of 1 mg/L to keep the water column from going hypoxic. For planning purposes, it was
assumed that all aeration systems would be installed in waters that are not less than 6-feet below
MLLW. In some areas, this will require injection of slightly more airflow per square meter if
those areas are adjacent to shallow area so that the tidal flow can transport the inject air into the
shallow areas. The probable total project cost of this enhanced aeration system is $115.3 million.
The enhanced aeration could provide a significant increase in dissolved oxygen levels
within the waterbody, but does not address the level of pollutants entering through CSO
discharges. Therefore, this alternative also includes elements that control floatables at the four
outfalls with the largest baseline annual overflow volumes to address some of the aesthetic
impairments related to CSO discharges. These four facilities would remove over 83,000 pounds
(EPA, 1999e) of floatables on an average annual basis. The probable total project cost of
installing in-line CSO floatables control facilities at outfalls NCB-015, NCB-083, NCQ-077, and
BBL-026 is $89.8 million. This cost estimate for the floatable controls is based on in-line netting
facilities and do not include rehabilitation of the outfalls.
The Brooklyn and Manhattan Pumping Stations are undergoing upgrades. The upgraded
stations will have five pumps with each capable of handling 100 MGD of influent flow. The

New York City Department of Environmental Protection Waterbody/Watershed Facility Plan
Newtown Creek
7-50 June 2011
2004 Newtown Creek WWTP Enhanced Track 3 Facility Plan and the 2003 CSO Facility Plan
each call for the Brooklyn P.S. capacity to be set at 300 MGD (3 online with 2 standby) and the
Manhattan P.S. capacity to be set at 400 MGD (4 online with one standby). However, the
existing Newtown Creek WWOP (Appendix B) allows up to 400 MGD to be pumped from the
Brooklyn P.S. and modeling shows that the collection system can deliver greater than 400 MGD
to the Brooklyn pumping station. By continuing to operate during wet weather consistent with
the current wet weather operational protocol, the DEP will be able to maximize the proportion of
wet weather flow from the Brooklyn and Queens collection system treated at the WWTP. While
CSO related to the reduced capacity for Manhattan will be discharged to receiving waters (East
River/Open Waters), which has a greater assimilative capacity than the Newtown Creek
waterbody. Under this protocol, during smaller events when 300 MGD or less of capacity is
required from the Brooklyn side, the Manhattan station can still be utilized to pump up to 400
MGD. The pump station upgrades that would support this rated capacity are already ongoing are
included in this and all subsequent alternatives. The probable total project cost for these upgrades
is not included in this WB/WS facility plan as they do not increase the total rated pumping
capacity to the WWTP from the collection system that drains to Newtown Creek.
A summary of the cost for each component of Alternative 2 is provided in Table 7-7. The
estimated Probable Total Project Cost (PTCP) for Alternative 2 is $205.1 million.
Table 7-7. Summary of Alternative 2 Component PTPC ($ Million)
Floatables Control at NCB-015, NCB-083, NCQ-077, &
BBL-026
$89.8
Enhanced Aeration System $115.3
Total $205.1
7.3.4. Alternative 3: Alternative 2 and Bending Weirs/Regulator Modifications
This alternative includes the elements of Alternative 2 in addition to collection system
modifications to reduce CSOs to Newtown Creek. Modeling analysis of the Newtown Creek
WWTP service area was employed to identify locations within the collection system that could
be modified to further reduce CSO to Newtown Creek by conveyance of additional flow to the
WWTP. Two locations for bending weirs were evaluated: Regulator B1, which overflows to
outfall NCB-015, and Regulator Q1, which overflows to outfall NCQ-077. These two locations
discharge the second and third largest CSO volumes under Baseline Conditions and represent an
opportunity for considerable CSO reductions. They also can readily divert wet weather flow into
the Morgan Avenue Interceptor and then to the WWTP for treatment.
For the purpose of these modeling evaluations, three different WPCP wet weather flow
capacities were considered. The first was a flow capacity of 585 MGD, representing operating
conditions present in 2003, prior to adoption of many of the operating improvements associated
with the development of the Wet Weather Operating Plans. Next, the WPCP was assumed to
operate in wet weather at capacity of 2xDDWF (620 MGD), which is typical of all other NYC
DEP WPCPs. Finally, the WPCP wet weather capacity was set at 700 MGD (2.25xDDWF),
which represents the ultimate projected capacity after the ongoing reconstruction is completed.
New York City Department of Environmental Protection Waterbody/Watershed Facility Plan
Newtown Creek
7-51 June 2011
Bending weirs were evaluated in the model by converting the fixed weirs to variable crest
weirs and specifying real-time control (RTC) rules for the movement of the weir crest. The RTC
rules were based on raising the weir crest when the HGL was below the elevation of the top of
the bending weir (in its fully raised position) and lowering it when the HGL was above that
elevation. To satisfy the DEP requirement that weir modifications are hydraulically neutral, it
was assumed that existing weir heights would be unaffected, and that the bending weir would be
installed so that when the bending weir is fully open, the modified weir system would function as
the existing static weir. Based on consultation with a vendor specializing in bending weir
technology, the maximum height of the bending weir was limited to 5-feet for incremental
widths of 7-feet. The benefit of a bending weir was maximized at Regulator B1 by assuming that
this 5-foot height could be installed on top of the existing static weir, and that multiple bays
would be constructed as necessary to match the total existing weir length. Each bay will have a
10 foot width to accommodate the weir and its counterweight mechanism. The bending weirs
will occupy the existing dry weather flow channel in the diversion chamber (aka Regulator B-
1A). Relocation of the DWF channel is required. The DWF channel can be constructed in the
16’ x 10’ double barrel combined sewer upstream of the diversion chamber. The relocated DWF
channel will be connected to “Manhole A” which is between the diversion chamber and
Regulator B-1.
Regulator Q1 was similarly configured in the model, but the weir height was limited to 2-
feet because of space constraints. Regulator Q1 receives flow from four large sewers: a 7’-6” x
5’-6” sewer from the west, a 8’-0” x 7’-0” double barrel sewer from the north and a 7’-6” x 7’-0”
sewer from the east. All sewers converge at the Regulator. The confluence of the flows will
yield extremely turbulent conditions during wet weather which could jeopardize the function of
bending weirs. Reconstruction of sewers so as to combine all flows upstream of Regulator Q1 is
one proposed approach, in which flow will enter the bending weir facility from one direction that
will improve the performance and reliability of the bending weir mechanism. A description of
the various runs is presented in Table 7-8 and the results in Table 7-9.
The primary limitation to conveying additional flow through the Morgan Avenue
Interceptor is that the HGL cannot rise high enough before relief at regulator B-1 upstream
occurs. The interceptor itself can convey well over 200 MGD under surcharged conditions, but
because it is shallow, surcharging cannot occur without inducing upstream overflow and
flooding. Therefore, any collection system optimization scheme requires addressing this
limitation in the Morgan Avenue Interceptor. Modeling indicated that surface and basement
flooding at topographic low spots along the 72-inch trunk sewer on Morgan Ave would result
from the complete elimination of Regulator B1, rendering the option untenable. Consideration
was also given to raising the static weir one foot and installing the bending weirs on top of the
elevated weir crest. Runs 2 through 7 employed this approach (“BW(1)” in Table 7-8), whereas
Runs 8 through 11 reverted to installing the bending weir on the existing weir crest (“BW(2)”).
Runs 7 and 8 isolate the difference between these two approaches, resulting in only 13 MG of net
improvement on an annual basis. Considering that this option would not be approvable without
hydraulic neutrality (increasing the length of weir to compensate for a vertical height increase),
the limited CSO improvement that may be realized using this alternative approach does not
justify the increase in construction cost. Thus, of the two scenarios, Run 8 would be preferred.

New York City Department of Environmental Protection Waterbody/Watershed Facility Plan
Newtown Creek
7-52 June 2011
Table 7-8. Bending Weir Collection System Configurations Evaluated
Simulation Newtown Creek WWTP Outfall NCB-015 Outfall NCQ-077
Kent Ave
Throttling Run Capacity Control
Regulator
B-1 Weir Orifice
Dimensions Regulator
Q-1 Weir Orifice
Dimensions
-
585
WB/WS
Facility
Plan
Baseline
Existing existing existing existing none
1 620 Existing* El -4.79* 8ft x 3ft* El +2.83* 2ft x 2ft* none*
2 620 Existing* BW(1)
8ft x 3ft* El +2.83* 2ft x 2ft* none*
3 620 Existing* BW(1) 10ft x 3ft El +2.83* 2ft x 2ft* none*
4 700 Existing* BW(1) 10ft x 3ft El +2.83* 2ft x 2ft* none*
5 620 Existing* BW(1) 8ft x 3ft* El +2.83* 3.5ftx3.5ft none*
6 620 Existing* BW(1) 10ft x 3ft BW
(3) 3.5ftx3.5ft none*
7 700 Existing* BW(1) 10ft x 3ft BW
(3) 3.5ftx3.5ft none*
8 700 Existing* BW(2)
10ft x 3ft BW(3) 3.5ftx3.5ft none*
9 700 Optimized(4)
BW(2) 10ft x 3ft BW
(3) 3.5ftx3.5ft none*
10 700 Optimized(4) BW
(2) 10ft x 3ft BW(3) 3.5ftx3.5ft Yes
(5)
11 700 Optimized(4) BW
(2) 10ft x 3ft BW(3) 3.5ftx3.5ft Yes
(5)
Notes:
(1) 5-ft bending weir on top of static weir elevation increased by 1 ft to -3.79 ft;
(2) 5 ft bending weir on top of existing static weir (El -4.79 ft);
(3) 2-ft bending weir on top of existing static weir (El +2.83 ft);
(4) Gate closure at HGL in wet well 5 ft above existing to a minimum of 2.0 ft instead of existing 3.6 ft minimum
opening;
(5) Throttle limit 200 MGD;
(6) Throttle limit 100 MGD.
*Existing condition
After eliminating Run 7, the most promising remaining scenarios based on overall CSO
reduction from Baseline were Runs 8, 9, and 10. Each run sequentially adds an additional
control: Run 8 includes modifications to both regulators, Run 9 adds to this WPCP optimization,
and Run 10 adds the Kent Avenue 200 MGD throttling to Run 9. The throttling gate on the Kent
Avenue interceptor was expected to limit the contribution of flows from that interceptor and
allow more flow from the Morgan Avenue interceptor to reach the WPCP, thus reducing CSOs
to Newtown Creek. By comparing Runs 9 and 10, it is evident that it does reduce CSO to
Newtown Creek by 29 MG. However, this is offset by a 33 MG increase in CSO to the East
River, so that the CSO benefit from the throttling facility is limited to flow transference (i.e., no
net reduction is realized). Because of its better assimilative capacity than Newtown Creek, a
transfer of CSO to the East River may ultimately yield the greatest water quality benefit, but the
scale of the transfer in comparison to the total volume of CSO discharged to each waterbody
suggests that little to no measurable effect would occur. Thus, the throttling facility is not
justifiable from a water quality perspective even if it has an operational benefit. The last scenario
(Run 11) includes throttling to 100 MGD instead of 200 MGD, resulting in a relatively large
increase in CSO and suggesting caution when sizing such a facility.
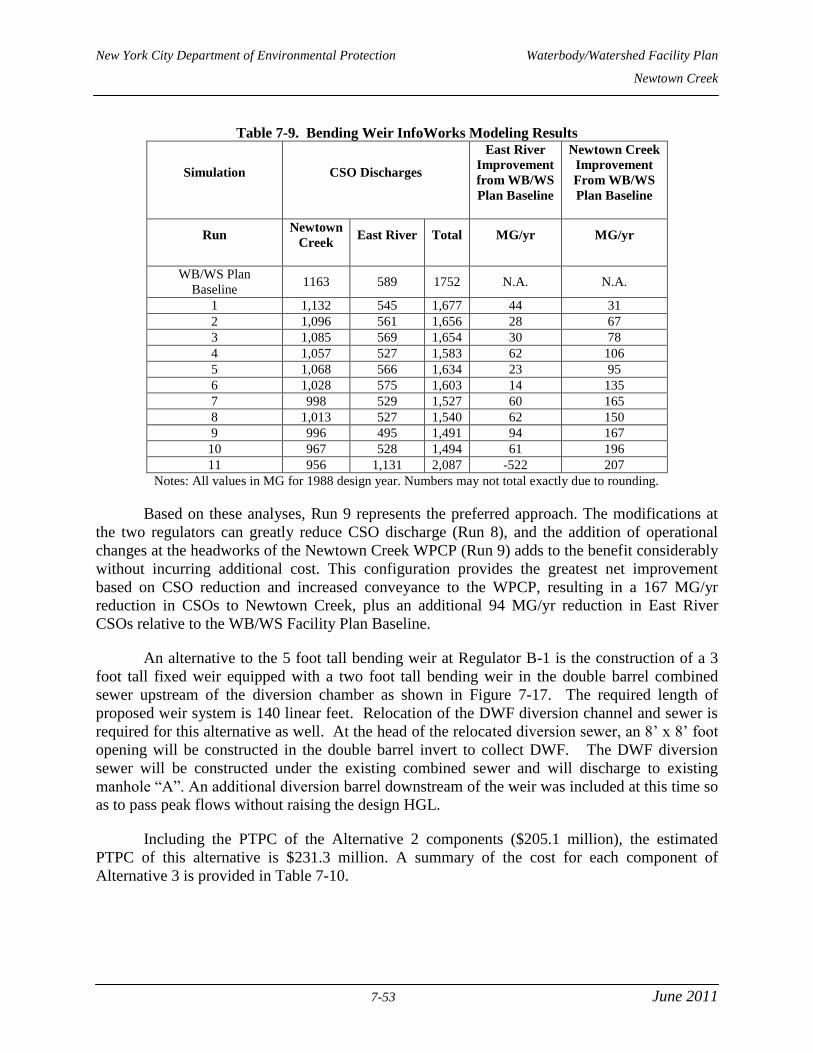
New York City Department of Environmental Protection Waterbody/Watershed Facility Plan
Newtown Creek
7-53 June 2011
Table 7-9. Bending Weir InfoWorks Modeling Results
Simulation CSO Discharges
East River
Improvement
from WB/WS
Plan Baseline
Newtown Creek
Improvement
From WB/WS
Plan Baseline
Run Newtown
Creek East River Total MG/yr MG/yr
WB/WS Plan
Baseline 1163 589 1752 N.A. N.A.
1 1,132 545 1,677 44 31
2 1,096 561 1,656 28 67
3 1,085 569 1,654 30 78
4 1,057 527 1,583 62 106
5 1,068 566 1,634 23 95
6 1,028 575 1,603 14 135
7 998 529 1,527 60 165
8 1,013 527 1,540 62 150
9 996 495 1,491 94 167
10 967 528 1,494 61 196
11 956 1,131 2,087 -522 207
Notes: All values in MG for 1988 design year. Numbers may not total exactly due to rounding.
Based on these analyses, Run 9 represents the preferred approach. The modifications at
the two regulators can greatly reduce CSO discharge (Run 8), and the addition of operational
changes at the headworks of the Newtown Creek WPCP (Run 9) adds to the benefit considerably
without incurring additional cost. This configuration provides the greatest net improvement
based on CSO reduction and increased conveyance to the WPCP, resulting in a 167 MG/yr
reduction in CSOs to Newtown Creek, plus an additional 94 MG/yr reduction in East River
CSOs relative to the WB/WS Facility Plan Baseline.
An alternative to the 5 foot tall bending weir at Regulator B-1 is the construction of a 3
foot tall fixed weir equipped with a two foot tall bending weir in the double barrel combined
sewer upstream of the diversion chamber as shown in Figure 7-17. The required length of
proposed weir system is 140 linear feet. Relocation of the DWF diversion channel and sewer is
required for this alternative as well. At the head of the relocated diversion sewer, an 8’ x 8’ foot
opening will be constructed in the double barrel invert to collect DWF. The DWF diversion
sewer will be constructed under the existing combined sewer and will discharge to existing
manhole “A”. An additional diversion barrel downstream of the weir was included at this time so
as to pass peak flows without raising the design HGL.
Including the PTPC of the Alternative 2 components ($205.1 million), the estimated
PTPC of this alternative is $231.3 million. A summary of the cost for each component of
Alternative 3 is provided in Table 7-10.
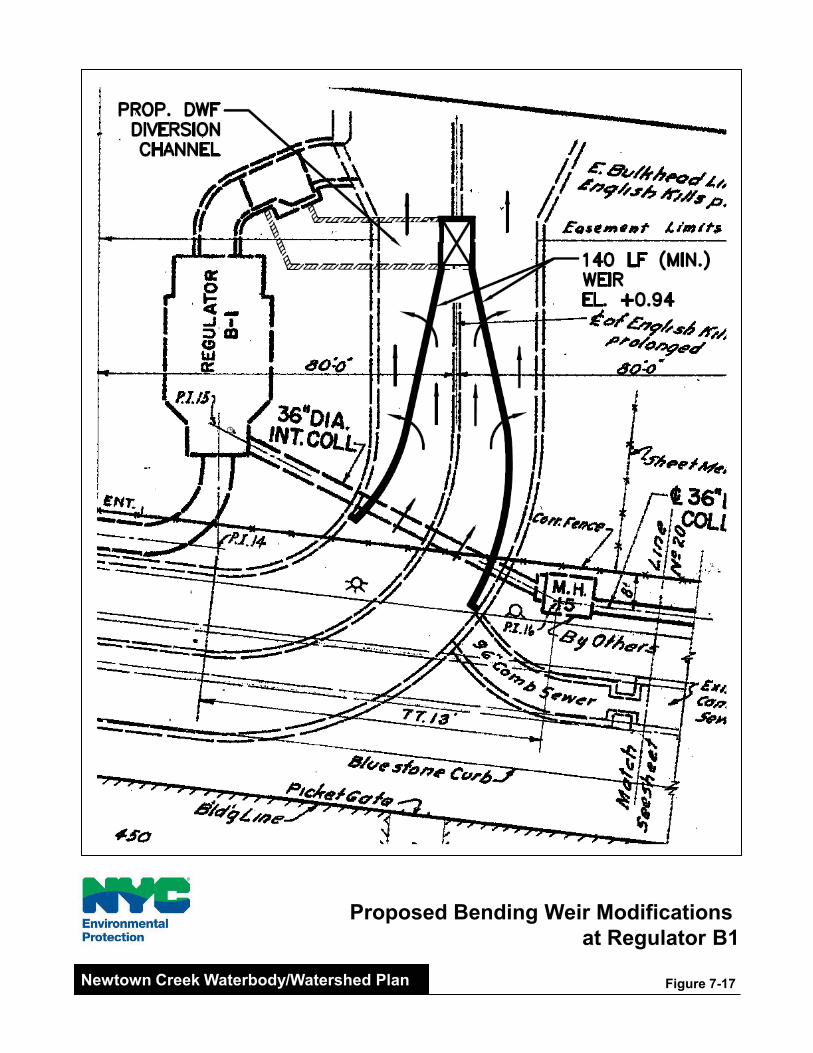
Proposed Bending Weir Modifications at Regulator B1
Figure 7-17Newtown Creek Waterbody/Watershed Plan

New York City Department of Environmental Protection Waterbody/Watershed Facility Plan
Newtown Creek
7-55 June 2011
Table 7-10. Summary of Alternative 3 Component PTPC ($ Million)
Floatables Control at NCB-015, NCB-083, NCQ-077, &
BBL-026
$89.8
Enhanced Aeration System $115.3
Bending Weirs at Regulators B1 and Q1 $26.2
Total $231.3
7.3.5. Alternative 4: Alternative 3 and Dutch Kills Relief Sewer
This alternative combines the elements of Alternative 3 and a Dutch Kills relief sewer
and corresponding weir modifications to further reduce CSOs discharging to Newtown Creek.
The relief sewer and weir modification elements are intended to reduce CSO discharges to Dutch
Kills, which was not addressed under the 2003 CSO Facility Plan, by modifying the collection
system upstream of the two outfalls BBL-009 and BBL-026. These outfalls contribute the two
largest Baseline CSO discharge volumes to Dutch Kills. The modifications include raising the
weir in Regulator BB-L3B that discharges through outfall BBL-009, disconnecting the upstream
end of a 39-inch diameter sewer from Regulator BB-L39 that currently discharges to sewers
upstream of outfall BBL-026, and constructing a new 72-inch relief sewer in its place to convey
flows to Regulator BBL-018. According to modeling results, 72 inches is the minimum diameter
required to prevent surcharging of the sewer during the 1988 precipitation year. A drainage plan
analysis was performed to determine the corresponding increase in weir length required at
Regulator L3B, such that the higher weir elevation does not increase the design water surface
elevation in the upstream sewers. Through this analysis it was determined that the tide gates act
as an orifice at the design water surface elevation of 5.8 QSD, which is nearly 3 feet above the
tide gate openings. Because of this configuration, the lip of the tide gate openings can be shifted
upward, and this effectively increases the discharge weir elevation with no corresponding
lengthening for all upstream water surface elevations where the tide gates are not submerged. It
is proposed to increase the elevation of the tide gate lip from 0.0 QSD to 1.25 QSD, while
increasing the height of the tide gates from 3’0” to 3’-11”, so that there will be no change in the
design water surface elevation. Figure 7-18 shows the locations of Regulators BB-L3B, L39,
and L18, as well as the proposed route of the relief sewer.
Construction of the Dutch Kills Relief Sewer is not without its challenges. Problems
exist in crossing the LIRR/Amtrak rail yard, the Jackson Avenue subway, the MTA vent
structure and utilities that will be necessary to construct the relief sewer with a positive slope
towards the East River. Additionally, geotechnical issues for supporting the sewer will need to be
resolved as it may affect adjacent structure and highway foundations. Such issues and challenges
have engineering solutions which would be addressed fully during design.
The probable total project cost of these regulator modifications and the relief sewer is
$94.7 million. The regulator modifications and the addition of a 72-inch relief sewer reduces
the annual average CSO volume to Dutch Kills by 28% without increasing overflows to the East
River and thus achieves a nearly 6% reduction in total overflows from the Bowery Bay low level
collection system. Including the PTPC of the Alternative 3 components ($231.3 million), the
estimated PTPC of this alternative is $326 million. A summary of the cost for each component
of Alternative 4 is provided in Table 7-11.
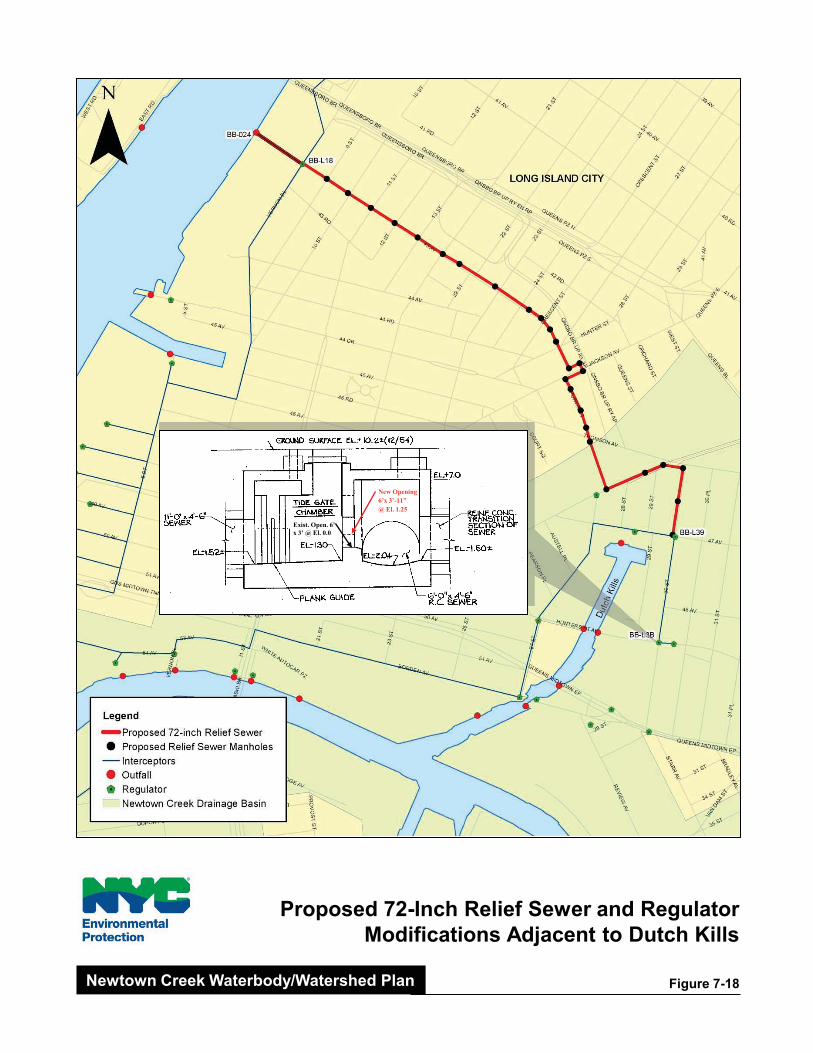
Proposed 72-Inch Relief Sewer and RegulatorModifications Adjacent to Dutch Kills
Figure 7-18Newtown Creek Waterbody/Watershed Plan
BB-L3BBB-L3B
New Opening6’x 3’-11”@ El. 1.25
Exist. Open. 6’ x 3’ @ El. 0.0

New York City Department of Environmental Protection Waterbody/Watershed Facility Plan
Newtown Creek
7-57 June 2011
Table 7-11. Summary of Alternative 4 Component PTPC ($ Million)
Floatables Control at NCB-015, NCB-083, NCQ-077, &
BBL-026
$89.8
Enhanced Aeration System $115.3
Bending Weirs at Regulators B1 and Q1 $26.2
Dutch Kills Relief Sewer $94.7
Total $326.0
7.3.6. Alternative 5: Alternative 2, St. Nicholas Relief Sewer, and Inflatable Dams
This alternative includes the elements of Alternative 2 in addition to a St. Nicholas Relief
Sewer larger than the one proposed in the CSO Facility Plan and inflatable dams installed
downstream of Regulator B1. It was determined through modeling that adding additional
capacity via a 36-inch relief sewer to redirect flows from outfall NCB-083 to Regulator NC-B1
reduces overflows to the entire Newtown Creek waterbody, and more substantially to East
Branch. Increasing the size of the relief sewer to 48-inches further reduces flow to East Branch
by 1 million gallons during the largest storm in the typical year and increases the flow to the
plant by over 500,000 gallons during that same event. The probable total project cost of
installing a 48-inch relief sewer is $17.0 million.
As discussed in Section 7.3.2, through a drainage plan analysis it was determined that
raising the weir to the elevation proposed by the 2003 CSO Facility Plan would require over 400
linear feet of weir length, and therefore raising this weir is no longer considered a feasible
option. However, there remains benefit in increasing the flow through cross-sectional area of the
sluice gates in Regulator B1, which would lower the downstream headloss in the diversion and
consequently the water surface upstream of the weir. The probable total project cost of enlarging
the sluice gate openings as proposed in the 2003 CSO Facility Plan is $2.7 million.
As noted, the physical configuration required in Regulator B1 to pass the design flows
without adversely impacting upstream hydraulic conditions is impractical. Therefore,
Alternative 5 includes the installation of two inflatable dams in the double barrel outfall
downstream of Regulator B1 as an alternative to raising the weir height. These inflatable dams
would close off the outfall during smaller rainfall events, which would back up the system and
drive more flow to the Newtown Creek WWTP for treatment. The dams were modeled to deflate
when the upstream water surface elevation increased beyond 1.06 BHD, which is less than the
current design water surface elevation of 2.74 BHD. After a storm event, the stored volume
would drain by gravity to Regulator B-1. The probable total project cost for the inflatable dams
is $10.3 million. Including the PTPC of the Alternative 2 components ($205.1 million), the
estimated PTPC of this alternative is $235.1 million. A summary of the cost for each component
of Alternative 5 is provided in Table 7-12.
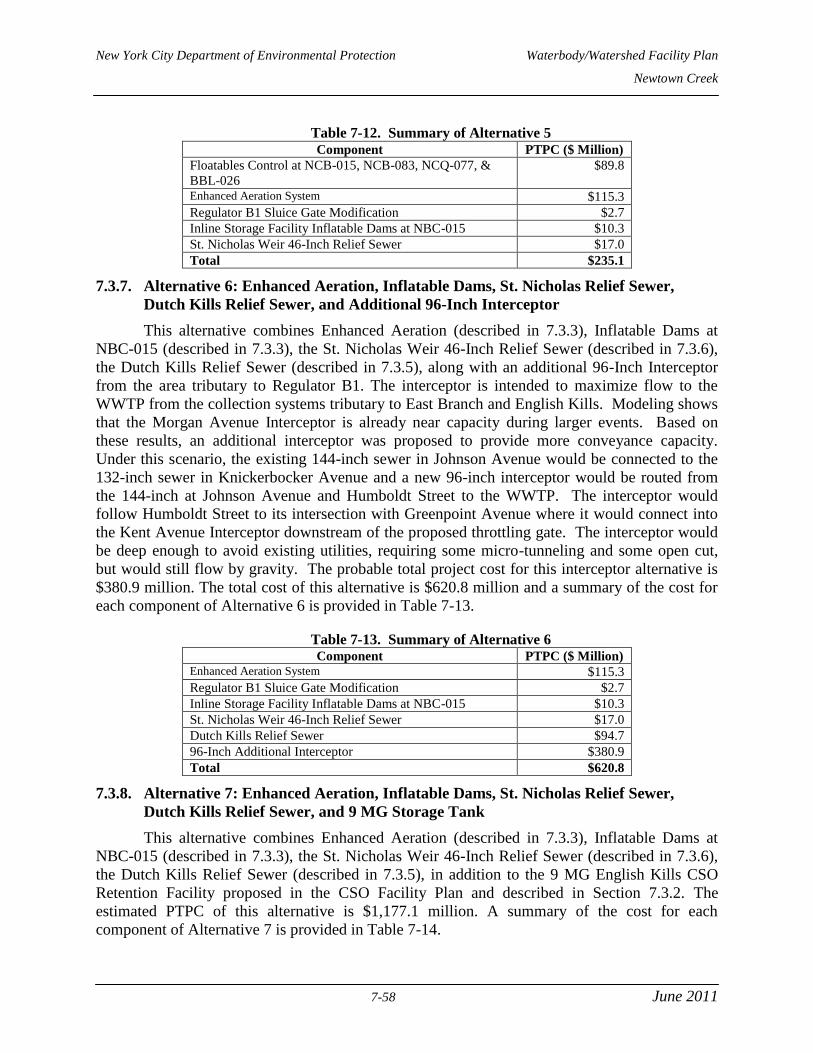
New York City Department of Environmental Protection Waterbody/Watershed Facility Plan
Newtown Creek
7-58 June 2011
Table 7-12. Summary of Alternative 5 Component PTPC ($ Million)
Floatables Control at NCB-015, NCB-083, NCQ-077, &
BBL-026
$89.8
Enhanced Aeration System $115.3
Regulator B1 Sluice Gate Modification $2.7
Inline Storage Facility Inflatable Dams at NBC-015 $10.3
St. Nicholas Weir 46-Inch Relief Sewer $17.0
Total $235.1
7.3.7. Alternative 6: Enhanced Aeration, Inflatable Dams, St. Nicholas Relief Sewer,
Dutch Kills Relief Sewer, and Additional 96-Inch Interceptor
This alternative combines Enhanced Aeration (described in 7.3.3), Inflatable Dams at
NBC-015 (described in 7.3.3), the St. Nicholas Weir 46-Inch Relief Sewer (described in 7.3.6),
the Dutch Kills Relief Sewer (described in 7.3.5), along with an additional 96-Inch Interceptor
from the area tributary to Regulator B1. The interceptor is intended to maximize flow to the
WWTP from the collection systems tributary to East Branch and English Kills. Modeling shows
that the Morgan Avenue Interceptor is already near capacity during larger events. Based on
these results, an additional interceptor was proposed to provide more conveyance capacity.
Under this scenario, the existing 144-inch sewer in Johnson Avenue would be connected to the
132-inch sewer in Knickerbocker Avenue and a new 96-inch interceptor would be routed from
the 144-inch at Johnson Avenue and Humboldt Street to the WWTP. The interceptor would
follow Humboldt Street to its intersection with Greenpoint Avenue where it would connect into
the Kent Avenue Interceptor downstream of the proposed throttling gate. The interceptor would
be deep enough to avoid existing utilities, requiring some micro-tunneling and some open cut,
but would still flow by gravity. The probable total project cost for this interceptor alternative is
$380.9 million. The total cost of this alternative is $620.8 million and a summary of the cost for
each component of Alternative 6 is provided in Table 7-13.
Table 7-13. Summary of Alternative 6 Component PTPC ($ Million)
Enhanced Aeration System $115.3
Regulator B1 Sluice Gate Modification $2.7
Inline Storage Facility Inflatable Dams at NBC-015 $10.3
St. Nicholas Weir 46-Inch Relief Sewer $17.0
Dutch Kills Relief Sewer $94.7
96-Inch Additional Interceptor $380.9
Total $620.8
7.3.8. Alternative 7: Enhanced Aeration, Inflatable Dams, St. Nicholas Relief Sewer,
Dutch Kills Relief Sewer, and 9 MG Storage Tank
This alternative combines Enhanced Aeration (described in 7.3.3), Inflatable Dams at
NBC-015 (described in 7.3.3), the St. Nicholas Weir 46-Inch Relief Sewer (described in 7.3.6),
the Dutch Kills Relief Sewer (described in 7.3.5), in addition to the 9 MG English Kills CSO
Retention Facility proposed in the CSO Facility Plan and described in Section 7.3.2. The
estimated PTPC of this alternative is $1,177.1 million. A summary of the cost for each
component of Alternative 7 is provided in Table 7-14.

New York City Department of Environmental Protection Waterbody/Watershed Facility Plan
Newtown Creek
7-59 June 2011
Table 7-14. Summary of Alternative 7 Component PTPC ($ Million)
Enhanced Aeration System $115.3
Regulator B1 Sluice Gate Modification $2.7
Inline Storage Facility Inflatable Dams at NBC-015 $10.3
St. Nicholas Weir 46-Inch Relief Sewer $17.0
Dutch Kills Relief Sewer $94.7
English Kills 9 MG CSO Retention Facility $556.3
Total $796.2
7.3.9. Alternatives 8-11 and 100% Reduction Alternative: CSO Capture Tunnels
As noted above, offline capture of CSO can provide a relatively constant flow into the
treatment plant and thus reduce the size of treatment facilities required. However, considering
the highly congested urban area surrounding Newtown Creek, land requirements, traffic
disruptions, and associated costs would prohibit storage pipeline or retention basin alternatives
extensive enough to have a large impact on reducing CSO volumes to Newtown Creek.
Therefore, CSO capture tunnels are considered the only viable off-line storage alternative that
could be implemented on a large enough scale to beneficially impact water quality through
abatement of CSO from some of Newtown Creek’s 23 CSO outfalls, which are spread
throughout the waterbody.
CSO capture tunnels can target specific outfalls throughout the waterbody. Outfalls
captured by the tunnel concepts discussed below were selected based on their baseline annual
volume, their location within the waterbody, and their proximity to other outfalls. Ten different
tunnel concepts, spanning a wide range of both cost and annual percent CSO reduction, were
simulated and evaluated. Alternative tunnel layouts were then devised to cost effectively target
the most critical outfalls, while providing for the analysis of a range of capture (33%, 55%, 76%,
78%, 95%, 98%, 99%, and 100%) consistent with Federal CSO Policy. These alternatives
capture flow from some or all of the outfalls discharging to Newtown Creek, targeting both
localized water quality issues and volume reductions. Each tunnel alternative is described below
(Dawn, 2006), and the outfalls that are addressed are highlighted in Table 7-15.
1. A 101.5 MG CSO Capture Tunnel – This alternative would capture all of the CSO
discharged from the two largest outfalls in the watershed (English Kills outfall NCB-
015, East Branch outfall NCB-083), as well as the three largest outfalls discharging to
Dutch Kills (outfalls BBL-026, BBL-009, and BBL-042), during the typical year.
The proposed tunnel diameter, routing, drop shafts locations, and pumping station site
are shown in Figure 7-19. The pumping station shaft would be located in Block
2585, which is currently used as a parking lot for Newtown Creek WWTP employees.
The probable total project cost for this tunnel layout is $2,482.7 million. The
pumping station shaft and associated odor control facility for this tunnel would be
located adjacent to the Newtown Creek WWTP. Dewatering would be initiated 12
hours after an event ends, and the tunnel would be dewatered to the Morgan Avenue
Interceptor just upstream of its junction with the Kent Avenue Interceptor within 24
hours based on having available capacity at the WWTP.
New York City Department of Environmental Protection Waterbody/Watershed Facility Plan
Newtown Creek
7-60 June 2011
2. A 128 MG CSO Capture Tunnel – This alternative would capture all of the CSO
discharged from the outfalls picked up under the 101.5 MG tunnel, as well as the all
of the typical year discharges from Maspeth Creek outfall NCQ-077, and from outfall
NCQ-029 near the mouth of Maspeth Creek. The proposed tunnel diameter, routing,
drop shafts locations, and pumping station site are shown in Figure 7-20. The
probable total project cost for this tunnel layout is $2,849.0 million. The locations of
the tunnel pumping station and shaft, and the dewatering point would be the same as
for the 101.5 MG tunnel.
3. A 132.5 MG CSO Capture Tunnel – This alternative would capture all of the CSO
discharged from the 10 outfalls with the largest baseline annual overflow volumes. It
includes all outfalls picked up under the 128 MG tunnel, as well as the all of the
typical year discharges from Newtown Creek Outfalls BBL-013, BBL-043, and NCB-
022. The proposed tunnel diameter, routing, drop shafts locations and pumping
station site are shown in Figure 7-21. The probable total project cost for this tunnel
layout is $2,885.2 million. The locations of the tunnel pumping station and shaft, and
the dewatering point would be the same as for the 101.5 MG tunnel.
4. A 145 MG CSO Capture Tunnel and Modifications to Regulator BB-L4 – This
alternative would capture all of the CSO discharged from the outfalls picked up under
the 128 MG tunnel, except NCQ-029. Additionally, under this alternative the outfall
for Regulator BB-L4 would be bulkheaded downstream of the tunnel connection and
the regulator modified to lower the overflow elevation and remove the tide gates.
This configuration would allow more flow to enter the tunnel at this location, and
consequently reduce overflows at other upstream and downstream outfalls that are not
captured by the tunnel. The proposed tunnel diameter, routing, drop shafts locations
and pumping station site are shown in Figure 7-22. The probable total project cost for
this tunnel layout is $2,983.8 million. As with the other alternatives discussed above,
the locations of the pumping station and shaft and the dewatering point would be the
same as for the 101.5 MG tunnel.
5. A 107 MG CSO Capture Tunnel – This alternative would capture all of the CSO
discharged from the 3 outfalls with the largest baseline annual overflow volumes
during the typical year; English Kills outfall NCB-015, East Branch outfall NCB-083,
and Maspeth Creek outfall NCQ-077. The pumping station would be located at the
corner of Johnson and Morgan Avenues, the preferred site of the CSO storage tank
proposed under the 2003 CSO Facility Plan and would dewater to the Morgan
Avenue Interceptor for conveyance to the Newtown Creek WWTP. This site is Block
2974, Lot 170. It is owned by Berry Bridge Inc. and is currently used by Fedex and
other businesses. The proposed tunnel diameter, routing, drop shafts locations and
pumping station site are shown in Figure 7-23. The probable total project cost for this
tunnel layout is $2,148.2 million.
6. A 72 MG CSO Capture Tunnel and HRPCT Facility – This alternative also provides
for 100% capture of the typical year overflow from the three largest outfalls, except
that the pumping station will discharge to a high rate physical chemical treatment
(HRPCT) facility located on the same site as the pump station, which would then
New York City Department of Environmental Protection Waterbody/Watershed Facility Plan
Newtown Creek
7-61 June 2011
discharge to the head end of English Kills. Such a configuration would allow
dewatering of the tunnel to be independent of the availably capacity at the Newtown
Creek WWTP. As such, dewatering could start at the onset of a capture event and run
throughout the event until the event is over and the tunnel fully dewatered. This
configuration thus reduces the required tunnel volume or the required HRPCT
capacity that would otherwise be required by either of these stand-alone technologies.
7. The proposed tunnel diameter, routing, drop shafts locations and pumping station site
are shown in Figure 7-24. The probable total project cost for this tunnel layout and
72 MGD HRPCT facility is $2,167.7 million.
8. A 40 MG CSO Capture Tunnel – This alternative would pick up 70% of the baseline
annual overflow volume from the 3 outfalls with the largest baseline annual overflow
volumes during the typical year. By limiting the total capture volume to 70%, this
alternative provides for a more efficient use of the tunnel storage volume while still
significantly reducing the overflow volume to the head end of Newtown Creek. As
with the 107 MG tunnel, the dewatering pumping station would be sited on the site at
the intersection of Morgan and Johnson Avenues, and would discharge to the Morgan
Avenue Interceptor for conveyance to the Newtown Creek WWTP. The proposed
tunnel diameter, routing, drop shafts locations and pumping station site are shown in
Figure 7-25. The probable total project cost for this tunnel layout is $1,470.0 million.
Dewatering would still be initiated 12 hours after an event ends, and be completed
within 24 hours based on having available capacity at the WWTP.
9. A 24.5 MG CSO Capture Tunnel and HRPCT Facility – This alternative provides the
same capture level as the 40 MG tunnel, from the same three outfalls, but it
discharges though a HRPCT facility to English Kills. The proposed tunnel diameter,
routing, drop shafts locations and pumping station site are shown in Figure 7-26. The
probable total project cost for this tunnel layout and 24.5 MGD HRPCT facility is
$1,334.1 million.
10. A 19 MG CSO Capture Tunnel – This alternative would pick up approximately 33%
of the baseline annual overflow volume from the 3 outfalls with the largest baseline
annual overflow volumes during the typical year. However, it is envisioned that this
tunnel would be used in conjunction with another CSO abatement alternative such as
the additional interceptor, where it would capture nearly 60% of the remaining annual
flow to those outfalls. The probable total project cost for this tunnel layout is
$1,174.9 million. The routing, drop shafts, pumping station, and the dewatering point
would be the same as for the 40 MG tunnel.
11. 100% Capture Tunnel – This alternative is a 134 MG CSO capture tunnel that would
capture 100% of the CSO projected to discharge in a typical year. The proposed
tunnel diameter, routing, drop shafts locations, and pumping station site are shown in
Figure 7-27. The probable total project cost for this tunnel layout is $3,019.5 million.
The locations of the tunnel pumping station and shaft, and the dewatering point would
be the same as for the 101.5 MG tunnel.
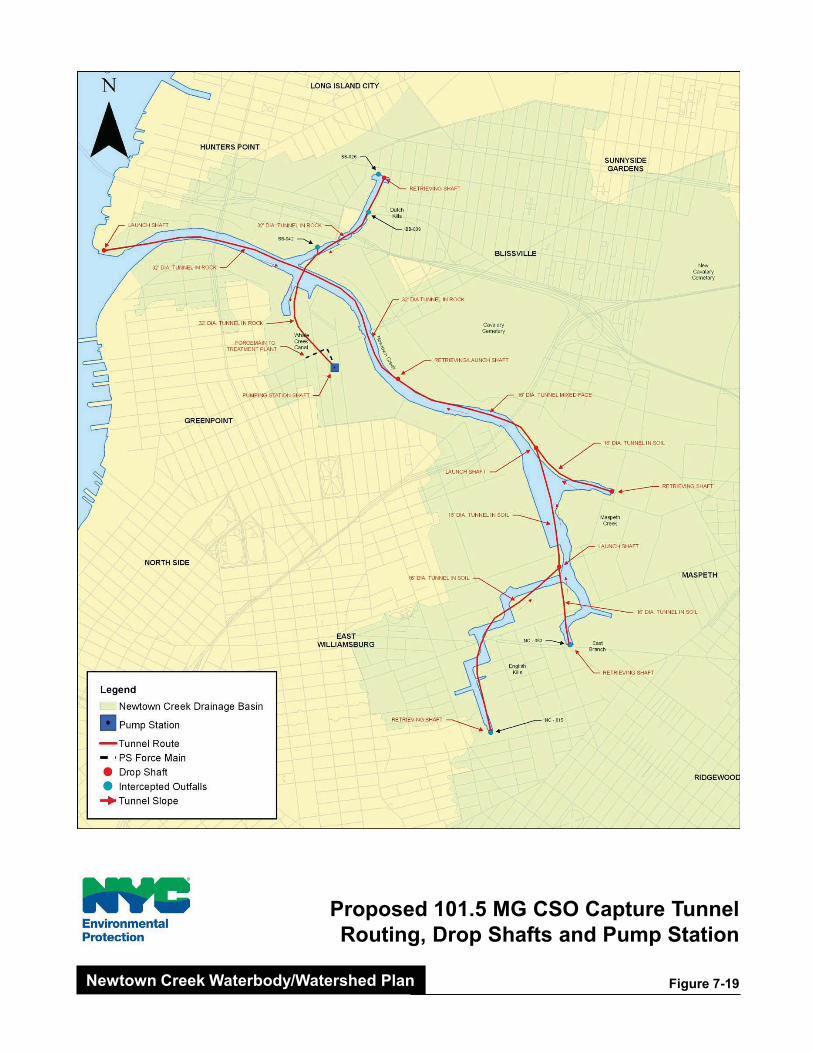
Proposed 101.5 MG CSO Capture TunnelRouting, Drop Shafts and Pump Station
Figure 7-19Newtown Creek Waterbody/Watershed Plan

Proposed 128 MG CSO Capture TunnelRouting, Drop Shafts and Pump Station
Figure 7-20Newtown Creek Waterbody/Watershed Plan
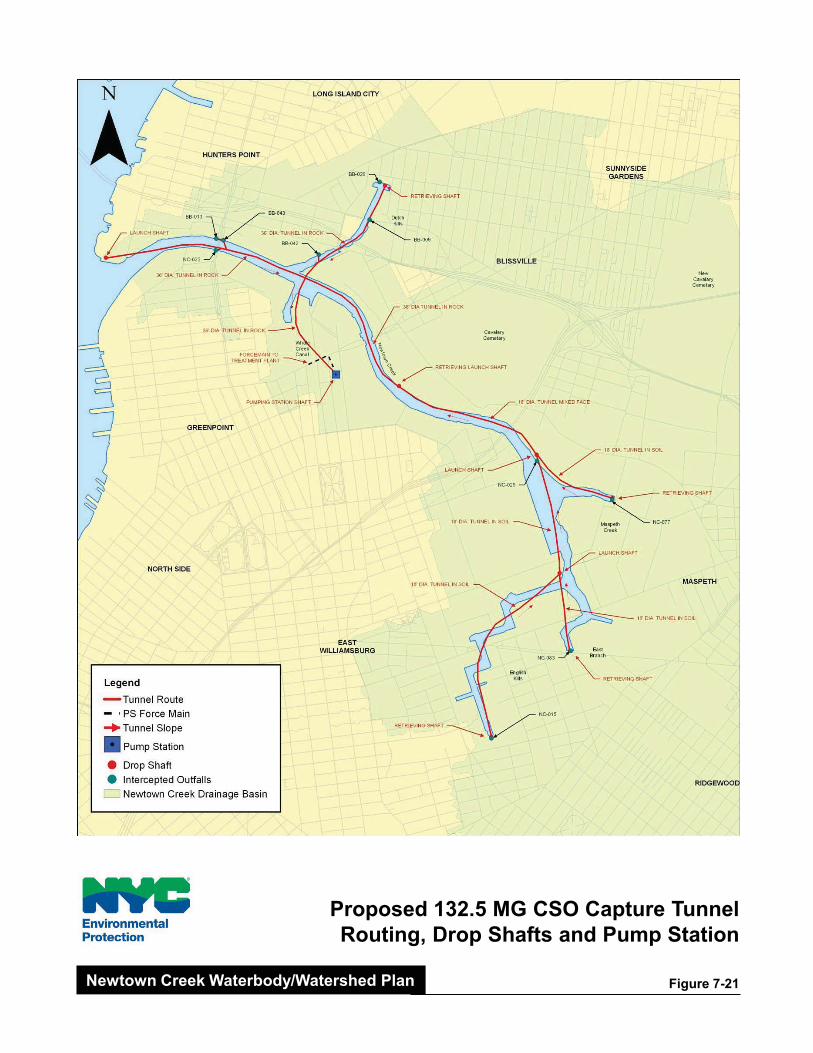
Proposed 132.5 MG CSO Capture TunnelRouting, Drop Shafts and Pump Station
Figure 7-21Newtown Creek Waterbody/Watershed Plan
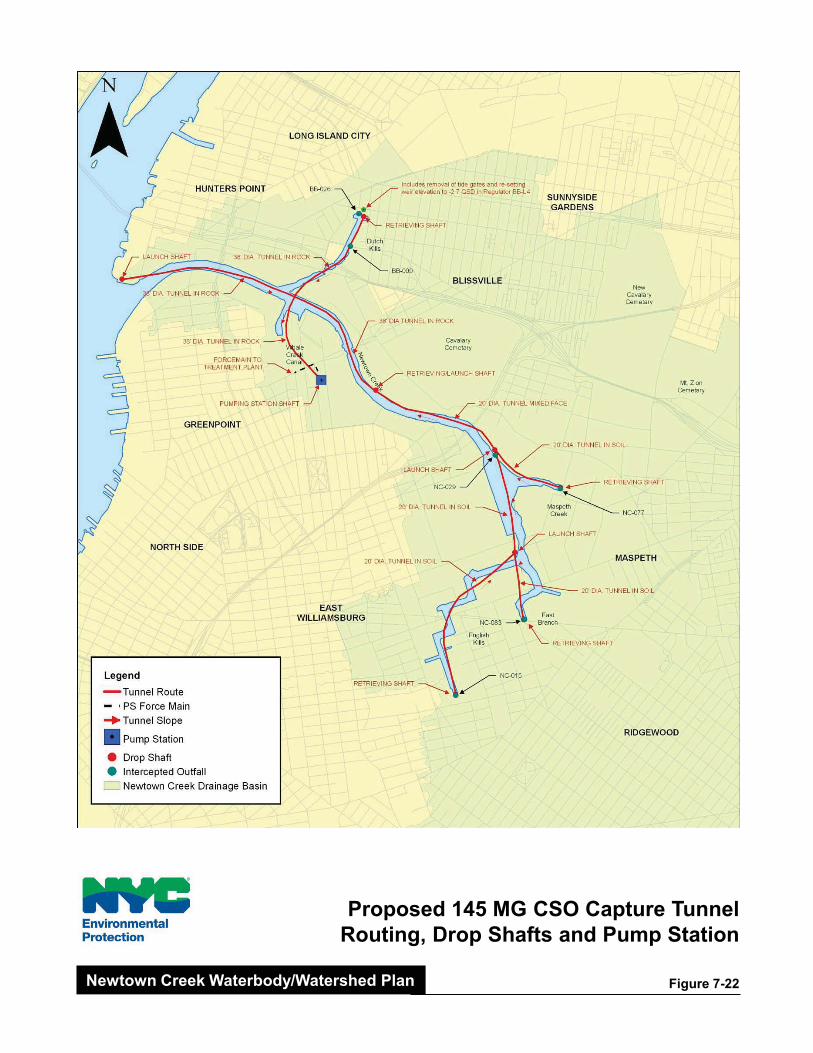
Proposed 145 MG CSO Capture TunnelRouting, Drop Shafts and Pump Station
Figure 7-22Newtown Creek Waterbody/Watershed Plan

Proposed 107 MG CSO Capture TunnelRouting, Drop Shafts and Pump Station
Figure 7-23Newtown Creek Waterbody/Watershed Plan
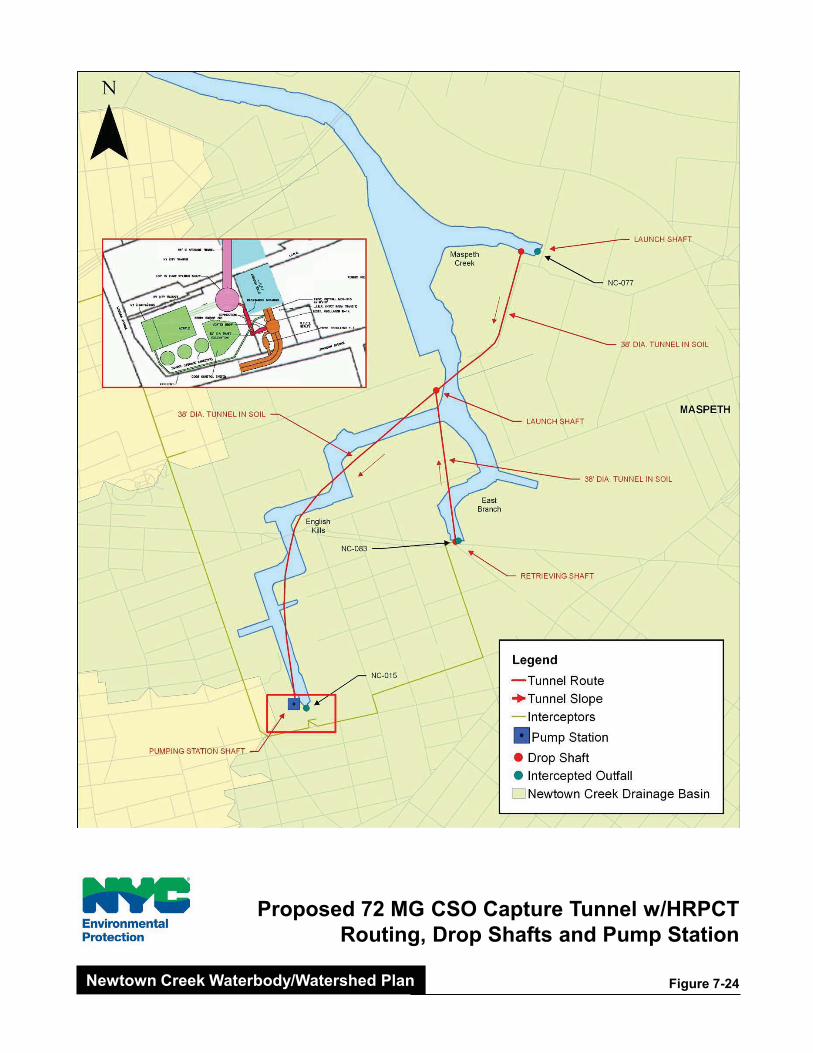
Proposed 72 MG CSO Capture Tunnel w/HRPCTRouting, Drop Shafts and Pump Station
Figure 7-24Newtown Creek Waterbody/Watershed Plan
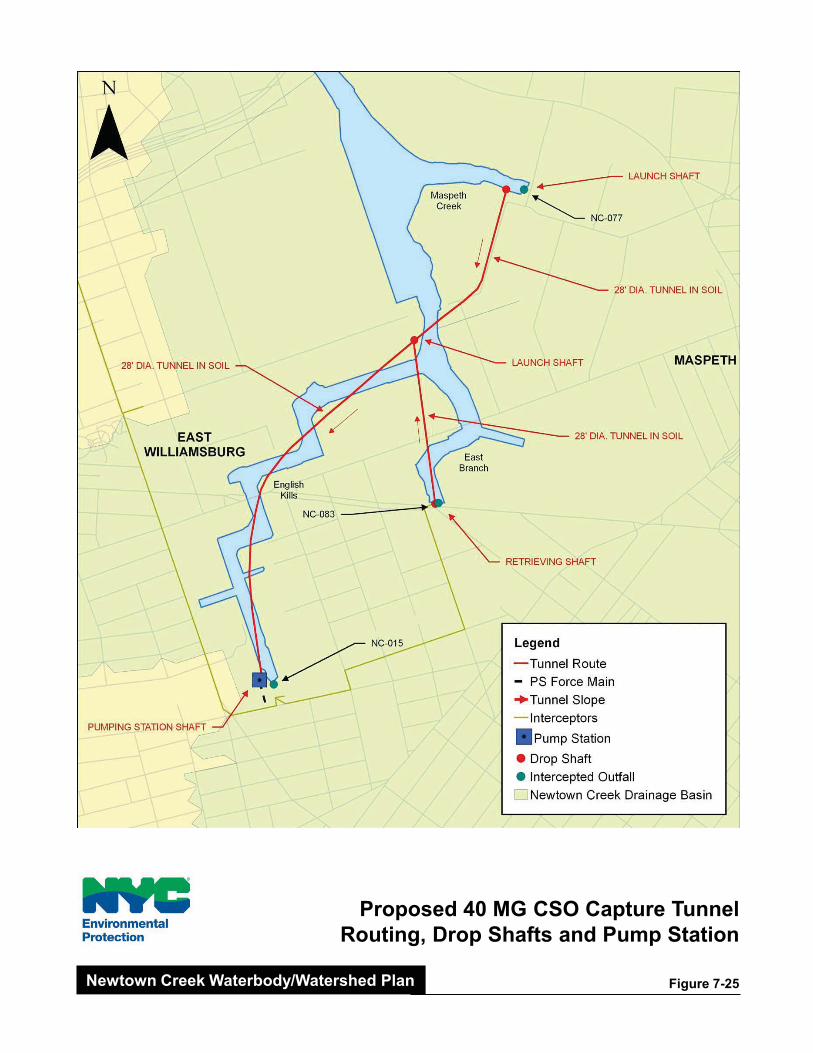
Proposed 40 MG CSO Capture TunnelRouting, Drop Shafts and Pump Station
Figure 7-25Newtown Creek Waterbody/Watershed Plan
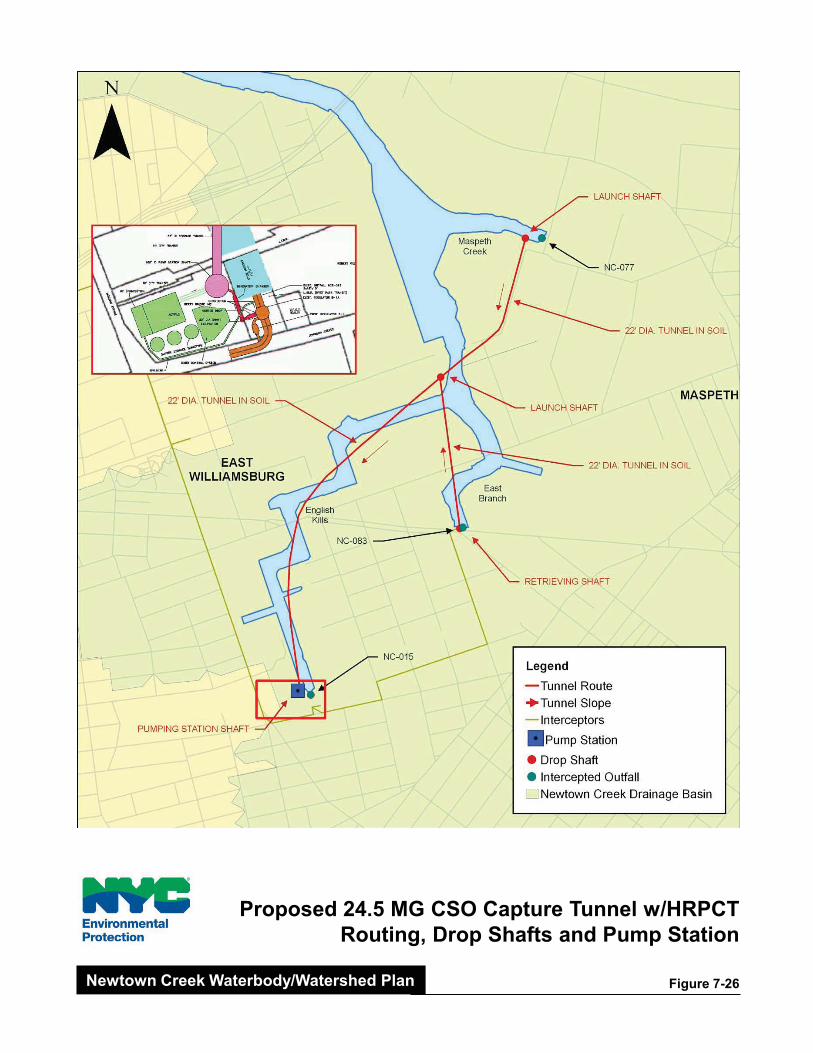
Proposed 24.5 MG CSO Capture Tunnel w/HRPCTRouting, Drop Shafts and Pump Station
Figure 7-26Newtown Creek Waterbody/Watershed Plan
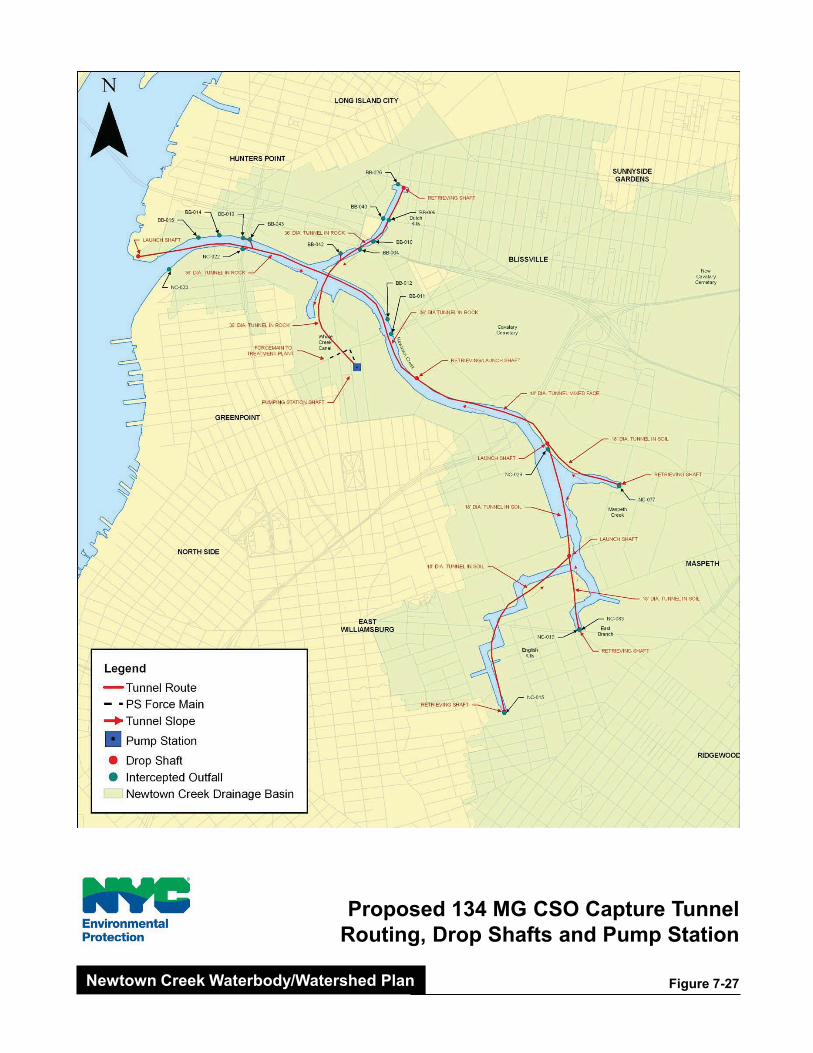
Proposed 134 MG CSO Capture TunnelRouting, Drop Shafts and Pump Station
Figure 7-27Newtown Creek Waterbody/Watershed Plan
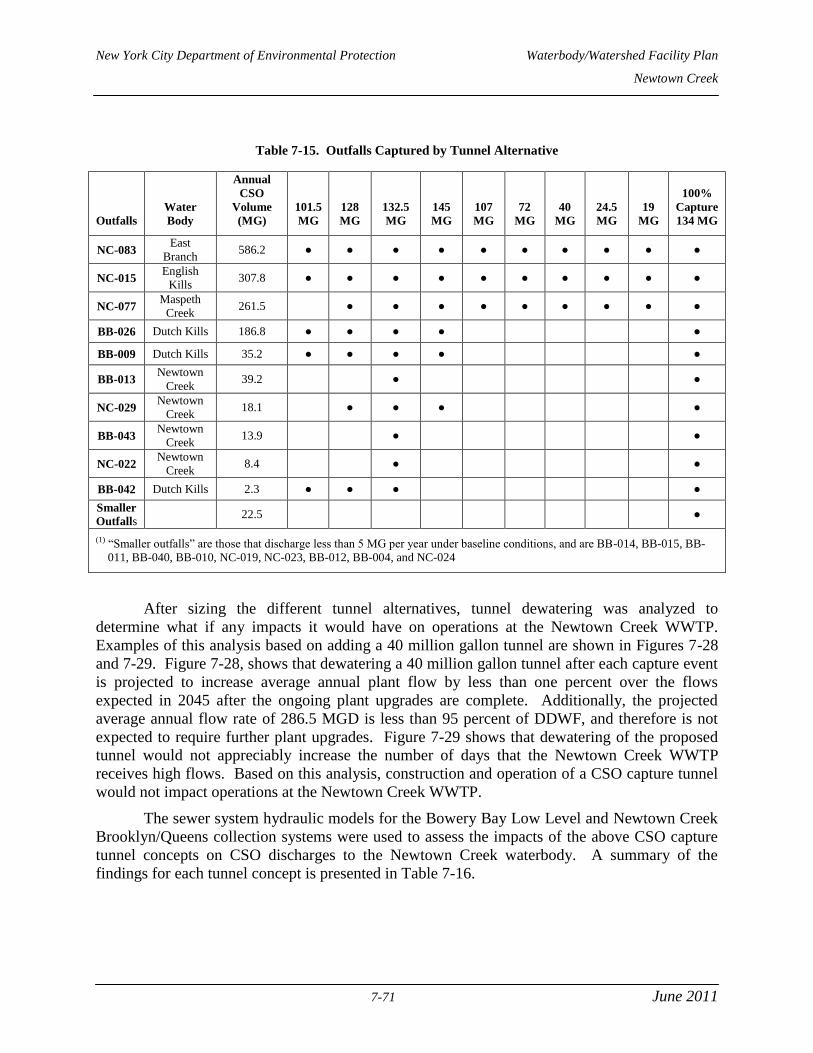
New York City Department of Environmental Protection Waterbody/Watershed Facility Plan
Newtown Creek
7-71 June 2011
Table 7-15. Outfalls Captured by Tunnel Alternative
Outfalls
Water
Body
Annual
CSO
Volume
(MG)
101.5
MG
128
MG
132.5
MG
145
MG
107
MG
72
MG
40
MG
24.5
MG
19
MG
100%
Capture
134 MG
NC-083 East
Branch 586.2 ● ● ● ● ● ● ● ● ● ●
NC-015 English
Kills 307.8 ● ● ● ● ● ● ● ● ● ●
NC-077 Maspeth
Creek 261.5 ● ● ● ● ● ● ● ● ●
BB-026 Dutch Kills 186.8 ● ● ● ● ●
BB-009 Dutch Kills 35.2 ● ● ● ● ●
BB-013 Newtown
Creek 39.2 ● ●
NC-029 Newtown
Creek 18.1 ● ● ● ●
BB-043 Newtown
Creek 13.9 ● ●
NC-022 Newtown
Creek 8.4 ● ●
BB-042 Dutch Kills 2.3 ● ● ● ●
Smaller
Outfalls 22.5 ●
(1) “Smaller outfalls” are those that discharge less than 5 MG per year under baseline conditions, and are BB-014, BB-015, BB-
011, BB-040, BB-010, NC-019, NC-023, BB-012, BB-004, and NC-024
After sizing the different tunnel alternatives, tunnel dewatering was analyzed to
determine what if any impacts it would have on operations at the Newtown Creek WWTP.
Examples of this analysis based on adding a 40 million gallon tunnel are shown in Figures 7-28
and 7-29. Figure 7-28, shows that dewatering a 40 million gallon tunnel after each capture event
is projected to increase average annual plant flow by less than one percent over the flows
expected in 2045 after the ongoing plant upgrades are complete. Additionally, the projected
average annual flow rate of 286.5 MGD is less than 95 percent of DDWF, and therefore is not
expected to require further plant upgrades. Figure 7-29 shows that dewatering of the proposed
tunnel would not appreciably increase the number of days that the Newtown Creek WWTP
receives high flows. Based on this analysis, construction and operation of a CSO capture tunnel
would not impact operations at the Newtown Creek WWTP.
The sewer system hydraulic models for the Bowery Bay Low Level and Newtown Creek
Brooklyn/Queens collection systems were used to assess the impacts of the above CSO capture
tunnel concepts on CSO discharges to the Newtown Creek waterbody. A summary of the
findings for each tunnel concept is presented in Table 7-16.
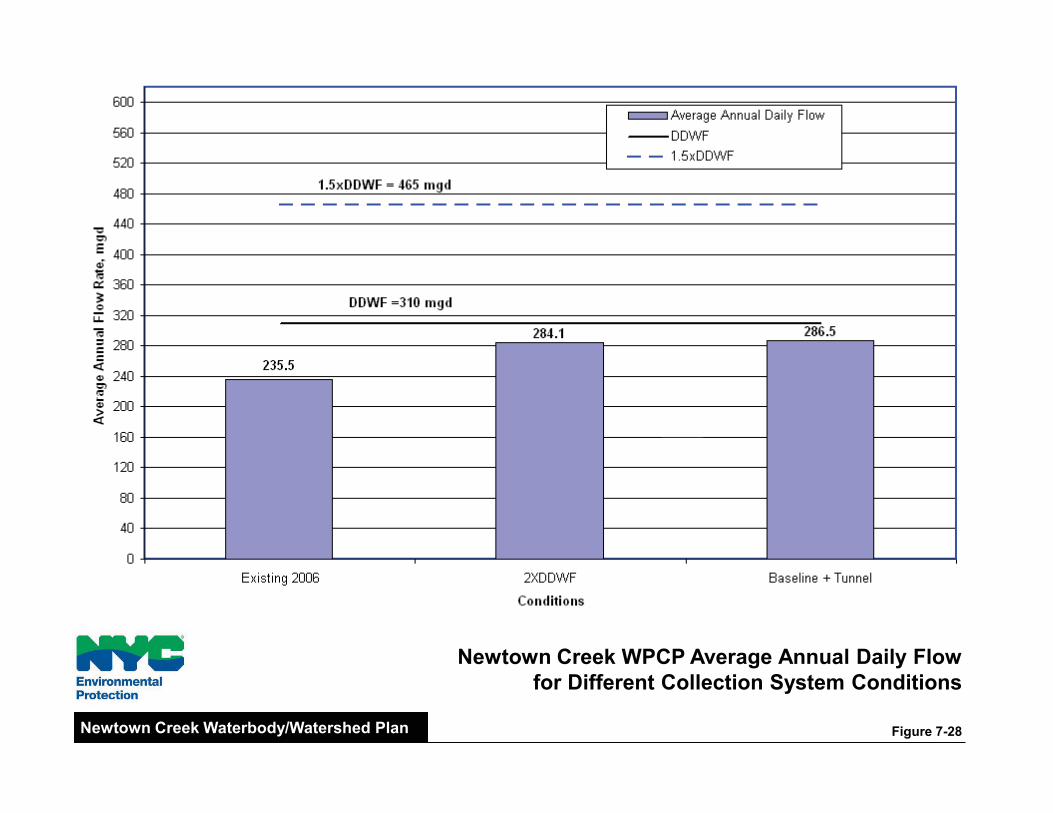
Newtown Creek WPCP Average Annual Daily Flowfor Different Collection System Conditions
Figure 7-28Newtown Creek Waterbody/Watershed Plan
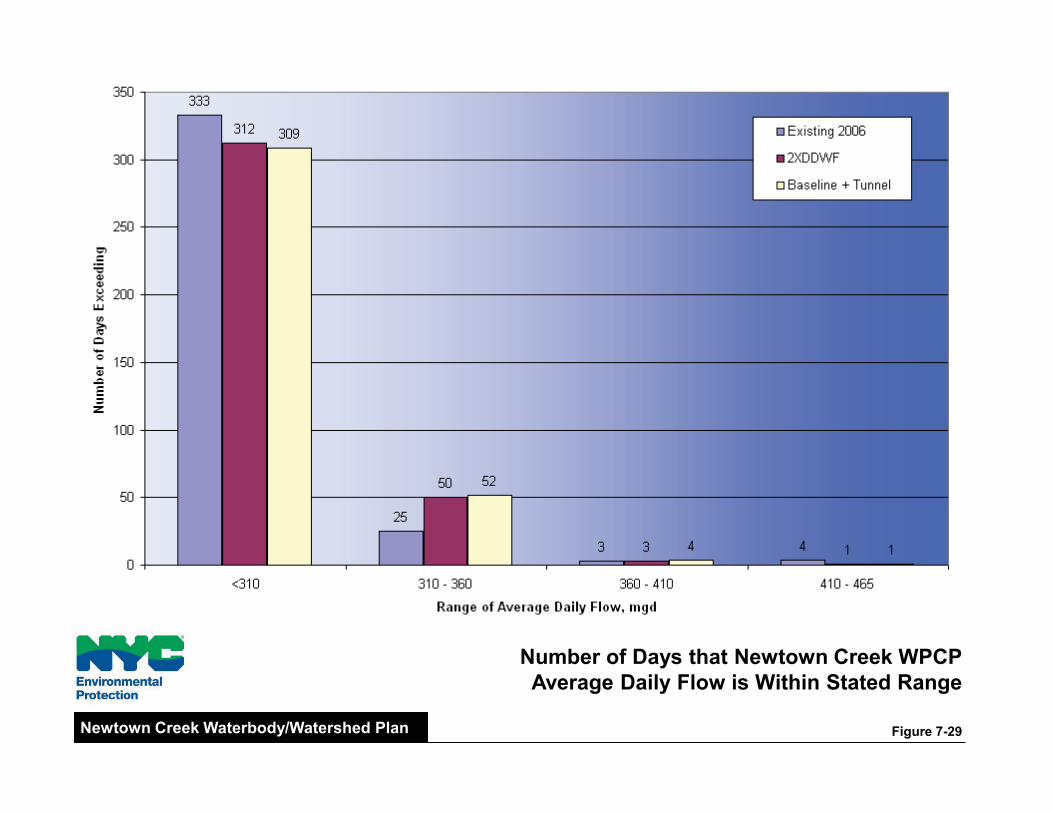
Number of Days that Newtown Creek WPCPAverage Daily Flow is Within Stated Range
Figure 7-29Newtown Creek Waterbody/Watershed Plan
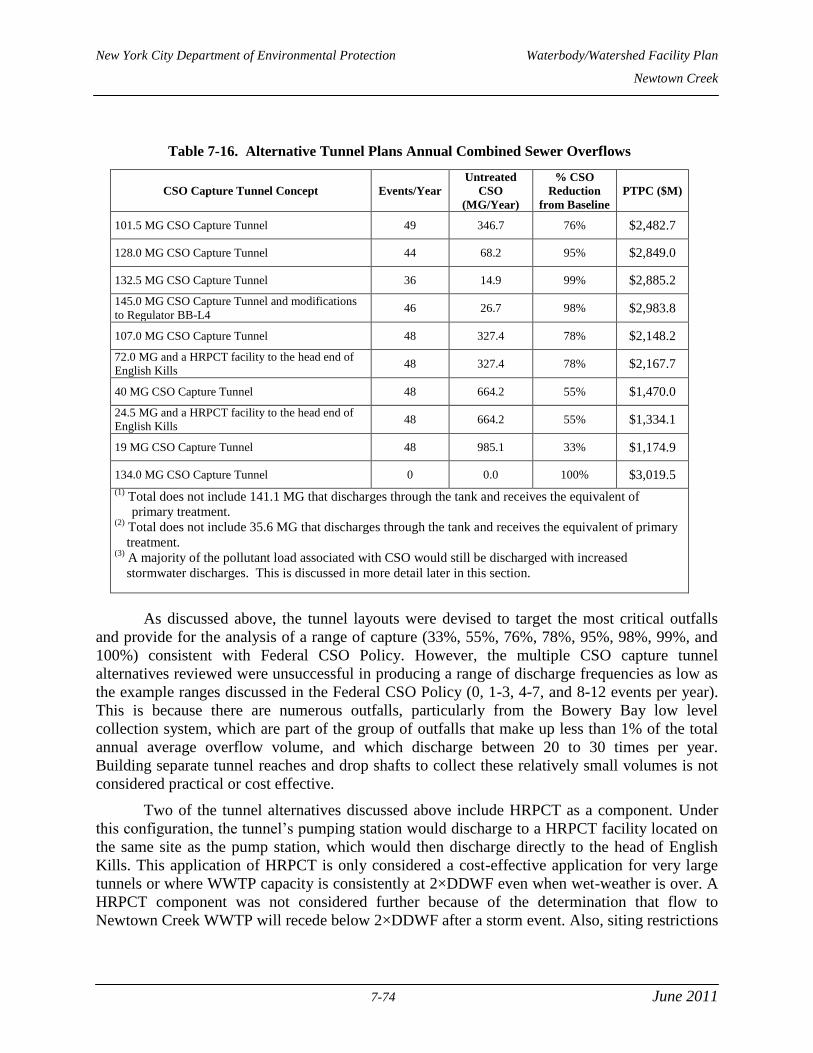
New York City Department of Environmental Protection Waterbody/Watershed Facility Plan
Newtown Creek
7-74 June 2011
Table 7-16. Alternative Tunnel Plans Annual Combined Sewer Overflows
CSO Capture Tunnel Concept Events/Year
Untreated
CSO
(MG/Year)
% CSO
Reduction
from Baseline
PTPC ($M)
101.5 MG CSO Capture Tunnel 49 346.7 76% $2,482.7
128.0 MG CSO Capture Tunnel 44 68.2 95% $2,849.0
132.5 MG CSO Capture Tunnel 36 14.9 99% $2,885.2
145.0 MG CSO Capture Tunnel and modifications
to Regulator BB-L4 46 26.7 98% $2,983.8
107.0 MG CSO Capture Tunnel 48 327.4 78% $2,148.2
72.0 MG and a HRPCT facility to the head end of
English Kills 48 327.4 78% $2,167.7
40 MG CSO Capture Tunnel 48 664.2 55% $1,470.0
24.5 MG and a HRPCT facility to the head end of
English Kills 48 664.2 55% $1,334.1
19 MG CSO Capture Tunnel 48 985.1 33% $1,174.9
134.0 MG CSO Capture Tunnel 0 0.0 100% $3,019.5
(1) Total does not include 141.1 MG that discharges through the tank and receives the equivalent of
primary treatment. (2)
Total does not include 35.6 MG that discharges through the tank and receives the equivalent of primary
treatment. (3)
A majority of the pollutant load associated with CSO would still be discharged with increased
stormwater discharges. This is discussed in more detail later in this section.
As discussed above, the tunnel layouts were devised to target the most critical outfalls
and provide for the analysis of a range of capture (33%, 55%, 76%, 78%, 95%, 98%, 99%, and
100%) consistent with Federal CSO Policy. However, the multiple CSO capture tunnel
alternatives reviewed were unsuccessful in producing a range of discharge frequencies as low as
the example ranges discussed in the Federal CSO Policy (0, 1-3, 4-7, and 8-12 events per year).
This is because there are numerous outfalls, particularly from the Bowery Bay low level
collection system, which are part of the group of outfalls that make up less than 1% of the total
annual average overflow volume, and which discharge between 20 to 30 times per year.
Building separate tunnel reaches and drop shafts to collect these relatively small volumes is not
considered practical or cost effective.
Two of the tunnel alternatives discussed above include HRPCT as a component. Under
this configuration, the tunnel’s pumping station would discharge to a HRPCT facility located on
the same site as the pump station, which would then discharge directly to the head of English
Kills. This application of HRPCT is only considered a cost-effective application for very large
tunnels or where WWTP capacity is consistently at 2×DDWF even when wet-weather is over. A
HRPCT component was not considered further because of the determination that flow to
Newtown Creek WWTP will recede below 2×DDWF after a storm event. Also, siting restrictions
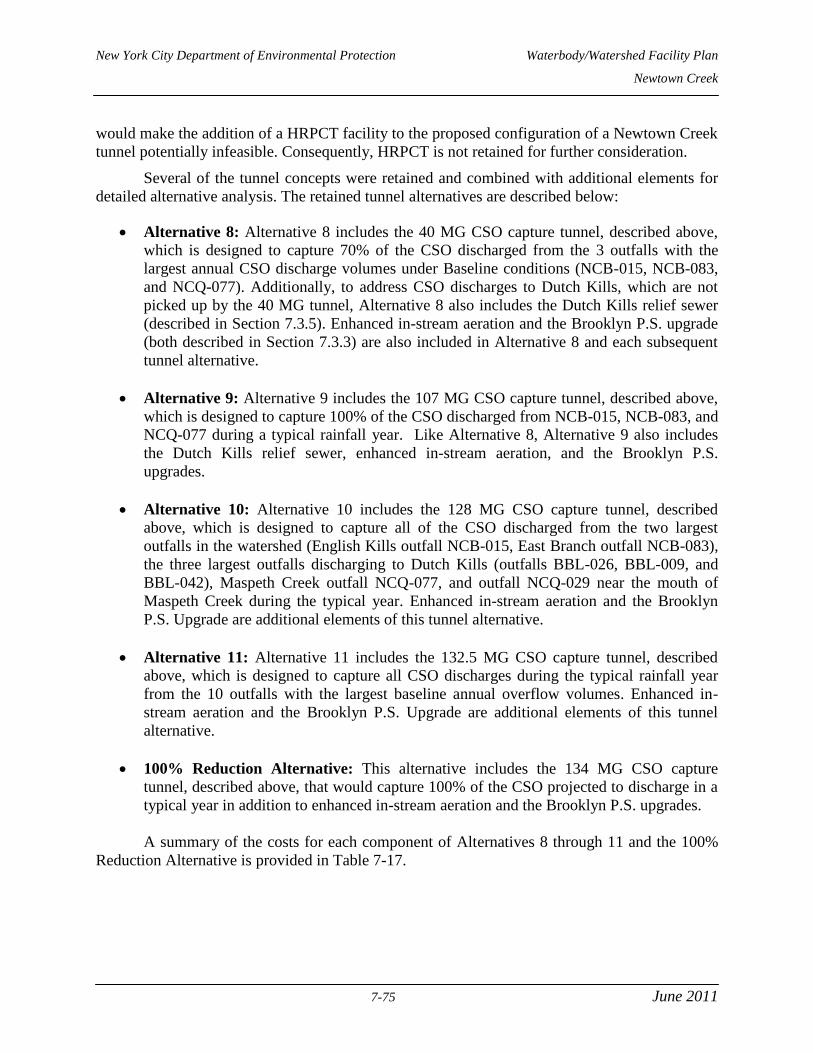
New York City Department of Environmental Protection Waterbody/Watershed Facility Plan
Newtown Creek
7-75 June 2011
would make the addition of a HRPCT facility to the proposed configuration of a Newtown Creek
tunnel potentially infeasible. Consequently, HRPCT is not retained for further consideration.
Several of the tunnel concepts were retained and combined with additional elements for
detailed alternative analysis. The retained tunnel alternatives are described below:
Alternative 8: Alternative 8 includes the 40 MG CSO capture tunnel, described above,
which is designed to capture 70% of the CSO discharged from the 3 outfalls with the
largest annual CSO discharge volumes under Baseline conditions (NCB-015, NCB-083,
and NCQ-077). Additionally, to address CSO discharges to Dutch Kills, which are not
picked up by the 40 MG tunnel, Alternative 8 also includes the Dutch Kills relief sewer
(described in Section 7.3.5). Enhanced in-stream aeration and the Brooklyn P.S. upgrade
(both described in Section 7.3.3) are also included in Alternative 8 and each subsequent
tunnel alternative.
Alternative 9: Alternative 9 includes the 107 MG CSO capture tunnel, described above,
which is designed to capture 100% of the CSO discharged from NCB-015, NCB-083, and
NCQ-077 during a typical rainfall year. Like Alternative 8, Alternative 9 also includes
the Dutch Kills relief sewer, enhanced in-stream aeration, and the Brooklyn P.S.
upgrades.
Alternative 10: Alternative 10 includes the 128 MG CSO capture tunnel, described
above, which is designed to capture all of the CSO discharged from the two largest
outfalls in the watershed (English Kills outfall NCB-015, East Branch outfall NCB-083),
the three largest outfalls discharging to Dutch Kills (outfalls BBL-026, BBL-009, and
BBL-042), Maspeth Creek outfall NCQ-077, and outfall NCQ-029 near the mouth of
Maspeth Creek during the typical year. Enhanced in-stream aeration and the Brooklyn
P.S. Upgrade are additional elements of this tunnel alternative.
Alternative 11: Alternative 11 includes the 132.5 MG CSO capture tunnel, described
above, which is designed to capture all CSO discharges during the typical rainfall year
from the 10 outfalls with the largest baseline annual overflow volumes. Enhanced in-
stream aeration and the Brooklyn P.S. Upgrade are additional elements of this tunnel
alternative.
100% Reduction Alternative: This alternative includes the 134 MG CSO capture
tunnel, described above, that would capture 100% of the CSO projected to discharge in a
typical year in addition to enhanced in-stream aeration and the Brooklyn P.S. upgrades.
A summary of the costs for each component of Alternatives 8 through 11 and the 100%
Reduction Alternative is provided in Table 7-17.

New York City Department of Environmental Protection Waterbody/Watershed Facility Plan
Newtown Creek
7-76 June 2011
Table 7-17. Summary of Alternatives 8 - 11 and 100% Reduction Alternative
Component Alt. 8 Alt. 9 Alt. 10 Alt. 11 100%
Alt
Tunnel Volume (MG) 40 107 128 132.5 134
High Level Aeration System (PTPC $ Million) $115.3 $115.3 $115.3 $115.3 $115.3
Dutch Kills Relief Sewer (PTPC $ Million) $94.7 $94.7 - - -
Tunnel and Dewatering Facility (PTPC $ Million) $1,470.0 $2,148.2 $2,849.0 $2,885.2 $3,019.5
Total (PTPC $ Million) $1,769.8 $2,447.9 $3,054.1 $3,090.3 $3,224.6
7.3.10. Dredging
Dredging portions of Newtown Creek has the potential to greatly reduce the hydrogen
sulfide (H2S) flux from creek sediments, and consequently, the odors. Dredging as a standalone
alternative would be proposed for areas of Newtown Creek where sediments are less than 3-feet
below mean lower low water (MLLW). Alternatively, where in stream aeration is proposed, a
greater water column depth would more effectively transfer oxygen and require less air be
injected in adjacent areas. In these areas, a final dredge depth of 6-feet below MLLW would be
proposed if dredging were initiated in Newtown Creek. The existing sediments have been found
to exceed the DEC “No Appreciable Contamination Criteria” (URS, 2000b).
The implementation of dredging, however, is complicated by EPA's designation of
Newtown Creek as a Superfund site in September 2010. A dredging alternative cannot be fully
developed until the Remedial Investigation/Feasibility Study (RI/FS) is released, and owing to
the complexity of the site and the number of potentially responsible parties, this document may
not be available for some time. Therefore, dredging is not included as an element of the WB/WS
Facility Plan at this time but will be re-evaluated as an element of the LTCP.
7.3.11. High Level Sewer Separation
The City of New York is expecting to continue its program of high level sewer separation
to improve the overall level-of-service. Both PlaNYC and the Green Infrastructure Plan
submitted by the City consider HLSS as an integral component to cost-effective water quality
improvements, and HLSS is therefore retained for further consideration.
To simulate HLSS in detail, GIS data was used to determine the area within each model
subcatchment that is composed of property lots as defined by the Department of City Planning,
then assuming that the “non-lot areas” would constitute the streets and sidewalks that would no
longer contribute runoff to the combined sewers. Both the total subcatchment area and the
percent impervious were recomputed and the model was rerun with the adjusted runoff
properties. Approximately 657 acres tributary to outfall NCB-083 was targeted in Newtown
Creek for HLSS, as shown in Figure 7-30. Model simulations indicate that HLSS in this area
would result in a CSO reduction of 184 MG, about 10 percent of all CSO tributary to the
Newtown Creek complex. The estimated cost of HLSS for this area is about $180 million.
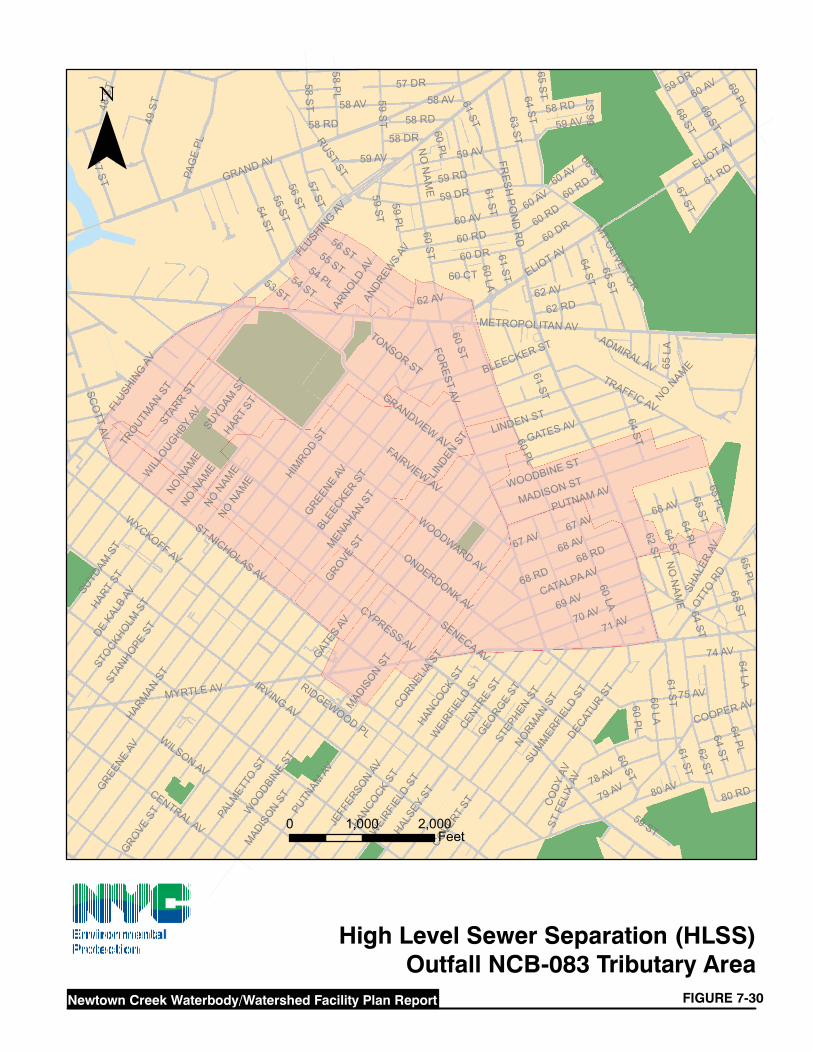
MYRTLE AV IRVING AV
MENAH
ANST
HARM
ANST
HIMROD
ST
PALM
ETTO
ST
BLEE
CKER
ST
WYCKOFF AV
CYPRESS AV
SENECAAV
60PL
GRAND AV
FOR
ESTAV
METROPOLITAN AVFR
ESHPO
ND
RD
STAN
HOPEST
WOODWARD AV
STAR
RST
59 DR
DEKA
LBAV
70 AV69 AV
WILSON AV
CORNELIA
ST
64PL
HART
ST69
ST
COOPER AV
CATALPA AV
71 AV
49S
T
80 AV
STOCKH
OLMST
58 AV
ST NICHOLAS AV
60LA
68 AV
PUTN
AMAV
59 RDELIOT AV
63ST
61S
T64
ST68
ST
65ST
62ST
FAIRVIEWAV
54ST
GATES AV
TROUTM
ANST
SUYD
AMST
47ST
RUSTST
64LA
78 AV
FLUSH
ING
AV
57 DR
55ST
75 AV
GRANDVIEWAV
DECAT
URST
MADISON ST
67 AV
LINDEN ST
61 RD
GREENE
AV59 AV
56ST
NORMAN
ST68 RD
WOODBINE ST
STFE
LIX
AV
WIL
LOUGHBY
AV
74 AV
PAG
EPL
MT
OLIVET
CR
60 DR
69PL
TRAFFIC AV
STEP
HENST
58P
L
48S
T
57ST
GEORGE
ST
CENTR
EST
58 RD
OTTO
RD
59 ST
62 AV
54 PL
62 RD
SUM
MER
FIEL
DST
60 RD
HALSE
YST
58S
T
60ST
65PL
SCO
TTAV
79 AV
60 AV
WEI
RFIEL
DST
67ST
65LA
HANCOCK
ST
ADMIRAL AV
SHAL
ERAV
COVERT
ST
CENTRAL AV
58 DR
NONAME
CODY
AV
80 RD
53 ST
ARNOLD
AV
TONSOR ST
GROVEST
59P
L
ANDREW
SAV
JEFF
ERSO
NAV
ONDERDONK AV
RIDGEWOOD PL
66ST
60 CT
NO
NA
ME
NO
NA
ME
64ST
BLEECKER ST
60S
TW
EIRFI
ELD
ST
59 AV
PUTNAM AV
HANCOCK
ST
60 AV
60 DR
HART
ST
67 AV
NONAM
E
59 DR
61ST
59S
T
60LA
60 AV
62ST
64ST
SUYDAM
ST
61ST
GREENE
AV
68 RD
60 RD
64ST
64ST
65PL
60P
L
59S
T
60P
L
65S
T
61ST
FLUSHIN
GAV
NONAM
E
65ST
ELIOT AV
60LA
62 AV
58 RD
60 RD56 ST
NONAM
E
60 AV
MAD
ISON
ST
GROVEST
68 AV
66S
T
64PL
58 AV
MADIS
ONST
GATES
AV
NONAM
E
54 ST
59 AV
61ST
61S
T
58 RD
LINDEN
ST
60ST
64ST
65ST
55 ST
WOODBI
NEST
Newtown Creek Waterbody/Watershed Facility Plan Report FIGURE 7-30
High Level Sewer Separation (HLSS)Outfall NCB-083 Tributary Area
¯
0 1,000 2,000Feet
New York City Department of Environmental Protection Waterbody/Watershed Facility Plan
Newtown Creek
7-78 June 2011
The anticipated schedule requirements for the Newtown Creek WB/WS Facility Plan do
not allow adequate time to fully build out HLSS in the local area. Therefore, HLSS will be
deferred to the LTCP phase for this waterbody.
7.4. EVALUATION OF ALTERNATIVES
7.4.1. CSO Reduction
The sewer system hydraulic models for the Bowery Bay Low Level and Newtown Creek
Brooklyn/Queens collection systems were used to assess the impacts of the above alternatives on
CSO discharges to the Newtown Creek waterbody.
Table 7-18 shows the elements included in each alternative that was developed using the
retained technologies from Section 7.2. All of the alternatives, except for Alternative 1, the CSO
Facility Plan, include a Brooklyn Pumping Station capacity of 400 MGD (WWTP at 700MGD).
As noted above the costs for the upgrades to the Brooklyn and Manhattan Pumping Stations are
not included in these analyses as they do not increase total pumping capacity to the Newtown
Creek WWTP. The alternatives span a wide range of CSO reduction. Hydraulic model results
are summarized in Table 7-19 along with each alternative’s cost. Key observations are as
follows:
Enlarging the sluice gate openings in Regulator NC-B1 and raising the weir in tide
gate chamber B1A (Section 7.3.2) would reduce overflows to Newtown Creek and
increase flow through the Morgan Avenue Interceptor and to the Newtown Creek
WWTP, and was retained for further consideration. However, an impractically long
weir would be required to avoid increasing the design water surface elevation and to
avoid increasing the potential for upstream flooding. As such, raising the weir is not
consistent with the drainage plan and modifying the weir elevation is not considered
further. As alternatives, inflatable dams (Sections 7.3.6 through 7.3.8) and bending
weirs (Sections 7.3.4 and 7.3.5), which would not restrict the diversion at high flows
were considered.
Modeling shows that the collection system can deliver greater than 400 MGD to the
Brooklyn pumping station. The Kent Avenue Interceptor contributes 61% of the flow
to the pump station, while Morgan Avenue Interceptor accounts for the remaining
39%. By not reducing the capacity of this flow limiting element as planned in the
Newtown Creek WWTP and CSO Facility Plans, combined sewer overflows to the
Newtown Creek waterbody during higher intensity, longer duration storm events can
be minimized. Furthermore, pump station upgrades that would support this rated
capacity are already ongoing. This alternative is considered a key element for the
final WB/WS Plan (described in Section 7.3.3).
Adding additional capacity via a 36-inch relief sewer (Section 7.3.2) to redirect flows
from outfall NCB-083 to Regulator NC-B1 reduces overflows to the entire Newtown
Creek waterbody, and more substantially to East Branch. Increasing the size of the
relief sewer to 48-inches further reduces flow to East Branch by 1 million gallons
during the largest storm in the typical year and increases the flow to the plant by over
New York City Department of Environmental Protection Waterbody/Watershed Facility Plan
Newtown Creek
7-79 June 2011
500,000 gallons during that same event. This larger relief sewer was therefore
retained for further evaluation (Section 7.3.6 through 7.3.8).
Regulator modifications and the addition of a 72-inch Dutch Kills Relief Sewer in the
Bowery Bay low level collection system reduces annual average overflows to Dutch
Kills by 22% without increasing overflows to the East River and thus achieves a
nearly 14% reduction in total overflows from the Bowery Bay low level collection
system (Sections 7.3.5, 7.3.6 through 7.3.9). The only other alternatives that directly
address water quality within Dutch Kills are the more comprehensive flushing and
capture tunnel alternatives. The proposed 72-inch Dutch Kills Relief Sewer has
several constructability issues which must addressed during final design. The major
issues are the crossing of the Sunnyside Railroad yard, the crossing of the Jackson
Avenue subway, and a potential interference with the recently constructed MTA vent
structure.
CSO capture tunnels (Section 7.3.9) can target specific outfalls throughout the
waterbody. Outfalls captured by the alternatives discussed above were selected based
on their baseline annual volume, their location within the waterbody, and their
proximity to other outfalls. Alternative tunnel layouts were then devised to cost
effectively target the most critical outfalls, while providing for the analysis of a range
of capture (33%, 55%, 76%, 78%, 95%, 98%, 99%, and 100%) consistent with
Federal CSO Policy. However, the multiple CSO capture tunnel alternatives
reviewed were unsuccessful in producing a range of discharge frequencies as low as
the example ranges discussed in the Federal CSO Policy (0, 1-3, 4-7, and 8-12 events
per year). This is because there are numerous outfalls, particularly from the Bowery
Bay low level collection system, which are part of the group of outfalls that make up
less than 1% of the total annual average overflow volume, and which discharge
between 20 to 30 times per year. Building separate tunnel reaches and drop shafts to
collect these relatively small volumes is not considered practical or cost effective.
Alternative 6 (Section 7.3.7) would discharge 24.5 MG more CSO to Newtown Creek
in the typical year than would Alternative 7 (Section 7.3.8). Another 36 MG of CSO
would be discharged from the 9 MG tank in Alternative 7 after the equivalent of only
preliminary treatment. However, the Alternative 6 would discharge over 100 MG
more through the East River CSOs than Alternative 7. As such other considerations
such as water quality impacts and operational and maintenance complexities need to
be considered and both of these elements were retained for further analysis.
Floatables control facilities (Sections 7.3.3 through 7.3.6), aimed at removing
floatables from overflows, compliment direct water quality improvement alternatives
such as full aeration. However, very few of the existing regulators within the Bowery
Bay low level and Newtown Creek Brooklyn collection systems have overflow weirs,
and as such cannot be easily retrofitted to utilize baffles or screens. Therefore,
installation of control facilities that can be installed downstream of these regulators
on the outfall pipe will be considered further.
Newtown Creek, with its numerous CSOs spread throughout the highly urban
watershed, lends itself well to storage tunnel alternatives. Additionally, due to lack of
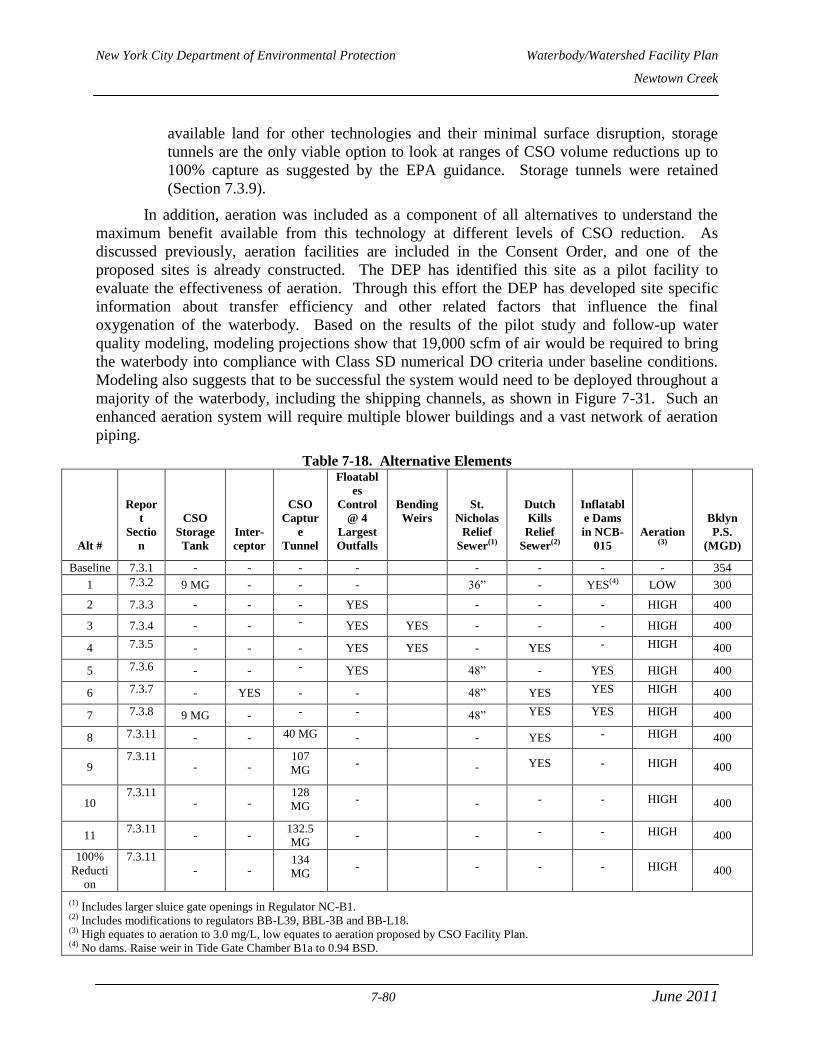
New York City Department of Environmental Protection Waterbody/Watershed Facility Plan
Newtown Creek
7-80 June 2011
available land for other technologies and their minimal surface disruption, storage
tunnels are the only viable option to look at ranges of CSO volume reductions up to
100% capture as suggested by the EPA guidance. Storage tunnels were retained
(Section 7.3.9).
In addition, aeration was included as a component of all alternatives to understand the
maximum benefit available from this technology at different levels of CSO reduction. As
discussed previously, aeration facilities are included in the Consent Order, and one of the
proposed sites is already constructed. The DEP has identified this site as a pilot facility to
evaluate the effectiveness of aeration. Through this effort the DEP has developed site specific
information about transfer efficiency and other related factors that influence the final
oxygenation of the waterbody. Based on the results of the pilot study and follow-up water
quality modeling, modeling projections show that 19,000 scfm of air would be required to bring
the waterbody into compliance with Class SD numerical DO criteria under baseline conditions.
Modeling also suggests that to be successful the system would need to be deployed throughout a
majority of the waterbody, including the shipping channels, as shown in Figure 7-31. Such an
enhanced aeration system will require multiple blower buildings and a vast network of aeration
piping.
Table 7-18. Alternative Elements
Alt #
Repor
t
Sectio
n
CSO
Storage
Tank
Inter-
ceptor
CSO
Captur
e
Tunnel
Floatabl
es
Control
@ 4
Largest
Outfalls
Bending
Weirs
St.
Nicholas
Relief
Sewer(1)
Dutch
Kills
Relief
Sewer(2)
Inflatabl
e Dams
in NCB-
015
Aeration(3)
Bklyn
P.S.
(MGD)
Baseline 7.3.1 - - - - - - - - 354
1 7.3.2 9 MG - - - 36” - YES(4) LOW 300
2 7.3.3 - - - YES - - - HIGH 400
3 7.3.4 - - - YES YES - - - HIGH 400
4 7.3.5 - - - YES YES - YES - HIGH 400
5 7.3.6 - - - YES 48” - YES HIGH 400
6 7.3.7 - YES - - 48” YES YES HIGH 400
7 7.3.8 9 MG - - - 48” YES YES HIGH 400
8 7.3.11 - - 40 MG - - YES - HIGH 400
9 7.3.11
- - 107
MG - - YES - HIGH 400
10 7.3.11
- - 128
MG - - - - HIGH 400
11 7.3.11
- - 132.5
MG - - - - HIGH 400
100%
Reducti
on
7.3.11
- - 134
MG - - - - HIGH 400
(1) Includes larger sluice gate openings in Regulator NC-B1. (2) Includes modifications to regulators BB-L39, BBL-3B and BB-L18.
(3) High equates to aeration to 3.0 mg/L, low equates to aeration proposed by CSO Facility Plan. (4) No dams. Raise weir in Tide Gate Chamber B1a to 0.94 BSD.

Proposed Aeration Area and BlowerBuilding Locations
Figure 7-31Newtown Creek Waterbody/Watershed Plan
Facility RecentlyConstructed
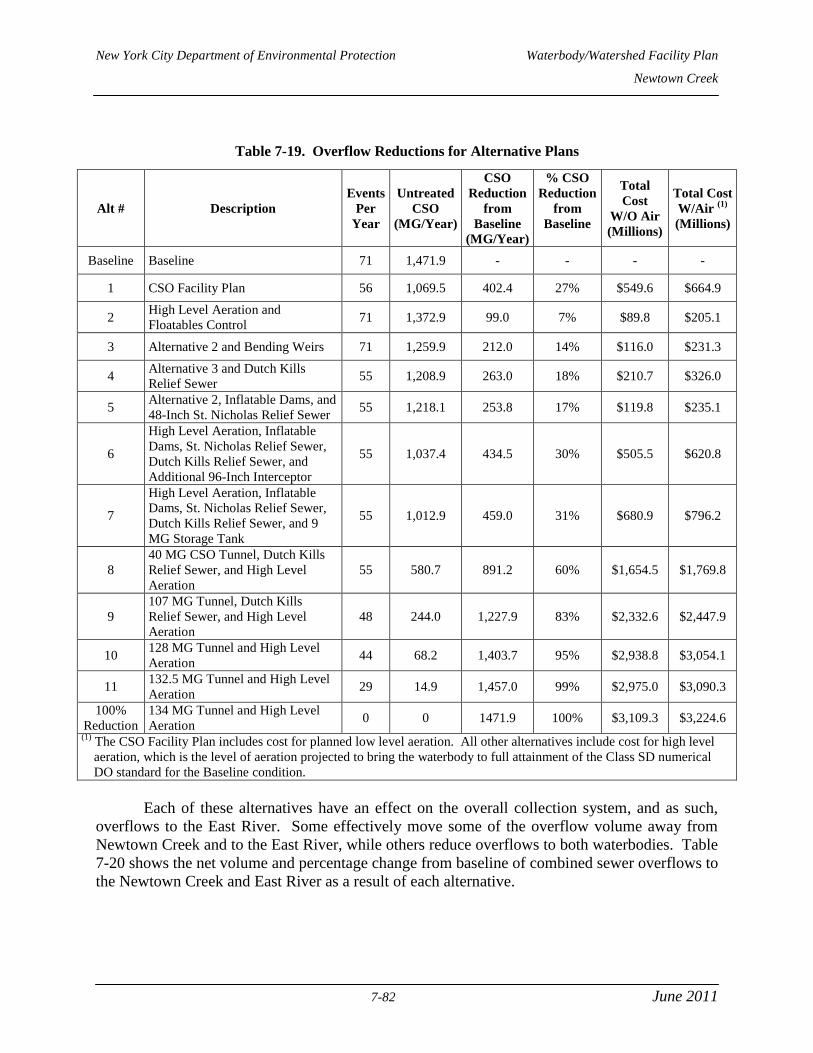
New York City Department of Environmental Protection Waterbody/Watershed Facility Plan
Newtown Creek
7-82 June 2011
Table 7-19. Overflow Reductions for Alternative Plans
Alt # Description
Events
Per
Year
Untreated
CSO
(MG/Year)
CSO
Reduction
from
Baseline
(MG/Year)
% CSO
Reduction
from
Baseline
Total
Cost
W/O Air
(Millions)
Total Cost
W/Air (1)
(Millions)
Baseline Baseline 71 1,471.9 - - - -
1 CSO Facility Plan 56 1,069.5 402.4 27% $549.6 $664.9
2 High Level Aeration and
Floatables Control 71 1,372.9 99.0 7% $89.8 $205.1
3 Alternative 2 and Bending Weirs 71 1,259.9 212.0 14% $116.0 $231.3
4 Alternative 3 and Dutch Kills
Relief Sewer 55 1,208.9 263.0 18% $210.7 $326.0
5 Alternative 2, Inflatable Dams, and
48-Inch St. Nicholas Relief Sewer 55 1,218.1 253.8 17% $119.8 $235.1
6
High Level Aeration, Inflatable
Dams, St. Nicholas Relief Sewer,
Dutch Kills Relief Sewer, and
Additional 96-Inch Interceptor
55 1,037.4 434.5 30% $505.5 $620.8
7
High Level Aeration, Inflatable
Dams, St. Nicholas Relief Sewer,
Dutch Kills Relief Sewer, and 9
MG Storage Tank
55 1,012.9 459.0 31% $680.9 $796.2
8
40 MG CSO Tunnel, Dutch Kills
Relief Sewer, and High Level
Aeration
55 580.7 891.2 60% $1,654.5 $1,769.8
9
107 MG Tunnel, Dutch Kills
Relief Sewer, and High Level
Aeration
48 244.0 1,227.9 83% $2,332.6 $2,447.9
10 128 MG Tunnel and High Level
Aeration 44 68.2 1,403.7 95% $2,938.8 $3,054.1
11 132.5 MG Tunnel and High Level
Aeration 29 14.9 1,457.0 99% $2,975.0 $3,090.3
100%
Reduction
134 MG Tunnel and High Level
Aeration 0 0 1471.9 100% $3,109.3 $3,224.6
(1) The CSO Facility Plan includes cost for planned low level aeration. All other alternatives include cost for high level
aeration, which is the level of aeration projected to bring the waterbody to full attainment of the Class SD numerical
DO standard for the Baseline condition.
Each of these alternatives have an effect on the overall collection system, and as such,
overflows to the East River. Some effectively move some of the overflow volume away from
Newtown Creek and to the East River, while others reduce overflows to both waterbodies. Table
7-20 shows the net volume and percentage change from baseline of combined sewer overflows to
the Newtown Creek and East River as a result of each alternative.
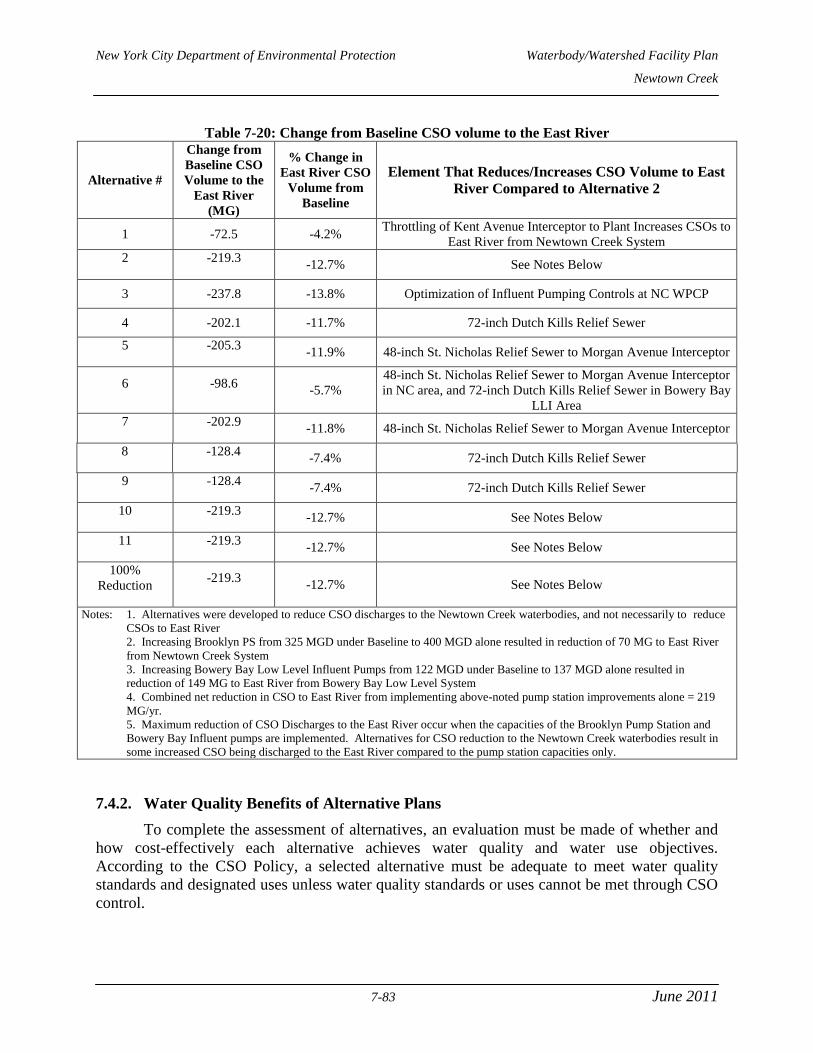
New York City Department of Environmental Protection Waterbody/Watershed Facility Plan
Newtown Creek
7-83 June 2011
Table 7-20: Change from Baseline CSO volume to the East River
Alternative #
Change from
Baseline CSO
Volume to the
East River
(MG)
% Change in
East River CSO
Volume from
Baseline
Element That Reduces/Increases CSO Volume to East
River Compared to Alternative 2
1 -72.5 -4.2% Throttling of Kent Avenue Interceptor to Plant Increases CSOs to
East River from Newtown Creek System
2
-219.3
-12.7% See Notes Below
3 -237.8 -13.8% Optimization of Influent Pumping Controls at NC WPCP
4 -202.1 -11.7% 72-inch Dutch Kills Relief Sewer
5
-205.3
-11.9% 48-inch St. Nicholas Relief Sewer to Morgan Avenue Interceptor
6
-98.6
-5.7%
48-inch St. Nicholas Relief Sewer to Morgan Avenue Interceptor
in NC area, and 72-inch Dutch Kills Relief Sewer in Bowery Bay
LLI Area
7
-202.9
-11.8% 48-inch St. Nicholas Relief Sewer to Morgan Avenue Interceptor
8 -128.4
-7.4% 72-inch Dutch Kills Relief Sewer
9
-128.4
-7.4% 72-inch Dutch Kills Relief Sewer
10
-219.3
-12.7% See Notes Below
11
-219.3
-12.7% See Notes Below
100%
Reduction
-219.3
-12.7% See Notes Below
Notes: 1. Alternatives were developed to reduce CSO discharges to the Newtown Creek waterbodies, and not necessarily to reduce
CSOs to East River
2. Increasing Brooklyn PS from 325 MGD under Baseline to 400 MGD alone resulted in reduction of 70 MG to East River
from Newtown Creek System
3. Increasing Bowery Bay Low Level Influent Pumps from 122 MGD under Baseline to 137 MGD alone resulted in
reduction of 149 MG to East River from Bowery Bay Low Level System
4. Combined net reduction in CSO to East River from implementing above-noted pump station improvements alone = 219
MG/yr.
5. Maximum reduction of CSO Discharges to the East River occur when the capacities of the Brooklyn Pump Station and
Bowery Bay Influent pumps are implemented. Alternatives for CSO reduction to the Newtown Creek waterbodies result in
some increased CSO being discharged to the East River compared to the pump station capacities only.
7.4.2. Water Quality Benefits of Alternative Plans
To complete the assessment of alternatives, an evaluation must be made of whether and
how cost-effectively each alternative achieves water quality and water use objectives.
According to the CSO Policy, a selected alternative must be adequate to meet water quality
standards and designated uses unless water quality standards or uses cannot be met through CSO
control.

New York City Department of Environmental Protection Waterbody/Watershed Facility Plan
Newtown Creek
7-84 June 2011
Dissolved Oxygen
Each of the alternatives would increase dissolved oxygen levels through either a
reduction in organic loadings to the waterbody or addition of oxygen, or a combination of both.
To determine the maximum benefit available from CSO reduction alone, many of the alternatives
were modeled with and without aeration. From the modeling results, the percent of the time
(hours per year) that the dissolved oxygen concentration was predicted by the water quality
model to be at or above 3.0 mg/L was plotted on the transects. Table 7-21 summarizes the
typical year minimum percentage attainment value in the transect plots for select alternatives
without added aeration, and for comparison, the projected effectiveness of high level aeration
alone, with no CSO volume reduction (baseline plus aeration). Although not shown, percent
attainment in Newtown Creek and its tributaries when aeration is included with any of the
alternatives is equal to or greater than that shown for baseline plus aeration.
Table 7-21. Minimum Percent of Time That DO Concentrations Exceed 3.0 mg/L(1)
Waterbody
Alternative Plan No.
Baselin
e 1
(2) 6 7 8 9
100%
Removal Baseline + Aeration
Dutch Kills 85.7% 87.7% 90.5% 90.2% 86.7% 87.9% 99.3% 98.5%
Newtown
Creek Main
Branch
79.4% 82.9% 81.8% 81.0% 84.2% 85.6% 86.9% 99.6%
Maspeth
Creek 80.8% 84.0% 82.1% 82.8% 88.7% 90.2% 90.8% 98.9%
East
Branch 55.8% 62.4% 62.9% 62.6% 74.1% 84.5% 86.3% 93%
English
Kills 56.1% 66.5% 72.1% 69.9% 74.1% 84.5% 86.3% 90.3%
(1) Aeration is not included in any of the alternatives listed in the table except for Baseline + Aeration.
(2) CSO Facility Plan results include the planned low level of aeration.
To further illustrate the projected effectiveness of aeration, the complete transect plots for
several of the alternatives during the summer, the most impaired season in terms of DO, are
shown on Figure 7-32. This figure shows that without aeration projected dissolved oxygen
levels are largely unaffected by reductions in CSO volume alone, and that aeration with little or
no corresponding CSO reduction is projected to attain the 3.0 mg/L threshold a majority of the
time.

*
Dissolved Oxygen Transect PlotsS mmer Da s Attaining 3 0 mg/L at Bottom
* Includes planned low-level aeration
High-level aeration is not included in any of the alternatives except for Baseline + Aeration
Summer Days Attaining 3.0 mg/L at Bottom
Figure 7-32aNewtown Creek Waterbody/Watershed Plan
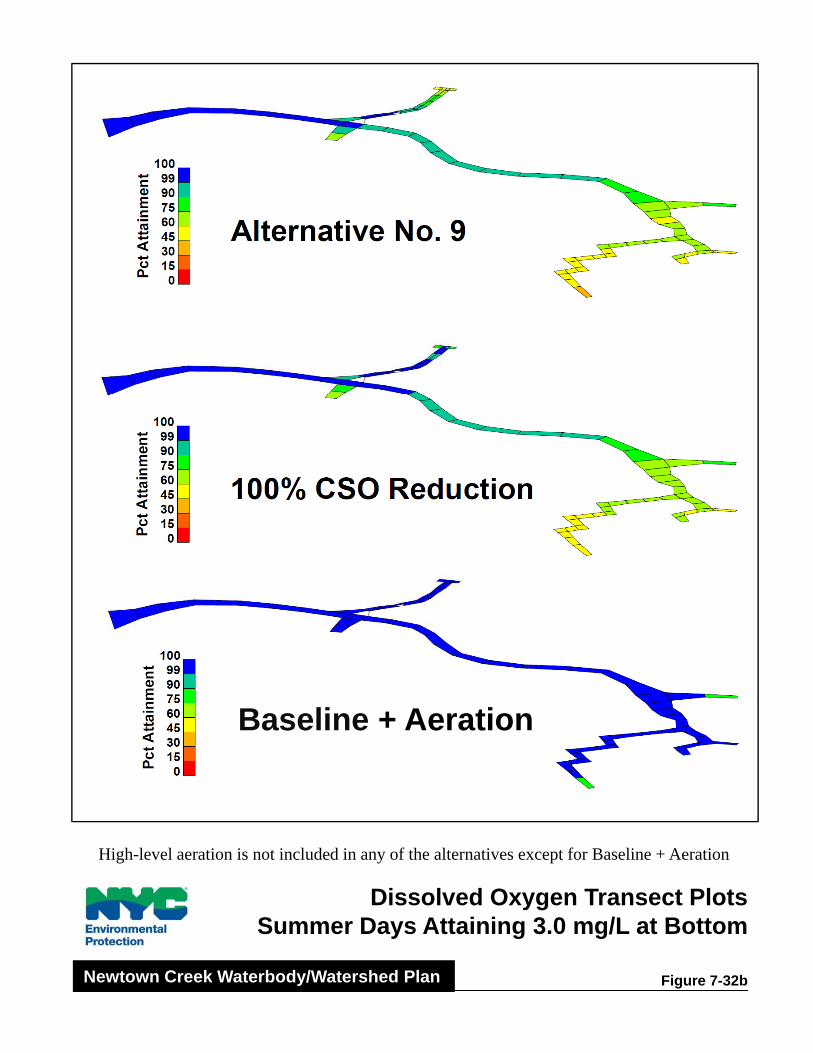
Baseline + Aeration
Dissolved Oxygen Transect PlotsS mmer Da s Attaining 3 0 mg/L at Bottom
High-level aeration is not included in any of the alternatives except for Baseline + Aeration
Summer Days Attaining 3.0 mg/L at Bottom
Figure 7-32bNewtown Creek Waterbody/Watershed Plan
New York City Department of Environmental Protection Waterbody/Watershed Facility Plan
Newtown Creek
7-87 June 2011
Odor Improvements
Each of the alternatives target odor reductions through CSO volume reductions. By
reducing the volume of CSO discharges to Newtown Creek, the amount of organic carbon from
CSOs settling in the waterbody is also reduced. These highly reactive organic solids are
oxidized rapidly. In the absence of oxygen, carbon is assimilated by bacteria in the sediments
using the oxygen bound up in sulfates in the water column, which ultimately results in H2S gases
being produced and released into the atmosphere. Reductions in the annual amount of combined
sewage overflowing into Newtown Creek will reduce the carbon discharged into the waterbody
and reduce the amount of odor produced from the sediments through the anaerobic decay of this
carbon. These annual reductions in CSO discharge are shown in Table 7-19 above.
Floatables Improvements
As discussed in Section 5, the DEP has taken a number of steps to reduce floatables
entering Newtown Creek through the implementation of the 14 SPDES required BMPs. The
major floatables reductions associated with these programs come through the diversion of
additional wet weather flow to the WWTPs for treatment, capture of floatables in catch basins
with the installation of catch basin hoods, and the end-of-pipe collection of floatables in the
Interim Floatables Containment Program (booms in English Kills, East Branch, and Maspeth
Creek). Despite these efforts, floatables are still discharged to Newtown Creek from CSOs. And
even though floatables are not as much of a concern in Newtown Creek as they are in some other
waterbodies (since the Creek’s major use is as a commercial waterway), these discharges may
lead to visual impairment of the waterbody.
To address this potential issue, each of the alternatives noted above have elements
designed to provide substantial reductions in floatables entering Newtown Creek. Many of the
plans would convey additional flow to the WWTP for treatment, and would reduce floatables in
proportion to the amount of additional flow treated at the WWTP. For example alternatives
including storage, such as a tunnel, would increase flow to the WWTP by retaining CSO and
later dewatering it to the WWTP for treatment when capacity is available (Alternatives 1 and 6
through 11, and the 100% Reduction Alternative). Other alternatives, such as those that include
the CSO storage tank, or the floatable control facilities, include positive screening of floatables
(Alternatives 1 through 5 and 7); therefore the flow discharging from the outfalls with these
controls will have a substantial portion of the visible floatables removed before discharge. The
annual reductions in floatables for each alternative are shown in Table 7-22 below.
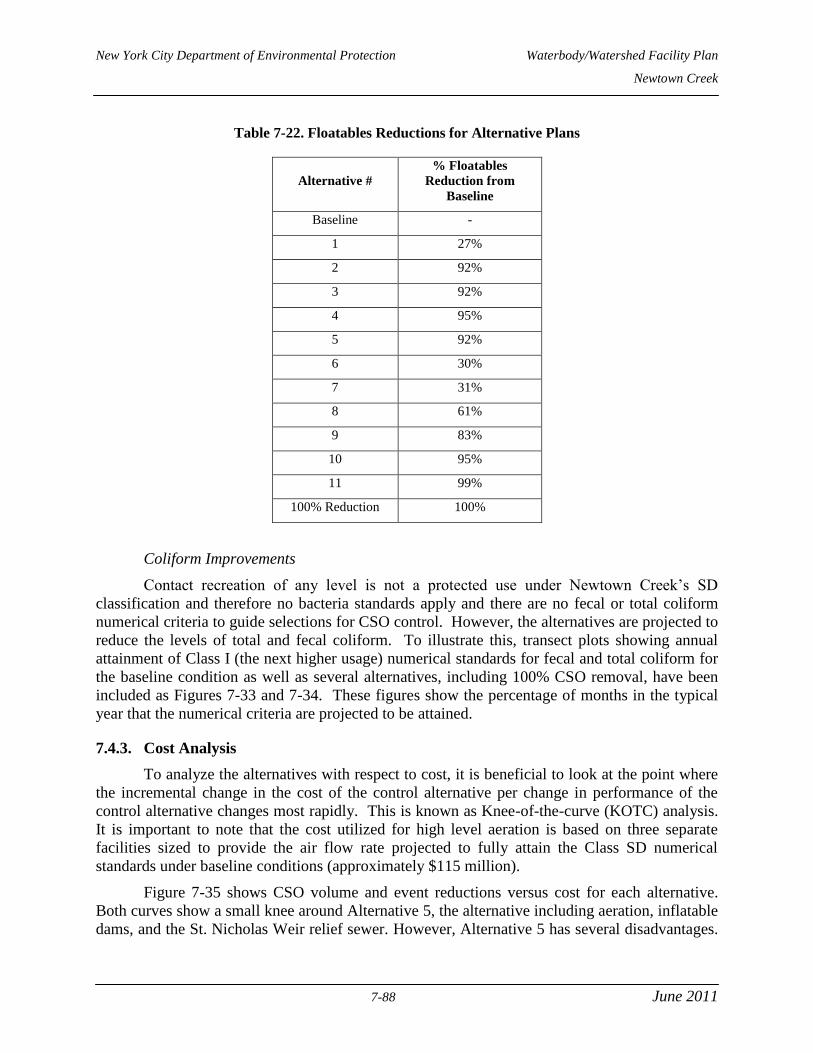
New York City Department of Environmental Protection Waterbody/Watershed Facility Plan
Newtown Creek
7-88 June 2011
Table 7-22. Floatables Reductions for Alternative Plans
Alternative #
% Floatables
Reduction from
Baseline
Baseline -
1 27%
2 92%
3 92%
4 95%
5 92%
6 30%
7 31%
8 61%
9 83%
10 95%
11 99%
100% Reduction 100%
Coliform Improvements
Contact recreation of any level is not a protected use under Newtown Creek’s SD
classification and therefore no bacteria standards apply and there are no fecal or total coliform
numerical criteria to guide selections for CSO control. However, the alternatives are projected to
reduce the levels of total and fecal coliform. To illustrate this, transect plots showing annual
attainment of Class I (the next higher usage) numerical standards for fecal and total coliform for
the baseline condition as well as several alternatives, including 100% CSO removal, have been
included as Figures 7-33 and 7-34. These figures show the percentage of months in the typical
year that the numerical criteria are projected to be attained.
7.4.3. Cost Analysis
To analyze the alternatives with respect to cost, it is beneficial to look at the point where
the incremental change in the cost of the control alternative per change in performance of the
control alternative changes most rapidly. This is known as Knee-of-the-curve (KOTC) analysis.
It is important to note that the cost utilized for high level aeration is based on three separate
facilities sized to provide the air flow rate projected to fully attain the Class SD numerical
standards under baseline conditions (approximately $115 million).
Figure 7-35 shows CSO volume and event reductions versus cost for each alternative.
Both curves show a small knee around Alternative 5, the alternative including aeration, inflatable
dams, and the St. Nicholas Weir relief sewer. However, Alternative 5 has several disadvantages.

New York City Department of Environmental Protection Waterbody/Watershed Facility Plan
Newtown Creek
7-89 June 2011
Certain purchase, installation, and operation and maintenance issues must be considered prior to
selecting any plan that uses inflatable dams. At other locations in the City where inflatable dam
systems were considered, acquiring a bidder was difficult. Competition in the market has
diminished with one of the two manufacturers (Bridgestone) no longer producing the dam fabric,
and the other (Sumitomo) curtailing direct service in the United States market. A third company,
Dyrhoff, has purchased the rights to furnish Sumitomo dam systems in the United States, and has
located a fabric supplier in China that can supply fabric similar to Bridgestone’s, but they cannot
use the Bridgestone clamping arrangement and there has not been a satisfactory demonstration of
a hybrid system in New York City. There is thus only one potential distributor with one tested
system, creating a problem purchasing the system and ensuring a reliable supply of replacement
parts. Furthermore, inflatable dams would cause periodic stagnant water in the outfall sewer for
NBC-015 that would lead to sediment accumulation over time. Confined space entry with a
front end loader would be required to remove this sediment.
The next closest alternative in terms of CSO reduction is Alternative 4 which achieves a
CSO reduction similar to Alternative 5, albeit at a somewhat higher cost. Bending weirs and a
relief sewer would be much easier to maintain than the inflatable dam system. However, the
Dutch Kills Relief Sewer would present considerable constructability challenges. Additionally
the relief sewer only results in 4 percent reduction in annual CSO volume beyond what is
achieved by bending weirs alone (Alternative 3) at an added cost of nearly $95 million.
Reviewing alternatives with CSO reductions equal to or greater than the CSO Facility
Plan, the volume curve shows steadily increasing benefit with increasing cost and no knee, while
the events curve shows that a significant cost must be incurred before the number of events can
be reduced significantly from the CSO Plan level. While providing a good graphic
representation of the challenges associated with CSO control in Newtown Creek, these curves
generally do not assist in identifying a preferred alternative to the CSO Facility Plan.
The next consideration is water quality. Figure 7-36 presents water quality cost-benefit
curves that depict projected Class SD dissolved oxygen attainment versus cost for each evaluated
alternative with and without aeration. Here, water quality benefit is determined as the minimum
percentage of hours during the year that any location in the waterbody is projected to attain the
applicable DEC Class SD dissolved oxygen criterion (which is equivalent to the IEC Class B-2
criterion as noted in Section 1). Without aeration, there is no pronounced knee, but each
alternative is shown to provide equal or better water quality than the CSO Facility Plan, which
includes the planned low level of aeration.
With aeration, the curve shows that the CSO Facility Plan with the planned level of
aeration does not fully attain the Class SD numerical criteria and does not even fall on the curve.
However, the curve shows that the water quality model projects nearly 100% attainment with a
higher level of aeration and no corresponding CSO reduction (Alternative 2). This reflects that
the level of aeration required to meet the existing SD standard under baseline hydraulic
conditions has been projected to be as much as six times higher than the CSO Facility Plan level,
and the model shows that aeration would need to be applied to a much larger area of the
waterbody than has been planned. Based on these Figure 7-36, the waterbody can attain the
existing Class SD numerical standard through aeration, with or without additional CSO
reduction.
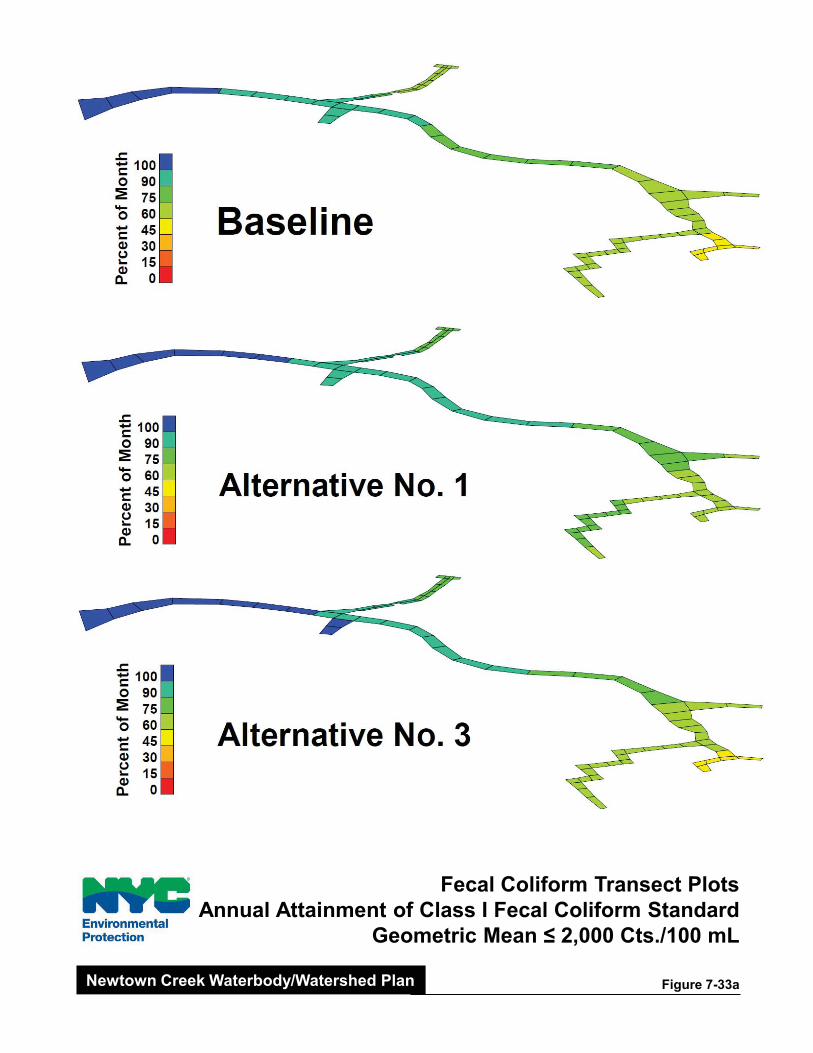
Fecal Coliform Transect PlotsAnnual Attainment of Class I Fecal Coliform Standard
Geometric Mean � 2,000 Cts./100 mL
Figure 7-33aNewtown Creek Waterbody/Watershed Plan

Fecal Coliform Transect PlotsAnnual Attainment of Class I Fecal Coliform Standard
Geometric Mean � 2,000 Cts./100 mL
Figure 7-33bNewtown Creek Waterbody/Watershed Plan

Total Coliform Transect PlotsAnnual Attainment of Class I Total Coliform Standard
Geometric Mean � 10,000 Cts./100 mL
Figure 7-34aNewtown Creek Waterbody/Watershed Plan

Total Coliform Transect PlotsAnnual Attainment of Class I Total Coliform Standard
Geometric Mean � 10,000 Cts./100 mL
Figure 7-34bNewtown Creek Waterbody/Watershed Plan
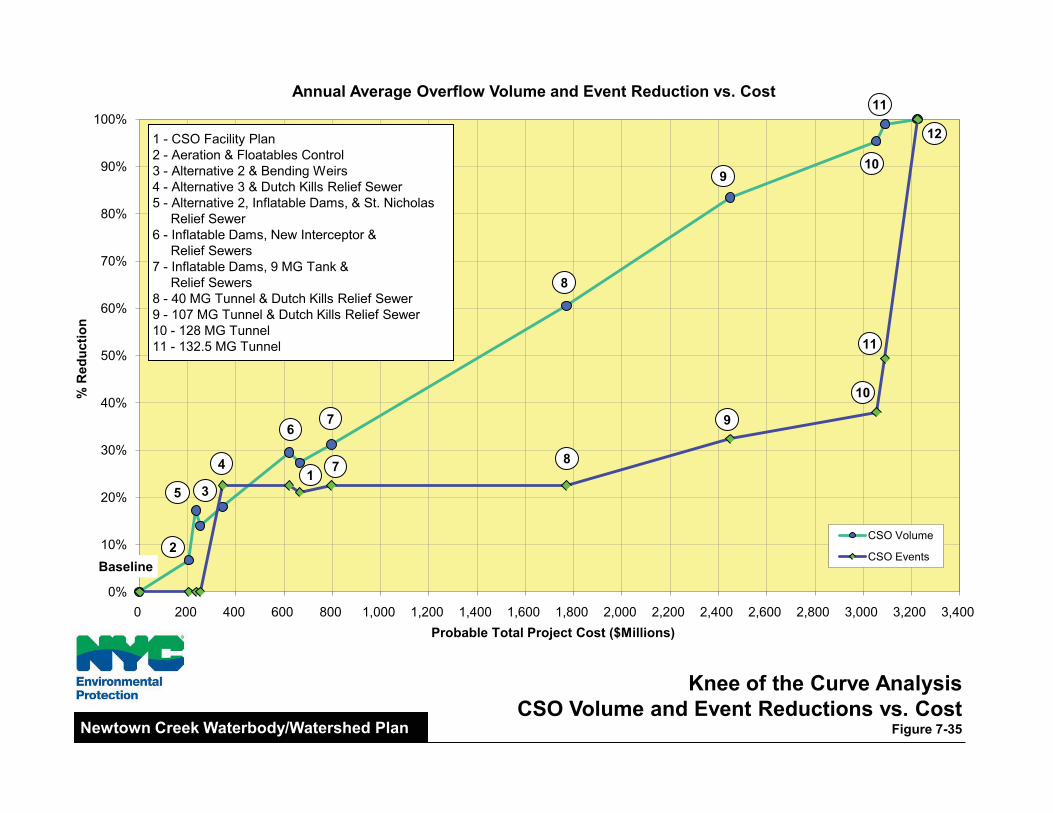
Knee of the Curve AnalysisCSO Volume and Event Reductions vs. Cost
Figure 7-35Newtown Creek Waterbody/Watershed Plan
0%
10%
20%
30%
40%
50%
60%
70%
80%
90%
100%
0 200 400 600 800 1,000 1,200 1,400 1,600 1,800 2,000 2,200 2,400 2,600 2,800 3,000 3,200 3,400
% R
educ
tion
Probable Total Project Cost ($Millions)
Annual Average Overflow Volume and Event Reduction vs. Cost
CSO Volume
CSO Events
1 - CSO Facility Plan2 - Aeration & Floatables Control3 - Alternative 2 & Bending Weirs4 - Alternative 3 & Dutch Kills Relief Sewer5 - Alternative 2, Inflatable Dams, & St. Nicholas
Relief Sewer6 - Inflatable Dams, New Interceptor &
Relief Sewers7 - Inflatable Dams, 9 MG Tank &
Relief Sewers8 - 40 MG Tunnel & Dutch Kills Relief Sewer9 - 107 MG Tunnel & Dutch Kills Relief Sewer10 - 128 MG Tunnel11 - 132.5 MG Tunnel
15
4
2
7
6
9
7
8
9
10
8
3
Baseline
10
11
11
12
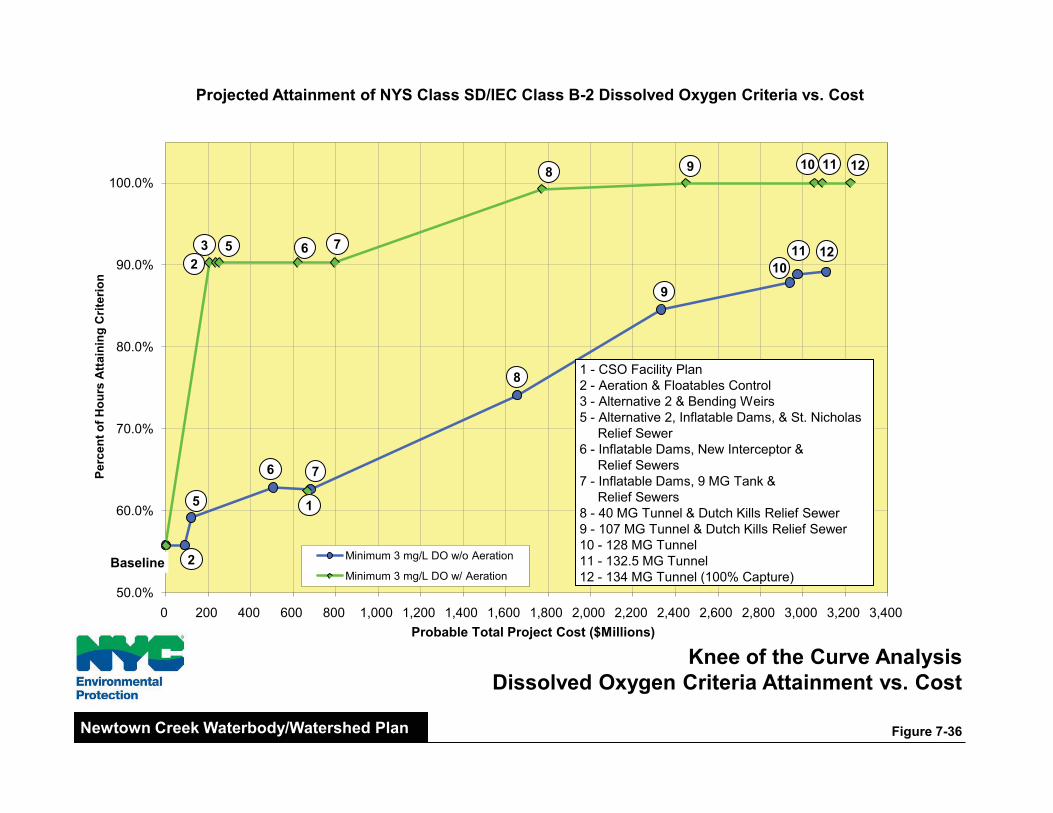
Knee of the Curve AnalysisDissolved Oxygen Criteria Attainment vs. Cost
Figure 7-36Newtown Creek Waterbody/Watershed Plan
50.0%
60.0%
70.0%
80.0%
90.0%
100.0%
0 200 400 600 800 1,000 1,200 1,400 1,600 1,800 2,000 2,200 2,400 2,600 2,800 3,000 3,200 3,400
Perc
ent o
f Hou
rs A
ttain
ing
Crit
erio
n
Probable Total Project Cost ($Millions)
Projected Attainment of NYS Class SD/IEC Class B-2 Dissolved Oxygen Criteria vs. Cost
Minimum 3 mg/L DO w/o Aeration
Minimum 3 mg/L DO w/ Aeration
310
9
8
7
6
5
1098
7
6
52
1
Baseline
1 - CSO Facility Plan2 - Aeration & Floatables Control3 - Alternative 2 & Bending Weirs5 - Alternative 2, Inflatable Dams, & St. Nicholas
Relief Sewer6 - Inflatable Dams, New Interceptor &
Relief Sewers7 - Inflatable Dams, 9 MG Tank &
Relief Sewers8 - 40 MG Tunnel & Dutch Kills Relief Sewer9 - 107 MG Tunnel & Dutch Kills Relief Sewer10 - 128 MG Tunnel11 - 132.5 MG Tunnel12 - 134 MG Tunnel (100% Capture)
2
1211
1211

New York City Department of Environmental Protection Waterbody/Watershed Facility Plan
Newtown Creek
7-96 June 2011
As discussed previously in this section, the CSO Facility Plan has been thoroughly
reviewed using the latest landside hydraulic and water quality models. In addition, collection
systems tributary to Newtown Creek have been analyzed for other opportunities to reduce
combined sewer overflows and to improve the water quality within Newtown Creek. These
analyses indicate that several elements of the CSO Facility Plan are not practical, such as a 400
foot long weir at Regulator B1.As such, alternatives were devised from the available
technologies that remained after considerable screening, to modify or replace some or all of the
CSO Facility Plan elements.
A thorough analysis of these alternatives has shown that Alternative 2, which includes
high level aeration and floatables control at the four outfalls with the largest baseline annual
overflow volume would provide the greatest projected attainment of existing water quality
standards on a per dollar basis. However, Alternative 2 does not provide significant CSO
volume or event reductions. When looking at alternatives that provide cost-effective and highly
implementable reductions, and taking into account waterbody use goals, including secondary
contact recreation, Alternative 3, which includes high level aeration, floatables control at the four
outfalls with the largest baseline annual overflow volume, and bending weirs and regulator
modifications at B1 and Q1 provides cost-effective and highly implementable CSO controls.
During the LTCP phase alternatives like the Dutch Kills Relief Sewer and HLSS will be
reevaluated to provide additional CSO reductions. The proposed Newtown Creek WB/WS
Facility Plan includes the following elements:
Floatables control for the four outfalls with the largest typical year overflow volumes.
Enhanced aeration to attain the existing Class SD numerical standard.
Bending Weirs at Regulators B1 and Q1 to reduce CSO discharges
Continued operation of the Brooklyn Pumping Station at up to 400 MGD during wet
weather.
This plan has been selected to attain existing water quality standards, as well as to target
higher waterbody use goals, and to provide a greater benefit to the waterbody in terms of CSO
reduction and water quality than the CSO Facility Plan. Other more costly alternatives offer
little or no water quality improvement beyond that projected for this WB/WS Facility Plan.
To further illustrate how this plan compares to other benchmark levels of CSO control, a
comparison of projected attainment of dissolved oxygen criteria is presented in Table 7-23 for
the Baseline, CSO Facility Plan, WB/WS Plan, and 100% CSO Reduction alternatives. This
table shows the minimum and average values by water quality model transect.
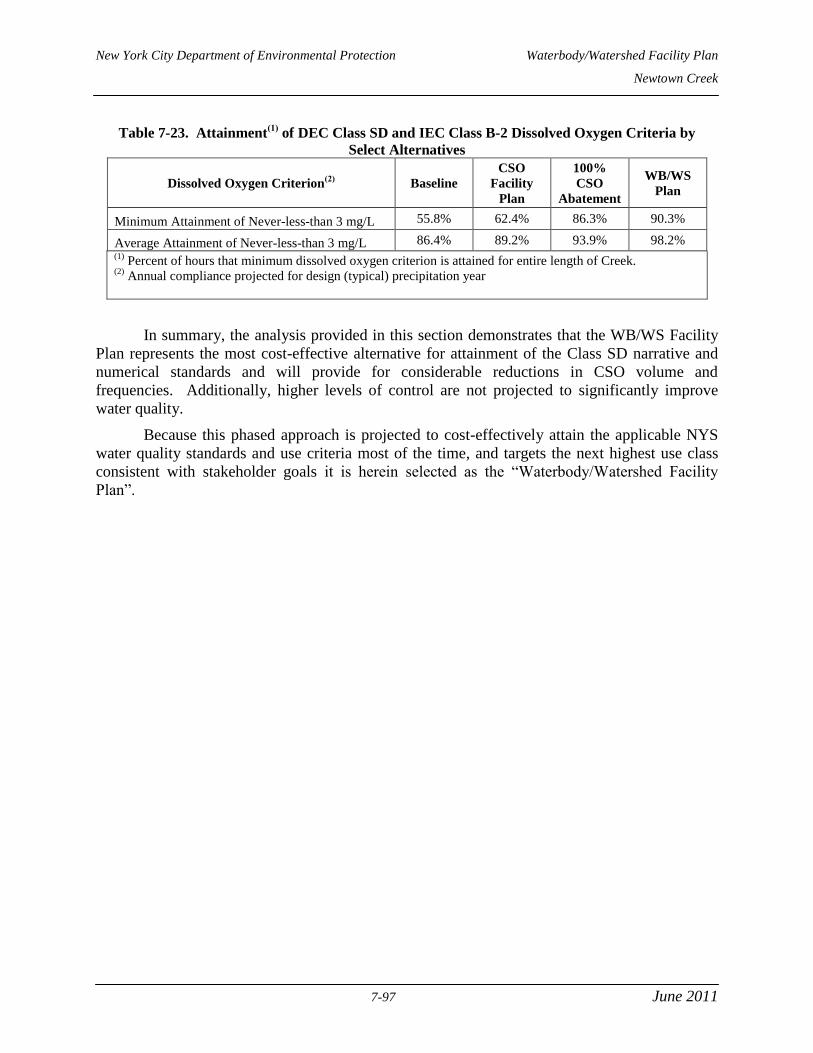
New York City Department of Environmental Protection Waterbody/Watershed Facility Plan
Newtown Creek
7-97 June 2011
Table 7-23. Attainment(1)
of DEC Class SD and IEC Class B-2 Dissolved Oxygen Criteria by
Select Alternatives
Dissolved Oxygen Criterion(2)
Baseline
CSO
Facility
Plan
100%
CSO
Abatement
WB/WS
Plan
Minimum Attainment of Never-less-than 3 mg/L 55.8% 62.4% 86.3% 90.3%
Average Attainment of Never-less-than 3 mg/L 86.4% 89.2% 93.9% 98.2% (1)
Percent of hours that minimum dissolved oxygen criterion is attained for entire length of Creek. (2)
Annual compliance projected for design (typical) precipitation year
In summary, the analysis provided in this section demonstrates that the WB/WS Facility
Plan represents the most cost-effective alternative for attainment of the Class SD narrative and
numerical standards and will provide for considerable reductions in CSO volume and
frequencies. Additionally, higher levels of control are not projected to significantly improve
water quality.
Because this phased approach is projected to cost-effectively attain the applicable NYS
water quality standards and use criteria most of the time, and targets the next highest use class
consistent with stakeholder goals it is herein selected as the “Waterbody/Watershed Facility
Plan”.

New York City Department of Environmental Protection Waterbody/Watershed Facility Plan
Newtown Creek
7-98 June 2011
NO TEXT ON THIS PAGE

New York City Department of Environmental Protection Waterbody/Watershed Facility Plan
Newtown Creek
8-1 June 2011
8.0 Waterbody/Watershed Facility Plan
The efforts of the DEP to develop an approach to achieve the goals of the CWA have
culminated herein with the development of a Waterbody/Watershed Facility Plan that recognizes
that achieving water quality objectives may require more than the simple reduction in CSO
discharges. The multi-faceted approach incorporates several cost-effective engineering solutions
with demonstrable positive impacts on water quality, including increased DO concentrations,
decreased coliform concentrations, and reductions in the deleterious aesthetic consequences of
CSO discharges such as nuisance odors and floatables. The recommended approach also
maximizes utilization of the existing collection system infrastructure and treatment of combined
sewage at the Bowery Bay and Newtown Creek WWTPs.
The subsections that follow present the recommended CSO control components required
to ensure the full implementation of the Newtown Creek WB/WS Facility Plan goals. Post-
construction compliance monitoring (including modeling), discussed in detail in Section 8.3, is
an integral part of the WB/WS Facility Plan, and provides the basis for adaptive management for
Newtown Creek.
If post-construction monitoring indicates that additional controls are required, protocols
established by DEP and the City of New York for capital expenditures require that certain
evaluations are completed prior to the construction of the additional CSO controls. Depending
on the technology implemented and on the engineer‟s cost estimate for the project, these
evaluations may include pilot testing, detailed facility planning, preliminary design, and value
engineering. Each of these steps provides additional opportunities for refinement and adaptation
so that the fully implemented program achieves the goals of this WB/WS Facility Plan.
8.1 PLAN OVERVIEW
The recommended Newtown Creek Waterbody/Watershed Facility Plan proposes
elements intended to attain existing Class SD narrative and dissolved oxygen water quality
standards. This plan is in addition to the ongoing modernization the Bowery Bay WWTP
headworks and the upgrade to full secondary treatment at the Newtown Creek WWTP (which
will provide for treatment at the Newtown Creek WWTP beyond the 2XDDWF normally seen at
other WWTPs). Costs for the plant upgrades are not included in this WB/WS facility plan as
they are accounted for in the Open Water/East River WB/WS Facility Plan.
The recommended Newtown Creek Waterbody/Watershed Plan consists of the following
elements:
Continued operation the Brooklyn Pumping Station at up to 400 MGD during wet
weather.
Construction of bending weirs at B1 and Q1.
Floatables Control at or around the four largest annual average volume CSOs in
Dutch Kills, Maspeth Creek, East Branch, and English Kills.
Construction of Enhanced Zone II Aeration.
Continued Implementation of Programmatic Controls.
New York City Department of Environmental Protection Waterbody/Watershed Facility Plan
Newtown Creek
8-2 June 2011
Locations of the selected elements for the Waterbody/Watershed Facility Plan are shown
on Figure 8-1 .
The probable total project cost of the selected WB/WS Plan is $231.3 million. Probable
total project costs are defined in Section 11 as being adjusted to June 2011 dollars, and were used
in the cost/benefit analyses described in Section 7 to determine the most cost effective
Waterbody/Watershed Facility Plan. This section further describes these elements, including
their implementation and schedule.
This planning-level cost estimate is in addition to the DEP‟s current projected costs of
$3,778 million to complete the upgrade of the Newtown Creek WWTP to full secondary
treatment, which includes the cost of the Brooklyn and Manhattan P.S upgrades, and the $8
million for construction of the full-scale Zone I pilot aeration facility.
8.2 WATERBODY/WATERSHED FACILITY PLAN COMPONENTS
8.2.1 Brooklyn Pumping Station Operational Control
Combined sewer overflows and their associated water quality impacts within the
Newtown Creek waterbody will be minimized by maximizing the proportion of flow to the
Newtown Creek WWTP from the Brooklyn and Queens collection systems. Under this protocol,
the Brooklyn pump station would pump up to 400 MGD of flow during wet weather to the plant
for treatment. This protocol is consistent with the April 2010 Newtown Creek WWTP Wet
Weather Operating Plan (WWOP) included as Appendix B. The WWOP indicates that the
Brooklyn pumps should pump to a maximum capacity of 400 MGD during a wet weather event
always leaving one pump out of service as a standby and that the Manhattan pumps provide a
minimum of 300 MGD during wet weather always leaving two pumps out of service as standby
pumps. The cost of this plan component is not included, as the upgrades to the Brooklyn and
Manhattan pumping stations do not increase total rated pumping capacity to the Newtown Creek
WWTP.
8.2.2 Bending Weirs
As discussed in Section 7.3.4, two locations for bending weirs were identified to provide
considerable CSO reductions. These two locations, Regulator B1 (which overflows to outfall
NCB-015) and Regulator Q1 (which overflows to outfall NCQ-077), discharge the second and
third largest CSO volumes under Baseline conditions. Bending weirs at these locations also can
readily divert wet weather flow into the Morgan Avenue Interceptor and then to the WWTP for
treatment. Each regulator will be retrofitted with bending weirs, installed on top of static weirs,
and modifications made to the regulator orifices to convey additional flow to the WWTP. The
orifices, which control flow into the interceptor, will be enlarged at each regulator so as to
further increase flow to the interceptors. Implementation of bending weir systems will require
modifications to the sewer system and diversion chambers at each regulator. The estimated cost
of the bending weirs and regulator modifications is $26.2 million in June 2011 dollars.
A 3 foot tall 140 foot long fixed weir equipped with a two foot tall bending weir is
proposed for Regulator B-1. The weir system will be constructed in the 16' x 10' double barrel
combined sewer upstream of the diversion chamber as shown in Figure 7-16. Relocation of the
DWF diversion channel and sewer is required. At the head of the relocated diversion sewer, an
8‟ x 8‟ foot opening will be constructed in the double barrel invert to collect DWF. The DWF
New York City Department of Environmental Protection Waterbody/Watershed Facility Plan
Newtown Creek
8-3 June 2011
diversion sewer will be constructed under the existing combined sewer and will discharge to
existing manhole “A”. An additional diversion barrel downstream of the weir was included at
this time so as to pass peak flows without raising the design HGL. The orifices at Regulator B-
1 will be expanded from the existing 8-ft by 3-ft to 10-ft by 3-ft.
Regulator Q1 receives flow from four large sewers: a 7‟-6” x 5‟-6” sewer from the west,
a 8‟-0” x 7‟-0” double barrel sewer from the north and a 7‟-6” x 7‟-0” sewer from the east. All
sewers converge at the Regulator. The confluence of the flows will yield extremely turbulent
conditions during wet weather which will jeopardize the function of bending weirs.
Reconstruction of sewers so as to combined all flows upstream of Regulator Q1 is proposed.
Flow will enter the bending weir facility from one direction which will improve the performance
and reliability of the bending weir mechanism. At Regulator Q1, the bending weir will be 2 feet
tall and the orifice would be expanded from the existing 2-ft square opening to a 3.5-ft square
opening.
8.2.3 Floatables Control
Only minor CSO volume reduction is expected during the Waterbody/Watershed Facility
Plan implementation, which focuses on attaining the existing Class SD narrative and numerical
water quality standards. Therefore, the DEP will construct floatables control facilities to address
floatables at or near the four CSOs with the largest baseline annual overflow volumes (BB-026,
NCQ-077, NCB-083, and NCB-015). The feasibility of siting and maintaining such facilities
on or around these outfalls will be determined during detailed facility planning performed under
the design contract. The estimated capital cost of installing facilities to control floatables from
the four outfalls with largest baseline annual overflow volume is $89.8 million in June 2011
dollars.
8.2.4 Enhanced Zone II Aeration
As discussed in Section 7.3.3, the CSO Facility Plan proposed two zones of aeration,
sized to increase the minimum dissolved oxygen level in Newtown Creek to 1 mg/L.
Construction of Zone I in upper English Kills was completed by the Consent Order milestone of
December 2008. Zone II aeration, which is included in the Consent Order with a completion
milestone of June 2014, was to include aeration of lower English Kills, East Branch and Dutch
Kills. However, the Waterbody/Watershed Facility Plan calls for enhancing Zone II to provide
enough oxygen to the water column to attain the existing Class SD numerical DO standard
throughout the Creek. The DEP has identified constructed Zone I aeration site as a pilot facility
to evaluate the effectiveness of aeration. Through this effort the DEP has developed site specific
information about transfer efficiency and other related factors that influence the final aeration of
the waterbody. Based on the results of the pilot study and follow-up water quality modeling,
modeling projections show that 19,000 scfm of air would be required to bring the waterbody into
compliance with Class SD numerical DO criteria under baseline conditions. Modeling also
projects that to be successful the system would need to be deployed throughout a majority of the
waterbody, including the shipping channels. Such an enhanced aeration system will require
multiple blower buildings and a vast network of aeration piping. Information from the pilot
study will be used during detailed facility planning and design of Enhanced Zone II Aeration to
determine the number of blower facilities, system sizing requirements, and any necessary
upgrades to the Zone I facility currently being constructed. Aeration will first be implemented in
Lower English Kills, followed by East Branch and portions of Newtown Creek. The final
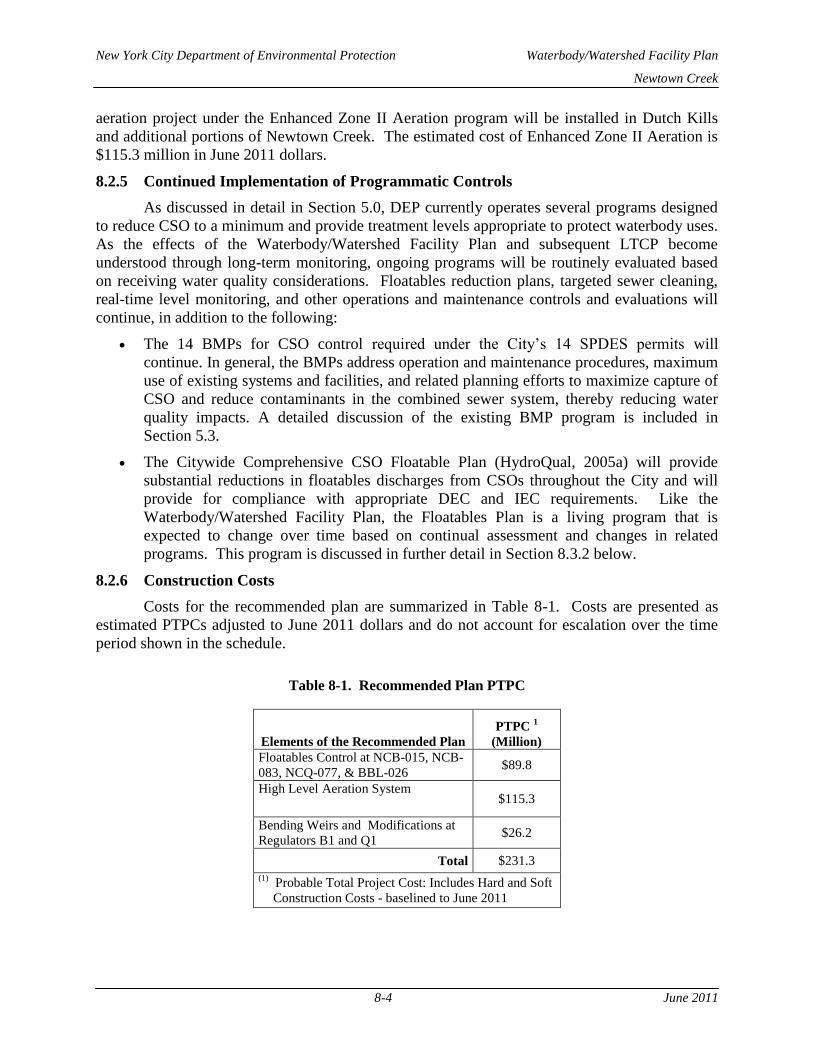
New York City Department of Environmental Protection Waterbody/Watershed Facility Plan
Newtown Creek
8-4 June 2011
aeration project under the Enhanced Zone II Aeration program will be installed in Dutch Kills
and additional portions of Newtown Creek. The estimated cost of Enhanced Zone II Aeration is
$115.3 million in June 2011 dollars.
8.2.5 Continued Implementation of Programmatic Controls
As discussed in detail in Section 5.0, DEP currently operates several programs designed
to reduce CSO to a minimum and provide treatment levels appropriate to protect waterbody uses.
As the effects of the Waterbody/Watershed Facility Plan and subsequent LTCP become
understood through long-term monitoring, ongoing programs will be routinely evaluated based
on receiving water quality considerations. Floatables reduction plans, targeted sewer cleaning,
real-time level monitoring, and other operations and maintenance controls and evaluations will
continue, in addition to the following:
The 14 BMPs for CSO control required under the City‟s 14 SPDES permits will
continue. In general, the BMPs address operation and maintenance procedures, maximum
use of existing systems and facilities, and related planning efforts to maximize capture of
CSO and reduce contaminants in the combined sewer system, thereby reducing water
quality impacts. A detailed discussion of the existing BMP program is included in
Section 5.3.
The Citywide Comprehensive CSO Floatable Plan (HydroQual, 2005a) will provide
substantial reductions in floatables discharges from CSOs throughout the City and will
provide for compliance with appropriate DEC and IEC requirements. Like the
Waterbody/Watershed Facility Plan, the Floatables Plan is a living program that is
expected to change over time based on continual assessment and changes in related
programs. This program is discussed in further detail in Section 8.3.2 below.
8.2.6 Construction Costs
Costs for the recommended plan are summarized in Table 8-1. Costs are presented as
estimated PTPCs adjusted to June 2011 dollars and do not account for escalation over the time
period shown in the schedule.
Table 8-1. Recommended Plan PTPC
Elements of the Recommended Plan
PTPC 1
(Million)
Floatables Control at NCB-015, NCB-
083, NCQ-077, & BBL-026 $89.8
High Level Aeration System $115.3
Bending Weirs and Modifications at
Regulators B1 and Q1 $26.2
Total $231.3
(1) Probable Total Project Cost: Includes Hard and Soft
Construction Costs - baselined to June 2011

Newtown Creek Waterbody/WatershedFacility Plan
Figure 8-1Newtown Creek Waterbody/Watershed Plan
Dutch Kills•Floatables Control for BB-026•In-Stream Aeration
Maspeth Creek•Floatables Control for NCQ-077•In-Stream Aeration•Bending Weir at NC-Q1
East Branch•Floatables Control for NCQ-083•In-Stream Aeration
English Kills•Floatables Control for NCB-015•In-Stream Aeration•Bending Weir at NC-B1
Newtown Creek•Assess LIDs/BMPs•Continued Programatic Controls•400 MGD Brooklyn PS•In-Stream Aeration
New York City Department of Environmental Protection Waterbody/Watershed Facility Plan
Newtown Creek
8-6 June 2011
8.3 POST-CONSTRUCTION COMPLIANCE MONITORING
Post-construction compliance monitoring will commence just prior to implementation of
CSO controls and will continue for several years in order to quantify the difference between the
expected performance (as described in this report) and the actual performance once those
controls are fully implemented. Any performance gap identified by the monitoring program can
then be addressed through operations adjustments, retrofitting additional controls, or initiating a
Use Attainability Analysis (UAA) if it becomes clear that CSO control will not result in full
attainment of applicable standards Due to the dynamic nature of water quality standards and
approaches to non-compliance conditions, a period of ten years of operation will be necessary to
generate the minimal amount of data necessary to perform meaningful statistical analyses for
water quality standards review and for any formal Use Attainability Analysis (UAA) that may be
indicated. The data collection monitoring will contain three basic components:
1. Monitoring and reporting requirements contained in the Bowery Bay WWTP and
Newtown Creek WWTP SPDES permits.
2. DEP Harbor Survey program data collection in Newtown Creek; and
3. Modeling of the associated receiving waters to characterize water quality.
8.3.1 Receiving Water Monitoring
The New York City Harbor Survey primarily measures four parameters related to water
quality: DO, fecal coliform, chlorophyll "a", and secchi depth. These parameters have been used
by the City to identify historical and spatial trends in water quality throughout New York Harbor.
Secchi depth and chlorophyll "a" have been monitored since 1986; DO and fecal coliform have
been monitored since before 1972. Recently, enterococci analysis has been added to the
program. Except for secchi depth and vertical profiling of conductivity, temperature, and DO
parameters are analyzed from samples collected at a depth of three feet below the water surface
to reduce influences external to the water column chemistry itself, such as wind and precipitation
influences near the surface. DEP samples 33 open water stations routinely, which are
supplemented each year with approximately 20 rotating tributary stations or periodic special
stations sampled in coordination with capital projects, planning, changes in facility operation, or
in response to regulatory changes.
The post-construction compliance monitoring program will continue along the protocols
of the Harbor Survey initially, including laboratory protocols listed in Table 8-2. As shown in
Figure 8-2, Newtown Creek contains four stations that will be monitored regularly. These four
stations will serve as the Newtown Creek post-construction monitoring sites. All stations related
to the Newtown Creek Post-Construction Compliance Monitoring Program will be sampled a
minimum of twice per month from May through September and a minimum of once per month
during the remainder of the year.
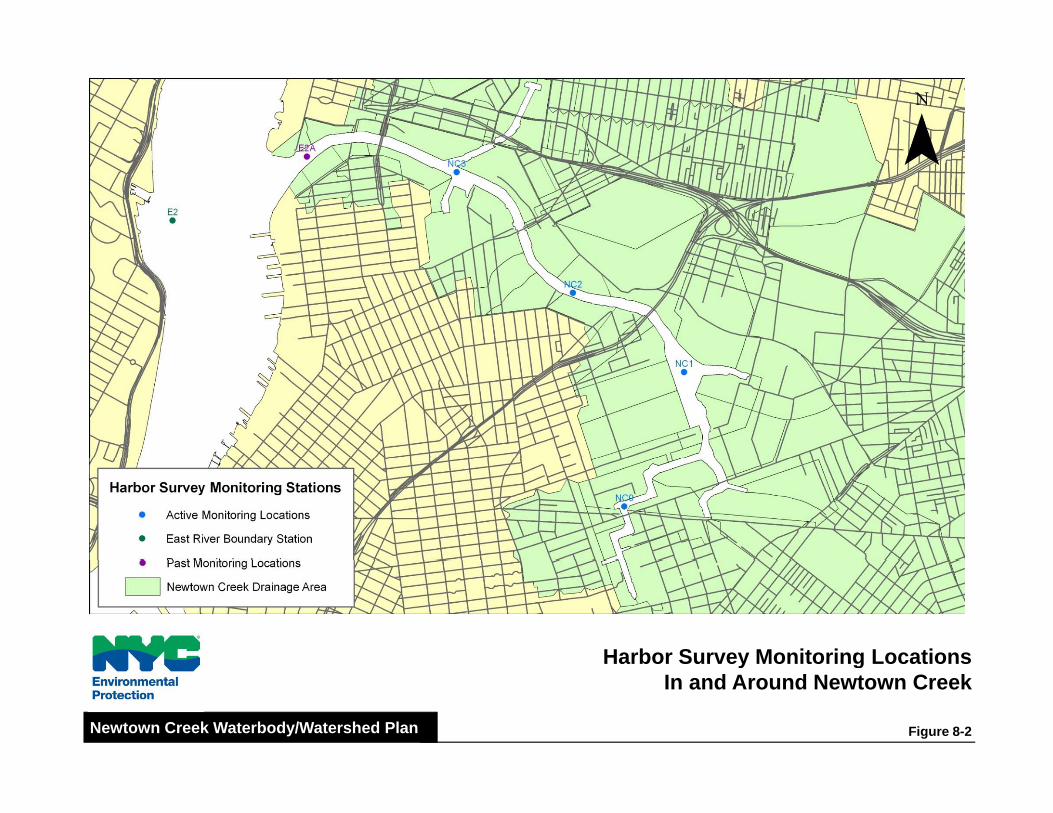
Harbor Survey Monitoring LocationsHarbor Survey Monitoring LocationsIn and Around Newtown Creek
Figure 8-2Newtown Creek Waterbody/Watershed Plan

New York City Department of Environmental Protection Waterbody/Watershed Facility Plan
Newtown Creek
8-8 June 2011
Table 8-2. Current Harbor Survey Laboratory Protocols
Parameter Method
Ammonia (as N) EPA 350.1
Chlorophyll „a‟ EPA 445.0, modified for the Welschmeyer Method
Dissolved Oxygen SM 4500-O C, Azide Modification (Winkler Method)
Dissolved Silica SM 18-19 4500-Si D or USGS I-2700-85
Enterococcus EPA Method 1600, Membrane Filter
Fecal Coliform SM 18-20 9222D, Membrane Filter
Nitrate (as N) EPA 353.2 or SM 18-20 4500-NO3 F
Orthophosphate (as P) EPA 365.1
pH SM 4500-H B, Electrometric Method
Total Kjeldahl Nitrogen EPA 351.2
Total Phosphorus EPA 365.4
Total Suspended Solids SM 18-20 2540D
Notes: SM – Standard Methods for the Examination of Water and Wastewater; EPA –
EPA‟s Sampling and Analysis Methods. Field instrumentation also includes an SBE 911
Sealogger CTD which collects salinity, temperature, and conductivity, among other
parameters.
Data collected during this program will be used primarily to verify the East River
Tributaries Model (ERTM) that will be used to demonstrate relative compliance levels in
Newtown Creek. Therefore, during each annual cycle of compliance monitoring, the data
collected will be evaluated for its utility in model verification and stations may be added,
eliminated, or relocated depending on this evaluation. Similarly, the parameters measured will
be evaluated for their utility and appropriateness for verifying the receiving water model
calibration. At a minimum, the program will collect those parameters with numeric WQS (i.e.,
DO, fecal coliform, and enterococci). In addition, moored instrumentation may be added or
substituted at one or more of these locations if continuous monitoring is determined to be
beneficial to model verification or if logistical considerations preclude the routine operation of
the program (navigational limits, laboratory issues, etc.).
Post-construction monitoring protocols, QA/QC, and other details are being fully
developed under the Citywide LTCP to assure adequate spatial coverage and a technically sound
sampling program. The monitoring within each waterbody under DEP‟s purview will commence
no later than the activation of any constructed CSO abatement facility. In those waterbodies
where constructed facilities are not proposed, sampling will commence no later than the summer
following DEC approval of the WB/WS Facility Plan.
8.3.2 Floatables Monitoring Program
The Newtown Creek Waterbody/Watershed Facility Plan incorporates by reference the
Citywide Comprehensive CSO Floatables Plan Modified Facility Planning Report (DEP, 2005b)
and Addendum 1 – Pilot Floatables Monitoring Program (December 2005) to the Floatables
Plan. These documents contain a conceptual framework for the monitoring of floatables
conditions in New York Harbor and a work plan for the ongoing pilot program to develop and
test the monitoring methodology envisioned in the framework. The objectives set forth in the
Floatables Plan provides a metric for LTCP performance, and floatables monitoring is conducted
in conjunction with post-construction compliance monitoring with regard to staffing, timing, and

New York City Department of Environmental Protection Waterbody/Watershed Facility Plan
Newtown Creek
8-9 June 2011
location of monitoring sites. The program includes the collection of basic floatables
presence/absence data from monitoring sites throughout the harbor that will be used to rate and
track floatables conditions, correlate rating trends to floatables control programs where
applicable, and trigger investigations into the possible causes of consistently poor ratings should
they occur. Actions based on the floatables monitoring data and investigations could include
short term remediation in areas where monitored floatables conditions create acute human or
navigation hazards and, as appropriate, longer term remediation actions and modifications to the
Newtown Creek WB/WS Facility Plan if monitored floatables trends indicate impairment of
waters relative to their intended uses. Currently, the results of this ongoing monitoring program
are reported in the annual BMP report. Meteorological Conditions
The performance of any CSO control facility cannot be fully evaluated without a detailed
analysis of precipitation, including the intensity, duration, total rainfall volume, and precipitation
event distribution that led to an overflow or, conversely, the statistical bounds within which the
facility may be expected to control CSO completely. DEP has established 1988 as representative
of long-term average conditions and therefore uses it for analyzing facilities where “typical”
conditions (rather than extreme conditions) serve as the basis for design. The comparison of
rainfall records at JFK airport from 1988 to the long-term rainfall record is shown in Table 8-3,
and includes the return period for 1988 conditions.
Table 8-3. Rainfall Statistics, JFK Airport, 1988 and Long-Term
Average
Statistic 1970-2002
Median
1988
Value Return Period
(years)
Total Volume (inches) 39.4 40.7 2.6
Intensity (in/hr) 0.057 0.068 11.3
Number of Storms 112 100 1.1
Storm Duration (hours) 6.08 6.12 2.1
In addition to its aggregate statistics indicating that 1988 was representative of overall
long-term average conditions, 1988 also includes critical rainfall conditions during both beach
season and shellfishing periods. Further, the average storm intensity for 1988 is greater than one
standard deviation from the mean, so that using 1988 as a design rainfall year would be
conservative with regard to water quality impacts since CSOs and stormwater discharges are
driven primarily by rainfall intensity. However, considering the complexity and stochastic
nature of rainfall, selection of any year as “typical” is ultimately qualitative.
Given the uncertainty of the actual performance of the proposed upgrades and the
response of Newtown Creek with respect to widely varying precipitation conditions, rainfall
analysis is an essential component of the post-construction compliance monitoring. Multiple
sources of rainfall data will be compiled as part of the final City-Wide Post-Construction
Monitoring Program. On an interim basis, however, the primary source of rainfall data will be
from La Guardia Airport and from any DEP gauges that may be available. The use of NEXRAD
cloud reflectivity data as proposed in the Waterbody/Watershed Facility Plan will be limited to
testing implementation techniques until its utility is fully understood. Any data sets determined
to be of limited value in the analysis of compliance may be discontinued.
New York City Department of Environmental Protection Waterbody/Watershed Facility Plan
Newtown Creek
8-10 June 2011
8.3.3 Analysis
The performance of the Newtown Creek WB/WS Facility Plan will be evaluated on an
annual basis using a landside mathematical computer model, as approved by DEC. The
collection system model that was used in the development of the present WB/WS Facility Plan is
expected to serve as the basis for future model-related activities. In addition, DEP believes that
the analysis of water quality compliance is best accomplished using computer modeling
supported and verified with a water quality monitoring program. Modeling has several
advantages over monitoring:
1. Modeling provides a comprehensive vertical, spatial, and temporal coverage that
cannot reasonably be equaled with a monitoring program;
2. Modeling provides the data volume necessary to compute aggregate statistical
compliance values, such as a geometric mean, an absolute limit (e.g., “never-less-
than” or “not-to-exceed”), or a cumulative statistic (e.g., the 66-day deficit-duration
standard for DO to be promulgated by DEC in the near future);
3. Discrete grab sampling for data collection is necessarily biased to locations and
periods of logistical advantage, such as navigable waters, safe weather conditions,
daylight hours, etc.; and
4. Quantification of certain chemical parameters must be performed in a laboratory
setting which either (a) complicates the use of a smaller sampling vessel that is
necessary to access shallower waters not navigable by a vessel with on-board
laboratory facilities or (b) limits the number of sampling locations that can be
accessed due to holding times and other laboratory quality assurance requirements if
remote laboratory (non-vessel mounted) facilities are used.
The InfoWorks collection system model of the Bowery Bay and Newtown Creek WWTP
service area was developed under the LTCP project based in part on historical models used in
facility planning. InfoWorks is a state-of-the-art modeling package that includes the ability to
represent storage tunnel dynamics, hydraulic analyses and other sophisticated aspects of
performance within the collection system. Overflow volumes will be quantitatively analyzed on
a monthly basis to isolate any periods of performance issues and their impact on water quality.
Water quality modeling re-assessment will be conducted every two years based on the previous
two years quality field data. Modeling conditions will be based on the hydrodynamic and
meteorological conditions for the study year, documented operational issues that may have
impacted the facility performance, and water quality boundary conditions based on the Harbor
Survey Monitoring Station E2 (see Figure 8-2). Results will be compared to the relevant Harbor
Survey data to validate the water quality modeling system, and performance will be expressed in
a quantitative attainment level for applicable numerical criteria based on the receiving water
model. Should this analysis indicate that progress towards the desired results is not being made,
the analysis will:
Re-verify all model inputs, collected data and available QA/QC reports;
Consult with operations personnel to ensure unusual operational problems (e.g.,
screening channel overload/shutdown, pump repair, etc.) were adequately
documented;
Evaluate specific periods of deviations from modeled performance;
New York City Department of Environmental Protection Waterbody/Watershed Facility Plan
Newtown Creek
8-11 June 2011
Confirm that all operational protocols were implemented, and that these protocols
are sufficient to avoid operationally-induced underperformance;
Re-evaluate protocols as higher frequency and routine problems reveal themselves;
and finally,
Revise protocols as appropriate and conduct Use Attainability Analysis (UAA) and,
if necessary, revise the WB/WS Facility Plan.
Following completion of the tenth annual report containing data during facility operation,
a more detailed evaluation of the capability of the Newtown Creek Waterbody/Watershed
Facility Plan to achieve the desired water quality goals will take place, with appropriate weight
given to the various issues New York City identified during the evaluations documented in the
annual reports. If it is determined that the desired results are not achieved for dissolved oxygen,
DEP will implement additional measures to improve levels of attainment for dissolved oxygen
numerical criterion under typical precipitation conditions. Alternatively, the water quality
standards revision process may commence with a UAA that would likely rely in part on the
findings of the post-construction compliance monitoring program. The approach to future
improvements beyond the 10-year post-construction monitoring program will be dictated by the
findings of that program as well as the input from DEC SPDES permit and CSO Consent Order
administrators.
8.3.4 Reporting
Post-construction compliance monitoring will be added to the annual BMP report
submitted by DEP in accordance with their SPDES permits. The monitoring report will provide
summary statistics on rainfall, the amount of combined sewage, and the proportions directed to
the Newtown Creek WWTP and bypassed to the associated CSO outfalls. Verification and
refinement of the model framework as necessary will be documented, and modeling results will
be presented to assess water quality impacts in lieu of high-resolution sampling. Analyses of
precipitation, temperature effects, and other conditions external to the CSO Facility performance
will also be included in the Annual BMP Report.
In addition to the information to be provided in the Annual BMP Report, DEP will
submit a summary of the monitoring and modeling, including the data, once every five years.
DEC has acknowledged that the variability in precipitation dynamics may require more than five
successive years of data to statistically validate the models used for evaluating compliance, but
have nonetheless stated that this information will be used to identify areas of significant water
quality non-compliance and gaps in the water quality modeling, and measure progress with the
LTCP goals. They have also stated that they intend to verify the 1988 rainfall data as the
“average” year.
8.4 OPERATIONAL PLAN
USEPA guidance specifies that municipalities should be required to develop and
document programs for operating and maintaining the components of their combined sewer
systems (EPA, 1995a). Prior to new facilities being placed into service, the municipality‟s
operation and maintenance program should be modified to incorporate the facilities and operating
strategies associated with selected controls. To this end, DEP has developed and submitted wet
weather operating plans (WWOPs) for both the Newtown Creek and Bowery Bay WWTPs.
These WWOPs will be appended to the drainage basin specific Long Term Control Plan (LTCP)
for Newtown Creek when it is developed.

New York City Department of Environmental Protection Waterbody/Watershed Facility Plan
Newtown Creek
8-12 June 2011
Because this Waterbody/Watershed Facility Plan requires review and approval by DEC,
the operational plan for the remaining components will be developed subsequent to that approval
and after all components are designed.
Upon implementation of the Waterbody/Watershed Plan elements, DEP intends to
operate the facilities as designed. However, it is both environmentally responsible and fiscally
prudent to be responsive to changing and unforeseen limitations and conditions. An adaptive
management approach will be employed to accomplish this flexibility. Post-construction
compliance monitoring may trigger a sequence of more detailed investigations that, depending on
the findings, could culminate in corrective actions. During the first nine post-construction years,
the analysis will ultimately determine whether the performance of the CSO controls was
adequate. If the performance is unacceptable, the finding will be verified, the causes will be
identified, and reasonable corrective actions will be taken. Modifications and retrofits that are
implemented and demonstrate improvement will be documented through the issuance of an LTCP
update, subject to DEC approval.
8.5 SCHEDULE
The time frames anticipated to develop and implement the elements of the
Waterbody/Watershed Facility Plan are presented in Figure 8-3. As shown, all elements of the
Plan will be implemented by 2019. It should be noted that elements shown in this schedule
address implementation of the recommended Waterbody/Watershed Facility Plan elements only.
As noted in the Order on Consent (Section III.C.2) “once the Department approves a Drainage
Basin Specific LTCP, the approved Drainage Specific LTCP is hereby incorporated by reference,
and made an enforceable part of this Order”. As such, a schedule will be incorporated by
reference only when this Waterbody/Watershed Facility Plan is further developed and submitted
as an LTCP in accordance with dates presented in Appendix A of the Order on Consent.
Dredging of Newtown Creek will be considered in the future pending the results of the Remedial
Investigation/Feasibility Study. In addition, the DEP will also continue to support and sponsor
the USACE in its Hudson-Raritan Estuary Ecosystem Restoration Project, and to support the
recommend actions when that study is finalized.
8.6 CONSISTENCY WITH FEDERAL CSO POLICY
The Newtown Creek Waterbody/Watershed Facility Plan was developed so that it
satisfies the requirements of the Federal CSO Control Policy. Through extensive water quality
and sewer system modeling, data collection, community involvement, and engineering analysis,
the DEP has adopted a plan that incorporates the findings of over a decade of inquiry to achieve
the highest reasonably attainable use of Newtown Creek. This WB/WS Facility Plan addresses
each of the nine minimum elements of long-term CSO control as defined by federal policy and
shown in Table 8-2.

2003 2004 2005 2006 2007 2008 2009 2010Task Name
Calendar Year
2011 2012 2013 2014 2015 2016 2017 2018 2019 2020 2021 2022
A. Facility Plan Development
- Submit Modified CSO Facility Plan Report
B. Comprehensive Watershed Planning
- Submit Approvable Newtown Creek
2/04
Consent Order Requirements
ppWaterbody/Watershed Facility Plan Report
C. Submit Approvable Drainage Basin Specific LTCP for Newtown Creek
6/07
Calendar Year
2/16
June 2012
Estimated; LTCP is Due 6 Months after WB/WS Facility Plan Approval*2003 2004 2005 2006 2007 2008 2009 2010Task Name 2011 2012 2013 2014
6/11
2015 2016 2017 2018 2019 2020 2021 2022
Bending Weirs at B1 and Q1 / Floatables Control
- Final Design- Bid and Award- Construction
6/13
12/14
12/17
Construction of Enhanced Zone II Aeration
- Lower English Kills- Design - Bid and Award - Construction
12/13
6/1112/12
6/07
- East Branch and Portions of Newtown Creek- Design- Bid and Award- Construction
- Dutch Kills and Portions of Newtown Creek- Design
6/18
12/13
6/15
6/10
6/1512/16
6/10
Legend:
g- Bid and Award- Construction 12/19
12/16
Waterbody/Watershed Facility PlanImplementation Schedule
Figure 8-3Newtown Creek Waterbody/Watershed Plan
Completed Not Completed Milestones
New York City Department of Environmental Protection Waterbody/Watershed Facility Plan
Newtown Creek
8-14 June 2011
Table 8-2. Nine Elements of Long-Term CSO Control
Element
Report
Section Summary
1. Characterization, Monitoring,
and Modeling of the Combined
Sewer System
3.0
Addressed during Inner Harbor Facility planning (1993), CSO
Facility Plan (1993-2003), USA Project (1999-2004), and WB/WS
Plan development (2004-2005).
2. Public Participation 6.0
The WB/WS Plan was developed with active involvement from
the affected public and other stakeholders during its development.
In addition, four stakeholder meetings were held to develop the
plan during the USA Project.
3. Consideration of Sensitive
Areas 4.7
The DEC, as the permitting authority, has determined that the
Newtown Creek waterbody as a whole is a sensitive area.
4. Evaluation of Alternatives 7.0
Detailed evaluations conducted during facility planning projects
and herein clearly establish the combination of alternatives that
comprise the WB/WS Facility Plan.
5. Cost/Performance
Considerations 7.0
Both facility planning and WB/WS Plan development evaluations
of cost suggest that the highest-level controls (100% CSO capture)
provide insignificant additional water quality benefits despite
inordinate costs. WB/WS Facility Plan CSO facilities were sized
according to a “knee-of-the-curve” type cost-benefit analysis.
6. Operational Plan 8.0
DEP will continue to satisfy the operational requirements of the 14
BMPs for CSO control, including the Bowery Bay and Newtown
Creek WWTP Wet Weather Operating Plans, as required under the
City‟s SPDES permits. The BMPs satisfy the nine minimum
control requirement of federal CSO policy. DEP will also
continue implementation of other programmatic controls.
7. Maximizing Treatment at the
Existing WWTP 7.0
Maximization of treatment at the Bowery Bay and Newtown
Creek WWTPs is included in the WB/WS Plan through
satisfaction of the operational requirements of the WWTP
WWOPs.
8. Implementation Schedule 8.0
The Newtown Creek Enhanced Track 3 Facility Upgrade was
underway at the time of the writing of this report. Construction
activity is anticipated to conclude in 2013. Construction of the
Zone 1 Aeration Facility was also ongoing is anticipated to
conclude in 2008.
9. Post-Construction Compliance
Monitoring 8.0
Post-construction monitoring will be performed per CSO Control
Policy requirements: receiving water will be monitored per Harbor
Survey protocols at the four stations within Newtown Creek and
one station in the East River. Monitoring data will be used to
assess compliance, to optimize facility performance, and to trigger
adaptive management alternatives.
8.7 ANTICIPATED WATERBODY/WATERSHED PLAN BENEFITS
Implementation of the Waterbody/Watershed Facility Plan will provide both sewer-
system performance benefits and water-quality benefits. The various components of the Plan
will reduce CSO discharges, improve aesthetic conditions, and enhance habitat to levels
consistent with regulatory and stakeholder use goals.
Sewer-system performance benefits of the Waterbody/Watershed Facility Plan can be
described using the results of the landside modeling projections for the design (typical)
precipitation year. Table 8-3 details CSO discharge volume and frequency reductions from each

New York City Department of Environmental Protection Waterbody/Watershed Facility Plan
Newtown Creek
8-15 June 2011
of the outfalls that discharge to the Newtown Creek waterbody as well as total volume reduction
to the waterbody.
Table 8-3. Waterbody/Watershed Plan Reductions from Baseline (1) (2)
Outfall Discharge
Volume (MG)
% Volume Reduction
from Baseline
Number of
Discharges
% Reduction in
Discharges from
Baseline
Combined Sewer (3)
NCB-083 586.2 0.0% 71 0.0%
BB-026 172.8 0.7% 44 6.4%
NCQ-077 190.6 27.0% 35 28.6%
NCB-015 196.4 36.2% 26 21.2%
BB-013 29.8 23.7% 41 6.8%
NCQ-029 18.1 0.0% 48 0.0%
BB-043 12.2 12.2% 37 7.5%
BB-009 34.4 2.3% 34 2.9%
NCB-022 7.0 16.7% 42 0.0%
BB-014 2.2 31.3% 30 14.3%
BB-042 1.9 17.2% 27 6.9%
BB-011 2.8 0.0% 24 0.0%
BB-040 0.7 11.1% 18 14.3%
BB-015 2.1 32.3% 36 7.7%
BB-010 1.6 0.0% 16 0.0%
NCB-023 0.2 0.0% 5 0.0%
NCB-019 0.6 25.0% Increase 12 71.4%Increase
BB-012 0.2 0.0% 5 0.0%
BB-004 0.1 0.0% 4 0.0%
NCB-024 0.0 0.0% 0 0.0%
Total CSO 1259.9 14.4%
Storm Sewer (4) (5)
NCB-629 62.1 0.0% 71 0.0%
NCB-631 55.9 0.0% 71 0.0%
NCB-632 51.9 0.0% 71 0.0%
NC Non-Permitted 324.1 0.0% 71 0.0%
BB Non-Permitted 82.7 0.0% 71 0.0%
Total Stormwater 576.7 0.0%
Total 1,836.6 11.5% (1)
Baseline condition reflects design precipitation record (JFK, 1998) and sanitary flows projected for year 2045
(Bowery Bay WWTP: 236 MGD, Newtown Creek WWTP: 585 MGD). (2)
Totals may not sum precisely due to rounding. (3)
CSO Outfalls BBL-049 and NCB-021 are not incorporated into the model due to lack of as-built data. The
adjacent drainage areas are distributed to nearby outfalls. Outfall 002 is the Newtown Creek WPCP high relief
that discharges to Whale Creek Canal. This flow is treated before discharge and is built into the water quality
model runs. (4)
The collection system models include a total of 44 non-CSO discharges to Newtown Creek. (5)
SPDES permitted storm outfalls NCB-630 and 633 are not incorporated into the model due to lack of as-built
data.
In addition to the projected CSO reductions identified above, this WB/WS Plan is not
projected to increase CSO discharges to other waterbodies.
Although the Waterbody/Watershed Facility Plan will provide significant benefits with
respect to sewer-system performance and reduction of CSO discharges, the projected

New York City Department of Environmental Protection Waterbody/Watershed Facility Plan
Newtown Creek
8-16 June 2011
improvement to water quality affords a more meaningful measure of the impact of the Plan.
Water quality conditions projected with implementation of the Waterbody/Watershed Facility
Plan are presented in Figures 8-4 and 8-5. Anticipated water quality improvements to dissolved
oxygen, aesthetics, and bacteria are discussed below.
8.7.1 Dissolved Oxygen
Dissolved oxygen is perhaps the most meaningful measure of the impact of the Newtown
Creek Waterbody/Watershed Facility Plan because it is due to low levels of dissolved oxygen
that Newtown Creek is currently on DEC‟s 303(d) list of impaired waterbodies. As shown on
Figure 8-4, implementation of the Waterbody/Watershed Facility Plan is projected to
substantially increase dissolved oxygen levels throughout the Creek. As discussed in Section 7.5
and summarized in Table 7-21, implementation of the first phase of the Newtown Creek
Waterbody/Watershed Facility Plan is expected to provide greater average dissolved-oxygen
levels, and corresponding aquatic-life uses, than the much more costly 100% CSO reduction.
Higher levels of control, including complete elimination of all CSO discharges, do not fully
attain the Class SD dissolved oxygen criteria, and do not significantly improve the attainment of
higher use levels in the waterbody beyond what is achieved with the Waterbody/Watershed
Facility Plan.
8.7.2 Aesthetics
The Waterbody/Watershed Facility Plan is expected to substantially reduce floatables. In
addition to the reductions of floatables and solids that will result from the Citywide
implementation of the Floatables Plan and the 14 BMPs for CSO control, the
Waterbody/Watershed Facility Plan will include projects to directly reduce floatables in the first
phase, and is projected to reduce CSO discharges containing these materials by about 61 percent
after implementation of all phases. Remaining floatables issues will be addressed with periodic
deployment of a skimmer vessel to conduct waterbody floatables removal.
8.7.3 Bacteria
The DEC designates Newtown Creek as a Class SD waterbody. This classification is not
suitable for contact recreation and hence is not subject to associated indicator bacteria standards.
However, acknowledging stakeholder use goals, levels of indicator bacteria were projected for
purposes of comparison between the Baseline and Waterbody/Watershed Facility Plan. Figure
8-5 presents the average and maximum projected levels of total coliform and fecal coliform
bacteria in Newtown Creek and its tributaries for the design (typical) precipitation year for the
Baseline and Waterbody/Watershed Facility Plan conditions. As shown, the
Waterbody/Watershed Facility Plan is projected to reduce average and maximum levels overall
and particularly near the head of the Creek within East Branch and English Kills.
8.8 GREEN STRATEGY ASSESSMENTS AND IMPLEMENTATION
The NYC Green Infrastructure Plan, as described in section 5.8, included five key
components: construct cost effective grey infrastructure; optimize the existing wastewater system
through interceptor cleaning and other maintenance measures; control runoff from 10 percent of
impervious surfaces through green infrastructure; institute an adaptive management approach to
better inform decisions moving forward; and engage stakeholders in
the development/implementation of these green strategies.
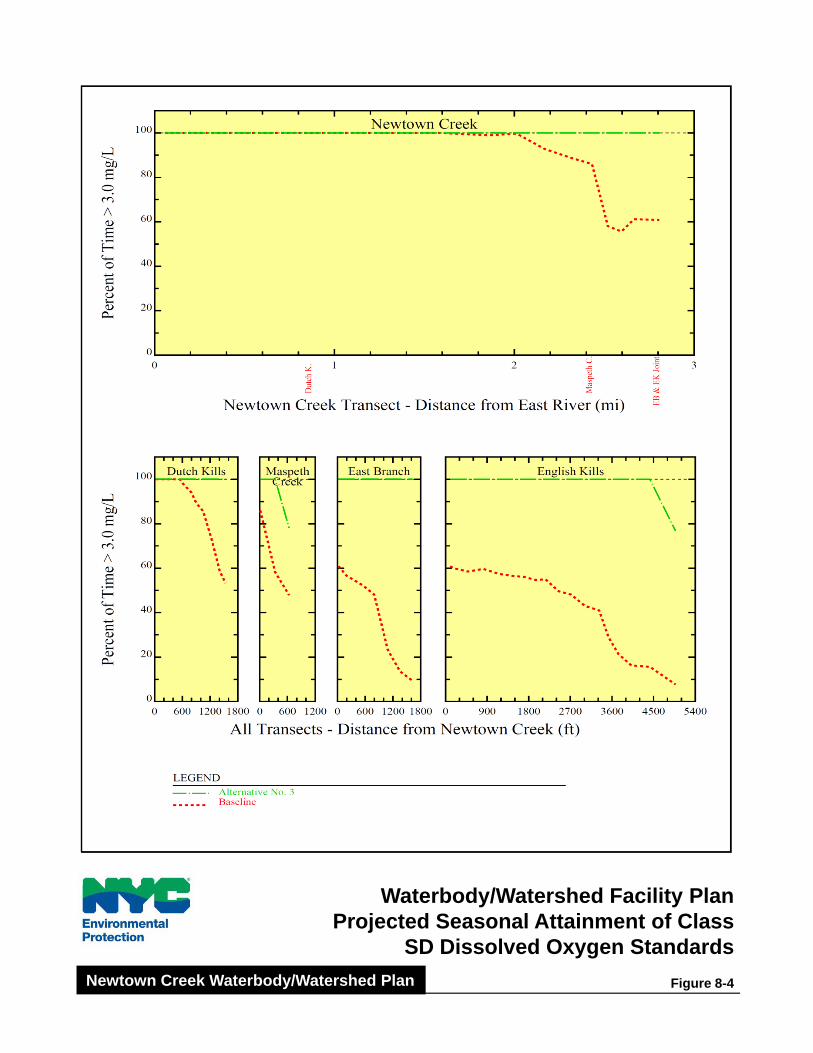
Waterbody/Watershed Facility PlanProjected Seasonal Attainment of Class
SD Dissolved Oxygen Standards
Figure 8-4Newtown Creek Waterbody/Watershed Plan
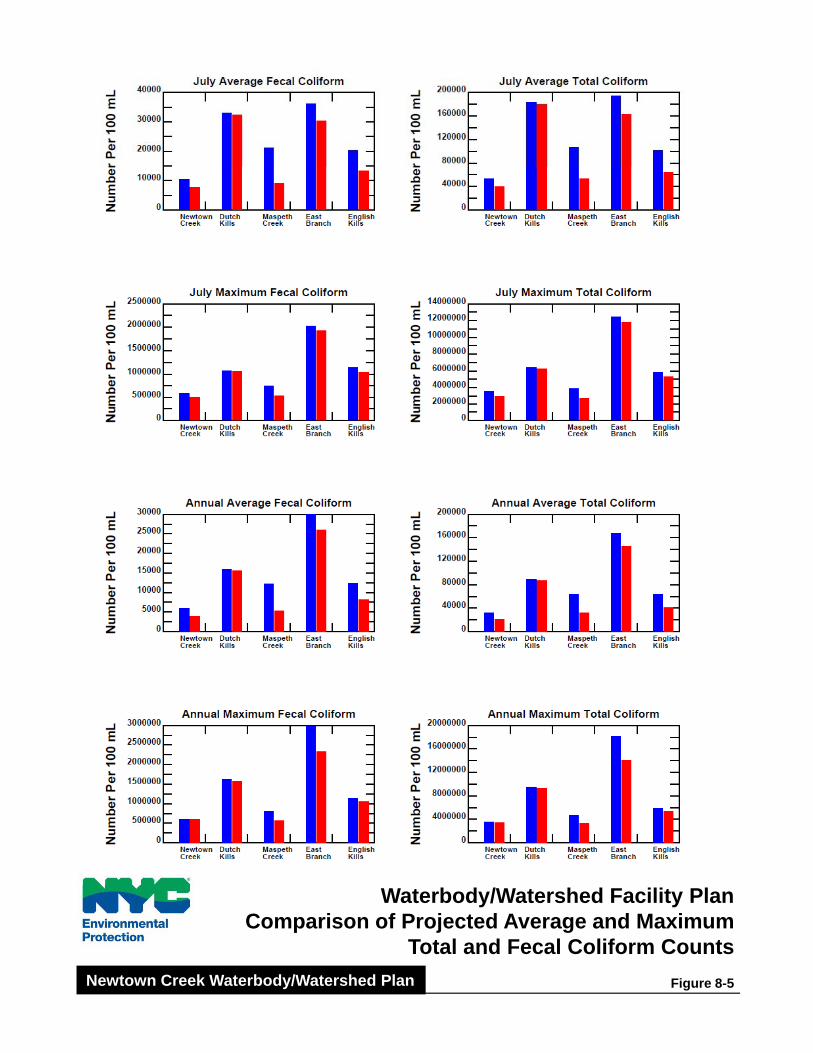
Waterbody/Watershed Facility PlanComparison of Projected Average and Maximum
Total and Fecal Coliform Counts
Figure 8-5Newtown Creek Waterbody/Watershed Plan

New York City Department of Environmental Protection Waterbody/Watershed Facility Plan
Newtown Creek
8-19 June 2011
As part of the LTCP process, DEP will evaluate green infrastructure in combination with
other LTCP strategies to better understand the extent to which green infrastructure would
provide incremental benefits and would be cost-effective. DEP models will be refined by
including new data collected from green infrastructure pilots, new impervious cover data and
extending predictions to ambient water quality for the development of the LTCP. Based on these
evaluations, and in combination with cost effective grey infrastructure, DEP will reassess the
green infrastructure strategy.
New York City Department of Environmental Protection Waterbody/Watershed Facility Plan
Newtown Creek
8-20 June 2011
NO TEXT ON THIS PAGE
New York City Department of Environmental Protection Waterbody/Watershed Facility Plan
Newtown Creek
9-1 June 2011
9.0. Water Quality Standards Review
The Newtown Creek Waterbody/Watershed Facility Plan is a component of the New
York City Department of Environmental Protection’s Combined Sewer Overflow Long-Term
Control Plan. This Plan is being prepared in a manner fully consistent with the USEPA’s CSO
Control Policy, the Wet Weather Water Quality Act of 2000 and applicable USEPA guidance.
As noted in Section 1.2 and as stated in the Clean Water Act, it is a national goal to
achieve “fishable/swimmable” water quality in the nation’s waters wherever attainable. The
CSO Policy also reflects the CWA’s objectives to achieve high water quality standards by
controlling CSO impacts, but the Policy recognizes the site-specific nature of CSOs and their
impacts and provides the necessary flexibility to tailor controls to local situations. The key
principles of the CSO Policy were developed to ensure that CSO controls are cost-effective and
meet the objectives of the CWA. In doing so, the Policy provides flexibility to municipalities to
consider the site-specific nature of CSOs and to determine the most cost-effective means of
reducing pollutants and meeting CWA objectives and requirements. The Policy also provides
for the review and revision, as appropriate, of water quality standards when developing CSO
control plans to reflect the site-specific wet weather impacts of CSOs.
In 2001, USEPA published guidance for coordinating CSO long-term planning with
water quality standards reviews. This guidance re-affirmed that USEPA regulations and
guidance provide States with the opportunity to adapt their WQS to reflect site-specific
conditions related to CSOs. The guidance encouraged the States to define more explicitly their
recreational and aquatic life uses and then, if appropriate, modify the criteria accordingly to
protect the designated uses.
The Newtown Creek Waterbody/Watershed Facility Plan was developed in a manner
consistent with the CSO Policy and applicable guidance. Specifically, cost-effectiveness and
knee-of-the-curve evaluations were performed for CSO load reduction evaluations using long-
term rainfall records. Baseline and Waterbody/Watershed Facility Plan receiving water impact
evaluations were performed for average annual rainfall conditions consistent with CSO Policy
guidance. The plan resulting from following USEPA regulations and guidance will provide
substantial benefits. However, it does not fully attain the “fishable/swimmable” standard. When
the planning process has this result, the national policy calls for a review and, where appropriate,
a revision to water quality standards. The purpose of this section, therefore, is to address the
water quality standards review and revision guidance applicable to the CSO Policy.
9.1. WATER QUALITY STANDARDS REVIEW
This section reviews the applicable water quality standards and their attainability in
Newtown Creek, as well as waterbody uses and other practical considerations such as partial
attainment.

New York City Department of Environmental Protection Waterbody/Watershed Facility Plan
Newtown Creek
9-2 June 2011
9.1.1. Numeric Water Quality Standards
New York State waterbody classifications and numerical criteria which are or may
become applicable to Newtown Creek are shown in Table 9-1.
Newtown Creek is classified as SD with a best usage of fishing. This classification is
considered to be suitable for fish survival but not for fish propagation. This classification does
not satisfy the “fishable” goal of the CWA. In addition, this classification is not considered
suitable for either secondary or primary contact recreation and, therefore, does not have any
bacteriological criteria specified. Class SD is not consistent with the “swimmable” goal of the
CWA. Satisfaction of the “fishable” goal would require Newtown Creek to be reclassified to
Class I, SB or SC, which are considered suitable for fish propagation and survival. It is
understood at present that the Class I dissolved oxygen criterion of never less than 4.0 mg/L is
considered satisfactory for fish propagation and survival, and therefore consistent with the
fishable goal of the CWA. Satisfaction of the “swimmable” goal would require reclassification
to Class SB or SC which are considered suitable for primary contact recreation. Reclassification
to the fishable/swimmable Class SB/SC requires meeting numerical bacteria standards and also
increases the minimum dissolved oxygen requirement to never less than 5.0 mg/L from the never
less than 3.0 mg/L under Class SD.
Table 9-1. New York State Numeric Surface Water Quality Standards (Saline)
Class
Dissolved Oxygen
(mg/L)
Bacteria (Pathogens)
Total Coliform (1,4)
(per 100 mL)
Fecal Coliform (2,4)
(per 100 mL)
Enterococci(3)
(per 100 mL)
SD ≥ 3.0 N/A N/A N/A
I ≥ 4.0 ≤ 10,000 ≤ 2,000 N/A
SB, SC ≥ 5.0 ≤ 2,400
≤ 5,000 ≤ 200 ≤ 35
(1) Total coliform criteria are based on monthly geometric means for Class I, and on monthly medians for Classes SB
and SC; second criterion for SC and SB is for 80% of samples. (2) Fecal coliform criteria are based on monthly geometric means. (3) The enterococci standard is based on monthly geometric means per the USEPA Bacteria Rule and applies to the
bathing season. The enterococci coastal recreation water infrequent use reference level (upper 95% confidence
limit) = 501/100 mL. (4) Per 6 NYCRR 703.4(c), Class I, SB and SC bacteria standards are applicable only when disinfection is practiced.
N/A: not applicable
The Interstate Environmental Commission (IEC) waterbody classifications applicable to
waters within the Interstate Environmental District are shown in Table 9-2. Newtown Creek is
classified as Class B-2 with best intended uses for passage of anadromous fish and maintenance
of fish life.
IEC bacterial standards apply to effluent discharges from municipal and industrial
wastewater treatment plants and not to receiving waters.
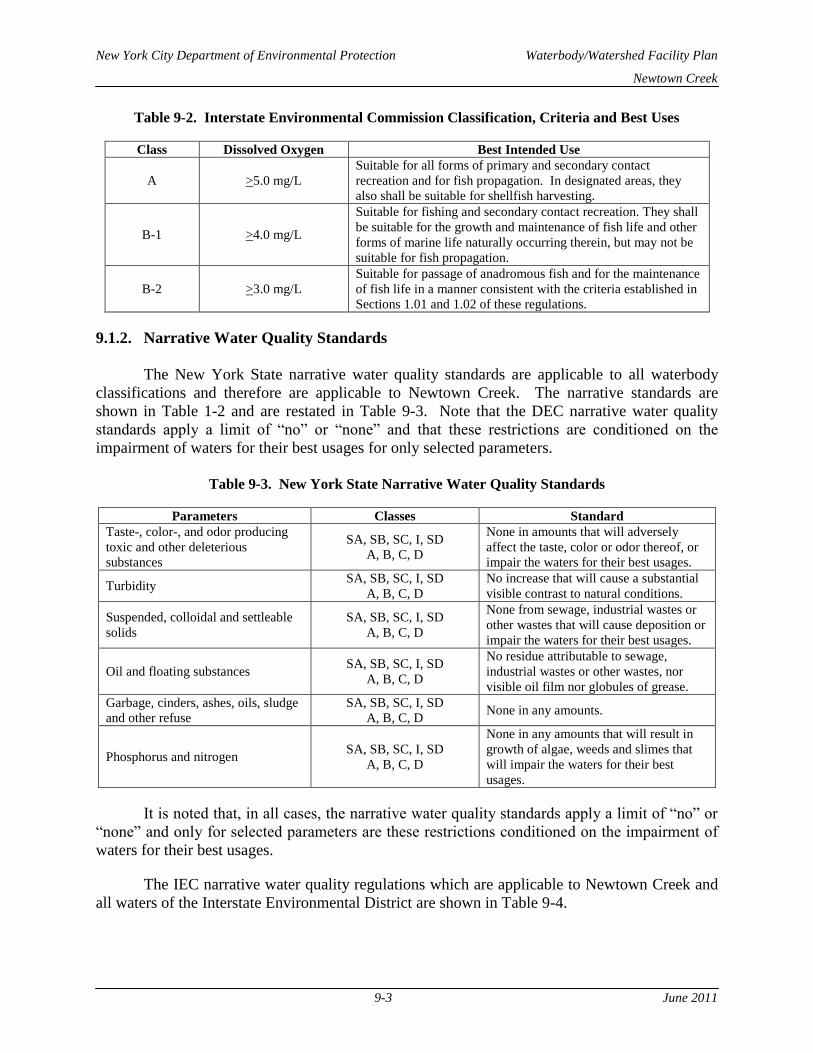
New York City Department of Environmental Protection Waterbody/Watershed Facility Plan
Newtown Creek
9-3 June 2011
Table 9-2. Interstate Environmental Commission Classification, Criteria and Best Uses
Class Dissolved Oxygen Best Intended Use
A >5.0 mg/L
Suitable for all forms of primary and secondary contact
recreation and for fish propagation. In designated areas, they
also shall be suitable for shellfish harvesting.
B-1 >4.0 mg/L
Suitable for fishing and secondary contact recreation. They shall
be suitable for the growth and maintenance of fish life and other
forms of marine life naturally occurring therein, but may not be
suitable for fish propagation.
B-2 >3.0 mg/L
Suitable for passage of anadromous fish and for the maintenance
of fish life in a manner consistent with the criteria established in
Sections 1.01 and 1.02 of these regulations.
9.1.2. Narrative Water Quality Standards
The New York State narrative water quality standards are applicable to all waterbody
classifications and therefore are applicable to Newtown Creek. The narrative standards are
shown in Table 1-2 and are restated in Table 9-3. Note that the DEC narrative water quality
standards apply a limit of “no” or “none” and that these restrictions are conditioned on the
impairment of waters for their best usages for only selected parameters.
Table 9-3. New York State Narrative Water Quality Standards
Parameters Classes Standard
Taste-, color-, and odor producing
toxic and other deleterious
substances
SA, SB, SC, I, SD
A, B, C, D
None in amounts that will adversely
affect the taste, color or odor thereof, or
impair the waters for their best usages.
Turbidity SA, SB, SC, I, SD
A, B, C, D
No increase that will cause a substantial
visible contrast to natural conditions.
Suspended, colloidal and settleable
solids
SA, SB, SC, I, SD
A, B, C, D
None from sewage, industrial wastes or
other wastes that will cause deposition or
impair the waters for their best usages.
Oil and floating substances SA, SB, SC, I, SD
A, B, C, D
No residue attributable to sewage,
industrial wastes or other wastes, nor
visible oil film nor globules of grease.
Garbage, cinders, ashes, oils, sludge
and other refuse
SA, SB, SC, I, SD
A, B, C, D None in any amounts.
Phosphorus and nitrogen SA, SB, SC, I, SD
A, B, C, D
None in any amounts that will result in
growth of algae, weeds and slimes that
will impair the waters for their best
usages.
It is noted that, in all cases, the narrative water quality standards apply a limit of “no” or
“none” and only for selected parameters are these restrictions conditioned on the impairment of
waters for their best usages.
The IEC narrative water quality regulations which are applicable to Newtown Creek and
all waters of the Interstate Environmental District are shown in Table 9-4.
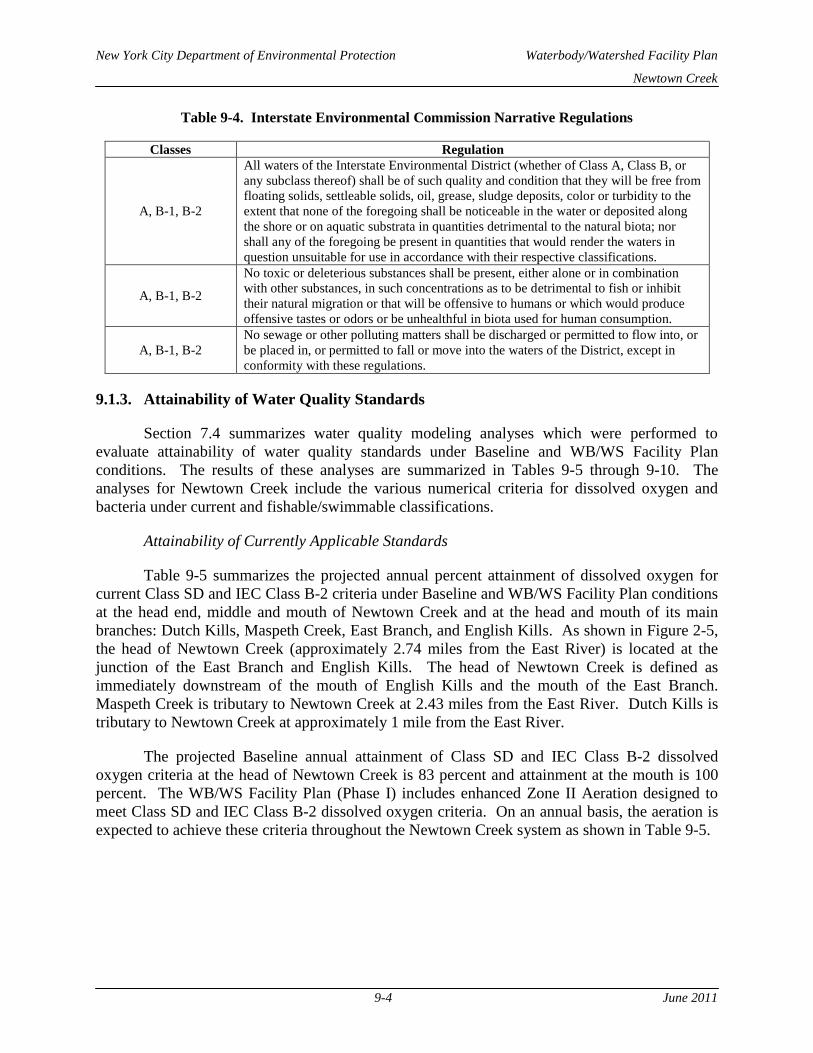
New York City Department of Environmental Protection Waterbody/Watershed Facility Plan
Newtown Creek
9-4 June 2011
Table 9-4. Interstate Environmental Commission Narrative Regulations
Classes Regulation
A, B-1, B-2
All waters of the Interstate Environmental District (whether of Class A, Class B, or
any subclass thereof) shall be of such quality and condition that they will be free from
floating solids, settleable solids, oil, grease, sludge deposits, color or turbidity to the
extent that none of the foregoing shall be noticeable in the water or deposited along
the shore or on aquatic substrata in quantities detrimental to the natural biota; nor
shall any of the foregoing be present in quantities that would render the waters in
question unsuitable for use in accordance with their respective classifications.
A, B-1, B-2
No toxic or deleterious substances shall be present, either alone or in combination
with other substances, in such concentrations as to be detrimental to fish or inhibit
their natural migration or that will be offensive to humans or which would produce
offensive tastes or odors or be unhealthful in biota used for human consumption.
A, B-1, B-2
No sewage or other polluting matters shall be discharged or permitted to flow into, or
be placed in, or permitted to fall or move into the waters of the District, except in
conformity with these regulations.
9.1.3. Attainability of Water Quality Standards
Section 7.4 summarizes water quality modeling analyses which were performed to
evaluate attainability of water quality standards under Baseline and WB/WS Facility Plan
conditions. The results of these analyses are summarized in Tables 9-5 through 9-10. The
analyses for Newtown Creek include the various numerical criteria for dissolved oxygen and
bacteria under current and fishable/swimmable classifications.
Attainability of Currently Applicable Standards
Table 9-5 summarizes the projected annual percent attainment of dissolved oxygen for
current Class SD and IEC Class B-2 criteria under Baseline and WB/WS Facility Plan conditions
at the head end, middle and mouth of Newtown Creek and at the head and mouth of its main
branches: Dutch Kills, Maspeth Creek, East Branch, and English Kills. As shown in Figure 2-5,
the head of Newtown Creek (approximately 2.74 miles from the East River) is located at the
junction of the East Branch and English Kills. The head of Newtown Creek is defined as
immediately downstream of the mouth of English Kills and the mouth of the East Branch.
Maspeth Creek is tributary to Newtown Creek at 2.43 miles from the East River. Dutch Kills is
tributary to Newtown Creek at approximately 1 mile from the East River.
The projected Baseline annual attainment of Class SD and IEC Class B-2 dissolved
oxygen criteria at the head of Newtown Creek is 83 percent and attainment at the mouth is 100
percent. The WB/WS Facility Plan (Phase I) includes enhanced Zone II Aeration designed to
meet Class SD and IEC Class B-2 dissolved oxygen criteria. On an annual basis, the aeration is
expected to achieve these criteria throughout the Newtown Creek system as shown in Table 9-5.

New York City Department of Environmental Protection Waterbody/Watershed Facility Plan
Newtown Creek
9-5 June 2011
Table 9-5. Annual Attainability of Class SD Dissolved
Oxygen Criteria for Design Year – Newtown Creek
Location
Class SD and IEC Class B-2
Dissolved Oxygen
(>3.0 mg/L)
Percent Attainment
Baseline WB/WS FP
Newtown Creek
Head 83 99.6
Mid 97 99.4
Mouth 100 100
Dutch Kills
Head
86 98.5
Mouth 99+ 100
Maspeth Creek
Head 81 98.9
Mouth 86 99.8
East Branch
Head 56 93.0
Mouth 84 99.1
English Kills
Head 56 90.3
Mouth 84 99.0
As currently classified SD, Newtown Creek does not support recreational use and no
bacteria standards are applicable.
Attainability of Potential Future Standards – Class I
The DEC considers Class SD dissolved oxygen standards supportive of fish survival but
not consistent with the “fishable” goal of the CWA. Therefore, a standards reclassification
would be necessary for full fishable use attainment in Newtown Creek. Class I dissolved oxygen
standards are considered fully supportive of aquatic life uses and consistent with the “fishable”
goal of the CWA. An evaluation of the Baseline and WB/WS Facility Plan attainment of the
Class I dissolved oxygen criterion, never-less-than 4.0 mg/L, is summarized on Table 9-6.
Baseline annual attainment of Class I dissolved oxygen criterion 70 percent at the head of
Newtown Creek and essentially 100 percent at the mouth. Annual Baseline compliance at the
head of the tributaries ranges from 48 percent (East Branch) to 74 percent (Dutch Kills). Annual
dissolved oxygen attainment of the Class I criterion shown in Table 9-6 for the WB/WS Facility
Plan is based on the level of aeration planned for Newtown Creek under the WB/WS Facility
Plan. As shown, the projected attainment of the Class I criterion improves significantly from
Baseline for the WB/WS Facility Plan condition: over 97 attainment in Newtown Creek, and
over 95 percent at the head of the various tributaries.
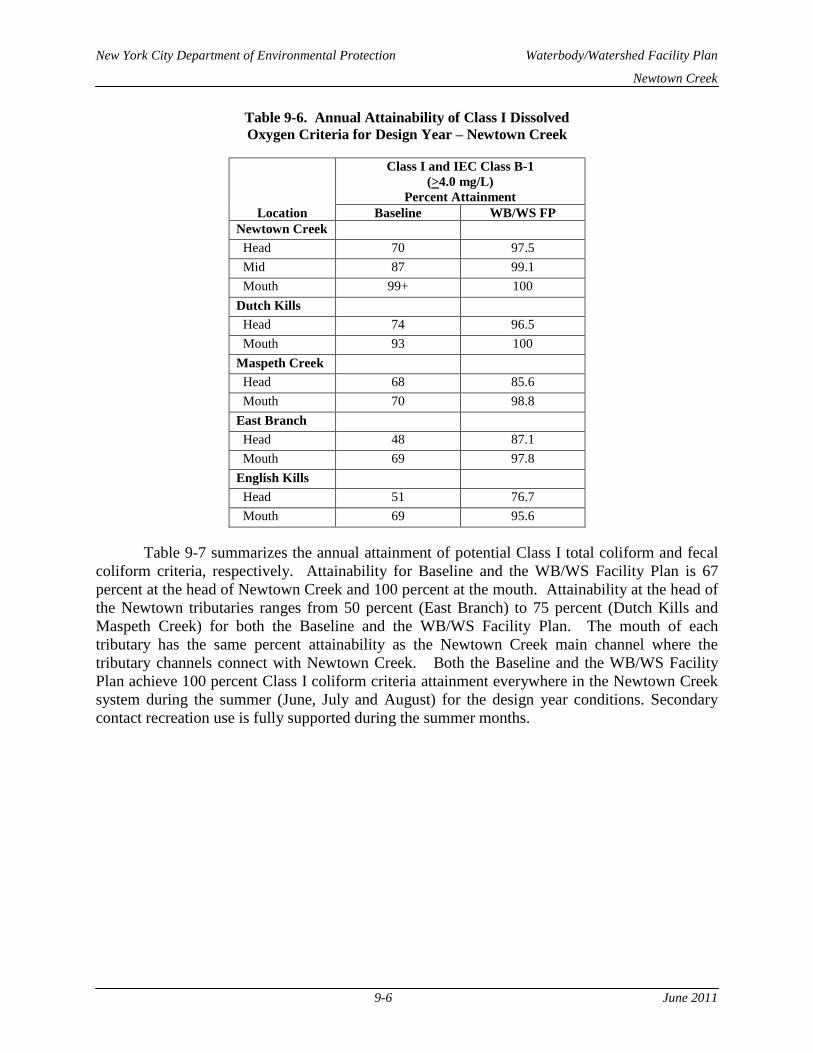
New York City Department of Environmental Protection Waterbody/Watershed Facility Plan
Newtown Creek
9-6 June 2011
Table 9-6. Annual Attainability of Class I Dissolved
Oxygen Criteria for Design Year – Newtown Creek
Location
Class I and IEC Class B-1
(>4.0 mg/L)
Percent Attainment
Baseline WB/WS FP
Newtown Creek
Head 70 97.5
Mid 87 99.1
Mouth 99+ 100
Dutch Kills
Head
74 96.5
Mouth 93 100
Maspeth Creek
Head 68 85.6
Mouth 70 98.8
East Branch
Head 48 87.1
Mouth 69 97.8
English Kills
Head 51 76.7
Mouth 69 95.6
Table 9-7 summarizes the annual attainment of potential Class I total coliform and fecal
coliform criteria, respectively. Attainability for Baseline and the WB/WS Facility Plan is 67
percent at the head of Newtown Creek and 100 percent at the mouth. Attainability at the head of
the Newtown tributaries ranges from 50 percent (East Branch) to 75 percent (Dutch Kills and
Maspeth Creek) for both the Baseline and the WB/WS Facility Plan. The mouth of each
tributary has the same percent attainability as the Newtown Creek main channel where the
tributary channels connect with Newtown Creek. Both the Baseline and the WB/WS Facility
Plan achieve 100 percent Class I coliform criteria attainment everywhere in the Newtown Creek
system during the summer (June, July and August) for the design year conditions. Secondary
contact recreation use is fully supported during the summer months.
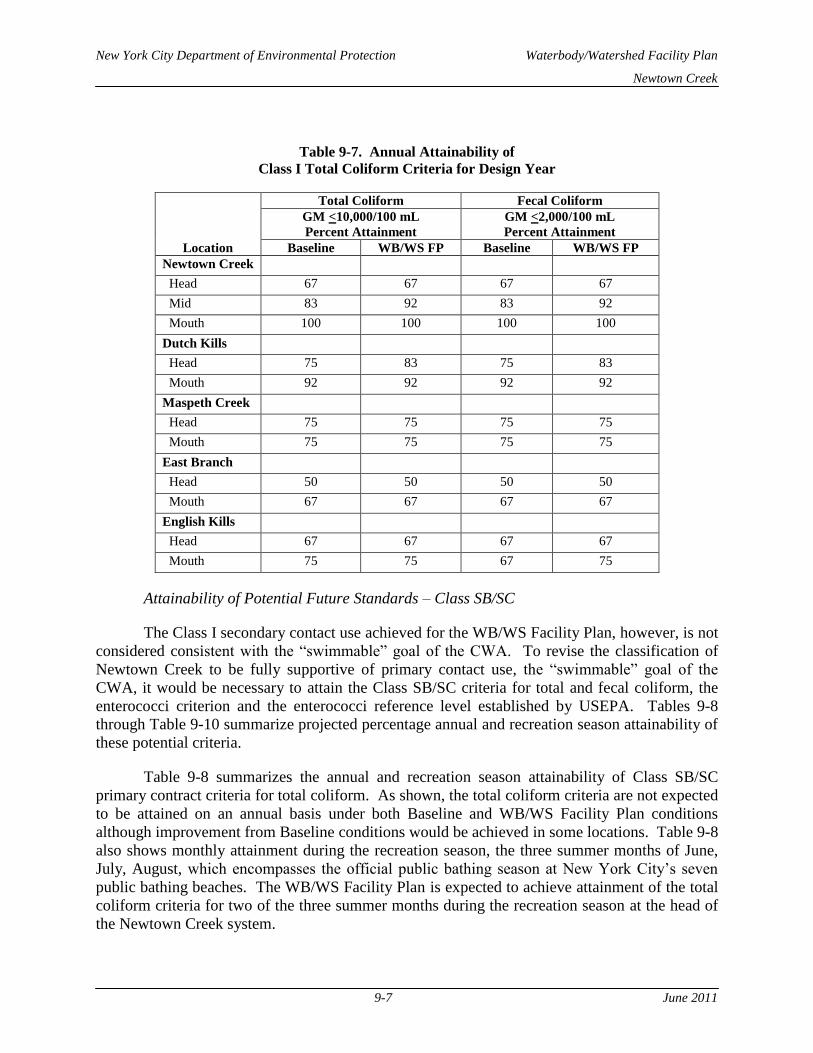
New York City Department of Environmental Protection Waterbody/Watershed Facility Plan
Newtown Creek
9-7 June 2011
Table 9-7. Annual Attainability of
Class I Total Coliform Criteria for Design Year
Location
Total Coliform Fecal Coliform
GM <10,000/100 mL
Percent Attainment
GM <2,000/100 mL
Percent Attainment
Baseline WB/WS FP Baseline WB/WS FP
Newtown Creek
Head 67 67 67 67
Mid 83 92 83 92
Mouth 100 100 100 100
Dutch Kills
Head 75 83 75 83
Mouth 92 92 92 92
Maspeth Creek
Head 75 75 75 75
Mouth 75 75 75 75
East Branch
Head 50 50 50 50
Mouth 67 67 67 67
English Kills
Head 67 67 67 67
Mouth 75 75 67 75
Attainability of Potential Future Standards – Class SB/SC
The Class I secondary contact use achieved for the WB/WS Facility Plan, however, is not
considered consistent with the “swimmable” goal of the CWA. To revise the classification of
Newtown Creek to be fully supportive of primary contact use, the “swimmable” goal of the
CWA, it would be necessary to attain the Class SB/SC criteria for total and fecal coliform, the
enterococci criterion and the enterococci reference level established by USEPA. Tables 9-8
through Table 9-10 summarize projected percentage annual and recreation season attainability of
these potential criteria.
Table 9-8 summarizes the annual and recreation season attainability of Class SB/SC
primary contract criteria for total coliform. As shown, the total coliform criteria are not expected
to be attained on an annual basis under both Baseline and WB/WS Facility Plan conditions
although improvement from Baseline conditions would be achieved in some locations. Table 9-8
also shows monthly attainment during the recreation season, the three summer months of June,
July, August, which encompasses the official public bathing season at New York City’s seven
public bathing beaches. The WB/WS Facility Plan is expected to achieve attainment of the total
coliform criteria for two of the three summer months during the recreation season at the head of
the Newtown Creek system.

New York City Department of Environmental Protection Waterbody/Watershed Facility Plan
Newtown Creek
9-8 June 2011
Table 9-8. Attainability of
SB/SC Total Coliform Criteria for Design Year
Location
Class SB/SC
Percent Attainment
Annual Recreation Season
Median <2,400/100 mL and
80% <5,000/100 mL
Median <2,400/100 mL and
80% <5,000/100 mL
Baseline WB/WS FP Baseline WB/WS FP
Newtown Creek
Head 0 0 0 0
Mid 8 25 33 67
Mouth 33 42 67 67
Dutch Kills
Head 17 17 33 33
Mouth 17 25 33 67
Maspeth Creek
Head 17 17 67 67
Mouth 8 8 33 33
East Branch
Head 0 0 0 0
Mouth 0 0 0 0
English Kills
Head 17 17 67 67
Mouth 0
0 0 0
Results for fecal coliform, shown in Table 9-9, predict that the WB/WS Facility Plan will
achieve attainment during two of the three summer months throughout the Newtown Creek
system. It is noted that modeling projects that not even 100 percent elimination of all CSO
discharges to Newtown Creek would attain the primary contact fecal coliform criterion on an
annual basis due to the presence of stormwater discharges.
Table 9-9. Attainability of
SB/SC Fecal Coliform Criteria for Design Year
Location Annual Recreation Season
Class SB/SC
GM <200
Percent Attainment
Class SB/SC
GM <200
Percent Attainment
Baseline WB/WS FP Baseline WB/WS FP
Newtown Creek
Head 25 25 67 67
Mid 25 5 67 67
Mouth 8 25 33 67
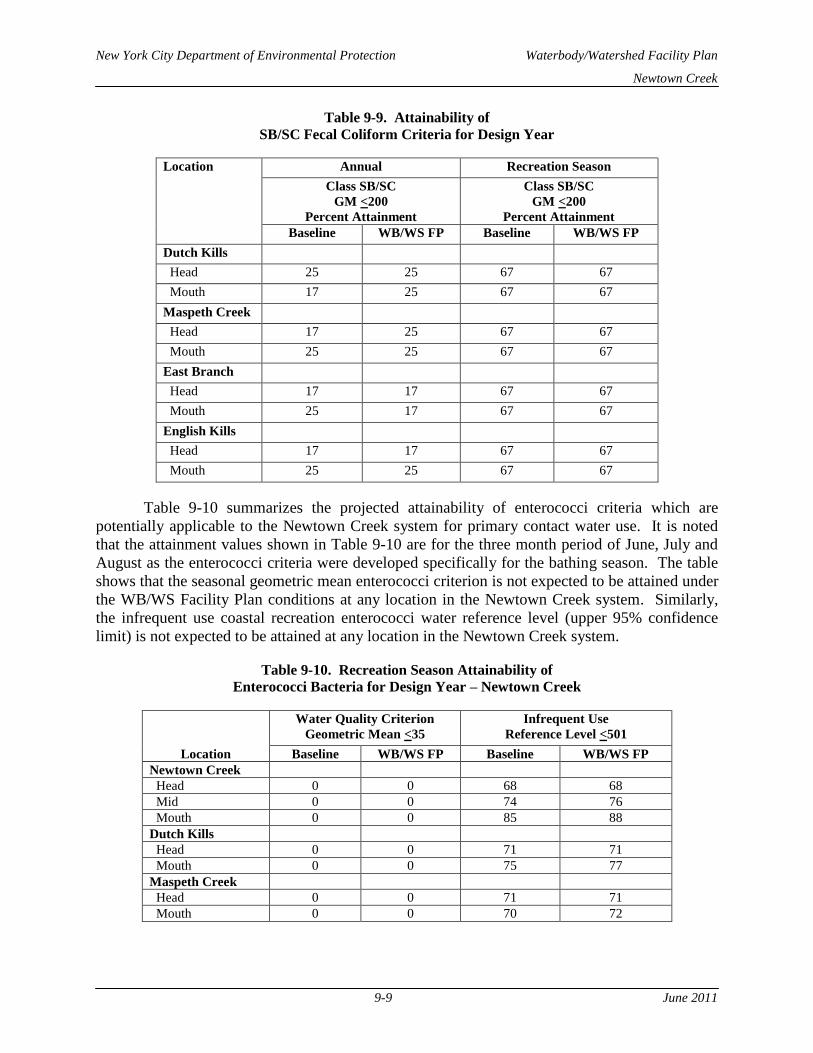
New York City Department of Environmental Protection Waterbody/Watershed Facility Plan
Newtown Creek
9-9 June 2011
Table 9-9. Attainability of
SB/SC Fecal Coliform Criteria for Design Year
Location Annual Recreation Season
Class SB/SC
GM <200
Percent Attainment
Class SB/SC
GM <200
Percent Attainment
Baseline WB/WS FP Baseline WB/WS FP
Dutch Kills
Head 25 25 67 67
Mouth 17 25 67 67
Maspeth Creek
Head 17 25 67 67
Mouth 25 25 67 67
East Branch
Head 17 17 67 67
Mouth 25 17 67 67
English Kills
Head 17 17 67 67
Mouth 25 25 67 67
Table 9-10 summarizes the projected attainability of enterococci criteria which are
potentially applicable to the Newtown Creek system for primary contact water use. It is noted
that the attainment values shown in Table 9-10 are for the three month period of June, July and
August as the enterococci criteria were developed specifically for the bathing season. The table
shows that the seasonal geometric mean enterococci criterion is not expected to be attained under
the WB/WS Facility Plan conditions at any location in the Newtown Creek system. Similarly,
the infrequent use coastal recreation enterococci water reference level (upper 95% confidence
limit) is not expected to be attained at any location in the Newtown Creek system.
Table 9-10. Recreation Season Attainability of
Enterococci Bacteria for Design Year – Newtown Creek
Location
Water Quality Criterion
Geometric Mean <35
Infrequent Use
Reference Level <501
Baseline WB/WS FP Baseline WB/WS FP
Newtown Creek
Head 0 0 68 68
Mid 0 0 74 76
Mouth 0 0 85 88
Dutch Kills
Head 0 0 71 71
Mouth 0 0 75 77
Maspeth Creek
Head 0 0 71 71
Mouth 0 0 70 72
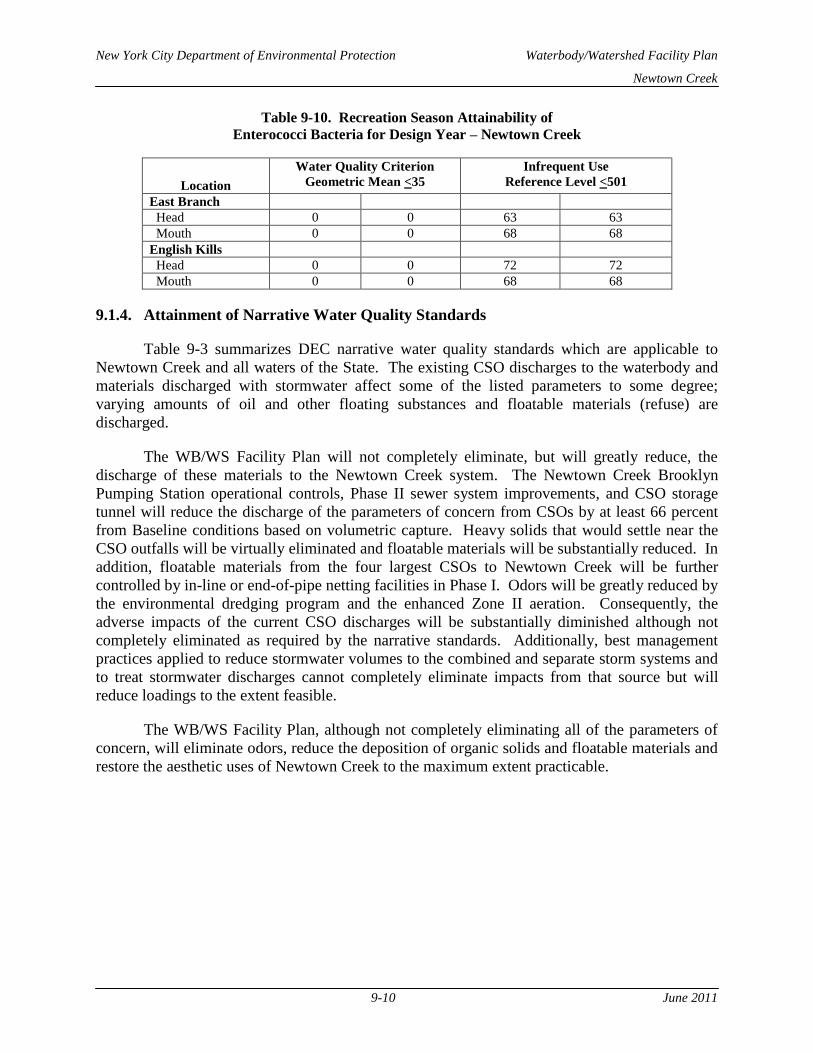
New York City Department of Environmental Protection Waterbody/Watershed Facility Plan
Newtown Creek
9-10 June 2011
Table 9-10. Recreation Season Attainability of
Enterococci Bacteria for Design Year – Newtown Creek
Location
Water Quality Criterion
Geometric Mean <35
Infrequent Use
Reference Level <501
East Branch
Head 0 0 63 63
Mouth 0 0 68 68
English Kills
Head 0 0 72 72
Mouth 0 0 68 68
9.1.4. Attainment of Narrative Water Quality Standards
Table 9-3 summarizes DEC narrative water quality standards which are applicable to
Newtown Creek and all waters of the State. The existing CSO discharges to the waterbody and
materials discharged with stormwater affect some of the listed parameters to some degree;
varying amounts of oil and other floating substances and floatable materials (refuse) are
discharged.
The WB/WS Facility Plan will not completely eliminate, but will greatly reduce, the
discharge of these materials to the Newtown Creek system. The Newtown Creek Brooklyn
Pumping Station operational controls, Phase II sewer system improvements, and CSO storage
tunnel will reduce the discharge of the parameters of concern from CSOs by at least 66 percent
from Baseline conditions based on volumetric capture. Heavy solids that would settle near the
CSO outfalls will be virtually eliminated and floatable materials will be substantially reduced. In
addition, floatable materials from the four largest CSOs to Newtown Creek will be further
controlled by in-line or end-of-pipe netting facilities in Phase I. Odors will be greatly reduced by
the environmental dredging program and the enhanced Zone II aeration. Consequently, the
adverse impacts of the current CSO discharges will be substantially diminished although not
completely eliminated as required by the narrative standards. Additionally, best management
practices applied to reduce stormwater volumes to the combined and separate storm systems and
to treat stormwater discharges cannot completely eliminate impacts from that source but will
reduce loadings to the extent feasible.
The WB/WS Facility Plan, although not completely eliminating all of the parameters of
concern, will eliminate odors, reduce the deposition of organic solids and floatable materials and
restore the aesthetic uses of Newtown Creek to the maximum extent practicable.
New York City Department of Environmental Protection Waterbody/Watershed Facility Plan
Newtown Creek
9-11 June 2011
9.1.5. Water Uses Restored
Fish and Aquatic Life Protection Use
Table 9-5 presents the dissolved oxygen improvements expected to be attained in
Newtown Creek by the WB/WS Facility Plan as compared to Baseline conditions for current
DEC and IEC dissolved oxygen criteria. The plan is expected to achieve between 99 to 100
percent attainment for the current Class SD and IEC Class B-2 criteria on an annual basis, a very
significant improvement from the near anoxia of the Baseline condition in Maspeth Creek, East
Branch and English Kills and near the head of Dutch Kills. This is considered to be a high level
of attainment in terms of the survival of fish and aquatic life. The Newtown Creek WB/WS
Facility Plan is expected to completely restore the fish survival designated use of the system.
In addition to the protection of the designated fish survival use, the WB/WS Facility Plan
is projected to achieve dissolved oxygen conditions supporting fish propagation use criteria.
Table 9-6 indicates that the Class I dissolved oxygen criteria of 4.0 mg/L is expected to be
attained 99 percent of the time or more on an annual basis after full Facility Plan
implementation. Thus conditions supportive of fish larval survival should prevail in the
Newtown Creek system throughout the year.
Secondary Contact Recreation Use
As noted, Class SD and IEC Class B-2 do not support primary or secondary contact
recreational activities as designated water uses and therefore have no bacteriological criteria.
However, Table 9-7 indicates that the Newtown Creek WB/WS Facility Plan is projected to
nearly completely attain Class I secondary contact recreational criteria for total and fecal
coliform on an annual basis. The one month of non-attainment at various locations is expected
to occur during November, when secondary contact recreational use is sharply reduced. The
attainment of water quality supporting the secondary contact recreational use is considered an
important water use restored to Newtown Creek.
Aesthetic Use
As discussed in Section 9.1.4, the WB/WS Facility Plan will not completely eliminate all
regulated parameters in the DEC narrative water quality standards to zero discharge levels, but
will significantly reduce the volumetric discharge of such substances. Settleable solids will be
substantially reduced by the Brooklyn Pumping Station operational controls, sewer system
improvements and the CSO Storage Tunnel. The effect of floatable materials from CSOs will be
curtailed by volumetric reduction and the proposed positive floatables controls at the four largest
CSO outfalls and the effect of narrative materials from stormwater inputs will be reduced to the
maximum extent practicable. Odors will be virtually eliminated by environmental dredging and
the enhanced Zone II aeration. Accordingly, the aesthetic conditions in Newtown Creek should
improve to a level consistent with the other attained water uses and the nature of the adjacent
shoreline uses.
New York City Department of Environmental Protection Waterbody/Watershed Facility Plan
Newtown Creek
9-12 June 2011
9.1.6. Practical Considerations
The previous section describes the improvement in the level of attainment of the DEC
Class SD and IEC Class B-2 dissolved oxygen criteria, which is expected to result from the
WB/WS Facility Plan. As noted, the annual attainment is expected to be virtually complete in
the Newtown Creek system thus supporting the fish survival goal of the classifications.
Additionally, as discussed, conditions supportive of fish and aquatic life propagation are
expected most of the year.
For all but approximately 90 hours of the year, attainment of fish propagation criteria
throughout the waterbody is expected. In the limited times where criteria excursions are
expected, it should be noted that any adverse impact on fish larval propagation may be limited.
Fish larvae spawning in Newtown Creek will be exchanged with, and transported to, East River
waters where dissolved oxygen will be greater. The organisms will therefore not be
continuously exposed to Newtown Creek dissolved oxygen that may be depressed below the
criteria. Consequently, the impact on larval survival will be less than that projected based on
laboratory studies where organisms are confined and exposed continuously to the same
depressed dissolved oxygen level. Because of the significant amount of larval transport that
occurs in Newtown Creek, and the exposure of the organisms to continuously varying, rather
than static, dissolved oxygen concentrations, it is considered to be reasonable to view the
ecosystem in its entirety rather than by individual tributary or sub-region for purposes of fish and
aquatic life protection.
Tables 9-8 and 9-9 indicate that during the summer recreation season, water quality in
Newtown Creek may be supportive of numerical criteria for the swimmable (primary contact
recreation) goal of the CWA during two of the three summer recreation season months.
However, swimming should not be considered as a partially attained use in this waterbody due to
periodic overflows still projected under the WB/WS Facility Plan, other regional CSO discharges
and continuing stormwater discharges. Further, Table 9-10 indicates that the enterococci criteria
needed for primary contact would not be achieved at many locations in the Newtown Creek
system.
9.2. WATER QUALITY STANDARDS REVISION
This section discusses use and standards attainability based on the information presented
above and throughout this Waterbody/Watershed Facility Plan Report.
9.2.1. Overview of Use Attainability and Recommendations
Section 9.1 summarizes the existing and potential water quality standards for Newtown
Creek and expected levels of attainment based on modeling calculations. For aquatic life
protection, the attainment of the water use can be expected to be greater than that suggested by
the attainability of numerical criteria during the summer period due to the limited larval
residence time in Newtown Creek, organism transport to the East River and beyond and the
appropriateness of considering the ecosystem, both open waters and tributary, in its entirety
rather than as individual components.
New York City Department of Environmental Protection Waterbody/Watershed Facility Plan
Newtown Creek
9-13 June 2011
For recreational activity, the use of secondary contact recreation in Newtown Creek,
although not required under current classifications, is expected to be practically attained under
WB/WS Facility Plan conditions. Further, numerical water quality conditions (for the total and
fecal coliform bacteriological indicators) suitable to support primary contact may be attained
during most of the summer recreation season in Newtown Creek, although bathing and
swimming activities would not be considered the best use.
As a result of the water quality conditions and uses expected to be attained in Newtown
Creek after implementation the WB/WS Facility Plan, it is recommended that the current
waterbody classification, Class SD, in Newtown Creek be retained at this time. The water use
goals for the Class SD classification in Newtown Creek are expected to be achieved, either
numerically or for practical purposes, once the WB/WS Facility Plan is constructed and
operational except periodically following overflows still expected after implementation of the
Newtown Creek WB/WS Facility Plan from heavy rainfall events. However, the attainment of
the designated uses, while expected, should be demonstrated from long-term post construction
water quality monitoring data and numerical modeling.
As noted previously, expected levels of water quality criteria compliance are based on
modeling calculations which are subject to some level of uncertainty. In addition, calculations
are based on a typical year with an average amount of annual rainfall. Therefore, it is
recommended that the actual improvements in water quality conditions resulting from the
WB/WS Facility Plan be assessed from the multi-year long-term post construction monitoring
program described in Section 8 of this WB/WS Facility Plan report. The monitoring program
will document the actual attainment of uses: whether the current Class SD uses are attained as
expected; whether other levels of usage are actually achieved supporting a waterbody
reclassification, for example, Class I in Newtown Creek.
As described in this report, complete attainment throughout the Newtown Creek area of
the Class SD narrative water quality criteria would require other controls beyond 100 percent
abatement of CSO discharges to the waterbody. This water quality based effluent limit
(WQBEL) of zero annual overflows is neither cost effective nor consistent with the CSO Control
Policy. Therefore, until the long-term post-construction monitoring program is completed to
document conditions actually attained in Newtown Creek, it is recommended that a variance to
the WQBEL for appropriate effluent variables be applied for, and approved, for the Newtown
Creek WB/WS Facility Plan.
9.2.2. DEC Requirements for Variances to Effluent Limitations
The requirements for variances to WQBELs are described in Section 702.17 of DEC’s
Water Quality Regulations. The following is an abbreviated summary of the variance
requirements that are considered applicable to Newtown Creek. The lettering and numbering are
those used in Section 702.17.
(a) The department may grant, to a SPDES permittee, a variance to a water quality-
based effluent limitation included in a SPDES permit.

New York City Department of Environmental Protection Waterbody/Watershed Facility Plan
Newtown Creek
9-14 June 2011
(1) A variance applies only to the permittee identified in such variance and only
to the pollutant specified in the variance. A variance does not affect or require
the department to modify a corresponding standard or guidance value.
(5) A variance term shall not exceed the term of the SPDES permit. Where the
term of the variance is the same as the permit, the variance shall stay in effect
until the permit is reissued, modified or revoked.
(b) A variance may be granted if the requester demonstrates that achieving the effluent
limitation is not feasible because:
(1) Naturally occurring pollutant concentrations prevent attainment of the
standard or guidance value;
(2) Natural, ephemeral, intermittent or low flow conditions or water levels
prevent attainment, unless these conditions may be compensated for by the
discharge of sufficient volume of effluent to enable the standard or guidance value
to be met without violating water conservation requirements.
(3) human-caused conditions or sources of pollution prevent attainment of the
standard or guidance value and cannot be remedied or would cause more
environmental damage to correct them to leave in place.
(4) Dams, diversions or other types of hydrologic modifications preclude
attainment of the standard or guidance value, and it is not feasible to restore the
waterbody to its original condition or to operate such modification in a way that
would result in such attainment.
(5) Physical conditions related to the natural features of the waterbody, such as
the lack of a proper substrate cover, flow, depth, pools, riffles, and the like,
unrelated to chemical water quality, preclude attainment of the standard or
guidance value; or
(6) Controls more stringent than those required by section 754.1(a)(1) and (2) of
this Title would result in substantial and widespread economic and social impact.
(c) In addition to the requirements of subdivision (b) of this section, the requestor shall
also characterize, using adequate and sufficient data and principles, any increased risk
to human health and the environment associated with granting the variance compared
with attainment of the standard or guidance value absent the variance, and demonstrate
to the satisfaction of the department that the risk will not adversely affect the public
health, safety and welfare.
(d) The requestor shall submit a written application for a variance to the department.
The application shall include:
(1) all relevant information demonstrating that achieving the effluent limitation is
not feasible based on subdivision (b) of this section; and

New York City Department of Environmental Protection Waterbody/Watershed Facility Plan
Newtown Creek
9-15 June 2011
(2) All relevant information demonstrating compliance with the conditions is
subdivision (c) of this section.
(e) Where a request for a variance satisfies the requirements of this section, the
department shall authorize the variance through the SPDES permit. The variance
request shall be available to the public for review during the public notice period for the
permit. The permit shall contain all conditions needed to implement the variance. Such
conditions shall, at minimum, include:
(1) Compliance with an initial effluent limitation that, at the time the variance is
granted represents the level currently achievable by the requestor, and that is no
less stringent than that achieved under the previous permit where applicable.
(2) that reasonable progress be made toward achieving the effluent limitations
based on the standard or guidance value, including, where reasonable, an effluent
limitation more stringent than the initial effluent limitations;
(3) Additional monitoring, biological studies and pollutant minimization
measures as deemed necessary by the department.
(4) when the duration of a variance is shorter than the duration of a permit,
compliance with an effluent limitation sufficient to meet the underlying standard
or guidance value, upon the expiration of the variance; and
(5) A provision that allows the department to reopen and modify the permit for
revisions to the variance.
(g) A variance may be renewed, subject to the requirements of this section. As part of
any renewal application, the permittee shall again demonstrate that achieving the
effluent limitation is not feasible based on the requirements of this section.
(i) The department will make available to the public a list of every variance that has been
granted and that remains in effect.
9.2.3. Manner of Compliance with the Variance Requirements
Subdivision (a) authorizes DEC to grant a variance to a “water quality based effluent
limitation…included in a SPDES permit.” It is understood that the Newtown Creek WB/WS
Facility Plan, when referenced in the Newtown Creek WWTP SPDES permit along with other
presumed actions necessary to attain water quality standards, can be interpreted as the equivalent
of an “effluent limitation” in accordance with the “alternative effluent control strategies”
provision of Section 302(a) of the CWA.
Subdivision (a)(1) indicates that a variance will apply only to a specific permittee, in this
case, DEP, and only to the pollutant specified in the variance. It is understood that “pollutant”
can be interpreted in the plural, and one application and variance can be used for one or more
relevant pollutants. In Newtown Creek, a variance would be needed for the following pollutants:
effluent constituents covered by narrative water quality standards (suspended, colloidal and
New York City Department of Environmental Protection Waterbody/Watershed Facility Plan
Newtown Creek
9-16 June 2011
settleable solids; oil and floating substances). A variance for dissolved oxygen criteria would not
be requested as the Newtown Creek WB/WS Facility Plan is expected to attain Class SD
requirements within the constraints of modeling uncertainty.
Subdivision (b) requires the permittee to demonstrate that achieving the water quality
based effluent limitation is not feasible due to a number of factors. It is noted that these factors
are the same as those in 40 CFR 131.10(g) which indicate federal requirements for a Use
Attainability Analysis. As with the federal regulations, it is assumed that any one of the six
factors is justification for the granting of a variance. If a UAA is required, it is anticipated that
the applicability of at least two of the six factors cited in Subdivision (b): (3) human caused
conditions and (4) hydrologic modifications, would provide the basis of the analysis.
Subdivision (c) requires the applicant to demonstrate to the department any increased risk
to human health associated with granting of the variance compared with attainment of the water
quality standards absent the granting of the variance. As noted above, the variance application is
needed for suspended, colloidal and settleable solids, and oil and floating substances in the
periodic overflows from the Newtown Creek WB/WS Facility Plan. Further, as described above
in Section 9.1.4, a 66 percent volumetric reduction is expected from Baseline CSO loadings to
Newtown Creek, with additional capture of floatables from the positive controls at the four
largest outfalls.
Subdivision (d) of the variance regulations requires that the requestor submit a written
application for a variance to DEC that includes all relevant information pertaining to
Subdivisions (b) and (c). DEP will submit a variance application for the Newtown Creek
WB/WS Facility Plan to DEC six months before the plan is placed in operation. The application
will be accompanied by the Newtown Creek WB/WS Facility Plan report, the Newtown Creek
Use Attainability Evaluation, if required, and all other supporting documentation pertaining to
Subdivisions (b) and (c) and as required by any other subdivisions of the variance requirements.
Subdivision (e) stipulates that approved variances be authorized through the appropriate
SPDES permit, be available to the public for review and contain a number of conditions:
It is assumed that the initial effluent limitation achievable by the permittee, at the
time the variance becomes effective after WB/WS Facility Plan construction, will be
based upon the performance characteristics of the WB/WS Facility Plan as agreed
upon between DEC and DEP. These interim operational conditions will be based on
the WB/WS Facility Plan’s design specifications. It is expected that a fact sheet
outlining the basis for the WQBEL and interim operational conditions will be
appended to the SPDES permits.
It is assumed that the requirement for demonstration of reasonable progress after
construction as required in the permit will include DEP activities such as
implementation of the long-term monitoring program and additional waterbody
improvement projects as delineated in Section 5 of this WB/WS Facility Plan report.
Such actions and projects include: 14 best management practices, the City-wide CSO
plan for floatables abatement, other long-term CSO control planning activities which
may affect Newtown Creek (except the Newtown Creek CSO Facility Plan elements

New York City Department of Environmental Protection Waterbody/Watershed Facility Plan
Newtown Creek
9-17 June 2011
not selected as part of the WB/WS Facility Plan), various East River water quality
improvement projects, and various ecosystem restoration activities. These activities
are also required under section (3) of the Subdivision.
It is assumed that the SPDES permits authorizing the Newtown Creek WB/WS
Facility Plan variance will contain a provision that allows the department to reopen
and modify the permit for revisions to the variance.
Subdivision (g) indicates that a variance may be renewed. It is anticipated that a variance
for the Newtown Creek WB/WS Facility Plan would require renewals to allow for sufficient
long-term monitoring to assess the degree of water quality standards compliance. As
appropriate, a variance renewal application will be submitted 180 days before SPDES permit
expiration.
At the completion of the variance period(s), it is expected that the results of the long-term
monitoring program will demonstrate each of the following:
The degree to which the WB/WS Facility Plan attains the current Class SD
classification water quality criteria and uses;
The degree to which the WB/WS Facility Plan achieves water quality criteria
consistent with the fishable/swimmable goals of the CWA, whether any new cost
effective technology is available to enhance the WB/WS Facility Plan performance,
if needed, whether Newtown Creek should be reclassified, or whether a Use
Attainability Analysis should be approved.
In this manner, the approval of a WQBEL variance for Newtown Creek together with an
appropriate long-term monitoring program can be considered as a step toward a determination of
the following:
Can Newtown Creek be reclassified in a manner that is wholly or partially
compatible with the fishable/swimmable goals of the Clean Water Act, or
Is a Use Attainability Analysis needed for Newtown Creek and for which water
quality criteria?
Although Newtown Creek’s current waterbody classification, Class SD, is not wholly
compatible with the goals of the Clean Water Act, and would normally require reclassification or
a UAA in the State’s triennial review obligation, it is considered to be more appropriate to
proceed with the more deliberative variance approval/monitoring procedure outlined above. The
recommended procedure will determine actual improvements resulting from WB/WS Facility
Plan implementation, enable a proper determination for the appropriate waterbody classification
for Newtown Creek, and perhaps avoid unnecessary, repetitive and possibly contradictory
rulemaking.
New York City Department of Environmental Protection Waterbody/Watershed Facility Plan
Newtown Creek
9-18 June 2011
9.2.4. Future Considerations
Urban Tributary Classification
The possibility is recognized that the long-term monitoring program recommended for
Newtown Creek, and ultimately for other confined waterbodies throughout the City, may
indicate that the highest attainable uses are not compatible with the use goals of the Clean Water
Act and State Water Quality Regulations. It is therefore recommended that consideration be
given to the development of a new waterbody classification in DEC Water Quality Regulations,
that being “Urban Tributary”. This classification would have the following attributes:
Recognition of wet weather conditions in the designation of uses and water quality
criteria;
Application to urban confined waterbodies which satisfy any of the UAA criteria
enumerated in 40CFR131.10(g);
Definition of required baseline water uses;
Fish and aquatic life survival (if attainable); and
Secondary contact recreation (if attainable).
Other attainable higher uses would be waterbody specific and dependent upon the
effectiveness of the site-specific CSO WB/WS Facility Plan or LTCP based upon knee-of-the-
curve considerations, technical feasibility and ease of implementation.
The Urban Tributary classification could be implemented through the application of a
generic UAA procedure for confined urban waterbodies based on the criteria of
40CFR131.10(g). This procedure could avoid the necessity for repeated UAAs on different
waterbodies with similar characteristics. Those waterbodies which comply with the designation
criteria can be identified at one time, and the reclassification completed in one rulemaking.
If either of the designated baseline uses of fish and aquatic life survival and secondary
contact recreation did not appear to be attainable in a particular setting, then a site-specific UAA
would be required.
Narrative Criteria
The recommendation for a WQBEL variance for the Newtown Creek WB/WS Facility
Plan would apply with regard to the narrative water quality criteria previously cited. However, a
broad issue remains with the practical ability to attain the requirements of the narrative criteria in
situations where wet weather discharges are unavoidable and will occasionally occur after
controls. Therefore, it is recommended that DEC review the application of the narrative criteria,
provide for a wet weather exclusion with demonstrated need, or make all narrative criteria
conditional upon the impairment of waters for their best usage.
New York City Department of Environmental Protection Waterbody/Watershed Facility Plan
Newtown Creek
9-19 June 2011
Synopsis
Although this WB/WS Facility Plan is expected to result in improvements to the water
quality in Newtown Creek, it is not expected to completely attain all applicable water quality
criteria. As such, the SPDES Permit for the Newtown Creek WWTP may require a WQBEL
variance for the Newtown Creek WB/WS Facility Plan if contravention of some criteria
continues to occur. If water quality criteria are demonstrated to be unrealistic after a period of
monitoring, DEP would request reclassification of portions of Newtown Creek based on a Use
Attainability Analysis (UAA). Until the recommended UAAs and required regulatory processes
are completed, the current DEC classification of Newtown Creek, Class SD, will be retained.
New York City Department of Environmental Protection Waterbody/Watershed Facility Plan
Newtown Creek
9-20 June 2011
NO TEXT ON THIS PAGE
New York City Department of Environmental Protection Long-Term CSO Control Plan Report
Newtown Creek
10-1 June 2011
10.0. References
Adams, D.A., J.S. O'Connor, S.W. Weisberg. 1998. Sediment Quality of the NY/NJ Harbor
System. An Investigation under the Regional Environmental Monitoring and Assessment
Program (REMAP), March 1998.
Aliquier, M., et. al. 1982. Improvement of Swirl Concentrator, Journal of the Environmental
Engineering Division, ASCE, Vol. 108, No. EE2, April 1982.
Allee King Rosen & Fleming. 1994. Final Environmental Impact Statement for the Paerdegat
Basin Water Quality Facility Plan. Prepared with Hazen and Sawyer, P.C., HydroQual, Inc.,
and Historical Perspectives, Inc. for the City of New York Department of Environmental
Protection, Bureau of Environmental Engineering and Office of Environmental Planning,
March 1994.
Aller, R.C. 1982. The effects of macrobenthos on chemical properties of marine sediment and
overlying water. Animal-Sediment Relations. The Biogenic Alteration of Sediments.
Plenum Press, New York. pp.53-102.
Bopp, R.F., H.J. Simpson, S. N. Chillrud, and D.W. Robinson. 1993. Sediment-derived
chronologies of persistent contaminants in Jamaica Bay - historical trends in contamination
of estuarine and coastal sediments. Estuaries 16(3B): 608-616.
Buckley, L. J. 1984. RNA-DNA ratio: an index of larval fish growth in the sea. Marine Biology
80: 291-298.
Buckley, L., E. Caldarone, and T.L. Ong. 1999. RNA/DNA ratio and other nucleic acid-based
indicators for growth and condition of marine fishes. Hydrobiologia 401: 265-277.
City of Indianapolis. 1996. Implementation of Early Action CSO Control Projects: Pilot
Facilities for In-System Storage and Solids/Floatables Control.
Cornwell, J.C. and M. Owens. 1998. Sediment biogeochemical processes in Jamaica Bay, New
York. Final Report to HydroQual, Inc., Mahwah, NJ. Horn Point Laboratory, University of
Maryland Center for Environmental Science.
Cosper, E.M., A. West, and W.S. Kim. 1989. A comparison of plankton and primary
productivity in the waters of the waters of the Gateway National Recreation Area: A final
data report to the National Park Service, Gateway National Recreation Area, Brooklyn, NY.
Dawn Underground Engineering. 2006. Newtown Creek Storage Tunnel Preliminary Drop
Structure Evaluation, December 2006.
Dean, T.A. and V.J. Bellis. 1975. Seasonal and Spatial Distribution of Epifauna in the Pamlico
River Estuary, North Carolina. Journal of Elisha Mitchell Scientific Society 91(1): 1-12.
Diaz, R.J. and R. Rosenberg. 1995. Marine benthic hypoxia: a review of its ecological effects
and the behavioral responses of benthic macrofauna. Oceanography and Marine Biology: An
Annual Review, 33: 245-303.

New York City Department of Environmental Protection Long-Term CSO Control Plan Report
Newtown Creek
10-2 June 2011
DiToro, D.M. and J.J. Fitzpatrick. 1993. Chesapeake Bay Sediment Flux Model. Prepared for
the USACE Waterways Experiment Station, Environmental Laboratory, Vicksburg,
Mississippi by HydroQual, Inc., Mahwah, NJ.
EEA, Inc. 1991. East River Landing Aquatic Environmental Study Final Report. Prepared for
the New York City Public Development Corporation, April 1991.
EEA, Inc. 1997. Jamaica Bay Eutrophication Study: Biological Productivity Study. Draft
Prepared for the New York City Department of Environmental Protection, December 1997.
ENSR Consulting. 1999. East River Repowering Project at the East River Generating Station,
New York, NY, September 1999.
Fair, G. and Geyer, J. 1965. Elements of Water Supply and Wastewater Disposal, John Wiley &
Sons, Inc., New York.
Ferrara, R. A. and Witkowski, P. 1983. Stormwater Quality Characteristics in Detention Basins,
Journal of Environmental Engineering ASCE, Vol. 109, No. 2.
Franz D. R. and W. H. Harris. 1985. Benthos Study: A final report to the National Parks Service.
Jamaica Bay Wildlife Refuge (GNRA), New York.
Gaffoglio, Robert. 2001. Letter to Eugene Brickman. Hudson-Raritan Estuary (HRE) Ecosystem
Restoration Study, November 30, 2001.
Gosner, K.L. 1978. “A Field Guide to the Atlantic Seashore.” Peterson Field Guides. Houghton
Mifflin Company. New York.
Greeley and Hansen. 1982. Newtown Creek WPCP 201 Facilities Plan Infiltration/Inflow
Analysis. Prepared for the City of New York Department of Environmental Protection,
Bureau of Water Pollution Control, December 1982.
Greeley and Hansen. 1985. Memorandum Report on CSO Swirl Concentrator Facility (Vortex
Separator) Testing Program.
Great Lakes – Upper Mississippi River Board. 2004. Recommended Standards for Wastewater
Facilities – Policies for the Design, Review, and approval of Plans and Specifications for
Wastewater Collection and Treatment Facilities. Report of the Wastewater Committee of the
Great Lakes – Upper Mississippi River Board of State and Provincial Public Health and
Environmental Managers, 2004 edition.
Hazen and Sawyer. 1981. Newtown Creek Water Pollution Control Plant Final Report
Monitoring Program (May – October 1980). Prepared for the City of New York Department
of Environmental Protection.
Hazen and Sawyer. 1989. Paerdegat Basin Water Quality Facility Plan Draft Task Reports 2.5
and 3.4: Receiving Water Conditions. Prepared for the City of New York Department of
Environmental Protection, Bureau of Environmental Engineering.
Hazen and Sawyer. 1991. Paerdegat Basin Water Quality Facility Plan, Draft Facility Planning
Report. Prepared for the City of New York Department of Environmental Protection, Bureau
of Environmental Engineering, September 1991.
New York City Department of Environmental Protection Long-Term CSO Control Plan Report
Newtown Creek
10-3 June 2011
Hazen and Sawyer. 1994. Public Participation for the Paerdegat Basin Water Quality Facility
Planning Project. Prepared for the City of New York Department of Environmental
Protection, February 1994.
Hazen and Sawyer. 1999. Evaluation of Supplemental Aeration for the Paerdegat Basin Water
Quality Facility Project. Prepared for the City of New York Department of Environmental
Protection, Bureau of Environmental Engineering, February 1999.
Hazen and Sawyer. 2004. Paerdegat Basin Water Quality Facility Plan, Modified CSO Facility
Planning Report. Prepared for the City of New York Department of Environmental
Protection, Bureau of Environmental Engineering, April 2003; revised February 2004.
Houghton, R, G. Gordon, and B. Huber. 2002. Dye Tracer Experiments in Jamaica Bay.
Prepared for Gateway National Recreation Area by Columbia Earth Institute.
HydroQual Engineers and Scientists, P.C. 1993. Sources, Fate and Control of Floatable Materials
in New York Harbor (Final Report). Prepared for the City of New York Department of
Environmental Protection, Bureau of Environmental Engineering, December, 1993.
HydroQual Engineers and Scientists, P.C. 1995a. Floatables Pilot Program - Evaluation of Non-
Structural Methods to Control Combined and Storm Sewer Floatable Materials (Final
Report). Prepared for the City of New York Department of Environmental Protection,
January, 1995.
HydroQual Engineers and Scientists, P.C. 1995b. City-Wide Floatables Study. Prepared for the
City of New York Department of Environmental Protection, Bureau of Environmental
Engineering, Division of Water Quality Improvement.
HydroQual, 1997. City-Wide CSO Floatables Plan, Draft. Prepared for The City of New York
Department of Environmental Protection, Bureau of Environmental Engineering, June 1997.
HydroQual Engineers and Scientists, P.C. 1999. East River Water Quality Plan, Task 10.0
System-Wide Eutrophication Model (SWEM), Sub-Task 10.2 Obtain and Reduce
Loading/Water Quality Data, Draft Report. Prepared for New York City Department of
Environmental Protection under subcontract to Greeley and Hansen, April 1999.
HydroQual Engineers and Scientists, P.C. 2000a. Paerdegat Basin Field Sampling and Analysis
Program, Years 2000-2001. Prepared for the City of New York Department of
Environmental Protection, Bureau of Environmental Engineering.
HydroQual Engineers and Scientists, P.C. 2000b. Develop and Evaluate Alternatives - Task 6.0
Technical Memorandum. Prepared for the City of New York Department of Environmental
Engineering, June 2000.
HydroQual Engineers and Scientists, P.C. 2001a. Jamaica Bay Field Sampling and Analysis
Program, Years 2001-2002. Prepared for the City of New York Department of
Environmental Protection, Bureau of Environmental Engineering.
HydroQual Engineers and Scientists, P.C. 2001b. Ichthyoplankton Field Sampling and Analysis
Program, Year 2001. Prepared for the City of New York Department of Environmental
Protection, Bureau of Environmental Engineering.
New York City Department of Environmental Protection Long-Term CSO Control Plan Report
Newtown Creek
10-4 June 2011
HydroQual Engineers and Scientists, P.C. 2001c. Epibenthic Recruitment and Survival Field
Sampling and Analysis Program, Years 2001-2002. Prepared for the City of New York
Department of Environmental Protection, Bureau of Environmental Engineering.
HydroQual Engineers and Scientists, P.C. 2001d. Use and Standards Attainment Project Field
and Laboratory Standard Operating Procedures. Prepared for the City of New York
Department of Environmental Protection, Bureau of Environmental Engineering.
HydroQual Engineers and Scientists, P.C. 2001e. East River Field Sampling and Analysis
Program, Year 2001. Prepared for New York City Department of Environmental Protection,
Bureau of Environmental Engineering, May 2001.
HydroQual Engineers and Scientists, P.C. 2001f. East River Water Quality Plan, Task 10.0
System-Wide Eutrophication Model (SWEM), Sub-Task 10.1 Construct SWEM. Prepared
for New York City Department of Environmental Protection under subcontract to Greeley
and Hansen, April 2001.
HydroQual Engineers and Scientists, P.C. 2001g. East River Water Quality Plan, Task 10.0
System-Wide Eutrophication Model (SWEM), Sub-Task 10.2 Obtain and Reduce
Loading/Water Quality Data. Prepared for New York City Department of Environmental
Protection under subcontract to Greeley and Hansen, April 2001.
HydroQual Engineers and Scientists, P.C. 2001h. East River Water Quality Plan, Task 10.0
System-Wide Eutrophication Model (SWEM), Sub-Task 10.4 Calibrate SWEM Water
Quality and Sub-Task 10.6 Validate SWEM Water Quality. Prepared for New York City
Department of Environmental Protection under subcontract to Greeley and Hansen, April
2001.
HydroQual Engineers and Scientists, P.C., 2001i. Use and Standards Attainment Project,
Waterbody Work Plan. Prepared for the City of New York Department of Environmental
Protection, Bureau of Environmental Engineering, January 2001.
HydroQual. 2002a. Supplemental Aquatic Life Characterization of East River and Jamaica Bay
Field Sampling and Analysis Program, Year 2002. Prepared for the City of New York
Department of Environmental Protection, Bureau of Environmental Engineering.
HydroQual. 2002b. A water quality model for Jamaica Bay: Calibration of the Jamaica Bay
Eutrophication Model (JEM). Prepared for the City of New York Department of
Environmental Protection under subcontract to O'Brien & Gere.
HydroQual. 2002c. Tributary Benthos Characterization Field Sampling and Analysis Program,
Year 2002. Prepared for New York City Department of Environmental Protection, Bureau of
Environmental Engineering.
HydroQual. 2003a. Subtital Benthos and Ichthyoplankton Characterization Field Sampling and
Analysis Program, Year 2003. Prepared for the City of New York Department of
Environmental Protection, Bureau of Environmental Engineering, September 2003.
New York City Department of Environmental Protection Long-Term CSO Control Plan Report
Newtown Creek
10-5 June 2011
HydroQual. 2003b. Tributary Toxicity Characterization Field Sampling and Analysis Program,
Year 2003. Prepared for the City of New York Department of Environmental Protection,
Bureau of Environmental Engineering, August 2003.
HydroQual. 2005a. City-Wide Comprehensive CSO Floatable Plan, Modified Facility Planning
Report. Prepared for the City of New York Department of Environmental Protection, Bureau
of Engineering Design & Construction, July 2005.
HydroQual. 2005b. NY/NJ Harbor Estuary Program Model Application of Stormwater Sampling
Results, Memorandum to C. Villari, NYCDEP, from C. Dujardin and W. Leo, May 4, 2005.
HydroQual. 2007. Pilot Floatables Monitoring Program Progress Report. Prepared for the City of
New York Department of Environmental Protection, Bureau of Engineering Design &
Construction, March 2007.
Hyland, J., I. Karakassis, P. Magni, A. Petrov and J. Shine. 2000. Ad hoc Benthic Indicator
Group – Results of Initial Planning Meeting. Intergovernmental Oceanographic Commission
(IOC) Technical Series No. 57. SC-2000/WS/60. United Nations Educational, Scientific and
Cultural Organization (UNESCO), Paris, France.
Kuropat, C., R. Mercaldo-Allen, E. Caldarone, R. Goldberg, B. Phelan, and F. Thurberg. 2002.
Evaluation of RNA concentration as an indicator of growth in young-of-the-year winter
flounder Pseudopleuronectes americanus and tautog Tautoga onitis. Mar. Ecol. Prog. Ser.
230:265-274.
Lerberg, S.B., A.F. Holland, and D.M. Sanger. 2000. Responses of tidal creek macrobenthic
communities to the effects of watershed development. Estuaries. 23:838-853.
Levandowsky, M. 1994. An Investigation of Water Discoloration and Odor in Paerdegat Basin, a
Tributary of Jamaica Bay, During the Summer of 1994. Haskins Laboratories, Pace
University, New York, NY.
Lawler, Matusky & Skelly Engineers LLP (LMS). 1993. Newtown Creek Water Quality Facility
Planning Project, Subtask 5.3 Receiving Water Modeling - Draft. Prepared for the New York
City Department of Environmental Protection under subcontract to URS Consultants, April
1993.
Lawler, Matusky & Skelly Engineers LLP (LMS). 1997. Newtown Creek Water Quality Facility
Planning Project, Task 20.0 1996 Aeration Pilot Study Model Report. Prepared for the New
York City Department of Environmental Protection under subcontract to URS Greiner, Inc.,
July 1997.
Greeley and Hansen, LLC / Hazen and Sawyer, P.C. / Malcolm Pirnie, Inc. (NC WPCP JV).
1998. Capital Project No. WP-283, Newtown Creek Water Pollution Control Project, Track 3
Facility Plan, July 1998.
Greeley and Hansen, LLC / Hazen and Sawyer, P.C. / Malcolm Pirnie, Inc. (NC WPCP JV).
2004. Capital Project No. WP-283, Newtown Creek Water Pollution Control Project,
Enhanced Track 3 Facility Plan, March 2004.
New York City Department of Environmental Protection Long-Term CSO Control Plan Report
Newtown Creek
10-6 June 2011
Greeley and Hansen, LLC / Hazen and Sawyer, P.C. / O’Brien & Gere, Inc. (LTCP-JV). 2005.
Bowery Bay Water Pollution Control Plant 2xDDWF Sustainability. Prepared for the City of
New York Department of Environmental Protection, November 2005.
Greeley and Hansen, LLC / Hazen and Sawyer, P.C. / O’Brien & Gere, Inc. (LTCP-JV). 2006a.
City-Wide Long-Term CSO Control Planning, Landside Modeling Report, Volume 3, Coney
Island WPCP Sewershed. Prepared for the City of New York Department of Environmental
Protection, Bureau of Engineering Design & Construction. Draft under review; finalization
scheduled for September 2006.
Greeley and Hansen, LLC / Hazen and Sawyer, P.C. / O’Brien & Gere, Inc. (LTCP-JV). 2006b.
City-Wide Long-Term CSO Control Planning, Receiving Water Quality Modeling Report,
Volume 13 – Paerdegat Basin. Prepared for the City of New York Department of
Environmental Protection, Bureau of Engineering Design & Construction. Draft under
review; finalization scheduled for September 2006.
Malcolm Pirnie. 2004. Coney Island Water Pollution Control Plant Conceptual Design -
Evaluation of BNR Upgrades (Draft Report). Prepared for the City of New York Department
of Environmental Protection, Bureau of Environmental Engineering, July 2004.
Michael, G.Y. and T.F. Moore. 1997. A suggested framework for conducting UAAs and
interpreting results. Project 91-NPS-1. Prepared for the Water Environment Research
Foundation.
Metropolitan Council of Governments (MWCOG). 1983. Urban Runoff in the Washington
Metropolitan Area, Final Report, Washington, D.C. Area, Urban Runoff Project, U.S. EPA
Nationwide Urban Runoff Program, Water Resources Planning Board.
Mugdan, Walter. Correspondence from Walter Mugdan, USEPA Region 2, to Sandra Allen,
NYSDEC. 10 August 2004.
"Newtown Creek" Hudson-Raritan Estuary Ecosystem Restoration. U.S. Army Corps of
Engineers. 16 Aug. 2006 <http://hudsonraritanrestoration.org/index.htm>.
New York City Department of City Planning (NYCDCP). 2002. The New Waterfront
Revitalization Program, September 2002.
New York City Department of Environmental Protection (NYCDEP). 1994. Inner Harbor CSO
Facility Planning Project, Facilities Planning Report. Prepared for the NYCDEP by Hazen
and Sawyer, P.C., and HydroQual.
New York City Department of Environmental Protection (NYCDEP). 1997. CSO Abatement in
the City of New York: Report on Meeting the Nine Minimum CSO Control Standards.
New York City Department of Environmental Protection (NYCDEP). 20002009. Harbor Survey
Annual Report.
New York City Department of Environmental Protection (NYCDEP). 2002. New York City
Department of Environmental Protection, Bureau of Wastewater Treatment, Process
Engineering Section Operating Data Fiscal Year 2002.
New York City Department of Environmental Protection Long-Term CSO Control Plan Report
Newtown Creek
10-7 June 2011
New York City Department of Environmental Protection (NYCDEP). 2003a. Use and Standards
Attainment Project, Newtown Creek Stakeholder Meeting No. 1 Meeting Notes, September
30, 2003.
New York City Department of Environmental Protection (NYCDEP). 2003b. Use and Standards
Attainment Project, Newtown Creek Stakeholder Meeting No. 2 Meeting Notes, November
19, 2003.
New York City Department of Environmental Protection (NYCDEP). 2003c. Evaluation of
Corona Avenue Vortex Facility, 2-volumes, City of New York Department of Environmental
Protection, September 29, 2003.
New York City Department of Environmental Protection (NYCDEP). 2004a. Use and Standards
Attainment Project, Newtown Creek Stakeholder Meeting No. 3 Meeting Notes, February 18,
2004.
New York City Department of Environmental Protection (NYCDEP). 2004b. Use and Standards
Attainment Project, Newtown Creek Stakeholder Meeting No. 4 Draft Meeting Notes, May
26, 2004.
New York City Department of Environmental Protection (NYCDEP). 2005a. Corona Avenue
Vortex Facility Underflow Evaluation, City of New York, Department of Environmental
Protection, October 2005.
New York City Department of Environmental Protection (NYCDEP). 2005b. City-Wide
Comprehensive CSO Floatables Plan Modified Facility Planning Report.
New York City Department of Environmental Protection (NYCDEP). 2006. 2005 New York
Harbor Water Quality Report.
New York City Department of City Planning, New York City Population Projections by Age/Sex
& Borough, 2000-2030, Report, December 2006. www.nyc.gov.
New York State Codes, Rules and Regulations (NYCRR). 2005. 6 NYCRR Part 371,
Identification and Listing of Hazardous Wastes, effective September 3, 2005.
New York State Department of Environmental Conservation (NYSDEC). 2004a. Technical and
Operational Guidance Series (TOGS) 5.1.9, In-Water and Riparian Management of Sediment
and Dredged Material, November 2004.
New York State Department of Environmental Conservation (NYSDEC). 2004b. Order on
Consent (CSO Order), DEC Case No. CO2-20000107-8.
New York State Department of Environmental Conservation (NYSDEC). 2005. Response to
Comments on the 2004 Administrative Consent Order for Implementation of the Combined
Sewer Overflow Abatement Program in New York City (Final Version), January 14, 2005.
New York State Department of Environmental Conservation (NYSDEC). 2006. The Draft of
New York State 2006 Section 303(d) List of Impaired Waters Requiring a TMDL (Draft
Version), February 10, 2006.
New York City Department of Environmental Protection Long-Term CSO Control Plan Report
Newtown Creek
10-8 June 2011
New York State Department of Transportation and NY MTA. 2004. Second Avenue Subway in
the Borough of Manhattan, New York County, NY. Final Environmental Impact Statement.
Chapter 15.
Novotny, V., J. Braden, D. White, A. Capodaglio, R. Schonter, R. Larson, and K. Algozin. 1997.
A Comprehensive UAA Technical Reference. Project 91-NPS-1. Prepared for the Water
Environment Research Foundation.
O’Brien & Gere. 1993. Jamaica Bay CSO Abatement Facility Planning Project, Draft Facility
Planning Report. Prepared for the City of New York Department of Environmental
Protection, November 1993.
O’Brien & Gere. 1994. Fresh Creek CSO Facility Plan. Prepared for the City of New York
Department of Environmental Protection.
O’Brien & Gere. 2004. Hunts Point Inline Storage Prototype Project, Draft Operations Report,
May 2004.
O’Brien & Gere. 2006. Comparative Cost Analysis for CSO Abatement Technologies – Costing
Factors, Memorandum from P. Ripke to P. Young et. al., April 25, 2006.
Office of the Mayor. 2005. New York City Industrial Policy: Protecting and Growing New York
City’s Industrial Job Base, January 2005.
Oliver, L. J. and Grigoropoulos, S. G. 1981. Control of Storm Generated Pollutants Using a
Small Urban Lake, Journal WPCF, Vol. 53, No. 5, May 1981.
Pearson, T.H. and R. Rosenberg. 1978. Macrobenthic Succession in Relation to Organic
Enrichment and Pollution of the Marine Environment. Oceanography and Marine Biology
Annual Review 16: 229-311.
Peterson, W.T. and H.G. Dam. 1989. Hydrography and Plankton of Jamaica Bay (Internal
Report). Marine Sciences Research Center, State University of New York at Stony Brook.
Rhoads, D.C. and J.D. Germano. 1986. Interpreting long-term changes in benthic community
structure, a new protocol. Hydrobiologia. 142:291-308.
Sunset Energy Fleet. 2002. Summary of data from the East River Generating Station for Article
X Application Gowanus Bay. New York State Public Service Commission, Case 99-F-0478.
Sutherland, R. 1995. Street Sweeper Pick-up Performance. Kurahashi and Associates, Inc.,
Seattle, WA.
TAMS Consulting. 1999. Environmental Report, FDR Drive Southbound Rehabilitation. New
York, NY. Prepared for the New York Department of Transportation, October 1999.
Tanacredi, J.T., M.P. Schreibman, and G.W. Frame. 2002. Jamaica Bay Research and
Restoration Team (JABERRT), Final Report.
URS Consultants, Inc. (URS). 1986. Infiltration/Inflow Analysis, Bowery Bay Water Pollution
Control Plant. Task 1 of the Flushing Bay Water Quality Facility Plan. Prepared for the New
New York City Department of Environmental Protection Long-Term CSO Control Plan Report
Newtown Creek
10-9 June 2011
York City Department of Environmental Protection, Bureau of Water Pollution Control,
September 1986.
URS Consultants, Inc. (URS). 1990. Bowery Bay WPCP Interim Report. Task 11.6 of the
Flushing Bay Sewer System Evaluation Survey. Prepared for the New York City Department
of Environmental Protection, March 1990.
URS Consultants, Inc. (URS). 1992. Bowery Bay WPCP Final Report. Task 13.5 of the
Flushing Bay Sewer System Evaluation Survey. Prepared for the New York City Department
of Environmental Protection, Division of CSO Abatement, January 1992.
URS Consultants, Inc. (URS). 1993. Newtown Creek Water Quality Facility Planning Project,
Draft Facilities Plan Report. Prepared for the City of New York Department of
Environmental Protection, January 1993.
URS Consultants, Inc. (URS). 1994. Newtown Creek Water Quality Facility Planning Project,
Feasibility Study for Non-CSO Abatement Alternatives. Prepared for the City of New York
Department of Environmental Protection, June 1994.
URS Consultants, Inc. (URS). 1995a. Newtown Creek Water Quality Facility Planning Project,
Addendum to Facilities Plan Report Executive Summary. Prepared for the City of New York
Department of Environmental Protection, January 1995.
URS Consultants, Inc. (URS). 1995b. Newtown Creek Water Quality Facility Planning Project,
Addendum to Facilities Plan Report. Prepared for the City of New York Department of
Environmental Protection, May 1995.
URS Greiner Woodward Clyde (URS). 1999. Newtown Creek Water Quality Facility Planning
Project, Addendum to Facilities Plan Report Phase I Aeration Facilities. Prepared for the
City of New York Department of Environmental Protection, April 1999.
URS Greiner Woodward Clyde (URS). 2000a. Newtown Creek Water Quality Facility Planning
Project, Subsurface Investigation Report. Prepared for the City of New York Department of
Environmental Protection, January 2000.
URS Greiner Woodward Clyde (URS). 2000b. Newtown Creek Water Quality Facility Planning
Project, Dredging Feasibility Study. Prepared for the City of New York Department of
Environmental Protection, September 2000.
URS Consultants (URS). 2001. Newtown Creek Water Quality Facility Planning Project, Sewer
System Modeling and Technical Memorandum. Prepared for the City of New York
Department of Environmental Protection, April 2001.
URS Corporation (URS). 2002. Newtown Creek Water Quality Facility Planning Project,
Updated Facility Plan Draft Report. Prepared for the City of New York Department of
Environmental Protection, June 2002.
URS Corporation (URS). 2003. Newtown Creek Water Quality Facility Planning Project, Final
Facility Plan Report. Prepared for the City of New York Department of Environmental
Protection, September 2003.
New York City Department of Environmental Protection Long-Term CSO Control Plan Report
Newtown Creek
10-10 June 2011
U.S. Army Corps of Engineers (USACE). 1999. Dredged Material Management Plan for the
Port of New York and New Jersey: Draft Implementation Report, September 1999.
U.S. Army Corps of Engineers (USACE). 2002. Jamaica Bay Ecosystem Restoration Project,
Existing Conditions, Future without Project Conditions, Goals and Objectives, Final Report
Prepared by the New York District, December 2002.
U.S. Army Corps of Engineers (USACE). 2003. Jamaica Bay Ecosystem Restoration Project:
Land History Disturbance maps, Interagency Meeting, September 2003.
U.S. Environmental Protection Agency (USEPA), 1977. Municipal Environmental Research
Laboratory, Office of Research and Development, 1977. Catchbasin technology Overview
and Assessment, EPA-600/2-77-051, May 1977.
U.S. Environmental Protection Agency (USEPA), 1978. Construction Costs for Municipal
Wastewater Treatment Plants 1973-1977. EPA 430/9-77-013.
U.S. Environmental Protection Agency (USEPA), 1983. Results of Nationwide Urban Runoff
Program, Executive Summary, Water Planning Division.
U.S. Environmental Protection Agency (USEPA), 1994a. Seminars, Combined Sewer Overflow
Control, EPA-625-K-94-003, Office of Research and Development, Washington, DC, July
1994.
U.S. Environmental Protection Agency (USEPA), 1994b. Combined Sewer Overflow (CSO)
Control Policy; Notice, FRL-4732-7, Federal Register Volume 59 No. 75, April 1994.
U.S. Environmental Protection Agency (USEPA), 1995a. Combined Sewer Overflows,
Guidance for Long-Term Control Plan, EPA-832-B-95-002, Office of Water, Washington,
DC, September 1995.
U.S. Environmental Protection Agency (USEPA), 1995b. Combined Sewer Overflows,
Guidance for Nine Minimum Controls, EPA 832-B-95-003
U.S. Environmental Protection Agency (USEPA), 1995c. Combined Sewer Overflows,
Guidance for Permit Writers, EPA 832-B-95-008
U.S. Environmental Protection Agency (USEPA), 1997. Technical Guidance Manual For
Developing Total Maximum Daily Loads, Book 2: Streams and Rivers, Part 1: Biochemical
Oxygen Demand/Dissolved Oxygen and Nutrients/Eutrophication, EPA 823 B 97 002.
Office of Water, Washington, DC, March, 1997.
U.S. Environmental Protection Agency (USEPA), 1998. EPA Guidance for Quality Assurance
Project Plans, EA QA/G-5. EPA/600/R-98/018, February 1998.
U.S. Environmental Protection Agency (USEPA), 1999a. Combined Sewer Overflows –
Guidance for Monitoring and Modeling. EPA 832-B-99-002, January 1999.
U.S. Environmental Protection Agency (USEPA), 1999b. Combined Sewer Overflow Control
Fact Sheet - Screens. EPA 832-F-99-040.

New York City Department of Environmental Protection Long-Term CSO Control Plan Report
Newtown Creek
10-11 June 2011
U.S. Environmental Protection Agency (USEPA), 1999c. Combined Sewer Overflow
Technology Fact Sheet – Chlorine Disinfection. EPA 832-F-99-034.
U.S. Environmental Protection Agency (USEPA), 1999d. Combined Sewer Overflow
Technology Fact Sheet – Alternative Disinfection Methods. EPA 832-F-99-033.
U.S. Environmental Protection Agency (USEPA), 1999e. Combined Sewer Overflow
Technology Fact Sheet – Netting Systems for Floatables Control. EPA 832-F-99-037.
U.S. Environmental Protection Agency (USEPA), 2000. Ambient Aquatic Life Water Quality
Criteria for Dissolved Oxygen (Saltwater): Cape Cod to Cape Hatteras, EPA 822 R 00 012.
Office of Water, Washington, DC, November 2000.
U.S. Environmental Protection Agency (USEPA), 2001a. EPA Requirements for Quality
Management Plans, EPA QA/R-2. EPA/240/B-01/002, March 2001.
U.S. Environmental Protection Agency (USEPA), 2001b. EPA Requirements for Quality
Assurance Project Plans, EPA QA/R-5. EPA/240/B-01/003, March 2001.
U.S. Environmental Protection Agency (USEPA), 2001c. Guidance for Preparing Standard
Operating Procedures (SOPs), EPA QA/G-6. EPA/240/B-01/004, March 2001.
U.S. Environmental Protection Agency (USEPA), 2001d. Guidance: Coordinating CSO Long-
Term Planning With Water Quality Standards Reviews, EPA 833 R 01 002, Office of Water,
Washington, DC, July 2001.
U.S. Environmental Protection Agency (USEPA), 2004. Water Quality Standards for Coastal
and Great Lakes Recreation Waters (Final Rule). 69 FR 220, pp. 67218-67243, November
16, 2004.
Vogel, Leigh. 2005. Letter to Gary Kline (NYCDEP), DEC Region 2 Natural Resources’
Response to Request for Input Regarding Sensitive Areas Identified in the NYC Long-Term
CSO Control Plan. New York, June 17, 2005.
Weisberg, S.B., J.A. Ranasinghe, D.M. Dauer, L.C. Schaffner, R.J. Diaz, and J.B. Frithsen.
1997. An Estuarine Benthic Index of Biotic Integrity (B-IBI) for Chesapeake Bay. Estuaries,
20 (1): 149-158.
Weiss, H.M. 1995. Marine Animals of Southern New England and New York. State Geological
and Natural History Survey of Connecticut. Department of Environmental Protection.
West-Valle, A.S., C.J. Decker, and R.L. Swanson. 1992. Use Impairments of Jamaica Bay.
Marine Sciences Research Center, University of New York, Stony Brook. May 1992.
Wildish, D. and D. Kristmanson. 1997. Benthic Suspension Feeders and Flow. Cambridge
University Press: NY.
Zappala S. 2001. Growth and Development of Epibenthic and Benthic Communities Associated
with Waterfront Shipping Piers of the Upper Bay of New York Harbor. Masters Thesis.

New York City Department of Environmental Protection Long-Term CSO Control Plan Report
Newtown Creek
10-12 June 2011
NO TEXT ON THIS PAGE
New York City Department of Environmental Protection Waterbody/Watershed Facility Plan
Newtown Creek
11-1 June 2011
11.0 Glossary and Abbreviations
A Posteriori Classification: A classification based on the
results of experimentation.
A Priori Classification: A classification made prior to
experimentation.
ACO: Administrative Consent Order
Activated Sludge: The product that results when primary
effluent is mixed with bacteria-laden sludge and then
agitated and aerated to promote biological treatment,
speeding the breakdown of organic matter in raw sewage
undergoing secondary waste treatment.
Acute Toxicity: The ability of a substance to cause severe
biological harm or death soon after a single exposure or
dose. Also, any poisonous effect resulting from a single
short-term exposure to a toxic substance (see chronic
toxicity, toxicity).
Administrative Consent Order (ACO): A legal
agreement between a regulatory authority and an
individual, business, or other entity through which the
violator agrees to pay for correction of violations, take the
required corrective or cleanup actions, or refrain from an
activity. It describes the actions to be taken, may be
subject to a comment period, applies to civil actions, and
can be enforced in court.
Administrative Law Judge (ALJ): An officer in a
government agency with quasi-judicial functions including
conducting hearings, making findings of fact, and making
recommendations for resolution of disputes concerning the
agency’s actions.
Advanced Treatment: A level of wastewater treatment
more stringent than secondary treatment; requires an 85-
percent reduction in conventional pollutant concentration or
a significant reduction in non-conventional pollutants.
Sometimes called tertiary treatment.
Advanced Wastewater Treatment: Any treatment of
sewage that goes beyond the secondary or biological water
treatment stage and includes the removal of nutrients such
as phosphorus and nitrogen and a high percentage of
suspended solids. (See primary, secondary treatment.)
Advection: Bulk transport of the mass of discrete chemical
or biological constituents by fluid flow within a receiving
water. Advection describes the mass transport due to the
velocity, or flow, of the waterbody. Example: The
transport of pollution in a river: the motion of the water
carries the polluted water downstream.
ADWF: Average Dry Weather Flow
Aeration: A process that promotes biological degradation
of organic matter in water. The process may be passive (as
when waste is exposed to air), or active (as when a mixing
or bubbling device introduces the air). Exposure to
additional air may be by means of natural of engineered
systems.
Aerobic: Environmental conditions characterized by the
presence of dissolved oxygen; used to describe biological
or chemical processes that occur in the presence of oxygen.
Algae: Simple rootless plants that live floating or
suspended in sunlit water or may be attached to structures,
rocks or other submerged surfaces. Algae grow in
proportion to the amount of available nutrients. They can
affect water quality adversely since their biological
activities can appreciably affect pH and low dissolved
oxygen of the water. They are food for fish and small
aquatic animals.
Algal Bloom: A heavy sudden growth of algae in and on a
body of water which can affect water quality adversely and
indicate potentially hazardous changes in local water
chemistry. The growth results from excessive nutrient
levels or other physical and chemical conditions that enable
algae to reproduce rapidly.
ALJ: Administrative Law Judge
Allocations: Allocations are that portion of a receiving
water’s loading capacity that is attributed to one of its
existing or future sources (non-point or point) of pollution
or to natural background sources. (Wasteload allocation
(WLA) is that portion of the loading capacity allocated to
an existing or future point source and a load allocation
(LA) is that portion allocated to an existing or future non-
point source or to a natural background source. Load
allocations are best estimates of the loading, which can
range from reasonably accurate estimates to gross
allotments, depending on the availability of data and
appropriate techniques for predicting loading.)
Ambient Water Quality: Concentration of water quality
constituent as measured within the waterbody.
Ammonia (NH3): An inorganic form of nitrogen is
contained in fertilizers, septic system effluent, and animal
wastes. It is also a product of bacterial decomposition of
organic matter. NH3-N becomes a concern if high levels of
the un-ionized form are present. In this form NH3-N can be
toxic to aquatic organisms.
Anaerobic: Environmental condition characterized by zero
oxygen levels. Describes biological and chemical processes
New York City Department of Environmental Protection Waterbody/Watershed Facility Plan
Newtown Creek
11-2 June 2011
that occur in the absence of oxygen. Anoxia. No dissolved
oxygen in water.
Anthropogenic: Pertains to the [environmental] influence
of human activities.
Antidegradation: Part of federal water quality
requirements. Calls for all existing uses to be protected, for
deterioration to be avoided or at least minimized when
water quality meets or exceeds standards, and for
outstanding waters to be strictly protected.
Aquatic Biota: Collective term describing the organisms
living in or depending on the aquatic environment.
Aquatic Community: An association of interacting
populations of aquatic organisms in a given waterbody or
habitat.
Aquatic Ecosystem: Complex of biotic and abiotic
components of natural waters. The aquatic ecosystem is an
ecological unit that includes the physical characteristics
(such as flow or velocity and depth), the biological
community of the water column and benthos, and the
chemical characteristics such as dissolved solids, dissolved
oxygen, and nutrients. Both living and nonliving
components of the aquatic ecosystem interact and influence
the properties and status of each component.
Aquatic Life Uses: A beneficial use designation in which
the waterbody provides suitable habitat for survival and
reproduction of desirable fish, shellfish, and other aquatic
organisms.
Assemblage: An association of interacting populations of
organisms in a given waterbody (e.g., fish assemblage or
benthic macro-invertebrate assemblage).
Assessed Waters: Waters that states, tribes and other
jurisdictions have assessed according to physical, chemical
and biological parameters to determine whether or not the
waters meet water quality standards and support designated
beneficial uses.
Assimilation: The ability of a body of water to purify
itself of pollutants.
Assimilative Capacity: The capacity of a natural body of
water to receive wastewaters or toxic materials without
deleterious efforts and without damage to aquatic life or
humans who consume the water. Also, the amount of
pollutant load that can be discharged to a specific
waterbody without exceeding water quality standards.
Assimilative capacity is used to define the ability of a
waterbody to naturally absorb and use a discharged
substance without impairing water quality or harming
aquatic life.
Attribute: Physical and biological characteristics of
habitats which can be measured or described.
Average Dry Weather Flow (ADWF): The average non-
storm flow over 24 hours during the dry months of the year
(May through September). It is composed of the average
dry weather inflow/infiltration.
Bacteria: (Singular: bacterium) Microscopic living
organisms that can aid in pollution control by metabolizing
organic matter in sewage, oil spills or other pollutants.
However, some types of bacteria in soil, water or air can
also cause human, animal and plant health problems.
Bacteria of the coliform group are considered the primary
indicators of fecal contamination and are often used to
assess water quality.
Measured in number of bacteria organisms per 100
milliliters of sample (No./ml or #/100 ml).
BASINS: Better Assessment Science Integrating Point and
Non-point Sources
BEACH: Beaches Environmental Assessment and Coastal
Health
Beaches Environmental Assessment and Coastal Health
(BEACH): The BEACH Act requires coastal and Great
Lakes States to adopt the 1986 USEPA Water Quality
Criteria for Bacteria and to develop and implement beach
monitoring and notification plans for bathing beaches.
Benthic: Refers to material, especially sediment, at the
bottom of an aquatic ecosystem. It can be used to describe
the organisms that live on, or in, the bottom of a waterbody.
Benthic Macroinvertebrates: See benthos.
Benthos: Animals without backbones, living in or on the
sediments, of a size large enough to be seen by the unaided
eye, and which can be retained by a U.S. Standard No. 30
sieve (28 openings/in, 0.595-mm openings). Also referred
to as benthic macroinvertebrates, infauna, or macrobenthos.
Best Available Technology (BAT): The most stringent
technology available for controlling emissions; major
sources of emissions are required to use BAT, unless it can
be demonstrated that it is unfeasible for energy,
environmental, or economic reasons.
Best Management Practice (BMP): Methods, measures
or practices that have been determined to be the most
effective, practical and cost effective means of preventing
or reducing pollution from non-point sources.
Better Assessment Science Integrating Point and Non-
point Sources (BASINS): A computer tool that contains an
assessment and planning component that allows users to
organize and display geographic information for selected
watersheds. It also contains a modeling component to
examine impacts of pollutant loadings from point and non-
point sources and to characterize the overall condition of
specific watersheds.
Bioaccumulation: A process by which chemicals are taken
up by aquatic organisms and plants directly from water as
well as through exposure via other routes, such as
consumption of food and sediment containing the
chemicals.

New York City Department of Environmental Protection Waterbody/Watershed Facility Plan
Newtown Creek
11-3 June 2011
Biochemical Oxygen Demand (BOD): A measure of the
amount of oxygen per unit volume of water required to
bacterially or chemically breakdown (stabilize) the organic
matter in water. Biochemical oxygen demand
measurements are usually conducted over specific time
intervals (5,10,20,30 days). The term BOD generally refers
to a standard 5-day BOD test. It is also considered a
standard measure of the organic content in water and is
expressed as mg/L. The greater the BOD, the greater the
degree of pollution.
Bioconcentration: A process by which there is a net
accumulation of a chemical directly from water into aquatic
organisms resulting from simultaneous uptake (e.g., via gill
or epithelial tissue) and elimination. In other words, the
accumulation of a chemical in tissues of a fish or other
organism to levels greater than the surrounding medium.
Biocriteria: A combination of narrative and numerical
measures, such as the number and kinds of benthic, or
bottom-dwelling, insects living in a stream, that describe
the biological condition (structure and function) of aquatic
communities inhabiting waters of a designated aquatic life
use. Biocriteria are regulatory-based biological
measurements and are part of a state’s water quality
standards.
Biodegradable: A substance or material that is capable of
being decomposed (broken down) by natural biological
processes.
Biodiversity: Refers to the variety and variability among
living organisms and the ecological complexes in which
they occur. Diversity can be defined as the number of
different items and their relative frequencies. For biological
diversity, these items are organized at many levels, ranging
from complete ecosystems to the biological structures that
are the molecular basis of heredity. Thus, the term
encompasses different ecosystems, species and genes.
Biological Assemblage: A group of phylogenetically (e.g.,
fish) or ecologically (e.g., benthic macroinvertebrates)
related organisms that are part of an aquatic community.
Biological Assessment or Bioassessment: An evaluation
of the condition of a waterbody using biological surveys
and other direct measures of the resident biota of the
surface waters, in conjunction with biological criteria.
Biological Criteria or Biocriteria: Guidelines or
benchmarks adopted by States to evaluate the relative
biological integrity of surface waters. Biocriteria are
narrative expressions or numerical values that describe
biological integrity of aquatic communities inhabiting
waters of a given classification or designated aquatic life
use.
Biological Indicators: Plant or animal species or
communities with a narrow range of environmental
tolerances that may be selected for monitoring because
their absence or presence and relative abundances serve as
barometers of environmental conditions.
Biological Integrity: The condition of the aquatic
community inhabiting unimpaired waterbodies of a
specified habitat as measured by community structure and
function.
Biological Monitoring or Biomonitoring: Multiple,
routine biological surveys over time using consistent
sampling and analysis methods for detection of changes in
biological condition.
Biological Nutrient Removal (BNR): The removal of
nutrients, such as nitrogen and/or phosphorous during
wastewater treatment.
Biological Oxygen Demand (BOD): An indirect measure
of the concentration of biologically degradable material
present in organic wastes. It usually reflects the amount of
oxygen consumed in five days by biological processes
breaking down organic wastes.
Biological Survey or Biosurvey: Collecting, processing
and analyzing representative portions of an estuarine or
marine community to determine its structure and function.
Biological Magnification: Refers to the process whereby
certain substances such as pesticides or heavy metals move
up the food chain, work their way into rivers and lakes, and
are eaten by aquatic organisms such as fish, which in turn
are eaten by large birds, animals or humans. The
substances become concentrated in tissues or internal
organs as they move up the food chain. he result of the
processes of bioconcentration and bioaccumulation by
which tissue concentrations of bioaccumulated chemicals
increase as the chemical passes up through two or more
trophic levels in the food chain. (See bioaccumulation.)
Biota: Plants, animals and other living resources in a given
area.
Biotic Community: A naturally occurring assemblage of
plants and animals that live in the same environment and
are mutually sustaining and interdependent.
BMP: Best Management Practice
BNR: Biological Nutrient Removal
BOD: Biological Oxygen Demand; Biochemical Demand
Borrow Pit: See Subaqueous Borrow Pit.
Brackish: Water with salt content ranging between that of
sea water and fresh water; commonly used to refer to
Oligohaline waters.
Brooklyn Sewer Datum (BSD): Coordinate system and
origins utilized by surveyors in the Borough of Brooklyn,
New York City.
BSD: Brooklyn Sewer Datum
CAC: Citizens Advisory Committee
New York City Department of Environmental Protection Waterbody/Watershed Facility Plan
Newtown Creek
11-4 June 2011
Calcareous: Pertaining to or containing calcium carbonate;
Calibration; The process of adjusting model parameters
within physically defensible ranges until the resulting
predictions give a best possible fit to observed data.
Calibration: The process of adjusting model parameters
within physically defensible ranges until the resulting
predictions give a best possible fit to observed data.
CALM: Consolidated Assessment and Listing
Methodology
Capital Improvement Program (CIP): A budget and
planning tool used to implement non-recurring
expenditures or any expenditure for physical
improvements, including costs for: acquisition of existing
buildings, land, or interests in land; construction of new
buildings or other structures, including additions and major
alterations; construction of streets and highways or utility
lines; acquisition of fixed equipment; landscaping; and
similar expenditures.
Capture: The total volume of flow collected in the
combined sewer system during precipitation events on a
system-wide, annual average basis (not percent of volume
being discharged).
Catch Basin: (1) A buried chamber, usually built below
curb grates seen at the curbline of a street, to relieve street
flooding, which admits surface water for discharge into the
sewer system and/or a receiving waterbody. (2) A
sedimentation area designed to remove pollutants from
runoff before being discharged into a stream or pond.
Carbonaceous Biochemical Oxygen Demand (CBOD5): The amount of oxygen required to oxidize any carbon
containing matter present in water in five days.
CATI: Computer Assisted Telephone Interviews
CBOD5: Carbonaceous Biochemical Oxygen Demand
CEA: Critical Environmental Area
CEQR: City Environmental Quality Review
CERCLIS: Comprehensive Environmental Response,
Compensation and Liability Information System
CFR: Code of Federal Regulation
Channel: A natural stream that conveys water; a ditch or
channel excavated for the flow of water.
Channelization: Straightening and deepening streams so
water will move faster or facilitate navigation - a tactic that
can interfere with waste assimilation capacity, disturb fish
and wildlife habitats, and aggravate flooding.
Chemical Oxygen Demand (COD): A measure of the
oxygen required to oxidize all compounds, both organic
and inorganic, in water.
Chlorination: The application of chlorine to drinking
water, sewage, or industrial waste to disinfect or to oxidize
undesirable compounds. Typically employed as a final
process in water and wastewater treatment.
Chrome+6 (Cr+6): Chromium is a steel-gray, lustrous,
hard metal that takes a high polish, is fusible with
difficulty, and is resistant to corrosion and tarnishing. The
most common oxidation states of chromium are +2, +3, and
+6, with +3 being the most stable. +4 and +5 are relatively
rare. Chromium compounds of oxidation state 6 are powerful oxidants.
Chronic Toxicity: The capacity of a substance to cause
long-term poisonous health effects in humans, animals, fish
and other organisms (see acute toxicity).
CIP: Capital Improvement Program
Citizens Advisory Committee (CAC): Committee
comprised of various community stakeholders formed to
provide input into a planning process.
City Environmental Quality Review (CEQR): CEQR is
a process by which agencies of the City of New York
review proposed discretionary actions to identify the effects
those actions may have on the environment.
Clean Water Act (CWA): The Clean Water Act (formerly
referred to as the Federal Water Pollution Control Act or
Federal Water Pollution Control Act Amendments of
1972), Public Law 92-500, as amended by Public Law 96-
483 and Public Law 97-117, 33 U.S.C. 1251 et seq. The
CWA contains a number of provisions to restore and
maintain the quality of the nation’s water resources. One of
these provisions is section 303(d), which establishes the
Total maximum Daily Load (TMDL) program.
Coastal Waters: Marine waters adjacent to and receiving
estuarine discharges and extending seaward over the
continental shelf and/or the edge of the U.S. territorial sea.
Coastal Zone Boundary (CZB): Generally, the part of the
land affected by its proximity to the sea and that part of the
sea affected by its proximity to the land as the extent to
which man’s land-based activities have a measurable
influence on water chemistry and marine ecology.
Specifically, New York’s Coastal zone varies from region
to region while incorporating the following conditions:
The inland boundary is approximately 1,000 feet from the
shoreline of the mainland. In urbanized and developed
coastal locations the landward boundary is approximately
500 feet from the mainland’s shoreline, or less than 500
feet where a roadway or railroad line runs parallel to the
shoreline at a distance of under 500 feet and defines the
boundary. In locations where major state-owned lands and
facilities or electric power generating facilities abut the
shoreline, the boundary extends inland to include them. In
some areas, such as Long Island Sound and the Hudson
River Valley, the boundary may extend inland up to 10,000
feet to encompass significant coastal resources, such as
areas of exceptional scenic value, agricultural ore
recreational lands, and major tributaries and headlands.
New York City Department of Environmental Protection Waterbody/Watershed Facility Plan
Newtown Creek
11-5 June 2011
Coastal Zone: Lands and waters adjacent to the coast that
exert an influence on the uses of the sea and its ecology, or
whose uses and ecology are affected by the sea.
COD: Chemical Oxygen Demand
Code of Federal Regulations (CFR): Document that
codifies all rules of the executive departments and agencies
of the federal government. It is divided into fifty volumes,
known as titles. Title 40 of the CFR (references as 40 CFR)
lists most environmental regulations.
Coliform Bacteria: Common name for Escherichia coli
that is used as an indicator of fecal contamination of water,
measured in terms of coliform count. (See Total Coliform
Bacteria)
Coliforms: Bacteria found in the intestinal tract of warm-
blooded animals; used as indicators of fecal contamination
in water.
Collection System: Pipes used to collect and carry
wastewater from individual sources to an interceptor sewer
that will carry it to a treatment facility.
Collector Sewer: The first element of a wastewater
collection system used to collect and carry wastewater from
one or more building sewers to a main sewer. Also called a
lateral sewer.
Combined Sewage: Wastewater and storm drainage
carried in the same pipe.
Combined Sewer Overflow (CSO): Discharge of a
mixture of storm water and domestic waste when the flow
capacity of a sewer system is exceeded during rainstorms.
CSOs discharged to receiving water can result in
contamination problems that may prevent the attainment of
water quality standards.
Combined Sewer Overflow Event: The discharges from
any number of points in the combined sewer system
resulting from a single wet weather event that do not
receive minimum treatment (i.e., primary clarification,
solids disposal, and disinfection, where appropriate). For
example, if a storm occurs that results in untreated
overflows from 50 different CSO outfalls within the
combined sewer system (CSS), this is considered one
overflow event.
Combined Sewer System (CSS): A sewer system that
carries both sewage and storm-water runoff. Normally, its
entire flow goes to a waste treatment plant, but during a
heavy storm, the volume of water may be so great as to
cause overflows of untreated mixtures of storm water and
sewage into receiving waters. Storm-water runoff may also
carry toxic chemicals from industrial areas or streets into
the sewer system.
Comment Period: Time provided for the public to review
and comment on a proposed USEPA action or rulemaking
after publication in the Federal Register.
Community: In ecology, any group of organisms
belonging to a number of different species that co-occur in
the same habitat or area; an association of interacting
assemblages in a given waterbody. Sometimes, a
particular subgrouping may be specified, such as the fish
community in a lake.
Compliance Monitoring: Collection and evaluation of
data, including self-monitoring reports, and verification to
show whether pollutant concentrations and loads contained
in permitted discharges are in compliance with the limits
and conditions specified in the permit.
Compost: An aerobic mixture of decaying organic matter,
such as leaves and manure, used as fertilizer.
Comprehensive Environmental Response,
Compensation and Liability Information System
(CERCLIS): Database that contains information on
hazardous waste sites, potentially hazardous waste sites and
remedial activities across the nation. The database includes
sites that are on the National Priorities List or being
considered for the List.
Comprehensive Waterfront Plan (CWP): Plan proposed
by the Department of City Planning that provides a
framework to guide land use along the city's entire 578-
mile shoreline in a way that recognizes its value as a
natural resource and celebrates its diversity. The plan
presents a long-range vision that balances the needs of
environmentally sensitive areas and the working port with
opportunities for waterside public access, open space, housing and commercial activity.
Computer Assisted Telephone Interviews (CATI): CATI is the use of computers to automate and control the
key activities of a telephone interview.
Conc: Abbreviation for ―Concentration‖.
Concentration: Amount of a substance or material in a
given unit volume of solution. Usually measured in
milligrams per liter (mg/l) or parts per million (ppm).
Consolidated Assessment and Listing Methodology
(CALM): EPA framework for states and other
jurisdictions to document how they collect and use water
quality data and information for environmental decision
making. The primary purposes of these data analyses are to
determine the extent that all waters are attaining water
quality standards, to identify waters that are impaired and
need to be added to the 303(d) list, and to identify waters
that can be removed from the list because they are attaining
standards.
Contamination: Introduction into the water, air and soil of
microorganisms, chemicals, toxic substances, wastes or
wastewater in a concentration that makes the medium unfit
for its next intended use.
Conventional Pollutants: Statutorily listed pollutants
understood well by scientists. These may be in the form or
organic waste, sediment, acid, bacteria, viruses, nutrients,
oil and grease, or heat.
New York City Department of Environmental Protection Waterbody/Watershed Facility Plan
Newtown Creek
11-6 June 2011
Cost-Benefit Analysis: A quantitative evaluation of the
costs, which would be incurred by implementing an
alternative versus the overall benefits to society of the
proposed alternative.
Cost-Share Program: A publicly financed program
through which society, as a beneficiary of environmental
protection, allocates project funds to pay a percentage of
the cost of constructing or implementing a best
management practice. The producer pays the remainder of
the costs.
Cr+6: Chrome +6
Critical Condition: The combination of environmental
factors that results in just meeting water quality criterion
and has an acceptably low frequency of occurrence.
Critical Environmental Area (CEA): A CEA is a
specific geographic area designated by a state or local
agency as having exceptional or unique environmental
characteristics. In establishing a CEA, the fragile or
threatened environmental conditions in the area are
identified so that they will be taken into consideration in
the site-specific environmental review under the State
Environmental Quality Review Act.
Cross-Sectional Area: Wet area of a waterbody normal to
the longitudinal component of the flow.
Cryptosporidium: A protozoan microbe associated with
the disease cryptosporidiosis in man. The disease can be
transmitted through ingestion of drinking water, person-to-
person contact, or other pathways, and can cause acute
diarrhea, abdominal pain, vomiting, fever and can be fatal.
(See protozoa).
CSO: Combined Sewer Overflow
CSS: Combined Sewer System
Cumulative Exposure: The summation of exposures of an
organism to a chemical over a period of time.
Clean Water Act (CWA): Federal law stipulating actions
to be carried out to improve water quality in U.S. waters.
CWA: Clean Water Act
CWP: Comprehensive Waterfront Plan
CZB: Coastal Zone Boundary
DDWF: design dry weather flow
DEC: New York State Department of Environmental
Conservation
Decay: Gradual decrease in the amount of a given
substance in a given system due to various sink processes
including chemical and biological transformation,
dissipation to other environmental media, or deposition into
storage areas.
Decomposition: Metabolic breakdown of organic
materials; that releases energy and simple organics and
inorganic compounds. (See Respiration)
Degradable: A substance or material that is capable of
decomposition; chemical or biological.
Delegated State: A state (or other governmental entity
such as a tribal government) that has received authority to
administer an environmental regulatory program in lieu of a
federal counterpart.
Demersal: Living on or near the bottom of a body of water
(e.g., mid-water and bottom-dwelling fish and shellfish, as
opposed to surface fish).
DEP: New York City Department of Environmental
Protection
Department of Sanitation of New York (DSNY): New
York City agency responsible for solid waste and refuse
disposal in New York City
Design Capacity: The average daily flow that a treatment
plant or other facility is designed to accommodate.
Design Dry Weather Flow (DDWF): The flow basis for
design of New York City wastewater treatment plants. In
general, the plants have been designed to treat 1.5 times
this value to full secondary treatment standards and 2.0
times this value, through at least primary settling and
disinfection, during stormwater events.
Designated Uses: Those water uses specified in state
water quality standards for a waterbody, or segment of a
waterbody, that must be achieved and maintained as
required under the Clean Water Act. The uses, as defined
by states, can include cold-water fisheries, natural fisheries,
public water supply, irrigation, recreation, transportation, or
mixed uses.
Deoxyribonucleic Acid (DNA): The genetic material of
living organisms; the substance of heredity. It is a large,
double-stranded, helical molecule that contains genetic
instructions for growth, development, and replication.
Destratification: Vertical mixing within a lake or
reservoir to totally or partially eliminate separate layers of
temperature, plant, or animal life.
Deterministic Model: A model that does not include built-
in variability: same input will always equal the same
output.
Die-Off Rate: The first-order decay rate for bacteria,
pathogens, and viruses. Die-off depends on the particular
type of waterbody (i.e. stream, estuary , lake) and
associated factors that influence mortality.
Dilution: Addition of less concentrated liquid (water) that
results in a decrease in the original concentration.
New York City Department of Environmental Protection Waterbody/Watershed Facility Plan
Newtown Creek
11-7 June 2011
Direct Runoff: Water that flows over the ground surface or
through the ground directly into streams, rivers, and lakes.
Discharge Permits (NPDES): A permit issued by the
USEPA or a state regulatory agency that sets specific limits
on the type and amount of pollutants that a municipality or
industry can discharge to a receiving water; it also includes
a compliance schedule for achieving those limits. It is
called the NPDES because the permit process was
established under the National Pollutant Discharge
Elimination System, under provisions of the Federal Clean
Water Act.
Discharge: Flow of surface water in a stream or canal or
the outflow of ground water from a flowing artesian well,
ditch, or spring. It can also apply to discharges of liquid
effluent from a facility or to chemical emissions into the air
through designated venting mechanisms.
Discriminant Analysis: A type of multivariate analysis
used to distinguish between two groups.
Disinfect (Disinfected): A water and wastewater treatment
process that kills harmful microorganisms and bacteria by
means of physical, chemical and alternative processes such
as ultraviolet radiation.
Disinfectant: A chemical or physical process that kills
disease-causing organisms in water, air, or on surfaces.
Chlorine is often used to disinfect sewage treatment
effluent, water supplies, wells, and swimming pools.
Dispersion: The spreading of chemical or biological
constituents, including pollutants, in various directions
from a point source, at varying velocities depending on the
differential instream flow characteristics.
Dissolved Organic Carbon (DOC): All organic carbon
(e.g., compounds such as acids and sugars, leached from
soils, excreted from roots, etc) dissolved in a given volume
of water at a particular temperature and pressure.
Dissolved Oxygen (DO): The dissolved oxygen freely
available in water that is vital to fish and other aquatic life
and is needed for the prevention of odors. DO levels are
considered a most important indicator of a water body’s
ability to support desirable aquatic life. Secondary and
advanced waste treatments are generally designed to ensure
adequate DO in waste-receiving waters. It also refers to a
measure of the amount of oxygen available for biochemical
activity in a waterbody, and as an indicator of the quality of
that water.
Dissolved Solids: The organic and inorganic particles that
enter a waterbody in a solid phase and then dissolve in
water.
DNA: deoxyribonucleic acid
DO: dissolved oxygen
DOC: Dissolved Organic Carbon
Drainage Area or Drainage Basin: An area drained by a
main river and its tributaries (see Watershed).
Dredging: Dredging is the removal of mud from the
bottom of waterbodies to facilitate navigation or remediate
contamination. This can disturb the ecosystem and cause
silting that can kill or harm aquatic life. Dredging of
contaminated mud can expose biota to heavy metals and
other toxics. Dredging activities are subject to regulation
under Section 404 of the Clean Water Act.
Dry Weather Flow (DWF): Hydraulic flow conditions
within a combined sewer system resulting from one or
more of the following: flows of domestic sewage, ground
water infiltration, commercial and industrial wastewaters,
and any other non-precipitation event related flows (e.g.,
tidal infiltration under certain circumstances).
Dry Weather Overflow: A combined sewer overflow that
occurs during dry weather flow conditions.
DSNY: Department of Sanitation of New York
DWF: Dry weather flow
Dynamic Model: A mathematical formulation describing
the physical behavior of a system or a process and its
temporal variability. Ecological Integrity. The condition of
an unimpaired ecosystem as measured by combined
chemical, physical (including habitat), and biological
attributes.
E. Coli: Escherichia Coli.
Ecoregion: Geographic regions of ecological similarity
defined by similar climate, landform, soil, natural
vegetation, hydrology or other ecologically relevant
variables.
Ecosystem: An interactive system that includes the
organisms of a natural community association together with
their abiotic physical, chemical, and geochemical
environment.
Effects Range-Low: Concentration of a chemical in
sediment below which toxic effects were rarely observed
among sensitive species (10th percentile of all toxic
effects).
Effects Range-Median: Concentration of a chemical in
sediment above which toxic effects are frequently observed
among sensitive species (50th percentile of all toxic
effects).
Effluent: Wastewater, either municipal sewage or
industrial liquid waste that flows out of a treatment plant,
sewer or outfall untreated, partially treated, or completely
treated.
Effluent Guidelines: Technical USEPA documents which
set effluent limitations for given industries and pollutants.
New York City Department of Environmental Protection Waterbody/Watershed Facility Plan
Newtown Creek
11-8 June 2011
Effluent Limitation: Restrictions established by a state or
USEPA on quantities, rates, and concentrations in
wastewater discharges.
Effluent Standard: See effluent limitation.
EIS: Environmental Impact Statement
EMAP: Environmental Monitoring and Assessment
Program
EMC: Event Mean Concentration
Emergency Planning and Community Right-to-Know
Act of 1986, The (SARA Title III): Law requiring federal,
state and local governments and industry, which are
involved in either emergency planning and/or reporting of
hazardous chemicals, to allow public access to information
about the presence of hazardous chemicals in the
community and releases of such substances into the
environment.
Endpoint: An endpoint is a characteristic of an ecosystem
that may be affected by exposure to a stressor. Assessment
endpoints and measurement endpoints are two distinct
types of endpoints that are commonly used by resource
managers. An assessment endpoint is the formal expression
of a valued environmental characteristic and should have
societal relevance. A measurement endpoint is the
expression of an observed or measured response to a stress
or disturbance. It is a measurable environmental
characteristic that is related to the valued environmental
characteristic chosen as the assessment endpoint. The
numeric criteria that are part of traditional water quality
standards are good examples of measurement endpoints.
Enforceable Requirements: Conditions or limitations in
permits issued under the Clean Water Act Section 402 or
404 that, if violated, could result in the issuance of a
compliance order or initiation of a civil or criminal action
under federal or applicable state laws.
Enhancement: In the context of restoration ecology, any
improvement of a structural or functional attribute.
Enteric: Of or within the gastrointestinal tract.
Enterococci: A subgroup of the fecal streptococci that
includes S. faecalis and S. faecium. The enterococci are
differentiated from other streptococci by their ability to
grow in 6.5% sodium chloride, at pH 9.6, and at 10°C and
45°C. Enterococci are a valuable bacterial indicator for
determining the extent of fecal contamination of
recreational surface waters.
Environment: The sum of all external conditions and
influences affecting the development and life of organisms.
Environmental Impact Statement (EIS): A document
required of federal agencies by the National Environmental
Policy Act for major projects or legislative proposals
significantly affecting the environment. A tool for decision
making, it describes the positive and negative effects of the
undertaking and cites alternative actions.
Environmental Monitoring and Assessment Program
(EMAP): The Environmental Monitoring and Assessment
Program (EMAP) is a research program to develop the
tools necessary to monitor and assess the status and trends
of national ecological resources. EMAP's goal is to develop
the scientific understanding for translating environmental
monitoring data from multiple spatial and temporal scales
into assessments of current ecological condition and
forecasts of future risks to our natural resources.
Epibenthic: Those animals/organisms located at the
surface of the sediments on the bay bottom, generally
referring to algae.
Epibenthos: Those animals (usually excluding fishes)
living on the top of the sediment surface.
Epidemiology: All the elements contributing to the
occurrence or non-occurrence of a disease in a population;
ecology of a disease.
Epifauna: Benthic animals living on the sediment or on
and among rocks and other structures.
EPMC: Engineering Program Management Consultant
Escherichia Coli: A subgroup of the fecal coliform
bacteria. E. coli is part of the normal intestinal flora in
humans and animals and is, therefore, a direct indicator of
fecal contamination in a waterbody. The O157 strain,
sometimes transmitted in contaminated waterbodies, can
cause serious infection resulting in gastroenteritis. (See
fecal coliform bacteria)
Estuarine Number: Nondimensional parameter
accounting for decay, tidal dispersion, and advection
velocity. Used for classification of tidal rivers and estuarine
systems.
Estuarine or Coastal Marine Classes: Classes that reflect
basic biological communities and that are based on physical
parameters such as salinity, depth, sediment grain size,
dissolved oxygen and basin geomorphology.
Estuarine Waters: Semi-enclosed body of water which
has a free connection with the open sea and within which
seawater is measurably diluted with fresh water derived
from land drainage.
Estuary: Region of interaction between rivers and near-
shore ocean waters, where tidal action and river flow mix
fresh and salt water. Such areas include bays, mouths of
rivers, salt marshes, and lagoons. These brackish water
ecosystems shelter and feed marine life, birds, and wildlife
(see wetlands).
Eutrophication: A process in which a waterbody becomes
rich in dissolved nutrients, often leading to algal blooms,
low dissolved oxygen and changes in the composition of
plants and animals in the waterbody. This occurs naturally,
but can be exacerbated by human activity which increases
nutrient inputs to the waterbody.

New York City Department of Environmental Protection Waterbody/Watershed Facility Plan
Newtown Creek
11-9 June 2011
Event Mean Concentration (EMC): Input data, typically
for urban areas, for a water quality model. EMC represents
the concentration of a specific pollutant contained in
stormwater runoff coming from a particular land use type
within a watershed.
Existing Use: Describes the use actually attained in the
waterbody on or after November 28, 1975, whether or not it
is included in the water quality standards (40 CFR 131.3).
Facility Plan: A planning project that uses engineering and
science to address pollution control issues and will most
likely result in the enhancement of existing water pollution
control facilities or the construction of new facilities.
Facultative: Capable of adaptive response to varying
environments.
Fecal Coliform Bacteria: A subset of total coliform
bacteria that are present in the intestines or feces of warm-
blooded animals. They are often used as indicators of the
sanitary quality of water. They are measured by running the
standard total coliform test at an elevated temperature
(44.5EC). Fecal coliform is approximately 20 percent of
total coliform. (See Total Coliform Bacteria)
Fecal Streptococci: These bacteria include several
varieties of streptococci that originate in the gastrointestinal
tract of warm-blooded animals such as humans
(Streptococcus faecalis) and domesticated animals such as
cattle (Streptococcus bovis) and horses (Streptococcus
equinus).
Feedlot: A confined area for the controlled feeding of
animals. The area tends to concentrate large amounts of
animal waste that cannot be absorbed by the soil and,
hence, may be carried to nearby streams or lakes by rainfall
runoff.
FEIS: Final Environmental Impact Statement
Field Sampling and Analysis Program (FSAP):
Biological sampling program undertaken to fill-in
ecosystem data gaps in New York Harbor.
Final Environmental Impact Statement (FEIS): A
document that responds to comments received on the Draft
EIS and provides updated information that has become
available after publication of the Draft EIS.
Fish Kill: A natural or artificial condition in which the
sudden death of fish occurs due to the introduction of
pollutants or the reduction of the dissolved oxygen
concentration in a waterbody.
Floatables: Large waterborne materials, including litter
and trash that are buoyant or semi-buoyant and float either
on or below the water surface. These materials, which are
generally man-made and sometimes characteristic of
sanitary wastewater and storm runoff, may be transported
to sensitive environmental areas such as bathing beaches
where they can become an aesthetic nuisance. Certain types
of floatables also cause harm to marine wildlife and can be
hazardous to navigation.
Flocculation: The process by which suspended colloidal or
very fine particles are assembled into larger masses or
floccules that eventually settle out of suspension.
Flux: Movement and transport of mass of any water quality
constituent over a given period of time. Units of mass flux
are mass per unit time.
FOIA: Freedom of Information Act
Food Chain: A sequence of organisms, each of which
uses the next, lower member of the sequence as a food
source.
Freedom of Information Act (FOIA): A federal statute
which allows any person the right to obtain federal agency
records unless the records (or part of the records) are
protected from disclosure by any of the nine exemptions in
the law.
FSAP: Field Sampling and Analysis Program
gallons per day per foot (gpd/ft): unit of measure
Gastroenteritis: An inflammation of the stomach and the
intestines.
General Permit: A permit applicable to a class or category
of discharges.
Geochemical: Refers to chemical reactions related to earth
materials such as soil, rocks, and water.
Geographical Information System (GIS): A computer
system that combines database management system
functionality with information about location. In this way it
is able to capture, manage, integrate, manipulate, analyze
and display data that is spatially referenced to the earth's
surface.
Giardia lamblia: Protozoan in the feces of humans and
animals that can cause severe gastrointestinal Ailments. It
is a common contaminant of surface waters. (See
protozoa).
GIS: Geographical Information System
Global Positioning System (GPS): A GPS comprises a
group of satellites orbiting the earth (24 are now
maintained by the U.S. Government) and a receiver, which
can be highly portable. The receiver can generate accurate
coordinates for a point, including elevation, by calculating
its own position relative to three or more satellites that are
above the visible horizon at the time of measurement.
GPD: Gallons per Day
gpd/ft: gallons per day per foot
gpd/sq ft: gallons per day per square foot
GPS: Global Positioning System
New York City Department of Environmental Protection Waterbody/Watershed Facility Plan
Newtown Creek
11-10 June 2011
Gradient: The rate of decrease (or increase) of one
quantity with respect to another; for example, the rate of
decrease of temperature with depth in a lake.
Groundwater: The supply of fresh water found beneath
the earth’s surface, usually in aquifers, which supply wells
and springs. Because groundwater is a major source of
drinking water, there is growing concern over
contamination from leaching agricultural or industrial
pollutants and leaking underground storage tanks.
H2S: Hydrogen Sulfide
Habitat Conservation Plans (HCPs): As part of the
Endangered Species Act, Habitat Conservation Plans are
designed to protect a species while allowing development.
HCP’s give the U.S. Fish and Wildlife Service the authority
to permit ―taking‖ of endangered or threatened species as
long as the impact is reduced by conservation measures.
They allow a landowner to determine how best to meet the
agreed-upon fish and wildlife goals.
Habitat: A place where the physical and biological
elements of ecosystems provide an environment and
elements of the food, cover and space resources needed for
plant and animal survival.
Halocline: A vertical gradient in salinity.
HCP: Habitat Conservation Plan
Heavy Metals: Metallic elements with high atomic weights
(e.g., mercury, chromium, cadmium, arsenic, and lead); can
damage living things at low concentrations and tend to
accumulate in the food chain.
High Rate Treatment (HRT): A traditional gravity
settling process enhanced with flocculation and settling
aids to increase loading rates and improve performance.
Holding Pond: A pond or reservoir, usually made of earth,
built to store polluted runoff.
Holoplankton: An aggregate of passively floating, drifting
or somewhat motile organisms throughout their entire life
cycle; Hot spot locations in waterbodies or sediments
where hazardous substances have accumulated to levels
which may pose risks to aquatic life, wildlife, fisheries, or
human health.
HRT: High Rate Treatment
Hydrogen Sulfide (H2S): A flammable, toxic, colorless
gas with an offensive odor (similar to rotten eggs) that is a
byproduct of degradation in anaerobic conditions.
Hydrology: The study of the distribution, properties, and
effects of water on the earth’s surface, in the soil and
underlying rocks, and in the atmosphere.
Hypoxia: The condition of low dissolved oxygen in aquatic
systems (typically with a dissolved oxygen concentration
less than 3.0 mg/L).
Hypoxia/Hypoxic Waters: Waters with dissolved oxygen
concentrations of less than 2 ppm, the level generally
accepted as the minimum required for most marine life to
survive and reproduce.
I/I: Inflow/Infiltration
Index of Biotic Integrity: A fish community assessment
approach that incorporates the zoogeographic, ecosystem,
community and population aspects of fisheries biology into
a single ecologically-based index of the quality of a water
resource.
IBI: Indices of Biological Integrity
IDNP: Illegal Dumping Notification Program
IEC: Interstate Environmental Commission
IFCP: Interim Floatables Containment Program
Illegal Dumping Notification Program (IDNP): New
York City program wherein the DEP field personnel report
any observed evidence of illegal shoreline dumping to the
Sanitation Police section of DSNY, who have the authority
to arrest dumpers who, if convicted, are responsible for
proper disposal of the material.
Impact: A change in the chemical, physical or biological
quality or condition of a waterbody caused by external
sources.
Impaired Waters: Waterbodies not fully supporting their
designated uses.
Impairment: A detrimental effect on the biological
integrity of a waterbody caused by an impact.
Impermeable: Impassable; not permitting the passage of a
fluid through it.
In situ: Measurements taken in the natural environment.
in.: Abbreviation for ―Inches‖.
Index Period: A sampling period, with selection based on
temporal behavior of the indicator(s) and the practical
considerations for sampling.
Indicator Organism: Organism used to indicate the
potential presence of other (usually pathogenic) organisms.
Indicator organisms are usually associated with the other
organisms, but are usually more easily sampled and
measured.
Indicator Taxa or Indicator Species: Those organisms
whose presence (or absence) at a site is indicative of
specific environmental conditions.
Indicator: Measurable quantity that can be used to
evaluate the relationship between pollutant sources and
their impact on water quality. Abiotic and biotic indicators
can provide quantitative information on environmental
conditions.
New York City Department of Environmental Protection Waterbody/Watershed Facility Plan
Newtown Creek
11-11 June 2011
Indices of Biological Integrity (IBI): A usually
dimensionless numeric combination of scores derived from
biological measures called metrics.
Industrial Pretreatment Programs (IPP): Program
mandated by USEPA to control toxic discharges to public
sewers that are tributary to sewage treatment plants by
regulating Significant Industrial Users (SIUs). DEP
enforces the IPP through Chapter 19 of Title 15 of the
Rules of the City of New York (Use of Public Sewers).
Infauna: Animals living within submerged sediments. (See
benthos.)
Infectivity: Ability to infect a host. Infiltration. 1. Water
other than wastewater that enters a wastewater system and
building sewers from the ground through such means as
defective pipes, pipe joints, connections or manholes.
(Infiltration does not include inflow.) 2. The gradual
downward flow of water from the ground surfaces into the
soil.
Infiltration: The penetration of water from the soil into
sewer or other pipes through defective joints, connections,
or manhole walls.
Infiltration/Inflow (I/I): The total quantity of water
entering a sewer system from both infiltration and inflow.
Inflow: Water other than wastewater that enters a
wastewater system and building sewer from sources such as
roof leaders, cellar drains, yard drains, foundation drains,
drains from springs and swampy areas, manhole covers,
cross connections between storm drains and sanitary
sewers, catch basins, cooling towers, stormwaters, surface
runoff, street wash waters or drainage. (Inflow does not
include infiltration.)
Influent: Water, wastewater, or other liquid flowing into a
reservoir, basin, or treatment plant.
Initial Mixing Zone: Region immediately downstream of
an outfall where effluent dilution processes occur. Because
of the combined effects of the effluent buoyancy, ambient
stratification, and current, the prediction of initial dilution
can be involved.
Insolation: Exposure to the sun’s rays.
Instream Flow: The amount of flow required to sustain
stream values, including fish, wildlife, and recreation.
Interceptor Sewers: Large sewer lines that, in a combined
system, collect and carry sewage flows from main and
trunk sewers to the treatment plant for treatment and
discharge. The sewer has no building sewer connections.
During some storm events, their capacity is exceeded and
regulator structures relieve excess flow to receiving waters
to prevent flooding basements, businesses and streets.
Interim Floatables Containment Program (IFCP): A
New York City Program that includes containment booms
at 24 locations, end-of-pipe nets, skimmer vessels that pick
up floatables and transports them to loading stations.
Interstate Environmental Commission (IEC): The
Interstate Environmental Commission is a joint agency of
the States of New York, New Jersey, and Connecticut. The
IEC was established in 1936 under a Compact between
New York and New Jersey and approved by Congress. The
State of Connecticut joined the Commission in 1941. The
mission of the IEC is to protect and enhance environmental
quality through cooperation, regulation, coordination, and
mutual dialogue between government and citizens in the tri-state region.
Intertidal: The area between the high- and low-tide lines.
IPP: Industrial Pretreatment Programs
Irrigation: Applying water or wastewater to land areas to
supply the water and nutrient needs of plants.
JABERRT: Jamaica Bay Ecosystem Research and
Restoration Team
Jamaica Bay Ecosystem Research and Restoration
Team (JABERRT): Team established by the Army Corps
of Engineers to conduct a detailed inventory and
biogeochemical characterization of Jamaica Bay for the
2000-2001 period and to compile the most detailed
literature search established.
Jamaica Eutrophication Model (JEM): Model
developed for Jamaica Bay in 1996 as a result of a cost-
sharing agreement between the DEP and US Army Corps
of Engineers.
JEM: Jamaica Eutrophication Model
Karst Geology: Solution cavities and closely-spaced
sinkholes formed as a result of dissolution of carbonate
bedrock.
Knee-off-the-Curve: The point where the incremental
change in the cost of the control alternative per change in
performance of the control alternative changes most
rapidly.
Kurtosis: A measure of the departure of a frequency
distribution from a normal distribution, in terms of its
relative peakedness or flatness.
LA: Load Allocation
Land Application: Discharge of wastewater onto the
ground for treatment or reuse. (See irrigation)
Land Use: How a certain area of land is utilized
(examples: forestry, agriculture, urban, industry).
Landfill: A large, outdoor area for waste disposal; landfills
where waste is exposed to the atmosphere (open dumps)
are now illegal; in constructed landfills, waste is layered,

New York City Department of Environmental Protection Waterbody/Watershed Facility Plan
Newtown Creek
11-12 June 2011
covered with soil, and is built upon impermeable materials
or barriers to prevent contamination of surroundings.
lb/day/cf: pounds per day per cubic foot
lbs/day: pounds per day
LC: Loading Capacity
Leachate: Water that collects contaminants as it trickles
through wastes, pesticides, or fertilizers. Leaching can
occur in farming areas, feedlots, and landfills and can result
in hazardous substances entering surface water,
groundwater, or soil.
Leaking Underground Storage Tank (LUST): An
underground container used to store gasoline, diesel fuel,
home heating oil, or other chemicals that is damaged in
some way and is leaking its contents into the ground; may
contaminate groundwater.
LID: Low Impact Development
LID-R: Low Impact Development - Retrofit
Limiting Factor: A factor whose absence exerts influence
upon a population or organism and may be responsible for
no growth, limited growth (decline) or rapid growth.
Littoral Zone: The intertidal zone of the estuarine or
seashore; i.e., the shore zone between the highest and
lowest tides.
Load Allocation (LA): The portion of a receiving water’s
loading capacity that is attributed either to one of its
existing or future non-point sources of pollution or to
natural background sources. Load allocations are best
estimates of the loading, which can range from reasonably
accurate estimates to gross allotments, depending on the
availability of data and appropriate techniques for
predicting the loading. Wherever possible, natural and non-
point source loads should be distinguished. (40 CFR
130.2(g))
Load, Loading, Loading Rate: The total amount of
material (pollutants) entering the system from one or
multiple sources; measured as a rate in mass per unit time.
Loading Capacity (LC): The greatest amount of loading
that a water can receive without violating water quality
standards.
Long Term Control Plan (LTCP): A document
developed by CSO communities to describe existing
waterway conditions and various CSO abatement
technologies that will be used to control overflows.
Low-Flow: Stream flow during time periods where no
precipitation is contributing to runoff to the stream and
contributions from groundwater recharge are low. Low
flow results in less water available for dilution of pollutants
in the stream. Due to the limited flow, direct discharges to
the stream dominate during low flow periods. Exceedences
of water quality standards during low flow conditions are
likely to be caused by direct discharges such as point
sources, illicit discharges, and livestock or wildlife in the
stream.
Low Impact Development (LID): A sustainable storm
water management strategy implemented in response to
burgeoning infrastructural costs of new development and
redevelopment projects, more rigorous environmental
regulations, concerns about the urban heat island effect, and
the impacts of natural resources due to growth and
development. The LID strategy controls water at the
source—both rainfall and storm water runoff—which is
known as 'source-control' technology. It is a decentralized
system that distributes storm water across a project site in
order to replenish groundwater supplies rather than sending
it into a system of storm drain pipes and channelized
networks that control water downstream in a large storm
water management facility. The LID approach promotes the
use of various devices that filter water and infiltrate water
into the ground. It promotes the use of roofs of buildings,
parking lots, and other horizontal surfaces to convey water
to either distribute it into the ground or collect it for reuse.
Low Impact Development – Retrofit (LID-R):
Modification of an existing site to accomplish LID goals.
LTCP: Long-Term CSO Control Plan
LUST: leaking underground storage tank
Macrobenthos: Benthic organisms (animals or plants)
whose shortest dimension is greater than or equal to 0.5
mm. (See benthos.)
Macrofauna: Animals of a size large enough to be seen by
the unaided eye and which can be retained by a U.S.
Standard No. 30 sieve (28 meshes/in, 0.595-mm openings).
Macro-invertebrate: Animals/organism without
backbones (Invertebrate) that is too large to pass through a
No. 40 Screen (0.417mm) but can be retained by a U.S.
Standard No. 30 sieve (28 meshes/in, 0.595-mm openings).
The organism size is of sufficient size for it to be seen by
the unaided eye and which can be retained
Macrophytes: Large aquatic plants that may be rooted,
non-rooted, vascular or algiform (such as kelp); including
submerged aquatic vegetation, emergent aquatic vegetation,
and floating aquatic vegetation.
Major Oil Storage Facilities (MOSF): Onshore facility
with a total combined storage capacity of 400,000 gallons
or more of petroleum and/or vessels involved in the
transport of petroleum on the waters of New York State.
Margin of Safety (MOS): A required component of the
TMDL that accounts for the uncertainty about the
relationship between the pollutant loads and the quality of
the receiving waterbody (CWA section 303(d)(1)(C)). The
MOS is normally incorporated into the conservative
assumptions used to develop TMDLs (generally within the
calculations or models) and approved by EPA either
individually or in state/EPA agreements. If the MOS needs

New York City Department of Environmental Protection Waterbody/Watershed Facility Plan
Newtown Creek
11-13 June 2011
to be larger than that which is allowed through the
conservative assumptions, additional MOS can be added as
a separate component of the TMDL (in this case,
quantitatively, a TMDL = LC = WLA + LA + MOS).
Marine Protection, Research and Sanctuaries Act of
1972, The Ocean Dumping Act: Legislation regulating the
dumping of any material in the ocean that may adversely
affect human health, marine environments or the economic
potential of the ocean.
Mass Balance: A mathematical accounting of substances
entering and leaving a system, such as a waterbody, from
all sources. A mass balance model for a waterbody is useful
to help understand the relationship between the loadings of
a pollutant and the levels in the water, biota and sediments,
as well as the amounts that can be safely assimilated by the
waterbody.
Mass Loading: The quantity of a pollutant transported to a
waterbody.
Mathematical Model: A system of mathematical
expressions that describe the spatial and temporal
distribution of water quality constituents resulting from
fluid transport and the one, or more, individual processes
and interactions within some prototype aquatic ecosystem.
A mathematical water quality model is used as the basis for
wasteload allocation evaluations.
Mean Low Water (MLW): A tidal level. The average of
all low waters observed over a sufficiently long period.
Mean Lower Low Water (MLLW): A tidal level. The
average of all lower low waters observed over a sufficiently
long period.
Median Household Income (MHI): The median
household income is one measure of average household
income. It divides the household income distribution into
two equal parts: one-half of the cases fall below the median
household income, and one-half above it.
Meiofauna: Small interstitial; i.e., occurring between
sediment particles, animals that pass through a 1-mm mesh
sieve but are retained by a 0.1-mm mesh.
Memorandum of Understanding (MOU): An agreement
between two or more public agencies defining the roles and
responsibilities of each agency in relation to the other or
others with respect to an issue over which the agencies
have concurrent jurisdiction.
Meningitis: Inflammation of the meninges, especially as a
result of infection by bacteria or viruses.
Meroplankton: Organisms that are planktonic only during
the larval stage of their life history.
Mesohaline: The estuarine salinity zone with a salinity
range of 5-18-ppt.
Metric: A calculated term or enumeration which represents
some aspect of biological assemblage structure, function, or
other measurable characteristic of the biota that changes in
some predictable way in response to impacts to the
waterbody.
mf/L: Million fibers per liter – A measure of
concentration.
MG: Million Gallons – A measure of volume.
mg/L: Milligrams Per Liter – A measure of concentration.
MGD: Million Gallons per Day – A measure of the rate of
water flow.
MHI: Median Household Income
Microgram per liter (ug/L): A measure of concentration
Microorganisms: Organisms too small to be seen with the
unaided eye, including bacteria, protozoans, yeasts, viruses
and algae.
milligrams per liter (mg/L): This weight per volume
designation is used in water and wastewater analysis. 1
mg/l=1 ppm.
milliliters (mL): A unit of length equal to one thousandth
(10-3) of a meter, or 0.0394 inch.
Million fibers per liter (mf/L): A measure of
concentration.
million gallons (MG): A unit of measure used in water
and wastewater to express volume. To visualize this
volume, if a good-sized bath holds 50 gallons, so a million
gallons would be equal to 20,000 baths.
million gallons per day (MGD): Term used to express
water-use data. Denotes the volume of water utilized in a
single day.
Mitigation: Actions taken to avoid, reduce, or compensate
for the effects of environmental damage. Among the broad
spectrum of possible actions are those which restore,
enhance, create, or replace damaged ecosystems.
Mixing Zone: A portion of a waterbody where water
quality criteria or rules are waived in order to allow for
dilution of pollution. Mixing zones have been allowed by
states in many NPDES permits when discharges were
expected to have difficulty providing enough treatment to
avoid violating standards for the receiving water at the
point of discharge.
mL: milliliters
MLW: mean low water
Modeling: An investigative technique using a
mathematical or physical representation of a system or
theory, usually on a computer, that accounts for all or some
of its known properties. Models are often used to test the
effect of changes of system components on the overall
performance of the system.
New York City Department of Environmental Protection Waterbody/Watershed Facility Plan
Newtown Creek
11-14 June 2011
Monitoring: Periodic or continuous surveillance or testing
to determine the level of compliance with statutory
requirements and/or pollutant levels in various media or in
humans, plants, and animals.
Monte Carlo Simulation: A stochastic modeling
technique that involves the random selection of sets of
input data for use in repetitive model runs. Probability
distributions of receiving water quality concentrations are
generated as the output of a Monte Carlo simulation.
MOS: Margin of Safety
MOSF: major oil storage facilities
MOU: Memorandum of Understanding
MOUSE: Computer model developed by the Danish
Hydraulic Institute used to model the combined sewer
system.
MS4: municipal separate storm sewer systems
Multimetric Approach: An analysis technique that uses a
combination of several measurable characteristics of the
biological assemblage to provide an assessment of the
status of water resources.
Multivariate Community Analysis: Statistical methods
(e.g., ordination or discriminant analysis) for analyzing
physical and biological community data using multiple
variables.
municipal separate storm sewer systems.
Municipal Separate Sewer Systems (MS4): A
conveyance or system of conveyances (roads with drainage
systems, municipal streets, catch basins, curbs, gutters,
ditches, man-made channels, storm drains) that is 1) Owned
or operated by a state, city, town, borough, county, parish,
district, association, or other public body (created by or
pursuant to State law) having jurisdiction over disposal of
sewage, industrial wastes, stormwater, or other wastes,
including special districts under State law such as a sewer
district, flood control district or drainage districts, or
similar entity, or an Indian tribe or an authorized Indian
tribal organization, or a designated and approved
management agency under section 208 of the Clean Water
Act that discharges to waters of the United States; 2)
Designed or used for collecting or conveying stormwater;
3) Which is not a combined sewer; and 4) Which is not part
of a publicly owned treatment works.
Municipal Sewage: Wastes (mostly liquid) originating
from a community; may be composed of domestic
wastewater and/or industrial discharges.
National Estuary Program: A program established under
the Clean Water Act Amendments of 1987 to develop and
implement conservation and management plans for
protecting estuaries and restoring and maintaining their
chemical, physical, and biological integrity, as well as
controlling point and non-point pollution sources.
National Marine Fisheries Service (NMFS): A federal
agency - with scientists, research vessels, and a data
collection system - responsible for managing the nation’s
saltwater fish. It oversees the actions of the Councils under
the Fishery Conservation and Management Act.
National Pollutant Discharge Elimination System
(NPDES): The national program for issuing, modifying,
revoking and reissuing, terminating, monitoring, and
enforcing permits, and imposing and enforcing
pretreatment requirements, under Sections 307, 402, 318,
and 405 of the Clean Water Act. The program imposes
discharge limitations on point sources by basing them on
the effluent limitation capabilities of a control technology
or on local water quality standards. It prohibits discharge
of pollutants into water of the United States unless a special
permit is issued by EPA, a state, or, where delegated, a
tribal government on an Indian reservation.
National Priorities List (NPL): EPA's list of the most
serious uncontrolled or abandoned hazardous waste sites
identified for possible long-term remedial action under
Superfund. The list is based primarily on the score a site
receives from the Hazard Ranking System. EPA is required
to update the NPL at least once a year. A site must be on
the NPL to receive money from the Trust Fund for remedial
action.
National Wetland Inventory (NWI): The National
Wetlands Inventory (NWI) of the U.S. Fish & Wildlife
Service produces information on the characteristics, extent,
and status of the Nation’s wetlands and deepwater habitats.
The National Wetlands Inventory information is used by
Federal, State, and local agencies, academic institutions,
U.S. Congress, and the private sector. Congressional
mandates in the Emergency Wetlands Resources Act
requires the Service to map wetlands, and to digitize,
archive and distribute the maps.
Natural Background Levels: Natural background levels
represent the chemical, physical, and biological conditions
that would result from natural geomorphological processes
such as weathering or dissolution.
Natural Waters: Flowing water within a physical system
that has developed without human intervention, in which
natural processes continue to take place.
Navigable Waters: Traditionally, waters sufficiently deep
and wide for navigation; such waters in the United States
come under federal jurisdiction and are protected by the
Clean Water Act.
New York City Department of City Planning
(NYCDCP): New York City agency responsible for the
city's physical and socioeconomic planning, including land
use and environmental review; preparation of plans and
policies; and provision of technical assistance and planning
information to government agencies, public officials, and
community boards.
New York City Department of Environmental
Protection (DEP): New York City agency responsible for
New York City Department of Environmental Protection Waterbody/Watershed Facility Plan
Newtown Creek
11-15 June 2011
addressing the environmental needs of the City’s residents
in areas including water, wastewater, air, noise and hazmat.
New York City Department of Parks and Recreation
(NYCDPR): The New York City Department of Parks and
Recreation is the branch of government of the City of New
York responsible for maintaining the city's parks system,
preserving and maintaining the ecological diversity of the
city's natural areas, and furnishing recreational
opportunities for city's residents.
New York City Department of Transportation
(NYCDOT): New York City agency responsible for
maintaining and improving New York City’s transportation
network.
New York City Economic Development Corporation
(NYCEDC): City's primary vehicle for promoting
economic growth in each of the five boroughs. NYCEDC
works to stimulate investment in New York and broaden
the City's tax and employment base, while meeting the
needs of businesses large and small. To realize these
objectives, NYCEDC uses its real estate and financing
tools to help companies that are expanding or relocating
anywhere within the city.
New York District (NYD): The local division of the
United States Army Corps of Engineers,
New York State Code of Rules and Regulations
(NYCRR): Official statement of the policy(ies) that
implement or apply the Laws of New York.
New York State Department of Environmental
Conservation (DEC): New York State agency that
conserves, improves, and protects New York State's natural
resources and environment, and controls water, land and air
pollution, in order to enhance the health, safety and welfare
of the people of the state and their overall economic and
social well being.
New York State Department of State (NYSDOS):
Known as the ―keeper of records‖ for the State of New
York. Composed of two main divisions including the
Office of Business and Licensing Services and the Office
of Local Government Services. The latter office includes
the Division of Coastal Resources and Waterfront
Revitalization.
NH3: Ammonia
Nine Minimum Controls (NMC): Controls recommended
by the USEPA to minimize CSO impacts. The controls
include: (1) proper operation and maintenance for sewer
systems and CSOs; (2) maximum use of the collection
system for storage; (3) review pretreatment requirements to
minimize CSO impacts; (4) maximize flow to treatment
facility; (5) prohibit combines sewer discharge during dry
weather; (6) control solid and floatable materials in CSOs;
(7) pollution prevention; (8) public notification of CSO
occurrences and impacts; and, (9) monitor CSOs to
characterize impacts and efficacy of CSO controls.
NMC: nine minimum controls
NMFS: National Marine Fisheries Service
No./mL (or #/mL): number of bacteria organisms per
milliliter – measure of concentration
Non-Compliance: Not obeying all promulgated
regulations, policies or standards that apply.
Non-Permeable Surfaces: Surfaces which will not allow
water to penetrate, such as sidewalks and parking lots.
Non-Point Source (NPS): Pollution that is not released
through pipes but rather originates from multiple sources
over a relatively large area (i.e., without a single point of
origin or not introduced into a receiving stream from a
specific outlet). The pollutants are generally carried off the
land by storm water. Non-point sources can be divided
into source activities related to either land or water use
including failing septic tanks, improper animal-keeping
practices, forest practices, and urban and rural runoff.
Common non-point sources are agriculture, forestry, urban,
mining, construction, dams, channels, land disposal,
saltwater intrusion, and city streets.
NPDES: National Pollution Discharge Elimination System
NPL: National Priorities List
NPS: Non-Point Source
Numeric Targets: A measurable value determined for the
pollutant of concern which is expected to result in the
attainment of water quality standards in the listed
waterbody.
Nutrient Pollution: Contamination of water resources by
excessive inputs of nutrients. In surface waters, excess algal
production as a result of nutrient pollution is a major
concern.
Nutrient: Any substance assimilated by living things that
promotes growth. The term is generally applied to nitrogen
and phosphorus in wastewater, but is also applied to other
essential and trace elements.
NWI: National Wetland Inventory
NYCDCP: New York City Department of City Planning
NYCDOT: New York City Department of Transportation
NYCDPR: New York City Department of Parks and
Recreation
NYCEDC: New York City Economic Development
Corporation
NYCRR: New York State Code of Rules and Regulations
NYD: New York District
NYSDOS: New York State Department of State

New York City Department of Environmental Protection Waterbody/Watershed Facility Plan
Newtown Creek
11-16 June 2011
O&M: Operation and Maintenance
Oligohaline: The estuarine salinity zone with a salinity
range of 0.5-5-ppt.
ONRW: Outstanding National Resource Waters
Operation and Maintenance (O&M): Actions taken after
construction to ensure that facilities constructed will be
properly operated and maintained to achieve normative
efficiency levels and prescribed effluent eliminations in an
optimum manner.
Optimal: Most favorable point, degree, or amount of
something for obtaining a given result; in ecology most
natural or minimally disturbed sites.
Organic Chemicals/Compounds: Naturally occurring
(animal or plant-produced or synthetic) substances
containing mainly carbon, hydrogen, nitrogen, and oxygen.
Organic Material: Material derived from organic, or
living, things; also, relating to or containing carbon
compounds.
Organic Matter: Carbonaceous waste (organic fraction)
that includes plant and animal residue at various stages of
decomposition, cells and tissues of soil organisms, and
substances synthesized by the soil population originating
from domestic or industrial sources. It is commonly
determined as the amount of organic material contained in
a soil or water sample.
Organic: (1) Referring to other derived from living
organisms. (2) In chemistry, any compound containing
carbon.
Ortho P: Ortho Phosphorus
Ortho Phosphorus: Soluble reactive phosphorous readily
available for uptake by plants. The amount found in a
waterbody is an indicator of how much phosphorous is
available for algae and plant growth. Since aquatic plant
growth is typically limited by phosphorous, added
phosphorous especially in the dissolved, bioavailable form
can fuel plant growth and cause algae blooms.
Outfall: Point where water flows from a conduit, stream,
or drain into a receiving water.
Outstanding National Resource Waters (ONRW):
Outstanding national resource waters (ONRW)
designations offer special protection (i.e., no degradation)
for designated waters, including wetlands. These are areas
of exceptional water quality or recreational/ecological
significance. State antidegradation policies should provide
special protection to wetlands designated as outstanding
national resource waters in the same manner as other
surface waters; see Section 131.12(a)(3) of the WQS
regulation and EPA guidance (Water Quality Standards
Handbook (USEPA 1983b), and Questions and Answers
on: Antidegradation (USEPA 1985a)).
Overflow Rate: A measurement used in wastewater
treatment calculations for determining solids settling. It is
also used for CSO storage facility calculations and is
defined as the flow through a storage basin divided by the
surface area of the basin. It can be thought of as an average
flow rate through the basin. Generally expressed as gallons
per day per square foot (gpd/sq.ft.).
Oxidation Pond: A relatively shallow body of wastewater
contained in an earthen basin; lagoon; stabilization pond.
Oxidation: The chemical union of oxygen with metals or
organic compounds accompanied by a removal of hydrogen
or another atom. It is an important factor for soil formation
and permits the release of energy from cellular fuels.
Oxygen Demand: Measure of the dissolved oxygen used
by a system (microorganisms) in the oxidation of organic
matter. (See also biochemical oxygen demand)
Oxygen Depletion: The reduction of dissolved oxygen in a
waterbody.
PAH: Polycyclic Aromatic Hydrocarbons
Partition Coefficients: Chemicals in solution are
partitioned into dissolved and particulate adsorbed phase
based on their corresponding sediment-to-water
partitioning coefficient.
Parts per Million (ppm): The number of "parts" by weight
of a substance per million parts of water. This unit is
commonly used to represent pollutant concentrations.
Large concentrations are expressed in percentages.
Pathogen: Disease-causing agent, especially
microorganisms such as bacteria, protozoa, and viruses.
PCBs: Polychlorinated biphenyls
PCS: Permit Compliance System
PE: Primary Effluent
Peak Flow: The maximum flow that occurs over a specific
length of time (e.g., daily, hourly, instantaneous).
Pelagic Zone: The area of open water beyond the littoral
zone.
Pelagic: Pertaining to open waters or the organisms which
inhabit those waters.
Percent Fines: In analysis of sediment grain size, the
percent of fine (.062-mm) grained fraction of sediment in a
sample.
Permit Compliance System (PCS): Computerized
management information system which contains data on
NPDES permit-holding facilities. PCS keeps extensive
records on more than 65,000 active water-discharge permits
on sites located throughout the nation. PCS tracks permit,
compliance, and enforcement status of NPDES facilities.
New York City Department of Environmental Protection Waterbody/Watershed Facility Plan
Newtown Creek
11-17 June 2011
Permit: An authorization, license, or equivalent control
document issued by EPA or an approved federal, state, or
local agency to implement the requirements of an
environmental regulation; e.g., a permit to operate a
wastewater treatment plant or to operate a facility that may
generate harmful emissions.
Petit Ponar Grab Sampler: Dredge designed to take
samples from all types of benthos sediments on all varieties
of waterbody bottoms, except those of the hardest clay.
When the jaws contact the bottom they obtain a good
penetration with very little sample disturbance. Can be used in both fresh and salt water.
pH: An expression of the intensity of the basic or acid
condition of a liquid. The pH may range from 0 to 14,
where 0 is most acid, 14 most basic and 7 neutral. Natural
waters usually have a pH between 6.5 and 8.5.
Phased Approach: Under the phased approach to TMDL
development, load allocations (LAs) and wasteload
allocations (WLAs) are calculated using the best available
data and information recognizing the need for additional
monitoring data to accurately characterize sources and
loadings. The phased approach is typically employed when
non-point sources dominate. It provides for the
implementation of load reduction strategies while
collecting additional data.
Photic Zone: The region in a waterbody extending from
the surface to the depth of light penetration.
Photosynthesis: The process by which chlorophyll-
containing plants make carbohydrates from water, and from
carbon dioxide in the air, using energy derived from
sunlight.
Phytoplankton: Free-floating or drifting microscopic algae
with movements determined by the motion of the water.
Point Source: (1) A stationary location or fixed facility
from which pollutant loads are discharged. (2) Any single
identifiable source of pollutants including pipes, outfalls,
and conveyance channels from either municipal wastewater
treatment systems or industrial waste treatment facilities.
(3) Point sources can also include pollutant loads
contributed by tributaries to the main receiving water
stream or river.
Pollutant: Dredged spoil, solid waste, incinerator residue,
sewage, garbage, sewage sludge, munitions, chemical
wastes, biological materials, radioactive materials, heat,
wrecked or discarded equipment, rock, sand, cellar dirt and
industrial, municipal, and agricultural waste discharged into
water. (CWA Section 502(6)).
Pollution: Generally, the presence of matter or energy
whose nature, location, or quantity produces undesired
environmental effects. Under the Clean Water Act, for
example, the term is defined as the man-made or man-
induced alteration of the physical, biological, chemical, and
radiological integrity of water.
Polychaete: Marine worms of the class Polychaeta of the
invertebrate worm order Annelida. Polychaete species
dominate the marine benthos, with dozens of species
present in natural marine environments. These worms are
highly diversified, ranging from detritivores to predators,
with some species serving as good indicators of
environmental stress.
Polychlorinated Biphenyls (PCBs): A group of synthetic
polychlorinated aromatic hydrocarbons formerly used for
such purposes as insulation in transformers and capacitors
and lubrication in gas pipeline systems. Production, sale
and new use were banned by law in 1977 following passage
of the Toxic Substances Control Act. PCBs have a strong
tendency to bioaccumulate. They are quite stable, and
therefore persist in the environment for long periods of
time. They are classified by EPA as probable human
carcinogens.
Polycyclic Aromatic Hydrocarbons (PAHs): A group of
petroleum-derived hydrocarbon compounds, present in
petroleum and related materials, and used in the
manufacture of materials such as dyes, insecticides and
solvents.
Population: An aggregate of interbreeding individuals of a
biological species within a specified location.
POTW: Publicly Owned Treatment Plant
pounds per day per cubic foot: lb/day/cf
pounds per day: lbs/day; unit of measure
ppm: parts per million
Precipitation Event: An occurrence of rain, snow, sleet,
hail, or other form of precipitation that is generally
characterized by parameters of duration and intensity
(inches or millimeters per unit of time).
Pretreatment: The treatment of wastewater from non-
domestic sources using processes that reduce, eliminate, or
alter contaminants in the wastewater before they are
discharged into Publicly Owned Treatment Works
(POTWs).
Primary Effluent (PE): Partially treated water (screened
and undergoing settling) passing from the primary treatment processes a wastewater treatment plant.
Primary Treatment: A basic wastewater treatment
method, typically the first step in treatment, that uses
skimming, settling in tanks to remove most materials that
float or will settle. Usually chlorination follows to remove
pathogens from wastewater. Primary treatment typically
removes about 35 percent of biochemical oxygen demand
(BOD) and less than half of the metals and toxic organic
substances.
Priority Pollutants: A list of 129 toxic pollutants
including metals developed by the USEPA as a basis for
New York City Department of Environmental Protection Waterbody/Watershed Facility Plan
Newtown Creek
11-18 June 2011
defining toxics and is commonly referred to as ―priority
pollutants‖.
Probable Total Project Cost (PTPC): Represents the
realistic total of all hard costs, soft costs, and ancillary costs
associated with a particular CSO abatement technology per
the definitions provided in memorandum entitled
―Comparative Cost Analysis for CSO Abatement
Technologies – Costing Factors‖ (O’Brien & Gere, April
2006). All PTPCs shown in this report are adjusted to July
2005 dollars (ENR CCI = 11667.99).
Protozoa: Single-celled organisms that reproduce by
fission and occur primarily in the aquatic environment.
Waterborne pathogenic protozoans of primary concern
include Giardia lamblia and Cryptosporidium, both of
which affect the gastrointestinal tract.
PS: Pump Station or Pumping Station
Pseudoreplication: The repeated measurement of a single
experimental unit or sampling unit, with the treatment of
the measurements as if they were independent replicates of
the sampling unit.
PTPC: Probable Total Project Cost – represents the
realistic total of all hard costs, soft costs, and ancillary costs
associated with a particular CSO abatement technology per
the definitions provided in O’Brien & Gere, April 2006.
All PTPCs shown in this report are adjusted to July 2005
dollars (ENR CCI = 11667.99).
Public Comment Period: The time allowed for the public
to express its views and concerns regarding action by
USEPA or states (e.g., a Federal Register notice of a
proposed rule-making, a public notice of a draft permit, or a
Notice of Intent to Deny).
Publicly Owned Treatment Works (POTW): Any device
or system used in the treatment (including recycling and
reclamation) of municipal sewage or industrial wastes of a
liquid nature that is owned by a state or municipality. This
definition includes sewers, pipes, or other conveyances
only if they convey wastewater to a POTW providing
treatment.
Pump Station or Pumping Station: Sewer pipes are
generally gravity driven. Wastewater flows slowly
downhill until it reaches a certain low point. Then pump, or
"lift," stations push the wastewater back uphill to a high
point where gravity can once again take over the process.
Pycnocline: A zone of marked density gradient.
Q: Symbol for Flow (designation when used in equations)
R.L: Reporting Limit
Rainfall Duration: The length of time of a rainfall event.
Rainfall Intensity: The amount of rainfall occurring in a
unit of time, usually expressed in inches per hour.
Raw Sewage: Untreated municipal sewage (wastewater)
and its contents.
RCRAInfo: Resource Conservation and Recovery Act
Information
Real-Time Control (RTC): A system of data gathering
instrumentation used in conjunction with control
components such as dams, gates and pumps to maximize
storage in the existing sewer system.
Receiving Waters: Creeks, streams, rivers, lakes,
estuaries, groundwater formations, or other bodies of water
into which surface water and/or treated or untreated waste
are discharged, either naturally or in man-made systems.
Red Tide: A reddish discoloration of coastal surface waters
due to concentrations of certain toxin producing algae.
Reference Condition: The chemical, physical or biological
quality or condition exhibited at either a single site or an
aggregation of sites that represents the least impaired
condition of a classification of waters to which the
reference condition applies.
Reference Sites: Minimally impaired locations in similar
waterbodies and habitat types at which data are collected
for comparison with test sites. A separate set of reference
sites are defined for each estuarine or coastal marine class.
Regional Environmental Monitoring and Assessment
Program (REMAP): The Environmental Monitoring and
Assessment Program (EMAP) is a research program to
develop the tools necessary to monitor and assess the status
and trends of national ecological resources. EMAP's goal is
to develop the scientific understanding for translating
environmental monitoring data from multiple spatial and
temporal scales into assessments of current ecological
condition and forecasts of future risks to our natural
resources.
Regulator: A device in combined sewer systems for
diverting wet weather flows which exceed downstream
capacity to an overflow.
REMAP: Regional Environmental Monitoring and
Assessment Program
Replicate: Taking more than one sample or performing
more than one analysis.
Reporting Limit (RL): The lowest concentration at which
a contaminant is reported.
Residence Time: Length of time that a pollutant remains
within a section of a waterbody. The residence time is
determined by the streamflow and the volume of the river
reach or the average stream velocity and the length of the
river reach.
Resource Conservation and Recovery Act Information
(RCRAinfo): Database with information on existing
hazardous materials sites. USEPA was authorized to
develop a hazardous waste management system, including
New York City Department of Environmental Protection Waterbody/Watershed Facility Plan
Newtown Creek
11-19 June 2011
plans for the handling and storage of wastes and the
licensing of treatment and disposal facilities. The states
were required to implement the plans under authorized
grants from the USEPA. The act generally encouraged
―cradle to grave‖ management of certain products and emphasized the need for recycling and conservation.
Respiration: Biochemical process by means of which
cellular fuels are oxidized with the aid of oxygen to permit
the release of the energy required to sustain life; during
respiration, oxygen is consumed and carbon dioxide is
released.
Restoration: Return of an ecosystem to a close
approximation of its condition prior to disturbance. Re-
establishing the original character of an area such as a
wetland or forest.
Riparian Zone: The border or banks of a stream. Although
this term is sometimes used interchangeably with
floodplain, the riparian zone is generally regarded as
relatively narrow compared to a floodplain. The duration of
flooding is generally much shorter, and the timing less
predictable, in a riparian zone than in a river floodplain.
Ribonucleic acid (RNA): RNA is the generic term for
polynucleotides, similar to DNA but containing ribose in
place of deoxyribose and uracil in place of thymine. These
molecules are involved in the transfer of information from
DNA, programming protein synthesis and maintaining
ribosome structure.
Riparian Habitat: Areas adjacent to rivers and streams
with a differing density, diversity, and productivity of plant
and animal species relative to nearby uplands.
Riparian: Relating to or living or located on the bank of a
natural watercourse (as a river) or sometimes of a lake or a
tidewater.
RNA: ribonucleic acid
RTC: Real-Time Control
Runoff: That part of precipitation, snow melt, or irrigation
water that runs off the land into streams or other surface
water. It can carry pollutants from the air and land into
receiving waters.
Safe Drinking Water Act: The Safe Drinking Water Act
authorizes EPA to set national health-based standards for
drinking water to protect against both naturally occurring
and man-made contaminants that may be found in drinking
water. USEPA, states, and water systems then work
together to make sure these standards are met.
Sanitary Sewer Overflow (SSO): When wastewater
treatment systems overflow due to unforeseen pipe
blockages or breaks, unforeseen structural, mechanical, or
electrical failures, unusually wet weather conditions,
insufficient system capacity, or a deteriorating system.
Sanitary Sewer: Underground pipes that transport only
wastewaters from domestic residences and/or industries to
a wastewater treatment plant. No stormwater is carried.
Saprobien System: An ecological classification of a
polluted aquatic system that is undergoing self-purification.
Classification is based on relative levels of pollution,
oxygen concentration and types of indicator
microorganisms; i.e., saprophagic microorganisms –
feeding on dead or decaying organic matter.
SCADA: Supervisory Control and Data Acquisition
scfm: standard cubic feet per minute
Scoping Modeling: Involves simple, steady-state analytical
solutions for a rough analysis of the problem.
Scour: To abrade and wear away. Used to describe the
weathering away of a terrace or diversion channel or
streambed. The clearing and digging action of flowing
water, especially the downward erosion by stream water in
sweeping away mud and silt on the outside of a meander or
during flood events.
Secchi Disk: Measures the transparency of water.
Transparency can be affected by the color of the water,
algae and suspended sediments. Transparency decreases as
color, suspended sediments or algal abundance increases.
Secondary Treatment: The second step in most publicly
owned waste treatment systems in which bacteria consume
the organic parts of the waste. It is accomplished by
bringing together waste, bacteria, and oxygen in trickling
filters or in the activated sludge process. This treatment
removes floating and settleable solids and about 90 percent
of the oxygen-demanding substances and suspended solids.
Disinfection is the final stage of secondary treatment. (See
primary, tertiary treatment.)
Sediment Oxygen Demand (SOD): A measure of the
amount of oxygen consumed in the biological process that
breaks down organic matter in the sediment.
Sediment: Insoluble organic or inorganic material often
suspended in liquid that consists mainly of particles derived
from rocks, soils, and organic materials that eventually
settles to the bottom of a waterbody; a major non-point
source pollutant to which other pollutants may attach.
Sedimentation: Deposition or settling of suspended solids
settle out of water, wastewater or other liquids by gravity
during treatment.
Sediments: Soil, sand, and minerals washed from land
into water, usually after rain. They pile up in reservoirs,
rivers and harbors, destroying fish and wildlife habitat, and
clouding the water so that sunlight cannot reach aquatic
plants. Careless farming, mining, and building activities
will expose sediment materials, allowing them to wash off
the land after rainfall.
New York City Department of Environmental Protection Waterbody/Watershed Facility Plan
Newtown Creek
11-20 June 2011
Seiche: A wave that oscillates (for a period of a few
minutes to hours) in lakes, bays, lagoons or gulfs as a result
of seismic or atmospheric disturbances (e.g., "wind tides").
Sensitive Areas: Areas of particular environmental
significance or sensitivity that could be adversely affected
by discharges, including Outstanding National Resource
Waters, National Marine Sanctuaries, waters with
threatened or endangered species, waters with primary
contact recreation, public drinking water intakes, shellfish
beds, and other areas identified by State or Federal
agencies.
Separate Sewer System: Sewer systems that receive
domestic wastewater, commercial and industrial
wastewaters, and other sources but do not have connections
to surface runoff and are not directly influenced by rainfall
events.
Separate Storm Water System (SSWS): A system of
catch basin, pipes, and other components that carry only
surface run off to receiving waters.
Septic System: An on-site system designed to treat and
dispose of domestic sewage. A typical septic system
consists of a tank that receives waste from a residence or
business and a system of tile lines or a pit for disposal of
the liquid effluent (sludge) that remains after
decomposition of the solids by bacteria in the tank; must be
pumped out periodically.
SEQRA: State Environmental Quality Review Act
Settleable Solids: Material heavy enough to sink to the
bottom of a wastewater treatment tank.
Settling Tank: A vessel in which solids settle out of water
by gravity during drinking and wastewater treatment
processes.
Sewage: The waste and wastewater produced by
residential and commercial sources and discharged into
sewers.
Sewer Sludge: Sludge produced at a Publicly Owned
Treatment Works (POTW), the disposal of which is
regulated under the Clean Water Act.
Sewer: A channel or conduit that carries wastewater and
storm-water runoff from the source to a treatment plant or
receiving stream. ―Sanitary‖ sewers carry household,
industrial, and commercial waste. ―Storm‖ sewers carry
runoff from rain or snow. ―Combined‖ sewers handle both.
Sewerage: The entire system of sewage collection,
treatment, and disposal.
Sewershed: A defined area that is tributary to a single point
along an interceptor pipe (a community connection to an
interceptor) or is tributary to a single lift station.
Community boundaries are also used to define sewer-shed
boundaries.
SF: Square foot, unit of area
Significant Industrial User (SIU): A Significant
Industrial User is defined by the USEPA as an
industrial user that discharges process wastewater into a
publicly owned treatment works and meets at least one
of the following: (1) All industrial users subject to
Categorical Pretreatment Standards under the Code of
Federal Regulations - Title 40 (40 CFR) Part
403.6, and CFR Title 40 Chapter I, Subchapter N-
Effluent Guidelines and Standards; and (2) Any other
industrial user that discharges an average of 25,000
gallons per day or more of process wastewater to the
treatment plant (excluding sanitary, non-contact cooling
and boiler blowdown wastewater); or contributes a
process waste stream which makes up 5 percent or more
of any design capacity of the treatment plant; or is
designated as such by the municipal Industrial Waste
Section on the basis that the industrial user has a
reasonable potential for adversely affecting the
treatment plants operation or for violating any
pretreatment standard or requirement.
Siltation: The deposition of finely divided soil and rock
particles upon the bottom of stream and river beds and
reservoirs.
Simulation Models: Mathematical models (logical
constructs following from first principles and assumptions),
statistical models (built from observed relationships
between variables), or a combination of the two.
Simulation: Refers to the use of mathematical models to
approximate the observed behavior of a natural water
system in response to a specific known set of input and
forcing conditions. Models that have been validated, or
verified, are then used to predict the response of a natural
water system to changes in the input or forcing conditions.
Single Sample Maximum (SSM): A maximum allowable
enterococci or E. Coli density for a single sample.
Site Spill Identifier List (SPIL): Federal database with
information on existing Superfund Sites.
SIU: Significant Industrial User
Skewness: The degree of statistical asymmetry (or
departure from symmetry) of a population. Positive or
negative skewness indicates the presence of a long, thin tail
on the right or left of a distribution respectively.
Slope: The degree of inclination to the horizontal. Usually
expressed as a ratio, such as 1:25 or 1 on 25, indicating one
unit vertical rise in 25 units of horizontal distance, or in a
decimal fraction (0.04); degrees (2 degrees 18 minutes), or
percent (4 percent).
Sludge: Organic and Inorganic solid matter that settles to
the bottom of septic or wastewater treatment plant
sedimentation tanks, must be disposed of by bacterial
digestion or other methods or pumped out for land disposal,
incineration or recycled for fertilizer application.
SNWA: Special Natural Waterfront Area
New York City Department of Environmental Protection Waterbody/Watershed Facility Plan
Newtown Creek
11-21 June 2011
SOD: Sediment Oxygen Demand
SOP: Standard Operating Procedure
Sorption: The adherence of ions or molecules in a gas or
liquid to the surface of a solid particle with which they are
in contact.
SPDES: State Pollutant Discharge Elimination System
Special Natural Waterfront Area (SNWA): A large area
with concentrations of important coastal ecosystem features
such as wetlands, habitats and buffer areas, many of which
are regulated under other programs.
SPIL: Site Spill Identifier List
SRF: State Revolving Fund
SSM: single sample maximum
SSO: Sanitary Sewer Overflow
SSWS: Separate Storm Water System
Stakeholder: One who is interested in or impacted by a
project.
Standard Cubic Feet per Minute (SCFM): A standard
measurement of airflow that indicates how many cubic feet
of air pass by a stationary point in one minute. The higher
the number, the more air is being forced through the
system. The volumetric flow rate of a liquid or gas in cubic
feet per minute. 1 CFM equals approximately 2 liters per
second.
State Environmental Quality Review Act (SEQRA):
New York State program requiring all local government
agencies to consider environmental impacts equally with
social and economic factors during discretionary decision-
making. This means these agencies must assess the
environmental significance of all actions they have
discretion to approve, fund or directly undertake. SEQR
requires the agencies to balance the environmental impacts
with social and economic factors when deciding to approve or undertake an action.
Standard Operating Procedure (SOP): Document
describing a procedure or set of procedures to perform a
given operation or evolutions or in reaction to a given event.
State Pollutant Discharge Elimination System (SPDES):
New York State has a state program which has been
approved by the United States Environmental Protection
Agency for the control of wastewater and stormwater
discharges in accordance with the Clean Water Act. Under
New York State law the program is known as the State
Pollutant Discharge Elimination System (SPDES) and is
broader in scope than that required by the Clean Water Act
in that it controls point source discharges to groundwaters as well as surface waters.
State Revolving Fund (SRF): Revolving funds are
financial institutions that make loans for specific water
pollution control purposes and use loan repayment,
including interest, to make new loans for additional water
pollution control activities. The SRF program is based on
the 1987 Amendments to the Clean Water Act, which
established the SRF program as the CWA’s original
Construction Grants Program was phased out.
Steady-State Model: Mathematical model of fate and
transport that uses constant values of input variables to
predict constant values of receiving water quality
concentrations.
Storage: Treatment holding of waste pending treatment or
disposal, as in containers, tanks, waste piles, and surface
impoundments.
STORET: U.S. Environmental Protection Agency (EPA)
national water quality database for STORage and
RETrieval (STORET). Mainframe water quality database
that includes physical, chemical, and biological data
measured in waterbodies throughout the United States.
Storm Runoff: Stormwater runoff, snowmelt runoff, and
surface runoff and drainage; rainfall that does not evaporate
or infiltrate the ground because of impervious land surfaces
or a soil infiltration rate lower than rainfall intensity, but
instead flows onto adjacent land or waterbodies or is routed
into a drain or sewer system.
Storm Sewer: A system of pipes (separate from sanitary
sewers) that carries waste runoff from buildings and land
surfaces.
Stormwater: The portion of precipitation that does not
naturally percolate into the ground or evaporate, but flows
via overland flow, interflow, channels or pipes into a
defined surface water channel, or a constructed infiltration
facility.
Stormwater Management Models (SWMM): USEPA
mathematical model that simulates the hydraulic operation
of the combined sewer system and storm drainage
sewershed.
Stormwater Protection Plan (SWPP): A plan to describe
a process whereby a facility thoroughly evaluates potential
pollutant sources at a site and selects and implements
appropriate measures designed to prevent or control the
discharge of pollutants in stormwater runoff.
Stratification (of waterbody): Formation of water layers
each with specific physical, chemical, and biological
characteristics. As the density of water decreases due to
surface heating, a stable situation develops with lighter
water overlaying heavier and denser water.
Stressor: Any physical, chemical, or biological entity that
can induce an adverse response.
Subaqueous Burrow Pit: An underwater depression left
after the mining of large volumes of sand and gravel for

New York City Department of Environmental Protection Waterbody/Watershed Facility Plan
Newtown Creek
11-22 June 2011
projects ranging from landfilling and highway construction
to beach nourishment.
Substrate: The substance acted upon by an enzyme or a
fermenter, such as yeast, mold or bacteria.
Subtidal: The portion of a tidal-flat environment that lies
below the level of mean low water for spring tides.
Normally it is covered by water at all stages of the tide.
Supervisory Control and Data Acquisition (SCADA): System for controlling and collecting and recording data on
certain elements of WASA combined sewer system.
Surcharge Flow: Flow in which the water level is above
the crown of the pipe causing pressurized flow in pipe
segments.
Surface Runoff: Precipitation, snow melt, or irrigation
water in excess of what can infiltrate the soil surface and be
stored in small surface depressions; a major transporter of
non-point source pollutants in rivers, streams, and lakes.
Surface Water: All water naturally open to the atmosphere
(rivers, lakes, reservoirs, ponds, streams, impoundments,
seas, estuaries, etc.) and all springs, wells, or other
groundwater collectors directly influenced by surface
water.
Surficial Geology: Geology relating to surface layers,
such as soil, exposed bedrock, or glacial deposits.
Suspended Loads: Specific sediment particles maintained
in the water column by turbulence and carried with the flow
of water.
Suspended Solids or Load: Organic and inorganic
particles (sediment) suspended in and carried by a fluid
(water). The suspension is governed by the upward
components of turbulence, currents, or colloidal
suspension. Suspended sediment usually consists of
particles <0.1 mm, although size may vary according to
current hydrological conditions. Particles between 0.1 mm
and 1 mm may move as suspended or bedload. It is a
standard measure of the concentration of particulate matter
in wastewater, expressed in mg/L. Technology-Based
Standards. Minimum pollutant control standards for
numerous categories of industrial discharges, sewage
discharges and for a growing number of other types of
discharges. In each industrial category, they represent
levels of technology and pollution control performance that
the EPA expects all discharges in that category to employ.
SWEM: System-wide Eutrophication Model
SWMM: Stormwater Management Model
SWPP: Stormwater Protection Plan
System-wide Eutrophication Model (SWEM):
Comprehensive hydrodynamic model developed for the
New York/New Jersey Harbor System.
Taxa: The plural of taxon, a general term for any of the
hierarchical classification groups for organisms, such as
genus or species.
TC: Total coliform
TDS: Total Dissolved Solids
Technical and Operational Guidance Series (TOGS):
Memorandums that provide information on determining
compliance with a standard.
Tertiary Treatment: Advanced cleaning of wastewater
that goes beyond the secondary or biological stage,
removing nutrients such as phosphorus, nitrogen, and most
biochemical oxygen demand (BOD) and suspended solids.
Test Sites: Those sites being tested for biological
impairment.
Threatened Waters: Water whose quality supports
beneficial uses now but may not in the future unless action
is taken.
Three-Dimensional Model (3-D): Mathematical model
defined along three spatial coordinates where the water
quality constituents are considered to vary over all three
spatial coordinates of length, width, and depth.
TKN: Total Kjeldahl Nitrogen
TMDL: Total Maximum Daily Loads
TOC: Total Organic Carbon
TOGS: Technical and Operational Guidance Series
Topography: The physical features of a surface area
including relative elevations and the position of natural and
man-made features.
Total Coliform Bacteria: A particular group of bacteria,
found in the feces of warm-blooded animals that are used
as indicators of possible sewage pollution. They are
characterized as aerobic or facultative anaerobic, gram-
negative, nonspore-forming, rod-shaped bacteria which
ferment lactose with gas formation within 48 hours at 35°.
Note that many common soil bacteria are also total
coliforms, but do not indicate fecal contamination. (See
also fecal coliform bacteria)
Total Coliform (TC): The coliform bacteria group
consists of several genera of bacteria belonging to the
family enterobacteriaceae. These mostly harmless bacteria
live in soil, water, and the digestive system of animals.
Fecal coliform bacteria, which belong to this group, are
present in large numbers in the feces and intestinal tracts of
humans and other warm-blooded animals, and can enter
water bodies from human and animal waste. If a large
number of fecal coliform bacteria (over 200 colonies/100
milliliters (ml) of water sample) are found in water, it is
possible that pathogenic (disease- or illness-causing)
organisms are also present in the water. Swimming in
waters with high levels of fecal coliform bacteria increases
New York City Department of Environmental Protection Waterbody/Watershed Facility Plan
Newtown Creek
11-23 June 2011
the chance of developing illness (fever, nausea or stomach
cramps) from pathogens entering the body through the mouth, nose, ears, or cuts in the skin.
Total Dissolved Solids (TDS): Solids that pass through a
filter with a pore size of 2.0 micron or smaller. They are
said to be non-filterable. After filtration the filtrate (liquid)
is dried and the remaining residue is weighed and
calculated as mg/L of Total Dissolved Solids.
Total Kjeldahl Nitrogen (TKN): The sum of organic
nitrogen and ammonia nitrogen.
Total Maximum Daily Load (TMDL): The sum of the
individual wasteload allocations (WLAs) for point sources,
load allocations (LAs) for non-point sources and natural
background, and a margin of safety (MOS). TMDLs can be
expressed in terms of mass per time, toxicity, or other
appropriate measures that relate to a state’s water quality
standard.
Total Organic Carbon (TOC): A measure of the
concentration of organic carbon in water, determined by
oxidation of the organic matter into carbon dioxide (CO2).
TOC includes all the carbon atoms covalently bonded in
organic molecules. Most of the organic carbon in drinking
water supplies is dissolved organic carbon, with the
remainder referred to as particulate organic carbon. In
natural waters, total organic carbon is composed primarily
of nonspecific humic materials.
Total P: Total Phosphorus
Total Phosphorus (Total P): A nutrient essential to the
growth of organisms, and is commonly the limiting factor
in the primary productivity of surface water bodies. Total
phosphorus includes the amount of phosphorus in solution
(reactive) and in particle form. Agricultural drainage,
wastewater, and certain industrial discharges are typical
sources of phosphorus, and can contribute to the
eutrophication of surface water bodies. Measured in
milligrams per liter (mg/L).
Total Suspended Solids (TSS): See Suspended Solids
Toxic Substances. Those chemical substances which can
potentially cause adverse effects on living organisms. Toxic
substances include pesticides, plastics, heavy metals,
detergent, solvent, or any other materials that are
poisonous, carcinogenic, or otherwise directly harmful to
human health and the environment as a result of dose or
exposure concentration and exposure time. The toxicity of
toxic substances is modified by variables such as
temperature, chemical form, and availability.
Total Volatile Suspended Solids (VSS): Volatile solids
are those solids lost on ignition (heating to 550 degrees C.)
They are useful to the treatment plant operator because they
give a rough approximation of the amount of organic
matter present in the solid fraction of wastewater, activated
sludge and industrial wastes.
Toxic Pollutants: Materials that cause death, disease, or
birth defects in organisms that ingests or absorbs them.
The quantities and exposures necessary to cause these
effects can vary widely.
Toxicity: The degree to which a substance or mixture of
substances can harm humans or animals. Acute toxicity
involves harmful effects in an organism through a single or
short-term exposure. Chronic toxicity is the ability of a
substance or mixture of substances to cause harmful effects
over an extended period, usually upon repeated or
continuous exposure sometimes lasting for the entire life of
the exposed organism.
Treated Wastewater: Wastewater that has been subjected
to one or more physical, chemical, and biological processes
to reduce its potential of being a health hazard.
Treatment Plant: Facility for cleaning and treating
freshwater for drinking, or cleaning and treating wastewater
before discharging into a water body.
Treatment: (1) Any method, technique, or process
designed to remove solids and/or pollutants from solid
waste, waste-streams, effluents, and air emissions. (2)
Methods used to change the biological character or
composition of any regulated medical waste so as to
substantially reduce or eliminate its potential for causing
disease.
Tributary: A lower order stream compared to a receiving
waterbody. "Tributary to" indicates the largest stream into
which the reported stream or tributary flows.
Trophic Level: The functional classification of organisms
in an ecological community based on feeding relationships.
The first trophic level includes green plants; the second
trophic level includes herbivores; and so on.
TSS: Total Suspended Solids
Turbidity: The cloudy or muddy appearance of a naturally
clear liquid caused by the suspension of particulate matter.
It can be measured by the amount of light that is scattered
or absorbed by a fluid.
Two-Dimensional Model (2-D): Mathematical model
defined along two spatial coordinates where the water
quality constituents are considered averaged over the third
remaining spatial coordinate. Examples of 2-D models
include descriptions of the variability of water quality
properties along: (a) the length and width of a river that
incorporates vertical averaging or (b) length and depth of a
river that incorporates lateral averaging across the width of
the waterbody.
U.S. Army Corps of Engineers (USACE): The United
States Army Corps of Engineers, or USACE, is made up of
some 34,600 civilian and 650 military men and women.
The Corps' mission is to provide engineering services to the
United States, including: Planning, designing, building and
operating dams and other civil engineering projects ;
Designing and managing the construction of military
facilities for the Army and Air Force; and, Providing design
and construction management support for other Defense
and federal agencies

New York City Department of Environmental Protection Waterbody/Watershed Facility Plan
Newtown Creek
11-24 June 2011
United States Environmental Protection Agency
(USEPA): The Environmental Protection Agency (EPA or
sometimes USEPA) is an agency of the United States
federal government charged with protecting human health
and with safeguarding the natural environment: air, water,
and land. The USEPA began operation on December 2,
1970. It is led by its Administrator, who is appointed by the
President of the United States. The USEPA is not a cabinet
agency, but the Administrator is normally given cabinet
rank.
U.S. Fish and Wildlife Service (USFWS): The United
States Fish and Wildlife Service is a unit of the United
States Department of the Interior that is dedicated to
managing and preserving wildlife. It began as the U.S.
Commission on Fish and Fisheries in the United States
Department of Commerce and the Division of Economic
Ornithology and Mammalogy in the United States
Department of Agriculture and took its present form in
1939.
U.S. Geological Survey (USGS): The USGS serves the
Nation by providing reliable scientific information to
describe and understand the Earth; minimize loss of life
and property from natural disasters; manage water,
biological, energy, and mineral resources; and enhance and
protect our quality of life.
UAA: Use Attainability Analysis
ug/L: Microgram per liter – A measure of concentration
Ultraviolet Light (UV): Similar to light produced by the
sun; produced in treatment processes by special lamps. As
organisms are exposed to this light, they are damaged or
killed.
ULURP: Uniform Land Use Review Procedure
Underground Storage Tanks (UST): Buried storage tank
systems that store petroleum or hazardous substances that
can harm the environment and human health if the USTs
release their stored contents.
Uniform Land Use Review Procedure (ULURP): New
York City program wherein a standardized program would
be used to publicly review and approve applications
affecting the land use of the city would be publicly
reviewed. The program also includes mandated time frames
within which application review must take place.
Unstratified: Indicates a vertically uniform or well-mixed
condition in a waterbody. (See also Stratification)
Urban Runoff: Storm water from city streets and adjacent
domestic or commercial properties that carries pollutants of
various kinds into the sewer systems and receiving waters.
Urban Runoff: Water containing pollutants like oil and
grease from leaking cars and trucks; heavy metals from
vehicle exhaust; soaps and grease removers; pesticides
from gardens; domestic animal waste; and street debris,
which washes into storm drains and enters receiving
waters.
USA: Use and Standards Attainability Project
USACE: United States Army Corps of Engineers
Use and Standards Attainability Project (USA): A DEP
program that supplements existing Harbor water quality
achievements. The program involves the development of a
four-year, expanded, comprehensive plan (the Use and
Standards Attainment or "USA" Project) that is to be
directed towards increasing water quality improvements in
26 specific bodies of water located throughout the entire
City. These waterbodies were selected by DEP based on the
City's drainage patterns and on New York State
Department of Environmental Conservation (DEC)
waterbody classification standards.
Use Attainability Analysis (UAA): An evaluation that
provides the scientific and economic basis for a
determination that the designated use of a water body is not
attainable based on one or more factors (physical, chemical,
biological, and economic) proscribed in federal regulations.
Use Designations: Predominant uses each State determines
appropriate for a particular estuary, region, or area within
the class.
USEPA: United States Environmental Protection Agency
USFWS: U.S. Fish and Wildlife Service
USGS: United States Geological Survey
UST: underground storage tanks
UV: ultraviolet light
Validation (of a model): Process of determining how well
the mathematical representation of the physical processes
of the model code describes the actual system behavior.
Verification (of a model): Testing the accuracy and
predictive capabilities of the calibrated model on a data set
independent of the data set used for calibration.
Viewsheds: The major segments of the natural terrain
which are visible above the natural vegetation from
designated scenic viewpoints.
Virus: Submicroscopic pathogen consisting of a nucleic
acid core surrounded by a protein coat. Requires a host in
which to replicate (reproduce).
VSS: Total Volatile Suspended Solids
Wasteload Allocation (WLA): The portion of a receiving
water’s loading capacity that is allocated to one of its
existing or future point sources of pollution. WLAs
constitute a type of water quality-based effluent limitation
(40 CFR 130.2(h)).

New York City Department of Environmental Protection Waterbody/Watershed Facility Plan
Newtown Creek
11-25 June 2011
Wastewater Treatment Plant (WWTP): A facility that
receives wastewaters (and sometimes runoff) from
domestic and/or industrial sources, and by a combination of
physical, chemical, and biological processes reduces
(treats) the wastewaters to less harmful byproducts; known
by the acronyms, STP (sewage treatment plant), POTW
(publicly owned treatment works), WPCP (water pollution
control plant) and WWTP.
Wastewater Treatment: Chemical, biological, and
mechanical procedures applied to an industrial or municipal
discharge or to any other sources of contaminated water in
order to remove, reduce, or neutralize contaminants.
Wastewater: The used water and solids from a community
(including used water from industrial processes) that flows
to a treatment plant. Stormwater, surface water and
groundwater infiltration also may be included in the
wastewater that enters a wastewater treatment plant. The
term sewage usually refers to household wastes, but this
word is being replaced by the term wastewater.
Water Pollution Control Plant (WPCP): A facility that
receives wastewaters (and sometimes runoff) from
domestic and/or industrial sources, and by a combination of
physical, chemical, and biological processes reduces
(treats) the wastewaters to less harmful byproducts; known
by the acronyms, STP (sewage treatment plant), POTW
(publicly owned treatment works), WWTP (wastewater
treatment) and WPCP.
Water Pollution: The presence in water of enough
harmful or objectionable material to damage the water’s
quality.
Water Quality Criteria: Levels of water quality expected
to render a body of water suitable for its designated use.
Criteria are based on specific levels of pollutants that
would make the water harmful if used for drinking,
swimming, farming, fish production, or industrial
processes.
Water Quality Standard (WQS): State or federal law or
regulation consisting of a designated use or uses for the
waters of the United States, water quality criteria for such
waters based upon such uses, and an antidegradation policy
and implementation procedures. Water quality standards
protect the public health or welfare, enhance the quality of
water and serve the purposes of the Clean Water Act.
Water Quality Standards may include numerical or
narrative criteria.
Water Quality: The biological, chemical, and physical
conditions of a waterbody. It is a measure of a waterbody’s
ability to support beneficial uses.
Water Quality-Based Limitations: Effluent limitations
applied to discharges when mere technology-based
limitations would cause violations of water quality
standards.
Water Quality-Based Permit: A permit with an effluent
limit more stringent than technology based standards. Such
limits may be necessary to protect the designated uses of
receiving waters (e.g., recreation, aquatic life protection).
Waterbody Inventory/Priority Waterbody List
(WI/PWL): The WI/PWL incorporates monitoring data,
information from state and local communities and public
participation. The Waterbody Inventory portion refers to
the listing of all waters, identified as specific individual
waterbodies, within the state that are assessed. The Priority
Waterbodies List is the subset of waters in the Waterbody
Inventory that have documented water quality impacts,
impairments or threats.
Waterbody Segmentation: Implementation of a more
systematic approach to defining the bounds of individual
waterbodies using waterbody type, stream classification,
hydrologic drainage, waterbody length/size and
homogeneity of land use and watershed character as
criteria.
Waterfront Revitalization Program (WRP): New York
City’s principal coastal zone management tool. As
originally adopted in 1982 and revised in 1999, it
establishes the city's policies for development and use of
the waterfront and provides the framework for evaluating
the consistency of all discretionary actions in the coastal
zone with those policies. When a proposed project is
located within the coastal zone and it requires a local, state,
or federal discretionary action, a determination of the
project's consistency with the policies and intent of the
WRP must be made before the project can move forward.
Watershed Approach: A coordinated framework for
environmental management that focuses public and private
efforts on the highest priority problems within
hydrologically-defined geographic area taking into
consideration both ground and surface water flow.
Watershed: A drainage area or basin that drains or flows
toward a central collector such as a stream, river, estuary or
bay: the watershed for a major river may encompass a
number of smaller watersheds that ultimately combined at a
common point.
Weir: (1) A wall or plate placed in an open channel to
measure the flow of water. (2) A wall or obstruction used to
control flow from settling tanks and clarifiers to ensure a
uniform flow rate and avoid short-circuiting.
Wet Weather Flow: Hydraulic flow conditions within a
combined sewer system resulting from a precipitation
event. Flow within a combined sewer system under these
conditions may include street runoff, domestic sewage,
ground water infiltration, commercial and industrial
wastewaters, and any other non-precipitation event related
flows. In a separately sewered system, this type of flow
could result from dry weather flow being combined with
inflow.
Wet Weather Operating Plan (WWOP): Document
required by a permit holder’s SPDES permit that optimizes
the plant’s wet weather performance.
New York City Department of Environmental Protection Waterbody/Watershed Facility Plan
Newtown Creek
11-26 June 2011
Wetlands: An area that is constantly or seasonally
saturated by surface water or groundwater with vegetation
adapted for life under those soil conditions, as in swamps,
bogs, fens, marshes, and estuaries. Wetlands form an
interface between terrestrial (land-based) and aquatic
environments; include freshwater marshes around ponds
and channels (rivers and streams), brackish and salt
marshes.
WI/PWL: Waterbody Inventory/Priority Waterbody List
WLA: Waste Load Allocation
WPCP: Water Pollution Control Plant
WQS: Water Quality Standards
WRP: Waterfront Revitalization Program
WWOP: Wet Weather Operating Plan
WWTP: Wastewater Treatment Plant
Zooplankton: Free-floating or drifting animals with
movements determined by the motion of the water.

APPENDIX A
NEWTOWN CREEK WASTEWATER TREATMENT
PLANT WET WEATHER OPERATING PLAN

NO TEXT ON THIS PAGE
May 2002May 2002
G HREELEY ND ANSEN A H SAZEN ND AWYER A
A Joint Venture
M PALCOLM IRNIE
Bureau of Wastewater Treatment
Capital Project No. WP-283
Newtown Creek WPCP Wet Weather Operating Plan
April 2010
GREELEY AND HANSEN HAZEN AND SAWYER MALCOLM PIRNIE
A Joint Venture

Newtown Creek WPCP WP-283
Wet Weather Operating Plan
April 2010
Table of Contents
Section Page
1.0 INTRODUCTION ---------------------------------------------------------------------- 1-1
1.1 Background on Existing System ----------------------------------------------------- 1-1 1.2 Effluent Permit Limits ----------------------------------------------------------------- 1-7 1.3 Performance Goals for Wet Weather Events --------------------------------------- 1-8 1.4 Wet Weather Capacity – Effects of Units in Service ------------------------------ 1-9
1.4.1 Bar Screens ------------------------------------------------------------------------- 1-9
1.4.2 Pumping Station ------------------------------------------------------------------- 1-9
1.4.3 Batteries (Grit Tanks, Aeration Tanks, Final Sedimentation Tanks) ----- 1-11
1.4.4 Chlorine Contact Tanks --------------------------------------------------------- 1-12 1.5 Purpose of this Plan ------------------------------------------------------------------- 1-12 1.6 Using this Plan ------------------------------------------------------------------------- 1-12 1.7 Revisions to This Plan ---------------------------------------------------------------- 1-13
2.0 EXISTING FACILITY WET WEATHER OPERATION PROCEDURES AND
GUIDELINES -------------------------------------------------------------------------- 2-1
2.1 Influent Throttling Gates -------------------------------------------------------------- 2-1 2.1.1 Equipment -------------------------------------------------------------------------- 2-1 2.1.2 Wet Weather Operating Protocol for the Brooklyn/Queens Headworks -- 2-1
2.1.3 Wet Weather Operating Protocol for the Manhattan Headworks ---------- 2-3
2.2 Main Wastewater Screens ------------------------------------------------------------- 2-5 2.2.1 Equipment -------------------------------------------------------------------------- 2-5 2.2.2 Wet Weather Operating Protocol for the Brooklyn/Queens Headworks -- 2-5
2.2.3 Wet Weather Operating Protocol for the Manhattan Headworks ---------- 2-7 2.3 Influent Wastewater Pumping -------------------------------------------------------- 2-9
2.3.1 Equipment -------------------------------------------------------------------------- 2-9 2.3.2 Wet Weather Operating Protocol for the Brooklyn/Queens Pump Station 2-9 2.3.3 Wet Weather Operating Protocol for the Manhattan Pump Station------- 2-11
2.4 Grit Removal --------------------------------------------------------------------------- 2-13
2.4.1 Equipment ------------------------------------------------------------------------- 2-13
2.4.2 Wet Weather Operating Protocol ---------------------------------------------- 2-13 2.5 Aeration Tanks ------------------------------------------------------------------------- 2-15
2.5.1 Equipment ------------------------------------------------------------------------- 2-15 2.5.2 Wet Weather Operating Protocol ---------------------------------------------- 2-15
2.6 Final Sedimentation Tanks ----------------------------------------------------------- 2-17 2.6.1 Equipment ------------------------------------------------------------------------- 2-17 2.6.2 Wet Weather Operating Protocol ---------------------------------------------- 2-17
2.7 Effluent Chlorination ----------------------------------------------------------------- 2-19 2.7.1 Equipment ------------------------------------------------------------------------- 2-19
2.7.2 Wet Weather Operating Protocol ---------------------------------------------- 2-19
2.8 Effluent discharges to the East River and Whale Creek ------------------------- 2-21
2.9 Solids Handling: Thickening -------------------------------------------------------- 2-22 2.9.1 Equipment ------------------------------------------------------------------------- 2-22 2.9.2 Wet Weather Operating Protocol ---------------------------------------------- 2-22 2.9.3 Equipment ------------------------------------------------------------------------- 2-23
Newtown Creek WPCP WP-283
Wet Weather Operating Plan
April 2010
2.9.4 Wet Weather Operating Protocol ---------------------------------------------- 2-23 3.0 REMAINING PLANNED TRACK 3 PLANT UPGRADES -------------------- 3-1
3.1 New and Upgraded Secondary Treatment Systems ------------------------------- 3-4 3.2 Brooklyn/Queens Pump Station Improvements ------------------------------------ 3-4
3.3 Manhattan Pump Station Improvements -------------------------------------------- 3-5 3.4 Secondary Screening and Residuals Handling Facility --------------------------- 3-5 3.5 Upgrade of South Battery to Track 3 Configuration ------------------------------ 3-6

Newtown Creek WPCP WP-283
Wet Weather Operating Plan
April 2010
LIST OF FIGURES
Figure No. Page
1.1 Newtown Creek WPCP Location Map and Service Area ------------------------ 1-3
1.2 Newtown Creek WPCP Existing Facility Site Plan ------------------------------- 1-4
1.3 Newtown Creek WPCP Existing Facilty Process Flow Diagram --------------- 1-6
3.1 Newtown Creek WPCP Track 3 Facility Site Plan -------------------------------- 3-2
3.2 Newtown Creek WPCP Track 3 Process Flow Diagram ------------------------- 3-3
LIST OF TABLES
Table No. Page
1.1 Newtown Creek WPCP Interim Permit Limits ------------------------------------- 1-7
1.2 Newtown Creek WPCP Proposed Effluent Permit Limits ------------------------ 1-8
1.3 Minimum Hydraulic Capacity of Bar Screens in the Brooklyn/Queens and
Manhattan Headworks ----------------------------------------------------------------- 1-9
1.4 Minimum Pumping Capacity During Pump Station Upgrades ----------------- 1-10
1.5 Minimum Hydraulic Capacity per Battery (MGD) ------------------------------- 1-11
1.6 Chlorine Contact Tank Capacity for a 15-Minute Detention Time------------- 1-12
2.1 India Street/Whale Creek Canal Outfall Effluent Flow Split ------------------- 2-21
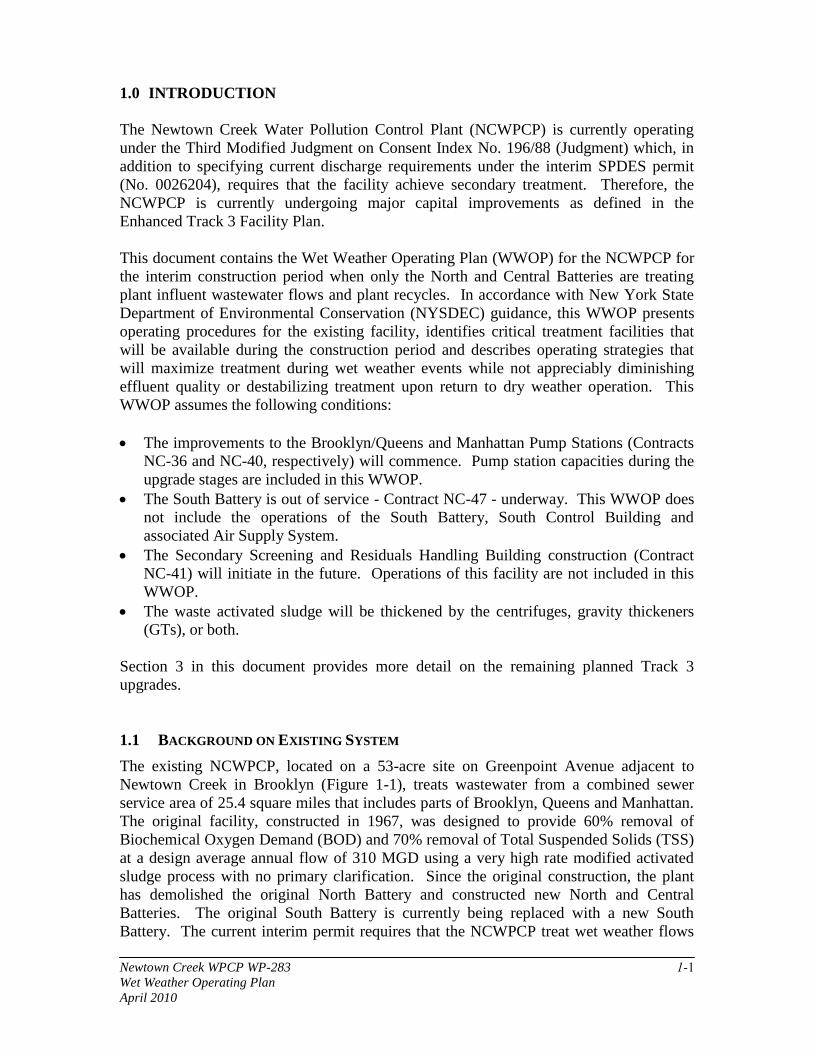
Newtown Creek WPCP WP-283 1-1
Wet Weather Operating Plan
April 2010
1.0 INTRODUCTION
The Newtown Creek Water Pollution Control Plant (NCWPCP) is currently operating
under the Third Modified Judgment on Consent Index No. 196/88 (Judgment) which, in
addition to specifying current discharge requirements under the interim SPDES permit
(No. 0026204), requires that the facility achieve secondary treatment. Therefore, the
NCWPCP is currently undergoing major capital improvements as defined in the
Enhanced Track 3 Facility Plan.
This document contains the Wet Weather Operating Plan (WWOP) for the NCWPCP for
the interim construction period when only the North and Central Batteries are treating
plant influent wastewater flows and plant recycles. In accordance with New York State
Department of Environmental Conservation (NYSDEC) guidance, this WWOP presents
operating procedures for the existing facility, identifies critical treatment facilities that
will be available during the construction period and describes operating strategies that
will maximize treatment during wet weather events while not appreciably diminishing
effluent quality or destabilizing treatment upon return to dry weather operation. This
WWOP assumes the following conditions:
The improvements to the Brooklyn/Queens and Manhattan Pump Stations (Contracts
NC-36 and NC-40, respectively) will commence. Pump station capacities during the
upgrade stages are included in this WWOP.
The South Battery is out of service - Contract NC-47 - underway. This WWOP does
not include the operations of the South Battery, South Control Building and
associated Air Supply System.
The Secondary Screening and Residuals Handling Building construction (Contract
NC-41) will initiate in the future. Operations of this facility are not included in this
WWOP.
The waste activated sludge will be thickened by the centrifuges, gravity thickeners
(GTs), or both.
Section 3 in this document provides more detail on the remaining planned Track 3
upgrades.
1.1 BACKGROUND ON EXISTING SYSTEM
The existing NCWPCP, located on a 53-acre site on Greenpoint Avenue adjacent to
Newtown Creek in Brooklyn (Figure 1-1), treats wastewater from a combined sewer
service area of 25.4 square miles that includes parts of Brooklyn, Queens and Manhattan.
The original facility, constructed in 1967, was designed to provide 60% removal of
Biochemical Oxygen Demand (BOD) and 70% removal of Total Suspended Solids (TSS)
at a design average annual flow of 310 MGD using a very high rate modified activated
sludge process with no primary clarification. Since the original construction, the plant
has demolished the original North Battery and constructed new North and Central
Batteries. The original South Battery is currently being replaced with a new South
Battery. The current interim permit requires that the NCWPCP treat wet weather flows
Newtown Creek WPCP WP-283 1-2
Wet Weather Operating Plan
April 2010
up to 620 MGD (two times the permitted dry weather flow). Flow in excess of the plant
flow is discharged through the Combined Sewer Overflows (CSOs) at the regulators in
the collections system. The amount of flow discharged through the CSOs is governed by
the regulators, plant operations and rainfall characteristics (intensity, duration and
location). The NCWPCP currently treats an average daily flow of approximately 240
MGD and has achieved peak wet weather flow rates in excess of 620 MGD. The plant
operators control the flow to the plant using the influent pumps at the two main influent
pump stations. Influent flow to the pump stations during severe wet weather events is
limited by throttling gates at both influent pump stations to maintain acceptable influent
wet well levels and protect the pump stations from flooding. Figure 1-2 presents the
existing facilities as of April 2009.

Newtown Creek WPCP WP-283 1-3
Wet Weather Operating Plan
April 2010
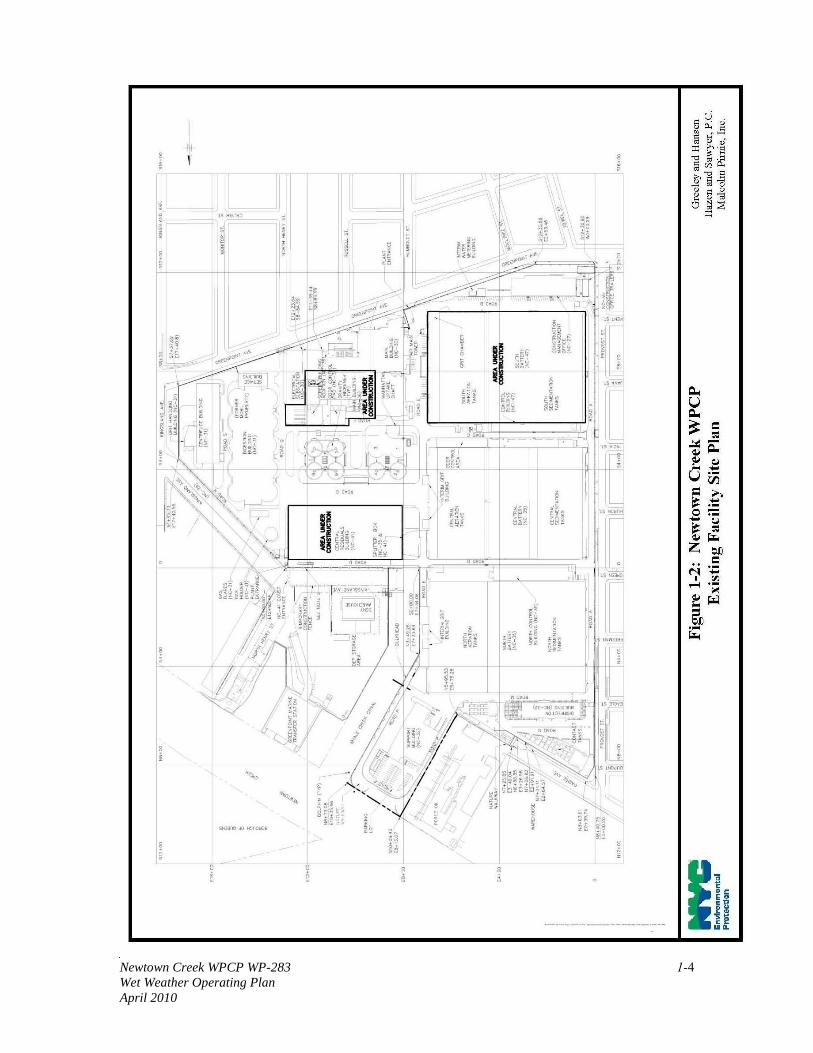
Newtown Creek WPCP WP-283 1-4
Wet Weather Operating Plan
April 2010

Newtown Creek WPCP WP-283 1-5
Wet Weather Operating Plan
April 2010
The existing wet stream treatment at the NCWPCP includes preliminary screening,
detritor grit removal, high rate step feed activated sludge biological treatment, final
sedimentation and chlorine disinfection using sodium hypochlorite. A process flow
diagram is shown in Figure 1-3.
The plant receives wastewater from two service areas, Brooklyn/Queens and Manhattan.
The Brooklyn/Queens flow enters the Brooklyn/Queens (B/Q) pump station located at the
plant. The Manhattan flow is pumped from the Manhattan Pump Station (MPS), located
at Avenue D between east 12th
St. and East 13th
St. in Manhattan. The B/Q and MPS
influent flow and plant recycle flow are combined in a splitter box and distributed
between two existing treatment batteries (North and Central). Each battery includes 8
grit tanks, 4 aeration tanks and 8 final sedimentation tanks.
Wastewater from the splitter box flows by gravity to the grit tanks. Effluent from each
grit tank enters a common aeration tank feed channel, which can distribute flow to each
aeration tank pass through four individual motorized slide gates (1 per pass). Return
activated sludge enters the aeration tanks (ATs) at the head end of the first pass. AT
effluent enters a common AT effluent channel which distributes MLSS to the head of the
sedimentation tanks. Common feed channels allow for individual tanks to be removed
without affecting associated tankage. For example, if an AT needs to be taken out of
service, its associated grit tanks can remain in service to accept higher grit loads during
storm events. The final sedimentation tank effluent combines in a common effluent
channel which flows to the chlorine contact tanks (CCTs) where it is chlorinated and
discharged to the East River or during high flow periods caused by wet weather and/or
high tide periods from storm tides, both the East River and Whale Creek.
In each battery, Return Activated Sludge (RAS)/ Waste Activated Sludge (WAS) is
removed from each final sedimentation tank via a telescoping valve and is routed by
gravity to a common RAS/WAS wet well. RAS is then pumped to the RAS splitter box,
which distributes the RAS to Pass A of each AT.
WAS is pumped from the RAS/WAS wet well directly to the centrifuge wet wells and/or
gravity thickener (GT) distribution box. WAS is thickened by centrifuges and/or GTs,
anaerobically digested and then hauled by barge to offsite dewatering facilities. The
digested sludge can also be thickened using centrifuges prior to discharge to barge.
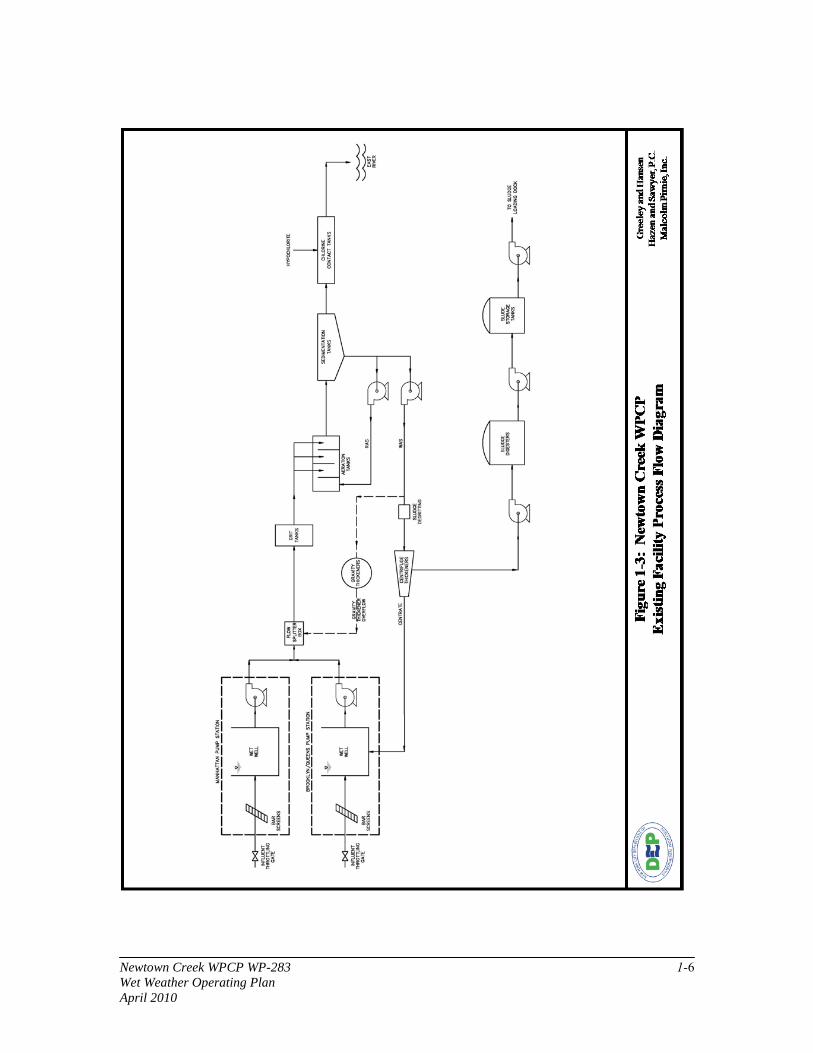
Newtown Creek WPCP WP-283 1-6
Wet Weather Operating Plan
April 2010
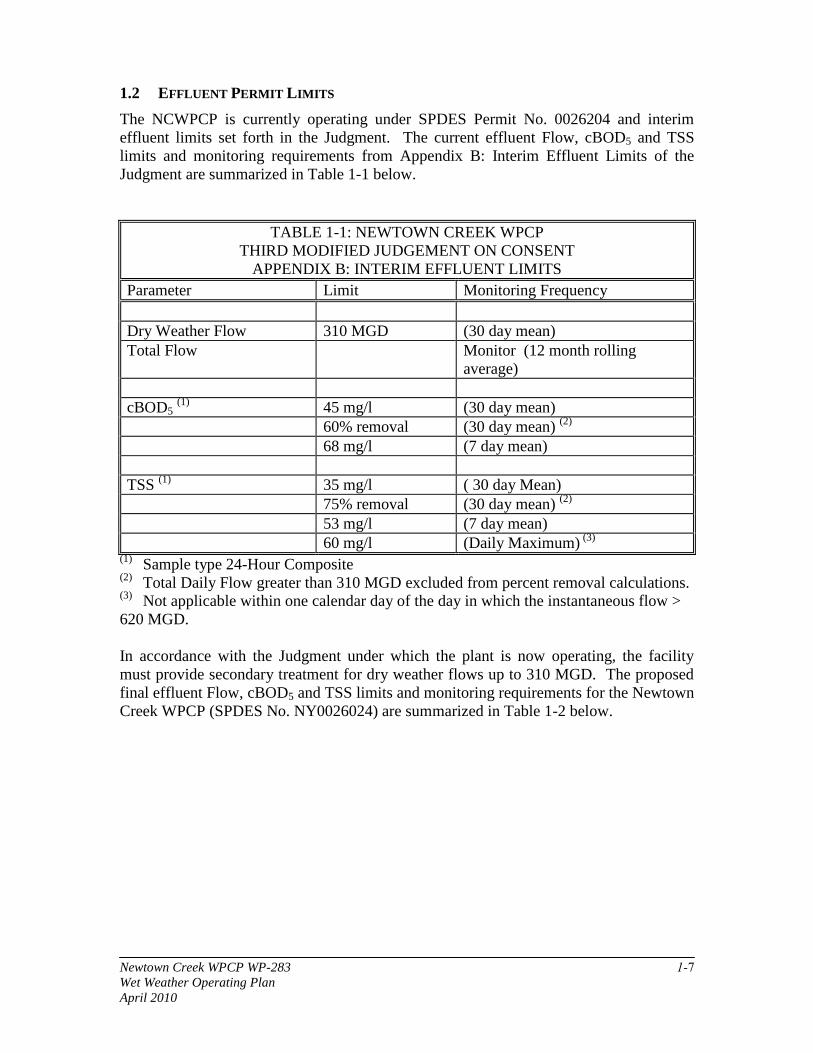
Newtown Creek WPCP WP-283 1-7
Wet Weather Operating Plan
April 2010
1.2 EFFLUENT PERMIT LIMITS
The NCWPCP is currently operating under SPDES Permit No. 0026204 and interim
effluent limits set forth in the Judgment. The current effluent Flow, cBOD5 and TSS
limits and monitoring requirements from Appendix B: Interim Effluent Limits of the
Judgment are summarized in Table 1-1 below.
TABLE 1-1: NEWTOWN CREEK WPCP
THIRD MODIFIED JUDGEMENT ON CONSENT
APPENDIX B: INTERIM EFFLUENT LIMITS
Parameter Limit Monitoring Frequency
Dry Weather Flow 310 MGD (30 day mean)
Total Flow Monitor (12 month rolling
average)
cBOD5 (1)
45 mg/l (30 day mean)
60% removal (30 day mean) (2)
68 mg/l (7 day mean)
TSS (1)
35 mg/l ( 30 day Mean)
75% removal (30 day mean) (2)
53 mg/l (7 day mean)
60 mg/l (Daily Maximum) (3)
(1)
Sample type 24-Hour Composite (2)
Total Daily Flow greater than 310 MGD excluded from percent removal calculations. (3)
Not applicable within one calendar day of the day in which the instantaneous flow >
620 MGD.
In accordance with the Judgment under which the plant is now operating, the facility
must provide secondary treatment for dry weather flows up to 310 MGD. The proposed
final effluent Flow, cBOD5 and TSS limits and monitoring requirements for the Newtown
Creek WPCP (SPDES No. NY0026024) are summarized in Table 1-2 below.
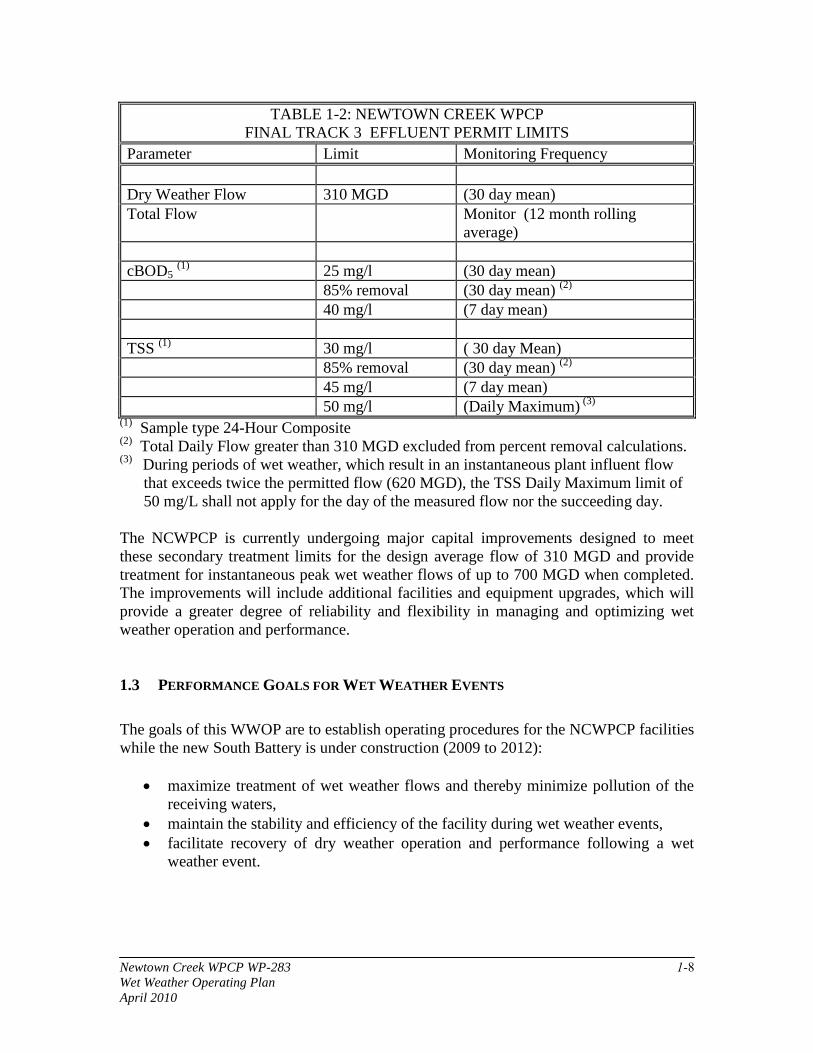
Newtown Creek WPCP WP-283 1-8
Wet Weather Operating Plan
April 2010
TABLE 1-2: NEWTOWN CREEK WPCP
FINAL TRACK 3 EFFLUENT PERMIT LIMITS
Parameter Limit Monitoring Frequency
Dry Weather Flow 310 MGD (30 day mean)
Total Flow Monitor (12 month rolling
average)
cBOD5 (1)
25 mg/l (30 day mean)
85% removal (30 day mean) (2)
40 mg/l (7 day mean)
TSS (1)
30 mg/l ( 30 day Mean)
85% removal (30 day mean) (2)
45 mg/l (7 day mean)
50 mg/l (Daily Maximum) (3)
(1)
Sample type 24-Hour Composite (2)
Total Daily Flow greater than 310 MGD excluded from percent removal calculations. (3)
During periods of wet weather, which result in an instantaneous plant influent flow
that exceeds twice the permitted flow (620 MGD), the TSS Daily Maximum limit of
50 mg/L shall not apply for the day of the measured flow nor the succeeding day.
The NCWPCP is currently undergoing major capital improvements designed to meet
these secondary treatment limits for the design average flow of 310 MGD and provide
treatment for instantaneous peak wet weather flows of up to 700 MGD when completed.
The improvements will include additional facilities and equipment upgrades, which will
provide a greater degree of reliability and flexibility in managing and optimizing wet
weather operation and performance.
1.3 PERFORMANCE GOALS FOR WET WEATHER EVENTS
The goals of this WWOP are to establish operating procedures for the NCWPCP facilities
while the new South Battery is under construction (2009 to 2012):
maximize treatment of wet weather flows and thereby minimize pollution of the
receiving waters,
maintain the stability and efficiency of the facility during wet weather events,
facilitate recovery of dry weather operation and performance following a wet
weather event.
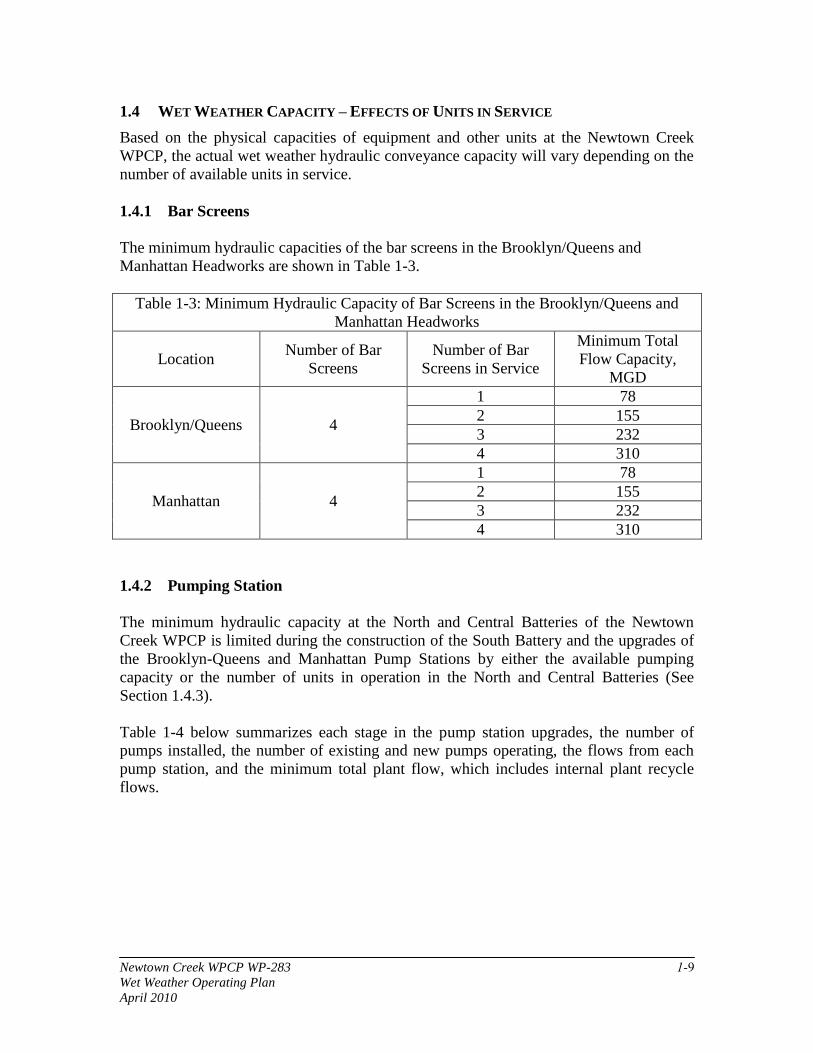
Newtown Creek WPCP WP-283 1-9
Wet Weather Operating Plan
April 2010
1.4 WET WEATHER CAPACITY – EFFECTS OF UNITS IN SERVICE
Based on the physical capacities of equipment and other units at the Newtown Creek
WPCP, the actual wet weather hydraulic conveyance capacity will vary depending on the
number of available units in service.
1.4.1 Bar Screens
The minimum hydraulic capacities of the bar screens in the Brooklyn/Queens and
Manhattan Headworks are shown in Table 1-3.
Table 1-3: Minimum Hydraulic Capacity of Bar Screens in the Brooklyn/Queens and
Manhattan Headworks
Location Number of Bar
Screens
Number of Bar
Screens in Service
Minimum Total
Flow Capacity,
MGD
Brooklyn/Queens 4
1 78
2 155
3 232
4 310
Manhattan 4
1 78
2 155
3 232
4 310
1.4.2 Pumping Station
The minimum hydraulic capacity at the North and Central Batteries of the Newtown
Creek WPCP is limited during the construction of the South Battery and the upgrades of
the Brooklyn-Queens and Manhattan Pump Stations by either the available pumping
capacity or the number of units in operation in the North and Central Batteries (See
Section 1.4.3).
Table 1-4 below summarizes each stage in the pump station upgrades, the number of
pumps installed, the number of existing and new pumps operating, the flows from each
pump station, and the minimum total plant flow, which includes internal plant recycle
flows.
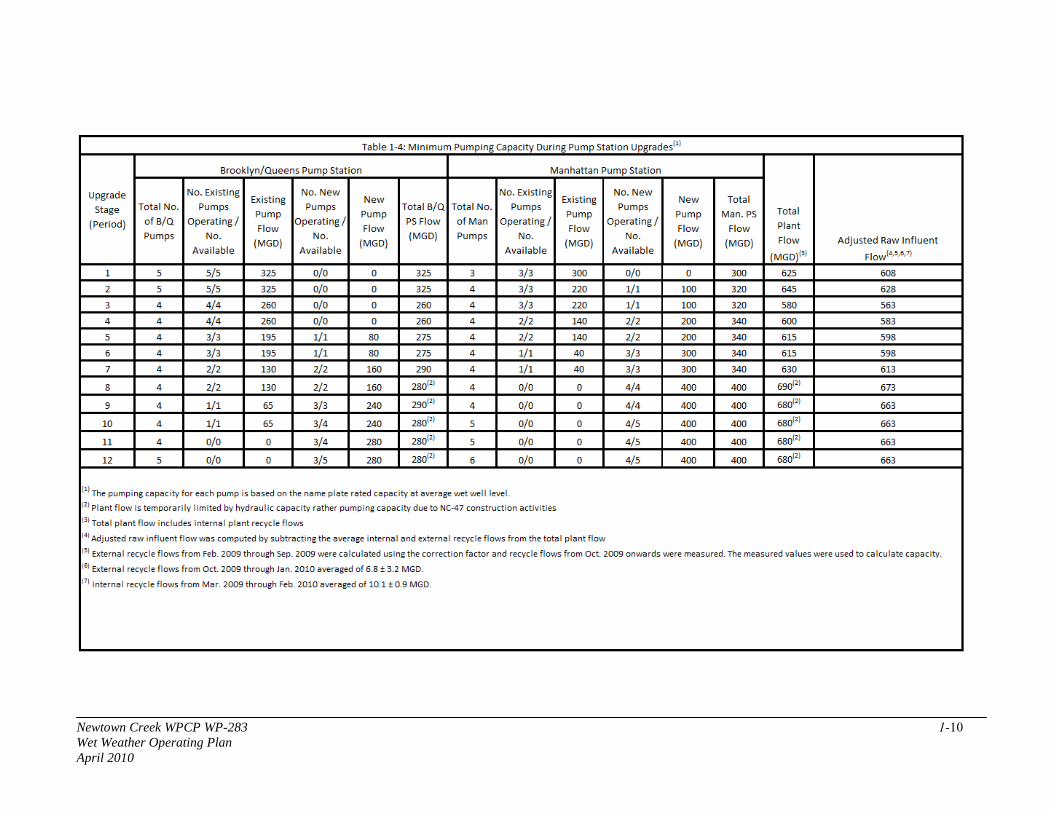
Newtown Creek WPCP WP-283 1-10
Wet Weather Operating Plan
April 2010
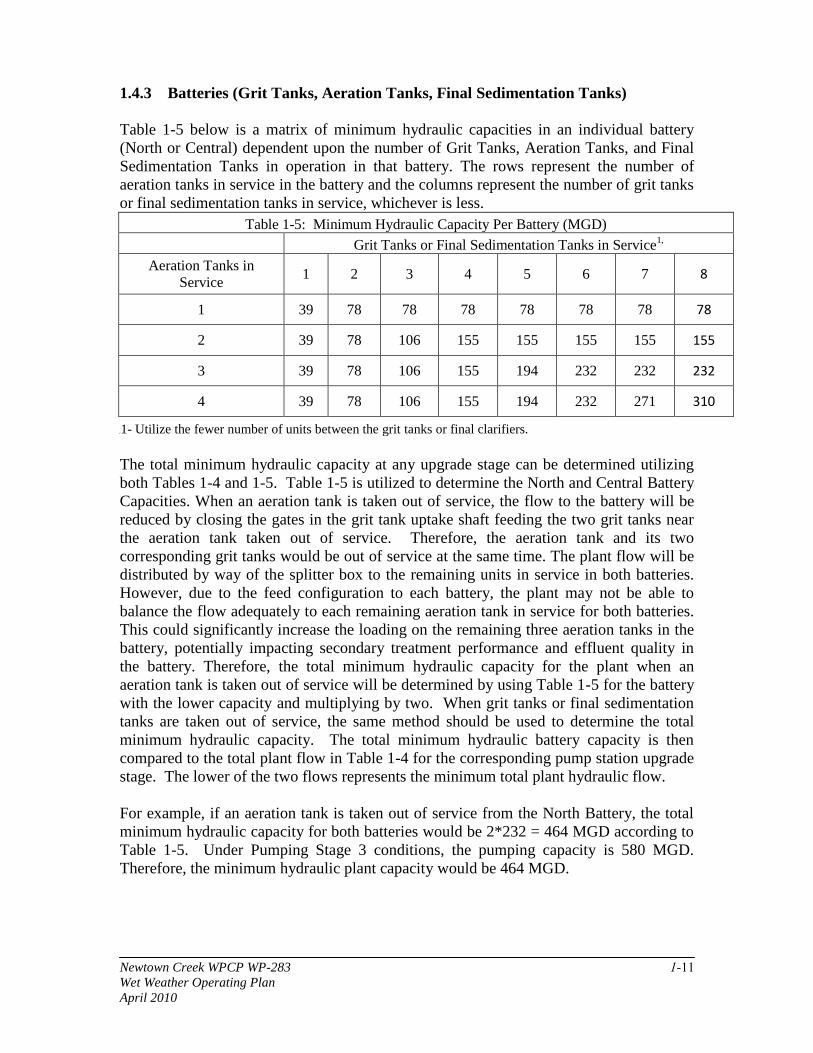
Newtown Creek WPCP WP-283 1-11
Wet Weather Operating Plan
April 2010
1.4.3 Batteries (Grit Tanks, Aeration Tanks, Final Sedimentation Tanks)
Table 1-5 below is a matrix of minimum hydraulic capacities in an individual battery
(North or Central) dependent upon the number of Grit Tanks, Aeration Tanks, and Final
Sedimentation Tanks in operation in that battery. The rows represent the number of
aeration tanks in service in the battery and the columns represent the number of grit tanks
or final sedimentation tanks in service, whichever is less.
Table 1-5: Minimum Hydraulic Capacity Per Battery (MGD)
Grit Tanks or Final Sedimentation Tanks in Service1,
Aeration Tanks in
Service 1 2 3 4 5 6 7 8
1 39 78 78 78 78 78 78 78
2 39 78 106 155 155 155 155 155
3 39 78 106 155 194 232 232 232
4 39 78 106 155 194 232 271 310
11- Utilize the fewer number of units between the grit tanks or final clarifiers.
The total minimum hydraulic capacity at any upgrade stage can be determined utilizing
both Tables 1-4 and 1-5. Table 1-5 is utilized to determine the North and Central Battery
Capacities. When an aeration tank is taken out of service, the flow to the battery will be
reduced by closing the gates in the grit tank uptake shaft feeding the two grit tanks near
the aeration tank taken out of service. Therefore, the aeration tank and its two
corresponding grit tanks would be out of service at the same time. The plant flow will be
distributed by way of the splitter box to the remaining units in service in both batteries.
However, due to the feed configuration to each battery, the plant may not be able to
balance the flow adequately to each remaining aeration tank in service for both batteries.
This could significantly increase the loading on the remaining three aeration tanks in the
battery, potentially impacting secondary treatment performance and effluent quality in
the battery. Therefore, the total minimum hydraulic capacity for the plant when an
aeration tank is taken out of service will be determined by using Table 1-5 for the battery
with the lower capacity and multiplying by two. When grit tanks or final sedimentation
tanks are taken out of service, the same method should be used to determine the total
minimum hydraulic capacity. The total minimum hydraulic battery capacity is then
compared to the total plant flow in Table 1-4 for the corresponding pump station upgrade
stage. The lower of the two flows represents the minimum total plant hydraulic flow.
For example, if an aeration tank is taken out of service from the North Battery, the total
minimum hydraulic capacity for both batteries would be 2*232 = 464 MGD according to
Table 1-5. Under Pumping Stage 3 conditions, the pumping capacity is 580 MGD.
Therefore, the minimum hydraulic plant capacity would be 464 MGD.
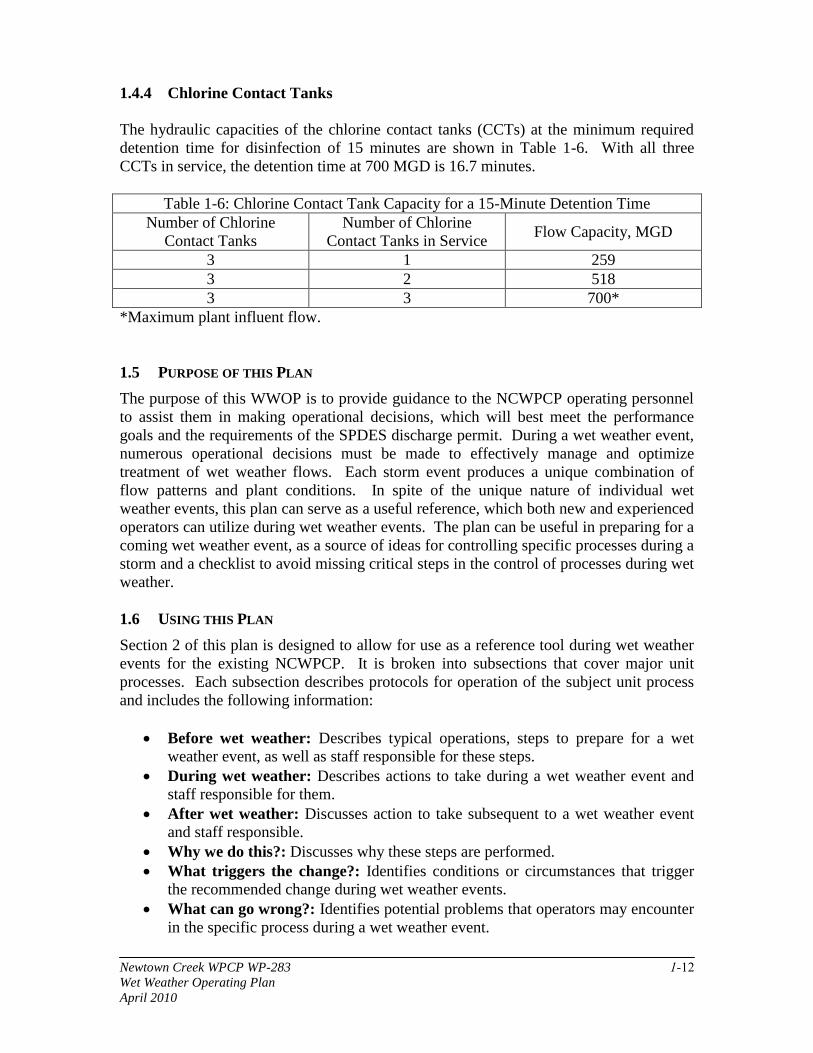
Newtown Creek WPCP WP-283 1-12
Wet Weather Operating Plan
April 2010
1.4.4 Chlorine Contact Tanks
The hydraulic capacities of the chlorine contact tanks (CCTs) at the minimum required
detention time for disinfection of 15 minutes are shown in Table 1-6. With all three
CCTs in service, the detention time at 700 MGD is 16.7 minutes.
Table 1-6: Chlorine Contact Tank Capacity for a 15-Minute Detention Time
Number of Chlorine
Contact Tanks
Number of Chlorine
Contact Tanks in Service Flow Capacity, MGD
3 1 259
3 2 518
3 3 700*
*Maximum plant influent flow.
1.5 PURPOSE OF THIS PLAN
The purpose of this WWOP is to provide guidance to the NCWPCP operating personnel
to assist them in making operational decisions, which will best meet the performance
goals and the requirements of the SPDES discharge permit. During a wet weather event,
numerous operational decisions must be made to effectively manage and optimize
treatment of wet weather flows. Each storm event produces a unique combination of
flow patterns and plant conditions. In spite of the unique nature of individual wet
weather events, this plan can serve as a useful reference, which both new and experienced
operators can utilize during wet weather events. The plan can be useful in preparing for a
coming wet weather event, as a source of ideas for controlling specific processes during a
storm and a checklist to avoid missing critical steps in the control of processes during wet
weather.
1.6 USING THIS PLAN
Section 2 of this plan is designed to allow for use as a reference tool during wet weather
events for the existing NCWPCP. It is broken into subsections that cover major unit
processes. Each subsection describes protocols for operation of the subject unit process
and includes the following information:
Before wet weather: Describes typical operations, steps to prepare for a wet
weather event, as well as staff responsible for these steps.
During wet weather: Describes actions to take during a wet weather event and
staff responsible for them.
After wet weather: Discusses action to take subsequent to a wet weather event
and staff responsible.
Why we do this?: Discusses why these steps are performed.
What triggers the change?: Identifies conditions or circumstances that trigger
the recommended change during wet weather events.
What can go wrong?: Identifies potential problems that operators may encounter
in the specific process during a wet weather event.
Newtown Creek WPCP WP-283 1-13
Wet Weather Operating Plan
April 2010
Section 3 – “Remaining Planned Track 3 Plant Upgrades” identifies the remaining
improvements to be implemented at the plant as part of the Track 3 Upgrade. The
improvements are presented in the order in which they are scheduled to be completed and
available for service.
1.7 REVISIONS TO THIS PLAN
In addition to revisions based on plant operating experience, this plan will also be revised
as modifications are made to the NCWPCP that effect the plant’s ability to receive and
treat wet weather flows. This facility is currently undergoing a complete upgrade to
secondary treatment. As required by the Judgment, specific procedures based on actual
operating experience for the upgraded facilities will be provided in a revised WWOP,
which will be issued following certification by the DEC that the facility is in compliance
with secondary treatment limits in accordance with Appendix A-2 of the Judgment.

Newtown Creek WPCP WP-283 2-1
Wet Weather Operating Plan
April 2010
2.0 EXISTING FACILITY WET WEATHER OPERATION PROCEDURES AND
GUIDELINES
This section presents equipment summaries and wet weather operating protocols for each
major unit operation of the plant. The protocols are divided into steps to be followed
before, during and after a wet weather event. Also addressed are the bases for the
protocols (Why do we do this?), events or observations that trigger the protocols (What
triggers the change?), and a discussion of potential problems (What can go wrong?).
2.1 INFLUENT THROTTLING GATES
2.1.1 Equipment
UNIT PROCESS EQUIPMENT
Brooklyn/Queens Pump Station
Influent Throttling Gate
1 – pneumo electro-hydraulic influent
throttling gate with both remote and local
control
Manhattan Pump Station
Influent Throttling Gate
2 – pneumo hydraulic influent throttling
gates with remote control
2.1.2 Wet Weather Operating Protocol for the Brooklyn/Queens Headworks
WHO DOES IT? WHAT DO WE DO?
SUPERVISORY IMPLEMENTATION
Before Wet Weather Event
Shift Supervisor
(Watch Engineer)
Operator (STW/SSTW) Monitor local online weather reports.
Influent gate is parked within six
inches of normal operating level.
Monitor influent wastewater
elevation in the wet well downstream
of the bar screens via level indicators.
Track the wet well level on control
panel readout.
The wet well elevation is
continuously monitored and recorded
by a circular chart.
The wet well and screenings channel
elevation is normally approximately
-16 ft.
During Wet Weather Event
Shift Supervisor
(Watch Engineer)
Operator (STW/SSTW) During a wet weather event, pump
up to the capacity of the pump
station before use of the influent
throttling gate. Table 1-4 shows the
pumping capacity of the

Newtown Creek WPCP WP-283 2-2
Wet Weather Operating Plan
April 2010
Brooklyn/Queens Pump Station
during various stages of
construction.
Supervisor (Watch Engineer)
determines the number and speed of
the main sewage pumps that must be
operated in order to maintain a wet
well elevation of approximately -16
feet.
Pump the Brooklyn/Queens influent
flow up to the maximum pumping
capacity of the Brooklyn/Queens
Pump Station or the difference
between the maximum plant flow
capacity with process units out of
service and the Manhattan Pump
Station pumping capacity, whichever
is lower. Then, continue operation of
pumps and begin to close the influent
throttling gate while maintaining the
maximum flow capacity to the pump
station, the difference between the
maximum plant flow capacity with
process units out of service and the
Manhattan Pump Station pumping
capacity, whichever is lower.
Visually monitor influent flow in the
in-service channels.
After Wet Weather Event
Shift Supervisor
(Watch Engineer)
Operator (STW/SSTW) As the wet well wastewater elevation
decreases below elevation of -16 feet
with the pumps operating, open the
throttling gate to normal operation
height.
Reduce the number of main sewage
pumps while maintaining a wet well
elevation of approximately -16 feet.
Why do we do this?
Prevent flooding of bar screens/channels and screen room, while maximizing flow into
the plant for secondary treatment. This is also performed to minimize regulator overflow.
What triggers the change?
High flow rates, as determined from monitoring the wet well level. The wet well and
screenings channel elevation is normally approximately -16 ft.
What can go wrong?
Flooding due to bar screens, pumps, and/or influent throttling gate failure.
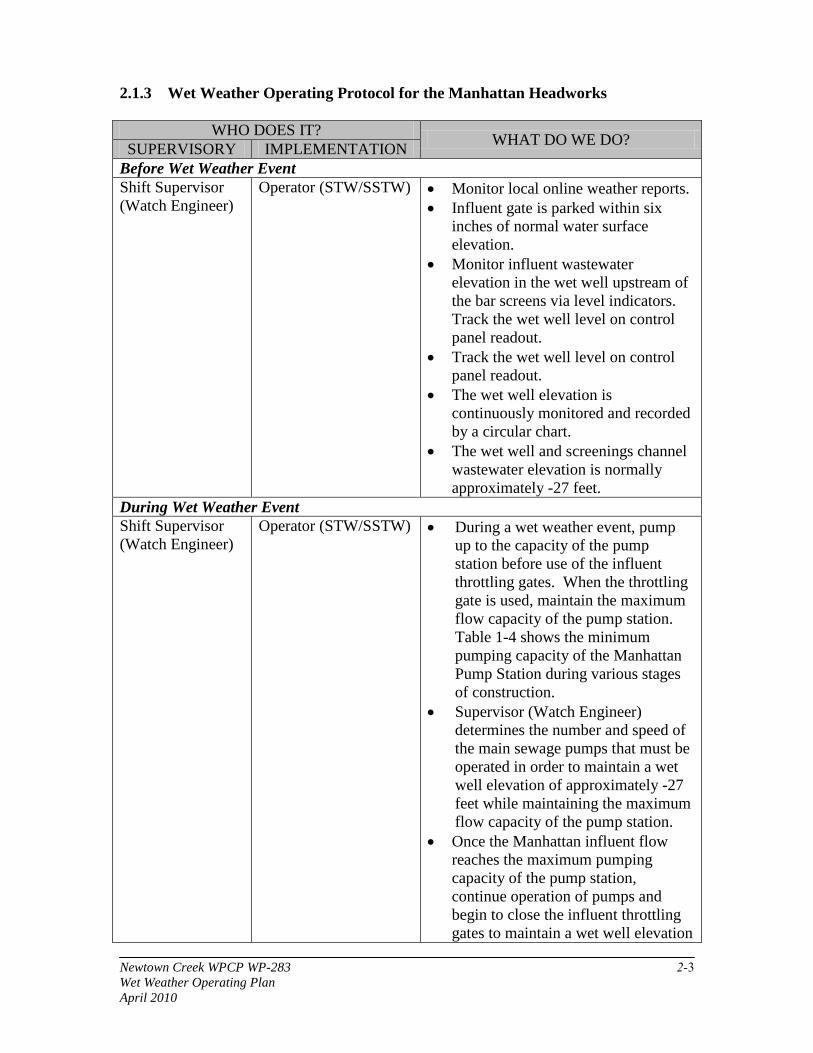
Newtown Creek WPCP WP-283 2-3
Wet Weather Operating Plan
April 2010
2.1.3 Wet Weather Operating Protocol for the Manhattan Headworks
WHO DOES IT? WHAT DO WE DO?
SUPERVISORY IMPLEMENTATION
Before Wet Weather Event
Shift Supervisor
(Watch Engineer)
Operator (STW/SSTW) Monitor local online weather reports.
Influent gate is parked within six
inches of normal water surface
elevation.
Monitor influent wastewater
elevation in the wet well upstream of
the bar screens via level indicators.
Track the wet well level on control
panel readout.
Track the wet well level on control
panel readout.
The wet well elevation is
continuously monitored and recorded
by a circular chart.
The wet well and screenings channel
wastewater elevation is normally
approximately -27 feet.
During Wet Weather Event
Shift Supervisor
(Watch Engineer)
Operator (STW/SSTW) During a wet weather event, pump
up to the capacity of the pump
station before use of the influent
throttling gates. When the throttling
gate is used, maintain the maximum
flow capacity of the pump station.
Table 1-4 shows the minimum
pumping capacity of the Manhattan
Pump Station during various stages
of construction.
Supervisor (Watch Engineer)
determines the number and speed of
the main sewage pumps that must be
operated in order to maintain a wet
well elevation of approximately -27
feet while maintaining the maximum
flow capacity of the pump station.
Once the Manhattan influent flow
reaches the maximum pumping
capacity of the pump station,
continue operation of pumps and
begin to close the influent throttling
gates to maintain a wet well elevation
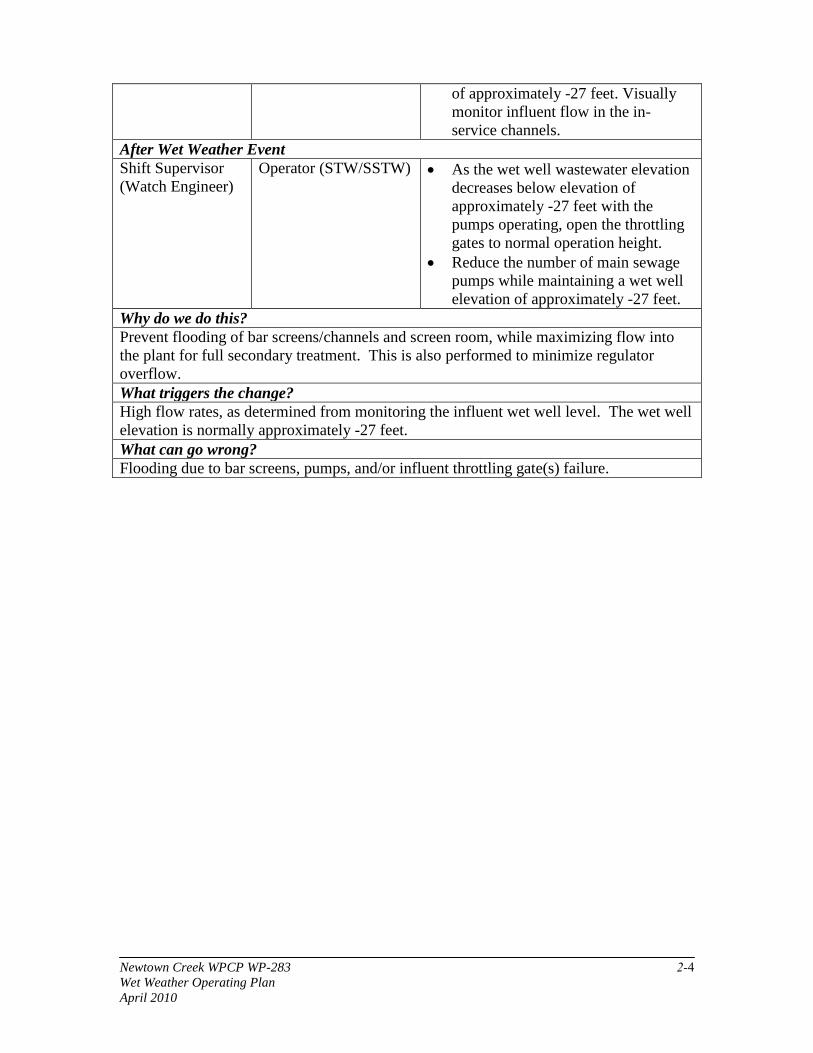
Newtown Creek WPCP WP-283 2-4
Wet Weather Operating Plan
April 2010
of approximately -27 feet. Visually
monitor influent flow in the in-
service channels.
After Wet Weather Event
Shift Supervisor
(Watch Engineer)
Operator (STW/SSTW) As the wet well wastewater elevation
decreases below elevation of
approximately -27 feet with the
pumps operating, open the throttling
gates to normal operation height.
Reduce the number of main sewage
pumps while maintaining a wet well
elevation of approximately -27 feet.
Why do we do this?
Prevent flooding of bar screens/channels and screen room, while maximizing flow into
the plant for full secondary treatment. This is also performed to minimize regulator
overflow.
What triggers the change?
High flow rates, as determined from monitoring the influent wet well level. The wet well
elevation is normally approximately -27 feet.
What can go wrong?
Flooding due to bar screens, pumps, and/or influent throttling gate(s) failure.
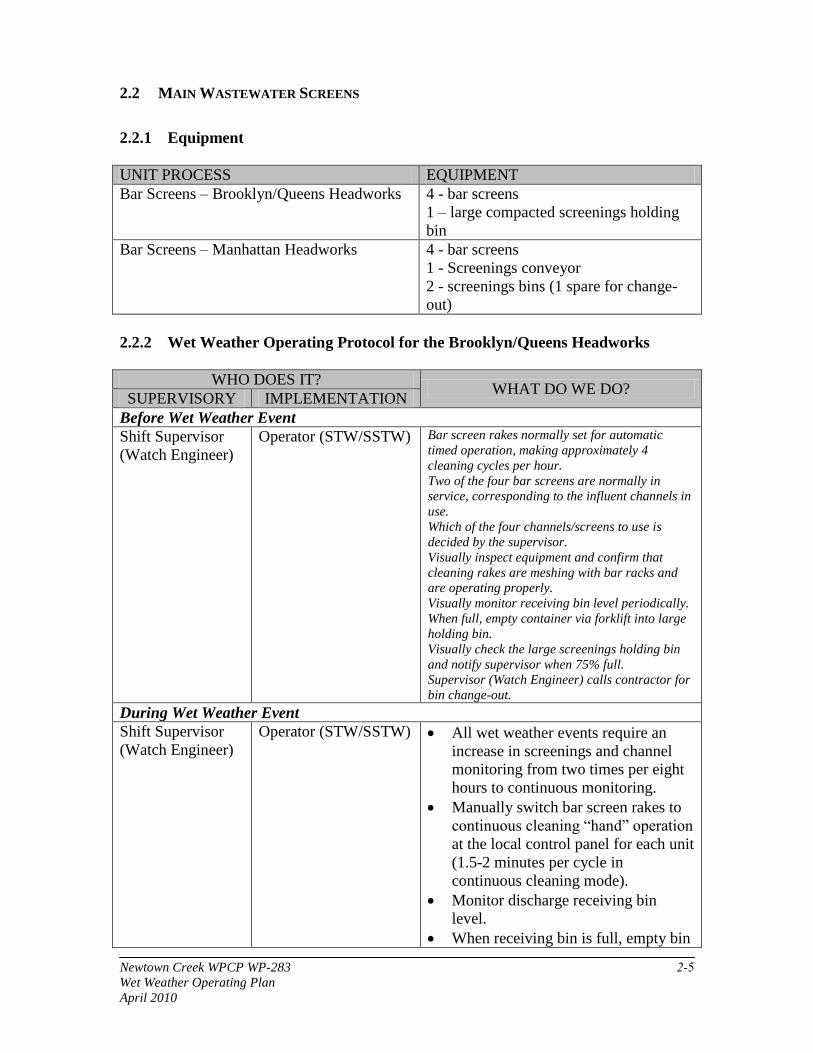
Newtown Creek WPCP WP-283 2-5
Wet Weather Operating Plan
April 2010
2.2 MAIN WASTEWATER SCREENS
2.2.1 Equipment
UNIT PROCESS EQUIPMENT
Bar Screens – Brooklyn/Queens Headworks 4 - bar screens
1 – large compacted screenings holding
bin
Bar Screens – Manhattan Headworks 4 - bar screens
1 - Screenings conveyor
2 - screenings bins (1 spare for change-
out)
2.2.2 Wet Weather Operating Protocol for the Brooklyn/Queens Headworks
WHO DOES IT? WHAT DO WE DO?
SUPERVISORY IMPLEMENTATION
Before Wet Weather Event
Shift Supervisor
(Watch Engineer)
Operator (STW/SSTW) Bar screen rakes normally set for automatic
timed operation, making approximately 4
cleaning cycles per hour.
Two of the four bar screens are normally in
service, corresponding to the influent channels in
use.
Which of the four channels/screens to use is
decided by the supervisor.
Visually inspect equipment and confirm that
cleaning rakes are meshing with bar racks and
are operating properly.
Visually monitor receiving bin level periodically.
When full, empty container via forklift into large
holding bin.
Visually check the large screenings holding bin
and notify supervisor when 75% full.
Supervisor (Watch Engineer) calls contractor for
bin change-out.
During Wet Weather Event
Shift Supervisor
(Watch Engineer)
Operator (STW/SSTW) All wet weather events require an
increase in screenings and channel
monitoring from two times per eight
hours to continuous monitoring.
Manually switch bar screen rakes to
continuous cleaning “hand” operation
at the local control panel for each unit
(1.5-2 minutes per cycle in
continuous cleaning mode).
Monitor discharge receiving bin
level.
When receiving bin is full, empty bin
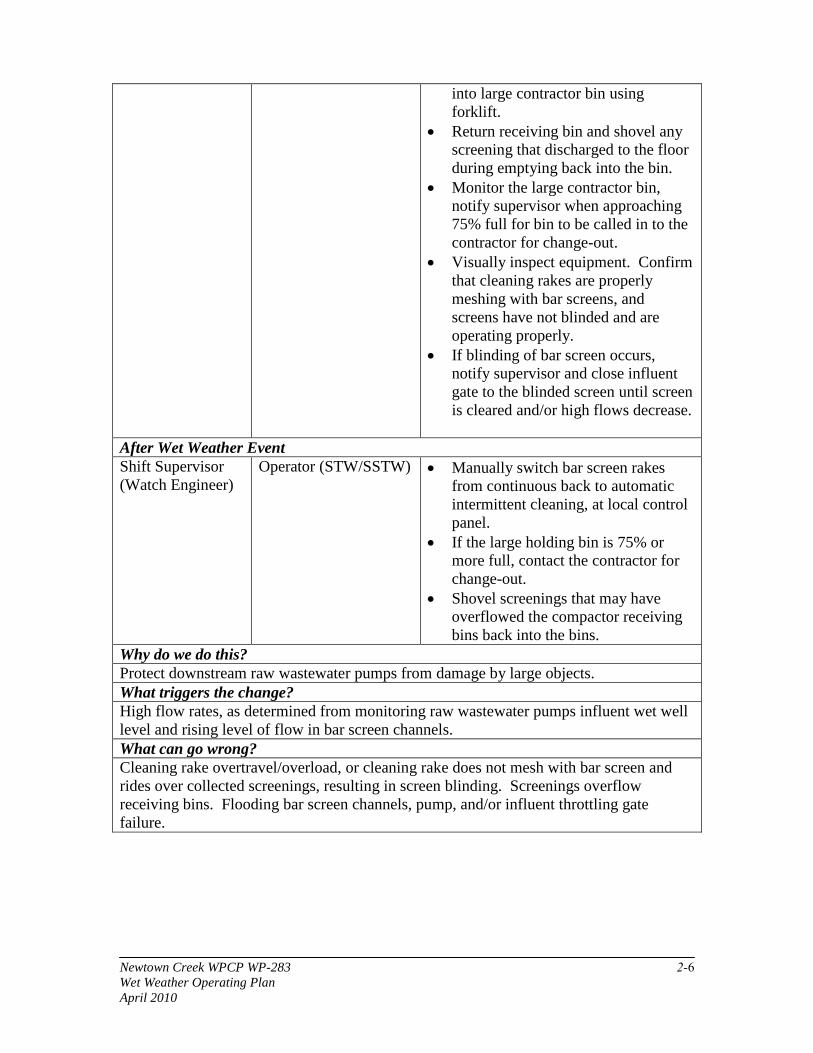
Newtown Creek WPCP WP-283 2-6
Wet Weather Operating Plan
April 2010
into large contractor bin using
forklift.
Return receiving bin and shovel any
screening that discharged to the floor
during emptying back into the bin.
Monitor the large contractor bin,
notify supervisor when approaching
75% full for bin to be called in to the
contractor for change-out.
Visually inspect equipment. Confirm
that cleaning rakes are properly
meshing with bar screens, and
screens have not blinded and are
operating properly.
If blinding of bar screen occurs,
notify supervisor and close influent
gate to the blinded screen until screen
is cleared and/or high flows decrease.
After Wet Weather Event
Shift Supervisor
(Watch Engineer)
Operator (STW/SSTW) Manually switch bar screen rakes
from continuous back to automatic
intermittent cleaning, at local control
panel.
If the large holding bin is 75% or
more full, contact the contractor for
change-out.
Shovel screenings that may have
overflowed the compactor receiving
bins back into the bins.
Why do we do this?
Protect downstream raw wastewater pumps from damage by large objects.
What triggers the change?
High flow rates, as determined from monitoring raw wastewater pumps influent wet well
level and rising level of flow in bar screen channels.
What can go wrong?
Cleaning rake overtravel/overload, or cleaning rake does not mesh with bar screen and
rides over collected screenings, resulting in screen blinding. Screenings overflow
receiving bins. Flooding bar screen channels, pump, and/or influent throttling gate
failure.

Newtown Creek WPCP WP-283 2-7
Wet Weather Operating Plan
April 2010
2.2.3 Wet Weather Operating Protocol for the Manhattan Headworks
WHO DOES IT? WHAT DO WE DO?
SUPERVISORY IMPLEMENTATION
Before Wet Weather Event
Shift Supervisor
(Watch Engineer)
Operator (STW/SSTW) Bar screen rakes normally set for automatic
timed operation, making approximately 4
cleaning cycles per hour.
Two of the four bar screens are normally in
service, corresponding to the influent channels in
use.
Which of the four channels/screens to use is
decided by the supervisor.
Visually inspect equipment and confirm that
cleaning rakes are meshing with bar racks.
Visually monitor conveyor periodically.
When full, empty container via forklift into large
holding bin.
Visually check the screenings holding bin and
notify supervisor when 75% full.
Supervisor (Watch Engineer) calls contractor for
bin change-out.
During Wet Weather Event
Shift Supervisor
(Watch Engineer)
Operator (STW/SSTW) All wet weather events require an
increase in screenings and channel
monitoring from two times per eight
hours to continuous monitoring.
Manually switch bar screen rakes to
continuous cleaning “hand” operation
at the local control panel for each unit
(1.5-2 minutes per cycle in
continuous cleaning mode).
When receiving bin is full, empty bin
into large contractor bin using
forklift.
Return receiving bin and shovel any
screening that discharged to the floor
during emptying back into the bin.
Monitor the large contractor bin,
notify supervisor when approaching
75% full for bin to be called in to the
contractor for change-out.
Visually inspect equipment. Confirm
that cleaning rakes are properly
meshing with bar screens and screens
have not blinded.
If blinding of bar screen occurs,
notify supervisor and close influent
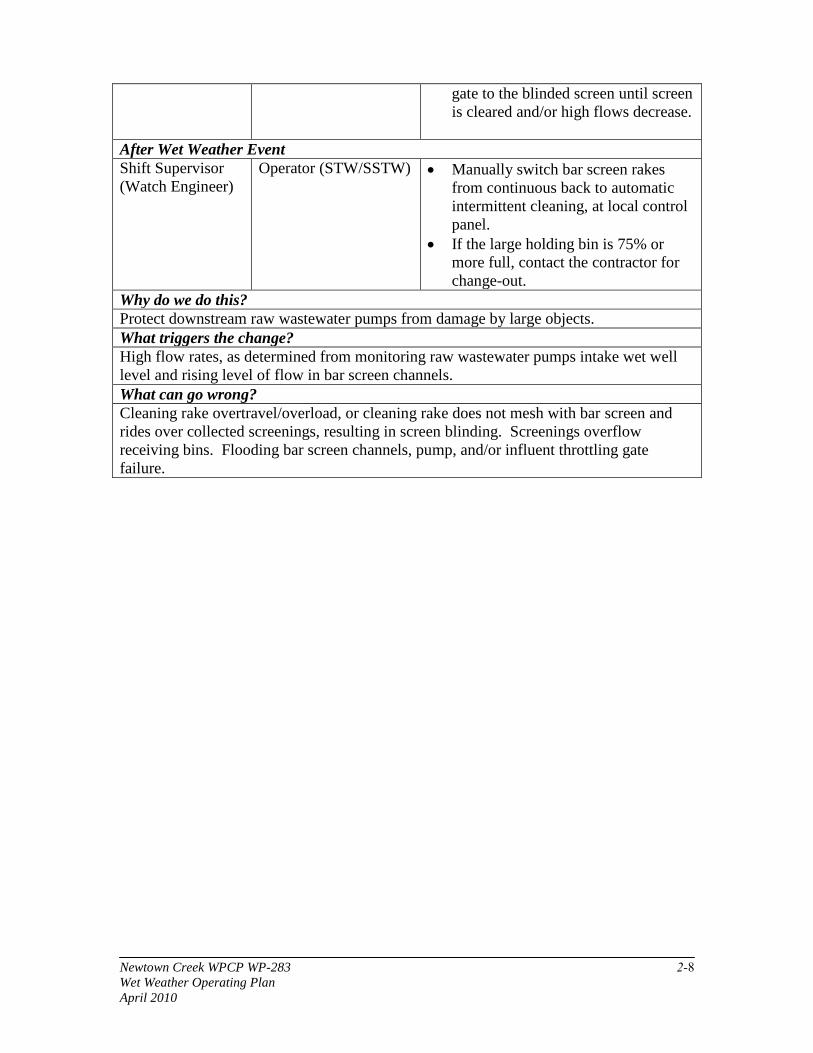
Newtown Creek WPCP WP-283 2-8
Wet Weather Operating Plan
April 2010
gate to the blinded screen until screen
is cleared and/or high flows decrease.
After Wet Weather Event
Shift Supervisor
(Watch Engineer)
Operator (STW/SSTW) Manually switch bar screen rakes
from continuous back to automatic
intermittent cleaning, at local control
panel.
If the large holding bin is 75% or
more full, contact the contractor for
change-out.
Why do we do this?
Protect downstream raw wastewater pumps from damage by large objects.
What triggers the change?
High flow rates, as determined from monitoring raw wastewater pumps intake wet well
level and rising level of flow in bar screen channels.
What can go wrong?
Cleaning rake overtravel/overload, or cleaning rake does not mesh with bar screen and
rides over collected screenings, resulting in screen blinding. Screenings overflow
receiving bins. Flooding bar screen channels, pump, and/or influent throttling gate
failure.
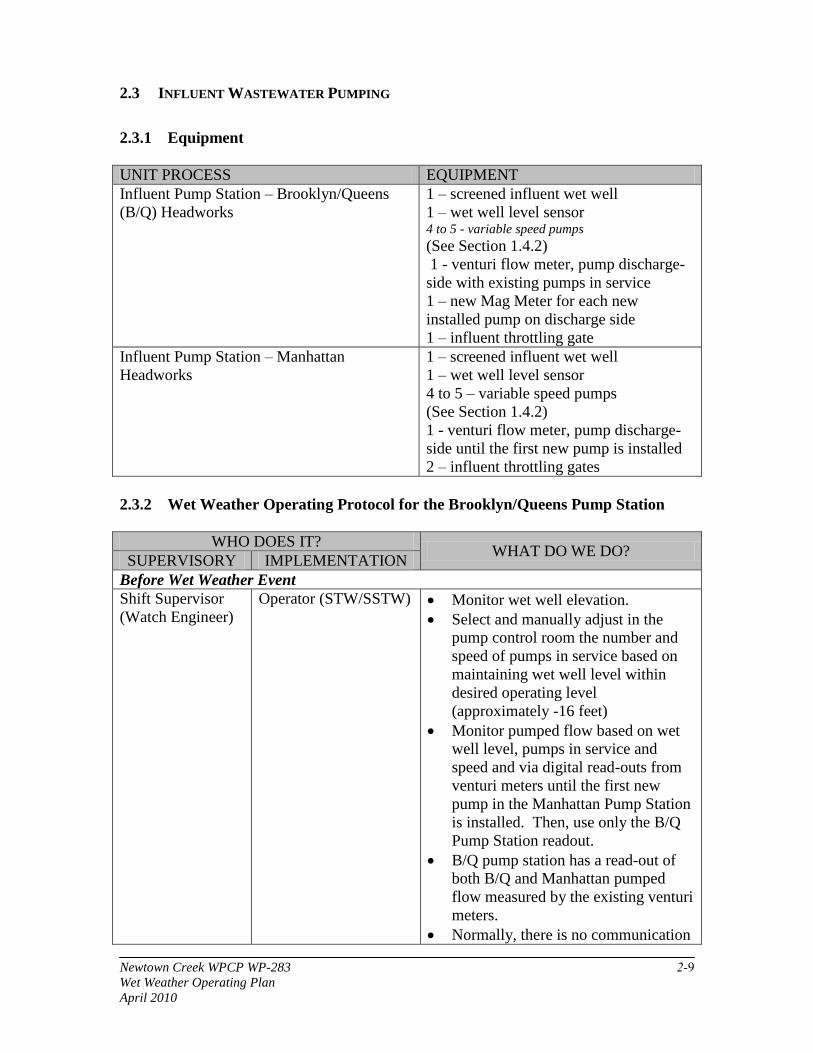
Newtown Creek WPCP WP-283 2-9
Wet Weather Operating Plan
April 2010
2.3 INFLUENT WASTEWATER PUMPING
2.3.1 Equipment
UNIT PROCESS EQUIPMENT
Influent Pump Station – Brooklyn/Queens
(B/Q) Headworks
1 – screened influent wet well
1 – wet well level sensor 4 to 5 - variable speed pumps
(See Section 1.4.2)
1 - venturi flow meter, pump discharge-
side with existing pumps in service
1 – new Mag Meter for each new
installed pump on discharge side
1 – influent throttling gate
Influent Pump Station – Manhattan
Headworks
1 – screened influent wet well
1 – wet well level sensor
4 to 5 – variable speed pumps
(See Section 1.4.2)
1 - venturi flow meter, pump discharge-
side until the first new pump is installed
2 – influent throttling gates
2.3.2 Wet Weather Operating Protocol for the Brooklyn/Queens Pump Station
WHO DOES IT? WHAT DO WE DO?
SUPERVISORY IMPLEMENTATION
Before Wet Weather Event
Shift Supervisor
(Watch Engineer)
Operator (STW/SSTW) Monitor wet well elevation.
Select and manually adjust in the
pump control room the number and
speed of pumps in service based on
maintaining wet well level within
desired operating level
(approximately -16 feet)
Monitor pumped flow based on wet
well level, pumps in service and
speed and via digital read-outs from
venturi meters until the first new
pump in the Manhattan Pump Station
is installed. Then, use only the B/Q
Pump Station readout.
B/Q pump station has a read-out of
both B/Q and Manhattan pumped
flow measured by the existing venturi
meters.
Normally, there is no communication

Newtown Creek WPCP WP-283 2-10
Wet Weather Operating Plan
April 2010
between B/Q and Manhattan Pump
Stations (PSs). Operations pumping
decisions are made independently for
each PS. The only form of
information exchange between pump
stations is the Manhattan pumped
flow read-out in the B/Q control
room for the existing pumps only.
During Wet Weather Event
Shift Supervisor
(Watch Engineer)
Operator (STW/SSTW) Monitor wet well elevation.
As the wet well level rises, place
pumps in service and increase speed
of variable speed pumps as necessary
to maintain a wet well wastewater
elevation of approximately -16 feet.
Pump to maximum capacity of the
pumping station or the difference
between the maximum plant flow
capacity with process units out of
service and the Manhattan Pump
Station pumping capacity, whichever
is lower.
All adjustments are made manually
by Operator (STW/SSTW) in the
pump control room based on
maintaining wet well level within
desired operating range.
Restrict flow through influent
throttling gate if pumping rate is
maximized and wet well level
continues to rise (see Section 2.1.2
for influent throttling gate
operations).
After Wet Weather Event
Shift Supervisor
(Watch Engineer)
Operator (STW/SSTW) Maintain pumping rate as required to
keep wet well level at the operating
level.
If influent throttling gates have been
throttled, maintain maximum
pumping rate until all previously
constricted influent gates are returned
to fully open position and flow
begins to decrease lowering wet well
level.
Reduce pump speeds and number in
service to maintain wet well level and

Newtown Creek WPCP WP-283 2-11
Wet Weather Operating Plan
April 2010
return to dry weather operation.
Why do we do this?
Maximize flow to treatment plant, and minimize need for flow storage in collection
system and associated storm overflow from collection system into river.
What triggers the change?
High flows.
What can go wrong?
Pump fails to start. Pump fails while running. Screens blind, necessitating pump speed
reduction or shutdown.
2.3.3 Wet Weather Operating Protocol for the Manhattan Pump Station
WHO DOES IT? WHAT DO WE DO?
SUPERVISORY IMPLEMENTATION
Before Wet Weather Event
Shift Supervisor
(Watch Engineer)
Operator (STW/SSTW) Monitor wet well elevation.
Select and manually adjust in the
pump control room the number and
speed of pumps in service based on
maintaining wet well level within
desired operating range ( below
approximately - 27 feet).
Monitor pumped flow based on wet
well level, pumps in service and
speed and via digital read-outs from
venturi meters until the first new
pump in the Manhattan Pump Station
is installed. Then calculate/estimate
total Manhattan Pump Station flows
by subtracting the B/Q flow from the
total plant flow or using pump and
horsepower draw curves.
Manhattan pump station has a read-
out of the Manhattan pumped flow
only from discharge venturi meter.
Normally, there is no communication
between B/Q and Manhattan Pump
Stations. Operations pumping
decisions are made independently for
each PS. The only form of
information exchange between pump
stations is the Manhattan pumped
flow read-out for existing pumps in
the B/Q control room.
During Wet Weather Event
Shift Supervisor Operator (STW/SSTW) Monitor wet well elevation.

Newtown Creek WPCP WP-283 2-12
Wet Weather Operating Plan
April 2010
(Watch Engineer) As the wet well level rises, place
pumps in service and increase speed
of variable speed pumps as
necessary.
Pump a minimum of 300 MGD
during a wet weather event.
All adjustments are made manually
by Operator (STW/SSTW) in the
pump control room based on
maintaining wet well level within
desired operating range.
Restrict flow through influent
throttling gates if pumping rate is
maximized and wet well level
continues to rise (see Section 2.1.3
for influent throttling gate
operations).
After Wet Weather Event
Shift Supervisor
(Watch Engineer)
Operator (STW/SSTW) Maintain pumping rate as required to
keep wet well level in operating
range.
If influent throttling gates have been
throttled, maintain maximum
pumping rate until all previously
constricted influent throttling gates
are returned to fully open position
and flow begins to decrease lowering
wet well level.
Reduce pump speeds and number in
service to maintain wet well level and
return to dry weather operation.
Why do we do this?
Maximize flow to treatment plant, and minimize need for flow storage in collection
system and associated storm overflow from collection system into river.
What triggers the change?
High flows.
What can go wrong?
Pump fails to start. Pump fails while running. Screens blind, necessitating pump speed
reduction or shutdown.

Newtown Creek WPCP WP-283 2-13
Wet Weather Operating Plan
April 2010
2.4 GRIT REMOVAL
2.4.1 Equipment
UNIT PROCESS EQUIPMENT
Grit Removal 16 – Grit Tanks (8 per battery)
32– Circular grit collector mechanisms
with rotating rake arms (2 per Grit Tank)
32 – Grit pumps (1 operating and 1
standby per Grit Tank).
4 – Grit Houses
16 – Cyclone degritters
4 – grit classifiers
8 – roll-off containers
(4 cyclone degritters, 1 grit classifier and
2 roll-off containers per Grit House).
2.4.2 Wet Weather Operating Protocol
WHO DOES IT? WHAT DO WE DO?
SUPERVISORY IMPLEMENTATION
Before Wet Weather Event
Shift Supervisor
(Watch Engineer)
Operator (STW/SSTW) All detritors, associated grit pumps,
grit cyclones and classifiers in service
are operated continuously. Monitor
by visual observation.
Monitor detritor grit collector torque
and grit pump discharge pressure.
During Wet Weather Event
Shift Supervisor
(Watch Engineer)
Operator (STW/SSTW) Monitor the grit roll-off containers.
Notify Supervisor (Watch Engineer)
when approaching 75% full and
request additional containers, as
determined by Supervisor.
Operate up to 4 Grit Houses as
determined by Supervisor based on
plant experience.
Maintain a maximum number of
detritors on line in accordance with
Section 1.4.3.
After Wet Weather Event
Shift Supervisor
(Watch Engineer)
Operator (STW/SSTW) No action required.
Why do we do this?
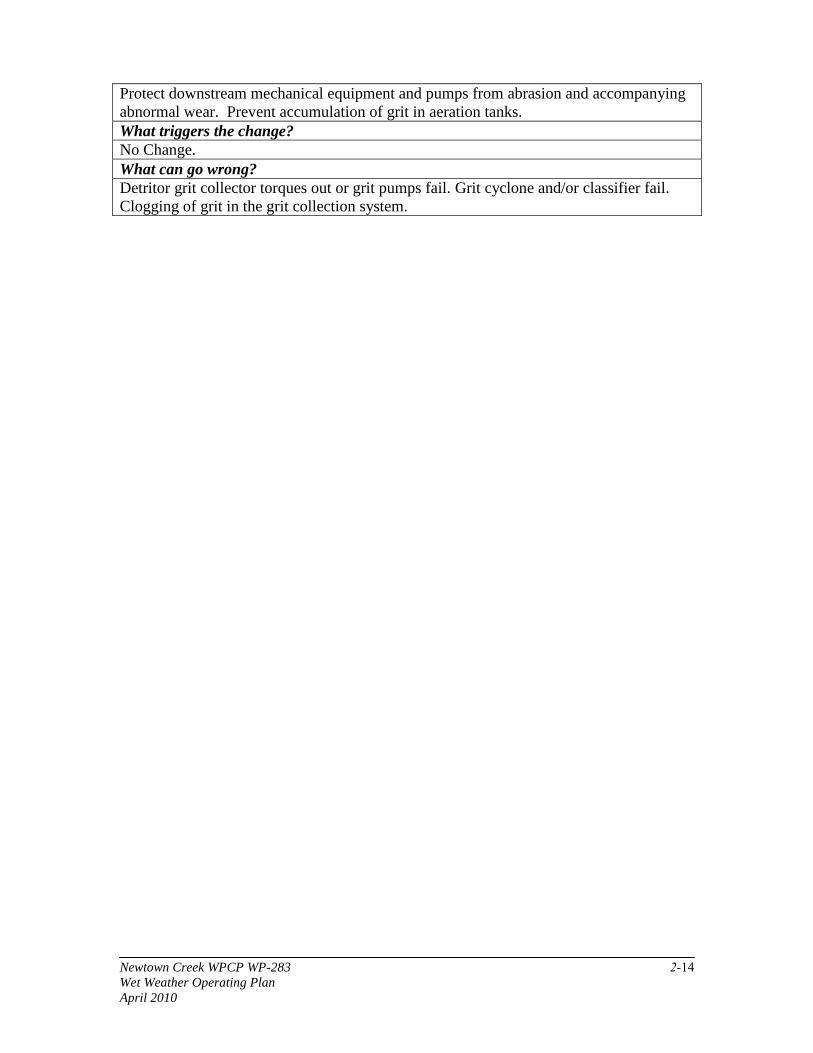
Newtown Creek WPCP WP-283 2-14
Wet Weather Operating Plan
April 2010
Protect downstream mechanical equipment and pumps from abrasion and accompanying
abnormal wear. Prevent accumulation of grit in aeration tanks.
What triggers the change?
No Change.
What can go wrong?
Detritor grit collector torques out or grit pumps fail. Grit cyclone and/or classifier fail.
Clogging of grit in the grit collection system.

Newtown Creek WPCP WP-283 2-15
Wet Weather Operating Plan
April 2010
2.5 AERATION TANKS
2.5.1 Equipment
UNIT PROCESS EQUIPMENT
Aeration Tanks (ATs) 8 – 4-pass aeration tanks (2 batteries of 4
ATs)
2- Aeration tank influent channels (1 per
battery)
32 – Automatic step-feed gates (4 gates
per aeration tank)
2.5.2 Wet Weather Operating Protocol
WHO DOES IT? WHAT DO WE DO?
SUPERVISORY IMPLEMENTATION
Before Wet Weather Event
Shift Supervisor
(Watch Engineer)
Operator (STW/SSTW) Currently, normal operation involves
aeration influent flow split between
the four passes as required.
Adjustments to influent feed (pass)
gates are made by staff, as necessary.
Set the operation of the influent pass
gates to automatic.
RAS is sent to pass A.
During Wet Weather Event
Shift Supervisor
(Watch Engineer)
Operator (STW/SSTW) Flow rates determine aeration tank
influent pass gate settings
automatically
o When influent flow exceeds
400 MGD, open the D pass
gate to 100% and then close
the B pass gate.
After Wet Weather Event
Shift Supervisor
(Watch Engineer)
Operator (STW/SSTW) Gate positions reset automatically,
based on operator prompt.
o When the influent flow to the
tank drops below 300 MGD,
open the B pass step feed
gates and wait a minimum of
2 hours.
o At the end of 2 hours, return
Pass D gate to its original pre-
Wet Weather event setting.
Why do we do this?

Newtown Creek WPCP WP-283 2-16
Wet Weather Operating Plan
April 2010
Gate positions are automatically set to park solids to prevent solids washout in the final
tanks.
What triggers the change?
High flows. Increasing speed and/or starting additional raw wastewater pumps to
accommodate high wet weather flows.
What can go wrong? Gate failure. Gates not in automatic mode.

Newtown Creek WPCP WP-283 2-17
Wet Weather Operating Plan
April 2010
2.6 FINAL SEDIMENTATION TANKS
2.6.1 Equipment
UNIT PROCESS EQUIPMENT
Final Sedimentation Tanks (FSTs) 16 – sedimentation tanks (8 per battery)
8 – common system RAS pumps (4 per
battery)
8 – common system WAS pumps (4 per
battery)
96 – chain-and-flight collectors (2 per
FST bay)
16 – sludge trough cross-collectors (1 per
FST)
16 – common system telescoping sludge
flow control valves (1 per FST)
2 – scum pits (1 per battery)
8 – scum pumps (4 per battery)
2 – RAS/WAS wet wells
2 – RAS splitter boxes
3 – Polymer Metering Pumps
2.6.2 Wet Weather Operating Protocol
WHO DOES IT? WHAT DO WE DO?
SUPERVISORY IMPLEMENTATION
Before Wet Weather Event
Shift Supervisor
(Watch Engineer)
Operator (STW/SSTW) Currently, normal operation involves
all FSTs in-service
Common influent channel allows for
all FSTs to be in service even if an
aeration tank is out of service.
Scum is removed periodically
through scum gates.
Scum discharges to a scum pit, one
for each battery of FSTs.
RAS flow rate is manually set
(constant) as directed by the process
engineer or automatically flow paced
according to plant influent flow.
Automatic flow pacing should
include a maximum RAS flow rate.
WAS flow rate is set as directed by
the process engineer.
RAS flow rates are controlled based
on pump speed and number in service
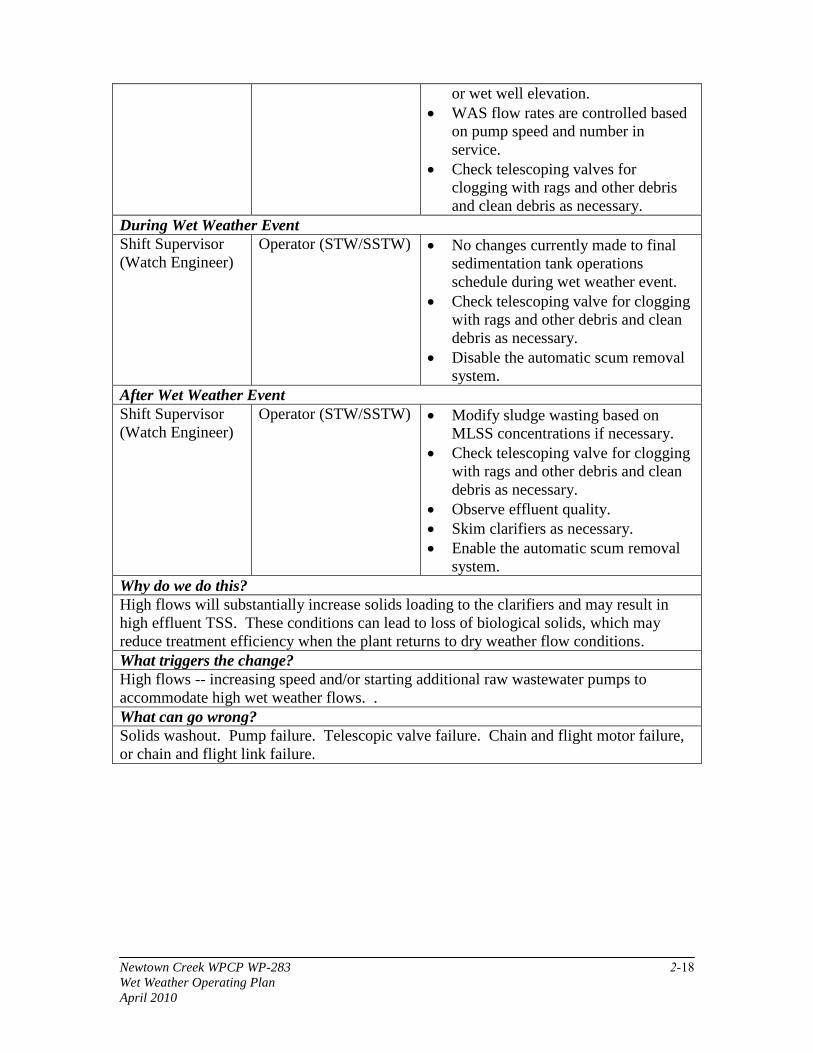
Newtown Creek WPCP WP-283 2-18
Wet Weather Operating Plan
April 2010
or wet well elevation.
WAS flow rates are controlled based
on pump speed and number in
service.
Check telescoping valves for
clogging with rags and other debris
and clean debris as necessary.
During Wet Weather Event
Shift Supervisor
(Watch Engineer)
Operator (STW/SSTW) No changes currently made to final
sedimentation tank operations
schedule during wet weather event.
Check telescoping valve for clogging
with rags and other debris and clean
debris as necessary.
Disable the automatic scum removal
system.
After Wet Weather Event
Shift Supervisor
(Watch Engineer)
Operator (STW/SSTW) Modify sludge wasting based on
MLSS concentrations if necessary.
Check telescoping valve for clogging
with rags and other debris and clean
debris as necessary.
Observe effluent quality.
Skim clarifiers as necessary.
Enable the automatic scum removal
system.
Why do we do this?
High flows will substantially increase solids loading to the clarifiers and may result in
high effluent TSS. These conditions can lead to loss of biological solids, which may
reduce treatment efficiency when the plant returns to dry weather flow conditions.
What triggers the change?
High flows -- increasing speed and/or starting additional raw wastewater pumps to
accommodate high wet weather flows. .
What can go wrong?
Solids washout. Pump failure. Telescopic valve failure. Chain and flight motor failure,
or chain and flight link failure.

Newtown Creek WPCP WP-283 2-19
Wet Weather Operating Plan
April 2010
2.7 EFFLUENT CHLORINATION
2.7.1 Equipment
UNIT PROCESS EQUIPMENT
Effluent Chlorination 3 – Chlorine Contact Tanks (CCTs)
6- Hypochlorite metering pumps (3
stand-by)
6- Hypochlorite storage tanks
6- Induction mixers (3 stand-by)
2- Chlorine dosing analyzers
1- Effluent analyzer
2.7.2 Wet Weather Operating Protocol
WHO DOES IT? WHAT DO WE DO?
SUPERVISORY IMPLEMENTATION
Before Wet Weather Event
Shift Supervisor
(Watch Engineer)
Operator (STW/SSTW) All three CCTs are normally in
service except for tank cleaning or
maintenance
Each CCT normally will have one
induction mixer (for the hypo dosing
point) and one dual-head metering
pump in service for each CCT
The chlorine dosage is normally
automatically adjusted to maintain a
target residual with a flow paced
residual trim control strategy
A target chlorine residual is
maintained with the detention time
of the three CCTs to achieve
adequate fecal coliform kills
The shift supervisor can monitor the
residual remotely with the PMCS,
but the operator makes any changes
locally
Hypochlorite storage capacity should
be maintained to insure adequate
chemical is available for any sized
storm event
Skim the manual scum collection
area through the scum weirs as
needed.
During Wet Weather Event
Shift Supervisor Operator (STW/SSTW) All three CCTs are needed to
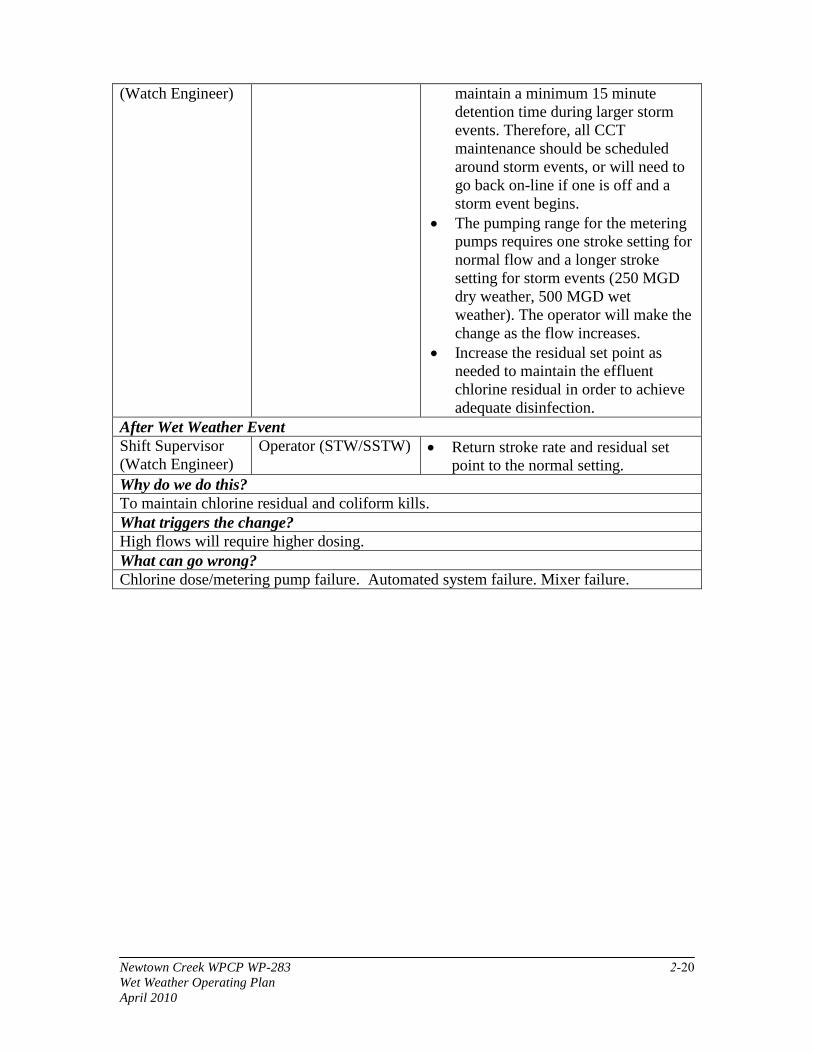
Newtown Creek WPCP WP-283 2-20
Wet Weather Operating Plan
April 2010
(Watch Engineer) maintain a minimum 15 minute
detention time during larger storm
events. Therefore, all CCT
maintenance should be scheduled
around storm events, or will need to
go back on-line if one is off and a
storm event begins.
The pumping range for the metering
pumps requires one stroke setting for
normal flow and a longer stroke
setting for storm events (250 MGD
dry weather, 500 MGD wet
weather). The operator will make the
change as the flow increases.
Increase the residual set point as
needed to maintain the effluent
chlorine residual in order to achieve
adequate disinfection.
After Wet Weather Event
Shift Supervisor
(Watch Engineer)
Operator (STW/SSTW) Return stroke rate and residual set
point to the normal setting.
Why do we do this?
To maintain chlorine residual and coliform kills.
What triggers the change?
High flows will require higher dosing.
What can go wrong?
Chlorine dose/metering pump failure. Automated system failure. Mixer failure.
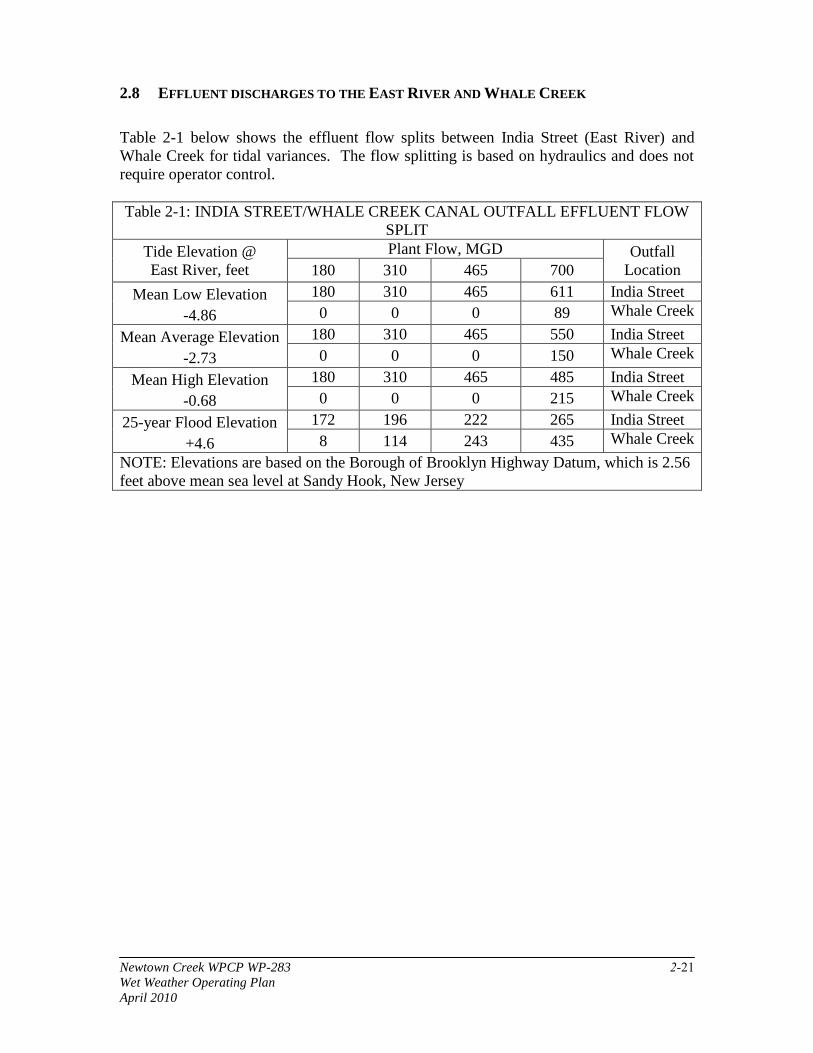
Newtown Creek WPCP WP-283 2-21
Wet Weather Operating Plan
April 2010
2.8 EFFLUENT DISCHARGES TO THE EAST RIVER AND WHALE CREEK
Table 2-1 below shows the effluent flow splits between India Street (East River) and
Whale Creek for tidal variances. The flow splitting is based on hydraulics and does not
require operator control.
Table 2-1: INDIA STREET/WHALE CREEK CANAL OUTFALL EFFLUENT FLOW
SPLIT
Tide Elevation @
East River, feet
Plant Flow, MGD Outfall
Location 180 310 465 700
Mean Low Elevation
-4.86
180 310 465 611 India Street
0 0 0 89 Whale Creek
Mean Average Elevation
-2.73
180 310 465 550 India Street
0 0 0 150 Whale Creek
Mean High Elevation
-0.68
180 310 465 485 India Street
0 0 0 215 Whale Creek
25-year Flood Elevation
+4.6
172 196 222 265 India Street
8 114 243 435 Whale Creek
NOTE: Elevations are based on the Borough of Brooklyn Highway Datum, which is 2.56
feet above mean sea level at Sandy Hook, New Jersey
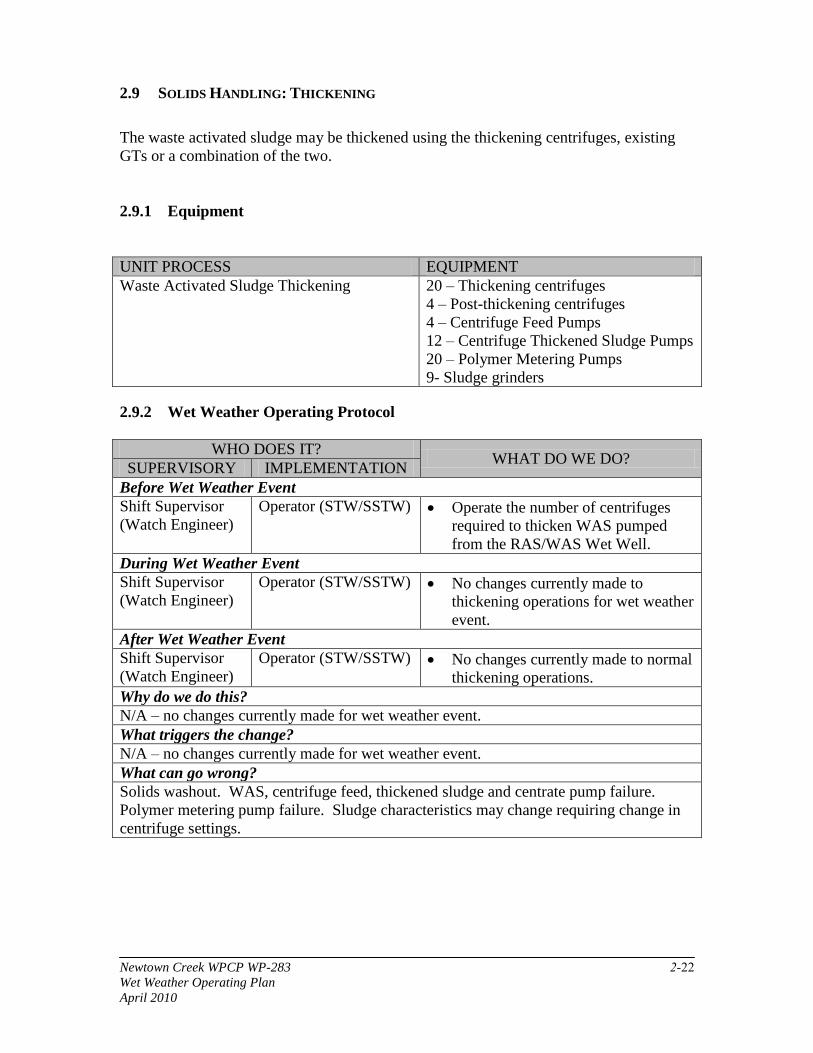
Newtown Creek WPCP WP-283 2-22
Wet Weather Operating Plan
April 2010
2.9 SOLIDS HANDLING: THICKENING
The waste activated sludge may be thickened using the thickening centrifuges, existing
GTs or a combination of the two.
2.9.1 Equipment
UNIT PROCESS EQUIPMENT
Waste Activated Sludge Thickening 20 – Thickening centrifuges
4 – Post-thickening centrifuges
4 – Centrifuge Feed Pumps
12 – Centrifuge Thickened Sludge Pumps
20 – Polymer Metering Pumps
9- Sludge grinders
2.9.2 Wet Weather Operating Protocol
WHO DOES IT? WHAT DO WE DO?
SUPERVISORY IMPLEMENTATION
Before Wet Weather Event
Shift Supervisor
(Watch Engineer)
Operator (STW/SSTW) Operate the number of centrifuges
required to thicken WAS pumped
from the RAS/WAS Wet Well.
During Wet Weather Event
Shift Supervisor
(Watch Engineer)
Operator (STW/SSTW) No changes currently made to
thickening operations for wet weather
event.
After Wet Weather Event
Shift Supervisor
(Watch Engineer)
Operator (STW/SSTW) No changes currently made to normal
thickening operations.
Why do we do this?
N/A – no changes currently made for wet weather event.
What triggers the change?
N/A – no changes currently made for wet weather event.
What can go wrong?
Solids washout. WAS, centrifuge feed, thickened sludge and centrate pump failure.
Polymer metering pump failure. Sludge characteristics may change requiring change in
centrifuge settings.
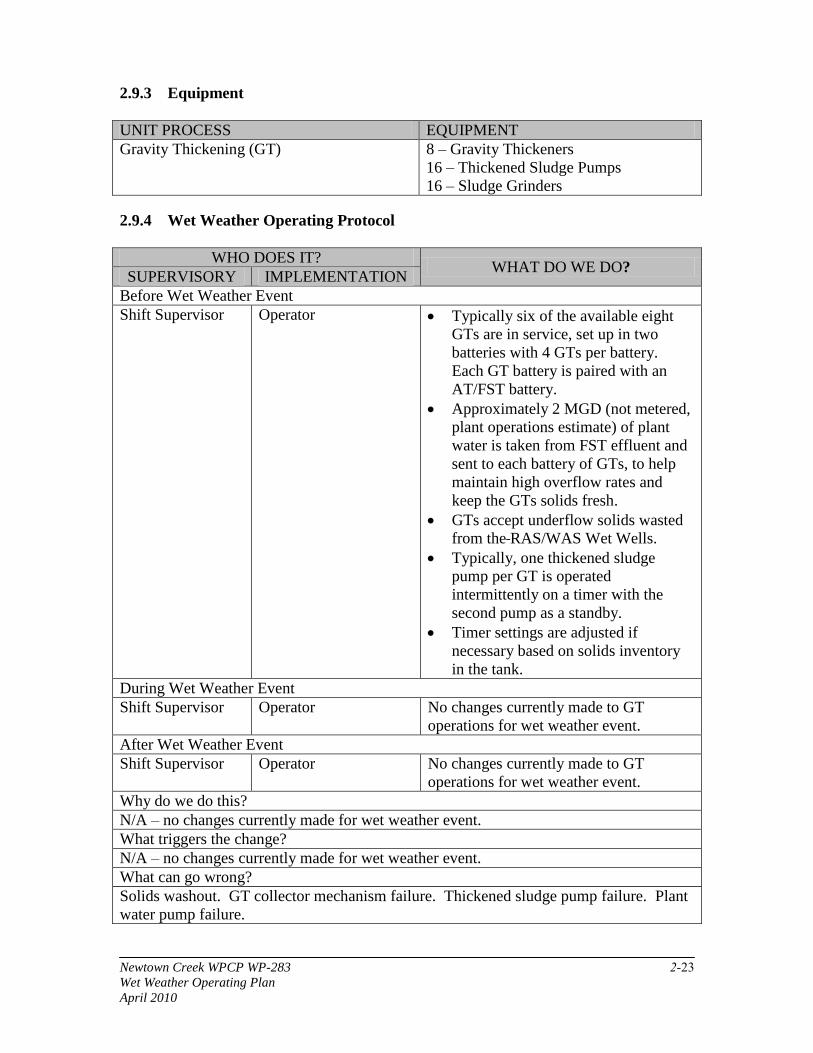
Newtown Creek WPCP WP-283 2-23
Wet Weather Operating Plan
April 2010
2.9.3 Equipment
UNIT PROCESS EQUIPMENT
Gravity Thickening (GT) 8 – Gravity Thickeners
16 – Thickened Sludge Pumps
16 – Sludge Grinders
2.9.4 Wet Weather Operating Protocol
WHO DOES IT? WHAT DO WE DO?
SUPERVISORY IMPLEMENTATION
Before Wet Weather Event
Shift Supervisor Operator Typically six of the available eight
GTs are in service, set up in two
batteries with 4 GTs per battery.
Each GT battery is paired with an
AT/FST battery.
Approximately 2 MGD (not metered,
plant operations estimate) of plant
water is taken from FST effluent and
sent to each battery of GTs, to help
maintain high overflow rates and
keep the GTs solids fresh.
GTs accept underflow solids wasted
from the RAS/WAS Wet Wells.
Typically, one thickened sludge
pump per GT is operated
intermittently on a timer with the
second pump as a standby.
Timer settings are adjusted if
necessary based on solids inventory
in the tank.
During Wet Weather Event
Shift Supervisor Operator No changes currently made to GT
operations for wet weather event.
After Wet Weather Event
Shift Supervisor Operator No changes currently made to GT
operations for wet weather event.
Why do we do this?
N/A – no changes currently made for wet weather event.
What triggers the change?
N/A – no changes currently made for wet weather event.
What can go wrong?
Solids washout. GT collector mechanism failure. Thickened sludge pump failure. Plant
water pump failure.

Newtown Creek WPCP WP-283 3-1
Wet Weather Operating Plan
April 2010
3.0 REMAINING PLANNED TRACK 3 PLANT UPGRADES
The NCWPCP is undergoing major capital improvements as defined in the Track 3
Facility Plan to meet secondary treatment limits and provide a greater degree of
flexibility in managing and optimizing wet weather operation and performance. A site
plan and process flow diagram for the Track 3 facilities are presented in Figures 3-1 and
3-2 respectively.
At the heart of the Track 3 design is the addition of a new third treatment battery of grit,
aeration and sedimentation tanks equal in volume to each of the existing two batteries,
increased oxygen transfer capacity, increased RAS and WAS capacity, and solids
settleability enhancements including anaerobic selector zones in the aeration tanks and
polymer addition to the clarifier influent. The Track 3 design provides a 2-hour HRT at
the design average daily flow of 310 MGD and supports operation with a significantly
higher average mixed liquor inventory and subsequent higher SRT than the existing
system. Numerous additional upgrades are being provided throughout the facility to
support the Track 3 process design and provide improved process management and
overall system reliability.
This section provides a summary of the remaining major improvements to be
implemented as part of the overall plant upgrade.
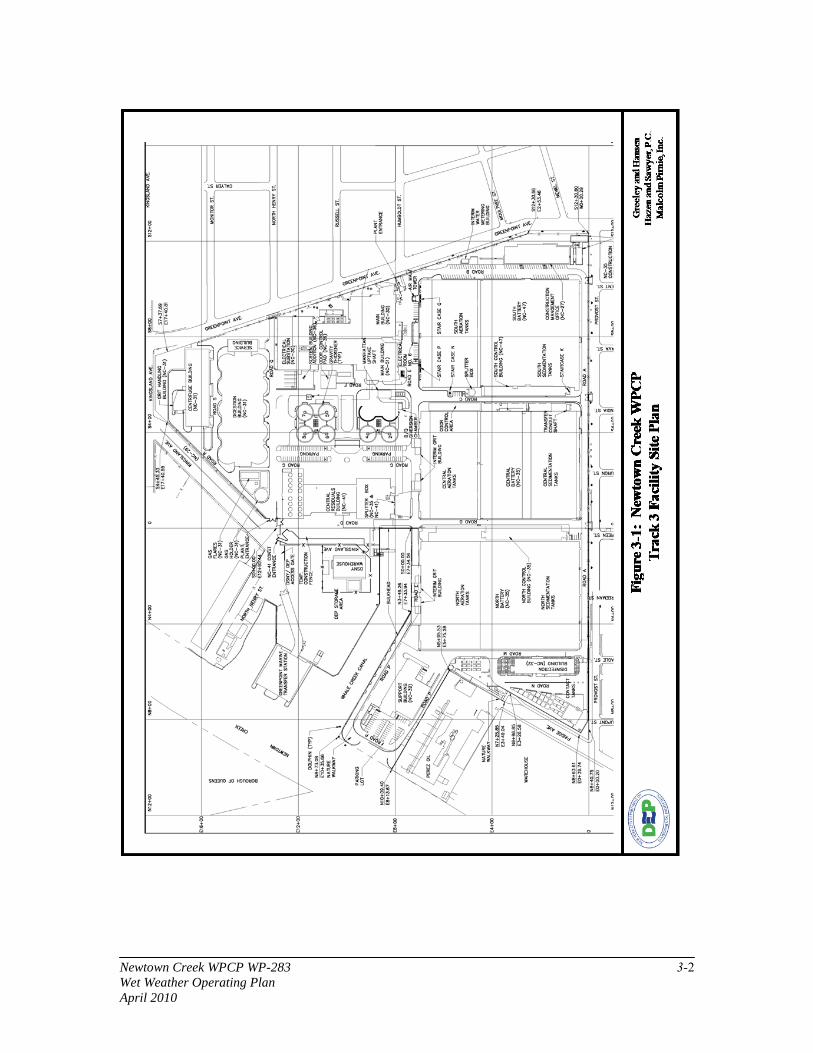
Newtown Creek WPCP WP-283 3-2
Wet Weather Operating Plan
April 2010

Newtown Creek WPCP WP-283 3-3
Wet Weather Operating Plan
April 2010
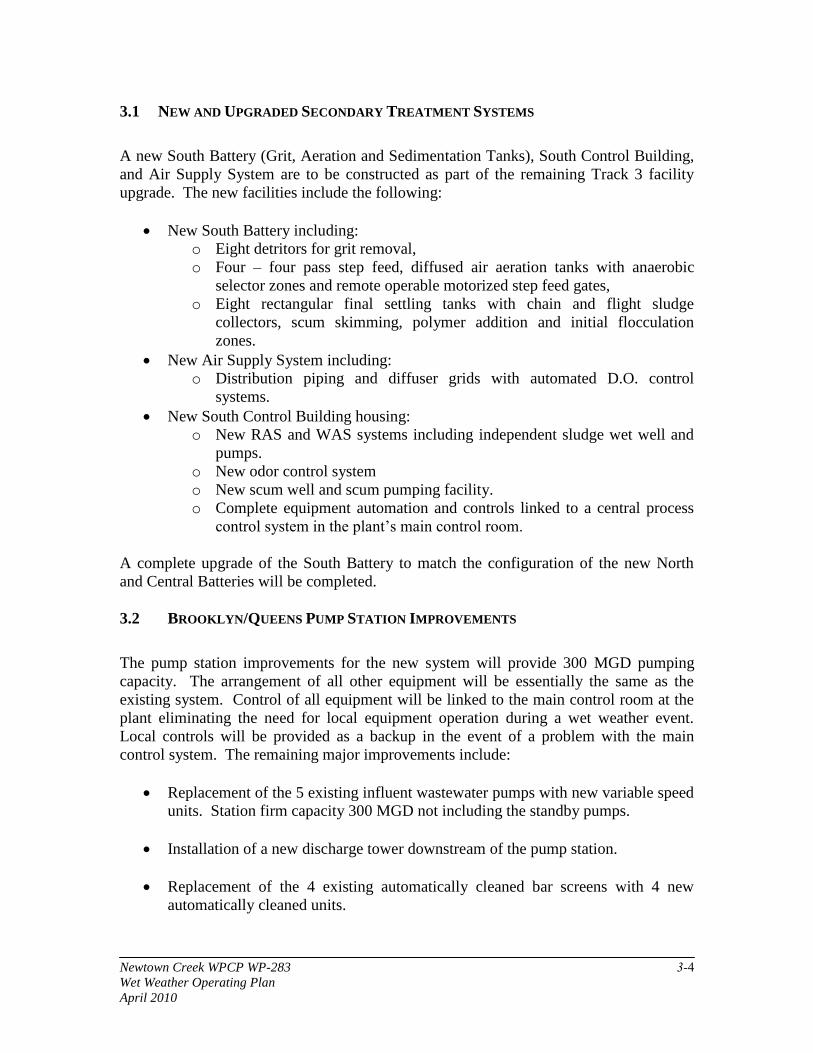
Newtown Creek WPCP WP-283 3-4
Wet Weather Operating Plan
April 2010
3.1 NEW AND UPGRADED SECONDARY TREATMENT SYSTEMS
A new South Battery (Grit, Aeration and Sedimentation Tanks), South Control Building,
and Air Supply System are to be constructed as part of the remaining Track 3 facility
upgrade. The new facilities include the following:
New South Battery including:
o Eight detritors for grit removal,
o Four – four pass step feed, diffused air aeration tanks with anaerobic
selector zones and remote operable motorized step feed gates,
o Eight rectangular final settling tanks with chain and flight sludge
collectors, scum skimming, polymer addition and initial flocculation
zones.
New Air Supply System including:
o Distribution piping and diffuser grids with automated D.O. control
systems.
New South Control Building housing:
o New RAS and WAS systems including independent sludge wet well and
pumps.
o New odor control system
o New scum well and scum pumping facility.
o Complete equipment automation and controls linked to a central process
control system in the plant’s main control room.
A complete upgrade of the South Battery to match the configuration of the new North
and Central Batteries will be completed.
3.2 BROOKLYN/QUEENS PUMP STATION IMPROVEMENTS
The pump station improvements for the new system will provide 300 MGD pumping
capacity. The arrangement of all other equipment will be essentially the same as the
existing system. Control of all equipment will be linked to the main control room at the
plant eliminating the need for local equipment operation during a wet weather event.
Local controls will be provided as a backup in the event of a problem with the main
control system. The remaining major improvements include:
Replacement of the 5 existing influent wastewater pumps with new variable speed
units. Station firm capacity 300 MGD not including the standby pumps.
Installation of a new discharge tower downstream of the pump station.
Replacement of the 4 existing automatically cleaned bar screens with 4 new
automatically cleaned units.
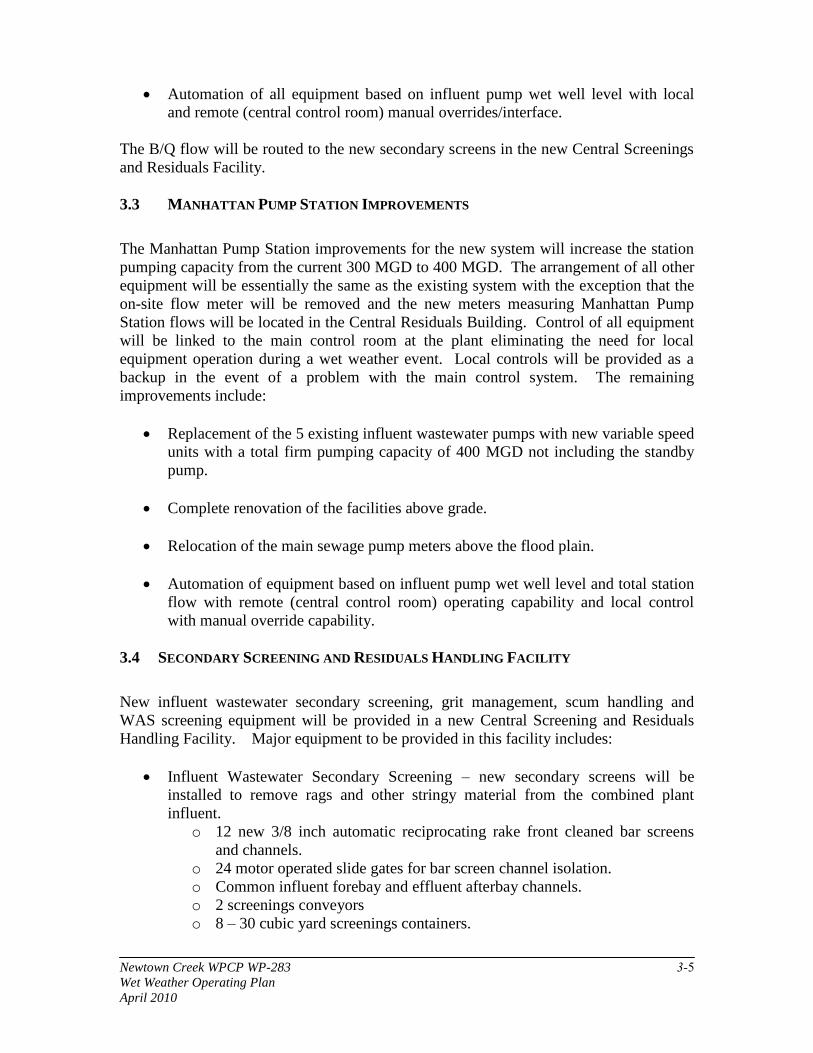
Newtown Creek WPCP WP-283 3-5
Wet Weather Operating Plan
April 2010
Automation of all equipment based on influent pump wet well level with local
and remote (central control room) manual overrides/interface.
The B/Q flow will be routed to the new secondary screens in the new Central Screenings
and Residuals Facility.
3.3 MANHATTAN PUMP STATION IMPROVEMENTS
The Manhattan Pump Station improvements for the new system will increase the station
pumping capacity from the current 300 MGD to 400 MGD. The arrangement of all other
equipment will be essentially the same as the existing system with the exception that the
on-site flow meter will be removed and the new meters measuring Manhattan Pump
Station flows will be located in the Central Residuals Building. Control of all equipment
will be linked to the main control room at the plant eliminating the need for local
equipment operation during a wet weather event. Local controls will be provided as a
backup in the event of a problem with the main control system. The remaining
improvements include:
Replacement of the 5 existing influent wastewater pumps with new variable speed
units with a total firm pumping capacity of 400 MGD not including the standby
pump.
Complete renovation of the facilities above grade.
Relocation of the main sewage pump meters above the flood plain.
Automation of equipment based on influent pump wet well level and total station
flow with remote (central control room) operating capability and local control
with manual override capability.
3.4 SECONDARY SCREENING AND RESIDUALS HANDLING FACILITY
New influent wastewater secondary screening, grit management, scum handling and
WAS screening equipment will be provided in a new Central Screening and Residuals
Handling Facility. Major equipment to be provided in this facility includes:
Influent Wastewater Secondary Screening – new secondary screens will be
installed to remove rags and other stringy material from the combined plant
influent.
o 12 new 3/8 inch automatic reciprocating rake front cleaned bar screens
and channels.
o 24 motor operated slide gates for bar screen channel isolation.
o Common influent forebay and effluent afterbay channels.
o 2 screenings conveyors
o 8 – 30 cubic yard screenings containers.
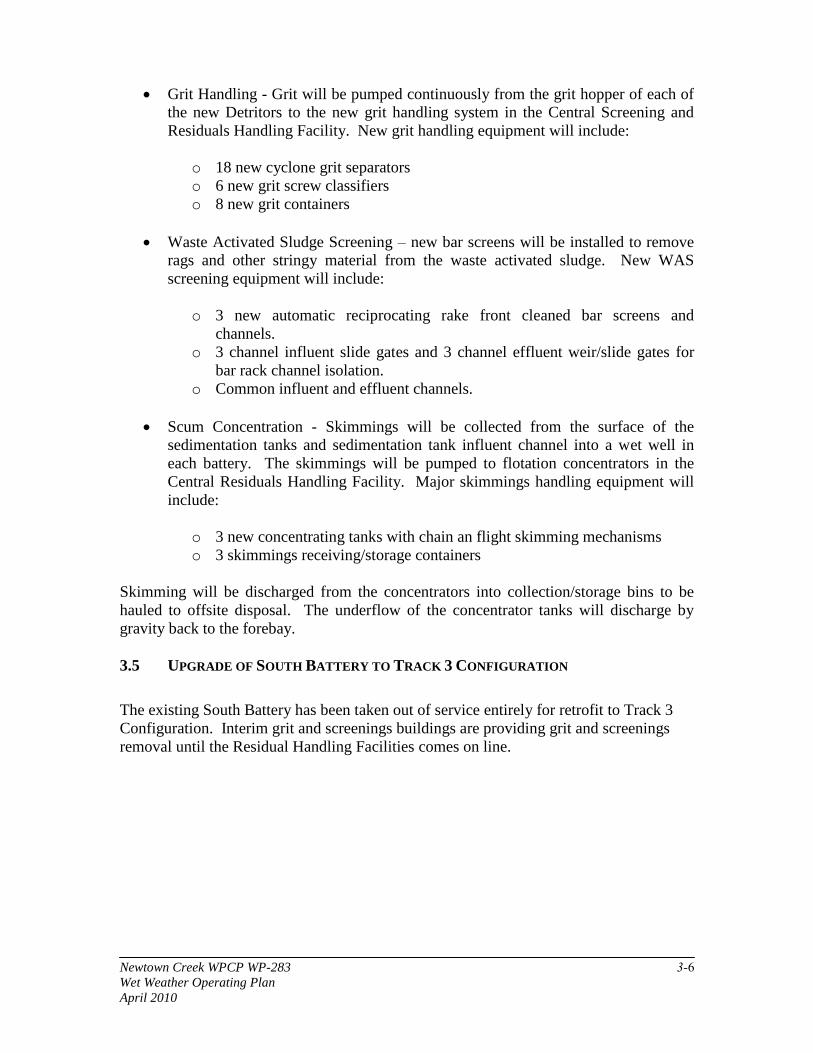
Newtown Creek WPCP WP-283 3-6
Wet Weather Operating Plan
April 2010
Grit Handling - Grit will be pumped continuously from the grit hopper of each of
the new Detritors to the new grit handling system in the Central Screening and
Residuals Handling Facility. New grit handling equipment will include:
o 18 new cyclone grit separators
o 6 new grit screw classifiers
o 8 new grit containers
Waste Activated Sludge Screening – new bar screens will be installed to remove
rags and other stringy material from the waste activated sludge. New WAS
screening equipment will include:
o 3 new automatic reciprocating rake front cleaned bar screens and
channels.
o 3 channel influent slide gates and 3 channel effluent weir/slide gates for
bar rack channel isolation.
o Common influent and effluent channels.
Scum Concentration - Skimmings will be collected from the surface of the
sedimentation tanks and sedimentation tank influent channel into a wet well in
each battery. The skimmings will be pumped to flotation concentrators in the
Central Residuals Handling Facility. Major skimmings handling equipment will
include:
o 3 new concentrating tanks with chain an flight skimming mechanisms
o 3 skimmings receiving/storage containers
Skimming will be discharged from the concentrators into collection/storage bins to be
hauled to offsite disposal. The underflow of the concentrator tanks will discharge by
gravity back to the forebay.
3.5 UPGRADE OF SOUTH BATTERY TO TRACK 3 CONFIGURATION
The existing South Battery has been taken out of service entirely for retrofit to Track 3
Configuration. Interim grit and screenings buildings are providing grit and screenings
removal until the Residual Handling Facilities comes on line.
APPENDIX B
BOWERY BAY WASTEWATER TREATMENT
PLANT WET WEATHER OPERATING PLAN

NO TEXT ON THIS PAGE

City of New York Department of Environmental Protection Bureau of Wastewater Treatment
Bowery Bay Water Pollution Control Plant Wet Weather Operating Plan
Prepared by:
The New York City Department of Environmental Protection
Bureau of Wastewater Treatment
March 2009
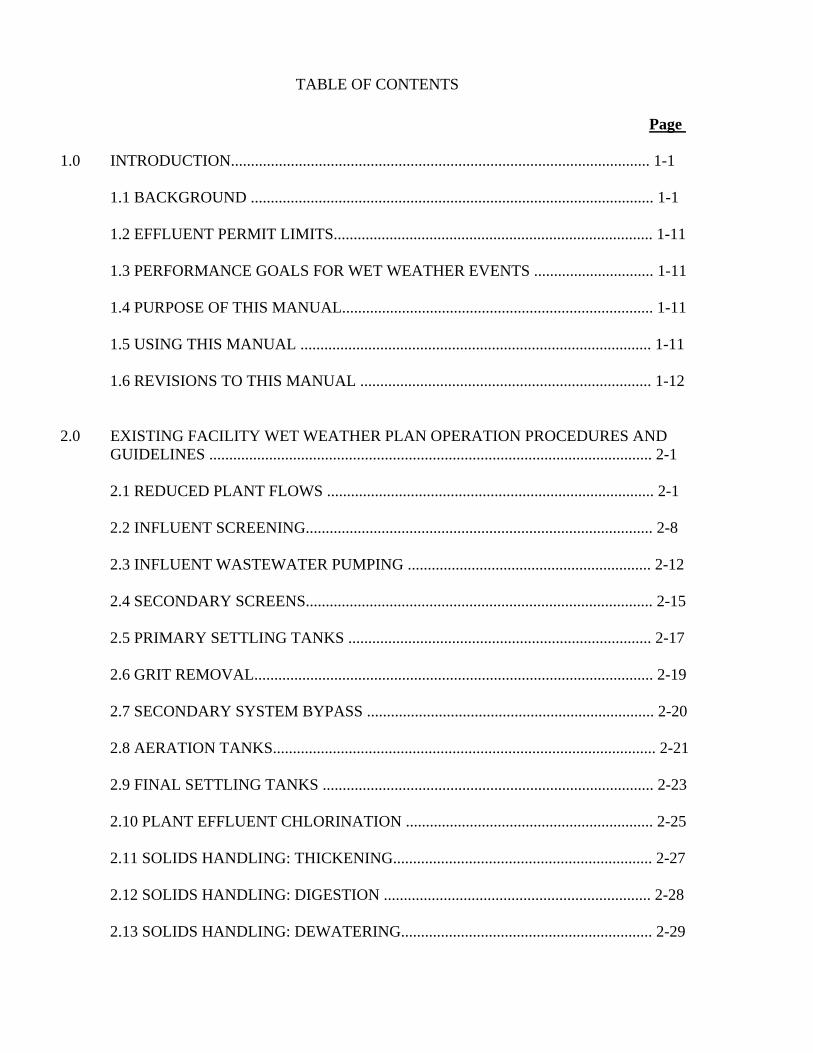
TABLE OF CONTENTS
Page
1.0 INTRODUCTION......................................................................................................... 1-1 1.1 BACKGROUND ..................................................................................................... 1-1 1.2 EFFLUENT PERMIT LIMITS................................................................................ 1-11 1.3 PERFORMANCE GOALS FOR WET WEATHER EVENTS .............................. 1-11 1.4 PURPOSE OF THIS MANUAL.............................................................................. 1-11 1.5 USING THIS MANUAL ........................................................................................ 1-11 1.6 REVISIONS TO THIS MANUAL ......................................................................... 1-12
2.0 EXISTING FACILITY WET WEATHER PLAN OPERATION PROCEDURES AND GUIDELINES ............................................................................................................... 2-1
2.1 REDUCED PLANT FLOWS .................................................................................. 2-1 2.2 INFLUENT SCREENING....................................................................................... 2-8 2.3 INFLUENT WASTEWATER PUMPING ............................................................. 2-12 2.4 SECONDARY SCREENS....................................................................................... 2-15 2.5 PRIMARY SETTLING TANKS ............................................................................ 2-17 2.6 GRIT REMOVAL.................................................................................................... 2-19 2.7 SECONDARY SYSTEM BYPASS ........................................................................ 2-20 2.8 AERATION TANKS................................................................................................ 2-21 2.9 FINAL SETTLING TANKS ................................................................................... 2-23 2.10 PLANT EFFLUENT CHLORINATION .............................................................. 2-25 2.11 SOLIDS HANDLING: THICKENING................................................................. 2-27 2.12 SOLIDS HANDLING: DIGESTION ................................................................... 2-28 2.13 SOLIDS HANDLING: DEWATERING............................................................... 2-29

3.0 PLANNED PLANT UPGRADES ................................................................................ 3-1 3.1 INFLUENT SCREENING AND MAIN SEWAGE PUMPING............................. 3-1 3.2 PRIMARY SETTLING TANKS ............................................................................. 3-1 3.3 AERATION TANKS................................................................................................ 3-1 3.4 FINAL SETTLING TANKS ................................................................................... 3-1 3.5 PLANT EFFLUENT CHLORINATION................................................................. 3-4 3.6 CHEMICAL ADDITION SYSTEMS ..................................................................... 3-4 3.8 RAS AND WAS SYSTEMS ................................................................................... 3-4 3.9 GRAVITY THICKENERS...................................................................................... 3-4 3.10 SLUDGE DIGESTION AND STORAGE ............................................................ 3-4
APPENDIX A CORONA AVENUE VORTEX FACILITY (CAVF) WET WEATHER OPERATING PLAN
LIST OF FIGURES
Page
Figure 1-1 Drainage Area ............................................................................................................1-3 Figure 1-2 Existing Facility Site Plan...........................................................................................1-9 Figure 1-3 Existing Facility Process Flow Diagram.................................................................... 1-10 Figure 2-1 Operating Procedures Before Wet Weather Event at the Bowery Bay WPCP…...... 2-3 Figure 2-2 Operating Procedures During Wet Weather Event at the Bowery Bay WPCP ........ 2-4 Figure 2-3 Operating Procedures After Wet Weather Event at the Bowery Bay WPCP ........... 2-5 Figure 3-1 Upgraded Facility Site Plan ...................................................................................... 3-2 Figure 3-2 Upgraded Facility Process Flow Diagram ................................................................ 3-3
LIST OF TABLES Page
Table 1-1 Pumping Stations Regulators, Tide Gates, and Overflow Chambers ........................ 1-4 Table 2-1 Maximum Hydraulic Capacities for Equipment in Service ....................................... 2-5

1.0 Introduction
The Nitrogen Administrative Order on Consent, DEC Case # CO2-20010131-7 (the “Order” entered into by the City of New York (“City”) and the New York State Department of Environmental Conservation (“DEC”) was effective as of April 22, 2002. Pursuant to Appendix A: Upper East River WPCPs Upgrade Schedule and Compliance Deadlines, the City must submit a Wet Weather Operating Plan (WWOP) for the Bowery Bay Water Pollution Control Plant (WPCP) by July 20, 2003. The WWOP shall describe procedures to maximize treatment during wet weather events while the Bowery Bay WPCP is under construction. This shall be accomplished by having the WWOP specify procedures for the operation of unit processes to treat maximum flows, without materially diminishing effluent quality or destabilizing treatment upon return to dry weather operation. The WWOP will establish process control procedures and set points to maintain stability and efficiency of Biological Nutrient Removal (BNR) Processes. The WWOP will specify the treatment facilities that will be available at each WPCP during the construction period, as identified in the Bowery Bay plan. The WWOP shall be based on operations of process units that are available during the construction period operated at the peak hydraulic loading rate. The actual process control set points will be established by the WWOP. Upon completion of construction, the WWOP shall be revised to reflect the operation of the fully upgraded Facility. The revised WWOP for Bowery Bay shall be submitted to DEC within 18 months of the completion of the construction of the Facility.
This document contains the WWOP for the Bowery Bay WPCP operation during construction.
1.1 BACKGROUND
The existing Bowery Bay WPCP, located on a 34.6-acre site adjacent to Berrian Boulevard in Astoria, Queens (Figure 1-1) treats wastewater from a 16,105-acre service area in the Borough of Queens of mostly combined sewers that is divided into high level and low level service areas. The high level service area consists of 11,557 acres in the eastern two thirds of the drainage area. The low level service area includes 4,548 acres in the western third of the service area. The flow from the high level and low level service area enters the plant separately.
There are 27 regulators located in the high level service area. Two of these are designed as hydraulic sluice gates. The remaining 25 regulators are weir chambers that will bypass wastewater to a storm sewer whenever the water in the sewer reaches the weir level. The elevations of the weirs were set during the original design to allow a known volume of combined sewage to remain in the interceptors leading to the plant. No control of these regulators is necessary. Three of the weir chambers use tide gates to prevent backflow from the receiving water into the intercepting sewer.
The Corona Avenue Vortex Facility (CAVF) is located in the high level service area near the junction of Corona Avenue and Saultell Avenue, and services a drainage area of approximately 3,730 acres. The facility is located entirely within Corona Avenue and is completely underground and consists of three, 43-ft diameter vortex concentrators that operate in parallel. As a prototype
Bowery Bay WPCP 1- Wet Weather Operating Plan March 2009
1

Bowery Bay WPCP 1-2 Wet Weather Operating Plan March 2009
demonstration facility the units were designed to permit one, two or all three units to be operated during wet weather events. The three vortex units represent the following vortex design configurations: the EPA Swirl Concentrator; the Storm King hydrodynamic separator of British design; and the FluidSep vortex separator, of German design. The hydraulic capacity of each vortex unit is approximately 130 million gallons per day (mgd). The peak hydraulic capacity of the overall facility is approximately 400 mgd. The CAVF was not designed to provide end-of-pipe CSO treatment. However, the facility does remove a portion of the floatables and settleable solids that would otherwise be discharged into Flushing Bay through Outfall BB-006. The units remove settleable solids and floatables and discharges these materials through an underflow stream to the 108
th Street Pump Station which discharges into the high level interceptor. The overflow from the
units is discharged to the BB-006 lower deck sewer which transports it to Flushing Bay through Outfall BB-006. A WWOP for the CAVF facility is attached to this WWOP as Appendix A.
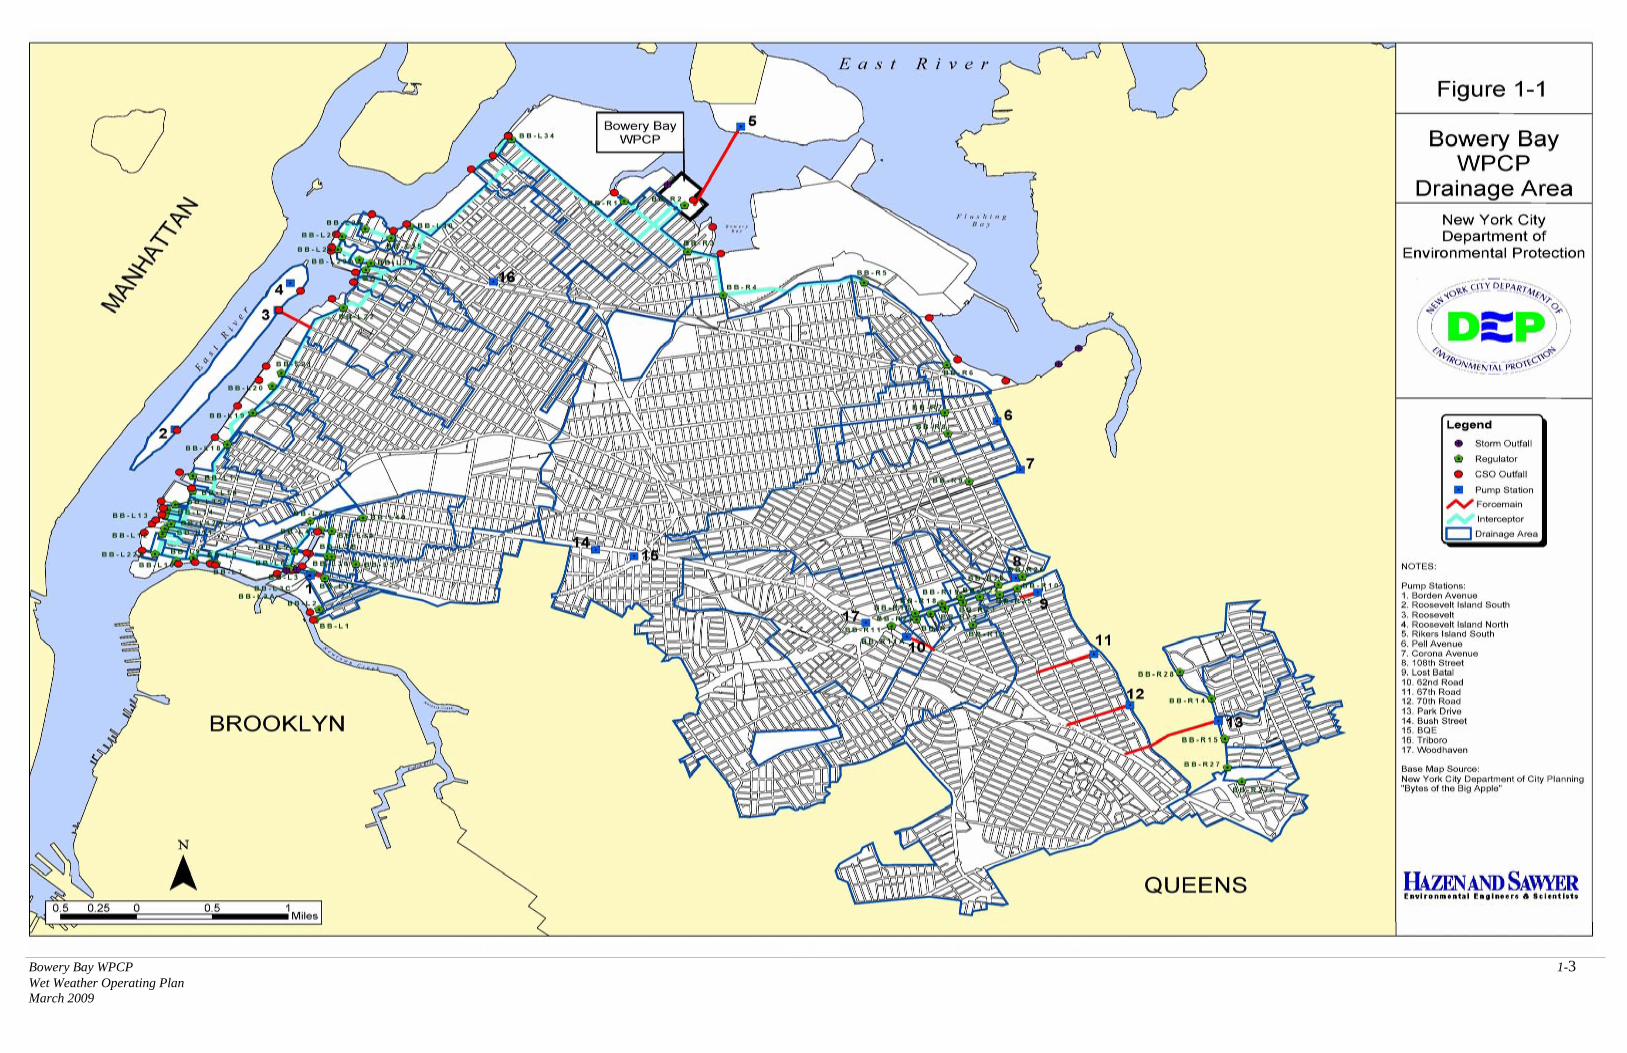
Bowery Bay 3 Wet WeatherMarch 2009
WPCP 1- Operating Plan
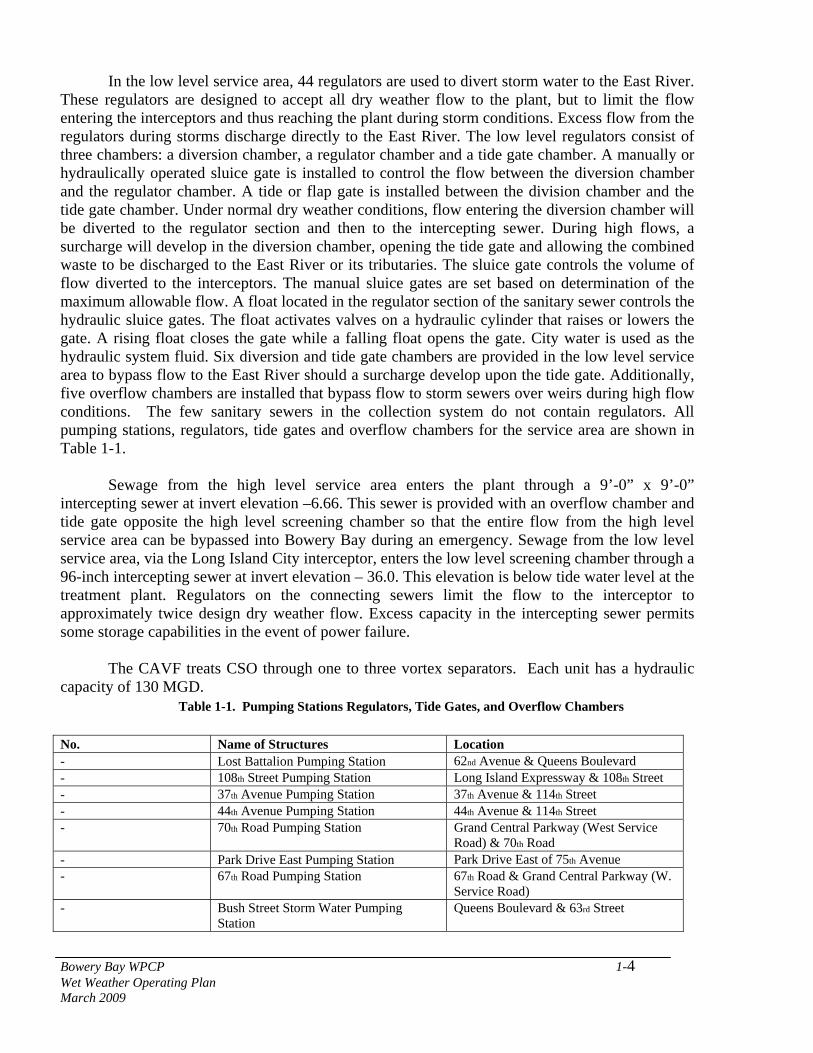
In the low level service area, 44 regulators are used to divert storm water to the East River.
These regulators are designed to accept all dry weather flow to the plant, but to limit the flow entering the interceptors and thus reaching the plant during storm conditions. Excess flow from the regulators during storms discharge directly to the East River. The low level regulators consist of three chambers: a diversion chamber, a regulator chamber and a tide gate chamber. A manually or hydraulically operated sluice gate is installed to control the flow between the diversion chamber and the regulator chamber. A tide or flap gate is installed between the division chamber and the tide gate chamber. Under normal dry weather conditions, flow entering the diversion chamber will be diverted to the regulator section and then to the intercepting sewer. During high flows, a surcharge will develop in the diversion chamber, opening the tide gate and allowing the combined waste to be discharged to the East River or its tributaries. The sluice gate controls the volume of flow diverted to the interceptors. The manual sluice gates are set based on determination of the maximum allowable flow. A float located in the regulator section of the sanitary sewer controls the hydraulic sluice gates. The float activates valves on a hydraulic cylinder that raises or lowers the gate. A rising float closes the gate while a falling float opens the gate. City water is used as the hydraulic system fluid. Six diversion and tide gate chambers are provided in the low level service area to bypass flow to the East River should a surcharge develop upon the tide gate. Additionally, five overflow chambers are installed that bypass flow to storm sewers over weirs during high flow conditions. The few sanitary sewers in the collection system do not contain regulators. All pumping stations, regulators, tide gates and overflow chambers for the service area are shown in Table 1-1.
Sewage from the high level service area enters the plant through a 9’-0” x 9’-0” intercepting sewer at invert elevation –6.66. This sewer is provided with an overflow chamber and tide gate opposite the high level screening chamber so that the entire flow from the high level service area can be bypassed into Bowery Bay during an emergency. Sewage from the low level service area, via the Long Island City interceptor, enters the low level screening chamber through a 96-inch intercepting sewer at invert elevation – 36.0. This elevation is below tide water level at the treatment plant. Regulators on the connecting sewers limit the flow to the interceptor to approximately twice design dry weather flow. Excess capacity in the intercepting sewer permits some storage capabilities in the event of power failure.
The CAVF treats CSO through one to three vortex separators. Each unit has a hydraulic capacity of 130 MGD.
Table 1-1. Pumping Stations Regulators, Tide Gates, and Overflow Chambers
No. Name of Structures Location - Lost Battalion Pumping Station 62nd Avenue & Queens Boulevard - 108th Street Pumping Station Long Island Expressway & 108th Street - 37th Avenue Pumping Station 37th Avenue & 114th Street - 44th Avenue Pumping Station 44th Avenue & 114th Street - 70th Road Pumping Station Grand Central Parkway (West Service
Road) & 70th Road - Park Drive East Pumping Station Park Drive East of 75th Avenue - 67th Road Pumping Station 67th Road & Grand Central Parkway (W.
Service Road) - Bush Street Storm Water Pumping
Station Queens Boulevard & 63rd Street
Bowery Bay WPCP 1- Wet Weather Operating Plan March 2009
4

- Cypress Hills Storm Water Pumping
Station Interborough Parkway 800 feet West of Cypress Hill Road
- Central Avenue Storm Water Pumping Station
Central Avenue & 76th Street
- Woodhaven Boulevard Storm Water Pumping Station
Queens Boulevard & Woodhaven Boulevard
- Brooklyn-Queens Expressway Storm Water Pumping Station
Brooklyn-Queens Expressway & 65th
Street 1 Tide Gate Chamber 37th Street & 19th Avenue 2 Tide Gate Chamber 45th Street at Plant 3 Regulator Weir Hazen Street & 19th Avenue MH Chamber “A” Regulator Manhole Ditmars Boulevard – 21st Avenue & 81st
Street MH Chamber “B” Regulator Manhole 19th Avenue & 80th Street MH Chamber “C” Regulator Manhole 19th Avenue & Hazen Street MH Chamber “D” Regulator Manhole 19th Avenue & 45th Street 4 Regulator Weir LaGuardia Airport (82nd Street &
Ditmars Boulevard) Chamber “A” Regulator Manhole Ditmars Boulevard & 82nd Street Chamber “B” Regulator Manhole Ditmars Boulevard & 88th Street Chamber “C” Regulator Manhole Ditmars Boulevard & 91st Street Culvert Chamber “D” Culvert Regulator Manhole Ditmars Boulevard & 92nd Street Chamber “E” Regulator Manhole Ditmars Boulevard & 98th Street Chamber “F” Regulator Manhole Ditmars Boulevard & 99th Street 5 Regulator Weir 100th Street (22nd Road) & Ditmars
Boulevard 6 Regulator Weir Ditmars Boulevard & 108th Street 7 Regulator Weir 34th Avenue & 108th Street 8 Regulator Weir 37th Avenue & 108th Street 9 Regulator Weir 43rd Avenue & 108th Street 10 Regulator Weir Long Island Expressway & 108th Street 11 Regulator Weir 94th Street & Long Island Expressway 12 Regulator Weir 99th Street & 63rd Drive 13 Tide Gate Chamber 111th Street & Corona Avenue 14 Regulator Weir & Sluice Gate 72nd Avenue & Park Drive East 15 Regulator Weir & Sluice Gate 77th Avenue & Park Drive East 16 Regulator Weir Junction Boulevard & Long Island
Expressway, North Side 17 Regulator Weir 97th Street & Long Island Expressway,
North Side Table 1-1. Pumping Stations Regulators, Tide Gates, and Overflow Chambers (Continued)
No. Name of Structures Location 18 Regulator Weir 98th Street & Long Island Expressway,
North Side 19 Regulator Weir 99th Street & Long Island Expressway,
North Side 20 Regulator Weir Xenia Street & Long Island Expressway,
South Side 21 Regulator Weir Junction Boulevard & Long Island
Expressway, South Side
Bowery Bay WPCP 1- Wet Weather Operating Plan March 2009
5
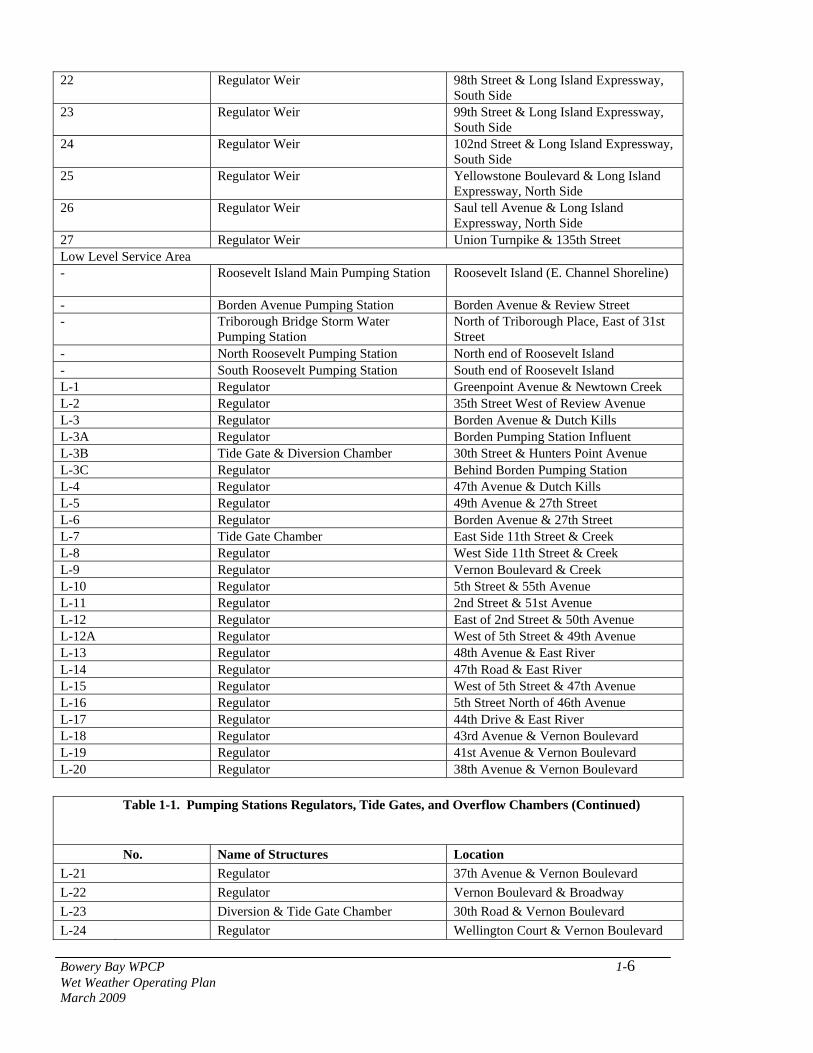
22 Regulator Weir 98th Street & Long Island Expressway,
South Side 23 Regulator Weir 99th Street & Long Island Expressway,
South Side 24 Regulator Weir 102nd Street & Long Island Expressway,
South Side 25 Regulator Weir Yellowstone Boulevard & Long Island
Expressway, North Side 26 Regulator Weir Saul tell Avenue & Long Island
Expressway, North Side 27 Regulator Weir Union Turnpike & 135th Street Low Level Service Area - Roosevelt Island Main Pumping Station Roosevelt Island (E. Channel Shoreline)
- Borden Avenue Pumping Station Borden Avenue & Review Street - Triborough Bridge Storm Water
Pumping Station North of Triborough Place, East of 31st Street
- North Roosevelt Pumping Station North end of Roosevelt Island - South Roosevelt Pumping Station South end of Roosevelt Island L-1 Regulator Greenpoint Avenue & Newtown Creek L-2 Regulator 35th Street West of Review Avenue L-3 Regulator Borden Avenue & Dutch Kills L-3A Regulator Borden Pumping Station Influent L-3B Tide Gate & Diversion Chamber 30th Street & Hunters Point Avenue L-3C Regulator Behind Borden Pumping Station L-4 Regulator 47th Avenue & Dutch Kills L-5 Regulator 49th Avenue & 27th Street L-6 Regulator Borden Avenue & 27th Street L-7 Tide Gate Chamber East Side 11th Street & Creek L-8 Regulator West Side 11th Street & Creek L-9 Regulator Vernon Boulevard & Creek L-10 Regulator 5th Street & 55th Avenue L-11 Regulator 2nd Street & 51st Avenue L-12 Regulator East of 2nd Street & 50th Avenue L-12A Regulator West of 5th Street & 49th Avenue L-13 Regulator 48th Avenue & East River L-14 Regulator 47th Road & East River L-15 Regulator West of 5th Street & 47th Avenue L-16 Regulator 5th Street North of 46th Avenue L-17 Regulator 44th Drive & East River L-18 Regulator 43rd Avenue & Vernon Boulevard L-19 Regulator 41st Avenue & Vernon Boulevard L-20 Regulator 38th Avenue & Vernon Boulevard Table 1-1. Pumping Stations Regulators, Tide Gates, and Overflow Chambers (Continued)
No. Name of Structures Location L-21 Regulator 37th Avenue & Vernon Boulevard L-22 Regulator Vernon Boulevard & Broadway L-23 Diversion & Tide Gate Chamber 30th Road & Vernon Boulevard L-24 Regulator Wellington Court & Vernon Boulevard
Bowery Bay WPCP 1- Wet Weather Operating Plan March 2009
6
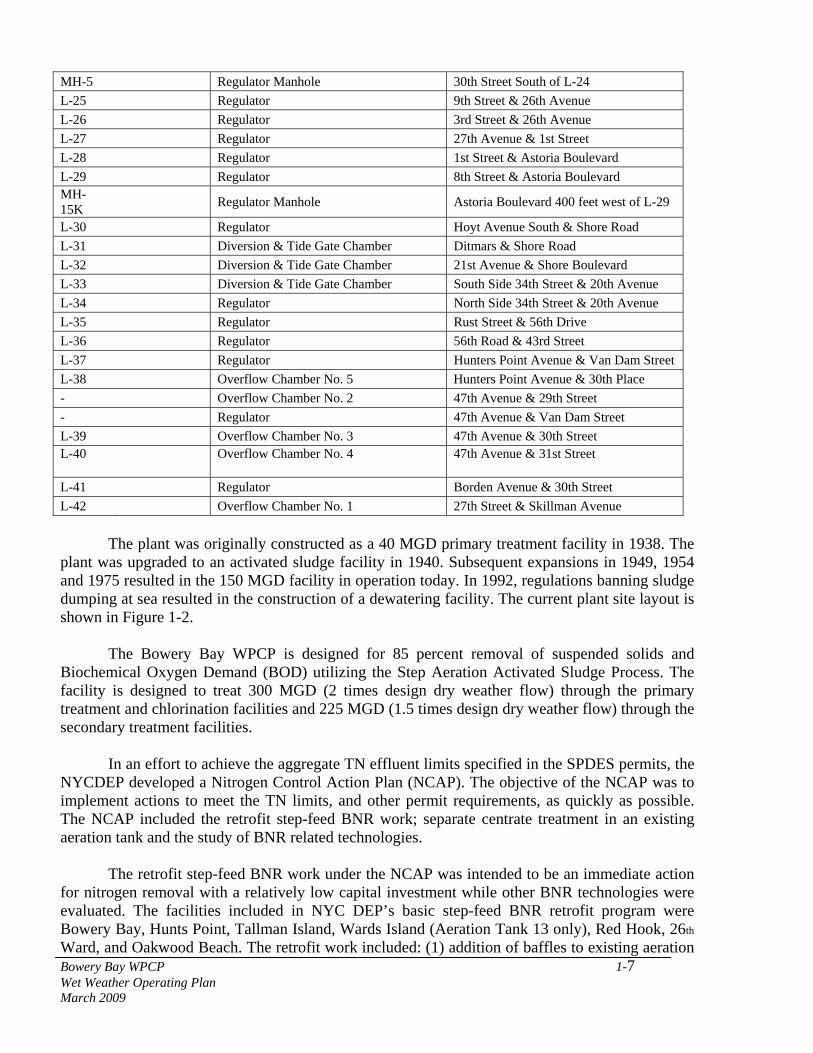
MH-5 Regulator Manhole 30th Street South of L-24 L-25 Regulator 9th Street & 26th Avenue L-26 Regulator 3rd Street & 26th Avenue L-27 Regulator 27th Avenue & 1st Street L-28 Regulator 1st Street & Astoria Boulevard L-29 Regulator 8th Street & Astoria Boulevard MH-15K
Regulator Manhole Astoria Boulevard 400 feet west of L-29
L-30 Regulator Hoyt Avenue South & Shore Road L-31 Diversion & Tide Gate Chamber Ditmars & Shore Road L-32 Diversion & Tide Gate Chamber 21st Avenue & Shore Boulevard L-33 Diversion & Tide Gate Chamber South Side 34th Street & 20th Avenue L-34 Regulator North Side 34th Street & 20th Avenue L-35 Regulator Rust Street & 56th Drive L-36 Regulator 56th Road & 43rd Street L-37 Regulator Hunters Point Avenue & Van Dam Street L-38 Overflow Chamber No. 5 Hunters Point Avenue & 30th Place - Overflow Chamber No. 2 47th Avenue & 29th Street - Regulator 47th Avenue & Van Dam Street L-39 Overflow Chamber No. 3 47th Avenue & 30th Street L-40 Overflow Chamber No. 4 47th Avenue & 31st Street
L-41 Regulator Borden Avenue & 30th Street L-42 Overflow Chamber No. 1 27th Street & Skillman Avenue
The plant was originally constructed as a 40 MGD primary treatment facility in 1938. The plant was upgraded to an activated sludge facility in 1940. Subsequent expansions in 1949, 1954 and 1975 resulted in the 150 MGD facility in operation today. In 1992, regulations banning sludge dumping at sea resulted in the construction of a dewatering facility. The current plant site layout is shown in Figure 1-2.
The Bowery Bay WPCP is designed for 85 percent removal of suspended solids and Biochemical Oxygen Demand (BOD) utilizing the Step Aeration Activated Sludge Process. The facility is designed to treat 300 MGD (2 times design dry weather flow) through the primary treatment and chlorination facilities and 225 MGD (1.5 times design dry weather flow) through the secondary treatment facilities.
In an effort to achieve the aggregate TN effluent limits specified in the SPDES permits, the NYCDEP developed a Nitrogen Control Action Plan (NCAP). The objective of the NCAP was to implement actions to meet the TN limits, and other permit requirements, as quickly as possible. The NCAP included the retrofit step-feed BNR work; separate centrate treatment in an existing aeration tank and the study of BNR related technologies.
Bowery Bay WPCP 1- Wet Weather Operating Plan March 2009
7
The retrofit step-feed BNR work under the NCAP was intended to be an immediate action for nitrogen removal with a relatively low capital investment while other BNR technologies were evaluated. The facilities included in NYC DEP’s basic step-feed BNR retrofit program were Bowery Bay, Hunts Point, Tallman Island, Wards Island (Aeration Tank 13 only), Red Hook, 26th
Ward, and Oakwood Beach. The retrofit work included: (1) addition of baffles to existing aeration
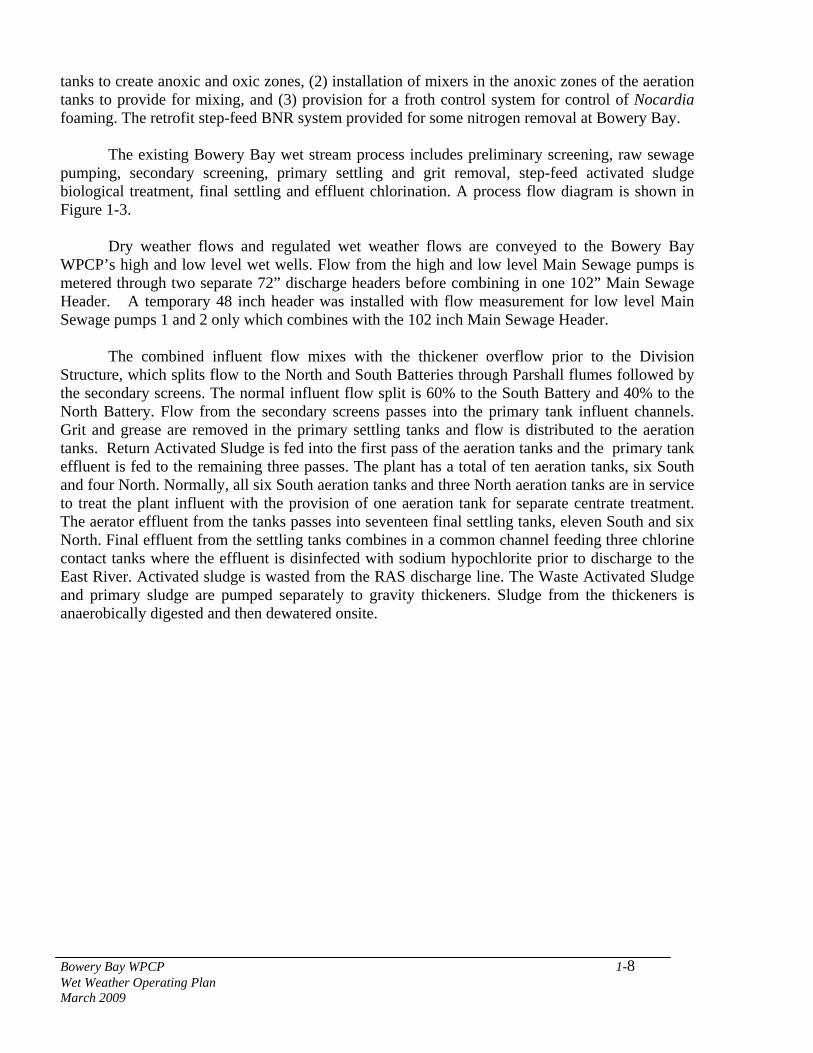
Bowery Bay WPCP 1-8 Wet Weather Operating Plan March 2009
tanks to create anoxic and oxic zones, (2) installation of mixers in the anoxic zones of the aeration tanks to provide for mixing, and (3) provision for a froth control system for control of Nocardia foaming. The retrofit step-feed BNR system provided for some nitrogen removal at Bowery Bay.
The existing Bowery Bay wet stream process includes preliminary screening, raw sewage pumping, secondary screening, primary settling and grit removal, step-feed activated sludge biological treatment, final settling and effluent chlorination. A process flow diagram is shown in Figure 1-3.
Dry weather flows and regulated wet weather flows are conveyed to the Bowery Bay WPCP’s high and low level wet wells. Flow from the high and low level Main Sewage pumps is metered through two separate 72” discharge headers before combining in one 102” Main Sewage Header. A temporary 48 inch header was installed with flow measurement for low level Main Sewage pumps 1 and 2 only which combines with the 102 inch Main Sewage Header.
The combined influent flow mixes with the thickener overflow prior to the Division Structure, which splits flow to the North and South Batteries through Parshall flumes followed by the secondary screens. The normal influent flow split is 60% to the South Battery and 40% to the North Battery. Flow from the secondary screens passes into the primary tank influent channels. Grit and grease are removed in the primary settling tanks and flow is distributed to the aeration tanks. Return Activated Sludge is fed into the first pass of the aeration tanks and the primary tank effluent is fed to the remaining three passes. The plant has a total of ten aeration tanks, six South and four North. Normally, all six South aeration tanks and three North aeration tanks are in service to treat the plant influent with the provision of one aeration tank for separate centrate treatment. The aerator effluent from the tanks passes into seventeen final settling tanks, eleven South and six North. Final effluent from the settling tanks combines in a common channel feeding three chlorine contact tanks where the effluent is disinfected with sodium hypochlorite prior to discharge to the East River. Activated sludge is wasted from the RAS discharge line. The Waste Activated Sludge and primary sludge are pumped separately to gravity thickeners. Sludge from the thickeners is anaerobically digested and then dewatered onsite.
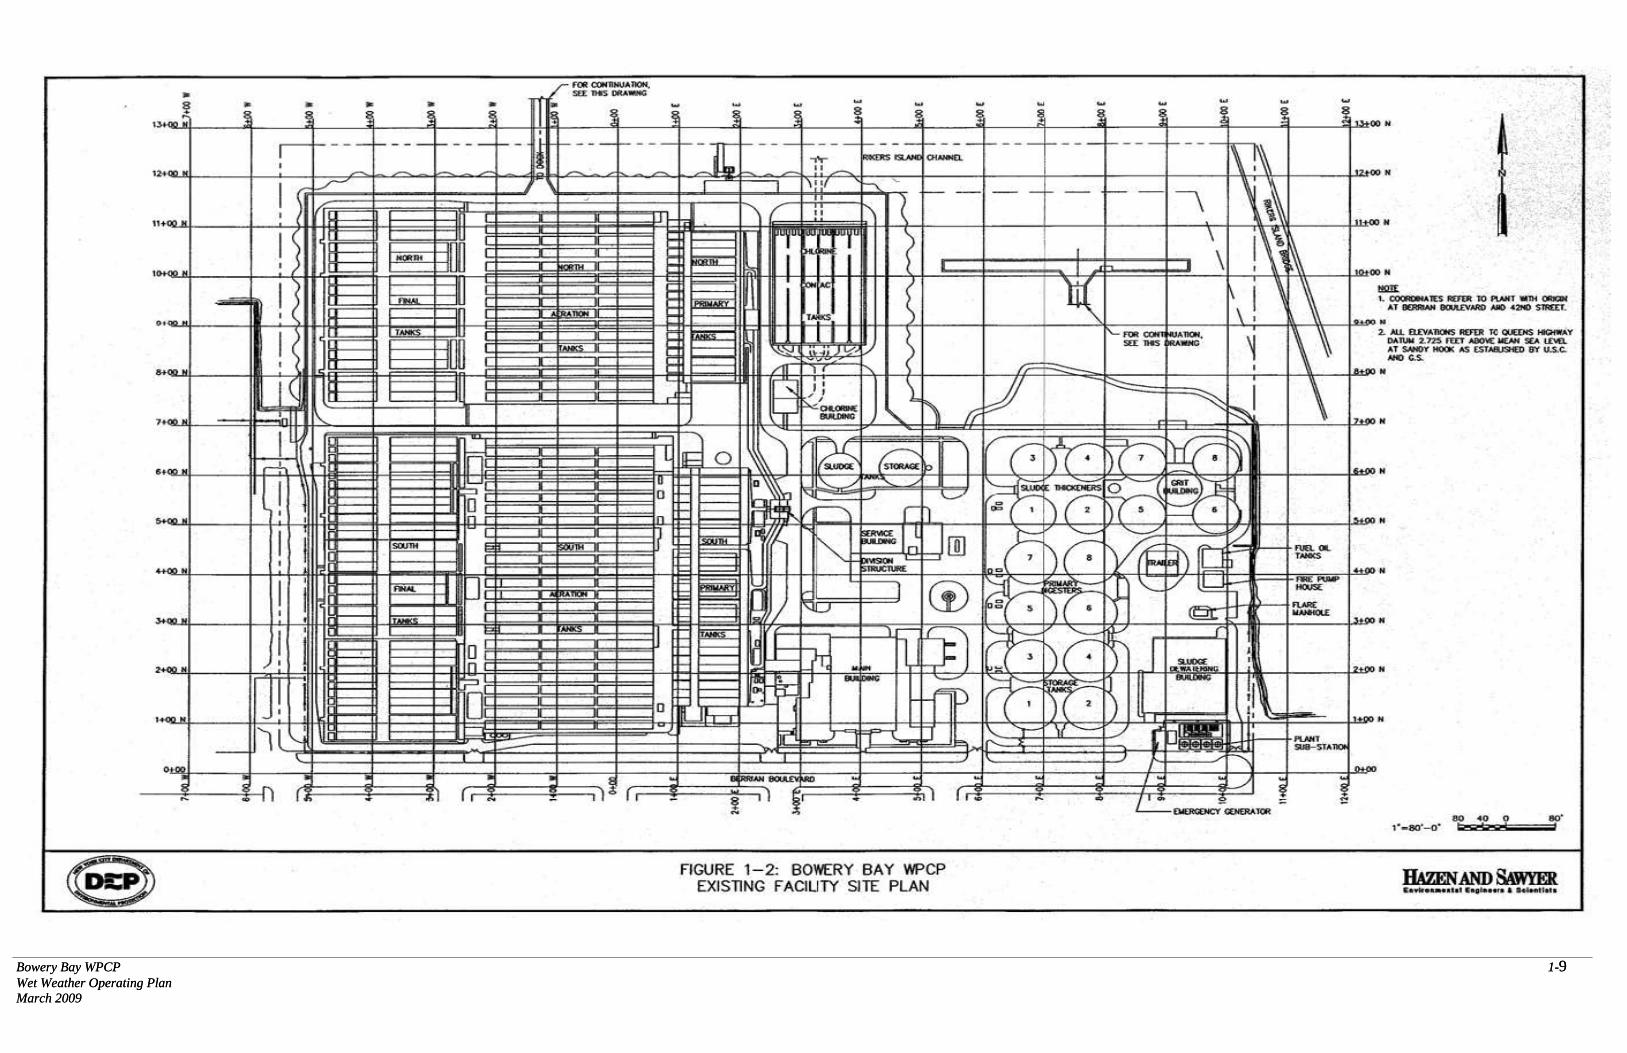
Bowery Bay WPCP 1-9 Wet Weather Operating Plan March 2009
Bowery Bay WPCP 1-9 Wet Weather Operating Plan March 2009
Bowery Bay WPCP 1-10 Wet Weather Operating Plan March 2009
1.2 EFFLUENT PERMIT LIMITS
The Bowery Bay WPCP is currently operating under SPDES permit No. NY0026158. The plant is one of four facilities located on the Upper East River (UER) that are under an aggregate total nitrogen limit. The current permit requires the plant to remove 85% of CBOD and Suspended Solids and all four UER WPCP’s to meet a combined effluent total nitrogen limit aggregate.
Based on the LISS Total Maximum Daily Limit (TMDL) the effluent nitrogen goals for the UER aggregate, including offset for the Lower East River (LER) and Non-Point Sources, are 72, 600 lbs/day in 2004; 48,950 lbs/day in 2009 and 32,350 lbs/day in 2014. Utilizing a trading ratio of 2:1 between the UER and the LER, the negotiated Administrative Consent Order limits including LER offset are 73,200 lbs/day in 2010, 64,100 lbs/day in 2012 and 53, 100 lbs/day in August 2014. After 2014, the long-term limit will be determined based on the actual operation of the UER plants.
As a result of the Phase I LISS plan, the four Upper East River facilities (Wards Island, Tallman Island, Hunts Point and Bowery Bay) have effluent nitrogen limits in their current SPDES permits, requiring nitrogen removal. Instead of individual effluent limits, the four facilities are combined under an effluent aggregate.
The Bowery Bay WPCP is undergoing a plant stabilization and a BNR upgrade that is anticipated to be complete in December 2010. Phase 1 construction is currently underway. With the removal of an aeration tank on November 1, 2002 for spray water work at the Hunts Point WPCP, the total nitrogen aggregate for the UER WPCPs increased to a twelve month rolling average of 95,900 lbs/day with a twelve month rolling average goal of 88,600 lbs/day. The BNR upgrade will include additional facilities that will provide the capability of the four UER plants to meet the long-term nitrogen aggregate limits. 1.3 PERFORMANCE GOALS FOR WET WEATHER EVENTS
The goals of this manual are to establish operating procedures for Bowery Bay that will:
• Maximize flows to the plant as early as possible to prevent overflows at the collection system regulators,
• Maintain stable operation and maximize removals during wet weather events, • Reduce solids losses in the secondary system to allow for a stable recovery back to dry
weather operations following a wet weather event. 1.4 PURPOSE OF THIS MANUAL
The purpose of this manual is to provide a set of operating guidelines to assist the Bowery Bay operating staff in making operational decisions that will best meet the performance goals stated in Section 1.3 and the requirements of the SPDES discharge permit.
1.5 USING THIS MANUAL
Bowery Bay WPCP 1-11 Wet Weather Operating Plan
Section 2 of this manual is designed to be used as a quick reference tool for wet weather events during the Bowery Bay upgrade construction. This manual is divided into sections that
March 2009
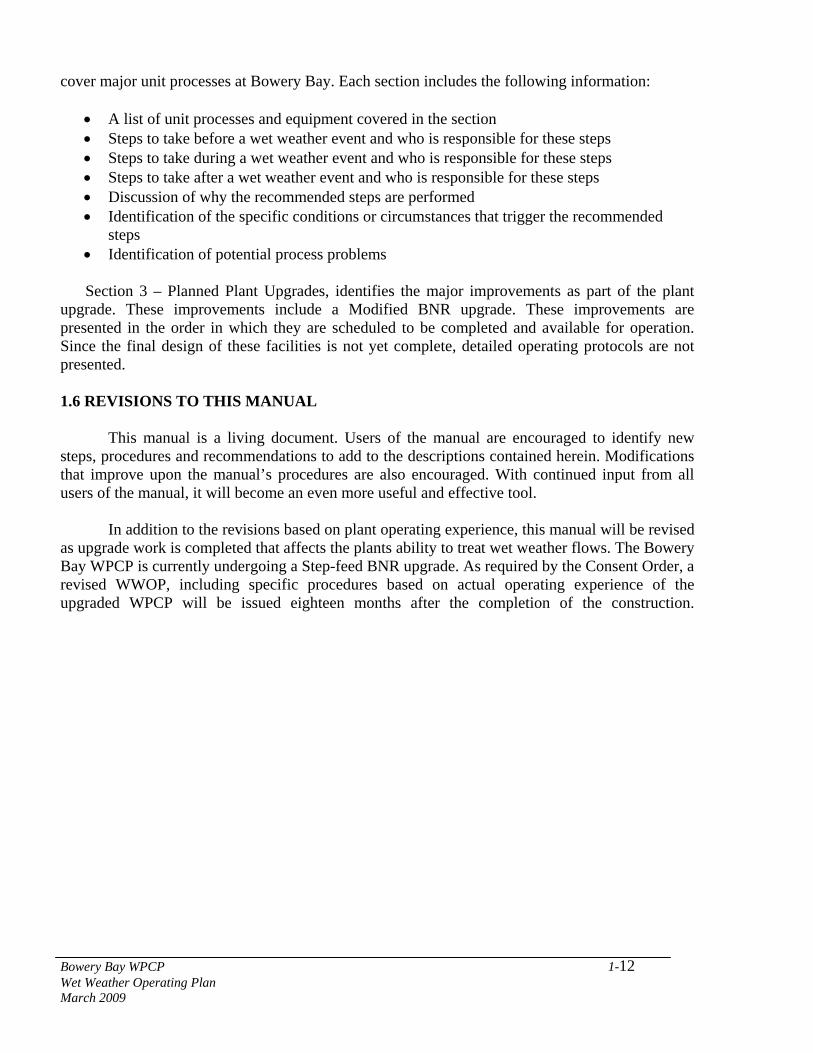
cover major unit processes at Bowery Bay. Each section includes the following information:
• A list of unit processes and equipment covered in the section • Steps to take before a wet weather event and who is responsible for these steps • Steps to take during a wet weather event and who is responsible for these steps • Steps to take after a wet weather event and who is responsible for these steps • Discussion of why the recommended steps are performed • Identification of the specific conditions or circumstances that trigger the recommended
steps • Identification of potential process problems
Section 3 – Planned Plant Upgrades, identifies the major improvements as part of the plant
upgrade. These improvements include a Modified BNR upgrade. These improvements are presented in the order in which they are scheduled to be completed and available for operation. Since the final design of these facilities is not yet complete, detailed operating protocols are not presented.
1.6 REVISIONS TO THIS MANUAL
This manual is a living document. Users of the manual are encouraged to identify new steps, procedures and recommendations to add to the descriptions contained herein. Modifications that improve upon the manual’s procedures are also encouraged. With continued input from all users of the manual, it will become an even more useful and effective tool.
In addition to the revisions based on plant operating experience, this manual will be revised as upgrade work is completed that affects the plants ability to treat wet weather flows. The Bowery Bay WPCP is currently undergoing a Step-feed BNR upgrade. As required by the Consent Order, a revised WWOP, including specific procedures based on actual operating experience of the upgraded WPCP will be issued eighteen months after the completion of the construction.
Bowery Bay WPCP 1-12 Wet Weather Operating Plan March 2009
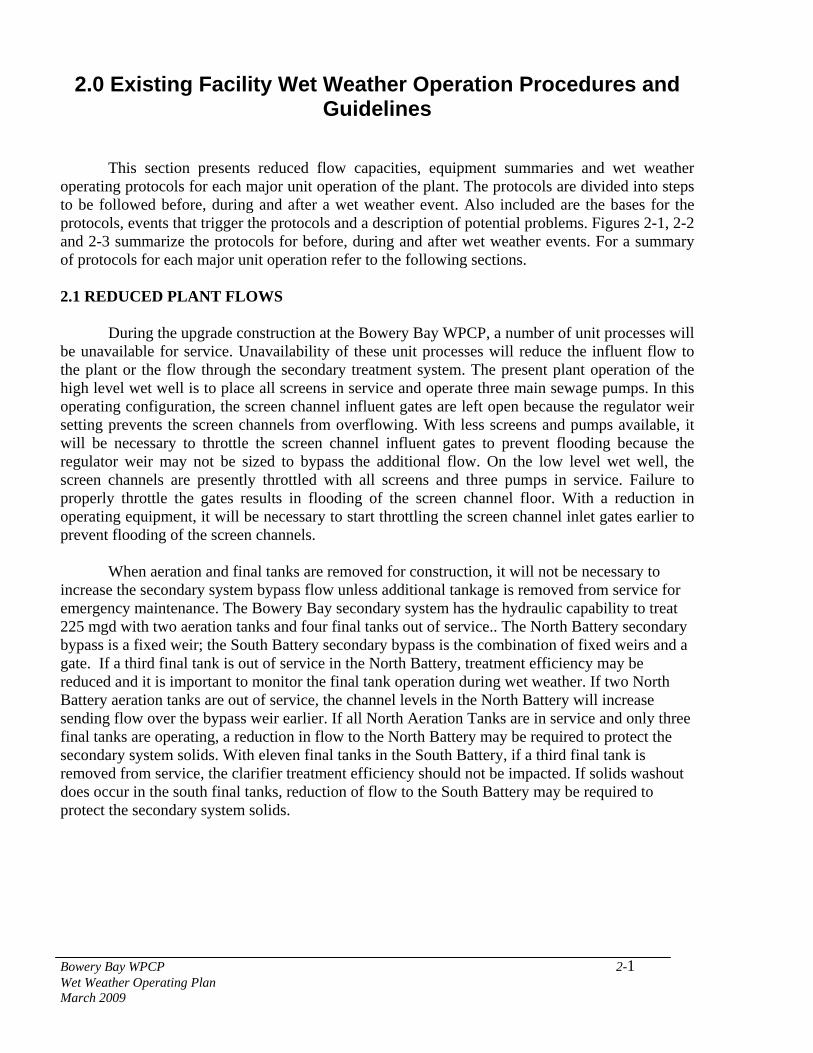
Bowery Bay WPCP 2-1 Wet Weather Operating Plan March 2009
2.0 Existing Facility Wet Weather Operation Procedures and Guidelines
This section presents reduced flow capacities, equipment summaries and wet weather operating protocols for each major unit operation of the plant. The protocols are divided into steps to be followed before, during and after a wet weather event. Also included are the bases for the protocols, events that trigger the protocols and a description of potential problems. Figures 2-1, 2-2 and 2-3 summarize the protocols for before, during and after wet weather events. For a summary of protocols for each major unit operation refer to the following sections.
2.1 REDUCED PLANT FLOWS
During the upgrade construction at the Bowery Bay WPCP, a number of unit processes will be unavailable for service. Unavailability of these unit processes will reduce the influent flow to the plant or the flow through the secondary treatment system. The present plant operation of the high level wet well is to place all screens in service and operate three main sewage pumps. In this operating configuration, the screen channel influent gates are left open because the regulator weir setting prevents the screen channels from overflowing. With less screens and pumps available, it will be necessary to throttle the screen channel influent gates to prevent flooding because the regulator weir may not be sized to bypass the additional flow. On the low level wet well, the screen channels are presently throttled with all screens and three pumps in service. Failure to properly throttle the gates results in flooding of the screen channel floor. With a reduction in operating equipment, it will be necessary to start throttling the screen channel inlet gates earlier to prevent flooding of the screen channels.
When aeration and final tanks are removed for construction, it will not be necessary to increase the secondary system bypass flow unless additional tankage is removed from service for emergency maintenance. The Bowery Bay secondary system has the hydraulic capability to treat 225 mgd with two aeration tanks and four final tanks out of service.. The North Battery secondary bypass is a fixed weir; the South Battery secondary bypass is the combination of fixed weirs and a gate. If a third final tank is out of service in the North Battery, treatment efficiency may be reduced and it is important to monitor the final tank operation during wet weather. If two North Battery aeration tanks are out of service, the channel levels in the North Battery will increase sending flow over the bypass weir earlier. If all North Aeration Tanks are in service and only three final tanks are operating, a reduction in flow to the North Battery may be required to protect the secondary system solids. With eleven final tanks in the South Battery, if a third final tank is removed from service, the clarifier treatment efficiency should not be impacted. If solids washout does occur in the south final tanks, reduction of flow to the South Battery may be required to protect the secondary system solids.
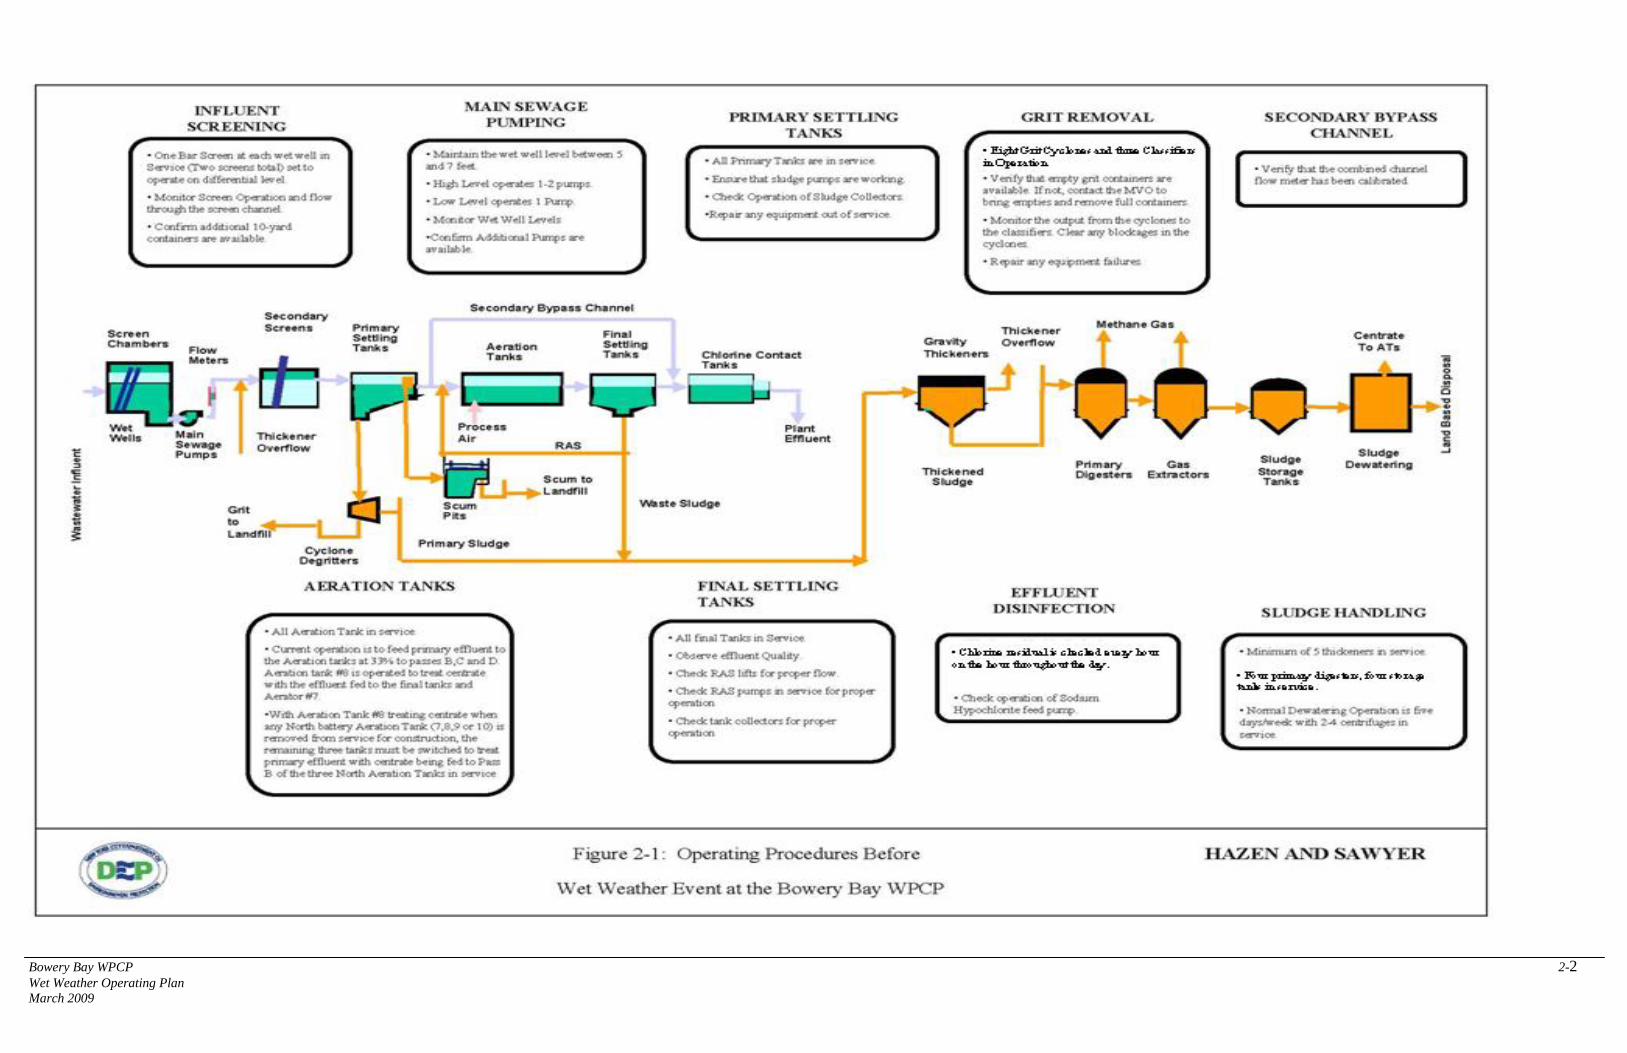
Bowery Bay WPCP 2-2 Wet Weather Operating Plan March 2009
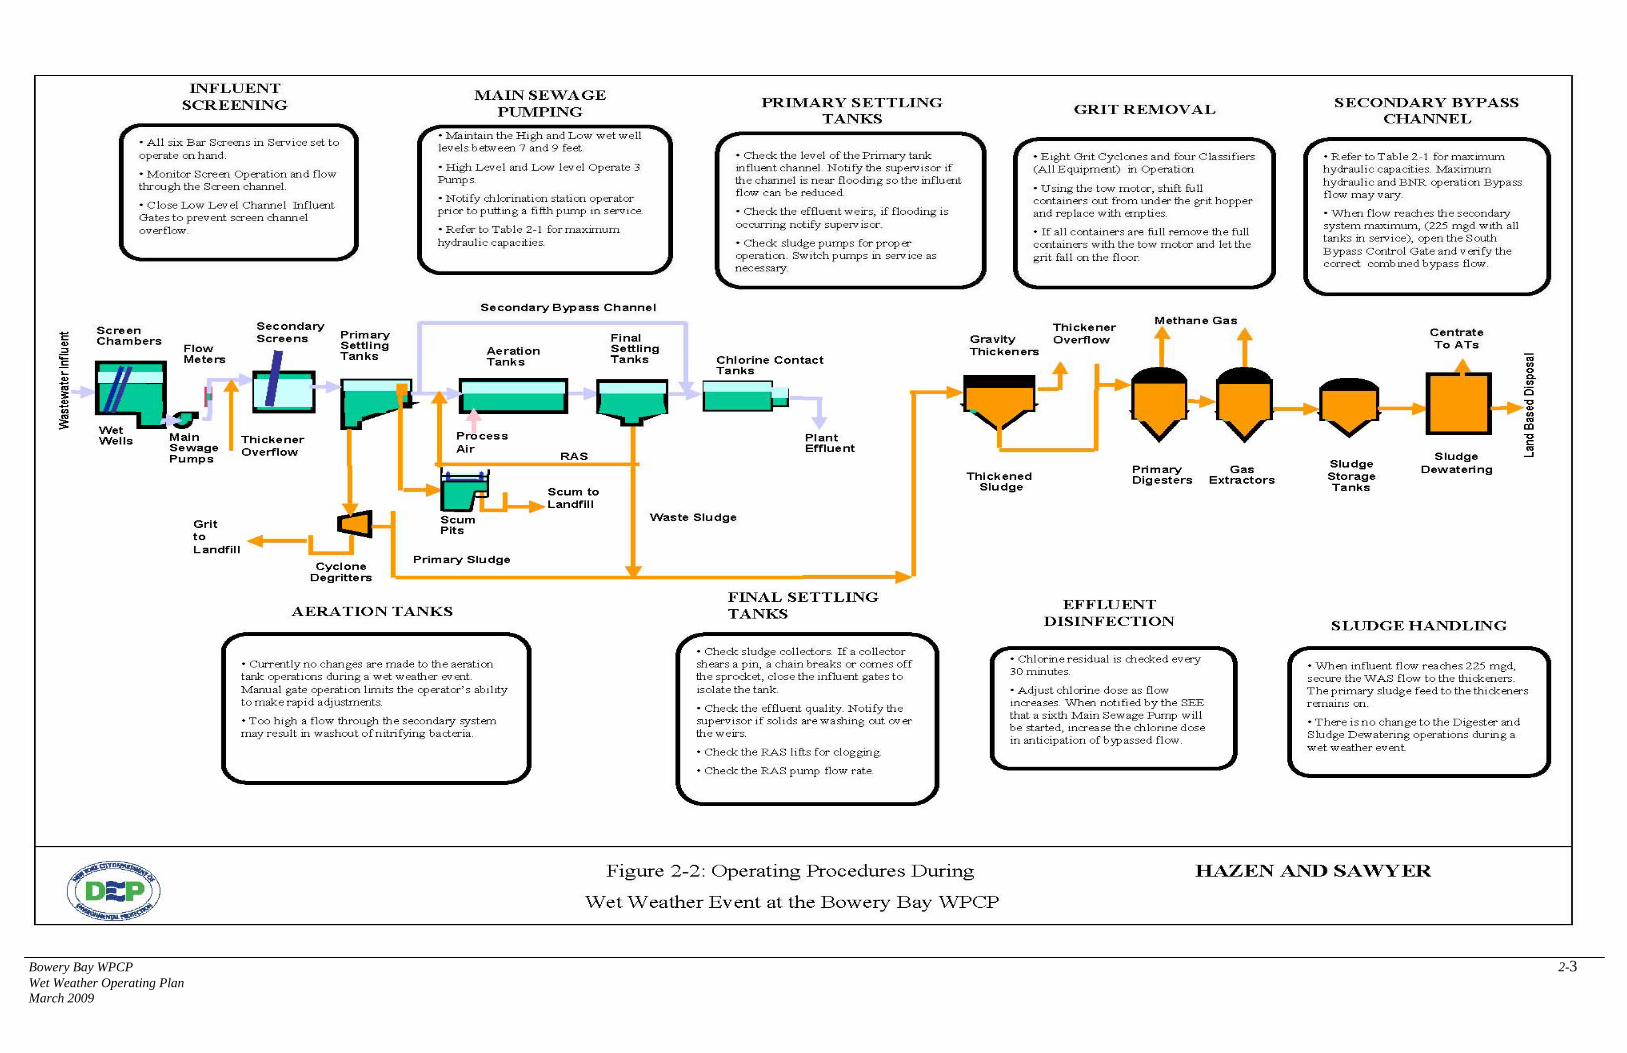
Bowery Bay WPCP 2-3 Wet Weather Operating Plan March 2009
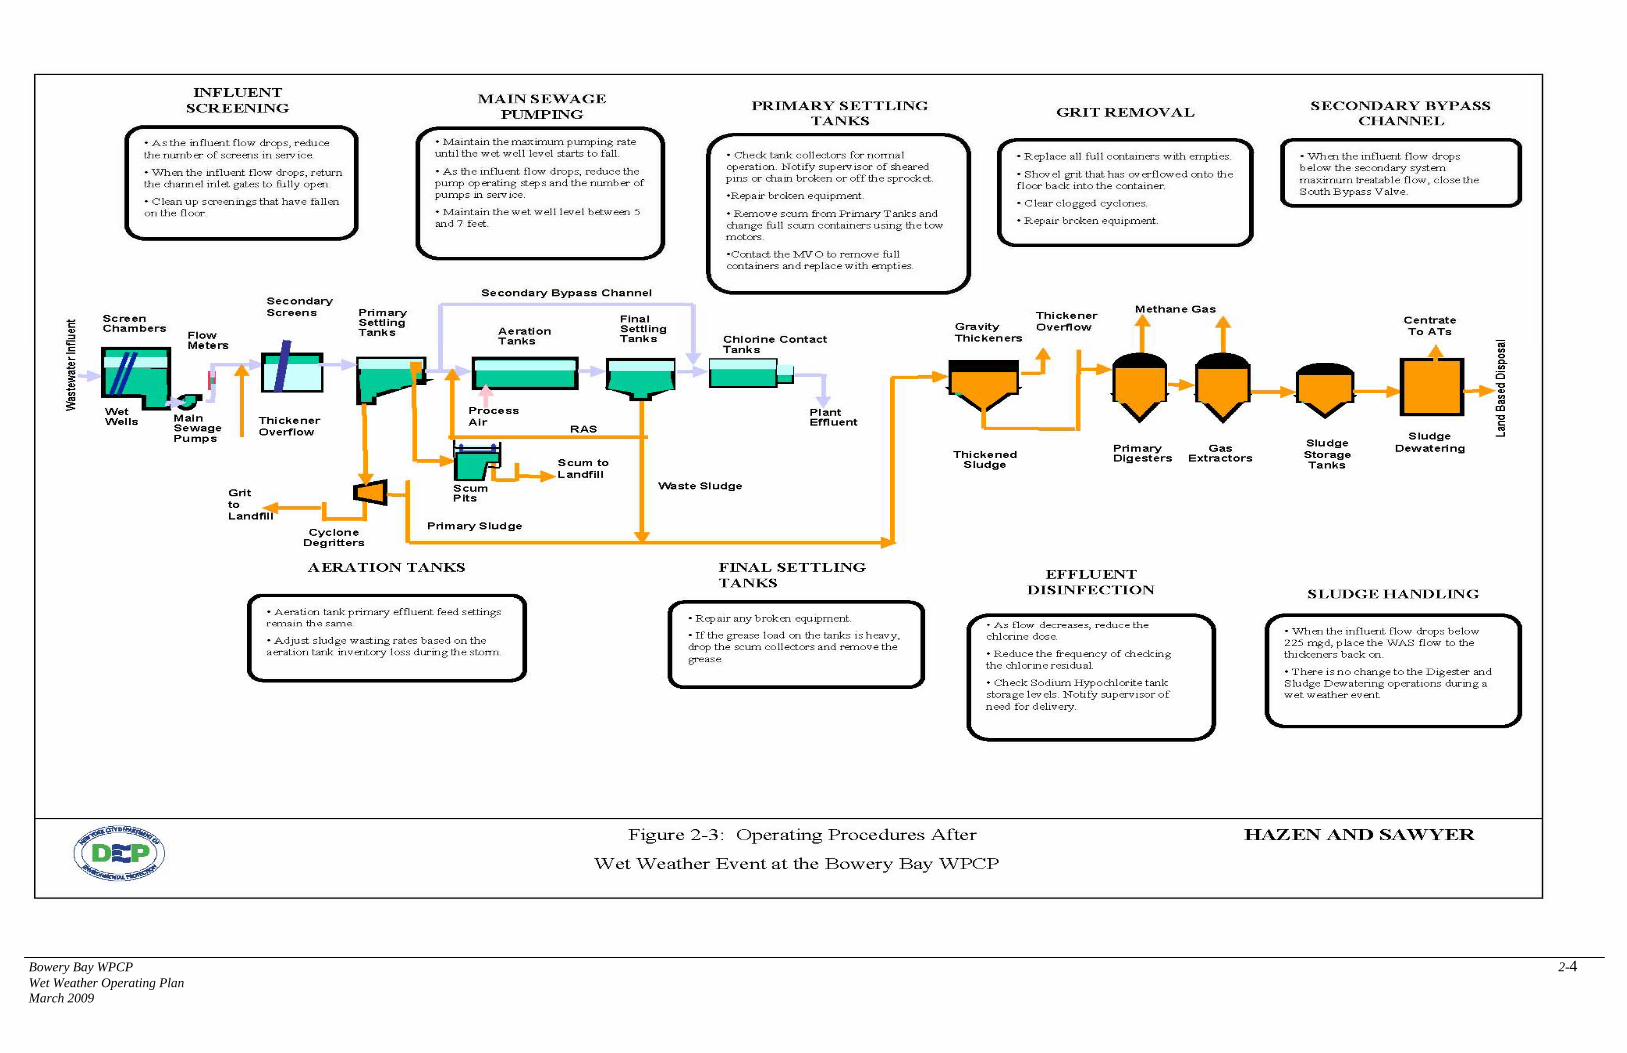
ay WPCP 2-r Operating Plan
09
4
Bowery BWet WeatheMarch 20
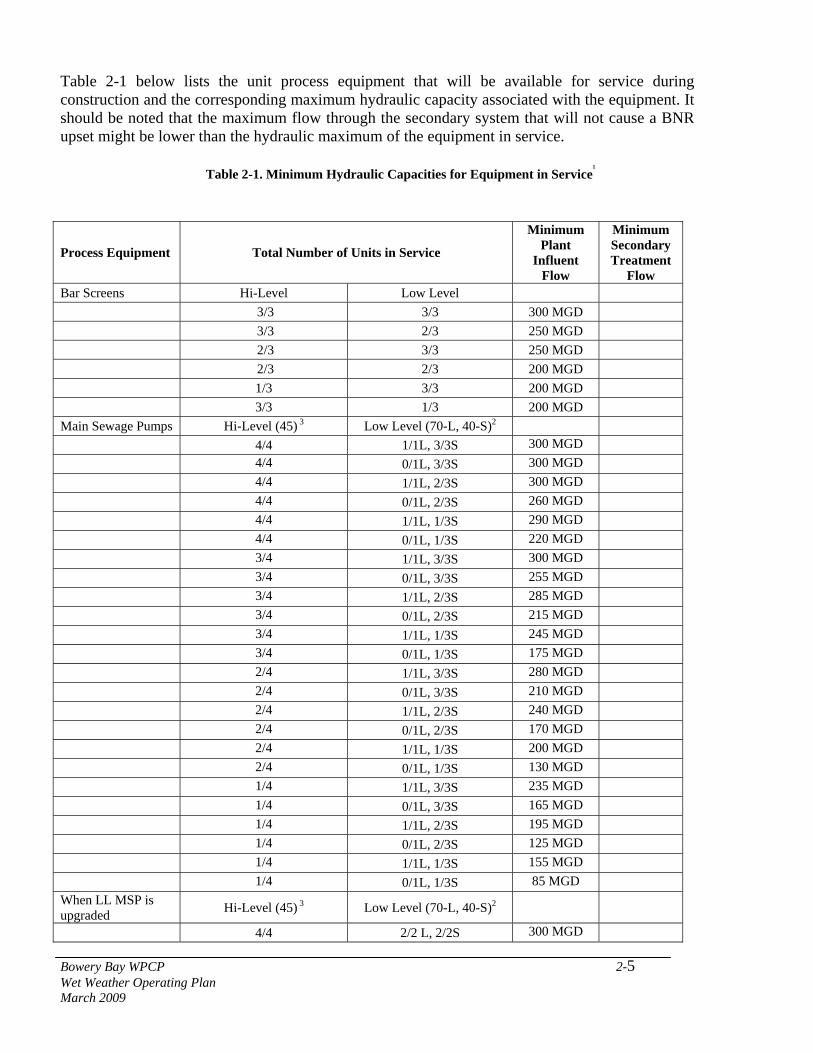
Table 2-1 below lists the unit process equipment that will be available for service during construction and the corresponding maximum hydraulic capacity associated with the equipment. It should be noted that the maximum flow through the secondary system that will not cause a BNR upset might be lower than the hydraulic maximum of the equipment in service.
Table 2-1. Minimum Hydraulic Capacities for Equipment in Service1
Process Equipment Total Number of Units in Service
Minimum Plant
Influent Flow
Minimum Secondary Treatment
Flow Bar Screens Hi-Level Low Level 3/3 3/3 300 MGD 3/3 2/3 250 MGD 2/3 3/3 250 MGD 2/3 2/3 200 MGD 1/3 3/3 200 MGD 3/3 1/3 200 MGD Main Sewage Pumps Hi-Level (45) 3 Low Level (70-L, 40-S)2 4/4 1/1L, 3/3S 300 MGD 4/4 0/1L, 3/3S 300 MGD 4/4 1/1L, 2/3S 300 MGD 4/4 0/1L, 2/3S 260 MGD 4/4 1/1L, 1/3S 290 MGD 4/4 0/1L, 1/3S 220 MGD 3/4 1/1L, 3/3S 300 MGD 3/4 0/1L, 3/3S 255 MGD 3/4 1/1L, 2/3S 285 MGD 3/4 0/1L, 2/3S 215 MGD 3/4 1/1L, 1/3S 245 MGD 3/4 0/1L, 1/3S 175 MGD 2/4 1/1L, 3/3S 280 MGD 2/4 0/1L, 3/3S 210 MGD 2/4 1/1L, 2/3S 240 MGD 2/4 0/1L, 2/3S 170 MGD 2/4 1/1L, 1/3S 200 MGD 2/4 0/1L, 1/3S 130 MGD 1/4 1/1L, 3/3S 235 MGD 1/4 0/1L, 3/3S 165 MGD 1/4 1/1L, 2/3S 195 MGD 1/4 0/1L, 2/3S 125 MGD 1/4 1/1L, 1/3S 155 MGD 1/4 0/1L, 1/3S 85 MGD When LL MSP is upgraded Hi-Level (45) 3 Low Level (70-L, 40-S)2
4/4 2/2 L, 2/2S 300 MGD
Bowery Bay WPCP 2-5 Wet Weather Operating Plan March 2009
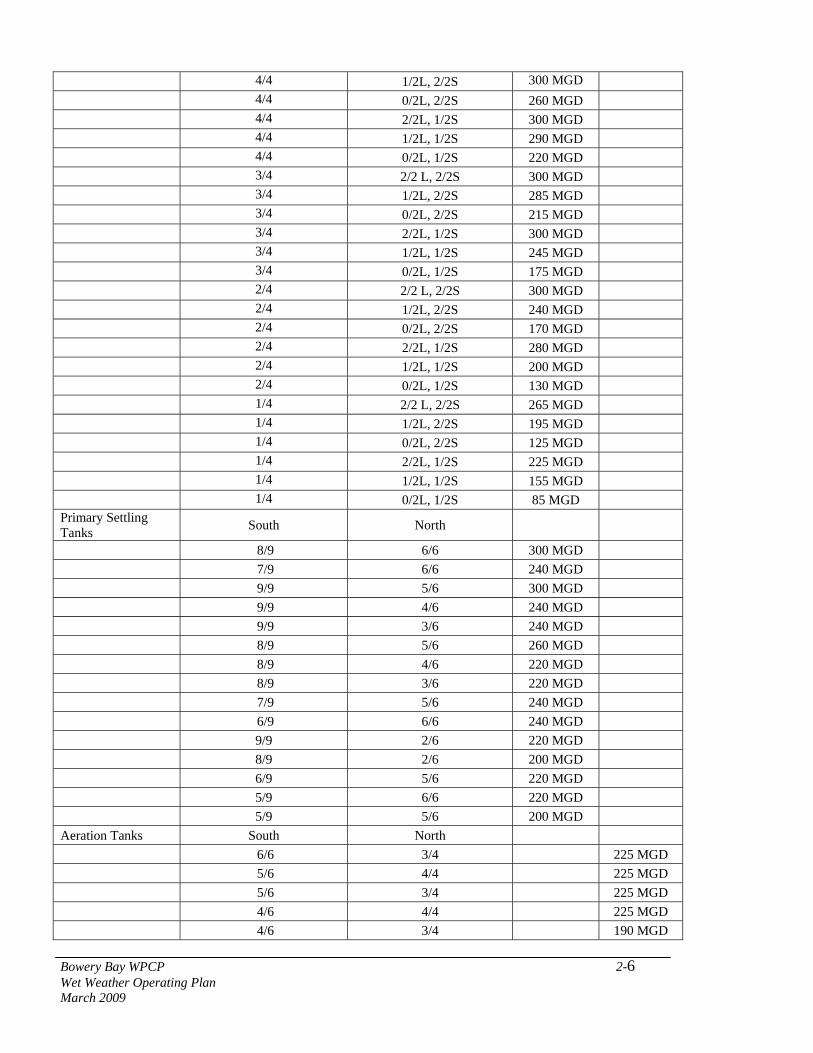
4/4 1/2L, 2/2S 300 MGD 4/4 0/2L, 2/2S 260 MGD 4/4 2/2L, 1/2S 300 MGD 4/4 1/2L, 1/2S 290 MGD 4/4 0/2L, 1/2S 220 MGD 3/4 2/2 L, 2/2S 300 MGD 3/4 1/2L, 2/2S 285 MGD 3/4 0/2L, 2/2S 215 MGD 3/4 2/2L, 1/2S 300 MGD 3/4 1/2L, 1/2S 245 MGD 3/4 0/2L, 1/2S 175 MGD 2/4 2/2 L, 2/2S 300 MGD 2/4 1/2L, 2/2S 240 MGD 2/4 0/2L, 2/2S 170 MGD 2/4 2/2L, 1/2S 280 MGD 2/4 1/2L, 1/2S 200 MGD 2/4 0/2L, 1/2S 130 MGD 1/4 2/2 L, 2/2S 265 MGD 1/4 1/2L, 2/2S 195 MGD 1/4 0/2L, 2/2S 125 MGD 1/4 2/2L, 1/2S 225 MGD 1/4 1/2L, 1/2S 155 MGD 1/4 0/2L, 1/2S 85 MGD Primary Settling Tanks South North
8/9 6/6 300 MGD 7/9 6/6 240 MGD 9/9 5/6 300 MGD 9/9 4/6 240 MGD 9/9 3/6 240 MGD 8/9 5/6 260 MGD 8/9 4/6 220 MGD 8/9 3/6 220 MGD 7/9 5/6 240 MGD 6/9 6/6 240 MGD 9/9 2/6 220 MGD 8/9 2/6 200 MGD 6/9 5/6 220 MGD 5/9 6/6 220 MGD 5/9 5/6 200 MGD Aeration Tanks South North 6/6 3/4 225 MGD 5/6 4/4 225 MGD 5/6 3/4 225 MGD 4/6 4/4 225 MGD 4/6 3/4 190 MGD
Bowery Bay WPCP 2-6 Wet Weather Operating Plan March 2009
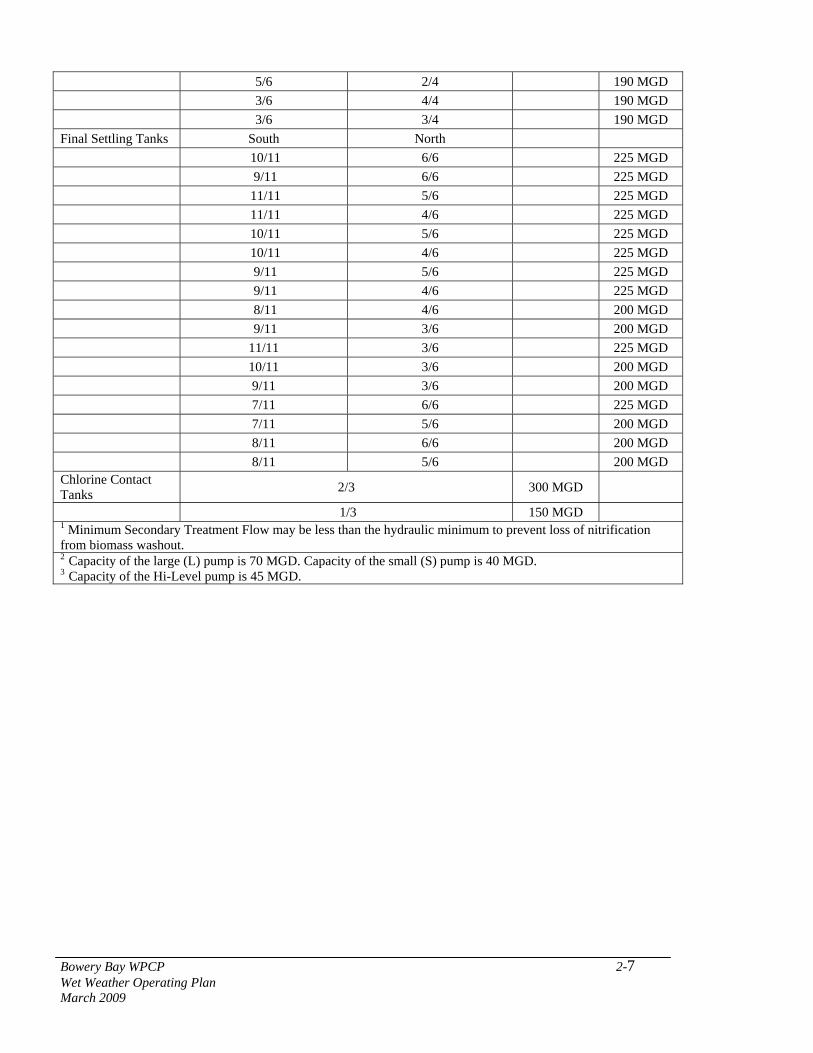
5/6 2/4 190 MGD 3/6 4/4 190 MGD 3/6 3/4 190 MGD Final Settling Tanks South North 10/11 6/6 225 MGD 9/11 6/6 225 MGD 11/11 5/6 225 MGD 11/11 4/6 225 MGD 10/11 5/6 225 MGD 10/11 4/6 225 MGD 9/11 5/6 225 MGD 9/11 4/6 225 MGD 8/11 4/6 200 MGD 9/11 3/6 200 MGD 11/11 3/6 225 MGD 10/11 3/6 200 MGD 9/11 3/6 200 MGD 7/11 6/6 225 MGD 7/11 5/6 200 MGD 8/11 6/6 200 MGD 8/11 5/6 200 MGD Chlorine Contact Tanks 2/3 300 MGD
1/3 150 MGD 1 Minimum Secondary Treatment Flow may be less than the hydraulic minimum to prevent loss of nitrification from biomass washout. 2 Capacity of the large (L) pump is 70 MGD. Capacity of the small (S) pump is 40 MGD. 3 Capacity of the Hi-Level pump is 45 MGD.
Bowery Bay WPCP 2-7 Wet Weather Operating Plan March 2009

2.2 INFLUENT SCREENING
2.2.1 Unit Processes and Equipment List
UNIT PROCESS EQUIPMENT Hi Level Screens 2 – Chamber Influent Sluice Gates (Auto)
3 – Channel Influent Sluice Gates (Manual) 3 – Channel Outlet Sluice Gates (Manual) 3 – Bar Screens 1 – Belt Conveyors 1 – Bubbler System 3 – 10 Cubic Yard Containers on Dollies
Low Level Screens 3 – Channel Influent Sluice Gates (Auto) 3 – Channel Outlet Sluice Gates (Manual) 3 – Bar Screens 1 – Belt Conveyors 1 – Bubbler System 3 – 10 Cubic Yard Containers on Dollies
2.2.2 Wet Weather Operating Procedures High Level Wet Well
WHO DOES IT? SUPERVISORY IMPLEMENTATION
WHAT DO WE DO
Before Wet Weather Event SEE SSTW/STW •During dry weather operation, maintain the wet
well level between 5-7 feet. The zero level is the bottom of the wet well. The bubbler levels are not actual elevations from mean sea level. •One bar screen is in service during peak diurnal dry weather flow. •The bar screen mechanism is set for level differential. •Visually inspect the screen to confirm proper operation. •Visually monitor the flow through the screen channel. •Visually inspect the 10-yard container. If the container is full, use the tow motor to switch containers. •Confirm that additional empty 10-yard containers are available.
Bowery Bay WPCP 2-8 Wet Weather Operating Plan March 2009
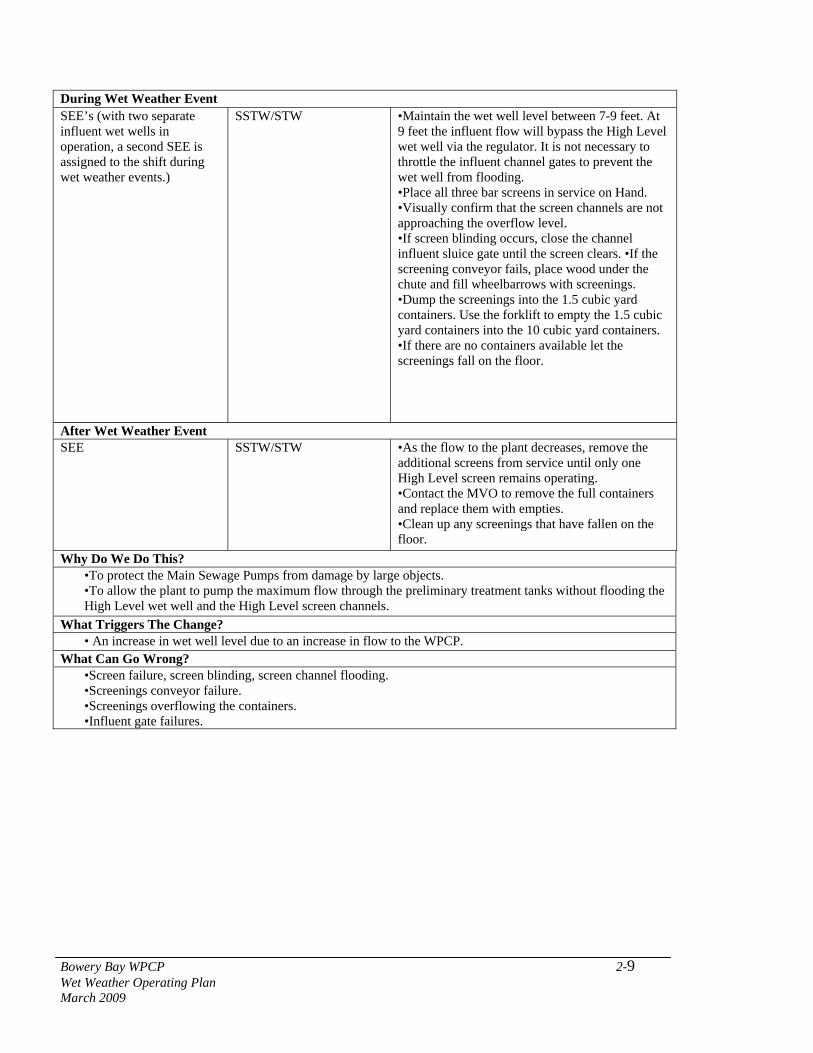
During Wet Weather Event SEE’s (with two separate influent wet wells in operation, a second SEE is assigned to the shift during wet weather events.)
SSTW/STW •Maintain the wet well level between 7-9 feet. At 9 feet the influent flow will bypass the High Level wet well via the regulator. It is not necessary to throttle the influent channel gates to prevent the wet well from flooding. •Place all three bar screens in service on Hand. •Visually confirm that the screen channels are not approaching the overflow level. •If screen blinding occurs, close the channel influent sluice gate until the screen clears. •If the screening conveyor fails, place wood under the chute and fill wheelbarrows with screenings. •Dump the screenings into the 1.5 cubic yard containers. Use the forklift to empty the 1.5 cubic yard containers into the 10 cubic yard containers. •If there are no containers available let the screenings fall on the floor.
After Wet Weather Event SEE SSTW/STW •As the flow to the plant decreases, remove the
additional screens from service until only one High Level screen remains operating. •Contact the MVO to remove the full containers and replace them with empties. •Clean up any screenings that have fallen on the floor.
Why Do We Do This? •To protect the Main Sewage Pumps from damage by large objects. •To allow the plant to pump the maximum flow through the preliminary treatment tanks without flooding the High Level wet well and the High Level screen channels.
What Triggers The Change? • An increase in wet well level due to an increase in flow to the WPCP.
What Can Go Wrong? •Screen failure, screen blinding, screen channel flooding. •Screenings conveyor failure. •Screenings overflowing the containers. •Influent gate failures.
Bowery Bay WPCP 2-9 Wet Weather Operating Plan March 2009
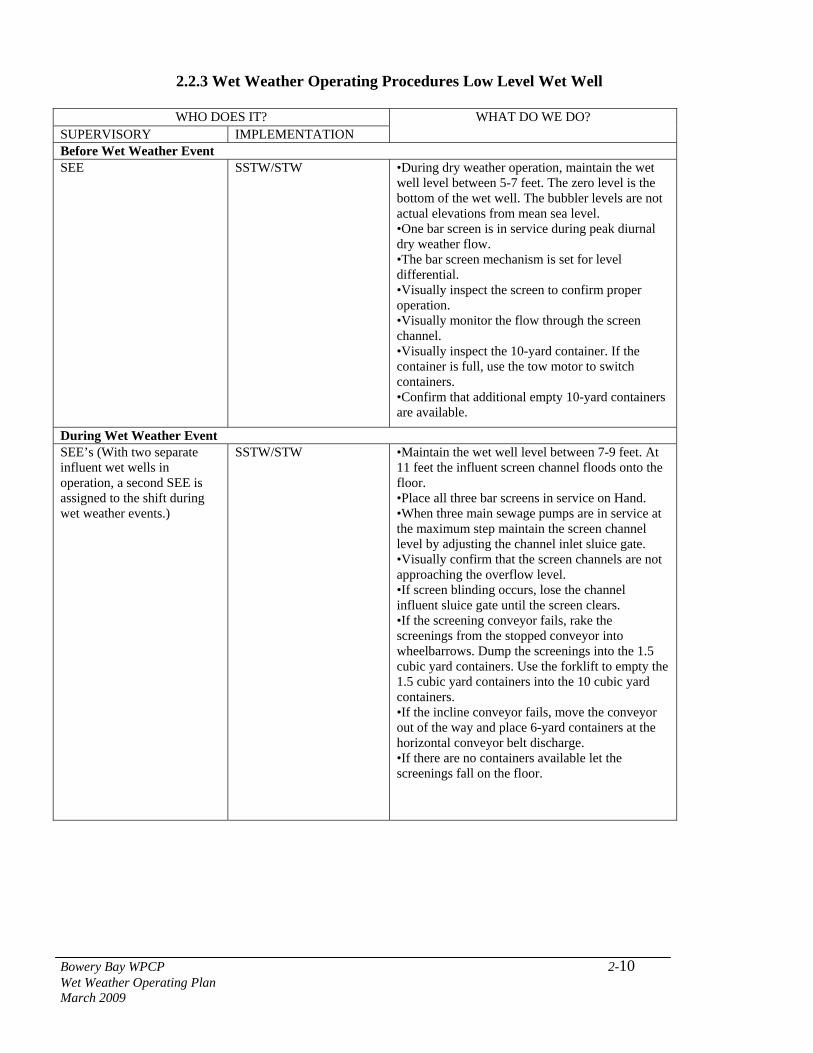
2.2.3 Wet Weather Operating Procedures Low Level Wet Well
WHO DOES IT?
SUPERVISORY IMPLEMENTATION WHAT DO WE DO?
Before Wet Weather Event SEE SSTW/STW •During dry weather operation, maintain the wet
well level between 5-7 feet. The zero level is the bottom of the wet well. The bubbler levels are not actual elevations from mean sea level. •One bar screen is in service during peak diurnal dry weather flow. •The bar screen mechanism is set for level differential. •Visually inspect the screen to confirm proper operation. •Visually monitor the flow through the screen channel. •Visually inspect the 10-yard container. If the container is full, use the tow motor to switch containers. •Confirm that additional empty 10-yard containers are available.
During Wet Weather Event SEE’s (With two separate influent wet wells in operation, a second SEE is assigned to the shift during wet weather events.)
SSTW/STW •Maintain the wet well level between 7-9 feet. At 11 feet the influent screen channel floods onto the floor. •Place all three bar screens in service on Hand. •When three main sewage pumps are in service at the maximum step maintain the screen channel level by adjusting the channel inlet sluice gate. •Visually confirm that the screen channels are not approaching the overflow level. •If screen blinding occurs, lose the channel influent sluice gate until the screen clears. •If the screening conveyor fails, rake the screenings from the stopped conveyor into wheelbarrows. Dump the screenings into the 1.5 cubic yard containers. Use the forklift to empty the 1.5 cubic yard containers into the 10 cubic yard containers. •If the incline conveyor fails, move the conveyor out of the way and place 6-yard containers at the horizontal conveyor belt discharge. •If there are no containers available let the screenings fall on the floor.
Bowery Bay WPCP 2-10 Wet Weather Operating Plan March 2009
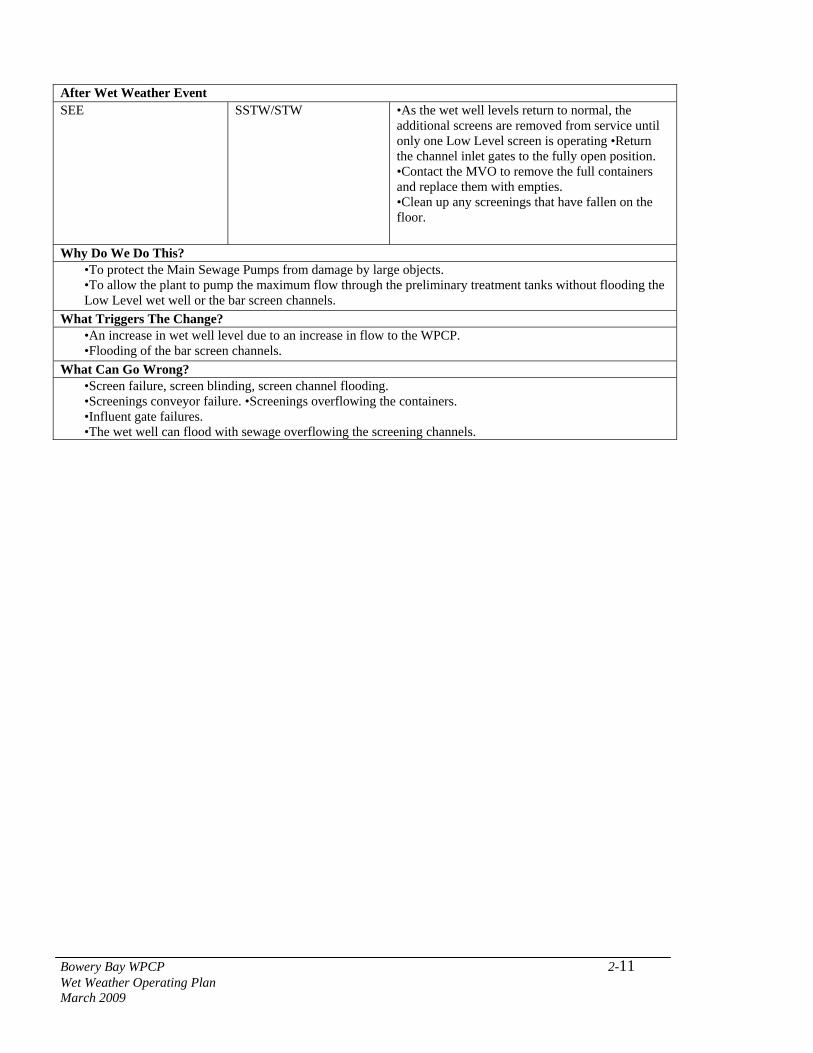
After Wet Weather Event SEE SSTW/STW •As the wet well levels return to normal, the
additional screens are removed from service until only one Low Level screen is operating •Return the channel inlet gates to the fully open position. •Contact the MVO to remove the full containers and replace them with empties. •Clean up any screenings that have fallen on the floor.
Why Do We Do This? •To protect the Main Sewage Pumps from damage by large objects. •To allow the plant to pump the maximum flow through the preliminary treatment tanks without flooding the Low Level wet well or the bar screen channels.
What Triggers The Change? •An increase in wet well level due to an increase in flow to the WPCP. •Flooding of the bar screen channels.
What Can Go Wrong? •Screen failure, screen blinding, screen channel flooding. •Screenings conveyor failure. •Screenings overflowing the containers. •Influent gate failures. •The wet well can flood with sewage overflowing the screening channels.
Bowery Bay WPCP 2-11 Wet Weather Operating Plan March 2009
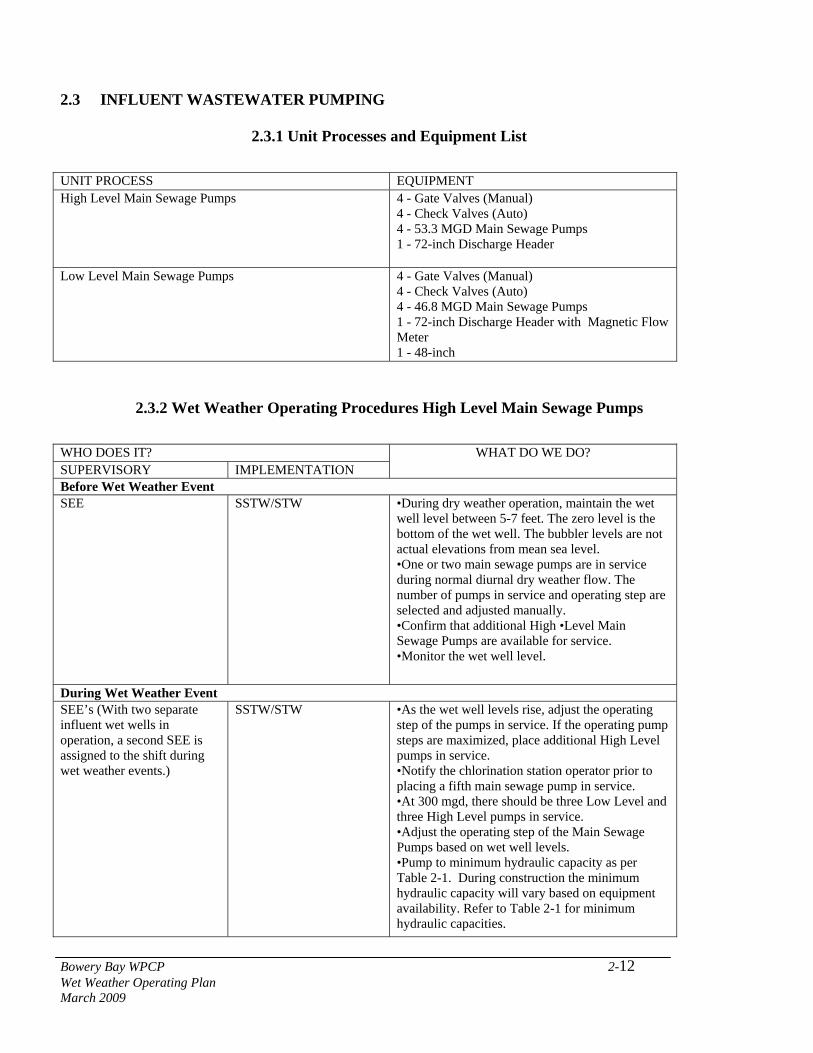
2.3 INFLUENT WASTEWATER PUMPING
2.3.1 Unit Processes and Equipment List
UNIT PROCESS EQUIPMENT High Level Main Sewage Pumps 4 - Gate Valves (Manual)
4 - Check Valves (Auto) 4 - 53.3 MGD Main Sewage Pumps 1 - 72-inch Discharge Header
Low Level Main Sewage Pumps 4 - Gate Valves (Manual) 4 - Check Valves (Auto) 4 - 46.8 MGD Main Sewage Pumps 1 - 72-inch Discharge Header with Magnetic Flow Meter 1 - 48-inch
2.3.2 Wet Weather Operating Procedures High Level Main Sewage Pumps
WHO DOES IT? SUPERVISORY IMPLEMENTATION
WHAT DO WE DO?
Before Wet Weather Event SEE SSTW/STW •During dry weather operation, maintain the wet
well level between 5-7 feet. The zero level is the bottom of the wet well. The bubbler levels are not actual elevations from mean sea level. •One or two main sewage pumps are in service during normal diurnal dry weather flow. The number of pumps in service and operating step are selected and adjusted manually. •Confirm that additional High •Level Main Sewage Pumps are available for service. •Monitor the wet well level.
During Wet Weather Event SEE’s (With two separate influent wet wells in operation, a second SEE is assigned to the shift during wet weather events.)
SSTW/STW •As the wet well levels rise, adjust the operating step of the pumps in service. If the operating pump steps are maximized, place additional High Level pumps in service. •Notify the chlorination station operator prior to placing a fifth main sewage pump in service. •At 300 mgd, there should be three Low Level and three High Level pumps in service. •Adjust the operating step of the Main Sewage Pumps based on wet well levels. •Pump to minimum hydraulic capacity as per Table 2-1. During construction the minimum hydraulic capacity will vary based on equipment availability. Refer to Table 2-1 for minimum hydraulic capacities.
Bowery Bay WPCP 2-12 Wet Weather Operating Plan March 2009
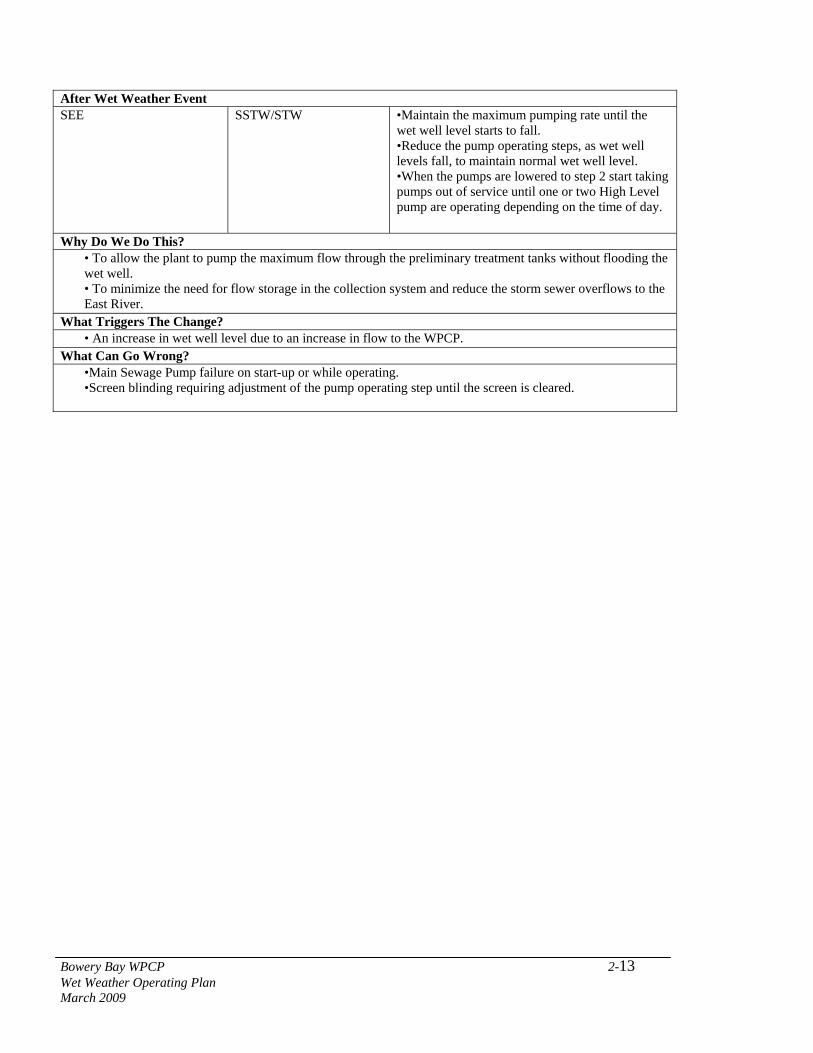
After Wet Weather Event SEE SSTW/STW •Maintain the maximum pumping rate until the
wet well level starts to fall. •Reduce the pump operating steps, as wet well levels fall, to maintain normal wet well level. •When the pumps are lowered to step 2 start taking pumps out of service until one or two High Level pump are operating depending on the time of day.
Why Do We Do This? • To allow the plant to pump the maximum flow through the preliminary treatment tanks without flooding the wet well. • To minimize the need for flow storage in the collection system and reduce the storm sewer overflows to the East River.
What Triggers The Change? • An increase in wet well level due to an increase in flow to the WPCP.
What Can Go Wrong? •Main Sewage Pump failure on start-up or while operating. •Screen blinding requiring adjustment of the pump operating step until the screen is cleared.
Bowery Bay WPCP 2-13 Wet Weather Operating Plan March 2009

2.3.3 Wet Weather Operating Procedures Low Level Main Sewage Pumps
WHO DOES IT? SUPERVISORY IMPLEMENTATION
WHAT DO WE DO?
Before Wet Weather Event SEE SSTW/STW •During dry weather operation, maintain the wet
well level between 5-7 feet. The zero level is the bottom of the wet well. The bubbler levels are not actual elevations from mean sea level. •One or two Main Sewage Pumps are in service during normal diurnal dry weather flow. The number of pumps in service and operating step are selected and adjusted manually. •Confirm that additional Low Level Main Sewage Pumps are available for service. •Monitor the wet well level.
During Wet Weather Event SEE’s (With two separate influent wet wells in operation, a second SEE is assigned to the shift during wet weather events.)
SSTW/STW •As the wet well levels rise, adjust the operating step of the pumps in service. If the operating pump steps are maximized, place additional Low Level pumps in service. •Notify the chlorination station operator prior to placing a fifth main sewage pump in service. •At 300 mgd, there should be three Low Level and three High Level pumps in service. •Adjust the operating step of the Main Sewage Pumps based on wet well levels. •Pump to minimum hydraulic capacity as per Table 2-1. During construction the minimum capacity will vary based on equipment availability. Refer to Table 2-1 for minimum hydraulic capacities.
After Wet Weather Event SEE SSTW/STW •If the channel influent gates have been throttled,
maintain the maximum pumping rate until the gates are fully open and the wet well levels start to fall. •Reduce the pump operating steps, as wet well levels fall, to maintain normal wet well level. •When the pumps are lowered to step 2 start taking pumps out of service until only one Low Level pump is operating.
Why Do We Do This? •To allow the plant to pump the maximum flow through the preliminary treatment tanks without flooding the Low Level wet well or the bar screen channels. •To minimize the need for flow storage in the collection system and reduce the storm sewer overflows to the East River.
What Triggers The Change? • An increase in wet well level due to an increase in flow to the WPCP.
What Can Go Wrong? •Main Sewage Pump failure on start-up or while operating. •Screen blinding requiring adjustment of the pump operating step until the screen is cleared.
Bowery Bay WPCP 2-14 Wet Weather Operating Plan
March 2009
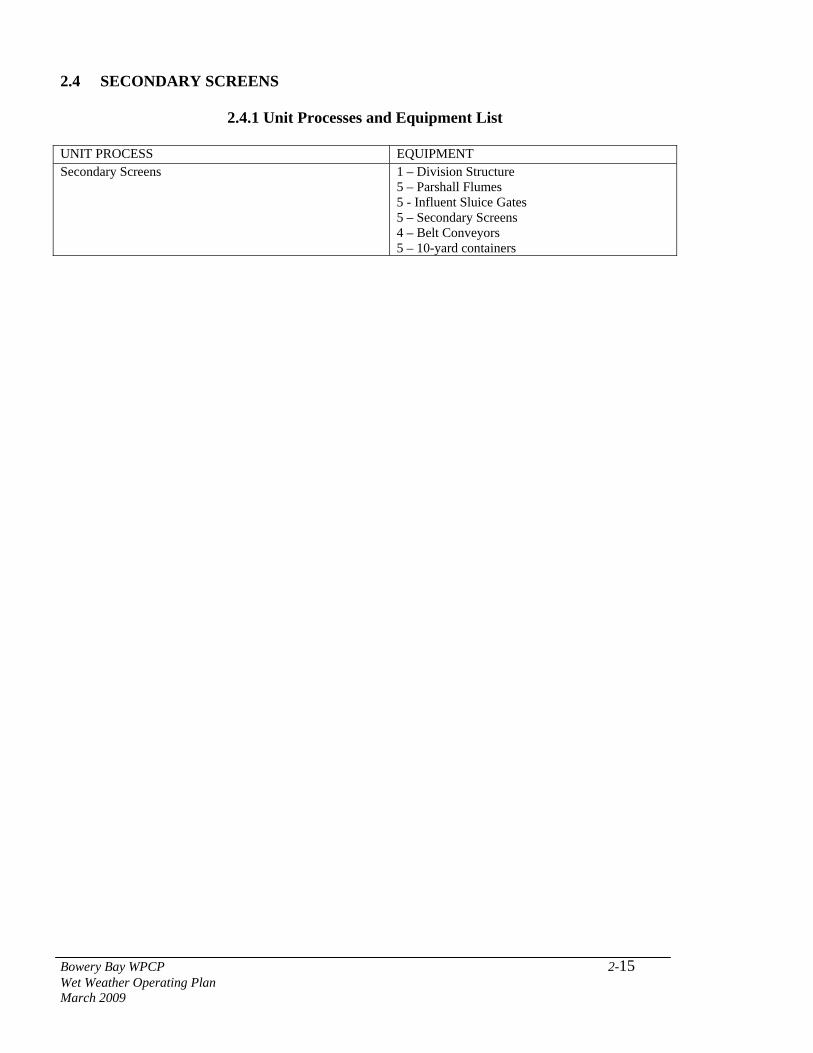
2.4 SECONDARY SCREENS
2.4.1 Unit Processes and Equipment List
UNIT PROCESS EQUIPMENT Secondary Screens 1 – Division Structure
5 – Parshall Flumes 5 - Influent Sluice Gates 5 – Secondary Screens 4 – Belt Conveyors 5 – 10-yard containers
Bowery Bay WPCP 2-15 Wet Weather Operating Plan March 2009
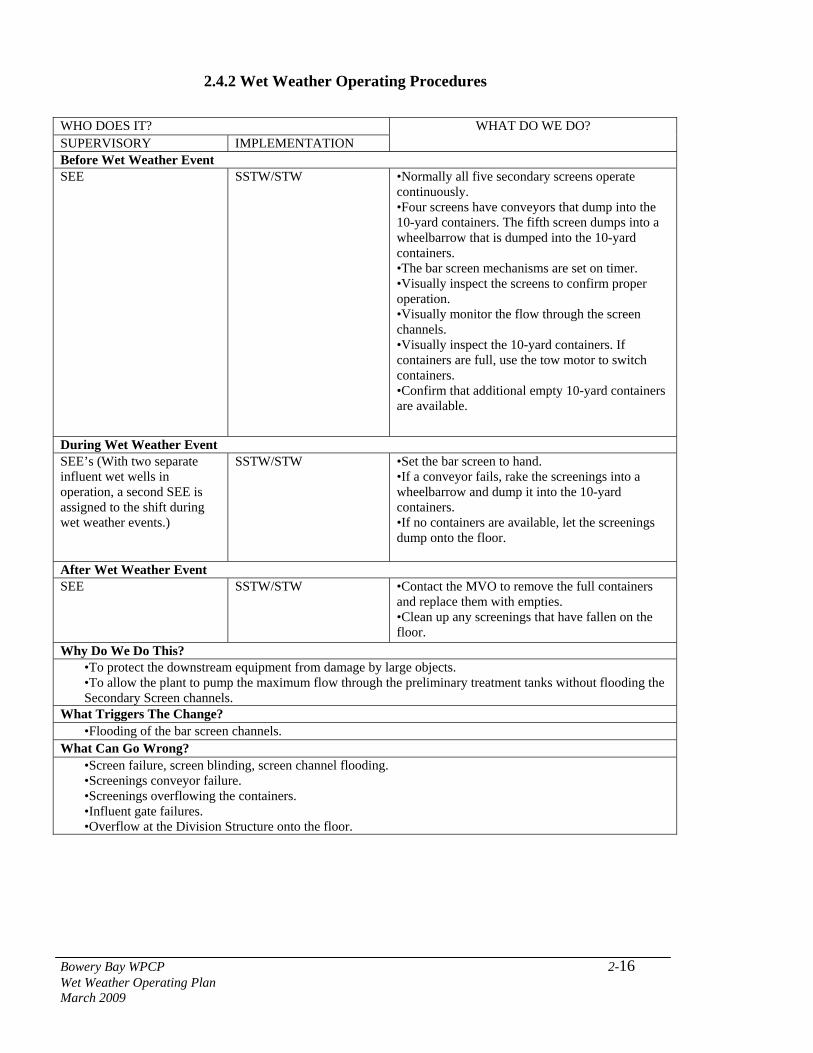
2.4.2 Wet Weather Operating Procedures
WHO DOES IT? SUPERVISORY IMPLEMENTATION
WHAT DO WE DO?
Before Wet Weather Event SEE
SSTW/STW •Normally all five secondary screens operate continuously. •Four screens have conveyors that dump into the 10-yard containers. The fifth screen dumps into a wheelbarrow that is dumped into the 10-yard containers. •The bar screen mechanisms are set on timer. •Visually inspect the screens to confirm proper operation. •Visually monitor the flow through the screen channels. •Visually inspect the 10-yard containers. If containers are full, use the tow motor to switch containers. •Confirm that additional empty 10-yard containers are available.
During Wet Weather Event SEE’s (With two separate influent wet wells in operation, a second SEE is assigned to the shift during wet weather events.)
SSTW/STW •Set the bar screen to hand. •If a conveyor fails, rake the screenings into a wheelbarrow and dump it into the 10-yard containers. •If no containers are available, let the screenings dump onto the floor.
After Wet Weather Event SEE SSTW/STW •Contact the MVO to remove the full containers
and replace them with empties. •Clean up any screenings that have fallen on the floor.
Why Do We Do This? •To protect the downstream equipment from damage by large objects. •To allow the plant to pump the maximum flow through the preliminary treatment tanks without flooding the Secondary Screen channels.
What Triggers The Change? •Flooding of the bar screen channels.
What Can Go Wrong? •Screen failure, screen blinding, screen channel flooding. •Screenings conveyor failure. •Screenings overflowing the containers. •Influent gate failures. •Overflow at the Division Structure onto the floor.
Bowery Bay WPCP 2-16 Wet Weather Operating Plan March 2009
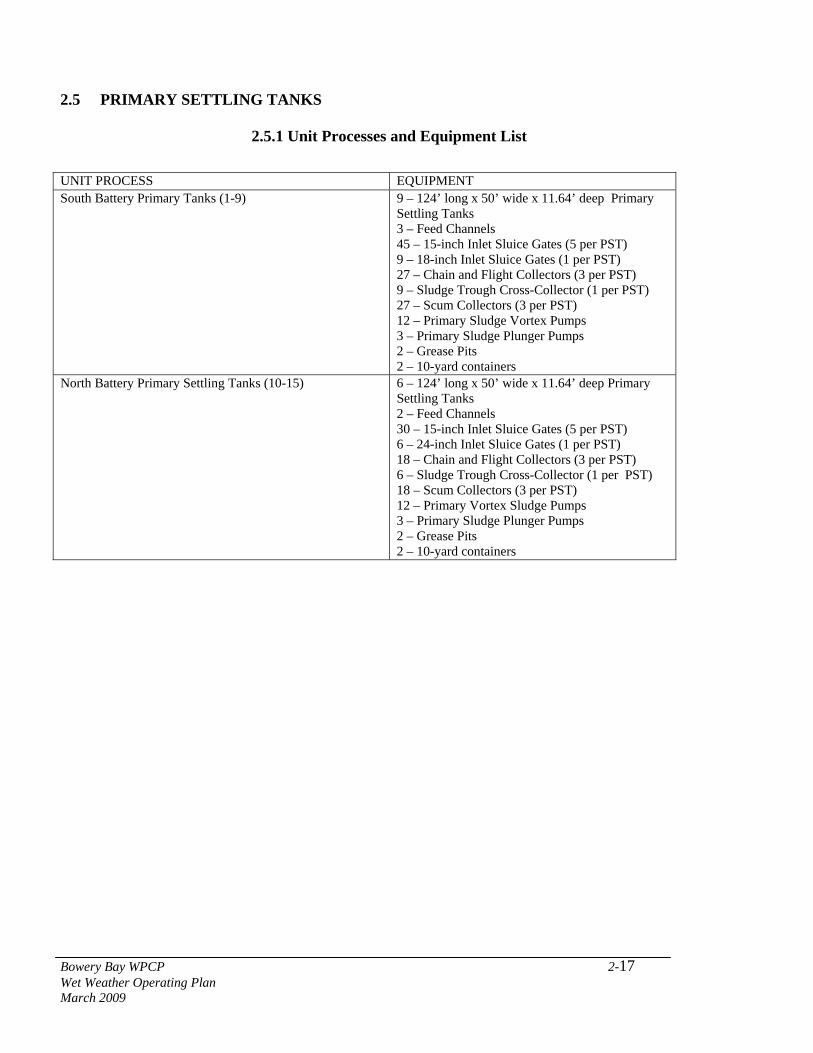
2.5 PRIMARY SETTLING TANKS
2.5.1 Unit Processes and Equipment List
UNIT PROCESS EQUIPMENT South Battery Primary Tanks (1-9) 9 – 124’ long x 50’ wide x 11.64’ deep Primary
Settling Tanks 3 – Feed Channels 45 – 15-inch Inlet Sluice Gates (5 per PST) 9 – 18-inch Inlet Sluice Gates (1 per PST) 27 – Chain and Flight Collectors (3 per PST) 9 – Sludge Trough Cross-Collector (1 per PST) 27 – Scum Collectors (3 per PST) 12 – Primary Sludge Vortex Pumps 3 – Primary Sludge Plunger Pumps 2 – Grease Pits 2 – 10-yard containers
North Battery Primary Settling Tanks (10-15) 6 – 124’ long x 50’ wide x 11.64’ deep Primary Settling Tanks 2 – Feed Channels 30 – 15-inch Inlet Sluice Gates (5 per PST) 6 – 24-inch Inlet Sluice Gates (1 per PST) 18 – Chain and Flight Collectors (3 per PST) 6 – Sludge Trough Cross-Collector (1 per PST) 18 – Scum Collectors (3 per PST) 12 – Primary Vortex Sludge Pumps 3 – Primary Sludge Plunger Pumps 2 – Grease Pits 2 – 10-yard containers
Bowery Bay WPCP 2-17 Wet Weather Operating Plan March 2009

2.5.2 Wet Weather Operating Procedures 2.6.2 Wet Weather Operating Procedures
WHO DOES IT? SUPERVISORY IMPLEMENTATION
WHAT DO WE DO?
Before Wet Weather Event SEE SSTW/STW •All primary tanks are in service during normal
operation. •Skim grease from the tank and remove it from the scum pits into the containers as needed. •Ensure that the sludge pumps are working. •Check the operation of the sludge collectors. •Repair any critical/priority equipment out of service. •Confirm additional 10-yard containers are available.
During Wet Weather Event SEE’s (With two separate influent wet wells in operation, a second SEE is assigned to the shift during wet weather events.)
SSTW/STW •Check the level of the primary tank influent channel. Notify the supervisor if the channel is near flooding so the influent flow can be reduced. •Check the effluent weirs; if flooding is occurring notify the supervisor. •Check the sludge pumps for proper operation. Switch pumps in service as necessary. If the sludge pump suction line appears clogged shut the pump and back flush through the pump from the discharge of a second pump. •If the sludge discharge line to the grit cyclones clogs, switch the valves to pump through the second line. •If the tank cross collector fails, remove the tank from service.
After Wet Weather Event SEE SSTW/STW •Check the tank collectors for normal operation.
Notify the supervisor of sheared pins or chain broken or off the sprocket. •Begin the process to repair broken equipment. •Remove scum from the Primary Tanks and change full scum containers using the tow motors. •Contact the MVO to remove the full containers and replace them with empties.
Why Do We Do This? •To maximize the amount of flow that receives primary treatment. •To protect the downstream processes from abnormal wear due to grit abrasion. •To prevent grit and grease accumulation in the aeration tanks.
What Triggers The Change? •An increase in flow to the primary settling tanks.
What Can Go Wrong? •Broken shear pins, broken or slipped collector chains. •Plugged sludge pump suction and discharge lines. •Grease and grit carryover to the aeration tanks.
Bowery Bay WPCP 2-18 Wet Weather Operating Plan March 2009
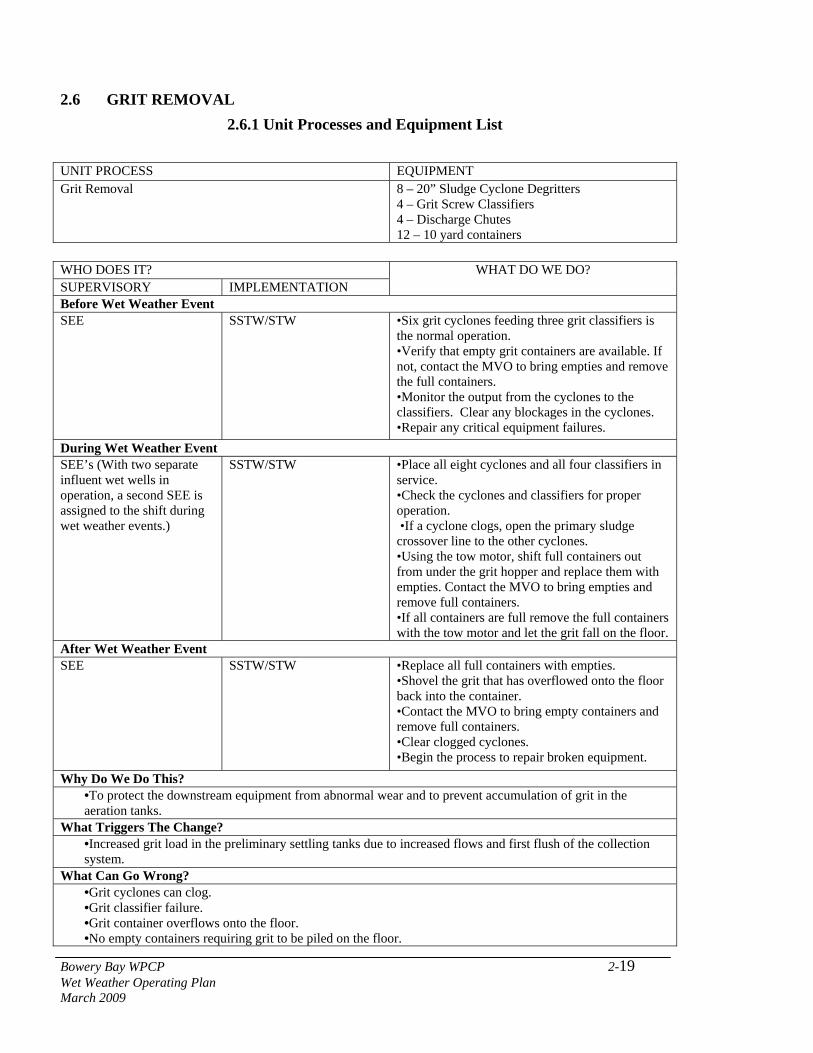
2.6 GRIT REMOVAL
2.6.1 Unit Processes and Equipment List
UNIT PROCESS EQUIPMENT Grit Removal 8 – 20” Sludge Cyclone Degritters
4 – Grit Screw Classifiers 4 – Discharge Chutes 12 – 10 yard containers
WHO DOES IT? SUPERVISORY IMPLEMENTATION
WHAT DO WE DO?
Before Wet Weather Event SEE SSTW/STW •Six grit cyclones feeding three grit classifiers is
the normal operation. •Verify that empty grit containers are available. If not, contact the MVO to bring empties and remove the full containers. •Monitor the output from the cyclones to the classifiers. Clear any blockages in the cyclones. •Repair any critical equipment failures.
During Wet Weather Event SEE’s (With two separate influent wet wells in operation, a second SEE is assigned to the shift during wet weather events.)
SSTW/STW •Place all eight cyclones and all four classifiers in service. •Check the cyclones and classifiers for proper operation. •If a cyclone clogs, open the primary sludge crossover line to the other cyclones. •Using the tow motor, shift full containers out from under the grit hopper and replace them with empties. Contact the MVO to bring empties and remove full containers. •If all containers are full remove the full containers with the tow motor and let the grit fall on the floor.
After Wet Weather Event SEE SSTW/STW •Replace all full containers with empties.
•Shovel the grit that has overflowed onto the floor back into the container. •Contact the MVO to bring empty containers and remove full containers. •Clear clogged cyclones. •Begin the process to repair broken equipment.
Why Do We Do This? •To protect the downstream equipment from abnormal wear and to prevent accumulation of grit in the aeration tanks.
What Triggers The Change? •Increased grit load in the preliminary settling tanks due to increased flows and first flush of the collection system.
What Can Go Wrong? •Grit cyclones can clog. •Grit classifier failure. •Grit container overflows onto the floor. •No empty containers requiring grit to be piled on the floor.
Bowery Bay WPCP 2-19 Wet Weather Operating Plan March 2009
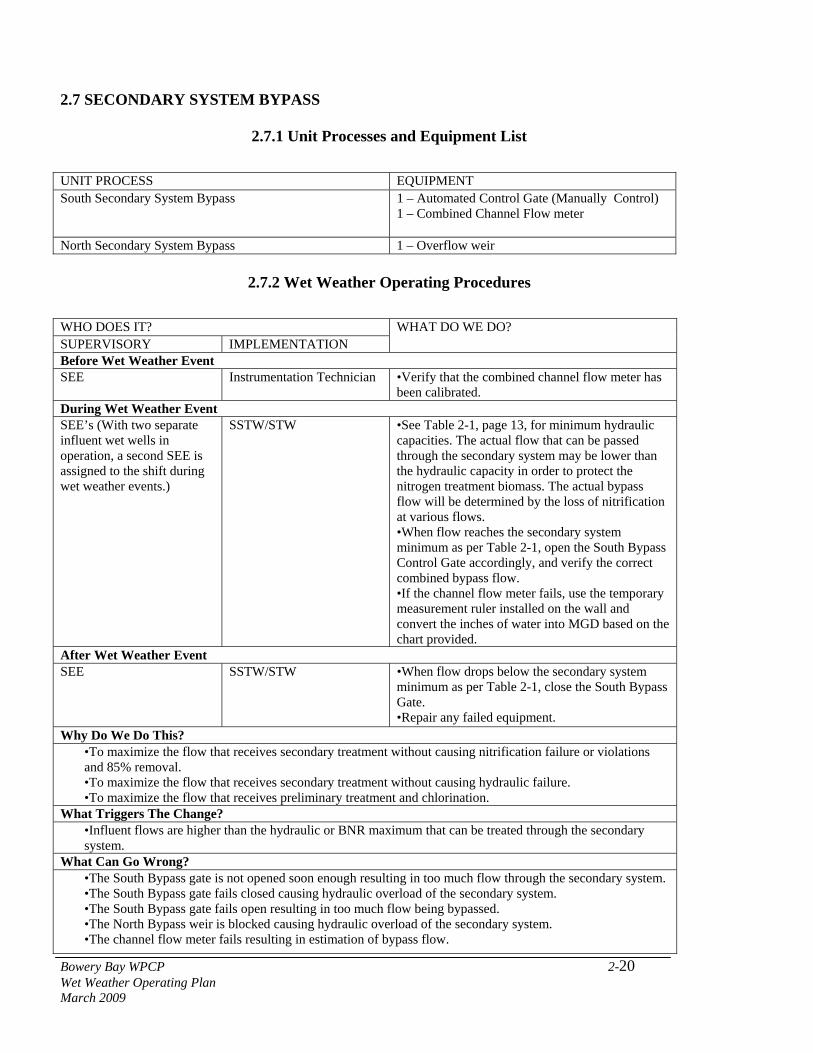
2.7 SECONDARY SYSTEM BYPASS
2.7.1 Unit Processes and Equipment List
UNIT PROCESS EQUIPMENT South Secondary System Bypass 1 – Automated Control Gate (Manually Control)
1 – Combined Channel Flow meter
North Secondary System Bypass 1 – Overflow weir
2.7.2 Wet Weather Operating Procedures
WHO DOES IT? SUPERVISORY IMPLEMENTATION
WHAT DO WE DO?
Before Wet Weather Event SEE Instrumentation Technician •Verify that the combined channel flow meter has
been calibrated. During Wet Weather Event SEE’s (With two separate influent wet wells in operation, a second SEE is assigned to the shift during wet weather events.)
SSTW/STW •See Table 2-1, page 13, for minimum hydraulic capacities. The actual flow that can be passed through the secondary system may be lower than the hydraulic capacity in order to protect the nitrogen treatment biomass. The actual bypass flow will be determined by the loss of nitrification at various flows. •When flow reaches the secondary system minimum as per Table 2-1, open the South Bypass Control Gate accordingly, and verify the correct combined bypass flow. •If the channel flow meter fails, use the temporary measurement ruler installed on the wall and convert the inches of water into MGD based on the chart provided.
After Wet Weather Event SEE SSTW/STW •When flow drops below the secondary system
minimum as per Table 2-1, close the South Bypass Gate. •Repair any failed equipment.
Why Do We Do This? •To maximize the flow that receives secondary treatment without causing nitrification failure or violations and 85% removal. •To maximize the flow that receives secondary treatment without causing hydraulic failure. •To maximize the flow that receives preliminary treatment and chlorination.
What Triggers The Change? •Influent flows are higher than the hydraulic or BNR maximum that can be treated through the secondary system.
What Can Go Wrong? •The South Bypass gate is not opened soon enough resulting in too much flow through the secondary system. •The South Bypass gate fails closed causing hydraulic overload of the secondary system. •The South Bypass gate fails open resulting in too much flow being bypassed. •The North Bypass weir is blocked causing hydraulic overload of the secondary system. •The channel flow meter fails resulting in estimation of bypass flow.
Bowery Bay WPCP 2-20 Wet Weather Operating Plan March 2009
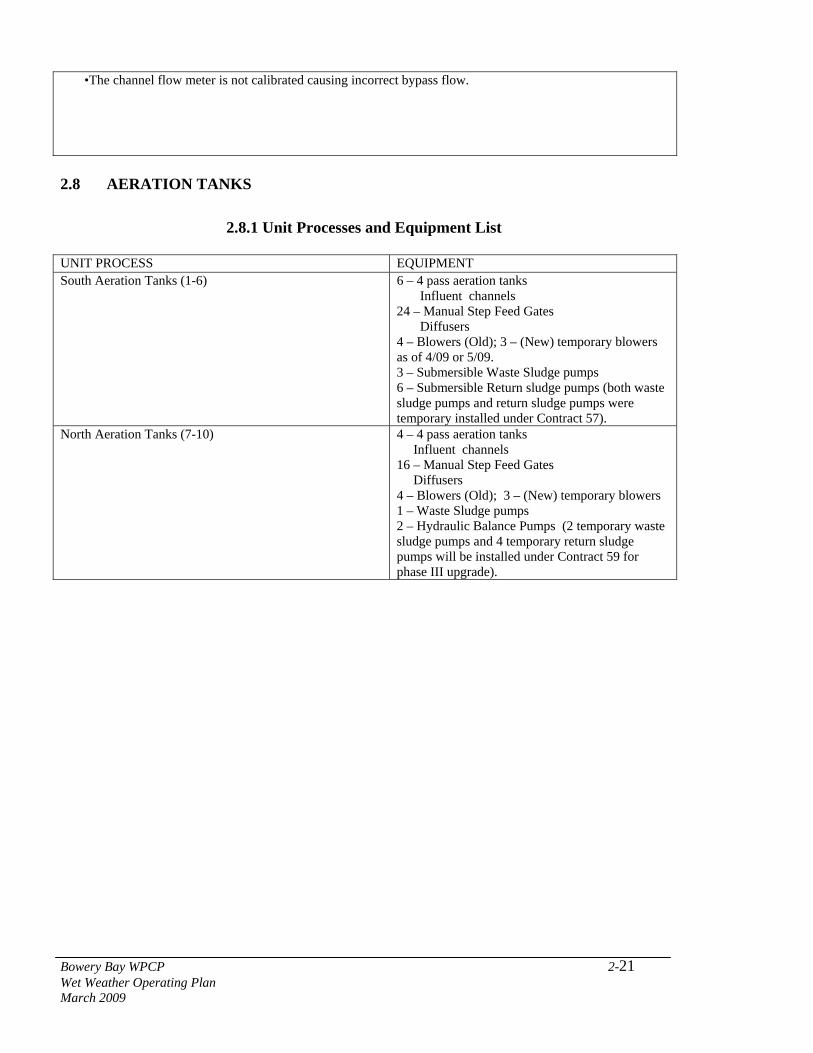
•The channel flow meter is not calibrated causing incorrect bypass flow.
2.8 AERATION TANKS
2.8.1 Unit Processes and Equipment List UNIT PROCESS EQUIPMENT South Aeration Tanks (1-6) 6 – 4 pass aeration tanks
Influent channels 24 – Manual Step Feed Gates Diffusers 4 – Blowers (Old); 3 – (New) temporary blowers as of 4/09 or 5/09. 3 – Submersible Waste Sludge pumps 6 – Submersible Return sludge pumps (both waste sludge pumps and return sludge pumps were temporary installed under Contract 57).
North Aeration Tanks (7-10) 4 – 4 pass aeration tanks Influent channels 16 – Manual Step Feed Gates Diffusers 4 – Blowers (Old); 3 – (New) temporary blowers 1 – Waste Sludge pumps 2 – Hydraulic Balance Pumps (2 temporary waste sludge pumps and 4 temporary return sludge pumps will be installed under Contract 59 for phase III upgrade).
Bowery Bay WPCP 2-21 Wet Weather Operating Plan March 2009
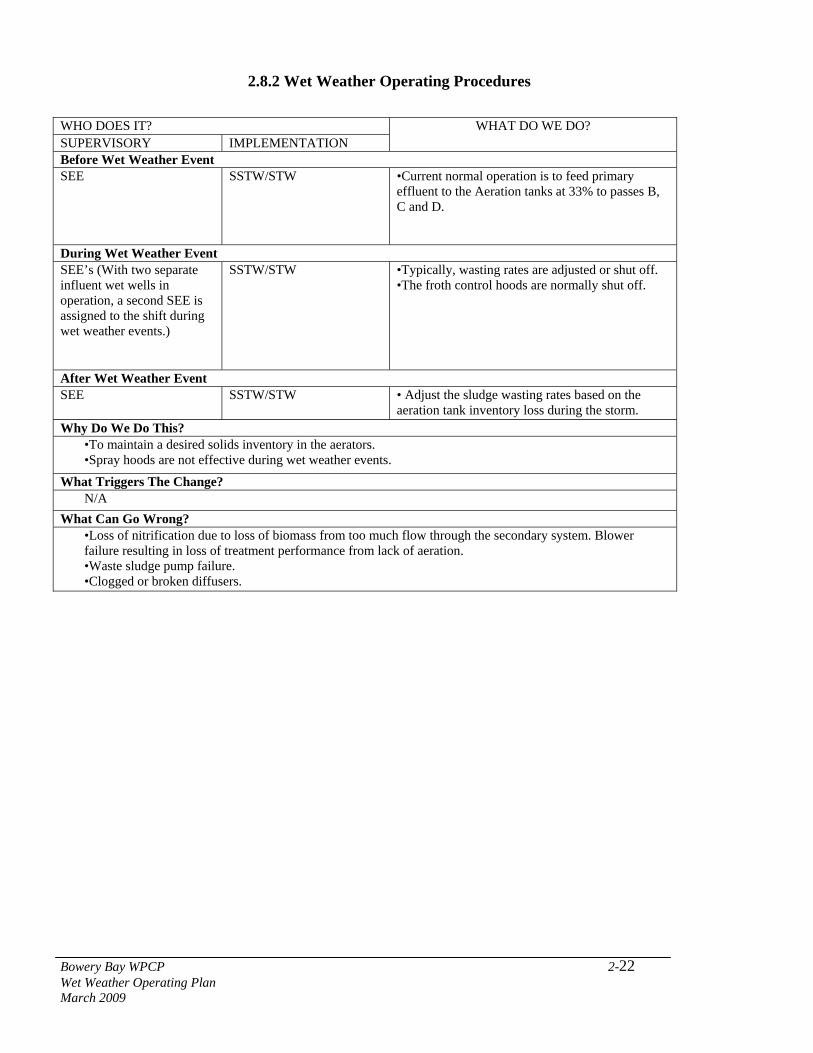
2.8.2 Wet Weather Operating Procedures
WHO DOES IT? SUPERVISORY IMPLEMENTATION
WHAT DO WE DO?
Before Wet Weather Event SEE SSTW/STW •Current normal operation is to feed primary
effluent to the Aeration tanks at 33% to passes B, C and D.
During Wet Weather Event SEE’s (With two separate influent wet wells in operation, a second SEE is assigned to the shift during wet weather events.)
SSTW/STW •Typically, wasting rates are adjusted or shut off. •The froth control hoods are normally shut off.
After Wet Weather Event SEE SSTW/STW • Adjust the sludge wasting rates based on the
aeration tank inventory loss during the storm. Why Do We Do This?
•To maintain a desired solids inventory in the aerators. •Spray hoods are not effective during wet weather events.
What Triggers The Change? N/A
What Can Go Wrong? •Loss of nitrification due to loss of biomass from too much flow through the secondary system. Blower failure resulting in loss of treatment performance from lack of aeration. •Waste sludge pump failure. •Clogged or broken diffusers.
Bowery Bay WPCP 2-22 Wet Weather Operating Plan March 2009
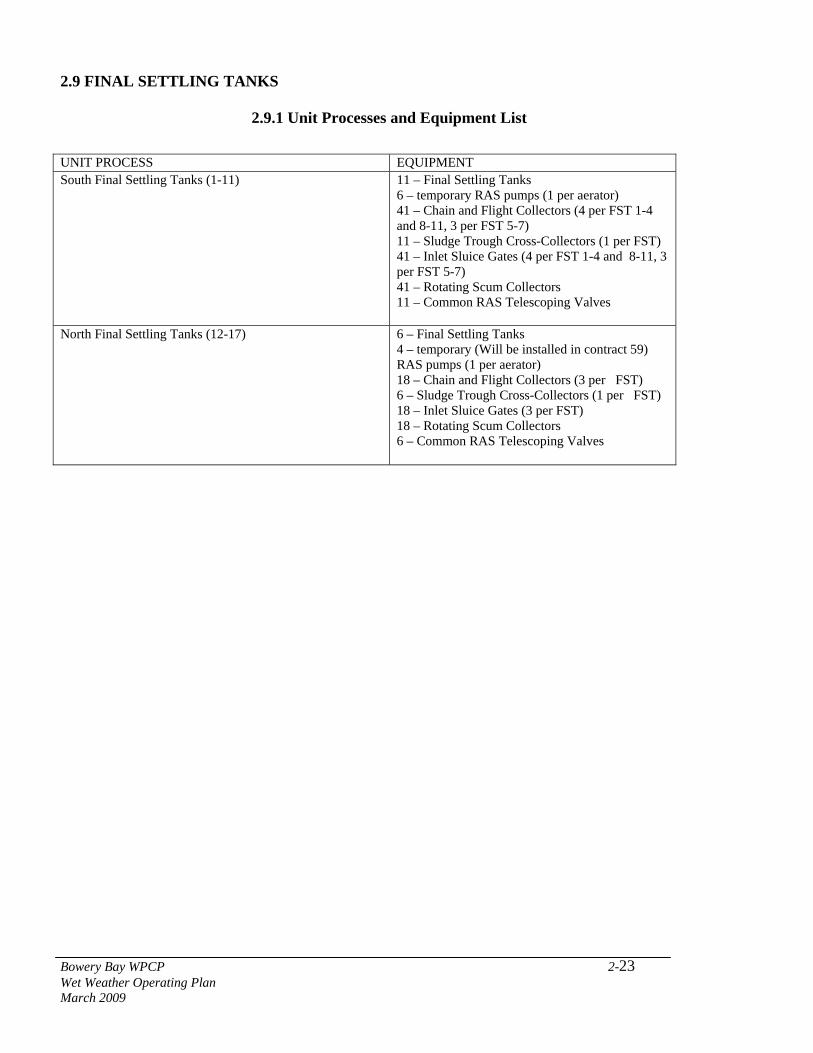
2.9 FINAL SETTLING TANKS
2.9.1 Unit Processes and Equipment List
UNIT PROCESS EQUIPMENT South Final Settling Tanks (1-11) 11 – Final Settling Tanks
6 – temporary RAS pumps (1 per aerator) 41 – Chain and Flight Collectors (4 per FST 1-4 and 8-11, 3 per FST 5-7) 11 – Sludge Trough Cross-Collectors (1 per FST) 41 – Inlet Sluice Gates (4 per FST 1-4 and 8-11, 3 per FST 5-7) 41 – Rotating Scum Collectors 11 – Common RAS Telescoping Valves
North Final Settling Tanks (12-17) 6 – Final Settling Tanks 4 – temporary (Will be installed in contract 59) RAS pumps (1 per aerator) 18 – Chain and Flight Collectors (3 per FST) 6 – Sludge Trough Cross-Collectors (1 per FST) 18 – Inlet Sluice Gates (3 per FST) 18 – Rotating Scum Collectors 6 – Common RAS Telescoping Valves
Bowery Bay WPCP 2-23 Wet Weather Operating Plan March 2009
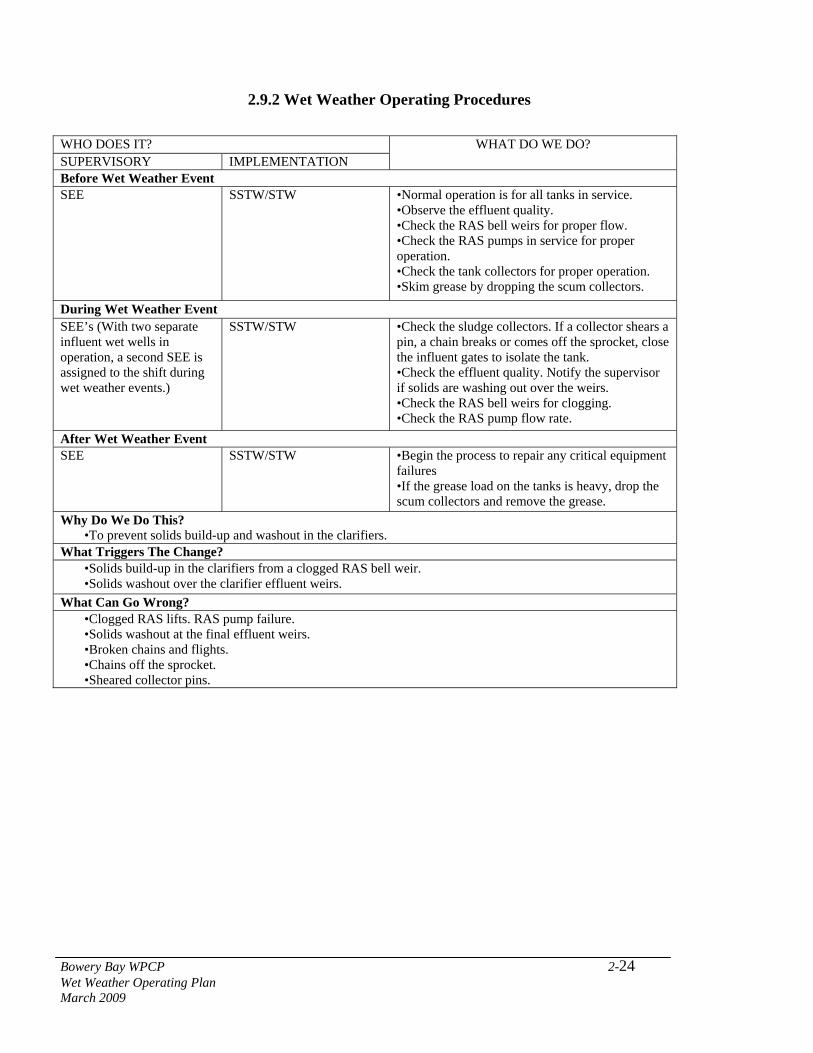
2.9.2 Wet Weather Operating Procedures
WHO DOES IT? SUPERVISORY IMPLEMENTATION
WHAT DO WE DO?
Before Wet Weather Event SEE SSTW/STW •Normal operation is for all tanks in service.
•Observe the effluent quality. •Check the RAS bell weirs for proper flow. •Check the RAS pumps in service for proper operation. •Check the tank collectors for proper operation. •Skim grease by dropping the scum collectors.
During Wet Weather Event SEE’s (With two separate influent wet wells in operation, a second SEE is assigned to the shift during wet weather events.)
SSTW/STW •Check the sludge collectors. If a collector shears a pin, a chain breaks or comes off the sprocket, close the influent gates to isolate the tank. •Check the effluent quality. Notify the supervisor if solids are washing out over the weirs. •Check the RAS bell weirs for clogging. •Check the RAS pump flow rate.
After Wet Weather Event SEE SSTW/STW •Begin the process to repair any critical equipment
failures •If the grease load on the tanks is heavy, drop the scum collectors and remove the grease.
Why Do We Do This? •To prevent solids build-up and washout in the clarifiers.
What Triggers The Change? •Solids build-up in the clarifiers from a clogged RAS bell weir. •Solids washout over the clarifier effluent weirs.
What Can Go Wrong? •Clogged RAS lifts. RAS pump failure. •Solids washout at the final effluent weirs. •Broken chains and flights. •Chains off the sprocket. •Sheared collector pins.
Bowery Bay WPCP 2-24 Wet Weather Operating Plan March 2009
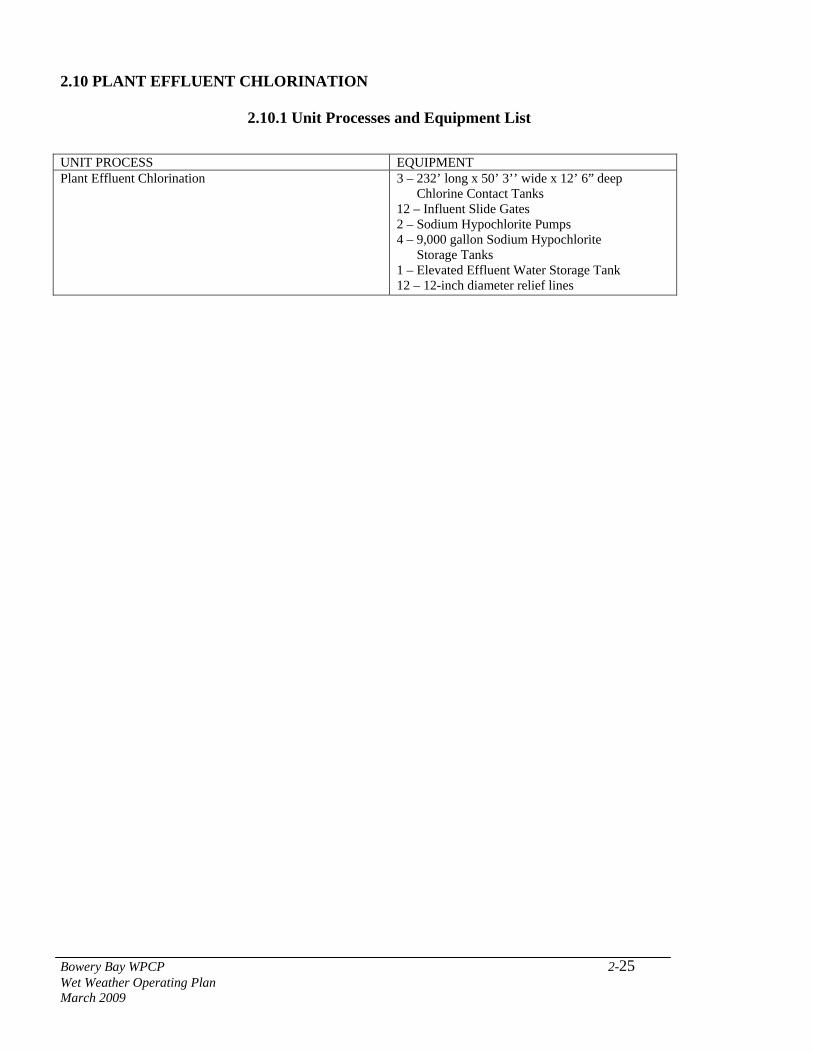
2.10 PLANT EFFLUENT CHLORINATION
2.10.1 Unit Processes and Equipment List
UNIT PROCESS EQUIPMENT Plant Effluent Chlorination 3 – 232’ long x 50’ 3’’ wide x 12’ 6” deep
Chlorine Contact Tanks 12 – Influent Slide Gates 2 – Sodium Hypochlorite Pumps 4 – 9,000 gallon Sodium Hypochlorite Storage Tanks 1 – Elevated Effluent Water Storage Tank 12 – 12-inch diameter relief lines
Bowery Bay WPCP 2-25 Wet Weather Operating Plan March 2009
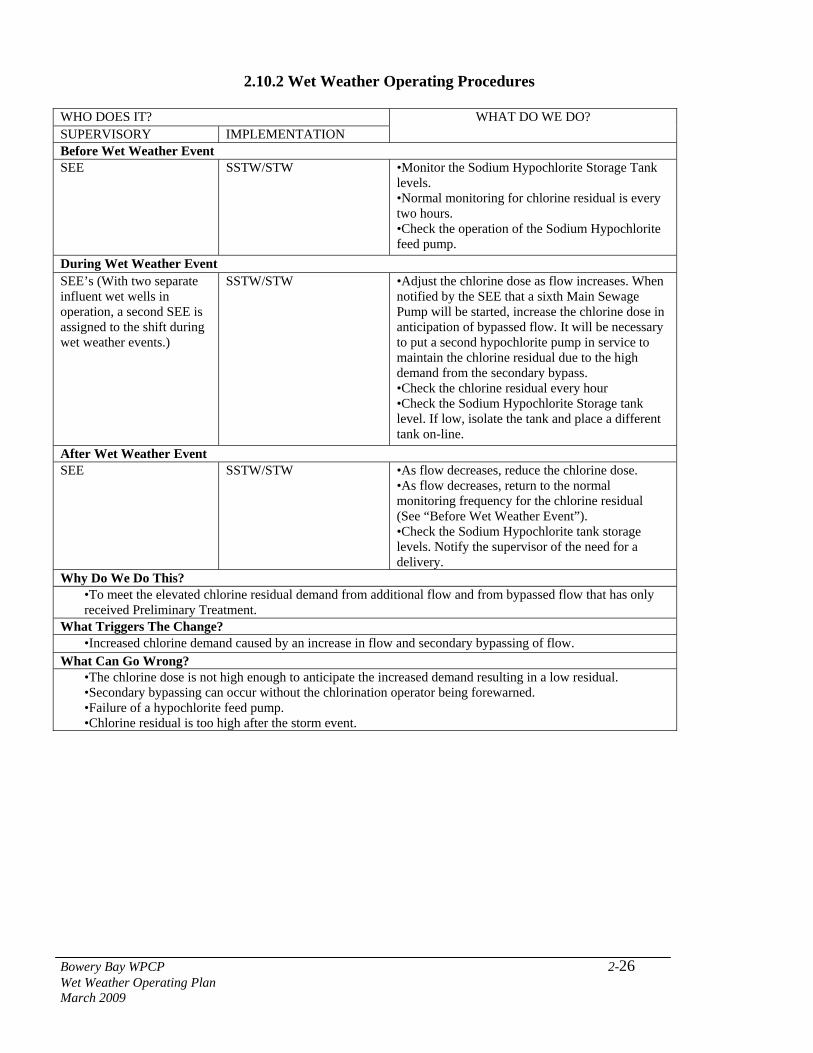
2.10.2 Wet Weather Operating Procedures
WHO DOES IT? SUPERVISORY IMPLEMENTATION
WHAT DO WE DO?
Before Wet Weather Event SEE SSTW/STW •Monitor the Sodium Hypochlorite Storage Tank
levels. •Normal monitoring for chlorine residual is every two hours. •Check the operation of the Sodium Hypochlorite feed pump.
During Wet Weather Event SEE’s (With two separate influent wet wells in operation, a second SEE is assigned to the shift during wet weather events.)
SSTW/STW •Adjust the chlorine dose as flow increases. When notified by the SEE that a sixth Main Sewage Pump will be started, increase the chlorine dose in anticipation of bypassed flow. It will be necessary to put a second hypochlorite pump in service to maintain the chlorine residual due to the high demand from the secondary bypass. •Check the chlorine residual every hour •Check the Sodium Hypochlorite Storage tank level. If low, isolate the tank and place a different tank on-line.
After Wet Weather Event SEE SSTW/STW •As flow decreases, reduce the chlorine dose.
•As flow decreases, return to the normal monitoring frequency for the chlorine residual (See “Before Wet Weather Event”). •Check the Sodium Hypochlorite tank storage levels. Notify the supervisor of the need for a delivery.
Why Do We Do This? •To meet the elevated chlorine residual demand from additional flow and from bypassed flow that has only received Preliminary Treatment.
What Triggers The Change? •Increased chlorine demand caused by an increase in flow and secondary bypassing of flow.
What Can Go Wrong? •The chlorine dose is not high enough to anticipate the increased demand resulting in a low residual. •Secondary bypassing can occur without the chlorination operator being forewarned. •Failure of a hypochlorite feed pump. •Chlorine residual is too high after the storm event.
Bowery Bay WPCP 2-26 Wet Weather Operating Plan March 2009

2.11 SOLIDS HANDLING: THICKENING
2.11.1 Unit Processes and Equipment List
UNIT PROCESS EQUIPMENT Gravity Thickeners 1 – Inlet Distribution Box
8 – 70’ Diameter Gravity Thickening Tanks 8 – Inlet Slide Gates 14 – Thickened Sludge Pumps (before construction) 8 – Thickener Collector Mechanisms
2.11.2 Wet Weather Operating Procedures
WHO DOES IT? SUPERVISORY IMPLEMENTATION
WHAT DO WE DO?
Before Wet Weather Event SEE SSTW/STW •Normal operation is with a minimum of six out of
eight thickeners in service. •Thickeners receive primary sludge and WAS via separate lines that meet at the influent distribution box.
During Wet Weather Event SEE’s (With two separate influent wet wells in operation, a second SEE is assigned to the shift during wet weather events.)
SSTW/STW •No changes are currently made to thickening operations during wet weather events. •The primary sludge flow to the thickeners remains in service.
After Wet Weather Event SEE SSTW/STW •No changes are currently made to thickening
operations during wet weather events. Why Do We Do This?
•To prevent flooding of the thickener overflow weirs. What Triggers The Change?
•Increased flow to the division structure, which requires additional head for the Gravity Thickener Overflow to drain properly.
What Can Go Wrong? •The gravity thickeners will flood and start to short circuit solids. •Collector mechanism failure. •Thickened Sludge Pump failure. •Waste sludge pump failure. •Thickened sludge is over pumped when no WAS is sent to the thickeners and water enters the digester.
Bowery Bay WPCP 2-27 Wet Weather Operating Plan March 2009
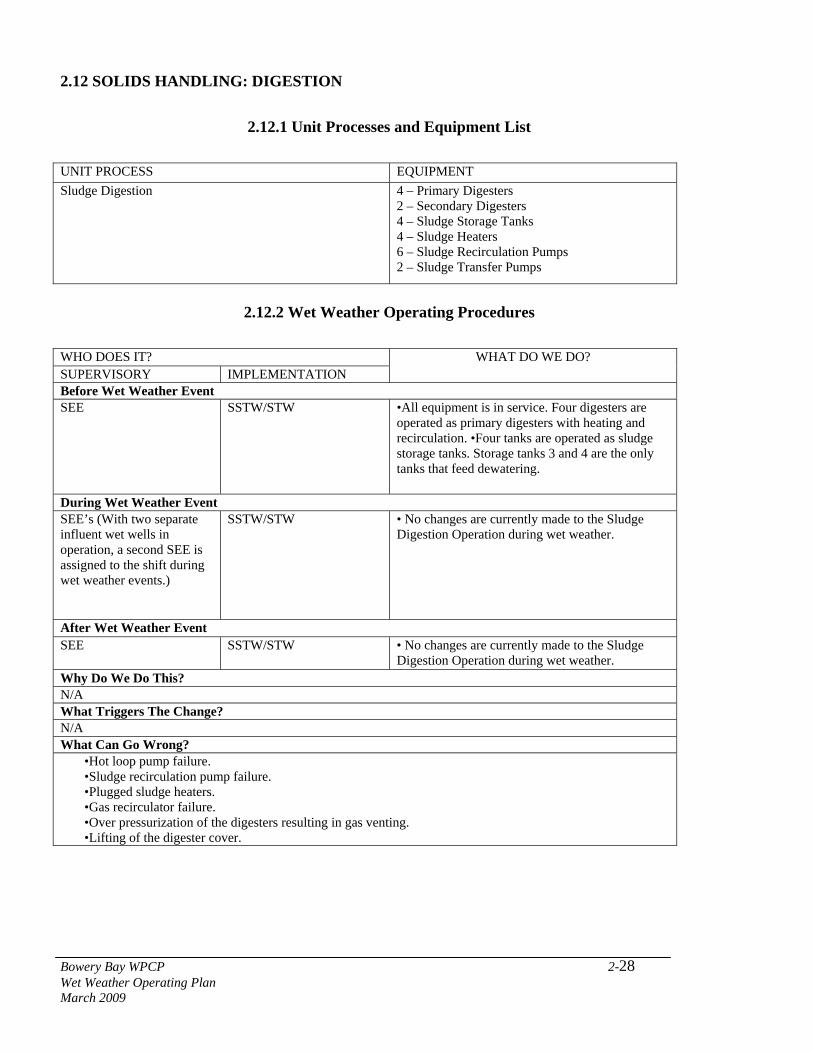
2.12 SOLIDS HANDLING: DIGESTION
2.12.1 Unit Processes and Equipment List
UNIT PROCESS EQUIPMENT Sludge Digestion 4 – Primary Digesters
2 – Secondary Digesters 4 – Sludge Storage Tanks 4 – Sludge Heaters 6 – Sludge Recirculation Pumps 2 – Sludge Transfer Pumps
2.12.2 Wet Weather Operating Procedures
WHO DOES IT? SUPERVISORY IMPLEMENTATION
WHAT DO WE DO?
Before Wet Weather Event SEE SSTW/STW •All equipment is in service. Four digesters are
operated as primary digesters with heating and recirculation. •Four tanks are operated as sludge storage tanks. Storage tanks 3 and 4 are the only tanks that feed dewatering.
During Wet Weather Event SEE’s (With two separate influent wet wells in operation, a second SEE is assigned to the shift during wet weather events.)
SSTW/STW • No changes are currently made to the Sludge Digestion Operation during wet weather.
After Wet Weather Event SEE SSTW/STW • No changes are currently made to the Sludge
Digestion Operation during wet weather. Why Do We Do This? N/A What Triggers The Change? N/A What Can Go Wrong?
•Hot loop pump failure. •Sludge recirculation pump failure. •Plugged sludge heaters. •Gas recirculator failure. •Over pressurization of the digesters resulting in gas venting. •Lifting of the digester cover.
Bowery Bay WPCP 2-28 Wet Weather Operating Plan March 2009
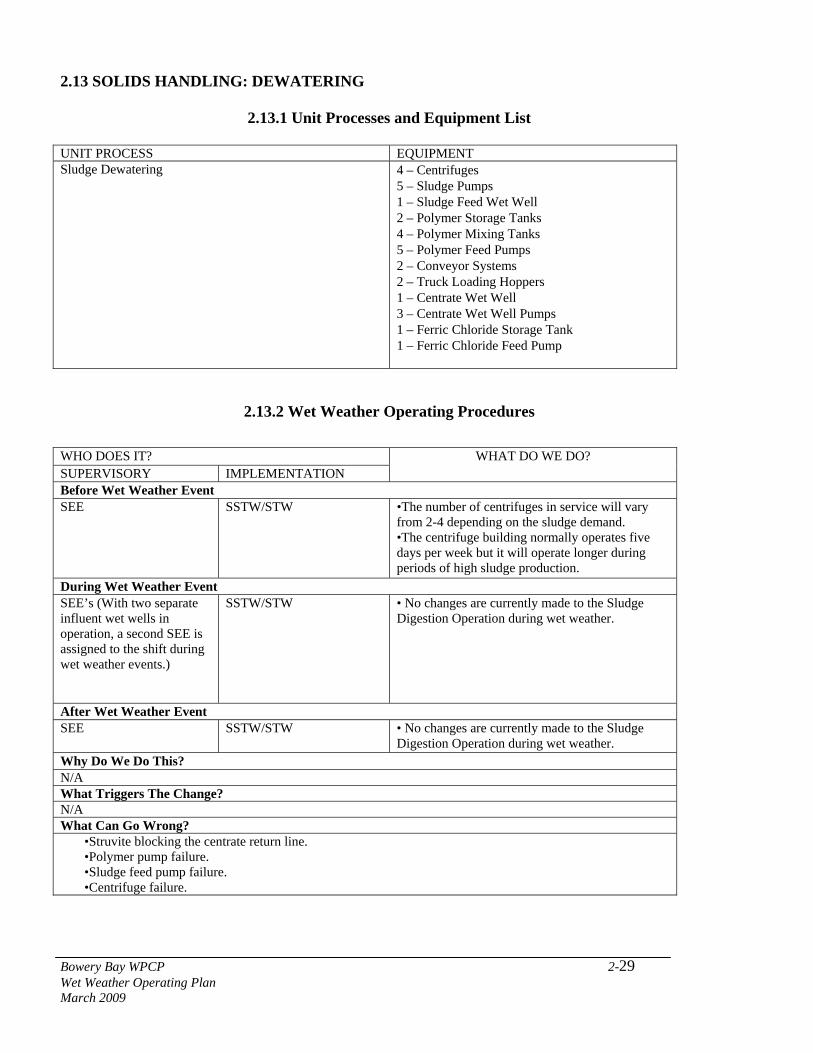
2.13 SOLIDS HANDLING: DEWATERING
2.13.1 Unit Processes and Equipment List
UNIT PROCESS EQUIPMENT Sludge Dewatering 4 – Centrifuges
5 – Sludge Pumps 1 – Sludge Feed Wet Well 2 – Polymer Storage Tanks 4 – Polymer Mixing Tanks 5 – Polymer Feed Pumps 2 – Conveyor Systems 2 – Truck Loading Hoppers 1 – Centrate Wet Well 3 – Centrate Wet Well Pumps 1 – Ferric Chloride Storage Tank 1 – Ferric Chloride Feed Pump
2.13.2 Wet Weather Operating Procedures
WHO DOES IT? SUPERVISORY IMPLEMENTATION
WHAT DO WE DO?
Before Wet Weather Event SEE SSTW/STW •The number of centrifuges in service will vary
from 2-4 depending on the sludge demand. •The centrifuge building normally operates five days per week but it will operate longer during periods of high sludge production.
During Wet Weather Event SEE’s (With two separate influent wet wells in operation, a second SEE is assigned to the shift during wet weather events.)
SSTW/STW • No changes are currently made to the Sludge Digestion Operation during wet weather.
After Wet Weather Event SEE SSTW/STW • No changes are currently made to the Sludge
Digestion Operation during wet weather. Why Do We Do This? N/A What Triggers The Change? N/A What Can Go Wrong?
•Struvite blocking the centrate return line. •Polymer pump failure. •Sludge feed pump failure. •Centrifuge failure.
Bowery Bay WPCP 2-29 Wet Weather Operating Plan March 2009
Bowery BWet WeatheMarc
ay WPCP 3-1 r Operating Plan
h 2009
3.0 Planned Plant Upgrades
The Bowery Bay WPCP is undergoing a plant stabilization and a BNR upgrade. A site plan and process flow diagram for the upgraded facilities are presented in Figures 3-1 and 3-2, respectively.
The plant upgrade will result in no increase to the current 300 mgd maximum capacity. This section summarizes the major improvements to be implemented as part of the overall plant upgrade.
3.1 INFLUENT SCREENING AND MAIN SEWAGE PUMPING
The present capacity of the main sewage pumps at Bowery Bay is 46.8 mgd for pumps 2-4 and 53.3 mgd for pumps 5-8. Main sewage pump No. 1 was installed under contract 57 with a capacity of 75mgd. LL MSP No. 2 will be upgraded to 75mgd under the same contract. A diversion sewer was installed that allows flow to be rerouted from before the high level wet well to the low level wet well. This will allow for a short-term shutdown of the high level wet well.
3.2 PRIMARY SETTLING TANKS
The number of primary settling tanks will remain at 15.
3.3 AERATION TANKS
The number of Aeration Tanks at Bowery Bay will remain at ten. The tanks will have anoxic/oxic switch zones constructed to allow the flexibility of changing the aerobic volume for nitrification. The tanks will also undergo an aeration system upgrade with new blowers, air piping, airflow measurement and control, new diffusers to allow the influent and centrate nitrogen load to be completely nitrified in the aeration tanks. Automated gates will also be installed to allow automatic control of excess storm flow to pass D. This is done to protect the biomass to prevent washout of the nitrifiers. Step Feed BNR Operation may require that secondary bypassing occur at flows lower than 225 mgd. If necessary, this will be performed based on the loss of nitrification following storm conditions and the secondary system bypass flow will be determined from actual operating experience.
3.4 FINAL SETTLING TANKS
The existing seventeen final settling tanks were upgraded with new chains, flights and effluent weirs, and will undergo an upgrade consisting of scum removal and increased RAS withdrawal capacity.
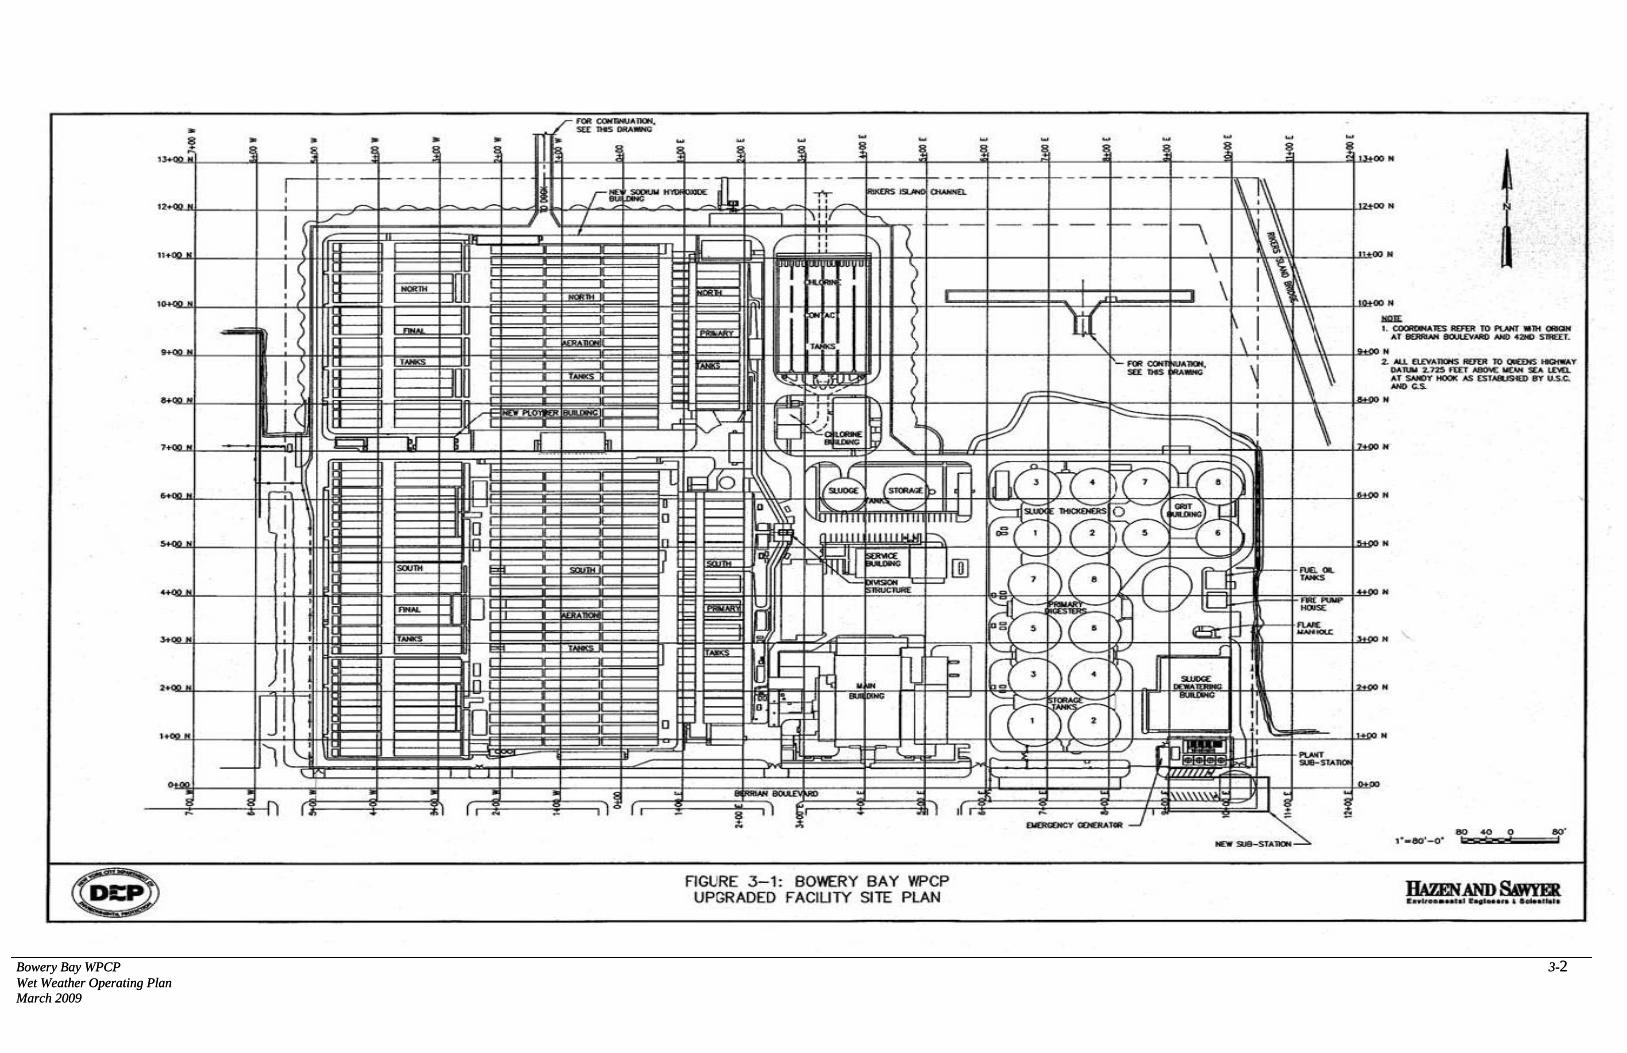
Bowery Bay WPCP 3-2 Wet Weather Operating Plan March 2009
Bowery Bay WPCP 3-2 Wet Weather Operating Plan March 2009
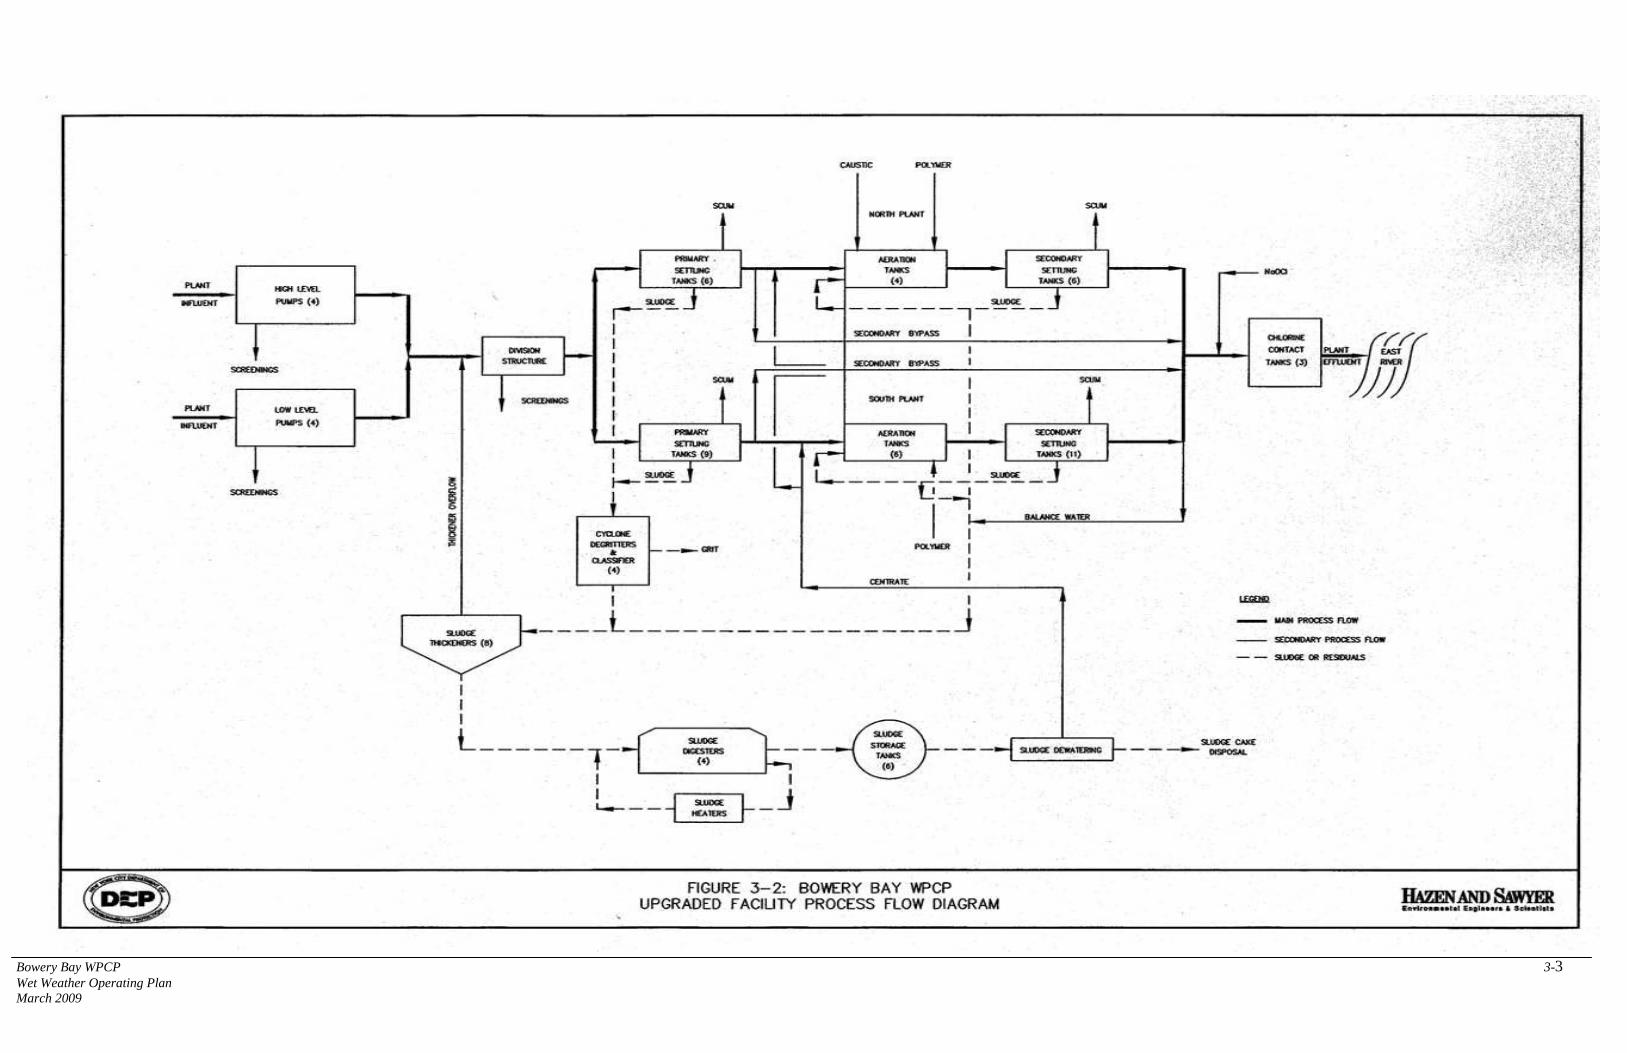
Bowery Bay WPCP 3-3 Wet Weather Operating Plan March 2009

3.5 PLANT EFFLUENT CHLORINATION
The existing chlorine contact tanks were upgraded and improved to reduce short-circuiting, increase mixing efficiency and increase the flow measurement accuracy. The Sodium Hypochlorite storage and feed system will be rehabilitated and upgraded.
3.6 CHEMICAL ADDITION SYSTEMS
A new Froth Control Building will be constructed between the North and South Final Settling Tanks and will supply sodium hypochlorite to the new froth control hoods located in Pass A and B of each aeration tank as well as the two RAS distribution boxes.
A new chemical building will be constructed to house the sodium hydroxide and the polymer systems. Sodium hydroxide will be the alkalinity source to the separate centrate treatment aeration tank.
3.7 RAS AND WAS SYSTEMS
A new RAS pump station will be constructed with the capacity to return a maximum of 150-mgd, which is the recommended capacity from the Comprehensive Nitrogen Management Plan Plant Upgrading Guidance Technical Memorandum.
A new WAS system will be constructed with flow meters and controls to maintain a constant SRT in the aeration tanks possibly in the future upgrades.
3.8 GRAVITY THICKENERS
The gravity thickeners are undergoing a complete rehabilitation with new mechanisms, overflow piping and thickened sludge pumps. A new gravity thickener overflow return line will be constructed that feeds directly into the Division Structure.
3.9 SLUDGE DIGESTION AND STORAGE
The four existing anaerobic sludge digesters heat exchangers are to be replaced. Storage tanks 1 through 4 will be upgraded with new pumps in order to pump to the sludge boats. Open roof storage tanks 1, 4, 9 and 10 will be covered and an odor control system provided.
The digester gas system will be overhauled and two new digester gas flares will be constructed.
Bowery Bay WPCP 3-4 Wet Weather Operating Plan March 2009

APPENDIX A
CORONA AVENUE VORTEX FACILITY WWOP
Corona Avenue Vortex Facility
Corona, New York
Wet Weather Operating Plan Corona Avenue Vortex Facility
Addendum to Bowery Bay WWOP
TABLE OF CONTENTS
Page
1. INTRODUCTION .......................................................................................................... 1-1
1.1 Background........................................................................................................... 1-2
1.1.1 Drainage Area and Collection System................................................... 1-6
1.1.2 Facility Capacity.................................................................................... 1-7
1.1.3 CSO Outfall Characteristics.................................................................. 1-10
1.1.4 Floatables and Settleable Solids Removal............................................. 1-10
1.1.5 Combined Sewage Diversion to the CAVF.......................................... 1-11
1.1.6 Wet Weather Flow Control................................................................... 1-12
1.2 Performance Goals for Wet-Weather Events....................................................... 1-13
1.3 Purpose of this Manual ........................................................................................ 1-13
1.4 Using the Manual................................................................................................. 1-13
2. FACILITY OPERATION................................................................................................ 2-1
2.1 Operation of the CAVF During Dry Weather Conditions.................................... 2-1
2.2 Operation of the CAVF During Wet Weather Event........................................... 2-2
2.3 Operation of the CAVF After Wet Weather Event.............................................. 2-2
i

LIST OF FIGURES
Figure Page
Facility Site Location................................................................................................. 1-3
CAVF Schematic Plan ............................................................................................... 1-5
Schematic of Existing CSO System........................................................................... 1-8
Facility Drainage Area............................................................................................... 1-9
ii
1. INTRODUCTION
The purpose of a wet weather operating plan (WWOP) is to provide a set of operating guidelines
to assist operating personnel in making operational decisions that will best meet the wet weather
operating performance goals. This WWOP is also a SPDES requirement for the Corona Avenue
Vortex Facility (CAVF) as well as for the Bowery Bay Water Pollution Control Plant (WPCP).
During wet weather events, numerous operational decisions must be made to effectively manage
and optimize treatment of wet weather flows and combined sewer overflows (CSOs). However,
each wet weather event produces a unique combination of flow patterns and facility conditions.
Therefore, no plan or manual can provide specific, step-by-step procedures for every possible
wet weather scenario. However, a WWOP can provide a consistent method of operation for
various situations. The WWOP is intended to provide a basis for consistent wet weather
operating practices, and that will maximize the utility of the CAVF during wet weather
conditions.
This WWOP for the CAVF provides for operation during dry and wet weather flow periods.
The CAVF was designed as a prototype, demonstration facility for the study of floatables
removal from CSOs from the lower deck sewer of Outfall CS-3 (SPDES No. BB-006) in the
Bowery Bay WPCP drainage area. The combined collection system drainage area of CSO
Outfall BB-006 consists of approximately 3,730 acres serving the southeastern portion of the
Bowery Bay WPCP service area.
The CAVF was not designed to provide end-of-pipe CSO treatment. However, the facility does
remove a portion of the floatables and settleable solids that would otherwise be discharged into
Flushing Bay through Outfall BB-006.
The CAVF is located in the Borough of Queens, New York City on Corona Avenue near the
junction of Corona Avenue and Saultell Avenue, and within the service area of the Bowery Bay
WPCP. Figure 1-1 presents an aerial view of the facility location. The facility is located entirely
within Corona Avenue and is completely underground. A schematic of the facility is presented in
Bowery Bay WPCP 1-1 Wet Weather Operating Plan March 2009
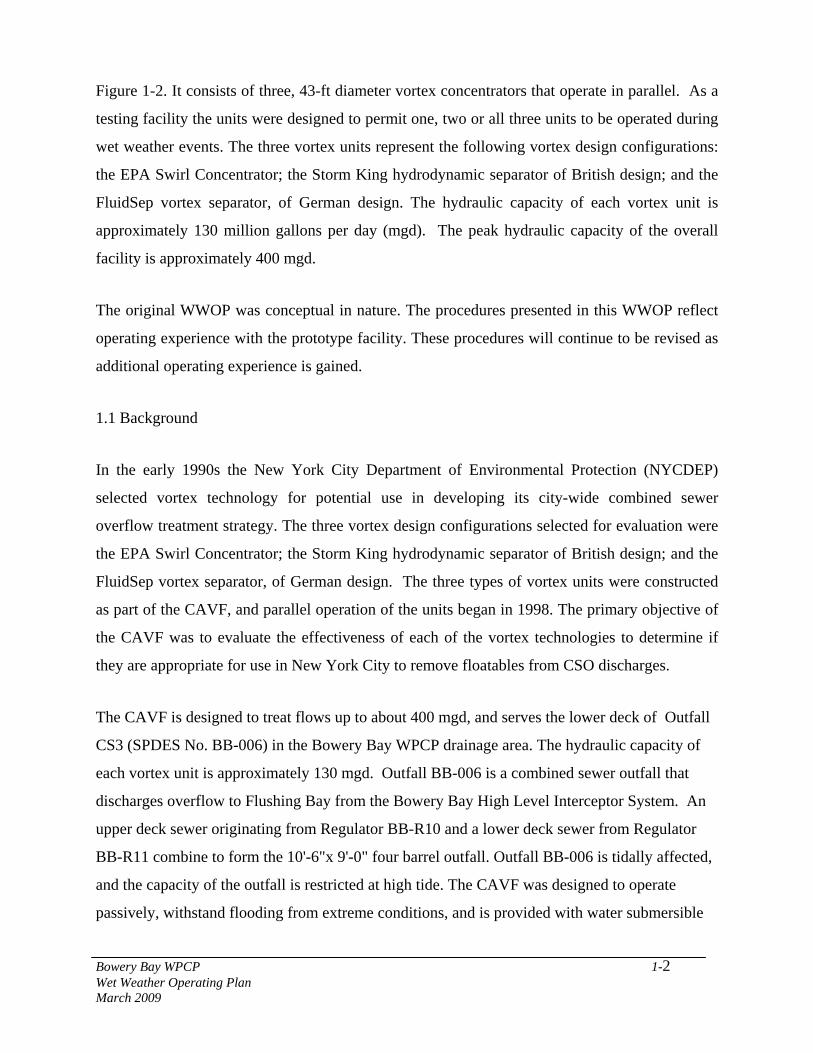
Bowery Bay WPCP 1-2 Wet Weather Operating Plan March 2009
Figure 1-2. It consists of three, 43-ft diameter vortex concentrators that operate in parallel. As a
testing facility the units were designed to permit one, two or all three units to be operated during
wet weather events. The three vortex units represent the following vortex design configurations:
the EPA Swirl Concentrator; the Storm King hydrodynamic separator of British design; and the
FluidSep vortex separator, of German design. The hydraulic capacity of each vortex unit is
approximately 130 million gallons per day (mgd). The peak hydraulic capacity of the overall
facility is approximately 400 mgd.
The original WWOP was conceptual in nature. The procedures presented in this WWOP reflect
operating experience with the prototype facility. These procedures will continue to be revised as
additional operating experience is gained.
1.1 Background
In the early 1990s the New York City Department of Environmental Protection (NYCDEP)
selected vortex technology for potential use in developing its city-wide combined sewer
overflow treatment strategy. The three vortex design configurations selected for evaluation were
the EPA Swirl Concentrator; the Storm King hydrodynamic separator of British design; and the
FluidSep vortex separator, of German design. The three types of vortex units were constructed
as part of the CAVF, and parallel operation of the units began in 1998. The primary objective of
the CAVF was to evaluate the effectiveness of each of the vortex technologies to determine if
they are appropriate for use in New York City to remove floatables from CSO discharges.
The CAVF is designed to treat flows up to about 400 mgd, and serves the lower deck of Outfall
CS3 (SPDES No. BB-006) in the Bowery Bay WPCP drainage area. The hydraulic capacity of
each vortex unit is approximately 130 mgd. Outfall BB-006 is a combined sewer outfall that
discharges overflow to Flushing Bay from the Bowery Bay High Level Interceptor System. An
upper deck sewer originating from Regulator BB-R10 and a lower deck sewer from Regulator
BB-R11 combine to form the 10'-6"x 9'-0" four barrel outfall. Outfall BB-006 is tidally affected,
and the capacity of the outfall is restricted at high tide. The CAVF was designed to operate
passively, withstand flooding from extreme conditions, and is provided with water submersible

ay WPCP 1-3 Wet Weather Operating Plan March 2009
Bowery B

Bowery Bay WPCP 1-4 Wet Weather Operating Plan March 2009
equipment, elevated local switches and panels, and electrical components located in a separate,
isolated control room.
Vortex separation technology uses the inherent energy within the flow-stream and induced by the
specific geometry of the device to remove floatables and settleable solids from influent CSO.
The vortex units have no moving parts, and rely on the inertial forces induced by the flow-path to
remove a concentrated stream of pollutants from the CSO stream. During CSO events, flows
into the CAVF are routed tangentially into each vortex unit. The vortex devices differ from
sedimentation tanks in that they are designed to use the differences in inertia between the
particles and the liquid as well as gravitational forces to effect solid-liquid separation at high
flow rates.
Flows enter the vortex units through large inlet pipes, and exit each vortex device via a route at
the base of the unit, and a route at the surface of the unit. Solids, including settleable solids, tend
to concentrate inward towards the center, exiting at the base of the units as an underflow stream.
The CAVF was designed to transfer the underflow from the CAVF to a gravity sewer, the Foul
Waste Sewer, which discharges to the wet well of the 108th
Street Pumping Station. The
underflow is transported to the Foul Waste Pit through a combination of gravity flow and
pumping. Gravity can deliver the underflow to the Foul Waste Sewer when the vortex units are
running. When flow to the vortex units subsides after a rain event the units will partially drain by
gravity after which foul waste pumps are activated to fully drain the units.
From the foul waste effluent chamber, the combined underflow of the three vortex units flows by
gravity to the 108th
Street Pumping Station. From the 108th
Street Pumping Station, the
underflow is pumped to the collection system of the Bowery Bay WPCP, and is conveyed to the
WPCP for final treatment. As the underflow mixes with the combined sewage in the interceptor
a portion of it is released in CSO’s through inline regulators. The operators can also choose to
retain the underflow in the CAVF units and not discharge it to the Foul Waste Sewer. Because of
the potential loss of underflow through CSO’s the operators currently retain the underflow in the
units and discharge it to the Foul Waste Sewer after wet weather flows and the hydraulic
gradeline in the interceptor subside.
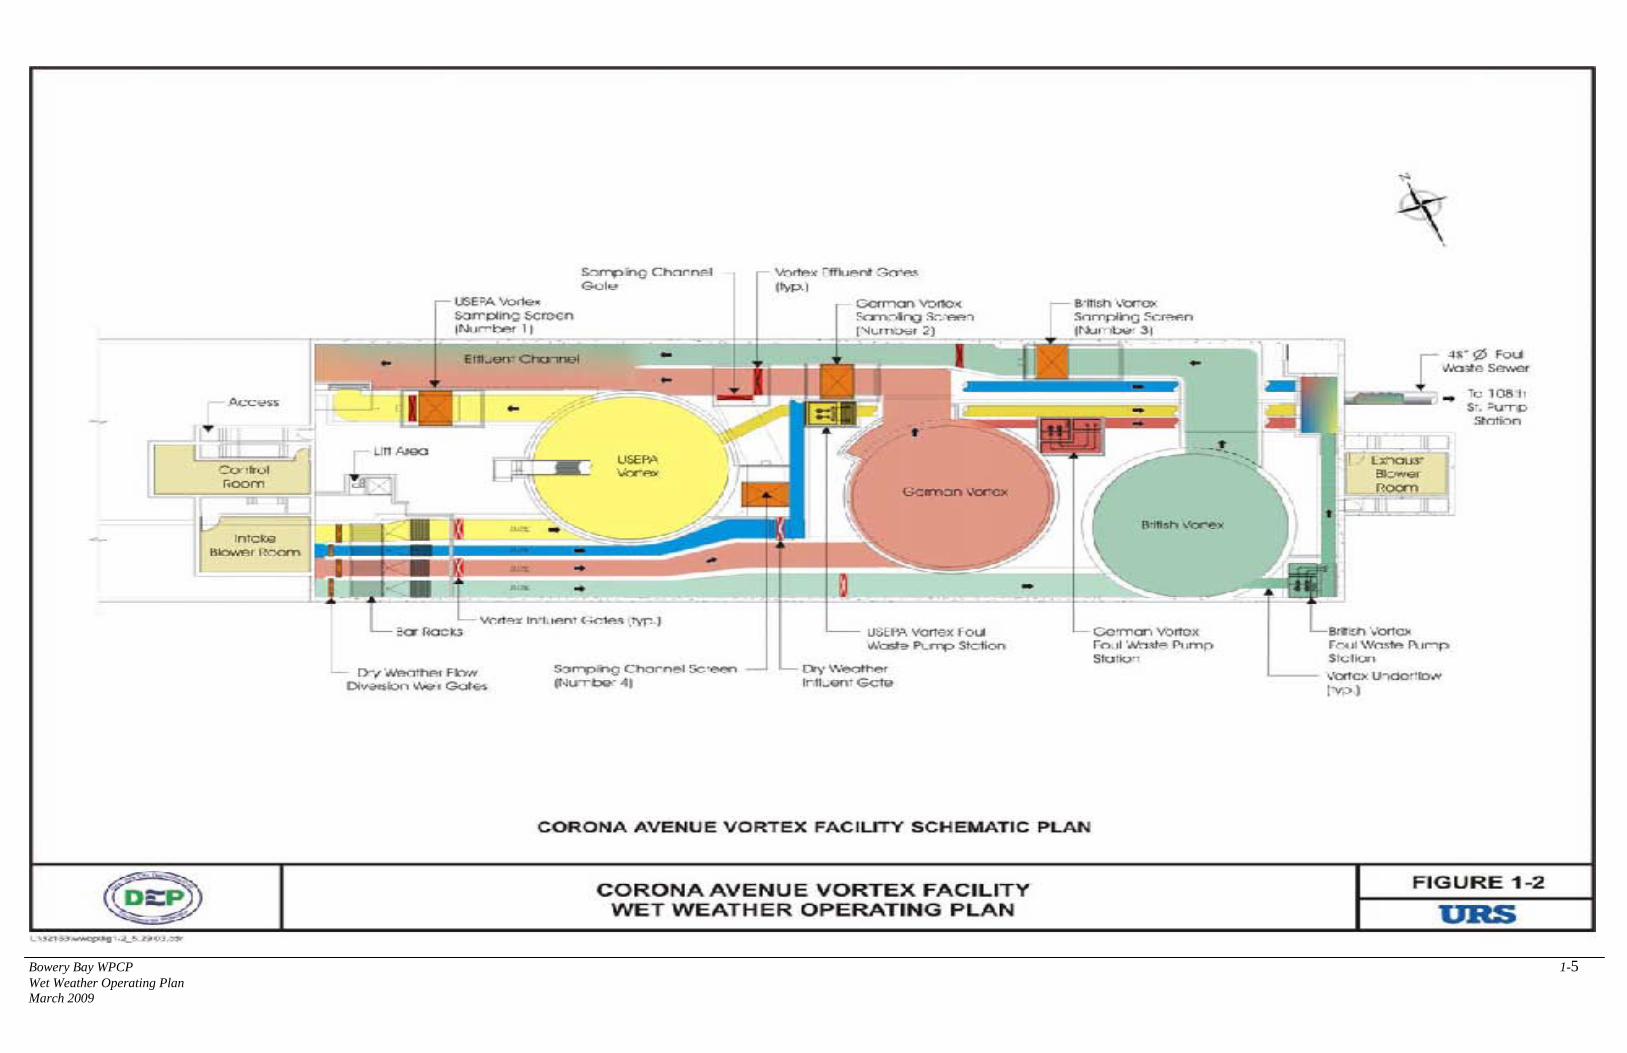
ay WPCP 1-r Operating Plan
09
5
Bowery BWet WeatheMarch 20
As a demonstration facility, the CAVF was constructed with features and equipment to facilitate
the collection of data for the evaluation of floatables and pollutant capture efficiencies. A
sampling and monitoring program of the CAVF was performed from December 6, 1999 to
October 3, 2002. The results of the program are presented in a September 29, 2003 report
entitled Evaluation of Corona Avenue Vortex Facility.
1.1.1 Drainage Area and Collection System
The combined collection system drainage area of Outfall BB-006 consists of approximately
3,730 acres serving the southeastern portion of the Bowery Bay WPCP service area. Outfall BB-
006 receives flow from two subsystems: the upper deck drainage area which originates at
Regulator BBR10, and the lower deck drainage area which originates from Regulator BB-R11.
The discharges from both decks combine at a transition chamber downstream of the CAVF, and
discharge to Flushing Bay through a four-barrel 10'-6" W x 9' -0" H (inner dimensions) sewer.
The lower deck drainage area is 1,528 acres, and contributes approximately 67 percent of the
combined sewage that overflows to Flushing Bay through Outfall BB-006.
Prior to the construction of the CAVF, the collection system of the BB-006 drainage area was
regulated by 15 regulators as follows:
Upper Deck - Regulator BB-R10 (Upper Deck)
Lower Deck -Regulators BB-R11, BB-R12, BB-R16, BB-R17, BB-R18, BB-R19, BB-
R20, BB-R21, BB-R22, BB-R23E, BB-R22W, BB-R24, BB-R25, and
BB-R26
The construction of the CAVF changed the collection system such that the CAVF serves as the
CSO regulator for the lower deck sewers. Modifications of the collection system have been made
such that dry weather as well as combined flows only from the regulator BBHL-11 is coming to
108 ST. pump station and the thirteen lower deck regulators are now directed to the existing
lower deck overflow sewer to the existing lower deck overflow sewer. The diversion weirs in Bowery Bay WPCP 1-6 Wet Weather Operating Plan March 2009
Bowery Bay WPCP 1-7 Wet Weather Operating Plan March 2009
these thirteen regulators have been removed, and the dry weather outlets have been permanently
bulkheaded. A schematic diagram of the collection system of the BB-006 drainage area after the
construction of the CAVF, the existing CSO system, is shown in Figure 1-3. Figure 1-4 shows
the drainage area of the CAVF overlaid on an aerial photograph; the location of the Outfall BB-
006 is also shown.
1.1.2 Facility Capacity
A wet weather bypass weir is located within the CAVF Diversion Structure and limits the
maximum CSO flow to the CAVF to approximately 400 mgd. Flows that exceed this capacity
pass through a baffle, spill over the wet weather bypass weir, and discharge to Flushing Bay
through Outfall BB-006. The maximum hydraulic capacity of the BB-006 lower deck combined
sewer outfall conduit is approximately 650 mgd.
During wet weather flows within the capacity of the CAVF enter the facility through the influent
channel, and as the water surface elevation rises, the one, two or all three vortex units begin
operating automatically, each one coming on line at preset water surface elevations. The
diverted flow passes through the vortex units, and floatables and settleable solids are captured.
Overflows from the vortex units are returned to the BB-006 lower deck sewer, downstream of
the wet weather bypass weir, for discharge into Flushing Bay through Outfall BB-006. The
underflow, which contains floatables and settleables from each vortex unit, is pumped to the Foul
Waste Effluent Chamber, after the event (during dry weather) where it then flows by gravity to
the 108th
Street Pumping Station. This additional wet weather flow being conveyed to the 108th
Street Pumping Station is within the overall capacity of the station.
Presently, dry weather flow, up to an average of about 10 mgd, also enters the CAVF. This flow
bypasses the vortex units and is discharged to the Foul Waste Chamber then to the 108th
Street
Pumping Station.

ay WPCP 1-r Operating Plan
09
8
Bowery BWet WeatheMarch 20

Bowery Bay WPCP 1-9 Wet Weather Operating Plan March 2009

1.1.3 CSO Outfall Characteristics
Prior to construction of the CAVF, CSO from the lower deck system of the BB-006 sewers
upstream of the CAVF was discharged into Flushing Bay through Outfall BB-006. Outfall BB-
006 is equipped with timber tide gates.
Construction of the CAVF has not significantly altered the way in which combined sewage
overflows to Flushing Bay through Outfall BB-006. However, there are two notable differences,
as follows:
Prior to discharging to Flushing Bay through Outfall BB-006, combined sewage, up to approximately 400 mgd, is routed through the CAVF, where floatables and settleable solids removal takes place. During storms in which the vortex units overflow, a portion of settleable solids and floatables are removed and retained in the units. The effluent is discharged to Outfall BB-006. . The foul waste pumps pump the underflow from each vortex unit to the Foul Waste Effluent Chamber after the storm event. The underflow then flows by gravity from the Foul Waste Effluent Chamber through the 48-inch Foul Waste Sewer to the 108
th
Street Pumping Station.
1.1.4 Floatables and Settleable Solids Removal
In a typical vortex facility design, the foul waste line discharges by gravity to a sewer. The
underflow, or foul waste, is equal to up to 10 percent of the vortex influent flow, and includes
solids and floatables removed in the vortex unit. However, since the invert elevations of the
CAVF vortex units are approximately 10 to 20 feet lower than the invert of the elevation of the
48-inch diameter line that discharges to the 108th
Street Pumping Station, the vortex units cannot
be completely drained by gravity.
Each vortex unit is equipped with its own foul waste chamber that collects the underflow. Each
of the foul waste chambers is furnished with two foul waste pumps (1 main, 1 standby) to pump
the underflow to a common foul waste effluent chamber that is part of the CAVF.
Bowery Bay WPCP 1-10 Wet Weather Operating Plan March 2009
The foul waste pumps are rated at 10 hp submersible pumps and have vertical, semi-open
chopper impellers and cutter bars, and bottom inlet and side discharges. Their rated capacities
are:
USEPA Vortex - 575 gpm @ 28 ft TDH Storm King Vortex (British) - 500 gpm @ 30.8 ft TDH FluiSep Vortex (German) - 475 gpm @ 31.5 TDH
The foul waste pumps are activated manually after a wet weather event. The pumps discharge the
underflow to the Foul Waste Chambers which transports the underflow to the 108th
Street
Pumping Station. In order to prevent solids from settling out in the foul waste chambers, the
chambers are equipped with liquid mixing eductors that utilize City water as the operating liquid.
Flow to the eductors is controlled by solenoid valves that are activated when the foul waste
pumps are activated.
1.1.5 Combined Sewage Diversion to the CAVF
The CAVF Diversion Structure is located in the intersection of Saultell Avenue and Corona
Avenue. It consists of the diversion chamber, located within the previously existing 15'-0" x 9'-
22" Double Barrel Lower Deck CSO line to Outfall BB-006, and the influent and effluent
channels to the vortex facility. The Diversion Structure diverts dry weather flow in the CS3
Lower Deck combined sewer to the CAVF. During wet weather, the Diversion Structure also
diverts combined sewage to the vortex units. The maximum hydraulic capacity of the CS3 Lower
Deck combined sewer and the CSO outfall line is approximately 650 mgd. The diversion
structure is designed to limit the maximum flow rate to the CAVF to approximately 400 mgd.
Combined sewage is diverted to the CAVF by a 6'-2½" high wet weather bypass weir located
within the lower deck of the BB-006 sewer, at the influent chamber (Diversion Structure) to the
CAVF.
Bowery Bay WPCP 1-11 Wet Weather Operating Plan March 2009
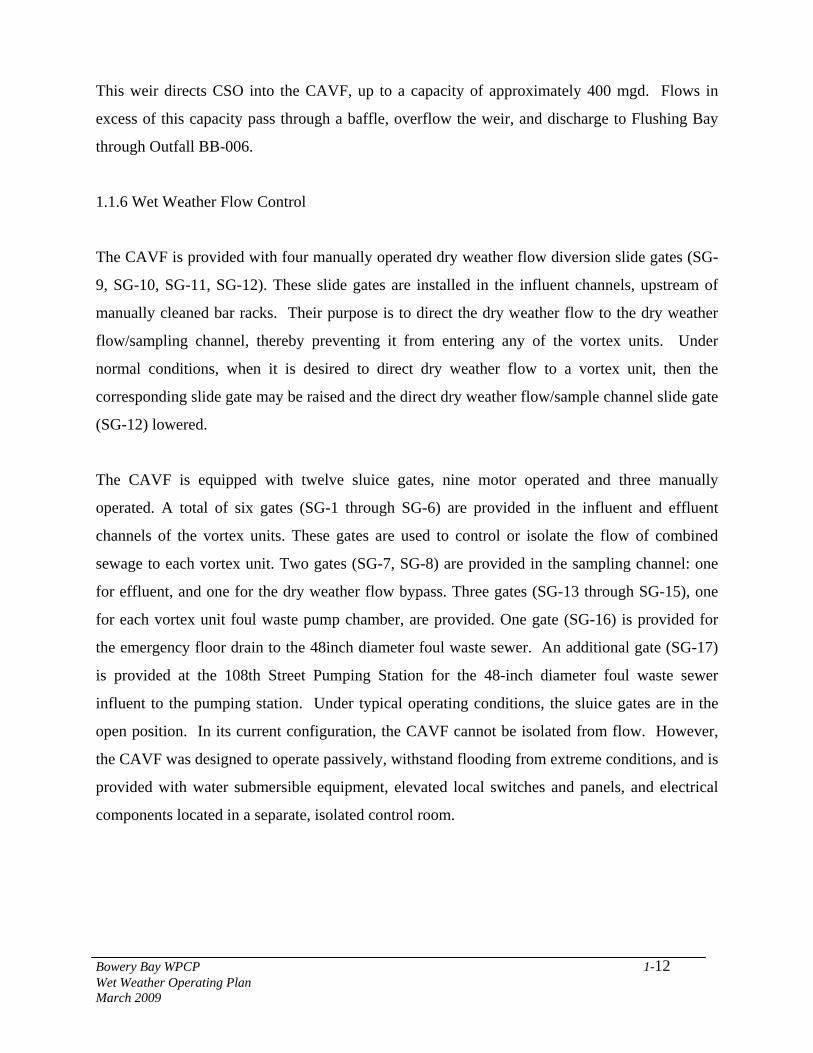
This weir directs CSO into the CAVF, up to a capacity of approximately 400 mgd. Flows in
excess of this capacity pass through a baffle, overflow the weir, and discharge to Flushing Bay
through Outfall BB-006.
1.1.6 Wet Weather Flow Control
The CAVF is provided with four manually operated dry weather flow diversion slide gates (SG-
9, SG-10, SG-11, SG-12). These slide gates are installed in the influent channels, upstream of
manually cleaned bar racks. Their purpose is to direct the dry weather flow to the dry weather
flow/sampling channel, thereby preventing it from entering any of the vortex units. Under
normal conditions, when it is desired to direct dry weather flow to a vortex unit, then the
corresponding slide gate may be raised and the direct dry weather flow/sample channel slide gate
(SG-12) lowered.
The CAVF is equipped with twelve sluice gates, nine motor operated and three manually
operated. A total of six gates (SG-1 through SG-6) are provided in the influent and effluent
channels of the vortex units. These gates are used to control or isolate the flow of combined
sewage to each vortex unit. Two gates (SG-7, SG-8) are provided in the sampling channel: one
for effluent, and one for the dry weather flow bypass. Three gates (SG-13 through SG-15), one
for each vortex unit foul waste pump chamber, are provided. One gate (SG-16) is provided for
the emergency floor drain to the 48inch diameter foul waste sewer. An additional gate (SG-17)
is provided at the 108th Street Pumping Station for the 48-inch diameter foul waste sewer
influent to the pumping station. Under typical operating conditions, the sluice gates are in the
open position. In its current configuration, the CAVF cannot be isolated from flow. However,
the CAVF was designed to operate passively, withstand flooding from extreme conditions, and is
provided with water submersible equipment, elevated local switches and panels, and electrical
components located in a separate, isolated control room.
Bowery Bay WPCP 1-12 Wet Weather Operating Plan March 2009

1.2 Performance Goals for Wet-Weather Events
The CAVF is intended primarily as a floatables removal demonstration facility, and as a CSO
regulator. However, the facility will also remove a portion of the floatables and settleable solids
that would otherwise be discharged into Flushing Bay through Outfall BB-006.
Settleable solids are defined as those heavier solids associated with street runoff and having a
specific gravity of 2.65 at a particle size of 0.4 to 1.0 mm. Particles that have lower specific
gravity but are proportionately larger in size will also be removed. During overflow events, the
performance of the units as a solid separator is expected to decrease as storms progress. This
occurs because solids separation operations are more efficient at high solids concentrations, and
solids concentrations during overflow events are likely to be relatively low after the initial period
of a rainstorm.
1.3 Purpose of this Manual
The purpose of this manual is to provide a set of operating guidelines to assist NYCDEP staff in
making operational decisions which will best meet the performance goals stated in Section 1.2
and the requirements of the New York SPDES discharge permit.
1.4 Using the Manual
This manual is designed to allow use as a general reference during wet weather events, and is
meant to supplement the facility operation and maintenance manual with which operating
personnel should be familiar. This manual is broken down into sections that cover operation of
the CAVF. The following information is included:
Steps to take before, during and after a wet weather event; Discussion of why the recommended control steps are performed; Identification of specific circumstances that trigger the recommended changes; and Identification of things that can go wrong with the equipment.
Bowery Bay WPCP 1-13 Wet Weather Operating Plan March 2009
This WWOP is a living document, and is subject to modification. Users of the WWOP are
encouraged to identify new steps, procedures, and recommendations to further improve the wet-
weather operating efficiency of the CAVF. Modifications, which improve upon the manual=s
procedures, are encouraged. With continued input from experienced operations staff, this
WWOP will become a more useful and effective tool.
Bowery Bay WPCP 1-14 Wet Weather Operating Plan March 2009

2. FACILITY OPERATION
This section presents wet weather operating procedures followed for the CAVF. This section is
divided into operation of the facility during dry weather, operation during rising level event
(onset of wet weather), and during falling level event (end of wet weather with receding water
levels). The operating procedures address the basis for the protocol, events or observations that
trigger the protocol, and a discussion of what can go wrong.
2.1 Operation of the CAVF During Dry Weather Conditions
During dry weather conditions (no storm flow) the flow in the BB-006 sewer is diverted from the
BB-006 sewer through the Diversion Structure by the 6'-22" high wet weather bypass weir
located within the lower deck of the BB-006 sewer, at the influent chamber to the CAVF. This
weir directs CSO into the CAVF, up to a capacity of approximately 400 mgd during wet weather.
Flows in excess of this capacity pass through a baffle, overflow the weir, and discharge to
Flushing Bay through Outfall BB-006.
Why Do We Do This?
To direct dry-weather flow to the 108th
Street Pumping Station rather than the CAVF.
What Triggers the Change?
During dry weather conditions, level in the Dry Weather Diversion Chamber is less than El. (-)
1.50, therefore level transmitters do not send signal to trigger the computer control system.
What Can Go Wrong?
• The dry weather diversion weir has been designed to passively control flow to the vortex
facility. Therefore, operational problems are not anticipated.
• During dry weather conditions, make sure that the dry weather diversion slide gates are
closed. Sluice gate 7 should be shut; sluice gate 8 should be open.
Bowery Bay WPCP 2-1 Wet Weather Operating Plan March 2009
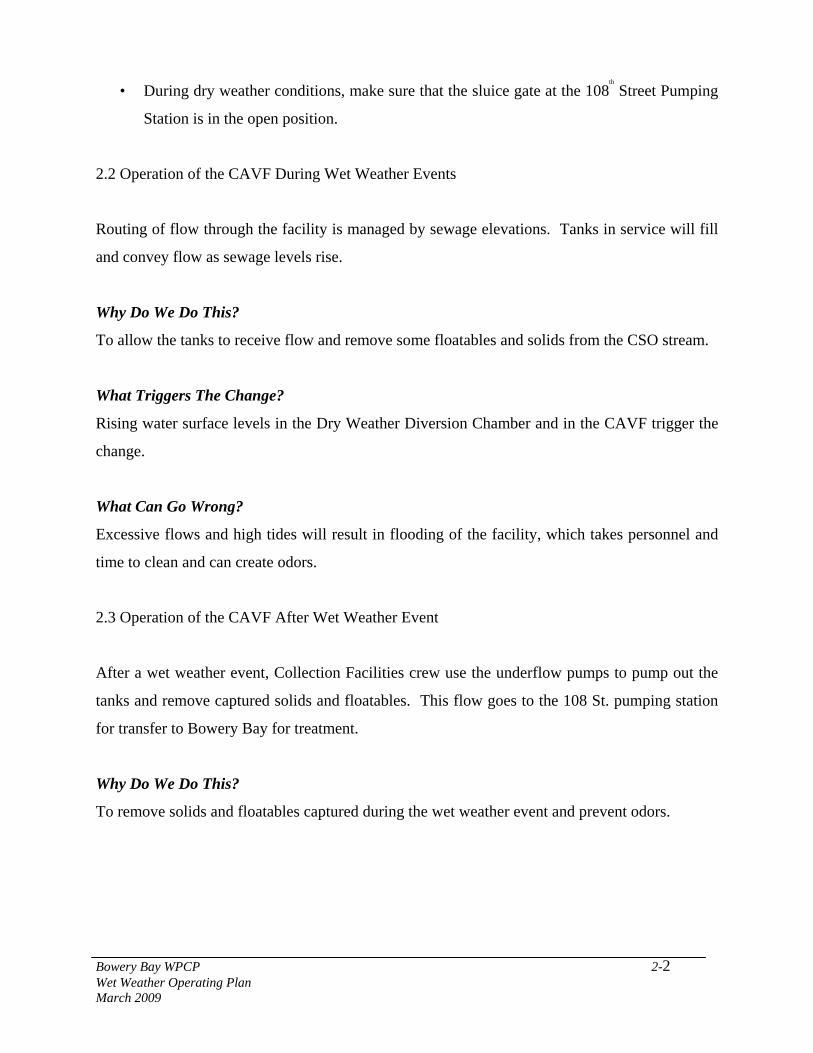
• During dry weather conditions, make sure that the sluice gate at the 108th
Street Pumping
Station is in the open position.
2.2 Operation of the CAVF During Wet Weather Events
Routing of flow through the facility is managed by sewage elevations. Tanks in service will fill
and convey flow as sewage levels rise.
Why Do We Do This?
To allow the tanks to receive flow and remove some floatables and solids from the CSO stream.
What Triggers The Change?
Rising water surface levels in the Dry Weather Diversion Chamber and in the CAVF trigger the
change.
What Can Go Wrong?
Excessive flows and high tides will result in flooding of the facility, which takes personnel and
time to clean and can create odors.
2.3 Operation of the CAVF After Wet Weather Event
After a wet weather event, Collection Facilities crew use the underflow pumps to pump out the
tanks and remove captured solids and floatables. This flow goes to the 108 St. pumping station
for transfer to Bowery Bay for treatment.
Why Do We Do This?
To remove solids and floatables captured during the wet weather event and prevent odors.
Bowery Bay WPCP 2-2 Wet Weather Operating Plan
March 2009
What Triggers The Change?
The end of the wet weather event and the available capacity in the interceptor to Bowey Bay.
What Can Go Wrong?
If sewage is left in Vortex tanks for an extended period of time, odors can be encountered.
Bowery Bay WPCP 2-3 Wet Weather Operating Plan March 2009
1
New York City Waterways Study
Newtown CreekFall 2003
2
Purpose and Objectives
New Yorkers’ awareness of the major New York City waterways;
Their use of the water and the land areas alongside the water for recreational use for various waterways;
The recreational activities they have participated in and how enjoyable they found these activities;
If they have not used the various waterways for recreational purposes, the reasons why not;
Their attitudes toward New York City waterways on a variety of aspects;
The improvements they have seen in New York City waterways and their desired future improvements.
Newtown CreekAssessment Area
The overall purpose of the study was to measure New York City residents’ use of and attitudes toward the water resources in their community and elsewhere. The research covered many different areas relevant to this overall purpose. Among the key topics included were:
3
Method
HydroQual selected 26 New York City “primary waterways” to be studied. The specific waterways respondents were asked about were determined by their zip code.
The sample size for each waterway was to be 300.
However, because some zip codes are proximate to more than one primary waterway, respondents in those zip codes were asked about two and sometimes three primary waterways. As a result, the number of responses for some individual waterways is greaterthan 300. In turn, a total of 7,424 interviews were conducted which yielded a total of 8,031 responses to questions about primary waterways.
Newtown CreekAssessment Area
Interviews were conducted via CATI (Computer Assisted Telephone Interviews) among 18+ year old residents of the five boroughs of New York City.
The sample design for the study was as follows:
4
Method (cont’d)
Of the total of 7,424 interviews, 5,488 interviews (74%) were conducted using a RDD (random digit dial) sample of the five boroughs.
The balance of 1,936 interviews was conducted using listed sample specific to the zip codes for those waterways with remaining sample assignments, (i.e., for those assessment areas where an RDD method would have been dispro-portionately expensive due to the relatively low incidence of people living in the areas.)
Within each household, whether from the RDD or the listed sample, the specific individual interviewed was selected at random from all 18+ year old residents at home.
Newtown CreekAssessment Area
A list of the 26 primary waterways studied is provided in Appendix A.
5
Method (cont’d)
Written instructions regarding the correct administration of thequestionnaire were provided and all field supervisors and interviewers were briefed on the study prior to conducting any interviews.
A pre-test was conducted prior to the full field to ensure that the questionnaire would be clearly understood by respondents.
The full fieldwork was conducted from late June until early September. Interviewing hours throughout the period were weekday evenings and during both the day and evening on the weekend.
Newtown CreekAssessment Area
As a first step in the questionnaire development process a series of 5 focus groups was conducted among residents of the five boroughs (one in each borough) to ensure that the questionnaire for the telephone survey covered all the relevant issues, and did so in a way that would be clear to respondents. The questionnaire was then designed in close consultation with HydroQual and NYC DEP senior personnel. A copy is appended at the end of this report.The interviews, which averaged about 18 minutes in length, were conducted as follows:
6
Method (cont’d)
Weights were applied to correct for:
The unequal probability of household selection due to households with more than one voice telephone number; and
The unequal probability of selection of the individual selected for the interview due to different numbers of individuals being available to be interviewed in different households.
Newtown CreekAssessment Area
The data were edited and cleaned prior to tabulation. In addition, “other specify” responses to all pre-coded answer list questions were examined and where a sufficient number of responses clustered around a general theme (at least 2% of responses), a code for those responses was added to the pre-coded list in tabulating the data
The final data were weighted as follows:

2
7
Method (cont’d)
In addition, post-stratification weighting was applied separately for each of the 26 primary waterways to balance the sample data to 2000 U.S. Census Data for:
The composition of the household -- Single adult (18+) households vs. 2+ adult with children households vs. 2+ adult without children households;
Age within gender; and
Race/ethnicity.
Data for each waterbody area were projected to actual populationcounts from the 2000 Census, so that the areas could be easily combined to yield an appropriately weighted sample of all adults 18+ in the five boroughs of New York City.
Newtown CreekAssessment Area
8
Organization of the Report
Awareness of primary waterways
Visiting primary waterways
Participation in recreational activities and attitudes toward primary waterways
Improvements to primary waterways -- past and desired in the future
Demographic and other profile information.
Newtown CreekAssessment Area
A separate report is provided for each of the 26 primary waterways included in the study. In each report, the results for the subject primary waterway is compared to the average for all 26 waterways. (A separate report of the findings on a city-wide basis has also been prepared.)
The findings for each individual waterway are organized as follows:
9
Glossary and Other Reading Notes
Area residents -- live in one of the zip codes that define the subject primary waterway Total NYC residents -- all respondentsPrimary waterway – one of the 26 New York City waterways for which respondents were asked their use of and attitudes towardOther NYC waterways – other New York City waterways respondents volunteered in response to various questionsUnaided awareness -- a mention of a NYC waterway without prompting or aiding the respondentTotal awareness -- a combination of unaided awareness and aided awareness. i.e., the respondent is given the name and asked if they have ever heard of that waterwayVisiting a waterway -- spending recreational or leisure time in or on the waterway or the land alongside those watersOn water activities – boating/speed boating, canoeing, cruising/tour boat, ferryboat ride (for leisure), kayaking, sailing.In water activities – jet skiing, surfing, swimming, wading.
Newtown CreekAssessment Area
10
Glossary and Other Reading Notes (cont’d)
A base of 8,031 for all questions that are specific to a primarywaterway; and
A base of 7,424 for all questions that are not specific to a primary waterway.
Newtown CreekAssessment Area
All base sizes shown are the actual number of people who were asked the question, prior to projecting them to the population of New York City.
As mentioned earlier, two base sizes are shown for the total for New York City residents depending on the question:
11
Glossary and Other Reading Notes (cont’d)
An average of the values for all 26 primary waterways; and
A median value for the 26 waterways -- the value at the mid-point of the values for the 26 waterways, that is, there are an equal number of values above and below the median value.
Newtown CreekAssessment Area
Comparisons of the findings for the subject waterway are made to all New York City residents in two ways:
The median value is shown whenever extremely high values for a few waterways tend to distort the average. In these cases, the median value is more helpful than the average in placing where the subject waterway stands relative to all the other waterways.
Awareness of Primary Waterway
Newtown Creek
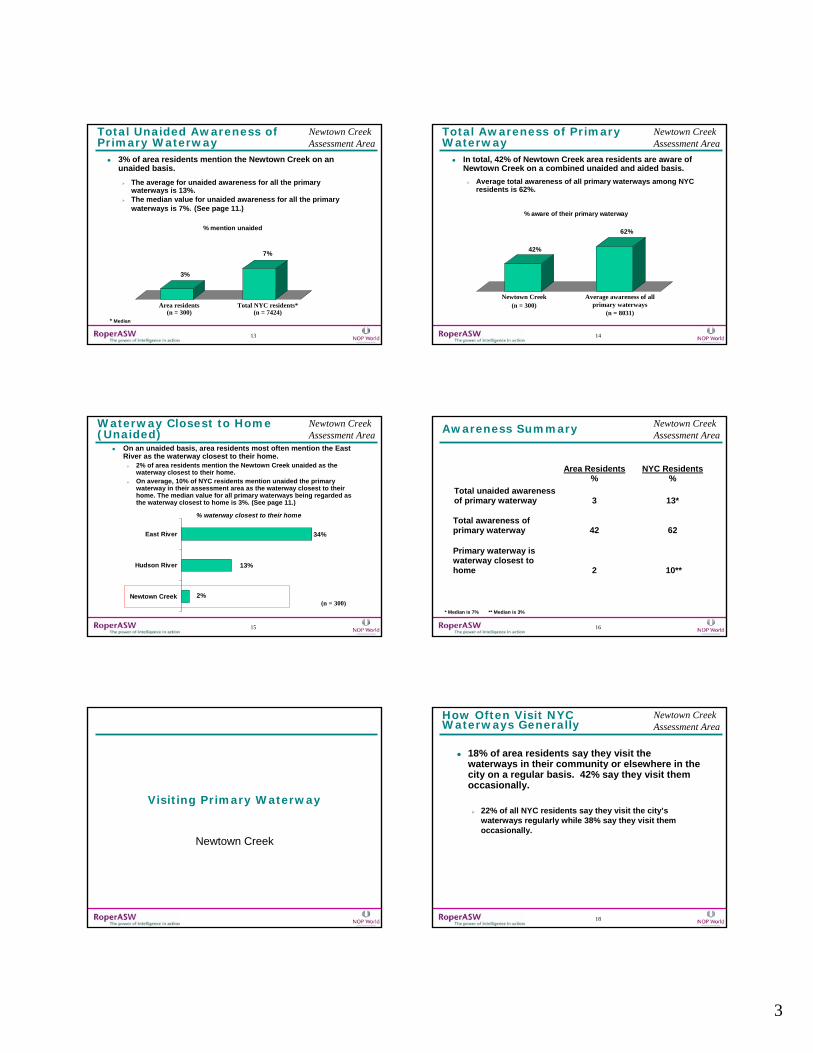
3
13
Total Unaided Awareness of Primary Waterway
3% of area residents mention the Newtown Creek on an unaided basis.
The average for unaided awareness for all the primary waterways is 13%.The median value for unaided awareness for all the primary waterways is 7%. (See page 11.)
3%
7%
% mention unaided
Area residents(n = 300)
Total NYC residents*(n = 7424)
Newtown CreekAssessment Area
* Median
14
Total Awareness of Primary Waterway
In total, 42% of Newtown Creek area residents are aware of Newtown Creek on a combined unaided and aided basis.
Average total awareness of all primary waterways among NYC residents is 62%.
42%
62%
% aware of their primary waterway
Newtown Creek(n = 300)
Average awareness of all primary waterways
(n = 8031)
Newtown CreekAssessment Area
15
Waterway Closest to Home (Unaided)
On an unaided basis, area residents most often mention the East River as the waterway closest to their home.
2% of area residents mention the Newtown Creek unaided as the waterway closest to their home.On average, 10% of NYC residents mention unaided the primary waterway in their assessment area as the waterway closest to their home. The median value for all primary waterways being regarded as the waterway closest to home is 3%. (See page 11.)
% waterway closest to their home
34%
13%
2%Newtown Creek
Hudson River
East River
(n = 300)
Newtown CreekAssessment Area
16
Area Residents %
NYC Residents%
Total unaided awareness of primary waterway 3 13*
Total awareness of primary waterway 42 62
Primary waterway is waterway closest to home 2 10**
Awareness Summary Newtown CreekAssessment Area
* Median is 7% ** Median is 3%
Visiting Primary Waterway
Newtown Creek
18
How Often Visit NYC Waterways Generally
18% of area residents say they visit the waterways in their community or elsewhere in the city on a regular basis. 42% say they visit them occasionally.
22% of all NYC residents say they visit the city’s waterways regularly while 38% say they visit them occasionally.
Newtown CreekAssessment Area
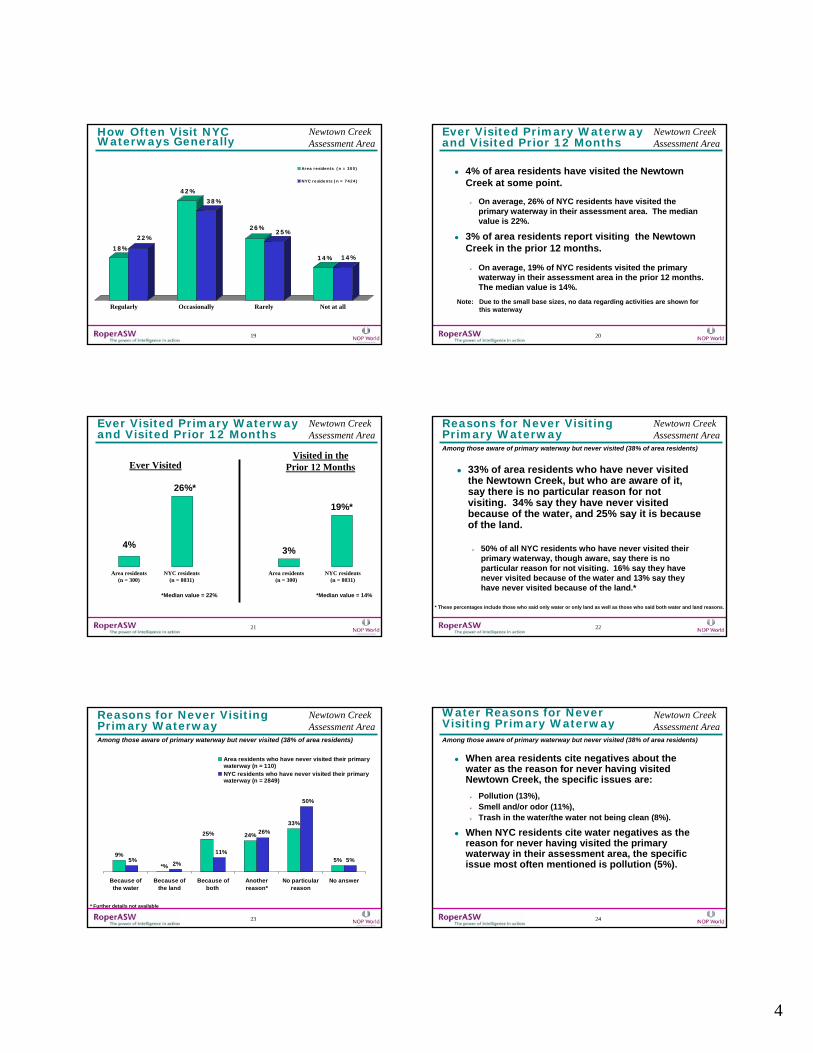
4
19
How Often Visit NYC Waterways Generally
Regularly Occasionally Rarely Not at all
Newtown CreekAssessment Area
18%
22%
42%
38%
26%25%
14% 14%
Area residents (n = 300)
NYC residents (n = 7424)
20
Ever Visited Primary Waterway and Visited Prior 12 Months
4% of area residents have visited the Newtown Creek at some point.
On average, 26% of NYC residents have visited the primary waterway in their assessment area. The median value is 22%.
3% of area residents report visiting the Newtown Creek in the prior 12 months.
On average, 19% of NYC residents visited the primary waterway in their assessment area in the prior 12 months. The median value is 14%.
Newtown CreekAssessment Area
Note: Due to the small base sizes, no data regarding activities are shown for this waterway
21
Ever Visited Primary Waterway and Visited Prior 12 Months
3%
19%*
26%*
4%
Ever VisitedVisited in the
Prior 12 Months
Area residents(n = 300)
NYC residents(n = 8031)
Area residents(n = 300)
NYC residents(n = 8031)
Newtown CreekAssessment Area
*Median value = 22% *Median value = 14%
22
Reasons for Never Visiting Primary Waterway
33% of area residents who have never visited the Newtown Creek, but who are aware of it, say there is no particular reason for not visiting. 34% say they have never visited because of the water, and 25% say it is because of the land.
50% of all NYC residents who have never visited their primary waterway, though aware, say there is no particular reason for not visiting. 16% say they have never visited because of the water and 13% say they have never visited because of the land.*
Among those aware of primary waterway but never visited (38% of area residents)
Newtown CreekAssessment Area
* These percentages include those who said only water or only land as well as those who said both water and land reasons.
23
9%
24%
33%
5% 5%*%
25% 26%
50%
5%2%
11%
Because ofthe water
Because ofthe land
Because ofboth
Anotherreason*
No particularreason
No answer
Area residents who have never visited their primarywaterway (n = 110)NYC residents who have never visited their primarywaterway (n = 2849)
Reasons for Never Visiting Primary Waterway
Newtown CreekAssessment Area
Among those aware of primary waterway but never visited (38% of area residents)
* Further details not available
24
Newtown CreekAssessment Area
When area residents cite negatives about the water as the reason for never having visited Newtown Creek, the specific issues are:
Pollution (13%), Smell and/or odor (11%), Trash in the water/the water not being clean (8%).
When NYC residents cite water negatives as the reason for never having visited the primary waterway in their assessment area, the specific issue most often mentioned is pollution (5%).
Water Reasons for Never Visiting Primary WaterwayAmong those aware of primary waterway but never visited (38% of area residents)
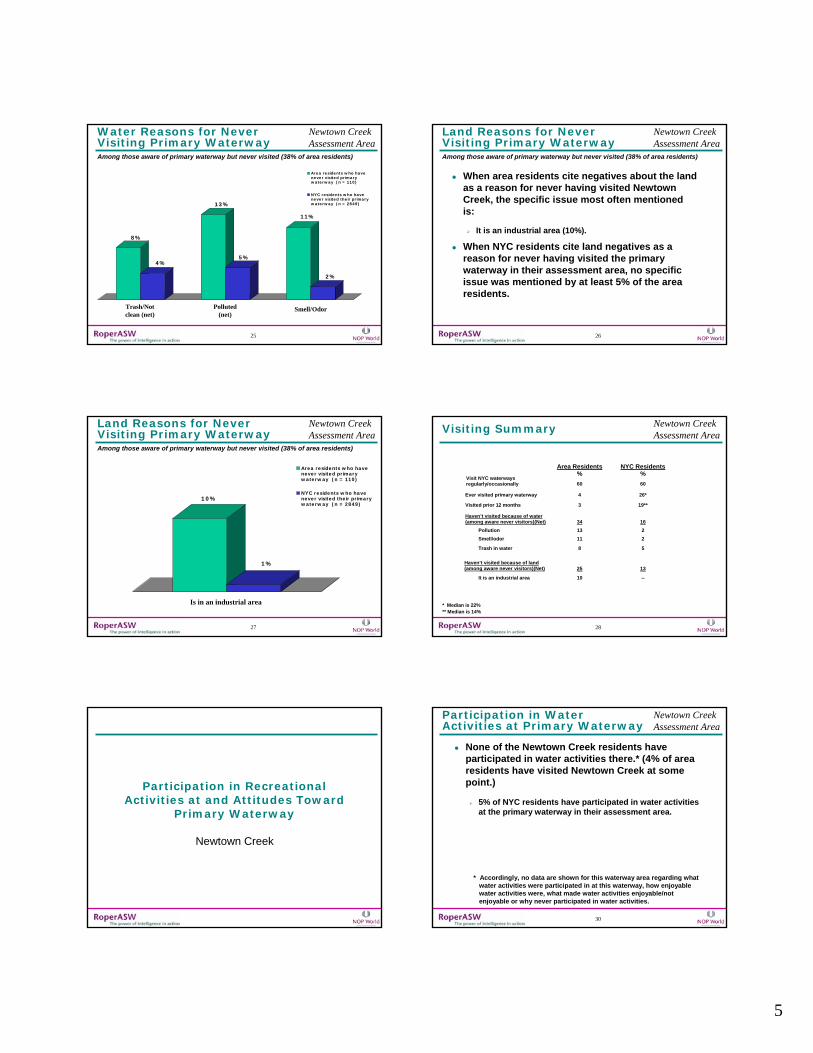
5
25
Water Reasons for Never Visiting Primary Waterway
Trash/Not clean (net)
Polluted (net)
Smell/Odor
Newtown CreekAssessment Area
8%
4%
13%
5%
11%
2%
Area residents who havenever visited primarywaterway (n = 110)
NYC residents who havenever visited their primarywaterway (n = 2849)
Among those aware of primary waterway but never visited (38% of area residents)
26
Land Reasons for Never Visiting Primary Waterway
Newtown CreekAssessment Area
When area residents cite negatives about the land as a reason for never having visited Newtown Creek, the specific issue most often mentioned is:
It is an industrial area (10%).
When NYC residents cite land negatives as a reason for never having visited the primary waterway in their assessment area, no specific issue was mentioned by at least 5% of the area residents.
Among those aware of primary waterway but never visited (38% of area residents)
27
Land Reasons for Never Visiting Primary Waterway
10%
1%
Area residents who havenever visited primarywaterway (n = 110)
NYC residents who havenever visited their primarywaterway (n = 2849)
Is in an industrial area
Newtown CreekAssessment Area
Among those aware of primary waterway but never visited (38% of area residents)
28
Area Residents %
NYC Residents %
Visit NYC waterways regularly/occasionally 60 60
Ever visited primary waterway 4 26*
Visited prior 12 months 3 19**
Haven’t visited because of water (among aware never visitors)(Net) 34 16
Pollution 13 2
Smell/odor 11 2
Trash in water 8 5
Haven’t visited because of land (among aware never visitors)(Net) 25 13
It is an industrial area 10 --
Visiting Summary Newtown CreekAssessment Area
* Median is 22%** Median is 14%
Participation in Recreational Activities at and Attitudes Toward
Primary Waterway
Newtown Creek
30
None of the Newtown Creek residents have participated in water activities there.* (4% of area residents have visited Newtown Creek at some point.)
5% of NYC residents have participated in water activities at the primary waterway in their assessment area.
Participation in Water Activities at Primary Waterway
Newtown CreekAssessment Area
* Accordingly, no data are shown for this waterway area regarding what water activities were participated in at this waterway, how enjoyable water activities were, what made water activities enjoyable/not enjoyable or why never participated in water activities.
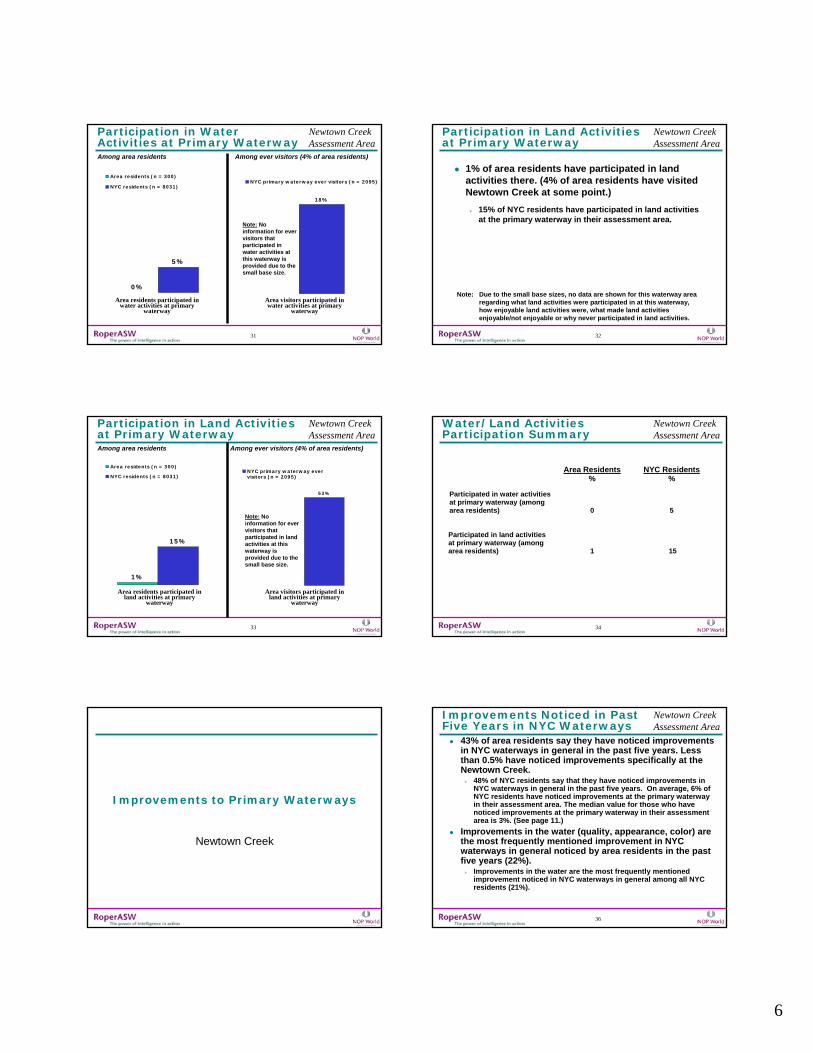
6
31
Participation in Water Activities at Primary Waterway
18%
NYC primary waterway ever visitors (n = 2095)
Area visitors participated in water activities at primary
waterway
Newtown CreekAssessment Area
0%
5%
Area residents (n = 300)
NYC residents (n = 8031)
Area residents participated in water activities at primary
waterway
Among area residents Among ever visitors (4% of area residents)
Note: No information for ever visitors that participated in water activities at this waterway is provided due to the small base size.
32
1% of area residents have participated in land activities there. (4% of area residents have visited Newtown Creek at some point.)
15% of NYC residents have participated in land activities at the primary waterway in their assessment area.
Participation in Land Activities at Primary Waterway
Newtown CreekAssessment Area
Note: Due to the small base sizes, no data are shown for this waterway area regarding what land activities were participated in at this waterway, how enjoyable land activities were, what made land activities enjoyable/not enjoyable or why never participated in land activities.
33
Participation in Land Activities at Primary Waterway
53%
NYC primary waterway evervisitors (n = 2095)
Area visitors participated in land activities at primary
waterway
Newtown CreekAssessment Area
1%
15%
Area residents (n = 300)
NYC residents (n = 8031)
Area residents participated in land activities at primary
waterway
Among area residents Among ever visitors (4% of area residents)
Note: No information for ever visitors that participated in land activities at this waterway is provided due to the small base size.
34
Area Residents %
NYC Residents %
Participated in water activities at primary waterway (among area residents) 0 5
Participated in land activities at primary waterway (among area residents) 1 15
Water/Land Activities Participation Summary
Newtown CreekAssessment Area
Improvements to Primary Waterways
Newtown Creek
36
43% of area residents say they have noticed improvements in NYC waterways in general in the past five years. Less than 0.5% have noticed improvements specifically at the Newtown Creek.
48% of NYC residents say that they have noticed improvements in NYC waterways in general in the past five years. On average, 6% of NYC residents have noticed improvements at the primary waterway in their assessment area. The median value for those who have noticed improvements at the primary waterway in their assessmentarea is 3%. (See page 11.)
Improvements in the water (quality, appearance, color) are the most frequently mentioned improvement in NYC waterways in general noticed by area residents in the past five years (22%).
Improvements in the water are the most frequently mentioned improvement noticed in NYC waterways in general among all NYC residents (21%).
Improvements Noticed in Past Five Years in NYC Waterways
Newtown CreekAssessment Area
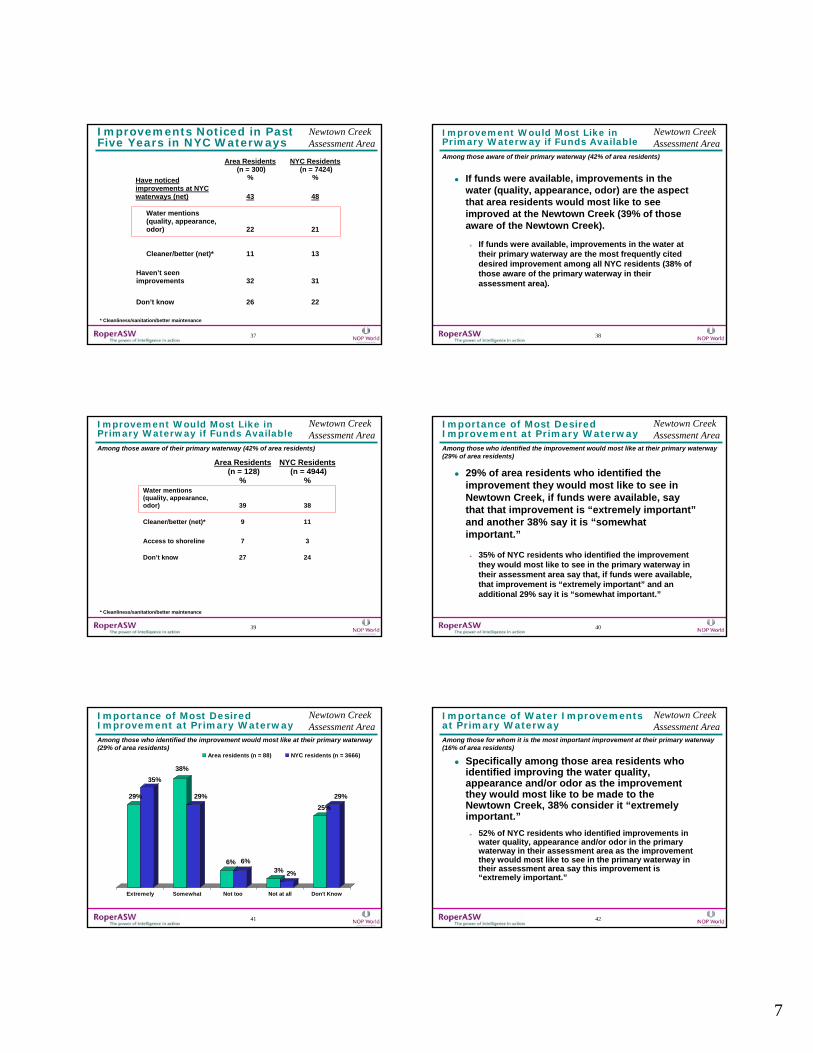
7
37
Area Residents (n = 300)
%
NYC Residents (n = 7424)
%Have noticedimprovements at NYCwaterways (net) 43 48
Water mentions(quality, appearance,odor) 22 21
Cleaner/better (net)* 11 13
Haven’t seenimprovements 32 31
Don’t know 26 22
Improvements Noticed in Past Five Years in NYC Waterways
Newtown CreekAssessment Area
* Cleanliness/sanitation/better maintenance
38
Improvement Would Most Like in Primary Waterway if Funds Available
If funds were available, improvements in the water (quality, appearance, odor) are the aspect that area residents would most like to see improved at the Newtown Creek (39% of those aware of the Newtown Creek).
If funds were available, improvements in the water at their primary waterway are the most frequently cited desired improvement among all NYC residents (38% of those aware of the primary waterway in their assessment area).
Newtown CreekAssessment Area
Among those aware of their primary waterway (42% of area residents)
39
Area Residents (n = 128)
%
NYC Residents (n = 4944)
% Water mentions (quality, appearance, odor) 39 38
Cleaner/better (net)* 9 11
Access to shoreline 7 3
Don’t know 27 24
Improvement Would Most Like in Primary Waterway if Funds Available
Newtown CreekAssessment Area
Among those aware of their primary waterway (42% of area residents)
* Cleanliness/sanitation/better maintenance
40
29% of area residents who identified the improvement they would most like to see in Newtown Creek, if funds were available, say that that improvement is “extremely important”and another 38% say it is “somewhat important.”
35% of NYC residents who identified the improvement they would most like to see in the primary waterway in their assessment area say that, if funds were available, that improvement is “extremely important” and an additional 29% say it is “somewhat important.”
Importance of Most Desired Improvement at Primary Waterway
Newtown CreekAssessment Area
Among those who identified the improvement would most like at their primary waterway (29% of area residents)
41
29%
35%
38%
29%
6% 6%3% 2%
25%
29%
Extremely Somewhat Not too Not at all Don't Know
Area residents (n = 88) NYC residents (n = 3666)
Importance of Most Desired Improvement at Primary Waterway
Newtown CreekAssessment Area
Among those who identified the improvement would most like at their primary waterway (29% of area residents)
42
Importance of Water Improvements at Primary Waterway
Specifically among those area residents who identified improving the water quality, appearance and/or odor as the improvement they would most like to be made to the Newtown Creek, 38% consider it “extremely important.”
52% of NYC residents who identified improvements in water quality, appearance and/or odor in the primary waterway in their assessment area as the improvement they would most like to see in the primary waterway in their assessment area say this improvement is “extremely important.”
Newtown CreekAssessment Area
Among those for whom it is the most important improvement at their primary waterway (16% of area residents)
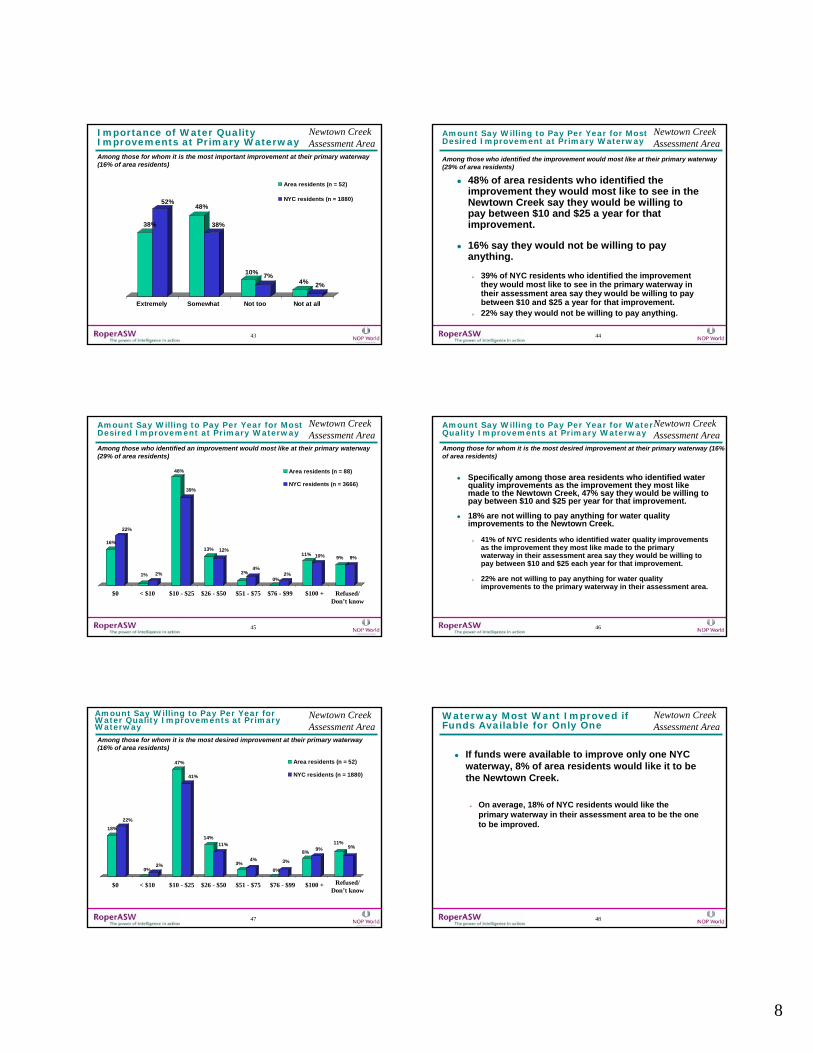
8
43
38%
52%48%
38%
10%7%
4% 2%
Extremely Somewhat Not too Not at all
Area residents (n = 52)
NYC residents (n = 1880)
Importance of Water Quality Improvements at Primary Waterway
Newtown CreekAssessment Area
Among those for whom it is the most important improvement at their primary waterway (16% of area residents)
44
48% of area residents who identified the improvement they would most like to see in the Newtown Creek say they would be willing to pay between $10 and $25 a year for that improvement.
16% say they would not be willing to pay anything.
39% of NYC residents who identified the improvement they would most like to see in the primary waterway in their assessment area say they would be willing to pay between $10 and $25 a year for that improvement.22% say they would not be willing to pay anything.
Amount Say Willing to Pay Per Year for Most Desired Improvement at Primary Waterway
Newtown CreekAssessment Area
Among those who identified the improvement would most like at their primary waterway (29% of area residents)
45
16%
22%
1% 2%
48%
39%
13% 12%
2%4%
0%2%
11% 10% 9% 9%
Area residents (n = 88)
NYC residents (n = 3666)
Amount Say Willing to Pay Per Year for Most Desired Improvement at Primary Waterway
Newtown CreekAssessment Area
$0 < $10 $10 - $25 $26 - $50 $51 - $75 $76 - $99 $100 +
Among those who identified an improvement would most like at their primary waterway (29% of area residents)
Refused/ Don’t know
46
Amount Say Willing to Pay Per Year for Water Quality Improvements at Primary Waterway
Specifically among those area residents who identified water quality improvements as the improvement they most like made to the Newtown Creek, 47% say they would be willing to pay between $10 and $25 per year for that improvement.
18% are not willing to pay anything for water quality improvements to the Newtown Creek.
41% of NYC residents who identified water quality improvements as the improvement they most like made to the primary waterway in their assessment area say they would be willing to pay between $10 and $25 each year for that improvement.
22% are not willing to pay anything for water quality improvements to the primary waterway in their assessment area.
Newtown CreekAssessment Area
Among those for whom it is the most desired improvement at their primary waterway (16% of area residents)
47
18%
22%
0%2%
47%
41%
14%11%
3%4%
0%
3%
8%9%
11%9%
Area residents (n = 52)
NYC residents (n = 1880)
Amount Say Willing to Pay Per Year for Water Quality Improvements at Primary Waterway
Newtown CreekAssessment Area
$0 < $10 $10 - $25 $26 - $50 $51 - $75 $76 - $99 $100 +
Among those for whom it is the most desired improvement at their primary waterway (16% of area residents)
Refused/ Don’t know
48
If funds were available to improve only one NYC waterway, 8% of area residents would like it to be the Newtown Creek.
On average, 18% of NYC residents would like the primary waterway in their assessment area to be the one to be improved.
Waterway Most Want Improved if Funds Available for Only One
Newtown CreekAssessment Area

9
49
Area Residents (n = 300)
%
NYC Residents (n = 7424)
%
Newtown Creek 8 1
The East River 27 18
The Hudson River 20 22
Rockaway Beach* 7 3
Jamaica Bay 1 3
Don’t know 20 17
Waterway Most Want Improved if Funds Available for Only One
Newtown CreekAssessment Area
* Not one of the 26 primary waterways studied.
50
Area Residents %
NYC Residents %
Noticed improvements in NYC waterways in past 5 years 43 48
Noticed improvements in primary waterway in past 5 years * 6**
Improvements in water improvement most frequently noticed (at NYC waterways) 22 21
Improvements in water most desired improvement at primary waterway (among those aware of primary waterway) 39 38
Improvements Summary Newtown CreekAssessment Area
* Less than 0.5%**Median is 3%.
51
Area Residents %
NYC Residents% Percent rating most desired
improvement “extremely/ somewhat important” (among those who identified improvement would most like at primary waterway) 67 64
Percent rating water improvements “extremely/ somewhat important” (among those for whom it is the most desired improvement at primary waterway) 86 90 Would pay $10-$25 annually for most desired improvement (among those who identified improvement would most like at primary waterway) 48 39
Would pay $10-$25 annually for water improvements (among those for whom it is the most desired improvement at primary waterway) 47 41
Primary waterway is one most want improved 8 18
Improvements Summary (cont’d)
Newtown CreekAssessment Area
Demographics
Newtown Creek
53
Demographics
Newtown Creek Total NYC Residents
Gender % % Male 48 46 Female 52 54
Age 18-34 37 36
18-24 12 14 25-34 25 21
35-54 37 37
35-44 20 22 45-54 17 15
55+ 25 26 55-64 15 13 65+ 9 13
Newtown CreekAssessment Area
54
Demographics
Newtown Creek Total NYC Residents
Children Under 18 in HH % % Yes 42 37
1 18 17 2 15 11 3 7 5 4 2 2 5 * 1 6+ -- 1
No 56 62
Ethnicity/Race African-American 11 21 Asian 11 10 Hispanic 30 22 White 37 35 Other 11 12
Newtown CreekAssessment Area
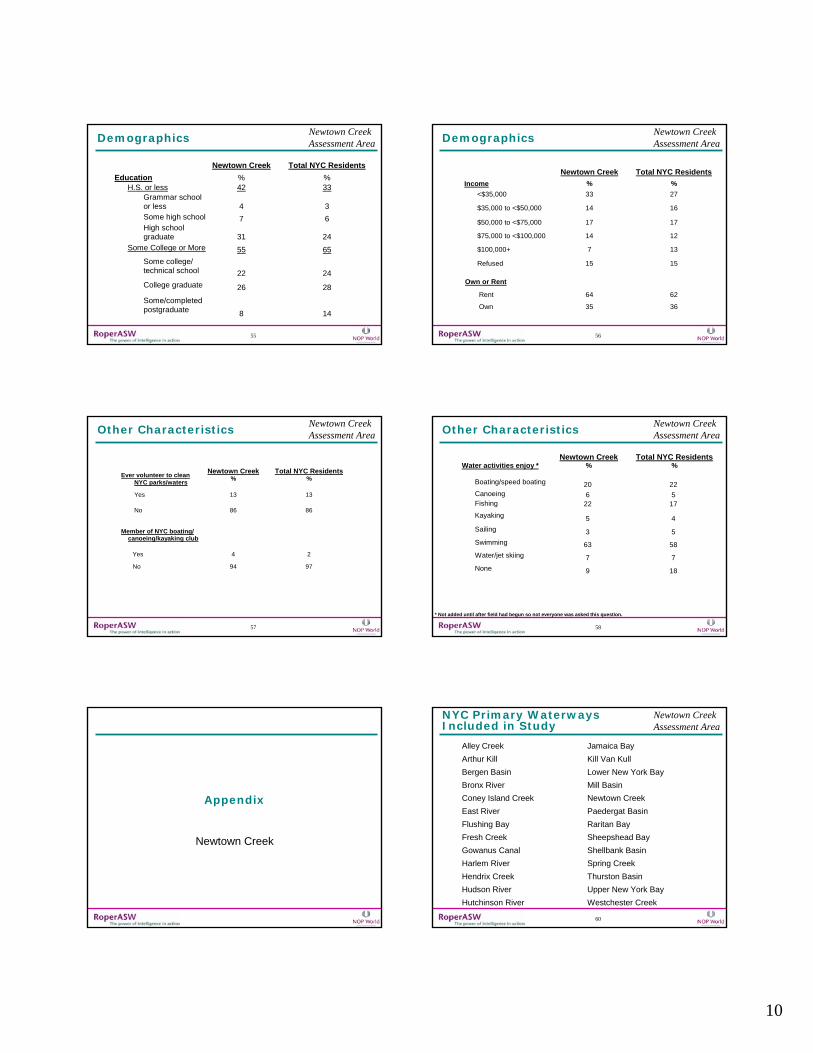
10
55
Demographics
Newtown Creek Total NYC Residents
Education % % H.S. or less 42 33
Grammar school or less 4 3 Some high school 7 6 High school graduate 31 24
Some College or More 55 65 Some college/ technical school 22 24 College graduate 26 28
Some/completed postgraduate 8 14
Newtown CreekAssessment Area
56
Demographics
Newtown Creek Total NYC Residents
Income % %
<$35,000 33 27
$35,000 to <$50,000 14 16
$50,000 to <$75,000 17 17
$75,000 to <$100,000 14 12
$100,000+ 7 13
Refused 15 15
Own or Rent
Rent 64 62
Own 35 36
Newtown CreekAssessment Area
57
Other Characteristics
Ever volunteer to clean NYC parks/waters
Newtown Creek %
Total NYC Residents%
Yes 13 13
No 86 86
Member of NYC boating/ canoeing/kayaking club
Yes 4 2
No 94 97
Newtown CreekAssessment Area
58
Other Characteristics
Water activities enjoy * Newtown Creek
% Total NYC Residents
%
Boating/speed boating 20 22 Canoeing 6 5 Fishing 22 17 Kayaking 5 4 Sailing 3 5 Swimming 63 58 Water/jet skiing 7 7 None 9 18
Newtown CreekAssessment Area
* Not added until after field had begun so not everyone was asked this question.
Appendix
Newtown Creek
60
NYC Primary Waterways Included in Study
Newtown CreekAssessment Area
Raritan Bay
Westchester CreekHutchinson RiverUpper New York BayHudson RiverThurston BasinHendrix CreekSpring CreekHarlem RiverShellbank BasinGowanus CanalSheepshead BayFresh Creek
Flushing BayPaedergat BasinEast RiverNewtown CreekConey Island CreekMill BasinBronx RiverLower New York BayBergen BasinKill Van KullArthur KillJamaica BayAlley Creek

11
61
Questionnaire
NOTE: Final copies of each report will contain a copy of the questionnaire.
APPENDIX D
NEWTOWN CREEK STAKEHOLDER TEAM MEETING MINUTES

NO TEXT ON THIS PAGE
APPENDIX D.1
STAKEHOLDER TEAM MEETING NO. 1
OCTOBER 25TH, 2006

NO TEXT ON THIS PAGE

Long Term Control Plan Newtown Creek Stakeholder Team Meeting No. 1 October 25th, 2006
The first Newtown Creek Stakeholder team meeting of the Long Term Control Plan (LTCP) for Combined Sewer Overflows (CSO) of the NYC Department of Environmental Protection (DEP) was held on October 25, 2006, at 6:30 p.m. at the Newtown Creek Water Pollution Control Plant, 329 Greenpoint Avenue in Greenpoint, Brooklyn. Mark Klein, Project Director for the LTCP, opened the meeting and introduced John Leonforte, Director of Capital Project Outreach (DEP). Mark said that DEP is currently working to draft individual Waterbody/Watershed plans (WB/WS) for CSOs, including one for Newtown Creek. All of the plans must be submitted by June 2007. The subsequent detailed review of the WB/WS plans by the State, along with any refinement by DEP, will lead to the NYSDEC’s regulatory approval of the LTCP document. Stephen Whitehouse, Starr Whitehouse, defined CSOs. They occur when the flow from a storm event exceeds the capacity of the treatment plant or conveyance system, in which case combined sewage—a mixture of sanitary and storm water—is discharged into adjacent waterbodies. He said that most of the city is served by combined sewers, including Most of the Newtown Creek area. A stakeholder asked whether CSO caused basement flooding. John replied that, as the collection sewers are deep, it is unlikely. He asked the stakeholder to describe the problem and suggested replacing the caps. Stephen showed the locations of the city-wide CSOs and the Water Pollution Control Plants (WPCP). Stephen Whitehouse presented a general background of the LTCP. He described the history of CSO policy and previous water quality planning, including the Use and Standards Attainment (USA) project. The preparation of the LTCP is a requirement of the January 2005 consent order on CSO’s with the NY State Department of Environmental Conservation, which also sets schedules for completion of specific water quality improvement projects, including the construction of a Newtown Creek CSO retention tank and aeration projects on the creek. Stephen said that the City’s first CSO abatement projects prioritized the most impacted waterbodies, including Flushing Bay and Creek, Paerdegat Basin, and Newtown Creek. A stakeholder asked for further information about the holding tank operations. Stephen explained that the basic concept of the tank is to retain wet weather flow and then, during dry weather, pump the contents of the tank to the WPCP for treatment. A stakeholder asked for a document outlining the multiple consent orders with regards to conditions and projects in Newtown Creek, so as to better understanding the current regulatory framework of CSO related projects; the project team agreed to pull together a summary. Another stakeholder asked what other city-wide waterbodies had stakeholder groups. Stephen said that there were ten stakeholder groups: Paerdegat Basin; Gowanus Canal; Coney Island Creek; Newtown Creek; Alley Creek and Little Neck Bay; Flushing Bay and Creek; the waterbodies around Jamaica Bay; the
Long Term Control Plan Newtown Creek Stakeholder Team Meeting No. 1 October 25th, 2006
Bronx River; the Westchester Creek and Hutchinson River; and the Open Waters or the Harlem River, East River, and Harbor. He added that stakeholders were invited to join the Open Water group. Stephen said that each WB/WS plan would be developed with a group of stakeholders like the one assembled. The stakeholders are instrumental for identifying the existing and desired uses for a waterbody. They also help to define waterbody characteristics. He said that stakeholders would share in the review and analysis of the WB/WS plan. He defined stakeholder as any person or representative of an entity with a demonstrated interest in the project area. The stakeholder group for Newtown Creek is composed of stakeholders from the USA Project and was refined through recent conversations with Queens Community Boards 2 and 5 and Brooklyn Community Board 1. Stephen emphasized that the scope of this project is limited to CSOs, only one of the many water quality issues in Newtown Creek. Curtis Courter, Hazen and Sawyer, presented an introduction to the waterbody. He said that Newtown Creek was an urbanized water body, largely bulkheaded and channelized. He said that there are 23 CSO outfalls and 5 permitted storm sewer outfalls in the creek and that the creek is served by both the Newtown Creek and Bowery Bay WPCP collection systems. The water quality standard for the creek is class SD, with designated uses of fishing and fish survival. A stakeholder asked whether the East River would meet swimming standards. Curtis said that the East River water quality is meeting federal primary contact standards but that these are not the same as the Department of Health standards, and that other issues, such as strong currents, preclude swimming. Curtis described the significant marine and industrial uses in the area. He said that there was limited public access, although the NYC Economic Development Corporation is completing a park at the end of Manhattan Street and DEP is building a waterfront promenade in the new Newtown Creek WPCP. Next, Curtis described the sampling efforts that have taken place in Newtown Creek. He showed the different sampling points, shared some sampling results, and discussed the history of various sampling efforts. A stakeholder asked what the highest pathogen levels were and where they were located. Curtis said that that information would be shared at the next meeting. Another stakeholder said that he hoped that the data would not be displayed in averages, as the different sampling points have radically different water quality issues. Curtis said that the data would be displayed along a transept which shows that the water quality is worse at the head end of the creek. A stakeholder asked if the sampling data was correlated with wet and dry weather. Curtis said that it was. Another stakeholder expressed trepidation that data from the 1990s was used in the powerpoint presentation. She asked that, at the next meeting, more recent data would be shown. Curtis said that it would. Curtis reviewed the major water quality issues in Newtown Creek, which include sediment deposits and low dissolved oxygen, in part due to sediment oxygen demand. He said that there was ongoing groundwater remediation pursuant to a consent order

Long Term Control Plan Newtown Creek Stakeholder Team Meeting No. 1 October 25th, 2006
concerning an underground oil spill. A stakeholder said that the remediation did not improve groundwater quality; its only goal was to remove the oil. A stakeholder asked what funds were available for the remediation of the Phelps Dodge superfund site. Another stakeholder said that she would look into it. Curtis said that he had tried, but was unable, to get that information. Curtis shared the baseline modeling results. He reviewed some of the WB/WS elements that were included in the CSO facility plan that was submitted to the state in 2003: a tank at the head of English Kills, relief sewer from the East Branch, and a throttling gate. He said that there was an initial small scale pilot of instream aeration Upper English Kills and that a full-scale facility for aeration is currently under construction for the same zone. A second phase of aeration is planned for lower English Kills, East Branch, and Dutch Kills. Data on aeration will be presented at the next meeting. A stakeholder expressed a concern that, if the 2003 Consent order was modifiable, the water quality standard could be decreased through a use attainability analysis (UAA). Curtis said that the SD water standard for Newtown Creek was the lowest possible standard and could not be lowered. He said that the fact that the 2003 CSO facility plan can be modified does not provide a back door, but to the contrary, creates opportunities for additional improvements. John added that NYSDEC was unlikely to remove facility plan elements. Stephen said that the WB/WS plan that will be submitted to the NYSDEC is a draft and would be subject to public comment prior to an approval from NYSDEC. He added that, while the City could not anticipate all potential issues the State may raise in its technical review, it was the DEP’s goal that the draft WB/WS plan developed with the current stakeholder meetings will be largely the same as the plan that will be brought back to the public for comment after NYSDEC review. Another stakeholder asked about modeling efforts. Curtis said that modeling is carried out by HydroQual, one of the project consultants. More information will be presented about modeling at the next meeting. Curtis reviewed elements that may become part of the WB/WS plan, including dredging and flushing tunnels. Several stakeholders asked why separately sewered systems, particularly for new construction, were not included on the list of abatement alternatives. Curtis said that such a system would be costly. Additionally, since they would be located within a combined sewer area, the volume from the separate sewers would be merged and would have a minimal impact. A stakeholder expressed concern that low impact development alternatives (LIDs) were not included. Stephen said that efforts were currently underway within DEP to understand the effects of LIDs on a watershed level. He added that, while DEP supports LIDs and constructs them into their own facilities, the timeline required to develop a citywide policy on LIDs, which necessitates interagency evaluations and regulatory actions, will extend beyond the June 2007 milestone for delivery of an approvable WB/WS Facility Plan to NYSDEC. A separate but related effort to create a city-wide policy on LIDs, with the Mayor’s Office of Sustainability and Long Term Planning, is currently underway.
Long Term Control Plan Newtown Creek Stakeholder Team Meeting No. 1 October 25th, 2006
A stakeholder asked whether the forecasted improvements took into account the area’s projected growth. Curtis said that the baseline for the model assumed 2045 population projections and no significant changes, with the exception of the ongoing upgrades to the Newtown Creek WPCP. The stakeholders said that they would like to see the current existing conditions used as a baseline. Curtis said that the assumptions made in modeling tended towards overestimation, as that will ensure that there is ample capacity. He added that, given that the rule of thumb for the ratio of stormwater to sanitary waste in CSOs is 80-90% against 10-20%, the population growth expected in the area will not have a significant effect in total volume. The main factor that overwhelms the sewer infrastructure is the increment from the storm. He said that, in future work, the alternatives would be measured against the volume of CSOs eliminated and the reduction in CSO events per year. One of the stakeholders said that, considering that USA project on CSOs suddenly disappeared, she mistrusts the current process. John shared his belief that DEP should have continued to keep the USA stakeholders up to date. A stakeholder said that she would like to see more participation from neighborhoods close to, but not abutting, the creek, such as Bushwick. A community board member suggested that the participants present were those that were most affected and most interested. She thought that increased outreach efforts may not have significant results. Curtis reviewed the next steps. He said that the team would submit a WB/WS facility plan in June 2007. The group picked a tentative next meeting date of December 13th. Meeting notes will be available several weeks before the meeting.
APPENDIX D.2
STAKEHOLDER TEAM MEETING NO. 2
DECEMBER 13TH, 2006

NO TEXT ON THIS PAGE
Long Term Control Plan Newtown Creek Stakeholder Team Meeting No. 2 December 13th, 2006
The second Newtown Creek Stakeholder team meeting of the Long Term Control Plan (LTCP) for Combined Sewer Overflows (CSO) of the NYC Department of Environmental Protection (DEP) was held on December 13th, 2006 at 6:30 p.m. at the Newtown Creek Water Pollution Control Plant, 329 Greenpoint Avenue in Greenpoint, Brooklyn. Stephen Whitehouse, Starr Whitehouse, began the meeting. He reviewed the meeting notes from the previous meetings. The notes will be finalized. In response to a request from the first meeting, Stakeholders were provided a brief summary of different consent orders that apply to Newtown Creek. Stephen went over the activities of other stakeholder teams for the LTCP. He said that four stakeholder teams have completed their tasks of advising DEP on the Waterbody/Watershed (WB/WS) plans and that all of these project areas had significant facility planning prior to the onset of the LTCP project. Some changes have been made to the preexisting plans during the LTCP process, including a change based on stakeholder recommendations in Alley Creek. These plans will now be submitted to the New York State Department of Environmental Conservation (NYSDEC) for review. Curtis Courter, Hazen and Sawyer, spoke about the designated uses and regulatory issues facing Newtown Creek. He said that the existing designated use is Class SD, which provides for fish survival. Curtis reviewed a map of the CSOs on Newtown Creek and its tributaries; the seven largest CSO’s are mainly at the head ends of each of the creek’s branches. He said that the drainage area for Newtown Creek has a population of approximately 330,000 residents. A stakeholder asked Curtis to show the five DEP storm outfalls on the map at the next meeting. Curtis reviewed the key water quality issues in Newtown Creek, including sediment deposits at the head end, sediment oxygen demand, and low dissolved oxygen (DO) in the creek’s tributaries. Curtis listed ongoing problems unrelated to CSOs, including the oil spill at the Exxon Mobil site, currently undergoing remediation; the Phelps Dodge Superfund site; and other industrial discharges. Curtis reviewed the sampling locations in Newtown Creek and showed 1990 and 2003 data of the DO levels in the creek. Both data sets showed a direct progression of decreasing water quality toward the head end of the creek. Next, Curtis compared data from 1990 with a water quality modeling forecasting 100% CSO removal. The modeling data indicated that, even with 100% CSO removal, DO could still occasionally fall below the standard, to lower than 3 mg/L, in some parts of the creek in the summer months. A stakeholder asked whether the implementation of Low Impact Developments (LIDs) would help to improve water quality. Curtis said that DEP is currently working towards a possible implementation of these alternatives. DEP is carrying out a study to analyze and quantify the effect of LIDs on a watershed scale in the Jamaica Bay Watershed Protection
Long Term Control Plan Newtown Creek Stakeholder Team Meeting No. 2 December 13th, 2006
Plan (JBWPP) and it is also working with the Mayor’s Office of Sustainability and Long Term Planning on an interagency effort to implement LIDs. Both of these projects are on a longer timeframe than the LTCP and DEP will work to fold the findings of the JBWPP into the LTCP at a later date. A stakeholder asked whether DEP could incorporate findings from other cities in order to better facilitate the inclusion of LIDs into New York City’s LTCP. Stephen said that there were no other LTCPs on a comparable scale and with comparable weather patterns that would enable them to be applied directly to the conditions in New York City. Then, Curtis reviewed the aeration pilot studies, as requested at the first meeting. Curtis said that the boundary conditions had a direct effect on the ability to raise DO in the pilot area through aeration. He also said that the aeration induced a DO level of 1mg/L in English Kills. While this is still below the standard, raising the DO in the head end of the creek helps to bring other areas of the creek to standard. Estimated oxygen requirements were increased based on the study. Although there is no pathogen standard related to the waterbody’s current SD classification, Curtis compared the existing fecal coliform levels with the predicted levels in a scenario of 100% CSO capture, derived from the water quality model. This preliminary modeling shows that under the 100% CSO removal scenario, fecal coliform would be less than 2,000 counts per 100 mL, the next highest water quality standard, 100% of the time. Next, Curtis showed a map of the sediment mounds. Curtis said that the main issue with the sediment mounds is that, when exposed, they emit an odor. To prevent this, the mounds would have to be dredged to three feet below mean lower low tide level (MLLW). A stakeholder inquired about sediment disposal. Curtis said that disposal will be offsite and Stephen added that any dredging would be accompanied by environmental permitting, which requires an extensive regulatory process wherein such issues are discussed. Another stakeholder asked about the feasibility of constructing wetlands in the creek. Curtis said that the continuous deposition of sediments would be noxious to the wellbeing of wetland plants. Curtis reviewed previous projects and programs on Newtown Creek, including a comprehensive floatables abatement plan, part of the city’s trash removal program, which includes the installation and regular maintenance of hooded catch basins and sediment booms. He also mentioned the Newtown Creek CSO Facility Planning; the Use and Standards Attainment (USA) Project, which identified many of the gaps in CSO planning now being addressed in the LTCP; Newtown Creek Water Pollution Control Plant (WPCP) Facility Plan; and the Inner Harbor CSO Facility Plan. Then Curtis went over current projects and programs, including the Newtown Creek WPCP upgrade to secondary treatment. He went over the elements in the CSO facility plan, including a 9MG CSO storage basin; Zone 1 and 2 Aeration facility of which Zone 1 is under construction and the design of Zone 2 has been put out to bid; the Kent Avenue Interceptor throttling facility, currently in design; the design of St. Nicholas Weir Relief Sewer which is out to bid; and Regulator B1/B1A Modifications. Curtis said the timetable for the CSO Facility Plan projects is stipulated in the consent order and that the

Long Term Control Plan Newtown Creek Stakeholder Team Meeting No. 2 December 13th, 2006
DEP is working to implement these measures and adhere to that schedule. Curtis added NYSDEC will only consider an alternative to these measures if the alternatives are proven to produce equal water quality in a more efficient way or better water quality for a similar investment. Curtis said that the CSO facility plan generally targets the head end, where CSO problems are aggravated. A stakeholder inquired about the size of the 9MG CSO storage tank. Curtis said that the tank is approximately the size of a city block. Another stakeholder asked how aeration works. Curtis described it as similar to a fish tank, where air is pumped through in order to provide oxygen across a body of water. A stakeholder asked about the purpose of the relief sewer. Curtis explained that the relief sewer provides additional conveyance capacity of the sewage infrastructure during storms and thus minimizes overflow. In the CSO Facility Plan, the relief sewer is provided to move more flow to the CSO tank, which can store these flows until the WPCP has capacity to treat the captured flow. Curtis reviewed other alternatives being evaluated for the Waterbody/Watershed Plan, which will become the LTCP. Alternatives under evaluation include different combinations of dredging, flushing tunnels, aeration, relief sewers, floatables control, CSO storage tunnels, and high rate physical/chemical treatment (HRPCT) in different areas on the creek. Fred Edmond, of the DEP, asked Curtis whether the CSO retention tank will be manned. Curtis confirmed that it would be. Curtis said that at the next meeting, the plan will be discussed in greater detail including an analysis of the costs and benefits. One stakeholder asked about the inter-agency project on LIDs run by the Mayor’s Office of Sustainability. Curtis said that it was unlikely that there would be geographically quantified data by the next meeting and that there would be little to report relevant to Newtown Creek. Stakeholders requested that a representative from the Mayor’s Office of Sustainability give a presentation at the next meeting. The DEP team agreed to ask. Stephen and Curtis reviewed the current waterbody uses. Stephen noted that in the USA project meetings, some stated uses included boating and recreational fishing at the bus depot on Commercial Street, Manhattan Avenue, the lot 100 pier, the Pulaski Bridge and Gantry State Park. Stephen also reviewed use goals compiled at the last USA meeting including improved habitat, the removal of odors, and secondary contact recreation, such as boating. At that time, the stakeholder group stated that primary contact recreation in Newtown Creek was difficult to achieve and possibly represents a conflict with current and potential industrial uses. However, many current stakeholders clarified that primary recreation, swimming, should always be considered as the ultimate goal. Stephen noted that area constituents want improved access for boating. Stakeholders also advocated for restored wetlands in the tidal inlets and education programs. A stakeholder asked that a representative from New York State DOT be invited to the next meeting. Next Stephen reviewed the progress of Newtown Creek Plan in the LTCP process. He said that the DEP is putting together a plan to submit to the NYSDEC for review. When the plan has been reviewed, it will be brought back to the public. The group picked a next meeting date of March 21st. Meeting notes will be available prior to the meeting.

NO TEXT ON THIS PAGE
APPENDIX D.3
STAKEHOLDER TEAM MEETING NO. 3
MARCH 21ST, 2007

NO TEXT ON THIS PAGE
Long Term Control Plan Newtown Creek Stakeholder Team Meeting No. 3 March 21th, 2007 The third Newtown Creek Stakeholder team meeting of the Long Term Control Plan (LTCP) for Combined Sewer Overflows (CSO) of the NYC Department of Environmental Protection (DEP) was held on March 21th, 2007 at 6:30 p.m. at the Newtown Creek Water Pollution Control Plant, 329 Greenpoint Avenue in Greenpoint, Brooklyn. Stephen Whitehouse, Starr Whitehouse, began the meeting. He reviewed the meeting notes from the previous meetings. Stakeholders asked for a revision to the notes that would better reflect the groups’ aspirations for higher use standards. The change has been incorporated and the notes were finalized. Stakeholders asked about the project timeline. Sue McCormick, New York State Department of Environment Conservation (NYSDEC), spoke about the differences between Waterbody/Watershed Facility plans and the LTCP. The WB/WS plans, due June 2007, are immediate, interim measures to address compliance with existing standards before the LTCP can be drafted and implemented. The LTCP will address the gap between the WB/WS plan and the attainment of fishable/swimmable water quality called for in the Clean Water Act. Sue said that the LTCP for Newtown Creek will be submitted in February 2016, but that projects from the WB/WS facility plan will be implemented sooner than that. Stakeholders inquired as to how the water quality standards could be upgraded in Newtown Creek. The upgrade of water quality standards in Newtown Creek will be addressed in the LTCP, current water quality standards will be addressed in the WB/WS plan. Additionally, Sue mentioned that the DEC is in the process of modifying their marine water standards for DO and that the public comment period was currently open. She told stakeholders that more information is available online on NYSDEC’s Environmental Notice Bulletin. Stephen said that DEP has received the Newtown Creek Alliance’s letter and is working on a response. He noted that Bureau of Environmental Planning and Assessment (BEPA), which is the bureau at DEP currently working on source controls, was unable to attend the meeting. The stakeholders asked whether the Mayor’s Office of Sustainability was invited to the meeting as requested. Stephen said that they were but could not attend. He said that they are currently preparing an update on plaNYC 2030 which will be released in April. A stakeholder stated that she believes that the Mayor’s Office of Sustainability should attend every LTCP meeting and that she was concerned about the local sensitivity of the plan that will be presented in April. Stephen spoke about public participation efforts beyond the June 2007 submission of the WB/WS plans. DEP is considering a bi-annual meeting of all stakeholders in addition to the meetings stipulated by the Long Term Control Plan process. Stakeholders requested that the DEP notify the Newtown
Long Term Control Plan Newtown Creek Stakeholder Team Meeting No. 3 March 21th, 2007 Creek Monitoring Committee on all items concerning public notification, such as the February 28th Offline Meeting on that topic. Curtis Courter, Hazen and Sawyer said that, after review of past materials, his presentation would focus on abatement alternatives, anticipated benefits, and preliminary costs. He showed a map of the drainage area and CSO and storm outflows. A stakeholder asked about the monitoring of privately controlled outflows. Sue responded that all discharges are permitted by the State. Curtis reviewed the designated uses, regulatory issues, and stakeholder goals in Newtown Creek. Curtis spoke about the use goals outlined in the Newtown Creek Alliance’s letter to Commissioner Emily Lloyd, including upgrading the water quality standard to Class I. Curt reviewed the baseline modeling results and showed the five largest outfalls. He reviewed the elements of the 2003 CSO facility plan included in the 2004 consent order. He said that these elements were called out in the plan but that they could be altered in the process of drafting a WB/WS plan. Next, Stephen spoke about DEP’s source control efforts. Stephen said that DEP feels that the unique environment of New York City --with high density, specific rain patterns, extensive subterranean infrastructure, and other characteristics-- merits pilots. Such projects will help DEP to adapt source control methods to New York City’s specific context. Pilot projects are being initiated through the Jamaica Bay Watershed Protection Plan and data collected from these efforts will be transferable to other parts of the city. Findings will be finalized after the June 2007 submission date for the WB/WB Facility Plans. As data is gathered, it will be folded into the DEP’s CSO LTCP. A stakeholder expressed the need for a legally binding placeholder for source control in the LTCP. Sue confirmed that there is such a placeholder in effect. Then, Curt reviewed alternatives under consideration for inclusion in the WB/WS plan. He stressed that the project team is still evaluating these alternatives and looking to ways that they can be grouped into a plan. He spoke about dredging of sediment mounds to below three feet below low tide. A stakeholder asked how this would improve water quality. Dredging would remove exposed sediment mounds, which would improve the aesthetics of the waterbody and eliminate odors, caused by exposed sediment. Curtis reviewed a Weir Modification and relief sewer at Dutch Kills that is under consideration. Raising the weir would improve conveyance to the plant and allow the plant to treat more flow. This alternative is projected to reduce CSO by 23% in Dutch Kills. Next, Curtis discussed the possibility of aeration which would directly add oxygen to the water. Aeration projects would require dredging to six feet below mean low tide to provide enough water depth for the oxygen to transfer to the water. He showed several proposed sites but stressed that the project was not near site selection. Aeration as a stand alone alternative would result in a projected 3% CSO reduction due to ongoing plant upgrades, but appears to be more effective when paired with other alternatives. Curtis also reviewed elements of the 2003 CSO Facility Plan, including a 9 MG CSO storage tank where initial preparation for the ULURP process has begun, Kent Avenue Interceptor throttling, regulator B1/B1A modifications, Zone 1 and 2 Aeration, and a St.

Long Term Control Plan Newtown Creek Stakeholder Team Meeting No. 3 March 21th, 2007 Nicolas weir relief sewer. The plan is projected to result in an overall reduction of 24% but would not attain Class SD standards. Curtis noted that current studies show that throttling the Kent Avenue Interceptor does not appear have the intended impact. Curtis reviewed a proposed new interceptor which could run roughly parallel to the existing Morgan Avenue Interceptor. This is projected to result in 22% CSO reduction but would not attain Class SD standards unless it was paired with aeration projects. Curtis indicated that this alternative would include inflatable dams at the upstream regulator to increase the water surface during lower flows to drive flow through the interceptor. Next Curtis described a series of CSO storage tunnels, which also satisfy regulatory requirements to look at ranges of CSO reduction. The storage tunnels range from 38.5 million gallons (mg) to 134 mg. The latter would capture 100% of CSO volume in a typical year for rain. Even the largest of the tunnels is not projected to bring Newtown Creek to class SD standards without complementary aeration. Curtis also spoke about the possibility of constructing a flushing tunnel, such as the one that feeds the Gowanus Canal. He showed possible locations. He stressed that the tunnels were expensive and did not provide significantly more improvement to water quality than other, less expensive solutions. Stakeholders stated that they were concerned about the community impact and stressed that street repair should be coordinated with other agencies. Specifically, stakeholders brought up the upcoming reconstruction of Nassau Avenue and asked whether a flushing tunnel could be built in conjunction with that project to minimize the impact of construction in the neighborhood. The NYCDEP does coordinate with other agencies where available, however such coordination comes later in the process as designs begin to be finalized. A stakeholder asked about the possibility of filling in Maspeth Creek. Sue said that NYSDEC would not consider this as an option as it would harm wetlands. Curtis reviewed the DO deficit component analysis which shows that Newtown Creek is failing to meet dissolved oxygen standards. Modeling indicates that the main reason for the Creek’s DO problems comes from sources outside of Newtown Creek. The second largest cause of DO deficiency is from CSO discharges to the Creek. Curtis reviewed a table showing how different plans incorporate different combinations of the alternatives that he presented. Stakeholders expressed great interest in wetland construction. A stakeholder asked whether dredging would harm wetlands. Sue and Curtis said that there were numerous benefits to dredging and that dredging and wetlands did not conflict. Stephen mentioned that siting wetlands directly at CSO outflows would expose them to sediment build-up and scouring, which could be detrimental to establishing wetlands. Next, Kate Zidar gave a presentation for the Newtown Creek Alliance, a community organization that works to improve the environmental and economic situation of Newtown Creek. She described the broad base of membership, ranging from elected
Long Term Control Plan Newtown Creek Stakeholder Team Meeting No. 3 March 21th, 2007 officials to local residents. Kate categorized the Newtown Creek watershed as an area that carries a heavy environmental burden. She said that the area’s open space ratio was low and the there are high concentrations of brownfields and severely polluted sites. She described the Alliance’s recent work, such as the Vernon Street End Park project and application for State Brownfield Opportunity Area funds. Kate outlined the Alliance’s main goals for the LTCP: interagency collaboration on stormwater management, pilot projects for source control methods on Newtown Creek; habitat restoration including wetlands restoration; and safe access to the creek. Kate also emphasized the need for stormwater guidelines for new development and a legally binding placeholder for source control in the LTCP. Stephen noted that public notification, one of the concerns for safe access, will be addressed in the LTCP after a discussion in an offline meeting that Kate took part in. Kate expressed concern that public notification efforts would focus on waterbodies that are currently more actively used. She argued that public notification efforts in Newtown Creek should be greater, as associated risks are greater. Additionally, stakeholders expressed interest in improving water quality standards to allow for primary contact recreation. Stakeholders asked that the project team request a special meeting between the Newtown Creek Alliance and the Mayor’s Office of Sustainability. The project team set the next meeting date for May 23rd. Notes will be available prior to the meeting.
APPENDIX D.1
STAKEHOLDER TEAM MEETING NO. 1
MAY 23RD, 2007

NO TEXT ON THIS PAGE
Long Term Control Plan Newtown Creek Stakeholder Team Meeting No. 4 May 23rd, 2007 The fourth and final Newtown Creek Stakeholder team meeting of the Long Term Control Plan (LTCP) for Combined Sewer Overflows (CSO) of the NYC Department of Environmental Protection (DEP) was held on May 23rd, 2007 at 6:30 p.m. at the Newtown Creek Water Pollution Control Plant, 329 Greenpoint Avenue. Keith Mahoney, DEP, opened the meeting. Stephen Whitehouse, Starr Whitehouse, made introductions, including Ariella Rosenburg, from the Mayor’s Office of Long Term Planning and Sustainability. He reviewed the previous meeting’s notes. Stakeholders asked for a revision that would better reflect the group’s aspiration for primary contact recreation standards. The change was made and the notes were finalized. Stephen explained the next steps. He said that the draft Waterbody/Watershed facility (WB/WS) plan, presented tonight, would be finalized by June and submitted to the New York State Department of Environmental Conservation (DEC) for review. Shortly after the plan submission, the plan will be made available to Stakeholders in electronic form, on either the DEP website or the project data-sharing site. This WB/WSplan will be prepared into a LTCP to be submitted to DEC for approval by February 2016. Next, a stakeholder shared part of a documentary describing the current water quality in Newtown Creek and uses of the creek, including swimming. Curtis Courter, Hazen and Sawyer, reviewed Newtown Creek’s existing conditions. Newtown Creek is currently classed as SD, which supports fish survival but not recreational use. The main metric for SD classification is dissolved oxygen (DO). Curtis said that the SD standard does not have a metric for pathogens, as pathogens are used to measure suitability for human recreation. Next, Curtis reviewed the baseline modeling results, which are the baseline conditions presuming projected population to 2045 and no water quality improvement initiatives. Analysis of the baseline conditions allows the project team to compare alternatives. He showed the annual CSO volume and identified the five largest outfalls. Curtis showed a map of the DO levels in different areas in Newtown Creek, derived from DO sampling efforts from 1984 to 2003. Curtis characterized Newtown Creek as having low DO throughout, with particularly high deficiency at the head end of the creek where there is little tidal mixing. Next, Curtis reviewed the different sources of DO deficiency, the largest source of which is related to boundary conditions in the East River. A stakeholder expressed concern that the analysis does not take into account the largest source of water quality problems because it does not treat boundary conditions. Curtis explained that understanding the boundary conditions allows the project team to focus on CSO loading. The mandate of the plan is to improve water quality problems that are caused by CSOs. CSOs are the second largest source of DO deficiency. A stakeholder asked if the outfall at India Street, one of the
ccourter
Draft
Long Term Control Plan Newtown Creek Stakeholder Team Meeting No. 4 May 23rd, 2007 largest, affects the water quality of the East River. Curtis affirmed that the effects of this outfall were included in the East River sources component. He also noted that the high level overflow from the Newtown Creek WPCP into the Whale Creek Canal is included in the models. Curtis summarized that a plan that removed 100% of CSOs would not solve all of the water quality issues on the creek, as other factors contribute to low DO. Curtis reviewed stakeholder goals: improved habitat, removal of odors, and an upgrade to Water Quality Standard Class I, which allows for secondary contact recreation. Curtis said that the project team examined a number of technologies and retained a group of alternatives for additional evaluation, including: environmental dredging; system optimization which maximizes the use of the existing sewer infrastructure; sewer separation; in-stream aeration to improve DO; floatables control; flushing tunnels; CSO storage tanks and tunnels; and low impact development (LIDs). He said that the team grouped alternatives into ten plans and modeled their impact. The project team used cost benefit analysis to select a plan. Cost benefit analysis weighs the projected benefit against probable total project cost. Curtis explained that many plans are very expensive and, after a certain point, provide decreasing increment of benefit per dollar in expenditure. The project team targeted the plan that achieves the maximum benefit per dollar, or the knee of the curve. Curtis shared a number of cost benefit graphs, plotting project costs against percent reduction and percent of hours attaining Class SD standards. A stakeholder asked how the cost data was derived. Curtis explained that a team of cost estimators calculated the data. It was also noted that two independent reviews of the WB/WS Facility Plan were planned, a Value Engineering session with the Office of Management and Budget is scheduled in July, and a Cost and Constructibility Evaluation that was not yet scheduled. The stakeholder asked to see their cost estimations and meet with the team. Next, Curtis showed a cost benefit graph plotting different plans against Class I standards for total and fecal coliform. One set of solutions exhibited a clear knee of the curve. This plan would bring Newtown Creek into compliance with Class I standards over 90% of the months of the year. Curtis said that this figure reflects the compliance of the worst sample in the creek and it is possible that most of the creek would be in compliance with Class I standards all of the time. A stakeholder asked whether fish would die if Newtown Creek was only in compliance for eight months out of the year. Curtis explained the graph showed Class I standards, which are have higher use goals than fish survival. He reiterated that, during the other four months, only the worst spots in Newtown Creek would not be in compliance with Class I pathogen standards. Curtis presented the proposed WB/WS Facility Plan. The first phase of the plan will include: enhanced aeration; environmental dredging; floatables control; and assessment of LIDs. Curtis said that the project team found that aeration was necessary in order to increase the DO levels. A pilot aeration facility in English Kills is currently under construction to be completed in December 2008. Curtis said that, while the modeling results are encouraging, the project team would like to use the opportunity to monitor the effectiveness of aeration after construction to better understand the impact of aeration and
ccourter
Draft

Long Term Control Plan Newtown Creek Stakeholder Team Meeting No. 4 May 23rd, 2007 help to design additional facilities required in the plan. Curtis said that aeration, which works similarly to air bubbles in a fish tank, would be used to attain Class SD standards and that the first target of the plan is to attain existing standards. The plan includes environmental dredging, which will improve DO (in the short term) and remove odors. The plan stipulates dredging to a final elevation of six feet below mean lower low water. This depth can accommodate aeration. A stakeholder asked whether dredging was sited in wetlands. Curtis said that it was not as the sediment targeted for removal is caused by CSOs. Stephen added that DEC process to permit dredging will be public and will examine issues such as schedule and sediment disposal. The third prong of Phase I of the plan is floatables control, which removes trash including sanitary wastes. The plan favors the use of in-line netting, which are cleaned after every storm, but in some cases, where nets are not feasible, booms will continue to be used. Several stakeholders stated that the removal of booms would improve boating conditions. The fourth prong in Phase I is assessment of LIDs. Next, Curtis described the second phase of the WB/WS facility plan, which includes: the implementation of LIDs assessed in Phase I; a raised weir in regulator BB-L3B near Dutch Kills, which would retain more volume in the sewers during storm events; the addition of a 72 inch sewer from BB-L39 to BB-L18; and a CSO storage tunnel which would be sized to achieve Class I standards. The project team hopes to downsize the CSO storage tunnel, decreasing total project costs, with the success of LID implementation. Curtis showed a map of the tunnel’s current alignment, planned to capture a portion of the flow from the three largest outfalls. He showed the approximate location and several possible sites for the pump station and odor control facility at outfall NCB-015, where the CSO from the tunnel would be pumped to the Water Pollution Control Plant. Curtis showed the location and potential sites of the drop shafts which would capture outflow from NCB-083 and NCQ-077. Further facility planning will refine the design of these facilities and site selection will include a ULURP and associated public review. Next, Curtis showed maps comparing the proposed WB/WS plans projected attainment of Class I standards, --including DO, total coliform, and fecal coliform-- and the baseline conditions, the previous CSO facility plan, and a 100% CSO removal scenario. He said that the total plan would cost $1.3B in today’s dollars. The floor was opened for questions:
• A stakeholder asked if the project team considered natural methods. Curtis confirmed that she was referring to LIDs, which will be implemented in the plan.
• A stakeholder asked about timeframe. Curtis said that the phased approach is lengthy but that many plan components will be started before the 2016 ratification of the LTCP. The LTCP will include enforceable dates for the completion of various components. Draft dates will be included in the WB/WS report.
• A stakeholder asked about the likelihood of funding the plan. Curtis said that, if the plan is approved by DEC, DEP will be legally bound to fund the projects.
• A stakeholder asked whether the plan could be funded by private sector polluters. Another stakeholder responded that, as DEP is responsible for CSO-related pollution, only DEP can be held accountable in this instance.
ccourter
Draft

Long Term Control Plan Newtown Creek Stakeholder Team Meeting No. 4 May 23rd, 2007
• A stakeholder expressed concern that the plan would force a raise in water rates. Stephen acknowledged that much of the recommended plan is not presently in DEP’s 10-year $19.6B Capital Plan, and that this increased commitment to CSO control would likely require additional revenues or a future reallocation of capital priorities.
Next, John McLaughlin, from the DEP’s Bureau of Environmental Planning and Assessment, spoke about DEP’s work with LIDs. He said that in 2005, the Mayor signed Local Law 71, requiring DEP to develop a plan to address the issue of disappearing wetlands in Jamaica Bay. The ensuing Jamaica Bay Wildlife Protection Plan stipulated the exploration of different stormwater capture pilots, which DEP is elaborating with the help of the Gaia Institute. The data from these projects will be collected for three years, after construction, and the findings will be used to inform city-wide projects. John reviewed the types of pilots underway: street side swales; porous pavement; enhanced tree openings, which can be equipped with additional water storage; and constructed urban wetlands adapting vacant parcels for storm water retention. The DEP team is also looking at green roofs and their application in different use districts. Larger, flat roofs provide the best opportunities for green roofs. John stressed that the application of many of these methods requires an in-depth understanding of specific site conditions. Other projects are included in the Mayor’s PLANYC, including the use of oysters and oyster habitat for water cleansing and the distribution of rain barrels to private property owners. • A stakeholder asked if New York City schools can participate in these projects.
John said that, in GIS-driven site selection, the team favors sites that within close proximity to schools so as to create opportunities for education.
• A stakeholder asked whether there would be incentives for property owners for certain projects. Ariella Rosenburg said that the Mayor’s Office has drafted a package of incentives that is currently under review by the State Legislature.
• A stakeholder asked whether sewers could be separated in large, new developments. Ariella confirmed that this is under consideration for projects, such as Hudson Yards and Queens West. Ariella added that an Interagency BMP Taskforce is being formed. Their mandate will to develop a systematic plan to implement LIDs.
• A member of the Newtown Creek Alliance (NCA) asked whether Ariella could speak with NCA about opportunities for LIDs on Newtown Creek. Ariella stressed that her group is focusing on developping a citywide approach to LIDs but that she would be interested to speak with them.
• Another stakeholder asked whether the Waterfront Access Plan for the Greenpoint area could be updated, given current research. Ariella said that the Interagency Task Force will be looking at how to incorporate these findings into the zoning. The stakeholder said that, considering the pace of local development, this work would be immediately useful to the neighborhood.
• A stakeholder asked whether the water bill could be used to encourage private property owners to implement LIDs. Stephen said DEP is looking into it.
ccourter
Draft

Long Term Control Plan Newtown Creek Stakeholder Team Meeting No. 4 May 23rd, 2007 Additional footage from the documentary was played. The meeting closed at 9:30. Stakeholders will be informed when the plan is available.
ccourter
Draft

NO TEXT ON THIS PAGE