Final Supplemental Environmental Impact Statement for the ...
Upload
khangminh22Category
view
1download
0
FINAL ENVIRONMENTAL IMPACT STATEMENT FOR THE CATSKILL/DELAWARE UV FACILITY
5.1. KENSICO RESERVOIR WORK SITES ....................................................................... 1 5.1.1. Introduction............................................................................................................. 1
5.1.1.1. Upper Effluent Chamber................................................................................. 2 5.1.1.2. Dike Grade Tunnel.......................................................................................... 3 5.1.1.3. Lower Effluent Chamber ................................................................................ 3 5.1.1.4. New Screen Chamber ..................................................................................... 5 5.1.1.5. Catskill and Delaware Aerators ...................................................................... 5 5.1.1.6. Separate UV Building ..................................................................................... 6 5.1.1.7. Delaware Shaft No. 18.................................................................................... 6 5.1.1.8. Fluoridation Pit ............................................................................................... 7 5.1.1.9. Screen Chamber .............................................................................................. 7 5.1.1.10. Catskill Venturi Meter .................................................................................... 7 5.1.1.11. Boat Hole ........................................................................................................ 7 5.1.1.12. Work on the Catskill Aqueduct....................................................................... 8
5.1.2. Baseline Conditions ................................................................................................ 9 5.1.2.1. Existing Conditions......................................................................................... 9
5.1.2.1.1. Land Use, Zoning, and Public Policy .......................................................... 9 5.1.2.1.2. Visual Character......................................................................................... 19 5.1.2.1.3. Community Facilities................................................................................. 19 5.1.2.1.4. Open Space ................................................................................................ 20 5.1.2.1.5. Neighborhood Character............................................................................ 20 5.1.2.1.6. Socioeconomic Conditions ........................................................................ 21 5.1.2.1.7. Growth Inducement ................................................................................... 22 5.1.2.1.8. Traffic and Transportation ......................................................................... 22 5.1.2.1.9. Noise .......................................................................................................... 39 5.1.2.1.10. Air Quality ............................................................................................... 43 5.1.2.1.11. Historic and Archaeological Resources ................................................... 44 5.1.2.1.12. Hazardous Materials ................................................................................ 45 5.1.2.1.13. Natural Resources .................................................................................... 52 5.1.2.1.14. Water Resources ...................................................................................... 54 5.1.2.1.15. Infrastructure and Energy ........................................................................ 54 5.1.2.1.16. Electric and Magnetic Fields (EMF)/Extremely Low Frequency (ELF). 54 5.1.2.1.17. Solid Waste .............................................................................................. 55 5.1.2.1.18. Public Health............................................................................................ 55
5.1.2.2. Future Without the Project............................................................................ 55 5.1.3. Potential Impacts................................................................................................... 56
5.1.3.1. Potential Project Impacts .............................................................................. 56 5.1.3.2. Potential Construction Impacts ..................................................................... 58
5.1.3.2.1. Land Use, Zoning, and Public Policy ........................................................ 59 5.1.3.2.2. Visual Character......................................................................................... 61 5.1.3.2.3. Community Facilities................................................................................. 63 5.1.3.2.4. Open Space ................................................................................................ 63 5.1.3.2.5. Neighborhood Character............................................................................ 64 5.1.3.2.6. Socioeconomic Conditions ........................................................................ 64 5.1.3.2.7. Traffic and Transportation ......................................................................... 65 5.1.3.2.8. Noise ........................................................................................................ 110

FINAL ENVIRONMENTAL IMPACT STATEMENT FOR THE CATSKILL/DELAWARE UV FACILITY
5.1.3.2.9. Air Quality ............................................................................................... 125 5.1.3.2.10. Historic and Archaeological Resources ................................................. 138 5.1.3.2.11. Hazardous Materials .............................................................................. 139 5.1.3.2.12. Natural Resources .................................................................................. 141 5.1.3.2.13. Water Resources .................................................................................... 145 5.1.3.2.14. Infrastructure and Energy ...................................................................... 145 5.1.3.2.15. Electric and Magnetic Fields (EMF)/Extremely Low Frequency (ELF) Fields 147 5.1.3.2.16. Solid Waste ............................................................................................ 147 5.1.3.2.17. Public Health.......................................................................................... 148 5.1.3.2.18. Permits and Approvals........................................................................... 149
FLOWCHART 5.1-1. TRAFFIC AND TRANSPORTATION FRAMEWORK OF ANALYSIS....................................................................................................................................24 FIGURE 5.1-1. KENSICO RESERVOIR WORK SITES ............................................................ 4 FIGURE 5.1-2. OFF SITE FACILITIES: LAND USE............................................................... 11 FIGURE 5.1-3. OFF-SITE FACILITIES: ZONING................................................................... 18 FIGURE 5.1-16. MOBILE SOURCE ANALYSIS..................................................................... 42 FIGURE 5.1-17. SOIL AND GROUNDWATER SAMPLING LOCATIONS........................... 50 FIGURE 5.1-18. INTERSECTIONS FOR MOBILE SOURCE ANALYSIS .......................... 130 TABLE 5.1-1. KENSICO RESERVOIR WORK SITES: ZONING DISTRICTS IN THE
STUDY AREA ..................................................................................................................... 14 TABLE 5.1-2. EXISTING TRAFFIC CONDITIONS 2006 ....................................................... 31 TABLE 5.1-3. EXISTING TRAFFIC CONDITIONS; OPTION E SIGNALIZED
INTERSECTIONS 2006....................................................................................................... 34 TABLE 5.1-4. EXISTING TRAFFIC CONDITIONS; OPTION E UNSIGNALIZED
ANALYSIS 2006.................................................................................................................. 35 TABLE 5.1-5. LEVEL OF SERVICE ANALYSIS RESULTS: 2004 EXISTING CONDITIONS
............................................................................................................................................... 38 TABLE 5.1-6. ROUTE SEGMENTS CONSIDERED FOR MOBILE SOURCE NOISE
ANALYSIS NEAR THE KENSICO RESERVIOR............................................................. 40 TABLE 5.1-7. EXISTING NOISE LEVELS OFF-SITE (IN DBA)........................................... 41 TABLE 5.1-8. EXISTING NOISE LEVELS OFF-SITE (IN DBA)........................................... 43 TABLE 5.1-9. SOIL SAMPLE ANALYSIS FOR THE KENSICO SITE ................................. 47 TABLE 5.1-A. 2002/2003/2004 EXISTING AND 2006 FUTURE WITHOUT THE PROJECT
TRAFFIC CONDITIONS..................................................................................................... 68 TABLE 5.1-B. LAKEVIEW TRUCK ROUTE (OPTION A) LEVEL-OF-SERVICE
ANALYSIS RESULTS FOR INTERSECTIONS: 2006 FUTURE CONDITIONS WITHOUT THE PROJECT VERSUS FUTURE CONDITIONS WITH THE PROJECT (WITHOUT THE CROTON PROJECT) ............................................................................. 72
TABLE 5.1-C. LAKEVIEW TRUCK ROUTE (OPTION A) LEVEL-OF-SERVICE ANALYSIS RESULTS FOR INTERSECTIONS: 2006 FUTURE CONDITIONS

FINAL ENVIRONMENTAL IMPACT STATEMENT FOR THE CATSKILL/DELAWARE UV FACILITY
WITHOUT THE PROJECT VERSUS FUTURE CONDITIONS WITH THE PROJECT (WITH THE CROTON PROJECT) ..................................................................................... 75
TABLE 5.1-D. COMMERCE TRUCK ROUTE (OPTION B) LEVEL-OF-SERVICE ANALYSIS RESULTS FOR INTERSECTIONS: 2006 FUTURE CONDITIONS WITHOUT THE PROJECT VERSUS FUTURE CONDITIONS WITH THE PROJECT (WITHOUT THE CROTON PROJECT) ............................................................................. 80
TABLE 5.1-E. COMMERCE TRUCK ROUTE (OPTION B) LEVEL-OF-SERVICE ANALYSIS RESULTS FOR INTERSECTIONS: 2006 FUTURE CONDITIONS WITHOUT THE PROJECT VERSUS FUTURE CONDITIONS WITH THE PROJECT (WITH THE CROTON PROJECT) ..................................................................................... 83
TABLE 5.1-F. SPLIT LAKEVIEW/COMMERCE TRUCK ROUTE (OPTION C) LEVEL-OF-SERVICE ANALYSIS RESULTS FOR INTERSECTIONS: 2006 FUTURE CONDITIONS WITHOUT THE PROJECT VERSUS FUTURE CONDITIONS WITH THE PROJECT (WITHOUT THE CROTON PROJECT) .................................................. 88
TABLE 5.1-G. SPLIT LAKEVIEW/COMMERCE TRUCK ROUTE (OPTION C) LEVEL-OF-SERVICE ANALYSIS RESULTS FOR INTERSECTIONS: 2006 FUTURE CONDITIONS WITHOUT THE PROJECT VERSUS FUTURE CONDITIONS WITH THE PROJECT (WITH THE CROTON PROJECT)........................................................... 91
TABLE 5.1-H. CIRCULAR LAKEVIEW/COMMERCE TRUCK ROUTE (OPTION D) LEVEL-OF-SERVICE ANALYSIS RESULTS FOR UNSIGNALIZED INTERSECTIONS: 2006 FUTURE CONDITIONS WITHOUT THE PROJECT VERSUS FUTURE CONDITIONS WITH THE PROJECT (WITHOUT THE CROTON PROJECT)............................................................................................................................................... 97
TABLE 5.1-I. OPTION E – 100 PERCENT ROUTE 9A/ROUTE 141/KENSICO ROAD/COLUMBUS AVENUE LEVEL-OF-SERVICE ANALYSIS RESULTS FOR UNSIGNALIZED INTERSECTIONS: 2006 FUTURE CONDITIONS WITHOUT THE PROJECT VERSUS FUTURE CONDITIONS WITH THE PROJECT (WITHOUT THE CROTON PROJECT)......................................................................................................... 103
TABLE 5.1-J. KENSICO LEVEL-OF-SERVICE ANALYSIS RESULTS: 2004 EXISTING AND 2010 NO BUILD CONDITIONS ............................................................................. 108
TABLE 5.1-K. KENSICO LEVEL-OF-SERVICE ANALYSIS RESULTS: 2010 NO BUILD AND BUILD (OPERATION) CONDITIONS................................................................... 109
TABLE 5.1-10. COMPARISON OF EXISTING PCES TO ANTICIPATED FUTURE WITH THE PROJECT PCES DURING CONSTRUCTION (2006) WITHOUT CROTON PROJECT (TRUCK ROUTE OPTION A)......................................................................... 113
TABLE 5.1-11. COMPARISON OF EXISTING PCES TO ANTICIPATED FUTURE WITH THE PROJECT PCES DURING CONSTRUCTION (2006) WITHOUT CROTON PROJECT (TRUCK ROUTE OPTION B)......................................................................... 114
TABLE 5.1-12. COMPARISON OF EXISTING PCES TO ANTICIPATE FUTURE WITH THE PROJECT PCES DURING CONSTRUCTION (2006) WITHOUT CROTON PROJECT (TRUCK ROUTE OPTION C)......................................................................... 115
TABLE 5.1-13. COMPARISON OF EXISTING PCES TO ANTICIPATED FUTURE WITH THE PROJECT PCES DURING CONSTRUCTION (2006) WITHOUT CROTON PROJECT (TRUCK ROUTE OPTION E) ......................................................................... 116
FINAL ENVIRONMENTAL IMPACT STATEMENT FOR THE CATSKILL/DELAWARE UV FACILITY
TABLE 5.1-14. COMPARISON OF EXISTING PCES TO ANTICIPATED PCES IN THE FUTURE WITH THE PROJECT DURING CONSTRUCTION (2006) WITH THE CROTON PROJECT (TRUCK ROUTE OPTION A) ....................................................... 117
TABLE 5.1-15. COMPARISON OF EXISTING PCES TO ANTICIPATED PCES IN THE FUTURE WITH THE PROJECT DURING CONSTRUCTION (2006) WITH THE CROTON PROJECT (TRUCK ROUTE OPTION B) ....................................................... 118
TABLE 5.1-16. COMPARISON OF EXISTING PCES TO ANTICIPATED PCES IN THE FUTURE WITH THE PROJECT DURING CONSTRUCTION (2006) WITH THE CROTON PROJECT (TRUCK ROUTE OPTION C) ....................................................... 119
TABLE 5.1-17. COMPARISON OF EXISTING PCES TO ANTICIPATED PCES IN THE FUTURE WITH THE PROJECT DURING CONSTRUCTION (2006) WITH THE CROTON PROJECT (TRUCK ROUTE OPTION E)........................................................ 120
TABLE 5.1-18. COMPARISON OF EXISTING PCES TO ANTICIPATED PCES IN THE FUTURE WITH THE PROJECT DURING CONSTRUCTION (2010) WITHOUT THE CROTON PROJECT .......................................................................................................... 123
TABLE 5.1-19. COMPARISON OF EXISTING PCES TO ANTICIPATED FUTURE WITH THE PROJECT PCES DURING CONSTRUCTION (2010) WITH CROTON PROJECT............................................................................................................................................. 124
TABLE 5.1-20. INTERSECTIONS SELECTED FOR AIR QUALITY MOBILE SOURCE ANALYSIS......................................................................................................................... 126
TABLE 5.1-21. PREDICTED PM10 24-HOUR AND ANNUAL CONCENTRATIONS IN THE FUTURE WITHOUT THE FILL OPERATION WITHOUT CROTON PROJECT TRUCK ROUTE OPTION A(µG/M3).............................................................................................. 127
TABLE 5.1-22. PREDICTED PM10 24-HOUR AND ANNUAL CONCENTRATIONS IN THE FUTURE WITHOUT THE FILL OPERATION WITHOUT CROTON PROJECT TRUCK ROUTE OPTION B(µG/M3) .............................................................................................. 127
TABLE 5.1-23. PREDICTED PM10 24-HOUR AND ANNUAL CONCENTRATIONS IN THE FUTURE WITHOUT THE FILL OPERATION WITHOUT CROTON PROJECT TRUCK ROUTE OPTION C(µG/M3) .............................................................................................. 127
TABLE 5.1-24. PREDICTED PM10 24-HOUR AND ANNUAL CONCENTRATIONS IN THE FUTURE WITHOUT THE FILL OPERATION WITHOUT CROTON PROJECT TRUCK ROUTE OPTION D(µG/M3).............................................................................................. 128
TABLE 5.1-25. PREDICTED PM10 24-HOUR AND ANNUAL CONCENTRATIONS IN THE FUTURE WITHOUT THE FILL OPERATION WITH CROTON PROJECT TRUCK ROUTE OPTION A(µG/M3).............................................................................................. 128
TABLE 5.1-26. PREDICTED PM10 24-HOUR AND ANNUAL CONCENTRATIONS IN THE FUTURE WITHOUT THE FILL OPERATION WITH CROTON PROJECT TRUCK ROUTE OPTION B(µG/M3) .............................................................................................. 129
TABLE 5.1-27. PREDICTED PM10 24-HOUR AND ANNUAL CONCENTRATIONS IN THE FUTURE WITHOUT THE FILL OPERATION WITH CROTON PROJECT TRUCK ROUTE OPTION C(µG/M3) .............................................................................................. 129
TABLE 5.1-28. PREDICTED PM10 24-HOUR AND ANNUAL CONCENTRATIONS IN THE FUTURE WITHOUT THE FILL OPERATION WITH CROTON PROJECT TRUCK ROUTE OPTION D(µG/M3).............................................................................................. 129
FINAL ENVIRONMENTAL IMPACT STATEMENT FOR THE CATSKILL/DELAWARE UV FACILITY
TABLE 5.1-29. PREDICTED PM10 24-HOUR AND ANNUAL CONCENTRATIONS IN THE FUTURE WITH THE PROJECT WITHOUT CROTON PROJECT TRUCK ROUTE OPTION A(µG/M3) ............................................................................................................ 131
TABLE 5.1-30. PREDICTED PM10 24-HOUR AND ANNUAL CONCENTRATIONS IN THE FUTURE WITH THE PROJECT WITHOUT CROTON PROJECT TRUCK ROUTE OPTION B(µG/M3) ............................................................................................................ 132
TABLE 5.1-31. PREDICTED PM10 24-HOUR AND ANNUAL CONCENTRATIONS IN THE FUTURE WITH THE PROJECT WITHOUT CROTON PROJECT TRUCK ROUTE OPTION C(µG/M3) ............................................................................................................ 132
TABLE 5.1-32. PREDICTED PM10 24-HOUR AND ANNUAL CONCENTRATIONS IN THE FUTURE WITH THE PROJECT WITHOUT CROTON PROJECT TRUCK ROUTE OPTION D(µG/M3) ............................................................................................................ 133
TABLE 5.1-33. PREDICTED PM2.5 24-HOUR AND ANNUAL CONCENTRATIONS IN THE FUTURE WITH THE PROJECT WITHOUT CROTON PROJECT TRUCK ROUTE OPTION A (µG/M3) .......................................................................................................... 133
TABLE 5.1-34. PREDICTED PM2.5 24-HOUR AND ANNUAL CONCENTRATIONS IN THE FUTURE WITH THE PROJECT WITHOUT CROTON PROJECT TRUCK ROUTE OPTION B (µG/M3)........................................................................................................... 134
TABLE 5.1-35. PREDICTED PM2.5 24-HOUR AND ANNUAL CONCENTRATIONS IN THE FUTURE WITH THE PROJECT WITHOUT CROTON PROJECT TRUCK ROUTE OPTION C (µG/M3)........................................................................................................... 134
TABLE 5.1-36. PREDICTED PM2.5 24-HOUR AND ANNUAL CONCENTRATIONS IN THE FUTURE WITH THE PROJECT WITHOUT CROTON PROJECT TRUCK ROUTE OPTION D (µG/M3) .......................................................................................................... 135
TABLE 5.1-37. PREDICTED PM10 24-HOUR AND ANNUAL CONCENTRATIONS IN THE FUTURE WITH THE PROJECT WITH CROTON PROJECT TRUCK ROUTE OPTION A(µG/M3)............................................................................................................................ 136
TABLE 5.1-38. PREDICTED PM10 24-HOUR AND ANNUAL CONCENTRATIONS IN THE FUTURE WITH THE PROJECT WITH CROTON PROJECT TRUCK ROUTE OPTION B(µG/M3) ............................................................................................................................ 136
TABLE 5.1-39. PREDICTED PM10 24-HOUR AND ANNUAL CONCENTRATIONS IN THE FUTURE WITH THE PROJECT WITH CROTON PROJECT TRUCK ROUTE OPTION C(µG/M3) ............................................................................................................................ 137
TABLE 5.1-40. PREDICTED PM2.5 24-HOUR AND ANNUAL CONCENTRATIONS IN THE FUTURE WITH THE PROJECT WITH CROTON PROJECT TRUCK ROUTE OPTION A (µG/M3) .......................................................................................................................... 137
TABLE 5.1-41. PREDICTED PM2.5 24-HOUR AND ANNUAL CONCENTRATIONS IN THE FUTURE WITH THE PROJECT WITH CROTON PROJECT TRUCK ROUTE OPTION B (µG/M3) .......................................................................................................................... 138
TABLE 5.1-42. PREDICTED PM2.5 24-HOUR AND ANNUAL CONCENTRATIONS IN THE FUTURE WITH THE PROJECT WITH CROTON PROJECT TRUCK ROUTE OPTION C (µG/M3) .......................................................................................................................... 138
TABLE 5. 1-43: SUMMARY OF TREES CUT AT THE KENSICO WORK SITES.............. 143 TABLE 5. 1-44: SUMMARY OF TREES IDENTIFIED AT THE KENSICO WORK SITES 144 TABLE 5.1-45. POTENTIAL DISCRETIONARY APPROVALS FOR KENSICO
RESERVOIR WORK SITES UNDER THE PROPOSED UV FACILITY PROJECT..... 149

FINAL ENVIRONMENTAL IMPACT STATEMENT FOR THE CATSKILL/DELAWARE UV FACILITY
THE FOLLOWING FIGURES ARE LOCATED AT END OF SECTION FIGURE 5.1-4. INTERSECTION NUMBERS: TRAFFIC STUDY AREA FOR 2006 ANALYSIS FIGURE 5.1-5. TRAFFIC STUDY AREA AND TRUCK ROUTES FOR 2006 ANALYSIS FIGURE 5.1-6. INTERSECTION NUMBERS: TRUCK ROUTE OPTION E TRAFFIC STRUDY AREA (ROUTE 9A/ROUTE 141 KENSICO ROAD/COLUMBUS AVENUE) FIGURE 5.1-7. 2004 EXISTING TRAFFIC VOLUMES AM PEAK HOUR (8:00 – 9:00 AM) FIGURE 5.1-8. 2004 EXISTING TRAFFIC VOLUMES MIDDAY PEAK HOUR (1:00 – 2:00 PM) FIGURE 5.1-9. 2004 EXISTING TRAFFIC VOLUMES PM PEAK HOUR (3:30 – 4:30 PM) FIGURE 5.1-10. 2004 EXISTING TRAFFIC VOLUMES AM PEAK HOUR (8:00 – 9:00 AM) TRUCK ROUTE OPTION E (ROUTE 9A/ROUTE 141 KENSICO ROAD/COLUMBUS AVENUE) FIGURE 5.1-11. 2004 EXISTING TRAFFIC VOLUMES MIDDAY PEAK HOUR (1:00 – 2:00 PM) TRUCK ROUTE OPTION E (ROUTE 9A/ROUTE 141 KENSICO ROAD/COLUMBUS AVENUE) FIGURE 5.1-12. 2004 EXISTING TRAFFIC VOLUMES PM PEAK HOUR (3:30 – 4:30 PM) TRUCK ROUTE OPTION E (ROUTE 9A/ROUTE 141 KENSICO ROAD/COLUMBUS AVENUE) FIGURE 5.1-13. 2004 EXISTING TRAFFIC VOLUMES (INTERSECTIONS ANALYZED FOR THE 2010 CONSTRUCTION YEAR) AM EARLY PEAK HOUR (6:30-7:30AM) FIGURE 5.1-14. 2004 EXISTING TRAFFIC VOLUMES (INTERSECTIONS ANALYZED FOR THE 2010 CONSTRUCTION YEAR) AM LATE PEAK HOUR (8:00-9:00 AM) FIGURE 5.1-15. 2004 EXISTING TRAFFIC VOLUMES (INTERSECTIONS ANALYZED FOR THE 2010 CONSTRUCTION YEAR) PM PEAK HOUR (3:30-4:30PM) FIGURE 5.1-A. 2006 FUTURE WITHOUT THE PROJECT TRAFFIC VOLUMES AM PEAK HOUR (8:00-9:00AM) FIGURE 5.1-B. 2006 FUTURE WITHOUT THE PROJECT TRAFFIC VOLUMES MIDDAY PEAK HOUR (1:00-2:00PM) FIGURE 5.1-C. 2006 FUTURE WITHOUT THE PROJECT TRAFFIC VOLUMES PM PEAK HOUR (3:30PM-4:30PM) FIGURE 5.1-D. 2006 FUTURE WITHOUT THE PROJECT TRAFFIC VOLUMES AM PEAK HOUR (8:00-9:00AM) TRUCK ROUTE OPTION E (ROUTE 9A/ROUTE 141 KENSICO ROAD/COLUMBUS AVENUE) FIGURE 5.1-E. 2006 FUTURE WITHOUT THE PROJECT TRAFFIC VOLUMES MIDDAY PEAK HOUR (1:00-2:00PM) TRUCK ROUTE OPTION E (ROUTE 9A/ROUTE 141 KENSICO ROAD/COLUMBUS AVENUE) FIGURE 5.1-F. 2006 FUTURE WITHOUT THE PROJECT TRAFFIC VOLUMES PM PEAK HOUR (3:30PM-4:30PM) TRUCK ROUTE OPTION E (ROUTE 9A/ROUTE 141 KENSICO ROAD/COLUMBUS AVENUE) FIGURE 5.1-G. 2006 BUILD CAT-DEL ALONE LAKEVIEW ROUTE TRAFFIC ASSIGNMENT AM AND MIDDAY PEAK HOURS (8:00- 9:00AM/1:00-2:00PM) FIGURE 5.1-H. 2006 BUILD CAT-DEL ALONE LAKEVIEW ROUTE TRAFFIC ASSIGNMENT PM PEAK HOUR (3:30-4:30PM)

FINAL ENVIRONMENTAL IMPACT STATEMENT FOR THE CATSKILL/DELAWARE UV FACILITY
FIGURE 5.1-I. 2006 BUILD WITH CROTON LAKEVIEW ROUTE TRAFFIC ASSIGNMENT AM AND MIDDAY PEAK HOURS (8:00- 9:00AM/1:00-2:00PM) FIGURE 5.1-J. 2006 BUILD WITH CROTON LAKEVIEW ROUTE TRAFFIC ASSIGNMENT PM PEAK HOUR (3:30-4:30PM) FIGURE 5.1-K. 2006 BUILD CAT-DEL ALONE LAKEVIEW ROUTE TRAFFIC VOLUMES AM PEAK HOUR (8:00-9:00AM) FIGURE 5.1-L. 2006 BUILD CAT-DEL ALONE LAKEVIEW ROUTE TRAFFIC VOLUMES MIDDAY PEAK HOUR (1:00-2:00PM) FIGURE 5.1-M. 2006 BUILD CAT-DEL ALONE LAKEVIEW ROUTE TRAFFIC VOLUMES PM PEAK HOUR (3:30-4:30PM) FIGURE 5.1-N. 2006 BUILD WITH CROTON LAKEVIEW ROUTE TRAFFIC VOLUMES AM PEAK HOUR (8:00-9:00AM) FIGURE 5.1-O. 2006 BUILD WITH CROTON LAKEVIEW ROUTE TRAFFIC VOLUMES MIDDAY PEAK HOUR (1:00-2:00PM) FIGURE 5.1-P. 2006 BUILD WITH CROTON LAKEVIEW ROUTE TRAFFIC VOLUMES PM PEAK HOUR (3:30-4:30PM) FIGURE 5.1-Q. 2006 BUILD CAT-DEL ALONE COMMERCE ROUTE TRAFFIC ASSIGNMENT AM AND MIDDAY PEAK HOURS (8:00- 9:00AM/1:00-2:00PM) FIGURE 5.1-R. 2006 BUILD CAT-DEL ALONE COMMERCE ROUTE TRAFFIC ASSIGNMENT PM PEAK HOUR (3:30-4:30PM) FIGURE 5.1-S. 2006 BUILD WITH CROTON COMMERCE ROUTE TRAFFIC ASSIGNMENT AM AND MIDDAY PEAK HOURS (8:00- 9:00AM/1:00-2:00PM) FIGURE 5.1-T. 2006 BUILD WITH CROTON COMMERCE ROUTE TRAFFIC ASSIGNMENT PM PEAK HOURS (3:30-4:30PM) FIGURE 5.1-U. 2006 BUILD CAT-DEL ALONE COMMERCE ROUTE TRAFFIC VOLUMES AM PEAK HOUR (8:00-9:00AM) FIGURE 5.1-V. 2006 BUILD CAT-DEL ALONE COMMERCE ROUTE TRAFFIC VOLUMES MIDDAY PEAK HOUR (1:00-2:00PM) FIGURE 5.1-W. 2006 BUILD CAT-DEL ALONE COMMERCE ROUTE TRAFFIC VOLUMES PM PEAK HOUR (3:30-4:30PM) FIGURE 5.1-X. 2006 BUILD WITH CROTON COMMERCE ROUTE TRAFFIC VOLUMES AM PEAK HOUR (8:00-9:00AM) FIGURE 5.1-Y. 2006 BUILD WITH CROTON COMMERCE ROUTE TRAFFIC VOLUMES MIDDAY PEAK HOUR (1:00-2:00PM) FIGURE 5.1-Z. 2006 BUILD WITH CROTON COMMERCE ROUTE TRAFFIC VOLUMES PM PEAK HOUR (3:30-4:30PM) FIGURE 5.1-AA. 2006 BUILD CAT-DEL ALONE SPLIT ROUTE TRAFFIC ASSIGNMENT AM AND MIDDAY PEAK HOURS (8:00-9:00AM/1:00-2:00PM) FIGURE 5.1-BB. 2006 BUILD CAT-DEL ALONE SPLIT ROUTE TRAFFIC ASSIGNMENT PM PEAK HOUR (3:30-4:30PM) FIGURE 5.1-CC. 2006 BUILD WITH CROTON SPLIT ROUTE TRAFFIC ASSIGNMENT AM AND MIDDAY PEAK HOURS (8:00-9:00AM/1:00-2:00PM) FIGURE 5.1-DD. 2006 BUILD WITH CROTON SPLIT ROUTE TRAFFIC ASSIGNMENT PM PEAK HOUR (3:30-4:30PM) FIGURE 5.1-EE. 2006 BUILD CAT-DEL ALONE SPLIT ROUTE TRAFFIC VOLUMES AM PEAK HOUR (8:00-9:00PM)

FINAL ENVIRONMENTAL IMPACT STATEMENT FOR THE CATSKILL/DELAWARE UV FACILITY
FIGURE 5.1-FF. 2006 BUILD CAT-DEL ALONE SPLIT ROUTE TRAFFIC VOLUMES MIDDAY PEAK HOUR (1:00-2:00 PM) FIGURE 5.1-GG. 2006 BUILD CAT-DEL ALONE SPLIT ROUTE TRAFFIC VOLUMES PM PEAK HOUR (3:30-4:30PM) FIGURE 5.1-HH: 2006 BUILD WITH CROTON SPLIT ROUTE TRAFFIC VOLUMES AM PEAK HOUR (8:00-9:00AM) FIGURE 5.1-II: 2006 BUILD WITH CROTON SPLIT ROUTE TRAFFIC VOLUMES MIDDAY PEAK HOUR (1:00-2:00PM) FIGURE 5.1-JJ: 2006 BUILD WITH CROTON SPLIT ROUTE TRAFFIC VOLUMES PM PEAK HOUR (3:30-4:30PM) FIGURE 5.1-KK: 2006 BUILD CAT-DEL ALONE CIRCULAR ROUTE TRAFFIC ASSIGNMENT AM AND MIDDAY PEAK HOURS (8:00-9:00AM/1:00-2:00PM) FIGURE 5.1-LL: 2006 BUILD CAT-DEL ALONE CIRCULAR ROUTE TRAFFIC ASSIGNMENT PM PEAK HOUR (3:30-4:30PM) FIGURE 5.1-MM. 2006 BUILD CAT-DEL ALONE CIRCULAR ROUTE TRAFFIC VOLUMES AM PEAK HOUR (8:00-9:00AM) FIGURE 5.1-NN. 2006 BUILD CAT-DEL ALONE CIRCULAR ROUTE TRAFFIC VOLUMES MIDDAY PEAK HOUR (1:00-2:00PM) FIGURE 5.1-OO. 2006 BUILD CAT-DEL ALONE CIRCULAR ROUTE TRAFFIC VOLUMES PM PEAK HOUR (3:30-4:30PM) FIGURE 5.1-PP. 2006 BUILD CAT-DEL ALONE TRUCK ROUTE OPTION E TRAFFIC ASSIGNMENT AM/MIDDAY PEAK HOURS (8:00 – 9:00 AM/1:00 – 2:00 PM) (ROUTE 9A/ROUTE 141/KENSICO ROAD/COLUMBUS AVENUE) FIGURE 5.1-QQ. 2006 BUILD CAT-DEL ALONE TRUCK ROUTE OPTION E TRAFFIC ASSIGNMENT PM PEAK HOUR (3:30 – 4:30 PM) (ROUTE 9A/ROUTE 141/KENSICO ROAD/COLUMBUS AVENUE) FIGURE 5.1-RR. 2006 BUILD CAT-DEL ALONE TRAFFIC VOLUMES AM PEAK HOUR (8:00 - 9:00 AM) TRUCK ROUTE OPTION E (ROUTE 9A/ROUTE 141/KENSICO ROAD/COLUMBUS AVENUE) FIGURE 5.1-SS. 2006 BUILD CAT-DEL ALONE TRAFFIC VOLUMES MIDDAY PEAK HOUR (1:00 – 2:00 PM) TRUCK ROUTE OPTION E (ROUTE 9A/ROUTE 141/KENSICO ROAD/COLUMBUS AVENUE) FIGURE 5.1-TT. 2006 BUILD CAT-DEL ALONE TRAFFIC VOLUMES PM PEAK HOUR (3:30 – 4:30 PM) TRUCK ROUTE OPTION E (ROUTE 9A/ROUTE 141/KENSICO ROAD/COLUMBUS AVENUE) FIGURE 5.1-UU. 2010 FUTURE WITHOUT THE PROJECT TRAFFIC VOLUMES AM EARLY PEAK HOUR (6:30-7:30AM) FIGURE 5.1-VV. 2010 FUTURE WITHOUT THE PROJECT TRAFFIC VOLUMES AM LATE PEAK HOUR (8:00-9:00AM) FIGURE 5.1-WW. 2010 FUTURE WITHOUT THE PROJECT TRAFFIC VOLUMES PM PEAK HOUR (3:30-4:30 AM) FIGURE 5.1-XX. 2010 FUTURE WITH THE PROJECT TRAFFIC ASSIGNMENT AM EARLY PEAK HOUR (6:30-7:30 AM) FIGURE 5.1-YY. 2010 FUTURE WITH THE PROJECT TRAFFIC ASSIGNMENT AM LATE PEAK HOUR (8:00-9:00AM)

FINAL ENVIRONMENTAL IMPACT STATEMENT FOR THE CATSKILL/DELAWARE UV FACILITY
FIGURE 5.1-ZZ. 2010 FUTURE WITH THE PROJECT TRAFFIC ASSIGNMENT PM PEAK HOUR (3:30-4:30 PM) FIGURE 5.1-AAA. 2010 FUTURE WITH THE PROJECT TRAFFIC VOLUMES AM EARLY PEAK HOUR (6:30-7:30AM) FIGURE 5.1-BBB. 2010 FUTURE WITH THE PROJECT TRAFFIC VOLUMES AM LATE PEAK HOUR (8:00-9:00AM) FIGURE 5.1-CCC. 2010 FUTURE WITH THE PROJECT TRAFFIC VOLUMES AM EARLY PEAK HOUR (3:30-4:30PM)

FEIS KENRESWORKSITES 1
5.1. KENSICO RESERVOIR WORK SITES The proposed construction work at the off-site facilities would be conducted at two locations: near the Taconic State Parkway and near the Kensico Reservoir, both of which are located in the Town of Mount Pleasant in Westchester County, New York. This section describes the work that would be conducted at the Kensico Reservoir work sites and assesses its potential environmental impacts. 5.1.1. Introduction The Kensico Reservoir was constructed as part of the Catskill System; it also serves as a balancing reservoir for the Delaware System. Water from both the Catskill and Delaware Aqueducts is normally discharged into the Kensico Reservoir before being conveyed through the Delaware and Catskill Aqueducts to the Hillview Reservoir. The proposed work at the Kensico Reservoir work sites would entail pressurization of the Catskill Aqueduct, construction of a new Screen Chamber, and filling the existing Aerators with excavated material from the Eastview Site. Work at the Kensico Reservoir could also include installation of a water main from Delaware Shaft No. 18 to the Town of Mount Pleasant’s Commerce Street Pumping Station in order to supply the Town of Mount Pleasant with water during the pressurization work on the Catskill Aqueduct. As mentioned in Section 1, Introduction & Project Background, the section of the Catskill Aqueduct between Kensico Reservoir and the Eastview Site must be pressurized in order to convey up to 1,000 million gallons per day (mgd) of raw (i.e., untreated) water to the proposed UV Facility at the correct elevation so that it can be treated in the facility without construction of a new 700 mgd pumping station. The 1,000 mgd available through pressurization is greater than the 700 mgd that would be available from a pumping station supplied from the existing unpressurized Catskill Aqueduct. All of the pressurization work would be conducted seasonally (from approximately September through May) over a period of three to four years. The work at each site would vary with the type of construction activities involved. This time frame would coincide with the construction period for the proposed UV Facility. Work on the new screen chamber (see below) would occur year-round from 2008 through 2010. At the time this Final EIS was prepared, a complete design for all the project elements related to the proposed pressurization of the Catskill Aqueduct between Kensico Reservoir and the Eastview Site had not been finalized. Conceptual design possibilities were developed based on the inspections of the Aqueduct between Kensico Reservoir and the Eastview Site that were completed in April 2004. In order to disclose the potential reasonable worst-case environmental impacts that may be associated with the pressurization of this component of the Catskill Aqueduct, the potential reconstruction efforts that would likely have the maximum short-term construction and final operational characteristics of the pressurized Catskill Aqueduct are included in this Final EIS. Based on this reasonable worst-case scenario, estimates of related construction activities were generated and used as the basis for the evaluation of potential construction impacts from this component of the project. For example, as discussed further below under Section 5.1.1.10, for the impact assessment it was assumed that the Catskill Aqueduct could be excavated and rebuilt as a pressurized conduit for the segment of the

FEIS KENRESWORKSITES 2
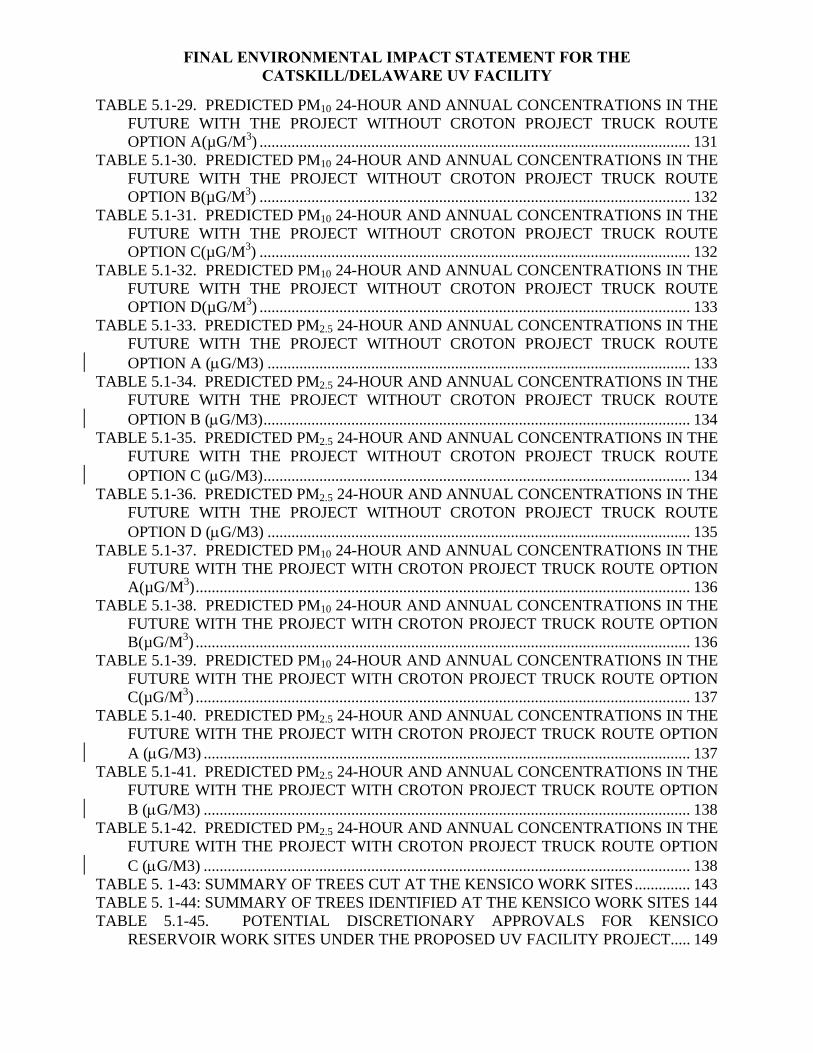
Aqueduct between the Lower Effluent Chamber and the Boat Hole. The Catskill Aqueduct pressurization work between the Boat Hole and the Eastview Site is covered under Section 4, Ultraviolet Light Disinfection Facility, and Section 5.2, Taconic State Parkway Work Sites. Based on the reasonable worst-case scenario projected for the Final EIS, a maximum of 100 workers could be associated with the Catskill Aqueduct pressurization work at any one time (40 workers at two Aqueduct pressurization work sites; 50 workers at the new Screen Chamber; and 10 workers Aerator filling). Work would occur Monday through Friday on an eight-hour shift. No extended shifts are anticipated. It is anticipated that there would be 1 to 2 truck deliveries per day at each pressurization site. A maximum of 20 to 30 truck deliveries per day are anticipated for the new Screen Chamber during the placement of concrete. Additionally, the installation of a water main from Delaware Shaft No. 18 to the Mount Pleasant Commerce Street Pumping Station, if this option is chosen, would occur prior to the first planned shutdown of the Catskill Aqueduct in 2007 and would be similar to a typical utility installation along public road right-of-ways, and would cover approximately 100 linear feet per day. The proposed work sites in the vicinity of the Kensico Reservoir that would be used as construction staging areas and access points by workers and materials for this proposed pressurization work include: the Upper Effluent Chamber; the Lower Effluent Chamber; the Fluoridation Pit; the Screen Chamber; the Catskill Venturi meter; and, the Boat Hole (Figure 5.1-1). Work on the Dike Grade Tunnel would also be staged from these access points. For work within the Catskill Aqueduct, ventilation would be provided as needed at the work location access points. Any ventilation system would be located within an aboveground structure. Descriptions of these areas and facilities are given below. Depending upon conclusions reached from the Aqueduct investigations, the section of the Catskill Aqueduct between the Lower Effluent Chamber and Boat Hole may either be uncovered and rebuilt as a pressurized conduit or rehabilitated in-situ with work staged from the existing access points. New construction in the vicinity of Kensico Reservoir would include a new screen chamber building, located between the Lower Effluent Chamber and the Catskill Aerator. In addition, the Catskill and Delaware Aerators located to the west of Kensico Reservoir would be filled with excavated material from the Eastview Site and re-landscaped. The Delaware Aerator and a portion of the Catskill Aerator would likely be filled and landscaped from late 2005 to early 2006. During this time, an existing chlorine line in the vicinity of the Delaware Aerator would also be replaced. Approximately 80 percent of the filling operations for the Catskill and Delaware Aerators are anticipated to occur over approximately a six month period in 2006. At this time, the Catskill Aerator would be partially filled. The remainder of the filling activity and landscaping of the Catskill Aerator would occur concurrently with construction of the new Screen chamber and Catskill pressurization work, in late 2009 or early 2010.
5.1.1.1. Upper Effluent Chamber
Located at the Kensico Reservoir site, the Upper Effluent Chamber (UEC) is part of the Catskill System. The UEC provides for the isolation of the Catskill Aqueduct from Kensico Reservoir. Flows pass through the UEC upon exiting the Kensico Reservoir and are directed to the Lower Effluent Chamber (LEC) prior to discharging into the Catskill Aqueduct for

FEIS KENRESWORKSITES 3
conveyance to the City’s distribution system. Both the UEC and the Lower Effluent Chambers also handle flows to the Catskill Aqueduct that may bypass the Kensico Reservoir.
Under the proposed project, the UEC would be used as a staging and access point for the rehabilitation and pressurization of the Catskill Aqueduct for approximately six months. A hydraulic crane would be used to raise and lower materials from the UEC to the Aqueduct; a forklift would be used to manage materials; and an air compressor would be used to power tools. An area for a small office trailer and some material storage would also be needed. Deliveries (approximately one to two trucks per day) would include materials for an Aqueduct lining system and fuel for construction equipment. Staging would be located on City property adjacent to the UEC; no clearing would necessary for this staging area. Interior mechanical work within the UEC would also be performed and the existing sluice gates would be rehabilitated. The exterior of the building would be cleaned (i.e., power washed) as part of the proposed project. A maximum of 20 workers would be utilized at the UEC. Workers entering the Aqueduct at this point would park on City property at the Kensico Reservoir campus (either on Lakeview Avenue or in existing contractor lots) and would be shuttled to the UEC.
5.1.1.2. Dike Grade Tunnel
The Dike Grade Tunnel is the portion of the Catskill Aqueduct located between the UEC and the Lower Effluent Chamber (LEC). The grade tunnel would be rehabilitated by repairing the existing concrete lining. No surface disturbance would be associated with this activity.
5.1.1.3. Lower Effluent Chamber
Discharging from Kensico Reservoir, water flows pass from the UEC to the Lower Effluent Chamber (LEC), which controls flow to the Catskill Aqueduct. The flow of the Catskill Aqueduct is currently regulated through hydroelectric turbines and/or sluice gates at the LEC. Under the proposed project, the LEC would be an access and staging point to the Catskill Aqueduct for rehabilitation and pressurization work, for approximately six months. In addition, with flow controls moved to the proposed UV Facility, the existing turbines would be removed and the sluice gates would be rehabilitated for pressurization, since once the Aqueduct is pressurized there would be no available hydraulic head to operate the turbines. A hydraulic crane would be used to raise and lower materials from the LEC into the Aqueduct; a forklift could be used at the site to manage materials; an air compressor would be used to power tools; and an area for a small office trailer and some material storage would be necessary. The exterior of the building would be cleaned as part of the proposed project. Deliveries (approximately one to two trucks per day) would include materials for Aqueduct repair and fuel for construction equipment. A maximum of 20 workers would be utilized at the LEC. Workers would park on City property within the Kensico Reservoir campus and would be shuttled to the LEC.

N
Kensico Reservoir
ValhallaMiddle/High
School
ValhallaMiddle/High
School
AERATOR DRIVE
WEST LAKE DRIVE
LAKEVIEW AVENUE
CO
LON
IAL
LANE
Access ViaRoute 22
Access ViaLakeviewAvenue
Access ViaStevensAvenue
CatskillVenturi
Boat Hole
ScreenChamber
UpperEffluentChamber
LowerEffluentChamber
N
Catskill/Delaware UV Facility
Catskill Aqueduct Pressurization and Aerator Filling:Kensico Reservoir Work Sites
Figure 5.1-1
H&
S F
ile: 9
470\
360\
Fina
l EIS
Gra
phic
s\M
p1-K
ensi
coS
ites.
ai 1
0/26
/04
LEGENDWork Sites
Aerators to be Filled and Landscaped
Access Routes
NYCDEP Property Boundary
Construction Disturbance Area SCALE
0 200 400 FEET
CO
LU
MB
US
AV
EN
UE
Catskill Aerator
Delaware Aerator
New ScreenChamber
Shaft No. 18
Fluoridation Pit

FEIS KENRESWORKSITES 5
5.1.1.4. New Screen Chamber
From the LEC, flows pass through a nearby existing Screen Chamber that includes
traveling screens. The screens collect debris that might enter the system and prevent the debris from traveling the Catskill Aqueduct. Prior to leaving the chamber, flows are chlorinated through diffusers mounted downstream of the screens. Under the proposed project, a new Screen Chamber would be constructed between the LEC and the Catskill Aerator. This screen chamber would replace the function of the existing Screen Chamber located to the west of Columbus Avenue (Figure 5.1-1). Once the Aqueduct is pressurized, the existing Screen Chamber cannot be used. The elevation of the existing Screen Chamber is too low (elevation 330 ft. compared to elevation 360 ft. required for pressurization). The new Screen Chamber structure would be approximately 100 feet by 80 feet by 40 feet in height above the ground. The building’s floor elevation would match that of the adjacent Lower Effluent Chamber (elevation 360 ft.). The new Screen Chamber would serve to prevent debris from entering the Catskill Aqueduct. Construction of this new screen chamber would take between two and two and one-half years year-round. Approximately 50 workers would be needed to construct the Screen Chamber. It is anticipated that construction of this new screen chamber would start in 2008 and be completed by 2010. Workers would park on City property within the Kensico Reservoir campus.
5.1.1.5. Catskill and Delaware Aerators
Located at the Kensico Reservoir, the Catskill and Delaware Aerators were used in the past to aerate the water from Kensico Reservoir before the water entered the Catskill and Delaware Aqueducts. This process provided a fountain-like appearance at the site that was enjoyed by area visitors. The Aerators, which were removed from service over forty years ago, are no longer utilized as part of the Catskill/Delaware Water Supply System because of advancements in water treatment technologies. Under the proposed project, and following discussions with local officials, the Aerators would be filled with a portion of the excavated material from the Eastview Site; this material would be brought in via trucks from the Eastview Site. Prior to the fill work, the concrete floor of the Aerators would be dismantled. The Delaware Aerator would be filled over approximately six months. The Catskill Aerator would be filled after construction of the new Screen Chamber. Conceptual designs currently call for the Delaware Aerator to be filled from late 2005 to early 2006 and the Catskill Aerator to be partially filled from late 2005 to early 2006, with the balance of the filling occurring concurrently with the construction of the new Screen Chamber in late 2009 or early 2010. As noted above, the filling of the Aerators in 2006 could take approximately six months to complete. After each Aerator is filled, the areas would be graded and landscaped. It is anticipated that a maximum of 10 workers would be needed for this work. These workers would park on City property within the Kensico Reservoir campus.

FEIS KENRESWORKSITES 6
5.1.1.6. Separate UV Building If the Town concurs, a separate UV building could be constructed for the Town of Mount
Pleasant at the existing Stevens Avenue Storage Tanks, which are supplied from the existing Commerce Street Pump Station. The UV units would be installed within a new stand-alone building located on Town property, to the southeast of the existing water storage tanks. The footprint of the Mount Pleasant UV Building would be approximately 30 feet by 40 feet. The building would be located on a cleared area that is part of the Town’s property. The Town would have the ability to draw from either the Catskill or Delaware Aqueducts through the existing Commerce Street Pumping Station from either: 1) the Delaware Aqueduct via a 30-inch gravity feed connection from Shaft No. 18 installed for supplying Delaware Aqueduct water during extended shutdowns of the Catskill Aqueduct for pressurization work, or 2) from the Town’s existing connection to the Kensico Siphon of the Catskill Aqueduct.
5.1.1.7. Delaware Shaft No. 18
The Town of Mount Pleasant could be supplied with water during shutdowns of the Catskill Aqueduct, if this option is selected, through an existing connection and pipeline at the Delaware Shaft No. 18 Flow Control Structure, which was installed as part of another NYCDEP project; water would be conveyed to the Mount Pleasant Commerce Street Pumping Station by gravity flow. This would provide a permanent backup supply to their current Catskill Aqueduct supply. The existing connection stub is approximately 700 feet in length and extends from the valve box to the east curb line of West Lake Drive on the Kensico campus. Approximately 6,000 additional linear feet of 30-inch diameter piping would be required to connect the existing connection stub to the 16-inch diameter suction piping at the Commerce Street Pumping Station. The piping would be routed from the intersection of Columbus Avenue and West Lake Drive, down Lakeview Avenue, Wall Street, and along Commerce Street to the Pumping Station. Valving would be provided so that the Pumping Station could draw from the existing Catskill Aqueduct or the new Delaware Aqueduct connection. Therefore, the Town of Mount Pleasant would continue to operate its Commerce Street Pumping Station throughout the reconstruction work on the Catskill Aqueduct. This work would occur after the movement of excavated material to the Aerators from 2005 through 2006, but before the first planned shutdown of the Catskill Aqueduct in Fall 2007. After the pressurization work on the Catskill Aqueduct is complete, and if this option is chosen, a separate two-unit UV building would be constructed on Town property adjacent to the Mount Pleasant storage tanks on Stevens Avenue to provide the Town with UV-treated water. Under this option, the water main from Delaware Shaft No. 18 would still be utilized to send water to the Commerce Street Pumping Station. The Town would also be able to utilize their existing connection to the Catskill Aqueduct. Water would then be sent from the pumping station to the UV building, into the storage tanks, and finally distributed throughout the Town’s water distribution system. Work at Delaware Shaft No. 18 would also include replacement of an existing chlorine line on City property near the Delaware Aerator. This routine maintenance work would occur prior to fill placement in the Aerator and would be similar to a typical utility line installation.

FEIS KENRESWORKSITES 7
5.1.1.8. Fluoridation Pit
The fluoridation pit is located adjacent to Columbus Avenue; there is no surface structure
associated with this facility. Under the proposed project, the facility would be reconstructed to function as a pressurized conduit. The fluoridation pit would no longer be used to fluoridate the water; this would occur at the rehabilitated fluoridation building (expected to be completed by 2010) within the Kensico Reservoir campus. It is anticipated that a maximum of 20 workers would be needed to reconstruct the fluoridation pit; these workers would park on City property within the Kensico Reservoir campus. The construction is anticipated to last for approximately six months.
5.1.1.9. Screen Chamber
The existing Catskill Screen Chamber is located directly west of Columbus Avenue on
across from the Kensico Reservoir campus on City property. This aboveground building contains large traveling screens and chlorine injection equipment. Under the proposed project, this equipment would be removed. The portion of the building beneath the foundation would be reconstructed so that the existing water conduit could be pressurized. In addition, the exterior of the building would be cleaned as part of the proposed project. It is anticipated that a maximum of 20 workers would be needed to rehabilitate the existing screen chamber; these workers would park on City property within the Kensico Reservoir campus. The construction is anticipated to last for approximately six months.
5.1.1.10. Catskill Venturi Meter
The Catskill Venturi Meter is located between the existing Catskill Screen Chamber and the Boat Hole. The Venturi Meter is part of the Aqueduct itself and monitors the Aqueduct’s flow. There is a small surface structure associated with this facility providing a stairway access to the Aqueduct below. Under the proposed project, the Catskill Venturi Meter would be reconstructed to accommodate the increased flow of a pressurized Catskill Aqueduct. It is anticipated that a maximum of 10 workers would be needed to rehabilitate this structure. Workers would park on City property within the Kensico Reservoir campus and would be shuttled to the work sites. The construction is anticipated to last for approximately six months.
5.1.1.11. Boat Hole
The Boat Hole is located to the west of the Catskill Venturi Meter; there is no surface structure associated with this facility (Figure 5.1-1). Under the proposed project, the Boat Hole would be used as an access and staging point to the Catskill Aqueduct for rehabilitation and pressurization purposes, for two six month periods over a span of two years. Equipment at this site would include a hydraulic crane to raise and lower materials from the chamber. A forklift would be used to manage materials; an air compressor would be used to power tools. Deliveries would include materials for lining system and fuel for construction equipment. It is anticipated that a maximum of 20 workers would be utilized at this structure. Workers would park on City property within the Kensico Reservoir campus and would be shuttled to the Boat Hole.

FEIS KENRESWORKSITES 8
5.1.1.12. Work on the Catskill Aqueduct
Based on recent field investigations, NYCDEP would determine the level of work
required on the Catskill Aqueduct. For example, between the LEC and the Boat Hole, the Catskill Aqueduct could be excavated and rebuilt as a pressurized conduit if in-situ construction is determined inadequate for pressurization. If this work is required, activities in this area could include open cut (cut and cover) excavation; demolition of the existing Aqueduct using hydraulic concrete crushers (excavator with crushing jaw attachment); hoe rams (excavator with jackhammer attachment) and saws; hauling demolished Aqueduct materials off-site; importing materials (gravel, structural fill, etc.) for sub-base preparation; construction deliveries for formwork, rebar, and concrete; backfilling; grading; paving; and site restoration. These activities would require a common staging area for materials storage, equipment storage and field offices, for approximately two years. This area would be located on City property between the LEC and Columbus Avenue. If Aqueduct rebuilding were required under Columbus Avenue, the road would not be closed. A temporary bypass would be constructed on adjacent City property within the Kensico Reservoir campus so that traffic flow would be maintained. It is anticipated that a maximum of 30 feet on either side of the Aqueduct would be disturbed during construction, and some trees could be cut as part of this disturbance where they have grown since the Aqueduct’s original open cut construction. It is anticipated that a maximum of 20 workers would be utilized in the rebuilding of the Catskill Aqueduct in this location. Workers would park on City property within the Kensico Reservoir campus and would be shuttled to the area where rebuilding of the Catskill Aqueduct is occurring. If cut and cover operations would be required between the LEC and the Boat Hole, as discussed below under Section 5.1.3.2, short-term localized impacts during construction would occur along this segment of the Catskill Aqueduct. This is anticipated to occur over a three month period for any one segment. However, the duration of activities near any individual neighboring parcel would be limited, since the location construction activities would move over time along the Catskill Aqueduct.
Environmental Analysis. No operational impacts are anticipated from the proposed work near the Kensico Reservoir; none of the facilities would maintain permanent staff, and traffic associated with operations of these facilities is anticipated to be minimal. Therefore, the following sections focus on possible construction impacts as a result of the pressurization work, the construction of a new Screen Chamber at Kensico Reservoir, the possible connection from Shaft No. 18 to the Commerce Street Pumping Station, and the transfer of fill material from the Eastview Site to the two Aerators at Kensico Reservoir. The construction analysis for all the sections is 2010, and in the case of traffic, air quality and noise, the analysis also examines the year 2006, when the Delaware Aerator and the majority of the Catskill Aerator would be filled without other construction activities on the Kensico campus. A study area of one-quarter mile was established from the sites in conducting the following analyses. The methodology used to prepare these analyses is presented in Section 3, Data Collection and Impact Methodologies.

FEIS KENRESWORKSITES 9
5.1.2. Baseline Conditions
5.1.2.1. Existing Conditions
5.1.2.1.1. Land Use, Zoning, and Public Policy
Land Use. Work Sites. The Kensico Reservoir work sites are located on two tax lots, as follows:
Lot 39, Block 1 of Section 117.06 (which also includes one of the Taconic State Parkway work sites); and Lot 1, Block 3, of Section 117.11. The sites are all located on City-owned property near the Kensico Reservoir in the vicinity of Columbus Avenue and Lakeview Avenue. Known as the “Kensico campus,” this area consists of many water supply-related infrastructure components, as discussed above. Some of the facilities near the Kensico Reservoir are located beside a low-density residential neighborhood. Of the Kensico Reservoir work sites, only the Upper and Lower Effluent Chambers, the Screen Chamber, Delaware Shaft No. 18, and the Catskill and Delaware Aerators are above grade structures. The buildings are similar to each other in appearance, with grey stone facades, standing at approximately 40 feet tall. The Aerators consists of concrete basins at grade. The remaining work sites are simply marked by concrete blocks or metal hatches laid flush with the ground, providing access to the Catskill Aqueduct. Within the Kensico campus, construction is currently being conducted at Delaware Shaft No. 18, as part of an effort to increase the capacity of the Delaware Aqueduct from 1,400 mgd to as much as 1,640 mgd. This construction activity is anticipated to be completed by the end of 2004. Study Area. The majority of the land within the one-quarter mile study area to the east of Columbus Avenue is considered a water supply land use, owned by the City, including the Kensico Reservoir itself (see Figure 5.1-2). Valhalla Middle/High School is located to the north of these water supply uses on the east side of Columbus Avenue. In the northeastern portion of the study area, there is a low-density residential neighborhood located on Norwood Street, High Street, Sedgewick Avenue, and Johns Road. In addition, there is a small pocket of undeveloped land located between this neighborhood and the City water supply lands. To the west of Columbus Avenue, land uses range from very low-density to high-density residential neighborhoods, and also include undeveloped land and a small area of large office parks. A restaurant is located on the west side of Columbus Avenue north of West Lake Drive. Just south of the fork in the road formed by Columbus Avenue and West Lake Drive, there is a church and a soccer field, both located across from the Kensico campus. Where the Catskill Aqueduct extends west from the Kensico campus, beyond Columbus Avenue, land uses surrounding the Aqueduct right-of-way include undeveloped land and low-density residential neighborhoods. As mentioned in Section 4.1, Introduction and Project Description, a separate UV building may be constructed for the Town of Mount Pleasant at the existing Stevens Avenue Storage Tanks. The majority of land within one-quarter mile of this location is occupied by office parks, including the Summit at Westchester on the west side of Columbus Avenue, and two large office parks on the east side of Columbus Avenue, one of which is anchored by NYNEX, the other of which is anchored by Pepsico. The Valhalla Fire Department is located between these two office

FEIS KENRESWORKSITES 10
parks. To the east of these office parks, on the north side of Stevens Avenue, there is a Town park with a public swimming pool (this park is classified as active open space); and on the south side of Stevens Avenue, there is a low-density residential neighborhood. The southwest portion of the Stevens Avenue Storage Tanks one-quarter mile study area contains a very low-density residential neighborhood. In the middle of the study area, the northbound and southbound lanes of Columbus Avenue diverge and the avenue is divided by a large median. Mount Pleasant Town Hall is located in this median. The northern portion of the Valhalla Middle/High School campus is located in the southernmost part of this study area. In addition to the one-quarter mile study area used in this analysis, land uses along local roadways that would convey project-generated construction traffic were examined. As discussed in Section 5.1.2.1.8, five routes are being considered for the trucks that could transport excavated material from the Eastview Site to the Kensico campus in order to fill the Aerators. These include: (Option A) Grasslands Road (Route 100C) to Bradhurst Avenue and to Lakeview Avenue (the most direct route); (Option B) Grasslands Road to Legion Drive to Commerce Street and to Lakeview Avenue; (Option C) Includes both Option A & B Routes; (Option D) Also includes both Option A & B Routes; and (Option E) Saw Mill River Road (Route 9A) to Broadway to Route 141 to Kensico Road and to Columbus Avenue.
Truck Route Option A. The short segment of Route 100C between the Eastview Site and Bradhurst Avenue is dominated by transportation uses, namely the large Sprain Brook Parkway interchange. Directly east of the Eastview Site, Route 100C is bounded on the north side by Grasslands Reservation, a County-owned institutional property, described in more detail in Section 4.2, Land Use, Zoning, and Public Policy. Directly across from Grasslands Reservation on the south side of Route 100C is a small residential neighborhood along Taylor Road. To the east of the parkway, commercial land uses occupy the southern side of the Route 100C/Bradhurst Avenue/Knollwood Road intersection, including a gas station and restaurant. On the north side of this intersection is the Blythedale Children’s Hospital and a high-density residential neighborhood, both of which have access from Bradhurst Avenue. Moving north along Bradhurst Avenue, there is a mix of very low- and low-density residential uses. In addition, the Margaret Chapman School for children and adults with special needs is located on the west side of Bradhurst Avenue, near the Lakeview Avenue intersection. Several commercial uses are also located beside this intersection, including florists and monument sales offices serving the adjacent cemeteries. Lakeview Avenue continues east from Bradhurst Avenue beside Gate of Heaven Cemetery on the north and Kensico Cemetery on the south. (Kensico Cemetery is bounded by Lakeview Avenue, Commerce Street, Legion Drive, and Route 100C; Gate of Heaven Cemetery is bounded by Lakeview Avenue, Route 100C, and the Taconic State Parkway.) Where Lakeview Avenue approaches the Taconic State Parkway, there is an at-grade crossing of the Metro-North commuter railroad. Additional commercial uses associated with the cemeteries are also located in this area. On the east side of the parkway, Lakeview Avenue traverses a high- and low-density residential neighborhood as it makes its way to Columbus Avenue. (Lakeview Avenue ends at its intersection with Columbus Avenue, across from the NYCDEP Kensico campus.) Many of the residential properties on this segment of Lakeview Avenue have driveways that connect directly to the avenue and vehicles frequently park alongside the road.


FEIS KENRESWORKSITES 12
Truck Route Option B. Starting immediately to the east of the Route 100C/Bradhurst Avenue/Knollwood Road intersection, Route 100C is bordered by very low- and low-density residential neighborhoods, followed by some undeveloped land. Farther to the east, Route 100C is bordered by Kensico Cemetery to the north and Westchester Community College to the south. East of Westchester Community College is a Board of Cooperative Educational Services (BOCES) office building. In the vicinity of Route 100C’s intersection with Legion Drive, there is an area of undeveloped land, as well as a small low-density residential neighborhood. Legion Drive is bounded to the west by Kensico Cemetery, and to the east by a low-density residential neighborhood. There is an American Legion Post on the corner of Legion Drive and Commerce Street. Proceeding north, Commerce Street runs through Kensico Cemetery, parallel to the Taconic State Parkway and then intersects with Lakeview Avenue where Kensico Cemetery meets the Gate of Heaven Cemetery. As discussed above, on the east side of the parkway, Lakeview Avenue traverses a high- and low-density residential neighborhood as it makes its way to Columbus Avenue. (Lakeview Avenue ends at its intersection with Columbus Avenue, across from the NYCDEP Kensico campus.) Many of the residential properties on this segment of Lakeview Avenue have driveways that connect directly to the avenue and vehicles frequently park alongside the road.
Truck Route Option C. The third truck route option, Option C, is a combination of both Options A and B (i.e., splitting the traffic evenly among both routes). See the text above for a full description of the land uses located along those two routes.
Truck Route Option D. The fourth truck route option, Option D is also a combination of
both Options A and B. All trucks destined to Kensico from Eastview would make a left turn from Grasslands onto Bradhurst to Lakeview Avenue to Columbus to West Lake Drive. Return trips to Eastview would make a left turn from Lakeview onto Commerce Street with a right turn on Legion, followed by a right turn onto Grasslands Road. It is essentially a circular route See the text above for a full description of the land uses located along those two routes.
Truck Route Option E. For the fifth truck route option, Option E, all trucks destined to Kensico from Eastview would use Walker Road to Dana Road to Route 9A to Route 141 (also known as Commerce Street between Elwood Avenue and Circular Street) to Kensico Road to Columbus Avenue to West Lake Drive. On the return trip, trucks would make a right turn onto Columbus Avenue to Kensico Road to Route 141 to Route 9A to Dana Road to Walker Road. Leaving the Eastview Site via Walker and Dana Roads, truck route Option E follows Route 9A north to Route 141. The west side of Route 9A just north of its intersection with Dana Road is dominated by a vegetative buffer separating it from the Saw Mill River Parkway, while the east side is characterized by commercial uses and an office park, the Mid-Westchester Executive Park. Farther north along Route 9A, the predominant commercial uses includes restaurants, motels, and movie theaters. Moving farther north, there is a small area of manufacturing uses on both the east and west sides of Route 9A; these uses include a lumberyard and a printing manufacturer. Just north of these manufacturing uses, Route 9A is characterized by a mix of commercial uses, office space, and very low- to low-density residential neighborhoods.

FEIS KENRESWORKSITES 13
At this point, truck route Option E turns east and follows Broadway to Route 141. On the south side of Broadway, there is a commercial area containing a gas station, car wash, and hair salon. The northern portion of a low-density residential neighborhood is also located in this area. On the north side of Broadway, there is a mixed use commercial/residential building. North of this building is the intersection of the Saw Mill River Parkway and Taconic State Parkway. Traveling east on Route 141, there are areas of passive open space on both the north and south sides of the road acting as a buffer between it and the Taconic State Parkway. As Route 141 turns in a more northerly direction, Metro-North Railroad runs parallel to the street on the west side. To the west of the railroad tracks, there is a mixed use area consisting of office space, commercial/residential buildings, commercial uses, and small parks. The east side of Route 141 is dominated by an area containing small offices in buildings that look like residences, as well as a low-density residential neighborhood with some commercial uses interspersed. Graham Hills Park is located to the northwest of Route 141. Truck route Option E then turns southeast along Kensico Road. At the intersection of Route 141 and Kensico Road, there is a commercial area with uses such as a gas station, restaurants, a spa/beauty salon, a dry cleaner, and medical offices. Southeast of this commercial area, there are low-density residential uses on either side of Kensico Road, as well as a condominium complex just to the east of the commercial area. As Kensico Road approaches its intersection with Columbus Avenue, the area changes to a very low-density neighborhood. Leitas Pond Park is a small parcel of private recreation land separating the low- from the very low-density neighborhoods. Just to the east of where Kensico Road joins Nanny Hagen Road, there is a 3-story townhouse complex located on Rockhagen Road. Columbus Avenue is a relatively busy collector road, with two lanes in each direction. The west side of the street is characterized alternately by undeveloped wooded areas and office complexes, including the Summit at Westchester office park. South of the Summit at Westchester, there is a very low-density residential area. The east side of Columbus Avenue, moving from north to south, is characterized by a very low-density residential neighborhood, the Rose Hill Shopping Center, an office park, and Columbus Elementary School. There is a stretch of undeveloped land separating the school from two large office parks, one of which is anchored by NYNEX, the other of which is anchored by Pepsico. The Valhalla Fire Department is located between these two office parks. At this point, the northbound and southbound lanes of Columbus Avenue diverge and the avenue is divided by a large median. Mount Pleasant Town Hall is located in this median. As stated above in the description of land uses within one-quarter mile of the Kensico Reservoir work sites, the Valhalla Middle/High School is located to the north of the water supply uses on the east side of Columbus Avenue.
Zoning. Work Sites. The Kensico campus is located within the Town of Mount Pleasant’s R-40
“One Family Residential” zoning district (see Figure 5.1-3). The portion of the Catskill Aqueduct between the Lower Effluent Chamber and the Boat Hole is located within both the R-20 and R-40 “One Family Residential” districts. The permitted uses for both the R-20 and R-40 districts are summarized in Table 5.1-1, below. The R-40 district requires a minimum lot area of 40,000 sq. ft. (approximately one acre) and a minimum lot width of 100 ft. at the front yard

FEIS KENRESWORKSITES 14
setback line. The R-20 district requires a minimum lot area of 20,000 sq. ft. and a minimum lot width of 85 ft. at the front yard setback line.
Study Area. The study area is predominantly zoned R-20 and R-40. In addition to these zoning districts, other districts within the study area for the Kensico Reservoir work sites include: the R-10 “One Family Residential;” R-5A and R-3AU “Multi-Family Residential.” PRD-T-1 and PRD-T-2 “Planned Residential Development Transitional;” OB-1 “General Office;” OB-2 “Public Utility Office;” OB-5 “Office Business;” OB-6 “Office Building, Distribution, Limited Fabrication;” OB-T-1 and OB-T-2 “Office Building Transitional;” OB-CE “Corporate Education;” C-NR “Neighborhood Retail;” C-PS “Planned Shopping;” C-RB “Rural Business;” C-GC “General Commercial;” M-1 “Planned Light Industry;” and M-2 “Light Industry” districts. Table 5.1-1, below, lists the minimum lot area and summarizes the permitted uses for each of these districts.
TABLE 5.1-1. KENSICO RESERVOIR WORK SITES: ZONING DISTRICTS IN
THE STUDY AREA District District Name Minimum Lot
Area Permitted Uses
R-40* One-Family Residential 40,000 sq. ft. One-family dwellings; churches and other places of worship; public schools; railroad stations; playgrounds, parks, libraries, firehouses, police stations, and other municipal uses; recreation areas and swimming pools; and municipal, state, or national historic sites or museums.
R-20* One-Family Residential 20,000 sq. ft. Uses permitted in R-40. R-10* One-Family Residential 10,000 sq. ft. Uses permitted in R-40 R-5A* Multifamily Residential 10,000 sq. ft.;
10 acres for multifamily dwellings
Uses permitted in the R-10 district, as well as two-family dwellings, and multi-family dwellings, provided that there is no more than one dwelling unit for every 5,000 sq. ft. of site area.
R-3AU Multifamily Residential 10,000 sq. ft.; 2 acres for multifamily dwellings
Uses permitted in R-5A, provided that there is no more than one multifamily dwelling unit for every 3,500 sq. ft. of site area.
PRD-T-1
Planned Residential Development Transitional-1
No less than 3 acres, no more than 5 acres
Uses permitted in R-5A.
PRD-T-2
Planned Residential Development, Transitional-2
No less than 4 acres, no more than 6 acres
Uses permitted in R-5A, provided that there is no more than one dwelling unit for every 8,300 sq. ft. of site area.
OB-1 General Office Building 25 acres Principal uses permitted in a residence district; office buildings for business and professional uses; and laboratories devoted exclusively to research design and experimentation.
OB-2 Public Utility Office Building
20 acres Any principal use permitted in a residence district; and public utility office building

FEIS KENRESWORKSITES 15
TABLE 5.1-1. KENSICO RESERVOIR WORK SITES: ZONING DISTRICTS IN THE STUDY AREA
District District Name Minimum Lot Area
Permitted Uses
uses. OB-5 Office Business 25 acres Uses permitted in OB-1; production,
processing, and assembly of small, light electronic parts or precision instruments; establishments for the printing, publishing, and distribution of newspapers and other periodicals on parcels of 15 acres or more; developments planned and designed to function as an integrated unit for commercial, industrial, office, recreational, and warehousing uses on parcels of 15 acres or more; and child day-care centers.
OB-6 Office Building, Distribution, Limited Fabrication
10 acres Uses permitted in OB-1; public utility office building uses; executive and administrative offices; engineering offices; sales offices; accounting offices; record offices; general business offices; warehouses for storage of business records and documents; research, development and sales development laboratories; training schools for employees; employees’ medical dispensaries and infirmaries; employees’ dining halls; employees’ recreation halls; United States post office substation; printing; publishing; the production, processing, and assembly of small items such as light electronic parts; enclosed storage, warehousing, and distribution of manufactured goods and products for wholesale; and child day-care centers.
OB-CE Office Corporate Education
50 acres Conference and training facilities to include but not be limited to continuing education activities and facilities, classroom space and teaching equipment, and offices for staff; indoor and outdoor physical recreational facilities; housing and dining facilities provided they are not operated as a public hotel or restaurant.
OB-T-1 Office Business Transitional-1
1 acre All uses permitted in OB-1, except laboratories devoted exclusively to research design and experimentation; and child day-care centers.
OB-T-2 Office Park Transitional-2
6 acres Uses permitted in OB-6.

FEIS KENRESWORKSITES 16
TABLE 5.1-1. KENSICO RESERVOIR WORK SITES: ZONING DISTRICTS IN THE STUDY AREA
District District Name Minimum Lot Area
Permitted Uses
C-NR Neighborhood Retail 10,000 sq. ft. for dwellings; no requirement for nonresidential uses, but total floor area of buildings should not exceed area of lot
Uses permitted in R-10; stores for sale of goods at retail or performance of customary personal services or services clearly incident to retail sales; business, professional, or banking offices; restaurants and cafes; parking lots for transient motor vehicles; and telephone exchanges.
C-PS Planned Shopping Same as most restrictive residential use in any abutting district for all dwellings; 5 acres for all permitted nonresidential uses
The most restrictive residential use permitted in any abutting district; all principal nonresidential uses permitted in C-NR; motion-picture or other theaters; and office building uses as permitted in OB-1.
C-RB Rural Business 20,000 sq. ft. for all dwellings; 40,000 sq. ft. for all permitted nonresidential uses
Restaurants or cafés; business, professional, banking, and general offices; freestanding highway-oriented retail stores, including but not limited to furniture or antique stores, home appliance shops, carpet or floor-covering stores, automotive accessory stores, garden or farm supply and equipment stores, and other similar retail stores or service establishments; motion-picture or other theaters; indoor recreation facilities; warehouse and storage facilities; and child day-care centers.
C-GC General Commercial 10,000 sq. ft. for all dwellings; no requirement for nonresidential uses, but total floor area of buildings shall not exceed 1½ times the area of the lot
Uses permitted in C-NR; as well as motion-picture or other theaters; assembly halls, dance halls, bowling alleys, billiard or pool rooms; wholesale or storage businesses; printing shops, heating, air-conditioning, plumbing, or electrical businesses; laundries, dry-cleaning plants, creameries, and ice cream plants; parking lots or showrooms for new or used motor vehicles for sale or hire; bottling plants; municipal garages and public works storage yards; and any business similar to those above, but not including any manufacturing or fabrication, or any use

FEIS KENRESWORKSITES 17
TABLE 5.1-1. KENSICO RESERVOIR WORK SITES: ZONING DISTRICTS IN THE STUDY AREA
District District Name Minimum Lot Area
Permitted Uses
which would be a nuisance to surrounding properties.
M-1* Planned Light Industry 10 acres Any principal nonresidential use permitted in any other district, except child day-care centers which are expressly prohibited; and light industrial or manufacturing uses, provided that such uses would not be a nuisance to surrounding properties, including bakers and baked goods manufacturing; bookbinders, engravers, or lithographers; cabinetmakers, carpenters’ shops, or power woodworking; clock and watch manufacturing; cold-storage plant; electrical small-parts manufacturing; furniture repairs, finishing and upholstering; jewelry manufacturing; limited fabrication; machine shops for small parts; and optical good manufacturing.
M-2 Light Industry None Uses permitted in M-1. Note: * Zoning that applies to the Kensico Reservoir work sites. Watershed and water supply uses require a special permit.
Public Policy. The same public policies apply to the Kensico Reservoir work sites and the study area as those that apply to the Eastview Site, with the exception of the Town of Greenburgh’s Comprehensive Plan. See Section 4.2, Land Use, Zoning, and Public Policy, for a description of the applicable public policies.


FEIS KENRESWORKSITES 19
5.1.2.1.2. Visual Character
Work Sites. As mentioned above in the Section 4.2 Land Use, Zoning, and Public Policy,
all of the work sites where work would be conducted in order to pressurize the Catskill Aqueduct, fill the Aerators, and to potentially install a water main connection from Delaware Shaft No. 18 to the Commerce Street Pumping Station, are located on City-owned property. This area consists of many water supply-related infrastructure components. The Upper and Lower Effluent Chambers, the existing Screen Chamber, and the Delaware Shaft No. 18 are above grade structures. They are similar in appearance, with grey stone facades, with heights of approximately 40 feet. The Catskill and Delaware Aerators are two at-grade structures that are clearly visible from viewpoints off-site due to their size. A separate UV building could also be constructed for the Town of Mount Pleasant, if this option is chosen, at the existing Stevens Avenue Storage Tanks within a new stand-alone building located on Town property, to the southeast of the existing storage tanks. The building would be located on a cleared area that is part of Town property. The footprint of the Mount Pleasant UV building would be approximately 30 feet by 40 feet. The remaining work sites are simply marked by at-grade cement blocks or metal plates, which provide access to the Catskill Aqueduct. The visual character of the area near the Kensico Reservoir work sites is anticipated to remain largely unchanged, with the exception of the construction of a new Screen Chamber and the filling of the Catskill and Delaware Aerators. The effects of these changes are described below in Section 5.1.3.1, Potential Project Impacts. Additionally, during construction, temporary activities could change the visual character of the area. These effects are presented below in Section 5.1.3.2.2, Potential Construction Impacts, Visual Character.
5.1.2.1.3. Community Facilities
There is only one school within the study area for the Kensico Reservoir work sites. It is the Valhalla Middle/High School and it is located at 300 Columbus Avenue. In 2002-2003, 336 students enrolled in the middle school and 365 students enrolled in the high school.1 The school is just north of the northern City property boundary of the Kensico campus. It is part of the Valhalla Union Free School District. The school has athletic fields that are described in the Open Space section below.
No direct impacts on the area community facilities are anticipated as part of this off-site work associated with the proposed project. Therefore, a detailed analysis of the potential impacts of the off-site work on this parameter was not conducted. Potential temporary effects on community facilities during construction are discussed in the Section 5.1.3.2, Potential Construction Impacts below.
1 Information taken on April 25, 2004 from New York State School Report Card Comprehensive Information Report for Valhalla High School & New York State School Report Card Comprehensive Information Report for Valhalla Middle School (http://www.emsc.nysed.gov/repcrdfall2003/cir/660805030004.pdf & http://www.emsc.nysed.gov/repcrd2003/cir/660805030005.pdf).

FEIS KENRESWORKSITES 20
5.1.2.1.4. Open Space
All of the locations at Kensico Reservoir are owned by the City of New York, are not
accessible to the public, and have not been designated for recreational or environmental purposes. Therefore, an analysis of direct impacts on open space is not necessary. However, there are open spaces associated with Valhalla Middle/High School. These open spaces include four baseball/softball fields, a running track, and a soccer-sized athletic field inside the running track.
5.1.2.1.5. Neighborhood Character
The Kensico Reservoir work locations are located in the Town of Mount Pleasant beside
the southwestern shore of Kensico Reservoir and they generally follow the route of the Catskill Aqueduct, with the exception of the Delaware Aerator and the Delaware Shaft No. 18. The four aboveground structures (the UEC, LEC, Screen Chamber, and the Delaware Shaft No. 18) are similar in appearance, with grey stone facades. The Catskill and Delaware Aerators are at-grade structures. The remaining work locations are simply marked by concrete blocks or metal hatches laid flush with the ground. Large overhead electrical transmission lines follow the path of the Catskill Aqueduct, which is generally characterized as an open corridor without trees or shrubs. In general, the easternmost work location (the UEC) is situated at the highest elevation, and the land slopes downward as it approaches the westernmost location (the Boat Hole). The UEC is located on the bank of the Reservoir and is surrounded by a heavily wooded area. The Delaware Shaft No. 18 is also located in a cleared area on the bank of the Kensico Reservoir. The remaining work sites are located in more open areas, with the LEC, Catskill and Delaware Aerators, Fluoridation Pit, and Screen Chamber having direct views from adjacent public roadways and/or residences. The Catskill Venturi and Boat Hole are visible only to local residences. The Kensico Reservoir work sites may meet the eligibility criteria for listing on the National Register of Historic Places. They were constructed in the early 1900s. The study area surrounding the Kensico Reservoir work locations has a relatively low population density, as the majority of the land in this area is occupied by water supply uses and institutional uses, and the residential areas are predominantly low-density neighborhoods. Employment in the study area is generated by the NYCDEP on the Kensico campus and by the Valhalla Union Free School District, with its high school and middle school located directly north of the Kensico campus. While some of the work locations are located within the Kensico campus east of Columbus Avenue, the remaining work locations are located within a narrow right-of-way that abuts several residential properties, as well as areas of undeveloped land. There are several homes located along the west side of Columbus Avenue, but the majority of homes within the study area are located on smaller, interior local roads. The Kensico Reservoir and the above ground water supply structures mentioned above are the dominant visual forms in this area. Views of these locations are most pronounced from residences and motorists traveling along West Lake Drive and Columbus Avenue (see Visual Character above). Several community services are located in the study area, including the Valhalla Middle/High School, a soccer field, and a church. During

FEIS KENRESWORKSITES 21
athletic events, the soccer field generates a considerable amount of activity along West Lake Drive, where no off-street parking is available. Vehicles park along the western side of West Lake Drive, directly beside the field. No parking is permitted on the eastern side of the roadway, beside the Kensico campus, so there is no pedestrian activity across the roadway. The study area’s principal collector roads include West Lake Drive, Columbus Avenue, and Lakeview Avenue. In addition to these roads, Route 100C, Bradhurst Avenue, Legion Drive, and Commerce Street have also been examined, as they may convey trucks carrying excavated material from the Eastview Site to the Aerators. Many of these roads are bordered by large cemeteries. Route 100C and Columbus Avenue convey the greatest amount of traffic, which means they are also characterized by higher noise levels than the local roadways, where most residences are located. Route 100C and Columbus Avenue are also characterized by large institutional land uses such as Grasslands Reservation, Blythedale Children’s Hospital, the Margaret Chapman School, Westchester Community College, and the Valhalla Middle/High School. There are no major commercial centers in the quarter-mile study area or along the truck routes; instead, there are scattered commercial uses catering to the cemeteries and travelers near the Sprain Brook Parkway interchange.
5.1.2.1.6. Socioeconomic Conditions
The analysis of socioeconomic conditions refers to the potential for the proposed work at the off-site work sites to either directly (i.e., geographically) displace existing populations, employment, or facilities; or indirectly displace existing populations, employment, or facilities due to changes in taxes, property values, living conditions, or water rates that could potentially result from the proposed project. As noted in Section 4.7, Socioeconomic Conditions, the project as a whole is not anticipated to have indirect displacement impacts related to increases in water rates. (The water rate analysis considered the capital costs of work related to the Kensico Reservoir work sites.) Therefore, a water rate discussion is not necessary in this section. Within the Kensico campus, employment is generated by NYCDEP and employment in the surrounding study area is generated by a middle school, high school, and a church. The study area contains a relatively small residential population, as the majority of the area is occupied by water supply uses and institutional uses, and the residential areas are mainly low-density neighborhoods.
The Kensico campus, including all of the work sites and other water supply facilities, currently (2004 for Town and County; 2003/2004 for School) generates annual property taxes/PILOTs of $4.44 million, including $589,692 for the Town of Mount Pleasant, $2.94 million for the Valhalla Union Free School District, and $911,717 for the County.2
2 Information provided by Town of Mount Pleasant Tax Department on May 18, 2004.

FEIS KENRESWORKSITES 22
5.1.2.1.7. Growth Inducement
Construction at the Kensico Reservoir work locations is unlikely to induce growth since the work would entail modifications to existing structures and two small new structures (the new Screen Chamber and the possible separate UV building). These improvements are unlikely to produce additional tax revenues for the Town of Mount Pleasant or school district. Therefore, an analysis of growth inducement is not necessary.
5.1.2.1.8. Traffic and Transportation
This section identifies the study area and street system considered in the analyses and describes the operation of the various study area intersections (and their approaches and lane groups) based on their ability to process traffic and calculated using the HCM methodologies, described in Section 3.9, Data Collection and Impact Methodologies, Traffic and Transportation. The study examines the proposed trucking activity associated with the filling of the Aerators, and the traffic that would be generated by the pressurization of the Catskill Aqueduct and construction of the new Screen Chamber. Two separate studies were conducted: an analysis of 2006 conditions, when the Delaware Aerator and a portion of the Catskill Aerator would be filled; and an analysis of 2010, the year of construction activity at the Kensico Reservoir work sites, when all three components of the proposed work would be underway (the balance of filling of the Catskill Aerator, Aqueduct pressurization, construction of the new Screen Chamber). The 2006 analysis examines some of the same intersections (as shaded in gray in Figure 5.1-4 (for ease of reading, Figures 5.1-4 to 5.1-12 are located at the end of Section 5.1) as the main traffic analysis in Section 4.9, Traffic and Transportation, plus additional intersections along Grasslands Road, Lakeview Avenue, Commerce Street, Stevens Avenue, and Virginia Road that are close to the Kensico campus. The 2010 analysis examines two to four key intersections (depending on the peak hour analyzed) near the Kensico campus. See Flowchart 5.1-1, which shows the framework of the traffic analysis.
2006 Analysis. For the 2006 analysis, “existing” conditions are an amalgamation of traffic volumes established between 2002 and 2004. Peak future trucking activity associated with filling the Aerators in 2006 (peak year of truck activity) is examined both with and without the Croton project for five truck route options.3 These five truck route options examine different routes that trucks could travel between the Eastview Site (source of the fill) and the Delaware and Catskill Aerators at Kensico Reservoir (where the fill would be placed). These routes are as follows:
• Option A - 100 percent of the trucks traveling on Lakeview Avenue. • Option B - 100 percent of the trucks traveling on Grasslands Road (Route
100/100C)/Commerce Street. • Option C- An even 50/50 percent split between Lakeview Avenue and Grasslands
Road (Route 100/100C/Commerce Street.
3 The Croton project may be constructed on the Eastview Site, depending on the outcome of legal challenges to the preferred Mosholu Site. Trips generated by the Croton project at the Eastview Site would utilize the same traffic network as the trips generated by the proposed construction work at Kensico Reservoir.
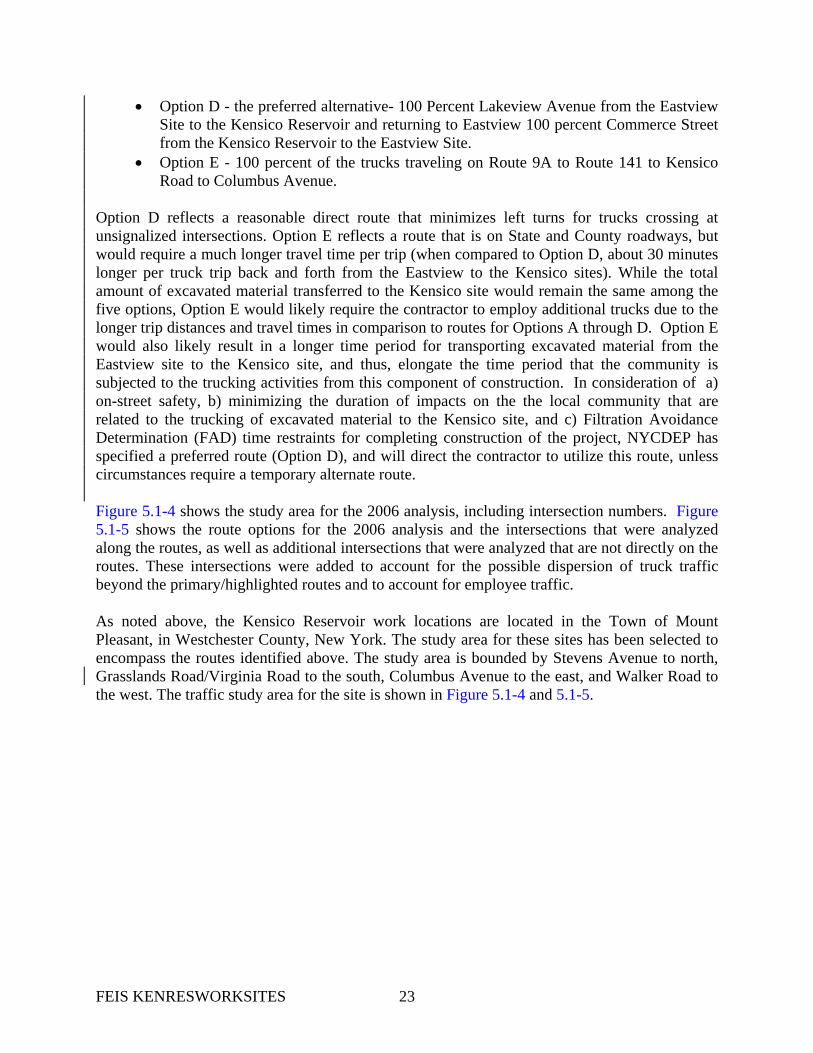
FEIS KENRESWORKSITES 23
• Option D - the preferred alternative- 100 Percent Lakeview Avenue from the Eastview Site to the Kensico Reservoir and returning to Eastview 100 percent Commerce Street from the Kensico Reservoir to the Eastview Site.
• Option E - 100 percent of the trucks traveling on Route 9A to Route 141 to Kensico Road to Columbus Avenue.
Option D reflects a reasonable direct route that minimizes left turns for trucks crossing at unsignalized intersections. Option E reflects a route that is on State and County roadways, but would require a much longer travel time per trip (when compared to Option D, about 30 minutes longer per truck trip back and forth from the Eastview to the Kensico sites). While the total amount of excavated material transferred to the Kensico site would remain the same among the five options, Option E would likely require the contractor to employ additional trucks due to the longer trip distances and travel times in comparison to routes for Options A through D. Option E would also likely result in a longer time period for transporting excavated material from the Eastview site to the Kensico site, and thus, elongate the time period that the community is subjected to the trucking activities from this component of construction. In consideration of a) on-street safety, b) minimizing the duration of impacts on the the local community that are related to the trucking of excavated material to the Kensico site, and c) Filtration Avoidance Determination (FAD) time restraints for completing construction of the project, NYCDEP has specified a preferred route (Option D), and will direct the contractor to utilize this route, unless circumstances require a temporary alternate route.
Figure 5.1-4 shows the study area for the 2006 analysis, including intersection numbers. Figure 5.1-5 shows the route options for the 2006 analysis and the intersections that were analyzed along the routes, as well as additional intersections that were analyzed that are not directly on the routes. These intersections were added to account for the possible dispersion of truck traffic beyond the primary/highlighted routes and to account for employee traffic.
As noted above, the Kensico Reservoir work locations are located in the Town of Mount Pleasant, in Westchester County, New York. The study area for these sites has been selected to encompass the routes identified above. The study area is bounded by Stevens Avenue to north, Grasslands Road/Virginia Road to the south, Columbus Avenue to the east, and Walker Road to the west. The traffic study area for the site is shown in Figure 5.1-4 and 5.1-5.

NOTES: FOOT NOTES:
See Section 4.9 - Traffic and Transportation for the 2008 and 2010 Analysis ofConstruction and Operation Respectively, of the Proposed UV Facility.
See Section 7 - Alternatives, for the Traffic Analysis of Extended Hours DuringSite Preparation, Trades Workers Double Shifts, and No Filling of Aerators
1 - Analyzes Some of the Same Study Area Intersections as Section 4.9 Plus Addidtional Intersections
2 - Analyzes 2 to 4 Key Intersections
3 - No Operational Traffic Analysis was Conducted, because no Additional Traffic would be Generated after the Work is Completed
2002 - 2004
20061
Future Analysis Year
20102
Future Analysis Year
Future Without the Project(Section 5.1.3.2.7)
Future Without the Project(Section 5.1.3.2.7)
Future With the Project3
(Section 5.1.3.2.7)
TRUCK ROUTE OPTIONS:
Future With the Project3
(Section 5.1.3.2.7)
EXISTING CONDITIONS(Section 5.1.2.1.8)
2004
TRUCK ANALYSIS OFFILLING OF DELAWARE AERATOR
ANALYSIS OFFILLING OF CATSKILL AERATOR,
CATSKILL AQUEDUCT PRESSURIZATION,AND NEW SCREEN CHAMBER
EXISTING CONDITIONS(Section 5.1.2.1.8)
Opt. A - 100% Lakeview Ave.
Opt. B - 100% Grasslands Rd./Commerce St.
Opt. C - 50/50% Split between Opt. A and Opt. B
Opt. D - Circular Route
Opt. E - Rt. 9A/Rt. 141/Columbus Ave.
Catskill/Delaware UV Facility
Flowchart 5.1-1
H&
S F
ile: G
:\947
0\36
0\Fi
nal E
IS G
raph
ics\
Traf
fic F
inal
\Ch1
-Flo
wch
art.a
i 10
/04
�
Traffic and TransportationFramework of Analysis

FEIS KENRESWORKSITES 25
The street network consists primarily of three north-south roadways – the Taconic State Parkway (TSP), Commerce Street, Columbus Avenue, and two east-west roadways – Grasslands Road and Lakeview Avenue.
The TSP is a major north-south arterial roadway that begins in Valhalla and travels north to Columbia County in upstate New York. In this area, the TSP consists of two travel lanes in each direction with a guard rail center median.
Commerce Street and Columbus Avenue are one- to two-lane, north-south local roads. Commerce Street intersects with the TSP to a form a signalized intersection. Columbus Avenue at its intersection with West Lake Drive provides access to City property at the Kensico campus.
Grasslands Road4 (Route 100/100C) is an east-west collector roadway. In the study area, Route 100C consists of one to two lanes in each direction.
Lakeview Avenue is a local east-west roadway that provides one travel lane in each direction. Lakeview Avenue extends from Bradhurst Avenue (its western terminus) to Columbus Avenue (its eastern terminus). Within the study area, Lakeview Avenue is signalized at its intersection with the TSP and Columbus Avenue. For the 2006 truck route Option E analysis, “existing” conditions are an amalgamation of traffic volumes established between 2002 and 2004. Peak future trucking activity associated with filling of the Aerators in 2006 (peak year of truck activity) is examined without the Croton project for truck route Option E. As shown in Figure 5.1-6, the following 13 intersections were identified for detailed analysis:
• Dana Road/Route 9A • Saw Mill River Parkway NB Ramps/Route 9A/Hotel-Applebee’s Driveway • Route 141/Memorial Drive/Sprain Brook Parkway SB Ramp • Route 141/W. Cross Street/Broadway • Route 141/Elwood Avenue • Route 141 (Elwood Avenue)/Commerce Street • Route 141 (Commerce Street)/Manhattan Avenue/Lincoln Avenue • Route 141 (Broadway)/Kensico Road/Marble Avenue • Kensico Road/Commerce Street/Westchester Avenue • Kensico Road/Nanny Hagen Road • Columbus Avenue/Stevens Avenue NB • Columbus Avenue/Stevens Avenue SB • Columbus Avenue/West Lake Drive
4 Grasslands Road is designated as Route 100C from its intersection with Saw Mill River Road (Route 9A) to its intersection with Bradhurst Avenue (Route 100). East of this intersection, Grasslands Road is designated as Route 100.
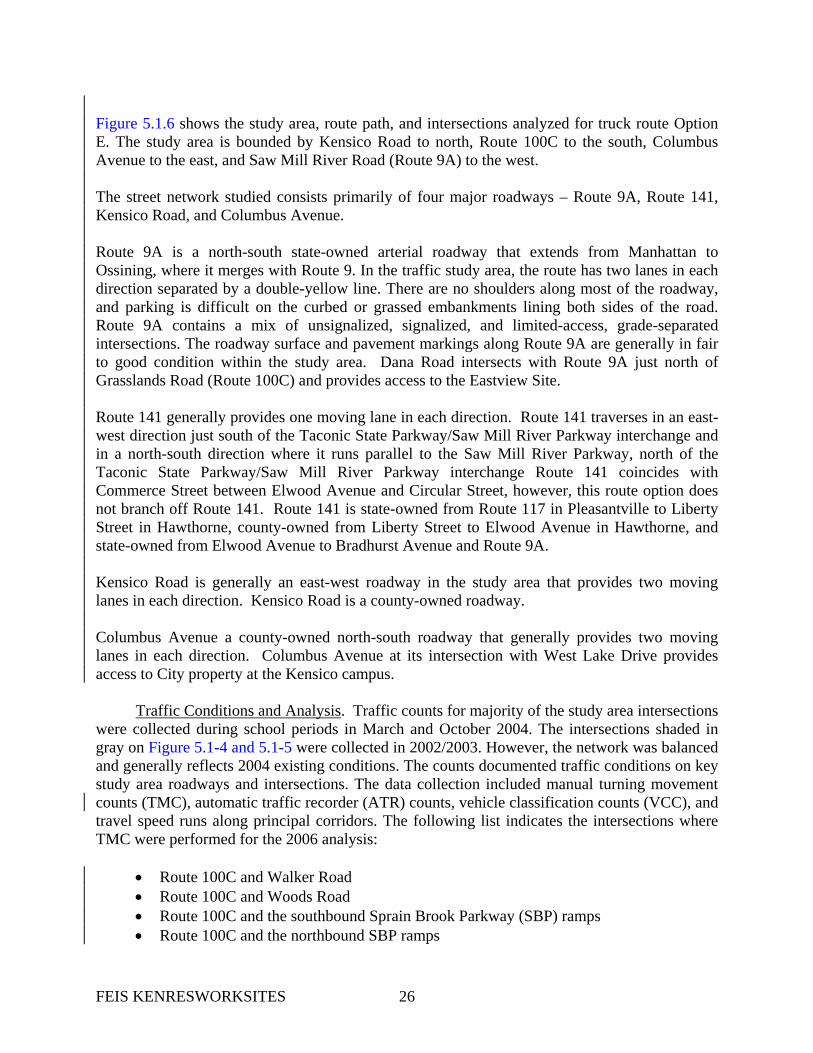
FEIS KENRESWORKSITES 26
Figure 5.1.6 shows the study area, route path, and intersections analyzed for truck route Option E. The study area is bounded by Kensico Road to north, Route 100C to the south, Columbus Avenue to the east, and Saw Mill River Road (Route 9A) to the west. The street network studied consists primarily of four major roadways – Route 9A, Route 141, Kensico Road, and Columbus Avenue. Route 9A is a north-south state-owned arterial roadway that extends from Manhattan to Ossining, where it merges with Route 9. In the traffic study area, the route has two lanes in each direction separated by a double-yellow line. There are no shoulders along most of the roadway, and parking is difficult on the curbed or grassed embankments lining both sides of the road. Route 9A contains a mix of unsignalized, signalized, and limited-access, grade-separated intersections. The roadway surface and pavement markings along Route 9A are generally in fair to good condition within the study area. Dana Road intersects with Route 9A just north of Grasslands Road (Route 100C) and provides access to the Eastview Site. Route 141 generally provides one moving lane in each direction. Route 141 traverses in an east-west direction just south of the Taconic State Parkway/Saw Mill River Parkway interchange and in a north-south direction where it runs parallel to the Saw Mill River Parkway, north of the Taconic State Parkway/Saw Mill River Parkway interchange Route 141 coincides with Commerce Street between Elwood Avenue and Circular Street, however, this route option does not branch off Route 141. Route 141 is state-owned from Route 117 in Pleasantville to Liberty Street in Hawthorne, county-owned from Liberty Street to Elwood Avenue in Hawthorne, and state-owned from Elwood Avenue to Bradhurst Avenue and Route 9A. Kensico Road is generally an east-west roadway in the study area that provides two moving lanes in each direction. Kensico Road is a county-owned roadway. Columbus Avenue a county-owned north-south roadway that generally provides two moving lanes in each direction. Columbus Avenue at its intersection with West Lake Drive provides access to City property at the Kensico campus.
Traffic Conditions and Analysis. Traffic counts for majority of the study area intersections were collected during school periods in March and October 2004. The intersections shaded in gray on Figure 5.1-4 and 5.1-5 were collected in 2002/2003. However, the network was balanced and generally reflects 2004 existing conditions. The counts documented traffic conditions on key study area roadways and intersections. The data collection included manual turning movement counts (TMC), automatic traffic recorder (ATR) counts, vehicle classification counts (VCC), and travel speed runs along principal corridors. The following list indicates the intersections where TMC were performed for the 2006 analysis:
• Route 100C and Walker Road • Route 100C and Woods Road • Route 100C and the southbound Sprain Brook Parkway (SBP) ramps • Route 100C and the northbound SBP ramps

FEIS KENRESWORKSITES 27
• Route 100C and Bradhurst Avenue (Route 100)/Knollwood Road (Route 100A) • Route 100 and the Westchester Community College (WCC) West Gate • Route 100 and the WCC East Gate • Route 100 and Legion Drive • Route 100 and Virginia Road • Virginia Road and the Bronx River Parkway • Bradhurst Avenue and Lakeview Avenue • Lakeview Avenue and Commerce Street • Lakeview Avenue and the TSP • Lakeview Avenue and Columbus Avenue • Commerce Street and Legion Drive • Commerce Street and the TSP • Commerce Street and Stevens Avenue • Stevens Avenue and the TSP • Stevens Avenue and Columbus Avenue (Northbound and Southbound roadways) • Columbus Avenue and West Lake Drive
Additional Option E Intersections:
• Route 141 and Memorial Drive and Sprain Brook Parkway SB Ramp • Route 141 and W. Cross Street and Broadway • Route 141 and Elwood Avenue • Route 141 (Elwood Avenue) and Commerce Street • Route 141 (Commerce Street) and Manhattan Avenue/Lincoln Avenue • Route 141 (Broadway) and Kensico Road/Marble Avenue • Kensico Road and Commerce Street/Westchester Avenue • Kensico Road and Nanny Hagen Road • Columbus Avenue (Northbound and Southbound) and Stevens Avenue • Columbus Avenue and West Lake Drive
The TMC at the first 20 of the above listed intersections were conducted on mid-weekdays (Tuesday to Thursday) from 6:30AM to 10AM and from 2PM to 6PM to capture the AM, midday and PM peak hours. The mid-day peak hour was created by factoring the TMC data with the ATR data. For Option E the TMC at all of the remaining 10 intersections were conducted on mid-weekdays (Tuesday to Thursday) from 6:00 AM to 9 AM, 12:00 PM to 2:00 PM, and 3:00 PM to 6:00 PM to capture the AM, midday, and PM peak hours, respectively.

FEIS KENRESWORKSITES 28
The volumes for the remaining intersections were obtained from the Croton project Final Supplemental EIS (these counts were collected in 2002/2003, however the network was balanced and generally reflects 2004 existing conditions):
• Route 9A/Dana Road • Route 9A/Saw Mill River Parkway NB Ramps
In addition to TMC, ATR data counts have been performed for 24-hour periods for seven days at the following locations:
• Lakeview Avenue between Bradhurst Avenue and Commerce Street • Columbus Avenue -- south of Lakeview Avenue
For Option E TMC, ATR data counts have been performed for 24-hour periods for seven days at these additional ocations:
• Route 141 - just north of Ft. Washington Avenue • Kensico Road - just north of Nanny Hagen Road • Columbus Avenue - just north of Stevens Avenue • Route 9A - just north of Dana Road
The vehicle classification counts were performed from 6:30 AM to 10AM and 2PM to 6PM. These hours, as well as the hours for which the TMC were performed, were chosen as representative of the periods of heaviest traffic volumes during potential fill activity. It has been assumed that the fill operation would commerce at 8AM and finish no later than 4:30 PM. For Option E, the VCC were performed concurrently with the TMC and consisted of 20-minute sample counts at key intersections along the truck route, via the floating car method6, speed run measurements were taken concurrently with the TMC and VCC during the AM, midday, and PM peak periods along the route. To develop the existing condition traffic volumes for the study area intersections, the traffic volumes from the TMC were factored utilizing the ATR counts. The resultant intersection turning movement volumes represent an average mid-weekday volume. Since the study intersections represent only a portion of the roadways in the study area, the turning movement volumes of adjacent intersections may not balance, i.e., the traffic exiting one study intersection may not equal the traffic entering the adjacent study intersection. This is due to several possible factors including other intersecting roads and residential and commercial entrances between study area intersections, different count days, and counts performed in different months. The existing condition traffic volumes for the AM, midday and PM peak hours are illustrated in Figures 5.1-7, 5.1-8, and 5.1-9, respectively.
6 Travel speed and delay data are generally collected via the “floating car technique,” in which the survey car seeks to travel at the speed of a typical car in the traffic stream. It achieves this by passing approximately the same number of cars as it is passed by.

FEIS KENRESWORKSITES 29
Currently, traffic volumes along Route 100C/Route 100 in the study area range between 290 and 1,380 vehicles per hour (vph) in each direction during the AM peak hour. During the midday peak hour, volumes range from 225 to 720 vph. During the PM peak hour, volumes range from 390 to 1,115 vph. Currently, traffic volumes along Lakeview Avenue range between 75 and 295 vph in each direction during the AM peak hour. During the midday peak hour volumes range from 65 to 135 vph. During the PM peak hour, volumes range from 110 to 235 vph. Currently, traffic volumes along Commerce Street range between 20 and 105 vph in each direction during the AM peak hour. During the midday peak hour, volumes range from 50 to 95 vph. During the PM peak hour, volumes range from 70 to 160 vph. Currently, traffic volumes along Columbus Avenue range between 295 and 650 vph in each direction during the AM peak hour. During the midday peak hour, volumes range from 320 to 670 vph. During the PM peak hour, volumes range from 410 to 1,140 vph. Currently, traffic volumes along the TSP in the study area range between 320 and 1,330 vph in each direction during the AM peak hour. During the midday peak hour, volumes range from 530 to 1,320 vph. During the PM peak hour, volumes range from 760 to 2,100 vph. Under existing conditions, all signalized intersections (see Table 5-1.2) operate with an acceptable overall level of service (LOS) D or better during all three peak hours analyzed. The two exceptions are the intersection of Virginia Road and the Bronx River Parkway, which operates at unacceptable LOS D and LOS E during the AM and PM peak hours, respectively and the intersection of Grasslands Road (Route 100C) and Bradhurst Avenue which operates at unacceptable LOS D during the AM peak hour. At unsignalized intersections (see Table 5.1-2), all approaches operate at acceptable LOS D or better with the following exceptions:
• The westbound approach at the Grasslands Road (Route 100) and Virginia Road intersection operates at LOS E during the AM peak hour and LOS F during both the midday and PM peak hours.
• The southbound approach at the Grasslands Road (Route 100) and Legion Drive
intersection operates at LOS F during all three peak hours analyzed. • The northbound approach at the Grasslands Road (Route 100) and the WCC West Gate
intersection operates at LOS F during the AM peak hour and LOS E during the PM peak hour.
• The southbound approach at the Commerce Street and Legion Drive intersection operates
at LOS F during the PM peak hour.

FEIS KENRESWORKSITES 30
• The westbound approach at the Columbus Avenue and West Lake Drive intersection operates at LOS E during the PM peak hour.
Option E Intersections The existing condition traffic volumes for the AM, midday and PM peak hours for Option E are illustrated in Figures 5.1-10, 5.1-11, and 5.1-12, respectively. Currently, traffic volumes along Saw Mill River Road (Route 9A) in the study area range between 412 and 1,036 vehicles per hour (vph) in each direction during the AM peak hour. During the midday peak hour, volumes range from 640 to 914 vph. During the PM peak hour, volumes range from 671 to 890 vph. Currently, traffic volumes along Route 141 range between 175 and 1,022 vph in each direction during the AM peak hour in the study area. During the midday peak hour, volumes range from 233 to 618 vph. During the PM peak hour, volumes range from 225 to 785 vph. Currently, traffic volumes along Kensico Road range between 514 and 1,253 vph in each direction during the AM peak hour in the study area. During the midday peak hour, volumes range from 507 to 583 vph. During the PM peak hour, volumes range from 496 to 891 vph. Currently, traffic volumes along Columbus Avenue range between 326 and 984 vph in each direction during the AM peak hour in the study area. During the midday peak hour, volumes range from 308 to 677 vph. During the PM peak hour, volumes range from 411 to 1,140 vph. Under existing conditions, all signalized intersections (see Table 5.1-3) operate with an acceptable overall level of service (LOS) D or better during all three peak hours analyzed (a LOS D for signalized intersections is considered unacceptable when the vehicle delay value is greater than 45.0 seconds). The one exception is the intersection of Broadway (Route 141) and Kensico Road/Marble Avenue which operates at unacceptable LOS D during the AM peak hour. At the unsignalized intersections (see Table 5.1-4), all approaches operate at acceptable LOS D or better during all three peak hours analyzed (a LOS D for unsignalized intersections is considered unacceptable when the vehicle delay value is greater than 30.0 seconds). The one exception is the westbound approach (left-turn lane group) at the Columbus Avenue and West Lake Drive intersection which operates at unacceptable LOS E during the PM peak hour.

2002/2003/2004 Existing ConditionsAM Peak Hour Midday Peak Hour PM Peak Hour
Lane v/c Delay v/c Delay v/c DelayIntersection No. Approach Group Ratio (sec) LOS Ratio (sec) LOS Ratio (sec) LOS
Grasslands Road (Rt. 100C) (E-W) @ 6 Eastbound L 1.05 97.8 F 0.19 14.7 B 1.01 113.0 FBradhurst Avenue (Rt. 100) T 0.96 58.2 E 0.32 58.2 B 0.52 21.0 C
R 0.34 16.2 B 0.16 9.4 A 0.24 11.8 BWestbound L 1.00 151.7 F 0.06 13.5 B 0.18 17.5 B
TR 0.64 30.4 C 0.36 16.5 B 0.88 37.1 DNorthbound L 0.33 27.4 C 0.48 44.0 D 0.72 41.9 D
TR 0.28 25.2 C 0.13 26.0 C 0.18 16.2 BSouthbound L 0.53 39.5 D 0.24 35.6 D 0.27 24.7 C
TR 0.86 65.3 E 0.92 69.0 E 1.01 76.1 EIntersection 51.0 D 31.7 C 42.6 D
Grasslands Road (Rt.100C) @ 24 Eastbound L 0.03 17.8 B 0.01 6.5 A 0.03 9.1 AClearbrook Road/Walker Road TR 0.84 29.3 C 0.45 8.9 A 0.61 14.3 B
Westbound L 0.86 44.6 D 0.27 7.9 A 0.82 34.3 CTR 0.90 32.4 C 0.30 7.9 A 0.60 14.2 B
Northbound LT 0.21 28.8 C 0.12 18.6 B 0.18 19.8 BSouthbound LT 0.03 27.4 C 0.18 19.1 B 0.21 20.1 C
R 0.00 27.2 C 0.00 17.9 B 0.01 18.5 BIntersection 33.5 C 9.6 A 17.4 B
Grasslands Road (Rt.100C) @ 25 Eastbound L 0.36 11.3 B 0.10 5.8 A 0.25 11.7 BWoods Drive/Taylor Road TR 0.27 4.6 A 0.33 6.7 A 0.48 11.4 B
Westbound L 0.02 8.9 A 0.00 10.6 B 0.00 12.5 BTR 0.71 16.2 B 0.31 12.8 B 0.63 19.1 B
Northbound LTR 0.03 34.6 C 0.01 31.3 C 0.01 24.6 CSouthbound LT 0.45 38.7 D 0.77 48.9 D 0.72 37.0 D
R 0.07 21.7 C 0.09 21.9 C 0.10 17.1 BIntersection 13.6 B 14.8 B 17.8 B
Grasslands Road (Rt.100C) @ 26 Eastbound TR 0.32 4.2 A 0.35 2.9 A 0.57 10.1 BSprain Brook Pkwy SB Ramp Westbound T 0.50 5.2 A 0.20 2.4 A 0.46 8.9 A
Southbound L 0.45 40.0 D 0.43 47.0 D 0.16 29.5 CR 1.05 105.6 F 0.27 45.4 D 0.10 29.0 C
Intersection 19.1 B 4.9 A 10.4 BGrasslands Road (Rt.100C) @ 27 Eastbound L 0.12 12.8 B 0.29 10.3 B 0.43 14.4 BSprain Brook Pkwy NB Ramp 30 T 0.39 14.6 B 0.22 9.7 A 0.28 8.7 A
Westbound TR 0.44 20.0 C 0.39 16.8 B 0.95 39.6 DNorthbound LT 1.05 77.4 E 0.35 28.4 C 0.58 26.1 C
R 0.93 55.6 E 0.16 26.6 C 0.32 22.8 CIntersection 44.4 D 16.0 B 27.9 C
Virginia Road (E-W) @ 31 Eastbound LT 1.05 96.2 F 1.05 105.2 F 1.05 103.3 FBronx River Parkway R 0.32 20.9 C 0.32 33.7 C 0.36 34.2 C
Westbound LTR 0.54 37.3 D 0.6 39.9 D 1.05 107.4 FNorthbound L 0.08 46.6 D 0.02 9.4 A 0.04 10.5 B
TR 0.57 24.4 C 0.35 21.1 C 0.58 24.6 CSouthbound L 1.05 111.6 F 0.06 9.3 A 0.12 11.2 B
T 1.05 68.3 E 0.42 21.9 C 0.55 24.0 CIntersection 62.4 E 40 D 46.1 D
Grasslands Road (Rt 100) @ 34 Eastbound T 0.33 5.0 A 0.56 11.1 B 0.66 15.0 BWCC East Gate Westbound L 0.32 2.9 A 0.13 6.9 A 0.19 10.3 B
T 0.32 2.0 A 0.28 4.3 A 0.53 7.4 ANorthbound L 0.25 51.7 D 0.4 27.7 C 0.58 29.5 C
Intersection 4.6 A 10.4 B 13.5 BTaconic State Parkway @ 38 Eastbound LTR 1.05 104.6 F 0.69 42.6 D 1.05 107.4 FLakeview Avenue (E-W) Westbound LTR 0.95 93.9 F 0.43 34.9 C 0.99 96.7 F
Northbound L 0.20 4.8 A 0.05 4.0 A 0.15 4.4 ATR 0.20 4.4 A 0.61 7.1 A 1.02 36.9 D
Southbound L 0.03 3.9 A 0.11 4.3 A 0.32 7.2 ATR 0.55 6.5 A 0.27 4.7 A 0.40 5.4 A
Intersection 24.5 C 10.5 B 36.7 DTaconic State Parkway @ 39 Eastbound LTR 0.48 39.6 D 0.16 27.7 C 0.24 28.4 CCommerce St. (E-W) Westbound LTR 0.69 49.5 D 0.34 29.3 C 0.67 36.2 D
Northbound LTR 0.26 2.8 A 0.66 10.7 B 1.05 50.8 DSouthbound LTR 0.58 4.4 A 0.35 7.4 A 0.70 12.2 B
Intersection 7.9 A 11.3 B 39.0 D
TABLE 5.1-2. LEVEL-OF-SERVICE ANALYSIS RESULTS FOR SIGNALIZED INTERSECTIONS: 2002/2003/2004 EXISTING TRAFFIC CONDITIONS
FEIS KENRESWORKSITES 31

2002/2003/2004 Existing ConditionsAM Peak Hour Midday Peak Hour PM Peak Hour
Lane v/c Delay v/c Delay v/c DelayIntersection No. Approach Group Ratio (sec) LOS Ratio (sec) LOS Ratio (sec) LOS
TABLE 5.1-2. LEVEL-OF-SERVICE ANALYSIS RESULTS FOR SIGNALIZED INTERSECTIONS: 2002/2003/2004 EXISTING TRAFFIC CONDITIONS
Lakeview Avenue (E-W) @ 40 Eastbound LR 0.48 21.4 C 0.35 19.4 B 0.46 20.9 CColumbus Avenue Northbound LT 0.25 8.5 A 0.36 9.4 A 0.69 14.1 B
Southbound TR 0.32 8.9 A 0.20 8.1 A 0.27 8.6 AIntersection 11.7 B 10.8 B 13.6 B
Columbus Avenue (Northbound) @ 42 Eastbound LT 0.53 18.3 B 0.25 14.4 B 0.33 15.3 BStevens Avenue Westbound T 0.39 16.2 B 0.29 14.8 B 0.57 19.1 B
R 0.08 13.0 B 0.07 12.8 B 0.13 13.3 BNorthbound LT 0.47 13.1 B 0.36 10.7 B 0.62 13.5 B
R 0.12 10.4 B 0.21 9.9 A 0.34 11.3 BIntersection 14.8 B 11.9 B 14.6 B
Columbus Avenue (Southbound) @ 43 Eastbound TR 0.77 25.2 C 0.34 14.7 B 0.43 15.9 BStevens Avenue Westbound LT 1.05 76.5 E 0.72 25.0 C 1.05 68.3 E
Southbound LTR 0.25 11.0 B 0.23 10.2 B 0.31 10.8 BIntersection 39.0 D 16.8 B 38.2 D
Stevens Avenue (E-W) @ 44A Eastbound LTR 0.50 19.9 B 0.20 15.2 B 0.33 16.3 BCommerce Street* Westbound LTR 0.24 17.4 B 0.45 17.4 B 0.90 35.8 D
Northbound LTR 0.39 23.4 C 0.28 26.3 C 0.47 28.0 CSouthbound LTR 0.29 22.5 C 0.46 28.1 C 0.66 33.5 C
Intersection 20.6 C 20.4 C 31.3 CElwood Avenue @ 44B Southbound LTR 0.55 33.1 C 0.45 26.3 C 0.63 29.7 CStevens Avenue/Commerce Street* Intersection 33.1 C 26.3 C 29.7 CTaconic State Parkway @ 45 Eastbound LTR 0.06 34.2 C 0.27 31.8 C 0.37 32.8 CStevens Avenue (E-W) Westbound LTR 0.93 81.1 F 0.93 69.6 E 1.05 89.4 F
Northbound L 0.03 3.1 A 0.00 4.4 A 0.01 4.4 ATR 0.14 3.3 A 0.58 7.6 A 0.97 25.6 C
Southbound L 0.42 4.7 A 0.29 6.4 A 0.90 79.5 ETR 0.50 4.9 A 0.23 5.2 A 0.33 5.7 A
Intersection 11.7 B 15.6 B 32.1 CNotes:L = Left Turn, T = Through, R = Right Turn, Def = Defacto Left Turn; LOS = Level of Service.* These two intersections form a 5-leg intersection at Stevens Avenue, Commerce Street, and Elwood Avenue.
FEIS KENRESWORKSITES 32

2002/2003/2004 Existing ConditionsAM Peak Hour Midday Peak Hour PM Peak Hour
Lane v/c Delay v/c Delay v/c DelayIntersection No. Approach Group Ratio (sec) LOS Ratio (sec) LOS Ratio (sec) LOS
Bradhurst Avenue (Rt. 100) @ 5 Southbound LT 0.04 8.5 A 0.01 7.7 A 0.01 8.0 ALakeview Avenue (E-W) Westbound LR 0.44 25.0 D 0.16 11.7 B 0.38 16.4 CGrasslands Road (Rt. 100) (N-S) @ 32 Southbound LT 0.33 9.5 A 0.32 9.1 A 0.33 9.9 AVirginia Road Westbound LR 0.85 41.4 E 0.91 61.7 F 1.01 77.2 FGrasslands Road (Rt. 100) (E-W) @ 33 Eastbound LT 0.11 9.3 A 0.17 9.0 A 0.21 10.3 BLegion Drive Southbound L 0.73 59.6 F 1.02 134.2 F 0.99 106.5 F
Southbound R 0.35 15.7 C 0.27 12.6 B 0.41 17.4 CGrasslands Road (Rt. 100) (E-W) @ 34 Westbound LT 0.01 10.2 B 0.06 8.4 A 0.11 8.9 AWCC West Gate Driveway Northbound L 0.73 59.4 F 0.06 19.3 C 0.21 40.5 E
Northbound R 0.06 14.1 B 0.41 14.7 B 0.44 16.4 CCommerce Street @ 36 Eastbound LTR 0.01 7.8 A 0.03 8.0 A 0.05 8.4 ALegion Drive (E-W) Westbound LTR 0.01 7.8 A 0.03 7.9 A 0.06 8.4 A
Northbound LTR 0.15 11.6 B 0.15 13.8 B 0.39 24.1 CSouthbound LTR 0.15 12.2 B 0.21 18.9 C 0.57 55.7 F
Lakeview Avenue (E-W) @ 37 Eastbound LTR 0.02 7.6 A 0.00 7.5 A 0.00 7.7 ACommerce Street Westbound LTR 0.04 8.1 A 0.01 7.5 A 0.01 7.6 A
Northbound LTR 0.05 13.7 B 0.11 10.1 B 0.21 11.6 BSouthbound LTR 0.08 15.3 C 0.09 11.2 B 0.16 13.5 B
Columbus Avenue (N-S) @ 41 Southbound LT 0.13 9.4 A 0.07 9.1 A 0.12 10.7 BWest Lake Drive Westbound L 0.03 25.7 D 0.02 19.6 C 0.09 36.8 E
Westbound R 0.27 12.0 B 0.17 11.3 B 0.39 16.0 CNotes:L = Left Turn, T = Through, R = Right Turn; LOS = Level of Service.
TABLE 5.1-2. LEVEL-OF-SERVICE ANALYSIS RESULTS FOR UNSIGNALIZED INTERSECTIONS: 2002/2003/2004 EXISTING TRAFFIC CONDITIONS
FEIS KENRESWORKSITES 33

2002/2003/2004 Existing ConditionsAM Peak Hour Midday Peak Hour PM Peak Hour
Lane v/c Delay v/c Delay v/c DelayIntersection No. Approach Group Ratio (sec) LOS Ratio (sec) LOS Ratio (sec) LOS
Saw Mill River Road (Rt. 9A) @ 4 Eastbound L 1.03 88.1 F 0.56 42.1 D 0.48 28.6 CSaw Mill River Parkway NB Ramps LTR 0.28 29.0 C 0.08 36.7 D 0.07 25.3 C
Westbound L 0.40 37.5 D 0.09 39.3 D 0.13 34.1 CLT 0.31 36.4 D 0.05 39.1 D 0.08 33.8 CR 0.11 34.9 C 0.02 38.9 D 0.04 33.5 C
Northbound L 0.17 9.6 A 0.46 12.0 B 0.58 16.8 BTR 0.31 8.6 A 0.40 11.6 B 0.47 14.4 B
Southbound L 0.06 12.3 B 0.06 15.6 B 0.10 21.1 CTR 0.75 20.2 C 0.51 20.0 B 0.83 33.7 C
Intersection 30.4 C 18.0 B 24.0 CSaw Mill River Road (Rt. 9A) @ 20 Westbound LR 0.45 37.6 D 0.88 73.9 E 0.70 34.5 CDana Road Northbound TR 0.44 3.3 A 0.41 5.6 A 0.46 7.4 A
Southbound LT 0.78 8.3 A 0.41 5.6 A 0.49 7.7 AIntersection 7.0 A 14.1 B 11.3 B
Columbus Avenue Northbound @ 42 Eastbound LT 0.53 18.3 B 0.25 14.4 B 0.33 15.3 BStevens Avenue Westbound T 0.39 16.2 B 0.29 14.8 B 0.57 19.1 B
R 0.08 13.0 B 0.07 12.8 B 0.13 13.3 BNorthbound LT 0.47 13.1 B 0.36 10.7 B 0.62 13.5 B
R 0.12 10.4 B 0.21 9.9 A 0.34 11.3 BIntersection 14.8 B 11.9 B 14.6 B
Columbus Avenue Southbound @ 43 Eastbound TR 0.77 25.2 C 0.34 14.7 B 0.43 15.9 BStevens Avenue Westbound LT 1.05 76.5 E 0.72 25.0 C 1.05 68.3 E
Southbound LTR 0.25 11.0 B 0.23 10.2 B 0.31 10.8 BIntersection 39.0 D 16.8 B 38.2 D
Broadway (Rt. 141) @ 46A Eastbound TR 0.31 31.3 C 0.47 26.3 C 0.34 34.3 CBradhurst Avenue & Memorial Drive Westbound LT 0.30 31.3 C 0.62 32.3 C 0.39 34.9 C
R 0.26 2.0 A 0.25 2.4 A 0.24 2.3 ANorthbound LTR 0.56 43.2 D 0.28 26.9 C 0.25 39.6 DSouthbound LTR 1.04 54.5 D 0.57 9.6 A 0.69 15.3 B
Intersection 41.5 D 11.9 B 16.2 BBroadway (Rt. 141) @ 47 Eastbound LTR 0.32 6.4 A 0.25 6.0 A 0.27 6.1 AW. Cross Street Westbound LTR 0.29 6.2 A 0.32 6.4 A 0.39 6.8 A
Northbound LTR 0.90 48.8 D 0.69 28.8 C 0.80 35.9 DSouthbound LTR 0.07 20.3 C 0.17 20.9 C 0.29 21.8 C
Intersection 20.5 C 13.0 B 15.3 BBroadway (Rt. 141) @ 51 Eastbound L 0.52 21.0 C 0.49 14.5 B 0.96 73.9 EKensico Road/Marble Avenue TR 1.01 64.5 E 0.49 24.3 C 0.47 18.5 B
Westbound L 0.22 27.2 C 0.09 12.8 B 0.26 25.8 CT 0.48 33.2 C 0.27 21.7 C 0.69 30.8 CR 0.27 31.1 C 0.35 22.7 C 0.42 27.0 C
Northbound L 0.47 21.1 C 0.63 32.5 C 0.39 15.9 BTR 0.40 33.2 C 0.60 41.4 D 0.42 26.9 C
Southbound L 0.27 18.6 B 0.45 26.9 C 0.27 14.2 BTR 0.80 48.0 D 0.98 85.3 F 0.87 49.1 D
Intersection 45.6 D 33.5 C 32.7 CCommerce Street @ 52 Eastbound L 0.06 4.2 A 0.14 11.7 B 0.20 4.9 AKensico Road TR 0.45 5.9 A 0.28 12.6 B 0.19 4.6 A
Westbound L 0.17 4.8 A 0.16 7.6 A 0.15 4.5 ATR 0.21 4.7 A 0.25 8.1 A 0.31 5.2 A
Northbound LT 0.13 29.7 C 0.25 26.4 C 0.41 32.2 CR 0.41 32.1 C 0.22 26.0 C 0.36 31.7 C
Southbound LT 0.15 29.9 C 0.13 32.1 C 0.22 30.4 CR 0.42 32.2 C 0.21 32.8 C 0.26 30.8 C
Intersection 9.3 A 13.3 B 9.8 AColumbus Avenue @ 53 Westbound L 0.53 35.3 D 0.32 32.9 C 0.51 34.9 CNanny Hagen Road R 0.40 19.1 B 0.25 17.6 B 0.44 19.5 B
Northbound T 0.16 13.3 B 0.28 14.3 B 0.42 15.5 BSouthbound L 0.64 8.3 A 0.32 5.7 A 0.44 6.9 A
T 0.41 6.2 A 0.23 5.2 A 0.18 5.0 AIntersection 11.5 B 11.5 B 14.3 B
Notes:L = Left Turn, T = Through, R = Right Turn; LOS = Level of Service.
TABLE 5.1-3. ROUTE 9A/ROUTE 141/KENSICO ROAD/COLUMBUS AVENUE TRUCK ROUTE (OPTION E) LEVEL-OF-SERVICE ANALYSIS RESULTS FOR SIGNALIZED
INTERSECTIONS: 2002/2003/2004 EXISTING TRAFFIC CONDITIONS
FEIS KENRESWORKSITES 34

2002/2003/2004 Existing ConditionsAM Peak Hour Midday Peak Hour PM Peak Hour
Lane v/c Delay v/c Delay v/c DelayIntersection No. Approach Group Ratio (sec) LOS Ratio (sec) LOS Ratio (sec) LOSColumbus A 41 Westbound L 0.03 25.7 D 0.02 19.6 C 0.09 36.8 EWest Lake Drive R 0.27 12.0 B 0.17 11.3 B 0.39 16.0 C
Southbound LT 0.13 9.4 A 0.07 9.1 A 0.12 10.7 BBroadway ( 46B Westbound LT 0.18 12.3 B 0.13 9.6 A 0.25 11.2 BSprain Parkway Southbound RampRoute 141 48A Northbound L 0.19 13.5 B 0.22 15.0 B 0.29 15.4 CElwood Avenue (triangle, western leg) Route 141 48B Eastbound L 0.33 14.2 B 0.43 15.3 C 0.40 14.8 BElwood Avenue R 0.00 9.6 A 0.00 9.7 A 0.00 9.6 A
Northbound LT 0.00 8.1 A 0.00 8.1 A 0.00 8.1 AElwood Ave 49 Eastbound LR 0.26 10.9 B 0.41 12.2 B 0.42 12.9 BCommerce Street Northbound LT 0.00 8.1 A 0.01 8.1 A 0.01 8.1 ACommerce 50 Westbound LR 0.03 13.9 B 0.03 12.2 B 0.05 11.8 BLincoln Place Southbound LT 0.00 8.0 A 0.00 8.1 A 0.01 8.1 ANotes:L = Left Turn, T = Through, R = Right Turn; LOS = Level of Service.
TABLE 5.1-4. ROUTE 9A/ROUTE 141/KENSICO ROAD/COLUMBUS AVENUE TRUCK ROUTE (OPTION E) LEVEL-OF-SERVICE ANALYSIS RESULTS FOR UNSIGNALIZED INTERSECTIONS: 2002/2003/2004 EXISTING
TRAFFIC CONDITIONS
FEIS KENRESWORKSITES 35

FEIS KENRESWORKSITES 36
2010 Analysis. As noted above, the 2010 analysis examines the peak year of construction activity at the Kensico Reservoir work sites, when all three components of the proposed work would be underway (filling of the Catskill Aerator, Catskill Aqueduct pressurization, and construction of the new Screen Chamber). For the 2010 analysis, existing conditions are based on traffic volumes established in 2004. The study area consists of two to four key intersections, depending on the peak hour analyzed, as follows:
• Columbus Avenue and Lakeview Avenue (Early AM, Late AM, and PM Peak Hours) • Columbus Avenue and West Lake Drive (Early AM, Late AM, and PM Peak Hours) • Columbus Avenue (Northbound) and Stevens Avenue (Early AM and PM Peak Hours) • Columbus Avenue (Southbound) and Stevens Avenue (Early AM and PM Peak Hours)
The street network consists primarily of Columbus Avenue, a north-south roadway, and Stevens Avenue, Lakeview Avenue, and West Lake Drive, which are east-west roadways.
Columbus Avenue at the intersection of West Lake Drive provides access to Kensico campus. In the study area, Columbus Avenue consists of one to two lanes in each direction. Just south of Stevens Avenue, Columbus Avenue divides into two separate northbound and southbound roadways, creating two separate signalized intersections with Stevens Avenue. Stevens Avenue, Lakeview Avenue, and West Lake Drive are east-west local roadways that generally have one moving lane in each direction. Stevens Avenue and Lakeview Avenue are signalized at Columbus Avenue. West Lake Drive is unsignalized at Columbus Avenue.
Traffic Conditions and Analysis. Traffic counts for majority of the study area
intersections were collected during school periods in March 2004. The counts documented traffic conditions on key study area roadways and intersections. The data collection included manual TMCs, ATR counts, vehicle classification counts, and travel speed runs along principal corridors. The TMCs were performed for all four intersections listed above during the mid-weekdays (Tuesday to Thursday) from 6AM to 9AM and from 3PM to 6PM to capture the AM and PM peak hours, respectively. In addition to TMC, ATR counts have been performed for 24-hour periods for 7 days at the following locations:
• Columbus Avenue – Between Locust Avenue and Stevens Avenue • Lakeview Avenue – Between Bradhurst Avenue and Columbus Avenue
The vehicle classification counts were performed from 6AM to 9PM and 3PM to 6PM. These hours, as well as the hours for which the TMCs were performed, were chosen as representative of the periods of heaviest traffic volumes during the proposed construction work. To develop the existing condition traffic volumes for the study intersections, the traffic volumes from the TMC were factored utilizing adjacent ATR counts. The resultant intersection turning movement volumes represent an average mid-weekday volume. Since the study intersections represent only a portion of the roadways in the study area, the turning movement volumes of

FEIS KENRESWORKSITES 37
adjacent intersections may not balance, (i.e., the traffic exiting one study intersection may not equal the traffic entering the adjacent study intersection.) This is due to several possible factors including other intersecting roads and residential and commercial entrances between study intersections, different count days, and counts performed in different months. The existing condition traffic volumes for the early AM, late AM, and PM peak hours are illustrated in Figure 5.1-13, 5.1-14, and 5.1-15. Currently, traffic volumes along Columbus Avenue in the study area range between 135 and 289 vehicles per hour (vph) in each direction during the 6:30 AM to 7:30 AM peak hour. During the PM peak hour, volumes range from 384 to 1,140 vph. Under existing conditions all signalized intersections (see Table 5.1-5) operate with an acceptable overall LOS D or better during all three peak hours analyzed. At unsignalized intersections (see Table 5.1-5) all movements/approaches operate at acceptable LOS D or better with the following exceptions:
• The westbound left-turn movement at the Columbus Avenue and West Lake Drive intersection operates at LOS E during the PM peak hour. Safety. For both the 2006 and 2010 analysis, accident data was obtained for the most
recent three-year period at study area intersections and is discussed in Section 4.9, Traffic and Transportation.

Lane v/c DelayIntersection No. Approach Group Ratio (sec) LOS
6:30 - 7:30 AMLakeview Avenue (E-W) @ 40 Eastbound LR 0.27 18.4 BColumbus Avenue Northbound LT 0.14 7.8 A(Signalized) Southbound TR 0.23 8.3 A
Intersection 10.2 BColumbus Avenue (N-S) @ 41 Southbound LT 0.08 8.3 AWest Lake Drive Westbound L 0.00 15.5 C(Unsignalized) R 0.16 10.0 AColumbus Avenue (Northbound) @ 42 Eastbound LT 0.31 15.1 BStevens Avenue Westbound T 0.18 13.8 B(Signalized) R 0.04 12.6 B
Northbound LT 0.21 10.7 BR 0.05 9.8 A
Intersection 12.6 BColumbus Avenue (Southbound) @ 43 Eastbound TR 0.31 15.1 BStevens Avenue Westbound LT 0.31 15.2 B(Signalized) Southbound LTR 0.17 10.5 B
Intersection 13.4 B8:00 - 9:00 AM
Lakeview Avenue (E-W) @ 40 Eastbound LR 0.48 21.4 CColumbus Avenue Northbound LT 0.25 8.5 A(Signalized) Southbound TR 0.32 8.9 A
Intersection 11.7 BColumbus Avenue (N-S) @ 41 Southbound LT 0.13 9.4 AWest Lake Drive Westbound L 0.03 25.7 D(Unsignalized) R 0.27 12.0 B
3:30 - 4:30 PMLakeview Avenue (E-W) @ 40 Eastbound LR 0.46 20.9 CColumbus Avenue Northbound LT 0.69 14.1 B(Signalized) Southbound TR 0.27 8.6 A
Intersection 13.6 BColumbus Avenue (N-S) @ 41 Southbound LT 0.12 10.7 BWest Lake Drive Westbound L 0.09 36.8 E(Unsignalized) R 0.39 16.0 CColumbus Avenue (Northbound) @ 42 Eastbound LT 0.33 15.3 BStevens Avenue Westbound T 0.57 19.1 B(Signalized) R 0.13 13.3 B
Northbound LT 0.62 13.5 BR 0.34 11.3 B
Intersection 14.6 BColumbus Avenue (Southbound) @ 43 Eastbound TR 0.43 15.9 BStevens Avenue Westbound LT 1.05 68.3 E(Signalized) Southbound LTR 0.31 10.8 B
Intersection 38.2 DNotes:L = Left Turn, T = Through, R = Right Turn; LOS = Level of Service.
2004 Existing
TABLE 5.1-5. LEVEL-OF-SERVICE ANALYSIS RESULTS: 2004 EXISTING CONDITIONS
FEIS KENRESWORKSITES 38

FEIS KENRESWORKSITES 39
5.1.2.1.9. Noise Preliminary Noise Screening for Mobile Source Noise Analysis. As outlined in Section
3.11, Data Collection and Impact Methodologies, Noise, and as the initial step in the mobile source analysis, a preliminary noise screening using passenger car equivalence (PCE) values was performed to determine whether receptors located near the identified noise-sensitive route segments would experience an increase in noise levels of 3 dBA or more as a result of the additional vehicular traffic generated by the proposed project. Existing and future anticipated traffic data for the noise-sensitive route segments in the vicinity of the Kensico Reservoir work locations were analyzed to determine a PCE value for each segment for the morning peak hour, midday hour, and the afternoon peak hour. The preliminary noise screening was performed by comparing the existing PCEs with existing PCEs plus the addition of the future project-generated PCEs. The equation shown below was used for this comparison. Future PCEs would be from additional traffic resulting from the proposed project.
If Existing PCEs + Future Project-Generated PCEs > 2.0 then an impact may occur. Existing PCEs This comparative analysis of existing PCEs and future PCEs was used to determine whether the receptors near the identified noise-sensitive route segments would potentially experience a doubling or more of PCEs. Three decibels (dBA) is the threshold used for screening purposes since it correlates to an increase that is perceptible to human auditory sensitivity. This threshold is used as a guideline to determine whether anticipated project impacts warrant further field measurements and subsequent Traffic Noise Model (TNM) analysis. A doubling of PCEs corresponds to a noise increase of 3-dBA. The CEQR Technical Manual has established a project-induced noise level increase threshold of 3 to 5 dBA at receptors. Route segments that did not experience a doubling of PCEs due to project-induced traffic, therefore, would not exceed this impact threshold. The time period representing the largest increase in future PCEs resulting from the proposed construction activities was used for the comparative analysis. (No new activity would be generated at the Kensico Reservoir work sites once the construction work is completed.). The year 2006 was selected for the construction noise analysis for the filling of the Delaware Aerator, as this is the year with the maximum amount of truck trips this would be generated. The year 2010 was selected for the construction noise analysis for the Kensico Reservoir work sites during the filling of the Catskill Aerator, Catskill Aqueduct Pressurization, and New Screen Chamber, as this is the year when the maximum amount of truck and employee traffic would be generated. Mobile Source Noise. The roadways considered for mobile source noise analysis at the Kensico Reservoir work locations are those presented in Table 5.1-6 and Figure 5.1-16. The roadways considered for analysis were those local routes identified as possible transportation routes that connect the major thoroughfares to the site. Sensitive receptors along the proposed project’s transportation routes were identified. Route segments that did not contain sensitive receptors along them were not considered for further noise analysis. As noted above, under

FEIS KENRESWORKSITES 40
Traffic and Transportation, trucks would be routed from the Eastview Site to the Kensico Reservoir via five potential routes. Commuter traffic (e.g., passenger cars) could use these roads as well as the trucks carrying fill material from the Eastview Site to the Kensico Campus. Therefore, the potential for noise impacts along those proposed project’s transportation routes connecting these routes to the work sites were evaluated.
TABLE 5.1-6. ROUTE SEGMENTS CONSIDERED FOR MOBILE SOURCE NOISE ANALYSIS NEAR THE KENSICO RESERVIOR
No. Route Segment 6a Bradhurst between Grasslands and Lakeview 7 Grasslands Road between Bradhurst and Sprain Brook Parkway 8 Grasslands Road between Sprain Brook Parkway and Walker Road 12 Grasslands Road between Saw Mill River Road (9A) and Walker Road 13 Bradhurst Avenue between Grasslands Road and Lakeview Avenue 14 Lakeview Avenue between Bradhurst Avenue and Commerce Street 15 Lakeview Avenue between Wall Street and Pamela Lane 6b Elwood Avenue between Route 141 and Commerce Street 9 Kensico Road. between Commerce Street and Nanny Hagen Road 10 Kensico Road. north of Columbus Avenue and Nanny Hagen Road.
Existing noise levels were monitored at the ten most critical route segments with sensitive receptors for 20-minute measurement intervals during the three peak time periods which were as follows: weekday AM (6:30 AM – 7:30 AM), midday (MD) (1:00 PM – 2:00 PM), and PM (3:30 PM – 4:30 PM) peak periods. Table 5.1-7 shows the measured levels at these segments.
Stationary Source Noise. Stationary source noise monitoring was performed at the Kensico Reservoir work locations in order to establish baseline conditions. This monitoring was performed in 20-minute intervals in order to establish the period of the day with the potential for the greatest incremental change in noise. The monitoring was performed at the existing Boat Hole, which connects to the Catskill Aqueduct (see Figure 5.1-4). This location was chosen because it is adjacent to single-family residences.
Monitoring periods were chosen to reflect the anticipated construction schedules at the work sites. Construction activities are anticipated to take place on Mondays through Fridays from 7 AM to 4 PM.

FEIS KENRESWORKSITES 41
TABLE 5.1-7. EXISTING NOISE LEVELS OFF-SITE (IN dBA) No. Route Segments Time Leq L10 6a AM 73.4 77.0 MD
Bradhurst between Grasslands and Lakeview
PM 72.6 76.5 7 AM * * MD * *
Grasslands Road between Bradhurst and Sprain Brook Parkway
PM * * 8 AM * * MD * *
Grasslands Road between Sprain Brook Parkway and Walker Road
PM * * 12 AM * * MD * *
Grasslands Road between Saw Mill River Road (9A) and Walker Road
PM * * 13 AM 73.4 77.0 MD 71.3 74.5
Bradhurst Avenue between Route 100C and Lakeview Avenue (at residences #1 Bradhurst Avenue) PM 72.6 76.5
14 AM 65.9 70.8 MD 65.9 70.0
Lakeview Avenue between Bradhurst Avenue and Commerce Street
PM 61.4 66.2 15 AM 69.8 73.5 MD 61.8 65.5
Lakeview Avenue btw Wall Street and Pamela Lane (at residences on steep hill)
PM 60.8 64.5 6b AM 70.3 73.0 MD 67.1 70.5
Elwood Avenue between Route 141 and Commerce Street
PM 65.7 69.0 9 AM 79.3 78.5 MD 72.1 75.5
Kensico Road. between Commerce Street and Nanny Hagen Road (near Commerce Street)
PM 72.1 76.0 10 AM 69.2 72.5 MD 72.2 74.5
Kensico Road. north of Columbus Avenue and Nanny Hagen Road.(near Columbus Avenue)
PM 72.2 75.0 Notes: Field measurements were performed on March 3rd, 11th, 26th, and 29th, and April 20th, 2004. * Existing traffic data was utilized to calculate PCE from which noise levels were derived for this route segment
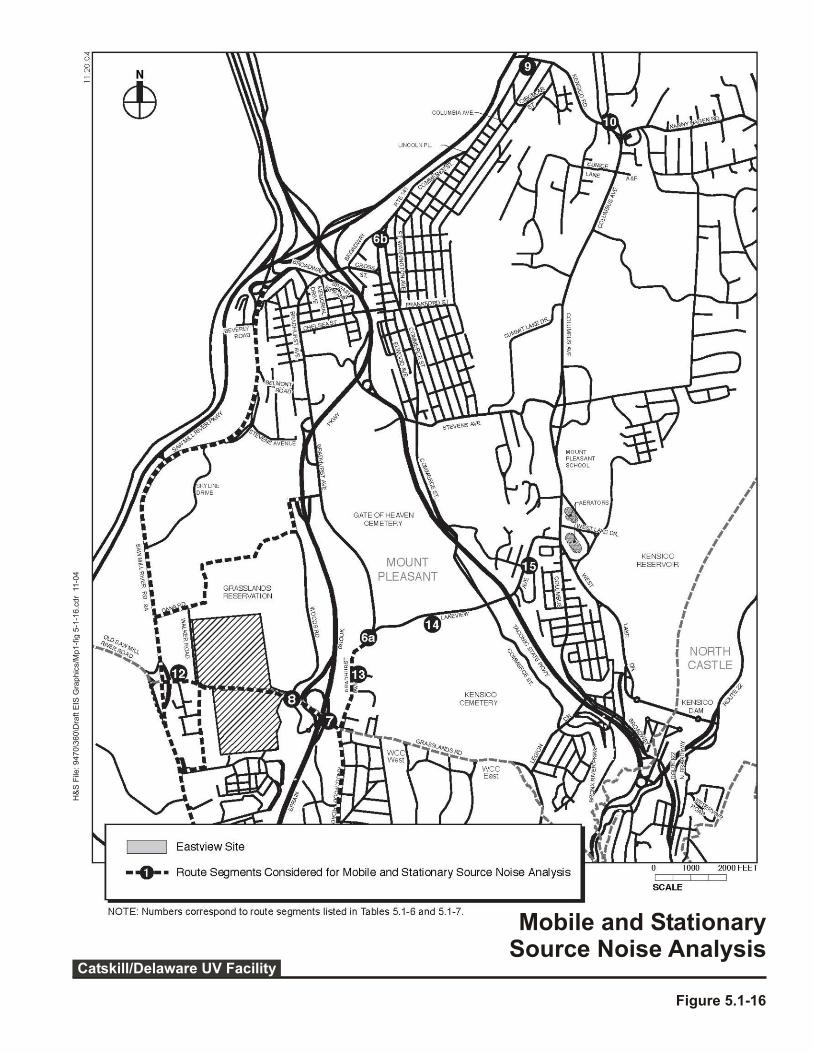

FEIS KENRESWORKSITES 43
Weekday Baseline Monitoring. The 20-minute baseline noise levels measured on a
weekday and the existing noise levels measured during the peak periods are presented in Table 5.1-8 Residences were assumed to be occupied (and therefore sensitive to noise occupations) at all times.
TABLE 5.1-8. EXISTING NOISE LEVELS OFF-SITE (IN dBA)
Site Location Time Leq L10 AM 45.4 48.0 MD 45.2 46.4
1 Boat Hole
PM 44.3 47.2 Notes: Field measurements were performed on April 20, 2004.
5.1.2.1.10. Air Quality
An analysis of potential air quality impacts from mobile sources (i.e., vehicle emissions)
was conducted for the Kensico Reservoir work sites. Given the limited number of construction worker trips associated with the potential construction activity at these sites, only a screening level analysis was required for that component of the work (see Section 5.1.3.2, Potential Construction Impacts, below). The proposed filling of the Aerators would utilize the excavated material from the Eastview Site. The filling would be accomplished in two phases: Delaware Aerator filling and partial filling of the Catskill Aerator would occur in 2006 and the remainder of the filling of the Catskill Aerator in 2009-2010. The 2006 filling activity would take approximately six months. Since the filling of the Aerators would result in truck trips exceeding the screening threshold for particulate matter, the modeling of particulate matter (PM10 and PM2.5) is presented. Trucks would be routed from the Eastview Site to the Kensico Reservoir via five potential routes. Commuter traffic (e.g., passenger cars) could use these roads as well as the trucks carrying fill material from the Eastview Site to the Kensico campus. Therefore, the potential for air quality impacts along those proposed project’s transportation routes connecting these routes to the work sites were evaluated.
The baseline data for the analysis are the same as the data presented in Section 4.10, Air Quality, for the Eastview Site. See that section for the location of the monitoring stations, list of criteria pollutants, and year 2002 ambient air quality monitoring data representative of air quality in the vicinity of Kensico Reservoir. (The Kensico Reservoir work sites are located approximately one mile east of the Eastview Site.)
No stationary source air quality impacts are anticipated as a result of the proposed work at the Kensico Reservoir work sites. Therefore, a detailed analysis was not conducted for these locations.

FEIS KENRESWORKSITES 44
5.1.2.1.11. Historic and Archaeological Resources
Historic Resources. There are no known historic resources located on the Kensico Reservoir work sites, or in the immediate vicinity of the work sites. However, the Catskill Aqueduct (including both below-grade and above-ground structures) may meet the eligibility criteria for listing on the National Register of Historic Places. The Catskill Aqueduct was constructed between 1907 and 1917. The Kensico Reservoir and the above-ground Catskill Aqueduct facilities located between it and the Eastview Site were completed in 1915. As the second major water supply system constructed to provide water to New York City (after the Old and New Croton Aqueducts), the Catskill Aqueduct may meet eligibility Criterion A (association with events that have made a significant contribution to the broad patterns of history), as well as Criterion C in the areas of architecture and engineering. The above-ground features of the Catskill Aqueduct that are located on the proposed Kensico Reservoir work sites include the UEC, the LEC, and the existing Screen Chamber. Completed in 1915, these structures are similar concrete-faced buildings with steel truss roof systems. They are all designed to resemble Italian Renaissance palazzos with heavily rusticated concrete facades set on smooth concrete plinths, large metal entrance doors, entablatures with denticulated cornices, and hipped roofs. The only structure that contains original equipment is the LEC, which houses original sluice gates that have been decommissioned. Also located on the project site are the Catskill and Delaware Aerators, which were built during construction of the Delaware Aqueduct and have been decommissioned as well. The Catskill Aerator is a large clover-shaped basin with masonry retaining walls; the Delaware Aerator has a more elongated circular shape, and also contains masonry retaining walls. Set in front of the LEC, they have been out of service for over 40 years, and they are in disrepair and overgrown with weeds and have been altered through partial infill and the removal of material. The Delaware Shaft No. 18 is located to the south of the Delaware Aerator. Completed in 1938, this structure is similar in appearance to the other nearby Catskill Aqueduct structures. It is a large, Italian Renaissance palazzo-style building with a rusticated concrete facade, arched windows, and a hipped tile roof. No other potential historic resources were identified in the immediate vicinity of the Kensico Reservoir work sites.
Archaeological Resources. To evaluate the possibility that archaeological resources might exist on the Kensico Reservoir work sites, an archaeological assessment was prepared.7 Addressing each work site individually, it focuses first on potential precontact-period (Native American) archaeological resources and then on those from the historic period (beginning in the 17th century). The background research was designed to address the level of potential for archaeological resources to exist on the project site and then to address the likelihood that such resources might have survived historic-period subsurface disturbances. This research included a review of primary and secondary sources, cartographic analysis, site file reviews of previously reported archaeological findings, informant interviews, and field visits. The following discussion briefly summarizes the archaeological assessment. 7 Historical Perspectives, Inc., Cultural Resource Assessment, Catskill Aqueduct Pressurization, Kensico Reservoir and Taconic State Parkway Work Sites, Westchester County, New York. Revised November 2004

FEIS KENRESWORKSITES 45
Precontact-Period Potential and Sensitivity. The area’s physiographic profile suggests
that Native Americans likely exploited the Kensico Reservoir work sites and immediate environs for settlements, camp sites, and/or food procurement and processing sites. Further, a site file search at the New York State Museum and at the New York State Office of Parks, Recreation and Historic Preservation (OPRHP) identified twelve documented precontact-period archaeological sites within a two-mile radius of the Kensico Reservoir work sites. These documented sites vary in size and recovered material, but types of archaeological artifacts recovered include quartz flakes and other worked lithic materials, pottery fragments, a combination of mussel shells and charcoal, and projectile points. Although the project area would have been conducive to exploitation by Native Americans, the archaeological assessment concludes that the Kensico Reservoir work sites are not sensitive for precontact-period archaeological resources due to historic-period subsurface disturbance. Native American resources are typically shallowly buried (within 3 to 4 feet), and construction of the Catskill Aqueduct would have destroyed any potential resources that might have been located at each of the work sites. Therefore, no further consideration of precontact-period archaeological resources is warranted.
Historic-Period Potential and Sensitivity. Research conducted for the archaeological assessment revealed that no structures were located on any of the Kensico Reservoir work sites or in the immediate vicinities during the historic period (the 17th through 19th centuries). Due to the lack of documented use during the historic period, each work site has little or no, potential to contain significant buried historic-period archaeological resources. In any case, construction of the Catskill Aqueduct would have destroyed, at each work site, any undocumented archaeological resources that might have been present. Therefore, no further consideration of historic-period archaeological resources is warranted.
5.1.2.1.12. Hazardous Materials
An Environmental Site Assessment (ESA)8 of the Kensico Reservoir work sites was conducted to identify the potential for the presence of hazardous materials and/or petroleum products. The ESA included results from limited asbestos and lead paint surveys of the various structures at the Kensico site. A copy of the ESA is included in Appendix E. Based on the ESA, hazardous materials are known to exist in the Kensico site structures. The ESA asbestos survey identified asbestos containing materials (ACMs) in: the insulation of the limit switch electrical box in the UEC; interior window sealant and a gasket in the service water line in the basement of the LEC; and window sealant debris and window caulking in the Screen Chamber. The ESA lead paint survey identified lead-containing paint in several painted components in the UEC, LEC, Fluoridation Pit, Screen Chamber, and Boat Hole facilities. According to NYCDEP personnel who accompanied the hazardous materials analysts during several field visits, paint containing polychlorinated biphenyls (PCBs) is currently being removed from the walls of the UEC, and
8 Reservoir Work Sites, New York, (July 2004). Additional fieldwork conducted in October 2004.

FEIS KENRESWORKSITES 46
lead and PCB-containing paint has been removed from the exposed brick walls of the Screen Chamber. There is a potential for additional hazardous materials to be present in these and other Kensico Reservoir work locations. The asbestos survey was conducted only in accessible areas of the on-site buildings; walls and ceilings were not disturbed, and roofing materials were not sampled. Additional asbestos materials may exist in areas not accessible during the survey, including: underground piping insulation or materials; old window caulking that may be underneath new silicone-sealed windows; water service line gaskets; window glazing on replacement panes; vapor barriers that could be present below ground or between layers of walls; electrical wiring and insulation; power supply transformers; and roofing materials. In addition, PCBs could be present in electrical equipment (i.e., transformers, capacitors, fluorescent light ballasts), corrosion-resistant paint, and lubricating oil used for gate valve stems.
Soil. In October 2004, 14 soil borings were advanced at the Kensico Reservoir work sites to evaluate the subsurface soil conditions that could be encountered during construction of the UV Facility and related components. The borings ranged in depth from 3.5 to 30 feet below ground surface (bgs). During drilling, soil samples were field screened for contamination using direct observation (visual and olfactory) and ambient air sampling above the sample using an organic vapor meter (OVM). Field observations during drilling activities provided no indication of potential contamination. Groundwater was encountered in only three of the 14 borings, and at these locations soil samples were collected at the interval (6 to 16 feet bgs) immediately above the water table. The samples collected from the remaining borings were collected at the interval before the final depth of the boring (2.5 to 28 bgs) Samples were collected from the Geoprobe sampler or hand auger using stainless steel trowels and transferred to the sample jar. Soil samples were analyzed for Target Compound List (TCL), volatile organic compounds (VOCs) by USEPA Method 8260, PCL semi-volatile organic compounds (SVOCs) by USEPA Method 8270, Target Analyte List (TAL) metals by USEPA Method 6000/7000 series, PCL pesticides by USEPA Method 8081, and TCL PCBs by USEPA Method 8082. Analytical results from the soil samples are summarized in Table 5.1-9. Complete laboratory analytical reports are included in Appendix F. The sampling locations are depicted in Figure 5.1-17.

TABLE 5.1-9.SUMMARY OF CHEMICAL CONSTITUENTS DETECTED IN SITE SOILS KENSICO RESERVOIR AND OFF-SITE STRUCTURES
Sample NameNYSDEC
TAGM Eastern USAS-K2-12-
14S-K1-26-
28KS-K3-9-
11S-K4-12-
13S-K7-14-
16S-K18-3.5-
4S-K11-3-
3.5S-K12-4-
4.5 Criteria1 Background2
PARAMETER Soil Soil Soil Soil Soil Soil Soil SoilSample Depth 12'-14' 26'-28' 9'-11' 12'-13' 14'-16' 3.5'-4 3'-3.5' 4'-4.5'Sample Date 10/4/2004 10/4/2004 10/4/2004 10/4/2004 10/4/2004 10/4/2004 10/4/2004 10/4/2004
Conc Conc Conc Conc Conc Conc Conc ConcVolatiles (ppb)Acetone 200 NA 2.9 B 3.9 B 6.2 B 5 B 4.6 B 5 B 4.5 B 4.5 BMethylene chloride 100 NA ND(0.28) ND(0.27) ND(0.29) 1.6 B 1.8 B ND(0.29) 1.5 B 1.5 BTOTAL TICs NR NR 21 JN 8 JN 8 JN 7 JN 6 JN 7 JNSemivolatiles (ppb)Bis(2-ethylhexyl)phthalate 50,000 NA ND(140) ND(140) 160 ND(150) ND(150) ND(150) ND(150) ND(150)TOTAL TICs 150 J 1031 J/JN 169 JN 130 J 130 JN 829 J/JN 520 J/JN 210 JNPCB's (ppb)None DetectedPesticides (ppb)4 4'-DDT 2,100 NA ND(0.39) ND(0.42) ND(0.43) ND(0.46) ND(0.43) ND(0.41) 0.92 ND(0.43)Metals (ppm)Aluminum (Al) SB 33000 3 14900 14600 25600 11200 7860 12300 12000 14500Antimony (Sb) SB NA ND(1.5) N ND(1.5) N ND(1.7) N ND(1.6) N ND(1.5) N ND(1.5) N ND(1.6) N ND(1.6) NArsenic (As) 7.5 or SB 3.0-12 2.1 B 1.2 B 3.0 B 2.2 B 1.7 B 4.8 2.1 B 2.7 BBarium (Ba) 300 or SB 15-600 147 219 193 137 80.8 126 118 182Beryllium (Be) 0.16 or SB 0.0-1.75 0.29 B 0.38 B 0.97 0.29 B 0.17 B 0.37 B 0.3 B 0.37 BCalcium (Ca) SB 130-35,000 964 3390 4120 1770 8550 1680 2600 2620Chromium (Cr) 10 or SB 1.5-40 29.1 28.2 70.3 27.7 17.7 21.7 22.1 30Cobalt (Co) 30 or SB 2.5-60 17.7 20.5 17.9 11.7 8.8 12 12 15.5Copper (Cu) 25 or SB 1.0-50 43.3 * 43.6 * 47.9 * 22.3 * 16.6 * 27 * 20.3 * 28.1 *Iron (Fe) 2,000 or SB 2000-550,000 26000 24100 38200 19100 13400 18900 18300 24900Lead (Pb) SB NA 4.5 3.6 10.7 4.6 3.3 14.9 7.1 5.9Magnesium (Mg) SB 100-5,000 6530 7220 12100 5730 8010 4920 5900 7270Manganese (Mn) SB 50-5,000 595 138 550 324 254 420 409 436Mercury (Hg) 0.1 0.001-0.2 ND(0.050) ND(0.053) ND(0.057) ND(0.056) 0.12 ND(0.052) ND(0.056) ND(0.054)Nickel (Ni) 13 or SB 0.5-25 24.4 27.5 35.8 18.9 14 19.4 16.6 22.6Potassium (K) 13 or SB 8,500-43,000 7400 E 9060 7000 4200 3060 E 2530 E 3840 E 6150 ESelenium (Se) 2 or SB 0.1-3.9 3.7 B 2.7 B 5.1 B 2.8 B 2.8 B 2.5 B 2.6 B 3.6 BSilver (Ag) SB NA ND(0.40) N 0.72 BN ND(0.45) N ND(0.42) N ND(0.39) N ND(0.41) N ND(0.42) N ND(0.43) NSodium (Na) SB 6,000-8,000 ND(27.7) ND(27.6) ND(30.7) ND(28.6) ND(26.7) 205 ND(29.0) ND(29.3)Vanadium (V) 150 or SB 1.0-300 50.1 43.6 89 31.7 25.5 30.8 30.8 41.5Zinc (Zn) 20 or SB 9.0-50 57.1 E 70.1 E 88.2 E 45.2 E 28.4 E 67.7 E 45.1 E 62.6 EInorganics (ppm)None ReportedSolids (%)% Moisture NA NA 9.8 5.8 11.7 14.2 11.4 11.8 10.5 11.2% Solids NA NA 90.2 94.2 88.3 85.8 88.6 88.2 89.5 88.8
Notes: This summary table lists only those compounds detected in at least one sample. The complete data package is provided in Appendix H.1 - Recommended Soil Cleanup Objectives as defined in NYSDEC Technical and Administrative Guidance Memorandum #4046 Determination of Soil Cleanup Objectives and Cleanup Levels, January 24, 19942 - Source: NYSDEC Technical and Administrative Guidance Memorandum #4046, Table 2 3 - Site BackgroundNA - Not AvailableND (5.8) - This compound was not detected above the method detection limit (5.8)NR - Analyte not required to be analyzedSB - Standard Background
ORGANIC QUALIFIERSB - Indicates that the analyte was found in both the sample and its associated laboratory blank. It indicates possible/probable blank contamination and warns the data user to take appropriate action.J - Indicates an estimated value. This qualifier is used either when estimating a concentration for tentatively identified compounds where a 1:1 response is assumed or when the mass spectral data indicatesthe presence of a compound that meets the identification criteria and the result is less than the specified detection limit but greater than zero.N - Indicates presumptive evidence of a compound. This flag is only used for tentatively identified compounds, where the identification is based on a mass spectral library search. It is applied to all TIC reFor generic characterization of a TIC, such as chlorinated hydrocarbon, the N code is not used.
INORGANIC QUALIFIERSB - The reported value is less than the Contract Required Detection Limit (CRDL), but greater than the Instrument Detection Limit (IDL).E - Indicates an estimated value because of the presence of interference.N - Spiked sample recovery not within control limits.* - Duplicate analysis not within control limits.
** - This soil sample was re-analyzed for Mercury and a concentration of 0.31 ppm was reported.
FEIS KENRESWORKSITES 47

TABLE 5.1-9.SUMMARY OF CHEMICAL CONSTITUENTS DETECTED IN SITE SOILS KENSICO RESERVOIR AND OFF-SITE STRUCTURES
Sample NameNYSDEC
TAGM Eastern USAS-K13-3.5-
4 S-K5-6-8 S-K6-8-12 TB-1 S-FB-1S-K8-12-
14S-K9-12-
14S-K10-10-
12S-K17-13-
15 S-K20-4-8 Criteria1 Background2
PARAMETER Soil Soil Soil Aqueous Aqueous Soil Soil Soil Soil SoilSample Depth 3.5'-4' 6'-8' 8'-12' --- --- 12'-14' 12'-14' 10'-12' 13'-15' 4'-8'Sample Date 10/4/2004 10/4/2004 10/4/2004 10/4/2004 10/4/2004 10/5/2004 10/5/2004 10/5/2004 10/5/2004 10/5/2004
Conc Conc Conc Conc Conc Conc Conc Conc Conc ConcVolatiles (ppb)Acetone 200 NA 7.2 B 5.8 B 5.5 B 2.8 B 3.2 B 3.7 B 3.3 B 6.8 B 3.5 B 10.0 BMethylene chloride 100 NA 0.88 ND(0.32) ND(0.29) 1.1 0.93 0.61 B 0.60 B ND(0.29) 0.80 B 0.62TOTAL TICs 6 JN 120 J 29 JN NR NR 7 JN 90 J 8 JN 6 JN 14 JNSemivolatiles (ppb)Bis(2-ethylhexyl)phthalate 50,000 NA ND(150) ND(170) 150 NR ND(1.6) ND(150) ND(160) ND(160) 350 ND(150)TOTAL TICs 1397 J/JN 380 JN 469 J/JN NR NR 210 JN 220 JN 330 JN 510 JN 217 J/JNPCB's (ppb)None DetectedPesticides (ppb)4 4'-DDT 2,100 NA ND(0.43) ND(0.49) ND(0.43) NR ND(0.043) ND(0.45) ND(0.45) ND(0.46) ND(0.46) ND(0.44)Metals (ppm)Aluminum (Al) SB 33000 3 12600 10200 12000 NR ND(38.4) 13600 10400 14000 15300 14600Antimony (Sb) SB NA ND(1.6) N ND(1.9) N ND(1.5) N NR 13.5 ND(1.6) N ND(1.6) N ND(1.7) N ND(1.6) N ND(1.6) NArsenic (As) 7.5 or SB 3.0-12 2.1 B 2 B 1.6 B NR 6.5 3.0 B 2.3 B 2.4 B 2.7 B 2.7 BBarium (Ba) 300 or SB 15-600 173 129 124 NR ND(0.40) 141 95.3 143 110 162Beryllium (Be) 0.16 or SB 0.0-1.75 0.34 B 0.26 B 0.28 B NR ND(0.40) 0.36 B 0.2 B 0.34 B 0.35 B 0.41 BCalcium (Ca) SB 130-35,000 5850 42900 3660 NR ND(75.6) 6320 2410 14500 1250 2640Chromium (Cr) 10 or SB 1.5-40 23.5 25.1 24.3 NR ND(0.70) 26.2 19.8 27.1 28.0 26.4Cobalt (Co) 30 or SB 2.5-60 15.8 10.9 12.2 NR ND(3.2) 13.7 10.9 12.8 12.1 15.4Copper (Cu) 25 or SB 1.0-50 31.8 * 21 * 35 * NR ND(3.3) 26.0 17.3 22.4 24.0 33.1Iron (Fe) 2,000 or SB 2000-550,000 22100 13100 17900 NR ND(18.9) 22300 17600 20400 21300 25300Lead (Pb) SB NA 6.2 5.6 4.1 NR ND(2.5) 5.6 3.4 5.3 5.5 7.0Magnesium (Mg) SB 100-5,000 8240 4960 5600 NR ND(11.7) 7700 6470 8250 5690 6730Manganese (Mn) SB 50-5,000 319 275 237 NR ND(1.1) 397 N 309 N 359 N 315 N 340 NMercury (Hg) 0.1 0.001-0.2 0.20 ND(0.063) 0.15 NR ND(0.20) ND(0.052) ND(0.052) ND(0.053) ND(0.056) 0.11Nickel (Ni) 13 or SB 0.5-25 21.6 25.4 20.8 NR ND(2.6) 19.2 14.9 18.7 18.8 25.2Potassium (K) 13 or SB 8,500-43,000 6620 E 3580 E 5000 E NR 111 4570 3120 5230 2540 4850Selenium (Se) 2 or SB 0.1-3.9 3.1 B ND(2.3) 2.5 B NR ND(8.7) 2.0 BN ND(2.0) N ND(2.0) N ND(2.0) N 2.8 BNSilver (Ag) SB NA 0.43 BN 0.52 BN ND(0.41) N NR ND(1.9) N ND(0.43) N 0.44 BN ND(0.44) N ND(0.43) N ND(0.42) NSodium (Na) SB 6,000-8,000 ND(29.2) 189 113 B NR 728 543 ND(29.3) 60.7 B ND(29.2) ND(29.0)Vanadium (V) 150 or SB 1.0-300 35.3 22.3 33.4 NR ND(3.3) 37.7 29.6 35.7 38.4 36.9Zinc (Zn) 20 or SB 9.0-50 61.2 E 28.4 E 38.2 E NR ND(1.9) 55.9 E 53.2 E 50.7 E 46.2 E 64.7 EInorganics (ppm)None ReportedSolids (%)% Moisture NA NA 10.8 20.8 12.4 NR NR 12.1 12.9 14.2 14.3 10.4% Solids NA NA 89.2 79.2 87.6 NR NR 87.9 87.1 85.8 85.7 89.6
Notes: This summary table lists only those compounds detected in at least one sample. The complete data package is provided in Appendix H.1 - Recommended Soil Cleanup Objectives as defined in NYSDEC Technical and Administrative Guidance Memorandum #4046 Determination of Soil Cleanup Objectives and Cleanup Levels, January 24, 19942 - Source: NYSDEC Technical and Administrative Guidance Memorandum #4046, Table 2 3 - Site BackgroundNA - Not AvailableND (5.8) - This compound was not detected above the method detection limit (5.8)NR - Analyte not required to be analyzedSB - Standard Background
ORGANIC QUALIFIERSB - Indicates that the analyte was found in both the sampleand its associated laboratory blank. It indicates possible/probable blank contamination and warns the data user to take appropriate action.J - Indicates an estimated value. This qualifier is used either when estimating a concentration for tentatively identified compounds where a 1:1 response is assumed or when the mass spectral data indicates the presence of a compound that meets the identification criteria and the result is less than the specified detection limit but greater than zero.N - Indicates presumptive evidence of a compound. This flag is only used for tentatively identified compounds, where the identification is based on a mass spectral library search. It is applied to all TIC results. For generic characterization of a TIC, such as chlorinated hydrocarbon, the N code is not used.
INORGANIC QUALIFIERSB - The reported value is less than the Contract Required Detection Limit (CRDL), but greater than the Instrument Detection Limit (IDL).E - Indicates an estimated value because of the presence of interference.N - Spiked sample recovery not within control limits.* - Duplicate analysis not within control limits.
** - This soil sample was re-analyzed for Mercury and a concentration of 0.31 ppm was reported.
FEIS KENRESWORKSITES 48

TABLE 5.1-9.SUMMARY OF CHEMICAL CONSTITUENTS DETECTED IN SITE SOILS KENSICO RESERVOIR AND OFF-SITE STRUCTURES
Sample NameNYSDEC
TAGM Eastern USAS-K19-8-
10S-K21-8-
10 S-K22-7-9S-K16-2-
2.5S-K14-2.5-
3 S-FB2 Criteria1 Background2
PARAMETER Soil Soil Soil Soil Soil AqueousSample Depth 8'-10' 8'-10' 7'-9' 2'-2.5' 2.5'-3' ---Sample Date 10/5/2004 10/5/2004 10/5/2004 10/6/2004 10/6/2004 10/6/2004
Conc Conc Conc Conc Conc ConcVolatiles (ppb)Acetone 200 NA 3.9 B 2.8 B 2.0 B 4.3 B 2.7 B 2.6 BMethylene chloride 100 NA 0.81 B 0.67 B 0.57 0.62 1.7 B 2.8 BTOTAL TICs 15 JN NR NR 10 JN NR NRSemivolatiles (ppb)Bis(2-ethylhexyl)phthalate 50,000 NA ND(170) ND(150) ND(150) ND(150) ND(150) ND(1.6)TOTAL TICs 160 JN 200 JN 200 JN 250 J/JN 83 J NRPCB's (ppb)None DetectedPesticides (ppb)4 4'-DDT 2,100 NA ND(0.50) ND(0.43) 0.83 ND(0.45) ND(0.45) ND(0.044)Metals (ppm)Aluminum (Al) SB 33000 3 17700 11000 12000 10500 13900 ND(18.2)Antimony (Sb) SB NA ND(1.8) N ND(1.5) N ND(1.5) N ND(1.6) N ND(1.6) N ND(5.8)Arsenic (As) 7.5 or SB 3.0-12 5.1 1.7 B 2.5 B 1.9 B 2.3 B ND(1.9)Barium (Ba) 300 or SB 15-600 91.9 142 119 147 154 ND(0.40) EBeryllium (Be) 0.16 or SB 0.0-1.75 0.55 0.39 B 0.26 B 0.37 B 0.33 B ND(0.30)Calcium (Ca) SB 130-35,000 2230 1520 1380 1170 E 4740 E ND(90.4)Chromium (Cr) 10 or SB 1.5-40 20.9 24.4 29.0 16.5 27.4 ND(0.60)Cobalt (Co) 30 or SB 2.5-60 11.0 21.0 12.2 12.4 15 ND(2.5)Copper (Cu) 25 or SB 1.0-50 13.9 40.3 21.5 46.6 30 ND(1.6)Iron (Fe) 2,000 or SB 2000-550,000 22700 23900 18700 17700 23600 ND(16.8)Lead (Pb) SB NA 10.8 8.5 6.7 46 * 4.4 * ND(1.1)Magnesium (Mg) SB 100-5,000 4180 5890 5470 4140 7800 ND(6.0)Manganese (Mn) SB 50-5,000 622 N 385 N 325 N 327 E 381 E ND(0.90) EMercury (Hg) 0.1 0.001-0.2 0.20 0.55** ND(0.054) 0.057 ND(0.057) ND(0.20)Nickel (Ni) 13 or SB 0.5-25 14.8 21.4 17.9 14.4 23.4 ND(1.7)Potassium (K) 13 or SB 8,500-43,000 1120 5300 3540 4990 4720 129Selenium (Se) 2 or SB 0.1-3.9 2.3 BN 3.0 BN ND(1.9) N 2.6 BN 2.5 BN ND(8.7) NSilver (Ag) SB NA ND(0.48) N 0.59 BN ND(0.41) N 0.53 BN 0.52 BN ND(2.2) NSodium (Na) SB 6,000-8,000 46.6 B ND(27.8) ND(28.1) ND(29.1) ND(28.4) 680Vanadium (V) 150 or SB 1.0-300 32.4 32.2 34.0 25.1 39.8 ND(2.3)Zinc (Zn) 20 or SB 9.0-50 58.7 E 48.6 E 49.2 E 46.5 E 51.3 E ND(3.9)Inorganics (ppm)None ReportedSolids (%)% Moisture NA NA 21.6 8.4 7.4 10.7 12 NR% Solids NA NA 78.4 91.6 92.6 89.3 88 NR
Notes: This summary table lists only those compounds detected in at least one sample. The complete data package is provided in Appendix H.1 - Recommended Soil Cleanup Objectives as defined in NYSDEC Technical and Administrative Guidance Memorandum #4046 Determination of Soil Cleanup Objectives and Cleanup Levels, January 24, 19942 - Source: NYSDEC Technical and Administrative Guidance Memorandum #4046, Table 2 3 - Site BackgroundNA - Not AvailableND (5.8) - This compound was not detected above the method detection limit (5.8)NR - Analyte not required to be analyzedSB - Standard Background
ORGANIC QUALIFIERSB - Indicates that the analyte was found in both the sampleand its associated laboratory blank. It indicates possible/probable blank contamination and warns the data user to take appropriate action.J - Indicates an estimated value. This qualifier is used either when estimating a concentration for tentatively identified compounds where a 1:1 response is assumed or when the mass spectral data indicates the presence of a compound that meets the identification criteria and the result is less than the specified detection limit but greater than zero.N - Indicates presumptive evidence of a compound. This flag is only used for tentatively identified compounds, where the identification is based on a mass spectral library search. It is applied to all TIC results. For generic characterization of a TIC, such as chlorinated hydrocarbon, the N code is not used.
INORGANIC QUALIFIERSB - The reported value is less than the Contract Required Detection Limit (CRDL), but greater than the Instrument Detection Limit (IDL).E - Indicates an estimated value because of the presence of interference.N - Spiked sample recovery not within control limits.* - Duplicate analysis not within control limits.
** - This soil sample was re-analyzed for Mercury and a concentration of 0.31 ppm was reported.
FEIS KENRESWORKSITES 49


FEIS KENRESWORKSITES 51
PCBs were not detected in the 14 soil samples collected at the Kensico Reservoir work sites. The volatile organic compound, acetone, was detected in all of the soil samples. Similarly, the volatile organic compound, methylene chloride, was detected in eight of the 14 soil samples. The detected concentrations of acetone and methylene chloride were well below the Recommended Soil Cleanup Objective (RSCO) listed in New York State Department of Environmental Conservation (NYSDEC) Technical and Administrative Guidance Memorandum (TAGM) #4046. Acetone and methylene chloride were also identified in the quality assurance/quality control laboratory method blanks, trip blanks, and field blanks at similar concentrations. Therefore, these results suggest that the detected volatile organic compounds are due to laboratory contamination and are not indicative of on-site contamination. One semi-volatile organic compound, bis (2-ethylhexyl) phthalate, was detected in two of the 14 soil samples but at concentrations well below the RSCO listed in NYSDEC TAGM #4046. Phthalates, at the low concentrations reported, are commonly indicative of laboratory cross-contamination and/or artifacts of drilling activities. Therefore, the bis (2-ethylhexyl) phthalate detected in the soil sample from the site is likely not attributable to on-site contamination and does not represent an environmental concern. The pesticide compound, 4 4’-DDT, was detected in one of the seven soil samples, at trace concentrations well below the NYSDEC TAGM #4046 soil cleanup criteria. In 1972, DDT was banned from use in the United States due to the damage caused to wildlife. Prior to this time it was used as a pesticide to control mosquitoes and other insects in agriculture. Residual traces from historical use of the pesticide at the site may have been carried down from the surface during the drilling and sampling activities. There is no other known probable source. Since the results are well below TAGM criteria and no visible sources of contamination were apparent at the time of sampling or during site reconnaissance, this data does not represent an environmental concern. Zinc, chromium, magnesium, selenium, and/or nickel were detected in all of soil samples at concentrations exceeding Eastern United States background concentrations listed in NYSDEC TAGM #4046. These metals are common to the geology of the area, and the detected concentrations are considered to be within normal ranges for the geology found at the site. Therefore, these detected metals are not anticipated to be a result of on-site operations and do not represent an environmental concern.
Groundwater. In October 2004, groundwater samples were collected from three
temporary wells at the Kensico Reservoir work sites The temporary wells were installed at each of the boring locations where groundwater was encountered. These temporary wells were installed to provide a complete subsurface investigation inclusive of soil and groundwater analysis of the Kensico Reservoir work sites. The locations are depicted in Figure 5.1-17
The groundwater samples were analyzed for TCL volatile organic compounds by USEPA Method 624, TCL semi-volatile organic compounds by USEPA Method 625, TAL metals by USEPA Methods 200.7 and 245.1, and TCL pesticides and PCBs by USEPA Method 608.

FEIS KENRESWORKSITES 52
The groundwater sampling data indicated that semi-volatile organic compound, PCB, and pesticide concentrations in all of the samples were below laboratory detection limits. The volatile organic compound, methylene chloride, was detected in all of the groundwater samples. The detected concentrations of methylene chloride were well below the Ambient Water Quality Standards and Guidance Values (AWQS/GVs) listed in NYSDEC Technical and Operational Guidance Series (TOGS) 1.1.1. Methylene chloride was also identified in the quality assurance/quality control laboratory method blanks, trip blanks, and field blanks at similar concentrations. Therefore, these results suggest that the detected volatile organic compound is due to laboratory contamination and are not indicative of on-site contamination. Metals were detected in all of the groundwater samples. Only antimony, iron, and sodium were detected at concentrations above the applicable AWQS/GVs listed in NYSDEC TOGS 1.1.1. The groundwater sampling methodology resulted in high levels of turbidity being present in the groundwater samples. Excess sediment in groundwater samples often results in metals concentrations in the associated samples being biased high, which would not be representative of actual groundwater conditions. These detected metals in groundwater are not anticipated to be a result of on-site contamination and do not represent an environmental concern. In summary, based on a review of historic maps and Federal, State, and local databases, there do not appear to be historic land uses or on/off-site chemical releases that would have affected soil and/or groundwater underneath the Kensico Reservoir work locations. The subsurface investigation indicated no evidence of soil or groundwater contamination from on-site or off-site sources.
5.1.2.1.13. Natural Resources
Based on the current level of design information available for the proposed work at the Kensico Reservoir work sites, no significant impacts to natural resources are anticipated as part of the operation of facilities at the Kensico Reservoir work sites. Therefore, a detailed analysis of natural resources was not conducted for these sites. Potential construction impacts at the Kensico Reservoir work sites are discussed in the Potential Construction Impacts section below.
Upper Effluent Chamber. The area adjacent to the UEC is a successional southern hardwood forest (Reschke, C., et. al., 2002). Canopy trees include northern red oak, black birch, silver maple, bigtooth aspen, and white pine. The white pines appear to have been planted along the UEC access road. An understory of shrubs and small tree saplings exists as well and includes white ash, black cherry, bush honeysuckle, flowering dogwood, and multiflora rose. The herbaceous layer was dominated by garlic mustard. Vines included poison ivy and bittersweet. The eaves of the UEC building contain multiple cliff swallow colonies. The cliff swallows have built several mud “clay pot” nests. Cliff swallows are not on the NYSDEC list of endangered, threatened, and special concern fish and wildlife species.
Lower Effluent Chamber. The area to the rear of the LEC has a similar forested community as the UEC. The side and front of the LEC is predominantly landscaped lawn.

FEIS KENRESWORKSITES 53
There are 20 softwood trees (Norway spruce/white spruce/northern white cedar/oriental arbor-vitae) that appear to have been planted in front of the LEC. Diameter at breast height for these trees range from 10 to 20 inches. Cliff swallow colonies are also present in the eaves of the LEC building.
Catskill and Delaware Aerators. Small (less than 4 inch dbh), recently planted landscape trees and shrubs are located along Columbus Avenue and West Lake Drive surrounding the Catskill and Delaware Aerators. The landscape trees and shrubs surrounding the Catskill Aerator include sugar maple, tulip tree, red oak, sweet gum, flowering dogwood, oriental arbor-vitae, common hackberry and red chokeberry. The landscape trees and shrubs surrounding the Delaware Aerator include sugar maple, black birch, pin oak, American beech, willow, red oak, oriental arbor-vitae, hawthorn, red chokeberry, cotoneaster, and bayberry.
Delaware Shaft No. 18. The area surrounding Delaware Shaft No. 18 is a combination
of disturbed area and landscaped lawn. Construction activities are currently taking place within the area adjacent to the Shaft No. 18 superstructure.
Fluoridation Pit. The area surrounding the Fluoridation Pit is landscaped lawn. Some of the small, recently planted landscape trees described above are located along Columbus Avenue in the vicinity of the Fluoridation Pit.
Screen Chamber/Catskill Venturi Meter/Boat Hole. The area immediately surrounding the Screen Chamber consists of a gravel roadway and maintained lawn. The right of way between the Screen Chamber and the Boat Hole consists of a gravel access road with maintained lawn on either side. Successional shrubland occurs beyond the lawn area, which consists of milkweed, mugwort, multiflora rose, and poison ivy. Steep slopes occur on the north and south side of the roadway between the Screen Chamber and Venturi Meter. Clove Brook flows at the bottom of the steep slope to the north of the roadway and an unnamed tributary to Clove Brook flows at the bottom of the steep slope to the south of the roadway. There are small interspersed terraces along Clove Brook on the north side of the roadway that contain limited wetland vegetation. Clove Brook crosses under the Catskill Aqueduct in a concrete culvert at the Venturi Meter where the tributary stream connects to it on the south side of the roadway. Stands of mature hardwood trees occur beyond the two streams. Canopy trees to the north of Clove Brook are typical of oak-tulip tree forests and include tulip tree, sugar maple, red oak, American beech, and black birch. The understory of this area includes barberry, jewelweed, false Solomon’s seal, and Christmas fern. The tributary to Clove Brook to the south of the roadway has very steep slopes on both sides and does not contain any wetland terraces. Canopy trees to the south of the south stream are typical of a hemlock-northern hardwood forest and include hemlock and American beech. The steep slopes on either side of the roadway begin to level out between the Venturi Meter and the Boat Hole. The dominant cover type on either side of the roadway is still successional shrubland dominated by a mix of multiflora rose and bramble. There is a small pocket wetland (approximately 0.01 acres) on the north side of the roadway caused by a groundwater seep.

FEIS KENRESWORKSITES 54
The successional shrubland cover type continues on either side of the roadway between the Boat Hole and the North Siphon Chamber with the multiflora rose/bramble mix and green brier as the dominant vegetative cover. Cultural planted trees (red maple and white pine) occur along the south side of the roadway. A stream crossing occurs midway between the Boat Hole and North Siphon Chamber with a culvert directing flow from the cemetery across the right-of-way. This is not a wetland feature and most likely dries up in the summer. Two small wetlands occur due east of the North Siphon Chamber. One is approximately ¼ acre and the other is approximately 1/8 acre in size. These wetlands occur within the right-of-way and the access road appears to bisect the larger wetland.
Separate UV Building. If this alternative is chosen, a separate UV building could be constructed for the Town of Mount Pleasant at the existing Stevens Avenue Storage Tanks. The UV units would be installed within a new stand-alone building located on Town property, to the southeast of the existing water storage tanks. The footprint of the Mount Pleasant UV building would be approximately 30 feet by 40 feet. The building would be located on a cleared, grassed area that is part of the Town’s property.
5.1.2.1.14. Water Resources
No impacts to water resources are anticipated as part of the work proposed at the Kensico Reservoir work sites. It is not anticipated that the construction activities would require ground disturbance that would result in potential impacts to the groundwater system. In addition, a stormwater collection system would be introduced with the new Screen Chamber that would prevent increased stormwater flows. During construction activities, sedimentation and erosion control measures would be in place to protect the property. Therefore, a detailed analysis of water resources was not conducted for these work sites.
5.1.2.1.15. Infrastructure and Energy
As a result of the work being performed at the Kensico Reservoir work sites, the Catskill Aqueduct would be enabled to convey up to 1,000 million gallons per day (mgd) to the proposed UV Facility for disinfection. Additionally, a separate UV building could be constructed to supply the Town of Mount Pleasant with UV treated water. No impacts to energy resources within the study area are anticipated as part of this project. Potential impacts to study area infrastructure during construction are discussed in the Potential Construction Impacts section below.
5.1.2.1.16. Electric and Magnetic Fields (EMF)/Extremely Low Frequency (ELF)
No impacts related to electric and magnetic fields or extremely low frequency fields are anticipated as part of the work proposed at the Kensico Reservoir work sites. Therefore, a detailed analysis of these parameters was not conducted for these sites.

FEIS KENRESWORKSITES 55
5.1.2.1.17. Solid Waste
No impacts related to solid waste handling or facilities are anticipated as part of the work proposed at the Kensico Reservoir work sites. Potential construction impacts are discussed in the Potential Construction Impacts section below.
5.1.2.1.18. Public Health
There is the potential for public health related issues to arise from the construction work proposed at the Kensico Reservoir work sites. Of particular concern are the potential health effects from particulate matter emissions from fuel-burning sources at these sites, as well as diesel emissions from construction-related activities, especially in relation to their effects on asthma rates within Westchester County. As described in the Potential Construction Impacts section below (Air Quality), during construction of the proposed project, construction equipment would generate particulate matter emissions from the combustion of fuel and construction-related activities. These emissions would potentially be of greatest concern in 2006 and in 2010, when truck traffic related to the proposed filling of the Aerators would need to traverse the local community. However, the construction sources at work sites are not anticipated to have any significant or adverse impacts on air quality. See Section 5.13.2, Potential Construction Impacts for Air Quality, below.
5.1.2.2. Future Without the Project
In the Future Without the Project, the Kensico Reservoir work sites and study area would remain relatively unchanged from their existing conditions, with the exception of the rehabilitation of the existing Fluoridation Building on the Kensico campus a new NYCDEP laboratory building that could be constructed, and the possible relocation of West Lake Drive between Columbus Avenue and the Kensico Reservoir to the north of the Catskill Aerator. The current construction work near Shaft No. 18 of the Delaware Aqueduct should be completed in 2005. With the exception of routine maintenance of the Aqueduct and related structures, the Kensico campus would generate relatively low levels of activity. A significant number of employees are not anticipated to be introduced to the site as a result of the improvements listed above. There may be some modest infill development within the neighboring residential areas, as there is some undeveloped land currently located within these areas, but there are no known development proposals before the Town of Mount Pleasant Planning Board at this time within the surrounding area. NYSDOT plans to conduct a paving project on Route 141 between Liberty Street and Route 117 by 2006. Another paving project for Route 9A between Route 119 and Grasslands Road (Route 100C) is scheduled for 2006 or 2007. However, NYSDOT is currently evaluating design alternatives for the Route 9A project, which is expected to be under construction by 2008. If the Route 9A Bypass project is approved, the paving along Route 9A between Route 119 and Grasslands Road (Route 100C) would be undertaken as part of that project and would occur under the project’s schedule. The timeline for implementation of the Route 9A project could vary depending on the outcome of the design evaluation. In addition, NYSDOT is planning the widening and realignment of Route 100 from Virginia Road to just west of the Westchester

FEIS KENRESWORKSITES 56
Community College driveway (west gate), which may also include the signalization of Route 100 at Virginia Road and Legion Drive. As part of the project new pavement markings, signage and exclusive turn lanes would be created along Route 100C at its intersection with Virginia Road and Legion Drive. This work is separate from the work proposed on the Kensico campus for the UV Facility. In the Future Without the Project, the predominant open space and low-density residential character of the area surrounding the work sites would be preserved. In addition, it is anticipated that the existing structures on the Kensico campus would remain relatively unchanged. For analysis parameters that performed quantified impact analyses for this scenario, the Future Without the Project conditions are reported in the Potential Impacts section below. 5.1.3. Potential Impacts
5.1.3.1. Potential Project Impacts
The anticipated year of completion of the proposed work at the Kensico Reservoir is 2011, when the pressurization of the Catskill Aqueduct would be completed. (The new Screen Chamber, filling activities, and the water main from Delaware Shaft No. 18 to the Commerce Street Pumping Station would have been completed in 2010.) During operation, the land uses at the Kensico Reservoir work sites would return to their existing levels of activity. No new employment would be generated by the rehabilitated structures and the new Screen Chamber. The improvements are unlikely to produce additional tax revenues for the Town of Mount Pleasant or school district. The operation and maintenance costs would be minimal. The three above ground structures that would be included in the pressurization work—the UEC, the LEC, and the existing Screen Chamber—would remain similar in appearance once the work is complete, as the exterior of the buildings would not be disturbed as part of the proposed project. However, a new Screen Chamber is proposed to be constructed between the LEC and the Catskill Aerator. The new structure, which would be approximately 100 ft. by 80 ft., with a height of 40 ft., would block views of the LEC from Columbus Avenue and West Lake Drive and would obscure the direct visual relationship between the LEC and the existing Screen Chamber. However, it is not anticipated that this would be an adverse visual impact because the new screen chamber would be designed to be compatible with the surrounding 1915 Renaissance Revival-style structures, and the LEC and existing Screen Chamber would continue to be individually visible from various vantage points. In addition, as part of the proposed project, the Catskill and Delaware Aerators could be filled with a portion of the excavated material from the Eastview Site. This action could have visual effects on the Kensico campus, as it would alter the historic appearance of the campus by burying (and thus removing from view) an original above-grade feature of the Catskill Aqueduct system (the Catskill Aerator). It would also alter the setting of the LEC, which overlooks the Aerators. However, after the Aerators are filled, the areas would be graded and landscaped,

FEIS KENRESWORKSITES 57
which would improve the overall appearance of the Kensico Reservoir work sites by creating more natural space on the Kensico campus. (The Aerators are currently out of service.) The Town of Mount Pleasant would be consulted prior to the establishment of new plantings or landscaping in these areas. As mentioned above, if this alternative is chosen, a water main could be installed from Delaware Shaft No. 18 along roadways and a Mount Pleasant right-of-way to the existing Commerce Street Pumping Station. This connection could be available to the Town during and after the Catskill pressurization work. In addition, a separate UV Facility may be constructed for the Town of Mount Pleasant at the existing Stevens Avenue Storage Tanks, which are supplied by the existing Commerce Street Pump Station. If this option for conveying UV treated water to the Town is selected, the UV units would be installed within a new stand-alone building located on Town property, to the southeast of the existing storage tanks. The dimensions of the Mount Pleasant UV building would be approximately 30 ft. long by 40 ft. wide. The building would be located on a cleared area that is part of the property. Compared to the land uses immediately surrounding the Mount Pleasant UV building site, which are comprised predominantly of office parks, the structure itself would be much smaller. As the building would be located on an area within the Stevens Avenue Storage Tanks property that has already been cleared, there would be little if any vegetation disturbed due to the presence of this new building. Therefore, no significant adverse impacts to land uses surrounding the Mount Pleasant UV building site are anticipated from the operation of this facility. The remaining work sites are at or below grade and would not substantially change from existing to operations conditions. Although the specific use of several of the aboveground facilities at the Kensico campus would be altered, the proposed project would continue the general historic use of the Aqueduct and the aboveground facilities for drinking water storage, treatment and delivery. Therefore, the proposed project is not anticipated to have adverse contextual impacts on the UEC, the LEC, Delaware Shaft No. 18, or the existing Screen Chamber. In addition, the proposed project is not anticipated to have visual impacts on any of the other aboveground features of the Catskill Aqueduct because no above-ground structures would be constructed in their vicinity. Furthermore, since there would be no permanent employees assigned to the new screen chamber, there would be no effects on community facilities and services. With respect to infrastructure and energy, the power presently generated by the existing turbines in the LEC would no longer be available, as the turbines would have been removed during the pressurization work. In addition, since there would be no active personnel at these sites, there would be no need for potable water or solid waste disposal. The electrical power distribution for the Kensico campus sites is as follows: the electrical power requirements for the UEC and the LEC are 480V; this supply is already being supplied and would remain when the UEC and LEC are online. The existing Screen Chamber is currently supplied with 480V; the total power requirement is anticipated to be less when the new Screen Chamber is placed online. The Delaware Shaft No. 18 is also currently supplied with power; this supply would not be affected the installation and operation of a gravity-fed water main from this facility. The existing Screen Chamber equipment would be removed as part of the work at the Kensico Reservoir work sites, but power (480V) would still be supplied to this facility. The Boat

FEIS KENRESWORKSITES 58
Hole currently has no electrical demand; there would be no demand at this facility in the foreseeable future. Con Edison maintains the power to the Kensico campus and is anticipated to continue to do so for the foreseeable future. The annual amount of energy consumed by these sites is minimal, and comparable to an average household use. The Kensico campus sites do not maintain any stormwater drainage system. In a storm event, runoff from these sites is discharged to the surrounding vegetation areas. There would be no impact on public health from the operation of the new screen chamber or from the operation of the existing facilities. With the end of the construction process, no additional truck or vehicle trips to the Kensico campus sites would be required, nor would the new facility generate additional air emissions or noise. Lastly, there would be no effects from hazardous materials or EMF/ELF, since there is no planned use or storage of hazardous materials at the Kensico campus sites, and all electrical equipment would be housed within an enclosed building within shielded equipment and lines, thus shielding the public as well as workers from possible EMF/ELF exposure; therefore, no significant impacts would occur.
5.1.3.2. Potential Construction Impacts
The anticipated year of peak construction of the proposed Catskill Aqueduct pressurization work at the Kensico campus sites is 2010, when the filling of the Catskill Aerator, construction of the new screen chamber, and the rehabilitation of a portion of the Catskill Aqueduct would be undertaken simultaneously. Therefore, potential construction impacts have been assessed by comparing the Future With the Project conditions against the Future Without the Project conditions for the year 2010. Proposed construction work would take place seasonally (September through May) between 2007 and 2011. For the analyses of traffic, air quality and noise, a 2006 analysis year was also examined in order to isolate the potential impacts of the proposed trucking activity. The total filling of the Aerators at the Kensico campus may require approximately 280,000 cubic yards of backfill, most of which would be excavated at the Eastview Site. Approximately 80 percent of the material associated with filling of the Catskill and Delaware Aerators, (approximately 220,000 cubic yards of fill), would be transported to the Kensico campus in the construction year 2006. A reasonable worst-case estimate of 24 truck trips per hour (192 per day) was used to assess the construction impacts for 2006. In the 2010 construction year, the remaining fill material up to 60,000 cubic yards, of excavated material would be transported to complete the grading of the Catskill Aerator, which represents only 20 percent of the total fill work being conducted at the Kensico campus. The 2010 filling activity would be undertaken concurrently with the proposed pressurization of the Catskill Aqueduct and the construction of the new Screen Chamber. Construction of the new Screen Chamber and the proposed pressurization are anticipated to generate 12 truck trips per day. In addition to this, for analysis purposes it was assumed that the filling/grading remaining at the Catskill Aqueduct would generate up to 200 truck trips per day. However, if the filling/grading at

FEIS KENRESWORKSITES 59
the Catskill Aqueduct was performed over a six month period 72 truck trips per day would likely occur.
5.1.3.2.1. Land Use, Zoning, and Public Policy
Land Use. During the proposed pressurization work, land use at the Kensico Reservoir work sites would change temporarily in terms of the overall level of activity occurring on each site. Starting in 2008, the Catskill Aqueduct Pressurization work would take place seasonally (September through May) for three to four years. A total of 40 workers would be active at the pressurization work sites at any one time, with the exception of the Aerators and the new screen chamber building sites. The new screen chamber would be under construction continuously for about 2 years from 2008 to 2010, employing approximately 50 workers at the site near the LEC. An additional 10 employees would be involved with filling of the Aerators. As discussed above, the Delaware Aerator would be filled first, from late 2005 to early 2006 and the Catskill Aerator would be filled in late 2009 or early 2010. A separate UV building could also be constructed at the existing Stevens Avenue Storage Tanks, if this option for conveying UV treated water to the Town of Mount Pleasant is selected. Parking areas for construction workers would be provided on the Kensico campus in existing contractor parking lots and along interior roadways such as Aerator Drive and West Lake Drive. Construction work would occur only during the daytime, between 7AM and 4 PM, with no work proposed during the weekends. A construction fence would be erected around the areas to be disturbed. See Figure 5.1-2 for the land use study area. The proposed construction activities are not anticipated to have any significant adverse land use impacts on sensitive land uses surrounding the work sites, namely the residences along Highclere Lane, Colonial Lane, Lakeview Avenue, and Columbus Avenue. The construction work that would take place at the UEC and the LEC would primarily take place inside the buildings and construction equipment would not be visible. In addition, parking for construction workers would be provided on the Kensico campus within an already cleared area and along roadways where parking is currently permitted. While a larger degree of activity could occur at the Catskill and Delaware Aerators, with up to 200 trucks per day traveling to and from these sites carrying fill from the Eastview Site, this activity would be temporary, occurring for approximately six months in 2005 and 2006 and for a shorter duration in late 2009 or early 2010, and would ultimately result in a larger landscaped area at these sites. In addition, traffic along Columbus Avenue would not be affected during the reconstruction of the fluoridation pit and Aqueduct, as a temporary bypass road would be constructed on adjacent City property so that traffic flow would be maintained. There are several homes located in the vicinity of the Catskill Aqueduct where excavation and building of the pressurized conduit between the LEC and the Boat Hole could occur. The closest residence is on Columbus Avenue directly north of the existing Screen Chamber. Although a maximum of 50 feet on either side of this portion of the Catskill Aqueduct, including some trees, would be cleared, this would not be out of character with the existing conditions of these areas. There is currently a swath of cleared land directly above the Aqueduct, with Con Edison’s electrical transmission lines running overhead. In addition, fencing would be erected around the areas to be disturbed during the construction period. Furthermore, the primary staging area for construction would be located on the east side of Columbus Avenue in the Catskill Aerator, away

FEIS KENRESWORKSITES 60
from the existing homes. The use of the Catskill Aerator for staging would occur before the Aerator is completely filled. As mentioned above, a separate UV building could be constructed for the Town of Mount Pleasant at the existing Stevens Avenue Storage Tanks. The Town would have the ability to draw from either the Catskill or Delaware Aqueducts through the existing Commerce Street Pumping Station from either (1) the Delaware Aqueduct via a 30-inch gravity feed connection from Shaft No. 18 installed for supplying Delaware Aqueduct water during extended shutdowns of the Catskill Aqueduct for pressurization work, or (2) from the Town’s existing connection to the Kensico Siphon of the Catskill Aqueduct. If the first of these options were chosen, the 30-inch gravity feed connection would need to be installed at Delaware Aqueduct Shaft No. 18. This installation would result in temporary impacts on neighboring land uses, due to increased traffic from construction-related vehicles and increased noise in the vicinity of the site, but these impacts would be temporary and would not occur once construction work is complete. For the construction of the UV building itself, minimal site clearing would be required, as the building would be located on an already cleared area. Furthermore, land uses surrounding the UV building site would not be considered sensitive uses, as the buildings within the adjacent office parks are set back far from the road and are relatively self-contained on-site. Therefore, no significant adverse land uses are anticipated from construction of this building. With the exception of the filling of the Catskill and Delaware Aerators, truck traffic at the work locations and new screen chamber would be minimal, with two to ten truck deliveries per day. This would not result in a significant adverse impact to the land uses in the vicinity of these sites. However, as mentioned above, up to 200 trucks could be traveling to and from the Aerators during the peak construction period. These trips could result in adverse impacts to the study area intersections, regardless of which route is chosen (truck route Options A, B, C, D, or E), but these impacts would be temporary and would not occur once the construction work is complete. As noted above, the filling of the Aerators would occur over a relatively short periods in 2006 an 2010, and the filling activity would be confined to the weekdays, from 8 AM to 4:30 PM. See Section 5.1.3.2.7, Potential Construction Impacts, Traffic and Transportation, for a description of how traffic would be affected in the vicinity of the Kensico Reservoir work sites during the construction period as trucks travel to and from the Eastview Site.
Zoning. The Town of Mount Pleasant's zoning regulations would only apply to the construction of the new Screen Chamber building and the separate UV building for the Town of Mount Pleasant. (All other proposed work would involve rehabilitation to existing water supply facilities, of which are underground) The new Screen Chamber would require a special use permit from the Town, similar to the UV Facility at the Eastview Site. As discussed in Section 4.2, watershed and water supply facilities are a "permitted special use" within the R-40 (within which the new Screen Chamber would be located) and OB-1 (within which the new UV building for the Town of Mount Pleasant would be located) zoning districts, and are subject to conformance with additional standards as provided in Article III of the Town zoning ordinance (Chapter 218); see Section 4.2.3.1 for a list of these additional standards. The new Screen Chamber building would conform to all of the bulk requirements of the Town of Mount Pleasant's R-40 district, including the maximum building coverage and setback

FEIS KENRESWORKSITES 61
regulations, with exception of the maximum building height. The height of the proposed new Screen Chamber (40 ft.) would exceed the district's 35-ft. maximum building height requirement by five feet. Therefore, an area variance from the height requirement would need to be obtained from the Mount Pleasant Town Board for construction of this new structure. It is likely that the new UV building for the Town of Mount Pleasant would conform to all of the bulk requirements of the Town of Mount Pleasant’s OB-1 district, including the maximum building coverage and setback regulations. Although an area variance would be required in order to construct the new Screen Chamber, the variance requested would only be slightly above the maximum height requirement (40 ft. versus 35 ft.). Furthermore, the proposed structure would be designed to be similar in height and appearance to the existing water supply structures on the Kensico campus. Therefore, it is anticipated that the proposed new Screen Chamber would not result in a potential significant impact on zoning patterns on the Kensico campus or in the study area. Similarly, the proposed UV building for the Town of Mount Pleasant would be designed to smaller in scale to the surrounding uses; therefore, it is anticipated that the new facility would not result in a potential significant impact on zoning patterns in the Kensico Reservoir Work Sites study area. See Figure 5.1-2 for zoning regulations in the study area.
Public Policy. The proposed work to be done at the Kensico Reservoir work sites would adhere to the goals discussed in Patterns for Westchester and the Town of Mount Pleasant's Comprehensive Plan (see Section 4.2.2.1 for a discussion of these public policy documents). The character of the community would be preserved, degradation of the water supply would be prevented, and the proposed new Screen Chamber structure would be compatible with the infrastructure and light industrial land use pattern found on the Kensico campus, and would not interfere with other land uses in the study area. Furthermore, the proposed construction would help protect the quality of the Catskill and Delaware Water Supply System and also could provide a continuous supply of water to the Town of Mount Pleasant.
5.1.3.2.2. Visual Character
In order to secure the construction site and provide a safe working environment, a temporary fence would surround the construction areas during the three to four year seasonal construction periods. At the year round construction sites (i.e. the Catskill and Delaware Aerators and new Screen Chamber), there would be a temporary fence around the sites throughout the duration of the construction. Some trees may need to be cut in the area where the Catskill Aqueduct could potentially be excavated and reconstructed as a pressurized conduit. The building of the fence and removal of trees would be a temporary visual impact to the Kensico Reservoir work sites for the duration of construction. Since the pressurization construction is only anticipated to take place seasonally for four years, the filling of the Aerators would likely take place over one season for each Aerator, and the new Screen Chamber construction would take place year round for four years, these adverse impacts can be considered temporary and not significant. Specific impacts that can be anticipated from the construction work at the Kensico Reservoir work sites are presented below.

FEIS KENRESWORKSITES 62
Upper Effluent Chamber. During construction at the UEC, there would be construction equipment and a trailer stored at the facility. The trailer and construction equipment would be stored just outside the UEC along its access road. No clearing would be required for this storage area. All work would be inside the UEC except for the cleaning of the building exterior. Since the UEC is located off of a secondary road and the work would be temporary, no impacts on the study area visual character are anticipated from construction activities at the UEC.
Lower Effluent Chamber. Construction at the LEC would include use of a hydraulic crane, a backhoe/loader, an air compressor, and a small office trailer and material storage. While views of the LEC could be hindered by construction equipment, the construction work at the LEC would be temporary and located inside the structure, except for exterior cleaning. Therefore, any potential impacts from the work at the LEC would not be significant.
Catskill and Delaware Aerators. During a construction work period of approximately
six months for each Aerator, the Catskill and Delaware Aerators would be filled with excavated material from the Eastview Site; the Catskill Aerator would also be filled with excavated material from the construction of the new Screen Chamber (see below). This construction work could create an adverse visual effect for people traveling on Columbus Avenue or to those whose homes face the Kensico campus. However, any negative visual effects associated with the filling of the Aerators would be temporary and therefore would not be considered a significant adverse impact and upon completion of the filling, the area would be graded and landscaped, thus proving a better viewscape for viewers than was there prior to the filling.
Delaware Aqueduct Shaft No. 18. A water main could be constructed from existing
piping adjacent to Shaft No. 18 to Mount Pleasant’s Commerce Street Pumping Station to provide water to the Town both temporarily during the shutdown of the Catskill Aqueduct and permanently after the completion of the proposed UV Facility. Installation of this water main would be similar to a typical utility line installation; any visual impacts associated with this activity would be short-term and would therefore not be considered significant.
New Screen Chamber. The construction of the new Screen Chamber would take place between the LEC and the Catskill Aerator. Close to or upon completion of the new Screen Chamber, the Catskill Aerator would be filled with excavated materials associated with the construction of the new Screen Chamber and with excavated material from the Eastview Site. This construction work could create an adverse visual effect to people traveling on Columbus Avenue or to those whose homes face the Kensico campus. However, any visual impacts associated with construction of the new screen chamber would be temporary, and therefore would not be considered a significant adverse impact.
Work on the Catskill Aqueduct. Between the LEC and the Boat Hole, the Catskill Aqueduct could be excavated and reconstructed as a pressurized conduit. During the seasonal construction period associated with this work, it is anticipated that a maximum of 50 feet on either side of the Aqueduct could be disturbed, and some trees could be cut as part of this disturbance. It is anticipated that some trees would be removed in the vicinity of the Catskill Aqueduct between the LEC and the Boat Hole. Bypass lanes would be constructed onto City property to keep Columbus Avenue open while the Aqueduct would be rehabilitated under the

FEIS KENRESWORKSITES 63
road. Any visual impacts associated with work on the Catskill Aqueduct would have no lasting impacts on visual resources and would therefore not be considered significant.
Separate UV Building. If this option is chosen, a separate UV building would be
constructed for the Town of Mount Pleasant at the existing Stevens Avenue Storage Tanks. The UV units would be installed within a new stand-alone building located on Town property, to the southeast of the existing storage tanks. The footprint of the Mount Pleasant UV building would be approximately 30 feet by 40 feet. The building would be located on a cleared area that is part of the property. No significant visual impacts are anticipated from construction of this facility; the area already contains two large water tanks, so the addition of a small UV building would not represent a significant change to visual character.
5.1.3.2.3. Community Facilities
Local Emergency Services representatives would work with the NYCDEP and its contractors to establish a safety and emergency response plan that would adequately assess the construction activities and identify needs. In the event of an emergency, the construction workers at the work sites would activate the response plan. It is not anticipated that these needs would result in a significantly adverse impact to services provided in the study area. The Valhalla Middle/High School could experience temporary indirect effects associated with proposed construction activities at the Kensico Reservoir work sites such as possible traffic congestion along Columbus Avenue. Since the nature of this construction work is short-term, it is not anticipated that workers would move into the study area and introduce their children to the area schools. Therefore, any impacts would be temporary and would not be considered significant. In case of a medical emergency, first responders would transport patients to the Westchester Medical Center. Given the minimal number of workers at the proposed work sites, it is not anticipated that the Medical Center would experience a significant impact. Between the issuance of the Draft and Final EIS, NYCDEP has been in communication with local representatives. Uniformed police officers would be provided for traffic control at key intersections.
5.1.3.2.4. Open Space
The proposed construction work at the Kensico Reservoir work sites is not anticipated to have a direct impact on open space resources (i.e., increasing the demand) due to the: (1) industrial nature of the work, (2) relatively short time period during which it would occur, and (3) number and types of employees the work would generate. Construction workers would likely utilize open spaces on the NYCDEP Kensico Reservoir campus. There is the potential for the enjoyment of adjacent open spaces (e.g., Valhalla High/Middle School) to be impacted by the construction activities proposed at the Kensico Reservoir work sites. These open spaces are located directly north of Kensico Reservoir work sites and have the potential to be utilized during the same times of day that construction would be scheduled to occur if they are publicly accessible. However, these open spaces are shielded from the Kensico work sites by wooded areas and steep slopes; therefore, access of the open sites near the school by construction workers is highly unlikely. Since construction on the pressurization of the Catskill Aqueduct would be

FEIS KENRESWORKSITES 64
scheduled during the winter months it would likely not interfere with the athletic use of the open space facilities. The construction of the new screen chamber would occur year-round but would not present an adverse effect from construction-related activities.
5.1.3.2.5. Neighborhood Character
During the proposed pressurization work, neighborhood character in the vicinity of the Kensico Reservoir work sites would change temporarily in terms of the overall level of activity occurring at each location. During the weekdays in the peak construction year (2010), between the hours of 7AM and 4PM, a maximum of 100 construction workers would be assigned to various locations in the Kensico campus. While the Aerators are filled up to 200 trucks would deliver fill from the Eastview Site to the Kensico campus during the weekdays from 8AM to 4:30 PM. Although noise levels would be higher during these hours, they are not anticipated to have any significant adverse impacts on nearby sensitive receptors. Furthermore, a construction fence would be erected around the areas to be disturbed, which would serve as a buffer to nearby residences. As a result of the proposed construction work, traffic would increase on the roadways near the Kensico work sites and farther away along the route(s) selected for the Aerator filling activity in 2006. At some intersections, there would be temporary adverse traffic impacts from the truck trips, in 2006ese would occur over a relatively short period (approximately six months) and confined to the weekdays between 8AM and 4:30 PM (see Section 5.1.3.2.7, Potential Construction Impacts, Traffic and Transportation). As discussed below, there would be no significant adverse impacts on ambient air quality from the proposed construction work at the Kensico Reservoir work sites. In general, the effects on neighborhood character from the proposed construction work would be temporary and in some cases, intermittent. For example, the pressurization work would be conducted seasonally, from September to May, for three to four years. Given the temporal nature of the work, no significant adverse impacts on neighborhood character are anticipated to occur from the Kensico Reservoir work sites.
5.1.3.2.6. Socioeconomic Conditions
Jobs. The peak construction period on the Kensico Reservoir work sites would introduce a total of approximately 100 construction employees into the study area. These construction workers would have a median salary of approximately $42,200 (based on the salaries of the types of construction workers that would be on-site). Neither Westchester County nor the Town of Mount Pleasant would receive any income tax benefits from these construction workers, since neither the County nor the Town imposes tax on personal income. If residing in the City of New York, however, the worker would pay approximately $1,400 in taxes per year to the City.
Direct Displacement. The proposed construction work would not displace existing populations, employment, or facilities at the Kensico Reservoir work sites. These sites are currently uninhabited, although a modest amount of employment is generated by the above-ground structures such as the LEC. NYCDEP staff levels would remain the same after

FEIS KENRESWORKSITES 65
construction is completed and there would be no additional employment on the Kensico campus as a result of the proposed work. Two existing water supply facilities (the Aerators) would be filled in and they would no longer appear on the campus, but these facilities have been out of service for over 40 years.
Indirect Effects. The 100 construction workers would likely add money to the local economy through their visits to area businesses. The RIMS II multipliers for the construction industry indicate that the sectors that would see the most benefits during construction are retail trade and business services. It is not possible to determine exactly where the workers may conduct business, but it is likely that they would visit gas stations, convenience stores, and restaurants. It should be noted that the economic benefits would likely affect a region larger than the County, since materials may be purchased outside of the County limits. For the complete analysis of indirect effects, see Section 4.7, Socioeconomic Conditions, Potential Construction Impacts.
Property Taxes. Construction of the new Screen Chamber, may be considered by the Town of Mount Pleasant an improvement to the Kensico campus and therefore would be taxed. The potential tax increase or payment in lieu of taxes (PILOT) from this component of the proposed project has not been projected, but it is not anticipated to be substantial. The separate UV building, which is the only other above-ground structure that is possibly could be constructed , would be maintained by the Town after construction and would not generate taxes for the Town.
5.1.3.2.7. Traffic and Transportation
As discussed above, the following analysis includes two future analysis periods, 2006 and 2010. The total filling of the Aerators at the Kensico campus may require approximately 280,000 cubic yards of backfill, most of which would be excavated at the Eastview Site. Approximately 80 percent of the material associated with filling of the Catskill and Delaware Aerators, (approximately 220,000 cubic yards of fill), would be transported to the Kensico campus in the peak construction year 2006. A reasonable worst-case estimate of 24 truck trips per hour (192 per day) was used to assess the construction impacts for 2006. In the 2010 construction year, the remaining backfill material up to 60,0000 cubic yards, of excavated material would be transported to complete the grading of the Catskill Aerator, which represents only 20 percent of the total fill work being conducted at the Kensico campus. The 2010 filling activity would be undertaken concurrently with the proposed pressurization of the Catskill Aqueduct and the construction of the new Screen Chamber. Transport of the backfill material would occur as it is needed during the proposed pressurization, as opposed to the earlier bulk-filling of the Catskill and Delaware Aerators, and is estimated to peak at eight truck trips per hour (64 per day). An extra truck trip per hour was added to account for material deliveries during pressurization for a total of 9 truck trips per hour (72 per day). The filling activity accounts for the majority of the truck trips generated in both construction years. Because of the comparatively smaller overall volume of fill being delivered in 2010, the overlap of the filling activity with the Catskill pressurization work and the construction of the screen chamber would occur for a very short duration. As such, if this work was performed over a six month time period

FEIS KENRESWORKSITES 66
an average of 9 truck trips per hour would occur. An average of 24 truck trips per hour would occur only if the construction period in 2010 was shortened to approximately two to four months. Therefore, impacts associated with the trucking activity on traffic, air quality, and noise in 2010 are conservatively estimated to be equal to or less than the impacts projected for the construction year 2006. For ease of reading, these sections include both the Future Without the Project and Future With the Project.
2006 Future Without the Project. To account for traffic growth that would arise from anticipated site developments as well as from general background growth in the study area, an annual growth rate 1.5 percent per year was applied to the existing condition traffic volumes for a total of 3.0 percent growth to reflect 2006 traffic conditions. In addition, the traffic generated by two specific projects was also assigned to the 2006 traffic network:
• Avalon Green – This proposed residential development would be located on the south side of Route 119 just east of I-287. This development project would include 794 residential units, a daycare center, 200,000 square feet of office space, and 30,000 square feet of retail space. A build year has not been established for this project, but for the purposes of this analysis, it is anticipated that it would be completed by 2006. The estimated vehicles trips for this project were assigned to the various study area analysis locations; thus increasing the overall No Build volumes in addition to the general background growth projections.
• Home Depot – This development would be located north of Old Saw Mill River Road
and west of Route 9A. This development project would include a 117,000 square-foot Home Depot home improvement retail store. This project is anticipated to be completed by the end of 2005 or the beginning of 2006. The estimated vehicles trips for this project were assigned to the various study area analysis locations; thus increasing the overall No Build volumes in addition to the general background growth projections.
The 2006 Future traffic volumes without the fill operations for the AM, midday and PM peak hours are illustrated in Figures 5.1-A, 5.1-B, and 5.1-C, respectively. (For ease of reading, Figures 5.1-A to 5.1-CCC are located at the end of Section 5.1.) The traffic volumes resulting from these proposed site development, taken together with the projected background growth, would result in increased congestion throughout the project area. A comparison of HCM analysis between Existing Conditions versus the 2006 Future Conditions without the fill operations is presented in Table 5.1-A. For signalized intersections there would be one notable change in LOS:
• The overall LOS at the intersection of Route 100C and Bradhurst Avenue (Route 100) would deteriorate from LOS D to E during the AM peak hour.

FEIS KENRESWORKSITES 67
For unsignalized intersection there would be one notable change in LOS:
• The westbound approach of the Grasslands Road (Route 100) and Virginia Road intersection would deteriorate from LOS E to F during the AM peak hour.
For Option E only the traffic generated by the Home Depot project (detailed above) was assigned to the 2006 traffic network, in addition to the background growth rate of 3.0 percent (general background growth in the study area plus annual growth rate of 1.5 percent per year applied to the existing condition traffic volumes). The 2006 future traffic volumes without the fill operations for the AM, midday and PM peak hours are illustrated in Figures 5.1-D, 5.1-E, and 5.1-F, respectively. For the signalized intersections there would be the following notable change in LOS:
• The overall LOS at the intersection of Broadway (Route 141) and Kensico Road/Marble Avenue would deteriorate from LOS C to LOS D during both the midday and PM peak hours.
For the unsignalized intersections there would be no notable changes in LOS.
2006 Future With the Project.
Two 2006 Future conditions were analyzed for the filling of the Catskill and Delaware Aerators: with and without the Croton project. During the filling process, there would be approximately 24 trucks traveling from the Eastview Site to the Kensico Reservoir, and the same number traveling back to the Eastview Site from Kensico Reservoir every hour of the day from (8 AM to 4:30 PM) for approximately six months as part of the reasonable worst-case estimate. This number would be the same for both scenarios, with and without the Croton project. The filling of the Aerators is associated only with the proposed UV Facility. If the Croton project is built on the Eastview Site, some construction-related traffic from that project (including both trucks and employee vehicles) would travel through the Kensico study area in 2006. However, this traffic would be relatively minor, and would not be associated with the fill operations. Nonetheless, the following traffic analysis accounted for the potential traffic contributions from the Croton project. For Option E only the 2006 Future With the Project, without the Croton project condition was analyzed for the filling of the Aerators.
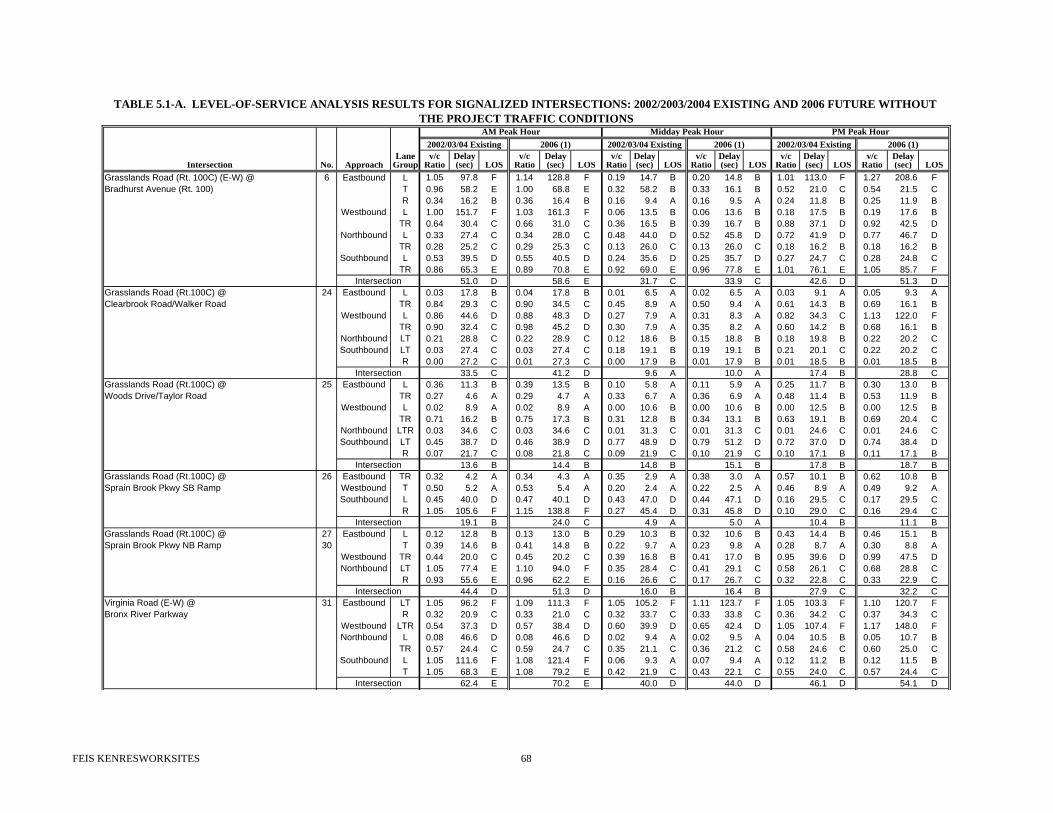
AM Peak Hour Midday Peak Hour PM Peak Hour
Lane v/c Delay v/c Delay v/c Delay v/c Delay v/c Delay v/c DelayIntersection No. Approach Group Ratio (sec) LOS Ratio (sec) LOS Ratio (sec) LOS Ratio (sec) LOS Ratio (sec) LOS Ratio (sec) LOS
Grasslands Road (Rt. 100C) (E-W) @ 6 Eastbound L 1.05 97.8 F 1.14 128.8 F 0.19 14.7 B 0.20 14.8 B 1.01 113.0 F 1.27 208.6 FBradhurst Avenue (Rt. 100) T 0.96 58.2 E 1.00 68.8 E 0.32 58.2 B 0.33 16.1 B 0.52 21.0 C 0.54 21.5 C
R 0.34 16.2 B 0.36 16.4 B 0.16 9.4 A 0.16 9.5 A 0.24 11.8 B 0.25 11.9 BWestbound L 1.00 151.7 F 1.03 161.3 F 0.06 13.5 B 0.06 13.6 B 0.18 17.5 B 0.19 17.6 B
TR 0.64 30.4 C 0.66 31.0 C 0.36 16.5 B 0.39 16.7 B 0.88 37.1 D 0.92 42.5 DNorthbound L 0.33 27.4 C 0.34 28.0 C 0.48 44.0 D 0.52 45.8 D 0.72 41.9 D 0.77 46.7 D
TR 0.28 25.2 C 0.29 25.3 C 0.13 26.0 C 0.13 26.0 C 0.18 16.2 B 0.18 16.2 BSouthbound L 0.53 39.5 D 0.55 40.5 D 0.24 35.6 D 0.25 35.7 D 0.27 24.7 C 0.28 24.8 C
TR 0.86 65.3 E 0.89 70.8 E 0.92 69.0 E 0.96 77.8 E 1.01 76.1 E 1.05 85.7 FIntersection 51.0 D 58.6 E 31.7 C 33.9 C 42.6 D 51.3 D
Grasslands Road (Rt.100C) @ 24 Eastbound L 0.03 17.8 B 0.04 17.8 B 0.01 6.5 A 0.02 6.5 A 0.03 9.1 A 0.05 9.3 AClearbrook Road/Walker Road TR 0.84 29.3 C 0.90 34.5 C 0.45 8.9 A 0.50 9.4 A 0.61 14.3 B 0.69 16.1 B
Westbound L 0.86 44.6 D 0.88 48.3 D 0.27 7.9 A 0.31 8.3 A 0.82 34.3 C 1.13 122.0 FTR 0.90 32.4 C 0.98 45.2 D 0.30 7.9 A 0.35 8.2 A 0.60 14.2 B 0.68 16.1 B
Northbound LT 0.21 28.8 C 0.22 28.9 C 0.12 18.6 B 0.15 18.8 B 0.18 19.8 B 0.22 20.2 CSouthbound LT 0.03 27.4 C 0.03 27.4 C 0.18 19.1 B 0.19 19.1 B 0.21 20.1 C 0.22 20.2 C
R 0.00 27.2 C 0.01 27.3 C 0.00 17.9 B 0.01 17.9 B 0.01 18.5 B 0.01 18.5 BIntersection 33.5 C 41.2 D 9.6 A 10.0 A 17.4 B 28.8 C
Grasslands Road (Rt.100C) @ 25 Eastbound L 0.36 11.3 B 0.39 13.5 B 0.10 5.8 A 0.11 5.9 A 0.25 11.7 B 0.30 13.0 BWoods Drive/Taylor Road TR 0.27 4.6 A 0.29 4.7 A 0.33 6.7 A 0.36 6.9 A 0.48 11.4 B 0.53 11.9 B
Westbound L 0.02 8.9 A 0.02 8.9 A 0.00 10.6 B 0.00 10.6 B 0.00 12.5 B 0.00 12.5 BTR 0.71 16.2 B 0.75 17.3 B 0.31 12.8 B 0.34 13.1 B 0.63 19.1 B 0.69 20.4 C
Northbound LTR 0.03 34.6 C 0.03 34.6 C 0.01 31.3 C 0.01 31.3 C 0.01 24.6 C 0.01 24.6 CSouthbound LT 0.45 38.7 D 0.46 38.9 D 0.77 48.9 D 0.79 51.2 D 0.72 37.0 D 0.74 38.4 D
R 0.07 21.7 C 0.08 21.8 C 0.09 21.9 C 0.10 21.9 C 0.10 17.1 B 0.11 17.1 BIntersection 13.6 B 14.4 B 14.8 B 15.1 B 17.8 B 18.7 B
Grasslands Road (Rt.100C) @ 26 Eastbound TR 0.32 4.2 A 0.34 4.3 A 0.35 2.9 A 0.38 3.0 A 0.57 10.1 B 0.62 10.8 BSprain Brook Pkwy SB Ramp Westbound T 0.50 5.2 A 0.53 5.4 A 0.20 2.4 A 0.22 2.5 A 0.46 8.9 A 0.49 9.2 A
Southbound L 0.45 40.0 D 0.47 40.1 D 0.43 47.0 D 0.44 47.1 D 0.16 29.5 C 0.17 29.5 CR 1.05 105.6 F 1.15 138.8 F 0.27 45.4 D 0.31 45.8 D 0.10 29.0 C 0.16 29.4 C
Intersection 19.1 B 24.0 C 4.9 A 5.0 A 10.4 B 11.1 BGrasslands Road (Rt.100C) @ 27 Eastbound L 0.12 12.8 B 0.13 13.0 B 0.29 10.3 B 0.32 10.6 B 0.43 14.4 B 0.46 15.1 BSprain Brook Pkwy NB Ramp 30 T 0.39 14.6 B 0.41 14.8 B 0.22 9.7 A 0.23 9.8 A 0.28 8.7 A 0.30 8.8 A
Westbound TR 0.44 20.0 C 0.45 20.2 C 0.39 16.8 B 0.41 17.0 B 0.95 39.6 D 0.99 47.5 DNorthbound LT 1.05 77.4 E 1.10 94.0 F 0.35 28.4 C 0.41 29.1 C 0.58 26.1 C 0.68 28.8 C
R 0.93 55.6 E 0.96 62.2 E 0.16 26.6 C 0.17 26.7 C 0.32 22.8 C 0.33 22.9 CIntersection 44.4 D 51.3 D 16.0 B 16.4 B 27.9 C 32.2 C
Virginia Road (E-W) @ 31 Eastbound LT 1.05 96.2 F 1.09 111.3 F 1.05 105.2 F 1.11 123.7 F 1.05 103.3 F 1.10 120.7 FBronx River Parkway R 0.32 20.9 C 0.33 21.0 C 0.32 33.7 C 0.33 33.8 C 0.36 34.2 C 0.37 34.3 C
Westbound LTR 0.54 37.3 D 0.57 38.4 D 0.60 39.9 D 0.65 42.4 D 1.05 107.4 F 1.17 148.0 FNorthbound L 0.08 46.6 D 0.08 46.6 D 0.02 9.4 A 0.02 9.5 A 0.04 10.5 B 0.05 10.7 B
TR 0.57 24.4 C 0.59 24.7 C 0.35 21.1 C 0.36 21.2 C 0.58 24.6 C 0.60 25.0 CSouthbound L 1.05 111.6 F 1.08 121.4 F 0.06 9.3 A 0.07 9.4 A 0.12 11.2 B 0.12 11.5 B
T 1.05 68.3 E 1.08 79.2 E 0.42 21.9 C 0.43 22.1 C 0.55 24.0 C 0.57 24.4 CIntersection 62.4 E 70.2 E 40.0 D 44.0 D 46.1 D 54.1 D
TABLE 5.1-A. LEVEL-OF-SERVICE ANALYSIS RESULTS FOR SIGNALIZED INTERSECTIONS: 2002/2003/2004 EXISTING AND 2006 FUTURE WITHOUT THE PROJECT TRAFFIC CONDITIONS
2002/03/04 Existing 2006 (1)2002/03/04 Existing 2006 (1) 2002/03/04 Existing 2006 (1)
FEIS KENRESWORKSITES 68

AM Peak Hour Midday Peak Hour PM Peak Hour
Lane v/c Delay v/c Delay v/c Delay v/c Delay v/c Delay v/c DelayIntersection No. Approach Group Ratio (sec) LOS Ratio (sec) LOS Ratio (sec) LOS Ratio (sec) LOS Ratio (sec) LOS Ratio (sec) LOS
TABLE 5.1-A. LEVEL-OF-SERVICE ANALYSIS RESULTS FOR SIGNALIZED INTERSECTIONS: 2002/2003/2004 EXISTING AND 2006 FUTURE WITHOUT THE PROJECT TRAFFIC CONDITIONS
2002/03/04 Existing 2006 (1)2002/03/04 Existing 2006 (1) 2002/03/04 Existing 2006 (1)
Grasslands Road (Rt 100) @ 34 Eastbound T 0.33 5.0 A 0.34 5.1 A 0.56 11.1 B 0.58 11.4 B 0.66 15.0 B 0.68 15.6 BWCC East Gate Westbound L 0.32 2.9 A 0.34 3.1 A 0.13 6.9 A 0.14 7.1 A 0.19 10.3 B 0.20 10.6 B
T 0.32 2.0 A 0.32 2.1 A 0.28 4.3 A 0.29 4.3 A 0.53 7.4 A 0.55 7.6 ANorthbound L 0.25 51.7 D 0.26 51.9 D 0.40 27.7 C 0.43 27.9 C 0.58 29.5 C 0.61 30.4 C
Intersection 4.6 A 4.7 A 10.4 B 10.6 B 13.5 B 14.0 BTaconic State Parkway @ 38 Eastbound LTR 1.05 104.6 F 1.08 114.3 F 0.69 42.6 D 0.71 43.9 D 1.05 107.4 F 1.09 121.4 FLakeview Avenue (E-W) Westbound LTR 0.95 93.9 F 0.97 101.5 F 0.43 34.9 C 0.45 35.1 D 0.99 96.7 F 1.02 106.1 F
Northbound L 0.20 4.8 A 0.21 5.0 A 0.05 4.0 A 0.06 4.0 A 0.15 4.4 A 0.15 4.4 ATR 0.20 4.4 A 0.21 4.4 A 0.61 7.1 A 0.63 7.4 A 1.02 36.9 D 1.05 46.8 D
Southbound L 0.03 3.9 A 0.04 3.9 A 0.11 4.3 A 0.12 4.4 A 0.32 7.2 A 0.34 7.4 ATR 0.55 6.5 A 0.57 6.6 A 0.27 4.7 A 0.27 4.7 A 0.40 5.4 A 0.41 5.4 A
Intersection 24.5 C 26.4 C 10.5 B 10.8 B 36.7 D 44.3 DTaconic State Parkway @ 39 Eastbound LTR 0.48 39.6 D 0.49 39.8 D 0.16 27.7 C 0.17 27.7 C 0.24 28.4 C 0.26 28.5 CCommerce St. (E-W) Westbound LTR 0.69 49.5 D 0.71 50.8 D 0.34 29.3 C 0.35 29.4 C 0.67 36.2 D 0.69 37.4 D
Northbound LTR 0.26 2.8 A 0.27 2.9 A 0.66 10.7 B 0.68 11.1 B 1.05 50.8 D 1.09 63.3 ESouthbound LTR 0.58 4.4 A 0.60 4.6 A 0.35 7.4 A 0.36 7.6 A 0.70 12.2 B 0.73 12.9 B
Intersection 7.9 A 8.1 A 11.3 B 11.6 B 39.0 D 47.3 DLakeview Avenue (E-W) @ 40 Eastbound LR 0.48 21.4 C 0.50 21.7 C 0.35 19.4 B 0.36 19.6 B 0.46 20.9 C 0.47 21.2 CColumbus Avenue Northbound LT 0.25 8.5 A 0.26 8.6 A 0.36 9.4 A 0.37 9.5 A 0.69 14.1 B 0.71 14.7 B
Southbound TR 0.32 8.9 A 0.33 9.0 A 0.20 8.1 A 0.21 8.2 A 0.27 8.6 A 0.28 8.7 AIntersection 11.7 B 11.8 B 10.8 B 10.9 B 13.6 B 13.9 B
Columbus Avenue (Northbound) @ 42 Eastbound LT 0.53 18.3 B 0.54 18.6 B 0.25 14.4 B 0.26 14.5 B 0.33 15.3 B 0.34 15.4 BStevens Avenue Westbound T 0.39 16.2 B 0.40 16.4 B 0.29 14.8 B 0.30 15.0 B 0.57 19.1 B 0.59 19.5 B
R 0.08 13.0 B 0.08 13.0 B 0.07 12.8 B 0.07 12.8 B 0.13 13.3 B 0.13 13.4 BNorthbound LT 0.47 13.1 B 0.48 13.2 B 0.36 10.7 B 0.39 10.9 B 0.62 13.5 B 0.64 13.9 B
R 0.12 10.4 B 0.12 10.4 B 0.21 9.9 A 0.22 10.0 A 0.34 11.3 B 0.36 11.4 BIntersection 14.8 B 15.0 B 11.9 B 12.0 B 14.6 B 14.8 B
Columbus Avenue (Southbound) @ 43 Eastbound TR 0.77 25.2 C 0.79 26.3 C 0.34 14.7 B 0.35 14.8 B 0.43 15.9 B 0.45 16.1 BStevens Avenue Westbound LT 1.05 76.5 E 1.12 101.8 F 0.72 25.0 C 0.76 27.4 C 1.05 68.3 E 1.10 86.8 F
Southbound LTR 0.25 11.0 B 0.25 11.1 B 0.23 10.2 B 0.24 10.3 B 0.31 10.8 B 0.32 10.9 BIntersection 39.0 D 48.1 D 16.8 B 17.8 B 38.2 D 46.7 D
Stevens Avenue (E-W) @ 44A Eastbound LTR 0.50 19.9 B 0.52 20.1 C 0.20 15.2 B 0.20 15.3 B 0.33 16.3 B 0.34 16.5 BCommerce Street* Westbound LTR 0.24 17.4 B 0.25 17.4 B 0.45 17.4 B 0.47 17.5 B 0.90 35.8 D 0.93 40.2 D
Northbound LTR 0.39 23.4 C 0.40 23.5 C 0.28 26.3 C 0.28 26.4 C 0.47 28.0 C 0.48 28.1 CSouthbound LTR 0.29 22.5 C 0.30 22.6 C 0.46 28.1 C 0.48 28.2 C 0.66 33.5 C 0.68 34.7 C
Intersection 20.6 C 20.8 C 20.4 C 20.6 C 31.3 C 34.0 CElwood Avenue @ 44B Southbound LTR 0.55 33.1 C 0.56 33.5 C 0.45 26.3 C 0.47 26.5 C 0.63 29.7 C 0.64 30.2 CStevens Avenue/Commerce Street* Intersection 33.1 C 33.5 C 26.3 C 26.5 C 29.7 C 30.2 CTaconic State Parkway @ 45 Eastbound LTR 0.06 34.2 C 0.06 34.2 C 0.27 31.8 C 0.28 31.9 C 0.37 32.8 C 0.39 33.0 CStevens Avenue (E-W) Westbound LTR 0.93 81.1 F 0.95 87.2 F 0.93 69.6 E 0.96 76.5 E 1.05 89.4 F 1.08 99.5 F
Northbound L 0.03 3.1 A 0.03 3.1 A 0.00 4.4 A 0.00 4.4 A 0.01 4.4 A 0.01 4.4 ATR 0.14 3.3 A 0.15 3.3 A 0.58 7.6 A 0.60 7.9 A 0.97 25.6 C 1.00 32.4 C
Southbound L 0.42 4.7 A 0.44 4.8 A 0.29 6.4 A 0.33 6.7 A 0.90 79.5 E 0.93 87.6 FTR 0.50 4.9 A 0.52 5.0 A 0.23 5.2 A 0.24 5.3 A 0.33 5.7 A 0.34 5.8 A
Intersection 11.7 B 12.3 B 15.6 B 16.6 B 32.1 C 37.9 DNotes: L = Left Turn, T = Through, R = Right Turn, Def = Defacto Left Turn; LOS = Level of Service.* These two intersections form a 5-leg intersection at Stevens Avenue, Commerce Street, and Elwood Avenue(1) 2006 Future Conditions without the Delaware Aerator Fill Operation
FEIS KENRESWORKSITES 69

AM Peak Hour Midday Peak Hour PM Peak Hour
Lane v/c Delay v/c Delay v/c Delay v/c Delay v/c Delay v/c DelayIntersection No. Approach Group Ratio (sec) LOS Ratio (sec) LOS Ratio (sec) LOS Ratio (sec) LOS Ratio (sec) LOS Ratio (sec) LOS
Bradhurst Avenue (Rt. 100) @ 5 Southbound LT 0.04 8.5 A 0.04 8.6 A 0.01 7.7 A 0.01 7.7 A 0.01 8.0 A 0.01 8.0 ALakeview Avenue (E-W) Westbound LR 0.44 25.0 D 0.47 27.1 D 0.16 11.7 B 0.17 11.9 B 0.38 16.4 C 0.40 17.0 CGrasslands Road (Rt. 100) (N-S) @ 32 Southbound LT 0.33 9.5 A 0.35 9.6 A 0.32 9.1 A 0.33 9.2 A 0.33 9.9 A 0.34 10.1 BVirginia Road Westbound LR 0.85 41.4 E 0.92 53.5 F 0.91 61.7 F 0.99 80.3 F 1.01 77.2 F 1.10 103.5 FGrasslands Road (Rt. 100) (E-W) @ 33 Eastbound LT 0.11 9.3 A 0.11 9.4 A 0.17 9.0 A 0.18 9.1 A 0.21 10.3 B 0.22 10.5 BLegion Drive Southbound L 0.73 59.6 F 0.79 71.3 F 1.02 134.2 F 1.13 172.8 F 0.99 106.5 F 1.08 138.1 F
Southbound R 0.35 15.7 C 0.37 16.2 C 0.27 12.6 B 0.28 12.9 B 0.41 17.4 C 0.44 18.4 CGrasslands Road (Rt. 100) (E-W) @ 34 Westbound LT 0.01 10.2 B 0.01 10.4 B 0.06 8.4 A 0.06 8.5 A 0.11 8.9 A 0.11 9.0 AWCC West Gate Driveway Northbound L 0.73 59.4 F 0.80 72.9 F 0.06 19.3 C 0.08 20.5 C 0.21 40.5 E 0.24 45.2 E
Northbound R 0.06 14.1 B 0.06 14.5 B 0.41 14.7 B 0.43 15.3 C 0.44 16.4 C 0.46 17.3 CCommerce Street @ 36 Eastbound LTR 0.01 7.8 A 0.01 7.8 A 0.03 8.0 A 0.03 8.0 A 0.05 8.4 A 0.05 8.4 ALegion Drive (E-W) Westbound LTR 0.01 7.8 A 0.01 7.9 A 0.03 7.9 A 0.03 8.0 A 0.06 8.4 A 0.06 8.5 A
Northbound LTR 0.15 11.6 B 0.16 11.7 B 0.15 13.8 B 0.16 14.0 B 0.39 24.1 C 0.43 26.4 DSouthbound LTR 0.15 12.2 B 0.16 12.3 B 0.21 18.9 C 0.22 19.7 C 0.57 55.7 F 0.63 65.5 F
Lakeview Avenue (E-W) @ 37 Eastbound LTR 0.02 7.6 A 0.02 7.6 A 0.00 7.5 A 0.00 7.5 A 0.00 7.7 A 0.00 7.7 ACommerce Street Westbound LTR 0.04 8.1 A 0.04 8.1 A 0.01 7.5 A 0.01 7.5 A 0.01 7.6 A 0.01 7.6 A
Northbound LTR 0.05 13.7 B 0.06 13.9 B 0.11 10.1 B 0.12 10.3 B 0.21 11.6 B 0.22 11.7 BSouthbound LTR 0.08 15.3 C 0.09 15.6 C 0.09 11.2 B 0.10 11.3 B 0.16 13.5 B 0.17 13.8 B
Columbus Avenue (N-S) @ 41 Southbound LT 0.13 9.4 A 0.14 9.4 A 0.07 9.1 A 0.07 9.1 A 0.12 10.7 B 0.12 10.9 BWest Lake Drive Westbound L 0.03 25.7 D 0.04 26.8 D 0.02 19.6 C 0.02 20.3 C 0.09 36.8 E 0.09 38.9 E
Westbound R 0.27 12.0 B 0.28 12.1 B 0.17 11.3 B 0.18 11.4 B 0.39 16.0 C 0.41 16.6 CNotes:L = Left Turn, T = Through, R = Right Turn; LOS = Level of Service.(1) 2006 Future Conditions without the Delaware Aerator Fill Operations
TABLE 5.1-A. LEVEL-OF-SERVICE ANALYSIS RESULTS FOR UNSIGNALIZED INTERSECTIONS: 2002/2003/2004 EXISTING AND 2006 FUTURE WITHOUT THE PROJECT TRAFFIC CONDITIONS
2002/03/04 Existing 2006 (1)2002/03/04 Existing 2006 (1) 2002/03/04 Existing 2006 (1)
FEIS KENRESWORKSITES 70

FEIS KENRESWORKSITES 71
Option A – 100 Percent Lakeview Avenue. Figures 5.1-G and 5.1-H show the truck
assignments for truck route Option A (100 percent of the truck traffic traveling on Lakeview Avenue) for the AM and midday, and PM peak hours, respectively, for the Future With the Proposed Project, Without the Croton project (“Cat/Del Alone,” as depicted on the figures). Figures 5.1-I and 5.1-J show the truck assignments for truck route Option A for the AM and midday, and PM peak hours, respectively for the Future With the Project, With the Croton project. Figures 5.1-K, 5.1-L, and 5.1-M show the projected traffic volumes for the Future With the Proposed Project, Without the Croton project. Figures 5.1-N, 5.1-O, and 5.1-P show the projected traffic volumes for the Future With the Proposed Project, With the Croton project. Table 5.1-B presents a comparison of 2006 Future Without the Project conditions to 2006 Future With the Project conditions (without the Croton project). Table 5-1.C presents a comparison of 2006 Future Without the Project conditions to 2006 Future With the Project conditions (with the Croton project). There would be the following potential adverse impacts associated with truck route Option A (100 percent of the truck traffic traveling on Lakeview Avenue) during the filling of the Delaware Aerator in 2006. Each of the identified impacts would occur in both future scenarios (Future With the Project, both With and Without the Croton Project), but With the Croton project, the delays would be the same or slightly higher.
Signalized Intersections:
• The eastbound left-turn movement at the intersection of Grasslands Road (Route 100C) and Bradhurst Avenue (Route 100) would experience a potential adverse impact. The delay would increase from 128.8 seconds (LOS F) to 195.7 seconds (LOS F) and 208.6 seconds (LOS F) to greater than 240.0 seconds (LOS F) during the AM and PM peak hours, respectively.
• The northbound left-turn movement at the intersection of Grasslands Road (Route 100C) and Bradhurst Avenue (Route 100) would experience a potential adverse impact. The delay would increase from 45.8 seconds (LOS D) to 51.8 seconds (LOS D) during the midday peak hour.
• The southbound through/right movement at the intersection of Grasslands Road
(Route 100C) and Bradhurst Avenue (Route 100) would experience a potential adverse impact. The delay would increase from 70.8 seconds (LOS E) to 115.7 seconds (LOS F), 77.8 seconds (LOS E) to 117.3 seconds (LOS F), and 85.7 seconds (LOS F) to 125.3 seconds (LOS F) during the AM, midday, and PM peak hours, respectively.

AM Peak Hour Midday Peak Hour PM Peak Hour2006 (1) 2006 Option A (2) 2006 (1) 2006 Option A (2) 2006 (1) 2006 Option A (2)
Lane v/c Delay v/c Delay v/c Delay v/c Delay v/c Delay v/c DelayIntersection No. Approach Group Ratio (sec) LOS Ratio (sec) LOS Ratio (sec) LOS Ratio (sec) LOS Ratio (sec) LOS Ratio (sec) LOS
Grasslands Road (Rt. 100C) (E-W) @ 6 Eastbound L 1.14 128.8 F 1.31 195.7 + F 0.20 14.8 B 0.32 16.1 B 1.27 208.6 F * ** + FBradhurst Avenue (Rt. 100) T 1.00 68.8 E 1.00 68.8 E 0.33 16.1 B 0.33 16.1 B 0.54 21.5 C 0.55 21.5 C
R 0.36 16.4 B 0.36 16.4 B 0.16 9.5 A 0.16 9.5 A 0.25 11.9 B 0.25 11.9 BWestbound L 1.03 161.3 F 1.03 161.3 F 0.06 13.6 B 0.06 13.6 B 0.19 17.6 B 0.19 17.6 B
TR 0.66 31.0 C 0.66 31.0 C 0.39 16.7 B 0.39 16.7 B 0.92 42.5 D 0.92 42.8 DNorthbound L 0.34 28.0 C 0.34 28.4 C 0.52 45.8 D 0.60 51.8 + D 0.77 46.7 D 0.80 51.2 D
TR 0.29 25.3 C 0.29 25.3 C 0.13 26.0 C 0.13 26.0 C 0.18 16.2 B 0.18 16.2 BSouthbound L 0.55 40.5 D 0.55 40.5 D 0.25 35.7 D 0.25 35.7 D 0.28 24.8 C 0.28 24.8 C
TR 0.89 70.8 E 1.06 115.7 + F 0.96 77.8 E 1.09 117.3 + F 1.05 85.7 F 1.16 125.3 + FIntersection 58.6 E 74.6 E 33.9 C 45.0 D 51.3 D 79.9 E
Grasslands Road (Rt.100C) @ 24 Eastbound L 0.04 17.8 B 0.04 17.8 B 0.02 6.5 A 0.02 6.5 A 0.05 9.3 A 0.06 9.4 AClearbrook Road/Walker Road TR 0.90 34.5 C 0.90 34.5 C 0.50 9.4 A 0.50 9.4 A 0.69 16.1 B 0.69 16.1 B
Westbound L 0.88 48.3 D 0.88 48.3 D 0.31 8.3 A 0.31 8.3 A 1.13 122.0 F 1.13 122.0 FTR 0.98 45.2 D 1.04 61.7 + E 0.35 8.2 A 0.41 8.7 A 0.68 16.1 B 0.75 18.4 B
Northbound LT 0.22 28.9 C 0.22 29.0 C 0.15 18.8 B 0.15 18.8 B 0.22 20.2 C 0.28 20.8 CSouthbound LT 0.03 27.4 C 0.20 28.8 C 0.19 19.1 B 0.36 20.5 C 0.22 20.2 C 0.49 23.0 C
R 0.01 27.3 C 0.01 27.3 C 0.01 17.9 B 0.01 17.9 B 0.01 18.5 B 0.05 18.8 BIntersection 41.2 D 47.9 D 10.0 A 10.6 B 28.8 C 29.0 C
Grasslands Road (Rt.100C) @ 25 Eastbound L 0.39 13.5 B 0.41 15.0 B 0.11 5.9 A 0.12 6.1 A 0.30 13.0 B 0.32 13.8 BWoods Drive/Taylor Road TR 0.29 4.7 A 0.30 4.8 A 0.36 6.9 A 0.38 7.0 A 0.53 11.9 B 0.58 12.6 B
Westbound L 0.02 8.9 A 0.02 8.9 A 0.00 10.6 B 0.00 10.6 B 0.00 12.5 B 0.01 12.6 BTR 0.75 17.3 B 0.78 18.0 B 0.34 13.1 B 0.37 13.4 B 0.69 20.4 C 0.73 21.2 C
Northbound LTR 0.03 34.6 C 0.03 34.6 C 0.01 31.3 C 0.01 31.3 C 0.01 24.6 C 0.01 24.6 CSouthbound LT 0.46 38.9 D 0.46 38.9 D 0.79 51.2 D 0.79 51.2 D 0.74 38.4 D 0.74 38.4 D
R 0.08 21.8 C 0.08 21.8 C 0.10 21.9 C 0.10 21.9 C 0.11 17.1 B 0.11 17.1 BIntersection 14.4 B 14.8 B 15.1 B 15.0 B 18.7 B 19.1 B
Grasslands Road (Rt.100C) @ 26 Eastbound TR 0.34 4.3 A 0.36 4.3 A 0.38 3.0 A 0.40 3.1 A 0.62 10.8 B 0.67 11.7 BSprain Brook Pkwy SB Ramp Westbound T 0.53 5.4 A 0.55 5.5 A 0.22 2.5 A 0.24 2.5 A 0.49 9.2 A 0.52 9.5 A
Southbound L 0.47 40.1 D 0.47 40.1 D 0.44 47.1 D 0.44 47.1 D 0.17 29.5 C 0.17 29.5 CR 1.15 138.8 F 1.15 138.8 F 0.31 45.8 D 0.31 45.8 D 0.16 29.4 C 0.16 29.4 C
Intersection 24.0 C 23.5 C 5.0 A 4.9 A 11.1 B 11.6 BGrasslands Road (Rt.100C) @ 27 Eastbound L 0.13 13.0 B 0.14 13.2 B 0.32 10.6 B 0.34 10.9 B 0.46 15.1 B 0.52 15.8 BSprain Brook Pkwy NB Ramp 30 T 0.41 14.8 B 0.44 15.1 B 0.23 9.8 A 0.25 9.9 A 0.30 8.8 A 0.33 9.0 A
Westbound TR 0.45 20.2 C 0.48 20.6 C 0.41 17.0 B 0.44 17.4 B 0.99 47.5 D 1.03 58.9 + ENorthbound LT 1.10 94.0 F 1.10 94.0 F 0.41 29.1 C 0.41 29.1 C 0.68 28.8 C 0.68 28.8 C
R 0.96 62.2 E 0.96 62.2 E 0.17 26.7 C 0.17 26.7 C 0.33 22.9 C 0.33 22.9 CIntersection 51.3 D 50.4 D 16.4 B 16.5 B 32.2 C 37.7 D
Virginia Road (E-W) @ 31 Eastbound LT 1.09 111.3 F 1.09 111.3 F 1.11 123.7 F 1.11 123.7 F 1.10 120.7 F 1.10 120.7 FBronx River Parkway R 0.33 21.0 C 0.33 21.0 C 0.33 33.8 C 0.33 33.8 C 0.37 34.3 C 0.37 34.3 C
Westbound LTR 0.57 38.4 D 0.57 38.4 D 0.65 42.4 D 0.65 42.4 D 1.17 148.0 F 1.17 148.0 FNorthbound L 0.08 46.6 D 0.08 46.6 D 0.02 9.5 A 0.02 9.5 A 0.05 10.7 B 0.05 10.7 B
TR 0.59 24.7 C 0.59 24.7 C 0.36 21.2 C 0.36 21.2 C 0.60 25.0 C 0.60 25.0 CSouthbound L 1.08 121.4 F 1.08 121.4 F 0.07 9.4 A 0.07 9.4 A 0.12 11.5 B 0.12 11.5 B
T 1.08 79.2 E 1.08 79.2 E 0.43 22.1 C 0.43 22.1 C 0.57 24.4 C 0.57 24.4 CIntersection 70.2 E 70.2 E 44.0 D 44.0 D 54.1 D 54.1 D
TABLE 5.1-B. LAKEVIEW TRUCK ROUTE (OPTION A) LEVEL-OF-SERVICE ANALYSIS RESULTS FOR SIGNALIZED INTERSECTIONS: 2006 FUTURE CONDITIONS WITHOUT THE PROJECT VERSUS FUTURE CONDITIONS WITH THE PROJECT (WITHOUT THE CROTON PROJECT)
FEIS KENRESWORKSITES 72

AM Peak Hour Midday Peak Hour PM Peak Hour2006 (1) 2006 Option A (2) 2006 (1) 2006 Option A (2) 2006 (1) 2006 Option A (2)
Lane v/c Delay v/c Delay v/c Delay v/c Delay v/c Delay v/c DelayIntersection No. Approach Group Ratio (sec) LOS Ratio (sec) LOS Ratio (sec) LOS Ratio (sec) LOS Ratio (sec) LOS Ratio (sec) LOS
TABLE 5.1-B. LAKEVIEW TRUCK ROUTE (OPTION A) LEVEL-OF-SERVICE ANALYSIS RESULTS FOR SIGNALIZED INTERSECTIONS: 2006 FUTURE CONDITIONS WITHOUT THE PROJECT VERSUS FUTURE CONDITIONS WITH THE PROJECT (WITHOUT THE CROTON PROJECT)
Grasslands Road (Rt 100) @ 34 Eastbound T 0.34 5.1 A 0.34 5.1 A 0.58 11.4 B 0.58 11.4 B 0.68 15.6 B 0.69 15.6 BWCC East Gate Westbound L 0.34 3.1 A 0.34 3.1 A 0.14 7.1 A 0.14 7.1 A 0.20 10.6 B 0.20 10.6 B
T 0.32 2.1 A 0.32 2.1 A 0.29 4.3 A 0.29 4.3 A 0.55 7.6 A 0.55 7.6 ANorthbound L 0.26 51.9 D 0.26 51.9 D 0.43 27.9 C 0.43 27.9 C 0.61 30.4 C 0.61 30.4 C
Intersection 4.7 A 4.7 A 10.6 B 10.6 B 14.0 B 14.0 BTaconic State Parkway @ 38 Eastbound LTR 1.08 114.3 F 1.30 196.8 + F 0.71 43.9 D 0.96 81.3 + F 1.09 121.4 F 1.38 231.3 + FLakeview Avenue (E-W) Westbound LTR 0.97 101.5 F 1.22 178.5 + F 0.45 35.1 D 0.67 42.1 D 1.02 106.1 F 1.23 174.7 + F
Northbound L 0.21 5.0 A 0.21 5.0 A 0.06 4.0 A 0.06 4.0 A 0.15 4.4 A 0.15 4.4 ATR 0.21 4.4 A 0.21 4.4 A 0.63 7.4 A 0.63 7.4 A 1.05 46.8 D 1.05 46.8 D
Southbound L 0.04 3.9 A 0.04 3.9 A 0.12 4.4 A 0.12 4.4 A 0.34 7.4 A 0.34 7.4 ATR 0.57 6.6 A 0.57 6.6 A 0.27 4.7 A 0.27 4.7 A 0.41 5.4 A 0.41 5.4 A
Intersection 26.4 C 48.7 D 10.8 B 16.4 B 44.3 D 59.9 ETaconic State Parkway @ 39 Eastbound LTR 0.49 39.8 D 0.49 39.8 D 0.17 27.7 C 0.17 27.7 C 0.26 28.5 C 0.26 28.5 CCommerce St. (E-W) Westbound LTR 0.71 50.8 D 0.71 50.8 D 0.35 29.4 C 0.35 29.4 C 0.69 37.4 D 0.69 37.4 D
Northbound LTR 0.27 2.9 A 0.27 2.9 A 0.68 11.1 B 0.68 11.1 B 1.09 63.3 E 1.09 63.3 ESouthbound LTR 0.60 4.6 A 0.60 4.6 A 0.36 7.6 A 0.36 7.6 A 0.73 12.9 B 0.73 12.9 B
Intersection 8.1 A 8.1 A 11.6 B 11.6 B 47.3 D 47.3 DLakeview Avenue (E-W) @ 40 Eastbound LR 0.50 21.7 C 0.60 23.9 C 0.36 19.6 B 0.49 21.5 C 0.47 21.2 C 0.59 23.7 CColumbus Avenue Northbound LT 0.26 8.6 A 0.26 8.6 A 0.37 9.5 A 0.38 9.6 A 0.71 14.7 B 0.73 15.2 B
Southbound TR 0.33 9.0 A 0.36 9.3 A 0.21 8.2 A 0.24 8.4 A 0.28 8.7 A 0.31 8.9 AIntersection 11.8 B 12.8 B 10.9 B 11.9 B 13.9 B 14.9 B
Columbus Avenue (Northbound) @ 42 Eastbound LT 0.54 18.6 B 0.54 18.6 B 0.26 14.5 B 0.26 14.5 B 0.34 15.4 B 0.34 15.4 BStevens Avenue Westbound T 0.40 16.4 B 0.40 16.4 B 0.30 15.0 B 0.30 15.0 B 0.59 19.5 B 0.59 19.5 B
R 0.08 13.0 B 0.08 13.0 B 0.07 12.8 B 0.07 12.8 B 0.13 13.4 B 0.13 13.4 BNorthbound LT 0.48 13.2 B 0.48 13.2 B 0.39 10.9 B 0.39 10.9 B 0.64 13.9 B 0.64 13.9 B
R 0.12 10.4 B 0.12 10.4 B 0.22 10.0 A 0.22 10.0 A 0.36 11.4 B 0.36 11.4 BIntersection 15.0 B 15.0 B 12.0 B 12.0 B 14.8 B 14.8 B
Columbus Avenue (Southbound) @ 43 Eastbound TR 0.79 26.3 C 0.79 26.3 C 0.35 14.8 B 0.35 14.8 B 0.45 16.1 B 0.45 16.1 BStevens Avenue Westbound LT 1.12 101.8 F 1.12 101.8 F 0.76 27.4 C 0.76 27.4 C 1.10 86.8 F 1.10 86.8 F
Southbound LTR 0.25 11.1 B 0.25 11.1 B 0.24 10.3 B 0.24 10.3 B 0.32 10.9 B 0.32 10.9 B Intersection 48.1 D 48.1 D 17.8 B 17.8 B 46.7 D 46.7 D
Stevens Avenue (E-W) @ 44A Eastbound LTR 0.52 20.1 C 0.52 20.1 C 0.20 15.3 B 0.20 15.3 B 0.34 16.5 B 0.34 16.5 BCommerce Street* Westbound LTR 0.25 17.4 B 0.25 17.4 B 0.47 17.5 B 0.47 17.5 B 0.93 40.2 D 0.93 40.2 D
Northbound LTR 0.40 23.5 C 0.40 23.5 C 0.28 26.4 C 0.28 26.4 C 0.48 28.1 C 0.48 28.1 CSouthbound LTR 0.30 22.6 C 0.30 22.6 C 0.48 28.2 C 0.48 28.2 C 0.68 34.7 C 0.68 34.7 C
Intersection 20.8 C 20.8 C 20.6 C 20.6 C 34.0 C 34.0 CElwood Avenue @ 44B Southbound LTR 0.56 33.5 C 0.56 33.5 C 0.47 26.5 C 0.47 26.5 C 0.64 30.2 C 0.64 30.2 CStevens Avenue/Commerce Street* Intersection 33.5 C 33.5 C 26.5 C 26.5 C 30.2 C 30.2 CTaconic State Parkway @ 45 Eastbound LTR 0.06 34.2 C 0.06 34.2 C 0.28 31.9 C 0.28 31.9 C 0.39 33.0 C 0.39 33.0 CStevens Avenue (E-W) Westbound LTR 0.95 87.2 F 0.95 87.2 F 0.96 76.5 E 0.96 76.5 E 1.08 99.5 F 1.08 99.5 F
Northbound L 0.03 3.1 A 0.03 3.1 A 0.00 4.4 A 0.00 4.4 A 0.01 4.4 A 0.01 4.4 ATR 0.15 3.3 A 0.15 3.3 A 0.60 7.9 A 0.60 7.9 A 1.00 32.4 C 1.00 32.4 C
Southbound L 0.44 4.8 A 0.44 4.8 A 0.33 6.7 A 0.33 6.7 A 0.93 87.6 F 0.93 87.6 FTR 0.52 5.0 A 0.52 5.0 A 0.24 5.3 A 0.24 5.3 A 0.34 5.8 A 0.34 5.8 A
Intersection 12.3 B 12.3 B 16.6 B 16.6 B 37.9 D 37.9 DNotes: L = Left Turn, T = Through, R = Right Turn, Def = Defacto Left Turn; LOS = Level of Service. "+" indicates Potential Adverse Impacts.* These two intersections form a 5-leg intersection at Stevens Avenue, Commerce Street, and Elwood Avenue.(1) 2006 Future Conditions without the Delaware Aerator Fill Operations (2) 2006 Future Conditions with the Delaware Aerator Fill Operations
FEIS KENRESWORKSITES 73

AM Peak Hour Midday Peak Hour PM Peak Hour2006 (1) 2006 Option A (2) 2006 (1) 2006 Option A (2) 2006 (1) 2006 Option A (2)
Lane v/c Delay v/c Delay v/c Delay v/c Delay v/c Delay v/c DelayIntersection No. Approach Group Ratio (sec) LOS Ratio (sec) LOS Ratio (sec) LOS Ratio (sec) LOS Ratio (sec) LOS Ratio (sec) LOS
Bradhurst Avenue (Rt. 100) @ 5 Southbound LT 0.04 8.6 A 0.04 8.8 A 0.01 7.7 A 0.01 7.8 A 0.01 8.0 A 0.01 8.1 ALakeview Avenue (E-W) Westbound LR 0.47 27.1 D 0.70 42.3 + E 0.17 11.9 B 0.26 13.1 B 0.40 17.0 C 0.53 20.8 CGrasslands Road (Rt. 100) (N-S) @ 32 Southbound LT 0.35 9.6 A 0.35 9.6 A 0.33 9.2 A 0.33 9.2 A 0.34 10.1 B 0.34 10.1 BVirginia Road Westbound LR 0.92 53.5 F 0.92 53.5 F 0.99 80.3 F 0.99 80.3 F 1.10 103.5 F 1.10 105.4 FGrasslands Road (Rt. 100) (E-W) @ 33 Eastbound LT 0.11 9.4 A 0.11 9.4 A 0.18 9.1 A 0.18 9.1 A 0.22 10.5 B 0.22 10.5 BLegion Drive Southbound L 0.79 71.3 F 0.79 71.3 F 1.13 172.8 F 1.13 172.8 F 1.08 138.1 F 1.09 140.1 + F
Southbound R 0.37 16.2 C 0.37 16.2 C 0.28 12.9 B 0.28 12.9 B 0.44 18.4 C 0.44 18.5 CGrasslands Road (Rt. 100) (E-W) @ 34 Westbound LT 0.01 10.4 B 0.01 10.4 B 0.06 8.5 A 0.06 8.5 A 0.11 9.0 A 0.11 9.0 AWCC West Gate Driveway Northbound L 0.80 72.9 F 0.80 72.9 F 0.08 20.5 C 0.08 20.5 C 0.24 45.2 E 0.24 45.2 E
Northbound R 0.06 14.5 B 0.06 14.5 B 0.43 15.3 C 0.43 15.3 C 0.46 17.3 C 0.46 17.3 CCommerce Street @ 36 Eastbound LTR 0.01 7.8 A 0.01 7.8 A 0.03 8.0 A 0.03 8.0 A 0.05 8.4 A 0.05 8.4 ALegion Drive (E-W) Westbound LTR 0.01 7.9 A 0.01 7.9 A 0.03 8.0 A 0.03 8.0 A 0.06 8.5 A 0.06 8.5 A
Northbound LTR 0.16 11.7 B 0.16 11.7 B 0.16 14.0 B 0.16 14.0 B 0.43 26.4 D 0.43 26.4 DSouthbound LTR 0.16 12.3 B 0.16 12.3 B 0.22 19.7 C 0.22 19.7 C 0.63 65.5 F 0.63 65.5 F
Lakeview Avenue (E-W) @ 37 Eastbound LTR 0.02 7.6 A 0.02 7.7 A 0.00 7.5 A 0.00 7.6 A 0.00 7.7 A 0.00 7.8 ACommerce Street Westbound LTR 0.04 8.1 A 0.04 8.3 A 0.01 7.5 A 0.01 7.7 A 0.01 7.6 A 0.01 7.8 A
Northbound LTR 0.06 13.9 B 0.07 15.4 C 0.12 10.3 B 0.14 11.1 B 0.22 11.7 B 0.25 13.0 BSouthbound LTR 0.09 15.6 C 0.10 17.7 C 0.10 11.3 B 0.11 12.6 B 0.17 13.8 B 0.21 16.1 C
Columbus Avenue (N-S) @ 41 Southbound LT 0.14 9.4 A 0.15 9.7 A 0.07 9.1 A 0.07 9.3 A 0.12 10.9 B 0.13 11.2 BWest Lake Drive Westbound L 0.04 26.8 D 0.43 43.2 + E 0.02 20.3 C 0.28 26.4 D 0.09 38.9 E 0.63 81.3 + F
Westbound R 0.28 12.1 B 0.29 12.6 B 0.18 11.4 B 0.18 11.8 B 0.41 16.6 C 0.43 17.4 CNotes:L = Left Turn, T = Through, R = Right Turn, Def = Defacto Left Turn; LOS = Level of Service. "+" indicates Potential Adverse Impacts.(1) 2006 Future Conditions without the Delaware Aerator Fill Operations(2) 2006 Future Conditions with the Delaware Aerator Fill Operations
TABLE 5.1-B. LAKEVIEW TRUCK ROUTE (OPTION A) LEVEL-OF-SERVICE ANALYSIS RESULTS FOR UNSIGNALIZED INTERSECTIONS: 2006 FUTURE CONDITIONS WITHOUT THE PROJECT VERSUS FUTURE CONDITIONS WITH THE PROJECT (WITHOUT THE CROTON
PROJECT)
FEIS KENRESWORKSITES 74

AM Peak Hour Midday Peak Hour PM Peak Hour2006 (1) 2006 Option A (2) 2006 (1) 2006 Option A (2) 2006 (1) 2006 Option A (2)
Lane v/c Delay v/c Delay v/c Delay v/c Delay v/c Delay v/c DelayIntersection No. Approach Group Ratio (sec) LOS Ratio (sec) LOS Ratio (sec) LOS Ratio (sec) LOS Ratio (sec) LOS Ratio (sec) LOS
Grasslands Road (Rt. 100C) (E-W) @ 6 Eastbound L 1.14 128.8 F 1.31 195.7 + F 0.20 14.8 B 0.32 16.1 B 1.27 208.6 F * ** + FBradhurst Avenue (Rt. 100) T 1.00 68.8 E 1.00 68.8 E 0.33 16.1 B 0.33 16.1 B 0.54 21.5 C 0.55 21.7 C
R 0.36 16.4 B 0.36 16.5 B 0.16 9.5 A 0.17 9.5 A 0.25 11.9 B 0.26 12.0 BWestbound L 1.03 161.3 F 1.03 161.3 F 0.06 13.6 B 0.06 13.6 B 0.19 17.6 B 0.19 17.7 B
TR 0.66 31.0 C 0.66 31.0 C 0.39 16.7 B 0.39 16.7 B 0.92 42.5 D 0.92 43.2 DNorthbound L 0.34 28.0 C 0.35 28.5 C 0.52 45.8 D 0.62 52.6 + D 0.77 46.7 D 0.82 52.9 + D
TR 0.29 25.3 C 0.29 25.3 C 0.13 26.0 C 0.13 26.0 C 0.18 16.2 B 0.18 16.2 BSouthbound L 0.55 40.5 D 0.55 40.5 D 0.25 35.7 D 0.25 35.7 D 0.28 24.8 C 0.28 24.8 C
TR 0.89 70.8 E 1.06 115.7 + F 0.96 77.8 E 1.09 117.3 + F 1.05 85.7 F 1.16 125.3 + FIntersection 58.6 E 74.5 E 33.9 C 45.0 D 51.3 D 80.9 F
Grasslands Road (Rt.100C) @ 24 Eastbound L 0.04 17.8 B 0.04 17.8 B 0.02 6.5 A 0.02 6.5 A 0.05 9.3 A 0.10 9.8 AClearbrook Road/Walker Road TR 0.90 34.5 C 0.90 34.5 C 0.50 9.4 A 0.50 9.4 A 0.69 16.1 B 0.69 16.1 B
Westbound L 0.88 48.3 D 0.88 48.3 D 0.31 8.3 A 0.31 8.3 A 1.13 122.0 F 1.13 122.0 FTR 0.98 45.2 D 1.04 61.7 + E 0.35 8.2 A 0.41 8.7 A 0.68 16.1 B 0.75 18.4 B
Northbound LT 0.22 28.9 C 0.22 29.0 C 0.15 18.8 B 0.15 18.8 B 0.22 20.2 C 0.49 23.9 CSouthbound LT 0.03 27.4 C 0.20 28.8 C 0.19 19.1 B 0.36 20.5 C 0.22 20.2 C 1.06 89.6 + F
R 0.01 27.3 C 0.01 27.3 C 0.01 17.9 B 0.01 17.9 B 0.01 18.5 B 0.19 19.9 BIntersection 41.2 D 47.9 D 10.0 A 10.6 B 28.8 C 40.4 D
Grasslands Road (Rt.100C) @ 25 Eastbound L 0.39 13.5 B 0.41 15.1 B 0.11 5.9 A 0.12 6.1 A 0.30 13.0 B 0.32 13.9 BWoods Drive/Taylor Road TR 0.29 4.7 A 0.31 4.8 A 0.36 6.9 A 0.39 7.0 A 0.53 11.9 B 0.69 14.7 B
Westbound L 0.02 8.9 A 0.02 8.9 A 0.00 10.6 B 0.00 10.6 B 0.00 12.5 B 0.01 12.6 BTR 0.75 17.3 B 0.78 18.1 B 0.34 13.1 B 0.38 13.4 B 0.69 20.4 C 0.73 21.4 C
Northbound LTR 0.03 34.6 C 0.03 34.6 C 0.01 31.3 C 0.01 31.3 C 0.01 24.6 C 0.01 24.6 CSouthbound LT 0.46 38.9 D 0.46 38.9 D 0.79 51.2 D 0.79 51.2 D 0.74 38.4 D 0.74 38.4 D
R 0.08 21.8 C 0.08 21.8 C 0.10 21.9 C 0.10 21.9 C 0.11 17.1 B 0.11 17.1 BIntersection 14.4 B 14.8 B 15.1 B 15.0 B 18.7 B 19.6 B
Grasslands Road (Rt.100C) @ 26 Eastbound TR 0.34 4.3 A 0.36 4.4 A 0.38 3.0 A 0.41 3.1 A 0.62 10.8 B 0.79 14.6 BSprain Brook Pkwy SB Ramp Westbound T 0.53 5.4 A 0.55 5.5 A 0.22 2.5 A 0.24 2.5 A 0.49 9.2 A 0.52 9.5 A
Southbound L 0.47 40.1 D 0.47 40.1 D 0.44 47.1 D 0.44 47.1 D 0.17 29.5 C 0.17 29.5 CR 1.15 138.8 F 1.15 138.8 F 0.31 45.8 D 0.31 45.8 D 0.16 29.4 C 0.16 29.4 C
Intersection 24.0 C 23.4 C 5.0 A 4.9 A 11.1 B 13.2 BGrasslands Road (Rt.100C) @ 27 Eastbound L 0.13 13.0 B 0.14 13.3 B 0.32 10.6 B 0.35 10.9 B 0.46 15.1 B 0.78 30.0 CSprain Brook Pkwy NB Ramp 30 T 0.41 14.8 B 0.44 15.1 B 0.23 9.8 A 0.25 10.0 A 0.30 8.8 A 0.33 9.0 A
Westbound TR 0.45 20.2 C 0.49 20.7 C 0.41 17.0 B 0.45 17.4 B 0.99 47.5 D 1.04 60.5 + ENorthbound LT 1.10 94.0 F 1.10 94.0 F 0.41 29.1 C 0.41 29.1 C 0.68 28.8 C 0.68 28.8 C
R 0.96 62.2 E 0.96 62.2 E 0.17 26.7 C 0.17 26.7 C 0.33 22.9 C 0.33 22.9 CIntersection 51.3 D 50.3 D 16.4 B 16.5 B 32.2 C 39.0 D
Virginia Road (E-W) @ 31 Eastbound LT 1.09 111.3 F 1.09 111.3 F 1.11 123.7 F 1.11 123.7 F 1.10 120.7 F 1.10 120.7 FBronx River Parkway R 0.33 21.0 C 0.33 21.0 C 0.33 33.8 C 0.33 33.8 C 0.37 34.3 C 0.37 34.3 C
Westbound LTR 0.57 38.4 D 0.57 38.4 D 0.65 42.4 D 0.65 42.4 D 1.17 148.0 F 1.17 148.0 FNorthbound L 0.08 46.6 D 0.08 46.6 D 0.02 9.5 A 0.02 9.5 A 0.05 10.7 B 0.05 10.7 B
TR 0.59 24.7 C 0.59 24.7 C 0.36 21.2 C 0.36 21.2 C 0.60 25.0 C 0.60 25.0 CSouthbound L 1.08 121.4 F 1.08 121.4 F 0.07 9.4 A 0.07 9.4 A 0.12 11.5 B 0.12 11.5 B
T 1.08 79.2 E 1.08 79.2 E 0.43 22.1 C 0.43 22.1 C 0.57 24.4 C 0.57 24.4 CIntersection 70.2 E 70.2 E 44.0 D 44.0 D 54.1 D 54.1 D
TABLE 5.1-C. LAKEVIEW TRUCK ROUTE (OPTION A) LEVEL-OF-SERVICE ANALYSIS RESULTS FOR SIGNALIZED INTERSECTIONS: 2006 FUTURE CONDITIONS WITHOUT THE PROJECT VERSUS FUTURE CONDITIONS WITH THE PROJECT (WITH THE CROTON PROJECT)
FEIS KENRESWORKSITES 75

AM Peak Hour Midday Peak Hour PM Peak Hour2006 (1) 2006 Option A (2) 2006 (1) 2006 Option A (2) 2006 (1) 2006 Option A (2)
Lane v/c Delay v/c Delay v/c Delay v/c Delay v/c Delay v/c DelayIntersection No. Approach Group Ratio (sec) LOS Ratio (sec) LOS Ratio (sec) LOS Ratio (sec) LOS Ratio (sec) LOS Ratio (sec) LOS
TABLE 5.1-C. LAKEVIEW TRUCK ROUTE (OPTION A) LEVEL-OF-SERVICE ANALYSIS RESULTS FOR SIGNALIZED INTERSECTIONS: 2006 FUTURE CONDITIONS WITHOUT THE PROJECT VERSUS FUTURE CONDITIONS WITH THE PROJECT (WITH THE CROTON PROJECT)
Grasslands Road (Rt 100) @ 34 Eastbound T 0.34 5.1 A 0.34 5.1 A 0.58 11.4 B 0.58 11.4 B 0.68 15.6 B 0.69 15.9 BWCC East Gate Westbound L 0.34 3.1 A 0.34 3.1 A 0.14 7.1 A 0.14 7.1 A 0.20 10.6 B 0.20 10.7 B
T 0.32 2.1 A 0.32 2.1 A 0.29 4.3 A 0.29 4.3 A 0.55 7.6 A 0.55 7.6 ANorthbound L 0.26 51.9 D 0.26 51.9 D 0.43 27.9 C 0.43 27.9 C 0.61 30.4 C 0.61 30.4 C
Intersection 4.7 A 4.7 A 10.6 B 10.6 B 14.0 B 14.1 BTaconic State Parkway @ 38 Eastbound LTR 1.08 114.3 F 1.30 196.8 + F 0.71 43.9 D 0.96 81.3 + F 1.09 121.4 F 1.38 231.3 + FLakeview Avenue (E-W) Westbound LTR 0.97 101.5 F 1.22 178.5 + F 0.45 35.1 D 0.67 42.1 D 1.02 106.1 F 1.23 174.7 + F
Northbound L 0.21 5.0 A 0.21 5.0 A 0.06 4.0 A 0.06 4.0 A 0.15 4.4 A 0.15 4.4 ATR 0.21 4.4 A 0.21 4.4 A 0.63 7.4 A 0.63 7.4 A 1.05 46.8 D 1.05 46.8 D
Southbound L 0.04 3.9 A 0.04 3.9 A 0.12 4.4 A 0.12 4.4 A 0.34 7.4 A 0.34 7.4 ATR 0.57 6.6 A 0.57 6.6 A 0.27 4.7 A 0.27 4.7 A 0.41 5.4 A 0.41 5.4 A
Intersection 26.4 C 48.7 D 10.8 B 16.4 B 44.3 D 59.9 ETaconic State Parkway @ 39 Eastbound LTR 0.49 39.8 D 0.49 39.8 D 0.17 27.7 C 0.17 27.7 C 0.26 28.5 C 0.26 28.5 CCommerce St. (E-W) Westbound LTR 0.71 50.8 D 0.71 50.8 D 0.35 29.4 C 0.35 29.4 C 0.69 37.4 D 0.69 37.4 D
Northbound LTR 0.27 2.9 A 0.27 2.9 A 0.68 11.1 B 0.68 11.1 B 1.09 63.3 E 1.09 63.3 ESouthbound LTR 0.60 4.6 A 0.60 4.6 A 0.36 7.6 A 0.36 7.6 A 0.73 12.9 B 0.73 12.9 B
Intersection 8.1 A 8.1 A 11.6 B 11.6 B 47.3 D 47.3 DLakeview Avenue (E-W) @ 40 Eastbound LR 0.50 21.7 C 0.60 23.9 C 0.36 19.6 B 0.49 21.5 C 0.47 21.2 C 0.59 23.7 CColumbus Avenue Northbound LT 0.26 8.6 A 0.26 8.6 A 0.37 9.5 A 0.38 9.6 A 0.71 14.7 B 0.73 15.2 B
Southbound TR 0.33 9.0 A 0.36 9.3 A 0.21 8.2 A 0.24 8.4 A 0.28 8.7 A 0.31 8.9 AIntersection 11.8 B 12.8 B 10.9 B 11.9 B 13.9 B 14.9 B
Columbus Avenue (Northbound) @ 42 Eastbound LT 0.54 18.6 B 0.54 18.6 B 0.26 14.5 B 0.26 14.5 B 0.34 15.4 B 0.34 15.4 BStevens Avenue Westbound T 0.40 16.4 B 0.40 16.4 B 0.30 15.0 B 0.30 15.0 B 0.59 19.5 B 0.59 19.5 B
R 0.08 13.0 B 0.08 13.0 B 0.07 12.8 B 0.07 12.8 B 0.13 13.4 B 0.13 13.4 BNorthbound LT 0.48 13.2 B 0.48 13.2 B 0.39 10.9 B 0.39 10.9 B 0.64 13.9 B 0.64 13.9 B
R 0.12 10.4 B 0.12 10.4 B 0.22 10.0 A 0.22 10.0 A 0.36 11.4 B 0.36 11.4 BIntersection 15.0 B 15.0 B 12.0 B 12.0 B 14.8 B 14.8 B
Columbus Avenue (Southbound) @ 43 Eastbound TR 0.79 26.3 C 0.79 26.3 C 0.35 14.8 B 0.35 14.8 B 0.45 16.1 B 0.45 16.1 BStevens Avenue Westbound LT 1.12 101.8 F 1.12 101.8 F 0.76 27.4 C 0.76 27.4 C 1.10 86.8 F 1.10 86.8 F
Southbound LTR 0.25 11.1 B 0.25 11.1 B 0.24 10.3 B 0.24 10.3 B 0.32 10.9 B 0.32 10.9 BIntersection 48.1 D 48.1 D 17.8 B 17.8 B 46.7 D 46.7 D
Stevens Avenue (E-W) @ 44A Eastbound LTR 0.52 20.1 C 0.52 20.1 C 0.20 15.3 B 0.20 15.3 B 0.34 16.5 B 0.34 16.5 BCommerce Street* Westbound LTR 0.25 17.4 B 0.25 17.4 B 0.47 17.5 B 0.47 17.5 B 0.93 40.2 D 0.93 40.2 D
Northbound LTR 0.40 23.5 C 0.40 23.5 C 0.28 26.4 C 0.28 26.4 C 0.48 28.1 C 0.48 28.1 CSouthbound LTR 0.30 22.6 C 0.30 22.6 C 0.48 28.2 C 0.48 28.2 C 0.68 34.7 C 0.68 34.7 C
Intersection 20.8 C 20.8 C 20.6 C 20.6 C 34.0 C 34.0 CElwood Avenue @ 44B Southbound LTR 0.56 33.5 C 0.56 33.5 C 0.47 26.5 C 0.47 26.5 C 0.64 30.2 C 0.64 30.2 CStevens Avenue/Commerce Street* Intersection 33.5 C 33.5 C 26.5 C 26.5 C 30.2 C 30.2 CTaconic State Parkway @ 45 Eastbound LTR 0.06 34.2 C 0.06 34.2 C 0.28 31.9 C 0.28 31.9 C 0.39 33.0 C 0.39 33.0 CStevens Avenue (E-W) Westbound LTR 0.95 87.2 F 0.95 87.2 F 0.96 76.5 E 0.96 76.5 E 1.08 99.5 F 1.08 99.5 F
Northbound L 0.03 3.1 A 0.03 3.1 A 0.00 4.4 A 0.00 4.4 A 0.01 4.4 A 0.01 4.4 ATR 0.15 3.3 A 0.15 3.3 A 0.60 7.9 A 0.60 7.9 A 1.00 32.4 C 1.00 32.4 C
Southbound L 0.44 4.8 A 0.44 4.8 A 0.33 6.7 A 0.33 6.7 A 0.93 87.6 F 0.93 87.6 FTR 0.52 5.0 A 0.52 5.0 A 0.24 5.3 A 0.24 5.3 A 0.34 5.8 A 0.34 5.8 A
Intersection 12.3 B 12.3 B 16.6 B 16.6 B 37.9 D 37.9 DNotes: L = Left Turn, T = Through, R = Right Turn, Def = Defacto Left Turn; LOS = Level of Service. "+" indicates Potential Adverse Impacts.* These two intersections form a 5-leg intersection at Stevens Avenue, Commerce Street, and Elwood Avenue.(1) 2006 Future Conditions without the Delaware Aerator Fill Operations(2) 2006 Future Conditions with the Delaware Aerator Fill Operations
FEIS KENRESWORKSITES 76

AM Peak Hour Midday Peak Hour PM Peak Hour2006 (1) 2006 Option A (2) 2006 (1) 2006 Option A (2) 2006 (1) 2006 Option A (2)
Lane v/c Delay v/c Delay v/c Delay v/c Delay v/c Delay v/c DelayIntersection No. Approach Group Ratio (sec) LOS Ratio (sec) LOS Ratio (sec) LOS Ratio (sec) LOS Ratio (sec) LOS Ratio (sec) LOS
Bradhurst Avenue (Rt. 100) @ 5 Southbound LT 0.04 8.6 A 0.04 8.8 A 0.01 7.7 A 0.01 7.8 A 0.01 8.0 A 0.01 8.1 ALakeview Avenue (E-W) Westbound LR 0.47 27.1 D 0.70 42.3 + E 0.17 11.9 B 0.26 13.1 B 0.40 17.0 C 0.53 20.8 CGrasslands Road (Rt. 100) (N-S) @ 32 Southbound LT 0.35 9.6 A 0.35 9.6 A 0.33 9.2 A 0.33 9.2 A 0.34 10.1 B 0.34 10.1 BVirginia Road Westbound LR 0.92 53.5 F 0.92 53.5 F 0.99 80.3 F 0.99 80.3 F 1.10 103.5 F 1.10 106.4 FGrasslands Road (Rt. 100) (E-W) @ 33 Eastbound LT 0.11 9.4 A 0.11 9.4 A 0.18 9.1 A 0.18 9.1 A 0.22 10.5 B 0.23 10.5 BLegion Drive Southbound L 0.79 71.3 F 0.79 70.4 F 1.13 172.8 F 1.13 172.8 F 1.08 138.1 F 1.09 142.2 + F
Southbound R 0.37 16.2 C 0.37 16.2 C 0.28 12.9 B 0.28 12.9 B 0.44 18.4 C 0.44 18.5 CGrasslands Road (Rt. 100) (E-W) @ 34 Westbound LT 0.01 10.4 B 0.01 10.4 B 0.06 8.5 A 0.06 8.5 A 0.11 9.0 A 0.11 9.0 AWCC West Gate Driveway Northbound L 0.80 72.9 F 0.80 72.9 F 0.08 20.5 C 0.08 20.5 C 0.24 45.2 E 0.24 46.1 E
Northbound R 0.06 14.5 B 0.06 14.5 B 0.43 15.3 C 0.43 15.3 C 0.46 17.3 C 0.47 17.6 CCommerce Street @ 36 Eastbound LTR 0.01 7.8 A 0.01 7.8 A 0.03 8.0 A 0.03 8.0 A 0.05 8.4 A 0.05 8.4 ALegion Drive (E-W) Westbound LTR 0.01 7.9 A 0.01 7.9 A 0.03 8.0 A 0.03 8.0 A 0.06 8.5 A 0.06 8.5 A
Northbound LTR 0.16 11.7 B 0.16 11.7 B 0.16 14.0 B 0.16 14.0 B 0.43 26.4 D 0.43 26.4 DSouthbound LTR 0.16 12.3 B 0.16 12.3 B 0.22 19.7 C 0.22 19.7 C 0.63 65.5 F 0.63 65.5 F
Lakeview Avenue (E-W) @ 37 Eastbound LTR 0.02 7.6 A 0.02 7.7 A 0.00 7.5 A 0.00 7.6 A 0.00 7.7 A 0.00 7.8 ACommerce Street Westbound LTR 0.04 8.1 A 0.04 8.3 A 0.01 7.5 A 0.01 7.7 A 0.01 7.6 A 0.01 7.8 A
Northbound LTR 0.06 13.9 B 0.07 15.4 C 0.12 10.3 B 0.13 11.0 B 0.22 11.7 B 0.25 13.0 BSouthbound LTR 0.09 15.6 C 0.10 17.7 C 0.10 11.3 B 0.11 12.6 B 0.17 13.8 B 0.21 16.1 C
Columbus Avenue (N-S) @ 41 Southbound LT 0.14 9.4 A 0.15 9.7 A 0.07 9.1 A 0.07 9.3 A 0.12 10.9 B 0.13 11.2 BWest Lake Drive Westbound L 0.04 26.8 D 0.43 43.2 + E 0.02 20.3 C 0.28 26.4 D 0.09 38.9 E 0.63 81.3 + F
Westbound R 0.28 12.1 B 0.29 12.6 B 0.18 11.4 B 0.18 11.8 B 0.41 16.6 C 0.43 17.4 CNotes:L = Left Turn, T = Through, R = Right Turn, Def = Defacto Left Turn; LOS = Level of Service. "+" indicates Potential Adverse Impacts.(1) 2006 Future Conditions without the Delaware Aerator Fill Operations(2) 2006 Future Conditions with the Delaware Aerator Fill Operations
TABLE 5.1-C. LAKEVIEW TRUCK ROUTE (OPTION A) LEVEL-OF-SERVICE ANALYSIS RESULTS FOR UNSIGNALIZED INTERSECTIONSFUTURE CONDITIONS WITHOUT THE PROJECT VERSUS FUTURE CONDITIONS WITH THE PROJECT (WITH THE CROTON PROJEC
FEIS KENRESWORKSITES 77

FEIS KENRESWORKSITES 78
• The westbound through/right movement at the intersection of Grasslands Road (Route 100C) and Clearbrook Road/Walker Road would experience a potential adverse impact. The delay would increase from 45.2 seconds (LOS D) to 61.7 seconds (LOS E) during the AM peak hour.
• The westbound approach at the intersection of Grasslands Road (Route 100C) and the Sprain Brook Parkway Northbound Ramp would experience a potential adverse impact. The delay would increase from 47.5 seconds (LOS D) to 58.9 seconds (LOS E) during the PM peak hour.
• The eastbound approach at the intersection of the Taconic State Parkway and Lakeview Avenue would experience a potential adverse impact. The delay would increase from 114.3 seconds (LOS F) to 196.8 seconds (LOS F), 43.9 seconds (LOS D) to 81.3 seconds (LOS F), and 121.4 seconds (LOS F) to 231.3 seconds (LOS F) during the AM, midday, and PM peak hours, respectively.
• The westbound approach at the intersection of the Taconic State Parkway and Lakeview Avenue would experience a potential adverse impact. The delay would increase from 101.5 seconds (LOS F) to 178.5 seconds (LOS F) and 106.1 seconds (LOS F) and 174.7 seconds (LOS F) during the AM and PM peak hours, respectively.
Unsignalized Intersections:
• The westbound approach at the intersection of Bradhurst Avenue (Route 100) and
Lakeview Avenue would experience a potential adverse impact. The delay would increase from 27.1 seconds (LOS D) to 42.3 seconds (LOS E) during the AM peak hour.
• The southbound left approach at the intersection of Grasslands Road (Route 100) and Legion Drive would experience a potential adverse impact. The delay would increase from 138.1 seconds (LOS F) to 140.1 seconds (LOS F) during the PM peak hour.
• The westbound left-turn movement at the intersection of Columbus Avenue and West Lake Drive would experience a potential adverse impact. The delay would increase from 26.8 seconds (LOS D) to 43.2 seconds (LOS E) and 38.9 seconds (LOS E) to 81.3 seconds (LOS F) during the AM and PM peak hours, respectively.
In the Future With the Project, With the Croton Project, there would be the following additional potential adverse impacts at signalized intersections. (There would be no additional impacts on unsignalized intersections.)
• The northbound left-turn movement at the intersection of Grasslands Road (Route 100C) and Bradhurst Avenue (Route 100) would experience a potential adverse impact. The delay would increase from 46.7 seconds (LOS D) to 52.9 seconds (LOS D) during the PM peak hour.

FEIS KENRESWORKSITES 79
• The southbound left/through movement at the intersection of Grasslands Road (Route 100C) and Clearbrook Road/Walker Road would experience a potential adverse impact. The delay would increase from 20.2 seconds (LOS C) to 89.6 seconds (LOS F) during the PM peak hour.
Under truck route Option A, there would be 17 potential temporary adverse impacted lane groups/approaches in the Future With the Project, Without the Croton Project. With the Croton project, there would be 19 potential adverse impacted lane groups/approaches. Mitigation measures for the intersections that would experience potential adverse impacts are discussed in Section 6, Mitigation of Potential Significant or Temporary Adverse Impacts.
Option B – 100 Percent Grasslands Road (Route 100/100C)/Commerce Street. Figures 5.1-Q and 5.1-R show the truck assignments for truck route Option B (100 percent of the truck traffic traveling on Grasslands Road (Route 100/100C)/Commerce Street) for the AM and midday, and PM peak hours, respectively for the Future With the Project, Without the Croton Project (“Cat-Del Alone,” as depicted in the figures). Figures 5.1-S and 5.1-T show the truck assignments for truck route Option B for the AM and midday, and PM peak hours, respectively for the Future With the Project, With the Croton Project. Figures 5.1-U, 5.1-V, and 5.1-W show the projected traffic volumes for the Future With the Project, Without the Croton Project. Figures 5.1-X, 5.1-Y, and 5.1-Z show the projected traffic volumes for the Future With the Project, With the Croton Project. Table 5.1-D presents a comparison of 2006 Future Without the Project conditions to 2006 Future With the Project conditions (without the Croton project). Table 5-1.E presents a comparison of 2006 Future Without the Project conditions to 2006 Future With the Project conditions (with the Croton project). There would be the following potential adverse impacts associated with truck route Option B (100 percent of the truck traffic traveling on Grasslands Road and Commerce Street) for the 2006 Future With the Project. Each of the identified impacts would occur in both future scenarios (Future With the Project, both With and Without the Croton Project), but With the Croton project, the delays would be the same or slightly higher.
Signalized Intersections:
• The eastbound left-turn movement at the intersection of Grasslands Road (Route 100C) and Bradhurst Avenue (Route 100) would experience a potential adverse impact. The delay would increase from 128.8 seconds (LOS F) to 238.1 seconds (LOS F) and 208.6 seconds (LOS F) to greater than 240.0 seconds (LOS F) during the AM and PM peak hours, respectively.

AM Peak Hour Midday Peak Hour PM Peak Hour2006 (1) 2006 Option A (2) 2006 (1) 2006 Option A (2) 2006 (1) 2006 Option A (2)
Lane v/c Delay v/c Delay v/c Delay v/c Delay v/c Delay v/c DelayIntersection No. Approach Group Ratio (sec) LOS Ratio (sec) LOS Ratio (sec) LOS Ratio (sec) LOS Ratio (sec) LOS Ratio (sec) LOS
Grasslands Road (Rt. 100C) (E-W) @ 6 Eastbound L 1.14 128.8 F 1.40 238.1 + F 0.20 14.8 B 0.22 15.1 B 1.27 208.6 F * ** + FBradhurst Avenue (Rt. 100) T 1.00 68.8 E 1.07 89.4 + F 0.33 16.1 B 0.39 16.8 B 0.54 21.5 C 0.62 23.1 C
R 0.36 16.4 B 0.36 16.4 B 0.16 9.5 A 0.16 9.5 A 0.25 11.9 B 0.25 11.9 BWestbound L 1.03 161.3 F 1.03 161.3 F 0.06 13.6 B 0.07 13.6 B 0.19 17.6 B 0.22 18.0 B
TR 0.66 31.0 C 0.73 33.6 C 0.39 16.7 B 0.44 17.4 B 0.92 42.5 D 0.99 58.0 + ENorthbound L 0.34 28.0 C 0.34 28.0 C 0.52 45.8 D 0.52 45.8 D 0.77 46.7 D 0.77 46.7 D
TR 0.29 25.3 C 0.29 25.3 C 0.13 26.0 C 0.13 26.0 C 0.18 16.2 B 0.18 16.2 BSouthbound L 0.55 40.5 D 0.55 40.5 D 0.25 35.7 D 0.25 35.7 D 0.28 24.8 C 0.28 24.8 C
TR 0.89 70.8 E 0.89 70.8 E 0.96 77.8 E 0.96 77.8 E 1.05 85.7 F 1.05 85.7 FIntersection 58.6 E 77.5 E 33.9 C 33.2 C 51.3 D 61.4 E
Grasslands Road (Rt.100C) @ 24 Eastbound L 0.04 17.8 B 0.04 17.8 B 0.02 6.5 A 0.02 6.5 A 0.05 9.3 A 0.06 9.4 AClearbrook Road/Walker Road TR 0.90 34.5 C 0.90 34.5 C 0.50 9.4 A 0.50 9.4 A 0.69 16.1 B 0.69 16.1 B
Westbound L 0.88 48.3 D 0.88 48.3 D 0.31 8.3 A 0.31 8.3 A 1.13 122.0 F 1.13 122.0 FTR 0.98 45.2 D 1.04 61.7 + E 0.35 8.2 A 0.41 8.7 A 0.68 16.1 B 0.75 18.4 B
Northbound LT 0.22 28.9 C 0.22 29.0 C 0.15 18.8 B 0.15 18.8 B 0.22 20.2 C 0.28 20.8 CSouthbound LT 0.03 27.4 C 0.20 28.8 C 0.19 19.1 B 0.36 20.5 C 0.22 20.2 C 0.49 23.0 C
R 0.01 27.3 C 0.01 27.3 C 0.01 17.9 B 0.01 17.9 B 0.01 18.5 B 0.05 18.8 BIntersection 41.2 D 47.9 D 10.0 A 10.6 B 28.8 C 29.0 C
Grasslands Road (Rt.100C) @ 25 Eastbound L 0.39 13.5 B 0.41 15.0 B 0.11 5.9 A 0.12 6.1 A 0.30 13.0 B 0.32 13.8 BWoods Drive/Taylor Road TR 0.29 4.7 A 0.30 4.8 A 0.36 6.9 A 0.38 7.0 A 0.53 11.9 B 0.58 12.6 B
Westbound L 0.02 8.9 A 0.02 8.9 A 0.00 10.6 B 0.00 10.6 B 0.00 12.5 B 0.01 12.6 BTR 0.75 17.3 B 0.78 18.0 B 0.34 13.1 B 0.37 13.4 B 0.69 20.4 C 0.73 21.2 C
Northbound LTR 0.03 34.6 C 0.03 34.6 C 0.01 31.3 C 0.01 31.3 C 0.01 24.6 C 0.01 24.6 CSouthbound LT 0.46 38.9 D 0.46 38.9 D 0.79 51.2 D 0.79 51.2 D 0.74 38.4 D 0.74 38.4 D
R 0.08 21.8 C 0.08 21.8 C 0.10 21.9 C 0.10 21.9 C 0.11 17.1 B 0.11 17.1 BIntersection 14.4 B 14.8 B 15.1 B 15.0 B 18.7 B 19.1 B
Grasslands Road (Rt.100C) @ 26 Eastbound TR 0.34 4.3 A 0.36 4.3 A 0.38 3.0 A 0.40 3.1 A 0.62 10.8 B 0.67 11.7 BSprain Brook Pkwy SB Ramp Westbound T 0.53 5.4 A 0.55 5.5 A 0.22 2.5 A 0.24 2.5 A 0.49 9.2 A 0.52 9.5 A
Southbound L 0.47 40.1 D 0.47 40.1 D 0.44 47.1 D 0.44 47.1 D 0.17 29.5 C 0.17 29.5 CR 1.15 138.8 F 1.15 138.8 F 0.31 45.8 D 0.31 45.8 D 0.16 29.4 C 0.16 29.4 C
Intersection 24.0 C 23.5 C 5.0 A 4.9 A 11.1 B 11.6 BGrasslands Road (Rt.100C) @ 27 Eastbound L 0.13 13.0 B 0.14 13.2 B 0.32 10.6 B 0.34 10.9 B 0.46 15.1 B 0.52 15.8 BSprain Brook Pkwy NB Ramp 30 T 0.41 14.8 B 0.44 15.1 B 0.23 9.8 A 0.25 9.9 A 0.30 8.8 A 0.33 9.0 A
Westbound TR 0.45 20.2 C 0.48 20.6 C 0.41 17.0 B 0.44 17.4 B 0.99 47.5 D 1.03 58.9 + ENorthbound LT 1.10 94.0 F 1.10 94.0 F 0.41 29.1 C 0.41 29.1 C 0.68 28.8 C 0.68 28.8 C
R 0.96 62.2 E 0.96 62.2 E 0.17 26.7 C 0.17 26.7 C 0.33 22.9 C 0.33 22.9 CIntersection 51.3 D 50.4 D 16.4 B 16.5 B 32.2 C 37.7 D
Virginia Road (E-W) @ 31 Eastbound LT 1.09 111.3 F 1.09 111.3 F 1.11 123.7 F 1.11 123.7 F 1.10 120.7 F 1.10 120.7 FBronx River Parkway R 0.33 21.0 C 0.33 21.0 C 0.33 33.8 C 0.33 33.8 C 0.37 34.3 C 0.37 34.3 C
Westbound LTR 0.57 38.4 D 0.57 38.4 D 0.65 42.4 D 0.65 42.4 D 1.17 148.0 F 1.17 148.0 FNorthbound L 0.08 46.6 D 0.08 46.6 D 0.02 9.5 A 0.02 9.5 A 0.05 10.7 B 0.05 10.7 B
TR 0.59 24.7 C 0.59 24.7 C 0.36 21.2 C 0.36 21.2 C 0.60 25.0 C 0.60 25.0 CSouthbound L 1.08 121.4 F 1.08 121.4 F 0.07 9.4 A 0.07 9.4 A 0.12 11.5 B 0.12 11.5 B
T 1.08 79.2 E 1.08 79.2 E 0.43 22.1 C 0.43 22.1 C 0.57 24.4 C 0.57 24.4 CIntersection 70.2 E 70.2 E 44.0 D 44.0 D 54.1 D 54.1 D
Grasslands Road (Rt 100) @ 34 Eastbound T 0.34 5.1 A 0.39 5.3 A 0.58 11.4 B 0.64 12.6 B 0.68 15.6 B 0.75 17.8 BWCC East Gate Westbound L 0.34 3.1 A 0.35 3.4 A 0.14 7.1 A 0.15 7.7 A 0.20 10.6 B 0.21 11.4 B
T 0.32 2.1 A 0.36 2.2 A 0.29 4.3 A 0.34 4.6 A 0.55 7.6 A 0.60 8.3 ANorthbound L 0.26 51.9 D 0.26 51.9 D 0.43 27.9 C 0.43 27.9 C 0.61 30.4 C 0.61 30.4 C
Intersection 4.7 A 4.8 A 10.6 B 11.0 B 14.0 B 15.0 B
TABLE 5.1-D. COMMERCE TRUCK ROUTE (OPTION B) LEVEL-OF-SERVICE ANALYSIS RESULTS FOR SIGNALIZED INTERSECTIONS: 2006 FUTURE CONDITIONS WITHOUT THE PROJECT VERSUS FUTURE CONDITIONS WITH THE PROJECT (WITHOUT THE CROTON PROJECT)
FEIS KENRESWORKSITES 80

AM Peak Hour Midday Peak Hour PM Peak Hour2006 (1) 2006 Option A (2) 2006 (1) 2006 Option A (2) 2006 (1) 2006 Option A (2)
Lane v/c Delay v/c Delay v/c Delay v/c Delay v/c Delay v/c DelayIntersection No. Approach Group Ratio (sec) LOS Ratio (sec) LOS Ratio (sec) LOS Ratio (sec) LOS Ratio (sec) LOS Ratio (sec) LOS
TABLE 5.1-D. COMMERCE TRUCK ROUTE (OPTION B) LEVEL-OF-SERVICE ANALYSIS RESULTS FOR SIGNALIZED INTERSECTIONS: 2006 FUTURE CONDITIONS WITHOUT THE PROJECT VERSUS FUTURE CONDITIONS WITH THE PROJECT (WITHOUT THE CROTON PROJECT)
Taconic State Parkway @ 38 Eastbound LTR 1.08 114.3 F 1.30 196.8 + F 0.71 43.9 D 0.96 81.3 + F 1.09 121.4 F 1.38 231.3 + FLakeview Avenue (E-W) Westbound LTR 0.97 101.5 F 1.22 178.5 + F 0.45 35.1 D 0.67 42.1 D 1.02 106.1 F 1.23 174.7 + F
Northbound L 0.21 5.0 A 0.21 5.0 A 0.06 4.0 A 0.06 4.0 A 0.15 4.4 A 0.15 4.4 ATR 0.21 4.4 A 0.21 4.4 A 0.63 7.4 A 0.63 7.4 A 1.05 46.8 D 1.05 46.8 D
Southbound L 0.04 3.9 A 0.04 3.9 A 0.12 4.4 A 0.12 4.4 A 0.34 7.4 A 0.34 7.4 ATR 0.57 6.6 A 0.57 6.6 A 0.27 4.7 A 0.27 4.7 A 0.41 5.4 A 0.41 5.4 A
Intersection 26.4 C 48.7 D 10.8 B 16.4 B 44.3 D 59.9 ETaconic State Parkway @ 39 Eastbound LTR 0.49 39.8 D 0.49 39.8 D 0.17 27.7 C 0.17 27.7 C 0.26 28.5 C 0.26 28.5 CCommerce St. (E-W) Westbound LTR 0.71 50.8 D 0.71 50.8 D 0.35 29.4 C 0.35 29.4 C 0.69 37.4 D 0.69 37.4 D
Northbound LTR 0.27 2.9 A 0.27 2.9 A 0.68 11.1 B 0.68 11.1 B 1.09 63.3 E 1.09 63.3 ESouthbound LTR 0.60 4.6 A 0.60 4.6 A 0.36 7.6 A 0.36 7.6 A 0.73 12.9 B 0.73 12.9 B
Intersection 8.1 A 8.1 A 11.6 B 11.6 B 47.3 D 47.3 DLakeview Avenue (E-W) @ 40 Eastbound LR 0.50 21.7 C 0.60 23.9 C 0.36 19.6 B 0.49 21.5 C 0.47 21.2 C 0.59 23.7 CColumbus Avenue Northbound LT 0.26 8.6 A 0.26 8.6 A 0.37 9.5 A 0.38 9.6 A 0.71 14.7 B 0.73 15.2 B
Southbound TR 0.33 9.0 A 0.36 9.3 A 0.21 8.2 A 0.24 8.4 A 0.28 8.7 A 0.31 8.9 AIntersection 11.8 B 12.8 B 10.9 B 11.9 B 13.9 B 14.9 B
Columbus Avenue (Northbound) @ 42 Eastbound LT 0.54 18.6 B 0.54 18.6 B 0.26 14.5 B 0.26 14.5 B 0.34 15.4 B 0.34 15.4 BStevens Avenue Westbound T 0.40 16.4 B 0.40 16.4 B 0.30 15.0 B 0.30 15.0 B 0.59 19.5 B 0.59 19.5 B
R 0.08 13.0 B 0.08 13.0 B 0.07 12.8 B 0.07 12.8 B 0.13 13.4 B 0.13 13.4 BNorthbound LT 0.48 13.2 B 0.48 13.2 B 0.39 10.9 B 0.39 10.9 B 0.64 13.9 B 0.64 13.9 B
R 0.12 10.4 B 0.12 10.4 B 0.22 10.0 A 0.22 10.0 A 0.36 11.4 B 0.36 11.4 BIntersection 15.0 B 15.0 B 12.0 B 12.0 B 14.8 B 14.8 B
Columbus Avenue (Southbound) @ 43 Eastbound TR 0.79 26.3 C 0.79 26.3 C 0.35 14.8 B 0.35 14.8 B 0.45 16.1 B 0.45 16.1 BStevens Avenue Westbound LT 1.12 101.8 F 1.12 101.8 F 0.76 27.4 C 0.76 27.4 C 1.10 86.8 F 1.10 86.8 F
Southbound LTR 0.25 11.1 B 0.25 11.1 B 0.24 10.3 B 0.24 10.3 B 0.32 10.9 B 0.32 10.9 BIntersection 48.1 D 48.1 D 17.8 B 17.8 B 46.7 D 46.7 D
Stevens Avenue (E-W) @ 44A Eastbound LTR 0.52 20.1 C 0.52 20.1 C 0.20 15.3 B 0.20 15.3 B 0.34 16.5 B 0.34 16.5 BCommerce Street* Westbound LTR 0.25 17.4 B 0.25 17.4 B 0.47 17.5 B 0.47 17.5 B 0.93 40.2 D 0.93 40.2 D
Northbound LTR 0.40 23.5 C 0.40 23.5 C 0.28 26.4 C 0.28 26.4 C 0.48 28.1 C 0.48 28.1 CSouthbound LTR 0.30 22.6 C 0.30 22.6 C 0.48 28.2 C 0.48 28.2 C 0.68 34.7 C 0.68 34.7 C
Intersection 20.8 C 20.8 C 20.6 C 20.6 C 34.0 C 34.0 CElwood Avenue @ 44B Southbound LTR 0.56 33.5 C 0.56 33.5 C 0.47 26.5 C 0.47 26.5 C 0.64 30.2 C 0.64 30.2 CStevens Avenue/Commerce Street* Intersection 33.5 C 33.5 C 26.5 C 26.5 C 30.2 C 30.2 CTaconic State Parkway @ 45 Eastbound LTR 0.06 34.2 C 0.06 34.2 C 0.28 31.9 C 0.28 31.9 C 0.39 33.0 C 0.39 33.0 CStevens Avenue (E-W) Westbound LTR 0.95 87.2 F 0.95 87.2 F 0.96 76.5 E 0.96 76.5 E 1.08 99.5 F 1.08 99.5 F
Northbound L 0.03 3.1 A 0.03 3.1 A 0.00 4.4 A 0.00 4.4 A 0.01 4.4 A 0.01 4.4 ATR 0.15 3.3 A 0.15 3.3 A 0.60 7.9 A 0.60 7.9 A 1.00 32.4 C 1.00 32.4 C
Southbound L 0.44 4.8 A 0.44 4.8 A 0.33 6.7 A 0.33 6.7 A 0.93 87.6 F 0.93 87.6 FTR 0.52 5.0 A 0.52 5.0 A 0.24 5.3 A 0.24 5.3 A 0.34 5.8 A 0.34 5.8 A
Intersection 12.3 B 12.3 B 16.6 B 16.6 B 37.9 D 37.9 DNotes:L = Left Turn, T = Through, R = Right Turn, Def = Defacto Left Turn; LOS = Level of Service. "+" indicates Potential Adverse Impacts.* These two intersections form a 5-leg intersection at Stevens Avenue, Commerce Street, and Elwood Avenue.(1) 2006 Future Conditions without the Delaware Aerator Fill Operations(2) 2006 Future Conditions with the Delaware Aerator Fill Operations
FEIS KENRESWORKSITES 81

AM Peak Hour Midday Peak Hour PM Peak Hour2006 (1) 2006 Option A (2) 2006 (1) 2006 Option A (2) 2006 (1) 2006 Option A (2)
Lane v/c Delay v/c Delay v/c Delay v/c Delay v/c Delay v/c DelayIntersection No. Approach Group Ratio (sec) LOS Ratio (sec) LOS Ratio (sec) LOS Ratio (sec) LOS Ratio (sec) LOS Ratio (sec) LOS
Bradhurst Avenue (Rt. 100) @ 5 Southbound LT 0.04 8.6 A 0.04 8.6 A 0.01 7.7 A 0.01 7.7 A 0.01 8.0 A 0.01 8.0 ALakeview Avenue (E-W) Westbound LR 0.47 27.1 D 0.47 27.1 D 0.17 11.9 B 0.17 11.9 B 0.40 17.0 C 0.40 17.0 CGrasslands Road (Rt. 100) (N-S) @ 32 Southbound LT 0.35 9.6 A 0.35 9.6 A 0.33 9.2 A 0.33 9.2 A 0.34 10.1 B 0.34 10.1 BVirginia Road Westbound LR 0.92 53.5 F 0.92 53.5 F 0.99 80.3 F 0.99 80.3 F 1.10 103.5 F 1.10 105.4 + FGrasslands Road (Rt. 100) (E-W) @ 33 Eastbound LT 0.11 9.4 A 0.17 9.7 A 0.18 9.1 A 0.22 9.3 A 0.22 10.5 B 0.29 10.9 BLegion Drive Southbound L 0.79 71.3 F 0.99 130.6 + F 1.13 172.8 F 1.39 ** + F 1.08 138.1 F 1.31 230.5 + F
Southbound R 0.37 16.2 C 0.47 18.1 C 0.28 12.9 B 0.38 14.2 B 0.44 18.4 C 0.56 22.1 CGrasslands Road (Rt. 100) (E-W) @ 34 Westbound LT 0.01 10.4 B 0.01 10.7 B 0.06 8.5 A 0.06 8.7 A 0.11 9.0 A 0.12 9.2 AWCC West Gate Driveway Northbound L 0.80 72.9 F 0.93 109.0 + F 0.08 20.5 C 0.09 23.6 C 0.24 45.2 E 0.29 55.8 + F
Northbound R 0.06 14.5 B 0.06 15.3 C 0.43 15.3 C 0.46 16.9 C 0.46 17.3 C 0.50 19.3 CCommerce Street @ 36 Eastbound LTR 0.01 7.8 A 0.06 8.0 A 0.03 8.0 A 0.08 8.2 A 0.05 8.4 A 0.10 8.6 ALegion Drive (E-W) Westbound LTR 0.01 7.9 A 0.01 7.9 A 0.03 8.0 A 0.03 8.0 A 0.06 8.5 A 0.06 8.5 A
Northbound LTR 0.16 11.7 B 0.18 13.0 B 0.16 14.0 B 0.20 16.5 C 0.43 26.4 D 0.55 38.1 + ESouthbound LTR 0.16 12.3 B 0.25 13.2 B 0.22 19.7 C 0.35 20.2 C 0.63 65.5 F 0.90 101.4 + F
Lakeview Avenue (E-W) @ 37 Eastbound LTR 0.02 7.6 A 0.02 7.6 A 0.00 7.5 A 0.00 7.5 A 0.00 7.7 A 0.00 7.7 ACommerce Street Westbound LTR 0.04 8.1 A 0.08 8.3 A 0.01 7.5 A 0.05 7.7 A 0.01 7.6 A 0.05 7.7 A
Northbound LTR 0.06 13.9 B 0.15 12.6 B 0.12 10.3 B 0.20 10.7 B 0.22 11.7 B 0.33 12.9 BSouthbound LTR 0.09 15.6 C 0.11 18.7 C 0.10 11.3 B 0.12 13.1 B 0.17 13.8 B 0.22 17.1 C
Columbus Avenue (N-S) @ 41 Southbound LT 0.14 9.4 A 0.15 9.7 A 0.07 9.1 A 0.07 9.3 A 0.12 10.9 B 0.13 11.2 BWest Lake Drive Westbound L 0.04 26.8 D 0.43 43.2 + E 0.02 20.3 C 0.28 26.4 D 0.09 38.9 E 0.63 81.3 + F
Westbound R 0.28 12.1 B 0.29 12.6 B 0.18 11.4 B 0.18 11.8 B 0.41 16.6 C 0.43 17.4 CNotes:L = Left Turn, T = Through, R = Right Turn, Def = Defacto Left Turn; LOS = Level of Service. "+" indicates Potential Adverse Impacts." ** " indicates a calculated delay greater than 240 seconds.(1) 2006 Future Conditions without the Delaware Aerator Fill Operations(2) 2006 Future Conditions with the Delaware Aerator Fill Operations
TABLE 5.1-D. COMMERCE TRUCK ROUTE (OPTION B) LEVEL-OF-SERVICE ANALYSIS RESULTS FOR UNSIGNALIZED INTERSECTIONS: 2006 FUTURE CONDITIONS WITHOUT THE PROJECT VERSUS FUTURE CONDITIONS WITH THE PROJECT (WITHOUT THE CROTON
PROJECT)
FEIS KENRESWORKSITES 82

AM Peak Hour Midday Peak Hour PM Peak Hour2006 (1) 2006 Option A (2) 2006 (1) 2006 Option A (2) 2006 (1) 2006 Option A (2)
Lane v/c Delay v/c Delay v/c Delay v/c Delay v/c Delay v/c DelayIntersection No. Approach Group Ratio (sec) LOS Ratio (sec) LOS Ratio (sec) LOS Ratio (sec) LOS Ratio (sec) LOS Ratio (sec) LOS
Grasslands Road (Rt. 100C) (E-W) @ 6 Eastbound L 1.14 128.8 F 1.40 238.1 + F 0.20 14.8 B 0.22 15.1 B 1.27 208.6 F * ** + FBradhurst Avenue (Rt. 100) T 1.00 68.8 E 1.07 89.4 + F 0.33 16.1 B 0.39 16.8 B 0.54 21.5 C 0.63 23.3 C
R 0.36 16.4 B 0.36 16.5 B 0.16 9.5 A 0.17 9.5 A 0.25 11.9 B 0.26 12.0 BWestbound L 1.03 161.3 F 1.03 161.3 F 0.06 13.6 B 0.07 13.6 B 0.19 17.6 B 0.23 18.1 B
TR 0.66 31.0 C 0.73 33.6 C 0.39 16.7 B 0.44 17.4 B 0.92 42.5 D 0.99 58.7 + ENorthbound L 0.34 28.0 C 0.35 28.1 C 0.52 45.8 D 0.53 46.3 D 0.77 46.7 D 0.79 48.0 D
TR 0.29 25.3 C 0.29 25.3 C 0.13 26.0 C 0.13 26.0 C 0.18 16.2 B 0.18 16.2 BSouthbound L 0.55 40.5 D 0.55 40.5 D 0.25 35.7 D 0.25 35.7 D 0.28 24.8 C 0.28 24.8 C
TR 0.89 70.8 E 0.89 70.8 E 0.96 77.8 E 0.96 77.8 E 1.05 85.7 F 1.05 85.7 FIntersection 58.6 E 77.4 E 33.9 C 33.9 C 51.3 D 61.5 E
Grasslands Road (Rt.100C) @ 24 Eastbound L 0.04 17.8 B 0.04 17.8 B 0.02 6.5 A 0.02 6.5 A 0.05 9.3 A 0.10 9.8 AClearbrook Road/Walker Road TR 0.90 34.5 C 0.90 34.5 C 0.50 9.4 A 0.50 9.4 A 0.69 16.1 B 0.69 16.1 B
Westbound L 0.88 48.3 D 0.88 48.3 D 0.31 8.3 A 0.31 8.3 A 1.13 122.0 F 1.13 122.0 FTR 0.98 45.2 D 1.04 61.7 + E 0.35 8.2 A 0.41 8.7 A 0.68 16.1 B 0.75 18.4 B
Northbound LT 0.22 28.9 C 0.22 29.0 C 0.15 18.8 B 0.15 18.8 B 0.22 20.2 C 0.49 23.9 CSouthbound LT 0.03 27.4 C 0.20 28.8 C 0.19 19.1 B 0.36 20.5 C 0.22 20.2 C 1.06 89.6 + F
R 0.01 27.3 C 0.01 27.3 C 0.01 17.9 B 0.01 17.9 B 0.01 18.5 B 0.19 19.9 BIntersection 41.2 D 47.9 D 10.0 A 10.6 B 28.8 C 40.4 D
Grasslands Road (Rt.100C) @ 25 Eastbound L 0.39 13.5 B 0.41 15.1 B 0.11 5.9 A 0.12 6.1 A 0.30 13.0 B 0.32 13.9 BWoods Drive/Taylor Road TR 0.29 4.7 A 0.31 4.8 A 0.36 6.9 A 0.39 7.0 A 0.53 11.9 B 0.69 14.7 B
Westbound L 0.02 8.9 A 0.02 8.9 A 0.00 10.6 B 0.00 10.6 B 0.00 12.5 B 0.01 12.6 BTR 0.75 17.3 B 0.78 18.1 B 0.34 13.1 B 0.38 13.4 B 0.69 20.4 C 0.73 21.4 C
Northbound LTR 0.03 34.6 C 0.03 34.6 C 0.01 31.3 C 0.01 31.3 C 0.01 24.6 C 0.01 24.6 CSouthbound LT 0.46 38.9 D 0.46 38.9 D 0.79 51.2 D 0.79 51.2 D 0.74 38.4 D 0.74 38.4 D
R 0.08 21.8 C 0.08 21.8 C 0.10 21.9 C 0.10 21.9 C 0.11 17.1 B 0.11 17.1 BIntersection 14.4 B 14.8 B 15.1 B 15.0 B 18.7 B 19.6 B
Grasslands Road (Rt.100C) @ 26 Eastbound TR 0.34 4.3 A 0.36 4.4 A 0.38 3.0 A 0.41 3.1 A 0.62 10.8 B 0.79 14.6 BSprain Brook Pkwy SB Ramp Westbound T 0.53 5.4 A 0.55 5.5 A 0.22 2.5 A 0.24 2.5 A 0.49 9.2 A 0.52 9.5 A
Southbound L 0.47 40.1 D 0.47 40.1 D 0.44 47.1 D 0.44 47.1 D 0.17 29.5 C 0.17 29.5 CR 1.15 138.8 F 1.15 138.8 F 0.31 45.8 D 0.31 45.8 D 0.16 29.4 C 0.16 29.4 C
Intersection 24.0 C 23.4 C 5.0 A 4.9 A 11.1 B 13.2 BGrasslands Road (Rt.100C) @ 27 Eastbound L 0.13 13.0 B 0.14 13.3 B 0.32 10.6 B 0.35 10.9 B 0.46 15.1 B 0.78 30.0 CSprain Brook Pkwy NB Ramp 30 T 0.41 14.8 B 0.44 15.1 B 0.23 9.8 A 0.25 10.0 A 0.30 8.8 A 0.33 9.0 A
Westbound TR 0.45 20.2 C 0.49 20.7 C 0.41 17.0 B 0.45 17.4 B 0.99 47.5 D 1.04 60.5 + ENorthbound LT 1.10 94.0 F 1.10 94.0 F 0.41 29.1 C 0.41 29.1 C 0.68 28.8 C 0.68 28.8 C
R 0.96 62.2 E 0.96 62.2 E 0.17 26.7 C 0.17 26.7 C 0.33 22.9 C 0.33 22.9 CIntersection 51.3 D 50.3 D 16.4 B 16.5 B 32.2 C 39.0 D
Virginia Road (E-W) @ 31 Eastbound LT 1.09 111.3 F 1.09 111.3 F 1.11 123.7 F 1.11 123.7 F 1.10 120.7 F 1.10 120.7 FBronx River Parkway R 0.33 21.0 C 0.33 21.0 C 0.33 33.8 C 0.33 33.8 C 0.37 34.3 C 0.37 34.3 C
Westbound LTR 0.57 38.4 D 0.57 38.4 D 0.65 42.4 D 0.65 42.4 D 1.17 148.0 F 1.17 148.0 FNorthbound L 0.08 46.6 D 0.08 46.6 D 0.02 9.5 A 0.02 9.5 A 0.05 10.7 B 0.05 10.7 B
TR 0.59 24.7 C 0.59 24.7 C 0.36 21.2 C 0.36 21.2 C 0.60 25.0 C 0.60 25.0 CSouthbound L 1.08 121.4 F 1.08 121.4 F 0.07 9.4 A 0.07 9.4 A 0.12 11.5 B 0.12 11.5 B
T 1.08 79.2 E 1.08 79.2 E 0.43 22.1 C 0.43 22.1 C 0.57 24.4 C 0.57 24.4 CIntersection 70.2 E 70.2 E 44.0 D 44.0 D 54.1 D 54.1 D
Grasslands Road (Rt 100) @ 34 Eastbound T 0.34 5.1 A 0.39 5.3 A 0.58 11.4 B 0.64 12.6 B 0.68 15.6 B 0.76 18.1 BWCC East Gate Westbound L 0.34 3.1 A 0.35 3.4 A 0.14 7.1 A 0.15 7.7 A 0.20 10.6 B 0.21 11.5 B
T 0.32 2.1 A 0.36 2.2 A 0.29 4.3 A 0.34 4.6 A 0.55 7.6 A 0.60 8.3 ANorthbound L 0.26 51.9 D 0.26 51.9 D 0.43 27.9 C 0.43 27.9 C 0.61 30.4 C 0.61 30.4 C
Intersection 4.7 A 4.8 A 10.6 B 11.0 B 14.0 B 15.2 B
TABLE 5.1-E. COMMERCE TRUCK ROUTE (OPTION B) LEVEL-OF-SERVICE ANALYSIS RESULTS FOR SIGNALIZED INTERSECTIONS: 2006 FUTURE CONDITIONS WITHOUT THE PROJECT VERSUS FUTURE CONDITIONS WITH THE PROJECT (WITH THE CROTON PROJECT)
FEIS KENRESWORKSITES 83

AM Peak Hour Midday Peak Hour PM Peak Hour2006 (1) 2006 Option A (2) 2006 (1) 2006 Option A (2) 2006 (1) 2006 Option A (2)
Lane v/c Delay v/c Delay v/c Delay v/c Delay v/c Delay v/c DelayIntersection No. Approach Group Ratio (sec) LOS Ratio (sec) LOS Ratio (sec) LOS Ratio (sec) LOS Ratio (sec) LOS Ratio (sec) LOS
TABLE 5.1-E. COMMERCE TRUCK ROUTE (OPTION B) LEVEL-OF-SERVICE ANALYSIS RESULTS FOR SIGNALIZED INTERSECTIONS: 2006 FUTURE CONDITIONS WITHOUT THE PROJECT VERSUS FUTURE CONDITIONS WITH THE PROJECT (WITH THE CROTON PROJECT)
Taconic State Parkway @ 38 Eastbound LTR 1.08 114.3 F 1.30 196.8 + F 0.71 43.9 D 0.96 81.3 + F 1.09 121.4 F 1.38 231.3 + FLakeview Avenue (E-W) Westbound LTR 0.97 101.5 F 1.22 178.5 + F 0.45 35.1 D 0.67 42.1 D 1.02 106.1 F 1.23 174.7 + F
Northbound L 0.21 5.0 A 0.21 5.0 A 0.06 4.0 A 0.06 4.0 A 0.15 4.4 A 0.15 4.4 ATR 0.21 4.4 A 0.21 4.4 A 0.63 7.4 A 0.63 7.4 A 1.05 46.8 D 1.05 46.8 D
Southbound L 0.04 3.9 A 0.04 3.9 A 0.12 4.4 A 0.12 4.4 A 0.34 7.4 A 0.34 7.4 ATR 0.57 6.6 A 0.57 6.6 A 0.27 4.7 A 0.27 4.7 A 0.41 5.4 A 0.41 5.4 A
Intersection 26.4 C 48.7 D 10.8 B 16.4 B 44.3 D 59.9 ETaconic State Parkway @ 39 Eastbound LTR 0.49 39.8 D 0.49 39.8 D 0.17 27.7 C 0.17 27.7 C 0.26 28.5 C 0.26 28.5 CCommerce St. (E-W) Westbound LTR 0.71 50.8 D 0.71 50.8 D 0.35 29.4 C 0.35 29.4 C 0.69 37.4 D 0.69 37.4 D
Northbound LTR 0.27 2.9 A 0.27 2.9 A 0.68 11.1 B 0.68 11.1 B 1.09 63.3 E 1.09 63.3 ESouthbound LTR 0.60 4.6 A 0.60 4.6 A 0.36 7.6 A 0.36 7.6 A 0.73 12.9 B 0.73 12.9 B
Intersection 8.1 A 8.1 A 11.6 B 11.6 B 47.3 D 47.3 DLakeview Avenue (E-W) @ 40 Eastbound LR 0.50 21.7 C 0.60 23.9 C 0.36 19.6 B 0.49 21.5 C 0.47 21.2 C 0.59 23.7 CColumbus Avenue Northbound LT 0.26 8.6 A 0.26 8.6 A 0.37 9.5 A 0.38 9.6 A 0.71 14.7 B 0.73 15.2 B
Southbound TR 0.33 9.0 A 0.36 9.3 A 0.21 8.2 A 0.24 8.4 A 0.28 8.7 A 0.31 8.9 AIntersection 11.8 B 12.8 B 10.9 B 11.9 B 13.9 B 14.9 B
Columbus Avenue (Northbound) @ 42 Eastbound LT 0.54 18.6 B 0.54 18.6 B 0.26 14.5 B 0.26 14.5 B 0.34 15.4 B 0.34 15.4 BStevens Avenue Westbound T 0.40 16.4 B 0.40 16.4 B 0.30 15.0 B 0.30 15.0 B 0.59 19.5 B 0.59 19.5 B
R 0.08 13.0 B 0.08 13.0 B 0.07 12.8 B 0.07 12.8 B 0.13 13.4 B 0.13 13.4 BNorthbound LT 0.48 13.2 B 0.48 13.2 B 0.39 10.9 B 0.39 10.9 B 0.64 13.9 B 0.64 13.9 B
R 0.12 10.4 B 0.12 10.4 B 0.22 10.0 A 0.22 10.0 A 0.36 11.4 B 0.36 11.4 BIntersection 15.0 B 15.0 B 12.0 B 12.0 B 14.8 B 14.8 B
Columbus Avenue (Southbound) @ 43 Eastbound TR 0.79 26.3 C 0.79 26.3 C 0.35 14.8 B 0.35 14.8 B 0.45 16.1 B 0.45 16.1 BStevens Avenue Westbound LT 1.12 101.8 F 1.12 101.8 F 0.76 27.4 C 0.76 27.4 C 1.10 86.8 F 1.10 86.8 F
Southbound LTR 0.25 11.1 B 0.25 11.1 B 0.24 10.3 B 0.24 10.3 B 0.32 10.9 B 0.32 10.9 BIntersection 48.1 D 48.1 D 17.8 B 17.8 B 46.7 D 46.7 D
Stevens Avenue (E-W) @ 44A Eastbound LTR 0.52 20.1 C 0.52 20.1 C 0.20 15.3 B 0.20 15.3 B 0.34 16.5 B 0.34 16.5 BCommerce Street* Westbound LTR 0.25 17.4 B 0.25 17.4 B 0.47 17.5 B 0.47 17.5 B 0.93 40.2 D 0.93 40.2 D
Northbound LTR 0.40 23.5 C 0.40 23.5 C 0.28 26.4 C 0.28 26.4 C 0.48 28.1 C 0.48 28.1 CSouthbound LTR 0.30 22.6 C 0.30 22.6 C 0.48 28.2 C 0.48 28.2 C 0.68 34.7 C 0.68 34.7 C
Intersection 20.8 C 20.8 C 20.6 C 20.6 C 34.0 C 34.0 CElwood Avenue @ 44B Southbound LTR 0.56 33.5 C 0.56 33.5 C 0.47 26.5 C 0.47 26.5 C 0.64 30.2 C 0.64 30.2 CStevens Avenue/Commerce Street* Intersection 33.5 C 33.5 C 26.5 C 26.5 C 30.2 C 30.2 CTaconic State Parkway @ 45 Eastbound LTR 0.06 34.2 C 0.06 34.2 C 0.28 31.9 C 0.28 31.9 C 0.39 33.0 C 0.39 33.0 CStevens Avenue (E-W) Westbound LTR 0.95 87.2 F 0.95 87.2 F 0.96 76.5 E 0.96 76.5 E 1.08 99.5 F 1.08 99.5 F
Northbound L 0.03 3.1 A 0.03 3.1 A 0.00 4.4 A 0.00 4.4 A 0.01 4.4 A 0.01 4.4 ATR 0.15 3.3 A 0.15 3.3 A 0.60 7.9 A 0.60 7.9 A 1.00 32.4 C 1.00 32.4 C
Southbound L 0.44 4.8 A 0.44 4.8 A 0.33 6.7 A 0.33 6.7 A 0.93 87.6 F 0.93 87.6 FTR 0.52 5.0 A 0.52 5.0 A 0.24 5.3 A 0.24 5.3 A 0.34 5.8 A 0.34 5.8 A
Intersection 12.3 B 12.3 B 16.6 B 16.6 B 37.9 D 37.9 DNotes:L = Left Turn, T = Through, R = Right Turn, Def = Defacto Left Turn; LOS = Level of Service. "+" indicates Potential Adverse Impacts.* These two intersections form a 5-leg intersection at Stevens Avenue, Commerce Street, and Elwood Avenue.(1) 2006 Future Conditions without the Delaware Aerator Fill Operations(2) 2006 Future Conditions with the Delaware Aerator Fill Operations
FEIS KENRESWORKSITES 84

AM Peak Hour Midday Peak Hour PM Peak Hour2006 (1) 2006 Option A (2) 2006 (1) 2006 Option A (2) 2006 (1) 2006 Option A (2)
Lane v/c Delay v/c Delay v/c Delay v/c Delay v/c Delay v/c DelayIntersection No. Approach Group Ratio (sec) LOS Ratio (sec) LOS Ratio (sec) LOS Ratio (sec) LOS Ratio (sec) LOS Ratio (sec) LOS
Bradhurst Avenue (Rt. 100) @ 5 Southbound LT 0.04 8.6 A 0.04 8.6 A 0.01 7.7 A 0.01 7.7 A 0.01 8.0 A 0.01 8.0 ALakeview Avenue (E-W) Westbound LR 0.47 27.1 D 0.47 27.1 D 0.17 11.9 B 0.17 11.9 B 0.40 17.0 C 0.40 17.0 CGrasslands Road (Rt. 100) (N-S) @ 32 Southbound LT 0.35 9.6 A 0.35 9.6 A 0.33 9.2 A 0.33 9.2 A 0.34 10.1 B 0.34 10.1 BVirginia Road Westbound LR 0.92 53.5 F 0.92 53.5 F 0.99 80.3 F 0.99 80.3 F 1.10 103.5 F 1.10 106.4 FGrasslands Road (Rt. 100) (E-W) @ 33 Eastbound LT 0.11 9.4 A 0.17 9.7 A 0.18 9.1 A 0.22 9.3 A 0.22 10.5 B 0.29 10.9 BLegion Drive Southbound L 0.79 71.3 F 0.99 128.3 + F 1.13 172.8 F 1.39 ** + F 1.08 138.1 F 1.32 234.0 + F
Southbound R 0.37 16.2 C 0.47 18.1 C 0.28 12.9 B 0.38 14.2 B 0.44 18.4 C 0.56 22.1 CGrasslands Road (Rt. 100) (E-W) @ 34 Westbound LT 0.01 10.4 B 0.01 10.7 B 0.06 8.5 A 0.06 8.7 A 0.11 9.0 A 0.12 9.3 AWCC West Gate Driveway Northbound L 0.80 72.9 F 0.93 109.0 + F 0.08 20.5 C 0.09 23.6 C 0.24 45.2 E 0.29 57.3 + F
Northbound R 0.06 14.5 B 0.06 15.3 C 0.43 15.3 C 0.46 16.9 C 0.46 17.3 C 0.51 19.6 CCommerce Street @ 36 Eastbound LTR 0.01 7.8 A 0.06 8.0 A 0.03 8.0 A 0.08 8.2 A 0.05 8.4 A 0.10 8.6 ALegion Drive (E-W) Westbound LTR 0.01 7.9 A 0.01 7.9 A 0.03 8.0 A 0.03 8.0 A 0.06 8.5 A 0.06 8.5 A
Northbound LTR 0.16 11.7 B 0.18 13.0 B 0.16 14.0 B 0.20 16.5 C 0.43 26.4 D 0.55 38.1 + ESouthbound LTR 0.16 12.3 B 0.25 13.2 B 0.22 19.7 C 0.35 20.2 C 0.63 65.5 F 0.90 101.4 + F
Lakeview Avenue (E-W) @ 37 Eastbound LTR 0.02 7.6 A 0.02 7.6 A 0.00 7.5 A 0.00 7.5 A 0.00 7.7 A 0.00 7.7 ACommerce Street Westbound LTR 0.04 8.1 A 0.07 8.2 A 0.01 7.5 A 0.05 7.7 A 0.01 7.6 A 0.05 7.7 A
Northbound LTR 0.06 13.9 B 0.15 12.5 B 0.12 10.3 B 0.20 10.7 B 0.22 11.7 B 0.33 12.9 BSouthbound LTR 0.09 15.6 C 0.10 18.2 C 0.10 11.3 B 0.12 13.1 B 0.17 13.8 B 0.22 17.1 C
Columbus Avenue (N-S) @ 41 Southbound LT 0.14 9.4 A 0.15 9.7 A 0.07 9.1 A 0.07 9.3 A 0.12 10.9 B 0.13 11.2 BWest Lake Drive Westbound L 0.04 26.8 D 0.43 43.2 + E 0.02 20.3 C 0.28 26.4 D 0.09 38.9 E 0.63 81.3 + F
Westbound R 0.28 12.1 B 0.29 12.6 B 0.18 11.4 B 0.18 11.8 B 0.41 16.6 C 0.43 17.4 CNotes:L = Left Turn, T = Through, R = Right Turn, Def = Defacto Left Turn; LOS = Level of Service. "+" indicates Potential Adverse Impacts." ** " indicates a calculated delay greater than 240 seconds.(1) 2006 Future Conditions without the Delaware Aerator Fill Operations(2) 2006 Future Conditions with the Delaware Aerator Fill Operations
TABLE 5.1-E. COMMERCE TRUCK ROUTE (OPTION B) LEVEL-OF-SERVICE ANALYSIS RESULTS FOR UNSIGNALIZED INTERSECTIONS: 2006 FUTURE CONDITIONS WITHOUT THE PROJECT VERSUS FUTURE CONDITIONS WITH THE PROJECT (WITH THE CROTON
PROJECT)
FEIS KENRESWORKSITES 85

FEIS KENRESWORKSITES 86
• The eastbound through movement at the intersection of Grasslands Road (Route 100C) and Bradhurst Avenue (Route 100) would experience a potential adverse impact. The delay would increase from 68.8 seconds (LOS E) to 89.4 seconds (LOS F) during the AM peak hour.
• The westbound through/right movement at the intersection of Grasslands Road (Route 100C) and Bradhurst Avenue (Route 100) would experience a potential adverse impact. The delay would increase from 42.5 seconds (LOS D) to 58.0 seconds (LOS E) during the PM peak hour.
• The westbound through/right movement at the intersection of Grasslands Road (Route 100C) and Clearbrook Road/Walker Road would experience a potential adverse impact. The delay would increase from 45.2 seconds (LOS D) to 61.7 seconds (LOS E) during the AM peak hour.
• The westbound through/right movement at the intersection of Grasslands Road (Route 100C) and the Sprain Brook Parkway Northbound Ramp would experience a potential adverse impact. The delay would increase form 47.5 seconds (LOS D) to 58.9 seconds (LOS E) during the PM peak hour.
• The eastbound approach at the intersection of the Taconic State Parkway and Lakeview Avenue would experience a potential adverse impact. The delay would increase from 114.3 seconds (LOS F) to 196.8 seconds (LOS F), 43.9 seconds (LOS D) to 81.3 seconds (LOS F), and 121.4 seconds (LOS F) to 231.3 seconds (LOS F) during the AM, midday, and PM peak hours, respectively.
• The westbound approach at the intersection of the Taconic State Parkway and Lakeview Avenue would experience a potential adverse impact. The delay would increase from 101.5 seconds (LOS F) to 178.5 seconds (LOS F) and 106.1 seconds (LOS F) and 174.7 seconds (LOS F) during the AM and PM peak hours, respectively.
Unsignalized Intersections:
• The southbound left-turn movement at the intersection of Grasslands Road (Route
100) and Legion Drive would experience a potential adverse impact. The delay would increase from 71.3 seconds (LOS F) to 130.6 seconds (LOS F), 172.8 seconds (LOS F) to greater than 240.0 seconds (LOS F) and 138.1 seconds (LOS F) to 230.5 seconds (LOS F) during the AM, midday, and PM peak hours, respectively.
• The northbound left-turn movement at the intersection of Grasslands Road (Route 100) and the Westchester Community College West Gate Driveway intersection would experience a potential adverse impact. The delays would increase from 72.9 seconds (LOS F) to 109.0 seconds (LOS F) and 45.2 seconds (LOS E) to 55.8 seconds (LOS F) during the AM and PM peak hours, respectively.
FEIS KENRESWORKSITES 87
• The northbound approach at the intersection of Commerce Street and Legion Drive would experience a potential adverse impact. The delay would increase from 26.4 seconds (LOS D) to 38.1 seconds (LOS E) during the PM peak hour.
• The southbound approach at the intersection of Commerce Street and Legion Drive would experience a potential adverse impact. The delay would increase from 65.5 seconds (LOS F) to 101.4 seconds (LOS F) during the PM peak hour.
• The westbound left-turn movement at the intersection of Columbus Avenue and West Lake Drive would experience a potential adverse impact. The delay would increase from 26.8 seconds (LOS D) to 43.2 seconds (LOS E) and 38.9 seconds (LOS E) to 81.3 seconds (LOS F) during the AM and PM peak hours, respectively.
In the Future With the Project, With the Croton Project, there would be the following additional potential adverse impacts at signalized intersections. (There would be no additional impacts on unsignalized intersections.)
• The southbound approach at the intersection of Grasslands Road (Route 100C) and Clearbrook Road/Walker Road would experience a potential adverse impact. The delay would increase from 20.2 seconds (LOS C) to 89.6 seconds (LOS F) during the PM peak hour.
Under Option B, there would be 20 potential temporary adverse impacted lane groups/approaches in the Future With the Project, Without the Croton Project. With the Croton Project, there would be 21 potential adverse impacted lane groups/approaches. Mitigation measures for the intersections that would experience potential adverse impacts are discussed in Chapter 6, Mitigation of Potential Impacts.
Option C – An even 50/50 percent split between Lakeview Avenue and Grasslands Road (Route 100/100C)/Commerce Street. Figures 5.1-AA and 5.1-BB show the truck assignments for truck route Option C (an even 50/50 percent split between Lakeview Avenue and Grasslands Road/Commerce Street) for the AM and midday, and PM peak hours, respectively for the Future With the Project, Without the Croton Project (“Cat-Del Alone,” as depicted in the figures). Figures 5.1-CC and 5.1-DD show the truck assignments for truck route Option C for the AM and midday, and PM peak hours, respectively for the Future With the Project, With the Croton Project. Figures 5.1-EE, 5.1-FF, and 5.1-GG show the projected 2006 traffic volumes for the Future With the Project, Without the Croton Project. Figures 5.1-HH, 5.1-II, and 5.1-JJ show the projected 2006 traffic volumes for the Future With the Project, With the Croton Project. Table 5.1-F presents a comparison of 2006 Future Without the Project conditions to 2006 Future With the Project conditions (without the Croton project). Table 5-1.G presents a comparison of 2006 Future Without the Project conditions to 2006 Future With the Project conditions (with the Croton project).

AM Peak Hour Midday Peak Hour PM Peak Hour2006 (1) 2006 Option A (2) 2006 (1) 2006 Option A (2) 2006 (1) 2006 Option A (2)
Lane v/c Delay v/c Delay v/c Delay v/c Delay v/c Delay v/c DelayIntersection No. Approach Group Ratio (sec) LOS Ratio (sec) LOS Ratio (sec) LOS Ratio (sec) LOS Ratio (sec) LOS Ratio (sec) LOS
Grasslands Road (Rt. 100C) (E-W) @ 6 Eastbound L 1.14 128.8 F 1.35 215.7 + F 0.20 14.8 B 0.27 15.6 B 1.27 208.6 F * ** + FBradhurst Avenue (Rt. 100) T 1.00 68.8 E 1.04 78.5 + E 0.33 16.1 B 0.36 16.4 B 0.54 21.5 C 0.58 22.2 C
R 0.36 16.4 B 0.36 16.4 B 0.16 9.5 A 0.16 9.5 A 0.25 11.9 B 0.25 11.9 BWestbound L 1.03 161.3 F 1.03 161.3 F 0.06 13.6 B 0.06 13.6 B 0.19 17.6 B 0.20 17.8 B
TR 0.66 31.0 C 0.70 32.2 C 0.39 16.7 B 0.42 17.1 B 0.92 42.5 D 0.96 49.3 + DNorthbound L 0.34 28.0 C 0.34 28.3 C 0.52 45.8 D 0.56 48.6 D 0.77 46.7 D 0.80 50.9 D
TR 0.29 25.3 C 0.29 25.3 C 0.13 26.0 C 0.13 26.0 C 0.18 16.2 B 0.18 16.2 BSouthbound L 0.55 40.5 D 0.55 40.5 D 0.25 35.7 D 0.25 35.7 D 0.28 24.8 C 0.28 24.8 C
TR 0.89 70.8 E 0.98 91.2 + F 0.96 77.8 E 1.03 96.5 + F 1.05 85.7 F 1.10 104.3 + FIntersection 58.6 E 75.4 E 33.9 C 38.5 D 51.3 D 75.2 E
Grasslands Road (Rt.100C) @ 24 Eastbound L 0.04 17.8 B 0.04 17.8 B 0.02 6.5 A 0.02 6.5 A 0.05 9.3 A 0.06 9.4 AClearbrook Road/Walker Road TR 0.90 34.5 C 0.90 34.5 C 0.50 9.4 A 0.50 9.4 A 0.69 16.1 B 0.69 16.1 B
Westbound L 0.88 48.3 D 0.88 48.3 D 0.31 8.3 A 0.31 8.3 A 1.13 122.0 F 1.13 122.0 FTR 0.98 45.2 D 1.04 61.7 + E 0.35 8.2 A 0.41 8.7 A 0.68 16.1 B 0.75 18.4 B
Northbound LT 0.22 28.9 C 0.23 29.0 C 0.15 18.8 B 0.15 18.8 B 0.22 20.2 C 0.28 20.8 CSouthbound LT 0.03 27.4 C 0.21 28.9 C 0.19 19.1 B 0.36 20.5 C 0.22 20.2 C 0.49 23.0 C
R 0.01 27.3 C 0.01 27.3 C 0.01 17.9 B 0.01 17.9 B 0.01 18.5 B 0.05 18.8 BIntersection 41.2 D 47.9 D 10.0 A 10.6 B 28.8 C 29.0 C
Grasslands Road (Rt.100C) @ 25 Eastbound L 0.39 13.5 B 0.41 15.0 B 0.11 5.9 A 0.12 6.1 A 0.30 13.0 B 0.32 13.8 BWoods Drive/Taylor Road TR 0.29 4.7 A 0.30 4.8 A 0.36 6.9 A 0.38 7.0 A 0.53 11.9 B 0.58 12.6 B
Westbound L 0.02 8.9 A 0.02 8.9 A 0.00 10.6 B 0.00 10.6 B 0.00 12.5 B 0.01 12.6 BTR 0.75 17.3 B 0.78 18.0 B 0.34 13.1 B 0.37 13.4 B 0.69 20.4 C 0.73 21.2 C
Northbound LTR 0.03 34.6 C 0.03 34.6 C 0.01 31.3 C 0.01 31.3 C 0.01 24.6 C 0.01 24.6 CSouthbound LT 0.46 38.9 D 0.46 38.9 D 0.79 51.2 D 0.79 51.2 D 0.74 38.4 D 0.74 38.4 D
R 0.08 21.8 C 0.08 21.8 C 0.10 21.9 C 0.10 21.9 C 0.11 17.1 B 0.11 17.1 BIntersection 14.4 B 14.8 B 15.1 B 15.0 B 18.7 B 19.1 B
Grasslands Road (Rt.100C) @ 26 Eastbound TR 0.34 4.3 A 0.36 4.3 A 0.38 3.0 A 0.40 3.1 A 0.62 10.8 B 0.67 11.7 BSprain Brook Pkwy SB Ramp Westbound T 0.53 5.4 A 0.55 5.5 A 0.22 2.5 A 0.24 2.5 A 0.49 9.2 A 0.52 9.5 A
Southbound L 0.47 40.1 D 0.47 40.1 D 0.44 47.1 D 0.44 47.1 D 0.17 29.5 C 0.17 29.5 CR 1.15 138.8 F 1.15 138.8 F 0.31 45.8 D 0.31 45.8 D 0.16 29.4 C 0.16 29.4 C
Intersection 24.0 C 23.5 C 5.0 A 4.9 A 11.1 B 11.6 BGrasslands Road (Rt.100C) @ 27 Eastbound L 0.13 13.0 B 0.14 13.2 B 0.32 10.6 B 0.34 10.9 B 0.46 15.1 B 0.52 15.8 BSprain Brook Pkwy NB Ramp 30 T 0.41 14.8 B 0.44 15.1 B 0.23 9.8 A 0.25 9.9 A 0.30 8.8 A 0.33 9.0 A
Westbound TR 0.45 20.2 C 0.48 20.6 C 0.41 17.0 B 0.44 17.4 B 0.99 47.5 D 1.03 58.9 + ENorthbound LT 1.10 94.0 F 1.10 94.0 F 0.41 29.1 C 0.41 29.1 C 0.68 28.8 C 0.68 28.8 C
R 0.96 62.2 E 0.96 62.2 E 0.17 26.7 C 0.17 26.7 C 0.33 22.9 C 0.33 22.9 CIntersection 51.3 D 50.4 D 16.4 B 16.5 B 32.2 C 37.7 D
Virginia Road (E-W) @ 31 Eastbound LT 1.09 111.3 F 1.09 111.3 F 1.11 123.7 F 1.11 123.7 F 1.10 120.7 F 1.10 120.7 FBronx River Parkway R 0.33 21.0 C 0.33 21.0 C 0.33 33.8 C 0.33 33.8 C 0.37 34.3 C 0.37 34.3 C
Westbound LTR 0.57 38.4 D 0.57 38.4 D 0.65 42.4 D 0.65 42.4 D 1.17 148.0 F 1.17 148.0 FNorthbound L 0.08 46.6 D 0.08 46.6 D 0.02 9.5 A 0.02 9.5 A 0.05 10.7 B 0.05 10.7 B
TR 0.59 24.7 C 0.59 24.7 C 0.36 21.2 C 0.36 21.2 C 0.60 25.0 C 0.60 25.0 CSouthbound L 1.08 121.4 F 1.08 121.4 F 0.07 9.4 A 0.07 9.4 A 0.12 11.5 B 0.12 11.5 B
T 1.08 79.2 E 1.08 79.2 E 0.43 22.1 C 0.43 22.1 C 0.57 24.4 C 0.57 24.4 CIntersection 70.2 E 70.2 E 44.0 D 44.0 D 54.1 D 54.1 D
Grasslands Road (Rt 100) @ 34 Eastbound T 0.34 5.1 A 0.36 5.2 A 0.58 11.4 B 0.61 11.9 B 0.68 15.6 B 0.72 16.6 BWCC East Gate Westbound L 0.34 3.1 A 0.35 3.2 A 0.14 7.1 A 0.15 7.4 A 0.20 10.6 B 0.21 11.0 B
T 0.32 2.1 A 0.34 2.1 A 0.29 4.3 A 0.31 4.4 A 0.55 7.6 A 0.58 7.9 ANorthbound L 0.26 51.9 D 0.26 51.9 D 0.43 27.9 C 0.43 27.9 C 0.61 30.4 C 0.61 30.4 C
Intersection 4.7 A 4.7 A 10.6 B 10.8 B 14.0 B 14.4 B
TABLE 5.1-F. SPLIT LAKEVIEW/COMMERCE TRUCK ROUTE (OPTION C) LEVEL-OF-SERVICE ANALYSIS RESULTS FOR SIGNALIZED INTERSECTIONS: 2006 FUTURE CONDITIONS WITHOUT THE PROJECT VERSUS FUTURE CONDITIONS WITH THE PROJECT (WITHOUT THE CROTON PROJECT)
FEIS KENRESWORKSITES 88

AM Peak Hour Midday Peak Hour PM Peak Hour2006 (1) 2006 Option A (2) 2006 (1) 2006 Option A (2) 2006 (1) 2006 Option A (2)
Lane v/c Delay v/c Delay v/c Delay v/c Delay v/c Delay v/c DelayIntersection No. Approach Group Ratio (sec) LOS Ratio (sec) LOS Ratio (sec) LOS Ratio (sec) LOS Ratio (sec) LOS Ratio (sec) LOS
TABLE 5.1-F. SPLIT LAKEVIEW/COMMERCE TRUCK ROUTE (OPTION C) LEVEL-OF-SERVICE ANALYSIS RESULTS FOR SIGNALIZED INTERSECTIONS: 2006 FUTURE CONDITIONS WITHOUT THE PROJECT VERSUS FUTURE CONDITIONS WITH THE PROJECT (WITHOUT THE CROTON PROJECT)
Taconic State Parkway @ 38 Eastbound LTR 1.08 114.3 F 1.30 196.8 + F 0.71 43.9 D 0.96 81.3 + F 1.09 121.4 F 1.38 231.3 + FLakeview Avenue (E-W) Westbound LTR 0.97 101.5 F 1.22 178.5 + F 0.45 35.1 D 0.67 42.1 D 1.02 106.1 F 1.23 174.7 + F
Northbound L 0.21 5.0 A 0.21 5.0 A 0.06 4.0 A 0.06 4.0 A 0.15 4.4 A 0.15 4.4 ATR 0.21 4.4 A 0.21 4.4 A 0.63 7.4 A 0.63 7.4 A 1.05 46.8 D 1.05 46.8 D
Southbound L 0.04 3.9 A 0.04 3.9 A 0.12 4.4 A 0.12 4.4 A 0.34 7.4 A 0.34 7.4 ATR 0.57 6.6 A 0.57 6.6 A 0.27 4.7 A 0.27 4.7 A 0.41 5.4 A 0.41 5.4 A
Intersection 26.4 C 48.7 D 10.8 B 16.4 B 44.3 D 59.9 ETaconic State Parkway @ 39 Eastbound LTR 0.49 39.8 D 0.49 39.8 D 0.17 27.7 C 0.17 27.7 C 0.26 28.5 C 0.26 28.5 CCommerce St. (E-W) Westbound LTR 0.71 50.8 D 0.71 50.8 D 0.35 29.4 C 0.35 29.4 C 0.69 37.4 D 0.69 37.4 D
Northbound LTR 0.27 2.9 A 0.27 2.9 A 0.68 11.1 B 0.68 11.1 B 1.09 63.3 E 1.09 63.3 ESouthbound LTR 0.60 4.6 A 0.60 4.6 A 0.36 7.6 A 0.36 7.6 A 0.73 12.9 B 0.73 12.9 B
Intersection 8.1 A 8.1 A 11.6 B 11.6 B 47.3 D 47.3 DLakeview Avenue (E-W) @ 40 Eastbound LR 0.50 21.7 C 0.60 23.9 C 0.36 19.6 B 0.49 21.5 C 0.47 21.2 C 0.59 23.7 CColumbus Avenue Northbound LT 0.26 8.6 A 0.26 8.6 A 0.37 9.5 A 0.38 9.6 A 0.71 14.7 B 0.73 15.2 B
Southbound TR 0.33 9.0 A 0.36 9.3 A 0.21 8.2 A 0.24 8.4 A 0.28 8.7 A 0.31 8.9 AIntersection 11.8 B 12.8 B 10.9 B 11.9 B 13.9 B 14.9 B
Columbus Avenue (Northbound) @ 42 Eastbound LT 0.54 18.6 B 0.54 18.6 B 0.26 14.5 B 0.26 14.5 B 0.34 15.4 B 0.34 15.4 BStevens Avenue Westbound T 0.40 16.4 B 0.40 16.4 B 0.30 15.0 B 0.30 15.0 B 0.59 19.5 B 0.59 19.5 B
R 0.08 13.0 B 0.08 13.0 B 0.07 12.8 B 0.07 12.8 B 0.13 13.4 B 0.13 13.4 BNorthbound LT 0.48 13.2 B 0.48 13.2 B 0.39 10.9 B 0.39 10.9 B 0.64 13.9 B 0.64 13.9 B
R 0.12 10.4 B 0.12 10.4 B 0.22 10.0 A 0.22 10.0 A 0.36 11.4 B 0.36 11.4 BIntersection 15.0 B 15.0 B 12.0 B 12.0 B 14.8 B 14.8 B
Columbus Avenue (Southbound) @ 43 Eastbound TR 0.79 26.3 C 0.79 26.3 C 0.35 14.8 B 0.35 14.8 B 0.45 16.1 B 0.45 16.1 BStevens Avenue Westbound LT 1.12 101.8 F 1.12 101.8 F 0.76 27.4 C 0.76 27.4 C 1.10 86.8 F 1.10 86.8 F
Southbound LTR 0.25 11.1 B 0.25 11.1 B 0.24 10.3 B 0.24 10.3 B 0.32 10.9 B 0.32 10.9 BIntersection 48.1 D 48.1 D 17.8 B 17.8 B 46.7 D 46.7 D
Stevens Avenue (E-W) @ 44A Eastbound LTR 0.52 20.1 C 0.52 20.1 C 0.20 15.3 B 0.20 15.3 B 0.34 16.5 B 0.34 16.5 BCommerce Street* Westbound LTR 0.25 17.4 B 0.25 17.4 B 0.47 17.5 B 0.47 17.5 B 0.93 40.2 D 0.93 40.2 D
Northbound LTR 0.40 23.5 C 0.40 23.5 C 0.28 26.4 C 0.28 26.4 C 0.48 28.1 C 0.48 28.1 CSouthbound LTR 0.30 22.6 C 0.30 22.6 C 0.48 28.2 C 0.48 28.2 C 0.68 34.7 C 0.68 34.7 C
Intersection 20.8 C 20.8 C 20.6 C 20.6 C 34.0 C 34.0 CElwood Avenue @ 44B Southbound LTR 0.56 33.5 C 0.56 33.5 C 0.47 26.5 C 0.47 26.5 C 0.64 30.2 C 0.64 30.2 CStevens Avenue/Commerce Street* Intersection 33.5 C 33.5 C 26.5 C 26.5 C 30.2 C 30.2 CTaconic State Parkway @ 45 Eastbound LTR 0.06 34.2 C 0.06 34.2 C 0.28 31.9 C 0.28 31.9 C 0.39 33.0 C 0.39 33.0 CStevens Avenue (E-W) Westbound LTR 0.95 87.2 F 0.95 87.2 F 0.96 76.5 E 0.96 76.5 E 1.08 99.5 F 1.08 99.5 F
Northbound L 0.03 3.1 A 0.03 3.1 A 0.00 4.4 A 0.00 4.4 A 0.01 4.4 A 0.01 4.4 ATR 0.15 3.3 A 0.15 3.3 A 0.60 7.9 A 0.60 7.9 A 1.00 32.4 C 1.00 32.4 C
Southbound L 0.44 4.8 A 0.44 4.8 A 0.33 6.7 A 0.33 6.7 A 0.93 87.6 F 0.93 87.6 FTR 0.52 5.0 A 0.52 5.0 A 0.24 5.3 A 0.24 5.3 A 0.34 5.8 A 0.34 5.8 A
Intersection 12.3 B 12.3 B 16.6 B 16.6 B 37.9 D 37.9 DNotes:L = Left Turn, T = Through, R = Right Turn, Def = Defacto Left Turn; LOS = Level of Service. "+" indicates Potential Adverse Impacts.* These two intersections form a 5-leg intersection at Stevens Avenue, Commerce Street, and Elwood Avenue.(1) 2006 Future Conditions without the Delaware Aerator Fill Operations(2) 2006 Future Conditions with the Delaware Aerator Fill Operations
FEIS KENRESWORKSITES 89
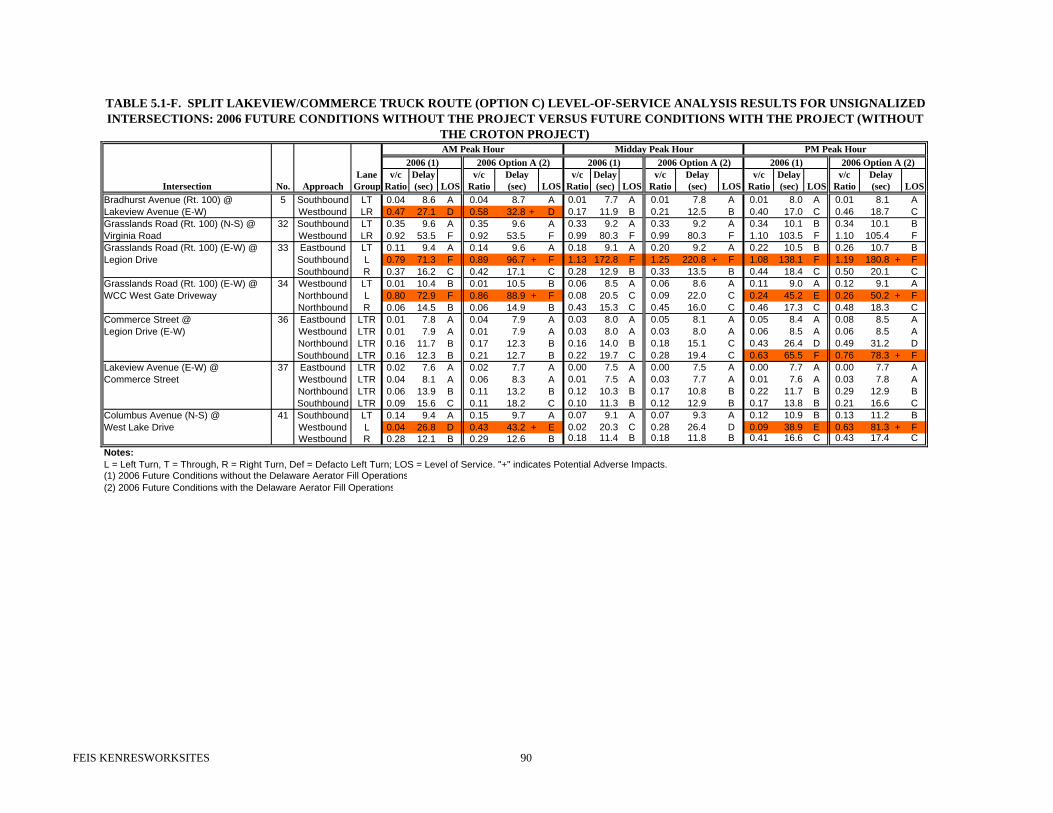
AM Peak Hour Midday Peak Hour PM Peak Hour2006 (1) 2006 Option A (2) 2006 (1) 2006 Option A (2) 2006 (1) 2006 Option A (2)
Lane v/c Delay v/c Delay v/c Delay v/c Delay v/c Delay v/c DelayIntersection No. Approach Group Ratio (sec) LOS Ratio (sec) LOS Ratio (sec) LOS Ratio (sec) LOS Ratio (sec) LOS Ratio (sec) LOS
Bradhurst Avenue (Rt. 100) @ 5 Southbound LT 0.04 8.6 A 0.04 8.7 A 0.01 7.7 A 0.01 7.8 A 0.01 8.0 A 0.01 8.1 ALakeview Avenue (E-W) Westbound LR 0.47 27.1 D 0.58 32.8 + D 0.17 11.9 B 0.21 12.5 B 0.40 17.0 C 0.46 18.7 CGrasslands Road (Rt. 100) (N-S) @ 32 Southbound LT 0.35 9.6 A 0.35 9.6 A 0.33 9.2 A 0.33 9.2 A 0.34 10.1 B 0.34 10.1 BVirginia Road Westbound LR 0.92 53.5 F 0.92 53.5 F 0.99 80.3 F 0.99 80.3 F 1.10 103.5 F 1.10 105.4 FGrasslands Road (Rt. 100) (E-W) @ 33 Eastbound LT 0.11 9.4 A 0.14 9.6 A 0.18 9.1 A 0.20 9.2 A 0.22 10.5 B 0.26 10.7 BLegion Drive Southbound L 0.79 71.3 F 0.89 96.7 + F 1.13 172.8 F 1.25 220.8 + F 1.08 138.1 F 1.19 180.8 + F
Southbound R 0.37 16.2 C 0.42 17.1 C 0.28 12.9 B 0.33 13.5 B 0.44 18.4 C 0.50 20.1 CGrasslands Road (Rt. 100) (E-W) @ 34 Westbound LT 0.01 10.4 B 0.01 10.5 B 0.06 8.5 A 0.06 8.6 A 0.11 9.0 A 0.12 9.1 AWCC West Gate Driveway Northbound L 0.80 72.9 F 0.86 88.9 + F 0.08 20.5 C 0.09 22.0 C 0.24 45.2 E 0.26 50.2 + F
Northbound R 0.06 14.5 B 0.06 14.9 B 0.43 15.3 C 0.45 16.0 C 0.46 17.3 C 0.48 18.3 CCommerce Street @ 36 Eastbound LTR 0.01 7.8 A 0.04 7.9 A 0.03 8.0 A 0.05 8.1 A 0.05 8.4 A 0.08 8.5 ALegion Drive (E-W) Westbound LTR 0.01 7.9 A 0.01 7.9 A 0.03 8.0 A 0.03 8.0 A 0.06 8.5 A 0.06 8.5 A
Northbound LTR 0.16 11.7 B 0.17 12.3 B 0.16 14.0 B 0.18 15.1 C 0.43 26.4 D 0.49 31.2 DSouthbound LTR 0.16 12.3 B 0.21 12.7 B 0.22 19.7 C 0.28 19.4 C 0.63 65.5 F 0.76 78.3 + F
Lakeview Avenue (E-W) @ 37 Eastbound LTR 0.02 7.6 A 0.02 7.7 A 0.00 7.5 A 0.00 7.5 A 0.00 7.7 A 0.00 7.7 ACommerce Street Westbound LTR 0.04 8.1 A 0.06 8.3 A 0.01 7.5 A 0.03 7.7 A 0.01 7.6 A 0.03 7.8 A
Northbound LTR 0.06 13.9 B 0.11 13.2 B 0.12 10.3 B 0.17 10.8 B 0.22 11.7 B 0.29 12.9 BSouthbound LTR 0.09 15.6 C 0.11 18.2 C 0.10 11.3 B 0.12 12.9 B 0.17 13.8 B 0.21 16.6 C
Columbus Avenue (N-S) @ 41 Southbound LT 0.14 9.4 A 0.15 9.7 A 0.07 9.1 A 0.07 9.3 A 0.12 10.9 B 0.13 11.2 BWest Lake Drive Westbound L 0.04 26.8 D 0.43 43.2 + E 0.02 20.3 C 0.28 26.4 D 0.09 38.9 E 0.63 81.3 + F
Westbound R 0.28 12.1 B 0.29 12.6 B 0.18 11.4 B 0.18 11.8 B 0.41 16.6 C 0.43 17.4 CNotes:L = Left Turn, T = Through, R = Right Turn, Def = Defacto Left Turn; LOS = Level of Service. "+" indicates Potential Adverse Impacts.(1) 2006 Future Conditions without the Delaware Aerator Fill Operations(2) 2006 Future Conditions with the Delaware Aerator Fill Operations
TABLE 5.1-F. SPLIT LAKEVIEW/COMMERCE TRUCK ROUTE (OPTION C) LEVEL-OF-SERVICE ANALYSIS RESULTS FOR UNSIGNALIZED INTERSECTIONS: 2006 FUTURE CONDITIONS WITHOUT THE PROJECT VERSUS FUTURE CONDITIONS WITH THE PROJECT (WITHOUT
THE CROTON PROJECT)
FEIS KENRESWORKSITES 90

AM Peak Hour Midday Peak Hour PM Peak Hour2006 (1) 2006 Option A (2) 2006 (1) 2006 Option A (2) 2006 (1) 2006 Option A (2)
Lane v/c Delay v/c Delay v/c Delay v/c Delay v/c Delay v/c DelayIntersection No. Approach Group Ratio (sec) LOS Ratio (sec) LOS Ratio (sec) LOS Ratio (sec) LOS Ratio (sec) LOS Ratio (sec) LOS
Grasslands Road (Rt. 100C) (E-W) @ 6 Eastbound L 1.14 128.8 F 1.35 215.7 + F 0.20 14.8 B 0.27 15.6 B 1.27 208.6 F * ** + FBradhurst Avenue (Rt. 100) T 1.00 68.8 E 1.04 78.5 + E 0.33 16.1 B 0.36 16.4 B 0.54 21.5 C 0.59 22.4 C
R 0.36 16.4 B 0.36 16.5 B 0.16 9.5 A 0.17 9.5 A 0.25 11.9 B 0.26 12.0 BWestbound L 1.03 161.3 F 1.03 161.3 F 0.06 13.6 B 0.06 13.6 B 0.19 17.6 B 0.21 17.9 B
TR 0.66 31.0 C 0.70 32.2 C 0.39 16.7 B 0.42 17.1 B 0.92 42.5 D 0.96 49.8 + DNorthbound L 0.34 28.0 C 0.35 28.4 C 0.52 45.8 D 0.58 49.2 D 0.77 46.7 D 0.82 52.6 + D
TR 0.29 25.3 C 0.29 25.3 C 0.13 26.0 C 0.13 26.0 C 0.18 16.2 B 0.18 16.2 BSouthbound L 0.55 40.5 D 0.55 40.5 D 0.25 35.7 D 0.25 35.7 D 0.28 24.8 C 0.28 24.8 C
TR 0.89 70.8 E 0.98 91.2 + F 0.96 77.8 E 1.03 96.5 + F 1.05 85.7 F 1.10 104.3 + FIntersection 58.6 E 75.3 E 33.9 C 38.6 D 51.3 D 75.2 E
Grasslands Road (Rt.100C) @ 24 Eastbound L 0.04 17.8 B 0.04 17.8 B 0.02 6.5 A 0.02 6.5 A 0.05 9.3 A 0.10 9.8 AClearbrook Road/Walker Road TR 0.90 34.5 C 0.90 34.5 C 0.50 9.4 A 0.50 9.4 A 0.69 16.1 B 0.69 16.1 B
Westbound L 0.88 48.3 D 0.88 48.3 D 0.31 8.3 A 0.31 8.3 A 1.13 122.0 F 1.13 122.0 FTR 0.98 45.2 D 1.04 61.7 + E 0.35 8.2 A 0.41 8.7 A 0.68 16.1 B 0.75 18.4 B
Northbound LT 0.22 28.9 C 0.22 29.0 C 0.15 18.8 B 0.15 18.8 B 0.22 20.2 C 0.49 23.9 CSouthbound LT 0.03 27.4 C 0.20 28.8 C 0.19 19.1 B 0.36 20.5 C 0.22 20.2 C 1.06 89.6 + F
R 0.01 27.3 C 0.01 27.3 C 0.01 17.9 B 0.01 17.9 B 0.01 18.5 B 0.19 19.9 BIntersection 41.2 D 47.9 D 10.0 A 10.6 B 28.8 C 40.4 D
Grasslands Road (Rt.100C) @ 25 Eastbound L 0.39 13.5 B 0.41 15.1 B 0.11 5.9 A 0.12 6.1 A 0.30 13.0 B 0.32 13.9 BWoods Drive/Taylor Road TR 0.29 4.7 A 0.31 4.8 A 0.36 6.9 A 0.39 7.0 A 0.53 11.9 B 0.69 14.7 B
Westbound L 0.02 8.9 A 0.02 8.9 A 0.00 10.6 B 0.00 10.6 B 0.00 12.5 B 0.01 12.6 BTR 0.75 17.3 B 0.78 18.1 B 0.34 13.1 B 0.38 13.4 B 0.69 20.4 C 0.73 21.4 C
Northbound LTR 0.03 34.6 C 0.03 34.6 C 0.01 31.3 C 0.01 31.3 C 0.01 24.6 C 0.01 24.6 CSouthbound LT 0.46 38.9 D 0.46 38.9 D 0.79 51.2 D 0.79 51.2 D 0.74 38.4 D 0.74 38.4 D
R 0.08 21.8 C 0.08 21.8 C 0.10 21.9 C 0.10 21.9 C 0.11 17.1 B 0.11 17.1 BIntersection 14.4 B 14.8 B 15.1 B 15.0 B 18.7 B 19.6 B
Grasslands Road (Rt.100C) @ 26 Eastbound TR 0.34 4.3 A 0.36 4.4 A 0.38 3.0 A 0.41 3.1 A 0.62 10.8 B 0.79 14.6 BSprain Brook Pkwy SB Ramp Westbound T 0.53 5.4 A 0.55 5.5 A 0.22 2.5 A 0.24 2.5 A 0.49 9.2 A 0.52 9.5 A
Southbound L 0.47 40.1 D 0.47 40.1 D 0.44 47.1 D 0.44 47.1 D 0.17 29.5 C 0.17 29.5 CR 1.15 138.8 F 1.15 138.8 F 0.31 45.8 D 0.31 45.8 D 0.16 29.4 C 0.16 29.4 C
Intersection 24.0 C 23.4 C 5.0 A 4.9 A 11.1 B 13.2 BGrasslands Road (Rt.100C) @ 27 Eastbound L 0.13 13.0 B 0.14 13.3 B 0.32 10.6 B 0.35 10.9 B 0.46 15.1 B 0.78 30.0 CSprain Brook Pkwy NB Ramp 30 T 0.41 14.8 B 0.44 15.1 B 0.23 9.8 A 0.25 10.0 A 0.30 8.8 A 0.33 9.0 A
Westbound TR 0.45 20.2 C 0.49 20.7 C 0.41 17.0 B 0.45 17.4 B 0.99 47.5 D 1.04 60.5 + ENorthbound LT 1.10 94.0 F 1.10 94.0 F 0.41 29.1 C 0.41 29.1 C 0.68 28.8 C 0.68 28.8 C
R 0.96 62.2 E 0.96 62.2 E 0.17 26.7 C 0.17 26.7 C 0.33 22.9 C 0.33 22.9 CIntersection 51.3 D 50.3 D 16.4 B 16.5 B 32.2 C 39.0 D
Virginia Road (E-W) @ 31 Eastbound LT 1.09 111.3 F 1.09 111.3 F 1.11 123.7 F 1.11 123.7 F 1.10 120.7 F 1.10 120.7 FBronx River Parkway R 0.33 21.0 C 0.33 21.0 C 0.33 33.8 C 0.33 33.8 C 0.37 34.3 C 0.37 34.3 C
Westbound LTR 0.57 38.4 D 0.57 38.4 D 0.65 42.4 D 0.65 42.4 D 1.17 148.0 F 1.17 148.0 FNorthbound L 0.08 46.6 D 0.08 46.6 D 0.02 9.5 A 0.02 9.5 A 0.05 10.7 B 0.05 10.7 B
TR 0.59 24.7 C 0.59 24.7 C 0.36 21.2 C 0.36 21.2 C 0.60 25.0 C 0.60 25.0 CSouthbound L 1.08 121.4 F 1.08 121.4 F 0.07 9.4 A 0.07 9.4 A 0.12 11.5 B 0.12 11.5 B
T 1.08 79.2 E 1.08 79.2 E 0.43 22.1 C 0.43 22.1 C 0.57 24.4 C 0.57 24.4 CIntersection 70.2 E 70.2 E 44.0 D 44.0 D 54.1 D 54.1 D
Grasslands Road (Rt 100) @ 34 Eastbound T 0.34 5.1 A 0.36 5.2 A 0.58 11.4 B 0.61 11.9 B 0.68 15.6 B 0.73 16.9 BWCC East Gate Westbound L 0.34 3.1 A 0.35 3.2 A 0.14 7.1 A 0.15 7.4 A 0.20 10.6 B 0.21 11.1 B
T 0.32 2.1 A 0.34 2.1 A 0.29 4.3 A 0.31 4.4 A 0.55 7.6 A 0.58 8.0 ANorthbound L 0.26 51.9 D 0.26 51.9 D 0.43 27.9 C 0.43 27.9 C 0.61 30.4 C 0.61 30.4 C
Intersection 4.7 A 4.7 A 10.6 B 10.8 B 14.0 B 14.6 B
TABLE 5.1-G. SPLIT LAKEVIEW/COMMERCE TRUCK ROUTE (OPTION C) LEVEL-OF-SERVICE ANALYSIS RESULTS FOR SIGNALIZED INTERSECTIONS: 2006 FUTURE CONDITIONS WITHOUT THE PROJECT VERSUS FUTURE CONDITIONS WITH THE PROJECT (WITH THE CROTON PROJECT)
FEIS KENRESWORKSITES 91

AM Peak Hour Midday Peak Hour PM Peak Hour2006 (1) 2006 Option A (2) 2006 (1) 2006 Option A (2) 2006 (1) 2006 Option A (2)
Lane v/c Delay v/c Delay v/c Delay v/c Delay v/c Delay v/c DelayIntersection No. Approach Group Ratio (sec) LOS Ratio (sec) LOS Ratio (sec) LOS Ratio (sec) LOS Ratio (sec) LOS Ratio (sec) LOS
TABLE 5.1-G. SPLIT LAKEVIEW/COMMERCE TRUCK ROUTE (OPTION C) LEVEL-OF-SERVICE ANALYSIS RESULTS FOR SIGNALIZED INTERSECTIONS: 2006 FUTURE CONDITIONS WITHOUT THE PROJECT VERSUS FUTURE CONDITIONS WITH THE PROJECT (WITH THE CROTON PROJECT)
Taconic State Parkway @ 38 Eastbound LTR 1.08 114.3 F 1.30 196.8 + F 0.71 43.9 D 0.96 81.3 + F 1.09 121.4 F 1.38 231.3 + FLakeview Avenue (E-W) Westbound LTR 0.97 101.5 F 1.22 178.5 + F 0.45 35.1 D 0.67 42.1 + D 1.02 106.1 F 1.23 174.7 + F
Northbound L 0.21 5.0 A 0.21 5.0 A 0.06 4.0 A 0.06 4.0 A 0.15 4.4 A 0.15 4.4 ATR 0.21 4.4 A 0.21 4.4 A 0.63 7.4 A 0.63 7.4 A 1.05 46.8 D 1.05 46.8 D
Southbound L 0.04 3.9 A 0.04 3.9 A 0.12 4.4 A 0.12 4.4 A 0.34 7.4 A 0.34 7.4 ATR 0.57 6.6 A 0.57 6.6 A 0.27 4.7 A 0.27 4.7 A 0.41 5.4 A 0.41 5.4 A
Intersection 26.4 C 48.7 D 10.8 B 16.4 44.3 D 59.9 ETaconic State Parkway @ 39 Eastbound LTR 0.49 39.8 D 0.49 39.8 D 0.17 27.7 C 0.17 27.7 C 0.26 28.5 C 0.26 28.5 CCommerce St. (E-W) Westbound LTR 0.71 50.8 D 0.71 50.8 D 0.35 29.4 C 0.35 29.4 C 0.69 37.4 D 0.69 37.4 D
Northbound LTR 0.27 2.9 A 0.27 2.9 A 0.68 11.1 B 0.68 11.1 B 1.09 63.3 E 1.09 63.3 ESouthbound LTR 0.60 4.6 A 0.60 4.6 A 0.36 7.6 A 0.36 7.6 A 0.73 12.9 B 0.73 12.9 B
Intersection 8.1 A 8.1 A 11.6 B 11.6 B 47.3 D 47.3 DLakeview Avenue (E-W) @ 40 Eastbound LR 0.50 21.7 C 0.60 23.9 C 0.36 19.6 B 0.49 21.5 C 0.47 21.2 C 0.59 23.7 CColumbus Avenue Northbound LT 0.26 8.6 A 0.26 8.6 A 0.37 9.5 A 0.38 9.6 A 0.71 14.7 B 0.73 15.2 B
Southbound TR 0.33 9.0 A 0.36 9.3 A 0.21 8.2 A 0.24 8.4 A 0.28 8.7 A 0.31 8.9 AIntersection 11.8 B 12.8 B 10.9 B 11.9 B 13.9 B 14.9 B
Columbus Avenue (Northbound) @ 42 Eastbound LT 0.54 18.6 B 0.54 18.6 B 0.26 14.5 B 0.26 14.5 B 0.34 15.4 B 0.34 15.4 BStevens Avenue Westbound T 0.40 16.4 B 0.40 16.4 B 0.30 15.0 B 0.30 15.0 B 0.59 19.5 B 0.59 19.5 B
R 0.08 13.0 B 0.08 13.0 B 0.07 12.8 B 0.07 12.8 B 0.13 13.4 B 0.13 13.4 BNorthbound LT 0.48 13.2 B 0.48 13.2 B 0.39 10.9 B 0.39 10.9 B 0.64 13.9 B 0.64 13.9 B
R 0.12 10.4 B 0.12 10.4 B 0.22 10.0 A 0.22 10.0 A 0.36 11.4 B 0.36 11.4 BIntersection 15.0 B 15.0 B 12.0 B 12.0 B 14.8 B 14.8 B
Columbus Avenue (Southbound) @ 43 Eastbound TR 0.79 26.3 C 0.79 26.3 C 0.35 14.8 B 0.35 14.8 B 0.45 16.1 B 0.45 16.1 BStevens Avenue Westbound LT 1.12 101.8 F 1.12 101.8 F 0.76 27.4 C 0.76 27.4 C 1.10 86.8 F 1.10 86.8 F
Southbound LTR 0.25 11.1 B 0.25 11.1 B 0.24 10.3 B 0.24 10.3 B 0.32 10.9 B 0.32 10.9 BIntersection 48.1 D 48.1 D 17.8 B 17.8 B 46.7 D 46.7 D
Stevens Avenue (E-W) @ 44A Eastbound LTR 0.52 20.1 C 0.52 20.1 C 0.20 15.3 B 0.20 15.3 B 0.34 16.5 B 0.34 16.5 BCommerce Street* Westbound LTR 0.25 17.4 B 0.25 17.4 B 0.47 17.5 B 0.47 17.5 B 0.93 40.2 D 0.93 40.2 D
Northbound LTR 0.40 23.5 C 0.40 23.5 C 0.28 26.4 C 0.28 26.4 C 0.48 28.1 C 0.48 28.1 CSouthbound LTR 0.30 22.6 C 0.30 22.6 C 0.48 28.2 C 0.48 28.2 C 0.68 34.7 C 0.68 34.7 C
Intersection 20.8 C 20.8 C 20.6 C 20.6 C 34.0 C 34.0 CElwood Avenue @ 44B Southbound LTR 0.56 33.5 C 0.56 33.5 C 0.47 26.5 C 0.47 26.5 C 0.64 30.2 C 0.64 30.2 CStevens Avenue/Commerce Street* Intersection 33.5 C 33.5 C 26.5 C 26.5 C 30.2 C 30.2 CTaconic State Parkway @ 45 Eastbound LTR 0.06 34.2 C 0.06 34.2 C 0.28 31.9 C 0.28 31.9 C 0.39 33.0 C 0.39 33.0 CStevens Avenue (E-W) Westbound LTR 0.95 87.2 F 0.95 87.2 F 0.96 76.5 E 0.96 76.5 E 1.08 99.5 F 1.08 99.5 F
Northbound L 0.03 3.1 A 0.03 3.1 A 0.00 4.4 A 0.00 4.4 A 0.01 4.4 A 0.01 4.4 ATR 0.15 3.3 A 0.15 3.3 A 0.60 7.9 A 0.60 7.9 A 1.00 32.4 C 1.00 32.4 C
Southbound L 0.44 4.8 A 0.44 4.8 A 0.33 6.7 A 0.33 6.7 A 0.93 87.6 F 0.93 87.6 FTR 0.52 5.0 A 0.52 5.0 A 0.24 5.3 A 0.24 5.3 A 0.34 5.8 A 0.34 5.8 A
Intersection 12.3 B 12.3 B 16.6 B 16.6 B 37.9 D 37.9 DNotes:L = Left Turn, T = Through, R = Right Turn, Def = Defacto Left Turn; LOS = Level of Service. "+" indicates Potential Adverse Impacts.* These two intersections form a 5-leg intersection at Stevens Avenue, Commerce Street, and Elwood Avenue.(1) 2006 Future Conditions without the Delaware Aerator Fill Operations(2) 2006 Future Conditions with the Delaware Aerator Fill Operations
FEIS KENRESWORKSITES 92

AM Peak Hour Midday Peak Hour PM Peak Hour2006 (1) 2006 Option A (2) 2006 (1) 2006 Option A (2) 2006 (1) 2006 Option A (2)
Lane v/c Delay v/c Delay v/c Delay v/c Delay v/c Delay v/c DelayIntersection No. Approach Group Ratio (sec) LOS Ratio (sec) LOS Ratio (sec) LOS Ratio (sec) LOS Ratio (sec) LOS Ratio (sec) LOS
Bradhurst Avenue (Rt. 100) @ 5 Southbound LT 0.04 8.6 A 0.04 8.7 A 0.01 7.7 A 0.01 7.8 A 0.01 8.0 A 0.01 8.1 ALakeview Avenue (E-W) Westbound LR 0.47 27.1 D 0.58 32.8 + D 0.17 11.9 B 0.21 12.5 B 0.40 17.0 C 0.46 18.7 CGrasslands Road (Rt. 100) (N-S) @ 32 Southbound LT 0.35 9.6 A 0.35 9.6 A 0.33 9.2 A 0.33 9.2 A 0.34 10.1 B 0.34 10.1 BVirginia Road Westbound LR 0.92 53.5 F 0.92 53.5 F 0.99 80.3 F 0.99 80.3 F 1.10 103.5 F 1.10 106.4 FGrasslands Road (Rt. 100) (E-W) @ 33 Eastbound LT 0.11 9.4 A 0.14 9.6 A 0.18 9.1 A 0.20 9.2 A 0.22 10.5 B 0.26 10.7 BLegion Drive Southbound L 0.79 71.3 F 0.88 95.1 + F 1.13 172.8 F 1.25 220.8 + F 1.08 138.1 F 1.20 183.6 + F
Southbound R 0.37 16.2 C 0.42 17.1 C 0.28 12.9 B 0.33 13.5 B 0.44 18.4 C 0.50 20.1 CGrasslands Road (Rt. 100) (E-W) @ 34 Westbound LT 0.01 10.4 B 0.01 10.5 B 0.06 8.5 A 0.06 8.6 A 0.11 9.0 A 0.12 9.2 AWCC West Gate Driveway Northbound L 0.80 72.9 F 0.86 88.9 + F 0.08 20.5 C 0.09 22.0 C 0.24 45.2 E 0.27 51.3 + F
Northbound R 0.06 14.5 B 0.06 14.9 B 0.43 15.3 C 0.45 16.0 C 0.46 17.3 C 0.49 18.6 CCommerce Street @ 36 Eastbound LTR 0.01 7.8 A 0.04 7.9 A 0.03 8.0 A 0.05 8.1 A 0.05 8.4 A 0.08 8.5 ALegion Drive (E-W) Westbound LTR 0.01 7.9 A 0.01 7.9 A 0.03 8.0 A 0.03 8.0 A 0.06 8.5 A 0.06 8.5 A
Northbound LTR 0.16 11.7 B 0.17 12.3 B 0.16 14.0 B 0.18 15.1 C 0.43 26.4 D 0.49 31.2 DSouthbound LTR 0.16 12.3 B 0.21 12.7 B 0.22 19.7 C 0.28 19.4 C 0.63 65.5 F 0.76 78.3 + F
Lakeview Avenue (E-W) @ 37 Eastbound LTR 0.02 7.6 A 0.02 7.7 A 0.00 7.5 A 0.00 7.5 A 0.00 7.7 A 0.00 7.7 ACommerce Street Westbound LTR 0.04 8.1 A 0.06 8.3 A 0.01 7.5 A 0.03 7.7 A 0.01 7.6 A 0.03 7.8 A
Northbound LTR 0.06 13.9 B 0.11 13.2 B 0.12 10.3 B 0.17 10.8 B 0.22 11.7 B 0.29 12.9 BSouthbound LTR 0.09 15.6 C 0.11 18.2 C 0.10 11.3 B 0.12 12.9 B 0.17 13.8 B 0.21 16.6 C
Columbus Avenue (N-S) @ 41 Southbound LT 0.14 9.4 A 0.15 9.7 A 0.07 9.1 A 0.07 9.3 A 0.12 10.9 B 0.13 11.2 BWest Lake Drive Westbound L 0.04 26.8 D 0.43 43.2 + E 0.02 20.3 C 0.28 26.4 D 0.09 38.9 E 0.63 81.3 + F
Westbound R 0.28 12.1 B 0.29 12.6 B 0.18 11.4 B 0.18 11.8 B 0.41 16.6 C 0.43 17.4 CNotes:L = Left Turn, T = Through, R = Right Turn, Def = Defacto Left Turn; LOS = Level of Service. "+" indicates Potential Adverse Impacts.(1) 2006 Future Conditions without the Delaware Aerator Fill Operations(2) 2006 Future Conditions with the Delaware Aerator Fill Operations
TABLE 5.1-G. SPLIT LAKEVIEW/COMMERCE TRUCK ROUTE (OPTION C) LEVEL-OF-SERVICE ANALYSIS RESULTS FOR UNSIGNALIZED INTERSECTIONS: 2006 FUTURE CONDITIONS WITHOUT THE PROJECT VERSUS FUTURE CONDITIONS WITH THE PROJECT (WITH THE
CROTON PROJECT)
FEIS KENRESWORKSITES 93

FEIS KENRESWORKSITES 94
There would be the following potential adverse impacts associated with truck route Option C (an even 50/50 percent split between Lakeview Avenue and Grasslands Road/Commerce Street) for 2006 for the Aerator fill operations. Each of the identified impacts would occur in both future scenarios (Future With the Project, both With and Without the Croton Project), but With the Croton project, the delays would be the same or slightly higher.
Signalized Intersections:
• The eastbound left-turn movement at the intersection of Grasslands Road (Route 100C) and Bradhurst Avenue (Route 100) would experience a potential adverse impact. The delay would increase from 128.8 seconds (LOS F) to 215.7 seconds (LOS F) and 208.6 seconds (LOS F) to greater than 240.0 seconds (LOS F) during the AM and PM peak hours, respectively.
• The eastbound through movement at the intersection of Grasslands Road (Route 100C) and Bradhurst Avenue (Route 100) would experience a potential adverse impact. The delay would increase from 68.8 seconds (LOS E) to 78.5 seconds (LOS E) during the AM peak hour.
• The westbound through/right movement at the intersection of Grasslands Road (Route 100C) and Bradhurst Avenue (Route 100) would experience a potential adverse impact. The delay would increase from 42.5 seconds (LOS D) to 49.3 seconds (LOS D) during the PM peak hour.
• The southbound through/right movement at the intersection of Grasslands Road (Route 100C) and Bradhurst Avenue (Route 100) would experience a potential adverse impact. The delay would increase from 70.8 seconds (LOS E) to 91.2 seconds (LOS F), 77.8 seconds (LOS E) to 96.5 seconds (LOS F) and 85.7 seconds (LOS F) to 104.3 seconds (LOS F) during the AM, midday, and PM peak hours, respectively.
• The westbound through/right movement at the intersection of Grasslands Road (Route 100C) and Clearbrook Road/Walker Road would experience a potential adverse impact. The delay would increase from 45.2 seconds (LOS D) to 61.7 seconds (LOS E) during the AM peak hour.
• The westbound approach at the intersection of Grasslands Road (Route 100C) and the Sprain Brook Northbound Ramp would experience a potential adverse impact. The delay would increase from 47.5 seconds (LOS D) to 58.9 seconds (LOS E) during the PM peak hour.
• The eastbound approach at the intersection of the Taconic State Parkway and Lakeview Avenue would experience a potential adverse impact. The delay would increase from 114.3 seconds (LOS F) to 196.8 seconds (LOS F), 43.9 seconds (LOS D) to 81.3 seconds (LOS F), and 121.4 seconds (LOS F) to 231.3 seconds (LOS F) during the AM, midday, and PM peak hours, respectively.

FEIS KENRESWORKSITES 95
• The westbound approach at the intersection of the Taconic State Parkway and Lakeview Avenue would experience a potential adverse impact. The delay would increase from 101.5 seconds (LOS F) to 178.5 seconds (LOS F) and 106.1 seconds (LOS F) and 174.7 seconds (LOS F) during the AM and PM peak hours, respectively.
Unsignalized Intersections:
• The westbound approach at the intersection of Bradhurst Avenue (Route 100) and
Lakeview Avenue would experience a potential adverse impact. The delay would increase from 27.1 seconds (LOS D) to 32.8 seconds (LOS D) during the AM peak hour.
• The southbound left-turn movement at the intersection of Grasslands Road (Route 100) and Legion Drive would experience a potential adverse impact. The delay would increase from 71.3 seconds (LOS F) to 96.7 seconds (LOS F), 172.8 seconds (LOS F) to 220.8 seconds (LOS F) and 138.1 seconds (LOS F) to 180.8 seconds (LOS F) during the AM, midday, and PM peak hours, respectively.
• The northbound left-turn movement at the intersection of Grasslands Road (Route 100) and the Westchester West Gate Driveway would experience a potential adverse impact. The delay would increase from 72.9 seconds (LOS F) to 88.9 seconds (LOS F) and 45.2 seconds (LOS E) to 50.2 seconds (LOS F) during the AM and PM peak hours, respectively.
• The southbound approach at the intersection of Commerce Street and Legion Drive would experience a potential adverse impact. The delay would increase from 65.5 seconds (LOS F) to 78.3 seconds (LOS F) during the PM peak hour.
• The westbound left-turn movement at the intersection of Columbus Avenue and West Lake Drive would experience a potential adverse impact. The delay would increase from 26.8 seconds (LOS D) to 43.2 seconds (LOS E) and 38.9 seconds (LOS E) to 81.3 seconds (LOS F) during the AM and PM peak hours, respectively.
In the Future With the Project, With the Croton Project, there would be the following additional potential adverse impacts at signalized intersections. (There would be no additional impacts on unsignalized intersections.)
• The northbound left-turn movement at the intersection of Grasslands Road (Route 100C) and Bradhurst Avenue (Route 100) would experience a potential adverse impact. The delay would increase from 46.7 seconds (LOS D) to 52.6 seconds (LOS D) during the PM peak hour.
• The southbound left/through movement at the intersection of Grasslands Road (Route 100C) and Clearbrook Road/Walker Road would experience a potential adverse impact. The delay would increase from 20.2 seconds (LOS C) to 89.6 seconds (LOS F) during the PM peak hour.

FEIS KENRESWORKSITES 96
• The eastbound approach at the intersection of the Taconic State Parkway and
Lakeview Avenue would experience a potential adverse impact. The delay would increase from 43.9 seconds (LOS D) to 81.3 seconds (LOS D) during the midday peak hour.
Under truck route Option C, there would be 23 potential temporary adverse impacted lane groups/approaches in the Future With the Project, Without the Croton Project. With the Croton project, there would be 26 potential adverse impacted lane groups/approaches. Mitigation measures for the intersections that would experience potential adverse impacts are discussed in Section 6, Mitigation of Potential Significant or Temporary Adverse Impacts.
Option D – 100 Percent Lakeview Avenue from the Eastview Site to the Kensico Reservoir, 100 percent Commerce Street from the Kensico Reservoir to the Eastview Site. Figures 5.1-KK and 5.1-LL show the truck and employee automobile assignments for truck route Option D (100 percent of the truck traffic traveling on Lakeview Avenue from the Eastview Site to the Kensico Reservoir and 100 percent of the truck traffic traveling on Commerce Avenue from the Kensico Reservoir to the Eastview Site) for the AM and midday, and PM peak hours, respectively, for the Future With the Proposed Project, Without the Croton project (“Cat/Del Alone,” as depicted on the figures). Figures 5.1-MM, 5.1-NN, and 5.1-OO show the projected traffic volumes for the Future With the Proposed Project, Without the Croton project. Option D is the preferred alternative. Option D reflects a reasonable direct route that minimizes left turns for trucks crossing at unsignalized intersections. Option E reflects a route that is on State and County roadways, but would require a much longer travel time per trip (when compared to Option D, about 30 minutes longer per truck trip back and forth from the Eastview to the Kensico sites). While the total amount of excavated material transferred to the Kensico site would remain the same among the five options, Option E would likely require the contractor to employ additional trucks due to the longer trip distances and travel times in comparison to routes for Options A through D. Option E would also likely result in a longer time period for transporting excavated material from the Eastview site to the Kensico site, and thus, elongate the time period that the community is subjected to the trucking activities from this component of construction. In consideration of a) on-street safety, b) minimizing the duration of impacts on the the local community that are related to the trucking of excavated material to the Kensico site, and c) Filtration Avoidance Determination (FAD) time restraints for completing construction of the project, NYCDEP has specified a preferred route (Option D), and will direct the contractor to utilize this route, unless circumstances require a temporary alternate route. Table 5.1-H presents a comparison of 2006 Future Without the Project conditions to 2006 Future With the Project conditions (without the Croton project).

AM Peak Hour Midday Peak Hour PM Peak Hour2006 (1) 2006 Option D (2) 2006 (1) 2006 Option D (2) 2006 (1) 2006 Option D (2)
Lane v/c Delay v/c Delay v/c Delay v/c Delay v/c Delay v/c DelayIntersection No. Approach Group Ratio (sec) LOS Ratio (sec) LOS Ratio (sec) LOS Ratio (sec) LOS Ratio (sec) LOS Ratio (sec) LOS
Grasslands Road (E-W) @ 6 Eastbound L 1.14 128.8 F * ** + F 0.20 14.8 B 0.35 16.6 B 1.27 208.6 F * ** + FBradhurst Avenue T 1.00 68.8 E 1.00 68.8 E 0.33 16.1 B 0.33 16.1 B 0.54 21.5 C 0.55 21.5 C
R 0.36 16.4 B 0.36 16.4 B 0.16 9.5 A 0.16 9.5 A 0.25 11.9 B 0.25 11.9 BWestbound L 1.03 161.3 F 1.03 161.3 F 0.06 13.6 B 0.06 13.6 B 0.19 17.6 B 0.19 17.6 B
TR 0.66 31.0 C 0.73 33.6 C 0.39 16.7 B 0.44 17.4 B 0.92 42.5 D 0.99 58.0 + ENorthbound L 0.34 28.0 C 0.34 28.0 C 0.52 45.8 D 0.52 45.8 D 0.77 46.7 D 0.77 46.7 D
TR 0.29 25.3 C 0.29 25.3 C 0.13 26.0 C 0.13 26.0 C 0.18 16.2 B 0.18 16.2 BSouthbound L 0.55 40.5 D 0.55 40.5 D 0.25 35.7 D 0.25 35.7 D 0.28 24.8 C 0.28 24.8 C
TR 0.89 70.8 E 0.89 70.8 E 0.96 77.8 E 0.96 77.8 E 1.05 85.7 F 1.05 85.7 FIntersection 58.6 E 87.6 F 33.9 C 33.9 C 51.3 D 88.0 F
Grasslands Road (Rt.100C) @ 24 Eastbound L 0.04 17.8 B 0.04 17.8 B 0.02 6.5 A 0.02 6.5 A 0.05 9.3 A 0.06 9.4 AClearbrook Road/Walker Road TR 0.90 34.5 C 0.90 34.5 C 0.50 9.4 A 0.50 9.4 A 0.69 16.1 B 0.69 16.1 B
Westbound L 0.88 48.3 D 0.88 48.3 D 0.31 8.3 A 0.31 8.3 A 1.13 122.0 F 1.13 122.0 FTR 0.98 45.2 D 1.04 61.7 + E 0.35 8.2 A 0.41 8.7 A 0.68 16.1 B 0.75 18.4 B
Northbound LT 0.22 28.9 C 0.22 29.0 C 0.15 18.8 B 0.15 18.8 B 0.22 20.2 C 0.28 20.8 CSouthbound LT 0.03 27.4 C 0.20 28.8 C 0.19 19.1 B 0.36 20.5 C 0.22 20.2 C 0.49 23.0 C
R 0.01 27.3 C 0.01 27.3 C 0.01 17.9 B 0.01 17.9 B 0.01 18.5 B 0.05 18.8 BIntersection 41.2 D 47.9 D 10.0 A 10.6 B 28.8 C 29.0 C
Grasslands Road (Rt.100C) @ 25 Eastbound L 0.39 13.5 B 0.41 15.0 B 0.11 5.9 A 0.12 6.1 A 0.30 13.0 B 0.32 13.8 BWoods Drive/Taylor Road TR 0.29 4.7 A 0.30 4.8 A 0.36 6.9 A 0.38 7.0 A 0.53 11.9 B 0.58 12.6 B
Westbound L 0.02 8.9 A 0.02 8.9 A 0.00 10.6 B 0.00 10.6 B 0.00 12.5 B 0.01 12.6 BTR 0.75 17.3 B 0.78 18.0 B 0.34 13.1 B 0.37 13.4 B 0.69 20.4 C 0.73 21.2 C
Northbound LTR 0.03 34.6 C 0.03 34.6 C 0.01 31.3 C 0.01 31.3 C 0.01 24.6 C 0.01 24.6 CSouthbound LT 0.46 38.9 D 0.46 38.9 D 0.79 51.2 D 0.79 51.2 D 0.74 38.4 D 0.74 38.4 D
R 0.08 21.8 C 0.08 21.8 C 0.10 21.9 C 0.10 21.9 C 0.11 17.1 B 0.11 17.1 BIntersection 14.4 B 14.8 B 15.1 B 15.0 B 18.7 B 19.1 B
Grasslands Road (Rt.100C) @ 26 Eastbound TR 0.34 4.3 A 0.36 4.3 A 0.38 3.0 A 0.40 3.1 A 0.62 10.8 B 0.67 11.7 BSprain Brook Pkwy SB Ramp Westbound T 0.53 5.4 A 0.55 5.5 A 0.22 2.5 A 0.24 2.5 A 0.49 9.2 A 0.52 9.5 A
Southbound L 0.47 40.1 D 0.47 40.1 D 0.44 47.1 D 0.44 47.1 D 0.17 29.5 C 0.17 29.5 CR 1.15 138.8 F 1.15 138.8 F 0.31 45.8 D 0.31 45.8 D 0.16 29.4 C 0.16 29.4 C
Intersection 24.0 C 23.5 C 5.0 A 4.9 A 11.1 B 11.6 BGrasslands Road (Rt.100C) @ 27 Eastbound L 0.13 13.0 B 0.14 13.2 B 0.32 10.6 B 0.34 10.9 B 0.46 15.1 B 0.52 15.8 BSprain Brook Pkwy NB Ramp 30 T 0.41 14.8 B 0.44 15.1 B 0.23 9.8 A 0.25 9.9 A 0.30 8.8 A 0.33 9.0 A
Westbound TR 0.45 20.2 C 0.48 20.6 C 0.41 17.0 B 0.44 17.4 B 0.99 47.5 D 1.03 58.9 + ENorthbound LT 1.10 94.0 F 1.10 94.0 F 0.41 29.1 C 0.41 29.1 C 0.68 28.8 C 0.68 28.8 C
R 0.96 62.2 E 0.96 62.2 E 0.17 26.7 C 0.17 26.7 C 0.33 22.9 C 0.33 22.9 CIntersection 51.3 D 50.4 D 16.4 B 16.5 B 32.2 C 37.7 D
Notes:L = Left Turn, T = Through, R = Right Turn, Def = Defacto Left Turn; LOS = Level of Service. "+" indicates Potential Adverse Impacts." * " indicates a v/c ratio greater than 1.50; " ** " indicates a calculated delay greater than 240 seconds.(1) 2006 Future Conditions without the Delaware Aerator Fill Operations(2) 2006 Future Conditions with the Delaware Aerator Fill Operations
TABLE 5.1-H. CIRCULAR LAKEVIEW/COMMERCE TRUCK ROUTE (OPTION D) LEVEL-OF-SERVICE ANALYSIS RESULTS FOR SIGNALIZED INTERSECTIONS: 2006 FUTURE CONDITIONS WITHOUT THE PROJECT VERSUS FUTURE CONDITIONS WITH THE PROJECT (WITHOUT THE CROTON
PROJECT)
FEIS KENRESWORKSITES 97

AM Peak Hour Midday Peak Hour PM Peak Hour2006 (1) 2006 Option D (2) 2006 (1) 2006 Option D (2) 2006 (1) 2006 Option D (2)
Lane v/c Delay v/c Delay v/c Delay v/c Delay v/c Delay v/c DelayIntersection No. Approach Group Ratio (sec) LOS Ratio (sec) LOS Ratio (sec) LOS Ratio (sec) LOS Ratio (sec) LOS Ratio (sec) LOS
Virginia Road (E-W) @ 31 Eastbound LT 1.09 111.3 F 1.09 111.3 F 1.11 123.7 F 1.11 123.7 F 1.10 120.7 F 1.10 120.7 FBronx River Parkway R 0.33 21.0 C 0.33 21.0 C 0.33 33.8 C 0.33 33.8 C 0.37 34.3 C 0.37 34.3 C
Westbound LTR 0.57 38.4 D 0.57 38.4 D 0.65 42.4 D 0.65 42.4 D 1.17 148.0 F 1.17 148.0 FNorthbound L 0.08 46.6 D 0.08 46.6 D 0.02 9.5 A 0.02 9.5 A 0.05 10.7 B 0.05 10.7 B
TR 0.59 24.7 C 0.59 24.7 C 0.36 21.2 C 0.36 21.2 C 0.60 25.0 C 0.60 25.0 CSouthbound L 1.08 121.4 F 1.08 121.4 F 0.07 9.4 A 0.07 9.4 A 0.12 11.5 B 0.12 11.5 B
T 1.08 79.2 E 1.08 79.2 E 0.43 22.1 C 0.43 22.1 C 0.57 24.4 C 0.57 24.4 CIntersection 70.2 E 70.2 E 44.0 D 44.0 D 54.1 D 54.1 D
Grasslands Road (Rt 100) @ 34 Eastbound T 0.34 5.1 A 0.34 5.1 A 0.58 11.4 B 0.58 11.4 B 0.68 15.6 B 0.69 15.6 BWCC East Gate Westbound L 0.34 3.1 A 0.34 3.1 A 0.14 7.1 A 0.14 7.1 A 0.20 10.6 B 0.20 10.6 B
T 0.32 2.1 A 0.36 2.2 A 0.29 4.3 A 0.34 4.6 A 0.55 7.6 A 0.60 8.3 ANorthbound L 0.26 51.9 D 0.26 51.9 D 0.43 27.9 C 0.43 27.9 C 0.61 30.4 C 0.61 30.4 C
Intersection 4.7 A 4.6 A 10.6 B 10.6 B 14.0 B 14.1 BTaconic State Parkway @ 38 Eastbound LTR 1.08 114.3 F 1.30 196.8 + F 0.71 43.9 D 0.96 81.3 + F 1.09 121.4 F 1.38 231.3 + FLakeview Avenue (E-W) Westbound LTR 0.97 101.5 F 1.22 178.5 + F 0.45 35.1 D 0.67 42.1 D 1.02 106.1 F 1.23 174.7 + F
Northbound L 0.21 5.0 A 0.21 5.0 A 0.06 4.0 A 0.06 4.0 A 0.15 4.4 A 0.15 4.4 ATR 0.21 4.4 A 0.21 4.4 A 0.63 7.4 A 0.63 7.4 A 1.05 46.8 D 1.05 46.8 D
Southbound L 0.04 3.9 A 0.04 3.9 A 0.12 4.4 A 0.12 4.4 A 0.34 7.4 A 0.34 7.4 ATR 0.57 6.6 A 0.57 6.6 A 0.27 4.7 A 0.27 4.7 A 0.41 5.4 A 0.41 5.4 A
Intersection 26.4 C 48.7 D 10.8 B 16.4 B 44.3 D 59.9 ETaconic State Parkway @ 39 Eastbound LTR 0.49 39.8 D 0.49 39.8 D 0.17 27.7 C 0.17 27.7 C 0.26 28.5 C 0.26 28.5 CCommerce St. (E-W) Westbound LTR 0.71 50.8 D 0.71 50.8 D 0.35 29.4 C 0.35 29.4 C 0.69 37.4 D 0.69 37.4 D
Northbound LTR 0.27 2.9 A 0.27 2.9 A 0.68 11.1 B 0.68 11.1 B 1.09 63.3 E 1.09 63.3 ESouthbound LTR 0.60 4.6 A 0.60 4.6 A 0.36 7.6 A 0.36 7.6 A 0.73 12.9 B 0.73 12.9 B
Intersection 8.1 A 8.1 A 11.6 B 11.6 B 47.3 D 47.3 DLakeview Avenue (E-W) @ 40 Eastbound LR 0.50 21.7 C 0.60 23.9 C 0.36 19.6 B 0.49 21.5 C 0.47 21.2 C 0.59 23.7 CColumbus Avenue Northbound LT 0.26 8.6 A 0.26 8.6 A 0.37 9.5 A 0.38 9.6 A 0.71 14.7 B 0.73 15.2 B
Southbound TR 0.33 9.0 A 0.36 9.3 A 0.21 8.2 A 0.24 8.4 A 0.28 8.7 A 0.31 8.9 AIntersection 11.8 B 12.8 B 10.9 B 11.9 B 13.9 B 14.9 B
Columbus Avenue (Northbound) @ 42 Eastbound LT 0.54 18.6 B 0.54 18.6 B 0.26 14.5 B 0.26 14.5 B 0.34 15.4 B 0.34 15.4 BStevens Avenue Westbound T 0.40 16.4 B 0.40 16.4 B 0.30 15.0 B 0.30 15.0 B 0.59 19.5 B 0.59 19.5 B
R 0.08 13.0 B 0.08 13.0 B 0.07 12.8 B 0.07 12.8 B 0.13 13.4 B 0.13 13.4 BNorthbound LT 0.48 13.2 B 0.48 13.2 B 0.39 10.9 B 0.39 10.9 B 0.64 13.9 B 0.64 13.9 B
R 0.12 10.4 B 0.12 10.4 B 0.22 10.0 A 0.22 10.0 A 0.36 11.4 B 0.36 11.4 BIntersection 15.0 B 15.0 B 12.0 B 12.0 B 14.8 B 14.8 B
Notes:L = Left Turn, T = Through, R = Right Turn, Def = Defacto Left Turn; LOS = Level of Service. "+" indicates Potential Adverse Impacts.(1) 2006 Future Conditions without the Delaware Aerator Fill Operations(2) 2006 Future Conditions with the Delaware Aerator Fill Operations
TABLE 5.1-H. CIRCULAR LAKEVIEW/COMMERCE TRUCK ROUTE (OPTION D) LEVEL-OF-SERVICE ANALYSIS RESULTS FOR SIGNALIZED INTERSECTIONS: 2006 FUTURE CONDITIONS WITHOUT THE PROJECT VERSUS FUTURE CONDITIONS WITH THE PROJECT (WITHOUT THE CROTON
PROJECT)
FEIS KENRESWORKSITES 98

AM Peak Hour Midday Peak Hour PM Peak Hour2006 (1) 2006 Option D (2) 2006 (1) 2006 Option D (2) 2006 (1) 2006 Option D (2)
Lane v/c Delay v/c Delay v/c Delay v/c Delay v/c Delay v/c DelayIntersection No. Approach Group Ratio (sec) LOS Ratio (sec) LOS Ratio (sec) LOS Ratio (sec) LOS Ratio (sec) LOS Ratio (sec) LOS
Columbus Avenue (Southbound) @ 43 Eastbound TR 0.79 26.3 C 0.79 26.3 C 0.35 14.8 B 0.35 14.8 B 0.45 16.1 B 0.45 16.1 BStevens Avenue Westbound LT 1.12 101.8 F 1.12 101.8 F 0.76 27.4 C 0.76 27.4 C 1.10 86.8 F 1.10 86.8 F
Southbound LTR 0.25 11.1 B 0.25 11.1 B 0.24 10.3 B 0.24 10.3 B 0.32 10.9 B 0.32 10.9 BIntersection 48.1 D 48.1 D 17.8 B 17.8 B 46.7 D 46.7 D
Stevens Avenue (E-W) @ 44A Eastbound LTR 0.52 20.1 C 0.52 20.1 C 0.20 15.3 B 0.20 15.3 B 0.34 16.5 B 0.34 16.5 BCommerce Street* Westbound LTR 0.25 17.4 B 0.25 17.4 B 0.47 17.5 B 0.47 17.5 B 0.93 40.2 D 0.93 40.2 D
Northbound LTR 0.40 23.5 C 0.40 23.5 C 0.28 26.4 C 0.28 26.4 C 0.48 28.1 C 0.48 28.1 CSouthbound LTR 0.30 22.6 C 0.30 22.6 C 0.48 28.2 C 0.48 28.2 C 0.68 34.7 C 0.68 34.7 C
Intersection 20.8 C 20.8 C 20.6 C 20.6 C 34.0 C 34.0 CElwood Avenue @ 44B Southbound LTR 0.56 33.5 C 0.56 33.5 C 0.47 26.5 C 0.47 26.5 C 0.64 30.2 C 0.64 30.2 CStevens Avenue/Commerce Street* Intersection 33.5 C 33.5 C 26.5 C 26.5 C 30.2 C 30.2 CTaconic State Parkway @ 45 Eastbound LTR 0.06 34.2 C 0.06 34.2 C 0.28 31.9 C 0.28 31.9 C 0.39 33.0 C 0.39 33.0 CStevens Avenue (E-W) Westbound LTR 0.95 87.2 F 0.95 87.2 F 0.96 76.5 E 0.96 76.5 E 1.08 99.5 F 1.08 99.5 F
Northbound L 0.03 3.1 A 0.03 3.1 A 0.00 4.4 A 0.00 4.4 A 0.01 4.4 A 0.01 4.4 ATR 0.15 3.3 A 0.15 3.3 A 0.60 7.9 A 0.60 7.9 A 1.00 32.4 C 1.00 32.4 C
Southbound L 0.44 4.8 A 0.44 4.8 A 0.33 6.7 A 0.33 6.7 A 0.93 87.6 F 0.93 87.6 FTR 0.52 5.0 A 0.52 5.0 A 0.24 5.3 A 0.24 5.3 A 0.34 5.8 A 0.34 5.8 A
Intersection 12.3 B 12.3 B 16.6 B 16.6 B 37.9 D 37.9 DNotes:L = Left Turn, T = Through, R = Right Turn, Def = Defacto Left Turn; LOS = Level of Service. "+" indicates Potential Adverse Impacts.* These two intersections form a 5-leg intersection at Stevens Avenue, Commerce Street, and Elwood Avenue.(1) 2006 Future Conditions without the Delaware Aerator Fill Operations(2) 2006 Future Conditions with the Delaware Aerator Fill Operations
TABLE 5.1-H. CIRCULAR LAKEVIEW/COMMERCE TRUCK ROUTE (OPTION D) LEVEL-OF-SERVICE ANALYSIS RESULTS FOR SIGNALIZED INTERSECTIONS: 2006 FUTURE CONDITIONS WITHOUT THE PROJECT VERSUS FUTURE CONDITIONS WITH THE PROJECT (WITHOUT THE CROTON
PROJECT)
FEIS KENRESWORKSITES 99

AM Peak Hour Midday Peak Hour PM Peak Hour2006 (1) 2006 Option D (2) 2006 (1) 2006 Option D (2) 2006 (1) 2006 Option D (2)
Lane v/c Delay v/c Delay v/c Delay v/c Delay v/c Delay v/c DelayIntersection No. Approach Group Ratio (sec) LOS Ratio (sec) LOS Ratio (sec) LOS Ratio (sec) LOS Ratio (sec) LOS Ratio (sec) LOS
Bradhurst Avenue @ 5 Southbound LT 0.04 8.6 A 0.04 8.8 A 0.01 7.7 A 0.01 7.8 A 0.01 8.0 A 0.01 8.1 ALakeview Avenue (E-W) Westbound LR 0.47 27.1 D 0.49 28.8 D 0.17 11.9 B 0.17 12.2 B 0.40 17.0 C 0.41 17.8 CGrasslands Road (N-S) @ 32 Southbound LT 0.35 9.6 A 0.35 9.6 A 0.33 9.2 A 0.33 9.2 A 0.34 10.1 B 0.34 10.1 BVirginia Road Westbound LR 0.92 53.5 F 0.92 53.5 F 0.99 80.3 F 0.99 80.3 F 1.10 103.5 F 1.10 105.4 FGrasslands Road (E-W) @ 33 Eastbound LT 0.11 9.4 A 0.11 9.4 A 0.18 9.1 A 0.18 9.1 A 0.22 10.5 B 0.22 10.5 BLegion Drive Southbound L 0.79 71.3 F 0.79 71.3 F 1.13 172.8 F 1.13 172.8 F 1.08 138.1 F 1.09 140.1 + F
Southbound R 0.37 16.2 C 0.47 18.1 C 0.28 12.9 B 0.38 14.2 B 0.44 18.4 C 0.56 22.1 CGrasslands Road (E-W) @ 34 Westbound LT 0.01 10.4 B 0.01 10.4 B 0.06 8.5 A 0.06 8.5 A 0.11 9.0 A 0.11 9.0 AWCC West Gate Driveway Northbound L 0.80 72.9 F 0.86 88.9 + F 0.08 20.5 C 0.09 21.9 C 0.24 45.2 E 0.26 50.2 + F
Northbound R 0.06 14.5 B 0.06 14.5 B 0.43 15.3 C 0.43 15.3 C 0.46 17.3 C 0.46 17.3 CCommerce Street @ 36 Eastbound LTR 0.01 7.8 A 0.01 7.8 A 0.03 8.0 A 0.03 8.0 A 0.05 8.4 A 0.05 8.4 ALegion Drive (E-W) Westbound LTR 0.01 7.9 A 0.01 7.9 A 0.03 8.0 A 0.03 8.0 A 0.06 8.5 A 0.06 8.5 A
Northbound LTR 0.16 11.7 B 0.16 12.1 B 0.16 14.0 B 0.17 14.6 B 0.43 26.4 D 0.46 28.7 DSouthbound LTR 0.16 12.3 B 0.23 12.3 B 0.22 19.7 C 0.30 19.7 C 0.63 65.5 F 0.73 65.5 F
Lakeview Avenue (E-W) @ 37 Eastbound LTR 0.02 7.6 A 0.02 7.6 A 0.00 7.5 A 0.00 7.5 A 0.00 7.7 A 0.00 7.7 ACommerce Street Westbound LTR 0.04 8.1 A 0.09 8.5 A 0.01 7.5 A 0.05 7.8 A 0.01 7.6 A 0.06 7.9 A
Northbound LTR 0.06 13.9 B 0.07 16.7 C 0.12 10.3 B 0.14 11.5 B 0.22 11.7 B 0.27 13.9 BSouthbound LTR 0.09 15.6 C 0.11 19.6 C 0.10 11.3 B 0.13 13.7 B 0.17 13.8 B 0.23 18.0 C
Columbus Avenue (N-S) @ 41 Southbound LT 0.14 9.4 A 0.15 9.7 A 0.07 9.1 A 0.07 9.3 A 0.12 10.9 B 0.13 11.2 BWest Lake Drive Westbound L 0.04 26.8 D 0.43 43.2 + E 0.02 20.3 C 0.28 26.4 D 0.09 38.9 E 0.63 81.3 + F
Westbound R 0.28 12.1 B 0.29 12.6 B 0.18 11.4 B 0.18 11.8 B 0.41 16.6 C 0.43 17.4 CNotes:L = Left Turn, T = Through, R = Right Turn, Def = Defacto Left Turn; LOS = Level of Service. "+" indicates Potential Adverse Impacts.(1) 2006 Future Conditions without the Delaware Aerator Fill Operations(2) 2006 Future Conditions with the Delaware Aerator Fill Operations
TABLE 5.1-H. CIRCULAR LAKEVIEW/COMMERCE TRUCK ROUTE (OPTION D) LEVEL-OF-SERVICE ANALYSIS RESULTS FOR UNSIGNALIZED INTERSECTIONS: 2006 FUTURE CONDITIONS WITHOUT THE PROJECT VERSUS FUTURE CONDITIONS WITH THE PROJECT (WITHOUT THE CROTON
PROJECT)
FEIS KENRESWORKSITES 100

FEIS KENRESWORKSITES 101
There would be the following potential adverse impacts associated with truck route Option D (100 percent of the truck traffic traveling on Lakeview Avenue from the Eastview Site to the Kensico Reservoir and 100 percent of the truck traffic traveling on Commerce Avenue from the Kensico Reservoir to the Eastview Site) during the filling of the Delaware Aerator in 2006. Each of the identified impacts would occur in the Future Condition With the Project, (without the Croton Project).
Signalized Intersections:
• The eastbound left-turn movement at the intersection of Grasslands Road (Route 100C) and Bradhurst Avenue (Route 100) would experience a potential adverse impact. The delay would increase from 128.8 seconds (LOS F) to greater than 240.0 seconds (LOS F) and 208.6 seconds (LOS F) to greater than 240.0 seconds (LOS F) during the AM and PM peak hours, respectively.
• The westbound through/right-turn movement at the intersection of Grasslands Road (Route 100C) and Bradhurst Avenue (Route 100) would experience a potential adverse impact. The delay would increase from 42.5 seconds (LOS D) to 58.0 seconds (LOS E) during the PM peak hour.
• The westbound through/right movement at the intersection of Grasslands Road
(Route 100C) and Clearbrook Road/Walker Road would experience a potential adverse impact. The delay would increase from 45.2 seconds (LOS D) to 61.7 seconds (LOS E) during the AM peak hour.
• The westbound approach at the intersection of Grasslands Road (Route 100C) and the Sprain Brook Parkway Northbound Ramp would experience a potential adverse impact. The delay would increase from 47.5 seconds (LOS D) to 58.9 seconds (LOS E) during the PM peak hour.
• The eastbound approach at the intersection of the Taconic State Parkway and Lakeview Avenue would experience a potential adverse impact. The delay would increase from 114.3 seconds (LOS F) to 196.8 seconds (LOS F), 43.9 seconds (LOS D) to 81.3 seconds (LOS F), and 121.4 seconds (LOS F) to 231.3 seconds (LOS F) during the AM, midday, and PM peak hours, respectively.
• The westbound approach at the intersection of the Taconic State Parkway and Lakeview Avenue would experience a potential adverse impact. The delay would increase from 101.5 seconds (LOS F) to 178.5 seconds (LOS F) and 106.1 seconds (LOS F) to 174.7 seconds (LOS F) during the AM and PM peak hours, respectively.
Unsignalized Intersections:
• The southbound left-turn movement at the intersection of Grasslands Road (Route
100) and Legion Drive would experience a potential adverse impact. The delay would

FEIS KENRESWORKSITES 102
increase from 138.1 seconds (LOS F) to 140.1 seconds (LOS F) during the PM peak hour.
• The northbound left-turn movement at the intersection of Grasslands Road (Route
100) and the Westchester Community College West Gate Driveway would experience a potential adverse impact. The delay would increase from 72.9 seconds (LOS F) to 88.9 seconds (LOS F) and 45.2 seconds (LOS E) to 50.2 seconds (LOS F) during the AM and PM peak hours, respectively.
• The westbound left-turn movement at the intersection of Columbus Avenue and West Lake Drive would experience a potential adverse impact. The delay would increase from 26.8 seconds (LOS D) to 43.2 seconds (LOS E) and 38.9 seconds (LOS E) to 81.3 seconds (LOS F) during the AM and PM peak hours, respectively.
Under truck route Option D, there would be 15 potential temporary adverse impacted lane groups/approaches in the Future With the Project, Without the Croton Project. Mitigation measures for the intersections that would experience potential adverse impacts are discussed in Section 6.2, Mitigation of Potential Significant or Temporary Adverse Impacts, Off-Site Facilities.
Option E – 100 Percent Route 9A/Route 141/Kensico Road/Columbus Avenue. Figures 5.1-PP and 5.1-QQ show the truck assignments for truck route Option E (100 percent of the truck traffic traveling on Route 9A/Route 141/Kensico Road/Columbus Avenue) for the AM and midday, and PM peak hours, respectively, for the Future With the Proposed Project, Without the Croton project (“Cat/Del Alone,” as depicted on the figures). Figures 5.1-RR, 5.1-SS, 5.1-TT show the projected traffic volumes for the Future With the Proposed Project, Without the Croton project. Table 5.1-I presents a comparison of 2006 Future Without the Project conditions to 2006 Future With the Project conditions (without the Croton project). There would be the following potential temporary adverse impacts associated with truck route Option E (100 percent of the truck traffic traveling on Route 9A/Route 141/Kensico Road/Columbus Avenue) during the filling of the Delaware Aerator in 2006.
Signalized Intersections:
• The southbound through/right-turn movement at the intersection of Saw Mill River Road (Route 9A) and the Saw Mill River Parkway Northbound Ramps would experience a potential adverse impact. The delay would increase from 43.4 seconds (LOS D) to 56.0 seconds (LOS E) during the PM peak hour.
• The westbound approach at the intersection of Saw Mill River Road (Route 9A) and Dana Road would experience a potential adverse impact. The delay would increase from 40.7 seconds (LOS D) to 49.6 seconds (LOS D) and from 41.9 seconds (LOS D) to 71.6 seconds (LOS E) during the midday and PM peak hours, respectively.

AM Peak Hour Midday Peak Hour PM Peak Hour2006 (1) 2006 Option E (2)* 2006 (1) 2006 Option E (2)* 2006 (1) 2006 Option E (2)*
Lane v/c Delay v/c Delay v/c Delay v/c Delay v/c Delay v/c DelayIntersection No. Approach Group Ratio (sec) LOS Ratio (sec) LOS Ratio (sec) LOS Ratio (sec) LOS Ratio (sec) LOS Ratio (sec) LOS
Saw Mill River Road (Rt. 9A) @ 4 Eastbound L 1.06 96.9 F 1.06 96.9 F 0.57 42.6 D 0.57 42.6 D 0.49 28.8 C 0.49 28.8 CSaw Mill River Parkway NB Ramps LTR 0.32 29.3 C 0.32 29.3 C 0.15 37.3 D 0.15 37.3 D 0.15 25.8 C 0.15 25.8 C
Westbound L 0.42 37.7 D 0.42 37.7 D 0.09 39.3 D 0.09 39.3 D 0.14 34.1 C 0.14 34.1 CLT 0.31 36.4 D 0.31 36.4 D 0.06 39.1 D 0.06 39.1 D 0.08 33.8 C 0.08 33.8 CR 0.11 34.9 C 0.11 34.9 C 0.02 38.9 D 0.02 38.9 D 0.04 33.5 C 0.04 33.5 C
Northbound L 0.24 10.3 B 0.25 10.9 B 0.56 13.7 B 0.59 14.7 B 0.76 26.7 C 0.80 30.4 CTR 0.33 8.8 A 0.37 9.0 A 0.44 12.0 B 0.46 12.3 B 0.52 15.0 B 0.57 15.6 B
Southbound L 0.07 12.3 B 0.07 12.3 B 0.07 15.7 B 0.07 15.8 B 0.12 21.3 C 0.13 21.4 CTR 0.79 21.7 C 0.84 24.0 C 0.55 20.7 C 0.59 21.4 C 0.92 43.4 D 0.99 56.0 + E
Intersection 32.2 C 32.4 C 18.6 B 19.0 B 28.9 C 34.3 CSaw Mill River Road (Rt. 9A) @ 20 Eastbound LT 0.16 33.3 C 0.17 33.3 C 0.23 31.4 C 0.25 31.7 C 0.34 26.7 C 0.40 27.5 CDana Road R 0.19 33.4 C 0.19 33.4 C 0.22 31.2 C 0.22 31.2 C 0.31 26.1 C 0.31 26.1 C
Westbound LTR 0.37 35.1 D 0.59 39.7 D 0.68 40.7 D 0.81 49.6 + D 0.79 41.9 D 0.97 71.6 + ENorthbound L 0.13 3.7 A 0.13 3.7 A 0.27 9.2 A 0.27 9.2 A 0.41 9.9 A 0.41 9.9 A
TR 0.47 5.1 A 0.47 5.1 A 0.50 10.9 B 0.50 10.9 B 0.50 10.0 A 0.50 10.0 ASouthbound L 0.55 7.3 A 0.70 12.6 B 0.15 8.3 A 0.35 10.1 B 0.16 7.8 A 0.36 9.5 A
TR 0.44 4.9 A 0.44 4.9 A 0.41 9.9 A 0.41 9.9 A 0.44 9.5 A 0.44 9.5 AIntersection 7.0 A 8.4 A 15.1 B 16.8 B 15.0 B 19.9 B
Columbus Avenue Northbound @ 42 Eastbound LT 0.54 18.6 B 0.54 18.6 B 0.26 14.5 B 0.26 14.5 B 0.34 15.4 B 0.34 15.4 BStevens Avenue Westbound T 0.40 16.4 B 0.40 16.4 B 0.29 14.9 B 0.29 14.9 B 0.59 19.5 B 0.59 19.5 B
R 0.08 13.0 B 0.08 13.0 B 0.07 12.8 B 0.07 12.8 B 0.13 13.4 B 0.13 13.4 BNorthbound LT 0.48 13.2 B 0.52 13.7 B 0.38 10.8 B 0.41 11.0 B 0.64 13.9 B 0.67 14.4 B
R 0.12 10.4 B 0.12 10.4 B 0.21 9.9 A 0.21 9.9 A 0.36 11.4 B 0.36 11.4 BIntersection 15.0 B 15.1 B 12.0 B 12.1 B 14.8 B 15.1 B
Columbus Avenue Southbound @ 43 Eastbound TR 0.79 26.3 C 0.79 26.3 C 0.35 14.8 B 0.35 14.8 B 0.45 16.1 B 0.45 16.1 BStevens Avenue Westbound LT 1.12 101.8 F 1.12 101.8 F 0.76 27.4 C 0.76 27.4 C 1.10 86.8 F 1.10 86.8 F
Southbound LTR 0.25 11.1 B 0.29 11.4 B 0.24 10.3 B 0.28 10.5 B 0.32 10.9 B 0.36 11.2 BIntersection 48.1 D 48.1 D 17.8 B 17.8 B 46.7 D 46.7 D
Broadway (Rt. 141) @ 46A Eastbound TR 0.32 31.4 C 0.32 31.4 C 0.48 26.4 C 0.48 26.4 C 0.35 34.3 C 0.35 34.3 CBradhurst Avenue & Memorial Drive Westbound LT 0.31 31.4 C 0.31 31.4 C 0.64 33.7 C 0.64 33.7 C 0.42 35.2 D 0.42 35.2 D
R 0.27 2.1 A 0.31 2.2 A 0.27 2.5 A 0.31 2.6 A 0.25 2.3 A 0.30 2.5 ANorthbound LTR 0.57 44.0 D 0.57 44.0 D 0.28 26.9 C 0.28 26.9 C 0.27 39.7 D 0.27 39.7 DSouthbound LTR 1.07 65.6 E 1.12 85.3 + F 0.59 9.9 A 0.64 10.8 B 0.72 16.2 B 0.77 18.0 B
Intersection 48.8 D 60.8 E 12.1 B 12.1 B 16.6 B 17.2 BBroadway (Rt. 141) @ 47 Eastbound LTR 0.34 6.5 A 0.39 6.8 A 0.27 6.1 A 0.31 6.3 A 0.28 6.1 A 0.33 6.4 AW. Cross Street Westbound LTR 0.30 6.2 A 0.34 6.5 A 0.34 6.4 A 0.38 6.7 A 0.41 6.9 A 0.47 7.3 A
Northbound LTR 0.93 53.2 D 0.93 53.2 D 0.71 30.1 C 0.71 30.1 C 0.83 38.8 D 0.83 38.8 DSouthbound LTR 0.07 20.3 C 0.07 20.3 C 0.18 21.0 C 0.18 21.0 C 0.31 21.9 C 0.31 21.9 C
Intersection 21.9 C 21.9 C 13.3 B 13.3 B 16.1 B 16.1 BBroadway (Rt. 141) @ 51 Eastbound L 0.54 21.5 C 0.54 21.5 C 0.51 14.8 B 0.51 14.8 B 1.01 89.6 F 1.01 89.6 FKensico Road/Marble Avenue TR 1.04 72.8 E 1.04 72.8 E 0.51 24.6 C 0.51 24.6 C 0.48 18.6 B 0.48 18.6 B
Westbound L 0.23 27.5 C 0.56 32.6 C 0.10 12.9 B 0.24 13.6 B 0.27 25.9 C 0.55 30.9 CT 0.50 33.4 C 0.50 33.4 C 0.28 21.8 C 0.28 21.8 C 0.71 31.4 C 0.71 31.4 CR 0.28 31.2 C 0.28 31.2 C 0.36 22.9 C 0.36 22.9 C 0.43 27.1 C 0.43 27.1 C
Northbound L 0.49 21.5 C 0.49 21.5 C 0.67 35.2 D 0.67 35.2 D 0.41 16.2 B 0.41 16.2 BTR 0.41 33.3 C 0.55 35.8 D 0.62 42.1 D 0.80 53.4 + D 0.43 27.0 C 0.57 29.2 C
Southbound L 0.28 18.6 B 0.31 19.1 B 0.47 27.1 C 0.55 29.0 C 0.28 14.3 B 0.31 14.6 BTR 0.83 50.3 D 0.83 50.3 D 1.01 94.4 F 1.01 94.4 F 0.90 53.6 D 0.90 53.6 D
Intersection 49.4 D 49.4 D 35.2 D 36.3 D 35.2 D 35.3 DCommerce Street @ 52 Eastbound L 0.06 4.2 A 0.06 4.2 A 0.14 11.8 B 0.15 11.8 B 0.22 4.9 A 0.23 5.0 AKensico Road TR 0.47 6.0 A 0.49 6.2 A 0.29 12.7 B 0.32 12.9 B 0.20 4.7 A 0.22 4.7 A
Westbound L 0.18 4.8 A 0.19 4.9 A 0.17 7.7 A 0.18 7.8 A 0.16 4.6 A 0.17 4.6 ATR 0.21 4.7 A 0.23 4.8 A 0.25 8.1 A 0.28 8.3 A 0.32 5.2 A 0.34 5.3 A
Northbound LT 0.13 29.7 C 0.13 29.7 C 0.26 26.4 C 0.26 26.4 C 0.42 32.3 C 0.42 32.3 CR 0.42 32.2 C 0.42 32.2 C 0.23 26.1 C 0.23 26.1 C 0.37 31.8 C 0.37 31.8 C
Southbound LT 0.16 29.9 C 0.16 29.9 C 0.13 32.2 C 0.13 32.2 C 0.23 30.5 C 0.23 30.5 CR 0.43 32.4 C 0.43 32.4 C 0.21 32.9 C 0.21 32.9 C 0.27 30.9 C 0.27 30.9 C
Intersection 9.4 A 9.4 A 13.4 B 13.4 B 9.8 A 9.8 AColumbus Avenue @ 53 Westbound L 0.55 35.7 D 0.55 35.7 D 0.33 33.0 C 0.33 33.0 C 0.53 35.2 D 0.53 35.2 DNanny Hagen Road R 0.41 19.2 B 0.41 19.2 B 0.25 17.6 B 0.25 17.6 B 0.45 19.7 B 0.45 19.7 B
Northbound T 0.17 13.4 B 0.20 13.6 B 0.29 14.3 B 0.32 14.6 B 0.43 15.6 B 0.46 16.0 BSouthbound L 0.66 8.7 A 0.68 9.3 A 0.34 5.8 A 0.35 5.9 A 0.46 7.1 A 0.48 7.5 A
T 0.42 6.3 A 0.45 6.4 A 0.23 5.2 A 0.26 5.4 A 0.19 5.0 A 0.21 5.2 AIntersection 11.7 B 11.8 B 11.5 B 11.6 B 14.4 B 14.4 B
Notes:L = Left Turn, T = Through, R = Right Turn; LOS = Level of Service. "+" indicates Potential Adverse Impacts.(1) 2006 Future Conditions without the Delaware Aerator Fill Operations(2) 2006 Future Conditions with the Delaware Aerator Fill Operations* Also referred to as "Build Conditions".
TABLE 5.1-I. ROUTE 9A/ROUTE 141/KENSICO ROAD/COLUMBUS AVENUE TRUCK ROUTE (OPTION E) LEVEL-OF-SERVICE ANALYSIS RESULTS FOR SIGNALIZED INTERSECTIONS: 2006 FUTURE CONDITIONS WITHOUT THE PROJECT VERSUS FUTURE
CONDITIONS WITH THE PROJECT (WITHOUT THE CROTON PROJECT)
FEIS KENRESWORKSITES 103

AM Peak Hour Midday Peak Hour PM Peak Hour2006 (1) 2006 Option E (2)* 2006 (1) 2006 Option E (2)* 2006 (1) 2006 Option E (2)*
Lane v/c Delay v/c Delay v/c Delay v/c Delay v/c Delay v/c DelayIntersection No. Approach Group Ratio (sec) LOS Ratio (sec) LOS Ratio (sec) LOS Ratio (sec) LOS Ratio (sec) LOS Ratio (sec) LOSColumbus 41 Westbound L 0.04 26.8 D 0.04 32.7 + D 0.02 20.3 C 0.03 24.1 C 0.09 38.9 E 0.12 50.5 + FWest Lake Drive R 0.28 12.1 B 0.37 13.1 B 0.18 11.4 B 0.27 12.2 B 0.41 16.6 C 0.52 19.2 C
Southbound LT 0.14 9.4 A 0.19 9.8 A 0.07 9.1 A 0.13 9.4 A 0.12 10.9 B 0.20 11.5 BBroadway 46B Westbound LT 0.19 12.7 B 0.20 13.1 B 0.13 9.8 A 0.14 10.0 B 0.27 11.6 B 0.28 12.0 BSprain Parkway Southbound RampRoute 141 48A Northbound L 0.21 13.9 B 0.24 15.7 C 0.24 15.5 C 0.27 17.8 C 0.32 16.1 C 0.37 19.0 CElwood Avenue (triangle, western leg) Route 141 48B Eastbound L 0.35 14.7 B 0.46 17.0 C 0.45 15.9 C 0.56 19.0 C 0.43 15.4 C 0.54 18.2 CElwood Avenue R 0.00 9.6 A 0.00 9.8 A 0.00 9.7 A 0.00 9.9 A 0.00 9.7 A 0.00 9.9 A
Northbound LT 0.00 8.1 A 0.00 8.3 A 0.01 8.1 A 0.00 8.3 A 0.00 8.2 A 0.00 8.3 AElwood Av 49 Eastbound LR 0.27 11.0 B 0.33 11.6 B 0.43 12.4 B 0.49 13.4 B 0.44 13.2 B 0.51 14.3 BCommerce Street Northbound LT 0.00 8.1 A 0.00 8.3 A 0.01 8.1 A 0.01 8.3 A 0.01 8.1 A 0.01 8.3 ACommerce 50 Westbound LR 0.03 14.1 B 0.04 15.7 C 0.03 12.4 B 0.03 13.3 B 0.05 12.0 B 0.06 12.8 BLincoln Place Southbound LT 0.00 8.1 A 0.00 8.2 A 0.00 8.1 A 0.00 8.3 A 0.01 8.1 A 0.01 8.2 ANotes:L = Left Turn, T = Through, R = Right Turn; LOS = Level of Service. "+" indicates Potential Adverse Impacts.(1) 2006 Future Conditions without the Delaware Aerator Fill Operations(2) 2006 Future Conditions with the Delaware Aerator Fill Operations* Also referred to as "Build Conditions".
TABLE 5.1-I. ROUTE 9A/ROUTE 141/KENSICO ROAD/COLUMBUS AVENUE TRUCK ROUTE (OPTION E) LEVEL-OF-SERVICE ANALYSIS RESULTS FOR UNSIGNALIZED INTERSECTIONS: 2006 FUTURE CONDITIONS WITHOUT THE PROJECT VERSUS FUTURE CONDITIONS WITH THE PROJECT (WITHOUT THE CROTON PROJECT)
FEIS KENRESWORKSITES 104

FEIS KENRESWORKSITES 105
• The southbound approach at the intersection of Broadway (Route 141), Bradhurst
Avenue, and Memorial Drive would experience a potential adverse impact. The delay would increase from 65.6 seconds (LOS E) to 85.3 seconds (LOS F) during the AM peak hour.
• The northbound through/right-turn movement at the intersection of Broadway (Route 141) and Kensico Road/Marble Avenue would experience a potential adverse impact. The delay would increase from 42.1 seconds (LOS D) to 53.4 seconds (LOS D) during the midday peak hour.
Unsignalized Intersections:
• The westbound left-turn movement at the intersection of Columbus Avenue and West
Lake Drive would experience a potential adverse impact. The delay would increase from 26.8 seconds (LOS D) to 32.7 seconds (LOS D) and 38.9 seconds (LOS E) to 50.5 seconds (LOS F) during the AM and PM peak hours, respectively.
Under truck route Option E, there would be 7 potential temporary adverse impacted lane groups/approaches in the Future With the Project, Without the Croton Project. Mitigation measures for the intersections that would experience potential adverse impacts are discussed in Section 6.2, Mitigation of Potential Significant or Temporary Adverse Impacts, Off-Site Facilities.
2010 Future Without the Project. As noted above, the 2010 analysis accounts for the peak construction period at the Kensico Reservoir work sites, when all three components of the proposed work would be underway at the same time (filling of the Catskill Aerator, Aqueduct pressurization, and construction of the new Screen Chamber). To account for traffic growth that would arise from anticipated site developments, as well as from general background growth in the study area, an annual growth rate 1.5 percent per year was applied to the existing condition traffic volumes for a total of 9.0 percent growth to reflect 2010 traffic conditions. In addition, the traffic generated by specific projects (e.g., Home Depot, Avalon, etc.) was included in the analysis. Three peak periods were analyzed – early AM (6:30 AM to 7:30 AM), late AM (8AM to 9AM), and PM (3:30 PM to 4:30 PM) peak hours. Projected traffic volumes for the 2010 Future Without the Project condition for the early AM, late AM, and PM peak hour are illustrated in Figures 5.1-UU, 5.1-VV, and 5.1-WW, respectively. The traffic volumes resulting from the projected background growth would result in increased congestion throughout the project area. A comparison of HCM analysis between Existing conditions versus the 2010 Future Without the Project conditions is presented in Table 5.1-J. For signalized intersections, there would be one notable change in LOS:

FEIS KENRESWORKSITES 106
• The overall LOS at the intersection of Columbus Avenue (southbound) and Stevens Avenue would deteriorate from LOS D to E during the PM peak hour.
For unsignalized intersections there would be no notable changes in LOS.
2010 Future With the Project. The proposed pressurization of the Catskill Aqueduct, construction of the new Screen Chamber, and filling the Catskill Aerator would generate approximately 100 worker trips during the 6:30 AM to 7:30 AM (arriving trips) and 3:30 PM to 4:30 PM (departing trips) peak hours. Construction of the new Screen Chamber and the proposed pressurization are anticipated to generate 12 truck trips per day. In addition to this for analysis purposes it was assumed that the filling/grading remaining at the Catskill Aqueduct would generate up to 200 truck trips per day. However, if the filling/grading was performed over a six month period 72 truck trips per day would likely occur. Three peak periods were analyzed – early AM (6:30 AM to 7:30 AM), AM (8AM to 9AM), and PM (3:30 PM to 4:30 PM) peak hours.
• Figures 5.1-XX, 5.1-YY, and 5.1-ZZ show the traffic assignments for the Future With the Project during the early AM, late AM, and PM peak hours. Figures 5.1-AAA, 5.1-BBB, and 5.1-CCC show the projected traffic volumes for the 2010 Future With the Project conditions during the early AM, AM, and PM peak hours, respectively.
Table 5.1-K presents a comparison of 2010 Future Without the Project conditions and 2006 Future With the Project conditions. There would be the following potential adverse impacts associated with the projected traffic in the Future With the Project in 2010:
Signalized Intersections:
• The westbound left-turn through movement at the intersection of Columbus Avenue (southbound) and Stevens Avenue would experience a potential adverse impact. The delay would increase from 132.7seconds (LOS F) to 142.4 seconds (LOS F) during the PM peak hour.
Unsignalized Intersections:
• The westbound left-turn movement at the intersection of Columbus Avenue and West
Lake Drive would experience a potential adverse impact. The delay would increase from 29.8 seconds (LOS D) to 53.9 seconds (LOS F) during the late AM peak hour and from 45.8 seconds (LOS E) to 147.6 seconds (LOS F) during the PM peak hour.

FEIS KENRESWORKSITES 107
• In addition to these intersections, the 2010 Future With the Project scenario would result in temporary adverse impacts at the intersections identified above for the 2006 scenario, due to trucking associated with the filling of the Catskill Aerator in 2010. As with the 2006 scenario, these impacts would occur for a relatively short period of approximately six months.
Pavement Infrastructure. Roadway pavements deteriorate with traffic loads,
environmental conditions and time. Highways are typically able to carry higher traffic loads than arterials and other lower volume roadways. The principal measure of traffic loading is “equivalent 18,000 pounds single axle loads” (18 kip Equivalent Single Axle Load (ESAL)) over the useful life of the pavement, typically 20 years. As these loads are applied, over time, the pavement’s serviceability declines to the point where it must be repaired. Different types of trucks affect pavement differently. Trucks that have concentrated wheel loads (e.g., full concrete trucks) would cause worse pavement effects than a flat-bed tractor-trailer combination carrying steel reinforcing rods. Highways can have design loads of 10,000,000 to 80,000,000 (or more) ESAL, arterials generally between 2,000,000 to 5,000,000 ESAL (or more), and low-volume roadways 50,000 to 500,000 ESAL (or more). The proposed filling of the Aerators would take approximately six months in 2006. During peak filling operations for the Aerators, it is anticipated that a total of approximately 17,600 total truck trips would be generated between the Eastview Site (source of the fill) and the Kensico Reservoir (where the soil would be dumped). This would translate to approximately a predicted truck load of 24,000 ESAL on the proposed truck routes to and from the site (e.g., Lakeview Avenue, Grasslands Road, and Commerce Street, depending on the truck route selected). Compared, the predicted truck loads with designed loads for an arterial and local roadway the anticipated loads generated from the proposed filling operation are not anticipated to be significant adverse impacts and would not result in significant damage to the roadways.
Safety. See Section 4.9, Traffic and Transportation, which contains a full description and accident analysis for all study area intersections. Currently, many schoolchildren walk or are driven past the Kensico Reservoir campus during the morning and afternoon peak traffic periods. NYCDEP would work with Town and school officials to establish a security/safety plan for the period when trucks would be transporting fill material to the Catskill and Delaware Aqueducts and during construction of the new Screen Chamber.

Lane v/c Delay v/c DelayIntersection No. Approach Group Ratio (sec) LOS Ratio (sec) LOS
6:30 - 7:30 AMLakeview Avenue (E-W) @ 40 Eastbound LR 0.27 18.4 B 0.30 18.7 BColumbus Avenue Northbound LT 0.14 7.8 A 0.15 7.8 A(Signalized) Southbound TR 0.23 8.3 A 0.25 8.5 A
Intersection 10.2 B 10.4 BColumbus Avenue (N-S) @ 41 Southbound LT 0.08 8.3 A 0.09 8.4 AWest Lake Drive Westbound L 0.00 15.5 C 0.00 16.7 C(Unsignalized) R 0.16 10.0 A 0.17 10.2 BColumbus Avenue (Northbound) @ 42 Eastbound LT 0.31 15.1 B 0.34 15.5 BStevens Avenue Westbound T 0.18 13.8 B 0.20 14.0 B(Signalized) R 0.04 12.6 B 0.04 12.7 B
Northbound LT 0.21 10.7 B 0.22 10.9 BR 0.05 9.8 A 0.06 9.9 A
Intersection 12.6 B 12.8 BColumbus Avenue (Southbound) @ 43 Eastbound TR 0.31 15.1 B 0.34 15.5 BStevens Avenue Westbound LT 0.31 15.2 B 0.34 15.5 B(Signalized) Southbound LTR 0.17 10.5 B 0.19 10.6 B
Intersection 13.4 B 13.7 B8:00 - 9:00 AM
Lakeview Avenue (E-W) @ 40 Eastbound LR 0.48 21.4 C 0.53 22.3 CColumbus Avenue Northbound LT 0.25 8.5 A 0.28 8.8 A(Signalized) Southbound TR 0.32 8.9 A 0.35 9.2 A
Intersection 11.7 B 12.0 BColumbus Avenue (N-S) @ 41 Southbound LT 0.13 9.4 A 0.15 9.7 AWest Lake Drive Westbound L 0.03 25.7 D 0.04 29.8 D(Unsignalized) R 0.27 12.0 B 0.31 12.6 B
3:30 - 4:30 PMLakeview Avenue (E-W) @ 40 Eastbound LR 0.46 20.9 C 0.50 21.7 CColumbus Avenue Northbound LT 0.69 14.1 B 0.77 16.3 B(Signalized) Southbound TR 0.27 8.6 A 0.30 8.8 A
Intersection 13.6 B 14.9 BColumbus Avenue (N-S) @ 41 Southbound LT 0.12 10.7 B 0.14 11.4 BWest Lake Drive Westbound L 0.09 36.8 E 0.12 45.8 E(Unsignalized) R 0.39 16.0 C 0.46 18.1 CColumbus Avenue (Northbound) @ 42 Eastbound LT 0.33 15.3 B 0.36 15.7 BStevens Avenue Westbound T 0.57 19.1 B 0.62 20.3 C(Signalized) R 0.13 13.3 B 0.14 13.5 B
Northbound LT 0.62 13.5 B 0.67 14.5 BR 0.34 11.3 B 0.38 11.7 B
Intersection 14.6 B 15.4 BColumbus Avenue (Southbound) @ 43 Eastbound TR 0.43 15.9 B 0.47 16.5 BStevens Avenue Westbound LT 1.05 68.3 E 1.22 132.7 F(Signalized) Southbound LTR 0.31 10.8 B 0.34 11.1 B
Intersection 38.2 D 67.8 ENotes:L = Left Turn, T = Through, R = Right Turn; LOS = Level of Service.
2004 Existing 2010 No BuildTABLE 5.1-J. KENSICO LEVEL-OF-SERVICE ANALYSIS RESULTS: 2004 EXISTING
FEIS KENRESWORKSITES 108

Lane v/c Delay v/c DelayIntersection No. Approach Group Ratio (sec) LOS Ratio (sec) LOS
6:30 - 7:30 AMLakeview Avenue (E-W) @ 40 Eastbound LR 0.30 18.7 B 0.30 18.7 BColumbus Avenue Northbound LT 0.15 7.8 A 0.16 7.9 A(Signalized) Southbound TR 0.25 8.5 A 0.25 8.5 A
Intersection 10.4 B 10.3 BColumbus Avenue (N-S) @ 41 Southbound LT 0.09 8.4 A 0.21 9.0 AWest Lake Drive Westbound L 0.00 16.7 C 0.01 25.8 D(Unsignalized) R 0.17 10.2 B 0.18 10.3 BColumbus Avenue (Northbound) @ 42 Eastbound LT 0.34 15.5 B 0.34 15.5 BStevens Avenue Westbound T 0.20 14.0 B 0.22 14.2 B(Signalized) R 0.04 12.7 B 0.04 12.7 B
Northbound LT 0.22 10.9 B 0.22 10.9 BR 0.06 9.9 A 0.06 9.9 A
Intersection 12.8 B 12.9 BColumbus Avenue (Southbound) @ 43 Eastbound TR 0.34 15.5 B 0.39 16.1 BStevens Avenue Westbound LT 0.34 15.5 B 0.38 16.1 B(Signalized) Southbound LTR 0.19 10.6 B 0.25 11.0 B
Intersection 13.7 B 14.0 B8:00 - 9:00 AM
Lakeview Avenue (E-W) @ 40 Eastbound LR 0.53 22.3 C 0.63 24.8 CColumbus Avenue Northbound LT 0.28 8.8 A 0.28 8.8 A(Signalized) Southbound TR 0.35 9.2 A 0.38 9.5 A
Intersection 12.0 B 13.1 BColumbus Avenue (N-S) @ 41 Southbound LT 0.15 9.7 A 0.16 10.0 BWest Lake Drive Westbound L 0.04 29.8 D 0.51 53.9 + F(Unsignalized) R 0.31 12.6 B 0.32 13.2 B
3:30 - 4:30 PMLakeview Avenue (E-W) @ 40 Eastbound LR 0.50 21.7 C 0.63 24.6 CColumbus Avenue Northbound LT 0.77 16.3 B 0.79 17.3 B(Signalized) Southbound TR 0.30 8.8 A 0.34 9.1 A
Intersection 14.9 B 16.1 BColumbus Avenue (N-S) @ 41 Southbound LT 0.14 11.4 B 0.15 11.7 BWest Lake Drive Westbound L 0.12 45.8 E 0.91 147.6 + F(Unsignalized) R 0.46 18.1 C 0.71 28.7 DColumbus Avenue (Northbound) @ 42 Eastbound LT 0.36 15.7 B 0.36 15.7 BStevens Avenue Westbound T 0.62 20.3 C 0.62 20.3 C(Signalized) R 0.14 13.5 B 0.14 13.5 B
Northbound LT 0.67 14.5 B 0.73 15.7 BR 0.38 11.7 B 0.39 11.9 B
Intersection 15.4 B 16.0 BColumbus Avenue (Southbound) @ 43 Eastbound TR 0.47 16.5 B 0.47 16.5 BStevens Avenue Westbound LT 1.22 132.7 F 1.24 142.4 + F(Signalized) Southbound LTR 0.34 11.1 B 0.34 11.1 B
Intersection 67.8 E 73.3 ENotes:L = Left Turn, T = Through, R = Right Turn; LOS = Level of Service. "+" indicates Potential Adverse Impacts.
2010 No Build 2010 BuildTABLE 5.1-K: KENSICO LEVEL-OF-SERVICE ANALYSIS RESULTS: 2010 NO BUILD
FEIS KENRESWORKSITES 109
FEIS KENRESWORKSITES 110
5.1.3.2.8. Noise
There would not be any significant adverse mobile-source noise impacts from the operation of the proposed UV Facility, because the trips associated with operational conditions in 2010 are minimal in comparison to the traffic on the area’s surrounding roadways. Therefore, this section describes the potential temporary adverse impacts of construction activities in 2006 and 2010 related to the proposed trucking activity associated with the filling of the Aerators, and the traffic that would be generated by the pressurization of the Catskill Aqueduct and construction of the new Screen Chamber. Two separate studies were conducted: an analysis of 2006 conditions, when the Delaware Aerator would be filled; and an analysis of 2010, the peak year of construction activity at the Kensico Reservoir work sites, when all three components of the proposed work would be underway (filling of the second Aerator, aqueduct pressurization, and construction of new Screen Chamber). The analyses compare 2006 Future without the Project conditions (both with and without the Croton project under construction at the Eastview site) to 2006 Construction conditions. As was described for the traffic analyses in 2006, five truck routing options were investigated. Four of these five options have been examined in the 2006 analyses. Truck route Option D presents the same number of trucks as Option C, traveling along Lakeview Avenue and Grasslands Road between the Eastview Site and the Kensico Reservoir, and is therefore not analyzed for 2006 or 2010. This section also compares the 2010 future conditions to 2010 conditions with these construction activities, for Options A, B, and C. Option E is only analyzed for the Future With the Project without the Croton project under 2006 construction conditions.
2006 Conditions without Croton Project.
The screening analyses performed for 2006 Construction conditions examines four truck route options. These options involve different routes that trucks could travel between the Eastview Site (source of the fill) and the Delaware Aerator at Kensico Reservoir (where the fill would be placed). These routes are as follows:
• 100 percent of the trucks traveling on Lakeview Avenue (Option A). • 100 percent of the trucks traveling on Grasslands Avenue (Route 100C)/Commerce
Street (Option B). • An even 50/50 percent split between Lakeview Avenue and Route 100C/Commerce
Street (Option C). • 100 percent of the trucks traveling on Route 9A to Route 141 to Kensico Road to
Columbus Avenue (Option E). The results of the analyses for conditions for four truck route options in 2006, and three truck route options in 2010 , are discussed in the sections below. A comparison of the existing PCEs to the anticipated future maximum PCEs resulting from anticipated construction-related peak truck and employee traffic along the route segments were elevated both with and without the Croton project (see Tables 5.1-10 through 5.1-17).

FEIS KENRESWORKSITES 111
2006 Construction Conditions without the Croton Project. Option A Conditions. Under 2006 Construction Option A conditions, four of the seven
route segments examined were predicted to have temporary adverse increases in noise levels from construction-related traffic during the AM, midday, and/or PM peak periods, of more than 3.0 dBA. The results of the analysis for the 2006 Construction Option A conditions are shown in Table 5.1-10. The temporary adverse noise increases are predicted to range between 3.89 and 4.66 dBA, over the predicted 2006 Future without the Project noise levels. While these increases would be above the 3.0 dBA threshold they are temporary as peak construction activity in 2006 is estimated to last approximately six months. Therefore, these impacts are not considered significant. Increases in noise levels from construction-related traffic in 2006 under the Option A condition along the other three route segments examined during the AM, midday, and/or PM peak periods, were predicted to range between 0.00 and 2.90 dBA.
Option B Conditions. Under 2006 Construction Option B conditions, one of the seven
route segments examined was predicted to have a temporary adverse increase in noise levels from construction-related traffic during the AM, midday, and/or PM peak periods, of more than 3.0 dBA. The results of the analysis for the 2006 Construction Option B conditions are shown in Table 5.1-11. The temporary adverse noise increases are predicted to range between 3.89 and 4.66 dBA, over the predicted 2006 Future without the Project noise levels. While these increases would be above the 3.0 dBA threshold they are temporary as peak construction activity in 2006 is estimated to last approximately six months. Therefore, these impacts are not considered significant. Increases in noise levels from construction related traffic in 2006 under Option B conditions along the other six route segments examined during the AM, midday, and/or PM peak periods, were predicted to range between 0.00 and 2.90 dBA.
Option C Conditions. Under 2006 Construction Option C conditions, one of the seven
route segments examined was predicted to have a temporary adverse increase in noise levels from construction-related traffic during the AM, midday, and/or PM peak periods, of more than 3.0 dBA. The results of the analysis for the 2006 Construction Option C conditions are shown in Table 5.1-12. The temporary adverse noise increases are predicted to range between 3.89 and 4.66 dBA, over the predicted 2006 Future without the Project noise levels. While these increases would be above the 3.0 dBA threshold they are temporary as peak construction activity in 2006 is estimated to last approximately six months. Therefore, these impacts are not considered significant. Increases in noise levels from construction- related traffic in 2006 under Option C conditions along the other six route segments examined during the AM, midday, and/or PM peak periods, were predicted to range between 0.00 and 2.93 dBA.
Option E Conditions– Under 2006 Construction Option E conditions, the three route segments examined were predicted to have temporary adverse increases in noise levels from construction-related traffic during the AM, midday, and/or PM peak periods, of more than 3.0 dBA. The results of the screening analysis for the 2006 Construction Option E conditions are shown in Table 5.1-13. The temporary adverse noise increases are predicted to range between 3.10 and 4.78 dBA, over the predicted 2006 Future without the Project noise levels. While these increases would be above the 3.0 dBA threshold, they do not exceed 5.0 dBA at any route

FEIS KENRESWORKSITES 112
segment. Furthermore, they are temporary as peak construction activity in 2006 is estimated to last approximately six months. Therefore, these impacts are not considered significant.
2006 Construction Conditions with the Croton Project Option A Conditions. Under 2006 Construction Option A conditions, five of the seven
route segments examined were predicted to have temporary adverse increases in noise levels from construction-related traffic during the AM, midday, and/or PM peak periods, of more than 3.0 dBA. The results of the analysis for the 2006 Construction Option A conditions are shown in Table 5.1-14. The temporary adverse noise increases are predicted to range between 3.02 and 4.66 dBA, over the predicted 2006 Future without the Project noise levels. While these increases would be above the 3.0 dBA threshold they are temporary as peak construction activity in 2006 is estimated to last approximately six months. Therefore, these impacts are not considered significant. Increases in noise levels from construction- related traffic in 2006 under Option A conditions along the other route segments examined during the AM, midday, and/or PM peak periods, were predicted to range between 0.00 and 2.70 dBA.
Option B Conditions. Under 2006 Construction Option B conditions, two of the seven
route segments examined were predicted to have temporary adverse increases in noise levels from construction-related traffic during the AM, midday, and/or PM peak periods, of more than 3.0 dBA. The results of the analysis for the 2006 Construction Option B conditions are shown in Table 5.1-15. The temporary adverse noise increases are predicted to range between 3.02 and 4.66 dBA, over the predicted 2006 Future without the Project noise levels. While these increases would be above the 3.0 dBA threshold they are temporary as peak construction activity in 2006 is estimated to last approximately six months. Therefore, these impacts are not considered significant. Increases in noise levels from construction- related traffic in 2006 under Option B conditions along the other route segments examined during the AM, midday, and/or PM peak periods, were predicted to range between 0.00 and 2.70 dBA.
Option C Conditions. Under 2006 Construction Option C conditions, two of the seven route segments examined were predicted to have temporary adverse increases in noise levels from construction-related traffic during the AM, midday, and/or PM peak periods, of more than 3.0 dBA. The results of the analysis for the 2006 Construction Option C conditions are shown in Table 5.1-16. The temporary adverse noise increases are predicted to range between 3.03 and 4.66 dBA, over the predicted 2006 Future without the Project noise levels. While these increases would be above the 3.0 dBA threshold, they are temporary as peak construction activity in 2006 is estimated to last approximately six months. Therefore, these impacts are not considered significant. Increases in noise levels from construction- related traffic in 2006 under Option C conditions along the other route segments examined during the AM, midday, and/or PM peak periods, were predicted to range between 0.00 and 2.93 dBA.

TABLE 5.1-10. COMPARISON OF EXISTING PCES TO ANTICIPATED FUTURE WITH THE PROJECT PCES DURING CONSTRUCTION (2006) WITHOUT CROTON PROJECT (TRUCK ROUTE OPTION A)
Period of Analysis (Weekday)
Pure No Build (without Croton)
PCEs
Time New Passenger Car (CatDel)
New Trucks
(CatDel)New PCEs PCE Ratio Incremental
Change in dBAImpact Criteria
Exceeded?
6 Bradhurst btw Grasslands and Lakeview AM Peak 1555 8:00-9:00 0 48 2256 2.45 3.89 YesMD Peak 1171 1:00-2:00 0 48 2256 2.93 4.66 YesPM Peak 1171 3:30-4:30 0 48 2256 2.93 4.66 Yes
7 Grasslands Rd. btw Bradhurst and Sprain Brook Pkwy AM Peak 3299 8:00-9:00 0 48 2256 1.68 2.26 NoMD Peak 2451 1:00-2:00 0 48 2256 1.92 2.83 NoPM Peak 2451 3:30-4:30 3 48 2259 1.92 2.84 No
8 Grasslands Rd. btw Sprain Brook Pkwy and Walker Road AM Peak 2838 8:00-9:00 0 48 2256 1.79 2.54 NoMD Peak 2422 1:00-2:00 0 48 2256 1.93 2.86 NoPM Peak 2422 3:30-4:30 47 48 2303 1.95 2.90 No
12 Grasslands Rd. btw Saw Mill River Rd (9A) and Walker Rd. AM Peak 2838 8:00-9:00 0 0 0 1.00 0.00 NoMD Peak 2422 1:00-2:00 0 0 0 1.00 0.00 NoPM Peak 2422 3:30-4:30 18 0 18 1.01 0.03 No
13 Bradhurst Ave. btw Grasslands Rd. and Lakeview Ave. AM Peak 1555 8:00-9:00 0 48 2256 2.45 3.89 YesMD Peak 1171 1:00-2:00 0 48 2256 2.93 4.66 YesPM Peak 1171 3:30-4:30 0 48 2256 2.93 4.66 Yes
14 Lakeview Ave. btw Bradhurst Ave. and Commerce Str. AM Peak 1555 8:00-9:00 0 48 2256 2.45 3.89 YesMD Peak 1171 1:00-2:00 0 48 2256 2.93 4.66 YesPM Peak 1171 3:30-4:30 0 48 2256 2.93 4.66 Yes
15 Lakeview Ave. btw Wall Street and Pamela Lane AM Peak 1555 8:00-9:00 0 48 2256 2.45 3.89 YesMD Peak 1171 1:00-2:00 0 48 2256 2.93 4.66 YesPM Peak 1171 3:30-4:30 0 48 2256 2.93 4.66 Yes
(Future NB 2006)Notes:New PCEs = (no. of cars + no. of trucks*(47))PCE ratio = (Existing PCEs + Project generated PCEs) / Existing PCEsIncremental change in dBA = 10 log (PCE ratio)
Route Segment
FEIS KENRESWORKSITES 113

TABLE 5.1-11. COMPARISON OF EXISTING PCES TO ANTICIPATED FUTURE WITH THE PROJECT PCES DURING CONSTRUCTION (2006) WITHOUT CROTON PROJECT (TRUCK ROUTE OPTION B)
Period of Analysis (Weekday)
Pure No Build (without Croton)
PCEs
Time New Passenger Car (CatDel)
New Trucks
(CatDel)New PCEs PCE Ratio Incremental
Change in dBAImpact Criteria
Exceeded?
6 Bradhurst btw Grasslands and Lakeview AM Peak 1555 8:00-9:00 0 0 0 1.00 0.00 NoMD Peak 1171 1:00-2:00 0 0 0 1.00 0.00 NoPM Peak 1171 3:30-4:30 0 0 0 1.00 0.00 No
7 Grasslands Rd. btw Bradhurst and Sprain Brook Pkwy AM Peak 3299 8:00-9:00 0 48 2256 1.68 2.26 NoMD Peak 2451 1:00-2:00 0 48 2256 1.92 2.83 NoPM Peak 2451 3:30-4:30 3 48 2259 1.92 2.84 No
8 Grasslands Rd. btw Sprain Brook Pkwy and Walker Road AM Peak 2838 8:00-9:00 0 48 2256 1.79 2.54 NoMD Peak 2422 1:00-2:00 0 48 2256 1.93 2.86 NoPM Peak 2422 3:30-4:30 47 48 2303 1.95 2.90 No
12 Grasslands Rd. btw Saw Mill River Rd (9A) and Walker Rd. AM Peak 2838 8:00-9:00 0 0 0 1.00 0.00 NoMD Peak 2422 1:00-2:00 0 0 0 1.00 0.00 NoPM Peak 2422 3:30-4:30 18 0 18 1.01 0.03 No
13 Bradhurst Ave. btw Grasslands Rd. and Lakeview Ave. AM Peak 1555 8:00-9:00 0 0 0 1.00 0.00 NoMD Peak 1171 1:00-2:00 0 0 0 1.00 0.00 NoPM Peak 1171 3:30-4:30 0 0 0 1.00 0.00 No
14 Lakeview Ave. btw Bradhurst Ave. and Commerce Str. AM Peak 1555 8:00-9:00 0 0 0 1.00 0.00 NoMD Peak 1171 1:00-2:00 0 0 0 1.00 0.00 NoPM Peak 1171 3:30-4:30 0 0 0 1.00 0.00 No
15 Lakeview Ave. btw Wall Street and Pamela Lane AM Peak 1555 8:00-9:00 0 48 2256 2.45 3.89 YesMD Peak 1171 1:00-2:00 0 48 2256 2.93 4.66 YesPM Peak 1171 3:30-4:30 0 48 2256 2.93 4.66 Yes
(Future NB 2006)Notes:New PCEs = (no. of cars + no. of trucks*(47))PCE ratio = (Existing PCEs + Project generated PCEs) / Existing PCEsIncremental change in dBA = 10 log (PCE ratio)
Route Segment
FEIS KENRESWORKSITES 114

TABLE 5.1-12. COMPARISON OF EXISTING PCES TO ANTICIPATE FUTURE WITH THE PROJECT PCES DURING CONSTRUCTION (2006) WITHOUT CROTON PROJECT (TRUCK ROUTE OPTION C)
Period of Analysis (Weekday)
Pure No Build (without Croton)
PCEs
Time New Passenger Car (CatDel)
New Trucks
(CatDel)New PCEs PCE Ratio Incremental
Change in dBAImpact Criteria
Exceeded?
6 Bradhurst btw Grasslands and Lakeview AM Peak 1555 8:00-9:00 0 24 1128 1.73 2.37 NoMD Peak 1171 1:00-2:00 0 24 1128 1.96 2.93 NoPM Peak 1171 3:30-4:30 0 24 1128 1.96 2.93 No
7 Grasslands Rd. btw Bradhurst and Sprain Brook Pkwy AM Peak 3299 8:00-9:00 0 48 2256 1.68 2.26 NoMD Peak 2451 1:00-2:00 0 48 2256 1.92 2.83 NoPM Peak 2451 3:30-4:30 3 48 2259 1.92 2.84 No
8 Grasslands Rd. btw Sprain Brook Pkwy and Walker Road AM Peak 2838 8:00-9:00 0 48 2256 1.79 2.54 NoMD Peak 2422 1:00-2:00 0 48 2256 1.93 2.86 NoPM Peak 2422 3:30-4:30 47 48 2303 1.95 2.90 No
12 Grasslands Rd. btw Saw Mill River Rd (9A) and Walker Rd. AM Peak 2838 8:00-9:00 0 0 0 1.00 0.00 NoMD Peak 2422 1:00-2:00 0 0 0 1.00 0.00 NoPM Peak 2422 3:30-4:30 18 0 18 1.01 0.03 No
13 Bradhurst Ave. btw Grasslands Rd. and Lakeview Ave. AM Peak 1555 8:00-9:00 0 24 1128 1.73 2.37 NoMD Peak 1171 1:00-2:00 0 24 1128 1.96 2.93 NoPM Peak 1171 3:30-4:30 0 24 1128 1.96 2.93 No
14 Lakeview Ave. btw Bradhurst Ave. and Commerce Str. AM Peak 1555 8:00-9:00 0 24 1128 1.73 2.37 NoMD Peak 1171 1:00-2:00 0 24 1128 1.96 2.93 NoPM Peak 1171 3:30-4:30 0 24 1128 1.96 2.93 No
15 Lakeview Ave. btw Wall Street and Pamela Lane AM Peak 1555 8:00-9:00 0 48 2256 2.45 3.89 YesMD Peak 1171 1:00-2:00 0 48 2256 2.93 4.66 YesPM Peak 1171 3:30-4:30 0 48 2256 2.93 4.66 Yes
(Future NB 2006)Notes:New PCEs = (no. of cars + no. of trucks*(47))PCE ratio = (Existing PCEs + Project generated PCEs) / Existing PCEsIncremental change in dBA = 10 log (PCE ratio)
Route Segment
FEIS KENRESWORKSITES 115

TABLE 5.10-13. COMPARISON OF EXISTING PCES TO ANTICIPATED FUTURE WITH THE PROJECT PCES DURING CONSTRUCTION (2006) WITHOUT CROTON PROJECT (TRUCK ROUTE OPTION E)
Period of Analysis (Weekday)
Pure No Build (without Croton)
PCEs
Time New Passenger Car (CatDel)
New Trucks
(CatDel)New PCEs PCE Ratio Incremental
Change in dBAImpact Criteria
Exceeded?
6 Elwood Ave (Rt. 141) / Commerce Street AM Peak 1566 8:00-9:00 0 48 2256 2.44 3.87 YesMD Peak 1382 1:00-2:00 0 48 2256 2.63 4.20 YesPM Peak 1125 3:30-4:30 0 48 2256 3.01 4.78 Yes
9 Kensico Rd. & Westchester Ave. / Commerce Street AM Peak 2165 8:00-9:00 0 48 2256 2.04 3.10 YesMD Peak 2048 1:00-2:00 0 48 2256 2.10 3.23 YesPM Peak 1906 3:30-4:30 0 48 2256 2.18 3.39 Yes
10 Kensico Rd. / Columbus Ave & Nanny Hagen Rd. AM Peak 3592 8:00-9:00 0 48 2256 1.63 2.12 NoMD Peak 2858 1:00-2:00 0 48 2256 1.79 2.53 NoPM Peak 1770 3:30-4:30 0 48 2256 2.27 3.57 Yes
Notes:New PCEs = (no. of cars + no. of trucks*(47))PCE ratio = (Existing PCEs + Project generated PCEs) / Existing PCEsIncremental change in dBA = 10 log (PCE ratio)
Route Segment
FEIS KENRESWORKSITES 116

TABLE 5.1-14. COMPARISON OF EXISTING PCES TO ANTICIPATED PCES IN THE FUTURE WITH THE PROJECT DURING CONSTRUCTION (2006) WITH THE CROTON PROJECT (TRUCK ROUTE OPTION A)
Period of Analysis (Weekday)
Pure No Build (without Croton)
PCEs
Time New Passenger Car (Croton)
New Trucks
(Croton)
New Passenger Car (CatDel)
New Trucks
(CatDel)New PCEs PCE Ratio Incremental
Change in dBAImpact Criteria
Exceeded?
6 Bradhurst btw Grasslands and Lakeview AM Peak 1555 8:00-9:00 0 0 0 48 2256 2.45 3.89 YesMD Peak 1171 1:00-2:00 0 0 0 48 2256 2.93 4.66 YesPM Peak 1171 3:30-4:30 0 0 0 48 2256 2.93 4.66 Yes
7 Grasslands Rd. btw Bradhurst and Sprain Brook Pkwy AM Peak 3299 8:00-9:00 0 4 0 48 2444 1.74 2.41 NoMD Peak 2451 1:00-2:00 0 4 0 48 2444 2.00 3.00 NoPM Peak 2451 3:30-4:30 12 4 3 48 2459 2.00 3.02 Yes
8 Grasslands Rd. btw Sprain Brook Pkwy and Walker Road AM Peak 2838 8:00-9:00 0 4 0 48 2444 1.86 2.70 NoMD Peak 2422 1:00-2:00 0 4 0 48 2444 2.01 3.03 YesPM Peak 2422 3:30-4:30 205 4 47 48 2696 2.11 3.25 Yes
12 Grasslands Rd. btw Saw Mill River Rd (9A) and Walker Rd. AM Peak 2838 8:00-9:00 0 0 0 0 0 1.00 0.00 NoMD Peak 2422 1:00-2:00 0 0 0 0 0 1.00 0.00 NoPM Peak 2422 3:30-4:30 75 0 18 0 93 1.04 0.16 No
13 Bradhurst Ave. btw Grasslands Rd. and Lakeview Ave. AM Peak 1555 8:00-9:00 0 0 0 48 2256 2.45 3.89 YesMD Peak 1171 1:00-2:00 0 0 0 48 2256 2.93 4.66 YesPM Peak 1171 3:30-4:30 0 0 0 48 2256 2.93 4.66 Yes
14 Lakeview Ave. btw Bradhurst Ave. and Commerce Str. AM Peak 1555 8:00-9:00 0 0 0 48 2256 2.45 3.89 YesMD Peak 1171 1:00-2:00 0 0 0 48 2256 2.93 4.66 YesPM Peak 1171 3:30-4:30 0 0 0 48 2256 2.93 4.66 Yes
15 Lakeview Ave. btw Wall Street and Pamela Lane AM Peak 1555 8:00-9:00 0 0 0 48 2256 2.45 3.89 YesMD Peak 1171 1:00-2:00 0 0 0 48 2256 2.93 4.66 YesPM Peak 1171 3:30-4:30 0 0 0 48 2256 2.93 4.66 Yes
(Future NB 2006)Notes:New PCEs = (no. of cars + no. of trucks*(47))PCE ratio = (Existing PCEs + Project generated PCEs) / Existing PCEsIncremental change in dBA = 10 log (PCE ratio)
Route Segment
FEIS KENRESWORKSITES 117

TABLE 5.1-15. COMPARISON OF EXISTING PCES TO ANTICIPATED PCES IN THE FUTURE WITH THE PROJECT DURING CONSTRUCTION (2006) WITH THE CROTON PROJECT (TRUCK ROUTE OPTION B)
Period of Analysis (Weekday)
Pure No Build (without Croton)
PCEs
Time New Passenger Car (Croton)
New Trucks
(Croton)
New Passenger
Car (CatDel)
New Trucks
(CatDel)New PCEs PCE Ratio Incremental
Change in dBAImpact Criteria
Exceeded?
6 Bradhurst btw Grasslands and Lakeview AM Peak 1555 8:00-9:00 0 0 0 0 0 1.00 0.00 NoMD Peak 1171 1:00-2:00 0 0 0 0 0 1.00 0.00 NoPM Peak 1171 3:30-4:30 0 0 0 0 0 1.00 0.00 No
7 Grasslands Rd. btw Bradhurst and Sprain Brook Pkwy AM Peak 3299 8:00-9:00 0 4 0 48 2444 1.74 2.41 NoMD Peak 2451 1:00-2:00 0 4 0 48 2444 2.00 3.00 NoPM Peak 2451 3:30-4:30 12 4 3 48 2459 2.00 3.02 Yes
8 Grasslands Rd. btw Sprain Brook Pkwy and Walker Road AM Peak 2838 8:00-9:00 0 4 0 48 2444 1.86 2.70 NoMD Peak 2422 1:00-2:00 0 4 0 48 2444 2.01 3.03 YesPM Peak 2422 3:30-4:30 205 4 47 48 2696 2.11 3.25 Yes
12 Grasslands Rd. btw Saw Mill River Rd (9A) and Walker Rd. AM Peak 2838 8:00-9:00 0 0 0 0 0 1.00 0.00 NoMD Peak 2422 1:00-2:00 0 0 0 0 0 1.00 0.00 NoPM Peak 2422 3:30-4:30 75 0 18 0 93 1.04 0.16 No
13 Bradhurst Ave. btw Grasslands Rd. and Lakeview Ave. AM Peak 1555 8:00-9:00 0 0 0 0 0 1.00 0.00 NoMD Peak 1171 1:00-2:00 0 0 0 0 0 1.00 0.00 NoPM Peak 1171 3:30-4:30 0 0 0 0 0 1.00 0.00 No
14 Lakeview Ave. btw Bradhurst Ave. and Commerce Str. AM Peak 1555 8:00-9:00 0 0 0 0 0 1.00 0.00 NoMD Peak 1171 1:00-2:00 0 0 0 0 0 1.00 0.00 NoPM Peak 1171 3:30-4:30 0 0 0 0 0 1.00 0.00 No
15 Lakeview Ave. btw Wall Street and Pamela Lane AM Peak 1555 8:00-9:00 0 0 0 48 2256 2.45 3.89 YesMD Peak 1171 1:00-2:00 0 0 0 48 2256 2.93 4.66 YesPM Peak 1171 3:30-4:30 0 0 0 48 2256 2.93 4.66 Yes
(Future NB 2006)Notes:New PCEs = (no. of cars + no. of trucks*(47))PCE ratio = (Existing PCEs + Project generated PCEs) / Existing PCEsIncremental change in dBA = 10 log (PCE ratio)
Route Segment
FEIS KENRESWORKSITES 118

TABLE 5.1-16. COMPARISON OF EXISTING PCES TO ANTICIPATED PCES IN THE FUTURE WITH THE PROJECT DURING CONSTRUCTION (2006) WITH THE CROTON PROJECT (TRUCK ROUTE OPTION C)
Period of Analysis (Weekday)
Pure No Build (without Croton)
PCEs
Time New Passenger Car (Croton)
New Trucks
(Croton)
New Passenger
Car (CatDel)
New Trucks
(CatDel)New PCEs PCE Ratio Incremental
Change in dBAImpact Criteria
Exceeded?
6 Bradhurst btw Grasslands and Lakeview AM Peak 1555 8:00-9:00 0 0 0 24 1128 1.73 2.37 NoMD Peak 1171 1:00-2:00 0 0 0 24 1128 1.96 2.93 NoPM Peak 1171 3:30-4:30 0 0 0 24 1128 1.96 2.93 No
7 Grasslands Rd. btw Bradhurst and Sprain Brook Pkwy AM Peak 3299 8:00-9:00 0 4 0 48 2444 1.74 2.41 NoMD Peak 2451 1:00-2:00 0 4 0 48 2444 2.00 3.00 NoPM Peak 2451 3:30-4:30 12 4 3 48 2459 2.00 3.02 Yes
8 Grasslands Rd. btw Sprain Brook Pkwy and Walker Road AM Peak 2838 8:00-9:00 0 4 0 48 2444 1.86 2.70 NoMD Peak 2422 1:00-2:00 0 4 0 48 2444 2.01 3.03 YesPM Peak 2422 3:30-4:30 205 4 47 48 2696 2.11 3.25 Yes
12 Grasslands Rd. btw Saw Mill River Rd (9A) and Walker Rd. AM Peak 2838 8:00-9:00 0 0 0 0 0 1.00 0.00 NoMD Peak 2422 1:00-2:00 0 0 0 0 0 1.00 0.00 NoPM Peak 2422 3:30-4:30 75 0 18 0 93 1.04 0.16 No
13 Bradhurst Ave. btw Grasslands Rd. and Lakeview Ave. AM Peak 1555 8:00-9:00 0 0 0 24 1128 1.73 2.37 NoMD Peak 1171 1:00-2:00 0 0 0 24 1128 1.96 2.93 NoPM Peak 1171 3:30-4:30 0 0 0 24 1128 1.96 2.93 No
14 Lakeview Ave. btw Bradhurst Ave. and Commerce Str. AM Peak 1555 8:00-9:00 0 0 0 24 1128 1.73 2.37 NoMD Peak 1171 1:00-2:00 0 0 0 24 1128 1.96 2.93 NoPM Peak 1171 3:30-4:30 0 0 0 24 1128 1.96 2.93 No
15 Lakeview Ave. btw Wall Street and Pamela Lane AM Peak 1555 8:00-9:00 0 0 0 48 2256 2.45 3.89 YesMD Peak 1171 1:00-2:00 0 0 0 48 2256 2.93 4.66 YesPM Peak 1171 3:30-4:30 0 0 0 48 2256 2.93 4.66 Yes
(Future NB 2006)Notes:New PCEs = (no. of cars + no. of trucks*(47))PCE ratio = (Existing PCEs + Project generated PCEs) / Existing PCEsIncremental change in dBA = 10 log (PCE ratio)
Route Segment
FEIS KENRESWORKSITES 119

TABLE 5.1-17. COMPARISON OF EXISTING PCES TO ANTICIPATED FUTURE WITH THE PROJECT PCES DURING CONSTRUCTION (2006) WITH CROTON PROJECT (TRUCK ROUTE OPTION E)
Period of Analysis (Weekday)
Pure No Build (without Croton)
PCEs
Time New Passenger Car (CatDel)
New Trucks
(CatDel)New PCEs PCE Ratio Incremental
Change in dBAImpact Criteria
Exceeded?
6 Elwood Ave (Rt. 141) / Commerce Street AM Peak 1566 8:00-9:00 0 48 2256 2.44 3.87 YesMD Peak 1382 1:00-2:00 0 48 2256 2.63 4.20 YesPM Peak 1125 3:30-4:30 0 48 2256 3.01 4.78 Yes
9 Kensico Rd. & Westchester Ave. / Commerce Street AM Peak 2165 8:00-9:00 0 48 2256 2.04 3.10 YesMD Peak 2048 1:00-2:00 0 48 2256 2.10 3.23 YesPM Peak 1906 3:30-4:30 0 48 2256 2.18 3.39 Yes
10 Kensico Rd. / Columbus Ave & Nanny Hagen Rd. AM Peak 3592 8:00-9:00 0 48 2256 1.63 2.12 NoMD Peak 2858 1:00-2:00 0 48 2256 1.79 2.53 NoPM Peak 1770 3:30-4:30 0 48 2256 2.27 3.57 Yes
Notes:New PCEs = (no. of cars + no. of trucks*(47))PCE ratio = (Existing PCEs + Project generated PCEs) / Existing PCEsIncremental change in dBA = 10 log (PCE ratio)
Route Segment
FEIS KENRESWORKSITES 120

FEIS KENRESWORKSITES 121
Option E Conditions. Under 2006 Construction Option E conditions, two of the seven route segments examined were predicted to have temporary adverse increases in noise levels from construction-related traffic during the AM, midday, and/or PM peak periods, of more than 3.0 dBA. The results of the analysis for the 2006 Construction Option E conditions are shown in Table 5.1-17. The temporary adverse noise increases are predicted to range between 3.03 and 4.66 dBA, over the predicted 2006 Future without the Project noise levels. While these increases would be above the 3.0 dBA threshold, they are temporary as peak construction activity in 2006 is estimated to last approximately six months. Therefore, these impacts are not considered significant. Increases in noise levels from construction- related traffic in 2006 under Option E conditions along the other route segments examined during the AM, midday, and/or PM peak periods, were predicted to range between 0.00 and 2.93 dBA.
2010 Construction Conditions
As noted above, the 2010 analysis examines the peak year of construction activity at the Kensico Reservoir work sites, when three components of the proposed work would be underway (balance filling and grading of the Catskill Aerator, aqueduct pressurization, and construction of the new Screen Chamber). As with the other analyses, conditions with and without the Croton project are examined (see Tables 5.1-18 and 5.1-19).
Without the Croton Project.
Under 2010 Construction conditions (without the Croton project), none of the three route segments examined were predicted to have temporary adverse increases in noise levels from construction-related traffic during the AM, midday, and/or PM peak periods. The results of the analysis for these 2010 Construction conditions are shown in Table 5.1-18. Segment 15 (Lakeview Avenue between Wall Street and Pamela Lane) would experience an increase of 3.02 dBA during the PM peak period, imperceptibly above the 3.0 dBA threshold for adverse impacts. Because the majority of the predicted increases are below 3.0 dBA, and all are well below 5.0 dBA and the increases would only be temporary (peak construction activity in 2010 is estimated to last for a shorter duration that 2006 peak construction activity), none of the increases are considered to be adverse impacts.
With the Croton Project.
Under 2010 Construction conditions (with the Croton project), none of the three route
segments examined were predicted to have temporary adverse increases in noise levels from construction-related traffic during the AM, midday, and/or PM peak periods. The results of the screening analysis for the 2010 Construction conditions (with the Croton project) are similar to the 2010 Construction conditions (without the Croton project) since the Croton project would not have any project-generated vehicle trips along these three critical route segments, during the peak time periods analyzed (see Table 5.1-19).

FEIS KENRESWORKSITES 122
2006 Construction Stationary Source. The adjacent sensitive receptors to the Boat Hole, which connects to the Catskill Aqueduct, would experience increases in noise levels from construction-related stationary sources. The construction equipment would be spread out along the 1,000 foot length of the aqueduct, and at most, two pieces of equipment would be used per construction stage. Also, during excavation, construction activity would take place approximately 25 feet below grade, and thus the equipment would be shielded from the nearby residences. Therefore, these increases in noise levels would only be temporary (construction activity is estimated to last approximately six months); none of the increases have been considered to be adverse impacts.

TABLE 5.1-18. COMPARISON OF EXISTING PCES TO ANTICIPATED PCES IN THE FUTURE WITH THE PROJECT DURING CONSTRUCTION (2010) WITHOUT THE CROTON PROJECT
Period of Analysis (Weekday)
Pure No Build (without Croton)
PCEs
Time New Passenger Car (CatDel)
New Trucks
(CatDel)New PCEs PCE Ratio Incremental
Change in dBAImpact Criteria
Exceeded?
15 Lakeview Ave. btw Wall Street and Pamela Lane Early AM Peak 1197 6:30-7:30 0 0 0 1.00 0.00 NoAM Peak 1555 8:00-9:00 0 25 1175 1.76 2.44 NoPM Peak 1171 3:30-4:30 0 25 1175 2.00 3.02 Yes
16 Columbus Ave. btw Ann Place and Fountain Drive Early AM Peak 1197 6:30-7:30 10 0 10 1.01 0.04 NoAM Peak 1555 8:00-9:00 0 25 1175 1.76 2.44 NoPM Peak 1171 3:30-4:30 10 0 10 1.01 0.04 No
17 Columbus Ave. btw Aerator Drive and Highclere Lane Early AM Peak 1197 6:30-7:30 90 0 90 1.08 0.31 NoAM Peak 1555 8:00-9:00 0 25 1175 1.76 2.44 NoPM Peak 1171 3:30-4:30 90 0 90 1.08 0.32 No
(Future NB 2010)Notes:New PCEs = (no. of cars + no. of trucks*(47))PCE ratio = (Existing PCEs + Project generated PCEs) / Existing PCEsIncremental change in dBA = 10 log (PCE ratio)
Route Segment
FEIS KENRESWORKSITES 123

TABLE 5.1-19. COMPARISON OF EXISTING PCES TO ANTICIPATED FUTURE WITH THE PROJECT PCES DURING CONSTRUCTION (2010) WITH CROTON PROJECT
Period of Analysis (Weekday)
Pure No Build (without Croton)
PCEs
Time New Passenger Car (Croton)
New Trucks
(Croton)
New Passenger Car (CatDel)
New Trucks
(CatDel)New PCEs PCE Ratio Incremental
Change in dBAImpact Criteria
Exceeded?
15 Lakeview Ave. btw Wall Street and Pamela Lane Early AM Peak 1197 6:30-7:30 0 0 0 0 0 1.00 0.00 NoAM Peak 1555 8:00-9:00 0 0 0 25 1175 1.76 2.44 NoPM Peak 1171 3:30-4:30 0 0 0 25 1175 2.00 3.02 Yes
16 Columbus Ave. btw Ann Place and Fountain Drive Early AM Peak 1197 6:30-7:30 0 0 10 0 10 1.01 0.04 NoAM Peak 1555 8:00-9:00 0 0 0 25 1175 1.76 2.44 NoPM Peak 1171 3:30-4:30 0 0 10 0 10 1.01 0.04 No
17 Columbus Ave. btw Aerator Drive and Highclere Lane Early AM Peak 1197 6:30-7:30 0 0 90 0 90 1.08 0.31 NoAM Peak 1555 8:00-9:00 0 0 0 25 1175 1.76 2.44 NoPM Peak 1171 3:30-4:30 0 0 90 0 90 1.08 0.32 No
(Future NB 2010)Notes:New PCEs = (no. of cars + no. of trucks*(47))PCE ratio = (Existing PCEs + Project generated PCEs) / Existing PCEsIncremental change in dBA = 10 log (PCE ratio)
Route Segment
FEIS KENRESWORKSITES 124

FEIS KENRESWORKSITES 125
5.1.3.2.9. Air Quality
Trucks would be routed from the Eastview Site to the Kensico Reservoir via five potential
routes. Commuter traffic (e.g., passenger cars) could use these roads as well as the trucks carrying fill material from the Eastview Site to the Kensico campus. Therefore, the potential for air quality impacts along those proposed project’s transportation routes connecting these routes to the work sites were evaluated. If the Croton project is built on the Eastview Site, some construction-related traffic from that project (including both trucks and employee vehicles) would travel through the Kensico study area in 2006. This traffic would be relatively minor, and would not be associated with the fill operations. Of the five separate truck route options, four options (Options A through D) were analyzed and the concentrations of PM10 and PM2.5 of the four options are presented in the tables below A comparison of the LOS analyses for the five options has indicated that impacts would be less for Option E than those presented in the tables below. Therefore air quality impacts for Option E have been screened from this analysis. As discussed above, impacts associated with the trucking activity on air quality, in 2010 are conservatively estimated to be equal to or less than the impacts projected for the construction year 2006.
Work Related to Catskill Aqueduct Pressurization. The mobile source screening thresholds for microscale analyses are 100 vehicles per hour for CO impacts and 21 diesel trucks per hour for PM impacts. During the peak construction year (2006), approximately 100 construction worker trips would be generated each day during the construction season at the Kensico Reservoir work sites: a) The filling of the Aerators would generate up to 10 construction worker trips per day; b) Construction of the new Screen Chamber would generate 50 worker trips per day; and c) The remaining sites for the Catskill Aqueduct pressurization (e.g., Boat Hole) would generate 40 worker trips (20 split between two of the individual sites) per day. With the exception of the filling of the Aerators (which is discussed separately below), only 12 truck trips would be generated by the Kensico Reservoir work sites per day (10 from the new Screen Chamber and 2 from the two other pressurization sites). The number of construction worker trips and truck trips at each site would be under the screening thresholds for carbon monoxide and fine particulate matter. The construction worker traffic would be considerably lower during other construction seasons at Kensico Reservoir.
During construction, the work sites may include some minor activities that include the use of a crane or backhoe. Excavation work may occur at some locations but would be limited in scale and duration. As mentioned above, trucks from the Eastview Site would deliver fill material for the Delaware and Catskill Aerators. This activity is not anticipated to create a high level of fugitive dust (such as that associated with construction of the proposed UV Facility at the Eastview Site) at the Aerators. Given that the more intensive construction activities of the proposed UV Facility at the Eastview Site would not result in predicted significant adverse impacts on the adjacent property, the construction at these work sites, which are less intensive

FEIS KENRESWORKSITES 126
and shorter in duration, are not anticipated to have any significant or adverse impacts on air quality.
Work Related to Filling of Aerators: A quantified analysis of the potential PM10 and PM2.5 impacts from the truck delivering fill to the Aerators was performed. A neighborhood analysis was used to determine annual impacts for PM2.5. The intersections selected for analysis are presented in Table 5.1-20 and illustrated in Figure 5.1-18).
TABLE 5.1-20. INTERSECTIONS SELECTED FOR AIR QUALITY MOBILE SOURCE ANALYSIS
Intersection ID Number Intersection Names 27, 30 Route 100C at Sprain Brook Parkway 24 Route 100C at Clearbrook Road/Walker Road 6 Route 100C at Bradhurst Avenue
The anticipated peak year for construction truck traffic (2006) was used for the construction analysis. The filling is anticipated to generate approximately 192 trips per day or 24 trips per hour for approximately six months. This number of heavy duty diesel trucks would be under the screening thresholds for carbon monoxide but would exceed the threshold for fine particulate matter. Therefore, the PM10 and PM2.5 impacts from these heavy trucks were modeled. The intersections presented in Table 5.1-20 are those that would be most affected by project-generated construction traffic (i.e., highest project increments for heavy trucks).
Future Without the Project.
If the Croton project is built on the Eastview Site, some construction-related traffic from
that project (including both trucks and employee vehicles) would travel through the Kensico study area in 2006. This traffic would be relatively minor, and would not be associated with the fill operations. However, two Future Without the Project scenarios are presented below, both with and without the Croton project at the Eastview Site for each of the truck route options analyzed. As noted above, the filling of the Aerators would generate truck trips between the Eastview Site and the Kensico Reservoir work sites.
Without Croton Project at Eastview Site.
Particulate Matter (PM10). As indicated in Tables 5.1-21 to 5.1-24 the predicted concentrations of PM10 in the Future Without the Project (i.e., without the filling of the Aerators) and without the Croton project for the analysis year are below the corresponding ambient air quality standards. Both the 24-hour and annual averaging periods for each modeled intersection would be in compliance with the standard.

FEIS KENRESWORKSITES 127
TABLE 5.1-21. PREDICTED PM10 24-HOUR AND ANNUAL CONCENTRATIONS IN THE FUTURE WITHOUT THE FILL OPERATION WITHOUT CROTON PROJECT
TRUCK ROUTE OPTION A(µg/m3)
Intersection Averaging Period
Ambient AQ Background
Model Results
Total Predicted
Conc.1 Standard
Construction Year 2006 24 hour 45 42.02 87 150 Route 100C at Sprain Brook
Parkway Interchange Annual 21 15.36 36 50 24 hour 45 42.61 88 150 Route 100C at Clearbrook
Road/Walker Road Annual 21 14.31 35 50 24 hour 45 49.47 94 150 Route 100C at Bradhurst
Avenue Annual 21 15.37 36 50 Notes: 1 Total Predicted Concentration = Ambient AQ Background + Model Results. TABLE 5.1-22. PREDICTED PM10 24-HOUR AND ANNUAL CONCENTRATIONS IN THE FUTURE WITHOUT THE FILL OPERATION WITHOUT CROTON PROJECT
TRUCK ROUTE OPTION B(µg/m3)
Intersection Averaging Period
Ambient AQ Background
Model Results
Total Predicted
Conc.1 Standard
Construction Year 2006 24 hour 45 42.02 87 150 Route 100C at Sprain Brook
Parkway Interchange Annual 21 15.36 36 50 24 hour 45 42.61 88 150 Route 100C at Clearbrook
Road/Walker Road Annual 21 14.31 35 50 24 hour 45 49.47 94 150 Route 100C at Bradhurst
Avenue Annual 21 15.37 36 50 Notes: 1 Total Predicted Concentration = Ambient AQ Background + Model Results. TABLE 5.1-23. PREDICTED PM10 24-HOUR AND ANNUAL CONCENTRATIONS IN THE FUTURE WITHOUT THE FILL OPERATION WITHOUT CROTON PROJECT
TRUCK ROUTE OPTION C(µg/m3)
Intersection Averaging Period
Ambient AQ Background
Model Results
Total Predicted
Conc.1 Standard
Construction Year 2006 24 hour 45 42.02 87 150 Route 100C at Sprain Brook
Parkway Interchange Annual 21 15.36 36 50 24 hour 45 42.61 88 150 Route 100C at Clearbrook
Road/Walker Road Annual 21 14.31 35 50 24 hour 45 49.47 94 150 Route 100C at Bradhurst
Avenue Annual 21 15.37 36 50 Notes: 1 Total Predicted Concentration = Ambient AQ Background + Model Results.
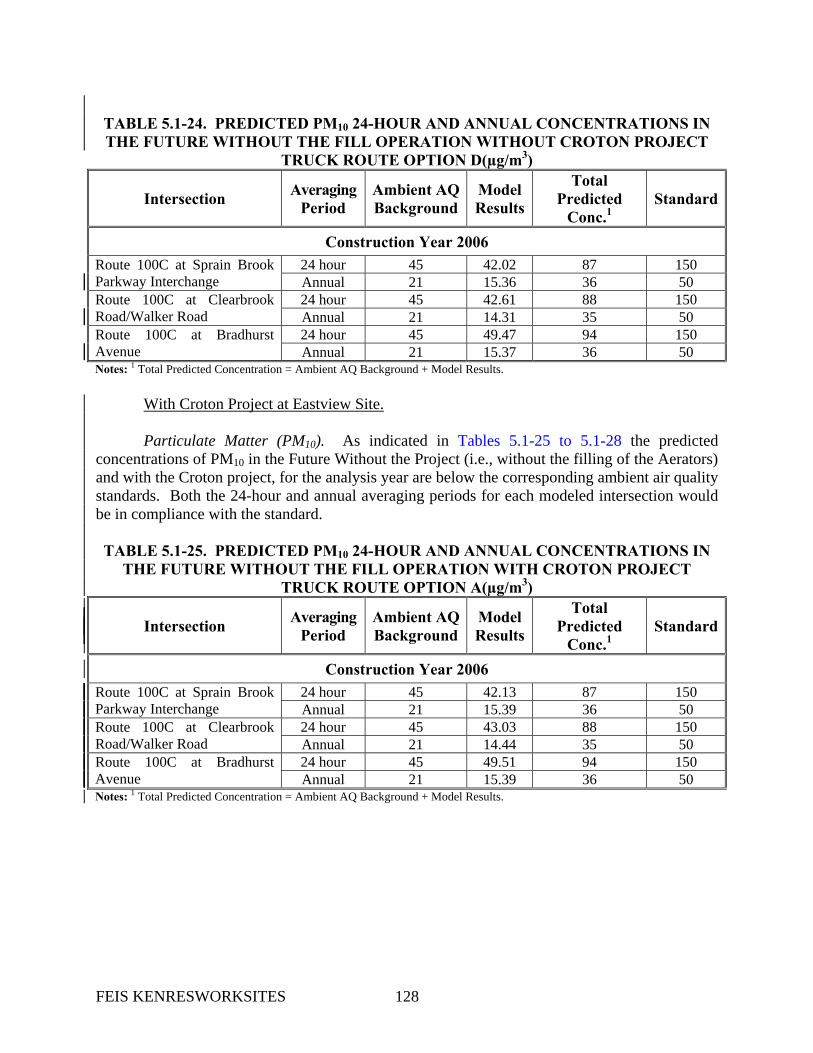
FEIS KENRESWORKSITES 128
TABLE 5.1-24. PREDICTED PM10 24-HOUR AND ANNUAL CONCENTRATIONS IN THE FUTURE WITHOUT THE FILL OPERATION WITHOUT CROTON PROJECT
TRUCK ROUTE OPTION D(µg/m3)
Intersection Averaging Period
Ambient AQ Background
Model Results
Total Predicted
Conc.1 Standard
Construction Year 2006 24 hour 45 42.02 87 150 Route 100C at Sprain Brook
Parkway Interchange Annual 21 15.36 36 50 24 hour 45 42.61 88 150 Route 100C at Clearbrook
Road/Walker Road Annual 21 14.31 35 50 24 hour 45 49.47 94 150 Route 100C at Bradhurst
Avenue Annual 21 15.37 36 50 Notes: 1 Total Predicted Concentration = Ambient AQ Background + Model Results.
With Croton Project at Eastview Site.
Particulate Matter (PM10). As indicated in Tables 5.1-25 to 5.1-28 the predicted concentrations of PM10 in the Future Without the Project (i.e., without the filling of the Aerators) and with the Croton project, for the analysis year are below the corresponding ambient air quality standards. Both the 24-hour and annual averaging periods for each modeled intersection would be in compliance with the standard. TABLE 5.1-25. PREDICTED PM10 24-HOUR AND ANNUAL CONCENTRATIONS IN
THE FUTURE WITHOUT THE FILL OPERATION WITH CROTON PROJECT TRUCK ROUTE OPTION A(µg/m3)
Intersection Averaging Period
Ambient AQ Background
Model Results
Total Predicted
Conc.1 Standard
Construction Year 2006 24 hour 45 42.13 87 150 Route 100C at Sprain Brook
Parkway Interchange Annual 21 15.39 36 50 24 hour 45 43.03 88 150 Route 100C at Clearbrook
Road/Walker Road Annual 21 14.44 35 50 24 hour 45 49.51 94 150 Route 100C at Bradhurst
Avenue Annual 21 15.39 36 50 Notes: 1 Total Predicted Concentration = Ambient AQ Background + Model Results.

FEIS KENRESWORKSITES 129
TABLE 5.1-26. PREDICTED PM10 24-HOUR AND ANNUAL CONCENTRATIONS IN THE FUTURE WITHOUT THE FILL OPERATION WITH CROTON PROJECT
TRUCK ROUTE OPTION B(µg/m3)
Intersection Averaging Period
Ambient AQ Background
Model Results
Total Predicted
Conc.1 Standard
Construction Year 2006 24 hour 45 42.13 87 150 Route 100C at Sprain Brook
Parkway Interchange Annual 21 15.39 36 50 24 hour 45 43.03 88 150 Route 100C at Clearbrook
Road/Walker Road Annual 21 14.44 35 50 24 hour 45 49.51 94 150 Route 100C at Bradhurst
Avenue Annual 21 15.39 36 50 Notes: 1 Total Predicted Concentration = Ambient AQ Background + Model Results. TABLE 5.1-27. PREDICTED PM10 24-HOUR AND ANNUAL CONCENTRATIONS IN
THE FUTURE WITHOUT THE FILL OPERATION WITH CROTON PROJECT TRUCK ROUTE OPTION C(µg/m3)
Intersection Averaging Period
Ambient AQ Background
Model Results
Total Predicted
Conc.1 Standard
Construction Year 2006 24 hour 45 42.13 87 150 Route 100C at Sprain Brook
Parkway Interchange Annual 21 15.39 36 50 24 hour 45 43.03 88 150 Route 100C at Clearbrook
Road/Walker Road Annual 21 14.44 35 50 24 hour 45 49.51 94 150 Route 100C at Bradhurst
Avenue Annual 21 15.39 36 50 Notes: 1 Total Predicted Concentration = Ambient AQ Background + Model Results.
TABLE 5.1-28. PREDICTED PM10 24-HOUR AND ANNUAL CONCENTRATIONS IN
THE FUTURE WITHOUT THE FILL OPERATION WITH CROTON PROJECT TRUCK ROUTE OPTION D(µg/m3)
Intersection Averaging Period
Ambient AQ Background
Model Results
Total Predicted
Conc.1 Standard
Construction Year 2006 24 hour 45 42.13 87 150 Route 100C at Sprain Brook
Parkway Interchange Annual 21 15.39 36 50 24 hour 45 43.03 88 150 Route 100C at Clearbrook
Road/Walker Road Annual 21 14.44 35 50 24 hour 45 49.51 94 150 Route 100C at Bradhurst
Avenue Annual 21 15.39 36 50 Notes: 1 Total Predicted Concentration = Ambient AQ Background + Model Results.
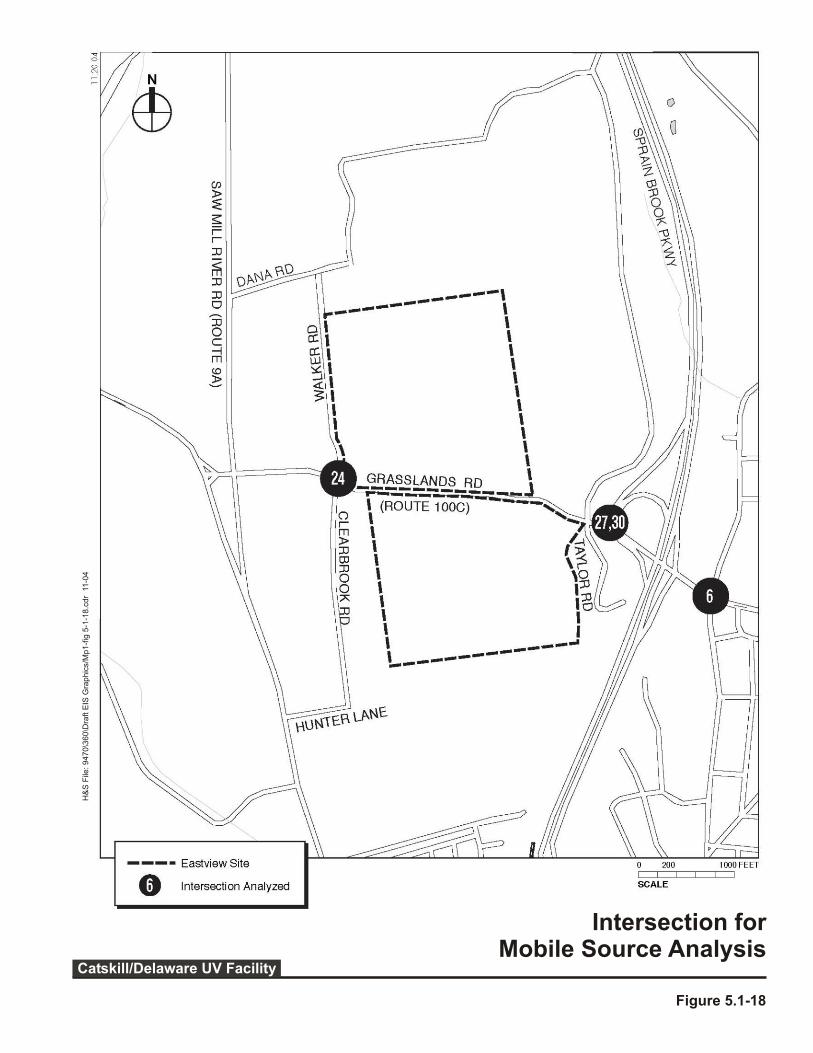

FEIS KENRESWORKSITES 131
Future With the Project. Without Croton Project at Eastview Site. During the peak year (2006) of truck operations associated with filling the Kensico
Aerators, there would be approximately 24 trucks every hour traveling from the Eastview Site to the Kensico campus, and the same number traveling back to the Eastview Site from Kensico campus during the eight (8) construction hours each day.
This number would be the same for both scenarios, with and without the Croton project at the Eastview Site. In addition, the same number of trucks would pass through these three analyzed intersections for all four parking options. In the Future With the Croton project scenario, there would be some additional truck traffic that would travel through the Kensico study area in 2006. However, this traffic would be relatively minor, and would not be associated with the fill operations. Therefore, the impact analyses focused on the potential impacts of the proposed project in 2006 from the filling of the Delaware Aerator at the Kensico campus. Of the five separate truck route options, four options (Options A through D) were analyzed and the concentrations of PM10 and PM2.5 of the four options are presented in the tables below A comparison of the LOS analyses for the five options has indicated that impacts would be less for Option E than those presented in the tables below. Therefore air quality impacts for Option E have been screened from this analysis.
Particulate Matter (PM10). As indicated in Tables 5.1-29 to 5.1-32, the predicted concentrations of PM10, for the analysis year 2006, for each of the separate truck route options are below the corresponding ambient air quality standards. The concentrations for both the 24-hour and annual averaging periods for each modeled intersection are in compliance with the standard. Therefore, it can be concluded that there would be no significant PM10 impacts at the Kensico Reservoir work sites from the proposed filling of the Delaware Aerator.
TABLE 5.1-29. PREDICTED PM10 24-HOUR AND ANNUAL CONCENTRATIONS IN THE FUTURE WITH THE PROJECT WITHOUT CROTON PROJECT TRUCK
ROUTE OPTION A(µg/m3)
Intersection Averaging Period
Ambient AQ Background
Model Results
Total Predicted
Conc.1 Standard
Construction Year 2006 24 hour 45 42.31 87 150 Route 100C at Sprain
Brook Parkway Interchange Annual 21 15.49 36 50
24 hour 45 43.05 88 150 Route 100C at Clearbrook Rd/Walker Rd Annual 21 14.49 35 50
24 hour 45 50.02 95 150 Route 100C at Bradhurst Avenue Annual 21 15.44 36 50 Notes: 1Ambient AQ Background + Model Results (Future With Project [with fill operation] without Croton) = Total Predicted Concentration.

FEIS KENRESWORKSITES 132
TABLE 5.1-30. PREDICTED PM10 24-HOUR AND ANNUAL CONCENTRATIONS IN THE FUTURE WITH THE PROJECT WITHOUT CROTON PROJECT TRUCK
ROUTE OPTION B(µg/m3)
Intersection Averaging Period
Ambient AQ Background
Model Results
Total Predicted
Conc.1 Standard
Construction Year 2006 24 hour 45 42.31 87 150 Route 100C at Sprain
Brook Parkway Interchange Annual 21 15.49 36 50
24 hour 45 43.05 88 150 Route 100C at Clearbrook Rd/Walker Rd Annual 21 14.49 35 50
24 hour 45 49.78 95 150 Route 100C at Bradhurst Avenue Annual 21 15.52 37 50 Notes: 1Ambient AQ Background + Model Results (Future With Project [with fill operation] without Croton) = Total Predicted Concentration.
TABLE 5.1-31. PREDICTED PM10 24-HOUR AND ANNUAL CONCENTRATIONS IN THE FUTURE WITH THE PROJECT WITHOUT CROTON PROJECT TRUCK
ROUTE OPTION C(µg/m3)
Intersection Averaging Period
Ambient AQ Background
Model Results
Total Predicted
Conc.1 Standard
Construction Year 2006 24 hour 45 42.31 87 150 Route 100C at Sprain
Brook Parkway Interchange Annual 21 15.49 36 50
24 hour 45 43.05 88 150 Route 100C at Clearbrook Rd/Walker Rd Annual 21 14.49 35 50
24 hour 45 49.91 95 150 Route 100C at Bradhurst Avenue Annual 21 15.48 36 50 Notes: 1Ambient AQ Background + Model Results (Future With Project [with fill operation] without Croton) = Total Predicted Concentration.

FEIS KENRESWORKSITES 133
TABLE 5.1-32. PREDICTED PM10 24-HOUR AND ANNUAL CONCENTRATIONS IN THE FUTURE WITH THE PROJECT WITHOUT CROTON PROJECT TRUCK
ROUTE OPTION D(µg/m3)
Intersection Averaging Period
Ambient AQ Background
Model Results
Total Predicted
Conc.1 Standard
Construction Year 2006 24 hour 45 42.31 87 150 Route 100C at Sprain
Brook Parkway Interchange Annual 21 15.49 36 50
24 hour 45 43.05 88 150 Route 100C at Clearbrook Rd/Walker Rd Annual 21 14.49 35 50
24 hour 45 49.90 95 150 Route 100C at Bradhurst Avenue Annual 21 15.47 37 50 Notes: 1Ambient AQ Background + Model Results (Future With Project [with fill operation] without Croton) = Total Predicted Concentration.
Fine Particulate Matter Analysis. As indicated in Table 5.1-33 to 5.1-36, the predicted
incremental concentrations of PM2.5, for the analysis year 2006 for each of the separate truck route options are below the corresponding ambient air quality interim guidance levels Therefore, it can be concluded that there would be no significant impacts for PM2.5 at the Kensico Reservoir work sites. TABLE 5.1-33. PREDICTED PM2.5 24-HOUR AND ANNUAL CONCENTRATIONS IN
THE FUTURE WITH THE PROJECT WITHOUT CROTON PROJECT TRUCK ROUTE OPTION A (µg/m3)
Predicted Conc.1 Intersection Averaging
Time With Project
Without Project
Project Increment2
Interim Guidance
Construction Year 2006 24-hour 7.34 7.16 0.18 5 Route 100C at Sprain
Brook Parkway Interchange Annual 0.36 0.34 0.02 0.1
24-hour 7.60 7.44 0.16 5 Route 100C at Clearbrook Rd/Walker Rd Annual 0.33 0.31 0.02 0.1
24-hour 8.97 8.73 0.24 5 Route 100C at Bradhurst Avenue Annual 0.38 0.35 0.03 0.1 Notes: 1 Annual impacts are for neighborhood receptors. 2The increment was calculated by subtracting PM2.5 concentrations for the Future Without the Project (without fill operation) without Croton from the PM2.5 concentrations for the Future With the Project (with fill operation) without Croton.

FEIS KENRESWORKSITES 134
TABLE 5.1-34. PREDICTED PM2.5 24-HOUR AND ANNUAL CONCENTRATIONS IN THE FUTURE WITH THE PROJECT WITHOUT CROTON PROJECT TRUCK
ROUTE OPTION B (µg/m3) Predicted Conc.1
Intersection Averaging Time With
Project Without Project
Project Increment2
Interim Guidance
Construction Year 2006 24-hour 7.34 7.16 0.18 5 Route 100C at Sprain
Brook Parkway Interchange Annual 0.36 0.34 0.02 0.1
24-hour 7.60 7.44 0.16 5 Route 100C at Clearbrook Rd/Walker Rd Annual 0.33 0.31 0.02 0.1
24-hour 8.87 8.73 0.14 5 Route 100C at Bradhurst Avenue Annual 0.38 0.35 0.03 0.1 Notes: 1 Annual impacts are for neighborhood receptors. 2The increment was calculated by subtracting PM2.5 concentrations for the Future Without the Project (without fill operation) without Croton from the PM2.5 concentrations for the Future With the Project (with fill operation) without Croton.
TABLE 5.1-35. PREDICTED PM2.5 24-HOUR AND ANNUAL CONCENTRATIONS IN THE FUTURE WITH THE PROJECT WITHOUT CROTON PROJECT TRUCK
ROUTE OPTION C (µg/m3) Predicted Conc.1
Intersection Averaging Time With
Project Without Project
Project Increment2
Interim Guidance
Construction Year 2006 24-hour 7.34 7.16 0.18 5 Route 100C at Sprain
Brook Parkway Interchange Annual 0.36 0.34 0.02 0.1
24-hour 7.60 7.44 0.16 5 Route 100C at Clearbrook Rd/Walker Rd Annual 0.33 0.31 0.02 0.1
24-hour 8.92 8.73 0.19 5 Route 100C at Bradhurst Avenue Annual 0.37 0.35 0.02 0.1 Notes: 1 Annual impacts are for neighborhood receptors. 2The increment was calculated by subtracting PM2.5 concentrations for the Future Without the Project (without fill operation) without Croton from the PM2.5 concentrations for the Future With the Project (with fill operation) without Croton.

FEIS KENRESWORKSITES 135
TABLE 5.1-36. PREDICTED PM2.5 24-HOUR AND ANNUAL CONCENTRATIONS IN
THE FUTURE WITH THE PROJECT WITHOUT CROTON PROJECT TRUCK ROUTE OPTION D (µg/m3)
Predicted Conc.1 Intersection Averaging
Time With Project
Without Project
Project Increment2
Interim Guidance
Construction Year 2006 24-hour 7.34 7.16 0.18 5 Route 100C at Sprain
Brook Parkway Interchange Annual 0.36 0.34 0.02 0.1
24-hour 7.60 7.44 0.16 5 Route 100C at Clearbrook Rd/Walker Rd Annual 0.33 0.31 0.02 0.1
24-hour 8.93 8.73 0.20 5 Route 100C at Bradhurst Avenue Annual 0.37 0.35 0.02 0.1 Notes: 1 Annual impacts are for neighborhood receptors. 2The increment was calculated by subtracting PM2.5 concentrations for the Future Without the Project (without fill operation) without Croton from the PM2.5 concentrations for the Future With the Project (with fill operation) without Croton.
With Croton Project at Eastview Site.
If the Croton project were to be constructed simultaneously in 2006, the number of trucks
generated for truck route Option D would be similar to the Future With the Project the without Croton project scenario. Therefore, the maximum PM10 and PM2.5 impacts for Option D are presented in the previous section and Option D is not further analyzed here,
Particulate Matter (PM10). As indicated in Tables 5.1-37 to 5.1-39 the predicted
concentrations of PM10, for the analysis year 2006, for the separate truck route options analyzed, are below the corresponding ambient air quality standards. The concentrations for both the 24-hour and annual averaging periods for each modeled intersection are in compliance with the standard. Therefore, it can be concluded that there would be no significant PM10 impacts at the Kensico Reservoir work sites from the proposed filling of the Delaware Aerator.

FEIS KENRESWORKSITES 136
TABLE 5.1-37. PREDICTED PM10 24-HOUR AND ANNUAL CONCENTRATIONS IN THE FUTURE WITH THE PROJECT WITH CROTON PROJECT TRUCK
ROUTE OPTION A(µg/m3)
Intersection Averaging Period
Ambient AQ Background
Model Results
Total Predicted
Conc.1 Standard
Construction Year 2006 24 hour 45 42.43 87 150 Route 100C at Sprain
Brook Parkway Interchange Annual 21 15.52 37 50
24 hour 45 43.46 88 150 Route 100C at Clearbrook Road/Walker Road Annual 21 14.62 36 50
24 hour 45 50.07 95 150 Route 100C at Bradhurst Avenue Annual 21 15.46 36 50 Notes: 1Ambient AQ Background + Model Results (Future With Project [with fill operation] with Croton) = Total Predicted Concentration.
TABLE 5.1-38. PREDICTED PM10 24-HOUR AND ANNUAL CONCENTRATIONS IN THE FUTURE WITH THE PROJECT WITH CROTON PROJECT TRUCK
ROUTE OPTION B(µg/m3)
Intersection Averaging Period
Ambient AQ Background
Model Results
Total Predicted
Conc.1 Standard
Construction Year 2006 24 hour 45 42.43 87 150 Route 100C at Sprain
Brook Parkway Interchange Annual 21 15.52 37 50
24 hour 45 43.46 88 150 Route 100C at Clearbrook Road/Walker Road Annual 21 14.62 36 50
24 hour 45 49.83 95 150 Route 100C at Bradhurst Avenue Annual 21 15.54 36 50 Notes: 1Ambient AQ Background + Model Results (Future With Project [with fill operation] with Croton) = Total Predicted Concentration.

FEIS KENRESWORKSITES 137
TABLE 5.1-39. PREDICTED PM10 24-HOUR AND ANNUAL CONCENTRATIONS IN THE FUTURE WITH THE PROJECT WITH CROTON PROJECT TRUCK
ROUTE OPTION C(µg/m3)
Intersection Averaging Period
Ambient AQ Background
Model Results
Total Predicted
Conc.1 Standard
Construction Year 2006 24 hour 45 42.43 87 150 Route 100C at Sprain
Brook Parkway Interchange Annual 21 15.52 37 50
24 hour 45 43.46 88 150 Route 100C at Clearbrook Road/Walker Road Annual 21 14.62 36 50
24 hour 45 49.96 95 150 Route 100C at Bradhurst Avenue Annual 21 15.50 36 50 Notes: 1Ambient AQ Background + Model Results (Future With Project [with fill operation] with Croton) = Total Predicted Concentration.
Fine Particulate Matter Analysis. As indicated in Table 5.1-40 to 5.1-42, the predicted
incremental concentrations of PM2.5 for the analysis year 2006 for each of the separate truck route options analyzed are below the corresponding ambient air quality interim guidance levels Therefore, it can be concluded that there would be no significant impacts for PM2.5 at the Kensico Reservoir work sites. TABLE 5.1-40. PREDICTED PM2.5 24-HOUR AND ANNUAL CONCENTRATIONS IN
THE FUTURE WITH THE PROJECT WITH CROTON PROJECT TRUCK ROUTE OPTION A (µg/m3)
Predicted Conc.1 Intersection Averaging
Time With Project
Without Project
Project Increment2
Interim Guidance
Construction Year 2006 24-hour 7.39 7.20 0.19 5 Route 100C at Sprain
Brook Parkway Interchange Annual 0.36 0.34 0.02 0.1
24-hour 7.66 7.50 0.16 5 Route 100C at Clearbrook Road/Walker Road Annual 0.33 0.31 0.02 0.1
24-hour 8.99 8.76 0.23 5 Route 100C at Bradhurst Avenue Annual 0.38 0.35 0.03 0.1 Notes: 1 Annual impacts are for neighborhood receptors. 2The increment was calculated by subtracting PM2.5 concentrations for the Future Without the Project (without fill operation) with Croton from the PM2.5 concentrations for the Future With the Project (with fill operation) with Croton.

FEIS KENRESWORKSITES 138
TABLE 5.1-41. PREDICTED PM2.5 24-HOUR AND ANNUAL CONCENTRATIONS IN THE FUTURE WITH THE PROJECT WITH CROTON PROJECT TRUCK ROUTE
OPTION B (µg/m3) Predicted Conc.1
Intersection Averaging Time With
Project Without Project
Project Increment2
Interim Guidance
Construction Year 2006 24-hour 7.39 7.20 0.19 5 Route 100C at Sprain
Brook Parkway Interchange Annual 0.36 0.34 0.02 0.1
24-hour 7.66 7.50 0.16 5 Route 100C at Clearbrook Road/Walker Road Annual 0.33 0.31 0.02 0.1
24-hour 8.84 8.71 0.13 5 Route 100C at Bradhurst Avenue Annual 0.38 0.35 0.03 0.1 Notes: 1 Annual impacts are for neighborhood receptors. 2The increment was calculated by subtracting PM2.5 concentrations for the Future Without the Project (without fill operation) with Croton from the PM2.5 concentrations for the Future With the Project (with fill operation) with Croton.
TABLE 5.1-42. PREDICTED PM2.5 24-HOUR AND ANNUAL CONCENTRATIONS IN
THE FUTURE WITH THE PROJECT WITH CROTON PROJECT TRUCK ROUTE OPTION C (µg/m3)
Predicted Conc.1 Intersection Averaging
Time With Project
Without Project
Project Increment2
Interim Guidance
Construction Year 2006 24-hour 7.39 7.20 0.19 5 Route 100C at Sprain
Brook Parkway Interchange Annual 0.36 0.34 0.02 0.1
24-hour 7.66 7.50 0.16 5 Route 100C at Clearbrook Road/Walker Road Annual 0.33 0.31 0.02 0.1
24-hour 8.89 8.71 0.18 5 Route 100C at Bradhurst Avenue Annual 0.37 0.35 0.02 0.1 Notes: 1 Annual impacts are for neighborhood receptors. 2The increment was calculated by subtracting PM2.5 concentrations for the Future Without the Project (without fill operation) with Croton from the PM2.5 concentrations for the Future With the Project (with fill operation) with Croton.
5.1.3.2.10. Historic and Archaeological Resources
Historic Resources. The proposed project would have limited potential for physical impacts to historic resources. To avoid adverse construction-related impacts on the LEC from adjacent construction of the new Screen Chamber, NYCDEP would implement construction

FEIS KENRESWORKSITES 139
protection measures, in consultation with Secretary of the Interior’s Standards for the Treatment of Historic Properties and SHPO. These measures could include structural analyses of the LEC to determine any existing damage or potential weaknesses, establishing protection procedures such the erection of protective fencing or bracing, and establishing a monitoring program to measure vibrations and vertical and lateral movement. No exterior work would be performed on the UEC or the Screen Chamber and, although interior equipment would be removed from these structures, the equipment is not original. To avoid accidental construction damage to the UEC and Screen Chamber during equipment removal and their use as staging areas, NYCDEP in consultation with SHPO would implement construction protection measures, similar to those implemented for the LEC. Although the proposed project could have visual effects on the Kensico campus by filling portions of the Catskill and Delaware Aerators with excavated material from the Eastview Site—thus removing from view an above-grade feature of the Catskill Aqueduct system, the Catskill Aerator—the aerators are out of service and in a high state of disrepair. After the Aerators are filled, the areas would be graded and landscaped, which would improve the overall appearance of the Kensico Reservoir work sites. The proposed project would rebuild the aqueduct as a pressurized conduit between the LEC and the Boat Hole. Although rebuilding this section of the aqueduct would physically alter the potential historic resource, pressurization is necessary for the proposed project. Further, only a small section of the lengthy aqueduct would be rebuilt, alterations would be not be visible, and the aqueduct’s use for conveying water would not be changed. In addition, although the eligibility of the Catskill Aqueduct for either the State or National Registers of Historic Places has not been determined, NYCDEP is in consultation with SHPO on this issue. If it is determined that the Aqueduct is eligible for the Register(s), NYCDEP would undertake measures, in consultation with SHPO and in accordance with the Secretary of the Interior’s Standards for the Treatment of Historic Properties, to ensure preservation of the Aqueduct’s historic character. Therefore, the proposed project would not have a significant adverse impact on historic resources.
Archaeological Resources. As described above, none of the Kensico Reservoir work sites are sensitive for precontact- or historic-period archaeological resources due to subsurface disturbance from construction of the Catskill Aqueduct. Therefore, the proposed project would not have significant adverse impacts on archaeological resources at the Kensico Reservoir work sites.
5.1.3.2.11. Hazardous Materials
Hazardous Materials Disturbed During Construction. As discussed above, the Phase I ESA confirmed the presence of hazardous materials in many of the Kensico Reservoir work locations and indicated the possible presence of additional hazardous materials. The proposed actions at the Kensico Reservoir work locations would potentially disturb some of these materials. Any hazardous materials (asbestos, lead-based paint, PCB-containing materials) identified in areas to be disturbed would be properly abated prior to the commencement of construction activities in compliance with all applicable federal, state, and local regulations. If

FEIS KENRESWORKSITES 140
suspect building components not sampled during the Phase I ESA are to be disturbed, these components would be sampled prior to commencement of construction activities and properly abated if required. If petroleum storage tanks are identified in areas to be disturbed, the tanks would be properly decommissioned, their contents disposed of off-site, and any contaminated soil and/or groundwater remediated according to applicable regulations prior to starting construction. Therefore, the proposed actions are not anticipated to have an adverse impact with respect to hazardous materials disturbed during construction at the Kensico Reservoir work locations.
Hazardous Materials Used During Construction. During construction activities at the Kensico Reservoir work locations, the Contractor may introduce a variety of hazardous materials to the Kensico campus to support the construction activity. The specific types and quantities of hazardous materials stored and used on the construction sites would depend on the nature and extent of activities being performed. In general, various petroleum-related materials would be used to support the operation of vehicles and heavy equipment (e.g., diesel fuel, gasoline, lubricants, glycol) as well as hazardous materials used in the construction process itself (e.g., concrete release agents, adhesives, paints and coatings). Each contractor would provide Material Safety Data Sheets (MSDS) for the construction-related hazardous materials that they would introduce to the work locations. In addition, these materials would be stored and handled in a manner that would prevent improper releases to the environment and/or exposure to site workers, according to applicable Federal, State and local regulations. These measures would be specified in a Construction Health and Safety Plan. Therefore, no significant adverse impacts are anticipated to result from hazardous materials used during construction activities.
Hazardous Materials Associated with the Catskill and Delaware Aerators. It is
anticipated that elemental mercury may be present within the aerator piping due to the age of the infrastructure associated with these structures. Prior to the dismantling of the aerators, a hazardous material survey with targeted sampling would be conducted, and if necessary, a more detailed site assessment would also be conducted. Based on the survey and sampling, appropriate remediation would be conducted, which would include removal of contaminated soils, debris, or infrastructure and a worker health and safety plan (HASP) that would ensure the public health and safety of construction workers and adjacent site occupants. Therefore, no significant adverse impacts are anticipated in association with the installation of this water main.
Hazardous Materials Associated with Delaware Shaft No. 18 Connection. If this
alternative water supply to the Town is chosen, prior to construction, a hazardous material survey would be conducted, and if necessary, a more detailed site assessment would be conducted. If necessary, appropriate remediation would be conducted which would, at a minimum, include a worker health and safety plan that would ensure the public health and safety of construction workers and adjacent site occupants. Therefore, no significant adverse impacts are anticipated in association with the installation of this water main.
Hazardous Materials Associated with Separate UV Building. If this alternative water
supply to the Town is chosen, prior to construction, a hazardous material survey would be conducted, and if necessary, a site assessment would be conducted. If necessary, appropriate remediation would be conducted which would, at a minimum, include a worker health and safety

FEIS KENRESWORKSITES 141
plan that would ensure the public health and safety of construction workers and adjacent site occupants. Therefore, no significant adverse impacts are anticipated in association with the construction of a separate UV building, which will provide the Town of Mount Pleasant with UV treated water.
5.1.3.2.12. Natural Resources
Upper Effluent Chamber. No clearing for a construction staging area is planned, and no exterior work is planned at this facility other than cleaning of the UEC building. Building vibrations during construction and the cleaning of the building exterior would most likely disturb the cliff swallow colonies that occur under the building eaves but only temporarily during construction. Cliff swallows are not on the NYSDEC list of endangered, threatened, and special concern fish and wildlife species and therefore do not require protection. However, care would be taken to minimize disturbance during their nesting period. No other impacts to natural resources at this location during construction are anticipated.
Lower Effluent Chamber. Building vibrations during construction and the cleaning of the building exterior would most likely disturb the cliff swallow colonies that occur under the building eaves but only temporarily during construction. Cliff swallows are not on the NYSDEC list of endangered, threatened, and special concern fish and wildlife species. However, care would be taken to minimize disturbance during their nesting period. It is anticipated that the 20 softwood trees in front of the Lower Effluent Chamber would be cut during construction activities (Table 5.1-43).
Catskill and Delaware Aerators. The small diameter landscape trees located in the
vicinity of the Aerators would be lost as a result of construction activities. These would be replaced upon the completion of construction activities and the landscaping of the Aerators.
Delaware Shaft No. 18. No impacts to natural resources are anticipated at the Delaware
Shaft No. 18. All proposed work would occur in previously disturbed areas.
New Screen Chamber. Clearing and excavation of a portion of the lawn between the LEC and the Catskill Aerator on City property would occur to allow for construction of the new Screen Chamber. Some of the small diameter landscape trees located along Columbus Avenue would be lost as a result of construction activities; these would be replaced upon the completion of construction activities at the site.
Fluoridation Pit. No clearing for a construction staging area is planned in association
with work at this facility. Some of the small diameter landscape trees along Columbus Avenue may be lost; these would be replaced upon the completion of construction activities at the site. No other impacts to natural resources at this location during construction are anticipated.
Existing Screen Chamber/Catskill Venturi Meter/Boat Hole. Cut and cover construction operations could disturb portions of the existing lawn and scrub/shrub habitat within an area approximately 50 feet on either side of the aqueduct centerline. The precise disturbance boundaries are not known at this point as the results of the inspection are still being evaluated for

FEIS KENRESWORKSITES 142
this aspect of the proposed pressurization work. Due to the steep slopes on either side of the roadway between the Screen Chamber and Venturi Meter, sidecasting of excavated material would be avoided. Excavated material from this area would be immediately hauled off-site. The portion of Clove Brook that flows under the Catskill Venturi Meter would not need to be diverted during construction. Any impacts to the stream would be minimized through the use of sediment erosion controls and implementation of a storm water pollution prevention plan. The small pocket wetland that occurs to the north of the roadway between the Venturi Meter and the Boat Hole could be impacted. Approximately 45 of the hardwood trees located on the north side of the roadway between the Venturi Meter and the Boat Hole may need to be cut to accommodate construction activities. These trees have been allowed to grow within the Catskill Aqueduct right-of-way and would eventually need to be removed even without the proposed project. Table 5.1-44 summarizes the number and species of trees identified within 50 feet of the Catskill Aqueduct centerline between the Screen Chamber and the Boat Hole. Since these trees are located in previously disturbed, sparsely wooded area it is not anticipated that construction in this area would result in significant adverse impacts to natural resources. The construction work would be seasonal (September through May). Potential wetland loss would be compensated for by the restoration plan proposed in Section 6, Mitigation of Potential Significant or Temporary Adverse Impacts. Any impacts to the stream would be compensated for by on-site stream restoration.
Separate UV Building. If this water supply alternative to the town is chosen, no clearing for a construction staging area is planned in association with work at this location.

Common Name Scientific Name 4-6 6-9 10-12 13-15 16-18 19-21 22-24 25-27 28-30 31-33 33-36 >36Norway spruce Picea abies -- -- -- -- -- 2 -- -- -- -- -- -- 2White Spruce Picea glauca -- -- -- 2 1 2 -- -- -- -- -- -- 5Northern White Ceda Thuja occidentalis -- 1 1 1 3 3 -- -- -- -- -- -- 9Oriental Arbor-Vitae Thuja orientalis -- -- 1 2 1 -- -- -- -- -- -- -- 4
TOTAL BY DBH 0 1 2 5 5 7 0 0 0 0 0 0 20
TABLE 5.1-43. SUMMARY OF TREES CUT AT THE KENSICO WORK SITESLower Effluent Chamber
Diameter at Breast Height (inches) Total By Species
FEIS KENRESWORKSITES 143

Common Name Scientific Name 4-6 6-9 10-12 13-15 16-18 19-21 22-24 25-27 28-30 31-33 33-36 >36Norway Maple Acer platanoides 4 8 5 4 2 -- 1 -- -- -- -- -- 24Red Maple Acer rubrum 1 4 2 2 -- -- -- -- -- -- -- -- 9Sugar Maple Acer saccharum 1 -- -- -- -- -- -- -- -- -- -- -- 1Tree of Heaven Ailanthus altissima -- 1 -- 1 -- -- -- -- -- -- -- -- 2Black Birch Betula lenta 1 1 -- 1 -- -- -- -- -- -- -- -- 3Hickory Carya sp. -- 2 -- 2 1 -- -- -- -- -- -- -- 5Flowering DogwoodCornus florida 2 2 1 -- -- -- -- -- -- -- -- -- 5American Beech Fagus grandifolia 10 5 -- -- -- -- -- -- -- -- -- -- 15Black Walnut Juglans nigra -- 5 5 2 1 -- -- -- -- -- -- -- 13Tulip Tree Liriodendron tulipifera 1 1 -- -- 1 -- -- -- -- -- -- -- 3Apple Malus sp. -- 2 -- -- -- -- -- -- -- -- -- -- 2American Sycamore Platanus occidentalis -- 1 -- -- -- -- -- -- -- -- -- -- 1Black Cherry Prunus serotina 1 1 1 -- -- -- -- -- -- -- -- -- 3Red Oak Quercus rubra 2 2 3 3 1 3 -- 1 -- -- 1 16Black Locust Robinia pseudoacacia -- 3 2 1 -- -- -- -- -- -- -- -- 6Sassafras Sassafras albidum -- 1 -- -- -- -- -- -- -- -- -- -- 1
TOTAL BY DBH 23 39 16 16 8 1 4 0 1 0 0 1 109
TABLE 5.1-44. SUMMARY OF TREES IDENTIFIED AT THE KENSICO WORK SITESScreenChamber/Venturi Meter/Boat Hole
Diameter at Breast Height (inches) Total By Species
FEIS KENRESWORKSITES 144

FEIS KENRESWORKSITES 145
5.1.3.2.13. Water Resources
As stated above, the stream that flows under the Catskill Venturi Meter would not need to
be diverted during construction. Potential impacts to the stream would be minimized through the use of sediment erosion controls and implementation of a storm water pollution prevention plan. It is not anticipated that construction operations in this area would cause significant, long-term impacts to the stream. The construction work would be seasonal (October through April); any impacts to the stream would be attenuated with on-site stream flow restoration.
Construction staging would be limited to the area within the construction fencing. A Stormwater Pollution Prevention Plan (SWPPP) would be implemented. These plans typically specify that a row of hay bales would be installed inside the construction fence to collect the minimal dust and soil anticipated from any equipment wash-water. Therefore, no significant adverse impact is anticipated on the existing stormwater drainage system within the study area.
5.1.3.2.14. Infrastructure and Energy
During construction, the contractor would be responsible for providing an independent source of water for drinking and construction uses. The contractor would likely select a method of supplying water from alternate sources to best suit its method of working; therefore, no significant impact would occur to the local water supply system. The proposed pressurization work on the Catskill Aqueduct would result in periodic shutdowns of this system. The shutdowns could result in potential impacts to a limited number of the upstate communities along the Catskill Aqueduct. These upstate communities located between Kensico Reservoir and the Eastview Site include the Town of Mount Pleasant and Westchester County Water District No. 3. Upstate communities located between the Eastview Site and Hillview Reservoir that could be affected include United Water New Rochelle and the City of Yonkers. All other users have backup connections to the Delaware Aqueduct, the New Croton Aqueduct, or another supply. Two options are being considered for providing temporary water to affected consumers of the Catskill Aqueduct water supply during extended shutdowns to be conducted during the pressurization work.
Option 1 - Temporary Pumping Station/Bypass Main. A temporary Delaware Shaft No. 19 Pumping Station would be established at the Eastview Site to convey Delaware Aqueduct water to the Catskill Aqueduct, downstream of the existing CCC. The estimated capacity of the station would be 50 mgd, based upon historic demand data. Three pumps (2 duty, 1 standby) would be located on existing Shaft No. 19. The pumps and valves would be enclosed in a temporary housing. Roof openings could be provided in the structure to allow for pump access by mobile crane.

FEIS KENRESWORKSITES 146
Electrical Power. Electrical power would be supplied to the site from two 4160-volt feeds (double-ended), installed in a concrete encased ductbank.
Emergency Generator. An emergency diesel generator would be located to the north of
Shaft No. 19, in the vicinity of the proposed UV Facility construction trailer offices. The estimated capacity of the emergency diesel generator would be about 1,500 kW.
Catskill Bypass Pipeline. A 42-inch diameter bypass main would be constructed to convey water from Shaft No. 19 to the Catskill Aqueduct. The design capacity of the bypass main would be 50 mgd. Approximately 2,800 linear feet of main would be required for the bypass. The bypass main would run south along the east property line, passing under Route 100C. Upon crossing Route 100C, the transmission line would be routed further to the east, across the Catskill Aqueduct and would continue south along the east side of the Catskill Aqueduct. The “tap” or aqueduct connection would be located downstream of the CCC. The 42-inch bypass main would be installed using traditional open cut soil/rock excavation, with exception of the section required to traverse Route 100C. This segment would be jacked/bored in order to minimize traffic impacts.
Option 2 - Backfeed from Hillview Reservoir.
Under this option, Delaware Aqueduct water could be supplied to Uptake Chamber #1, located at Hillview Reservoir, during Catskill Aqueduct shutdowns and allowed to backfeed into the Catskill Aqueduct to supply affected users. Water would flow up the Aqueduct without pumping if the water level within Hillview Reservoir is maintained above a minimum water level; otherwise pumping could be required. The City of Yonkers and Mt. Vernon draw water directly from the forebay of Uptake Chamber #1. If required to maintain a minimum water level in Uptake #1, temporary pumping equipment could be installed to feed water into Uptake #1. Due to limited space inside the Uptake Chamber, the pumps would likely be installed in the reservoir, adjacent to Uptake Chamber #1. The discharge from the pumps would either penetrate the exterior wall of existing Uptake #1 superstructure or, if possible, a sub-aqueous discharge could be provided through the existing waterways on the east or west side of the Uptake #1 Chamber. Three submersible pumps would lift water from the Reservoir and discharge into the uptake shaft. Pumping would only be required when the water elevation in the shaft was less than a minimum level required to feed affected users. Since the normal operating range for Hillview Reservoir satisfies the minimum required water level for users operating on backfeed from Hillview Reservoir, pumping would only be required on an as-needed basis. An emergency generator would be located in the vicinity of the Uptake #1 Chamber on the north end of Hillview to power the pumps in the event of a power failure. Construction of either of these water supply options would commence in late 2006.

FEIS KENRESWORKSITES 147
Construction staging would be limited to the area within the construction fencing, and impacts would be minimized through the use of sediment erosion controls and implementation of a storm water pollution prevention plan. A row of hay bales would be installed inside the construction fence to collect the minimal dust and soil anticipated from any equipment wash-water. Therefore, no significant impact is anticipated on the existing stormwater drainage system within the study area. The proposed pressurization work would involve installation of some temporary electricity service lines at the construction sites where a small office trailer could be located. Temporary electrical service would be provided by an 110/220V, 400A service to small office trailers located at the UEC and LEC. Con Edison would be responsible for supplying this temporary power independently of the existing system. The Aerators, Fluoridation Pit, the existing Screen Chamber, the Catskill Venturi Meter, and the Boat Hole would have no structures that need power. Therefore, there are no significant adverse impacts anticipated on the existing energy supply within the study area. Natural gas would not be utilized during construction; therefore, no significant adverse impacts are anticipated on the existing gas utilities within the study area.
5.1.3.2.15. Electric and Magnetic Fields (EMF)/Extremely Low Frequency (ELF) Fields
Since temporary electrical equipment is located several hundred feet away from the nearest receptor locations, there would be no significant increase above existing magnetic field levels. In addition, all electrical equipment would be housed within an enclosed building; therefore, no impacts related to EMF/ELF are anticipated.
5.1.3.2.16. Solid Waste
Construction activities would produce worker-generated solid waste and miscellaneous construction debris. All worker-generated and miscellaneous construction debris would be removed from the work sites by a private hauler. At each of these work sites the peak number of workers vary, as would the amount of waste. The UEC, LEC, Fluoridation Pit, Existing Screen Chamber, Catskill Venturi Meter, and Boat Hole work sites would have a maximum number of 40 workers, each generating approximately 13 lbs/week of solid waste. Therefore, total amount of solid waste generated at these work sites would be 520 lbs/week (40 x 13 lbs/week). The Aerators would have a maximum of 10 workers, each generating approximately 13 lbs/week of solid waste. The total amount of solid waste generated would be 130 lbs/week (10 x 13 lbs/week). This volume of solid waste would be collected and transported off-site by a private hauler. No operations employees would be stationed at these sites after construction. The new Screen Chamber would be constructed within 2 to 2.5 years. This work would take place all year round and would have a maximum of 50 employees, each generating 13 lbs/week of sold waste. The total amount of solid waste generated would be 650 lbs/wk (50 x 13 lbs/wk).

FEIS KENRESWORKSITES 148
This volume of solid waste would be collected and transported off-site by a private hauler. No operations employees would be stationed at the work sites after construction. Additional solid waste would be generated as a byproduct of construction. This material would be highly variable in nature; it would include cardboard, wood, block, plastics, scrap steel, ductwork, sheetrock and pipe wire. This amount of waste would be added to the worker-generated waste as described above. The increase in solid waste generated from construction activities would be minimal. The quantity of solid waste generated during construction would be negligible compared to the amount handled by the County solid waste disposal system. It is anticipated that the solid waste produced by construction workers would not result in a significant adverse impact on local or regional solid waste.
5.1.3.2.17. Public Health As noted above in Section 5.13.2.9, Air Quality, Potential Construction Impacts, the construction sources at work sites are not anticipated to have any significant impacts on air quality. Therefore, no public health impacts are anticipated as a result of the proposed construction activities at the Kensico Reservoir work sites.

FEIS KENRESWORKSITES 149
5.1.3.2.18. Permits and Approvals
TABLE 5.1-45. POTENTIAL DISCRETIONARY APPROVALS FOR KENSICO RESERVOIR WORK SITES UNDER THE
PROPOSED UV FACILITY PROJECT
Kensico Reservoir Work Sites:
Regulatory requirement
Cat
skill
A
qued
uct
Pres
suri
zatio
n Se
para
te U
V
Faci
lity
Bui
ldin
g U
pper
E
fflu
ent
Cha
mbe
r L
ower
E
fflu
ent
Cha
mbe
r
New
Scr
een
Cha
mbe
r
Aer
ator
s
Shaf
t No.
18
Fluo
rida
tion
Pit
Exi
stin
g Sc
reen
C
ham
ber
Cat
skill
V
entu
ri
Boa
t Hol
e
New York State Department of Environmental Conservation •
√
• Protection of Water Permit (Environmental Conservation Law, Article 15, Title 15; 6NYCRR Part 608)
√
• Freshwater Wetlands Permit (Environmental Conservation Law, Article 24; 6NYCRR Parts 663 through 665)
√
• Stream Disturbance Permit (Environmental Conservation Law, Article 15, Title 15; 6 NYCRR Part 608)
√ √
• State Pollution Discharge Elimination System (SPDES); SPDES General Permit (GP-02-01) for Storm Water Discharge
√

FEIS KENRESWORKSITES 150
TABLE 5.1-45. POTENTIAL DISCRETIONARY APPROVALS FOR KENSICO RESERVOIR WORK SITES UNDER THE PROPOSED UV FACILITY PROJECT
Kensico Reservoir Work Sites:
Regulatory requirement
Cat
skill
A
qued
uct
Pres
suri
zatio
n Se
para
te U
V
Faci
lity
Bui
ldin
g U
pper
E
fflu
ent
Cha
mbe
r L
ower
E
fflu
ent
Cha
mbe
r
New
Scr
een
Cha
mbe
r
Aer
ator
s
Shaf
t No.
18
Fluo
rida
tion
Pit
Exi
stin
g Sc
reen
C
ham
ber
Cat
skill
V
entu
ri
Boa
t Hol
e
from Construction Activity (Environmental Conservation Law, Article 17, Title8; 6 NYCRR Parts 750 through 757)
New York State Department of Parks, Recreation, and Historic Preservation
• Project Approval (National Historic Preservation Act of 1966 and the New York State Historic Preservation Act of 1980)
√ √ √ √ √ √ √ √ √
New York State Department of Health
• State Environmental Review Certification for New York Revolving Fund Program (Public Health Law, Sections 1161 and 1162; 21 NYCRR Part 2604)
√ √ √ √ √ √ √ √ √
• Approval of Plans for Water Supply Improvements (NYCRR Title 10 Part 5-1.22)
√

FEIS KENRESWORKSITES 151
TABLE 5.1-45. POTENTIAL DISCRETIONARY APPROVALS FOR KENSICO RESERVOIR WORK SITES UNDER THE PROPOSED UV FACILITY PROJECT
Kensico Reservoir Work Sites:
Regulatory requirement
Cat
skill
A
qued
uct
Pres
suri
zatio
n Se
para
te U
V
Faci
lity
Bui
ldin
g U
pper
E
fflu
ent
Cha
mbe
r L
ower
E
fflu
ent
Cha
mbe
r
New
Scr
een
Cha
mbe
r
Aer
ator
s
Shaf
t No.
18
Fluo
rida
tion
Pit
Exi
stin
g Sc
reen
C
ham
ber
Cat
skill
V
entu
ri
Boa
t Hol
e
• Permit to Construct and Operate Potable Water Works (NYCRR Title 10 Part 5-1.22)
√
New York State Department of Transportation
• Highway Work Permit (Title 17, Part 126 of NYCRR) √ √ √
• Traffic Enhancement Permits (Title 17, Part 126 of NYCRR) √ √ √
Westchester County Department of Planning
• Planning Board Review (Section 239 L, M, and N of NYS General Municipal Law and Section 277.1 of County Administrative Code)
√ √
Westchester County Department of Public Works
• Building Approval √ √ • Westchester County Road
Opening Permit (Westchester County Administrative Code)
√ √

FEIS KENRESWORKSITES 152
TABLE 5.1-45. POTENTIAL DISCRETIONARY APPROVALS FOR KENSICO RESERVOIR WORK SITES UNDER THE PROPOSED UV FACILITY PROJECT
Kensico Reservoir Work Sites:
Regulatory requirement
Cat
skill
A
qued
uct
Pres
suri
zatio
n Se
para
te U
V
Faci
lity
Bui
ldin
g U
pper
E
fflu
ent
Cha
mbe
r L
ower
E
fflu
ent
Cha
mbe
r
New
Scr
een
Cha
mbe
r
Aer
ator
s
Shaf
t No.
18
Fluo
rida
tion
Pit
Exi
stin
g Sc
reen
C
ham
ber
Cat
skill
V
entu
ri
Boa
t Hol
e
Town of Mount Pleasant Planning Board
• Site Plan Approval (Mount Pleasant Code, Section 218-97) √ √ √ √ √ √ √ √ √ √ √
• Freshwater Wetlands Permit (Mount Pleasant Code, Section 111.1)
√
Town of Mount Pleasant Town Board • Special Use Permit (Mount
Pleasant Code, Section 218-55) √ Town of Mount Pleasant Building Department
• Building Permit (Mount Pleasant Code, Section 68-7) √ √ √ √ √ √ √ √ √ √
• Excavation and Removal of Soil (Mount Pleasant Code, Section 96-5)
√ √ √ √
• Construction Activity during hours other than normal business hours*
√ √
Town of Mount Pleasant Highway Department • Curb/Street Cut Access Permit √ √

FEIS KENRESWORKSITES 153
TABLE 5.1-45. POTENTIAL DISCRETIONARY APPROVALS FOR KENSICO RESERVOIR WORK SITES UNDER THE PROPOSED UV FACILITY PROJECT
Kensico Reservoir Work Sites:
Regulatory requirement
Cat
skill
A
qued
uct
Pres
suri
zatio
n Se
para
te U
V
Faci
lity
Bui
ldin
g U
pper
E
fflu
ent
Cha
mbe
r L
ower
E
fflu
ent
Cha
mbe
r
New
Scr
een
Cha
mbe
r
Aer
ator
s
Shaf
t No.
18
Fluo
rida
tion
Pit
Exi
stin
g Sc
reen
C
ham
ber
Cat
skill
V
entu
ri
Boa
t Hol
e
(Mount Pleasant Code, Section 188)
New York City Art Commission
• Project Approval √ *A Noise Variance may be needed for the operation of ventilation fans during construction work within the Catskill Aqueduct. This will be clarified as more information becomes available regarding the Catskill Aqueduct pressurization work.


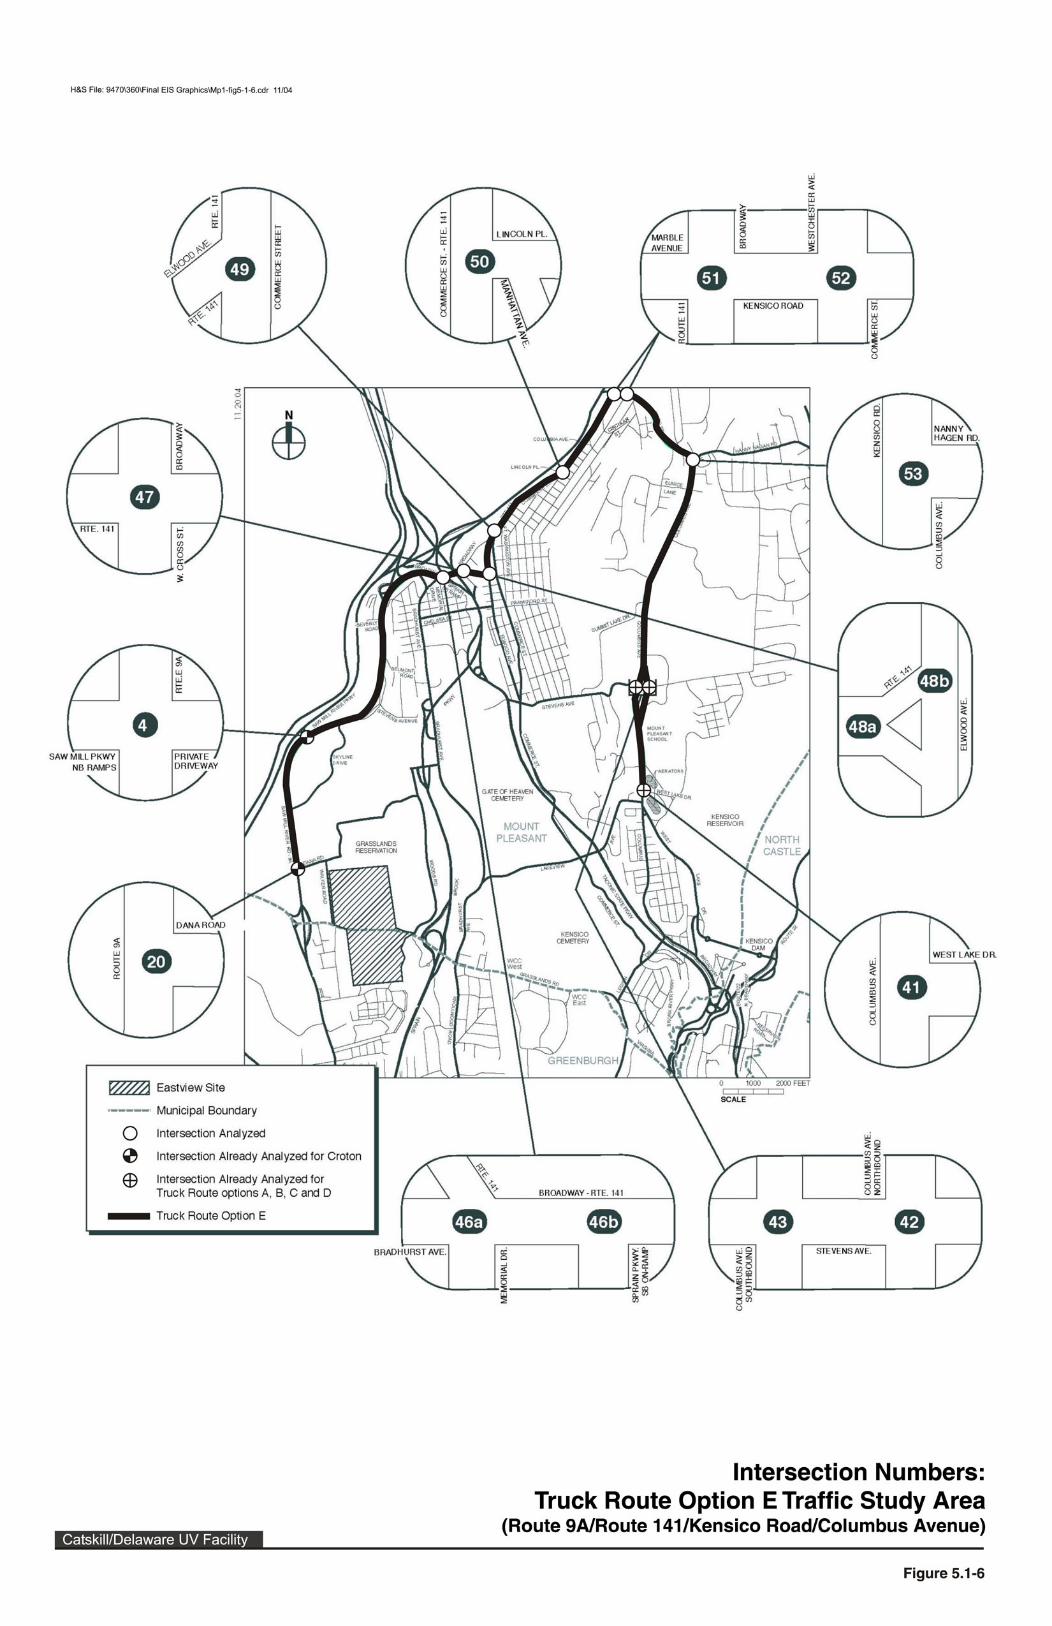


Not To Scale
Figure 5.1-14
Catskill/Delaware UV Facility
2004 Existing Traffic Volumes(Intersections Analyzed for
the 2010 Construction Year)AM Late Peak Hour (8:00 - 9:00 AM)
H&
S F
ile: 9
47
0\3
60
\Fin
al E
IS G
rap
hic
s\M
p1
-Fig
5-1
-14
.cd
r 1
1/0
4


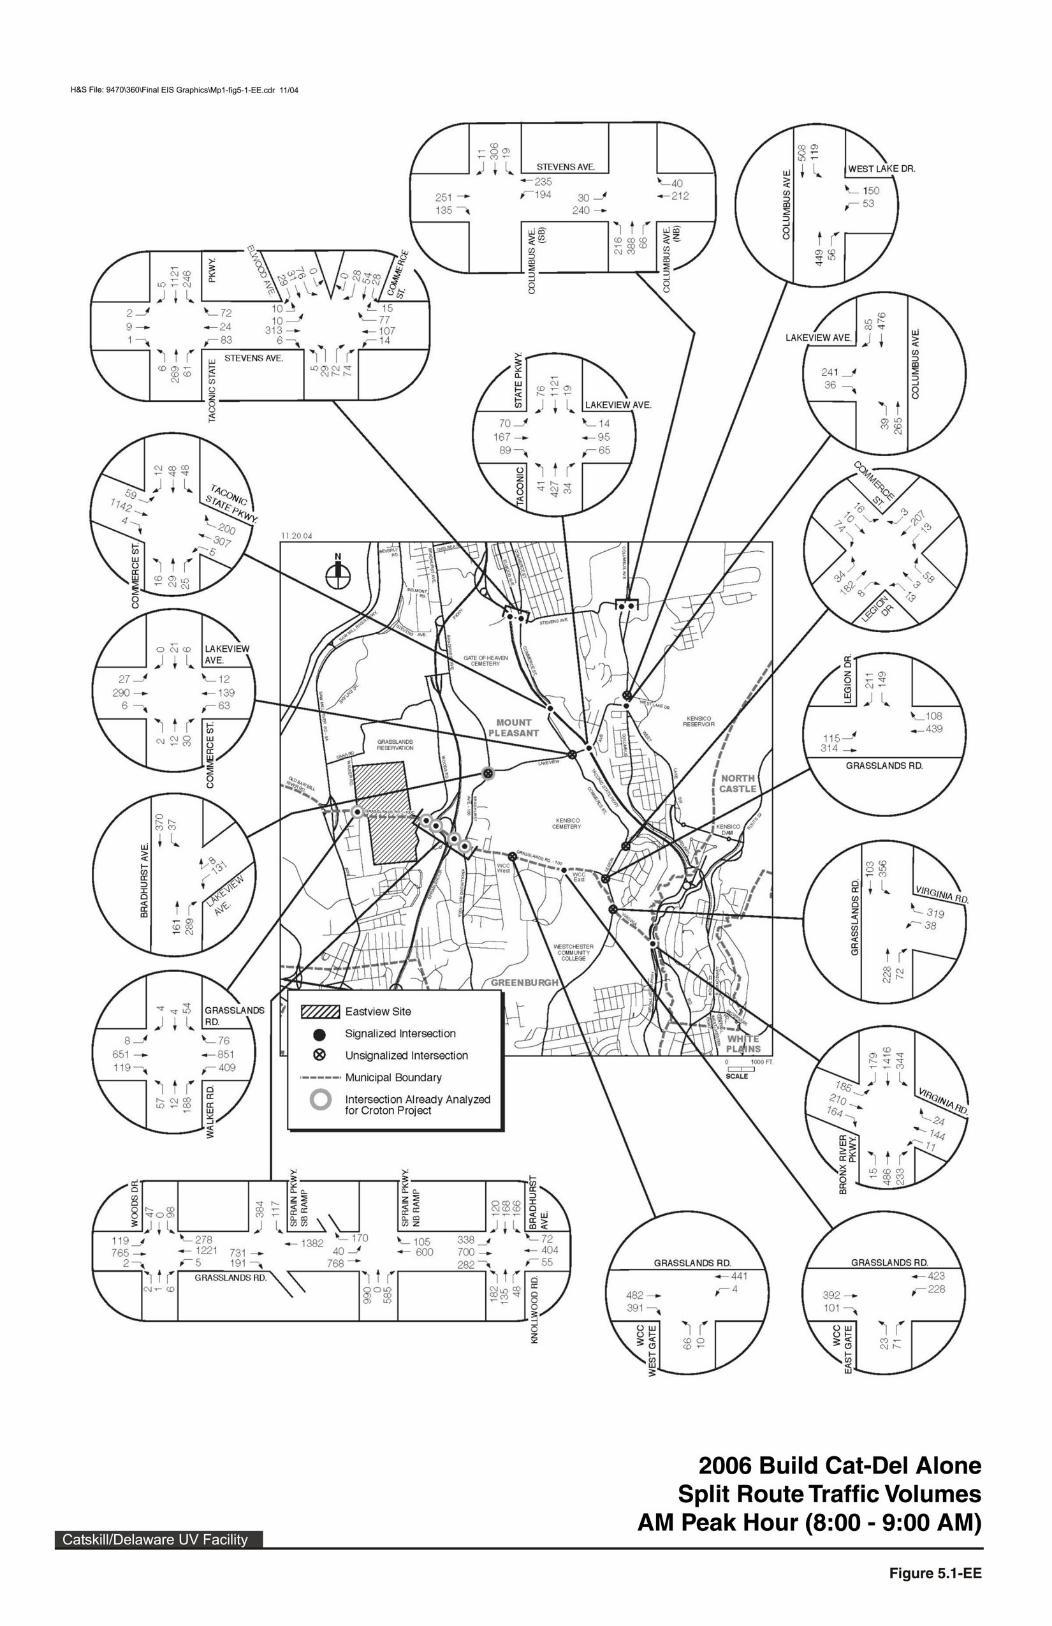


Copyright © 2022 FDOKUMEN